UNITED STATES
SECURITIES AND EXCHANGE COMMISSION
Washington, D.C. 20549
FORM N-CSR
CERTIFIED SHAREHOLDER REPORT OF REGISTERED
MANAGEMENT INVESTMENT COMPANIES
Investment Company Act file number | 811-21471 |
|
Nuveen Tax-Advantaged Total Return Strategy Fund |
(Exact name of registrant as specified in charter) |
|
Nuveen Investments 333 West Wacker Drive Chicago, IL 60606 |
(Address of principal executive offices) (Zip code) |
|
Kevin J. McCarthy Nuveen Investments 333 West Wacker Drive Chicago, IL 60606 |
(Name and address of agent for service) |
|
Registrant’s telephone number, including area code: | (312) 917-7700 | |
|
Date of fiscal year end: | December 31 | |
|
Date of reporting period: | December 31, 2012 | |
| | | | | | |
Form N-CSR is to be used by management investment companies to file reports with the Commission not later than 10 days after the transmission to stockholders of any report that is required to be transmitted to stockholders under Rule 30e-1 under the Investment Company Act of 1940 (17 CFR 270.30e-1). The Commission may use the information provided on Form N-CSR in its regulatory, disclosure review, inspection, and policymaking roles.
A registrant is required to disclose the information specified by Form N-CSR, and the Commission will make this information public. A registrant is not required to respond to the collection of information contained in Form N-CSR unless the Form displays a currently valid Office of Management and Budget (“OMB”) control number. Please direct comments concerning the accuracy of the information collection burden estimate and any suggestions for reducing the burden to Secretary, Securities and Exchange Commission, 450 Fifth Street, NW, Washington, DC 20549-0609. The OMB has reviewed this collection of information under the clearance requirements of 44 U.S.C. ss. 3507.
ITEM 1. REPORTS TO SHAREHOLDERS

Nuveen Investments
Closed-End Funds
Seeks Opportunities for Capital Appreciation and Tax-Advantaged Distributions
from a Portfolio of Value Equities and Senior Loans
Annual Report
December 31, 2012

Nuveen Tax-Advantaged
Total Return Strategy
Fund
JTA

Nuveen makes things e-simple.
It only takes a minute to sign up for e-Reports. Once enrolled, you'll receive an e-mail as soon as your Nuveen Fund information is ready. No more waiting for delivery by regular mail. Just click on the link within the e-mail to see the report and save it on your computer if you wish.
Free e-Reports right to your e-mail!
www.investordelivery.com
If you receive your Nuveen Fund distributions and statements from your financial advisor or brokerage account.
OR
www.nuveen.com/accountaccess
If you receive your Nuveen Fund distributions and statements directly from Nuveen.

Chairman's Letter to Shareholders | | | 4 | | |
Portfolio Managers' Comments | | | 5 | | |
Fund Leverage and Other Information | | | 9 | | |
Common Share Distribution and Price Information | | | 11 | | |
Performance Overview | | | 14 | | |
Report of Independent Registered Public Accounting Firm | | | 15 | | |
Portfolio of Investments | | | 16 | | |
Statement of Assets & Liabilities | | | 23 | | |
Statement of Operations | | | 24 | | |
Statement of Changes in Net Assets | | | 25 | | |
Statement of Cash Flows | | | 26 | | |
Financial Highlights | | | 28 | | |
Notes to Financial Statements | | | 30 | | |
Board Members & Officers | | | 41 | | |
Glossary of Terms Used in this Report | | | 46 | | |
Additional Fund Information | | | 51 | | |
Chairman's
Letter to Shareholders

Dear Shareholders,
Despite the global economy's ability to muddle through the many economic headwinds of 2012, investors continue to have good reasons to remain cautious. The European Central Bank's decisions to extend intermediate term financing to major European banks and to support sovereign debt markets have begun to show signs of a stabilized euro area financial market. The larger member states of the European Union (EU) are working diligently to strengthen the framework for a tighter financial and banking union and meaningful progress has been made by agreeing to centralize large bank regulation under the European Central Bank. However, economic conditions in the southern tier members are not improving and the pressures on their political leadership remain intense. The jury is out on whether the respective populations will support the continuing austerity measures that are needed to meet the EU fiscal targets.
In the U.S., the Fed remains committed to low interest rates into 2015 through its third program of Quantitative Easing (QE3). Inflation remains low but a growing number of economists are expressing concern about the economic distortions resulting from negative real interest rates. The highly partisan atmosphere in Congress led to a disappointingly modest solution for dealing with the end-of-year tax and spending issues. Early indications for the new Congressional term have not given much encouragement that the atmosphere for dealing with the sequestration legislation and the debt ceiling issues, let alone a more encompassing "grand bargain," will be any better than the last Congress. Over the longer term, there are some encouraging trends for the U.S. economy: house prices are beginning to recover, banks and corporations continue to strengthen their financial positions and incentives for capital investment in the U.S. by domestic and foreign corporations are increasing due to more competitive energy and labor costs.
During 2012 U.S. investors have benefited from strong returns in the domestic equity markets and solid returns in most fixed income markets. However, many of the macroeconomic risks of 2012 remain unresolved, including negotiating through the many U.S. fiscal issues, managing the risks of another year of abnormally low U.S. interest rates, sustaining the progress being made in the euro area and reducing the potential economic impact of geopolitical issues, particularly in the Middle East. In the face of these uncertainties, the experienced investment professionals at Nuveen Investments seek out investments that are enjoying positive economic conditions. At the same time they are always on the alert for risks in markets subject to excessive optimism or for opportunities in markets experiencing undue pessimism. Monitoring this process is a critical function for the Fund Board as it oversees your Nuveen Fund on your behalf.
As always, I encourage you to communicate with your financial consultant if you have any questions about your investment in a Nuveen Fund. On behalf of the other members of your Fund Board, we look forward to continuing to earn your trust in the months and years ahead.
Sincerely,

Robert P. Bremner
Chairman of the Board
February 22, 2013
Nuveen Investments
4
Portfolio Managers' Comments
Certain statements in this report are forward-looking statements. Discussions of specific investments are for illustration only and are not intended as recommendations of individual investments. The forward-looking statements and other views expressed herein are those of the portfolio managers as of the date of this report. Actual future results or occurrences may differ significantly from those anticipated in any forward-looking statements and the views expressed herein are subject to change at any time, due to numerous market and other factors. The Fund disclaims any obligation to update publicly or revise any forward-looking statements or views expressed herein.
Ratings shown are the highest rating given by one of the following national rating agencies: Standard & Poor's Group, Moody's Investors Service, Inc. or Fitch, Inc. Credit ratings are subject to change. AAA, AA, A, and BBB are investment grade ratings; BB, B, CCC, CC, C and D are below investment grade ratings. Certain bonds backed by U.S. Government or agency securities are regarded as having an implied rating equal to the rating of such securities. Holdings designated N/R are not rated by a national rating agency.
Nuveen Tax-Advantaged Total Return Strategy Fund (JTA)
The Fund features management by two affiliates of Nuveen Investments. The Fund's investments in dividend-paying common and preferred stocks are managed by NWQ Investment Management Company, LLC (NWQ), while the Fund's investments in senior corporate loans and other debt instruments are managed by Symphony Asset Management LLC (Symphony). The NWQ team is led by Jon Bosse, Chief Investment Officer of NWQ, James Stephenson, CFA, and Michael Carne, CFA. The Symphony team is led by Gunther Stein, who serves as that firm's Chief Investment Officer. Here they discuss the general market conditions, their management strategies and the performance of the Fund for the twelve-month period ended December 31, 2012.
What were the general market conditions and trends over the course of this reporting period?
During this period, the U.S. economy's progress toward recovery from recession continued at a moderate pace. The Federal Reserve (Fed) maintained its efforts to improve the overall economic environment by holding the benchmark fed funds rate at the record low level of zero to 0.25% that it established in December 2008. The central bank decided during its December 2012 meeting to keep the fed funds rate at "exceptionally low levels" until either the unemployment rate reaches 6.5% or expected inflation goes above 2.5%. The Fed also affirmed its decision, announced in September 2012, to purchase $40 billion of mortgage-backed securities each month in an effort to stimulate the housing market. In addition to this new, open-ended stimulus program, the Fed plans to continue its program to extend the average maturity of its holdings of U.S. Treasury securities through the end of December 2012. The goals of these actions, which together will increase the Fed's holdings of longer-term securities by approximately $85 billion a month through the end of the year, are to put downward pressure on longer-term interest rates, make broader financial conditions more accommodative and support a stronger economic recovery as well as continued progress toward the Fed's mandates of maximum employment and price stability.
In the fourth quarter 2012, the U.S. economy, as measured by the U.S. gross domestic product (GDP), decreased at an estimated annualized rate of 0.1%, down from a 3.1% increase in the third quarter. This slight decline was due to lower inventory investment, federal spending and net exports. The Consumer Price Index (CPI) rose 1.7% year-over-year as of December 2012, after a 3.0% increase in 2011. The core CPI (which excludes food and energy) increased 1.9% during the period, staying just within the Fed's unofficial objective of 2.0% or lower for this inflation measure. As of January 2013, the national unemployment rate was 7.9%, slightly higher than the 7.8% unemployment rate for
Nuveen Investments
5
December 2012 but below the 8.3% level recorded in January 2012. The housing market continued to show signs of improvement, with the average home price in the S&P/Case-Shiller Index of 20 major metropolitan areas rising 5.5% for the twelve months ended November 2012 (most recent data available at the time this report was prepared). This was the largest year-over-year price gain since August 2006. The outlook for the U.S. economy remained clouded by uncertainty about global financial markets and the continued negotiations by Congress regarding potential spending cuts and tax policy reform.
The U.S. equity markets delivered impressive gains in 2012 despite significant market volatility and overarching economic uncertainty brought on by the European credit crisis, combined with the presidential election and its ultimate impact on the fiscal cliff. Congress averted the fiscal cliff with tax legislation, but spending cuts and entitlement reforms still need to be addressed in 2013. Asset flows continued into bonds from equities, and into passive equity strategies away from active managers.
Prices in the secondary senior loan market continued to be impacted by supply and demand. Senior loan issuance remained steady throughout the period, as demand remained robust from both retail and institutional investors. Steady demand for loan assets led to positive momentum for the senior loan market throughout the reporting period.
What key strategies were used to manage the Fund during this reporting period?
The Fund is designed to seek a high level of after-tax total return consisting primarily of tax-advantaged dividend income and capital appreciation. In an effort to achieve this, the Fund invests primarily in common stocks whose dividends may be eligible for favorable income tax treatment. The Fund also invests to a more limited extent in preferred stocks that are eligible to pay tax-advantaged dividends, as well as in senior loans and other debt instruments.
For the common and preferred equity portion of the Fund's portfolio, NWQ continued to employ an opportunistic, bottom-up strategy that focused on identifying undervalued companies possessing favorable risk/reward characteristics as well as what we thought were emerging catalysts that could unlock value or improve profitability. These catalysts included management changes, restructuring efforts, recognition of hidden assets or a positive change in the underlying fundamentals. We also focused on downside risk management and paid a great deal of attention to a company's balance sheet and cash flow statement, not just the income statement. We believed that cash flow analysis offered a more objective picture of a company's financial position than an evaluation based on earnings alone.
Preferred securities, especially those with perpetual maturities and low dividend rates, typically exhibit a measure of duration extension during an environment of rising interest rates. While NWQ does not foresee a significant rise in either longer-term or short-term interest rates through 2013, in that eventuality, we expect to invest in shorter duration preferred stocks with higher dividend rates as well as preferred securities with floating rate features in order to help mitigate price depreciation due to rising rates.
Nuveen Investments
6
Past performance is not predictive of future results. Current performance may be higher or lower than the data shown. Returns do not reflect the deduction of taxes that shareholders may have to pay on Fund distributions or upon the sale of Fund shares.
For additional information, see the Performance Overview page in this report.
* Since inception returns are from 1/27/04.
** Refer to Glossary of Terms Used in this Report for definitions. Indexes and Benchmarks are not available for direct investment.
In the senior loan and other debt portion of the Fund's portfolio, Symphony continued to manage and monitor senior loan market risks. Credit risk remained low during the period. Defaults averaged below 2% for the senior loan market. Any weaknesses observed were in very specific areas, such as the coal-mining sector.
The Fund's capital remained invested in issuers who maintain strong credit profiles among non-investment grade debt while offering attractive current income and yield. Fundamentally, Symphony feels that many of these companies have stable businesses, good asset coverage for senior debt holders and could perform well in a stable to slow growth environment.
How did the Fund perform over this period?
The performance of the Fund, as well as for a comparative benchmark and index, is presented in the accompanying table.
Average Annual Total Returns on Common Share Net Asset Value
For periods ended 12/31/12
| | 1-Year | | 5-Year | | Since
Inception* | |
JTA | | | 14.54 | % | | | -5.16 | % | | | 2.25 | % | |
Comparative Benchmark** | | | 16.41 | % | | | 1.56 | % | | | 5.24 | % | |
S&P 500® Index** | | | 16.00 | % | | | 1.66 | % | | | 4.62 | % | |
For the twelve-month period ended December 31, 2012, the total return on common share net asset value (NAV) for the Fund underperformed its comparative benchmark and the general market index.
Several positions contributed to the Fund's underperformance versus the benchmark. The investment in Hewlett-Packard Company hurt performance during the period. The company had an opportunity to create value from the combination of shareholder and board activism, cost cuts and asset sales. However, this restructuring opportunity was overwhelmed by weak fundamentals and a lack of profitability in its EDS (electronic data systems) services business. NWQ sold the Fund's position in Hewlett Packard during the period. Best Buy Co., Inc. share price declined as increased competition from online retailers reduced profit margins. Despite near-term uncertainty, NWQ remains optimistic about the appointment of a new CEO, positive traction in a new store prototype and ongoing cost reduction initiatives. Our gold mining stocks AngloGold Ashanti Limited, Sponsored ADR and Barrick Gold Corporation also underperformed during the period. Gold companies have been negatively impacted by project cost overruns, structural cost inflation, grade degradation and sovereign renegotiation over the past several years. The price of gold has roughly doubled over the past five years while many gold equities have been flat or declined over the same period. Therefore, we believe our holdings have attractive valuations and have the potential to generate free cash flow in the intermediate timeframe.
Several positions contributed positively to the Fund's relative performance. Citigroup Inc. share price appreciated due to attractive valuation and improving fundamentals. The company appointed Michael Corbat as its new CEO in late 2012. Corbat's plan to cut
Nuveen Investments
7
costs by $1.1 billion starting in 2014 was well received by investors. NWQ believes that negative attitudes towards the financial sector have peaked and are likely to improve given strong equity capital ratios and loss reserves built since the credit crisis in 2008. General Motors Company appreciated as the government reduced its stake in the company, removing a significant overhang on the stock. In December, the U.S. Treasury sold 200 million shares back to the company and gave indications that it will liquidate its remaining 19% stake in an orderly fashion over the next 12-15 months. We believe the valuation of the stock remains very attractive. Lastly, Ingersoll-Rand Company Limited appreciated due to early indications of a cyclical recovery in the housing and construction markets after a three year decline. The company also made progress towards resolving internal profit pressures, particularly within its HVAC (heating, ventilation and air conditioning) business.
During the reporting period, NWQ added several new positions including American International Group Inc., Applied Materials Inc., Capital One Financial Corporation and Ericsson. We also eliminated positions in Genworth Financial Inc., Intersil Corporation, Hewlett-Packard Company, Canadian Natural Resources Ltd., Exxon Mobil Corporation, Freeport-McMoRan Copper & Gold, Inc., Goldman Sachs Group, Inc., Lincoln National Corporation, Loews Corporation, Motorola Solutions Inc. and Nielsen Holdings NV to pursue more attractive investment opportunities.
During the reporting period, the preferred sleeve of the Fund outperformed its benchmark. NWQ's holdings in the banking sector contributed to this outperformance. In particular, Wells Fargo & Company, U.S. Bancorp and HSBC Finance Corporation were among the largest contributors for the period.
During this period, NWQ also wrote (sold) covered call options on individual stocks held in the Fund's portfolio, while investing in the same stocks, to enhance returns while foregoing some upside potential. This had a very small negative effect on performance for the period.
The senior loan sleeve managed by Symphony positively contributed to the Fund's performance during the reporting period. The senior loan portion of the Fund benefited from positive cash flows and fundamentals. Symphony's positions in U.S. Foodservice and First Data Corporation performed well during the period. Detracting from performance was Frac Tech International, whose natural gas related businesses have been hurt by pricing pressure. Additionally, exposure to Travelport lagged the overall market despite releasing numbers late in the period that were largely ahead of expectations.
Nuveen Investments
8
Fund Leverage
and Other Information
IMPACT OF THE FUND'S LEVERAGE STRATEGIES ON PERFORMANCE
One important factor impacting the returns of the Fund relative to the comparative index was the Fund's use of leverage through the use of bank borrowings. The Fund uses leverage because its managers believe that, over time, leveraging provides opportunities for additional income and total return for common shareholders. However, use of leverage also can expose common shareholders to additional volatility. For example, as the prices of securities held by the Fund decline, the negative impact of these valuation changes on common share net asset value and common shareholder total return is magnified by the use of leverage. Conversely, leverage may enhance common share returns during periods when the prices of securities held by the Fund generally are rising. During the period, the Fund entered into forward starting interest rate swap contracts, which have yet to become effective, in order to hedge future leverage costs. The combination of those forward starting swaps along with the existing interest rate swap contracts that were previously entered into in order to hedge a portion of the Fund's leverage costs partially detracted from the overall positive contribution of leverage. Short-term floating interest rates remained below the existing fixed swap rates for the period which increased realized leverage costs and exceeded the combined positive mark-to-market impact of unrealized gains.
RISK CONSIDERATIONS
Fund shares are not guaranteed or endorsed by any bank or other insured depository institution, and are not federally insured by the Federal Deposit Insurance Corporation. Shares of closed-end funds are subject to investment risks, including the possible loss of principal invested. Past performance is no guarantee of future results. Fund common shares are subject to a variety of risks, including:
Investment, Market and Price Risk. An investment in common shares is subject to investment risk, including the possible loss of the entire principal amount that you invest. Your investment in common shares represents an indirect investment in the corporate securities owned by the Fund, which generally trade in the over-the-counter markets. Shares of closed-end investment companies like the Fund frequently trade at a discount to their net asset value (NAV). Your common shares at any point in time may be worth less than your original investment, even after taking into account the reinvestment of Fund dividends and distributions.
Leverage Risk. The Fund's use of leverage creates the possibility of higher volatility for the Fund's per share NAV, market price and distributions. Leverage risk can be introduced through regulatory leverage (issuing preferred shares or debt borrowings at the Fund level) or through certain derivative investments held in a Fund's portfolio.
Nuveen Investments
9
Leverage typically magnifies the total return of a Fund's portfolio, whether that return is positive or negative. The use of leverage creates an opportunity for increased common share net income, but there is no assurance that a Fund's leveraging strategy will be successful.
Tax Risk: The Fund's investment program and the tax treatment of Fund distributions may be affected by IRS interpretations of the Internal Revenue Code and future changes in tax laws and regulations that may alter the existing favorable tax treatment of tax-advantaged dividends. The American Taxpayer Relief Act of 2012 increased the maximum rate on tax-advantaged dividends to 20% effective January 1, 2013 on persons earning over $400,000 for individuals and $450,000 for married couples filing jointly. There can be no assurance as to the percentage of a Fund's distributions that will qualify as tax-advantaged dividends.
Common Stock Risk. Common stock returns often have experienced significant volatility.
Issuer Credit Risk. This is the risk that a security in the Fund's portfolio will fail to make dividend or interest payments when due.
Illiquid Securities Risk. This is the risk that the Fund may not be able to sell securities in its portfolio at the time or price desired by the Fund.
Below-Investment Grade Risk. Investments in securities below investment grade quality are predominantly speculative and subject to greater volatility and risk of default.
Unrated Investment Risk. In determining whether an unrated security is an appropriate investment for the Fund, the manager will consider information from industry sources, as well as its own quantitative and qualitative analysis, in making such a determination. However, such a determination by the manager is not the equivalent of a rating by a rating agency.
Dividend Income Risk. There is no guarantee that the issuers of common stocks in which the Fund invests will declare dividends in the future or that, if declared, they will remain at current levels or increase over time.
Risks from Unsecured Adjustable Rate Loans or Insufficient Collateral Securing Adjustable Rate Loans. Some of the adjustable rate loans in which the Fund may invest will be unsecured or insufficiently collateralized, thereby increasing the risk of loss to the Fund in the event of issuer default.
Value Stock Risks. Value stocks are securities that the manager believes to be undervalued, or mispriced. If the manager's assessment of a company's prospects is wrong, the price of the company's common stock or other equity securities may fall, or may not approach the value that the manager has placed on them.
Derivatives Strategy Risk. Derivative securities, such as calls, puts, warrants, swaps and forwards, carry risks different from, and possibly greater than, the risks associated with the underlying investments.
Reinvestment Risk. If market interest rates decline, income earned from the Fund's portfolio may be reinvested at rates below that of the original bond that generated the income.
Nuveen Investments
10
Common Share Distribution
and Price Information
Distribution Information
The following information regarding the Fund's distributions is current as of December 31, 2012, and likely will vary over time based on the Fund's investment activities and portfolio investment changes.
During the current reporting period, the Fund made no change to its quarterly distribution to common shareholders. Some of the important factors affecting the amount and composition of these distributions are summarized below.
The Fund employs financial leverage through the use of bank borrowings. Financial leverage provides the potential for higher earnings (net investment income), total returns and distributions over time, but also increases the variability of common shareholders' net asset value per share in response to changing market conditions.
The Fund has a managed distribution program. The goal of this program is to provide common shareholders relatively consistent and predictable cash flow by systematically converting the Fund's expected long-term return potential into regular distributions. As a result, regular distributions throughout the year are likely to include a portion of expected long-term gains (both realized and unrealized), along with net investment income.
Important points to understand about the managed distribution program are:
• The Fund seeks to establish a relatively stable common share distribution rate that roughly corresponds to the projected total return from its investment strategy over an extended period of time. However, you should not draw any conclusions about the Fund's past or future investment performance from its current distribution rate.
• Actual common share returns will differ from projected long-term returns (and therefore the Fund's distribution rate), at least over shorter time periods. Over a specific timeframe, the difference between actual returns and total distributions will be reflected in an increasing (returns exceed distributions) or a decreasing (distributions exceed returns) Fund net asset value.
• Each distribution is expected to be paid from some or all of the following sources:
• net investment income (regular interest and dividends),
• realized capital gains, and
• unrealized gains, or, in certain cases, a return of principal (non-taxable distributions).
• A non-taxable distribution is a payment of a portion of the Fund's capital. When the Fund's returns exceed distributions, it may represent portfolio gains generated, but
Nuveen Investments
11
*** The Fund elected to retain a portion of its realized long-term capital gains for the tax years ended December 31, 2007 and December 31, 2006, and pay required federal corporate income taxes on these amounts. As reported on Form 2439, Common shareholders on record date must include their pro-rata share of these gains on their applicable federal tax returns, and are entitled to take offsetting tax credits, for their pro-rata share of the taxes paid by the Fund. The total returns "Including retained gain tax credit/refund" include the economic benefit to Common shareholders on record date of these tax credits/refunds. The Fund had no retained capital gains for the tax years ended December 31, 2012 through December 31, 2008 or for the tax years ended prior to December 31, 2006.
not realized as a taxable capital gain. In periods when the Fund's returns fall short of distributions, the shortfall will represent a portion of your original principal, unless the shortfall is offset during other time periods over the life of your investment (previous or subsequent) when the Fund's total return exceeds distributions.
• Because distribution source estimates are updated during the year based on the Fund's performance and forecast for its current fiscal year (which is the calendar year for the Fund), estimates on the nature of your distributions provided at the time the distributions are paid may differ from both the tax information reported to you in your Fund's IRS Form 1099 statement provided at year end, as well as the ultimate economic sources of distributions over the life of your investment.
The following table provides information regarding the Fund's common share distributions and total return performance for the year ended December 31, 2012. This information is intended to help you better understand whether the Fund's returns for the specified time period were sufficient to meet the Fund's distributions.
As of 12/31/12 (Common Shares) | | JTA | |
Inception date | | 1/27/04 | |
Fiscal year (calendar year) ended December 31, 2012: | |
Per share distribution: | |
From net investment income | | $ | 0.48 | | |
From long-term capital gains | | | 0.00 | | |
From short-term capital gains | | | 0.00 | | |
Return of capital | | | 0.40 | | |
Total per share distribution | | $ | 0.88 | | |
Distribution rate on NAV | | | 7.54 | % | |
Average annual total returns: | |
Excluding retained gain tax credit/refund***: | |
| 1-Year on NAV | | | 14.54 | % | |
| 5-Year on NAV | | | -5.16 | % | |
Since inception on NAV | | | 2.25 | % | |
Including retained gain tax credit/refund***: | |
| 1-Year on NAV | | | 14.54 | % | |
| 5-Year on NAV | | | -5.16 | % | |
Since inception on NAV | | | 2.57 | % | |
Certain dividends received by the Fund may be eligible for favorable federal income taxation at rates applicable to long-term capital gains ("tax-advantaged dividends"). The favorable qualified dividend income provisions of the federal tax code, which were set to expire on December 31, 2012, were permanently extended on a modified basis by the American Taxpayer Relief Act of 2012.
Nuveen Investments
12
Common Share Repurchases and Price Information
During November 2012, the Nuveen Funds Board of Directors/Trustees reauthorized the Fund's open-market share repurchase program, allowing the Fund to repurchase an aggregate of up to approximately 10% of its outstanding common shares.
As of December 31, 2012, and since the inception of the Fund's repurchase program, the Fund has cumulatively repurchased and retired its common shares as shown in the accompanying table.
Common Shares
Repurchased and Retired | | % of Outstanding
Common Shares | |
| | 122,745 | | | | 0.9 | % | |
During the current reporting period, the Fund repurchased and retired shares at a weighted average price and a weighted average discount per share as shown in the accompanying table.
Common Shares
Repurchased and Retired | | Weighted Average Price
Per Common Share
Repurchased and Retired | | Weighted Average Discount
Per Common Share
Repurchased and Retired | |
| | 12,983 | | | $ | 9.98 | | | | 11.07 | % | |
As of December 31, 2012, the Fund's common share price was trading at a discount of -9.94% to its NAV, compared with an average discount of -9.03% for the entire twelve-month period.
Nuveen Investments
13
Fund Snapshot
Common Share Price | | $ | 10.51 | | |
Common Share Net Asset Value (NAV) | | $ | 11.67 | | |
Premium/(Discount) to NAV | | | -9.94 | % | |
| Current Distribution Rate1 | | | 8.37 | % | |
Net Assets Applicable to
Common Shares ($000) | | $ | 161,395 | | |
Leverage
Regulatory Leverage | | | 29.61 | % | |
Effective Leverage | | | 29.61 | % | |
Portfolio Composition
(as a % of total investments)2,3
Pharmaceuticals | | | 14.3 | % | |
Media | | | 11.7 | % | |
Insurance | | | 11.0 | % | |
Oil, Gas & Consumable Fuels | | | 5.9 | % | |
Diversified Financial Services | | | 5.8 | % | |
Software | | | 5.3 | % | |
Commercial Banks | | | 4.5 | % | |
Metals & Mining | | | 3.7 | % | |
Communications Equipment | | | 3.0 | % | |
Consumer Finance | | | 2.8 | % | |
Wireless Telecommunication Services | | | 2.0 | % | |
Food & Staples Retailing | | | 2.0 | % | |
Electric Utilities | | | 1.9 | % | |
Automobiles | | | 1.9 | % | |
Health Care Providers & Services | | | 1.8 | % | |
Short-Term Investments | | | 3.3 | % | |
Other | | | 19.1 | % | |
Average Annual Total Returns
(Inception 1/27/04)
| | | On Share Price | | On NAV | |
| 1-Year | | | 19.31 | % | | | 14.54 | % | |
| 5-Year | | | -4.84 | % | | | -5.16 | % | |
Since Inception | | | 1.22 | % | | | 2.25 | % | |
Average Annual Total Returns4
(Including retained gain tax credit/refund)
| | | On Share Price | | On NAV | |
| 1-Year | | | 19.31 | % | | | 14.54 | % | |
| 5-Year | | | -4.84 | % | | | -5.16 | % | |
Since Inception | | | 1.55 | % | | | 2.57 | % | |
JTA
Performance
OVERVIEW
Nuveen Tax-Advantaged Total Return Strategy Fund
December 31, 2012
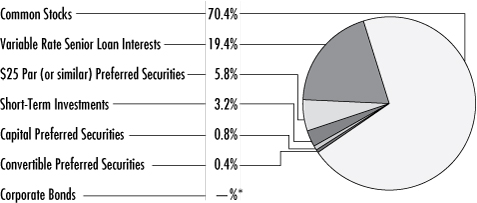
Portfolio Allocation (as a % of total investments)2,3
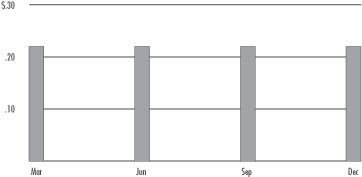
2012 Distributions Per Common Share
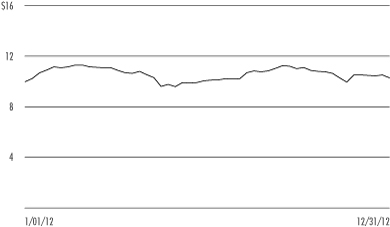
Share Price Performance — Weekly Closing Price
Refer to the Glossary of Terms Used in this Report for further definition of the terms used within this Fund's Performance Overview page.
1 Current Distribution Rate is based on the Fund's current annualized quarterly distribution divided by the Fund's current market price. The Fund's quarterly distributions to its shareholders may be comprised of ordinary income, net realized capital gains and, if at the end of the calendar year the Fund's cumulative net ordinary income and net realized gains are less than the amount of the Fund's distributions, a return of capital for tax purposes.
2 Excluding investments in derivatives.
3 Holdings are subject to change.
4 As previously explained in the Common Share Distribution and Price Information section of this report, the Fund elected to retain a portion of its realized long-term capital gains for the tax years ended December 31, 2007 and December 31, 2006, and pay required federal corporate income taxes on these amounts. These standardized total returns include the economic benefit to Common shareholders of record of this tax credit/refund. The Fund had no retained capital gains for the tax years ended December 31, 2012 through December 31, 2008 or for the tax years ended prior to December 31, 2006.
* Rounds to less than 1%.
Nuveen Investments
14
Report of INDEPENDENT REGISTERED
PUBLIC ACCOUNTING FIRM
The Board of Trustees and Shareholders
Nuveen Tax-Advantaged Total Return Strategy Fund
We have audited the accompanying statement of assets and liabilities, including the portfolio of investments, of Nuveen Tax-Advantaged Total Return Strategy Fund (the "Fund") as of December 31, 2012, and the related statements of operations and cash flows for the year then ended, the statements of changes in net assets for each of the two years in the period then ended, and the financial highlights for each of the five years in the period then ended. These financial statements and financial highlights are the responsibility of the Fund's management. Our responsibility is to express an opinion on these financial statements and financial highlights based on our audits.
We conducted our audits in accordance with the standards of the Public Company Accounting Oversight Board (United States). Those standards require that we plan and perform the audits to obtain reasonable assurance about whether the financial statements and financial highlights are free of material misstatement. We were not engaged to perform an audit of the Fund's internal control over financial reporting. Our audits included consideration of internal control over financial reporting as a basis for designing audit procedures that are appropriate in the circumstances, but not for the purpose of expressing an opinion on the effectiveness of the Fund's internal control over financial reporting. Accordingly, we express no such opinion. An audit also includes examining, on a test basis, evidence supporting the amounts and disclosures in the financial statements and financial highlights, assessing the accounting principles used and significant estimates made by management, and evaluating the overall financial statement presentation. Our procedures included confirmation of securities owned as of December 31, 2012, by correspondence with the custodian, counterparty, selling or agent banks, and brokers or by other appropriate auditing procedures where replies from brokers were not received. We believe that our audits provide a reasonable basis for our opinion.
In our opinion, the financial statements and financial highlights referred to above present fairly, in all material respects, the financial position of Nuveen Tax-Advantaged Total Return Strategy Fund at December 31, 2012, and the results of its operations and its cash flows for the year then ended, the changes in its net assets for each of the two years in the period then ended, and the financial highlights for each of the five years in the period then ended, in conformity with U.S. generally accepted accounting principles.

Chicago, Illinois
February 27, 2013
Nuveen Investments
15
Nuveen Tax-Advantaged Total Return Strategy Fund
Portfolio of Investments
December 31, 2012
| Shares | | Description (1) | | Value | |
| | | Common Stocks – 101.5% (70.4% of Total Investments) | |
| | | Aerospace & Defense – 1.7% | |
| | 48,000 | | | Raytheon Company | | $ | 2,762,880 | | |
| | | Automobiles – 2.7% | |
| | 151,000 | | | General Motors Company, (2) | | | 4,353,330 | | |
| | | Chemicals – 1.5% | |
| | 44,000 | | | Mosaic Company | | | 2,491,720 | | |
| | | Commercial Banks – 3.8% | |
| | 180,500 | | | Wells Fargo & Company | | | 6,169,490 | | |
| | | Communications Equipment – 4.0% | |
| | 285,000 | | | Cisco Systems, Inc. | | | 5,600,250 | | |
| | 86,000 | | | LM Ericsson Telefonaktiebolaget, Sponsored ADR | | | 868,600 | | |
| | | Total Communications Equipment | | | 6,468,850 | | |
| | | Consumer Finance – 3.1% | |
| | 86,000 | | | Capital One Financial Corporation | | | 4,981,980 | | |
| | | Diversified Financial Services – 7.4% | |
| | 153,200 | | | Citigroup Inc. | | | 6,060,592 | | |
| | 133,500 | | | JPMorgan Chase & Co. | | | 5,869,995 | | |
| | | Total Diversified Financial Services | | | 11,930,587 | | |
| | | Diversified Telecommunication Services – 0.9% | |
| | 356,700 | | | Frontier Communications Corporation | | | 1,526,676 | | |
| | | Energy Equipment & Services – 1.1% | |
| | 50,000 | | | Halliburton Company | | | 1,734,500 | | |
| | | Food & Staples Retailing – 2.8% | |
| | 95,000 | | | CVS Caremark Corporation | | | 4,593,250 | | |
| | | Industrial Conglomerates – 1.1% | |
| | 87,600 | | | General Electric Company | | | 1,838,724 | | |
| | | Insurance – 13.0% | |
| | 174,500 | | | American International Group, (2) | | | 6,159,850 | | |
| | 234,000 | | | Hartford Financial Services Group, Inc. | | | 5,250,960 | | |
| | 73,700 | | | MetLife, Inc. | | | 2,427,678 | | |
| | 127,544 | | | Symetra Financial Corporation | | | 1,655,521 | | |
| | 260,700 | | | Unum Group | | | 5,427,774 | | |
| | | Total Insurance | | | 20,921,783 | | |
| | | Machinery – 2.1% | |
| | 37,500 | | | Ingersoll Rand Company Limited, Class A | | | 1,798,500 | | |
| | 34,700 | | | PACCAR Inc. | | | 1,568,787 | | |
| | | Total Machinery | | | 3,367,287 | | |
Nuveen Investments
16
| Shares | | Description (1) | | Value | |
| | | Media – 11.4% | |
| | 286,000 | | | Interpublic Group Companies, Inc. | | $ | 3,151,720 | | |
| | 16,393 | | | Metro-Goldwyn-Mayer, (3) | | | 618,836 | | |
| | 211,300 | | | National CineMedia, Inc. | | | 2,985,669 | | |
| | 61,100 | | | News Corporation, Class A | | | 1,560,494 | | |
| | 98,800 | | | Time Warner Inc. | | | 4,725,604 | | |
| | 100,000 | | | Viacom Inc., Class B | | | 5,274,000 | | |
| | | Total Media | | | 18,316,323 | | |
| | | Metals & Mining – 5.4% | |
| | 128,300 | | | AngloGold Ashanti Limited, Sponsored ADR | | | 4,024,771 | | |
| | 97,200 | | | Barrick Gold Corporation | | | 3,402,972 | | |
| | 27,500 | | | Newmont Mining Corporation | | | 1,277,100 | | |
| | | Total Metals & Mining | | | 8,704,843 | | |
| | | Oil, Gas & Consumable Fuels – 7.2% | |
| | 18,900 | | | Occidental Petroleum Corporation | | | 1,447,929 | | |
| | 62,200 | | | Royal Dutch Shell PLC, Class A | | | 4,288,690 | | |
| | 127,000 | | | Talisman Energy Inc. | | | 1,438,910 | | |
| | 86,600 | | | Total S.A., Sponsored ADR | | | 4,504,066 | | |
| | | Total Oil, Gas & Consumable Fuels | | | 11,679,595 | | |
| | | Pharmaceuticals – 18.8% | |
| | 135,000 | | | GlaxoSmithKline PLC, Sponsored ADR | | | 5,868,450 | | |
| | 113,000 | | | Merck & Company Inc. | | | 4,626,220 | | |
| | 335,800 | | | Pfizer Inc. | | | 8,421,864 | | |
| | 181,000 | | | Sanofi-Aventis, ADR | | | 8,575,780 | | |
| | 78,200 | | | Teva Pharmaceutical Industries Limited, Sponsored ADR | | | 2,919,988 | | |
| | | Total Pharmaceuticals | | | 30,412,302 | | |
| | | Semiconductors & Equipment – 1.1% | |
| | 151,000 | | | Applied Materials, Inc. | | | 1,727,440 | | |
| | | Software – 6.5% | |
| | 279,943 | | | CA Technologies, Inc. | | | 6,153,147 | | |
| | 163,000 | | | Microsoft Corporation, (4) | | | 4,356,990 | | |
| | | Total Software | | | 10,510,137 | | |
| | | Specialty Retail – 0.6% | |
| | 79,000 | | | Best Buy Co., Inc. | | | 936,150 | | |
| | | Tobacco – 2.6% | |
| | 49,400 | | | Philip Morris International | | | 4,131,816 | | |
| | | Wireless Telecommunication Services – 2.7% | |
| | 170,000 | | | Vodafone Group PLC, Sponsored ADR | | | 4,282,300 | | |
| | | Total Common Stocks (cost $148,140,892) | | | 163,841,963 | | |
| Shares | | Description (1) | | Coupon | | | | Ratings (5) | | Value | |
| | | Convertible Preferred Securities – 0.5% (0.4% of Total Investments) | |
| | | Commercial Banks – 0.5% | |
| | 700 | | | Wells Fargo & Company, Convertible Bond | | | 7.500 | % | | | | | | BBB+ | | $ | 857,500 | | |
| | | | | Total Convertible Preferred Securities (cost $635,761) | | | | | | | | | | | | | | | 857,500 | | |
Nuveen Investments
17
Nuveen Tax-Advantaged Total Return Strategy Fund (continued)
Portfolio of Investments December 31, 2012
| Shares | | Description (1) | | Coupon | | | | Ratings (5) | | Value | |
| | | $25 Par (or similar) Preferred Securities – 8.3% (5.8% of Total Investments) | |
| | | Capital Markets – 0.4% | |
| | 25,000 | | | State Street Corporation | | | 5.250 | % | | | | | | BBB+ | | $ | 635,250 | | |
| | | Commercial Banks – 1.8% | |
| | 25,000 | | | BB&T Corporation | | | 5.850 | % | | | | | | BBB | | | 649,500 | | |
| | 6,525 | | | Cobank Agricultural Credit Bank, (6) | | | 6.250 | % | | | | | | A- | | | 679,620 | | |
| | 25,000 | | | First Republic Bank of San Francisco | | | 6.200 | % | | | | | | BBB | | | 652,500 | | |
| | 10,000 | | | PNC Financial Services | | | 6.125 | % | | | | | | BBB | | | 277,100 | | |
| | 25,000 | | | U.S. Bancorp. | | | 6.500 | % | | | | | | BBB+ | | | 716,000 | | |
| | | Total Commercial Banks | | | | | | | | | | | | | | | 2,974,720 | | |
| | | Consumer Finance – 0.4% | |
| | 28,500 | | | HSBC Finance Corporation | | | 6.360 | % | | | | | | A | | | 714,210 | | |
| | | Diversified Consumer Services – 0.4% | |
| | 25,000 | | | Gabelli Equity Trust | | | 5.000 | % | | | | | | AAA | | | 641,250 | | |
| | | Diversified Financial Services – 0.2% | |
| | 10,000 | | | JPMorgan Chase & Company | | | 5.500 | % | | | | | | BBB | | | 251,400 | | |
| | | Electric Utilities – 1.9% | |
| | 18,150 | | | Alabama Power Company, (6) | | | 6.500 | % | | | | | | A- | | | 518,977 | | |
| | 10,000 | | | Alabama Power Company, (6) | | | 6.450 | % | | | | | | A- | | | 279,063 | | |
| | 12,000 | | | Connecticut Power & Light Company, (6) | | | 4.960 | % | | | | | | BBB | | | 598,876 | | |
| | 5,000 | | | Georgia Power Company, (6) | | | 6.500 | % | | | | | | A- | | | 568,282 | | |
| | 5,000 | | | Gulf Power Company, (6) | | | 6.450 | % | | | | | | BBB+ | | | 547,448 | | |
| | 3,600 | | | SCE Trust I | | | 5.625 | % | | | | | | BBB+ | | | 92,880 | | |
| | 4,400 | | | Southern California Edison Company, (6) | | | 6.125 | % | | | | | | BBB+ | | | 441,513 | | |
| | | Total Electric Utilities | | | | | | | | | | | | | | | 3,047,039 | | |
| | | Insurance – 2.8% | |
| | 25,000 | | | Arch Capital Group Limited | | | 6.750 | % | | | | | | BBB | | | 670,750 | | |
| | 3,800 | | | Aspen Insurance Holdings Limited | | | 7.401 | % | | | | | | BBB- | | | 99,750 | | |
| | 15,410 | | | Aspen Insurance Holdings Limited | | | 7.250 | % | | | | | | BBB- | | | 403,433 | | |
| | 25,000 | | | Axis Capital Holdings Limited | | | 6.875 | % | | | | | | BBB | | | 667,500 | | |
| | 25,000 | | | Endurance Specialty Holdings Limited | | | 7.750 | % | | | | | | BBB- | | | 662,250 | | |
| | 3,500 | | | Endurance Specialty Holdings Limited | | | 7.500 | % | | | | | | BBB- | | | 93,310 | | |
| | 25,000 | | | MetLife Inc. | | | 6.500 | % | | | | | | Baa2 | | | 630,250 | | |
| | 25,000 | | | PartnerRe Limited | | | 7.250 | % | | | | | | BBB+ | | | 675,750 | | |
| | 25,000 | | | Principal Financial Group | | | 6.518 | % | | | | | | BBB | | | 643,500 | | |
| | | Total Insurance | | | | | | | | | | | | | | | 4,546,493 | | |
| | | Oil, Gas & Consumable Fuels – 0.4% | |
| | 25,000 | | | Kayne Anderson MLP Trust, (4) | | | 4.950 | % | | | | | | AA | | | 631,500 | | |
| | | Total $25 Par (or similar) Preferred Securities (cost $12,547,505) | | | | | | | | | | | | | | | 13,441,862 | | |
Principal
Amount (000) | | Description (1) | | Coupon | | Maturity (7) | | Ratings (5) | | Value | |
| | | Variable Rate Senior Loan Interests – 28.0% (19.4% of Total Investments) (8) | |
| | | Aerospace & Defense – 0.3% | |
$ | 438 | | | Hamilton Sundstrand, Term Loan B | | | 5.000 | % | | 12/05/19 | | B+ | | $ | 441,913 | | |
| | | Airlines – 0.3% | |
| | 500 | | | Delta Air Lines, Inc., Term Loan B1 | | | 5.250 | % | | 10/18/18 | | Ba2 | | | 504,532 | | |
Nuveen Investments
18
Principal
Amount (000) | | Description (1) | | Coupon | | Maturity (7) | | Ratings (5) | | Value | |
| | | Auto Components – 1.1% | |
$ | 1,300 | | | Federal-Mogul Corporation, Tranche B, Term Loan | | | 2.148 | % | | 12/29/14 | | B1 | | $ | 1,197,153 | | |
| | 663 | | | Federal-Mogul Corporation, Tranche C, Term Loan | | | 2.148 | % | | 12/28/15 | | B1 | | | 610,792 | | |
| | 1,963 | | | Total Auto Components | | | 1,807,945 | | |
| | | Biotechnology – 0.6% | |
| | 884 | | | Grifols, Inc., Term Loan | | | 4.500 | % | | 6/01/17 | | BB | | | 893,671 | | |
| | | Chemicals – 0.6% | |
| | 980 | | | Univar, Inc., Term Loan | | | 5.000 | % | | 6/30/17 | | B+ | | | 979,727 | | |
| | | Communications Equipment – 0.3% | |
| | 490 | | | Avaya, Inc., Term Loan | | | 3.220 | % | | 10/27/14 | | B1 | | | 480,441 | | |
| | | Consumer Finance – 0.5% | |
| | 750 | | | Springleaf Financial Funding Company, Term Loan | | | 5.500 | % | | 5/10/17 | | B3 | | | 746,954 | | |
| | | Containers & Packaging – 1.2% | |
| | 1,595 | | | Reynolds Group Holdings, Inc., Term Loan | | | 4.750 | % | | 9/28/18 | | B+ | | | 1,616,351 | | |
| | 357 | | | Sealed Air Corporation, Term Loan B1 | | | 4.000 | % | | 10/03/18 | | Ba1 | | | 362,483 | | |
| | 1,952 | | | Total Containers & Packaging | | | 1,978,834 | | |
| | | Diversified Telecommunication Services – 0.6% | |
| | 856 | | | Intelsat Jackson Holdings, Ltd., Term Loan B1 | | | 4.500 | % | | 4/02/18 | | BB- | | | 863,781 | | |
| | | Electric Utilities – 0.9% | |
| | 1,860 | | | TXU Corporation, 2014 Term Loan | | | 3.746 | % | | 10/10/14 | | B2 | | | 1,419,632 | | |
| | | Food Products – 2.0% | |
| | 1,000 | | | AdvancePierre Foods, Inc., Term Loan, First Lien | | | 5.750 | % | | 7/10/17 | | B1 | | | 1,013,125 | | |
| | 1,255 | | | Michael Foods Group, Inc., Term Loan | | | 4.250 | % | | 2/25/18 | | Ba3 | | | 1,264,990 | | |
| | 976 | | | U.S. Foodservice, Inc., Extended Term Loan | | | 5.750 | % | | 3/31/17 | | B2 | | | 981,854 | | |
| | 3,231 | | | Total Food Products | | | 3,259,969 | | |
| | | Health Care Equipment & Supplies – 0.9% | |
| | 1,485 | | | Kinetic Concepts, Inc., Term Loan C1 | | | 5.500 | % | | 5/04/18 | | Ba2 | | | 1,503,562 | | |
| | | Health Care Providers & Services – 2.6% | |
| | 1,000 | | | DaVita, Inc., New Term Loan B2 | | | 4.000 | % | | 11/01/19 | | Ba2 | | | 1,009,163 | | |
| | 985 | | | Golden Living, Term Loan | | | 5.000 | % | | 5/04/18 | | B1 | | | 928,008 | | |
| | 76 | | | HCA, Inc., Tranche B2, Term Loan | | | 3.561 | % | | 3/31/17 | | BB | | | 76,227 | | |
| | 903 | | | Kindred Healthcare, Term Loan | | | 5.250 | % | | 6/01/18 | | Ba3 | | | 884,107 | | |
| | 990 | | | Select Medical Corporation, Term Loan | | | 5.500 | % | | 6/01/18 | | BB- | | | 995,724 | | |
| | 305 | | | Universal Health Services, Inc., Term Loan B | | | 3.750 | % | | 11/15/16 | | BB+ | | | 306,374 | | |
| | 4,259 | | | Total Health Care Providers & Services | | | 4,199,603 | | |
| | | Health Care Technology – 0.6% | |
| | 990 | | | Emdeon Business Services LLC, Term Loan B1 | | | 5.000 | % | | 11/02/18 | | BB- | | | 1,001,280 | | |
| | | Hotels, Restaurants & Leisure – 2.3% | |
| | 955 | | | 24 Hour Fitness Worldwide, Inc., New Term Loan | | | 7.500 | % | | 4/22/16 | | Ba3 | | | 964,414 | | |
| | 500 | | | MGM Resorts International | | | 4.250 | % | | 12/20/19 | | BB | | | 506,094 | | |
| | 1,248 | | | Seaworld Parks and Entertainment, Inc., Term Loan B | | | 4.000 | % | | 8/17/17 | | BB- | | | 1,259,356 | | |
| | 1,015 | | | Six Flags Theme Parks, Inc., Term Loan B | | | 4.000 | % | | 12/20/18 | | BB+ | | | 1,021,880 | | |
| | 3,718 | | | Total Hotels, Restaurants & Leisure | | | 3,751,744 | | |
| | | Internet & Catalog Retail – 0.4% | |
| | 706 | | | Burlington Coat Factory Warehouse Corporation, Term Loan B1 | | | 5.500 | % | | 2/23/17 | | B | | | 713,342 | | |
Nuveen Investments
19
Nuveen Tax-Advantaged Total Return Strategy Fund (continued)
Portfolio of Investments December 31, 2012
Principal
Amount (000) | | Description (1) | | Coupon | | Maturity (7) | | Ratings (5) | | Value | |
| | | Internet Software & Services – 0.1% | |
$ | 173 | | | Go Daddy Operating Co. LLC, Term Loan, Tranche B1 | | | 5.500 | % | | 12/17/18 | | Ba3 | | $ | 173,608 | | |
| | | IT Services – 0.4% | |
| | 398 | | | SunGard Data Systems, Inc., Term Loan B | | | 1.959 | % | | 2/28/14 | | BB | | | 399,944 | | |
| | 274 | | | Frac Tech International LLC, Term Loan | | | 8.500 | % | | 5/06/16 | | B+ | | | 228,246 | | |
| | 672 | | | Total IT Services | | | 628,190 | | |
| | | Media – 5.4% | |
| | 263 | | | Nielsen Finance LLC, Term Loan C | | | 3.463 | % | | 5/02/16 | | Ba2 | | | 264,680 | | |
| | 1,564 | | | Univision Communications, Inc., Term Loan | | | 4.462 | % | | 3/31/17 | | B+ | | | 1,541,100 | | |
| | 613 | | | Bresnan Broadband Holdings LLC, Term Loan B | | | 4.500 | % | | 12/14/17 | | BB+ | | | 617,285 | | |
| | 496 | | | Cequel Communications LLC, Term Loan | | | 4.000 | % | | 2/14/19 | | Ba2 | | | 499,283 | | |
| | 750 | | | Cumulus Media, Inc., Term Loan, Second Lien | | | 7.500 | % | | 9/16/19 | | B2 | | | 774,375 | | |
| | 1,246 | | | Interactive Data Corporation, Term Loan B | | | 4.500 | % | | 2/11/18 | | Ba3 | | | 1,254,637 | | |
| | 1,000 | | | Kabel Deutschland GmbH, Term Loan F | | | 4.250 | % | | 1/20/19 | | Ba2 | | | 1,007,292 | | |
| | 1,451 | | | Mediacom Broadband LLC, Tranche F, Term Loan | | | 4.500 | % | | 10/23/17 | | BB- | | | 1,455,814 | | |
| | 850 | | | Tribune Company, Exit Term Loan B, WI/DD | | | TBD | | | TBD | | BB+ | | | 850,106 | | |
| | 438 | | | WideOpenWest Finance LLC, Term Loan B | | | 6.250 | % | | 7/12/18 | | B1 | | | 443,512 | | |
| | 8,671 | | | Total Media | | | 8,708,084 | | |
| | | Oil, Gas & Consumable Fuels – 0.9% | |
| | 500 | | | El Paso Corporation, Tranche B1, Term Loan | | | 5.000 | % | | 5/24/18 | | Ba3 | | | 504,196 | | |
| | 860 | | | Energy Transfer Partners LP, Term Loan B | | | 3.750 | % | | 3/24/17 | | BB | | | 867,995 | | |
| | 1,360 | | | Total Oil, Gas & Consumable Fuels | | | 1,372,191 | | |
| | | Pharmaceuticals – 1.8% | |
| | 500 | | | Bausch & Lomb, Inc., Delayed Draw, Term Loan | | | 4.750 | % | | 9/30/15 | | B+ | | | 504,688 | | |
| | 746 | | | Bausch & Lomb, Inc., Term Loan B | | | 5.250 | % | | 5/17/19 | | B+ | | | 753,979 | | |
| | 748 | | | Quintiles Transnational Corporation, Term Loan B, WI/DD | | | TBD | | | TBD | | BB- | | | 756,093 | | |
| | 134 | | | Warner Chilcott Company LLC, Term Loan B1 Additional | | | 4.250 | % | | 3/15/18 | | BBB- | | | 134,536 | | |
| | 352 | | | Warner Chilcott Corporation, Term Loan B1 | | | 4.250 | % | | 3/15/18 | | BBB- | | | 354,256 | | |
| | 176 | | | Warner Chilcott Corporation, Term Loan B2 | | | 4.250 | % | | 3/15/18 | | BBB- | | | 177,128 | | |
| | 242 | | | Warner Chilcott Corporation, Term Loan B3 | | | 4.250 | % | | 3/15/18 | | BBB- | | | 243,551 | | |
| | 2,898 | | | Total Pharmaceuticals | | | 2,924,231 | | |
| | | Real Estate Investment Trust – 0.6% | |
| | 964 | | | iStar Financial, Inc., Term Loan | | | 5.750 | % | | 10/15/17 | | BB- | | | 976,031 | | |
| | | Real Estate Management & Development – 0.2% | |
| | 372 | | | LNR Property Corporation, Term Loan | | | 4.750 | % | | 4/29/16 | | BB+ | | | 374,432 | | |
| | | Road & Rail – 0.4% | |
| | 568 | | | Swift Transportation Company, Inc., Term Loan, Tranche B2 | | | 5.000 | % | | 12/21/17 | | BB | | | 574,893 | | |
| | | Semiconductors & Equipment – 1.1% | |
| | 750 | | | NXP BV Term Loan | | | 4.750 | % | | 12/06/19 | | B+ | | | 754,453 | | |
| | 983 | | | NXP Semiconductor LLC, Term Loan | | | 4.500 | % | | 3/03/17 | | B2 | | | 992,478 | | |
| | 1,733 | | | Total Semiconductors & Equipment | | | 1,746,931 | | |
| | | Software – 1.1% | |
| | 875 | | | Datatel Parent Corp, Term Loan B | | | 6.250 | % | | 7/19/18 | | B+ | | | 886,985 | | |
| | 871 | | | Infor Enterprise Applications, Term Loan B | | | 5.250 | % | | 4/05/18 | | Ba3 | | | 880,290 | | |
| | 1,746 | | | Total Software | | | 1,767,275 | | |
| | | Specialty Retail – 0.6% | |
| | 952 | | | Tempur-Pedic International, Inc., Term Loan B, WI/DD | | | TBD | | | TBD | | BB | | | 965,675 | | |
Nuveen Investments
20
Principal
Amount (000) | | Description (1) | | Coupon | | Maturity (7) | | Ratings (5) | | Value | |
| | | Wireless Telecommunication Services — 0.2% | |
$ | 441 | | | Clear Channel Communications, Inc., Tranche B, Term Loan | | | 3.862 | % | | 1/29/16 | | CCC+ | | $ | 366,965 | | |
$ | 45,612 | | | Total Variable Rate Senior Loan Interests (cost $45,270,265) | | | | | | | | | | | | | | | 45,125,436 | | |
Principal
Amount (000) | | Description (1) | | Coupon | | Maturity | | Ratings (5) | | Value | |
| | | Corporate Bonds – 0.1% (0.0% of Total Investments) | |
| | | Media – 0.1% | |
$ | 133 | | | Clear Channel Communications, Inc., 144A | | | 9.000 | % | | 12/15/19 | | CCC+ | | $ | 121,695 | | |
$ | 133 | | | Total Corporate Bonds (cost $109,127) | | | | | | | | | | | | | | | 121,695 | | |
Principal
Amount (000)/
Shares | | Description (1) | | Coupon | | Maturity | | Ratings (5) | | Value | |
| | | Capital Preferred Securities – 1.2% (0.8% of Total Investments) | |
| | | Commercial Banks – 0.4% | |
| | 500 | | | PNC Financial Services Inc. | | | 6.750 | % | | | N/A (9) | | | BBB | | $ | 567,870 | | |
| | | Diversified Financial Services – 0.8% | |
| | 600 | | | General Electric Capital Corporation | | | 7.125 | % | | 12/15/49 | | AA- | | | 678,174 | | |
| | 500 | | | JPMorgan Chase & Company | | | 7.900 | % | | | N/A (9) | | | BBB | | | 566,505 | | |
| | | | | Total Diversified Financial Services | | | | | | | | | | | | | | | 1,244,679 | | |
| | | Insurance – 0.0% | |
| | 44 | | | Prudential PLC | | | 7.750 | % | | | N/A (9) | | | A- | | | 47,586 | | |
| | | | | Total Capital Preferred Securities (cost $1,631,267) | | | | | | | | | | | | | | | 1,860,135 | | |
Principal
Amount (000) | | Description (1) | | Coupon | | Maturity | | | | Value | |
| | | Short-Term Investments – 4.7% (3.2% of Total Investments) | |
$ | 4,328
| | | Repurchase Agreement with Fixed Income Clearing Corporation, dated
12/31/12, repurchase price $4,327,540, collateralized by $4,230,000
U.S. Treasury Notes, 1.750%, due 7/31/15, value $4,414,775 | | | 0.010 | % | | 1/02/13 | | | | $ | 4,327,538 | | |
| 3,255
| | | Repurchase Agreement with Fixed Income Clearing Corporation, dated
12/31/12, repurchase price $3,255,297, collateralized by $3,325,000
U.S. Treasury Bills, 0.000%, due 6/06/13, value $3,323,338 | | | 0.010 | % | | 1/02/13 | | | | | 3,255,295 | | |
$ | 7,583 | | | Total Short-Term Investments (cost $7,582,833) | | | | | | | | | | | | | | | 7,582,833 | | |
| | | | | Total Investments (cost $215,917,650) – 144.3% | | | | | | | | | | | | | | | 232,831,424 | | |
| | | | | Borrowings – (42.1)% (10), (11) | | | | | | | | | | | | | | | (67,900,000 | ) | |
| | | | | Other Assets Less Liabilities – (2.2)% (12) | | | | | | | | | | | | | | | (3,536,584 | ) | |
| | | | | Net Assets Applicable to Common Shares – 100% | | | | | | | | | | | | | | $ | 161,394,840 | | |
Investments in Derivatives as of December 31, 2012
Call Options Written outstanding:
Number of
Contracts | | Type | | Notional
Amount (13) | | Expiration
Date | | Strike
Price | | Value (12) | |
| | (740 | ) | | Pfizer Inc. | | $ | (1,924,000 | ) | | 2/16/13 | | $ | 26 | | | $ | (14,060 | ) | |
| | (154 | ) | | Talisman Energy Inc. | | | (184,800 | ) | | 4/20/13 | | | 12 | | | | (9,240 | ) | |
| | (894 | ) | | Total Call Options Written (premiums received $41,069) | | $ | (2,108,800 | ) | | | | | | | | | | $ | (23,300 | ) | |
Nuveen Investments
21
Nuveen Tax-Advantaged Total Return Fund (continued)
Portfolio of INVESTMENTS December 31, 2012
Interest Rate Swaps outstanding:
Counterparty | | Notional
Amount | | Fund
Pay/Receive
Floating Rate | | Floating Rate
Index | | Fixed Rate* | | Fixed Rate
Payment
Frequency | | Effective
Date (14) | | Termination
Date | | Unrealized
Appreciation
(Depreciation) (12) | |
JPMorgan | | $ | 13,975,000 | | | Receive | | 1-Month USD-LIBOR | | | 1.412 | % | | Monthly | | 3/29/11 | | 3/29/14 | | $ | (205,726 | ) | |
JPMorgan | | | 18,475,000 | | | Receive | | 1-Month USD-LIBOR | | | 1.255 | | | Monthly | | 12/01/14 | | 12/01/18 | | | 43,543 | | |
JPMorgan | | | 18,475,000 | | | Receive | | 1-Month USD-LIBOR | | | 1.673 | | | Monthly | | 12/01/14 | | 12/01/20 | | | 106,298 | | |
Morgan Stanley | | | 13,975,000 | | | Receive | | 1-Month USD-LIBOR | | | 2.323 | | | Monthly | | 3/29/11 | | 3/29/16 | | | (857,973 | ) | |
| | | | | | | | | | | | | | | $ | (913,858 | ) | |
* Annualized.
For Fund portfolio compliance purposes, the Fund's industry classifications refer to any one or more of the industry sub-classifications used by one or more widely recognized market indexes or ratings group indexes, and/or as defined by Fund management. This definition may not apply for purposes of this report, which may combine industry sub-classifications into sectors for reporting ease.
(1) All percentages shown in the Portfolio of Investments are based on net assets applicable to Common shares unless otherwise noted.
(2) Non-income producing; issuer has not declared a dividend within the past twelve months.
(3) For fair value measurement disclosure purposes, Common Stock classified as Level 2. See Notes to Financial Statements, Footnote 1—General Information and Significant Accounting Policies, Investment Valuation for more information.
(4) Investment, or portion of investment, has been pledged to collateralize the net payment obligations for investments in derivatives.
(5) Ratings (not covered by the report of independent registered public accounting firm): Using the highest of Standard & Poor's Group ("Standard & Poor's"), Moody's Investors Service, Inc. ("Moody's") or Fitch, Inc. ("Fitch") rating. Ratings below BBB by Standard & Poor's, Baa by Moody's or BBB by Fitch are considered to be below investment grade.
(6) For fair value measurement disclosure purposes, $25 Par (or similar) Preferred Securities categorized as Level 2. See Notes to Financial Statements, Footnote 1—General Information and Significant Accounting Policies, Investment Valuation for more information.
(7) Senior Loans generally are subject to mandatory and/or optional prepayment. Because of these mandatory prepayment conditions and because there may be significant economic incentives for a borrower to prepay, prepayments of Senior Loans may occur. As a result, the actual remaining maturity of Senior Loans held may be substantially less than the stated maturities shown.
(8) Senior Loans generally pay interest at rates which are periodically adjusted by reference to a base short-term, floating lending rate plus an assigned fixed rate. These floating lending rates are generally (i) the lending rate referenced by the London Inter-Bank Offered Rate ("LIBOR"), or (ii) the prime rate offered by one or more major United States banks.
Senior Loans may be considered restricted in that the Fund ordinarily is contractually obligated to receive approval from the Agent Bank and/or borrower prior to the disposition of a Senior Loan.
(9) Perpetual security. Maturity date is not applicable.
(10) Borrowings as a percentage of Total Investments is 29.2%.
(11) The Fund may pledge up to 100% of its eligible investments in the Portfolio of Investments as collateral for Borrowings. As of the end of the reporting period, investments with a value of $146,783,306 have been pledged as collateral for Borrowings.
(12) Other Assets Less Liabilities includes the Value and the Unrealized Appreciation (Depreciation) of derivative instruments as noted within Investments in Derivatives as of the end of the reporting period.
(13) For disclosure purposes, Notional Amount is calculated by multiplying the Number of Contracts by the Strike Price by 100.
(14) Effective date represents the date on which both the Fund and Counterparty commence interest payment accruals on each swap contract.
N/A Not applicable.
WI/DD Purchased on a when-issued or delayed delivery basis.
144A Investment is exempt from registration under Rule 144A of the Securities Act of 1933, as amended. These investments may only be resold in transactions exempt from registration, which are normally those transactions with qualified institutional buyers.
ADR American Depositary Receipt.
TBD Senior Loan purchased on a when-issued or delayed-delivery basis. Certain details associated with this purchase are not known prior to the settlement date of the transaction. In addition, Senior Loans typically trade without accrued interest and therefore a weighted average coupon rate is not available prior to settlement. At settlement, if still unknown, the borrower or counterparty will provide the Fund with the final weighted average coupon rate and maturity date.
USD-LIBOR United States Dollar-London Inter-Bank Offered Rate.
See accompanying notes to financial statements.
Nuveen Investments
22
Statement of
ASSETS & LIABILITIES
December 31, 2012
Assets | |
Investments, at value (cost $215,917,650) | | $ | 232,831,424 | | |
Receivables: | |
Dividends | | | 414,056 | | |
Interest | | | 235,605 | | |
Investments sold | | | 54,277 | | |
Matured senior loans | | | 283,093 | | |
Reclaims | | | 114,183 | | |
Other assets | | | 30,187 | | |
Total assets | | | 233,962,825 | | |
Liabilities | |
Borrowings | | | 67,900,000 | | |
Call options written, at value (premiums received $41,069) | | | 23,300 | | |
Unrealized depreciation on interest rate swaps, net | | | 913,858 | | |
Payable for investments purchased | | | 3,430,223 | | |
Accrued expenses: | |
Interest on borrowings | | | 9,261 | | |
Management fees | | | 168,508 | | |
Trustees fees | | | 29,960 | | |
Other | | | 92,875 | | |
Total liabilities | | | 72,567,985 | | |
Net assets applicable to Common shares | | $ | 161,394,840 | | |
Common shares outstanding | | | 13,835,522 | | |
Net asset value per Common share outstanding (net assets applicable to Common shares, divided by Common shares outstanding) | | $ | 11.67 | | |
Net assets applicable to Common shares consist of: | |
Common shares, $.01 par value per share | | $ | 138,355 | | |
Paid-in surplus | | | 235,600,061 | | |
Undistributed (Over-distribution of) net investment income | | | 8,319 | | |
Accumulated net realized gain (loss) | | | (90,369,580 | ) | |
Net unrealized appreciation (depreciation) | | | 16,017,685 | | |
Net assets applicable to Common shares | | $ | 161,394,840 | | |
Authorized shares: | |
Common | | | Unlimited | | |
FundPreferred | | | Unlimited | | |
See accompanying notes to financial statements.
Nuveen Investments
23
Statement of
OPERATIONS
Year Ended December 31, 2012
Investment Income | |
Dividends (net of foreign tax withheld of $152,295) | | $ | 5,435,399 | | |
Interest | | | 2,711,337 | | |
Other | | | 89,315 | | |
Total investment income | | | 8,236,051 | | |
Expenses | |
Management fees | | | 1,997,212 | | |
Interest expense on borrowings | | | 937,875 | | |
Shareholder servicing agent fees and expenses | | | 1,164 | | |
Custodian fees and expenses | | | 82,236 | | |
Trustees fees and expenses | | | 6,493 | | |
Professional fees | | | 44,172 | | |
Shareholder reporting expenses | | | 81,310 | | |
Stock exchange listing fees | | | 8,453 | | |
Investor relations expense | | | 46,147 | | |
Other expenses | | | 14,680 | | |
Total expenses before expense reimbursement | | | 3,219,742 | | |
Expense reimbursement | | | (15,388 | ) | |
Net expenses | | | 3,204,354 | | |
Net investment income (loss) | | | 5,031,697 | | |
Realized and Unrealized Gain (Loss) | |
Net realized gain (loss) from: | |
Investments | | | (196,132 | ) | |
Call options written | | | 1,674,628 | | |
Interest rate swaps | | | (460,782 | ) | |
Change in net unrealized appreciation (depreciation) of: | |
Investments | | | 15,791,195 | | |
Call options written | | | (201,995 | ) | |
Interest rate swaps | | | 179,612 | | |
Net realized and unrealized gain (loss) | | | 16,786,526 | | |
Net increase (decrease) in net assets applicable to Common shares from operations | | $ | 21,818,223 | | |
See accompanying notes to financial statements.
Nuveen Investments
24
Statement of
CHANGES in NET ASSETS
| | | Year Ended
12/31/12 | | Year Ended
12/31/11 | |
Operations | |
Net investment income (loss) | | $ | 5,031,697 | | | $ | 5,049,392 | | |
Net realized gain (loss) from: | |
Investments | | | (196,132 | ) | | | 41,011 | | |
Call options written | | | 1,674,628 | | | | 1,495,405 | | |
Interest rate swaps | | | (460,782 | ) | | | (366,793 | ) | |
Change in net unrealized appreciation (depreciation) of: | |
Investments | | | 15,791,195 | | | | (12,125,906 | ) | |
Call options written | | | (201,995 | ) | | | 435,726 | | |
Interest rate swaps | | | 179,612 | | | | (1,093,470 | ) | |
Net increase (decrease) in net assets applicable to Common shares from operations | | | 21,818,223 | | | | (6,564,635 | ) | |
Distributions to Common Shareholders | |
From net investment income | | | (6,614,524 | ) | | | (5,537,134 | ) | |
Return of capital | | | (5,569,304 | ) | | | (6,944,101 | ) | |
Decrease in net assets applicable to Common shares
from distributions to Common shareholders | | | (12,183,828 | ) | | | (12,481,235 | ) | |
Capital Share Transactions | |
Common shares repurchased and retired | | | (129,819 | ) | | | (284,003 | ) | |
Net increase (decrease) in net assets applicable to Common shares from
capital share transactions | | | (129,819 | ) | | | (284,003 | ) | |
Net increase (decrease) in net assets applicable to Common shares | | | 9,504,576 | | | | (19,329,873 | ) | |
Net assets applicable to Common shares at the beginning of period | | | 151,890,264 | | | | 171,220,137 | | |
Net assets applicable to Common shares at the end of period | | $ | 161,394,840 | | | $ | 151,890,264 | | |
Undistributed (Over-distribution of) net investment income at the end of period | | $ | 8,319 | | | $ | (19,970 | ) | |
See accompanying notes to financial statements.
Nuveen Investments
25
Statement of
CASH FLOWS
Year Ended December 31, 2012
Cash Flows from Operating Activities: | |
Net Increase (Decrease) in Net Assets Applicable to Common Shares from Operations | | $ | 21,818,223 | | |
Adjustments to reconcile the net increase (decrease) in net assets applicable to Common
shares from operations to net cash provided by (used in) operating activities: | |
Purchases of investments | | | (84,096,433 | ) | |
Proceeds from sales and maturities of investments | | | 86,753,735 | | |
Proceeds from (Purchases of) short-term investments, net | | | 2,491,114 | | |
Proceeds from (Payments for) interest rate swap contracts, net | | | (460,782 | ) | |
Premiums received for call options written | | | 1,761,124 | | |
Cash paid for call options written | | | (431,041 | ) | |
Amortization (Accretion) of premiums and discounts, net | | | (151,117 | ) | |
(Increase) Decrease in: | |
Receivable for dividends | | | 214,670 | | |
Receivable for interest | | | 91,153 | | |
Receivable for investments sold | | | 137,848 | | |
Receivable for matured senior loans | | | (89,315 | ) | |
Receivable for reclaims | | | (69,907 | ) | |
Other assets | | | (5,130 | ) | |
(Increase) Decrease in: | |
Payable for investments purchased | | | 1,056,320 | | |
Accrued interest on borrowings | | | 3,462 | | |
Accrued management fees | | | 24,131 | | |
Accrued trustees fees | | | 4,340 | | |
Accrued other expenses | | | 19,046 | | |
Net realized (gain) loss from: | |
Investments | | | 196,132 | | |
Call options written | | | (1,674,628 | ) | |
Interest rate swaps | | | 460,782 | | |
Change in net unrealized (appreciation) depreciation of: | |
Investments | | | (15,791,195 | ) | |
Call options written | | | 201,995 | | |
Interest rate swaps | | | (179,612 | ) | |
Proceeds from litigation settlement | | | 7,251 | | |
Net cash provided by (used in) operating activities | | | 12,292,166 | | |
Cash Flows from Financing Activities: | |
Cash distributions paid to Common shareholders | | | (12,183,828 | ) | |
Cost of Common shares repurchased and retired | | | (129,819 | ) | |
Net cash provided by (used in) financing activities | | | (12,313,647 | ) | |
Net Increase (Decrease) in Cash | | | (21,481 | ) | |
Cash at the beginning of period | | | 21,481 | | |
Cash at the End of Period | | $ | — | | |
Supplemental Disclosure of Cash Flow Information
Cash paid for interest on borrowings (excluding borrowing costs) during the fiscal year ended December 31, 2012, was $914,413.
See accompanying notes to financial statements.
Nuveen Investments
26
Nuveen Investments
27
Selected data for a Common share outstanding throughout each period:
| | | | | | |
| | | | | Investment Operations | | Less Distributions | | | | | |
| | | Beginning
Common
Share
Net Asset
Value | | Net
Investment
Income
(Loss)(a) | | Net
Realized/
Unrealized
Gain
(Loss) | | Distributions
from Net
Investment
Income to
FundPreferred
Share-
holders(b) | | Distributions
from
Accumulated
Net Realized
Gains to
FundPreferred
Share-
holders(b) | | Total | | From Net
Investment
Income to
Common
Share-
holders | | From
Accum-
ulated
Net
Realized
Gains to
Common
Share-
holders | | Return of
Capital to
Common
Share-
holders | | Total | | Discount
from
Common
Shares
Repurchased
and
Retired | | Ending
Common
Share
Net Asset
Value | |
Year Ended 12/31: | |
2012 | | $ | 10.97 | | | $ | .37 | | | $ | 1.21 | | | $ | — | | | $ | — | | | $ | 1.58 | | | | (.48 | ) | | $ | — | | | $ | (.40 | ) | | $ | (.88 | ) | | $ | — | * | | $ | 11.67 | | |
2011 | | | 12.34 | | | | .36 | | | | (.83 | ) | | | — | | | | — | | | | (0.47 | ) | | | (.40 | ) | | | — | | | | (.50 | ) | | | (.90 | ) | | | — | * | | | 10.97 | | |
2010 | | | 11.63 | | | | .27 | | | | 1.38 | | | | — | | | | — | | | | 1.65 | | | | (.94 | ) | | | — | | | | — | | | | (.94 | ) | | | — | | | | 12.34 | | |
2009 | | | 9.42 | | | | .40 | | | | 2.75 | | | | (.02 | ) | | | — | | | | 3.13 | | | | (.38 | ) | | | — | | | | (.55 | ) | | | (.93 | ) | | | .01 | | | | 11.63 | | |
2008 | | | 23.54 | | | | .77 | | | | (13.06 | ) | | | (.12 | ) | | | — | | | | (12.41 | ) | | | (.70 | ) | | | (.21 | ) | | | (.80 | ) | | | (1.71 | ) | | | — | | | | 9.42 | | |
| | FundPreferred Shares at the End of Period | | Borrowings at the End of Period | |
| | | Aggregate
Amount
Outstanding
(000) | | Liquidation
and Market
Value
Per Share | | Asset
Coverage
Per Share | | Aggregate
Amount
Outstanding
(000) | | Asset
Coverage
Per $1,000 | |
Year Ended 12/31: | |
2012 | | $ | — | | | $ | — | | | $ | — | | | $ | 67,900 | | | $ | 3,377 | | |
2011 | | | — | | | | — | | | | — | | | | 67,900 | | | | 3,237 | | |
2010 | | | — | | | | — | | | | — | | | | 52,600 | | | | 4,255 | | |
2009 | | | — | | | | — | | | | — | | | | 52,600 | | | | 4,069 | | |
2008 | | | 28,850 | | | | 25,000 | | | | 138,992 | | | | 35,000 | | | | 5,583 | | |
(a) Per share Net Investment Income (Loss) is calculated using the average daily shares method.
(b) The amounts shown are based on Common share equivalents.
(c) Total Return Based on Market Value is the combination of changes in the market price per share and the effect of reinvested dividend income and reinvested capital gains distributions, if any, at the average price paid per share at the time of reinvestment. The last dividend declared in the period, which is typically paid on the first business day of the following month, is assumed to be reinvested at the ending market price. The actual reinvestment for the last dividend declared in the period takes place over several days, and in some instances may not be based on the market price, so the actual reinvestment price may be different from the price used in the calculation. Total returns are not annualized.
Total Return Based on Common Share Net Asset Value is the combination of changes in Common share net asset value, reinvested dividend income at net asset value and reinvested capital gains distributions at net asset value, if any. The last dividend declared in the period, which is typically paid on the first business day of the following month, is assumed to be reinvested at the ending net asset value. The actual reinvest price for the last dividend declared in the period may often be based on the Fund's market price (and not its net asset value), and therefore may be different from the price used in the calculation. Total returns are not annualized.
Nuveen Investments
28
| | | Ratios/Supplemental Data | |
| | | | | Total Returns | | | | Ratios to Average Net Assets
Applicable to Common Shares
Before Reimbursement(d) | | Ratios to Average Net Assets
Applicable to Common Shares
After Reimbursement(d)(e) | | | |
| | | Ending
Market
Value | | Based on
Market
Value(c) | | Based on
Common
Share
Net
Asset
Value(c) | | Ending
Net Assets
Applicable to
Common
Shares (000) | | Expenses | | Net
Investment
Income (Loss) | | Expenses | | Net
Investment
Income (Loss) | | Portfolio
Turnover
Rate | |
Year Ended 12/31: | |
2012 | | $ | 10.51 | | | | 19.31 | % | | | 14.54 | % | | $ | 161,395 | | | | 2.00 | % | | | 3.11 | % | | | 1.99 | % | | | 3.12 | % | | | 37 | % | |
2011 | | | 9.56 | | | | (7.48 | ) | | | (3.87 | ) | | | 151,890 | | | | 1.85 | | | | 2.96 | | | | 1.73 | | | | 3.08 | | | | 56 | | |
2010 | | | 11.24 | | | | 14.73 | | | | 14.99 | | | | 171,220 | | | | 1.77 | | | | 2.14 | | | | 1.55 | | | | 2.36 | | | | 48 | | |
2009 | | | 10.66 | | | | 56.47 | | | | 35.50 | | | | 161,404 | | | | 1.86 | | | | 3.71 | | | | 1.53 | | | | 4.04 | | | | 55 | | |
2008 | | | 7.58 | | | | (60.54 | ) | | | (55.29 | ) | | | 131,546 | | | | 3.74 | | | | 4.03 | | | | 3.24 | | | | 4.53 | | | | 24 | | |
(d) • Ratios do not reflect the effect of dividend payments to FundPreferred shareholders, where applicable.
• Net Investment Income (Loss) ratios reflect income earned and expenses incurred on assets attributable to FundPreferred Shares, FundNotes and/or borrowings, where applicable.
• Each Ratio of Expenses to Average Net Assets Applicable to Common Shares and each Ratio of Net Investment Income (Loss) to Average Net Assets Applicable to Common Shares includes the effect of interest expense paid on FundNotes and all interest expense and other costs related to borrowings, where applicable as follows:
| | | Ratios of FundNotes Interest Expense to
Average Net Assets Applicable to Common Shares(f) | | Ratios of Borrowings Interest Expense to
Average Net Assets Applicable to Common Shares | |
Year Ended 12/31: | |
2012 | | | — | % | | | .58 | % | |
2011 | | | — | | | | .48 | | |
2010 | | | — | | | | .45 | | |
2009 | | | — | | | | .44 | | |
2008 | | | 1.12 | | | | 1.00 | | |
(e) After expense reimbursement from the Adviser, where applicable. As of January 31, 2012, the Adviser is no longer reimbursing the Fund for any fees or expenses.
(f) The Fund redeemed all $78 million of its outstanding FundNotes during the fiscal year ended December 31, 2008.
* Rounds to less than $.01 per share.
See accompanying notes to financial statements.
Nuveen Investments
29
Notes to
FINANCIAL STATEMENTS
1. General Information and Significant Accounting Policies
General Information
Nuveen Tax-Advantaged Total Return Strategy Fund (the "Fund") is a diversified, closed-end registered investment company registered under the Investment Company Act of 1940, as amended. The Fund's Common shares are listed on the New York Stock Exchange ("NYSE") and trade under the ticker symbol "JTA." The Fund was organized as a Massachusetts business trust on October 1, 2003.
On December 31, 2012, the Fund's investment adviser converted from a Delaware corporation to a Delaware limited liability company. As a result, Nuveen Fund Advisors, Inc., a wholly-owned subsidiary of Nuveen Investments, Inc. ("Nuveen"), changed its name to Nuveen Fund Advisors, LLC (the "Adviser"). There were no changes to the identities or roles of any personnel as a result of the change.
The Fund's investment objective is to achieve a high level of after-tax total return consisting primarily of tax-advantaged dividend income and capital appreciation by investing primarily in a portfolio of dividend-paying common stocks that the Fund believes at the time of investment are eligible to pay dividends that may be eligible for favorable federal income taxation at rates applicable to long-term capital gains ("tax-advantaged dividends"). The Fund also invests, to a more limited extent, in preferred securities that are eligible to pay tax-advantaged dividends, as well as in senior loans (both secured and unsecured), domestic corporate bonds, notes and debentures, convertible debt securities and other similar types of corporate instruments, including high-yield debt securities, that are not eligible to pay tax-advantaged dividends. Certain dividends received by the Fund may be eligible for favorable federal income taxation at rates applicable to long-term capital gains ("tax-advantaged dividends"). The favorable qualified dividend income provisions of the federal tax code, which were set to expire on December 31, 2012, were permanently extended on a modified basis by the American Taxpayer Relief Act of 2012.
Significant Accounting Policies
The following is a summary of significant accounting policies followed by the Fund in the preparation of its financial statements in accordance with U.S. generally accepted accounting principles ("U.S. GAAP").
Investment Valuation
Common stocks and other equity-type securities are valued at the last sales price on the securities exchange on which such securities are primarily traded and are generally classified as Level 1 for fair value measurement purposes. Securities primarily traded on the NASDAQ National Market ("NASDAQ") are valued, except as indicated below, at the NASDAQ Official Closing Price and are generally classified as Level 1. However, securities traded on a securities exchange or NASDAQ for which there were no transactions on a given day or securities not listed on a securities exchange or NASDAQ are valued at the quoted bid price and are generally classified as Level 2. Prices of certain American Depositary Receipts ("ADR") held by the Fund that trade in the United States are valued based on the last traded price, official closing price or the most recent bid price of the underlying non-U.S.-traded stock, adjusted as appropriate for the underlying-to-ADR conversion ratio and foreign exchange rate, and from time-to-time may also be adjusted further to take into account material events that may take place after the close of the local non-U.S. market but before the close of the NYSE, which may represent a transfer from a Level 1 to a Level 2 security.
Prices of fixed-income securities, senior loans and interest rate swap contracts are provided by a pricing service approved by the Fund's Board of Trustees. These securities are generally classified as Level 2. The pricing service establishes a security's fair value using methods that may include consideration of the following: yields or prices of investments of comparable quality, type of issue, coupon, maturity and rating, market quotes or indications of value from security dealers, evaluations of anticipated cash flows or collateral, general market conditions and other information and analysis, including the obligor's credit characteristics considered relevant. In pricing certain securities, particularly less liquid and lower quality securities, the pricing service may consider information about a security, its issuer, or market activity provided by the Adviser. These securities are generally classified as Level 2 or Level 3 depending on the priority of the significant inputs.
Like most fixed-income securities, the senior and subordinated loans in which the Fund invests are not listed on an organized exchange. The secondary market of such investments may be less liquid relative to markets for other fixed-income securities.
Nuveen Investments
30
Consequently, the value of senior and subordinated loans, determined as described above, may differ significantly from the value that would have been determined had there been an active market for that senior loan. These securities are generally classified as Level 2.
The value of exchange-traded options are based on the mean of the closing bid and ask prices. Exchange-traded options are generally classified as Level 1. Options traded in the over-the-counter market are valued using an evaluated mean price and are generally classified as Level 2.
Repurchase agreements are valued at contract amount plus accrued interest, which approximates market value. These securities are generally classified as Level 2.
Certain securities may not be able to be priced by the pre-established pricing methods as described above. Such securities may be valued by the Fund's Board of Trustees or its designee at fair value. These securities generally include, but are not limited to, restricted securities (securities which may not be publicly sold without registration under the Securities Act of 1933, as amended) for which a pricing service is unable to provide a market price; securities whose trading has been formally suspended; debt securities that have gone into default and for which there is no current market quotation; a security whose market price is not available from a pre-established pricing source; a security with respect to which an event has occurred that is likely to materially affect the value of the security after the market has closed but before the calculation of the Fund's net asset value (as may be the case in non-U.S. markets on which the security is primarily traded) or make it difficult or impossible to obtain a reliable market quotation; and a security whose price, as provided by the pricing service, is not deemed to reflect the security's fair value. As a general principle, the fair value of a security would appear to be the amount that the owner might reasonably expect to receive for it in a current sale. A variety of factors may be considered in determining the fair value of such securities, which may include consideration of the following: yields or prices of investments of comparable quality, type of issue, coupon, maturity and rating, market quotes or indications of value from security dealers, evaluations of anticipated cash flows or collateral, general market conditions and other information and analysis, including the obligor's credit characteristics considered relevant. These securities are generally classified as Level 2 or Level 3 depending on the priority of the significant inputs. Regardless of the method employed to value a particular security, all valuations are subject to review by the Fund's Board of Trustees or its designee.
Refer to Footnote 2—Fair Value Measurements for further details on the leveling of securities held by the Fund as of the end of the reporting period.
Investment Transactions
Investment transactions are recorded on a trade date basis. Trade date for senior and subordinated loans purchased in the "primary market" is considered the date on which the loan allocations are determined. Trade date for senior and subordinated loans purchased in the "secondary market" is the date on which the transaction is entered into. Realized gains and losses from investment transactions are determined on the specific identification method, which is the same basis used for federal income tax purposes. Investments purchased on a when-issued/delayed delivery basis may have extended settlement periods. Any investments so purchased are subject to market fluctuation during this period. The Fund has instructed the custodian to earmark securities in the Fund's portfolio with a current value at least equal to the amount of the when-issued/delayed delivery purchase commitments. As of December 31, 2012, the Fund had outstanding when-issued/delayed delivery purchase commitments of $2,534,357.
Investment Income
Dividend income is recorded on the ex-dividend date or, for foreign securities, when information is available. Interest income, which reflects the amortization of premiums and includes accretion of discounts for financial reporting purposes, is recorded on an accrual basis. Fee income consists primarily of amendment fees. Amendment fees are earned as compensation for evaluating and accepting changes to an original senior loan agreement and are recognized when received. Fee income and amendment fees are a component of "Interest income," if any.
Professional Fees
Professional fees presented on the Statement of Operations consist of legal fees incurred in the normal course of operations, audit fees, tax consulting fees and, in some cases, workout expenditures. Workout expenditures are incurred in an attempt to protect or enhance an investment, or to pursue other claims or legal actions on behalf of Fund shareholders. Legal fee refund presented on the Statement of Operations reflects a refund of workout expenditures paid in a prior reporting period, when applicable.
Income Taxes
The Fund intends to distribute substantially all of its investment company taxable income to shareholders and to otherwise comply with the requirements of Subchapter M of the Internal Revenue Code applicable to regulated investment companies. In any year when the Fund realizes net capital gains, the Fund may choose to distribute all or a portion of its net capital gains to shareholders, or alternatively, to retain all or a portion of its net capital gains and pay federal corporate income taxes on such retained gains.
For all open tax years and all major taxing jurisdictions, management of the Fund has concluded that there are no significant uncertain tax positions that would require recognition in the financial statements. Open tax years are those that are open for examination by taxing authorities (i.e., generally the last four tax year ends and the interim tax period since then). Furthermore,
Nuveen Investments
31
Notes to
FINANCIAL STATEMENTS (continued)
management of the Fund is also not aware of any tax positions for which it is reasonably possible that the total amounts of unrecognized tax benefits will significantly change in the next twelve months.
Dividends and Distributions to Common Shareholders
Distributions to Common shareholders are recorded on the ex-dividend date. The amount and timing of distributions are determined in accordance with federal income tax regulations, which may differ from U.S. GAAP.
The Fund makes quarterly cash distributions to Common shareholders of a stated dollar amount per share. Subject to approval and oversight by the Fund's Board of Trustees, the Fund seeks to maintain a stable distribution level designed to deliver the long-term return potential of the Fund's investment strategy through regular quarterly distributions (a "Managed Distribution Program"). Total distributions during a calendar year generally will be made from the Fund's net investment income, net realized capital gains and net unrealized capital gains in the Fund's portfolio, if any. The portion of distributions paid attributed to net unrealized gains, if any, is distributed from the Fund's assets and is treated by shareholders as a non-taxable distribution ("Return of Capital") for tax purposes. In the event that total distributions during a calendar year exceed the Fund's total return on net asset value, the difference will reduce net asset value per share. If the Fund's total return on net asset value exceeds total distributions during a calendar year, the excess will be reflected as an increase in net asset value per share. The final determination of the source and character of all distributions for the fiscal year are made after the end of the fiscal year and are reflected in the financial statements contained in the annual report as of December 31 each year.
The actual character of distributions made by the Fund during the fiscal years ended December 31, 2012 and December 31, 2011, are reflected in the accompanying statements.
FundPreferred Shares
The Fund is authorized to issue auction rate preferred ("FundPreferred") shares. During the fiscal year ended December 31, 2009, the Fund redeemed all $45,000,000 of its outstanding FundPreferred shares, at liquidation value.
Matured Senior Loans
The Fund may hold senior loans, which have matured prior to the end of the current fiscal period. The net realizable value for matured senior loans is recognized on the Statement of Assets and Liabilities as "Receivable for matured senior loans." The net increase or decrease in the net realizable value of the receivable for matured senior loans during the fiscal period is recognized on the Statement of Operations as a component of "Other income" or "Other expenses," respectively, when applicable.
Options Transactions
The Fund is subject to equity price risk in the normal course of pursuing its investment objectives and is authorized to purchase and write (sell) call and put options on securities, futures, swaps ("swaptions") or currencies, in an attempt to manage such risk. The purchase of options involves the risk of loss of all or a part of the cash paid for the options (the premium). The market risk associated with purchasing options is limited to the premium paid. The counterparty credit risk of purchasing options, however, needs also to take into account the current value of the option, as this is the performance expected from the counterparty. When the Fund purchases an option, an amount equal to the premium paid (the premium plus commission) is recognized as a component of "Call and/or Put options purchased, at value" on the Statement of Assets and Liabilities. When the Fund writes an option, an amount equal to the net premium received (the premium less commission) is recognized as a component of "Call and/or Put options written, at value" on the Statement of Assets and Liabilities and is subsequently adjusted to reflect the current value of the written option until the option is exercised or expires or the Fund enters into a closing purchase transaction. The changes in the value of options purchased during the fiscal period are recognized as a component of "Change in net unrealized appreciation (depreciation) of call and/or put options purchased" on the Statement of Operations. The changes in the value of options written during the fiscal period are recognized as a component of "Change in net unrealized appreciation (depreciation) of call and/or put options written" on the Statement of Operations. When an option is exercised or expires or the Fund enters into a closing purchase transaction, the difference between the net premium received and any amount paid at expiration or on executing a closing purchase transaction, including commission, is recognized as a component of "Net realized gain (loss) from call/put options purchased and/or written" on the Statement of Operations. The Fund, as a writer of an option, has no control over whether the underlying instrument may be sold
Nuveen Investments
32
(called) or purchased (put) and as a result bears the risk of an unfavorable change in the market value of the instrument underlying the written option. There is also the risk the Fund may not be able to enter into a closing transaction because of an illiquid market.
During the fiscal year ended December 31, 2012, the Fund wrote call options on individual stocks, while investing in these same stocks, to enhance returns while foregoing some upside potential. The Fund did not purchase call or put options or write put options during the fiscal year ended December 31, 2012.
The average notional amount of call options written during the fiscal year ended December 31, 2012, was as follows:
Average notional amount of call options written* | | $ | (7,742,420 | ) | |
* The average notional amount is calculated based on the outstanding notional at the beginning of the fiscal year and at the end of each fiscal quarter within the current fiscal year.
Refer to Footnote 3—Derivative Instruments and Hedging Activities and Footnote 5—Investment Transactions for further details on options activity.
Interest Rate Swap Contracts
The Fund is subject to interest rate risk in the normal course of pursuing its investment objectives and is authorized to invest in interest rate swap transactions in an attempt to manage such risk. The Fund's use of interest rate swap contracts is intended to mitigate the negative impact that an increase in short-term interest rates could have on Common share net earnings as a result of leverage. Forward interest rate swap transactions involve the Fund's agreement with a counterparty to pay, in the future, a fixed or variable rate payment in exchange for the counterparty paying the Fund a variable or fixed rate payment, the accruals for which would begin at a specified date in the future (the "effective date"). Interest rate swap contracts involve the Fund's agreement with the counterparty to pay or receive a fixed rate payment in exchange for the counterparty receiving or paying a variable rate payment that is intended to approximate the Fund's variable rate payment obligation on FundPreferred shares or any variable rate borrowing. The payment obligation is based on the notional amount of the interest rate swap contract. Interest rate swap contracts do not involve the delivery of securities or other underlying assets or principal. Accordingly, the risk of loss with respect to the swap counterparty on such transactions is limited to the net amount of interest payments that the Fund is to receive. Interest rate swap positions are valued daily. The Fund accrues the fixed rate payment expected to be paid or received and the variable rate payment expected to be received or paid on interest rate swap contracts on a daily basis, and recognizes the daily change in the fair value of the Fund's contractual rights and obligations under the contracts. The net amount recorded for these transactions for each counterparty is recognized on the Statement of Assets and Liabilities as a component of "Unrealized appreciation or depreciation on interest rate swaps (, net)" with the change during the fiscal period recognized on the Statement of Operations as a component of "Change in net unrealized appreciation (depreciation) of interest rate swaps." Income received or paid by the Fund is recognized as a component of "Net realized gain (loss) from interest rate swaps" on the Statement of Operations, in addition to the net realized gains or losses recognized upon the termination of an interest rate swap contract and are equal to the difference between the Fund's basis in the interest rate swap and the proceeds from (or cost of) the closing transaction. Payments received or made at the beginning of the measurement period, if any, are recognized as a component of "Interest rate swap premiums paid and/or received" on the Statement of Assets and Liabilities, when applicable. For tax purposes, periodic payments are treated as ordinary income or expense.
During the fiscal year ended December 31, 2012, the Fund continued to use interest rate swap contracts to partially fix the interest cost of leverage, which the Fund uses through the use of bank borrowings.
The average notional amount of interest rate swap contracts outstanding during the fiscal year ended December 31, 2012, was as follows:
Average notional amount of interest rate swap contracts outstanding* | | $ | 38,135,000 | | |
* The average notional amount is calculated based on the outstanding notional at the beginning of the fiscal year and at the end of each fiscal quarter within the current fiscal year.
Refer to Footnote 3—Derivative Instruments and Hedging Activities for further details on interest rate swap contract activity.
Market and Counterparty Credit Risk
In the normal course of business the Fund may invest in financial instruments and enter into financial transactions where risk of potential loss exists due to changes in the market (market risk) or failure of the other party to the transaction to perform (counterparty credit risk). The potential loss could exceed the value of the financial assets recorded on the financial statements. Financial assets, which potentially expose the Fund to counterparty credit risk, consist principally of cash due from counterparties on forward, option and swap transactions, when applicable. The extent of the Fund's exposure to counterparty credit risk in respect to these financial assets approximates their carrying value as recorded on the Statement of Assets and Liabilities. Futures contracts, when applicable, expose the Fund to minimal counterparty credit risk as they are exchange traded and the exchange's clearinghouse, which is counterparty to all exchange traded futures, guarantees the futures contracts against default.
Nuveen Investments
33
Notes to
FINANCIAL STATEMENTS (continued)
The Fund helps manage counterparty credit risk by entering into agreements only with counterparties the Adviser believes have the financial resources to honor their obligations and by having the Adviser monitor the financial stability of the counterparties. Additionally, counterparties may be required to pledge collateral daily (based on the daily valuation of the financial asset) on behalf of the Fund with a value approximately equal to the amount of any unrealized gain above a pre-determined threshold. Reciprocally, when the Fund has an unrealized loss, the Fund has instructed the custodian to pledge assets of the Fund as collateral with a value approximately equal to the amount of the unrealized loss above a pre-determined threshold. Collateral pledges are monitored and subsequently adjusted if and when the valuations fluctuate, either up or down, by at least the pre-determined threshold amount.
Repurchase Agreements
In connection with transactions in repurchase agreements, it is the Fund's policy that its custodian take possession of the underlying collateral securities, the fair value of which exceeds the principal amount of the repurchase transaction, including accrued interest, at all times. If the counterparty defaults, and the fair value of the collateral declines, realization of the collateral may be delayed or limited.
Zero Coupon Securities
The Fund is authorized to invest in zero coupon securities. A zero coupon security does not pay a regular interest coupon to its holders during the life of the security. Income to the holder of the security comes from accretion of the difference between the original purchase price of the security at issuance and the par value of the security at maturity and is effectively paid at maturity. The market prices of zero coupon securities generally are more volatile than the market prices of securities that pay interest periodically.
Indemnifications
Under the Fund's organizational documents, its officers and trustees are indemnified against certain liabilities arising out of the performance of their duties to the Fund. In addition, in the normal course of business, the Fund enters into contracts that provide general indemnifications to other parties. The Fund's maximum exposure under these arrangements is unknown as this would involve future claims that may be made against the Fund that have not yet occurred. However, the Fund has not had prior claims or losses pursuant to these contracts and expects the risk of loss to be remote.
Use of Estimates
The preparation of financial statements in conformity with U.S. GAAP requires management to make estimates and assumptions that affect the reported amounts of assets and liabilities at the date of the financial statements and the reported amounts of increases and decreases in net assets applicable to Common shares from operations during the reporting period. Actual results may differ from those estimates.
2. Fair Value Measurements
Fair value is defined as the price that the Fund would receive upon selling an investment or transferring a liability in an orderly transaction to an independent buyer in the principal or most advantageous market for the investment. A three-tier hierarchy is used to maximize the use of observable market data and minimize the use of unobservable inputs and to establish classification of fair value measurements for disclosure purposes. Observable inputs reflect the assumptions market participants would use in pricing the asset or liability. Observable inputs are based on market data obtained from sources independent of the reporting entity. Unobservable inputs reflect the reporting entity's own assumptions about the assumptions market participants would use in pricing the asset or liability. Unobservable inputs are based on the best information available in the circumstances. The following is a summary of the three-tiered hierarchy of valuation input levels.
Level 1 — Inputs are unadjusted and prices are determined using quoted prices in active markets for identical securities.
Level 2 — Prices are determined using other significant observable inputs (including quoted prices for similar securities, interest rates, prepayment speeds, credit risk, etc.).
Level 3 — Prices are determined using significant unobservable inputs (including management's assumptions in determining the fair value of investments).
Nuveen Investments
34
The inputs or methodologies used for valuing securities are not an indication of the risks associated with investing in those securities. The following is a summary of the Fund's fair value measurements as of the end of the reporting period:
| | | Level 1 | | Level 2 | | Level 3 | | Total | |
Long-Term Investments*: | |
Common Stocks | | $ | 163,223,127 | | | $ | 618,836 | | | $ | — | | | $ | 163,841,963 | | |
Convertible Preferred Securities | | | 857,500 | | | | — | | | | — | | | | 857,500 | | |
$25 Par (or similar) Preferred Securities | | | 9,808,083 | | | | 3,633,779 | | | | — | | | | 13,441,862 | | |
Variable Rate Senior Loan Interests | | | — | | | | 45,125,436 | | | | — | | | | 45,125,436 | | |
Corporate Bonds | | | — | | | | 121,695 | | | | — | | | | 121,695 | | |
Capital Preferred Securities | | | — | | | | 1,860,135 | | | | — | | | | 1,860,135 | | |
Short-Term Investments: | |
Repurchase Agreements | | | — | | | | 7,582,833 | | | | — | | | | 7,582,833 | | |
Derivatives: | |
Call Options Written | | | (23,300 | ) | | | — | | | | — | | | | (23,300 | ) | |
Interest Rate Swaps** | | | — | | | | (913,858 | ) | | | — | | | | (913,858 | ) | |
Total | | $ | 173,865,410 | | | $ | 58,028,856 | | | $ | — | | | $ | 231,894,266 | | |
* Refer to the Fund's Portfolio of Investments for industry classifications and breakdown of Common Stocks and $25 Par (or similar) Preferred Securities classified as Level 2.
** Represents net unrealized appreciation (depreciation) as reported in the Fund's Portfolio of Investments.
The Nuveen funds' Board of Directors/Trustees is responsible for the valuation process and has delegated the oversight of the daily valuation process to the Adviser's Valuation Committee. The Valuation Committee, pursuant to the valuation policies and procedures adopted by the Board of Directors/Trustees, is responsible for making fair value determinations, evaluating the effectiveness of the funds' pricing policies, and reporting to the Board of Directors/Trustees. The Valuation Committee is aided in its efforts by the Adviser's dedicated Securities Valuation Team, which is responsible for administering the daily valuation process and applying fair value methodologies as approved by the Valuation Committee. When determining the reliability of independent pricing services for investments owned by the funds, the Valuation Committee, among other things, conducts due diligence reviews of the pricing services and monitors the quality of security prices received through various testing reports conducted by the Securities Valuation Team.
The Valuation Committee will consider pricing methodologies it deems relevant and appropriate when making fair value determinations. Examples of possible methodologies include, but are not limited to, multiple of earnings; discount from market of a similar freely traded security; discounted cash-flow analysis; book value or a multiple thereof; risk premium/yield analysis; yield to maturity; and/or fundamental investment analysis. The Valuation Committee will also consider factors it deems relevant and appropriate in light of the facts and circumstances. Examples of possible factors include, but are not limited to, the type of security; the issuer's financial statements; the purchase price of the security; the discount from market value of unrestricted securities of the same class at the time of purchase; analysts' research and observations from financial institutions; information regarding any transactions or offers with respect to the security; the existence of merger proposals or tender offers affecting the security; the price and extent of public trading in similar securities of the issuer or comparable companies; and the existence of a shelf registration for restricted securities.
For each portfolio security that has been fair valued pursuant to the policies adopted by the Board of Directors/Trustees, the fair value price is compared against the last available and next available market quotations. The Valuation Committee reviews the results of such testing and fair valuation occurrences are reported to the Board of Directors/Trustees.
3. Derivative Instruments and Hedging Activities
The Fund records derivative instruments at fair value, with changes in fair value recognized on the Statement of Operations, when applicable. Even though the Fund's investments in derivatives may represent economic hedges, they are not considered to be hedge transactions for financial reporting purposes. For additional information on the derivative instruments in which the Fund was invested during and at the end of the reporting period, refer to the Portfolio of Investments, Financial Statements and Footnote 1—General Information and Significant Accounting Policies.
Nuveen Investments
35
Notes to
FINANCIAL STATEMENTS (continued)
The following table presents the fair value of all derivative instruments held by the Fund as of December 31, 2012, the location of these instruments on the Statement of Assets and Liabilities, and the primary underlying risk exposure.
| | | | | Location on the Statement of Assets and Liabilities | |
Underlying | | Derivative | | Asset Derivatives | | Liability Derivatives | |
Risk Exposure | | Instrument | | Location | | Value | | Location | | Value | |
Equity Price | | Options | | | — | | | $ | — | | | Call options written, at value | | $ | (23,300 | ) | |
Interest Rate
| | Swaps
| | | —
| | | | —
| | | Unrealized depreciation on
interest rate swaps, net | | | 149,841
| | |
Interest Rate
| | Swaps
| | | —
| | | | —
| | | Unrealized depreciation on
interest rate swaps, net | | | (1,063,699
| ) | |
Total | | | | | | $ | — | | | | | $ | (937,158 | ) | |
The following tables present the amount of net realized gain (loss) and change in net unrealized appreciation (depreciation) recognized for the fiscal year ended December 31, 2012, on derivative instruments, as well as the primary risk exposure associated with each.
Net Realized Gain (Loss) from Call Options Written | |
Risk Exposure | |
Equity Price | | $ | 1,674,628 | | |
Net Realized Gain (Loss) from Interest Rate Swaps | |
Risk Exposure | |
Interest Rate | | $ | (460,782 | ) | |
Change in Net Unrealized Appreciation (Depreciation) of Call Options Written | |
Risk Exposure | |
Equity Price | | $ | (201,995 | ) | |
Change in Net Unrealized Appreciation (Depreciation) of Interest Rate Swaps | |
Risk Exposure | |
Interest Rate | | $ | 179,612 | | |
4. Fund Shares
Common Shares
Transactions in Common shares were as follows:
| | | Year Ended
12/31/12 | | Year Ended
12/31/11 | |
Common shares repurchased and retired | | | (12,983 | ) | | | (30,062 | ) | |
Weighted average: | |
Price per Common share repurchased and retired | | $ | 9.98 | | | $ | 9.43 | | |
Discount per Common share repurchased and retired | | | 11.07 | % | | | 14.39 | % | |
5. Investment Transactions
Purchases and sales (including maturities but excluding short-term investments and derivative transactions) during the fiscal year ended December 31, 2012, aggregated $84,096,433 and $86,753,735, respectively.
Nuveen Investments
36
Transactions in call options written during the fiscal year ended December 31, 2012, were as follows:
| | | Number of
Contracts | | Premiums
Received | |
Options outstanding, beginning of the period | | | 1,350 | | | $ | 385,614 | | |
Options written | | | 14,211 | | | | 1,761,124 | | |
Options terminated in closing purchase transactions | | | (4,459 | ) | | | (846,954 | ) | |
Options exercised | | | (5,742 | ) | | | (753,644 | ) | |
Options expired | | | (4,466 | ) | | | (505,071 | ) | |
Options outstanding, end of the period | | | 894 | | | $ | 41,069 | | |
6. Income Tax Information
The following information is presented on an income tax basis. Differences between amounts for financial statement and federal income tax purposes are primarily due to the recognition of premium amortization and timing differences in recognizing certain gains and losses on investment transactions. To the extent that differences arise that are permanent in nature, such amounts are reclassified within the capital accounts as detailed below. Temporary differences do not require reclassification. Temporary and permanent differences do not impact the net asset value of the Fund.
As of December 31, 2012, the cost and unrealized appreciation (depreciation) of investments (excluding investments in derivatives), as determined on a federal income tax basis, were as follows:
Cost of investments | | $ | 218,004,653 | | |
Gross unrealized: | |
Appreciation | | $ | 25,269,666 | | |
Depreciation | | | (10,442,895 | ) | |
Net unrealized appreciation (depreciation) of investments | | $ | 14,826,771 | | |
Permanent differences, primarily due to tax basis earnings and profits adjustments, treatment of notional principal contracts, and return of capital resulted in reclassifications among the Fund's components of Common share net assets as of December 31, 2012, the Fund's tax year end, as follows:
Paid-in-surplus | | $ | (7,641,172 | ) | |
Undistributed (Over-distribution of) net investment income | | | 7,180,420 | | |
Accumulated net realized gain (loss) | | | 460,752 | | |
The tax components of undistributed net ordinary income and net long-term capital gains as of December 31, 2012, the Fund's tax year end, were as follows:
Undistributed net ordinary income | | $ | — | | |
Undistributed net long-term capital gains | | | — | | |
The tax character of distributions paid during the Fund's tax years ended December 31, 2012 and December 31, 2011, was designated for purposes of the dividends paid deduction as follows:
2012 | |
Distributions from net ordinary income* | | $ | 6,614,524 | | |
Distributions from net long-term capital gains | | | — | | |
Return of capital | | | 5,569,304 | | |
2011 | |
Distributions from net ordinary income* | | $ | 5,537,134 | | |
Distributions from net long-term capital gains | | | — | | |
Return of capital | | | 6,944,101 | | |
* Net ordinary income consists of net taxable income derived from dividends and interest, and current year earnings and profits attributable to realized gains.
As of December 31, 2012, the Fund's tax year end, the Fund had unused capital loss carryforwards available for federal income tax purposes to be applied against future capital gains, if any. If not applied, the carryforwards will expire as follows:
Expiration: | |
December 31, 2016 | | $ | 55,052,098 | | |
December 31, 2017 | | | 32,157,951 | | |
Total | | $ | 87,210,049 | | |
During the tax year ended December 31, 2012, the Fund utilized $2,071,868 of its capital loss carryforwards.
Nuveen Investments
37
Notes to
FINANCIAL STATEMENTS (continued)
Under the Regulated Investment Company Modernization Act of 2010, capital losses incurred by the Fund after December 31, 2010, will not be subject to expiration. During the Fund's tax year ended December 31, 2012, there were no post-enactment capital losses generated.
The Fund has elected to defer losses incurred from November 1, 2012 through December 31, 2012, the Fund's tax year end, in accordance with federal income tax rules. These losses are treated as having arisen on the first day of the following fiscal year. The Fund has elected to defer losses as follows:
Post-October capital losses | | $ | 1,057,044 | | |
Late-year ordinary losses | | | — | | |
7. Management Fees and Other Transactions with Affiliates
The Fund's management fee consists of two components—a fund-level fee, based only on the amount of assets within the Fund, and a complex-level fee, based on the aggregate amount of all eligible fund assets managed by the Adviser. This pricing structure enables Fund shareholders to benefit from growth in the assets within the Fund as well as from growth in the amount of complex-wide assets managed by the Adviser.
The annual fund-level fee, payable monthly, is calculated according to the following schedule:
Average Daily Managed Assets * | | Fund-Level Fee Rate | |
For the first $500 million | | | .7000 | % | |
For the next $500 million | | | .6750 | | |
For the next $500 million | | | .6500 | | |
For the next $500 million | | | .6250 | | |
For managed assets over $2 billion | | | .6000 | | |
The annual complex-level fee, payable monthly, is calculated according to the following schedule:
Complex-Level Managed Asset Breakpoint Level * | | Effective Rate at Breakpoint Level | |
| $55 billion | | | .2000 | % | |
| $56 billion | | | .1996 | | |
| $57 billion | | | .1989 | | |
| $60 billion | | | .1961 | | |
| $63 billion | | | .1931 | | |
| $66 billion | | | .1900 | | |
| $71 billion | | | .1851 | | |
| $76 billion | | | .1806 | | |
| $80 billion | | | .1773 | | |
| $91 billion | | | .1691 | | |
| $125 billion | | | .1599 | | |
| $200 billion | | | .1505 | | |
| $250 billion | | | .1469 | | |
| $300 billion | | | .1445 | | |
* For the fund-level and complex-level fees, managed assets include closed-end fund assets managed by the Adviser that are attributable to financial leverage. For these purposes, financial leverage includes the funds' use of preferred stock and borrowings and certain investments in the residual interest certificates (also called inverse floating rate securities) in tender option bond (TOB) trusts, including the portion of assets held by a TOB trust that has been effectively financed by the trust's issuance of floating rate securities, subject to an agreement by the Adviser as to certain funds to limit the amount of such assets for determining managed assets in certain circumstances. The complex-level fee is calculated based upon the aggregate daily managed assets of all Nuveen Funds that constitute "eligible assets". Eligible assets do not include assets attributable to investments in other Nuveen Funds or assets in excess of $2 billion added to the Nuveen Fund complex in connection with the Adviser's assumption of the management of the former First American Funds effective January 1, 2011. As of December 31, 2012, the complex-level fee rate for the Fund was .1684%.
Nuveen Investments
38
The management fee compensates the Adviser for overall investment advisory and administrative services and general office facilities. The Adviser is responsible for the Fund's overall strategy and asset allocation decisions. The Adviser has entered into sub-advisory agreements with NWQ Investment Management Company, LLC ("NWQ") and Symphony Asset Management LLC ("Symphony"), each an affiliate of Nuveen. The Adviser is responsible for overseeing the Fund's investments in interest rate swap contracts. NWQ manages the portion of the Fund's investment portfolio allocated to dividend-paying common and preferred stocks, including ADRs and the Fund's options strategy. Symphony manages the portion of the Fund's investment portfolio allocated to senior loans and other debt instruments. NWQ and Symphony are compensated for their services to the Fund from the management fees paid to the Adviser.
The Fund pays no compensation directly to those of its trustees who are affiliated with the Adviser or to its officers, all of whom receive remuneration for their services to the Fund from the Adviser or its affiliates. The Board of Trustees has adopted a deferred compensation plan for independent trustees that enables trustees to elect to defer receipt of all or a portion of the annual compensation they are entitled to receive from certain Nuveen-advised funds. Under the plan, deferred amounts are treated as though equal dollar amounts had been invested in shares of select Nuveen-advised funds.
For the first eight years of the Fund's operations, the Adviser has agreed to reimburse the Fund, as a percentage of average daily managed assets, for fees and expenses in the amounts and for the time periods set forth below:
Year Ending
January 31, | | Year Ending
January 31, | |
| | 2004 | * | | | .32 | % | | | 2009 | | | | .32 | % | |
| | 2005 | | | | .32 | | | | 2010 | | | | .24 | | |
| | 2006 | | | | .32 | | | | 2011 | | | | .16 | | |
| | 2007 | | | | .32 | | | | 2012 | | | | .08 | | |
| | 2008 | | | | .32 | | | | | | | | | | |
* From the commencement of operations.
The Adviser has not agreed to reimburse the Fund for any portion of its fees and expenses beyond January 31, 2012.
8. Senior Loan Commitments
Unfunded Commitments
Pursuant to the terms of certain of the variable rate senior loan agreements, the Fund may have unfunded senior loan commitments. The Fund will maintain with its custodian, cash, liquid securities and/or liquid senior loans having an aggregate value at least equal to the amount of unfunded senior loan commitments. As of December 31, 2012, the Fund had no unfunded senior loan commitments.
Participation Commitments
With respect to the senior loans held in the Fund's portfolio, the Fund may: 1) invest in assignments; 2) act as a participant in primary lending syndicates; or 3) invest in participations. If the Fund purchases a participation of a senior loan interest, the Fund would typically enter into a contractual agreement with the lender or other third party selling the participation, rather than directly with the borrower. As such, the Fund not only assumes the credit risk of the borrower, but also that of the selling participant or other persons interpositioned between the Fund and the borrower. As of December 31, 2012, there were no such outstanding participation commitments.
9. Borrowing Arrangements
The Fund has entered into a $77 million (maximum commitment amount) prime brokerage facility ("Borrowings") with BNP Paribas Prime Brokerage, Inc. ("BNP") as a means of financial leverage. On May 25, 2012, the Fund increased its maximum commitment amount from $69 million to $77 million. As of December 31, 2012, the Fund's outstanding balance on these Borrowings was $67.9 million. During the fiscal year ended December 31, 2012, the average daily balance outstanding and average annual interest rate on these Borrowings were $67.9 million and 1.28%, respectively.
In order to maintain these Borrowings, the Fund must meet certain collateral, asset coverage and other requirements. Borrowings outstanding are fully secured by securities held in the Fund's portfolio of investments. Interest is charged on these Borrowings at 3-Month LIBOR (London Inter-bank Offered Rate) plus .85% on the amount borrowed and .50% on the undrawn balance. The Fund also incurred a one-time .25% amendment fee on the increase to the maximum commitment amount, which was fully expensed during the current reporting period.
Effective January 9, 2012, interest charged on the amount borrowed changed from 3-Month LIBOR plus .95% to 3-Month LIBOR plus .85%. All other terms remain unchanged.
Borrowings outstanding are recognized as "Borrowings" on the Statement of Assets and Liabilities. Interest expense incurred on the borrowed amount and undrawn balance and the one-time amendment fee are recognized as a component of "Interest expense on borrowings" on the Statement of Operations.
Nuveen Investments
39
Notes to
FINANCIAL STATEMENTS (continued)
10. New Accounting Pronouncements
Financial Accounting Standards Board ("FASB") Balance Sheet (Topic 210): Disclosures about Offsetting Assets and Liabilities
In December 2011, the FASB issued Accounting Standards Update ("ASU") No. 2011-11 ("ASU No. 2011-11") to enhance disclosures about financial instruments and derivative instruments that are subject to offsetting ("netting") on the Statement of Assets and Liabilities. This information will enable users of the entity's financial statements to evaluate the effect or potential effect of netting arrangements on the entity's financial position. ASU No. 2011-11 is effective prospectively during interim or annual periods beginning on or after January 1, 2013. At this time, management is evaluating the implications of this guidance and the impact it will have to the financial statements amounts and footnote disclosures, if any.
Nuveen Investments
40
Board Members & Officers (Unaudited)
The management of the Funds, including general supervision of the duties performed for the Funds by the Adviser, is the responsibility of the board members of the Funds. The number of board members of the Funds is currently set at ten. None of the board members who are not "interested" persons of the Funds (referred to herein as "independent board members") has ever been a director or employee of, or consultant to, Nuveen or its affiliates. The names and business addresses of the board members and officers of the Funds, their principal occupations and other affiliations during the past five years, the number of portfolios each oversees and other directorships they hold are set forth below.
Name, Birthdate
& Address | | Position(s) Held
with the Funds | | Year First
Elected or
Appointed
and Term(1) | | Principal Occupation(s)
including other Directorships
During Past 5 Years | | Number of Portfolios
in Fund Complex
Overseen by
Board Member | |
Independent Board Members: | | | |
| nROBERT P. BREMNER | | | |
8/22/40
333 W. Wacker Drive
Chicago, IL 60606 | | Chairman of
the Board
and Board Member | |
1996
Class III | | Private Investor and Management Consultant; Treasurer and Director, Humanities Council of Washington, D.C.; Board Member, Independent Directors Council affiliated with the Investment Company Institute. | | | 216 | | |
| nJACK B. EVANS | | | |
10/22/48
333 W. Wacker Drive
Chicago, IL 60606 | | Board Member | |
1999
Class III | | President, The Hall-Perrine Foundation, a private philanthropic corporation (since 1996); Director and Chairman, United Fire Group, a publicly held company; member of the Board of Regents for the State of Iowa University System; Director, Source Media Group; Life Trustee of Coe College and the Iowa College Foundation; formerly, Director, Alliant Energy; formerly, Director, Federal Reserve Bank of Chicago; formerly, President and Chief Operating Officer, SCI Financial Group, Inc., a regional financial services firm. | | | 216 | | |
| nWILLIAM C. HUNTER | | | |
3/6/48
333 W. Wacker Drive
Chicago, IL 60606 | | Board Member | |
2004
Class I | | Dean Emeritus (since June 30, 2012), formerly, Dean, Tippie College of Business, University of Iowa (2006-2012); Director (since 2004) of Xerox Corporation; Director (since 2005), and President (since July 2012) Beta Gamma Sigma, Inc., The International Honor Society; Director of Wellmark, Inc. (since 2009); formerly, Dean and Distinguished Professor of Finance, School of Business at the University of Connecticut (2003-2006); previously, Senior Vice President and Director of Research at the Federal Reserve Bank of Chicago (1995-2003); formerly, Director (1997-2007), Credit Research Center at Georgetown University. | | | 216 | | |
Nuveen Investments
41
Board Members & Officers (Unaudited) (continued)
Name, Birthdate
& Address | | Position(s) Held
with the Funds | | Year First
Elected or
Appointed
and Term(1) | | Principal Occupation(s)
including other Directorships
During Past 5 Years | | Number of Portfolios
in Fund Complex
Overseen by
Board Member | |
Independent Board Members (continued): | | | |
| nDAVID J. KUNDERT | | | |
10/28/42
333 W. Wacker Drive
Chicago, IL 60606 | | Board Member | |
2005
Class II | | Director, Northwestern Mutual Wealth Management Company; retired (since 2004) as Chairman, JPMorgan Fleming Asset Management, President and CEO, Banc One Investment Advisors Corporation, and President, One Group Mutual Funds; prior thereto, Executive Vice President, Banc One Corporation and Chairman and CEO, Banc One Investment Management Group; Regent Emeritus, Member of Investment Committee, Luther College; member of the Wisconsin Bar Association; member of Board of Directors, Friends of Boerner Botanical Gardens; member of Board of Directors and Chair of Investment Committee, Greater Milwaukee Foundation; member of the Board of Directors (Milwaukee), College Possible. | | | 216 | | |
| nWILLIAM J. SCHNEIDER | | | |
9/24/44
333 W. Wacker Drive
Chicago, IL 60606 | | Board Member | |
1996
Class III | | Chairman of Miller-Valentine Partners Ltd., a real estate investment company; formerly, Senior Partner and Chief Operating Officer (retired 2004) of Miller-Valentine Group; member, University of Dayton Business School Advisory Council; member, Mid-America Health System Board; formerly, member and chair, Dayton Philharmonic Orchestra Association; formerly, member, Business Advisory Council, Cleveland Federal Reserve Bank. | | | 216 | | |
| nJUDITH M. STOCKDALE | | | |
12/29/47
333 W. Wacker Drive
Chicago, IL 60606 | | Board Member | |
1997
Class I | | Formerly, Executive Director (1994-2012), Gaylord and Dorothy Donnelley Foundation (since 1994); prior thereto, Executive Director, Great Lakes Protection Fund (1990-1994). | | | 216 | | |
| nCAROLE E. STONE | | | |
6/28/47
333 W. Wacker Drive
Chicago, IL 60606 | | Board Member | |
2007
Class I | | Director, Chicago Board Options Exchange (since 2006); Director, C2 Options Exchange, Incorporated (since 2009); formerly, Commissioner, New York State Commission on Public Authority Reform (2005-2010); formerly, Chair, New York Racing Association Reform (2005-2010); formerly, Chair, New York Racing Association Oversight Board (2005-2007). | | | 216 | | |
| nVIRGINIA L. STRINGER | | | |
8/16/44
333 W. Wacker Drive
Chicago, IL 60606 | | Board Member | |
2011
Class I | | Board Member, Mutual Fund Directors Forum; former governance consultant and non-profit board member; former Owner and President, Strategic Management Resources, Inc. a management consulting firm; former Member, Governing Board, Investment Company Institute's Independent Directors Council; previously, held several executive positions in general management, marketing and human resources at IBM and The Pillsbury Company; Independent Director, First American Fund Complex (1987-2010) and Chair (1997-2010). | | | 216 | | |
Nuveen Investments
42
Name, Birthdate
& Address | | Position(s) Held
with the Funds | | Year First
Elected or
Appointed
and Term(1) | | Principal Occupation(s)
including other Directorships
During Past 5 Years | | Number of Portfolios
in Fund Complex
Overseen by
Board Member | |
Independent Board Members (continued): | | | |
| nTERENCE J. TOTH | | | |
9/29/59
333 W. Wacker Drive
Chicago, IL 60606 | | Board Member | |
2008
Class II | | Director, Legal & General Investment Management America, Inc. (since 2008); Managing Partner, Promus Capital (since 2008); formerly, CEO and President, Northern Trust Global Investments (2004-2007); Executive Vice President, Quantitative Management & Securities Lending (2000-2004); prior thereto, various positions with Northern Trust Company (since 1994); member: Chicago Fellowship Board (since 2005), Catalyst Schools of Chicago Board (since 2008) and Mather Foundation Board (since 2012), and a member of its investment committee; formerly, Member, Northern Trust Mutual Funds Board (2005-2007), Northern Trust Global Investments Board (2004-2007), Northern Trust Japan Board (2004-2007), Northern Trust Securities Inc. Board (2003-2007) and Northern Trust Hong Kong Board (1997-2004). | | | 216 | | |
Interested Board Member: | | | |
| nJOHN P. AMBOIAN(2) | | | |
6/14/61 333
W. Wacker Drive
Chicago, IL 60606 | | Board Member | |
2008
Class II | | Chief Executive Officer and Chairman (since 2007) and Director (since 1999) of Nuveen Investments, Inc., formerly, President (1999-2007); Chief Executive Officer (since 2007) of Nuveen Investments Advisers, Inc.; Director (since 1998) formerly, Chief Executive Officer (2007-2010) of Nuveen Fund Advisors, LLC. | | | 216 | | |
Name, Birthdate
and Address | | Position(s) Held with
the Funds | | Year First
Elected or
Appointed(3) | | Principal Occupation(s)
During Past 5 Years | | Number of Portfolios
in Fund Complex
Overseen by
Officer | |
Officers of the Funds: | | | |
| nGIFFORD R. ZIMMERMAN | | | |
9/9/56
333 W. Wacker Drive
Chicago, IL 60606 | | Chief
Administrative
Officer | |
1988 | | Managing Director (since 2002), and Assistant Secretary of Nuveen Securities, LLC; Managing Director (since 2004) and Assistant Secretary (since 1994) of Nuveen Investments, Inc.; Managing Director (since 2002), Assistant Secretary (since 1997) and Co-General Counsel (since 2011) of Nuveen Fund Advisors, LLC; Managing Director, Assistant Secretary and Associate General Counsel of Nuveen Asset Management, LLC (since 2011); Managing Director, Associate General Counsel and Assistant Secretary, of Symphony Asset Management LLC (since 2003); Vice President and Assistant Secretary of NWQ Investment Management Company, LLC (since 2002), Nuveen Investments Advisers Inc. (since 2002), Santa Barbara Asset Management, LLC (since 2006), and of Winslow Capital Management, LLC, (since 2010); Chief Administrative Officer and Chief Compliance Officer (since 2006) of Nuveen Commodities Asset Management, LLC; Chartered Financial Analyst. | | | 216 | | |
Nuveen Investments
43
Board Members & Officers (Unaudited) (continued)
Name, Birthdate
and Address | | Position(s) Held with
the Funds | | Year First
Elected or
Appointed(3) | | Principal Occupation(s)
During Past 5 Years | | Number of Portfolios
in Fund Complex
Overseen by
Officer | |
Officers of the Funds (continued): | | | |
| nWILLIAM ADAMS IV | | | |
6/9/55
333 W. Wacker Drive
Chicago, IL 60606 | | Vice President | |
2007 | | Senior Executive Vice President, Global Structured Products (since 2010), formerly, Executive Vice President (1999-2010) of Nuveen Securities, LLC; Co-President of Nuveen Fund Advisors, LLC (since 2011); President (since 2011), formerly, Managing Director (2010-2011) of Nuveen Commodities Asset Management, LLC. | | | 116 | | |
| nCEDRIC H. ANTOSIEWICZ | | | |
1/11/62
333 W. Wacker Drive
Chicago, IL 60606 | | Vice President | |
2007 | | Managing Director of Nuveen Securities, LLC. | | | 116 | | |
| nMARGO L. COOK | | | |
4/11/64
333 W. Wacker Drive
Chicago, IL 60606 | | Vice President | |
2009 | | Executive Vice President (since 2008) of Nuveen Investments, Inc. and of Nuveen Fund Advisors, LLC (since 2011); Managing Director-Investment Services of Nuveen Commodities Asset Management, LLC (since August 2011), previously, Head of Institutional Asset Management (2007-2008) of Bear Stearns Asset Management; Head of Institutional Asset Management (1986-2007) of Bank of NY Mellon; Chartered Financial Analyst. | | | 216 | | |
| nLORNA C. FERGUSON | | | |
10/24/45
333 W. Wacker Drive
Chicago, IL 60606 | | Vice President | |
1998 | | Managing Director (since 2005) of Nuveen Fund Advisors, LLC and Nuveen Securities, LLC (since 2004). | | | 216 | | |
| nSTEPHEN D. FOY | | | |
5/31/54
333 W. Wacker Drive
Chicago, IL 60606 | | Vice President
and Controller | |
1998 | | Senior Vice President (since 2010), formerly, Vice President (2005-2010) and Funds Controller of Nuveen Securities, LLC; Vice President of Nuveen Fund Advisors, LLC; Chief Financial Officer of Nuveen Commodities Asset Management, LLC (since 2010); Certified Public Accountant. | | | 216 | | |
| nSCOTT S. GRACE | | | |
8/20/70
333 W. Wacker Drive
Chicago, IL 60606 | | Vice President
and Treasurer | |
2009 | | Managing Director, Corporate Finance & Development, Treasurer (since 2009) of Nuveen Securities, LLC; Managing Director and Treasurer (since 2009) of Nuveen Fund Advisors, LLC, Nuveen Investments Advisers, Inc., Nuveen Investments Holdings Inc. and (since 2011) Nuveen Asset Management, LLC; Vice President and Treasurer of NWQ Investment Management Company, LLC, Tradewinds Global Investors, LLC, Symphony Asset Management LLC and Winslow Capital Management, LLC.; Vice President of Santa Barbara Asset Management, LLC; formerly, Treasurer (2006-2009), Senior Vice President (2008-2009), previously, Vice President (2006-2008) of Janus Capital Group, Inc.; formerly, Senior Associate in Morgan Stanley's Global Financial Services Group (2000-2003); Chartered Accountant Designation. | | | 216 | | |
Nuveen Investments
44
Name, Birthdate
and Address | | Position(s) Held with
the Funds | | Year First
Elected or
Appointed(3) | | Principal Occupation(s)
During Past 5 Years | | Number of Portfolios
in Fund Complex
Overseen by
Officer | |
Officers of the Funds (continued): | | | |
| nWALTER M. KELLY | | | |
2/24/70
333 W. Wacker Drive
Chicago, IL 60606 | | Chief Compliance
Officer and
Vice President | |
2003 | | Senior Vice President (since 2008) and Assistant Secretary (since 2003) of Nuveen Fund Advisors, LLC; Senior Vice President (since 2008) of Nuveen Investment Holdings, Inc.; formerly, Senior Vice President (2008-2011) of Nuveen Securities, LLC. | | | 216 | | |
| nTINA M. LAZAR | | | |
8/27/61
333 W. Wacker Drive
Chicago, IL 60606 | | Vice President | |
2002 | | Senior Vice President (since 2010), formerly, Vice President (2005-2010) of Nuveen Fund Advisors, LLC. | | | 216 | | |
| nKEVIN J. MCCARTHY | | | |
3/26/66
333 W. Wacker Drive
Chicago, IL 60606 | | Vice President
and Secretary | |
2007 | | Managing Director and Assistant Secretary (since 2008), formerly, Vice President (2007-2008), Nuveen Securities, LLC; Managing Director (since 2008), Assistant Secretary (since 2007) and Co-General Counsel (since 2011) of Nuveen Fund Advisors, LLC; Managing Director, Assistant Secretary and Associate General Counsel (since 2011) of Nuveen Asset Management, LLC; Managing Director (since 2008), and Assistant Secretary, Nuveen Investment Holdings, Inc.; Vice President (since 2007) and Assistant Secretary of Nuveen Investments Advisers Inc., NWQ Investment Management Company, LLC, NWQ Holdings, LLC,Symphony Asset Management LLC, Santa Barbara Asset Management,LLC, and of Winslow Capital Management, LLC (since 2010); Vice President and Secretary (since 2010) of Nuveen Commodities Asset Management, LLC; prior thereto, Partner, Bell, Boyd & Lloyd LLP (1997-2007). | | | 216 | | |
| nKATHLEEN L. PRUDHOMME | | | |
3/30/53
901 Marquette Avenue
Minneapolis, MN 55402 | | Vice President and
Assistant Secretary | |
2011 | | Managing Director, Assistant Secretary and Co-General Counsel (since 2011) of Nuveen Fund Advisors, LLC; Managing Director, Assistant Secretary and Associate General Counsel (since 2011) of Nuveen Asset Management, LLC; Managing Director and Assistant Secretary (since 2011) of Nuveen Securities, LLC; formerly, Deputy General Counsel, FAF Advisors, Inc. (2004-2010). | | | 216 | | |
(1) The Board Members serve three year terms. The Board of Trustees is divided into three classes. Class I, Class II, and Class III, with each being elected to serve until the third succeeding annual shareholders' meeting subsequent to its election or thereafter in each case when its respective successors are duly elected or appointed. The first year elected or appointed represents the year in which the board member was first elected or appointed to any fund in the Nuveen Complex.
(2) Mr. Amboian is an interested Director because of his position with Nuveen Investments, Inc. and certain of its subsidiaries, which are affiliates of the Nuveen Funds.
(3) Officers serve one year terms through August of each year. The year first elected or appointed represents the year in which the Officer was first elected or appointed to any fund in the Nuveen Complex.
Nuveen Investments
45
Glossary of Terms
Used in this Report
• Average Annual Total Return: This is a commonly used method to express an investment's performance over a particular, usually multi-year time period. It expresses the return that would have been necessary each year to equal the investment's actual cumulative performance (including change in NAV or market price and reinvested dividends and capital gains distributions, if any) over the time period being considered.
• Comparative Benchmark: A blended return comprised of: 1) 56% of the return of the Russell 3000® Value Index, which measures the performance of those Russell 3000® Index companies with lower price-to book ratios and lower forecasted growth values, 2) 16% of the return of the MSCI EAFE ex-Japan Value Index, a capitalization weighted index that selects the lower 50% of the price-to-book ranked value stocks traded in the developed markets of Europe, Asia and the Far East, excluding Japan, 3) 8% of the return of the Merrill Lynch DRD (dividends received deduction) Preferred Index, which consists of investment-grade, DRD-eligible, exchange-traded preferred stocks with one year or more to maturity, and 4) 20% of the return of the CSFB Leveraged Loan Index, which consists of approximately $150 billion of tradable term loans with at least one year to maturity and rated BBB or lower. Index returns assume reinvestment of distributions, but do not include the effects of any applicable sales charges or management fees.
• Current Distribution Rate: An investment's current annualized distribution divided by its current market price.
• Effective Leverage: Effective leverage is a Fund's effective economic leverage, and includes both Regulatory Leverage (see below) and the leverage effects of certain derivative investments in the Fund's portfolio that increase the Fund's investment exposure.
• Gross Domestic Product (GDP): The total market value of all final goods and services produced in a country/region in a given year, equal to total consumer, investment and government spending, plus the value of exports, minus the value of imports.
• Leverage: Using borrowed money to invest in securities or other assets, seeking to increase the return of an investment or portfolio.
• Net Asset Value (NAV): The net market value of all securities held in a portfolio.
Nuveen Investments
46
• Net Asset Value (NAV) Per Share: The market value of one share of a mutual fund or closed-end fund. For a Fund, the NAV is calculated daily by taking the Fund's total assets (securities, cash, and accrued earnings), subtracting the Fund's liabilities, and dividing by the number of shares outstanding.
• Regulatory Leverage: Regulatory Leverage consists of preferred shares issued by or borrowings of a Fund. Both of these are part of the Fund's capital structure. Regulatory Leverage is sometimes referred to as "'40 Act Leverage" and is subject to asset coverage limits set in the Investment Company Act of 1940.
• S&P 500® Index: An unmanaged index generally considered representative of the U.S. stock market. Index returns assume reinvestment of distributions, but do not reflect any applicable sales charges or management fees.
Nuveen Investments
47
Nuveen Investments
48
Nuveen Investments
49
Nuveen Investments
50
Additional Fund Information
Board of Trustees
John P. Amboian
Robert P. Bremner
Jack B. Evans
William C. Hunter
David J. Kundert
William J. Schneider
Judith M. Stockdale
Carole E. Stone
Virginia L. Stringer
Terence J. Toth
Fund Manager
Nuveen Fund Advisors, LLC
333 West Wacker Drive
Chicago, IL 60606
Custodian
State Street Bank & Trust Company
Boston, MA
Transfer Agent and
Shareholder Services
State Street Bank & Trust Company
Nuveen Funds
P.O. Box 43071
Providence, RI 02940-3071
(800) 257-8787
Legal Counsel
Chapman and Cutler LLP
Chicago, IL
Independent Registered
Public Accounting Firm
Ernst & Young LLP
Chicago, IL
Quarterly Portfolio of Investments and Proxy Voting Information
You may obtain (i) the Fund's quarterly portfolio of investments, (ii) information regarding how the Fund voted proxies relating to portfolio securities held during the most recent twelve-month period ended June 30, and (iii) a description of the policies and procedures that the Fund used to determine how to vote proxies relating to portfolio securities without charge, upon request, by calling Nuveen Investments toll-free at (800) 257-8787 or on Nuveen's website at www.nuveen.com.
You may also obtain this and other Fund information directly from the Securities and Exchange Commission (SEC). The SEC may charge a copying fee for this information. Visit the SEC on-line at http://www.sec.gov or in person at the SEC's Public Reference Room in Washington, D.C. Call the SEC at (202) 942-8090 for room hours and operation. You may also request Fund information by sending an e-mail request to publicinfo@sec.gov or by writing to the SEC's Public Reference Section at 100 F Street NE, Washington, D.C. 20549.
CEO Certification Disclosure
The Fund's Chief Executive Officer has submitted to the New York Stock Exchange (NYSE) the annual CEO certification as required by Section 303A.12(a) of the NYSE Listed Company Manual.
The Fund has filed with the SEC the certification of its Chief Executive Officer and Chief Financial Officer required by Section 302 of the Sarbanes-Oxley Act.
Distribution Information
The Fund hereby designates its percentages of dividends paid from net ordinary income as dividends qualifying for the 70% dividends received deduction (DRD) for corporations and its percentages as qualified dividend income (QDI) for individuals under Section 1(h)(11) of the Internal Revenue Code as shown in the accompanying table. The actual qualified dividend income distributions will be reported to shareholders on Form 1099-DIV which will be sent to shareholders shortly after calendar year end.
| | % of DRD | | % of QDI | |
JTA | | | 57.37 | % | | | 77.11 | % | |
Common Share Information
The Fund intends to repurchase shares of its own common stock in the future at such times and in such amounts as is deemed advisable. During the period covered by this report, the Fund repurchased shares of its common stock as shown in the accompanying table.
| | | Common Shares
Repurchased | |
JTA | | | 12,983 | | |
Any future repurchases will be reported to shareholders in the next annual or semi-annual report.
Nuveen Investments
51
Nuveen Investments:
Serving Investors for Generations
Since 1898, financial advisors and their clients have relied on Nuveen Investments to provide dependable investment solutions through continued adherence to proven, long-term investing principles. Today, we offer a range of high quality equity and fixed-income solutions designed to be integral components of a well-diversified core portfolio.
Focused on meeting investor needs.
Nuveen Investments provides high-quality investment services designed to help secure the long-term goals of institutional and individual investors as well as the consultants and financial advisors who serve them. Nuveen Investments markets a wide range of specialized investment solutions which provide investors access to capabilities of its high-quality boutique investment affiliates—Nuveen Asset Management, Symphony Asset Management, NWQ Investment Management Company, Santa Barbara Asset Management, Tradewinds Global Investors, Winslow Capital Management and Gresham Investment Management. In total, Nuveen Investments managed $219 billion as of December 31, 2012.
Find out how we can help you.
To learn more about how the products and services of Nuveen Investments may be able to help you meet your financial goals, talk to your financial advisor, or call us at (800) 257-8787. Please read the information provided carefully before you invest. Investors should consider the investment objective and policies, risk considerations, charges and expenses of any investment carefully. Where applicable, be sure to obtain a prospectus, which contains this and other relevant information. To obtain a prospectus, please contact your securities representative or Nuveen Investments, 333 W. Wacker Dr., Chicago, IL 60606. Please read the prospectus carefully before you invest or send money.
Learn more about Nuveen Funds at: www.nuveen.com/cef
Distributed by
Nuveen Securities, LLC
333 West Wacker Drive
Chicago, IL 60606
www.nuveen.com/cef
ITEM 2. CODE OF ETHICS.
As of the end of the period covered by this report, the registrant has adopted a code of ethics that applies to the registrant’s principal executive officer, principal financial officer, principal accounting officer or controller, or persons performing similar functions. There were no amendments to or waivers from the Code during the period covered by this report. The registrant has posted the code of ethics on its website at www.nuveen.com/CEF/Shareholder/FundGovernance.aspx. (To view the code, click on Code of Conduct.)
ITEM 3. AUDIT COMMITTEE FINANCIAL EXPERT.
The registrant’s Board of Directors or Trustees (“Board”) determined that the registrant has at least one “audit committee financial expert” (as defined in Item 3 of Form N-CSR) serving on its Audit Committee. The registrant’s audit committee financial expert is Carole E. Stone, who is “independent” for purposes of Item 3 of Form N-CSR.
Ms. Stone served for five years as Director of the New York State Division of the Budget. As part of her role as Director, Ms. Stone was actively involved in overseeing the development of the State’s operating, local assistance and capital budgets, its financial plan and related documents; overseeing the development of the State’s bond-related disclosure documents and certifying that they fairly presented the State’s financial position; reviewing audits of various State and local agencies and programs; and coordinating the State’s system of internal audit and control. Prior to serving as Director, Ms. Stone worked as a budget analyst/examiner with increasing levels of responsibility over a 30 year period, including approximately five years as Deputy Budget Director. Ms. Stone has also served as Chair of the New York State Racing Association Oversight Board, as Chair of the Public Authorities Control Board, as a Commissioner on the New York State Commission on Public Authority Reform and as a member of the Boards of Directors of several New York State public authorities. These positions have involved overseeing operations and finances of certain entities and assessing the adequacy of project/entity financing and financial reporting. Currently, Ms. Stone is on the Board of Directors of CBOE Holdings, Inc., of the Chicago Board Options Exchange, and of C2 Options Exchange. Ms. Stone’s position on the boards of these entities and as a member of both CBOE Holdings’ Audit Committee and its Finance Committee has involved, among other things, the oversight of audits, audit plans and preparation of financial statements.
ITEM 4. PRINCIPAL ACCOUNTANT FEES AND SERVICES.
NUVEEN TAX-ADVANTAGED TOTAL RETURN STRATEGY FUND
The following tables show the amount of fees that Ernst & Young LLP, the Fund’s auditor, billed to the Fund during the Fund’s last two full fiscal years. For engagements with Ernst & Young LLP the Audit Committee approved in advance all audit services and non-audit services that Ernst & Young LLP provided to the Fund, except for those non-audit services that were subject to the pre-approval exception under Rule 2-01 of Regulation S-X (the “pre-approval exception”). The pre-approval exception for services provided directly to the Fund waives the pre-approval requirement for services other than audit, review or attest services if: (A) the aggregate amount of all such services provided constitutes no more than 5% of the total amount of revenues paid by the Fund to its accountant during the fiscal year in which the services are provided; (B) the Fund did not recognize the services as non-audit services at the time of the engagement; and (C) the services are promptly brought to the Audit Committee’s attention, and the Committee (or its delegate) approves the services before the audit is completed.
The Audit Committee has delegated certain pre-approval responsibilities to its Chairman (or, in his absence, any other member of the Audit Committee).
SERVICES THAT THE FUND’S AUDITOR BILLED TO THE FUND
| | Audit Fees Billed | | Audit-Related Fees | | Tax Fees | | All Other Fees | |
Fiscal Year Ended | | to Fund (1) | | Billed to Fund (2) | | Billed to Fund (3) | | Billed to Fund (4) | |
December 31, 2012 | | $ | 27,000 | | $ | 0 | | $ | 0 | | $ | 0 | |
| | | | | | | | | |
Percentage approved pursuant to pre-approval exception | | 0 | % | 0 | % | 0 | % | 0 | % |
| | | | | | | | | |
December 31, 2011 | | $ | 26,100 | | $ | 0 | | $ | 0 | | $ | 0 | |
| | | | | | | | | |
Percentage approved pursuant to pre-approval exception | | 0 | % | 0 | % | 0 | % | 0 | % |
(1) | “Audit Fees” are the aggregate fees billed for professional services for the audit of the Fund’s annual financial statements and services provided in connection with statutory and regulatory filings or engagements. |
| |
(2) | “Audit-Related Fees” are the aggregate fees billed for assurance and related services reasonably related to the performance of the audit or review of financial statements that are not reported under “Audit Fees”. These fees include offerings related to the Fund’s common shares and leverage. |
| |
(3) | “Tax Fees” are the aggregate fees billed for professional services for tax advice, tax compliance, and tax planning. These fees include: all global withholding tax services; excise and state tax reviews; capital gain, tax equalization and taxable basis calculations performed by the principal accountant. |
| |
(4) | “All Other Fees” are the aggregate fees billed for products and services other than “Audit Fees”, “Audit-Related Fees” and “Tax Fees”. These fees represent all “Agreed-Upon Procedures” engagements pertaining to the Fund’s use of leverage. |
SERVICES THAT THE FUND’S AUDITOR BILLED TO THE
ADVISER AND AFFILIATED FUND SERVICE PROVIDERS
The following tables show the amount of fees billed by Ernst & Young LLP to Nuveen Fund Advisors, LLC (formerly Nuveen Fund Advisors, Inc.) (the “Adviser”), and any entity controlling, controlled by or under common control with the Advisor that provides ongoing services to the Fund (“Affiliated Fund Service Provider”), for engagements directly related to the Fund’s operations and financial reporting, during the Fund’s last two full fiscal years.
The tables also show the percentage of fees subject to the pre-approval exception. The pre-approval exception for services provided to the Adviser and any Affiliated Fund Service Provider (other than audit, review or attest services) waives the pre-approval requirement if: (A) the aggregate amount of all such services provided constitutes no more than 5% of the total amount of revenues paid to Ernst & Young LLP by the Fund, the Adviser and Affiliated Fund Service Providers during the fiscal year in which the services are provided that would have to be pre-approved by the Audit Committee; (B) the Fund did not recognize the services as non-audit services at the time of the engagement; and (C) the services are promptly brought to the Audit Committee’s attention, and the Committee (or its delegate) approves the services before the Fund’s audit is completed.
| | Audit-Related Fees | | Tax Fees Billed to | | All Other Fees | |
| | Billed to Adviser and | | Adviser and | | Billed to Adviser | |
| | Affiliated Fund | | Affiliated Fund | | and Affiliated Fund | |
Fiscal Year Ended | | Service Providers | | Service Providers | | Service Providers | |
December 31, 2012 | | $ | 0 | | $ | 0 | | $ | 0 | |
| | | | | | | |
Percentage approved pursuant to pre-approval exception | | 0 | % | 0 | % | 0 | % |
| | | | | | | |
December 31, 2011 | | $ | 0 | | $ | 0 | | $ | 0 | |
| | | | | | | |
Percentage approved pursuant to pre-approval exception | | 0 | % | 0 | % | 0 | % |
NON-AUDIT SERVICES
The following table shows the amount of fees that Ernst & Young LLP billed during the Fund’s last two full fiscal years for non-audit services. The Audit Committee is required to pre-approve non-audit services that Ernst & Young LLP provides to the Adviser and any Affiliated Fund Services Provider, if the engagement related directly to the Fund’s operations and financial reporting (except for those subject to the pre-approval exception described above). The Audit Committee requested and received information from Ernst & Young LLP about any non-audit services that Ernst & Young LLP rendered during the Fund’s last fiscal year to the Adviser and any Affiliated Fund Service Provider. The Committee considered this information in evaluating Ernst & Young LLP’s independence.
| | | | Total Non-Audit Fees | | | | | |
| | | | billed to Adviser and | | | | | |
| | | | Affiliated Fund Service | | Total Non-Audit Fees | | | |
| | | | Providers (engagements | | billed to Adviser and | | | |
| | | | related directly to the | | Affiliated Fund Service | | | |
| | Total Non-Audit Fees | | operations and financial | | Providers (all other | | | |
Fiscal Year Ended | | Billed to Fund | | reporting of the Fund) | | engagements) | | Total | |
December 31, 2012 | | $ | 0 | | $ | 0 | | $ | 0 | | $ | 0 | |
December 31, 2011 | | $ | 0 | | $ | 0 | | $ | 0 | | $ | 0 | |
“Non-Audit Fees billed to Fund” for both fiscal year ends represent “Tax Fees” and “All Other Fees” billed to Fund in their respective amounts from the previous table.
Less than 50 percent of the hours expended on the principal accountant’s engagement to audit the registrant’s financial statements for the most recent fiscal year were attributed to work performed by persons other than the principal accountant’s full-time, permanent employees.
Audit Committee Pre-Approval Policies and Procedures. Generally, the Audit Committee must approve (i) all non-audit services to be performed for the Fund by the Fund’s independent accountants and (ii) all audit and non-audit services to be performed by the Fund’s independent accountants for the Affiliated Fund Service Providers with respect to operations and financial reporting of the Fund. Regarding tax and research projects conducted by the independent accountants for the Fund and Affiliated Fund Service Providers (with respect to operations and financial reports of the Fund) such engagements will be (i) pre-approved by the Audit Committee if they are expected to be for amounts greater than $10,000; (ii) reported to the Audit Committee chairman for his verbal approval prior to engagement if they are expected to be for amounts under $10,000 but greater than $5,000; and (iii) reported to the Audit Committee at the next Audit Committee meeting if they are expected to be for an amount under $5,000.
ITEM 5. AUDIT COMMITTEE OF LISTED REGISTRANTS.
The registrant’s Board has a separately designated Audit Committee established in accordance with Section 3(a)(58)(A) of the Securities Exchange Act of 1934, as amended (15 U.S.C. 78c(a)(58)(A)). The members of the audit committee are Robert P. Bremner, David J. Kundert, William J. Schneider, Carole E. Stone and Terence J. Toth.
ITEM 6. SCHEDULE OF INVESTMENTS.
(a) See Portfolio of Investments in Item 1.
(b) Not applicable.
ITEM 7. DISCLOSURE OF PROXY VOTING POLICIES AND PROCEDURES FOR CLOSED-END MANAGEMENT INVESTMENT COMPANIES.
Nuveen Fund Advisors, LLC, formerly known as Nuveen Fund Advisors, Inc., is the registrant’s investment adviser (also referred to as the “Adviser”). The Adviser is responsible for the on-going monitoring of the Fund’s investment portfolio, managing the Fund’s business affairs and providing certain clerical, bookkeeping and administrative services. The Adviser has engaged NWQ Investment Management Company, LLC (“NWQ”) and Symphony Asset Management, LLC (“Symphony”) (NWQ and Symphony are collectively referred to as “Sub-Advisers”) as Sub-Advisers to provide discretionary investment advisory services. As part of these services, the Adviser has delegated to each Sub-Adviser the full responsibility for proxy voting and related duties in accordance with each Sub-Adviser’s policies and procedures. The Adviser periodically monitors each Sub-Adviser’s voting to ensure that it is carrying out its duties. Each Sub-Adviser’s proxy voting policies and procedures are attached to this filing as an exhibit and incorporated herein by reference or summarized below.
SYMPHONY
Symphony has adopted and implemented proxy voting guidelines to ensure that proxies are voted in the best interest of its Clients. These are merely guidelines and specific situations may call for a vote which does not follow the guidelines. In determining how to vote proxies, Symphony will follow the Proxy Voting Guidelines of the independent third party which Symphony has retained to provide proxy voting services (“Symphony’s Proxy Guidelines”).
Symphony has created a Proxy Voting Committee to periodically review Symphony’s Proxy Guidelines, address conflicts of interest, specific situations and any portfolio manager’s decision to deviate from Symphony’s Proxy Guideline, (including the third party’s guidelines). Under certain circumstances, Symphony may vote one way for some Clients and another way for other Clients. For example, votes for a Client who provides specific voting instructions may differ from votes for Clients who do not provide proxy voting instructions. However, when Symphony has discretion, proxies will generally be voted the same way for all Clients. In addition, conflicts of interest in voting proxies may arise between Clients, between Symphony and its employees, or a lending or other material relationship. As a general rule, conflicts will be resolved by Symphony voting in accordance with Symphony’s Proxy Guidelines when:
· Symphony manages the account of a corporation or a pension fund sponsored by a corporation in which Clients of Symphony also own stock. Symphony will vote the proxy for its other Clients in accordance with Symphony’s Proxy Guidelines and will follow any directions from the corporation or the pension plan, if different than Symphony’s Proxy Guidelines;
· An employee or a member of his/her immediate family is on the Board of Directors or a member of senior management of the company that is the issuer of securities held in Client’s account;
· Symphony has a borrowing or other material relationship with a corporation whose securities are the subject of the proxy.
Proxies will always be voted in the best interest of Symphony’s Clients. Those situations that do not fit within the general rules for the resolution of conflicts of interest will be reviewed by the Proxy Voting Committee. The Proxy Voting Committee, after consulting with senior management, if appropriate, will determine how the proxy should be voted. For example, when a portfolio manager decides not to follow Symphony’s Proxy Guidelines, the Proxy Voting Committee will review a portfolio manager’s recommendation and determine how to vote the proxy. Decisions by the Proxy Voting Committee will be documented and kept with records related to the voting of proxies. A summary of specific votes will be retained in accordance with Symphony’s Books and Records Requirements which are set forth Symphony’s Compliance Manual and Code of Ethics.
ITEM 8. PORTFOLIO MANAGERS OF CLOSED-END MANAGEMENT INVESTMENT COMPANIES.
Nuveen Fund Advisors, LLC, formerly known as Nuveen Fund Advisors, Inc. (“NFALLC”), is the registrant’s investment adviser (NFALLC is also referred to as the “Adviser”). NFALLC is responsible for the selection and on-going monitoring of the Fund’s investment portfolio, managing the Fund’s business affairs and providing certain clerical, bookkeeping and administrative services. The Adviser has engaged Symphony Asset Management, LLC (“Symphony”) and NWQ Investment Management Company, LLC (“NWQ”), as Sub-Advisers to provide discretionary investment advisory services with respect to the registrant’s investments in senior loans and other debt instruments and equity investments, respectively (Symphony and NWQ are also collectively referred to as “Sub-Advisers”). The following section provides information on the portfolio managers at each Sub-Adviser:
SYMPHONY
Item 8(a)(1). PORTFOLIO MANAGER BIOGRAPHY
Gunther Stein
Gunther Stein, Chief Investment Officer and Chief Executive Officer, is responsible for overseeing Symphony’s fixed-income and equity investments. Mr. Stein has over 25 years of investment and research experience and is actively involved with the management of the firm’s fixed-income products. Prior to joining Symphony in 1999, Mr. Stein spent six years at Wells Fargo where he was most recently a high-yield portfolio manager after being in the firm’s Loan Syndications & Leveraged Finance Group. Before joining Wells Fargo, he was a Euro-currency deposit trader at First Interstate Bank. He also worked for Standard Chartered Bank in Mexico City and Citibank Investment Bank in London. Mr. Stein received an MBA from the University of Texas at Austin and a BA in economics from the University of California, Berkeley.
Item 8(a)(2). OTHER ACCOUNTS MANAGED
Other Accounts Managed by Symphony PM As of 12/31/12
| | Gunther Stein | |
(a) RICs | | | |
Number of accts | | 16 | |
Assets | | $ | 2,427,697,965 | |
| | | |
(b) Other pooled accts | | | |
Non-performance fee accts | | | |
Number of accts | | 15 | |
Assets | | $ | 116,013,700 | |
Performance fee accts | | | |
Number of accts | | 17 | |
Assets | | $ | 1,795,027,488 | |
| | | |
(c) Other | | | |
Non-performance fee accts | | | |
Number of accts | | 9 | |
Assets | | $ | 72,169,856 | |
Performance fee accts | | | |
Number of accts | | 5 | |
Assets | | $ | 293,034,463 | |
POTENTIAL MATERIAL CONFLICTS OF INTEREST
As described above, the portfolio manager may manage other accounts with investment strategies similar to the Fund, including other investment companies and separately managed accounts. Fees earned by the sub-advisers may vary among these accounts and the portfolio managers may personally invest in some but not all of these accounts. In addition, certain accounts may be subject to performance-based fees. These factors could create conflicts of interest because a portfolio manager may have incentives to favor certain accounts over others, resulting in other accounts outperforming the Fund. A conflict may also exist if a portfolio manager identified a limited investment opportunity that may be appropriate for more than one account, but the Fund is not able to take full advantage of that opportunity due to the need to allocate that opportunity among multiple accounts. In addition, the portfolio manager may execute transactions for another account that may adversely impact the value of securities held by the Fund. However, the sub-advisers believe that these risks are mitigated by the fact that accounts with like investment strategies managed by a particular portfolio manager are generally managed in a similar fashion, subject to exceptions to account for particular investment restrictions or policies applicable only to certain accounts, differences in cash flows and account sizes, and other factors. In addition, each sub-adviser has adopted trade allocation procedures that require equitable allocation of trade orders for a particular security among participating accounts.
Item 8(a)(3). FUND MANAGER COMPENSATION
Symphony investment professionals receive compensation based on three elements: fixed-base salary, participation in a bonus pool and certain long-term incentives.
The fixed-base salary is set at a level determined by Symphony and is reviewed periodically to ensure that it is competitive with base salaries paid by similar financial services companies for persons playing similar roles.
The portfolio manager is also eligible to receive an annual bonus from a pool based on Symphony’s aggregate asset-based and performance fees after all operating expenses. The level of this bonus to each individual portfolio manager is determined by senior management’s assessment of the team’s performance, and the individual’s contribution to and performance on that team. Factors considered in that assessment include the total return and risk-adjusted total return performance of the accounts for which the individual serves as portfolio manager relative to any benchmarks established for those accounts; the individual’s effectiveness in communicating investment performance to investors and/or their advisors; and the individual’s contribution to the firm’s overall investment process and to the execution of investment strategies.
Finally, certain key employees of Symphony, including the portfolio manager, have received profits interests in Symphony which entitle their holders to participate in the firm’s growth over time.
Item 8(a)(4). OWNERSHIP OF JTA SECURITIES AS OF DECEMBER 31, 2012
Name of Portfolio
Manager | | None | | $1 -
$10,000 | | $10,001-
$50,000 | | $50,001-
$100,000 | | $100,001-
$500,000 | | $500,001-
$1,000,000 | | Over
$1,000,000 | |
Gunther Stein | | X | | | | | | | | | | | | | |
NWQ
Item 8(a)(1). PORTFOLIO MANAGER BIOGRAPHIES
Jon D. Bosse, CFA, Chief Investment Officer, Co-President of NWQ, and Portfolio Manager
Prior to joining NWQ in 1996, Mr. Bosse spent ten years with ARCO Investment Management Company where, in addition to managing a value-oriented fund, he was the Director of Equity Research. Previously, he spent four years with ARCO in Corporate Finance. Mr. Bosse received his B.A. in Economics from Washington University, St. Louis, where he was awarded the John M. Olin Award for excellence in economics, and graduated summa cum laude. He received his M.B.A. from the Wharton Business School, University of Pennsylvania. In addition, he received his Chartered Financial Analyst designation in 1992 and is a member of the CFA Institute and the Los Angeles Society of Financial Analysts.
Michael Carne, CFA, Managing Director and Fixed Income Portfolio Manager
Prior to joining NWQ in 2002, Mr. Carne managed institutional, private client fixed income and balanced portfolios for over twenty years. During this time, he held assignments as Director of Global Fixed Income at Aetna Capital Management, as Chief Investment Officer of a Phoenix Home Life affiliate and was a principal in Standard Asset Group. Mr. Carne graduated from the University of Massachusetts with a B.B.A. degree in Finance and received his M.B.A. from Harvard University. He earned the designation of Chartered Financial Analyst in 1989.
James Stephenson, CFA, Managing Director, Portfolio Manager, and Equity Analyst
Prior to joining NWQ in 2006, Mr. Stephenson spent seven years at Bel Air Investment Advisors, LLC, a State Street Global Advisors Company, where he was a Managing Director and Partner. Most recently, Mr. Stephenson was Chairman of the firm’s Equity Policy Committee and the Portfolio Manager for Bel Air’s Large Cap Core and Select strategies. Previous to this, he spent five years as an Analyst and Portfolio Manager at ARCO Investment Management Company. Prior to that, he was an Equity Analyst at Trust Company of the West. Mr. Stephenson received his B.B.A. and M.S. in Business from the University of Wisconsin-Madison, where he participated in the Applied Security Analysis Program. In addition, he earned the designation of Chartered Financial Analyst in 1993 and is a member of the CFA Institute and the Los Angeles Society of Financial Analysts.
Item 8(a)(2). OTHER ACCOUNTS MANAGED
| | Jon Bosse | | Michael Carne | | James
Stephenson | |
(a) RICs | | | | | | | |
Number of accts | | 6 | | 3 | | 2 | |
Assets ($000s) | | $ | 1,639,007,555 | | $ | 749,625,685 | | $ | 88,711,470 | |
| | | | | | | |
(b) Other pooled accts | | | | | | | |
Non-performance fee accts | | | | | | | |
Number of accts | | 18 | | 0 | | 0 | |
Assets ($000s) | | $ | 740,301,544 | | 0 | | 0 | |
(c) Other | | | | | | | |
Non-performance fee accts | | | | | | | |
Number of accts | | 19,552 | | 5,894 | | 1 | |
Assets ($000s) | | $ | 9,162,041,072 | * | $ | 1,159,660,764 | | 801,618 | |
Performance fee accts | | | | | | | |
Number of accts | | 5 | | 0 | | 0 | |
Assets ($000s) | | $ | 271,208,461 | | 0 | | 0 | |
| | | | | | | | | | |
*Includes $743,446,901 of model program assets.
POTENTIAL MATERIAL CONFLICTS OF INTEREST
NWQ has an investment philosophy and operating belief which seeks to manage each account in a particular strategy alike. Conflicts of interest may include, but are not limited to:
· The management of multiple accounts may result in a portfolio manager devoting unequal time and attention to the management of each account. NWQ seeks to manage such competing interests for the time and attention of portfolio managers by having portfolio managers focus on a particular investment discipline. Most accounts managed by a portfolio manager in a particular investment strategy are managed using the same investment models.
· If a portfolio manager identifies a limited investment opportunity which may be suitable for more than one account, an account may not be able to take full advantage of that opportunity due to its limited availability (i.e., an allocation of filled purchase or sale orders across all eligible accounts.) To deal with these situations, NWQ has adopted procedures for allocating limited opportunities across multiple accounts.
· In the event a client has directed certain brokerage activities, NWQ may place separate, non-simultaneous, transactions for a Fund and other accounts which may temporarily affect the market price of the security or the execution of the transactions, or both, to the detriment of the Fund or the other accounts.
· The appearance of a conflict of interest may arise where NWQ has an incentive, such as a performance-based management fee, which relates to the management of some accounts, where a portfolio manager has day-to-day management responsibilities. However, again, NWQ has an operating belief/philosophy which seeks to manage all accounts alike.
NWQ has adopted certain compliance procedures which are designed to address these types of conflicts. However, there is no guarantee that such procedures will detect each and every situation in which a conflict arises.
Item 8(a)(3). FUND MANAGER COMPENSATION
NWQ offers a highly competitive compensation structure with the purpose of attracting and retaining the most talented investment professionals. These professionals are rewarded through a combination of cash and long-term incentive compensation as determined by the firm’s executive committee. Total cash compensation (TCC) consists of both a base salary and an annual bonus that can be a multiple of the base salary. The firm annually benchmarks TCC to prevailing industry norms with the objective of achieving competitive levels for all contributing professionals.
Available bonus pool compensation is primarily a function of the firm’s overall annual profitability, and in the interest of employee and client interest alliance, NWQ’s bonus pool will be augmented should the firm outperform its benchmarks on a 1, 2 and 3 year basis. Individual bonuses are based primarily on the following:
· Overall performance of client portfolios
· Objective review of stock recommendations and the quality of primary research
· Subjective review of the professional’s contributions to portfolio strategy, teamwork, collaboration and work ethic
To further strengthen our incentive compensation package and to create an even stronger alignment to the long-term success of the firm, NWQ provides a number of other incentive opportunities through long-term employment contracts with senior executives, retention agreements, and an equity incentive plan with non-solicitation and non-compete provisions for participating employees. The equity incentive plan provides meaningful equity to employees which is similar to restricted stock and options and which vests over the next 5 to 7 years. Equity incentive plans allowing key employees of NWQ to participate in the firm’s growth over time have been in place since Nuveen’s acquisition of NWQ.
At NWQ, we believe that we are an employer of choice. Our analysts have a meaningful impact on the portfolio and, therefore, are compensated in a manner similar to portfolio managers at many other firms. Benefits besides compensation include a college tuition program for the children of all full-time employees whereby they are eligible for reimbursement of tuition and other mandatory fees, among others.
Item 8(a)(4). OWNERSHIP OF JTA SECURITIES AS OF DECEMBER 31, 2012
Name of Portfolio
Manager | | None | | $1 -
$10,000 | | $10,001-
$50,000 | | $50,001-
$100,000 | | $100,001-
$500,000 | | $500,001-
$1,000,000 | | Over
$1,000,000 | |
Jon Bosse | | X | | | | | | | | | | | | | |
Mike Carne | | X | | | | | | | | | | | | | |
James Stephenson | | X | | | | | | | | | | | | | |
ITEM 9. PURCHASES OF EQUITY SECURITIES BY CLOSED-END MANAGEMENT INVESTMENT COMPANY AND AFFILIATED PURCHASERS.
| | | | (b) | | (c) | | (d)* | |
| | (a) | | AVERAGE | | TOTAL NUMBER OF SHARES | | MAXIMUM NUMBER (OR | |
| | TOTAL NUMBER OF | | PRICE | | (OR UNITS) PURCHASED AS | | APPROXIMATE DOLLAR VALUE) OF | |
| | SHARES (OR | | PAID PER | | PART OF PUBLICLY | | SHARES (OR UNITS) THAT MAY YET | |
| | UNITS) | | SHARE (OR | | ANNOUNCED PLANS OR | | BE PURCHASED UNDER THE PLANS OR | |
Period* | | PURCHASED | | UNIT) | | PROGRAMS | | PROGRAMS | |
| | | | | | | | | |
JANUARY 1-31, 2012 | | 0 | | | | 0 | | 1,369,260 | |
| | | | | | | | | |
FEBRUARY 1-29, 2012 | | 0 | | | | 0 | | 1,369,260 | |
| | | | | | | | | |
MARCH 1-31, 2012 | | 0 | | | | 0 | | 1,369,260 | |
| | | | | | | | | |
APRIL 1-30, 2012 | | 0 | | | | 0 | | 1,369,260 | |
| | | | | | | | | |
MAY 1-31, 2012 | | 0 | | | | 0 | | 1,369,260 | |
| | | | | | | | | |
JUNE 1-30, 2012 | | 0 | | | | 0 | | 1,369,260 | |
| | | | | | | | | |
JULY 1-31, 2012 | | 0 | | | | 0 | | 1,369,260 | |
| | | | | | | | | |
AUGUST 1-31, 2012 | | 0 | | | | 0 | | 1,369,260 | |
| | | | | | | | | |
SEPTEMBER 1-30, 2012 | | 0 | | | | 0 | | 1,369,260 | |
| | | | | | | | | |
OCTOBER 1-31, 2012 | | 0 | | | | 0 | | 1,369,260 | |
| | | | | | | | | |
NOVEMBER 1-30, 2012 | | 12,983 | | $ | 9.98 | | 12,983 | | 1,381,000 | |
| | | | | | | | | |
DECEMBER 1-31, 2012 | | 0 | | | | 0 | | 1,381,000 | |
| | | | | | | | | |
TOTAL | | 12,983 | | | | | | | |
| | | | | | | | | | |
* The registrant’s repurchase program, for the repurchase of 1,380,000 shares, was authorized November 16, 2011. The program was reauthorized for a maximum repurchase amount of 1,385,000 shares on November 15, 2012. Any repurchases made by the registrant pursuant to the program were made through open-market transactions.
ITEM 10. SUBMISSION OF MATTERS TO A VOTE OF SECURITY HOLDERS.
There have been no material changes to the procedures by which shareholders may recommend nominees to the registrant’s Board implemented after the registrant last provided disclosure in response to this Item.
ITEM 11. CONTROLS AND PROCEDURES.
(a) | The registrant’s principal executive and principal financial officers, or persons performing similar functions, have concluded that the registrant’s disclosure controls and procedures (as defined in Rule 30a-3(c) under the Investment Company Act of 1940, as amended (the “1940 Act”) (17 CFR 270.30a-3(c))) are effective, as of a date within 90 days of the filing date of this report that includes the disclosure required by this paragraph, based on their evaluation of the controls and procedures required by Rule 30a-3(b) under the 1940 Act (17 CFR 270.30a-3(b)) and Rules 13a-15(b) or 15d-15(b) under the Securities Exchange Act of 1934, as amended (the “Exchange Act”) (17 CFR 240.13a-15(b) or 240.15d-15(b)). |
| |
(b) | There were no changes in the registrant’s internal control over financial reporting (as defined in Rule 30a-3(d) under the 1940 Act (17 CFR 270.30a-3(d)) that occurred during the second fiscal quarter of the period covered by this report that has materially affected, or is reasonably likely to materially affect, the registrant’s internal control over financial reporting. |
ITEM 12. EXHIBITS.
File the exhibits listed below as part of this Form.
(a)(1) Any code of ethics, or amendment thereto, that is the subject of the disclosure required by Item 2, to the extent that the registrant intends to satisfy the Item 2 requirements through filing of an exhibit: Not applicable because the code is posted on registrant’s website at www.nuveen.com/CEF/Shareholder/FundGovernance.aspx and there were no amendments during the period covered by this report. (To view the code, click on Code of Conduct.)
(a)(2) A separate certification for each principal executive officer and principal financial officer of the registrant as required by Rule 30a-2(a) under the 1940 Act (17 CFR 270.30a-2(a)) in the exact form set forth below: Ex-99.CERT Attached hereto.
(a)(3) Any written solicitation to purchase securities under Rule 23c-1 under the 1940 Act (17 CFR 270.23c-1) sent or given during the period covered by the report by or on behalf of the registrant to 10 or more persons. Not applicable.
(b) If the report is filed under Section 13(a) or 15(d) of the Exchange Act, provide the certifications required by Rule 30a-2(b) under the 1940 Act (17 CFR 270.30a-2(b)); Rule 13a-14(b) or Rule 15d-14(b) under the Exchange Act (17 CFR 240.13a-14(b) or 240.15d-14(b)), and Section 1350 of Chapter 63 of Title 18 of the United States Code (18 U.S.C. 1350) as an exhibit. A certification furnished pursuant to this paragraph will not be deemed “filed” for purposes of Section 18 of the Exchange Act (15 U.S.C. 78r), or otherwise subject to the liability of that section. Such certification will not be deemed to be incorporated by reference into any filing under the Securities Act of 1933 or the Exchange Act, except to the extent that the registrant specifically incorporates it by reference. Ex-99.906 CERT attached hereto.
SIGNATURES
Pursuant to the requirements of the Securities Exchange Act of 1934 and the Investment Company Act of 1940, the registrant has duly caused this report to be signed on its behalf by the undersigned, thereunto duly authorized.
(Registrant) Nuveen Tax-Advantaged Total Return Strategy Fund
By (Signature and Title) | /s/ Kevin J. McCarthy | |
| Kevin J. McCarthy | |
| Vice President and Secretary | |
Date: March 8, 2013
Pursuant to the requirements of the Securities Exchange Act of 1934 and the Investment Company Act of 1940, this report has been signed below by the following persons on behalf of the registrant and in the capacities and on the dates indicated.
By (Signature and Title) | /s/ Gifford R. Zimmerman | |
| Gifford R. Zimmerman | |
| Chief Administrative Officer | |
| (principal executive officer) | |
Date: March 8, 2013
By (Signature and Title) | /s/ Stephen D. Foy | |
| Stephen D. Foy | |
| Vice President and Controller | |
| (principal financial officer) | |
Date: March 8, 2013