
Aspen Insurance Holdings Limited
Credit Suisse Investor Conference
Chris O’Kane
Chief Executive Officer
15 November 2007
AHL: NYSE
Exhibit 99.1

Safe Harbor Disclosure
This slide presentation is for information purposes only. It should be read in conjunction with our financial supplement posted on our website on the Investor Relations page and with other documents filed or to be filed shortly by Aspen Insurance Holdings Limited (the “Company” or “Aspen”) with the U.S. Securities and Exchange Commission.
Non-GAAP Financial Measures
In presenting Aspen's results, management has included and discussed certain "non-GAAP financial measures", as such term is defined in Regulation G. Management believes that these non-GAAP measures, which may be defined differently by other companies, better explain Aspen's results of operations in a manner that allows for a more complete understanding of the underlying trends in Aspen's business. However, these measures should not be viewed as a substitute for those determined in accordance with GAAP. The reconciliation of such non-GAAP financial measures to their respective most directly comparable GAAP financial measures in accordance with Regulation G is included herein or in the financial supplement, as applicable, which can be obtained from the Investor Relations section of Aspen's website at www.aspen.bm.
Application of the Safe Harbor of the Private Securities Litigation Reform Act of 1995:
This presentation contains written or oral "forward-looking statements" within the meaning of the U.S. federal securities laws. These statements are made pursuant to the safe harbor provisions of the Private Securities Litigation Reform Act of 1995. Forward-looking statements include all statements that do not relate solely to historical or current facts, and can be identified by the use of words such as "expect," "intend," "plan," "believe," "project," "anticipate," "seek," "will," "estimate," "may," "continue,“ “guidance," and similar expressions of a future or forward-looking nature.
In addition, any estimates relating to loss events involve the exercise of considerable judgment and reflect a combination of ground-up evaluations, information available to date from brokers and cedants, market intelligence, initial tentative loss reports and other sources. Due to the complexity of factors contributing to the losses and the preliminary nature of the information used to prepare these estimates, there can be no assurance that Aspen's ultimate losses will remain within the stated amount.
All forward-looking statements address matters that involve risks and uncertainties. Accordingly, there are or will be important factors that could cause actual results to differ materially from those indicated in these statements. Aspen believes these factors include, but are not limited to: changes in the total industry losses resulting from Hurricanes Katrina, Rita and Wilma and any other events, and the actual number of Aspen's insureds incurring losses from these events; with respect to events such as Hurricanes Katrina, Rita and Wilma, Aspen’s reliance on loss reports received from cedants and loss adjustors, Aspen's reliance on industry loss estimates and those generated by modeling techniques, the impact of these events on Aspen's reinsurers, any changes in Aspen's reinsurers' credit quality, the amount and timing of reinsurance recoverables and reimbursements actually received by Aspen from its reinsurers and the overall level of competition and the related demand and supply dynamics as contracts come up for renewal; the impact that our future operating results, capital position and rating agency and other considerations have on the execution of any capital management initiatives; the impact of any capital management activities on our financial condition; the impact of acts of terrorism and related legislation and acts of war; the possibility of greater frequency or severity of claims and loss activity, including as a result of natural or man-made catastrophic events than our underwriting, reserving or investment practices have anticipated; evolving interpretive issues with respect to coverage as a result of Hurricanes Katrina, Rita and Wilma and any other events such as the UK floods; the level of inflation in repair costs due to limited availability of labor and materials after catastrophes; the effectiveness of Aspen's loss limitation methods; changes in the availability, cost or quality of reinsurance or retrocessional coverage, which may affect our decision to purchase such coverage; the reliability of, and changes in assumptions to, catastrophe pricing, accumulation and estimated loss models; loss of key personnel; a decline in our operating subsidiaries' ratings with Standard & Poor's, A.M. Best Company or Moody's Investors Service; changes in general economic conditions including inflation, foreign currency exchange rates, interest rates and other factors that could affect our investment portfolio; the number and type of insurance and reinsurance contracts that we wrote at the January 1st and other renewal periods in 2007 and the premium rates available at the time of such renewals within our targeted business lines; increased competition on the basis of pricing, capacity, coverage terms or other factors; decreased demand for Aspen’s insurance or reinsurance products and cyclical downturn of the industry; changes in governmental regulations, interpretations or tax laws in jurisdictions where Aspen conducts business; proposed and future changes to insurance laws and regulations, including with respect to U.S. state- and other government-sponsored reinsurance funds and primary insurers; Aspen or its Bermudian subsidiary becoming subject to income taxes in the United States or the United Kingdom; the effect on insurance markets, business practices and relationships of ongoing litigation, investigations and regulatory activity by the New York State Attorney General's office and other authorities concerning contingent commission arrangements with brokers and bid solicitation activities. For a more detailed description of these uncertainties and other factors, please see the "Risk Factors" section in Aspen's Annual Reports on Form 10-K as filed with the U.S. Securities and Exchange Commission on February 22, 2007. Aspen undertakes no obligation to publicly update or revise any forward-looking statements, whether as a result of new information, future events or otherwise. Readers are cautioned not to place undue reliance on these forward-looking statements, which speak only as of the dates on which they are made.
2
AHL: NYSE

Probability Distributions of 2008 ROAE and Return
on Allocated Equity: Disclaimers
3
This presentation includes slides relating to the probability distributions of the 2008 ROAE and Return on Allocated Equity based on model outputs only and are not, and should not be construed as guidance for 2008. The Company relies on the outputs of its Dynamic Financial Analysis (“DFA”) model in addition to other considerations in the establishment of its public guidance. No 2008 guidance is given in this presentation.
No representation or warranty of any kind is or can be made with respect to the accuracy or completeness of, and no representation or warranty should be inferred from, the probability distributions of the 2008 ROAE and Return on Allocated Equity in these slides or the assumptions underlying them or their suitability. No representation or warranty is or can be made as to the future operations or the amount of any future income or loss.
The figures shown are the result of numerous assumptions made within our DFA model, many of which are subject to uncertainty which could lead actual results to vary considerably from those indicated by the model, including our estimates of catastrophe and non-catastrophe losses, our estimates of reserve movements and our estimates of investment income.
No explicit allowance has been made within the modelling for the possibility that the model could be wrong or assumptions within the model incorrect. This includes the possibility that catastrophe models are incorrect.
Changes in market conditions and variations from expected underwriting and investment strategy may lead to results varying considerably from those indicated by the model.
No reliance should be placed on the accuracy of our DFA probability distributions of the 2008 ROAE and Return on Allocated Equity as they are based on (i) assumptions and other factors made at the time of modeling which may be subject to uncertainty or which may change subsequently, (ii) currently available information derived from modeling techniques, which may be incorrect, and (iii) modeling assumptions that may be inaccurate or incorrect. Therefore, the results of the model are illustrative and not to be viewed as facts or forecasts, and should not be relied upon as a representation of the future value of an investment in Aspen shares.
See Slide 2 – Safe Harbor Disclosure for reference to important factors that could cause actual results to differ from the probability distribution of 2008 ROAE and Return on Allocated Equity provided in the previous slides. Changes in market conditions and variations from expected underwriting and investment strategy may lead to results varying considerably from those indicated by the model.
For a more detailed description of these uncertainties and other factors, please see the “Risk Factors” section in Aspen’s Annual Reports on Form 10-K as filed with the U.S. Securities and Exchange Commission on February 22, 2007. Aspen undertakes no obligation to publicly update or revise any forward-looking statements, whether as a result of new information, future events or otherwise. Readers are cautioned not to place undue reliance on these forward-looking statements, which speak only as of the dates on which they were made.
AHL: NYSE

Contents
Aspen at a Glance
Key Performance Drivers
Tax
Capital Management and Financial Leverage
Investment Income
Underwriting Results
Business Enablement
Enterprise Risk Management
Diversification
Cycle Management
4
AHL: NYSE

Aspen at a Glance
5
A Bermuda based diversified Specialty Insurer and Reinsurer with particular strengths in
Marine, Energy and Transport Insurance
Specialty and Casualty Reinsurance
Property Catastrophe Insurance and Reinsurance
$2.5bn market cap
$2.3bn common equity and $3.0bn total capital, as of September 30, 2007
500 employees in 12 offices in 6 countries
Ratings of A (S&P), A2 (Moody’s) and A / A- (AM Best, for Aspen UK and Aspen
Bermuda)
$1.9bn Gross Written Premium (GWP) in 2006, estimate $1.8bn +/- 5% GWP for
2007
35% Insurance, 65% Reinsurance
43% Casualty, 57% Property
AHL: NYSE
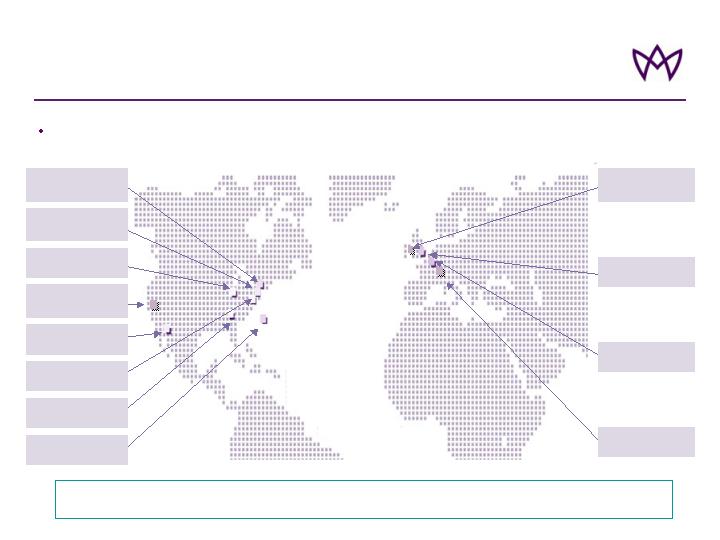
Aspen at a Glance:
Widespread distribution-efficient infrastructure
500 Employees Across Twelve Offices
129 Underwriters, 25 Actuaries and 29 Risk Management professionals
London
(294)
Paris
(3)
Zurich
(7)
Dublin
(6)
Bermuda
(56)
Atlanta
(18)
Connecticut
(34)
Arizona
(9)
Illinois
(2)
California
(6)
New York
(1)
Massachusetts
(63)
Key platforms in London, Bermuda and US with seven additional distribution centres
6
AHL: NYSE
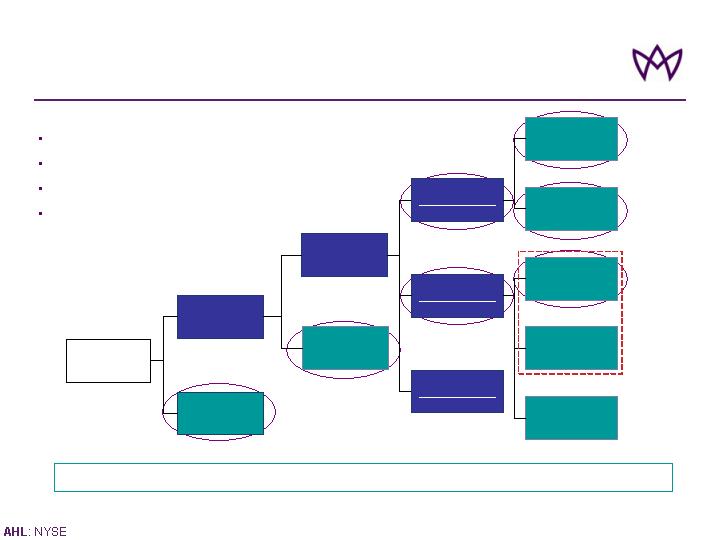
Aspen at a Glance:
Key Performance Drivers - Framework
i. Asset Leverage defined as Invested Assets / Capital. Capital defined as Ordinary and Preferred Shareholders’ Equity plus Long-term Debt
ii. Leverage defined as (Preferred Shareholders’ Equity + Long-term Debt) / Capital
iii. Operating Leverage defined as Net Premium Earned / Average Ordinary Shareholders Equity
7
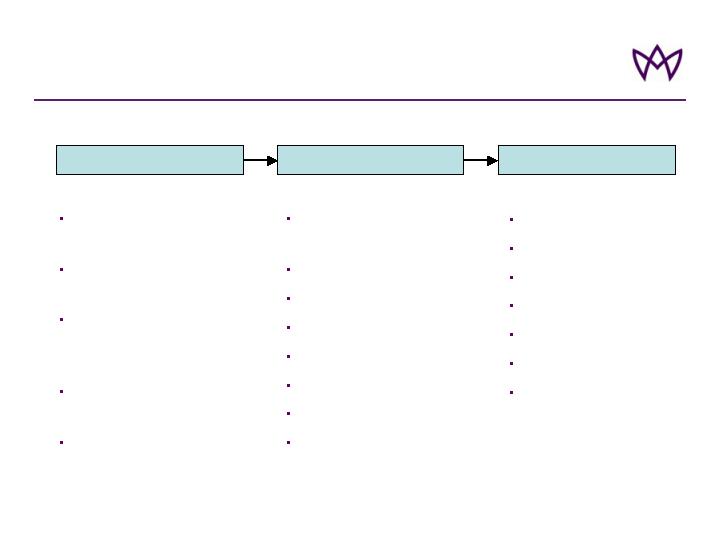
Targeted Management of Underlying Levers of ROAE to Enhance Performance
Pre
-
tax Return
on Capital
Leverage
(
1
–
Tax rate
)
Pre
-
tax
ROAE
x
Expense Ratio
Loss Ratio
Operating
Leverage
Asset Leverage
Investment Yield
+
x
x
+
–
Interest
Expense
Capital
Underwriting
Result
Capital
Investment
Income
Capital
(i)
(ii)
(iii)
ROAE
Tax
Capital Management and Financial Leverage
Investment Income
Underwriting Results
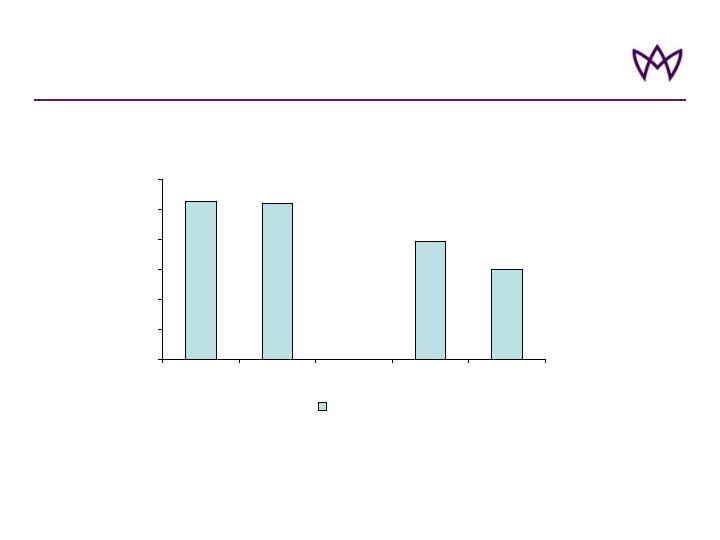
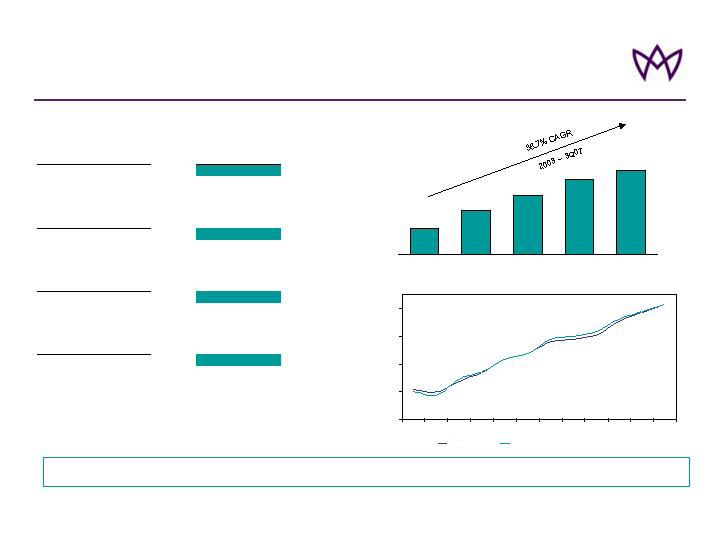
Key Performance Driver: Increasing Tax Efficiency
0%
5%
10%
15%
20%
25%
30%
2003
2004
2005*
2006
9mths 2007
Tax rate
* In 2005 Aspen Insurance Holdings Limited reported a loss before tax of $160.4 million. In addition to the loss, the group incurred a tax charge of $17.4
8
AHL: NYSE
million in relation to profits earned by Aspen Insurance UK Limited
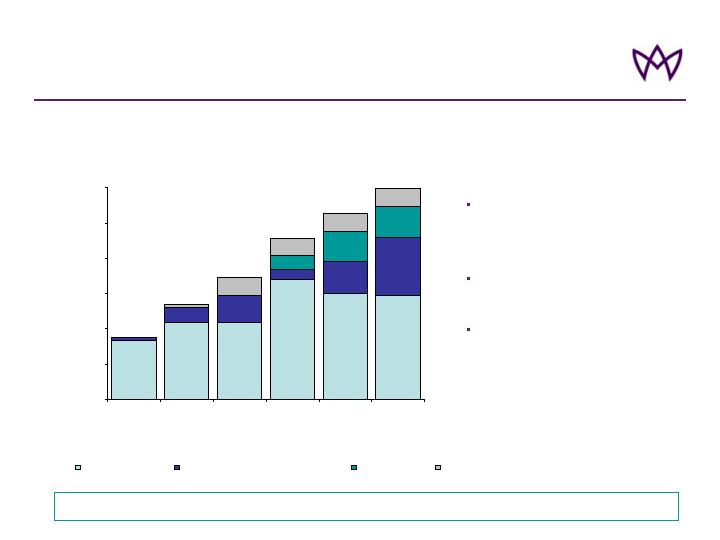
Key Performance Driver:
Capital Management and Financial Leverage
837
1,091
1,096
1,693
1,503
1,471
208
385
147
457
832
200
430
430
249
249
249
249
41
40
0
500
1,000
1,500
2,000
2,500
3,000
2002
2003
2004
2005
2006
Q3 2007
$ mil
Common share capital
Retained earnings inc OCI and issue costs
Preference shares
Debt
Capital Structure and Financial Leverage
9
Share buy back: completed
$300m program, final $50m on
November 9
Preference shares: issued
$200m Q4 2006
Strong balance sheet with
opportunity for further leverage
Active Balance Sheet Management to Deliver Consistent, Quality ROAE
878
1,339
1,731
2,289
2,639
2,983
22.8%
25.7%
19.6%
14.4%
3.0%
Leverage
AHL: NYSE
3.0%
3.5%
4.0%
4.5%
5.0%
Q404
Q105
Q205
Q305
Q405
Q106
Q206
Q306
Q406
Q107
Q207
Q307
Fixed Income
Fixed income and cash and cash equivalents
Key Performance Driver: Growing Investment Income
Average: 2003 – 2007 1H
4.4%
Peer Group Average
3.8%
ASPEN
4.0%
Peer Group Average
3.5%
ASPEN
2005
4.9%
Peer Group Average
4.4%
ASPEN
2006
5.4%
Peer Group Average
5.6%
ASPEN
Pre-tax Investment
Yield¹
2007 1H
$1,616
$2,736
$3,689
$4,681
$5,219
2003
2004
2005
2006
3Q 2007
Peer Group includes: ACE, ACGL, AXS, ORH, ENH, RE, IPCR, TRH, MXGL, MRH, PRE, PTP, AWH, RNR, XL
Source: Company Filings
1. Pre-Tax Investment Yield computed by dividing net investment income for the period by average invested assets and cash / cash equivalents for the applicable period. 2007 1H annualized by
compounding 1H investment return for two six month periods.
10
Total Investments have increased
Investment Yield improving
Increasing Investment Yield; Investment Income Increasing Component of Total Return
AHL: NYSE
Key Performance Driver:
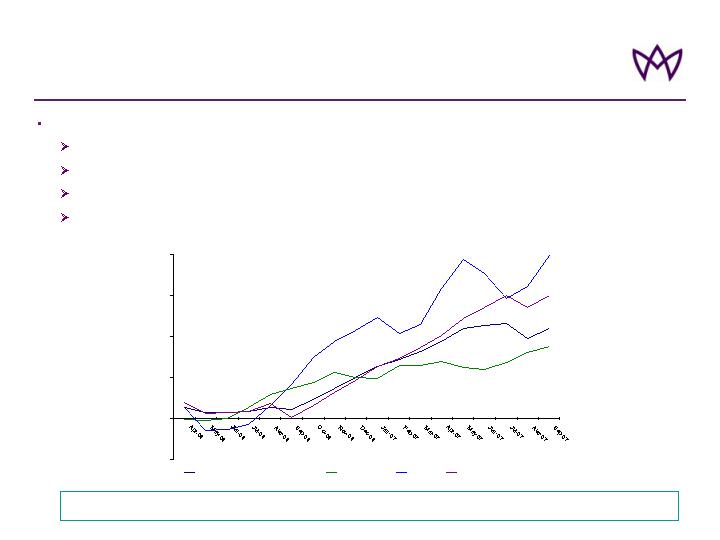
Significant Improvement in Investment Performance
Improving Yields With Consistent Prudent Investment Management Approach
Fund of Hedge Funds Performance
$489m investment = 8.5% of investible assets; scope to increase to 10% of investible assets
21.3% of common equity
Multi manager, multi strategy approach
Performance: YTD Sep 30 2007, 10.0% (13.2% annualized)
-5%
0%
5%
10%
15%
20%
HFRI FOF: Conservative Index
Lehman Agg
S&P500
Aspen FOHF weighted
11
AHL: NYSE
Key Performance Driver: Strong Underwriting Results
95.4
Peer Median
117.6
Peer Median
84.6
Peer Median
85.6
Peer Median
Average: 2003 – 2007 1H
89.0%
ASPEN
117.2%
ASPEN
2005
82.4%
ASPEN
2006
83.9%
ASPEN
Combined Ratio (GAAP)
2007 1H
* Without taking into account variance in other performance measures
Source: SNL Financial
Peers include ACE, ACGL, AXS, ORH, ENH, RE, IPCR, TRH, MXGL, MRH, PRE, PTP, AWH, RNR, XL
12
80
90
100
110
120
20071H
2006
2005
2003-
20071H
Aspen
Median
Combined
Ratio
%
In 2008 We Require a Combined Ratio of 90% to Achieve an ROAE of 15%*
AHL: NYSE

Business Enablement:
Enterprise Risk Management Core Strategic Enabler
Strong ERM framework
Recognised as an Aspen strength by S&P in 2006 and reaffirmed in 2007; awarded ‘strong rating’, second highest, only 3 out of 29 Global Reinsurance companies have higher rating
Managing risk is the job of everyone at Aspen,
- but 29 professionals work in our risk functions
13
AHL: NYSE
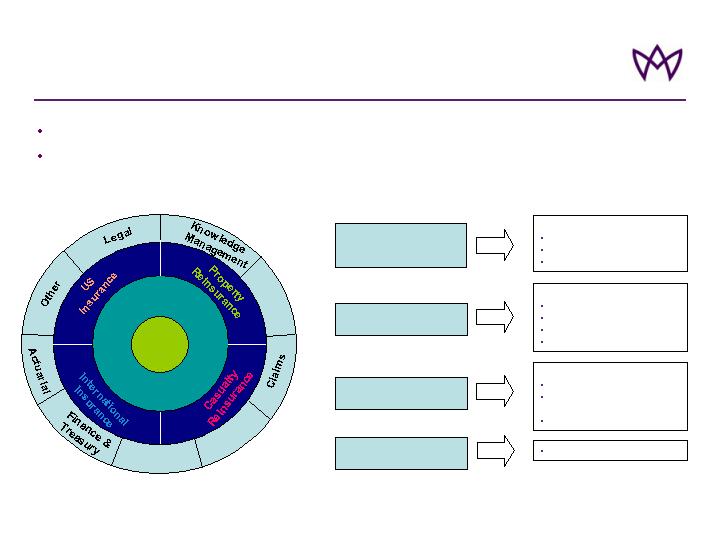
Enterprise Risk Management: Core Strategic Enabler
IT
Ceded
Reinsurance
Risk Management
Risk Management
Group
Executive
HR
Product Segments
145 people
Support Services
187 people
Risk Management
29 people
Board / Management
Team
14 People
Function
Responsibility
‘Implementing the rules’
Risk measurement
Risk monitoring
Control infra-structure
Risk governance
Business enablement
Production
Sales & marketing
Customer relationship
management
Product development
‘Setting the rules’
Strategy
Capital management
Capital allocation
A risk based approach to managing
Integrated Strategic Planning - Operational Management - Internal Control
14
AHL: NYSE
ERM in Practice - Key Stages
Strategic Planning
Operational Management
Internal Control
Group risk appetites set using
advanced simulation modelling
Stress tests used to understand
model weaknesses and tails
Risk limits set for underwriting,
investment and operations
management
Risk transfer plans for reinsurance
and capital markets
Issue Aspen ‘Licenses’ to risk
takers
Insurance product capacity
budgets
Technical price thresholds
Technical terms thresholds
Underwriting guidelines
Product portfolio optimisation
Risk and control schedules
Reinsurance placements
Capital market actions
Accumulation control
Price monitoring
Coverage monitoring
Underwriting quality reviews
Internal audits
Reserving Committee
Performance review
15
AHL: NYSE
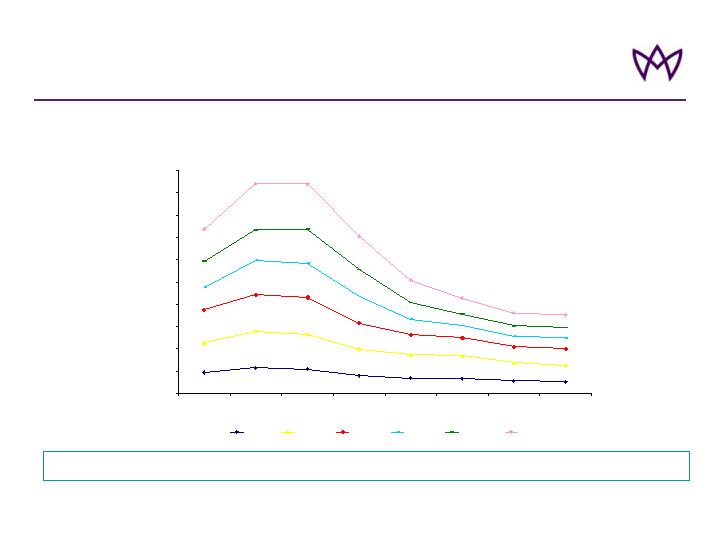
Business Enablement: Understanding Catastrophe Risk
Significant Reduction in Exposure to Natural Catastrophes Post 2005 At All Return Periods
* Aggregate Exceedance Probability (excludes inwards reinstatement premiums, includes outwards reinstatement premiums, net of tax)
Note: For net figures applied 2007 reinsurance / retro program to reflect our previous exposure versus our current structure
Note that assumptions have been made to bring prior periods, modelled in old RMS versions, in line with RMS version 6.
Group Net AEP, Combined All Perils
“As-If” to RMS v6
16
200
400
600
800
1,000
1,200
1,400
1,600
1,800
2,000
2004-08
2005-02
2005-08
2006-02
2006-08
2007-03
2007-06
2007-09
Date
Annual Cat Loss in USD m
Mean
1 in 10
1 in 25
1 in 50
1 in 100
1 in 250
AHL: NYSE
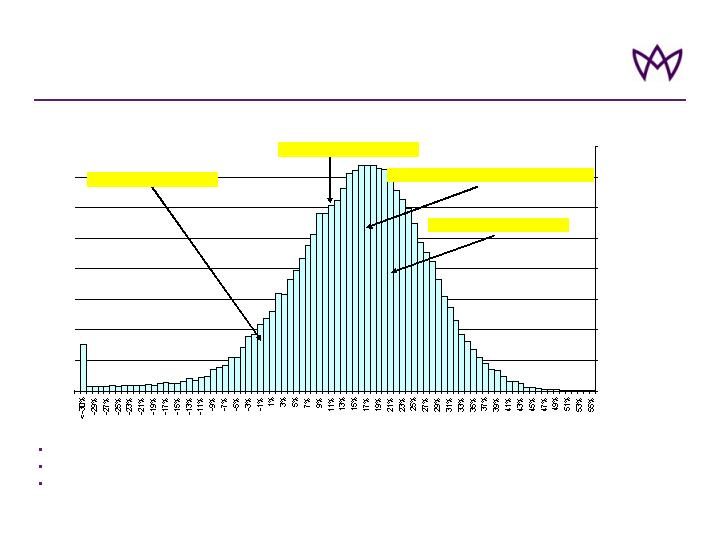
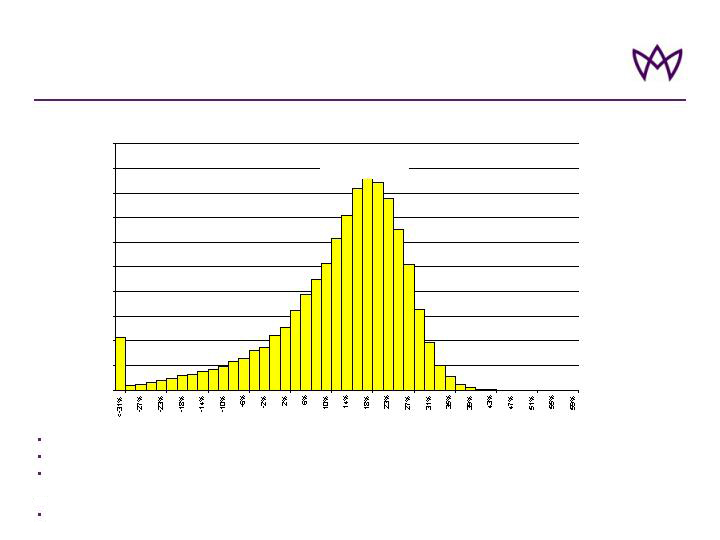
Business Enablement: Understanding Risk
Result of 50,000 simulations of the 2008 year net income using Aspen DFA model
Risks modelled include underwriting (cat and non cat), reserving, market, credit and operational
Subject to the caveats on slides 2 and 3, this represents our estimates of modelled outcomes for 2008
17
ROAE Distribution all Risks: 2008 Plan
0.00%
0.50%
1.00%
1.50%
2.00%
2.50%
3.00%
3.50%
4.00%
ROAE
Probability
Chance of an ROAE < 0=9.2%
Chance of an ROAE > 10%=71%
Chance of an ROAE between 14% and 20%=25%
Chance of an ROAE > 20%=37%
AHL: NYSE
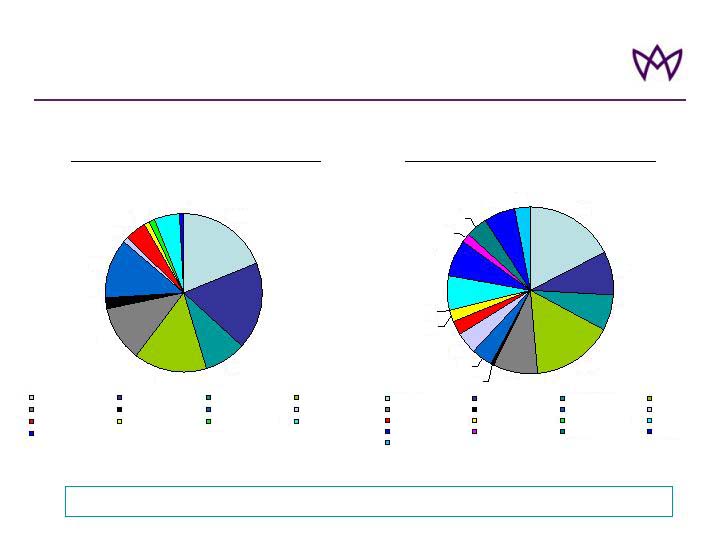
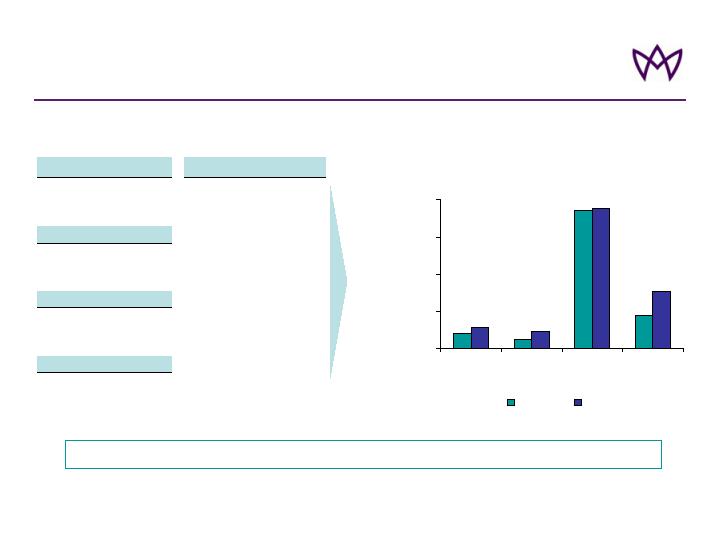
Improved Diversification
Targeted Growth in Specialty Lines And Improved Spread of Risk
$1.4bn split by Product Line
9 months to Sept 2004
$1.5bn split by Product Line
9 months to Sept 2007
18
17%
8%
7%
16%
9%
1%
4%
4%
3%
2%
0%
6%
7%
2%
4%
6%
3%
Catastrophe
Risk XS
Pro Rata Treaty
US Casualty
International Casualty
Casualty Facultative
UK Liability
US Liability
UK Commercial Property
US Commercial Property
Worldwide Property
Specialty RI
Marine Liability
Property Facultative
Aviation
Energy
Marine Hull
20%
18%
9%
15%
11%
2%
12%
1%
4%
1%
1%
5%
1%
Catastrophe
Risk XS
Pro Rata Treaty
US Casualty
International Casualty
Casualty Facultative
UK Liability
US Liability
UK Commercial Property
US Commercial Property
Worldwide Property
Specialty RI
Marine Liability
AHL: NYSE
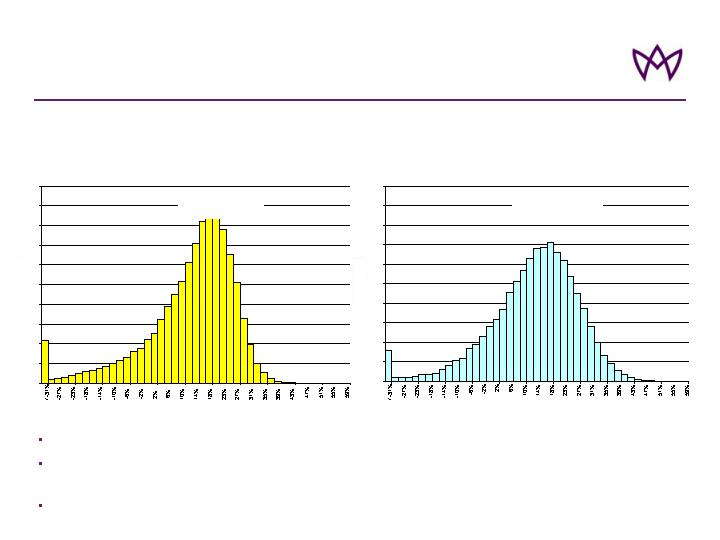
Business Enablement: Benefits of Diversification
Property Reinsurance product segment only
No diversification with other product segments
Relatively large tail and high volatility as measured by the Standard Deviation (“SD”) and the Sharpe Ratio
(calculated using return on allocated shareholders’ common equity)
Subject to the caveats on slides 2 and 3, this represents our estimates of modelled outcomes for 2008
19
Return on Allocated Equity – Property Reinsurance Only
0.00%
1.00%
2.00%
3.00%
4.00%
5.00%
6.00%
7.00%
8.00%
9.00%
10.00%
Return On Allocated Equity (ROAE for segment)
Probabilities
SD = 13.1%
Sharpe Ratio = 0.69
AHL: NYSE
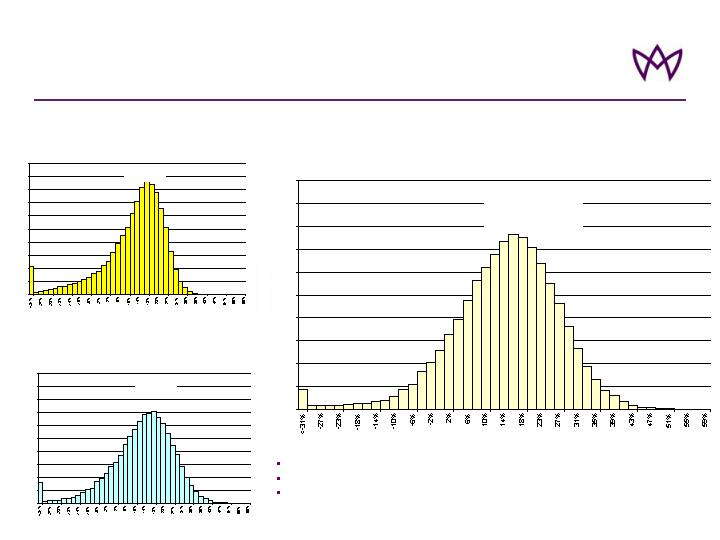
Business Enablement: Benefits of Diversification
20
Property Reinsurance and Casualty
Reinsurance
Property Reinsurance product
segment only
Diversification leads to a reduction of the risk of unfavourable outcomes
Return on allocated equity less volatile (SD reduces to 10.7% from 13.1%, Sharpe Ratio increases from
0.69 to 0.90)
Subject to the caveats on slides 2 and 3, this represents our estimates of modelled outcomes for 2008
0.00%
1.00%
2.00%
3.00%
4.00%
5.00%
Probabilities
6.00%
7.00%
8.00%
9.00%
10.00%
Return On Allocated Equity (ROAE for segment)
SD = 13.1%
Sharpe Ratio = 0.69
0.00%
1.00%
2.00%
3.00%
4.00%
5.00%
Probabilities
6.00%
7.00%
8.00%
9.00%
10.00%
Return On Allocated Equity (ROAE for segment)
SD = 10.7%
Sharpe Ratio = 0.90
AHL: NYSE
Business Enablement: Benefits of Diversification
21
Property Reinsurance and Casualty Reinsurance
Property Reinsurance product segment only
Reinsurance and Insurance Combined
SD reduces further to 9.4% and Sharpe Ratio increases to 1.16
Diversification reduces volatility and gives better risk / return balance
Subject to the caveats on slides 2 and 3, this represents our estimates of
modelled outcomes for 2008
0.00%
1.00%
2.00%
3.00%
4.00%
Probabilities
5.00%
6.00%
7.00%
8.00%
9.00%
10.00%
Return On Allocated Equity (ROAE for segment)
SD = 13.1%
Sharpe Ratio = 0.69
0.00%
1.00%
2.00%
3.00%
4.00%
Probabilities
5.00%
6.00%
7.00%
8.00%
9.00%
10.00%
Return On Allocated Equity (ROAE for segment)
SD = 10.7%
Sharpe Ratio = 0.90
0.00%
1.00%
2.00%
3.00%
4.00%
5.00%
Probabilities
6.00%
7.00%
8.00%
9.00%
10.00%
Total ROAE
SD = 9.4%
Sharpe Ratio = 1.16
AHL: NYSE

Approach to Cycle Management
Business pricing must meet or exceed adequacy levels
Key components
Underwriting integrity
Optimizing business mix
Strong risk management
Efficient use of reinsurance / retrocession purchasing
Expense control
Improving investment contribution
Return Excess Capital to Shareholders when Appropriate
22
AHL: NYSE
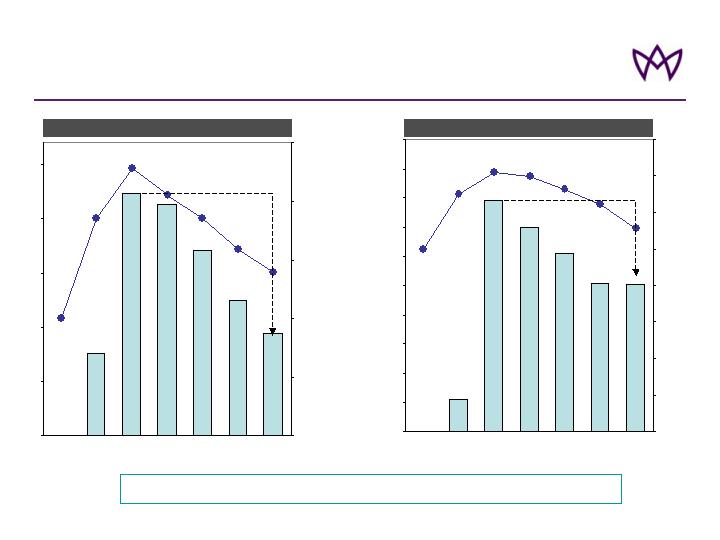
GWP and rate index
2001
2002*
2003
2004
2005
2006
2007**
Proactive Cycle Management
11
79
70
61
51
50
0
10
20
30
40
50
60
70
80
90
100
GWP
$millions
0
20
40
60
80
100
120
140
160
Rate
Index,
2001=100%
RRV
(right scale)
GWP
(left scale)
UK Commercial Property
% change ‘03-’07
Rates: -22%
GWP: -37%
GWP
$millions
76
223
213
171
125
87
0
50
100
150
200
250
2001
2002*
2003
2004
2005
2006
2007**
0
50
100
150
200
250
Rate
Index ,
2001=100%
RRV
(right scale)
GWP
(left scale)
UK Liability
% change ‘03-’07
Rates: -39%
GWP: -61%
Disciplined Underwriting and Cycle Management
* Since inception June 2002
** Projected year end 2007
23
AHL: NYSE

Conclusions
Strong underwriting performance
Improving investment contribution
Efficient in our use of capital
Effective enterprise risk management, core strategic enabler
High quality, diversified underwriting portfolio designed with the benefit of sophisticated
capital allocation models
Strong, quality, improving returns
BVPS 33.9% growth over last 6 quarters
Annualised ROAE >18% over last 6 quarters
24
Well positioned to manage the cycle and generate attractive returns
AHL: NYSE


Aspen Insurance Holdings Limited
Credit Suisse Investor Conference
Chris O’Kane
Chief Executive Officer
15 November 2007
AHL: NYSE
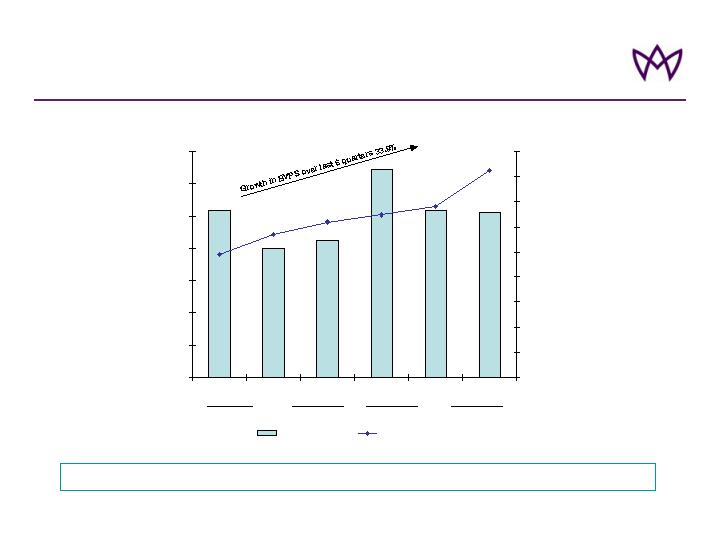
Growth in ROAE and Book Value Per Share
10%
12%
14%
16%
18%
20%
22%
24%
Q2
Q3
Q4
Q1
Q2
Q3
ROAE %
10.0
12.0
14.0
16.0
18.0
20.0
22.0
24.0
26.0
28.0
$ Diluted B/V Per Share
Annualised ROAE
Diluted BV Per Share*
06
07
Annualised ROAE >18% Over Last 6 Quarters
26
Note: See Aspen's quarterly financial supplement for a reconciliation of diluted book value per share to basic book value per share, reconciliation of average equity to closing
shareholders’ equity in the Investor Relations section of Aspen's website at www.aspen.bm
Appendix
AHL: NYSE

With increasing investment income contribution...
$178
$204
-$259
$296
$199
$208
$68
$121
$142
$30
$204
$219
2003
2004
2005
2006
9mths
2006
9mths
2007
Underwriting
Income
Investment Income
Resulting in improving ROAE
15.9%
14.0%
18.5%
16.4%
21.2%
-11.7%
2003
2004
2005
2006
9mths 2006
9mths 2007
Due to strong underwriting...
25%
25%
27%
29%
30%
29%
53%
59%
90%
55%
55%
53%
2003
2004
2005
2006
9mths
2006
9mths
2007
Expense Ratio
Loss Ratio
Profitability has increased substantially...
$152
$195
$378
$259
$354
($178)
2003
2004
2005
2006
9mths 2006
9mths 2007
Financial Performance
($ in millions)
27
Delivering Results
($ in millions – Net Income)
Note: Reconciliation of average equity to closing shareholders’ equity is provided in our quarterly financial supplements available in the Financial Results section of the Investor
Relations page of Aspen’s website, www.aspen.bm
Appendix
AHL: NYSE