|
|
|
| |
Exhibit 99.2 | ||||


|
Prior Quarterly Comparative Underwriting Results Revised For The New
Segmental Structure Announced In The Third Quarter 2007
The information contained herein is for information purposes only. It should be read in
conjunction with other documents filed or to be filed shortly by Aspen Insurance
Holdings Limited with the United States Securities and Exchange Commission.
AHL: NYSE
|
| ASPEN INSURANCE HOLDINGS LIMITED |
|
|
TABLE OF CONTENTS |
|
| PAGE |
1. Basis of Presentation |
| 2 |
2. Explanation of Segment Change |
| 3 |
3. Prior Quarterly Comparative Underwriting Results By Operating Segment |
|
|
- Consolidated Underwriting Results for Three Months Ended September 30, 2007 and September 30, 2006 |
| 4 |
- Consolidated Underwriting Results For Nine Months Ended September 30, 2007 and September 30, 2006 |
| 5 |
- Consolidated Underwriting Results for Three Months Ended June 30, 2007 and June 30, 2006 |
| 6 |
- Consolidated Underwriting Results For Six Months Ended June 30, 2007 and June 30, 2006 |
| 7 |
- Consolidated Underwriting Results For Three Months Ended March 31, 2007 and March 31, 2006 |
| 8 |
- Consolidated Underwriting Results for Three Months Ended December 31, 2006 and Twelve Months Ended December 31, 2006 |
| 9 |
|
| ASPEN INSURANCE HOLDINGS LIMITED |
|
|
BASIS OF PRESENTATION |
Definitions and presentation: All financial information contained herein is unaudited except for information for the fiscal year ended December 31, 2006. Unless otherwise noted, all data is in US dollars millions, except for per share, percentage and ratio information.
Underwriting ratios (GAAP financial measures): The Company, along with others in the industry, uses underwriting ratios as measures of performance. The loss ratio is the ratio of net claims and claims adjustment expenses to net premiums earned. The acquisition expense ratio is the ratio of underwriting expenses (commissions; premium taxes, licenses and fees; as well as other underwriting expenses) to net premiums earned. The general and administrative expense ratio is the ratio of general and administrative expenses to net premiums earned. The combined ratio is the sum of the loss ratio, the acquisition expense ratio and the general and administrative expense ratio. These ratios are relative measurements that describe for every $100 of net premiums earned or written, the cost of losses and expenses, respectively. The combined ratio presents the total cost per $100 of earned premium. A combined ratio below 100% demonstrates underwriting profit; a combined ratio above 100% demonstrates underwriting loss.
GAAP combined ratios differ from US statutory combined ratios primarily due to the deferral of certain third party acquisition expenses for GAAP reporting purposes and the use of net premiums earned rather than net premiums written in the denominator when calculating the acquisition expense and the general and administrative expense ratios.
2
|
| ASPEN INSURANCE HOLDINGS LIMITED |
|
|
As a result of a shift in the Company’s operating structure and the implementation of a number of strategic initiatives in 2007, the Company changed the composition of its business segments in the third quarter of 2007 to reflect the manner in which the business is managed. The Company is currently organized into four business segments; property reinsurance, casualty reinsurance, international insurance and U.S. insurance. These segments form the basis of how the Company monitors the performance of its operations.
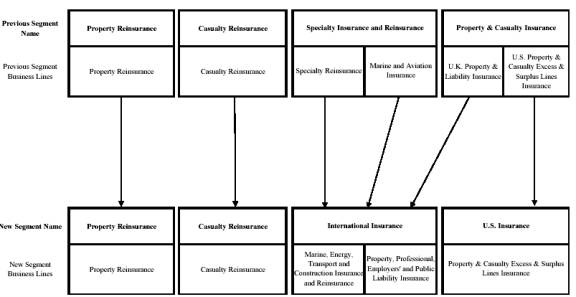
The Property and Casualty Insurance segment was previously comprised of U.S. property and casualty insurance business written on an excess and surplus lines basis, U.K. commercial property and liability insurance and international property facultative business. With the appointment of Nathan Warde, as head of U.S. insurance and Matthew Yeldham, as head of international insurance, we have now redesignated U.S. property and casualty insurance business as a separate segment. The U.K commercial property and casualty insurance business now forms part of our International Insurance segment which also consists of marine, energy, liability and aviation insurance, professional liability insurance and non-marine transport lines of business as well as specialty reinsurance. We have also re-allocated our international property facultative business to the Property Reinsurance segment, which was previously part of the Property and Casualty Insurance segment. After these changes, the four operating segments are: Property Reinsurance, Casualty Reinsurance, International Insurance and U.S. Insurance.
3
|
| ASPEN INSURANCE HOLDINGS LIMITED |
|
|
UNDERWRITING RESULTS BY OPERATING SEGMENT |
The following tables summarize comparative gross and net written and earned premium, losses and loss expenses, policy acquisition, operating and administrative expenses, underwriting results, reserves and combined ratios for each of our four business segments on a quarterly basis starting in the first quarter of 2006.
|
| Three Months Ended September 30, 2007 |
| Three Months Ended September 30, 2006 |
| ||||||||||||||||
|
| Property Reinsurance |
| Casualty Reinsurance |
| International Insurance |
| U.S. Insurance |
| Total |
| Property Reinsurance |
| Casualty Reinsurance |
| International Insurance |
| U.S. Insurance |
| Total |
|
(in US$ millions) |
|
|
|
|
|
|
|
|
|
|
|
|
|
|
|
|
|
|
|
|
|
Gross written premiums |
| 139.5 |
| 77.5 |
| 129.0 |
| 27.5 |
| 373.5 |
| 201.7 |
| 96.6 |
| 123.5 |
| 35.7 |
| 457.5 |
|
Net written premiums |
| 131.5 |
| 77.1 |
| 118.1 |
| 22.1 |
| 348.8 |
| 194.5 |
| 96.2 |
| 112.3 |
| 30.5 |
| 433.5 |
|
Gross earned premiums |
| 150.2 |
| 125.5 |
| 164.2 |
| 33.2 |
| 473.1 |
| 176.3 |
| 132.0 |
| 165.6 |
| 39.6 |
| 513.5 |
|
Net earned premiums |
| 125.3 |
| 123.7 |
| 146.7 |
| 24.0 |
| 419.7 |
| 128.7 |
| 128.3 |
| 145.2 |
| 27.1 |
| 429.3 |
|
Losses and loss expenses |
| (42.9 | ) | (92.2 | ) | (75.3 | ) | (9.5 | ) | (219.9 | ) | (58.6 | ) | (82.0 | ) | (63.8 | ) | (27.6 | ) | (232.0 | ) |
Policy acquisition expenses |
| (25.4 | ) | (19.8 | ) | (26.4 | ) | (4.5 | ) | (76.1 | ) | (32.3 | ) | (19.5 | ) | (21.6 | ) | (5.5 | ) | (78.9 | ) |
Operating and administration expenses |
| (18.3 | ) | (13.8 | ) | (17.2 | ) | (9.3 | ) | (58.6 | ) | (9.3 | ) | (8.1 | ) | (14.4 | ) | (5.0 | ) | (36.8 | ) |
Underwriting income (loss) |
| 38.7 |
| (2.1 | ) | 27.8 |
| 0.7 |
| 65.1 |
| 28.5 |
| 18.7 |
| 45.4 |
| (11.0 | ) | 81.6 |
|
|
|
|
|
|
|
|
|
|
|
|
|
|
|
|
|
|
|
|
|
|
|
Net reserves for loss and loss adjustment expenses |
| 480.0 |
| 1,201.9 |
| 909.7 |
| 55.6 |
| 2,647.2 |
| 565.7 |
| 887.6 |
| 697.3 |
| 50.4 |
| 2,201.0 |
|
|
|
|
|
|
|
|
|
|
|
|
|
|
|
|
|
|
|
|
|
|
|
Ratios |
|
|
|
|
|
|
|
|
|
|
|
|
|
|
|
|
|
|
|
|
|
Loss ratio |
| 34.2 | % | 74.5 | % | 51.3 | % | 39.6 | % | 52.4 | % | 45.5 | % | 63.9 | % | 43.9 | % | 101.8 | % | 54.0 | % |
Policy acquisition expense ratio |
| 20.3 | % | 16.0 | % | 18.0 | % | 18.8 | % | 18.1 | % | 25.1 | % | 15.2 | % | 14.9 | % | 20.3 | % | 18.4 | % |
Operating and administration expense ratio |
| 14.6 | % | 11.2 | % | 11.7 | % | 38.9 | % | 14.0 | % | 7.2 | % | 6.3 | % | 9.9 | % | 18.5 | % | 8.6 | % |
Expense ratio |
| 34.9 | % | 27.2 | % | 29.7 | % | 57.7 | % | 32.1 | % | 32.3 | % | 21.5 | % | 24.8 | % | 38.8 | % | 27.0 | % |
Combined ratio |
| 69.1 | % | 101.7 | % | 81.0 | % | 97.3 | % | 84.5 | % | 77.8 | % | 85.4 | % | 68.7 | % | 140.6 | % | 81.0 | % |
4
|
| ASPEN INSURANCE HOLDINGS LIMITED |
|
|
UNDERWRITING RESULTS BY OPERATING SEGMENT |
|
| Nine Months Ended September 30, 2007 |
| Nine Months Ended September 30, 2006 |
| ||||||||||||||||
|
| Property Reinsurance |
| Casualty Reinsurance |
| International Insurance |
| U.S. Insurance |
| Total |
| Property Reinsurance |
| Casualty Reinsurance |
| International Insurance |
| U.S. Insurance |
| Total |
|
(in US$ millions) |
|
|
|
|
|
|
|
|
|
|
|
|
|
|
|
|
|
|
|
|
|
Gross written premiums |
| 521.9 |
| 380.2 |
| 513.2 |
| 98.2 |
| 1,513.5 |
| 565.1 |
| 435.8 |
| 538.6 |
| 119.1 |
| 1,658.6 |
|
Net written premiums |
| 424.2 |
| 371.8 |
| 454.9 |
| 71.5 |
| 1,322.4 |
| 423.8 |
| 419.3 |
| 462.1 |
| 80.3 |
| 1,385.5 |
|
Gross earned premiums |
| 462.8 |
| 364.3 |
| 496.7 |
| 105.4 |
| 1,429.2 |
| 514.3 |
| 376.6 |
| 509.4 |
| 115.0 |
| 1,515.3 |
|
Net earned premiums |
| 423.0 |
| 355.8 |
| 449.5 |
| 81.6 |
| 1,309.9 |
| 378.4 |
| 364.8 |
| 439.3 |
| 78.4 |
| 1,260.9 |
|
Losses and loss expenses |
| (170.7 | ) | (244.6 | ) | (252.3 | ) | (50.5 | ) | (718.1 | ) | (157.3 | ) | (210.3 | ) | (258.2 | ) | (62.4 | ) | (688.2 | ) |
Policy acquisition expenses |
| (83.9 | ) | (56.3 | ) | (80.1 | ) | (15.2 | ) | (235.5 | ) | (104.3 | ) | (62.8 | ) | (73.6 | ) | (14.7 | ) | (255.4 | ) |
Operating and administration expenses |
| (49.6 | ) | (33.9 | ) | (45.2 | ) | (19.6 | ) | (148.3 | ) | (36.9 | ) | (28.6 | ) | (40.1 | ) | (12.4 | ) | (118.0 | ) |
Underwriting income (loss) |
| 118.8 |
| 21.0 |
| 71.9 |
| (3.7 | ) | 208.0 |
| 79.9 |
| 63.1 |
| 67.4 |
| (11.1 | ) | 199.3 |
|
|
|
|
|
|
|
|
|
|
|
|
|
|
|
|
|
|
|
|
|
|
|
Net reserves for loss and loss adjustment expenses |
| 480.0 |
| 1,201.9 |
| 909.7 |
| 55.6 |
| 2,647.2 |
| 565.7 |
| 887.6 |
| 697.3 |
| 50.4 |
| 2,201.0 |
|
|
|
|
|
|
|
|
|
|
|
|
|
|
|
|
|
|
|
|
|
| |
Ratios |
|
|
|
|
|
|
|
|
|
|
|
|
|
|
|
|
|
|
|
|
|
Loss ratio |
| 40.4 | % | 68.7 | % | 56.1 | % | 61.9 | % | 54.8 | % | 41.6 | % | 57.6 | % | 58.8 | % | 79.6 | % | 54.6 | % |
Policy acquisition expense ratio |
| 19.8 | % | 15.8 | % | 17.8 | % | 18.6 | % | 18.0 | % | 27.6 | % | 17.2 | % | 16.8 | % | 18.7 | % | 20.3 | % |
Operating and administration expense ratio |
| 11.7 | % | 9.5 | % | 10.1 | % | 24.1 | % | 11.3 | % | 9.8 | % | 7.8 | % | 9.1 | % | 15.8 | % | 9.4 | % |
Expense ratio |
| 31.5 | % | 25.3 | % | 27.9 | % | 42.7 | % | 29.3 | % | 37.4 | % | 25.0 | % | 25.9 | % | 34.5 | % | 29.7 | % |
Combined ratio |
| 71.9 | % | 94.0 | % | 84.0 | % | 104.6 | % | 84.1 | % | 79.0 | % | 82.6 | % | 84.7 | % | 114.1 | % | 84.3 | % |
5
|
| ASPEN INSURANCE HOLDINGS LIMITED |
|
|
UNDERWRITING RESULTS BY OPERATING SEGMENT |
|
| Three Months Ended June 30, 2007 |
| Three Months Ended June 30, 2006 |
| ||||||||||||||||
|
| Property |
| Casualty |
| International |
| U.S. |
| Total |
| Property |
| Casualty |
| International |
| U.S. |
| Total |
|
(in US$ millions) |
|
|
|
|
|
|
|
|
|
|
|
|
|
|
|
|
|
|
|
|
|
Gross written premiums |
| 190.3 |
| 79.4 |
| 198.9 |
| 34.9 |
| 503.5 |
| 198.0 |
| 63.8 |
| 217.6 |
| 43.0 |
| 522.4 |
|
Net written premiums |
| 115.6 |
| 78.1 |
| 196.9 |
| 27.9 |
| 418.5 |
| 195.1 |
| 57.5 |
| 225.7 |
| 21.8 |
| 500.1 |
|
Gross earned premiums |
| 151.3 |
| 127.8 |
| 169.7 |
| 33.3 |
| 482.1 |
| 183.6 |
| 112.6 |
| 174.3 |
| 37.8 |
| 508.3 |
|
Net earned premiums |
| 144.3 |
| 125.7 |
| 156.0 |
| 25.2 |
| 451.2 |
| 142.9 |
| 107.9 |
| 155.5 |
| 22.7 |
| 429.0 |
|
Losses and loss expenses |
| (63.7 | ) | (91.6 | ) | (95.7 | ) | (21.7 | ) | (272.7 | ) | (51.0 | ) | (40.9 | ) | (113.6 | ) | (18.3 | ) | (223.8 | ) |
Policy acquisition expenses |
| (31.1 | ) | (17.2 | ) | (28.3 | ) | (5.1 | ) | (81.7 | ) | (36.8 | ) | (17.3 | ) | (25.5 | ) | (3.6 | ) | (83.2 | ) |
Operating and administration expenses |
| (16.8 | ) | (10.2 | ) | (13.3 | ) | (4.1 | ) | (44.4 | ) | (13.4 | ) | (10.5 | ) | (15.4 | ) | (3.7 | ) | (43.0 | ) |
Underwriting income (loss) |
| 32.7 |
| 6.7 |
| 18.7 |
| (5.7 | ) | 52.4 |
| 41.7 |
| 39.2 |
| 1.0 |
| (2.9 | ) | 79.0 |
|
|
|
|
|
|
|
|
|
|
|
|
|
|
|
|
|
|
|
|
|
|
|
Net reserves for loss and loss adjustment expenses |
| 554.0 |
| 1,107.1 |
| 771.4 |
| 97.6 |
| 2,530.1 |
| 386.9 |
| 805.9 |
| 635.2 |
| 16.9 |
| 1,844.9 |
|
|
|
|
|
|
|
|
|
|
|
|
|
|
|
|
|
|
|
|
|
|
|
Ratios |
|
|
|
|
|
|
|
|
|
|
|
|
|
|
|
|
|
|
|
|
|
Loss ratio |
| 44.1 | % | 72.9 | % | 61.3 | % | 86.1 | % | 60.5 | % | 35.7 | % | 37.9 | % | 73.1 | % | 80.6 | % | 52.2 | % |
Policy acquisition expense ratio |
| 21.6 | % | 13.7 | % | 18.2 | % | 20.2 | % | 18.1 | % | 25.8 | % | 16.1 | % | 16.4 | % | 15.8 | % | 19.4 | % |
Operating and administration expense ratio |
| 11.6 | % | 8.1 | % | 8.5 | % | 16.3 | % | 9.8 | % | 9.3 | % | 9.7 | % | 9.9 | % | 16.3 | % | 10.0 | % |
Expense ratio |
| 33.2 | % | 21.8 | % | 26.7 | % | 36.5 | % | 27.9 | % | 35.1 | % | 25.8 | % | 26.3 | % | 32.1 | % | 29.4 | % |
Combined ratio |
| 77.3 | % | 94.7 | % | 88.0 | % | 122.6 | % | 88.4 | % | 70.8 | % | 63.7 | % | 99.4 | % | 112.7 | % | 81.6 | % |
6
|
| ASPEN INSURANCE HOLDINGS LIMITED |
|
|
UNDERWRITING RESULTS BY OPERATING SEGMENT |
|
| Six Months Ended June 30, 2007 |
| Six Months Ended June 30, 2006 |
| ||||||||||||||||
|
| Property |
| Casualty |
| International |
| U.S. |
| Total |
| Property |
| Casualty |
| International |
| U.S. |
| Total |
|
(in US$ millions) |
|
|
|
|
|
|
|
|
|
|
|
|
|
|
|
|
|
|
|
|
|
Gross written premiums |
| 382.4 |
| 302.7 |
| 384.2 |
| 70.7 |
| 1,140.0 |
| 363.4 |
| 339.2 |
| 415.1 |
| 83.4 |
| 1,201.1 |
|
Net written premiums |
| 292.7 |
| 294.7 |
| 336.8 |
| 49.4 |
| 973.6 |
| 229.3 |
| 323.1 |
| 349.8 |
| 49.8 |
| 952.0 |
|
Gross earned premiums |
| 312.6 |
| 238.8 |
| 332.5 |
| 72.2 |
| 956.1 |
| 338.0 |
| 244.6 |
| 343.8 |
| 75.4 |
| 1,001.8 |
|
Net earned premiums |
| 297.7 |
| 232.1 |
| 302.8 |
| 57.6 |
| 890.2 |
| 249.7 |
| 236.5 |
| 294.1 |
| 51.3 |
| 831.6 |
|
Losses and loss expenses |
| (127.8 | ) | (152.4 | ) | (177.0 | ) | (41.0 | ) | (498.2 | ) | (98.7 | ) | (128.3 | ) | (194.4 | ) | (34.8 | ) | (456.2 | ) |
Policy acquisition expenses |
| (58.5 | ) | (36.5 | ) | (53.7 | ) | (10.7 | ) | (159.4 | ) | (72.0 | ) | (43.2 | ) | (52.0 | ) | (9.3 | ) | (176.5 | ) |
Operating and administration expenses |
| (31.3 | ) | (20.1 | ) | (28.0 | ) | (10.3 | ) | (89.7 | ) | (27.6 | ) | (20.6 | ) | (25.7 | ) | (7.3 | ) | (81.2 | ) |
Underwriting income (loss) |
| 80.1 |
| 23.1 |
| 44.1 |
| (4.4 | ) | 142.9 |
| 51.4 |
| 44.4 |
| 22.0 |
| (0.1 | ) | 117.7 |
|
|
|
|
|
|
|
|
|
|
|
|
|
|
|
|
|
|
|
|
|
|
|
Net reserves for loss and loss adjustment expenses |
| 554.0 |
| 1,107.1 |
| 771.4 |
| 97.6 |
| 2,530.1 |
| 386.9 |
| 805.9 |
| 635.2 |
| 16.9 |
| 1,844.9 |
|
|
|
|
|
|
|
|
|
|
|
|
|
|
|
|
|
|
|
|
|
| |
Ratios |
|
|
|
|
|
|
|
|
|
|
|
|
|
|
|
|
|
|
|
|
|
Loss ratio |
| 42.9 | % | 65.7 | % | 58.5 | % | 71.2 | % | 55.9 | % | 39.5 | % | 54.2 | % | 66.1 | % | 67.8 | % | 54.8 | % |
Policy acquisition expense ratio |
| 19.7 | % | 15.7 | % | 17.7 | % | 18.6 | % | 17.9 | % | 28.8 | % | 18.3 | % | 17.7 | % | 18.1 | % | 21.2 | % |
Operating and administration expense ratio |
| 10.4 | % | 8.7 | % | 9.3 | % | 17.9 | % | 10.1 | % | 11.1 | % | 8.7 | % | 8.7 | % | 14.2 | % | 9.8 | % |
Expense ratio |
| 30.1 | % | 24.4 | % | 27.0 | % | 36.5 | % | 28.0 | % | 39.9 | % | 27.0 | % | 26.4 | % | 32.4 | % | 31.0 | % |
Combined ratio |
| 73.0 | % | 90.1 | % | 85.5 | % | 107.7 | % | 83.9 | % | 79.4 | % | 81.2 | % | 92.5 | % | 100.2 | % | 85.8 | % |
7
|
| ASPEN INSURANCE HOLDINGS LIMITED |
|
|
UNDERWRITING RESULTS BY OPERATING SEGMENT |
|
| Three Months Ended March 31, 2007 |
| Three Months Ended March 31, 2006 |
| ||||||||||||||||
|
| Property Reinsurance |
| Casualty Reinsurance |
| International Insurance |
| U.S. Insurance |
| Total |
| Property Reinsurance |
| Casualty Reinsurance |
| International Insurance |
| U.S. Insurance |
| Total |
|
(in US$ millions) |
|
|
|
|
|
|
|
|
|
|
|
|
|
|
|
|
|
|
|
|
|
Gross written premiums |
| 192.1 |
| 223.3 |
| 185.3 |
| 35.8 |
| 636.5 |
| 165.4 |
| 275.4 |
| 197.5 |
| 40.4 |
| 678.7 |
|
Net written premiums |
| 177.1 |
| 216.6 |
| 139.9 |
| 21.5 |
| 555.1 |
| 34.2 |
| 265.6 |
| 124.1 |
| 28.0 |
| 451.9 |
|
Gross earned premiums |
| 161.3 |
| 111.0 |
| 162.8 |
| 38.9 |
| 474.0 |
| 154.4 |
| 132.0 |
| 169.5 |
| 37.6 |
| 493.5 |
|
Net earned premiums |
| 153.4 |
| 106.4 |
| 146.8 |
| 32.4 |
| 439.0 |
| 106.8 |
| 128.6 |
| 138.6 |
| 28.6 |
| 402.6 |
|
Losses and loss expenses |
| (64.1 | ) | (60.8 | ) | (81.3 | ) | (19.3 | ) | (225.5 | ) | (47.7 | ) | (87.4 | ) | (80.8 | ) | (16.5 | ) | (232.4 | ) |
Policy acquisition expenses |
| (27.4 | ) | (19.3 | ) | (25.4 | ) | (5.6 | ) | (77.7 | ) | (35.2 | ) | (25.9 | ) | (26.5 | ) | (5.7 | ) | (93.3 | ) |
Operating and administration expenses |
| (14.5 | ) | (9.9 | ) | (14.7 | ) | (6.2 | ) | (45.3 | ) | (14.2 | ) | (10.1 | ) | (10.3 | ) | (3.6 | ) | (38.2 | ) |
Underwriting income (loss) |
| 47.4 |
| 16.4 |
| 25.4 |
| 1.3 |
| 90.5 |
| 9.7 |
| 5.2 |
| 21.0 |
| 2.8 |
| 38.7 |
|
|
|
|
|
|
|
|
|
|
|
|
|
|
|
|
|
|
|
|
|
|
|
Net reserves for loss and loss adjustment expenses |
| 523.9 |
| 1,017.5 |
| 726.4 |
| 84.6 |
| 2,352.4 |
| 506.7 |
| 759.0 |
| 587.4 |
| 1.0 |
| 1,854.1 |
|
|
|
|
|
|
|
|
|
|
|
|
|
|
|
|
|
|
|
|
|
|
|
Ratios |
|
|
|
|
|
|
|
|
|
|
|
|
|
|
|
|
|
|
|
|
|
Loss ratio |
| 41.8 | % | 57.2 | % | 55.4 | % | 59.6 | % | 51.4 | % | 44.7 | % | 68.0 | % | 58.3 | % | 57.7 | % | 57.7 | % |
Policy acquisition expense ratio |
| 17.9 | % | 18.1 | % | 17.3 | % | 17.3 | % | 17.7 | % | 33.0 | % | 20.1 | % | 19.1 | % | 19.9 | % | 23.2 | % |
Operating and administration expense ratio |
| 9.4 | % | 9.3 | % | 10.0 | % | 19.1 | % | 10.3 | % | 13.2 | % | 7.9 | % | 7.4 | % | 12.6 | % | 9.5 | % |
Expense ratio |
| 27.3 | % | 27.4 | % | 27.3 | % | 36.4 | % | 28.0 | % | 46.2 | % | 28.0 | % | 26.5 | % | 32.5 | % | 32.7 | % |
Combined ratio |
| 69.1 | % | 84.6 | % | 82.7 | % | 96.0 | % | 79.4 | % | 90.9 | % | 96.0 | % | 84.8 | % | 90.2 | % | 90.4 | % |
8
|
| ASPEN INSURANCE HOLDINGS LIMITED |
|
|
UNDERWRITING RESULTS BY OPERATING SEGMENT |
|
| Three Months Ended December 31, 2006 |
| Twelve Months Ended December 31, 2006 |
| ||||||||||||||||
|
| Property Reinsurance |
| Casualty Reinsurance |
| International Insurance |
| U.S. Insurance |
| Total |
| Property Reinsurance |
| Casualty Reinsurance |
| International Insurance |
| U.S. Insurance |
| Total |
|
(in US$ millions) |
|
|
|
|
|
|
|
|
|
|
|
|
|
|
|
|
|
|
|
|
|
Gross written premiums |
| 58.0 |
| 49.7 |
| 144.8 |
| 34.4 |
| 286.9 |
| 623.1 |
| 485.5 |
| 683.4 |
| 153.5 |
| 1,945.5 |
|
Net written premiums |
| 52.7 |
| 54.7 |
| 145.1 |
| 25.6 |
| 278.1 |
| 476.5 |
| 474.0 |
| 607.2 |
| 105.9 |
| 1,663.6 |
|
Gross earned premiums |
| 155.4 |
| 126.1 |
| 165.9 |
| 38.2 |
| 485.6 |
| 669.7 |
| 502.7 |
| 675.3 |
| 153.2 |
| 2,000.9 |
|
Net earned premiums |
| 116.7 |
| 125.1 |
| 148.3 |
| 25.2 |
| 415.3 |
| 495.1 |
| 489.9 |
| 587.6 |
| 103.6 |
| 1,676.2 |
|
Losses and loss expenses |
| (56.3 | ) | (75.3 | ) | (54.8 | ) | (15.3 | ) | (201.7 | ) | (213.6 | ) | (285.6 | ) | (313.0 | ) | (77.7 | ) | (889.9 | ) |
Policy acquisition expenses |
| (19.6 | ) | (18.6 | ) | (23.4 | ) | (5.8 | ) | (67.4 | ) | (123.9 | ) | (81.4 | ) | (97.0 | ) | (20.5 | ) | (322.8 | ) |
Operating and administration expenses |
| (17.6 | ) | (13.0 | ) | (14.5 | ) | (4.8 | ) | (49.9 | ) | (54.5 | ) | (41.6 | ) | (54.6 | ) | (17.2 | ) | (167.9 | ) |
Underwriting income (loss) |
| 23.2 |
| 18.2 |
| 55.6 |
| (0.7 | ) | 96.3 |
| 103.1 |
| 81.3 |
| 123.0 |
| (11.8 | ) | 295.6 |
|
|
|
|
|
|
|
|
|
|
|
|
|
|
|
|
|
|
|
|
|
|
|
Net reserves for loss and loss adjustment expenses |
| 553.5 |
| 961.8 |
| 763.4 |
| 73.0 |
| 2,351.7 |
| 553.5 |
| 961.8 |
| 763.4 |
| 73.0 |
| 2,351.7 |
|
|
|
|
|
|
|
|
|
|
|
|
|
|
|
|
|
|
|
|
|
|
|
Ratios |
|
|
|
|
|
|
|
|
|
|
|
|
|
|
|
|
|
|
|
|
|
Loss ratio |
| 48.2 | % | 60.2 | % | 36.9 | % | 60.7 | % | 48.6 | % | 43.1 | % | 58.3 | % | 53.3 | % | 75.0 | % | 53.1 | % |
Policy acquisition expense ratio |
| 16.8 | % | 14.9 | % | 15.8 | % | 23.1 | % | 16.2 | % | 25.0 | % | 16.6 | % | 16.5 | % | 19.8 | % | 19.3 | % |
Operating and administration expense ratio |
| 15.1 | % | 10.4 | % | 9.8 | % | 19.0 | % | 12.0 | % | 11.0 | % | 8.5 | % | 9.3 | % | 16.6 | % | 10.0 | % |
Expense ratio |
| 31.9 | % | 25.3 | % | 25.6 | % | 42.1 | % | 28.2 | % | 36.0 | % | 25.1 | % | 25.8 | % | 36.4 | % | 29.3 | % |
Combined ratio |
| 80.1 | % | 85.5 | % | 62.5 | % | 102.8 | % | 76.8 | % | 79.2 | % | 83.4 | % | 79.1 | % | 111.4 | % | 82.4 | % |
9