UNITED STATES
SECURITIES AND EXCHANGE COMMISSION
Washington, D.C. 20549
FORM N-CSR
CERTIFIED SHAREHOLDER REPORT OF REGISTERED
MANAGEMENT INVESTMENT COMPANIES
Investment Company Act File Number: 811-21454
| T. Rowe Price Diversified Mid-Cap Growth Fund, Inc. |
| (Exact name of registrant as specified in charter) |
| 100 East Pratt Street, Baltimore, MD 21202 |
| (Address of principal executive offices) |
| David Oestreicher |
| 100 East Pratt Street, Baltimore, MD 21202 |
| (Name and address of agent for service) |
Registrant’s telephone number, including area code: (410) 345-2000
Date of fiscal year end: December 31
Date of reporting period: December 31, 2011
Item 1. Report to Shareholders
 |
| Diversified Mid-Cap Growth Fund | December 31, 2011 |
The views and opinions in this report were current as of December 31, 2011. They are not guarantees of performance or investment results and should not be taken as investment advice. Investment decisions reflect a variety of factors, and the managers reserve the right to change their views about individual stocks, sectors, and the markets at any time. As a result, the views expressed should not be relied upon as a forecast of the fund’s future investment intent. The report is certified under the Sarbanes-Oxley Act, which requires mutual funds and other public companies to affirm that, to the best of their knowledge, the information in their financial reports is fairly and accurately stated in all material respects.
REPORTS ON THE WEB
Sign up for our E-mail Program, and you can begin to receive updated fund reports and prospectuses online rather than through the mail. Log in to your account at troweprice.com for more information.
Manager’s Letter
Fellow Shareholders
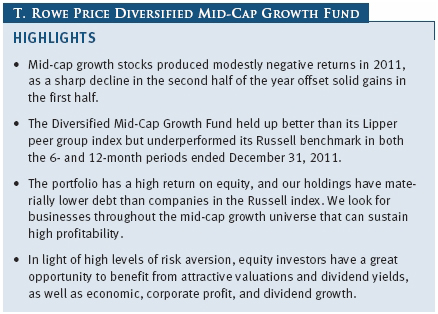
Despite favorable corporate earnings and healthy balance sheets, mid-cap growth stocks produced modestly negative returns in 2011, as a sharp decline in the second half of the year offset solid gains in the first half. Stocks rose strongly through April but started falling in May as the U.S. and European economies weakened and the European sovereign debt crisis intensified. Market volatility and risk aversion soared after Standard & Poor’s downgraded the U.S. government’s long-term sovereign credit rating from AAA to AA+ in early August. S&P’s action occurred shortly after a divided Congress agreed to raise the statutory federal debt ceiling and authorize budget cuts over the next decade. Shares bottomed in early October, then rebounded strongly in the fourth quarter as extreme risk aversion dissipated.
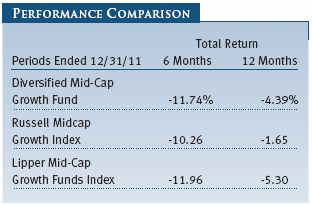
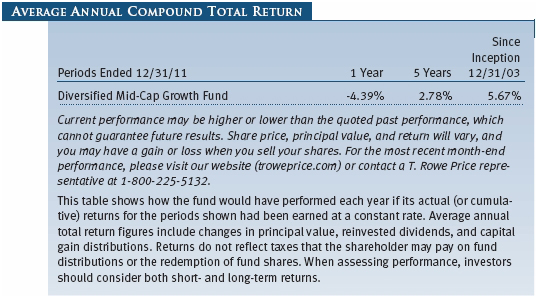
Your fund returned -11.74% in the second half of 2011 and -4.39% for the full year. As shown in the Performance Comparison table, the fund outperformed its Lipper peer group index but lagged its Russell benchmark in both periods. While our stock selection in certain sectors was favorable, stock selection in aggregate hurt our relative performance in both periods. Our sector allocations in aggregate also detracted but to a lesser extent. We’ll discuss this in greater detail in the Portfolio Review section of the letter.
MARKET ENVIRONMENT
The U.S. economy in the last few months has continued to produce modest growth. Corporate profits remain healthy and balance sheets are flush with cash. The Federal Reserve maintained highly stimulative monetary policies throughout the year, including Treasury purchases to suppress long-term interest rates and promises to keep short-term rates very low until at least mid-2013. Nevertheless, many investors remain hesitant to invest in equities for long-term growth, preferring instead the perceived safety of low-yielding U.S. government securities. Long-term Treasuries were, in fact, last year’s best performing asset class: The Citigroup 30-Year Treasury Index soared an incredible 35.45%. This return reflects that investors were terrified.
Another clear phenomenon was that many chased higher-yielding equities given the abysmal yields offered by investment-grade fixed income securities. Like Treasuries, these stocks were bid up to unfavorable prices. Defensive stocks outperformed in this capital market environment. These factors present a very attractive opportunity for investors with a longer-term orientation.
In the equity market, small- and mid-cap stocks underperformed large-caps in both our 6- and 12-month reporting periods. In the second half of 2011, the small-cap Russell 2000 Index and the Russell Midcap Index returned -9.77% and -8.91%, respectively, versus -3.69% for the large-cap S&P 500 Index. For the one-year period, the Russell 2000 and the Russell Midcap Index returned -4.18% and -1.55%, respectively, versus 2.11% for the S&P 500.
As measured by various Russell indexes, growth stocks held up better than value stocks among large-cap shares in the last six months; the reverse was true among small- and mid-cap names. For the entire year, growth stocks outperformed value stocks among large- and small-cap names; in the mid-cap space, value stocks fared about the same as growth. Higher-yielding companies throughout the equity market had a performance advantage in 2011, as investors sought their attractive yields in an environment of very low interest rates.
Within the Russell Midcap Growth Index, sector performance was broadly negative in the last six months. Information technology, telecommunication services, health care, and materials were the worst-performing sectors. Financials and industrials and business services performed mostly in line with the index, while energy, consumer discretionary, and consumer staples held up better. Utilities, a very small part of the index, produced mild gains. For the 12-month period, sector performance was widely mixed. Utilities and consumer staples produced robust returns, as investors favored these noncyclical defensive sectors in last year’s highly uncertain economic environment. Consumer discretionary and health care stocks generated milder gains. Financials and the economically sensitive energy, materials, and industrials and business services sectors fell moderately. Telecommunication services and information technology stocks fell sharply.
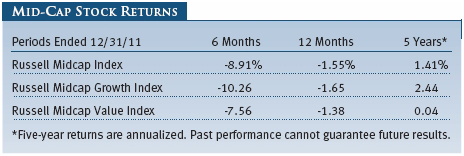
As shown in the table, mid-cap growth stocks trailed their value counterparts in the 6- and 12-month periods ended December 31, 2011, but had a solid performance advantage in what was a very volatile five-year period. Mid-caps have also outpaced their larger counterparts during that timeframe: For the five-year period ended December 31, 2011, the Russell Midcap Index produced an annualized return of 1.41% versus -0.25% for the S&P 500.
INVESTMENT STRATEGY
Before discussing the portfolio’s performance in detail, we would like to welcome new investors and thank all of our longer-term investors for their continuing confidence in our portfolio management abilities, particular during this time of heightened uncertainty and market volatility. Our reports to you focus on fund activity and performance in the most recent 6- or 12-month periods, but our time horizon for investing is much longer, so we are prepared to wait for years for our investments to bear fruit. While the investment landscape may be constantly in flux, we remain committed to the same strategy and the principles that have guided our management of the portfolio since its inception at the end of 2003. We believe these will help us navigate through the challenges of the years ahead and provide patient investors with long-term capital growth:
- The Diversified Mid-Cap Growth Fund invests in mid-cap stocks of companies whose earnings are expected to grow at an above-average rate. We define mid-cap companies as those whose market capitalization at the time of purchase falls within the range of either the S&P MidCap 400 Index or the Russell Midcap Growth Index.
- We keep the fund fully invested because we believe that successful market timing is virtually impossible—you would need to be right twice—and that the costs associated with frequent trading reduce the likelihood of outperforming the market. We do not worry about short-term performance or try to forecast the direction of the economy or the market. Our focus is to find mid-cap companies with the best long-term growth potential.
- We use a number of proprietary quantitative models to identify and evaluate the characteristics of individual mid-cap growth companies and the portfolio as a whole.
- Stock selection is based on a combination of fundamental, bottom-up analysis and quantitative strategies in an attempt to identify companies with superior long-term appreciation prospects.
- We use a growth approach, looking for companies with a demonstrated ability to increase revenues, earnings, and cash flow consistently; capable management; attractive business niches; and a sustainable competitive advantage. We favor companies with above-average earnings growth and lower earnings variability.
- Valuations are also very important. We look for the best relative values among companies with the strongest businesses and managements.
- Unlike other mid-cap growth portfolios that are highly concentrated, the Diversified Mid-Cap Growth Fund typically invests in about 300 stocks. A high degree of diversification helps to mitigate the downside risk attributable to any single poorly performing security. We invest in companies that are early in their life cycles, and some will ultimately not be as successful as we hope. Accordingly, we balance risk with potential returns.
- Our time horizons are longer than those of other mid-cap growth investors. Our portfolio turnover rate in 2011 was 42.1%, which is substantially less than the 2011 average of about 106% for mid-cap growth funds, according to data from Morningstar Direct. (Morningstar only calculates portfolio turnover for their averages at year-end, using the most recent year-end portfolio turnover figures provided to Morningstar by each of the underlying funds in the average. The Morningstar data was quoted as of January 17, 2012.) This means that our holding period for a typical stock is more than two years, whereas our average competitor holds a given stock for slightly less than one year. Consequently, we view ourselves as long-term investors; we are not short-term speculators or day-traders.
PORTFOLIO REVIEW
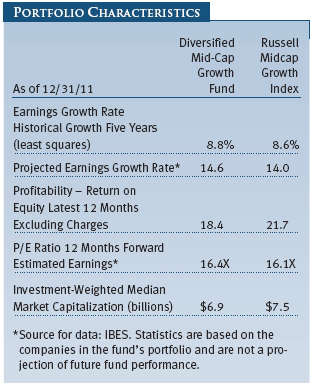
The Diversified Mid-Cap Growth Fund’s fundamental characteristics are similar to those of the Russell Midcap Growth Index, as indicated by the Portfolio Characteristics table. The portfolio’s median market capitalization ($6.9 billion), price/earnings (P/E) ratio (16.4), and projected earnings growth rate (14.6%) are all comparable to those of the index. These metrics reflect our commitment to mid-cap companies with excellent long-term growth prospects.
The fund’s return on equity (ROE), which measures how effectively and efficiently a company and its management are using stockholder investments, is 18.4% versus 21.7% for the benchmark. A high ROE is desirable, and it is notable that our holdings have materially lower debt than businesses represented in the Russell index. We look for businesses throughout the mid-cap growth universe that can sustain high profitability.
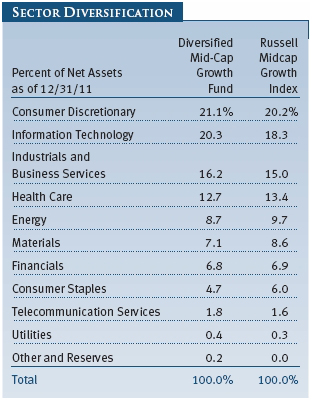
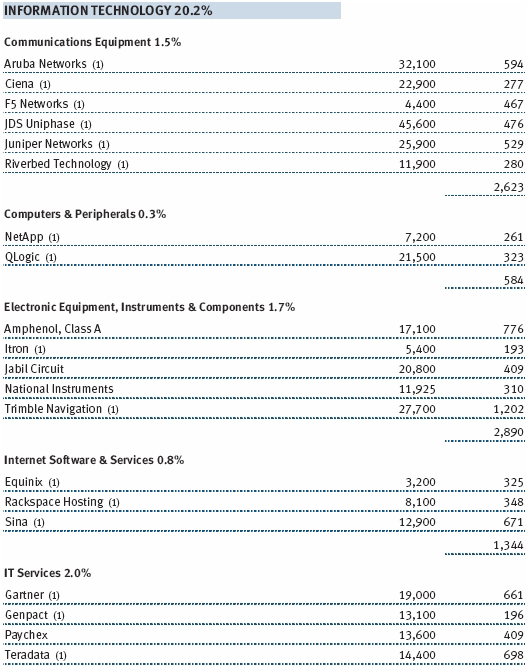
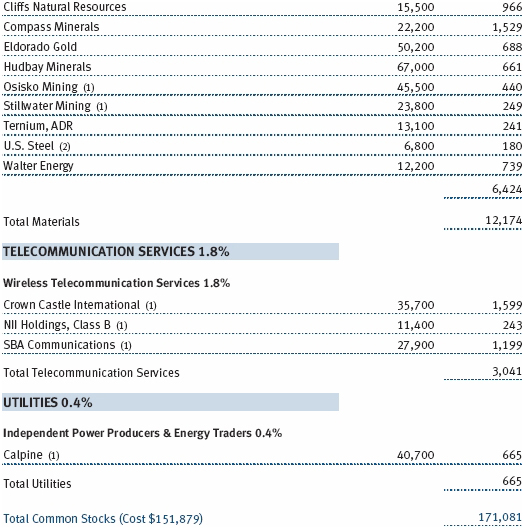
At the end of 2011, the fund’s sector allocations were somewhat similar to those of the Russell index, as shown in the Sector Diversification table on page 7, since we do not make material sector tilts. In absolute terms, our largest commitments were to consumer discretionary, information technology, industrials and business services, and health care. We have very little exposure to telecommunication services and utilities because there are very few businesses in those sectors that meet our growth criteria.
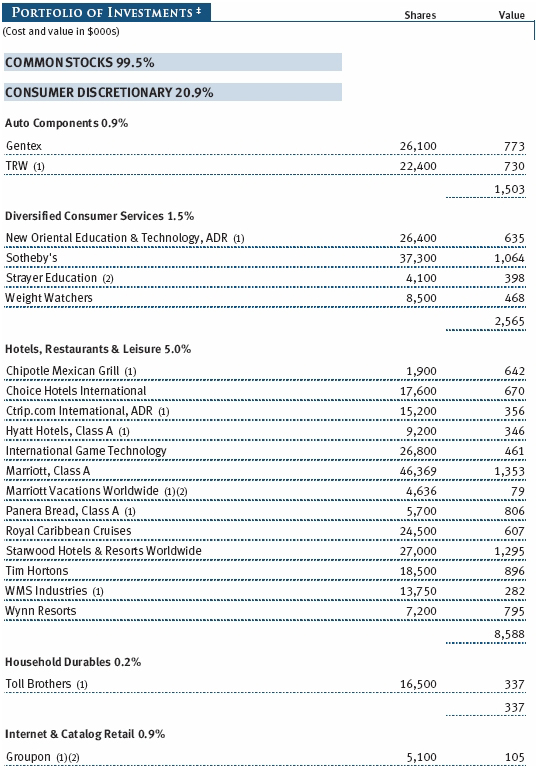
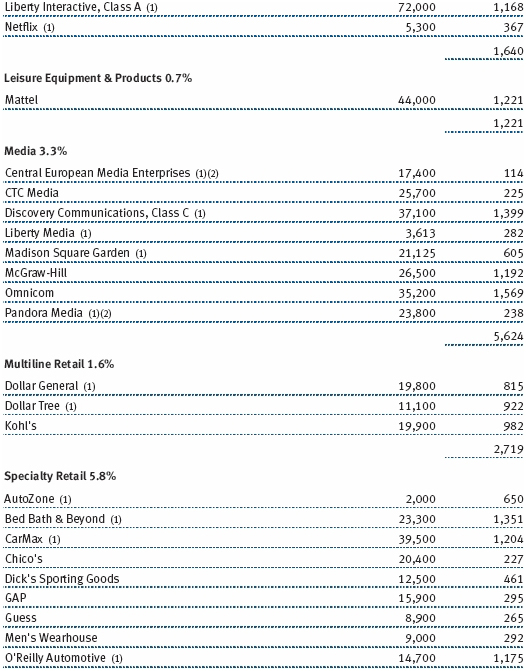
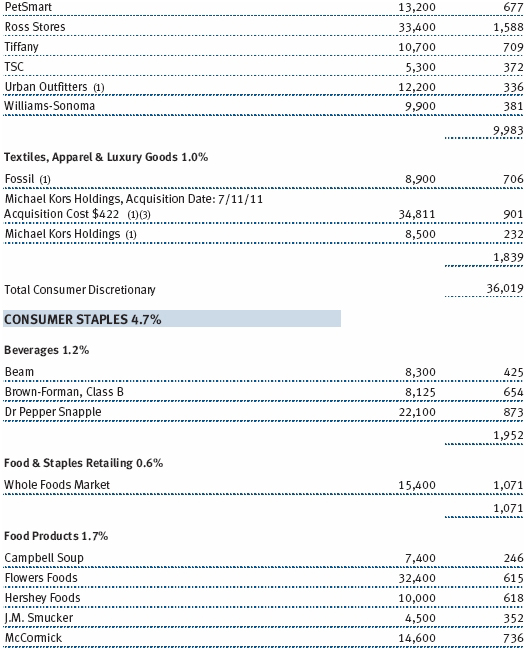
Our consumer discretionary stocks held up relatively well in the second half of 2011 and contributed the most to fund performance in absolute terms for the year. However, our holdings lagged those in the Russell index for the year. This sector, which was the largest in the fund and the benchmark at the end of December, includes an eclectic assortment of businesses, including retailers, media companies, hotels, and restaurants. We are currently overweighting consumer discretionary; we find that many companies in the sector have good business models, excellent cash flow, and other favorable attributes. Specialty retailers did well in our 6- and 12-month reporting periods, with O’Reilly Automotive, which sells car parts, and discount retailer Ross Stores among our largest contributors in the entire portfolio. Retailers Dollar Tree and Dollar General were also significant contributors in both periods. Internet and catalog retailers were lackluster in the last six months, but priceline.com was an outstanding contributor to our 12-month results. Following an extended period of strong performance that lifted the company into the large-cap universe, we eliminated our longtime position. Media and diversified consumer services companies generally sagged in both of our reporting periods. Hotel, gaming, and leisure stocks fared poorly, as many of these businesses were hurt by higher fuel costs that discouraged travel and restrained consumer spending beyond necessities. Casual restaurants Panera Bread and Chipotle Mexican Grill held up quite well in the last six months and produced strong 12-month returns. (Please refer to the fund’s portfolio of investments for a complete list of holdings and the amount each represents in the portfolio.)
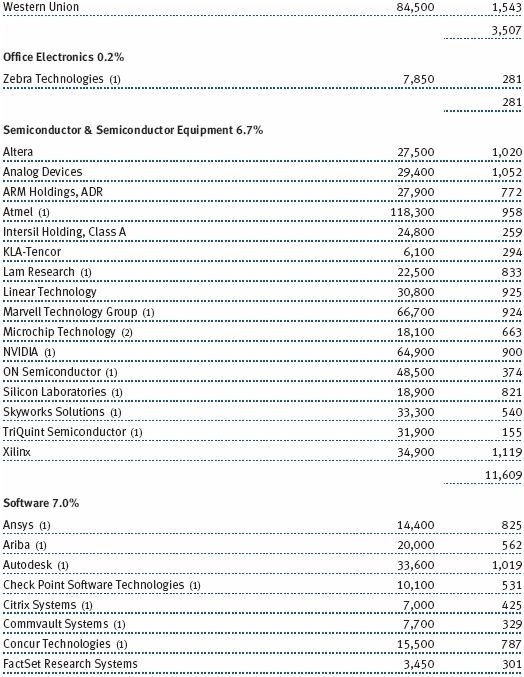
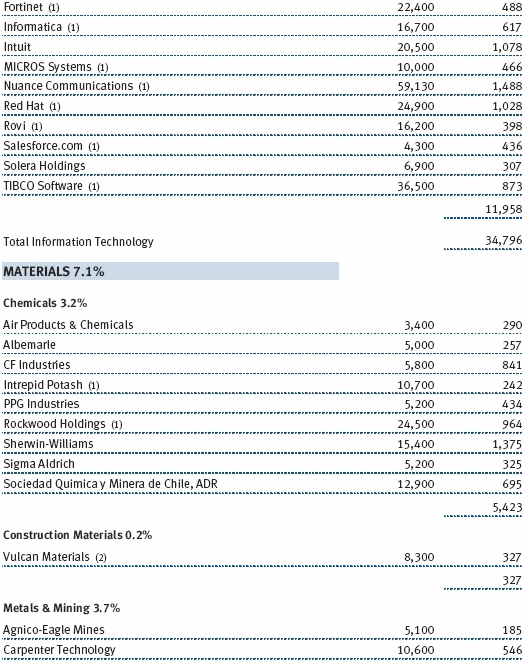
The information technology sector, our second-largest allocation and our largest overweight versus the benchmark, detracted the most in absolute terms in both of our reporting periods. Stock selection helped the fund’s relative performance for the full year but not for the six-month period. Although investors have steered away from tech stocks due to macroeconomic uncertainty and risk aversion, we still believe the sector features businesses with some of the best long-term growth potential. We continue to favor companies with strong business models in industries that have high barriers to entry and low risk of commoditization, such as software. We also like semiconductor-related companies with quality business models and reasonable valuations. In the last six months, software stocks fared worst, with Rovi and Autodesk among our biggest disappointments in both the 6- and 12-month reporting periods. However, software stocks held up very well for the full year, thanks to first-half strength from speech recognition software maker Nuance Communications and network security company Check Point Software Technologies. Semiconductor stocks stumbled in the last six months but held up fairly well for the full year, largely due to strength in National Semiconductor and Varian Semiconductor Equipment, both of which we eliminated as they were acquired. Among Internet software companies, Sina, a Chinese Internet portal and a top performer in the first half of the year, fell sharply in the second half. We maintained our position in this longtime holding, as we believe its long-term prospects remain favorable and its valuation reasonable compared with U.S. social media companies. Our electronic equipment and communications equipment companies generally sagged in both reporting periods; in contrast, IT services held up best in both periods.
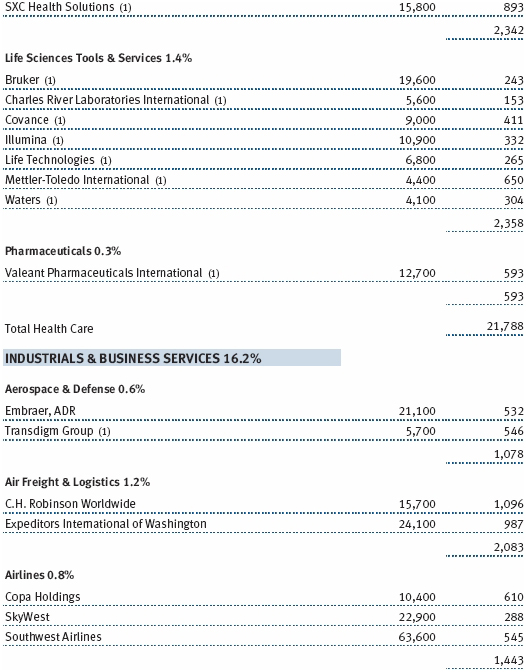
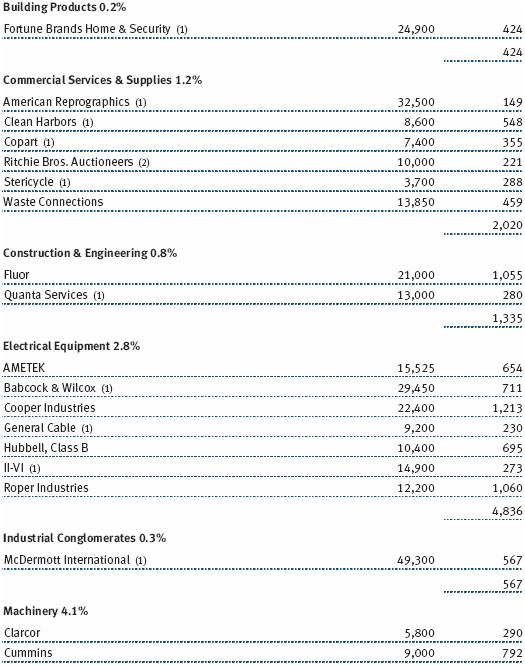
Our industrials and business services stocks struggled as the broader market declined in the last six months, but our holdings held up well for the one-year period. Good stock selection in both periods helped our relative returns. At the end of December, we overweighted the sector relative to the Russell benchmark because we believe many companies have attractive valuations and are world class in their respective niches. While our holdings are currently more cyclical than those in the benchmark—a theme that generally worked against the fund throughout the year, as the portfolio has a cyclical rather than a defensive bias—we tend to favor industrials with greater earnings stability. Machinery stocks fared worst in both of our reporting periods, with WABCO Holdings and Cummins weighing on their aggregate performance. Electrical equipment companies were lackluster over the last year, but two companies—Rockwell Automation and Roper Industries—were solid contributors to the fund’s 12-month performance. Our aerospace and defense stocks were flat in the second half but produced good returns for the full year. Goodrich was one of our best performers in both periods, as the company agreed in September to be acquired by United Technologies.
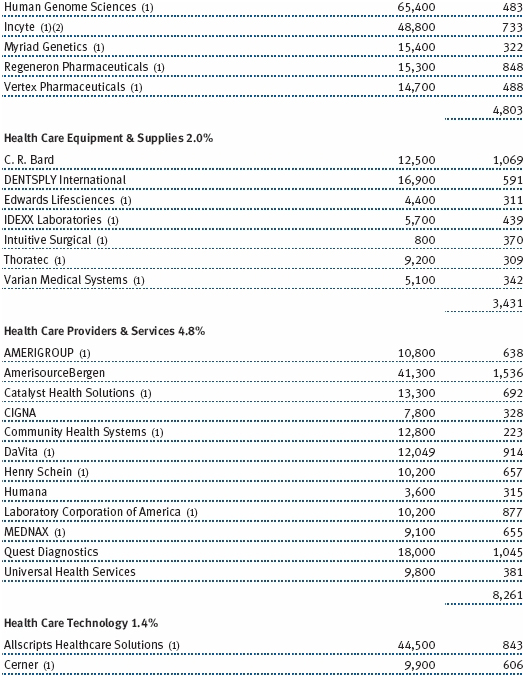
Health care stocks produced mild gains in absolute terms in 2011, though the sector was one of the weakest in the mid-cap growth universe in the last six months. At year-end, we slightly underweighted the sector versus the benchmark. Health care remains a challenging sector in which to invest, given that innovation is difficult, expensive, and increasingly unaffordable. Still, the sector features some good long-term investment opportunities. We currently favor managed-care and volume-related companies that should benefit from demographic trends and increased demand for access to health care services. In the last six months, biotechnology was the worst-performing industry in the sector, as the poor performance of Human Genome Sciences and Dendreon stemming from disappointing sales of new drugs more than offset the excellent performance of Alexion Pharmaceuticals, which was driven by growing sales of its rare blood disorder drug Soliris. The potential for extreme investment outcomes such as this underscores our reason for broadly diversifying among biotechs. Life sciences and tools companies also fared poorly, led by longtime holding Illumina. Our positions in medical device makers held up fairly well in the last six months and led the sector for the full year, especially Intuitive Surgical.
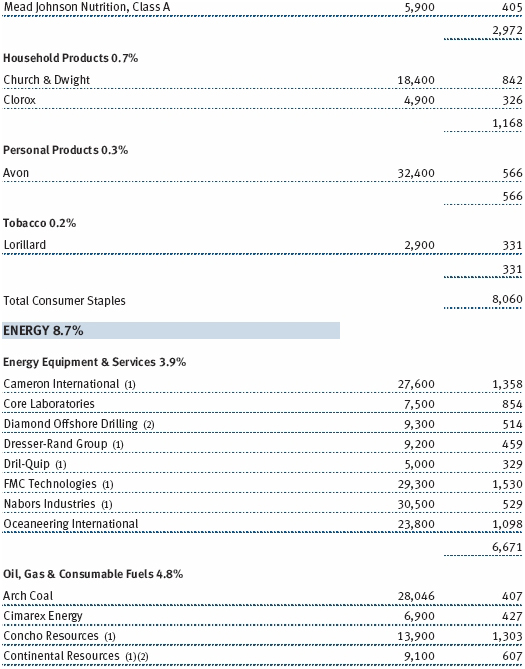
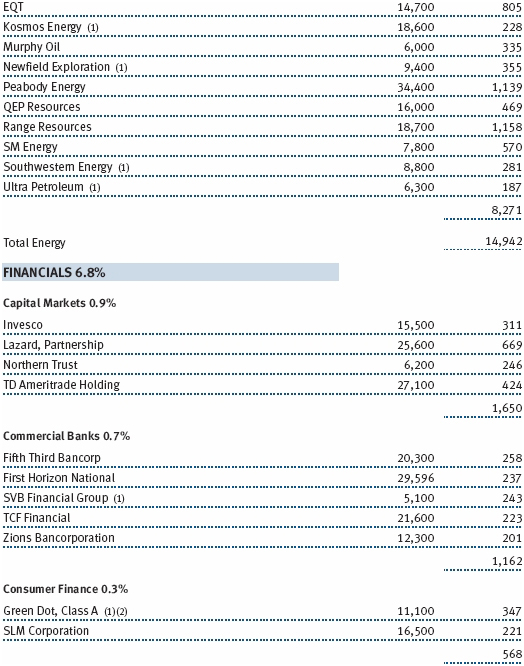
Energy stocks declined and were very volatile in our 6- and 12-month reporting periods. As our long-term investors know, we do not attempt to forecast commodity prices, nor do we invest in energy stocks in an attempt to play short-term price movements. Rather, we look to invest in differentiated service companies and those that are skilled at finding underlying resources. We also try to diversify our production-oriented holdings geographically to reduce risks. In both of our reporting periods, companies that produce consumable fuels, such as oil, gas, and coal, fared much worse than energy equipment and services companies. Two of our weakest energy holdings were coal companies Arch Coal and Peabody Energy. We are maintaining our positions, as we believe these companies offer an excellent long-term risk/reward trade-off. On the plus side, natural gas exploration and production company Range Resources did very well in both periods amid better-than-expected earnings and increasing production. Among energy equipment and services companies, Nabors Industries disappointed in both periods, but FMC Technologies did well throughout the year amid increasing profit margins.
Our materials stocks were among the portfolio’s largest absolute performance detractors in both of our reporting periods. Stock selection also hurt the fund’s relative performance. As with energy stocks, we do not attempt to forecast commodity price fluctuations or make investments in an attempt to profit from such movements. Our approach is to seek differentiated basic materials companies that are well positioned for the long term. Defensive companies such as paint maker Sherwin-Williams were relative outperformers.
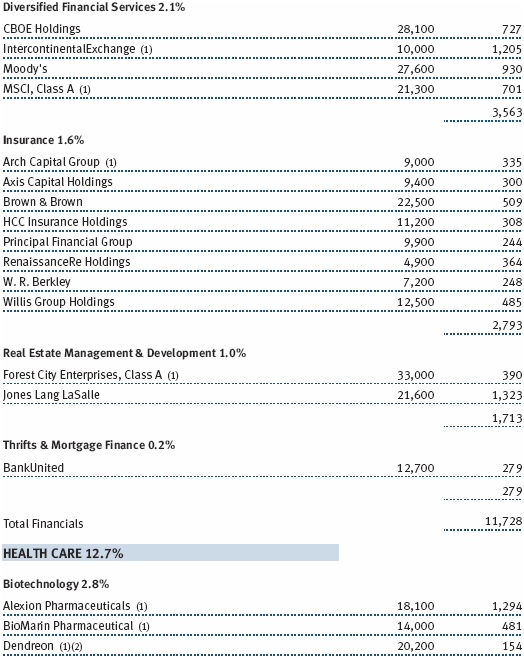
Financials stocks, though a relatively small portion of the fund and the Russell index, struggled throughout 2011, and stock selection hurt our relative performance. Financials fell sharply in the last six months, especially during the third quarter, as the intensifying European sovereign debt crisis weighed on expectations for global economic growth and heightened the pressure on banks around the world. Capital markets companies were among the worst performers in both of our reporting periods, led by Lazard. Despite the fact that many of our commercial banks have valuations below book value and high deposit shares in their regions, they remained disappointing investments throughout the year due to slow economic growth, low loan growth, and lingering regulatory uncertainty. We eliminated a few of these holdings in the last six months in search of better opportunities elsewhere but maintained investments in Fifth Third Bancorp and a few other regional banks. The performance of our insurance companies was lackluster in both of our reporting periods, but we believe the pricing environment for insurers will be better in 2012 than is generally expected.
The consumer staples sector was one of the strongest in the mid-cap growth universe for the full year, as risk-averse investors favored this defensive, noncyclical sector in a very uncertain economic environment. Underweighting this sector in 2011 hurt the fund’s relative performance—as mentioned earlier, the portfolio has a cyclical rather than a defensive bias—though stock selection contributed slightly. In the last six months, consumer staples companies contributed the most to the fund’s absolute performance. Notable performers include spirits company Beam (which emerged from the October breakup of Fortune Brands), organic grocer Whole Foods Market, household products maker Church & Dwight, and Hershey Foods.
OUTLOOK
Despite last year’s volatility and negative returns, we believe the current environment provides patient investors who are willing to take some risks with a great opportunity to invest in equities for long-term capital appreciation. The U.S. economy and corporate earnings are growing, and the Federal Reserve’s monetary policies are highly accommodative. Corporations have substantial cash reserves on their balance sheets and are increasing dividends to shareholders. In some cases, stock dividend yields are higher than yields offered by investment-grade bonds; stocks also provide greater long-term return potential. In addition, equity valuations are attractive, and the market is far from speculative, as many investors remain scared on the sidelines.
We believe this environment is particularly favorable for our investment management approach. Through the Diversified Mid-Cap Growth Fund, we offer broad diversification in the mid-cap growth universe, a focus on risk control, and investments in high-quality companies that we believe have the potential to generate strong long-term returns.
Thank you for your confidence in T. Rowe Price.
Respectfully submitted,

Donald J. Peters
Cochairman of the fund’s Investment Advisory Committee

Donald J. Easley
Cochairman of the fund’s Investment Advisory Committee
January 24, 2012
The committee cochairmen have day-to-day responsibility for managing the portfolio and work with committee members in developing and executing the fund’s investment program.
RISKS OF INVESTING
As with all equity funds, this fund’s share price can fall because of weakness in the broad market, a particular industry, or specific holdings. The market as a whole can decline for many reasons, including adverse political or economic developments here or abroad, changes in investor psychology, or heavy institutional selling. The prospects for an industry or company may deteriorate because of a variety of factors, including disappointing earnings or changes in the competitive environment. In addition, our assessment of companies held in the fund may prove incorrect, resulting in losses or poor performance even in a rising market. Finally, the fund’s investment approach could fall out of favor with the investing public, resulting in lagging performance versus other types of stock funds.
The stocks of mid-cap companies entail greater risk and are usually more volatile than the shares of large companies. In addition, growth stocks can be volatile for several reasons. Since they usually reinvest a high proportion of earnings in their own businesses, they may lack the dividends usually associated with value stocks that can cushion their decline in a falling market. Also, since investors buy these stocks because of their expected superior earnings growth, earnings disappointments often result in sharp price declines.
Diversification cannot protect against loss in a declining market or assure a profit.
GLOSSARY
Earnings growth rate – current fiscal year: Measures the annualized percent change in earnings per share from the prior fiscal year to the current fiscal year.
Lipper indexes: Fund benchmarks that consist of a small number (10 to 30) of the largest mutual funds in a particular category as tracked by Lipper Inc.
Price-to-earnings (P/E) ratio – 12 months forward: A valuation measure calculated by dividing the price of a stock by the analysts’ forecast of the next 12 months expected earnings. The ratio is a measure of how much investors are willing to pay for the company’s future earnings. The higher the P/E, the more investors are paying for a company’s earnings growth in the next 12 months.
Projected earnings growth rate (IBES): A company’s expected earnings per share growth rate for a given time period based on the forecast from the Institutional Brokers’ Estimate System, which is commonly referred to as IBES.
Return on equity (ROE) – current fiscal year: A valuation measure calculated by dividing the company’s current fiscal year net income by shareholders’ equity (i.e., the company’s book value). ROE measures how much a company earns on each dollar that common stock investors have put into the company. It indicates how effectively and efficiently a company and its management are using stockholder investments.
Russell Midcap Growth Index: An index that tracks the performance of mid-cap stocks with higher price-to-book ratios and higher forecasted growth values.
Russell Midcap Index: An unmanaged index that tracks the performance of the 800 smallest companies in the Russell 1000 Index.
Russell Midcap Value Index: An index that tracks the performance of mid-cap stocks with lower price-to-book ratios and lower forecasted growth values.
S&P MidCap 400 Index: An unmanaged index that tracks the stocks of 400 U.S. mid-cap companies.
Performance and Expenses
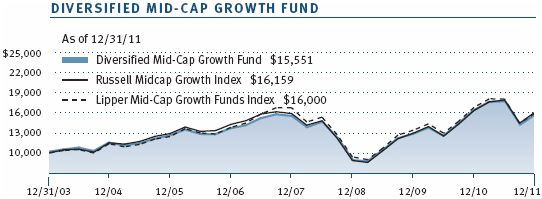
| Growth of $10,000 |
This chart shows the value of a hypothetical $10,000 investment in the fund over the past 10 fiscal year periods or since inception (for funds lacking 10-year records). The result is compared with benchmarks, which may include a broad-based market index and a peer group average or index. Market indexes do not include expenses, which are deducted from fund returns as well as mutual fund averages and indexes.
| Fund Expense Example |
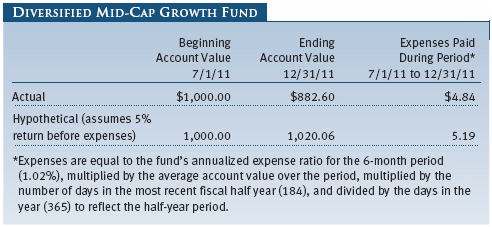
As a mutual fund shareholder, you may incur two types of costs: (1) transaction costs, such as redemption fees or sales loads, and (2) ongoing costs, including management fees, distribution and service (12b-1) fees, and other fund expenses. The following example is intended to help you understand your ongoing costs (in dollars) of investing in the fund and to compare these costs with the ongoing costs of investing in other mutual funds. The example is based on an investment of $1,000 invested at the beginning of the most recent six-month period and held for the entire period.
Actual Expenses
The first line of the following table (“Actual”) provides information about actual account values and expenses based on the fund’s actual returns. You may use the information on this line, together with your account balance, to estimate the expenses that you paid over the period. Simply divide your account value by $1,000 (for example, an $8,600 account value divided by $1,000 = 8.6), then multiply the result by the number on the first line under the heading “Expenses Paid During Period” to estimate the expenses you paid on your account during this period.
Hypothetical Example for Comparison Purposes
The information on the second line of the table (“Hypothetical”) is based on hypothetical account values and expenses derived from the fund’s actual expense ratio and an assumed 5% per year rate of return before expenses (not the fund’s actual return). You may compare the ongoing costs of investing in the fund with other funds by contrasting this 5% hypothetical example and the 5% hypothetical examples that appear in the shareholder reports of the other funds. The hypothetical account values and expenses may not be used to estimate the actual ending account balance or expenses you paid for the period.
Note: T. Rowe Price charges an annual account service fee of $20, generally for accounts with less than $10,000 ($1,000 for UGMA/UTMA). The fee is waived for any investor whose T. Rowe Price mutual fund accounts total $50,000 or more; accounts employing automatic investing; accounts electing to receive electronic delivery of account statements, transaction confirmations, prospectuses, and shareholder reports; accounts of an investor who is a T. Rowe Price Preferred Services, Personal Services, or Enhanced Personal Services client (enrollment in these programs generally requires T. Rowe Price assets of at least $100,000); and IRAs and other retirement plan accounts that utilize a prototype plan sponsored by T. Rowe Price (although a separate custodial or administrative fee may apply to such accounts). This fee is not included in the accompanying table. If you are subject to the fee, keep it in mind when you are estimating the ongoing expenses of investing in the fund and when comparing the expenses of this fund with other funds.
You should also be aware that the expenses shown in the table highlight only your ongoing costs and do not reflect any transaction costs, such as redemption fees or sales loads. Therefore, the second line of the table is useful in comparing ongoing costs only and will not help you determine the relative total costs of owning different funds. To the extent a fund charges transaction costs, however, the total cost of owning that fund is higher.
The accompanying notes are an integral part of these financial statements.
The accompanying notes are an integral part of these financial statements.
The accompanying notes are an integral part of these financial statements.
The accompanying notes are an integral part of these financial statements.
The accompanying notes are an integral part of these financial statements.
| Notes to Financial Statements |
T. Rowe Price Diversified Mid-Cap Growth Fund, Inc. (the fund), is registered under the Investment Company Act of 1940 (the 1940 Act) as a diversified, open-end management investment company. The fund commenced operations on December 31, 2003. The fund seeks to provide long-term capital growth by investing primarily in the common stocks of mid-cap growth companies.
NOTE 1 - SIGNIFICANT ACCOUNTING POLICIES
Basis of Preparation The accompanying financial statements were prepared in accordance with accounting principles generally accepted in the United States of America (GAAP), which require the use of estimates made by management. Management believes that estimates and valuations are appropriate; however, actual results may differ from those estimates, and the valuations reflected in the accompanying financial statements may differ from the value ultimately realized upon sale or maturity.
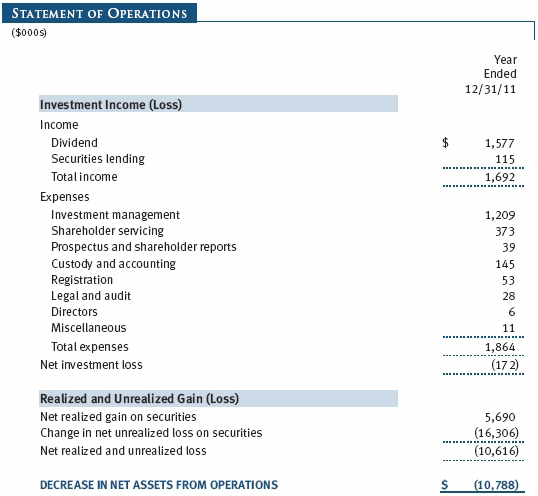
Investment Transactions, Investment Income, and Distributions Income and expenses are recorded on the accrual basis. Dividends received from mutual fund investments are reflected as dividend income; capital gain distributions are reflected as realized gain/loss. Dividend income and capital gain distributions are recorded on the ex-dividend date. Income tax-related interest and penalties, if incurred, would be recorded as income tax expense. Investment transactions are accounted for on the trade date. Realized gains and losses are reported on the identified cost basis. Distributions to shareholders are recorded on the ex-dividend date. Income distributions are declared and paid annually. Capital gain distributions, if any, are generally declared and paid by the fund annually.
Rebates and Credits Subject to best execution, the fund may direct certain security trades to brokers who have agreed to rebate a portion of the related brokerage commission to the fund in cash. Commission rebates are reflected as realized gain on securities in the accompanying financial statements. Additionally, the fund earns credits on temporarily uninvested cash balances held at the custodian, which reduce the fund’s custody charges. Custody expense in the accompanying financial statements is presented before reduction for credits.
New Accounting Pronouncements In December 2011, the Financial Accounting Standards Board issued amended guidance to enhance disclosure for offsetting assets and liabilities. The guidance is effective for fiscal years and interim periods beginning on or after January 1, 2013; adoption will have no effect on the fund’s net assets or results of operations.
NOTE 2 - VALUATION
The fund’s financial instruments are reported at fair value as defined by GAAP. The fund determines the values of its assets and liabilities and computes its net asset value per share at the close of the New York Stock Exchange (NYSE), normally 4 p.m. ET, each day that the NYSE is open for business.
Valuation Methods Equity securities listed or regularly traded on a securities exchange or in the over-the-counter (OTC) market are valued at the last quoted sale price or, for certain markets, the official closing price at the time the valuations are made, except for OTC Bulletin Board securities, which are valued at the mean of the latest bid and asked prices. A security that is listed or traded on more than one exchange is valued at the quotation on the exchange determined to be the primary market for such security. Listed securities not traded on a particular day are valued at the mean of the latest bid and asked prices for domestic securities and the last quoted sale price for international securities.
Investments in mutual funds are valued at the mutual fund’s closing net asset value per share on the day of valuation.
Other investments, including restricted securities and private placements, and those financial instruments for which the above valuation procedures are inappropriate or are deemed not to reflect fair value, are stated at fair value as determined in good faith by the T. Rowe Price Valuation Committee, established by the fund’s Board of Directors (the Board). Subject to oversight by the Board, the Valuation Committee develops pricing-related policies and procedures and approves all fair-value determinations. The Valuation Committee regularly makes good faith judgments, using a wide variety of sources and information, to establish and adjust valuations of certain securities as events occur and circumstances warrant. For instance, in determining the fair value of private-equity instruments, the Valuation Committee considers a variety of factors, including the company’s business prospects, its financial performance, strategic events impacting the company, relevant valuations of similar companies, new rounds of financing, and any negotiated transactions of significant size between other investors in the company. Because any fair-value determination involves a significant amount of judgment, there is a degree of subjectivity inherent in such pricing decisions.
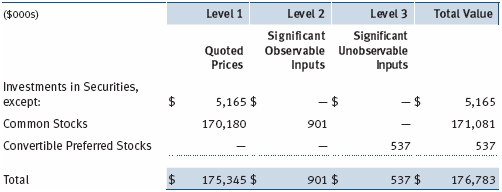
Valuation Inputs Various inputs are used to determine the value of the fund’s financial instruments. These inputs are summarized in the three broad levels listed below:
Level 1 – quoted prices in active markets for identical financial instruments
Level 2 – observable inputs other than Level 1 quoted prices (including, but not limited to, quoted prices for similar financial instruments, interest rates, prepayment speeds, and credit risk)
Level 3 – unobservable inputs
Observable inputs are those based on market data obtained from sources independent of the fund, and unobservable inputs reflect the fund’s own assumptions based on the best information available. The input levels are not necessarily an indication of the risk or liquidity associated with financial instruments at that level. The following table summarizes the fund’s financial instruments, based on the inputs used to determine their values on December 31, 2011:
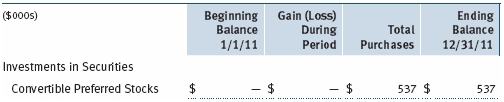
Following is a reconciliation of the fund’s Level 3 holdings for the year ended December 31, 2011. Gain (loss) reflects both realized and change in unrealized gain (loss) on Level 3 holdings during the period, if any, and is included on the accompanying Statement of Operations. The change in unrealized gain (loss) on Level 3 instruments held at December 31, 2011, totaled $0 for the year ended December 31, 2011.
NOTE 3 - OTHER INVESTMENT TRANSACTIONS
Consistent with its investment objective, the fund engages in the following practices to manage exposure to certain risks and/or to enhance performance. The investment objective, policies, program, and risk factors of the fund are described more fully in the fund’s prospectus and Statement of Additional Information.
Restricted Securities The fund may invest in securities that are subject to legal or contractual restrictions on resale. Prompt sale of such securities at an acceptable price may be difficult and may involve substantial delays and additional costs.
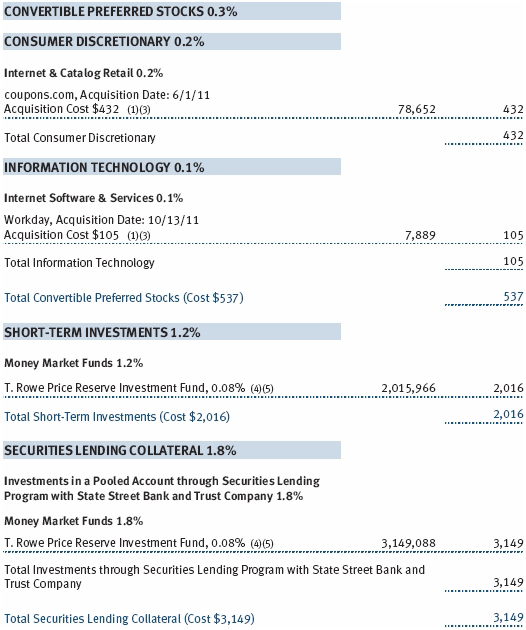
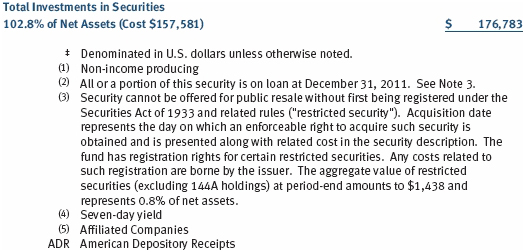
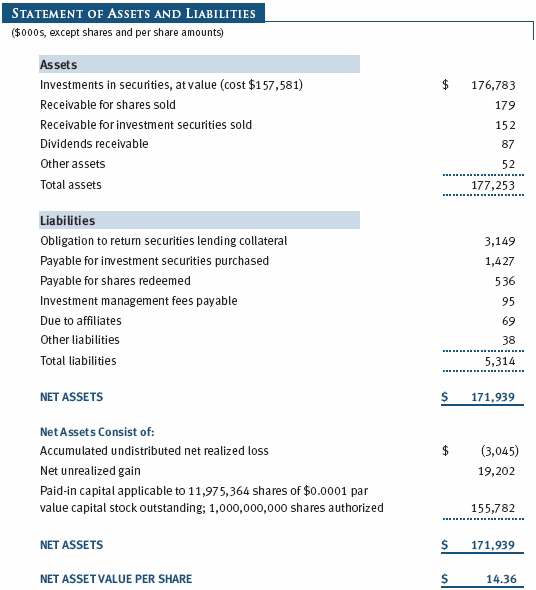
Securities Lending The fund lends its securities to approved brokers to earn additional income. It receives as collateral cash and U.S. government securities valued at 102% to 105% of the value of the securities on loan. Cash collateral is invested by the fund’s lending agent(s) in accordance with investment guidelines approved by management. Although risk is mitigated by the collateral, the fund could experience a delay in recovering its securities and a possible loss of income or value if the borrower fails to return the securities or if collateral investments decline in value. Securities lending revenue recognized by the fund consists of earnings on invested collateral and borrowing fees, net of any rebates to the borrower and compensation to the lending agent. In accordance with GAAP, investments made with cash collateral are reflected in the accompanying financial statements, but collateral received in the form of securities are not. On December 31, 2011, the value of cash collateral investments was $3,149,000, and the value of loaned securities was $3,070,000.
Other Purchases and sales of portfolio securities other than short-term securities aggregated $106,032,000 and $78,013,000, respectively, for the year ended December 31, 2011.
NOTE 4 - FEDERAL INCOME TAXES
No provision for federal income taxes is required since the fund intends to continue to qualify as a regulated investment company under Subchapter M of the Internal Revenue Code and distribute to shareholders all of its taxable income and gains. Distributions determined in accordance with federal income tax regulations may differ in amount or character from net investment income and realized gains for financial reporting purposes. Financial reporting records are adjusted for permanent book/tax differences to reflect tax character but are not adjusted for temporary differences.
The fund files U.S. federal, state, and local tax returns as required. The fund’s tax returns are subject to examination by the relevant tax authorities until expiration of the applicable statute of limitations, which is generally three years after the filing of the tax return but which can be extended to six years in certain circumstances. Tax returns for open years have incorporated no uncertain tax positions that require a provision for income taxes.
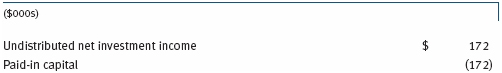
Reclassifications to paid-in capital relate primarily to the current net operating loss. For the year ended December 31, 2011, the following reclassifications were recorded to reflect tax character (there was no impact on results of operations or net assets):
There were no distributions in the years ended December 31, 2011 and December 31, 2010. At December 31, 2011, the tax-basis cost of investments and components of net assets were as follows:
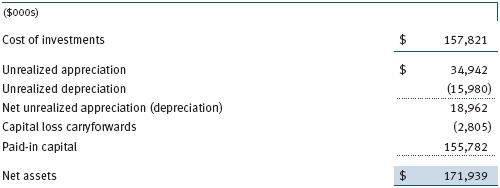
The difference between book-basis and tax-basis net unrealized appreciation (depreciation) is attributable to the deferral of losses from wash sales for tax purposes. As a result of the Regulated Investment Company Modernization Act of 2010, net capital losses realized on or after January 1, 2011 (effective date) may be carried forward indefinitely to offset future realized capital gains; however, post-effective losses must be used before pre-effective capital loss carryforwards with expiration dates. Accordingly, it is possible that all or a portion of the fund’s pre-effective capital loss carryforwards could expire unused. All or a portion of the fund’s capital loss carryforwards may be from losses realized between November 1 and the fund’s fiscal year-end, which are deferred for tax purposes until the subsequent year but recognized for financial reporting purposes in the year realized. The fund intends to retain realized gains to the extent of available capital loss carryforwards. During the year ended December 31, 2011, the fund utilized $6,293,000 of capital loss carryforwards. The fund’s available capital loss carryforwards as of December 31, 2011, expire as follows: $2,120,000 in fiscal 2017; $685,000 have no expiration.
NOTE 5 - RELATED PARTY TRANSACTIONS
The fund is managed by T. Rowe Price Associates, Inc. (Price Associates), a wholly owned subsidiary of T. Rowe Price Group, Inc. (Price Group). The investment management agreement between the fund and Price Associates provides for an annual investment management fee, which is computed daily and paid monthly. The fee consists of an individual fund fee, equal to 0.35% of the fund’s average daily net assets, and a group fee. The group fee rate is calculated based on the combined net assets of certain mutual funds sponsored by Price Associates (the group) applied to a graduated fee schedule, with rates ranging from 0.48% for the first $1 billion of assets to 0.28% for assets in excess of $300 billion. The fund’s group fee is determined by applying the group fee rate to the fund’s average daily net assets. At December 31, 2011, the effective annual group fee rate was 0.30%.
In addition, the fund has entered into service agreements with Price Associates and two wholly owned subsidiaries of Price Associates (collectively, Price). Price Associates computes the daily share price and provides certain other administrative services to the fund. T. Rowe Price Services, Inc., provides shareholder and administrative services in its capacity as the fund’s transfer and dividend disbursing agent. T. Rowe Price Retirement Plan Services, Inc., provides subaccounting and recordkeeping services for certain retirement accounts invested in the fund. For the year ended December 31, 2011, expenses incurred pursuant to these service agreements were $96,000 for Price Associates; $265,000 for T. Rowe Price Services, Inc.; and $6,000 for T. Rowe Price Retirement Plan Services, Inc. The total amount payable at period-end pursuant to these service agreements is reflected as Due to Affiliates in the accompanying financial statements.
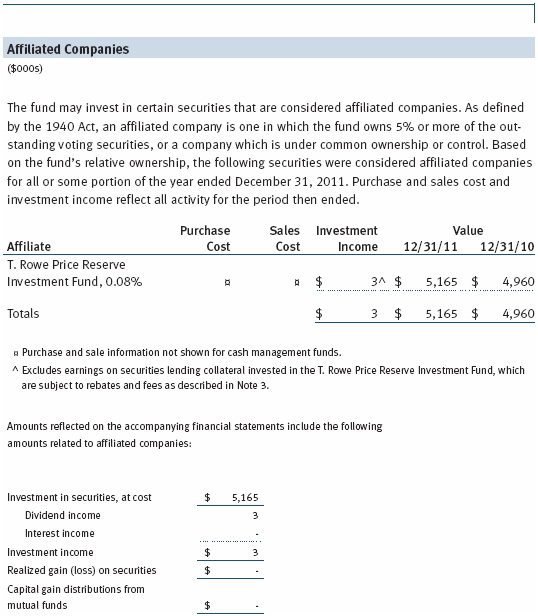
The fund may invest in the T. Rowe Price Reserve Investment Fund and the T. Rowe Price Government Reserve Investment Fund (collectively, the T. Rowe Price Reserve Investment Funds), open-end management investment companies managed by Price Associates and considered affiliates of the fund. The T. Rowe Price Reserve Investment Funds are offered as cash management options to mutual funds, trusts, and other accounts managed by Price Associates and/or its affiliates and are not available for direct purchase by members of the public. The T. Rowe Price Reserve Investment Funds pay no investment management fees.
| Report of Independent Registered Public Accounting Firm |
To the Board of Directors and Shareholders of
T. Rowe Price Diversified Mid-Cap Growth Fund, Inc.
In our opinion, the accompanying statement of assets and liabilities, including the portfolio of investments, and the related statements of operations and of changes in net assets and the financial highlights present fairly, in all material respects, the financial position of T. Rowe Price Diversified Mid-Cap Growth Fund, Inc. (the “Fund”) at December 31, 2011, and the results of its operations, the changes in its net assets and the financial highlights for each of the periods indicated therein, in conformity with accounting principles generally accepted in the United States of America. These financial statements and financial highlights (hereafter referred to as “financial statements”) are the responsibility of the Fund’s management; our responsibility is to express an opinion on these financial statements based on our audits. We conducted our audits of these financial statements in accordance with the standards of the Public Company Accounting Oversight Board (United States). Those standards require that we plan and perform the audit to obtain reasonable assurance about whether the financial statements are free of material misstatement. An audit includes examining, on a test basis, evidence supporting the amounts and disclosures in the financial statements, assessing the accounting principles used and significant estimates made by management, and evaluating the overall financial statement presentation. We believe that our audits, which included confirmation of securities at December 31, 2011 by correspondence with the custodian and brokers, and confirmation of the underlying funds by correspondence with the transfer agent, provide a reasonable basis for our opinion.
PricewaterhouseCoopers LLP
Baltimore, Maryland
February 17, 2012
| Information on Proxy Voting Policies, Procedures, and Records |
A description of the policies and procedures used by T. Rowe Price funds and portfolios to determine how to vote proxies relating to portfolio securities is available in each fund’s Statement of Additional Information, which you may request by calling 1-800-225-5132 or by accessing the SEC’s website, sec.gov. The description of our proxy voting policies and procedures is also available on our website, troweprice.com. To access it, click on the words “Our Company” at the top of our corporate homepage. Then, when the next page appears, click on the words “Proxy Voting Policies” on the left side of the page.
Each fund’s most recent annual proxy voting record is available on our website and through the SEC’s website. To access it through our website, follow the directions above, then click on the words “Proxy Voting Records” on the right side of the Proxy Voting Policies page.
| How to Obtain Quarterly Portfolio Holdings |
The fund files a complete schedule of portfolio holdings with the Securities and Exchange Commission for the first and third quarters of each fiscal year on Form N-Q. The fund’s Form N-Q is available electronically on the SEC’s website (sec.gov); hard copies may be reviewed and copied at the SEC’s Public Reference Room, 450 Fifth St. N.W., Washington, DC 20549. For more information on the Public Reference Room, call 1-800-SEC-0330.
| About the Fund’s Directors and Officers |
Your fund is overseen by a Board of Directors (Board) that meets regularly to review a wide variety of matters affecting the fund, including performance, investment programs, compliance matters, advisory fees and expenses, service providers, and other business affairs. The Board elects the fund’s officers, who are listed in the final table. At least 75% of the Board’s members are independent of T. Rowe Price Associates, Inc. (T. Rowe Price), and its affiliates; “inside” or “interested” directors are employees or officers of T. Rowe Price. The business address of each director and officer is 100 East Pratt Street, Baltimore, Maryland 21202. The Statement of Additional Information includes additional information about the fund directors and is available without charge by calling a T. Rowe Price representative at 1-800-638-5660.
| Independent Directors | ||
| Name | ||
| (Year of Birth) | Principal Occupation(s) and Directorships of Public Companies and | |
| Year Elected* | Other Investment Companies During the Past Five Years | |
| William R. Brody, M.D., | President and Trustee, Salk Institute for Biological Studies (2009 | |
| Ph.D. | to present); Director, Novartis, Inc. (2009 to present); Director, IBM | |
| (1944) | (2007 to present); President and Trustee, Johns Hopkins University | |
| 2009 | (1996 to 2009); Chairman of Executive Committee and Trustee, | |
| Johns Hopkins Health System (1996 to 2009) | ||
| Jeremiah E. Casey | Retired | |
| (1940) | ||
| 2005 | ||
| Anthony W. Deering | Chairman, Exeter Capital, LLC, a private investment firm (2004 | |
| (1945) | to present); Director, Under Armour (2008 to present); Director, | |
| 2003 | Vornado Real Estate Investment Trust (2004 to present); Director, | |
| Mercantile Bankshares (2002 to 2007); Director and Member of the | ||
| Advisory Board, Deutsche Bank North America (2004 to present) | ||
| Donald W. Dick, Jr. | Principal, EuroCapital Partners, LLC, an acquisition and management | |
| (1943) | advisory firm (1995 to present) | |
| 2003 | ||
| Karen N. Horn | Senior Managing Director, Brock Capital Group, an advisory and | |
| (1943) | investment banking firm (2004 to present); Director, Eli Lilly and | |
| 2003 | Company (1987 to present); Director, Simon Property Group (2004 | |
| to present); Director, Norfolk Southern (2008 to present); Director, | ||
| Fannie Mae (2006 to 2008) | ||
| Theo C. Rodgers | President, A&R Development Corporation (1977 to present) | |
| (1941) | ||
| 2005 | ||
| John G. Schreiber | Owner/President, Centaur Capital Partners, Inc., a real estate | |
| (1946) | investment company (1991 to present); Cofounder and Partner, | |
| 2003 | Blackstone Real Estate Advisors, L.P. (1992 to present); Director, | |
| General Growth Properties, Inc. (2010 to present) | ||
| Mark R. Tercek | President and Chief Executive Officer, The Nature Conservancy (2008 | |
| (1957) | to present); Managing Director, The Goldman Sachs Group, Inc. | |
| 2009 | (1984 to 2008) | |
| *Each independent director oversees 130 T. Rowe Price portfolios and serves until retirement, resignation, or election of a successor. | ||
| Inside Directors | ||
| Name | ||
| (Year of Birth) | ||
| Year Elected* | ||
| [Number of T. Rowe Price | Principal Occupation(s) and Directorships of Public Companies and | |
| Portfolios Overseen] | Other Investment Companies During the Past Five Years | |
| Edward C. Bernard | Director and Vice President, T. Rowe Price; Vice Chairman of the | |
| (1956) | Board, Director, and Vice President, T. Rowe Price Group, Inc.; | |
| 2006 | Chairman of the Board, Director, and President, T. Rowe Price | |
| [130] | Investment Services, Inc.; Chairman of the Board and Director, | |
| T. Rowe Price Retirement Plan Services, Inc., T. Rowe Price Savings | ||
| Bank, and T. Rowe Price Services, Inc.; Chairman of the Board, Chief | ||
| Executive Officer, and Director, T. Rowe Price International; Chief | ||
| Executive Officer, Chairman of the Board, Director, and President, | ||
| T. Rowe Price Trust Company; Chairman of the Board, all funds | ||
| John H. Laporte, CFA | Vice President, T. Rowe Price, T. Rowe Price Group, Inc., and T. Rowe | |
| (1945) | Price Trust Company | |
| 2006 | ||
| [16] | ||
| *Each inside director serves until retirement, resignation, or election of a successor. | ||
| Officers | ||
| Name (Year of Birth) | ||
| Position Held With Diversified | ||
| Mid-Cap Growth Fund | Principal Occupation(s) | |
| Kennard W. Allen (1977) | Vice President, T. Rowe Price and T. Rowe Price | |
| Vice President | Group, Inc. | |
| Peter J. Bates, CFA (1974) | Vice President, T. Rowe Price and T. Rowe Price | |
| Vice President | Group, Inc. | |
| Brian W.H. Berghuis, CFA (1958) | Vice President, T. Rowe Price, T. Rowe Price | |
| Vice President | Group, Inc., and T. Rowe Price Trust Company | |
| Donald J. Easley, CFA (1971) | Vice President, T. Rowe Price and T. Rowe Price | |
| Executive Vice President | Group, Inc. | |
| Roger L. Fiery III, CPA (1959) | Vice President, Price Hong Kong, Price | |
| Vice President | Singapore, T. Rowe Price, T. Rowe Price Group, | |
| Inc., T. Rowe Price International, and T. Rowe | ||
| Price Trust Company | ||
| John R. Gilner (1961) | Chief Compliance Officer and Vice President, | |
| Chief Compliance Officer | T. Rowe Price; Vice President, T. Rowe Price | |
| Group, Inc., and T. Rowe Price Investment | ||
| Services, Inc. | ||
| Gregory S. Golczewski (1966) | Vice President, T. Rowe Price and T. Rowe Price | |
| Vice President | Trust Company | |
| Gregory K. Hinkle, CPA (1958) | Vice President, T. Rowe Price, T. Rowe Price | |
| Treasurer | Group, Inc., and T. Rowe Price Trust Company; | |
| formerly Partner, PricewaterhouseCoopers LLP | ||
| (to 2007) | ||
| Patricia B. Lippert (1953) | Assistant Vice President, T. Rowe Price and | |
| Secretary | T. Rowe Price Investment Services, Inc. | |
| Sudhir Nanda, Ph.D., CFA (1959) | Vice President, T. Rowe Price and T. Rowe Price | |
| Vice President | Group, Inc. | |
| David Oestreicher (1967) | Director and Vice President, T. Rowe Price | |
| Vice President | Investment Services, Inc., T. Rowe Price | |
| Retirement Plan Services, Inc., T. Rowe | ||
| Price Services, Inc., and T. Rowe Price Trust | ||
| Company; Vice President, Price Hong Kong, | ||
| Price Singapore, T. Rowe Price, T. Rowe Price | ||
| Group, Inc., and T. Rowe Price International | ||
| Timothy E. Parker, CFA (1974) | Vice President, T. Rowe Price and T. Rowe Price | |
| Vice President | Group, Inc. | |
| Donald J. Peters (1959) | Vice President, T. Rowe Price and T. Rowe Price | |
| President | Group, Inc. | |
| Deborah D. Seidel (1962) | Vice President, T. Rowe Price, T. Rowe Price | |
| Vice President | Group, Inc., and T. Rowe Price Investment | |
| Services, Inc.; Vice President and Assistant | ||
| Treasurer, T. Rowe Price Services, Inc. | ||
| Amit Seth (1979) | Vice President, T. Rowe Price; formerly student, | |
| Vice President | Harvard Business School (to 2009); Senior | |
| Associate, Centennial Ventures (to 2007) | ||
| John F. Wakeman (1962) | Vice President, T. Rowe Price and T. Rowe Price | |
| Vice President | Group, Inc. | |
| Julie L. Waples (1970) | Vice President, T. Rowe Price | |
| Vice President | ||
| Rouven J. Wool-Lewis, Ph.D. (1973) | Vice President, T. Rowe Price; formerly Vice | |
| Vice President | President of Corporate Strategy, UnitedHealth | |
| Group (to 2011); Associate Analyst, | ||
| Oppenheimer & Company (to 2009); Senior | ||
| Associate, Friedman, Billings, Ramsey & Co. | ||
| (to 2008) | ||
| Unless otherwise noted, officers have been employees of T. Rowe Price or T. Rowe Price International for at least 5 years. | ||
Item 2. Code of Ethics.
The registrant has adopted a code of ethics, as defined in Item 2 of Form N-CSR, applicable to its principal executive officer, principal financial officer, principal accounting officer or controller, or persons performing similar functions. A copy of this code of ethics is filed as an exhibit to this Form N-CSR. No substantive amendments were approved or waivers were granted to this code of ethics during the period covered by this report.
Item 3. Audit Committee Financial Expert.
The registrant’s Board of Directors/Trustees has determined that Mr. Anthony W. Deering qualifies as an audit committee financial expert, as defined in Item 3 of Form N-CSR. Mr. Deering is considered independent for purposes of Item 3 of Form N-CSR.
Item 4. Principal Accountant Fees and Services.
(a) – (d) Aggregate fees billed to the registrant for the last two fiscal years for professional services rendered by the registrant’s principal accountant were as follows:
Audit fees include amounts related to the audit of the registrant’s annual financial statements and services normally provided by the accountant in connection with statutory and regulatory filings. Audit-related fees include amounts reasonably related to the performance of the audit of the registrant’s financial statements and specifically include the issuance of a report on internal controls and, if applicable, agreed-upon procedures related to fund acquisitions. Tax fees include amounts related to services for tax compliance, tax planning, and tax advice. The nature of these services specifically includes the review of distribution calculations and the preparation of Federal, state, and excise tax returns. All other fees include the registrant’s pro-rata share of amounts for agreed-upon procedures in conjunction with service contract approvals by the registrant’s Board of Directors/Trustees.
(e)(1) The registrant’s audit committee has adopted a policy whereby audit and non-audit services performed by the registrant’s principal accountant for the registrant, its investment adviser, and any entity controlling, controlled by, or under common control with the investment adviser that provides ongoing services to the registrant require pre-approval in advance at regularly scheduled audit committee meetings. If such a service is required between regularly scheduled audit committee meetings, pre-approval may be authorized by one audit committee member with ratification at the next scheduled audit committee meeting. Waiver of pre-approval for audit or non-audit services requiring fees of a de minimis amount is not permitted.
(2) No services included in (b) – (d) above were approved pursuant to paragraph (c)(7)(i)(C) of Rule 2-01 of Regulation S-X.
(f) Less than 50 percent of the hours expended on the principal accountant’s engagement to audit the registrant’s financial statements for the most recent fiscal year were attributed to work performed by persons other than the principal accountant’s full-time, permanent employees.
(g) The aggregate fees billed for the most recent fiscal year and the preceding fiscal year by the registrant’s principal accountant for non-audit services rendered to the registrant, its investment adviser, and any entity controlling, controlled by, or under common control with the investment adviser that provides ongoing services to the registrant were $1,764,000 and $1,417,000, respectively.
(h) All non-audit services rendered in (g) above were pre-approved by the registrant’s audit committee. Accordingly, these services were considered by the registrant’s audit committee in maintaining the principal accountant’s independence.
Item 5. Audit Committee of Listed Registrants.
Not applicable.
Item 6. Investments.
(a) Not applicable. The complete schedule of investments is included in Item 1 of this Form N-CSR.
(b) Not applicable.
Item 7. Disclosure of Proxy Voting Policies and Procedures for Closed-End Management Investment Companies.
Not applicable.
Item 8. Portfolio Managers of Closed-End Management Investment Companies.
Not applicable.
Item 9. Purchases of Equity Securities by Closed-End Management Investment Company and Affiliated Purchasers.
Not applicable.
Item 10. Submission of Matters to a Vote of Security Holders.
Not applicable.
Item 11. Controls and Procedures.
(a) The registrant’s principal executive officer and principal financial officer have evaluated the registrant’s disclosure controls and procedures within 90 days of this filing and have concluded that the registrant’s disclosure controls and procedures were effective, as of that date, in ensuring that information required to be disclosed by the registrant in this Form N-CSR was recorded, processed, summarized, and reported timely.
(b) The registrant’s principal executive officer and principal financial officer are aware of no change in the registrant’s internal control over financial reporting that occurred during the registrant’s second fiscal quarter covered by this report that has materially affected, or is reasonably likely to materially affect, the registrant’s internal control over financial reporting.
Item 12. Exhibits.
(a)(1) The registrant’s code of ethics pursuant to Item 2 of Form N-CSR is attached.
(2) Separate certifications by the registrant's principal executive officer and principal financial officer, pursuant to Section 302 of the Sarbanes-Oxley Act of 2002 and required by Rule 30a-2(a) under the Investment Company Act of 1940, are attached.
(3) Written solicitation to repurchase securities issued by closed-end companies: not applicable.
(b) A certification by the registrant's principal executive officer and principal financial officer, pursuant to Section 906 of the Sarbanes-Oxley Act of 2002 and required by Rule 30a-2(b) under the Investment Company Act of 1940, is attached.
SIGNATURES
Pursuant to the requirements of the Securities Exchange Act of 1934 and the Investment Company Act of 1940, the registrant has duly caused this report to be signed on its behalf by the undersigned, thereunto duly authorized.
T. Rowe Price Diversified Mid-Cap Growth Fund, Inc.
| By | /s/ Edward C. Bernard | |
| Edward C. Bernard | ||
| Principal Executive Officer | ||
| Date February 17, 2012 | ||
Pursuant to the requirements of the Securities Exchange Act of 1934 and the Investment Company Act of 1940, this report has been signed below by the following persons on behalf of the registrant and in the capacities and on the dates indicated.
| By | /s/ Edward C. Bernard | |
| Edward C. Bernard | ||
| Principal Executive Officer | ||
| Date February 17, 2012 | ||
| By | /s/ Gregory K. Hinkle | |
| Gregory K. Hinkle | ||
| Principal Financial Officer | ||
| Date February 17, 2012 | ||