| UNITED STATES |
| SECURITIES AND EXCHANGE COMMISSION |
| Washington, D.C. 20549 |
FORM N-CSR |
CERTIFIED SHAREHOLDER REPORT OF REGISTERED |
MANAGEMENT INVESTMENT COMPANIES |
| Investment Company Act File Number: 811-21454 |
| T. Rowe Price Diversified Mid-Cap Growth Fund, Inc. |
| (Exact name of registrant as specified in charter) |
| 100 East Pratt Street, Baltimore, MD 21202 |
| (Address of principal executive offices) |
| David Oestreicher |
| 100 East Pratt Street, Baltimore, MD 21202 |
| (Name and address of agent for service) |
| Registrant’s telephone number, including area code: (410) 345-2000 |
| Date of fiscal year end: December 31 |
| Date of reporting period: December 31, 2008 |
Item 1: Report to Shareholders
 |
| Diversified Mid-Cap Growth Fund | December 31, 2008 |
The views and opinions in this report were current as of December 31, 2008. They are not guarantees of performance or investment results and should not be taken as investment advice. Investment decisions reflect a variety of factors, and the managers reserve the right to change their views about individual stocks, sectors, and the markets at any time. As a result, the views expressed should not be relied upon as a forecast of the fund’s future investment intent. The report is certified under the Sarbanes-Oxley Act, which requires mutual funds and other public companies to affirm that, to the best of their knowledge, the information in their financial reports is fairly and accurately stated in all material respects.
REPORTS ON THE WEB
Sign up for our E-mail Program, and you can begin to receive updated fund reports and prospectuses online rather than through the mail. Log in to your account at troweprice.com for more information.
Manager’s Letter
Fellow Shareholders
U.S. stocks plunged in 2008 as the economic downturn and credit crunch intensified in the last six months. Unfortunately, mid-cap growth stocks were among the worst performers in both periods. The year was marked by extreme volatility, heightened risk aversion, and intense pressures on financial companies stemming from severe mortgage losses and excessive speculation. The Federal Reserve and Treasury Department attempted to lessen the damage to the economy and the financial markets by taking extraordinary actions. These included slashing short-term interest rates to all-time lows, creating unusual credit facilities, and committing hundreds of billions of dollars to several major financial institutions to prevent them from collapsing. Given the low level of real (inflation-adjusted) interest rates, these drastic measures will have very severe implications for inflation once the economy stabilizes and improves.
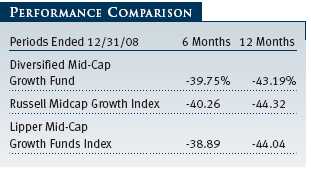
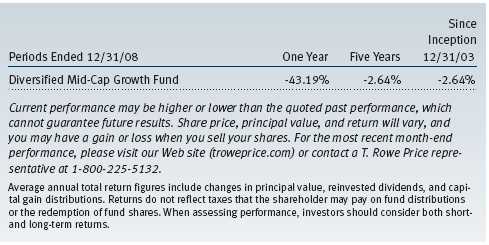
We are disappointed to report that your fund returned -39.75% in the second half of 2008 and -43.19% for the entire year. As shown in the Performance Comparison table, the fund modestly outperformed the Russell Midcap Growth Index in both periods and its Lipper peer group index for the year.
HIGHLIGHTS
• U.S. stocks plunged in 2008 as the economic downturn and credit crunch intensified in the last six months. Unfortunately, mid-cap growth stocks were among the worst performers in both periods.
• Although absolute returns were disappointing, your fund modestly outperformed the Russell Midcap Growth Index in both periods and its Lipper peer group index for the year.
• We remain committed to seeking long-term capital growth on your behalf by investing in high-quality mid-cap growth companies with good business models, strong managements, and favorable long-term prospects.
• When fear and pessimism subside, investors once again will be willing to accept risks in pursuit of higher returns. Given our bias toward quality companies, we believe the fund will be well positioned for that change in sentiment.
In the last six months, fund performance versus the Russell benchmark was helped by relatively good stock selection. It was solid in financials and information technology shares, but this advantage was offset by poor performance of our holdings in health care, energy, and materials. Sector allocations in aggregate had little impact on the fund’s relative performance, as all sectors were hammered amid indiscriminate selling. For the one-year period, fund performance versus the Russell benchmark was helped by relatively good stock selection, particularly in the industrials and business services and technology sectors. As was the case for the six-month period, sector allocations collectively had little impact on full-year relative performance because of the broad severity of losses.
We, like you, are surprised by the depth of the downturn and the speed at which the market environment deteriorated in the last few months. As a fellow shareholder in this portfolio, your fund manager knows that the losses in the last six months have been very painful for you. Frankly, it has been striking to watch investor sentiment go from extremely aggressive to extremely risk averse over the last 18 months. It appears that investors fled the equity asset class for the perceived safety of Treasuries. Last year’s 41.27% return for the Citigroup 30-Year Treasury Index is reflective of the rolling bubbles that have roiled the capital markets for the last decade. Treasuries will most likely be one of the worst-performing asset classes, on an inflation-adjusted basis, over the next several years. As recent emerging markets equity investors have learned (the MSCI Emerging Markets Index returned -53.18% in 2008), when an asset class has outperformed dramatically, trend following can be ruinous. In contrast, U.S. equities are attractively valued and offer a very favorable risk/reward trade-off. It is clear that fear has trounced greed. A disciplined and unemotional strategy is necessary, particularly in times of panic when it is difficult to act rationally.
We remain committed to seeking long-term capital growth on your behalf by investing in high-quality mid-cap growth companies with good business models, strong managements, and favorable long-term prospects. This is an attractive time for longer-term investors to use this panic as an opportunity to buy companies that are not leveraged and have sustainable competitive advantages.
MARKET ENVIRONMENT
The U.S. economy is currently in a serious recession that officially began in December 2007. Consumer spending, stock prices, and home values have declined; national unemployment increased to 7.2% by the end of 2008; and weakened financial institutions have raised capital to survive. The fed funds target rate—a lending rate used by banks to meet overnight reserve requirements—was 4.25% at the end of 2007, but the central bank reduced it to a range of 0.00% to 0.25% by the end of 2008.
Mid-cap shares lagged their smaller and larger peers in 6- and 12-month periods ended December 31, 2008. In the last six months, the Russell Midcap Index returned -36.67% versus -26.94% for the small-cap Russell 2000 Index and -28.48% for the large-cap S&P 500 Index. For the one-year period, the Russell Midcap Index returned -41.46% versus -33.79% for the Russell 2000 and -37.00% for the S&P 500.
Mid-cap growth stocks did worse than value stocks in the 6- and 12-month periods ended December 31, 2008. Within the Russell Midcap Growth Index, all major sectors fell sharply in both periods. Consumer staples and health care stocks held up best, which is not unusual in economic downturns, as these sectors are largely noncyclical. Typically, higher-quality companies and stocks with lower volatility outperform during market downturns. Thus far in this bear market, that has not occurred to the degree we would have expected.
INVESTMENT STRATEGY
Before discussing the portfolio’s performance in detail, we would like to welcome new investors and thank all of our longer-term investors for their continuing confidence in our portfolio management abilities, especially during this extremely difficult period for the financial markets. Periods of high volatility and sharp declines often prompt investors and portfolio managers to question their strategy or core investment principles. We would like to assure you that we are not changing our investment approach in response to the market downturn. We believe our strategy and the principles that guide our management of the portfolio—which we summarize on the next page—will help us navigate through this difficult time and, ultimately, provide patient investors with long-term capital growth:
• The Diversified Mid-Cap Growth Fund invests in mid-cap stocks of companies whose earnings are expected to grow at an above-average rate. We define mid-cap companies as those whose market capitalization at the time of purchase falls within the range of either the S&P MidCap 400 Index or the Russell Midcap Growth Index.
• We keep the fund fully invested because we believe that successful market timing is virtually impossible—you would need to be right twice—and that the costs associated with frequent trading reduce the likelihood of outperforming the market. We do not spend undue time worrying about short-term performance or trying to forecast the direction of the economy or the market. Our focus is to find mid-cap companies with the best long-term growth potential.
• Unlike other mid-cap growth portfolios that are highly concentrated, the Diversified Mid-Cap Growth Fund typically will invest in about 275 stocks. This high degree of diversification helps to mitigate the downside risk attributable to any single poorly performing security. It is notable that we are investing in companies that are early in their life cycles, and it is inevitable that some will not be as successful as we hope. Accordingly, we balance risk with potential returns.
• Stock selection is based on a combination of fundamental, bottom-up analysis and quantitative strategies in an attempt to identify companies with superior long-term appreciation prospects. We use a growth approach, looking for companies with a demonstrated ability to increase revenues, earnings, and cash flow consistently; capable management; attractive business niches; and a sustainable competitive advantage. We favor companies with above-average earnings growth and lower earnings variability.
• Our time horizons are longer than those of other mid-cap growth investors. Our portfolio turnover rate in the last 12 months was about 38%, which is substantially less than the average of about 121% for mid-cap growth funds, according to data from Morningstar. This means that our holding period for a typical stock is almost three years, whereas our average competitor holds a given stock for less than one year. Consequently, we view ourselves as long-term investors; we are not short-term speculators or day traders.
• Valuations are also very important: We look for the best relative values among companies with the strongest businesses and managements.
• We use a number of proprietary quantitative models to identify and evaluate the characteristics of individual mid-cap growth companies and the portfolio as a whole.
PORTFOLIO REVIEW
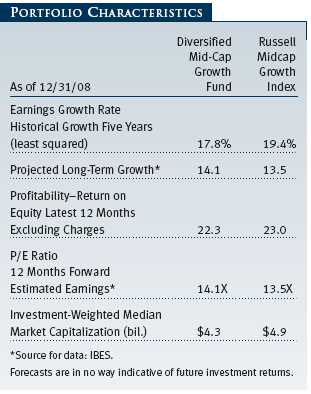
The Diversified Mid-Cap Growth Fund’s fundamental characteristics are similar to those of mid-cap growth benchmarks, such as the Russell Midcap Growth Index, as indicated by the Portfolio Characteristics table. The portfolio’s median market capitalization is slightly smaller than that of the index, but its projected earnings growth rate (14.1%) and its forward price/earnings (P/E) ratio (14.1X) are a little higher. These measures reflect our commitment to companies with excellent long-term growth prospects. The fund’s return on equity (ROE), which measures how effectively and efficiently a company and its management are using stockholder investments, is lower than that of the index but is still high. Due to the economic downturn, these 12-month trailing numbers are likely to decline, as many cyclical companies have probably passed their peak levels of profitability. Nevertheless, we remain committed to finding and investing in companies that we believe can maintain high and sustainable profitability.
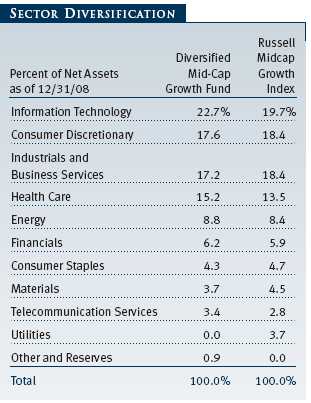
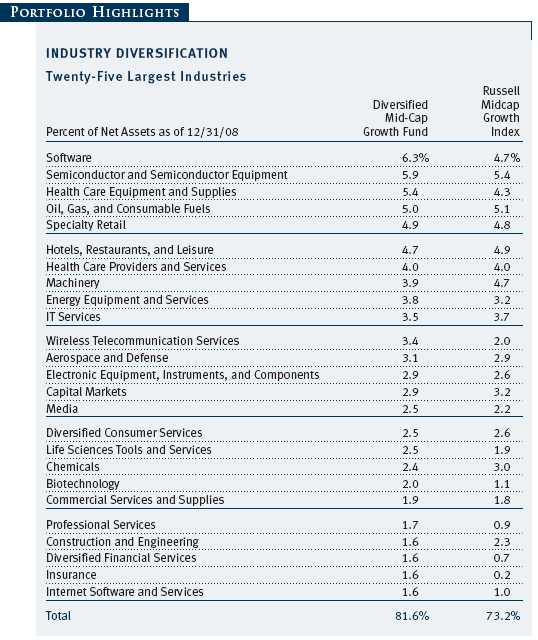
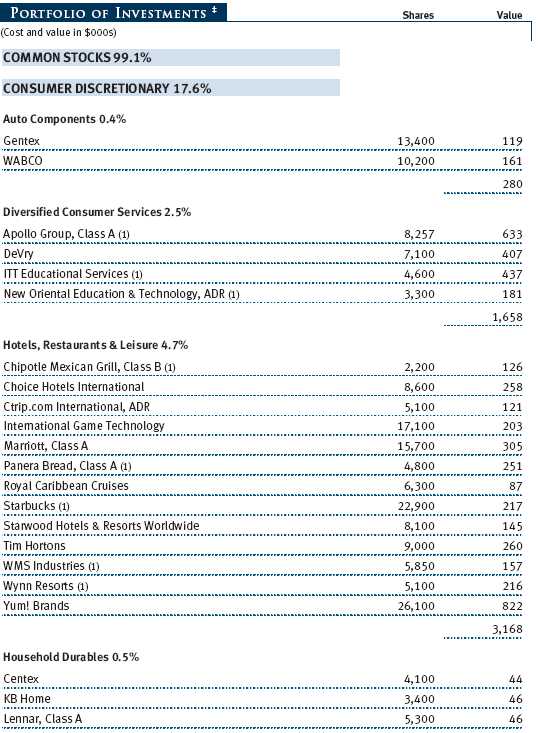
Our sector allocations have some resemblance to those of the Russell index, though we have a few strategic overweightings or underweightings, as shown in the Sector Diversification table on page 7. Our largest sector commitments at the end of December were information technology, consumer discretionary, industrials and business services, and health care. Our energy and financials sector allocations are notably smaller. We have no exposure to utilities and very few investments in consumer staples, telecommunication services, and materials stocks. Mid-cap companies in those segments typically do not meet our criteria for growth and return on invested capital.
The information technology sector, which represented almost 23% of fund assets at year-end, was our largest overweight relative to our Russell benchmark. In the sector, we emphasize companies with strong business models in industries with high barriers to entry, and we prefer semiconductor companies with quality business models and reasonable valuations. In addition, we underweight makers of computers and peripherals because we believe such companies have a higher risk of commoditization. Although most of our tech holdings fell sharply last year, they generally held up better than those in the Russell benchmark in the 6- and 12-month reporting periods. Our electronic equipment companies did better than most tech industries in both periods, thanks in part to the good performance of Cogent, a maker of automated fingerprint identification systems. The company seems to be weathering a tech spending slowdown fairly well, as its end markets are mainly funded by the government. (Please refer to the fund’s portfolio of investments for a complete listing of holdings and the amount each represents in the portfolio.)
The industrials and business services sector was our third-largest sector allocation as of December 31, 2008. We underweight this sector versus the Russell benchmark because we avoid highly cyclical stocks with expensive valuations, though we like logistics companies that should benefit from globalization trends. Commercial services and supply companies were among our better performers in the sector in our 6- and 12-month reporting periods, helped by Copart, an online remarketer of automobiles that we added to the portfolio in 2008. In contrast, machinery stocks were among the fund’s largest detractors in absolute terms. However, we added several attractively valued companies to the portfolio last year, such as Valmont, Harsco, and Flowserve, which makes and sells flow control equipment to various industrial firms.
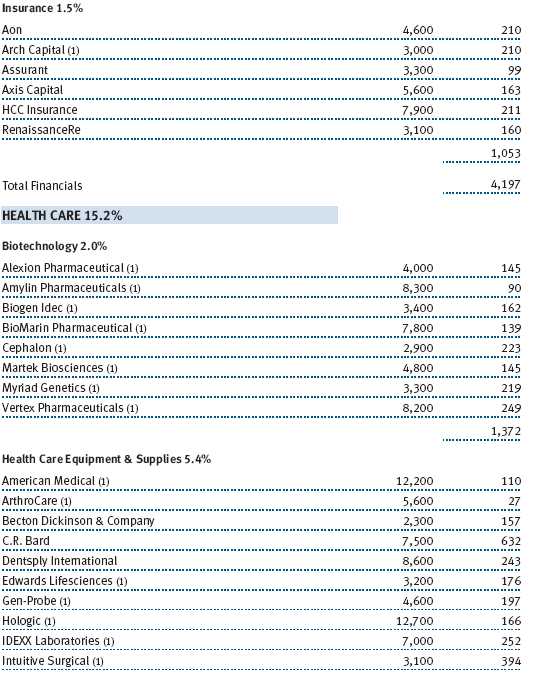
Our overweight in health care stocks versus the Russell benchmark helped the fund’s relative performance in our 6- and 12-month reporting periods. Our focus on services companies and medical device makers was unrewarding, as these segments fared poorly in both periods. In contrast, stocks in the biotechnology industry performed very well last year due to generally good earnings and some industry consolidation, and our holdings were among the portfolio’s largest contributors to absolute performance. Myriad Genetics was outstanding in both periods; the company’s plan to separate its drug development business from its diagnostics business was well received by investors. We try to stay well diversified to reduce the risks of investing in this industry; we added several biotech names to the fund and eliminated others over the course of the year.
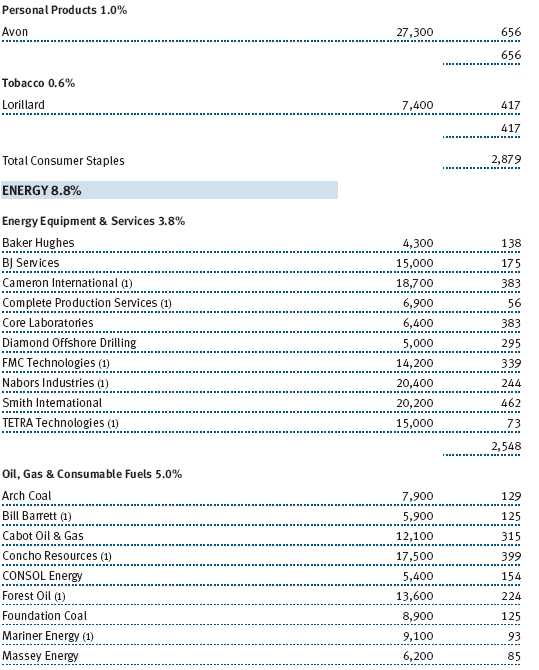
Energy stocks were slammed in the last six months—a stark contrast to their incredible ascent over the last few years—as commodity prices tumbled and global growth prospects dimmed. Our stock selection and a slight overweighting versus the Russell benchmark hurt the fund’s relative performance in both the 6- and 12-month reporting periods. As our long-term investors know, we do not invest in the sector based on an attempt to accurately predict commodity price trends. Rather, we prefer to invest in differentiated service companies or exploration companies with good production growth. Unfortunately, this preference did not shield us from the sector’s abrupt downfall. Nevertheless, we are maintaining our exposure to energy because we are very concerned—in light of the federal government’s policy responses to the economic and market turmoil—about the potential for inflation once the global economic and credit crises have passed.
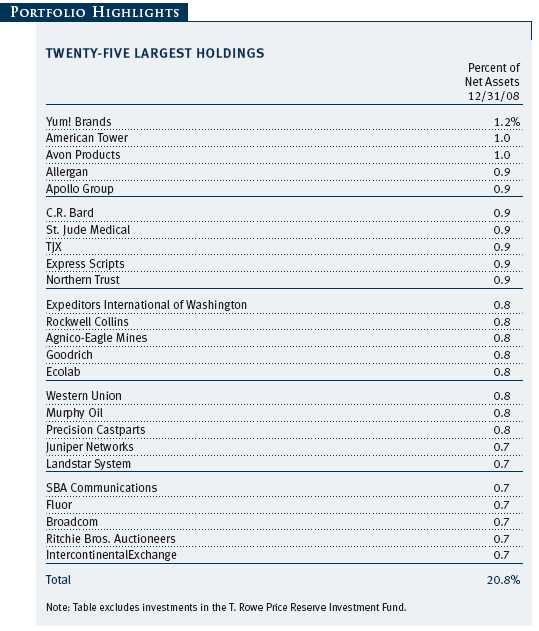
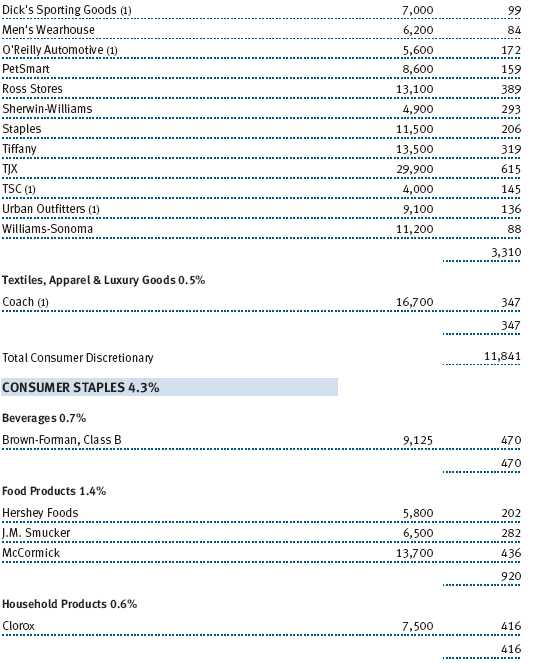
Stocks in the consumer discretionary sector, in which we had a small underweight versus the Russell benchmark, had a difficult year. In the first half, consumers reduced their spending due to rising food and energy prices; in the second half, despite some relief at the gas pump, consumers retrenched as the U.S. economic outlook turned bleak. Media stocks fared worst in both of our reporting periods in anticipation of significant cuts in advertising spending. Similarly, hotel, restaurant, and gaming stocks suffered as consumers cut back on nonessentials. Specialty retailers also struggled, but Ross Stores did well in the one-year period as shoppers gravitated toward discounted merchandise. The only bright spot in the sector was diversified consumer services companies, particularly for-profit education businesses such as Apollo Group and ITT Educational Services. During difficult economic environments, enrollment usually increases as people seek to enhance their career prospects.
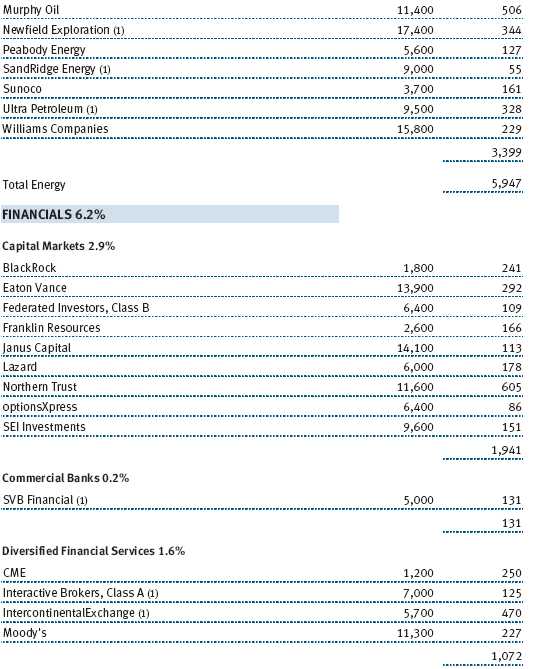
Financials had a tough year in 2008. Remarkably, the sector was not the worst performer in our 6- and 12-month reporting periods; in fact, relatively strong stock selection in the second half of the year was advantageous. Since the fund’s inception, we generally have avoided traditional banks. It is unlikely that this approach will change, as we typically invest in more differentiated companies. Insurance companies were among the best six-month performers in the entire portfolio, led by property and casualty insurer Philadelphia Consolidated, which we sold after the company received a buyout offer from a Japanese insurer in July. Capital markets companies generally struggled, but asset manager BlackRock was an exception. We continue to like trust banks and asset managers, such as Franklin Resources, which we added to the portfolio in recent months.
FUND DISTRIBUTIONS
In mid-December, the fund’s Board of Directors declared a distribution of long-term capital gains totaling $0.08 per share. This distribution is taxable to investors in nonretirement accounts, and by now you should have received your check or statement reflecting this distribution as well as Form 1099-DIV summarizing this information for 2008 tax purposes.
Investors who would like to minimize such taxable events may want to consider the T. Rowe Price Tax-Efficient Multi-Cap Growth Fund as an alternative investment. Like the Diversified Mid-Cap Growth Fund, the Tax-Efficient Multi-Cap Growth Fund focuses primarily on the mid- and small-cap segment and uses a similar investment process, but its objectives are to minimize taxable distributions to shareholders and produce the best possible long-term after-tax returns. In the Diversified Mid-Cap Growth Fund, we eliminate investments in good companies when their market capitalizations grow beyond that of a mid-cap company, whereas in the Tax-Efficient Multi-Cap Growth Fund, we will continue to hold such companies as long as they remain a good longer-term investment. Of course, there is no guarantee that the fund’s attempts to manage its portfolio in a tax-efficient manner will be successful. The fund is subject to market risk, including possible loss of principal. Please remember that an exchange from one fund to another involves the sale of shares. In a nonretirement account, such a transaction could result in the realization of a capital gain.
OUTLOOK
The painful unwinding of years of financial excess is likely to continue for some time, and investors will probably remain risk averse. Nevertheless, attempting to accurately forecast the direction of the economy and capital markets is a losing proposition. Fortunately, we are patient and have a very long-term view of our investments. We are also investing in an asset class that has favorable long-term characteristics. We will continue to use fundamental, bottom-up analysis and quantitative strategies in an attempt to identify quality mid-cap companies with superior long-term appreciation prospects.
As our longer-term investors know, we invest in medium-sized companies with a demonstrated ability to increase revenues, earnings, and cash flow consistently; capable management; attractive business niches; and a sustainable competitive advantage. In fact, the market’s decline has also given us the opportunity to invest in good companies that had been too large or too expensive. When fear and pessimism subside, investors once again will be willing to accept risks in pursuit of higher returns. Given our bias toward quality companies, we believe the fund will be well positioned for that change in sentiment.
As always, we thank you for your confidence in T. Rowe Price, particularly during this extraordinarily challenging period.
Respectfully submitted,
Donald J. Peters
Chairman of the fund’s Investment Advisory Committee
January 20, 2009
The committee chairman has day-to-day responsibility for managing the portfolio and works with committee members in developing and executing the fund’s investment program.
RISKS OF INVESTING
As with all equity funds, this fund’s share price can fall because of weakness in the broad market, a particular industry, or specific holdings. The market as a whole can decline for many reasons, including adverse political or economic developments here or abroad, changes in investor psychology, or heavy institutional selling. The prospects for an industry or company may deteriorate because of a variety of factors, including disappointing earnings or changes in the competitive environment. In addition, our assessment of companies held in the fund may prove incorrect, resulting in losses or poor performance even in a rising market. Finally, the fund’s investment approach could fall out of favor with the investing public, resulting in lagging performance versus other types of stock funds.
The stocks of mid-cap companies entail greater risk and are usually more volatile than the shares of large companies. In addition, growth stocks can be volatile for several reasons. Because they usually reinvest a high proportion of earnings in their own businesses, they may lack the dividends usually associated with value stocks that can cushion their decline in a falling market. Also, since investors buy these stocks because of their expected superior earnings growth, earnings disappointments often result in sharp price declines.
Diversification cannot assure a profit or protect against loss in a declining market.
GLOSSARY
Fed funds target rate: An overnight lending rate set by the Federal Reserve and used by banks to meet reserve requirements. Banks also use the fed funds rate as a benchmark for their prime lending rates.
Lipper indexes: Consist of a small number (10 to 30) of the largest mutual funds in a particular category as tracked by Lipper Inc.
Price/earnings (P/E) ratio: A ratio that shows the “multiple” of earnings at which a stock is selling. It is calculated by dividing a stock’s current price by its current earnings per share. For example, if a stock’s price is $60 per share and the issuing company earns $2 per share, the P/E ratio is $60/$2, or 30.
Real interest rate: An interest rate that has been adjusted for inflation. It is calculated by subtracting the inflation rate from the nominal interest rate. For example, if a 10-year Treasury note is yielding 5% and inflation is 2%, the real interest rate is 3%.
Russell Midcap Index: Measures the performance of the 800 smallest companies in the Russell 1000 Index.
Russell Midcap Growth Index: Measures the performance of those Russell Midcap companies with higher price-to-book ratios and higher forecasted growth values. The stocks are also members of the Russell 1000 Growth Index.
Russell Midcap Value Index: Measures the performance of those Russell Midcap companies with lower price-to-book ratios and lower forecasted growth values. The stocks are also members of the Russell 1000 Value Index.
S&P MidCap 400 Index: An unmanaged index that tracks the stocks of 400 U.S. mid-cap companies.
Performance and Expenses
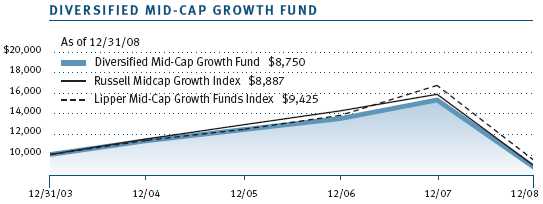
| GROWTH OF $10,000 |
This chart shows the value of a hypothetical $10,000 investment in the fund over the past 10 fiscal year periods or since inception (for funds lacking 10-year records). The result is compared with benchmarks, which may include a broad-based market index and a peer group average or index. Market indexes do not include expenses, which are deducted from fund returns as well as mutual fund averages and indexes.
| AVERAGE ANNUAL COMPOUND TOTAL RETURN |
This table shows how the fund would have performed each year if its actual (or cumulative) returns for the periods shown had been earned at a constant rate.
| FUND EXPENSE EXAMPLE |
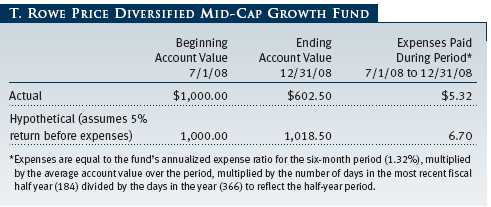
As a mutual fund shareholder, you may incur two types of costs: (1) transaction costs, such as redemption fees or sales loads, and (2) ongoing costs, including management fees, distribution and service (12b-1) fees, and other fund expenses. The following example is intended to help you understand your ongoing costs (in dollars) of investing in the fund and to compare these costs with the ongoing costs of investing in other mutual funds. The example is based on an investment of $1,000 invested at the beginning of the most recent six-month period and held for the entire period.
Actual Expenses
The first line of the following table (“Actual”) provides information about actual account values and expenses based on the fund’s actual returns. You may use the information in this line, together with your account balance, to estimate the expenses that you paid over the period. Simply divide your account value by $1,000 (for example, an $8,600 account value divided by $1,000 = 8.6), then multiply the result by the number in the first line under the heading “Expenses Paid During Period” to estimate the expenses you paid on your account during this period.
Hypothetical Example for Comparison Purposes
The information on the second line of the table (“Hypothetical”) is based on hypothetical account values and expenses derived from the fund’s actual expense ratio and an assumed 5% per year rate of return before expenses (not the fund’s actual return). You may compare the ongoing costs of investing in the fund with other funds by contrasting this 5% hypothetical example and the 5% hypothetical examples that appear in the shareholder reports of the other funds. The hypothetical account values and expenses may not be used to estimate the actual ending account balance or expenses you paid for the period.
Note: T. Rowe Price charges an annual small-account maintenance fee of $10, generally for accounts with less than $2,000 ($500 for UGMA/UTMA). The fee is waived for any investor whose T. Rowe Price mutual fund accounts total $25,000 or more, accounts employing automatic investing, and IRAs and other retirement plan accounts that utilize a prototype plan sponsored by T. Rowe Price (although a separate custodial or administrative fee may apply to such accounts). This fee is not included in the accompanying table. If you are subject to the fee, keep it in mind when you are estimating the ongoing expenses of investing in the fund and when comparing the expenses of this fund with other funds.
You should also be aware that the expenses shown in the table highlight only your ongoing costs and do not reflect any transaction costs, such as redemption fees or sales loads. Therefore, the second line of the table is useful in comparing ongoing costs only and will not help you determine the relative total costs of owning different funds. To the extent a fund charges transaction costs, however, the total cost of owning that fund is higher.
The accompanying notes are an integral part of these financial statements.


The accompanying notes are an integral part of these financial statements.

The accompanying notes are an integral part of these financial statements.
The accompanying notes are an integral part of these financial statements.
The accompanying notes are an integral part of these financial statements.
| NOTES TO FINANCIAL STATEMENTS |
T. Rowe Price Diversified Mid-Cap Growth Fund, Inc. (the fund), is registered under the Investment Company Act of 1940 (the 1940 Act) as a diversified, open-end management investment company. The fund commenced operations on December 31, 2003. The fund seeks to provide long-term capital growth by investing primarily in the common stocks of mid-cap growth companies.
NOTE 1 - SIGNIFICANT ACCOUNTING POLICIES
Basis of Preparation The accompanying financial statements were prepared in accordance with accounting principles generally accepted in the United States of America, which require the use of estimates made by fund management. Fund management believes that estimates and security valuations are appropriate; however, actual results may differ from those estimates, and the security valuations reflected in the financial statements may differ from the value the fund ultimately realizes upon sale of the securities.
Investment Transactions, Investment Income, and Distributions Income and expenses are recorded on the accrual basis. Dividends received from mutual fund investments are reflected as dividend income; capital gain distributions are reflected as realized gain/loss. Dividend income and capital gain distributions are recorded on the ex-dividend date. Income tax-related interest and penalties, if incurred, would be recorded as income tax expense. Investment transactions are accounted for on the trade date. Realized gains and losses are reported on the identified cost basis. Distributions to shareholders are recorded on the ex-dividend date. Income distributions are declared and paid on an annual basis. Capital gain distributions, if any, are declared and paid by the fund, typically on an annual basis.
Rebates Subject to best execution, the fund may direct certain security trades to brokers who have agreed to rebate a portion of the related brokerage commission to the fund in cash. Commission rebates are reflected as realized gain on securities in the accompanying financial statements.
New Accounting Pronouncements On January 1, 2008, the fund adopted Statement of Financial Accounting Standards No. 157 (FAS 157), Fair Value Measurements. FAS 157 defines fair value, establishes the framework for measuring fair value, and expands the disclosures of fair value measurements in the financial statements. Adoption of FAS 157 did not have a material impact on the fund’s net assets or results of operations.
In March 2008, the Financial Accounting Standards Board issued Statement of Financial Accounting Standards No. 161 (FAS 161), Disclosures about Derivative Instruments and Hedging Activities, which is effective for fiscal years and interim periods beginning after November 15, 2008. FAS 161 requires enhanced disclosures about derivative and hedging activities, including how such activities are accounted for and their effect on financial position, performance and cash flows. Management is currently evaluating the impact the adoption of FAS 161 will have on the fund’s financial statements and related disclosures.
NOTE 2 - VALUATION
The fund’s investments are reported at fair value as defined under FAS 157. The fund values its investments and computes its net asset value per share at the close of the New York Stock Exchange (NYSE), normally 4 p.m. ET, each day that the NYSE is open for business.
Valuation Methods Equity securities listed or regularly traded on a securities exchange or in the over-the-counter (OTC) market are valued at the last quoted sale price or, for certain markets, the official closing price at the time the valuations are made, except for OTC Bulletin Board securities, which are valued at the mean of the latest bid and asked prices. A security that is listed or traded on more than one exchange is valued at the quotation on the exchange determined to be the primary market for such security. Listed securities not traded on a particular day are valued at the mean of the latest bid and asked prices for domestic securities and the last quoted sale price for international securities.
Investments in mutual funds are valued at the mutual fund’s closing net asset value per share on the day of valuation.
Other investments, including restricted securities, and those for which the above valuation procedures are inappropriate or are deemed not to reflect fair value are stated at fair value as determined in good faith by the T. Rowe Price Valuation Committee, established by the fund’s Board of Directors.
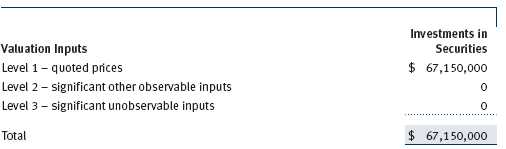
Valuation Inputs Various inputs are used to determine the value of the fund’s investments. These inputs are summarized in the three broad levels listed below:
Level 1 – quoted prices in active markets for identical securities
Level 2 – observable inputs other than Level 1 quoted prices (including, but not limited to, quoted prices for similar securities, interest rates, prepayment speeds, credit risk)
Level 3 – unobservable inputs
Observable inputs are those based on market data obtained from sources independent of the fund, and unobservable inputs reflect the fund’s own assumptions based on the best information available. The input levels are not necessarily an indication of the risk or liquidity associated with investments at that level. The following table summarizes the fund’s investments, based on the inputs used to determine their values on December 31, 2008:
NOTE 3 - INVESTMENT TRANSACTIONS
Consistent with its investment objective, the fund engages in the following practices to manage exposure to certain risks or to enhance performance. The investment objective, policies, program, and risk factors of the fund are described more fully in the fund’s prospectus and Statement of Additional Information.
Securities Lending The fund lends its securities to approved brokers to earn additional income. It receives as collateral cash and U.S. government securities valued at 102% to 105% of the value of the securities on loan. Cash collateral is invested by the fund’s lending agent(s) in accordance with investment guidelines approved by fund management. Although risk is mitigated by the collateral, the fund could experience a delay in recovering its securities and a possible loss of income or value if the borrower fails to return the securities or if collateral investments decline in value. Securities lending revenue recognized by the fund consists of earnings on invested collateral and borrowing fees, net of any rebates to the borrower and compensation to the lending agent. At December 31, 2008, there were no securities on loan.
Other Purchases and sales of portfolio securities, other than short-term securities, aggregated $39,336,000 and $38,404,000, respectively, for the year ended December 31, 2008.
NOTE 4 - FEDERAL INCOME TAXES
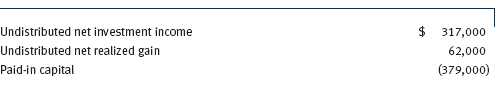
No provision for federal income taxes is required since the fund intends to continue to qualify as a regulated investment company under Subchapter M of the Internal Revenue Code and distribute to shareholders all of its taxable income and gains. Distributions are determined in accordance with Federal income tax regulations, which differ from generally accepted accounting principles, and, therefore, may differ significantly in amount or character from net investment income and realized gains for financial reporting purposes. Financial reporting records are adjusted for permanent book/tax differences to reflect tax character but are not adjusted for temporary differences.
Reclassifications to paid-in capital relate primarily to the current net operating loss. For the year ended December 31, 2008, the following reclassifications, which had no impact on results of operations or net assets, were recorded to reflect tax character:
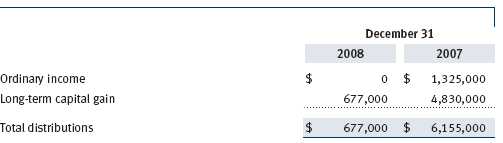
Distributions during the years ended December 31, 2008 and December 31, 2007 were characterized for tax purposes as follows:
At December 31, 2008, the tax-basis cost of investments and components of net assets were as follows:
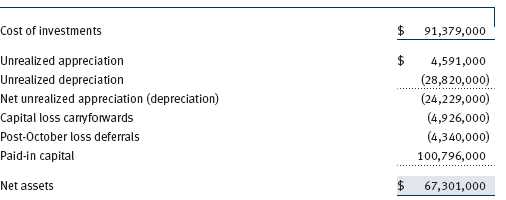
The difference between book-basis and tax-basis net unrealized appreciation (depreciation) is attributable to the deferral of losses from wash sales for tax purposes. The fund intends to retain realized gains to the extent of available capital loss carryforwards. As of December 31, 2008, all unused capital loss carryforwards expire in fiscal 2016. Pursuant to federal income tax regulations applicable to investment companies, recognition of capital losses on certain transactions is deferred until the subsequent tax year. Consequently, realized losses reflected in the accompanying financial statements include net capital losses realized between November 1 and the fund’s fiscal year-end that have not been recognized for tax purposes (Post-October loss deferrals).
NOTE 5 - RELATED PARTY TRANSACTIONS
The fund is managed by T. Rowe Price Associates, Inc. (the manager or Price Associates), a wholly owned subsidiary of T. Rowe Price Group, Inc. The investment management agreement between the fund and the manager provides for an annual investment management fee, which is computed daily and paid monthly. The fee consists of an individual fund fee, equal to 0.35% of the fund’s average daily net assets, and a group fee. The group fee rate is calculated based on the combined net assets of certain mutual funds sponsored by Price Associates (the group) applied to a graduated fee schedule, with rates ranging from 0.48% for the first $1 billion of assets to 0.285% for assets in excess of $220 billion. The fund’s group fee is determined by applying the group fee rate to the fund’s average daily net assets. At December 31, 2008, the effective annual group fee rate was 0.31%.
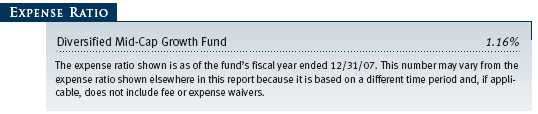
The fund is also subject to a contractual expense limitation through April 30, 2008. During the limitation period, the manager is required to waive its management fee and reimburse the fund for any expenses, excluding interest, taxes, brokerage commissions, and extraordinary expenses, that would otherwise cause the fund’s ratio of annualized total expenses to average net assets (expense ratio) to exceed its expense limitation of 1.25%. For a period of three years after the date of any reimbursement or waiver, the fund is required to repay the manager for expenses previously reimbursed and management fees waived to the extent its net assets have grown or expenses have declined sufficiently to allow repayment without causing the fund’s expense ratio to exceed its expense limitation. Pursuant to this agreement, management fees in the amount of $20,000 were repaid during the year ended December 31, 2008. At December 31, 2008, there were no amounts subject to repayment by the fund.
In addition, the fund has entered into service agreements with Price Associates and two wholly owned subsidiaries of Price Associates (collectively, Price). Price Associates computes the daily share price and provides certain other administrative services to the fund. T. Rowe Price Services, Inc., provides shareholder and administrative services in its capacity as the fund’s transfer and dividend disbursing agent. T. Rowe Price Retirement Plan Services, Inc., provides subaccounting and recordkeeping services for certain retirement accounts invested in the fund. For the year ended December 31, 2008, expenses incurred pursuant to these service agreements were $105,000 for Price Associates, $244,000 for T. Rowe Price Services, Inc., and $1,000 for T. Rowe Price Retirement Plan Services, Inc. The total amount payable at period-end pursuant to these service agreements is reflected as Due to Affiliates in the accompanying financial statements.
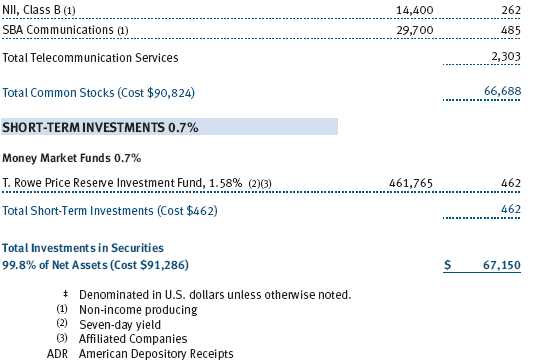
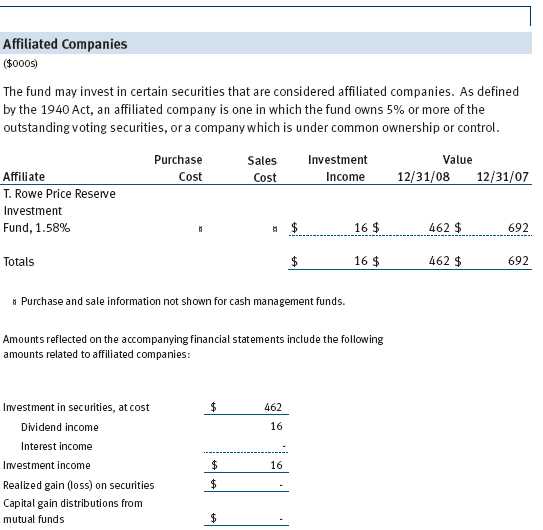
The fund may invest in the T. Rowe Price Reserve Investment Fund and the T. Rowe Price Government Reserve Investment Fund (collectively, the T. Rowe Price Reserve Investment Funds), open-end management investment companies managed by Price Associates and considered affiliates of the fund. The T. Rowe Price Reserve Investment Funds are offered as cash management options to mutual funds, trusts, and other accounts managed by Price Associates and/or its affiliates and are not available for direct purchase by members of the public. The T. Rowe Price Reserve Investment Funds pay no investment management fees.
| REPORT OF INDEPENDENT REGISTERED PUBLIC ACCOUNTING FIRM |
To the Board of Directors and Shareholders of
T. Rowe Price Diversified Mid-Cap Growth Fund, Inc.
In our opinion, the accompanying statement of assets and liabilities, including the schedule of investments, and the related statements of operations and of changes in net assets and the financial highlights present fairly, in all material respects, the financial position of T. Rowe Price Diversified Mid-Cap Growth Fund, Inc. (the “Fund”) at December 31, 2008, the results of its operations for the year then ended, the changes in its net assets for each of the two years in the period then ended and the financial highlights for each of the five years in the period then ended, in conformity with accounting principles generally accepted in the United States of America. These financial statements and financial highlights (hereafter referred to as “financial statements”) are the responsibility of the Fund’s management; our responsibility is to express an opinion on these financial statements based on our audits. We conducted our audits of these financial statements in accordance with the standards of the Public Company Accounting Oversight Board (United States). Those standards require that we plan and perform the audit to obtain reasonable assurance about whether the financial statements are free of material misstatement. An audit includes examining, on a test basis, evidence supporting the amounts and disclosures in the financial statements, assessing the accounting principles used and significant estimates made by management, and evaluating the overall financial statement presentation. We believe that our audits, which included confirmation of securities at December 31, 2008 by correspondence with the custodian and confirmation of the underlying fund by correspondence with the transfer agent, provide a reasonable basis for our opinion.
PricewaterhouseCoopers LLP
Baltimore, Maryland
February 12, 2009
| TAX INFORMATION (UNAUDITED) FOR THE TAX YEAR ENDED 12/31/08 |
We are providing this information as required by the Internal Revenue Code. The amounts shown may differ from those elsewhere in this report because of differences between tax and financial reporting requirements.
The fund’s distributions to shareholders included $677,000 from long-term capital gains, subject to the 15% rate gains category.
| INFORMATION ON PROXY VOTING POLICIES, PROCEDURES, AND RECORDS |
A description of the policies and procedures used by T. Rowe Price funds and portfolios to determine how to vote proxies relating to portfolio securities is available in each fund’s Statement of Additional Information, which you may request by calling 1-800-225-5132 or by accessing the SEC’s Web site, www.sec.gov. The description of our proxy voting policies and procedures is also available on our Web site, www.troweprice.com. To access it, click on the words “Our Company” at the top of our corporate homepage. Then, when the next page appears, click on the words “Proxy Voting Policies” on the left side of the page.
Each fund’s most recent annual proxy voting record is available on our Web site and through the SEC’s Web site. To access it through our Web site, follow the directions above, then click on the words “Proxy Voting Records” on the right side of the Proxy Voting Policies page.
| HOW TO OBTAIN QUARTERLY PORTFOLIO HOLDINGS |
The fund files a complete schedule of portfolio holdings with the Securities and Exchange Commission for the first and third quarters of each fiscal year on Form N-Q. The fund’s Form N-Q is available electronically on the SEC’s Web site (www.sec.gov); hard copies may be reviewed and copied at the SEC’s Public Reference Room, 450 Fifth St. N.W., Washington, DC 20549. For more information on the Public Reference Room, call 1-800-SEC-0330.
| ABOUT THE FUND’S DIRECTORS AND OFFICERS |
Your fund is governed by a Board of Directors (Board) that meets regularly to review a wide variety of matters affecting the fund, including performance, investment programs, compliance matters, advisory fees and expenses, service providers, and other business affairs. The Board elects the fund’s officers, who are listed in the final table. At least 75% of Board members are independent of T. Rowe Price Associates, Inc. (T. Rowe Price), and T. Rowe Price International, Inc. (T. Rowe Price International); “inside” or “interested” directors are employees or officers of T. Rowe Price. The business address of each director and officer is 100 East Pratt Street, Baltimore, Maryland 21202. The Statement of Additional Information includes additional information about the directors and is available without charge by calling a T. Rowe Price representative at 1-800-225-5132.
| Independent Directors | |
| Name | |
| (Year of Birth) | Principal Occupation(s) During Past Five Years and Directorships of |
| Year Elected* | Other Public Companies |
| Jeremiah E. Casey | Director, National Life Insurance (2001 to 2005); Director, The Rouse |
| (1940) | Company, real estate developers (1990 to 2004) |
| 2005 | |
| Anthony W. Deering | Chairman, Exeter Capital, LLC, a private investment firm (2004 to |
| (1945) | present); Director, Under Armour (8/08 to present); Director, Vornado |
| 2003 | Real Estate Investment Trust (3/04 to present); Director, Mercantile |
| Bankshares (2002 to 2007); Member, Advisory Board, Deutsche Bank | |
| North America (2004 to present); Director, Chairman of the Board, and | |
| Chief Executive Officer, The Rouse Company, real estate developers | |
| (1997 to 2004) | |
| Donald W. Dick, Jr. | Principal, EuroCapital Advisors, LLC, an acquisition and management |
| (1943) | advisory firm (10/95 to present); Chairman, The Haven Group, a cus- |
| 2003 | tom manufacturer of modular homes (1/04 to present) |
| David K. Fagin | Chairman and President, Nye Corporation (6/88 to present); Director, |
| (1938) | Golden Star Resources Ltd. (5/92 to present); Director, Pacific Rim |
| 2003 | Mining Corp. (2/02 to present); Director, B.C. Corporation (3/08 to |
| present); Chairman, Canyon Resources Corp. (8/07 to 3/08); Director, | |
| Atna Resources Ltd. (3/08 to present) | |
| Karen N. Horn | Director, Eli Lilly and Company (1987 to present); Director, Simon |
| (1943) | Property Group (2004 to present); Director, Federal National Mortgage |
| 2003 | Association (9/06 to present); Director, Norfolk Southern (2/08 to pres- |
| ent); Director, Georgia Pacific (5/04 to 12/05); Managing Director and | |
| President, Global Private Client Services, Marsh Inc. (1999 to 2003) | |
| Theo C. Rodgers | President, A&R Development Corporation (1977 to present) |
| (1941) | |
| 2005 | |
| John G. Schreiber | Owner/President, Centaur Capital Partners, Inc., a real estate invest- |
| (1946) | ment company (1991 to present); Partner, Blackstone Real Estate |
| 2003 | Advisors, L.P. (10/92 to present) |
| *Each independent director oversees 126 T. Rowe Price portfolios (except for Mr. Fagin, who oversees 125 T. Rowe | |
| Price portfolios) and serves until retirement, resignation, or election of a successor. | |
| Inside Directors | |
| Name | |
| (Year of Birth) | |
| Year Elected* | |
| [Number of T. Rowe Price | Principal Occupation(s) During Past Five Years and Directorships of |
| Portfolios Overseen] | Other Public Companies |
| Edward C. Bernard | Director and Vice President, T. Rowe Price; Vice Chairman of the Board, |
| (1956) | Director, and Vice President, T. Rowe Price Group, Inc.; Chairman of |
| 2006 | the Board, Director, and President, T. Rowe Price Investment Services, |
| [126] | Inc.; Chairman of the Board and Director, T. Rowe Price Global Asset |
| Management Limited, T. Rowe Price Global Investment Services Limited, | |
| T. Rowe Price Retirement Plan Services, Inc., T. Rowe Price Savings | |
| Bank, and T. Rowe Price Services, Inc.; Director, T. Rowe Price | |
| International, Inc.; Chief Executive Officer, Chairman of the Board, | |
| Director, and President, T. Rowe Price Trust Company; Chairman of | |
| the Board, all funds | |
| John H. Laporte, CFA | Director and Vice President, T. Rowe Price and T. Rowe Price Group, |
| (1945) | Inc.; Vice President, T. Rowe Price Trust Company |
| 2006 | |
| [16] | |
| *Each inside director serves until retirement, resignation, or election of a successor. | |
| Officers | |
| Name (Year of Birth) | |
| Title and Fund(s) Served | Principal Occupation(s) |
| Donald J. Easley, CFA (1971) | Vice President, T. Rowe Price and T. Rowe Price |
| Executive Vice President, Diversified Mid-Cap | Group, Inc. |
| Growth Fund | |
| Roger L. Fiery III, CPA (1959) | Vice President, T. Rowe Price, T. Rowe Price |
| Vice President, Diversified Mid-Cap Growth Fund | Group, Inc., T. Rowe Price International, Inc., |
| and T. Rowe Price Trust Company | |
| John R. Gilner (1961) | Chief Compliance Officer and Vice President, |
| Chief Compliance Officer, Diversified Mid-Cap | T. Rowe Price; Vice President, T. Rowe Price |
| Growth Fund | Group, Inc., and T. Rowe Price Investment |
| Services, Inc. | |
| Gregory S. Golczewski (1966) | Vice President, T. Rowe Price and T. Rowe Price |
| Vice President, Diversified Mid-Cap Growth Fund | Trust Company |
| Gregory K. Hinkle, CPA (1958) | Vice President, T. Rowe Price, T. Rowe Price |
| Treasurer, Diversified Mid-Cap Growth Fund | Group, Inc., T. Rowe Price Investment Services, |
| Inc., and T. Rowe Price Trust Company; formerly | |
| Partner, PricewaterhouseCoopers LLP (to 2007) | |
| Patricia B. Lippert (1953) | Assistant Vice President, T. Rowe Price and |
| Secretary, Diversified Mid-Cap Growth Fund | T. Rowe Price Investment Services, Inc. |
| Sudhir Nanda, Ph.D., CFA (1959) | Vice President, T. Rowe Price and T. Rowe Price |
| Vice President, Diversified Mid-Cap Growth Fund | Group, Inc. |
| Philip A. Nestico (1976) | Vice President, T. Rowe Price and T. Rowe Price |
| Vice President, Diversified Mid-Cap Growth Fund | Group, Inc. |
| David Oestreicher (1967) | Director and Vice President, T. Rowe Price |
| Vice President, Diversified Mid-Cap Growth Fund | Investment Services, Inc., T. Rowe Price Trust |
| Company, and T. Rowe Price Services, Inc.; Vice | |
| President, T. Rowe Price, T. Rowe Price Global | |
| Asset Management Limited, T. Rowe Price Global | |
| Investment Services Limited, T. Rowe Price | |
| Group, Inc., T. Rowe Price International, Inc., | |
| and T. Rowe Price Retirement Plan Services, Inc. | |
| Donald J. Peters (1959) | Vice President, T. Rowe Price and T. Rowe Price |
| President, Diversified Mid-Cap Growth Fund | Group, Inc. |
| John F. Wakeman (1962) | Vice President, T. Rowe Price and T. Rowe Price |
| Vice President, Diversified Mid-Cap Growth Fund | Group, Inc. |
| Julie L. Waples (1970) | Vice President, T. Rowe Price |
| Vice President, Diversified Mid-Cap Growth Fund | |
| Mark R. Weigman, CFA, CIC (1962) | Vice President, T. Rowe Price, T. Rowe Price |
| Vice President, Diversified Mid-Cap Growth Fund | Group, Inc., and T. Rowe Price Trust Company |
| Unless otherwise noted, officers have been employees of T. Rowe Price or T. Rowe Price International for at least | |
| five years. | |
Item 2. Code of Ethics.
The registrant has adopted a code of ethics, as defined in Item 2 of Form N-CSR, applicable to its principal executive officer, principal financial officer, principal accounting officer or controller, or persons performing similar functions. A copy of this code of ethics is filed as an exhibit to this Form N-CSR. No substantive amendments were approved or waivers were granted to this code of ethics during the period covered by this report.
Item 3. Audit Committee Financial Expert.
The registrant’s Board of Directors/Trustees has determined that Ms. Karen N. Horn qualifies as an audit committee financial expert, as defined in Item 3 of Form N-CSR. Ms. Horn is considered independent for purposes of Item 3 of Form N-CSR.
Item 4. Principal Accountant Fees and Services.
(a) – (d) Aggregate fees billed to the registrant for the last two fiscal years for professional services rendered by the registrant’s principal accountant were as follows:
Audit fees include amounts related to the audit of the registrant’s annual financial statements and services normally provided by the accountant in connection with statutory and regulatory filings. Audit-related fees include amounts reasonably related to the performance of the audit of the registrant’s financial statements and specifically include the issuance of a report on internal controls and, if applicable, agreed-upon procedures related to fund acquisitions. Tax fees include amounts related to services for tax compliance, tax planning, and tax advice. The nature of these services specifically includes the review of distribution calculations and the preparation of Federal, state, and excise tax returns. All other fees include the registrant’s pro-rata share of amounts for agreed-upon procedures in conjunction with service contract approvals by the registrant’s Board of Directors/Trustees.
(e)(1) The registrant’s audit committee has adopted a policy whereby audit and non-audit services performed by the registrant’s principal accountant for the registrant, its investment adviser, and any entity controlling, controlled by, or under common control with the investment adviser that provides ongoing services to the registrant require pre-approval in advance at regularly scheduled audit committee meetings. If such a service is required between regularly scheduled audit committee meetings, pre-approval may be authorized by one audit committee member with ratification at the next scheduled audit committee meeting. Waiver of pre-approval for audit or non-audit services requiring fees of a de minimis amount is not permitted.
(2) No services included in (b) – (d) above were approved pursuant to paragraph (c)(7)(i)(C) of Rule 2-01 of Regulation S-X.
(f) Less than 50 percent of the hours expended on the principal accountant’s engagement to audit the registrant’s financial statements for the most recent fiscal year were attributed to work performed by persons other than the principal accountant’s full-time, permanent employees.
(g) The aggregate fees billed for the most recent fiscal year and the preceding fiscal year by the registrant’s principal accountant for non-audit services rendered to the registrant, its investment adviser, and any entity controlling, controlled by, or under common control with the investment adviser that provides ongoing services to the registrant were $1,922,000 and $1,486,000, respectively.
(h) All non-audit services rendered in (g) above were pre-approved by the registrant’s audit committee. Accordingly, these services were considered by the registrant’s audit committee in maintaining the principal accountant’s independence.
Item 5. Audit Committee of Listed Registrants.
Not applicable.
Item 6. Investments.
(a) Not applicable. The complete schedule of investments is included in Item 1 of this Form N-CSR.
(b) Not applicable.
Item 7. Disclosure of Proxy Voting Policies and Procedures for Closed-End Management Investment Companies.
Not applicable.
Item 8. Portfolio Managers of Closed-End Management Investment Companies.
Not applicable.
Item 9. Purchases of Equity Securities by Closed-End Management Investment Company and Affiliated Purchasers.
Not applicable.
Item 10. Submission of Matters to a Vote of Security Holders.
Not applicable.
Item 11. Controls and Procedures.
(a) The registrant’s principal executive officer and principal financial officer have evaluated the registrant’s disclosure controls and procedures within 90 days of this filing and have concluded that the registrant’s disclosure controls and procedures were effective, as of that date, in ensuring that information required to be disclosed by the registrant in this Form N-CSR was recorded, processed, summarized, and reported timely.
(b) The registrant’s principal executive officer and principal financial officer are aware of no change in the registrant’s internal control over financial reporting that occurred during the registrant’s second fiscal quarter covered by this report that has materially affected, or is reasonably likely to materially affect, the registrant’s internal control over financial reporting.
Item 12. Exhibits.
(a)(1) The registrant’s code of ethics pursuant to Item 2 of Form N-CSR is attached.
(2) Separate certifications by the registrant's principal executive officer and principal financial officer, pursuant to Section 302 of the Sarbanes-Oxley Act of 2002 and required by Rule 30a-2(a) under the Investment Company Act of 1940, are attached.
(3) Written solicitation to repurchase securities issued by closed-end companies: not applicable.
(b) A certification by the registrant's principal executive officer and principal financial officer, pursuant to Section 906 of the Sarbanes-Oxley Act of 2002 and required by Rule 30a-2(b) under the Investment Company Act of 1940, is attached.
SIGNATURES | |
| Pursuant to the requirements of the Securities Exchange Act of 1934 and the Investment | |
| Company Act of 1940, the registrant has duly caused this report to be signed on its behalf by the | |
| undersigned, thereunto duly authorized. | |
| T. Rowe Price Diversified Mid-Cap Growth Fund, Inc. | |
| By | /s/ Edward C. Bernard |
| Edward C. Bernard | |
| Principal Executive Officer | |
| Date | February 19, 2009 |
| Pursuant to the requirements of the Securities Exchange Act of 1934 and the Investment | |
| Company Act of 1940, this report has been signed below by the following persons on behalf of | |
| the registrant and in the capacities and on the dates indicated. | |
| By | /s/ Edward C. Bernard |
| Edward C. Bernard | |
| Principal Executive Officer | |
| Date | February 19, 2009 |
| By | /s/ Gregory K. Hinkle |
| Gregory K. Hinkle | |
| Principal Financial Officer | |
| Date | February 19, 2009 |