Item 1: Report to Shareholders
 |
| Diversified Mid-Cap Growth Fund | December 31, 2005 |
The views and opinions in this report were current as of December 31, 2005. They are not guarantees of performance or investment results and should not be taken as investment advice. Investment decisions reflect a variety of factors, and the managers reserve the right to change their views about individual stocks, sectors, and the markets at any time. As a result, the views expressed should not be relied upon as a forecast of the fund’s future investment intent. The report is certified under the Sarbanes-Oxley Act of 2002, which requires mutual funds and other public companies to affirm that, to the best of their knowledge, the information in their financial reports is fairly and accurately stated in all material respects.
REPORTS ON THE WEB
Sign up for our E-mail Program, and you can begin to receive updated fund reports and prospectuses online rather than through the mail. Log in to your account at troweprice.com for more information.
Fellow Shareholders
Mid-cap growth stocks rose strongly and outperformed other investment styles in the second half of 2005. Despite soaring energy prices, rising borrowing costs, and widespread damage along the Gulf Coast stemming from several hurricanes, equities forged ahead, supported by firm economic and corporate earnings growth, merger activity, and growing anticipation that the Federal Reserve would soon stop raising short-term interest rates. For the entire year, mid-caps did better than large- and small-cap shares, though value stocks across all market capitalizations generally maintained a slight performance advantage over growth.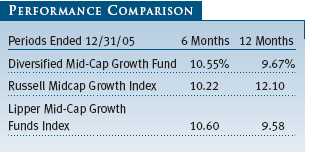
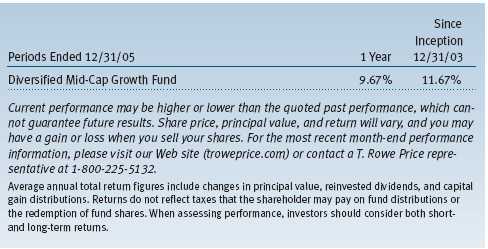
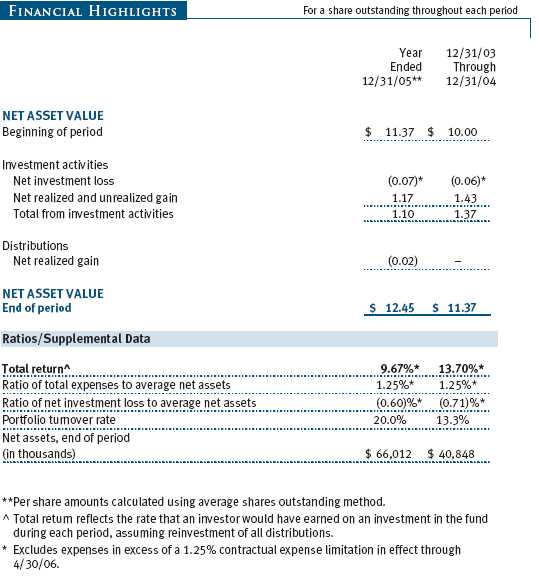
Your fund returned 10.55% in the last six months and 9.67% for all of 2005. As shown in the table, the fund fared slightly better than the Russell Midcap Growth Index in the last six months and was essentially in line with the Lipper peer group index. For the 12-month period, the fund’s performance was comparable to that of the Lipper benchmark but trailed the Russell index.
There were two main factors that limited our gains in 2005. The first was our underweighting of the energy sector. We tend to limit our exposure to the sector because not many energy companies can truly grow their earnings over the long term at a strong or consistent pace in the absence of rising oil prices. Our preference is to find those companies that grow via the drill bit. It is unusual for energy to have such a large representation in growth indexes; the sector’s weighting in the Russell Midcap Growth Index is now more than twice the norm.
The second was our decision not to own several companies that have strong short-term fundamental strength but extreme valuations, thus representing an unfavorable risk/reward tradeoff. We prefer higher-quality companies with good business models and other favorable attributes, and we are encouraged to see such companies performing better than they had, though the improvement has not been dramatic. Nevertheless, investors seem to be paying more attention to companies with sustainable earnings growth—a trend that we believe will continue as the economic expansion matures and growth moderates.
MARKET ENVIRONMENT
Conditions in the U.S. economy were favorable in the last six months. Economic growth as measured by gross domestic product (GDP) was probably about 3%, job growth was steady, and unemployment hovered around 5%. Fears of higher inflation and slower economic growth, however, picked up in the third quarter. Oil prices spiked in late August to $70 per barrel as Hurricane Katrina severely disrupted energy production along the Gulf Coast but settled around $60 by the end of December. In addition, consumer sentiment soured as gasoline temporarily surged above $3 per gallon and higher oil and natural gas prices presaged a significant jump in heating costs this winter. A fourth-quarter decline in energy costs from peak levels helped lift consumer sentiment and tempered fears of a significant acceleration of inflation.
Federal Reserve officials acknowledged the economic uncertainty stemming from hurricane damage and elevated energy costs but concluded that the effects on the economy would be temporary and persisted in raising short-term interest rates at a gradual pace. In the last six months, the central bank lifted the federal funds target rate from 3.25% to 4.25%, a level not seen in more than four years. However, there have been signs in recent months that the Fed may be nearing the end of its rate-tightening program, which began 18 months ago when the fed funds rate was 1.00%. The strongest evidence comes from the Fed’s most recent monetary policy meeting on December 13. According to the minutes and the post-meeting statement, central bank officials no longer characterize monetary policy as being "accommodative," and they believe that the number of additional interest rate increases "would not be large."
Mid-cap stocks decisively outperformed their smaller and larger peers in the second half of the year, as they did in the first half. In the last six months, the S&P MidCap 400 Index advanced 8.38% versus 5.88% for the small-cap Russell 2000 Index and 5.77% for the large-cap S&P 500 Index. For all of 2005, the S&P MidCap 400 Index gained 12.56% versus 4.91% for the S&P 500 and 4.55% for the Russell 2000.
Although the mid-cap asset class offers very attractive longer-term return-versus-risk characteristics, it has done extraordinarily well for several years. Over the five-year period ended December 31, 2005, the Russell Midcap Index has outperformed the S&P 500 by about 8% per year: the Russell index’s average annual total return during that period was 8.45% versus 0.54% for the S&P 500. This performance disparity is unlikely to continue.
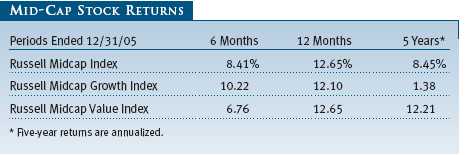
Another longer-term trend is the dominance of value stocks over growth. As measured by various Russell indexes, value stocks generally maintained a performance advantage over growth for the entire year, but growth stocks outperformed value across all market capitalizations in the last six months. We do not know if this heralds the beginning of a long-expected period of growth-stock outperformance, but we do believe in mean reversion—the idea that certain equity sectors that outperform for some time will eventually experience a period of sub-par performance, resulting in longer-term returns that are consistent with historical averages.
Sector performance in 2005 provides a good short-term example. Energy and utility stocks produced excellent returns in the first nine months of 2005, but in the fourth quarter, these sectors fell sharply while other sectors that had struggled all year produced better returns. As you may recall from our mid-year letter, the energy segment was one of the few mid-cap sectors that produced gains in the first half. Because of the fourth-quarter performance reversal, there was less disparity among sectors regarding full-year returns.
In the last six months, virtually all major mid-cap growth sectors produced gains. Information technology shares performed best, led by software stocks. The health care sector was also robust, as biotechnology and health care providers and service companies produced brisk returns. Energy stocks were strong, and financials, particularly companies tied to the capital markets, also performed well. Consumer-related stocks lagged, however, as higher energy costs tempered spending, especially among lower-income consumers. For all of 2005, health care and energy shares topped the performance charts, but industrials and business services, telecommunication services, and financials also performed well. Consumer stocks were generally disappointing, especially media companies.
INVESTMENT STRATEGY
The popularity of mid-cap investing is evident by the outperformance of mid-cap stocks in 2005, as well as the growing number of shareholders in the fund. Before discussing the portfolio’s performance in detail, we would like to welcome new shareholders, thank all of our longer-term investors for their confidence in our investment abilities, and review the investment strategy and principles that guide our management of the portfolio.
- The Diversified Mid-Cap Growth Fund invests in mid-cap stocks of companies whose earnings are expected to grow at an above-average rate. We define mid-cap companies as those whose market capitalization at the time of purchase falls within the range of either the S&P MidCap 400 Index or the Russell Midcap Growth Index.
- Our intention is to keep the fund fully invested because we believe that successful market timing is virtually impossible and that the costs associated with frequent trading reduce the likelihood of outperforming the market. We will not spend undue time worrying about short-term performance or trying to forecast the direction of the market. That allows us to focus on finding mid-cap companies with the best long-term growth potential.
- Unlike other mid-cap growth portfolios that are highly concentrated, the Diversified Mid-Cap Growth Fund will typically invest in about 300 stocks. (As of December 31, we owned approximately 280 names.) This high degree of diversification helps mitigate the downside risk attributable to any single poorly performing security. It is notable that we are investing in companies that are early in their life cycles, and it is inevitable that some will not be as successful as we hope. Accordingly, we balance risk with potential returns.
- Stock selection is based on a combination of fundamental, bottom-up analysis and top-down quantitative strategies in an effort to identify companies with superior long-term appreciation prospects. We use a growth approach, looking for companies with a demonstrated ability to increase revenues, earnings, and cash flow consistently; capable management; attractive business niches; and a sustainable competitive advantage. We favor companies with above-average earnings growth and lower earnings variability.
- Valuations are also important: we look for the best relative values among companies with the strongest businesses and managements.
- We use a number of proprietary quantitative models to identify and evaluate the characteristics of individual mid-cap growth companies and the portfolio as a whole.
PORTFOLIO REVIEW
The fund’s fundamental characteristics are somewhat similar to those of mid-cap growth benchmarks, such as the Russell Midcap Growth Index, as indicated by the Portfolio Characteristics table. The portfolio’s forward price/earnings (P/E) ratio is slightly higher than that of the index, and our median market capitalization is a bit lower, but the average company yield and projected earnings growth rate of our holdings are comparable. The fund’s return on equity, which measures how effectively and efficiently a company and its management are using stockholder investments, is lower than that of the index but still fairly high. We believe that companies with high and sustainable profitability are good long-term investments.
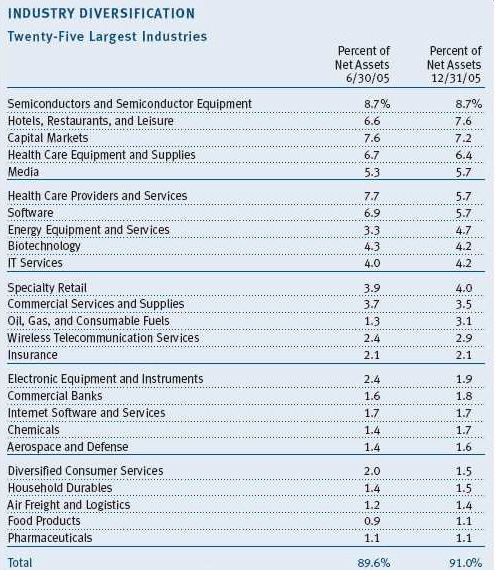
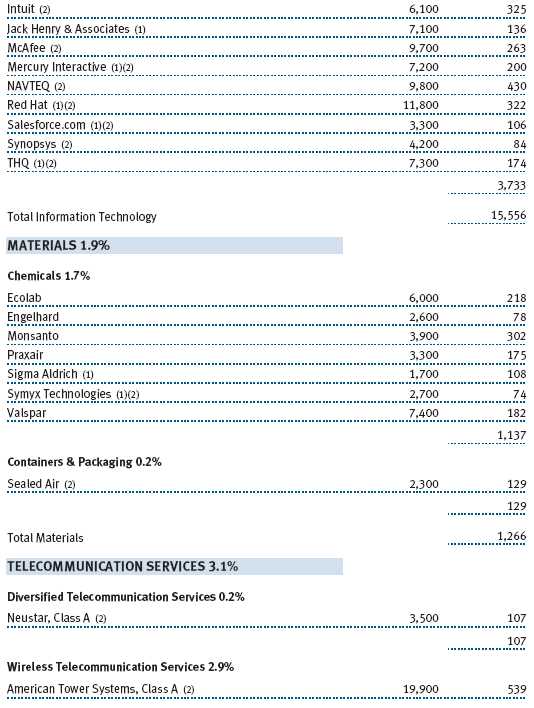
Our sector allocations have some resemblance to those of the index, though we have a few strategic over- or underweightings. Our three largest sector commitments are information technology, consumer discretionary, and health care. Investments in the financials, industrials and business services, and energy segments are smaller. We own no utilities and have very little exposure to consumer staples, materials, and telecommunication services stocks.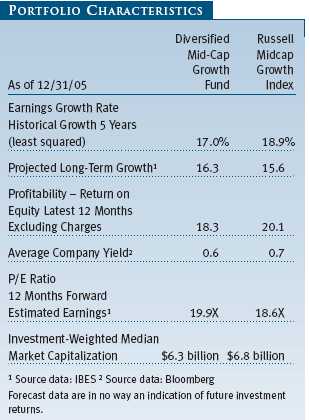
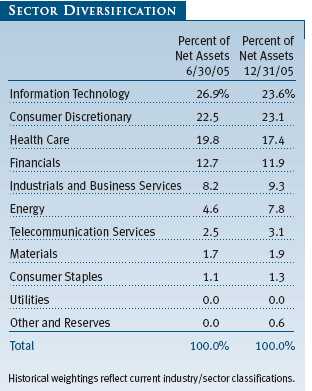
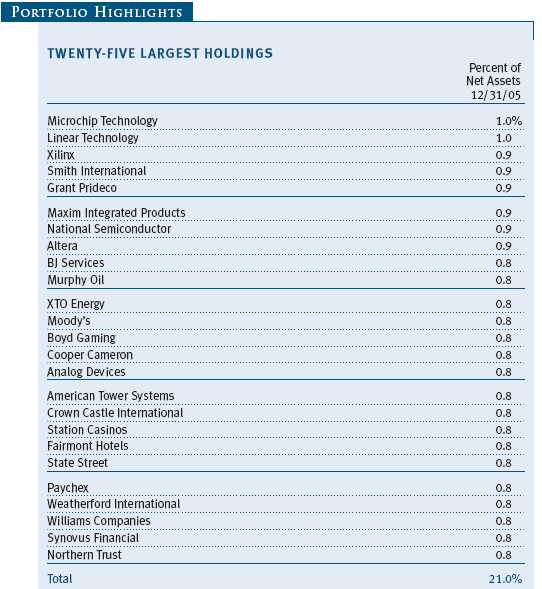
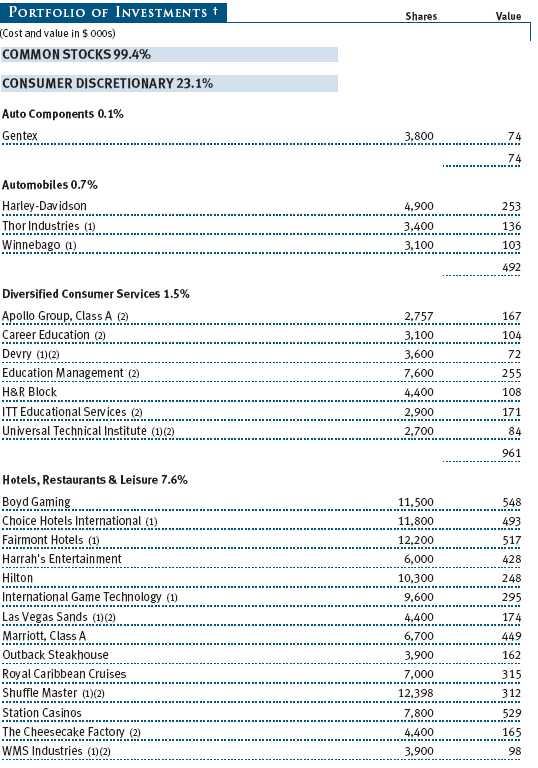
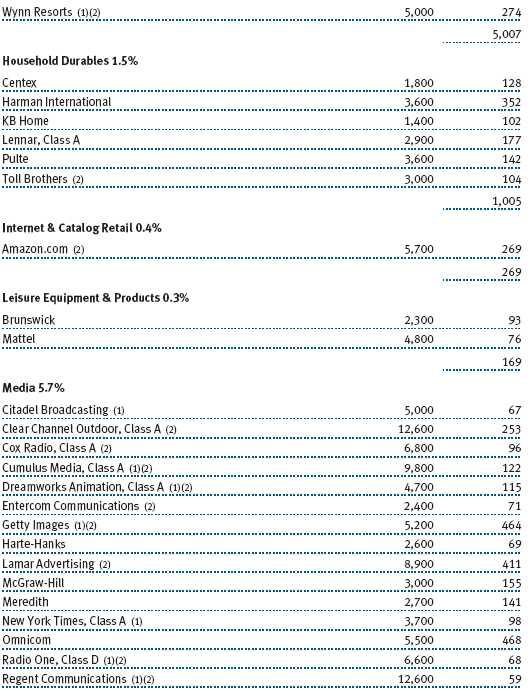
The consumer discretionary sector (23.1% of assets as of December 31) continues to offer great long-term investment opportunities, namely companies with exceptional business models and cash flow. We still favor hotel, restaurant, and leisure-oriented companies, which are enjoying very good fundamentals, as well as media stocks. The sector as a whole struggled throughout 2005, as mentioned earlier, yet our holdings contributed the most to our relative performance in the last six months. Stock selection in media was advantageous, especially Getty Images and Omnicom. We have been adding to our positions in outdoor media companies, as we like their valuations and prospects, though we continued trimming traditional media businesses. Internet retailer Amazon.com was also robust. In addition, underweighting specialty retailers and househo ld durables relative to the Russell index helped our results. (Please refer to the portfolio of investments for a complete listing of the fund’s holdings and the amount each represents in the portfolio.)
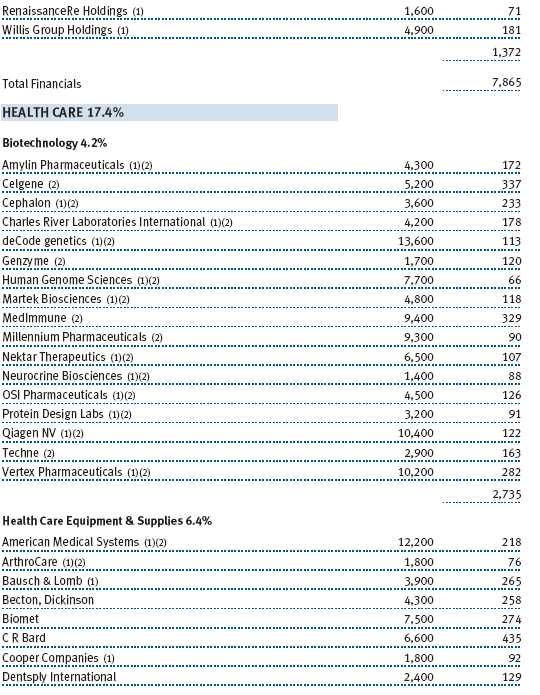
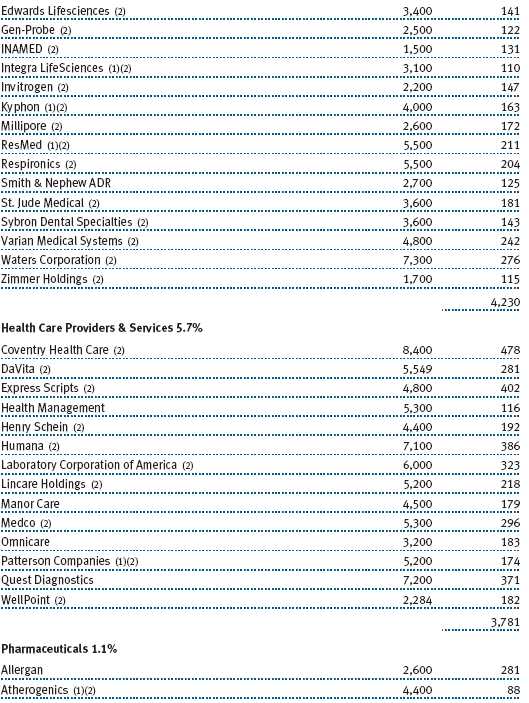
Health care companies (17.4% of assets) contributed significantly to our 6- and 12-month performance in absolute terms. We maintained an emphasis on equipment and service companies, and we are well diversified among biotechnology shares to help reduce risk. Stock selection in the last six months was excellent. Our overweighting of biotechnology shares was advantageous, and several of our holdings, such as Vertex Pharmaceuticals and Cephalon, were among our largest contributors to performance. Providers and service companies also did well, and medical device companies Kyphon and St. Jude Medical produced strong relative performance.
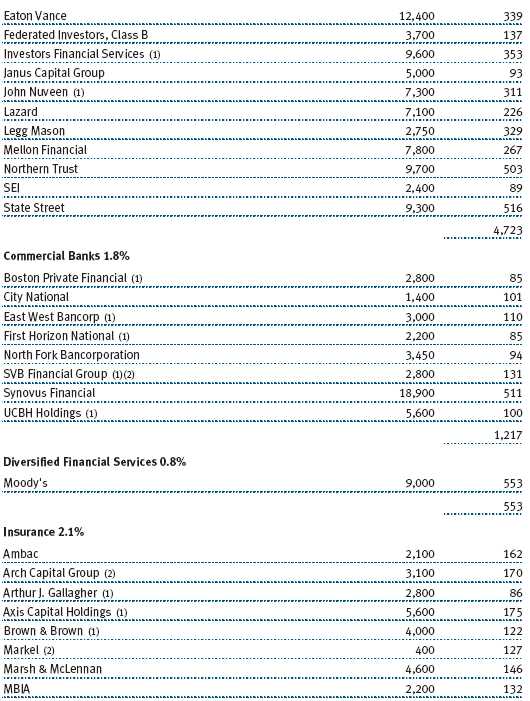
Financials (11.9% of assets), which we are overweighting relative to the Russell benchmark, greatly added value in the second half of the year. Lack of exposure to real estate companies and strong performance of credit rating agency Moody’s were helpful, but our emphasis on trust banks, asset managers, and brokerages was primarily responsible for the sector’s contribution to our results, as shares were lifted by the broad market’s advance as well as increased market activity from individual investors. The risk/reward tradeoff in this segment is not as favorable as before, though long-term prospects for our holdings remain excellent, in our view.
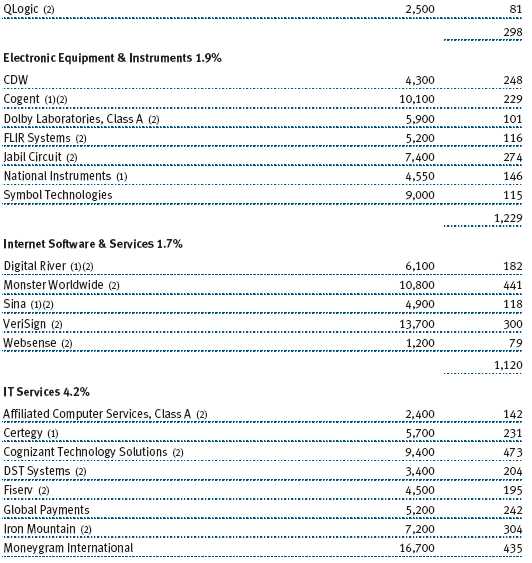
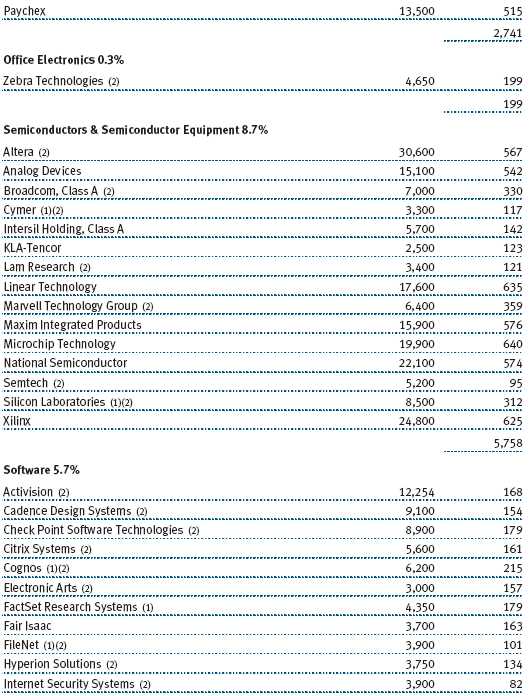
In the information technology sector (23.6% of assets), we continued to overweight semiconductor, software, and IT services companies due to our focus on better businesses within the sector. Despite the improved performance of tech stocks in the second half of 2005, our stock selection detracted from our relative performance. Some of our communications equipment holdings, such as Juniper Networks, declined in the last six months. Linux software company Red Hat produced stellar returns, but most of our other software stocks substantially trailed. In addition, our electronic equipment holdings lagged those in the Russell benchmark, despite good performance of National Instruments. Semiconductor companies still have great fundamentals—we prefer those with quality business models and reasonable valuations—but other technology companies with popu lar products, such as Apple Computer’s iPods, have commanded investor attention, and being sensitive toward valuations (such as P/E ratios) has limited our gains.
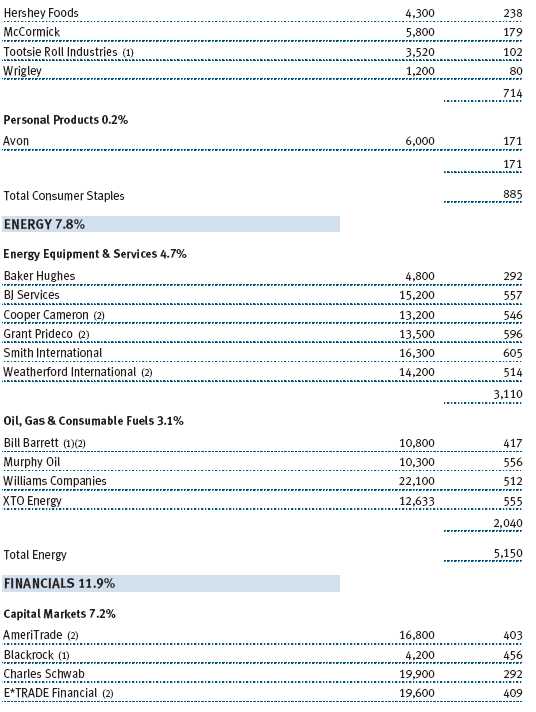
Energy stocks (7.8% of assets) fared best and trounced all other sectors in 2005. Virtually all of our holdings produced gains in the last six months, and several were among our 10-largest contributors to performance in absolute terms. However, underweighting the sector limited our upside potential. We believe companies with good production growth are better long-term investments than those that are leveraged to the price of oil. Although we added three names to the portfolio, we are becoming more cautious about energy stocks in general. It is ominous, in our opinion, to see growth investors taking sizable positions in stocks that are not true growth stocks but rather beneficiaries of a short-term commodity price spike. If earnings growth fails to materialize, particularly in response to a decline in oil prices, these investors could be very disappointed.
YEAR-END DISTRIBUTION
On December 12, 2005, your fund’s Board of Directors declared a short-term capital gain of $0.02 per share for shareholders of record on the same date. You should already have received a check or statement reflecting this distribution, which is taxable to investors in nonretirement accounts.
On a related matter, taxable investors who are concerned about the potential for larger taxable distributions from this fund in the future might consider the T. Rowe Price Tax-Efficient Multi-Cap Growth Fund as an alternative investment. Like the Diversified Mid-Cap Growth Fund, the Tax-Efficient Multi-Cap Growth Fund focuses primarily on the mid- and small-cap segment and uses a similar investment process, but it is specifically managed to minimize taxable distributions to shareholders, and its objective is to produce the best possible long-term after-tax returns. In the Diversified Mid-Cap Growth Fund, we eliminate investments in good companies when their market capitalizations grow beyond that of a mid-cap company, whereas in the Tax-Efficient Multi-Cap Growth Fund, we will continue to hold such companies as long as they remain a good longer-term investment. Of course, there is no guarantee that the fund’s attempts to manage its portfolio in a tax-efficient manner will be successf ul. The fund is subject to market risk, including possible loss of principal.
For more information on this fund, please visit our Web site, troweprice.com, or call 1-800-225-5132 to request a prospectus or a briefer profile; each includes investment objectives, risks, fees, expenses, and other information that you should read and consider carefully before investing.
OUTLOOK
In general, the environment for equities going into 2006 looks quite favorable. The U.S. economy is growing at a steady clip, the Federal Reserve is nearly finished raising short-term interest rates, corporate profit growth remains healthy, and corporate balance sheets are flush with cash.
Of course, there are a few hints of speculative investment activity we should not overlook. For example, some investors seem to be reaching for returns without respecting the risks or downside potential of an investment, while companies with favorable characteristics, such as a sustainable competitive advantage and a demonstrated ability to increase revenues, earnings, and cash flow, seem to be undervalued. Energy stocks are reminiscent of technology stock performance in 1999, which we all know ended painfully. In addition, private equity buyout activity is brisk, but such investors will eventually want to see some returns on their investments.
That said, our outlook for mid-cap growth stocks has really not changed in the last six months, as our time horizon is much longer. Our holdings still have strong fundamentals. We balance risk and reward potential when seeking and analyzing current and potential investments. In addition, we value strong businesses and competent managements with a long-term orientation.
As mentioned earlier, we are encouraged to see higher-quality companies performing better than they have in the last few years, and we believe this trend will continue, particularly if profit growth slows as the business cycle matures and investors place a premium on companies that can grow their earnings steadily in more challenging economic conditions.
Respectfully submitted,
Donald J. Peters
Chairman of the fund’s Investment Advisory Committee
January 20, 2006
The committee chairman has day-to-day responsibility for managing the portfolio and works with committee members in developing and executing the fund’s investment program.
RISKS OF INVESTING
As with all equity funds, this fund’s share price can fall because of weakness in the broad market, a particular industry, or specific holdings. The market as a whole can decline for many reasons, including adverse political or economic developments here or abroad, changes in investor psychology, or heavy institutional selling. The prospects for an industry or company may deteriorate because of a variety of factors, including disappointing earnings or changes in the competitive environment. In addition, our assessment of companies held in the fund may prove incorrect, resulting in losses or poor performance even in a rising market. Finally, the fund’s investment approach could fall out of favor with the investing public, resulting in lagging performance versus other types of stock funds.
The stocks of mid-cap companies entail greater risk and are usually more volatile than the shares of large companies. In addition, growth stocks can be volatile for several reasons. Since they usually reinvest a high proportion of earnings in their own businesses, they may lack the dividends usually associated with value stocks that can cushion their decline in a falling market. Also, since investors buy these stocks because of their expected superior earnings growth, earnings disappointments often result in sharp price declines.
Diversification cannot protect against loss in a declining market or assure a profit.
GLOSSARY
Fed funds target rate: An overnight lending rate set by the Federal Reserve and used by banks to meet reserve requirements. Banks also use the fed funds rate as a benchmark for their prime lending rates.
Lipper indexes: Consist of a small number (10 to 30) of the largest mutual funds in a particular category as tracked by Lipper Inc.
Price/earnings (P/E) ratio: A ratio that shows the "multiple" of earnings at which a stock is selling. It is calculated by dividing a stock’s current price by its current earnings per share. For example, if a stock’s price is $60 per share and the issuing company earns $2 per share, the P/E ratio is $60/$2, or 30.
Russell Midcap Index: Measures the performance of the 800 smallest companies in the Russell 1000 Index.
Russell Midcap Growth Index: Measures the performance of those Russell Midcap companies with higher price-to-book ratios and higher forecasted growth values. The stocks are also members of the Russell 1000 Growth Index.
Russell Midcap Value Index: Measures the performance of those Russell Midcap companies with lower price-to-book ratios and lower forecasted growth values. The stocks are also members of the Russell 1000 Value Index.
Russell 2000 Index: Tracks the performance of 2,000 small U.S. companies.
S&P MidCap 400 Index: Tracks the performance of 400 U.S. mid-cap companies.
S&P 500 Index: Tracks the performance of 500 primarily large U.S. companies.
Note: Table excludes investments in the T. Rowe Price Reserve Investment Fund and securities lending collateral.
Historical weightings reflect current industry/sector classifications.
| GROWTH OF $10,000 |
This chart shows the value of a hypothetical $10,000 investment in the fund over the past 10 fiscal year periods or since inception (for funds lacking 10-year records). The result is compared with benchmarks, which may include a broad-based market index and a peer group average or index. Market indexes do not include expenses, which are deducted from fund returns as well as mutual fund averages and indexes.

| AVERAGE ANNUAL COMPOUND TOTAL RETURN |
This table shows how the fund would have performed each year if its actual (or cumulative) returns for the periods shown had been earned at a constant rate.
| FUND EXPENSE EXAMPLE |
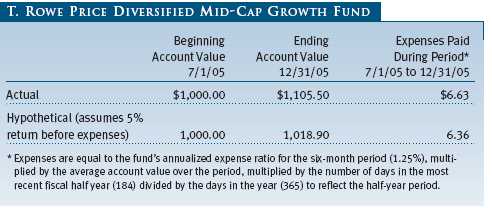
As a mutual fund shareholder, you may incur two types of costs: (1) transaction costs such as redemption fees or sales loads and (2) ongoing costs, including management fees, distribution and service (12b-1) fees, and other fund expenses. The following example is intended to help you understand your ongoing costs (in dollars) of investing in the fund and to compare these costs with the ongoing costs of investing in other mutual funds. The example is based on an investment of $1,000 invested at the beginning of the most recent six-month period and held for the entire period.
Actual Expenses
The first line of the following table ("Actual") provides information about actual account values and actual expenses. You may use the information in this line, together with your account balance, to estimate the expenses that you paid over the period. Simply divide your account value by $1,000 (for example, an $8,600 account value divided by $1,000 = 8.6), then multiply the result by the number in the first line under the heading "Expenses Paid During Period" to estimate the expenses you paid on your account during this period.
Hypothetical Example for Comparison Purposes
The information on the second line of the table ("Hypothetical") is based on hypothetical account values and expenses derived from the fund’s actual expense ratio and an assumed 5% per year rate of return before expenses (not the fund’s actual return). You may compare the ongoing costs of investing in the fund with other funds by contrasting this 5% hypothetical example and the 5% hypothetical examples that appear in the shareholder reports of the other funds. The hypothetical account values and expenses may not be used to estimate the actual ending account balance or expenses you paid for the period.
Note: T. Rowe Price charges an annual small-account maintenance fee of $10, generally for accounts with less than $2,000 ($500 for UGMA/UTMA). The fee is waived for any investor whose T. Rowe Price mutual fund accounts total $25,000 or more, accounts employing automatic investing, and IRAs and other retirement plan accounts that utilize a prototype plan sponsored by T. Rowe Price (although a separate custodial or administrative fee may apply to such accounts). This fee is not included in the accompanying table. If you are subject to the fee, keep it in mind when you are estimating the ongoing expenses of investing in the fund and when comparing the expenses of this fund with other funds.
You should also be aware that the expenses shown in the table highlight only your ongoing costs and do not reflect any transaction costs, such as redemption fees or sales loads. Therefore, the second line of the table is useful in comparing ongoing costs only and will not help you determine the relative total costs of owning different funds. To the extent a fund charges transaction costs, however, the total cost of owning that fund is higher.
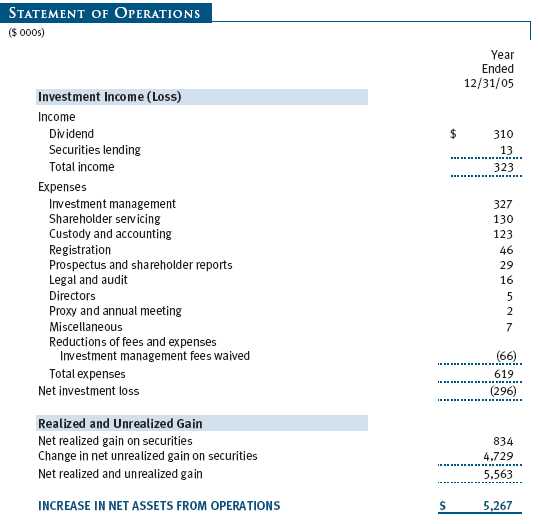
The accompanying notes are an integral part of these financial statements.
![]()

![]()
The accompanying notes are an integral part of these financial statements.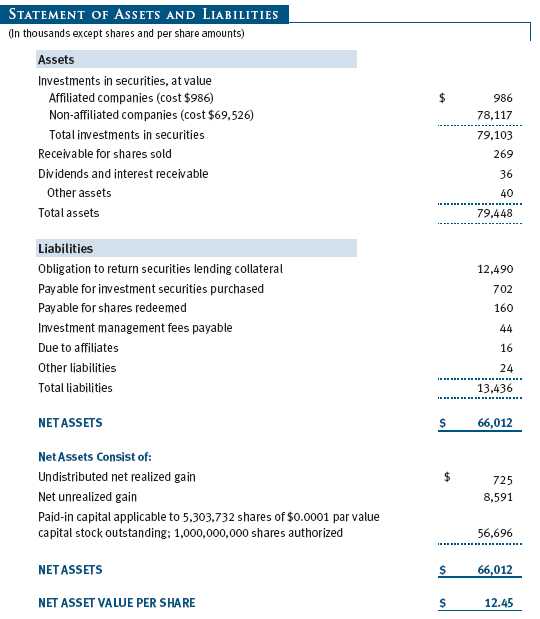
The accompanying notes are an integral part of these financial statements.
The accompanying notes are an integral part of these financial statements.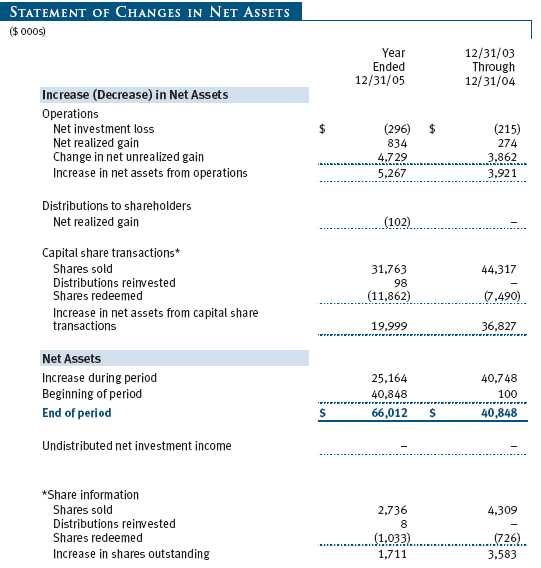
The accompanying notes are an integral part of these financial statements.
| NOTES TO FINANCIAL STATEMENTS |
NOTE 1 - SIGNIFICANT ACCOUNTING POLICIES
T. Rowe Price Diversified Mid-Cap Growth Fund, Inc. (the fund) is registered under the Investment Company Act of 1940 (the 1940 Act) as a diversified, open-end management investment company. The fund commenced operations on December 31, 2003. The fund seeks to provide long-term capital growth by investing primarily in the common stocks of mid-cap growth companies.
The accompanying financial statements were prepared in accordance with accounting principles generally accepted in the United States of America, which require the use of estimates made by fund management. Fund management believes that estimates and security valuations are appropriate; however actual results may differ from those estimates, and the security valuations reflected in the financial statements may differ from the value the fund ultimately realizes upon sale of the securities.
Valuation The fund values its investments and computes its net asset value per share at the close of the New York Stock Exchange (NYSE), normally 4 p.m. ET, each day that the NYSE is open for business. Equity securities listed or regularly traded on a securities exchange or in the over-the-counter market are valued at the last quoted sale price or, for certain markets, the official closing price at the time the valuations are made, except for OTC Bulletin Board securities, which are valued at the mean of the latest bid and asked prices. A security that is listed or traded on more than one exchange is valued at the quotation on the exchange determined to be the primary market for such security. Listed securities not traded on a particular day are valued at the mean of the latest bid and asked prices for domestic securities and the last quoted sale price for international securities.
Investments in mutual funds are valued at the mutual fund’s closing net asset value per share on the day of valuation.
Other investments, including restricted securities, and those for which the above valuation procedures are inappropriate or are deemed not to reflect fair value are stated at fair value as determined in good faith by the T. Rowe Price Valuation Committee, established by the fund’s Board of Directors.
Most foreign markets close before the close of trading on the NYSE. If the fund determines that developments between the close of a foreign market and the close of the NYSE will, in its judgment, materially affect the value of some or all of its portfolio securities, which in turn will affect the fund’s share price, the fund will adjust the previous closing prices to reflect the fair value of the securities as of the close of the NYSE, as determined in good faith by the T. Rowe Price Valuation Committee, established by the fund’s Board of Directors. A fund may also fair value securities in other situations, such as when a particular foreign market is closed but the fund is open. In deciding whether to make fair value adjustments, the fund reviews a variety of factors, including developments in foreign markets, the performance of U.S. securities markets, and the performance of instruments trading in U.S. markets that represent foreig n securities and baskets of foreign securities. The fund uses outside pricing services to provide it with closing market prices and information used for adjusting those prices. The fund cannot predict when and how often it will use closing prices and when it will adjust those prices to reflect fair value. As a means of evaluating its fair value process, the fund routinely compares closing market prices, the next day’s opening prices in the same markets, and adjusted prices.
Currency Translation Assets, including investments, and liabilities denominated in foreign currencies are translated into U.S. dollar values each day at the prevailing exchange rate, using the mean of the bid and asked prices of such currencies against U.S. dollars as quoted by a major bank. Purchases and sales of securities, income, and expenses are translated into U.S. dollars at the prevailing exchange rate on the date of the transaction. The effect of changes in foreign currency exchange rates on realized and unrealized security gains and losses is reflected as a component of security gains and losses.
Rebates and Credits Subject to best execution, the fund may direct certain security trades to brokers who have agreed to rebate a portion of the related brokerage commission to the fund in cash. Commission rebates are reflected as realized gain on securities in the accompanying financial statements. Additionally, the fund earns credits on temporarily uninvested cash balances at the custodian that reduce the fund’s custody charges. Custody expense in the accompanying financial statements is presented before reduction for credits.
Investment Transactions, Investment Income, and Distributions Income and expenses are recorded on the accrual basis. Dividends received from mutual fund investments are reflected as dividend income; capital gain distributions are reflected as realized gain/loss. Dividend income and capital gain distributions are recorded on the ex-dividend date. Investment transactions are accounted for on the trade date. Realized gains and losses are reported on the identified cost basis. Distributions to shareholders are recorded on the ex-dividend date. Income distributions are declared and paid on an annual basis. Capital gain distributions, if any, are declared and paid by the fund, typically on an annual basis.
NOTE 2 - INVESTMENT TRANSACTIONS
Consistent with its investment objective, the fund engages in the following practices to manage exposure to certain risks or enhance performance. The investment objective, policies, program, and risk factors of the fund are described more fully in the fund’s prospectus and Statement of Additional Information.
Securities Lending The fund lends its securities to approved brokers to earn additional income. It receives as collateral cash and U.S. government securities valued at 102% to 105% of the value of the securities on loan. Cash collateral is invested in a money market pooled trust managed by the fund’s lending agent in accordance with investment guidelines approved by fund management. Collateral is maintained over the life of the loan in an amount not less than the value of loaned securities, as determined at the close of fund business each day; any additional collateral required due to changes in security values is delivered to the fund the next business day. Although risk is mitigated by the collateral, the fund could experience a delay in recovering its securities and a possible loss of income or value if the borrower fails to return the securities. Securities lending revenue recognized by the fund consists of earnings on invested collateral and borro wing fees, net of any rebates to the borrower and compensation to the lending agent. At December 31, 2005, the value of loaned securities was $12,135,000; aggregate collateral consisted of $12,490,000 in the money market pooled trust.
Other Purchases and sales of portfolio securities, other than short-term securities, aggregated $29,079,000 and $9,916,000, respectively, for the year ended December 31, 2005.
NOTE 3 - FEDERAL INCOME TAXES
No provision for federal income taxes is required since the fund intends to continue to qualify as a regulated investment company under Subchapter M of the Internal Revenue Code and distribute to shareholders all of its taxable income and gains. Federal income tax regulations differ from generally accepted accounting principles; therefore, distributions determined in accordance with tax regulations may differ significantly in amount or character from net investment income and realized gains for financial reporting purposes. Financial reporting records are adjusted for permanent book/tax differences to reflect tax character. Financial records are not adjusted for temporary differences.
Distributions during the year ended December 31, 2005 totaled $102,000 and were characterized as ordinary income for tax purposes. At December 31, 2005, the tax-basis components of net assets were as follows: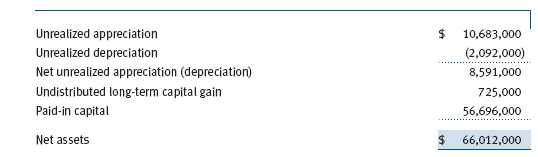
For the year ended December 31, 2005, the fund recorded the following permanent reclassifications to reflect tax character. Reclassifications to paid-in capital relate primarily to the current net operating loss. Results of operations and net assets were not affected by these reclassifications.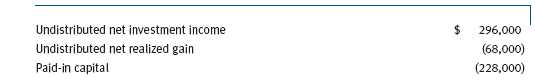
At December 31, 2005, the cost of investments for federal income tax purposes was $70,512,000.
NOTE 4 - RELATED PARTY TRANSACTIONS
The fund is managed by T. Rowe Price Associates, Inc. (the manager or Price Associates), a wholly owned subsidiary of T. Rowe Price Group, Inc. The investment management agreement between the fund and the manager provides for an annual investment management fee, which is computed daily and paid monthly. The fee consists of an individual fund fee, equal to 0.35% of the fund’s average daily net assets, and a group fee. The group fee rate is calculated based on the combined net assets of certain mutual funds sponsored by Price Associates (the group) applied to a graduated fee schedule, with rates ranging from 0.48% for the first $1 billion of assets to 0.29% for assets in excess of $160 billion. Prior to May 1, 2005, the maximum group fee rate in the graduated fee schedule had been 0.295% for assets in excess of $120 billion. The fund’s group fee is determined by applying the group fee rate to the fund’s average daily net assets. At December 31, 2005, the effective annual group fee rate was 0.31%.
The fund is also subject to a contractual expense limitation through April 30, 2006. During the limitation period, the manager is required to waive its management fee and reimburse the fund for any expenses, excluding interest, taxes, brokerage commissions, and extraordinary expenses, that would otherwise cause the fund’s ratio of total expenses to average net assets (expense ratio) to exceed its expense limitation of 1.25%. For a period of three years after the date of any reimbursement or waiver, the fund is required to repay the manager for expenses previously reimbursed and management fees waived to the extent its net assets have grown or expenses have declined sufficiently to allow repayment without causing the fund’s expense ratio to exceed its expense limitation. Pursuant to this agreement, at December 31, 2005, management fees waived in the amount of $195,000 remain subject to repayment by the fund.
In addition, the fund has entered into service agreements with Price Associates and two wholly owned subsidiaries of Price Associates (collectively, Price). Price Associates computes the daily share price and maintains the financial records of the fund. T. Rowe Price Services, Inc., provides shareholder and administrative services in its capacity as the fund’s transfer and dividend disbursing agent. T. Rowe Price Retirement Plan Services, Inc., provides subaccounting and recordkeeping services for certain retirement accounts invested in the fund. For the year ended December 31, 2005, expenses incurred pursuant to these service agreements were $64,000 for Price Associates, $103,000 for T. Rowe Price Services, Inc., and $0 for T. Rowe Price Retirement Plan Services, Inc. The total amount payable at period end pursuant to these service agreements is reflected as Due to Affiliates in the accompanying financial statements.
The fund may invest in the T. Rowe Price Reserve Investment Fund and the T. Rowe Price Government Reserve Investment Fund (collectively, the T. Rowe Price Reserve Funds), open-end management investment companies managed by Price Associates and affiliates of the fund. The T. Rowe Price Reserve Funds are offered as cash management options to mutual funds, trusts, and other accounts managed by Price Associates and/or its affiliates, and are not available for direct purchase by members of the public. The T. Rowe Price Reserve Funds pay no investment management fees. During the year ended December 31, 2005, dividend income from the T. Rowe Price Reserve Funds totaled $13,000, and the value of shares of the T. Rowe Price Reserve Funds held at December 31, 2005 and December 31, 2004 was $986,000 and $1,000, respectively.
As of December 31, 2005, T. Rowe Price Group, Inc. and/or its wholly owned subsidiaries owned 150,237 shares of the fund, representing 3% of the fund’s net assets.
| REPORT OF INDEPENDENT REGISTERED PUBLIC ACCOUNTING FIRM |
To the Board of Directors and Shareholders of T. Rowe Price Diversified Mid-Cap Growth Fund, Inc.
In our opinion, the accompanying statement of assets and liabilities, including the portfolio of investments, and the related statements of operations and of changes in net assets and the financial highlights present fairly, in all material respects, the financial position of T. Rowe Price Diversified Mid-Cap Growth Fund, Inc. (the "Fund" at December 31, 2005, the results of its operations for the year then ended and the changes in its net assets and the financial highlights for the year then ended and for the period December 31, 2003 (commencement of operations) through December 31, 2004, in conformity with accounting principles generally accepted in the United States of America. These financial statements and financial highlights (hereafter referred to as "financial statements") are the responsibility of the Fund’s management; our responsibility is to express an opinion on these financial statements based on our audits. We conducted our audits of these fina ncial statements in accordance with the standards of the Public Company Accounting Oversight Board (United States). Those standards require that we plan and perform the audit to obtain reasonable assurance about whether the financial statements are free of material misstatement. An audit includes examining, on a test basis, evidence supporting the amounts and disclosures in the financial statements, assessing the accounting principles used and significant estimates made by management, and evaluating the overall financial statement presentation. We believe that our audits, which included confirmation of securities at December 31, 2005 by correspondence with the custodian, and by agreement to the underlying ownership records for T. Rowe Price Reserve Investment Fund, provide a reasonable basis for our opinion.
PricewaterhouseCoopers LLP
Baltimore, Maryland
February 13, 2006
| TAX INFORMATION (UNAUDITED) FOR THE TAX YEAR ENDED 12/31/05 |
We are providing this information as required by the Internal Revenue Code. The amounts shown may differ from those elsewhere in this report because of differences between tax and financial reporting requirements. The fund’s distributions to shareholders included:
- $61,000 from short-term capital gains,
- $45,000 from long-term capital gains, subject to the 15% rate gains category.
| INFORMATION ON PROXY VOTING POLICIES, PROCEDURES, AND RECORDS |
A description of the policies and procedures used by T. Rowe Price funds and portfolios to determine how to vote proxies relating to portfolio securities is available in each fund’s Statement of Additional Information, which you may request by calling 1-800-225-5132 or by accessing the SEC’s Web site, www.sec.gov. The description of our proxy voting policies and procedures is also available on our Web site, www.troweprice.com. To access it, click on the words "Company Info" at the top of our homepage for individual investors. Then, in the window that appears, click on the "Proxy Voting Policy" navigation button in the top left corner.
Each fund’s most recent annual proxy voting record is available on our Web site and through the SEC’s Web site. To access it through our Web site, follow the directions above, then click on the words "Proxy Voting Record" at the bottom of the Proxy Voting Policy page.
| HOW TO OBTAIN QUARTERLY PORTFOLIO HOLDINGS |
The fund files a complete schedule of portfolio holdings with the Securities and Exchange Commission for the first and third quarters of each fiscal year on Form N-Q. The fund’s Form N-Q is available electronically on the SEC’s Web site (www.sec.gov); hard copies may be reviewed and copied at the SEC’s Public Reference Room, 450 Fifth St. N.W., Washington, DC 20549. For more information on the Public Reference Room, call 1-800-SEC-0330.
| ABOUT THE FUND’S DIRECTORS AND OFFICERS |
Your fund is governed by a Board of Directors that meets regularly to review investments, performance, compliance matters, advisory fees, expenses, and other business affairs, and is responsible for protecting the interests of shareholders. The majority of the fund’s directors are independent of T. Rowe Price Associates, Inc. (T. Rowe Price); "inside" directors are officers of T. Rowe Price. The Board of Directors elects the fund’s officers, who are listed in the final table. The business address of each director and officer is 100 East Pratt Street, Baltimore, MD 21202. The Statement of Additional Information includes additional information about the fund directors and is available without charge by calling a T. Rowe Price representative at 1-800-225-5132.
| Independent Directors | |
| Name | |
| (Year of Birth) | |
| Year Elected* | |
| [Number of T. Rowe Price | Principal Occupation(s) During Past 5 Years |
| Portfolios Overseen] | and Directorships of Other Public Companies |
| Jeremiah E. Casey** | Director, National Life Insurance (2001 to 8/05); Director, The Rouse |
| (1940) | Company, real estate developers (1990 to 2004) |
| 2005 | |
| [59] | |
| Anthony W. Deering | Chairman, Exeter Capital, LLC, a private investment firm (2004 to |
| (1945) | present); Director, Chairman of the Board, and Chief Executive Officer, |
| 2003 | The Rouse Company, real estate developers (1997 to 2004); Director, |
| [113] | Mercantile Bank (4/03 to present) |
| Donald W. Dick, Jr. | Principal, EuroCapital Advisors, LLC, an acquisition and management |
| (1943) | advisory firm; Chairman, President, and Chief Executive Officer, |
| 2003 | The Haven Group, a custom manufacturer of modular homes |
| [113] | (1/04 to present) |
| David K. Fagin | Chairman and President, Nye Corporation (6/88 to present); |
| (1938) | Director, Canyon Resources Corp. and Golden Star Resources Ltd. |
| 2003 | (5/00 to present) and Pacific Rim Mining Corp. (2/02 to present) |
| [113] | |
| Karen N. Horn | Managing Director and President, Global Private Client Services, |
| (1943) | Marsh Inc. (1999 to 2003); Managing Director and Head of |
| 2003 | International Private Banking, Bankers Trust (1996 to 1999); |
| [113] | Director, Eli Lilly and Company and Georgia Pacific |
| F. Pierce Linaweaver | President, F. Pierce Linaweaver & Associates, Inc., consulting environ- |
| (1934) | mental and civil engineers |
| 2003 | |
| [113] | |
| Theo C. Rodgers*** | President, A&R Development Corporation |
| (1941) | |
| 2005 | |
| [97] | |
| John G. Schreiber | Owner/President, Centaur Capital Partners, Inc., a real estate invest- |
| (1946) | ment company; Partner, Blackstone Real Estate Advisors, L.P.; |
| 2003 | Director, AMLI Residential Properties Trust |
| [113] | |
| * | Each independent director serves until retirement, resignation, or election of a successor. |
| ** | Elected effective October 19, 2005. |
| *** | Elected effective April 1, 2005. |
| Inside Directors | |
| Name | |
| (Year of Birth) | |
| Year Elected* | |
| [Number of T. Rowe Price | Principal Occupation(s) During Past 5 Years |
| Portfolios Overseen] | and Directorships of Other Public Companies |
| James A.C. Kennedy, CFA | Director and Vice President, T. Rowe Price and T. Rowe Price Group, |
| (1953) | Inc.; Director, T. Rowe Price Global Asset Management Limited, |
| 2003 | T. Rowe Price Global Investment Services Limited, and T. Rowe |
| [45] | Price International, Inc. |
| James S. Riepe | Director and Vice President, T. Rowe Price; Vice Chairman of the Board, |
| (1943) | Director, and Vice President, T. Rowe Price Group, Inc.; Chairman of the |
| 2003 | Board and Director, T. Rowe Price Global Asset Management Limited, |
| [113] | T. Rowe Price Global Investment Services Limited, T. Rowe Price |
| Investment Services, Inc., T. Rowe Price Retirement Plan Services, | |
| Inc., and T. Rowe Price Services, Inc.; Chairman of the Board, Director, | |
| President, and Trust Officer, T. Rowe Price Trust Company; Director, | |
| T. Rowe Price International, Inc.; Chairman of the Board, all funds | |
| * Each inside director serves until retirement, resignation, or election of a successor. |
| Officers | |
| Name (Year of Birth) | |
| Title and Fund(s) Served | Principal Occupation(s) |
| Joseph A. Carrier (1960) | Vice President, T. Rowe Price, T. Rowe Price |
| Treasurer, Diversified Mid-Cap Growth Fund | Group, Inc., T. Rowe Price Investment Services, |
| Inc., and T. Rowe Price Trust Company | |
| Donald J. Easley, CFA (1971) | Vice President, T. Rowe Price and T. Rowe Price |
| Vice President, Diversified Mid-Cap Growth | Group, Inc. |
| Fund | |
| Roger L. Fiery III, CPA (1959) | Vice President, T. Rowe Price, T. Rowe Price |
| Vice President, Diversified Mid-Cap Growth | Group, Inc., T. Rowe Price International, Inc., |
| Fund | and T. Rowe Price Trust Company |
| John R. Gilner (1961) | Chief Compliance Officer and Vice President, |
| Chief Compliance Officer, Diversified Mid-Cap | T. Rowe Price; Vice President, T. Rowe Price |
| Growth Fund | Group, Inc., and T. Rowe Price Investment |
| Services, Inc. | |
| Gregory S. Golczewski (1966) | Vice President, T. Rowe Price and T. Rowe Price |
| Vice President, Diversified Mid-Cap Growth | Trust Company |
| Fund | |
| Henry H. Hopkins (1942) | Director and Vice President, T. Rowe Price |
| Vice President, Diversified Mid-Cap Growth | Investment Services, Inc., T. Rowe Price |
| Fund | Services, Inc., and T. Rowe Price Trust Company; |
| Vice President, T. Rowe Price, T. Rowe Price | |
| Group, Inc., T. Rowe Price International, Inc., | |
| and T. Rowe Price Retirement Plan Services, Inc. | |
| Patricia B. Lippert (1953) | Assistant Vice President, T. Rowe Price and |
| Secretary, Diversified Mid-Cap Growth Fund | T. Rowe Price Investment Services, Inc. |
| Sudhir Nanda, Ph.D., CFA (1959) | Vice President, T. Rowe Price and T. Rowe Price |
| Vice President, Diversified Mid-Cap Growth | Group, Inc. |
| Fund | |
| Philip A. Nestico (1976) | Vice President, T. Rowe Price |
| Vice President, Diversified Mid-Cap Growth | |
| Fund | |
| Donald J. Peters (1959) | Vice President, T. Rowe Price and T. Rowe Price |
| President, Diversified Mid-Cap Growth Fund | Group, Inc. |
| John F. Wakeman (1962) | Vice President, T. Rowe Price and T. Rowe Price |
| Vice President, Diversified Mid-Cap Growth Fund | Group, Inc. |
| Julie L. Waples (1970) | Vice President, T. Rowe Price |
| Vice President, Diversified Mid-Cap Growth Fund | |
| Mark R. Weigman, CFA, CIC (1962) | Vice President, T. Rowe Price, T. Rowe Price |
| Vice President, Diversified Mid-Cap Growth Fund | Group, Inc., and T. Rowe Price Trust Company |
| Unless otherwise noted, officers have been employees of T. Rowe Price or T. Rowe Price International for at least |
| five years. |
The registrant has adopted a code of ethics, as defined in Item 2 of Form N-CSR, applicable to its principal executive officer, principal financial officer, principal accounting officer or controller, or persons performing similar functions. A copy of this code of ethics is filed as an exhibit to this Form N-CSR. No substantive amendments were approved or waivers were granted to this code of ethics during the period covered by this report.
Item 3. Audit Committee Financial Expert.
The registrant’s Board of Directors/Trustees has determined that Mr. Donald W. Dick Jr. qualifies as an audit committee financial expert, as defined in Item 3 of Form N-CSR. Mr. Dick is considered independent for purposes of Item 3 of Form N-CSR.
Item 4. Principal Accountant Fees and Services.
(a) – (d) Aggregate fees billed to the registrant for the last two fiscal years for professional services rendered by the registrant’s principal accountant were as follows:
| 2005 | 2004 | |
| Audit Fees | $7,589 | $11,778 |
| Audit-Related Fees | 488 | 725 |
| Tax Fees | 2,156 | 3,194 |
| All Other Fees | 252 | - |
Audit fees include amounts related to the audit of the registrant’s annual financial statements and services normally provided by the accountant in connection with statutory and regulatory filings. Audit-related fees include amounts reasonably related to the performance of the audit of the registrant’s financial statements and specifically include the issuance of a report on internal controls. Tax fees include amounts related to services for tax compliance, tax planning, and tax advice. The nature of these services specifically includes the review of distribution calculations and the preparation of Federal, state, and excise tax returns. All other fees include the registrant’s pro-rata share of amounts for agreed-upon procedures in conjunction with service contract approvals by the registrant’s Board of Directors/Trustees.
(e)(1) The registrant’s audit committee has adopted a policy whereby audit and non-audit services performed by the registrant’s principal accountant for the registrant, its investment adviser, and any entity controlling, controlled by, or under common control with the investment adviser that provides ongoing services to the registrant require pre-approval in advance at regularly scheduled audit committee meetings. If such a service is required between regularly scheduled audit committee meetings, pre-approval may be authorized by one audit committee member with ratification at the next scheduled audit committee meeting. Waiver of pre-approval for audit or non-audit services requiring fees of a de minimis amount is not permitted.
(2) No services included in (b) – (d) above were approved pursuant to paragraph (c)(7)(i)(C) of Rule 2-01 of Regulation S-X.
(f) Less than 50 percent of the hours expended on the principal accountant’s engagement to audit the registrant’s financial statements for the most recent fiscal year were attributed to work performed by persons other than the principal accountant’s full-time, permanent employees.
(g) The aggregate fees billed for the most recent fiscal year and the preceding fiscal year by the registrant’s principal accountant for non-audit services rendered to the registrant, its investment adviser, and any entity controlling, controlled by, or under common control with the investment adviser that provides ongoing services to the registrant were $1,008,000 and $903,000, respectively, and were less than the aggregate fees billed for those same periods by the registrant’s principal accountant for audit services rendered to the T. Rowe Price Funds.
(h) All non-audit services rendered in (g) above were pre-approved by the registrant’s audit committee. Accordingly, these services were considered by the registrant’s audit committee in maintaining the principal accountant’s independence.Item 5. Audit Committee of Listed Registrants.
Not applicable.
Item 6. Schedule of Investments.
Not applicable. The complete schedule of investments is included in Item 1 of this Form N-CSR.
Item 7. Disclosure of Proxy Voting Policies and Procedures for Closed-End Management Investment Companies.
Not applicable.
Item 8. Portfolio Managers of Closed-End Management Investment Companies.
Not applicable.
Item 9. Purchases of Equity Securities by Closed-End Management Investment Company and Affiliated Purchasers.
Not applicable.
Item 10. Submission of Matters to a Vote of Security Holders.
Not applicable.
Item 11. Controls and Procedures.
(a) The registrant’s principal executive officer and principal financial officer have evaluated the registrant’s disclosure controls and procedures within 90 days of this filing and have concluded that the registrant’s disclosure controls and procedures were effective, as of that date, in ensuring that information required to be disclosed by the registrant in this Form N-CSR was recorded, processed, summarized, and reported timely.
(b) The registrant’s principal executive officer and principal financial officer are aware of no change in the registrant’s internal control over financial reporting that occurred during the registrant’s second fiscal quarter covered by this report that has materially affected, or is reasonably likely to materially affect, the registrant’s internal control over financial reporting.
Item 12. Exhibits.
(a)(1) The registrant’s code of ethics pursuant to Item 2 of Form N-CSR is attached.
(2) Separate certifications by the registrant's principal executive officer and principal financial officer, pursuant to Section 302 of the Sarbanes-Oxley Act of 2002 and required by Rule 30a-2(a) under the Investment Company Act of 1940, are attached.
(3) Written solicitation to repurchase securities issued by closed-end companies: not applicable.
(b) A certification by the registrant's principal executive officer and principal financial officer, pursuant to Section 906 of the Sarbanes-Oxley Act of 2002 and required by Rule 30a-2(b) under the Investment Company Act of 1940, is attached.
SIGNATURES | |
| Pursuant to the requirements of the Securities Exchange Act of 1934 and the Investment | |
| Company Act of 1940, the registrant has duly caused this report to be signed on its behalf by the | |
| undersigned, thereunto duly authorized. | |
| T. Rowe Price Diversified Mid-Cap Growth Fund, Inc. | |
| By | /s/ James S. Riepe |
| James S. Riepe | |
| Principal Executive Officer | |
| Date | February 21, 2006 |
| Pursuant to the requirements of the Securities Exchange Act of 1934 and the Investment | |
| Company Act of 1940, this report has been signed below by the following persons on behalf of | |
| the registrant and in the capacities and on the dates indicated. | |
| By | /s/ James S. Riepe |
| James S. Riepe | |
| Principal Executive Officer | |
| Date | February 21, 2006 |
| By | /s/ Joseph A. Carrier |
| Joseph A. Carrier | |
| Principal Financial Officer | |
| Date | February 21, 2006 |