Item 1: Report to Shareholders
 |
| Diversified Mid-Cap Growth Fund | December 31, 2006 |
The views and opinions in this report were current as of December 31, 2006. They are not guarantees of performance or investment results and should not be taken as investment advice. Investment decisions reflect a variety of factors, and the managers reserve the right to change their views about individual stocks, sectors, and the markets at any time. As a result, the views expressed should not be relied upon as a forecast of the fund’s future investment intent. The report is certified under the Sarbanes-Oxley Act, which requires mutual funds and other public companies to affirm that, to the best of their knowledge, the information in their financial reports is fairly and accurately stated in all material respects.
REPORTS ON THE WEB
Sign up for our E-mail Program, and you can begin to receive updated fund reports and prospectuses online rather than through the mail. Log in to your account at troweprice.com for more information.
Fellow Shareholders
Mid-cap growth stocks produced good returns in the second half of 2006, as the U.S. stock market completed its fourth consecutive year of gains since the end of the 2000–2002 bear market. Equities were lifted by substantial merger and leveraged buyout activity, continued strong corporate earnings growth despite an economic deceleration, and declining oil prices and long-term interest rates. Investors were also pleased that the Federal Reserve, which increased the federal funds target rate to 5.25% at the end of June, refrained from raising it further in anticipation that slower economic growth would allow inflation to moderate over time.
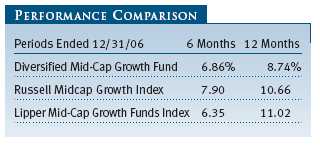
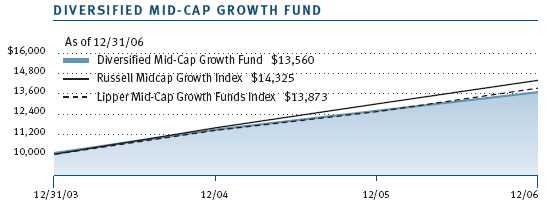
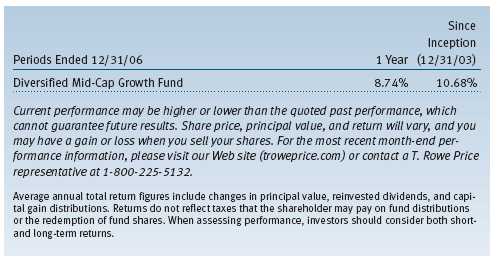
Your fund returned 6.86% in the second half of 2006 and 8.74% for the entire year. As shown in the Performance Comparison table, the fund did better than the Lipper peer group index but trailed the Russell Midcap Growth Index in the last six months. For the 12-month period, the fund lagged both benchmarks.
HIGHLIGHTS
• Mid-cap growth stocks produced good returns in the last six months, as the stock market completed its fourth consecutive positive year.
• Your fund did better than its Lipper peer group index but trailed the Russell Midcap Growth Index in the last six months.
• Growth stocks continued to lag value in 2006, but our steady investment approach is not predicated on timing a relative performance cycle. We think investing in high-quality growth companies at attractive valuations never goes out of style.
• Macroeconomic fundamentals currently appear to be favorable; during tougher market environments, we believe our strategy should provide much better capital preservation than more aggressive and speculative alternatives.
In the last six months, fund performance relative to other mid-cap growth portfolios was helped by favorable stock selection in the health care, information technology, and consumer staples sectors. Relative weakness among our energy, telecommunication services, and industrials and business services holdings reduced our performance advantage, as did our underweighting in the materials sector, which returned 31% within the Russell Midcap Growth Index in 2006. We do not own many materials companies because we focus on differentiated businesses and do not attempt to forecast the direction of commodity prices. In addition, we believe that materials stocks, having substantially outperformed other sectors over the last few years, will eventually experience a period of subpar performance as global economic growth moderates. Fund performance relative to the Russell index was helped by favorable stock selection in the consumer staples and industrials and business services sectors, but our performance advantage was eroded by relative weakness among our consumer discretionary and energy holdings.
Stock market activity in 2006 has been driven in part by speculative activity. Consider the following: lower-quality companies have outperformed better businesses; stocks that tend to be relatively stable have lagged more volatile equities; investors have been willing to embrace disproportionate risks in pursuit of higher returns; and merger and acquisition activity has reached a fevered pitch. Although some of our holdings have appreciated as a result of buyouts, the other factors have been somewhat disadvantageous to our strategy in the short run. As the economic expansion matures and investors become more mindful of investment risks, we believe they will increasingly favor what we favor: high-quality companies with solid fundamentals and great business models that can maintain strong earnings growth rates without a cyclical tailwind.
MARKET ENVIRONMENT
U.S. economic growth moderated significantly over the course of 2006. According to the latest data, the economy expanded at an annualized rate of 2.0% in the third quarter versus 2.6% in the second and 5.6% in the first. The slowdown reflected a cooler housing market, softer manufacturing activity, and some deceleration of consumer spending amid high energy costs, rising mortgage costs, and slower housing equity growth.
The overall rate of inflation has eased somewhat as oil and gas prices declined from their summer peaks, but “core” inflation (excluding food and energy prices) has remained above the stated comfort zone of Federal Reserve officials. Nevertheless, the central bank refrained from raising the fed funds rate in the last six months based on the moderation of U.S. economic growth and expectations that inflation will diminish over time. However, Fed officials believe that “some inflation risks remain” and have left open the possibility of additional rate increases.
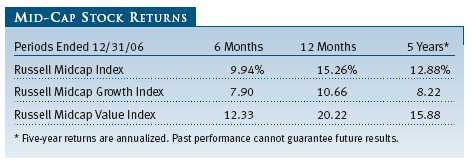
Mid-cap stocks lagged large-cap shares in the 6- and 12-month periods ended December 31, 2006—a reversal of their outperformance in 2005. In the last six months, the Russell Midcap Index returned 9.94% versus 12.74% for the large-cap S&P 500 Index. For all of 2006, the Russell Midcap Index rose 15.26% versus 15.79% for the S&P 500. As shown in the table above, mid-cap growth stocks substantially lagged their value counterparts during our fiscal year and over the last five years.
Over the last several years, value styles have dominated growth across all market capitalizations. Investors have been enamored with higher-yielding stocks, which have generated extraordinary relative returns. In addition, international indexes have trounced domestic benchmarks, and higher-quality companies have lagged materially. We forecast mean reversion regarding these performance patterns. The timing is impossible to forecast, but investors should always incorporate the level of risk assumed when assessing the prospect of anticipated returns. “Chasing performance”—buying asset classes that have already produced outstanding relative returns in the recent past—is rarely rewarding over longer periods. Our steady investment approach is not predicated on timing a relative performance cycle. We think investing in high-quality businesses at attractive valuations never goes out of style, but relative performance can be bumpy.
INVESTMENT STRATEGY
Before discussing the portfolio in detail, we would like to welcome new shareholders, thank all of our longer-term investors for their continuing confidence in our investment abilities, and review the investment strategy and principles that guide our management of the fund.
• The Diversified Mid-Cap Growth Fund invests in mid-cap stocks of companies whose earnings are expected to grow at an above-average rate. We define mid-cap companies as those whose market capitalization at the time of purchase falls within the range of either the S&P MidCap 400 Index or the Russell Midcap Growth Index.
• We intend to keep the fund fully invested because we believe that successful market timing is virtually impossible and that the costs associated with frequent trading reduce the likelihood of outperforming the market. We do not spend undue time worrying about short-term performance or trying to forecast the direction of the market. Our focus is to find mid-cap companies with the best long-term growth potential.
• Unlike other mid-cap growth portfolios that are highly concentrated, the Diversified Mid-Cap Growth Fund will typically invest in about 300 stocks. This high degree of diversification helps to mitigate the downside risk attributable to any single poorly performing security. It is notable that we are investing in companies that are early in their life cycles, and it is inevitable that some will not be as successful as we hope. Accordingly, we balance risk with potential returns.
• Stock selection is based on a combination of fundamental, bottom-up analysis and top-down quantitative strategies in an attempt to identify companies with superior long-term appreciation prospects. We use a growth approach, looking for companies with a demonstrated ability to increase revenues, earnings, and cash flow consistently; capable management; attractive business niches; and a sustainable competitive advantage. We favor companies with above-average earnings growth and lower earnings variability.
• Valuations are also very important: We look for the best relative values among companies with the strongest businesses and managements.
• We use a number of proprietary quantitative models to identify and evaluate the characteristics of individual mid-cap growth companies and the portfolio as a whole.
PORTFOLIO REVIEW
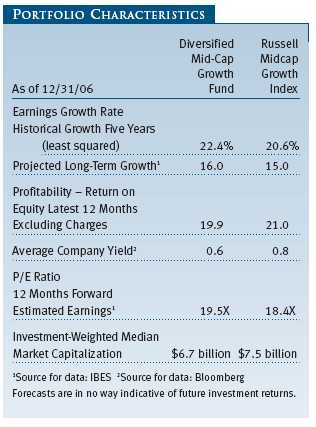
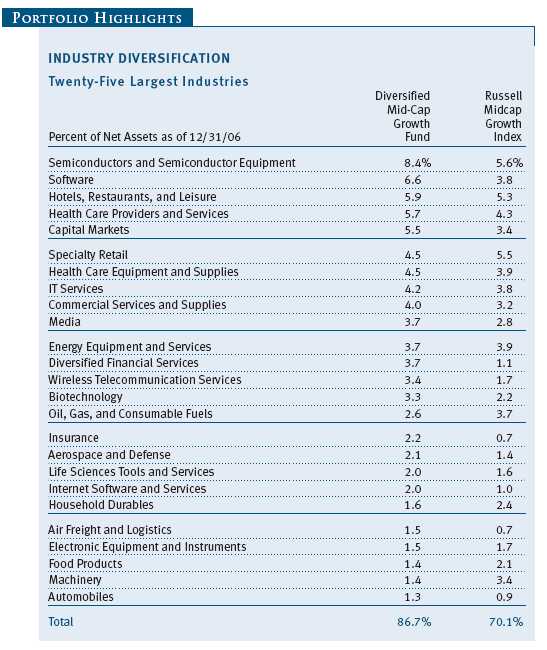
The Diversified Mid-Cap Growth Fund’s fundamental characteristics are similar to those of mid-cap growth benchmarks, such as the Russell Midcap Growth Index, as indicated by the Portfolio Characteristics table. The portfolio’s median market capitalization is similar to that of the index. Its average company yield (0.6%) is a bit lower than the benchmark’s, while its forward price/earnings (P/E) ratio (19.5X) and the projected earnings growth rate of our holdings (16.0%) are slightly higher. These attributes attest to our commitment to companies with excellent long-term growth prospects. The fund’s return on equity, which measures how effectively and efficiently a company and its management are using stockholder investments, is lower than that of the index but still very high. The index has a higher cyclical orientation, and, at this stage of the economic cycle, many companies are at or near peak levels of profitability. We continue to believe that the best long-term equity investments are companies with high and, at least as importantly, sustainable profitability.
Our sector allocations have some resemblance to those of the index, though we have a few strategic over- or underweightings. Our three largest sector commitments at year-end and six months ago were information technology, consumer discretionary, and health care. It is notable that information technology and health care are the two worst-performing sectors over the last five years. Accordingly, we have found many attractively valued companies with terrific longer-term prospects in these sectors. Investments in the industrials and business services, financials, and energy sectors are smaller. Exposure to the utilities, materials, consumer staples, and telecommunication services sectors remains low because those areas have relatively few mid-cap companies that meet our growth criteria.
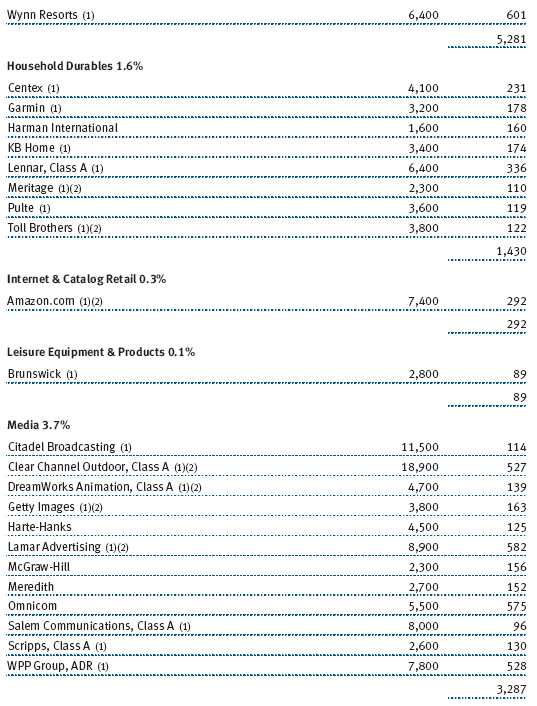
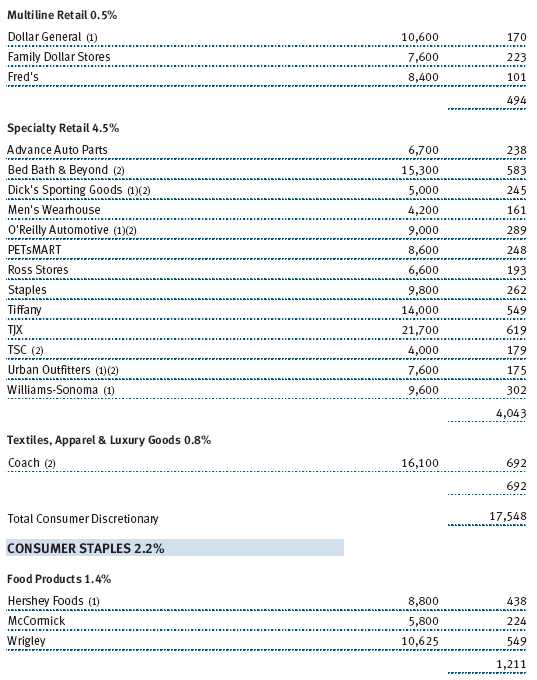
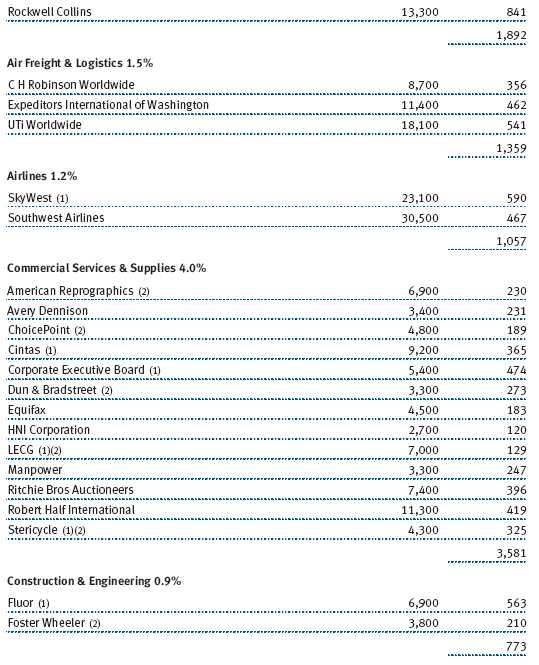
The consumer discretionary sector (19.6% of the fund’s net assets as of December 31) contributed the most to our performance in absolute terms in the last six months. We believe many companies in the sector have good business models, excellent cash flow, and other favorable fundamentals. Our specialty retailers did best, led by TJX. Hotel and gaming stocks were also very strong—especially Marriott, International Game Technology, and Wynn Resorts—as consumer spending was boosted by the dramatic decline in energy prices, and our industry overweighting helped our performance. Several gaming stocks performed exceptionally well, helped by excellent industry fundamentals, brisk expansion of gaming in the Chinese city of Macau, and leveraged buyout activity. Media stocks lagged somewhat but were also lifted by private equity buyouts as well as asset sales and cost cutting, as the industry continued to grapple with intense competition from Internet media. (Please refer to the fund’s portfolio of investments for a complete listing of the fund’s holdings and the amount each represents in the portfolio.)
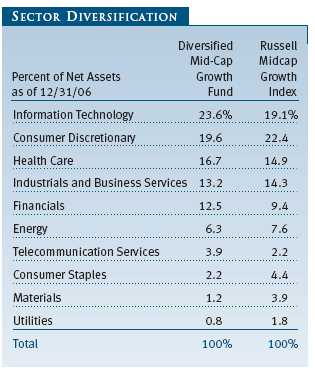
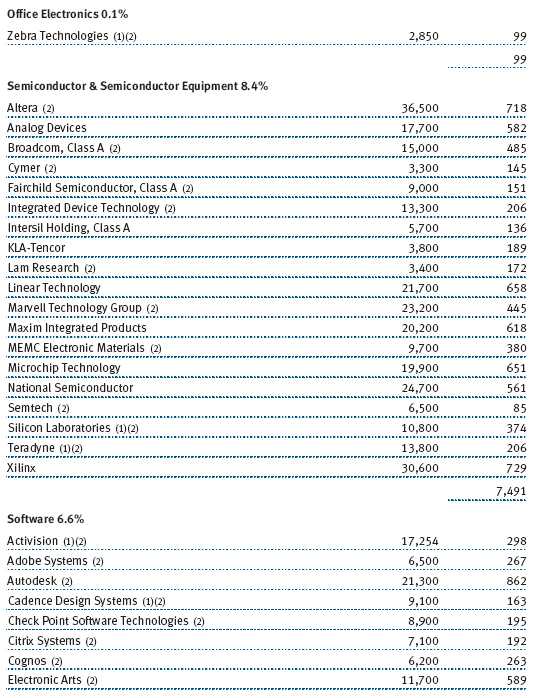
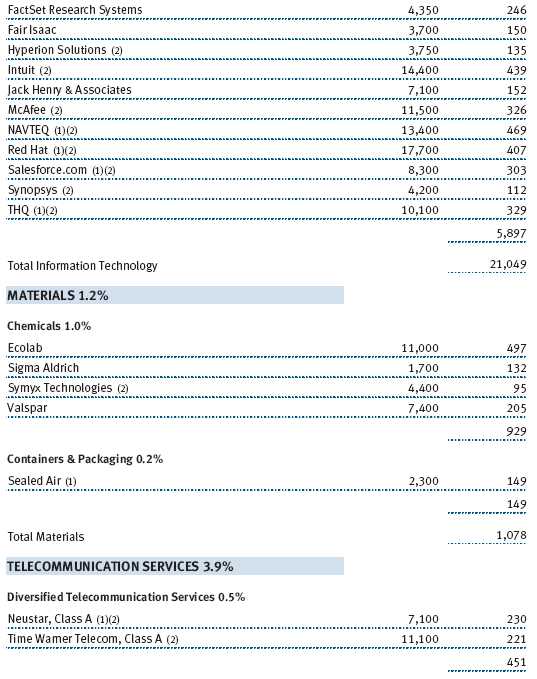
The information technology sector was our largest sector commitment at year-end, representing 23.6% of net assets, and we overweighted the sector relative to our benchmarks. We continued to emphasize tech companies with strong business models in industries with high barriers to entry and low risk of commoditization, which prompts us to maintain overweights in the software and semiconductor-related industries. Software stocks greatly helped our relative performance in the last six months, especially Adobe Systems, THQ, and Autodesk, which we recently added to the portfolio. Consumer demand for home video games and new systems has been a favorable tailwind for this segment of the software industry. In contrast, the performance of our semiconductor companies was generally lackluster. We were not rewarded for favoring companies with solid long-term prospects, good business models, and reasonable valuations. Linear Technology and Marvell Technology were two of our largest detractors in the entire portfolio.
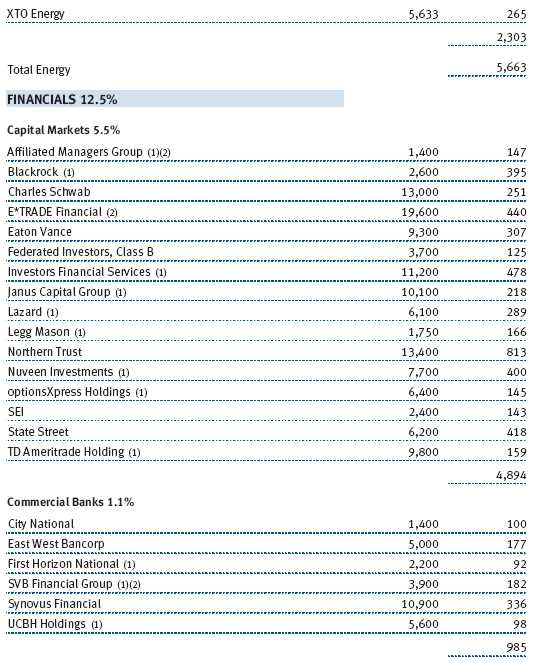
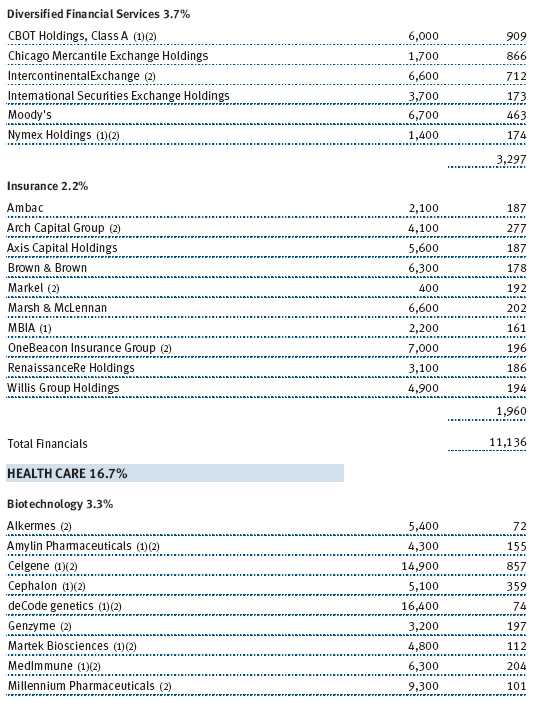
The financials sector (12.5% of net assets), which we overweighted versus the Russell benchmark, contributed materially to our gains in the last six months. Financial services companies performed very well, especially credit rating agency Moody’s and CBOT Holdings, the parent company of the Chicago Board of Trade. We added stocks of several companies that own various securities and commodities exchanges because we like their business models and long-term prospects. Capital markets companies, which we emphasized relative to our peers and our Russell benchmark, also did very well, benefiting from favorable market conditions. Asset managers and trust banks, such as Mellon Financial (which is merging with Bank of New York and which we sold in December) and longtime holdings Northern Trust and State Street, were among our largest contributors in this area. We continue to believe that such companies have excellent long-term prospects and a good risk-return trade-off. Insurance companies also produced good returns, helped by the dearth of disaster-related claims following a quiet 2006 Atlantic hurricane season. Although this year’s hurricane season was very modest, we invest only in disciplined underwriters such as Markel and Arch Capital Group.
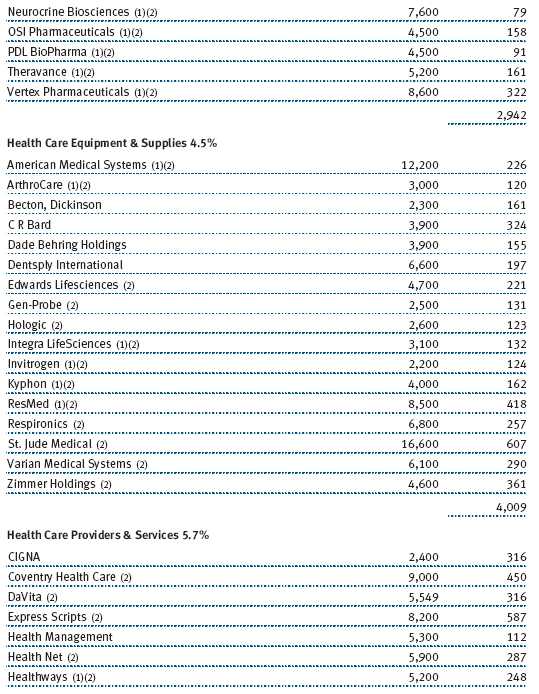
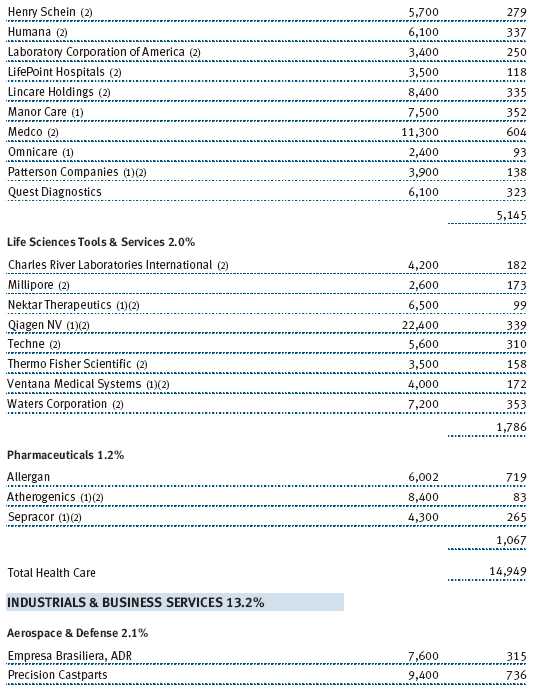
Health care stocks, which represented 16.7% of fund net assets and which we overweighted relative to our benchmarks, helped our performance in the second half of 2006. The sector lagged somewhat throughout the year, however, despite good underlying growth trends and reasonable valuations. Favorable stock selection among medical device makers, especially Biomet (which agreed to be acquired by a private equity group) and Zimmer Holdings, was key. Our biotechnology stocks also performed well, led by Celgene and Myogen, which we sold after the company agreed to be acquired by Gilead Sciences. We are well diversified in the biotech industry to reduce risk. Our providers and service companies were lackluster relative to other health care industries; hence, overweighting this industry limited our potential gains.
Industrials and business services stocks (13.2% of net assets) were also lackluster in the second half of our fiscal year, which is not surprising considering the economic deceleration throughout the year that tends to weigh on the performance of cyclical stocks. We underweighted the sector relative to the Russell benchmark because we felt that many stock valuations in the sector were expensive, following several years of robust performance. Given current valuations for most companies in the sector and their cyclicality, we find better opportunities elsewhere, and this proved to be advantageous. Nevertheless, our two airline holdings, SkyWest and Southwest, which feature strong balance sheets and solid business models in a brutal business, did not perform as well as other airline stocks with weaker fundamentals amid falling jet fuel prices and industry consolidation. In addition, the poor performance of two logistics companies—C H Robinson Worldwide and Expeditors International of Washington—was also disadvantageous. We maintained our positions because the long-term globalization trend should remain beneficial to these magnificently managed businesses.
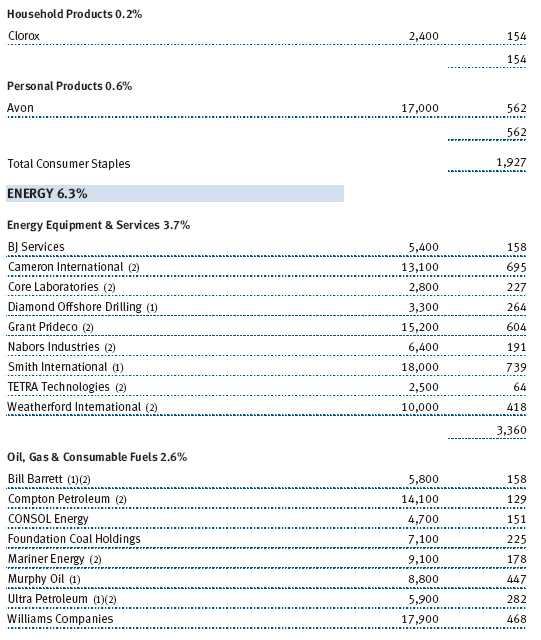
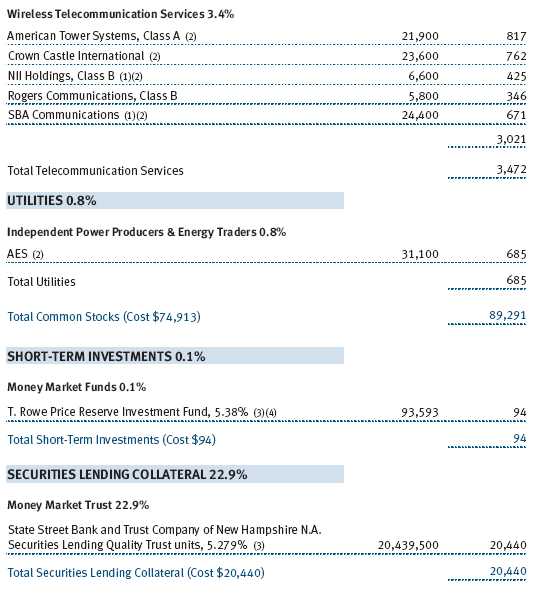
Energy stocks (6.3% of net assets) crumbled as oil prices declined from approximately $78 per barrel in mid-July to about $61 at year-end. In fact, the energy sector was the only sector in our portfolio that lost value. Our holdings generally performed worse than those held by other mid-cap growth portfolios, which also hurt the fund’s relative performance. Our exposure to the sector does not represent a “play” on commodity prices, and we do not attempt to predict price trends. Rather, we seek differentiated services companies or exploration companies with good production growth because we believe they are better long-term investments.
FUND DISTRIBUTIONS
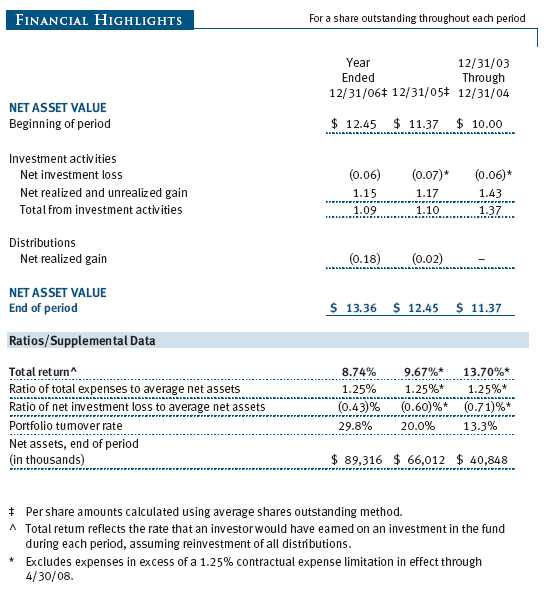
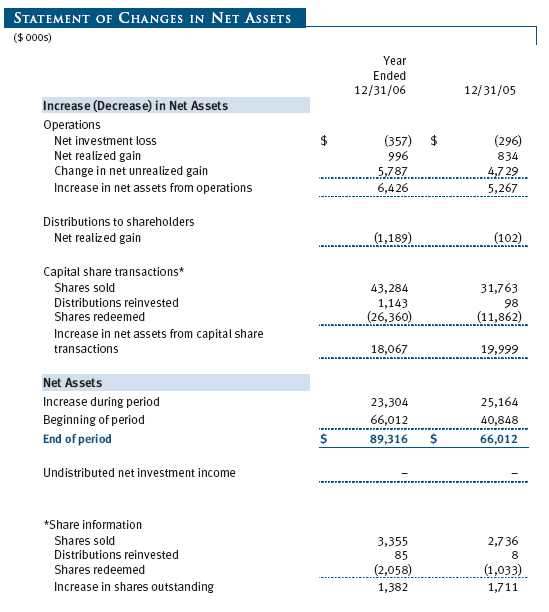
The fund’s Board of Directors declared a distribution of capital gains totaling $0.18 per share—$0.01822 for short-term gains and $0.16178 for long-term gains. These distributions are taxable to investors in non-retirement accounts, and by now you should have received your check or statement reflecting these distributions as well as Form 1099-DIV summarizing this information for 2006 tax purposes.
During 2006, the portfolio’s turnover rate was 29.8%, which is substantially less than the average of 109% for mid-cap growth funds, according to data from Morningstar. In addition, this means that our holding period for a typical stock is more than three years. Nevertheless, we do expect to make annual distributions.
Taxable investors might consider the T. Rowe Price Tax-Efficient Multi-Cap Growth Fund as an alternative investment. Like the Diversified Mid-Cap Growth Fund, the Tax-Efficient Multi-Cap Growth Fund focuses primarily on the mid- and small-cap segment and uses a similar investment process, but it is specifically managed to minimize taxable distributions to shareholders, and its objective is to produce the best possible long-term after-tax returns. In the Diversified Mid-Cap Growth Fund, we eliminate investments in good companies when their market capitalizations grow beyond that of a mid-cap company, whereas in the Tax-Efficient Multi-Cap Growth Fund, we will continue to hold such companies as long as they remain a good longer-term investment. Of course, there is no guarantee that the fund’s attempts to manage its portfolio in a tax-efficient manner will be successful. The fund is subject to market risk, including possible loss of principal.
For more information on this fund, please visit our Web site, www.troweprice.com, or call 1-800-225-5132 to request a prospectus or a briefer profile; each includes investment objectives, risks, fees, expenses, and other information that you should read and consider carefully before investing.
OUTLOOK
Macroeconomic fundamentals currently appear to be favorable. The economy seems to be expanding at a healthy but moderate pace, corporate profits remain strong, energy costs have fallen substantially from their peaks, and interest rates, though not as low as they were a few years ago, remain supportive. These factors should bode well for equities in the near term, though our investment horizon is much longer. The speculative activity we discussed earlier could continue for some time, but it will eventually end, most likely when risk-seeking behavior abates. History suggests that the longer it lasts, the more abrupt the transition back to more rational investment behavior and returns that are more consistent with long-term averages. Our strategy is steady and should provide much better capital preservation during tougher market environments than more aggressive and speculative alternatives.
Our outlook has not changed in the last six months. We still favor high-quality growth companies with solid fundamentals—such as strong business models and competent managements with a long-term orientation—that have the ability to grow their earnings at a strong or steady pace, even in tougher economic conditions. We will continue to balance risk and reward potential when seeking and analyzing current and prospective long-term investments for the fund. In addition, we believe that the fund’s relative performance will be better during more difficult periods for the equity markets, when investors are more mindful of risks.
Thank you for your confidence in T. Rowe Price.
Respectfully submitted,

Donald J. Peters
Chairman of the fund’s Investment Advisory Committee
January 18, 2007
The committee chairman has day-to-day responsibility for managing the portfolio and works with committee members in developing and executing the fund’s investment program.
RISKS OF INVESTING
As with all equity funds, this fund’s share price can fall because of weakness in the broad market, a particular industry, or specific holdings. The market as a whole can decline for many reasons, including adverse political or economic developments here or abroad, changes in investor psychology, or heavy institutional selling. The prospects for an industry or company may deteriorate because of a variety of factors, including disappointing earnings or changes in the competitive environment. In addition, our assessment of companies held in the fund may prove incorrect, resulting in losses or poor performance even in a rising market. Finally, the fund’s investment approach could fall out of favor with the investing public, resulting in lagging performance versus other types of stock funds.
The stocks of mid-cap companies entail greater risk and are usually more volatile than the shares of large companies. In addition, growth stocks can be volatile for several reasons. Since they usually reinvest a high proportion of earnings in their own businesses, they may lack the dividends usually associated with value stocks that can cushion their decline in a falling market. Also, since investors buy these stocks because of their expected superior earnings growth, earnings disappointments often result in sharp price declines.
Diversification cannot protect against loss in a declining market or assure a profit.
GLOSSARY
Fed funds target rate: An overnight lending rate set by the Federal Reserve and used by banks to meet reserve requirements. Banks also use the fed funds rate as a benchmark for their prime lending rates.
Lipper indexes: Consist of a small number (10 to 30) of the largest mutual funds in a particular category as tracked by Lipper Inc.
Price/earnings (P/E) ratio: A ratio that shows the “multiple” of earnings at which a stock is selling. It is calculated by dividing a stock’s current price by its current earnings per share. For example, if a stock’s price is $60 per share and the issuing company earns $2 per share, the P/E ratio is $60/$2, or 30.
Russell Midcap Index: Measures the performance of the 800 smallest companies in the Russell 1000 Index.
Russell Midcap Growth Index: Measures the performance of those Russell Midcap companies with higher price-to-book ratios and higher forecasted growth values. The stocks are also members of the Russell 1000 Growth Index.
Russell Midcap Value Index: Measures the performance of those Russell Midcap companies with lower price-to-book ratios and lower forecasted growth values. The stocks are also members of the Russell 1000 Value Index.
S&P MidCap 400 Index: An unmanaged index that tracks the stocks of 400 U.S. mid-cap companies.

| GROWTH OF $10,000 |
This chart shows the value of a hypothetical $10,000 investment in the fund over the past 10 fiscal year periods or since inception (for funds lacking 10-year records). The result is compared with benchmarks, which may include a broad-based market index and a peer group average or index. Market indexes do not include expenses, which are deducted from fund returns as well as mutual fund averages and indexes.
| AVERAGE ANNUAL COMPOUND TOTAL RETURN |
This table shows how the fund would have performed each year if its actual (or cumulative) returns for the periods shown had been earned at a constant rate.
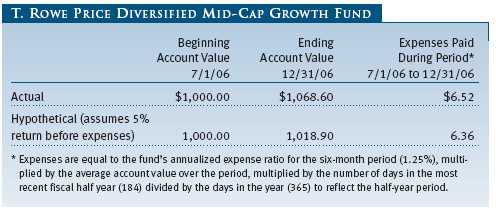
| FUND EXPENSE EXAMPLE |
As a mutual fund shareholder, you may incur two types of costs: (1) transaction costs, such as redemption fees or sales loads, and (2) ongoing costs, including management fees, distribution and service (12b-1) fees, and other fund expenses. The following example is intended to help you understand your ongoing costs (in dollars) of investing in the fund and to compare these costs with the ongoing costs of investing in other mutual funds. The example is based on an investment of $1,000 invested at the beginning of the most recent six-month period and held for the entire period.
Actual Expenses
The first line of the following table (“Actual”) provides information about actual account values and expenses based on the fund’s actual returns. You may use the information in this line, together with your account balance, to estimate the expenses that you paid over the period. Simply divide your account value by $1,000 (for example, an $8,600 account value divided by $1,000 = 8.6), then multiply the result by the number in the first line under the heading “Expenses Paid During Period” to estimate the expenses you paid on your account during this period.
Hypothetical Example for Comparison Purposes
The information on the second line of the table (“Hypothetical”) is based on hypothetical account values and expenses derived from the fund’s actual expense ratio and an assumed 5% per year rate of return before expenses (not the fund’s actual return). You may compare the ongoing costs of investing in the fund with other funds by contrasting this 5% hypothetical example and the 5% hypothetical examples that appear in the shareholder reports of the other funds. The hypothetical account values and expenses may not be used to estimate the actual ending account balance or expenses you paid for the period.
Note: T. Rowe Price charges an annual small-account maintenance fee of $10, generally for accounts with less than $2,000 ($500 for UGMA/UTMA). The fee is waived for any investor whose T. Rowe Price mutual fund accounts total $25,000 or more, accounts employing automatic investing, and IRAs and other retirement plan accounts that utilize a prototype plan sponsored by T. Rowe Price (although a separate custodial or administrative fee may apply to such accounts). This fee is not included in the accompanying table. If you are subject to the fee, keep it in mind when you are estimating the ongoing expenses of investing in the fund and when comparing the expenses of this fund with other funds.
You should also be aware that the expenses shown in the table highlight only your ongoing costs and do not reflect any transaction costs, such as redemption fees or sales loads. Therefore, the second line of the table is useful in comparing ongoing costs only and will not help you determine the relative total costs of owning different funds. To the extent a fund charges transaction costs, however, the total cost of owning that fund is higher.
The accompanying notes are an integral part of these financial statements.

The accompanying notes are an integral part of these financial statements.
The accompanying notes are an integral part of these financial statements.
The accompanying notes are an integral part of these financial statements.
The accompanying notes are an integral part of these financial statements.
| NOTES TO FINANCIAL STATEMENTS |
NOTE 1 - SIGNIFICANT ACCOUNTING POLICIES
T. Rowe Price Diversified Mid-Cap Growth Fund, Inc. (the fund), is registered under the Investment Company Act of 1940 (the 1940 Act) as a diversified, open-end management investment company. The fund commenced operations on December 31, 2003. The fund seeks to provide long-term capital growth by investing primarily in the common stocks of mid-cap growth companies.
The accompanying financial statements were prepared in accordance with accounting principles generally accepted in the United States of America, which require the use of estimates made by fund management. Fund management believes that estimates and security valuations are appropriate; however, actual results may differ from those estimates, and the security valuations reflected in the financial statements may differ from the value the fund ultimately realizes upon sale of the securities.
Valuation The fund values its investments and computes its net asset value per share at the close of the New York Stock Exchange (NYSE), normally 4 p.m. ET, each day that the NYSE is open for business. Equity securities listed or regularly traded on a securities exchange or in the over-the-counter (OTC) market are valued at the last quoted sale price or, for certain markets, the official closing price at the time the valuations are made, except for OTC Bulletin Board securities, which are valued at the mean of the latest bid and asked prices. A security that is listed or traded on more than one exchange is valued at the quotation on the exchange determined to be the primary market for such security. Listed securities not traded on a particular day are valued at the mean of the latest bid and asked prices for domestic securities and the last quoted sale price for international securities.
Investments in mutual funds are valued at the mutual fund’s closing net asset value per share on the day of valuation.
Other investments, including restricted securities, and those for which the above valuation procedures are inappropriate or are deemed not to reflect fair value are stated at fair value as determined in good faith by the T. Rowe Price Valuation Committee, established by the fund’s Board of Directors.
Most foreign markets close before the close of trading on the NYSE. If the fund determines that developments between the close of a foreign market and the close of the NYSE will, in its judgment, materially affect the value of some or all of its portfolio securities, which in turn will affect the fund’s share price, the fund will adjust the previous closing prices to reflect the fair value of the securities as of the close of the NYSE, as determined in good faith by the T. Rowe Price Valuation Committee, established by the fund’s Board of Directors. A fund may also fair value securities in other situations, such as when a particular foreign market is closed but the fund is open. In deciding whether to make fair value adjustments, the fund reviews a variety of factors, including developments in foreign markets, the performance of U.S. securities markets, and the performance of instruments trading in U.S. markets that represent foreign securities and baskets of foreign securities. The fund uses outside pricing services to provide it with closing market prices and information used for adjusting those prices. The fund cannot predict when and how often it will use closing prices and when it will adjust those prices to reflect fair value. As a means of evaluating its fair value process, the fund routinely compares closing market prices, the next day’s opening prices in the same markets, and adjusted prices.
Currency Translation Assets, including investments, and liabilities denominated in foreign currencies are translated into U.S. dollar values each day at the prevailing exchange rate, using the mean of the bid and asked prices of such currencies against U.S. dollars as quoted by a major bank. Purchases and sales of securities, income, and expenses are translated into U.S. dollars at the prevailing exchange rate on the date of the transaction. The effect of changes in foreign currency exchange rates on realized and unrealized security gains and losses is reflected as a component of security gains and losses.
Rebates and Credits Subject to best execution, the fund may direct certain security trades to brokers who have agreed to rebate a portion of the related brokerage commission to the fund in cash. Commission rebates are reflected as realized gain on securities in the accompanying financial statements. Additionally, the fund earns credits on temporarily uninvested cash balances at the custodian that reduce the fund’s custody charges. Custody expense in the accompanying financial statements is presented before reduction for credits.
Investment Transactions, Investment Income, and Distributions Income and expenses are recorded on the accrual basis. Dividends received from mutual fund investments are reflected as dividend income; capital gain distributions are reflected as realized gain/loss. Dividend income and capital gain distributions are recorded on the ex-dividend date. Investment transactions are accounted for on the trade date. Realized gains and losses are reported on the identified cost basis. Distributions to shareholders are recorded on the ex-dividend date. Income distributions are declared and paid on an annual basis. Capital gain distributions, if any, are declared and paid by the fund, typically on an annual basis.
New Accounting Pronouncements In June 2006, the Financial Accounting Standards Board (“FASB”) issued FASB Interpretation No. 48 (“FIN 48”), Accounting for Uncertainty in Income Taxes, a clarification of FASB Statement No. 109, Accounting for Income Taxes. FIN 48 establishes financial reporting rules regarding recognition and measurement of tax positions taken or expected to be taken on a tax return. Management is evaluating the anticipated impact, if any, that FIN 48 will have on the fund upon adoption, which, pursuant to a delay granted by the U.S. Securities and Exchange Commission, is expected to be on the last business day of the fund’s semi-annual period, June 29, 2007.
In September 2006, the FASB released the Statement of Financial Accounting Standard No. 157 (“FAS 157”), Fair Value Measurements. FAS 157 clarifies the definition of fair value and establishes the framework for measuring fair value, as well as proper disclosure of this methodology in the financial statements. It will be effective for the fund’s fiscal year beginning January 1, 2008. Management is evaluating the effects of FAS 157; however, it is not expected to have a material impact on the fund’s net assets or results of operations.
NOTE 2 - INVESTMENT TRANSACTIONS
Consistent with its investment objective, the fund engages in the following practices to manage exposure to certain risks or to enhance performance. The investment objective, policies, program, and risk factors of the fund are described more fully in the fund’s prospectus and Statement of Additional Information.
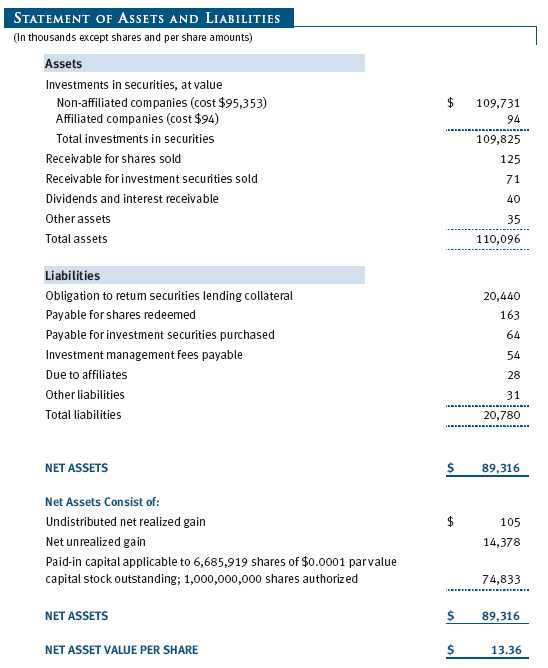
Securities Lending The fund lends its securities to approved brokers to earn additional income. It receives as collateral cash and U.S. government securities valued at 102% to 105% of the value of the securities on loan. Cash collateral is invested in a money market pooled trust managed by the fund’s lending agent in accordance with investment guidelines approved by fund management. Collateral is maintained over the life of the loan in an amount not less than the value of loaned securities, as determined at the close of fund business each day; any additional collateral required due to changes in security values is delivered to the fund the next business day. Although risk is mitigated by the collateral, the fund could experience a delay in recovering its securities and a possible loss of income or value if the borrower fails to return the securities. Securities lending revenue recognized by the fund consists of earnings on invested collateral and borrowing fees, net of any rebates to the borrower and compensation to the lending agent. At December 31, 2006, the value of loaned securities was $19,881,000; aggregate collateral consisted of $20,440,000 in the money market pooled trust.
Other Purchases and sales of portfolio securities, other than short-term securities, aggregated $41,559,000 and $24,596,000, respectively, for the year ended December 31, 2006.
NOTE 3 - FEDERAL INCOME TAXES
No provision for federal income taxes is required since the fund intends to continue to qualify as a regulated investment company under Subchapter M of the Internal Revenue Code and distribute to shareholders all of its taxable income and gains. Federal income tax regulations differ from generally accepted accounting principles; therefore, distributions determined in accordance with tax regulations may differ significantly in amount or character from net investment income and realized gains for financial reporting purposes. Financial reporting records are adjusted for permanent book/tax differences to reflect tax character. Financial records are not adjusted for temporary differences.
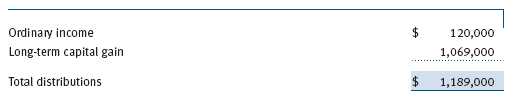
Distributions during the year ended December 31, 2006, were characterized as follows for tax purposes:
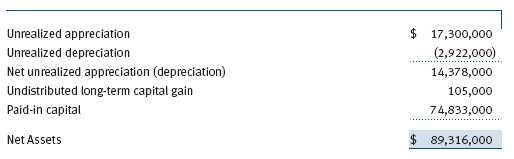
At December 31, 2006, the tax-basis components of net assets were as follows:
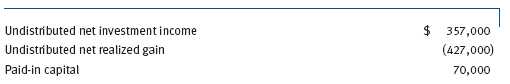
For the year ended December 31, 2006, the fund recorded the following permanent reclassifications to reflect tax character. Reclassifications to paid-in capital relate primarily to a tax practice that treats a portion of the proceeds from each redemption of capital shares as a distribution of taxable net investment income and/or realized capital gain. Reclassifications between income and gain relate primarily to the offset of the current net operating loss against realized gains. Results of operations and net assets were not affected by these reclassifications.
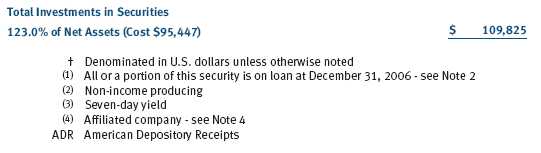
At December 31, 2006, the cost of investments for federal income tax purposes was $95,447,000.
NOTE 4 - RELATED PARTY TRANSACTIONS
The fund is managed by T. Rowe Price Associates, Inc. (the manager or Price Associates), a wholly owned subsidiary of T. Rowe Price Group, Inc. The investment management agreement between the fund and the manager provides for an annual investment management fee, which is computed daily and paid monthly. The fee consists of an individual fund fee, equal to 0.35% of the fund’s average daily net assets, and a group fee. The group fee rate is calculated based on the combined net assets of certain mutual funds sponsored by Price Associates (the group) applied to a graduated fee schedule, with rates ranging from 0.48% for the first $1 billion of assets to 0.29% for assets in excess of $160 billion. The fund’s group fee is determined by applying the group fee rate to the fund’s average daily net assets. At December 31, 2006, the effective annual group fee rate was 0.31%.
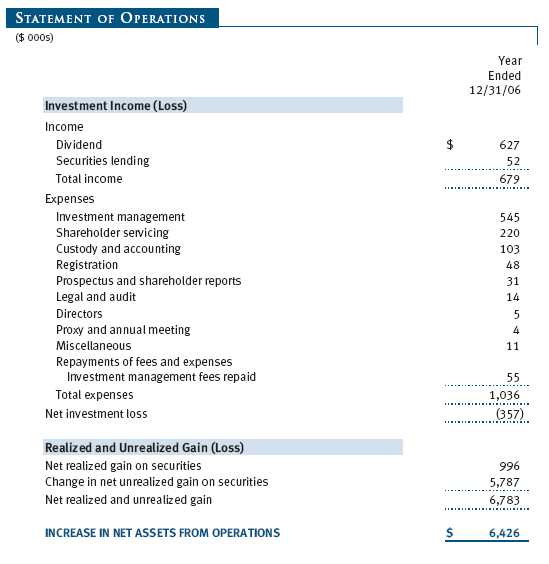
The fund is also subject to a contractual expense limitation through April 30, 2008. During the limitation period, the manager is required to waive its management fee and reimburse the fund for any expenses, excluding interest, taxes, brokerage commissions, and extraordinary expenses, that would otherwise cause the fund’s ratio of total expenses to average net assets (expense ratio) to exceed its expense limitation of 1.25% . For a period of three years after the date of any reimbursement or waiver, the fund is required to repay the manager for expenses previously reimbursed and management fees waived to the extent its net assets have grown or expenses have declined sufficiently to allow repayment without causing the fund’s expense ratio to exceed its expense limitation. Pursuant to this agreement, management fees in the amount of $55,000 were repaid during the year ended December 31, 2006. Management fees waived in the amount of $140,000 remain subject to repayment at December 31, 2006.
In addition, the fund has entered into service agreements with Price Associates and two wholly owned subsidiaries of Price Associates (collectively, Price). Price Associates computes the daily share price and provides certain other administrative services to the fund. T. Rowe Price Services, Inc., provides shareholder and administrative services in its capacity as the fund’s transfer and dividend disbursing agent. T. Rowe Price Retirement Plan Services, Inc., provides subaccounting and recordkeeping services for certain retirement accounts invested in the fund. For the year ended December 31, 2006, expenses incurred pursuant to these service agreements were $68,000 for Price Associates, $174,000 for T. Rowe Price Services, Inc., and $0 for T. Rowe Price Retirement Plan Services, Inc. The total amount payable at period-end pursuant to these service agreements is reflected as Due to Affiliates in the accompanying financial statements.
The fund may invest in the T. Rowe Price Reserve Investment Fund and the T. Rowe Price Government Reserve Investment Fund (collectively, the T. Rowe Price Reserve Funds), open-end management investment companies managed by Price Associates and affiliates of the fund. The T. Rowe Price Reserve Funds are offered as cash management options to mutual funds, trusts, and other accounts managed by Price Associates and/or its affiliates, and are not available for direct purchase by members of the public. The T. Rowe Price Reserve Funds pay no investment management fees. During the year ended December 31, 2006, dividend income from the T. Rowe Price Reserve Funds totaled $19,000, and the value of shares of the T. Rowe Price Reserve Funds held at December 31, 2006, and December 31, 2005, was $94,000 and $986,000, respectively.
As of December 31, 2006, T. Rowe Price Group, Inc., and/or its wholly owned subsidiaries owned 152,246 shares of the fund, representing 2% of the fund’s net assets.
| REPORT OF INDEPENDENT REGISTERED PUBLIC ACCOUNTING FIRM |
To the Board of Directors and Shareholders of T. Rowe Price Diversified Mid-Cap Growth Fund, Inc.
In our opinion, the accompanying statement of assets and liabilities, including the portfolio of investments, and the related statements of operations and of changes in net assets and the financial highlights present fairly, in all material respects, the financial position of T. Rowe Price Diversified Mid-Cap Growth Fund, Inc. (the “Fund”) at December 31, 2006, the results of its operations for the year then ended, the changes in its net assets for each of the two years in the period then ended and the financial highlights for each of the fiscal periods presented, in conformity with accounting principles generally accepted in the United States of America. These financial statements and financial highlights (hereafter referred to as “financial statements”) are the responsibility of the Fund’s management; our responsibility is to express an opinion on these financial statements based on our audits. We conducted our audits of these financial statements in accordance with the auditing standards of the Public Company Accounting Oversight Board (United States). Those standards require that we plan and perform the audit to obtain reasonable assurance about whether the financial statements are free of material misstatement. An audit includes examining, on a test basis, evidence supporting the amounts and disclosures in the financial statements, assessing the accounting principles used and significant estimates made by management, and evaluating the overall financial statement presentation. We believe that our audits, which included confirmation of securities at December 31, 2006 by correspondence with the custodian and by agreement to the underlying ownership records for T. Rowe Price Reserve Investment Fund, provide a reasonable basis for our opinion.
PricewaterhouseCoopers LLP
Baltimore, Maryland
February 12, 2007
| TAX INFORMATION (UNAUDITED) FOR THE TAX YEAR ENDED 12/31/06 |
We are providing this information as required by the Internal Revenue Code. The amounts shown may differ from those elsewhere in this report because of differences between tax and financial reporting requirements.
The fund’s distributions to shareholders included:
• $120,000 from short-term capital gains,
• $1,139,000 from long-term capital gains, subject to the 15% rate gains category.
For taxable non-corporate shareholders, $120,000 of the fund’s income represents qualified dividend income subject to the 15% rate category.
For corporate shareholders, $120,000 of the fund’s income qualifies for the dividends-received deduction.
| INFORMATION ON PROXY VOTING POLICIES, PROCEDURES, AND RECORDS |
A description of the policies and procedures used by T. Rowe Price funds and portfolios to determine how to vote proxies relating to portfolio securities is available in each fund’s Statement of Additional Information, which you may request by calling 1-800-225-5132 or by accessing the SEC’s Web site, www.sec.gov. The description of our proxy voting policies and procedures is also available on our Web site, www.troweprice.com. To access it, click on the words “Company Info” at the top of our homepage for individual investors. Then, in the window that appears, click on the “Proxy Voting Policy” navigation button in the top left corner.
Each fund’s most recent annual proxy voting record is available on our Web site and through the SEC’s Web site. To access it through our Web site, follow the directions above, then click on the words “Proxy Voting Record” at the bottom of the Proxy Voting Policy page.
| HOW TO OBTAIN QUARTERLY PORTFOLIO HOLDINGS |
The fund files a complete schedule of portfolio holdings with the Securities and Exchange Commission for the first and third quarters of each fiscal year on Form N-Q. The fund’s Form N-Q is available electronically on the SEC’s Web site (www.sec.gov); hard copies may be reviewed and copied at the SEC’s Public Reference Room, 450 Fifth St. N.W., Washington, DC 20549. For more information on the Public Reference Room, call 1-800-SEC-0330.
| ABOUT THE FUND’S DIRECTORS AND OFFICERS |
Your fund is governed by a Board of Directors that meets regularly to review a wide variety of matters affecting the fund, including performance, investment programs, compliance matters, advisory fees and expenses, service providers, and other business affairs. The Board of Directors elects the fund’s officers, who are listed in the final table. At least 75% of Board members are independent of T. Rowe Price Associates, Inc. (T. Rowe Price), and T. Rowe Price International, Inc. (T. Rowe Price International); “inside” or “interested” directors are officers of T. Rowe Price. The business address of each director and officer is 100 East Pratt Street, Baltimore, Maryland 21202. The Statement of Additional Information includes additional information about the fund directors and is available without charge by calling a T. Rowe Price representative at 1-800-225-5132.
| Independent Directors | |
| Name | |
| (Year of Birth) | Principal Occupation(s) During Past 5 Years and |
| Year Elected* | Directorships of Other Public Companies |
| Jeremiah E. Casey | Director, Allfirst Financial Inc. (previously First Maryland Bankcorp) |
| (1940) | (1983 to 2002); Director, National Life Insurance (2001 to 2005); |
| 2005 | Director, The Rouse Company, real estate developers (1990 to 2004) |
| Anthony W. Deering | Chairman, Exeter Capital, LLC, a private investment firm (2004 to |
| (1945) | present); Director, Vornado Real Estate Investment Trust (3/04 to |
| 2003 | present); Director, Mercantile Bankshares (4/03 to present); Member, |
| Advisory Board, Deutsche Bank North America (2004 to present); | |
| Director, Chairman of the Board, and Chief Executive Officer, The | |
| Rouse Company, real estate developers (1997 to 2004) | |
| Donald W. Dick, Jr. | Principal, EuroCapital Advisors, LLC, an acquisition and management |
| (1943) | advisory firm; Chairman, President, and Chief Executive Officer, The |
| 2003 | Haven Group, a custom manufacturer of modular homes (1/04 to |
| present) | |
| David K. Fagin | Chairman and President, Nye Corporation (6/88 to present); Director, |
| (1938) | Canyon Resources Corp., Golden Star Resources Ltd. (5/92 to present), |
| 2003 | and Pacific Rim Mining Corp. (2/02 to present) |
| Karen N. Horn | Director, Federal National Mortgage Association (9/06 to present); |
| (1943) | Managing Director and President, Global Private Client Services, |
| 2003 | Marsh Inc. (1999 to 2003); Director, Georgia Pacific (5/04 to 12/05), |
| Eli Lilly and Company, and Simon Property Group | |
| Theo C. Rodgers | President, A&R Development Corporation |
| (1941) | |
| 2005 | |
| John G. Schreiber | Owner/President, Centaur Capital Partners, Inc., a real estate invest- |
| (1946) | ment company; Partner, Blackstone Real Estate Advisors, L.P. |
| 2003 | |
* Each independent director oversees 115 T. Rowe Price portfolios and serves until retirement, resignation, or election of a successor.
| Inside Directors | |
| Name | |
| (Year of Birth) | |
| Year Elected* | |
| [Number of T. Rowe Price | Principal Occupation(s) During Past 5 Years and |
| Portfolios Overseen] | Directorships of Other Public Companies |
| Edward C. Bernard | Director and Vice President, T. Rowe Price and T. Rowe Price Group, |
| (1956) | Inc.; Chairman of the Board, Director, and President, T. Rowe Price |
| 2006 | Investment Services, Inc.; Chairman of the Board and Director, T. Rowe |
| [115] | Price International, Inc., T. Rowe Price Retirement Plan Services, Inc., |
| T. Rowe Price Services, Inc., and T. Rowe Price Savings Bank; Director, | |
| T. Rowe Price Global Asset Management Limited and T. Rowe Price | |
| Global Investment Services Limited; Chief Executive Officer, Chairman | |
| of the Board, Director, and President, T. Rowe Price Trust Company; | |
| Chairman of the Board, all funds | |
| John H. Laporte | Vice President, T. Rowe Price, T. Rowe Price Group, Inc., and T. Rowe |
| (1945) | Price Trust Company |
| 2006 | |
| [15] | |
| * Each inside director serves until retirement, resignation, or election of a successor. | |
| Officers | |
| Name (Year of Birth) | |
| Title and Fund(s) Served | Principal Occupation(s) |
| Joseph A. Carrier, CPA (1960) | Vice President, T. Rowe Price, T. Rowe Price |
| Treasurer, Diversified Mid-Cap Growth Fund | Group, Inc., T. Rowe Price Investment Services, |
| Inc., and T. Rowe Price Trust Company | |
| Donald J. Easley, CFA (1971) | Vice President, T. Rowe Price and T. Rowe Price |
| Vice President, Diversified Mid-Cap | Group, Inc. |
| Growth Fund | |
| Roger L. Fiery III, CPA (1959) | Vice President, T. Rowe Price, T. Rowe Price |
| Vice President, Diversified Mid-Cap | Group, Inc., T. Rowe Price International, Inc., |
| Growth Fund | and T. Rowe Price Trust Company |
| John R. Gilner (1961) | Chief Compliance Officer and Vice President, |
| Chief Compliance Officer, Diversified Mid-Cap | T. Rowe Price; Vice President, T. Rowe Price |
| Growth Fund | Group, Inc., and T. Rowe Price Investment |
| Services, Inc. | |
| Gregory S. Golczewski (1966) | Vice President, T. Rowe Price and T. Rowe Price |
| Vice President, Diversified Mid-Cap | Trust Company |
| Growth Fund | |
| Henry H. Hopkins (1942) | Director and Vice President, T. Rowe Price |
| Vice President, Diversified Mid-Cap | Investment Services, Inc., T. Rowe Price |
| Growth Fund | Services, Inc., and T. Rowe Price Trust Company; |
| Vice President, T. Rowe Price, T. Rowe Price | |
| Group, Inc., T. Rowe Price International, Inc., | |
| and T. Rowe Price Retirement Plan Services, Inc. | |
| Patricia B. Lippert (1953) | Assistant Vice President, T. Rowe Price and |
| Secretary, Diversified Mid-Cap Growth Fund | T. Rowe Price Investment Services, Inc. |
| Sudhir Nanda, Ph.D., CFA (1959) | Vice President, T. Rowe Price and T. Rowe Price |
| Vice President, Diversified Mid-Cap | Group, Inc. |
| Growth Fund | |
| Philip A. Nestico (1976) | Vice President, T. Rowe Price |
| Vice President, Diversified Mid-Cap | |
| Growth Fund | |
| Donald J. Peters (1959) | Vice President, T. Rowe Price and T. Rowe Price |
| President, Diversified Mid-Cap Growth Fund | Group, Inc. |
| John F. Wakeman (1962) | Vice President, T. Rowe Price and T. Rowe Price |
| Vice President, Diversified Mid-Cap | Group, Inc. |
| Growth Fund | |
| Julie L. Waples (1970) | Vice President, T. Rowe Price |
| Vice President, Diversified Mid-Cap | |
| Growth Fund | |
| Mark R. Weigman, CFA, CIC (1962) | Vice President, T. Rowe Price, T. Rowe Price |
| Vice President, Diversified Mid-Cap | Group, Inc., and T. Rowe Price Trust Company |
| Growth Fund | |
Unless otherwise noted, officers have been employees of T. Rowe Price or T. Rowe Price International for at least five years.
Item 2. Code of Ethics.
The registrant has adopted a code of ethics, as defined in Item 2 of Form N-CSR, applicable to its principal executive officer, principal financial officer, principal accounting officer or controller, or persons performing similar functions. A copy of this code of ethics is filed as an exhibit to this Form N-CSR. No substantive amendments were approved or waivers were granted to this code of ethics during the period covered by this report.
Item 3. Audit Committee Financial Expert.
The registrant’s Board of Directors/Trustees has determined that Mr. Donald W. Dick Jr. qualifies as an audit committee financial expert, as defined in Item 3 of Form N-CSR. Mr. Dick is considered independent for purposes of Item 3 of Form N-CSR.
Item 4. Principal Accountant Fees and Services.
(a) – (d) Aggregate fees billed to the registrant for the last two fiscal years for professional services rendered by the registrant’s principal accountant were as follows:
Audit fees include amounts related to the audit of the registrant’s annual financial statements and services normally provided by the accountant in connection with statutory and regulatory filings. Audit-related fees include amounts reasonably related to the performance of the audit of the registrant’s financial statements and specifically include the issuance of a report on internal controls and, if applicable for 2006, agreed-upon procedures related to fund acquisitions. Tax fees include amounts related to services for tax compliance, tax planning, and tax advice. The nature of these services specifically includes the review of distribution calculations and the preparation of Federal, state, and excise tax returns. Reclassification from tax fees to audit fees of fiscal 2005 amounts related to the auditing of tax disclosures within the registrant’s annual financial statements has been made in order to conform to fiscal 2006 presentation. All other fees include the registrant’s pro-rata share of amounts for agreed-upon procedures in conjunction with service contract approvals by the registrant’s Board of Directors/Trustees.
(e)(1) The registrant’s audit committee has adopted a policy whereby audit and non-audit services performed by the registrant’s principal accountant for the registrant, its investment adviser, and any entity controlling, controlled by, or under common control with the investment adviser that provides ongoing services to the registrant require pre-approval in advance at regularly scheduled audit committee meetings. If such a service is required between regularly scheduled audit committee meetings, pre-approval may be authorized by one audit committee member with ratification at the next scheduled audit committee meeting. Waiver of pre-approval for audit or non-audit services requiring fees of a de minimis amount is not permitted.
(2) No services included in (b) – (d) above were approved pursuant to paragraph (c)(7)(i)(C) of Rule 2-01 of Regulation S-X.
(f) Less than 50 percent of the hours expended on the principal accountant’s engagement to audit the registrant’s financial statements for the most recent fiscal year were attributed to work performed by persons other than the principal accountant’s full-time, permanent employees.
(g) The aggregate fees billed for the most recent fiscal year and the preceding fiscal year by the registrant’s principal accountant for non-audit services rendered to the registrant, its investment adviser, and any entity controlling, controlled by, or under common control with the investment adviser that provides ongoing services to the registrant were $1,401,000 and $883,000, respectively, and were less than the aggregate fees billed for those same periods by the registrant’s principal accountant for audit services rendered to the T. Rowe Price Funds. Preceding fiscal year amount reflects the reclassification of tax fees described in (a) – (d) above.
(h) All non-audit services rendered in (g) above were pre-approved by the registrant’s audit committee. Accordingly, these services were considered by the registrant’s audit committee in maintaining the principal accountant’s independence.Item 5. Audit Committee of Listed Registrants.
Not applicable.
Item 6. Schedule of Investments.
Not applicable. The complete schedule of investments is included in Item 1 of this Form N-CSR.
Item 7. Disclosure of Proxy Voting Policies and Procedures for Closed-End Management Investment Companies.
Not applicable.
Item 8. Portfolio Managers of Closed-End Management Investment Companies.
Not applicable.
Item 9. Purchases of Equity Securities by Closed-End Management Investment Company and Affiliated Purchasers.
Not applicable.
Item 10. Submission of Matters to a Vote of Security Holders.
Not applicable.
Item 11. Controls and Procedures.
(a) The registrant’s principal executive officer and principal financial officer have evaluated the registrant’s disclosure controls and procedures within 90 days of this filing and have concluded that the registrant’s disclosure controls and procedures were effective, as of that date, in ensuring that information required to be disclosed by the registrant in this Form N-CSR was recorded, processed, summarized, and reported timely.
(b) The registrant’s principal executive officer and principal financial officer are aware of no change in the registrant’s internal control over financial reporting that occurred during the registrant’s second fiscal quarter covered by this report that has materially affected, or is reasonably likely to materially affect, the registrant’s internal control over financial reporting.
Item 12. Exhibits.
(a)(1) The registrant’s code of ethics pursuant to Item 2 of Form N-CSR is attached.
(2) Separate certifications by the registrant's principal executive officer and principal financial officer, pursuant to Section 302 of the Sarbanes-Oxley Act of 2002 and required by Rule 30a-2(a) under the Investment Company Act of 1940, are attached.
(3) Written solicitation to repurchase securities issued by closed-end companies: not applicable.
(b) A certification by the registrant's principal executive officer and principal financial officer, pursuant to Section 906 of the Sarbanes-Oxley Act of 2002 and required by Rule 30a-2(b) under the Investment Company Act of 1940, is attached.
SIGNATURES | |
| Pursuant to the requirements of the Securities Exchange Act of 1934 and the Investment | |
| Company Act of 1940, the registrant has duly caused this report to be signed on its behalf by the | |
| undersigned, thereunto duly authorized. | |
| T. Rowe Price Diversified Mid-Cap Growth Fund, Inc. | |
| By | /s/ Edward C. Bernard |
| Edward C. Bernard | |
| Principal Executive Officer | |
| Date | February 16, 2007 |
| Pursuant to the requirements of the Securities Exchange Act of 1934 and the Investment | |
| Company Act of 1940, this report has been signed below by the following persons on behalf of | |
| the registrant and in the capacities and on the dates indicated. | |
| By | /s/ Edward C. Bernard |
| Edward C. Bernard | |
| Principal Executive Officer | |
| Date | February 16, 2007 |
| By | /s/ Joseph A. Carrier |
| Joseph A. Carrier | |
| Principal Financial Officer | |
| Date | February 16, 2007 |