UNITED STATES
SECURITIES AND EXCHANGE COMMISSION
Washington, D.C. 20549
FORM N-CSR
CERTIFIED SHAREHOLDER REPORT OF REGISTERED
MANAGEMENT INVESTMENT COMPANIES
Investment Company Act File Number: 811-21454
| T. Rowe Price Diversified Mid-Cap Growth Fund, Inc. |
|
| (Exact name of registrant as specified in charter) |
| |
| 100 East Pratt Street, Baltimore, MD 21202 |
|
| (Address of principal executive offices) |
| |
| David Oestreicher |
| 100 East Pratt Street, Baltimore, MD 21202 |
|
| (Name and address of agent for service) |
Registrant’s telephone number, including area code: (410) 345-2000
Date of fiscal year end: December 31
Date of reporting period: December 31, 2015
Item 1. Report to Shareholders
| Diversified Mid-Cap Growth Fund | December 31, 2015 |
The views and opinions in this report were current as of December 31, 2015. They are not guarantees of performance or investment results and should not be taken as investment advice. Investment decisions reflect a variety of factors, and the managers reserve the right to change their views about individual stocks, sectors, and the markets at any time. As a result, the views expressed should not be relied upon as a forecast of the fund’s future investment intent. The report is certified under the Sarbanes-Oxley Act, which requires mutual funds and other public companies to affirm that, to the best of their knowledge, the information in their financial reports is fairly and accurately stated in all material respects.
REPORTS ON THE WEB
Sign up for our E-mail Program, and you can begin to receive updated fund reports and prospectuses online rather than through the mail. Log in to your account at troweprice.com for more information.
Manager’s Letter
Fellow Shareholders
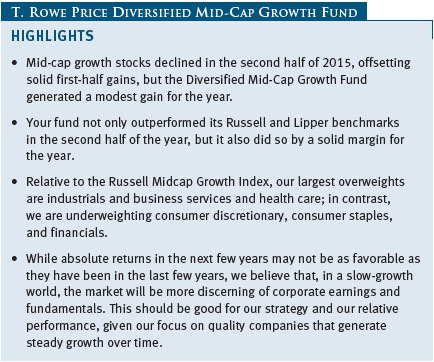
Mid-cap growth stocks declined in the second half of 2015, offsetting solid first-half gains, but the Diversified Mid-Cap Growth Fund generated a modest gain for the year. Equities fell sharply around the world during the summer in response to a plunge in Chinese stocks, which stemmed from China’s decelerating economy and uncertainty regarding Chinese policy responses. Crumbling crude oil and commodity prices added to worries about slowing global growth. The U.S. economic expansion was largely unfazed by the global turmoil, however, and domestic stocks rebounded somewhat in the final months of the year.
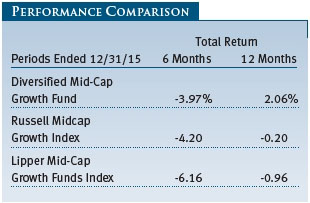
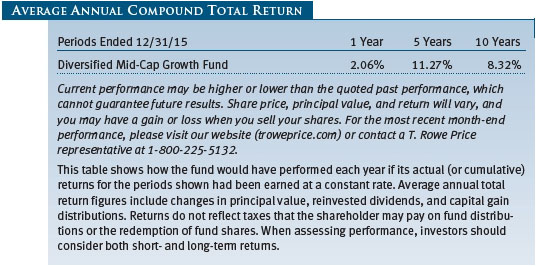
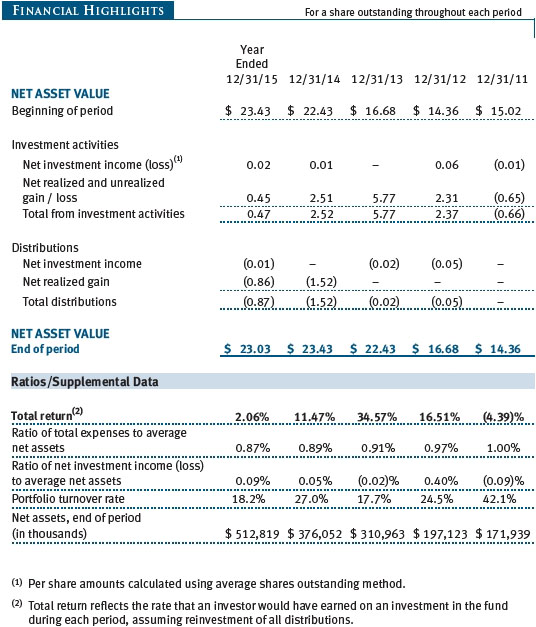
Your fund returned -3.97% in the last six months of 2015 and 2.06% for the full year. As shown in the Performance Comparison table, the fund fell less than its Russell and Lipper benchmarks in the second half of the year and outperformed the indexes by a solid margin for the year.
Stock selection drove the fund’s outperformance versus the Russell index over the last year, particularly in the information technology and health care sectors. Stock selection in the energy sector—though a very small part of the fund and the benchmark—was also a big contributor, as our holdings outperformed those in the index. On the other hand, stock selection among consumer staples and industrials and business services companies eroded our performance advantage. Also, sector allocations had a marginal negative impact on our relative performance.
The fund’s longer-term performance versus its competitors has been favorable, and we attribute our success to our analysts, whose rigorous research and ongoing analysis help us find and invest in mid-cap growth companies with solid long-term prospects and other attractive attributes. Lipper ranked the Diversified Mid-Cap Growth Fund in the top quartile of the mid-cap growth funds universe for the 1-, 5-, and 10-year periods ended December 31, 2015. Lipper also ranked the fund in the top quintile for the three-year period. Based on cumulative total return, Lipper ranked the fund 84 of 397, 62 of 342, 73 of 313, and 53 of 221 mid-cap growth funds for the 1-, 3-, 5-, and 10-year periods ended December 31, 2015, respectively. (Results may vary for other periods. Past performance cannot guarantee future results.)
MARKET ENVIRONMENT
Although the domestic economy expanded slowly in 2015, the U.S. was an outlier in a generally stagnant global economy. Job growth has been solid throughout 2015, averaging more than 200,000 per month, and the national unemployment rate has fallen to 5.0%, its lowest level since 2008. While inflation has been very low and is likely to remain low in the near term due to declining oil and other commodity prices, Federal Reserve officials decided to raise short-term rates on December 16 because of labor market improvement and their confidence that inflation will return to 2% over the medium term. The pace of rate hikes is likely to be gradual by historical standards.
Outside of the beleaguered energy and materials sectors, U.S. corporations are financially strong, though year-over-year earnings growth has been negative in recent quarters. While corporate leverage (debt) has increased, balance sheets are generally healthy, providing businesses with flexibility to increase capital spending, return capital to shareholders through dividends and stock buybacks, or pursue mergers and acquisitions (M&A). Increased capital spending was largely absent in 2015, as dividends and buybacks were the preferred use of corporate cash flows. M&A activity was robust with a record number of transactions in 2015, supported by extraordinarily low financing costs. In contrast, initial public offering (IPO) activity has diminished, both in the U.S. and worldwide.
Stock market leadership in 2015 was narrow, as large-caps produced slight positive returns for the year while broad small- and mid-cap indexes declined. In fact, if we factor out the high-octane performance of a handful of momentum stocks, the market’s performance in 2015 was rather disappointing. That said, it was a good environment for us as active portfolio managers, as fundamental research and holding the right names were critical to our outperformance. Avoiding the largest losers was a major factor. While our mid-cap holdings may not always be exciting or high-profile businesses, we believe they are steady, reliable growth companies that have many desirable attributes and can be held for long periods.
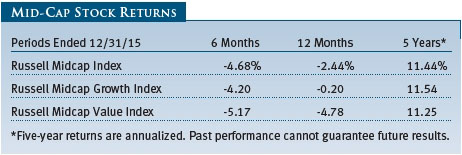
Mid-cap shares, though they lagged large-caps in 2015, compared well versus their smaller peers. The Russell Midcap Index returned -2.44% versus 0.92% for the large-cap Russell 1000 Index and -4.41% for the small-cap Russell 2000 Index. Growth stocks outperformed value stocks across all market capitalizations. In the Russell mid-cap growth universe, sector performance was widely divergent. Health care stocks, driven by brisk gains in biotechnology shares, and consumer staples stocks did best. Information technology and financial stocks eked out modest gains. Most remaining sectors fell moderately, but energy stocks plunged as oil prices tumbled to multiyear lows.
Looking at longer-term performance, we note that U.S. mid-cap companies have had excellent returns, outpacing small-caps but slightly trailing large-caps. For the five years ended December 31, 2015, the Russell Midcap Index produced an average annual return of 11.44% versus 9.19% for the Russell 2000 and 12.44% for the Russell 1000. While growth stocks have outperformed value shares across all market capitalizations in the last five years, the margin of growth stock outperformance was the smallest in the mid-cap space. If we consider the global picture, we note that non-U.S. equities have significantly underperformed domestic shares over the last five years. The MSCI EAFE Index and the MSCI Emerging Markets Index produced annualized returns of 4.07% and -4.47%, respectively.
PORTFOLIO REVIEW
The Diversified Mid-Cap Growth Fund’s fundamental characteristics are similar to those of the Russell Midcap Growth Index, as indicated in the Portfolio Characteristics table. The portfolio’s $10.1 billion median market capitalization was a little lower than that of the Russell benchmark, while its 20.7 price-to-earnings (P/E) ratio and its historical and projected earnings growth rates are comparable to those of the index. These metrics reflect our commitment to mid-cap companies with excellent long-term growth prospects.
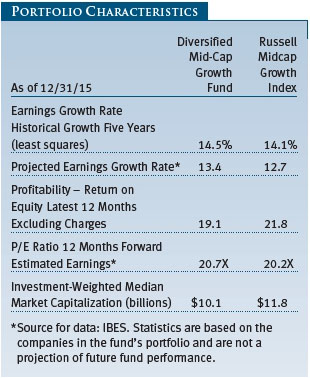
The fund’s return on equity (ROE), which measures how effectively and efficiently a company and its management are using stockholder investments, is 19.1% versus 21.8% for the benchmark. We consider a high ROE to be desirable; we do not necessarily seek companies with the highest ROEs. We look for businesses that can sustain high profitability. One attribute not shown in the table is that our holdings have lower debt than businesses in the Russell index, based on certain long-term debt-to-equity measures. As interest rates rise and risk aversion increases, we would expect a period in which highly indebted companies will fall out of favor with investors. Looking back at fourth-quarter and full-year market performance, we note that the most levered companies were laggards. The evidence is more compelling when we consider the poor performance of equities and bonds issued by highly indebted energy companies, as well as the recent stock performance of companies financing acquisitions with significant new debt issuance.
Our time horizon for investing is longer than that of other mid-cap growth investors. Our 12-month portfolio turnover rate through December 31, 2015, was 18.2%, which is substantially less than the 2015 average of 64.77% for mid-cap growth funds, according to data from Morningstar Direct. (Morningstar only calculates portfolio turnover for its averages at year-end, using the most recent year-end portfolio turnover figures provided to Morningstar by each of the underlying funds in the average. The Morningstar data were quoted as of January 19, 2016.) This implies that our holding period for a typical stock is about five-and-a-half years, whereas our average competitor holds a given stock for about one-and-a-half years. Our relatively low turnover reflects our long-term approach.
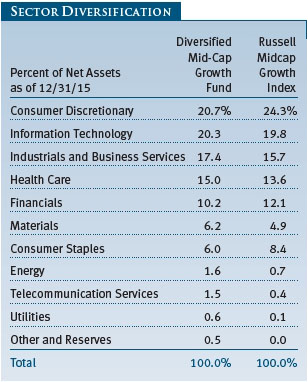
The Sector Diversification table on page 6 shows our allocations and those of the Russell index as of December 31, 2015. We have very low absolute exposure to utilities, telecommunication services, and energy companies because there are not many businesses in those sectors that meet our growth criteria. Relative to the Russell index, our largest overweights are industrials and business services and health care; in contrast, we are underweighting consumer discretionary, consumer staples, and financials.
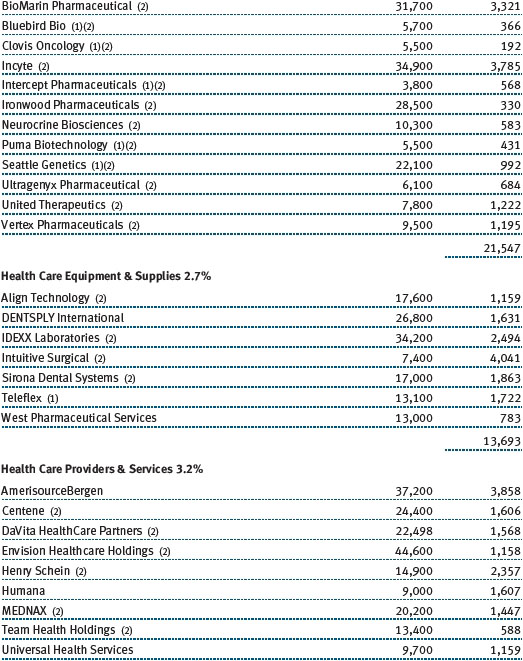
Health care stocks contributed the most to the fund’s 12-month absolute performance, though their performance in the second half of the year was far from robust. Biotechnology shares paced the sector’s advance, helped by acquisitions, promising new drug trial data, and FDA approvals for new medicines. We emphasize innovative biotechnology companies with promising products to address large unmet medical needs or rare diseases; to reduce risk, we broadly diversify our holdings. One solid biotech performer in 2015 was Vertex Pharmaceuticals, which is currently developing drugs to treat cystic fibrosis. We first purchased Vertex shares when the fund incepted at the end of 2003, and the company’s market cap has grown to about $30 billion as it has produced significant returns for us over the years. While it is now at the upper range of the mid-cap universe, we continue to hold the shares as our biotech analyst believes that the company offers a good long-term risk/reward trade-off if the cystic fibrosis drugs prove to be successful. We like to keep our winners as long as the fundamentals remain favorable. However, as successful companies like Vertex become large-caps, we will eventually need to eliminate them to keep our mid-cap focus. (Please refer to the fund’s portfolio of investments for a complete list of holdings and the amount each represents in the portfolio.)
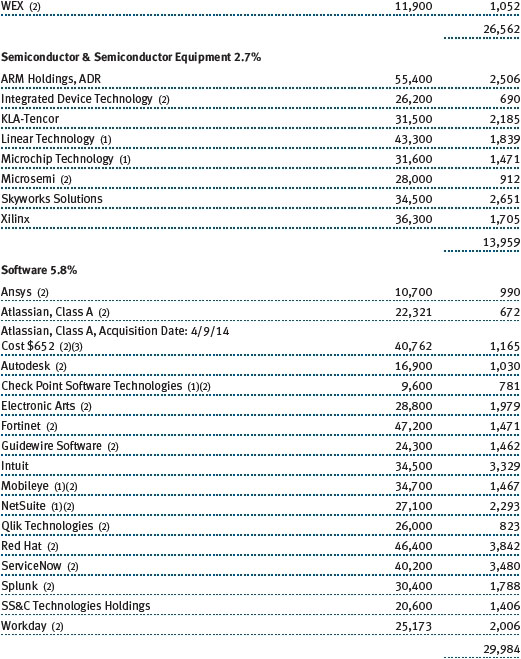
Our information technology stocks produced solid 12-month returns, but as with health care, their performance in the second half of the year was less than stellar. We favor companies with strong business models in industries with high barriers to entry and lower risk of commoditization. This is usually a “winner take all” space, where an industry leader emerges and eclipses its competitors. Hence, we try to avoid companies whose business models are impaired by competing products or services. A relatively new holding in the portfolio is Atlassian, a profitable Australian software company that went public in December and is listed in the U.S. The company’s application development software, Jira, has become the global standard workflow platform for software programmers. It has a unique business model: It eschews a traditional sales force and relies on the products selling themselves through “viral” marketing. We first invested in Atlassian back in 2014, while it was still a private company, and we purchased additional shares at its IPO. This is something we do periodically, but on a limited basis, when strong reward versus risk opportunities are available. It can be mutually beneficial. We provide capital that helps a private company expand, and it gives our investors a chance to benefit from the rapid growth of an emerging company.
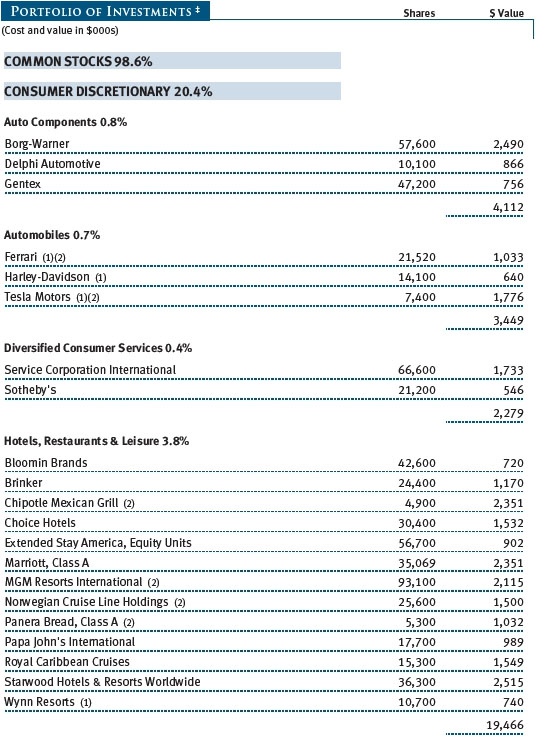
Many of our consumer discretionary companies, such as retailers, hotels, and restaurants, declined during our 6- and 12-month reporting periods. Falling energy costs did not translate into increased spending on nonessentials in 2015; on the contrary, many consumers seem to be using the windfall to pay debts. We take a longer-term approach, looking for companies with good business models, excellent cash flow, and other favorable attributes. Ross Stores, which was one of our largest absolute contributors to fund performance in our reporting periods, is an excellent example of what we seek in this sector. This off-price retailer, which recently reported favorable third-quarter earnings, is poised to continue increasing its store base and maintain solid same-store sales growth. We have owned Ross Stores since the fund’s inception, and we believe that the company will remain a strong generator of cash, some of which could be returned to shareholders via dividends and stock buybacks.
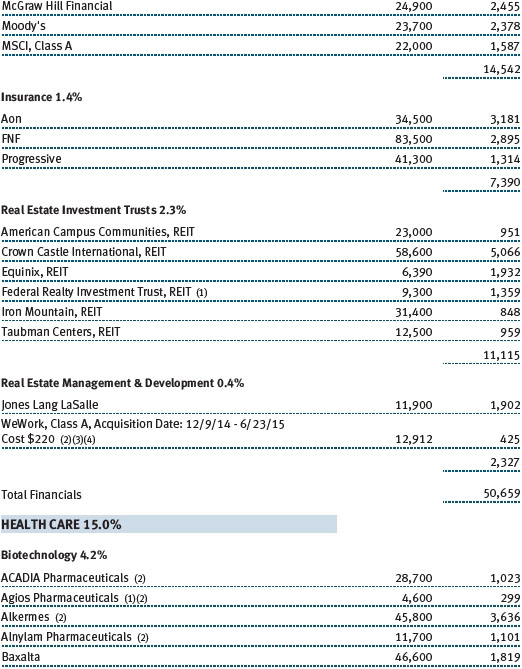
Stocks in the financials sector were solid absolute contributors to our 2015 performance, though our capital markets companies, especially asset managers, struggled throughout the year. We like strong niche companies in the diversified financial services segment, such as Moody’s. The company’s credit ratings operation generates about two-thirds of its revenue, while its Moody’s Analytics research and data unit generates the rest. We first purchased shares at the end of 2003. Moody’s is a high-quality and remarkably steady company whose ratings business has generated year-over-year revenue growth for many years, except in 2009. Moody’s declined in the last six months, offsetting much of its first-half gains, and while its valuation is currently above its longer-term average, we believe that the company will remain a steady business that will continue to reward long-term investors.
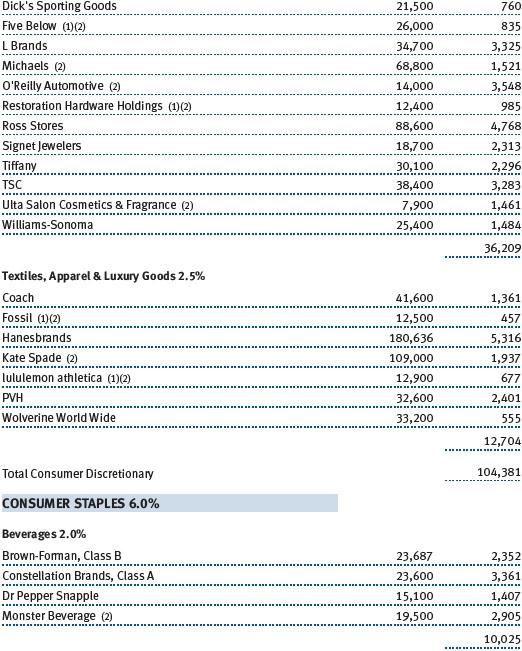
Consumer staples companies detracted from our 2015 performance, although they were modest absolute contributors in the last six months. We are underweighting the sector, as noted earlier, because many company valuations are full. We favor food and beverage makers with strong brands, such as longtime holding McCormick, a maker of spices and seasonings, whose U.S. market share exceeds 50%. McCormick produced reasonable gains for the portfolio over the last year. The company is very focused, and it is looking to reverse a recent slide in U.S. market share by converting a significant portion of its product line to help open up new sales opportunities through natural and organic grocery stores.
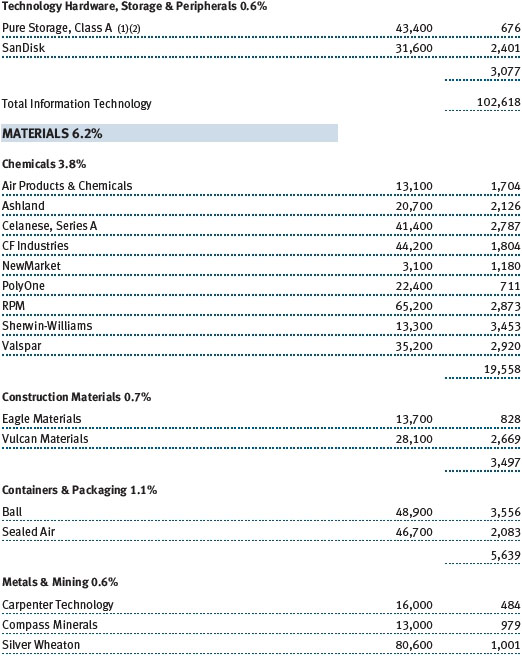
Our materials stocks declined in our 6- and 12-month reporting periods, dragged lower by falling commodity prices. Our investments here are not based on predictions of commodity price movements; rather, we seek differentiated companies that are well positioned for the long term. Many of our holdings are in the chemicals industry, and we eliminated several in the last six months, including Airgas, which agreed in November to be acquired by Air Liquide. Shares of one of our older holdings, paint-maker Sherwin-Williams, which we first purchased in late 2008, fared poorly in 2015. The company reduced its full-year earnings guidance in July. The company’s longer-term prospects still seem solid, however, and we are maintaining a position in this leading U.S. paint producer.
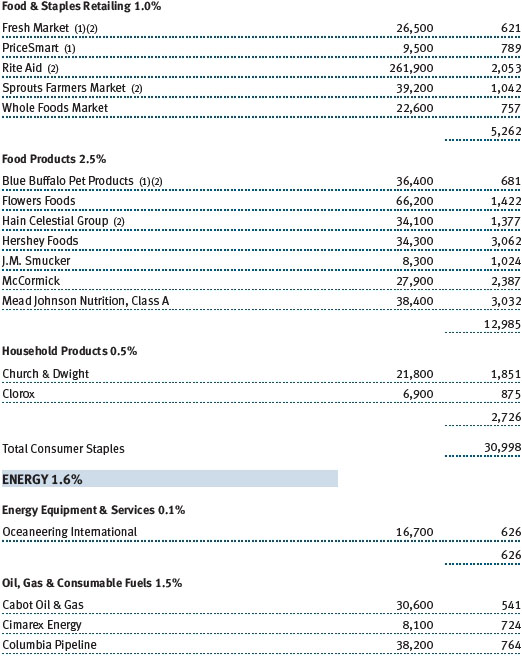
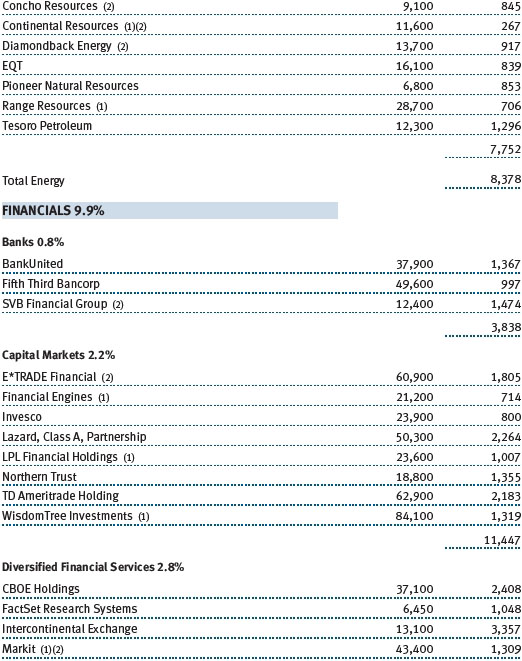
Most of our energy sector investments declined in 2015. As with materials companies, we do not invest based on predictions of commodity price movements; rather, we seek differentiated service companies and low-cost producers with strong balance sheets. This worked to our advantage, as many of our energy companies operate in the profitable and well-established Permian basin in Texas and New Mexico and held up much better than their peers in the Russell benchmark. Oil refinery operator Tesoro Petroleum was a rare bright spot in the sector, generating positive returns for us in 2015.
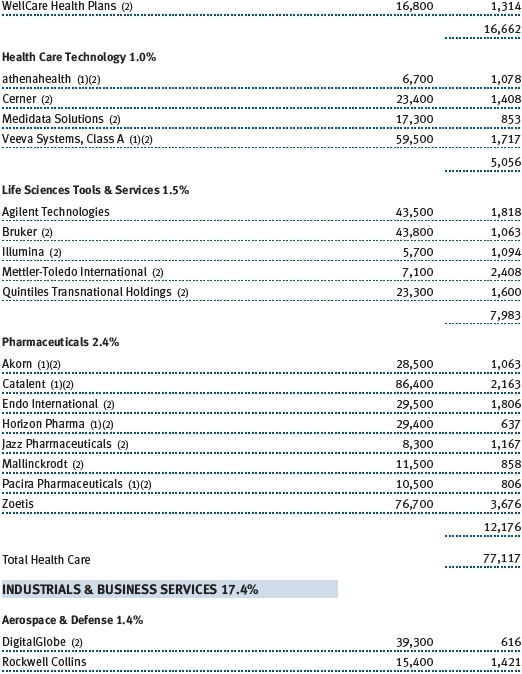
Our industrials and business services stocks declined in the last six months and were among our largest absolute detractors in 2015. The sector is considered to be highly cyclical, but we favor high-quality companies whose earnings are relatively steady throughout varying economic conditions. An excellent example of what we seek in this sector is longtime holding Roper Technologies, which generated good returns over the last year. Roper’s businesses design and develop software and engineered products and solutions for a variety of niche end markets, including health care, transportation, food, energy, and water. Roper uses its significant free cash flow to acquire companies with high profit margins and durable growth characteristics, which helps reduce its cyclical downside risk. The company has been a rewarding long-term investment for our portfolio, and while its current valuation is at a premium to its historic valuation multiples, we are maintaining our position, as we believe the company’s long-term-oriented strategy and management will continue to generate value for shareholders.
OUTLOOK
Stocks have had a rough start to 2016, as last year’s global growth concerns seem to have intensified. Given today’s modest growth and fair valuations, it is reasonable to expect equity market returns in the years ahead to be lower than historical norms. Compared with low-yielding fixed income investments, however, we expect equities to have better long-term return potential.
While absolute returns in the next few years are not likely to be as favorable as they have been in the last few years, we believe that, in a slow-growth world, the market will be more discerning of corporate earnings and fundamentals. This should be good for our strategy and our relative performance, given our focus on quality companies that generate steady growth over time. Specifically, we believe that companies that can generate earnings growth in a slow-growth environment will stand out. Our diversification across more than 300 stocks, being conscious of absolute and relative valuations, and managing position sizes are among the measures that should also help mitigate risks.
Another potential positive for our investment approach—though not our primary reason for investing in any given company—is merger activity in the mid-cap space, which we believe could remain strong in a growth-challenged world for larger companies. Many potential acquirers of mid-cap companies look for the same attributes we value, such as a demonstrated ability to increase revenues, earnings, and cash flow consistently; capable management; attractive business niches; and a sustainable competitive advantage. Likewise, mid-cap companies with favorable fundamentals may seek to improve their businesses and earnings potential through acquisitions of smaller competitors.
Thank you for your confidence in T. Rowe Price.
Respectfully submitted,

Donald J. Peters
Cochairman of the fund’s Investment Advisory Committee

Donald J. Easley
Cochairman of the fund’s Investment Advisory Committee
January 22, 2016
The committee cochairmen have day-to-day responsibility for managing the portfolio and work with committee members in developing and executing the fund’s investment program.
RISKS OF INVESTING
As with all equity funds, this fund’s share price can fall because of weakness in the broad market, a particular industry, or specific holdings. The market as a whole can decline for many reasons, including adverse political or economic developments here or abroad, changes in investor psychology, or heavy institutional selling. The prospects for an industry or company may deteriorate because of a variety of factors, including disappointing earnings or changes in the competitive environment. In addition, our assessment of companies held in the fund may prove incorrect, resulting in losses or poor performance even in a rising market. Finally, the fund’s investment approach could fall out of favor with the investing public, resulting in lagging performance versus other types of stock funds.
The stocks of mid-cap companies entail greater risk and are usually more volatile than the shares of large companies. In addition, growth stocks can be volatile for several reasons. Since they usually reinvest a high proportion of earnings in their own businesses, they may lack the dividends usually associated with value stocks that can cushion their decline in a falling market. Also, since investors buy these stocks because of their expected superior earnings growth, earnings disappointments often result in sharp price declines.
Diversification cannot protect against loss in a declining market or assure a profit.
GLOSSARY
Earnings growth rate–current fiscal year: Measures the annualized percent change in earnings per share from the prior fiscal year to the current fiscal year.
Initial public offering (IPO): The first sale of stock to the public by a formerly private company.
Lipper indexes: Fund benchmarks that consist of a small number (10 to 30) of the largest mutual funds in a particular category as tracked by Lipper Inc.
MSCI EAFE Index: An index that measures equity market performance of developed countries in the Europe, Australasia, and Far East regions.
MSCI Emerging Markets Index: A capitalization-weighted index of stocks from 23 emerging market countries that only includes securities that may be traded by foreign investors.
Price-to-earnings (P/E) ratio–12 months forward: A valuation measure calculated by dividing the price of a stock by the analysts’ forecast of the next 12 months’ expected earnings. The ratio is a measure of how much investors are willing to pay for the company’s future earnings. The higher the P/E, the more investors are paying for a company’s earnings growth in the next 12 months.
Projected earnings growth rate (IBES): A company’s expected earnings per share growth rate for a given time period based on the forecast from the Institutional Brokers’ Estimate System, which is commonly referred to as IBES.
Real estate investment trusts (REITs): Publicly traded companies that own, develop, and operate apartment complexes, hotels, office buildings, and other commercial properties.
Return on equity (ROE)–current fiscal year: A valuation measure calculated by dividing the company’s current fiscal year net income by shareholders’ equity (i.e., the company’s book value). ROE measures how much a company earns on each dollar that common stock investors have put into the company. It indicates how effectively and efficiently a company and its management are using stockholder investments.
Russell Midcap Growth Index: An index that tracks the performance of mid-cap stocks with higher price-to-book ratios and higher forecast growth values.
Russell Midcap Index: An unmanaged index that tracks the performance of the 800 smallest companies in the Russell 1000 Index.
Russell Midcap Value Index: An index that tracks the performance of mid-cap stocks with lower price-to-book ratios and lower forecast growth values.
S&P 500 Index: An unmanaged index that tracks the stocks of 500 primarily large-cap U.S. companies.
S&P MidCap 400 Index: An unmanaged index that tracks the stocks of 400 U.S. mid-cap companies.
Note: MSCI makes no express or implied warranties or representations and shall have no liability whatsoever with respect to any MSCI data contained herein. The MSCI data may not be further redistributed or used as a basis for other indices or any securities or financial products. This report is not approved, reviewed, or produced by MSCI.
Note: Russell Investment Group is the source and owner of the trademarks, service marks, and copyrights related to the Russell indexes. Russell® is a trademark of Russell Investment Group.
Performance and Expenses
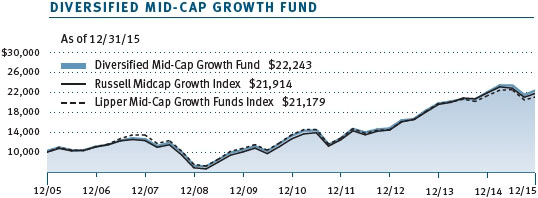
This chart shows the value of a hypothetical $10,000 investment in the fund over the past 10 fiscal year periods or since inception (for funds lacking 10-year records). The result is compared with benchmarks, which may include a broad-based market index and a peer group average or index. Market indexes do not include expenses, which are deducted from fund returns as well as mutual fund averages and indexes.
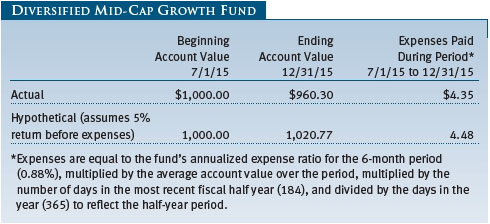
As a mutual fund shareholder, you may incur two types of costs: (1) transaction costs, such as redemption fees or sales loads, and (2) ongoing costs, including management fees, distribution and service (12b-1) fees, and other fund expenses. The following example is intended to help you understand your ongoing costs (in dollars) of investing in the fund and to compare these costs with the ongoing costs of investing in other mutual funds. The example is based on an investment of $1,000 invested at the beginning of the most recent six-month period and held for the entire period.
Actual Expenses
The first line of the following table (Actual) provides information about actual account values and expenses based on the fund’s actual returns. You may use the information on this line, together with your account balance, to estimate the expenses that you paid over the period. Simply divide your account value by $1,000 (for example, an $8,600 account value divided by $1,000 = 8.6), then multiply the result by the number on the first line under the heading “Expenses Paid During Period” to estimate the expenses you paid on your account during this period.
Hypothetical Example for Comparison Purposes
The information on the second line of the table (Hypothetical) is based on hypothetical account values and expenses derived from the fund’s actual expense ratio and an assumed 5% per year rate of return before expenses (not the fund’s actual return). You may compare the ongoing costs of investing in the fund with other funds by contrasting this 5% hypothetical example and the 5% hypothetical examples that appear in the shareholder reports of the other funds. The hypothetical account values and expenses may not be used to estimate the actual ending account balance or expenses you paid for the period.
Note: T. Rowe Price charges an annual account service fee of $20, generally for accounts with less than $10,000. The fee is waived for any investor whose T. Rowe Price mutual fund accounts total $50,000 or more; accounts electing to receive electronic delivery of account statements, transaction confirmations, prospectuses, and shareholder reports; or accounts of an investor who is a T. Rowe Price Preferred Services, Personal Services, or Enhanced Personal Services client (enrollment in these programs generally requires T. Rowe Price assets of at least $100,000). This fee is not included in the accompanying table. If you are subject to the fee, keep it in mind when you are estimating the ongoing expenses of investing in the fund and when comparing the expenses of this fund with other funds.
You should also be aware that the expenses shown in the table highlight only your ongoing costs and do not reflect any transaction costs, such as redemption fees or sales loads. Therefore, the second line of the table is useful in comparing ongoing costs only and will not help you determine the relative total costs of owning different funds. To the extent a fund charges transaction costs, however, the total cost of owning that fund is higher.
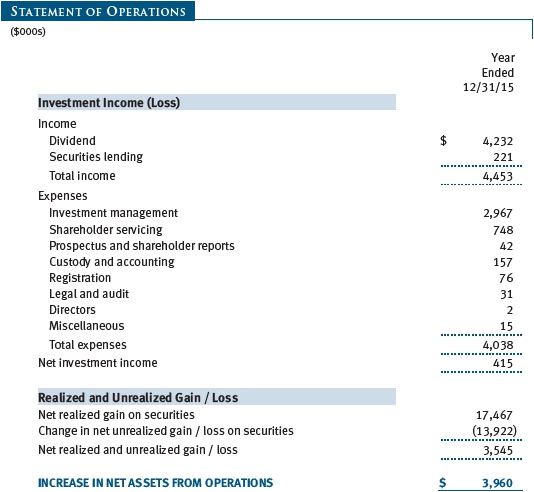
The accompanying notes are an integral part of these financial statements.
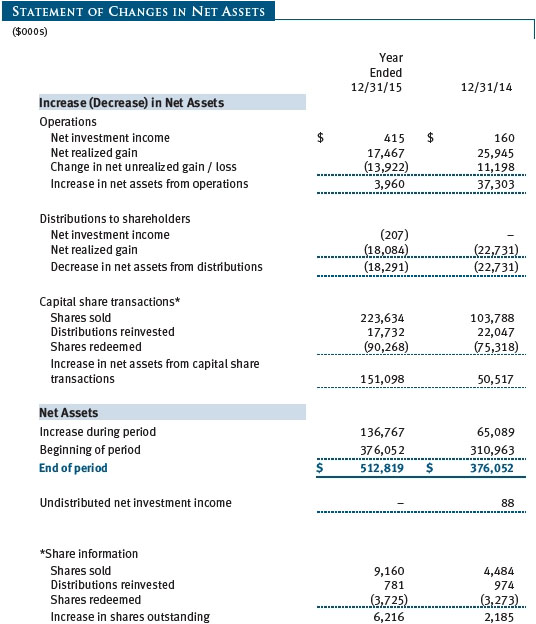
The accompanying notes are an integral part of these financial statements.
The accompanying notes are an integral part of these financial statements.
The accompanying notes are an integral part of these financial statements.
The accompanying notes are an integral part of these financial statements.
| Notes to Financial Statements |
T. Rowe Price Diversified Mid-Cap Growth Fund, Inc. (the fund), is registered under the Investment Company Act of 1940 (the 1940 Act) as a diversified, open-end management investment company. The fund commenced operations on December 31, 2003. The fund seeks to provide long-term capital growth by investing primarily in the common stocks of mid-cap growth companies.
NOTE 1 - SIGNIFICANT ACCOUNTING POLICIES
Basis of Preparation The fund is an investment company and follows accounting and reporting guidance in the Financial Accounting Standards Board (FASB) Accounting Standards Codification Topic 946 (ASC 946). The accompanying financial statements were prepared in accordance with accounting principles generally accepted in the United States of America (GAAP), including, but not limited to, ASC 946. GAAP requires the use of estimates made by management. Management believes that estimates and valuations are appropriate; however, actual results may differ from those estimates, and the valuations reflected in the accompanying financial statements may differ from the value ultimately realized upon sale or maturity.
Investment Transactions, Investment Income, and Distributions Income and expenses are recorded on the accrual basis Dividends received from mutual fund investments are reflected as dividend income; capital gain distributions are reflected as realized gain/loss. Earnings on investments recognized as partnerships for federal income tax purposes reflect the tax character of such earnings. Dividend income and capital gain distributions are recorded on the ex-dividend date. Income tax-related interest and penalties, if incurred, would be recorded as income tax expense. Investment transactions are accounted for on the trade date. Realized gains and losses are reported on the identified cost basis. Distributions to shareholders are recorded on the ex-dividend date. Distributions from REITs are initially recorded as dividend income and, to the extent such represent a return of capital or capital gain for tax purposes, are reclassified when such information becomes available. Income distributions are declared and paid annually. Capital gain distributions, if any, are generally declared and paid by the fund annually.
Rebates Subject to best execution, the fund may direct certain security trades to brokers who have agreed to rebate a portion of the related brokerage commission to the fund in cash. Commission rebates are reflected as realized gain on securities in the accompanying financial statements and totaled less than $1,000 for the year ended December 31, 2015.
New Accounting Guidance In May 2015, FASB issued ASU No. 2015-07, Fair Value Measurement (Topic 820), Disclosures for Investments in Certain Entities That Calculate Net Asset Value per Share (or Its Equivalent). The ASU removes the requirement to categorize within the fair value hierarchy all investments for which fair value is measured using the net asset value per share practical expedient and amends certain disclosure requirements for such investments. The ASU is effective for interim and annual reporting periods beginning after December 15, 2015. Adoption will have no effect on the fund’s net assets or results of operations.
NOTE 2 - VALUATION
The fund’s financial instruments are valued and its net asset value (NAV) per share is computed at the close of the New York Stock Exchange (NYSE), normally 4 p.m. ET, each day the NYSE is open for business.
Fair Value The fund’s financial instruments are reported at fair value, which GAAP defines as the price that would be received to sell an asset or paid to transfer a liability in an orderly transaction between market participants at the measurement date. The T. Rowe Price Valuation Committee (the Valuation Committee) has been established by the fund’s Board of Directors (the Board) to ensure that financial instruments are appropriately priced at fair value in accordance with GAAP and the 1940 Act. Subject to oversight by the Board, the Valuation Committee develops and oversees pricing-related policies and procedures and approves all fair value determinations. Specifically, the Valuation Committee establishes procedures to value securities; determines pricing techniques, sources, and persons eligible to effect fair value pricing actions; oversees the selection, services, and performance of pricing vendors; oversees valuation-related business continuity practices; and provides guidance on internal controls and valuation-related matters. The Valuation Committee reports to the Board and has representation from legal, portfolio management and trading, operations, risk management, and the fund’s treasurer.
Various valuation techniques and inputs are used to determine the fair value of financial instruments. GAAP establishes the following fair value hierarchy that categorizes the inputs used to measure fair value:
Level 1 – quoted prices (unadjusted) in active markets for identical financial instruments that the fund can access at the reporting date
Level 2 – inputs other than Level 1 quoted prices that are observable, either directly or indirectly (including, but not limited to, quoted prices for similar financial instruments in active markets, quoted prices for identical or similar financial instruments in inactive markets, interest rates and yield curves, implied volatilities, and credit spreads)
Level 3 – unobservable inputs
Observable inputs are developed using market data, such as publicly available information about actual events or transactions, and reflect the assumptions that market participants would use to price the financial instrument. Unobservable inputs are those for which market data are not available and are developed using the best information available about the assumptions that market participants would use to price the financial instrument. GAAP requires valuation techniques to maximize the use of relevant observable inputs and minimize the use of unobservable inputs. When multiple inputs are used to derive fair value, the financial instrument is assigned to the level within the fair value hierarchy based on the lowest-level input that is significant to the fair value of the financial instrument. Input levels are not necessarily an indication of the risk or liquidity associated with financial instruments at that level but rather the degree of judgment used in determining those values.
Valuation Techniques Equity securities listed or regularly traded on a securities exchange or in the over-the-counter (OTC) market are valued at the last quoted sale price or, for certain markets, the official closing price at the time the valuations are made. OTC Bulletin Board securities are valued at the mean of the closing bid and asked prices. A security that is listed or traded on more than one exchange is valued at the quotation on the exchange determined to be the primary market for such security. Listed securities not traded on a particular day are valued at the mean of the closing bid and asked prices. Actively traded equity securities listed on a domestic exchange generally are categorized in Level 1 of the fair value hierarchy. OTC Bulletin Board securities, certain preferred securities, and equity securities traded in inactive markets generally are categorized in Level 2 of the fair value hierarchy.
Investments in mutual funds are valued at the mutual fund’s closing NAV per share on the day of valuation and are categorized in Level 1 of the fair value hierarchy. Assets and liabilities other than financial instruments, including short-term receivables and payables, are carried at cost, or estimated realizable value, if less, which approximates fair value.
Thinly traded financial instruments and those for which the above valuation procedures are inappropriate or are deemed not to reflect fair value are stated at fair value as determined in good faith by the Valuation Committee. The objective of any fair value pricing determination is to arrive at a price that could reasonably be expected from a current sale. Financial instruments fair valued by the Valuation Committee are primarily private placements, restricted securities, warrants, rights, and other securities that are not publicly traded.
Subject to oversight by the Board, the Valuation Committee regularly makes good faith judgments to establish and adjust the fair valuations of certain securities as events occur and circumstances warrant. For instance, in determining the fair value of an equity investment with limited market activity, such as a private placement or a thinly traded public company stock, the Valuation Committee considers a variety of factors, which may include, but are not limited to, the issuer’s business prospects, its financial standing and performance, recent investment transactions in the issuer, new rounds of financing, negotiated transactions of significant size between other investors in the company, relevant market valuations of peer companies, strategic events affecting the company, market liquidity for the issuer, and general economic conditions and events. In consultation with the investment and pricing teams, the Valuation Committee will determine an appropriate valuation technique based on available information, which may include both observable and unobservable inputs. The Valuation Committee typically will afford greatest weight to actual prices in arm’s length transactions, to the extent they represent orderly transactions between market participants, transaction information can be reliably obtained, and prices are deemed representative of fair value. However, the Valuation Committee may also consider other valuation methods such as market-based valuation multiples; a discount or premium from market value of a similar, freely traded security of the same issuer; or some combination. Fair value determinations are reviewed on a regular basis and updated as information becomes available, including actual purchase and sale transactions of the issue. Because any fair value determination involves a significant amount of judgment, there is a degree of subjectivity inherent in such pricing decisions, and fair value prices determined by the Valuation Committee could differ from those of other market participants. Depending on the relative significance of unobservable inputs, including the valuation technique(s) used, fair valued securities may be categorized in Level 2 or 3 of the fair value hierarchy.
Valuation Inputs The following table summarizes the fund’s financial instruments, based on the inputs used to determine their fair values on December 31, 2015:
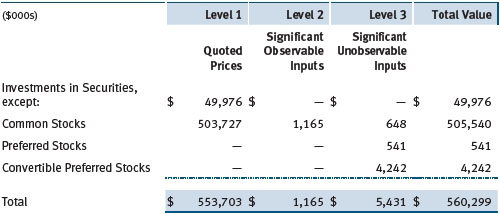
There were no material transfers between Levels 1 and 2 during the year ended December 31, 2015.
Following is a reconciliation of the fund’s Level 3 holdings for the year ended December 31, 2015. Gain (loss) reflects both realized and change in unrealized gain/loss on Level 3 holdings during the period, if any, and is included on the accompanying Statement of Operations. The change in unrealized gain/loss on Level 3 instruments held at December 31, 2015, totaled $912,000 for the year ended December 31, 2015. Transfers into and out of Level 3 are reflected at the value of the financial instrument at the beginning of the period. During the year, transfers out of Level 3 were because observable market data became available for the security.

NOTE 3 - OTHER INVESTMENT TRANSACTIONS
Consistent with its investment objective, the fund engages in the following practices to manage exposure to certain risks and/or to enhance performance. The investment objective, policies, program, and risk factors of the fund are described more fully in the fund’s prospectus and Statement of Additional Information.
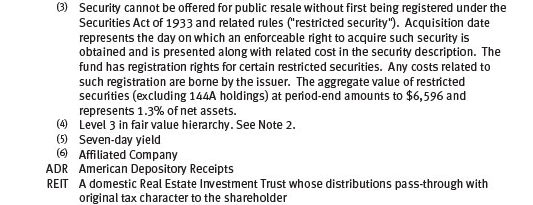
Restricted Securities The fund may invest in securities that are subject to legal or contractual restrictions on resale. Prompt sale of such securities at an acceptable price may be difficult and may involve substantial delays and additional costs.
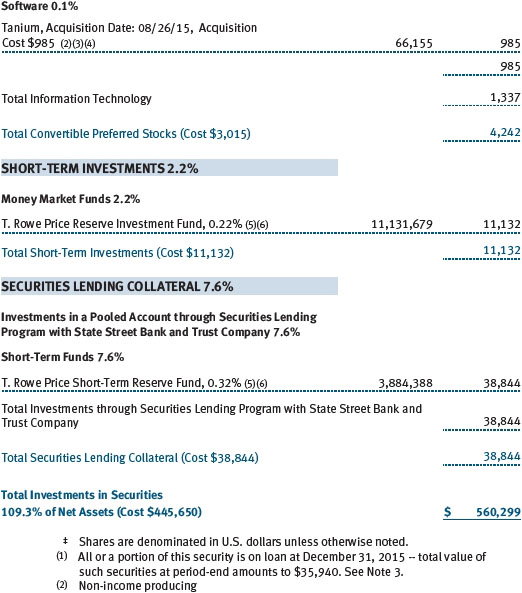
Securities Lending The fund may lend its securities to approved brokers to earn additional income. Its securities lending activities are administered by a lending agent in accordance with a securities lending agreement. Security loans generally do not have stated maturity dates, and the fund may recall a security at any time. The fund receives collateral in the form of cash or U.S. government securities, valued at 102% to 105% of the value of the securities on loan. Collateral is maintained over the life of the loan in an amount not less than the value of loaned securities; any additional collateral required due to changes in security values is delivered to the fund the next business day. Cash collateral is invested by the lending agent(s) in accordance with investment guidelines approved by fund management. Additionally, the lending agent indemnifies the fund against losses resulting from borrower default. Although risk is mitigated by the collateral and indemnification, the fund could experience a delay in recovering its securities and a possible loss of income or value if the borrower fails to return the securities, collateral investments decline in value, and the lending agent fails to perform. Securities lending revenue consists of earnings on invested collateral and borrowing fees, net of any rebates to the borrower, compensation to the lending agent, and other administrative costs. In accordance with GAAP, investments made with cash collateral are reflected in the accompanying financial statements, but collateral received in the form of securities is not. At December 31, 2015, the value of loaned securities was $35,940,000; the value of cash collateral and related investments was $38,844,000.
Other Purchases and sales of portfolio securities other than short-term securities aggregated $216,557,000 and $83,198,000, respectively, for the year ended December 31, 2015.
NOTE 4 - FEDERAL INCOME TAXES
No provision for federal income taxes is required since the fund intends to continue to qualify as a regulated investment company under Subchapter M of the Internal Revenue Code and distribute to shareholders all of its taxable income and gains. Distributions determined in accordance with federal income tax regulations may differ in amount or character from net investment income and realized gains for financial reporting purposes. Financial reporting records are adjusted for permanent book/tax differences to reflect tax character but are not adjusted for temporary differences.
The fund files U.S. federal, state, and local tax returns as required. The fund’s tax returns are subject to examination by the relevant tax authorities until expiration of the applicable statute of limitations, which is generally three years after the filing of the tax return but which can be extended to six years in certain circumstances. Tax returns for open years have incorporated no uncertain tax positions that require a provision for income taxes.
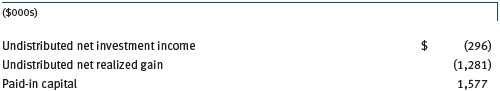
Reclassifications to paid-in capital relate primarily to a tax practice that treats a portion of the proceeds from each redemption of capital shares as a distribution of taxable net investment income or realized capital gain. For the year ended December 31, 2015, the following reclassifications were recorded to reflect tax character (there was no impact on results of operations or net assets):
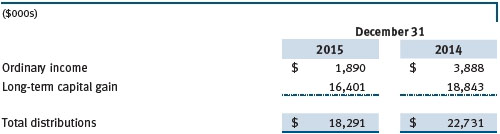
Distributions during the years ended December 31, 2015 and December 31, 2014, were characterized for tax purposes as follows:
At December 31, 2015, the tax-basis cost of investments and components of net assets were as follows:
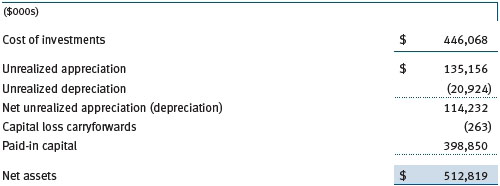
The difference between book-basis and tax-basis net unrealized appreciation (depreciation) is attributable to the deferral of losses from wash sales for tax purposes. The fund intends to retain realized gains to the extent of available capital loss carryforwards. Net realized capital losses may be carried forward indefinitely to offset future realized capital gains. All or a portion of the capital loss carryforwards may be from losses realized between November 1 and the fund’s fiscal year-end, which are deferred for tax purposes until the subsequent year but recognized for financial reporting purposes in the year realized.
NOTE 5 - RELATED PARTY TRANSACTIONS
The fund is managed by T. Rowe Price Associates, Inc. (Price Associates), a wholly owned subsidiary of T. Rowe Price Group, Inc. (Price Group). The investment management agreement between the fund and Price Associates provides for an annual investment management fee, which is computed daily and paid monthly. The fee consists of an individual fund fee, equal to 0.35% of the fund’s average daily net assets, and a group fee. The group fee rate is calculated based on the combined net assets of certain mutual funds sponsored by Price Associates (the group) applied to a graduated fee schedule, with rates ranging from 0.48% for the first $1 billion of assets to 0.275% for assets in excess of $400 billion. The fund’s group fee is determined by applying the group fee rate to the fund’s average daily net assets. At December 31, 2015, the effective annual group fee rate was 0.29%.
In addition, the fund has entered into service agreements with Price Associates and two wholly owned subsidiaries of Price Associates (collectively, Price). Price Associates provides certain accounting and administrative services to the fund. T. Rowe Price Services, Inc., provides shareholder and administrative services in its capacity as the fund’s transfer and dividend-disbursing agent. T. Rowe Price Retirement Plan Services, Inc., provides subaccounting and recordkeeping services for certain retirement accounts invested in the fund. For the year ended December 31, 2015, expenses incurred pursuant to these service agreements were $78,000 for Price Associates; $486,000 for T. Rowe Price Services, Inc.; and $10,000 for T. Rowe Price Retirement Plan Services, Inc. The total amount payable at period-end pursuant to these service agreements is reflected as Due to Affiliates in the accompanying financial statements.
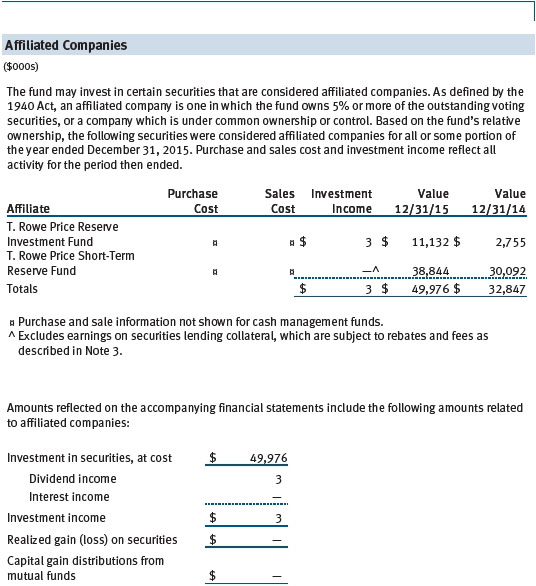
The fund may invest in the T. Rowe Price Reserve Investment Fund, the T. Rowe Price Government Reserve Investment Fund, or the T. Rowe Price Short-Term Reserve Fund (collectively, the Price Reserve Investment Funds), open-end management investment companies managed by Price Associates and considered affiliates of the fund. The Price Reserve Investment Funds are offered as short-term investment options to mutual funds, trusts, and other accounts managed by Price Associates or its affiliates and are not available for direct purchase by members of the public. The Price Reserve Investment Funds pay no investment management fees.
| Report of Independent Registered Public Accounting Firm |
To the Board of Directors and Shareholders of
T. Rowe Price Diversified Mid-Cap Growth Fund, Inc.
In our opinion, the accompanying statement of assets and liabilities, including the portfolio of investments, and the related statements of operations and of changes in net assets and the financial highlights present fairly, in all material respects, the financial position of T. Rowe Price Diversified Mid-Cap Growth Fund, Inc. (the “Fund”) at December 31, 2015, the results of its operations, the changes in its net assets and the financial highlights for each of the periods indicated therein, in conformity with accounting principles generally accepted in the United States of America. These financial statements and financial highlights (hereafter referred to as “financial statements”) are the responsibility of the Fund’s management. Our responsibility is to express an opinion on these financial statements based on our audits. We conducted our audits of these financial statements in accordance with the standards of the Public Company Accounting Oversight Board (United States). Those standards require that we plan and perform the audit to obtain reasonable assurance about whether the financial statements are free of material misstatement. An audit includes examining, on a test basis, evidence supporting the amounts and disclosures in the financial statements, assessing the accounting principles used and significant estimates made by management, and evaluating the overall financial statement presentation. We believe that our audits, which included confirmation of securities at December 31, 2015 by correspondence with the custodian and brokers, and confirmation of the underlying funds by correspondence with the transfer agent, provide a reasonable basis for our opinion.
PricewaterhouseCoopers LLP
Baltimore, Maryland
February 17, 2016
| Tax Information (Unaudited) for the Tax Year Ended 12/31/15 |
We are providing this information as required by the Internal Revenue Code. The amounts shown may differ from those elsewhere in this report because of differences between tax and financial reporting requirements.
The fund’s distributions to shareholders included:
| ● | $1,881,000 from short-term capital gains,
|
| ● | $17,483,000 from long-term capital gains, subject to a long-term capital gains tax rate of not greater than 20%. |
For taxable non-corporate shareholders, $2,211,000 of the fund’s income represents qualified dividend income subject to a long-term capital gains tax rate of not greater than 20%.
For corporate shareholders, $2,211,000 of the fund’s income qualifies for the dividends-received deduction.
| Information on Proxy Voting Policies, Procedures, and Records |
A description of the policies and procedures used by T. Rowe Price funds and portfolios to determine how to vote proxies relating to portfolio securities is available in each fund’s Statement of Additional Information. You may request this document by calling 1-800-225-5132 or by accessing the SEC’s website, sec.gov.
The description of our proxy voting policies and procedures is also available on our website, troweprice.com. To access it, click on the words “Social Responsibility” at the top of our corporate homepage. Next, click on the words “Conducting Business Responsibly” on the left side of the page that appears. Finally, click on the words “Proxy Voting Policies” on the left side of the page that appears.
Each fund’s most recent annual proxy voting record is available on our website and through the SEC’s website. To access it through our website, follow the above directions to reach the “Conducting Business Responsibly” page. Click on the words “Proxy Voting Records” on the left side of that page, and then click on the “View Proxy Voting Records” link at the bottom of the page that appears.
| How to Obtain Quarterly Portfolio Holdings |
The fund files a complete schedule of portfolio holdings with the Securities and Exchange Commission for the first and third quarters of each fiscal year on Form N-Q. The fund’s Form N-Q is available electronically on the SEC’s website (sec.gov); hard copies may be reviewed and copied at the SEC’s Public Reference Room, 100 F St. N.E., Washington, DC 20549. For more information on the Public Reference Room, call 1-800-SEC-0330.
| About The Fund’s Directors and Officers |
Your fund is overseen by a Board of Directors (Board) that meets regularly to review a wide variety of matters affecting or potentially affecting the fund, including performance, investment programs, compliance matters, advisory fees and expenses, service providers, and business and regulatory affairs. The Board elects the fund’s officers, who are listed in the final table. At least 75% of the Board’s members are independent of T. Rowe Price Associates, Inc. (T. Rowe Price), and its affiliates; “inside” or “interested” directors are employees or officers of T. Rowe Price. The business address of each director and officer is 100 East Pratt Street, Baltimore, Maryland 21202. The Statement of Additional Information includes additional information about the fund directors and is available without charge by calling a T. Rowe Price representative at 1-800-638-5660.
Independent Directors
| Name | | |
| (Year of Birth) | | |
| Year Elected* | | |
| [Number of T. Rowe Price | | Principal Occupation(s) and Directorships of Public Companies and |
| Portfolios Overseen] | | Other Investment Companies During the Past Five Years |
| | | |
| William R. Brody, M.D., Ph.D. | | President and Trustee, Salk Institute for Biological Studies (2009 to |
| (1944) | | present); Director, BioMed Realty Trust (2013 to present); Director, |
| 2009 | | Novartis, Inc. (2009 to 2014); Director, IBM (2007 to present) |
| [181] | | |
| | | |
| Anthony W. Deering | | Chairman, Exeter Capital, LLC, a private investment firm (2004 to |
| (1945) | | present); Director, Brixmor Real Estate Investment Trust (2012 to |
| 2003 | | present); Director and Advisory Board Member, Deutsche Bank |
| [181] | | North America (2004 to present); Director, Under Armour (2008 |
| | to present); Director, Vornado Real Estate Investment Trust (2004 |
| | to 2012) |
| | | |
| Bruce W. Duncan | | President, Chief Executive Officer, and Director, First Industrial |
| (1951) | | Realty Trust, an owner and operator of industrial properties |
| 2013 | | (2009 to present); Chairman of the Board (2005 to present) and |
| [181] | | Director (1999 to present), Starwood Hotels & Resorts, a hotel |
| | and leisure company |
| | | |
| Robert J. Gerrard, Jr. | | Chairman of Compensation Committee and Director, Syniverse |
| (1952) | | Holdings, Inc., a provider of wireless voice and data services for |
| 2012 | | telecommunications companies (2008 to 2011); Advisory Board |
| [181] | | Member, Pipeline Crisis/Winning Strategies, a collaborative |
| | working to improve opportunities for young African Americans |
| | (1997 to present) |
| | | |
| Paul F. McBride | | Former Company Officer and Senior Vice President, Human |
| (1956) | | Resources and Corporate Initiatives, Black & Decker Corporation |
| 2013 | | (2004 to 2010) |
| [181] | | |
| | | |
| Cecilia E. Rouse, Ph.D. | | Dean, Woodrow Wilson School (2012 to present); Professor and |
| (1963) | | Researcher, Princeton University (1992 to present); Director, MDRC, |
| 2012 | | a nonprofit education and social policy research organization |
| [181] | | (2011 to present); Member, National Academy of Education (2010 |
| | to present); Research Associate, National Bureau of Economic |
| | Research’s Labor Studies Program (2011 to present); Member, |
| | President’s Council of Economic Advisers (2009 to 2011); Chair |
| | of Committee on the Status of Minority Groups in the Economic |
| | Profession, American Economic Association (2012 to present) |
| | | |
| John G. Schreiber | | Owner/President, Centaur Capital Partners, Inc., a real estate |
| (1946) | | investment company (1991 to present); Cofounder and Partner, |
| 2003 | | Blackstone Real Estate Advisors, L.P. (1992 to present); Director, |
| [181] | | General Growth Properties, Inc. (2010 to 2013); Director, Blackstone |
| | Mortgage Trust, a real estate financial company (2012 to present); |
| | Director and Chairman of the Board, Brixmor Property Group, Inc. |
| | (2013 to present); Director, Hilton Worldwide (2013 to present); |
| | Director, Hudson Pacific Properties (2014 to present) |
| | | |
| Mark R. Tercek | | President and Chief Executive Officer, The Nature Conservancy |
| (1957) | | (2008 to present) |
| 2009 | | |
| [181] | | |
| |
| *Each independent director serves until retirement, resignation, or election of a successor. |
| |
| Inside Directors | | |
| |
| Name | | |
| (Year of Birth) | | |
| Year Elected* | | |
| [Number of T. Rowe Price | | Principal Occupation(s) and Directorships of Public Companies and |
| Portfolios Overseen] | | Other Investment Companies During the Past Five Years |
| | | |
| Edward C. Bernard | | Director and Vice President, T. Rowe Price; Vice Chairman of the |
| (1956) | | Board, Director, and Vice President, T. Rowe Price Group, Inc.; |
| 2006 | | Chairman of the Board, Director, and President, T. Rowe Price |
| [181] | | Investment Services, Inc.; Chairman of the Board and Director, |
| | T. Rowe Price Retirement Plan Services, Inc., and T. Rowe Price |
| | Services, Inc.; Chairman of the Board, Chief Executive Officer, |
| | Director, and President, T. Rowe Price International and T. Rowe |
| | Price Trust Company; Chairman of the Board, all funds |
| | | |
| Brian C. Rogers, CFA, CIC | | Chief Investment Officer, Director, and Vice President, T. Rowe Price; |
| (1955) | | Chairman of the Board, Chief Investment Officer, Director, and Vice |
| 2013 | | President, T. Rowe Price Group, Inc.; Vice President, T. Rowe Price |
| [127] | | Trust Company |
| |
| *Each inside director serves until retirement, resignation, or election of a successor. |
Officers
| Name (Year of Birth) | | |
| Position Held With Diversified | | |
| Mid-Cap Growth Fund | | Principal Occupation(s) |
| | | |
| Kennard W. Allen (1977) | | Vice President, T. Rowe Price and T. Rowe Price |
| Vice President | | Group, Inc. |
| | | |
| Peter J. Bates, CFA (1974) | | Vice President, T. Rowe Price and T. Rowe Price |
| Vice President | | Group, Inc. |
| | | |
| Brian W.H. Berghuis, CFA (1958) | | Vice President, T. Rowe Price, T. Rowe Price |
| Vice President | | Group, Inc., and T. Rowe Price Trust Company |
| | | |
| Darrell N. Braman (1963) | | Vice President, Price Hong Kong, Price |
| Vice President | | Singapore, T. Rowe Price, T. Rowe Price Group, |
| | Inc., T. Rowe Price International, T. Rowe Price |
| | Investment Services, Inc., and T. Rowe Price |
| | Services, Inc. |
| | | |
| Eric L. DeVilbiss, CFA (1983) | | Vice President, T. Rowe Price and T. Rowe Price |
| Vice President | | Group, Inc. |
| | | |
| Donald J. Easley, CFA (1971) | | Vice President, T. Rowe Price and T. Rowe Price |
| Executive Vice President | | Group, Inc. |
| | | |
| John R. Gilner (1961) | | Chief Compliance Officer and Vice President, |
| Chief Compliance Officer | | T. Rowe Price; Vice President, T. Rowe Price |
| | Group, Inc., and T. Rowe Price Investment |
| | Services, Inc. |
| | | |
| Dominic Janssens (1965) | | Vice President, T. Rowe Price, T. Rowe Price |
| Vice President | | Group, Inc., and T. Rowe Price Trust Company |
| | | |
| Paul J. Krug, CPA (1964) | | Vice President, T. Rowe Price, T. Rowe Price |
| Vice President | | Group, Inc., and T. Rowe Price Trust Company |
| | | |
| Patricia B. Lippert (1953) | | Assistant Vice President, T. Rowe Price and |
| Secretary | | T. Rowe Price Investment Services, Inc. |
| | | |
| Catherine D. Mathews (1963) | | Vice President, T. Rowe Price, T. Rowe Price |
| Treasurer and Vice President | | Group, Inc., and T. Rowe Price Trust Company |
| | | |
| Sudhir Nanda, Ph.D., CFA (1959) | | Vice President, T. Rowe Price and T. Rowe Price |
| Vice President | | Group, Inc. |
| | | |
| David Oestreicher (1967) | | Director, Vice President, and Secretary, T. Rowe |
| Vice President | | Price Investment Services, Inc., T. Rowe |
| | Price Retirement Plan Services, Inc., T. Rowe |
| | | Price Services, Inc., and T. Rowe Price Trust |
| | Company; Chief Legal Officer, Vice President, |
| | and Secretary, T. Rowe Price Group, Inc.; Vice |
| | President and Secretary, T. Rowe Price and |
| | T. Rowe Price International; Vice President, |
| | Price Hong Kong and Price Singapore |
| | | |
| Timothy E. Parker, CFA (1974) | | Vice President, T. Rowe Price and T. Rowe Price |
| Vice President | | Group, Inc. |
| | | |
| Donald J. Peters (1959) | | Vice President, T. Rowe Price and T. Rowe Price |
| President | | Group, Inc. |
| | | |
| John W. Ratzesberger (1975) | | Vice President, T. Rowe Price, T. Rowe Price |
| Vice President | | Group, Inc., and T. Rowe Price Trust Company; |
| | formerly, North American Head of Listed |
| | Derivatives Operation, Morgan Stanley (to 2013) |
| | | |
| Deborah D. Seidel (1962) | | Vice President, T. Rowe Price, T. Rowe Price |
| Vice President | | Group, Inc., T. Rowe Price Investment Services, |
| | | Inc., and T. Rowe Price Services, Inc. |
| | | |
| John F. Wakeman (1962) | | Vice President, T. Rowe Price and T. Rowe Price |
| Vice President | | Group, Inc. |
| | | |
| Rouven J. Wool-Lewis, Ph.D. (1973) | | Vice President, T. Rowe Price and T. Rowe |
| Vice President | | Price Group, Inc.; formerly, Vice President |
| | of Corporate Strategy, UnitedHealth Group |
| | (to 2011) |
| | | |
| Jeffrey T. Zoller (1970) | | Vice President, T. Rowe Price, T. Rowe Price |
| Vice President | | International, and T. Rowe Price Trust Company |
| |
| Unless otherwise noted, officers have been employees of T. Rowe Price or T. Rowe Price International for at least 5 years. |
Item 2. Code of Ethics.
The registrant has adopted a code of ethics, as defined in Item 2 of Form N-CSR, applicable to its principal executive officer, principal financial officer, principal accounting officer or controller, or persons performing similar functions. A copy of this code of ethics is filed as an exhibit to this Form N-CSR. No substantive amendments were approved or waivers were granted to this code of ethics during the period covered by this report.
Item 3. Audit Committee Financial Expert.
The registrant’s Board of Directors/Trustees has determined that Mr. Bruce W. Duncan qualifies as an audit committee financial expert, as defined in Item 3 of Form N-CSR. Mr. Duncan is considered independent for purposes of Item 3 of Form N-CSR.
Item 4. Principal Accountant Fees and Services.
(a) – (d) Aggregate fees billed for the last two fiscal years for professional services rendered to, or on behalf of, the registrant by the registrant’s principal accountant were as follows:
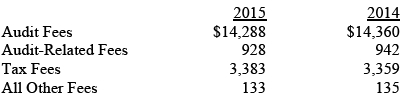
Audit fees include amounts related to the audit of the registrant’s annual financial statements and services normally provided by the accountant in connection with statutory and regulatory filings. Audit-related fees include amounts reasonably related to the performance of the audit of the registrant’s financial statements and specifically include the issuance of a report on internal controls and, if applicable, agreed-upon procedures related to fund acquisitions. Tax fees include amounts related to services for tax compliance, tax planning, and tax advice. The nature of these services specifically includes the review of distribution calculations and the preparation of Federal, state, and excise tax returns. All other fees include the registrant’s pro-rata share of amounts for agreed-upon procedures in conjunction with service contract approvals by the registrant’s Board of Directors/Trustees.
(e)(1) The registrant’s audit committee has adopted a policy whereby audit and non-audit services performed by the registrant’s principal accountant for the registrant, its investment adviser, and any entity controlling, controlled by, or under common control with the investment adviser that provides ongoing services to the registrant require pre-approval in advance at regularly scheduled audit committee meetings. If such a service is required between regularly scheduled audit committee meetings, pre-approval may be authorized by one audit committee member with ratification at the next scheduled audit committee meeting. Waiver of pre-approval for audit or non-audit services requiring fees of a de minimis amount is not permitted.
(2) No services included in (b) – (d) above were approved pursuant to paragraph (c)(7)(i)(C) of Rule 2-01 of Regulation S-X.
(f) Less than 50 percent of the hours expended on the principal accountant’s engagement to audit the registrant’s financial statements for the most recent fiscal year were attributed to work performed by persons other than the principal accountant’s full-time, permanent employees.
(g) The aggregate fees billed for the most recent fiscal year and the preceding fiscal year by the registrant’s principal accountant for non-audit services rendered to the registrant, its investment adviser, and any entity controlling, controlled by, or under common control with the investment adviser that provides ongoing services to the registrant were $2,158,000 and $2,283,000, respectively.
(h) All non-audit services rendered in (g) above were pre-approved by the registrant’s audit committee. Accordingly, these services were considered by the registrant’s audit committee in maintaining the principal accountant’s independence.
Item 5. Audit Committee of Listed Registrants.
Not applicable.
Item 6. Investments.
(a) Not applicable. The complete schedule of investments is included in Item 1 of this Form N-CSR.
(b) Not applicable.
Item 7. Disclosure of Proxy Voting Policies and Procedures for Closed-End Management Investment Companies.
Not applicable.
Item 8. Portfolio Managers of Closed-End Management Investment Companies.
Not applicable.
Item 9. Purchases of Equity Securities by Closed-End Management Investment Company and Affiliated Purchasers.
Not applicable.
Item 10. Submission of Matters to a Vote of Security Holders.
Not applicable.
Item 11. Controls and Procedures.
(a) The registrant’s principal executive officer and principal financial officer have evaluated the registrant’s disclosure controls and procedures within 90 days of this filing and have concluded that the registrant’s disclosure controls and procedures were effective, as of that date, in ensuring that information required to be disclosed by the registrant in this Form N-CSR was recorded, processed, summarized, and reported timely.
(b) The registrant’s principal executive officer and principal financial officer are aware of no change in the registrant’s internal control over financial reporting that occurred during the registrant’s second fiscal quarter covered by this report that has materially affected, or is reasonably likely to materially affect, the registrant’s internal control over financial reporting.
Item 12. Exhibits.
(a)(1) The registrant’s code of ethics pursuant to Item 2 of Form N-CSR is attached.
(2) Separate certifications by the registrant's principal executive officer and principal financial officer, pursuant to Section 302 of the Sarbanes-Oxley Act of 2002 and required by Rule 30a-2(a) under the Investment Company Act of 1940, are attached.
(3) Written solicitation to repurchase securities issued by closed-end companies: not applicable.
(b) A certification by the registrant's principal executive officer and principal financial officer, pursuant to Section 906 of the Sarbanes-Oxley Act of 2002 and required by Rule 30a-2(b) under the Investment Company Act of 1940, is attached.
SIGNATURES
Pursuant to the requirements of the Securities Exchange Act of 1934 and the Investment Company Act of 1940, the registrant has duly caused this report to be signed on its behalf by the undersigned, thereunto duly authorized.
T. Rowe Price Diversified Mid-Cap Growth Fund, Inc.
| | By | /s/ Edward C. Bernard |
| | Edward C. Bernard |
| | Principal Executive Officer |
| |
| Date February 17, 2016 | | |
Pursuant to the requirements of the Securities Exchange Act of 1934 and the Investment Company Act of 1940, this report has been signed below by the following persons on behalf of the registrant and in the capacities and on the dates indicated.
| | By | /s/ Edward C. Bernard |
| | Edward C. Bernard |
| | Principal Executive Officer |
| |
| Date February 17, 2016 | | |
| |
| |
| By | /s/ Catherine D. Mathews |
| | Catherine D. Mathews |
| | Principal Financial Officer |
| |
| Date February 17, 2016 | | |