UNITED STATES
SECURITIES AND EXCHANGE COMMISSION
Washington, D.C. 20549
FORM N-CSR
CERTIFIED SHAREHOLDER REPORT OF REGISTERED
MANAGEMENT INVESTMENT COMPANIES
Investment Company Act File Number: 811-21454
| T. Rowe Price Diversified Mid-Cap Growth Fund, Inc. |
|
| (Exact name of registrant as specified in charter) |
| |
| 100 East Pratt Street, Baltimore, MD 21202 |
|
| (Address of principal executive offices) |
| |
| David Oestreicher |
| 100 East Pratt Street, Baltimore, MD 21202 |
|
| (Name and address of agent for service) |
Registrant’s telephone number, including area code: (410) 345-2000
Date of fiscal year end: December 31
Date of reporting period: December 31, 2017
Item 1. Report to Shareholders
| Diversified Mid-Cap Growth Fund | December 31, 2017 |
The views and opinions in this report were current as of December 31, 2017. They are not guarantees of performance or investment results and should not be taken as investment advice. Investment decisions reflect a variety of factors, and the managers reserve the right to change their views about individual stocks, sectors, and the markets at any time. As a result, the views expressed should not be relied upon as a forecast of the fund’s future investment intent. The report is certified under the Sarbanes-Oxley Act, which requires mutual funds and other public companies to affirm that, to the best of their knowledge, the information in their financial reports is fairly and accurately stated in all material respects.
REPORTS ON THE WEB
Sign up for our Email Program, and you can begin to receive updated fund reports and prospectuses online rather than through the mail. Log in to your account at troweprice.com for more information.
Manager’s Letter
Fellow Shareholders
Mid-cap growth stocks produced excellent returns in 2017, lagging only large-cap growth stocks, according to Russell style indexes. Equities were lifted by favorable U.S. corporate earnings and economic growth, as well as an acceleration of global growth. Stocks were also propelled by tax reform legislation that was passed in December, as well as a more reasonable regulatory environment. The Tax Cuts and Jobs Act of 2017, which reduces tax rates for corporations and closely held businesses and marginal tax rates for individuals at most income levels, is expected to increase corporate profits and add to U.S. gross domestic product growth in 2018.
PERFORMANCE COMPARISON
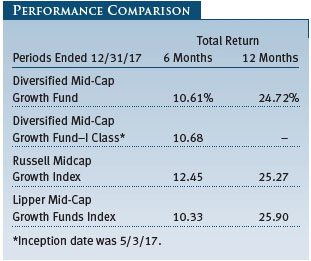
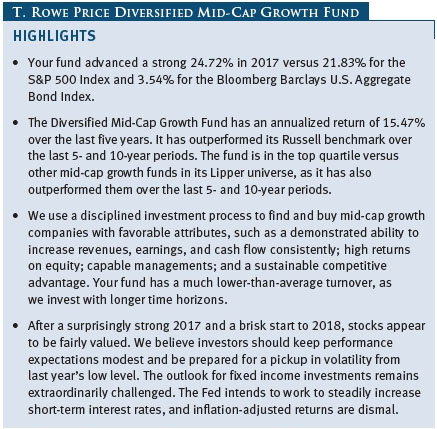
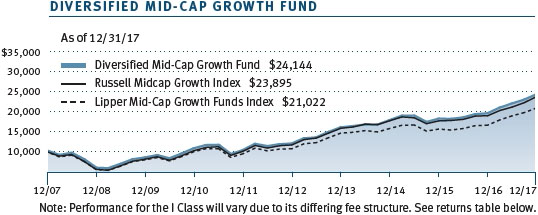
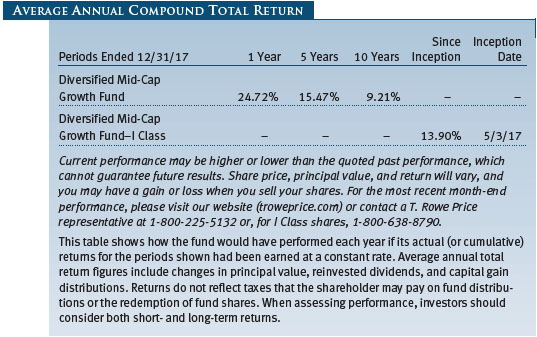
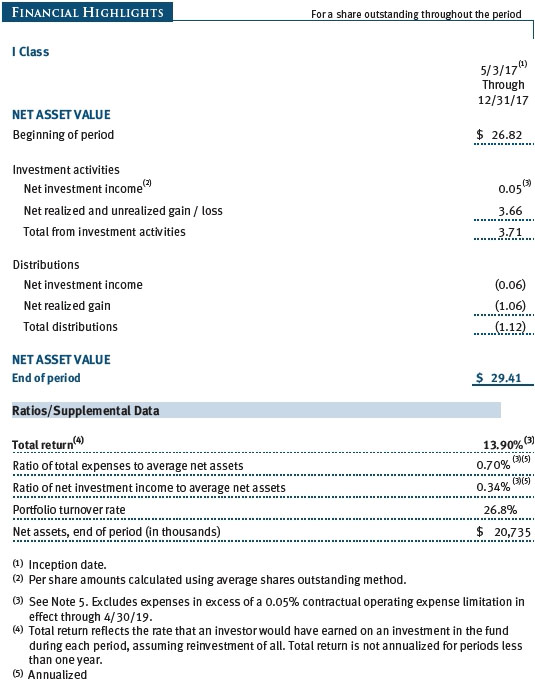
Your fund returned 10.61% in the last six months of 2017 and 24.72% for the full year. As shown in the Performance Comparison table, the fund outperformed its Lipper peer group index in the last six months but lagged for the year. The fund modestly lagged the Russell Midcap Growth Index in both periods. (Performance for the fund’s I Class shares will vary due to a different fee structure. The fund’s I Class shares are designed to be sold to various institutional investors and generally require a minimum initial investment of $1 million.)
In the last six months, fund performance versus the Russell benchmark was hurt by stock selection, particularly in the information technology (IT) and industrials and business services sectors. Good stock selection in the consumer discretionary, consumer staples, and energy sectors reduced our performance disadvantage, however. Over the last year, our consumer discretionary and consumer staples stocks outperformed their peers in the benchmark, but our IT and materials stocks underperformed. Sector allocations in both periods provided a slight performance benefit versus the Russell index.
As we look back at 2017, we note that our underweight in “momentum” stocks—those that continue rising strongly because they have performed well in the recent past—was a headwind for the fund’s performance. The fund is positioned less aggressively versus its Russell benchmark, and especially so versus other mid-cap growth funds. Growth stocks have materially outperformed value over the last three years, so we have been finding more opportunities among those companies that do not have the fastest anticipated growth. We believe it is more prudent to pay close attention to absolute and relative valuations and to look for reasonably priced growth companies that we can own for long periods. Other tools to help us mitigate downside risks include maintaining broad portfolio diversification—currently we own more than 300 stocks—and carefully managing position sizes.
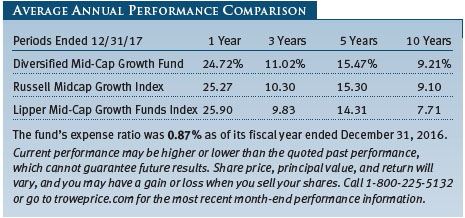
We are pleased to report that your fund has outperformed its Russell and Lipper benchmarks for the 3-, 5-, and 10-year periods ended December 31, 2017, as shown in the table on page 3. We believe this testifies to the validity of our long-term investment approach and demonstrates that we are delivering what investors expect from us. In fact, Lipper ranked the Diversified Mid-Cap Growth Fund in the top quartile of the mid-cap growth funds universe for the 5- and 10-year periods ended December 31, 2017. Based on cumulative total return, Lipper ranked the fund 189 of 383, 101 of 356, 66 of 316, and 41 of 227 mid-cap growth funds for the 1-, 3-, 5-, and 10-year periods ended December 31, 2017, respectively. (Results may vary for other periods. Past performance cannot guarantee future results.)
MARKET ENVIRONMENT
U.S. economic growth was moderate in 2017, having improved following a weak first quarter. Global growth has been generally good, too. The U.S. labor market is strong, with the unemployment rate dipping to a 17-year low of 4.1% by the end of the year. Inflation data are normalizing after very weak readings earlier in the year.
The Federal Reserve raised short-term interest rates three times in 2017, and more rate increases are likely this year. With the Fed having started to shrink its balance sheet in October—and other central banks around the world likely to reduce their bond purchases in 2018—we remain convinced that the outlook for fixed income investments is poor. Stocks clearly offer better prospects for favorable long-term performance. However, our expectations are that equity returns will be materially lower than they were in the last three to five years.
U.S. corporate earnings were better than expected in 2017, and the Tax Cuts and Jobs Act of 2017 is likely to boost earnings in 2018. Business fundamentals remain solid, and corporate balance sheets are generally healthy, which allows companies to buy back shares, boost dividends, or increase capital spending. Initial public offering (IPO) activity in 2017 was modest, but there was a year-over-year increase. There have been few signs of excessive speculative activity in the market.
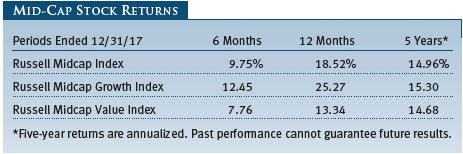
As measured by various Russell indexes, growth stocks topped value stocks across all market capitalizations for the year. Mid-cap shares lagged large-caps but outperformed small-caps: The Russell Midcap Index returned 18.52% versus 21.69% for the large-cap Russell 1000 Index and 14.65% for the small-cap Russell 2000 Index.
In the mid-cap growth universe, as measured by the Russell Midcap Growth Index, sector performance in 2017 was broadly positive. IT shares far outpaced other segments, with many leading companies recording impressive gains in revenues and earnings during the year. Financial stocks also did very well amid rising interest rates, solid economic growth, and expectations for lesser regulation on the sector. Consumer discretionary and consumer staples stocks lagged with milder gains. Energy stocks fell for the year.
Looking at performance since the end of 2012, we note that U.S. mid-cap companies have performed much like they did in 2017: slightly weaker than large-caps, but better than small-caps. For the five years ended December 31, 2017, the Russell Midcap Index produced an average annual return of 14.96% versus 15.71% for the Russell 1000 Index and 14.12% for the Russell 2000 Index. Growth stocks surpassed value across all market capitalizations during that time frame. The long-term performance data convey that mid-caps offer higher returns and lower volatility versus smaller companies. Relative to larger companies, mid-caps’ longer-term returns tend to be better, but at a cost of higher volatility. It is notable that, over the last five years, large-cap growth has outperformed mid-cap growth by about 200 basis points (two percentage points) per year; it would not be surprising to see this pattern revert to the mean.
As for non-U.S. equities, they produced excellent returns over the last year but underperformed U.S. stocks significantly over the last five years. The MSCI EAFE Index and the MSCI Emerging Markets Index returned 25.62% and 37.75%, respectively, in 2017; for the five-year period ended December 31, 2017, they produced annualized returns of 8.39% and 4.73%, respectively. In contrast, the five-year annualized return for the S&P 500 was 15.79%.
PORTFOLIO REVIEW
The Diversified Mid-Cap Growth Fund’s fundamental characteristics are fairly similar to those of the Russell Midcap Growth Index, as indicated by the Portfolio Characteristics table. The portfolio’s $12.6 billion median market capitalization was slightly lower than that of the Russell benchmark, while its 22.8 price/earnings (P/E) ratio and its 12.3% projected earnings growth rate are in line with those of the index. These metrics reflect our commitment to mid-cap companies with excellent long-term growth prospects.
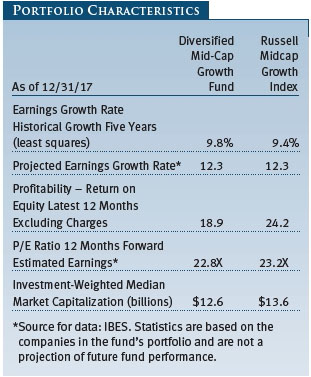
The fund’s return on equity (ROE), which measures how effectively and efficiently a company and its management are using stockholder investments, is 18.9%. While we consider a high ROE to be desirable, we do not necessarily seek companies with the highest ROEs. Rather, we look for businesses that can sustain high profitability. One attribute not shown in the table is that our holdings have lower debt than businesses in the Russell index, based on certain long-term debt-to-equity measures.
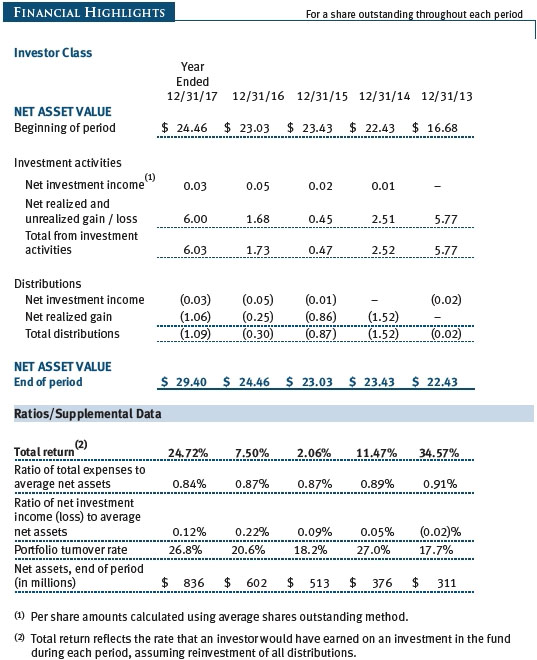
Our time horizon for investing is longer than that of other mid-cap growth investors. Our 12-month portfolio turnover rate in 2017 was 26.8%, which is well below the 2017 average of 49.84% for mid-cap growth funds, according to data from Morningstar Direct. (Morningstar only calculates portfolio turnover for its averages at fiscal year-end, using the most recent fiscal year-end portfolio turnover figures provided to Morningstar by each of the underlying funds in the average. The Morningstar data were quoted as of December 31, 2017.) This implies that our holding period for a typical stock is almost four years, whereas our average competitor holds a given stock for about two years. Our relatively low turnover reflects our long-term approach.
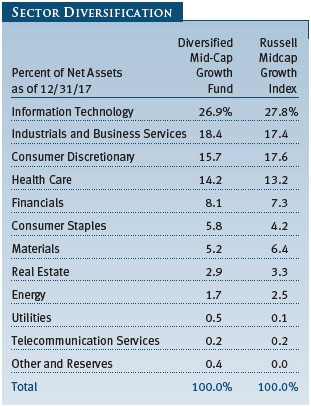
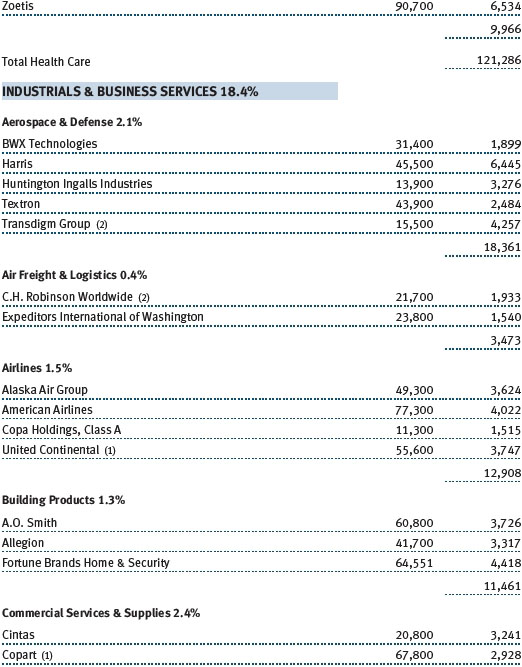
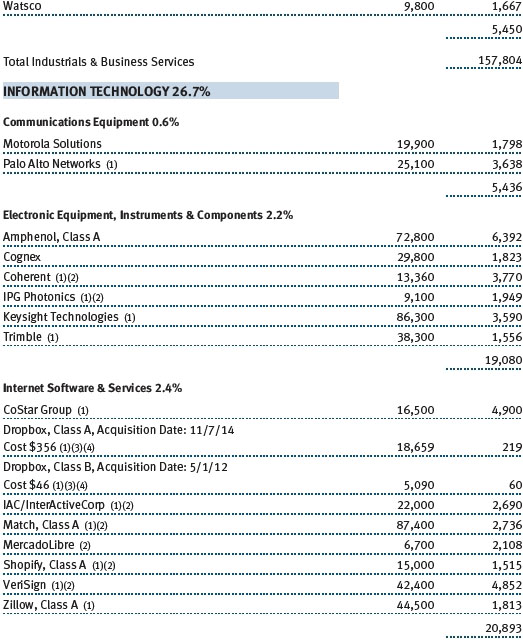
The Sector Diversification table below shows our allocations and those of the Russell Midcap Growth Index as of December 31, 2017. We continue to have very low absolute exposure to energy, utilities, and telecommunication services companies because few of those businesses meet our growth criteria. Relative to the Russell index, our largest sector overweights are consumer staples, industrials and business services, and health care. We have a sizable underweight to the consumer discretionary sector, and smaller underweights in materials and information technology.
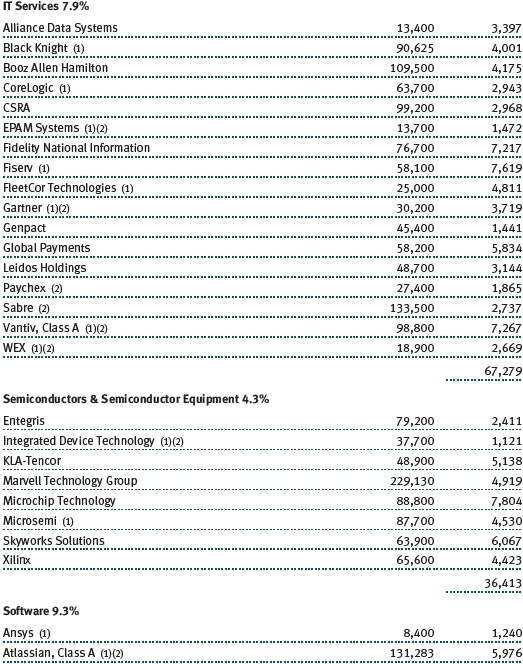
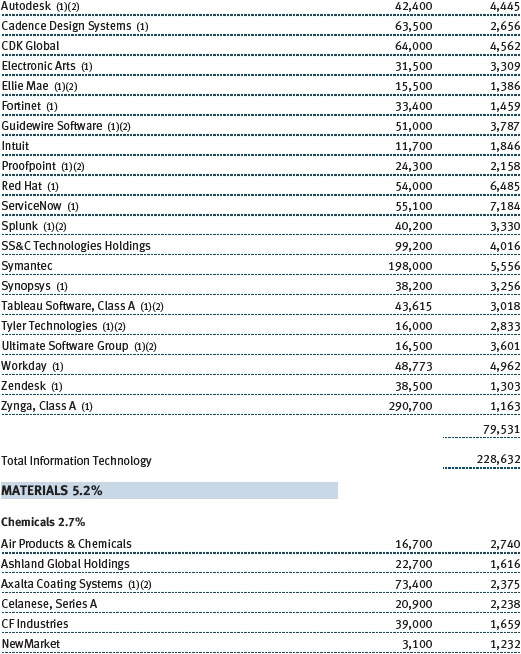
Stocks in the IT sector were our top contributors to absolute performance in 2017. Virtually all of our holdings appreciated. We are broadly diversified in the sector, and we favor companies with strong business models in industries with high barriers to entry and low risk of commoditization. This is usually a “winner take all” space, in which a given company tends to dominate an industry. We try to avoid companies whose business models are challenged by competing products or services—these often turn out to be value traps. Software stocks were our top tech performers, especially Red Hat, which we have owned since the fund incepted 14 years ago. Red Hat is the leading provider of open-source software with a core dominant position in Linux operating systems, a fast-growing middleware business, and promising efforts in broader cloud infrastructure. We believe the company’s core businesses will continue to drive strong earnings growth, and we are encouraged that some of its newer products and businesses are showing signs of eventually becoming major contributors to Red Hat’s bottom line. (Please refer to the fund’s portfolio of investments for a complete list of holdings and the amount each represents in the portfolio.)
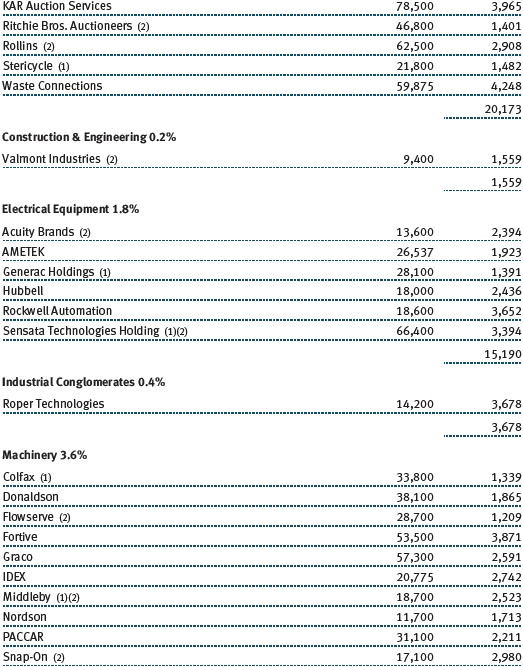
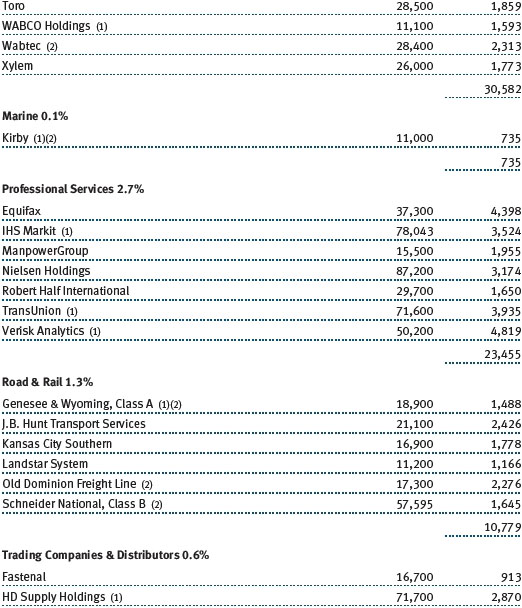
Industrials and business services stocks were also strong absolute contributors. We believe many companies in this sector have attractive valuations and are world-class in their respective niches. While industrials are generally considered to be cyclical companies, we look for high-quality companies that provide more stable earnings under varying economic conditions. Machinery and professional services, our two largest industries in the sector, fared best. Several of our aerospace and defense stocks did well, too, especially Harris, a leading provider of defense electronics products. Harris is a technologically differentiated company with good management, and it is likely to capitalize on the emerging opportunity to modernize the U.S. military’s tactical radios. As an added bonus, the company should see a material earnings boost stemming from a lower corporate tax rate.
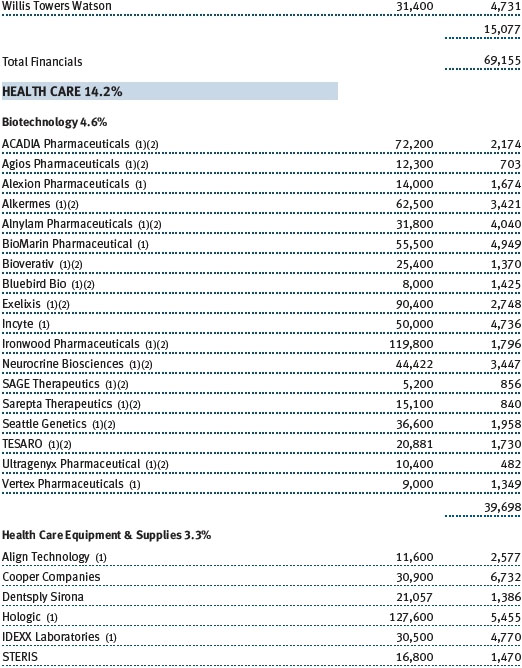
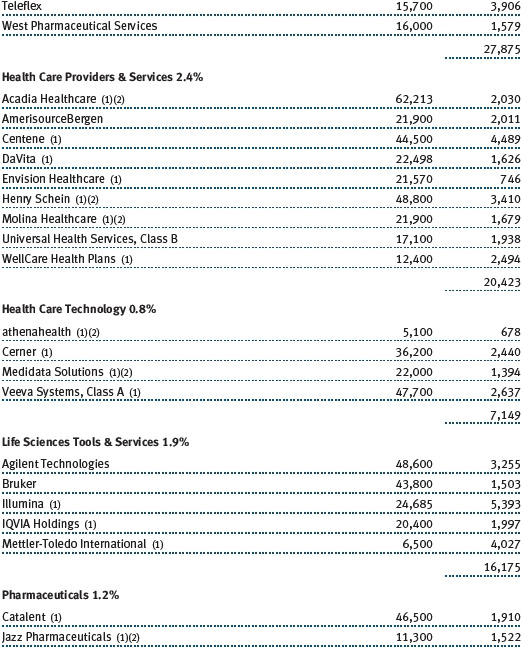
Our health care shares performed well over the last year. Biotechnology stocks were among our top contributors. We emphasize innovative companies with promising products that address large, unmet needs or rare diseases, and while we overweight biotechs versus the Russell benchmark, we stay broadly diversified to reduce risks. Our health care equipment and supply companies also did well, especially Cooper Companies, which has a secure position in the contact lens industry and also provides women’s health products and services. The company has been reporting solid earnings and revenue growth, and its execution in the core contact lens business has improved markedly in recent quarters. In the last six months, we parted company with Intuitive Surgical, which we have owned for most of the last 10 years. This dominant maker of robotic surgical systems is likely to continue enjoying strong earnings and revenue growth, but with a market capitalization now exceeding $40 billion, it is no longer appropriate for our mid-cap portfolio. Also in the last six months, we eliminated several underperforming pharmaceutical stocks for which our investment thesis has proven to be wrong.
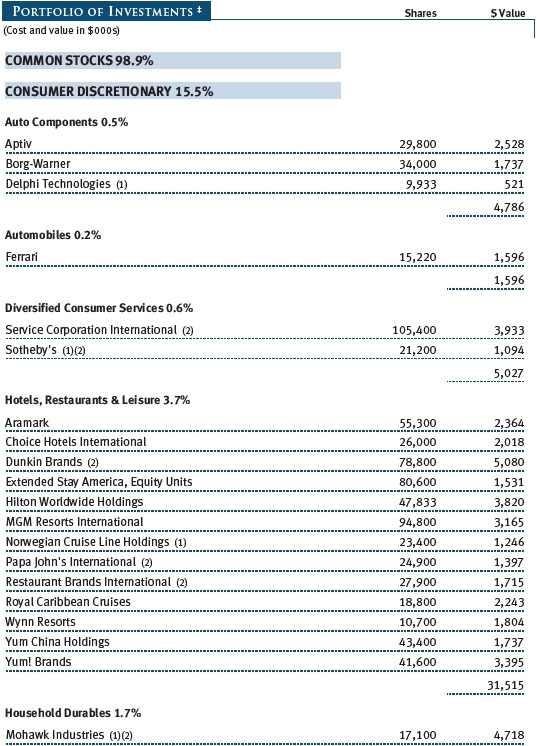
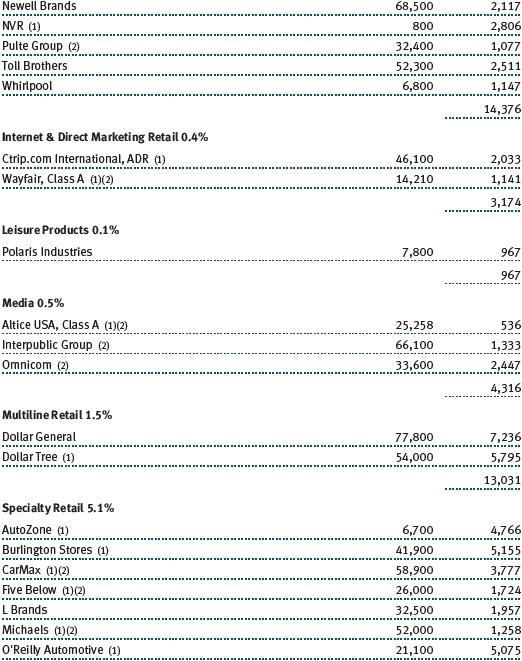
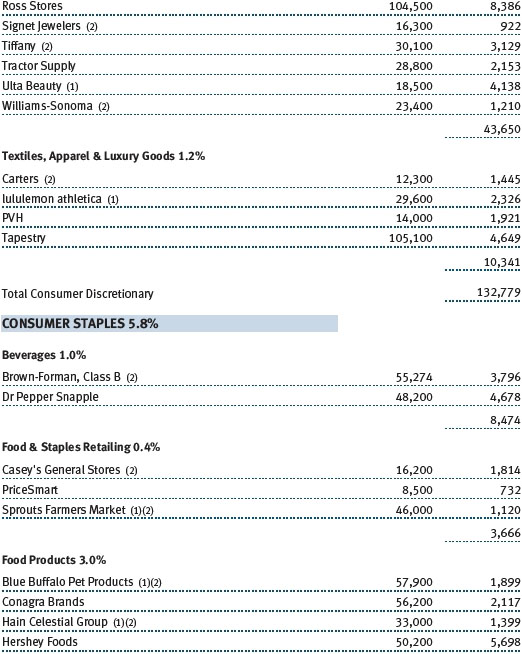
Consumer discretionary shares produced reasonable returns in 2017; their performance in the second half improved with the growing likelihood of tax reform. The sector includes an eclectic assortment of businesses, including retailers and media companies. Many companies in the sector have good business models, excellent cash flow, and other favorable attributes, and we focus our investments in leading companies within their respective niches. Within retail, we avoid companies that Amazon.com can easily attack. Hotels, restaurants, and companies associated with leisure were our top contributors in the sector during the year, especially coffee and donut shop operator Dunkin’ Brands, which is a relatively new addition to the portfolio. The company is an attractive business, sells a widely used product, and tends to have stable earnings growth because of its franchise model. In the specialty retail space, auto parts retailers did well for the year, with O’Reilly Automotive and AutoZone rebounding from first-half weakness as fears of being “Amazoned” waned and demand for car parts picked up in the second half. Ross Stores and Dollar General also performed very well in the last six months and for the full year, as off-price retailers and dollar store operators are well insulated from Amazon’s encroachment.
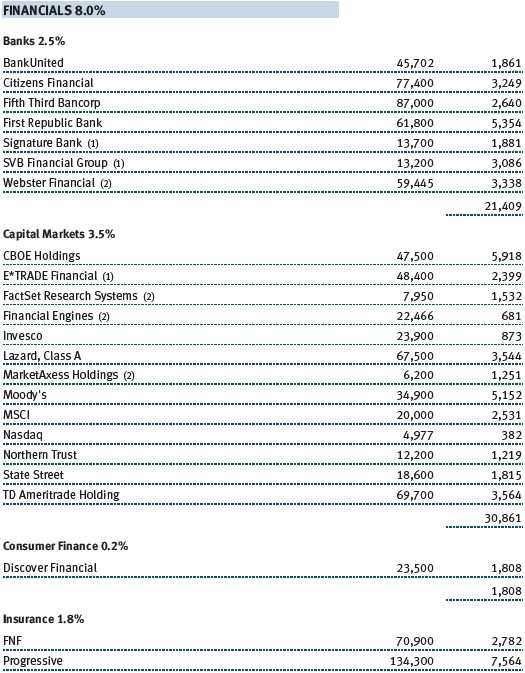
In the financials sector, we look for differentiated companies with high returns on invested capital. Several of our capital markets companies did very well, especially options exchange operator CBOE Global Markets, but our trust banks lagged. Regional banks rose, as rising interest rates should make lending more profitable for them. Insurance company Progressive was one of our top contributors for the year: The company has several sustainable competitive advantages that we believe will enable it to produce above-average growth in a generally low growth industry. We added to our position in recent months.
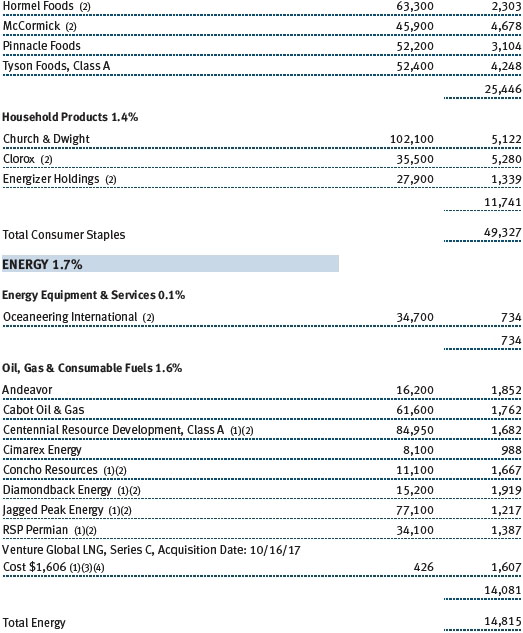
We have a modest allocation to the consumer staples sector. Most of our staples holdings are makers of food and beverage products with strong brands. Chocolate maker Hershey Foods and poultry producer Tyson Foods were strong full-year contributors to performance. Snack maker Snyders-Lance, which we added to the portfolio back in March, produced a solid gain. We eliminated it in December, when the company received a buyout offer from Campbell Soup. Cleaning products maker Clorox, which we have owned since late 2006, produced a modest gain. We added to our position in recent months because it is a well-managed, reasonably priced growth company, and demand for its products is not tied to the economy.
OUTLOOK
Equities have started the new year strongly, supported by global economic growth and last year’s tax reform legislation. At present, it is difficult to foresee why stocks could suffer a material setback or why the global backdrop could worsen in the near term. That said, we believe that stocks are fairly valued—neither overpriced nor underpriced—and that investors should keep performance expectations modest despite last year’s surprisingly strong gains. We would not be surprised to see some pickup in volatility this year from historically low levels.
The prospects for fixed income alternatives remain dim. The annualized five-year return for the Bloomberg Barclays U.S. Aggregate Bond Index was 2.10%. This return is not materially different versus what the inflation rate has been over this span. It is unlikely that the inflation-adjusted returns for most fixed income alternatives will be much better than those of the previous five years.
Our longer-term record is favorable, and we believe that our disciplined investment process will continue to serve our investors well over time. We remain committed to finding and buying mid-cap growth companies with favorable attributes, such as a demonstrated ability to increase revenues, earnings, and cash flow consistently; high returns on equity; capable managements; and a sustainable competitive advantage. We expect that this approach will continue to produce attractive risk-adjusted returns.
Thank you for your confidence in T. Rowe Price.
Respectfully submitted,

Donald J. Peters
Cochairman of the fund’s Investment Advisory Committee

Donald J. Easley
Cochairman of the fund’s Investment Advisory Committee
January 16, 2018
The committee cochairmen have day-to-day responsibility for managing the portfolio and work with committee members in developing and executing the fund’s investment program.
RISKS OF INVESTING
As with all equity funds, this fund’s share price can fall because of weakness in the broad market, a particular industry, or specific holdings. The market as a whole can decline for many reasons, including adverse political or economic developments here or abroad, changes in investor psychology, or heavy institutional selling. The prospects for an industry or company may deteriorate because of a variety of factors, including disappointing earnings or changes in the competitive environment. In addition, our assessment of companies held in the fund may prove incorrect, resulting in losses or poor performance even in a rising market. Finally, the fund’s investment approach could fall out of favor with the investing public, resulting in lagging performance versus other types of stock funds.
The stocks of mid-cap companies entail greater risk and are usually more volatile than the shares of large companies. In addition, growth stocks can be volatile for several reasons. Since they usually reinvest a high proportion of earnings in their own businesses, they may lack the dividends usually associated with value stocks that can cushion their decline in a falling market. Also, since investors buy these stocks because of their expected superior earnings growth, earnings disappointments often result in sharp price declines.
Diversification cannot assure a profit or protect against loss in a declining market.
GLOSSARY
Bloomberg Barclays U.S. Aggregate Bond Index: An unmanaged index that tracks domestic investment-grade bonds, including corporate, government, and mortgage-backed securities.
Earnings growth rate—current fiscal year: Measures the annualized percent change in earnings per share from the prior fiscal year to the current fiscal year.
Gross domestic product: The total market value of all goods and services produced in a country in a given year.
Lipper indexes: Fund benchmarks that consist of a small number (10 to 30) of the largest mutual funds in a particular category as tracked by Lipper Inc.
MSCI EAFE Index: An index that measures equity market performance of developed countries in the Europe, Australasia, and Far East regions.
MSCI Emerging Markets Index: A capitalization-weighted index of stocks from 24 emerging market countries.
Price-to-earnings (P/E) ratio—12 months forward: A valuation measure calculated by dividing the price of a stock by the analysts’ forecast of the next 12 months’ expected earnings. The ratio is a measure of how much investors are willing to pay for the company’s future earnings. The higher the P/E, the more investors are paying for a company’s earnings growth in the next 12 months.
Projected earnings growth rate (IBES): A company’s expected earnings per share growth rate for a given time period based on the forecast from the Institutional Brokers’ Estimate System, which is commonly referred to as IBES.
Return on equity (ROE)—current fiscal year: A valuation measure calculated by dividing the company’s current fiscal year net income by shareholders’ equity (i.e., the company’s book value). ROE measures how much a company earns on each dollar that common stock investors have put into the company. It indicates how effectively and efficiently a company and its management are using stockholder investments.
Russell Midcap Growth Index: An index that tracks the performance of mid-cap stocks with higher price-to-book ratios and higher forecast growth values.
Russell Midcap Index: An unmanaged index that tracks the performance of the 800 smallest companies in the Russell 1000 Index.
Russell Midcap Value Index: An index that tracks the performance of mid-cap stocks with lower price-to-book ratios and lower forecast growth values.
S&P 500 Index: An unmanaged index that tracks the stocks of 500 primarily large-cap U.S. companies.
S&P MidCap 400 Index: An unmanaged index that tracks the stocks of 400 U.S. mid-cap companies.
Note: MSCI makes no express or implied warranties or representations and shall have no liability whatsoever with respect to any MSCI data contained herein. The MSCI data may not be further redistributed or used as a basis for other indices or any securities or financial products. This report is not approved, reviewed, or produced by MSCI.
Note: Russell Investment Group is the source and owner of the trademarks, service marks, and copyrights related to the Russell indexes. Russell® is a trademark of Russell Investment Group.
Note: Bloomberg Index Services Ltd. Copyright 2018, Bloomberg Index Services Ltd. Used with permission.
Performance and Expenses
This chart shows the value of a hypothetical $10,000 investment in the fund over the past 10 fiscal year periods or since inception (for funds lacking 10-year records). The result is compared with benchmarks, which may include a broad-based market index and a peer group average or index. Market indexes do not include expenses, which are deducted from fund returns as well as mutual fund averages and indexes.
As a mutual fund shareholder, you may incur two types of costs: (1) transaction costs, such as redemption fees or sales loads, and (2) ongoing costs, including management fees, distribution and service (12b-1) fees, and other fund expenses. The following example is intended to help you understand your ongoing costs (in dollars) of investing in the fund and to compare these costs with the ongoing costs of investing in other mutual funds. The example is based on an investment of $1,000 invested at the beginning of the most recent six-month period and held for the entire period.
Please note that the fund has two share classes: The original share class (Investor Class) charges no distribution and service (12b-1) fee, and the I Class shares are also available to institutionally oriented clients and impose no 12b-1 or administrative fee payment. Each share class is presented separately in the table.
Actual Expenses
The first line of the following table (Actual) provides information about actual account values and expenses based on the fund’s actual returns. You may use the information on this line, together with your account balance, to estimate the expenses that you paid over the period. Simply divide your account value by $1,000 (for example, an $8,600 account value divided by $1,000 = 8.6), then multiply the result by the number on the first line under the heading “Expenses Paid During Period” to estimate the expenses you paid on your account during this period.
Hypothetical Example for Comparison Purposes
The information on the second line of the table (Hypothetical) is based on hypothetical account values and expenses derived from the fund’s actual expense ratio and an assumed 5% per year rate of return before expenses (not the fund’s actual return). You may compare the ongoing costs of investing in the fund with other funds by contrasting this 5% hypothetical example and the 5% hypothetical examples that appear in the shareholder reports of the other funds. The hypothetical account values and expenses may not be used to estimate the actual ending account balance or expenses you paid for the period.
Note: T. Rowe Price charges an annual account service fee of $20, generally for accounts with less than $10,000. The fee is waived for any investor whose T. Rowe Price mutual fund accounts total $50,000 or more; accounts electing to receive electronic delivery of account statements, transaction confirmations, prospectuses, and shareholder reports; or accounts of an investor who is a T. Rowe Price Personal Services or Enhanced Personal Services client (enrollment in these programs generally requires T. Rowe Price assets of at least $250,000). This fee is not included in the accompanying table. If you are subject to the fee, keep it in mind when you are estimating the ongoing expenses of investing in the fund and when comparing the expenses of this fund with other funds.
You should also be aware that the expenses shown in the table highlight only your ongoing costs and do not reflect any transaction costs, such as redemption fees or sales loads. Therefore, the second line of the table is useful in comparing ongoing costs only and will not help you determine the relative total costs of owning different funds. To the extent a fund charges transaction costs, however, the total cost of owning that fund is higher.

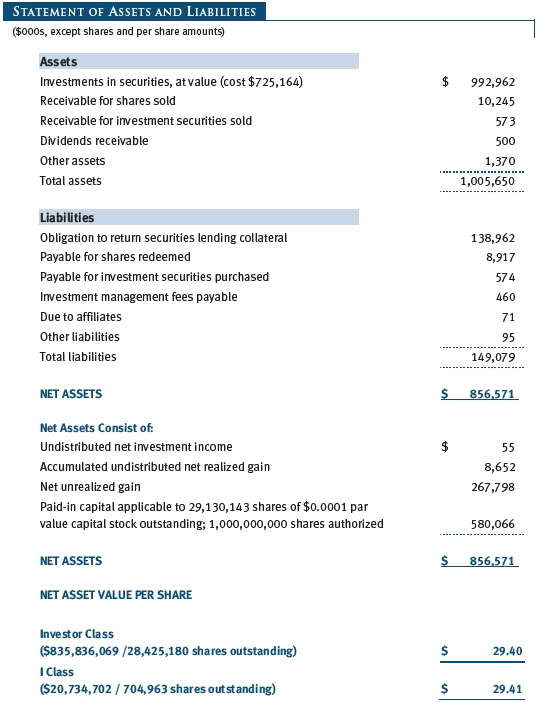
The accompanying notes are an integral part of these financial statements.
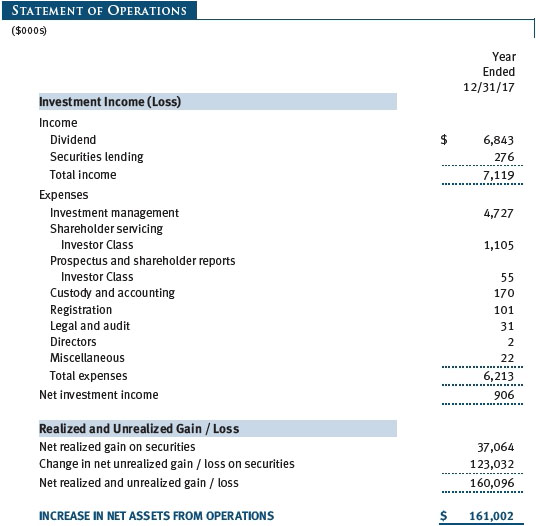
The accompanying notes are an integral part of these financial statements.
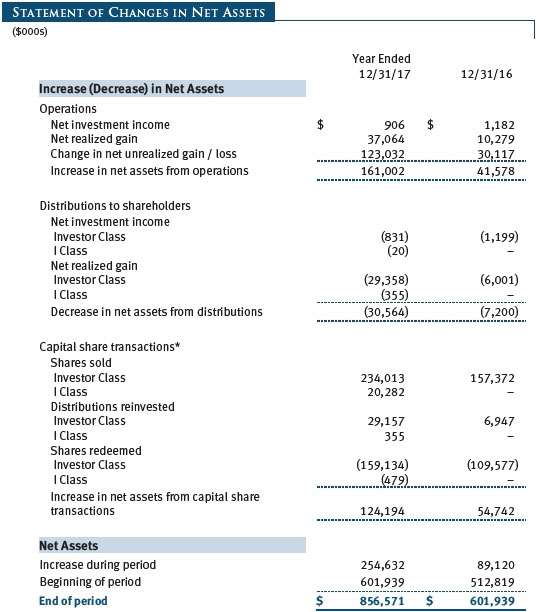
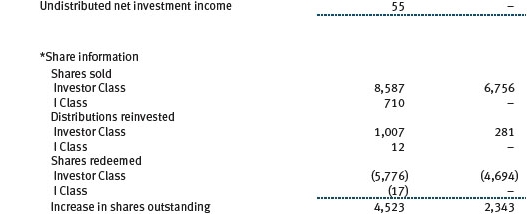
The accompanying notes are an integral part of these financial statements.
The accompanying notes are an integral part of these financial statements.
The accompanying notes are an integral part of these financial statements.
The accompanying notes are an integral part of these financial statements.
| Notes to Financial Statements |
T. Rowe Price Diversified Mid-Cap Growth Fund, Inc. (the fund) is registered under the Investment Company Act of 1940 (the 1940 Act) as a diversified, open-end management investment company. The fund seeks to provide long-term capital growth by investing primarily in the common stocks of mid-cap growth companies. The fund has two classes of shares: the Diversified Mid-Cap Growth Fund (Investor Class) and the Diversified Mid-Cap Growth Fund–I Class (I Class). I Class shares generally are available only to investors meeting a $1,000,000 minimum investment or certain other criteria. Each class has exclusive voting rights on matters related solely to that class; separate voting rights on matters that relate to both classes; and, in all other respects, the same rights and obligations as the other class.
NOTE 1 - SIGNIFICANT ACCOUNTING POLICIES
Basis of Preparation The fund is an investment company and follows accounting and reporting guidance in the Financial Accounting Standards Board (FASB) Accounting Standards Codification Topic 946 (ASC 946). The accompanying financial statements were prepared in accordance with accounting principles generally accepted in the United States of America (GAAP), including, but not limited to, ASC 946. GAAP requires the use of estimates made by management. Management believes that estimates and valuations are appropriate; however, actual results may differ from those estimates, and the valuations reflected in the accompanying financial statements may differ from the value ultimately realized upon sale or maturity.
Investment Transactions, Investment Income, and Distributions Investment transactions are accounted for on the trade date basis. Income and expenses are recorded on the accrual basis. Realized gains and losses are reported on the identified cost basis. Dividends received from mutual fund investments are reflected as dividend income; capital gain distributions are reflected as realized gain/loss. Dividend income and capital gain distributions are recorded on the ex-dividend date. Income tax-related interest and penalties, if incurred, are recorded as income tax expense. Distributions from REITs are initially recorded as dividend income and, to the extent such represent a return of capital or capital gain for tax purposes, are reclassified when such information becomes available. Income distributions are declared and paid by each class annually. Distributions to shareholders are recorded on the ex-dividend date. A capital gain distribution may also be declared and paid by the fund annually.
Class Accounting Shareholder servicing, prospectus, and shareholder report expenses incurred by each class are charged directly to the class to which they relate. Expenses common to both classes, investment income, and realized and unrealized gains and losses are allocated to the classes based upon the relative daily net assets of each class. To the extent any expenses are waived or reimbursed in accordance with an expense limitation (see Note 5), the waiver or reimbursement is charged to the applicable class or allocated across the classes in the same manner as the related expense.
Rebates Subject to best execution, the fund may direct certain security trades to brokers who have agreed to rebate a portion of the related brokerage commission to the fund in cash. Commission rebates are reflected as realized gain on securities in the accompanying financial statements and totaled $2,000 for the year ended December 31, 2017.
New Accounting Guidance In March 2017, the FASB issued amended guidance to shorten the amortization period for certain callable debt securities, held at a premium. The guidance is effective for fiscal years and interim periods beginning after December 15, 2018. Adoption will have no effect on the fund’s net assets or results of operations.
On August 1, 2017, the fund implemented amendments to Regulation S-X, issued by the Securities and Exchange Commission, which require standardized, enhanced disclosures, particularly related to derivatives, in investment company financial statements. Adoption had no effect on the fund’s net assets or results of operations.
Indemnification In the normal course of business, the fund may provide indemnification in connection with its officers and directors, service providers, and/or private company investments. The fund’s maximum exposure under these arrangements is unknown; however, the risk of material loss is currently considered to be remote.
NOTE 2 - VALUATION
The fund’s financial instruments are valued and each class’s net asset value (NAV) per share is computed at the close of the New York Stock Exchange (NYSE), normally 4 p.m. ET, each day the NYSE is open for business. However, the NAV per share may be calculated at a time other than the normal close of the NYSE if trading on the NYSE is restricted, if the NYSE closes earlier, or as may be permitted by the SEC.
Fair Value The fund’s financial instruments are reported at fair value, which GAAP defines as the price that would be received to sell an asset or paid to transfer a liability in an orderly transaction between market participants at the measurement date. The T. Rowe Price Valuation Committee (the Valuation Committee) is an internal committee that has been delegated certain responsibilities by the fund’s Board of Directors (the Board) to ensure that financial instruments are appropriately priced at fair value in accordance with GAAP and the 1940 Act. Subject to oversight by the Board, the Valuation Committee develops and oversees pricing-related policies and procedures and approves all fair value determinations. Specifically, the Valuation Committee establishes procedures to value securities; determines pricing techniques, sources, and persons eligible to effect fair value pricing actions; oversees the selection, services, and performance of pricing vendors; oversees valuation-related business continuity practices; and provides guidance on internal controls and valuation-related matters. The Valuation Committee reports to the Board and has representation from legal, portfolio management and trading, operations, risk management, and the fund’s treasurer.
Various valuation techniques and inputs are used to determine the fair value of financial instruments. GAAP establishes the following fair value hierarchy that categorizes the inputs used to measure fair value:
Level 1 – quoted prices (unadjusted) in active markets for identical financial instruments that the fund can access at the reporting date
Level 2 – inputs other than Level 1 quoted prices that are observable, either directly or indirectly (including, but not limited to, quoted prices for similar financial instruments in active markets, quoted prices for identical or similar financial instruments in inactive markets, interest rates and yield curves, implied volatilities, and credit spreads)
Level 3 – unobservable inputs
Observable inputs are developed using market data, such as publicly available information about actual events or transactions, and reflect the assumptions that market participants would use to price the financial instrument. Unobservable inputs are those for which market data are not available and are developed using the best information available about the assumptions that market participants would use to price the financial instrument. GAAP requires valuation techniques to maximize the use of relevant observable inputs and minimize the use of unobservable inputs. When multiple inputs are used to derive fair value, the financial instrument is assigned to the level within the fair value hierarchy based on the lowest-level input that is significant to the fair value of the financial instrument. Input levels are not necessarily an indication of the risk or liquidity associated with financial instruments at that level but rather the degree of judgment used in determining those values.
Valuation Techniques Equity securities listed or regularly traded on a securities exchange or in the over-the-counter (OTC) market are valued at the last quoted sale price or, for certain markets, the official closing price at the time the valuations are made. OTC Bulletin Board securities are valued at the mean of the closing bid and asked prices. A security that is listed or traded on more than one exchange is valued at the quotation on the exchange determined to be the primary market for such security. Listed securities not traded on a particular day are valued at the mean of the closing bid and asked prices. Actively traded equity securities listed on a domestic exchange generally are categorized in Level 1 of the fair value hierarchy. OTC Bulletin Board securities, certain preferred securities, and equity securities traded in inactive markets generally are categorized in Level 2 of the fair value hierarchy.
Investments in mutual funds are valued at the mutual fund’s closing NAV per share on the day of valuation and are categorized in Level 1 of the fair value hierarchy. Assets and liabilities other than financial instruments, including short-term receivables and payables, are carried at cost, or estimated realizable value, if less, which approximates fair value.
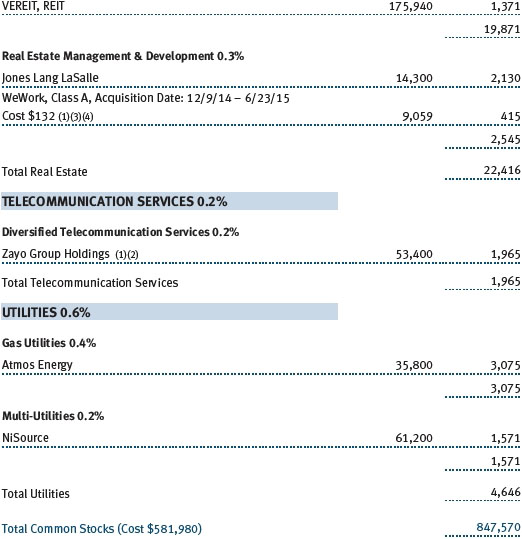
Thinly traded financial instruments and those for which the above valuation procedures are inappropriate or are deemed not to reflect fair value are stated at fair value as determined in good faith by the Valuation Committee. The objective of any fair value pricing determination is to arrive at a price that could reasonably be expected from a current sale. Financial instruments fair valued by the Valuation Committee are primarily private placements, restricted securities, warrants, rights, and other securities that are not publicly traded.
Subject to oversight by the Board, the Valuation Committee regularly makes good faith judgments to establish and adjust the fair valuations of certain securities as events occur and circumstances warrant. For instance, in determining the fair value of an equity investment with limited market activity, such as a private placement or a thinly traded public company stock, the Valuation Committee considers a variety of factors, which may include, but are not limited to, the issuer’s business prospects, its financial standing and performance, recent investment transactions in the issuer, new rounds of financing, negotiated transactions of significant size between other investors in the company, relevant market valuations of peer companies, strategic events affecting the company, market liquidity for the issuer, and general economic conditions and events. In consultation with the investment and pricing teams, the Valuation Committee will determine an appropriate valuation technique based on available information, which may include both observable and unobservable inputs. The Valuation Committee typically will afford greatest weight to actual prices in arm’s length transactions, to the extent they represent orderly transactions between market participants, transaction information can be reliably obtained, and prices are deemed representative of fair value. However, the Valuation Committee may also consider other valuation methods such as market-based valuation multiples; a discount or premium from market value of a similar, freely traded security of the same issuer; or some combination. Fair value determinations are reviewed on a regular basis and updated as information becomes available, including actual purchase and sale transactions of the issue. Because any fair value determination involves a significant amount of judgment, there is a degree of subjectivity inherent in such pricing decisions, and fair value prices determined by the Valuation Committee could differ from those of other market participants. Depending on the relative significance of unobservable inputs, including the valuation technique(s) used, fair valued securities may be categorized in Level 2 or 3 of the fair value hierarchy.
Valuation Inputs The following table summarizes the fund’s financial instruments, based on the inputs used to determine their fair values on December 31, 2017:
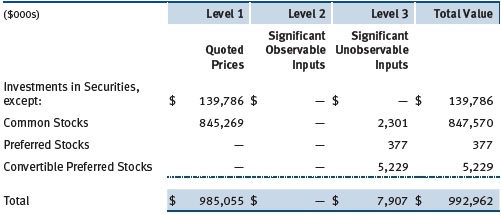
There were no material transfers between Levels 1 and 2 during the year ended December 31, 2017.
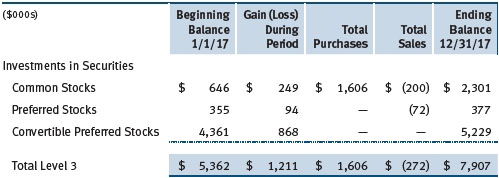
Following is a reconciliation of the fund’s Level 3 holdings for the year ended December 31, 2017. Gain (loss) reflects both realized and change in unrealized gain/loss on Level 3 holdings during the period, if any, and is included on the accompanying Statement of Operations. The change in unrealized gain/loss on Level 3 instruments held at December 31, 2017, totaled $1,100,000 for the year ended December 31, 2017.
NOTE 3 - OTHER INVESTMENT TRANSACTIONS
Consistent with its investment objective, the fund engages in the following practices to manage exposure to certain risks and/or to enhance performance. The investment objective, policies, program, and risk factors of the fund are described more fully in the fund’s prospectus and Statement of Additional Information.
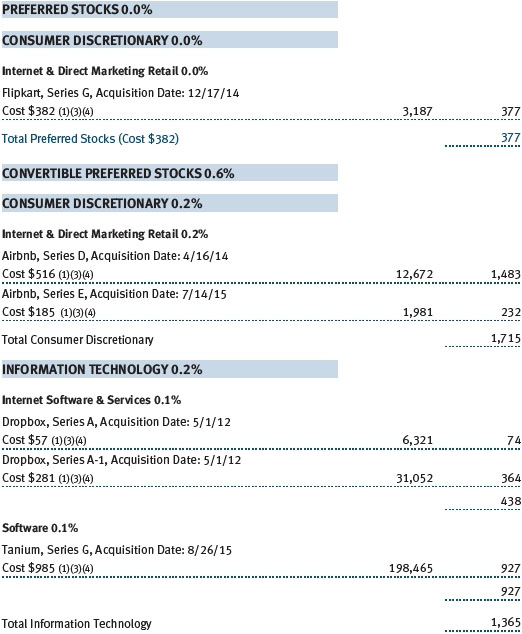
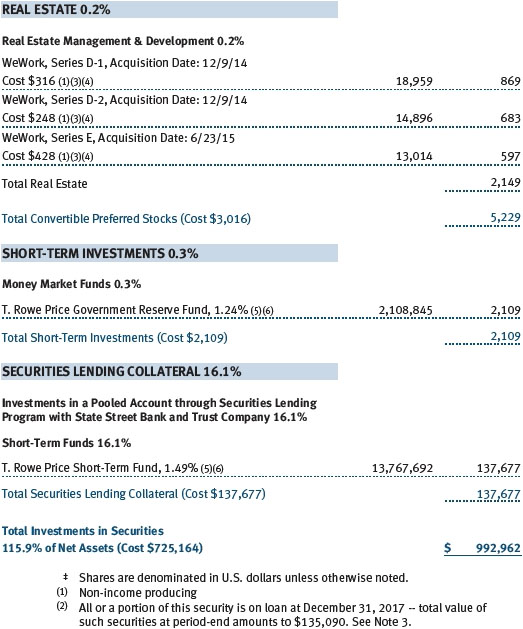
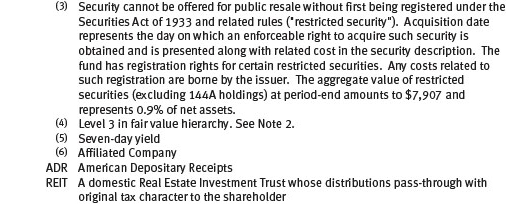
Restricted Securities The fund may invest in securities that are subject to legal or contractual restrictions on resale. Prompt sale of such securities at an acceptable price may be difficult and may involve substantial delays and additional costs.
Securities Lending The fund may lend its securities to approved borrowers to earn additional income. Its securities lending activities are administered by a lending agent in accordance with a securities lending agreement. Security loans generally do not have stated maturity dates, and the fund may recall a security at any time. The fund receives collateral in the form of cash or U.S. government securities, valued at 102% to 105% of the value of the securities on loan. Collateral is maintained over the life of the loan in an amount not less than the value of loaned securities; any additional collateral required due to changes in security values is delivered to the fund the next business day. Cash collateral is invested in accordance with investment guidelines approved by fund management. Additionally, the lending agent indemnifies the fund against losses resulting from borrower default. Although risk is mitigated by the collateral and indemnification, the fund could experience a delay in recovering its securities and a possible loss of income or value if the borrower fails to return the securities, collateral investments decline in value, and the lending agent fails to perform. Securities lending revenue consists of earnings on invested collateral and borrowing fees, net of any rebates to the borrower, compensation to the lending agent, and other administrative costs. In accordance with GAAP, investments made with cash collateral are reflected in the accompanying financial statements, but collateral received in the form of securities is not. At December 31, 2017, the value of loaned securities was $135,090,000; the value of cash collateral and related investments was $138,962,000.
Other Purchases and sales of portfolio securities other than short-term securities aggregated $291,300,000 and $197,198,000, respectively, for the year ended December 31, 2017.
NOTE 4 - FEDERAL INCOME TAXES
No provision for federal income taxes is required since the fund intends to continue to qualify as a regulated investment company under Subchapter M of the Internal Revenue Code and distribute to shareholders all of its taxable income and gains. Distributions determined in accordance with federal income tax regulations may differ in amount or character from net investment income and realized gains for financial reporting purposes. Financial reporting records are adjusted for permanent book/tax differences to reflect tax character but are not adjusted for temporary differences.
The fund files U.S. federal, state, and local tax returns as required. The fund’s tax returns are subject to examination by the relevant tax authorities until expiration of the applicable statute of limitations, which is generally three years after the filing of the tax return but which can be extended to six years in certain circumstances. Tax returns for open years have incorporated no uncertain tax positions that require a provision for income taxes.
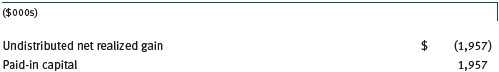
Reclassifications to paid-in capital relate primarily to a tax practice that treats a portion of the proceeds from each redemption of capital shares as a distribution of taxable net investment income or realized capital gain. For the year ended December 31, 2017, the following reclassifications were recorded to reflect tax character (there was no impact on results of operations or net assets):
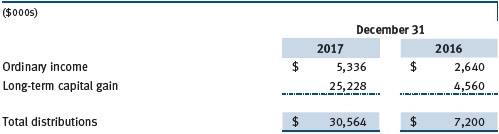
Distributions during the years ended December 31, 2017 and December 31, 2016, were characterized for tax purposes as follows:
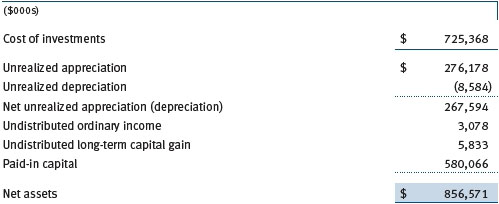
At December 31, 2017, the tax-basis cost of investments, including derivatives, and components of net assets were as follows:
NOTE 5 - RELATED PARTY TRANSACTIONS
The fund is managed by T. Rowe Price Associates, Inc. (Price Associates), a wholly owned subsidiary of T. Rowe Price Group, Inc. (Price Group). The investment management agreement between the fund and Price Associates provides for an annual investment management fee, which is computed daily and paid monthly. The fee consists of an individual fund fee, equal to 0.35% of the fund’s average daily net assets, and a group fee. The group fee rate is calculated based on the combined net assets of certain mutual funds sponsored by Price Associates (the group) applied to a graduated fee schedule, with rates ranging from 0.48% for the first $1 billion of assets to 0.265% for assets in excess of $650 billion. The fund’s group fee is determined by applying the group fee rate to the fund’s average daily net assets. At December 31, 2017, the effective annual group fee rate was 0.29%.
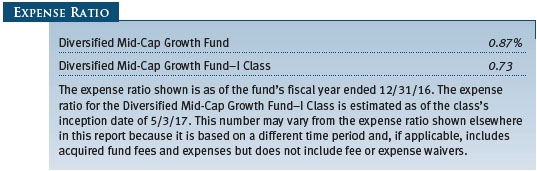
The I Class is subject to an operating expense limitation (I Class limit) pursuant to which Price Associates is contractually required to pay all operating expenses of the I Class, excluding management fees, interest, expenses related to borrowings, taxes, brokerage, and other non-recurring expenses permitted by the investment management agreement, to the extent such operating expenses, on an annualized basis, exceed 0.05% of average net assets. This agreement will continue until April 30, 2019, and may be renewed, revised, or revoked only with approval of the fund’s Board. The I Class is required to repay Price Associates for expenses previously paid to the extent the class’s net assets grow or expenses decline sufficiently to allow repayment without causing the class’s operating expenses (after the repayment is taken into account) to exceed both: (1) the expense limitation in place at the time such amounts were paid; and (2) the class’s current expense limitation. However, no repayment will be made more than three years after the date of a payment or waiver.
Pursuant to this agreement, less than $1,000 of expenses were waived/paid by Price Associates during the year ended December 31, 2017 and remain subject to repayment by the fund.
In addition, the fund has entered into service agreements with Price Associates and two wholly owned subsidiaries of Price Associates (collectively, Price). Price Associates provides certain accounting and administrative services to the fund. T. Rowe Price Services, Inc. provides shareholder and administrative services in its capacity as the fund’s transfer and dividend-disbursing agent. T. Rowe Price Retirement Plan Services, Inc. provides subaccounting and recordkeeping services for certain retirement accounts invested in the Investor Class and I Class. For the year ended December 31, 2017, expenses incurred pursuant to these service agreements were $86,000 for Price Associates; $591,000 for T. Rowe Price Services, Inc.; and $9,000 for T. Rowe Price Retirement Plan Services, Inc. The total amount payable at period-end pursuant to these service agreements is reflected as Due to Affiliates in the accompanying financial statements.
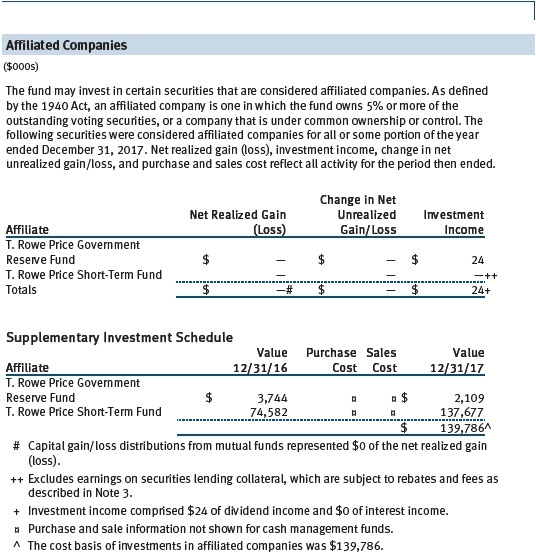
The fund may invest its cash reserves in certain open-end management investment companies managed by Price Associates and considered affiliates of the fund: the T. Rowe Price Government Reserve Fund or the T. Rowe Price Treasury Reserve Fund, organized as money market funds, or the T. Rowe Price Short-Term Fund, a short-term bond fund (collectively, the Price Reserve Funds). The Price Reserve Funds are offered as short-term investment options to mutual funds, trusts, and other accounts managed by Price Associates or its affiliates and are not available for direct purchase by members of the public. Cash collateral from securities lending is invested in the T. Rowe Price Short-Term Fund. The Price Reserve Funds pay no investment management fees.
As of December 31, 2017, T. Rowe Price Group, Inc., or its wholly owned subsidiaries owned 9,321 shares of the I Class, representing 1% of the I Class’s net assets.
The fund may participate in securities purchase and sale transactions with other funds or accounts advised by Price Associates (cross trades), in accordance with procedures adopted by the fund’s Board and Securities and Exchange Commission rules, which require, among other things, that such purchase and sale cross trades be effected at the independent current market price of the security. During the year ended December 31, 2017, the fund had no purchases or sales cross trades with other funds or accounts advised by Price Associates.
| Report of Independent Registered Public Accounting Firm |
To the Board of Directors and Shareholders of
T. Rowe Price Diversified Mid-Cap Growth Fund, Inc.
Opinion on the Financial Statements
We have audited the accompanying statement of assets and liabilities, including the portfolio of investments, of T. Rowe Price Diversified Mid-Cap Growth Fund, Inc. (the “Fund”) as of December 31, 2017, the related statement of operations for the year ended December 31, 2017, the statement of changes in net assets for each of the two years in the period ended December 31, 2017, including the related notes, and the financial highlights for each of the periods indicated therein (collectively referred to as the “financial statements”). In our opinion, the financial statements present fairly, in all material respects, the financial position of the Fund as of December 31, 2017, the results of its operations for the year then ended, the changes in its net assets for each of the two years in the period ended December 31, 2017 and the financial highlights for each of the periods indicated therein, in conformity with accounting principles generally accepted in the United States of America.
Basis for Opinion
These financial statements are the responsibility of the Fund’s management. Our responsibility is to express an opinion on the Fund’s financial statements based on our audits. We are a public accounting firm registered with the Public Company Accounting Oversight Board (United States) (“PCAOB”) and are required to be independent with respect to the Fund in accordance with the U.S. federal securities laws and the applicable rules and regulations of the Securities and Exchange Commission and the PCAOB.
We conducted our audits of these financial statements in accordance with the standards of the PCAOB. Those standards require that we plan and perform the audit to obtain reasonable assurance about whether the financial statements are free of material misstatement, whether due to error or fraud.
Our audits included performing procedures to assess the risks of material misstatement of the financial statements, whether due to error or fraud, and performing procedures that respond to those risks. Such procedures included examining, on a test basis, evidence regarding the amounts and disclosures in the financial statements. Our audits also included evaluating the accounting principles used and significant estimates made by management, as well as evaluating the overall presentation of the financial statements. Our procedures included confirmation of securities owned as of December 31, 2017 by correspondence with the custodians, transfer agent and brokers; when replies were not received from brokers, we performed other auditing procedures. We believe that our audits provide a reasonable basis for our opinion.
PricewaterhouseCoopers LLP
Baltimore, Maryland
February 15, 2018
We have served as the auditor of one or more investment companies in the T. Rowe Price group of investment companies since 1973.
| Tax Information (Unaudited) for the Tax Year Ended 12/31/17 |
We are providing this information as required by the Internal Revenue Code. The amounts shown may differ from those elsewhere in this report because of differences between tax and financial reporting requirements.
The fund’s distributions to shareholders included:
| ● | $4,877,000 from short-term capital gains. |
| |
| ● | $26,792,000 from long-term capital gains, subject to a long-term capital gains tax rate of not greater than 20%. |
For taxable non-corporate shareholders, $5,092,000 of the fund’s income represents qualified dividend income subject to a long-term capital gains tax rate of not greater than 20%.
For corporate shareholders, $4,474,000 of the fund’s income qualifies for the dividends-received deduction.
| Information on Proxy Voting Policies, Procedures, and Records |
A description of the policies and procedures used by T. Rowe Price funds and portfolios to determine how to vote proxies relating to portfolio securities is available in each fund’s Statement of Additional Information. You may request this document by calling 1-800-225-5132 or by accessing the SEC’s website, sec.gov.
The description of our proxy voting policies and procedures is also available on our corporate website. To access it, please visit the following Web page:
https://www3.troweprice.com/usis/corporate/en/utility/policies.html
Scroll down to the section near the bottom of the page that says, “Proxy Voting Policies.” Click on the Proxy Voting Policies link in the shaded box.
Each fund’s most recent annual proxy voting record is available on our website and through the SEC’s website. To access it through T. Rowe Price, visit the website location shown above, and scroll down to the section near the bottom of the page that says, “Proxy Voting Records.” Click on the Proxy Voting Records link in the shaded box.
| How to Obtain Quarterly Portfolio Holdings |
The fund files a complete schedule of portfolio holdings with the Securities and Exchange Commission for the first and third quarters of each fiscal year on Form N-Q. The fund’s Form N-Q is available electronically on the SEC’s website (sec.gov); hard copies may be reviewed and copied at the SEC’s Public Reference Room, 100 F St. N.E., Washington, DC 20549. For more information on the Public Reference Room, call 1-800-SEC-0330.
| About the Fund’s Directors and Officers |
Your fund is overseen by a Board of Directors (Board) that meets regularly to review a wide variety of matters affecting or potentially affecting the fund, including performance, investment programs, compliance matters, advisory fees and expenses, service providers, and business and regulatory affairs. The Board elects the fund’s officers, who are listed in the final table. At least 75% of the Board’s members are independent of T. Rowe Price Associates, Inc. (T. Rowe Price), and its affiliates; “inside” or “interested” directors are employees or officers of T. Rowe Price. The business address of each director and officer is 100 East Pratt Street, Baltimore, Maryland 21202. The Statement of Additional Information includes additional information about the fund directors and is available without charge by calling a T. Rowe Price representative at 1-800-638-5660.
| Independent Directors | | |
| |
| Name | | |
| (Year of Birth) | | |
| Year Elected* | | |
| [Number of T. Rowe Price | | Principal Occupation(s) and Directorships of Public Companies and |
| Portfolios Overseen] | | Other Investment Companies During the Past Five Years |
| | | |
| Bruce W. Duncan | | Chief Executive Officer and Director (2009 to December 2016), |
| (1951) | | Chairman of the Board (January 2016 to present), and President |
| 2013 | | (2009 to September 2016), First Industrial Realty Trust, an owner and |
| [187] | | operator of industrial properties; Chairman of the Board (2005 to |
| | September 2016) and Director (1999 to September 2016), Starwood |
| | Hotels & Resorts, a hotel and leisure company; Director, Boston |
| | Properties (May 2016 to present); Director, Marriott International, |
| | Inc. (September 2016 to present) |
| | | |
| Robert J. Gerrard, Jr. | | Advisory Board Member, Pipeline Crisis/Winning Strategies, a |
| (1952) | | collaborative working to improve opportunities for young African |
| 2012 | | Americans (1997 to present) |
| [187] | | |
| | | |
| Paul F. McBride | | Advisory Board Member, Vizzia Technologies (2015 to present) |
| (1956) | | |
| 2013 | | |
| [187] | | |
| | | |
| Cecilia E. Rouse, Ph.D. | | Dean, Woodrow Wilson School (2012 to present); Professor and |
| (1963) | | Researcher, Princeton University (1992 to present); Member of |
| 2012 | | National Academy of Education (2010 to present); Director, MDRC, |
| [187] | | a nonprofit education and social policy research organization |
| | (2011 to present); Research Associate of Labor Studies Program |
| | (2011 to 2015) and Board Member (2015 to present), National |
| | Bureau of Economic Research (2011 to present); Chair of |
| | Committee on the Status of Minority Groups in the Economic |
| | Profession (2012 to present); Vice President (2015 to present), |
| | American Economic Association |
| | | |
| John G. Schreiber | | Owner/President, Centaur Capital Partners, Inc., a real estate |
| (1946) | | investment company (1991 to present); Cofounder, Partner, and |
| 2003 | | Cochairman of the Investment Committee, Blackstone Real Estate |
| [187] | | Advisors, L.P. (1992 to 2015); Director, General Growth Properties, |
| | Inc. (2010 to 2013); Director, Blackstone Mortgage Trust, a real |
| | estate finance company (2012 to 2016); Director and Chairman of |
| | the Board, Brixmor Property Group, Inc. (2013 to present); Director, |
| | Hilton Worldwide (2013 to present); Director, Hudson Pacific |
| | Properties (2014 to 2016) |
| |
| Mark R. Tercek | | President and Chief Executive Officer, The Nature Conservancy (2008 |
| (1957) | | to present) |
| 2009 | | |
| [187] | | |
| |
| *Each independent director serves until retirement, resignation, or election of a successor. |
| Inside Directors | | |
| |
| Name | | |
| (Year of Birth) | | |
| Year Elected* | | |
| [Number of T. Rowe Price | | Principal Occupation(s) and Directorships of Public Companies and |
| Portfolios Overseen] | | Other Investment Companies During the Past Five Years |
| | | |
| Edward C. Bernard | | Director and Vice President, T. Rowe Price; Vice Chairman of the |
| (1956) | | Board, Director, and Vice President, T. Rowe Price Group, Inc.; |
| 2006 | | Chairman of the Board, Director, and Vice President, T. Rowe Price |
| [187] | | Investment Services, Inc., and T. Rowe Price Services, Inc.; Chairman |
| | of the Board and Director, T. Rowe Price Retirement Plan Services, |
| | Inc.; Chairman of the Board, Chief Executive Officer, Director, and |
| | President, T. Rowe Price International and T. Rowe Price Trust |
| | Company; Chairman of the Board, all funds |
| | | |
| Robert W. Sharps, CFA, | | Vice President, T. Rowe Price, T. Rowe Price Group, Inc., and T. Rowe |
| CPA** | | Price Trust Company |
| (1971) | | |
| 2017 | | |
| [135] | | |
| | | |
| *Each inside director serves until retirement, resignation, or election of a successor. |
| ** Effective April 1, 2017, Brian C. Rogers was replaced by Robert W. Sharps as an inside director of certain Price Funds. |
| Officers | | |
| |
| Name (Year of Birth) | | |
| Position Held With Diversified Mid-Cap | | |
| Growth Fund | | Principal Occupation(s) |
| | | |
| Jason R. Adams (1979) | | Vice President, T. Rowe Price and T. Rowe Price |
| Vice President | | Group, Inc.; formerly, Research Analyst, Caxton |
| | Associates (to 2015) |
| | | |
| Kennard W. Allen (1977) | | Vice President, T. Rowe Price and T. Rowe Price |
| Vice President | | Group, Inc. |
| | | |
| Brian W.H. Berghuis, CFA (1958) | | Vice President, T. Rowe Price, T. Rowe Price |
| Vice President | | Group, Inc., and T. Rowe Price Trust Company |
| | | |
| Darrell N. Braman (1963) | | Vice President, Price Hong Kong, Price |
| Vice President and Secretary | | Singapore, T. Rowe Price, T. Rowe Price Group, |
| | Inc., T. Rowe Price International, T. Rowe Price |
| | Investment Services, Inc., and T. Rowe Price |
| | Services, Inc. |
| | | |
| Eric L. DeVilbiss, CFA (1983) | | Vice President, T. Rowe Price and T. Rowe Price |
| Vice President | | Group, Inc. |
| | | |
| Donald J. Easley, CFA (1971) | | Vice President, T. Rowe Price and T. Rowe Price |
| Executive Vice President | | Group, Inc. |
| | | |
| John R. Gilner (1961) | | Chief Compliance Officer and Vice President, |
| Chief Compliance Officer | | T. Rowe Price; Vice President, T. Rowe Price |
| | Group, Inc., and T. Rowe Price Investment |
| | Services, Inc. |
| | | |
| Stephon A. Jackson, CFA (1962) | | Vice President, T. Rowe Price and T. Rowe Price |
| Vice President | | Group, Inc. |
| | | |
| Paul J. Krug, CPA (1964) | | Vice President, T. Rowe Price, T. Rowe Price |
| Vice President | | Group, Inc., and T. Rowe Price Trust Company |
| | | |
| P. Matt Mahon (1985) | | Vice President, T. Rowe Price; formerly, |
| Vice President | | student, The Wharton School, University of |
| | Pennsylvania (to 2016); Analyst, Water Street |
| | Capital (to 2014) |
| | | |
| Catherine D. Mathews (1963) | | Vice President, T. Rowe Price, T. Rowe Price |
| Treasurer and Vice President | | Group, Inc., and T. Rowe Price Trust Company |
| | | |
| Sudhir Nanda, Ph.D., CFA (1959) | | Vice President, T. Rowe Price and T. Rowe Price |
| Vice President | | Group, Inc. |
| | | |
| David Oestreicher (1967) | | Director, Vice President, and Secretary, T. Rowe |
| Vice President | | Price Investment Services, Inc., T. Rowe Price |
| | Retirement Plan Services, Inc., T. Rowe |
| | Price Services, Inc., and T. Rowe Price Trust |
| | Company; Chief Legal Officer, Vice President, |
| | and Secretary, T. Rowe Price Group, Inc.; Vice |
| | President and Secretary, T. Rowe Price and |
| | T. Rowe Price International; Vice President, |
| | Price Hong Kong and Price Singapore |
| | | |
| Donald J. Peters (1959) | | Vice President, T. Rowe Price and T. Rowe Price |
| President | | Group, Inc. |
| | | |
| John W. Ratzesberger (1975) | | Vice President, T. Rowe Price, T. Rowe Price |
| Vice President | | Group, Inc., and T. Rowe Price Trust Company; |
| | formerly, North American Head of Listed |
| | Derivatives Operation, Morgan Stanley |
| | (to 2013) |
| | | |
| Shannon H. Rauser (1987) | | Employee, T. Rowe Price |
| Assistant Secretary | | |
| | | |
| John F. Wakeman (1962) | | Vice President, T. Rowe Price and T. Rowe Price |
| Vice President | | Group, Inc. |
| | | |
| Megan Warren (1968) | | Vice President, T. Rowe Price, T. Rowe Price |
| Vice President | | Group, Inc., T. Rowe Price Retirement Plan |
| | Services, Inc., T. Rowe Price Services, Inc., |
| | and T. Rowe Price Trust Company; formerly, |
| | Executive Director, JP Morgan Chase (to 2017) |
| | | |
| Rouven J. Wool-Lewis, Ph.D. (1973) | | Vice President, T. Rowe Price and T. Rowe Price |
| Vice President | | Group, Inc. |
| |
| Unless otherwise noted, officers have been employees of T. Rowe Price or T. Rowe Price International for at least 5 years. |
Item 2. Code of Ethics.
The registrant has adopted a code of ethics, as defined in Item 2 of Form N-CSR, applicable to its principal executive officer, principal financial officer, principal accounting officer or controller, or persons performing similar functions. A copy of this code of ethics is filed as an exhibit to this Form N-CSR. No substantive amendments were approved or waivers were granted to this code of ethics during the period covered by this report.
Item 3. Audit Committee Financial Expert.
The registrant’s Board of Directors/Trustees has determined that Mr. Bruce W. Duncan qualifies as an audit committee financial expert, as defined in Item 3 of Form N-CSR. Mr. Duncan is considered independent for purposes of Item 3 of Form N-CSR.
Item 4. Principal Accountant Fees and Services.
(a) – (d) Aggregate fees billed for the last two fiscal years for professional services rendered to, or on behalf of, the registrant by the registrant’s principal accountant were as follows:
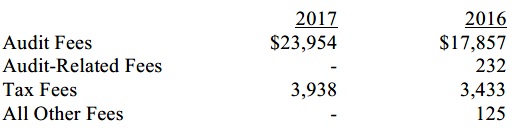
Audit fees include amounts related to the audit of the registrant’s annual financial statements and services normally provided by the accountant in connection with statutory and regulatory filings. Audit-related fees include amounts reasonably related to the performance of the audit of the registrant’s financial statements and specifically include the issuance of a report on internal controls and, if applicable, agreed-upon procedures related to fund acquisitions. Tax fees include amounts related to services for tax compliance, tax planning, and tax advice. The nature of these services specifically includes the review of distribution calculations and the preparation of Federal, state, and excise tax returns. All other fees include the registrant’s pro-rata share of amounts for agreed-upon procedures in conjunction with service contract approvals by the registrant’s Board of Directors/Trustees.
(e)(1) The registrant’s audit committee has adopted a policy whereby audit and non-audit services performed by the registrant’s principal accountant for the registrant, its investment adviser, and any entity controlling, controlled by, or under common control with the investment adviser that provides ongoing services to the registrant require pre-approval in advance at regularly scheduled audit committee meetings. If such a service is required between regularly scheduled audit committee meetings, pre-approval may be authorized by one audit committee member with ratification at the next scheduled audit committee meeting. Waiver of pre-approval for audit or non-audit services requiring fees of a de minimis amount is not permitted.
(2) No services included in (b) – (d) above were approved pursuant to paragraph (c)(7)(i)(C) of Rule 2-01 of Regulation S-X.
(f) Less than 50 percent of the hours expended on the principal accountant’s engagement to audit the registrant’s financial statements for the most recent fiscal year were attributed to work performed by persons other than the principal accountant’s full-time, permanent employees.
(g) The aggregate fees billed for the most recent fiscal year and the preceding fiscal year by the registrant’s principal accountant for non-audit services rendered to the registrant, its investment adviser, and any entity controlling, controlled by, or under common control with the investment adviser that provides ongoing services to the registrant were $2,169,000 and $2,146,000, respectively.
(h) All non-audit services rendered in (g) above were pre-approved by the registrant’s audit committee. Accordingly, these services were considered by the registrant’s audit committee in maintaining the principal accountant’s independence.
Item 5. Audit Committee of Listed Registrants.
Not applicable.
Item 6. Investments.
(a) Not applicable. The complete schedule of investments is included in Item 1 of this Form N-CSR.
(b) Not applicable.
Item 7. Disclosure of Proxy Voting Policies and Procedures for Closed-End Management Investment Companies.
Not applicable.
Item 8. Portfolio Managers of Closed-End Management Investment Companies.
Not applicable.
Item 9. Purchases of Equity Securities by Closed-End Management Investment Company and Affiliated Purchasers.
Not applicable.
Item 10. Submission of Matters to a Vote of Security Holders.
Not applicable.
Item 11. Controls and Procedures.
(a) The registrant’s principal executive officer and principal financial officer have evaluated the registrant’s disclosure controls and procedures within 90 days of this filing and have concluded that the registrant’s disclosure controls and procedures were effective, as of that date, in ensuring that information required to be disclosed by the registrant in this Form N-CSR was recorded, processed, summarized, and reported timely.
(b) The registrant’s principal executive officer and principal financial officer are aware of no change in the registrant’s internal control over financial reporting that occurred during the registrant’s second fiscal quarter covered by this report that has materially affected, or is reasonably likely to materially affect, the registrant’s internal control over financial reporting.
Item 12. Exhibits.
(a)(1) The registrant’s code of ethics pursuant to Item 2 of Form N-CSR is attached.
(2) Separate certifications by the registrant's principal executive officer and principal financial officer, pursuant to Section 302 of the Sarbanes-Oxley Act of 2002 and required by Rule 30a-2(a) under the Investment Company Act of 1940, are attached.
(3) Written solicitation to repurchase securities issued by closed-end companies: not applicable.
(b) A certification by the registrant's principal executive officer and principal financial officer, pursuant to Section 906 of the Sarbanes-Oxley Act of 2002 and required by Rule 30a-2(b) under the Investment Company Act of 1940, is attached.
SIGNATURES
Pursuant to the requirements of the Securities Exchange Act of 1934 and the Investment Company Act of 1940, the registrant has duly caused this report to be signed on its behalf by the undersigned, thereunto duly authorized.
T. Rowe Price Diversified Mid-Cap Growth Fund, Inc.
| By | | /s/ Edward C. Bernard |
| | | Edward C. Bernard |
| | | Principal Executive Officer |
| |
| Date | | February 15, 2018 | | | | |
Pursuant to the requirements of the Securities Exchange Act of 1934 and the Investment Company Act of 1940, this report has been signed below by the following persons on behalf of the registrant and in the capacities and on the dates indicated.
| By | | /s/ Edward C. Bernard |
| | | Edward C. Bernard |
| | | Principal Executive Officer |
| |
| Date | | February 15, 2018 | | | | |
| |
| |
| By | | /s/ Catherine D. Mathews |
| | | Catherine D. Mathews |
| | | Principal Financial Officer |
| |
| Date | | February 15, 2018 | | | | |