Table of Contents
UNITED STATES
SECURITIES AND EXCHANGE COMMISSION
WASHINGTON, D.C. 20549
FORM N-CSR
CERTIFIED SHAREHOLDER REPORT OF REGISTERED MANAGEMENT
INVESTMENT COMPANIES
Investment Company Act file number 811-21465
CBRE Clarion Global Real Estate Income Fund
(Exact name of registrant as specified in charter)
201 King of Prussia Road, Suite 600
Radnor, PA 19087
(Address of principal executive offices) (Zip code)
T. Ritson Ferguson, President and Chief Executive Officer
CBRE Clarion Global Real Estate Income Fund
201 King of Prussia Road, Suite 600
Radnor, PA 19087
(Name and address of agent for service)
Registrant’s telephone number, including area code: 1-877-711-4272
Date of fiscal year end: December 31
Date of reporting period: June 30, 2020
Form N-CSR is to be used by management investment companies to file reports with the Commission not later than 10 days after the transmission to stockholders of any report that is required to be transmitted to stockholders under Rule 30e-1 under the Investment Company Act of 1940 (17 CFR 270.30e-1). The Commission may use the information provided on Form N-CSR in its regulatory, disclosure review, inspection, and policymaking roles.
A registrant is required to disclose the information specified by Form N-CSR, and the Commission will make this information public. A registrant is not required to respond to the collection of information contained in Form N-CSR unless the Form displays a currently valid Office of Management and Budget (“OMB”) control number. Please direct comments concerning the accuracy of the information collection burden estimate and any suggestions for reducing the burden to Secretary, Securities and Exchange Commission, 450 Fifth Street, NW, Washington, DC 20549-0609. The OMB has reviewed this collection of information under the clearance requirements of 44 U.S.C. § 3507.
Table of Contents
Item 1. Reports to Stockholders.
The semi-annual Report of CBRE Clarion Global Real Estate Income Fund (the “Trust”) transmitted to shareholders pursuant to Rule 30e-1 under the Investment Company Act of 1940 is as follows:
Table of Contents

CBRE CLARION GLOBAL REAL ESTATE
INCOME FUND
Semi-Annual Report for the Six Months Ended June 30, 2020

Table of Contents
CBRE Clarion Global Real Estate Income Fund (the “Trust”), acting in accordance with an exemptive order received from the Securities and Exchange Commission (“SEC”) and with approval of its Board of Trustees (the “Board”), has adopted a managed distribution policy (the “Policy”) with the purpose of distributing over the course of each year, through periodic distributions as nearly equal as practicable and any required special distributions, an amount closely approximating the total taxable income of the Trust during such year and all of the returns of capital paid by portfolio companies to the Trust during such year. In accordance with its Policy, the Trust distributes a fixed amount per common share, currently $0.05, each month to its common shareholders. This amount is subject to change from time to time in the discretion of the Board. Although the level of distributions is independent of fund performance, the Trust expects such distributions to correlate with its performance over time. Each monthly distribution to shareholders is expected to be at the fixed amount established by the Board, except for extraordinary distributions and potential increases or decreases in the final dividend periods for each year in light of the Trust’s performance for the entire calendar year and to enable the Trust to comply with the distribution requirements imposed by the Internal Revenue Code. Over time, the Trust expects that the distribution rate in relation to the Trust’s Net Asset Value (“NAV”) will approximately equal the Trust’s total return on NAV.
The fixed amount of distributions will be reviewed and amended as necessary by the Board at regular intervals with consideration of the level of investment income and realized gains. The Board strives to establish a level regular distribution that will meet the Trust’s requirement to pay out all taxable income (including amounts representing return of capital paid by portfolio companies) with a minimum of special distributions. The Trust’s total return in relation to changes in NAV is presented in the financial highlights table. Shareholders should not draw any conclusions about the Trust’s investment performance from the amount of the current distribution or from the terms of the Policy. The Board may amend or terminate the Policy without prior notice to Trust shareholders.
Shareholders should note that the Policy is subject to change or termination as a result of many factors. The Trust is subject to risks through ownership of its portfolio company holdings including, but not limited to, declines in the value of real estate held by the portfolio company, risks related to general and local economic conditions, and portfolio company losses. Moreover, an economic downturn could have a material adverse effect on the real estate markets and on real estate companies in which the Trust invests, which in turn could result in the Trust not achieving its investment or distribution objectives thereby jeopardizing the continuance of the Policy. Please refer to the Trust’s prospectus for a fuller description of risks.
Table of Contents
CBRE CLARION GLOBAL REAL ESTATE INCOME FUND SEMI-ANNUAL REPORT 2020 (unaudited)
| 2 | ||||
| 7 | ||||
| 10 | ||||
| 15 | ||||
| 21 | ||||
Investors should consider a fund’s investment objectives, risks, charges and expenses carefully before investing. A copy of the prospectus that contains this and other information about the Fund may be obtained by calling 888-711-4272. Please read the prospectus carefully before investing. Investing in closed-end funds involves risk, including possible loss of principal. Past performance does not guarantee future results.
Real Estate investments are subject to changes in economic conditions, credit risk, and interest rate fluctuations. International investments may involve risk of capital loss from unfavorable fluctuation in currency values, from differences in generally accepted accounting principles or from economic or political instability in other nations. Because real estate funds concentrate their investments in the real estate industry, the portfolio may experience more volatility and be exposed to greater risk than the portfolios of other funds.
Closed-end funds are traded on the secondary market through one of the stock exchanges. The Fund’s investment return and principal value will fluctuate so that an investor’s shares may be worth more or less than the original cost. Shares of closed-end funds may trade above (a premium) or below (a discount) the net asset value (NAV) of the fund’s portfolio. There is no assurance that the Fund will achieve its investment objective.
| SEMI-ANNUAL REPORT 2020 | 1 |
Table of Contents

T. Ritson Ferguson

Joseph P. Smith

Kenneth S. Weinberg
Dear Shareholder:
We are pleased to present the 2020 Semi-Annual Report for the CBRE Clarion Global Real Estate Income Fund (the “Trust”).
Performance Review
Real estate securities fell materially during the first half of the year. Global real estate stocks fell sharply in March due to the unfolding health crisis and economic recession related to COVID-19. Despite a rally of +10% in the second quarter global real estate stocks remain down more than -20% for the year-to-date and significantly underperformed the broader equity market which rallied nearly +20% to finish down just over -5% for the first half of the year.(1) We expect real estate stocks to rebound given their good relative value and attractive dividend yield in the current low-yield environment.
Real estate stocks in the Asia-Pacific region performed modestly better than North America and Europe. Preferred securities outperformed common stocks.
Global Real Estate Market Performance
Performance as of June 30, 2020
| Region | 1H2020 | CY2019 | ||||||
North America (2) | -21.5 | % | 23.0 | % | ||||
Europe (2) | -21.7 | % | 26.4 | % | ||||
Asia-Pacific (2) | -20.7 | % | 16.6 | % | ||||
Global Common Stock (2) | -21.3 | % | 21.9 | % | ||||
U.S. Preferred (3) | -10.4 | % | 19.9 | % | ||||
80/20 Blend of Global Common Stock & U.S. Preferred Stock | -18.9 | % | 21.6 | % | ||||
The Trust’s net asset value (“NAV”) return was -16.7% during the first half of 2020, outperforming the -18.9% return for an 80/20 mix of global common stock and preferred securities. Investments in U.S. data center, communication tower, and industrial property companies provided the most significant contribution to our performance in the U.S. Our performance also benefitted from having only about 1% of the portfolio in malls and hotels, which were the worst performing property sectors year-to-date (YTD) through June 30, 2020. In Europe, our positioning in German residential stocks and UK industrial landlords helped performance, as did our significant underweight to retail landlords. In the Asia-Pacific region, the Trust’s best investments were in Hong Kong and Japan. Elsewhere in the region we avoided some of the worst performers in Australian retail companies, helping our relative performance.
The Trust made total distributions of $0.30 per share during 1H2020, maintaining a level monthly distribution of $0.05 per share. The annualized distribution represents a 10.1%
| (1) | Global real estate stocks as measured by the FTSE EPRA Nareit Developed Index – Net, which returned +10.1% during the second quarter of 2020 and -21.5% for the first half of the year. The broader equity market as measured by the MSCI World Index, which returned +19.5% during the second quarter of 2020 and -5.5% for the first half of the year. |
| (2) | Represented by the FTSE EPRA Nareit Developed Index – Net. The Index is an unmanaged market-weighted index consisting of real estate companies from developed markets, where greater than 75% of constituents’ EBITDA (earnings before interest, taxes, depreciation, and amortization) is derived from relevant real estate activities, and is calculated net of withholding taxes. Investors cannot invest directly in an index. |
| (3) | Represented by the MSCI REIT Preferred Index, a preferred stock market capitalization weighted index of certain exchange traded preferred securities issued by U.S. equity and U.S. hybrid REITs. Investors cannot invest directly in an index. |
| 2 | CBRE CLARION GLOBAL REAL ESTATE INCOME FUND |
Table of Contents
distribution rate on the $5.97 share price and an 8.5% distribution rate on the $7.08 NAV as of June 30th. (4) The Board continues to regularly review the level of the Trust’s distribution and the ability to sustain it in light of market conditions and total return expectations.
The Trust continues to maintain a flexible strategy for managing portfolio leverage. Having leverage well below allowable limits helped performance during the worst of the sell-off and allowed us to add some leverage to take advantage of the rebound in real estate securities during the second quarter. The Trust’s leverage position was 21% as of June 30th.
Portfolio Review
The Trust’s investments remain well-diversified by property type and geography. During the first half of the year, we continued to reduce our allocation to preferred securities as we see better upside in common stock positions. We used those proceeds to increase our exposure to data centers and communication towers. At June 30th, the Trust’s portfolio was approximately 88% invested in common stock securities (55% in the Americas, 20% in Asia-Pacific, and 13% in Europe) with 12% of the portfolio invested in preferred stock of U.S. real estate companies.
| Geographic Diversification | Sector Diversification | |
| 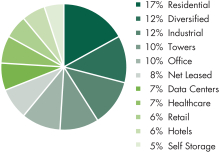 | |
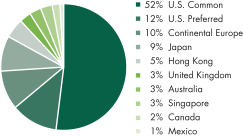
Source: CBRE Clarion Securities as of 06/30/2020.
Geographic and Sector diversification are unaudited. Percentages presented are based on managed trust assets, which include borrowings. The percentages in the pie charts will differ from those on the Portfolio of Investments because the figures on the Portfolio of Investments are calculated using net assets of the Trust.
Market Outlook
Based on our proprietary valuation tools, real estate securities valuations are very compelling relative to the private real estate, fixed income, and broader stock markets. It is unusual for real estate securities to be “cheap” relative to all three of these broader asset classes at the same time. At June 30, 2020, real estate stocks were trading at a global average -11.7% discount to private market real estate value (i.e., “Net Asset Value (NAV)”). Typically, REITs trade near NAV and a discount of over -10% is unusual. The implied “cap rate” (i.e., unleveraged cash flow yield) for global real estate companies is now 5.8%. In the U.S., the spread between implied cap rates and investment grade Baa corporate bonds is an eye-popping +250 basis points versus a long-term average of +93 basis points. Outside the U.S., these spreads are also historically wide. Relative to the broader stock market, REITs look cheap as well. The forward multiple of global REIT earnings is 15.4 versus the 20.2 Price to Earnings ratio of the MSCI World Equity Index.(5) At the beginning of this year, the equity multiples for REITs and the broader market were both approximately the same at 17 times earnings. The present gap of 4.8x has not been seen since the Global Financial Crisis. These types of valuation disparities in the past have often been followed by periods of very strong absolute and relative performance for listed real estate.
CBRE Global Investors’ economic forecast expects, after the sharp global recession in the first half of 2020, a partial rebound in the second half of 2020 followed by positive economic growth in 2021. We believe that the monetary and fiscal measures that were implemented around the globe will help mitigate the depth and length of the recession resulting from the COVID-19 pandemic. We believe the U.S. Federal Reserve and other Central Bankers around the world are applying lessons learned in the GFC to implement appropriate monetary policy and avoid a broader credit market freeze. Importantly too, governments are stepping up to provide complimentary fiscal stimulus to help make up for the slow-down in personal and corporate spending.
| (4) | The Fund is currently paying distributions in excess of its net investment income, which may result in a return of capital. Absent this, the distribution rate would have been lower. The estimated composition of each distribution, including any return of capital, will be provided to shareholders of record and is also available at www.cbreclarion.com. |
| (5) | Forward multiple of global REIT earnings as measured by the FTSE EPRA Nareit Developed Index – Net. |
| SEMI-ANNUAL REPORT 2020 | 3 |
Table of Contents
Our 2020 earnings growth forecast for global listed real estate companies has been revised down to -3.8% (versus the +4.6% we expected at the beginning of the year). However, we expect growth to rebound to approximately 12% in 2021. We believe select sectors and companies could be more resilient given their business models and financial strength. With earnings of real estate companies generated by contractual leases of varying lengths, the quality and consistency of earnings growth is high. Despite the quality and consistency of real estate cash flows in general, earnings in several sectors are expected to be negatively impacted by the pandemic and the ensuing recession. We expect the biggest impact to be on hotels, malls, and discretionary retail. Senior housing, student housing and office will likely have more muted and differentiated effects. Based on our modeling work, we expect the following property sectors to be the most resilient: apartments, single family housing for rent, manufactured housing, data centers, communication towers, life science research facilities, medical office buildings, office buildings with long-term leases to credit tenants, and industrial buildings tied to e-commerce.
Regional Earnings Growth Forecast
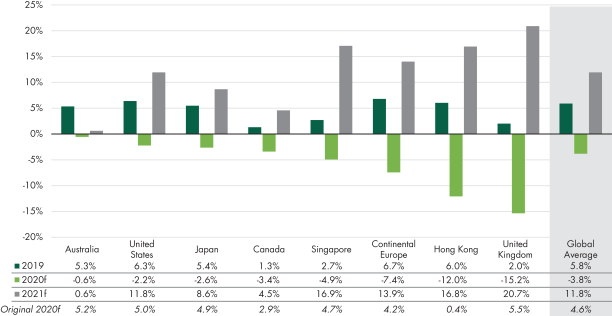
Source: CBRE Clarion as of 06/30/2020.
“f” refers to “forecasts”. Forecasts are the opinion of CBRE Clarion, which is subject to change and is not intended to be a guarantee of future results or investment advice. Forecasts are not indicative of future investment performance.
| 4 | CBRE CLARION GLOBAL REAL ESTATE INCOME FUND |
Table of Contents
We believe real estate dividend yield remains attractive and dividends could grow again in 2020. Current income generated by listed property’s dividend yields remains a defining investment characteristic of the sector. Dividend yield for real estate stocks remains attractive, in the 3-4% range.
Current Dividend Yield
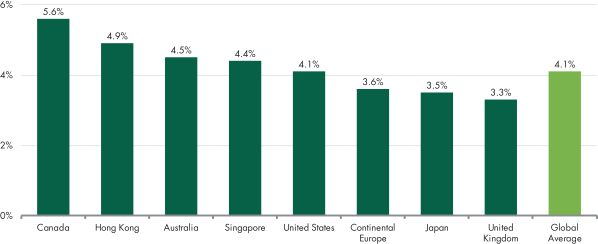
Source: CBRE Clarion as of 06/30/2020. Not all countries included.
Dividend yields fluctuate and are not necessarily indicative of present or future investment performance.
Information is subject to change and should not be construed as investment advice. Past performance is no guarantee of future results.
We own a portfolio of securities that have been screened for the resiliency of their business model and balance sheet strength, quality of management, and attractive relative valuation. We are encouraged by the massive stimulus already enacted by central banks and political leaders around the world. Real estate companies’ balance sheets are generally in good shape and, unlike during the Global Financial Crisis, most companies continue to have consistent access to capital markets or adequate liquidity levels to get through the anticipated trough in economic growth. This economic recession is about demand destruction as a result of shutting down the economy. As a result, our focus is on underwriting the depth of demand destruction and the subsequent pace of demand recovery for the various property sectors and regions. No company will be totally immune from an economic recession or the effects of COVID-19. However, after significant price declines, there are resilient regions, property sectors, and companies that we find very attractively priced. In the U.S., we favor towers, apartments, single family for rent, medical office, life science, and West Coast office. In Japan, we like industrial and office REITs as well as some of the larger diversified real estate companies that have committed to improving their corporate governance. In Hong Kong, we like diversified companies that have best in class management teams and balance sheets with low levels of debt. In Australia, we prefer residential and a few select diversified companies. In the U.K., we favor the industrial, storage, and residential sectors, and companies with superior balance sheets and the management acumen to create value in times of uncertainty. In Continental Europe, we own the German residential companies and we continue to prefer property companies in markets with resilience, including Germany and the Nordics.
Finally, we want to recognize and thank Steve Burton for his service as Co-Portfolio manager as he retires after 25 years with CBRE Clarion Securities at the end of June. Joe Smith, President and Co-CIO of CBRE Clarion Securities, has joined Ritson Ferguson and Ken Weinberg as a Co-Portfolio Manager of the Trust’s portfolio and will provide continuity and depth to your portfolio management team.
| SEMI-ANNUAL REPORT 2020 | 5 |
Table of Contents
We appreciate your continued faith and confidence.
Sincerely,
CBRE CLARION SECURITIES LLC
 |  |  | ||
| T. Ritson Ferguson, CFA | Kenneth S. Weinberg, CFA | Joseph P. Smith | ||
| Co-Portfolio Manager | Co-Portfolio Manager | Co-Portfolio Manager | ||
| President & CEO |
IMPORTANT DISCLOSURES AND RISK INFORMATION
The views expressed represent the opinion of CBRE Clarion Securities (“CBRE Clarion”), which are subject to change and are not intended as investment advice or a guarantee of future results. This material is for informational purposes only. It is not intended as an endorsement of any specific investment. Stated information is derived from proprietary and non-proprietary sources which have not been independently verified for accuracy or completeness. While CBRE Clarion believes the information to be accurate and reliable, we do not claim or accept responsibility for its completeness, accuracy, or reliability. Statements of future expectations, forecasts, estimates, projections, and other forward-looking statements are based on CBRE Clarion’s view at the time such statements were made. Accordingly, such statements are inherently speculative, as they are based on assumptions which may involve known and unknown risks and uncertainties. Any discussion of particular securities herein should not be perceived as a recommendation to purchase or sell any of those securities. It should not be assumed that investments in any securities discussed were or will be profitable. Actual results, performance or events may differ materially from those expressed or implied in such statements. Investing in real estate securities involves risks including the potential loss of principal. Real estate equities are subject to risks similar to those associated with the direct ownership of real estate. Portfolios concentrated in real estate securities may experience price volatility and other risks associated with non-diversification. While equities may offer the potential for greater long-term growth than most debt securities, they generally have higher volatility. International (non-US) investments may involve risk of capital loss from unfavorable fluctuation in currency values, from differences in generally accepted accounting principles, or from economic or political instability in other nations. Past performance is no guarantee of future results.
| 6 | CBRE CLARION GLOBAL REAL ESTATE INCOME FUND |
Table of Contents
Portfolio of Investments (unaudited)
June 30, 2020
| Shares | Market Value | |||||||||||||||
| Real Estate Securities* – 127.3% | ||||||||||||||||
| Common Stock – 111.4% | ||||||||||||||||
| Australia – 3.5% | ||||||||||||||||
| 1,977,420 | Dexus | $ | 12,525,372 | |||||||||||||
| 3,583,147 | GPT Group | 10,287,375 | ||||||||||||||
| 1,877,772 | Ingenia Communities Group | 5,804,878 | ||||||||||||||
| 28,617,625 | ||||||||||||||||
| Belgium – 2.0% | ||||||||||||||||
| 147,379 | Shurgard Self Storage SA | 5,536,936 | ||||||||||||||
| 407,437 | Warehouses De Pauw CVA | 11,119,993 | ||||||||||||||
| 16,656,929 | ||||||||||||||||
| Canada – 2.4% | ||||||||||||||||
| 556,616 | Canadian Apartment Properties REIT | 19,857,542 | ||||||||||||||
| Finland – 0.7% | ||||||||||||||||
| 291,440 | Kojamo OYJ | 6,153,820 | ||||||||||||||
| Germany – 8.2% | ||||||||||||||||
| 532,617 | alstria office REIT-AG (a) | 7,932,249 | ||||||||||||||
| 114,981 | Deutsche Wohnen SE | 5,159,179 | ||||||||||||||
| 244,039 | Grand City Properties SA | 5,629,858 | ||||||||||||||
| 170,355 | LEG Immobilien AG (a) | 21,620,767 | ||||||||||||||
| 439,387 | Vonovia SE (a) | 26,935,095 | ||||||||||||||
| 67,277,148 | ||||||||||||||||
| Hong Kong – 6.2% | ||||||||||||||||
| 3,333,000 | Hang Lung Properties Ltd. | 7,895,526 | ||||||||||||||
| 1,955,500 | Link REIT | 15,983,708 | ||||||||||||||
| 7,472,000 | Sino Land Co. Ltd. | 9,399,712 | ||||||||||||||
| 1,420,000 | Sun Hung Kai Properties Ltd. | 18,129,141 | ||||||||||||||
| 51,408,087 | ||||||||||||||||
| Ireland – 0.5% | ||||||||||||||||
| 3,146,225 | Hibernia REIT PLC | 3,968,326 | ||||||||||||||
| Japan – 11.4% | ||||||||||||||||
| 1,224 | Activia Properties, Inc. | 4,214,821 | ||||||||||||||
| 6,188 | AEON REIT Investment Corp. | 6,561,683 | ||||||||||||||
| 1,487 | Kenedix Office Investment Corp. | 8,283,700 | ||||||||||||||
| 9,412 | LaSalle Logiport REIT | 14,499,462 | ||||||||||||||
| 10,288 | MCUBS MidCity Investment Corp. | 7,457,215 | ||||||||||||||
| 1,243,500 | Mitsubishi Estate Co. Ltd. | 18,470,675 | ||||||||||||||
| 311,000 | Mitsui Fudosan Co., Ltd. | 5,504,514 | ||||||||||||||
| 282,000 | Nomura Real Estate Holdings, Inc. | 5,227,789 | ||||||||||||||
| 13,240 | Orix JREIT, Inc. | 17,353,070 | ||||||||||||||
| Shares | Market Value | |||||||||||||||
| 597,900 | Tokyo Tatemono Co. Ltd. | $ | 6,849,927 | |||||||||||||
| 94,422,856 | ||||||||||||||||
| Mexico – 1.5% | ||||||||||||||||
| 6,890,088 | Prologis Property Mexico SA de CV | 12,314,910 | ||||||||||||||
| Norway – 0.7% | ||||||||||||||||
| 461,843 | Entra ASA (b) | 5,878,959 | ||||||||||||||
| Singapore – 3.3% | ||||||||||||||||
| 5,048,200 | CapitaLand Ltd. (a) | 10,566,463 | ||||||||||||||
| 3,322,600 | CapitaLand Mall Trust | 4,668,145 | ||||||||||||||
| 4,452,100 | Mapletree Commercial Trust | 6,159,315 | ||||||||||||||
| 2,630,000 | Mapletree Industrial Trust | 5,410,631 | ||||||||||||||
| 26,804,554 | ||||||||||||||||
| Sweden – 0.9% | ||||||||||||||||
| 649,206 | Fabege AB | 7,588,407 | ||||||||||||||
| United Kingdom – 3.7% | ||||||||||||||||
| 453,461 | Big Yellow Group PLC | 5,625,379 | ||||||||||||||
| 168,934 | Derwent London PLC | 5,794,482 | ||||||||||||||
| 1,878,486 | Grainger PLC | 6,638,227 | ||||||||||||||
| 1,154,019 | Segro PLC | 12,761,864 | ||||||||||||||
| 30,819,952 | ||||||||||||||||
| United States – 66.4% | ||||||||||||||||
| 101,806 | Alexandria Real Estate Equities, Inc. | 16,518,023 | ||||||||||||||
| 203,211 | American Tower Corp. | 52,538,172 | ||||||||||||||
| 107,491 | AvalonBay Communities, Inc. | 16,622,408 | ||||||||||||||
| 86,512 | Boston Properties, Inc. | 7,818,955 | ||||||||||||||
| 109,136 | Camden Property Trust | 9,955,386 | ||||||||||||||
| 474,218 | Columbia Property Trust, Inc. | 6,231,225 | ||||||||||||||
| 341,073 | Crown Castle International Corp. | 57,078,567 | ||||||||||||||
| 575,316 | CubeSmart | 15,527,779 | ||||||||||||||
| 201,997 | CyrusOne, Inc. | 14,695,282 | ||||||||||||||
| 492,970 | Duke Realty Corp. | 17,446,208 | ||||||||||||||
| 44,342 | Equinix, Inc. | 31,141,387 | ||||||||||||||
| 402,066 | Equity Residential | 23,649,522 | ||||||||||||||
| 97,715 | Federal Realty Investment Trust | 8,326,295 | ||||||||||||||
| 571,025 | Healthcare Trust of America, Inc., Class A | 15,143,583 | ||||||||||||||
| 681,673 | Healthpeak Properties, Inc. | 18,786,908 | ||||||||||||||
| 202,100 | Highwoods Properties, Inc. | 7,544,393 | ||||||||||||||
| 407,291 | Host Hotels & Resorts, Inc. | 4,394,670 | ||||||||||||||
| 573,515 | Hudson Pacific Properties, Inc. | 14,429,637 | ||||||||||||||
| 832,375 | Invitation Homes, Inc. | 22,915,284 | ||||||||||||||
| 145,900 | Life Storage, Inc. | 13,853,205 | ||||||||||||||
See notes to financial statements.
| SEMI-ANNUAL REPORT 2020 | 7 |
Table of Contents
Portfolio of Investments continued
| Shares | Market Value | |||||||||||||||
| 482,633 | MGM Growth Properties LLC, Class A | $ | 13,132,444 | |||||||||||||
| 303,293 | Physicians Realty Trust | 5,313,693 | ||||||||||||||
| 390,492 | Piedmont Office Realty Trust, Inc., Class A | 6,486,072 | ||||||||||||||
| 477,963 | Prologis, Inc. | 44,608,287 | ||||||||||||||
| 94,900 | QTS Realty Trust, Inc., Class A | 6,082,141 | ||||||||||||||
| 241,975 | Simon Property Group, Inc. | 16,546,250 | ||||||||||||||
| 294,067 | Spirit Realty Capital, Inc. | 10,251,176 | ||||||||||||||
| 515,095 | STORE Capital Corp. | 12,264,412 | ||||||||||||||
| 212,850 | Ventas, Inc. | 7,794,567 | ||||||||||||||
| 3,889,348 | VEREIT, Inc. | 25,008,508 | ||||||||||||||
| 832,265 | VICI Properties, Inc. | 16,803,430 | ||||||||||||||
| 181,203 | Welltower, Inc. | 9,377,255 | ||||||||||||||
| 548,285,124 | ||||||||||||||||
| Total Common Stock (cost $931,433,731) | 920,054,239 | |||||||||||||||
| Preferred Stock – 15.9% | ||||||||||||||||
| United States – 15.9% | ||||||||||||||||
| 525,265 | American Homes 4 Rent, Series D, 6.500% | 13,367,994 | ||||||||||||||
| 500,302 | Digital Realty Trust, Inc., Series C, 6.625% | 12,912,794 | ||||||||||||||
| 245,403 | Digital Realty Trust, Inc., Series J, 5.250% | 6,213,604 | ||||||||||||||
| 301,100 | Digital Realty Trust, Inc., Series L, 5.200% | 7,578,687 | ||||||||||||||
| 282,200 | Federal Realty Investment Trust, Series C, 5.000% | 6,942,120 | ||||||||||||||
| 277,856 | iStar, Inc., Series I, 7.500% | 6,790,801 | ||||||||||||||
| 405,900 | National Storage Affiliates Trust, Series A, 6.000% | 10,395,099 | ||||||||||||||
| 550,000 | Pebblebrook Hotel Trust, Series D, 6.375% | 10,444,500 | ||||||||||||||
| 376,619 | Pebblebrook Hotel Trust, Series E, 6.375% | 6,775,376 | ||||||||||||||
| 500,000 | Pebblebrook Hotel Trust, Series F, 6.300% | 9,265,000 | ||||||||||||||
| 143,517 | Rexford Industrial Realty, Inc., Series B, 5.875% | 3,671,165 | ||||||||||||||
| 150,000 | STAG Industrial, Inc., Series C, 6.875% | 3,886,500 | ||||||||||||||
| 225,000 | Summit Hotel Properties, Inc., Series D, 6.450% | 4,108,500 | ||||||||||||||
| 287,077 | Summit Hotel Properties, Inc., Series E, 6.250% | 5,141,549 | ||||||||||||||
| 475,700 | Sunstone Hotel Investors, Inc., Series E, 6.950% | 11,664,164 | ||||||||||||||
| 379,377 | Sunstone Hotel Investors, Inc., Series F, 6.450% | 9,237,830 | ||||||||||||||
| Shares | Market Value | |||||||||||||||
| 120,000 | Taubman Centers, Inc., Series K, 6.250% | $ | 2,586,000 | |||||||||||||
| Total Preferred Stock (cost $146,581,628) | 130,981,683 | |||||||||||||||
Total Investments – 127.3% (cost $1,078,015,359) | 1,051,035,922 | |||||||||||||||
| Liabilities in Excess of Other Assets – (27.3)% | (225,184,160 | ) | ||||||||||||||
| Net Assets – 100.0% | $ | 825,851,762 | ||||||||||||||
| * | Includes U.S. Real Estate Investment Trusts (“REIT”) and Real Estate Operating Companies (“REOC”) as well as entities similarly formed under the laws of non-U.S. countries. |
| (a) | Non-income producing security. |
| (b) | Securities are exempt from registration under Rule 144A of the Securities Act of 1933. These securities may be resold in transactions that are exempt from registration, normally to qualified institutional buyers. At June 30, 2020, the securities amounted to $5,878,959 or 0.7% of net assets. |
See notes to financial statements.
| 8 | CBRE CLARION GLOBAL REAL ESTATE INCOME FUND |
Table of Contents
Portfolio of Investments concluded
Securities Valuation The following is a summary of various inputs used in determining the value of the Trust’s investments. These inputs are summarized in three broad levels. Level 1 includes quoted prices in active markets for identical investments. Level 2 includes other significant observable inputs (including quoted prices for similar investments, interest rates, prepayment speeds, credit risk, etc.). Level 3 includes significant unobservable inputs (including the Trust’s own assumptions in determining the fair value of investments). The level assigned to the securities valuations may not be an indication of the risk or liquidity associated with investing in those securities. The following is a summary of inputs used as of June 30, 2020. For information on the Trust’s policy regarding the valuation of investments, please refer to the Security Valuation section of Note 2 in the accompanying Notes to Financial Statements.
| Assets | Level 1 | Level 2 | Level 3 | Total | ||||||||||||
Investments in Real Estate Securities | ||||||||||||||||
Common Stock | ||||||||||||||||
Australia | $ | 28,617,625 | $ | — | $ | — | $ | 28,617,625 | ||||||||
Belgium | 16,656,929 | — | — | 16,656,929 | ||||||||||||
Canada | 19,857,542 | — | — | 19,857,542 | ||||||||||||
Finland | 6,153,820 | — | — | 6,153,820 | ||||||||||||
Germany | 67,277,148 | — | — | 67,277,148 | ||||||||||||
Hong Kong | 51,408,087 | — | — | 51,408,087 | ||||||||||||
Ireland | 3,968,326 | — | — | 3,968,326 | ||||||||||||
Japan | 94,422,856 | — | — | 94,422,856 | ||||||||||||
Mexico | 12,314,910 | — | — | 12,314,910 | ||||||||||||
Norway | 5,878,959 | — | — | 5,878,959 | ||||||||||||
Singapore | 26,804,554 | — | — | 26,804,554 | ||||||||||||
Sweden | 7,588,407 | — | — | 7,588,407 | ||||||||||||
United Kingdom | 30,819,952 | — | — | 30,819,952 | ||||||||||||
United States | 548,285,124 | — | — | 548,285,124 | ||||||||||||
Total Common Stock | 920,054,239 | — | — | 920,054,239 | ||||||||||||
Preferred Stock | ||||||||||||||||
United States | 130,981,683 | — | — | 130,981,683 | ||||||||||||
Total Investment in Real Estate Securities | $ | 1,051,035,922 | $ | — | $ | — | $ | 1,051,035,922 | ||||||||
See notes to financial statements.
| SEMI-ANNUAL REPORT 2020 | 9 |
Table of Contents
Statement of Assets and Liabilities (unaudited)
| June 30, 2020 | ||||||||
Assets | ||||||||
Investments, at value (cost $1,078,015,359) | $1,051,035,922 | |||||||
Cash and cash equivalents | 172,066 | |||||||
Receivable for investment securities sold | 7,617,112 | |||||||
Dividends and interest receivable | 5,106,512 | |||||||
Dividend withholding reclaims receivable | 290,068 | |||||||
Other assets | 98,050 | |||||||
Total Assets | 1,064,319,730 | |||||||
Liabilities | ||||||||
Line of credit payable | 225,415,100 | |||||||
Payable for investment securities purchased | 11,596,613 | |||||||
Management fees payable | 740,419 | |||||||
Dividend and distributions payable | 172,045 | �� | ||||||
Line of credit interest payable | 146,256 | |||||||
Unrealized depreciation on spot contracts | 22,516 | |||||||
Accrued expenses | 375,019 | |||||||
Total Liabilities | 238,467,968 | |||||||
Net Assets | $825,851,762 | |||||||
Composition of Net Assets | ||||||||
$0.001 par value per share; | $116,590 | |||||||
Additional paid-in capital | 985,679,167 | |||||||
Distributable earnings / (accumulated loss) | (159,943,995 | ) | ||||||
Net Assets | $825,851,762 | |||||||
Net Asset Value | $7.08 | |||||||
See notes to financial statements.
| 10 | CBRE CLARION GLOBAL REAL ESTATE INCOME FUND |
Table of Contents
Statement of Operations (unaudited)
| For the Six Months Ended June 30, 2020 | ||||||||
Investment Income | ||||||||
Dividends (net of foreign withholding taxes of $642,470) | $15,781,382 | |||||||
Interest | 13 | |||||||
Total Investment Income | 15,781,395 | |||||||
Expenses: | ||||||||
Management fees | 4,476,169 | |||||||
Interest expense on line of credit | 1,260,243 | |||||||
Printing and mailing fees | 220,168 | |||||||
Trustees’ fees and expenses | 133,094 | |||||||
Administration fees | 110,294 | |||||||
Custodian fees | 85,821 | |||||||
Legal fees | 76,721 | |||||||
Insurance fees | 75,865 | |||||||
NYSE listing fee | 59,426 | |||||||
Audit and tax fees | 41,930 | |||||||
Transfer agent fees | 40,739 | |||||||
Miscellaneous expenses | 41,830 | |||||||
Total Expenses | 6,622,300 | |||||||
Net Investment Income | 9,159,095 | |||||||
Net Realized and Unrealized Gain (Loss) on Investments, Written Options, and Foreign Currency Transactions | ||||||||
Net realized gain (loss) on: | ||||||||
Investments | (48,546,152 | ) | ||||||
Written options | 1,759,659 | |||||||
Foreign currency transactions | 185,907 | |||||||
Total Net Realized Loss | (46,600,586 | ) | ||||||
Net change in unrealized appreciation (depreciation) on: | ||||||||
Investments | (134,607,609 | ) | ||||||
Foreign currency denominated assets and liabilities | (11,592 | ) | ||||||
Total Net Change in Unrealized Depreciation | (134,619,201 | ) | ||||||
Net Realized and Unrealized Loss on Investments, Written Options, and Foreign Currency Transactions | (181,219,787 | ) | ||||||
Net Decrease in Net Assets Resulting from Operations | $(172,060,692 | ) | ||||||
See notes to financial statements.
| SEMI-ANNUAL REPORT 2020 | 11 |
Table of Contents
Statements of Changes in
Net Assets
| For the Six Months Ended June 30, 2020 (Unaudited) | For the Year Ended December 31, 2019 | |||||||||||||||
Change in Net Assets Resulting from Operations | ||||||||||||||||
Net investment income | $9,159,095 | $18,935,583 | ||||||||||||||
Net realized gain (loss) on investments, written options, and foreign currency transactions | (46,600,586 | ) | 28,183,757 | |||||||||||||
Net change in unrealized appreciation (depreciation) on investments, and foreign currency denominated assets and liabilities | (134,619,201 | ) | 175,088,986 | |||||||||||||
Net increase (decrease) in net assets resulting from operations | (172,060,692 | ) | 222,208,326 | |||||||||||||
Distributions on Common Shares | ||||||||||||||||
Distributions from distributable earnings | (34,977,148 | ) | (34,394,639 | ) | ||||||||||||
Distribution of return of capital | — | (35,559,657 | ) | |||||||||||||
Total distributions on Common Shares | (34,977,148 | ) | (69,954,296 | ) | ||||||||||||
Net Increase (Decrease) in Net Assets | (207,037,840 | ) | 152,254,030 | |||||||||||||
Net Assets | ||||||||||||||||
Beginning of period | 1,032,889,602 | 880,635,572 | ||||||||||||||
End of period | $825,851,762 | $1,032,889,602 | ||||||||||||||
See notes to financial statements.
| 12 | CBRE CLARION GLOBAL REAL ESTATE INCOME FUND |
Table of Contents
Statement of Cash Flows (unaudited)
For the Six Months Ended June 30, 2020 | ||||||||
Cash Flows from Operating Activities: | ||||||||
Net Decrease in Net Assets Resulting from Operations | $(172,060,692 | ) | ||||||
Adjustments to Reconcile Net Decrease in Net Assets Resulting from Operations to | ||||||||
Net change in unrealized appreciation/depreciation on investments | 134,607,609 | |||||||
Net realized loss on investments | 48,546,152 | |||||||
Net realized gain on written options | (1,759,659 | ) | ||||||
Cost of securities purchased | (526,442,583 | ) | ||||||
Proceeds from sale of securities | 499,713,002 | |||||||
Premiums received on written options | 1,844,222 | |||||||
Decrease in receivable for investment securities sold | 13,908,607 | |||||||
Decrease in dividends and interest receivable | 563,399 | |||||||
Decrease in dividend withholding reclaims receivable | 4,661 | |||||||
Increase in unrealized depreciation on spot contracts | 5,788 | |||||||
Decrease in other assets | 11,196 | |||||||
Decrease in payable for investment securities purchased | (69,555,207 | ) | ||||||
Decrease in management fees payable | (97,336 | ) | ||||||
Decrease in line of credit interest payable | (133,499 | ) | ||||||
Decrease in accrued expenses | (46,488 | ) | ||||||
Net Cash Used in Operating Activities | (70,890,828 | ) | ||||||
Cash Flows From Financing Activities: | ||||||||
Cash distributions paid on common shares | (34,976,736 | ) | ||||||
Proceeds from borrowing on line of credit | 235,136,400 | |||||||
Payments on line of credit borrowings | (130,740,800 | ) | ||||||
Net Cash Provided by Financing Activities | 69,418,864 | |||||||
Net Decrease in cash | (1,471,964 | ) | ||||||
Cash and Cash Equivalents at Beginning of Year | 1,644,030 | |||||||
Cash and Cash Equivalents at End of Year | $ 172,066 | |||||||
Supplemental disclosure | ||||||||
Interest paid on line of credit borrowings | $1,393,742 | |||||||
See notes to financial statements.
| SEMI-ANNUAL REPORT 2020 | 13 |
Table of Contents
Financial Highlights
| Per share operating performance for a share outstanding throughout the period | For the Six Months Ended June 30, 2020 (unaudited) | For the Year Ended December 31, 2019 | For the Year Ended December 31, 2018 | For the Year Ended December 31, 2017 | For the Year Ended December 31, 2016 | For the Year Ended December 31, 2015 | ||||||||||||||||||||||||||||||||||||||||||
Net asset value, beginning of period | $8.86 | $7.55 | $8.99 | $8.65 | $9.04 | $10.16 | ||||||||||||||||||||||||||||||||||||||||||
Income from investment operations | ||||||||||||||||||||||||||||||||||||||||||||||||
Net investment income (1) | 0.08 | 0.16 | 0.19 | 0.27 | 0.26 | 0.27 | ||||||||||||||||||||||||||||||||||||||||||
Net realized and unrealized gain (loss) on investments, written options and foreign currency transactions | (1.56 | ) | 1.75 | (1.03 | ) | 0.67 | (0.05 | ) | (0.82 | ) | ||||||||||||||||||||||||||||||||||||||
Total from investment operations | (1.48 | ) | 1.91 | (0.84 | ) | 0.94 | 0.21 | (0.55 | ) | |||||||||||||||||||||||||||||||||||||||
Distributions on Common Shares | ||||||||||||||||||||||||||||||||||||||||||||||||
Net investment income | (0.30 | ) | (0.30 | ) | (0.17 | ) | (0.60 | ) | (0.34 | ) | (0.57 | ) | ||||||||||||||||||||||||||||||||||||
Return of capital | — | (0.30 | ) | (0.43 | ) | — | (0.26 | ) | — | |||||||||||||||||||||||||||||||||||||||
Total distributions to Common Shareholders | (0.30 | ) | (0.60 | ) | (0.60 | ) | (0.60 | ) | (0.60 | ) | (0.57 | ) | ||||||||||||||||||||||||||||||||||||
Net asset value, end of period | $7.08 | $8.86 | $7.55 | $8.99 | $8.65 | $9.04 | ||||||||||||||||||||||||||||||||||||||||||
Market value, end of period | $5.97 | $8.02 | $6.16 | $7.92 | $7.30 | $7.64 | ||||||||||||||||||||||||||||||||||||||||||
Total investment return (2) | ||||||||||||||||||||||||||||||||||||||||||||||||
Net asset value | (16.75 | )% | 25.74 | % | (9.75 | )% | 11.28 | % | 2.17 | % | (5.57 | )% | ||||||||||||||||||||||||||||||||||||
Market value | (21.87 | )% | 40.87 | % | (15.52 | )% | 17.22 | % | 3.17 | % | (8.89 | )% | ||||||||||||||||||||||||||||||||||||
Ratios and supplemental data | ||||||||||||||||||||||||||||||||||||||||||||||||
Net assets, applicable to Common Shares, end of period (thousands) | $825,852 | $1,032,890 | $880,636 | $1,048,432 | $1,008,918 | $1,053,863 | ||||||||||||||||||||||||||||||||||||||||||
Ratios to average net assets applicable to Common Shares of: | ||||||||||||||||||||||||||||||||||||||||||||||||
Net expenses | 1.51 | %(3) | 1.57 | % | 1.54 | % | 1.43 | % | 1.18 | % | 1.19 | % | ||||||||||||||||||||||||||||||||||||
Net expenses, excluding interest on line of credit | 1.23 | %(3) | 1.16 | % | 1.17 | % | 1.16 | % | 1.09 | % | 1.10 | % | ||||||||||||||||||||||||||||||||||||
Net investment income | 2.09 | %(3) | 1.89 | % | 2.30 | % | 3.02 | % | 2.86 | % | 2.79 | % | ||||||||||||||||||||||||||||||||||||
Portfolio turnover rate | 46.42 | % | 44.97 | % | 70.38 | % | 124.07 | % | 67.36 | % | 76.54 | % | ||||||||||||||||||||||||||||||||||||
| (1) | Based on average shares outstanding. |
| (2) | Total investment return does not reflect brokerage commissions. Dividends and distributions are assumed to be reinvested at the prices obtained under the Trust’s Dividend Reinvestment Plan. Net Asset Value (“NAV”) total return is calculated assuming reinvestment of distributions at NAV on the date of the distribution. |
| (3) | Annualized. |
See notes to financial statements.
| 14 | CBRE CLARION GLOBAL REAL ESTATE INCOME FUND |
Table of Contents
Notes to Financial Statements (unaudited)
1. Fund Organization
CBRE Clarion Global Real Estate Income Fund (the “Trust”) is a diversified, closed-end management investment company that was organized as a Delaware statutory trust on November 6, 2003 and registered with the Securities and Exchange Commission (“SEC”) under the Investment Company Act of 1940, as amended. The Trust is an investment company and accordingly follows the Investment Company accounting and reporting guidance of the Financial Accounting Standards Board (“FASB”) Accounting Standards Codification Topic 946 Financial Services-Investment Companies. CBRE Clarion Securities LLC (the “Advisor”) is the Trust’s investment advisor. The Advisor is a majority-owned subsidiary of CBRE Group, Inc. and is partially owned by its senior management team. The Trust commenced operations on February 18, 2004.
| 2. | Significant Accounting Policies |
The following accounting policies are in accordance with U.S. generally accepted accounting principles (“U.S. GAAP”) and are consistently followed by the Trust.
Securities Valuation – The net asset value of the common shares of the Trust will be computed based upon the value of the Trust’s portfolio securities and other assets. The Trust calculates net asset value per common share by subtracting the Trust’s liabilities (including accrued expenses, dividends payable and any borrowings of the Trust) and the liquidation value of any outstanding preferred shares from the Trust’s total assets (the value of the securities the Trust holds, plus cash and/or other assets, including dividends accrued but not yet received) and dividing the result by the total number of common shares of the Trust outstanding. Net asset value per common share will be determined as of the close of the regular trading session (usually 4:00 p.m., EST) on the New York Stock Exchange (“NYSE”) on each business day on which the NYSE is open for trading.
For purposes of determining the net asset value of the Trust, readily marketable portfolio assets (including common stock, preferred stock, and options) traded principally on an exchange, or on a similar regulated market reporting contemporaneous transaction prices, are valued, except as indicated below, at the last sale price for such assets on such principal markets on the business day on which such value is being determined. If there has been no sale on such day, the securities are valued at the mean of the closing bid and asked prices on such day. Foreign securities are valued based upon quotations from the primary market in which they are traded and are translated from the local currency into U.S. dollars using current exchange rates. During the period that a forward foreign currency contract is open, changes in the value of the contract are recognized as unrealized appreciation or depreciation by marking to market such contract on a daily basis to reflect the market value of the contract at the end of each day’s trading. Securities and other assets for which market quotations are not readily available or for which the above valuation procedures are deemed not to reflect fair value are valued in a manner that is intended to reflect their fair value as determined in accordance with procedures approved by the Trust’s Board of Trustees (the “Board”).
Short-term securities which mature in more than 60 days are valued at current market quotations. Short-term securities, which mature in 60 days or less, are valued at amortized cost, which approximates market value.
U.S. GAAP provides guidance on fair value measurements. In accordance with the standard, fair value is defined as the price that the Trust would receive to sell an investment or pay to transfer a liability in a timely transaction with an independent buyer in the principal market, or in the absence of a principal market the most advantageous market for the investment or liability. It establishes a single definition of fair value, creates a three-tier hierarchy as a framework for measuring fair value based on inputs used to value the Trust’s investments, and requires additional disclosure about fair value.
For Level 1 inputs, the Trust uses unadjusted quoted prices in active markets for assets or liabilities with sufficient frequency and volume to provide pricing information as the most reliable evidence of fair value.
The Trust’s Level 2 valuation techniques include inputs other than quoted prices within Level 1 that are observable for an asset or liability, either directly or indirectly. Level 2 observable inputs may include quoted prices for similar assets and liabilities in active markets or quoted prices for identical or similar assets or liabilities in markets that are not active in which there are few transactions, the prices are not current, or price quotations vary substantially over time or among market participants. Inputs that are observable for the asset or liability in Level 2 include such factors as interest rates, yield curves, prepayment speeds, credit risk, and default rates for similar liabilities.
| SEMI-ANNUAL REPORT 2020 | 15 |
Table of Contents
Notes to Financial Statements continued
For Level 3 valuation techniques, the Trust uses unobservable inputs that reflect assumptions market participants would be expected to use in pricing the asset or liability. Unobservable inputs are used to measure fair value to the extent that observable inputs are not available and are developed based on the best information available under the circumstances. In developing unobservable inputs, market participant assumptions are used if they are reasonably available without undue cost and effort.
The primary third party pricing vendor for the Trust’s listed preferred stock investments is FT Interactive Data (“IDC”). When available, the Trust will obtain a closing exchange price to value the preferred stock investments and, in such instances, the investment will be classified as Level 1 since an unadjusted quoted price was utilized. When a closing price is not available for the listed preferred stock investments, IDC will produce an evaluated mean price (midpoint between the bid and the ask evaluation) and such investments will be classified as Level 2 since other observable inputs were used in the valuation. Factors used in the IDC evaluation include trading activity, the presence of a two-sided market, and other relevant market data.
Pursuant to the Trust’s fair value procedures noted previously, equity securities (including exchange traded securities and open-end regulated investment companies) and exchange traded derivatives (i.e. futures contracts and options) are generally categorized as Level 1 securities in the fair value hierarchy. Fixed income securities, non-exchange traded derivatives and money market instruments are generally categorized as Level 2 securities in the fair value hierarchy. Investments for which there are no such quotations, or for which quotations do not appear reliable, are valued at fair value as determined in accordance with procedures established by and under the general supervision of the Trustees. These valuations are typically categorized as Level 2 or Level 3 securities in the fair value hierarchy.
For the period ended June 30, 2020, there have been no significant changes to the Trust’s fair valuation methodology.
Foreign Currency Translation – The books and records of the Trust are maintained in U.S. dollars. Foreign currency amounts are translated into U.S. dollars on the following basis:
| (i) | market value of investment securities, other assets and liabilities – at the current rates of exchange; |
| (ii) | purchases and sales of investment securities, income and expenses – at the rate of exchange prevailing on the respective dates of such transactions. |
Although the net assets of the Trust are presented at the foreign exchange rates and market values at the close of each fiscal year, the Trust does not isolate that portion of the results of operations arising as a result of changes in the foreign exchange rates from the fluctuations arising from changes in the market prices of long-term securities held at the end of the fiscal year. Similarly, the Trust does not isolate the effect of changes in foreign exchange rates from the fluctuations arising from changes in the market prices of portfolio securities sold during the fiscal year. Accordingly, realized foreign currency gains or losses will be included in the reported net realized gains or losses on investment transactions.
Net realized gains or losses on foreign currency transactions represent net foreign exchange gains or losses from the holding of foreign currencies, currency gains or losses realized between the trade date and settlement date on securities transactions, and the difference between the amounts of dividends, interest and foreign withholding taxes recorded on the Trust’s books and the U.S. dollar equivalent amounts actually received or paid. Net unrealized currency gains or losses from valuing foreign currency denominated assets or liabilities (other than investments) at year end exchange rates are reflected as a component of net unrealized appreciation or depreciation on investments and foreign currencies.
Foreign security and currency transactions may involve certain considerations and risks not typically associated with those of domestic origin as a result of, among other factors, the possibility of political or economic instability, or the level of governmental supervision and regulation of foreign securities markets.
Forward Foreign Currency Contracts – The Trust enters into forward foreign currency contracts in order to hedge its exposure to changes in foreign currency exchange rates on its foreign portfolio holdings, to hedge certain Trust purchase and sales commitments denominated in foreign currencies and for investment purposes. A forward foreign currency contract is a commitment to purchase or sell a foreign currency on a future date at a negotiated forward rate. The gain or loss arising from the difference between the original contracts and the closing of such contracts would be included in net realized gain or loss on foreign currency transactions.
| 16 | CBRE CLARION GLOBAL REAL ESTATE INCOME FUND |
Table of Contents
Notes to Financial Statements continued
Fluctuations in the value of open forward foreign currency contracts are recorded for financial reporting purposes as unrealized appreciation and depreciation by the Trust.
The Trust’s custodian will place and maintain cash not available for investment or other liquid assets in a separate account of the Trust having a value at least equal to the aggregate amount of the Trust’s commitments under forward foreign currency contracts entered into with respect to position hedges.
Risks may arise from the potential inability of a counterparty to meet the terms of a contract and from unanticipated movements in the value of a foreign currency relative to the U.S. dollar. The face or contract amount, in U.S. dollars, reflects the total exposure the Trust has in that particular currency contract. As of June 30, 2020, the Trust did not hold any forward foreign currency contracts.
Options – The Trust may purchase or sell (write) options on securities and securities indices which are listed on a national securities exchange or in the over-the-counter (“OTC”) market as a means of achieving additional return or of hedging the value of the Trust’s portfolio.
An option on a security is a contract that gives the holder of the option, in return for a premium, the right to buy from (in the case of a call) or sell to (in the case of a put) the writer of the option the security underlying the option at a specified exercise or “strike” price. The writer of an option on a security has an obligation upon exercise of the option to deliver the underlying security upon payment of the exercise price (in the case of a call) or to pay the exercise price upon delivery of the underlying security (in the case of a put).
There are several risks associated with transactions in options on securities. As the writer of a covered call option, the Trust forgoes, during the option’s life, the opportunity to profit from increases in the market value of the security covering the call option above the sum of the premium and the strike price of the call but has retained the risk of loss should the price of the underlying security decline. The writer of an option has no control over the time when it may be required to fulfill its obligation as writer of the option. Once an option writer has received an exercise notice, it cannot effect a closing purchase transaction in order to terminate its obligation under the option and must deliver the underlying security at the exercise price. As of June 30, 2020, the Trust did not hold any options contracts.
Securities Transactions and Investment Income – Securities transactions are recorded on a trade date basis. Realized gains and losses from securities transactions are recorded on the basis of identified cost. Dividend income is recorded on the ex-dividend date. Distributions received from investments in REITs are recorded as dividend income on ex-dividend date, subject to reclassification upon notice of the character of such distributions by the issuer. The portion of dividend attributable to the return of capital is recorded against the cost basis of the security. Withholding taxes on foreign dividends are recorded net of reclaimable amounts, at the time the related income is earned. Non-cash dividends included in dividend income, if any, are recorded at the fair market value of the securities received. Interest income, including accretion of original issue discount, where applicable, and accretion of discount on short-term investments, is recorded on the accrual basis.
Dividends and Distributions to Shareholders – Dividends from net investment income, if any, are declared and paid on a monthly basis. Income dividends and capital gain distributions to common shareholders are recorded on the ex-dividend date. To the extent the Trust’s net realized capital gains, if any, can be offset by capital loss carryforwards, it is the policy of the Trust not to distribute such gains.
On August 5, 2008, the Trust acting in accordance with an exemptive order received from the SEC and with approval of the Board, adopted a managed distribution policy under which the Trust intends to make regular monthly cash distributions to common shareholders, stated in terms of a fixed amount per common share. This managed distribution policy permits the Trust to include long-term capital gains in its distribution as frequently as twelve times a year. In practice, the Board views this policy as a potential means of further supporting the market price of the Trust’s shares through the payment of a steady and predictable level of cash distributions to shareholders.
The current monthly distribution rate is $0.05 per share. The Trust continues to evaluate its monthly distribution policy in light of ongoing economic and market conditions and may change the amount of the monthly distributions in the future.
Use of Estimates – The preparation of financial statements, in conformity with U.S. GAAP, requires management to make estimates and assumptions that affect the reported amounts of assets and liabilities at the date of the financial statements and the reported amounts of expenses during the reporting year. Actual results could differ from those estimates.
| SEMI-ANNUAL REPORT 2020 | 17 |
Table of Contents
Notes to Financial Statements continued
| 3. | Derivative Instruments |
The effect of derivative instruments on the Trust’s Statement of Operations for the period ended June 30, 2020 was as follows:
Derivatives not accounted for as hedging instruments | Realized gain (loss) | |||||
Equity Risk | ||||||
Written options | $ | 1,759,659 | ||||
For the period ended June 30, 2020, the average month-end notional value of written options was $29,449,091.
| 4. | Concentration of Risk |
Under normal market conditions, the Trust’s investments will be concentrated in income-producing common equity securities, preferred securities, convertible securities and non-convertible debt securities issued by companies deriving the majority of their revenue from the ownership, construction, financing, management and/or sale of commercial, industrial, and/or residential real estate. Values of the securities of such companies may fluctuate due to economic, legal, cultural, geopolitical or technological developments affecting various global real estate industries.
| 5. | Investment Management Agreement and Other Agreements |
Pursuant to an investment management agreement between the Advisor and the Trust, the Advisor is responsible for the daily management of the Trust’s portfolio of investments, which includes buying and selling securities for the Trust, as well as investment research. The Trust pays for investment advisory services and facilities through a fee payable monthly in arrears at an annual rate equal to 0.85% of the average daily value of the Trust’s managed assets plus certain direct and allocated expenses of the Advisor incurred on the Trust’s behalf. During the period ended June 30, 2020, the Trust incurred management fees of $4,476,169, of which $740,419 is payable as of the end of the period.
The Trust has multiple service agreements with the Bank of New York Mellon (“BNYM”). Under the servicing agreements, BNYM will perform custodial, fund accounting, and certain administrative services for the Trust. As custodian, BNYM is responsible for the custody of the Trust’s assets. As administrator, BNYM is responsible for maintaining the books and records of the Trust’s securities and cash.
Computershare is the Trust’s transfer agent and as such is responsible for performing transfer agency services for the Trust.
| 6. | Portfolio Securities |
For the period ended June 30, 2020, there were purchases and sales transactions (excluding short-term securities) of $526,953,958 and $495,689,092, respectively. These purchases and sales transaction amounts differ from the amounts disclosed on the Statement of Cash Flows primarily due to the re-characterization of dividends from ordinary income to return of capital and capital gain.
| 7. | Federal Income Taxes |
The Trust intends to elect to be, and qualify for treatment as, a regulated investment company under Subchapter M of the Internal Revenue Code of 1986, as amended (the “Code”). A regulated investment company generally pays no federal income tax on the income and gains that it distributes. The Trust intends to meet the calendar year distribution requirements imposed by the Code to avoid the imposition of a 4% excise tax.
The Trust is required to evaluate tax positions taken or expected to be taken in the course of preparing the Trust’s tax returns to determine whether the tax positions are “more-likely-than-not” of being sustained by the applicable tax authority. Income tax and related interest and penalties would be recognized by the Trust as tax expense in the Statement of Operations if the tax positions were deemed to not meet the more-likely-than-not threshold. For the period ended June 30, 2020, the Trust did not incur any income tax, interest, or penalties. Management has analyzed the Trust’s tax positions taken on federal, state and local income tax returns for all open tax years (since inception) and has concluded that no provisions for federal, state and local income tax are required in the Trust’s financial statements.
| 18 | CBRE CLARION GLOBAL REAL ESTATE INCOME FUND |
Table of Contents
Notes to Financial Statements continued
The Trust distinguishes between dividends on a tax basis and on a financial reporting basis and only distributions in excess of tax basis earnings and profits are reported in the financial statements as a tax return of capital. Differences in the recognition or classification of income between the financial statements and tax earnings and profits which result in temporary over-distributions for financial statement purposes are classified as distributable earnings or accumulated losses in the composition of net assets on the Statement of Assets and Liabilities.
In order to present paid-in capital in excess of par and total distributable earnings /(Accumulated Loss) on the Statement of Assets and Liabilities that more closely represent their tax character, certain adjustments have been made to additional paid-in capital, and total distributable earnings. For the year ended December 31, 2019, the adjustments were to increase additional paid-in capital by $308,075 and decrease distributable earnings by $308,075 due to the difference in the treatment for book and tax purposes of passive foreign investment company (“PFIC”) investments and recognition of foreign currency gain (loss) as ordinary income (loss) and distribution reclasses. Results of operations and net assets were not affected by these reclassifications.
At December 31, 2019, the Trust had capital loss carryforwards which will reduce the Trust’s taxable income arising from future net realized gain on investments, if any, to the extent permitted by the code and thus will reduce the amount of distributions to shareholders which would otherwise be necessary to relieve the Trust of any liability for federal income tax.
The Regulated Investment Company Modernization Act of 2010 (the “Act”) eliminated the eight-year carryover period for capital losses that arise in taxable years beginning after its enactment date of December 22, 2010. Consequently, these capital losses can be carried forward for an unlimited period. However, capital losses with an expiration period may not be used to offset capital gains until all net capital losses without an expiration date have been utilized. Additionally, post-enactment capital loss carryovers will retain their character as either short-term or long-term capital losses instead of as short-term capital losses as under prior law. At December 31, 2019, the Trust had no expiring capital losses. The Trust had short-term capital losses of $21,624,969, with no expiration and long-term capital losses of $20,913,185, with no expiration.
The final determination of the source of the 2020 distributions for tax purposes will be made after the end of the Trust’s fiscal year and will be reported to shareholders in February 2021 on the Form 1099-DIV.
For the year ended December 31, 2019, the tax character of distributions paid, as reflected in the Statements of Changes in Net Assets, was $34,394,639 of ordinary income (reflected in the Statement of Changes in Net Assets as distributions from distributable earnings) and $35,559,657 of return of capital, respectively. For the year ended December 31, 2018, the tax character of distributions paid, as reflected in the Statements of Changes in Net Assets, was $19,584,966 of ordinary income and $50,369,330 of return of capital, respectively.
Information on the tax components of net assets as of December 31, 2019 is as follows:
| Cost of Investments for Tax Purposes | Gross Tax Unrealized Appreciation | Gross Tax Unrealized Depreciation | Net Tax Unrealized Depreciation on Investments | Net Tax Unrealized Appreciation on Foreign Currency | Qualified Late Year Ordinary Losses | Qualified Post- October Capital Deferral | Undistributed Long-Term Capital Gains/ (Accumulated Capital Loss) | |||||||
| $1,115,295,931 | $115,336,116 | $(23,087,382) | $92,248,734 | $4,621 | $2,621,093 | $0 | $(42,538,417) |
| 8. | Borrowings |
The Trust has access to a secured line of credit up to $300,000,000 from BNYM for borrowing purposes. Borrowings under this arrangement bear interest at the Federal funds rate plus 75 basis points. At June 30, 2020, there were borrowings in the amount of $225,415,100 on the Trust’s line of credit.
The average daily amount of borrowings during the period ended June 30, 2020 was $179,724,153 with an average interest rate of 1.41%. The maximum amount outstanding for the period ended June 30, 2020, was $225,415,100. The Trust had borrowings under the line of credit for all 182 days during the period.
| SEMI-ANNUAL REPORT 2020 | 19 |
Table of Contents
Notes to Financial Statements concluded
| 9. | Capital |
During 2004, the Trust issued 101,000,000 shares of common stock at $15.00. In connection with the Trust’s Dividend Reinvestment Plan (“DRIP”), the Trust issued no common shares for the period ended June 30, 2020 and the year ended December 31, 2019, respectively. At June 30, 2020, the Trust had outstanding common shares of 116,590,494 with a par value of $0.001 per share. The Advisor owned none of the common shares outstanding as of June 30, 2020.
At June 30, 2020, the Trust had no shares of auction rate preferred securities outstanding.
| 10. | Indemnifications |
The Trust enters into contracts that contain a variety of indemnifications. The Trust’s exposure under these arrangements is unknown. However, the Trust has not had prior claims or losses or current claims or losses pursuant to these contracts.
| 11. | Subsequent Events |
Events or transactions that occur after the balance sheet date but before the financial statements are issued are categorized as recognized or non-recognized for financial statement purposes. Since June 30, 2020, the Trust paid a dividend on July 31, 2020 of $0.05 per share for the month of July 2020. No other notable events have occurred between year-end and the issuance of these financial statements.
| 20 | CBRE CLARION GLOBAL REAL ESTATE INCOME FUND |
Table of Contents
Supplemental Information (unaudited)
Trustees
The Trustees of the CBRE Clarion Global Real Estate Income Fund and their principal occupations during the past five years:
Name, Address and Age | Term of Office and Length of Time Served (1) | Title | Principal Occupations Five Years | Number of Portfolios in the Fund Complex Overseen by Trustee | Other Directorships Held by Trustee | |||||
| Trustees: | ||||||||||
| T. Ritson Ferguson* 201 King of Prussia Road, Suite 600 Radnor, PA 19087 Age: 60 | 3 years/ since inception | Trustee, President and Chief Executive Officer | Chief Executive Officer and Co-Chief Investment Officer of CBRE Clarion Securities LLC (since 1995); Chief Executive Officer, Chief Investment Officer and Global Chief Investment Officer of CBRE Global Investors (2015 - 2019) | 1 | Duke Management Company (DUMAC) (since 2018) | |||||
Asuka Nakahara 201 King of Prussia Road, Suite 600 Radnor, PA 19087 Age: 64 | 3 years/ since inception | Trustee | Associate Director of the Zell-Lurie Real Estate Center at the Wharton School, University of Pennsylvania (since 1999); Practice Professor of Real Estate at the Wharton School, University of Pennsylvania (since 1999); Partner of Triton Atlantic Partners (since 2009) | 1 | Comcast Corporation (since 2017) | |||||
| Frederick S. Hammer 201 King of Prussia Road, Suite 600 Radnor, PA 19087 Age: 84 | 3 years/ since inception | Trustee | Co-Chairman of IA Capital Group and a member of its investment committee (1994 - 2018) | 1 | Payall, Inc. (since 2018); Homeowners Insurance Corp. (since 2006); JetPay Corporation (2011 - 2016) | |||||
| John R. Bartholdson 201 King of Prussia Road, Suite 600 Radnor, PA 19087 Age: 75 | 3 years/ 16 years | Trustee/ Audit Committee Financial Expert | Senior Vice President, CFO and Treasurer, and a Director of Triumph Group, Inc. (1993 - 2007)(Retired) | 1 | Berwyn Cornerstone Fund, Berwyn Income Fund, and Berwyn Fund (2013 - 2016) | |||||
Leslie E. Greis 201 King of Prussia Road, Suite 600 Radnor, PA 19087 Age: 61 | 3 years/ 1 year | Trustee | Managing Member, Perennial Capital Advisors, LLC (2003 - present) | 1 | AIM Mutual, Inc. (2016 - present), Kinefac Corporation (since 2009) | |||||
Heidi Stam 201 King of Prussia Road, Suite 600 Radnor, PA 19087 Age: 63 | 1 month | Trustee | Managing Director and General Counsel, The Vanguard Group, Inc. (2005 - 2016 Retired) | 1 | Investor Advisory Committee, U.S. Securities and Exchange Commission (since 2017); National Adjudicatory Council, FINRA (since 2017) | |||||
| (1) | Each Trustee is elected to serve a three-year term concurrent with the class of Trustees to which he or she belongs. Messrs. Ferguson and Hammer, and Ms. Stam, as Class I Trustees, are currently serving a term expiring at the Trust’s 2020 annual meeting of shareholders. Mr. Hammer has informed the Board that he intends to retire from the Board upon the conclusion of his term and, therefore, will not stand for re-election at the 2020 annual meeting of shareholders. Mr. Nakahara, as Class II Trustee, is currently serving a term expiring at the Trust’s 2021 annual meeting of shareholders. Mr. Bartholdson and Ms. Greis, as Class III Trustees, are each currently serving a term expiring at the Trust’s 2022 annual meeting of shareholders. |
| * | Mr. Ferguson is deemed to be an interested person of the Trust as defined in the Investment Company Act of 1940 (the “1940 ACT”), as amended, due to his position with the Advisor. |
| SEMI-ANNUAL REPORT 2020 | 21 |
Table of Contents
Supplemental Information (unaudited) continued
Officers
The Officers of the CBRE Clarion Global Real Estate Income Fund and their principal occupations during the past five years:
Name, Address, Age and Position(s) Held with Registrant | Length of Time Served | Principal Occupations During the Past Five Years and Other Affiliations | ||
| Officers: | ||||
Jonathan A. Blome 201 King of Prussia Road, Suite 600 Radnor, PA 19087 Age: 43 Chief Financial Officer | since 2006 | Chief Financial Officer and Director of Operations of CBRE Clarion Securities LLC (since 2011) | ||
Robert S. Tull III 201 King of Prussia Road, Suite 600 Radnor, PA 19087 Age: 43 Chief Compliance Officer and Secretary | since 2019 | Chief Compliance Officer of CBRE Clarion Securities LLC (since 2008); Global Chief Compliance Officer for CBRE Global Investors (2017 - 2018) | ||
| 22 | CBRE CLARION GLOBAL REAL ESTATE INCOME FUND |
Table of Contents
Supplemental Information (unaudited) continued
Additional Information
Statement of Additional Information includes additional information regarding the Trustees. This information is available upon request, without charge, by calling the following toll-free telephone number: 1-888-711-4272.
The Trust has delegated the voting of the Trust’s voting securities to the Trust’s advisor pursuant to the proxy voting policies and procedures of the advisor. You may obtain a copy of these policies and procedures by calling 1-888-711-4272. The policies may also be found on the website of the SEC (http://www.sec.gov).
Information regarding how the Trust voted proxies for portfolio securities, if applicable, during the most recent 12-month period ended December 31, is also available, without charge and upon request by calling the Trust at 1-888-711-4272 or by accessing the Trust’s Form N-PX on the Commission’s website at http://www.sec.gov.
The Trust files its complete schedule of portfolio holdings with the SEC for the first and third quarters of each fiscal year on Form N-PORT. Copies of the filings are available by visiting the SEC website at www.sec.gov. The filed forms may also be viewed and copied at the Commission’s Public Reference Room in Washington, DC. Information regarding the operations of the Public Reference Room may be obtained by calling (800) SEC-0330.
Beginning on January 1, 2021, as permitted by regulations adopted by the Securities and Exchange Commission, paper copies of the Fund’s shareholder reports like this one will no longer be sent by mail, unless you specifically request paper copies. Instead, the reports will be made available on a website, and you will be notified by mail each time a report is posted and provided with a website link to access the report.
You may elect to receive all future reports in paper free of charge. If you hold your shares through a financial intermediary (like a broker), you can inform the intermediary that you wish to continue receiving paper copies of your shareholder reports. If you are the registered owner of your shares, you should contact the Fund’s transfer agent.
Dividend Reinvestment Plan (unaudited)
Pursuant to the Trust’s Dividend Reinvestment Plan (the “Plan”), shareholders of the Trust are automatically enrolled, to have all distributions of dividends and capital gains reinvested by The Bank of New York Mellon (the “Plan Agent”) in the Trust’s shares pursuant to the Plan. You may elect not to participate in the Plan and to receive all dividends in cash by sending written instructions or by contacting The Bank of New York Mellon, as dividend disbursing agent, at the address set forth below. Participation in the Plan is completely voluntary and may be terminated or resumed at any time without penalty by contacting the Plan Agent before the dividend record date; otherwise such termination or resumption will be effective with respect to any subsequently declared dividend or other distribution. Shareholders who do not participate in the Plan will receive all distributions in cash paid by check and mailed directly to the shareholders of record (or if the shares are held in street or other nominee name, then to the nominee) by the Plan Agent, which serves as agent for the shareholders in administering the Plan.
After the Trust declares a dividend or determines to make a capital gain distribution, the Plan Agent will acquire shares for the participants’ account, depending upon the circumstances described below, either (i) through receipt of unissued but authorized shares from the Trust (“newly issued shares”) or (ii) by open market purchases. If, on the dividend payment date, the NAV is equal to or less than the market price per share plus estimated brokerage commissions (such condition being referred to herein as “market premium”), the Plan Agent will invest the dividend amount in newly issued shares on behalf of the participants. The number of newly issued shares to be credited to each participant’s account will be determined by dividing the dollar amount of the dividend by the NAV on the date the shares are issued. However, if the NAV is less than 95% of the market price on the payment date, the dollar amount of the dividend will be divided by 95% of the market price on the payment date. If, on the dividend payment date, the NAV is greater than the market value per share plus estimated brokerage commissions (such condition being referred to herein as “market discount”), the Plan Agent will invest the dividend amount in shares acquired on behalf of the participants in open-market purchases.
The Plan Agent’s fees for the handling of the reinvestment of dividends and distributions will be paid by the Trust. However, each participant will pay a pro rata share of brokerage commissions incurred with respect to the Plan Agent’s open market purchases in connection with the reinvestment of dividends and distributions. The automatic reinvestment of dividends and distributions will not relieve participants of any Federal income tax that may be payable on such dividends or distributions.
| SEMI-ANNUAL REPORT 2020 | 23 |
Table of Contents
Supplemental Information (unaudited) concluded
The Trust reserves the right to amend or terminate the Plan. There is no direct service charge to participants in the Plan; however, the Trust reserves the right to amend the Plan to include a service charge payable by the participants. Participants that request a sale of shares through the Plan Agent are subject to a $2.50 sales fee and a $0.15 per share sold brokerage commission. All correspondence concerning the Plan should be directed to the Plan Agent at Computershare Shareowner Services LLC, P.O. Box 505000, Louisville, KY 40233, Phone Number: (866) 221-1580.
| 24 | CBRE CLARION GLOBAL REAL ESTATE INCOME FUND |
Table of Contents
CBRE CLARION GLOBAL REAL ESTATE INCOME FUND
BOARD OF TRUSTEES
T. RITSON FERGUSON
ASUKA NAKAHARA
FREDERICK S. HAMMER
JOHN R. BARTHOLDSON
LESLIE E. GREIS
HEIDI STAM
OFFICERS
T. RITSON FERGUSON
PRESIDENT AND
CHIEF EXECUTIVE OFFICER
JONATHAN A. BLOME
CHIEF FINANCIAL OFFICER
ROBERT S. TULL III
CHIEF COMPLIANCE OFFICER
AND SECRETARY
INVESTMENT ADVISOR
CBRE CLARION SECURITIES LLC
201 KING OF PRUSSIA ROAD, SUITE 600
RADNOR, PA 19087
888-711-4272
ADMINISTRATOR AND CUSTODIAN
THE BANK OF NEW YORK MELLON
NEW YORK, NEW YORK
TRANSFER AGENT
COMPUTERSHARE
LOUISVILLE, KENTUCKY
LEGAL COUNSEL
MORGAN, LEWIS & BOCKIUS LLP
WASHINGTON, DC
INDEPENDENT REGISTERED PUBLIC ACCOUNTING FIRM
KPMG LLP
PHILADELPHIA, PENNSYLVANIA
Table of Contents
Item 2. Code of Ethics.
Not applicable for semi-annual reporting period.
Item 3. Audit Committee Financial Expert.
Not applicable for semi-annual reporting period.
Item 4. Principal Accountant Fees and Services.
Not applicable for semi-annual reporting period.
Item 5. Audit Committee of Listed Registrants.
Not applicable for semi-annual reporting period.
Item 6. Investments.
| (a) | The schedule of investments is included as part of the report to shareholders filed under Item 1 of this form. |
(b) Not applicable.
Item 7. Disclosure of Proxy Voting Policies and Procedures for Closed-End Management Investment Companies.
Not applicable for semi-annual reporting period.
Item 8. Portfolio Managers of Closed-End Management Investment Companies.
(a) Not applicable for semi-annual reporting period.
(b) Since the date of the registrant’s most recent annual report on Form N-CSR, Steven D. Burton has retired from CBRE Clarion Securities LLC and therefore no longer serves as a portfolio manager for the Fund. As such, as of August 19, 2020, the portfolio managers for the Fund are:
T. Ritson Ferguson
Principal, Chief Executive Officer and Global Chief Investment Officer, CBRE Clarion Securities LLC since 1992
Joseph P. Smith
Principal, President and Co-Chief Investment Officer, CBRE Clarion Securities LLC since 1997
Table of Contents
Kenneth S. Weinberg
Principal, Senior Portfolio Manager, CBRE Clarion Securities LLC since 2004
Item 9. Purchases of Equity Securities by Closed-End Management Investment Company and Affiliated Purchasers.
None.
Item 10. Submission of Matters to a Vote of Security Holders.
There have been no material changes to the procedures by which the shareholders may recommend nominees to the registrant’s board of directors, where those changes were implemented after the registrant last provided disclosure in response to the requirements of Item 407(c)(2)(iv) of Regulation S-K (17 CFR 229.407) (as required by Item 22(b)(15) of Schedule 14A (17 CFR 240.14a-101)), or this Item.
Item 11. Controls and Procedures.
| (a) | The Trust’s principal executive officer and principal financial officer have evaluated the Trust’s disclosure controls and procedures within 90 days of this filing and have concluded that the Trust’s disclosure controls and procedures were effective, as of that date, in ensuring that information required to be disclosed by the Trust in this Form N-CSR was recorded, processed, summarized, and reported timely. |
| (b) | The Trust’s principal executive officer and principal financial officer are aware of no changes in the Trust’s internal control over financial reporting that occurred during the period covered by this report that has materially affected, or is reasonably likely to materially affect, the Trust’s internal control over financial reporting. |
| Item 12. | Disclosure of Securities Lending Activities for Closed-End Management Investment Companies. |
Not applicable.
Item 13. Exhibits.
| (a)(1) | Not applicable. | |||
| (a)(2) | Certification of chief executive officer and chief financial officer pursuant to Section 302 of the Sarbanes-Oxley Act of 2002. | |||
| (a)(3) | Not applicable. | |||
Table of Contents
| (a)(4) | Not applicable. | |||
| (b) | ||||
| (c) | ||||
| 1 | The Trust has received exemptive relief from the Securities and Exchange Commission permitting it to make periodic distributions of long-term capital gains with respect to its outstanding common stock as frequently as twelve times each year. This relief is conditioned, in part, on an undertaking by the Trust to make the disclosures to the holders of the Trust’s common shares, in addition to the information required by Section 19(a) of the Investment Company Act and Rule 19a-1 thereunder. The Trust is likewise obligated to file with the Commission the information contained in any such notice to shareholders and, in that regard, has attached hereto copies of each such notice made during the period. |
Table of Contents
SIGNATURES
Pursuant to the requirements of the Securities Exchange Act of 1934 and the Investment Company Act of 1940, the registrant has duly caused this report to be signed on its behalf by the undersigned, thereunto duly authorized.
(Registrant) CBRE Clarion Global Real Estate Income Fund
By (Signature and Title)*: | /s/ T. Ritson Ferguson | |
T. Ritson Ferguson | ||
President and Chief Executive Officer |
| Date: | 8/19/2020 |
Pursuant to the requirements of the Securities Exchange Act of 1934 and the Investment Company Act of 1940, this report has been signed below by the following persons on behalf of the registrant and in the capacities and on the dates indicated.
By (Signature and Title)*: | /s/ T. Ritson Ferguson | |
T. Ritson Ferguson | ||
President and Chief Executive Officer |
| Date: | 8/19/2020 |
By (Signature and Title)*: | /s/ Jonathan A. Blome | |
Jonathan A. Blome | ||
Chief Financial Officer |
| Date: | 8/19/2020 |
* Print the name and title of each signing officer under his or her signature.