UNITED STATES
SECURITIES AND EXCHANGE COMMISSION
Washington, D.C. 20549
FORM N-CSR
CERTIFIED SHAREHOLDER REPORT OF REGISTERED
MANAGEMENT INVESTMENT COMPANIES
Investment Company Act file number 811‑21465
CBRE Global Real Estate Income Fund
(Exact name of registrant as specified in charter)
555 East Lancaster Avenue, Suite 120
Radnor, PA 19087
(Address of principal executive offices) (Zip code)
Joseph P. Smith, President and Chief Executive Officer
CBRE Global Real Estate Income Fund
555 East Lancaster Avenue, Suite 120
Radnor, PA 19087
(Name and address of agent for service)
Registrant’s telephone number, including area code: 1‑877‑711‑4272
Date of fiscal year end: December 31
Date of reporting period: June 30, 2023
Form N‑CSR is to be used by management investment companies to file reports with the Commission not later than 10 days after the transmission to stockholders of any report that is required to be transmitted to stockholders under Rule 30e‑1 under the Investment Company Act of 1940 (17 CFR 270.30e‑1). The Commission may use the information provided on Form N‑CSR in its regulatory, disclosure review, inspection, and policymaking roles.
A registrant is required to disclose the information specified by Form N‑CSR, and the Commission will make this information public. A registrant is not required to respond to the collection of information contained in Form N‑CSR unless the Form displays a currently valid Office of Management and Budget (“OMB”) control number. Please direct comments concerning the accuracy of the information collection burden estimate and any suggestions for reducing the burden to Secretary, Securities and Exchange Commission, 450 Fifth Street, NW, Washington, DC 20549-0609. The OMB has reviewed this collection of information under the clearance requirements of 44 U.S.C. § 3507.
| Item 1. | Reports to Stockholders. |
| (a) | The Report to Shareholders of CBRE Global Real Estate Income Fund (the “Trust”) is attached herewith. |
Semi-Annual Report
CBRE Global Real Estate
Income Fund
2023
Table of Contents
CBRE Global Real Estate Income Fund (unaudited)
| | | | | | |
| Semiannual Report 2023 CBRE Global Real Estate Income Fund | | Confidential & Proprietary | | | 1 | |
Important Information
CBRE Global Real Estate Income Fund (the “Trust”), acting in accordance with an exemptive order received from the Securities and Exchange Commission and with approval of its Board of Trustees (the “Board”), has adopted a managed distribution policy with the purpose of distributing over the course of each year, through periodic distributions as nearly equal as practicable and any required special distributions, an amount closely approximating the total taxable income of the Trust during such year plus, if so desired by the Board, all or a portion of the capital gains and returns of capital from portfolio companies received by the Trust during the year.
In furtherance of its policy, the Trust distributes a fixed amount per common share, currently $0.06, each month to its common shareholders. This amount is subject to change from time to time in the discretion of the Board. In an effort to maintain the Trust’s monthly distribution at a stable level, the Board recognizes that a portion of the Trust’s distributions may be characterized as a return of capital, particularly in periods when the Trust incurs losses on its portfolio securities. Under such circumstances, the Board will not necessarily reduce the Trust’s distribution, but will closely monitor its sustainability, recognizing that losses may be reversed and that, in subsequent periods, gains on portfolio securities may give rise to the need for a supplemental distribution, which the Trust seeks to minimize. In considering sustainability, the Board may consider realized gains that have been offset, for the purposes of calculating taxable income, by capital loss carryforwards. Thus, the level of the Trust’s distributions will be independent of its performance for a particular period, but the Trust expects its distributions to correlate to its performance over time. In particular, the Trust expects that its distribution rate in relation to its net asset value (“NAV”) will correlate to its total return on NAV over time. The Trust’s total return on NAV is presented in the financial highlights table.
Shareholders should not draw any conclusions about the Trust’s investment performance from the amount of the current distribution or from the terms of the Trust’s managed distribution policy. The Board may amend or terminate the policy without prior notice to shareholders. Shareholders should note that the managed distribution policy is subject to change or termination for a variety of reasons. Through its ownership of portfolio securities, the Trust is subject to risks including, but not limited to, declines in the value of real estate held by portfolio companies, risks related to general and local economic conditions, and portfolio company losses. An economic downturn might have a material adverse effect on the real estate markets and the real estate companies in which the Trust invests, which could result in the Trust failing to achieve its investment objectives and jeopardizing the continuance of the managed distribution policy. Please refer to the Trust’s Prospectus for a fuller description of the risks associated with investing in the Trust.
The views expressed represent the opinion of CBRE Investment Management Listed Real Assets LLC (“CBREIM”), which are subject to change and are not intended as investment advice or a guarantee of future results. This material is for informational purposes only. It is not intended as an endorsement of any specific investment. Stated information is derived from proprietary and non‑proprietary sources which have not been independently verified for accuracy or completeness. While CBREIM believes the information to be accurate and reliable, we do not claim or accept responsibility for its completeness, accuracy, or reliability. Statements of future expectations, forecasts, estimates, projections, and other forward-looking statements are based on CBREIM’s view at the time such statements were made. Accordingly, such statements are inherently speculative, as they are based on assumptions which may involve known and unknown risks and uncertainties. Any discussion of particular securities herein should not be perceived as a recommendation to purchase or sell any of those securities. It should not be assumed that investments in any securities discussed were or will be profitable. Actual results, performance or events may differ materially from those expressed or implied in such statements. Investing in real estate securities involves risks including the potential loss of principal. Real estate equities are subject to risks similar to those associated with the direct ownership of real estate. Portfolios concentrated in real estate securities may experience price volatility and other risks associated with non‑diversification. While equities may offer the potential for greater long-term growth than most debt securities, they generally have higher volatility. International (non‑US) investments may involve risk of capital loss from unfavorable fluctuation in currency values, from differences in generally accepted accounting principles, or from economic or political instability in other nations. Past performance is no guarantee of future results. FINRA compliance services: Foreside Fund Services, LLC.
| | | | | | |
| Semiannual Report 2023 CBRE Global Real Estate Income Fund | | Confidential & Proprietary | | | 2 | |
Letter to Shareholders
Joseph P. Smith
Kenneth S. Weinberg
Jonathan Miniman
Dear Shareholder:
We are pleased to present the 2023 Semi-Annual Report for the CBRE Global Real Estate Income Fund (the “Trust”).
PERFORMANCE REVIEW
Global real estate stocks were up +1.0% in the first half of the year (“1H2023”), underperforming the broader equity market which was up +15.4% during the period.1 For the majority of 2023, investors in global real estate stocks have been climbing a “wall of worries” which includes the direction of interest rates, the pace of inflation, the strength of the global economy, the debt ceiling negotiations in the United States, and what the weakness in the U.S. office sector means for commercial real estate and real estate stocks. As the year progresses, these worries are being addressed. The global economy remains strong and, as a result, the probability of a global recession in 2023 is diminishing. Inflation is moderating. Compromise was reached in the U.S. debt ceiling negotiations. Lastly, while office sector fundamentals remain challenged in many markets, U.S. office-focused real estate stocks comprise less than 5% of our real estate securities benchmark2 and therefore have no material impact on publicly traded commercial real estate stock index performance.
North America was the best-performing region during 1H2023 followed by Asia-Pacific and Europe. Common stocks underperformed preferred securities.
Global Real Estate Market Performance as of June 30, 2023
| | | | |
| | 1H2023 | | CY2022 |
| REGION | | | | |
| North America2 | | 4.6% | | -25.6% |
| Europe2 | | -6.1% | | -40.7% |
| Asia-Pacific2 | | -4.9% | | -11.4% |
| Global Real Estate Common Stocks3 | | 1.0% | | -25.1% |
| U.S. REIT Preferred Stocks4 | | 9.2% | | -20.8% |
| 80/20 Blend of Global Common Stock & U.S. Preferred Stock5 | | 2.7% | | -24.1% |
The Trust’s net asset value (“NAV”) return was ‑1.0% during 1H2023, underperforming the +2.7% return for an 80/20 mix of global common stock and preferred securities. While Common stock selection and sector allocation impacts were positive for 1H2023, the Trust’s underweight to the outperforming preferred stocks detracted from relative performance. We believe that an underweight position to preferred stocks is warranted given the discounted valuations our common stock universe continues to price in. The U.S. was the strongest country contributor on an absolute and relative basis in 1H2023, with a 4.6% return. Our exposure to the datacenter, residential, and storage sectors were the largest absolute contributors. We materially increased our exposure to the datacenter sector in 1H2023 as share price underperformance coupled with accelerating fundamentals set up an attractive entry point on a relative basis. Our storage exposure in 1H2023 was a positive contributor as well, given our positioning to M&A target Life Storage which was put in play by Public Storage. Extra Space Storage ended up being the highest bidder to purchase the company. Our underweight allocation to the net lease and office sectors were two significant contributions to relative performance. In the Asia-Pacific region, our stock selection in Japan through a position in out‑of‑benchmark REOC, Tokyu Fudosan Holdings Corp. was the main contributor to positive relative performance. In the European region, relative outperformance was driven by stock selection in Continental Europe. A stock that we were overweight that helped relative performance was high-quality retail landlord Klepierre, up +11% in 1H2023. Like in the U.S., the retail operating environment for landlords is quite healthy and the retail stocks remain very attractively priced.
In April of 2023, the Trust successfully completed a Transferable Rights Offering (the Offering) raising $117.6 million of additional capital. One of the primary goals of the Offering was to enhance the distribution and NAV appreciation potential of the Trust and we believe the capital was raised during a period of favorable market conditions. In the months following the close of the Offering, our portfolio management team patiently invested the capital in securities we believe offered historically attractive valuations and above total return potential.
| | | | | | |
| Semiannual Report 2023 CBRE Global Real Estate Income Fund | | Confidential & Proprietary | | | 3 | |
The Trust, acting in accordance with an exemptive order received from the U.S. Securities and Exchange Commission (SEC), utilizes a managed distribution policy under which the Trust’s regular monthly distribution may include both income and, where applicable, realized capital gains. The Trust may pay distributions in excess of the Fund’s investment company taxable income and net realized gains. This excess would be a return of capital distributed from the Fund’s assets. In accordance with its distribution policy, and with the approval of its Board of Trustees (the Board), the Trust made total distributions of $0.36 per share during 1H2023. The total annual distribution of $0.72 represents a 13.8% rate on the $5.23 share price and a 12.2% rate on the $5.90 NAV as of June 30th, 2023.6 The Board continues to regularly review the level of the Trust’s distribution and the ability to sustain it.
The Trust continues to utilize leverage with the goal of delivering incrementally higher distributions to shareholders. The Trust’s leverage position was 30% on June 30th, 2023, down slightly from 32% as of December 31st, 2022.
PORTFOLIO REVIEW
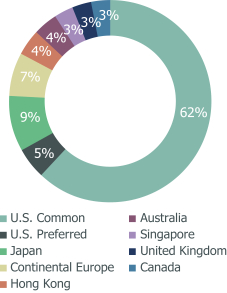
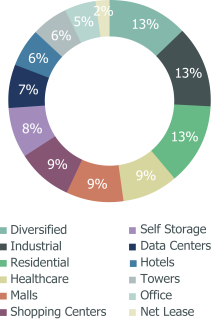
The Trust’s investments remain well-diversified by property type and geography. On June 30th, the Trust’s portfolio was approximately 95% invested in common stock securities (65% in the Americas, 20% in Asia-Pacific, and 10% in Europe) with 5% of the portfolio invested in preferred stock of U.S. real estate companies.
| | |
GEOGRAPHIC EXPOSURE as of June 30, 2023 | | SECTOR EXPOSURE as of June 30, 2023 |
| |
 | |  |
| Source: CBRE Investment Management as of 06/30/2023. | | |
Geographic and Sector diversification are unaudited. Percentages presented are based on managed trust assets, which include borrowings. The percentages in the pie charts will differ from those on the Portfolio of Investments because the figures on the Portfolio of Investments are calculated using net assets of the Trust.
MARKET OUTLOOK
We believe real estate stocks are oversold and attractively valued relative to private market real estate. We see continued earnings and dividend growth in listed real estate for 2023 and 2024. Real estate stocks can offer above-average and growing dividend yields, inflation-protected earnings growth, and a history of outperformance during periods of above-average inflation. We believe investors committing capital to listed real estate at this time have the potential to earn an attractive absolute and relative long-term total return.
Global REITs currently trade at an attractive discount to estimates of NAV or the estimated private market value of the real estate owned. Historically, when REIT valuations have traded at material discounts to NAV, investors have benefited from buying the space. We believe listed real estate is attractively priced compared to the private real estate market, and reasonably priced versus the fixed-income market and the broader stock market.
| | | | | | |
| Semiannual Report 2023 CBRE Global Real Estate Income Fund | | Confidential & Proprietary | | | 4 | |
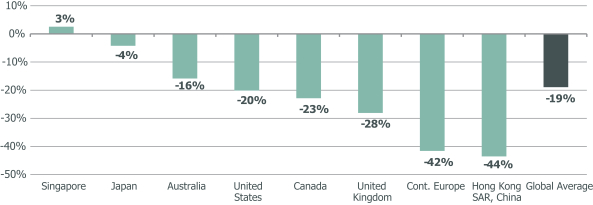
Global Real Estate NAV Premium/Discount
Estimated Net Asset Value is calculated based on individual REIT only stocks followed by the firm’s research team and are considered as investible. Global, Country, and Sector NAV Premium Discounts are calculated using simple average with CBRE Investment Management’s proprietary models. Information is the opinion of CBRE Investment Management as of 06/30/2023, is subject to change and is not intended to be a forecast of future events, or a guarantee of future results, or investment advice. Forecasts and any factors discussed are not indicative of future investment performance.
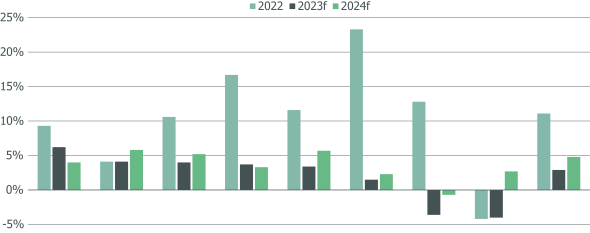
Additionally, the economic landscape continues to evidence modest growth and we believe that a positive mid‑single‑digit earnings growth rate is achievable given the significant pricing power and embedded organic growth present in sectors such as residential, industrial, storage, data centers, and lab space. We believe real estate earnings will remain more resilient than that of broad equities. Globally, our analysts cover close to 500 real estate stocks. We currently estimate 2023 earnings growth at approximately 3%, with most major markets experiencing positive earnings growth, while the 2024 earnings growth forecast is close to 5%. We believe the below earnings growth will drive material increases in dividends globally. We are forecasting dividends to grow in excess of 10% for 2023.
Global real estate earnings growth forecast by region
| | | | | | | | | | | | | | | | | | | | | | | | | | | | | | | | | | | | |
| | Japan | | | Canada | | | U.K. | | | Australia | | | U.S. | | | Singapore | | | Cont. Europe | | | Hong Kong
SAR, China | | | Global
Average | |
∎ 2022 | | | 9.3% | | | | 4.1% | | | | 10.6% | | | | 16.7% | | | | 11.6% | | | | 23.3% | | | | 12.8% | | | | -4.2% | | | | 11.1% | |
∎ 2023f | | | 6.2% | | | | 4.1% | | | | 4.0% | | | | 3.7% | | | | 3.4% | | | | 1.5% | | | | -3.6% | | | | -4.0% | | | | 2.9% | |
∎ 2024f | | | 4.0% | | | | 5.8% | | | | 5.2% | | | | 3.3% | | | | 5.7% | | | | 2.3% | | | | -0.7% | | | | 2.7% | | | | 4.8% | |
Source: CBRE Investment Management as of 06/30/2023. “F” refers to “forecasts.” 2022 and 2023 earnings growth for the U.S. hotel sector are represented by 2023/2019 and 2022/2019 CAGR. 2024 is represented by 2024/2023. The global average does not include the 2022 and 2023 growth rates for the U.S. hotel sector due to the negative hotel growth in 2020 as a result of the pandemic. Earnings growth forecasts are calculated based on FFO Growth of US Towers and individual stocks followed by the firm’s research team and are considered as investible. Global, Country, and Sector FFO Growth is calculated using weighted averages. Forecasts are the opinion of CBRE Investment Management, which is subject to change and is not intended to be a guarantee of future results or investment advice. Forecasts are not indicative of future investment performance.
| | | | | | |
| Semiannual Report 2023 CBRE Global Real Estate Income Fund | | Confidential & Proprietary | | | 5 | |
We believe real estate dividend yield remains attractive. Current income generated by listed property’s dividend yields remains an attractive investment characteristic of the sector.
We own a well-balanced portfolio of securities that have been screened for their growth prospects in combination with the quality of their business models, assets, balance sheets, and management teams. We are positive on property types, regions, and stocks that offer these qualities at reasonable valuations. In the United States, we are overweight malls, towers, storage, single-family homes for rent, manufactured housing, hotels, industrial, and healthcare. In Japan, we prefer mid‑cap diversified J‑REITs that are providing earnings growth and resiliency at very attractive relative valuations and select Japanese REOCs that have committed to improving their corporate governance. In Hong Kong, we are overweight diversified companies with a commercial bias and non‑discretionary retail. In Australia, we prefer industrial, retail, and a few select diversified companies. In the U.K., we favor the storage sector, as well as attractively priced diversified companies. Within Continental Europe, we have a positive bias toward retail, office, and select diversified companies.
We believe active management can offer significant relative return potential at this time when investors have a unique opportunity to invest in listed real estate at attractive valuations. We think our “infromation advantage” and the disciplined use of our proprietary analytical tools will allow us to ourperform a passive strategy in a variety of market environments overtime. As we look ahead, we believe our portfolio is well-positioned to deliver relative outperformance.
We appreciate your continued faith and confidence.
Sincerely,
CBRE Investment Management Listed Real Assets LLC
| | | | |
 | |  | |  |
Joseph P. Smith, CFA Portfolio Manager President & CEO | | Kenneth S. Weinberg, CFA Portfolio Manager | | Jonathan D. Miniman, CFA Portfolio Manager |
FOOTNOTES:
| 1. | | Global real estate stocks as measured by FTSE EPRA Nareit Developed Index – Net returned +1.0% during the first half of the year. The broader market as measured by the MSCI World Index (USD) returned +15.4% for the first half of the year. |
| 2. | | Regional allocations for the FTSE EPRA Nareit Developed Index – Net are determined based on classifications by CBRE Investment Management. North America regional performance excludes U.S. REIT preferred stocks and only represents U.S. common stocks within the FTSE EPRA Nareit Developed Index – Net. |
| 3. | | Represented by the FTSE EPRA Nareit Developed Index – Net. The Index is an unmanaged market-weighted index consisting of real estate companies from developed markets, where greater than 75% of constituents’ EBITDA (earnings before interest, taxes, depreciation, and amortization) is derived from relevant real estate activities and is calculated net of withholding taxes. Investors cannot invest directly in an index. |
| 4. | | Represented by the MSCI REIT Preferred Index, a preferred stock market capitalization-weighted index of certain exchange-traded preferred securities issued by U.S. equity and U.S. hybrid REITs. Investors cannot invest directly in an index. |
| 5. | | Represented by the daily weighted average of the following indices: 80% FTSE EPRA Nareit Developed – Net and 20% MSCI Preferred Index. Investors cannot invest directly in an index. |
| 6. | | The Trust is currently paying distributions in excess of its net investment income and capital gains, which may result in a return of capital. Absent this, the distribution rate would have been lower. The estimated composition of each distribution, including any return of capital, will be provided to shareholders of record and is also available at www.cbreim.com. Final determination of a distribution’s tax character will be made on Form 1099 DIV and sent to shareholders. |
IMPORTANT DISCLOSURES AND RISK INFORMATION
Must be preceded or accompanied by a prospectus.
The views expressed represent the opinion of CBRE Investment Management Listed Real Assets LLC (“CBREIM”), which are subject to change and are not intended as investment advice or a guarantee of future results. This material is for informational purposes only. It is not intended as an endorsement of any specific investment. Stated information is derived from proprietary and non‑proprietary sources which have not been independently verified for accuracy or completeness. While CBREIM believes the information to be accurate and reliable, we do not claim or accept responsibility for its completeness, accuracy, or reliability. Statements of future expectations, forecasts, estimates, projections, and other forward-looking statements are based on CBREIM’s view at the time such statements were made. Accordingly, such statements are inherently speculative, as they are based on assumptions that may involve known and unknown risks and uncertainties. Any discussion of securities herein should not be perceived as a recommendation to purchase or sell any of those securities. It should not be assumed that investments in any securities discussed were or will be profitable. Actual results, performance or events may differ materially from those expressed or implied in such statements. Investing in real estate securities involves risks including the potential loss of principal. Real estate equities are subject to risks like those associated with the direct ownership of real estate. Portfolios concentrated in real estate securities may experience price volatility and other risks associated with non‑diversification. While equities may offer
| | | | | | |
| Semiannual Report 2023 CBRE Global Real Estate Income Fund | | Confidential & Proprietary | | | 6 | |
the potential for greater long-term growth than most debt securities, they generally have higher volatility. International (non‑US) investments may involve risk of capital loss from unfavorable fluctuation in currency values, from differences in generally accepted accounting principles, or from economic or political instability in other nations. Past performance is no guarantee of future results.
Fund holdings and sector allocations are subject to change. For a complete list of holdings, please see the schedule of investments section.
Distributed by Foreside Funds Services
| | | | | | |
| Semiannual Report 2023 CBRE Global Real Estate Income Fund | | Confidential & Proprietary | | | 7 | |
Fees and Expenses (unaudited)
As a shareholder of the Fund, you incur two types of costs: (1) transaction costs, including brokerage commissions paid on purchases and sales of fund shares, and (2) ongoing costs, including management fees and other Fund expenses. The expense examples below are intended to help you understand your ongoing costs (in dollars) of investing in the Fund and to compare these costs with the ongoing costs of investing in other funds.
The examples in the table is based on an investment of $1,000 invested at the beginning of the six‑month period and held for the entire period (January 1, 2023 to June 30, 2023).
Actual expenses
The first line in the following table provides information about actual account values and actual expenses. You may use the information in this line, together with the amount you invested, to estimate the expenses that you paid over the period. Simply divide your account value by $1,000 (for example, an $8,600 account value divided by $1,000 = 8.6), then multiply the result by the number in the first line under the heading “Expenses Paid During the Period” to estimate the expenses you paid on your account during this period.
Hypothetical example for comparison purposes
The second line in the following table provides information about hypothetical account values and hypothetical expenses based on the Fund’s actual expense ratios and an assumed rate of return of 5% per year before expenses (which is not the Funds’ actual return). The hypothetical account values and expenses may not be used to estimate the actual ending account balance or expenses you paid for the period. You may use this information to compare the ongoing costs of investing in the Fund and other funds. To do so, compare this 5% hypothetical example with the 5% hypothetical examples that appear in the shareholder reports of the other funds.
Please note that the expenses shown in the tables are meant to highlight your ongoing costs only, and do not reflect any transactional costs. Therefore the second line in the table is useful in comparing ongoing costs only, and will not help you determine the relative total costs of owning different funds. In addition, if these transactional costs were included, your costs would have been higher.
| | | | | | | | | | | | | | | | |
| | | Beginning account
value | | | Ending account
value | | | Annualized
expense ratio | | | Expenses paid
during the period | |
| | | | |
| | | January 1, 2023 | | | June 30, 2023 | | | | | | Per $1,000(1) | |
| CBRE GLOBAL REAL ESTATE INCOME FUND | | | | | | | | | | | | | | | | |
| Actual | | $ | 1,000.00 | | | $ | 989.60 | | | | 3.68 | % | | $ | 18.15 | |
| Hypothetical (5% return before expenses) | | $ | 1,000.00 | | | $ | 1,006.55 | | | | 3.68 | % | | $ | 18.31 | |
| (1) | Expenses are equal to the Fund’s annualized expense ratio, multiplied by the average account value over the period, multiplied by 181 (the number of days in the most recent six‑month period), then divided by 365. |
| | | | | | |
| Semiannual Report 2023 CBRE Global Real Estate Income Fund | | Confidential & Proprietary | | | 8 | |
Additional Information – Investment Objectives, Policies, and Risks (unaudited)
Investment Objective
The Trust’s primary investment objective is high current income. The Trust’s secondary investment objective is capital appreciation. The Trust’s investment objectives and certain investment policies are considered fundamental and may not be changed without shareholder approval. There can be no assurance that the Trust’s investment objectives will be achieved.
Investment Policies
The Trust has a policy of concentrating its investments in the real estate industry and not in any other industry. Under normal market conditions, the Trust will invest substantially all but no less than 80% of its total assets in income-producing global “Real Estate Equity Securities.” Real Estate Equity Securities include common stocks, preferred securities, warrants and convertible securities issued by real estate companies, such as real estate investment trusts (“REITs”). The Trust, under normal market conditions, will invest in Real Estate Equity Securities of companies domiciled primarily in developed countries. However, the Trust may invest up to 15% of its total assets in Real Estate Equity Securities of companies domiciled in emerging market countries. Under normal market conditions, the Trust expects to have investments in at least three countries, including the United States.
The Trust may invest up to 25% of its total assets in preferred securities of global real estate companies. The Trust may invest up to 20% of its total assets in preferred securities that are rated below investment grade or that are not rated and are considered by the Trust’s investment adviser to be of comparable quality. Preferred securities of non‑investment grade quality are regarded as having predominantly speculative characteristics with respect to the capacity of the issuer of the preferred securities to pay interest and repay principal. Investment grade quality securities are those that are rated within the four highest grades by Moody’s Investors Service, Inc., S&P Global Ratings, or Fitch Ratings at the time of investment or are considered by the Trust’s investment adviser to be of comparable quality. Although it has no present intentions to do so, the Trust may invest up to 15% of its total assets in securities and other instruments that, at the time of investment, are illiquid (i.e., securities that are not readily marketable).
The Trust defines a real estate company as a company that derives at least 50% of its revenue from the ownership, construction, financing, management or sale of commercial, industrial or residential real estate or has at least 50% of its assets invested in such real estate. A common type of real estate company, a REIT, is a domestic corporation that pools investors’ funds for investment primarily in income-producing real estate or in real estate related loans (such as mortgages) or other interests. Therefore, a REIT normally derives its income from rents or from interest payments and may realize capital gains by selling properties that have appreciated in value. A REIT is not taxed on income distributed to its shareholders if it complies with several requirements of the Internal Revenue Code of 1986, as amended (the “Code”). As a result, REITs tend to pay relatively high dividends (as compared to other types of companies), and the Trust intends to use these REIT dividends in an effort to meet its primary objective of high current income.
Global real estate companies outside the U.S. include, but are not limited to, companies with similar characteristics to the REIT structure, in which revenue primarily consists of rent derived from owned, income-producing real estate properties, dividend distributions as a percentage of taxable net income are high (generally greater than 80%), debt levels are generally conservative and income derived from development activities is generally limited.
The Trust may invest in securities of foreign issuers in the form of American Depositary Receipts (“ADRs”) and European Depositary Receipts (“EDRs”).
| | | | | | |
| Semiannual Report 2023 CBRE Global Real Estate Income Fund | | Confidential & Proprietary | | | 9 | |
The Trust may engage in foreign currency transactions, including foreign currency forward contracts, options, swaps, and other strategic transactions in connection with its investments in foreign Real Estate Equity Securities. Although not intended to be a significant element in the Trust’s investment strategy, from time to time the Trust may use various other investment management techniques that also involve certain risks and special considerations, including engaging in interest rate transactions and short sales.
The Trust will invest in Real Estate Equity Securities where dividend distributions are subject to withholding taxes as determined by United States tax treaties with respective individual foreign countries. Generally, the Trust will invest in Real Estate Equity Securities that are excluded from the reduced tax rates as determined by the Jobs and Growth Tax Relief Reconciliation Act of 2003.
Risk Factors
The Trust is a diversified, closed‑end management investment company designed primarily as a long-term investment and not as a trading vehicle. The Trust is not intended to be a complete investment program and, due to the uncertainty inherent in all investments, there can be no assurance that the Trust will achieve its investment objectives. Your common shares at any point in time may be worth less than you invested, even after taking into account the reinvestment of Trust dividends and distributions.
GENERAL REAL ESTATE RISKS
Because the Trust concentrates its assets in the global real estate industry, your investment in the Trust will be closely linked to the performance of the global real estate markets. Property values may fall due to increasing vacancies or declining rents resulting from economic, legal, cultural or technological developments. The price of real estate company shares may drop because of falling property values, increased interest rates, poor management of the company or other factors. Many real estate companies utilize leverage, which increases investment risk and could adversely affect a company’s operations and market value in periods of rising interest rates.
There are also special risks associated with particular sectors of real estate investments.
| – | Retail Properties Retail properties are affected by the overall health of the economy and may be adversely affected by, among other things, the growth of alternative forms of retailing, bankruptcy, departure or cessation of operations of a tenant, a shift in consumer demand due to demographic changes, spending patterns and lease terminations. |
| – | Office Properties Office properties are affected by the overall health of the economy, and other factors such as a downturn in the businesses operated by their tenants, obsolescence and non‑competitiveness. |
| – | Hotel Properties The risks of hotel properties include, among other things, the necessity of a high level of continuing capital expenditures, competition, increases in operating costs which may not be offset by increases in revenues, dependence on business and commercial travelers and tourism, increases in fuel costs and other expenses of travel, and adverse effects of general and local economic conditions. Hotel properties tend to be more sensitive to adverse economic conditions and competition than many other commercial properties. |
| – | Healthcare Properties Healthcare properties and healthcare providers are affected by several significant factors, including federal, state and local laws governing licenses, certification, adequacy of care, pharmaceutical distribution, rates, equipment, personnel and other factors regarding operations, continued availability of revenue from government reimbursement programs, and competition on a local and regional basis. The failure of any healthcare operator to comply with governmental laws and regulations may affect its ability to operate its facility or receive government reimbursements. |
| – | Multifamily Properties The value and successful operation of a multifamily property may be affected by a number of factors such as the location of the property, the ability of the management team, the level of mortgage rates, the presence of competing properties, adverse economic conditions in the locale, oversupply and rent control laws or other laws affecting such properties. |
| – | Community Shopping Centers Community center properties are dependent upon the successful operations and financial condition of their tenants, particularly certain of their major tenants, and could be adversely affected by bankruptcy of those tenants. In some cases, a tenant may lease a significant portion of the space in one center, and the filing of bankruptcy could cause significant revenue loss. Like others in the commercial real estate industry, community centers are subject to environmental risks and interest rate risk. They also face the need to enter into new leases or renew leases on favorable terms to generate rental revenues. Community center properties could be adversely affected by changes in the local markets where their properties are located, as well as by adverse changes in national economic and market conditions. |
| – | Self-Storage Properties The value and successful operation of a self-storage property may be affected by a number of factors, such as the ability of the management team, the location of the property, the presence of competing properties, changes in traffic patterns, and adverse effects of general and local economic conditions with respect to rental rates and occupancy levels. |
| | | | | | |
| Semiannual Report 2023 CBRE Global Real Estate Income Fund | | Confidential & Proprietary | | | 10 | |
| – | Industrial Properties Industrial properties typically include warehouses, depots, storage, factories, logistics and distributions. Factors such as vacancy, tenant mix, lease term, property condition and design, redevelopment opportunities and property location could adversely affect the value and operation of industrial properties. |
| – | Towers Companies Cell towers and wireless services have seen an increased demand in recent years. However, owners and operators of towers may be subject to, and therefore must comply with, environmental laws that impose strict, joint and several liability for the cleanup of on‑site or off‑site contamination and related personal injury or property damage. |
| – | Data Centers Properties Data centers facilities house an organization’s most critical and proprietary assets. Therefore, operation of data centers properties depends upon the demand for technology-related real estate and global economic conditions that could adversely affect companies’ abilities to lease, develop or renew leases. Declining real estate valuations and impairment charges could adversely affect earnings and financial condition of data center properties. |
| – | Net Lease Properties Net lease properties require the tenant to pay (in addition to the rent) property taxes, insurance, and maintenance on the property. Tenant’s ability to pay rent, interest rate fluctuations, vacancy, property location, length of the lease are only few of the risks that could affect net lease properties operations. |
Other factors that may contribute to the riskiness of all real estate investments include:
| – | Lack of Insurance Certain of the portfolio companies may fail to carry comprehensive liability, fire, flood, earthquake extended coverage and rental loss insurance, or insurance in place may be subject to various policy specifications, limits and deductibles. Should any type of uninsured loss occur, the portfolio company could lose its investment in, and anticipated profits and cash flows from, a number of properties and as a result adversely affect the Trust’s investment performance. |
| – | Financial Leverage Global real estate companies may be highly leveraged and financial covenants may affect the ability of global real estate companies to operate effectively. |
| – | Environmental Issues In connection with the ownership (direct or indirect), operation, management and development of real properties that may contain hazardous or toxic substances, a portfolio company may be considered an owner, operator or responsible party of such properties and, therefore, may be potentially liable for removal or remediation costs, as well as certain other costs, including governmental fines and liabilities for injuries to persons and property. The existence of any such material environmental liability could have a material adverse effect on the results of operations and cash flow of any such portfolio company and, as a result, the amount available to make distributions on shares of the Trust could be reduced. |
| – | Recent Events The value of real estate is particularly susceptible to acts of terrorism and other changes in foreign and domestic conditions. |
| – | Acts of God and Geopolitical Risks The performance of certain investments could be affected by acts of God or other unforeseen and/or uncontrollable events (collectively, “disruptions”), including, but not limited to, natural disasters, public health emergencies (including any outbreak or threat of COVID‑19, SARS, H1N1/09 flu, avian flu, other coronavirus, Ebola, or other existing or new pandemic or epidemic diseases), terrorism, social and political discord, geopolitical events, national and international political circumstances, and other unforeseen and/or uncontrollable events with widespread impact. These disruptions may affect the level and volatility of security prices and liquidity of any investments. Unexpected volatility could impair an investment’s profitability or result in it suffering losses. Economies and financial markets throughout the world are becoming increasingly interconnected, which increases the likelihood that events or conditions in one country or region will adversely impact markets or securities industry participants in other countries or regions. |
The extent of the impact of any such disruption on the Trust will depend on many factors, including the duration and scope of such disruption, the extent of any related travel advisories and restrictions implemented, the impact of such disruption on overall supply and demand, goods and services, investor liquidity, consumer confidence and levels of economic activity and the extent of its disruption to important global, regional and local supply chains and economic markets, all of which are highly uncertain and cannot be predicted. A disruption may materially and adversely impact the value and performance of any investment, the Adviser’s ability to source, manage and divest investments, and the Adviser’s ability to achieve the Trust’s investment objectives, ultimately resulting in significant losses to investors. In addition, there is a risk that a long disruption will significantly impact the operations of the Adviser, the Trust, and its portfolio investments, or even temporarily or permanently halt their operations.
| – | REIT Issues REITs are subject to a highly technical and complex set of provisions in the Code. It is possible that the Trust may invest in a real estate company which purports to be a REIT, but which fails to qualify as a REIT. In the event of any such unexpected failure to qualify as a REIT, the purported REIT would be subject to corporate-level taxation, significantly reducing the return to the Trust on its investment in such company. |
Stock Market Risks A portion of your investment in common shares represents an indirect investment in equity securities owned by the Trust, substantially all of which are traded on a domestic or foreign securities exchange or in the over‑the‑counter markets. The value of these securities, like other stock market investments, may move up or down, sometimes rapidly and unpredictably.
| | | | | | |
| Semiannual Report 2023 CBRE Global Real Estate Income Fund | | Confidential & Proprietary | | | 11 | |
Common Stock Risk While common stock has historically generated higher average returns than fixed income securities, common stock has also experienced significantly more volatility in those returns. An adverse event, such as an unfavorable earnings report, may depress the value of common stock held by the Trust. Also, the price of common stock is sensitive to general movements in the stock market. A drop in the stock market may depress the price of common stock held by the Trust.
Foreign Securities Risks Although it is not the Trust’s current intent, the Trust may invest up to 100% of its total assets in real estate securities of non‑U.S. issuers or that are denominated in various foreign currencies or multinational currency units (“Foreign Securities”). Such investments involve certain risks not involved in domestic investments. Securities markets in certain foreign countries are not as developed, efficient or liquid as securities markets in the United States. Therefore, the prices of Foreign Securities often are volatile. In addition, the Trust will be subject to risks associated with adverse political and economic developments in foreign countries, which could cause the Trust to lose money on its investments in Foreign Securities. The Trust may hold any Foreign Securities of issuers in so‑called “emerging markets” which may entail additional risks.
Foreign Currency Risk Although the Trust will report its net asset value and pay dividends in U.S. dollars, Foreign Securities often are purchased with and make interest payments in foreign currencies. Therefore, when the Trust invests in Foreign Securities, it will be subject to foreign currency risk, which means that the Trust’s net asset value could decline as a result of changes in the exchange rates between foreign currencies and the U.S. dollar. Certain foreign countries may impose restrictions on the ability of issuers of Foreign Securities to make payment of principal and interest to investors located outside the country, due to blockage of foreign currency exchanges or otherwise.
Emerging Markets Risks The Trust may invest in Real Estate Equity Securities of issuers located or doing substantial business in “emerging markets.” Because of less developed markets and economies and, in some countries, less mature governments and governmental institutions, the risks of investing in foreign securities can be intensified in the case of investments in issuers domiciled or doing substantial business in emerging market countries. These risks include high concentration of market capitalization and trading volume in a small number of issuers representing a limited number of industries, as well as a high concentration of investors and financial intermediaries; political and social uncertainties; over- dependence on exports, especially with respect to primary commodities, making these economies vulnerable to changes in commodity prices; overburdened infrastructure and obsolete or unseasoned financial systems; environmental problems; less developed legal systems; and less reliable custodial services and settlement practices.
Leverage Risk The use of leverage through the use of debt creates an opportunity for increased common share net investment income dividends, but also creates risks for the holders of common shares. The Trust’s leveraging strategy may not be successful. Leverage creates two major types of risks for the holders of common shares:
| – | the likelihood of greater volatility of net asset value and market price of the common shares because changes in the value of the Trust’s portfolio, including securities bought with the proceeds of the leverage, are borne entirely by the holders of common shares; and |
| – | the possibility either that common share net investment income will fall if the leverage expense rises or that common share net investment income will fluctuate because the leverage expense varies. |
Small Cap Risk The Trust may invest in Real Estate Equity Securities of smaller companies which may entail additional risks. There may be less trading in a smaller company’s stock, which means that buy and sell transactions in that stock could have a larger impact on the stock’s price than is the case with larger company stocks. Smaller companies also may have fewer lines of business so that changes in any one line of business may have a greater impact on a smaller company’s stock price than is the case for a larger company. Further, smaller company stocks may perform in different cycles than larger company stocks. Accordingly, shares of these companies can be more volatile than, and at times will perform differently from, large company stocks such as those found in the Dow Jones Industrial Average. In addition, there are relatively few REITs when compared to other types of companies. Even the larger global real estate companies tend to be small to medium‑sized companies in comparison to many industrial and service companies.
Preferred Securities The Trust may invest in preferred securities, which entail special risks, including:
| – | Deferral Preferred securities may include provisions that permit the issuer, at its discretion, to defer distributions for a stated period without any adverse consequences to the issuer. If the Trust owns a preferred security that is deferring its distributions, the Trust may be required to report income for tax purposes although it has not yet received such income. |
| – | Subordination Preferred securities are subordinated to bonds and other debt instruments in a company’s capital structure with respect to priority to corporate income and liquidation payments, and therefore will be subject to greater credit risk than more senior debt instruments. |
| – | Liquidity Preferred securities may be substantially less liquid than many other securities, such as common stocks or U.S. government securities. |
| – | Limited Voting Rights Generally, preferred security holders (such as the Trust) have no voting rights with respect to the issuing company unless preferred dividends have been in arrears for a specified number of periods, at which time the preferred security holders may elect a number of directors to the issuer’s board. Generally, once all the arrearages have been paid, the preferred security holders no longer have voting rights. In the case of certain trust preferred securities, holders generally have no voting rights, except (i) if the issuer fails to pay dividends for a specified period of time or (ii) if a |
| | | | | | |
| Semiannual Report 2023 CBRE Global Real Estate Income Fund | | Confidential & Proprietary | | | 12 | |
| | declaration of default occurs and is continuing. In such an event, rights of holders of trust preferred securities generally would include the right to appoint and authorize a trustee to enforce the trust or special purpose entity’s rights as a creditor under the agreement with its operating company. |
| – | Special Redemption Rights In certain varying circumstances, an issuer of preferred securities may redeem the securities prior to a specified date. For instance, for certain types of preferred securities, a redemption may be triggered by a change in Federal income tax or securities laws. As with call provisions, a redemption by the issuer may negatively impact the return on the security held by the Trust. |
| – | New Types of Securities From time to time, preferred securities, including trust preferred securities, have been, and may in the future be, offered having features other than those described herein. The Trust reserves the right to invest in these securities if the Adviser believes that doing so would be consistent with the Trust’s investment objectives and policies. Since the market for these instruments would be new, the Trust may have difficulty disposing of them at a suitable price and time. In addition to limited liquidity, these instruments may present other risks, such as high price volatility. |
Illiquid Securities The Trust may invest up to 15% of its total assets in illiquid securities. Illiquid securities are securities that are not readily marketable and may include some restricted securities, which are securities that may not be resold to the public without an effective registration statement under the Securities Act of 1933, (the “Securities Act”) or, if they are unregistered, may be sold only in a privately negotiated transaction or pursuant to an exemption from registration. Illiquid investments involve the risk that the securities will not be able to be sold at the time desired by the Trust or at prices approximating the value at which the Trust is carrying the securities on its books.
Lower-Rated Securities The Trust will not invest more than 20% of its total assets in preferred securities rated below investment grade or unrated and considered by the Adviser to be of comparable quality.
The values of lower-rated securities often reflect individual corporate developments and have a higher sensitivity to economic changes than do higher rated securities. Issuers of lower-rated securities are often in the growth stage of their development and/or involved in a reorganization or takeover. The companies are often highly leveraged (have a significant amount of debt relative to shareholders’ equity) and may not have available to them more traditional financing methods, thereby increasing the risk associated with acquiring these types of securities. In some cases, obligations with respect to lower-rated securities are subordinated to the prior repayment of senior indebtedness, which will potentially limit the Trust’s ability to fully recover principal or to receive interest payments when senior securities are in default. Thus, investors in lower-rated securities have a lower degree of protection with respect to principal and interest payments than do investors in higher rated securities.
During an economic downturn, a substantial period of rising interest rates or a recession, issuers of lower-rated securities may experience financial distress possibly resulting in insufficient revenues to meet their principal and interest payment obligations, to meet projected business goals and to obtain additional financing. An economic downturn could also disrupt the market for lower-rated securities and adversely affect the ability of the issuers to repay principal and interest. If the issuer of a security held by the Trust defaults, the Trust may not receive full interest and principal payments due to it and could incur additional expenses if it chose to seek recovery of its investment.
Interest Rate Risk Interest rate risk is the risk that fixed income investments such as preferred securities, and to a lesser extent dividend-paying common stocks such as REIT common stocks, will decline in value because of changes in market interest rates. When market interest rates rise, the market value of such securities generally will fall. The Trust’s investment in such securities means that the net asset value and market price of its common shares will tend to decline if market interest rates rise. Because market interest rates are currently near their lowest levels in many years, there is a greater than normal risk that the Trust’s portfolio will decline in value due to rising interest rates. Your common shares at any point in time may be worth less than what you invested, even after taking into account the reinvestment of Trust dividends and distributions. The Trust utilizes leverage, which magnifies interest rate risk.
Strategic Transactions For general portfolio management purposes, the Trust may use various other investment management techniques that also involve certain risks and special considerations, including engaging in hedging and risk management transactions, including interest rate swaps and options and foreign currency transactions. These strategic transactions will be entered into to seek to manage the risks of the Trust’s portfolio of securities, but may have the effect of limiting the gains from favorable market movements.
Inflation Risk Inflation risk is the risk that the value of assets or income from investments will be worth less in the future as inflation decreases the value of money. As inflation increases, the real value of the common shares and distributions can decline and the dividend payments in respect of preferred shares, if any, or interest payments on any borrowings may increase.
Deflation Risk Deflation risk is the risk that the Trust’s dividends may be reduced in the future as lower prices reduce interest rates and earning power, resulting in lower distributions on the assets owned by the Trust.
Market Discount Risk Shares of closed‑end management investment companies frequently trade at a discount from their net asset value. This characteristic is a risk separate and distinct from the risk that the Trust’s net asset value could decrease as a result of Trust investment activities and may be greater for investors expecting to sell their shares in a relatively short period following the offering of Preferred Shares. Whether investors will realize gains or losses upon the sale of the shares will depend
| | | | | | |
| Semiannual Report 2023 CBRE Global Real Estate Income Fund | | Confidential & Proprietary | | | 13 | |
not upon the Trust’s net asset value but entirely upon whether the market price of the shares at the time of sale is above or below the investor’s purchase price for the shares. Because the market price of the shares will be determined by factors such as relative supply of and demand for shares in the market, general market and economic conditions, and other factors beyond the control of the Trust, we cannot predict whether the shares will trade at, below or above net asset value, or at, below or above the initial public offering price.
Investment Risk An investment in the Trust is subject to investment risk, including the possible loss of the entire principal amount that you invest.
Anti-Takeover Provisions The Trust’s Amended and Restated Agreement and Declaration of Trust (the “Agreement and Declaration of Trust”) includes provisions that could limit the ability of other entities or persons to acquire control of the Trust or convert the Trust to open‑end status. These provisions could deprive the holders of common shares of opportunities to sell their common shares at a premium over the then current market price of the common shares or at net asset value. In addition, if the Trust issues Preferred Shares, the holders of the Preferred Shares will have voting rights that could deprive holders of common shares of such opportunities.
Market Disruption Risk A disruption of the U.S. or world financial markets could impact interest rates, auctions, secondary trading, ratings, credit risk, inflation and other factors relating to the common shares.
Concentration Risk The Trust invests a substantial portion of its assets (“concentrates”) in a particular market, industry, group of industries, country, region, group of countries, asset class or sector generally is subject to greater risk than a portfolio that invests in a more diverse investment portfolio. In addition, the value of the Trust’s portfolio is more susceptible to any single economic, market, political or regulatory occurrence affecting, for example, that particular market, industry, region or sector. This is because, for example, issuers in a particular market, industry, region or sector often react similarly to specific economic, market, regulatory, or political developments.
| | | | | | |
| Semiannual Report 2023 CBRE Global Real Estate Income Fund | | Confidential & Proprietary | | | 14 | |
Financial
Statements
Portfolio of Investments (unaudited)
June 30, 2023
| | | | | | | | | | | | | | | | |
| Shares | | | | | | | | | | | Market value | |
| | | | |
| | | | | | | | | Real Estate Securities* – 142.5% | | | | | | | | |
| | | | |
| | | | | | | | | Common Stock – 134.7% | | | | | | | | |
| | | | |
| | | | | | | | | Australia – 5.4% | | | | | | | | |
| | | | |
| | 830,420 | | | | | | | Charter Hall Group | | | | | | $ | 5,920,161 | |
| | | | |
| | 1,525,133 | | | | | | | Dexus | | | | | | | 7,918,603 | |
| | | | |
| | 914,821 | | | | | | | Goodman Group | | | | | | | 12,221,647 | |
| | | | |
| | 2,931,273 | | | | | | | Mirvac Group | | | | | | | 4,409,719 | |
| | | | |
| | 1,848,334 | | | | | | | Scentre Group | | | | | | | 3,260,412 | |
| | | | |
| | 8,780,872 | | | | | | | Vicinity Centres | | | | | | | 10,784,009 | |
| | | | |
| | | | | | | | | | | | | | | | 44,514,551 | |
| | | | |
| | | | | | | | | Belgium – 2.2% | | | | | | | | |
| | | | |
| | 167,362 | | | | | | | Aedifica SA | | | | | | | 10,718,150 | |
| | | | |
| | 93,958 | | | | | | | Cofinimmo SA | | | | | | | 7,052,565 | |
| | | | |
| | | | | | | | | | | | | | | | 17,770,715 | |
| | | | |
| | | | | | | | | Canada – 5.0% | | | | | | | | |
| | | | |
| | 176,498 | | | | | | | Canadian Apartment Properties REIT | | | | | | | 6,783,819 | |
| | | | |
| | 728,500 | | | | | | | Chartwell Retirement Residences | | | | | | | 5,213,599 | |
| | | | |
| | 939,900 | | | | | | | H&R Real Estate Investment Trust | | | | | | | 7,280,540 | |
| | | | |
| | 850,000 | | | | | | | RioCan Real Estate Investment Trust | | | | | | | 12,384,659 | |
| | | | |
| | 1,060,471 | | | | | | | Tricon Residential, Inc. | | | | | | | 9,342,750 | |
| | | | |
| | | | | | | | | | | | | | | | 41,005,367 | |
| | | | |
| | | | | | | | | France – 3.8% | | | | | | | | |
| | | | |
| | 674,037 | | | | | | | Klepierre SA | | | | | | | 16,707,711 | |
| | | | |
| | 284,935 | | | | | | | Unibail-Rodamco-Westfield (a) | | | | | | | 14,968,110 | |
| | | | |
| | | | | | | | | | | | | | | | 31,675,821 | |
| | | | |
| | | | | | | | | Germany – 0.7% | | | | | | | | |
| | | | |
| | 105,598 | | | | | | | LEG Immobilien SE (a) | | | | | | | 6,064,520 | |
| | | | |
| | | | | | | | | Hong Kong – 5.5% | | | | | | | | |
| | | | |
| | 4,706,470 | | | | | | | Link REIT | | | | | | | 26,125,034 | |
| | | | |
| | 3,630,000 | | | | | | | New World Development Co. Ltd. | | | | | | | 8,930,710 | |
| | | | |
| | 4,382,000 | | | | | | | Swire Properties Ltd. | | | | | | | 10,769,635 | |
| | | | |
| | | | | | | | | | | | | | | | 45,825,379 | |
| | | | | | | | | | | | | | | | |
| Shares | | | | | | | | | | | Market value | |
| | | | |
| | | | | | | | | Japan – 13.1% | | | | | | | | |
| | | | |
| | 3,139 | | | | | | | Activia Properties, Inc. | | | | | | $ | 8,741,464 | |
| | | | |
| | 7,321 | | | | | | | AEON REIT Investment Corp. | | | | | | | 7,871,335 | |
| | | | |
| | 24,096 | | | | | | | Japan Metropolitan Fund Investment Corp. | | | | | | | 16,054,553 | |
| | | | |
| | 3,440 | | | | | | | Kenedix Office Investment Corp. | | | | | | | 8,246,861 | |
| | | | |
| | 10,619 | | | | | | | LaSalle Logiport REIT | | | | | | | 11,101,331 | |
| | | | |
| | 1,424,600 | | | | | | | Mitsui Fudosan Co., Ltd. | | | | | | | 28,194,336 | |
| | | | |
| | 10,122 | | | | | | | Orix JREIT, Inc. | | | | | | | 12,423,584 | |
| | | | |
| | 2,685,592 | | | | | | | Tokyu Fudosan Holdings Corp. | | | | | | | 15,295,806 | |
| | | | |
| | | | | | | | | | | | | | | | 107,929,270 | |
| | | | |
| | | | | | | | | Singapore – 4.9% | | | | | | | | |
| | | | |
| | 3,822,800 | | | | | | | CapitaLand Ascendas REIT | | | | | | | 7,683,168 | |
| | | | |
| | 11,760,444 | | | | | | | CapitaLand China Trust | | | | | | | 8,863,674 | |
| | | | |
| | 9,348,612 | | | | | | | CapitaLand Integrated Commercial Trust | | | | | | | 13,193,815 | |
| | | | |
| | 5,878,600 | | | | | | | Frasers Logistics & Commercial Trust | | | | | | | 5,429,674 | |
| | | | |
| | 8,338,000 | | | | | | | Keppel REIT | | | | | | | 5,544,907 | |
| | | | |
| | | | | | | | | | | | | | | | 40,715,238 | |
| | | | |
| | | | | | | | | Spain – 1.2% | | | | | | | | |
| | | | |
| | 1,142,990 | | | | | | | Merlin Properties Socimi SA | | | | | | | 9,776,500 | |
| | | | |
| | | | | | | | | Sweden – 1.0% | | | | | | | | |
| | | | |
| | 891,381 | | | | | | | Castellum AB (a) | | | | | | | 8,495,984 | |
| | | | |
| | | | | | | | | Switzerland – 0.9% | | | | | | | | |
| | | | |
| | 68,681 | | | | | | | PSP Swiss Property AG | | | | | | | 7,669,180 | |
| | | | |
| | | | | | | | | United Kingdom – 4.1% | | | | | | | | |
| | | | |
| | 1,200,719 | | | | | | | British Land Co. PLC (The) | | | | | | | 4,622,319 | |
| | | | |
| | 1,901,474 | | | | | | | Land Securities Group PLC | | | | | | | 13,880,854 | |
| | | | |
| | 829,603 | | | | | | | Safestore Holdings PLC | | | | | | | 8,954,485 | |
| | | | |
| | 2,668,000 | | | | | | | Supermarket Income REIT PLC | | | | | | | 2,476,118 | |
| | | | |
| | 2,696,061 | | | | | | | Tritax Big Box REIT PLC | | | | | | | 4,284,522 | |
| | | | |
| | | | | | | | | | | | | | | | 34,218,298 | |
See notes to financial statements
| | | | | | |
| Semiannual Report 2023 CBRE Global Real Estate Income Fund | | Confidential & Proprietary | | | 16 | |
Portfolio of Investments (unaudited) continued
| | | | | | | | | | | | | | | | |
| Shares | | | | | | | | | | | Market value | |
| | | | |
| | | | | | | | | United States – 86.9% | | | | | | | | |
| | | | |
| | 178,107 | | | | | | | Alexandria Real Estate Equities, Inc. | | | | | | $ | 20,213,363 | |
| | | | |
| | 93,273 | | | | | | | American Tower Corp. | | | | | | | 18,089,366 | |
| | | | |
| | 372,093 | | | | | | | Apartment Income REIT Corp. | | | | | | | 13,428,836 | |
| | | | |
| | 138,979 | | | | | | | AvalonBay Communities, Inc. | | | | | | | 26,304,555 | |
| | | | |
| | 791,471 | | | | | | | Brixmor Property Group, Inc. | | | | | | | 17,412,362 | |
| | | | |
| | 652,710 | | | | | | | Broadstone NET Lease, Inc. | | | | | | | 10,077,842 | |
| | | | |
| | 74,659 | | | | | | | Camden Property Trust | | | | | | | 8,128,125 | |
| | | | |
| | 258,236 | | | | | | | Crown Castle, Inc. | | | | | | | 29,423,410 | |
| | | | |
| | 741,425 | | | | | | | CubeSmart | | | | | | | 33,112,041 | |
| | | | |
| | 82,914 | | | | | | | Equinix, Inc. | | | | | | | 64,999,601 | |
| | | | |
| | 76,610 | | | | | | | Essex Property Trust, Inc. | | | | | | | 17,949,723 | |
| | | | |
| | 666,620 | | | | | | | Healthcare Realty Trust, Inc., Class A | | | | | | | 12,572,453 | |
| | | | |
| | 844,349 | | | | | | | Healthpeak Properties, Inc. | | | | | | | 16,971,415 | |
| | | | |
| | 454,631 | | | | | | | Hudson Pacific Properties, Inc. | | | | | | | 1,918,543 | |
| | | | |
| | 74,291 | | | | | | | Hyatt Hotels Corp., Class A | | | | | | | 8,512,263 | |
| | | | |
| | 418,300 | | | | | | | Independence Realty Trust, Inc. | | | | | | | 7,621,426 | |
| | | | |
| | 1,039,635 | | | | | | | Invitation Homes, Inc. | | | | | | | 35,763,444 | |
| | | | |
| | 1,003,594 | | | | | | | Macerich Co. (The) | | | | | | | 11,310,504 | |
| | | | |
| | 316,068 | | | | | | | National Storage Affiliates Trust | | | | | | | 11,008,648 | |
| | | | |
| | 800,659 | | | | | | | Park Hotels & Resorts, Inc. | | | | | | | 10,264,448 | |
| | | | |
| | 515,041 | | | | | | | Pebblebrook Hotel Trust | | | | | | | 7,179,672 | |
| | | | |
| | 696,892 | | | | | | | Piedmont Office Realty Trust, Inc., Class A | | | | | | | 5,066,405 | |
| | | | |
| | 672,408 | | | | | | | Prologis, Inc. | | | | | | | 82,457,393 | |
| | | | |
| | 128,528 | | | | | | | Public Storage | | | | | | | 37,514,753 | |
| | | | |
| | 581,300 | | | | | | | Retail Opportunity Investments Corp. | | | | | | | 7,853,363 | |
| | | | |
| | 505,000 | | | | | | | Rexford Industrial Realty, Inc. | | | | | | | 26,371,100 | |
| | | | |
| | 77,754 | | | | | | | SBA Communications Corp., Class A | | | | | | | 18,020,267 | |
| | | | |
| | 424,495 | | | | | | | Simon Property Group, Inc. | | | | | | | 49,020,683 | |
| | | | |
| | 585,007 | | | | | | | Spirit Realty Capital, Inc. | | | | | | | 23,037,576 | |
| | | | |
| | 262,148 | | | | | | | Sun Communities, Inc. | | | | | | | 34,199,828 | |
| | | | | | | | | | | | | | | | |
| Shares | | | | | | | | | | | Market value | |
| | | | |
| | 1,408,200 | | | | | | | Sunstone Hotel Investors, Inc. | | | | | | $ | 14,250,984 | |
| | | | |
| | 468,091 | | | | | | | Welltower, Inc. | | | | | | | 37,863,881 | |
| | | | |
| | | | | | | | | | | | | | | | 717,918,273 | |
| | | | |
| | | | | | | | | Total Common Stock | | | | | | | | |
| | | | |
| | | | | | | | | (cost $1,354,403,585) | | | | | | | 1,113,579,096 | |
| | | | |
| | | | | | | | | Preferred Stock – 7.8% | | | | | | | | |
| | | | |
| | | | | | | | | United States – 7.8% | | | | | | | | |
| | | | |
| | 245,403 | | | | | | | Digital Realty Trust, Inc., Series J, 5.250% | | | | | | | 5,219,722 | |
| | | | |
| | 301,100 | | | | | | | Digital Realty Trust, Inc., Series L, 5.200% | | | | | | | 6,491,716 | |
| | | | |
| | 282,200 | | | | | | | Federal Realty Investment Trust, Series C, 5.000% | | | | | | | 6,064,478 | |
| | | | |
| | 405,900 | | | | | | | National Storage Affiliates Trust, Series A, 6.000% | | | | | | | 9,469,647 | |
| | | | |
| | 383,644 | | | | | | | Pebblebrook Hotel Trust, Series E, 6.375% | | | | | | | 7,116,596 | |
| | | | |
| | 541,950 | | | | | | | Pebblebrook Hotel Trust, Series F, 6.300% | | | | | | | 10,557,186 | |
| | | | |
| | 262,125 | | | | | | | Pebblebrook Hotel Trust, Series G, 6.375% | | | | | | | 4,901,737 | |
| | | | |
| | 143,517 | | | | | | | Rexford Industrial Realty, Inc., Series B, 5.875% | | | | | | | 3,277,928 | |
| | | | |
| | 287,077 | | | | | | | Summit Hotel Properties, Inc., Series E, 6.250% | | | | | | | 5,956,848 | |
| | | | |
| | 265,000 | | | | | | | Sunstone Hotel Investors, Inc., Series H, 6.125% | | | | | | | 5,355,650 | |
| | | | |
| | | | | | | | | Total Preferred Stock | | | | | | | | |
| | | | |
| | | | | | | | | (cost $75,326,030) | | | | | | | 64,411,508 | |
| | | | |
| | | | | | | | | Total Investments – 142.5% | | | | | | | | |
| | | | |
| | | | | | | | | (cost $1,429,729,615) | | | | | | | 1,177,990,604 | |
| | | | |
| | | | | | | | | Liabilities in Excess of Other Assets – (42.5)% | | | | | | | (351,579,873 | ) |
| | | | |
| | | | | | | | | Net Assets – 100.0% | | | | | | $ | 826,410,731 | |
| * | Includes U.S. Real Estate Investment Trusts (“REIT”) and Real Estate Operating Companies (“REOC”) as well as entities similarly formed under the laws of non‑U.S. countries. |
| (a) | Non‑income producing security. |
See notes to financial statements
| | | | | | |
| Semiannual Report 2023 CBRE Global Real Estate Income Fund | | Confidential & Proprietary | | | 17 | |
Portfolio of Investments (unaudited) concluded
Securities Valuation
The following is a summary of various inputs used in determining the value of the Trust’s investments. These inputs are summarized in three broad levels. Level 1 includes quoted prices in active markets for identical investments. Level 2 includes other significant observable inputs (including quoted prices for similar investments, interest rates, prepayment speeds, credit risk, etc.). Level 3 includes significant unobservable inputs (including the Trust’s own assumptions in determining the fair value of investments). The level assigned to the securities valuations may not be an indication of the risk or liquidity associated with investing in those securities.
The following is a summary of inputs used as of June 30, 2023. For information on the Trust’s policy regarding the valuation of investments, please refer to the Security Valuation section of Note 2 in the accompanying Notes to Financial Statements.
| | | | | | | | | | | | | | | | |
| Assets | | | Level 1 | | | | Level 2 | | | | Level 3 | | | | Total | |
| INVESTMENT IN REAL ESTATE SECURITIES | | | | | | | | | | | | | | | | |
| Common Stock | | | | | | | | | | | | | | | | |
| Australia | | | $44,514,551 | | | | $ - | | | | $ - | | | | $44,514,551 | |
| Belgium | | | 17,770,715 | | | | - | | | | - | | | | 17,770,715 | |
| Canada | | | 41,005,367 | | | | - | | | | - | | | | 41,005,367 | |
| France | | | 31,675,821 | | | | - | | | | - | | | | 31,675,821 | |
| Germany | | | 6,064,520 | | | | - | | | | - | | | | 6,064,520 | |
| Hong Kong | | | 45,825,379 | | | | - | | | | - | | | | 45,825,379 | |
| Japan | | | 107,929,270 | | | | - | | | | - | | | | 107,929,270 | |
| Singapore | | | 40,715,238 | | | | - | | | | - | | | | 40,715,238 | |
| Spain | | | 9,776,500 | | | | - | | | | - | | | | 9,776,500 | |
| Sweden | | | 8,495,984 | | | | - | | | | - | | | | 8,495,984 | |
| Switzerland | | | 7,669,180 | | | | - | | | | - | | | | 7,669,180 | |
| United Kingdom | | | 34,218,298 | | | | - | | | | - | | | | 34,218,298 | |
| United States | | | 717,918,273 | | | | - | | | | - | | | | 717,918,273 | |
| Total Common Stock | | | 1,113,579,096 | | | | - | | | | - | | | | 1,113,579,096 | |
| Preferred Stock | | | | | | | | | | | | | | | | |
| United States | | | 64,411,508 | | | | - | | | | - | | | | 64,411,508 | |
| TOTAL INVESTMENT IN REAL ESTATE SECURITIES | | | $1,177,990,604 | | | | $ - | | | | $ - | | | | $1,177,990,604 | |
See notes to financial statements
| | | | | | |
| Semiannual Report 2023 CBRE Global Real Estate Income Fund | | Confidential & Proprietary | | | 18 | |
Statement of Assets and Liabilities (unaudited)
| | | | |
| |
| | | June 30, 2023 | |
| |
| Assets | | | | |
| |
| Investments, at value (cost $1,429,729,615) | | $ | 1,177,990,604 | |
| |
| Cash and cash equivalents | | | 257,280 | |
| |
| Dividends and interest receivable | | | 5,564,952 | |
| |
| Dividend withholding reclaims receivable | | | 928,811 | |
| |
| Other assets | | | 103,826 | |
| |
| Total assets | | | 1,184,845,473 | |
| |
| Liabilities | | | | |
| |
| Line of credit payable | | | 353,676,800 | |
| |
| Line of credit interest payable | | | 1,658,790 | |
| |
| Payable for investment securities purchased | | | 1,460,736 | |
| |
| Management fees payable | | | 815,963 | |
| |
| Dividend and distributions payable | | | 260,629 | |
| |
| Unrealized depreciation on spot contracts | | | 1,834 | |
| |
| Accrued expenses | | | 559,990 | |
| |
| Total liabilities | | | 358,434,742 | |
| |
| | | | | |
| |
| NET ASSETS | | $ | 826,410,731 | |
| |
| | | | | |
| |
| Composition of Net Assets | | | | |
| |
| $0.001 par value per share; | | | | |
| Unlimited number of shares authorized | | | | |
| 139,968,594 shares issued and outstanding | | $ | 139,969 | |
| |
| Additional paid‑in capital | | | 1,055,325,553 | |
| |
| Distributable earnings / (accumulated loss) | | | (229,054,791) | |
| |
| | | | | |
| |
| NET ASSETS | | $ | 826,410,731 | |
| |
| | | | | |
| |
| NET ASSET VALUE | | | | |
| |
| (BASED ON 139,968,594 SHARES OUTSTANDING) | | $ | 5.90 | |
See notes to financial statements
| | | | | | |
| Semiannual Report 2023 CBRE Global Real Estate Income Fund | | Confidential & Proprietary | | | 19 | |
Statement of Operations (unaudited)
| | | | |
| |
| | | For the six months ended
June 30, 2023 | |
| |
| Investment Income | | | | |
| |
| Dividends (net of foreign withholding taxes of $1,024,682) | | | $21,761,013 | |
| |
| Interest | | | 4,255 | |
| |
| Total investment income | | | 21,765,268 | |
| |
| | | | | |
| |
| Expenses | | | | |
| |
| Interest expense on line of credit | | | 9,010,949 | |
| |
| Management fees | | | 4,741,248 | |
| |
| Printing and mailing fees | | | 122,519 | |
| |
| Administration fees | | | 116,518 | |
| |
| Trustees’ fees and expenses | | | 110,570 | |
| |
| Legal fees | | | 100,683 | |
| |
| Custodian fees | | | 92,329 | |
| |
| Insurance fees | | | 81,102 | |
| |
| NYSE listing fee | | | 59,261 | |
| |
| Audit and tax fees | | | 44,629 | |
| |
| Transfer agent fees | | | 26,182 | |
| |
| Miscellaneous expenses | | | 75,543 | |
| |
| Total expenses | | | 14,581,533 | |
| |
| | | | | |
| |
| NET INVESTMENT INCOME | | | 7,183,735 | |
| |
| | | | | |
| |
| Net Realized and Unrealized Gain (Loss) on Investments, Written Options, and Foreign Currency Transactions | | | | |
| |
| Net realized gain (loss) on: | | | | |
| |
| Investments | | | 38,229,994 | |
| |
| Written options | | | 518,033 | |
| |
| Foreign currency transactions | | | (85,209) | |
| |
| Total Net Realized Gain | | | 38,662,818 | |
| |
| | | | | |
| |
| Net change in unrealized appreciation (depreciation) on: | | | | |
| |
| Investments | | | (24,920,534) | |
| |
| Foreign currency denominated assets and liabilities | | | (38,373) | |
| |
| Total Net Change in Unrealized Depreciation | | | (24,958,907) | |
| |
| | | | | |
| |
| NET REALIZED AND UNREALIZED GAIN ON INVESTMENTS, WRITTEN OPTIONS, AND FOREIGN CURRENCY TRANSACTIONS | | | 13,703,911 | |
| |
| | | | | |
| |
| NET INCREASE IN NET ASSETS RESULTING FROM OPERATIONS | | | $20,887,646 | |
See notes to financial statements
| | | | | | |
| Semiannual Report 2023 CBRE Global Real Estate Income Fund | | Confidential & Proprietary | | | 20 | |
Statements of Changes in Net Assets
| | | | | | | | |
| | |
| | | For the
six months ended
June 30, 2023
(unaudited) | | | For the
year ended
December 31, 2022 | |
| | |
| Change in Net Assets Resulting from Operations | | | | | | | | |
| | |
| Net investment income | | | $7,183,735 | | | | $23,011,947 | |
| | |
| Net realized gain on investments, written options, and foreign currency transactions | | | 38,662,818 | | | | 67,530,538 | |
| | |
| Net change in unrealized depreciation on investments, and foreign currency denominated assets and liabilities | | | (24,958,907) | | | | (494,527,416) | |
| | |
| Net increase (decrease) in net assets resulting from operations | | | 20,887,646 | | | | (403,984,931) | |
| | |
| Distributions on Common Shares | | | | | | | | |
| | |
| Distributions from distributable earnings | | | (46,180,636) | | | | (81,613,345) | |
| | |
| Total distributions on common shares | | | (46,180,636) | | | | (81,613,345) | |
| | |
| Capital Share transactions | | | | | | | | |
| | |
| Proceeds from shares sold | | | 117,591,843 | | | | – | |
| | |
| Offering costs for common shares charged to paid-in capital | | | (1,898,934) | | | | – | |
| | |
| Net increase from capital share transactions | | | 115,692,909 | | | | – | |
| | |
| | | | | | | | | |
| | |
| Net Increase (Decrease) in Net Assets | | | 90,399,919 | | | | (485,598,276) | |
| | |
| | | | | | | | | |
| | |
| Net Assets | | | | | | | | |
| | |
| Beginning of period | | | 736,010,812 | | | | 1,221,609,088 | |
| | |
| End of period | | | $826,410,731 | | | | $736,010,812 | |
See notes to financial statements
| | | | | | |
| Semiannual Report 2023 CBRE Global Real Estate Income Fund | | Confidential & Proprietary | | | 21 | |
Statement of Cash Flows (unaudited)
| | | | |
| |
| | | For the Six Months Ended
June 30, 2023 | |
| |
| Cash Flows from Operating Activities | | | | |
| |
| Net increase in net assets resulting from operations | | | $20,887,646 | |
| |
| | | | | |
| |
| Adjustments to Reconcile Net Increase in Net Assets Resulting from Operations to Net Cash Used in Operating Activities | | | | |
| |
| Net change in unrealized appreciation/depreciation on investments | | | 24,920,534 | |
| |
| Net realized gain on investments | | | (38,229,994) | |
| |
| Net realized gain on written options | | | (518,033) | |
| |
| Cost of securities purchased | | | (349,971,327) | |
| |
| Proceeds from sale of securities | | | 253,881,195 | |
| |
| Premiums received on written options | | | 545,959 | |
| |
| Payments to close written options | | | (27,926) | |
| |
| Decrease in receivable for investment securities sold | | | 9,936,848 | |
| |
| Increase in dividends and interest receivable | | | (979,280) | |
| |
| Increase in dividend withholding reclaims receivable | | | (397,181) | |
| |
| Decrease in unrealized appreciation on spot contracts | | | 1,557 | |
| |
| Decrease in other assets | | | 15,836 | |
| |
| Increase in payable for investment securities purchased | | | 1,460,736 | |
| |
| Increase in management fees payable | | | 30,373 | |
| |
| Increase in unrealized depreciation on spot contracts | | | 1,834 | |
| |
| Increase in line of credit interest payable | | | 263,959 | |
| |
| Increase in accrued expenses | | | 194,150 | |
| |
| NET CASH USED IN OPERATING ACTIVITIES | | | (77,983,114) | |
| |
| | | | | |
| |
| Cash Flows from Financing Activities: | | | | |
| |
| Cash distributions paid on Common Shares | | | (46,120,169) | |
| |
| Proceeds from shares sold | | | 117,591,843 | |
| |
| Offering costs for common shares charged to paid-in capital | | | (1,898,934) | |
| |
| Proceeds from borrowing on line of credit | | | 301,769,300 | |
| |
| Payments on line of credit borrowings | | | (293,301,900) | |
| |
| NET CASH PROVIDED BY FINANCING ACTIVITIES | | | 78,040,140 | |
| |
| Net increase in cash | | | 57,026 | |
| |
| Cash and Cash Equivalents at Beginning of Year | | | 200,254 | |
| |
| CASH AND CASH EQUIVALENTS AT END OF YEAR | | | $257,280 | |
| |
| | | | | |
| |
| Supplemental Disclosure | | | | |
| |
| Interest paid on line of credit borrowings | | | $8,746,990 | |
See notes to financial statements
| | | | | | |
| Semiannual Report 2023 CBRE Global Real Estate Income Fund | | Confidential & Proprietary | | | 22 | |
Financial Highlights
| | | | | | | | | | | | | | | | | | | | | | | | |
| | | | | | |
| | | For the
Six Months
Ended
June 30,
2023
(unaudited) | | | For the
Year Ended
December 31,
2022 | | | For the
Year Ended
December 31,
2021 | | | For the
Year Ended
December 31,
2020 | | | For the
Year Ended
December 31,
2019 | | | For the
Year Ended
December 31,
2018 | |
| | | | | | |
| Per share operating performance for a share outstanding throughout the period | | | | | | | | | | | | | | | | | | | | | | | | |
| | | | | | |
| | | | | | | | | | | | | | | | | | | | | | | | | |
| | | | | | |
| Net asset value, beginning of period | | | $6.31 | | | | $10.48 | | | | $8.11 | | | | $8.86 | | | | $7.55 | | | | $8.99 | |
| | | | | | |
| | | | | | | | | | | | | | | | | | | | | | | | | |
| | | | | | |
| Income from investment operations | | | | | | | | | | | | | | | | | | | | | | | | |
| | | | | | |
Net investment income(1) | | | 0.06 | | | | 0.20 | | | | 0.22 | | | | 0.17 | | | | 0.16 | | | | 0.19 | |
| | | | | | |
| Net realized and unrealized gain (loss) on investments, written options and foreign currency transactions | | | 0.11 | | | | (3.67) | | | | 2.75 | | | | (0.32) | | | | 1.75 | | | | (1.03) | |
| | | | | | |
| Total from investment operations | | | 0.17 | | | | (3.47) | | | | 2.97 | | | | (0.15) | | | | 1.91 | | | | (0.84) | |
| | | | | | |
| | | | | | | | | | | | | | | | | | | | | | | | | |
| | | | | | |
| Common Share transactions | | | | | | | | | | | | | | | | | | | | | | | | |
| | | | | | |
Dilutive effect on net asset value as a result of rights offering(2) | | | (0.21) | | | | – | | | | – | | | | – | | | | – | | | | – | |
| | | | | | |
| Offering costs charged to paid-in-capital | | | (0.01) | | | | – | | | | – | | | | – | | | | – | | | | – | |
| | | | | | |
| Total from Common Share transactions | | | (0.22) | | | | – | | | | – | | | | – | | | | – | | | | – | |
| | | | | | |
| | | | | | | | | | | | | | | | | | | | | | | | | |
| | | | | | |
| Distributions on Common Shares | | | | | | | | | | | | | | | | | | | | | | | | |
| | | | | | |
| Net investment income | | | (0.36) | | | | (0.21) | | | | (0.08) | | | | (0.21) | | | | (0.30) | | | | (0.17) | |
| | | | | | |
| Net realized gains | | | – | | | | (0.49) | | | | (0.52) | | | | – | | | | – | | | | – | |
| | | | | | |
| Return of capital | | | – | | | | – | | | | – | | | | (0.39) | | | | (0.30) | | | | (0.43) | |
| | | | | | |
| Total distributions to common shareholders | | | (0.36) | | | | (0.70) | | | | (0.60) | | | | (0.60) | | | | (0.60) | | | | (0.60) | |
| | | | | | |
| | | | | | | | | | | | | | | | | | | | | | | | | |
| | | | | | |
| NET ASSET VALUE, END OF PERIOD | | | $5.90 | | | | $6.31 | | | | $10.48 | | | | $8.11 | | | | $8.86 | | | | $7.55 | |
| | | | | | |
| | | | | | | | | | | | | | | | | | | | | | | | | |
| | | | | | |
| MARKET VALUE, END OF PERIOD | | | $5.23 | | | | $5.73 | | | | $9.79 | | | | $6.88 | | | | $8.02 | | | | $6.16 | |
| | | | | | |
| | | | | | | | | | | | | | | | | | | | | | | | | |
| | | | | | |
| Total investment return(3) | | | | | | | | | | | | | | | | | | | | | | | | |
| | | | | | |
| Net asset value | | | (1.04)% | | | | (33.97)% | | | | 37.88% | | | | (0.74)% | | | | 25.74% | | | | (9.75)% | |
| | | | | | |
| Market value | | | (2.78)% | | | | (35.54)% | | | | 52.66% | | | | (5.52)% | | | | 40.87% | | | | (15.52)% | |
| | | | | | |
| | | | | | | | | | | | | | | | | | | | | | | | | |
| | | | | | |
| Ratios and supplemental data | | | | | | | | | | | | | | | | | | | | | | | | |
| | | | | | |
| Net assets, applicable to common shares, end of period (thousands) | | | $826,411 | | | | $736,011 | | | | $1,221,609 | | | | $945,194 | | | | $1,032,890 | | | | $880,636 | |
| | | | | | |
| Borrowings (senior securities) outstanding, end of period (thousands) | | | $353,677 | | | | $345,209 | | | | $320,489 | | | | $289,727 | | | | $121,020 | | | | $74,111 | |
| | | | | | |
| Asset Coverage per $1,000(4) | | | $3,337 | | | | $3,132 | | | | $4,812 | | | | $4,262 | | | | $9,535 | | | | $12,883 | |
| | | | | | |
| | | | | | | | | | | | | | | | | | | | | | | | | |
| | | | | | |
| Ratios to average net assets applicable to common shares of: | | | | | | | | | | | | | | | | | | | | | | | | |
| | | | | | |
| Net expenses | | | 3.68%(5) | | | | 2.29% | | | | 1.46% | | | | 1.53% | | | | 1.57% | | | | 1.54% | |
| | | | | | |
| Net expenses, excluding interest on line of credit | | | 1.41%(5) | | | | 1.39% | | | | 1.24% | | | | 1.26% | | | | 1.16% | | | | 1.17% | |
| | | | | | |
| Net investment income | | | 1.81%(5) | | | | 2.49% | | | | 2.37% | | | | 2.25% | | | | 1.89% | | | | 2.30% | |
| | | | | | |
| | | | | | | | | | | | | | | | | | | | | | | | | |
| | | | | | |
| Portfolio turnover rate | | | 22.18% | | | | 53.88% | | | | 78.44% | | | | 72.50% | | | | 44.97% | | | | 70.38% | |
| | | | | | |
| | | | | | | | | | | | | | | | | | | | | | | | | |
| (1) | Based on average shares outstanding. |
| (2) | Shares issued at a 5% discount on a 5-day average market price from 3/31/2023 to 4/6/2023 |
| (3) | Total investment return does not reflect brokerage commissions. Dividends and distributions are assumed to be reinvested at the prices obtained under the Trust’s Dividend Reinvestment Plan. Net Asset Value (“NAV”) total return is calculated assuming reinvestment of distributions at NAV on the date of the distribution. |
| (4) | Asset Coverage per $1,000: Asset coverage per $1,000 of debt is calculated by subtracting the Trust’s liabilities and indebtedness not represented by senior securities from the Trust’s total assets, dividing the result by the aggregate amount of the Trust’s senior securities representing indebtedness then outstanding, and multiplying the result by 1,000. |
See notes to financial statements
| | | | | | |
| Semiannual Report 2023 CBRE Global Real Estate Income Fund | | Confidential & Proprietary | | | 23 | |
Notes to Financial
Statements (unaudited)
Notes to Financial Statements (unaudited)
CBRE Global Real Estate Income Fund (the “Trust”) is a diversified, closed‑end management investment company that was organized as a Delaware statutory trust on November 6, 2003 and registered with the Securities and Exchange Commission (“SEC”) under the Investment Company Act of 1940, as amended. The Trust is an investment company and accordingly follows the Investment Company accounting and reporting guidance of the Financial Accounting Standards Board (“FASB”) Accounting Standards Codification Topic 946 Financial Services-Investment Companies. CBRE Investment Management Listed Real Assets LLC (the “Adviser”) is the Trust’s investment adviser. The Adviser is a majority-owned subsidiary of CBRE Group, Inc. (“CBRE”) and is partially owned by its senior management team. The Trust commenced operations on February 18, 2004.
| | |
| 2 | | SIGNIFICANT ACCOUNTING POLICIES |
The following accounting policies are in accordance with U.S. generally accepted accounting principles (“U.S. GAAP”) and are consistently followed by the Trust.
Securities Valuation
The net asset value of the common shares of the Trust will be computed based upon the value of the Trust’s portfolio securities and other assets. The Trust calculates net asset value per common share by subtracting the Trust’s liabilities (including accrued expenses, dividends payable and any borrowings of the Trust) and the liquidation value of any outstanding preferred shares from the Trust’s total assets (the value of the securities the Trust holds, plus cash and/or other assets, including dividends accrued but not yet received) and dividing the result by the total number of common shares of the Trust outstanding. Net asset value per common share will be determined as of the close of the regular trading session (usually 4:00 p.m., EST) on the New York Stock Exchange (“NYSE”) on each business day on which the NYSE is open for trading.
For purposes of determining the net asset value of the Trust, readily marketable portfolio assets (including common stock, preferred stock, and options) traded principally on an exchange, or on a similar regulated market reporting contemporaneous transaction prices, are valued, except as indicated below, at the last sale price for such assets on such principal markets on the business day on which such value is being determined. If there has been no sale on such day, the securities are valued at the mean of the closing bid and ask prices on such day. Foreign securities are valued based upon quotations from the primary market in which they are traded and are translated from the local currency into U.S. dollars using current exchange rates.
During the period that a forward foreign currency contract is open, changes in the value of the contract are recognized as unrealized appreciation or depreciation by marking to market such contract on a daily basis to reflect the market value of the contract at the end of each day’s trading. Securities and other assets for which market quotations are not readily available or for which the above valuation procedures are deemed not to reflect fair value are valued in a manner that is intended to reflect their fair value as determined in accordance with procedures approved by the Trust’s Board of Trustees (the “Board”).
Short-term securities which mature in more than 60 days are valued at current market quotations. Short-term securities, which mature in 60 days or less, are valued at amortized cost, which approximates market value.
U.S. GAAP provides guidance on fair value measurements. In accordance with the standard, fair value is defined as the price that the Trust would receive to sell an investment or pay to transfer a liability in a timely transaction with an independent buyer in the principal market, or in the absence of a principal market the most advantageous market for the investment or liability. It establishes a single definition of fair value, creates a three-tier hierarchy as a framework for measuring fair value based on inputs used to value the Trust’s investments, and requires additional disclosure about fair value.
For Level 1 inputs, the Trust uses unadjusted quoted prices in active markets for assets or liabilities with sufficient frequency and volume to provide pricing information as the most reliable evidence of fair value.
The Trust’s Level 2 valuation techniques include inputs other than quoted prices within Level 1 that are observable for an asset or liability, either directly or indirectly. Level 2 observable inputs may include quoted prices for similar assets and liabilities in
| | | | | | |
| Semiannual Report 2023 CBRE Global Real Estate Income Fund | | Confidential & Proprietary | | | 25 | |
Notes to Financial Statements (unaudited) continued
active markets or quoted prices for identical or similar assets or liabilities in markets that are not active in which there are few transactions, the prices are not current, or price quotations vary substantially over time or among market participants. Inputs that are observable for the asset or liability in Level 2 include such factors as interest rates, yield curves, prepayment speeds, credit risk, and default rates for similar liabilities.
For Level 3 valuation techniques, the Trust uses unobservable inputs that reflect assumptions market participants would be expected to use in pricing the asset or liability. Unobservable inputs are used to measure fair value to the extent that observable inputs are not available and are developed based on the best information available under the circumstances. In developing unobservable inputs, market participant assumptions are used if they are reasonably available without undue cost and effort.
The primary third-party pricing vendor for the Trust’s listed preferred stock investments is FT Interactive Data (“IDC”). When available, the Trust will obtain a closing exchange price to value the preferred stock investments and, in such instances, the investment will be classified as Level 1 since an unadjusted quoted price was utilized. When a closing price is not available for the listed preferred stock investments, IDC will produce an evaluated mean price (midpoint between the bid and the ask evaluation) and such investments will be classified as Level 2 since other observable inputs were used in the valuation. Factors used in the IDC evaluation include trading activity, the presence of a two‑sided market, and other relevant market data.
Pursuant to the Trust’s fair value procedures noted previously, equity securities (including exchange traded securities and open‑end regulated investment companies) and exchange traded derivatives (i.e. futures contracts and options) are generally categorized as Level 1 securities in the fair value hierarchy. Fixed income securities, non‑exchange traded derivatives and money market instruments are generally categorized as Level 2 securities in the fair value hierarchy. Investments for which there are no such quotations, or for which quotations do not appear reliable, are valued at fair value as determined in accordance with procedures established by and under the general supervision of the Trustees. These valuations are typically categorized as Level 2 or Level 3 securities in the fair value hierarchy.
For the period ended June 30, 2023, there have been no significant changes to the Trust’s fair valuation methodology.
Foreign Currency Translation
The books and records of the Trust are maintained in U.S. dollars. Foreign currency amounts are translated into U.S. dollars on the following basis:
| (i) | market value of investment securities, other assets and liabilities – at the current rates of exchange; |
| (ii) | purchases and sales of investment securities, income and expenses – at the rate of exchange prevailing on the respective dates of such transactions. |
Although the net assets of the Trust are presented at the foreign exchange rates and market values at the close of each fiscal year, the Trust does not isolate that portion of the results of operations arising as a result of changes in the foreign exchange rates from the fluctuations arising from changes in the market prices of long-term securities held at the end of the fiscal year. Similarly, the Trust does not isolate the effect of changes in foreign exchange rates from the fluctuations arising from changes in the market prices of portfolio securities sold during the fiscal year. Accordingly, realized foreign currency gains or losses will be included in the reported net realized gains or losses on investment transactions.
Net realized gains or losses on foreign currency transactions represent net foreign exchange gains or losses from the holding of foreign currencies, currency gains or losses realized between the trade date and settlement date on securities transactions, and the difference between the amounts of dividends, interest and foreign withholding taxes recorded on the Trust’s books and the
U.S. dollar equivalent amounts actually received or paid. Net unrealized currency gains or losses from valuing foreign currency denominated assets or liabilities (other than investments) at year end exchange rates are reflected as a component of net unrealized appreciation or depreciation on investments and foreign currencies.
Foreign security and currency transactions may involve certain considerations and risks not typically associated with those of domestic origin as a result of, among other factors, the possibility of political or economic instability, or the level of governmental supervision and regulation of foreign securities markets.
Forward Foreign Currency Contracts
The Trust may enter into forward foreign currency contracts in order to hedge its exposure to changes in foreign currency exchange rates on its foreign portfolio holdings, to hedge certain Trust purchase and sales commitments denominated in
| | | | | | |
| Semiannual Report 2023 CBRE Global Real Estate Income Fund | | Confidential & Proprietary | | | 26 | |
Notes to Financial Statements (unaudited) continued
foreign currencies and for investment purposes. A forward foreign currency contract is a commitment to purchase or sell a foreign currency on a future date at a negotiated forward rate. The gain or loss arising from the difference between the original contracts and the closing of such contracts would be included in net realized gain or loss on foreign currency transactions.
Fluctuations in the value of open forward foreign currency contracts are recorded for financial reporting purposes as unrealized appreciation and depreciation by the Trust.
The Trust’s custodian will place and maintain cash not available for investment or other liquid assets in a separate account of the Trust having a value at least equal to the aggregate amount of the Trust’s commitments under forward foreign currency contracts entered into with respect to position hedges.
Risks may arise from the potential inability of a counterparty to meet the terms of a contract and from unanticipated movements in the value of a foreign currency relative to the U.S. dollar. The face or contract amount, in U.S. dollars, reflects the total exposure the Trust has in that particular currency contract. As of June 30, 2023, the Trust did not hold any forward foreign currency contracts.
Options
The Trust may purchase or sell (write) options on securities and securities indices which are listed on a national securities exchange or in the over‑the‑counter (“OTC”) market as a means of achieving additional return or of hedging the value of the Trust’s portfolio.
An option on a security is a contract that gives the holder of the option, in return for a premium, the right to buy from (in the case of a call) or sell to (in the case of a put) the writer of the option the security underlying the option at a specified exercise or “strike” price. The writer of an option on a security has an obligation upon exercise of the option to deliver the underlying security upon payment of the exercise price (in the case of a call) or to pay the exercise price upon delivery of the underlying security (in the case of a put).
There are several risks associated with transactions in options on securities. As the writer of a covered call option, the Trust forgoes, during the option’s life, the opportunity to profit from increases in the market value of the security covering the call option above the sum of the premium and the strike price of the call but has retained the risk of loss should the price of the underlying security decline. The writer of an option has no control over the time when it may be required to fulfill its obligation as writer of the option. Once an option writer has received an exercise notice, it cannot effect a closing purchase transaction in order to terminate its obligation under the option and must deliver the underlying security at the exercise price. As of June 30, 2023, the Trust did not hold any options contracts.
Securities Transactions and Investment Income
Securities transactions are recorded on a trade date basis. Realized gains and losses from securities transactions are recorded on the basis of identified cost. Dividend income is recorded on the ex‑dividend date. Distributions received from investments in REITs are recorded as dividend income on ex‑dividend date, subject to reclassification upon notice of the character of such distributions by the issuer. The portion of dividend attributable to the return of capital is recorded against the cost basis of the security. Withholding taxes on foreign dividends are recorded net of reclaimable amounts, at the time the related income is earned. Non‑cash dividends included in dividend income, if any, are recorded at the fair market value of the securities received. Interest income, including accretion of original issue discount, where applicable, and accretion of discount on short-term investments, is recorded on the accrual basis.
Dividends and Distributions to Shareholders
Dividends from net investment income, if any, are declared and paid on a monthly basis. Income dividends and capital gain distributions to common shareholders are recorded on the ex‑dividend date. To the extent the Trust’s net realized capital gains, if any, can be offset by capital loss carryforwards, it is the policy of the Trust not to distribute such gains.
On August 5, 2008, the Trust acting in accordance with an exemptive order received from the SEC and with approval of the Board, adopted a managed distribution policy under which the Trust intends to make regular monthly cash distributions to common shareholders, stated in terms of a fixed amount per common share. This managed distribution policy permits the Trust to include long-term capital gains in its distribution as frequently as twelve times a year. In practice, the Board views this policy as a potential means of further supporting the market price of the Trust’s shares through the payment of a steady and predictable level of cash distributions to shareholders.
| | | | | | |
| Semiannual Report 2023 CBRE Global Real Estate Income Fund | | Confidential & Proprietary | | | 27 | |
Notes to Financial Statements (unaudited) continued
The current monthly distribution rate is $0.06 per share. The Trust continues to evaluate its monthly distribution policy in light of ongoing economic and market conditions and may change the amount of the monthly distributions in the future.
Use of Estimates
The preparation of financial statements, in conformity with U.S. GAAP, requires management to make estimates and assumptions that affect the reported amounts of assets and liabilities at the date of the financial statements and the reported amounts of expenses during the reporting year. Actual results could differ from those estimates.
The effect of derivative instruments on the Trust’s Statement of Operations for the period ended June 30, 2023 was as follows:
Derivatives Not Accounted for as Hedging Instruments
| | | | |
| | | Realized gain | |
| EQUITY RISK | | | | |
| Written options | | | $518,033 | |
For the period ended June 30, 2023, the average month‑end notional value of written options was $6,170,000.
Under normal market conditions, the Trust’s investments will be concentrated in income-producing common equity securities, preferred securities, convertible securities and non‑convertible debt securities issued by companies deriving the majority of their revenue from the ownership, construction, financing, management and/or sale of commercial, industrial, and/or residential real estate. Values of the securities of such companies may fluctuate due to economic, legal, cultural, geopolitical or technological developments affecting various global real estate industries.
| | |
| 5 | | INVESTMENT MANAGEMENT AGREEMENT AND OTHER AGREEMENTS |
Pursuant to an investment management agreement between the Adviser and the Trust, the Adviser is responsible for the daily management of the Trust’s portfolio of investments, which includes buying and selling securities for the Trust, as well as investment research. The Trust pays for investment advisory services and facilities through a fee payable monthly in arrears at an annual rate equal to 0.85% of the average daily value of the Trust’s managed assets, which adds back the line of credit payable to net assets, plus certain direct and allocated expenses of the Adviser incurred on the Trust’s behalf. During the period ended June 30, 2023, the Trust incurred management fees of $4,741,248, of which $815,963 is payable as of the end of the period.
The Trust has multiple service agreements with the Bank of New York Mellon (“BNYM”). Under the servicing agreements, BNYM will perform custodial, fund accounting, and certain administrative services for the Trust. As custodian, BNYM is responsible for the custody of the Trust’s assets. As administrator, BNYM is responsible for maintaining the books and records of the Trust’s securities and cash.
Computershare is the Trust’s transfer agent and as such is responsible for performing transfer agency services for the Trust.
For the period ended June 30, 2023, there were purchases and sales transactions (excluding short-term securities) of $351,053,973 and $251,673,022, respectively. These purchases and sales transaction amounts differ from the amounts disclosed on the Statement of Cash Flows primarily due to the re‑characterization of dividends from ordinary income to return of capital and capital gain.
| | | | | | |
| Semiannual Report 2023 CBRE Global Real Estate Income Fund | | Confidential & Proprietary | | | 28 | |
Notes to Financial Statements (unaudited) continued
The Trust intends to elect to be, and qualify for treatment as, a regulated investment company under Subchapter M of the Internal Revenue Code of 1986, as amended (the “Code”). A regulated investment company generally pays no federal income tax on the income and gains that it distributes. The Trust intends to meet the calendar year distribution requirements imposed by the Code to avoid the imposition of a 4% excise tax.
The Trust is required to evaluate tax positions taken or expected to be taken in the course of preparing the Trust’s tax returns to determine whether the tax positions are “more‑likely‑than‑not” of being sustained by the applicable tax authority. Income tax and related interest and penalties would be recognized by the Trust as tax expense in the Statement of Operations if the tax positions were deemed to not meet the more‑likely‑than‑not threshold. For the year ended December 31, 2022, the Trust did not incur any income tax, interest, or penalties. Management has analyzed the Trust’s tax positions taken on federal, state and local income tax returns for all open tax years (since inception) and has concluded that no provisions for federal, state and local income tax are required in the Trust’s financial statements.
The Trust distinguishes between dividends on a tax basis and on a financial reporting basis and only distributions in excess of tax basis earnings and profits are reported in the financial statements as a tax return of capital. Differences in the recognition or classification of income between the financial statements and tax earnings and profits which result in temporary over- distributions for financial statement purposes are classified as distributable earnings or accumulated losses in the composition of net assets on the Statement of Assets and Liabilities.
In order to present paid‑in capital in excess of par and total distributable earnings /(Accumulated Loss) on the Statement of Assets and Liabilities that more closely represent their tax character, certain adjustments have been made to additional paid‑in capital, and total distributable earnings. For the year ended December 31, 2022, the adjustments were to decrease additional paid‑in capital by $22 and increase distributable earnings by $22 due to the difference in the treatment for book and tax purposes of certain items allocated for foreign partnership investments. Results of operations and net assets were not affected by these reclassifications.
At December 31, 2022, the Trust had no capital loss carryforwards.
Certain capital and qualified late year losses incurred after October 31 and within the current taxable year, are deemed to arise on the first business day of the Trust’s following taxable year. The Trust incurred no such losses during the year ended December 31, 2022.
The final determination of the source of the 2023 distributions for tax purposes will be made after the end of the Trust’s fiscal year and will be reported to shareholders in February 2024 on the Form 1099‑DIV.
For the year ended December 31, 2022, the tax character of distributions paid, as reflected in the Statements of Changes in Net Assets, was $24,667,447 of ordinary income (including net short-term capital gains) and $56,945,898 of long-term capital gain (both reflected in the Statements of Changes in Net Assets as distributions from distributable earnings), respectively. For the year ended December 31, 2021, the tax character of distributions paid, as reflected in the Statements of Changes in Net Assets, was $9,882,488 of ordinary income (including net short-term capital gains) and $60,071,809 of long-term capital gain (both reflected in the Statements of Changes in Net Assets as distributions from distributable earnings), respectively.
Information on the tax components of net assets as of December 31, 2022 is as follows:
| | | | | | | | | | | | | | | | |
Cost of
investments for tax purposes | | Gross tax
unrealized
appreciation | | Gross tax
unrealized
depreciation | | Net tax
unrealized
appreciation on
investments | | Net tax
unrealized
appreciation
on foreign
currency | | Qualified late
year ordinary
losses | | Qualified post‑
October capital
deferral | | Undistributed
ordinary
income | | Undistributed
long-term Capital gains / (accumulated
capital loss) |
| $1,298,126,318 | | $21,690,101 | | $(251,225,407) | | $(229,535,306) | | $(10,851) | | $0 | | $0 | | $20,029,505 | | $5,754,851 |
| | | | | | |
| Semiannual Report 2023 CBRE Global Real Estate Income Fund | | Confidential & Proprietary | | | 29 | |
Notes to Financial Statements (unaudited) concluded
The Trust has access to a secured line of credit of up to $400,000,000 from BNYM for borrowing purposes. Borrowings under this arrangement bear interest at the Federal funds rate plus 75 basis points. At June 30, 2023, there were borrowings in the amount of $353,676,800 on the Trust’s line of credit.
The average daily amount of borrowings during the period ended June 30, 2023 was $326,183,997 with an average interest rate of 5.50%. The maximum amount outstanding for the period ended June 30, 2023, was $368,712,000. The Trust had borrowings under the line of credit for all 181 days during the period.
During 2004, the Trust issued 101,000,000 shares of common stock at $15.00. In connection with the Trust’s Dividend Reinvestment Plan (“DRIP”), the Trust issued no common shares for the period ended June 30, 2023 and the year ended December 31, 2022, respectively.
Effective March 9, 2023, shareholders of record were issued one right for every share owned of the Trust. These rights allowed holders to subscribe to additional Common Shares of the Trust at a rate of one share for every five rights. On April 14, 2023, the Trust issued 23,378,100 additional Common Shares at an offering price of $5.03 per share as a result of the rights offering. This price was calculated at a 5% discount on a 5-day average market price from 3/31/2023 to 4/6/2023. The offering resulted in gross proceeds of $117,591,843, less $1,898,934 of offering expenses, for net proceeds of $115,692,909. The net asset value of the Trust decreased by $0.22 per share on the day the additional shares were issued due to the shares being issued below net asset value.
At June 30, 2023, the Trust had outstanding common shares of 139,968,594 with a par value of $0.001 per share. The Adviser owned none of the common shares outstanding as of June 30, 2023.
At June 30, 2023, the Trust had no shares of auction rate preferred securities outstanding.
The Trust enters into contracts that contain a variety of indemnifications. The Trust’s exposure under these arrangements is unknown. However, the Trust has not had prior claims or losses or current claims or losses pursuant to these contracts.
Events or transactions that occur after the balance sheet date but before the financial statements are issued are categorized as recognized or non‑recognized for financial statement purposes. Since June 30, 2023, the Trust paid a distribution on July 31, 2023 of $0.06 per share for the month of July 2023.
No other notable events have occurred between period‑end and the issuance of these financial statements.
| | | | | | |
| Semiannual Report 2023 CBRE Global Real Estate Income Fund | | Confidential & Proprietary | | | 30 | |
Supplemental
Information
(unaudited)
Supplemental Information (unaudited)
Trustees
The Trustees of the CBRE Global Real Estate Income Fund and their principal occupations during the past five years:
| | | | | | | | | | |
| Name, address and age | | Term of office
and length of
time served(1) | | Title | | Principal occupations during the
past five years | | Number of
portfolios in the
Trust complex
overseen by
Trustee | | Other directorships held
by trustee |
| Trustees: | | | | | | | | | | |
T. Ritson Ferguson(2) 555 East Lancaster Ave. Suite 120 Radnor, PA 19087 Age: 64 | | 3 years/ since inception | | Trustee | | Senior Fellow Wharton Real Estate Center (since 2022); Managing Director of TRF3 Advisors (since 2022); Independent Investment Committee Member of CBRE Investment Management Listed Real Assets LLC (since 2022); Vice Chairman (2021) and Chief Executive Officer and Co‑Chief Investment Officer (1995—2020) of CBRE Investment Management Listed Real Assets LLC; Chief Executive Officer, Chief Investment Officer and Global Chief Investment Officer of CBRE Global Investors (2015—2019) | | 1 | | Duke Management Company (DUMAC) (since 2018) |
Asuka Nakahara 555 East Lancaster Ave. Suite 120 Radnor, PA 19087 Age: 67 | | 3 years/ since inception | | Trustee | | Co‑Founder of Incompass Labs (since 2022); Associate Director of the Zell-Lurie Real Estate Center at the Wharton School, University of Pennsylvania (since 1999); Practice Professor of Real Estate at the Wharton School, University of Pennsylvania (since 1999); Partner of Triton Atlantic Partners (since 2009) | | 1 | | Rice Management Company (since 2022); Comcast Corporation (since 2017) |
John R. Bartholdson 555 East Lancaster Ave. Suite 120 Radnor, PA 19087 Age: 78 | | 3 years/ 19 years | | Trustee/ Audit Committee Financial Expert | | Senior Vice President, CFO and Treasurer, and a Director of Triumph Group, Inc. (1993—2007) (Retired) | | 1 | | Berwyn Cornerstone Fund, Berwyn Income Fund, and Berwyn Fund (2013—2016) |
Leslie E. Greis 555 East Lancaster Ave. Suite 120 Radnor, PA 19087 Age: 64 | | 3 years/ 41⁄2 years | | Trustee | | Founder and Managing Member of Perennial Capital Advisors, LLC (since 2003) | | 1 | | AIM Mutual, Inc. (2016), Kinefac Corporation (since 2009) |
| | | | | | |
| Semiannual Report 2023 CBRE Global Real Estate Income Fund | | Confidential & Proprietary | | | 32 | |
Supplemental Information (unaudited) continued
| | | | | | | | | | |
| Name, address and age | | Term of office
and length of
time served(1) | | Title | | Principal occupations during the
past five years | | Number of
portfolios in the
Trust complex
overseen by
Trustee | | Other directorships held
by trustee |
Heidi Stam 555 East Lancaster Ave. Suite 120 Radnor, PA 19087 Age 66 | | 3 years/ 3 years | | Trustee | | Managing Director and General Counsel, The Vanguard Group, Inc. (2005—2016) (Retired) | | 1 | | Bridge Builder Trust (since 2022), Edward Jones Money Market Fund (since 2022) Investor Advisory Committee, U.S. Securities and Exchange Commission (2017—2021); National Adjudicatory Council, FINRA (2017—2021) |
| (1) | Each Trustee is elected to serve a three-year term concurrent with the class of Trustees to which he or she belongs. Mr. Ferguson and Ms. Stam, as Class I Trustees, are currently serving a term expiring at the Trust’s 2023 annual meeting of shareholders. Mr. Nakahara, as Class II Trustee, is currently serving a term expiring at the Trust’s 2024 annual meeting of shareholders. Ms. Greis, as Class III Trustee, is currently serving a term expiring at the Trust’s 2025 annual meeting of shareholders. Mr. Bartholdson has informed the Board that he intends to retire from the Board upon the conclusion of his term and, therefore, will not stand for re‑election at the 2025 annual meeting of shareholders. |
| (2) | Mr. Ferguson is deemed to be an interested person of the Trust as defined in the Investment Company Act of 1940 (the “1940 ACT”), as amended, due to his previous position with the Adviser, and his engagement as an external consultant to the Adviser, which began on January 1, 2022. |
Officers
The Officers of the CBRE Global Real Estate Income Fund and their principal occupations during the past five years:
| | | | |
| Name, Address, Age and Position(s) Held with Registrant Officers: | | Length of Time Served | | Principal Occupations During the Past Five Years and Other Affiliations |
Joseph P. Smith 555 East Lancaster Ave, Suite 120 Radnor, PA 19087 Age: 55 President and Chief Executive Officer | | Since 20221 | | Chief Investment Officer (since 2021) and Co‑Chief Investment Officer (since 2011) of CBRE Investment Management Listed Real Assets LLC (formerly CBRE Clarion Securities LLC) |
Jonathan A. Blome 555 East Lancaster Ave, Suite 120
Radnor, PA 19087 Age: 46 Chief Financial Officer | | since 2006 | | Chief Operating Officer (since 2021) and Chief Financial Officer and Director of Operations (since 2011) of CBRE Investment Management Listed Real Assets LLC (formerly CBRE Clarion Securities LLC) |
Jeff Chang 555 East Lancaster Ave, Suite 120 Radnor, PA 19087 Age: 49 Chief Compliance Officer and Secretary | | since 20232 | | Chief Compliance Officer of CBRE Investment Management Listed Real Assets LLC (since 2023); Chief Compliance Officer of First Quadrant, LP (2012—2022) |
| 1 | Effective January 1, 2022, Mr. Smith assumed responsibilities as the President and Chief Executive Officer of the Trust; he maintains his role as Portfolio Manager of the Trust. |
| 2 | Effective January 1, 2023, Mr. Chang assumed responsibilities as the Chief Compliance Officer and Secretary of the Trust. |
| | | | | | |
| Semiannual Report 2023 CBRE Global Real Estate Income Fund | | Confidential & Proprietary | | | 33 | |
Supplemental Information (unaudited) continued
Additional Information
Statement of Additional Information includes additional information regarding the Trustees. This information is available upon request, without charge, by calling the following toll-free telephone number: 1‑888‑711‑4272.
The Trust has delegated the voting of the Trust’s voting securities to the Trust’s Adviser pursuant to the proxy voting policies and procedures of the Adviser. You may obtain a copy of these policies and procedures by calling 1‑888‑711‑4272. The policies may also be found on the website of the SEC (http://www.sec.gov).
Information regarding how the Trust voted proxies for portfolio securities, if applicable, during the most recent 12‑month period ended December 31, is also available, without charge and upon request by calling the Trust at 1‑888‑711‑4272 or by accessing the Trust’s Form N‑PX on the Commission’s website at http://www.sec.gov.
The Trust files its complete schedule of portfolio holdings with the SEC for the first and third quarters of each fiscal year on Form N‑PORT. Copies of the filings are available by visiting the SEC website at www.sec.gov. The filed forms may also be viewed and copied at the Commission’s Public Reference Room in Washington, DC. Information regarding the operations of the Public Reference Room may be obtained by calling (800) SEC‑0330.
Beginning on January 1, 2022, as permitted by regulations adopted by the Securities and Exchange Commission, paper copies of the Trust’s shareholder reports like this one will no longer be sent by mail, unless you specifically request paper copies. Instead, the reports will be made available on a website, and you will be notified by mail each time a report is posted and provided with a website link to access the report.
You may elect to receive all future reports in paper free of charge. If you hold your shares through a financial intermediary (like a broker), you can inform the intermediary that you wish to continue receiving paper copies of your shareholder reports. If you are the registered owner of your shares, you should contact the Trust’s transfer agent.
Dividend Reinvestment Plan (unaudited)
Pursuant to the Trust’s Dividend Reinvestment Plan (the “Plan”), shareholders of the Trust are automatically enrolled, to have all distributions of dividends and capital gains reinvested by Computershare Trust Company, N.A. (the “Plan Agent”) in the Trust’s shares pursuant to the Plan. You may elect not to participate in the Plan and to receive all dividends in cash by sending written instructions or by contacting Computershare Trust Company, N.A., as dividend disbursing agent, at the address set forth below. Participation in the Plan is completely voluntary and may be terminated or resumed at any time without penalty by contacting the Plan Agent before the dividend record date; otherwise such termination or resumption will be effective with respect to any subsequently declared dividend or other distribution. Shareholders who do not participate in the Plan will receive all distributions in cash paid by check and mailed directly to the shareholders of record (or if the shares are held in street or other nominee name, then to the nominee) by the Plan Agent, which serves as agent for the shareholders in administering the Plan.
After the Trust declares a dividend or determines to make a capital gain distribution, the Plan Agent will acquire shares for the participants’ account, depending upon the circumstances described below, either (i) through receipt of unissued but authorized shares from the Trust (“newly issued shares”) or (ii) by open market purchases. If, on the dividend payment date, the NAV is equal to or less than the market price per share plus estimated per share fees, which include any applicable brokerage commissions the Plan Agent is required to pay, (such condition being referred to herein as “market premium”), the Plan Agent will invest the dividend amount in newly issued shares on behalf of the participants. The number of newly issued shares to be credited to each participant’s account will be determined by dividing the dollar amount of the dividend by the NAV on the date the shares are issued. However, if the NAV is less than 95% of the market price on the payment date, the dollar amount of the dividend will be divided by 95% of the market price on the payment date. If, on the dividend payment date, the NAV is greater than the market value per share plus estimated per share fees (such condition being referred to herein as “market discount”), the Plan Agent will invest the dividend amount in shares acquired on behalf of the participants in open-market purchases.
The Plan Agent’s fees for the handling of the reinvestment of dividends and distributions will be paid by the Trust. However, each participant will pay per share fees (currently $0.03 per share) a pro rata share of brokerage commissions incurred with
| | | | | | |
| Semiannual Report 2023 CBRE Global Real Estate Income Fund | | Confidential & Proprietary | | | 34 | |
Supplemental Information (unaudited) concluded
respect to the Plan Agent’s open market purchases in connection with the reinvestment of dividends and distributions. Per share fees include any applicable brokerage commissions the Plan Agent is required to pay. The automatic reinvestment of dividends and distributions will not relieve participants of any Federal income tax that may be payable on such dividends or distributions.
The Trust reserves the right to amend or terminate the Plan. There is no direct service charge to participants in the Plan; however, the Trust reserves the right to amend the Plan to include a service charge payable by the participants. Participants that request a sale of shares through the Plan Agent are subject to a $2.50 sales fee and a $0.15 per share fee. Per share fees include any applicable brokerage commissions the Plan Agent is required to pay. All correspondence concerning the Plan should be directed to the Plan Agent at Computershare Trust Company, N.A., P.O. Box 43006, Providence, RI 02940-3006, Phone Number: (866) 221‑1580, Website: www.computershare.com/investor.
| | | | | | |
| Semiannual Report 2023 CBRE Global Real Estate Income Fund | | Confidential & Proprietary | | | 35 | |
Administration
Board of Trustees
T. Ritson Ferguson
Asuka Nakahara
John R. Bartholdson
Leslie E. Greis
Heidi Stam
Officers
Joseph P. Smith – President and Chief Executive Officer
Jonathan A. Blome – Chief Financial Officer
Jeff Chang – Chief Compliance Officer and Secretary
Investment Adviser
CBRE Investment Management Listed Real Assets LLC
555 East Lancaster Ave, Suite 120
Radnor, PA 19087
888‑711‑4272
Administrator and Custodian
The Bank of New York Mellon
New York, New York
Transfer Agent
Computershare
Canton,
Massachusetts
Legal Counsel
Morgan, Lewis & Bockius LLP
Washington, DC
Independent Registered Public Accounting Firm
KPMG LLP
Philadelphia, Pennsylvania
| | | | | | |
| Semiannual Report 2023 CBRE Global Real Estate Income Fund | | Confidential & Proprietary | | | 36 | |