Filed by Gas Natural SDG, S.A. pursuant to
Rule 425 of the Securities Act of 1933
Subject Company: Endesa, S.A.
Commission File No.: 333-07654
This communication is not an offering document and does not constitute an offer to sell or the solicitation of an offer to buy any securities or a solicitation of any vote or approval. The exchange offer will commence only (1) following approval of a final offer document by the SpanishComisión Nacional del Mercado de Valores (CNMV) and publication thereof and (2) on or after the date on which Gas Natural SDG, S.A. (Gas Natural) files a Registration Statement on Form F-4 with the U.S. Securities and Exchange Commission (SEC) relating to the exchange offer.
Investors in ordinary shares of Endesa, S.A. (Endesa) should not subscribe for any securities referred to herein except on the basis of the final approved and published offer document that will contain information equivalent to that of a prospectus pursuant to Directive 2003/71/EC and Regulation (EC) No. 809/2004. Investors and security holders may obtain a free copy of such final offer document (once it is approved and published) at the registered offices of Gas Natural, Endesa, the CNMV or the Spanish Stock Exchanges.
Investors in American Depositary Shares of Endesa and U.S. holders of ordinary shares of Endesa are urged to read the U.S. prospectus and tender offer statement regarding the exchange offer, when it becomes available, because it will contain important information. The U.S. prospectus and tender offer statement will be filed with the SEC as part of its Registration Statement on Form F-4. Investors and security holders may obtain a free copy of the U.S. prospectus and tender offer statement (when available) and other documents filed by Gas Natural with the SEC at the SEC’s website at www.sec.gov. A free copy of the U.S. prospectus and tender offer statement (when available) may also be obtained for free from Gas Natural.
These materials may contain forward-looking statements based on management’s current expectations or beliefs. These forward-looking statements may relate to, among other things:
| • | management strategies; |
| • | synergies and cost savings; |
| • | integration of the businesses; |
| • | market position; |
| • | expected gas and electricity mix and volume increases; |
| • | planned asset disposals and capital expenditures; |
| • | net debt levels and EBITDA and earnings per share growth; |
| • | dividend policy; and |
| • | timing and benefits of the offer and the combined company. |
These forward-looking statements are subject to a number of factors and uncertainties that could cause actual results to differ materially from those described in the forwarding-looking statements, including, but not limited to, changes in regulation, the natural gas and electricity industries and economic conditions; the ability to integrate the businesses; obtaining any applicable governmental approvals and complying with any conditions related thereto; costs relating to the offer and the integration; litigation; and the effects of competition.
Forward-looking statements may be identified by words such as “believes,” “expects,” “anticipates,” “projects,” “intends,” “should,” “seeks,” “estimates,” “future” or similar expressions.
These statements reflect our current expectations. In light of the many risks and uncertainties surrounding these industries and the offer, you should understand that we cannot assure you that the forward-looking statements contained in these materials will be realized. You are cautioned not to put undue reliance on any forward-looking information.
This communication is not for publication, release or distribution in or into or from Australia, Canada or Japan or any other jurisdiction where it would otherwise be prohibited.
* * *
The following is a press release issued by Gas Natural SDG, S.A. in connection with the offer by Gas Natural SDG for 100% of the share capital of Endesa.
Communications Department |  | |||
 |  | |||
2005 THIRD QUARTER PERFORMANCE RESULTS | ||||
NET PROFITS OF THE GAS NATURAL GROUP GREW 17.1% TO 528.9 MILLION EUROS | ||||
• Consolidated EBITDA rose 18.3% during the third quarter, putting annual EBITDA at 1,120,800,000 euros, 12.9% more than in 2004. | ||||
• Gas distribution activity in Spain represented 52% of total EBITDA, with 583.3 million euros, a 7.6% increase, and in Latin America, EBITDA grew by 35.6% to a total of 219.9 million euros. | ||||
• Gas Natural’s gas distribution customers totaled 10 million in Spain, Italy and Latin America. | ||||
• Electricity activities in Spain reflected an EBITDA of 76.8 million euros, indicating that performance results have doubled over the same period the prior year. | ||||
• Electrical power generated by the Group in Spain totaled 6,712 GWh, 61.3% higher than the same period in 2004, which permitted it to increase its regular system generation market share up to 4.1%. | ||||
• Material investment through September rose to 769.6 million euros, a 23.4% increase, owing to investment momentum in electricity generation in Spain. | ||||
Consolidatednet profits of the Gas Natural Group totaled 528.9 million euros through September, representing a 17.1% increase over the prior year. | ||||
| ||||
Net business turnover for the period of January-September 2005 totaled 5,782,500,000 euros, an increase of 30.4% over the same period in 2004, basically due to the growth in business activity of the Gas Natural Group, and in particular, to increased gas supply due to greater consumption compared to last year, and the high prices of natural gas, electricity operations in Spain and business momentum in Latin America. | ||||
CumulativeEBITDA through September of the Gas Natural Group totaled 1,120 million euros, an increase of 12.9% from the same period last year. | ||||
Gas distribution in the aggregate (Spain, Latin America and Italy) represented 73.3% of total EBITDA. The largest contribution corresponded to gas distribution in Spain, which was 52%. The electricity business in Spain has also boosted these results, as well as upstream and midstream operations, which represented 11.2% of the Group’s EBITDA. | ||||
Net financial debt at September 30, 2005, was 3,245 million euros, a 23% increase. This increase is due principally to acquisitions in the second quarter of the prior fiscal year (additional interests in CEG and CEG RIO, the Smedigas Group and Nettis in Italy, and windpower companies), as well as the acquisition last April of the windpower company DERSA, and the inclusion of its debt to that of the Group. | ||||
Theborrowing ratio was 37.8% as opposed to 35.7% at the close of the 2004 fiscal year. | ||||
Investments by the Gas Natural Group from January to September totaled 1,089.8 million euros, of which 769.6 million were designated formaterial investments, an increase of 23.4%, basically for the continued development of Gas Natural’s combined cycle electricity generation plans in Spain. | ||||
Distribution in Spain
The EBITDA of gas distribution operations in Spain was 583.3 million euros, 7.6% increase, in line with the increase of regulated compensation for fiscal year 2005.
Sales from regulated gas operations in Spain, which consolidates gas distribution and marketing at tariff rates and third party network access services (ATR), totaled 186,046 GWh, an increase of 13.8% over the prior year.
Distribution services for third party network access (ATR) increased by 18.6%, to 149,212 GWh, of which 68,347 GWh related to services performed for third parties, and the remaining 80,865 GWh to the Gas Natural Group, as the principal operator also in the liberalized market.
Thedistribution network grew more than 2,500 kilometers in the last 12 months, for a total of 39,146 kilometers at September 30, 2005, reflecting a year over year increase of 6.9%.
The Group maintains high growth rates for the number of customers,with an increase of 319,000 on a year to year basis. At September 30, 2005,gas distribution customers in Spain reached 5,033,000, a 6.8% increase.
Distribution in Latin America
The EBITDA for gas distribution in Latin America was 219.9 million euros, representing a 35.6% increase with respect to the prior year.
In comparing these results with those of the prior year, it should be noted that the variation in the consolidation method in Brazil represents a contribution to EBITDA of 25.8 million euros for 2004, and that the impact of conversion to euros of the different currencies of the financial statements of the Latin American countries meant an increase in EBITDA of approximately 9.9 million euros from the year before.
Without taking the above into account, EBITDA grew by 13.6% as a result of increased contribution of the gas distribution business in Mexico, Colombia and Brazil. Furthermore, during the second quarter of 2004, rate adjustments were reported in Colombia and Mexico which are having a positive effect on the contributions made by these countries to the 2005 performance results.
Gas activity sales in Latin America, which consolidate sales of gas and third party network access services (ATR), were 121,972 GWh, an increase of 6.5% over the prior year.
Third quarter gas sales in Argentina, Brazil and Colombia rose about 15%, which helped to push growth to 6.5%. The automotive market continues to strengthen, with a median increase of 16.8%.
Sales of third party network access services (ATR) grew by 6.6%, principally due to larger sales to other distributors and large customers in the case of Argentina.
The distribution network expanded by 2,195 kilometersin the last 12 months, and totaled55,868 kilometers at September 30, 2005, a figure that reflects year to year growth of 4.1%.
The number of gas distribution customers totaled 4,690,000 at September 30, 2005. The Group maintains elevated growth rates, with an increase of 255,000 customers
in the last 12 months, consistent with the strategic goal of increasing customer base in Latin America by more than 1.6 million in the 2004-2008 period.
Principal statistics by country
| Argentina | Brazil | Colombia | Mexico | Total | ||||||
Gas activity sales (GWh): | 52,098 | 30,981 | 8,184 | 30,709 | 121,972 | |||||
Increase vs. 9M 04 (%) | 6.8 | 12.9 | 15.0 | -1.4 | 6.5 | |||||
Distribution network (Km at 09/30) | 21,161 | 4,723 | 15,176 | 14,808 | 55,868 | |||||
Increase vs. 09/30/04 (Km) | 369 | 628 | 774 | 424 | 2,195 | |||||
Customers, in thousands (at 09/30) | 1,282 | 725 | 1,580 | 1,103 | 4,690 | |||||
Increase vs. 09/30/04, in thousands | 31 | 46 | 111 | 66 | 254 | |||||
Argentinastrengthened its business revitalization, with a new increase in customers and a strong recovery of residential consumption, which rose 24.4%. In the large customer market, the shifting of customers to ATR service held steady, which grew 22% due to the process of unbundling of activities, without affecting the economic outcome of the distribution business.
Sales of gas inBrazil rose by 12.9% with substantial increases in all its markets, among which the revival of the electricity generation market in the State of Rio de Janeiro is particularly notable, with six plants, as well as the strong momentum in the automotive market. Moreover, strong commercial efforts are being maintained, which resulted in 725,000 customers, with higher growth after the Group launched its activities in Brazil.
InColombia, the Group held on to the strong growth rate with double digit figures, benefited by the country’s economic revitalization. Number of customers increased by 7.6%, despite an average penetration exceeding 85% in distribution areas.
Mexicoexperienced a slight recovery and reported a downturn of 1.4% during the first nine months of the year, affected by lower ATR service to combined cycle plants, as well as a decrease in residential sales, following the rise in the cost of gas to the end user.
Distribution in Italy
EBITDA of gas distribution operations in Italy was 18.5 millioneuros, 1.7% of the Group’s total consolidated EBITDA. These figures show the Group’s business strength in this country.
The Gas distribution business in Italy totaled 1,927 GWh, with a notable increase from the same period last year, thanks to the consolidation of operations in Italy following the acquisition of the Smedigas Group and the Nettis Group in second quarter of 2004.
Electricity in Spain
This activity includes electricity generation in Spain using the combined cycle, wind power farms and cogeneration, trading for electricity purchases from the market wholesaler and the marketing of electricity in the liberalized Spanish market.
Electricity generation continues to be favorable due to elevated pool pricing, which remained at high levels in the third quarter, while the electricity marketing activity in the liberalized market continued to be burdened by high prices in the third quarter, higher than in other periods, having to compete with the slightly lower benchmark rate.
The combination of these factorsboosted EBITDA to 76.8 million euros in the first nine months of 2005, doubling the figures from the same period last year.
Generated power, which was principally sold to the market wholesaler in 2005, totaled 6,712 GWh, a 61.3% increase from the prior year.
Combined cycle electricity generation rose to 6,279 GWh. This generated energy measured in plant bars represented a coverage rate of 119% for electricity marketed by the Group. The share held by the Gas Natural Group in the regular system electricity generation market was placed at 4.1% in the first nine months of the year.
Electricity marketing sales rose 55.1% with respect to the same period last year. The biggest increase in electricity sales involved the residential customer portfolio, which has more than 475,000 customers. The Group’s share in the liberalized electricity market through September 2005 was approximately 7.4%.
Puerto Rico Electricity
The EBITDA of the Group’s activities in Puerto Rico totaled 56.2 million dollars, in local currency, 11.1% more than in the same period in the prior year.
The power generated by EcoEléctrica was 2,278GWh (the power attributable to the Group was 1,139 GWh), with a load factor greater than 68%, a notable improvement over the 66% recorded in the same period in 2004.
Gas supply:up+midstream
This activity includes the execution of GNL integrated projects, management of ocean transport and operation of the Magreb-Europe gas pipeline.
The EBITDA in the first nine months of the year was 125 million euros, a 5.3% increase from the prior year, despite reduced use of the fleet of methane transport ships (76% as opposed to 91% in the same period last year), which, in part, offset the increased economic contribution of the Magreb-Europe gas pipeline, due to larger volumes transported as a result of the recent increase in capacity, and which, in turn, was hurt by an adverse average dollar/euro exchange rate.
The gas transport business carried out in Morocco, through the EMPL and Metragaz companies, represented a total volume of 105,816 GWh, 27.8% more than last year, a result of the gas pipeline capacity increase, in operation since February of this year. Of total volume, 82,729 GWh were transported for Gas Natural, through the company Sagane, and 23,087 GWh for the Portuguese company Transgas.
Gas supply: wholesale and retail
This business consolidates the activities of gas provisioning and marketing both in Spain and abroad, and the marketing of other products and services related to retail commerce in Spain.
The EBITDA of this activity in the first nine months of the year was 38.1 million euros, compared to 65.8 million in the same period last year, and demonstrates a clear recovery in both the second and third quarters, with 24.5% growth between July and September. This activity was affected in the first quarter of 2005 by the substantial increase in gas demand in Spain during the period (exceeding 20%), due to the severe spring weather, which involved the purchase of additional gas with spot purchases in a context of higher gas prices worldwide.
The total provisioning and marketing by the Gas Natural Group grew 7.4% for a total of 223,557 GWh, of which 193,919 GWh were earmarked for the Spanish market (+9.4%) and the remaining 29,638 GWh for international markets (-3.6%).
The provisioning of gas to the regulated market (relating to the supply to Enagas which, together with the management of inventory, is intended for gas distribution companies, companies of the Gas Natural Group as well as third parties) totaled 44,288 GWh, a 0.8% increase, despite the opening up of the market and due basically to the use of the regulated market as a refuge by certain thermal plants and industrial customers that have left the liberalized market.
Sales in the liberalized market were 149,631 GWh, an increase of 12.2%. Of these sales, the Gas Natural Group marketed 115,738 GWh to end customers, which were primarily intended for the industrial market (66%), combined cycle supply (26%) and the residential market (8%). The provisioning to the liberalized market other gas marketers in the first nine months of 2005 totaled 33,893 GWh, a rise of 2.9%, and primarily involved the supply of gas under medium and long term contracts.
The provision of gas abroad fell by 3.6%, despite the strong momentum recorded by gas marketing activity in Europe. This drop is due to the lack of spot transactions in 2005, since, during the spring months, quantities of gas could not be slated for this market due to the necessities of the Spanish market.
Regarding the Group’s multiproduct business, between January and September 2005, close to 110,000 gas maintenance contracts were added, and thus contracts in effect at September 30, 2005 exceeded 1,265,000.
Likewise, the Group had 114 centers licensed and one center owned by it, to which 760 affiliated centers must be added, indicating a powerful single commercial network in Spain.
Product and service contracts in addition to gas sales, including financial services and electricity sales, exceeded 2,180,000, with an increase of 34.3% for contracts in effect at September 30, 2004, which puts theratio of contracts per customer in Spain at 1.46, consistent with the strategic goal of having two contracts per customer in 2008.
Similarly, the commercial activity helped boost the number of homes heated by gas by 20,500 and sales of appliances by 39,600, including more than 11,800 air conditioner installations.
Barcelona, November 3, 2005.
Consolidated third quarter income statement
(figures not audited)
| (€ millions) | 9M05 | 9M04 | ||
Net business turnover | 5.782,5 | 4.434,6 | ||
Other revenue | 60,0 | 46,2 | ||
Provisioning | -4.017,2 | -2.931,9 | ||
Employee expenses, net | -187,5 | -153,3 | ||
Other expenditures | -517,0 | -403,0 | ||
EBITDA | 1.120,8 | 992,6 | ||
Amortization allowance | -378,3 | -323,4 | ||
Reserves allowance | -20,4 | -16,9 | ||
OPERATING PROFITS | 722,1 | 652,3 | ||
Financial income, net | -165,7 | -105,8 | ||
Net income, asset impairment | -0,4 | 0,0 | ||
Affiliate profit sharing | 33,0 | 48,2 | ||
Profits from sale of non current assets | 215,8 | 61,5 | ||
PROFITS BEFORE TAXES | 804,8 | 656,2 | ||
Corporation taxes | -223,5 | -169,7 | ||
Minority interests | -52,4 | -34,8 | ||
PROFITS ATTRIBUTABLE TO THE GROUP | 528,9 | 451,7 |
Consolidated Balance Sheet
(figures not audited)
| (€ millions) | 09/30/05 | 09/30/04 | ||
Non-Current Assets - | 9,819.2 | 8,585.1 | ||
Capital assets | 7,298.6 | 6,284.1 | ||
Goodwill | 452.1 | 379.8 | ||
Other intangible assets | 1,281.9 | 1,017.1 | ||
Booked investments participation method | 204.8 | 371.8 | ||
Other non current assets | 581.8 | 532.3 | ||
Current Assets - | 2,491.8 | 2,102.6 | ||
Inventories | 430.0 | 297.5 | ||
Debtors and other accounts receivable | 1,609.8 | 1,314 | ||
Other current assets | 161.1 | 87.9 | ||
Cash and equivalent liquid assets | 290.9 | 403.2 | ||
TOTAL ASSETS | 12,311.0 | 10,687.7 | ||
(figures not audited)
| (in millions of €) | 09/30/05 | 09/30/04 | ||
Total Capital - | 5,344.0 | 4,798.9 | ||
Capital attributable to parent company | 5,069.9 | 4,554.4 | ||
Minority interests | 274.1 | 244.5 | ||
Non current Liabilities - | 4,657.2 | 3,550.1 | ||
Non current financial debt | 3,000.0 | 2,078.4 | ||
Allowances | 344.1 | 252.4 | ||
Other non current liabilities | 1,313.1 | 1,219.3 | ||
Current Liabilities - | 2,309.8 | 2,338.7 | ||
Current financial debt | 535.9 | 962.9 | ||
Suppliers and other current liabilities | 1,773.9 | 1,375.8 | ||
TOTAL LIABILITIES | 12,311.0 | 10,687.7 | ||
Principal statistics
| 3T05 | 3T04 | % | 9M05 | 9M04 | % | |||||||
| 95,487 | 87,364 | 9.3 | Gas Distribution (GWh): | 309,945 | 278,705 | 11.2 | ||||||
| 53,478 | 47,898 | 11.6 | Spain: | 186,046 | 163,511 | 13.8 | ||||||
| 7,801 | 8,664 | -10.0 | Gas sales by rate | 36,834 | 37,725 | -2.4 | ||||||
| 45,677 | 39,234 | 16.4 | ATR | 149,212 | 125,786 | 18.6 | ||||||
| 41,816 | 39,302 | 6.4 | Latin America: | 121,972 | 114,492 | 6.5 | ||||||
| 28,348 | 25,118 | 12.9 | Gas sales by rate | 74,218 | 69,675 | 6.5 | ||||||
| 13,468 | 14,184 | -5.0 | ATR | 47,754 | 44,817 | 6.6 | ||||||
| 193 | 164 | 17.7 | Italy: | 1,927 | 702 | — | ||||||
| 182 | 154 | 18.2 | Gas sales by rate | 1,867 | 657 | — | ||||||
| 11 | 10 | 10.0 | ATR | 60 | 45 | 33.3 | ||||||
| 65,460 | 65,458 | — | Gas Supply (GWh): | 223,557 | 208,060 | 7.4 | ||||||
| 58,533 | 54,874 | 6.7 | Spain | 193,919 | 177,322 | 9.4 | ||||||
| 6,927 | 10,584 | -34.6 | International | 29,638 | 30,738 | -3.6 | ||||||
| 34,270 | 29,023 | 18.1 | Gas Transport – EMPL (GWh) | 105,816 | 82,801 | 27.8 | ||||||
| 1,086 | 3,495 | -68.9 | Gas Distribution Network (Km): | 98,723 | 93,733 | 5.3 | ||||||
| 620 | 679 | -8.7 | Spain | 39,146 | 36,617 | 6.9 | ||||||
| 370 | 1,120 | -67.0 | Latin America | 55,868 | 53,673 | 4.1 | ||||||
| 96 | 1,696 | -94.3 | Italy | 3,709 | 3,443 | 7.7 | ||||||
| 149 | 152 | -2.0 | Increase in gas distribution supply points, in thousands | 433 | 451 | -4.0 | ||||||
| 73 | 76 | -3.9 | Spain | 225 | 232 | -3.0 | ||||||
| 65 | 72 | -9.7 | Latin America | 185 | 211 | -12.1 | ||||||
| 11 | 4 | — | Italy | 23 | 8 | — | ||||||
| — | — | — | Gas distribution supply points, in thousands (at 09/30): | 9,998 | 9,395 | 6.4 | ||||||
| — | — | — | Spain | 5,033 | 4,714 | 6.8 | ||||||
| — | — | — | Latin America | 4,690 | 4,435 | 5.7 | ||||||
| — | — | — | Italy | 275 | 246 | 11.8 | ||||||
| — | — | — | Contracts per customer in Spain (at 09/30) | 1,46 | 1,35 | 8.1 | ||||||
| 3,067 | 1,867 | 64.3 | Electrical energy produced (GWh): | 7,851 | 5,258 | 49.3 | ||||||
| 2,655 | 1,471 | 80.5 | Spain | 6,712 | 4,160 | 61.3 | ||||||
| 412 | 396 | 4.0 | Latin America | 1,139 | 1,098 | 3.7 | ||||||
| — | 6 | — | Electricity generation capacity (MW): | 2,173 | 1,092 | — | ||||||
| — | 6 | — | Spain | 1,902 | 821 | — | ||||||
| — | — | — | Latin America | 271 | 271 | — | ||||||
| — | — | — | Employees (at 09/30) | 6,788 | 6,748 | 0.6 | ||||||
 Third Quarter 2005 Results (9M05) November 3, 2005 |
 2 This document may contain market assumptions, different sourced information and forward-looking statements with respect to the financial condition, results of operations, business, strategy and the plans of Gas Natural SDG, S.A. and its subsidiaries. Such forward-looking statements are not guarantees of future performance and involve risks and uncertainties, and actual results may differ materially from those in the forward-looking statements as a result of various factors. Analysts and investors are cautioned not to place undue reliance on forward-looking statements, which speak only as of the date of this presentation. Gas Natural SDG, S.A. undertakes no obligation to release publicly the results of any revisions to these forward-looking statements which may be made to reflect events and circumstances after the date of this presentation, including, without limitation, changes in Gas Natural’s business or acquisition strategy or to reflect the occurrence of unanticipated events. Analysts and investors are encouraged to consult the Company’s financial and other information filed by the Company with the CNMV. November 2005 GAS NATURAL |
 3 Conclusions 9M05 Results Snapshot Highlights 9M05 Results Analysis by Activity GAS NATURAL – 9M05 Results Agenda |
 4 9M05 Results Snapshot Highlights 9M05 Results Analysis by Activity Conclusions GAS NATURAL – 9M05 Results Considerations regarding the EU dimension of the Tender Offer for Endesa |
 5 Moving towards a more solid and flexible Group, in line with Strategic Plan Improving operating business performance despite difficult market and regulatory conditions Focus on organic growth with higher investments in core businesses Developing a strong position in the Up + Midstream chain Strong franchise in gas distribution Adapting supply conditions to a more volatile environment Allow significant EBITDA recovery throughout the year Gassi Touil + Gassi Chergui Agreement with Repsol YPF on Up + Midstream Gassi Touil + Repsol YPF set the basis of future opportunities in this area +18% in gas distribution (Spain + LatAm) +39% in electricity generation in Spain Underpin GAS NATURAL’s high growth potential GAS NATURAL – 9M05 Results Highlights (I) |
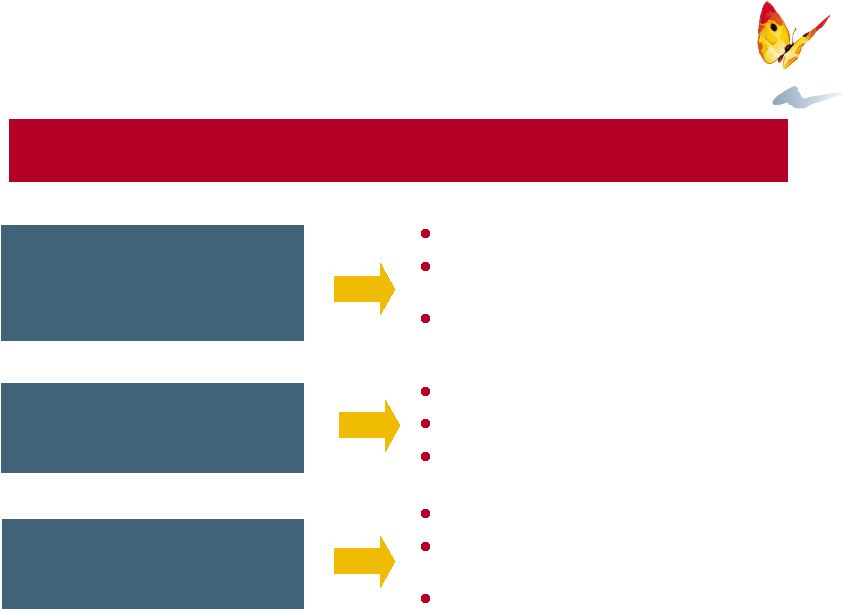
 6 EBITDA + 12.9% Consolidating overall performance… 992.6 1,120.8 9M04 9M05 Net Income + 17.1% 451.7 528.9 9M04 9M05 ( million) GAS NATURAL – 9M05 Results Highlights (II) |
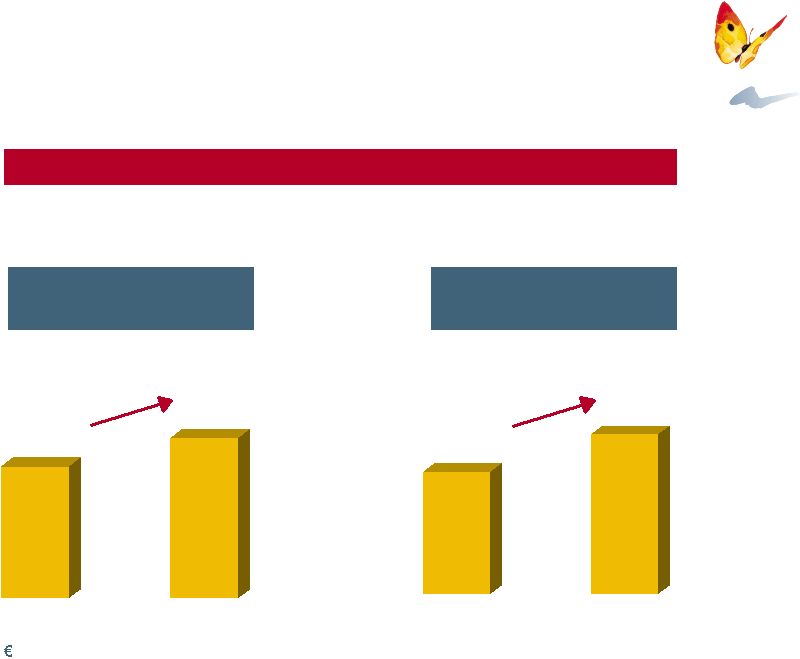
 7 … backed by consistent organic growth from all lines of business… 542.1 583.3 9M04 9M05 31.4 76.8 9M04 9M05 162.2 219.9 9M04 9M05 EBITDA Distribution Spain EBITDA Electricity Spain EBITDA Distribution LatAm + 7.6% + 144.6% + 35.6% GAS NATURAL – 9M05 Results Highlights (III) |
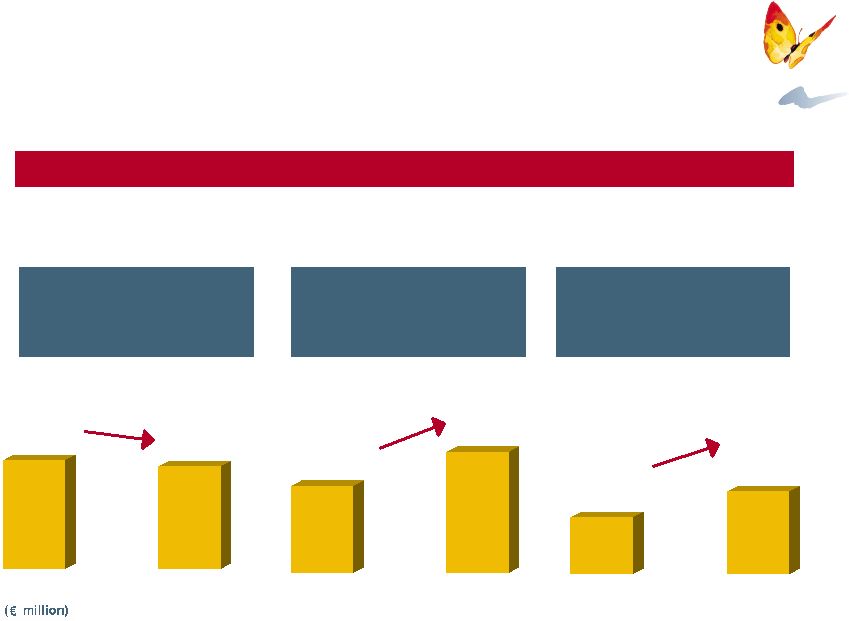 8 … and supported by focused investment (1) in core business - 5.9% + 39.1% + 45.2% 82.1 119.2 252.8 351.6 223.4 9M04 9M05 9M05 9M04 9M05 9M04 GAS NATURAL – 9M05 Results Highlights (IV) Distribution Spain (28.0% of total) Electricity Spain (44.1% of total) Distribution LatAm (14.9% of total) 237.3 (1) Tangible & Intangible |
 9 Conclusions 9M05 Results Snapshot Highlights 9M05 Results Analysis by Activity GAS NATURAL – 9M05 Results Considerations regarding the EU dimension of the Tender Offer for Endesa |
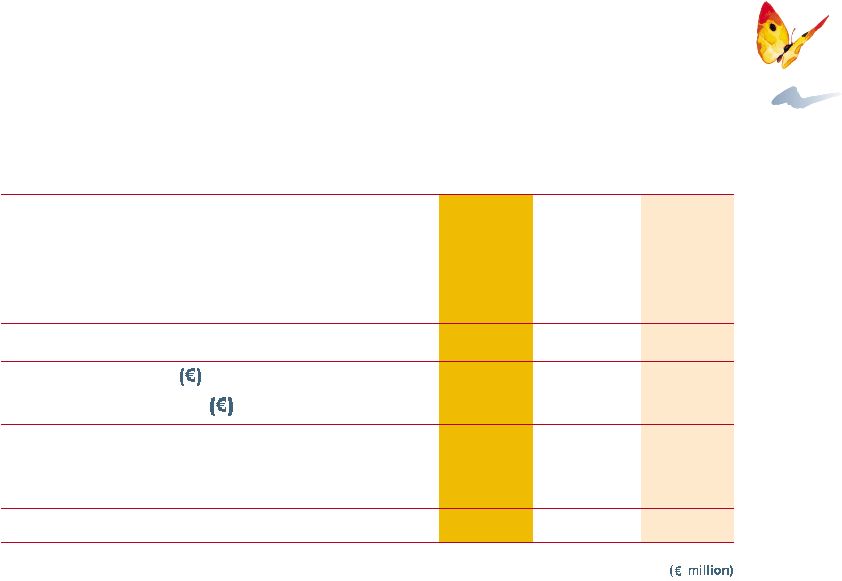 10 9M05 Net Sales EBITDA Operating Income Net Income Average no. of Shares (million) EBITDA per Share Net Income per Share Investments: Tangible & Intangible Financial & Other Net Debt (as of 30/09) 5,782.5 1,120.8 722.1 528.9 447.8 2.5 1.2 1,089.8 798.0 291.8 3,245.1 9M04 4,434.6 992.6 652.3 451.7 447.8 2.2 1.0 1,138.0 654.8 483.2 2,638.1 30.4 12.9 10.7 17.1 - 12.9 17.1 -4.2 21.9 -39.6 23.0 Change (%) 9M05 Results Snapshot Main Aggregates |
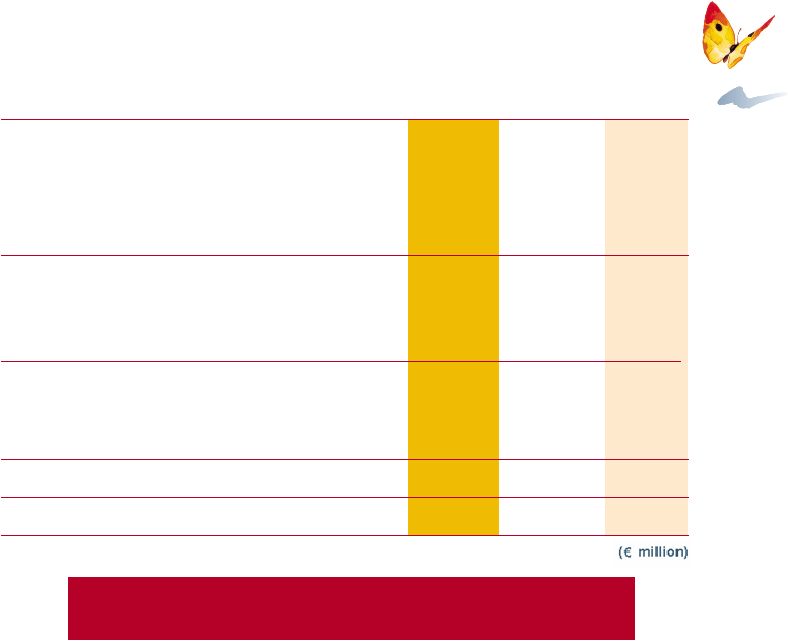
 11 9M05 Net Sales Purchases Gross Margin Personnel, net Other Expenses, net EBITDA Depreciation Provisions Operating Income Financial Results, net Net Lost from Assets Deterioration Equity Income Capital Gains Income Before Tax Taxes Minority Interest Net Income 5,782.5 -4,017.2 1,765.3 -187.5 -457.0 1,120.8 -378.3 -20.4 722.1 -165.7 -0.4 33.0 215.8 804.8 -223.5 -52.4 528.9 9M04 4,434.6 -2,931.9 1,502.7 -153.3 -356.8 992.6 -323.4 -16.9 652.3 -105.8 0.0 48.2 61.5 656.2 -169.7 -34.8 451.7 9M05 Results Snapshot Income Statement |
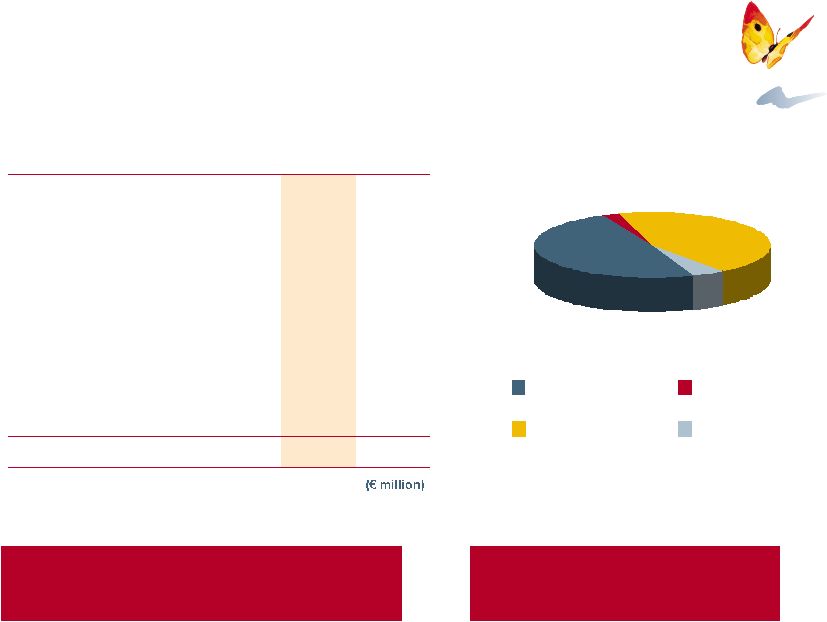
 12 9M04 Gas Distribution: Spain LatAm Italy Electricity: Spain Puerto Rico Gas Supply: Up + Midstream Wholesale & Retail Other Total EBITDA 719.0 542.1 162.2 14.7 72.6 31.4 41.2 184.5 118.7 65.8 16.5 992.6 9M05 821.7 583.3 219.9 18.5 121.3 76.8 44.5 163.1 125.0 38.1 14.7 1,120.8 14.3 7.6 35.6 25.9 67.1 144.6 8.0 -11.6 5.3 -42.1 -10.9 12.9 % Gas Distribution: 73.3% of total EBITDA and growing 14.3% vs. 9M04 9M05 Results Snapshot EBITDA Breakdown |
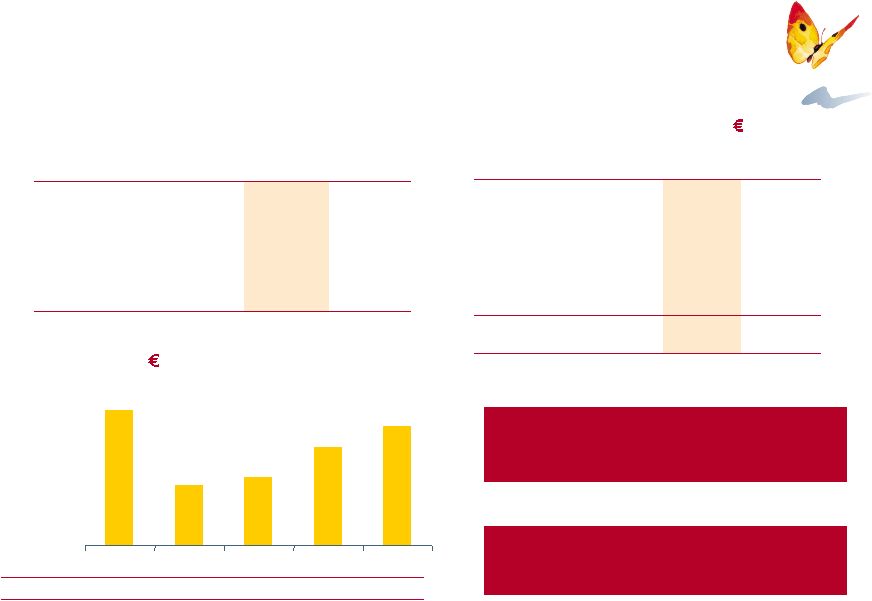
 13 By Activity Investments set basis for future profits growth Investments (Tangible & Intangible) 9M05 9M04 Distribution Spain Distribution LatAm Distribution Italy Electricity Spain Electricity Puerto Rico Up + Midstream Wholesale & Retail Other Total 223.4 119.2 46.2 351.6 3.5 8.4 8.0 37.7 798.0 237.3 82.1 8.9 252.8 6.2 29.2 4.8 33.5 654.8 84% of Investments in Euro 49% 2% 44% 5% Distribution Gas Electricity Others 9M05 Results Snapshot Investments |
 14 Leverage 49.0% 28.0% 29.3% 35.7% 37.8% 30/09/05 31/12/04 Leverage 37.8% 35.7% EBITDA/Net Interest 6.8x 8.7x Net Debt/EBITDA 2.2x 2.0x Financial Ratios Net Debt ( million) & Leverage (1) Debt Facilities as of September 30, 2005 ( million) Lines of Credit Loans Capital Markets Cash Placements Total 298 2,582 656 - 3,536 860 - 2,375 291 3,526 Drawn Undrawn (1) 2004 and 9M05 figures under IFRS 9M05 Results Snapshot Capital Structure Flexibility to pursue envisaged strategic growth In line with “A” long term rating target 3,677 1,627 1,869 2,663 3,245 2001 2002 2003 2004 9M05 |
 15 50% 25% 1% 11% 11% 2% Breakdown by Currency 57% 43% Fixed vs Floating Rate Fixed Floating EUR USD BRL COP MXN USD-Argentina 475 421 379 273 2005 2006 2007 2008 Post 2008 Rest 56% of Total Debt Repayment Schedule ( million) Total Gross Debt: 3,536 million 9M05 Results Snapshot Debt Structure |
 16 Conclusions 9M05 Results Snapshot Highlights 9M05 Results Analysis by Activity GAS NATURAL – 9M05 Results Considerations regarding the EU dimension of the Tender Offer for Endesa |
 17 Spain and Puerto Rico Spain, LatAm and Italy Developing Electricity Business Integrated Global Energy Company Availability of Equity Gas Leadership in Gas Distribution Flexible and Well Diversified Gas Supply Leadership in Multiproduct Offer in Spain Customer Orientation 9M05 Results Analysis by Activity Our Commitment (2004-2008) |
 18 Leadership in Gas Distribution Spain, LatAm and Italy Integrated Global Energy Company Availability of Equity Gas Flexible and Well Diversified Gas Supply Developing Electricity Business Spain and Puerto Rico Leadership in Multiproduct Offer in Spain Customer Orientation 9M05 Results Analysis by Activity Our Commitment (2004-2008) – Gas Supply |
 19 EBITDA: 125.0 million, +5.3% Lower use of fleet (76% vs 91% in 9M04) Startup of Gassi Touil LNG integrated project Considering potential participation in other midstream and upstream projects with Repsol-YPF 9M05 Results Analysis by Activity Gas Supply – Up + Midstream Establishment of Repsol-Gas Natural LNG, S.L. 61,651 82,729 21,150 26,356 Portugal Spain Transportation through EMPL (GWh) 82,801 109,085 31.7% The key step to the fulfillment of objective in Midstream 9M04 9M05 |
 20 177,322 25,652 5,086 193,919 21,201 8,437 Reshaping the procurement and customer portfolios 9M05 9M04 43,957 100,428 32,937 44,288 115,738 33,893 177,322 193,919 9.4% 15.2% 2.9% Regulated market Ex-ship Liberalized market 0.8% 208,060 223,557 7.4% -17.4% 65.9% 9M05 9M04 Spain Europe USA 9.4% 9M05 Results Analysis by Activity Gas Supply – Wholesale & Retail Spain (GWh) Total (GWh) October price review recognises CMP extra cost for 2005 |
 21 Leadership in Gas Distribution Spain, LatAm and Italy Integrated Global Energy Company Availability of Equity Gas Flexible and Well Diversified Gas Supply Developing Electricity Business Spain and Puerto Rico Leadership in Multiproduct Offer in Spain Customer Orientation 9M05 Results Analysis by Activity Our Commitment (2004-2008) – Gas Distribution |
 22 4,714 5,033 30/09/2004 30/09/2005 Connections (thousands) Non-tariff market: 84% vs. 80% in 9M04 TPA: +18.6% Regulated sales fell less than expected due to the higher than usual sales to conventional thermal generation Growth in connections and distribution network in accordance with Plan as well as with the parameters for the year’s Regulated Remuneration +6.9% 36,617 39,146 Network (km) 37,725 125,786 36,834 149,212 9M04 9M05 Tariff Sales TPA 163,511 186,046 13.8% -2.4% 18.6% +6.8% +319 9M05 Results Analysis by Activity Gas Distribution in Spain Operating Figures Sales (GWh) |
 23 1,251 1,282 30/09/2004 30/09/2005 Connections (thousands) +1.8% 20,792 21,161 Network (km) +2.5% 13,079 4,138 5,379 26,176 13,340 3,533 5,663 29,562 48,772 52,098 6.8% 5.3% -14.6% 2.0% 12.9% 9M05 9M04 Residential/Commercial Automotion TPA Industrial EBITDA: €24.9m, -18% Lower sales to residential/industrial compensated by higher TPAs Negotiations underway for tariff increase for the year 2005, setting basis for stable tariff regime +31 9M05 Results Analysis by Activity Gas Distribution in Argentina Operating Figures Sales (GWh) |
 24 679 725 30/09/2004 30/09/2005 Connections (thousands) +15.3% 4,095 4,723 Network (km) +6.8% 1,423 13,339 7,638 5,045 1,464 14,794 8,515 6,208 EBITDA: €81.0m, +102% in Euro, partly for full consolidation of CEG and CEG Rio 5-year regulatory review completed Solid growth in every one of the market segments with successful development of automotion segment +46 Residential/Commercial Automotion Industrial Power Plants 9M05 9M04 27,445 30,981 12.9% 11.5% 23.1% 10.9% 2.9% 9M05 Results Analysis by Activity Gas Distribution in Brazil Operating Figures Sales (GWh) |
 25 1,469 1,580 30/09/2004 30/09/2005 Connections (thousands) +5.4% 14,402 15,176 Network (km) +7.6% Residential/Commercial Automotion Industrial EBITDA: €62.5m, + 37.4% Tariff review completed in 2H04 with 27% average increase in tariffs Activity growth above Plan despite high market penetration +111 9M05 9M04 3,832 2,823 463 4,067 3,249 868 7,118 8,184 15.0% 15.1% 87.4% 6.1% 9M05 Results Analysis by Activity Gas Distribution in Colombia Operating Figures Sales (GWh) |
 26 1,037 1,103 30/09/2004 30/09/2005 Connections (thousands) +2.9% 14,384 14,808 Network (km) +6.4% Industrial Residential/Commercial Automotion TPA EBITDA: €51.6m, + 11% helped by higher tariffs despite lower sales Activity stagnation due to high demand elasticity to rising gas prices and competition from substitute fuels +66 9M05 9M04 5,822 6,620 18,641 74 5,617 6,831 18,192 69 31,157 30,709 -1,4% 3.2% -3.5% -7.3% -2.4% 9M05 Results Analysis by Activity Gas Distribution in Mexico Operating Figures Sales (GWh) |
 27 246 275 30/09/2004 30/09/2005 Connections (thousands) +7.7% 3,443 3,709 Network (km) 657 45 1,867 60 9M04 9M05 Sales TPA 702 1,927 174.5% 184.2% 33.3% +11.8% EBITDA: €18.5m (+25.9%) showing consolidation of GAS NATURAL’s activity in the country Regulated tariffs subject to seasonality Leveraging on our capacity to develop the gas distribution business: + 11.8% connections and +7.7% network +29 9M05 Results Analysis by Activity Gas Distribution in Italy Operating Figures Sales (GWh) |
 28 Leadership in Gas Distribution Spain, LatAm and Italy Integrated Global Energy Company Availability of Equity Gas Flexible and Well Diversified Gas Supply Developing Electricity Business Spain and Puerto Rico Leadership in Multiproduct Offer in Spain Customer Orientation 9M05 Results Analysis by Activity Our Commitment (2004-2008) – Electricity |
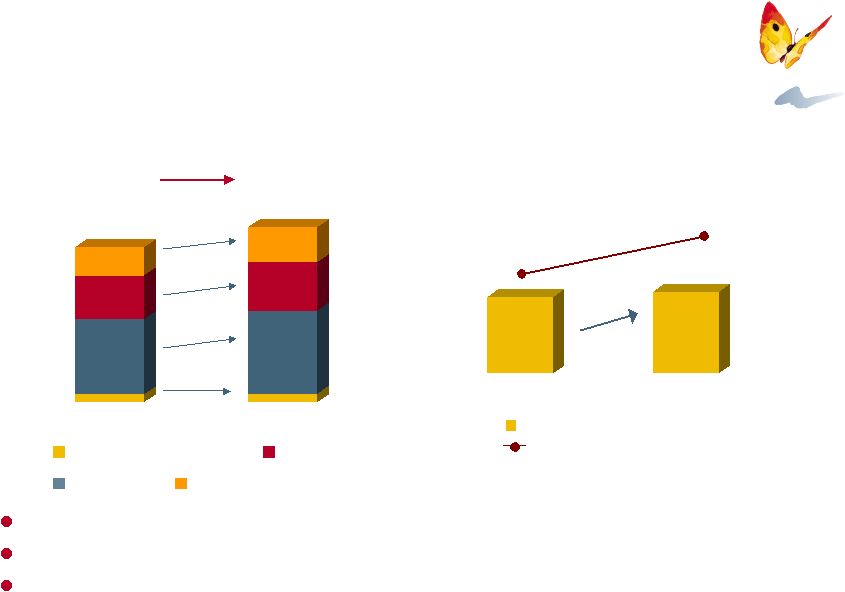
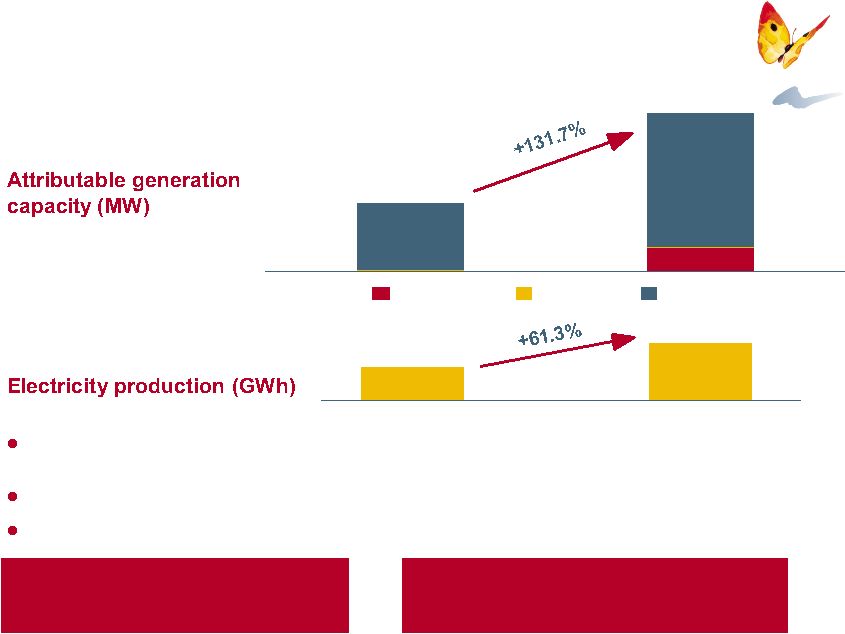 29 4,160 6,712 4.1% market share in electricity generation Inconsistency in regulatory regime: shortfall not accounted 30/09/04 30/09/05 Wind Cogen CCGT 800 1,600 21 23 279 821 1,902 CCGTs: Cartagena (1,200 MW) synchronised to the grid and Plana del Vent (800 MW) in progress 119% coverage of supply in 9M05 EBITDA: €76.8 +144.6% 9M04 9M05 9M05 Results Analysis by Activity Electricity in Spain |
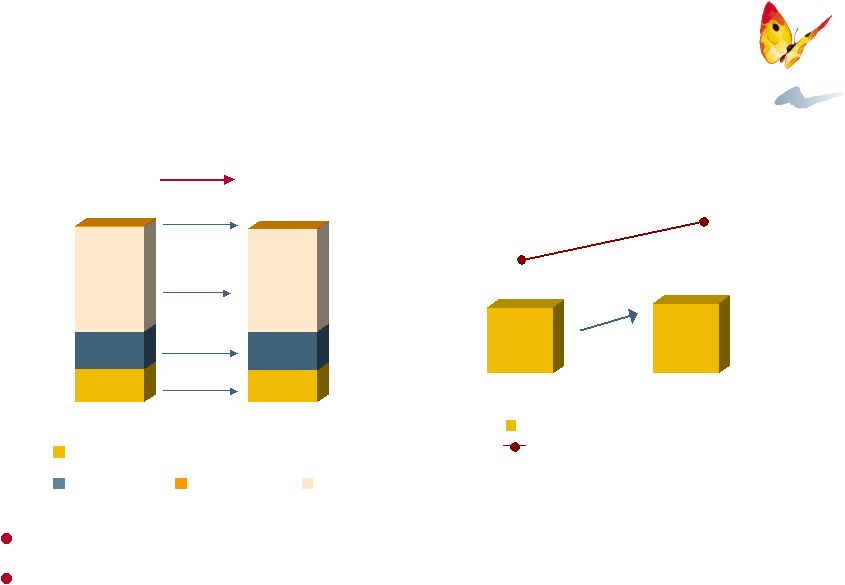
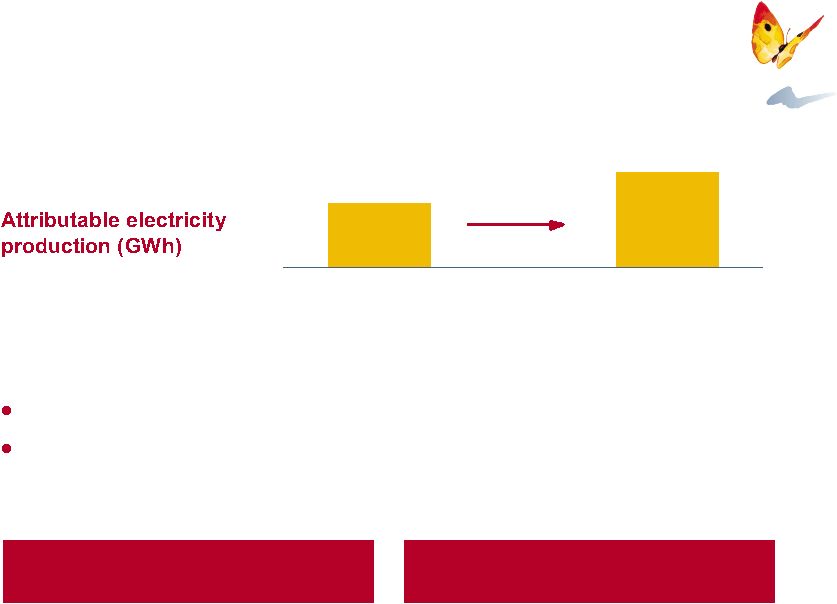 30 EBITDA: € 44.5m, +8.0% Load factor in 9M05: 68% vs 66% in 9M04 +3.7% 1,098 1,139 Attributable generation capacity: 271 MW New CCGT at Mayagüez in early development phase 9M04 9M05 Electricity Generation through EcoEléctrica (50%) 9M05 Results Analysis by Activity Electricity in Puerto Rico |
 31 Integrated Global Energy Company Availability of Equity Gas Leadership in Gas Distribution Developing Electricity Business Flexible and Well Diversified Gas Supply Leadership in Multiproduct Offer in Spain Spain and Puerto Rico Spain, LatAm and Italy Customer Orientation 9M05 Results Analysis by Activity Our Commitment (2004-2008) – Multiproduct Offer in Spain |
 32 1.5 million eligible residential gas customers Commercial network: 875 points of sale (own, franchised and associated) GAS NATURAL continues to enjoy the benefits from a strong and well-established brand all over Spain 1.3 million maintenance contracts 1.46 contracts per customer as of September 30, 2005. In line with 2004-2008 Strategic Plan (>2 contracts by 2008) 0.5 million residential electricity customers 82% residential gas customers retained 9M05 Results Analysis by Activity Multiproduct Offer in Spain |
 33 Conclusions 9M05 Results Snapshot Highlights 9M05 Results Analysis by Activity GAS NATURAL – 9M05 Results Considerations regarding the EU dimension of the Tender Offer for Endesa |
 34 Consistent organic growth in all business lines: Strong performance in Distribution, both in Spain and LatAm Increased contribution from electricity, driven by new and efficient CCGT and Wind Sustained growth in worldwide total end connections to 10.0 million Focused and growing investments in core business Increasing shareholder remuneration GAS NATURAL – Conclusions Solid financial position, coupled with strong cash flow generation, provide full flexibility to pursue envisaged growth, maintaining “A” category rating |
 Considerations regarding the EU dimension of the Tender Offer for Endesa November 3, 2005 |
 2 This communication is not an offering document and does not constitute an offer to sell or the solicitation of an offer to buy any securities or a solicitation of any vote or approval. The exchange offer will commence only (1) following approval of a final offer document by the Spanish Comisión Nacional del Mercado de Valores (CNMV) and publication thereof and (2) on or after the date on which Gas Natural SDG, S.A. files a Registration Statement on Form F-4 with the U.S. Securities and Exchange Commission (SEC) relating to the exchange offer. Investors in ordinary shares of Endesa, S.A. should not subscribe for any securities referred to herein except on the basis of the final approved and published offer document that will contain information equivalent to that of a prospectus pursuant to Directive 2003/71/EC and Regulation (EC) No. 809/2004. Investors and security holders may obtain a free copy of such final offer document (once it is approved and published) at the registered offices of Gas Natural, Endesa, the CNMV or the Spanish Stock Exchanges. Investors in American Depositary Shares of Endesa and U.S. holders of ordinary shares of Endesa are urged to read the U.S. prospectus and tender offer statement regarding the exchange offer, when it becomes available, because it will contain important information. The U.S. prospectus and tender offer statement will be filed with the SEC as part of its Registration Statement on Form F-4. Investors and security holders may obtain a free copy of the U.S. prospectus and tender offer statement (when available) and other documents filed by Gas Natural with the SEC at the SEC’s website at www.sec.gov. A free copy of the U.S. prospectus and tender offer statement (when available) may also be obtained for free from Gas Natural. These materials may contain forward-looking statements based on management’s current expectations or beliefs. These forward-looking statements relate to, among other things: • management strategies; • synergies and cost savings; • integration of the businesses; • market position; • expected gas and electricity mix and volume increases; • planned asset disposals and capital expenditures; • net debt levels and EBITDA and earnings per share growth; • dividend policy; and • timing and benefits of the offer and the combined company. Disclaimer and Important Legal Information |
 3 These forward-looking statements are subject to a number of factors and uncertainties that could cause actual results to differ materially from those described in the forward-looking statements, including, but not limited to, changes in regulation, the natural gas and electricity industries and economic conditions; the ability to integrate the businesses; obtaining any applicable governmental approvals and complying with any conditions related thereto; costs relating to the offer and the integration; litigation; and the effects of competition. Forward-looking statements may be identified by words such as “believes,” “expects,” “anticipates,” “projects,” “intends,” “should,” “seeks,” “estimates,” “future” or similar expressions. These statements reflect our current expectations. In light of the many risks and uncertainties surrounding these industries and the offer, you should understand that we cannot assure you that the forward-looking statements contained in these materials will be realized. You are cautioned not to put undue reliance on any forward-looking information. This communication is not for publication, release or distribution in or into or from Australia, Canada or Japan or any other jurisdiction where it would otherwise be prohibited. This communication is for distribution only to persons who (i) have professional experience in matters relating to investments or (ii) are persons falling within Article 49(2)(a) to (d) ("high net worth companies, unincorporated associations, etc") of The Financial Services and Markets Act 2000 (Financial Promotion) Order 2005 or (iii) are persons falling within Article 47 of The Financial Services and Markets Act 2000 (Financial Promotion) Order 2005 ("financial journalists") (all such persons together being referred to as "relevant persons"). This communication is directed only at relevant persons and must not be acted on or relied on by persons who are not relevant persons. Any investment or investment activity to which this communication relates is available only to relevant persons and will be engaged in only with relevant persons. This communication, which has not been and will not be submitted to the French Autorité des marchés financiers , is made available in France only to qualified investors ( investisseurs qualifiés ) and/or to a restricted circle of investors ( cercle restraint d'investisseurs ), provided in each case that such investors are acting for their own account, and/or to persons providing portfolio management financial services ( personnes fournissant le service d'investissement de gestion de portefeuille pour compte de tiers ), all as defined and in accordance with Article L. 411-2 of the French Code monétaire et financier and Decreee no. 2005-1007 dated 2 August 2005. Disclaimer and Important Legal Information |
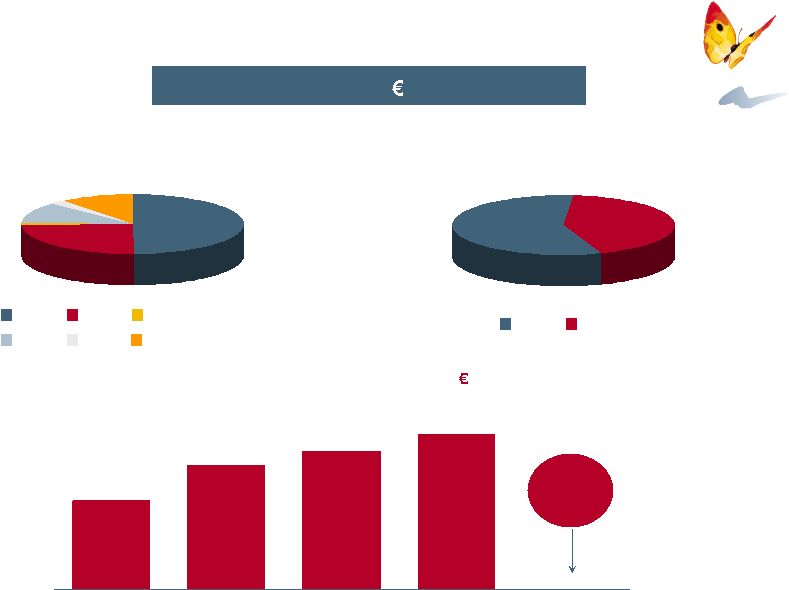
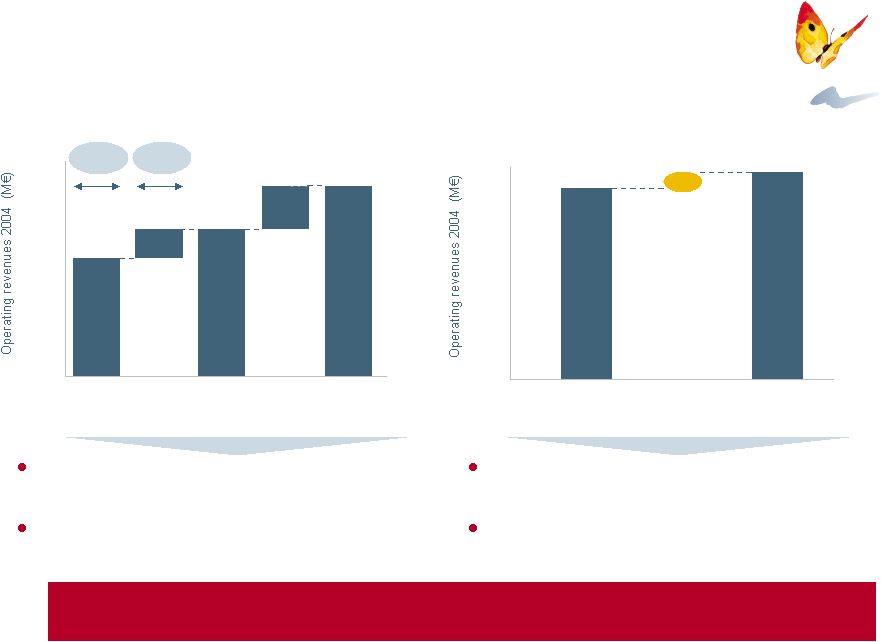 4 Gas Natural considers that the transaction does not have EU dimension 2/3 rule calculation with official information as of September 5th, 2005 2004 audited accounts approved by Endesa’s AGSM (Spanish GAAP) 2004 audited and certified accounts filed with the SEC by Endesa (US GAAP) According to the 2004 financial statements in Spanish GAAP, net revenues from Spain would represent more than 80% of the total revenues generated in Europe These accounts are complete, definitive and have been duly audited and approved at Endesa’s Annual General Shareholders’ Meeting According to US GAAP, the adjustment to Endesa’s revenues under Spanish GAAP is a €76 million increase to correct for certain upfront fees regarding new customers The US GAAP reconciliation is required by the US SEC but has not been approved by Endesa’s shareholders Source: Endesa’s 2004 consolidated financial statements and CNMV information Source: Endesa’s 20-F filed with the SEC, page F-126 1 Includes Net Sales and Other Revenues 80.5% 17,982 0 5,000 10,000 15,000 20,000 Total US GAAP1 +76 Total Spanish GAAP1 17,906 US GAAP Adjustments 17,906 4,140 13,766 2,691 11,075 0 5,000 10,000 15,000 20,000 Spain Rest of Europe Total Europe Rest of the world Total 19.5% Under Spanish law the only official accounts approved by Endesa’s Board and shareholders are the ones filed with the CNMV in Spanish GAAP |
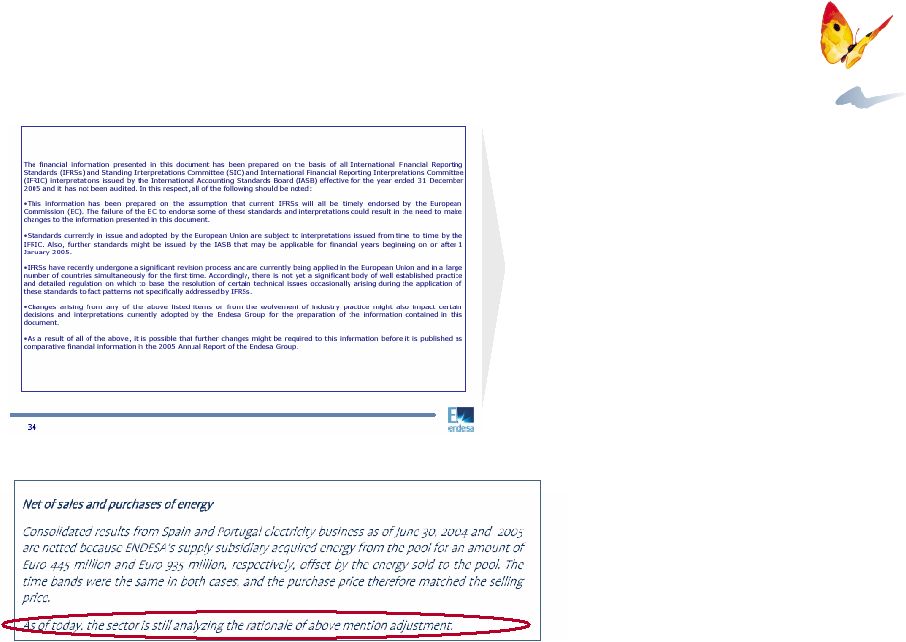 5 Endesa proposes to use financial statements which as of today are still provisional Endesa´ s IFRS presentation of April 5th, 2005 recognises the provisional nature of such IFRS criteria First Half results still recognise open issues with IFRS “The failure of the EC to endorse some of these standards and interpretations could result in the need to make changes to the information presented in this document” “… there is not yet a significant body of well established practice and detailed regulation on which to base the resolution of certain technical issues…” “Changes arising from any of the above listed items or from the evolvement of industry practice might also impact certain decisions and interpretations” “As a result of all of the above, it is possible that further changes might be required to this information before it is published as required comparative information in the 2005 Annual Report of the Endesa Group” Source: Adaptation of FY2004 Financial Statements to IFRS Presentation - April 5th, 2005 Source: Endesa First Half 2005 Financial Results (Page 46) - July 27th, 2005 |
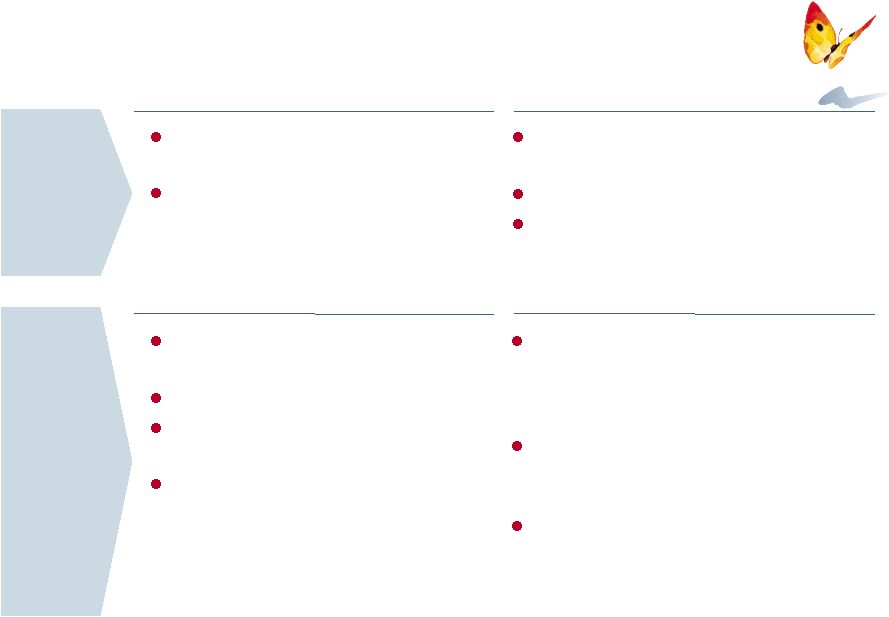
 6 Endesa’s claims are unprecedented and against the European Commission’s established principles Gas Natural’s position regarding the European Commission review Gas Natural’s position regarding Endesa’s adjustments The European Commission must follow the applicable law, precedents and its own established principles: 1 SDC - Servicio de Defensa de la Competencia (Spanish Anti Trust Authority) Section 5 DO C 66 2/3/98 : “The thresholds are only based on turnover instead of other criteria with an aim to provide a simple and objective mechanism that can be easily handled to determine if their transaction has a EU dimension” Section 26 DO C 66 2/3/98 : “As a general rule, the Commission will refer to audited or other definitive accounts” Section 7 DO C 66 2/3/98 : “Turnover should reflect as accurately as possible the economic strength of the undertakings involved in a transaction” Section 40 DO C 66 2/3/98 : all jointly controlled companies should be included in the calculation Endesa has adopted an “ad hoc” position in order to avoid the 2/3 rule, with a unilateral interpretation of the criteria to be applied Endesa’s arguments are inconsistent with its actions to date, in terms of information released to the market and previous presentations to the SDC¹ and EU Endesa’s principles and criteria for adjustments such as making adjustments to the audited statements based on Endesa’s interpretation of several provisional and subject-to-change IFRS criteria cannot be supported These adjustments have not been made in other similar transactions reviewed by the EU |
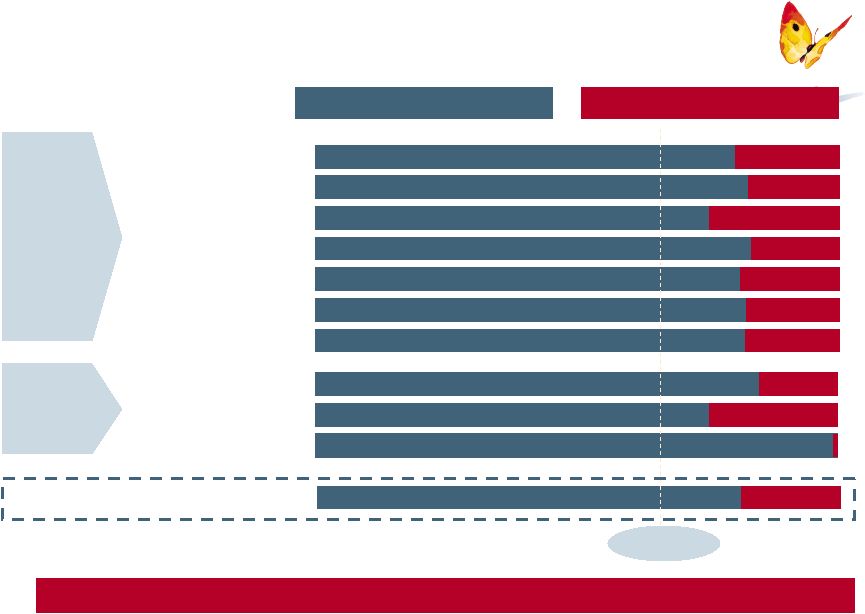 7 99% 75% 85% 25% 15% Customers Output (GWh) Headcount Real dimension of Spanish vs. European business Financial metrics (2004) 82% 82% 81% 83% 75% 83% 80% 18% 18% 19% 17% 25% 17% 20% Total investments Funds generated in operations EBIT EBITDA Utility plant Total Assets Rest of Europe Spain Operating metrics (2004) The 2/3 rule is not satisfied under any operating or financial metric Source: Endesa Annual Report 2004 Audited revenues (2004) 81% 19% Reality check 1% 2/3 limit Shareholders ’ equity |
 8 Adjustments according to Art. 5 Reg. CE Nº 139/2004 Conceptually acceptable to Gas Natural However, Endesa does not include revenue from jointly controlled AUNA Endesa has proposed several types of adjustments to claim EU jurisdiction IFRS adjustments per Endesa’s own interpretation Adjustments for subsidies Deduction of discounts, taxes and levies Adjustments for compensation relating to prior years Type II (interpretation) adjustments Revenue from jointly controlled companies Adjustment for purchases or sales of companies Main adjustments Type I (technical) adjustments Main adjustments Adjustments according to Endesa’s partial interpretation of the European Commission’s interpretative guidelines (DO C 66 2/3/98) Includes adjustment to net energy sales and purchases through OMEL, against the position of all other sector players Adjustments are mostly incorrect, inconsistent and not supported by precedents Overview Overview |
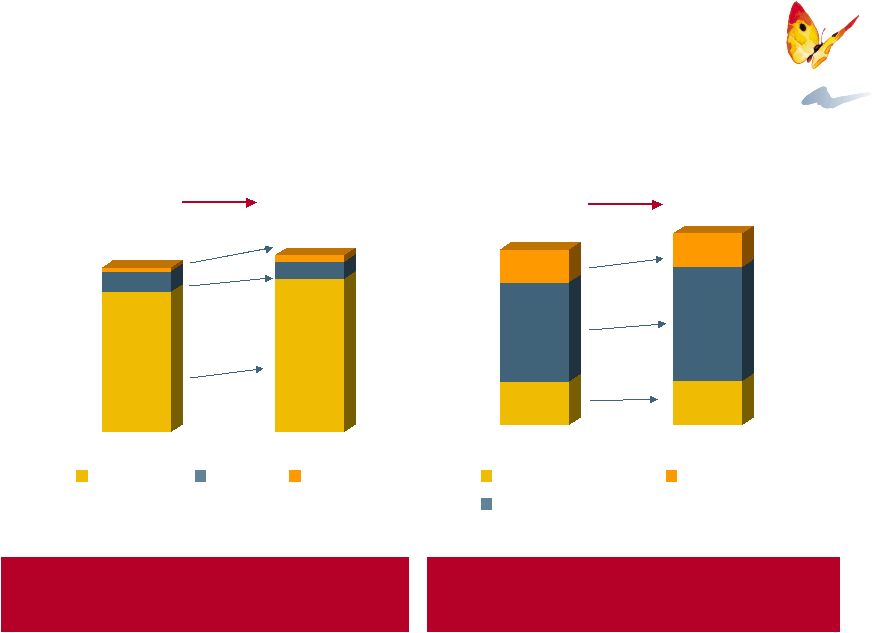
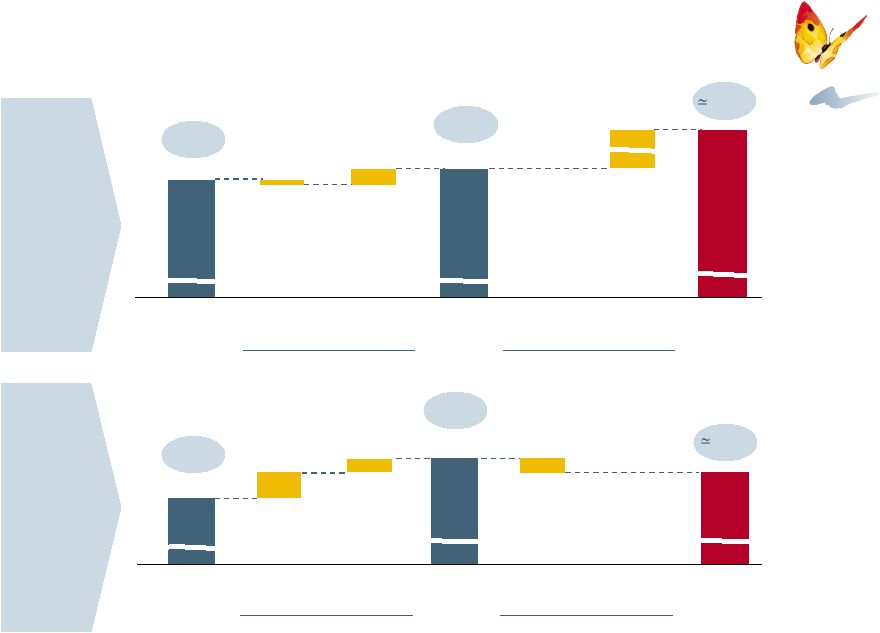 9 Summary impact of Art. 5 adjustments proposed by Endesa Adjustments to Spanish revenues 2004 (€M) Adjustments to European revenues 2004 (€M) Estimated corrections by Gas Natural¹ (3) Acquisition sale/of companies 11,075 Spanish GAAP 171 Spanish GAAP corrected Jointly- controlled companies Proposed by Endesa 11,243 Acquisition sale/of companies Jointly- controlled companies Estimated corrections by Gas Natural¹ NA 77.0% Spanish GAAP adjusted 80.5% 564 2,691 Rest of Europe (Spanish GAAP) 104 Rest of Europe corrected (Spanish GAAP) Acquisition sale/of companies Jointly- controlled companies Proposed by Endesa Acquisition sale/of companies Jointly- controlled companies 3,359 23.0% NA Rest of Europe adjusted (Spanish GAAP) 19.5% 1 Estimates based on Gas Natural’s review of information made publicly available by Endesa, which may be incomplete 80% 20% |
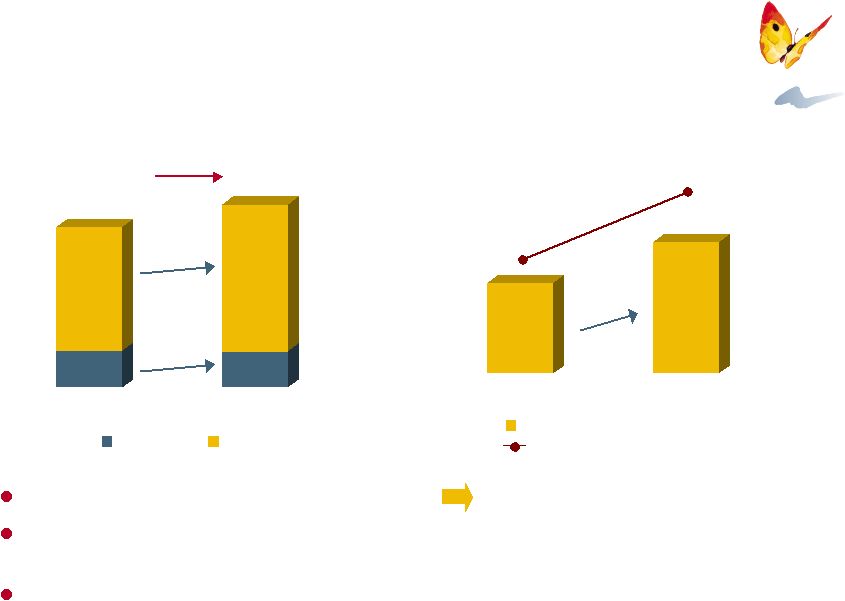
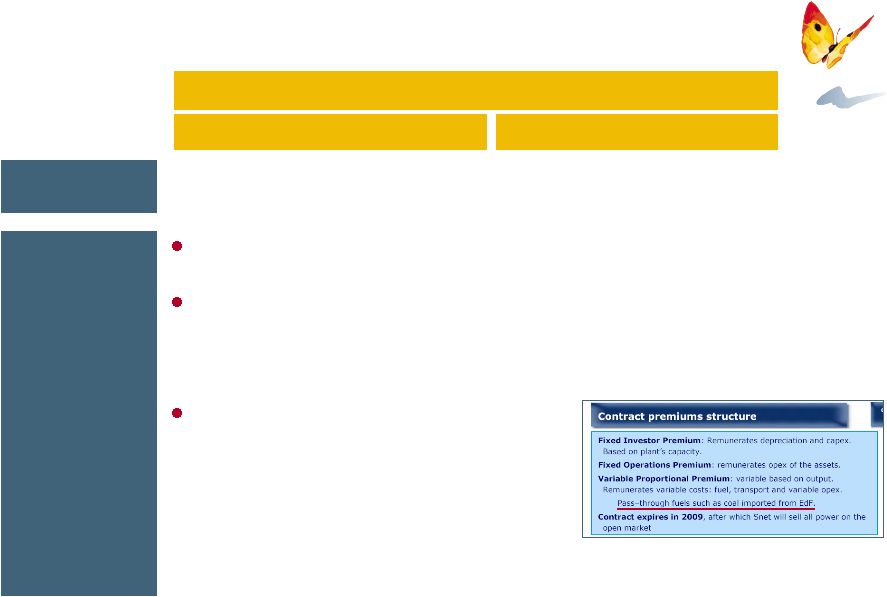 10 Revenue impact (€M) Endesa’s proposed Art. 5 adjustments Correction of revenues from purchases or sales of companies Spain Rest of Europe Comments Proposed by Endesa (3) 564 Endesa presentation September 13th, 2004 (“ Acquisition of an additional 35% of Snet”). Page 15 Adjustment to reflect the acquisition of control of SNET on September 2004 However, the SNET revenue figure considered by Endesa (€815M) does not reflect a number of additional required deductions, which Gas Natural has identified on the basis of the publicly available information Additionally, Endesa should net some fuel purchases which constitute a pass-through item against SNET’s sales to EdF (representing approximately 90% of SNET’s revenues until 2009). However, there is no public information available to know the real impact of this adjustment, which could be significant |
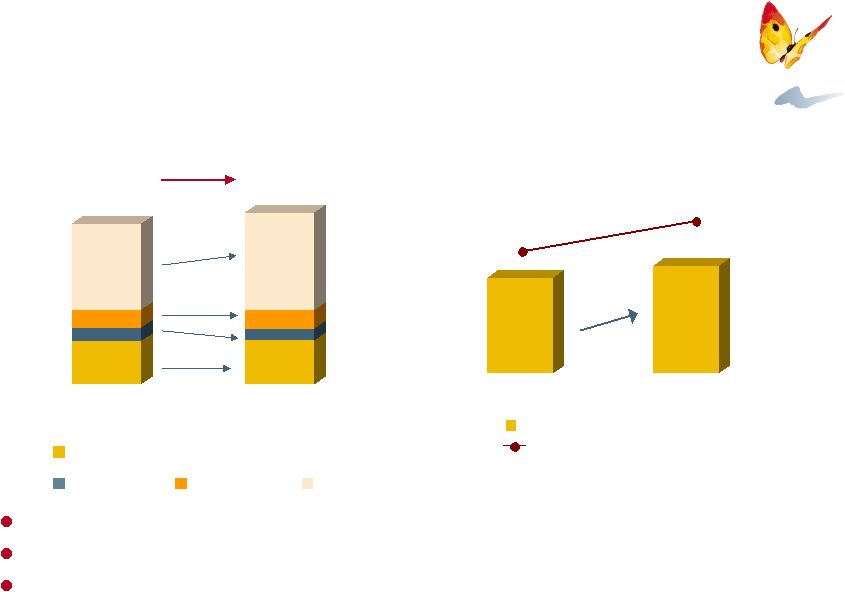
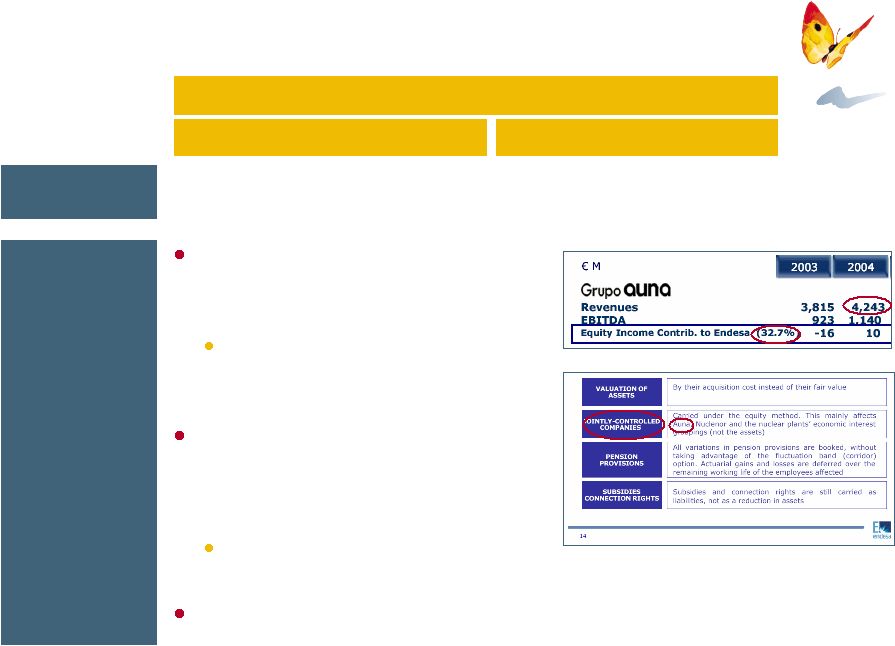 11 Endesa’s proposed Art. 5 adjustments Revenues from jointly-controlled companies Comments 171 104 Proposed by Endesa Revenue impact (€M) Spain Rest of Europe Adjustment to include the portion of the revenue of certain subsidiaries in which Endesa has joint-control. This includes 25 companies in Spain and 3 in Portugal However, Endesa provides no evidence regarding if and how joint-control is exercised in any of the aforementioned subsidiaries Moreover, Endesa does not include the revenue from AUNA , which is clearly a jointly- controlled subsidiary and was owned by Endesa at the time the offer was announced (and is indeed still owned by Endesa today) Endesa’s share of AUNA’s 2004 revenues (substantially all of which are in Spain) would amount to €1,387M Neither does Endesa include additional incremental revenue from non- consolidated Spanish subsidiaries (mainly gas) which are also fully or jointly controlled by Endesa Endesa Strategic & Financial Review (Edison). 21/2/05 (Page 14) Endesa Adaptation of FY2004 to IFRS. 5/4/05 (Page 14) |
 12 Endesa’s “Other Adjustments” cannot be justified Endesa uses internal information, which is not publicly available and cannot be independently verified to make the majority of the “Other Adjustments” The use of non-public information allows Endesa to revise it for its own benefit so that all the adjustments it makes, without exception, are directed to support the purported EU dimension of the offer by Gas Natural Endesa has selected only the most favourable adjustments to advance its position with regards to the 2/3 rule A limited review of the adjustments made by Endesa, based on the scarce public information available, reveals multiple inconsistencies and a contrived interpretation of the Commission’s interpretative guidelines The full and consistent application of the principles proposed by Endesa to all the applicable adjustments would result in the transaction not having EU dimension Therefore, the whole exercised submitted by Endesa is futile Endesa’s “Other Adjustments” are based on its partial interpretation of internal information which can be manipulated at will |
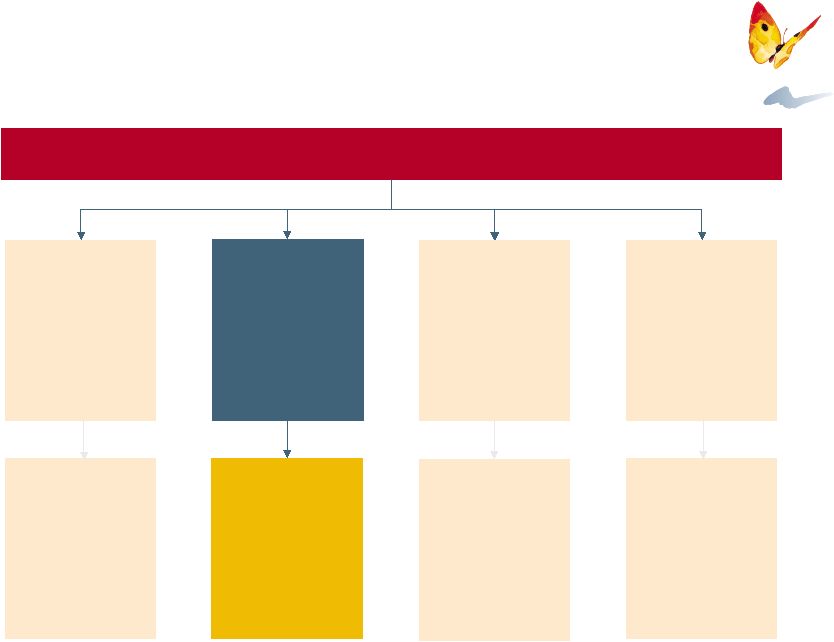
 13 Spain Summary impact of “Other Adjustments” proposed by Endesa Endesa requires multiple other adjustments based on the revision of non-definitive and unaudited information to further reduce the proportion of Spanish revenues² under 2/3 Rest of Europe % Spanish revenue Adjustments for subsidies Compensation relating to prior years Additional revenues of Endesa Italia Deduction of duties, taxes and levies Other adjustments (not explained) (4,401) NA (143) NA (51) NA NA 199 (104) NA (84) 58 Concept (49) (8) 67.0% 66.5% 66.3% 65.0% 64.7% 64.0% 67.1% 1 As per US GAAP reconciliation in Amended 20- F filed by Endesa with the SEC on October 28th, 2005 2 Not taking into account the estimated corrections by Gas Natural in pages 7, 8 and 9 IFRS adjustments - Consistent with US GAAP¹ - Inconsistent with US GAAP¹ |
 14 Endesa’s proposed “Other Adjustments” Adjustment for IFRS Comments (4,401) N/A IFRS accounts presented to CNMV by Endesa have no official nature, have not been audited, and the information they offer is still provisional, as pointed out by Endesa in its IFRS presentation of April 5th, 2005 and in its 2005 First Half results or evidenced by the amended figures sent to the European Commission in September 2005 Furthermore, Spanish GAAP shows the true and fair view of the economic reality of the business. As a matter of fact, Endesa has not informed the market (including its shareholders) that its official accounts do not reflect the true and fair view of the company. Further, it has used and the market has relied on, these figures for all years preceding this submission The only official accounts, approved by Endesa´s Board and shareholders are the ones filed with the CNMV in Spanish GAAP. The US GAAP reconciliation is provided for informational purposes to US investors and is not approved by Endesa’s shareholders nor filed with the CNMV Even so, Endesa´s IFRS adjustments differ from its US GAAP reconciliation Additionally, Endesa’s “IFRS criteria” for the pass through of energy purchases in distribution and the netting of sales to OMEL are not justified Differs from those adopted by the majority of the sector (Iberdrola, Unión Fenosa, HidroCantábrico and Viesgo) Goes against European Commission precedents such as the Enel/Viesgo and EDP/HidroCantábrico cases Revenue impact (€M) Spain Rest of Europe N/A (49) 1 As per US GAAP reconciliation in Amended 20-F filed by Endesa with the SEC on October 28th, 2005 Proposed by Endesa - Consistent with US GAAP¹ - Inconsistent with US GAAP¹ |
 15 Endesa’s proposed “Other Adjustments” Adjustment for subsidies Comments Includes the elimination of the “premium for the use of Spanish coal” • This adjustment is unacceptable given that the premium is not a public aid but rather a specific part of the tariff revenue, which is linked to the output and sale of electricity Also includes an adjustment relating to deferred revenue credited to income in connection with the depreciation of facilities built for clients This item was originally booked as extraordinary income rather than ordinary revenue and therefore was not part of the original revenue figure being adjusted Additionally, the adjustment proposed by Endesa is not compatible with Spanish GAAP for power utilities Additionally, includes the elimination of certain surcharges included in billings in Spain, which Endesa does not explain and go against Endesa’s own previous accounting practice Proposed by Endesa (143) N/A Revenue impact (€M) Spain Rest of Europe |
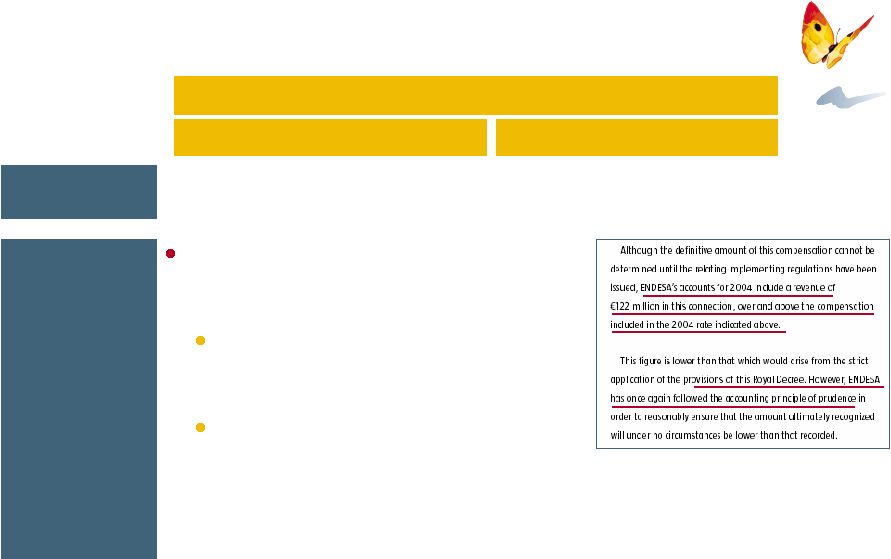 16 Endesa’s proposed “Other Adjustments” Compensation relating to prior years Comments Elimination of €51M compensation corresponding to the extra-peninsular systems costs for the years 2001-2003 No mention is made in the Annual Report, which, to the contrary, states the total figure of €122M is conservative Endesa goes against this very same principle when, in the case of Italy, it chooses not to adjust for €169M of CTCs¹ received in 2004 which correspond to the period 2000-2003 Proposed by Endesa (51) N/A Endesa 2004 Annual Report, Page 65 Revenue impact (€M) Spain Rest of Europe 1 Competition Transition Costs |
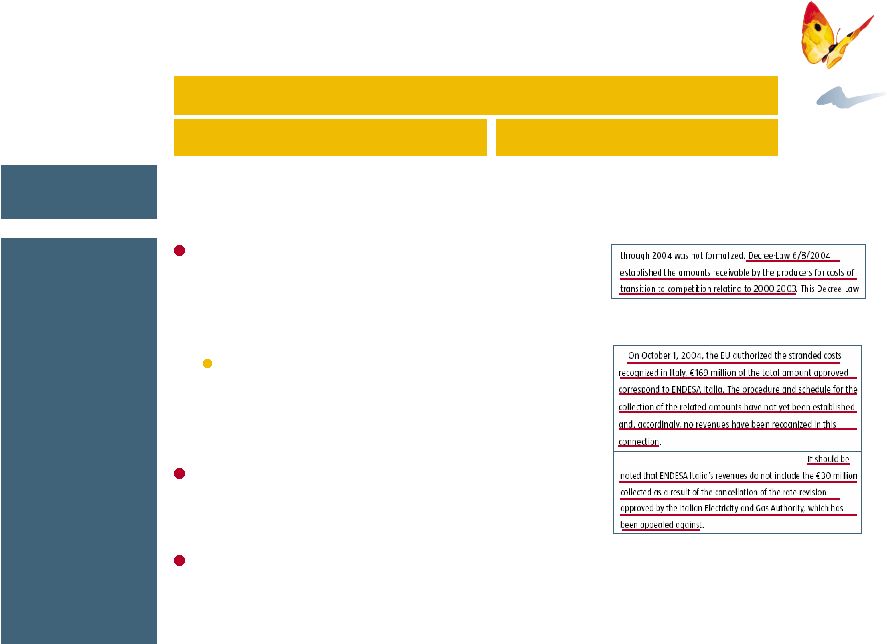 17 Endesa’s proposed “Other Adjustments” Additional revenues of Endesa Italia Comments €169M adjustment corresponding to stranded costs at Endesa Italia relating to 2000-2003 which are not registered in its accounts, following the prudence principle The recognition of revenues from past periods is incompatible with Endesa’s position for the extra-peninsular compensation for 2001-2003 Endesa includes €30M relating to a tariff revision which has been appealed against and is not in its accounts However, Endesa has not made a number of required deductions from Endesa Italia’s revenues, which Gas Natural has identified on the basis of the publicly available information Proposed by Endesa N/A 199 Endesa 2004 Annual Report (Legal Information), Page 20 Revenue impact (€M) Spain Rest of Europe Endesa 2004 Annual Report, Page 70 |
 18 Endesa’s proposed “Other Adjustments” Deduction of duties, taxes and levies Comments Endesa proposes to subtract the duty for the use of public domain (“tasa por aprovechamiento del dominio público”) of € 104M from the revenues generated in Spain However, this duty is a charge relating to the private use of the public domain by utilities, and therefore its nature is similar to that of a rental payment for the use of public space. As a result, this duty does not constitute a tax on sales Additionally, the duty for use of the public domain cannot by law be passed to the final consumer , which reinforces the notion that it is not a tax on sales Proposed by Endesa (104) N/A Revenue impact (€M) Spain Rest of Europe |
 19 Additional generally acceptable adjustments not proposed by Endesa Endesa has selectively omitted several clear adjustments which, based on public information, would be required as well for consistency In the previous pages we have detailed a number of voluntary omissions by Endesa in its partial and biased analysis of Art. 5 adjustments: Adjustments to SNET´s revenues Non-inclusion of AUNA as a jointly-controlled company Non-inclusion of several other (mainly gas) non-consolidated subsidiaries Adjustments to Endesa Italia revenues It is likely that other generally acceptable adjustments would also be appropriate. However, the lack of transparency into Endesa´s figures and some of its adjustments makes them impossible to quantify |
 20 Endesa’s latest potential misleading actions On October 28, 2005 Endesa filed a new set of accounts with the SEC reducing its consolidated US GAAP revenue figure by 25% (Euro 4.4 billion) Endesa has filed an Amended 20-F form with the SEC disclosing a reduction in its 2004 Spanish net sales figure under US GAAP of Euro 4,401 million, bringing its total net sales from Euro 17,718 million to Euro 13,317 million The excuse Endesa has used to justify this reduction is its “new” interpretation of EITF Issue No.99-19. However, this bulletin was issued five years ago and Endesa’s interpretation of it has been different until now Endesa´s latest 20-F filing in June 2005 already took into account Endesa´s proposed reconciliation to IFRS, which was filed with the CNMV on April 2005 Endesa’ s notification to the SEC comes in the middle of the discussion regarding the EU dimension of the offer by Gas Natural, to help justify using figures other than Endesa’s originally filed audited financial statements, as approved by its shareholders The reduction of Endesa’ s Spanish net sales figure in this new SEC filing aims to support Endesa’s own interpretation of the European Commission anti-trust rules Endesa’s latest revision in financial reporting worsens the unprecedented legal uncertainty created by Endesa and could, if accepted, open great questions on all past, present and future concentration transactions within the European Union |
 21 Conclusions Using Endesa’ s complete, official, public and audited 2004 financial statements, as approved by Endesa’s Board and shareholders, the transaction does not have EU dimension In fact the 2/3 rule is not satisfied under any financial or operating metric Endesa’s claim for EU dimension goes against established EU applicable law, precedents and the Commission’ s principles of simplicity, objectivity and legal certainty Endesa has presented incomplete and unaudited financial information based on its own interpretation of provisional IFRS accounting principles Endesa has also presented a large number of additional adjustments based on its own interpretation of Art. 5, and on the revision of internal information which cannot be independently verified by third parties Most of the adjustments proposed by Endesa are in direct conflict with the public and official information previously released by Endesa, are incomplete and cannot be justified at all Additionally, Endesa has selectively withheld critical information from the Commission Endesa’ s unjustified claims, if accepted, would create unprecedented legal uncertainty and insecurity which will adversely affect all concentration transactions in the EU |
INVESTOR RELATIONS Av. Portal de l’Àngel, 20 08002 BARCELONA (Spain) telf. 34 934 025 891 fax 34 934 025 896 e-mail: relinversor@gasnatural.com website: www.gasnatural.com Thank you |