UNITED STATES
SECURITIES AND EXCHANGE COMMISSION
Washington, D.C. 20549
FORM N-CSR
CERTIFIED SHAREHOLDER REPORT OF REGISTERED MANAGEMENT
INVESTMENT COMPANIES
Investment Company Act file number 811-21475
RBC Funds Trust
(Exact name of registrant as specified in charter)
100 South Fifth Street, Suite 2300
Minneapolis, MN 55402-1240
(Address of principal executive offices) (Zip code)
Lee Thoresen, Esq.
RBC Plaza
60 South Sixth Street
Minneapolis, MN 55402
(Name and address of agent for service)
Registrant’s telephone number, including area code:(612) 313-1341
Date of fiscal year end: September 30
Date of reporting period: September 30, 2011
Item 1. Reports to Stockholders.
The Report to Shareholders is attached herewith.
RBC Funds
|
| |||||||||||||||
About Your Annual Report |
This annual report includes detailed information about your Fund including financial statements, performance, and a complete list of its holdings.
The RBC Funds compare their performance against various Russell equity indices. Each of these indices is a widely recognized measure of return for the underlying category of securities. However, the indices are unmanaged, do not include fees, and cannot be invested in directly.
We hope the financial information presented will help you evaluate your investment in the RBC Funds. We also encourage you to read your Funds’ prospectus for further detail as to your Funds’ investment policies and risk profile. RBC Funds prospectuses and performance information subsequent to the date of this report are available on our website at www.rbcgam.us.
A description of the policies and procedures that your Fund uses to determine how to vote proxies relating to portfolio securities is available (i) without charge, upon request, by calling 1-800-422-2766; (ii) on the Fund’s website at www.rbcgam.us; and (iii) on the Securities and Exchange Commission’s (the “Commission”) website at http://www.sec.gov.
Information regarding how your Fund voted proxies relating to portfolio securities during the most recent 12-month period ended June 30 is available (i) on the Fund’s website at www.rbcgam.us; and (ii) on the Commission’s website at http://www.sec.gov.
A schedule of each Fund’s portfolio holdings will be filed with the Commission for the first and third quarters of each fiscal year on Form N-Q. This information is available on the Commission’s website at http://www.sec.gov and may be reviewed and copied at the Commission’s Public Reference Room in Washington, D.C. Information on the operation of the Public Reference Room is available by calling 1-202-551-8090.
|
| ||||||||||||||
| Table of | ||||||||||||||||
| Contents |
| 1 | ||||||||||||||
| Equity Portfolio Managers | 5 | |||||||||||||||
| Performance Summary | 7 | |||||||||||||||
| RBC SMID Cap Growth Fund | 12 | |||||||||||||||
| RBC Enterprise Fund | 14 | |||||||||||||||
| RBC Small Cap Core Fund | 16 | |||||||||||||||
| RBC Microcap Value Fund | 18 | |||||||||||||||
| RBC Mid Cap Value Fund | 20 | |||||||||||||||
| Schedules of Portfolio Investments | 22 | |||||||||||||||
| Financial Statements | ||||||||||||||||
| - Statements of Assets and Liabilities | 46 | |||||||||||||||
| - Statements of Operations | 48 | |||||||||||||||
| - Statements of Changes in Net Assets | 49 | |||||||||||||||
| Financial Highlights | 54 | |||||||||||||||
| Notes to Financial Statements | 64 | |||||||||||||||
| Report of Independent Registered Public Accounting Firm | 76 | |||||||||||||||
| Other Federal Income Tax Information | 77 | |||||||||||||||
| Management | 78 | |||||||||||||||
| Share Class Information | 82 | |||||||||||||||
| Supplemental Information | 83 | |||||||||||||||
| Approval of Investment Advisory Agreement | 85 | |||||||||||||||
| ||||||
| ||||||
SOME PATIENCE REQUIRED | ||||||
We still see the global economy producing sustained growth through 2011 and beyond, despite a slow down and notable risks evolving through the first nine months of the year. Plenty of opportunities exist for active managers, but it will take patience and a strong stomach to navigate these volatile markets. | ||||||
Equity markets struggled in the final quarter of the twelve month period, with returns worse than at any time since the first quarter of 2009. The main concerns in the quarter were the same as they have been all year – European sovereign debt, the strength of the U.S. recovery, and the pace of economic growth in China. That these concerns affected the market more in the final quarter than prior ones most likely reflects the continuing inability of political authorities to respond constructively to the difficulties. | ||||||
The pattern of returns when viewed on the basis of economic sectors reflects the poor returns of the market as a whole during the past twelve months. Within the broad market S&P 500 Index, defensive sectors performed best in all capitalization ranges, and across both growth and value. Utilities and Consumer Staples which returned +11.97% and +9.71%, respectively, were the best performing sectors. The worst performing sectors have varied somewhat, but have included, in almost all cases, Materials, which lost -6.28% and Financials, which lost -16.50%. | ||||||
Large capitalization stocks did better than midcap stocks which in turn performed better than small cap stocks. Over the past 12 months, the Russell 1000 Index returned +0.91%, the Russell Midcap Index lost -0.88%, and the Russell 2000 Index lost -3.53%. Returns to growth and value subgroups were consistent, with the growth stocks outperforming value. Among larger capitalization securities, the Russell 1000 Growth Index returned +3.78% versus a loss of -1.89% for the Russell 1000 Value Index. In the midcap area, the Russell Midcap Growth Index returned +0.80%, topping the Russell Midcap Value Index which lost -2.36%. The small cap Russell 2000 Growth Index lost -1.12%, while the corresponding Value Index lost -5.99%. | ||||||
MARKET PANIC | ||||||
The current developments are primarily due to the flight to safe haven assets. | ||||||
The downgrade of the U.S. by S&P was not a surprise; it had been signaled for a number of weeks. Therefore, the downgrade cannot be blamed as the sole trigger for the equity market collapse. In fact, many factors converged in this regard. First, in the U.S. the revised growth report retrospective to 2008 shows that the recession was deeper and the recovery weaker than presumed. Second, U.S. consumption stagnated in the time period between May and June 2011, the first standstill since the first half of 2009. Third, U.S. political disagreement means little to no fiscal resolution. Fourth, the public debt crisis in Europe expanded further, but the European Financial Stability Facility (EFSF) will not be fully operational before the fourth quarter of 2011. All of these factors are contributing to market concerns that the recession scenario will play out. | ||||||
Given this environment, we have adapted our forecasts, but we still expect the U.S. economy to grow between 1.5% and 2.0% in 2011. Finally, it is worth remembering that the fundamental environment is nowhere near as bad as in the time of the Lehman insolvency. In spite of its current condition the American labor market still creates earnings increases. The housing market shows some signs of stabilizing, exports are showing improvement and lower energy prices equal a gain in purchasing power. Nevertheless, the political |
1
LETTER FROM THE CIO OF EQUITIES | ||||||
situation will need to be remedied. That could mean QE3 (a third round of quantitative easing), although likely under a different name. In addition, a further step toward European integration through the common issuance of bonds may be necessary. | ||||||
POTENTIAL AHEAD: STOCKS STILL ATTRACTIVE | ||||||
We still believe the current market is in the mature stages of the advance that began in March 2009. It remains possible, in our view, that the market can retrace some of its declines as long as earnings remain robust and geopolitics does not spiral out of control. It is important to recognize this market is not without risks. Fiscal cutbacks are in effect across much of Europe, which could tip some of the continent’s economies back into recession, and the S&P’s downgrade clearly suggests the U.S. needs to put its own fiscal house in order. China’s economy is now clearly slowing down as inflation is the focus. All of these factors have contributed to cause U.S. GDP growth to moderate, making the economic recovery more fragile and keeping confidence levels quite low. | ||||||
So what does this mean for investors? The dramatic outperformance of small caps, especially since the spring 2009 market trough, has been severely tested through the recent sell-off. Our equilibrium models suggest small caps trade at a valuation premium, especially relative to large caps, but this ratio is not at an extreme relative to its history. Small caps have massively outperformed the large and mega cap market throughout this bull market, and comparisons with past cycle duration and relative valuations indicate the trend could continue for some time, although all of these suggest that a trend change is a real and growing possibility. Some analysts are concerned that the end of QE2 has shifted performance away from small caps and toward large companies, and clearly the rise in market volatility leading to the risk off trade has challenged the theme. | ||||||
U.S. corporate earnings remain firm, although earnings growth and quality has moderated in recent quarters. Profit margins may be near their peak, causing investors to further pause as they debate whether robust earnings gains can continue without a significant pick up in revenues. Corporate revenues continue to rise for the most part, which is aiding the current growth in earnings despite some of the ongoing headwinds from rising input prices. It is not unusual for revenues to struggle following recessions. In fact, revenues have struggled to increase for 18-36 months following the three most recent recessions. So far, profits have surprised to the upside as cost cutting and modest gains in nominal GDP have created a supportive earnings environment. | ||||||
Our forecast for S&P 500 earnings is that current levels of GDP are sufficient to deliver rising revenues and growing profits, although at a lower level than previously expected. Some analysts expect that if the U.S. achieves real GDP growth of 1.75% it would translate into profit growth of 4.8%. Prior GDP forecasts were for 3.0% which indicated profit gains of 8.0%. Stock markets have corrected coincident with this revision. | ||||||
As an investor it is important to remember that the stock market is rational. The triple threats (weak U.S. economy, the Eurozone crisis and U.S. debt standoff/downgrade) have changed the weights assigned to off-consensus outcomes for the economy, at the same time triggering movement in risk appetite expressed through changes in the valuation assigned to expected earnings. Currently, modest economic growth indicates a range of earnings and valuations holding the S&P 500 in a range of 1200-1300. But the potential for lower prices following a shock or through a typical recession-induced drop in earnings cannot be ignored. We look for a range of 1100-1300 as the market adjusts to the flow of data through the autumn. Should |
2
LETTER FROM THE CIO OF EQUITIES | ||||||
the threat of recession continue to grow, the possibility of significant earnings declines in that scenario could open up downside toward 900.
For the past couple of years macro/beta trades have ruled. This has been an unusual market as we don’t feel it has rewarded stock pickers. The high correlation of movement between individual stocks and the low spread of returns between winners and losers indicate a “stock market” and not a “market of stocks” as beta trading overwhelms returns to individual company factors. At some point (the million dollar question is when?) company specific differences will create tremendous valuation anomalies that will be hard for investors to ignore. The longer the level of differentiation is sustained, the greater the ultimate returns to fundamental stock pickers could be. | ||||||
|
Gordon Telfer Chief Investment Officer, Equity Products | |||||
Gordon Telfer | ||||||
| RBC Funds Chief Investment Officer | ||||||
| Equity Products | ||||||
Past performance is not a guarantee of future results. | ||||||
Mutual fund investing involves risk. Principal loss is possible. Investments in smaller companies involve more limited liquidity and greater volatility than larger companies.. | ||||||
Fund holdings and sector allocations are subject to change at any time and should not be considered recommendations to buy or sell any security. Please refer to the Schedule of Investments in this report for a complete list of fund holdings. | ||||||
The information provided herein represents the opinions of the Fund Managers and is not intended to be a forecast of future events, a guarantee of future results, nor investment advice. | ||||||
The S&P 500 Index is the Standard & Poor’s composite index of 500 stocks, a widely recognized, unmanaged index of common stock prices. | ||||||
The Russell 1000 Index is an unmanaged index that measures the performance of the large-cap segment of the U.S. equity universe. It is a subset of the Russell 3000® Index and includes approximately 1,000 of the largest securities based on a combination of their market cap and current index membership. | ||||||
The Russell Midcap Index measures the performance of the mid-cap segment of the U.S. equity universe. It is a subset of the Russell 1000® Index and includes approximately 800 of the smallest securities based on a combination of their market cap and current index membership. | ||||||
The Russell 2000® Index measures the performance of the small-cap segment of the U.S. equity universe. It is a subset of the Russell 3000 Index and represents approximately 10% of the total market capitalization of that index. It includes approximately 2,000 of the smallest securities based on a combination of their market cap and current index membership. | ||||||


3
LETTER FROM THE CIO OF EQUITIES | ||||||
The Russell 1000 Growth Index is an unmanaged index that measures the performance of U.S. large cap companies in the Russell 3000 Index with higher price-to-book ratios and higher forecasted growth values.
| ||||||
The Russell 1000 Value Index is an unmanaged index that measures the performance of U.S. large cap companies in the Russell 3000 Index, which have lower price-to-book ratios and lower forecasted growth rates.
| ||||||
The Russell Midcap Growth Index is an unmanaged index that measures the performance of U.S. mid cap companies in the Russell 3000 Index, which have higher price-to-book ratios and higher forecasted growth rates.
| ||||||
The Russell Midcap Value Index measures the performance of those Russell Mid Cap companies with lower price-to-book ratios and on average lower forecasted growth values.
| ||||||
The Russell 2000 Growth Index measures the performance of those Russell 2000 Index companies with higher price-to-book ratios and higher forecasted earnings growth rates..
| ||||||
The Russell 2000 Value Index measures the performance of those Russell 2000 Index companies with lower price-to-book ratios and lower forecasted growth values.
| ||||||
| It is not possible to invest directly in an index. | ||||||
4
| ||||||
RBC Global Asset Management (U.S.) Inc. (“RBC GAM (US)”) serves as the investment advisor to the RBC Funds. RBC GAM (US) employs a team approach to the management of the RBC Equity Funds, with no individual team member being solely responsible for the investment decisions. | ||||||
Gordon Telfer
Chief Investment Officer, Equity Products, Managing Director, Head of Growth Equities US.
Gordon Telfer is Chief Investment Officer, Equity Products and is responsible for directing RBC GAM (US)’s U.S. equities research efforts. He joined RBC GAM (US) in 2003 from Alliance Capital Management where he was a senior portfolio manager and a member of Alliance’s Investment Policy Group. Prior to Alliance, he worked for Scudder Kemper Investments as senior vice president and global strategist and spokesperson for Scudder Kemper’s U.S. and International Portfolio Management Group. Gordon began his career in the investment industry in 1986 at Murray Johnstone International in portfolio management. He has spoken at numerous regional and national conferences on portfolio management and been a guest on CNBC. A native of Glasglow, Scotland, Gordon received his Stock Exchange Diploma from the Herriott Watt University, Edinburgh, Scotland |
Gordon Telfer | |||||
Lance F. James
Managing Director, Senior Portfolio Manager
Lance James is responsible for portfolio management of the RBC Small Cap Core Fund, RBC Enterprise Fund, and RBC Microcap Value Fund. He is also co-manager of RBC Mid Cap Value Fund. Prior to joining RBC GAM (US) in 2006, Lance was an equity analyst and portfolio manager for OFI Institutional and Babson Capital Management, affiliated companies of Mass Mutual Life Insurance Company. During his tenure he served as head of the firm’s small/mid cap value investment team. Prior to joining Babson Capital in 1986, Lance worked at Rockwell International Corporation, EBF Associates of Boston and Hewitt Associates. Lance began his career in the investment industry in 1980. He received an AB in Economics from Princeton University and an MBA in Finance from the Wharton School of Business at the University of Pennsylvania. |
Lance F. James | |||||
George Prince
Portfolio Manager, Senior Equity Analyst
George Prince serves as the co-portfolio manager for the RBC Enterprise Fund. George also provides research support for the RBC Small Cap Core Fund. He joined RBC GAM (US) in 2006 from Eagle Asset Management, where he was a senior equity analyst. Prior to his experience at Eagle Asset Management, George was an analyst at Babson Capital Management. George also has a great deal of entrepreneurial experience and founded SignStorey, a leader in place-based digital communications in retail stores and co-founded Cutting Edge Inc., a global CAD-CAM technology company. George has over 12 years of investment industry experience. He received a BA from Yale University. |
George Prince | |||||


5
EQUITY PORTFOLIO MANAGERS | ||||||
Kenneth A. Tyszko |
Kenneth A. Tyszko, CPA, CFA
Vice President, Senior Portfolio Manager
Ken Tyszko is responsible for portfolio management of the RBC SMID Cap Growth Fund (formerly known as RBC Mid Cap Growth Fund). He joined RBC GAM (US) in 2001. Ken previously served as a portfolio manager for Oberweis Asset Management Inc., ABN AMRO Asset Management (USA) Inc., and Sears Investment Management Co. His background also includes experience at Main Hurdman, an international accounting and consulting firm. Ken began his career in the investment industry in 1984. He received a BS in Accountancy from the University of Illinois. Ken is both a CFA charterholder and a Certified Public Accountant. He is a member of the Illinois CPA Society, the CFA Society of Chicago and the CFA Institute. Ken has been a guest on Bloomberg Television, Bloomberg Radio, and WebFN. | |||||
Stephen E. Kylander |
Stephen E. Kylander
Vice President, Senior Portfolio Manager
Steve Kylander is responsible for portfolio management of the RBC Mid Cap Value Fund. Prior to joining RBC GAM (US) in 2006, he was a portfolio manager and research analyst for Babson Capital Management. Steve’s previous experience also includes strategy consulting, mergers and acquisitions work and investment banking for L.E.K. Consulting, The Yarmouth Group, and First Boston Corporation. He began working in the investment industry in 1986. Steve earned a BA from Dartmouth College and an MBA from Harvard Business School. | |||||


6
|
Average Annual Total Returns as of September 30, 2011 (Unaudited)
RBC SMID Cap Growth Fund (a)
| 1 Year | 3 Year | 5 Year | 10 Year | Since Inception(b) | Net Expense Ratio(1)(2) | Gross Expense Ratio(1)(2) | ||||||||||||||||||||||
Class A | ||||||||||||||||||||||||||||
- Including Maximum Sales Charge of 5.75% | (1.81)% | 2.23% | (0.46)% | 4.16% | 9.67% | |||||||||||||||||||||||
- At Net Asset Value | 4.21% | 4.26% | 0.72% | 4.78% | 9.98% | 1.35% | 1.61% | |||||||||||||||||||||
Class C (c) | ||||||||||||||||||||||||||||
- Including Contingent Deferred Sales Charge of 1.00% | 2.37% | 3.47% | (0.03)% | 3.99% | 9.16% | |||||||||||||||||||||||
- At Net Asset Value | 3.37% | 3.47% | (0.03)% | 3.99% | 9.16% | 2.09% | 2.36% | |||||||||||||||||||||
Class I | 4.55% | 4.55% | 1.00% | 5.05% | 10.31% | 1.10% | 1.35% | |||||||||||||||||||||
Class S (d) | 4.55% | 4.51% | 0.98% | 5.05% | 10.31% | 1.10% | 1.35% | |||||||||||||||||||||
Russell 2500 | ||||||||||||||||||||||||||||
Growth Index* | 0.59% | 4.56% | 1.91% | 6.32% | 8.68% | |||||||||||||||||||||||
Russell Midcap | ||||||||||||||||||||||||||||
Growth Index* | 0.80% | 5.89% | 1.64% | 6.70% | 9.31% | |||||||||||||||||||||||
| RBC Enterprise Fund (e) | ||||||||||||||||||||||||||||
| 1 Year | 3 Year | 5 Year | 10 Year | Since Inception(f) | Net Expense Ratio(1)(2) | Gross Expense Ratio(1)(2) | ||||||||||||||||||||||
Class A (g) | ||||||||||||||||||||||||||||
- Including Maximum Sales Charge of 5.75% | (6.79)% | (2.84)% | (4.53)% | 5.33% | 9.31% | |||||||||||||||||||||||
- At Net Asset Value | (1.11)% | (0.91)% | (3.40)% | 5.95% | 9.54% | 1.33% | 1.57% | |||||||||||||||||||||
Class C (g) | ||||||||||||||||||||||||||||
- Including Contingent Deferred Sales Charge of 1.00% | (2.83)% | (1.66)% | (4.12)% | 5.16% | 8.72% | |||||||||||||||||||||||
- At Net Asset Value | (1.85)% | (1.66)% | (4.12)% | 5.16% | 8.72% | 2.08% | 2.32% | |||||||||||||||||||||
Class I (h) | (0.96)% | (0.72)% | (3.18)% | 6.21% | 9.81% | 1.08% | 1.29% | |||||||||||||||||||||
Class S | (0.89)% | (0.69)% | (3.17)% | 6.21% | 9.81% | 1.08% | 1.32% | |||||||||||||||||||||
Russell 2000 Index* | (3.53)% | (0.37)% | (1.02)% | 6.12% | 8.10% | |||||||||||||||||||||||
Performance data quoted represents past performance. Past performance is no guarantee of future results. Investment return and principal value of an investment will fluctuate so that an investor’s shares, when redeemed, may be worth more or less than their original cost. Current performance may be lower or higher than performance quoted. Performance shown reflects contractual fee waivers, without such fee waivers total returns would be reduced. Performance information does not reflect the 2% fee on shares redeemed or exchanged within 30 days of purchase. If such redemption fee was included, performance would be reduced. For performance data current to the most recent month-end go to www.rbcgam.us. Please see footnotes beginning on page 9.
7
PERFORMANCE SUMMARY |
RBC Small Cap Core Fund (i)
| 1 Year | 3 Year | 5 Year | 10 Year | Since Inception(j) | Net Expense Ratio(1)(2) | Gross Expense Ratio(1)(2) | ||||||||||||||||||||||
Class A (g) | ||||||||||||||||||||||||||||
- Including Maximum Sales Charge of 5.75% | (5.56)% | 0.97% | (0.94)% | 6.22% | 8.70% | |||||||||||||||||||||||
- At Net Asset Value | 0.20% | 2.99% | 0.25% | 6.85% | 9.02% | 1.30% | 1.80% | |||||||||||||||||||||
Class C (g) | ||||||||||||||||||||||||||||
- Including Contingent Deferred Sales Charge of 1.00% | (1.58)% | 2.21% | (0.45)% | 6.08% | 8.22% | |||||||||||||||||||||||
- At Net Asset Value | (0.58)% | 2.21% | (0.45)% | 6.08% | 8.22% | 2.05% | 2.56% | |||||||||||||||||||||
Class S | 0.39% | 3.25% | 0.55% | 7.14% | 9.30% | 1.05% | 1.54% | |||||||||||||||||||||
Russell 2000 | ||||||||||||||||||||||||||||
Index* | (3.53)% | (0.37)% | (1.02)% | 6.12% | 8.21% | |||||||||||||||||||||||
| RBC Microcap Value Fund (k) | ||||||||||||||||||||||||||||
| 1 Year | 3 Year | 5 Year | 10 Year | Since Inception(l) | Net Expense Ratio(1)(2) | Gross Expense Ratio(1)(2) | ||||||||||||||||||||||
Class A (g) | ||||||||||||||||||||||||||||
- Including Maximum Sales Charge of 5.75% | (7.49)% | (3.19)% | (4.98)% | 5.49% | 7.46% | |||||||||||||||||||||||
- At Net Asset Value | (1.85)% | (1.26)% | (3.85)% | 6.11% | 7.72% | 1.32% | 1.60% | |||||||||||||||||||||
Class C (g) | ||||||||||||||||||||||||||||
- Including Contingent Deferred Sales Charge of 1.00% | (3.56)% | (2.01)% | (4.58)% | 5.32% | 6.92% | |||||||||||||||||||||||
- At Net Asset Value | (2.58)% | (2.01)% | (4.58)% | 5.32% | 6.92% | 2.07% | 2.35% | |||||||||||||||||||||
Class S | (1.59)% | (1.01)% | (3.61)% | 6.38% | 7.99% | 1.07% | 1.35% | |||||||||||||||||||||
Russell 2000 | ||||||||||||||||||||||||||||
Value Index* | (5.99)% | (2.78)% | (3.08)% | 6.47% | 8.76% | |||||||||||||||||||||||
Performance data quoted represents past performance. Past performance is no guarantee of future results. Investment return and principal value of an investment will fluctuate so that an investor’s shares, when redeemed, may be worth more or less than their original cost. Current performance may be lower or higher than performance quoted. Performance shown reflects contractual fee waivers, without such fee waivers total returns would be reduced. Performance information does not reflect the 2% fee on shares redeemed or exchanged within 30 days of purchase. If such redemption fee was included, performance would be reduced. For performance data current to the most recent month-end go to www.rbcgam.us. Please see footnotes beginning on page 9.
8
PERFORMANCE SUMMARY |
RBC Mid Cap Value Fund
1 Year | Since Inception(m) | Net Expense Ratio(1)(2) | Gross Expense Ratio(1)(2) | |||||
Class I | ||||||||
- At Net Asset Value | (5.35)% | 1.26% | 0.90% | 5.59% | ||||
Russell MidCap Value Index* | (2.36)% | 4.78% | ||||||
Performance data quoted represents past performance. Past performance is no guarantee of future results. Investment return and principal value of an investment will fluctuate so that an investor’s shares, when redeemed, may be worth more or less than their original cost. Current performance may be lower or higher than performance quoted. Performance shown reflects contractual fee waivers, without such fee waivers total returns would be reduced. Performance information does not reflect the 2% fee on shares redeemed or exchanged within 30 days of purchase. If such redemption fee was included, performance would be reduced. For performance data current to the most recent month-end go to www.rbcgam.us. Please see footnotes below.
(1) The Funds’ expenses reflect the most recent fiscal year-end (September 30, 2011).
(2) The Adviser has contractually agreed to waive fees and/or make payments in order to keep total operating expenses of the Fund to the levels listed under net expense ratio until January 31, 2012.
*Each of the comparative indices is a widely recognized market value weighted measure of the return of securities, but do not include sales fees or operating expenses. You cannot invest directly in indices.
| (a) | The performance in the table for the period from June 1, 1994 to April 19, 2004 reflects the performance of RBC Mid Cap Equity Fund , the predecessor to RBC SMID Cap Growth Fund. The performance of the Fund also includes the performance of a common trust fund (“CTF”) account advised by RBC GAM (US) (including its predecessor) and managed the same as the Fund in all material respects for the period from December 31, 1990 to June 1, 1994, as adjusted to reflect the full contractual rate of expenses associated with the Fund at its inception. The CTF account was not registered with the SEC under the 1940 Act and therefore was not subject to the investment restrictions imposed by law on registered mutual funds. If the CTF account had been registered, the CTF account’s performance may have been adversely affected. Fund performance reflects applicable fee waivers/expense reimbursements (which, if excluded, would cause performance to be lower). |
| (b) | The since inception date (commencement of operations) of the Fund is December 31, 1990. |
| (c) | The inception date for Class C Shares of the Fund is April 19, 2004. All performance shown for each such class of shares prior to its inception date is based on the performance of the Class A Shares of the Fund, adjusted to reflect the fees and expenses of Class C Shares, as applicable (and where applicable, the maximum sales charges of the Class C Shares). |
| (d) | The inception date for Class S Shares of the Fund is April 19, 2004. All performance shown for each such class of shares prior to its inception date is based on the performance of the Class I Shares of the Fund, adjusted to reflect the fees and expenses of Class S Shares. |
| (e) | The performance in the table for the period from December 2, 1983 to April 19, 2004 reflects the performance of Babson Enterprise Fund, the predecessor to RBC Enterprise Fund . Fund performance reflects applicable fee waivers/expense reimbursements (which, if excluded, would cause performance to be lower). |
| (f) | The since inception date (commencement of operations) of the Fund is December 2, 1983. The performance of the index since inception of the Fund is calculated from November 30, 1983. |
| (g) | The inception date for Class A and Class C Shares of the Fund is April 19, 2004. All performance shown for each such class of shares prior to its inception date is based on the performance of the Class S Shares of the Fund, adjusted to reflect the fees and expenses of Class A and Class C Shares, as applicable (and where applicable, the maximum sales charges of the Class A and Class C Shares). |
9
PERFORMANCE SUMMARY |
| (h) | The inception date for Class I Shares of the Fund is September 30, 2004. All performance shown for each such class of shares prior to its inception date is based on the performance of the Class S Shares of the Fund, adjusted to reflect the fees and expenses of Class I Shares, as applicable. |
| (i) | The performance in the table for the period from August 5, 1991 to April 19, 2004 reflects the performance of Babson Enterprise Fund II, the predecessor to RBC Small Cap Core Fund. Fund performance reflects applicable fee waivers/expense reimbursements (which, if excluded, would cause performance to be lower). |
| (j) | The since inception date (commencement of operations) of the Fund is August 5, 1991. The performance of the index since inception of the Fund is calculated from July 31, 1991. |
| (k) | The performance in the table for the period from September 10, 1987 to April 19, 2004 reflects the performance of Shadow Stock Fund, the predecessor to RBC Microcap Value Fund . Fund performance reflects applicable fee waivers/expense reimbursements (which, if excluded, would cause performance to be lower). |
| (l) | The since inception date (commencement of operations) of the Fund is September 10, 1987. The performance of the index since inception of the Fund is calculated from August 31, 1987. |
| (m) | The since inception date (commencement of operations) of the Fund is December 31, 2009. The performance of the index since inception of the Fund is calculated from December 31, 2009. |
The Russell 2500 Growth Index is an unmanaged index that measures the performance of those Russell 2500 companies with higher price-to-book ratios and higher forecasted growth values.
The Russell 2000 Value Index is an unmanaged index that measures the performance of those Russell 2000 companies with lower price-to-book ratios and lower forecasted growth values.
The Russell 2000 Index is an unmanaged index that measures the performance of approximately 2,000 of the smallest securities in the Russell 3000 Index based on a combination of their market cap and current index membership.
The Russell Midcap Value Index is an unmanaged, market-weighted total return index that tracks the performance of those Russell Midcap companies with lower price-to-book ratios and lower forecasted growth rates.
The Russell Midcap Growth Index is an unmanaged index that measures the performance of those Russell Midcap Index companies with higher price-to-book ratios and higher forecasted growth values.
The Russell Microcap Index is an unmanaged index that measures the performance of 1000 of the smallest securities in the Russell 2000 Index based on a combination of their market cap and current index membership.
10
|
This Page Intentionally Left Blank
11
MANAGEMENT DISCUSSION AND ANALYSIS (UNAUDITED) | ||||||
| ||||||
Investment Strategy | Seeks long-term growth by primarily investing in high quality, small and mid capitalization companies that display consistent earnings growth and superior financial characteristics. Utilizing fundamental research, the Fund employs a bottom-up approach and strict risk controls to build a diversified portfolio of stocks that offer above average expected growth with lower than average market risk.
| |||||
Performance |
For the twelve-month period ending September 30, 2011, the Fund had a total return of 4.55% (Class S). That compares to a total return of 0.59% for the Russell 2500 Growth Index, the Fund’s primary benchmark.
| |||||
Factors That Made Positive Contributions |
· Strong outperformance during the year was primarily driven by favorable stock selection in the consumer discretionary and industrials sectors as well as an overweight position in the consumer staples sector.
· Stock selection in the consumer discretionary sector was the leading contributor to the Fund as retailers Tractor Supply, Fossil and Ross Stores, as well as restaurant chain Panera Bread each reported better than expected revenue, earnings and same store sales growth throughout the year.
· Stock selection in the industrials sector was driven by strong financial results from less cyclical names Waste Connections, Towers Watson, Donaldson and Stericycle.
· The Fund’s overweight position in the more defensive Consumer Staples sector during a period of heightened market volatility was also a significant contributor to results during the year.
| |||||
Factors That Detracted From Relative Returns |
· Stock selection in the technology sector was the only significant detractor from performance during the period as both Akamai Technologies and Dolby Laboratories lowered forward guidance due to disappointing financial results and reduced visibility into future end market demand.
· The Fund’s modest cash position also detracted from results during the period.
| |||||
Mutual fund investing involves risk. Principal loss is possible. Investing in small cap companies involves additional risks, including greater fluctuations in value and lack of liquidity. These risks are more fully described in the prospectus. The Fund invests in foreign securities which involve political, economic and currency risks, greater volatility and differences in accounting methods. | ||||||
| ||||||
| ||||||
| ||||||
| ||||||
| ||||||
12
MANAGEMENT DISCUSSION AND ANALYSIS (UNAUDITED) | ||||||||||||||
RBC SMID Cap Growth Fund
| ||||||||||||||
Long-term capital appreciation. | Investment Objective | |||||||||||||
Russell Midcap Growth Index and Russell 2500 Growth Index
| Benchmark | |||||||||||||
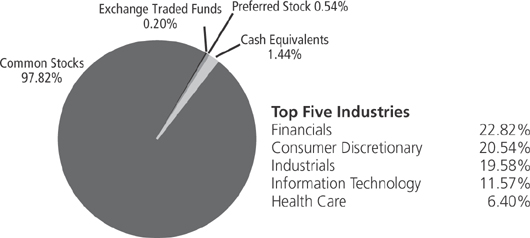
| Asset Allocation (as of 9/30/11) (% of fund’s investments) & Top Five Industries (as of 9/30/11) (% of fund’s net assets) | |||||||||||||
Tractor Supply Co. |
3.34% |
Cerner Corp. |
2.12% |
Top Ten Holdings (as of 9/30/11) (% of fund’s net assets) | ||||||||||
| Pricesmart, Inc. | 2.77% | LKQ Corp. | 2.04% | |||||||||||
| Catalyst Health Solutions, Inc. | 2.73% | Fossil, Inc. | 1.93% | |||||||||||
| Ross Stores, Inc. | 2.65% | Henry Schein, Inc. | 1.71% | |||||||||||
| Airgas, Inc. | 2.17% | MICROS Systems, Inc. | 1.71% | |||||||||||
| *A listing of all portfolio holdings can be found beginning on page 22. | ||||||||||||||
| Growth of $10,000 Initial Investment Over 10 Years | |||||||||||||
| The graph reflects an initial investment of $10,000 over a 10 year period and is based on Class S shares. The performance of the Fund for the period from September 30, 2001 to April 19, 2004 reflects the performance of RBC Mid Cap Equity Fund, the predecessor to RBC SMID Cap Growth Fund. The Fund’s total return includes reinvested dividends and capital gains. The Fund’s total return also includes operating expenses that reduce return, while the total return of the index does not. The graph does not reflect the deduction of taxes that a shareholder would pay on fund distributions or redemption of fund shares. Performance of other classes will vary due to differences in fee structures. | ||||||||||||||


13
14
MANAGEMENT DISCUSSION AND ANALYSIS (UNAUDITED) | ||||||||||||||
RBC Enterprise Fund
| ||||||||||||||
Long-term growth of capital. | Investment Objective | |||||||||||||
Russell 2000 Index
| Benchmark | |||||||||||||
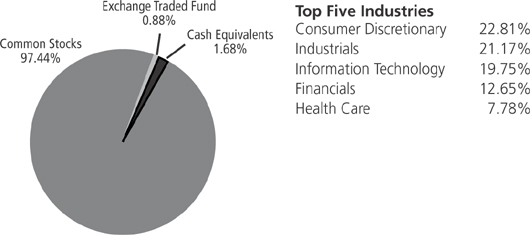
| Asset Allocation (as of 9/30/11) (% of fund’s investments) & Top Five Industries (as of 9/30/11) (% of fund’s net assets) | |||||||||||||
Steinway Musical Instruments | 4.19% | Casual Male Retail Group, Inc. | 3.82% | Top Ten Holdings (as of 9/30/11) (% of fund’s net assets) | ||||||||||
| Acacia Research - Acacia Technologies | 4.05% | Tyler Technologies, Inc. | 3.45% | |||||||||||
| AZZ, Inc. | 4.03% | NIC, Inc. | 3.25% | |||||||||||
| Universal Electronics, Inc. | 4.01% | Compass Diversified Holdings | 3.04% | |||||||||||
| Benihana, Inc., Class A | 3.88% | Interactive Intelligence Group | 2.98% | |||||||||||
*A listing of all portfolio holdings can be found beginning on page 25.
| ||||||||||||||
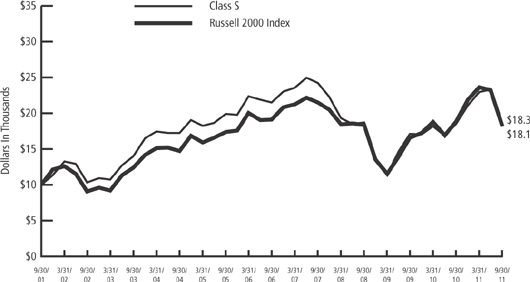
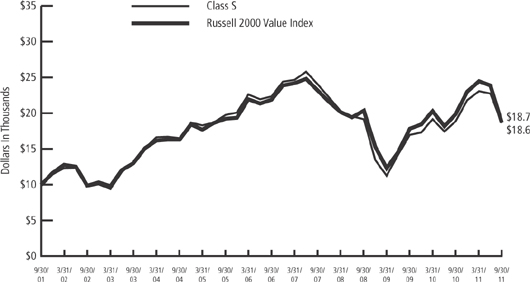
| Growth of $10,000 Initial Investment Over 10 Years | |||||||||||||
| The graph reflects an initial investment of $10,000 over a 10 year period and is based on Class S shares. The performance of the Fund for the period from September 30, 2001 to April 19, 2004 reflects the performance of Babson Enterprise Fund, the predecessor to RBC Enterprise Fund. The Fund’s total return includes reinvested dividends and capital gains. The Fund’s total return also includes operating expenses that reduce return, while the total return of the index does not. The graph does not reflect the deduction of taxes that a shareholder would pay on fund distributions or redemption of fund shares. Performance of other classes will vary due to differences in fee structures. | ||||||||||||||
15
MANAGEMENT DISCUSSION AND ANALYSIS (UNAUDITED) | ||||||
| ||||||
Investment Strategy | Seeks to provide superior long-term growth of capital compared to the Russell 2000 Index while taking a low risk approach to small company investing. The Adviser believes that portfolios of neglected small cap companies with low valuations, long-term attractive business fundamentals and near-term profitability improvement potential should produce strong absolute and risk-adjusted returns over time.
| |||||
| Performance |
For the twelve-month period ending September 30, 2011, the Fund had a total return of 0.39% (Class S). That compares to a total return of (3.53)% for the Russell 2000 Index, the Fund’s primary benchmark.
| |||||
| Factors That Made Positive Contributions | ||||||
— Favorable stock selection was the primary factor in the Fund’s higher performance compared to the Russell 2000 Index for the one-year period. | ||||||
— Favorable stock selection among consumer discretionary stocks was the most significant positive performance factor, especially among specialty retailers, apparel manufacturers, and leisure equipment makers. | ||||||
— Positive information technology stock selection was also an important factor with special strength among commercial services, communication equipment and software companies. | ||||||
— A sector underweight in the poorly performing financials sector also contributed to the Fund’s above-benchmark performance. | ||||||
Factors That Detracted From Relative Returns | ||||||
— Overall adverse sector weightings were a slight drag on performance for the one year period. | ||||||
— An overweight compared to the Russell 2000 Index in the poorly performing industrials sector and an underweight in the better performing healthcare sector were significant adverse performance factors. | ||||||
— Adverse stock selection among consumer staples companies also hindered performance compared to the Russell 2000 Index.
| ||||||
Mutual fund investing involves risk. Principal loss is possible. Investing in mid cap,small cap and micro cap companies involves additional risks, including greater fluctuations in value and lack of liquidity. These risks are more fully described in the prospectus. Although the Fund does not generally invest in initial public offerings (IPO’s), it has the ability to. Investment in IPO’s typically involve greater price volatility resulting in increased turnover and expenses as well as the potential for taxable gains. | ||||||
16
| MANAGEMENT DISCUSSION AND ANALYSIS (UNAUDITED) | ||||||||||||||||||
RBC Small Cap Core Fund
|
| |||||||||||||||||
Long-term growth of capital and income.
|
| Investment Objective | ||||||||||||||||
Russell 2000 Index
|
| Benchmark | ||||||||||||||||
|
| Asset Allocation (as of 9/30/11) (% of fund’s investments) & Top Five Industries (as of 9/30/11) (% of fund’s net assets) | ||||||||||||||||
Gardner Denver, Inc. | 3.44% | Universal Electronics, Inc. | 2.69% | Top Ten Holdings (as of 9/30/11) (% of fund’s net assets) | ||||||||||||||
Acacia Research - Acacia Technologies | 3.05% | AZZ, Inc. | 2.61% | |||||||||||||||
World Fuel Services Corp. | 3.00% | Universal Stainless & Alloy | 2.56% | |||||||||||||||
Casual Male Retail Group, Inc. | 2.84% | InterDigital, Inc. | 2.36% | |||||||||||||||
Steinway Musical Instruments | 2.78% | Compass Diversified Holdings | 2.32% | |||||||||||||||
| *A listing of all portfolio holdings can be found beginning on page 28. | ||||||||||||||||||
|
| Growth of $10,000 Initial Investment Over 10 Years | ||||||||||||||||
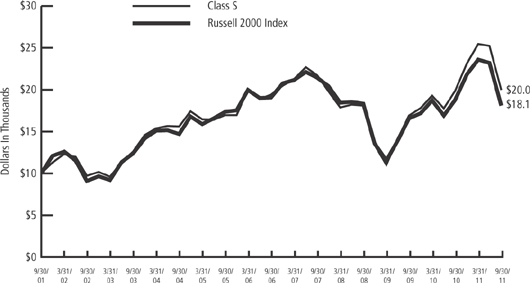
| The graph reflects an initial investment of $10,000 over a 10 year period and is based on Class S shares. The performance of the Fund for the period from September 30, 2001 to April 19, 2004 reflects the performance of Babson Enterprise Fund II, the predecessor to RBC Small Cap Core Fund. The Fund’s total return includes reinvested dividends and capital gains. The Fund’s total return also includes operating expenses that reduce return, while the total return of the index does not. The graph does not reflect the deduction of taxes that a shareholder would pay on fund distributions or redemption of fund shares. Performance of other classes will vary due to differences in fee structures. | ||||||||||||||||||

17
MANAGEMENT DISCUSSION AND ANALYSIS (UNAUDITED)
| ||||||||
| ||||||||
Investment Strategy | Invests in a diversified portfolio of the smallest companies that have been neglected by institutional shareholders. Utilizing a quantitative process to identify value-oriented investments, the Fund strives to achieve long-term growth while offering shareholders some protection from market declines and fluctuations.
| |||||||
| Performance |
For the twelve-month period ending September 30, 2011, the Fund had a total return of (1.59)% (Class S). That compares to a total return of (5.99)% for the Russell 2000 Value Index, the Fund’s primary benchmark.
| |||||||
Factors That Made Positive Contributions |
— |
Favorable stock selection provided the largest positive contribution to the Fund’s performance compared to the Russell 2000 Value index for the one-year period. | ||||||
| — | Favorable information technology stock selection was the most important positive performance factor, especially among internet software and services companies. | |||||||
| — | Favorable stock selection among consumer discretionary and healthcare companies was also an important contributor to above-benchmark performance.
| |||||||
Factors That Detracted From Relative Returns |
— |
The Fund’s concentration in microcap value stocks hurt relative performance in a period when the performance of the Russell Microcap Value Index trailed that of the Russell 2000 Value Index. | ||||||
| — | Adverse sector allocation was a small detractor from relative performance with an underweight in the strongly performing utilities sector being the most important. | |||||||
| — | A sector overweight in consumer discretionary and underweight in energy also marginally diminished performance relative to the Russell 2000 Value Index.
| |||||||
Mutual fund investing involves risk. Principal loss is possible. Investing in micro cap companies involves additional risks, including greater fluctuations in value and lack of liquidity. These risks are more fully described in the prospectus. Although the Fund does not generally invest in initial public offerings (IPO’s), it has the ability to. Investment in IPO’s typically involve greater price volatility resulting in increased turnover and expenses as well as the potential for taxable gains.
| ||||||||
18
MANAGEMENT DISCUSSION AND ANALYSIS (UNAUDITED)
| ||||||||||||||
RBC Microcap Value Fund
| ||||||||||||||
Long-term growth of capital.
| Investment Objective | |||||||||||||
Russell 2000 Value Index
| Benchmark | |||||||||||||
| Asset Allocation (as of 9/30/11) (% of fund’s investments) & Top Five Industries (as of 9/30/11) (% of fund’s net assets) | |||||||||||||
| Insight Enterprises, Inc. | 0.71% | MicroFinancial, Inc. | 0.66% | Top Ten Holdings (as of 9/30/11) (% of fund’s net assets) | ||||||||||
| Elizabeth Arden, Inc. | 0.70% | Keynote Systems, Inc. | 0.63% | |||||||||||
| Miller Industries, Inc. | 0.69% | Chesapeake Utilities Corp. | 0.62% | |||||||||||
| Innospec, Inc. | 0.68% | FPIC Insurance Group, Inc. | 0.62% | |||||||||||
| ePlus, Inc. | 0.66% | Standex International Corp. | 0.62% | |||||||||||
| *A listing of all portfolio holdings can be found beginning on page 31. | ||||||||||||||
The graph reflects an initial investment of $10,000 over a 10 year period and is based on Class S shares. The performance of the Fund for the period from September 30, 2001 to April 19, 2004 reflects the performance of Shadow Stock Fund, the predecessor to RBC Microcap Value Fund. The Fund’s total return includes reinvested dividends and capital gains. The Fund’s total return also includes operating expenses that reduce return, while the total return of the index does not. The graph does not reflect the deduction of taxes that a shareholder would pay on fund distributions or redemption of fund shares. Performance of other classes will vary due to differences in fee structures. | Growth of $10,000 Initial Investment Over 10 Years | |||||||||||||
| ||||||||||||||
| ||||||||||||||
| ||||||||||||||
19
MANAGEMENT DISCUSSION AND ANALYSIS (UNAUDITED) | ||||||
| ||||||
Investment Strategy | Seeks long-term capital appreciation by investing in common stocks of mid-sized companies that are considered to be undervalued in relation to earnings, dividends and/or assets. The Advisor uses a disciplined, bottom-up approach to select stocks for the Fund’s portfolio with a focus on fundamental research and qualitative analysis.
| |||||
| Performance | For the twelve-month period ending September 30, 2011, the Fund had a total return of (5.35)%. That compares to a total return of (2.36)% for the Russell Midcap Value Index, the Fund’s primary benchmark.
| |||||
Factors That Made Positive Contributions |
— Overall stock selection was a positive contributor to the Fund’s performance during the period. — Stock selection was particularly strong in the materials, financials and energy sectors.
| |||||
| Factors That Detracted From Relative Returns |
— The Fund was overweighted in cyclical sectors, including materials and industrials sectors compared to the Russell Midcap Value Index, which had a negative impact on the Fund’s relative performance. — An underweight in defensive sectors of utilities and consumer staples also detracted from performance. — An overweight to the automotive industry within the consumer discretionary sector also hindered relative performance.
| |||||
Mutual fund investing involves risk. Principal loss is possible. Investing in mid cap companies involves additional risks, including greater fluctuations in value and lack of liquidity. These risks are more fully described in the prospectus. Although the Fund does not generally invest in initial public offerings (IPO’s), it has the ability to. Investment in IPO’s typically involve greater price volatility resulting in increased turnover and expenses as well as the potential for taxable gains.
| ||||||
20
MANAGEMENT DISCUSSION AND ANALYSIS (UNAUDITED)
| ||||||||||||||
RBC Mid Cap Value Fund
| ||||||||||||||
Long-term capital appreciation.
| Investment Objective | |||||||||||||
Russell Mid Cap Value Index
| Benchmark | |||||||||||||
| Asset Allocation (as of 9/30/11) (% of fund’s investments) & Top Five Industries (as of 9/30/11) (% of fund’s net assets) | |||||||||||||
Schweitzer-Mauduit International, Inc. | 4.68% | People’s United Financial, Inc. | 3.06% | Top Ten Holdings (as of 9/30/11) (% of fund’s net assets) | ||||||||||
| Avnet, Inc. | 3.55% | Cameron International Corp. | 3.03% | |||||||||||
| Navistar International Corp. | 3.47% | Kohl’s Corp. | 2.87% | |||||||||||
| Tenneco, Inc. | 3.23% | Republic Services, Inc. | 2.79% | |||||||||||
| Ares Capital Corp. | 3.06% | Reinsurance Group of America, Inc. | 2.74% | |||||||||||
| *A listing of all portfolio holdings can be found beginning on page 42. | ||||||||||||||
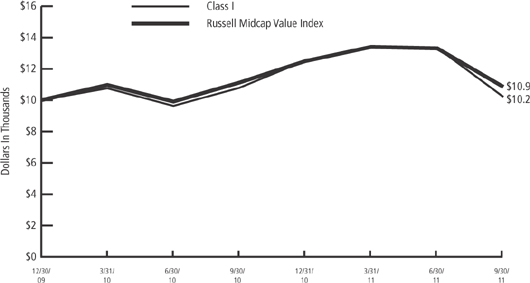
| Growth of $10,000 Initial Investment Since Inception (12/30/09) | |||||||||||||
| The graph reflects an initial investment of $10,000 over the period from December 30, 2009 to September 30, 2010 and is based on Class I shares. The Fund’s total return includes reinvested dividends and capital gains. The Fund’s total return also includes operating expenses that reduce return, while the total return of the index does not. The graph does not reflect the deduction of taxes that a shareholder would pay on fund distributions or redemption of fund shares. | ||||||||||||||

21
|
RBC SMID Cap Growth Fund
September 30, 2011
| Shares | Value | |||||
Common Stocks — 100.05% |
| |||||
Consumer Discretionary — 14.04% |
| |||||
| 14,000 | Fossil, Inc.* | $ | 1,134,840 | |||
| 17,600 | Guess?, Inc. | 501,424 | ||||
| 49,460 | LKQ Corp.* | 1,194,954 | ||||
| 20,000 | Monro Muffler Brake, Inc. | 659,400 | ||||
| 8,900 | Panera Bread Co., Class A* | 925,066 | ||||
| 19,800 | Ross Stores, Inc. | 1,558,062 | ||||
| 31,300 | Tractor Supply Co. | 1,957,815 | ||||
| 17,600 | WMS Industries, Inc.* | 309,584 | ||||
|
| |||||
| 8,241,145 | ||||||
|
| |||||
Consumer Staples — 6.92% |
| |||||
| 17,600 | Church & Dwight Co., Inc. | 777,920 | ||||
| 26,100 | Pricesmart, Inc. | 1,626,552 | ||||
| 9,000 | Ralcorp Holdings, Inc.* | 690,390 | ||||
| 26,100 | United Natural Foods, Inc.* | 966,744 | ||||
|
| |||||
| 4,061,606 | ||||||
|
| |||||
Energy — 6.00% |
| |||||
| 13,200 | Dril-Quip, Inc.* | 711,612 | ||||
| 19,600 | Gulfport Energy Corp* | 473,928 | ||||
| 25,080 | Oceaneering International, Inc. | 886,327 | ||||
| 15,300 | Oil States International, Inc.* | 779,076 | ||||
| 18,200 | Unit Corp.* | 671,944 | ||||
|
| |||||
| 3,522,887 | ||||||
|
| |||||
Financials — 5.21% |
| |||||
| 19,000 | Eaton Vance Corp. | 423,130 | ||||
| 16,000 | Federated Investors, Inc., Class B | 280,480 | ||||
| 29,100 | HCC Insurance Holdings, Inc. | 787,155 | ||||
| 29,900 | Raymond James Financial, Inc. | 776,204 | ||||
| 34,600 | Tower Group, Inc. | 790,956 | ||||
|
| |||||
| 3,057,925 | ||||||
|
| |||||
Health Care — 25.79% |
| |||||
| 48,600 | Bruker Corp.* | 657,558 | ||||
| 27,800 | Catalyst Health Solutions, Inc.* | 1,603,782 | ||||
| 22,700 | Cepheid, Inc.* | 881,441 | ||||
| 18,200 | Cerner Corp.* | 1,247,064 | ||||
| 10,700 | Charles River Laboratories International, Inc.* | 306,234 | ||||
| 9,000 | Edwards Lifesciences Corp.* | 641,520 | ||||
| 11,400 | Gen-Probe, Inc.* | 652,650 | ||||
| 16,200 | Henry Schein, Inc.* | 1,004,562 | ||||
| 12,900 | IDEXX Laboratories, Inc.* | 889,713 | ||||
| 13,600 | Integra LifeSciences Holdings Corp.* | 486,472 | ||||
| 6,800 | Laboratory Corp of America Holdings* | 537,540 | ||||
22
SCHEDULE OF PORTFOLIO INVESTMENTS |
RBC SMID Cap Growth Fund (cont.)
September 30, 2011
| Shares | Value | |||||
| 6,000 | Mettler-Toledo International, Inc.* | $ | 839,760 | |||
| 11,700 | MWI Veterinary Supply, Inc.* | 805,194 | ||||
| 18,700 | NuVasive, Inc.* | 319,209 | ||||
| 16,700 | Parexel International Corp.* | 316,131 | ||||
| 9,900 | Perrigo Co. | 961,389 | ||||
| 22,300 | Pharmaceutical Product Development, Inc. | 572,218 | ||||
| 9,000 | Varian Medical Systems, Inc.* | 469,440 | ||||
| 24,100 | Volcano Corp.* | 714,083 | ||||
| 10,700 | Waters Corp.* | 807,743 | ||||
11,400
| West Pharmaceutical Services, Inc.
|
| 422,940
|
| ||
|
| |||||
| 15,136,643 | ||||||
|
| |||||
Industrials — 17.83% | ||||||
| 9,000 | Alliant Techsystems, Inc. | 490,590 | ||||
| 29,900 | AMETEK, Inc. | 985,803 | ||||
| 14,420 | Donaldson Co., Inc. | 790,216 | ||||
| 13,280 | Expeditors International of Washington, Inc. | 538,504 | ||||
| 7,000 | Flowserve Corp. | 518,000 | ||||
| 10,340 | Huron Consulting Group, Inc.* | 321,884 | ||||
| 14,800 | Jacobs Engineering Group, Inc.* | 477,892 | ||||
| 13,700 | Landstar System, Inc. | 541,972 | ||||
| 15,900 | MSC Industrial Direct Co., Class A | 897,714 | ||||
| 13,490 | Roper Industries, Inc. | 929,596 | ||||
| 12,200 | Stericycle, Inc.* | 984,784 | ||||
| 13,400 | Teledyne Technologies, Inc.* | 654,724 | ||||
| 15,800 | Towers Watson & Co., Class A | 944,524 | ||||
| 20,500 | Waste Connections, Inc. | 693,310 | ||||
25,400
| Woodward Governor Co.
|
| 695,960
|
| ||
|
| |||||
| 10,465,473 | ||||||
|
| |||||
Information Technology — 18.50% | ||||||
| 23,700 | Akamai Technologies, Inc.* | 471,156 | ||||
| 13,820 | ANSYS, Inc.* | 677,733 | ||||
| 24,310 | Autodesk, Inc.* | 675,332 | ||||
| 12,900 | Comtech Telecommunications Corp. | 362,361 | ||||
| 22,100 | Digital River, Inc.* | 458,133 | ||||
| 12,940 | Dolby Laboratories, Inc., Class A* | 355,073 | ||||
| 9,700 | F5 Networks, Inc.* | 689,185 | ||||
| 20,800 | Global Payments, Inc. | 840,112 | ||||
| 15,600 | Informatica Corp* | 638,820 | ||||
| 9,100 | Mantech International Corp., Class A | 285,558 | ||||
| 22,150 | Microchip Technology, Inc. | 689,087 | ||||
| 22,800 | MICROS Systems, Inc.* | 1,001,148 | ||||
| 24,050 | National Instruments Corp. | 549,783 | ||||
| 15,900 | Open Text Corp.* | 828,708 | ||||
| 22,100 | Plexus Corp.* | 499,902 | ||||
| 29,400 | Riverbed Technology, Inc.* | 586,824 | ||||
| 22,100 | Synopsys, Inc.* | 538,356 | ||||
23
SCHEDULE OF PORTFOLIO INVESTMENTS |
RBC SMID Cap Growth Fund (cont.)
September 30, 2011
| Shares | Value | |||||
15,200 |
Ultimate Software Group, Inc.* | $
| 710,144
|
| ||
|
| |||||
| 10,857,415 | ||||||
|
| |||||
Materials — 5.76% | ||||||
| 20,000 | Airgas, Inc. | 1,276,400 | ||||
| 19,300 | AptarGroup, Inc. | 862,131 | ||||
| 13,400 | Reliance Steel & Aluminum Co. | 455,734 | ||||
| 12,700 | Sigma-Aldrich Corp. |
| 784,733
|
| ||
|
| |||||
| 3,378,998 | ||||||
|
| |||||
Total Common Stocks | 58,722,092 | |||||
|
| |||||
(Cost $48,066,149) | ||||||
Investment Company — 1.21% | ||||||
| 709,875 | JPMorgan Prime Money Market Fund | 709,875 | ||||
|
| |||||
Total Investment Company | 709,875 | |||||
|
| |||||
(Cost $709,875) | ||||||
Total Investments | $ | 59,431,967 | ||||
(Cost $48,776,024)(a) — 101.26% | ||||||
Liabilities in excess of other assets — (1.26)% | (737,229 | ) | ||||
|
| |||||
NET ASSETS — 100.00% | $ | 58,694,738 | ||||
|
| |||||
| * | Non-income producing security. |
| (a) | See notes to financial statements for the tax cost of securities and the breakdown of unrealized appreciation (depreciation). |
See notes to financial statements.
24
SCHEDULE OF PORTFOLIO INVESTMENTS |
RBC Enterprise Fund
September 30, 2011
| Shares | Value | |||||
Common Stocks — 97.85% | ||||||
Consumer Discretionary — 22.81% | ||||||
| 420,178 | Benihana, Inc., Class A* | $ | 3,617,733 | |||
| 88,400 | Books-A-Million, Inc. | 205,088 | ||||
| 947,773 | Casual Male Retail Group, Inc.* | 3,563,626 | ||||
| 119,694 | Delta Apparel, Inc.* | 1,885,181 | ||||
| 68,600 | Grand Canyon Education, Inc.* | 1,107,890 | ||||
| 44,630 | Mac-Gray Corp. | 576,173 | ||||
| 250,900 | RG Barry Corp. | 2,659,540 | ||||
| 181,233 | Steinway Musical Instruments* | 3,907,383 | ||||
| 227,700 | Universal Electronics, Inc.* | 3,732,003 | ||||
|
| |||||
| 21,254,617 | ||||||
|
| |||||
Energy — 4.92% |
| |||||
| 26,000 | GeoResources, Inc.* | 462,540 | ||||
| 107,400 | Gulfport Energy Corp.* | 2,596,932 | ||||
| 27,154 | OYO Geospace Corp.* | 1,528,499 | ||||
|
| |||||
| 4,587,971 | ||||||
|
| |||||
Financials — 12.65% |
| |||||
| 215,300 | Asta Funding, Inc. | 1,746,083 | ||||
| 96,100 | Boston Private Financial Holdings, Inc. | 565,068 | ||||
| 91,059 | CoBiz Financial, Inc. | 407,034 | ||||
| 232,900 | Compass Diversified Holdings | 2,836,722 | ||||
| 50,800 | Firstcity Financial Corp.* | 337,820 | ||||
| 122,800 | Imperial Holdings LLC* | 294,720 | ||||
| 56,400 | LaSalle Hotel Properties REIT | 1,082,880 | ||||
| 27,626 | Mercantile Bank Corp.* | 215,207 | ||||
| 80,389 | MetroCorp Bancshares, Inc.* | 401,141 | ||||
| 88,000 | National Interstate Corp. | 1,934,240 | ||||
| 69,174 | Northrim BanCorp, Inc. | 1,338,517 | ||||
| 65,000 | Washington Banking Co. | 632,450 | ||||
|
| |||||
| 11,791,882 | ||||||
|
| |||||
Health Care — 7.78% |
| |||||
| 235,600 | BioScrip, Inc.* | 1,498,416 | ||||
| 100,900 | Exactech, Inc.* | 1,420,672 | ||||
| 96 | HMS Holdings Corp.* | 2,341 | ||||
| 60,600 | Kensey Nash Corp.* | 1,484,700 | ||||
| 58,700 | Meridian Bioscience, Inc. | 923,938 | ||||
| 103,700 | US Physical Therapy, Inc. | 1,920,524 | ||||
|
| |||||
| 7,250,591 | ||||||
|
| |||||
Industrials — 20.26% |
| |||||
| 104,800 | Acacia Research - Acacia Technologies* | 3,771,752 | ||||
| 283,700 | Air Transport Services Group, Inc.* | 1,228,421 | ||||
| 111,456 | Allied Defense Group, Inc. (The)*(a)(b) | 601,862 | ||||
| 96,800 | AZZ, Inc. | 3,752,936 | ||||
| 238,325 | Columbus McKinnon Corp.* | 2,612,042 | ||||
25
SCHEDULE OF PORTFOLIO INVESTMENTS |
RBC Enterprise Fund (cont.)
September 30, 2011
| Shares | Value | |||||
| 59,900 | Ducommun, Inc. | $ | 897,302 | |||
| 65,000 | Eagle Bulk Shipping, Inc.* | 102,050 | ||||
| 81,600 | Ennis, Inc. | 1,065,696 | ||||
| 81,800 | Greenbrier Cos., Inc.* | 952,970 | ||||
| 13,500 | Hurco Cos, Inc.* | 274,050 | ||||
| 19,600 | Kimball International, Inc., Class B | 95,256 | ||||
| 13,500 | Marten Transport Ltd. | 232,740 | ||||
| 52,400 | NN, Inc.* | 264,620 | ||||
| 17,250 | Old Dominion Freight Line, Inc.* | 499,733 | ||||
| 99,900 | Orion Marine Group, Inc.* | 576,423 | ||||
| 376,000 | PGT, Inc.* | 470,000 | ||||
| 3,674 | Standard Parking Corp.* | 57,461 | ||||
| 66,050 | Sun Hydraulics Corp. | 1,346,099 | ||||
| 105,800 | TBS International PLC, Class A* | 75,118 | ||||
|
| |||||
| 18,876,531 | ||||||
|
| |||||
Information Technology — 20.66% |
| |||||
| 122,982 | Aspen Technology, Inc.* | 1,877,935 | ||||
| 147,674 | Computer Task Group, Inc.* | 1,649,519 | ||||
| 22,600 | comScore, Inc.* | 381,262 | ||||
| 102,200 | Interactive Intelligence Group* | 2,774,730 | ||||
| 119,400 | KEYW Holding Corp. (The)* | 848,934 | ||||
| 312,238 | Lionbridge Technologies, Inc.* | 768,105 | ||||
| 264,400 | NIC, Inc. | 3,027,380 | ||||
| 109,451 | Tessco Technologies, Inc. | 1,454,604 | ||||
| 46,800 | TNS, Inc.* | 879,840 | ||||
| 127,200 | Tyler Technologies, Inc.* | 3,215,616 | ||||
| 255,700 | Xyratex Ltd. | 2,370,339 | ||||
|
| |||||
| 19,248,264 | ||||||
|
| |||||
Materials — 7.23% |
| |||||
| 197,116 | Intertape Polymer Group, Inc.* | 384,376 | ||||
| 81,700 | Koppers Holdings, Inc. | 2,092,337 | ||||
| 110,300 | Landec Corp.* | 586,796 | ||||
| 269,900 | Omnova Solutions, Inc.* | 966,242 | ||||
| 106,588 | Universal Stainless & Alloy* | 2,709,467 | ||||
|
| |||||
| 6,739,218 | ||||||
|
| |||||
Utilities — 1.54% |
| |||||
| 55,800 | Unitil Corp. | 1,432,944 | ||||
|
| |||||
Total Common Stocks | 91,182,018 | |||||
|
| |||||
(Cost $86,458,264) |
| |||||
Rights/Warrants — 0.00% |
| |||||
| 6,203 | US Concrete, Inc. Warrants, Expire 8/31/17*(a)(b)(c) | 0 | ||||
26
SCHEDULE OF PORTFOLIO INVESTMENTS |
RBC Enterprise Fund (cont.)
September 30, 2011 |
| |||||
| Shares | Value | |||||
| 6,203 | US Concrete, Inc. Warrants, Expire 8/31/17*(a)(b)(c) | $ | 0 | |||
|
| |||||
Total Rights/Warrants | 0 | |||||
|
| |||||
(Cost $0) | ||||||
Exchange Traded Funds — 0.89% |
| |||||
| 42,800 | SPDR KBW Regional Banking | 826,468 | ||||
|
| |||||
Total Exchange Traded Funds | 826,468 | |||||
|
| |||||
(Cost $972,273) | ||||||
Investment Company — 1.68% | ||||||
| 1,566,378 | JPMorgan Prime Money Market Fund | 1,566,378 | ||||
|
| |||||
Total Investment Company | 1,566,378 | |||||
|
| |||||
(Cost $1,566,378) | ||||||
Total Investments | $ | 93,574,864 | ||||
(Cost $88,996,915)(d) — 100.42% | ||||||
Liabilities in excess of other assets — (0.42)% | (389,056 | ) | ||||
|
| |||||
NET ASSETS — 100.00% | $ | 93,185,808 | ||||
|
| |||||
| * | Non-income producing security. |
| (a) | Fair valued security under procedures established by the Fund’s Board of Trustees. |
| (b) | This security is restricted and illiquid as the security may not be offered or sold within the United States or to U.S. persons except to qualified purchasers who are also either qualified institutional buyers or “accredited investors” (as defined in Rule 501 (a) of Regulation D under the Securities Act of 1933). |
The total investment in restricted and illiquid securities representing $601,862 or 0.65% of net assets was as follows:
| Acquisition Shares | Issuer | Acquisition Date | Acquisition Cost | 9/30/11 Carrying Value Per Unit | ||||||||||||||
| 111,456 | Allied Defense Group, Inc. (The) | 12/21/2007 | $ | 667,484 | $ | 5.40 | ||||||||||||
| 6,203 | U.S. Concrete, Inc., Warrants | 09/09/2010 | $ | — | $ | — | ||||||||||||
| 6,203 | U.S. Concrete, Inc., Warrants | 09/09/2010 | $ | — | $ | — | ||||||||||||
| (c) | Security delisted or issuer in bankruptcy. |
| (d) | See notes to financial statements for the tax cost of securities and the breakdown of unrealized appreciation (depreciation). |
Abbreviations used are defined below:
REIT - Real Estate Investment Trust
See notes to financial statements.
27
SCHEDULE OF PORTFOLIO INVESTMENTS
|
RBC Small Cap Core Fund
| September 30, 2011 | ||||||
| Shares | Value | |||||
Common Stocks — 99.17% |
| |||||
Consumer Discretionary — 20.52% |
| |||||
| 27,500 | Ascena Retail Group, Inc.* | $ | 744,425 | |||
| 89,219 | Benihana, Inc., Class A* | 768,176 | ||||
| 332,500 | Casual Male Retail Group, Inc.* | 1,250,200 | ||||
| 24,700 | Drew Industries, Inc. | 493,506 | ||||
| 26,600 | Grand Canyon Education, Inc.* | 429,590 | ||||
| 12,800 | Maidenform Brands, Inc.* | 299,648 | ||||
| 51,023 | RG Barry Corp. | 540,844 | ||||
| 46,400 | Sally Beauty Holdings, Inc.* | 770,240 | ||||
| 56,907 | Steinway Musical Instruments* | 1,226,915 | ||||
| 17,775 | Steven Madden Ltd.* | 535,027 | ||||
| 29,800 | True Religion Apparel, Inc.* | 803,408 | ||||
| 72,323 | Universal Electronics, Inc.* | 1,185,374 | ||||
|
| |||||
| 9,047,353 | ||||||
|
| |||||
Consumer Staples — 1.26% |
| |||||
| 20,700 | Nash Finch Co. | 557,451 | ||||
|
| |||||
Energy — 7.65% |
| |||||
| 3,500 | CARBO Ceramics, Inc. | 358,855 | ||||
| 13,300 | Energen Corp. | 543,837 | ||||
| 23,500 | GeoResources, Inc.* | 418,065 | ||||
| 16,100 | Gulfport Energy Corp* | 389,298 | ||||
| 6,100 | OYO Geospace Corp.* | 343,369 | ||||
| 40,500 | World Fuel Services Corp. | 1,322,325 | ||||
|
| |||||
| 3,375,749 | ||||||
|
| |||||
Financials — 12.26% |
| |||||
| 34,600 | Amerisafe, Inc.* | 636,986 | ||||
| 54,500 | Ares Capital Corp. | 750,465 | ||||
| 46,327 | Asta Funding, Inc. | 375,712 | ||||
| 84,000 | Compass Diversified Holdings | 1,023,120 | ||||
| 46,525 | Delphi Financial Group, Inc., Class A | 1,001,218 | ||||
| 26,500 | LaSalle Hotel Properties REIT | 508,800 | ||||
| 12,600 | ProAssurance Corp. | 907,452 | ||||
| 21,500 | SeaBright Insurance Holdings, Inc. | 154,800 | ||||
| 4,072 | TriCo Bancshares | 49,963 | ||||
|
| |||||
| 5,408,516 | ||||||
|
| |||||
Health Care — 5.92% |
| |||||
| 42,600 | BioScrip, Inc.* | 270,936 | ||||
| 20,700 | Masimo Corp.* | 448,155 | ||||
| 18,000 | Meridian Bioscience, Inc. | 283,320 | ||||
| 23,175 | PSS World Medical, Inc.* | 456,316 | ||||
| 10,600 | Thoratec Corp.* | 345,984 | ||||
| 21,700 | West Pharmaceutical Services, Inc. | 805,070 | ||||
|
| |||||
| 2,609,781 | ||||||
|
| |||||
28
SCHEDULE OF PORTFOLIO INVESTMENTS
|
RBC Small Cap Core Fund (cont.)
| September 30, 2011 | ||||||
| Shares | Value | |||||
Industrials — 26.97% |
| |||||
| 37,414 | Acacia Research - Acacia Technologies* | $ | 1,346,530 | |||
| 71,000 | ACCO Brands Corp.* | 338,670 | ||||
| 5,800 | American Science & Engineering, Inc. | 354,090 | ||||
| 9,900 | Astronics Corp.* | 279,675 | ||||
| 860 | Astronics Corp., Class B* | 23,693 | ||||
| 16,200 | Atlas Air Worldwide Holdings, Inc.* | 539,298 | ||||
| 29,708 | AZZ, Inc. | 1,151,779 | ||||
| 12,000 | Chart Industries, Inc.* | 506,040 | ||||
| 59,600 | Columbus McKinnon Corp.* | 653,216 | ||||
| 31,000 | Ducommun, Inc. | 464,380 | ||||
| 14,500 | EnerSys* | 290,290 | ||||
| 23,900 | Gardner Denver, Inc. | 1,518,845 | ||||
| 32,300 | Greenbrier Cos., Inc.* | 376,295 | ||||
| 51,600 | II-VI, Inc.* | 903,000 | ||||
| 38,000 | Insteel Industries, Inc. | 382,660 | ||||
| 56,300 | Interface, Inc., Class A | 667,718 | ||||
| 14,900 | Knoll, Inc. | 204,130 | ||||
| 10,600 | LB Foster Co., Class A | 235,638 | ||||
| 65,100 | Meritor, Inc.* | 459,606 | ||||
| 6,100 | Old Dominion Freight Line, Inc.* | 176,717 | ||||
| 21,300 | Sun Hydraulics Corp. | 434,094 | ||||
| 11,100 | Wabtec Corp. | 586,857 | ||||
|
| |||||
| 11,893,221 | ||||||
|
| |||||
Information Technology — 16.53% |
| |||||
| 43,500 | Aspen Technology, Inc.* | 664,245 | ||||
| 28,800 | Checkpoint Systems, Inc.* | 391,104 | ||||
| 23,239 | Computer Task Group, Inc.* | 259,580 | ||||
| 13,400 | Interactive Intelligence Group* | 363,810 | ||||
| 22,300 | InterDigital, Inc. | 1,038,734 | ||||
| 14,500 | Measurement Specialties, Inc.* | 376,420 | ||||
| 58,200 | NIC, Inc. | 666,390 | ||||
| 23,000 | Skyworks Solutions, Inc.* | 412,620 | ||||
| 52,200 | STEC, Inc.* | 529,308 | ||||
| 64,400 | Take-Two Interactive Software, Inc.* | 819,168 | ||||
| 36,800 | Tyler Technologies, Inc.* | 930,304 | ||||
| 90,300 | Xyratex Ltd. | 837,081 | ||||
|
| |||||
| 7,288,764 | ||||||
|
| |||||
Materials — 7.21% |
| |||||
| 7,800 | AMCOL International Corp. | 187,122 | ||||
| 30,400 | Koppers Holdings, Inc. | 778,544 | ||||
| 93,400 | Omnova Solutions, Inc.* | 334,372 | ||||
| 8,300 | Rockwood Holdings, Inc.* | 279,627 | ||||
| 8,400 | Schweitzer-Mauduit International, Inc. | 469,308 | ||||
| 44,391 | Universal Stainless & Alloy* | 1,128,419 | ||||
|
| |||||
| 3,177,392 | ||||||
|
| |||||
29
SCHEDULE OF PORTFOLIO INVESTMENTS
|
RBC Small Cap Core Fund (cont.)
| September 30, 2011 | ||||||
| Shares | Value | |||||
Utilities — 0.85% |
| |||||
| 10,400 | Unisource Energy Corp. | $ | 375,336 | |||
|
| |||||
Total Common Stocks | 43,733,563 | |||||
|
| |||||
(Cost $38,524,873) | ||||||
Investment Company — 1.88% | ||||||
| 828,247 | JPMorgan Prime Money Market Fund | 828,247 | ||||
|
| |||||
Total Investment Company | 828,247 | |||||
|
| |||||
(Cost $828,247) | ||||||
Total Investments | $ | 44,561,810 | ||||
(Cost $39,353,120)(a) — 101.05% | ||||||
Liabilities in excess of other assets — (1.05)% | (462,730 | ) | ||||
|
| |||||
NET ASSETS — 100.00% | $ | 44,099,080 | ||||
|
| |||||
| * | Non-income producing security. |
| (a) | See notes to financial statements for the tax cost of securities and the breakdown of unrealized appreciation (depreciation). |
Abbreviations used are defined below:
REIT - Real Estate Investment Trust
See notes to financial statements.
30
SCHEDULE OF PORTFOLIO INVESTMENTS
|
RBC Microcap Value Fund
| September 30, 2011 | ||||||
| Shares | Value | |||||
Common Stocks — 97.83% |
| |||||
Consumer Discretionary — 20.54% |
| |||||
| 81,000 | Adams Golf, Inc.* | $ | 437,400 | |||
| 3,725 | Ambassadors International, Inc.* | 205 | ||||
| 14,500 | America’s Car-Mart, Inc.* | 420,790 | ||||
| 29,000 | Arctic Cat, Inc.* | 420,210 | ||||
| 28,000 | Asbury Automotive Group, Inc.* | 461,720 | ||||
| 59,000 | Audiovox Corp., Class A* | 323,910 | ||||
| 66,000 | Benihana, Inc., Class A* | 568,260 | ||||
| 800 | Biglari Holdings, Inc.* | 237,112 | ||||
| 54,000 | Bluegreen Corp.* | 113,400 | ||||
| 7,000 | Blyth, Inc. | 388,150 | ||||
| 46,000 | Books-A-Million, Inc. | 106,720 | ||||
| 15,127 | Bowl America, Inc., Class A | 191,659 | ||||
| 47,500 | Build-A-Bear Workshop, Inc.* | 242,250 | ||||
| 44,000 | Carriage Services, Inc. | 259,600 | ||||
| 35,000 | Christopher & Banks Corp. | 123,550 | ||||
| 12,000 | Core-Mark Holding Co., Inc.* | 367,560 | ||||
| 89,000 | Craftmade International, Inc.* | 195,800 | ||||
| 24,000 | CSS Industries, Inc. | 400,320 | ||||
| 38,000 | Delta Apparel, Inc.* | 598,500 | ||||
| 12,700 | Dorman Products, Inc.* | 420,116 | ||||
| 17,500 | Duckwall-ALCO Stores, Inc.* | 163,800 | ||||
| 23,000 | Entercom Communications Corp., Class A* | 120,750 | ||||
| 28,000 | Flexsteel Industries | 419,440 | ||||
| 36,000 | Fred’s, Inc., Class A | 383,760 | ||||
| 70,000 | Golfsmith International Holdings, Inc.* | 234,500 | ||||
| 11,000 | Group 1 Automotive, Inc. | 391,050 | ||||
| 58,000 | Hastings Entertainment, Inc.* | 171,100 | ||||
| 15,000 | Helen of Troy Ltd.* | 376,800 | ||||
| 31,000 | Hooker Furniture Corp. | 280,550 | ||||
| 50,000 | HOT Topic, Inc. | 381,500 | ||||
| 52,800 | Isle of Capri Casinos, Inc.* | 255,552 | ||||
| 27,800 | Jakks Pacific, Inc. | 526,810 | ||||
| 24,000 | Johnson Outdoors, Inc., Class A* | 369,120 | ||||
| 82,000 | Journal Communications, Inc., Class A* | 243,540 | ||||
| 36,000 | Kid Brands, Inc.* | 95,040 | ||||
| 50,310 | Lakeland Industries, Inc.* | 392,418 | ||||
| 95,270 | Lazare Kaplan International, Inc.* | 238,175 | ||||
| 47,000 | La-Z-Boy, Inc.* | 348,270 | ||||
| 31,000 | Lifetime Brands, Inc. | 298,840 | ||||
| 32,000 | Lithia Motors, Inc., Class A | 460,160 | ||||
| 46,000 | Luby’s, Inc.* | 188,600 | ||||
| 33,000 | Mac-Gray Corp. | 426,030 | ||||
| 33,000 | Marcus Corp. | 328,350 | ||||
| 19,000 | MarineMax, Inc.* | 122,930 | ||||
| 53,000 | McCormick & Schmick’s Seafood Restaurants, Inc.* | 366,760 | ||||
| 7,500 | McRae Industries, Inc., Class A | 97,350 | ||||
31
SCHEDULE OF PORTFOLIO INVESTMENTS
|
RBC Microcap Value Fund (cont.)
September 30, 2011 |
| |||||
| Shares | Value | |||||
| 26,000 | Media General, Inc., Class A* | $ 49,660 | ||||
| 13,800 | Meritage Homes Corp.* | 208,932 | ||||
| 21,300 | Mestek, Inc.* | 195,960 | ||||
| 20,000 | Modine Manufacturing Co.* | 181,200 | ||||
| 23,400 | Movado Group, Inc. | 285,012 | ||||
| 10,300 | Nobility Homes, Inc.* | 67,980 | ||||
| 32,000 | O’Charleys, Inc.* | 190,080 | ||||
| 41,000 | Orleans Homebuilders, Inc.*(a)(b)(c) | 0 | ||||
| 18,350 | Perry Ellis International, Inc.* | 344,980 | ||||
| 135,000 | Point.360* | 76,950 | ||||
| 90,600 | Radio One, Inc., Class D* | 111,438 | ||||
| 56,000 | Red Lion Hotels Corp.* | 375,760 | ||||
| 35,550 | Rex Stores Corp.* | 600,084 | ||||
| 40,000 | Rocky Brands, Inc.* | 397,200 | ||||
| 34,000 | Ruby Tuesday, Inc.* | 243,440 | ||||
| 16,000 | Saga Communications, Inc., Class A* | 472,160 | ||||
| 45,150 | Salem Communications Corp., Class A | 103,393 | ||||
| 45,000 | Shiloh Industries, Inc. | 403,650 | ||||
| 30,000 | Stage Stores, Inc. | 416,100 | ||||
| 44,000 | Standard Motor Products, Inc. | 570,680 | ||||
| 33,000 | Stein Mart, Inc. | 206,250 | ||||
| 26,000 | Steinway Musical Instruments* | 560,560 | ||||
| 80,000 | Stewart Enterprises, Inc., Class A | 476,000 | ||||
| 17,000 | Strattec Security Corp. | 407,660 | ||||
| 6,000 | Sturm Ruger & Co, Inc. | 155,880 | ||||
| 24,000 | Superior Industries International, Inc. | 370,800 | ||||
| 20,000 | Syms Corp.* | 175,400 | ||||
| 37,000 | Systemax, Inc.* | 470,640 | ||||
| 75,000 | Trans World Entertainment Corp.* | 142,500 | ||||
| 38,000 | Tuesday Morning Corp.* | 133,760 | ||||
| 30,000 | Universal Travel Group*(a)(c) | 0 | ||||
| 20,000 | Walking Co. Holdings, Inc. (The)* | 60,000 | ||||
| 12,400 | Weyco Group, Inc. | 276,520 | ||||
|
| |||||
| 22,689,056 | ||||||
|
| |||||
Consumer Staples — 4.24% |
| |||||
| 14,600 | Andersons, Inc. (The) | 491,436 | ||||
| 61,000 | Central Garden and Pet Co.* | 420,900 | ||||
| 36,000 | Chiquita Brands International, Inc.* | 300,240 | ||||
| 27,000 | Elizabeth Arden, Inc.* | 767,880 | ||||
| 34,000 | Ingles Markets, Inc., Class A | 484,160 | ||||
| 73,000 | ML Macadamia Orchards LP* | 178,850 | ||||
| 10,000 | Nash Finch Co. | 269,300 | ||||
| 8,000 | Oil-Dri Corp. of America | 148,640 | ||||
| 63,000 | Omega Protein Corp.* | 572,040 | ||||
| 40,000 | Prestige Brands Holdings, Inc.* | 362,000 | ||||
32
SCHEDULE OF PORTFOLIO INVESTMENTS |
RBC Microcap Value Fund (cont.)
September 30, 2011
| Shares | Value | |||||
| 31,000 | Schiff Nutrition International, Inc.* | $ 343,480 | ||||
| 22,000 | Spartan Stores, Inc. | 340,560 | ||||
|
| |||||
| 4,679,486 | ||||||
|
| |||||
Energy — 3.06% |
| |||||
| 29,000 | Calumet Specialty Products Partners LP | 491,260 | ||||
| 31,000 | Constellation Energy Partners LLC* | 86,180 | ||||
| 9,000 | Global Partners LP | 158,220 | ||||
| 57,000 | Harvest Natural Resources, Inc.* | 488,490 | ||||
| 17,000 | Hornbeck Offshore Services, Inc.* | 423,470 | ||||
| 34,000 | Knightsbridge Tankers Ltd. | 562,700 | ||||
| 19,000 | Natural Gas Services Group, Inc.* | 243,770 | ||||
| 30,000 | Newpark Resources, Inc.* | 182,700 | ||||
| 30,000 | North American Energy Partners, Inc.* | 174,600 | ||||
| 14,600 | PHI, Inc.* | 246,740 | ||||
| 13,000 | PHI, Inc., Non voting* | 248,820 | ||||
| 14,000 | Teekay Tankers, Ltd., Class A | 64,400 | ||||
| 110,300 | Trico Marine Services, Inc.* | 6,287 | ||||
|
| |||||
| 3,377,637 | ||||||
|
| |||||
| Financials — 22.82% | ||||||
| 70,000 | 21st Century Holding Co.* | 163,100 | ||||
| 40,000 | Affirmative Insurance Holdings, Inc.* | 64,400 | ||||
| 9,000 | Agree Realty Corp. REIT | 196,020 | ||||
| 55,000 | American Equity Investment Life Holding Co. | 481,250 | ||||
| 75,000 | American Independence Corp.* | 366,000 | ||||
| 23,000 | American Safety Insurance Holdings Ltd.* | 423,200 | ||||
| 34,190 | Ameris Bancorp* | 297,795 | ||||
| 68,000 | Asta Funding, Inc. | 551,480 | ||||
| 20,000 | Baldwin & Lyons, Inc., Class B | 427,400 | ||||
| 14,000 | Banco Latinoamericano de Comercio Exterior SA | 213,220 | ||||
| 63,600 | Bancorp, Inc.* | 455,376 | ||||
| 8,228 | Banner Corp. | 105,236 | ||||
| 100,000 | Beverly Hills Bancorp, Inc.* | 2,000 | ||||
| 38,000 | California First National Bancorp | 581,780 | ||||
| 21,000 | Camco Financial Corp.* | 24,990 | ||||
| 5,200 | Capital Southwest Corp. | 384,800 | ||||
| 38,000 | Capitol Bancorp Ltd.* | 3,116 | ||||
| 15,750 | Citizens South Banking Corp. | 65,205 | ||||
| 48,150 | Citizens, Inc.* | 308,641 | ||||
| 133,000 | Consumer Portfolio Services* | 131,670 | ||||
| 36,856 | Cowen Group, Inc., Class A* | 99,880 | ||||
| 15,000 | CYS Investments, Inc. | 181,350 | ||||
| 35,777 | Donegal Group, Inc., Class A | 430,755 | ||||
| 8,444 | Donegal Group, Inc., Class B | 122,438 | ||||
| 3,000 | Duff & Phelps Corp., Class A | 31,980 | ||||
| 58,040 | Dynex Capital, Inc. REIT | 467,802 | ||||
| 37,000 | Edelman Financial Group, Inc. | 239,020 | ||||
33
SCHEDULE OF PORTFOLIO INVESTMENTS |
RBC Microcap Value Fund (cont.)
September 30, 2011
| Shares | Value | |||||
| 27,000 | EMC Insurance Group, Inc. | $496,800 | ||||
| 20,000 | Federal Agricultural Mortgage Corp., Class C | 380,600 | ||||
| 34,300 | First Defiance Financial Corp.* | 459,620 | ||||
| 11,000 | First Financial Corp. | 302,610 | ||||
| 45,400 | First Financial Holdings, Inc. | 182,054 | ||||
| 54,000 | First Industrial Realty Trust, Inc. REIT* | 432,000 | ||||
| 54,000 | First Merchants Corp. | 380,700 | ||||
| 47,200 | First Pactrust Bancorp, Inc. | 534,776 | ||||
| 38,000 | First Place Financial Corp.* | 34,200 | ||||
| 42,000 | First State Bancorp* | 420 | ||||
| 25,000 | Firstcity Financial Corp.* | 166,250 | ||||
| 6,600 | Flagstar Bancorp, Inc.* | 3,233 | ||||
| 45,000 | FNB United Corp.* | 13,500 | ||||
| 16,500 | FPIC Insurance Group, Inc.* | 690,360 | ||||
| 2,250 | FRMO Corp.* | 4,950 | ||||
| 45,000 | Gladstone Investment Corp. | 306,000 | ||||
| 50,400 | Green Bankshares, Inc.* | 64,008 | ||||
| 78,000 | Guaranty Bancorp* | 93,600 | ||||
| 52,528 | Hercules Technology Growth Capital, Inc. | 447,539 | ||||
| 38,000 | HF Financial Corp. | 326,040 | ||||
| 36,000 | Independence Holding Co. | 261,000 | ||||
| 13,000 | Indiana Community Bancorp | 192,400 | ||||
| 10,000 | Infinity Property & Casualty Corp. | 524,800 | ||||
| 31,000 | Intervest Bancshares Corp., Class A* | 83,080 | ||||
| 8,300 | Investors Title Co. | 291,911 | ||||
| 24,000 | Jefferson Bancshares, Inc.* | 64,560 | ||||
| 24,000 | JMP Group, Inc. | 139,440 | ||||
| 17,000 | Kansas City Life Insurance Co. | 524,790 | ||||
| 53,000 | Marlin Business Services Corp.* | 561,800 | ||||
| 98,000 | MCG Capital Corp. | 388,080 | ||||
| 68,750 | Meadowbrook Insurance Group, Inc. | 612,563 | ||||
| 62,000 | Medallion Financial Corp. | 576,600 | ||||
| 131,000 | MicroFinancial, Inc. | 733,600 | ||||
| 52,100 | MutualFirst Financial, Inc. | 385,540 | ||||
| 5,300 | National Security Group, Inc. | 57,452 | ||||
| 4,000 | National Western Life Insurance Co., Class A | 542,000 | ||||
| 11,400 | Navigators Group, Inc.* | 492,480 | ||||
| 43,000 | NGP Capital Resources Co. | 281,220 | ||||
| 44,000 | Nicholas Financial, Inc. | 429,880 | ||||
| 13,000 | One Liberty Properties, Inc. REIT | 190,580 | ||||
| 13,000 | Onebeacon Insurance Group, Ltd., Class A | 177,320 | ||||
| 6,000 | Oppenheimer Holdings, Inc., Class A | 96,240 | ||||
| 18,000 | Pacific Mercantile Bancorp* | 60,300 | ||||
| 16,000 | Parkway Properties, Inc. REIT | 176,160 | ||||
| 29,000 | Peoples Bancorp, Inc. | 319,000 | ||||
| 37,900 | PMC Commercial Trust REIT | 295,620 | ||||
| 40,000 | Presidential Life Corp. | 328,800 | ||||
| 39,705 | Prospect Capital Corp. | 333,919 |
34
SCHEDULE OF PORTFOLIO INVESTMENTS |
RBC Microcap Value Fund (cont.)
September 30, 2011
| Shares | Value | |||||
| 19,000 | Provident Financial Holdings, Inc. | $ 166,060 | ||||
| 20,000 | Ramco-Gershenson Properties Trust REIT | 164,000 | ||||
| 59,000 | Reis, Inc.* | 523,330 | ||||
| 25,000 | Resource America, Inc., Class A | 112,750 | ||||
| 11,000 | Safety Insurance Group, Inc. | 416,130 | ||||
| 42,000 | SeaBright Insurance Holdings, Inc. | 302,400 | ||||
| 109,000 | Signature Group Holdings, Inc.* | 42,510 | ||||
| 14,000 | Simmons First National Corp., Class A | 303,800 | ||||
| 32,000 | Southern Community Financial Corp.* | 37,120 | ||||
| 38,300 | Southwest Bancorp, Inc.* | 161,626 | ||||
| 25,000 | Sterling Bancorp NY | 181,500 | ||||
| 75,600 | Sun Bancorp, Inc.* | 200,340 | ||||
| 46,500 | SWS Group, Inc. | 218,085 | ||||
| 54,000 | TierOne Corp.* | 108 | ||||
| 61,800 | Unico American Corp. | 647,046 | ||||
| 99,716 | United Community Financial Corp.* | 136,611 | ||||
| 19,000 | United Western Bancorp, Inc.* | 2,090 | ||||
| 29,000 | Winthrop Realty Trust REIT | 252,010 | ||||
| 4,600 | Ziegler Cos., Inc. (The)* | 82,800 | ||||
|
| |||||
| 25,210,615 | ||||||
|
| |||||
Health Care — 6.40% |
| |||||
| 7,000 | Air Methods Corp.* | 445,690 | ||||
| 34,000 | Albany Molecular Research, Inc.* | 95,880 | ||||
| 128,000 | Allied Healthcare International, Inc.* | 491,520 | ||||
| 11,000 | American Shared Hospital Services* | 30,250 | ||||
| 40,000 | Angiodynamics, Inc.* | 525,600 | ||||
| 16,000 | Assisted Living Concepts, Inc., Class A | 202,720 | ||||
| 77,000 | BioScrip, Inc.* | 489,720 | ||||
| 32,000 | Cantel Medical Corp. | 675,840 | ||||
| 45,000 | Capital Senior Living Corp.* | 277,650 | ||||
| 24,000 | Conmed Corp.* | 552,240 | ||||
| 46,000 | Cross Country Healthcare, Inc.* | 192,280 | ||||
| 40,000 | CryoLife, Inc.* | 179,600 | ||||
| 27,970 | Hanger Orthopedic Group, Inc.* | 528,353 | ||||
| 20,313 | IntegraMed America, Inc.* | 161,082 | ||||
| 20,000 | Invacare Corp. | 460,800 | ||||
| 7,100 | Kewaunee Scientific Corp. | 51,262 | ||||
| 10,362 | Kindred Healthcare, Inc.* | 89,320 | ||||
| 30,000 | Lannett Co., Inc.* | 114,900 | ||||
| 15,000 | Medcath Corp.* | 208,200 | ||||
| 19,000 | Mediware Information Systems* | 217,360 | ||||
| 47,000 | PharMerica Corp.* | 670,690 | ||||
| 25,000 | Symmetry Medical, Inc.* | 193,000 | ||||
| 13,000 | Triple-S Management Corp., Class B* | 217,750 | ||||
|
| |||||
| 7,071,707 | ||||||
|
| |||||
35
SCHEDULE OF PORTFOLIO INVESTMENTS |
RBC Microcap Value Fund (cont.)
September 30, 2011
| Shares | Value | |||||
Industrials — 19.58% |
| |||||
| 45,839 | Aceto Corp. | $242,488 | ||||
| 24,000 | Alamo Group, Inc. | 498,960 | ||||
| 110,000 | Allied Motion Technologies, Inc. | 545,600 | ||||
| 8,000 | Altra Holdings, Inc.* | 92,560 | ||||
| 8,000 | Ampco-Pittsburgh Corp. | 163,600 | ||||
| 10,000 | Amrep Corp.* | 72,500 | ||||
| 31,000 | Beacon Roofing Supply, Inc.* | 495,690 | ||||
| 17,000 | CAI International, Inc.* | 199,240 | ||||
| 14,800 | Cascade Corp. | 494,172 | ||||
| 30,000 | CBIZ, Inc.* | 197,700 | ||||
| 48,000 | Celadon Group, Inc. | 426,240 | ||||
| 93,525 | Cenveo, Inc.* | 281,510 | ||||
| 2,800 | Chicago Rivet & Machine Co. | 44,128 | ||||
| 16,400 | CIRCOR International, Inc. | 481,668 | ||||
| 40,000 | Compx International, Inc. | 508,000 | ||||
| 13,000 | Consolidated Graphics, Inc.* | 474,890 | ||||
| 58,000 | Contra Mair Holdings, Inc.*(a)(b)(c) | 0 | ||||
| 20,000 | Dolan Co. (The)* | 179,800 | ||||
| 24,000 | Ducommun, Inc. | 359,520 | ||||
| 43,000 | Eagle Bulk Shipping, Inc.* | 67,510 | ||||
| 14,700 | Eastern Co. (The) | 268,275 | ||||
| 9,880 | Ecology and Environment, Inc., Class A | 156,302 | ||||
| 23,000 | Encore Wire Corp. | 473,340 | ||||
| 35,000 | Ennis, Inc. | 457,100 | ||||
| 14,000 | EnPro Industries, Inc.* | 415,520 | ||||
| 28,000 | Espey Manufacturing & Electronics Corp. | 649,320 | ||||
| 56,000 | Excel Maritime Carriers Ltd.* | 116,480 | ||||
| 30,000 | Federal Signal Corp. | 132,600 | ||||
| 69,000 | Frozen Food Express Industries* | 137,310 | ||||
| 21,000 | G&K Services, Inc., Class A | 536,340 | ||||
| 40,000 | Gibraltar Industries, Inc.* | 324,800 | ||||
| 35,000 | Griffon Corp.* | 286,300 | ||||
| 25,750 | Hardinge, Inc. | 212,180 | ||||
| 3,000 | Insituform Technologies, Inc., Class A* | 34,740 | ||||
| 23,350 | International Shipholding Corp. | 431,741 | ||||
| 26,000 | Jinpan International Ltd. | 206,440 | ||||
| 12,000 | Key Technology, Inc.* | 139,320 | ||||
| 33,000 | Kforce, Inc.* | 323,730 | ||||
| 40,000 | Kimball International, Inc., Class B | 194,400 | ||||
| 9,408 | Kratos Defense & Security Solutions, Inc.* | 63,222 | ||||
| 64,000 | LECG Corp.* | 1,024 | ||||
| 38,000 | LS Starrett Co., Class A | 410,400 | ||||
| 51,750 | LSI Industries, Inc. | 322,403 | ||||
| 52,000 | Lydall, Inc.* | 462,800 | ||||
| 22,875 | Marten Transport Ltd. | 394,365 | ||||
| 72,000 | Mesa Air Group, Inc.*(a)(b)(c) | 0 | ||||
36
SCHEDULE OF PORTFOLIO INVESTMENTS |
RBC Microcap Value Fund (cont.)
September 30, 2011
| Shares | Value | |||||
| 38,117 | Met-Pro Corp. | $ 327,044 | ||||
| 89,294 | MFC Industrial Ltd. | 647,382 | ||||
| 44,000 | Miller Industries, Inc. | 763,400 | ||||
| 34,000 | NN, Inc.* | 171,700 | ||||
| 18,800 | Northwest Pipe Co.* | 381,452 | ||||
| 82,000 | On Assignment, Inc.* | 579,740 | ||||
| 20,000 | Orion Marine Group, Inc.* | 115,400 | ||||
| 53,600 | PAM Transportation Services, Inc.* | 533,856 | ||||
| 52,000 | Paragon Shipping, Inc., Class A | 41,080 | ||||
| 43,160 | Patrick Industries, Inc.* | 80,278 | ||||
| 29,000 | RCM Technologies, Inc.* | 130,210 | ||||
| 36,500 | Rush Enterprises, Inc., Class A* | 516,840 | ||||
| 13,000 | Schawk, Inc. | 128,310 | ||||
| 13,800 | SL Industries, Inc.* | 232,530 | ||||
| 22,000 | Standex International Corp. | 684,860 | ||||
| 41,000 | Superior Uniform Group, Inc. | 460,840 | ||||
| 58,115 | Supreme Industries, Inc., Class A* | 119,717 | ||||
| 5,269 | Sykes Enterprises, Inc.* | 78,772 | ||||
| 31,000 | Tredegar Corp. | 459,730 | ||||
| 3,000 | Trex Co., Inc.* | 48,090 | ||||
| 17,000 | Universal Forest Products, Inc. | 408,850 | ||||
| 16,000 | USA Truck, Inc.* | 124,160 | ||||
| 38,000 | Vitran Corp., Inc.* | 150,100 | ||||
| 43,200 | Volt Information Sciences, Inc.* | 289,440 | ||||
| 102,000 | WCA Waste Corp.* | 432,480 | ||||
| 75,000 | Willdan Group, Inc.* | 279,750 | ||||
| 41,000 | Willis Lease Finance Corp.* | 465,350 | ||||
|
| |||||
| 21,627,589 | ||||||
|
| |||||
Information Technology — 11.57% |
| |||||
| 67,300 | Acorn Energy, Inc.* | 358,036 | ||||
| 31,000 | Agilysys, Inc.* | 221,030 | ||||
| 32,000 | Anaren, Inc.* | 612,800 | ||||
| 12,000 | Black Box Corp. | 256,200 | ||||
| 70,000 | Ciber, Inc.* | 212,100 | ||||
| 50,000 | Comarco, Inc.* | 12,000 | ||||
| 21,000 | Communications Systems, Inc. | 273,000 | ||||
| 82 | DG FastChannel, Inc.* | 1,390 | ||||
| 30,000 | Digi International, Inc.* | 330,000 | ||||
| 49,598 | Dynamics Research Corp.* | 442,414 | ||||
| 30,000 | Edgewater Technology, Inc.* | 69,900 | ||||
| 41,000 | Electro Rent Corp. | 566,210 | ||||
| 33,000 | Electro Scientific Industries, Inc.* | 392,370 | ||||
| 29,400 | ePlus, Inc.* | 725,298 | ||||
| 21,332 | GSI Group, Inc.* | 163,830 | ||||
| 19,000 | GTSI Corp.* | 87,400 | ||||
| 32,000 | Infospace, Inc.* | 267,520 | ||||
| 52,000 | Insight Enterprises, Inc.* | 787,280 | ||||
37
SCHEDULE OF PORTFOLIO INVESTMENTS |
RBC Microcap Value Fund (cont.)
September 30, 2011
| Shares | Value | |||||
| 68,375 | Integrated Silicon Solution, Inc.* | $ 534,009 | ||||
| 33,000 | Keynote Systems, Inc. | 697,290 | ||||
| 21,000 | Magal Security Systems Ltd.* | 48,720 | ||||
| 22,000 | Measurement Specialties, Inc.* | 571,120 | ||||
| 56,000 | Methode Electronics, Inc. | 416,080 | ||||
| 45,000 | Newport Corp.* | 486,450 | ||||
| 29,000 | Oplink Communications, Inc.* | 439,060 | ||||
| 83,000 | Optical Cable Corp. | 266,430 | ||||
| 73,000 | PC Connection, Inc.* | 582,540 | ||||
| 67,000 | Perceptron, Inc.* | 363,810 | ||||
| 120,000 | Performance Technologies, Inc.* | 236,400 | ||||
| 37,930 | Photronics, Inc.* | 188,891 | ||||
| 28,000 | Retalix Ltd.* | 376,600 | ||||
| 47,000 | Richardson Electronics Ltd. | 639,670 | ||||
| 9,000 | Rosetta Stone, Inc.* | 82,350 | ||||
| 29,000 | Rudolph Technologies, Inc.* | 194,010 | ||||
| 70,000 | Sigmatron International, Inc.* | 231,700 | ||||
| 31,500 | Tessco Technologies, Inc. | 418,635 | ||||
| 30,000 | WebMediaBrands, Inc.* | 19,200 | ||||
| 100,000 | WPCS International, Inc.* | 205,000 | ||||
|
| |||||
| 12,776,743 | ||||||
|
| |||||
Materials — 4.69% |
| |||||
| 70,200 | American Pacific Corp.* | 514,566 | ||||
| 37,000 | Blue Earth Refineries, Inc.* | 13,320 | ||||
| 24,000 | Buckeye Technologies, Inc. | 578,640 | ||||
| 20,000 | China Green Agriculture, Inc.* | 95,800 | ||||
| 18,000 | Friedman Industries | 157,320 | ||||
| 5,000 | Hawkins, Inc. | 159,200 | ||||
| 50,000 | Headwaters, Inc.* | 72,000 | ||||
| 31,000 | Innospec, Inc.* | 750,510 | ||||
| 25,000 | Myers Industries, Inc. | 253,750 | ||||
| 10,400 | North American Palladium Ltd.* | 26,520 | ||||
| 21,000 | Olympic Steel, Inc. | 355,740 | ||||
| 38,000 | Penford Corp.* | 195,320 | ||||
| 6,000 | Quaker Chemical Corp. | 155,520 | ||||
| 29,000 | Schulman (A), Inc. | 492,710 | ||||
| 45,000 | Spartech Corp.* | 144,000 | ||||
| 8,000 | Stepan Co. | 537,440 | ||||
| 16,000 | Universal Stainless & Alloy* | 406,720 | ||||
| 3,200 | Vulcan International Corp. | 108,000 | ||||
| 25,000 | Wausau Paper Corp. | 159,750 | ||||
|
| |||||
| 5,176,826 | ||||||
|
| |||||
38
SCHEDULE OF PORTFOLIO INVESTMENTS |
RBC Microcap Value Fund (cont.)
September 30, 2011
| Shares | Value | |||||
Telecommunication Services — 0.92% |
| |||||
| 30,000 | Premiere Global Services, Inc.* | $ 192,600 | ||||
| 41,000 | SureWest Communications | 429,270 | ||||
| 30,000 | USA Mobility, Inc. | 396,000 | ||||
|
| |||||
| 1,017,870 | ||||||
|
| |||||
Utilities — 4.01% |
| |||||
| 9,000 | American States Water Co. | 305,370 | ||||
| 6,108 | California Water Service Group | 108,173 | ||||
| 11,000 | CH Energy Group, Inc. | 573,870 | ||||
| 16,990 | Chesapeake Utilities Corp. | 681,469 | ||||
| 21,500 | Connecticut Water Service, Inc. | 537,930 | ||||
| 9,000 | Delta Natural Gas Co., Inc. | 275,400 | ||||
| 18,600 | Empire District Electric Co. (The) | 360,468 | ||||
| 28,400 | Middlesex Water Co. | 484,788 | ||||
| 13,000 | RGC Resources, Inc. | 247,000 | ||||
| 17,800 | SJW Corp. | 387,506 | ||||
| 18,476 | Unitil Corp. | 474,464 | ||||
|
| |||||
| 4,436,438 | ||||||
|
| |||||
Total Common Stocks | 108,063,967 | |||||
|
| |||||
| (Cost $142,884,938) | ||||||
Preferred Stock — 0.54% |
| |||||
| 3,122 | Alere, Inc.* | 599,424 | ||||
|
| |||||
Total Preferred Stock | 599,424 | |||||
|
| |||||
| (Cost $504,723) | ||||||
Exchange Traded Funds — 0.20% |
| |||||
| 2,700 | iShares Russell Microcap Index Fund | 106,245 | ||||
| 13,400 | PowerShares Zacks Micro Cap Portfolio | 117,786 | ||||
|
| |||||
Total Exchange Traded Funds | 224,031 | |||||
|
| |||||
| (Cost $210,668) | ||||||
Rights/Warrants — 0.00% | ||||||
| 1,232 | Aventine Renewable Energy Holdings, Inc. Warrants, Expire 3/15/15*(a)(c) | 0 | ||||
| 3,585 | US Concrete, Inc. Warrants, Expire 8/31/17*(a)(b)(c) | 0 | ||||
| 3,585 | US Concrete, Inc. Warrants, Expire 8/31/17*(a)(b)(c) | 0 | ||||
|
| |||||
Total Rights/Warrants | 0 | |||||
|
| |||||
| (Cost $0) | ||||||
39
SCHEDULE OF PORTFOLIO INVESTMENTS |
RBC Microcap Value Fund (cont.)
September 30, 2011
Principal Amount | Value | |||||
Corporate Bonds — 0.00% | ||||||
| $1947 | Trenwick America Corp.*(a)(b)(c) | $0 | ||||
| 1625 | Trenwick America Corp.*(a)(b)(c) | 0 | ||||
|
| |||||
Total Corporate Bonds | 0 | |||||
|
| |||||
(Cost $0) | ||||||
Shares | ||||||
Investment Company — 1.44% | ||||||
| 1,584,484 | JPMorgan Prime Money Market Fund | 1,584,484 | ||||
|
| |||||
Total Investment Company | 1,584,484 | |||||
|
| |||||
(Cost $1,584,484) | ||||||
Total Investments | $110,471,906 | |||||
(Cost $$145,184,813)(d) — 100.01% | ||||||
Liabilities in excess of other assets — (0.01)% | (15,957) | |||||
|
| |||||
NET ASSETS — 100.00% | $110,455,949 | |||||
|
| |||||
40
SCHEDULE OF PORTFOLIO INVESTMENTS |
RBC Microcap Value Fund (cont.)
September 30, 2011
| * | Non-income producing security. |
| (a) | This security is restricted and illiquid as the security may not be offered or sold within the United States or to U.S. persons except to qualified purchasers who are also either qualified institutional buyers or “accredited investors” (as defined in Rule 501 (a) of Regulation D under the Securities Act of 1933). The total investment in restricted and illiquid securities representing $0 or 0.00% of net assets was as follows: |
Acquisition Shares | Issuer | Acquisition Date | Acquisition Cost | 9/30/11 Carrying Value Per Unit | ||||
Aventine Renewable | ||||||||
1,232 | Energy Holdings,Inc., Warrants | 04/14/2010 | $ — | $— | ||||
58,000 | Contra Mair Holdings, Inc. | 09/04/2008 | $ 6,960 | $— | ||||
72,000 | Mesa Air Group, Inc. | 11/01/2006 | $635,933 | $— | ||||
41,000 | Orleans Homebuilders, Inc. | 12/12/2006 | $685,227 | $— | ||||
3,585 | U.S. Concrete, Inc., Warrants | 09/09/2010 | $ — | $— | ||||
3,585 | U.S. Concrete, Inc., Warrants | 09/09/2010 | $ — | $— | ||||
30,000 | Universal Travel Group | 09/13/2010 | $157,113 | $— | ||||
Acquisition Principal Amount | ||||||||
$1,947 | Trenwick America Corp. | 05/18/2006 | $ — | $— | ||||
$1,625 | Trenwick America Corp. | 05/18/2006 | $ — | $— | ||||
| (b) | Security delisted or issuer in bankruptcy. |
| (c) | Fair valued security under procedures established by the Fund’s Board of Trustees. |
| (d) | See notes to financial statements for the tax cost of securities and the breakdown of unrealized appreciation (depreciation). |
Abbreviations used are defined below:
REIT - Real Estate Investment Trust
See notes to financial statements.
41
SCHEDULE OF PORTFOLIO INVESTMENTS |
RBC Mid Cap Value Fund
September 30, 2011
| Shares | Value | |||||
Common Stocks — 100.73% |
| |||||
Consumer Discretionary — 13.46% |
| |||||
| 920 | Ascena Retail Group, Inc.* | $ 24,904 | ||||
| 1,250 | Jarden Corp. | 35,325 | ||||
| 970 | Kohl’s Corp. | 47,627 | ||||
| 1,460 | Mattel, Inc. | 37,799 | ||||
| 2,090 | Tenneco, Inc.* | 53,525 | ||||
| 700 | TRW Automotive Holdings Corp.* | 22,911 | ||||
| 10 | VF Corp. | 1,215 | ||||
|
| |||||
| 223,306 | ||||||
|
| |||||
Consumer Staples — 0.07% |
| |||||
| 50 | Conagra Foods, Inc. | 1,211 | ||||
|
| |||||
Energy — 9.02% |
| |||||
| 600 | Berry Petroleum Co., Class A | 21,228 | ||||
| 1,210 | Cameron International Corp.* | 50,263 | ||||
| 450 | Dresser-Rand Group, Inc.* | 18,239 | ||||
| 2,200 | Key Energy Services, Inc.* | 20,878 | ||||
| 240 | Peabody Energy Corp. | 8,131 | ||||
| 400 | Swift Energy Co.* | 9,736 | ||||
| 650 | World Fuel Services Corp. | 21,223 | ||||
|
| |||||
| 149,698 | ||||||
|
| |||||
Financials — 26.70% |
| |||||
| 270 | Ameriprise Financial, Inc. | 10,627 | ||||
| 3,690 | Ares Capital Corp. | 50,811 | ||||
| 1,020 | Comerica, Inc. | 23,429 | ||||
| 1,850 | Delphi Financial Group, Inc., Class A | 39,812 | ||||
| 3,600 | Fifth Third Bancorp | 36,360 | ||||
| 210 | First Niagara Financial Group, Inc. | 1,921 | ||||
| 1,530 | Hartford Financial Services Group, Inc. (The) | 24,694 | ||||
| 1,100 | HCC Insurance Holdings, Inc. | 29,755 | ||||
| 4,800 | Huntington Bancshares, Inc. | 23,040 | ||||
| 5,570 | KKR Financial Holdings LLC REIT | 41,385 | ||||
| 260 | LaSalle Hotel Properties REIT | 4,992 | ||||
| 1,300 | MFA Financial, Inc. REIT | 9,126 | ||||
| 2,140 | New York Community Bancorp, Inc. | 25,466 | ||||
| 4,460 | People’s United Financial, Inc. | 50,844 | ||||
| 310 | Principal Financial Group, Inc. | 7,028 | ||||
| 10 | ProAssurance Corp. | 720 | ||||
| 990 | Reinsurance Group of America, Inc. | 45,491 | ||||
| 500 | Starwood Property Trust, Inc. REIT | 8,580 | ||||
| 390 | Tower Group, Inc. | 8,915 | ||||
|
| |||||
| 442,996 | ||||||
|
| |||||
Health Care — 3.85% |
| |||||
| 420 | Humana, Inc. | 30,547 | ||||
42
SCHEDULE OF PORTFOLIO INVESTMENTS |
RBC Mid Cap Value Fund (cont.)
September 30, 2011
| Shares | Value | |||||
| 1,960 | Mylan, Inc.* | $ 33,320 | ||||
|
| |||||
| 63,867 | ||||||
|
| |||||
Industrials — 17.67% | ||||||
| 890 | Fluor Corp. | 41,429 | ||||
| 560 | Gardner Denver, Inc. | 35,588 | ||||
| 100 | JB Hunt Transport Services, Inc. | 3,612 | ||||
| 1,790 | Navistar International Corp.* | 57,495 | ||||
| 780 | Old Dominion Freight Line, Inc.* | 22,597 | ||||
| 510 | Regal-Beloit Corp. | 23,144 | ||||
| 1,650 | Republic Services, Inc. | 46,299 | ||||
| 330 | SPX Corp. | 14,952 | ||||
| 3,900 | Swift Transporation Co.* | 25,116 | ||||
| 1,100 | Werner Enterprises, Inc. | 22,913 | ||||
|
| |||||
| 293,145 | ||||||
|
| |||||
Information Technology — 10.12% | ||||||
| 2,260 | Avnet, Inc.* | 58,941 | ||||
| 1,200 | Fairchild Semiconductor International, Inc.* | 12,960 | ||||
| 890 | Harris Corp. | 30,411 | ||||
| 890 | Ingram Micro, Inc., Class A* | 14,356 | ||||
| 960 | SanDisk Corp.* | 38,736 | ||||
| 1,220 | Seagate Technology Plc | 12,542 | ||||
|
| |||||
| 167,946 | ||||||
|
| |||||
Materials — 16.42% | ||||||
| 850 | Ashland, Inc. | 37,519 | ||||
| 590 | Celanese Corp., Class A | 19,193 | ||||
| 1,160 | Crown Holdings, Inc.* | 35,508 | ||||
| 254 | Cytec Industries, Inc. | 8,926 | ||||
| 180 | Eastman Chemical Co. | 12,335 | ||||
| 1,110 | International Paper Co. | 25,807 | ||||
| 1,930 | Owens-Illinois, Inc.* | 29,182 | ||||
| 770 | Reliance Steel & Aluminum Co. | 26,188 | ||||
| 1,390 | Schweitzer-Mauduit International, Inc. | 77,659 | ||||
|
| |||||
| 272,317 | ||||||
|
| |||||
Utilities — 3.42% | ||||||
| 910 | Edison International | 34,807 | ||||
| 410 | EQT Corp. | 21,878 | ||||
|
| |||||
| 56,685 | ||||||
|
| |||||
Total Common Stocks | 1,671,171 | |||||
|
| |||||
(Cost $2,010,086) | ||||||
43
SCHEDULE OF PORTFOLIO INVESTMENTS |
RBC Mid Cap Value Fund (cont.)
| September 30, 2011 | ||||||
| Shares | Value | |||||
Investment Company — 0.31% | ||||||
| 5,246 | JPMorgan Prime Money Market Fund | $5,246 | ||||
| ||||||
Total Investment Company | 5,246 | |||||
|
| |||||
(Cost $5,246) | ||||||
Total Investments | $1,676,417 | |||||
(Cost $2,015,332)(a) — 101.04% | ||||||
Liabilities in excess of other assets — (1.04)% | (17,317) | |||||
|
| |||||
NET ASSETS — 100.00% | $1,659,100 | |||||
|
| |||||
| * | Non-income producing security. |
| (a) | See notes to financial statements for the tax cost of securities and the breakdown of unrealized appreciation (depreciation). |
Abbreviations used are defined below:
REIT - Real Estate Investment Trust
See notes to financial statements.
44
|
This Page Intentionally Left Blank
45
|
Statements of Assets and Liabilities
| September 30, 2011 | ||||||||||||||||||||
| RBC SMID Cap Growth Fund | RBC Enterprise Fund | RBC Small Cap Core Fund | RBC Microcap Value Fund | RBC Mid Cap Value Fund | ||||||||||||||||
Assets: | ||||||||||||||||||||
Investments, at value (cost $48,776,024, $88,996,915, $39,353,120, $145,184,813 and $2,015,332, respectively) | $ | 59,431,967 | $ | 93,574,864 | $ | 44,561,810 | $ | 110,471,906 | $ | 1,676,417 | ||||||||||
Interest and dividends receivable | 12,264 | 57,402 | 24,064 | 146,658 | 2,493 | |||||||||||||||
Receivable from advisor | — | — | — | — | 13,695 | |||||||||||||||
Receivable for capital shares issued | 1,808 | 100 | 7,869 | 8,721 | — | |||||||||||||||
Receivable for investments sold | — | 5,953 | 47,474 | — | 15,513 | |||||||||||||||
Prepaid expenses | 46,282 | 44,782 | 37,592 | 47,320 | 10,411 | |||||||||||||||
|
|
|
|
|
|
|
|
|
| |||||||||||
Total Assets | 59,492,321 | 93,683,101 | 44,678,809 | 110,674,605 | 1,718,529 | |||||||||||||||
|
|
|
|
|
|
|
|
|
| |||||||||||
Liabilities: | ||||||||||||||||||||
Payable for capital shares redeemed | 696,594 | 182,104 | 344,132 | 47,453 | — | |||||||||||||||
Payable for investments purchased | — | 167,752 | 166,490 | — | 19,160 | |||||||||||||||
Accrued expenses and other payables: | ||||||||||||||||||||
Investment advisory fees | 11,292 | 64,947 | 15,362 | 61,932 | — | |||||||||||||||
Administration fees | 4,167 | 6,768 | 3,182 | 7,615 | 118 | |||||||||||||||
Audit fees | 30,895 | 30,918 | 30,886 | 30,918 | 30,864 | |||||||||||||||
Trustees’ fees | 83 | 167 | 60 | 204 | 39 | |||||||||||||||
Distribution fees | 18,360 | 2,556 | 1,066 | 7,477 | — | |||||||||||||||
Shareholder reports | 1,867 | 4,263 | 1,222 | 6,081 | 3,174 | |||||||||||||||
Transfer agent fees | 27,413 | 30,128 | 10,588 | 47,700 | 600 | |||||||||||||||
Other | 6,912 | 7,690 | 6,741 | 9,276 | 5,474 | |||||||||||||||
|
|
|
|
|
|
|
|
|
| |||||||||||
Total Liabilities | 797,583 | 497,293 | 579,729 | 218,656 | 59,429 | |||||||||||||||
|
|
|
|
|
|
|
|
|
| |||||||||||
Net Assets | $ | 58,694,738 | $ | 93,185,808 | $ | 44,099,080 | $ | 110,455,949 | $ | 1,659,100 | ||||||||||
|
|
|
|
|
|
|
|
|
| |||||||||||
Net Assets Consist Of: | ||||||||||||||||||||
Capital | $ | 48,521,688 | $ | 100,265,685 | $ | 35,845,655 | $ | 164,888,140 | $ | 1,729,610 | ||||||||||
Undistributed net investment income (loss) | — | — | 1,127 | 679,432 | 16,834 | |||||||||||||||
Accumulated net realized gains (losses) from investment transactions and foreign currency | (482,893 | ) | (11,657,826 | ) | 3,043,608 | (20,398,716 | ) | 251,571 | ||||||||||||
Net unrealized appreciation (depreciation) on investments and foreign currency | 10,655,943 | 4,577,949 | 5,208,690 | (34,712,907 | ) | (338,915 | ) | |||||||||||||
|
|
|
|
|
|
|
|
|
| |||||||||||
Net Assets | $ | 58,694,738 | $ | 93,185,808 | $ | 44,099,080 | $ | 110,455,949 | $ | 1,659,100 | ||||||||||
|
|
|
|
|
|
|
|
|
| |||||||||||
Net Assets: | ||||||||||||||||||||
Class A | $ | 23,592,781 | $ | 1,320,100 | $ | 1,420,164 | $ | 3,851,626 | N/A | |||||||||||
Class I | 33,834,756 | 3,377,587 | N/A | N/A | $ | 1,659,100 | ||||||||||||||
Class C | 39,788 | 423,648 | 32,187 | 613,189 | N/A | |||||||||||||||
Class S | 1,227,413 | 88,064,473 | 42,646,729 | 105,991,134 | N/A | |||||||||||||||
|
|
|
|
|
|
|
|
|
| |||||||||||
Total | $ | 58,694,738 | $ | 93,185,808 | $ | 44,099,080 | $ | 110,455,949 | $ | 1,659,100 | ||||||||||
|
|
|
|
|
|
|
|
|
| |||||||||||
46
FINANCIAL STATEMENTS |
Statements of Assets and Liabilities (cont.)
| RBC SMID Cap Growth Fund | RBC Enterprise Fund | RBC Small Cap Core Fund | RBC Microcap Value Fund | RBC Mid Cap Value Fund | ||||||||||||||||
Shares Outstanding (Unlimited number of shares authorized, no par value): | ||||||||||||||||||||
Class A | 2,067,895 | 92,516 | 70,927 | 269,322 | N/A | |||||||||||||||
Class I | 2,832,254 | 232,437 | N/A | N/A | 176,090 | |||||||||||||||
Class C | 3,708 | 31,913 | 1,720 | 45,180 | N/A | |||||||||||||||
Class S | 102,736 | 6,059,064 | 2,081,034 | 7,398,128 | N/A | |||||||||||||||
|
|
|
|
|
|
|
|
|
| |||||||||||
Total | 5,006,593 | 6,415,930 | 2,153,681 | 7,712,630 | 176,090 | |||||||||||||||
|
|
|
|
|
|
|
|
|
| |||||||||||
Net Asset Values and Redemption Prices per Share: | ||||||||||||||||||||
Class A(a) | $ | 11.41 | $ | 14.27 | $ | 20.02 | $ | 14.30 | N/A | |||||||||||
|
|
|
|
|
|
|
|
|
| |||||||||||
Class I | $ | 11.95 | $ | 14.53 | N/A | N/A | $ | 9.42 | ||||||||||||
|
|
|
|
|
|
|
|
|
| |||||||||||
Class C(b) | $ | 10.73 | $ | 13.28 | $ | 18.72 | (c) | $ | 13.57 | N/A | ||||||||||
|
|
|
|
|
|
|
|
|
| |||||||||||
Class S | $ | 11.95 | $ | 14.53 | $ | 20.49 | $ | 14.33 | N/A | |||||||||||
|
|
|
|
|
|
|
|
|
| |||||||||||
Maximum Offering Price Per Share: | ||||||||||||||||||||
Class A | $ | 12.11 | $ | 15.14 | $ | 21.24 | $ | 15.17 | N/A | |||||||||||
|
|
|
|
|
|
|
|
|
| |||||||||||
Maximum Sales Charge - Class A | 5.75 | % | 5.75 | % | 5.75 | % | 5.75 | % | N/A | |||||||||||
|
|
|
|
|
|
|
|
|
| |||||||||||
| (a) | For Class A shares, redemption price per share will be reduced by 1.00% for sales of shares within 12 months of purchase (only applicable on purchases of $1 million or more on which no initial sales charge was paid). Such reduction is not reflected in the net asset value and the redemption price per share. |
| (b) | For Class C shares, redemption price per share will be reduced by 1.00% for sales of shares within 12 months of purchase. Such reduction is not reflected in the net asset value and the redemption price per share. |
| (c) | Net asset value is calculated using unrounded net assets of $32,187.49 divided by the unrounded shares oustanding of 1,719.561. |
See notes to financial statements.
47
FINANCIAL STATEMENTS |
| For the Year Ended September 30, 2011 | ||||||||||||||||||||
| RBC SMID Cap Growth Fund | RBC Enterprise Fund | RBC Small Cap Core Fund | RBC Microcap Value Fund | RBC Mid Cap Value Fund | ||||||||||||||||
Investment Income: | ||||||||||||||||||||
Dividend income | $ | 433,294 | $ | 1,228,757 | $ | 501,176 | $ | 2,303,239 | $ | 41,034 | ||||||||||
Foreign tax withholding | — | — | — | (3,339 | ) | — | ||||||||||||||
|
|
|
|
|
|
|
|
|
| |||||||||||
Total Investment Income | 433,294 | 1,228,757 | 501,176 | 2,299,900 | 41,034 | |||||||||||||||
|
|
|
|
|
|
|
|
|
| |||||||||||
Expenses: | ||||||||||||||||||||
Investment advisory fees | 503,600 | 1,334,584 | 516,428 | 1,311,819 | 14,198 | |||||||||||||||
Distribution fees - Class A | 69,542 | 4,842 | 2,104 | 14,800 | — | |||||||||||||||
Distribution fees - Class C | 499 | 5,698 | 598 | 8,372 | — | |||||||||||||||
Accounting fees | 28,729 | 32,288 | 27,742 | 32,424 | 25,070 | |||||||||||||||
Administration fees | 53,957 | 107,277 | 39,097 | 109,318 | 1,521 | |||||||||||||||
Audit fees | 39,931 | 39,970 | 39,918 | 39,976 | 38,171 | |||||||||||||||
Custodian fees | 3,461 | 5,108 | 3,614 | 4,906 | 8,897 | |||||||||||||||
Insurance fees | 6,301 | 6,301 | 6,301 | 6,301 | 6,301 | |||||||||||||||
Legal fees | 1,215 | 2,494 | 2,999 | 5,037 | 1,107 | |||||||||||||||
Registration and filing fees | 95,798 | 92,704 | 81,237 | 77,035 | 8,834 | |||||||||||||||
Shareholder reports | 9,609 | 14,321 | 6,538 | 22,746 | — | |||||||||||||||
Transfer agent fees | 220,173 | 234,335 | 71,091 | 319,960 | 3,982 | |||||||||||||||
Trustees’ fees | 1,639 | 3,277 | 1,209 | 3,361 | 18 | |||||||||||||||
Other fees | 8,767 | 9,989 | 7,647 | 23,459 | 5,249 | |||||||||||||||
|
|
|
|
|
|
|
|
|
| |||||||||||
Total expenses before fee waiver/reimbursement | 1,043,221 | 1,893,188 | 806,523 | 1,979,514 | 113,348 | |||||||||||||||
Expenses waived/reimbursed by: | ||||||||||||||||||||
Adviser | (181,809 | ) | (340,139 | ) | (256,458 | ) | (396,734 | ) | (95,094 | ) | ||||||||||
|
|
|
|
|
|
|
|
|
| |||||||||||
Net Expenses | 861,412 | 1,553,049 | 550,065 | 1,582,780 | 18,254 | |||||||||||||||
|
|
|
|
|
|
|
|
|
| |||||||||||
Net Investment Income (Loss) | (428,118 | ) | (324,292 | ) | (48,889 | ) | 717,120 | 22,780 | ||||||||||||
|
|
|
|
|
|
|
|
|
| |||||||||||
Realized/Unrealized Gains (Losses) from Investment Transactions: | ||||||||||||||||||||
Net realized gains from investment transactions | 5,801,079 | 17,004,371 | 6,052,352 | 6,597,636 | 307,140 | |||||||||||||||
Net realized losses from foreign currency | — | — | — | (1,467 | ) | — | ||||||||||||||
Net change in unrealized appreciation/depreciation on investments and foreign currency | (1,409,826 | ) | (8,347,648 | ) | (5,687,024 | ) | (4,828,920 | ) | (423,886 | ) | ||||||||||
|
|
|
|
|
|
|
|
|
| |||||||||||
Net realized/unrealized gains (losses) from investments | 4,391,253 | 8,656,723 | 365,328 | 1,767,249 | (116,746 | ) | ||||||||||||||
|
|
|
|
|
|
|
|
|
| |||||||||||
Change in net assets resulting from operations | $ | 3,963,135 | $ | 8,332,431 | $ | 316,439 | $ | 2,484,369 | $ | (93,966 | ) | |||||||||
|
|
|
|
|
|
|
|
|
| |||||||||||
| See notes to the financial statements. | ||||||||||||||||||||
48
FINANCIAL STATEMENTS |
Statements of Changes in Net Assets
| RBC SMID Cap Growth Fund | ||||||||
| For the Year Ended September 30, 2011 | For the Year Ended September 30, 2010 | |||||||
From Investment Activities: | ||||||||
Operations: | ||||||||
Net investment loss | $ | (428,118 | ) | $ | (391,733 | ) | ||
Net realized gains from investment transactions | 5,801,079 | 9,006,109 | ||||||
Net change in unrealized appreciation/depreciation on investments | (1,409,826 | ) | 3,635,810 | |||||
|
|
|
| |||||
Change in net assets resulting from operations | 3,963,135 | 12,250,186 | ||||||
|
|
|
| |||||
Capital Transactions: | ||||||||
Proceeds from shares issued | 7,396,063 | 7,133,544 | ||||||
Cost of shares redeemed | (17,614,910 | ) | (15,569,207 | ) | ||||
|
|
|
| |||||
Change in net assets resulting from capital transactions | (10,218,847 | ) | (8,435,663 | ) | ||||
|
|
|
| |||||
Net increase (decrease) in net assets | (6,255,712 | ) | 3,814,523 | |||||
Net Assets: | ||||||||
Beginning of year | 64,950,450 | 61,135,927 | ||||||
|
|
|
| |||||
End of year | $ | 58,694,738 | $ | 64,950,450 | ||||
|
|
|
| |||||
Undistributed net investment income | $ | — | $ | — | ||||
|
|
|
| |||||
Share Transactions: | ||||||||
Issued | 601,446 | 686,333 | ||||||
Redeemed | (1,363,886 | ) | (1,600,438 | ) | ||||
|
|
|
| |||||
Change in shares resulting from capital transactions | (762,440 | ) | (914,105 | ) | ||||
|
|
|
| |||||
| See notes to financial statements. | ||||||||
49
FINANCIAL STATEMENTS |
Statements of Changes in Net Assets (cont.)
| RBC Enterprise Fund | ||||||||
| For the Year Ended September 30, 2011 | For the Year Ended September 30, 2010 | |||||||
From Investment Activities: | ||||||||
Operations: | ||||||||
Net investment loss | $ | (324,292 | ) | $ | (157,013 | ) | ||
Net realized gains (losses) from investment transactions | 17,004,371 | (10,852,614 | ) | |||||
Net change in unrealized appreciation/depreciation on investments | (8,347,648 | ) | 21,627,462 | |||||
|
|
|
| |||||
Change in net assets resulting from operations | 8,332,431 | 10,617,835 | ||||||
|
|
|
| |||||
Capital Transactions: | ||||||||
Proceeds from shares issued | 3,414,432 | 2,760,853 | ||||||
Cost of shares redeemed | (57,801,141 | ) | (20,830,494 | ) | ||||
|
|
|
| |||||
Change in net assets resulting from capital transactions | (54,386,709 | ) | (18,069,641 | ) | ||||
|
|
|
| |||||
Net decrease in net assets | (46,054,278 | ) | (7,451,806 | ) | ||||
Net Assets: | ||||||||
Beginning of year | 139,240,086 | 146,691,892 | ||||||
|
|
|
| |||||
End of year | $ | 93,185,808 | $ | 139,240,086 | ||||
|
|
|
| |||||
Undistributed net investment income | $ | — | $ | 38,170 | ||||
|
|
|
| |||||
Share Transactions: | ||||||||
Issued | 203,048 | 200,184 | ||||||
Redeemed | (3,289,647 | ) | (1,522,849 | ) | ||||
|
|
|
| |||||
Change in shares resulting from capital transactions | (3,086,599 | ) | (1,322,665 | ) | ||||
|
|
|
| |||||
| See notes to financial statements. | ||||||||
50
FINANCIAL STATEMENTS |
Statements of Changes in Net Assets (cont.)
| RBC Small Cap Core Fund | ||||||||
| For the Year Ended September 30, 2011 | For the Year Ended September 30, 2010 | |||||||
From Investment Activities: | ||||||||
Operations: | ||||||||
Net investment loss | $ | (48,889 | ) | $ | (96,644 | ) | ||
Net realized gains from investment transactions | 6,052,352 | 1,727,391 | ||||||
Net change in unrealized appreciation/depreciation on investments | (5,687,024 | ) | 5,509,913 | |||||
|
|
|
| |||||
Change in net assets resulting from operations | 316,439 | 7,140,660 | ||||||
|
|
|
| |||||
Capital Transactions: | ||||||||
Proceeds from shares issued | 9,631,033 | 5,425,799 | ||||||
Cost of shares redeemed | (9,893,792 | ) | (9,705,897 | ) | ||||
|
|
|
| |||||
Change in net assets resulting from capital transactions | (262,759 | ) | (4,280,098 | ) | ||||
|
|
|
| |||||
Net increase in net assets | 53,680 | 2,860,562 | ||||||
Net Assets: | ||||||||
Beginning of year | 44,045,400 | 41,184,838 | ||||||
|
|
|
| |||||
End of year | $ | 44,099,080 | $ | 44,045,400 | ||||
|
|
|
| |||||
Undistributed net investment income | $ | 1,127 | $ | 1,214 | ||||
|
|
|
| |||||
Share Transactions: | ||||||||
Issued | 416,277 | 287,779 | ||||||
Redeemed | (421,570 | ) | (503,926 | ) | ||||
|
|
|
| |||||
Change in shares resulting from capital transactions | (5,293 | ) | (216,147 | ) | ||||
|
|
|
| |||||
| See notes to financial statements. | ||||||||
51
FINANCIAL STATEMENTS |
Statements of Changes in Net Assets (cont.)
| RBC Microcap Value Fund | ||||||||
| For the Year Ended September 30, 2011 | For the Year Ended September 30, 2010 | |||||||
From Investment Activities: | ||||||||
Operations: | ||||||||
Net investment income | $ | 717,120 | $ | 578,943 | ||||
Net realized gains (losses) from investment transactions and foreign currency | 6,596,169 | (2,011,700 | ) | |||||
Net change in unrealized appreciation/depreciation on investments | (4,828,920 | ) | 18,307,643 | |||||
|
|
|
| |||||
Change in net assets resulting from operations | 2,484,369 | 16,874,886 | ||||||
|
|
|
| |||||
Distributions to Class A Shareholders: | ||||||||
From net investment income | (10,208 | ) | (11,456 | ) | ||||
Distributions to Class S Shareholders: | ||||||||
From net investment income | (587,562 | ) | (675,364 | ) | ||||
|
|
|
| |||||
Change in net assets resulting from shareholder distributions | (597,770 | ) | (686,820 | ) | ||||
|
|
|
| |||||
Capital Transactions: | ||||||||
Proceeds from shares issued | 19,768,305 | 26,521,029 | ||||||
Distributions reinvested | 578,852 | 655,144 | ||||||
Cost of shares redeemed | (65,574,944 | ) | (61,601,127 | ) | ||||
|
|
|
| |||||
Change in net assets resulting from capital transactions | (45,227,787 | ) | (34,424,954 | ) | ||||
|
|
|
| |||||
Net decrease in net assets | (43,341,188 | ) | (18,236,888 | ) | ||||
Net Assets: | ||||||||
Beginning of period | 153,797,137 | 172,034,025 | ||||||
|
|
|
| |||||
End of period | $ | 110,455,949 | $ | 153,797,137 | ||||
|
|
|
| |||||
Undistributed net investment income | $ | 679,432 | $ | 510,920 | ||||
|
|
|
| |||||
Share Transactions: | ||||||||
Issued | 1,190,604 | 1,851,377 | ||||||
Reinvested | 34,292 | 49,595 | ||||||
Redeemed | (4,038,145 | ) | (4,426,661 | ) | ||||
|
|
|
| |||||
Change in shares resulting from capital transactions | (2,813,249 | ) | (2,525,689 | ) | ||||
|
|
|
| |||||
| See notes to financial statements. | ||||||||
52
FINANCIAL STATEMENTS |
Statements of Changes in Net Assets (cont.)
| RBC Mid Cap Value Fund | ||||||||
| For the Year Ended September 30, 2011 | For the Period Ended September 30, 2010(a) | |||||||
From Investment Activities: | ||||||||
Operations: | ||||||||
Net investment income | $ | 22,780 | $ | 3,194 | ||||
Net realized gains from investment transactions | 307,140 | 30,401 | ||||||
Net change in unrealized appreciation/depreciation on investments | (423,886 | ) | 84,971 | |||||
|
|
|
| |||||
Change in net assets resulting from operations | (93,966 | ) | 118,566 | |||||
|
|
|
| |||||
Distributions to Class I Shareholders: | ||||||||
From net investment income | (76,421 | ) | — | |||||
From net realized gains | (83,847 | ) | — | |||||
|
|
|
| |||||
Change in net assets resulting from shareholder distributions | (160,268 | ) | — | |||||
|
|
|
| |||||
Capital Transactions: | ||||||||
Proceeds from shares issued | — | 1,634,500 | ||||||
Distributions reinvested | 160,268 | — | ||||||
|
|
|
| |||||
Change in net assets resulting from capital transactions | 160,268 | 1,634,500 | ||||||
|
|
|
| |||||
Net increase (decrease) in net assets | (93,966 | ) | 1,753,066 | |||||
|
|
|
| |||||
Net Assets | ||||||||
Beginning of period | 1,753,066 | — | ||||||
|
|
|
| |||||
End of period | $ | 1,659,100 | $ | 1,753,066 | ||||
|
|
|
| |||||
Undistributed net investment income | $ | 16,834 | $ | 67,068 | ||||
|
|
|
| |||||
Share Transactions: | ||||||||
Issued | — | 162,274 | ||||||
Reinvested | 13,816 | — | ||||||
|
|
|
| |||||
Change in shares resulting from capital transactions | 13,816 | 162,274 | ||||||
|
|
|
| |||||
| (a) | For the period from December 31, 2009 (commencement of operations) to September 30, 2010. |
See notes to financial statements.
53
|
| RBC SMID Cap Growth Fund | (Selected data for a share outstanding throughout the years indicated) |
| Investment Activities | Distributions | |||||||||||||||||||||||||||||||
| Net Asset Value, Beginning of Period | Net Investment Loss | Net Realized and Unrealized Gains (Losses) on Investments | Redemption Fees | Total from Investment Activities | Net Realized Gains | Total Distributions | Net Asset Value, End of Period | |||||||||||||||||||||||||
Class A | ||||||||||||||||||||||||||||||||
Year Ended September 30, 2011 | $10.94 | (0.10)(a) | 0.57 | (b) | 0.47 | — | — | $11.41 | ||||||||||||||||||||||||
Year Ended September 30, 2010 | 8.89 | (0.08)(a) | 2.13 | (b) | 2.05 | — | — | 10.94 | ||||||||||||||||||||||||
Year Ended September 30, 2009 | 10.18 | (0.04)(a) | (1.17) | (b) | (1.21) | (0.08) | (0.08) | 8.89 | ||||||||||||||||||||||||
Year Ended September 30, 2008 | 13.90 | (0.09)(a) | (2.52) | (b) | (2.61) | (1.11) | (1.11) | 10.18 | ||||||||||||||||||||||||
Year Ended September 30, 2007 | 12.47 | (0.10)(a) | 1.88 | (b) | 1.78 | (0.35) | (0.35) | 13.90 | ||||||||||||||||||||||||
Class I | ||||||||||||||||||||||||||||||||
Year Ended September 30, 2011 | $11.43 | (0.07)(a) | 0.59 | (b) | 0.52 | — | — | $11.95 | ||||||||||||||||||||||||
Year Ended September 30, 2010 | 9.27 | (0.06)(a) | 2.22 | (b) | 2.16 | — | — | 11.43 | ||||||||||||||||||||||||
Year Ended September 30, 2009 | 10.58 | (0.02)(a) | (1.21) | (b) | (1.23) | (0.08) | (0.08) | 9.27 | ||||||||||||||||||||||||
Year Ended September 30, 2008 | 14.36 | (0.06)(a) | (2.61) | (b) | (2.67) | (1.11) | (1.11) | 10.58 | ||||||||||||||||||||||||
Year Ended September 30, 2007 | 12.85 | (0.07)(a) | 1.93 | (b) | 1.86 | (0.35) | (0.35) | 14.36 | ||||||||||||||||||||||||
Class C | ||||||||||||||||||||||||||||||||
Year Ended September 30, 2011 | $10.38 | (0.18)(a) | 0.53 | (b) | 0.35 | — | — | $10.73 | ||||||||||||||||||||||||
Year Ended September 30, 2010 | 8.50 | (0.14)(a) | 2.02 | (b) | 1.88 | — | — | 10.38 | ||||||||||||||||||||||||
Year Ended September 30, 2009 | 9.81 | (0.09)(a) | (1.14) | (b) | (1.23) | (0.08) | (0.08) | 8.50 | ||||||||||||||||||||||||
Year Ended September 30, 2008 | 13.53 | (0.18)(a) | (2.43) | (b) | (2.61) | (1.11) | (1.11) | 9.81 | ||||||||||||||||||||||||
Year Ended September 30, 2007 | 12.24 | (0.19)(a) | 1.83 | (b) | 1.64 | (0.35) | (0.35) | 13.53 | ||||||||||||||||||||||||
Class S | ||||||||||||||||||||||||||||||||
Year Ended September 30, 2011 | $11.43 | (0.07)(a) | 0.59 | (b) | 0.52 | — | — | $11.95 | ||||||||||||||||||||||||
Year Ended September 30, 2010 | 9.28 | (0.06)(a) | 2.21 | (b) | 2.15 | — | — | 11.43 | ||||||||||||||||||||||||
Year Ended September 30, 2009 | 10.59 | (0.02)(a) | (1.21) | (b) | (1.23) | (0.08) | (0.08) | 9.28 | ||||||||||||||||||||||||
Year Ended September 30, 2008 | 14.38 | (0.06)(a) | (2.62) | (b) | (2.68) | (1.11) | (1.11) | 10.59 | ||||||||||||||||||||||||
Year Ended September 30, 2007 | 12.86 | (0.07)(a) | 1.94 | (b) | 1.87 | (0.35) | (0.35) | 14.38 | ||||||||||||||||||||||||
(a) Per share net investment income (loss) has been calculated using the average daily shares method. | (b) Less than $0.01 or $(0.01) per share. |
See notes to financial statements.
54
FINANCIAL HIGHLIGHTS |
| RBC SMID Cap Growth Fund (cont.) | (Selected data for a share outstanding throughout the years indicated) |
| Ratios/Supplemental Data | ||||||||||||||||||||||||
| Total Return* | Net Assets, End of Period (000’s) | Ratio of Net Expenses to Average Net Assets | Ratio of Net Investment Loss to Average Net Assets | Ratio of Expenses to Average Net Assets** | Portfolio Turnover Rate*** | |||||||||||||||||||
Class A | ||||||||||||||||||||||||
Year Ended September 30, 2011 | 4.21% | $23,593 | 1.35% | (0.75%) | 1.61% | 13% | ||||||||||||||||||
Year Ended September 30, 2010 | 23.06% | 21,940 | 1.35% | (0.81%) | 1.79% | 89% | ||||||||||||||||||
Year Ended September 30, 2009 | (11.61%) | 19,421 | 1.35% | (0.47%) | 1.88% | 62% | ||||||||||||||||||
Year Ended September 30, 2008 | (20.14%) | 25,483 | 1.32% | (0.74%) | 1.68% | 46% | ||||||||||||||||||
Year Ended September 30, 2007 | 14.52% | 33,887 | 1.35% | (0.78%) | 1.72% | 31% | ||||||||||||||||||
Class I | ||||||||||||||||||||||||
Year Ended September 30, 2011 | 4.55% | $33,835 | 1.10% | (0.49%) | 1.35% | 13% | ||||||||||||||||||
Year Ended September 30, 2010 | 23.30% | 41,121 | 1.10% | (0.57%) | 1.54% | 89% | ||||||||||||||||||
Year Ended September 30, 2009 | (11.36%) | 40,098 | 1.10% | (0.21%) | 1.38% | 62% | ||||||||||||||||||
Year Ended September 30, 2008 | (19.95%) | 60,998 | 1.07% | (0.48%) | 1.19% | 46% | ||||||||||||||||||
Year Ended September 30, 2007 | 14.89% | 75,721 | 1.10% | (0.53%) | 1.21% | 31% | ||||||||||||||||||
Class C | ||||||||||||||||||||||||
Year Ended September 30, 2011 | 3.37% | $40 | 2.09% | (1.49%) | 2.36% | 13% | ||||||||||||||||||
Year Ended September 30, 2010 | 22.12% | 67 | 2.09% | (1.57%) | 2.53% | 89% | ||||||||||||||||||
Year Ended September 30, 2009 | (12.26%) | 98 | 2.10% | (1.21%) | 2.38% | 62% | ||||||||||||||||||
Year Ended September 30, 2008 | (20.72%) | 129 | 2.07% | (1.52%) | 2.16% | 46% | ||||||||||||||||||
Year Ended September 30, 2007 | 13.73% | 1,265 | 2.10% | (1.52%) | 2.23% | 31% | ||||||||||||||||||
Class S | ||||||||||||||||||||||||
Year Ended September 30, 2011 | 4.55% | $1,227 | 1.10% | (0.52%) | 1.35% | 13% | ||||||||||||||||||
Year Ended September 30, 2010 | 23.17% | 1,822 | 1.10% | (0.56%) | 1.54% | 89% | ||||||||||||||||||
Year Ended September 30, 2009 | (11.35%) | 1,501 | 1.10% | (0.22%) | 1.38% | 62% | ||||||||||||||||||
Year Ended September 30, 2008 | (19.94%) | 1,495 | 1.06% | (0.49%) | 1.18% | 46% | ||||||||||||||||||
Year Ended September 30, 2007 | 14.88% | 1,878 | 1.10% | (0.53%) | 1.21% | 31% | ||||||||||||||||||
| * | Excludes sales charge. |
| ** | During the period, certain fees were contractually or voluntarily reduced and/or reimbursed. If such contractual/voluntary fee reductions and reimbursements had not occurred, the ratio would have been as indicated. |
| *** | Portfolio turnover rate is calculated on the basis of the fund as a whole without distinguishing between the classes of shares issued. |
See notes to financial statements.
55
FINANCIAL HIGHLIGHTS |
| RBC Enterprise Fund | (Selected data for a share outstanding throughout the years indicated) |
| Investment Activities | Distributions | |||||||||||||||||||||||||||||||||||
| Net Asset Value, Beginning of Period | Net Investment Income/(Loss) | Net Realized and Unrealized Gains (Losses) on Investments | Redemption Fees | Total from Investment Activities | Net Investment Income | Net Realized Gains | Total Distributions | Net Asset Value, End of Period | ||||||||||||||||||||||||||||
Class A | ||||||||||||||||||||||||||||||||||||
Year Ended September 30, 2011 | $14.43 | (0.07)(a) | (0.09) | (b) | (0.16) | — | — | — | $14.27 | |||||||||||||||||||||||||||
Year Ended September 30, 2010 | 13.37 | (0.05)(a) | 1.11 | (b) | 1.06 | — | — | — | 14.43 | |||||||||||||||||||||||||||
Year Ended September 30, 2009 | 16.95 | (0.02)(a) | (1.98) | (b) | (2.00) | — | (1.58) | (1.58) | 13.37 | |||||||||||||||||||||||||||
Year Ended September 30, 2008 | 25.86 | (0.08)(a) | (5.31) | (b) | (5.39) | (0.02) | (3.50) | (3.52) | 16.95 | |||||||||||||||||||||||||||
Year Ended September 30, 2007 | 25.12 | 0.03(a) | 2.95 | (b) | 2.98 | — | (2.24) | (2.24) | 25.86 | |||||||||||||||||||||||||||
Class I | ||||||||||||||||||||||||||||||||||||
Year Ended September 30, 2011 | $14.67 | (0.04)(a) | (0.10) | (b) | (0.14) | — | — | — | $14.53 | |||||||||||||||||||||||||||
Year Ended September 30, 2010 | 13.57 | (0.01)(a) | 1.11 | (b) | 1.10 | — | — | — | 14.67 | |||||||||||||||||||||||||||
Year Ended September 30, 2009 | 17.13 | 0.01(a) | (1.99) | (b) | (1.98) | — | (1.58) | (1.58) | 13.57 | |||||||||||||||||||||||||||
Year Ended September 30, 2008 | 26.10 | (0.04)(a) | (5.34) | (b) | (5.38) | (0.09) | (3.50) | (3.59) | 17.13 | |||||||||||||||||||||||||||
Year Ended September 30, 2007 | 25.31 | 0.09(a) | 2.96 | (b) | 3.05 | (0.02) | (2.24) | (2.26) | 26.10 | |||||||||||||||||||||||||||
Class C | ||||||||||||||||||||||||||||||||||||
Year Ended September 30, 2011 | $13.53 | (0.19)(a) | (0.06) | (b) | (0.25) | — | — | — | $13.28 | |||||||||||||||||||||||||||
Year Ended September 30, 2010 | 12.64 | (0.14)(a) | 1.03 | (b) | 0.89 | — | — | — | 13.53 | |||||||||||||||||||||||||||
Year Ended September 30, 2009 | 16.25 | (0.10)(a) | (1.93) | (b) | (2.03) | — | (1.58) | (1.58) | 12.64 | |||||||||||||||||||||||||||
Year Ended September 30, 2008 | 25.09 | (0.22)(a) | (5.12) | (b) | (5.34) | — | (3.50) | (3.50) | 16.25 | |||||||||||||||||||||||||||
Year Ended September 30, 2007 | 24.62 | (0.16)(a) | 2.87 | (b) | 2.71 | — | (2.24) | (2.24) | 25.09 | |||||||||||||||||||||||||||
Class S | ||||||||||||||||||||||||||||||||||||
Year Ended September 30, 2011 | $14.66 | (0.04)(a) | (0.09) | (b) | (0.13) | — | — | — | $14.53 | |||||||||||||||||||||||||||
Year Ended September 30, 2010 | 13.56 | (0.01)(a) | 1.11 | (b) | 1.10 | — | — | — | 14.66 | |||||||||||||||||||||||||||
Year Ended September 30, 2009 | 17.12 | 0.01(a) | (1.99) | (b) | (1.98) | — | (1.58) | (1.58) | 13.56 | |||||||||||||||||||||||||||
Year Ended September 30, 2008 | 26.09 | (0.04)(a) | (5.34) | (b) | (5.38) | (0.09) | (3.50) | (3.59) | 17.12 | |||||||||||||||||||||||||||
Year Ended September 30, 2007 | 25.30 | 0.09(a) | 2.96 | (b) | 3.05 | (0.02) | (2.24) | (2.26) | 26.09 | |||||||||||||||||||||||||||
(a) Per share net investment income (loss) has been calculated using the average daily shares method. | (b) Less than $0.01 or $(0.01) per share. |
See notes to financial statements.
56
FINANCIAL HIGHLIGHTS |
| RBC Enterprise Fund (cont.) | (Selected data for a share outstanding throughout the years indicated) |
| Ratios/Supplemental Data | ||||||||||||||||||||||||
| Total Return* | Net Assets, End of Period (000’s) | Ratio of Net Expenses to Average Net Assets | Ratio of Net Investment Income (Loss) to Average Net Assets | Ratio of Expenses to Average Net Assets** | Portfolio Turnover Rate*** | |||||||||||||||||||
Class A | ||||||||||||||||||||||||
Year Ended September 30, 2011 | (1.11%) | $1,320 | 1.33% | (0.44%) | 1.57% | 27% | ||||||||||||||||||
Year Ended September 30, 2010 | 7.93% | 2,426 | 1.33% | (0.35%) | 1.76% | 22% | ||||||||||||||||||
Year Ended September 30, 2009 | (8.83%) | 3,320 | 1.33% | (0.15%) | 2.01% | 20% | ||||||||||||||||||
Year Ended September 30, 2008 | (23.07%) | 6,398 | 1.33% | (0.43%) | 1.80% | 23% | ||||||||||||||||||
Year Ended September 30, 2007 | 12.40% | 18,933 | 1.33% | 0.09% | 1.80% | 22% | ||||||||||||||||||
Class I | ||||||||||||||||||||||||
Year Ended September 30, 2011 | (0.96%) | $3,378 | 1.08% | (0.25%) | 1.29% | 27% | ||||||||||||||||||
Year Ended September 30, 2010 | 8.11% | 25,999 | 1.08% | (0.10%) | 1.51% | 22% | ||||||||||||||||||
Year Ended September 30, 2009 | (8.60%) | 25,543 | 1.08% | 0.06% | 1.50% | 20% | ||||||||||||||||||
Year Ended September 30, 2008 | (22.82%) | 29,388 | 1.08% | (0.19%) | 1.31% | 23% | ||||||||||||||||||
Year Ended September 30, 2007 | 12.62% | 43,096 | 1.08% | 0.35% | 1.30% | 22% | ||||||||||||||||||
Class C | ||||||||||||||||||||||||
Year Ended September 30, 2011 | (1.85%) | $424 | 2.08% | (1.21%) | 2.32% | 27% | ||||||||||||||||||
Year Ended September 30, 2010 | 7.04% | 568 | 2.08% | (1.10%) | 2.51% | 22% | ||||||||||||||||||
Year Ended September 30, 2009 | (9.47%) | 778 | 2.08% | (0.92%) | 2.50% | 20% | ||||||||||||||||||
Year Ended September 30, 2008 | (23.61%) | 1,269 | 2.08% | (1.19%) | 2.30% | 23% | ||||||||||||||||||
Year Ended September 30, 2007 | 11.50% | 2,356 | 2.08% | (0.66%) | 2.30% | 22% | ||||||||||||||||||
Class S | ||||||||||||||||||||||||
Year Ended September 30, 2011 | (0.89%) | $88,064 | 1.08% | (0.21%) | 1.32% | 27% | ||||||||||||||||||
Year Ended September 30, 2010 | 8.11% | 110,248 | 1.08% | (0.10%) | 1.51% | 22% | ||||||||||||||||||
Year Ended September 30, 2009 | (8.60%) | 117,009 | 1.08% | 0.08% | 1.51% | 20% | ||||||||||||||||||
Year Ended September 30, 2008 | (22.83%) | 160,478 | 1.08% | (0.19%) | 1.31% | 23% | ||||||||||||||||||
Year Ended September 30, 2007 | 12.62% | 281,867 | 1.08% | 0.33% | 1.30% | 22% | ||||||||||||||||||
| * | Excludes sales charge. |
| ** | During the period, certain fees were contractually or voluntarily reduced and/or reimbursed. If such contractual/voluntary fee reductions and reimbursements had not occurred, the ratio would have been as indicated. |
| *** | Portfolio turnover rate is calculated on the basis of the fund as a whole without distinguishing between the classes of shares issued. |
See notes to financial statements.
57
FINANCIAL HIGHLIGHTS |
| RBC Small Cap Core Fund | (Selected data for a share outstanding throughout the years indicated) |
| Investment Activities | Distributions | |||||||||||||||||||||||||||||||||||
| Net Asset Value, Beginning of Period | Net Investment Income (Loss) | Net Realized and Unrealized Gains (Losses) on Investments | Redemption Fees | Total from Investment Activities | Net Investment Income | Net Realized Gains | Total Distributions | Net Asset Value, End of Period | ||||||||||||||||||||||||||||
Class A | ||||||||||||||||||||||||||||||||||||
Year Ended September 30, 2011 | $19.99 | (0.09)(a) | 0.12 | (b) | 0.03 | — | — | — | $20.02 | |||||||||||||||||||||||||||
Year Ended September 30, 2010 | 17.04 | (0.09)(a) | 3.04 | (b) | 2.95 | — | — | — | 19.99 | |||||||||||||||||||||||||||
Year Ended September 30, 2009 | 21.27 | (0.03)(a) | (2.17) | (b) | (2.20) | — | (2.03) | (2.03) | 17.04 | |||||||||||||||||||||||||||
Year Ended September 30, 2008 | 31.72 | (0.17)(a) | (4.79) | (b) | (4.96) | — | (5.49) | (5.49) | 21.27 | |||||||||||||||||||||||||||
Year Ended September 30, 2007 | 31.74 | 0.16(a) | 3.34 | (b) | 3.50 | (0.11) | (3.41) | (3.52) | 31.72 | |||||||||||||||||||||||||||
Class C | ||||||||||||||||||||||||||||||||||||
Year Ended September 30, 2011 | $18.83 | (0.22)(a) | 0.11 | (b) | (0.11) | — | — | — | $18.72 | |||||||||||||||||||||||||||
Year Ended September 30, 2010 | 16.18 | (0.22)(a) | 2.87 | (b) | 2.65 | — | — | — | 18.83 | |||||||||||||||||||||||||||
Year Ended September 30, 2009 | 20.47 | (0.13)(a) | (2.13) | (b) | (2.26) | — | (2.03) | (2.03) | 16.18 | |||||||||||||||||||||||||||
Year Ended September 30, 2008 | 30.86 | (0.34)(a) | (4.56) | (b) | (4.90) | — | (5.49) | (5.49) | 20.47 | |||||||||||||||||||||||||||
Year Ended September 30, 2007 | 31.08 | (0.12)(a) | 3.31 | (b) | 3.19 | — | (3.41) | (3.41) | 30.86 | |||||||||||||||||||||||||||
Class S | ||||||||||||||||||||||||||||||||||||
Year Ended September 30, 2011 | $20.41 | (0.02)(a) | 0.10 | (b) | 0.08 | — | — | — | $20.49 | |||||||||||||||||||||||||||
Year Ended September 30, 2010 | 17.35 | (0.04)(a) | 3.10 | (b) | 3.06 | — | — | — | 20.41 | |||||||||||||||||||||||||||
Year Ended September 30, 2009 | 21.55 | 0.01(a) | (2.18) | (b) | (2.17) | — | (2.03) | (2.03) | 17.35 | |||||||||||||||||||||||||||
Year Ended September 30, 2008 | 31.94 | (0.11)(a) | (4.75) | (b) | (4.86) | (0.04) | (5.49) | (5.53) | 21.55 | |||||||||||||||||||||||||||
Year Ended September 30, 2007 | 31.95 | 0.23(a) | 3.36 | (b) | 3.59 | (0.19) | (3.41) | (3.60) | 31.94 | |||||||||||||||||||||||||||
(a) Per share net investment income (loss) has been calculated using the average daily shares method. | (b) Less than $0.01 or $(0.01) per share. |
See notes to financial statements.
58
FINANCIAL HIGHLIGHTS |
| RBC Small Cap Core Fund (cont.) | (Selected data for a share outstanding throughout the years indicated) |
| Ratios/Supplemental Data | ||||||||||||||||||||||||
| Total Return* | Net Assets, End of Period (000’s) | Ratio of Net Expenses to Average Net Assets | Ratio of Net Investment Income (Loss) to Average Net Assets | Ratio of Expenses to Average Net Assets** | Portfolio Turnover Rate*** | |||||||||||||||||||
Class A | ||||||||||||||||||||||||
Year Ended September 30, 2011 | 0.20% | $1,420 | 1.30% | (0.37%) | 1.80% | 40% | ||||||||||||||||||
Year Ended September 30, 2010 | 17.31% | 519 | 1.47%† | (0.48%) | 2.28% | 31% | ||||||||||||||||||
Year Ended September 30, 2009 | (7.07%) | 656 | 1.55% | (0.20%) | 2.65% | 47% | ||||||||||||||||||
Year Ended September 30, 2008 | (17.15%) | 1,046 | 1.54% | (0.71%) | 2.27% | 47% | ||||||||||||||||||
Year Ended September 30, 2007 | 11.86% | 1,401 | 1.55% | 0.49% | 2.13% | 44% | ||||||||||||||||||
Class C | ||||||||||||||||||||||||
Year Ended September 30, 2011 | (0.58%) | $32 | 2.05% | (1.02%) | 2.56% | 40% | ||||||||||||||||||
Year Ended September 30, 2010 | 16.38% | 86 | 2.23%† | (1.26%) | 2.99% | 31% | ||||||||||||||||||
Year Ended September 30, 2009 | (7.70%) | 297 | 2.30% | (0.96%) | 3.16% | 47% | ||||||||||||||||||
Year Ended September 30, 2008 | (17.52%) | 384 | 2.29% | (1.47%) | 2.76% | 47% | ||||||||||||||||||
Year Ended September 30, 2007 | 11.01% | 570 | 2.30% | (0.41%) | 2.62% | 44% | ||||||||||||||||||
Class S | ||||||||||||||||||||||||
Year Ended September 30, 2011 | 0.39% | $42,647 | 1.05% | (0.09%) | 1.54% | 40% | ||||||||||||||||||
Year Ended September 30, 2010 | 17.64% | 43,441 | 1.22%† | (0.21%) | 2.04% | 31% | ||||||||||||||||||
Year Ended September 30, 2009 | (6.81%) | 40,205 | 1.30% | 0.04% | 2.16% | 47% | ||||||||||||||||||
Year Ended September 30, 2008 | (16.68%) | 45,905 | 1.29% | (0.46%) | 1.76% | 47% | ||||||||||||||||||
Year Ended September 30, 2007 | 12.10% | 65,771 | 1.30% | 0.70% | 1.62% | 44% | ||||||||||||||||||
| * | Excludes sales charge. |
| ** | During the period, certain fees were contractually or voluntarily reduced and/or reimbursed. If such contractual/voluntary fee reductions and reimbursements had not occurred, the ratio would have been as indicated. |
| *** | Portfolio turnover rate is calculated on the basis of the fund as a whole without distinguishing between the classes of shares issued. |
| † | Beginning May 26, 2010, the net operating expenses were contractually limited to 1.30%, 2.05% and 1.05% of average daily net assets for Class A, Class C, and Class S respectively. The ratio of net expenses to average net assets represents a blended percentage for the year ended September 30, 2010. |
See notes to financial statements.
59
FINANCIAL HIGHLIGHTS |
| RBC Microcap Value Fund | (Selected data for a share outstanding throughout the years indicated) |
| Investment Activities | Distributions | |||||||||||||||||||||||||||||||||||
| Net Asset Value, Beginning of Period | Net Investment Income (Loss) | Net Realized and Unrealized Gains (Losses) on Investments | Redemption Fees | Total from Investment Activities | Net Investment Income | Net Realized Gains | Total Distributions | Net Asset Value, End of Period | ||||||||||||||||||||||||||||
Class A | ||||||||||||||||||||||||||||||||||||
Year Ended September 30, 2011 | $14.59 | 0.05(a) | (0.32) | (b) | (0.27) | (0.02) | — | (0.02) | $14.30 | |||||||||||||||||||||||||||
Year Ended September 30, 2010 | 13.15 | 0.02(a) | 1.44 | (b) | 1.46 | (0.02) | — | (0.02) | 14.59 | |||||||||||||||||||||||||||
Year Ended September 30, 2009 | 16.38 | 0.05(a) | (2.30) | (b) | (2.25) | (0.03) | (0.95) | (0.98) | 13.15 | |||||||||||||||||||||||||||
Year Ended September 30, 2008 | 22.34 | 0.05(a) | (4.49) | (b) | (4.44) | (0.02) | (1.50) | (1.52) | 16.38 | |||||||||||||||||||||||||||
Year Ended September 30, 2007 | 22.17 | 0.03(a) | 1.68 | (b) | 1.71 | — | (1.54) | (1.54) | 22.34 | |||||||||||||||||||||||||||
Class C | ||||||||||||||||||||||||||||||||||||
Year Ended September 30, 2011 | $13.93 | (0.08)(a) | (0.28) | (b) | (0.36) | — | — | — | $13.57 | |||||||||||||||||||||||||||
Year Ended September 30, 2010 | 12.64 | (0.08)(a) | 1.37 | (b) | 1.29 | — | — | — | 13.93 | |||||||||||||||||||||||||||
Year Ended September 30, 2009 | �� | 15.86 | (0.03)(a) | (2.24) | (b) | (2.27) | — | (0.95) | (0.95) | 12.64 | ||||||||||||||||||||||||||
Year Ended September 30, 2008 | 21.82 | (0.08)(a) | (4.38) | (b) | (4.46) | — | (1.50) | (1.50) | 15.86 | |||||||||||||||||||||||||||
Year Ended September 30, 2007 | 21.84 | (0.13)(a) | 1.65 | (b) | 1.52 | — | (1.54) | (1.54) | 21.82 | |||||||||||||||||||||||||||
Class S | ||||||||||||||||||||||||||||||||||||
Year Ended September 30, 2011 | $14.62 | 0.08(a) | (0.30) | (b) | (0.22) | (0.07) | — | (0.07) | $14.33 | |||||||||||||||||||||||||||
Year Ended September 30, 2010 | 13.19 | 0.05(a) | 1.44 | (b) | 1.49 | (0.06) | — | (0.06) | 14.62 | |||||||||||||||||||||||||||
Year Ended September 30, 2009 | 16.47 | 0.08(a) | (2.32) | (b) | (2.24) | (0.09) | (0.95) | (1.04) | 13.19 | |||||||||||||||||||||||||||
Year Ended September 30, 2008 | 22.47 | 0.10(a) | (4.52) | (b) | (4.42) | (0.08) | (1.50) | (1.58) | 16.47 | |||||||||||||||||||||||||||
Year Ended September 30, 2007 | 22.27 | 0.09(a) | 1.68 | (b) | 1.77 | (0.03) | (1.54) | (1.57) | 22.47 | |||||||||||||||||||||||||||
(a) Per share net investment income (loss) has been calculated using the average daily shares method. | (b) Less than $0.01 or $(0.01) per share. |
See notes to financial statements.
60
FINANCIAL HIGHLIGHTS |
| RBC Microcap Value Fund (cont.) | (Selected data for a share outstanding throughout the years indicated) |
| Ratios/Supplemental Data | ||||||||||||||||||||||||
| Total Return* | Net Assets, End of Period (000’s) | Ratio of Net Expenses to Average Net Assets | Ratio of Net Investment Income (Loss) to Average Net Assets | Ratio of Expenses to Average Net Assets** | Portfolio Turnover Rate*** | |||||||||||||||||||
Class A | ||||||||||||||||||||||||
Year Ended September 30, 2011 | (1.85%) | $3,852 | 1.32% | 0.28% | 1.60% | 2% | ||||||||||||||||||
Year Ended September 30, 2010 | 11.12% | 6,968 | 1.32% | 0.12% | 1.64% | 9% | ||||||||||||||||||
Year Ended September 30, 2009 | (11.74%) | 8,358 | 1.32% | 0.50% | 1.87% | 17% | ||||||||||||||||||
Year Ended September 30, 2008 | (20.74%) | 19,641 | 1.31% | 0.29% | 1.74% | 18% | ||||||||||||||||||
Year Ended September 30, 2007 | 7.68% | 43,004 | 1.32% | 0.14% | 1.78% | 17% | ||||||||||||||||||
Class C | ||||||||||||||||||||||||
Year Ended September 30, 2011 | (2.58%) | $613 | 2.07% | (0.51%) | 2.35% | 2% | ||||||||||||||||||
Year Ended September 30, 2010 | 10.21% | 850 | 2.07% | (0.63%) | 2.39% | 9% | ||||||||||||||||||
Year Ended September 30, 2009 | (12.36%) | 1,124 | 2.07% | (0.25%) | 2.37% | 17% | ||||||||||||||||||
Year Ended September 30, 2008 | (21.34%) | 1,723 | 2.06% | (0.45%) | 2.23% | 18% | ||||||||||||||||||
Year Ended September 30, 2007 | 6.89% | 3,981 | 2.07% | (0.60%) | 2.28% | 17% | ||||||||||||||||||
Class S | ||||||||||||||||||||||||
Year Ended September 30, 2011 | (1.59%) | $105,991 | 1.07% | 0.51% | 1.35% | 2% | ||||||||||||||||||
Year Ended September 30, 2010 | 11.33% | 145,979 | 1.07% | 0.37% | 1.39% | 9% | ||||||||||||||||||
Year Ended September 30, 2009 | (11.47%) | 162,465 | 1.07% | 0.76% | 1.37% | 17% | ||||||||||||||||||
Year Ended September 30, 2008 | (20.53%) | 261,041 | 1.07% | 0.56% | 1.26% | 18% | ||||||||||||||||||
Year Ended September 30, 2007 | 7.95% | 318,947 | 1.07% | 0.39% | 1.27% | 17% | ||||||||||||||||||
| * | Excludes sales charge. |
| ** | During the period, certain fees were contractually or voluntarily reduced and/or reimbursed. If such contractual/voluntary fee reductions and reimbursements had not occurred, the ratio would have been as indicated. |
| *** | Portfolio turnover rate is calculated on the basis of the fund as a whole without distinguishing between the classes of shares issued. |
See notes to financial statements.
61
FINANCIAL HIGHLIGHTS |
| RBC Mid Cap Value Fund | (Selected data for a share outstanding throughout the years indicated) |
| Investment Activities | Distributions | |||||||||||||||||||||||||||||||||||
| Net Asset Value, Beginning of Period | Net Investment Income/(Loss) | Net Realized and Unrealized Gains (Losses) on Investments | Redemption Fees | Total from Investment Activities | Net Investment Income | Net Realized Gains | Total Distributions | Net Asset Value, End of Period | ||||||||||||||||||||||||||||
Class I | ||||||||||||||||||||||||||||||||||||
Year Ended September 30, 2011 | $10.80 | 0.13(a) | (0.52) | — | (0.39) | (0.47) | (0.52) | (0.99) | $9.42 | |||||||||||||||||||||||||||
Period Ended September 30, 2010(b) | 10.00 | 0.02(a) | 0.78 | — | 0.80 | — | — | — | 10.80 | |||||||||||||||||||||||||||
| (a) | Per share net investment income (loss) has been calculated using the average daily shares method. |
| (b) | For the period from December 31, 2009 (commencement of operations) to September 30, 2010. |
See notes to financial statements.
62
FINANCIAL HIGHLIGHTS |
| RBC Mid Cap Value Fund (cont.) | (Selected data for a share outstanding throughout the years indicated) |
| Ratios/Supplemental Data | ||||||||||||||||||||||||
| Total Return* | Net Assets, End of Period (000’s) | Ratio of Net Expenses to Average Net Assets | Ratio of Net Investment Income (Loss) to Average Net Assets | Ratio of Expenses to Average Net Assets** | Portfolio Turnover Rate | |||||||||||||||||||
Class I | ||||||||||||||||||||||||
Year Ended September 30, 2011 | (5.35%) | $1,659 | 0.90% | 1.12% | 5.59% | 174% | ||||||||||||||||||
Period Ended September 30, 2010(a) | 8.00%(b) | 1,753 | 0.90%(c) | 0.26%(c) | 12.64%(c) | 161% | ||||||||||||||||||
| * | Excludes sales charge. |
| ** | During the period, certain fees were contractually or voluntarily reduced and/or reimbursed. If such contractual/voluntary fee reductions and reimbursements had not occurred, the ratio would have been as indicated. |
(a) For the period from December 31, 2009 (commencement of operations) to September 30, 2010. | (c) Annualized. |
| (b) | Not annualized. |
See notes to financial statements.
63
|
September 30, 2011
1.Organization
RBC Funds Trust (“the Trust”) is registered under the Investment Company Act of 1940 (as amended) as an open-end management investment company. The Trust was organized as a Delaware statutory trust on December 16, 2003. Predecessor funds to the Trust were reorganized as portfolios of the Trust effective April 16, 2004. This annual report includes the following five investment portfolios (“Funds”):
- RBC SMID Cap Growth Fund (“SMID Cap Growth Fund”)
- RBC Enterprise Fund (“Enterprise Fund”)
- RBC Small Cap Core Fund (“Small Cap Core Fund”)
- RBC Microcap Value Fund (“Microcap Value Fund”)
- RBC Mid Cap Value Fund (“Mid Cap Value Fund”)
The SMID Cap Growth and Enterprise Funds offer four share classes: Class A, Class C, Class I and Class S shares. The Small Cap Core and Microcap Value Funds offer three share classes: Class A, Class C, and Class S shares. The Mid Cap Value Fund offers Class I shares. Class A shares are offered with a 5.75% maximum front-end sales charge and a 1.00% contingent deferred sales charge (“CDSC”) for redemption within 12 months of a $1 million or greater purchase on which no front-end sales charge was paid. Class C shares are offered at net asset value (i.e. no front-end sales charge), but are subject to a CDSC of 1.00% for redemptions within 12 months of purchase. Class I shares (intended for investors meeting certain investment minimum thresholds) and Class S shares (available to investors purchasing shares directly from the Funds’ transfer agent) are not subject to either a front-end sales charge or a CDSC.
RBC Global Asset Management (U.S.) Inc. (“RBC GAM (US)”) acts as the investment advisor for the Funds. The officers of the Trust (“Fund Management”) are also employees of RBC GAM (US) or its affiliates or of BNY Mellon Investment Servicing (US) Inc. (“BNY Mellon”), the co-administrator.
2. Significant Accounting Policies
Summarized below are the significant accounting policies of the Funds. These policies conform to accounting principles generally accepted in the United States of America (“U.S. GAAP”). Fund Management follows these policies when preparing financial statements. Management may also be required to make estimates and assumptions that affect the reported amounts of assets and liabilities at the date of the financial statements and the reported amounts of income and expenses for the period. Actual results could differ from those estimates. The financial statements are as of the close of regular trading on the New York Stock Exchange.
Security Valuation:
Equity securities are generally valued on the basis of prices furnished by pricing services approved by the Trust’s Board of Trustees (the “Board”). Equity securities traded on one or more U.S. exchanges shall be valued at the last available quoted sale price on the primary trading exchange as of the valuation time. Valuation time is as of the close of regular trading on the New York Stock Exchange (usually 4:00 p.m. Eastern Standard Time). If there was no sale on the primary exchange on the day the net asset value is calculated, the most recent bid quotation generally will be used. In cases where neither closing prices nor bid prices are available, or where those prices do not accurately reflect the value of the security, a security will be valued in accordance with the Funds’ approved pricing and valuation procedures to determine a security’s fair value. These procedures are also used to determine the fair value of a security if a significant event occurs that materially affects the value of the security. Bonds and other fixed income securities, including TBA commitments, are generally valued on the basis of prices furnished by pricing services approved by the Trust’s Board. The pricing services utilize both dealer-supplied valuations and electronic data processing techniques that take into account appropriate
64
NOTES TO FINANCIAL STATEMENTS
|
factors such as institutional-size trading in similar groups of securities yield, quality, coupon rate, maturity and type of issue. Investments in open-end investment companies are valued at net asset value. Short-term securities with less than 60 days to maturity at time of purchase are valued at amortized cost.
Fair Value Measurements:
Various input levels are used in determining the fair value of investments which are as follows:
• Level 1 - Inputs that reflect unadjusted quoted prices in active markets for identical assets or liabilities that the Funds have the ability to access at the measurement date.
• Level 2 - Inputs other than quoted prices that are observable for the asset or liability either directly or indirectly, including inputs in markets that are not considered to be active.
• Level 3 - Unobservable inputs based on the best information available in the circumstances, to the extent observable inputs are not available (including the Fund’s own assumptions in determining the fair value of investments).
The inputs or methodology used for valuing investments are not necessarily an indication of the risk associated with investing in those securities.
The summary of inputs used to determine the fair value of the Fund’s investments as of September 30, 2011 is as follows:
Funds | Level 1 Quoted Prices | Level 2 Significant Observable Inputs | Level 3 Significant Unobservable Inputs | Total | ||||||||||||
Investments in Securities | ||||||||||||||||
SMID Cap Growth Fund | $ | 59,431,967 | (a) | $— | $ — | $ | 59,431,967 | |||||||||
Enterprise Fund | 92,973,002 | (a) | — | 601,862 | 93,574,864 | |||||||||||
Small Cap Core Fund | 44,561,810 | (a) | — | — | 44,561,810 | |||||||||||
Microcap Value Fund | 110,471,906 | (a) | — | — | 110,471,906 | |||||||||||
Mid Cap Value Fund | 1,676,417 | (a) | — | — | 1,676,417 | |||||||||||
(a) The breakdown of the Funds’ investments into major categories is disclosed in the Schedules of Portfolio Investments.
The Funds did not have any liabilities that were measured at fair value on a recurring basis at September 30, 2011.
Following is a reconciliation of Level 3 investments for which significant unobservable inputs were used to determine fair value:
Enterprise Fund | Microcap Value Fund | |||||||
(Common Stocks Industrials) | (Common Stocks Consumer | |||||||
Balance as of 09/30/10 (value) | $ — | $ — | ||||||
Transfers in | 268,609 | 139,463 | ||||||
Change in unrealized (depreciation) * | 333,253 | (139,463) | ||||||
|
| |||||||
Balance as of 9/30/11(value) | $601,862 | $ — | ||||||
|
| |||||||
* Net change in unrealized appreciation/(depreciation) in level 3 securities still held at September 30, 2011.
65
NOTES TO FINANCIAL STATEMENTS
|
During the year ended September 30, 2011, the Funds recognized no significant transfers to/from level 1 or 2. The Fund’s policy is to recognize transfers between level 1, level 2 and level 3 at the end of the year utilizing fair value at the beginning of the year.
In May 2011, the Financial Accounting Standards Board (“FASB”) issued Accounting Standards Update (“ASU”) No. 2011-04 “Amendments to Achieve Common Fair Value Measurement and Disclosure Requirements” in U.S. GAAP and International Financial Reporting Standards (“IFRSs”). ASU 2011-04 includes common requirements for measurement of and disclosure about fair value between U.S. GAAP and IFRS. ASU 2011-04 will require reporting entities to disclose the following information for fair value measurements categorized within Level 3 of the fair value hierarchy: quantitative information about the unobservable inputs used in the fair value measurement, the valuation processes used by the reporting entity and a narrative description of the sensitivity of the fair value measurement to changes in unobservable inputs and the interrelationships between those unobservable inputs. In addition, ASU 2011-04 will require reporting entities to make disclosures about amounts and reasons for all transfers in and out of Level 1 and Level 2 fair value measurements. The new and revised disclosures are effective for interim and annual reporting periods beginning after December 15, 2011. Management is currently evaluating the implications of ASU No. 2011-04 and its impact on the financial statements.
Repurchase Agreements:
The Funds may enter into repurchase agreements with counterparties whom the Adviser has deemed creditworthy, including primary dealers that report to the Federal Reserve Bank of New York or other large U.S. commercial banks or broker-dealers. These repurchase agreements are subject to the seller’s agreement to repurchase such securities at a mutually agreed upon date and price. The repurchase price generally equals the price paid by the Funds plus interest negotiated on the basis of current short-term rates.
Securities pledged as collateral for repurchase agreements are held by a custodian bank until maturity of the repurchase agreement. The Funds have procedures to secure additional collateral, if needed, to ensure that the daily market value of the collateral remains in excess of the repurchase agreement in the event of a default. There were no Repurchase Agreements held at September 30, 2011.
Investment Transactions and Income:
Investment transactions are recorded on one business day after trade date, except on the last day of each fiscal quarter end, when they are recorded on trade date. Dividend income is recorded on the ex-dividend date. Realized gains and losses from investment transactions are calculated based on the cost of the specific security (also known as identified cost basis). Interest income is recognized on the accrual basis and includes, where applicable, the amortization or accretion of premium or discount using the effective yield method.
Expense, Investment Income and Gain/Loss Allocation:
Each Fund pays the expenses that are directly related to its operations, such as custodian fees or adviser fees. Expenses incurred by the Trust, such as trustee or legal fees, are allocated among each of the Funds either proportionately based upon each Fund’s relative net assets or using another reasonable basis such as equally across all Funds, depending on the nature of the expense. Individual share classes within a Fund are charged expenses specific to that class, such as distribution fees. Within a Fund, expenses other than class specific expenses are allocated daily to each class based upon the proportion of relative net assets. Investment income and realized and unrealized gains or losses are allocated to each class of shares based on relative net assets.
Real Estate Investment Trusts:
The Funds may own shares of real estate investment trusts (“REITs”) which report information on the source of their distributions annually. Dividends paid by a REIT, other than capital gain distributions, will be taxable as ordinary income up to the amount of the REIT’s current and accumulated earnings and profits. Capital gain dividends paid by a REIT to a fund will be treated as long term capital gains by the fund and, in turn, may be distributed by the fund to its shareholders as a capital gain distribution.
66
NOTES TO FINANCIAL STATEMENTS
|
Distributions received from a REIT in excess of its income are recorded as a return of capital and a reduction to the cost basis of the REIT.
Distributions to Shareholders:
Each Fund pays out any income that it receives, less expenses, in the form of dividends and capital gain distributions to its shareholders. Income dividends and capital gain distributions for each Fund are declared and paid at least annually. Distributions to shareholders are recorded on the ex-dividend date. The amount of dividends and distributions are calculated based on federal income tax regulations, which may differ from GAAP. These “book/tax” differences may be either temporary or permanent in nature. To the extent these differences are determined, as of the end of the tax year, to be permanent (e.g., net operating loss, foreign currency transactions, distribution redesignations and prior year spillbacks ), they are reclassified within a Fund’s capital accounts based on their federal tax basis treatment.
For the year ended September 30, 2011, permanent difference reclassification amounts were as follows:
| Increase/(Decrease) Paid in Capital | Increase/(Decrease) Accumulated Net Investment Income | Increase/(Decrease) Accumulated Realized Gain/(Loss) | ||||||||||
SMID Cap Growth Fund | $(428,118) | $428,118 | $ — | |||||||||
Enterprise Fund | (671,087) | 286,122 | 384,965 | |||||||||
Small Cap Core Fund | (157,475) | 48,802 | 108,673 | |||||||||
Microcap Value Fund | — | 49,162 | (49,162) | |||||||||
Mid Cap Value Fund | — | 3,407 | (3,407) | |||||||||
3. Agreements and Other Transactions with Affiliates
The Trust has entered into investment advisory agreements with RBC GAM (US) under which RBC GAM (US) manages each Fund’s assets and furnishes related office facilities, equipment, research and personnel. The agreements require each Fund to pay RBC GAM (US) a monthly fee based upon average daily net assets. Under the terms of the advisory contracts, RBC GAM (US) is entitled to receive fees based on a percentage of the average daily net assets of each of the Funds as follows:
Average Daily Net Assets of Fund | Annual Rate | |||||
SMID Cap Growth Fund | All Net Assets | 0.70% | ||||
Enterprise Fund | Up to $30 million | 1.00% | ||||
| Over $30 million | 0.90% | |||||
Small Cap Core Fund | Up to $30 million | 1.00% | ||||
| Over $30 million | 0.90% | |||||
Microcap Value Fund | All Net Assets | 0.90% | ||||
Mid Cap Value Fund | All Net Assets | 0.70% | ||||
On September 29, 2010, the Board approved a revised investment advisory agreement with respect to Enterprise Fund and Small Cap Core Fund that reflects the fee rates above and became effective November 22, 2010. For the period of October 1, 2010 to November 22, 2010, these two Funds paid RBC GAM (US) a monthly fee based on a percentage of the average daily net assets of the Funds shown below:
67
NOTES TO FINANCIAL STATEMENTS
|
Average Daily Net Assets of Fund | Annual Rate | |||||
Enterprise Fund | Up to $30 million | 1.40% | ||||
| Over $30 million | 0.90% | |||||
Small Cap Core Fund | Up to $30 million | 1.40% | ||||
| Over $30 million | 0.90% | |||||
RBC GAM (US) has contractually agreed to waive fees and/or make payments in order to keep total operating expenses of the Class S shares of each Fund and Class I shares of each Fund (except Small Cap Core Fund and Microcap Value Fund, which do not offer Class I shares) to the following levels. This expense limitation agreement is in place until January 31, 2013.
| Annual Rate | ||||
SMID Cap Growth Fund | 1.10% | |||
Enterprise Fund | 1.08% | |||
Small Cap Core Fund | 1.05% | |||
Microcap Value Fund | 1.07% | |||
Mid Cap Value Fund | 0.90% | |||
Classes A and C vary from these limits only by the addition of class-specific 12b-1 fees. Each Fund will carry forward, for a period not to exceed 12 months from the date on which a waiver or reimbursement is made by RBC GAM (US), any expenses in excess of the expense limitation and repay RBC GAM (US) such amounts, provided the Fund is able to effect such repayment and remain in compliance with the expense limitation stated above. At September 30, 2011, the amounts subject to possible recoupment under the expense limitation agreement are $181,809, $340,139, $256,458, $396,734 and $95,094 for SMID Cap Growth Fund, Enterprise Fund, Small Cap Core Fund, Microcap Value Fund and Mid Cap Value Fund, respectively.
RBC GAM (US) may also voluntarily waive and/or reimburse operating expenses of any Fund from time to time. Any such voluntary program may be changed or eliminated at any time without notice.
RBC GAM (US) serves as co-administrator to the Funds. BNY Mellon serves as co-administrator and fund accounting agent. Services provided under the administrative services contract include providing day-to-day administration of matters related to the Funds, maintenance of their records and the preparation of reports. Under the terms of the administrative services contract, RBC GAM (US) receives from each Fund a fee, payable monthly, at the annual rate of 0.075% of each Fund’s average daily net assets. BNY Mellon receives a fee for its services payable by the Funds based on the Funds’ average net assets. RBC GAM (US)’s fee is listed as “Administration fees” in the Statements of Operations. BNY Mellon’s fee is included with “Accounting fees” in the Statements of Operations.
Certain Officers and Trustees of the Trust are affiliated with the adviser or the co-administrator. Such Officers and Trustees receive no compensation from the Funds for serving in their respective roles.
The RBC Funds currently pay the independent Trustees (Trustees of the Trust who are not directors, officers or employees of the adviser, administrator or distributor) an annual retainer of $30,000 ($32,500 effective October 1, 2011). The Board Chairperson and Audit Committee Chairperson each receive an additional retainer of $2,500 annually, and all other trustees serving as Chair of a Board committee each receive an additional retainer of $1,000 annually. In addition, Independent Trustees receive a quarterly meeting fee of $5,000 for each in-person Board meeting attended, a meeting fee of $1,000 for each telephonic or Special Board meeting attended, and a $1,500 fee for each Board committee meeting attended and are reimbursed for all out-of-pocket expenses relating to attendance at such meetings.
68
NOTES TO FINANCIAL STATEMENTS
|
4. Fund Distribution
Each of the Funds has adopted a Master Distribution 12b-1 Plan (the “Plan”) in which Quasar Distributors LLC (the “Distributor”) acts as the Funds’ distributor. The Plan permits each Fund to make payments for or to reimburse the Distributor monthly for distribution-related costs and expenses of marketing shares of each share class covered under the Plan; and/or for providing shareholder services. The following chart shows the current Plan fee rate for each class.
Class A | Class C | |||
12b-1 Plan Fee | 0.25%* | 1.00% |
* Under the 12b-1 plan, the maximum fee rate for Class A shares is 0.50%. Currently the Board of Trustees has approved an annual limit of 0.25%.
Plan fees are based on average daily net assets of the applicable class. Up to 0.25% of each Plan fee may be designated as a Service Fee, as defined by the applicable rules of the Financial Industry Regulatory Authority. The Distributor, subject to applicable legal requirements, may waive a Plan fee voluntarily, in whole or in part.
For the year ended September 30, 2011, the Distributor received commissions of $5,059 from front-end sales charges of Class A and Class C shares of the Funds, of which $756 was paid to affiliated broker-dealers, and the remainder was either paid to unaffiliated broker-dealers or retained by the Distributor.
The Distributor also received $13 from CDSC fees from Class A and Class C shares of the Funds during the year ended September 30, 2011.
5. Securities Transactions
The cost of securities purchased and proceeds from securities sold (excluding securities maturing less than one year from acquisition) for the year ended September 30, 2011 were as follows:
| Purchases | Sales | |||||||||
SMID Cap Growth Fund | $ | 9,438,818 | $ | 17,722,033 | ||||||
Enterprise Fund | 36,831,616 | 91,576,669 | ||||||||
Small Cap Core Fund | 20,563,321 | 20,295,738 | ||||||||
Microcap Value Fund | 2,406,405 | 42,262,088 | ||||||||
Mid Cap Value Fund | 3,514,329 | 3,475,360 | ||||||||
Within the guidelines established by the Funds to always seek best execution when entering into portfolio transactions, certain of the Funds use directed brokerage transactions through LJR Recapture Services (“LJR”) and its correspondent brokers. A portion of the commissions paid for portfolio transactions under this program are reimbursed to the Funds and are recorded as net realized gains from investment transactions in the financial statements.
69
NOTES TO FINANCIAL STATEMENTS
|
6. Capital Share Transactions
The Trust is authorized to issue an unlimited number of shares of beneficial interest (“shares outstanding”) without par value. Transactions in capital stock of the Funds are summarized on the following pages:
| SMID Cap Growth Fund | Enterprise Fund | |||||||||||||||
| For the Year Ended September 30, 2011 | For the Year Ended September 30, 2010 | For the Year Ended September 30, 2011 | For the Year Ended September 30, 2010 | |||||||||||||
CAPITAL TRANSACTIONS: | ||||||||||||||||
Class A | ||||||||||||||||
Proceeds from shares issued and automatic conversion of shares | $ | 4,677,538 | $ | 1,261,111 | $ | 18,460 | $ | 143,799 | ||||||||
Distributions reinvested | — | — | — | — | ||||||||||||
Cost of shares redeemed | (3,948,963 | ) | (2,989,849 | ) | (1,258,647 | ) | (1,231,670 | ) | ||||||||
|
|
|
|
|
|
|
| |||||||||
Change in Class A | $ | 728,575 | $ | (1,728,738 | ) | $ | (1,240,187 | ) | $ | (1,087,871 | ) | |||||
|
|
|
|
|
|
|
| |||||||||
Class I | ||||||||||||||||
Proceeds from shares issued | $ | 2,566,987 | $ | 5,807,346 | $ | 2,471,463 | $ | 2,078,172 | ||||||||
Distributions reinvested | — | — | — | — | ||||||||||||
Cost of shares redeemed | (12,819,670 | ) | (12,418,052 | ) | (31,448,360 | ) | (3,565,672 | ) | ||||||||
|
|
|
|
|
|
|
| |||||||||
Change in Class I | $ | (10,252,683 | ) | $ | (6,610,706 | ) | $ | (28,976,897 | ) | $ | (1,487,500 | ) | ||||
|
|
|
|
|
|
|
| |||||||||
Class C | ||||||||||||||||
Proceeds from shares issued | $ | — | $ | — | $ | 3,534 | $ | 3,067 | ||||||||
Distributions reinvested | — | — | — | — | ||||||||||||
Cost of shares redeemed | (30,520 | ) | (44,116 | ) | (163,037 | ) | (251,543 | ) | ||||||||
|
|
|
|
|
|
|
| |||||||||
Change in Class C | $ | (30,520 | ) | $ | (44,116 | ) | $ | (159,503 | ) | $ | (248,476 | ) | ||||
|
|
|
|
|
|
|
| |||||||||
Class R | ||||||||||||||||
Proceeds from shares issued | $ | — | $ | 261 | $ | — | $ | 714 | ||||||||
Distributions reinvested | — | — | — | — | ||||||||||||
Cost of shares redeemed and automatic conversion of shares | — | (22,822 | ) | — | (43,439 | ) | ||||||||||
|
|
|
|
|
|
|
| |||||||||
Change in Class R | $ | — | $ | (22,561 | ) | $ | — | $ | (42,725 | ) | ||||||
|
|
|
|
|
|
|
| |||||||||
Class S | ||||||||||||||||
Proceeds from shares issued | $ | 151,538 | $ | 64,826 | $ | 920,975 | $ | 535,101 | ||||||||
Distributions reinvested | — | — | — | — | ||||||||||||
Cost of shares redeemed | (815,757 | ) | (94,368 | ) | (24,931,097 | ) | (15,738,170 | ) | ||||||||
|
|
|
|
|
|
|
| |||||||||
Change in Class S | $ | (664,219 | ) | $ | (29,542 | ) | $ | (24,010,122 | ) | $ | (15,203,069 | ) | ||||
|
|
|
|
|
|
|
| |||||||||
Change in net assets resulting from capital transactions | $ | (10,218,847 | ) | $ | (8,435,663 | ) | $ | (54,386,709 | ) | $ | (18,069,641 | ) | ||||
|
|
|
|
|
|
|
| |||||||||
SHARE TRANSACTIONS: | ||||||||||||||||
Class A | ||||||||||||||||
Issued and automatic conversion of shares | 380,703 | 125,150 | 1,143 | 10,663 | ||||||||||||
Reinvested | — | — | — | — | ||||||||||||
Redeemed | (318,977 | ) | (302,606 | ) | (76,730 | ) | (90,815 | ) | ||||||||
|
|
|
|
|
|
|
| |||||||||
Change in Class A | 61,726 | (177,456 | ) | (75,587 | ) | (80,152 | ) | |||||||||
|
|
|
|
|
|
|
| |||||||||
Class I | ||||||||||||||||
Issued | 209,055 | 554,729 | 147,155 | 150,826 | ||||||||||||
Reinvested | — | — | — | — | ||||||||||||
Redeemed | (973,857 | ) | (1,281,686 | ) | (1,687,334 | ) | (261,179 | ) | ||||||||
|
|
|
|
|
|
|
| |||||||||
Change in Class I | (764,802 | ) | (726,957 | ) | (1,540,179 | ) | (110,353 | ) | ||||||||
|
|
|
|
|
|
|
| |||||||||
70
NOTES TO FINANCIAL STATEMENTS
|
| SMID Cap Growth Fund | Enterprise Fund | |||||||||||||||
| For the Year Ended September 30, 2011 | For the Year Ended September 30, 2010 | For the Year Ended September 30, 2011 | For the Year Ended September 30, 2010 | |||||||||||||
(cont.) | ||||||||||||||||
Class C | ||||||||||||||||
Issued | — | — | 230 | 245 | ||||||||||||
Reinvested | — | — | — | — | ||||||||||||
Redeemed | (2,724 | ) | (5,044 | ) | (10,321 | ) | (19,808 | ) | ||||||||
|
|
|
|
|
|
|
| |||||||||
Change in Class C | (2,724 | ) | (5,044 | ) | (10,091 | ) | (19,563 | ) | ||||||||
|
|
|
|
|
|
|
| |||||||||
Class R | ||||||||||||||||
Issued | — | 27 | — | 55 | ||||||||||||
Reinvested | — | — | — | — | ||||||||||||
Redeemed and automatic conversion of shares | — | (2,262 | ) | — | (3,219 | ) | ||||||||||
|
|
|
|
|
|
|
| |||||||||
Change in Class R | — | (2,235 | ) | — | (3,164 | ) | ||||||||||
|
|
|
|
|
|
|
| |||||||||
Class S | ||||||||||||||||
Issued | 11,688 | 6,427 | 54,520 | 38,395 | ||||||||||||
Reinvested | — | — | — | — | ||||||||||||
Redeemed | (68,328 | ) | (8,840 | ) | (1,515,262 | ) | (1,147,828 | ) | ||||||||
|
|
|
|
|
|
|
| |||||||||
Change in Class S | (56,640 | ) | (2,413 | ) | (1,460,742 | ) | (1,109,433 | ) | ||||||||
|
|
|
|
|
|
|
| |||||||||
Change in shares resulting from capital transactions | (762,440 | ) | (914,105 | ) | (3,086,599 | ) | (1,322,665 | ) | ||||||||
|
|
|
|
|
|
|
| |||||||||
| Small Cap Core Fund | Microcap Value Fund | |||||||||||||||
| For the Year Ended September 30, 2011 | For the Year Ended September 30, 2010 | For the Year Ended September 30, 2011 | For the Year Ended September 30, 2010 | |||||||||||||
CAPITAL TRANSACTIONS: | ||||||||||||||||
Class A | ||||||||||||||||
Proceeds from shares issued and automatic conversion of shares | $ | 1,186,176 | $ | 43,795 | $ | 407,665 | $ | 779,295 | ||||||||
Distributions reinvested | — | — | 8,348 | 8,406 | ||||||||||||
Cost of shares redeemed | (163,399 | ) | (263,834 | ) | (3,901,379 | ) | (2,944,244 | ) | ||||||||
|
|
|
|
|
|
|
| |||||||||
Change in Class A | $ | 1,022,777 | $ | (220,039 | ) | $ | (3,485,366 | ) | $ | (2,156,543 | ) | |||||
|
|
|
|
|
|
|
| |||||||||
Class C | ||||||||||||||||
Proceeds from shares issued | $ | — | $ | — | $ | 21,358 | $ | 42,984 | ||||||||
Distributions reinvested | — | — | — | — | ||||||||||||
Cost of shares redeemed | (62,360 | ) | (240,507 | ) | (270,146 | ) | (406,090 | ) | ||||||||
|
|
|
|
|
|
|
| |||||||||
Change in Class C | $ | (62,360 | ) | $ | (240,507 | ) | $ | (248,788 | ) | $ | (363,106 | ) | ||||
|
|
|
|
|
|
|
| |||||||||
Class R | ||||||||||||||||
Proceeds from shares issued | $ | — | $ | 11,429 | $ | — | $ | 400,301 | ||||||||
Distributions reinvested | — | — | — | — | ||||||||||||
Cost of shares redeemed and automatic conversion of shares | — | (40,820 | ) | — | (503,076 | ) | ||||||||||
|
|
|
|
|
|
|
| |||||||||
Change in Class R | $ | — | $ | (29,391 | ) | $ | — | $ | (102,775 | ) | ||||||
|
|
|
|
|
|
|
| |||||||||
71
NOTES TO FINANCIAL STATEMENTS
|
| Small Cap Core Fund | Microcap Value Fund | |||||||||||||||
| For the Year Ended September 30, 2011 | For the Year Ended September 30, 2010 | For the Year Ended September 30, 2011 | For the Year Ended September 30, 2010 | |||||||||||||
(cont.) | ||||||||||||||||
Class S | ||||||||||||||||
Proceeds from shares issued | $ | 8,444,857 | $ | 5,370,575 | $ | 19,339,282 | $ | 25,298,449 | ||||||||
Distributions reinvested | — | — | 570,504 | 646,738 | ||||||||||||
Cost of shares redeemed | (9,668,033 | ) | (9,160,736 | ) | (61,403,419 | ) | (57,747,717 | ) | ||||||||
|
|
|
|
|
|
|
| |||||||||
Change in Class S | $ | (1,223,176 | ) | $ | (3,790,161 | ) | $ | (41,493,633 | ) | $ | (31,802,530 | ) | ||||
|
|
|
|
|
|
|
| |||||||||
Change in net assets resulting from capital transactions | $ | (262,759 | ) | $ | (4,280,098 | ) | $ | (45,227,787 | ) | $ | (34,424,954 | ) | ||||
|
|
|
|
|
|
|
| |||||||||
SHARE TRANSACTIONS: | ||||||||||||||||
Class A | ||||||||||||||||
Issued and automatic conversion of shares | 52,269 | 2,379 | 24,731 | 55,684 | ||||||||||||
Reinvested | — | — | 494 | 636 | ||||||||||||
Redeemed | (7,296 | ) | (14,929 | ) | (233,524 | ) | (214,031 | ) | ||||||||
|
|
|
|
|
|
|
| |||||||||
Change in Class A | 44,973 | (12,550 | ) | (208,299 | ) | (157,711 | ) | |||||||||
|
|
|
|
|
|
|
| |||||||||
Class C | ||||||||||||||||
Issued | — | — | 1,344 | 3,062 | ||||||||||||
Reinvested | — | — | — | — | ||||||||||||
Redeemed | (2,827 | ) | (13,839 | ) | (17,148 | ) | (31,012 | ) | ||||||||
|
|
|
|
|
|
|
| |||||||||
Change in Class C | (2,827 | ) | (13,839 | ) | (15,804 | ) | (27,950 | ) | ||||||||
|
|
|
|
|
|
|
| |||||||||
Class R | ||||||||||||||||
Issued | — | 630 | — | 29,103 | ||||||||||||
Reinvested | — | — | — | — | ||||||||||||
Redeemed and automatic conversion of shares | — | (2,183 | ) | — | (35,808 | ) | ||||||||||
|
|
|
|
|
|
|
| |||||||||
Change in Class R | — | (1,553 | ) | — | (6,705 | ) | ||||||||||
|
|
|
|
|
|
|
| |||||||||
Class S | ||||||||||||||||
Issued | 364,008 | 284,770 | 1,164,529 | 1,763,528 | ||||||||||||
Reinvested | — | — | 33,798 | 48,959 | ||||||||||||
Redeemed | (411,447 | ) | (472,975 | ) | (3,787,473 | ) | (4,145,810 | ) | ||||||||
|
|
|
|
|
|
|
| |||||||||
Change in Class S | (47,439 | ) | (188,205 | ) | (2,589,146 | ) | (2,333,323 | ) | ||||||||
|
|
|
|
|
|
|
| |||||||||
Change in shares resulting from capital transactions | (5,293 | ) | (216,147 | ) | (2,813,249 | ) | (2,525,689 | ) | ||||||||
|
|
|
|
|
|
|
| |||||||||
72
NOTES TO FINANCIAL STATEMENTS
|
Mid Cap Value Fund | ||||||||||
For the Year Ended 2011 | For the Period Ended | |||||||||
CAPITAL TRANSACTIONS: | ||||||||||
Class I | ||||||||||
Proceeds from shares issued | $ — | $1,634,500 | ||||||||
Distributions reinvested | 160,268 | — | ||||||||
|
| |||||||||
Change in net assets resulting from capital transactions | $160,268 | $1,634,500 | ||||||||
|
| |||||||||
SHARE TRANSACTIONS: | ||||||||||
Class I | ||||||||||
Issued | — | 162,274 | ||||||||
Reinvested | 13,816 | — | ||||||||
|
| |||||||||
Change in shares resulting from capital transactions | 13,816 | 162,274 | ||||||||
|
| |||||||||
| (a) | For the period from December 31, 2009 (commencement of operations) to September 30, 2010. |
7. Federal Income Taxes
It is the policy of each Fund to continue to qualify as a regulated investment company by complying with the provisions available to certain investment companies, as defined under Subchapter M of the Internal Revenue Code, and to distribute substantially all of its net investment income and net realized capital gains. Therefore, no federal tax liability is recorded in the financial statements of each Fund.
Management has analyzed the Funds’ tax positions taken or expected to be taken on federal income tax returns for all open tax years (for the tax years ended September 30 of the years 2008, 2009, 2010 and 2011), and has concluded that no provision for federal income tax is required in the Funds’ financial statements. The Funds’ federal and state income and federal excise tax returns for tax years for which the applicable statutes of limitations have not expired are subject to examination by the Internal Revenue Service and state departments of revenue.
As of and during the period ended September 30, 2011, the Funds did not have a liability for any unrecognized tax benefits. The Funds recognize interest and penalities, if any, related to unrecognized tax benefits as income tax expense in the statement of operations. During the period, the Funds did not incur any interest or penalties.
As of September 30, 2011, the tax cost of securities and the breakdown of unrealized appreciation (depreciation) for each Fund were as follows:
| Tax Cost of Securities | Unrealized Appreciation | Unrealized Depreciation | Net Unrealized Appreciation (Depreciation) | |||||||||||||
SMID Cap Growth Fund | $ | 49,215,601 | $ | 14,397,331 | $ | (4,180,965) | $ | 10,216,366 | ||||||||
Enterprise Fund | 89,231,600 | 20,999,309 | (16,656,045) | 4,343,264 | ||||||||||||
Small Cap Core Fund | 39,502,065 | 9,826,988 | (4,767,243) | 5,059,745 | ||||||||||||
Microcap Value Fund | 145,284,747 | 19,915,064 | (54,727,905) | (34,812,841) | ||||||||||||
Mid Cap Value Fund | 2,073,949 | 10,038 | (407,570) | (397,532) | ||||||||||||
The difference between book basis and tax basis unrealized appreciation/depreciation is attributable primarily to the tax deferral of losses on wash sales, and the timing of income recognition in REIT’s and Partnerships.
73
NOTES TO FINANCIAL STATEMENTS
|
The tax character of distributions during the fiscal year ended September 30, 2011 was as follows:
| Distributions Paid From | ||||||||||||||||
| Ordinary Income | Net Long Term Capital Gains | Total Taxable Distributions | Total Distributions Paid | |||||||||||||
SMID Cap Growth Fund | $ | — | $— | $ — | $ — | |||||||||||
Enterprise Fund | — | — | — | — | ||||||||||||
Small Cap Core Fund | — | — | — | — | ||||||||||||
Microcap Value Fund | 597,770 | — | 597,770 | 597,770 | ||||||||||||
Mid Cap Value Fund | 160,268 | — | 160,268 | 160,268 | ||||||||||||
The tax character of distributions during the fiscal year ended September 30, 2010 was as follows:
| Distributions Paid From | ||||||||||||||||
| Ordinary Income | Net Long Term Capital Gains | Total Taxable Distributions | Total Distributions Paid | |||||||||||||
SMID Cap Growth Fund | $ | — | $— | $ — | $ — | |||||||||||
Enterprise Fund | — | — | — | — | ||||||||||||
Small Cap Core Fund | — | — | — | — | ||||||||||||
Microcap Value Fund | 686,820 | — | 686,820 | 686,820 | ||||||||||||
Mid Cap Value Fund | — | — | — | — | ||||||||||||
As of September 30, 2011, the components of accumulated earnings/(losses) on a tax basis were as follows:
| Undistributed Ordinary Income | Undistributed Short Term Gain | Undistributed Long Term Gain | Accumulated Earnings | Accumulated Capital Loss Carryforwards | Deferred Post October Losses | Unrealized Appreciation/ (Depreciation) | Total Accumulated Earnings/(Losses) | |||||||||||||||||||||||||
SMID Cap Growth Fund | $ — | $ — | $ — | $ — | $ (43,316) | $— | $ 10,216,366 | $ 10,173,050 | ||||||||||||||||||||||||
Enterprise Fund | — | — | — | — | (11,423,141) | — | 4,343,264 | (7,079,877) | ||||||||||||||||||||||||
Small Cap Core Fund | — | — | 3,193,680 | 3,193,680 | — | — | 5,059,745 | 8,253,425 | ||||||||||||||||||||||||
Microcap Value Fund | 759,657 | — | — | 759,657 | (20,379,007) | — | (34,812,841) | (54,432,191) | ||||||||||||||||||||||||
Mid Cap Value Fund | 16,834 | 265,841 | 44,347 | 327,022 | — | — | (397,532) | (70,510) | ||||||||||||||||||||||||
As of September 30, 2011, the Funds had capital loss carryforwards for federal income tax purposes as follows:
| Capital Loss Carryforward | Expires | |||||||
SMID Cap Growth Fund | $ | 43,316 | 2018 | |||||
Enterprise Fund | 11,423,141 | 2018 | ||||||
Microcap Value Fund | 20,379,007 | 2018 | ||||||
During the year ended September 30, 2011, the Funds utilized capital loss carryforwards in the amounts of $5,753,146; $6,596,149; $2,735,835; $3,849,048 for the SMID Cap Growth Fund, the Enterprise Fund, the Small Cap Core Fund and the Microcap Value Fund, respectively.
The Regulated Investment Company Modernization Act of 2010 (The “Act”) was enacted on December 22, 2010. The Act makes changes to several tax rules impacting the Funds. In general, the provisions of the Act will be effective for the Funds’ fiscal year beginning after September 30, 2011. Although the Act provides several benefits, including the unlimited carryover of future capital losses, there may be a greater likelihood that all or a portion of each Fund’s pre-enactment capital loss
74
NOTES TO FINANCIAL STATEMENTS
|
carryovers may expire without being utilized due to the fact that post-enactment capital losses get utilized before pre-enactment capital loss carryovers. Relevant information regarding the impact of the Act on the Funds will be contained within this section of the Funds’ fiscal year ending September 30, 2012 financial statements.
8. Market Timing
The Trust strongly discourages attempts at market timing by Fund shareholders. Each Fund charges a redemption fee of 2% of the value of the shares redeemed or exchanged within 30 days of purchase, in addition to limiting the number of exchanges that may be made between Funds to five (5) per calendar year. When assessed, the redemption fee is deducted from the redemption proceeds and retained by the Fund, not by the Adviser. This redemption fee is not charged in cases where, for example, the redemption results from an automatic reinvestment or asset re-allocation not specifically directed by the shareholder. The Trust also reserves the right to reject any Fund purchase order made by persons deemed to be market timers. The Funds’ prospectus contains a full description of the Trust’s policies on market timing and/or excessive trading. The redemption fee is recorded as a credit to capital and is included in the capital transactions on the statements of changes in net assets.
During the year ended September 30, 2011, the redemption fees collected by the Funds which are included in the cost of shares redeemed on the statement of changes in net assets are as follows:
| Redemption Fees | ||||
SMID Cap Growth Fund | $ 253 | |||
Enterprise Fund | 49 | |||
Small Cap Core Fund | 612 | |||
Microcap Value Fund | 3,951 | |||
Mid Cap Value Fund | — | |||
9. Soft Dollars
The term soft dollars generally refers to arrangements in which services other than trade execution are received from a broker-dealer. Federal securities laws permit a fund advisor to incur commission charges on behalf of a Fund that are higher than another broker dealer would have charged if the advisor believes the charges are reasonable in relation to the brokerage and research services received. RBC GAM (US) has a fiduciary duty to the shareholders of the Funds to seek the best execution price for all of the Funds’ securities transactions. Fund management believes that using soft dollars to purchase brokerage and research services may, in certain cases, be in a Fund’s best interest. As of September 30, 2011, certain of the Funds used soft dollar arrangements on a limited basis. Fund management continues to closely monitor its current use of soft dollars, in addition to regulatory developments in this area for any possible impact on Fund policies.
10. Subsequent Events
Management has evaluated the impact of subsequent events of the Funds and has determined that there are no subsequent events that require recognition or disclosure in the financial statements.
75
REPORT OF INDEPENDENT REGISTERED PUBLIC ACCOUNTING FIRM
|
To the Shareholders and Board of Trustees of RBC Funds Trust
We have audited the accompanying statements of assets and liabilities, including the schedules of portfolio investments, of RBC SMID Cap Growth Fund, RBC Enterprise Fund, RBC Small Cap Core Fund, RBC Microcap Value Fund and RBC Mid Cap Value Fund (collectively the “Funds”), five of the portfolios constituting the RBC Funds Trust (the “Trust”), as of September 30, 2011, and the related statements of operations for the year then ended, the statements of changes in net assets for each of the two years in the period then ended, and the financial highlights for each of the periods presented. These financial statements and financial highlights are the responsibility of the Funds’ management. Our responsibility is to express an opinion on these financial statements and financial highlights based on our audits.
We conducted our audits in accordance with the standards of the Public Company Accounting Oversight Board (United States). Those standards require that we plan and perform the audits to obtain reasonable assurance about whether the financial statements and financial highlights are free of material misstatement. The Funds are not required to have, nor were we engaged to perform, an audit of their internal control over financial reporting. Our audits included consideration of internal control over financial reporting as a basis for designing audit procedures that are appropriate in the circumstances, but not for the purpose of expressing an opinion on the effectiveness of the Funds’ internal control over financial reporting. Accordingly, we express no such opinion. An audit also includes examining, on a test basis, evidence supporting the amounts and disclosures in the financial statements, assessing the accounting principles used and significant estimates made by management, as well as evaluating the overall financial statement presentation. Our procedures included confirmation of securities owned as of September 30, 2011, by correspondence with the Funds’ custodian and brokers; where replies were not received from brokers, we performed other auditing procedures. We believe that our audits provide a reasonable basis for our opinion.
In our opinion, the financial statements and financial highlights referred to above present fairly, in all material respects, the financial position of each of the portfolios of RBC Funds Trust referred to above, as of September 30, 2011, the results of their operations for the year then ended, the changes in their net assets for each of the two years in the period then ended, and the financial highlights for the periods presented, in conformity with accounting principles generally accepted in the United States of America.
DELOITTE & TOUCHE LLP
Chicago, Illinois
November 22, 2011
76
OTHER FEDERAL INCOME TAX INFORMATION (UNAUDITED)
|
For the fiscal year ended September 30, 2011, certain dividends paid by the Funds may be subject to a maximum tax rate of 15% as provided for by the Jobs and Growth Tax Reconciliation Act of 2003. The Funds intend to designate the maximum amount allowable as taxed at a maximum rate of 15%. Complete information will be reported in conjunction with your 2011 Form 1099-DIV.
All designations are based on financial information available as of the date of this annual report and, accordingly, are subject to change. For each item, it is the intention of the Funds to designate the maximum amount permitted under the Internal Revenue Code and the regulations thereunder.
For the year ended September 30, 2011, the following Funds had a qualified dividend income percentage of:
| Qualified Dividend Income | ||||
Microcap Value Fund | 100% | |||
Mid Cap Value Fund | 7.44% | |||
For corporate shareholders, the following percentage of the total ordinary income distributions paid during the fiscal year ended September 30, 2011 qualify for the corporate dividends received deduction:
| Dividends Received Deduction | ||||
Microcap Value Fund | 100% | |||
Mid Cap Value Fund | 7.63% | |||
The following Funds designate a portion of the income dividends distributed during the fiscal year ended September 30, 2011, as qualified interest income as defined in the Internal Revenue Code:
| Qualified Interest Income | ||||
Microcap Value Fund | 0.30% | |||
Mid Cap Value Fund | 0.29% | |||
The following Fund designates a portion of the income dividends distributed during the fiscal year ended September 30, 2011, as qualified short term gains:
| Qualified Short-term Gains | ||||
Mid Cap Value Fund | 100% | |||
77
|
Independent Trustees(1)(2)
T. Geron Bell (70)
Position, Term of Office and Length of Time Served with the Trust: Trustee since January 2004
Principal Occupation(s) During Past 5 Years: Chairman of the Executive Board of the Minnesota Twins (January 2011 to present); prior thereto President of Twins Sports, Inc. (parent company of the Minnesota Twins) (2002-2011); President of the Minnesota Twins Baseball Club Incorporated (1987-2002)
Number of Portfolios in Fund Complex Overseen by Trustee: 21
Other Director/Trustee Positions Held by Trustee During Past 5 Years: None
Lucy Hancock Bode (60)
Position, Term of Office and Length of Time Served with the Trust: Trustee since January 2004
Principal Occupation(s) During Past 5 Years: Healthcare consultant (self-employed)
Number of Portfolios in Fund Complex Overseen by Trustee: 21
Other Director/Trustee Positions Held by Trustee During Past 5 Years: BioSignia
Leslie H. Garner Jr. (61)
Position, Term of Office and Length of Time Served with the Trust: Trustee since January 2004
Principal Occupation(s) During Past 5 Years: President and CEO, The Greater Cedar Rapids Community Foundation (2010 to present); previously, President, Cornell College
Number of Portfolios in Fund Complex Overseen by Trustee: 21
Other Director/Trustee Positions Held by Trustee During Past 5 Years: None
Ronald James (60)
Position, Term of Office and Length of Time Served with the Trust: Trustee since January 2004
Principal Occupation(s) During Past 5 Years: President and Chief Executive Officer, Center for Ethical Business Cultures (2000 to present)
Number of Portfolios in Fund Complex Overseen by Trustee: 21
Other Director/Trustee Positions Held by Trustee During Past 5 Years: Best Buy Co. Inc.; Bremer Financial Corporation
John A. MacDonald (62)
Position, Term of Office and Length of Time Served with the Trust: Trustee since January 2004
Principal Occupation(s) During Past 5 Years: Vice President and Treasurer, Hall Family Foundation
Number of Portfolios in Fund Complex Overseen by Trustee: 21
Other Director/Trustee Positions Held by Trustee During Past 5 Years: None
H. David Rybolt (69)
Position, Term of Office and Length of Time Served with the Trust: Trustee since January 2004
Principal Occupation(s) During Past 5 Years: Consultant, HDR Associates (management consulting)
Number of Portfolios in Fund Complex Overseen by Trustee: 21
Other Director/Trustee Positions Held by Trustee During Past 5 Years: None
78
MANAGEMENT (Unaudited)
|
Independent Trustees(1)(2)
James R. Seward (59)
Position, Term of Office and Length of Time Served with the Trust: Chairman of the Board and Trustee since January 2004
Principal Occupation(s) During Past 5 Years: Private investor (2000 to present); CFA
Number of Portfolios in Fund Complex Overseen by Trustee: 21
Other Director/Trustee Positions Held by Trustee During Past 5 Years: Syntroleum Corporation; Brookdale Senior Living Inc.; LabOne, Inc.; American Retirement Corp.
William B. Taylor (66)
Position, Term of Office and Length of Time Served with the Trust: Trustee since September 2005
Principal Occupation(s) During Past 5 Years: Consultant (2003 to present); prior thereto Partner (until 2003) Ernst & Young LLP
Number of Portfolios in Fund Complex Overseen by Trustee: 21
Other Director/Trustee Positions Held by Trustee During Past 5 Years: J.E. Dunn Vermont Assurance
Interested Trustees(1)(2)(3)
Erik R. Preus (46)(5)
Position, Term of Office and Length of Time Served with the Trust: Trustee since March 2006
Principal Occupation(s) During Past 5 Years: President and Chief Executive Officer, RBC Funds Trust (2006 to present); Head, Strategic Relationships Group, RBC Global Asset Management (U.S.) Inc. (2009 to present); Head of Retail Asset Management, RBC Global Asset Management (U.S.) Inc. (2006-2009); Chief Operating Officer, RBC Global Asset Management (U.S.) Inc. (2005-2006); Director, Investment Consulting Services, RBC Dain Rauscher Inc. (2004-2005); Director, Voyageur Advisory Services, RBC Global Asset Management (U.S.) Inc. (2003-2004)
Number of Portfolios in Fund Complex Overseen by Trustee: 21
Other Director/Trustee Positions Held by Trustee During Past 5 Years: None
Executive Officers(1)(3)(4)
Erik R. Preus (46)
Position, Term of Office and Length of Time Served with the Trust: President and Chief Executive Officer since September 2006
Principal Occupation(s) During Past 5 Years: Head, Strategic Relationships Group, RBC Global Asset Management (U.S.) Inc. (2009 to present); Head of Retail Asset Management, RBC Global Asset Management (U.S.) Inc. (2006-2009); Chief Operating Officer, RBC Global Asset Management (U.S.) Inc. (2005-2006)
James A. Gallo (47)
Address: BNY Mellon Investment Servicing (US) Inc., 760 Moore Road, King of Prussia, PA 19406
Position, Term of Office and Length of Time Served with the Trust: Treasurer since October 2007
Principal Occupation(s) During Past 5 Years: Senior Vice President and Managing Director, BNY Mellon Investment Servicing (US) Inc. (2002 to present)
79
MANAGEMENT (Unaudited)
|
Executive Officers(1)(3)(4)
Kathleen A. Hegna (44)
Position, Term of Office and Length of Time Served with the Trust: Chief Financial Officer and Principal Accounting Officer since May 2009
Principal Occupation(s) During Past 5 Years: Associate Vice President and Director, Mutual Fund Accounting and Administration, RBC Global Asset Management (U.S.) Inc. (2009 to present); Senior Compliance Officer, RBC Global Asset Management (U.S.) Inc. (2006-2009); Director, Asset Management Compliance, RiverSource Investments (2005-2006)
Kathleen A. Gorman (47)
Position, Term of Office and Length of Time Served with the Trust: Chief Compliance Officer since April 2006 and Assistant Secretary since September 2006
Principal Occupation(s) During Past 5 Years: Chief Compliance Officer, RBC Funds Trust (2006 to present); Director of Regulatory Administration, RBC Global Asset Management (U.S.) Inc. (2007 to present); Chief Compliance Officer, RBC Global Asset Management (U.S.) Inc. (2006-2009)
Lee Thoresen (40)
Position, Term of Office and Length of Time Served with the Trust: Chief Legal Officer and Secretary since 2008
Principal Occupation(s) During Past 5 Years: Associate General Counsel, RBC Capital Markets, LLC (2006-present); Asset Management Compliance, RiverSource Investments (2004-2006)
John M. Huber (43)
Position, Term of Office and Length of Time Served with the Trust: Chief Investment Officer, U.S. Fixed Income Funds since February 2004
Principal Occupation(s) During Past 5 Years: Senior Managing Director and Chief Investment Officer, Fixed Income, RBC Global Asset Management (U.S.) Inc. (2004 to present)
Gordon Telfer (45)
Position, Term of Office and Length of Time Served with the Trust: Chief Investment Officer, U.S. Equity Funds since October 2009; Portfolio Strategist from March 2004 to October 2009
Principal Occupation(s) During Past 5 Years: Director of Equities - U.S., RBC Global Asset Management (U.S.) Inc. (June 2009 to present); Head of Growth Equities, RBC Global Asset Management (U.S.) Inc. (2008-2009); Senior Portfolio Manager, RBC Global Asset Management (U.S.) Inc. (2004-2008); Managing Director, RBC Global Asset Management (U.S.) Inc. (2007-present); Vice President, RBC Global Asset Management (U.S.) Inc. (2004-2007)
80
MANAGEMENT (Unaudited)
|
Executive Officers(1)(3)(4)
Mark Poole (50)
Address: BlueBay Asset Management Ltd., 77 Grosvenor Street, London, W1K 3JR, United Kingdom
Position, Term of Office and Length of Time Served with the Trust: Chief Investment Officer, Global Fixed Income Funds since September 2011
Principal Occupation(s) During Past 5 Years: Chief Investment Officer, BlueBay Asset Management Ltd. (2001 to present)
| (1) | Except as otherwise noted, the address of each Trustee/Officer is RBC Funds Trust, 100 South Fifth Street, Suite 2300, Minneapolis, Minnesota 55402. |
| (2) | All Trustees must retire on or before December 31 of the year in which they reach age 75. The Board may temporarily waive this requirement when necessary to avoid depriving the Board of a Trustee with a critical skill . |
| (3) | On December 31, 2009, Voyageur Asset Management Inc. changed its name to RBC Global Asset Management (U.S.) Inc. Any references to RBC Global Asset Management (U.S.) Inc. for prior periods are deemed to be references to the prior entity. |
| (4) | Each officer serves in such capacity for an indefinite period of time until his or her removal, resignation or retirement. |
| (5) | Erik R. Preus has been determined to be an interested Trustee by virtue of his affiliation with the Trust. |
The Funds’ Statement of Additional Information includes information about the Funds’ Trustees. To receive your free copy of the Statement of Additional Information, call toll free: 1-800-422-2766.
81
SHARE CLASS INFORMATION (UNAUDITED)
|
The RBC Equity Funds offer up to four share classes. These four share classes are the A, C, I, and S classes.
For an investor purchasing RBC Funds shares through a financial services intermediary, the question as to which share class, A or C, is the better choice is dependent on many factors, including the amount to be invested and the length of time an investor anticipates holding the shares. An investor should consult with his or her financial advisor about his or her personal financial situation to determine which share class is the best choice for his or her individual situation.
Class A
Class A shares of all Funds except Mid Cap Value are available for purchase primarily through investment advisors, broker-dealers, banks and other financial services intermediaries. Class A shares of the Funds are currently subject to a maximum up-front sales charge of 5.75% and a 1.00% CDSC for redemption within 12 months of a $1 million or greater purchase. Class A shares currently include a 0.25% (25 bps) annual 12b-1 service and distribution fee. Class A shares have a higher up-front sales charge (load) than Class C shares, but a lower annual expense ratio.
Class C
Class C shares of all Funds except Mid Cap Value are also available for purchase primarily through investment advisors, broker-dealers, banks and other financial services intermediaries. Class C shares redeemed within 12 months of purchase are subject to a CDSC of 1.00%. (No CDSC will be charged on shares acquired through reinvestment of dividends or capital gains.) C Class shares expenses include a 1.00% (100 bps) annual 12b-1 service and distribution fee. Class C shares have a lower up-front sales charge (load) than Class A shares, but due to the higher service and distribution fee, have higher annual expenses than A Class shares.
Class S
Class S shares of all Funds except Mid Cap Value are available to investors purchasing shares directly through the Fund or its agent, U.S. Bancorp Fund Services LLC, or through certain fee-based programs of broker-dealers or registered investment advisors. This share class does not have an up-front sales charge (load) or a 12b-1 service and distribution fee.
Class I
Class I shares are available in the SMID Cap Growth, Enterprise and Mid Cap Value Funds. This share class is intended for investors meeting certain minimum investment thresholds. This share class does not have an up-front sales charge (load) or a 12b-1 service and distribution fee.
82
SUPPLEMENTAL INFORMATION (UNAUDITED)
|
Shareholder Expense Examples
As a shareholder of the RBC Funds, you incur two types of costs: (1) transaction costs, including sales charges (loads) and (2) ongoing costs, including management fees; 12b-1 distribution and service fees; and other Fund expenses. This example is intended to help you understand your ongoing costs (in dollars) of investing in the RBC Funds and to compare these costs with the ongoing costs of investing in other mutual funds.
The example is based on an investment of $1,000 invested at the beginning of the period and held for the entire period from April 1, 2011 through September 30, 2011.
Actual Expenses and Performance
The table below provides information about actual account values and actual expenses. You may use the information below, together with the amount you invested, to estimate the expenses that you paid over the period. Simply divide your account value by $1,000 (for example, an $8,600 account value divided by $1,000 = 8.6), then multiply the result by the number in the table under the heading entitled “Expenses Paid During Period” to estimate the expenses you paid on your account during this period.
| Beginning Account Value 4/1/2011 | Ending Account Value 9/30/2011 | Expenses Paid During Period* 4/1/11-9/30/11 | Annualized Expense Ratio During Period 4/1/11-9/30/11 | ||||||||||||||||||||||
SMID Cap Growth Fund | Class A | $ | 1,000.00 | $ | 845.10 | $ | 6.31 | 1.35 | % | ||||||||||||||||
| Class I | 1,000.00 | 846.30 | 5.15 | 1.10 | % | ||||||||||||||||||||
| Class C | 1,000.00 | 842.20 | 9.80 | 2.10 | % | ||||||||||||||||||||
| Class S | 1,000.00 | 846.30 | 5.15 | 1.10 | % | ||||||||||||||||||||
Enterprise Fund | Class A | 1,000.00 | 797.60 | 6.06 | 1.33 | % | |||||||||||||||||||
| Class I | 1,000.00 | 797.90 | 4.88 | 1.07 | % | ||||||||||||||||||||
| Class C | 1,000.00 | 794.70 | 9.46 | 2.08 | % | ||||||||||||||||||||
| Class S | 1,000.00 | 798.30 | 4.92 | 1.08 | % | ||||||||||||||||||||
Small Cap Core Fund | Class A | 1,000.00 | 783.00 | 5.92 | 1.31 | % | |||||||||||||||||||
| Class C | 1,000.00 | 780.00 | 9.20 | 2.04 | % | ||||||||||||||||||||
| Class S | 1,000.00 | 783.90 | 4.75 | 1.05 | % | ||||||||||||||||||||
Microcap Value Fund | Class A | 1,000.00 | 805.60 | 6.04 | 1.32 | % | |||||||||||||||||||
| Class C | 1,000.00 | 802.50 | 9.46 | 2.07 | % | ||||||||||||||||||||
| Class S | 1,000.00 | 806.60 | 4.90 | 1.07 | % | ||||||||||||||||||||
Mid Cap Value Fund | Class I | 1,000.00 | 759.10 | 4.01 | 0.90 | % | |||||||||||||||||||
*Expenses are equal to the average account value times the Fund’s annualized expense ratio multiplied by 185/365 (to reflect one-half year period).
83
SUPPLEMENTAL INFORMATION (UNAUDITED)
|
Hypothetical Example for Comparison Purposes
The table below provides information about hypothetical account values and hypothetical expenses based on each RBC Funds’ actual expense ratio and an assumed rate of return of 5% per year before expenses, which is not the Fund’s actual return. The hypothetical account values and expenses may not be used to estimate the actual ending account balance or expenses you paid for the period. You may use this information to compare this 5% hypothetical example with the 5% hypothetical examples that appear in the shareholder reports of other funds.
Please note that the expenses shown in the table are meant to highlight your ongoing costs only and do not reflect any transactional costs, such as sales charges (loads), redemption fees, or exchange fees. Therefore, the table is useful in comparing ongoing costs only, and will not help you determine the relative total costs of owning different funds. In addition, if these transactional costs were included, your costs would have been higher.
| Beginning Account Value 4/1/2011 | Ending Account Value 9/30/2011 | Expenses Paid During Period* 4/1/11-9/30/11 | Annualized Expense Ratio During Period 4/1/11-9/30/11 | ||||||||||||||||||||||
SMID Cap Growth Fund | Class A | $ | 1,000.00 | $ | 1,018.50 | $ | 6.91 | 1.35 | % | ||||||||||||||||
| Class I | 1,000.00 | 1,019.77 | 5.63 | 1.10 | % | ||||||||||||||||||||
| Class C | 1,000.00 | 1,014.70 | 10.72 | 2.10 | % | ||||||||||||||||||||
| Class S | 1,000.00 | 1,019.77 | 5.63 | 1.10 | % | ||||||||||||||||||||
Enterprise Fund | Class A | 1,000.00 | 1,018.60 | 6.80 | 1.33 | % | |||||||||||||||||||
| Class I | 1,000.00 | 1,019.92 | 5.48 | 1.07 | % | ||||||||||||||||||||
| Class C | 1,000.00 | 1,014.80 | 10.62 | 2.08 | % | ||||||||||||||||||||
| Class S | 1,000.00 | 1,019.87 | 5.53 | 1.08 | % | ||||||||||||||||||||
Small Cap Core Fund | Class A | 1,000.00 | 1,018.70 | 6.70 | 1.31 | % | |||||||||||||||||||
| Class C | 1,000.00 | 1,015.00 | 10.42 | 2.04 | % | ||||||||||||||||||||
| Class S | 1,000.00 | 1,020.02 | 5.38 | 1.05 | % | ||||||||||||||||||||
Microcap Value Fund | Class A | 1,000.00 | 1,018.65 | 6.75 | 1.32 | % | |||||||||||||||||||
| Class C | 1,000.00 | 1,014.85 | 10.57 | 2.07 | % | ||||||||||||||||||||
| Class S | 1,000.00 | 1,019.92 | 5.48 | 1.07 | % | ||||||||||||||||||||
Mid Cap Value Fund | Class I | 1,000.00 | 1,020.78 | 4.61 | 0.90 | % | |||||||||||||||||||
*Expenses are equal to the average account value times the Fund’s annualized expense ratio multiplied by 185/365 (to reflect one-half year period).
84
APPROVAL OF INVESTMENT ADVISORY AGREEMENT (UNAUDITED)
|
Information Regarding the Approval of Investment Advisory Agreements
In September 2011, after evaluating the services provided by RBC Global Asset Management (U.S.), Inc. (the “Advisor”) and reviewing the performance, fees and expenses of the Funds, the RBC Funds Board of Trustees determined to approve the continuation of the investment advisory agreements (“Agreements”) with the Advisor for each Fund for an additional year.
As part of their review of the Agreements, the Trustees requested and considered information regarding the advisory services performed by the Advisor, the staffing and qualifications of the personnel responsible for operating and managing the Funds, and the Funds’ performance and expenses. The review process was guided by the Board’s Valuation, Portfolio Management and Performance Committee. The Trustees considered information provided at regular quarterly Board and Committee meetings throughout the year, as well as a special meeting to review requested material related to the proposed renewals and a meeting held to specifically consider the proposed renewals. In connection with their deliberations, the independent Trustees were advised by their own independent legal counsel with regard to the materials and their responsibilities under relevant laws and regulations.
The Trustees met with representatives from the Advisor’s senior management team, as well as senior investment professionals, to discuss the information and the Advisor’s ongoing management of the Funds. The Trustees reviewed the quality of the services provided to the Funds by the Advisor, including information prepared by an independent third-party consultant as to each Fund’s performance relative to appropriate index benchmarks as well as fund peer group comparative information requested by the Board. For the Enterprise and Microcap Value Funds, the Trustees also requested and reviewed supplemental performance material that included a peer group of other microcap funds, since the standard consultant material did not include such a benchmark category. The Trustees reviewed performance data both before and after fees and expenses.
The Trustees noted that the nearer-term performance of each of the Funds was favorable relative to their benchmarks and peer group averages, with the exception of the Microcap Value Fund, and recognized that the Advisor’s focus on higher quality companies within the micro-cap segment for the Microcap Value Fund accounted for the Fund’s lower risk profile and relative underperformance during market rallies. The Trustees discussed the Fund’s performance during more volatile periods and concluded that the Fund’s risk-adjusted performance was consistent with its investment mandate. The Trustees recognized the Advisor’s management and trading expertise that benefitted the Funds.
The Trustees reviewed the investment advisory fees payable to the Advisor, and reviewed comparative fee and expense information for similarly situated funds. The Trustees also received reports from the Advisor regarding other investment companies it advised, including the advisory fees paid, as well as other advisory client accounts and their related fees. The Trustees evaluated profitability data for the Advisor, and considered information regarding other benefits the Advisor and its affiliates derived from its relationships with the Funds. The Advisor had proposed to continue for an additional year the existing contractual fee waiver and expense limitation arrangements in order to limit operating expenses.
85
APPROVAL OF INVESTMENT ADVISORY AGREEMENT (UNAUDITED)
|
In considering the quality of the services performed for each Fund by the Advisor, the Trustees discussed the research capabilities and fundamental analysis performed by the firm and also considered the portfolio management experience of the Advisor’s staff, its trading expertise, compliance structure and systems, financial strength, and its implementation of strategic initiatives geared toward the success of the Funds. The Trustees were satisfied with the quality and capabilities of the portfolio management and analyst team, the trading expertise, and with the overall investment performance of each Fund given the market conditions.
Based upon their review, the Trustees determined that the advisory fees proposed to be payable to the Advisor were fair and reasonable in light of the nature and quality of services provided under all of the circumstances, and were within the range of what might have been negotiated at arms’ length. The Trustees concluded that it is in the interest of the Funds and their shareholders for the Trustees to approve the continuation of the Agreements and expense limitation arrangements for the Funds. In arriving at their decision to approve the renewal of the Agreements, the Trustees did not assign relative weights to the factors discussed above or deem any one or group of them to be controlling in and of itself.
86
|
This Page Intentionally Left Blank
87
|
This Page Intentionally Left Blank
88
|
This Page Intentionally Left Blank
89
|
This Page Intentionally Left Blank
90
|
This Page Intentionally Left Blank
91
|
This Page Intentionally Left Blank
92
RBC Funds
P.O. Box 701
Milwaukee, WI 53201-0701
800-422-2766
www.rbcgam.us
Performance data represents past performance and does not guarantee future results. The principal value of an investment and investment return will fluctuate so that an investor’s shares, when redeemed, may be worth more or less than their original cost.
This report and the financial statements contained herein are provided for the information of RBC Funds shareholders. This report is not authorized for distribution to prospective investors unless preceded or accompanied by a current prospectus, which contains information concerning investment objectives, risks, charges and expenses of the funds. Please read the prospectus carefully before investing.
This report and the financial statements contained herein are not intended to be a forecast of future events, a guarantee of future results, or investment advice. There is no assurance that certain securities will remain in or out of each fund’s portfolio. The views expressed in this report reflect those of the portfolio managers through the period ended September 30, 2011.
NOT FDIC INSURED — NO BANK GUARANTEE — MAY LOSE VALUE
RBC Global Asset Management, Inc. serves as investment adviser for the RBC Funds. RBC Funds are distributed by Quasar Distributors LLC.

| The RBC Funds are pleased to offer shareholder reports printed entirely on Forest Stewardship Council certified paper. FSC certification ensures that the paper used in this report contains fiber from well-managed and responsibly harvested forests that meet strict environmental and socioeconomic standards. |
RBCF-EQ AR 09-11
RBC Funds
| ||||||||
About Your Annual Report |
This annual report includes detailed information about your Fund including financial statements, performance, and a complete list of holdings.
We hope the financial information presented will help you evaluate your investment in the RBC Funds. We also encourage you to read your Fund’s prospectus for further detail as to your Fund’s investment policies and risk profile. RBC Funds prospectuses and additional performance information are available on our website at www.rbcgam.us.
A description of the policies and procedures that your Fund uses to determine how to vote proxies relating to portfolio securities is available (i) without charge, upon request, by calling 1-800-422-2766; (ii) on the Fund’s website at www.rbcgam.us; and (iii) on the Securities and Exchange Commission’s (“Commission”) website at http://www.sec.gov.
Information regarding how your Fund voted proxies relating to portfolio securities during the most recent 12-month period ended June 30 is available (i) on the Fund’s website at www.rbcgam.us; and (ii) on the Commission’s website at http://www.sec.gov.
A schedule of each Fund’s portfolio holdings will be filed with the Commission for the first and third quarters of each fiscal year on Form N-Q. This information is available on the Commission’s website at http://www.sec.gov and may be reviewed and copied at the Commission’s Public Reference Room in Washington, D.C. Information on the operation of the Public Reference Room is available by calling 1-202-551-8090.
| |||||||
Contents |
| 1 | ||||||
| Money Market Portfolio Managers | 3 | |||||||
| Performance Summary | 5 | |||||||
| Schedules of Portfolio Investments | 8 | |||||||
| Financial Statements | ||||||||
| - Statements of Assets and Liabilities | 36 | |||||||
| - Statements of Operations | 38 | |||||||
| - Statements of Changes in Net Assets | 39 | |||||||
| Financial Highlights | 42 | |||||||
| Notes to Financial Statements | 45 | |||||||
| Report of Independent Registered Public Accounting Firm | 55 | |||||||
| Other Federal Income Tax Information | 56 | |||||||
| Management | 57 | |||||||
| Supplemental Information | 61 | |||||||
| Approval of Investment Advisory Agreement | 63 | |||||||
| ||||
The RBC Funds enjoyed another solid year of providing financial solutions for our shareholders. We understand the critical role our funds play in helping our shareholders manage their liquidity needs while striving to ensure their wealth is preserved. In these uncertain economic times, it’s important we reinforce to our shareholders our ongoing commitment to protecting the safety of the assets held within our money market funds. It was three years ago that investors experienced a market crisis the likes of which we haven’t seen since the great depression. Then, as now, RBC Funds provided stability and strength to our shareholders.
From a financial perspective, I am pleased to report that all of our money market funds continued to perform as expected during the past year. While consistently outperforming our benchmarks in a risk-controlled manner is certainly one of our goals, it is not the ultimate goal for our funds. Protecting client assets remains the primary goal of our approach. We will continue to adhere to our principles to help ensure the safety of your principal.
So what has changed over the past year? From an economic perspective, what looked like decent U.S. growth in the first half of the year turned out to be more of a mirage. The recovery that was widely expected to take root over the second half of 2011 simply hasn’t developed. While a stronger global economy was a key argument for a sustainable recovery in the U.S., many of those countries are now facing diminished growth expectations. And while consumer and business confidence can be fickle, especially in a deleveraging environment, spending and hiring have all disappointed.
What has also changed is the level of discourse focused on the long term fiscal health of the United States and Europe. While the debt discussions this summer in Washington were a fiasco, changes are now forthcoming, whether they occur by force or choice. That will ultimately be good for credit quality. The S&P downgrade of U.S. debt from its AAA rating was certainly a new challenge. The combination of political theatrics and the downgrade dealt a real blow to investor confidence.
Many economic fundamentals, however, have not changed over the past year. Several baseline economic constraints remain firmly in place. Higher government debt burdens are associated with slower economic growth. Ongoing financial deleveraging limits consumption and reduces investment. Further, the natural reversal of fiscal stimulus continues to serve as an economic drag. Today’s economic growth is weak, but it is still positive. Corporations continue to produce solid earnings despite the economic environment. Balance sheets, cash flows and liquidity remain strong across most corporate sectors. Regulatory capital is increasing in the banking sector. Housing also appears to have bottomed, an important condition before economic growth can sustain itself.
The longer-term implications of all this should be quite limited. First, and contrary to expectations, American borrowing costs responded to the downgrade by going down, not up. And no major class of investor has abandoned or become ineligible to buy U.S. Treasuries. Second, the U.S. is quite unlike Greece. To that point, S&P downgraded the U.S. primarily due to political dysfunction, not intractable economic or fiscal problems. The U.S. economy is weak, but has good long-term prospects due to favorable | ||||
1
LETTER FROM THE CIO OF FIXED INCOME | ||||||
productivity and demographic trends. The debt burden is rising, but manageable, for the world’s reserve currency.
Concerns over the ongoing financial crisis in Europe are certainly reasonable, but those worries are nothing new. The markets increasingly understand we need to see real burden sharing between creditors and debtors along with a move to some form of a fiscal union. A Euro break-up, one which can be avoided through strong leadership, would certainly be a disaster for the global economy, but the global central banks and the G7 leaders have already done too much, through monetary and fiscal stimulus, to allow that to occur. It’s a problem that requires a global response. Ultimately, the costs involved in fixing the European problem are lower than the costs of failure.
Risk aversion is understandably elevated at present, contributing to historically low yields. Adjusting for inflation, real yields are already negative in most of the developed world. This type of environment punishes savers and rewards borrowers. More constructively, it also encourages risk-taking behavior, which is a necessary condition for more vibrant economic growth. This brings opportunity for those willing to take advantage of it.
Throughout my career, I have seen incredible bull markets and unimaginable bear markets. Through all the ups and downs, investors who have remained focused on their financial objectives, within the appropriate broad context, have generally been successful. As always, we will remain steadfast in our goal of principal preservation of our shareholders assets while striving to provide the necessary liquidity and income generation they expect. Thank you for your continued confidence and trust in the RBC Funds.
Sincerely, | ||||||
John Huber Chief Investment Officer Fixed Income |
John M. Huber, CFA Chief Investment Officer, Fixed Income RBC Funds
Past performance is not a guarantee of future results.
Opinions expressed are subject to change, are not guaranteed, and should not be considered a recommendation to buy or sell any security.
An investment in a Money Market Fund is not insured or guaranteed by the Federal Deposit Insurance Corporation or any other government agency. Although Money Market Funds seek to preserve the value of your investment at $1.00 per share, it is possible to lose money by investing in them. These risks are more fully described in the prospectus. | |||||


2
| ||||||
| RBC Global Asset Management (U.S.) Inc. (“RBC GAM (US)”), serves as the investment advisor to the RBC Funds. RBC GAM (US) employs a team approach to the management of each of the Money Market Funds, with no individual team member being solely responsible for the investment decisions. Each Fund’s management team has access to RBC GAM (US)’s investment research and other money management resources. | ||||||
John M. Huber, CFA Senior Managing Director, Chief Investment Officer — Fixed Income John Huber oversees RBC GAM (US)’s fixed income research and portfolio management efforts. He is a member of the firm’s Executive Committee. John joined RBC GAM (US) in 2001 from Galliard Capital Management where he was a founding member and principal. Before that, John was a portfolio manager at Norwest Investment Management, where he began his career in the capital markets group in 1990. He earned a BA from the University of Iowa and an MBA in Finance from the University of Minnesota Carlson School of Management. John acts as an advisor to the Carlson Funds Enterprise for the University of Minnesota. He is also a board member of the Minneapolis Downtown YMCA. John is a CFA charterholder and a member of the CFA Society of Minnesota. |
John M. Huber, CFA | |||||
Raye C. Kanzenbach, CFA Senior Managing Director, Senior Portfolio Manager Raye Kanzenbach leads the Municipal Research Team within RBC GAM (US)’s fixed income group. Raye has extensive experience researching and investing in municipal securities. His research responsibilities include tax-exempt money market securities, general obligations, and revenue bonds. Before joining RBC GAM (US) in 1983, Raye worked at First Bank, where he managed the firm’s municipal and money market trust funds. He was also previously an investment officer at The St. Paul Companies. Raye began his career in the investment industry in 1973. He earned a BA in Economics from Lawrence University and an MBA in Finance from the University of Michigan. Raye is a CFA charterholder. |
Raye C. Kanzenbach, CFA | |||||
Brandon T. Swensen, CFA Vice President, Portfolio Manager Brandon Swensen leads the Short Term Research Team within RBC GAM (US)’s fixed income group. Brandon researches asset-backed commercial paper and consumer asset-backed securities. He joined RBC GAM (US) in 2000, and has held several key positions in the firm’s fixed income group, including structured product analyst and credit analyst. Brandon began his career in the investment industry in 1998. He earned a BS in Finance from St. Cloud State University and an MBA in Finance from the University of St. Thomas. Brandon is a CFA charterholder and member of the CFA Society of Minnesota. |
Brandon T. Swensen, CFA | |||||
|


3
MONEY MARKET PORTFOLIO MANAGERS | ||||||
Chad Rice, CFA |
Chad Rice, CFA Vice President, Portfolio Manager Chad Rice is a member of the Municipal Research Team and is a portfolio manager for the Tax-Free Money Market Fund. His research responsibilities include tax-exempt money market securities and taxable and tax-exempt general obligations and revenue bonds. Chad joined RBC GAM (US) in 2011 from Sentry Insurance, where he was a senior portfolio manager responsible for municipal portfolio management for the firm’s property and casualty and life insurance businesses. He joined Sentry in 2003 after completing his MS in Finance, Investments, and Banking at the University of Wisconsin- Madison School of Business. While attending the Applied Security Analysis Program at Wisconsin, Chad was selected to co-manage a fixed-income portfolio, which spurred his interest in investment research. He earned a BS from the University of Wisconsin-Stevens Point and began his professional career as a medical technologist doing immunohematological testing for Marshfield Clinic Laboratory. Chad is a CFA charterholder and member of the National Federation of Municipal Analysts. | |||||

4
| ||||||
RBC Money Market Funds
| ||||||
The RBC Money Market Funds seek to achieve the highest level of current income as is consistent with prudent investment management emphasizing the safety of principal and the maintenance of suitable liquidity. The Funds invest in a variety of highly rated money market instruments. In the Tax-Free Money Market Fund, investments are made in highly rated debt obligations that pay interest exempt from federal income taxes and the alternative minimum tax.
The RBC Money Market Funds are not benchmarked to industry indices, although their performance is evaluated against each Fund’s respective peer group as reported by several service providers.
| RBC Money Market Funds | |||||
In this reporting period, short-term interest rates have remained at extremely low levels as the Federal Reserve continues to conduct aggressive monetary policies. The benchmark Federal Funds rate has remained within a target range of between 0.00% and 0.25%. During this period there has been volatility in the short-term credit markets in response to a changing regulatory environment, lackluster economic data and deepening concerns associated with certain European sovereign credits and financial institutions. While the issuance of financial and bank debt has remained fairly active, the amount of short-term debt issuance by non-financial issuers has continued to decline from high levels that were reached three-years prior. This in part reflects the significant cash balances held by corporations as well as decisions by those borrowers to issue debt for terms of longer than one year in the context of a very low interest rate climate.
During the past year, the institutional share classes of both the Prime and U.S. Government money market funds experienced a decline in their balances. We believe that the volatility in the asset size of institutional share classes is driven by relative yield comparisons as those investors chose to migrate cash assets into money funds offering yields in the top quartile of their peer group. However, there have been several days over this reporting period where there were temporary outflows from the broader money market sector in response to both domestic political debates surrounding the debt ceiling and at points where the European difficulties had seemed to reach an impasse.
We have positioned the portfolios in a manner that considers the institutional fund participants, that acknowledges the current market environment, and which meets the more rigorous ratings criteria enacted by the ratings agencies. The Funds’ portfolio management team continues to closely monitor the markets, adjust issuer approved lists and investment practices while maintaining a strategy whereby: | Taxable Money Market Funds | |||||
• A high percentage of assets were invested in securities that matured within 7 and 30 days; • Only a select set of the highest quality issuers were approved for investment in a highly diversified manner.
| ||||||
| During the past year, the modest contribution from the institutional share classes in the Tax-Free Money Market Fund have remained steady. The Fund held a majority of assets that provided either daily or weekly demand features (in other words, securities with maturities of seven days or less) with a more modest percentage of assets in highly rated notes with maturities of 180-397 days. As a result, the average maturities of the Fund fluctuated between 25- 35 days, which was fairly consistent with the average of funds in its peer group. | Tax-Free Money Market Fund | |||||
5
PERFORMANCE SUMMARY | ||||||||||||
Investment Objective | Each of the RBC Money Market Funds was managed to preserve principal. This means that the share price of each fund held steady at $1.00. A consistent share price of $1.00 is expected for a money market mutual fund. An investment in the Fund is not insured or guaranteed by the Federal Deposit Insurance Corporation or any other government agency. Although the Fund seeks to preserve the value of your investment at $1.00 per share, it is possible to lose money by investing in the Fund. These risks are more fully described in the prospectus. | |||||||||||
Total Return for the | SEC 7-Day Annualized Yield (1) | |||||||||||
| Year Ended September 30, 2011 | September 30, 2011 | September 30, 2010 | ||||||||||
Prime Money Market | ||||||||||||
RBC Institutional Class 1 | 0.13% | 0.07% | 0.23% | |||||||||
RBC Institutional Class 2 | 0.04% | 0.01% | 0.13% | |||||||||
RBC Investor Class | 0.01% | 0.01% | 0.01% | |||||||||
RBC Reserve Class | 0.01% | 0.01% | 0.01% | |||||||||
RBC Select Class | 0.01% | 0.01% | 0.01% | |||||||||
U.S. Government | ||||||||||||
RBC Institutional Class 1 | 0.05% | 0.01% | 0.14% | |||||||||
RBC Institutional Class 2 | 0.01% | 0.01% | 0.04% | |||||||||
RBC Investor Class | 0.01% | 0.01% | 0.01% | |||||||||
RBC Reserve Class | 0.01% | 0.01% | 0.01% | |||||||||
RBC Select Class | 0.01% | 0.01% | 0.01% | |||||||||
Tax-Free Money | ||||||||||||
RBC Institutional Class 1 | 0.09% | 0.05% | 0.24% | |||||||||
RBC Institutional Class 2 | 0.02% | 0.01% | 0.14% | |||||||||
RBC Investor Class | 0.02% | 0.01% | 0.01% | |||||||||
RBC Reserve Class | 0.02% | 0.01% | 0.01% | |||||||||
RBC Select Class | 0.02% | 0.01% | 0.01% | |||||||||
| Performance data quoted represents past performance. Past performance is no guarantee of future results. Investment return and principal value of an investment will fluctuate so that an investor’s shares, when redeemed, may be worth more or less than their original cost. Current performance may be lower or higher than performance quoted. Performance shown reflects contractual fee waivers, without such fee waivers total returns would be reduced. For performance data current to most recent month-end go to www.rbcgam.us. | ||||||||||||
| ||||||||||||
6
PERFORMANCE SUMMARY | ||||||||||||
(1) As money market returns respond rapidly to market changes, such as in the Fed Funds rate, the 7-Day yield is a more accurate reflection of current earnings than the total return for the year. Prior year 7-Day yield information is provided for comparative purposes. | ||||||||||||
Asset Allocation | ||||||||||||
Money Market Maturity Schedules as a percentage of value of investments based on effective maturity as of September 30, 2011. | ||||||||||||
Prime Money Market Fund | U.S. Government Money Market Fund | Tax-Free Money Market Fund | ||||||||||
Less than 8 days | 39.5% | 57.2% | 82.8% | |||||||||
8 to 14 Days | 5.4% | 6.9% | 0.3% | |||||||||
15 to 30 Days | 12.1% | 4.6% | 0.4% | |||||||||
31 to 180 Days | 36.3% | 20.3% | 11.9% | |||||||||
181 to 365 Days | 6.7% | 11.0% | 4.6% | |||||||||
7
|
Prime Money Market Fund
| September 30, 2011 | ||||||
Principal Amount | Value | |||||
Asset Backed Securities — 0.29% |
| |||||
Asset Backed Auto Receivables — 0.08% |
| |||||
| $ 389,696 | Hyundai Auto Receivables Trust, Series 2011-A, Class A1, 0.32%, 2/15/12 | $ | 389,696 | |||
| 9,734,876 | World Omni Auto Receivables Trust Series 2011-A Class A1, 0.29%, 3/15/12 | 9,734,876 | ||||
|
| |||||
| 10,124,572 | ||||||
|
| |||||
Finance - Diversified Domestic — 0.21% | ||||||
| 25,538,069 | Enterprise Fleet Financing LLC, 0.38%, 7/20/12(a) | 25,538,069 | ||||
|
| |||||
Total Asset Backed Securities | 35,662,641 | |||||
|
| |||||
(Cost $35,662,641) | ||||||
Asset Backed Commercial Paper — 1.36% | ||||||
Finance - Diversified Domestic — 1.36% | ||||||
| 70,000,000 | Kells Funding LLC, 0.33%, 3/30/12(a)(b) | 70,000,000 | ||||
| 50,000,000 | Kells Funding LLC, 0.36%, 12/1/11(a)(b) | 50,000,000 | ||||
| 50,000,000 | Kells Funding LLC, 0.41%, 12/1/11(a)(b) | 50,000,000 | ||||
|
| |||||
Total Asset Backed Commercial Paper | 170,000,000 | |||||
|
| |||||
(Cost $170,000,000) | ||||||
Commercial Paper — 38.67% | ||||||
Banks - Australia & New Zealand — 4.16% |
| |||||
| 100,000,000 | Australia & New Zealand Banking Group Ltd., 0.27%, 12/21/11(a)(b) | 99,940,750 | ||||
| 100,000,000 | Australia & New Zealand Banking Group Ltd., 0.29%, 11/8/11(a)(b) | 100,000,000 | ||||
| 50,000,000 | Commonwealth Bank Australia, 0.26%, 12/6/11(a)(b) | 49,976,889 | ||||
| 100,000,000 | Commonwealth Bank Australia, 0.29%, 4/30/12(a)(b) | 100,000,000 | ||||
| 100,000,000 | Commonwealth Bank Australia, 0.36%, 2/24/12(a)(b) | 100,000,000 | ||||
| 69,000,000 | Westpac Banking Corp., 0.02%, 10/6/11(a)(b) | 68,999,885 | ||||
|
| |||||
| 518,917,524 | ||||||
|
| |||||
Banks - Canadian — 0.40% |
| |||||
| 50,000,000 | Toronto Dominion Holdings USA, 0.18%, 10/17/11(a)(b) | 49,996,500 | ||||
|
| |||||
Banks - Domestic — 2.53% |
| |||||
| 18,707,294 | Bank of America Corp., 0.36%, 10/21/11(b) | 18,703,927 | ||||
| 200,000,000 | Union Bank NA, 0.13%, 10/3/11(b) | 200,000,000 | ||||
| 97,000,000 | Union Bank NA, 0.19%, 10/11/11(b) | 96,995,901 | ||||
|
| |||||
| 315,699,828 | ||||||
|
| |||||
Banks - Foreign — 2.05% |
| |||||
| 30,000,000 | Credit Suisse USA, Inc., 0.28%, 10/25/11(b) | 29,994,867 | ||||
| 46,000,000 | DnB NOR Bank ASA, 0.27%, 10/11/11(a)(b) | 45,997,240 | ||||
| 50,000,000 | DnB NOR Bank ASA, 0.30%, 1/23/12(a)(b) | 50,000,000 | ||||
| 50,000,000 | DnB NOR Bank ASA, 0.31%, 5/18/12(a)(b) | 50,000,000 | ||||
| 50,000,000 | Nordea North America, Inc., 0.24%, 10/24/11(b) | 49,993,000 | ||||
8
SCHEDULE OF PORTFOLIO INVESTMENTS |
Prime Money Market Fund (cont.)
September 30, 2011
Principal Amount | Value | |||||
| $ 30,000,000 | Svenska Handelsbank, Inc., 0.22%, 11/3/11(a)(b) | $ | 29,994,317 | |||
|
| |||||
| 255,979,424 | ||||||
|
| |||||
Chemicals — 1.23% |
| |||||
| 54,000,000 | BASF AG, 0.09%, 10/3/11(a)(b) | 54,000,000 | ||||
| 100,000,000 | BASF AG, 0.16%, 12/5/11(a)(b) | 99,972,000 | ||||
|
| |||||
| 153,972,000 | ||||||
|
| |||||
Consumer Discretionary — 4.30% |
| |||||
| 165,000,000 | Coca-Cola Co., 0.16%, 1/3/12(a)(b) | 164,932,538 | ||||
| 25,172,000 | Coca-Cola Co., 0.16%, 1/4/12(a)(b) | 25,161,591 | ||||
| 100,000,000 | Coca-Cola Co., 0.37%, 7/26/12(a)(b) | 99,694,759 | ||||
| 50,000,000 | eBay, Inc., 0.12%, 11/9/11(a)(b) | 49,993,833 | ||||
| 114,000,000 | eBay, Inc., 0.12%, 12/1/11(a)(b) | 113,977,580 | ||||
| 41,500,000 | eBay, Inc., 0.13%, 11/9/11(a)(b) | 41,494,467 | ||||
| 42,300,000 | Johnson & Johnson, 0.20%, 10/4/11(a)(b) | 42,299,765 | ||||
|
| |||||
| 537,554,533 | ||||||
|
| |||||
Consumer Staples — 1.29% |
| |||||
| 62,000,000 | Procter & Gamble Co., 0.15%, 1/10/12(a)(b) | 61,974,431 | ||||
| 99,000,000 | Procter & Gamble Co., 0.16%, 1/11/12(a)(b) | 98,955,987 | ||||
|
| |||||
| 160,930,418 | ||||||
|
| |||||
Finance - Diversified Domestic — 10.27% |
| |||||
| 90,000,000 | American Honda Finance Corp., 0.10%, 10/6/11(b) | 89,999,253 | ||||
| 50,000,000 | BHP Billiton Finance USA Ltd., 0.11%, 10/17/11(a)(b) | 49,997,861 | ||||
| 50,000,000 | BHP Billiton Finance USA Ltd., 0.13%, 11/16/11(a)(b) | 49,992,056 | ||||
| 100,000,000 | BHP Billiton Finance USA Ltd., 0.15%, 10/17/11(a)(b) | 99,994,170 | ||||
| 100,000,000 | BHP Billiton Finance USA Ltd., 0.16%, 1/4/12(a)(b) | 99,958,667 | ||||
| 14,000,000 | John Deere Bank SA, 0.07%, 10/13/11(a)(b) | 13,999,728 | ||||
| 30,000,000 | John Deere Credit, Inc., 0.05%, 10/12/11(a)(b) | 29,999,625 | ||||
| 100,000,000 | Northern Pines Funding LLC, 0.23%, 10/3/11(a)(b) | �� | 100,000,000 | |||
| 30,000,000 | Novartis Finance Corp., 0.03%, 10/6/11(a)(b) | 29,999,925 | ||||
| 25,000,000 | Novartis Finance Corp., 0.04%, 10/5/11(a)(b) | 24,999,944 | ||||
| 30,000,000 | Novartis Finance Corp., 0.05%, 10/6/11(a)(b) | 29,999,875 | ||||
| 60,100,000 | Novartis Securities Investments Ltd., 0.08%, 10/12/11(a)(b) | 60,098,797 | ||||
| 77,200,000 | PACCAR Financial Corp., 0.15%, 12/7/11(b) | 77,179,101 | ||||
| 27,000,000 | PACCAR Financial Corp., 0.20%, 12/28/11(b) | 26,987,100 | ||||
| 35,000,000 | Reckitt Benckiser Treasury Services, 0.45%, 11/21/11(a)(b) | 34,978,563 | ||||
| 75,000,000 | Reckitt Benckiser Treasury Services, 0.55%, 10/3/11(a)(b) | 75,000,000 | ||||
| 25,000,000 | Reckitt Benckiser Treasury Services, 0.60%, 10/18/11(a)(b) | 24,993,750 | ||||
| 50,000,000 | Reckitt Benckiser Treasury Services, 0.72%, 2/28/12(a)(b) | 49,852,000 | ||||
| 15,000,000 | Reckitt Benckiser Treasury Services, 0.73%, 4/13/12(a)(b) | 14,941,296 | ||||
| 75,000,000 | Toyota Motor Credit Corp., 0.19%, 10/7/11(b) | 74,998,420 | ||||
| 100,000,000 | Toyota Motor Credit Corp., 0.21%, 10/5/11(b) | 99,998,833 | ||||
| 93,000,000 | Toyota Motor Credit Corp., 0.21%, 10/6/11(b) | 92,998,372 | ||||
| 32,000,000 | Toyota Motor Credit Corp., 0.33%, 10/3/11(b) | 32,000,000 | ||||
|
| |||||
| 1,282,967,336 | ||||||
|
| |||||
9
SCHEDULE OF PORTFOLIO INVESTMENTS |
Prime Money Market Fund (cont.)
September 30, 2011
Principal Amount | Value | |||||
Finance - Diversified Foreign — 1.60% |
| |||||
| $ 75,000,000 | Erste Abwicklungsanstalt (EAA), 0.29%, 10/7/11(a)(b) | $ 74,997,583 | ||||
| 100,000,000 | Erste Abwicklungsanstalt (EAA), 0.37%, 1/9/12(a)(b) | 99,899,278 | ||||
| 25,000,000 | Erste Abwicklungsanstalt (EAA), 0.40%, 3/14/12(a)(b) | 24,954,722 | ||||
|
| |||||
| 199,851,583 | ||||||
|
| |||||
Health Care — 3.53% | ||||||
| 25,000,000 | Dean Health Systems, Inc., 0.23%, 10/11/11(b) | 24,998,724 | ||||
| 70,000,000 | Medtronic, Inc., 0.10%, 11/2/11(a)(b) | 69,994,157 | ||||
| 46,600,000 | Medtronic, Inc., 0.10%, 11/17/11(a)(b) | 46,594,172 | ||||
| 50,000,000 | Medtronic, Inc., 0.10%, 11/18/11(a)(b) | 49,993,602 | ||||
| 85,000,000 | Merck & Co., Inc., 0.08%, 10/3/11(a)(b) | 85,000,000 | ||||
| 150,000,000 | Merck & Co., Inc., 0.08%, 10/17/11(a)(b) | 149,995,315 | ||||
| 14,500,000 | Sanofi-Aventis, 0.06%, 10/12/11(a)(b) | 14,499,784 | ||||
|
| |||||
| 441,075,754 | ||||||
|
| |||||
Industrials — 3.31% | ||||||
| 40,000,000 | Danaher Corp., 0.07%, 10/5/11(b) | 39,999,844 | ||||
| 20,000,000 | Danaher Corp., 0.12%, 10/3/11(b) | 20,000,000 | ||||
| 50,000,000 | Danaher Corp., 0.13%, 10/3/11(b) | 50,000,000 | ||||
| 115,000,000 | Danaher Corp., 0.13%, 10/6/11(b) | 114,998,751 | ||||
| 30,000,000 | Danaher Corp., 0.13%, 10/7/11(b) | 29,999,566 | ||||
| 42,500,000 | Danaher Corp., 0.13%, 10/21/11(b) | 42,497,238 | ||||
| 30,000,000 | NetJets, Inc., 0.09%, 10/7/11(a)(b) | 29,999,702 | ||||
| 38,000,000 | NetJets, Inc., 0.11%, 11/1/11(a)(b) | 37,996,640 | ||||
| 48,000,000 | NetJets, Inc., 0.12%, 10/5/11(a)(b) | 47,999,681 | ||||
|
| |||||
| 413,491,422 | ||||||
|
| |||||
Information Technology — 1.08% | ||||||
| 25,000,000 | Hewlett-Packard Co., 0.17%, 11/28/11(a)(b) | 24,993,384 | ||||
| 50,000,000 | Hewlett-Packard Co., 0.24%, 1/17/12(a)(b) | 49,964,678 | ||||
| 9,500,000 | Texas Instruments, Inc., 0.06%, 10/12/11(b) | 9,499,858 | ||||
| 50,000,000 | Texas Instruments, Inc., 0.15%, 11/7/11(b) | 49,992,713 | ||||
|
| |||||
| 134,450,633 | ||||||
|
| |||||
Insurance — 0.52% | ||||||
| 35,000,000 | Metlife Short Term Funding LLC, 0.40%, 11/7/11(a)(b) | 34,986,389 | ||||
| 30,000,000 | New York Life Capital Corp., 0.19%, 12/13/11(a)(b) | 29,988,758 | ||||
|
| |||||
| 64,975,147 | ||||||
|
| |||||
Oil & Gas — 2.40% | ||||||
| 150,000,000 | Exxon Mobil Corp., 0.06%, 10/3/11(b) | 150,000,000 | ||||
| 150,000,000 | Exxon Mobil Corp., 0.06%, 10/4/11(b) | 149,999,750 | ||||
|
| |||||
| 299,999,750 | ||||||
|
| |||||
Total Commercial Paper | 4,829,861,852 | |||||
|
| |||||
(Cost $4,829,861,852) | ||||||
10
SCHEDULE OF PORTFOLIO INVESTMENTS |
Prime Money Market Fund (cont.)
September 30, 2011
Principal Amount | Value | |||||
Certificates of Deposit, Domestic — 2.40% |
| |||||
Banks - Domestic — 2.40% |
| |||||
| $ 300,000,000 | Citibank NA 0.07%, 10/3/11 | $ 300,000,000 | ||||
|
| |||||
Total Certificates of Deposit, Domestic | 300,000,000 | |||||
|
| |||||
| (Cost $300,000,000) | ||||||
Certificates of Deposit, Yankee(c) — 9.60% | ||||||
Banks - Australia & New Zealand — 0.32% | ||||||
| 40,000,000 | Westpac Banking Corp., 0.31%, 7/17/12 | 40,000,000 | ||||
|
| |||||
Banks - Canadian — 6.00% | ||||||
| 200,000,000 | Bank of Montreal Chicago, 0.01%, 10/3/11 | 200,000,000 | ||||
| 100,000,000 | Bank of Montreal Chicago, 0.24%, 11/23/11 | 100,000,000 | ||||
| 23,500,000 | Bank of Nova Scotia, 0.45%, 7/27/12 | 23,509,405 | ||||
| 113,090,000 | Bank of Nova Scotia, 0.50%, 3/5/12 | 113,195,672 | ||||
| 63,000,000 | Bank of Nova Scotia, 0.54%, 6/11/12 | 63,077,887 | ||||
| 100,000,000 | Toronto Dominion Bank NY, 0.29%, 10/28/11 | 100,004,803 | ||||
| 50,000,000 | Toronto Dominion Bank NY, 0.31%, 1/12/12 | 50,000,000 | ||||
| 100,000,000 | Toronto Dominion Bank NY, 0.40%, 4/30/12 | 100,000,000 | ||||
|
| |||||
| 749,787,767 | ||||||
|
| |||||
Banks - Foreign — 3.28% | ||||||
| 75,000,000 | DnB NOR Bank ASA, 0.31%, 4/11/12 | 75,000,000 | ||||
| 5,450,000 | Nordea Bank Finland NY, 0.55%, 10/14/11 | 5,450,422 | ||||
| 90,000,000 | Nordea Bank Finland NY, 0.55%, 10/20/11 | 90,012,271 | ||||
| 29,275,000 | Nordea Bank Finland NY, 0.55%, 4/13/12 | 29,314,536 | ||||
| 35,000,000 | Nordea Bank Finland NY, 0.62%, 7/12/12 | 35,095,103 | ||||
| 100,000,000 | Rabobank Nederland NY, 0.29%, 2/3/12 | 100,000,000 | ||||
| 75,000,000 | Svenska Handelsbanken NY, 0.30%, 10/27/11 | 75,000,250 | ||||
|
| |||||
| 409,872,582 | ||||||
|
| |||||
Total Certificates of Deposit, Yankee | 1,199,660,349 | |||||
|
| |||||
(Cost $1,199,660,349) | ||||||
Corporate Bonds — 21.48% | ||||||
Agriculture — 0.13% | ||||||
| 15,860,000 | Archer-Daniels-Midland Co., 0.45%, 8/13/12(d) | 15,882,536 | ||||
|
| |||||
Banks - Australia & New Zealand — 1.32% | ||||||
| 5,000,000 | Australia & New Zealand Banking Group Ltd., 0.55%, 10/21/11(a)(d) | 5,000,644 | ||||
| 10,000,000 | Westpac Banking Corp., 0.29%, 4/3/12(a)(d) | 9,999,652 | ||||
| 50,000,000 | Westpac Banking Corp., 0.32%, 6/15/12(d) | 50,000,000 | ||||
| 100,000,000 | Westpac Banking Corp., 0.41%, 9/7/12(a)(d) | 99,991,743 | ||||
|
| |||||
| 164,992,039 | ||||||
|
| |||||
Banks - Canadian — 0.80% | ||||||
| 100,000,000 | Bank of Nova Scotia, 0.32%, 10/11/12(d) | 100,000,000 | ||||
|
| |||||
11
SCHEDULE OF PORTFOLIO INVESTMENTS |
Prime Money Market Fund (cont.)
September 30, 2011
Principal Amount | Value | |||||
Banks - Domestic — 1.83% |
| |||||
| $ 50,000,000 | Bank of America Corp., 0.21%, 10/17/11 | $ 50,000,000 | ||||
| 42,745,000 | Bank of America Corp. (FDIC Insured under TLGP), 0.55%, 4/30/12(d) | 42,841,688 | ||||
| 35,995,000 | Wells Fargo & Co., 0.38%, 4/23/12(d) | 36,020,487 | ||||
| 47,375,000 | Wells Fargo & Co., 0.48%, 3/1/12(d) | 47,394,282 | ||||
| 52,437,000 | Wells Fargo & Co., 5.30%, 10/15/11 | 52,518,821 | ||||
|
| |||||
| 228,775,278 | ||||||
|
| |||||
Banks - Foreign — 3.10% | ||||||
| 99,582,000 | Credit Suisse USA, Inc., 6.13%, 11/15/11 | 100,234,198 | ||||
| 87,780,000 | Credit Suisse USA, Inc., 6.50%, 1/15/12 | 89,252,226 | ||||
| 50,000,000 | Rabobank Nederland NY, 0.32%, 4/2/12(d) | 50,000,000 | ||||
| 40,000,000 | Rabobank Nederland NY, 0.45%, 3/17/12(a)(d) | 40,009,022 | ||||
| 100,000,000 | Svenska Handelsbanken NY, 0.38%, 9/7/12(a)(d) | 100,000,000 | ||||
| 8,270,000 | Svenska Handelsbanken NY, 0.50%, 1/30/12(d) | 8,276,293 | ||||
|
| |||||
| 387,771,739 | ||||||
|
| |||||
Banks - United Kingdom — 0.91% | ||||||
| 96,895,000 | Royal Bank of Scotland PLC (The), 1.45%, 10/20/11(a) | 96,935,164 | ||||
| 16,518,000 | Royal Bank of Scotland PLC (The), 3.00%, 12/9/11(a) | 16,591,359 | ||||
|
| |||||
| 113,526,523 | ||||||
|
| |||||
Consumer Discretionary — 0.40% | ||||||
| 50,000,000 | Kimberly-Clark Corp., 4.43%, 12/19/11(a) | 50,390,394 | ||||
|
| |||||
Consumer Staples — 2.18% | ||||||
| 263,800,000 | Wal-Mart Stores, Inc. STEP, 5.23%, 6/1/12(d) | 272,425,588 | ||||
|
| |||||
Finance - Diversified Domestic — 7.85% | ||||||
| 10,500,000 | Caterpillar Financial Services Corp., 4.70%, 3/15/12 | 10,704,702 | ||||
| 125,000,000 | Citigroup Funding, Inc. (FDIC Insured under TLGP), 2.88%, 12/9/11 | 125,623,226 | ||||
| 11,460,000 | ETC Holdings LLC, 0.18%, 4/1/28(d) | 11,460,000 | ||||
| 3,705,000 | GBG LLC, 0.20%, 9/1/27(a)(d) | 3,705,000 | ||||
| 14,310,000 | General Electric Capital Corp., 0.42%, 7/27/12(d) | 14,326,068 | ||||
| 20,000,000 | General Electric Capital Corp., 3.50%, 8/13/12 | 20,504,952 | ||||
| 50,405,000 | General Electric Capital Corp., 4.38%, 3/3/12 | 51,208,696 | ||||
| 29,835,000 | General Electric Capital Corp., 5.00%, 4/10/12 | 30,523,508 | ||||
| 2,000,000 | General Electric Capital Corp., 5.25%, 2/21/12 | 2,036,613 | ||||
| 4,000,000 | General Electric Capital Corp., 5.25%, 10/19/12 | 4,179,600 | ||||
| 101,436,000 | General Electric Capital Corp., 5.88%, 2/15/12 | 103,389,242 | ||||
| 70,946,000 | General Electric Capital Corp., 6.00%, 6/15/12 | 73,647,844 | ||||
| 31,304,000 | John Deere Capital Corp., 7.00%, 3/15/12 | 32,238,338 | ||||
| 50,000,000 | JPMorgan Chase & Co., 0.27%, 5/21/12(d) | 50,010,782 | ||||
| 12,824,000 | JPMorgan Chase & Co., 0.39%, 2/22/12(d) | 12,826,613 | ||||
| 31,688,000 | JPMorgan Chase & Co., 0.44%, 2/1/12(d) | 31,705,523 | ||||
| 9,000,000 | JPMorgan Chase & Co., 0.48%, 12/21/11(d) | 9,001,832 | ||||
| 50,860,000 | JPMorgan Chase & Co., 0.51%, 11/28/11(d) | 50,872,903 | ||||
| 8,700,000 | JPMorgan Chase & Co., 4.50%, 1/15/12 | 8,797,307 | ||||
12
SCHEDULE OF PORTFOLIO INVESTMENTS |
Prime Money Market Fund (cont.)
September 30, 2011
Principal Amount | Value | |||||
| $ 98,171,000 | JPMorgan Chase & Co., 5.35%, 2/1/12 | $ 99,712,016 | ||||
| 31,321,000 | JPMorgan Chase & Co., 6.95%, 8/10/12 | 32,997,035 | ||||
| 35,000,000 | Merrill Lynch & Co., Inc., 0.45%, 11/1/11(d) | 35,002,751 | ||||
| 40,000,000 | NGSP, Inc., 0.63%, 6/1/46(d) | 40,000,000 | ||||
| 15,100,000 | Racetrac Capital LLC, 0.63%, 9/1/20(d) | 15,100,000 | ||||
| 9,660,000 | Ring-Missouri LP, 1.05%, 9/1/18(d) | 9,660,000 | ||||
| 10,790,000 | Schlitz Park Associates II LP, 0.18%, 12/1/21(d) | 10,790,000 | ||||
| 15,175,000 | SF Tarns LLC, 0.68%, 1/1/28(d) | 15,175,000 | ||||
| 75,000,000 | Twins Ballpark LLC, 0.22%, 10/1/34(a)(d) | 75,000,000 | ||||
|
| |||||
| 980,199,551 | ||||||
|
| |||||
Health Care — 0.42% |
| |||||
| 11,565,000 | The Portland Clinic LLP, 0.32%, 11/20/33(d) | 11,565,000 | ||||
| 40,400,000 | Sanofi-Aventis, 0.30%, 3/28/12(d) | 40,409,932 | ||||
|
| |||||
| 51,974,932 | ||||||
|
| |||||
Industrials — 0.03% |
| |||||
| 4,000,000 | 3M Co., 4.50%, 11/1/11 | 4,013,130 | ||||
|
| |||||
Information Technology — 0.08% |
| |||||
| 10,300,000 | International Business Machines Corp., 0.30%, 11/4/11(d) | 10,300,684 | ||||
|
| |||||
Insurance — 2.43% |
| |||||
| 85,070,000 | Berkshire Hathaway, Inc., 0.45%, 2/10/12(d) | 85,126,824 | ||||
| 200,000,000 | Metropolitan Life Global Funding, Series I, 0.41%, 7/6/12(a)(d) | 200,000,000 | ||||
| 18,210,000 | Metropolitan Life Global Funding, Series I, 5.13%, 11/9/11(a) | 18,295,491 | ||||
|
| |||||
| 303,422,315 | ||||||
|
| |||||
Total Corporate Bonds | 2,683,674,709 | |||||
|
| |||||
(Cost $2,683,674,709) | ||||||
Municipal Bonds — 13.36% |
| |||||
California — 3.37% |
| |||||
| 55,450,000 | Abag Finance Authority For Nonprofit Corps. Revenue, Series A, 0.15%, 12/15/37, (Credit Support: Fannie Mae)(d) | 55,450,000 | ||||
| 67,220,000 | California Housing Finance Agency Revenue, Series B, 0.12%, 2/1/35, (LOC: Freddie Mac, Fannie Mae)(d) | 67,220,000 | ||||
| 35,425,000 | California Housing Finance Agency Revenue, Series F, 0.12%, 2/1/37, (LOC: Freddie Mac, Fannie Mae)(d) | 35,425,000 | ||||
| 83,435,000 | California Housing Finance Agency Revenue, Series F, 0.12%, 2/1/38, (LOC: Freddie Mac, Fannie Mae)(d) | 83,435,000 | ||||
| 5,000,000 | California Statewide Communities Development Authority Revenue, Floaters Series 2114, 0.21%, 9/1/46(d) | 5,000,000 | ||||
| 1,603,000 | County of San Bernardino Refunding Program COP, Series B, 0.35%, 3/1/17, (LOC: Bank of America NA)(d) | 1,603,000 | ||||
| 7,870,000 | San Francisco City & County Housing Authority Refunding Revenue, 0.17%, 9/1/49, (LOC: Citibank NA)(d) | 7,870,000 | ||||
13
SCHEDULE OF PORTFOLIO INVESTMENTS |
Prime Money Market Fund (cont.)
September 30, 2011
Principal Amount | Value | |||||
| $30,000,000 | University of California Pension Funding Revenue, Series Y1, 0.30%, 7/1/12(d) | $ 30,000,000 | ||||
| 90,000,000 | University of California TECP, 0.14%, 10/12/11(b) | 89,996,850 | ||||
| 45,000,000 | University of California TECP, 0.23%, 1/9/12(b) | 44,971,825 | ||||
|
| |||||
| 420,971,675 | ||||||
|
| |||||
Connecticut — 0.33% | ||||||
| 40,775,000 | Connecticut Housing Finance Authority Revenue, 0.20%, 5/1/41(d) | 40,775,000 | ||||
|
| |||||
Georgia — 0.28% | ||||||
| 34,440,000 | Valdosta-Lowndes County Industrial Development Authority Revenue, Series B, 0.22%, 6/1/28, (LOC: Wells Fargo Bank)(d) | 34,440,000 | ||||
|
| |||||
Indiana — 0.13% | ||||||
| 15,625,000 | Indiana Finance Authority Indiana University Health Refunding Revenue, Series J, 0.18%, 3/1/33, (LOC: JP Morgan Chase Bank)(d) | 15,625,000 | ||||
|
| |||||
Kentucky — 0.01% | ||||||
| 660,000 | Lexington-Fayette Urban County Airport Board Refunding Revenue, Series C, 0.61%, 7/1/33, (LOC: JP Morgan Chase Bank)(d) | 660,000 | ||||
|
| |||||
Louisiana — 0.25% | ||||||
| 31,575,000 | Parish of Saint James Texaco Project Refunding Revenue, Series B, 0.09%, 7/1/12(d) | 31,575,000 | ||||
|
| |||||
Maryland — 0.08% | ||||||
| 10,475,000 | Montgomery County Housing Opportunites Commission Refunding Revenue, Series D, 0.22%, 7/1/39, (LOC: Fannie Mae, Freddie Mac)(d) | 10,475,000 | ||||
|
| |||||
Michigan — 0.20% | ||||||
| 25,000,000 | Michigan Finance Authority Taxable School Loan Refunding Revenue, 0.19%, 9/1/50, (LOC: PNC Bank NA)(d) | 25,000,000 | ||||
|
| |||||
Mississippi — 0.22% | ||||||
| 27,500,000 | Mississippi Business Finance Corp., Chevron USA Inc. Project Revenue, Series I, 0.08%, 11/1/35(d) | 27,500,000 | ||||
| 475,000 | Mississippi Development Bank Special Obligation Refunding Revenue, Series B, 0.36%, 10/1/31, (LOC: Bank of America NA)(d) | 475,000 | ||||
|
| |||||
| 27,975,000 | ||||||
|
| |||||
Nebraska — 0.08% | ||||||
| 10,000,000 | Nebraska Investment Finance Authority Multi Family Housing Revenue, Series A, 0.18%, 10/1/42, (LOC: Citibank NA)(d) | 10,000,000 | ||||
|
| |||||
New York — 1.90% | ||||||
| 9,895,000 | New York City Capital Resources Corp. Nursing Home Revenue, Series B, 0.28%, 1/1/37, (LOC: Bank of America NA)(d) | 9,895,000 | ||||
14
SCHEDULE OF PORTFOLIO INVESTMENTS |
Prime Money Market Fund (cont.)
September 30, 2011
Principal Amount | Value | |||||
| $23,375,000 | New York City Capital Resources Corp. Nursing Home Revenue, Series B-1, 0.28%, 7/1/37, (LOC: Bank of America NA)(d) | $ 23,375,000 | ||||
| 40,875,000 | New York City Housing Development Corp. Multi Family Housing Revenue, Series B, 0.18%, 4/15/36, (Credit Support: Fannie Mae)(d) | 40,875,000 | ||||
| 23,390,000 | New York State Housing Finance Agency 320 West 38th St. Refunding Revenue, Series A, 0.12%, 5/1/42, (LOC: Wells Fargo Bank)(d) | 23,390,000 | ||||
| 40,500,000 | New York State Housing Finance Agency 320 West 38th St. Refunding Revenue, Series B, 0.12%, 5/1/42, (LOC: Wells Fargo Bank)(d) | 40,500,000 | ||||
| 16,400,000 | New York State Housing Finance Agency Revenue, West 37th St. Project, Series B, 0.15%, 5/1/42, (LOC: Wells Fargo Bank)(d) | 16,400,000 | ||||
| 83,510,000 | New York State Urban Development Corp. State Personal Income Tax Revenue, 0.65%, 12/15/11 | 83,510,000 | ||||
|
| |||||
| 237,945,000 | ||||||
|
| |||||
Ohio — 0.18% |
| |||||
| 9,680,000 | City of Grove Multi Family Housing Regency Arms Apartment Revenue, 0.23%, 6/15/30, (Credit Support: Fannie Mae)(d) | 9,680,000 | ||||
| 12,500,000 | Ohio State Higher Educational Facilities Refunding Revenue, Series B, 0.21%, 5/1/42, (LOC: U.S. Bank NA)(d) | 12,500,000 | ||||
|
| |||||
| 22,180,000 | ||||||
|
| |||||
Pennsylvania — 0.92% |
| |||||
| 40,900,000 | Blair County Industrial Development Authority Refunding Revenue, 0.19%, 10/1/28, (LOC: PNC Bank NA)(d) | 40,900,000 | ||||
| 20,855,000 | City of Reading Refunding GO, Series D, 0.22%, 11/1/32, (LOC:Wells Fargo Bank)(d) | 20,855,000 | ||||
| 19,990,000 | Derry Township Industrial & Commercial Development Authority Revenue, 0.19%, 11/1/30, (LOC: PNC Bank NA)(d) | 19,990,000 | ||||
| 33,400,000 | Pennsylvania Economic Development Financing Authority Revenue, 0.26%, 11/1/28, (LOC: Bank of America NA)(d) | 33,400,000 | ||||
|
| |||||
| 115,145,000 | ||||||
|
| |||||
South Dakota — 0.43% |
| |||||
| 15,700,000 | South Dakota Housing Development Authority Home Ownership Mortgage Revenue, Series C, 0.20%, 5/1/37(d) | 15,700,000 | ||||
| 25,000,000 | South Dakota Housing Development Authority Home Ownership Mortgage Revenue, Series G, 0.15%, 5/1/35(d) | 25,000,000 | ||||
| 13,200,000 | South Dakota Housing Development Authority Home Ownership Mortgage Revenue, Series I, 0.20%, 5/1/38(d) | 13,200,000 | ||||
|
| |||||
| 53,900,000 | ||||||
|
| |||||
15
SCHEDULE OF PORTFOLIO INVESTMENTS |
Prime Money Market Fund (cont.)
September 30, 2011
Principal Amount | Value | |||||
Tennessee — 0.25% |
| |||||
| $ 19,600,000 | Johnson City Health & Educational Facilities Board Revenue, Series B2, 0.19%, 7/1/33, (LOC: PNC Bank NA)(d) | $ | 19,600,000 | |||
| 11,500,000 | Metropolitan Government Nashville & Davidson County Health & Educational Facilities Board Revenue, 0.18%, 6/1/42, (LOC: Citibank NA)(d) | 11,500,000 | ||||
|
| |||||
| 31,100,000 | ||||||
|
| |||||
Texas — 2.66% |
| |||||
| 44,010,000 | City of Houston Utilities System Refunding Revenue, Series D-1, 0.21%, 5/15/34, (Credit Support: AGM), (LOC: JP Morgan Chase Bank)(d) | 44,010,000 | ||||
| 200,000,000 | JPMorgan Chase Putters Drivers Trust Cash Flow Management Revenue, Series 3944, 0.20%, 8/30/12(a)(d) | 200,000,000 | ||||
| 25,000,000 | JPMorgan Chase Putters Drivers Trust Cash Flow Management Revenue, Series 3964, 0.16%, 8/30/12(a)(d) | 25,000,000 | ||||
| 6,645,000 | Texas State Veteran’s Fund Refunding GO, Series I-C, 0.18%, 12/1/25(d) | 6,645,000 | ||||
| 6,250,000 | Texas State Veteran’s Fund Refunding GO, Series I-D, 0.18%, 6/1/20(d) | 6,250,000 | ||||
| 18,685,000 | Texas State Veteran’s Fund Refunding GO, Series II-C, 0.18%, 6/1/29(d) | 18,685,000 | ||||
| 20,000,000 | Texas State Veteran’s Housing GO, Series A-2, 0.19%, 12/1/29(d) | 20,000,000 | ||||
| 12,315,000 | Texas State Veteran’s Housing Refunding GO, 0.18%, 6/1/31, (LOC: JP Morgan Chase Bank)(d) | 12,315,000 | ||||
|
| |||||
| 332,905,000 | ||||||
|
| |||||
Utah — 0.07% |
| |||||
| 8,270,000 | Ogden City Redevelopment Agency Refunding Revenue, Series A, 0.22%, 6/1/31, (LOC: Wells Fargo Bank)(d) | 8,270,000 | ||||
|
| |||||
Virginia — 1.79% |
| |||||
| 181,478,000 | Federal Home Loan Mortgage Corp., Multi Family Housing Revenue, Series M017, Class A, 0.21%, 9/15/50, (Credit Support: Freddie Mac)(d) | 181,478,000 | ||||
| 16,355,000 | Newport News Industrial Development Authority Industrial Improvement Revenue, Series B, 0.22%, 7/1/31, (LOC: Wells Fargo Bank)(d) | 16,355,000 | ||||
| 25,605,000 | Stafford County & Staunton Industrial Development Authority Revenue, Series B1, 0.26%, 12/1/28, (LOC: Bank of America NA)(d) | 25,605,000 | ||||
|
| |||||
| 223,438,000 | ||||||
|
| |||||
Washington — 0.21% |
| |||||
| 26,300,000 | Washington State Housing Finance Commission YMCA Greater Seattle Recreational Facility Revenue, 0.17%, 9/1/37, (LOC: Bank of America NA)(d) | 26,300,000 | ||||
|
| |||||
Total Municipal Bonds | 1,668,679,675 | |||||
|
| |||||
(Cost $1,668,679,675) |
| |||||
16
SCHEDULE OF PORTFOLIO INVESTMENTS |
Prime Money Market Fund (cont.)
September 30, 2011
Principal Amount | Value | |||||
U.S. Government Agency Obligations — 7.60% |
| |||||
Fannie Mae — 0.61% |
| |||||
| $ 42,800,000 | 0.21%, 11/1/11(d) | $ 42,792,932 | ||||
| 33,950,000 | 0.35%, 5/1/12(d) | 33,880,355 | ||||
|
| |||||
| 76,673,287 | ||||||
|
| |||||
Federal Farm Credit Bank — 0.99% |
| |||||
| 18,080,000 | 0.18%, 8/8/12(d) | 18,076,888 | ||||
| 16,265,000 | 0.18%, 8/20/12(d) | 16,262,101 | ||||
| 88,525,000 | 0.22%, 8/13/12(d) | 88,556,255 | ||||
|
| |||||
| 122,895,244 | ||||||
|
| |||||
Federal Home Loan Bank — 3.80% |
| |||||
| 100,000,000 | 0.13%, 7/25/12(d) | 100,000,000 | ||||
| 50,000,000 | 0.16%, 7/25/12(d) | 50,000,000 | ||||
| 83,525,000 | 0.17%, 10/4/11(d) | 83,525,000 | ||||
| 50,000,000 | 0.17%, 11/3/11(d) | 50,000,000 | ||||
| 91,000,000 | 0.88%, 8/22/12 | 91,469,200 | ||||
| 100,000,000 | 0.35%, 12/7/11 | 99,995,598 | ||||
|
| |||||
| 474,989,798 | ||||||
|
| |||||
Freddie Mac — 2.20% |
| |||||
| 100,000,000 | 0.18%, 12/21/11(d) | 100,009,009 | ||||
| 175,000,000 | 0.17%, 12/29/11(d) | 175,017,158 | ||||
|
| |||||
| 275,026,167 | ||||||
|
| |||||
Total U.S. Government Agency Obligations | 949,584,496 | |||||
|
| |||||
| (Cost $949,584,496) | ||||||
Repurchase Agreements — 4.20% |
| |||||
| 175,000,000 | Citigroup Global, dated 9/30/11; due 10/3/11 at 0.11% with maturity value of $175,001,604 (fully collateralized by Freddie Mac and Fannie Mae securities with maturity dates ranging from 11/1/25 to 10/1/40 at rates ranging from 4.00% to 5.50%) | 175,000,000 | ||||
| 100,000,000 | Merrill Lynch, Pierce, Fenner, Smith. dated 9/30/11; due 10/3/11 at 0.08% with maturity value of $100,000,667 (fully collateralized by Fannie Mae securities with maturity dates ranging from 8/1/41 to 9/1/41 at a rate of 4.50%) | 100,000,000 | ||||
| 250,000,000 | Merrill Lynch, Pierce, Fenner, Smith. dated 9/30/11; due 10/3/11 at 0.08% with maturity value of $250,001,667 (fully collateralized by Fannie Mae and Freddie Mac securities with maturity dates ranging from 2/1/26 to 10/1/41 at rates ranging from 3.50% to 6.50%) | 250,000,000 | ||||
|
| |||||
Total Repurchase Agreements | 525,000,000 | |||||
|
| |||||
| (Cost $525,000,000) | ||||||
17
SCHEDULE OF PORTFOLIO INVESTMENTS |
Prime Money Market Fund (cont.)
September 30, 2011
Total Investments | $ | 12,362,123,722 | ||
(Cost $12,362,123,722)(e) — 98.96% | ||||
Other assets in excess of liabilities — 1.04% | 129,752,707 | |||
|
| |||
NET ASSETS — 100.00% | $ | 12,491,876,429 | ||
|
|
| (a) | Security exempt from registration under Rule 144A or Section 4(2) of the Securities Act of 1933, as amended. These securities may be resold in transactions exempt from registration, normally to qualified institutional buyers. Security has been deemed to be liquid based on procedures approved by the Board of Trustees. |
| (b) | Represents effective yield to maturity on date of purchase. |
| (c) | Issuer is a U.S. branch of a foreign domiciled bank. |
| (d) | Variable rate security. The rate reflected in the Schedule of Portfolio Investments is the rate in effect on September 30, 2011. The maturity date represents the actual maturity date. The security’s effective maturity resets periodically. |
| (e) | Tax cost of securities is equal to book cost of securities. |
Abbreviations used are defined below:
AGM - Assured Guaranty Municipal
COP - Certificate of Participation
FDIC - Federal Deposit Insurance Corp.
GO - General Obligation
LOC - Letter of Credit
STEP - Step Coupon Bond
TECP - Tax Exempt Commercial Paper
TLGP - Temporary Liquidity Guarantee Program
See notes to financial statements.
18
SCHEDULE OF PORTFOLIO INVESTMENTS |
U.S. Government Money Market Fund
September 30, 2011
Principal Amount | Value | |||||
Asset Backed Commercial Paper — 1.75% |
| |||||
Finance - Diversified Domestic — 1.75% |
| |||||
| $ 50,000,000 | Straight-A Funding LLC, 0.16%, 10/3/11, (LOC: Federal Financing Bank), (Credit Support: Department of Education)(a)(b) | $ 50,000,000 | ||||
| 50,000,000 | Straight-A Funding LLC, 0.16%, 10/4/11, (LOC: Federal Financing Bank), (Credit Support: Department of Education)(a)(b) | 49,999,777 | ||||
|
| |||||
Total Asset Backed Commercial Paper | 99,999,777 | |||||
|
| |||||
| (Cost $99,999,777) | ||||||
FDIC-TLGP Backed Corporate Bonds — 28.42% |
| |||||
Banks - Domestic — 14.35% |
| |||||
| 65,000,000 | American Express Bank FSB, 1.21%, 12/9/11(c) | 65,121,364 | ||||
| 57,308,000 | American Express Bank FSB, 3.15%, 12/9/11 | 57,618,601 | ||||
| 2,740,000 | Bank of America Corp., 0.56%, 6/22/12(c) | 2,745,264 | ||||
| 25,000,000 | Bank of America Corp., 0.74%, 6/22/12(c) | 25,085,494 | ||||
| 163,350,000 | Bank of America Corp., 0.98%, 12/2/11(c) | 163,563,137 | ||||
| 28,750,000 | Bank of America Corp., 1.15%, 12/2/11(c) | 28,795,713 | ||||
| 18,015,000 | Bank of America Corp., 2.10%, 4/30/12 | 18,213,173 | ||||
| 43,096,000 | Bank of America Corp., 3.13%, 6/15/12 | 43,949,921 | ||||
| 20,280,000 | Citibank NA, 0.30%, 5/7/12(c) | 20,293,679 | ||||
| 22,198,000 | Citibank NA, 1.25%, 11/15/11 | 22,221,659 | ||||
| 76,110,000 | Citibank NA, 1.88%, 5/7/12 | 76,861,868 | ||||
| 3,890,000 | Citibank NA, 1.88%, 6/4/12 | 3,931,994 | ||||
| 128,711,000 | Regions Bank, 3.25%, 12/9/11 | 129,406,797 | ||||
| 9,500,000 | State Street Corp, 2.15%, 4/30/12 | 9,608,233 | ||||
| 115,000,000 | Wells Fargo & Co., 1.19%, 12/9/11(c) | 115,193,224 | ||||
| 37,158,000 | Wells Fargo & Co., 3.00%, 12/9/11 | 37,343,416 | ||||
|
| |||||
| 819,953,537 | ||||||
|
| |||||
Finance - Diversified Domestic — 14.07% |
| |||||
| 27,325,000 | Citigroup Funding, Inc., 0.58%, 4/30/12(c) | 27,392,216 | ||||
| 1,545,000 | Citigroup Funding, Inc., 0.67%, 3/30/12(c) | 1,548,013 | ||||
| 57,665,000 | Citigroup Funding, Inc., 2.13%, 4/30/12 | 58,291,807 | ||||
| 123,577,000 | Citigroup Funding, Inc., 2.88%, 12/9/11 | 124,170,253 | ||||
| 6,780,000 | General Electric Capital Corp., 0.22%, 5/8/12(c) | 6,781,399 | ||||
| 8,945,000 | General Electric Capital Corp., 0.54%, 3/12/12(c) | 8,956,613 | ||||
| 4,825,000 | General Electric Capital Corp., 1.27%, 12/9/11(c) | 4,834,045 | ||||
| 25,000,000 | General Electric Capital Corp., 2.20%, 6/8/12 | 25,326,443 | ||||
| 42,850,000 | General Electric Capital Corp., 3.00%, 12/9/11 | 43,068,371 | ||||
| 10,000,000 | Goldman Sachs Group, Inc., 0.52%, 11/9/11(c) | 10,003,205 | ||||
| 3,810,000 | Goldman Sachs Group, Inc., 0.55%, 3/15/12(c) | 3,815,030 | ||||
| 40,925,000 | Goldman Sachs Group, Inc., 1.02%, 12/5/11(c) | 40,987,818 | ||||
| 70,000,000 | Goldman Sachs Group, Inc., 3.25%, 6/15/12 | 71,463,424 | ||||
| 55,650,000 | JPMorgan Chase & Co., 0.48%, 6/15/12(c) | 55,774,954 | ||||
| 2,400,000 | JPMorgan Chase & Co., 0.74%, 6/22/12(c) | 2,407,762 | ||||
19
SCHEDULE OF PORTFOLIO INVESTMENTS |
U.S. Government Money Market Fund (cont.)
September 30, 2011
Principal Amount | Value | |||||
| $68,500,000 | JPMorgan Chase & Co., 0.98%, 12/2/11(c) | $ 68,589,223 | ||||
| 71,365,000 | JPMorgan Chase & Co., 2.13%, 6/22/12 | 72,318,237 | ||||
| 16,715,000 | JPMorgan Chase & Co., 2.20%, 6/15/12 | 16,939,528 | ||||
| 91,571,000 | JPMorgan Chase & Co., 3.13%, 12/1/11 | 91,984,626 | ||||
| 30,000,000 | Morgan Stanley, 0.55%, 2/10/12(c) | 30,035,828 | ||||
| 3,435,000 | Morgan Stanley, 0.70%, 6/20/12(c) | 3,445,272 | ||||
| 7,500,000 | PNC Funding Corp., 0.45%, 4/1/12(c) | 7,510,040 | ||||
| 27,341,000 | PNC Funding Corp., 2.30%, 6/22/12 | 27,753,616 | ||||
|
| |||||
| 803,397,723 | ||||||
|
| |||||
Total FDIC-TLGP Backed Corporate Bonds | 1,623,351,260 | |||||
|
| |||||
| (Cost $1,623,351,260) | ||||||
FHLB Backed Corporate Bonds — 0.30% |
| |||||
Finance - Diversified Domestic — 0.30% |
| |||||
| 13,165,000 | GFRE Holdings LLC, 0.25%, 12/1/49(c) | 13,165,000 | ||||
| 4,100,000 | Herman & Kittle Capital LLC, 0.18%, 2/1/37(c) | 4,100,000 | ||||
|
| |||||
Total FHLB Backed Corporate Bonds | 17,265,000 | |||||
|
| |||||
| (Cost $17,265,000) | ||||||
U.S. Government Agency Backed Municipal Bonds — 10.68% |
| |||||
California — 1.74% |
| |||||
| 7,400,000 | California Housing Finance Agency Revenue, Series B, 0.16%, 8/1/36, (LOC: Fannie Mae, Freddie Mac)(c) | 7,400,000 | ||||
| 18,720,000 | California Housing Finance Agency Revenue, Series K, 0.12%, 8/1/34, (LOC: Freddie Mac, Fannie Mae)(c) | 18,720,000 | ||||
| 14,600,000 | California Statewide Community Development Agency Multifamily Revenue, 0.16%, 10/15/36, (Credit Support: Fannie Mae)(c) | 14,600,000 | ||||
| 12,595,000 | San Diego Housing Authority Hillside Garden Apartment Revenue, Series B, 0.17%, 1/15/35, (Credit Support: Fannie Mae)(c) | 12,595,000 | ||||
| 20,800,000 | San Francisco City & County Housing Authority City Heights Apartments Refunding Revenue, Series A, 0.18%, 6/15/25, (Credit Support: Fannie Mae)(c) | 20,800,000 | ||||
| 25,200,000 | San Francisco City and County Redevelopment Agency Revenue, Series C, 0.12%, 6/15/34, (Credit Support: Fannie Mae)(c) | 25,200,000 | ||||
|
| |||||
| 99,315,000 | ||||||
|
| |||||
Colorado — 2.00% |
| |||||
| 4,025,000 | Colorado Housing & Finance Authority Refunding Revenue, Class I Series SF-1, 0.22%, 11/1/36, (LOC: Fannie Mae, Freddie Mac)(c) | 4,025,000 | ||||
| 25,200,000 | Colorado Housing & Finance Authority Refunding Revenue, Class I, Series A2, 0.17%, 5/1/38, (LOC: Fannie Mae, Freddie Mac)(c) | 25,200,000 | ||||
| 26,200,000 | Colorado Housing & Finance Authority Refunding Revenue, Class I, Series B1, 0.18%, 5/1/38, (LOC: Fannie Mae, Freddie Mac)(c) | 26,200,000 | ||||
20
SCHEDULE OF PORTFOLIO INVESTMENTS |
U.S. Government Money Market Fund (cont.)
September 30, 2011
Principal Amount | Value | |||||
| $ 16,360,000 | Colorado Housing & Finance Authority Refunding Revenue, Class I, Series C1, 0.18%, 11/1/32, (LOC: Fannie Mae, Freddie Mac)(c) | $ 16,360,000 | ||||
| 13,600,000 | Colorado Housing & Finance Authority Taxable Revenue, Class 1, Series A1, 0.17%, 11/1/37, (Credit Support: GO of Authority), (LOC: Fannie Mae, Freddie Mac)(c) | 13,600,000 | ||||
| 8,800,000 | Colorado Housing & Finance Authority Taxable Revenue, Class 1, Series B1, 0.17%, 11/1/36, (LOC: Fannie Mae, Freddie Mac)(c) | 8,800,000 | ||||
| 8,800,000 | Colorado Housing & Finance Authority Taxable Revenue, Class 1, Series C1, 0.17%, 11/1/36, (LOC: Fannie Mae, Freddie Mac)(c) | 8,800,000 | ||||
| 11,305,000 | Colorado Housing & Finance Authority Taxable Revenue, Series B-1, 0.17%, 11/1/33, (LOC: Fannie Mae, Freddie Mac)(c) | 11,305,000 | ||||
|
| |||||
| 114,290,000 | ||||||
|
| |||||
Indiana — 0.49% |
| |||||
| 27,700,000 | City of Indianapolis Lakeside Pointe & Fox Club Refunding Revenue, 0.14%, 11/15/37, (Credit Support: Fannie Mae)(c) | 27,700,000 | ||||
|
| |||||
Louisiana — 0.22% |
| |||||
| 12,600,000 | Louisiana Public Facilities Authority Refunding Revenue, 0.15%, 4/1/36, (Credit Support: Freddie Mac)(c) | 12,600,000 | ||||
|
| |||||
Michigan — 0.32% |
| |||||
| 9,435,000 | Lansing Economic Development Corp. Parking Facility Improvement Revenue, 0.26%, 3/1/42, (LOC: Federal Home Loan Bank)(c) | 9,435,000 | ||||
| 8,900,000 | Michigan State Housing Development Authority Refunding Revenue, Series C, 0.18%, 6/1/39, (LOC: Fannie Mae, Freddie Mac)(c) | 8,900,000 | ||||
|
| |||||
| 18,335,000 | ||||||
|
| |||||
New York — 4.22% |
| |||||
| 14,205,000 | New York City Housing Development Corp. First Avenue Development Revenue, Series A, 0.14%, 10/15/35, (Credit Support: Fannie Mae)(c) | 14,205,000 | ||||
| 36,770,000 | New York City Housing Development Corp. Multifamily Rental Housing Revenue, Series A, 0.11%, 11/15/19, (Credit Support: Fannie Mae)(c) | 36,770,000 | ||||
| 52,490,000 | New York State Dormitory Authority Nursing Home Improvements Revenue, Series A, 0.15%, 11/15/36, (Credit Support: Fannie Mae)(c) | 52,490,000 | ||||
| 43,785,000 | New York State Housing Finance Agency , Series A, 0.11%, 5/1/35, (Credit Support: Freddie Mac)(c) | 43,785,000 | ||||
| 7,500,000 | New York State Housing Finance Agency 38 St. Revenue, Series B, 0.16%, 5/15/33, (Credit Support: Fannie Mae)(c) | 7,500,000 | ||||
| 41,750,000 | New York State Housing Finance Agency North End Revenue, Series A, 0.14%, 11/15/36, (Credit Support: Fannie Mae)(c) | 41,750,000 | ||||
| 36,625,000 | New York State Housing Finance Agency Refunding Revenue, 0.13%, 5/15/39, (Credit Support: Fannie Mae)(c) | 36,625,000 | ||||
21
SCHEDULE OF PORTFOLIO INVESTMENTS |
U.S. Government Money Market Fund (cont.)
September 30, 2011
Principal Amount | Value | |||||
| $ 8,000,000 | New York State Housing Finance Agency W. 23 St. Revenue, Series B, 0.16%, 5/15/33, (Credit Support: Fannie Mae)(c) | $ 8,000,000 | ||||
|
| |||||
| 241,125,000 | ||||||
|
| |||||
Tennessee — 0.14% |
| |||||
| 8,210,000 | Shelby County Health Educational & Housing Facilities Board Revenue, 0.18%, 12/15/37, (Credit Support: Fannie Mae)(c) | 8,210,000 | ||||
|
| |||||
Virginia — 1.55% |
| |||||
| 54,970,000 | Federal Home Loan Mortgage Corp. Multi Family Housing Revenue, Series MO15, Class A, 0.21%, 5/15/46, (Credit Support: Freddie Mac)(c) | 54,970,000 | ||||
| 33,495,000 | Federal Home Loan Mortgage Corp. Multi Family Housing Revenue, Series MO21, Class A, 0.21%, 6/15/36, (Credit Support: Freddie Mac)(c) | 33,495,000 | ||||
|
| |||||
| 88,465,000 | ||||||
|
| |||||
Total U.S. Government Agency Backed Municipal Bonds | 610,040,000 | |||||
|
| |||||
| (Cost $610,040,000) | ||||||
U.S. Government Agency Obligations — 32.69% | ||||||
Fannie Mae — 10.17% | ||||||
| 58,229,000 | 0.02%, 10/12/11(b) | 58,228,715 | ||||
| 69,377,000 | 0.05%, 10/3/11(b) | 69,377,000 | ||||
| 35,124,000 | 0.09%, 1/3/12(b) | 35,116,146 | ||||
| 50,000,000 | 0.09%, 1/25/12(b) | 49,985,750 | ||||
| 27,150,000 | 0.13%, 10/3/11(b) | 27,150,000 | ||||
| 37,415,000 | 0.13%, 10/3/11(b) | 37,415,000 | ||||
| 59,529,000 | 0.13%, 10/3/11(b) | 59,529,000 | ||||
| 52,080,000 | 0.22%, 7/26/12(c) | 52,097,243 | ||||
| 113,030,700 | 0.25%, 4/2/12(b) | 112,887,842 | ||||
| 79,143,000 | 0.25%, 8/23/12(c) | 79,178,562 | ||||
|
| |||||
| 580,965,258 | ||||||
|
| |||||
Federal Farm Credit Bank — 4.74% | ||||||
| 75,000,000 | 0.16%, 8/1/12(c) | 74,994,093 | ||||
| 22,700,000 | 0.17%, 11/23/11(c) | 22,701,258 | ||||
| 47,000,000 | 0.17%, 8/15/12(c) | 46,987,654 | ||||
| 101,000,000 | 0.25%, 5/14/12(c) | 101,050,813 | ||||
| 25,000,000 | 0.32%, 12/16/11(b) | 24,983,555 | ||||
|
| |||||
| 270,717,373 | ||||||
|
| |||||
Federal Home Loan Bank — 12.11% | ||||||
| 3,950,000 | 0.12%, 2/10/12(b) | 3,948,360 | ||||
| 50,000,000 | 0.12%, 2/27/12 | 49,997,327 | ||||
| 115,000,000 | 0.13%, 7/25/12(c) | 115,000,000 | ||||
| 38,700,000 | 0.15%, 3/23/12 | 38,694,992 | ||||
| 50,000,000 | 0.15%, 5/1/12 | 49,984,848 | ||||
| 15,750,000 | 0.16%, 10/21/11(c) | 15,750,000 | ||||
| 75,000,000 | 0.16%, 7/25/12(c) | 75,000,000 | ||||
22
SCHEDULE OF PORTFOLIO INVESTMENTS |
U.S. Government Money Market Fund (cont.)
September 30, 2011
Principal Amount | Value | |||||
| $165,000,000 | 0.17%, 11/3/11(c) | $ | 165,000,000 | |||
| 20,000,000 | 0.19%, 10/6/11(c) | 20,000,291 | ||||
| 15,350,000 | 0.25%, 7/25/12 | 15,347,021 | ||||
| 15,000,000 | 0.25%, 10/13/11(c) | 15,000,512 | ||||
| 50,000,000 | 0.30%, 12/1/11 | 49,994,711 | ||||
| 35,000,000 | 0.35%, 12/7/11 | 34,998,459 | ||||
| 42,900,000 | 4.88%, 10/5/11 | 42,911,546 | ||||
|
| |||||
| 691,628,067 | ||||||
|
| |||||
Freddie Mac — 5.54% |
| |||||
| 23,000,000 | 0.08%, 1/13/12(c) | 22,995,458 | ||||
| 29,129,000 | 0.14%, 2/2/12(c) | 29,127,144 | ||||
| 26,430,000 | 0.15%, 1/11/12(c) | 26,430,678 | ||||
| 25,000,000 | 0.17%, 12/29/11(c) | 25,002,451 | ||||
| 58,000,000 | 0.18%, 12/21/11(c) | 58,005,155 | ||||
| 33,900,000 | 0.19%, 2/10/12(c) | 33,897,552 | ||||
| 95,175,000 | 0.21%, 5/11/12(c) | 95,201,937 | ||||
| 25,053,000 | 5.13%, 7/15/12 | 26,001,758 | ||||
|
| |||||
| 316,662,133 | ||||||
|
| |||||
Overseas Private Investment Corp. — 0.13% |
| |||||
| 1,400,000 | 0.08%, 3/15/15(c) | 1,400,000 | ||||
| 5,942,649 | 0.08%, 11/15/13(c) | 5,942,649 | ||||
|
| |||||
| 7,342,649 | ||||||
|
| |||||
Total U.S. Government Agency Obligations | 1,867,315,480 | |||||
|
| |||||
(Cost $1,867,315,480) | ||||||
Repurchase Agreements — 26.17% |
| |||||
| 35,000,000 | Barclays Capital Inc. dated 9/30/11; due 10/3/11 at 0.05% with maturity value of $35,000,146 (fully collateralized by US Treasury Inflation Notes with maturity dates ranging from 2/15/21 to 5/15/21 at rates ranging from 3.125% to 3.625%) | 35,000,000 | ||||
| 220,000,000 | BNP Paribas Securities Corp. dated 9/30/11; due 10/3/11 at 0.12% with maturity value of $220,002,200 (fully collateralized by Fannie Mae and Freddie Mac securities with maturity dates ranging from 9/11/21 to 6/1/41 at rates ranging from 3.00% to 6.50%) | 220,000,000 | ||||
| 225,000,000 | Citigroup Global, dated 9/30/11; due 10/3/11 at 0.11% with maturity value of $225,002,062 (fully collateralized by Freddie Mac and Fannie Mae securities with maturity dates ranging from 3/1/21 to 9/1/40 at rates ranging from 3.50% to 4.50%) | 225,000,000 | ||||
| 75,000,000 | Deutsche Bank AG dated 9/30/11; due 10/3/11 at 0.07% with maturity value of $75,000,437 (fully collateralized by a US Treasury Inflation Note with a maturity date of 9/30/13 at a rate of 0.125%) | 75,000,000 | ||||
23
SCHEDULE OF PORTFOLIO INVESTMENTS |
U.S. Government Money Market Fund (cont.)
September 30, 2011
Principal Amount | Value | |||||
| $190,000,000 | Goldman Sachs & Co. dated 9/30/11; due 10/3/11 at 0.04% with maturity value of $190,000,633 (fully collateralized by Fannie Mae, Freddie Mac and Federal Home Loan Bank securities with maturity dates ranging from 3/23/12 to 7/15/37 at rates ranging from 1.125% to 6.25%) | $ 190,000,000 | ||||
| 200,000,000 | JP Morgan Securities dated 9/30/11; due 10/3/11 at 0.08% with maturity value of $200,001,333 (fully collateralized by Fannie Mae securities with maturity dates ranging from 12/1/11 to 10/1/41 at rates ranging from 3.5% to 6.50%) | 200,000,000 | ||||
| 100,000,000 | Merrill Lynch, Pierce, Fenner, Smith. dated 9/30/11; due 10/3/11 at 0.08% with maturity value of $100,000,667 (fully collateralized by Fannie Mae securities with maturity dates ranging from 4/1/24 to 8/1/41 at rates ranging from 4.00% to 5.00%) | 100,000,000 | ||||
| 450,000,000 | Merrill Lynch, Pierce, Fenner, Smith. dated 9/30/11; due 10/3/11 at 0.08% with maturity value of $450,003,000 (fully collateralized by Fannie Mae and Freddie Mac securities with maturity dates ranging from 7/1/25 to 6/1/41 at rates ranging from 3.00% to 5.00%) | 450,000,000 | ||||
|
| |||||
Total Repurchase Agreements | 1,495,000,000 | |||||
|
| |||||
| (Cost $1,495,000,000) | ||||||
Total Investments | $5,712,971,517 | |||||
| (Cost $5,712,971,517)(d) — 100.01% | ||||||
Liabilities in excess of other assets — (0.01)% | (529,116) | |||||
|
| |||||
NET ASSETS — 100.00% |
|
$5,712,442,401 |
| |||
|
| |||||
| (a) | Security exempt from registration under Rule 144A or Section 4(2) of the Securities Act of 1933, as amended. These securities may be resold in transactions exempt from registration, normally to qualified institutional buyers. Security has been deemed to be liquid based on procedures approved by the Board of Trustees. |
| (b) | Represents effective yield to maturity on date of purchase. |
| (c) | Variable rate security. The rate reflected in the Schedule of Portfolio Investments is the rate in effect on September 30, 2011. The maturity date represents the actual maturity date. The security’s effective maturity resets periodically. |
| (d) | Tax cost of securities is equal to book cost of securities. |
Abbreviations used are defined below:
FDIC - Federal Deposit Insurance Corp.
LOC - Letter of Credit
TLGP - Temporary Liquidity Guaranty Program
See notes to financial statements.
24
SCHEDULE OF PORTFOLIO INVESTMENTS |
Tax-Free Money Market Fund
September 30, 2011
Principal Amount | Value | |||||
Municipal Bonds — 98.38% |
| |||||
Alabama — 0.88% |
| |||||
| $10,890,000 | Birmingham Waterworks Board Revenue, Series R-10412, 0.16%, 7/1/14, (Credit Support: BHAC, AGM)(a)(b) | $10,890,000 | ||||
|
| |||||
Alaska — 1.21% |
| |||||
| 15,000,000 | City of Anchorage Cash Flow Management GO, 1.50%, 12/29/11 | 15,042,731 | ||||
|
| |||||
Arizona — 1.13% |
| |||||
| 3,060,000 | Maricopa County Industrial Development Authority Gran Victoria Housing Revenue, Series A, 0.16%, 4/15/30, (Credit Support: Fannie Mae)(b) | 3,060,000 | ||||
| 5,200,000 | Maricopa County Industrial Development Authority Valley of the Sun YMCA Refunding Revenue, 0.15%, 12/1/37, (LOC: U.S. Bank NA)(b) | 5,200,000 | ||||
| 5,700,000 | Pima County Industrial Development Authority Delaware Military Academy Revenue, 0.16%, 9/1/38, (LOC: PNC Bank NA)(b) | 5,700,000 | ||||
|
| |||||
| 13,960,000 | ||||||
|
| |||||
California — 3.35% |
| |||||
| 10,000,000 | California Affordable Housing Agency Revenue, Series A, 0.15%, 9/15/33, (Credit Support: Fannie Mae)(b) | 10,000,000 | ||||
| 6,300,000 | California Statewide Communities Development Authority Refunding Revenue, Series R-11553, 0.16%, 11/15/32, (Credit Support: BHAC)(b) | 6,300,000 | ||||
| 4,840,000 | City of Berkeley Albany YMCA Refunding Revenue, 0.10%, 7/1/38, (LOC: Wells Fargo Bank NA)(b) | 4,840,000 | ||||
| 5,675,000 | City of Vacaville Sycamores Apartments Refunding Revenue, Series A, 0.14%, 5/15/29, (Credit Support: Fannie Mae)(b) | 5,675,000 | ||||
| 4,000,000 | County of Orange Harbor Pointe Refunding Revenue, Series D, 0.13%, 12/1/22, (Credit Support: Freddie Mac)(b) | 4,000,000 | ||||
| 5,800,000 | Padre Dam Municipal Water District Refunding COP, Series R-11792, 0.16%, 4/1/17(a)(b) | 5,800,000 | ||||
| 4,900,000 | Sacramento County Housing Authority Refunding Revenue, Series C, 0.13%, 7/15/29, (Credit Support: Fannie Mae)(b) | 4,900,000 | ||||
|
| |||||
| 41,515,000 | ||||||
|
| |||||
Colorado — 2.72% |
| |||||
| 3,170,000 | Aurora Centretech Metropolitan District Refunding GO, Series C, 0.18%, 12/1/28, (LOC: U.S. Bank NA)(b) | 3,170,000 | ||||
| 6,510,000 | Base Village Metropolitan District No. 2 GO, Series B, 0.18%, 12/1/38, (LOC: U.S. Bank NA)(b) | 6,510,000 | ||||
| 1,250,000 | Colorado Health Facilities Authority Arapahoe Housing Project Revenue, Series A,, 0.25%, 4/1/24, (LOC: Wells Fargo Bank)(b) | 1,250,000 | ||||
| 5,800,000 | Colorado Health Facilities Authority Crossroads Maranatha Project Refunding Revenue, 0.14%, 12/1/43, (LOC: U.S Bank NA)(b) | 5,800,000 | ||||
| 5,000,000 | Commerce City Northern Infrastructure General Improvement District GO, 0.18%, 12/1/28, (LOC: U.S. Bank NA)(b) | 5,000,000 | ||||
25
SCHEDULE OF PORTFOLIO INVESTMENTS |
Tax-Free Money Market Fund (cont.)
September 30, 2011
Principal Amount | Value | |||||
| $ 3,475,000 | County of Pitkin Refunding Revenue, Series A, 0.17%, 12/1/24, (LOC: U.S. Bank NA)(b) | $ 3,475,000 | ||||
| 5,125,000 | Gateway Regional Metropolitan District Refunding GO, 0.25%, 12/1/37, (LOC: Wells Fargo Bank)(b) | 5,125,000 | ||||
| 2,880,000 | Meridian Ranch Metropolitan District Refunding GO, 0.18%, 12/1/38, (LOC: U.S. Bank NA)(b) | 2,880,000 | ||||
| 485,000 | Parker Automotive Metropolitan District GO, 0.18%, 12/1/34, (LOC: U.S. Bank NA)(b) | 485,000 | ||||
|
| |||||
| 33,695,000 | ||||||
|
| |||||
Connecticut — 0.59% |
| |||||
| 7,325,000 | Connecticut Housing Finance Authority Refunding Revenue, Series G, 0.45%, 11/15/11, (Credit Support: GO of Authority)(b) | 7,325,000 | ||||
|
| |||||
District Of Columbia — 1.91% |
| |||||
| 4,195,000 | District of Columbia Children’s Defense Fund Refunding Revenue, 0.25%, 4/1/22, (LOC: Wells Fargo Bank)(b) | 4,195,000 | ||||
| 1,600,000 | District of Columbia Internships and Academic Revenue, 0.15%, 7/1/36, (LOC: Branch Banking & Trust)(b) | 1,600,000 | ||||
| 4,500,000 | District of Columbia Jesuit Conference Revenue, 0.16%, 10/1/37, (LOC: PNC Bank NA)(b) | 4,500,000 | ||||
| 3,980,000 | District of Columbia Water & Sewer Authority Refunding Revenue, Putters Series 3022, 0.18%, 4/1/16, (Credit Support: Assured GTY)(b) | 3,980,000 | ||||
| 9,360,000 | District of Columbia Water & Sewer Authority Refunding Revenue, Series R-11623, 0.17%, 4/1/29, (Credit Support: Assured GTY), Callable 10/1/18 @ 100(a)(b) | 9,360,000 | ||||
|
| |||||
| 23,635,000 | ||||||
|
| |||||
Florida — 5.98% |
| |||||
| 2,605,000 | Collier County Industrial Development Authority Revenue, 0.46%, 12/1/26, (LOC: Bank of America NA)(b) | 2,605,000 | ||||
| 15,000,000 | County of Palm Beach Pine Crest Preparatory Refunding Revenue, 0.26%, 6/1/38, (LOC: Bank of America NA)(b) | 15,000,000 | ||||
| 11,000,000 | Highlands County Health Facilities Authority Refunding Revenue, Series C, 0.12%, 11/15/26, (LOC: PNC Bank)(b) | 11,000,000 | ||||
| 4,000,000 | Hillsborough County TECP, 0.11%, 10/13/11, (LOC: State Street Bank & Trust)(c) | 4,000,000 | ||||
| 4,000,000 | Hillsborough County TECP, 0.21%, 11/3/11, (LOC: State Street Bank & Trust)(c) | 4,000,000 | ||||
| 5,245,000 | JP Morgan Chase Putters/Drivers Trust Seminole County Sales Tax Refunding Revenue, Series 3438Z, 0.18%, 4/1/27(a)(b) | 5,245,000 | ||||
| 2,225,000 | JP Morgan Chase Putters/Drivers Trust Tampa Water Revenue, Series 3617, 0.18%, 10/1/25(a)(b) | 2,225,000 | ||||
| 6,835,000 | Marion County Industrial Development Authority Refunding Revenue, 0.16%, 11/15/32, (Credit Support: Fannie Mae)(b) | 6,835,000 | ||||
| 4,955,000 | Miami-Dade County Industrial Development Authority Revenue, 0.36%, 9/1/29, (LOC: Bank of America NA)(b) | 4,955,000 | ||||
| 4,500,000 | Orange County Health Facilities Authority Refunding Revenue, Series E, 0.14%, 10/1/26, (LOC: Branch Banking & Trust)(b) | 4,500,000 | ||||
26
SCHEDULE OF PORTFOLIO INVESTMENTS |
Tax-Free Money Market Fund (cont.)
September 30, 2011
Principal Amount | Value | |||||
| $ 8,715,000 | Orange County Housing Finance Authority Refunding Revenue, 0.17%, 6/1/25, (Credit Support: Fannie Mae)(b) | $ 8,715,000 | ||||
| 4,995,000 | Tallahassee Energy System Revenue, Putters Series 2069Z, 0.18%, 4/1/15, (Credit Support: NATL-RE)(b) | 4,995,000 | ||||
|
| |||||
| 74,075,000 | ||||||
|
| |||||
Georgia — 4.60% |
| |||||
| 7,215,000 | Clayton County Housing Authority Refunding Revenue, 0.16%, 9/1/26, (Credit Support: Fannie Mae)(b) | 7,215,000 | ||||
| 15,000,000 | Cobb County Cash Flow Management GO, 1.25%, 12/30/11 | 15,034,231 | ||||
| 7,985,000 | Cobb County Development Authority Refunding Revenue, Series B, 0.15%, 7/1/34, (LOC: Branch Banking & Trust)(b) | 7,985,000 | ||||
| 4,755,000 | Cobb County Housing Authority Refunding Revenue, 0.15%, 3/1/24, (Credit Support: Freddie Mac)(b) | 4,755,000 | ||||
| 9,135,000 | Fulton County Development Authority Revenue, 0.26%, 4/1/34, (LOC: Bank of America NA)(b) | 9,135,000 | ||||
| 4,915,000 | Fulton County Development Authority School Improvement Revenue, 0.15%, 8/1/35, (LOC: Branch Banking & Trust)(b) | 4,915,000 | ||||
| 7,925,000 | Marietta Housing Authority Refunding Revenue, 0.16%, 7/1/24, (Credit Support: Fannie Mae)(b) | 7,925,000 | ||||
|
| |||||
| 56,964,231 | ||||||
|
| |||||
Illinois — 4.23% |
| |||||
| 7,400,000 | Illinois Development Finance Authority YMCA Metro Chicago Project Refunding Revenue, 0.15%, 6/1/29, (LOC: JP Morgan Chase Bank)(b) | 7,400,000 | ||||
| 3,300,000 | Illinois Finance Authority Cultural Pool Revenue, 0.19%, 12/1/25, (LOC: JP Morgan Chase Bank)(b) | 3,300,000 | ||||
| 9,645,000 | Illinois Finance Authority Dominican University Revenue, 0.15%, 3/1/36, (LOC: JP Morgan Chase Bank)(b) | 9,645,000 | ||||
| 3,930,000 | Illinois Finance Authority Garrett Evangelical Project Refunding Revenue, 0.16%, 6/1/40, (LOC: First Midwest Trust Co., Federal Home Loan Bank)(b) | 3,930,000 | ||||
| 4,995,000 | Illinois Finance Authority Revenue, Putters Series 2967, 0.18%, 2/15/16, (Credit Support: Assured GTY)(b) | 4,995,000 | ||||
| 16,100,000 | Illinois Finance Authority Revenue, Series R-11624, 0.28%, 8/15/39, (Credit Support: Assured GTY), Callable 8/15/18 @ 100(a)(b) | 16,100,000 | ||||
| 7,030,000 | Village of Channahon Morris Hospital Refunding Revenue, Series A, 0.17%, 12/1/23, (LOC: U.S. Bank NA)(b) | 7,030,000 | ||||
|
| |||||
| 52,400,000 | ||||||
|
| |||||
Indiana — 3.21% |
| |||||
| 6,180,000 | City of South Bend Genesis Project Industrial Improvement Revenue, 0.19%, 4/1/33, (LOC: Citizens Bank of PA., Federal Home Loan Bank)(b) | 6,180,000 | ||||
| 19,000,000 | Indiana Bond Bank Advance Funding Program Cash Flow Management Revenue, Series A, 2.00%, 1/5/12 | 19,071,492 | ||||
27
SCHEDULE OF PORTFOLIO INVESTMENTS |
Tax-Free Money Market Fund (cont.)
September 30, 2011
Principal Amount | Value | |||||
| $ 14,555,000 | Indiana Finance Authority Refunding Revenue, 0.17%, 3/1/36, (LOC: Branch Banking & Trust)(b) | $ 14,555,000 | ||||
|
| |||||
| 39,806,492 | ||||||
|
| |||||
Iowa — 1.92% |
| |||||
| 5,800,000 | City of Urbandale Interstate Acres LP Refunding Revenue, 0.18%, 12/1/14, (LOC: Bankers Trust Co., Federal Home Loan Bank)(b) | 5,800,000 | ||||
| 1,100,000 | Iowa Higher Education Loan Authority Cash Flow Management Revenue, 2.00%, 5/18/12, (LOC: U.S. Bank NA) | 1,110,224 | ||||
| 7,440,000 | Iowa Higher Education Loan Authority University & College Improvement Revenue, 0.16%, 10/1/33, (LOC: U.S. Bank NA)(b) | 7,440,000 | ||||
| 7,270,000 | Iowa Higher Education Loan Authority University & College Revenue, 0.25%, 5/1/20, (LOC: Wells Fargo Bank)(b) | 7,270,000 | ||||
| 2,150,000 | Woodbury County Revenue, 0.25%, 11/1/16, (LOC: U.S. Bank NA)(b) | 2,150,000 | ||||
|
| |||||
| 23,770,224 | ||||||
|
| |||||
Kentucky — 1.45% |
| |||||
| 7,855,000 | County of Warren Refunding Revenue, 0.21%, 4/1/37, (Credit Support: Assured GTY)(b) | 7,855,000 | ||||
| 10,000,000 | Louisville & Jefferson County Metropolitan Sewer District Refunding Revenue, 2.00%, 3/1/12 | 10,046,726 | ||||
|
| |||||
| 17,901,726 | ||||||
|
| |||||
Louisiana — 1.05% |
| |||||
| 9,055,000 | Louisiana Local Government Environmental Facilities & Community Development Authority Revenue, Series A, 0.16%, 10/1/37, (LOC: First NBC Bank, Federal Home Loan Bank)(b) | 9,055,000 | ||||
| 3,890,000 | Shreveport Home Mortgage Authority Refunding Revenue, 0.16%, 2/15/23, (Credit Support: Fannie Mae)(b) | 3,890,000 | ||||
|
| |||||
| 12,945,000 | ||||||
|
| |||||
Massachusetts — 1.29% |
| |||||
| 12,000,000 | Commonwealth of Massachusetts Central Artery Highway Improvements GO, Series B, 0.11%, 12/1/30(b) | 12,000,000 | ||||
| 4,000,000 | Massachusetts Industrial Finance Agency Refunding Revenue, 0.15%, 12/1/24, (LOC: TD Bank NA)(b) | 4,000,000 | ||||
|
| |||||
| 16,000,000 | ||||||
|
| |||||
Michigan — 1.02% |
| |||||
| 12,475,000 | Michigan Finance Authority Cash Flow Management Revenue, Series C-1, 2.00%, 8/20/12, (Credit Support: State Appropriation) | 12,634,787 | ||||
|
| |||||
Minnesota — 9.94% |
| |||||
| 1,825,000 | City of Bloomington Refunding Revenue, Series A1, 0.20%, 11/15/32, (Credit Support: Fannie Mae)(b) | 1,825,000 | ||||
| 8,350,000 | City of Burnsville Southwind Apartments Project Refunding Revenue, 0.18%, 1/1/35, (Credit Support: Freddie Mac)(b) | 8,350,000 | ||||
28
SCHEDULE OF PORTFOLIO INVESTMENTS |
Tax-Free Money Market Fund (cont.)
September 30, 2011
Principal Amount | Value | |||||
| $ 12,235,000 | City of Inver Grove Heights Refunding Revenue, 0.18%, 5/15/35, (Credit Support: Fannie Mae)(b) | $ 12,235,000 | ||||
| 1,200,000 | City of Minnetonka Refunding Revenue, 0.18%, 11/15/31, (Credit Support: Fannie Mae)(b) | 1,200,000 | ||||
| 13,250,000 | City of Oak Park Heights Refunding Revenue, 0.18%, 11/1/35, (Credit Support: Freddie Mac)(b) | 13,250,000 | ||||
| 5,565,000 | City of Saint Louis Park Westwind Apartments Project Refunding Revenue, 0.18%, 9/15/33, (Credit Support: Fannie Mae)(b) | 5,565,000 | ||||
| 1,210,000 | City of Spring Lake Park Refunding Revenue, 0.18%, 2/15/33, (Credit Support: Fannie Mae)(b) | 1,210,000 | ||||
| 4,265,000 | Elk River Independent School District No. 728 Refunding GO, Series A, 5.00%, 2/1/12, (Credit Support: School District Credit Program) | 4,329,266 | ||||
| 15,000,000 | JPMorgan Chase Putters Drivers Trust GO, Series 3955 Minneapolis St. Paul Met Council GO, 0.15%, 9/1/13(a)(b) | 15,000,000 | ||||
| 9,320,000 | Midwest Consortium of Municipal Utilities Refunding Revenue, Series B, 0.15%, 10/1/35, (LOC: U.S. Bank NA)(b) | 9,320,000 | ||||
| 6,730,000 | Minneapolis & St Paul Housing & Redevelopment Authority Revenue, Series B, 0.15%, 8/15/25, (Credit Support: AGM)(b) | 6,730,000 | ||||
| 8,000,000 | Rochester Health Care Facilities TECP, 0.12%, 10/5/11, (Credit Support: Mayo Clinic Foundation)(c) | 8,000,000 | ||||
| 11,000,000 | Rochester Health Care Facilities TECP, 0.12%, 10/5/11, (Credit Support: Mayo Clinic Foundation)(c) | 11,000,000 | ||||
| 10,000,000 | Rochester Health Care Facilities TECP, 0.15%, 12/1/11, (Credit Support: Mayo Clinic Foundation)(c) | 10,000,000 | ||||
| 11,000,000 | St. Francis Independent School District No 15 Cash Flow Management GO, Series 2011A, 1.00%, 9/12/12, (Credit Support: School District Credit Program) | 11,067,087 | ||||
| 2,040,000 | St. Paul Housing & Redevelopment Authority Revenue, Series A, 0.15%, 5/1/27, (LOC: U.S. Bank NA)(b) | 2,040,000 | ||||
| 1,930,000 | St. Paul Independent School District No. 625 Refunding GO, Series C, 4.00%, 2/1/12, (Credit Support: School District Credit Program) | 1,952,718 | ||||
|
| |||||
| 123,074,071 | ||||||
|
| |||||
Mississippi — 3.71% |
| |||||
| 7,140,000 | Mississippi Business Finance Corp. King Edward Hotel Project Revenue, 0.16%, 5/1/39, (LOC: Capital One NA, Federal Home Loan Bank)(b) | 7,140,000 | ||||
| 15,000,000 | Mississippi Business Finance Corp., Chevron USA Inc. Project Revenue, Series B, 0.08%, 12/1/30(b) | 15,000,000 | ||||
| 10,200,000 | Mississippi Business Finance Corp., Chevron USA Inc. Project Revenue, Series B, 0.10%, 12/1/30(b) | 10,200,000 | ||||
| 5,500,000 | Mississippi Business Finance Corp., Chevron USA Inc. Project Revenue, Series F, 0.09%, 12/1/30(b) | 5,500,000 | ||||
| 8,100,000 | Mississippi Business Finance Corp., Chevron USA Inc. Project Revenue, Series H, 0.09%, 11/1/35(b) | 8,100,000 | ||||
|
| |||||
| 45,940,000 | ||||||
|
| |||||
29
SCHEDULE OF PORTFOLIO INVESTMENTS |
Tax-Free Money Market Fund (cont.)
September 30, 2011
Principal Amount | Value | |||||
Missouri — 0.16% |
| |||||
| $ 2,000,000 | St. Charles County Industrial Development Authority Refunding Revenue, 0.16%, 2/1/29, (Credit Support: Fannie Mae)(b) | $ 2,000,000 | ||||
|
| |||||
Montana — 0.94% |
| |||||
| 11,700,000 | Montana Board of Investments Public Improvements Revenue, 0.48%, 3/1/35(b) | 11,700,000 | ||||
|
| |||||
Nebraska — 0.48% |
| |||||
| 6,000,000 | Madison County Hospital Authority No. 1 Revenue, Series B, 0.15%, 7/1/33, (LOC: U.S. Bank NA)(b) | 6,000,000 | ||||
|
| |||||
New Jersey — 2.53% |
| |||||
| 18,500,000 | New Jersey Economic Development Authority Diocese of Metuchen Project Refunding Revenue, 0.28%, 9/1/30, (LOC: Bank of America NA)(b) | 18,500,000 | ||||
| 12,895,000 | New Jersey Health Care Facilities Financing Authority Refunding Revenue, 0.12%, 7/1/33, (LOC: TD Bank NA)(b) | 12,895,000 | ||||
|
| |||||
| 31,395,000 | ||||||
|
| |||||
New York — 10.07% |
| |||||
| 7,200,000 | City of New York GO, Sub-Series A-4, 0.12%, 8/1/31, (LOC: Bank of Nova Scotia)(b) | 7,200,000 | ||||
| 25,000,000 | City of New York Refunding GO, Sub-Series C-5, 0.12%, 8/1/20, (LOC: BNY Mellon)(b) | 25,000,000 | ||||
| 2,900,000 | Erie County Industrial Development Agency Revenue, Putters Series 2090, 0.17%, 5/1/15, (Credit Support: AGM)(b) | 2,900,000 | ||||
| 15,000,000 | Metropolitan Transportation Authority TECP, 0.17%, 11/7/11, (LOC: Citibank NA)(c) | 15,000,000 | ||||
| 5,000,000 | Nassau Health Care Corp. Refunding Revenue, 0.12%, 8/1/29, (Credit Support: County GTY), (LOC: TD Bank NA)(b) | 5,000,000 | ||||
| 4,475,000 | New York City Industrial Development Agency College Improvement Revenue, Series B, 0.14%, 6/1/36, (Credit Support: Radian), (LOC: TD Bank NA)(b) | 4,475,000 | ||||
| 5,000,000 | New York Liberty Development Corp. World Trade Center Project Revenue, Series A-1, 0.42%, 1/19/12(b) | 5,000,000 | ||||
| 6,000,000 | New York Liberty Development Corp. World Trade Center Project Revenue, Series A-2, 0.35%, 12/1/49(b) | 6,000,000 | ||||
| 22,900,000 | New York State Dormitory Authority Refunding Revenue, Series D, 0.12%, 7/1/31, (LOC: TD Bank NA)(b) | 22,900,000 | ||||
| 3,800,000 | New York State Dormitory Authority Revenue, 0.12%, 7/1/38, (LOC: TD Bank NA)(b) | 3,800,000 | ||||
| 27,400,000 | New York State Energy Research & Development Authority Refunding Revenue, Series A, 0.35%, 8/1/15, (LOC: Wells Fargo Bank)(b) | 27,400,000 | ||||
|
| |||||
| 124,675,000 | ||||||
|
| |||||
North Carolina — 1.22% |
| |||||
| 2,100,000 | North Carolina Capital Facilities Finance Agency Refunding Revenue, 0.15%, 7/1/19, (LOC: Branch Banking & Trust)(b) | 2,100,000 | ||||
30
SCHEDULE OF PORTFOLIO INVESTMENTS |
Tax-Free Money Market Fund (cont.)
September 30, 2011
Principal Amount | Value | |||||
| $ 12,995,000 | North Carolina Municipal Power Agency No. 1 Catawba Revenue, Series R-211, 0.17%, 8/1/12, (Credit Support: BHAC)(b) | $ 12,995,000 | ||||
|
| |||||
| 15,095,000 | ||||||
|
| |||||
Ohio — 0.19% |
| |||||
| 2,400,000 | County of Lucas Cash Flow Management GO, Series 1, 1.00%, 7/19/12 | 2,408,505 | ||||
|
| |||||
Oregon — 0.39% |
| |||||
| 4,850,000 | Clackamas County Hospital Facility Authority Legacy Health Systems Revenue, Series B, 0.13%, 6/1/37, (LOC: U.S. Bank NA)(b) | 4,850,000 | ||||
|
| |||||
Pennsylvania — 9.50% |
| |||||
| 8,900,000 | Allegheny County Higher Education Building Authority Refunding Revenue, Series A, 0.16%, 3/1/38, (LOC: PNC Bank NA)(b) | 8,900,000 | ||||
| 7,500,000 | Allegheny County Hospital Development Authority Revenue, Series A, 0.16%, 6/1/30, (LOC: PNC Bank NA)(b) | 7,500,000 | ||||
| 4,735,000 | Allegheny County Industrial Development Authority Revenue, 0.16%, 6/1/38, (LOC: PNC Bank NA)(b) | 4,735,000 | ||||
| 12,575,000 | Butler County General Authority Iroquois School District Project Refunding Revenue, 0.22%, 8/1/31, (Credit Support: AGM)(b) | 12,575,000 | ||||
| 10,425,000 | Butler County General Authority South Park School District Project Refunding Revenue, 0.22%, 8/1/27, (Credit Support: AGM)(b) | 10,425,000 | ||||
| 5,000,000 | Delaware County Industrial Development Authority General Electric Capital Refunding Revenue, Series G, 0.13%, 12/1/31(b) | 5,000,000 | ||||
| 5,000,000 | Delaware County Industrial Development Authority General Electric Capital Refunding Revenue, Series G, 0.13%, 12/1/31(b) | 5,000,000 | ||||
| 3,850,000 | Emmaus General Authority Revenue, 0.20%, 12/1/28, (Credit Support: AGM)(b) | 3,850,000 | ||||
| 3,100,000 | Emmaus General Authority Revenue, Series A11, 0.14%, 3/1/24, (LOC: U.S. Bank NA)(b) | 3,100,000 | ||||
| 4,700,000 | Emmaus General Authority Revenue, Series F, 0.14%, 3/1/24, (LOC: U.S. Bank NA)(b) | 4,700,000 | ||||
| 8,155,000 | JP Morgan Chase Putters/Drivers Trust Refunding GO, Series 3405, 0.17%, 11/15/14, (Credit Support: AGM, State Aid Withholding)(a)(b) | 8,155,000 | ||||
| 7,740,000 | Luzerne County Convention Center Authority Revenue, Series A, 0.16%, 9/1/28, (LOC: PNC Bank NA)(b) | 7,740,000 | ||||
| 10,680,000 | Montgomery County Industrial Development Authority Refunding Revenue, 0.14%, 6/1/33, (LOC: TD Bank NA)(b) | 10,680,000 | ||||
| 3,930,000 | Pennsylvania Economic Development Financing Authority Revenue, 0.16%, 12/1/31, (LOC: PNC Bank NA)(b) | 3,930,000 | ||||
| 3,100,000 | Pennsylvania Higher Educational Facilties Authority Gannon University Refunding Revenue, 0.16%, 5/1/15, (LOC: PNC Bank NA)(b) | 3,100,000 | ||||
| 7,400,000 | Pennsylvania Higher Educational Facilties Authority Holy Family College Refunding Revenue, Series B, 0.16%, 12/1/32, (LOC: TD Bank NA)(b) | 7,400,000 | ||||
31
SCHEDULE OF PORTFOLIO INVESTMENTS |
Tax-Free Money Market Fund (cont.)
September 30, 2011
Principal Amount | Value | |||||
| $ 7,600,000 | Philadelphia Authority for Industrial Development Revenue, 0.25%, 12/1/37, (LOC: Wells Fargo Bank)(b) | $ 7,600,000 | ||||
| 3,335,000 | Shaler Area School District Refunding GO, 0.20%, 9/1/25, (Credit Support: AGM, State Aid Withholding)(b) | 3,335,000 | ||||
|
| |||||
| 117,725,000 | ||||||
|
| |||||
Rhode Island — 0.25% |
| |||||
| 3,075,000 | Rhode Island Health & Educational Building Corp. Refunding Revenue, 0.51%, 6/1/37, (LOC: Bank of America NA)(b) | 3,075,000 | ||||
|
| |||||
South Carolina — 2.64% |
| |||||
| 4,000,000 | City of Columbia Water Improvements Revenue, 0.12%, 2/1/38, (LOC: U.S. Bank NA)(b) | 4,000,000 | ||||
| 6,500,000 | County of Cherokee Revenue, 0.46%, 12/1/15, (LOC: Bank of America NA)(b) | 6,500,000 | ||||
| 14,600,000 | South Carolina Jobs-Economic Development Authority Refunding Revenue, 0.14%, 4/1/27, (LOC: Wells Fargo Bank)(b) | 14,600,000 | ||||
| 3,400,000 | South Carolina Jobs-Economic Development Authority Revenue, 0.18%, 5/1/29, (LOC: Branch Banking & Trust)(b) | 3,400,000 | ||||
| 4,250,000 | South Carolina Jobs-Economic Development Authority Revenue, 0.25%, 5/1/29, (LOC: Wells Fargo Bank)(b) | 4,250,000 | ||||
|
| |||||
| 32,750,000 | ||||||
|
| |||||
South Dakota — 1.02% |
| |||||
| 12,640,000 | City of Sioux Falls Sales Tax Revenue, Series 2057, 0.18%, 5/15/15(b) | 12,640,000 | ||||
|
| |||||
Tennessee — 0.16% |
| |||||
| 2,000,000 | Hendersonville Industrial Development Board Refunding Revenue, 0.23%, 2/15/28, (Credit Support: Fannie Mae)(b) | 2,000,000 | ||||
|
| |||||
Texas — 8.36% |
| |||||
| 2,685,000 | Crawford Education Facilities Corp. Revenue, 0.17%, 6/1/18, (LOC: U.S. Bank NA)(b) | 2,685,000 | ||||
| 7,050,000 | DeSoto Industrial Development Authority Caterpillar Refunding Revenue, 0.26%, 12/1/16(b) | 7,050,000 | ||||
| 18,000,000 | Harris County Cultural Educational Facilities TECP, 0.23%, 12/5/11, (Credit Support: Methodist Hospital)(c) | 18,000,000 | ||||
| 8,000,000 | Harris County Cultural Educational Facilities TECP, 0.25%, 12/5/11, (Credit Support: Methodist Hospital)(c) | 8,000,000 | ||||
| 9,000,000 | Harris County Cultural Educational Facilities TECP, 0.28%, 5/3/12, (Credit Support: Methodist Hospital)(c) | 9,000,000 | ||||
| 5,060,000 | Harris County Health Facilities Development Corp. Revenue, Series R-11404, 0.21%, 5/15/16, (Credit Support: Assured GTY)(b) | 5,060,000 | ||||
| 4,075,000 | Harris County Hospital District Refunding Revenue, Series R-12075, 0.17%, 8/15/15, (Credit Support: BHAC-CR, NATL-RE)(b) | 4,075,000 | ||||
| 3,505,000 | JP Morgan Chase Putters/Drivers Trust Houston Community College GO, Series 3356, 0.18%, 2/15/12(a)(b) | 3,505,000 | ||||
32
SCHEDULE OF PORTFOLIO INVESTMENTS |
Tax-Free Money Market Fund (cont.)
September 30, 2011
Principal Amount | Value | |||||
| $ 4,060,000 | Judson Independent School District School Improvements GO, Series R-11521, 0.21%, 2/1/31, (Credit Support: Assured GTY)(b) | $ 4,060,000 | ||||
| 11,120,000 | Lake Travis Independent School District Putters GO, Series 1882, 0.16%, 2/15/14, (Credit Support: PSF-GTD)(a)(b) | 11,120,000 | ||||
| 10,000,000 | Lower Colorado River Authority TECP, 0.13%, 10/4/11, (LOC: JPMorgan Chase, State Street Bank)(c) | 10,000,000 | ||||
| 6,000,000 | Lower Colorado River Authority TECP, 0.14%, 10/6/11, (LOC: Bank of America NA)(c) | 6,000,000 | ||||
| 10,000,000 | Lower Neches Valley Authority Industrial Development Corp. Exxon Mobil Project Refunding Revenue, Series A, 0.09%, 11/1/29(b) | 10,000,000 | ||||
| 5,050,000 | Splendora Higher Education Facilities Corp. Revenue, Series A, 0.25%, 12/1/26, (LOC: Wells Fargo Bank)(b) | 5,050,000 | ||||
|
| |||||
| 103,605,000 | ||||||
|
| |||||
Utah — 1.38% | ||||||
| 5,000,000 | County of Emery Refunding Revenue, 0.15%, 11/1/24, (LOC: Wells Fargo Bank)(b) | 5,000,000 | ||||
| 635,000 | County of Sanpete Revenue, 0.25%, 8/1/28, (LOC: U.S. Bank NA)(b) | 635,000 | ||||
| 3,700,000 | Duchesne County School District Revenue, 0.25%, 6/1/21, (LOC: U.S. Bank NA)(b) | 3,700,000 | ||||
| 3,310,000 | Ogden City Redevelopment Agency Tax Allocation Revenue, Series A, 0.25%, 4/1/25, (LOC: Wells Fargo Bank)(b) | 3,310,000 | ||||
| 4,435,000 | Salt Lake County Housing Authority Refunding Revenue, 0.16%, 2/15/31, (Credit Support: Fannie Mae)(b) | 4,435,000 | ||||
|
| |||||
| 17,080,000 | ||||||
|
| |||||
Vermont — 0.27% | ||||||
| 3,300,000 | Vermont Educational & Health Buildings Financing Agency Springfield Project Refunding Revenue, Series A, 0.15%, 9/1/31, (LOC: TD Bank NA)(b) | 3,300,000 | ||||
|
| |||||
Virginia — 3.71% | ||||||
| 7,160,000 | JP Morgan Chase Putters/Drivers Trust Virginia Housing Development Authority Revenue, Series 3313Z, 0.17%, 1/1/31, (Credit Support: GO of Authority)(b) | 7,160,000 | ||||
| 6,560,000 | Virginia Beach Development Authority Refunding Revenue, 0.25%, 7/1/33, (LOC: Bank of America NA)(b) | 6,560,000 | ||||
| 12,955,000 | Virginia College Building Authority Shenandoah University Project Refunding Revenue, 0.12%, 11/1/36, (LOC: Branch Banking & Trust)(b) | 12,955,000 | ||||
| 19,275,000 | Virginia Commonwealth University Nursing Home Improvement Revenue, Series C, 0.12%, 7/1/37, (LOC: Branch Banking & Trust)(b) | 19,275,000 | ||||
|
| |||||
| 45,950,000 | ||||||
|
| |||||
Washington — 0.99% | ||||||
| 4,995,000 | JP Morgan Chase Putters/Drivers Trust Snohomish County School District No. 15 GO, Series 3542Z, 0.18%, 12/1/14, (Credit Support: School Board GTY)(a)(b) | 4,995,000 | ||||
33
SCHEDULE OF PORTFOLIO INVESTMENTS |
Tax-Free Money Market Fund (cont.)
September 30, 2011
Principal Amount | Value | |||||
| $ 6,315,000 | Washington Health Care Facilities Authority Revenue, 0.46%, 8/1/26, (LOC: Bank of America NA)(b) | $ 6,315,000 | ||||
| 900,000 | Washington State Housing Finance Commission Revenue, 0.17%, 7/1/22, (LOC: U.S. Bank NA)(b) | 900,000 | ||||
|
| |||||
| 12,210,000 | ||||||
|
| |||||
Wisconsin — 3.60% | ||||||
| 20,000,000 | Eau Claire Area School District Cash Flow Management Revenue, 0.60%, 5/7/12 | 20,008,396 | ||||
| 8,040,000 | Wisconsin Health & Educational Facilities Authority Revenue, 0.25%, 6/1/28, (LOC: Wells Fargo Bank)(b) | 8,040,000 | ||||
| 6,907,000 | Wisconsin Health & Educational Facilities Authority Revenue, Series A, 0.15%, 9/1/19, (LOC: JP Morgan Chase Bank)(b) | 6,907,000 | ||||
| 7,500,000 | Wisconsin Health & Educational Facilities Authority Revenue, Series C, 0.14%, 4/1/28, (LOC: U.S. Bank NA)(b) | 7,500,000 | ||||
| 2,100,000 | Wisconsin Municipalities Private School Finance Commission Revenue, 0.17%, 3/1/23, (LOC: U.S. Bank NA)(b) | 2,100,000 | ||||
|
| |||||
| 44,555,396 | ||||||
|
| |||||
Wyoming — 0.33% | ||||||
| 4,100,000 | Sublette County Exxon Project Pollution Control Revenue, 0.10%, 11/1/14(b) | 4,100,000 | ||||
|
| |||||
Total Municipal Bonds (Cost $1,218,688,163) | 1,218,688,163 | |||||
|
| |||||
Shares | ||||||
Investment Company — 0.41% | ||||||
| 5,000,000 | Goldman Sachs Financial Square Tax Free Money Market Fund | 5,000,000 | ||||
|
| |||||
Total Investment Company (Cost $5,000,000) | 5,000,000 | |||||
|
| |||||
Total Investments (Cost $1,223,688,163)(d) — 98.79% | $1,223,688,163 | |||||
Other assets in excess of liabilities — 1.21% | 15,050,162 | |||||
|
| |||||
NET ASSETS — 100.00% | $1,238,738,325 | |||||
|
| |||||
| (a) | Security exempt from registration under Rule 144A or Section 4(2) of the Securities Act of 1933, as amended. These securities may be resold in transactions exempt from registration, normally to qualified institutional buyers. Security has been deemed to be liquid based on procedures approved by the Board of Trustees. |
| (b) | Variable rate demand security. The rate reflected in the Schedule of Portfolio Investments is the rate in effect on September 30, 2011. The maturity date represents the actual maturity date. The security’s effective maturity resets periodically. |
| (c) | Represents effective yield to maturity on date of purchase. |
34
SCHEDULE OF PORTFOLIO INVESTMENTS |
Tax-Free Money Market Fund (cont.)
September 30, 2011
| (d) | Tax cost of securities is equal to book cost of securities. |
Abbreviations used are defined below:
AGM – Assured Guaranty Municipal
BHAC – Berkshire Hathaway Assurance Corp.
BHAC-CR – Berkshire Hathaway Assurance Corp. Custodial Receipts
COP – Certificate of Participation
GO – General Obligation
GTY – Guaranty
LOC – Letter of Credit
NATL-RE – Insured by National Public Finance Guarantee Corp.
PSF-GTD – Permanent School Fund Guarantee
TECP – Tax Exempt Commercial Paper
See notes to financial statements.
35
|
Statements of Assets and Liabilities
September 30, 2011
| Prime Money Market Fund | U.S. Government Money Market Fund | Tax-Free Money Market Fund | ||||||||||
Assets: |
| |||||||||||
Investments, at value (cost $12,362,123,722; $5,712,971,517; $1,223,688,163 respectively) | $ | 12,362,123,722* | $ | 5,712,971,517** | $ | 1,223,688,163 | ||||||
Cash | 71,084,922 | 102,575,813 | 3,703,712 | |||||||||
Interest and dividends receivable | 20,853,295 | 10,504,344 | 994,407 | |||||||||
Receivable for investments sold | 44,998,526 | — | 10,530,000 | |||||||||
Prepaid expenses and other assets | 195,639 | 157,197 | 104,985 | |||||||||
|
|
|
|
|
| |||||||
Total Assets | 12,499,256,104 | 5,826,208,871 | 1,239,021,267 | |||||||||
|
|
|
|
|
| |||||||
Liabilities: | ||||||||||||
Distributions payable | 41,922 | 2,848 | 371 | |||||||||
Payable for investments purchased | 4,275,850 | 112,811,736 | — | |||||||||
Accrued expenses and other payables: | ||||||||||||
Investment advisory fees | 1,166,050 | 491,073 | 114,425 | |||||||||
Audit fees | 35,375 | 32,071 | 30,770 | |||||||||
Trustee fees | 20,735 | 7,514 | 1,808 | |||||||||
Distribution fees | 1,041,840 | 143,831 | 89,628 | |||||||||
Shareholder reports | 506,850 | 158,368 | 32,765 | |||||||||
Shareholder servicing fees | 111,261 | 50,336 | 1,613 | |||||||||
Transfer Agent fees | 7,648 | 2,074 | 2,230 | |||||||||
Other | 172,144 | 66,619 | 9,332 | |||||||||
|
|
|
|
|
| |||||||
Total Liabilities | 7,379,675 | 113,766,470 | 282,942 | |||||||||
|
|
|
|
|
| |||||||
Net Assets | $ | 12,491,876,429 | $ | 5,712,442,401 | $ | 1,238,738,325 | ||||||
|
|
|
|
|
| |||||||
Net Assets Consist Of: | ||||||||||||
Capital | $ | 12,496,226,349 | $ | 5,712,393,013 | $ | 1,238,757,053 | ||||||
Undistributed (distributions in excess of) net investment income | (1,031 | ) | 3,719 | (371 | ) | |||||||
Accumulated net realized gains (losses) from investment transactions | (4,348,889 | ) | 45,669 | (18,357 | ) | |||||||
|
|
|
|
|
| |||||||
Net Assets | $ | 12,491,876,429 | $ | 5,712,442,401 | $ | 1,238,738,325 | ||||||
|
|
|
|
|
| |||||||
Net Assets: | ||||||||||||
RBC Institutional Class 1 | $ | 1,978,447,930 | $ | 1,580,115,508 | $ | 36,806,146 | ||||||
RBC Institutional Class 2 | 687,394,326 | 142,208,249 | 214,421,940 | |||||||||
RBC Investor Class | 3,199,411,361 | 980,831,774 | 167,380,470 | |||||||||
RBC Reserve Class | 5,032,106,287 | 1,747,756,962 | 520,404,926 | |||||||||
RBC Select Class | 1,594,516,525 | 1,261,529,908 | 299,724,843 | |||||||||
|
|
|
|
|
| |||||||
Total | $ | 12,491,876,429 | $ | 5,712,442,401 | $ | 1,238,738,325 | ||||||
|
|
|
|
|
| |||||||
36
FINANCIAL STATEMENTS |
Statements of Assets and Liabilities (cont.)
| Prime Money Market Fund | U.S. Government Money Market Fund | Tax-Free Money Market Fund | ||||||||||
Shares Outstanding (Unlimited number of shares authorized, no par value): | ||||||||||||
RBC Institutional Class 1 | 1,978,335,441 | 1,580,085,050 | 36,819,928 | |||||||||
RBC Institutional Class 2 | 687,368,058 | 142,204,083 | 214,496,248 | |||||||||
RBC Investor Class | 3,201,416,539 | 980,836,701 | 167,373,749 | |||||||||
RBC Reserve Class | 5,034,157,799 | 1,747,765,921 | 520,396,527 | |||||||||
RBC Select Class | 1,595,068,479 | 1,261,535,645 | 299,717,430 | |||||||||
|
|
|
|
|
| |||||||
Total | 12,496,346,316 | 5,712,427,400 | 1,238,803,882 | |||||||||
|
|
|
|
|
| |||||||
Net Asset Values and Redemption Price per Share: | ||||||||||||
RBC Institutional Class 1 | $ | 1.00 | $ | 1.00 | $ | 1.00 | ||||||
|
|
|
|
|
| |||||||
RBC Institutional Class 2 | $ | 1.00 | $ | 1.00 | $ | 1.00 | ||||||
|
|
|
|
|
| |||||||
RBC Investor Class | $ | 1.00 | $ | 1.00 | $ | 1.00 | ||||||
|
|
|
|
|
| |||||||
RBC Reserve Class | $ | 1.00 | $ | 1.00 | $ | 1.00 | ||||||
|
|
|
|
|
| |||||||
RBC Select Class | $ | 1.00 | $ | 1.00 | $ | 1.00 | ||||||
|
|
|
|
|
| |||||||
| * | $525,000,000 of which are repurchase agreements. See Schedule of Portfolio Investments for details. |
| ** | $1,495,000,000 of which are repurchase agreements. See Schedule of Portfolio Investments for details. |
See notes to financial statements.
37
FINANCIAL STATEMENTS |
For the Year Ended September 30, 2011
| Prime Money Market Fund | U.S. Government Money Market Fund | Tax-Free Money Market Fund | ||||||||||
Investment Income: | ||||||||||||
Interest income | $ | 46,074,200 | $ | 11,780,772 | $ | 3,915,401 | ||||||
Dividend income | — | — | 13,091 | |||||||||
|
|
|
|
|
| |||||||
Total Investment Income | 46,074,200 | 11,780,772 | 3,928,492 | |||||||||
|
|
|
|
|
| |||||||
Expenses: | ||||||||||||
Investment advisory fees | 15,058,668 | 5,375,703 | 1,444,345 | |||||||||
Distribution fees-RBC Institutional Class 2 | 1,270,003 | 226,522 | 428,235 | |||||||||
Distribution fees-RBC Investor Class | 36,715,069 | 10,803,858 | 1,914,976 | |||||||||
Distribution fees-RBC Reserve Class | 47,646,091 | 15,782,335 | 5,433,387 | |||||||||
Distribution fees-RBC Select Class | 14,020,984 | 9,347,305 | 2,539,184 | |||||||||
Shareholder servicing fee-RBC Institutional Class 1 | 1,746,930 | 611,148 | 23,125 | |||||||||
Accounting fees | 752,933 | 268,785 | 72,217 | |||||||||
Audit fees | 43,828 | 38,056 | 35,888 | |||||||||
Custodian fees | 183,775 | 75,532 | 16,590 | |||||||||
Insurance fees | 145,289 | 34,405 | 11,931 | |||||||||
Legal fees | 404,417 | 131,246 | 52,141 | |||||||||
Registration and filing fees | 366,682 | 208,348 | 187,121 | |||||||||
Shareholder reports | 641,432 | 144,697 | 35,381 | |||||||||
Transfer agent fees | 55,375 | 10,974 | 10,476 | |||||||||
Trustees’ fees | 355,313 | 128,552 | 34,659 | |||||||||
Other fees | 436,536 | 178,300 | 55,989 | |||||||||
|
|
|
|
|
| |||||||
Total expenses before fee reductions | 119,843,325 | 43,365,766 | 12,295,645 | |||||||||
Expenses reduced by: | ||||||||||||
Shareholder Servicing Agent - Class Specific | — | (69,620 | ) | (952 | ) | |||||||
Distributor - Class Specific | (79,928,067 | ) | (32,522,481 | ) | (8,575,827 | ) | ||||||
|
|
|
|
|
| |||||||
Net Expenses | 39,915,258 | 10,773,665 | 3,718,866 | |||||||||
|
|
|
|
|
| |||||||
Net Investment Income | 6,158,942 | 1,007,107 | 209,626 | |||||||||
|
|
|
|
|
| |||||||
Realized/Unrealized Gains (Losses) from Investment Transactions: | ||||||||||||
Net realized gains (losses) from investment transactions | 364,928 | 78,276 | (18,807 | ) | ||||||||
|
|
|
|
|
| |||||||
Change in net assets resulting from operations | $ | 6,523,870 | $ | 1,085,383 | $ | 190,819 | ||||||
|
|
|
|
|
| |||||||
See notes to financial statements.
38
FINANCIAL STATEMENTS |
Statements of Changes in Net Assets
| Prime Money Market Fund | ||||||||
| For the Year Ended September 30, 2011 | For the Year Ended September 30, 2010 | |||||||
From Investment Activities: | ||||||||
Operations: | ||||||||
Net investment income | $ | 6,158,942 | $ | 12,317,827 | ||||
Net realized gains from investment transactions | 364,928 | 27,903 | ||||||
|
|
|
| |||||
Change in net assets resulting from operations | 6,523,870 | 12,345,730 | ||||||
|
|
|
| |||||
Distributions from Net Investment Income | ||||||||
RBC Institutional Class 1 Shareholders | (4,715,323 | ) | (10,667,327 | ) | ||||
RBC Institutional Class 2 Shareholders | (371,207 | ) | (560,839 | ) | ||||
RBC Investor Class Shareholders | (367,403 | ) | (424,583 | ) | ||||
RBC Reserve Class Shareholders | (529,673 | ) | (508,693 | ) | ||||
RBC Select Class Shareholders | (175,336 | ) | (156,498 | ) | ||||
|
|
|
| |||||
Change in net assets resulting from shareholder distributions | (6,158,942 | ) | (12,317,940 | ) | ||||
|
|
|
| |||||
Capital Transactions: | ||||||||
Proceeds from shares issued | 55,383,518,080 | 74,870,072,315 | ||||||
Distributions reinvested | 4,223,143 | 6,702,565 | ||||||
Cost of shares redeemed | (58,508,859,963 | ) | (74,621,293,370 | ) | ||||
|
|
|
| |||||
Change in net assets resulting from capital transactions | (3,121,118,740 | ) | 255,481,510 | |||||
|
|
|
| |||||
Net increase (decrease) in net assets | (3,120,753,812 | ) | 255,509,300 | |||||
Net Assets: | ||||||||
Beginning of year | 15,612,630,241 | 15,357,120,941 | ||||||
|
|
|
| |||||
End of year | $ | 12,491,876,429 | $ | 15,612,630,241 | ||||
|
|
|
| |||||
Distributions in excess of net investment income | $ | (1,031 | ) | $ | (1,031 | ) | ||
|
|
|
| |||||
Share Transactions: | ||||||||
Issued | 55,383,518,080 | 74,870,072,315 | ||||||
Reinvested | 4,223,143 | 6,702,565 | ||||||
Redeemed | (58,508,859,963 | ) | (74,621,293,370 | ) | ||||
|
|
|
| |||||
Change in shares resulting from capital transactions | (3,121,118,740 | ) | 255,481,510 | |||||
|
|
|
| |||||
See notes to financial statements.
39
FINANCIAL STATEMENTS |
Statements of Changes in Net Assets (cont.)
| U.S. Government Money Market Fund | ||||||||
| For the Year Ended September 30, 2011 | For the Year Ended September 30, 2010 | |||||||
From Investment Activities: | ||||||||
Operations: | ||||||||
Net investment income | $ | 1,007,107 | $ | 1,745,979 | ||||
Net realized gains (losses) from investment transactions | 78,276 | (24,157 | ) | |||||
|
|
|
| |||||
Change in net assets resulting from operations | 1,085,383 | 1,721,822 | ||||||
|
|
|
| |||||
Distributions from Net Investment Income | ||||||||
RBC Institutional Class 1 Shareholders | (591,712 | ) | (1,305,230 | ) | ||||
RBC Institutional Class 2 Shareholders | (15,108 | ) | (13,758 | ) | ||||
RBC Investor Class Shareholders | (108,071 | ) | (136,027 | ) | ||||
RBC Reserve Class Shareholders | (175,362 | ) | (172,829 | ) | ||||
RBC Select Class Shareholders | (116,852 | ) | (118,137 | ) | ||||
|
|
|
| |||||
Change in net assets resulting from shareholder distributions | (1,007,105 | ) | (1,745,981 | ) | ||||
|
|
|
| |||||
Capital Transactions: | ||||||||
Proceeds from shares issued | 11,731,772,486 | 16,226,059,737 | ||||||
Distributions reinvested | 750,750 | 762,532 | ||||||
Cost of shares redeemed | (10,957,608,972 | ) | (16,471,038,573 | ) | ||||
|
|
|
| |||||
Change in net assets resulting from capital transactions | 774,914,264 | (244,216,304 | ) | |||||
|
|
|
| |||||
Net increase (decrease) in net assets | 774,992,542 | (244,240,463 | ) | |||||
Net Assets: | ||||||||
Beginning of year | 4,937,449,859 | 5,181,690,322 | ||||||
|
|
|
| |||||
End of year | $ | 5,712,442,401 | $ | 4,937,449,859 | ||||
|
|
|
| |||||
Undistributed net investment income | $ | 3,719 | $ | 3,717 | ||||
|
|
|
| |||||
Share Transactions: | ||||||||
Issued | 11,731,772,486 | 16,226,059,737 | ||||||
Reinvested | 750,750 | 762,532 | ||||||
Redeemed | (10,957,608,972 | ) | (16,471,038,573 | ) | ||||
|
|
|
| |||||
Change in shares resulting from capital transactions | 774,914,264 | (244,216,304 | ) | |||||
|
|
|
| |||||
See notes to financial statements.
40
FINANCIAL STATEMENTS |
Statements of Changes in Net Assets (cont.)
| Tax-Free Money Market Fund | ||||||||
| For the Year Ended September 30, 2011 | For the Year Ended September 30, 2010 | |||||||
From Investment Activities: | ||||||||
Operations: | ||||||||
Net investment income | $ | 209,626 | $ | 637,673 | ||||
Net realized gains (losses) from investment transactions | (18,807 | ) | 82,268 | |||||
|
|
|
| |||||
Change in net assets resulting from operations | 190,819 | 719,941 | ||||||
|
|
|
| |||||
Distributions from Net Investment Income | ||||||||
RBC Institutional Class 1 Shareholders | (44,510 | ) | (302,641 | ) | ||||
RBC Institutional Class 2 Shareholders | (53,846 | ) | (232,358 | ) | ||||
RBC Investor Class Shareholders | (19,149 | ) | (22,371 | ) | ||||
RBC Reserve Class Shareholders | (60,382 | ) | (51,543 | ) | ||||
RBC Select Class Shareholders | (31,739 | ) | (29,008 | ) | ||||
|
|
|
| |||||
Change in net assets resulting from Distributions of Net Investment Income | (209,626 | ) | (637,921 | ) | ||||
|
|
|
| |||||
Distributions from Net Realized Gains | ||||||||
RBC Institutional Class 1 Shareholders | (2,490 | ) | (14,649 | ) | ||||
RBC Institutional Class 2 Shareholders | (15,077 | ) | (33,271 | ) | ||||
RBC Investor Class Shareholders | (9,193 | ) | (26,166 | ) | ||||
RBC Reserve Class Shareholders | (30,785 | ) | (52,895 | ) | ||||
RBC Select Class Shareholders | (14,254 | ) | (31,085 | ) | ||||
|
|
|
| |||||
Change in net assets resulting from Distributions of Net Realized Gains | (71,799 | ) | (158,066 | ) | ||||
|
|
|
| |||||
Capital Transactions: | ||||||||
Proceeds from shares issued | 1,612,678,587 | 2,744,497,706 | ||||||
Distributions reinvested | 280,174 | 768,289 | ||||||
Cost of shares redeemed | (1,834,297,551 | ) | (2,210,973,743 | ) | ||||
|
|
|
| |||||
Change in net assets resulting from capital transactions | (221,338,790 | ) | 534,292,252 | |||||
|
|
|
| |||||
Net increase (decrease) in net assets | (221,429,396 | ) | 534,216,206 | |||||
Net Assets: | ||||||||
Beginning of year | 1,460,167,721 | 925,951,515 | ||||||
|
|
|
| |||||
End of year | $ | 1,238,738,325 | $ | 1,460,167,721 | ||||
|
|
|
| |||||
Distributions in excess of net investment income | $ | (371 | ) | $ | — | |||
|
|
|
| |||||
Share Transactions: | ||||||||
Issued | 1,612,678,587 | 2,744,496,351 | ||||||
Reinvested | 280,174 | 768,289 | ||||||
Redeemed | (1,834,297,551 | ) | (2,210,973,743 | ) | ||||
|
|
|
| |||||
Change in shares resulting from capital transactions | (221,338,790 | ) | 534,290,897 | |||||
|
|
|
| |||||
See notes to financial statements.
41
|
| Prime Money Market Fund | (Selected data for a share outstanding throughout the periods indicated) |
| Investment Activities | Distributions | Ratios/Supplemental Data | ||||||||||||||||||||||||||||||||||||||||||||||
| Net Asset Value, Beginning of Period | Net Investment Income | Net Realized/ Unrealized Gain (Loss) on Investments | Total from Investment Activities | Net Investment Income | Total Distributions | Net Asset Value, End of Period | Total Return | Net Assets, End of Period (millions) | Ratio of Net Expenses to Average Net Assets | Ratio of Net Investment Income to Average Net Assets | Ratio of Expenses to Average Net Assets* | |||||||||||||||||||||||||||||||||||||
RBC Institutional Class 1 | ||||||||||||||||||||||||||||||||||||||||||||||||
Year Ended September 30, 2011 | $1.00 | (a)(b) | (b) | (b) | (b) | (b) | $1.00 | 0.13% | $1,978 | 0.17% | 0.14% | 0.17%(g) | ||||||||||||||||||||||||||||||||||||
Year Ended September 30, 2010 | 1.00 | (a)(b) | (b) | (b) | (b) | (b) | 1.00 | 0.19% | 4,051 | 0.17% | 0.19% | 0.17%(g) | ||||||||||||||||||||||||||||||||||||
Year Ended September 30, 2009 | 1.00 | 0.01(a) | (b) | 0.01 | (0.01) | (0.01) | 1.00 | 0.95% | 4,426 | 0.55%(f) | 1.03% | 0.55% | ||||||||||||||||||||||||||||||||||||
Year Ended September 30, 2008 | 1.00 | 0.03(a) | (b) | 0.03 | (0.03) | (0.03) | 1.00 | 3.02% | 10,591 | 0.84% | 2.94% | 0.87% | ||||||||||||||||||||||||||||||||||||
Year Ended September 30, 2007 | 1.00 | 0.05 | (b) | 0.05 | (0.05) | (0.05) | 1.00 | 4.69% | 9,662 | 0.80% | 4.59% | 0.89% | ||||||||||||||||||||||||||||||||||||
RBC Institutional Class 2 | ||||||||||||||||||||||||||||||||||||||||||||||||
Year Ended September 30, 2011 | $1.00 | (a)(b) | (b) | (b) | (b) | (b) | $1.00 | 0.04% | $687 | 0.26% | 0.04% | 0.27% | ||||||||||||||||||||||||||||||||||||
Year Ended September 30, 2010 | 1.00 | (a)(b) | (b) | (b) | (b) | (b) | 1.00 | 0.09% | 830 | 0.27% | 0.07% | 0.27%(g) | ||||||||||||||||||||||||||||||||||||
Period Ended September 30, 2009(e) | 1.00 | (a)(b) | (b) | (b) | (b) | (b) | 1.00 | 0.62%(c) | 19 | 0.31%(d) | 0.45%(d) | 0.32%(d) | ||||||||||||||||||||||||||||||||||||
RBC Investor Class | ||||||||||||||||||||||||||||||||||||||||||||||||
Year Ended September 30, 2011 | $1.00 | (a)(b) | (b) | (b) | (b) | (b) | $1.00 | 0.01% | $3,199 | 0.30% | 0.01% | 1.12% | ||||||||||||||||||||||||||||||||||||
Year Ended September 30, 2010 | 1.00 | (a)(b) | (b) | (b) | (b) | (b) | 1.00 | 0.01% | 3,995 | 0.35% | 0.01% | 1.13% | ||||||||||||||||||||||||||||||||||||
Period Ended September 30, 2009(e) | 1.00 | (a)(b) | (b) | (b) | (b) | (b) | 1.00 | 0.15%(c) | 4,659 | 0.91%(d) | 0.16%(d) | 1.19%(d) | ||||||||||||||||||||||||||||||||||||
RBC Reserve Class | ||||||||||||||||||||||||||||||||||||||||||||||||
Year Ended September 30, 2011 | $1.00 | (a)(b) | (b) | (b) | (b) | (b) | $1.00 | 0.01% | $5,032 | 0.29% | 0.01% | 1.01% | ||||||||||||||||||||||||||||||||||||
Year Ended September 30, 2010 | 1.00 | (a)(b) | (b) | (b) | (b) | (b) | 1.00 | 0.01% | 5,165 | 0.35% | 0.01% | 1.03% | ||||||||||||||||||||||||||||||||||||
Period Ended September 30, 2009(e) | 1.00 | (a)(b) | (b) | (b) | (b) | (b) | 1.00 | 0.22%(c) | 4,870 | 0.83%(d) | 0.24%(d) | 1.08%(d) | ||||||||||||||||||||||||||||||||||||
RBC Select Class | ||||||||||||||||||||||||||||||||||||||||||||||||
Year Ended September 30, 2011 | $1.00 | (a)(b) | (b) | (b) | (b) | (b) | $1.00 | 0.01% | $1,595 | 0.29% | 0.01% | 0.92% | ||||||||||||||||||||||||||||||||||||
Year Ended September 30, 2010 | 1.00 | (a)(b) | (b) | (b) | (b) | (b) | 1.00 | 0.01% | 1,572 | 0.35% | 0.01% | 0.92% | ||||||||||||||||||||||||||||||||||||
Period Ended September 30, 2009(e) | 1.00 | (a)(b) | (b) | (b) | (b) | (b) | 1.00 | 0.27%(c) | 1,383 | 0.77%(d) | 0.29%(d) | 0.97%(d) | ||||||||||||||||||||||||||||||||||||
| * | During the period, certain fees were contractually or voluntarily reduced and/or reimbursed. If such contractual/voluntary fee reductions and reimbursements had not occurred, the ratio would have been as indicated. |
(a) (b) (c) | Per share net investment income has been calculated using the average daily shares method. Less than $0.01 or $(0.01) per share. Not annualized. | (f) | Beginning November 21, 2008, the net operating expenses were contractually limited to 0.20% of average daily net assets. The ratio of net expenses to average net assets represents a blended percentage for the year ended September 30, 2009. | |||
(d) | Annualized. | (g) | There were no waivers or reimbursements during the period. | |||
(e) | For the period from November 21, 2008 (commencement of operations) to September 30, 2009. |
See notes to financial statements.
42
FINANCIAL HIGHLIGHTS |
| U.S. Government Money Market Fund | (Selected data for a share outstanding throughout the periods indicated) |
| Investment Activities | Distributions | Ratios/Supplemental Data | ||||||||||||||||||||||||||||||||||||||||||||||
| Net Asset Value, Beginning of Period | Net Investment Income | Net Realized/ Unrealized Gain (Loss) on Investments | Total from Investment Activities | Net Investment Income | Total Distributions | Net Asset Value, End of Period | Total Return | Net Assets, End of Period (millions) | Ratio of Net Expenses to Average Net Assets | Ratio of Net Investment Income to Average Net Assets | Ratio of Expenses to Average Net Assets* | |||||||||||||||||||||||||||||||||||||
RBC Institutional Class 1 | ||||||||||||||||||||||||||||||||||||||||||||||||
Year Ended September 30, 2011 | $1.00 | (a)(b) | (b) | (b) | (b) | (b) | $1.00 | 0.05% | $1,580 | 0.17% | 0.05% | 0.17% | ||||||||||||||||||||||||||||||||||||
Year Ended September 30, 2010 | 1.00 | (a)(b) | (b) | (b) | (b) | (b) | 1.00 | 0.11% | 662 | 0.17% | 0.11% | 0.17%(g) | ||||||||||||||||||||||||||||||||||||
Year Ended September 30, 2009 | 1.00 | 0.01(a) | (b) | 0.01 | (0.01) | (0.01) | 1.00 | 0.73% | 848 | 0.49%(f) | 0.98% | 0.49%(g) | ||||||||||||||||||||||||||||||||||||
Year Ended September 30, 2008 | 1.00 | 0.03(a) | (b) | 0.03 | (0.03) | (0.03) | 1.00 | 2.70% | 3,266 | 0.72% | 2.51% | 0.72%(g) | ||||||||||||||||||||||||||||||||||||
Year Ended September 30, 2007 | 1.00 | 0.04 | (b) | 0.04 | (0.04) | (0.04) | 1.00 | 4.56% | 1,393 | 0.76% | 4.47% | 0.76%(g) | ||||||||||||||||||||||||||||||||||||
RBC Institutional Class 2 | ||||||||||||||||||||||||||||||||||||||||||||||||
Year Ended September 30, 2011 | $1.00 | (a)(b) | (b) | (b) | (b) | (b) | $1.00 | 0.01% | $142 | 0.20% | 0.01% | 0.27% | ||||||||||||||||||||||||||||||||||||
Year Ended September 30, 2010 | 1.00 | (a)(b) | (b) | (b) | (b) | (b) | 1.00 | 0.02% | 124 | 0.27% | 0.02% | 0.27% | ||||||||||||||||||||||||||||||||||||
Period Ended September 30, 2009(e) | 1.00 | (a)(b) | (b) | (b) | (b) | (b) | 1.00 | 0.44%(c) | 14 | 0.30%(d) | 0.56%(d) | 0.30%(d) | ||||||||||||||||||||||||||||||||||||
RBC Investor Class | ||||||||||||||||||||||||||||||||||||||||||||||||
Year Ended September 30, 2011 | $1.00 | (a)(b) | (b) | (b) | (b) | (b) | $1.00 | 0.01% | $981 | 0.21% | 0.01% | 1.12% | ||||||||||||||||||||||||||||||||||||
Year Ended September 30, 2010 | 1.00 | (a)(b) | (b) | (b) | (b) | (b) | 1.00 | 0.01% | 1,260 | 0.27% | 0.01% | 1.13% | ||||||||||||||||||||||||||||||||||||
Period Ended September 30, 2009(e) | 1.00 | (a)(b) | (b) | (b) | (b) | (b) | 1.00 | 0.11%(c) | 1,372 | 0.65%(d) | 0.07%(d) | 1.17%(d) | ||||||||||||||||||||||||||||||||||||
RBC Reserve Class | ||||||||||||||||||||||||||||||||||||||||||||||||
Year Ended September 30, 2011 | $1.00 | (a)(b) | (b) | (b) | (b) | (b) | $1.00 | 0.01% | $1,748 | 0.21% | 0.01% | 1.02% | ||||||||||||||||||||||||||||||||||||
Year Ended September 30, 2010 | 1.00 | (a)(b) | (b) | (b) | (b) | (b) | 1.00 | 0.01% | 1,752 | 0.27% | 0.01% | 1.03% | ||||||||||||||||||||||||||||||||||||
Period Ended September 30, 2009(e) | 1.00 | (a)(b) | (b) | (b) | (b) | (b) | 1.00 | 0.14%(c) | 1,714 | 0.65%(d) | 0.15%(d) | 1.06%(d) | ||||||||||||||||||||||||||||||||||||
RBC Select Class | ||||||||||||||||||||||||||||||||||||||||||||||||
Year Ended September 30, 2011 | $1.00 | (a)(b) | (b) | (b) | (b) | (b) | $1.00 | 0.01% | $1,262 | 0.21% | 0.01% | 0.92% | ||||||||||||||||||||||||||||||||||||
Year Ended September 30, 2010 | 1.00 | (a)(b) | (b) | (b) | (b) | (b) | 1.00 | 0.01% | 1,139 | 0.27% | 0.01% | 0.93% | ||||||||||||||||||||||||||||||||||||
Period Ended September 30, 2009(e) | 1.00 | (a)(b) | (b) | (b) | (b) | (b) | 1.00 | 0.17%(c) | 1,233 | 0.63%(d) | 0.18%(d) | 0.95%(d) | ||||||||||||||||||||||||||||||||||||
| * | During the period, certain fees were contractually or voluntarily reduced and/or reimbursed. If such contractual/voluntary fee reductions and reimbursements had not occurred, the ratio would have been as indicated. |
(a) (b) (c) | Per share net investment income has been calculated using the average daily shares method. Less than $0.01 or $(0.01) per share. Not annualized. | (f) | Beginning November 21, 2008, the net operating expenses were contractually limited to 0.20% of average daily net assets. The ratio of net expenses to average net assets represents a blended percentage for the year ended September 30, 2009. | |||
(d) | Annualized. | (g) | Therewere no waivers or reimbursements during the period. | |||
(e) | For the period from November 21, 2008 (commencement of operations) to September 30, 2009. |
See notes to financial statements.
43
FINANCIAL HIGHLIGHTS |
| Tax-Free Money Market Fund | (Selected data for a share outstanding throughout the periods indicated) |
| Investment Activities | Distributions | Ratios/Supplemental Data | ||||||||||||||||||||||||||||||||||||||||||||||
| Net Asset Value, Beginning of Period | Net Investment Income | Net Realized/ Unrealized Gain(Loss) on Investments | Total from Investment Activities | Net Investment Income | Net Realized Gains | Net Asset Value, End of Period | Total Return | Net Assets, End of Period (millions) | Ratio of Net Expenses to Average Net Assets | Ratio of Net Investment Income(Loss) to Average Net Assets | Ratio of Expenses to Average Net Assets* | |||||||||||||||||||||||||||||||||||||
RBC Institutional Class 1 | ||||||||||||||||||||||||||||||||||||||||||||||||
Year Ended September 30, 2011 | $ | 1.00 | (a)(b) | (b) | (b) | (b) | (b) | $1.00 | 0.09% | $37 | 0.18% | 0.10% | 0.19% | |||||||||||||||||||||||||||||||||||
Year Ended September 30, 2010 | 1.00 | (a)(b) | (b) | (b) | (b) | (b) | 1.00 | 0.25% | 71 | 0.18% | 0.22% | 0.18%(g) | ||||||||||||||||||||||||||||||||||||
Year Ended September 30, 2009 | 1.00 | 0.01(a) | (b) | 0.01 | (0.01) | — | 1.00 | 0.74% | 51 | 0.71%(f) | 1.49% | 0.71% | ||||||||||||||||||||||||||||||||||||
Year Ended September 30, 2008 | 1.00 | 0.02(a) | (b) | 0.02 | (0.02) | — | 1.00 | 1.95% | 904 | 0.80% | 1.90% | 0.84% | ||||||||||||||||||||||||||||||||||||
Year Ended September 30, 2007 | 1.00 | 0.03 | (b) | 0.03 | (0.03) | — | 1.00 | 3.00% | 841 | 0.70% | 2.96% | 0.84% | ||||||||||||||||||||||||||||||||||||
RBC Institutional Class 2 | ||||||||||||||||||||||||||||||||||||||||||||||||
Year Ended September 30, 2011 | $ | 1.00 | (a)(b) | (b) | (b) | (b) | (b) | $1.00 | 0.02% | $214 | 0.26% | 0.02% | 0.29% | |||||||||||||||||||||||||||||||||||
Year Ended September 30, 2010 | 1.00 | (a)(b) | (b) | (b) | (b) | (b) | 1.00 | 0.15% | 282 | 0.28% | 0.09% | 0.28% | ||||||||||||||||||||||||||||||||||||
Period Ended September 30, 2009(e) | 1.00 | (a)(b) | (b) | (b) | (b) | — | 1.00 | 0.41%(c) | (h) | 0.34%(d) | 0.45%(d) | 0.34%(d) | ||||||||||||||||||||||||||||||||||||
RBC Investor Class | ||||||||||||||||||||||||||||||||||||||||||||||||
Year Ended September 30, 2011 | $ | 1.00 | �� | (a)(b) | (b) | (b) | (b) | (b) | $1.00 | 0.02% | $167 | 0.26% | 0.01% | 1.14% | ||||||||||||||||||||||||||||||||||
Year Ended September 30, 2010 | 1.00 | (a)(b) | (b) | (b) | (b) | (b) | 1.00 | 0.02% | 210 | 0.42% | 0.01% | 1.15% | ||||||||||||||||||||||||||||||||||||
Period Ended September 30, 2009(e) | 1.00 | (a)(b) | (b) | (b) | (b) | — | 1.00 | 0.04%(c) | 202 | 0.76%(d) | 0.03%(d) | 1.19%(d) | ||||||||||||||||||||||||||||||||||||
RBC Reserve Class | ||||||||||||||||||||||||||||||||||||||||||||||||
Year Ended September 30, 2011 | $ | 1.00 | (a)(b) | (b) | (b) | (b) | (b) | $1.00 | 0.02% | $520 | 0.26% | 0.01% | 1.04% | |||||||||||||||||||||||||||||||||||
Year Ended September 30, 2010 | 1.00 | (a)(b) | (b) | (b) | (b) | (b) | 1.00 | 0.02% | 612 | 0.40% | 0.01% | 1.04% | ||||||||||||||||||||||||||||||||||||
Period Ended September 30, 2009(e) | 1.00 | (a)(b) | (b) | (b) | (b) | — | 1.00 | 0.06%(c) | 432 | 0.74%(d) | 0.05%(d) | 1.09%(d) | ||||||||||||||||||||||||||||||||||||
RBC Select Class | ||||||||||||||||||||||||||||||||||||||||||||||||
Year Ended September 30, 2011 | $ | 1.00 | (a)(b) | (b) | (b) | (b) | (b) | $1.00 | 0.02% | $300 | 0.26% | 0.01% | 0.93% | |||||||||||||||||||||||||||||||||||
Year Ended September 30, 2010 | 1.00 | (a)(b) | (b) | (b) | (b) | (b) | 1.00 | 0.02% | 286 | 0.40% | 0.01% | 0.94% | ||||||||||||||||||||||||||||||||||||
Period Ended September 30, 2009(e) | 1.00 | (a)(b) | (b) | (b) | (b) | — | 1.00 | 0.11%(c) | 242 | 0.68%(d) | 0.10%(d) | 0.99%(d) | ||||||||||||||||||||||||||||||||||||
| * | During the period, certain fees were contractually or voluntarily reduced and/or reimbursed. If such contractual/voluntary fee reductions and reimbursements had not occurred, the ratio would have been as indicated. | |||||
| (a) | Per share net investment income has been calculated using the average daily shares method. | (f) | Beginning November 21, 2008, the net operating expenses were contractually limited to 0.20% of average daily net assets. The ratio of net expenses to average net assets represents a blended percentage for the year ended September 30, 2009. | |||
| (b) | Less than $0.01 or $(0.01) per share. | |||||
| (c) | Not annualized. | |||||
| (d) | Annualized. | (g) | There were no waivers or reimbursements during the period. | |||
| (e) | For the period from November 21, 2008 (commencement of operations) to September 30, 2009. | (h) | Less than $1,000,000. | |||
See notes to financial statements.
44
|
September 30, 2011
1. Organization
RBC Funds Trust (“the Trust”), is registered under the Investment Company Act of 1940 (as amended) as an open-end management investment company. The Trust was organized as a Delaware statutory trust on December 16, 2003. Predecessor funds to the Trust were reorganized as portfolios of the Trust effective April 16, 2004. This annual report includes the following three investment portfolios (“Funds”):
- Prime Money Market Fund
- U.S. Government Money Market Fund
- Tax-Free Money Market Fund
The Prime Money Market Fund, U.S. Government Money Market Fund and Tax-Free Money Market Fund offer five share classes: RBC Institutional Class 1, RBC Institutional Class 2, RBC Investor Class, RBC Reserve Class and RBC Select Class.
RBC Global Asset Management (U.S.) Inc (“RBC GAM (US)”) acts as the investment adviser for the Funds. The officers of the Trust (“Fund Management”) are also employees of RBC GAM (US) or its affiliates or BNY Mellon Investment Servicing (US) Inc. (“BNY Mellon”), the co-administrator.
2. Significant Accounting Policies
Summarized below are the significant accounting policies of the Funds. These policies conform to accounting principles generally accepted in the United States of America (“U.S. GAAP”). Fund management follows these policies when preparing financial statements. Management may also be required to make estimates and assumptions that affect the reported amounts of assets and liabilities at the date of the financial statements and the reported amounts of income and expenses for the period. Actual results could differ from those estimates.
Security Valuation:
Securities held by the Funds are valued at amortized cost, which approximates fair value, in order to maintain a constant net asset value of $1.00 per share. If amortized cost no longer approximates fair value due to credit or other impairments of an issuer, the Fund will use pricing and valuation procedures approved by the Trust’s Board of Trustees (the “Board”) to determine a security’s fair value. Investments in open-end companies are valued at net asset value.
Money market funds must invest exclusively in high quality securities. To be considered high quality, a security generally must be rated in one of the two highest short-term credit quality categories by at least two nationally recognized rating organizations such as Standard & Poors Corporation, Moody’s Investors Service or Fitch Investors Service. If unrated, a security must be determined by the Adviser to be of comparable quality.
Fair Value Measurements:
Various inputs are used in determining the fair value of investments which are as follows:
• Level 1 - Inputs that reflect unadjusted quoted prices in active markets for identical assets or liabilities that the Funds have the ability to access at the measurement date.
• Level 2 - Inputs other than quoted prices that are observable for the asset or liability either directly or indirectly, including inputs in markets that are not considered to be active. Generally, the types of securities included in Level 2 for the Funds are U.S. Treasury bills and certain money market instruments, including those valued at amortized cost under Rule 2a-7. Amortized cost approximates the current fair value of a security, but is not obtained from a quoted price in an active market.
45
NOTES TO FINANCIAL STATEMENTS |
• Level 3 - Unobservable inputs based on the best information available in the circumstances, to the extent observable inputs are not available (including the Fund’s own assumptions in determining the fair value of investments).
The inputs or methodology used for valuing securities are not necessarily an indication of the risk associated with investing in those securities.
The summary of inputs used to determine the fair value of the Fund’s investments as of September 30, 2011 is as follows:
Funds
| Level 1 Quoted Prices | Level 2 Significant Observable Inputs | Level 3 Significant Unobservable Inputs | Total | ||||||||||
Prime Money Market | $ | — | $ | 12,362,123,722(b) | $— | $ | 12,362,123,722 | |||||||
U.S. Government Money Market | — | 5,712,971,517(b)(c) | — | 5,712,971,517 | ||||||||||
Tax-Free Money Market | 5,000,000(a) | 1,218,688,163(c) | — | 1,223,688,163 | ||||||||||
(a) Level 1 investments consist of Investment Companies.
(b) The breakdown of the Fund’s investments by security type is disclosed in the Schedules of Portfolio Investments.
(c) The breakdown of the Fund’s investments by state classification or political subdivision is disclosed in the Schedules of Portfolio Investments.
During the year ended September 30, 2011, the Funds recognized no significant transfers to/from level 1 or 2. The Fund’s policy is to recognize transfers between level 1, level 2 and level 3 at the end of the year utilizing fair value at the beginning of the year.
In May 2011, the Financial Accounting Standards Board (“FASB”) issued Accounting Standards Update (“ASU”) No. 2011-04 “Amendments to Achieve Common Fair Value Measurement and Disclosure Requirements” in U.S. GAAP and International Financial Reporting Standards (“IFRSs”). ASU 2011-04 includes common requirements for measurement of and disclosure about fair value between U.S. GAAP and IFRS. ASU 2011-04 will require reporting entities to disclose the following information for fair value measurements categorized within Level 3 of the fair value hierarchy: quantitative information about the unobservable inputs used in the fair value measurement, the valuation processes used by the reporting entity and a narrative description of the sensitivity of the fair value measurement to changes in unobservable inputs and the interrelationships between those unobservable inputs. In addition, ASU 2011-04 will require reporting entities to make disclosures about amounts and reasons for all transfers in and out of Level 1 and Level 2 fair value measurements. The new and revised disclosures are effective for interim and annual reporting periods beginning after December 15,2011. Management is currently evaluating the implications of ASU No. 2011-04 and its impact on the financial statements.
Investment Transactions and Income:
Investment transactions are accounted for on the date the security is bought or sold (“trade date”). Dividend income is recorded on the ex-dividend date. Realized gains and losses from investment transactions are calculated based on the costs of the specific security (also known as identified cost basis). Interest income is recognized on the accrual basis. The Funds amortize all premiums and discounts on debt securities.
When Issued Transactions:
The Funds may engage in when-issued transactions. The Funds record when-issued securities on the trade date and maintain sufficient liquidity so that cash will be available to make payment for the securities purchased. Securities purchased on a when-issued basis are valued daily beginning on trade date and begin earning interest on the settlement date. As of September 30, 2011, the Funds held no when-issued securities.
46
NOTES TO FINANCIAL STATEMENTS |
Repurchase Agreements:
The Funds may enter into repurchase agreements with counterparties whom the Adviser has deemed creditworthy, including primary dealers that report to the Federal Reserve Bank of New York or other large U.S. commercial banks or broker-dealers. These repurchase agreements are subject to the seller’s agreement to repurchase such securities at a mutually agreed upon date and price. The repurchase price generally equals the price paid by the Funds plus interest negotiated on the basis of current short-term rates.
Securities pledged by the dealers as collateral for repurchase agreements are held by a custodian bank until maturity of the repurchase agreement. The Funds have procedures to secure additional collateral, if needed, to ensure that the daily market value of the collateral remains in excess of the market value of the repurchase agreement in the event of a default.
Expense, Investment Income and Gain/Loss Allocation:
Each Fund pays the expenses that are directly related to its operations, such as custodian fees or investment advisory fees. Expenses incurred by the Trust, such as trustee or legal fees, are allocated among each of the Funds either proportionately based upon each Fund’s relative net assets or using another reasonable basis such as equally across all Funds, depending on the nature of the expense. Individual share classes within a Fund are charged expenses specific to that class, such as distribution fees. Within a Fund, expenses other than class specific expenses are allocated daily to each class based upon the proportion of relative net assets. Investment income and realized and unrealized gains or losses are allocated to each class of shares based on the proportion of relative net assets.
Distributions to Shareholders:
Each Fund pays out any income that it receives, less expenses, in the form of dividends and capital gain distributions to its shareholders. Income dividends are declared daily and paid monthly. Dividends will also be paid at any time during the month upon total redemption of shares in an account. Capital gains, if any, are declared and paid at least annually. Distributions to shareholders are recorded on the ex-dividend date. The amount of dividends and distributions are calculated based on federal income tax regulations, which may differ from GAAP. These “book/tax” differences may be either temporary or permanent in nature. To the extent these differences are determined, as of the end of the tax year, to be permanent (e.g. expiring capital loss carryforward), they are reclassified within a Fund’s capital accounts based on their federal tax basis treatment.
For the year ended September 30, 2011, reclassifications for permanent differences were as follows:
| Decrease Undistributed Net Investment Income | Increase Accumulated Realized Gains | Decrease Accumulated Paid-in-Capital | ||||||||||
Tax-Free Money Market Fund | $(371) | $450 | $(79) | |||||||||
Credit Enhancement:
Certain obligations held in the Funds have credit enhancement or liquidity features that may, under certain circumstances, provide for repayment of principal and interest on the obligation upon demand date, interest rate reset date or final maturity. These enhancements may include: letters of credit; liquidity guarantees; security purchase agreements; tender option purchase agreements; and third party insurance (i.e., AMBAC and MBIA).
3. Agreements and Other Transactions with Affiliates
The Trust has entered into investment advisory agreements with RBC GAM (US) under which RBC GAM (US) manages the Funds’ assets and furnishes related office facilities, equipment, research and personnel. The agreements require the Funds to pay RBC GAM (US) a monthly fee based upon average daily net assets. Under the terms of the advisory contract RBC GAM (US) is entitled to receive fees based on a percentage of the average daily net assets as follows:
47
NOTES TO FINANCIAL STATEMENTS |
Average Daily Net Assets of Fund | Annual Rate | |||||
Prime Money Market Fund | All Net Assets | 0.10% | ||||
U.S. Government Money Market Fund | All Net Assets | 0.10% | ||||
Tax-Free Money Market Fund | All Net Assets | 0.10% | ||||
RBC Institutional Class 1 of Prime Money Market Fund, U.S. Government Money Market Fund and Tax-Free Money Market Fund pays an annual shareholder services administration fee of 0.05% of the average daily net assets attributable to RBC Institutional Class 1 shares of a Fund that is used to compensate financial intermediaries for providing services to shareholders and maintaining shareholder accounts. This shareholder services administration fee is not paid pursuant to Rule 12b-1.
RBC GAM (US) has contractually agreed to waive fees and/or reimburse expenses under an Expense Limitation Agreement in order to maintain the net annual fund operating expenses at 0.20% for RBC Institutional Class 1 of the Prime Money Market Fund, U.S. Government Money Market Fund and Tax-Free Money Market Fund. During the year ended September 30, 2011, there were no fees waived under this agreement.
RBC GAM (US) and BNY Mellon serve as co-administrators to the Funds. Services provided under the administrative services contract include providing day-to-day administration of matters related to the Funds, maintenance of their records and the preparation of reports. RBC GAM (US) does not receive an administration services fee. BNY Mellon receives a fee for its services payable by the Funds based on the Fund’s average net assets. BNY Mellon’s fee is included with “Accounting fees” in the Statements of Operations.
Certain Officers and Trustees of the Trust are affiliated with the adviser or the administrator. Such Officers and Trustees receive no compensation from the Funds for serving in their respective roles.
The RBC Funds currently pay the independent Trustees (Trustees of the Trust who are not directors, officers or employees of the adviser, administrator or distributor) an annual retainer of $30,000 ($32,500 effective October 1, 2011). The Board Chairperson and Audit Committee Chairperson each receive an additional retainer of $2,500 annually, and all other trustees serving as Chair of a Board committee each receive an additional retainer of $1,000 annually. In addition, Independent Trustees receive a quarterly meeting fee of $5,000 for each in-person Board meeting attended, a meeting fee of $1,000 for each telephonic or Special Board meeting attended, and a $1,500 fee for each Board committee meeting attended and are reimbursed for all out-of-pocket expenses relating to attendance at such meetings.
Security Transactions with Affiliated Funds
During the year ended September 30, 2011, the Prime Money Market Fund, U.S. Government Money Market Fund and Tax-Free Money Market Fund engaged in security purchase and sale transactions with other RBC Funds or investment advisory clients managed by RBC GAM (US). These purchase and sale transactions complied with Rule 17a-7 under the Investment Company Act of 1940 (as amended) and amounted to $356,880,000 and $181,275,000 for Prime Money Market Fund, respectively, $180,080,000 and $178,585,000 for U.S. Government Money Market Fund, respectively, and $43,760,000 and $93,725,000 for Tax-Free Money Market Fund, respectively.
48
NOTES TO FINANCIAL STATEMENTS |
4. Fund Distribution
The Prime Money Market, U. S. Government Money Market and Tax-Free Money Market Funds have adopted a Master Distribution 12b-1 Plan (the”Plan”) with respect to RBC Institutional Class 2, RBC Investor Class, RBC Reserve Class and the RBC Select Class, in which Quasar Distributors LLC (the “Distributor”) acts as the Funds’ distributor. The Plan permits each Fund to make payments for or to reimburse the Distributor or others, including RBC Capital Markets, LLC monthly for distribution-related costs and expenses of marketing shares of each share class covered under the Plan, and/or for providing shareholder services. The following chart shows the current Plan fee rate for each class:
| RBC Institutional Class 2 | RBC Investor Class | RBC Reserve Class | RBC Select Class | |||||||||||||
12b-1 Plan Fee | 0.15% | 1.00% | 0.90% | 0.80% | ||||||||||||
Plan fees are based on average daily net assets of the applicable class. Up to 0.25% of each Plan fee may be designated as a Service Fee, as defined by the applicable rules of the Financial Industry Regulatory Authority.
Pursuant to a Shareholder Account and Distribution Services Agreement between the Distributor and RBC Capital Markets, LLC, the Distributor has agreed to compensate RBC Capital Markets for certain shareholder account servicing support provided to the Funds. RBC Capital Markets has agreed to waive fees and/or reimburse expenses in order to maintain the net annual fund operating expenses for each class listed below for each Fund to the following amounts:
Fund | Operating Expense Limit | |||
Prime Money Market Fund | ||||
RBC Institutional Class 2 | 0.30% | |||
RBC Investor Class | 1.05% | |||
RBC Reserve Class | 0.90% | |||
RBC Select Class | 0.80% | |||
U.S. Government Money Market Fund | ||||
RBC Institutional Class 2 | 0.30% | |||
RBC Investor Class | 1.00% | |||
RBC Reserve Class | 0.85% | |||
RBC Select Class | 0.77% | |||
Tax-Free Money Market Fund | ||||
RBC Institutional Class 2 | 0.30% | |||
RBC Investor Class | 1.00% | |||
RBC Reserve Class | 0.85% | |||
RBC Select Class | 0.70% | |||
49
NOTES TO FINANCIAL STATEMENTS |
This Expense Limitation Agreement is in place until January 31, 2013 and shall continue for additional one-year terms unless terminated by either party at any time. Each Fund will carry forward, for a period not to exceed 12 months from the date on which a waiver or reimbursement is made by the Distributor, any expenses in excess of the Expense Limitation and repay the Distributor such amounts, provided the Fund is able to effect such repayment and remain in compliance with the Expense Limitation. At September 30, 2011, the amounts subject to possible recoupment under the expense limitation agreement are $11,317,413, $6,136,916 and $2,118,848 for the Prime Money Market Fund, U.S. Government Money Market Fund and Tax-Free Money Market Fund, respectively.
The RBC Capital Markets may voluntarily waive and/or reimburse additional fund operating expenses at any time, such as to maintain a minimum yield in a fund. Any such voluntary program may be modified or discontinued at any time without notice.
For the year ended September 30, 2011, the following distribution fees were waived:
Fund | Distribution Fees Waived | |||||
Prime Money Market Fund | ||||||
RBC Institutional Class 2 | $ 72,347 | |||||
RBC Investor Class | 30,330,458 | |||||
RBC Reserve Class | 38,533,690 | |||||
RBC Select Class | 10,991,572 | |||||
U.S. Government Money Market Fund | ||||||
RBC Institutional Class 2 | $ 105,091 | |||||
RBC Investor Class | 9,844,453 | |||||
RBC Reserve Class | 14,252,480 | |||||
RBC Select Class | 8,320,457 | |||||
Tax-Free Money Market Fund | ||||||
RBC Institutional Class 2 | $ 81,216 | |||||
RBC Investor Class | 1,675,291 | |||||
RBC Reserve Class | 4,670,949 | |||||
RBC Select Class | 2,148,371 | |||||
For the year ended September 30, 2011, shareholder servicing fees were voluntarily waived for the RBC Institutional Class 1 in the amount of $69,920 and $952 for the U.S. Government Money Market Fund and the Tax-Free Money Market Fund, respectively.
50
NOTES TO FINANCIAL STATEMENTS |
5. Capital Share Transactions
The number of shares sold, reinvested and redeemed correspond to the net proceeds from sale of shares, reinvestments of dividends and cost of shares redeemed, respectively, since shares are redeemed at $1.00 per share.
Transactions for the period were as follows:
| Prime Money Market Fund | U.S. Government Money Market Fund | |||||||||||||||
| For the Year Ended September 30, 2011 | For the Year Ended September 30, 2010 | For the Year Ended September 30, 2011 | For the Year Ended September 30, 2010 | |||||||||||||
CAPITAL TRANSACTIONS: | ||||||||||||||||
RBC Institutional Class 1 | ||||||||||||||||
Proceeds from shares issued | $ | 47,958,836,084 | $ | 65,954,109,708 | $ | 8,471,837,355 | $ | 11,960,090,750 | ||||||||
Distributions reinvested | 2,779,850 | 5,054,514 | 335,353 | 322,113 | ||||||||||||
Cost of shares redeemed | (50,033,766,650 | ) | (66,334,967,038 | ) | (7,553,849,882 | ) | (12,147,004,362 | ) | ||||||||
|
|
|
|
|
|
|
| |||||||||
Change in RBC Institutional | $ | (2,072,150,716 | ) | $ | (375,802,816 | ) | $ | 918,322,826 | $ | (186,591,499 | ) | |||||
|
|
|
|
|
|
|
| |||||||||
RBC Institutional Class 2 | ||||||||||||||||
Proceeds from shares issued | $ | 1,537,763,049 | $ | 2,085,510,694 | $ | 664,679,726 | $ | 278,951,408 | ||||||||
Distributions reinvested | 370,876 | 558,272 | 15,107 | 13,432 | ||||||||||||
Cost of shares redeemed | (1,680,872,073 | ) | (1,275,077,250 | ) | (646,731,961 | ) | (168,820,280 | ) | ||||||||
|
|
|
|
|
|
|
| |||||||||
Change in RBC Institutional | $ | (142,738,148 | ) | $ | 810,991,716 | $ | 17,962,872 | $ | 110,144,560 | |||||||
|
|
|
|
|
|
|
| |||||||||
RBC Investor Class | ||||||||||||||||
Proceeds from shares issued | $ | 1,487,557,623 | $ | 1,846,640,460 | $ | 470,599,974 | $ | 1,071,449,784 | ||||||||
Distributions reinvested | 367,405 | 424,582 | 108,072 | 136,023 | ||||||||||||
Cost of shares redeemed | (2,283,435,059 | ) | (2,510,904,014 | ) | (750,374,803 | ) | (1,182,760,630 | ) | ||||||||
|
|
|
|
|
|
|
| |||||||||
Change in RBC Investor Class | $ | (795,510,031 | ) | $ | (663,838,972 | ) | $ | (279,666,757 | ) | $ | (111,174,823 | ) | ||||
|
|
|
|
|
|
|
| |||||||||
RBC Reserve Class | ||||||||||||||||
Proceeds from shares issued | $ | 2,563,297,367 | $ | 2,996,746,846 | $ | 1,052,547,577 | $ | 1,265,180,323 | ||||||||
Distributions reinvested | 529,679 | 508,693 | 175,364 | 172,829 | ||||||||||||
Cost of shares redeemed | (2,696,929,651 | ) | (2,701,974,266 | ) | (1,056,632,356 | ) | (1,227,885,415 | ) | ||||||||
|
|
|
|
|
|
|
| |||||||||
Change in RBC Reserve Class | $ | (133,102,605 | ) | $ | 295,281,273 | $ | (3,909,415 | ) | $ | 37,467,737 | ||||||
|
|
|
|
|
|
|
| |||||||||
RBC Select Class | ||||||||||||||||
Proceeds from shares issued | $ | 1,836,063,957 | $ | 1,987,064,607 | $ | 1,072,107,854 | $ | 1,650,387,472 | ||||||||
Distributions reinvested | 175,333 | 156,504 | 116,854 | 118,135 | ||||||||||||
Cost of shares redeemed | (1,813,856,530 | ) | (1,798,370,802 | ) | (950,019,970 | ) | (1,744,567,886 | ) | ||||||||
|
|
|
|
|
|
|
| |||||||||
Change in RBC Select Class | $ | 22,382,760 | $ | 188,850,309 | $ | 122,204,738 | $ | (94,062,279 | ) | |||||||
|
|
|
|
|
|
|
| |||||||||
Change in net assets | $ | (3,121,118,740 | ) | $ | 255,481,510 | $ | 774,914,264 | $ | (244,216,304 | ) | ||||||
|
|
|
|
|
|
|
| |||||||||
51
NOTES TO FINANCIAL STATEMENTS |
| Tax-Free Money Market Fund | ||||||||
| For the Year Ended September 30, 2011 | For the Year Ended September 30, 2010 | |||||||
CAPITAL TRANSACTIONS: | ||||||||
RBC Institutional Class 1 | ||||||||
Proceeds from shares issued | $ | 47,748,219 | $ | 573,353,917 | ||||
Distributions reinvested | 45,747 | 289,586 | ||||||
Cost of shares redeemed | (81,866,423 | ) | (553,447,767 | ) | ||||
|
|
|
| |||||
Change in RBC Institutional Class 1 | $ | (34,072,457 | ) | $ | 20,195,736 | |||
|
|
|
| |||||
RBC Institutional Class 2 | ||||||||
Proceeds from shares issued | $ | 310,679,168 | $ | 605,851,460 | ||||
Distributions reinvested | 68,926 | 265,629 | ||||||
Cost of shares redeemed | (378,104,024 | ) | (324,274,695 | ) | ||||
|
|
|
| |||||
Change in RBC Institutional Class 2 | $ | (67,355,930 | ) | $ | 281,842,394 | |||
|
|
|
| |||||
RBC Investor Class | ||||||||
Proceeds from shares issued | $ | 201,253,242 | $ | 400,685,536 | ||||
Distributions reinvested | 28,344 | 48,539 | ||||||
Cost of shares redeemed | (243,457,745 | ) | (392,730,860 | ) | ||||
|
|
|
| |||||
Change in RBC Investor Class | $ | (42,176,159 | ) | $ | 8,003,215 | |||
|
|
|
| |||||
RBC Reserve Class | ||||||||
Proceeds from shares issued | $ | 530,161,442 | $ | 637,444,166 | ||||
Distributions reinvested | 91,163 | 104,440 | ||||||
Cost of shares redeemed | (622,044,607 | ) | (457,063,262 | ) | ||||
|
|
|
| |||||
Change in RBC Reserve Class | $ | (91,792,002 | ) | $ | 180,485,344 | |||
|
|
|
| |||||
RBC Select Class | ||||||||
Proceeds from shares issued | $ | 522,836,516 | $ | 527,162,627 | ||||
Distributions reinvested | 45,994 | 60,095 | ||||||
Cost of shares redeemed | (508,824,752 | ) | (483,457,159 | ) | ||||
|
|
|
| |||||
Change in RBC Select Class | $ | 14,057,758 | $ | 43,765,563 | ||||
|
|
|
| |||||
Change in net assets resulting from capital transactions | $ | (221,338,790 | ) | $ | 534,292,252* | |||
|
|
|
| |||||
* Includes a reimbursement from RBC GAM (US) in the amount of $1,355 for a commission/underwriter fee that was received by RBC Capital Markets. Without this reimbursement the change in shares resulting from capital transactions would be 534,290,897 which represents 20,195,627; 281,842,136;8,003,039;180,484,788 and 43,765,307 for the RBC Institutional Class 1, RBC Institutional Class 2, RBC Investor Class, RBC Reserve Class and RBC Select Class, respectively.
6. Federal Income Taxes
It is the policy of each Fund to continue to qualify as a regulated investment company by complying with the provisions applicable to certain investment companies, as defined under Subchapter M of the Internal Revenue Code, and to distribute substantially all of its net investment income and net realized capital gains. Therefore, no federal tax liability is recorded in the financial statements of each Fund.
Management has analyzed the Funds’ tax positions taken or expected to be taken on federal income tax returns for all open tax years (current and prior three tax years) and has concluded that no provision for federal income tax is required in the Funds’ financial statements. The Funds’ federal and state income and federal excise tax returns for tax years for which the applicable statutes of limitations have not expired are subject to examination by the Internal Revenue Service and state departments of revenue.
52
NOTES TO FINANCIAL STATEMENTS |
As of and during the period ended September 30, 2011, the Funds did not have a liability for any unrecognized tax benefits. The Funds recognize interest and penalities, if any, related to unrecognized tax benefits as income tax expense in the statement of operations. During the period, the Funds did not incur any interest or penalties.
The tax character of distributions during the fiscal year ended September 30, 2011 were as follows:
| Distributions Paid From | ||||||||||||||||||||||||
| Ordinary Income | Net Long Term Capital Gains | Net Short Term Capital Gains | Total Taxable Distributions | Tax Exempt Distributions | Total Distributions Paid* | |||||||||||||||||||
Prime Money Market Fund | $6,289,029 | $ — | $ — | $6,289,029 | $ — | $6,289,029 | ||||||||||||||||||
U.S. Government Money Market Fund | 1,024,577 | — | — | 1,024,577 | — | 1,024,577 | ||||||||||||||||||
Tax-Free Money Market Fund | 841 | 50,212 | 21,587 | 72,640 | 208,414 | 281,054 | ||||||||||||||||||
The tax character of distributions during the fiscal year ended September 30, 2010 were as follows:
| Distributions Paid From | ||||||||||||||||||||||||
| Ordinary Income | Net Long Term Capital Gains | Net Short Term Capital Gains | Total Taxable Distributions | Tax Exempt Distributions | Total Distributions Paid* | |||||||||||||||||||
Prime Money Market Fund | $12,778,513 | $ — | $ — | $12,778,513 | $ — | $12,778,513 | ||||||||||||||||||
U.S. Government Money Market Fund | 1,743,028 | — | — | 1,743,028 | — | 1,743,028 | ||||||||||||||||||
Tax-Free Money Market Fund | 35,940 | 51,126 | 107,188 | 194,254 | 601,733 | 795,987 | ||||||||||||||||||
*Total distributions paid may differ from the Statements of Changes in Net Assets because distributions are recognized when actually paid for tax purposes.
As of September 30, 2011, the components of accumulated earnings/(losses) on a tax basis were as follows:
| Undistributed Ordinary Income | Undistributed Short-Term Capital Gains | Undistributed Long-Term Capital Gains | Distributions Payable | Accumulated Capital Loss Carryforwards | Deferred Post October Losses | Unrealized Depreciation | Total Accumulated Earnings/(Losses) | |||||||||||||||||||||||||
Prime Money Market Fund | $40,891 | $ — | $— | $(41,922) | $(4,346,878) | $(2,011) | $— | $(4,349,920) | ||||||||||||||||||||||||
U.S. Government Money Market Fund | 6,567 | 45,669 | — | (2,848) | — | — | — | 49,388 | ||||||||||||||||||||||||
Tax-Free Money Market Fund | — | — | — | (371) | (12,260) | (6,097) | — | (18,728) | ||||||||||||||||||||||||
As of September 30, 2011, the following Funds had net capital loss carryforwards to offset future net capital gains, if any:
| Capital Loss Carryforward | Expires | |||||||
Prime Money Market Fund | $4,346,878 | 2017 | ||||||
Tax-Free Money Market Fund | 12,260 | 2019 | ||||||
Capital loss carryforwards utilized in the current year were $366,939 and $18,765 for the Prime Money Market Fund and U.S. Government Money Market Fund, respectively.
53
NOTES TO FINANCIAL STATEMENTS |
The Regulated Investment Company Modernization Act of 2010 (The “Act”) was enacted on December 22, 2010. The Act makes changes to several tax rules impacting the Funds. In general, the provisions of the Act will be effective for the Funds’ fiscal year beginning after 9/30/11. Although the Act provides several benefits, including the unlimited carryover of future capital losses, there may be a greater likelihood that all or a portion of each Funds’s pre-enactment capital loss carryovers may expire without being utilized due to the fact that post-enactment capital losses get utilized before pre-enactment capital loss carryovers. Relevant information regarding the impact of the Act on the Funds will be contained within this section of the Funds’ fiscal year ending September 30, 2012 financial statements.
Under current tax law, capital losses realized after October 31 of a Fund’s fiscal year may be deferred and treated as occurring on the first business day of the following fiscal year for tax purposes. The following Fund had deferred post October capital losses, which were treated as arising on the first business day of the fiscal year ending September 30, 2012 and as such are included in current year earnings.
| Deferred Post-October Losses | ||||
Prime Money Market Fund | $2,011 | |||
Tax-Free Money Market Fund | 6,097 | |||
7. Subsequent Events
Management has evaluated the impact of subsequent events of the Funds and has determined that there are no subsequent events that require recognition or disclosure in the financial statements.
54
|
To the Shareholders and Board of Trustees of RBC Funds Trust:
We have audited the accompanying statements of assets and liabilities, including the schedules of portfolio investments, of Prime Money Market Fund, U.S Government Money Market Fund and Tax-Free Money Market Fund (collectively the “Funds”), three of the portfolios constituting the RBC Funds Trust (the “Trust”), as of September 30, 2011, and the related statements of operations for the year then ended, the statements of changes in net assets for each of the two years in the period then ended and the financial highlights for each of the periods presented. These financial statements and financial highlights are the responsibility of the Funds’ management. Our responsibility is to express an opinion on these financial statements and financial highlights based on our audits.
We conducted our audits in accordance with the standards of the Public Company Accounting Oversight Board (United States). Those standards require that we plan and perform the audits to obtain reasonable assurance about whether the financial statements and financial highlights are free of material misstatement. The Funds were not required to have, nor were we engaged to perform, an audit of their internal control over financial reporting. Our audits included consideration of internal control over financial reporting as a basis for designing audit procedures that are appropriate in the circumstances, but not for the purpose of expressing an opinion on the effectiveness of the Funds’ internal control over financial reporting. Accordingly, we express no such opinion. An audit also includes examining, on a test basis, evidence supporting the amounts and disclosures in the financial statements, assessing the accounting principles used and significant estimates made by management, as well as evaluating the overall financial statement presentation. Our procedures included confirmation of securities owned as of September 30, 2011, by correspondence with the Funds’ custodian and brokers; where replies were not received from brokers, we performed other auditing procedures. We believe that our audits provide a reasonable basis for our opinion.
In our opinion, the financial statements and financial highlights referred to above present fairly, in all material respects, the financial position of Prime Money Market Fund, U.S Government Money Market Fund and Tax- Free Money Market Fund (collectively the “Funds”), three of the portfolios constituting the RBC Funds Trust (the “Trust”), as of September 30, 2011, the results of their operations for the year then ended, the changes in their net assets for each of the two years in the period then ended, and the financial highlights for the periods presented, in conformity with accounting principles generally accepted in the United States of America.
DELOITTE & TOUCHE LLP
Chicago, Illinois
November 22, 2011
55
|
During the fiscal year ended September 30, 2011, the Tax-Free Money Market Fund declared tax-exempt distributions of $208,414.
For the year ended September 30, 2011, the Tax-Free Money Market Fund had net long term capital gain distributions of $50,212.
The Funds designate a portion of the income dividends distributed during the fiscal year ended September 30, 2011, as U.S. Government Income as follows:
Prime Money Market Fund | 8.23 | % | ||
U.S. Government Money Market Fund | 21.03 | % |
U.S. Government Income represents the amount of interest that was derived from direct U.S. Government obligations. Generally, such interest is exempt from state income tax. However, for residents of California, New York and Connecticut the statutory threshold requirements were not satisfied. Due to the diversity in state and local tax law, it is recommended you consult a tax adviser as to the applicability of the information provided for your specific situation.
The Funds designate a portion of the income dividends distributed during the fiscal year ended September 30, 2011, as Qualified Interest Income as defined in the Internal Revenue Code as follows:
Prime Money Market Fund | 73.14 | % | ||
U.S. Government Money Market Fund | 100.00 | % | ||
Tax-Free Money Market Fund | 50.77 | % |
The Funds designate a portion of the income dividends distributed during the fiscal year ended September 30, 2011, as Qualified Short-Term Gain as defined in the Internal Revenue Code as follows:
Tax-Free Money Market Fund | 100.00 | % |
All designations are based on financial information available as of the date of this annual report and, accordingly, are subject to change. For each item above, it is the intention of the Funds to designate the maximum amount permitted under the Internal Revenue Code and the regulations thereunder.
56
|
Independent Trustees(1)(2)
T. Geron Bell (70)
Position, Term of Office and Length of Time Served with the Trust: Trustee since January 2004
Principal Occupation(s) During Past 5 Years: Chairman of the Executive Board of the Minnesota Twins (January 2011 to present); prior thereto President of Twins Sports, Inc. (parent company of the Minnesota Twins) (2002-2011); President of the Minnesota Twins Baseball Club Incorporated (1987-2002)
Number of Portfolios in Fund Complex Overseen by Trustee: 21
Other Director/Trustee Positions Held by Trustee During Past 5 Years: None
Lucy Hancock Bode (60)
Position, Term of Office and Length of Time Served with the Trust: Trustee since January 2004
Principal Occupation(s) During Past 5 Years: Healthcare consultant (self-employed)
Number of Portfolios in Fund Complex Overseen by Trustee: 21
Other Director/Trustee Positions Held by Trustee During Past 5 Years: BioSignia
Leslie H. Garner Jr. (61)
Position, Term of Office and Length of Time Served with the Trust: Trustee since January 2004
Principal Occupation(s) During Past 5 Years: President and CEO, The Greater Cedar Rapids Community Foundation (2010 to present); previously, President, Cornell College
Number of Portfolios in Fund Complex Overseen by Trustee: 21
Other Director/Trustee Positions Held by Trustee During Past 5 Years: None
Ronald James (60)
Position, Term of Office and Length of Time Served with the Trust: Trustee since January 2004
Principal Occupation(s) During Past 5 Years: President and Chief Executive Officer, Center for Ethical Business Cultures (2000 to present)
Number of Portfolios in Fund Complex Overseen by Trustee: 21
Other Director/Trustee Positions Held by Trustee During Past 5 Years: Best Buy Co. Inc.; Bremer Financial Corporation
John A. MacDonald (62)
Position, Term of Office and Length of Time Served with the Trust: Trustee since January 2004
Principal Occupation(s) During Past 5 Years: Vice President and Treasurer, Hall Family Foundation
Number of Portfolios in Fund Complex Overseen by Trustee: 21
Other Director/Trustee Positions Held by Trustee During Past 5 Years: None
H. David Rybolt (69)
Position, Term of Office and Length of Time Served with the Trust: Trustee since January 2004
Principal Occupation(s) During Past 5 Years: Consultant, HDR Associates (management consulting)
Number of Portfolios in Fund Complex Overseen by Trustee: 21
Other Director/Trustee Positions Held by Trustee During Past 5 Years: None
57
MANAGEMENT (Unaudited) |
Independent Trustees(1)(2)
James R. Seward (59)
Position, Term of Office and Length of Time Served with the Trust: Chairman of the Board and Trustee since January 2004
Principal Occupation(s) During Past 5 Years: Private investor (2000 to present); CFA
Number of Portfolios in Fund Complex Overseen by Trustee: 21
Other Director/Trustee Positions Held by Trustee During Past 5 Years: Syntroleum Corporation; Brookdale Senior Living Inc.; LabOne, Inc.; American Retirement Corp.
William B. Taylor (66)
Position, Term of Office and Length of Time Served with the Trust: Trustee since September 2005
Principal Occupation(s) During Past 5 Years: Consultant (2003 to present); prior thereto Partner (until 2003) Ernst & Young LLP
Number of Portfolios in Fund Complex Overseen by Trustee: 21
Other Director/Trustee Positions Held by Trustee During Past 5 Years: J.E. Dunn Vermont Assurance
Interested Trustees(1)(2)(3)
Erik R. Preus (46)(5)
Position, Term of Office and Length of Time Served with the Trust: Trustee since March 2006
Principal Occupation(s) During Past 5 Years: President and Chief Executive Officer, RBC Funds Trust (2006 to present); Head, Strategic Relationships Group, RBC Global Asset Management (U.S.) Inc. (2009 to present); Head of Retail Asset Management, RBC Global Asset Management (U.S.) Inc. (2006-2009); Chief Operating Officer, RBC Global Asset Management (U.S.) Inc. (2005-2006); Director, Investment Consulting Services, RBC Dain Rauscher Inc. (2004-2005); Director, Voyageur Advisory Services, RBC Global Asset Management (U.S.) Inc. (2003-2004)
Number of Portfolios in Fund Complex Overseen by Trustee: 21
Other Director/Trustee Positions Held by Trustee During Past 5 Years: None
Executive Officers(1)(3)(4)
Erik R. Preus (46)
Position, Term of Office and Length of Time Served with the Trust: President and Chief Executive Officer since September 2006
Principal Occupation(s) During Past 5 Years: Head, Strategic Relationships Group, RBC Global Asset Management (U.S.) Inc. (2009 to present); Head of Retail Asset Management, RBC Global Asset Management (U.S.) Inc. (2006-2009); Chief Operating Officer, RBC Global Asset Management (U.S.) Inc. (2005-2006)
James A. Gallo (47)
Address: BNY Mellon Investment Servicing (US) Inc., 760 Moore Road, King of Prussia, PA 19406
Position, Term of Office and Length of Time Served with the Trust: Treasurer since October 2007
Principal Occupation(s) During Past 5 Years: Senior Vice President and Managing Director, BNY Mellon Investment Servicing (US) Inc. (2002 to present)
58
MANAGEMENT (Unaudited) |
Executive Officers(1)(3)(4)
Kathleen A. Hegna (44)
Position, Term of Office and Length of Time Served with the Trust: Chief Financial Officer and Principal Accounting Officer since May 2009
Principal Occupation(s) During Past 5 Years: Associate Vice President and Director, Mutual Fund Accounting and Administration, RBC Global Asset Management (U.S.) Inc. (2009 to present); Senior Compliance Officer, RBC Global Asset Management (U.S.) Inc. (2006-2009); Director, Asset Management Compliance, RiverSource Investments (2005-2006)
Kathleen A. Gorman (47)
Position, Term of Office and Length of Time Served with the Trust: Chief Compliance Officer since April 2006 and Assistant Secretary since September 2006
Principal Occupation(s) During Past 5 Years: Chief Compliance Officer, RBC Funds Trust (2006 to present); Director of Regulatory Administration, RBC Global Asset Management (U.S.) Inc. (2007 to present); Chief Compliance Officer, RBC Global Asset Management (U.S.) Inc. (2006-2009)
Lee Thoresen (40)
Position, Term of Office and Length of Time Served with the Trust: Chief Legal Officer and Secretary since 2008
Principal Occupation(s) During Past 5 Years: Associate General Counsel, RBC Capital Markets, LLC (2006-present); Asset Management Compliance, RiverSource Investments (2004-2006)
John M. Huber (43)
Position, Term of Office and Length of Time Served with the Trust: Chief Investment Officer, U.S. Fixed Income Funds since February 2004
Principal Occupation(s) During Past 5 Years: Senior Managing Director and Chief Investment Officer, Fixed Income, RBC Global Asset Management (U.S.) Inc. (2004 to present)
Gordon Telfer (45)
Position, Term of Office and Length of Time Served with the Trust: Chief Investment Officer, U.S. Equity Funds since October 2009; Portfolio Strategist from March 2004 to October 2009
Principal Occupation(s) During Past 5 Years: Director of Equities - U.S., RBC Global Asset Management (U.S.) Inc. (June 2009 to present); Head of Growth Equities, RBC Global Asset Management (U.S.) Inc. (2008-2009); Senior Portfolio Manager, RBC Global Asset Management (U.S.) Inc. (2004-2008); Managing Director, RBC Global Asset Management (U.S.) Inc. (2007-present); Vice President, RBC Global Asset Management (U.S.) Inc. (2004-2007)
59
MANAGEMENT (Unaudited) |
Executive Officers(1)(3)(4)
Mark Poole (50)
Address: BlueBay Asset Management Ltd., 77 Grosvenor Street, London, W1K 3JR, United Kingdom
Position, Term of Office and Length of Time Served with the Trust: Chief Investment Officer, Global Fixed Income Funds since September 2011
Principal Occupation(s) During Past 5 Years: Chief Investment Officer, BlueBay Asset Management Ltd. (2001 to present)
| (1) | Except as otherwise noted, the address of each Trustee/Officer is RBC Funds Trust, 100 South Fifth Street, Suite 2300, Minneapolis, Minnesota 55402. |
| (2) | All Trustees must retire on or before December 31 of the year in which they reach age 75. The Board may temporarily waive this requirement when necessary to avoid depriving the Board of a Trustee with a critical skill . |
| (3) | On December 31, 2009, Voyageur Asset Management Inc. changed its name to RBC Global Asset Management (U.S.) Inc. Any references to RBC Global Asset Management (U.S.) Inc. for prior periods are deemed to be references to the prior entity. |
| (4) | Each officer serves in such capacity for an indefinite period of time until his or her removal, resignation or retirement. |
| (5) | Erik R. Preus has been determined to be an interested Trustee by virtue of his affiliation with the Trust. |
The Funds’ Statement of Additional Information includes information about the Funds’ Trustees. To receive your free copy of the Statement of Additional Information, call toll free: 1-800-422-2766.
60
|
Shareholder Expense Examples
As a shareholder of the RBC Funds, you incur two types of costs: (1) transaction costs, including sales charges (loads) and (2) ongoing costs, including management fees; 12b-1 distribution and service fees; and other Fund expenses. This example is intended to help you understand your ongoing costs (in dollars) of investing in the RBC Funds and to compare these costs with the ongoing costs of investing in other mutual funds.
The Example is based on an investment of $1,000 invested at the beginning of the period and held for the entire period from April 1, 2011 through September 30, 2011.
Actual Expenses and Performance
The table below provides information about actual account values and actual expenses. You may use the information below, together with the amount you invested, to estimate the expenses that you paid over the period. Simply divide your account value by $1,000 (for example, an $8,600 account value divided by $1,000 = 8.6), then multiply the result by the number in the table under the heading entitled “Expenses Paid During Period” to estimate the expenses you paid on your account during this period.
Beginning | Ending | Expenses Paid | Annualized | |||||
Prime Money Market Fund | ||||||||
RBC Institutional Class 1 | $1,000.00 | $1,000.50 | $0.86 | 0.17% | ||||
RBC Institutional Class 2 | 1,000.00 | 1,000.10 | 1.27 | 0.25% | ||||
RBC Investor Class | 1,000.00 | 1,000.10 | 1.32 | 0.26% | ||||
RBC Reserve Class | 1,000.00 | 1,000.10 | 1.32 | 0.26% | ||||
RBC Select Class | 1,000.00 | 1,000.10 | 1.32 | 0.26% | ||||
U.S. Government | ||||||||
Money Market Fund | ||||||||
RBC Institutional Class 1 | 1,000.00 | 1,000.10 | 0.81 | 0.16% | ||||
RBC Institutional Class 2 | 1,000.00 | 1,000.10 | 0.86 | 0.17% | ||||
RBC Investor Class | 1,000.00 | 1,000.10 | 0.86 | 0.17% | ||||
RBC Reserve Class | 1,000.00 | 1,000.10 | 0.86 | 0.17% | ||||
RBC Select Class | 1,000.00 | 1,000.10 | 0.86 | 0.17% | ||||
Tax-Free Money Market Fund | ||||||||
RBC Institutional Class 1 | 1,000.00 | 1,000.30 | 0.86 | 0.17% | ||||
RBC Institutional Class 2 | 1,000.00 | 1,000.10 | 1.12 | 0.22% | ||||
RBC Investor Class | 1,000.00 | 1,000.10 | 1.12 | 0.22% | ||||
RBC Reserve Class | 1,000.00 | 1,000.10 | 1.12 | 0.22% | ||||
RBC Select Class | 1,000.00 | 1,000.10 | 1.12 | 0.22% | ||||
| * | Expenses are equal to the average account value times the Fund’s annualized expense ratio multiplied by 185/365 (to reflect one-half year period). |
61
SUPPLEMENTAL INFORMATION (Unaudited) |
Hypothetical Example for Comparison Purposes
The table below provides information about hypothetical account values and hypothetical expenses based on each RBC Funds’ actual expense ratio and an assumed rate of return of 5% per year before expenses, which is not the Fund’s actual return. The hypothetical account values and expenses may not be used to estimate the actual ending account balance or expenses you paid for the period. You may use this information to compare this 5% hypothetical example with the 5% hypothetical examples that appear in the shareholder reports of other funds.
Please note that the expenses shown in the table are meant to highlight your ongoing costs only and do not reflect any transactional costs, such as sales charges (loads), redemption fees, or exchange fees. Therefore, the table is useful in comparing ongoing costs only, and will not help you determine the relative total costs of owning different funds. In addition, if these transactional costs were included, your costs would have been higher.
Beginning | Ending | Expenses Paid | Annualized Expense Ratio | |||||
Prime Money Market Fund | ||||||||
RBC Institutional Class 1 | $1,000.00 | $1,024.48 | $0.87 | 0.17% | ||||
RBC Institutional Class 2 | 1,000.00 | 1,024.07 | 1.28 | 0.25% | ||||
RBC Investor Class | 1,000.00 | 1,024.02 | 1.33 | 0.26% | ||||
RBC Reserve Class | 1,000.00 | 1,024.02 | 1.33 | 0.26% | ||||
RBC Select Class | 1,000.00 | 1,024.02 | 1.33 | 0.26% | ||||
U.S. Government | ||||||||
Money Market Fund | ||||||||
RBC Institutional Class 1 | 1,000.00 | 1,024.53 | 0.82 | 0.16% | ||||
RBC Institutional Class 2 | 1,000.00 | 1,024.48 | 0.87 | 0.17% | ||||
RBC Investor Class | 1,000.00 | 1,024.48 | 0.87 | 0.17% | ||||
RBC Reserve Class | 1,000.00 | 1,024.48 | 0.87 | 0.17% | ||||
RBC Select Class | 1,000.00 | 1,024.48 | 0.87 | 0.17% | ||||
Tax-Free Money Market Fund | ||||||||
RBC Institutional Class 1 | 1,000.00 | 1,024.48 | 0.87 | 0.17% | ||||
RBC Institutional Class 2 | 1,000.00 | 1,024.23 | 1.13 | 0.22% | ||||
RBC Investor Class | 1,000.00 | 1,024.23 | 1.13 | 0.22% | ||||
RBC Reserve Class | 1,000.00 | 1,024.23 | 1.13 | 0.22% | ||||
RBC Select Class | 1,000.00 | 1,024.23 | 1.13 | 0.22% | ||||
| * | Expenses are equal to the average account value times the Fund’s annualized expense ratio multiplied by 185/365 (to reflect one-half year period). |
62
|
Information Regarding the Approval of Investment Advisory Agreements
In September 2011, after evaluating the services provided by RBC Global Asset Management (U.S.), Inc. (the “Advisor”) and reviewing the performance, fees and expenses of the Funds, the RBC Funds Board of Trustees determined to approve the continuation of the investment advisory agreements (“Agreements”) with the Advisor for each Fund for an additional year.
As part of their review of the Agreements, the Trustees requested and considered information regarding the advisory services performed by the Advisor, the staffing and qualifications of the Advisor’s personnel responsible for operating and managing the Funds, and the Funds’ performance and expenses. The review process was guided by the Board’s Valuation, Portfolio Management and Performance Committee. The Trustees considered information provided at regular quarterly Board and Committee meetings throughout the year, as well as a special meeting to review requested material related to the proposed renewals and a meeting held to specifically consider the proposed renewals. In connection with their deliberations, the independent Trustees were advised by their own independent legal counsel with regard to the materials and their responsibilities under relevant laws and regulations.
The Trustees met with representatives from the Advisor’s senior management team, as well as the senior investment professionals responsible for managing the Funds, to discuss the information and the Advisor’s ongoing management of the Funds. The Trustees reviewed the quality of the services provided to the Funds by the Advisor, including information prepared by two separate independent third-party consultants as to each Fund’s performance relative to appropriate index benchmarks as well as fund peer group comparative information requested by the Board. The Trustees reviewed the investment advisory fees payable to the Advisor, and reviewed comparative fee and expense information for similarly situated funds (for both institutional and cash sweep cash management solutions). The Trustees evaluated profitability data for the Advisor, and considered information regarding other benefits the Advisor and its affiliates derived from its relationships with the Funds, including distribution and servicing fees paid to the Adviser’s broker-dealer affiliate in connection with cash sweep services provided to holders of selected classes of shares. The Advisor had proposed to continue for an additional year the existing contractual fee waiver and expense limitation arrangements in order to limit operating expenses. Also, as in the previous year, the Advisor’s affiliated broker-dealer had voluntarily waived receipt of some distribution and service fees payable for cash sweep services for certain retail share classes in order to maintain a positive yield in the dramatically low interest rate environment.
Because of the difficulty associated with evaluating investment performance when other money market funds have differing fee and expense structures, the Trustees reviewed performance data before and after fees and expenses and observed that performance was favorable relative to peer funds. In considering the quality of the services performed for each Fund by the Advisor, the Trustees recognized the significant research and fundamental analysis capabilities at the firm, as well as the deep portfolio management expertise and experience of the Advisor’s investment staff. The Trustees also viewed favorably the manner in which the Adviser’s staff had developed a strong compliance structure and operational systems, particularly in the wake of the recent challenges within the global credit markets and changes in money fund regulation. Trustees were satisfied with the quality and capabilities of the money market fund portfolio management and analyst team and with the overall investment performance of the Funds. The Trustees also recognized and appreciated the strategic commitment that the Advisor and its parent organization were making to cash management products and the Funds, and the financial strength of the Adviser and its parent organization.
63
APPROVAL OF INVESTMENT ADVISORY AGREEMENT (UNAUDITED) |
Based upon their review, the Trustees determined that the advisory fees proposed to be payable to the Advisor were reasonable and fair in light of the nature and quality of services provided under all of the circumstances, and were within the range of what might have been negotiated at arms’ length. The Trustees concluded that it is in the interest of the Funds and their shareholders for the Trustees to approve the continuation of the Agreements, as well as the expense limitation arrangements for the Funds. In arriving at their decision to approve the renewal of the Agreements, the Trustees did not assign relative weights to the factors discussed above or deem any one or group of them to be controlling in and of itself.
64
|
This Page Intentionally Left Blank
65
|
This Page Intentionally Left Blank
66
|
This Page Intentionally Left Blank
67
|
This Page Intentionally Left Blank
68
RBC Funds
P.O. Box 701
Milwaukee, WI 53201-0701
800-422-2766
www.rbcgam.us
Performance data represents past performance and does not guarantee future results. The principal value of an investment and investment return will fluctuate so that an investor’s shares, when redeemed, may be worth more or less than their original cost.
This report and the financial statements contained herein are provided for the information of RBC Funds shareholders. This report is not authorized for distribution to prospective investors unless preceded or accompanied by a current prospectus, which contains information concerning investment objectives, risks, charges and expenses of the funds. Please read the prospectus carefully before investing.
This report and the financial statements contained herein are not intended to be a forecast of future events, a guarantee of future results, or investment advice. There is no assurance that certain securities will remain in or out of each fund’s portfolio. The views expressed in this report reflect those of the portfolio managers through the period ended September 30, 2011.
NOT FDIC INSURED • NO BANK GUARANTEE • MAY LOSE VALUE
RBC Global Asset Management (U.S.), Inc. serves as investment adviser for the RBC Funds. RBC Funds are distributed by Quasar Distributors LLC.

The RBC Funds are pleased to offer shareholder reports printed entirely on Forest Stewardship Council certified paper. FSC certification ensures that the paper used in this report contains fiber from well-managed and responsibly harvested forests that meet strict environmental and socioeconomic standards. |
RBCF-MM AR 09-11
RBC Funds
|
| |||||||||||||||
About Your Annual Report |
This annual report includes detailed information about the Access Capital Community Investment Fund (the” Fund”) including financial statements, performance, and a complete list of holdings.
The Fund compares its performance against the Barclays Capital U.S. Securitized Index and the Barclays Capital U.S. Aggregate Bond Index which are widely used market indices.
We hope the financial information presented will help you evaluate your investment in the Fund. We also encourage you to read your Fund’s prospectus for further detail as to the Fund’s investment policies and risk profile. Fund prospectuses and performance information subsequent to the date of this report are available on our website at www.rbcgam.us.
A description of the policies and procedures that your Fund uses to determine how to vote proxies relating to portfolio securities is available (i) without charge, upon request, by calling 1-800-422-2766; (ii) on the Fund’s website at www.rbcgam.us; and (iii) on the Securities and Exchange Commission’s (the “Commission”) website at http://www.sec.gov.
Information regarding how your Fund voted proxies relating to portfolio securities during the most recent 12 month period ended June 30 is available (i) on the Fund’s website at www.rbcgam.us; and (ii) on the Commission’s website at http://www.sec.gov.
A schedule of the Fund’s portfolio holdings will be filed with the Commission for the first and third quarters of each fiscal year on Form N-Q. This information is available on the Commission’s website at http://www.sec.gov and may be reviewed and copied at the Commission’s Public Reference Room in Washington, D.C. Information on the operation of the Public Reference Room is available by calling 1-202-551-8090.
|
| ||||||||||||||
| Table of | ||||||||||||||||
| Contents |
| 1 | ||||||||||||||
| Portfolio Managers | 4 | |||||||||||||||
| Performance Summary | 5 | |||||||||||||||
| Management Discussion and Analysis | 6 | |||||||||||||||
| Schedule of Portfolio Investments | 9 | |||||||||||||||
| Financial Statements | ||||||||||||||||
| - Statement of Assets and Liabilities | 30 | |||||||||||||||
| - Statement of Operations | 32 | |||||||||||||||
| - Statements of Changes in Net Assets | 33 | |||||||||||||||
| - Statement of Cash Flows | 34 | |||||||||||||||
| Financial Highlights | 36 | |||||||||||||||
| Notes to Financial Statements | 38 | |||||||||||||||
| Report of Independent Registered Public Accounting Firm | 50 | |||||||||||||||
| Other Federal Income Tax Information | 51 | |||||||||||||||
| Management | 52 | |||||||||||||||
| Share Class Information | 56 | |||||||||||||||
| Supplemental Information | 57 | |||||||||||||||
| Approval of Investment Advisory Agreement | 58 | |||||||||||||||
| ||||||
| ||||||
Dear Shareholder: | ||||||
RBC Funds enjoyed another solid year of providing financial solutions for our shareholders. We understand the important role our funds play in helping our shareholders meet their financial goals. It was three years ago that investors experienced a market crisis the likes of which we haven’t seen since the great depression. Then, as now, RBC Funds provided the stability and strength our shareholders have come to expect and deserve. | ||||||
From a financial perspective, I am pleased to report that our Funds continued to perform as expected during the past fiscal year. The Access Capital Community Investment Fund continues to have a positive impact in underserved communities by filling capital gaps. The Fund is concluding its thirteenth year of providing returns to shareholders that include both an economic and a social benefit. The Fund invests in debt securities that support community development activities serving low and moderate income individuals and neighborhoods in the United States. The Fund’s investments promote home ownership, affordable rental housing, education, community health centers and small businesses. As of September 30, 2011, Fund shareholders called for community investments in 46 states, the District of Columbia, and one U.S. territory. The Fund purchased 684 mortgages for low- and moderate-income individuals, 322 units of affordable rental housing and 52 loans for small business development during the current fiscal year. | ||||||
The Fund has also demonstrated the ability to preserve capital for shareholders in a variety of markets as reflected in the highest overall Lipper Leader ranking we can achieve for principal preservation. The Access Capital Community Investment Fund was designated a Lipper Leader in the Preservation category among 4,333 U.S. Fixed Income funds for the overall period ending September 30, 2011*. The overall calculation is based on an equal-weighted average of percentile ranks for the Preservation metrics over the three-, five-, and ten-year periods. | ||||||
The Fund’s use of leverage enables it to make opportunistic purchases in difficult to serve regions and to inventory loans for future allocations. Over the course of the last year, use of leverage also aided performance marginally. | ||||||
So what has changed over the past year? From an economic perspective, what looked like decent U.S. growth in the first half of the year turned out to be more of a mirage. The recovery that was widely expected to take root over the second half of 2011 simply hasn’t developed. While a stronger global economy was a key argument for a sustainable recovery here in the U.S., many of those countries are now facing diminished growth expectations. And while consumer and business confidence can be fickle, especially in a deleveraging environment, spending and hiring have all disappointed. | ||||||
What has also changed is the level of discourse focused on the long term fiscal health of the United States and Europe. While the debt discussions this summer in Washington were a fiasco, changes are now forthcoming, whether they occur by force or choice. That’s ultimately good for credit quality. The S&P downgrade of U.S. debt from its AAA rating was certainly a new challenge. The combination of political theatrics and the downgrade dealt a real blow to investor confidence. | ||||||
1
LETTER FROM THE CIO | ||||||
Many economic fundamentals, however, have not changed over the past year. Several baseline economic constraints remain firmly in place. Higher government debt burdens are associated with slower economic growth. Ongoing financial deleveraging limits consumption and reduces investment. Further, the natural reversal of fiscal stimulus continues to serve as an economic drag. Today’s economic growth is weak, but it’s positive. Corporations continued to produce solid earnings despite the economic environment. Balance sheets, cash flow and liquidity remain strong across most corporate sectors. Regulatory capital is increasing in the banking sector. Housing also appears to have bottomed, an important condition before economic growth can sustain itself.
The longer-term implications of all this should be quite limited. First, and contrary to expectations, American borrowing costs responded to the downgrade by going down, not up. And no major class of investor has abandoned or become ineligible to buy U.S. Treasuries. Second, the U.S. is quite unlike Greece. To that point, S&P downgraded the U.S. primarily due to political dysfunction, not intractable economic or fiscal problems. The U.S. economy is weak, but has good long-term prospects due to favorable productivity and demographic trends. The debt burden is rising, but manageable, for the world’s reserve currency.
Concerns over the ongoing financial crisis in Europe are certainly reasonable, but those worries are nothing new. The markets increasingly understand we need to see real burden sharing between creditors and debtors along with a move to some form of a fiscal union. A Euro break-up, one which can be avoided through strong leadership, would certainly be a disaster for the global economy, but the global central banks and the G7 leaders have already done too much, through monetary and fiscal stimulus, to allow that to occur. It’s a problem that requires a global response. Ultimately, the costs involved in fixing the European problem are lower than the costs of failure.
Risk aversion is understandably elevated at present, contributing to historically low yields. Adjusting for inflation, real yields are already negative in most of the developed world. This type of environment punishes savers and rewards borrowers. More constructively, it also encourages risk-taking behavior, which is a necessary condition for more vibrant economic growth. This brings opportunity for those willing to take advantage of it.
Throughout my career, I have seen incredible bull markets and unimaginable bear markets. Through all the ups and downs, investors who have remained focused on their financial objectives, within the appropriate broad context, have generally been successful. As always, we will remain steadfast in our goal of preservation of our shareholders’ assets while striving to provide the necessary income and social impact they expect. Thank you for your continued confidence and trust in the RBC Funds. | ||||||
2
LETTER FROM THE CIO | ||||||
Sincerely,
John M. Huber, CFA Chief Investment Officer, Fixed Income RBC Funds
Past performance is not a guarantee of future results.
Fund holdings and sector allocations are subject to change at any time and should not be considered recommendations to buy or sell any security. Please refer to the Schedule of Investments in this report for a complete list of fund holdings.
Investment in the Fund involves risks including, but not limited to: the effects of leveraging the Fund’s portfolio; concentration in the affordable housing market and related mortgage backed securities; competition for investments; interest rate risk; and use of derivatives.
The information provided herein represents the opinions of the Fund Managers and is not intended to be a forecast of future results, nor investment advice.
Lipper Leader scores are subject to change every month and are calculated for the following time periods: 3-year, 5-year, 10-year, and overall. The overall calculation is based on an equal-weighted average of percentile rank for each category metric over three-, five-, and ten-year periods. The top 20% of funds in each classification are rated 5 and are named Lipper Leaders, the next 20% are rated 4, the middle 20% are rated 3, the next 20% are rated 2, and the lowest 20% are rated 1. For the three-year period, the Access Capital Community Investment Fund received a Lipper Leader rating of 5 in the Preservation category among 4,333 Fixed Income funds. For the five-year period, the Fund received a Lipper Leader rating of 5 in the Preservation category among 3,638 funds. For the ten-year period, the Fund received a Lipper Leader rating of 5 in the Preservation category among 2,559 funds.
*Lipper ratings for preservation reflect a fund’s historical loss avoidance relative to other funds within the same asset class, as of 9/30/2011. Preservation ratings are relative, rather than absolute measures, and funds named Lipper Leaders for Preservation may still experience losses periodically; those losses may be larger for equity and mixed equity funds than for fixed income funds.
Lipper Analytical Services, Inc. is an independent mutual fund research and rating service. Each Lipper peer group represents a universe of Funds with similar investment objectives. Past performance does not guarantee future results.
Investment in the Fund involves risks including, but not limited to: the effects of leveraging the Fund’s portfolio; concentration in the affordable housing market and related mortgage backed securities; competition for investments; interest rate risk; and use of derivatives. |
John Huber Chief Investment Officer Fixed Income | |||||


3
| ||||||
RBC Global Asset Management (U.S.) Inc.(“RBC GAM (US)”) serves as the investment advisor to the Access Capital Community Investment Fund. RBC GAM (US) employs a team approach to the management of the Access Capital Community Investment Fund, with no individual team member being solely responsible for the investment decisions. The Fund’s management team has access to RBC GAM (US)’s investment research and other money management resources.
| ||||||
John M. Huber, CFA | John M. Huber, CFA
Senior Managing Director, Chief Investment Officer — Fixed Income
John Huber oversees RBC GAM (US)’s fixed income research and portfolio management efforts. He is a member of the firm’s Executive Committee. John joined RBC GAM (US) in 2001 from Galliard Capital Management where he was a founding member and principal. Before that, John was a portfolio manager at Norwest Investment Management, where he began his career in the capital markets group in 1990. He earned a BA from the University of Iowa and an MBA in Finance from the University of Minnesota Carlson School of Management. John acts as an advisor to the Carlson Funds Enterprise for the University of Minnesota. He is also a board member of the Minneapolis Downtown YMCA. John is a CFA charterholder and a member of the CFA Society of Minnesota.
| |||||
Brian Svendahl, CFA | Brian Svendahl, CFA
Managing Director, Senior Portfolio Manager
Brian Svendahl is a senior portfolio manager leading RBC GAM (US)’s Risk Management Team which monitors various risks within our fixed income products. Brian also has specific research responsibilities for government and agency loans including small business administration and U.S.D.A. programs. Brian joined RBC GAM (US) in 2005 from Wells Fargo Brokerage Services, where he served as senior vice president and risk manager. Prior to that, Brian’s experiences include developing VAR analysis and off balance sheet hedging strategies for Wells Fargo’s Treasury group. Brian has worked in the investment industry since 1992. Brian received a BS in Economics from the University of Minnesota. He also received a BBA in Finance and an MBA from the University of Minnesota, Carlson School of Management. Brian is a CFA charterholder and member of the CFA Society of Minnesota.
| |||||
Todd Brux, CFA | Todd Brux, CFA
Managing Director, Senior Portfolio Manager
Todd Brux co-leads the Rates Research Team in RBC GAM (US)’s fixed income group. Todd has extensive fixed income industry experience and is currently responsible for researching Agency and whole-loan residential mortgage-backed securities as well as commercial mortgage- and asset-backed securities. He also has portfolio management responsibilities for our community investing, mortgage, and opportunistic high income mandates. Before joining RBC GAM (US) in 2004, Todd held senior positions at GMAC-RFC, and was previously a senior investment analyst at Galliard Capital Management. He began his career in the investment industry in 1994. Todd earned a BA in Economics from the University of Wisconsin-Madison. He is a CFA charterholder and a member of the CFA Society of Minnesota. | |||||


4
| ||||||||||||||||||
Average Annual Total Returns as of September 30, 2011 | ||||||||||||||||||
Access Capital Community Investment Fund | ||||||||||||||||||
| 1 Year | 3 Year | 5 Year | 10 Year | Since Inception | Expense Ratio* | |||||||||||||
| Class A (a) | ||||||||||||||||||
| - Including Maximum Sales Charge of 3.75% | 0.10% | 4.79% | 4.60% | 4.26% | 4.70% | |||||||||||||
| - At Net Asset Value | 3.98% | 6.15% | 5.41% | 4.66% | 5.00% | 1.03% | ||||||||||||
| Class I (b) | ||||||||||||||||||
| - At Net Asset Value | 4.23% | 6.34% | 5.57% | 4.85% | 5.29% | 0.79% | ||||||||||||
| Barclays Capital U. S. Securitized Index (c) | 5.46% | 7.31% | 6.46% | 5.52% | 6.03% | |||||||||||||
| Barclays Capital U. S. Aggregate Bond Index (c) | 5.26% | 7.97% | 6.53% | 5.66% | 6.05% | |||||||||||||
Performance data quoted represents past performance. Past performance is no guarantee of future results. Investment return and principal value of an investment will fluctuate so that an investor’s shares, when redeemed, may be worth more or less than their original cost. Current performance may be lower or higher than performance quoted. For performance data current to most recent month-end go to www.rbcgam.us.
The Barclays Capital U.S. Securitized Index is an unmanaged index that tracks the performance of mortgage-backed pass-through securities issued by Ginnie Mae, Fannie Mae, and Freddie Mac, investment-grade bonds and asset-backed securities.
The Barclays Capital U.S. Aggregate Bond Index is an unmanaged index that tracks the performance of a representative list of government, corporate, asset-backed and mortgage-backed securities.
(a) The inception date for Class A shares of the Fund is January 29, 2009. All performance shown for such class of shares prior to its inception date is based on the performance of the Class I shares of the Fund, adjusted to reflect the fees and expenses of Class A shares, as applicable.
(b) Class I commenced operations on July 28, 2008. The performance in the table reflects the performance of Access Capital Strategies Community Investment Fund, Inc., the predecessor to the Fund. From its inception, June 23, 1998, until May 30, 2006, the predecessor fund elected status as a business development company. From May 31, 2006 until July 27, 2008, the predecessor fund operated as a continuously offered closed-end interval management company. If the predecessor fund had operated as an open-end management company, performance may have been adversely affected. Fund performance reflects applicable fee waivers/expense reimbursements which, if excluded, would cause performance to be lower.
(c) You cannot invest directly into the index. * The Fund’s expenses reflect the most recent year end (September 30, 2011). | ||||||||||||||||||
5
| ||||||||
Access Capital Community Investment Fund
| ||||||||
Investment Strategy | Invests in geographically specific debt securities located in portions of the United States designated by Fund Shareholders. The Fund invests primarily in debt instruments supporting the affordable housing and economic development serving low- and moderate- income individuals and communities. Investment securities include government-guaranteed loans, asset-backed securities, particularly mortgage-backed securities, small business loans, and taxable municipal securities.
| |||||||
Performance |
For the twelve-month period ending September 30, 2011, the Fund had a total return of 4.23% (Class I). That compares to a total return of 5.46% for the Barclays Capital U.S. Securitized Index. The Fund’s performance continues to compare favorably versus its peers and benchmarks over longer time horizons, which is a more appropriate way to view value added performance for a high quality, longer maturity community investment mandate.
| |||||||
Factors That Made Positive Contributions |
— The Fund maintained a yield advantage vs. the Barclays Aggregate Index over the past twelve months. This was a positive contributor.
— The convexity advantage of agency MBS collateralized by mortgages to low income borrowers contributed positively to the Fund’s relative performance.
— The coupon dispersion of the mortgage backed securities in the Fund was also a positive contributor to relative returns.
| |||||||
Factors That Detracted from Relative Returns |
— Agency multi-family paper did not keep pace with Treasury securities as they rallied over the past year. The Fund’s allocation to this space was a negative contributor to relative returns.
— Municipal housing related securities underperformed Treasuries over the past twelve months. The Fund has a small allocation in this space which contributed negatively to the Fund’s relative performance.
— The Fund’s underweight to GNMA Mortgage Backed Securities also detracted from performance over the past twelve months as these securities out-performed conventional MBS.
| |||||||
Fund holdings and sector allocations are subject to change at any time and should not be considered recommendations to buy or sell any security.
Please refer to the Schedule of Portfolio Investments in this report for a complete list of Fund holdings. | ||||||||
6
MANAGEMENT DISCUSSION AND ANALYSIS (UNAUDITED) |
| |||||||||||||||||||
Access Capital Community Investment Fund
|
| |||||||||||||||||||
Current income and capital appreciation | Investment Objective | |||||||||||||||||||
Barclays Capital U.S. Securitized Index
Barclays Capital U.S. Aggregate Bond Index
| Benchmark | |||||||||||||||||||
| Asset Allocation (as of 9/30/11) (% of fund’s investments) | |||||||||||||||||||
Small Business Administration, | 3.20 | % |
Fannie Mae Pool #387590, |
|
1.86 |
% |
Top Ten Holdings | |||||||||||||
1.45%, 3/25/36 | 4.90%, 9/1/15 | |||||||||||||||||||
Fannie Mae Pool #466934, | 2.19 | % | Fannie Mae Pool #465537, | 1.53 | % | |||||||||||||||
4.10%, 1/1/21 | 4.20%, 7/1/20 | |||||||||||||||||||
Fannie Mae Pool #463212, | 2.13 | % | Fannie Mae Pool #466303, | 1.45 | % | |||||||||||||||
4.68%, 8/1/19 | 3.54%, 11/1/20 | |||||||||||||||||||
Fannie Mae Series 2004-T7, | 2.07 | % | Massachusetts Housing Finance | 1.34 | % | |||||||||||||||
Class A, 5.12%, 7/25/41 | Agency Revenue, Series B, | |||||||||||||||||||
Massachusetts Housing | 1.89 | % | 6.53%, 12/1/27 | |||||||||||||||||
Investment Corp. Term Loan, | Fannie Mae Pool #AC7199, | 0.92 | % | |||||||||||||||||
6.67%, 4/1/35 | 5.00%, 12/1/39 | |||||||||||||||||||
* A listing of all portfolio holdings can be found beginning on page 9.
|
| |||||||||||||||||||
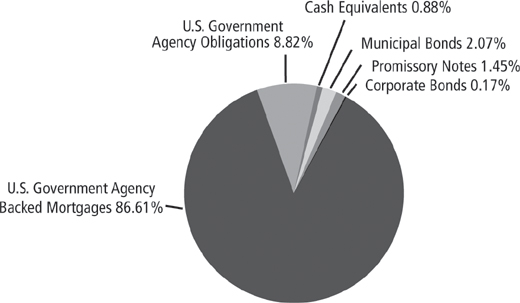
7
MANAGEMENT DISCUSSION AND ANALYSIS (UNAUDITED) | ||||||||
Access Capital Community Investment Fund
| ||||||||
Growth of $ 10,000 Initial |
| |||||||
| The graph reflects an initial investment of $10,000 over a 10 year period and is based on Class I shares. The Fund’s total return includes reinvested dividends and capital gains. The Fund’s total return also includes operating expenses that reduce return, while the total return of the index do not. The graph does not reflect the deduction of taxes that a shareholder would pay on fund distributions or redemption of fund shares. Performance of other classes will vary due to differences in fee structures. | ||||||||
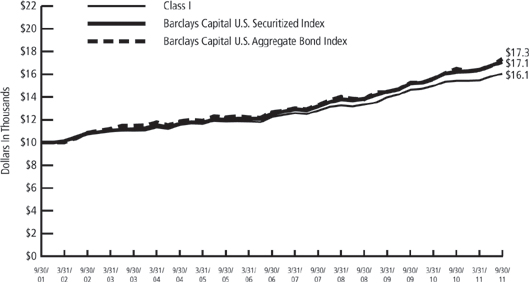
8
|
Access Capital Community Investment Fund
September 30, 2011
Principal Amount | Value | |||||
Municipal Bonds — 2.70% | ||||||
California — 0.30% | ||||||
| $ 320,000 | California Rural Home Mortgage Finance Authority Revenue, Series C, 5.40%, 8/1/35, (Credit Support: Ginnie Mae, Fannie Mae, Freddie Mac), Callable 2/1/17 @ 104 | $ 342,560 | ||||
| 975,000 | California Statewide Communities Development Authority Revenue, Series B, 5.25%, 10/20/42, (Credit Support: Ginnie Mae), Callable 10/20/17 @ 102 | 939,149 | ||||
| 330,000 | Camarillo California Community Development, Community Tax Allocation (Housing Set-Aside), Series A-T, 5.26%, 9/1/16, (Credit Support: AMBAC) | 334,646 | ||||
|
| |||||
| 1,616,355 | ||||||
|
| |||||
Guam — 0.02% | ||||||
| 140,000 | Guam Power Authority Revenue OID, Series A, 5.00%, 10/1/24, (Credit Support: AMBAC) | 132,810 | ||||
|
| |||||
Massachusetts — 1.34% | ||||||
| 6,790,000 | Massachusetts Housing Finance Agency Revenue, Series B, 6.53%, 12/1/27, (Credit Support: NATL-RE,IBC), Callable 6/1/17 @ 100 | 7,307,873 | ||||
|
| |||||
Mississippi — 0.02% | ||||||
| 100,000 | Mississippi Home Corp. Multi Family Revenue OID, 5.35%, 8/20/48, (Credit Support: Ginnie Mae, Fannie Mae), Callable 9/1/18 @ 105 | 98,599 | ||||
|
| |||||
New York — 0.74% | ||||||
| 665,000 | New York City Housing Development Corp. Revenue, Series A, 4.15%, 7/15/15, (Credit Support: Fannie Mae) | 685,948 | ||||
| 700,000 | New York State Housing Finance Agency Revenue, 4.50%, 11/15/27, (Credit Support: Fannie Mae), Callable 11/15/16 @ 100 | 712,096 | ||||
| 1,000,000 | New York State Housing Finance Agency Revenue, Series A, 4.65%, 11/15/38, (Credit Support: Fannie Mae), Callable 11/15/16 @ 100 | 971,860 | ||||
| 1,620,000 | Suffolk County Industrial Development Agency Revenue, 5.70%, 12/1/26, (LOC: Bank of New York), Callable 12/1/11 @ 102 | 1,661,828 | ||||
|
| |||||
| 4,031,732 | ||||||
|
| |||||
9
SCHEDULE OF PORTFOLIO INVESTMENTS |
Access Capital Community Investment Fund (cont.)
September 30, 2011
Principal Amount | Value | |||||
Texas — 0.21% | ||||||
| $1,085,000 | Texas Department of Housing & Community Affairs Revenue, 5.13%, 12/1/38, (Credit Support: Fannie Mae)(a) | $1,115,196 | ||||
|
| |||||
Utah — 0.07% | ||||||
| 397,000 | Utah Housing Corp. Multi Family Mortgage Revenue, 7.25%, 1/20/26, (Credit Support: Ginnie Mae) | 405,619 | ||||
|
| |||||
Total Municipal Bonds (Cost $14,063,949) | 14,708,184 | |||||
|
| |||||
Corporate Bonds — 0.22% | ||||||
Diversified Financials — 0.22% | ||||||
| 1,993,548 | Pacific Beacon LLC 0.65%, 7/15/51(Credit Support: MBIA)(a)(b)(c) | 1,196,109 | ||||
|
| |||||
Total Corporate Bonds (Cost $1,993,548) | 1,196,109 | |||||
|
| |||||
U.S. Government Agency Backed Mortgages — 112.68% | ||||||
Fannie Mae — 83.29% | ||||||
| 25,300 | Pool #253174, 7.25%, 12/1/29 | 28,717 | ||||
| 31,448 | Pool #253214, 7.00%, 1/1/15 | 33,579 | ||||
| 110,788 | Pool #257611, 5.50%, 5/1/38 | 121,205 | ||||
| 51,563 | Pool #257612, 5.00%, 5/1/38 | 56,131 | ||||
| 385,320 | Pool #257613, 5.50%, 6/1/38 | 419,984 | ||||
| 180,742 | Pool #257631, 6.00%, 7/1/38 | 200,496 | ||||
| 445,567 | Pool #257632, 5.50%, 7/1/38 | 485,929 | ||||
| 290,675 | Pool #257649, 5.50%, 7/1/38 | 317,915 | ||||
| 88,174 | Pool #257656, 6.00%, 8/1/38 | 97,811 | ||||
| 357,202 | Pool #257663, 5.50%, 8/1/38 | 390,676 | ||||
| 630,977 | Pool #257857, 6.00%, 12/1/37 | 694,814 | ||||
| 187,075 | Pool #257868, 6.50%, 11/1/37 | 207,069 | ||||
| 69,949 | Pool #257869, 5.50%, 12/1/37 | 76,865 | ||||
| 379,578 | Pool #257890, 5.50%, 2/1/38 | 414,852 | ||||
| 1,576,155 | Pool #257892, 5.50%, 2/1/38 | 1,718,933 | ||||
| 585,648 | Pool #257893, 6.00%, 2/1/38 | 645,265 | ||||
| 54,212 | Pool #257897, 5.50%, 2/1/38 | 59,571 | ||||
| 227,181 | Pool #257898, 6.00%, 2/1/38 | 251,053 | ||||
| 98,717 | Pool #257899, 5.00%, 2/1/38 | 107,154 | ||||
| 122,024 | Pool #257901, 5.50%, 2/1/38 | 133,363 | ||||
| 54,620 | Pool #257902, 6.00%, 2/1/38 | 60,735 | ||||
| 289,336 | Pool #257903, 5.50%, 2/1/38 | 315,410 | ||||
| 201,671 | Pool #257904, 6.00%, 2/1/38 | 222,862 | ||||
| 87,505 | Pool #257913, 5.50%, 1/1/38 | 95,855 | ||||
| 113,094 | Pool #257919, 6.00%, 2/1/38 | 124,978 | ||||
| 213,527 | Pool #257926, 5.50%, 3/1/38 | 233,369 | ||||
| 299,497 | Pool #257942, 5.50%, 4/1/38 | 327,329 | ||||
10
SCHEDULE OF PORTFOLIO INVESTMENTS |
Access Capital Community Investment Fund (cont.)
September 30, 2011
Principal Amount | Value | |||||
| $104,092 | Pool #257943, 6.00%, 4/1/38 | $115,322 | ||||
| 98,166 | Pool #257973, 5.00%, 5/1/38 | 106,710 | ||||
| 83,859 | Pool #257995, 6.00%, 7/1/38 | 93,025 | ||||
| 72,098 | Pool #258022, 5.50%, 5/1/34 | 78,606 | ||||
| 97,323 | Pool #258027, 5.00%, 5/1/34 | 104,972 | ||||
| 114,241 | Pool #258030, 5.00%, 5/1/34 | 123,219 | ||||
| 44,084 | Pool #258031, 5.00%, 5/1/34 | 47,548 | ||||
| 47,451 | Pool #258051, 5.00%, 5/1/34 | 51,180 | ||||
| 262,952 | Pool #258070, 5.00%, 6/1/34 | 284,769 | ||||
| 161,923 | Pool #258090, 5.00%, 6/1/34 | 174,649 | ||||
| 57,787 | Pool #258093, 5.50%, 6/1/34 | 63,004 | ||||
| 49,083 | Pool #258121, 5.50%, 6/1/34 | 53,514 | ||||
| 162,962 | Pool #258152, 5.50%, 8/1/34 | 177,648 | ||||
| 449,725 | Pool #258157, 5.00%, 8/1/34 | 485,071 | ||||
| 189,008 | Pool #258163, 5.50%, 8/1/34 | 206,218 | ||||
| 135,170 | Pool #258166, 5.50%, 9/1/34 | 147,351 | ||||
| 84,448 | Pool #258171, 5.50%, 10/1/34 | 92,058 | ||||
| 426,332 | Pool #258173, 5.50%, 10/1/34 | 464,752 | ||||
| 294,239 | Pool #258180, 5.00%, 10/1/34 | 317,319 | ||||
| 83,500 | Pool #258185, 5.50%, 10/1/34 | 91,024 | ||||
| 85,255 | Pool #258186, 5.50%, 11/1/34 | 92,938 | ||||
| 142,171 | Pool #258187, 5.50%, 11/1/34 | 154,983 | ||||
| 620,687 | Pool #258188, 5.50%, 11/1/34 | 677,204 | ||||
| 218,919 | Pool #258198, 5.50%, 10/1/34 | 238,648 | ||||
| 91,829 | Pool #258199, 5.50%, 9/1/34 | 100,104 | ||||
| 228,947 | Pool #258203, 5.50%, 10/1/34 | 249,579 | ||||
| 149,772 | Pool #258210, 5.50%, 11/1/34 | 163,269 | ||||
| 108,010 | Pool #258221, 5.50%, 11/1/34 | 117,744 | ||||
| 47,083 | Pool #258222, 5.00%, 11/1/34 | 50,776 | ||||
| 131,149 | Pool #258224, 5.50%, 12/1/34 | 142,967 | ||||
| 140,229 | Pool #258225, 5.50%, 11/1/34 | 152,866 | ||||
| 108,827 | Pool #258236, 5.00%, 12/1/34 | 117,363 | ||||
| 772,572 | Pool #258238, 5.00%, 1/1/35 | 833,171 | ||||
| 44,029 | Pool #258245, 5.50%, 12/1/34 | 47,997 | ||||
| 110,755 | Pool #258249, 5.00%, 12/1/34 | 119,442 | ||||
| 149,695 | Pool #258251, 5.50%, 1/1/35 | 163,302 | ||||
| 51,880 | Pool #258252, 5.50%, 12/1/34 | 56,555 | ||||
| 223,826 | Pool #258254, 5.50%, 12/1/34 | 243,996 | ||||
| 133,348 | Pool #258258, 5.00%, 1/1/35 | 143,787 | ||||
| 135,577 | Pool #258301, 5.50%, 2/1/35 | 147,774 | ||||
| 189,292 | Pool #258302, 5.00%, 3/1/35 | 204,702 | ||||
| 81,241 | Pool #258303, 5.00%, 2/1/35 | 87,601 | ||||
| 396,916 | Pool #258305, 5.00%, 3/1/35 | 427,987 | ||||
| 80,684 | Pool #258312, 5.50%, 2/1/35 | 87,943 | ||||
| 312,564 | Pool #258324, 5.50%, 4/1/35 | 340,683 | ||||
| 380,160 | Pool #258333, 5.00%, 4/1/35 | 409,919 | ||||
| 334,950 | Pool #258336, 5.00%, 4/1/35 | 361,171 | ||||
| 251,717 | Pool #258339, 5.00%, 4/1/35 | 271,422 | ||||
11
SCHEDULE OF PORTFOLIO INVESTMENTS |
Access Capital Community Investment Fund (cont.)
September 30, 2011
Principal Amount | Value | |||||
| $ 73,752 | Pool #258340, 5.00%, 3/1/35 | $ 79,525 | ||||
| 98,477 | Pool #258342, 5.00%, 4/1/35 | 106,186 | ||||
| 227,128 | Pool #258346, 5.00%, 3/1/35 | 244,908 | ||||
| 614,790 | Pool #258347, 5.00%, 4/1/35 | 662,916 | ||||
| 122,395 | Pool #258388, 5.50%, 6/1/35 | 133,367 | ||||
| 67,204 | Pool #258392, 5.00%, 6/1/35 | 72,454 | ||||
| 403,034 | Pool #258393, 5.00%, 5/1/35 | 434,584 | ||||
| 265,800 | Pool #258394, 5.00%, 5/1/35 | 286,607 | ||||
| 388,939 | Pool #258395, 5.50%, 6/1/35 | 423,806 | ||||
| 75,083 | Pool #258402, 5.00%, 6/1/35 | 81,148 | ||||
| 72,364 | Pool #258403, 5.00%, 6/1/35 | 78,018 | ||||
| 97,414 | Pool #258404, 5.00%, 6/1/35 | 105,025 | ||||
| 83,979 | Pool #258406, 5.50%, 5/1/35 | 91,534 | ||||
| 41,153 | Pool #258408, 5.00%, 5/1/34 | 44,555 | ||||
| 93,916 | Pool #258409, 5.00%, 5/1/35 | 101,678 | ||||
| 56,306 | Pool #258410, 5.00%, 4/1/35 | 60,714 | ||||
| 116,670 | Pool #258411, 5.50%, 5/1/35 | 127,165 | ||||
| 154,339 | Pool #258422, 5.00%, 6/1/35 | 166,396 | ||||
| 89,160 | Pool #258439, 5.50%, 6/1/35 | 97,237 | ||||
| 389,265 | Pool #258448, 5.00%, 8/1/35 | 419,676 | ||||
| 394,651 | Pool #258450, 5.50%, 8/1/35 | 430,031 | ||||
| 54,546 | Pool #258451, 5.50%, 7/1/35 | 59,488 | ||||
| 157,835 | Pool #258454, 5.50%, 7/1/35 | 171,985 | ||||
| 108,231 | Pool #258456, 5.00%, 8/1/35 | 116,687 | ||||
| 549,608 | Pool #258460, 5.00%, 8/1/35 | 592,546 | ||||
| 159,724 | Pool #258470, 5.00%, 7/1/35 | 172,203 | ||||
| 93,690 | Pool #258479, 5.50%, 7/1/35 | 102,089 | ||||
| 261,190 | Pool #258552, 5.00%, 11/1/35 | 282,738 | ||||
| 121,149 | Pool #258562, 5.50%, 11/1/35 | 131,972 | ||||
| 111,258 | Pool #258569, 5.00%, 10/1/35 | 119,950 | ||||
| 775,087 | Pool #258571, 5.50%, 11/1/35 | 845,299 | ||||
| 157,722 | Pool #258595, 5.50%, 12/1/35 | 171,812 | ||||
| 98,884 | Pool #258599, 5.50%, 1/1/36 | 107,811 | ||||
| 258,214 | Pool #258600, 6.00%, 1/1/36 | 284,742 | ||||
| 640,835 | Pool #258627, 5.50%, 2/1/36 | 698,085 | ||||
| 307,237 | Pool #258634, 5.50%, 2/1/36 | 334,684 | ||||
| 527,054 | Pool #258644, 5.50%, 2/1/36 | 574,797 | ||||
| 94,865 | Pool #258650, 5.50%, 1/1/36 | 103,340 | ||||
| 461,122 | Pool #258658, 5.50%, 3/1/36 | 502,317 | ||||
| 191,284 | Pool #258721, 5.50%, 4/1/36 | 208,372 | ||||
| 144,805 | Pool #258736, 5.00%, 3/1/36 | 156,095 | ||||
| 131,780 | Pool #258737, 5.50%, 12/1/35 | 143,429 | ||||
| 87,654 | Pool #258763, 6.00%, 5/1/36 | 96,441 | ||||
| 218,076 | Pool #258779, 6.00%, 5/1/36 | 239,934 | ||||
| 52,393 | Pool #259004, 8.00%, 2/1/30 | 60,450 | ||||
| 36,276 | Pool #259011, 8.00%, 3/1/30 | 41,854 | ||||
| 61,732 | Pool #259030, 8.00%, 4/1/30 | 71,066 | ||||
| 105,752 | Pool #259181, 6.50%, 3/1/31 | 117,632 | ||||
12
SCHEDULE OF PORTFOLIO INVESTMENTS |
Access Capital Community Investment Fund (cont.)
September 30, 2011
Principal Amount | Value | |||||
| $108,153 | Pool #259187, 6.50%, 4/1/31 | $119,844 | ||||
| 88,752 | Pool #259190, 6.50%, 4/1/31 | 98,696 | ||||
| 139,923 | Pool #259201, 6.50%, 4/1/31 | 155,592 | ||||
| 38,508 | Pool #259284, 6.50%, 8/1/31 | 42,829 | ||||
| 43,577 | Pool #259306, 6.50%, 9/1/31 | 48,418 | ||||
| 84,893 | Pool #259309, 6.50%, 10/1/31 | 94,417 | ||||
| 213,788 | Pool #259316, 6.50%, 11/1/31 | 237,750 | ||||
| 170,081 | Pool #259327, 6.00%, 11/1/31 | 187,995 | ||||
| 116,141 | Pool #259369, 6.00%, 1/1/32 | 128,149 | ||||
| 77,681 | Pool #259372, 6.00%, 1/1/32 | 85,894 | ||||
| 70,765 | Pool #259376, 6.00%, 1/1/32 | 78,068 | ||||
| 38,817 | Pool #259378, 6.00%, 12/1/31 | 42,897 | ||||
| 86,143 | Pool #259391, 6.00%, 1/1/32 | 95,259 | ||||
| 95,063 | Pool #259392, 6.50%, 1/1/32 | 105,740 | ||||
| 109,340 | Pool #259393, 6.00%, 1/1/32 | 120,898 | ||||
| 51,835 | Pool #259398, 6.50%, 2/1/32 | 57,660 | ||||
| 81,025 | Pool #259440, 6.50%, 4/1/32 | 89,915 | ||||
| 95,889 | Pool #259560, 6.00%, 9/1/32 | 106,247 | ||||
| 128,369 | Pool #259590, 5.50%, 11/1/32 | 140,018 | ||||
| 41,593 | Pool #259599, 6.00%, 10/1/32 | 45,567 | ||||
| 99,214 | Pool #259607, 5.50%, 11/1/32 | 108,217 | ||||
| 64,078 | Pool #259610, 5.50%, 11/1/32 | 69,893 | ||||
| 274,451 | Pool #259611, 5.50%, 11/1/32 | 299,355 | ||||
| 76,537 | Pool #259612, 5.50%, 11/1/32 | 83,482 | ||||
| 217,111 | Pool #259614, 6.00%, 11/1/32 | 240,424 | ||||
| 97,865 | Pool #259634, 5.50%, 12/1/32 | 106,731 | ||||
| 73,083 | Pool #259655, 5.50%, 2/1/33 | 79,703 | ||||
| 169,823 | Pool #259659, 5.50%, 2/1/33 | 185,206 | ||||
| 164,444 | Pool #259667, 5.50%, 2/1/33 | 179,341 | ||||
| 40,539 | Pool #259671, 5.50%, 2/1/33 | 44,211 | ||||
| 169,832 | Pool #259686, 5.50%, 3/1/33 | 185,217 | ||||
| 49,305 | Pool #259722, 5.00%, 5/1/33 | 53,187 | ||||
| 148,785 | Pool #259723, 5.00%, 5/1/33 | 160,502 | ||||
| 60,624 | Pool #259724, 5.00%, 5/1/33 | 65,399 | ||||
| 277,333 | Pool #259725, 5.00%, 5/1/33 | 299,172 | ||||
| 76,248 | Pool #259726, 5.00%, 5/1/33 | 82,252 | ||||
| 130,578 | Pool #259729, 5.00%, 6/1/33 | 140,861 | ||||
| 165,104 | Pool #259731, 5.00%, 6/1/33 | 178,105 | ||||
| 137,643 | Pool #259733, 5.50%, 6/1/33 | 150,112 | ||||
| 77,596 | Pool #259734, 5.50%, 5/1/33 | 84,625 | ||||
| 128,717 | Pool #259748, 5.00%, 6/1/33 | 138,854 | ||||
| 196,728 | Pool #259753, 5.00%, 7/1/33 | 212,220 | ||||
| 78,494 | Pool #259757, 5.00%, 6/1/33 | 84,676 | ||||
| 437,158 | Pool #259761, 5.00%, 6/1/33 | 473,497 | ||||
| 275,642 | Pool #259764, 5.00%, 7/1/33 | 297,348 | ||||
| 124,685 | Pool #259765, 5.00%, 7/1/33 | 134,504 | ||||
| 86,321 | Pool #259776, 5.00%, 6/1/33 | 93,119 | ||||
| 149,463 | Pool #259777, 5.00%, 7/1/33 | 161,233 | ||||
13
SCHEDULE OF PORTFOLIO INVESTMENTS |
Access Capital Community Investment Fund (cont.)
September 30, 2011
Principal Amount | Value | |||||
| $ 166,925 | Pool #259779, 5.00%, 7/1/33 | $ 180,071 | ||||
| 101,036 | Pool #259781, 5.00%, 7/1/33 | 108,992 | ||||
| 61,720 | Pool #259789, 5.00%, 7/1/33 | 66,581 | ||||
| 113,455 | Pool #259807, 5.00%, 8/1/33 | 122,390 | ||||
| 653,146 | Pool #259816, 5.00%, 8/1/33 | 704,581 | ||||
| 34,260 | Pool #259819, 5.00%, 8/1/33 | 36,958 | ||||
| 89,092 | Pool #259820, 5.00%, 8/1/33 | 96,109 | ||||
| 246,733 | Pool #259821, 5.00%, 7/1/33 | 266,665 | ||||
| 448,388 | Pool #259830, 5.00%, 8/1/33 | 484,610 | ||||
| 298,109 | Pool #259848, 5.00%, 9/1/33 | 321,585 | ||||
| 132,869 | Pool #259862, 5.50%, 9/1/33 | 144,905 | ||||
| 87,809 | Pool #259867, 5.50%, 10/1/33 | 95,846 | ||||
| 273,461 | Pool #259869, 5.50%, 10/1/33 | 298,232 | ||||
| 98,156 | Pool #259872, 5.50%, 11/1/33 | 107,032 | ||||
| 40,248 | Pool #259873, 5.50%, 10/1/33 | 43,888 | ||||
| 141,447 | Pool #259875, 5.50%, 10/1/33 | 154,260 | ||||
| 85,416 | Pool #259876, 5.50%, 10/1/33 | 93,140 | ||||
| 153,719 | Pool #259879, 5.50%, 10/1/33 | 167,644 | ||||
| 126,922 | Pool #259884, 5.50%, 11/1/33 | 138,399 | ||||
| 39,995 | Pool #259904, 5.50%, 11/1/33 | 43,612 | ||||
| 307,595 | Pool #259906, 5.50%, 11/1/33 | 335,459 | ||||
| 119,728 | Pool #259908, 5.50%, 11/1/33 | 130,555 | ||||
| 106,321 | Pool #259926, 5.50%, 12/1/33 | 115,935 | ||||
| 61,876 | Pool #259928, 5.50%, 12/1/33 | 67,529 | ||||
| 228,933 | Pool #259930, 5.00%, 11/1/33 | 246,961 | ||||
| 93,543 | Pool #259936, 5.50%, 11/1/33 | 102,003 | ||||
| 221,534 | Pool #259938, 5.50%, 12/1/33 | 241,568 | ||||
| 16,513 | Pool #259939, 5.50%, 11/1/33 | 18,006 | ||||
| 105,297 | Pool #259946, 5.50%, 12/1/33 | 114,819 | ||||
| 186,993 | Pool #259961, 5.50%, 3/1/34 | 203,903 | ||||
| 214,766 | Pool #259976, 5.00%, 3/1/34 | 232,585 | ||||
| 140,532 | Pool #259977, 5.00%, 3/1/34 | 151,577 | ||||
| 46,917 | Pool #259998, 5.00%, 3/1/34 | 50,604 | ||||
| 716,439 | Pool #380307, 6.53%, 6/1/16 | 751,858 | ||||
| 600,855 | Pool #381985, 7.97%, 9/1/17 | 666,312 | ||||
| 549,013 | Pool #382373, 7.58%, 5/1/18 | 648,046 | ||||
| 595,185 | Pool #383765, 6.70%, 6/1/19 | 692,414 | ||||
| 2,329,177 | Pool #386602, 4.66%, 10/1/13 | 2,471,701 | ||||
| 4,535,418 | Pool #386608, 5.37%, 11/1/21 | 4,976,910 | ||||
| 2,638,384 | Pool #386641, 5.80%, 12/1/33 | 3,027,299 | ||||
| 696,388 | Pool #386674, 5.51%, 11/1/21 | 761,865 | ||||
| 3,556,603 | Pool #387374, 5.60%, 5/1/23 | 4,107,331 | ||||
| 870,976 | Pool #387446, 5.22%, 6/1/20 | 997,905 | ||||
| 906,634 | Pool #387472, 4.89%, 6/1/15 | 998,965 | ||||
| 9,169,020 | Pool #387590, 4.90%, 9/1/15 | 10,153,363 | ||||
| 634,742 | Pool #462834, 4.70%, 2/1/17 | 685,467 | ||||
| 10,243,635 | Pool #463212, 4.68%, 8/1/19 | 11,613,630 | ||||
| 7,611,046 | Pool #465537, 4.20%, 7/1/20 | 8,359,572 | ||||
14
SCHEDULE OF PORTFOLIO INVESTMENTS |
Access Capital Community Investment Fund (cont.)
September 30, 2011
Principal Amount | Value | |||||
| $ 749,741 | Pool #465946, 3.61%, 9/1/20 | $ 793,668 | ||||
| 7,512,255 | Pool #466303, 3.54%, 11/1/20 | 7,914,897 | ||||
| 10,936,665 | Pool #466934, 4.10%, 1/1/21 | 11,948,015 | ||||
| 3,463,648 | Pool #467882, 4.24%, 6/1/21 | 3,814,778 | ||||
| 2,490,666 | Pool #468104, 3.93%, 5/1/18 | 2,696,911 | ||||
| 252,792 | Pool #557295, 7.00%, 12/1/29 | 285,823 | ||||
| 34,432 | Pool #575886, 7.50%, 1/1/31 | 39,553 | ||||
| 94,499 | Pool #576445, 6.00%, 1/1/31 | 104,174 | ||||
| 28,714 | Pool #576520, 5.50%, 3/1/16 | 31,134 | ||||
| 53,090 | Pool #577906, 6.50%, 4/1/31 | 58,899 | ||||
| 198,515 | Pool #579402, 6.50%, 4/1/31 | 220,833 | ||||
| 205,471 | Pool #583728, 6.50%, 6/1/31 | 228,336 | ||||
| 223,971 | Pool #585148, 6.50%, 7/1/31 | 248,857 | ||||
| 70,684 | Pool #590931, 6.50%, 7/1/31 | 78,598 | ||||
| 80,188 | Pool #590932, 6.50%, 7/1/31 | 89,161 | ||||
| 59,491 | Pool #591063, 6.50%, 7/1/31 | 66,170 | ||||
| 286,361 | Pool #601865, 6.50%, 4/1/31 | 319,749 | ||||
| 155,712 | Pool #601868, 6.00%, 7/1/29 | 171,509 | ||||
| 264,014 | Pool #607611, 6.50%, 11/1/31 | 293,530 | ||||
| 128,871 | Pool #613125, 6.50%, 10/1/31 | 143,301 | ||||
| 429,107 | Pool #634271, 6.50%, 5/1/32 | 477,937 | ||||
| 192,499 | Pool #640146, 5.00%, 12/1/17 | 206,808 | ||||
| 152,999 | Pool #644232, 6.50%, 6/1/32 | 170,471 | ||||
| 32,360 | Pool #644432, 6.50%, 7/1/32 | 36,021 | ||||
| 52,097 | Pool #644437, 6.50%, 6/1/32 | 58,045 | ||||
| 103,462 | Pool #647461, 6.00%, 6/1/32 | 114,433 | ||||
| 118,354 | Pool #657250, 6.00%, 10/1/32 | 131,106 | ||||
| 4,283,309 | Pool #663159, 5.00%, 7/1/32 | 4,621,958 | ||||
| 194,227 | Pool #670278, 5.50%, 11/1/32 | 211,852 | ||||
| 58,400 | Pool #676702, 5.50%, 11/1/32 | 63,699 | ||||
| 63,581 | Pool #677591, 5.50%, 12/1/32 | 69,341 | ||||
| 297,464 | Pool #681819, 5.50%, 1/1/33 | 324,410 | ||||
| 889,520 | Pool #681883, 6.00%, 3/1/33 | 985,297 | ||||
| 252,975 | Pool #683087, 5.00%, 1/1/18 | 271,780 | ||||
| 324,511 | Pool #684570, 5.00%, 12/1/32 | 350,117 | ||||
| 156,450 | Pool #684644, 4.50%, 6/1/18 | 166,552 | ||||
| 427,403 | Pool #686542, 5.50%, 3/1/33 | 466,120 | ||||
| 377,561 | Pool #686565, 5.50%, 4/1/33 | 411,763 | ||||
| 188,719 | Pool #689034, 5.00%, 5/1/33 | 203,581 | ||||
| 172,113 | Pool #689667, 5.50%, 4/1/33 | 187,704 | ||||
| 732,942 | Pool #695961, 5.50%, 1/1/33 | 799,450 | ||||
| 157,476 | Pool #695962, 6.00%, 11/1/32 | 174,401 | ||||
| 479,841 | Pool #696407, 5.50%, 4/1/33 | 523,308 | ||||
| 1,383,296 | Pool #702478, 5.50%, 6/1/33 | 1,508,603 | ||||
| 523,115 | Pool #702479, 5.00%, 6/1/33 | 564,310 | ||||
| 389,531 | Pool #703210, 5.50%, 9/1/32 | 423,232 | ||||
| 216,679 | Pool #705576, 5.50%, 5/1/33 | 236,308 | ||||
| 1,156,189 | Pool #720025, 5.00%, 8/1/33 | 1,247,239 | ||||
15
SCHEDULE OF PORTFOLIO INVESTMENTS |
Access Capital Community Investment Fund (cont.)
September 30, 2011
Principal Amount | Value | |||||
| $ 899,843 | Pool #723066, 5.00%, 4/1/33 | $ 970,847 | ||||
| 414,161 | Pool #723067, 5.50%, 5/1/33 | 451,678 | ||||
| 477,441 | Pool #723068, 4.50%, 5/1/33 | 510,209 | ||||
| 515,543 | Pool #723070, 4.50%, 5/1/33 | 550,604 | ||||
| 388,037 | Pool #723328, 5.00%, 9/1/33 | 418,594 | ||||
| 744,097 | Pool #727311, 4.50%, 9/1/33 | 794,469 | ||||
| 2,356,186 | Pool #727312, 5.00%, 9/1/33 | 2,541,735 | ||||
| 432,898 | Pool #727315, 6.00%, 10/1/33 | 480,077 | ||||
| 1,222,388 | Pool #738589, 5.00%, 9/1/33 | 1,318,651 | ||||
| 424,767 | Pool #738683, 5.00%, 9/1/33 | 458,217 | ||||
| 666,968 | Pool #739269, 5.00%, 9/1/33 | 719,491 | ||||
| 286,048 | Pool #743595, 5.50%, 10/1/33 | 311,960 | ||||
| 296,140 | Pool #748041, 4.50%, 10/1/33 | 316,187 | ||||
| 832,781 | Pool #749891, 5.00%, 9/1/33 | 902,005 | ||||
| 572,354 | Pool #749897, 4.50%, 9/1/33 | 611,100 | ||||
| 286,261 | Pool #750984, 5.00%, 12/1/18 | 307,540 | ||||
| 342,846 | Pool #751008, 5.00%, 12/1/18 | 369,870 | ||||
| 483,474 | Pool #753533, 5.00%, 11/1/33 | 521,547 | ||||
| 197,097 | Pool #755679, 6.00%, 1/1/34 | 218,578 | ||||
| 220,042 | Pool #755745, 5.00%, 1/1/34 | 237,370 | ||||
| 192,411 | Pool #755746, 5.50%, 12/1/33 | 209,811 | ||||
| 284,290 | Pool #763551, 5.50%, 3/1/34 | 309,998 | ||||
| 1,101,170 | Pool #763820, 5.50%, 1/1/34 | 1,200,749 | ||||
| 415,127 | Pool #763824, 5.00%, 3/1/34 | 447,819 | ||||
| 423,892 | Pool #765216, 5.00%, 1/1/19 | 457,598 | ||||
| 281,602 | Pool #765217, 4.50%, 1/1/19 | 300,609 | ||||
| 328,461 | Pool #765306, 5.00%, 2/1/19 | 354,329 | ||||
| 152,016 | Pool #773084, 4.50%, 3/1/19 | 161,832 | ||||
| 159,860 | Pool #773091, 4.00%, 3/1/19 | 169,907 | ||||
| 204,736 | Pool #773096, 4.50%, 3/1/19 | 218,892 | ||||
| 623,061 | Pool #773175, 5.00%, 5/1/34 | 672,029 | ||||
| 447,477 | Pool #773476, 5.50%, 7/1/19 | 486,317 | ||||
| 278,833 | Pool #773547, 5.00%, 5/1/34 | 300,748 | ||||
| 659,098 | Pool #773553, 5.00%, 4/1/34 | 710,899 | ||||
| 944,025 | Pool #773568, 5.50%, 5/1/34 | 1,029,245 | ||||
| 250,032 | Pool #773575, 6.00%, 7/1/34 | 276,891 | ||||
| 353,310 | Pool #776849, 5.00%, 11/1/34 | 381,022 | ||||
| 569,501 | Pool #776850, 5.50%, 11/1/34 | 620,823 | ||||
| 295,112 | Pool #776851, 6.00%, 10/1/34 | 326,260 | ||||
| 648,998 | Pool #777444, 5.50%, 5/1/34 | 707,585 | ||||
| 2,652,804 | Pool #777621, 5.00%, 2/1/34 | 2,861,712 | ||||
| 456,015 | Pool #781437, 6.00%, 8/1/34 | 505,002 | ||||
| 402,353 | Pool #781741, 6.00%, 9/1/34 | 444,820 | ||||
| 478,512 | Pool #781907, 5.00%, 2/1/21 | 517,073 | ||||
| 511,953 | Pool #781954, 5.00%, 6/1/34 | 552,189 | ||||
| 560,478 | Pool #781959, 5.50%, 6/1/34 | 611,075 | ||||
| 448,017 | Pool #781960, 5.50%, 6/1/34 | 488,461 | ||||
| 525,241 | Pool #783893, 5.50%, 12/1/34 | 572,575 | ||||
16
SCHEDULE OF PORTFOLIO INVESTMENTS |
Access Capital Community Investment Fund (cont.)
September 30, 2011
Principal Amount | Value | |||||
| $ 633,931 | Pool #783929, 5.50%, 10/1/34 | $ 691,059 | ||||
| 195,805 | Pool #788329, 6.50%, 8/1/34 | 217,221 | ||||
| 175,717 | Pool #790282, 6.00%, 7/1/34 | 194,593 | ||||
| 382,689 | Pool #797623, 5.00%, 7/1/35 | 412,586 | ||||
| 168,363 | Pool #797626, 5.50%, 7/1/35 | 183,456 | ||||
| 145,635 | Pool #797627, 5.00%, 7/1/35 | 157,013 | ||||
| 137,097 | Pool #797674, 5.50%, 9/1/35 | 149,387 | ||||
| 698,599 | Pool #798725, 5.50%, 11/1/34 | 761,554 | ||||
| 448,017 | Pool #799547, 5.50%, 9/1/34 | 488,391 | ||||
| 126,446 | Pool #799548, 6.00%, 9/1/34 | 139,792 | ||||
| 2,819,960 | Pool #806754, 4.50%, 9/1/34 | 3,009,096 | ||||
| 729,229 | Pool #806757, 6.00%, 9/1/34 | 806,197 | ||||
| 3,699,142 | Pool #806761, 5.50%, 9/1/34 | 4,033,076 | ||||
| 366,417 | Pool #808185, 5.50%, 3/1/35 | 399,380 | ||||
| 875,043 | Pool #808205, 5.00%, 1/1/35 | 943,543 | ||||
| 95,876 | Pool #813942, 5.00%, 11/1/20 | 103,633 | ||||
| 884,741 | Pool #815009, 5.00%, 4/1/35 | 954,000 | ||||
| 1,029,001 | Pool #817641, 5.00%, 11/1/35 | 1,109,392 | ||||
| 339,981 | Pool #820334, 5.00%, 9/1/35 | 366,542 | ||||
| 630,129 | Pool #820335, 5.00%, 9/1/35 | 679,358 | ||||
| 683,007 | Pool #820336, 5.00%, 9/1/35 | 736,367 | ||||
| 591,360 | Pool #822008, 5.00%, 5/1/35 | 637,653 | ||||
| 1,703,672 | Pool #829005, 5.00%, 8/1/35 | 1,836,772 | ||||
| 216,535 | Pool #829006, 5.50%, 9/1/35 | 235,947 | ||||
| 317,483 | Pool #829007, 4.50%, 8/1/35 | 338,281 | ||||
| 97,240 | Pool #829117, 5.50%, 9/1/35 | 106,049 | ||||
| 86,512 | Pool #829118, 5.50%, 9/1/35 | 94,267 | ||||
| 565,808 | Pool #829274, 5.00%, 8/1/35 | 610,012 | ||||
| 1,264,070 | Pool #829275, 5.00%, 8/1/35 | 1,362,825 | ||||
| 783,488 | Pool #829276, 5.00%, 8/1/35 | 844,698 | ||||
| 756,970 | Pool #829277, 5.00%, 8/1/35 | 816,109 | ||||
| 207,421 | Pool #829356, 5.00%, 9/1/35 | 224,533 | ||||
| 1,530,137 | Pool #829649, 5.50%, 3/1/35 | 1,668,028 | ||||
| 650,609 | Pool #835287, 5.00%, 8/1/35 | 701,438 | ||||
| 91,338 | Pool #843586, 5.50%, 11/1/35 | 99,498 | ||||
| 263,880 | Pool #843587, 6.00%, 12/1/35 | 290,743 | ||||
| 1,919,346 | Pool #844361, 5.50%, 11/1/35 | 2,091,412 | ||||
| 795,478 | Pool #845245, 5.50%, 11/1/35 | 866,792 | ||||
| 868,722 | Pool #866969, 6.00%, 2/1/36 | 957,156 | ||||
| 351,506 | Pool #867569, 6.00%, 2/1/36 | 387,288 | ||||
| 352,527 | Pool #867574, 5.50%, 2/1/36 | 384,020 | ||||
| 347,254 | Pool #868788, 6.00%, 3/1/36 | 382,603 | ||||
| 409,912 | Pool #868849, 6.00%, 4/1/36 | 451,000 | ||||
| 318,462 | Pool #870599, 6.00%, 6/1/36 | 350,383 | ||||
| 175,873 | Pool #870684, 6.00%, 7/1/36 | 193,502 | ||||
| 742,564 | Pool #871072, 5.50%, 2/1/37 | 807,509 | ||||
| 751,620 | Pool #873819, 6.39%, 8/1/24 | 881,984 | ||||
| 747,236 | Pool #874253, 5.29%, 8/1/17 | 847,600 | ||||
17
SCHEDULE OF PORTFOLIO INVESTMENTS |
Access Capital Community Investment Fund (cont.)
September 30, 2011
Principal Amount | Value | |||||
| $3,197,869 | Pool #874900, 5.45%, 10/1/17 | $3,680,744 | ||||
| 442,250 | Pool #881425, 6.00%, 7/1/36 | 486,579 | ||||
| 580,277 | Pool #882044, 6.00%, 5/1/36 | 638,441 | ||||
| 527,282 | Pool #883589, 6.00%, 4/1/36 | 580,958 | ||||
| 290,845 | Pool #884693, 5.50%, 4/1/36 | 316,828 | ||||
| 2,634,274 | Pool #885724, 5.50%, 6/1/36 | 2,867,140 | ||||
| 522,302 | Pool #899800, 6.00%, 8/1/37 | 573,186 | ||||
| 163,582 | Pool #901412, 6.00%, 8/1/36 | 179,979 | ||||
| 260,149 | Pool #905438, 6.00%, 11/1/36 | 285,819 | ||||
| 670,054 | Pool #907646, 6.00%, 1/1/37 | 736,169 | ||||
| 297,200 | Pool #908671, 6.00%, 1/1/37 | 328,105 | ||||
| 1,107,267 | Pool #908672, 5.50%, 1/1/37 | 1,204,110 | ||||
| 843,199 | Pool #911730, 5.50%, 12/1/21 | 917,967 | ||||
| 454,303 | Pool #919368, 5.50%, 4/1/37 | 495,172 | ||||
| 987,417 | Pool #922582, 6.00%, 12/1/36 | 1,085,773 | ||||
| 1,848,898 | Pool #934941, 5.00%, 8/1/39 | 1,997,098 | ||||
| 1,117,224 | Pool #934942, 5.00%, 9/1/39 | 1,201,191 | ||||
| 1,073,155 | Pool #941204, 5.50%, 6/1/37 | 1,169,697 | ||||
| 439,445 | Pool #941205, 5.00%, 5/1/37 | 473,296 | ||||
| 346,081 | Pool #941206, 5.50%, 5/1/37 | 375,917 | ||||
| 263,060 | Pool #941487, 6.00%, 8/1/37 | 290,414 | ||||
| 675,793 | Pool #943394, 5.50%, 6/1/37 | 737,855 | ||||
| 1,323,033 | Pool #944502, 6.00%, 6/1/37 | 1,452,752 | ||||
| 286,434 | Pool #945853, 6.00%, 7/1/37 | 315,592 | ||||
| 720,624 | Pool #948600, 6.00%, 8/1/37 | 790,828 | ||||
| 709,882 | Pool #948672, 5.50%, 8/1/37 | 771,303 | ||||
| 1,175,000 | Pool #952598, 6.00%, 7/1/37 | 1,297,181 | ||||
| 596,552 | Pool #952623, 6.00%, 8/1/37 | 655,043 | ||||
| 1,674,025 | Pool #952632, 6.00%, 7/1/37 | 1,838,158 | ||||
| 433,975 | Pool #952649, 6.00%, 7/1/37 | 476,524 | ||||
| 1,010,009 | Pool #952659, 6.00%, 8/1/37 | 1,109,037 | ||||
| 371,587 | Pool #952665, 6.00%, 8/1/37 | 409,297 | ||||
| 684,883 | Pool #952678, 6.50%, 8/1/37 | 755,619 | ||||
| 289,969 | Pool #952693, 6.50%, 8/1/37 | 319,329 | ||||
| 629,020 | Pool #956050, 6.00%, 12/1/37 | 690,300 | ||||
| 2,589,882 | Pool #957324, 5.43%, 5/1/18 | 2,984,823 | ||||
| 388,466 | Pool #958502, 5.07%, 5/1/19 | 443,097 | ||||
| 545,482 | Pool #959093, 5.50%, 11/1/37 | 594,554 | ||||
| 667,549 | Pool #960919, 5.00%, 2/1/38 | 718,971 | ||||
| 299,197 | Pool #965239, 5.84%, 9/1/38 | 330,431 | ||||
| 785,946 | Pool #975137, 5.00%, 5/1/38 | 845,261 | ||||
| 794,190 | Pool #975769, 5.50%, 3/1/38 | 862,037 | ||||
| 566,287 | Pool #982656, 5.50%, 6/1/38 | 615,107 | ||||
| 652,921 | Pool #982898, 5.00%, 5/1/38 | 705,257 | ||||
| 164,344 | Pool #983033, 5.00%, 5/1/38 | 177,004 | ||||
| 456,568 | Pool #984842, 5.50%, 6/1/38 | 497,926 | ||||
| 278,768 | Pool #986230, 5.00%, 7/1/38 | 303,029 | ||||
| 305,266 | Pool #986233, 5.00%, 6/1/38 | 328,782 | ||||
18
SCHEDULE OF PORTFOLIO INVESTMENTS |
Access Capital Community Investment Fund (cont.)
September 30, 2011
Principal Amount | Value | |||||
| $ 542,590 | Pool #986239, 6.00%, 7/1/38 | $ 597,824 | ||||
| 936,807 | Pool #986957, 5.50%, 7/1/38 | 1,016,692 | ||||
| 746,026 | Pool #986958, 5.50%, 7/1/38 | 813,605 | ||||
| 155,427 | Pool #986985, 5.00%, 7/1/23 | 168,001 | ||||
| 758,047 | Pool #990510, 5.50%, 8/1/38 | 822,688 | ||||
| 756,615 | Pool #990511, 6.00%, 8/1/38 | 830,090 | ||||
| 603,906 | Pool #990617, 5.50%, 9/1/38 | 655,403 | ||||
| 134,681 | Pool #AA0525, 5.50%, 12/1/38 | 146,797 | ||||
| 1,036,626 | Pool #AA0526, 5.00%, 12/1/38 | 1,120,365 | ||||
| 2,403,179 | Pool #AA0527, 5.50%, 12/1/38 | 2,619,371 | ||||
| 977,898 | Pool #AA0643, 4.00%, 3/1/39 | 1,027,213 | ||||
| 1,167,358 | Pool #AA0644, 4.50%, 3/1/39 | 1,239,816 | ||||
| 1,174,864 | Pool #AA0645, 4.50%, 3/1/39 | 1,254,764 | ||||
| 661,557 | Pool #AA0814, 5.50%, 12/1/38 | 721,072 | ||||
| 1,007,299 | Pool #AA2243, 4.50%, 5/1/39 | 1,071,081 | ||||
| 1,910,734 | Pool #AA3142, 4.50%, 3/1/39 | 2,038,888 | ||||
| 1,050,740 | Pool #AA3143, 4.00%, 3/1/39 | 1,102,743 | ||||
| 1,167,278 | Pool #AA3206, 4.00%, 4/1/39 | 1,226,873 | ||||
| 1,148,683 | Pool #AA3207, 4.50%, 3/1/39 | 1,221,418 | ||||
| 724,608 | Pool #AA4468, 4.00%, 4/1/39 | 761,603 | ||||
| 1,033,208 | Pool #AA7042, 4.50%, 6/1/39 | 1,098,631 | ||||
| 960,963 | Pool #AA7658, 4.00%, 6/1/39 | 1,011,827 | ||||
| 1,422,132 | Pool #AA7659, 4.50%, 6/1/39 | 1,514,848 | ||||
| 748,406 | Pool #AA7741, 4.50%, 6/1/24 | 802,344 | ||||
| 917,621 | Pool #AA8455, 4.50%, 6/1/39 | 977,446 | ||||
| 1,983,552 | Pool #AC1463, 5.00%, 8/1/39 | 2,132,628 | ||||
| 824,391 | Pool #AC1464, 5.00%, 8/1/39 | 887,894 | ||||
| 2,184,218 | Pool #AC2109, 4.50%, 7/1/39 | 2,319,110 | ||||
| 618,902 | Pool #AC4394, 5.00%, 9/1/39 | 665,417 | ||||
| 1,238,688 | Pool #AC4395, 5.00%, 9/1/39 | 1,347,266 | ||||
| 1,017,238 | Pool #AC5328, 5.00%, 10/1/39 | 1,105,452 | ||||
| 1,492,307 | Pool #AC5329, 5.00%, 10/1/39 | 1,611,925 | ||||
| 1,570,797 | Pool #AC6304, 5.00%, 11/1/39 | 1,696,707 | ||||
| 799,878 | Pool #AC6305, 5.00%, 11/1/39 | 864,744 | ||||
| 1,859,589 | Pool #AC6307, 5.00%, 12/1/39 | 2,008,646 | ||||
| 1,155,321 | Pool #AC6790, 5.00%, 12/1/39 | 1,255,509 | ||||
| 4,653,616 | Pool #AC7199, 5.00%, 12/1/39 | 5,026,632 | ||||
| 2,963,785 | Pool #AD1470, 5.00%, 2/1/40 | �� | 3,205,055 | |||
| 2,866,303 | Pool #AD1471, 4.50%, 2/1/40 | 3,060,338 | ||||
| 2,431,500 | Pool #AD1560, 5.00%, 3/1/40 | 2,626,399 | ||||
| 3,687,167 | Pool #AD1585, 4.50%, 2/1/40 | 3,936,771 | ||||
| 1,475,673 | Pool #AD1586, 5.00%, 1/1/40 | 1,595,802 | ||||
| 1,021,989 | Pool #AD1638, 4.50%, 2/1/40 | 1,084,785 | ||||
| 1,167,775 | Pool #AD1640, 4.50%, 3/1/40 | 1,245,368 | ||||
| 3,107,706 | Pool #AD1942, 4.50%, 1/1/40 | 3,318,083 | ||||
| 1,148,910 | Pool #AD1943, 5.00%, 1/1/40 | 1,242,438 | ||||
| 4,626,849 | Pool #AD1988, 4.50%, 2/1/40 | 4,940,065 | ||||
| 1,185,979 | Pool #AD2896, 5.00%, 3/1/40 | 1,289,567 | ||||
19
SCHEDULE OF PORTFOLIO INVESTMENTS |
Access Capital Community Investment Fund (cont.)
September 30, 2011
Principal Amount | Value | |||||
| $3,210,485 | Pool #AD4456, 4.50%, 4/1/40 | $3,423,807 | ||||
| 1,115,381 | Pool #AD4457, 4.50%, 4/1/40 | 1,186,007 | ||||
| 2,778,077 | Pool #AD4458, 4.50%, 4/1/40 | 2,948,777 | ||||
| 1,166,993 | Pool #AD4940, 4.50%, 6/1/40 | 1,247,087 | ||||
| 1,111,571 | Pool #AD4946, 4.50%, 6/1/40 | 1,179,872 | ||||
| 1,165,252 | Pool #AD5728, 5.00%, 4/1/40 | 1,267,030 | ||||
| 1,559,914 | Pool #AD7239, 4.50%, 7/1/40 | 1,666,975 | ||||
| 1,424,224 | Pool #AD7242, 4.50%, 7/1/40 | 1,518,857 | ||||
| 1,325,457 | Pool #AD7256, 4.50%, 7/1/40 | 1,416,427 | ||||
| 2,946,991 | Pool #AD7271, 4.50%, 7/1/40 | 3,142,805 | ||||
| 1,442,320 | Pool #AD7272, 4.50%, 7/1/40 | 1,541,310 | ||||
| 1,529,701 | Pool #AD8960, 5.00%, 6/1/40 | 1,654,706 | ||||
| 2,599,403 | Pool #AD9613, 4.50%, 8/1/40 | 2,772,121 | ||||
| 2,553,114 | Pool #AD9614, 4.50%, 8/1/40 | 2,709,991 | ||||
| 1,387,638 | Pool #AE2011, 4.00%, 9/1/40 | 1,458,484 | ||||
| 3,443,066 | Pool #AE2012, 4.00%, 9/1/40 | 3,612,395 | ||||
| 1,811,436 | Pool #AE2023, 4.00%, 9/1/40 | 1,900,522 | ||||
| 2,175,923 | Pool #AE5432, 4.00%, 10/1/40 | 2,282,934 | ||||
| 1,199,687 | Pool #AE5435, 4.50%, 9/1/40 | 1,273,402 | ||||
| 1,065,281 | Pool #AE5806, 4.50%, 9/1/40 | 1,138,394 | ||||
| 1,772,799 | Pool #AE5861, 4.00%, 10/1/40 | 1,859,985 | ||||
| 2,272,839 | Pool #AE5862, 4.00%, 10/1/40 | 2,393,140 | ||||
| 2,734,567 | Pool #AE5863, 4.00%, 10/1/40 | 2,879,306 | ||||
| 1,267,580 | Pool #AE6850, 4.00%, 10/1/40 | 1,329,919 | ||||
| 1,700,530 | Pool #AE6851, 4.00%, 10/1/40 | 1,784,162 | ||||
| 1,368,318 | Pool #AE7699, 4.00%, 11/1/40 | 1,435,611 | ||||
| 1,194,932 | Pool #AE7703, 4.00%, 10/1/40 | 1,253,699 | ||||
| 2,141,548 | Pool #AE7707, 4.00%, 11/1/40 | 2,246,869 | ||||
| 1,119,898 | Pool #AH0300, 4.00%, 11/1/40 | 1,174,974 | ||||
| 1,372,045 | Pool #AH0301, 3.50%, 11/1/40 | 1,411,063 | ||||
| 861,978 | Pool #AH0302, 4.00%, 11/1/40 | 904,370 | ||||
| 1,372,575 | Pool #AH0306, 4.00%, 12/1/40 | 1,445,225 | ||||
| 2,115,037 | Pool #AH0508, 4.00%, 11/1/40 | 2,219,054 | ||||
| 1,947,906 | Pool #AH0537, 4.00%, 12/1/40 | 2,047,356 | ||||
| 1,283,189 | Pool #AH0914, 4.50%, 11/1/40 | 1,362,035 | ||||
| 1,641,145 | Pool #AH0917, 4.00%, 12/1/40 | 1,721,856 | ||||
| 1,420,079 | Pool #AH1077, 4.00%, 1/1/41 | 1,497,462 | ||||
| 1,875,877 | Pool #AH2973, 4.00%, 12/1/40 | 1,968,132 | ||||
| 2,408,624 | Pool #AH2980, 4.00%, 1/1/41 | 2,527,080 | ||||
| 1,668,617 | Pool #AH5656, 4.00%, 1/1/41 | 1,753,808 | ||||
| 1,244,091 | Pool #AH5657, 4.00%, 2/1/41 | 1,305,275 | ||||
| 2,591,973 | Pool #AH5658, 4.00%, 2/1/41 | 2,719,446 | ||||
| 1,103,407 | Pool #AH5662, 4.00%, 2/1/41 | 1,157,672 | ||||
| 2,299,709 | Pool #AH5882, 4.00%, 2/1/26 | 2,425,564 | ||||
| 1,619,536 | Pool #AH6764, 4.00%, 3/1/41 | 1,699,184 | ||||
| 3,701,788 | Pool #AH6768, 4.00%, 3/1/41 | 3,883,841 | ||||
| 1,630,357 | Pool #AH7277, 4.00%, 3/1/41 | 1,716,651 | ||||
| 2,322,613 | Pool #AH7281, 4.00%, 3/1/41 | 2,445,548 | ||||
20
SCHEDULE OF PORTFOLIO INVESTMENTS |
Access Capital Community Investment Fund (cont.)
September 30, 2011
Principal Amount | Value | |||||
| $ 1,123,753 | Pool #AH7526, 4.50%, 3/1/41(d) | $ 1,198,421 | ||||
| 3,135,736 | Pool #AH7537, 4.00%, 3/1/41 | 3,301,710 | ||||
| 1,046,755 | Pool #AH7576, 4.00%, 3/1/41 | 1,098,234 | ||||
| 2,175,854 | Pool #AH8878, 4.50%, 4/1/41 | 2,310,230 | ||||
| 1,273,266 | Pool #AH8885, 4.50%, 4/1/41 | 1,351,502 | ||||
| 2,034,945 | Pool #AH9050, 3.50%, 2/1/26 | 2,126,915 | ||||
| 1,296,994 | Pool #AI0114, 4.00%, 3/1/41 | 1,365,644 | ||||
| 2,777,910 | Pool #AI1846, 4.50%, 5/1/41 | 2,949,468 | ||||
| 1,272,961 | Pool #AI1847, 4.50%, 5/1/41 | 1,351,576 | ||||
| 2,771,800 | Pool #AI1848, 4.50%, 5/1/41 | 2,942,980 | ||||
| 1,673,333 | Pool #AI1849, 4.50%, 5/1/41 | 1,779,812 | ||||
| 1,017,818 | Pool #AJ0651, 4.00%, 8/1/41 | 1,067,874 | ||||
| 478,823 | Pool #MC0007, 5.50%, 12/1/38 | 521,899 | ||||
| 126,895 | Pool #MC0013, 5.50%, 12/1/38 | 139,738 | ||||
| 129,115 | Pool #MC0014, 5.50%, 12/1/38 | 141,780 | ||||
| 68,865 | Pool #MC0015, 6.00%, 11/1/38 | 76,693 | ||||
| 83,311 | Pool #MC0016, 5.50%, 11/1/38 | 91,483 | ||||
| 553,690 | Pool #MC0038, 4.50%, 3/1/39 | 591,172 | ||||
| 139,220 | Pool #MC0046, 4.00%, 4/1/39 | 146,327 | ||||
| 295,195 | Pool #MC0047, 4.50%, 4/1/39 | 313,887 | ||||
| 57,930 | Pool #MC0059, 4.00%, 4/1/39 | 61,141 | ||||
| 402,159 | Pool #MC0081, 4.00%, 5/1/39 | 422,691 | ||||
| 516,520 | Pool #MC0082, 4.50%, 5/1/39 | 551,808 | ||||
| 509,678 | Pool #MC0111, 4.00%, 6/1/39 | 537,929 | ||||
| 315,515 | Pool #MC0112, 4.50%, 6/1/39 | 336,874 | ||||
| 372,503 | Pool #MC0127, 4.50%, 7/1/39 | 396,090 | ||||
| 77,990 | Pool #MC0135, 4.50%, 6/1/39 | 83,270 | ||||
| 1,393,241 | Pool #MC0137, 4.50%, 7/1/39 | 1,481,462 | ||||
| 1,888,777 | Pool #MC0154, 4.50%, 8/1/39 | 2,008,375 | ||||
| 104,955 | Pool #MC0155, 5.00%, 8/1/39 | 114,516 | ||||
| 652,680 | Pool #MC0160, 4.50%, 8/1/39 | 694,008 | ||||
| 1,633,241 | Pool #MC0171, 4.50%, 9/1/39 | 1,743,803 | ||||
| 615,310 | Pool #MC0177, 4.50%, 9/1/39 | 656,580 | ||||
| 663,061 | Pool #MC0270, 4.50%, 3/1/40 | 705,047 | ||||
| 976,436 | Pool #MC0325, 4.50%, 7/1/40 | 1,042,536 | ||||
| 291,307 | Pool #MC0422, 4.00%, 2/1/41 | 306,180 | ||||
| 198,063 | Pool #MC0426, 4.50%, 1/1/41 | 210,233 | ||||
| 74,973 | Pool #MC3344, 5.00%, 12/1/38 | 80,748 | ||||
| 9,904,833 | Series 2004-T7, Class A, 5.12%, 7/25/41 | 11,304,780 | ||||
|
| |||||
| 454,371,830 | ||||||
|
| |||||
Federal Agricultural Mortgage Corp. — 0.16% |
| |||||
| 814,535 | Series #S0282, 5.63%, 6/10/36(b) | 863,407 | ||||
|
| |||||
Freddie Mac — 17.07% |
| |||||
| 146,873 | Pool #A10124, 5.00%, 6/1/33 | 158,089 | ||||
| 262,351 | Pool #A10548, 5.00%, 6/1/33 | 282,386 | ||||
| 1,077,295 | Pool #A12237, 5.00%, 8/1/33 | 1,159,565 | ||||
21
SCHEDULE OF PORTFOLIO INVESTMENTS |
Access Capital Community Investment Fund (cont.)
September 30, 2011
Principal Amount | Value | |||||
| $ 437,545 | Pool #A12969, 4.50%, 8/1/33 | $ 466,943 | ||||
| 209,042 | Pool #A12985, 5.00%, 8/1/33 | 225,006 | ||||
| 405,001 | Pool #A12986, 5.00%, 8/1/33 | 435,930 | ||||
| 350,858 | Pool #A14028, 4.50%, 9/1/33 | 374,431 | ||||
| 1,022,801 | Pool #A14325, 5.00%, 9/1/33 | 1,100,909 | ||||
| 172,219 | Pool #A15268, 6.00%, 10/1/33 | 190,558 | ||||
| 786,391 | Pool #A15579, 5.50%, 11/1/33 | 855,354 | ||||
| 470,534 | Pool #A17393, 5.50%, 12/1/33 | 511,798 | ||||
| 558,423 | Pool #A17397, 5.50%, 1/1/34 | 607,394 | ||||
| 481,928 | Pool #A18617, 5.50%, 1/1/34 | 524,190 | ||||
| 523,910 | Pool #A19019, 5.50%, 2/1/34 | 569,855 | ||||
| 179,822 | Pool #A19362, 5.50%, 2/1/34 | 195,592 | ||||
| 471,310 | Pool #A20069, 5.00%, 3/1/34 | 507,008 | ||||
| 1,056,828 | Pool #A20070, 5.50%, 3/1/34 | 1,149,506 | ||||
| 1,052,775 | Pool #A20540, 5.50%, 4/1/34 | 1,144,769 | ||||
| 232,254 | Pool #A20541, 5.50%, 4/1/34 | 252,549 | ||||
| 244,867 | Pool #A21679, 5.50%, 4/1/34 | 266,264 | ||||
| 534,514 | Pool #A21681, 5.00%, 4/1/34 | 574,999 | ||||
| 501,142 | Pool #A23192, 5.00%, 5/1/34 | 539,100 | ||||
| 1,874,608 | Pool #A25310, 5.00%, 6/1/34 | 2,016,595 | ||||
| 413,147 | Pool #A25311, 5.00%, 6/1/34 | 444,439 | ||||
| 568,661 | Pool #A25600, 5.50%, 8/1/34 | 618,352 | ||||
| 86,389 | Pool #A26270, 6.00%, 8/1/34 | 95,426 | ||||
| 51,267 | Pool #A26386, 6.00%, 9/1/34 | 56,679 | ||||
| 365,783 | Pool #A26395, 6.00%, 9/1/34 | 404,047 | ||||
| 322,287 | Pool #A26396, 5.50%, 9/1/34 | 350,349 | ||||
| 1,405,138 | Pool #A28241, 5.50%, 10/1/34 | 1,527,484 | ||||
| 509,944 | Pool #A30055, 5.00%, 11/1/34 | 548,489 | ||||
| 591,721 | Pool #A30591, 6.00%, 12/1/34 | 653,621 | ||||
| 514,625 | Pool #A31135, 5.50%, 12/1/34 | 559,433 | ||||
| 346,078 | Pool #A32976, 5.50%, 8/1/35 | 376,049 | ||||
| 863,188 | Pool #A33167, 5.00%, 1/1/35 | 928,298 | ||||
| 1,266,104 | Pool #A34999, 5.50%, 4/1/35 | 1,375,948 | ||||
| 595,463 | Pool #A35628, 5.50%, 6/1/35 | 647,124 | ||||
| 973,573 | Pool #A37185, 5.00%, 9/1/35 | 1,046,858 | ||||
| 1,265,769 | Pool #A38830, 5.00%, 5/1/35 | 1,361,246 | ||||
| 238,028 | Pool #A39561, 5.50%, 11/1/35 | 258,641 | ||||
| 1,348,841 | Pool #A40538, 5.00%, 12/1/35 | 1,450,162 | ||||
| 536,726 | Pool #A42095, 5.50%, 1/1/36 | 583,123 | ||||
| 1,319,155 | Pool #A42097, 5.00%, 1/1/36 | 1,418,247 | ||||
| 286,658 | Pool #A42098, 5.50%, 1/1/36 | 311,438 | ||||
| 116,297 | Pool #A42099, 6.00%, 1/1/36 | 128,064 | ||||
| 539,466 | Pool #A42802, 5.00%, 2/1/36 | 579,990 | ||||
| 1,228,160 | Pool #A42803, 5.50%, 2/1/36 | 1,334,329 | ||||
| 279,879 | Pool #A42804, 6.00%, 2/1/36 | 308,194 | ||||
| 725,311 | Pool #A42805, 6.00%, 2/1/36 | 798,693 | ||||
| 96,802 | Pool #A44637, 5.50%, 4/1/36 | 105,171 | ||||
| 476,931 | Pool #A44638, 6.00%, 4/1/36 | 525,184 |
22
SCHEDULE OF PORTFOLIO INVESTMENTS |
Access Capital Community Investment Fund (cont.)
September 30, 2011
Principal Amount | Value | |||||
| $ 621,770 | Pool #A44639, 5.50%, 3/1/36 | $ 675,519 | ||||
| 877,577 | Pool #A45396, 5.00%, 6/1/35 | 943,773 | ||||
| 500,364 | Pool #A46321, 5.50%, 7/1/35 | 543,696 | ||||
| 879,799 | Pool #A46735, 5.00%, 8/1/35 | 946,024 | ||||
| 771,082 | Pool #A46746, 5.50%, 8/1/35 | 837,859 | ||||
| 434,544 | Pool #A46747, 5.50%, 8/1/35 | 472,176 | ||||
| 481,369 | Pool #A46748, 5.50%, 8/1/35 | 523,056 | ||||
| 106,360 | Pool #A46996, 5.50%, 9/1/35 | 115,570 | ||||
| 629,418 | Pool #A46997, 5.50%, 9/1/35 | 683,926 | ||||
| 798,673 | Pool #A47552, 5.00%, 11/1/35 | 858,667 | ||||
| 487,548 | Pool #A47553, 5.00%, 11/1/35 | 524,247 | ||||
| 446,683 | Pool #A47554, 5.50%, 11/1/35 | 485,366 | ||||
| 666,118 | Pool #A48788, 5.50%, 5/1/36 | 723,285 | ||||
| 936,553 | Pool #A48789, 6.00%, 5/1/36 | 1,029,843 | ||||
| 581,090 | Pool #A49013, 6.00%, 5/1/36 | 638,972 | ||||
| 418,953 | Pool #A49526, 6.00%, 5/1/36 | 460,685 | ||||
| 318,648 | Pool #A49843, 6.00%, 6/1/36 | 350,388 | ||||
| 763,230 | Pool #A49844, 6.00%, 6/1/36 | 839,255 | ||||
| 37,887 | Pool #A49845, 6.50%, 6/1/36 | 42,035 | ||||
| 565,591 | Pool #A50128, 6.00%, 6/1/36 | 622,459 | ||||
| 917,364 | Pool #A59530, 5.50%, 4/1/37 | 994,086 | ||||
| 453,033 | Pool #A59964, 5.50%, 4/1/37 | 493,611 | ||||
| 799,615 | Pool #A61754, 5.50%, 5/1/37 | 866,489 | ||||
| 245,225 | Pool #A61779, 5.50%, 5/1/37 | 266,423 | ||||
| 691,180 | Pool #A61915, 5.50%, 6/1/37 | 748,985 | ||||
| 1,768,137 | Pool #A61916, 6.00%, 6/1/37 | 1,939,840 | ||||
| 1,436,871 | Pool #A63456, 5.50%, 6/1/37 | 1,561,082 | ||||
| 889,705 | Pool #A64012, 5.50%, 7/1/37 | 963,280 | ||||
| 520,947 | Pool #A64015, 6.00%, 7/1/37 | 571,048 | ||||
| 358,311 | Pool #A64016, 6.50%, 7/1/37 | 396,815 | ||||
| 415,968 | Pool #A64447, 6.00%, 8/1/37 | 457,272 | ||||
| 587,299 | Pool #A64450, 6.00%, 8/1/37 | 645,984 | ||||
| 95,897 | Pool #A65713, 6.00%, 9/1/37 | 105,988 | ||||
| 415,310 | Pool #A65837, 6.00%, 9/1/37 | 455,251 | ||||
| 760,899 | Pool #A66043, 5.50%, 7/1/37 | 824,535 | ||||
| 1,502,640 | Pool #A66061, 5.50%, 8/1/37 | 1,628,310 | ||||
| 1,071,075 | Pool #A66116, 6.00%, 9/1/37 | 1,174,082 | ||||
| 644,308 | Pool #A66122, 6.00%, 8/1/37 | 708,688 | ||||
| 554,845 | Pool #A66133, 6.00%, 6/1/37 | 608,725 | ||||
| 1,723,790 | Pool #A66156, 6.50%, 9/1/37 | 1,905,529 | ||||
| 934,446 | Pool #A67630, 6.00%, 11/1/37 | 1,027,234 | ||||
| 840,487 | Pool #A68766, 6.00%, 10/1/37 | 924,995 | ||||
| 375,844 | Pool #A70292, 5.50%, 7/1/37 | 408,334 | ||||
| 231,772 | Pool #A73816, 6.00%, 3/1/38 | 255,728 | ||||
| 790,833 | Pool #A75113, 5.00%, 3/1/38 | 849,003 | ||||
| 798,302 | Pool #A76187, 5.00%, 4/1/38 | 856,023 | ||||
| 682,505 | Pool #A78354, 5.50%, 11/1/37 | 740,225 | ||||
| 657,926 | Pool #A79561, 5.50%, 7/1/38 | 711,922 |
23
SCHEDULE OF PORTFOLIO INVESTMENTS |
Access Capital Community Investment Fund (cont.)
September 30, 2011
Principal Amount | Value | |||||
| $ 1,088,857 | Pool #A91887, 5.00%, 4/1/40 | $ 1,172,010 | ||||
| 1,288,050 | Pool #A92388, 4.50%, 5/1/40 | 1,368,151 | ||||
| 1,028,501 | Pool #A93962, 4.50%, 9/1/40 | 1,095,996 | ||||
| 1,109,432 | Pool #A95573, 4.00%, 12/1/40 | 1,164,427 | ||||
| 1,002,271 | Pool #A96339, 4.00%, 12/1/40 | 1,051,954 | ||||
| 1,599,629 | Pool #A97099, 4.00%, 1/1/41 | 1,682,422 | ||||
| 1,251,444 | Pool #A97715, 4.00%, 3/1/41 | 1,311,132 | ||||
| 1,108,198 | Pool #A97716, 4.50%, 3/1/41 | 1,177,114 | ||||
| 87,782 | Pool #B31082, 6.00%, 3/1/31 | 97,802 | ||||
| 111,470 | Pool #B31128, 6.00%, 9/1/31 | 124,261 | ||||
| 188,400 | Pool #B31140, 6.50%, 10/1/31 | 212,379 | ||||
| 75,882 | Pool #B31150, 6.50%, 11/1/31 | 85,616 | ||||
| 191,002 | Pool #B31188, 6.00%, 1/1/32 | 212,636 | ||||
| 28,029 | Pool #B31206, 6.00%, 3/1/32 | 31,239 | ||||
| 110,805 | Pool #B31292, 6.00%, 9/1/32 | 123,545 | ||||
| 80,661 | Pool #B31493, 5.00%, 2/1/34 | 87,163 | ||||
| 496,107 | Pool #B31516, 5.00%, 4/1/34 | 536,090 | ||||
| 81,130 | Pool #B31517, 5.00%, 4/1/34 | 87,668 | ||||
| 243,600 | Pool #B31532, 5.00%, 5/1/34 | 263,232 | ||||
| 231,514 | Pool #B31545, 5.00%, 5/1/34 | 250,410 | ||||
| 99,455 | Pool #B31546, 5.50%, 5/1/34 | 108,773 | ||||
| 299,369 | Pool #B31547, 5.50%, 5/1/34 | 327,421 | ||||
| 230,330 | Pool #B31550, 5.00%, 6/1/34 | 248,889 | ||||
| 194,968 | Pool #B31551, 5.50%, 6/1/34 | 213,234 | ||||
| 256,877 | Pool #B31587, 5.00%, 11/1/34 | 277,583 | ||||
| 238,043 | Pool #B31588, 5.50%, 11/1/34 | 260,339 | ||||
| 310,256 | Pool #B31642, 5.50%, 5/1/35 | 339,298 | ||||
| 124,204 | Pool #B50443, 5.00%, 11/1/18 | 135,632 | ||||
| 178,607 | Pool #B50450, 4.50%, 1/1/19 | 193,403 | ||||
| 91,328 | Pool #B50451, 5.00%, 1/1/19 | 99,468 | ||||
| 48,761 | Pool #B50458, 4.50%, 3/1/19 | 52,301 | ||||
| 14,443 | Pool #B50470, 4.50%, 4/1/19 | 15,644 | ||||
| 170,371 | Pool #B50496, 5.50%, 9/1/19 | 188,047 | ||||
| 255,901 | Pool #B50499, 5.00%, 11/1/19 | 279,682 | ||||
| 53,183 | Pool #B50500, 5.50%, 10/1/19 | 58,833 | ||||
| 166,509 | Pool #B50501, 4.50%, 11/1/19 | 180,189 | ||||
| 174,606 | Pool #B50504, 5.50%, 11/1/19 | 192,938 | ||||
| 337,984 | Pool #B50506, 5.00%, 11/1/19 | 371,728 | ||||
| 90,713 | Pool #C35457, 7.50%, 1/1/30 | 103,812 | ||||
| 51,355 | Pool #C37233, 7.50%, 2/1/30 | 59,082 | ||||
| 87,376 | Pool #C48137, 7.00%, 1/1/31 | 98,998 | ||||
| 36,952 | Pool #C48138, 7.00%, 2/1/31 | 41,867 | ||||
| 376,844 | Pool #C51686, 6.50%, 5/1/31 | 419,750 | ||||
| 188,850 | Pool #C53210, 6.50%, 6/1/31 | 210,391 | ||||
| 63,888 | Pool #C53914, 6.50%, 6/1/31 | 71,198 | ||||
| 149,755 | Pool #C60020, 6.50%, 11/1/31 | 166,855 | ||||
| 65,145 | Pool #C60804, 6.00%, 11/1/31 | 71,985 | ||||
| 28,440 | Pool #C62574, 6.50%, 12/1/31 | 31,606 |
24
SCHEDULE OF PORTFOLIO INVESTMENTS |
Access Capital Community Investment Fund (cont.)
September 30, 2011
Principal Amount | Value | |||||
| $ 66,570 | Pool #C65616, 6.50%, 3/1/32 | $ 74,206 | ||||
| 60,685 | Pool #C68324, 6.50%, 6/1/32 | 67,669 | ||||
| 520,401 | Pool #C73273, 6.00%, 11/1/32 | 575,241 | ||||
| 292,776 | Pool #C73525, 6.00%, 11/1/32 | 324,050 | ||||
| 489,667 | Pool #C74672, 5.50%, 11/1/32 | 532,914 | ||||
| 686,098 | Pool #C77844, 5.50%, 3/1/33 | 746,587 | ||||
| 162,818 | Pool #C77845, 5.50%, 3/1/33 | 177,172 | ||||
| 415,462 | Pool #C78252, 5.50%, 3/1/33 | 452,091 | ||||
| 138,978 | Pool #C78380, 5.50%, 3/1/33 | 151,231 | ||||
| 148,928 | Pool #C79178, 5.50%, 4/1/33 | 162,058 | ||||
| 471,121 | Pool #J00980, 5.00%, 1/1/21 | 507,964 | ||||
| 174,275 | Pool #J05466, 5.50%, 6/1/22 | 188,557 | ||||
| 661,266 | Pool #N31468, 6.00%, 11/1/37 | 714,942 | ||||
| 1,338,483 | Pool #Q00462, 4.00%, 3/1/41 | 1,407,342 | ||||
| 1,683,022 | Pool #Q00465, 4.50%, 4/1/41 | 1,792,747 | ||||
|
| |||||
| 93,139,120 | ||||||
|
| |||||
Ginnie Mae — 12.16% | ||||||
| 1,380,000 | (TBA), 4.00%, 10/1/41(b) | 1,481,128 | ||||
| 518,036 | Pool #409117, 5.50%, 6/20/38 | 574,554 | ||||
| 743,884 | Pool #487643, 5.00%, 2/15/39 | 817,314 | ||||
| 1,334,398 | Pool #514702, 8.25%, 12/15/32 | 1,428,983 | ||||
| 470,388 | Pool #588448, 6.25%, 9/15/32 | 484,761 | ||||
| 1,309,885 | Pool #616936, 5.50%, 1/15/36 | 1,454,074 | ||||
| 568,725 | Pool #617904, 5.75%, 9/15/23 | 579,543 | ||||
| 3,220,898 | Pool #618363, 4.00%, 9/20/41 | 3,449,884 | ||||
| 560,974 | Pool #624106, 5.13%, 3/15/34 | 572,650 | ||||
| 451,641 | Pool #664269, 5.85%, 6/15/38 | 480,776 | ||||
| 1,200,237 | Pool #675509, 5.50%, 6/15/38 | 1,330,857 | ||||
| 852,171 | Pool #685140, 5.90%, 4/15/38 | 903,935 | ||||
| 873,416 | Pool #697672, 5.50%, 12/15/38 | 968,468 | ||||
| 744,433 | Pool #697814, 5.00%, 2/15/39 | 819,313 | ||||
| 757,972 | Pool #697885, 4.50%, 3/15/39 | 824,591 | ||||
| 1,307,404 | Pool #698112, 4.50%, 5/15/39 | 1,427,215 | ||||
| 2,536,973 | Pool #698113, 4.50%, 5/15/39 | 2,763,517 | ||||
| 796,512 | Pool #699294, 5.63%, 9/20/38 | 885,489 | ||||
| 4,244,249 | Pool #713519, 6.00%, 7/15/39 | 4,759,196 | ||||
| 979,552 | Pool #714561, 4.50%, 6/15/39 | 1,067,023 | ||||
| 1,240,435 | Pool #716822, 4.50%, 4/15/39 | 1,354,109 | ||||
| 1,190,131 | Pool #716823, 4.50%, 4/15/39 | 1,296,406 | ||||
| 1,118,243 | Pool #717132, 4.50%, 5/15/39 | 1,219,321 | ||||
| 1,341,230 | Pool #717133, 4.50%, 5/15/39 | 1,459,111 | ||||
| 1,362,985 | Pool #720080, 4.50%, 6/15/39 | 1,491,298 | ||||
| 1,128,731 | Pool #720521, 5.00%, 8/15/39 | 1,242,265 | ||||
| 2,846,940 | Pool #726550, 5.00%, 9/15/39 | 3,133,302 | ||||
| 1,759,204 | Pool #729018, 4.50%, 2/15/40 | 1,924,817 | ||||
| 1,019,375 | Pool #729019, 5.00%, 2/15/40 | 1,126,370 | ||||
25
SCHEDULE OF PORTFOLIO INVESTMENTS |
Access Capital Community Investment Fund (cont.)
September 30, 2011
Principal Amount | Value | |||||
| $1,015,060 | Pool #729346, 4.50%, 7/15/41 | $ 1,107,764 | ||||
| 1,468,609 | Pool #737574, 4.00%, 11/15/40 | 1,573,018 | ||||
| 1,069,272 | Pool #747241, 5.00%, 9/20/40 | 1,174,947 | ||||
| 1,368,765 | Pool #748654, 3.50%, 9/15/40 | 1,431,589 | ||||
| 1,016,566 | Pool #748846, 4.50%, 9/20/40 | 1,109,764 | ||||
| 1,116,318 | Pool #757016, 3.50%, 11/15/40 | 1,167,555 | ||||
| 1,083,842 | Pool #757017, 4.00%, 12/15/40 | 1,160,897 | ||||
| 1,493,025 | Pool #759196, 3.50%, 1/15/41 | 1,561,553 | ||||
| 1,006,169 | Pool #762877, 4.00%, 4/15/41 | 1,081,475 | ||||
| 1,136,654 | Pool #763564, 4.50%, 5/15/41 | 1,240,463 | ||||
| 1,655,390 | Pool #770391, 4.50%, 6/15/41 | 1,806,574 | ||||
| 1,790,650 | Pool #770481, 4.00%, 8/15/41 | 1,917,955 | ||||
| 1,073,689 | Pool #770482, 4.50%, 8/15/41 | 1,170,069 | ||||
| 2,525,544 | Pool #770517, 4.00%, 8/15/41 | 2,705,095 | ||||
| 1,163,143 | Pool #770529, 4.00%, 8/15/41 | 1,245,835 | ||||
| 2,252,208 | Pool #770537, 4.00%, 8/15/41 | 2,412,326 | ||||
| 1,049,806 | Pool #770738, 4.50%, 6/20/41 | 1,141,459 | ||||
|
| |||||
| 66,328,608 | ||||||
|
| |||||
Total U.S. Government Agency Backed Mortgages | 614,702,965 | |||||
|
| |||||
(Cost $574,334,696) | ||||||
U.S. Government Agency Obligations — 11.47% | ||||||
Community Reinvestment Revenue Notes — 0.79% | ||||||
| 4,410,415 | 3.98%, 8/1/35(c) | 4,322,691 | ||||
|
| |||||
Fannie Mae — 0.37% | ||||||
| 2,000,000 | 0.13%, 10/12/11(e)(f) | 1,999,980 | ||||
|
| |||||
Small Business Administration — 8.96% | ||||||
| 308,753 | 0.53%, 4/30/35(b) | 308,784 | ||||
| 172,006 | 0.53%, 10/14/20(b) | 172,109 | ||||
| 5,011,745 | 0.53%, 3/25/21(a) | 4,973,123 | ||||
| 250,675 | 0.55%, 4/25/28(a) | 248,435 | ||||
| 622,782 | 0.55%, 3/25/29(a) | 617,108 | ||||
| 1,236,569 | 0.55%, 9/25/30(a) | 1,224,978 | ||||
| 415,311 | 0.60%, 11/25/29(a) | 412,317 | ||||
| 263,997 | 0.60%, 3/25/28(a) | 262,156 | ||||
| 241,125 | 0.63%, 6/25/18(a) | 240,150 | ||||
| 1,090,338 | 0.63%, 3/19/32(b) | 1,092,955 | ||||
| 109,754 | 0.65%, 3/25/14(a) | 109,518 | ||||
| 434,243 | 0.66%, 6/8/32(b) | 435,545 | ||||
| 934,526 | 0.66%, 10/26/26(b) | 939,292 | ||||
| 197,439 | 0.66%, 3/8/26(b) | 198,407 | ||||
| 258,478 | 0.70%, 3/30/20(b) | 259,873 | ||||
| 83,633 | 0.70%, 2/13/20(b) | 84,077 | ||||
| 201,199 | 0.70%, 2/17/20(b) | 202,205 | ||||
| 262,316 | 0.70%, 8/6/19(b) | 263,339 | ||||
| 597,798 | 0.75%, 11/29/32(b) | 600,249 | ||||
26
SCHEDULE OF PORTFOLIO INVESTMENTS |
Access Capital Community Investment Fund (cont.)
September 30, 2011
Principal Amount | Value | |||||
| $ 168,954 | 0.80%, 8/8/32(b) | $ 169,833 | ||||
| 1,287,816 | 0.80%, 3/27/33(b) | 1,293,740 | ||||
| 313,724 | 0.80%, 9/14/29(b) | 315,763 | ||||
| 245,384 | 0.80%, 2/21/33(b) | 246,537 | ||||
| 757,572 | 0.88%, 1/26/32(b) | 763,026 | ||||
| 587,644 | 0.88%, 11/17/19(b) | 591,992 | ||||
| 36,097 | 0.88%, 6/4/14(b) | 36,144 | ||||
| 180,073 | 0.88%, 12/1/19(b) | 181,405 | ||||
| 1,337,402 | 0.88%, 8/1/32(b) | 1,346,229 | ||||
| 1,436,448 | 0.89%, 4/21/34(b) | 1,445,210 | ||||
| 1,051,489 | 0.90%, 3/14/18(b) | 1,057,378 | ||||
| 165,130 | 0.91%, 4/16/20(b) | 166,451 | ||||
| 97,977 | 1.13%, 7/30/17(a)(b) | 98,682 | ||||
| 1,036,089 | 1.14%, 11/4/34(b) | 1,049,662 | ||||
| 18,541,537 | 1.26%, 7/18/30*(b) | 424,899 | ||||
| 16,973,448 | 1.45%, 3/25/36(a) | 17,456,784 | ||||
| 647,137 | 2.00%, 6/20/14(b) | 651,731 | ||||
| 512,256 | 3.13%, 10/25/15(a) | 529,804 | ||||
| 849,617 | 3.38%, 10/25/15(a) | 868,505 | ||||
| 295,863 | 3.38%, 5/25/16(a) | 303,300 | ||||
| 437,574 | 3.58%, 12/25/15(a) | 448,357 | ||||
| 85,189 | 5.70%, 7/30/17(b) | 86,745 | ||||
| 372,902 | 5.85%, 11/27/27(b) | 394,408 | ||||
| 180,422 | 5.85%, 9/27/13(b) | 183,633 | ||||
| 106,532 | 5.86%, 11/15/22(b) | 111,315 | ||||
| 180,833 | 6.00%, 3/9/22(b) | 188,064 | ||||
| 528,269 | 6.03%, 10/31/32(b) | 559,928 | ||||
| 1,317,638 | 6.13%, 3/31/31(b) | 1,399,773 | ||||
| 165,455 | 6.25%, 8/30/27(b) | 175,380 | ||||
| 814,497 | 6.28%, 7/16/17(b) | 831,440 | ||||
| 117,111 | 6.30%, 4/15/18(b) | 119,180 | ||||
| 568,917 | 6.35%, 8/13/26(b) | 600,978 | ||||
| 980,068 | 6.45%, 2/19/32(b) | 1,041,795 | ||||
| 85,844 | 6.53%, 1/2/27(b) | 90,782 | ||||
| 56,999 | 6.69%, 5/28/24(b) | 59,785 | ||||
| 45,564 | 7.08%, 9/1/13(b) | 46,551 | ||||
| 110,521 | 7.08%, 1/19/14(b) | 112,754 | ||||
| 91,560 | 7.33%, 7/1/16(b) | 93,694 | ||||
| 195,341 | 7.33%, 6/29/16(b) | 199,829 | ||||
| 142,466 | 7.33%, 2/23/16(b) | 145,751 | ||||
| 29,244 | 7.38%, 4/1/15(b) | 29,906 | ||||
| 43,658 | 7.38%, 1/1/15(b) | 44,627 | ||||
| 62,059 | 7.58%, 8/1/16(b) | 63,647 | ||||
| 195,864 | 7.83%, 9/28/16(b) | 201,682 | ||||
| 601 | 8.08%, 2/15/14(b) | 621 | ||||
| 659 | 9.58%, 2/15/12(b) | 665 |
27
SCHEDULE OF PORTFOLIO INVESTMENTS |
Access Capital Community Investment Fund (cont.)
September 30, 2011
Principal Amount | Value | |||||
| $ 1,754 | 9.58%, 2/15/12(b) | $ 1,770 | ||||
| 2,988 | 9.83%, 12/15/11(b) | 2,997 | ||||
|
| |||||
| 48,877,752 | ||||||
|
| |||||
United States Department of Agriculture — 1.35% | ||||||
| 314,215 | 1.13%, 5/31/14(b) | 319,124 | ||||
| 179,606 | 5.09%, 3/1/20(b) | 184,085 | ||||
| 321,165 | 5.38%, 10/26/22(b) | 337,067 | ||||
| 181,863 | 5.59%, 1/20/38(b) | 190,103 | ||||
| 625,357 | 5.64%, 1/20/38(b) | 654,831 | ||||
| 69,151 | 5.64%, 1/20/38(b) | 72,410 | ||||
| 104,279 | 5.66%, 1/20/38(b) | 109,280 | ||||
| 276,200 | 5.70%, 1/20/38(b) | 289,840 | ||||
| 218,300 | 5.73%, 4/20/37(b) | 229,205 | ||||
| 450,989 | 5.73%, 2/1/30(b) | 475,050 | ||||
| 751,582 | 5.75%, 1/20/33(b) | 794,433 | ||||
| 89,960 | 5.83%, 11/1/20(b) | 92,693 | ||||
| 37,759 | 6.01%, 7/20/36(b) | 39,823 | ||||
| 218,958 | 6.01%, 1/20/38(b) | 231,153 | ||||
| 127,874 | 6.01%, 11/8/32(b) | 135,511 | ||||
| 402,689 | 6.05%, 1/1/37(b) | 423,454 | ||||
| 175,085 | 6.05%, 1/5/26(b) | 184,354 | ||||
| 507,066 | 6.07%, 4/20/37(b) | 535,553 | ||||
| 141,655 | 6.08%, 7/1/32(b) | 150,110 | ||||
| 93,840 | 6.09%, 5/17/22(b) | 97,586 | ||||
| 198,154 | 6.10%, 8/25/37(b) | 209,706 | ||||
| 45,661 | 6.10%, 1/1/13(b) | 46,413 | ||||
| 217,356 | 6.12%, 4/20/37(b) | 230,073 | ||||
| 90,969 | 6.13%, 7/20/22(b) | 94,666 | ||||
| 94,514 | 6.18%, 1/20/38(b) | 100,052 | ||||
| 222,803 | 6.22%, 1/20/37(b) | 235,940 | ||||
| 382,155 | 6.23%, 3/14/32(b) | 405,677 | ||||
| 62,446 | 6.28%, 3/1/14(b) | 63,530 | ||||
| 231,632 | 6.38%, 2/16/37(b) | 246,199 | ||||
| 197,468 | 6.64%, 4/20/37(b) | 210,961 | ||||
|
| |||||
| 7,388,882 | ||||||
|
| |||||
Total U.S. Government Agency Obligations | 62,589,305 | |||||
|
| |||||
(Cost $62,812,273) | ||||||
Promissory Notes — 1.89% | ||||||
| 9,375,000 | Massachusetts Housing Investment Corp. Term Loan, 6.67%, 4/1/35(b)(c) | 10,306,592 | ||||
|
| |||||
Total Promissory Notes | 10,306,592 | |||||
|
| |||||
(Cost $9,375,000) | ||||||
28
SCHEDULE OF PORTFOLIO INVESTMENTS |
Access Capital Community Investment Fund (cont.)
September 30, 2011
| Shares | Value | |||||
Investment Company — 1.14% | ||||||
| 6,228,259 | JPMorgan Prime Money Market Fund | $ | 6,228,259 | |||
|
| |||||
Total Investment Company | 6,228,259 | |||||
|
| |||||
(Cost $6,228,259) | ||||||
Total Investments | $ | 709,731,414 | ||||
(Cost $668,807,725)(g) — 130.10% | ||||||
Liabilities in excess of other assets — (30.10)% | (164,200,433 | ) | ||||
|
| |||||
NET ASSETS — 100.00% | $ | 545,530,981 | ||||
|
| |||||
| * | Interest Only security represents the right to receive the monthly interest payment on an underlying pool of mortgage loans. The principal amount shown represents the par value on the underlying pool. |
| (a) | Floating rate note. Rate shown is as of report date. |
| (b) | Fair valued security under procedures established by the Fund’s Board of Trustees. |
| (c) | This security is restricted and illiquid as the security may not be offered or sold within the United States or to U.S. persons except to qualified purchasers who are also either qualified institutional buyers or “accredited investors” (as defined in Rule 501 (a) of Regulation D under the Securities Act of 1933). |
The total investment in restricted and illiquid securities representing $15,825,392 or 2.90% of net assets are as follows:
Acquisition Principal Amount | Issuer | Acquisition Date | Acquisition Cost | 9/30/2011 Carrying Value Per Unit | ||||
$1,993,548 | Pacific Beacon LLC | 12/18/2006 | $1,993,548 | $0.60 | ||||
| Community Reinvestment | ||||||||
$4,410,415 | Revenue Note | 3/24/2008 | $4,354,402 | $0.98 | ||||
| Massachusetts Housing | ||||||||
$9,375,000 | Investment Corp. | 3/29/2005 | $9,375,000 | $1.10 |
| (d) | This security is partially pledged as collateral for reverse repurchase agreements. |
| (e) | This security is pledged as collateral for financial futures contracts. |
| (f) | The rate represents the annualized yield at time of purchase. |
| (g) | See notes to financial statements for the tax cost of securities and the breakdown of unrealized appreciation (depreciation). |
Abbreviations used are defined below:
AMBAC – Insured by American Municipal Bond Insurance Assurance Corp.
IBC - Insured by International Bancshares Corp.
LOC - Letter of Credit
MBIA – Insured by MBIA
NATL-RE - Insured by National Public Guarantee Corp.
OID - Original Issue Discount
See notes to financial statements.
29
|
Statement of Assets and Liabilities
| September 30, 2011 | ||||
Assets: | ||||
Investments in securities, at value (cost $668,807,725) | $ | 709,731,414 | ||
Segregated cash collateral for reverse repurchase agreements | 670,291 | |||
Interest and dividends receivable | 3,225,856 | |||
Receivable for Fund shares sold | 22,677 | |||
Deposits at broker for futures contracts | 1,764,970 | |||
Prepaid expenses and other assets | 22,516 | |||
|
| |||
Total Assets | 715,437,724 | |||
|
| |||
Liabilities: | ||||
Distributions payable | 1,383,256 | |||
Payable for capital shares redeemed | 14,141 | |||
Payable for investments purchased | 1,477,788 | |||
Reverse repurchase agreements (including interest of $32,803) | 166,609,940 | |||
Accrued expenses and other payables: | ||||
Investment advisory fees | 312,478 | |||
Accounting fees | 4,574 | |||
Distribution fees | 12,338 | |||
Trustee fees | 760 | |||
Audit fees | 45,365 | |||
Transfer Agent fees | 11,234 | |||
Other | 34,869 | |||
|
| |||
Total Liabilities | 169,906,743 | |||
|
| |||
Net Assets | $ | 545,530,981 | ||
|
| |||
Net Assets Consist Of: | ||||
Capital | $ | 547,859,373 | ||
Distributions in excess of net investment income | (1,324,828 | ) | ||
Accumulated net realized losses from investment transactions, futures contracts and sale commitments | (38,948,608 | ) | ||
Net unrealized appreciation on investments, futures contracts, and sale commitments | 37,945,044 | |||
|
| |||
Net Assets | $ | 545,530,981 | ||
|
| |||
30
FINANCIAL STATEMENTS |
Statement of Assets and Liabilities (cont.)
Net Assets: | ||||
Class A | $ | 8,211,709 | ||
Class I | 537,319,272 | |||
|
| |||
Total | $ | 545,530,981 | ||
|
| |||
Shares Outstanding (1,000,000,000 shares authorized, 100,000,000 shares registered at $.0000001 par value): | ||||
Class A | 842,183 | |||
Class I | 55,146,061 | |||
|
| |||
Total | 55,988,244 | |||
|
| |||
Net Asset Values and Redemption Price Per Share: | ||||
Class A(a) | $ | 9.75 | ||
Class I | $ | 9.74 | ||
Maximum Offering Price Per Share: | ||||
Class A | $ | 10.13 | ||
Maximum Sales Charge - Class A | 3.75 | % | ||
| (a) | For Class A shares, redemption price per share will be reduced by 1.00% for sales of shares within 12 months of purchase (only applicable on purchases of $1 million or more on which no initial sales charge was paid). Such reduction is not reflected in the net asset value and the redemption price per share. |
See notes to financial statements.
31
FINANCIAL STATEMENTS |
| For the Year Ended September 30, 2011 | ||||
Investment Income: | ||||
Interest income | $ | 29,797,549 | ||
Dividend income | 5,695 | |||
|
| |||
Total Investment Income | 29,803,244 | |||
|
| |||
Expenses: | ||||
Management fees | 3,456,084 | |||
Interest expense | 363,696 | |||
Distribution fees - Class A | 24,814 | |||
Accounting services | 52,501 | |||
Audit fees | 49,985 | |||
Legal fees | 57,455 | |||
Custodian fees | 51,721 | |||
Insurance fees | 6,187 | |||
Trustees’ fees and expenses | 13,092 | |||
Transfer agent fees | 61,967 | |||
Printing and shareholder reports | 23,178 | |||
Registration fees | 52,422 | |||
Other fees and expenses | 127,053 | |||
|
| |||
Total expenses | 4,340,155 | |||
|
| |||
Net Investment Income | 25,463,089 | |||
|
| |||
Realized/Unrealized Gains (Losses) from Investment Transactions and Futures Contracts: | ||||
Net realized losses from investment transactions | (530,809 | ) | ||
Net realized losses from sale commitments | (146,250 | ) | ||
Net realized losses from futures contracts | (7,135,745 | ) | ||
Net change in unrealized appreciation/depreciation on investments | 7,560,028 | |||
Net change in unrealized appreciation/depreciation on sale commitments | (1,871 | ) | ||
Net change in unrealized appreciation/depreciation on futures contracts | (2,584,504 | ) | ||
|
| |||
Net realized/unrealized losses from investments, sales commitments and futures contracts | (2,839,151 | ) | ||
|
| |||
Change in net assets resulting from operations | $ | 22,623,938 | ||
|
| |||
See notes to financial statements.
32
FINANCIAL STATEMENTS |
Statements of Changes in Net Assets
| For the Year Ended September 30, 2011 | For the Year Ended September 30, 2010 | |||||||
From Investment Activities: | ||||||||
Operations: | ||||||||
Net investment income | $ | 25,463,089 | $ | 27,532,428 | ||||
Net realized losses from investments, sale commitment sand futures contracts | (7,812,804 | ) | (3,730,927 | ) | ||||
Net change in unrealized appreciation/depreciation on investments, sale commitments and futures contracts | 4,973,653 | 5,353,525 | ||||||
|
|
|
| |||||
Change in net assets resulting from operations | 22,623,938 | 29,155,026 | ||||||
|
|
|
| |||||
Distributions to Class A Shareholders: | ||||||||
From net investment income | (447,645 | ) | (506,316 | ) | ||||
Distributions to Class I Shareholders: | ||||||||
From net investment income | (25,633,188 | ) | (27,631,062 | ) | ||||
|
|
|
| |||||
Change in net assets resulting from shareholder distributions | (26,080,833 | ) | (28,137,378 | ) | ||||
|
|
|
| |||||
Capital Transactions: | ||||||||
Proceeds from shares issued | 26,082,537 | 66,848,481 | ||||||
Distributions reinvested | 10,549,800 | 10,529,652 | ||||||
Cost of shares redeemed | (35,983,586 | ) | (99,866,348 | ) | ||||
|
|
|
| |||||
Change in net assets resulting from capital transactions | 648,751 | (22,488,215 | ) | |||||
|
|
|
| |||||
Net decrease in net assets | (2,808,144 | ) | (21,470,567 | ) | ||||
Net Assets: | ||||||||
Beginning of year | 548,339,125 | 569,809,692 | ||||||
|
|
|
| |||||
End of year | $ | 545,530,981 | $ | 548,339,125 | ||||
|
|
|
| |||||
Distributions in excess of net investment income | $ | (1,324,828 | ) | $ | (1,325,553 | ) | ||
|
|
|
| |||||
Share Transactions: | ||||||||
Issued | 2,688,679 | 6,806,808 | ||||||
Reinvested | 1,086,063 | 1,071,977 | ||||||
Redeemed | (3,717,395 | ) | (10,176,964 | ) | ||||
|
|
|
| |||||
Change in shares resulting from capital transactions | 57,347 | (2,298,179 | ) | |||||
|
|
|
| |||||
See notes to financial statements.
33
FINANCIAL STATEMENTS |
For the Year Ended September 30, 2011 | ||||
Cash Provided by Operating Activities: | ||||
Net increase in net assets resulting from operations | $ | 22,623,938 | ||
Adjustments to reconcile net increase in net assets | ||||
Decrease in interest and dividend receivable | 128,703 | |||
Decrease in variation margin receivable/payable | 40,625 | |||
Increase in deposits at broker for futures contracts | (1,050,156 | ) | ||
Decrease in prepaid expenses and other assets | 5,947 | |||
Decrease in segregated cash collateral for reverse repurchase | 7,199,709 | |||
Decrease in interest due on reverse repurchase agreements | (23,192 | ) | ||
Decrease in receivables for open maturities | 184,117 | |||
Proceeds from TBA sale commitments | 50,793,313 | |||
Increase in payable to investment adviser | 35,400 | |||
Decrease in accrued expenses and other liabilities | (81,684 | ) | ||
Proceeds from sales and paydowns of long-term securities | 120,700,734 | |||
Closing of TBA sales commitments | (50,856,563 | ) | ||
Purchases/proceeds from sales of short-term securities | 20,489,326 | |||
Purchases of long-term securities | (171,765,653 | ) | ||
Amortization of premium and discount - net | 358,275 | |||
Net realized losses from investment transactions | 530,809 | |||
Net realized losses from sales commitments | 146,250 | |||
Net change in unrealized (appreciation)/depreciation on | (7,558,157 | ) | ||
|
| |||
Net Cash used in Operating Activities | (8,098,259 | ) | ||
|
| |||
Cash Provided by Financing Activities: | ||||
Proceeds from issuance of shares | 41,074,331 | |||
Cash payments on shares redeemed | (35,973,795 | ) | ||
Cash receipts/payments from reverse repurchase agreements | 18,471,432 | |||
Distributions paid to shareholders | (15,473,709 | ) | ||
|
| |||
Net Cash Used in Financing Activities | 8,098,259 | |||
|
| |||
Cash: | ||||
Net change in cash | — | |||
Cash at beginning of year | — | |||
|
| |||
Cash at end of year | $ | — | ||
|
| |||
Cash Flow Information: | ||||
Cash paid for interest | 386,888 | |||
|
| |||
Noncash Financing Activities: | ||||
Capital shares issued in reinvestment of distributions paid to shareholders | 10,549,800 | |||
|
| |||
See notes to financial statements.
34
|
This Page Intentionally Left Blank
35
|
| Access Capital Community Investment Fund |
(Selected data for a share outstanding throughout the years indicated) |
| Investment Activities | Distributions | |||||||||||||||||||||||
| Net Asset Value, Beginning of Period | Net Investment Income(a) | Net Realized and Unrealized Gains (Losses) on Investments | Total from Investment Activities | Net Investment Income | Net Asset Value, End of Period | |||||||||||||||||||
Class A | ||||||||||||||||||||||||
Year Ended September 30, 2011 | $9.81 | 0.43 | (0.05) | 0.38 | (0.44) | $9.75 | ||||||||||||||||||
Year Ended September 30, 2010 | 9.80 | 0.46 | 0.02 | 0.48 | (0.47) | 9.81 | ||||||||||||||||||
Period Ended September 30, 2009(b) | 9.47 | 0.31 | 0.34 | 0.65 | (0.32) | 9.80 | ||||||||||||||||||
Class I(c) | ||||||||||||||||||||||||
Year Ended September 30, 2011 | $9.80 | 0.45 | (0.05) | 0.40 | (0.46) | $9.74 | ||||||||||||||||||
Year Ended September 30, 2010 | 9.79 | 0.49 | 0.02 | 0.51 | (0.50) | 9.80 | ||||||||||||||||||
Year Ended September 30, 2009 | 9.41 | 0.50 | 0.38 | 0.88 | (0.50) | 9.79 | ||||||||||||||||||
Period Ended September 30, 2008(d) | 9.48 | 0.16 | (0.07) | 0.09 | (0.16) | 9.41 | ||||||||||||||||||
Year Ended May 31, 2008 | 9.46 | 0.46 | 0.02 | 0.48 | (0.46) | 9.48 | ||||||||||||||||||
Year Ended May 31, 2007 | 9.29 | 0.44 | 0.17 | 0.61 | (0.44) | 9.46 | ||||||||||||||||||
(a) Based on average shares outstanding. | commencement of Class A Shares on January 29, 2009. | |||
(b) For the period January 29, 2009 (commencement of operations) to September 30, 2009. | (d) Effective September 30, 2008, the Fund’s fiscal year end changed from May 31 to September 30. | |||
(c) The existing share class was renamed Class I Shares with the |
See notes to financial statements.
36
FINANCIAL HIGHLIGHTS |
| Access Capital Community Investment Fund (cont.) |
(Selected data for a share outstanding throughout the years indicated) |
| Ratios to Average Net Assets(a) | Ratios to Average Net Assets Plus Average Borrowings(a)(b) | Supplemental Data | ||||||||||||||||||||||||||||||||||||||||||
| Total Return(c) | Total Expenses Net of Reimbursement and Excluding Interest Expense | Total Expenses Excluding Interest Expense | Net Expenses | Net Investment Income | Total Expenses Net of Reimbursement and Excluding Interest Expense and Investment Structuring Fees | Total Expenses Excluding Interest Expense | Net Expenses | Net Investment Income | Net Assets, End of Period (000’s) | Portfolio Turnover Rate | ||||||||||||||||||||||||||||||||||
Class A | ||||||||||||||||||||||||||||||||||||||||||||
Year Ended September 30, | 3.98% | 0.96% | 0.96% | 1.03% | 4.40% | 0.77% | 0.77% | 0.82% | 3.51% | $8,212 | 17% | |||||||||||||||||||||||||||||||||
Year Ended September 30, | 5.02% | 0.97% | 0.97% | 1.04% | 4.67% | 0.78% | 0.78% | 0.84% | 3.76% | 12,141 | 9% | |||||||||||||||||||||||||||||||||
Period Ended September 30, 2009(d) | 7.11% | 1.00% | 1.25% | 1.11% | 4.77% | 0.81% | 1.02% | 0.90% | 3.89% | 8,662 | 10% | |||||||||||||||||||||||||||||||||
Class I | ||||||||||||||||||||||||||||||||||||||||||||
Year Ended September 30, | 4.23% | 0.72% | 0.72% | 0.79% | 4.66% | 0.57% | 0.57% | 0.62% | 3.69% | $537,319 | 17% | |||||||||||||||||||||||||||||||||
Year Ended September 30, | 5.28% | 0.72% | 0.72% | 0.79% | 4.94% | 0.58% | 0.58% | 0.64% | 3.98% | 536,198 | 9% | |||||||||||||||||||||||||||||||||
Year Ended September 30, | 9.59% | 0.74% | 0.74% | 1.06% | 5.16% | 0.59% | 0.59% | 0.85% | 4.12% | 561,148 | 10% | |||||||||||||||||||||||||||||||||
Period Ended September 30, 2008 | 1.02% | 0.86% | 0.86% | 1.61% | 5.17% | 0.67% | 0.67% | 1.25% | 4.00% | 543,404 | 1% | |||||||||||||||||||||||||||||||||
Year Ended May 31, 2008 | 5.19% | 0.93%(e) | 0.93% | 1.99% | 4.83% | 0.75%(e) | 0.75% | 1.60% | 3.88% | 513,723 | 19% | |||||||||||||||||||||||||||||||||
Year Ended May 31, 2007 | 6.65% | 0.79% | 0.83% | 1.48% | 4.55% | 0.70% | 0.74% | 1.31% | 4.03% | 474,720 | 23% | |||||||||||||||||||||||||||||||||
(a) Annualized for those periods that are less than one year. | (e) To the extent that the Fund’s operating expenses (exclusive of management fees, distribution fees and interest expense) were less than 0.25% of the Fund’s monthly average net assets, the Fund repaid the Fund’s investment adviser and sub-adviser for operating expenses previously borne or reimbursed. | |
(b) These ratios are calculated based upon the average net assets plus average borrowings. | ||
(c) Total investment returns exclude the effect of sales charge. | ||
(d) Total expenses of the Fund for the period ended September 30, 2009 is 1.36% and 1.09% for the Class A and Class I shares, respectively. Total expenses for all other periods would be the same as shown in the financial highlights as net expenses because there were no fee waivers during these periods. |
See notes to financial statements.
37
|
September 30, 2011
1. Organization
RBC Funds Trust (the “Trust”) was organized as a Delaware statutory trust on December 16, 2003. Overall responsibility for the management of the Trust is vested in its Board of Trustees (the “Board”). This annual report includes the Access Capital Community Investment Fund (the “Fund”). At its inception in 1998, the Access Capital Strategies Community Investment Fund, Inc., the Fund’s predecessor, elected status as a business development company under the Investment Company Act of 1940 (the “1940 Act”), but withdrew its election on May 30, 2006, and registered as a continuously offered, closed-end interval management company under the 1940 Act. The predecessor fund was reorganized into a series of the Trust, a registered open-end management company under the 1940 Act, effective July 28, 2008.
The Fund offers two share classes: Class A and Class I shares. Class A shares are offered with a 3.75% maximum front-end sales charge and a 1.00% contingent deferred sales charge (“CDSC”) for redemption within 12 months of a $1 million or greater purchase on which no front-end sales charge was paid. Class I shares (intended for investors meeting certain investment minimum thresholds) are not subject to either a front-end sales charge or a CDSC.
RBC Global Asset Management (U.S.) Inc. (“RBC GAM (US)”) acts as the investment advisor for the Trust. The officers of the Trust (“Fund Management”) are also employees of RBC GAM (US) or its affiliates and BNY Mellon Investment Servicing (US) Inc. (“BNY Mellon”).
The Fund’s investment objective is to invest in geographically specific debt securities located in portions of the United States designated by Fund investors. The Fund seeks to achieve its investment objective by investing primarily in debt securities specifically designed to support underlying economic activities such as affordable housing, education, small business lending, and job-creating activities in areas of the United States designated by Fund investors.
2. Significant Accounting Policies
Summarized below are the significant accounting policies of the Fund. The policies conform to accounting principles generally accepted in the United States of America (“U.S. GAAP”). Fund Management follows these policies when preparing financial statements. Management may also be required to make estimates and assumptions that affect the reported amounts of assets and liabilities at the date of the financial statements and the reported amounts of income and expenses for the period. Actual results could differ from those estimates.
Security Valuation:
Bonds and other fixed income securities, including TBA commitments, are generally valued on the basis of prices furnished by pricing services approved by the Trust’s Board. The pricing services utilize both dealer-supplied valuations and electronic data processing techniques that take into account appropriate factors such as institutional-size trading in similar groups of securities, yield, quality, coupon rate, maturity and type of issue. Swaptions are fair valued using methodologies approved by the Trust’s Board. These valuation techniques take into account mutiple factors, including fundamental security analytical data, information from broker-dealers, market spreads and interest rates. Short-term debt obligations, with less than 60 days to maturity at time of purchase, are valued at amortized cost unless Fund Management determines that amortized cost no longer approximates market value. In such cases where a security price is unavailable, or where Fund Management determines that the value provided by the pricing services or amortized cost does not approximate fair value, the Board has approved pricing and valuation procedures to determine a security’s fair value. Some of the factors which may be considered in determining fair value are fundamental analytical data relating to the security, the issuer and the market, such as duration, prepayment and default rates; general level of interest rates and changes in interest rates; information from broker-dealers; and trading in similar securities. Investments in open-end investment companies are valued at net asset value. Exchange traded financial futures are valued at the settlement price as established by the exchange on which they are traded.
38
NOTES TO FINANCIAL STATEMENTS |
Financial Instruments:
Reverse Repurchase Agreements
To obtain short-term financing, the Fund entered into reverse repurchase agreements with primary dealers that report to the Federal Reserve Bank of New York or the 100 largest U.S. commercial banks, who are deemed creditworthy under guidelines approved by the Board. Interest on the value of the reverse repurchase agreements is based upon competitive market rates at the time of issuance. At the time the Fund enters into a reverse repurchase agreement, it will establish and maintain a segregated account with the custodian containing qualifying assets having a value, including accrued interest, not less than the repurchase price. Based on requirements with certain exchanges and third party broker-dealers, the Fund may also be required to deliver or deposit securities or cash as collateral. If the counterparty to the transaction is rendered insolvent, the ultimate realization of the securities to be repurchased by the Fund may be delayed or limited. For the year ended September 30, 2011, the average amount borrowed was approximately $142,992,660 and the daily weighted average interest rate was 0.25%.
Details of open reverse repurchase agreements at September 30, 2011 were as follows:
| Rate | Trade Date | Maturity Date | Net Closing Amount | Par | ||||||||||||||
Goldman Sachs | 0.26% | 8/15/11 | 10/04/11 | $ | (33,577,057) | $ | (33,564,936) | |||||||||||
Goldman Sachs | 0.25% | 8/25/11 | 10/17/11 | (20,533,555) | (20,526,000) | |||||||||||||
Goldman Sachs | 0.26% | 9/01/11 | 10/25/11 | (31,600,521) | (31,588,201) | |||||||||||||
Goldman Sachs | 0.29% | 9/15/11 | 11/02/11 | (38,620,928) | (38,606,000) | |||||||||||||
Goldman Sachs | 0.30% | 9/26/11 | 11/15/11 | (42,309,622) | (42,292,000) | |||||||||||||
Details of underlying collateral pledged for open reverse repurchase agreements in addition to the segregated cash collateral shown on the Statement of Assets and Liabilities at September 30, 2011 were as follows:
Description | Rate | Maturity Date | Par | Value | ||||||||||||
Goldman Sachs 8/15/11 to 10/04/11 | ||||||||||||||||
| Fannie Mae Pool #AH2980 | 4.00% | 1/01/41 | $ | 2,408,624 | $ | 2,527,080 | ||||||||||
| Fannie Mae Pool #AH5658 | 4.00% | 2/01/41 | 2,591,973 | 2,719,446 | ||||||||||||
| Fannie Mae Pool #AH6768 | 4.00% | 3/01/41 | 3,701,788 | 3,883,841 | ||||||||||||
| Fannie Mae Pool #AH7537 | 4.00% | 3/01/41 | 3,135,736 | 3,301,710 | ||||||||||||
| Fannie Mae Pool #AA3206 | 4.00% | 4/01/39 | 1,167,278 | 1,226,873 | ||||||||||||
| Fannie Mae Pool #AE7707 | 4.00% | 11/01/40 | 2,141,548 | 2,246,869 | ||||||||||||
| Fannie Mae Pool #AA0644 | 4.50% | 3/01/39 | 1,167,358 | 1,239,816 | ||||||||||||
| Fannie Mae Pool #AA3207 | 4.50% | 3/01/39 | 1,148,683 | 1,221,418 | ||||||||||||
| Fannie Mae Pool #AA7659 | 4.50% | 6/01/39 | 1,422,132 | 1,514,848 | ||||||||||||
| Fannie Mae Pool #AD1471 | 4.50% | 2/01/40 | 2,866,303 | 3,060,338 | ||||||||||||
| Fannie Mae Pool #AD4456 | 4.50% | 4/01/40 | 3,210,485 | 3,423,807 | ||||||||||||
| Fannie Mae Pool #AD4458 | 4.50% | 4/01/40 | 2,778,077 | 2,948,777 | ||||||||||||
| Fannie Mae Pool #AD4940 | 4.50% | 6/01/40 | 1,166,993 | 1,247,087 | ||||||||||||
| Fannie Mae Pool #AD7272 | 4.50% | 7/01/40 | 1,442,320 | 1,541,310 | ||||||||||||
| Fannie Mae Pool #934942 | 5.00% | 9/01/39 | 1,117,224 | 1,201,191 | ||||||||||||
| Fannie Mae Pool #AD8960 | 5.00% | 6/01/40 | 1,529,701 | $ | 1,654,706 | |||||||||||
|
| |||||||||||||||
| $ | 34,959,117 | |||||||||||||||
|
| |||||||||||||||
39
NOTES TO FINANCIAL STATEMENTS |
Description | Rate | Maturity Date | Par | Value | ||||||||||||
Goldman Sachs 8/25/11 to 10/17/11 | ||||||||||||||||
| Fannie Mae Pool #AH9050 | 3.50% | 2/01/26 | $ | 2,034,945 | $ | 2,126,915 | ||||||||||
| Fannie Mae Pool #AH0917 | 4.00% | 12/01/40 | 1,641,145 | 1,721,856 | ||||||||||||
| Fannie Mae Pool #AH5656 | 4.00% | 1/01/41 | 1,668,617 | 1,753,808 | ||||||||||||
| Fannie Mae Pool #AH6764 | 4.00% | 3/01/41 | 1,619,536 | 1,699,184 | ||||||||||||
| Fannie Mae Pool #AH7277 | 4.00% | 3/01/41 | 1,630,357 | 1,716,651 | ||||||||||||
| Fannie Mae Pool #663159 | 5.00% | 7/01/32 | 4,283,309 | 4,621,958 | ||||||||||||
| Fannie Mae Pool #806761 | 5.50% | 9/01/34 | 3,699,142 | 4,033,076 | ||||||||||||
| Fannie Mae Pool #844361 | 5.50% | 11/01/35 | 1,919,346 | 2,091,412 | ||||||||||||
| Fannie Mae Pool #944502 | 6.00% | 6/01/37 | 1,323,033 | 1,452,752 | ||||||||||||
|
| |||||||||||||||
| $ | 21,217,612 | |||||||||||||||
|
| |||||||||||||||
Goldman Sachs 9/01/11 to 10/25/11 | ||||||||||||||||
| Fannie Mae Pool #AH0301 | 3.50% | 11/01/40 | $ | 1,372,045 | $ | 1,411,063 | ||||||||||
| Fannie Mae Pool #AH0306 | 4.00% | 12/01/40 | 1,372,575 | 1,445,225 | ||||||||||||
| Fannie Mae Pool #AH1077 | 4.00% | 1/01/41 | 1,420,079 | 1,497,462 | ||||||||||||
| Fannie Mae Pool #AE7699 | 4.00% | 11/01/40 | 1,368,318 | 1,435,611 | ||||||||||||
| Fannie Mae Pool #AH0914 | 4.50% | 11/01/40 | 1,283,189 | 1,362,035 | ||||||||||||
| Fannie Mae Pool #806754 | 4.50% | 9/01/34 | 2,819,960 | 3,009,096 | ||||||||||||
| Fannie Mae Pool #AC2109 | 4.50% | 7/01/39 | 2,184,218 | 2,319,110 | ||||||||||||
| Fannie Mae Pool #AD1942 | 4.50% | 1/01/40 | 3,107,706 | 3,318,083 | ||||||||||||
| Fannie Mae Pool #AD7256 | 4.50% | 7/01/40 | 1,325,457 | 1,416,427 | ||||||||||||
| Fannie Mae Pool #AD7242 | 4.50% | 7/01/40 | 1,424,224 | 1,518,857 | ||||||||||||
| Fannie Mae Pool #AD9614 | 4.50% | 8/01/40 | 2,553,114 | 2,709,991 | ||||||||||||
| Fannie Mae Pool #738589 | 5.00% | 9/01/33 | 1,222,388 | 1,318,651 | ||||||||||||
| Fannie Mae Pool #777621 | 5.00% | 2/01/34 | 2,652,804 | 2,861,712 | ||||||||||||
| Fannie Mae Pool #829275 | 5.00% | 8/01/35 | 1,264,070 | 1,362,825 | ||||||||||||
| Fannie Mae Pool #AC1463 | 5.00% | 8/01/39 | 1,983,552 | 2,132,628 | ||||||||||||
| Fannie Mae Pool #AC4395 | 5.00% | 9/01/39 | 1,238,688 | 1,347,266 | ||||||||||||
| Fannie Mae Pool #AD1586 | 5.00% | 1/01/40 | 1,475,673 | 1,595,802 | ||||||||||||
| Fannie Mae Pool #AD1943 | 5.00% | 1/01/40 | 1,148,910 | 1,242,438 | ||||||||||||
|
| |||||||||||||||
| $ | 33,304,282 | |||||||||||||||
|
| |||||||||||||||
Goldman Sachs 9/15/11 to 11/02/11 | ||||||||||||||||
| Fannie Mae Pool #AE2023 | 4.00% | 9/01/40 | $ | 1,811,436 | $ | 1,900,522 | ||||||||||
| Fannie Mae Pool #AE5432 | 4.00% | 10/01/40 | 2,175,923 | 2,282,934 | ||||||||||||
| Fannie Mae Pool #AE5861 | 4.00% | 10/01/40 | 1,772,799 | 1,859,985 | ||||||||||||
| Fannie Mae Pool #AE6850 | 4.00% | 10/01/40 | 1,267,580 | 1,329,919 | ||||||||||||
| Fannie Mae Pool #AE6851 | 4.00% | 10/01/40 | 1,700,530 | 1,784,162 | ||||||||||||
| Fannie Mae Pool #AA3142 | 4.50% | 3/01/39 | 1,910,734 | 2,038,888 | ||||||||||||
| Fannie Mae Pool #AD7239 | 4.50% | 7/01/40 | 1,559,914 | 1,666,975 | ||||||||||||
40
NOTES TO FINANCIAL STATEMENTS |
Description | Rate | Maturity Date | Par | Value | ||||||||||||
| Fannie Mae Pool #MC0154 | 4.50% | 8/01/39 | $ | 1,888,777 | $ | 2,008,375 | ||||||||||
| Fannie Mae Pool #MC0171 | 4.50% | 9/01/39 | 1,633,241 | 1,743,803 | ||||||||||||
| Fannie Mae Pool #727312 | 5.00% | 9/01/33 | 2,356,186 | 2,541,735 | ||||||||||||
| Fannie Mae Pool #829005 | 5.00% | 8/01/35 | 1,703,672 | 1,836,772 | ||||||||||||
| Fannie Mae Pool #934941 | 5.00% | 8/01/39 | 1,848,898 | 1,997,098 | ||||||||||||
| Fannie Mae Pool #AA0526 | 5.00% | 12/01/38 | 1,036,626 | 1,120,365 | ||||||||||||
| Fannie Mae Pool #AC5329 | 5.00% | 10/01/39 | 1,492,307 | 1,611,925 | ||||||||||||
| Fannie Mae Pool #AC6304 | 5.00% | 11/01/39 | 1,570,797 | 1,696,707 | ||||||||||||
| Fannie Mae Pool #AC6307 | 5.00% | 12/01/39 | 1,859,589 | 2,008,646 | ||||||||||||
| Fannie Mae Pool #AD1470 | 5.00% | 2/01/40 | 2,963,785 | 3,205,055 | ||||||||||||
| Fannie Mae Pool #257892 | 5.50% | 2/01/38 | 1,576,155 | 1,718,933 | ||||||||||||
| Fannie Mae Pool #702478 | 5.50% | 6/01/33 | 1,383,296 | 1,508,603 | ||||||||||||
| Fannie Mae Pool #829649 | 5.50% | 3/01/35 | 1,530,137 | 1,668,028 | ||||||||||||
| Fannie Mae Pool #952598 | 6.00% | 7/01/37 | 1,175,000 | 1,297,181 | ||||||||||||
| Fannie Mae Pool #952632 | 6.00% | 7/01/37 | 1,674,025 | 1,838,158 | ||||||||||||
|
| |||||||||||||||
| $ | 40,664,769 | |||||||||||||||
|
| |||||||||||||||
Goldman Sachs 9/26/11 to 11/15/11 | ||||||||||||||||
| Fannie Mae Pool #AH5657 | 4.00% | 2/01/41 | $ | 1,244,091 | $ | 1,305,275 | ||||||||||
| Fannie Mae Pool #AE2012 | 4.00% | 9/01/40 | 3,443,066 | 3,612,395 | ||||||||||||
| Fannie Mae Pool #AE5862 | 4.00% | 10/01/40 | 2,272,839 | 2,393,140 | ||||||||||||
| Fannie Mae Pool #AE5863 | 4.00% | 10/01/40 | 2,734,567 | 2,879,306 | ||||||||||||
| Fannie Mae Pool #AE7703 | 4.00% | 10/01/40 | 1,194,932 | 1,253,699 | ||||||||||||
| Fannie Mae Pool #AA0645 | 4.50% | 3/01/39 | 1,174,864 | 1,254,764 | ||||||||||||
| Fannie Mae Pool #AD1585 | 4.50% | 2/01/40 | 3,687,167 | 3,936,771 | ||||||||||||
| Fannie Mae Pool #AD1988 | 4.50% | 2/01/40 | 4,626,849 | 4,940,065 | ||||||||||||
| Fannie Mae Pool #AD7271 | 4.50% | 7/01/40 | 2,946,991 | 3,142,805 | ||||||||||||
| Fannie Mae Pool #AD9613 | 4.50% | 8/01/40 | 2,599,403 | 2,772,121 | ||||||||||||
| Fannie Mae Pool #720025 | 5.00% | 8/01/33 | 1,156,189 | 1,247,239 | ||||||||||||
| Fannie Mae Pool #AC7199 | 5.00% | 12/01/39 | 4,653,616 | 5,026,632 | ||||||||||||
| Fannie Mae Pool #AC6790 | 5.00% | 12/01/39 | 1,155,321 | 1,255,509 | ||||||||||||
| Fannie Mae Pool #AD1560 | 5.00% | 3/01/40 | 2,431,500 | 2,626,399 | ||||||||||||
| Fannie Mae Pool #AD2896 | 5.00% | 3/01/40 | 1,185,979 | 1,289,567 | ||||||||||||
| Fannie Mae Pool #885724 | 5.50% | 6/01/36 | 2,634,274 | 2,867,140 | ||||||||||||
| Fannie Mae Pool #AA0527 | 5.50% | 12/01/38 | 2,403,179 | 2,619,371 | ||||||||||||
|
| |||||||||||||||
| $ | 44,422,198 | |||||||||||||||
|
| |||||||||||||||
Derivatives
The Fund may use derivative instruments, including futures, forwards, options, indexed securities, swaps and inverse securities for hedging purposes only. Derivatives allow the Fund to increase or decrease its risk exposure more quickly and efficiently than other types of instruments. Use of derivative contracts may give rise to losses. To the extent amounts due to the Fund from counterparties are not fully collateralized, contractually or otherwise, the Fund bears the risk of loss from counterparty non-performance. The Fund’s maximum risk of loss from counterparty credit risk on over-the-counter derivatives is generally the aggregate unrealized gain in excess of any
41
NOTES TO FINANCIAL STATEMENTS |
collateral pledged by the counterparty to the Fund. For over-the-counter purchased options, the Fund bears the risk of loss in the amount of the premiums paid and change in value of the options should the counterparty not perform under the contracts. Written options by the Fund do not give rise to counterparty credit risk, as written options obligate the Fund to perform and not the counterparty. Counterparty risk related to exchange traded financial futures contracts and options is minimal because of the protection against defaults provided by the exchange on which they trade. Hedging also involves the risk that changes in the value of the derivative will not match those of the holdings being hedged as expected by the Fund, in which case any losses on the holdings being hedged may not be reduced and may be increased. There can be no assurance that the Fund’s hedging strategy will reduce risk or that hedging transactions will be available or cost effective. The Fund is subject to interest rate risk in the normal course of pursuing its investment objectives by investing in various derivative instruments, as described below. For open derivative instruments as of September 30, 2011, see the following section for financial futures contracts.
The effect of Derivative Instruments on the Statement of Operations during the year ended September 30, 2011 is as follows:
Derivative Instruments Categorized by Risk Exposure | Net Realized Losses from Futures Contracts | Net Change in Unrealized Appreciation/Depreciation on Futures Contracts | ||||||
Interest Rate Risk | $(7,135,745) | $(2,584,504) | ||||||
For the year ended September 30, 2011, the average volume of derivative activities are as follows:
Futures Short Positions (Contracts) | ||||||
| 994 | ||||||
Financial Futures Contracts
The Fund entered into futures contracts in an effort to manage both the duration of the portfolio and hedge against certain market risk. A futures contract on a securities index is an agreement obligating one party to pay, and entitling the other party to receive, during the term of the contract, cash payments based on the level of a specified securities index. Futures transactions involve brokerage costs and require a Fund to segregate assets to cover contracts that would require it to purchase securities or currencies. A Fund may lose the expected benefit of futures transactions if interest rates, exchange rates or securities prices change in an unanticipated manner. Such unanticipated changes may also result in lower overall performance than if a Fund had not entered into any futures transactions.
Upon entering into a futures contract, a Fund is required to pledge to the broker an amount of cash, U.S. government securities, or other assets equal to a certain percentage of the contract amount. Subsequent payments are made or received by the Fund each day, depending on the daily fluctuations in the fair value of the underlying instrument. A Fund would record an unrealized gain or loss each day equal to these daily payments.
The Fund had the following open futures contracts at September 30, 2011:
42
| NOTES TO FINANCIAL STATEMENTS |
| Number of Contracts | Expiration Date | Unrealized Appreciation (Depreciation) | Notional Value | Counterparty | ||||||||||||
Short Position: | ||||||||||||||||
90 Day Euro | ||||||||||||||||
Dollar | 25 | March, 2012 | $ | (15,625) | $ | 6,197,500 | Barclays Capital | |||||||||
| 25 | March, 2013 | (57,812) | 6,154,688 | Barclays Capital | ||||||||||||
| 25 | March, 2014 | (99,062) | 6,081,875 | Barclays Capital | ||||||||||||
| 25 | June, 2012 | (26,250) | 6,186,875 | Barclays Capital | ||||||||||||
| 25 | June, 2013 | (65,625) | 6,142,500 | Barclays Capital | ||||||||||||
| 25 | June, 2014 | (103,125) | 6,066,562 | Barclays Capital | ||||||||||||
| 25 | September, 2012 | (37,187) | 6,176,563 | Barclays Capital | ||||||||||||
| 25 | September, 2013 | (70,938) | 6,130,313 | Barclays Capital | ||||||||||||
| 25 | September, 2014 | (106,250) | 6,051,563 | Barclays Capital | ||||||||||||
| 25 | December, 2011 | (9,688) | 6,207,188 | Barclays Capital | ||||||||||||
| 25 | December, 2012 | (48,750) | 6,164,688 | Barclays Capital | ||||||||||||
| 25 | December, 2013 | (94,688) | 6,096,250 | Barclays Capital | ||||||||||||
Ten Year | ||||||||||||||||
U.S. Treasury Notes | 325 | December, 2011 | (341,992) | 41,938,477 | Barclays Capital | |||||||||||
Thirty Year | ||||||||||||||||
U.S. Treasury Bonds | 325 | December, 2011 | (1,901,758) | 44,451,367 | Barclays Capital | |||||||||||
Details of underlying collateral pledged for open futures contracts in addition to the deposit at brokers shown on the Statement of Assets and Liabilities at September 30, 2011 is as follows:
Description | Yield | Maturity Date | Par | Market Value | ||||||||||||
| Fannie Mae Discount Note | 0.13 | % | 10/12/11 | $ | 2,000,000 | $ | 1,999,980 | |||||||||
Options
The Fund may write (or sell) put and call options on the securities that the Fund is authorized to buy or already holds in its portfolio. A Fund may also purchase put and call options. A call option gives the purchaser the right to buy, and the writer the obligation to sell, the underlying security at the agreed-upon exercise (or “strike”) price during the option period. A put option gives the purchaser the right to sell, and the writer the obligation to buy, the underlying security at the strike price during the option period. Purchasers of options pay an amount, known as a premium, to the option writer in exchange for the right under the option contract. The Fund does not have any outstanding options as of September 30, 2011.
Swaptions
The Fund may purchase or write swaptions in an attempt to gain additional protection against the effects of interest rate fluctuations. Swap options (swaptions) are similar to options on securities except that instead of selling or purchasing the right to buy or sell a security, the writer or purchaser of the swap option is granting or buying the right to enter into a previously agreed upon interest rate swap agreement at any time before the expiration of the option (interest rate risk). In purchasing and writing swaptions, the Fund bears the risk of an unfavorable change in the price of the underlying interest rate swap or the risk that the Fund may not be able to enter into a closing transaction due to an illiquid market. The Fund executes transactions in over-the-counter swaptions. Transactions in over-the-counter swaptions may expose the Fund to the risk of default by the counterparty to the transaction. In the event of default by the counterparty, the Fund’s maximum amount of loss is the premium paid (as purchaser) or the unrealized loss of the contract (as writer).The Fund does not have any outstanding call swaptions as of September 30, 2011.
43
NOTES TO FINANCIAL STATEMENTS |
TBA Commitments
The Fund may enter into to be announced (“TBA”) commitments to purchase or sell securities for a fixed price at a future date. TBA commitments are considered securities in themselves, and involve a risk of loss if the value of the security to be purchased/sold declines/increases prior to settlement date, which is in addition to the risk of decline in the value of a Fund’s other assets. Unsettled TBA commitments are valued at the current value of the underlying securities, according to the procedures described under “Security Valuation”.
Mortgage Backed Securities
Because the Fund will focus on community development investments, such as securities backed by commercial and/or residential mortgage loans, it will be affected by risks not typically associated with funds that do not specialize in community development investments. These risks include credit and prepayment risk and risk due to default on underlying loans within a security. Changes in economic conditions, including delinquencies and/or defaults or assets underlying these securities, can affect the value, income and/or liquidity of such positions.
In addition, the Fund invests in certain mortgage backed securities that qualify under the CRA in which the Fund may pay a premium for the geographically or other targeted nature of the securities. There can be no guarantee, however, that a similar premium will be received if the security is sold by the Fund.
Credit Enhancement
Certain obligations held in the Fund have credit enhancement or liquidity features that may, under certain circumstances, provide for repayment of principal and interest on the obligation upon demand date, interest rate reset date or final maturity. These enhancements may include: letters of credit; liquidity guarantees; security purchase agreements; tender option purchase agreements; and third party insurance (i.e., AMBAC and MBIA).
Fair Value Measurements:
Various inputs are used in determining the fair value of investments which are as follows:
· Level 1 - Inputs that reflect unadjusted quoted prices in active markets for identical assets or liabilities that the Funds have the ability to access at the measurement date.
· Level 2 - Inputs other than quoted prices that are observable for the asset or liability either directly or indirectly, including inputs in markets that are not considered to be active.
· Level 3 - Unobservable inputs based on the best information available in the circumstances, to the extent observable inputs are not available (including the Fund’s own assumptions in determining the fair value of investments).
44
NOTES TO FINANCIAL STATEMENTS |
The inputs or methodology used for valuing securities are not necessarily an indication of the risk associated with investing in those securities.
The summary of inputs used to determine the fair valuation of the Fund’s investments as of September 30, 2011 is as follows:
Level 1 Quoted Prices | Level 2 Significant Observable Inputs | Level 3 Significant Unobservable Inputs | Total | |||||||||||||
Assets: | ||||||||||||||||
Investments in Securities | ||||||||||||||||
Investment Company | $ | 6,228,259 | $ | — | $ | — | $ | 6,228,259 | ||||||||
Municipal Bonds | — | 14,708,184 | — | 14,708,184 | ||||||||||||
Corporate Bonds | — | 1,196,109 | — | 1,196,109 | ||||||||||||
U.S. Government Agency Backed Mortgages | — | 614,702,965 | — | 614,702,965 | ||||||||||||
U.S. Government Agency Obligations | — | 62,589,305 | — | 62,589,305 | ||||||||||||
Promissory Notes | — | 10,306,592 | — | 10,306,592 | ||||||||||||
|
|
|
|
|
|
|
| |||||||||
| $ | 6,228,259 | $ | 703,503,155 | $ | — | $ | 709,731,414 | |||||||||
|
|
|
|
|
|
|
| |||||||||
Total Assets | $ | 6,228,259 | $ | 703,503,155 | $ | — | $ | 709,731,414 | ||||||||
|
|
|
|
|
|
|
| |||||||||
Liabilities: | ||||||||||||||||
Other Financial Instruments(*) | ||||||||||||||||
Interest Rate Contracts | $ | (2,978,750) | $ | — | $ | — | $ | (2,978,750) | ||||||||
|
|
|
|
|
|
|
| |||||||||
* Other financial instruments are futures contracts which are not reflected in the Schedule of Portfolio Investments and are shown at the unrealized appreciation/(depreciation) on the investment.
During the year ended September 30, 2011, the Fund recognized no transfers to/from level 1 or 2. The Fund’s policy is to recognize transfers to/from level 1, level 2 and level 3 at the end of the year utilizing fair value at the beginning of the year.
In May 2011, the Financial Accounting Standards Board (“FASB”) issued Accounting Standards Update (“ASU”) No. 2011-04 “Amendments to Achieve Common Fair Value Measurement and Disclosure Requirements” in U.S. GAAP and International Financial Reporting Standards (“IFRSs”). ASU 2011-04 includes common requirements for measurement of and disclosure about fair value between U.S. GAAP and IFRS. ASU 2011-04 will require reporting entities to disclose the following information for fair value measurements categorized within Level 3 of the fair value hierarchy: quantitative information about the unobservable inputs used in the fair value measurement, the valuation processes used by the reporting entity and a narrative description of the sensitivity of the fair value measurement to changes in unobservable inputs and the interrelationships between those unobservable inputs. In addition, ASU 2011-04 will require reporting entities to make disclosures about amounts and reasons for all transfers in and out of Level 1 and Level 2 fair value measurements. The new and revised disclosures are effective for interim and annual reporting periods beginning after December 15, 2011. Management is currently evaluating the implications of ASU No. 2011-04 and its impact on the financial statements.
Investment Transactions and Income:
Investment transactions are recorded one business day after trade date, except on the last day of each fiscal quarter end, when they are recorded on trade date. Dividend income is recorded on the ex-dividend date. Realized gains and losses from investment transactions are calculated based on the costs of the specific security (also known as identified cost basis). Interest income is recognized on the accrual basis and includes, where applicable, the amortization and accretion of premium or discount using the effective yield method. Paydown gains and losses on mortgage and asset-backed securities are included in the financial statements as interest income.
45
NOTES TO FINANCIAL STATEMENTS |
Distributions to Shareholders:
The Fund pays out any income that it receives, less expenses, in the form of dividends and capital gains to its shareholders. Income dividends are declared daily and paid monthly. Dividends will also be paid at any time during the month upon total redemption of shares in an account. Capital gain distributions are declared and paid at least annually. Distributions to shareholders are recorded on the ex-dividend date. The amount of dividends and distributions are calculated based on federal income tax regulations, which may differ from GAAP. These “book/tax” differences may be either temporary or permanent in nature. To the extent these differences are determined, as of the end of the tax year, to be permanent (e.g., reclassification of paydown gains and losses, and expiring capital loss carryforward), they are reclassified within a Fund’s capital account based on their federal tax basis treatment.
For the year ended September 30, 2011, permanent difference reclassification amounts were as follows:
Increase Undistributed Net Investment Income | Decrease Accumulated Realized Loss | Decrease Paid-in-Capital | ||||||||
| $618,469 | $1,292,928 | $(1,911,397) | ||||||||
3. Agreements and Other Transactions with Affiliates
RBC GAM (US) serves as investment advisor to the Fund. The Advisor has agreed to waive or limit fees through January 31, 2013, to maintain expenses (excluding interest expense, management fees and distribution fees) at 0.20% of the Fund’s average monthly gross assets less liabilities, other than indebtness for borrowing. The Fund will carry forward, for a period not to exceed 12 months from the date on which a waiver or reimbursement is made by the Advisor, any expenses in excess of the expense limitation and repay the Advisor such amounts, provided the Fund is able to effect such repayment and remain in compliance with the expense limitation disclosed in the effective prospectus. During the year ended September 30, 2011, no reimbursements were made to the Advisor.
Under the terms of the Fund’s management agreement, the Advisor receives from the Fund an annual management fee, paid monthly, of 50 basis points (0.50%) of the Fund’s average daily total assets less liabilities, other than indebtedness for borrowing. For purposes of calculating the management fee, assets purchased with borrowed monies are included in the total that is subject to the management fee. As a result, the Advisor has an incentive to use leverage so as to increase the amount of assets upon which it may charge a fee. As of September 30, 2011, the impact of leverage raised the management fee to approximately 63 basis points (0.63%) of the Fund’s average net assets.
The RBC Funds currently pay the independent Trustees (Trustees of the Trust who are not directors, officers or employees of the adviser, administrator or distributor) an annual retainer of $30,000 ($32,500 effective October 1, 2011). The Board Chairperson and Audit Committee Chairperson each receive an additional retainer of $2,500 annually, and all other trustees serving as Chair of a Board committee each receive an additional retainer of $1,000 annually. In addition, Independent Trustees receive a quarterly meeting fee of $5,000 for each in-person Board meeting attended, a meeting fee of $1,000 for each telephonic or Special Board meeting attended, and a $1,500 fee for each Board committee meeting attended and are reimbursed for all out-of-pocket expenses relating to attendance at such meetings.
Expense, Investment Income and Gain/Loss Allocation:
The Fund pays the expenses that are directly related to its operations, such as custodian fees or adviser fees. Expenses incurred by the Trust, such as trustee or legal fees, are allocated to the Fund either proportionately based upon the Fund’s relative net assets or using another reasonable basis such as equally across all Funds in the Trust, depending on the nature of the expense. Individual share classes within the Fund are charged expenses specific to that class, such as distribution fees. Within the Fund, expenses other than class specific expenses are allocated daily to each class based upon the proportion of relative net assets. Investment income and realized and unrealized gains or losses are allocated to each class of shares based upon the proportion of relative net assets.
46
NOTES TO FINANCIAL STATEMENTS |
4. Fund Distribution:
The Fund has adopted a Master Distribution 12b-1 Plan (the “Plan”) in which Quasar Distributors LLC (the “Distributor”) acts as the Fund’s distributor. The Plan permits the Fund to make payments for, or to reimburse the Distributor monthly for, distribution-related costs and expenses of marketing shares of Class A covered under the Plan, and/or for providing shareholder services. The Plan does not apply to Class I. The following chart shows the current Plan fee rate for Class A.
| Class A | ||||
12b-1 Plan Fee | 0.25% | |||
Plan fees are based on average daily net assets of Class A. The Distributor, subject to applicable legal requirements, may waive the Plan fee voluntarily, in whole or in part. For the year ended September 30, 2011, there were no fees waived by the Distributor.
5. Securities Transactions:
The cost of securities purchased and proceeds from securities sold (excluding securities maturing less than one year from acquisition) for the year ended September 30, 2011 were as follows:
Purchases(Excl. U.S. Gov’t.) | Sales(Excl. U.S. Gov’t.) | Purchases of U.S. Gov’t. | Sales of U.S. Gov’t. | |||
$ 156,849,123 | $117,554,524 | $— | $— |
6. Capital Share Transactions:
The Trust is authorized to issue 1,000,000,000 shares of beneficial interest (“shares outstanding”) with par value of $.0000001. Transactions in shares of the Fund are summarized below:
| For the Year Ended September 30, 2011 | For the Year Ended September 30, 2010 | |||||||
CAPITAL TRANSACTIONS: | ||||||||
Class A | ||||||||
Proceeds from shares issued | $ | 4,360,376 | $ | 4,694,851 | ||||
Distributions reinvested | 205,393 | 124,567 | ||||||
Cost of shares redeemed | (8,377,225 | ) | (1,346,445 | ) | ||||
|
|
|
| |||||
Change in Class A | $ | (3,811,456 | ) | $ | 3,472,973 | |||
|
|
|
| |||||
Class I | ||||||||
Proceeds from shares issued | $ | 21,722,161 | $ | 62,153,630 | ||||
Distributions reinvested | 10,344,407 | 10,405,085 | ||||||
Cost of shares redeemed | (27,606,361 | ) | (98,519,903 | ) | ||||
|
|
|
| |||||
Change in Class I | $ | 4,460,207 | $ | (25,961,188 | ) | |||
|
|
|
| |||||
Change in net assets resulting from capital transactions | $ | 648,751 | $ | (22,488,215 | ) | |||
|
|
|
| |||||
47
NOTES TO FINANCIAL STATEMENTS |
| For the Year Ended September 30, 2011 | For the Year Ended September 30, 2010 | |||||||
SHARE TRANSACTIONS: | ||||||||
Class A | ||||||||
Issued | 450,086 | 477,077 | ||||||
Reinvested | 21,131 | 12,657 | ||||||
Redeemed | (866,187 | ) | (136,866 | ) | ||||
|
|
|
| |||||
Change in Class A | (394,970 | ) | 352,868 | |||||
|
|
|
| |||||
Class I | ||||||||
Issued | 2,238,593 | 6,329,731 | ||||||
Reinvested | 1,064,932 | 1,059,320 | ||||||
Redeemed | (2,851,208 | ) | (10,040,098 | ) | ||||
|
|
|
| |||||
Change in Class I | 452,317 | (2,651,047 | ) | |||||
|
|
|
| |||||
Change in shares resulting from capital transactions | 57,347 | (2,298,179 | ) | |||||
|
|
|
| |||||
7. Federal Income Taxes:
It is the policy of the Fund to continue to qualify as a regulated investment company by complying with the provisions available to certain investment companies, as defined under Subchapter M of the Internal Revenue Code, and to distribute substantially all of its net investment income and net realized capital gains. Therefore, no federal tax liability is recorded in the financial statements of the Fund.
As of September 30, 2011, the tax cost of securities and the breakdown of unrealized appreciation (depreciation) was as follows:
Tax Cost of Securities | Unrealized Appreciation | Unrealized Depreciation | Net Unrealized Appreciation | |||
$ 668,807,725 | $42,663,378 | $(1,739,689) | $40,923,689 |
The tax character of distributions were as follows:
| Distributions Paid From | ||||||||
| Ordinary Income | Total Distributions Paid | |||||||
For the year ended September 30, 2011 | $26,023,509 | $26,023,509 | ||||||
For the year ended September 30, 2010 | 28,353,542 | 28,353,542 | ||||||
48
NOTES TO FINANCIAL STATEMENTS |
As of September 30, 2011, the components of accumulated earnings/(losses) and tax character of distributions paid are as follows:
Undistributed Ordinary Income | Accumulated Earnings | Distributions Payable | Deferred Post October Losses | Accumulated Capital and Other Losses | Unrealized Appreciation | Total Accumulated Losses | ||||||||||||||||||
| $ 58,428 | $58,428 | $(1,383,256) | $(11,203,794) | $(30,723,459) | $40,923,689 | $(2,328,392) | ||||||||||||||||||
As of September 30, 2011, the Fund had capital loss carryforwards for federal income tax purposes as follows:
Capital Loss Carryforward | Expires | |||||||
| $ 3,756,334 | 2012 | |||||||
| 659,184 | 2013 | |||||||
| 27,743 | 2014 | |||||||
| 2,484,167 | 2015 | |||||||
| 8,197,543 | 2016 | |||||||
| 11,587,282 | 2018 | |||||||
| 4,011,206 | 2019 | |||||||
The Fund had capital loss carryforwards of $1,911,397 expire as of the end of the fiscal year ending September 30, 2011.
The Regulated Investment Company Modernization Act of 2010 (The “Act”) was enacted on December 22, 2010. The Act makes changes to several tax rules impacting the Fund. In general, the provisions of the Act will be effective for the Fund’s fiscal year beginning after September 30, 2011. Although the Act provides several benefits, including the unlimited carryover of future capital losses, there may be a greater likelihood that all or a portion of the Fund’s pre-enactment capital loss carryovers may expire without being utilized due to the fact that post-enactment capital losses get utilized before pre-enactment capital loss carryovers. Relevant information regarding the impact of the Act on the Fund will be contained within this section of the Fund’s fiscal year ending September 30, 2012 financial statements.
Under current tax law, capital losses realized after October 31 of a Fund’s fiscal year may be deferred and treated as occurring on the first business day of the following fiscal year for tax purposes. The Fund had deferred post October capital losses of $11,203,794 which were treated as arising on the first business day of the fiscal year ending September 30, 2012.
Management has analyzed the Fund’s tax positions taken or expected to be taken on federal income tax returns for all open tax years (for the tax years ended September 30 of the years 2008, 2009, 2010, 2011 and the tax year ended May 31 of 2008), and has concluded that no provision for federal income tax is required in the Fund’s financial statements. The Fund’s federal and state income and federal excise tax returns for tax years for which the applicable statutes of limitations have not expired are subject to examination by the Internal Revenue Service and state departments of revenue.
As of and during the period ended September 30, 2011, the Fund did not have a liability for any unrecognized tax benefits. The Fund recognizes interest and penalities, if any, related to unrecognized tax benefits as income tax expense in the statement of operations. During the period, the Fund did not incur any interest or penalties.
8. Subsequent Events.
Management has evaluated the impact of all subsequent events on the Fund and has determined that there were no subsequent events requiring recognition or disclosure in the financial statements.
49
|
To the Shareholders and Board of Trustees of Access Capital Community Investment Fund:
We have audited the accompanying statement of assets and liabilities, including the schedule of portfolio investments, of Access Capital Community Investment Fund (the “Fund”), one of the portfolios constituting the RBC Funds Trust (the “Trust”), as of September 30, 2011, and the related statements of operations and cash flows for the year then ended, the statements of changes in net assets for each of the two years in the period then ended and the financial highlights for each of the periods presented. These financial statements and financial highlights are the responsibility of the Fund’s management. Our responsibility is to express an opinion on these financial statements and financial highlights based on our audits.
We conducted our audits in accordance with the standards of the Public Company Accounting Oversight Board (United States). Those standards require that we plan and perform the audits to obtain reasonable assurance about whether the financial statements and financial highlights are free of material misstatement. The Fund is not required to have, nor were we engaged to perform, an audit of its internal control over financial reporting. Our audits included consideration of internal control over financial reporting as a basis for designing audit procedures that are appropriate in the circumstances, but not for the purpose of expressing an opinion on the effectiveness of the Fund’s internal control over financial reporting. Accordingly, we express no such opinion. An audit also includes examining, on a test basis, evidence supporting the amounts and disclosures in the financial statements, assessing the accounting principles used and significant estimates made by management, as well as evaluating the overall financial statement presentation. Our procedures included confirmation of securities owned as of September 30, 2011, by correspondence with the Funds’ custodian and brokers; where replies were not received from brokers, we performed other auditing procedures. We believe that our audits provide a reasonable basis for our opinion.
In our opinion, the financial statements and financial highlights referred to above present fairly, in all material respects, the financial position of Access Capital Community Investment Fund, as of September 30, 2011, the results of its operations and its cash flows for the year then ended, the changes in its net assets for each of the two years in the period then ended, and the financial highlights for each of the periods presented, in conformity with accounting principles generally accepted in the United States of America.
DELOITTE & TOUCHE LLP
Chicago, Illinois
November 22, 2011
50
|
The Fund designates a portion of the income dividends distributed during the fiscal year ended September 30, 2011, as qualified interest income as defined in the Internal Revenue Code as 100%.
The designation is based on financial information available as of the date of this annual report and, accordingly, is subject to change. It is the intention of the Fund to designate the maximum amount permitted under the Internal Revenue Code and the regulations thereunder.
51
|
Independent Trustees(1)(2)
T. Geron Bell (70)
Position, Term of Office and Length of Time Served with the Trust: Trustee since January 2004
Principal Occupation(s) During Past 5 Years: Chairman of the Executive Board of the Minnesota Twins (January 2011 to present); prior thereto President of Twins Sports, Inc. (parent company of the Minnesota Twins) (2002-2011); President of the Minnesota Twins Baseball Club Incorporated (1987-2002)
Number of Portfolios in Fund Complex Overseen by Trustee: 21
Other Director/Trustee Positions Held by Trustee During Past 5 Years: None
Lucy Hancock Bode (60)
Position, Term of Office and Length of Time Served with the Trust: Trustee since January 2004
Principal Occupation(s) During Past 5 Years: Healthcare consultant (self-employed)
Number of Portfolios in Fund Complex Overseen by Trustee: 21
Other Director/Trustee Positions Held by Trustee During Past 5 Years: BioSignia
Leslie H. Garner Jr. (61)
Position, Term of Office and Length of Time Served with the Trust: Trustee since January 2004
Principal Occupation(s) During Past 5 Years: President and CEO, The Greater Cedar Rapids Community Foundation (2010 to present); previously, President, Cornell College
Number of Portfolios in Fund Complex Overseen by Trustee: 21
Other Director/Trustee Positions Held by Trustee During Past 5 Years: None
Ronald James (60)
Position, Term of Office and Length of Time Served with the Trust: Trustee since January 2004
Principal Occupation(s) During Past 5 Years: President and Chief Executive Officer, Center for Ethical Business Cultures (2000 to present)
Number of Portfolios in Fund Complex Overseen by Trustee: 21
Other Director/Trustee Positions Held by Trustee During Past 5 Years: Best Buy Co. Inc.; Bremer Financial Corporation
John A. MacDonald (62)
Position, Term of Office and Length of Time Served with the Trust: Trustee since January 2004
Principal Occupation(s) During Past 5 Years: Vice President and Treasurer, Hall Family Foundation
Number of Portfolios in Fund Complex Overseen by Trustee: 21
Other Director/Trustee Positions Held by Trustee During Past 5 Years: None
H. David Rybolt (69)
Position, Term of Office and Length of Time Served with the Trust: Trustee since January 2004
Principal Occupation(s) During Past 5 Years: Consultant, HDR Associates (management consulting)
Number of Portfolios in Fund Complex Overseen by Trustee: 21
Other Director/Trustee Positions Held by Trustee During Past 5 Years: None
52
MANAGEMENT (Unaudited) |
Independent Trustees(1)(2)
James R. Seward (59)
Position, Term of Office and Length of Time Served with the Trust: Chairman of the Board and Trustee since January 2004
Principal Occupation(s) During Past 5 Years: Private investor (2000 to present); CFA
Number of Portfolios in Fund Complex Overseen by Trustee: 21
Other Director/Trustee Positions Held by Trustee During Past 5 Years: Syntroleum Corporation; Brookdale Senior Living Inc.; LabOne, Inc.; American Retirement Corp.
William B. Taylor (66)
Position, Term of Office and Length of Time Served with the Trust: Trustee since September 2005
Principal Occupation(s) During Past 5 Years: Consultant (2003 to present); prior thereto Partner (until 2003) Ernst & Young LLP
Number of Portfolios in Fund Complex Overseen by Trustee: 21
Other Director/Trustee Positions Held by Trustee During Past 5 Years: J.E. Dunn Vermont Assurance
Interested Trustees(1)(2)(3)
Erik R. Preus (46)(5)
Position, Term of Office and Length of Time Served with the Trust: Trustee since March 2006
Principal Occupation(s) During Past 5 Years: President and Chief Executive Officer, RBC Funds Trust (2006 to present); Head, Strategic Relationships Group, RBC Global Asset Management (U.S.) Inc. (2009 to present); Head of Retail Asset Management, RBC Global Asset Management (U.S.) Inc. (2006-2009); Chief Operating Officer, RBC Global Asset Management (U.S.) Inc. (2005-2006); Director, Investment Consulting Services, RBC Dain Rauscher Inc. (2004-2005); Director, Voyageur Advisory Services, RBC Global Asset Management (U.S.) Inc. (2003-2004)
Number of Portfolios in Fund Complex Overseen by Trustee: 21
Other Director/Trustee Positions Held by Trustee During Past 5 Years: None
Executive Officers(1)(3)(4)
Erik R. Preus (46)
Position, Term of Office and Length of Time Served with the Trust: President and Chief Executive Officer since September 2006
Principal Occupation(s) During Past 5 Years: Head, Strategic Relationships Group, RBC Global Asset Management (U.S.) Inc. (2009 to present); Head of Retail Asset Management, RBC Global Asset Management (U.S.) Inc. (2006-2009); Chief Operating Officer, RBC Global Asset Management (U.S.) Inc. (2005-2006)
James A. Gallo (47)
Address: BNY Mellon Investment Servicing (US) Inc., 760 Moore Road, King of Prussia, PA 19406
Position, Term of Office and Length of Time Served with the Trust: Treasurer since October 2007
Principal Occupation(s) During Past 5 Years: Senior Vice President and Managing Director, BNY Mellon Investment Servicing (US) Inc. (2002 to present)
53
MANAGEMENT (Unaudited) |
Executive Officers(1)(3)(4)
Kathleen A. Hegna (44)
Position, Term of Office and Length of Time Served with the Trust: Chief Financial Officer and Principal Accounting Officer since May 2009
Principal Occupation(s) During Past 5 Years: Associate Vice President and Director, Mutual Fund Accounting and Administration, RBC Global Asset Management (U.S.) Inc. (2009 to present); Senior Compliance Officer, RBC Global Asset Management (U.S.) Inc. (2006-2009); Director, Asset Management Compliance, RiverSource Investments (2005-2006)
Kathleen A. Gorman (47)
Position, Term of Office and Length of Time Served with the Trust: Chief Compliance Officer since April 2006 and Assistant Secretary since September 2006
Principal Occupation(s) During Past 5 Years: Chief Compliance Officer, RBC Funds Trust (2006 to present); Director of Regulatory Administration, RBC Global Asset Management (U.S.) Inc. (2007 to present); Chief Compliance Officer, RBC Global Asset Management (U.S.) Inc. (2006-2009)
Lee Thoresen (40)
Position, Term of Office and Length of Time Served with the Trust: Chief Legal Officer and Secretary since 2008
Principal Occupation(s) During Past 5 Years: Associate General Counsel, RBC Capital Markets, LLC (2006-present); Asset Management Compliance, RiverSource Investments (2004-2006)
John M. Huber (43)
Position, Term of Office and Length of Time Served with the Trust: Chief Investment Officer, U.S. Fixed Income Funds since February 2004
Principal Occupation(s) During Past 5 Years: Senior Managing Director and Chief Investment Officer, Fixed Income, RBC Global Asset Management (U.S.) Inc. (2004 to present)
Gordon Telfer (45)
Position, Term of Office and Length of Time Served with the Trust: Chief Investment Officer, U.S. Equity Funds since October 2009; Portfolio Strategist from March 2004 to October 2009
Principal Occupation(s) During Past 5 Years: Director of Equities - U.S., RBC Global Asset Management (U.S.) Inc. (June 2009 to present); Head of Growth Equities, RBC Global Asset Management (U.S.) Inc. (2008-2009); Senior Portfolio Manager, RBC Global Asset Management (U.S.) Inc. (2004-2008); Managing Director, RBC Global Asset Management (U.S.) Inc. (2007-present); Vice President, RBC Global Asset Management (U.S.) Inc. (2004-2007)
Mark Poole (50)
Address: BlueBay Asset Management Ltd., 77 Grosvenor Street, London, W1K 3JR, United Kingdom
Position, Term of Office and Length of Time Served with the Trust: Chief Investment Officer, Global Fixed Income Funds since September 2011
Principal Occupation(s) During Past 5 Years: Chief Investment Officer, BlueBay Asset Management Ltd. (2001 to present)
54
MANAGEMENT (Unaudited) |
Executive Officers(1)(3)(4)
Ronald A. Homer (64)
Position, Term of Office and Length of Time Served with the Trust: President since July 2008
Principal Occupation(s) During Past 5 Years: Managing Director, RBC Global Asset Management (U.S.) Inc. and President, Access Capital Community Investment Fund (July 2008 to present); Chief Executive Officer and Co-Managing Member, Access Capital Strategies LLC (1997-July 2008); Chairman, Access Capital Strategies Community Investment Fund (1998-July 2008)
| (1) | Except as otherwise noted, the address of each Trustee/Officer is RBC Funds Trust, 100 South Fifth Street, Suite 2300, Minneapolis, Minnesota 55402. |
| (2) | All Trustees must retire on or before December 31 of the year in which they reach age 75. The Board may temporarily waive this requirement when necessary to avoid depriving the Board of a Trustee with a critical skill. |
| (3) | On December 31, 2009, Voyageur Asset Management Inc. changed its name to RBC Global Asset Management (U.S.) Inc. Any references to RBC Global Asset Management (U.S.) Inc. for prior periods are deemed to be references to the prior entity. |
| (4) | Each officer serves in such capacity for an indefinite period of time until his or her removal, resignation or retirement. |
| (5) | Erik R. Preus has been determined to be an interested Trustee by virtue of his affiliation with the Trust. |
The Funds’ Statement of Additional Information includes information about the Funds’ Trustees. To receive your free copy of the Statement of Additional Information, call toll free: 1-800-422-2766.
55
|
The Access Capital Community Investment Fund offers Class A and Class I shares.
Class A
Class A shares are available for purchase primarily through investment advisors, broker-dealers, banks and other financial services intermediaries. Class A shares of the Fund are currently subject to a maximum up-front sales charge of 3.75% and a 1.00% CDSC for redemption within 12 months of a $1 million or greater purchase. Class A shares currently include a 0.25% annual 12b-1 service and distribution fee.
Class I
Class I shares are intended for investors meeting certain minimum investment thresholds. This share class does not have an up-front sales charge (load) or a 12b-1 service and distribution fee.
56
|
Shareholder Expense Examples
As a shareholder of the Access Capital Community Investment Fund, you incur two types of costs: (1) transaction costs, and (2) ongoing costs, including management fees and other Fund expenses. This example is intended to help you understand your ongoing costs (in dollars) of investing in the Fund and to compare these costs with the ongoing costs of investing in other mutual funds.
The Example is based on an investment of $1,000 invested at the beginning of the period and held for the entire period from April 1, 2011 through September 30, 2011.
Actual Expenses
The table below provides information about actual account values and actual expenses. You may use the information below, together with the amount you invested, to estimate the expenses that you paid over the period. Simply divide your account value by $1,000 (for example, an $8,600 account value divided by $1,000 = 8.6), then multiply the result by the number in the table under the heading entitled “Expenses Paid During Period” to estimate the expenses you paid on your account during this period.
| Beginning Account Value 4/1/11 | Ending Account Value 9/30/11 | Expenses Paid During Period* 4/1/11-9/30/11 | Annualized Expense Ratio During Period 4/1/11-9/30/11 | |||||
Class A | $ 1,000.00 | $1,038.90 | $5.53 | 1.07% | ||||
Class I | $ 1,000.00 | $1,039.10 | $4.24 | 0.82% |
Hypothetical Example for Comparison Purposes
The table below provides information about hypothetical account values and hypothetical expenses based on the Fund’s actual expense ratio and an assumed rate of return of 5% per year before expenses, which is not the Fund’s actual return. The hypothetical account values and expenses may not be used to estimate the actual ending account balance or expenses you paid for the period. You may use this information to compare this 5% hypothetical example with the 5% hypothetical examples that appear in the shareholder reports of other funds.
Please note that the expenses shown in the table are meant to highlight your ongoing costs only and do not reflect any transactional costs, such as sales charges (loads), redemption fees, or exchange fees. Therefore, the table is useful in comparing ongoing costs only, and will not help you determine the relative total costs of owning different funds. In addition, if these transactional costs were included, your costs would have been higher.
Beginning Account Value 4/1/11 | Ending Account Value 9/30/11 | Expenses Paid During Period* 4/1/11-9/30/11 | Annualized Expense Ratio During Period 4/1/11-9/30/11 | |||||
Class A | $ 1,000.00 | $1,019.92 | $5.48 | 1.07% | ||||
Class I | $ 1,000.00 | $1,021.19 | $4.20 | 0.82% |
*Expenses are equal to the average account value times the Fund’s annualized expense ratio multiplied by 185/365 (to reflect one half-year period).
57
|
Information Regarding the Approval of Investment Advisory Agreement
In September 2011, after evaluating the services provided by RBC Global Asset Management (U.S.), Inc. (the “Advisor”) and reviewing the performance, fees and expenses of the Fund, the RBC Funds Board of Trustees determined to approve the continuation of the investment advisory agreement (“Agreement”) with the Advisor for the Fund for an additional year.
As part of their review of the Agreement, the Trustees requested and considered information regarding the advisory services performed by the Advisor, the staffing and qualifications of the personnel responsible for operating and managing the Fund, and the Fund’s performance and expenses. The review process was guided by the Board’s Valuation, Portfolio Management and Performance Committee. The Trustees considered information provided at regular quarterly Board and Committee meetings throughout the year, as well as a special meeting to review requested material related to the proposed renewals and a meeting held to specifically consider the proposed renewals. In connection with their deliberations, the independent Trustees were advised by their own independent legal counsel with regard to the materials and their responsibilities under relevant laws and regulations.
The Trustees met with representatives from the Advisor’s senior management team, as well as the senior investment professionals responsible for managing the Fund, to discuss the information and the Advisor’s ongoing management of the Fund. The Trustees reviewed the nature and quality of the services provided to the Fund by the Advisor, including information prepared by an independent third-party consultant as to the Fund’s performance relative to appropriate securities index benchmarks as well as fund peer group comparative information requested by the Board. The Trustees also requested information regarding other funds that focus particularly on investments eligible for regulatory credit under the Community Reinvestment Act of 1977. The Trustees reviewed performance data both before and after fees and expenses. The Trustees reviewed the investment advisory fees payable to the Advisor, and reviewed comparative fee and expense information for similarly situated funds prepared by the consultant. The Trustees also received reports from the Advisor regarding the performance and fee levels for other advisory client accounts it advised in a similar strategy. The Trustees evaluated profitability data for the Advisor, and considered information regarding other benefits the Advisor and its affiliates derived from its relationships with the Fund.
With regard to Fund performance, the Trustees recognized that the Fund’s total return was near the peer group median, and that the Fund’s investment operations were consistent with its stated mandate. The Fund’s advisory fees and overall expense levels were higher than its peers, but the Trustees recognized that the Fund’s use of leverage contributed to its higher relative expenses.
In considering the quality of services to be provided by the Advisor, the Trustees discussed the Advisor’s specialized expertise in the area of fixed income investments eligible for regulatory credit under the Community Reinvestment Act of 1977 and the continued focus on the Fund’s related core mandate by the Advisor’s leadership team. The Trustees also considered the Advisor’s research, credit and fundamental analysis capabilities, the portfolio management experience of the Advisor’s staff, as well as its operational and compliance structure and systems and financial strength.
58
APPROVAL OF INVESTMENT ADVISORY AGREEMENT (UNAUDITED) |
Based upon their review, the Trustees determined that the advisory fees proposed to be payable to the Advisor were fair and reasonable in light of the nature and quality of services provided under all of the circumstances, and were within the range of what might have been negotiated at arms’ length. The Trustees concluded that it is in the interest of the Fund and its shareholders for the Trustees to approve the continuation of the Agreement for the Fund. In arriving at their decision to approve the renewal of the Agreement, the Trustees did not assign relative weights to the factors discussed above or deem any one or group of them to be controlling in and of itself.
59
|
This Page Intentionally Left Blank
60
Access Capital P.O.
Box 701
Milwaukee, WI 53201-0701
800-422-2766
www.rbcgam.us
Performance data represents past performance and does not guarantee future results. The principal value of an investment and investment return will fluctuate so that an investor’s shares, when redeemed, may be worth more or less than their original cost.
This report and the financial statements contained herein are provided for the information of RBC Funds shareholders. This report is not authorized for distribution to prospective investors unless preceded or accompanied by a current prospectus, which contains information concerning investment objectives, risks, charges and expenses of the Fund. Please read the prospectus carefully before investing.
This report and the financial statements contained herein are not intended to be a forecast of future events, a guarantee of future results, or investment advice. There is no assurance that certain securities will remain in or out of the Fund’s portfolio. The views expressed in this report reflect those of the portfolio managers through the period ended September 30, 2011.
NOT FDIC INSURED — NO BANK GUARANTEE — MAY LOSE VALUE
RBC Global Asset Management U.S., Inc. serves as investment adviser to the Access Capital Community Investment Fund. The Fund is distributed by Quasar Distributors LLC.

The RBC Funds are pleased to offer shareholder reports printed entirely on Forest Stewardship Council certified paper. FSC certification ensures that the paper used in this report contains fiber from well-managed and responsibly harvested forests that meet strict environmental and socioeconomic standards.
RBCF-AC AR09-11

RBC Funds
|
| |||||||||||
About Your Annual Report |
This annual report includes detailed information about the RBC U.S. Long Corporate Fund (the” Fund”) including financial statements, performance, and a complete list of holdings.
The Fund compares its performance against the Barclays Capital Long U.S. Corporate Index which is a widely used market index.
We hope the financial information presented will help you evaluate your investment in the Fund. We also encourage you to read your Fund’s prospectus for further detail as to the Fund’s investment policies and risk profile. Fund prospectuses and performance information subsequent to the date of this report are available on our website at www.rbcgam.us.
A description of the policies and procedures that your Fund uses to determine how to vote proxies relating to portfolio securities is available (i) without charge, upon request, by calling 1-800-422-2766; (ii) on the Fund’s website at www.rbcgam.us; and (iii) on the Securities and Exchange Commission’s (the “Commission”) website at http://www.sec.gov.
Information regarding how your Fund voted proxies relating to portfolio securities during the most recent 12 month period ended June 30 is available (i) on the Fund’s website at www.rbcgam.us; and (ii) on the Commission’s website at http://www.sec.gov.
A schedule of the Fund’s portfolio holdings will be filed with the Commission for the first and third quarters of each fiscal year on Form N-Q. This information is available on the Commission’s website at http://www.sec.gov and may be reviewed and copied at the Commission’s Public Reference Room in Washington, D.C. Information on the operation of the Public Reference Room is available by calling 1-202-551-8090.
|
| ||||||||||
Contents | ||||||||||||
| Letter from the CIO | 1 | |||||||||||
| Portfolio Managers | 3 | |||||||||||
| Performance Summary | 4 | |||||||||||
| Management Discussion and Analysis | 5 | |||||||||||
| Schedule of Portfolio Investments | 7 | |||||||||||
| Financial Statements | ||||||||||||
| - Statement of Assets and Liabilities | 10 | |||||||||||
| - Statement of Operations | 11 | |||||||||||
| - Statement of Changes in Net Assets | 12 | |||||||||||
| Financial Highlights | 13 | |||||||||||
| Notes to Financial Statements | 14 | |||||||||||
| Report of Independent Registered Public Accounting Firm | 19 | |||||||||||
| Other Federal Income Tax Information | 20 | |||||||||||
| Management | 21 | |||||||||||
| Supplemental Information | 25 | |||||||||||
| Approval of Investment Advisory Agreement | 26 | |||||||||||
| ||||||
| ||||||
Dear Shareholder:
Over the past year, what looked like decent U.S. growth in the first half of the year turned out to be more of a mirage. The recovery that was widely expected to take root over the second half of 2011 simply hasn’t developed. While a stronger global economy was a key argument for a sustainable recovery here in the U.S., many of those countries are now facing diminished growth expectations. And while consumer and business confidence can be fickle, especially in a deleveraging environment, spending and hiring have all disappointed.
What has also changed is the level of discourse focused on the long term fiscal health of the United States and Europe. While the debt discussions this summer in Washington were a fiasco, changes are now forthcoming, whether they occur by force or choice. That’s ultimately good for credit quality. The S&P downgrade of U.S. debt from its AAA rating was certainly a new challenge. The combination of political theatrics and the downgrade dealt a real blow to investor confidence.
Many economic fundamentals, however, have not changed over the past year. Several baseline economic constraints remain firmly in place. Higher government debt burdens are associated with slower economic growth. Ongoing financial deleveraging limits consumption and reduces investment. Further, the natural reversal of fiscal stimulus continues to serve as an economic drag. Today’s economic growth is weak, but it’s still positive. Corporations continued to produce solid earnings despite the economic environment. Balance sheets, cash flow and liquidity remain strong across most corporate sectors. Regulatory capital is increasing in the banking sector. Housing also appears to have bottomed, an important condition before economic growth can sustain itself.
The longer-term implications of all this should be quite limited. First, and contrary to expectations, American borrowing costs responded to the downgrade by going down, not up. And no major class of investor has abandoned or become ineligible to buy U.S. Treasuries. Second, the U.S. is quite unlike Greece. To that point, S&P downgraded the U.S. primarily due to political dysfunction, not intractable economic or fiscal problems. The U.S. economy is weak, but has good long-term prospects due to favorable productivity and demographic trends. The debt burden is rising, but manageable, for the world’s reserve currency.
Concerns over the ongoing financial crisis in Europe are certainly reasonable, but those worries are nothing new. The markets increasingly understand we need to see real burden sharing between creditors and debtors along with a move to some form of a fiscal union. A Euro break-up, one which can be avoided through strong leadership, would certainly be a disaster for the global economy, but the global central banks and the G7 leaders have already done too much, through monetary and fiscal stimulus, to allow that to occur. It’s a problem that requires a global response. Ultimately, the costs involved in fixing the European problem are lower than the costs of failure.
Risk aversion is understandably elevated at present, contributing to historically low yields. Real yields, adjusting for inflation, are already negative in most of the developed world. This type of environment punishes savers and rewards | ||||||
1
LETTER FROM THE CIO | ||||||
borrowers. More constructively, it also encourages risk-taking behavior, which is a necessary condition for more vibrant economic growth. This brings opportunity for those willing to take advantage of it.
Throughout my career, I have seen incredible bull markets and unimaginable bear markets. Through all the ups and downs, investors who have remained focused on their financial objectives, within the appropriate broad context, have generally been successful.
Thank you for your continued confidence and trust in the RBC Funds.
Sincerely, | ||||||
John Huber Chief Investment Officer Fixed Income |
John M. Huber, CFA Chief Investment Officer, Fixed Income RBC Funds | |||||
Past performance is not a guarantee of future results.
Mutual fund investing involves risk. Principal loss is possible.
Investments in debt securities typically decrease in value when interest rates rise. This risk is usually greater for longer-term debt securities.
The information provided herein represents the opinions of the Fund Managers and is not intended to be a forecast of future events, a guarantee of future results, nor investment advice. | ||||||


2
| ||||||
RBC Global Asset Management (U.S.) Inc.(“RBC GAM (US)”) serves as the investment advisor to the RBC U.S. Long Corporate Fund. RBC GAM (US) employs a team approach to the management of the RBC U.S. Long Corporate Fund, with no individual team member being solely responsible for the investment decisions. The Fund’s management team has access to RBC GAM (US)’s investment research and other money management resources.
| ||||||
John M. Huber, CFA
Senior Managing Director, Chief Investment Officer — Fixed Income
John Huber oversees RBC GAM (US)’s fixed income research and portfolio management efforts. He is a member of the firm’s Executive Committee. John joined RBC GAM (US) in 2001 from Galliard Capital Management where he was a founding member and principal. Before that, John was a portfolio manager at Norwest Investment Management, where he began his career in the capital markets group in 1990. He earned a BA from the University of Iowa and an MBA in Finance from the University of Minnesota Carlson School of Management. John acts as an advisor to the Carlson Funds Enterprise for the University of Minnesota. He is also a board member of the Minneapolis Downtown YMCA. John is a CFA charterholder and a member of the CFA Society of Minnesota. |
John M. Huber, CFA
| |||||
Susanna Gibbons, CFA
Vice President, Portfolio Manager
Susanna Gibbons leads our fixed income group’s Credit Research Team. Susanna has extensive fixed income industry experience and is currently responsible for researching the banking, energy, and utilities sectors of the credit markets. She also has considerable expertise in portfolio management, with current responsibilities for our core, investment grade, and high yield mandates. Susanna joined RBC GAM (US) in 2007 from Jeffrey Slocum & Associates, where she was the director of fixed income research. She previously held several senior credit and portfolio management positions at The St. Paul Companies. Susanna began her career in the investment industry in 1985 and has also worked for J.P. Morgan Investment Management and MetLife. She earned a BA from Bryn Mawr College and an MBA from the New York University Stern School of Business. Susanna is a CFA charterholder. |
Susanna Gibbons, CFA | |||||


3
| Aggregate Total Returns as of September 30, 2011 | ||||||||||
RBC U.S. Long Corporate Fund | ||||||||||
Since Inception | Expense Ratio* | |||||||||
| RBC U.S. Long Corporate Fund (a) - At Net Asset Value | 4.71% | 0.00% | ||||||||
| Barclays Capital Long U. S. Corporate Index (b) | 6.64% | |||||||||
| Performance data quoted represents past performance. Past performance is no guarantee of future results. Investment return and principal value of an investment will fluctuate so that an investor’s shares, when redeemed, may be worth more or less than their original cost. Current performance may be lower or higher than performance quoted. For performance data current to most recent month-end go to www.rbcgam.us. | ||||||||||
| The Barclays Capital Long U.S. Corporate Index is an unmanaged index that is composed of U.S. dollar-denominated investment grade, SEC-registered corporate bonds issued by industrial, utility, and financial companies that have at least 10 years to maturity. | ||||||||||
(a) The inception date for the RBC U.S. Long Corporate Fund is May 31, 2011. (b) You cannot invest directly into the index. * The Funds’s expenses reflect the most recent period end (September 30, 2011). The advisor has contractually agreed to waive all expenses for this period | ||||||||||
4
5
MANAGEMENT DISCUSSION AND ANALYSIS (UNAUDITED) | ||||||||||||||||||||
RBC U.S. Long Corporate Fund
|
| |||||||||||||||||||
Investment Objective
| Long-term total return. | |||||||||||||||||||
Benchmark |
Barclays Capital U.S. Long Corporate Index | |||||||||||||||||||
Asset Allocation |
|
| ||||||||||||||||||
| Top Ten Holdings | AT&T, Inc. | 3.42 | % | ONEOK Partners LP | 2.23 | % | ||||||||||||||
(as of 9/30/11) | General Electric Capital Corp. | 2.94 | % | Anheuser-Busch Cos., Inc. | 2.21 | % | ||||||||||||||
(% of fund’s | Norfolk Southern Corp. | 2.43 | % | Midamerican Energy Holdings Co. | 2.15 | % | ||||||||||||||
net assets) | Florida Power & Light Co. | 2.29 | % | Pacific Gas & Electric Co. | 2.14 | % | ||||||||||||||
| Estee Lauder Cos., Inc. (The) | 2.28 | % | ||||||||||||||||||
| GlaxoSmithKline Capital, Inc. | 2.23 | % | ||||||||||||||||||
*A listing of all portfolio holdings can be found beginning on page 7. |
| |||||||||||||||||||
| Growth of $10,000 Initial Investment Since Inception (5/31/11) |
|
| ||||||||||||||||||
| The graph reflects an initial investment of $10,000 over the period from May 31, 2011 to September 30, 2011. The Fund’s total return includes reinvested dividends and capital gains. The Fund’s total return also includes operating expenses that reduce return while the total return of the index does not. The graph does not reflect the deduction of taxes that a shareholder would pay on fund distributions or redemption of fund shares. | ||||||||||||||||||||
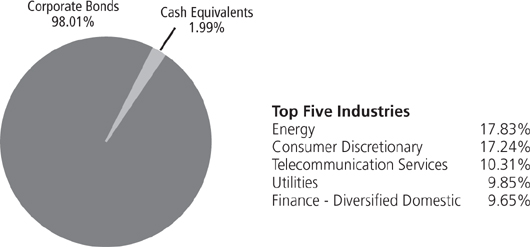
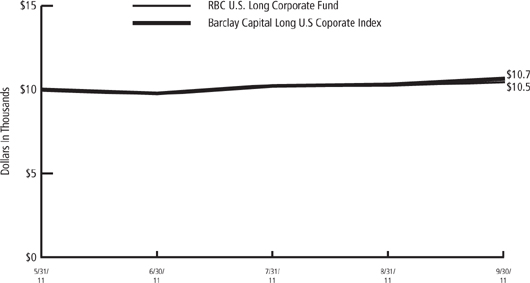
6
|
RBC U.S. Long Corporate Fund
September 30, 2011
Principal Amount | Value | |||||
Corporate Bonds — 98.40% |
| |||||
Banks - Domestic — 5.56% |
| |||||
$ 70,000 | Bank of America Corp., 6.50%, 9/15/37 | $ 56,907 | ||||
70,000 | Citigroup, Inc., 6.00%, 10/31/33 | 61,335 | ||||
25,000 | Fifth Third Bancorp, 8.25%, 3/1/38 | 29,908 | ||||
70,000 | Wachovia Corp., 5.50%, 8/1/35 | 68,898 | ||||
|
| |||||
| 217,048 | ||||||
|
| |||||
Consumer Discretionary — 17.24% | ||||||
65,000 | Anheuser-Busch Cos., Inc., 6.80%, 8/20/32 | 86,158 | ||||
40,000 | CBS Corp., 7.88%, 7/30/30 | 50,498 | ||||
70,000 | Comcast Corp., 6.40%, 5/15/38 | 80,581 | ||||
60,000 | Directv Holdings LLC/Directv Financing Co., Inc., 6.35%, 3/15/40 | 66,823 | ||||
70,000 | Estee Lauder Cos., Inc. (The), 6.00%, 5/15/37 | 89,003 | ||||
30,000 | McDonald’s Corp., 6.30%, 10/15/37 | 40,500 | ||||
70,000 | News America, Inc., 6.20%, 12/15/34 | 74,936 | ||||
60,000 | Time Warner Cable, Inc., 7.30%, 7/1/38 | 72,992 | ||||
60,000 | Time Warner, Inc., 7.70%, 5/1/32 | 76,136 | ||||
30,000 | Viacom, Inc., 6.88%, 4/30/36 | 35,749 | ||||
|
| |||||
| 673,376 | ||||||
|
| |||||
Consumer Staples — 7.33% | ||||||
50,000 | Archer-Daniels-Midland Co., 7.50%, 3/15/27 | 70,734 | ||||
70,000 | CVS Caremark Corp., 6.13%, 9/15/39 | 82,139 | ||||
65,000 | Kraft Foods, Inc., 6.88%, 2/1/38 | 81,940 | ||||
40,000 | Wal-Mart Stores, Inc., 6.20%, 4/15/38 | 51,579 | ||||
|
| |||||
| 286,392 | ||||||
|
| |||||
Energy — 17.83% | ||||||
70,000 | Anadarko Petroleum Corp., 6.45%, 9/15/36 | 74,045 | ||||
65,000 | Apache Corp., 6.00%, 1/15/37 | 80,880 | ||||
30,000 | Cameron International Corp., 7.00%, 7/15/38 | 37,098 | ||||
50,000 | ConocoPhillips Holding Co., 6.95%, 4/15/29 | 66,565 | ||||
25,000 | Devon Financing Corp., 7.88%, 9/30/31 | 35,011 | ||||
40,000 | Enterprise Products Operating LLC, 6.88%, 3/1/33 | 47,091 | ||||
30,000 | Hess Corp., 5.60%, 2/15/41 | 32,365 | ||||
43,000 | Kinder Morgan Energy Partners LP, 7.40%, 3/15/31 | 51,694 | ||||
70,000 | Midamerican Energy Holdings Co., 6.13%, 4/1/36 | 83,844 | ||||
75,000 | ONEOK Partners LP, 6.65%, 10/1/36 | 87,205 | ||||
65,000 | Transocean, Inc., 6.80%, 3/15/38 | 67,276 | ||||
30,000 | Williams Partners LP, 6.30%, 4/15/40 | 33,203 | ||||
|
| |||||
| 696,277 | ||||||
|
| |||||
Finance - Diversified Domestic — 9.65% | ||||||
30,000 | Credit Suisse USA, Inc., 7.13%, 7/15/32 | 34,325 | ||||
100,000 | General Electric Capital Corp., 6.88%, 1/10/39 | 114,774 | ||||
70,000 | Goldman Sachs Group, Inc., 6.75%, 10/1/37 | 64,032 | ||||
7
SCHEDULE OF PORTFOLIO INVESTMENTS |
RBC U.S. Long Corporate Fund (cont.)
September 30, 2011
Principal Amount | Value | |||||
$ 60,000 | HSBC Holdings Plc, 7.63%, 5/17/32 | $ | 63,176 | |||
70,000 | JP Morgan Chase Capital XXV, 6.80%, 10/1/37 | 70,254 | ||||
30,000 | Morgan Stanley, 7.25%, 4/1/32 | 30,320 | ||||
|
| |||||
| 376,881 | ||||||
|
| |||||
Health Care — 2.23% | ||||||
65,000 | GlaxoSmithKline Capital, Inc., 6.38%, 5/15/38 | 87,137 | ||||
|
| |||||
Industrials — 6.45% | ||||||
60,000 | Boeing Co. (The), 6.88%, 3/15/39 | 82,924 | ||||
70,000 | Norfolk Southern Corp., 7.05%, 5/1/37 | 94,974 | ||||
30,000 | United Technologies Corp., 6.13%, 7/15/38 | 37,815 | ||||
30,000 | Waste Management, Inc., 6.13%, 11/30/39 | 36,366 | ||||
|
| |||||
| 252,079 | ||||||
|
| |||||
Insurance — 4.75% | ||||||
50,000 | AXA SA, 8.60%, 12/15/30 | 55,978 | ||||
35,000 | Hartford Financial Services Group Inc., 6.10%, 10/1/41 | 30,485 | ||||
65,000 | MetLife, Inc., 6.40%, 12/15/36 | 57,615 | ||||
35,000 | Travelers Cos., Inc., 6.25%, 6/15/37 | 41,287 | ||||
|
| |||||
| 185,365 | ||||||
|
| |||||
Materials — 5.55% | ||||||
30,000 | ArcelorMittal, 7.00%, 10/15/39 | 26,756 | ||||
30,000 | Cliffs Natural Resources, Inc., 6.25%, 10/1/40 | 29,217 | ||||
65,000 | Dow Chemical Co. (The), 7.38%, 11/1/29 | 81,875 | ||||
35,000 | Rio Tinto Alcan, Inc., 6.13%, 12/15/33 | 41,022 | ||||
35,000 | Vale Overseas Ltd., 6.88%, 11/21/36 | 37,751 | ||||
|
| |||||
| 216,621 | ||||||
|
| |||||
Real Estate — 1.65% | ||||||
60,000 | HCP, Inc. REIT, 6.75%, 2/1/41 | 64,342 | ||||
|
| |||||
Telecommunication Services — 10.31% | ||||||
30,000 | Alltel Corp., 7.88%, 7/1/32 | 42,783 | ||||
115,000 | AT&T, Inc., 6.40%, 5/15/38 | 133,473 | ||||
65,000 | Cisco Systems, Inc., 5.90%, 2/15/39 | 78,072 | ||||
75,000 | Telefonica Emisiones SAU, 7.05%, 6/20/36 | 74,945 | ||||
60,000 | Verizon Communications, Inc., 6.40%, 2/15/38 | 73,543 | ||||
|
| |||||
| 402,816 | ||||||
|
| |||||
Utilities — 9.85% | ||||||
30,000 | Appalachian Power Co., 7.00%, 4/1/38 | 40,112 | ||||
70,000 | Florida Power & Light Co., 5.95%, 2/1/38 | 89,395 | ||||
70,000 | Pacific Gas & Electric Co., 6.05%, 3/1/34 | 83,547 | ||||
8
SCHEDULE OF PORTFOLIO INVESTMENTS |
RBC U.S. Long Corporate Fund (cont.)
September 30, 2011
Principal Amount | Value | |||||
$42,000 | Sempra Energy, 6.00%, 10/15/39 | $ 50,831 | ||||
50,000 | South Carolina Electric & Gas Co., 5.50%, 12/15/39 | 57,500 | ||||
50,000 | Virginia Electric & Power Co., 6.00%, 5/15/37 | 63,573 | ||||
|
| |||||
| 384,958 | ||||||
|
| |||||
Total Corporate Bonds (Cost $3,738,949) | 3,843,292 | |||||
|
| |||||
Shares | ||||||
Investment Company — 2.00% | ||||||
78,168 | JPMorgan Prime Money Market Fund | 78,168 | ||||
|
| |||||
Total Investment Company (Cost $78,168) | 78,168 | |||||
|
| |||||
Total Investments (Cost $3,817,117)(a) — 100.40% | $3,921,460 | |||||
Liabilities in excess of other assets — (0.40)% | (15,517) | |||||
|
| |||||
NET ASSETS — 100.00% | $3,905,943 | |||||
|
| |||||
| (a) | See notes to financial statements for the tax cost of securities and the breakdown of unrealized appreciation (depreciation). |
Abbreviations used are defined below:
REIT - Real Estate Investment Trust
See notes to financial statements.
9
|
Statement of Assets and Liabilities
September 30, 2011
Assets: | ||||
Investments in securities, at value (cost $3,817,117) | $ | 3,921,460 | ||
Interest and dividends receivable | 61,982 | |||
Receivable from the advisor | 20,067 | |||
Prepaid expenses and other assets | 6,817 | |||
|
| |||
Total Assets | 4,010,326 | |||
|
| |||
Liabilities: | ||||
Distributions payable | 1,136 | |||
Payable for investments purchased | 63,268 | |||
Accrued expenses and other payables: | ||||
Accounting fees | 2,184 | |||
Trustee fees | 15 | |||
Audit fees | 34,690 | |||
Transfer Agent fees | 700 | |||
Other | 2,390 | |||
|
| |||
Total Liabilities | 104,383 | |||
|
| |||
Net Assets | $ | 3,905,943 | ||
|
| |||
Net Assets Consist Of: | ||||
Capital | $ | 3,801,600 | ||
Net unrealized appreciation on investments | 104,343 | |||
|
| |||
Net Assets | $ | 3,905,943 | ||
|
| |||
Shares Outstanding (Unlimited number of shares authorized, no par value): | 379,942 | |||
|
| |||
Net Asset Values and Redemption Price Per Share: | $ | 10.28 | ||
See notes to financial statements.
10
FINANCIAL STATEMENTS |
For the Period Ended September 30, 2011(a)
Investment Income: | ||||
Interest income | $ | 69,221 | ||
Dividend income | 10 | |||
|
| |||
Total Investment Income | 69,231 | |||
|
| |||
Expenses: | ||||
Accounting services | 8,532 | |||
Audit fees | 39,806 | |||
Legal fees | 61 | |||
Custodian fees | 252 | |||
Insurance fees | 2,378 | |||
Trustees’ fees and expenses | 38 | |||
Transfer agent fees | 2,816 | |||
Printing and shareholder reports | 376 | |||
Other fees and expenses | 2,147 | |||
|
| |||
Total expenses | 56,406 | |||
|
| |||
Expenses reduced/waived by: | ||||
Advisor | (56,406 | ) | ||
|
| |||
Net Investment Income | 69,231 | |||
|
| |||
Net change in unrealized appreciation on investments | 104,343 | |||
|
| |||
Change in net assets resulting from operations | $ | 173,574 | ||
|
| |||
| (a) | For the period from May 31, 2011(commencement of operations) to September 30, 2011. |
See notes to financial statements.
11
FINANCIAL STATEMENTS |
Statement of Changes in Net Assets
| For the Period Ended September 30, 2011(a) | ||||
From Investment Activities: | ||||
Operations: | ||||
Net investment income | $ | 69,231 | ||
Net change in unrealized appreciation on investments | 104,343 | |||
|
| |||
Change in net assets resulting from operations | 173,574 | |||
|
| |||
Distributions to Shareholders: | ||||
From net investment income | (69,231 | ) | ||
|
| |||
Change in net assets resulting from shareholder distributions | (69,231 | ) | ||
|
| |||
Capital Transactions: | ||||
Proceeds from shares issued in-kind (note 5) | 3,598,672 | |||
Proceeds from shares issued | 144,833 | |||
Distributions reinvested | 68,095 | |||
Cost of shares redeemed | (10,000 | ) | ||
|
| |||
Change in net assets resulting from capital transactions | 3,801,600 | |||
|
| |||
Net increase in net assets | 3,905,943 | |||
Net Assets: | ||||
Beginning of period | — | |||
|
| |||
End of period | $ | 3,905,943 | ||
|
| |||
Share Transactions: | ||||
Issued in-kind | 359,867 | |||
Issued | 14,331 | |||
Reinvested | 6,773 | |||
Redeemed | (1,029 | ) | ||
|
| |||
Change in shares resulting from capital transactions | 379,942 | |||
|
| |||
| (a) | For the period from May 31, 2011 (commencement of operations) to September 30, 2011. |
See notes to financial statements.
12
|
RBC U.S. Long Corporate Fund
(Selected data for a share outstanding throughout the periods indicated)
| For the Period Ended September 30,2011(a) | |||||
Per Share Operating Performance: | |||||
Net asset value, beginning of period | $ | 10.00 | |||
|
| ||||
Net investment income(b) | 0.19 | ||||
Realized and unrealized gain (loss) | 0.28 | ||||
|
| ||||
Total from investment operations | 0.47 | ||||
|
| ||||
Less dividends from net investment income | (0.19 | ) | |||
|
| ||||
Net asset value, end of period | $ | 10.28 | |||
|
| ||||
Total Investment Return: | 4.71 | % | |||
Based on net asset value per share | |||||
Ratios to Average Net Assets:(c) | |||||
Ratio of Net Expenses to Average Net Assets | 0.00 | % | |||
Ratio of Net Investment Income to Average Net Assets | 5.52 | % | |||
Ratio of Expenses to Average Net Assets* | 2.40 | % | |||
Net assets, end of period (in thousands) | $ | 3,906 | |||
Portfolio turnover | 0 | % | |||
| * | During the period, certain fees were contractually or voluntarily reduced and/or reimbursed. If such contractual/voluntary fee reductions and reimbursements had not occurred, the ratio would have been as indicated. |
| (a) | For the period from May 31, 2011 (commencement of operations) to September 30, 2011. |
| (b) | Based on average shares outstanding. |
| (c) | Annualized for those periods that are less than one year. |
See notes to financial statements.
13
|
September 30, 2011
1. Organization
RBC Funds Trust (the “Trust”) is registered under the Investment Company Act of 1940 (as amended) as a open-end management Investment Company. The Trust was organized as a Delaware statutory trust on December 16, 2003. Overall responsibility for the management of the Trust is vested in its Board of Trustees (the “Board”). This annual report is for the RBC U.S. Long Corporate Fund (the “Fund”), which offers one share class.
RBC Global Asset Management (U.S.) Inc. (“RBC GAM (US)”) acts as the investment advisor for the Trust. The officers of the Trust (“Fund Management”) are also employees of RBC GAM (US) or its affiliates and BNY Mellon Investment Servicing (US) Inc. (“BNY Mellon”).
2. Significant Accounting Policies
Summarized below are the significant accounting policies of the Fund. The policies conform to accounting principles generally accepted in the United States of America (“U.S. GAAP”). Fund Management follows these policies when preparing financial statements. Management may also be required to make estimates and assumptions that affect the reported amounts of assets and liabilities at the date of the financial statements and the reported amounts of income and expenses for the period. Actual results could differ from those estimates.
Security Valuation:
Bonds and other fixed income securities, including TBA commitments, are generally valued on the basis of prices furnished by pricing services approved by the Trust’s Board. The pricing services utilize both dealer-supplied valuations and electronic data processing techniques that take into account appropriate factors such as institutional-size trading in similar groups of securities, yield, quality, coupon rate, maturity and type of issue. These valuation techniques take into account mutiple factors, including fundamental security analytical data, information from broker-dealers, market spreads and interest rates. Short-term debt obligations, with less than 60 days to maturity at time of purchase, are valued at amortized cost unless Fund Management determines that amortized cost no longer approximates market value. In such cases where a security price is unavailable, or where Fund Management determines that the value provided by the pricing services or amortized cost does not approximate fair value, the Board has approved pricing and valuation procedures to determine a security’s fair value. Some of the factors which may be considered in determining fair value are fundamental analytical data relating to the security, the issuer and the market, such as duration, prepayment and default rates; general level of interest rates and changes in interest rates; information from broker-dealers; and trading in similar securities. Investments in open-end investment companies are valued at net asset value.
Financial Instruments:
TBA Commitments
The Fund may enter into to be announced (“TBA”) commitments to purchase or sell securities for a fixed price at a future date. TBA commitments are considered securities in themselves, and involve a risk of loss if the value of the security to be purchased/sold declines/increases prior to settlement date, which is in addition to the risk of decline in the value of a Fund’s other assets. Unsettled TBA commitments are valued at the current value of the underlying securities, according to the procedures described under “Security Valuation”. There were no outstanding TBA commitments for the period ended September 30, 2011.
Credit Enhancement
Certain obligations held in the Fund have credit enhancement or liquidity features that may, under certain circumstances, provide for repayment of principal and interest on the obligation upon demand date, interest rate reset date or final maturity. These enhancements may include: letters of credit; liquidity guarantees; security purchase agreements; tender option purchase agreements; and
14
NOTES TO FINANCIAL STATEMENTS |
third party insurance (i.e., AMBAC and MBIA). For the period ending September 30, 2011, there are no obligations with credit enhancement or liquidity features.
Fair Value Measurements:
Various inputs are used in determining the fair value of investments which are as follows:
• Level 1 - Inputs that reflect unadjusted quoted prices in active markets for identical assets or liabilities that the Fund has the ability to access at the measurement date.
• Level 2 - Inputs other than quoted prices that are observable for the asset or liability either directly or indirectly, including inputs in markets that are not considered to be active.
• Level 3 - Unobservable inputs based on the best information available in the circumstances, to the extent observable inputs are not available (including the Fund’s own assumptions in determining the fair value of investments).
The inputs or methodology used for valuing securities are not necessarily an indication of the risk associated with investing in those securities.
The summary of inputs used to determine the fair valuation of the Fund’s investments as of September 30, 2011 is as follows:
| Level 1 Quoted Prices | Level 2 Significant Observable Inputs | Level 3 Significant Unobservable Inputs | Total | |||||||||||||
Assets: | ||||||||||||||||
Investments in Securities | ||||||||||||||||
Corporate Bonds | $ | — | $ | 3,843,292 | $ | — | $ | 3,843,292 | ||||||||
Investment Company | 78,168 | — | — | 78,168 | ||||||||||||
|
|
|
|
|
|
|
| |||||||||
| $ | 78,168 | $ | 3,843,292 | $ | — | $ | 3,921,460 | |||||||||
|
|
|
|
|
|
|
| |||||||||
During the period ended September 30, 2011, the Fund recognized no significant transfers to/from level 1 or 2. The Fund’s policy is to recognize transfers between level 1, level 2 and level 3 at the end of the year utilizing fair value at the beginning of the year.
In May 2011, the Financial Accounting Standards Board (“FASB”) issued Accounting Standards Update (“ASU”) No. 2011-04 “Amendments to Achieve Common Fair Value Measurement and Disclosure Requirements” in U.S. GAAP and International Financial Reporting Standards (“IFRSs”). ASU 2011-04 includes common requirements for measurement of and disclosure about fair value between U.S. GAAP and IFRS. ASU 2011-04 will require reporting entities to disclose the following information for fair value measurements categorized within Level 3 of the fair value hierarchy: quantitative information about the unobservable inputs used in the fair value measurement, the valuation processes used by the reporting entity and a narrative description of the sensitivity of the fair value measurement to changes in unobservable inputs and the interrelationships between those unobservable inputs. In addition, ASU 2011-04 will require reporting entities to make disclosures about amounts and reasons for all transfers in and out of Level 1 and Level 2 fair value measurements. The new and revised disclosures are effective for interim and annual reporting periods beginning after December 15,2011. Management is currently evaluating the implications of ASU No. 2011-04 and its impact on the financial statements.
Investment Transactions and Income:
Investment transactions are recorded one business day after trade date, except for on the last day of each fiscal quarter end, when they are recorded on trade date. Dividend income is recorded on the ex-dividend date. Realized gains and losses from investment transactions are calculated based on the costs of the specific security (also known as identified cost basis). Interest income is recognized on the accrual basis and includes the amortization and accretion of premium or discount using the effective yield method.
15
NOTES TO FINANCIAL STATEMENTS |
Distributions to Shareholders:
The Fund pays out any income that it receives, less expenses, in the form of dividends and capital gains to its shareholders. Income dividends are declared daily and paid monthly. Dividends will also be paid at any time during the month upon total redemption of shares in an account. Capital gain distributions are declared and paid at least annually. Distributions to shareholders are recorded on the ex-dividend date. The amount of dividends and distributions are calculated based on federal income tax regulations, which may differ from GAAP. These “book/tax” differences may be either temporary or permanent in nature. To the extent these differences are determined, as of the end of the tax year, to be permanent (e.g., reclassification of paydown gains and losses, and expiring capital loss carryforward), they are reclassified within a Fund’s capital account based on their federal tax basis treatment.
For the period ended September 30, 2011 there were no permanent difference reclassification amounts for the Fund.
3. Agreements and Other Transactions with Affiliates
RBC GAM (US) serves as investment advisor to the Fund. The Advisor has contractually agreed to waive fees and/or pay Fund operating expenses in order to limit the “Total Annual Fund Operating Expenses” of the Fund to 0.00% of the Fund’s average daily net assets (excluding interest, taxes, brokerage commissions, or non-routine expenses such as litigation). The expense limitation agreement is in place until November 22, 2012 and may not be terminated by the Advisor prior to that date.
The Fund will not pay the Advisor directly for advisory services. The Fund is designed to be a component of separately managed accounts for clients of RBC GAM (US), and for other pooled investment strategies managed by RBC GAM (US) and is not available for direct investment by the general public.
The RBC Funds currently pay the independent Trustees (Trustees of the Trust who are not directors, officers or employees of the adviser, administrator or distributor) an annual retainer of $30,000 ($32,500 effective October 1, 2011). The Board Chairperson and Audit Committee Chairperson each receive an additional retainer of $2,500 annually, and all other trustees serving as Chair of a Board committee each receive an additional retainer of $1,000 annually. In addition, Independent Trustees receive a quarterly meeting fee of $5,000 for each in-person Board meeting attended, a meeting fee of $1,000 for each telephonic or Special Board meeting attended, and a $1,500 fee for each Board committee meeting attended and are reimbursed for all out-of-pocket expenses relating to attendance at such meetings.
Expense Allocation:
The Fund pays the expenses that are directly related to its operations, such as custodian fees or administrative services fees. Expenses incurred by the Trust, such as trustee or legal fees, are allocated to the Fund either proportionately based upon the Fund’s relative net assets or using another reasonable basis such as equally across all Funds in the Trust, depending on the nature of the expense.
4. Securities Transactions:
The cost of securities purchased and proceeds from securities sold (excluding securities maturing less than one year from acquisition) for the period ended 9/30/11 were as follows:
Purchases(Excl. US. Gov’t.) | Sales(Excl. US. Gov’t.) | Purchases of US. Gov’t. | Sales of US. Gov’t. | |||
| $ 3,741,478 | $— | $— | $— |
16
NOTES TO FINANCIAL STATEMENTS |
5. Capital Share Transactions:
The Trust is authorized to issue an unlimited number of shares of beneficial interest (“shares outstanding”) without par value. Transactions in shares of the Fund are summarized below:
| For the Period Ended September 30, 2011(a) | ||||
CAPITAL TRANSACTIONS: | ||||
Proceeds from shares issued in-kind | $3,598,672 | |||
Proceeds from shares issued | 144,833 | |||
Distributions reinvested | 68,095 | |||
Cost of shares redeemed | (10,000 | ) | ||
|
| |||
Change in net assets resulting from capital transactions | $3,801,600 | |||
|
| |||
SHARE TRANSACTIONS: | ||||
Issued in-kind | 359,867 | |||
Issued | 14,331 | |||
Reinvested | 6,773 | |||
Redeemed | (1,029 | ) | ||
|
| |||
Change in shares resulting from capital transactions | 379,942 | |||
|
| |||
| (a) | For the period from May 31, 2011(commencement of operations) to September 30, 2011. |
| During | the period ended September 30, 2011, the Fund had in kind contributions of $3,598,672 which were contributed from RBC GAM (US), the Fund’s advisor. |
6. Federal Income Taxes:
It is the policy of the Fund to continue to qualify as a regulated investment company by complying with the provisions available to certain investment companies, as defined under Subchapter M of the Internal Revenue Code, and to distribute substantially all of its net investment income and net realized capital gains. Therefore, no federal tax liability is recorded in the financial statements of the Fund.
As of September 30, 2011 the tax cost of securities and the breakdown of unrealized appreciation (depreciation) was as follows:
| Tax Cost of Securities | Unrealized Appreciation | Unrealized Depreciation | Net Unrealized Appreciation | |||||||||
| $3,817,117 | $194,840 | $(90,497) | $104,343 | |||||||||
The tax character of distributions were as follows:
| Distributions Paid From | ||||||||
| Ordinary Income | Total Distributions Paid | |||||||
For the period ended September 30, 2011 | $68,095 | $68,095 | ||||||
17
NOTES TO FINANCIAL STATEMENTS |
As of September 30, 2011, the components of accumulated earnings/(losses) and tax character of distributions paid are as follows:
Undistributed Ordinary Income | Accumulated Earnings | Distributions Payable | Unrealized Appreciation | Total Distributable Earnings | ||||||||||||
| $ 1,136 | $1,136 | $(1,136) | $104,343 | $104,343 | ||||||||||||
As of September 30, 2011, the Fund did not have any capital loss carryforwards for federal income tax purposes.
Management has analyzed the Fund’s tax positions taken or expected to be taken on federal income tax returns for all open tax years (for the tax year ended September 30 of the year 2011), and has concluded that no provision for federal income tax is required in the Fund’s financial statements. The Fund’s federal and state income and federal excise tax returns for tax years for which the applicable statutes of limitations have not expired are subject to examination by the Internal Revenue Service and state departments of revenue.
As of and during the period ended September 30, 2011, the Fund did not have a liability for any unrecognized tax benefits. The Fund recognizes interest and penalities, if any, related to unrecognized tax benefits as income tax expense in the statement of operations. During the period, the Fund did not incur any interest or penalties.
8. Subsequent Events.
Management has evaluated the impact of all subsequent events on the Fund and has determined that there were no subsequent events requiring recognition or disclosure in the financial statements.
18
|
To the Shareholders and Board of Trustees of RBC U.S. Long Corporate Fund:
We have audited the accompanying statement of assets and liabilities, including the schedule of portfolio investments, of RBC U.S. Long Corporate Fund (the “Fund”), one of the portfolios constituting the RBC Funds Trust (the “Trust”), as of September 30, 2011, and the related statements of operations and changes in net assets and the financial highlights for the period from May 31, 2011 (commencement of operations) through September 30, 2011. These financial statements and financial highlights are the responsibility of the Fund’s management. Our responsibility is to express an opinion on these financial statements and financial highlights based on our audit.
We conducted our audit in accordance with the standards of the Public Company Accounting Oversight Board (United States). Those standards require that we plan and perform the audit to obtain reasonable assurance about whether the financial statements and financial highlights are free of material misstatement. The Fund is not required to have, nor were we engaged to perform, an audit of its internal control over financial reporting. Our audit included consideration of internal control over financial reporting as a basis for designing audit procedures that are appropriate in the circumstances, but not for the purpose of expressing an opinion on the effectiveness of the Fund’s internal control over financial reporting. Accordingly, we express no such opinion. An audit also includes examining, on a test basis, evidence supporting the amounts and disclosures in the financial statements, assessing the accounting principles used and significant estimates made by management, as well as evaluating the overall financial statement presentation. Our procedures included confirmation of securities owned as of September 30, 2011, by correspondence with the Fund’s custodian and brokers; where replies were not received from brokers, we performed other auditing procedures. We believe that our audit provides a reasonable basis for our opinion.
In our opinion, the financial statements and financial highlights referred to above present fairly, in all material respects, the financial position of RBC U.S. Long Corporate Fund, as of September 30, 2011, and the results of its operations and the changes in its net assets and the financial highlights for the period from May 31, 2011(commencement of operations) through September 30, 2011, in conformity with accounting principles generally accepted in the United States of America.
DELOITTE & TOUCHE LLP
Chicago, Illinois
November 22, 2011
19
|
The Fund designates a portion of the income dividends distributed during the fiscal year ended September 30, 2011, as qualified interest income as defined in the Internal Revenue Code as 100.00%.
The designation is based on financial information available as of the date of this annual report and, accordingly, is subject to change. It is the intention of the Fund to designate the maximum amount permitted under the Internal Revenue Code and the regulations thereunder.
20
|
Independent Trustees(1)(2)
T. Geron Bell (70)
Position, Term of Office and Length of Time Served with the Trust: Trustee since January 2004
Principal Occupation(s) During Past 5 Years: Chairman of the Executive Board of the Minnesota Twins (January 2011 to present); prior thereto President of Twins Sports, Inc. (parent company of the Minnesota Twins) (2002-2011); President of the Minnesota Twins Baseball Club Incorporated (1987-2002)
Number of Portfolios in Fund Complex Overseen by Trustee: 21
Other Director/Trustee Positions Held by Trustee During Past 5 Years: None
Lucy Hancock Bode (60)
Position, Term of Office and Length of Time Served with the Trust: Trustee since January 2004
Principal Occupation(s) During Past 5 Years: Healthcare consultant (self-employed)
Number of Portfolios in Fund Complex Overseen by Trustee: 21
Other Director/Trustee Positions Held by Trustee During Past 5 Years: BioSignia
Leslie H. Garner Jr. (61)
Position, Term of Office and Length of Time Served with the Trust: Trustee since January 2004
Principal Occupation(s) During Past 5 Years: President and CEO, The Greater Cedar Rapids Community Foundation (2010 to present); previously, President, Cornell College
Number of Portfolios in Fund Complex Overseen by Trustee: 21
Other Director/Trustee Positions Held by Trustee During Past 5 Years: None
Ronald James (60)
Position, Term of Office and Length of Time Served with the Trust: Trustee since January 2004
Principal Occupation(s) During Past 5 Years: President and Chief Executive Officer, Center for Ethical Business Cultures (2000 to present)
Number of Portfolios in Fund Complex Overseen by Trustee: 21
Other Director/Trustee Positions Held by Trustee During Past 5 Years: Best Buy Co. Inc.; Bremer Financial Corporation
John A. MacDonald (62)
Position, Term of Office and Length of Time Served with the Trust: Trustee since January 2004
Principal Occupation(s) During Past 5 Years: Vice President and Treasurer, Hall Family Foundation
Number of Portfolios in Fund Complex Overseen by Trustee: 21
Other Director/Trustee Positions Held by Trustee During Past 5 Years: None
H. David Rybolt (69)
Position, Term of Office and Length of Time Served with the Trust: Trustee since January 2004
Principal Occupation(s) During Past 5 Years: Consultant, HDR Associates (management consulting)
Number of Portfolios in Fund Complex Overseen by Trustee: 21
Other Director/Trustee Positions Held by Trustee During Past 5 Years: None
21
MANAGEMENT (Unaudited) |
Independent Trustees(1)(2)
James R. Seward (59)
Position, Term of Office and Length of Time Served with the Trust: Chairman of the Board and Trustee since January 2004
Principal Occupation(s) During Past 5 Years: Private investor (2000 to present); CFA
Number of Portfolios in Fund Complex Overseen by Trustee: 21
Other Director/Trustee Positions Held by Trustee During Past 5 Years: Syntroleum Corporation; Brookdale Senior Living Inc.; LabOne, Inc.; American Retirement Corp.
William B. Taylor (66)
Position, Term of Office and Length of Time Served with the Trust: Trustee since September 2005
Principal Occupation(s) During Past 5 Years: Consultant (2003 to present); prior thereto Partner (until 2003) Ernst & Young LLP
Number of Portfolios in Fund Complex Overseen by Trustee: 21
Other Director/Trustee Positions Held by Trustee During Past 5 Years: J.E. Dunn Vermont Assurance
Interested Trustees(1)(2)(3)
Erik R. Preus (46)(5)
Position, Term of Office and Length of Time Served with the Trust: Trustee since March 2006
Principal Occupation(s) During Past 5 Years: President and Chief Executive Officer, RBC Funds Trust (2006 to present); Head, Strategic Relationships Group, RBC Global Asset Management (U.S.) Inc. (2009 to present); Head of Retail Asset Management, RBC Global Asset Management (U.S.) Inc. (2006-2009); Chief Operating Officer, RBC Global Asset Management (U.S.) Inc. (2005-2006); Director, Investment Consulting Services, RBC Dain Rauscher Inc. (2004-2005); Director, Voyageur Advisory Services, RBC Global Asset Management (U.S.) Inc. (2003-2004)
Number of Portfolios in Fund Complex Overseen by Trustee: 21
Other Director/Trustee Positions Held by Trustee During Past 5 Years: None
Executive Officers(1)(3)(4)
Erik R. Preus (46)
Position, Term of Office and Length of Time Served with the Trust: President and Chief Executive Officer since September 2006
Principal Occupation(s) During Past 5 Years: Head, Strategic Relationships Group, RBC Global Asset Management (U.S.) Inc. (2009 to present); Head of Retail Asset Management, RBC Global Asset Management (U.S.) Inc. (2006-2009); Chief Operating Officer, RBC Global Asset Management (U.S.) Inc. (2005-2006)
James A. Gallo (47)
Address: BNY Mellon Investment Servicing (US) Inc., 760 Moore Road, King of Prussia, PA 19406
Position, Term of Office and Length of Time Served with the Trust: Treasurer since October 2007
Principal Occupation(s) During Past 5 Years: Senior Vice President and Managing Director, BNY Mellon Investment Servicing (US) Inc. (2002 to present)
22
MANAGEMENT (Unaudited) |
Executive Officers(1)(3)(4)
Kathleen A. Hegna (44)
Position, Term of Office and Length of Time Served with the Trust: Chief Financial Officer and Principal Accounting Officer since May 2009
Principal Occupation(s) During Past 5 Years: Associate Vice President and Director, Mutual Fund Accounting and Administration, RBC Global Asset Management (U.S.) Inc. (2009 to present); Senior Compliance Officer, RBC Global Asset Management (U.S.) Inc. (2006-2009); Director, Asset Management Compliance, RiverSource Investments (2005-2006)
Kathleen A. Gorman (47)
Position, Term of Office and Length of Time Served with the Trust: Chief Compliance Officer since April 2006 and Assistant Secretary since September 2006
Principal Occupation(s) During Past 5 Years: Chief Compliance Officer, RBC Funds Trust (2006 to present); Director of Regulatory Administration, RBC Global Asset Management (U.S.) Inc. (2007 to present); Chief Compliance Officer, RBC Global Asset Management (U.S.) Inc. (2006-2009)
Lee Thoresen (40)
Position, Term of Office and Length of Time Served with the Trust: Chief Legal Officer and Secretary since 2008
Principal Occupation(s) During Past 5 Years: Associate General Counsel, RBC Capital Markets, LLC (2006-present); Asset Management Compliance, RiverSource Investments (2004-2006)
John M. Huber (43)
Position, Term of Office and Length of Time Served with the Trust: Chief Investment Officer, U.S. Fixed Income Funds since February 2004
Principal Occupation(s) During Past 5 Years: Senior Managing Director and Chief Investment Officer, Fixed Income, RBC Global Asset Management (U.S.) Inc. (2004 to present)
Gordon Telfer (45)
Position, Term of Office and Length of Time Served with the Trust: Chief Investment Officer, U.S. Equity Funds since October 2009; Portfolio Strategist from March 2004 to October 2009
Principal Occupation(s) During Past 5 Years: Director of Equities - U.S., RBC Global Asset Management (U.S.) Inc. (June 2009 to present); Head of Growth Equities, RBC Global Asset Management (U.S.) Inc. (2008-2009); Senior Portfolio Manager, RBC Global Asset Management (U.S.) Inc. (2004-2008); Managing Director, RBC Global Asset Management (U.S.) Inc. (2007-present); Vice President, RBC Global Asset Management (U.S.) Inc. (2004-2007)
23
MANAGEMENT (Unaudited) |
Executive Officers(1)(3)(4)
Mark Poole (50)
Address: BlueBay Asset Management Ltd., 77 Grosvenor Street, London, W1K 3JR, United Kingdom
Position, Term of Office and Length of Time Served with the Trust: Chief Investment Officer, Global Fixed Income Funds since September 2011
Principal Occupation(s) During Past 5 Years: Chief Investment Officer, BlueBay Asset Management Ltd. (2001 to present)
| (1) | Except as otherwise noted, the address of each Trustee/Officer is RBC Funds Trust, 100 South Fifth Street, Suite 2300, Minneapolis, Minnesota 55402. |
| (2) | All Trustees must retire on or before December 31 of the year in which they reach age 75. The Board may temporarily waive this requirement when necessary to avoid depriving the Board of a Trustee with a critical skill . |
| (3) | On December 31, 2009, Voyageur Asset Management Inc. changed its name to RBC Global Asset Management (U.S.) Inc. Any references to RBC Global Asset Management (U.S.) Inc. for prior periods are deemed to be references to the prior entity. |
| (4) | Each officer serves in such capacity for an indefinite period of time until his or her removal, resignation or retirement. |
| (5) | Erik R. Preus has been determined to be an interested Trustee by virtue of his affiliation with the Trust. |
The Funds’ Statement of Additional Information includes information about the Funds’ Trustees. To receive your free copy of the Statement of Additional Information, call toll free: 1-800-422-2766.
24
|
Shareholder Expense Examples
As a shareholder of the RBC U.S. Long Corporate Fund, you incur two types of costs: (1) transaction costs, and (2) ongoing costs, including management fees and other Fund expenses. This example is intended to help you understand your ongoing costs (in dollars) of investing in the Fund and to compare these costs with the ongoing costs of investing in other mutual funds.
The Example is based on an investment of $1,000 invested at the beginning of the period and held for the entire period from May 31, 2011 (commencement of operations) through September 30, 2011.
Actual Expenses
The table below provides information about actual account values and actual expenses. You may use the information below, together with the amount you invested, to estimate the expenses that you paid over the period. Simply divide your account value by $1,000 (for example, an $8,600 account value divided by $1,000 = 8.6), then multiply the result by the number in the table under the heading entitled “Expenses Paid During Period” to estimate the expenses you paid on your account during this period.
Beginning Account Value 5/31/11 | Ending Account Value 9/30/11 | Expenses Paid During Period* 5/31/11-9/30/11 | Annualized Expense Ratio During Period 5/31/11-9/30/11 | |||
$ 1,000.00 | $1,000.00 | $— | 0.00% |
Hypothetical Example for Comparison Purposes
The table below provides information about hypothetical account values and hypothetical expenses based on the Fund’s actual expense ratio and an assumed rate of return of 5% per year before expenses, which is not the Fund’s actual return. The hypothetical account values and expenses may not be used to estimate the actual ending account balance or expenses you paid for the period. You may use this information to compare this 5% hypothetical example with the 5% hypothetical examples that appear in the shareholder reports of other funds.
Please note that the expenses shown in the table are meant to highlight your ongoing costs only and do not reflect any transactional costs, such as sales charges (loads), redemption fees, or exchange fees. Therefore, the table is useful in comparing ongoing costs only, and will not help you determine the relative total costs of owning different funds. In addition, if these transactional costs were included, your costs would have been higher.
Beginning Account Value 5/31/11 | Ending Account Value 9/30/11 | Expenses Paid During Period* 5/31/11-9/30/11 | Annualized Expense Ratio During Period 5/31/11-9/30/11 | |||
$ 1,000.00 | $1,025.34 | $— | 0.00% |
*Expenses are equal to the average account value times the Fund’s annualized expense ratio multiplied by 124/365 (to reflect one year period).
25
|
Information Regarding the Approval of Investment Advisory Agreement
During the period of this report, after evaluating the services to be provided by RBC Global Asset Management (U.S.), Inc. (the “Advisor”) for the Fund, along with the fee and expense structure, and planned use of the Fund as a tool within a Risk Based Investing strategy offered to institutional investors of the Advisor, the RBC Funds Board of Trustees determined to approve the investment advisory agreement (“Agreement”) with the Advisor for the Fund for an initial term.
As part of their review of the Agreement, the Trustees requested and considered information regarding the advisory services performed by the Advisor for the Fund, the staffing and qualifications of the personnel responsible for operating and managing the Fund, the experience and performance record of the Advisor with respect to the Risk Based Investing strategy, and the anticipated expense structure of the Fund. The review process was guided by the Board’s Valuation, Portfolio Management and Performance Committee. The Trustees considered information provided at a number of Board and Committee meetings throughout the year, during which the Board reviewed requested material related to the Fund and the proposed Agreement. In connection with their deliberations, the independent Trustees were advised by their own independent legal counsel with regard to the materials and their responsibilities under relevant laws and regulations.
The Trustees met with representatives from the Advisor’s senior management team, as well as the senior investment professionals responsible for managing the Fund, to discuss the information and the Advisor’s management of the Fund. The Trustees discussed the fact that the Fund would be used primarily as a tool within a Risk Based Investing strategy offered to institutional investors, and that the Advisor charges a related advisory fee to the investors outside of the Fund. Therefore, while the Fund’s Advisory Agreement contains typical substantive provisions governing the advisory relationship, it does not provide for any fee to be paid by the Fund to the Advisor. In addition, the Board considered the fact that the Advisor agreed, pursuant to an expense limitation agreement, to bear all of the operating expenses of the Fund. In view of the Fund’s particular fee and expense structure, the Trustees evaluated the legal and regulatory issues presented by a no-fee advisory agreement, and were comfortable that the structure was acceptable.
The Trustees focused their consideration of the Agreement mainly on reviewing the nature, extent and quality of the services provided under the Agreement, the Advisor’s experience managing portfolios of securities similar to those held by the Fund, and its experience managing portfolios in a Risk Based Investing approach. The Trustees also considered the Advisor’s commitment to the Fund and Risk Based Investing strategy.
In considering the quality of services to be provided by the Advisor, the Trustees discussed the Advisor’s specialized expertise in the area of fixed income investments and Risk Based Investing, and the Advisor’s research, credit and fundamental analysis capabilities, portfolio management experience, and operational and compliance structure and systems and financial strength.
Based upon their review, the Trustees determined that the nature and quality of services provided by the Advisor were of a high quality, and that it is in the interest of the Fund and its shareholders for the Trustees to approve the Agreement for the Fund. In arriving at their decision to approve the Agreement, the Trustees did not assign relative weights to the factors discussed above or deem any one or group of them to be controlling in and of itself.
26
|
This Page Intentionally Left Blank
27
|
This Page Intentionally Left Blank
28
RBC Funds
P.O. Box 701
Milwaukee, WI 53201-0701
800-422-2766
www.rbcgam.us
Performance data represents past performance and does not guarantee future results. The principal value of an investment and investment return will fluctuate so that an investor’s shares, when redeemed, may be worth more or less than their original cost.
This report and the financial statements contained herein are provided for the information of RBC Funds shareholders. This report is not authorized for distribution to prospective investors unless preceded or accompanied by a current prospectus, which contains information concerning investment objectives, risks, charges and expenses of the Fund. Please read the prospectus carefully before investing.
This report and the financial statements contained herein are not intended to be a forecast of future events, a guarantee of future results, or investment advice. There is no assurance that certain securities will remain in or out of the Fund’s portfolio. The views expressed in this report reflect those of the portfolio managers through the period ended September 30, 2011.
NOT FDIC INSURED • NO BANK GUARANTEE • MAY LOSE VALUE
RBC Global Asset Management U.S., Inc. serves as investment adviser to the RBC Funds. The Fund is distributed by Quasar Distributors LLC.

The RBC Funds are pleased to offer shareholder reports printed entirely on Forest Stewardship Council certified paper. FSC certification ensures that the paper used in this report contains fiber from well-managed and responsibly harvested forests that meet strict environmental and socioeconomic standards. |
RBCF-LC AR 09-11
Item 2. Code of Ethics.
| (a) | The registrant, as of the end of the period covered by this report, has adopted a code of ethics that applies to the registrant’s principal executive officer, principal financial officer, principal accounting officer or controller, or persons performing similar functions, regardless of whether these individuals are employed by the registrant or a third party. |
| (c) | There have been no amendments, during the period covered by this report, to a provision of the code of ethics that applies to the registrant’s principal executive officer, principal financial officer, principal accounting officer or controller, or persons performing similar functions, regardless of whether these individuals are employed by the registrant or a third party, and that relates to any element of the code of ethics description. |
| (d) | The registrant has not granted any waivers, including an implicit waiver, from a provision of the code of ethics that applies to the registrant’s principal executive officer, principal financial officer, principal accounting officer or controller, or persons performing similar functions, regardless of whether these individuals are employed by the registrant or a third party, that relates to one or more of the items set forth in paragraph (b) of this item’s instructions. |
Item 3. Audit Committee Financial Expert.
As of the end of the period covered by the report, the registrant’s board of directors has determined that William B. Taylor is qualified to serve as an audit committee financial expert serving on its audit committee and that he is “independent,” as defined by Item 3 of Form N-CSR.
Item 4. Principal Accountant Fees and Services.
Audit Fees
| (a) | The aggregate fees billed for each of the last two fiscal years for professional services rendered by the principal accountant for the audit of the registrant’s annual financial statements or services that are normally provided by the accountant in connection with statutory and regulatory filings or engagements for those fiscal years are $317,450 for 2011 and $283,350 for 2010. |
Audit-Related Fees
| (b) | The aggregate fees billed in each of the last two fiscal years for assurance and related services by the principal accountant that are reasonably related to the performance of the audit of the registrant’s financial statements and are not reported under paragraph (a) of this Item are $0 for 2011 and $0 for 2010. |
Tax Fees
| (c) | The aggregate fees billed in each of the last two fiscal years for professional services rendered by the principal accountant for tax compliance, tax advice, and tax planning are $37,500 for 2011 and $38,330 for 2010. |
Tax fees for both years relate to the review of the registrant’s tax returns. Amount requiring approval of the registrant’s audit committee is $0 and $0, respectively.
All Other Fees
| (d) | The aggregate fees billed in each of the last two fiscal years for products and services provided by the principal accountant, other than the services reported in paragraphs (a) through (c) of this Item are $0 for 2011 and $0 for 2010. |
| (e)(1) | Disclose the audit committee’s pre-approval policies and procedures described in paragraph (c)(7) of Rule 2-01 of Regulation S-X. |
The Audit Committee (“Committee”) will review and approve in advance any proposal (except as set forth in (1) through (3) below) that the Trust employ the Funds’ auditor to render “permissible non-audit services” to the Funds. A “permissible non-audit service” is defined as a non-audit service that is not prohibited by Rule 2-01(c)(4) of Regulation S-X or other applicable law or regulation. The Committee will also review and approve in advance any proposal (except as set forth in (1) through (3) below) that the Adviser, and any entity controlling, controlled by, or under common control with the Adviser that provides ongoing services to the Funds (an “Adviser-affiliated service provider”), employ the Funds’ auditor to render non-audit services, if such engagement would relate directly to the operations and financial reporting of the Funds. As a part of its review, the Committee shall consider whether the provision of such services is consistent with the auditor’s independence. (See also “Delegation” below.)
Pre-approval by the Committee of non-audit services is not required so long as:
(1) (A) with respect to the Funds, the aggregate amount of all such permissible non-audit services provided to the Funds constitutes no more than 5% of the total amount of revenues paid to the auditor by the Funds during the fiscal year in which the services are provided; or
(B) with respect to the Adviser and any Adviser-affiliated service provider, the aggregate amount of all such non-audit services provided constitutes no more than 5% of the total amount of revenues (of the type that would have to be pre-approved by the Committee) paid to the auditor by the Funds, the Adviser and any Adviser-affiliated service provider during the fiscal year in which the services are provided;
(2) such services were not recognized by the Funds at the time of the engagement to be non-audit services; and
(3) such services are promptly brought to the attention of the Committee and approved by the Committee or its delegate or delegates, as defined below, prior to the completion of the audit.
(c) Delegation
The Committee may delegate to one or more of its members and/or to officers of the Trust the authority to pre-approve the auditor’s provision of audit services or permissible non-audit services to the Funds up to a predetermined amount. Any pre-approval determination made by a delegate will be presented to the full Committee at its next meeting. The Committee will communicate any pre-approval made by a delegate to the Trust’s fund accounting agent, which will ensure that the appropriate disclosure is made in the Funds’ periodic reports and other documents as required under the Federal securities laws.
(e)(2) | The percentage of services described in each of paragraphs (b) through (d) of this Item that were approved by the audit committee pursuant to paragraph (c)(7)(i)(C) of Rule 2-01 of Regulation S-X are as follows: |
(b) N/A
(c) 100%
(d) N/A
| (f) | Not applicable. |
| (g) | The aggregate non-audit fees billed by the registrant’s accountant for services rendered to the registrant, and rendered to the registrant’s investment adviser (not including any sub-adviser whose role is primarily portfolio management and is subcontracted with or overseen by another investment adviser), and any entity controlling, controlled by, or under common control with the adviser that provides ongoing services to the registrant for each of the last two fiscal years of the registrant was $0 for 2011 and $0 for 2010. |
| (h) | Not applicable. |
Item 5. Audit Committee of Listed registrants.
Not applicable.
Item 6. Investments.
| (a) | Schedule of Investments in securities of unaffiliated issuers as of the close of the reporting period is included as part of the report to shareholders filed under Item 1 of this form. |
| (b) | Not applicable. |
Item 7. Disclosure of Proxy Voting Policies and Procedures for Closed-End Management
Investment Companies.
Not applicable.
Item 8. Portfolio Managers of Closed-End Management Investment Companies.
Not applicable.
Item 9. Purchases of Equity Securities by Closed-End Management Investment Company and
Affiliated Purchasers.
Not applicable.
Item 10. Submission of Matters to a Vote of Security Holders.
There have been no material changes to the procedures by which the shareholders may recommend nominees to the registrant’s board of directors, where those changes were implemented after the registrant last provided disclosure in response to the requirements of Item 407(c)(2)(iv) of Regulation S-K (17 CFR 229.407) (as required by Item 22(b)(15) of Schedule 14A (17 CFR 240.14a-101)), or this Item.
Item 11. Controls and Procedures.
| (a) | The registrant’s principal executive and principal financial officers, or persons performing similar functions, have concluded that the registrant’s disclosure controls and procedures (as defined in Rule 30a-3(c) under the Investment Company Act of 1940, as amended (the “1940 Act”) (17 CFR 270.30a-3(c))) are effective, as of a date within 90 days of the filing date of the report that includes the disclosure required by this paragraph, based on their evaluation of these controls and procedures required by Rule 30a-3(b) under the 1940 Act (17 CFR 270.30a-3(b)) and Rules 13a-15(b) or 15d-15(b) under the Securities Exchange Act of 1934, as amended (17 CFR 240.13a-15(b) or 240.15d-15(b)). |
| (b) | There were no changes in the registrant’s internal control over financial reporting (as defined in Rule 30a-3(d) under the 1940 Act (17 CFR 270.30a-3(d)) that occurred during the registrant’s second fiscal quarter of the period covered by this report that has materially affected, or is reasonably likely to materially affect, the registrant’s internal control over financial reporting. |
Item 12. Exhibits.
| (a)(1) | Code of ethics, or any amendment thereto, that is the subject of disclosure required by Item 2 is attached hereto. | |
| (a)(2) | Certifications pursuant to Rule 30a-2(a) under the 1940 Act and Section 302 of the Sarbanes-Oxley Act of 2002 are attached hereto. | |
| (a)(3) | Not applicable. | |
| (b) | Certifications pursuant to Rule 30a-2(b) under the 1940 Act and Section 906 of the Sarbanes-Oxley Act of 2002 are attached hereto. |
SIGNATURES
Pursuant to the requirements of the Securities Exchange Act of 1934 and the Investment Company Act of 1940, the registrant has duly caused this report to be signed on its behalf by the undersigned, thereunto duly authorized.
| (registrant) | RBC Funds Trust |
| By (Signature and Title)* | /s/ Erik R. Preus | |
Erik R. Preus, President and Chief Executive Officer | ||
(principal executive officer) |
| Date | 11/22/11 |
Pursuant to the requirements of the Securities Exchange Act of 1934 and the Investment Company Act of 1940, this report has been signed below by the following persons on behalf of the registrant and in the capacities and on the dates indicated.
By (Signature and Title)* | /s/ Erik R. Preus | |
Erik R. Preus, President and Chief Executive Officer | ||
(principal executive officer) |
| Date | 11/22/11 |
| By (Signature and Title)* | /s/ Kathleen A. Hegna | |
| Kathleen A. Hegna, Chief Financial Officer | ||
| (principal financial officer) |
Date | 11/22/11 |
* Print the name and title of each signing officer under his or her signature.