UNITED STATES
SECURITIES AND EXCHANGE COMMISSION
Washington, D.C. 20549
FORM N-CSR
CERTIFIED SHAREHOLDER REPORT OF REGISTERED MANAGEMENT
INVESTMENT COMPANIES
Investment Company Act file number 811-21475
| RBC Funds Trust |
| (Exact name of registrant as specified in charter) |
| 100 South Fifth Street, Suite 2300 |
| Minneapolis, MN 55402-1240 |
| (Address of principal executive offices) (Zip code) |
| Lee Thoresen, Esq. |
| RBC Plaza |
| 60 South Sixth Street |
| Minneapolis, MN 55402 |
| (Name and address of agent for service) |
Registrant’s telephone number, including area code: (612) 313-1341
Date of fiscal year end: September 30
Date of reporting period: September 30, 2012
| Item 1. | Reports to Stockholders. |
The Report to Shareholders is attached herewith.
RBC Funds | ||||||||||
About Your Annual Report |
This annual report includes detailed information about your Fund including financial statements, performance, and a complete list of its holdings.
The RBC Funds compare their performance against various Russell equity indices. Each of these indices is a widely recognized measure of return for the underlying category of securities. However, the indices are unmanaged, do not include fees, and cannot be invested in directly.
We hope the financial information presented will help you evaluate your investment in the RBC Funds. We also encourage you to read your Fund’s prospectus for further detail as to your Fund’s investment policies and risk profile. RBC Funds prospectuses and performance information subsequent to the date of this report are available on our website at www.rbcgam.us.
A description of the policies and procedures that your Fund uses to determine how to vote proxies relating to portfolio securities is available (i) without charge, upon request, by calling 1-800-422-2766; (ii) on the Fund’s website at www.rbcgam.us; and (iii) on the Securities and Exchange Commission’s (the “Commission”) website at http://www.sec.gov. |
| ||||||||
Information regarding how your Fund voted proxies relating to portfolio securities during the most recent 12-month period ended June 30 is available (i) on the Fund’s website at www.rbcgam.us; and (ii) on the Commission’s website at http://www.sec.gov. |
| |||||||||
A schedule of each Fund’s portfolio holdings will be filed with the Commission for the first and third quarters of each fiscal year on Form N-Q. This information is available on the Commission’s website at http://www.sec.gov and may be reviewed and copied at the Commission’s Public Reference Room in Washington, D.C. Information on the operation of the Public Reference Room is available by calling 1-202-551-8090. |
| |||||||||
Contents | ||||||||||
| 1 | ||||||||||
| 5 | ||||||||||
| 7 | ||||||||||
| 12 | ||||||||||
| 14 | ||||||||||
| 16 | ||||||||||
| 18 | ||||||||||
| 20 | ||||||||||
| 22 | ||||||||||
| 46 | ||||||||||
| 48 | ||||||||||
| 49 | ||||||||||
| 54 | ||||||||||
| 64 | ||||||||||
| 77 | ||||||||||
| 78 | ||||||||||
| 79 | ||||||||||
| 82 | ||||||||||
| 83 | ||||||||||
| | 85 | | ||||||||
MY HOW FAR WE’VE COME
It was a mere twelve months ago that equity markets, represented by the broad-based S&P 500 Index, were limping toward the finish line of an uninspiring year. The overall return of 1.1% for the 12-month period, fairly weak when taken at face value, masked an even worse trend that saw equity markets produce increasingly negative returns every month starting in May (-1.7%) and culminating with a September return of -7.0%. The final quarter ending September 30 seemingly broke the markets’ back with its -13.9% return, erasing what had been a promising year up to that point. The culprits behind the precipitous decline were the same that plague markets today —an escalating European sovereign debt crisis, the waxing and waning strength of the U.S. recovery, and a slowdown in global growth with a particular emphasis on China. With the markets on the ropes barely clinging to a positive return and just as investors were getting ready to cash in their chips, equities came roaring back to life with a ferocity not seen in nearly 20 years: markets gained 10.9% in the month of October, driven by reduced fear of a double dip in the United States as third quarter 2011 GDP grew at 2.5% and the announcement out of Brussels of a plan to recapitalize European banks and provide Greek debt relief.
Fast forward to today, and investors — grappling with many of the same concerns — are facing a vastly different landscape. Over the past twelve months ending September 30, the S&P 500 Index has returned a remarkable 30.2%, with strength fairly consistent throughout the year as the first quarter returned 11.8%, the second quarter, 12.6%, the third quarter, -2.8%, and the fourth quarter, 6.3%. The one outlier, the third quarter, was the result of a flare up in the European debt crisis and renewed fears of Greece (and potentially others) seceding from the European Union. With investors’ feathers ruffled, the quarter was poised for an even worse result as the wall of worry grew. It took only one simple utterance from European Central Bank president Mario Draghi, “we will do whatever it takes to preserve the euro,” and markets were once again off to the races recording a 4.1% return in June. The momentum continued through the summer and into the early fall, pushing markets to multi-year highs, culminating with the Fed’s September announcement of the next round of quantitative easing, “QE3.”
| ||||||
The strength of these past twelve months was broad based, with the strongest returns coming from economically sensitive, “risk on” sectors such as consumer discretionary (36.8%) and financials (35.7%). However, lest we think all investor fear had subsided, the high yielding, more defensive telecommunication services (35.4%) sector was also a top performer. Not surprisingly, however, in this risk-on time period the more classically defensive sectors, utilities (14.8%) and consumer staples (24.3%), though offering strong returns, underperformed the broader market.
| ||||||
For the most part, smaller cap stocks outperformed their larger cap counterparts. Over the past twelve months the Russell Microcap Index returned 36.1% and the Russell 2000 Index returned 31.9%, while the larger Russell Midcap and Russell 1000 Indices returned 28% and 30%, respectively. Returns to growth and value subgroups were consistent, with the value stocks outperforming the growth stocks. Among larger capitalization stocks, the Russell 1000 Value Index returned 30.9% versus the Russell 1000 Growth Index return of 29.1%. In the mid cap area, the Russell Midcap Value Index returned 29.3% compared to the Russell Midcap Growth Index return of 26.7%. Meanwhile, the Small Cap Russell 2000 Value Index returned 32.6% and the corresponding Russell 2000 Growth Index returned 31.2%.
| ||||||
1
LETTER FROM THE CHIEF INVESTMENT OFFICER | ||||||
OH THE PLACES WE WILL GO
As investors look back on these past twelve months with fatter wallets and fond memories of markets running up nearly unobstructed, we now turn to what lies ahead. What will prevail — the pessimistic outlook in which issues in Europe persist seemingly unabated, Chinese growth continues to slow, and the numerous uncertainties facing the United States (elections, fiscal cliff, debt ceiling) go unresolved? Or is an optimistic view more likely — one in which central banks stand ready and willing to shock markets back to life through monetary stimulus and fiscal easing (the United States, China, Brazil, the United Kingdom, and the euro zone have all taken these steps); a view in which the issues in the United States, in particular, are more short term in nature, with many of the problematic areas of the economy (housing, credit, and to a lesser extent employment) are at an inflection point verging on a normalized recovery?
While we note that a run like the one we’ve had carries the possibility of a near-term pullback (these fickle markets do tend to teeter on a negative headline), we remain optimistic about the longer term prospects. This outlook is not without its caveats. Global growth remains an issue, especially with Europe falling into an outright recession, but we believe that the potential for the worst possible outcome — a break up of the European Union — has passed. Though we expect a 0.75% decline in European GDP in 2012, we also see some relief on the horizon and forecast a 0.5% expansion in 2013. Our confidence in suggesting that this positive, albeit small, reversal will occur is based on the fact that the benefits of monetary stimulus tend to have a delayed effect, as well as our belief that the European monetary authorities have not yet concluded their effort to stimulate the economy.
| ||||||
| In the United States, policy uncertainty has essentially frozen the spending of both households and businesses. Companies can only guess at future tax rates, bank regulations, fiscal austerity, and the restructuring of health care — and that does not even consider the uncertainty surrounding the coming elections and fiscal cliff. Is it any wonder they have chosen to sit on their hands and wait, driving down investment spending and hiring? This too, shall pass, potentially in short order as early as the beginning of 2013, when either a new president or the incumbent will take office, and the fiscal cliff and debt ceiling will have been resolved to some degree. Resolutions in any form represent clarity, which could portend a marked increase in business confidence, unleash pent up business investment and drive hiring with the newly employed workers eager to spend once again. Even without the removal of these headwinds, we forecast real U.S. GDP growth of 2.0% in 2012 and 2.0% in 2013. This is not overwhelming growth, but we see little risk of the United States falling into a recession, and should existing headwinds abate, our estimates could prove conservative. | ||||||
So what does this mean for investors? The ability of the markets to shrug off the myriad concerns in the world over the past twelve months has been nothing short of impressive. And while the potential for a near-term pullback is real — markets do appear to be slightly overbought following the significant run of the past twelve months — over the longer term we expect outperformance as we return to a more normalized market environment. What gives us this confidence? Despite the obvious challenges of the past year, companies have remained for the most part profitable. They continue to hold large (and growing) cash balances, and we believe that as these companies are once again evaluated on their merits, fundamentals, and valuation, as opposed to trading in unison based on the headline of the day, markets can and will take the next step up. In addition, as economic readings stabilize, and clarity begins to improve, we believe that if market valuations can simply move halfway to equilibrium and earnings can reach 2012 top-down estimates, the S&P 500 could reach as high as 1555 (a 6.5% increase from current levels) and just 10 points below the all-time high of 1565 in
| ||||||
2
LETTER FROM THE CHIEF INVESTMENT OFFICER | ||||||
October 2007 — heady numbers to say the least. We also warn that these markets are not for the faint of heart: headline-driven swings will undoubtedly materialize from time to time. Nevertheless, we believe the patient equity investor will be rewarded in the long term as we slowly move from a market marked by chronic dysfunction to a more normalized environment.
Thank you for your continued confidence and trust in the RBC Funds. | ||||||
 | ||||||
| Michael Lee, CFA | ||||||
CEO, President and Chief Investment Officer RBC Global Asset Management (U.S.) Inc.
| ||||||
Past performance is not a guarantee of future results.
Mutual fund investing involves risk. Principal loss is possible. Investments in smaller companies involve more limited liquidity and greater volatility than larger companies.
Fund holdings and sector allocations are subject to change at any time and should not be considered recommendations to buy or sell any security. Please refer to the Schedule of Investments in this report for a complete list of fund holdings.
| ||||||
The information provided herein represents the opinions of the Fund Managers and is not intended to be a forecast of future events, a guarantee of future results, nor investment advice.
| ||||||
The S&P 500 Index is the Standard & Poor’s composite index of 500 stocks, a widely recognized, unmanaged index of common stock prices.
The Russell 1000 Index is an unmanaged index that measures the performance of the large-cap segment of the U.S. equity universe. It is a subset of the Russell 3000® Index and includes approximately 1,000 of the largest securities based on a combination of their market cap and current index membership.
The Russell Midcap Index measures the performance of the mid-cap segment of the U.S. equity universe. It is a subset of the Russell 1000® Index and includes approximately 800 of the smallest securities based on a combination of their market cap and current index membership.
| ||||||
The Russell 2000 Index measures the performance of the small-cap segment of the U.S. equity universe. It is a subset of the Russell 3000 Index and represents approximately 10% of the total market capitalization of that index. It includes approximately 2,000 of the smallest securities based on a combination of their market cap and current index membership.
The Russell Microcap Index measures the performance of the microcap segment of the U.S. equity market. Microcap stocks make up less than 3% of the U.S. equity market (by market cap) and consist of the smallest 1,000 securities in the small-cap Russell 2000® Index, plus the next smallest eligible securities by market cap.
| ||||||
3
LETTER FROM THE CHIEF INVESTMENT OFFICER | ||||||
The Russell 1000 Growth Index is an unmanaged index that measures the performance of U.S. large cap companies in the Russell 3000 Index with higher price-to-book ratios and higher forecasted growth values.
| ||||||
The Russell 1000 Value Index is an unmanaged index that measures the performance of U.S. large cap companies in the Russell 3000 Index, which have lower price-to-book ratios and lower forecasted growth rates.
The Russell Midcap Growth Index is an unmanaged index that measures the performance of U.S. mid cap companies in the Russell 3000 Index, which have higher price-to-book ratios and higher forecasted growth rates.
| ||||||
The Russell Midcap Value Index measures the performance of those Russell Mid Cap companies with lower price-to-book ratios and on average lower forecasted growth values.
The Russell 2000 Growth Index measures the performance of those Russell 2000 Index companies with higher price-to-book ratios and higher forecasted earnings growth rates.
| ||||||
The Russell 2000 Value Index measures the performance of those Russell 2000 Index companies with lower price-to-book ratios and lower forecasted growth values.
It is not possible to invest directly in an index.
|
4
RBC Global Asset Management (U.S.) Inc. (“RBC GAM (US)”) serves as the investment advisor to the RBC Funds. RBC GAM (US) employs a team approach to the management of the RBC Equity Funds, with no individual team member being solely responsible for the investment decisions.
| ||||||
Lance F. James
Managing Director, Senior Portfolio Manager
Lance James is responsible for portfolio management of the RBC Small Cap Core Fund, RBC Enterprise Fund, and RBC Microcap Value Fund. He is also co-manager of RBC Mid Cap Value Fund. Prior to joining RBC GAM (US) in 2006, Lance was an equity analyst and portfolio manager for OFI Institutional and Babson Capital Management, affiliated companies of Mass Mutual Life Insurance Company. During his tenure he served as head of the firm’s small/mid cap value investment team. Prior to joining Babson Capital in 1986, Lance worked at Rockwell International Corporation, EBF Associates of Boston and Hewitt Associates. Lance began his career in the investment industry in 1980. He received an AB in Economics from Princeton University and an MBA in Finance from the Wharton School of Business at the University of Pennsylvania.
|
| |||||
George Prince
Vice President, Portfolio Manager, Senior Equity Analyst
George Prince serves as the co-portfolio manager for the RBC Enterprise Fund. George also provides research support for the RBC Small Cap Core Fund. He joined RBC GAM (US) in 2006 from Eagle Asset Management, where he was a senior equity analyst. Prior to his experience at Eagle Asset Management, George was an analyst at Babson Capital Management. George also has a great deal of entrepreneurial experience and founded SignStorey, a leader in place-based digital communications in retail stores and co-founded Cutting Edge Inc., a global CAD-CAM technology company. George has over 12 years of investment industry experience. He received a BA from Yale University.
|
| |||||
Kenneth A. Tyszko, CPA, CFA
Managing Director, Senior Portfolio Manager
Ken Tyszko is responsible for portfolio management of the RBC SMID Cap Growth Fund, and is responsible for Small Cap Growth and SMID Cap Growth research and portfolio management at RBC GAM (US). Ken has been in the investment industry since 1984 and has been managing small cap growth and SMID cap growth portfolios since 1988. He joined RBC GAM (US) in 2001. Ken previously served as a portfolio manager for Oberweis Asset Management, ABN AMRO Asset Management (USA) Inc., ABN AMRO Incorporated, and Sears Investment Management Company. His background also includes experience at Main Hurdman, an international accounting and consulting firm. Ken earned a BS in Accountancy from the University of Illinois. He is a CFA charterholder. Ken is a member of the Illinois CPA Society, the CFA Society of Chicago, and the CFA Institute. He has been a guest on Bloomberg Television, Bloomberg Radio, CNBC, and WebFN. |  | |||||


5
EQUITY PORTFOLIO MANAGERS | ||||||
|
Stephen E. Kylander Vice President, Senior Portfolio Manager | |||||
Steve Kylander is responsible for portfolio management of the RBC Mid Cap Value Fund. Prior to joining RBC GAM (US) in 2006, he was a portfolio manager and research analyst for Babson Capital Management. Steve’s previous experience also includes strategy consulting, mergers and acquisitions work and investment banking for L.E.K. Consulting, The Yarmouth Group, and First Boston Corporation. He began working in the investment industry in 1986. Steve earned a BA from Dartmouth College and an MBA from Harvard Business School.
|

6
Average Annual Total Returns as of September 30, 2012 (Unaudited)
|
|
RBC SMID Cap Growth Fund (a)
| 1 Year | 3 Year | 5 Year | 10 Year | Since Inception(b) | Net Expense Ratio(1)(2) | Gross Expense Ratio(1)(2) | ||||||||
Class A | ||||||||||||||
- Including Maximum Sales Charge of 5.75% | 20.74% | 15.71% | 1.80% | 7.60% | 10.45% | |||||||||
- At Net Asset Value | 28.16% | 18.01% | 3.02% | 8.24% | 10.76% | 1.35% | 1.60% | |||||||
Class C (c) | ||||||||||||||
- Including Contingent Deferred Sales Charge of 1.00% | 26.21% | 17.10% | 2.24% | 7.44% | 9.93% | |||||||||
- At Net Asset Value | 27.21% | 17.10% | 2.24% | 7.44% | 9.93% | 2.10% | 2.35% | |||||||
Class I | 28.37% | 18.28% | 3.26% | 8.51% | 11.08% | 1.10% | 1.35% | |||||||
Class S (d) | 28.45% | 18.26% | 3.26% | 8.52% | 11.08% | 1.10% | 1.35% | |||||||
Russell 2500 Growth Index* | 29.52% | 15.17% | 3.26% | 11.24% | 9.56% | |||||||||
RBC Enterprise Fund (e)
| ||||||||||||||
| 1 Year | 3 Year | 5 Year | 10 Year | Since Inception(f) | Net Expense Ratio(1)(2) | Gross Expense Ratio(1)(2) | ||||||||
Class A (g) | ||||||||||||||
- Including Maximum Sales Charge of 5.75% | 28.47% | 11.08% | (0.78)% | 8.33% | 10.15% | |||||||||
- At Net Asset Value | 36.30% | 13.31% | 0.40% | 8.98% | 10.37% | 1.33% | 1.58% | |||||||
Class C (g) | ||||||||||||||
- Including Contingent Deferred Sales Charge of 1.00% | 34.17% | 12.40% | (0.36)% | 8.15% | 9.55% | |||||||||
- At Net Asset Value | 35.17% | 12.40% | (0.36)% | 8.15% | 9.55% | 2.08% | 2.33% | |||||||
Class I (h) | 36.61% | 13.52% | 0.63% | 9.24% | 10.64% | 0.99% | 1.26% | |||||||
Class S | 36.61% | 13.54% | 0.64% | 9.24% | 10.64% | 1.08% | 1.33% | |||||||
Russell 2000 Index* | 31.91% | 12.99% | 2.21% | 10.17% | 8.84% | |||||||||
Performance data quoted represents past performance. Past performance is no guarantee of future results. Investment return and principal value of an investment will fluctuate so that an investor’s shares, when redeemed, may be worth more or less than their original cost. Current performance may be lower or higher than performance quoted. Performance shown reflects contractual fee waivers, without such fee waivers total returns would be reduced. Performance information does not reflect the 2% fee on shares redeemed or exchanged within 30 days of purchase. If such redemption fee was included, performance would be reduced. For performance data current to the most recent month-end go to www.rbcgam.us. Please see footnotes beginning on page 9.
7
PERFORMANCE SUMMARY |
RBC Small Cap Core Fund (i)
| 1 Year | 3 Year | 5 Year | 10 Year | Since Inception(j) | Net Expense Ratio(1)(2) | Gross Expense Ratio(1)(2) | ||||||||
Class A (g) | ||||||||||||||
- Including Maximum Sales Charge of 5.75% | 22.31% | 12.86% | 2.05% | 9.36% | 9.61% | |||||||||
- At Net Asset Value | 29.76% | 15.11% | 3.27% | 10.01% | 9.92% | 1.30% | 1.77% | |||||||
Class C (g) | ||||||||||||||
- Including Contingent Deferred Sales Charge of 1.00% | 27.86% | 14.24% | 2.56% | 9.23% | 9.12% | |||||||||
- At Net Asset Value | 28.86% | 14.24% | 2.56% | 9.23% | 9.12% | 2.05% | 2.52% | |||||||
Class S | 30.08% | 15.39% | 3.59% | 10.31% | 10.21% | 1.05% | 1.52% | |||||||
Russell 2000 Index*
| 31.91%
| 12.99%
| 2.21%
| 10.17%
| 9.23%
| |||||||||
RBC Microcap Value Fund (k)
| ||||||||||||||
| 1 Year | 3 Year | 5 Year | 10 Year | Since Inception(l) | Net Expense Ratio(1)(2) | Gross Expense Ratio(1)(2) | ||||||||
Class A (g) | ||||||||||||||
- Including Maximum Sales Charge of 5.75% | 25.02% | 10.89% | (0.94)% | 8.80% | 8.36% | |||||||||
- At Net Asset Value | 32.62% | 13.09% | 0.24% | 9.45% | 8.62% | 1.32% | 1.60% | |||||||
Class C (g) | ||||||||||||||
- Including Contingent Deferred Sales Charge of 1.00% | 30.61% | 12.21% | (0.52)% | 8.63% | 7.81% | |||||||||
- At Net Asset Value | 31.61% | 12.21% | (0.52)% | 8.63% | 7.81% | 2.07% | 2.35% | |||||||
Class S | 32.97% | 13.36% | 0.50% | 9.73% | 8.89% | 1.07% | 1.35% | |||||||
Russell 2000 Value Index*
| 32.63%
| 11.72%
| 1.35%
| 9.68%
| 9.63%
| |||||||||
Performance data quoted represents past performance. Past performance is no guarantee of future results. Investment return and principal value of an investment will fluctuate so that an investor’s shares, when redeemed, may be worth more or less than their original cost. Current performance may be lower or higher than performance quoted. Performance shown reflects contractual fee waivers, without such fee waivers total returns would be reduced. Performance information does not reflect the 2% fee on shares redeemed or exchanged within 30 days of purchase. If such redemption fee was included, performance would be reduced. For performance data current to the most recent month-end go to www.rbcgam.us. Please see footnotes beginning on page 9.
8
PERFORMANCE SUMMARY |
RBC Mid Cap Value Fund
| 1 Year | Since Inception(m) | Net Expense Ratio(1)(2) | Gross Expense Ratio(1)(2) | |||||
Class I | 31.73% | 11.85% | 0.90% | 5.31% | ||||
Russell MidCap Value Index*
| 29.28%
| 13.12%
| ||||||
Performance data quoted represents past performance. Past performance is no guarantee of future results. Investment return and principal value of an investment will fluctuate so that an investor’s shares, when redeemed, may be worth more or less than their original cost. Current performance may be lower or higher than performance quoted. Performance shown reflects contractual fee waivers, without such fee waivers total returns would be reduced. Performance information does not reflect the 2% fee on shares redeemed or exchanged within 30 days of purchase. If such redemption fee was included, performance would be reduced. For performance data current to the most recent month-end go to www.rbcgam.us. Please see footnotes below.
(1) The Funds’ expenses reflect the most recent fiscal year-end (September 30, 2012).
(2) The Adviser has contractually agreed to waive fees and/or make payments in order to keep total operating expenses of the Fund to the levels listed under net expense ratio until January 31, 2013.
*Each of the comparative indices is a widely recognized market value weighted measure of the return of securities, but do not include sales fees or operating expenses. You cannot invest directly in indices.
| (a) | The performance in the table for the period from June 1, 1994 to April 19, 2004 reflects the performance of RBC Mid Cap Equity Fund, the predecessor to RBC SMID Cap Growth Fund. The performance of the Fund also includes the performance of a common trust fund (“CTF”) account advised by RBC GAM (US) (including its predecessor) and managed the same as the Fund in all material respects for the period from December 31, 1990 to June 1, 1994, as adjusted to reflect the full contractual rate of expenses associated with the Fund at its inception. The CTF account was not registered with the SEC under the 1940 Act and therefore was not subject to the investment restrictions imposed by law on registered mutual funds. If the CTF account had been registered, the CTF account’s performance may have been adversely affected. Fund performance reflects applicable fee waivers/expense reimbursements (which, if excluded, would cause performance to be lower). |
| (b) | The since inception date (commencement of operations) of the Fund is December 31, 1990. |
| (c) | The inception date for Class C Shares of the Fund is April 19, 2004. All performance shown for each such class of shares prior to its inception date is based on the performance of the Class A Shares of the Fund, adjusted to reflect the fees and expenses of Class C Shares, as applicable (and where applicable, the maximum sales charges of the Class C Shares). |
| (d) | The inception date for Class S Shares of the Fund is April 19, 2004. All performance shown for each such class of shares prior to its inception date is based on the performance of the Class I Shares of the Fund, adjusted to reflect the fees and expenses of Class S Shares. |
| (e) | The performance in the table for the period from December 2, 1983 to April 19, 2004 reflects the performance of Babson Enterprise Fund, the predecessor to RBC Enterprise Fund . Fund performance reflects applicable fee waivers/expense reimbursements (which, if excluded, would cause performance to be lower). |
| (f) | The since inception date (commencement of operations) of the Fund is December 2, 1983. The performance of the index since inception of the Fund is calculated from November 30, 1983. |
| (g) | The inception date for Class A and Class C Shares of the Fund is April 19, 2004. All performance shown for each such class of shares prior to its inception date is based on the performance of the Class S Shares of the Fund, adjusted to reflect the fees and expenses of Class A and Class C Shares, as applicable (and where applicable, the maximum sales charges of the Class A and Class C Shares). |
9
PERFORMANCE SUMMARY |
| (h) | The inception date for Class I Shares of the Fund is September 30, 2004. All performance shown for each such class of shares prior to its inception date is based on the performance of the Class S Shares of the Fund, adjusted to reflect the fees and expenses of Class I Shares, as applicable. |
| (i) | The performance in the table for the period from August 5, 1991 to April 19, 2004 reflects the performance of Babson Enterprise Fund II, the predecessor to RBC Small Cap Core Fund. Fund performance reflects applicable fee waivers/expense reimbursements (which, if excluded, would cause performance to be lower). |
| (j) | The since inception date (commencement of operations) of the Fund is August 5, 1991. The performance of the index since inception of the Fund is calculated from July 31, 1991. |
| (k) | The performance in the table for the period from September 10, 1987 to April 19, 2004 reflects the performance of Shadow Stock Fund, the predecessor to RBC Microcap Value Fund. Fund performance reflects applicable fee waivers/expense reimbursements (which, if excluded, would cause performance to be lower). |
| (l) | The since inception date (commencement of operations) of the Fund is September 10, 1987. The performance of the index since inception of the Fund is calculated from August 31, 1987. |
| (m) | The since inception date (commencement of operations) of the Fund is December 31, 2009. The performance of the index since inception of the Fund is calculated from December 31, 2009. |
The Russell 2500 Growth Index is an unmanaged index that measures the performance of those Russell 2500 companies with higher price-to-book ratios and higher forecasted growth values.
The Russell 2000 Value Index is an unmanaged index that measures the performance of those Russell 2000 companies with lower price-to-book ratios and lower forecasted growth values.
The Russell 2000 Index is an unmanaged index that measures the performance of approximately 2,000 of the smallest securities in the Russell 3000 Index based on a combination of their market cap and current index membership.
The Russell Midcap Value Index is an unmanaged, market-weighted total return index that tracks the performance of those Russell Midcap companies with lower price-to-book ratios and lower forecasted growth rates.
The Russell Microcap Index is an unmanaged index that measures the performance of 1000 of the smallest securities in the Russell 2000 Index based on a combination of their market cap and current index membership.
10
|
This Page Intentionally Left Blank
11
MANAGEMENT DISCUSSION AND ANALYSIS (UNAUDITED) | ||||||
| ||||||
Investment Strategy |
Seeks long-term growth by primarily investing in high quality, small and mid capitalization companies that display consistent earnings growth and superior financial characteristics. Utilizing fundamental research, the Fund employs a bottom-up approach and strict risk controls to build a diversified portfolio of stocks that offer above average expected growth with lower than average market risk.
| |||||
Performance |
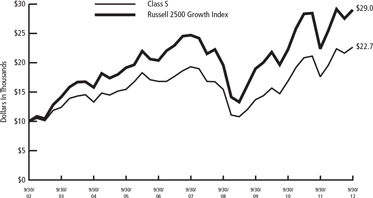
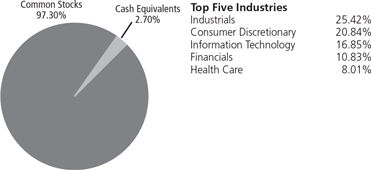
For the twelve-month period ending September 30, 2012, the Fund had a total return of 28.45% (Class S). That compares to a total return of 29.52% for the Russell 2500 Growth Index, the Fund’s primary benchmark.
| |||||
Factors That Made Positive |
— The primary positive contributors to performance during the period were favorable stock selection in the consumer discretionary, energy and consumer staples sectors.
— Stock selection in the consumer discretionary sector was the leading contributor to the Fund as retailers Tractor Supply and Ross Stores, as well as restaurant chain Panera Bread each reported better than expected revenue, earnings and same store sales growth throughout the year.
— Stock selection in the energy sector was driven by oil services companies Oceaneering, Oil States International and Dril-Quip which all benefited from better then expected financial results, increased drilling activity and rising oil prices.
— The Fund’s overweight position in health care, which was the top performing sector in the period, was also a positive contributor to results during the year.
| |||||
Factors That |
— Stock selection in the health care sector was the primary detractor from the Fund during the period as our lack of exposure to the more volatile biotechnology industry was a significant headwind during the period.
— Stock selection in the industrials sector also detracted from results due to underperformance of Polypore International, Towers Watson and Waste Connections.
— The Fund’s modest cash position during a period of strong market appreciation also detracted from results during the period.
| |||||
Mutual fund investing involves risk. Principal loss is possible. Investing in small cap companies involves additional risks, including greater fluctuations in value and lack of liquidity. These risks are more fully described in the prospectus. The Fund invests in foreign securities which involve political, economic and currency risks, greater volatility and differences in accounting methods.
| ||||||
12
MANAGEMENT DISCUSSION AND ANALYSIS (UNAUDITED) | ||||||||||||
RBC SMID Cap Growth Fund
| ||||||||||||
Long-term capital appreciation.
| Investment Objective
| |||||||||||
Russell Midcap Growth Index and Russell 2500 Growth Index
| Benchmark
| |||||||||||
|
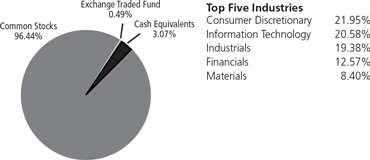
Asset Allocation (as of 9/30/12) (% of fund’s investments) & Top Five Industries (as of 9/30/12) (% of fund’s net assets)
| |||||||||||
| Tractor Supply Co. | 3.53% | United Natural Foods, Inc. | 1.99 | % |
Top Ten Holdings (as of 9/30/12) (% of fund’s net assets) | |||||||
| Pricesmart, Inc. | 2.55% | Ultimate Software Group, Inc. | 1.98 | % | ||||||||
| LKQ Corp. | 2.35% | Roper Industries, Inc. | 1.96 | % | ||||||||
| Airgas, Inc. | 2.14% | Oceaneering International, Inc. | 1.81 | % | ||||||||
| AMETEK, Inc. | 2.07% | Catamaran Corp. | 1.78 | % | ||||||||
| *A listing of all portfolio holdings can be found beginning on page 22. | ||||||||||||
|
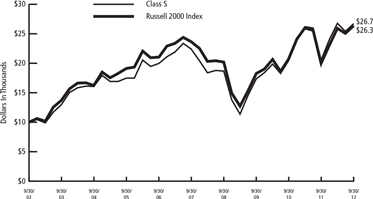
Growth of $10,000 Initial Investment Over 10 Years | |||||||||||
| The graph reflects an initial investment of $10,000 over a 10 year period and is based on Class S shares. The performance of the Fund for the period from September 30, 2001 to April 19, 2004 reflects the performance of RBC Mid Cap Equity Fund, the predecessor to RBC SMID Cap Growth Fund. The Fund’s total return includes reinvested dividends and capital gains. The Fund’s total return also includes operating expenses that reduce return, while the total return of the index does not. The graph does not reflect the deduction of taxes that a shareholder would pay on fund distributions or redemption of fund shares. Performance of other classes will vary due to differences in fee structures. | ||||||||||||

13
MANAGEMENT DISCUSSION AND ANALYSIS (UNAUDITED) | ||||||
| ||||||
Investment Strategy |
Seeks to provide superior long-term growth of capital compared to the Russell 2000 Index while taking a low risk approach to small company investing. The Adviser believes that portfolios of neglected small cap companies with low valuations, long-term attractive business fundamentals and near-term profitability improvement potential should produce strong absolute and risk-adjusted returns over time.
| |||||
| Performance |
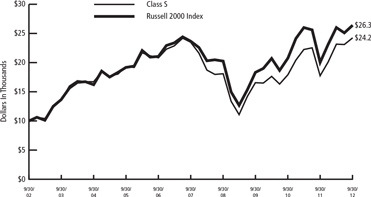
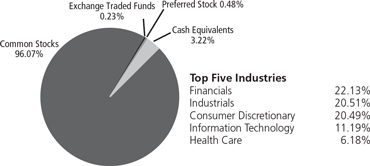
For the twelve-month period ending September 30, 2012, the Fund had a total return of 36.61% (Class S). That compares to a total return of 31.91% for the Russell 2000 Index, the Fund’s primary benchmark.
| |||||
Factors That Made Positive Contributions |
— Overall, stock selection was the primary factor in the Fund’s higher one-year performance compared to the Russell 200 Index.
— Favorable stock selection in the materials sector, particularly among chemicals, packaging and metals companies was a major positive performance factor.
— Favorable information technology stock selection, especially among makers of communications equipment and companies providing IT consulting services, also added significantly to overall portfolio performance.
— Favorable stock selection among oil and gas exploration and development companies and among energy equipment and service providers also boosted Fund performance versus the benchmark.
| |||||
Factors That Detracted From Relative Returns |
— Adverse sector allocation marginally detracted from performance compared to the Russell 2000 Index.
— Sector underweight compared to the Russell 2000 Index in the strongly performing financials and health care sectors were important adverse performance factors.
— Adverse stock selection compared to the Russell 2000 Index in consumer discretionary stocks, particularly among household durables and leisure equipment companies, also detracted from relative performance.
| |||||
Mutual fund investing involves risk. Principal loss is possible. Investing in small cap companies involves additional risks, including greater fluctuations in value and lack of liquidity. These risks are more fully described in the prospectus. Although the Fund does not generally invest in initial public offerings (IPO’s), it has the ability to. Investment in IPO’s typically involve greater price volatility resulting in increased turnover and expenses as well as the potential for taxable gains. | ||||||
14
| MANAGEMENT DISCUSSION AND ANALYSIS (UNAUDITED) | ||||||||||
RBC Enterprise Fund
| ||||||||||
Long-term growth of capital.
| Investment Objective
| |||||||||
Russell 2000 Index
| Benchmark
| |||||||||
|
Asset Allocation (as of 9/30/12) (% of fund’s investments) & Top Five Industries (as of 9/30/12) (% of fund’s net assets)
| |||||||||
| AZZ, Inc. | 4.49% | Universal Stainless & Alloy | 3.37% |
Top Ten Holdings (as of 9/30/12) (% of fund’s net assets) | ||||||
Casual Male Retail Group, Inc. | 3.61% | Tyler Technologies, Inc. | 3.31% | |||||||
Steinway Musical Instruments, Inc. | 3.57% | Gulfport Energy Corp. | 2.91% | |||||||
Universal Electronics, Inc. | 3.47% | Compass Diversified Holdings | 2.86% | |||||||
| RG Barry Corp. | 3.37% | Interactive Intelligence Group, Inc. | 2.74% | |||||||
* A listing of all portfolio holdings can be found beginning on page 25. | ||||||||||
|
Growth of $10,000 Initial Investment Over 10 Years | |||||||||
| The graph reflects an initial investment of $10,000 over a 10 year period and is based on Class S shares. The performance of the Fund for the period from September 30, 2001 to April 19, 2004 reflects the performance of Babson Enterprise Fund, the predecessor to RBC Enterprise Fund. The Fund’s total return includes reinvested dividends and capital gains. The Fund’s total return also includes operating expenses that reduce return, while the total return of the index does not. The graph does not reflect the deduction of taxes that a shareholder would pay on fund distributions or redemption of fund shares. Performance of other classes will vary due to differences in fee structures. | ||||||||||
15
MANAGEMENT DISCUSSION AND ANALYSIS (UNAUDITED) | ||||||
| ||||||
| Investment Strategy | Seeks to provide superior long-term growth of capital compared to the Russell 2000 Index while taking a low risk approach to small company investing. The Adviser believes that portfolios of neglected small cap companies with low valuations, long-term attractive business fundamentals and near-term profitability improvement potential should produce strong absolute and risk-adjusted returns over time.
| |||||
| Performance |
For the twelve-month period ending September 30, 2012, the Fund had a total return of 30.08% (Class S). That compares to a total return of 31.91% for the Russell 2000 Index, the Fund’s primary benchmark.
| |||||
Factors That Made Positive |
— Overall, stock selection was a favorable performance factor for the Fund compared to the Russell 2000 Index for the one-year period.
— Favorable stock selection among financials was the most significant positive performance factor, especially among insurance companies.
— Favorable stock selection in the materials sector was also an important positive performance factor with special strength among chemical companies in the metals and mining industry.
| |||||
| Factors That Detracted From Relative Returns |
— Overall adverse sector allocation was the primary factor in the Fund’s performance shortfall compared to the index for the one-year period.
— An underweight compared to the Russell 2000 Index in the strongly performing financials and health care sectors was a significant adverse performance factor.
— Cash holdings also detracted from performance versus the benchmark in a strong up market.
— Adverse stock selection among consumer staples and industrial companies also hindered performance compared to the Russell 2000 Index.
| |||||
Mutual fund investing involves risk. Principal loss is possible. Investing in mid cap,small cap and micro cap companies involves additional risks, including greater fluctuations in value and lack of liquidity. These risks are more fully described in the prospectus. Although the Fund does not generally invest in initial public offerings (IPO’s), it has the ability to. Investment in IPO’s typically involve greater price volatility resulting in increased turnover and expenses as well as the potential for taxable gains. | ||||||
16
| MANAGEMENT DISCUSSION AND ANALYSIS (UNAUDITED) | ||||||||||
RBC Small Cap Core Fund
| ||||||||||
Long-term growth of capital and income.
| Investment Objective | |||||||||
Russell 2000 Index
| Benchmark | |||||||||
|
Asset Allocation (as of 9/30/12) (% of fund’s investments) & Top Five Industries (as of 9/30/12) (% of fund’s net assets)
| |||||||||
| AZZ, Inc. | 3.38% | Compass Diversified Holdings | 2.36% |
Top Ten Holdings (as of 9/30/12) (% of fund’s net assets) | ||||||
Universal Stainless & Alloy | 3.03% | InterDigital, Inc. | 2.35% | |||||||
Casual Male Retail Group, Inc. | 2.75% | Universal Electronics, Inc. | 2.30% | |||||||
Gulfport Energy Corp. | 2.70% | Tyler Technologies, Inc. | 2.18% | |||||||
| Gardner Denver, Inc. | 2.61% | |||||||||
Steinway Musical Instruments, Inc. | 2.50% | |||||||||
| * A listing of all portfolio holdings can be found beginning on page 29. | ||||||||||
|
Growth of $10,000 Initial Investment Over 10 Years | |||||||||
| The graph reflects an initial investment of $10,000 over a 10 year period and is based on Class S shares. The performance of the Fund for the period from September 30, 2001 to April 19, 2004 reflects the performance of Babson Enterprise Fund II, the predecessor to RBC Small Cap Core Fund. The Fund’s total return includes reinvested dividends and capital gains. The Fund’s total return also includes operating expenses that reduce return, while the total return of the index does not. The graph does not reflect the deduction of taxes that a shareholder would pay on fund distributions or redemption of fund shares. Performance of other classes will vary due to differences in fee structures. | ||||||||||
17
MANAGEMENT DISCUSSION AND ANALYSIS (UNAUDITED) | ||||||
| ||||||
Investment Strategy |
Invests in a diversified portfolio of the smallest companies that have been neglected by institutional shareholders. Utilizing a quantitative process to identify value-oriented investments, the Fund strives to achieve long-term growth while offering shareholders some protection from market declines and fluctuations.
| |||||
Performance |
For the twelve-month period ending September 30, 2012, the Fund had a total return of 32.97% (Class S). That compares to a total return of 32.63% for the Russell 2000 Value Index, the Fund’s primary benchmark.
| |||||
Factors That Made Positive Contributions |
— Favorable stock selection provided the largest positive contribution to the Fund’s performance compared to the Russell 2000 Value Index for the one-year period.
— Favorable information technology stock selection was the most important area of positive stock selection, especially among IT consulting and service companies.
— A favorable sector overweight in consumer discretionary stocks compared to the benchmark was also an important contributor to above-benchmark performance.
| |||||
Factors That Detracted From Relative Returns |
— Overall, adverse sector allocation was a small detractor from performance relative to the Russell 2000 Value Index over the one-year period.
— A sector underweight in financials was the largest detractor from relative performance.
— Cash holdings also were a negative performance factor in a period of strong equity performance.
| |||||
Mutual fund investing involves risk. Principal loss is possible. Investing in micro cap companies involves additional risks, including greater fluctuations in value and lack of liquidity. These risks are more fully described in the prospectus. Although the Fund does not generally invest in initial public offerings (IPO’s), it has the ability to. Investment in IPO’s typically involve greater price volatility resulting in increased turnover and expenses as well as the potential for taxable gains. |
18
MANAGEMENT DISCUSSION AND ANALYSIS (UNAUDITED) | ||||||||||||||
RBC Microcap Value Fund
| ||||||||||||||
Long-term growth of capital.
| Investment Objective | |||||||||||||
Russell 2000 Value Index
| Benchmark | |||||||||||||
|
|
Asset Allocation (as of 9/30/12) (as of 9/30/12)
| ||||||||||||
| Cantel Medical Corp. | 0.88 | % | Arctic Cat, Inc. | 0.66 | % |
Top Ten Holdings (as of 9/30/12) | ||||||||
| On Assignment, Inc. | 0.85 | % | MFC Industrial Ltd. | 0.63 | % | |||||||||
| MicroFinancial, Inc. | 0.72 | % | American Pacific Corp. | 0.62 | % | |||||||||
| Marlin Business Services Corp. | 0.71 | % | First Merchants Corp. | 0.62 | % | |||||||||
| ePlus, Inc. | 0.67 | % | Lithia Motors, Inc., Class A | 0.61 | % | |||||||||
* A listing of all portfolio holdings can be found beginning on page 32. | ||||||||||||||
|
|
Growth of $10,000 Initial Investment Over 10 Years | ||||||||||||
| The graph reflects an initial investment of $10,000 over a 10 year period and is based on Class S shares. The performance of the Fund for the period from September 30, 2001 to April 19, 2004 reflects the performance of Shadow Stock Fund, the predecessor to RBC Microcap Value Fund. The Fund’s total return includes reinvested dividends and capital gains. The Fund’s total return also includes operating expenses that reduce return, while the total return of the index does not. The graph does not reflect the deduction of taxes that a shareholder would pay on fund distributions or redemption of fund shares. Performance of other classes will vary due to differences in fee structures. | ||||||||||||||

19
MANAGEMENT DISCUSSION AND ANALYSIS (UNAUDITED) | ||||||
| ||||||
Investment | Seeks long-term capital appreciation by investing in common stocks of mid-sized companies that are considered to be undervalued in relation to earnings, dividends and/or assets. The Advisor uses a disciplined, bottom-up approach to select stocks for the Fund’s portfolio with a focus on fundamental research and qualitative analysis.
| |||||
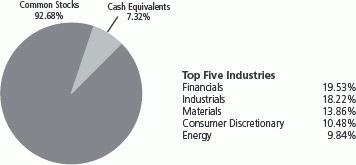
Performance | For the twelve-month period ending September 30, 2012, the Fund had a total return of 31.73%. That compares to a total return of 29.28% for the Russell Midcap Value Index, the Fund’s primary benchmark.
| |||||
Factors That |
— Overall stock selection was a positive contributor to the Fund’s performance during the period.
— Stock selection was particularly strong in the materials, financials and energy sectors.
— Sector allocation was also very positive aided by an underweight in utilities and overweight in materials.
| |||||
Factors That |
— Stock selection in industrials sector was negative due to some company specific issues.
— Stock selection in energy sector was impacted by the fall in natural gas prices impacting names with outsized exposure on the services and production side to natural gas.
— Normal level of residual cash was a head wind in a strong up market.
| |||||
Mutual fund investing involves risk. Principal loss is possible. Investing in mid cap companies involves additional risks, including greater fluctuations in value and lack of liquidity. These risks are more fully described in the prospectus. Although the Fund does not generally invest in initial public offerings (IPO’s), it has the ability to. Investment in IPO’s typically involve greater price volatility resulting in increased turnover and expenses as well as the potential for taxable gains.
| ||||||
20
| MANAGEMENT DISCUSSION AND ANALYSIS (UNAUDITED) | ||||||||||
RBC Mid Cap Value Fund
| ||||||||||
Long-term capital appreciation.
| Investment Objective
| |||||||||
Russell Midcap Value Index | Benchmark
| |||||||||
 | Asset Allocation (as of 9/30/12) (% of fund’s investments) & Top Five Industries (as of 9/30/12) (% of fund’s net assets)
| |||||||||
| Noble Corp. | 3.82% | Ashland, Inc. | 2.59% | Top Ten Holdings (as of 9/30/12) (% of fund’s net assets)
| ||||||
| KKR Financial Holdings LLC | 3.68% | Crown Holdings, Inc. | 2.57% | |||||||
| Fluor Corp. | 3.50% | Reinsurance Group of America, Inc. | 2.49% | |||||||
| ACCO Brands Corp. | 3.12% | Humana, Inc. | 2.38% | |||||||
| Edison International | 2.82% | |||||||||
| Universal Health Services, Inc., Class B | 2.64% | |||||||||
| * A listing of all portfolio holdings can be found beginning on page 43. | ||||||||||
 | Growth of $10,000 Initial Investment Since Inception (12/30/09) | |||||||||
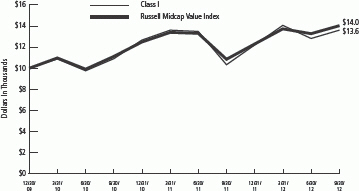
| The graph reflects an initial investment of $10,000 over the period from December 30, 2009 to September 30, 2012 and is based on Class I shares. The Fund’s total return includes reinvested dividends and capital gains. The Fund’s total return also includes operating expenses that reduce return, while the total return of the index does not. The graph does not reflect the deduction of taxes that a shareholder would pay on fund distributions or redemption of fund shares. | ||||||||||
21
RBC SMID Cap Growth Fund
|
|
September 30, 2012
Shares | Value | |||||
Common Stocks — 98.55% | ||||||
Consumer Discretionary — 11.28% | ||||||
11,000 | Fossil, Inc.* | $ | 931,700 | |||
15,000 | Guess?, Inc. | 381,300 | ||||
81,920 | LKQ Corp.* | 1,515,520 | ||||
22,100 | Monro Muffler Brake, Inc. | 777,699 | ||||
6,700 | Panera Bread Co., Class A* | 1,144,963 | ||||
23,000 | Tractor Supply Co. | 2,274,470 | ||||
15,000 | WMS Industries, Inc.* | 245,700 | ||||
|
| |||||
| 7,271,352 | ||||||
|
| |||||
Consumer Staples — 6.64% | ||||||
15,000 | Church & Dwight Co., Inc. | 809,850 | ||||
21,700 | Pricesmart, Inc. | 1,643,124 | ||||
7,400 | Ralcorp Holdings, Inc.* | 540,200 | ||||
22,000 | United Natural Foods, Inc.* | 1,285,900 | ||||
|
| |||||
| 4,279,074 | ||||||
|
| |||||
Energy — 7.47% | ||||||
11,000 | Dril-Quip, Inc.* | 790,680 | ||||
32,300 | Gulfport Energy Corp.* | 1,009,698 | ||||
21,080 | Oceaneering International, Inc. | 1,164,670 | ||||
13,200 | Oil States International, Inc.* | 1,048,872 | ||||
19,400 | Unit Corp.* | 805,100 | ||||
|
| |||||
| 4,819,020 | ||||||
|
| |||||
Financials — 7.44% | ||||||
6,400 | Affiliated Managers Group, Inc.* | 787,200 | ||||
16,200 | Eaton Vance Corp. | 469,152 | ||||
13,500 | Federated Investors, Inc., Class B | 279,315 | ||||
17,500 | First Cash Financial Services, Inc.* | 805,175 | ||||
24,700 | HCC Insurance Holdings, Inc. | 837,083 | ||||
29,000 | Raymond James Financial, Inc. | 1,062,850 | ||||
28,700 | Tower Group, Inc. | 556,493 | ||||
|
| |||||
| 4,797,268 | ||||||
|
| |||||
Health Care — 21.00% | ||||||
41,300 | Bruker Corp.* | 540,617 | ||||
11,720 | Catamaran Corp.* | 1,148,208 | ||||
19,300 | Cepheid, Inc.* | 666,043 | ||||
9,100 | Charles River Laboratories International, Inc.* | 360,360 | ||||
7,400 | Edwards Lifesciences Corp.* | 794,538 | ||||
13,700 | Henry Schein, Inc.* | 1,085,999 | ||||
11,100 | IDEXX Laboratories, Inc.* | 1,102,785 | ||||
11,600 | Integra LifeSciences Holdings Corp.* | 476,760 | ||||
5,900 | Laboratory Corp of America Holdings* | 545,573 | ||||
22
SCHEDULE OF PORTFOLIO INVESTMENTS |
RBC SMID Cap Growth Fund (cont.)
|
|
September 30, 2012
Shares | Value | |||||
| ||||||
5,000 | Mettler-Toledo International, Inc.* | $ | 853,700 | |||
10,000 | MWI Veterinary Supply, Inc.* | 1,066,800 | ||||
22,900 | NuVasive, Inc.* | 524,639 | ||||
22,300 | PAREXEL International Corp.* | 685,948 | ||||
8,300 | Perrigo Co. | 964,211 | ||||
9,400 | Varian Medical Systems, Inc.* | 567,008 | ||||
28,100 | Volcano Corp.* | 802,817 | ||||
9,500 | Waters Corp.* | 791,635 | ||||
10,500 | West Pharmaceutical Services, Inc. | 557,235 | ||||
|
| |||||
| 13,534,876 | ||||||
|
| |||||
Industrials — 20.05% | ||||||
7,400 | Alliant Techsystems, Inc. | 370,814 | ||||
37,600 | AMETEK, Inc. | 1,332,920 | ||||
14,100 | Clean Harbors, Inc.* | 688,785 | ||||
24,440 | Donaldson Co., Inc. | 848,312 | ||||
11,380 | Expeditors International of Washington, Inc. | 413,777 | ||||
5,900 | Flowserve Corp. | 753,666 | ||||
8,740 | Huron Consulting Group, Inc.* | 304,327 | ||||
12,500 | Jacobs Engineering Group, Inc.* | 505,375 | ||||
11,700 | Landstar System, Inc. | 553,176 | ||||
14,100 | MSC Industrial Direct Co., Class A | 951,186 | ||||
13,700 | Polypore International, Inc.* | 484,295 | ||||
6,600 | Portfolio Recovery Associates, Inc.* | 689,238 | ||||
11,490 | Roper Industries, Inc. | 1,262,636 | ||||
11,600 | Stericycle, Inc.* | 1,050,032 | ||||
11,400 | Teledyne Technologies, Inc.* | 722,646 | ||||
13,300 | Towers Watson & Co., Class A | 705,565 | ||||
18,500 | Waste Connections, Inc. | 559,625 | ||||
21,400 | Woodward, Inc. | 727,172 | ||||
|
| |||||
| 12,923,547 | ||||||
|
| |||||
Information Technology — 17.66% | ||||||
11,720 | ANSYS, Inc.* | 860,248 | ||||
20,210 | Autodesk, Inc.* | 674,408 | ||||
11,100 | Comtech Telecommunications Corp. | 306,804 | ||||
18,800 | Digital River, Inc.* | 313,208 | ||||
11,140 | Dolby Laboratories, Inc., Class A* | 364,835 | ||||
8,100 | F5 Networks, Inc.* | 848,070 | ||||
17,500 | Global Payments, Inc. | 732,025 | ||||
16,300 | Informatica Corp.* | 567,403 | ||||
7,500 | Mantech International Corp., Class A | 180,000 | ||||
18,850 | Microchip Technology, Inc. | 617,149 | ||||
19,400 | MICROS Systems, Inc.* | 952,928 | ||||
20,450 | National Instruments Corp. | 514,727 | ||||
14,000 | Open Text Corp.* | 771,960 | ||||
18,800 | Plexus Corp.* | 569,452 | ||||
44,700 | Riverbed Technology, Inc.* | 1,040,169 | ||||
23
SCHEDULE OF PORTFOLIO INVESTMENTS |
RBC SMID Cap Growth Fund (cont.)
|
|
September 30, 2012
Shares | Value | |||||
| ||||||
24,000 | Synopsys, Inc.* | $ | 792,480 | |||
12,500 | Ultimate Software Group, Inc.* | 1,276,250 | ||||
|
| |||||
| 11,382,116 | ||||||
|
| |||||
Materials — 7.01% | ||||||
16,800 | Airgas, Inc. | 1,382,640 | ||||
17,100 | AptarGroup, Inc. | 884,241 | ||||
22,600 | Balchem Corp. | 830,098 | ||||
11,400 | Reliance Steel & Aluminum Co. | 596,790 | ||||
11,500 | Sigma-Aldrich Corp. | 827,655 | ||||
|
| |||||
| 4,521,424 | ||||||
|
| |||||
Total Common Stocks | 63,528,677 | |||||
|
| |||||
(Cost $43,845,580) | ||||||
Investment Company — 2.20% | ||||||
1,417,345 | JPMorgan Prime Money Market Fund | 1,417,345 | ||||
|
| |||||
Total Investment Company | 1,417,345 | |||||
|
| |||||
(Cost $1,417,345) | ||||||
Total Investments | $ | 64,946,022 | ||||
(Cost $45,262,925)(a) — 100.75% | ||||||
Liabilities in excess of other assets — (0.75)% | (481,866 | ) | ||||
|
| |||||
NET ASSETS — 100.00% | $ | 64,464,156 | ||||
|
| |||||
| ||||||
| * | Non-income producing security. |
| (a) | See notes to financial statements for the tax cost of securities and the breakdown of unrealized appreciation (depreciation). |
See notes to financial statements.
24
SCHEDULE OF PORTFOLIO INVESTMENTS |
RBC Enterprise Fund
|
|
September 30, 2012
Shares | Value | |||||
| ||||||
Common Stocks — 96.22% | ||||||
Consumer Discretionary — 21.95% | ||||||
41,400 | Books-A-Million, Inc.* | $ | 121,302 | |||
35,000 | Bridgepoint Education, Inc.* | 355,250 | ||||
857,773 | Casual Male Retail Group, Inc.* | 3,971,489 | ||||
114,438 | Delta Apparel, Inc.* | 1,575,811 | ||||
22,500 | Gordmans Stores, Inc.* | 415,125 | ||||
63,800 | Grand Canyon Education, Inc.* | 1,501,214 | ||||
53,830 | Mac-Gray Corp. | 721,860 | ||||
19,000 | Red Robin Gourmet Burgers, Inc.* | 618,640 | ||||
250,900 | RG Barry Corp. | 3,698,266 | ||||
83,700 | Smith & Wesson Holding Corp.* | 921,537 | ||||
31,100 | Sodastream International Ltd.* | 1,218,187 | ||||
161,233 | Steinway Musical Instruments, Inc.* | 3,927,636 | ||||
216,700 | Universal Electronics, Inc.* | 3,809,586 | ||||
147,900 | Zagg, Inc.* | 1,261,587 | ||||
|
| |||||
| 24,117,490 | ||||||
|
| |||||
Energy — 4.34% | ||||||
102,400 | Gulfport Energy Corp.* | 3,201,024 | ||||
12,854 | OYO Geospace Corp.* | 1,573,458 | ||||
|
| |||||
| 4,774,482 | ||||||
|
| |||||
Financials — 12.57% | ||||||
205,300 | Asta Funding, Inc. | 1,927,767 | ||||
63,500 | Boston Private Financial Holdings, Inc. | 608,965 | ||||
91,059 | CoBiz Financial, Inc. | 637,413 | ||||
212,900 | Compass Diversified Holdings | 3,146,662 | ||||
50,800 | Firstcity Financial Corp.* | 407,924 | ||||
52,400 | LaSalle Hotel Properties REIT | 1,398,556 | ||||
27,626 | Mercantile Bank Corp.* | 473,510 | ||||
74,489 | MetroCorp Bancshares, Inc.* | 788,838 | ||||
80,000 | National Interstate Corp. | 2,064,000 | ||||
71,174 | Northrim BanCorp, Inc. | 1,433,444 | ||||
65,000 | Washington Banking Co. | 921,050 | ||||
|
| |||||
| 13,808,129 | ||||||
|
| |||||
Health Care — 6.75% | ||||||
235,600 | BioScrip, Inc.* | 2,146,316 | ||||
85,900 | Exactech, Inc.* | 1,531,597 | ||||
58,700 | Meridian Bioscience, Inc. | 1,125,866 | ||||
94,700 | US Physical Therapy, Inc. | 2,616,561 | ||||
|
| |||||
| 7,420,340 | ||||||
|
| |||||
Industrials — 19.38% | ||||||
98,800 | Acacia Research Corp.* | 2,708,108 | ||||
263,700 | Air Transport Services Group, Inc.* | 1,160,280 | ||||
111,456 | Allied Defense Group, Inc. (The)*(a)(b) | 592,946 | ||||
25
SCHEDULE OF PORTFOLIO INVESTMENTS |
RBC Enterprise Fund (cont.)
|
|
September 30, 2012
Shares | Value | |||||
| ||||||
130,000 | AZZ, Inc. | $ | 4,937,400 | |||
198,325 | Columbus McKinnon Corp.* | 2,996,691 | ||||
59,900 | Ducommun, Inc.* | 814,640 | ||||
81,600 | Ennis, Inc. | 1,339,056 | ||||
89,600 | Greenbrier Cos., Inc.* | 1,446,144 | ||||
13,500 | Hurco Cos, Inc.* | 308,880 | ||||
13,500 | Marten Transport Ltd. | 237,195 | ||||
83,200 | NN, Inc.* | 706,368 | ||||
20,325 | Old Dominion Freight Line, Inc.* | 613,002 | ||||
50,900 | Orion Marine Group, Inc.* | 378,187 | ||||
379,200 | PGT, Inc.* | 1,243,776 | ||||
68,150 | Sun Hydraulics Corp. | 1,810,745 | ||||
|
| |||||
| 21,293,418 | ||||||
|
| |||||
Information Technology — 20.58% | ||||||
48,082 | Aspen Technology, Inc.* | 1,242,920 | ||||
38,700 | AuthenTec, Inc.* | 309,987 | ||||
97,200 | Commtouch Software Ltd.* | 245,916 | ||||
147,674 | Computer Task Group, Inc.* | 2,389,365 | ||||
55,100 | comScore, Inc.* | 840,275 | ||||
243,500 | Glu Mobile, Inc.* | 1,127,405 | ||||
100,200 | Interactive Intelligence Group, Inc.* | 3,011,010 | ||||
93,100 | KEYW Holding Corp. (The)* | 1,163,750 | ||||
62,238 | Lionbridge Technologies, Inc.* | 219,078 | ||||
159,300 | NIC, Inc. | 2,357,640 | ||||
55,600 | Rubicon Technology, Inc.* | 532,648 | ||||
47,400 | STEC, Inc.* | 319,950 | ||||
112,851 | Tessco Technologies, Inc. | 2,389,056 | ||||
75,300 | TNS, Inc.* | 1,125,735 | ||||
82,700 | Tyler Technologies, Inc.* | 3,640,454 | ||||
184,500 | Xyratex Ltd. | 1,697,400 | ||||
|
| |||||
| 22,612,589 | ||||||
|
| |||||
Materials — 8.40% | ||||||
127,116 | Intertape Polymer Group, Inc. | 873,287 | ||||
63,700 | Koppers Holdings, Inc. | 2,225,041 | ||||
47,300 | Landec Corp.* | 541,585 | ||||
249,900 | OMNOVA Solutions, Inc.* | 1,891,743 | ||||
99,588 | Universal Stainless & Alloy* | 3,699,694 | ||||
|
| |||||
| 9,231,350 | ||||||
|
| |||||
Telecommunication Services — 0.87% | ||||||
234,200 | Towerstream Corp.* | 950,852 | ||||
|
| |||||
Utilities — 1.38% | ||||||
55,800 | Unitil Corp. | 1,518,876 | ||||
|
| |||||
Total Common Stocks | 105,727,526 | |||||
|
| |||||
(Cost $76,734,432) | ||||||
26
| SCHEDULE OF PORTFOLIO INVESTMENTS |
RBC Enterprise Fund (cont.)
September 30, 2012
Shares | Value | |||||
Rights/Warrants — 0.00% | ||||||
6,203 | US Concrete, Inc. Warrants, Expire 8/31/17*(a)(b)(c) | $ | 0 | |||
6,203 | US Concrete, Inc. Warrants, Expire 8/31/17*(a)(b)(c) | 0 | ||||
|
| |||||
Total Rights/Warrants | 0 | |||||
|
| |||||
(Cost $0) | ||||||
Exchange Traded Funds — 0.49% | ||||||
18,800 | SPDR S&P Regional Banking | 538,432 | ||||
|
| |||||
Total Exchange Traded Funds | 538,432 | |||||
|
| |||||
(Cost $373,522) | ||||||
Investment Company — 3.06% | ||||||
3,361,655 | JPMorgan Prime Money Market Fund | 3,361,655 | ||||
|
| |||||
Total Investment Company | 3,361,655 | |||||
|
| |||||
(Cost $3,361,655) | ||||||
Total Investments | $ | 109,627,613 | ||||
(Cost $80,469,609)(d) — 99.77% | ||||||
Other assets in excess of liabilities — 0.23% | 258,156 | |||||
|
| |||||
NET ASSETS — 100.00% | $ | 109,885,769 | ||||
|
| |||||
| * | Non-income producing security. |
| (a) | The Pricing Committee fair valued security under procedures established by the Fund’s Board of Trustees. |
| (b) | This security is restricted and illiquid as the security may not be offered or sold within the United States or to U.S. persons except to qualified purchasers who are also either qualified institutional buyers or “accredited investors” (as defined in Rule 501 (a) of Regulation D under the Securities Act of 1933). |
The total investment in restricted and illiquid securities representing $592,946 or 0.54% of net assets was as follows:
Acquisition Shares | Issuer | Acquisition Date | Acquisition Cost | 9/30/12 Carrying Value Per Unit | ||||||||
111,456 | Allied Defense Group, Inc. (The) | 12/21/2007 | $ | 667,484 | $ | 5.32 | ||||||
6,203 | U.S. Concrete, Inc., Warrants | 09/09/2010 | $ | — | $ | — | ||||||
6,203 | U.S. Concrete, Inc., Warrants | 09/09/2010 | $ | — | $ | — | ||||||
| (c) | Security delisted or issuer in bankruptcy. |
| (d) | See notes to financial statements for the tax cost of securities and the breakdown of unrealized appreciation (depreciation). |
27
| SCHEDULE OF PORTFOLIO INVESTMENTS |
RBC Enterprise Fund (cont.)
September 30, 2012
Abbreviations used are defined below:
REIT - Real Estate Investment Trust
See notes to financial statements.
28
SCHEDULE OF PORTFOLIO INVESTMENTS |
RBC Small Cap Core Fund |
|
September 30, 2012
Shares | Value | |||||
| ||||||
Common Stocks — 97.26% | ||||||
Consumer Discretionary — 20.84% | ||||||
40,900 | Ascena Retail Group, Inc.* | $ | 877,305 | |||
340,400 | Casual Male Retail Group, Inc.* | 1,576,052 | ||||
27,400 | Drew Industries, Inc.* | 827,754 | ||||
32,600 | Grand Canyon Education, Inc.* | 767,078 | ||||
17,800 | Libbey, Inc.* | 280,884 | ||||
19,500 | Maidenform Brands, Inc.* | 399,360 | ||||
68,223 | RG Barry Corp. | 1,005,607 | ||||
28,100 | Sally Beauty Holdings, Inc.* | 705,029 | ||||
17,600 | Sodastream International Ltd.* | 689,392 | ||||
58,907 | Steinway Musical Instruments, Inc.* | 1,434,974 | ||||
19,975 | Steven Madden Ltd.* | 873,307 | ||||
26,300 | True Religion Apparel, Inc. | 560,979 | ||||
75,123 | Universal Electronics, Inc.* | 1,320,662 | ||||
75,600 | Zagg, Inc.* | 644,868 | ||||
|
| |||||
| 11,963,251 | ||||||
|
| |||||
Consumer Staples — 0.70% |
| |||||
19,700 | Nash Finch Co. | 402,274 | ||||
|
| |||||
Energy — 6.28% |
| |||||
8,000 | C&J Energy Services, Inc.* | 159,200 | ||||
6,700 | CARBO Ceramics, Inc. | 421,564 | ||||
49,600 | Gulfport Energy Corp.* | 1,550,496 | ||||
5,600 | OYO Geospace Corp.* | 685,496 | ||||
22,100 | World Fuel Services Corp. | 786,981 | ||||
|
| |||||
| 3,603,737 | ||||||
|
| |||||
Financials — 10.83% |
| |||||
30,800 | AMERISAFE, Inc.* | 835,912 | ||||
43,327 | Asta Funding, Inc. | 406,840 | ||||
14,400 | Community Bank System, Inc. | 405,936 | ||||
91,700 | Compass Diversified Holdings | 1,355,326 | ||||
81,500 | KKR Financial Holdings LLC | 819,075 | ||||
27,500 | LaSalle Hotel Properties REIT | 733,975 | ||||
31,800 | Netspend Holdings, Inc.* | 312,594 | ||||
11,400 | ProAssurance Corp. | 1,031,016 | ||||
20,000 | Safeguard Scientifics, Inc.* | 313,800 | ||||
|
| |||||
| 6,214,474 | ||||||
|
| |||||
Health Care — 8.01% |
| |||||
129,800 | BioScrip, Inc.* | 1,182,478 | ||||
31,900 | Masimo Corp.* | 771,342 | ||||
17,600 | Meridian Bioscience, Inc. | 337,568 | ||||
19,875 | PSS World Medical, Inc.* | 452,753 | ||||
23,800 | US Physical Therapy, Inc. | 657,594 | ||||
29
SCHEDULE OF PORTFOLIO INVESTMENTS |
RBC Small Cap Core Fund (cont.)
|
|
September 30, 2012
Shares | Value | |||||
| ||||||
22,500 | West Pharmaceutical Services, Inc. | $ | 1,194,075 | |||
|
| |||||
| 4,595,810 | ||||||
|
| |||||
Industrials — 25.42% |
| |||||
40,314 | Acacia Research Corp.* | 1,105,007 | ||||
139,100 | ACCO Brands Corp.* | 902,759 | ||||
28,460 | Astronics Corp.* | 876,568 | ||||
13,500 | Atlas Air Worldwide Holdings, Inc.* | 697,005 | ||||
51,016 | AZZ, Inc. | 1,937,588 | ||||
8,900 | Chart Industries, Inc.* | 657,265 | ||||
69,200 | Columbus McKinnon Corp.* | 1,045,612 | ||||
26,900 | Ducommun, Inc.* | 365,840 | ||||
24,500 | EnerSys* | 864,605 | ||||
24,800 | Gardner Denver, Inc. | 1,498,168 | ||||
51,000 | Greenbrier Cos., Inc.* | 823,140 | ||||
28,900 | II-VI, Inc.* | 549,678 | ||||
32,000 | Insteel Industries, Inc. | 375,360 | ||||
48,900 | Interface, Inc. | 645,969 | ||||
22,400 | Meritor, Inc.* | 94,976 | ||||
10,950 | Old Dominion Freight Line, Inc.* | 330,252 | ||||
36,200 | Sun Hydraulics Corp. | 961,834 | ||||
10,700 | Wabtec Corp. | 859,103 | ||||
|
| |||||
| 14,590,729 | ||||||
|
| |||||
Information Technology — 16.85% |
| |||||
25,200 | Aspen Technology, Inc.* | 651,420 | ||||
48,439 | Computer Task Group, Inc.* | 783,743 | ||||
27,100 | Interactive Intelligence Group, Inc.* | 814,355 | ||||
36,200 | InterDigital, Inc. | 1,349,536 | ||||
20,800 | Measurement Specialties, Inc.* | 685,984 | ||||
51,100 | NIC, Inc. | 756,280 | ||||
43,500 | Sapient Corp.* | 463,710 | ||||
24,000 | Skyworks Solutions, Inc.* | 565,560 | ||||
23,000 | STEC, Inc.* | 155,250 | ||||
68,600 | Take-Two Interactive Software, Inc.* | 715,498 | ||||
32,000 | Tessco Technologies, Inc. | 677,440 | ||||
28,400 | Tyler Technologies, Inc.* | 1,250,168 | ||||
87,400 | Xyratex Ltd. | 804,080 | ||||
|
| |||||
| 9,673,024 | ||||||
|
| |||||
Materials — 7.63% |
| |||||
8,500 | Kaiser Aluminum, Corp. | 496,315 | ||||
31,100 | Koppers Holdings, Inc. | 1,086,323 | ||||
118,500 | OMNOVA Solutions, Inc.* | 897,045 | ||||
3,400 | Rockwood Holdings, Inc. | 158,440 | ||||
46,791 | Universal Stainless & Alloy* | 1,738,286 | ||||
|
| |||||
| 4,376,409 | ||||||
|
| |||||
30
SCHEDULE OF PORTFOLIO INVESTMENTS |
RBC Small Cap Core Fund (cont.)
|
|
September 30, 2012
Shares | Value | |||||
| ||||||
Utilities — 0.70% |
| |||||
9,600 | UNS Energy Corp. | $ | 401,856 | |||
|
| |||||
Total Common Stocks | 55,821,564 | |||||
|
| |||||
(Cost $41,259,936) |
| |||||
Investment Company — 2.70% |
| |||||
1,551,721 | JPMorgan Prime Money Market Fund | 1,551,721 | ||||
|
| |||||
Total Investment Company | 1,551,721 | |||||
|
| |||||
(Cost $1,551,721) |
| |||||
Total Investments | $ | 57,373,285 | ||||
(Cost $42,811,657)(a) — 99.96% |
| |||||
Other assets in excess of liabilities — 0.04% | 21,670 | |||||
|
| |||||
NET ASSETS — 100.00% | $ | 57,394,955 | ||||
|
| |||||
| * | Non-income producing security. |
| (a) | See notes to financial statements for the tax cost of securities and the breakdown of unrealized appreciation (depreciation). |
Abbreviations used are defined below:
REIT - Real Estate Investment Trust
See notes to financial statements.
31
SCHEDULE OF PORTFOLIO INVESTMENTS |
RBC Microcap Value Fund
|
|
September 30, 2012
Shares | Value | |||||
| ||||||
Common Stocks — 96.08% | ||||||
Consumer Discretionary — 20.49% | ||||||
17,500 | ALCO Stores, Inc.* | $ | 122,150 | |||
3,725 | Ambassadors International, Inc.* | 63 | ||||
18,000 | Ambow Education Holding Ltd. ADR* | 53,460 | ||||
15,000 | American Greetings Corp., Class A | 252,000 | ||||
13,500 | America’s Car-Mart, Inc.* | 613,845 | ||||
21,000 | Arctic Cat, Inc.* | 870,660 | ||||
25,000 | Asbury Automotive Group, Inc.* | 698,750 | ||||
800 | Biglari Holdings, Inc.* | 292,048 | ||||
54,000 | Bluegreen Corp.* | 339,120 | ||||
10,000 | Blyth, Inc. | 259,900 | ||||
46,000 | Books-A-Million, Inc.* | 134,780 | ||||
15,127 | Bowl America, Inc., Class A | 194,382 | ||||
14,000 | Brown Shoe Co., Inc. | 224,420 | ||||
47,500 | Build-A-Bear Workshop, Inc.* | 185,250 | ||||
44,000 | Carriage Services, Inc. | 425,480 | ||||
35,000 | Christopher & Banks Corp. | 122,850 | ||||
12,000 | Core-Mark Holding Co., Inc. | 577,320 | ||||
28,000 | CSS Industries, Inc. | 575,400 | ||||
34,000 | Delta Apparel, Inc.* | 468,180 | ||||
82 | Digital Generation, Inc.* | 932 | ||||
23,400 | Dorman Products, Inc.* | 737,334 | ||||
15,000 | E.W. Scripps Co. (The), Class A* | 159,750 | ||||
23,000 | Entercom Communications Corp., Class A* | 157,780 | ||||
28,000 | Flexsteel Industries, Inc. | 579,600 | ||||
36,000 | Fred’s, Inc., Class A | 512,280 | ||||
58,000 | Hastings Entertainment, Inc.* | 114,840 | ||||
10,000 | Haverty Furniture Cos., Inc. | 138,800 | ||||
15,000 | Helen of Troy Ltd.* | 477,450 | ||||
32,000 | hhgregg, Inc.* | 220,800 | ||||
31,000 | Hooker Furniture Corp. | 402,690 | ||||
52,800 | Isle of Capri Casinos, Inc.* | 366,960 | ||||
26,800 | JAKKS Pacific, Inc. | 390,476 | ||||
24,000 | Johnson Outdoors, Inc., Class A* | 513,360 | ||||
82,000 | Journal Communications, Inc., Class A* | 426,400 | ||||
36,000 | Kid Brands, Inc.* | 55,080 | ||||
50,310 | Lakeland Industries, Inc.* | 312,425 | ||||
95,270 | Lazare Kaplan International, Inc.* | 128,615 | ||||
42,000 | La-Z-Boy, Inc.* | 614,460 | ||||
31,000 | Lifetime Brands, Inc. | 369,210 | ||||
24,000 | Lithia Motors, Inc., Class A | 799,440 | ||||
46,000 | Luby’s, Inc.* | 309,580 | ||||
33,000 | Mac-Gray Corp. | 442,530 | ||||
33,000 | Marcus Corp. | 366,300 | ||||
19,000 | MarineMax, Inc.* | 157,510 | ||||
7,500 | McRae Industries, Inc., Class A | 118,125 | ||||
26,000 | Media General, Inc., Class A* | 134,680 | ||||
32
SCHEDULE OF PORTFOLIO INVESTMENTS |
RBC Microcap Value Fund (cont.)
|
|
September 30, 2012
Shares | Value | |||||
| ||||||
13,800 | Meritage Homes Corp.* | $ | 524,814 | |||
21,300 | Mestek, Inc.* | 296,070 | ||||
20,000 | Modine Manufacturing Co.* | 147,600 | ||||
23,400 | Movado Group, Inc. | 789,048 | ||||
10,300 | Nobility Homes, Inc.* | 52,015 | ||||
24,000 | OfficeMax, Inc. | 187,440 | ||||
41,000 | Orleans Homebuilders, Inc.*(a)(b)(c) | 0 | ||||
18,350 | Perry Ellis International, Inc.* | 404,617 | ||||
135,000 | Point.360* | 135,000 | ||||
90,600 | Radio One, Inc., Class D* | 75,198 | ||||
56,000 | Red Lion Hotels Corp.* | 350,000 | ||||
28,550 | REX American Resources Corp.* | 514,185 | ||||
40,000 | Rocky Brands, Inc.* | 462,000 | ||||
49,000 | Ruby Tuesday, Inc.* | 355,250 | ||||
16,000 | Saga Communications, Inc., Class A* | 648,320 | ||||
45,150 | Salem Communications Corp., Class A | 236,586 | ||||
45,000 | Shiloh Industries, Inc. | 504,900 | ||||
30,000 | Stage Stores, Inc. | 631,800 | ||||
31,000 | Standard Motor Products, Inc. | 571,020 | ||||
33,000 | Stein Mart, Inc.* | 280,830 | ||||
25,000 | Steinway Musical Instruments, Inc.* | 609,000 | ||||
80,000 | Stewart Enterprises, Inc., Class A | 671,600 | ||||
17,000 | Strattec Security Corp. | 361,930 | ||||
3,000 | Sturm Ruger & Co, Inc. | 148,470 | ||||
24,000 | Superior Industries International, Inc. | 410,160 | ||||
33,000 | Systemax, Inc.* | 389,730 | ||||
75,000 | Trans World Entertainment Corp.* | 273,000 | ||||
38,000 | Tuesday Morning Corp.* | 248,900 | ||||
26,000 | Unifi, Inc.* | 333,320 | ||||
30,000 | Universal Travel Group* | 20,700 | ||||
54,000 | VOXX International Corp.* | 403,920 | ||||
20,000 | Walking Co. Holdings, Inc. (The) | 155,000 | ||||
12,400 | Weyco Group, Inc. | 301,940 | ||||
|
| |||||
| 26,911,828 | ||||||
|
| |||||
Consumer Staples — 3.22% |
| |||||
13,600 | Andersons, Inc. (The) | 512,176 | ||||
61,000 | Central Garden and Pet Co.* | 725,290 | ||||
36,000 | Chiquita Brands International, Inc.* | 275,040 | ||||
30,000 | Ingles Markets, Inc., Class A | 490,500 | ||||
73,000 | ML Macadamia Orchards LP* | 292,000 | ||||
10,000 | Nash Finch Co. | 204,200 | ||||
12,000 | Oil-Dri Corp. of America | 277,680 | ||||
63,000 | Omega Protein Corp.* | 432,180 | ||||
40,000 | Prestige Brands Holdings, Inc.* | 678,400 | ||||
33
SCHEDULE OF PORTFOLIO INVESTMENTS |
RBC Microcap Value Fund (cont.)
|
|
September 30, 2012
Shares | Value | |||||
| ||||||
22,000 | Spartan Stores, Inc. | $ | 336,820 | |||
|
| |||||
| 4,224,286 | ||||||
|
| |||||
Energy — 3.11% |
| |||||
23,000 | Calumet Specialty Products Partners LP | 736,000 | ||||
31,000 | Constellation Energy Partners LLC* | 39,060 | ||||
17,000 | Endeavour International Corp.* | 164,390 | ||||
9,000 | Global Partners LP | 235,080 | ||||
27,000 | Harvest Natural Resources, Inc.* | 240,840 | ||||
17,000 | Hornbeck Offshore Services, Inc.* | 623,050 | ||||
34,000 | Knightsbridge Tankers Ltd. | 222,700 | ||||
19,000 | Natural Gas Services Group, Inc.* | 284,050 | ||||
30,000 | Newpark Resources, Inc.* | 222,300 | ||||
11,000 | Niska Gas Storage Partners LLC | 137,940 | ||||
30,000 | North American Energy Partners, Inc.* | 86,400 | ||||
14,600 | PHI, Inc.* | 478,004 | ||||
13,000 | PHI, Inc., Non voting* | 408,980 | ||||
25,000 | Teekay Tankers, Ltd., Class A | 93,500 | ||||
110,300 | Trico Marine Services, Inc.*(a)(c) | 0 | ||||
21,000 | Tsakos Energy Navigation Ltd. | 108,780 | ||||
|
| |||||
| 4,081,074 | ||||||
|
| |||||
Financials — 22.13% |
| |||||
40,000 | Affirmative Insurance Holdings, Inc.* | 18,000 | ||||
9,000 | Agree Realty Corp. REIT | 229,410 | ||||
28,000 | American Equity Investment Life Holding Co. | 325,640 | ||||
75,000 | American Independence Corp.* | 369,000 | ||||
27,900 | American Safety Insurance Holdings Ltd.* | 521,451 | ||||
34,190 | Ameris Bancorp* | 430,452 | ||||
9,000 | Apollo Commercial Real Estate Finance, Inc. REIT | 156,060 | ||||
6,000 | Arlington Asset Investment Corp., Class A | 143,160 | ||||
68,000 | Asta Funding, Inc. | 638,520 | ||||
20,000 | Baldwin & Lyons, Inc., Class B | 478,200 | ||||
14,000 | Banco Latinoamericano de Comercio Exterior SA | 309,260 | ||||
63,600 | Bancorp, Inc.* | 653,172 | ||||
8,228 | Banner Corp. | 222,979 | ||||
100,000 | Beverly Hills Bancorp, Inc.* | 2,000 | ||||
34,000 | California First National Bancorp | 626,960 | ||||
21,000 | Camco Financial Corp.* | 39,060 | ||||
4,612 | Capital Bank Financial Corp., Class A* | 83,009 | ||||
38,000 | Capitol Bancorp Ltd.* | 4,940 | ||||
15,750 | Citizens South Banking Corp. | 110,250 | ||||
48,150 | Citizens, Inc.* | 505,093 | ||||
133,000 | Consumer Portfolio Services* | 399,000 | ||||
18,856 | Cowen Group, Inc., Class A* | 50,911 | ||||
35,777 | Donegal Group, Inc., Class A | 502,309 | ||||
8,444 | Donegal Group, Inc., Class B | 151,908 | ||||
3,000 | Duff & Phelps Corp., Class A | 40,830 | ||||
34
SCHEDULE OF PORTFOLIO INVESTMENTS |
RBC Microcap Value Fund (cont.)
|
|
September 30, 2012
Shares | Value | |||||
| ||||||
58,040 | Dynex Capital, Inc. REIT | $ | 623,930 | |||
27,000 | EMC Insurance Group, Inc. | 567,000 | ||||
20,000 | Federal Agricultural Mortgage Corp., Class C | 514,800 | ||||
70,000 | Federated National Holding Co.* | 417,200 | ||||
34,300 | First Defiance Financial Corp. | 592,018 | ||||
11,000 | First Financial Corp. | 344,740 | ||||
45,400 | First Financial Holdings, Inc. | 589,746 | ||||
27,000 | First Industrial Realty Trust, Inc. REIT* | 354,780 | ||||
54,000 | First Merchants Corp. | 810,540 | ||||
47,200 | First Pactrust Bancorp, Inc. | 590,472 | ||||
38,000 | First Place Financial Corp.* | 27,075 | ||||
42,000 | First State Bancorporation* | 50 | ||||
25,000 | Firstcity Financial Corp.* | 200,750 | ||||
6,600 | Flagstar Bancorp, Inc.* | 7,260 | ||||
2,250 | FRMO Corp.* | 4,163 | ||||
43,000 | Guaranty Bancorp* | 86,860 | ||||
38,000 | HF Financial Corp. | 465,500 | ||||
6,059 | Hudson Valley Holding Corp. | 103,306 | ||||
39,600 | Independence Holding Co. | 398,772 | ||||
9,000 | Infinity Property & Casualty Corp. | 543,510 | ||||
31,000 | Intervest Bancshares Corp., Class A* | 117,800 | ||||
8,300 | Investors Title Co. | 541,492 | ||||
24,000 | Jefferson Bancshares, Inc.* | 56,880 | ||||
24,000 | JMP Group, Inc. | 131,760 | ||||
17,000 | Kansas City Life Insurance Co. | 655,010 | ||||
44,000 | Marlin Business Services Corp. | 933,240 | ||||
68,950 | Meadowbrook Insurance Group, Inc. | 530,226 | ||||
103,000 | MicroFinancial, Inc. | 942,450 | ||||
15,000 | Monmouth Real Estate Investment Corp. REIT, Class A | 167,850 | ||||
52,100 | MutualFirst Financial, Inc. | 592,898 | ||||
5,300 | National Security Group, Inc. | 42,983 | ||||
4,000 | National Western Life Insurance Co., Class A | 573,000 | ||||
11,400 | Navigators Group, Inc.* | 561,165 | ||||
44,000 | Nicholas Financial, Inc. | 568,040 | ||||
25,291 | Old National Bancorp | 344,210 | ||||
13,000 | One Liberty Properties, Inc. REIT | 242,450 | ||||
13,000 | Onebeacon Insurance Group, Ltd., Class A | 174,720 | ||||
6,000 | Oppenheimer Holdings, Inc., Class A | 95,700 | ||||
20,000 | Oriental Financial Group, Inc. | 210,400 | ||||
18,000 | Pacific Mercantile Bancorp* | 117,720 | ||||
8,000 | Parkway Properties, Inc. REIT | 106,960 | ||||
29,000 | Peoples Bancorp, Inc. | 663,810 | ||||
6,000 | Piper Jaffray Cos.* | 152,700 | ||||
37,900 | PMC Commercial Trust REIT | 284,250 | ||||
40,000 | Presidential Life Corp. | 557,200 | ||||
19,000 | Provident Financial Holdings, Inc. | 269,990 | ||||
27,000 | Provident New York Bancorp | 254,070 | ||||
20,000 | Ramco-Gershenson Properties Trust REIT | 250,600 | ||||
35
SCHEDULE OF PORTFOLIO INVESTMENTS |
RBC Microcap Value Fund (cont.)
|
|
September 30, 2012
Shares | Value | |||||
| ||||||
59,000 | Reis, Inc.* | $ | 674,960 | |||
23,000 | Resource Capital Corp. REIT | 135,240 | ||||
11,000 | Safety Insurance Group, Inc. | 504,680 | ||||
42,000 | SeaBright Holdings, Inc. | 462,000 | ||||
109,000 | Signature Group Holdings, Inc.* | 50,140 | ||||
14,000 | Simmons First National Corp., Class A | 340,970 | ||||
32,000 | Southern Community Financial Corp.* | 107,840 | ||||
38,300 | Southwest Bancorp, Inc.* | 415,555 | ||||
25,000 | Sterling Bancorp NY | 248,000 | ||||
35,600 | Sun Bancorp, Inc.* | 119,972 | ||||
46,500 | SWS Group, Inc.* | 284,115 | ||||
54,000 | TierOne Corp.*(a)(c) | 0 | ||||
52,000 | Unico American Corp. | 572,000 | ||||
99,716 | United Community Financial Corp.* | 348,009 | ||||
19,000 | United Western Bancorp, Inc.* | 2,850 | ||||
29,000 | Winthrop Realty Trust REIT | 312,620 | ||||
4,600 | Ziegler Cos., Inc. (The)* | 102,350 | ||||
|
| |||||
| 29,074,921 | ||||||
|
| |||||
Health Care — 6.18% |
| |||||
4,000 | Air Methods Corp.* | 477,480 | ||||
34,000 | Albany Molecular Research, Inc.* | 117,980 | ||||
11,000 | American Shared Hospital Services* | 33,000 | ||||
40,000 | AngioDynamics, Inc.* | 488,000 | ||||
16,000 | Assisted Living Concepts, Inc., Class A | 122,080 | ||||
77,000 | BioScrip, Inc.* | 701,470 | ||||
22,000 | Cambrex Corp.* | 258,060 | ||||
42,500 | Cantel Medical Corp. | 1,150,900 | ||||
45,000 | Capital Senior Living Corp.* | 651,150 | ||||
22,000 | CONMED Corp. | 627,000 | ||||
46,000 | Cross Country Healthcare, Inc.* | 217,120 | ||||
40,000 | CryoLife, Inc. | 268,800 | ||||
27,970 | Hanger, Inc.* | 797,984 | ||||
20,000 | Invacare Corp. | 282,800 | ||||
7,100 | Kewaunee Scientific Corp. | 81,011 | ||||
10,362 | Kindred Healthcare, Inc.* | 117,920 | ||||
30,000 | Lannett Co., Inc.* | 144,900 | ||||
15,000 | MedCath Corp.*(a)(b)(c) | 20,550 | ||||
19,000 | Mediware Information Systems* | 416,290 | ||||
49,000 | PharMerica Corp.* | 620,340 | ||||
25,000 | Symmetry Medical, Inc.* | 247,250 | ||||
13,000 | Triple-S Management Corp., Class B* | 271,700 | ||||
|
| |||||
| 8,113,785 | ||||||
|
| |||||
Industrials — 20.51% |
| |||||
45,839 | Aceto Corp. | 433,179 | ||||
24,000 | Aegean Marine Petroleum Network, Inc. | 145,680 | ||||
3,000 | Aegion Corp.* | 57,480 | ||||
36
SCHEDULE OF PORTFOLIO INVESTMENTS |
RBC Microcap Value Fund (cont.)
|
|
September 30, 2012
Shares | Value | |||||
| ||||||
21,000 | Alamo Group, Inc. | $ | 709,380 | |||
102,000 | Allied Motion Technologies, Inc. | 673,200 | ||||
8,000 | Altra Holdings, Inc. | 145,600 | ||||
8,000 | Ampco-Pittsburgh Corp. | 147,600 | ||||
10,000 | AMREP Corp.* | 100,000 | ||||
22,000 | Baltic Trading Ltd. | 71,060 | ||||
24,000 | Beacon Roofing Supply, Inc.* | 684,000 | ||||
17,000 | CAI International, Inc.* | 348,840 | ||||
10,800 | Cascade Corp. | 591,192 | ||||
30,000 | CBIZ, Inc.* | 180,600 | ||||
42,000 | Celadon Group, Inc. | 674,940 | ||||
93,525 | Cenveo, Inc.* | 214,172 | ||||
2,800 | Chicago Rivet & Machine Co. | 51,912 | ||||
14,400 | CIRCOR International, Inc. | 543,600 | ||||
12,000 | Comfort Systems USA, Inc. | 131,160 | ||||
36,178 | Compx International, Inc. | 549,182 | ||||
12,000 | Consolidated Graphics, Inc.* | 313,080 | ||||
20,000 | Dolan Co. (The)* | 107,600 | ||||
24,000 | Ducommun, Inc.* | 326,400 | ||||
10,750 | Eagle Bulk Shipping Inc* | 38,807 | ||||
14,700 | Eastern Co. (The) | 275,478 | ||||
9,880 | Ecology and Environment, Inc., Class A | 121,030 | ||||
21,000 | Encore Wire Corp. | 614,460 | ||||
35,000 | Ennis, Inc. | 574,350 | ||||
10,000 | EnPro Industries, Inc.* | 360,100 | ||||
24,000 | Espey Manufacturing & Electronics Corp. | 631,680 | ||||
56,000 | Excel Maritime Carriers Ltd.* | 38,920 | ||||
30,000 | Federal Signal Corp.* | 189,600 | ||||
16,000 | FLY Leasing Ltd. ADR | 216,160 | ||||
69,000 | Frozen Food Express Industries* | 135,930 | ||||
20,000 | G&K Services, Inc., Class A | 626,200 | ||||
15,000 | Genco Shipping & Trading Ltd.* | 55,200 | ||||
25,000 | GenCorp, Inc.* | 237,250 | ||||
40,000 | Gibraltar Industries, Inc.* | 512,800 | ||||
10,300 | GP Strategies Corp.* | 198,996 | ||||
35,000 | Griffon Corp. | 360,500 | ||||
25,750 | Hardinge, Inc. | 263,937 | ||||
22,000 | Hill International, Inc.* | 95,920 | ||||
23,350 | International Shipholding Corp. | 393,915 | ||||
26,000 | Jinpan International Ltd. | 126,360 | ||||
6,000 | Kadant, Inc.* | 139,140 | ||||
12,000 | Key Technology, Inc.* | 115,200 | ||||
33,000 | Kforce, Inc.* | 389,070 | ||||
40,000 | Kimball International, Inc., Class B | 488,800 | ||||
9,408 | Kratos Defense & Security Solutions, Inc.* | 54,943 | ||||
64,000 | LECG Corp.* | 480 | ||||
38,000 | LS Starrett Co. (The), Class A | 489,060 | ||||
51,750 | LSI Industries, Inc. | 348,795 | ||||
37
SCHEDULE OF PORTFOLIO INVESTMENTS |
RBC Microcap Value Fund (cont.)
|
|
September 30, 2012
Shares | Value | |||||
| ||||||
52,000 | Lydall, Inc.* | $ | 732,680 | |||
22,875 | Marten Transport Ltd. | 401,914 | ||||
72,000 | Mesa Air Group, Inc.*(a)(b)(c) | 0 | ||||
38,117 | Met-Pro Corp. | 341,147 | ||||
99,294 | MFC Industrial Ltd. | 829,105 | ||||
34,000 | Miller Industries, Inc. | 545,700 | �� | |||
34,000 | NN, Inc.* | 288,660 | ||||
18,800 | Northwest Pipe Co.* | 463,420 | ||||
56,000 | On Assignment, Inc.* | 1,115,520 | ||||
20,000 | Orion Marine Group, Inc.* | 148,600 | ||||
53,600 | PAM Transportation Services, Inc. | 534,124 | ||||
52,000 | Paragon Shipping, Inc., Class A* | 22,620 | ||||
43,160 | Patrick Industries, Inc.* | 667,685 | ||||
16,000 | Pike Electric Corp.* | 127,200 | ||||
29,000 | RCM Technologies, Inc.* | 157,760 | ||||
33,500 | Rush Enterprises, Inc., Class A* | 645,210 | ||||
13,000 | Schawk, Inc. | 169,650 | ||||
10,000 | SeaCube Container Leasing Ltd. | 187,500 | ||||
13,800 | SL Industries, Inc.* | 195,960 | ||||
16,000 | Standex International Corp. | 711,200 | ||||
41,000 | Superior Uniform Group, Inc. | 491,180 | ||||
58,115 | Supreme Industries, Inc., Class A* | 212,120 | ||||
5,269 | SYKES Enterprises, Inc.* | 70,815 | ||||
26,000 | Tredegar Corp. | 461,240 | ||||
3,000 | Trex Co., Inc.* | 102,360 | ||||
17,000 | Universal Forest Products, Inc. | 706,180 | ||||
16,000 | USA Truck, Inc.* | 58,240 | ||||
6,000 | Viad Corp. | 125,160 | ||||
38,000 | Vitran Corp., Inc.* | 226,100 | ||||
43,200 | Volt Information Sciences, Inc.* | 278,640 | ||||
75,000 | Willdan Group, Inc.* | 127,500 | ||||
41,000 | Willis Lease Finance Corp.* | 505,940 | ||||
|
| |||||
| 26,944,068 | ||||||
|
| |||||
Information Technology — 11.19% |
| |||||
67,300 | Acorn Energy, Inc. | 600,316 | ||||
31,000 | Agilysys, Inc.* | 266,600 | ||||
31,000 | Anaren, Inc.* | 619,690 | ||||
12,000 | Black Box Corp. | 306,120 | ||||
32,000 | Blucora, Inc.* | 569,920 | ||||
70,000 | CIBER, Inc.* | 242,900 | ||||
50,000 | Comarco, Inc.* | 11,050 | ||||
21,000 | Communications Systems, Inc. | 236,880 | ||||
13,000 | CTS Corp. | 130,910 | ||||
30,000 | Digi International, Inc.* | 304,800 | ||||
49,598 | Dynamics Research Corp.* | 339,746 | ||||
30,000 | Edgewater Technology, Inc.* | 117,300 | ||||
35,000 | Electro Rent Corp. | 619,150 | ||||
38
SCHEDULE OF PORTFOLIO INVESTMENTS |
RBC Microcap Value Fund (cont.)
|
|
September 30, 2012
Shares | Value | |||||
| ||||||
33,000 | Electro Scientific Industries, Inc. | $ | 403,260 | |||
22,400 | ePlus, Inc.* | 878,528 | ||||
9,000 | Fabrinet* | 104,310 | ||||
21,332 | GSI Group, Inc.* | 190,068 | ||||
41,000 | Insight Enterprises, Inc.* | 716,680 | ||||
63,375 | Integrated Silicon Solution, Inc.* | 586,853 | ||||
15,000 | JinkoSolar Holding Co. Ltd. ADR* | 56,850 | ||||
13,000 | Kemet Corp.* | 57,200 | ||||
25,000 | Keynote Systems, Inc. | 362,000 | ||||
21,000 | Magal Security Systems Ltd.* | 80,010 | ||||
20,000 | Measurement Specialties, Inc.* | 659,600 | ||||
56,000 | Methode Electronics, Inc. | 543,760 | ||||
39,000 | Newport Corp.* | 431,340 | ||||
29,000 | Oplink Communications, Inc.* | 479,660 | ||||
83,000 | Optical Cable Corp. | 379,310 | ||||
66,000 | PC Connection, Inc. | 759,660 | ||||
67,000 | Perceptron, Inc.* | 418,750 | ||||
120,000 | Performance Technologies, Inc.* | 163,200 | ||||
37,930 | Photronics, Inc.* | 203,684 | ||||
28,000 | Retalix Ltd.* | 578,200 | ||||
47,000 | Richardson Electronics Ltd. | 557,890 | ||||
9,000 | Rosetta Stone, Inc.* | 114,750 | ||||
29,000 | Rudolph Technologies, Inc.* | 304,500 | ||||
70,000 | Sigmatron International, Inc.* | 304,500 | ||||
13,000 | STR Holdings, Inc.* | 40,300 | ||||
31,500 | Tessco Technologies, Inc. | 666,855 | ||||
8,000 | Vishay Precision Group, Inc.* | 111,840 | ||||
4,285 | WebMediaBrands, Inc.* | 9,813 | ||||
100,000 | WPCS International, Inc.* | 45,100 | ||||
15,000 | XO Group, Inc.* | 125,250 | ||||
|
| |||||
| 14,699,103 | ||||||
|
| |||||
Materials — 4.82% |
| |||||
68,200 | American Pacific Corp.* | 812,262 | ||||
37,000 | Blue Earth Refineries, Inc.*(a)(c) | 0 | ||||
20,000 | China Green Agriculture, Inc.* | 65,600 | ||||
18,000 | Friedman Industries, Inc. | 183,420 | ||||
5,000 | Hawkins, Inc. | 207,750 | ||||
50,000 | Headwaters, Inc.* | 329,000 | ||||
23,000 | Innospec, Inc.* | 780,160 | ||||
25,000 | Myers Industries, Inc. | 390,500 | ||||
8,000 | Neenah Paper, Inc. | 229,120 | ||||
10,400 | North American Palladium Ltd.* | 19,760 | ||||
21,000 | Olympic Steel, Inc. | 354,480 | ||||
38,000 | Penford Corp.* | 284,240 | ||||
6,000 | Quaker Chemical Corp. | 280,020 | ||||
27,000 | Schulman (A), Inc. | 643,140 | ||||
45,000 | Spartech Corp.* | 240,750 | ||||
39
SCHEDULE OF PORTFOLIO INVESTMENTS |
RBC Microcap Value Fund (cont.)
|
|
September 30, 2012
Shares | Value | |||||
| ||||||
6,000 | Stepan Co. | $ | 576,720 | |||
16,000 | Universal Stainless & Alloy* | 594,400 | ||||
3,200 | Vulcan International Corp. | 113,600 | ||||
25,000 | Wausau Paper Corp. | 231,500 | ||||
|
| |||||
| 6,336,422 | ||||||
|
| |||||
Telecommunication Services — 0.72% |
| |||||
17,980 | Consolidated Communications Holdings, Inc. | 309,076 | ||||
30,000 | Premiere Global Services, Inc.* | 280,500 | ||||
30,000 | USA Mobility, Inc. | 356,100 | ||||
|
| |||||
| 945,676 | ||||||
|
| |||||
Utilities — 3.71% |
| |||||
9,000 | American States Water Co. | 399,870 | ||||
6,108 | California Water Service Group | 113,914 | ||||
11,000 | CH Energy Group, Inc. | 717,310 | ||||
14,990 | Chesapeake Utilities Corp. | 709,926 | ||||
21,500 | Connecticut Water Service, Inc. | 685,850 | ||||
18,000 | Delta Natural Gas Co., Inc. | 348,480 | ||||
18,600 | Empire District Electric Co. (The) | 400,830 | ||||
28,400 | Middlesex Water Co. | 544,144 | ||||
17,800 | SJW Corp. | 451,408 | ||||
18,476 | Unitil Corp. | 502,917 | ||||
|
| |||||
| 4,874,649 | ||||||
|
| |||||
Total Common Stocks | 126,205,812 | |||||
|
| |||||
(Cost $130,455,680) |
| |||||
Preferred Stock — 0.48% |
| |||||
3,122 | Alere, Inc. | 633,360 | ||||
|
| |||||
Total Preferred Stock | 633,360 | |||||
|
| |||||
(Cost $504,723) |
| |||||
Exchange Traded Funds — 0.23% |
| |||||
2,700 | iShares Russell Microcap Index Fund | 142,668 | ||||
13,400 | PowerShares Zacks Micro Cap Portfolio | 156,646 | ||||
|
| |||||
Total Exchange Traded Funds | 299,314 | |||||
|
| |||||
(Cost $210,668) |
| |||||
Rights/Warrants — 0.00% |
| |||||
1,232 | Aventine Renewable Energy Holdings, Inc. Warrants, Expire 3/15/15*(a)(c) | 0 | ||||
21,000 | Camco Financial Corp. Rights*(a)(c) | 0 | ||||
3,585 | US Concrete, Inc. Warrants, Expire 8/31/17*(a)(b)(c) | 0 | ||||
3,585 | US Concrete, Inc. Warrants, Expire 8/31/17*(a)(b)(c) | 0 | ||||
|
| |||||
Total Rights/Warrants | 0 | |||||
|
| |||||
(Cost $0) |
| |||||
40
SCHEDULE OF PORTFOLIO INVESTMENTS |
RBC Microcap Value Fund (cont.)
|
|
September 30, 2012
Principal Amount | Value | |||||
| ||||||
Corporate Bonds — 0.00% | ||||||
$1,947 | Trenwick America Corp.*(a)(b)(c) | $ | 0 | |||
1,625 | Trenwick America Corp.*(a)(b)(c) | 0 | ||||
|
| |||||
Total Corporate Bonds | 0 | |||||
|
| |||||
| (Cost $0) | ||||||
Shares | ||||||
| ||||||
Investment Company — 3.22% |
| |||||
4,236,055 | JPMorgan Prime Money Market Fund | 4,236,055 | ||||
|
| |||||
Total Investment Company | 4,236,055 | |||||
|
| |||||
| (Cost $4,236,055) | ||||||
Total Investments | 131,374,541 | |||||
(Cost $135,407,126)(d) — 100.01% |
| |||||
Liabilities in excess of other assets — (0.01)% | $ | (15,141 | ) | |||
|
| |||||
NET ASSETS — 100.00% | $ | 131,359,400 | ||||
|
| |||||
41
SCHEDULE OF PORTFOLIO INVESTMENTS |
RBC Microcap Value Fund (cont.)
|
|
September 30, 2012
| * | Non-income producing security. |
| (a) | This security is restricted and illiquid as the security may not be offered or sold within the United States or to U.S. persons except to qualified purchasers who are also either qualified institutional buyers or “accredited investors” (as defined in Rule 501 (a) of Regulation D under the Securities Act of 1933). |
The total investment in restricted and illiquid securities representing $20,550 or 0.02% of net assets was as follows:
Acquisition Shares | Issuer | Acquisition Date | Acquisition Cost | 9/30/12 Carrying Value Per Unit | |||||||
| Aventine Renewable | |||||||||||
1,232 | Energy Holdings,Inc., Warrants | 04/14/2010 | $ | — | $— | ||||||
21,000 | Camco Financial Corp. Rights | 02/18/2004 | $ | — | $— | ||||||
37,000 | Blue Earth Refineries, Inc. | 11/24/2003 | $ | — | $— | ||||||
15,000 | MedCath Corp. | 05/23/2008 | $ | 306,542 | $ 1.37 | ||||||
72,000 | Mesa Air Group, Inc. | 11/01/2006 | $ | 635,933 | $— | ||||||
41,000 | Orleans Homebuilders, Inc. | 12/12/2006 | $ | 685,227 | $— | ||||||
54,000 | Tier One Corp. | 02/18/2004 | $ | 1,223,407 | $— | ||||||
110,300 | Trico Marine Services, Inc. | 02/03/2009 | $ | 518,857 | $— | ||||||
3,585 | U.S. Concrete, Inc., Warrants | 09/09/2010 | $ | — | $— | ||||||
3,585 | U.S. Concrete, Inc., Warrants | 09/09/2010 | $ | — | $— | ||||||
Acquisition Principal Amount | |||||||||||
$1,947 | Trenwick America Corp. | 05/18/2006 | $ | — | $— | ||||||
$1,625 | Trenwick America Corp. | 05/18/2006 | $ | — | $— | ||||||
| (b) | Security delisted or issuer in bankruptcy. |
| (c) | The Pricing Committee fair valued security under procedures established by the Fund’s Board of Trustees. |
| (d) | See notes to financial statements for the tax cost of securities and the breakdown of unrealized appreciation (depreciation). |
Abbreviations used are defined below:
ADR - American Depositary Receipt
REIT - Real Estate Investment Trust
See notes to financial statements.
42
SCHEDULE OF PORTFOLIO INVESTMENTS |
RBC Mid Cap Value Fund
|
|
September 30, 2012
Shares | Value | |||||
| ||||||
Common Stocks — 96.86% | ||||||
Consumer Discretionary — 10.48% | ||||||
380 | ANN INC.* | $ | 14,337 | |||
780 | Ascena Retail Group, Inc.* | 16,731 | ||||
1,380 | Dana Holding Corp. | 16,974 | ||||
1,470 | H&R Block, Inc. | 25,475 | ||||
760 | Jarden Corp. | 40,158 | ||||
790 | Mattel, Inc. | 28,029 | ||||
2,170 | Newell Rubbermaid, Inc. | 41,425 | ||||
451 | Tenneco, Inc.* | 12,628 | ||||
760 | TRW Automotive Holdings Corp.* | 33,220 | ||||
|
| |||||
| 228,977 | ||||||
|
| |||||
Consumer Staples — 0.67% | ||||||
195 | Energizer Holdings, Inc. | 14,549 | ||||
|
| |||||
Energy — 9.84% | ||||||
850 | Cameron International Corp.* | 47,659 | ||||
710 | Dresser-Rand Group, Inc.* | 39,128 | ||||
520 | Key Energy Services, Inc.* | 3,640 | ||||
1,020 | McDermott International, Inc.* | 12,464 | ||||
2,330 | Noble Corp. | 83,367 | ||||
580 | QEP Resources, Inc. | 18,363 | ||||
1,500 | SandRidge Energy, Inc.* | 10,455 | ||||
|
| |||||
| 215,076 | ||||||
|
| |||||
Financials — 19.53% | ||||||
840 | American Financial Group, Inc. | 31,836 | ||||
3,260 | Fifth Third Bancorp | 50,563 | ||||
2,620 | Hartford Financial Services Group, Inc. | 50,933 | ||||
1,270 | HCC Insurance Holdings, Inc. | 43,040 | ||||
2,470 | Huntington Bancshares, Inc. | 17,043 | ||||
7,990 | KKR Financial Holdings LLC | 80,300 | ||||
1,480 | People’s United Financial, Inc. | 17,967 | ||||
520 | Principal Financial Group, Inc. | 14,009 | ||||
940 | Reinsurance Group of America, Inc. | 54,398 | ||||
1,490 | Tower Group, Inc. | 28,891 | ||||
1,960 | Unum Group | 37,671 | ||||
|
| |||||
| 426,651 | ||||||
|
| |||||
Health Care — 9.82% | ||||||
1,050 | AmerisourceBergen Corp. | 40,645 | ||||
710 | Endo Health Solutions, Inc.* | 22,521 | ||||
740 | Humana, Inc. | 51,911 | ||||
1,710 | Mylan, Inc.* | 41,724 | ||||
1,260 | Universal Health Services, Inc., Class B | 57,620 | ||||
|
| |||||
| 214,421 | ||||||
|
| |||||
Industrials — 18.22% | ||||||
1,150 | Acacia Research Corp.* | 31,521 | ||||
43
SCHEDULE OF PORTFOLIO INVESTMENTS |
RBC Mid Cap Value Fund (cont.)
|
|
September 30, 2012
Shares | Value | |||||
| ||||||
10,490 | ACCO Brands Corp.* | $ | 68,080 | |||
1,360 | Fluor Corp. | 76,541 | ||||
510 | Gardner Denver, Inc. | 30,809 | ||||
1,290 | KBR, Inc. | 38,468 | ||||
520 | Kirby Corp.* | 28,746 | ||||
375 | Old Dominion Freight Line, Inc.* | 11,310 | ||||
700 | Owens Corning* | 23,422 | ||||
120 | Regal-Beloit Corp. | 8,458 | ||||
1,050 | Republic Services, Inc. | 28,885 | ||||
420 | Spirit Airlines, Inc.* | 7,174 | ||||
100 | SPX Corp. | 6,541 | ||||
1,155 | Swift Transporation Co.* | 9,956 | ||||
1,320 | Werner Enterprises, Inc. | 28,208 | ||||
|
| |||||
| 398,119 | ||||||
|
| |||||
Information Technology — 8.90% | ||||||
1,160 | Arrow Electronics, Inc.* | 39,104 | ||||
1,210 | Avnet, Inc.* | 35,199 | ||||
190 | CACI International, Inc., Class A* | 9,840 | ||||
2,040 | Fairchild Semiconductor International, Inc.* | 26,765 | ||||
1,860 | Skyworks Solutions, Inc.* | 43,831 | ||||
1,950 | Western Union Co. (The) | 35,529 | ||||
110 | Zebra Technologies Corp., Class A* | 4,129 | ||||
|
| |||||
| 194,397 | ||||||
|
| |||||
Materials — 13.86% | ||||||
670 | Allegheny Technologies, Inc. | 21,373 | ||||
790 | Ashland, Inc. | 56,564 | ||||
1,530 | Crown Holdings, Inc.* | 56,228 | ||||
614 | Cytec Industries, Inc. | 40,229 | ||||
1,130 | International Paper Co. | 41,042 | ||||
2,310 | Owens-Illinois, Inc.* | 43,336 | ||||
210 | Reliance Steel & Aluminum Co. | 10,993 | ||||
1,000 | Schweitzer-Mauduit International, Inc. | 32,990 | ||||
|
| |||||
| 302,755 | ||||||
|
| |||||
Telecommunication Services — 0.60% | ||||||
1,306 | Windstream Corp. | 13,204 | ||||
|
| |||||
44
SCHEDULE OF PORTFOLIO INVESTMENTS |
RBC Mid Cap Value Fund (cont.)
|
|
September 30, 2012
Shares | Value | |||||
| ||||||
Utilities — 4.94% | ||||||
1,560 | CMS Energy Corp. | $ | 36,738 | |||
1,350 | Edison International | 61,682 | ||||
160 | EQT Corp. | 9,440 | ||||
|
| |||||
| 107,860 | ||||||
|
| |||||
Total Common Stocks | 2,116,009 | |||||
|
| |||||
(Cost $2,050,111) | ||||||
Investment Company — 7.65% | ||||||
167,073 | JPMorgan Prime Money Market Fund | 167,073 | ||||
|
| |||||
Total Investment Company | 167,073 | |||||
|
| |||||
(Cost $167,073) | ||||||
Total Investments | $ | 2,283,082 | ||||
(Cost $2,217,184)(a) — 104.51% | ||||||
Liabilities in excess of other assets — (4.51)% | (98,483 | ) | ||||
|
| |||||
NET ASSETS — 100.00% | $ | 2,184,599 | ||||
|
| |||||
| * | Non-income producing security. |
| (a) | See notes to financial statements for the tax cost of securities and the breakdown of unrealized appreciation (depreciation). |
See notes to financial statements.
45
Statements of Assets and Liabilities
|
|
September 30, 2012
| RBC SMID Cap Growth Fund | RBC Enterprise Fund | RBC Small Cap Core Fund | RBC Microcap Value Fund | RBC Mid Cap Value Fund | ||||||||||||||||
Assets: | ||||||||||||||||||||
Investments, at value (cost $45,262,925, $80,469,609, $42,811,657, $135,407,126 and $2,217,184, respectively) | $ | 64,946,022 | $ | 109,627,613 | $ | 57,373,285 | $ | 131,374,541 | $ | 2,283,082 | ||||||||||
Interest and dividends receivable | 19,178 | 83,437 | 36,615 | 135,795 | 2,832 | |||||||||||||||
Receivable from advisor | — | — | — | — | 2,874 | |||||||||||||||
Receivable for capital shares issued | 952 | — | 87,780 | 7,678 | — | |||||||||||||||
Receivable for investments sold | 168,911 | 283,315 | — | — | 11,972 | |||||||||||||||
Prepaid expenses | 35,959 | 36,942 | 30,297 | 34,523 | 9,241 | |||||||||||||||
|
|
|
|
|
|
|
|
|
| |||||||||||
Total Assets | 65,171,022 | 110,031,307 | 57,527,977 | 131,552,537 | 2,310,001 | |||||||||||||||
|
|
|
|
|
|
|
|
|
| |||||||||||
Liabilities: | ||||||||||||||||||||
Payable for capital shares redeemed | — | 16,424 | 18,946 | 38,737 | — | |||||||||||||||
Payable for investments purchased | 605,082 | — | 36,324 | — | 88,764 | |||||||||||||||
Accrued expenses and other payables: | ||||||||||||||||||||
Investment advisory fees | 29,728 | 60,098 | 21,079 | 60,239 | — | |||||||||||||||
Administration fees | 3,602 | 6,049 | 3,159 | 7,274 | 122 | |||||||||||||||
Audit fees | 26,810 | 26,810 | 26,810 | 26,810 | 27,152 | |||||||||||||||
Trustees’ fees | 18 | 28 | 15 | 34 | — | |||||||||||||||
Distribution fees | 11,197 | 2,521 | 3,592 | 8,132 | — | |||||||||||||||
Shareholder reports | 2,068 | 3,430 | 2,017 | 5,826 | 2,779 | |||||||||||||||
Transfer agent fees | 21,765 | 23,367 | 14,665 | 36,942 | 665 | |||||||||||||||
Other | 6,596 | 6,811 | 6,415 | 9,143 | 5,920 | |||||||||||||||
|
|
|
|
|
|
|
|
|
| |||||||||||
Total Liabilities | 706,866 | 145,538 | 133,022 | 193,137 | 125,402 | |||||||||||||||
|
|
|
|
|
|
|
|
|
| |||||||||||
Net Assets | $ | 64,464,156 | $ | 109,885,769 | $ | 57,394,955 | $ | 131,359,400 | $ | 2,184,599 | ||||||||||
|
|
|
|
|
|
|
|
|
| |||||||||||
Net Assets Consist Of: | ||||||||||||||||||||
Capital | $ | 38,228,457 | $ | 85,107,537 | $ | 38,742,511 | $ | 152,183,460 | $ | 2,056,691 | ||||||||||
Undistributed net investment income (loss) | (314,732 | ) | (209,710 | ) | (155,231 | ) | 683,001 | 21,577 | ||||||||||||
Accumulated net realized gains (losses) from investment transactions and foreign currency | 6,867,334 | (4,170,062 | ) | 4,246,047 | (17,474,476 | ) | 40,433 | |||||||||||||
Net unrealized appreciation (depreciation) on investments and foreign currency | 19,683,097 | 29,158,004 | 14,561,628 | (4,032,585 | ) | 65,898 | ||||||||||||||
|
|
|
|
|
|
|
|
|
| |||||||||||
Net Assets | $ | 64,464,156 | $ | 109,885,769 | $ | 57,394,955 | $ | 131,359,400 | $ | 2,184,599 | ||||||||||
|
|
|
|
|
|
|
|
|
| |||||||||||
Net Assets: | ||||||||||||||||||||
Class A | $ | 29,755,228 | $ | 1,387,348 | $ | 4,116,778 | $ | 4,288,629 | N/A | |||||||||||
Class I | 32,825,040 | 27,333 | N/A | N/A | $ | 2,184,599 | ||||||||||||||
Class C | 43,518 | 472,945 | 131,420 | 638,927 | N/A | |||||||||||||||
Class S | 1,840,370 | 107,998,143 | 53,146,757 | 126,431,844 | N/A | |||||||||||||||
|
|
|
|
|
|
|
|
|
| |||||||||||
Total | $ | 64,464,156 | $ | 109,885,769 | $ | 57,394,955 | $ | 131,359,400 | $ | 2,184,599 | ||||||||||
|
|
|
|
|
|
|
|
|
| |||||||||||
46
FINANCIAL STATEMENTS |
Statements of Assets and Liabilities (cont.)
|
|
| RBC SMID Cap Growth Fund | RBC Enterprise Fund | RBC Small Cap Core Fund | RBC Microcap Value Fund | RBC Mid Cap Value Fund | ||||||||||||||||
Shares Outstanding (Unlimited number of shares authorized, no par value): | ||||||||||||||||||||
Class A | 2,037,269 | 71,344 | 168,399 | 226,808 | N/A | |||||||||||||||
Class I | 2,139,356 | 1,377 | N/A | N/A | 211,328 | |||||||||||||||
Class C | 3,189 | 26,344 | 5,818 | 35,764 | N/A | |||||||||||||||
Class S | 119,923 | 5,439,865 | 2,116,241 | 6,680,138 | N/A | |||||||||||||||
|
|
|
|
|
|
|
|
|
| |||||||||||
Total | 4,299,737 | 5,538,930 | 2,290,458 | 6,942,710 | 211,328 | |||||||||||||||
|
|
|
|
|
|
|
|
|
| |||||||||||
Net Asset Values and Redemption Prices per Share: | ||||||||||||||||||||
Class A(a) | $ | 14.61 | $ | 19.45 | $ | 24.45 | $ | 18.91 | N/A | |||||||||||
|
|
|
|
|
|
|
|
|
| |||||||||||
Class I | $ | 15.34 | $ | 19.85 | N/A | N/A | $ | 10.34 | ||||||||||||
|
|
|
|
|
|
|
|
|
| |||||||||||
Class C(b) | $ | 13.65 | $ | 17.95 | $ | 22.59 | $ | 17.86 | (c) | N/A | ||||||||||
|
|
|
|
|
|
|
|
|
| |||||||||||
Class S | $ | 15.35 | $ | 19.85 | $ | 25.11 | $ | 18.93 | N/A | |||||||||||
|
|
|
|
|
|
|
|
|
| |||||||||||
Maximum Offering Price Per Share: | ||||||||||||||||||||
Class A | $ | 15.50 | $ | 20.64 | $ | 25.94 | $ | 20.06 | N/A | |||||||||||
|
|
|
|
|
|
|
|
|
| |||||||||||
Maximum Sales Charge - Class A | 5.75 | % | 5.75 | % | 5.75 | % | 5.75 | % | N/A | |||||||||||
|
|
|
|
|
|
|
|
|
| |||||||||||
| (a) | For Class A shares, redemption price per share will be reduced by 1.00% for sales of shares within 12 months of purchase (only applicable on purchases of $1 million or more on which no initial sales charge was paid). Such reduction is not reflected in the net asset value and the redemption price per share. |
| (b) | For Class C shares, redemption price per share will be reduced by 1.00% for sales of shares within 12 months of purchase. Such reduction is not reflected in the net asset value and the redemption price per share. |
| (c) | Net asset value is calculated using unrounded net assets of $638,926.78 divided by the unrounded shares outstanding of 35,764.412. |
See notes to financial statements.
47
FINANCIAL STATEMENTS |
|
|
For the Year Ended September 30, 2012
| RBC SMID Cap Growth Fund | RBC Enterprise Fund | RBC Small Cap Core Fund | RBC Microcap Value Fund | RBC Mid Cap Value Fund | ||||||||||||||||
Investment Income: | ||||||||||||||||||||
Dividend income | $ | 379,021 | $ | 1,235,645 | $ | 566,660 | $ | 2,259,968 | $ | 36,825 | ||||||||||
Foreign tax withholding | — | (1,538 | ) | — | (5,035 | ) | — | |||||||||||||
|
|
|
|
|
|
|
|
|
| |||||||||||
Total Investment Income | 379,021 | 1,234,107 | 566,660 | 2,254,933 | 36,825 | |||||||||||||||
|
|
|
|
|
|
|
|
|
| |||||||||||
Expenses: | ||||||||||||||||||||
Investment advisory fees | 455,431 | 954,718 | 519,506 | 1,111,277 | 14,433 | |||||||||||||||
Distribution fees - Class A | 70,732 | 3,465 | 6,831 | 10,369 | — | |||||||||||||||
Distribution fees - Class C | 439 | 4,518 | 977 | 6,636 | — | |||||||||||||||
Accounting fees | 28,242 | 30,127 | 27,709 | 31,163 | 25,092 | |||||||||||||||
Administration fees | 48,796 | 77,074 | 40,806 | 92,606 | 1,546 | |||||||||||||||
Audit fees | 30,124 | 30,101 | 30,133 | 30,101 | 30,154 | |||||||||||||||
Custodian fees | 3,793 | 2,700 | 4,340 | 3,768 | 9,792 | |||||||||||||||
Insurance fees | 7,848 | 7,847 | 7,848 | 7,847 | 7,846 | |||||||||||||||
Legal fees | 3,923 | 4,122 | 1,652 | 4,330 | 30 | |||||||||||||||
Registration and filing fees | 87,280 | 85,971 | 72,777 | 75,171 | 8,696 | |||||||||||||||
Shareholder reports | 12,740 | 19,417 | 12,407 | 30,338 | 344 | |||||||||||||||
Transfer agent fees | 189,013 | 137,208 | 95,824 | 255,895 | 3,742 | |||||||||||||||
Trustees’ fees | 1,647 | 2,578 | 1,359 | 3,077 | 15 | |||||||||||||||
Other fees | 11,142 | 11,410 | 10,218 | 24,912 | 7,897 | |||||||||||||||
|
|
|
|
|
|
|
|
|
| |||||||||||
Total expenses before fee waiver/reimbursement | 951,150 | 1,371,256 | 832,387 | 1,687,490 | 109,587 | |||||||||||||||
Expenses waived/reimbursed by: | ||||||||||||||||||||
Adviser | (164,300 | ) | (253,414 | ) | (253,298 | ) | (348,549 | ) | (91,030 | ) | ||||||||||
|
|
|
|
|
|
|
|
|
| |||||||||||
Net Expenses | 786,850 | 1,117,842 | 579,089 | 1,338,941 | 18,557 | |||||||||||||||
|
|
|
|
|
|
|
|
|
| |||||||||||
Net Investment Income (Loss) | (407,829 | ) | 116,265 | (12,429 | ) | 915,992 | 18,268 | |||||||||||||
|
|
|
|
|
|
|
|
|
| |||||||||||
Realized/Unrealized Gains (Losses) from Investment Transactions: | ||||||||||||||||||||
Net realized gains from investment transactions | 7,443,324 | 7,128,315 | 4,286,467 | 2,806,671 | 102,423 | |||||||||||||||
Net change in unrealized appreciation/depreciation on investments and foreign currency | 9,027,154 | 24,580,055 | 9,352,938 | 30,680,322 | 404,813 | |||||||||||||||
|
|
|
|
|
|
|
|
|
| |||||||||||
Net realized/unrealized gains from investments | 16,470,478 | 31,708,370 | 13,639,405 | 33,486,993 | 507,236 | |||||||||||||||
|
|
|
|
|
|
|
|
|
| |||||||||||
Change in net assets resulting from operations | $ | 16,062,649 | $ | 31,824,635 | $ | 13,626,976 | $ | 34,402,985 | $ | 525,504 | ||||||||||
|
|
|
|
|
|
|
|
|
| |||||||||||
See notes to the financial statements.
48
FINANCIAL STATEMENTS |
Statements of Changes in Net Assets
|
|
| RBC SMID Cap Growth Fund | ||||||||
| For the Year Ended September 30, 2012 | For the Year Ended September 30, 2011 | |||||||
From Investment Activities: | ||||||||
Operations: | ||||||||
Net investment loss | $ | (407,829 | ) | $ | (428,118 | ) | ||
Net realized gains from investment transactions | 7,443,324 | 5,801,079 | ||||||
Net change in unrealized appreciation/depreciation on investments | 9,027,154 | (1,409,826 | ) | |||||
|
|
|
| |||||
Change in net assets resulting from operations | 16,062,649 | 3,963,135 | ||||||
|
|
|
| |||||
Capital Transactions: | ||||||||
Proceeds from shares issued | 4,716,505 | 7,396,063 | ||||||
Cost of shares redeemed | (15,009,736 | ) | (17,614,910 | ) | ||||
|
|
|
| |||||
Change in net assets resulting from capital transactions | (10,293,231 | ) | (10,218,847 | ) | ||||
|
|
|
| |||||
Net increase (decrease) in net assets | 5,769,418 | (6,255,712 | ) | |||||
Net Assets: | ||||||||
Beginning of year | 58,694,738 | 64,950,450 | ||||||
|
|
|
| |||||
End of year | $ | 64,464,156 | $ | 58,694,738 | ||||
|
|
|
| |||||
Distributions in excess of net investment income | $ | (314,732 | ) | $ | — | |||
|
|
|
| |||||
Share Transactions: | ||||||||
Issued | 345,260 | 601,446 | ||||||
Redeemed | (1,052,116 | ) | (1,363,886 | ) | ||||
|
|
|
| |||||
Change in shares resulting from capital transactions | (706,856 | ) | (762,440 | ) | ||||
|
|
|
| |||||
See notes to financial statements.
49
FINANCIAL STATEMENTS |
Statements of Changes in Net Assets (cont.)
|
|
| RBC Enterprise Fund | ||||||||
| For the Year Ended September 30, 2012 | For the Year Ended September 30, 2011 | |||||||
From Investment Activities: | ||||||||
Operations: | ||||||||
Net investment income (loss) | $ | 116,265 | $ | (324,292 | ) | |||
Net realized gains from investment transactions | 7,128,315 | 17,004,371 | ||||||
Net change in unrealized appreciation/depreciation on investments | 24,580,055 | (8,347,648 | ) | |||||
|
|
|
| |||||
Change in net assets resulting from operations | 31,824,635 | 8,332,431 | ||||||
|
|
|
| |||||
Capital Transactions: | ||||||||
Proceeds from shares issued | 748,576 | 3,414,432 | ||||||
Cost of shares redeemed | (15,873,250 | ) | (57,801,141 | ) | ||||
|
|
|
| |||||
Change in net assets resulting from capital transactions | (15,124,674 | ) | (54,386,709 | ) | ||||
|
|
|
| |||||
Net increase (decrease) in net assets | 16,699,961 | (46,054,278 | ) | |||||
Net Assets: | ||||||||
Beginning of year | 93,185,808 | 139,240,086 | ||||||
|
|
|
| |||||
End of year | $ | 109,885,769 | $ | 93,185,808 | ||||
|
|
|
| |||||
Distributions in excess of net investment income | $ | (209,710 | ) | $ | — | |||
|
|
|
| |||||
Share Transactions: | ||||||||
Issued | 41,447 | 203,048 | ||||||
Redeemed | (918,447 | ) | (3,289,647 | ) | ||||
|
|
|
| |||||
Change in shares resulting from capital transactions | (877,000 | ) | (3,086,599 | ) | ||||
|
|
|
| |||||
See notes to financial statements.
50
FINANCIAL STATEMENTS |
Statements of Changes in Net Assets (cont.)
|
|
| RBC Small Cap Core Fund | ||||||||
| For the Year Ended September 30, 2012 | For the Year Ended September 30, 2011 | |||||||
From Investment Activities: | ||||||||
Operations: | ||||||||
Net investment loss | $ | (12,429 | ) | $ | (48,889 | ) | ||
Net realized gains from investment transactions | 4,286,467 | 6,052,352 | ||||||
Net change in unrealized appreciation/depreciation on investments | 9,352,938 | (5,687,024 | ) | |||||
|
|
|
| |||||
Change in net assets resulting from operations | 13,626,976 | 316,439 | ||||||
|
|
|
| |||||
Distributions to Class A Shareholders: | ||||||||
From net realized gains | (114,102 | ) | — | |||||
Distributions to Class C Shareholders: | ||||||||
From net realized gains | (2,165 | ) | — | |||||
Distributions to Class S Shareholders: | ||||||||
From net realized gains | (3,133,890 | ) | — | |||||
|
|
|
| |||||
Change in net assets resulting from shareholder distributions | (3,250,157 | ) | — | |||||
|
|
|
| |||||
Capital Transactions: | ||||||||
Proceeds from shares issued | 11,022,145 | 9,631,033 | ||||||
Distributions reinvested | 3,156,261 | — | ||||||
Cost of shares redeemed | (11,259,350 | ) | (9,893,792 | ) | ||||
|
|
|
| |||||
Change in net assets resulting from capital transactions | 2,919,056 | (262,759 | ) | |||||
|
|
|
| |||||
Net increase in net assets | 13,295,875 | 53,680 | ||||||
Net Assets: | ||||||||
Beginning of year | �� | 44,099,080 | 44,045,400 | |||||
|
|
|
| |||||
End of year | $ | 57,394,955 | $ | 44,099,080 | ||||
|
|
|
| |||||
Distributions in excess of net investment income/ Undistributed net investment income | $ | (155,231 | ) | $ | 1,127 | |||
|
|
|
| |||||
Share Transactions: | ||||||||
Issued | 463,429 | 416,277 | ||||||
Reinvested | 138,809 | — | ||||||
Redeemed | (465,461 | ) | (421,570 | ) | ||||
|
|
|
| |||||
Change in shares resulting from capital transactions | 136,777 | (5,293 | ) | |||||
|
|
|
| |||||
See notes to financial statements.
51
FINANCIAL STATEMENTS |
Statements of Changes in Net Assets (cont.)
|
|
| RBC Microcap Value Fund | ||||||||
| For the Year Ended September 30, 2012 | For the Year Ended September 30, 2011 | |||||||
From Investment Activities: | ||||||||
Operations: | ||||||||
Net investment income | $ | 915,992 | $ | 717,120 | ||||
Net realized gains from investment transactions and foreign currency | 2,806,671 | 6,596,169 | ||||||
Net change in unrealized appreciation/depreciation on investments | 30,680,322 | (4,828,920 | ) | |||||
|
|
|
| |||||
Change in net assets resulting from operations | 34,402,985 | 2,484,369 | ||||||
|
|
|
| |||||
Distributions to Class A Shareholders: | ||||||||
From net investment income | (11,983 | ) | (10,208 | ) | ||||
Distributions to Class S Shareholders: | ||||||||
From net investment income | (747,686 | ) | (587,562 | ) | ||||
|
|
|
| |||||
Change in net assets resulting from shareholder distributions | (759,669 | ) | (597,770 | ) | ||||
|
|
|
| |||||
Capital Transactions: | ||||||||
Proceeds from shares issued | 11,171,807 | 19,768,305 | ||||||
Distributions reinvested | 730,943 | 578,852 | ||||||
Cost of shares redeemed | (24,642,615 | ) | (65,574,944 | ) | ||||
|
|
|
| |||||
Change in net assets resulting from capital transactions | (12,739,865 | ) | (45,227,787 | ) | ||||
|
|
|
| |||||
Net increase (decrease) in net assets | 20,903,451 | (43,341,188 | ) | |||||
Net Assets: | ||||||||
Beginning of year | 110,455,949 | 153,797,137 | ||||||
|
|
|
| |||||
End of year | $ | 131,359,400 | $ | 110,455,949 | ||||
|
|
|
| |||||
Undistributed net investment income | $ | 683,001 | $ | 679,432 | ||||
|
|
|
| |||||
Share Transactions: | ||||||||
Issued | 630,909 | 1,190,604 | ||||||
Reinvested | 44,897 | 34,292 | ||||||
Redeemed | (1,445,726 | ) | (4,038,145 | ) | ||||
|
|
|
| |||||
Change in shares resulting from capital transactions | (769,920 | ) | (2,813,249 | ) | ||||
|
|
|
| |||||
See notes to financial statements.
52
FINANCIAL STATEMENTS |
Statements of Changes in Net Assets (cont.)
|
|
| RBC Mid Cap Value Fund | ||||||||
| For the Year Ended September 30, 2012 | For the Year Ended September 30, 2011 | |||||||
From Investment Activities: | ||||||||
Operations: | ||||||||
Net investment income | $ | 18,268 | $ | 22,780 | ||||
Net realized gains from investment transactions | 102,423 | 307,140 | ||||||
Net change in unrealized appreciation/depreciation on investments | 404,813 | (423,886 | ) | |||||
|
|
|
| |||||
Change in net assets resulting from operations | 525,504 | (93,966 | ) | |||||
|
|
|
| |||||
Distributions to Class I Shareholders: | ||||||||
From net investment income | (16,837 | ) | (76,421 | ) | ||||
From net realized gains | (310,191 | ) | (83,847 | ) | ||||
|
|
|
| |||||
Change in net assets resulting from shareholder distributions | (327,028 | ) | (160,268 | ) | ||||
|
|
|
| |||||
Capital Transactions: | ||||||||
Proceeds from shares issued | 75 | — | ||||||
Distributions reinvested | 327,014 | 160,268 | ||||||
Cost of shares redeemed | (66 | ) | — | |||||
|
|
|
| |||||
Change in net assets resulting from capital transactions | 327,023 | 160,268 | ||||||
|
|
|
| |||||
Net increase (decrease) in net assets | 525,499 | (93,966 | ) | |||||
|
|
|
| |||||
Net Assets | ||||||||
Beginning of year | 1,659,100 | 1,753,066 | ||||||
|
|
|
| |||||
End of year | $ | 2,184,599 | $ | 1,659,100 | ||||
|
|
|
| |||||
Undistributed net investment income | $ | 21,577 | $ | 16,834 | ||||
|
|
|
| |||||
Share Transactions: | ||||||||
Issued | 7 | — | ||||||
Reinvested | 35,238 | 13,816 | ||||||
Redeemed | (7 | ) | — | |||||
|
|
|
| |||||
Change in shares resulting from capital transactions | 35,238 | 13,816 | ||||||
|
|
|
| |||||
See notes to financial statements.
53
RBC SMID Cap Growth Fund
| (Selected data for a share outstanding throughout the years indicated)
| |||||||||||||||||||||||||||||
| Investment Activities | Distributions | |||||||||||||||||||||||||||||
| Net Asset Value, Beginning of Period | Net Investment Loss | Net Realized and Unrealized Gains (Losses) on Investments | Redemption Fees | Total from Investment Activities | Net Realized Gains | Total Distributions | Net Asset Value, End of Period | |||||||||||||||||||||||
Class A | ||||||||||||||||||||||||||||||
Year Ended September 30, 2012 | $11.41 | (0.10)(a) | 3.30 | (b) | 3.20 | — | — | $14.61 | ||||||||||||||||||||||
Year Ended September 30, 2011 | 10.94 | (0.10)(a) | 0.57 | (b) | 0.47 | — | — | 11.41 | ||||||||||||||||||||||
Year Ended September 30, 2010 | 8.89 | (0.08)(a) | 2.13 | (b) | 2.05 | — | — | 10.94 | ||||||||||||||||||||||
Year Ended September 30, 2009 | 10.18 | (0.04)(a) | (1.17) | (b) | (1.21) | (0.08) | (0.08) | 8.89 | ||||||||||||||||||||||
Year Ended September 30, 2008 | 13.90 | (0.09)(a) | (2.52) | (b) | (2.61) | (1.11) | (1.11) | 10.18 | ||||||||||||||||||||||
Class I | ||||||||||||||||||||||||||||||
Year Ended September 30, 2012 | $11.95 | (0.07)(a) | 3.46 | (b) | 3.39 | — | — | $15.34 | ||||||||||||||||||||||
Year Ended September 30, 2011 | 11.43 | (0.07)(a) | 0.59 | (b) | 0.52 | — | — | 11.95 | ||||||||||||||||||||||
Year Ended September 30, 2010 | 9.27 | (0.06)(a) | 2.22 | (b) | 2.16 | — | — | 11.43 | ||||||||||||||||||||||
Year Ended September 30, 2009 | 10.58 | (0.02)(a) | (1.21) | (b) | (1.23) | (0.08) | (0.08) | 9.27 | ||||||||||||||||||||||
Year Ended September 30, 2008 | 14.36 | (0.06)(a) | (2.61) | (b) | (2.67) | (1.11) | (1.11) | 10.58 | ||||||||||||||||||||||
Class C | ||||||||||||||||||||||||||||||
Year Ended September 30, 2012 | $10.73 | (0.19)(a) | 3.11 | (b) | 2.92 | — | — | $13.65 | ||||||||||||||||||||||
Year Ended September 30, 2011 | 10.38 | (0.18)(a) | 0.53 | (b) | 0.35 | — | — | 10.73 | ||||||||||||||||||||||
Year Ended September 30, 2010 | 8.50 | (0.14)(a) | 2.02 | (b) | 1.88 | — | — | 10.38 | ||||||||||||||||||||||
Year Ended September 30, 2009 | 9.81 | (0.09)(a) | (1.14) | (b) | (1.23) | (0.08) | (0.08) | 8.50 | ||||||||||||||||||||||
Year Ended September 30, 2008 | 13.53 | (0.18)(a) | (2.43) | (b) | (2.61) | (1.11) | (1.11) | 9.81 | ||||||||||||||||||||||
Class S | ||||||||||||||||||||||||||||||
Year Ended September 30, 2012 | $11.95 | (0.07)(a) | 3.47 | (b) | 3.40 | — | — | $15.35 | ||||||||||||||||||||||
Year Ended September 30, 2011 | 11.43 | (0.07)(a) | 0.59 | (b) | 0.52 | — | — | 11.95 | ||||||||||||||||||||||
Year Ended September 30, 2010 | 9.28 | (0.06)(a) | 2.21 | (b) | 2.15 | — | — | 11.43 | ||||||||||||||||||||||
Year Ended September 30, 2009 | 10.59 | (0.02)(a) | (1.21) | (b) | (1.23) | (0.08) | (0.08) | 9.28 | ||||||||||||||||||||||
Year Ended September 30, 2008 | 14.38 | (0.06)(a) | (2.62) | (b) | (2.68) | (1.11) | (1.11) | 10.59 | ||||||||||||||||||||||
| (a) | Per share net investment income (loss) has been calculated using the average daily shares method. |
| (b) | Less than $0.01 or $(0.01) per share. |
See notes to financial statements.
54
| FINANCIAL HIGHLIGHTS |
| RBC SMID Cap Growth Fund (cont.) | (Selected data for a share outstanding throughout the years indicated) |
| Ratios/Supplemental Data | ||||||||||||||||||||||||
| Total Return* | Net Assets, End of Period (000’s) | Ratio of Net Expenses to Average Net Assets | Ratio of Net Investment Loss to Average Net Assets | Ratio of Expenses to Average Net Assets** | Portfolio Turnover Rate*** | |||||||||||||||||||
Class A | ||||||||||||||||||||||||
Year Ended September 30, 2012 | 28.16% | $29,755 | 1.35% | (0.77%) | 1.60% | 10% | ||||||||||||||||||
Year Ended September 30, 2011 | 4.21% | 23,593 | 1.35% | (0.75%) | 1.61% | 13% | ||||||||||||||||||
Year Ended September 30, 2010 | 23.06% | 21,940 | 1.35% | (0.81%) | 1.79% | 89% | ||||||||||||||||||
Year Ended September 30, 2009 | (11.61%) | 19,421 | 1.35% | (0.47%) | 1.88% | 62% | ||||||||||||||||||
Year Ended September 30, 2008 | (20.14%) | 25,483 | 1.32% | (0.74%) | 1.68% | 46% | ||||||||||||||||||
Class I | ||||||||||||||||||||||||
Year Ended September 30, 2012 | 28.37% | $32,825 | 1.10% | (0.52%) | 1.35% | 10% | ||||||||||||||||||
Year Ended September 30, 2011 | 4.55% | 33,835 | 1.10% | (0.49%) | 1.35% | 13% | ||||||||||||||||||
Year Ended September 30, 2010 | 23.30% | 41,121 | 1.10% | (0.57%) | 1.54% | 89% | ||||||||||||||||||
Year Ended September 30, 2009 | (11.36%) | 40,098 | 1.10% | (0.21%) | 1.38% | 62% | ||||||||||||||||||
Year Ended September 30, 2008 | (19.95%) | 60,998 | 1.07% | (0.48%) | 1.19% | 46% | ||||||||||||||||||
Class C | ||||||||||||||||||||||||
Year Ended September 30, 2012 | 27.21% | $44 | 2.10% | (1.52%) | 2.35% | 10% | ||||||||||||||||||
Year Ended September 30, 2011 | 3.37% | 40 | 2.09% | (1.49%) | 2.36% | 13% | ||||||||||||||||||
Year Ended September 30, 2010 | 22.12% | 67 | 2.09% | (1.57%) | 2.53% | 89% | ||||||||||||||||||
Year Ended September 30, 2009 | (12.26%) | 98 | 2.10% | (1.21%) | 2.38% | 62% | ||||||||||||||||||
Year Ended September 30, 2008 | (20.72%) | 129 | 2.07% | (1.52%) | 2.16% | 46% | ||||||||||||||||||
Class S | ||||||||||||||||||||||||
Year Ended September 30, 2012 | 28.45% | $1,840 | 1.10% | (0.52%) | 1.35% | 10% | ||||||||||||||||||
Year Ended September 30, 2011 | 4.55% | 1,227 | 1.10% | (0.52%) | 1.35% | 13% | ||||||||||||||||||
Year Ended September 30, 2010 | 23.17% | 1,822 | 1.10% | (0.56%) | 1.54% | 89% | ||||||||||||||||||
Year Ended September 30, 2009 | (11.35%) | 1,501 | 1.10% | (0.22%) | 1.38% | 62% | ||||||||||||||||||
Year Ended September 30, 2008 | (19.94%) | 1,495 | 1.06% | (0.49%) | 1.18% | 46% | ||||||||||||||||||
| * | Excludes sales charge. |
| ** | During the period, certain fees were contractually or voluntarily reduced and/or reimbursed. If such contractual/voluntary fee reductions and reimbursements had not occurred, the ratio would have been as indicated. |
| *** | Portfolio turnover rate is calculated on the basis of the fund as a whole without distinguishing between the classes of shares issued. |
See notes to financial statements.
55
FINANCIAL HIGHLIGHTS |
| RBC Enterprise Fund | (Selected data for a share outstanding throughout the years indicated) |
Investment Activities | Distributions | |||||||||||||||||||||||||||||||||
| Net Asset Value, Beginning of Period | Net | Net Realized and Unrealized Gains(Losses) on Investments | Redemption Fees | Total from Investment Activities | Net Investment Income | Net Realized Gains | Total Distributions | Net Asset Value, End of Period | ||||||||||||||||||||||||||
Class A | ||||||||||||||||||||||||||||||||||
Year Ended September 30, 2012 | $14.27 | (0.02)(a) | 5.20 | (b) | 5.18 | — | — | — | $ 19.45 | |||||||||||||||||||||||||
Year Ended September 30, 2011 | 14.43 | (0.07)(a) | (0.09) | (b) | (0.16) | — | — | — | 14.27 | |||||||||||||||||||||||||
Year Ended September 30, 2010 | 13.37 | (0.05)(a) | 1.11 | (b) | 1.06 | — | — | — | 14.43 | |||||||||||||||||||||||||
Year Ended September 30, 2009 | 16.95 | (0.02)(a) | (1.98) | (b) | (2.00) | — | (1.58) | (1.58) | 13.37 | |||||||||||||||||||||||||
Year Ended September 30, 2008 | 25.86 | (0.08)(a) | (5.31) | (b) | (5.39) | (0.02) | (3.50) | (3.52) | 16.95 | |||||||||||||||||||||||||
Class I | ||||||||||||||||||||||||||||||||||
Year Ended September 30, 2012 | $14.53 | 0.12(a) | 5.20 | (b) | 5.32 | — | — | — | $ 19.85 | |||||||||||||||||||||||||
Year Ended September 30, 2011 | 14.67 | (0.04)(a) | (0.10) | (b) | (0.14) | — | — | — | 14.53 | |||||||||||||||||||||||||
Year Ended September 30, 2010 | 13.57 | (0.01)(a) | 1.11 | (b) | 1.10 | — | — | — | 14.67 | |||||||||||||||||||||||||
Year Ended September 30, 2009 | 17.13 | 0.01(a) | (1.99) | (b) | (1.98) | — | (1.58) | (1.58) | 13.57 | |||||||||||||||||||||||||
Year Ended September 30, 2008 | 26.10 | (0.04)(a) | (5.34) | (b) | (5.38) | (0.09) | (3.50) | (3.59) | 17.13 | |||||||||||||||||||||||||
Class C | ||||||||||||||||||||||||||||||||||
Year Ended September 30, 2012 | $13.28 | (0.14)(a) | 4.81 | (b) | 4.67 | — | — | — | $ 17.95 | |||||||||||||||||||||||||
Year Ended September 30, 2011 | 13.53 | (0.19)(a) | (0.06) | (b) | (0.25) | — | — | — | 13.28 | |||||||||||||||||||||||||
Year Ended September 30, 2010 | 12.64 | (0.14)(a) | 1.03 | (b) | 0.89 | — | — | — | 13.53 | |||||||||||||||||||||||||
Year Ended September 30, 2009 | 16.25 | (0.10)(a) | (1.93) | (b) | (2.03) | — | (1.58) | (1.58) | 12.64 | |||||||||||||||||||||||||
Year Ended September 30, 2008 | 25.09 | (0.22)(a) | (5.12) | (b) | (5.34) | — | (3.50) | (3.50) | 16.25 | |||||||||||||||||||||||||
Class S | ||||||||||||||||||||||||||||||||||
Year Ended September 30, 2012 | $14.53 | 0.02(a) | 5.30 | (b) | 5.32 | — | — | — | $ 19.85 | |||||||||||||||||||||||||
Year Ended September 30, 2011 | 14.66 | (0.04)(a) | (0.09) | (b) | (0.13) | — | — | — | 14.53 | |||||||||||||||||||||||||
Year Ended September 30, 2010 | 13.56 | (0.01)(a) | 1.11 | (b) | 1.10 | — | — | — | 14.66 | |||||||||||||||||||||||||
Year Ended September 30, 2009 | 17.12 | 0.01(a) | (1.99) | (b) | (1.98) | — | (1.58) | (1.58) | 13.56 | |||||||||||||||||||||||||
Year Ended September 30, 2008 | 26.09 | (0.04)(a) | (5.34) | (b) | (5.38) | (0.09) | (3.50) | (3.59) | 17.12 | |||||||||||||||||||||||||
| (a) | Per share net investment income (loss) has been calculated using the average daily shares method. |
| (b) | Less than $0.01 or $(0.01) per share. |
See notes to financial statements.
56
FINANCIAL HIGHLIGHTS |
| RBC Enterprise Fund (cont.) | (Selected data for a share outstanding throughout the years indicated) |
| Ratios/Supplemental Data | ||||||||||||||||||||||||
| Total Return* | Net Assets, End of Period (000’s) | Ratio of Net Expenses to Average Net Assets | Ratio of Net Investment Income (Loss) to Average Net Assets | Ratio of Expenses to Average Net Assets** | Portfolio Turnover Rate*** | |||||||||||||||||||
Class A | ||||||||||||||||||||||||
Year Ended September 30, 2012 | 36.30% | $ 1,387 | 1.33% | (0.12%) | 1.58% | 13% | ||||||||||||||||||
Year Ended September 30, 2011 | (1.11%) | 1,320 | 1.33% | (0.44%) | 1.57% | 27% | ||||||||||||||||||
Year Ended September 30, 2010 | 7.93% | 2,426 | 1.33% | (0.35%) | 1.76% | 22% | ||||||||||||||||||
Year Ended September 30, 2009 | (8.83%) | 3,320 | 1.33% | (0.15%) | 2.01% | 20% | ||||||||||||||||||
Year Ended September 30, 2008 | (23.07%) | 6,398 | 1.33% | (0.43%) | 1.80% | 23% | ||||||||||||||||||
Class I | ||||||||||||||||||||||||
Year Ended September 30, 2012 | 36.61% | $ 27 | 0.99% | 0.67% | 1.26% | 13% | ||||||||||||||||||
Year Ended September 30, 2011 | (0.96%) | 3,378 | 1.08% | (0.25%) | 1.29% | 27% | ||||||||||||||||||
Year Ended September 30, 2010 | 8.11% | 25,999 | 1.08% | (0.10%) | 1.51% | 22% | ||||||||||||||||||
Year Ended September 30, 2009 | (8.60%) | 25,543 | 1.08% | 0.06% | 1.50% | 20% | ||||||||||||||||||
Year Ended September 30, 2008 | (22.82%) | 29,388 | 1.08% | (0.19%) | 1.31% | 23% | ||||||||||||||||||
Class C | ||||||||||||||||||||||||
Year Ended September 30, 2012 | 35.17% | $ 473 | 2.08% | (0.88%) | 2.33% | 13% | ||||||||||||||||||
Year Ended September 30, 2011 | (1.85%) | 424 | 2.08% | (1.21%) | 2.32% | 27% | ||||||||||||||||||
Year Ended September 30, 2010 | 7.04% | 568 | 2.08% | (1.10%) | 2.51% | 22% | ||||||||||||||||||
Year Ended September 30, 2009 | (9.47%) | 778 | 2.08% | (0.92%) | 2.50% | 20% | ||||||||||||||||||
Year Ended September 30, 2008 | (23.61%) | 1,269 | 2.08% | (1.19%) | 2.30% | 23% | ||||||||||||||||||
Class S | ||||||||||||||||||||||||
Year Ended September 30, 2012 | 36.61% | $ 107,998 | 1.08% | 0.12% | 1.33% | 13% | ||||||||||||||||||
Year Ended September 30, 2011 | (0.89%) | 88,064 | 1.08% | (0.21%) | 1.32% | 27% | ||||||||||||||||||
Year Ended September 30, 2010 | 8.11% | 110,248 | 1.08% | (0.10%) | 1.51% | 22% | ||||||||||||||||||
Year Ended September 30, 2009 | (8.60%) | 117,009 | 1.08% | 0.08% | 1.51% | 20% | ||||||||||||||||||
Year Ended September 30, 2008 | (22.83%) | 160,478 | 1.08% | (0.19%) | 1.31% | 23% | ||||||||||||||||||
| * | Excludes sales charge. |
| ** | During the period, certain fees were contractually or voluntarily reduced and/or reimbursed. If such contractual/voluntary fee reductions and reimbursements had not occurred, the ratio would have been as indicated. |
| *** | Portfolio turnover rate is calculated on the basis of the fund as a whole without distinguishing between the classes of shares issued. |
See notes to financial statements.
57
FINANCIAL HIGHLIGHTS |
| RBC Small Cap Core Fund | (Selected data for a share outstanding throughout the years indicated) |
| Investment Activities | Distributions | |||||||||||||||||||||||||||||||||||
| Net Asset Value, Beginning of Period | Net Investment Income (Loss) | Net Realized and Unrealized Gains (Losses) on Investments | Redemption Fees | Total from Investment Activities | Net Investment Income | Net Realized Gains | Total Distributions | Net Asset Value, End of Period | ||||||||||||||||||||||||||||
Class A | ||||||||||||||||||||||||||||||||||||
Year Ended September 30, 2012 | $20.02 | (0.06)(a) | 5.89 | (b) | 5.83 | — | (1.40) | (1.40) | $24.45 | |||||||||||||||||||||||||||
Year Ended September 30, 2011 | 19.99 | (0.09)(a) | 0.12 | (b) | 0.03 | — | — | — | 20.02 | |||||||||||||||||||||||||||
Year Ended September 30, 2010 | 17.04 | (0.09)(a) | 3.04 | (b) | 2.95 | — | — | — | 19.99 | |||||||||||||||||||||||||||
Year Ended September 30, 2009 | 21.27 | (0.03)(a) | (2.17) | (b) | (2.20) | — | (2.03) | (2.03) | 17.04 | |||||||||||||||||||||||||||
Year Ended September 30, 2008 | 31.72 | (0.17)(a) | (4.79) | (b) | (4.96) | — | (5.49) | (5.49) | 21.27 | |||||||||||||||||||||||||||
Class C | ||||||||||||||||||||||||||||||||||||
Year Ended September 30, 2012 | $18.72 | (0.22)(a) | 5.49 | (b) | 5.27 | — | (1.40) | (1.40) | $22.59 | |||||||||||||||||||||||||||
Year Ended September 30, 2011 | 18.83 | (0.22)(a) | 0.11 | (b) | (0.11) | — | — | — | 18.72 | |||||||||||||||||||||||||||
Year Ended September 30, 2010 | 16.18 | (0.22)(a) | 2.87 | (b) | 2.65 | — | — | — | 18.83 | |||||||||||||||||||||||||||
Year Ended September 30, 2009 | 20.47 | (0.13)(a) | (2.13) | (b) | (2.26) | — | (2.03) | (2.03) | 16.18 | |||||||||||||||||||||||||||
Year Ended September 30, 2008 | 30.86 | (0.34)(a) | (4.56) | (b) | (4.90) | — | (5.49) | (5.49) | 20.47 | |||||||||||||||||||||||||||
Class S | ||||||||||||||||||||||||||||||||||||
Year Ended September 30, 2012 | $20.49 | —(a)(b) | 6.02 | (b) | 6.02 | — | (1.40) | (1.40) | $25.11 | |||||||||||||||||||||||||||
Year Ended September 30, 2011 | 20.41 | (0.02)(a) | 0.10 | (b) | 0.08 | — | — | — | 20.49 | |||||||||||||||||||||||||||
Year Ended September 30, 2010 | 17.35 | (0.04)(a) | 3.10 | (b) | 3.06 | — | — | — | 20.41 | |||||||||||||||||||||||||||
Year Ended September 30, 2009 | 21.55 | 0.01(a) | (2.18) | (b) | (2.17) | — | (2.03) | (2.03) | 17.35 | |||||||||||||||||||||||||||
Year Ended September 30, 2008 | 31.94 | (0.11)(a) | (4.75) | (b) | (4.86) | (0.04) | (5.49) | (5.53) | 21.55 | |||||||||||||||||||||||||||
| (a) | Per share net investment income (loss) has been calculated using the average daily shares method. |
| (b) | Less than $0.01 or $(0.01) per share. |
See notes to financial statements.
58
FINANCIAL HIGHLIGHTS |
|
| RBC Small Cap Core Fund (cont.) | (Selected data for a share outstanding throughout the years indicated) |
| Ratios/Supplemental Data | ||||||||||||||||||||||||
| Total Return* | Net Assets, End of Period (000’s) | Ratio of Net Expenses to Average Net Assets | Ratio of Net Investment Income (Loss) to Average Net Assets | Ratio of Expenses to Average Net Assets** | Portfolio Turnover Rate*** | |||||||||||||||||||
Class A | ||||||||||||||||||||||||
Year Ended September 30, 2012 | 29.76% | $ 4,117 | 1.30% | (0.27%) | 1.77% | 35% | ||||||||||||||||||
Year Ended September 30, 2011 | 0.20% | 1,420 | 1.30% | (0.37%) | 1.80% | 40% | ||||||||||||||||||
Year Ended September 30, 2010 | 17.31% | 519 | 1.47%† | (0.48%) | 2.28% | 31% | ||||||||||||||||||
Year Ended September 30, 2009 | (7.07%) | 656 | 1.55% | (0.20%) | 2.65% | 47% | ||||||||||||||||||
Year Ended September 30, 2008 | (17.15%) | 1,046 | 1.54% | (0.71%) | 2.27% | 47% | ||||||||||||||||||
Class C | ||||||||||||||||||||||||
Year Ended September 30, 2012 | 28.86% | $ 131 | 2.05% | (1.01%) | 2.52% | 35% | ||||||||||||||||||
Year Ended September 30, 2011 | (0.58%) | 32 | 2.05% | (1.02%) | 2.56% | 40% | ||||||||||||||||||
Year Ended September 30, 2010 | 16.38% | 86 | 2.23%† | (1.26%) | 2.99% | 31% | ||||||||||||||||||
Year Ended September 30, 2009 | (7.70%) | 297 | 2.30% | (0.96%) | 3.16% | 47% | ||||||||||||||||||
Year Ended September 30, 2008 | (17.52%) | 384 | 2.29% | (1.47%) | 2.76% | 47% | ||||||||||||||||||
Class S | ||||||||||||||||||||||||
Year Ended September 30, 2012 | 30.08% | $ 53,147 | 1.05% | (0.01%) | 1.52% | 35% | ||||||||||||||||||
Year Ended September 30, 2011 | 0.39% | 42,647 | 1.05% | (0.09%) | 1.54% | 40% | ||||||||||||||||||
Year Ended September 30, 2010 | 17.64% | 43,441 | 1.22% | † | (0.21%) | 2.04% | 31% | |||||||||||||||||
Year Ended September 30, 2009 | (6.81%) | 40,205 | 1.30% | 0.04% | 2.16% | 47% | ||||||||||||||||||
Year Ended September 30, 2008 | (16.68%) | 45,905 | 1.29% | (0.46%) | 1.76% | 47% | ||||||||||||||||||
| * | Excludes sales charge. |
| ** | During the period, certain fees were contractually or voluntarily reduced and/or reimbursed. If such contractual/voluntary fee reductions and reimbursements had not occurred, the ratio would have been as indicated. |
| *** | Portfolio turnover rate is calculated on the basis of the fund as a whole without distinguishing between the classes of shares issued. |
| † | Beginning May 26, 2010, the net operating expenses were contractually limited to 1.30%, 2.05% and 1.05% of average daily net assets for Class A, Class C, and Class S respectively. The ratio of net expenses to average net assets represents a blended percentage for the year ended September 30, 2010. |
See notes to financial statements.
59
FINANCIAL HIGHLIGHTS |
| RBC Microcap Value Fund | (Selected data for a share outstanding throughout the years indicated) |
| Investment Activities | Distributions | |||||||||||||||||||||||||||||||||||
| Net Asset Value, Beginning of Period | Net Investment Income (Loss) | Net Realized and Unrealized Gains (Losses) on Investments | Redemption Fees | Total from Investment Activities | Net Investment Income | Net Realized Gains | Total Distributions | Net Asset Value, End of Period | ||||||||||||||||||||||||||||
Class A | ||||||||||||||||||||||||||||||||||||
Year Ended September 30, 2012 | $14.30 | 0.09(a) | 4.57 | (b) | 4.66 | (0.05) | — | (0.05) | $18.91 | |||||||||||||||||||||||||||
Year Ended September 30, 2011 | 14.59 | 0.05(a) | (0.32) | (b) | (0.27) | (0.02) | — | (0.02) | 14.30 | |||||||||||||||||||||||||||
Year Ended September 30, 2010 | 13.15 | 0.02(a) | 1.44 | (b) | 1.46 | (0.02) | — | (0.02) | 14.59 | |||||||||||||||||||||||||||
Year Ended September 30, 2009 | 16.38 | 0.05(a) | (2.30) | (b) | (2.25) | (0.03) | (0.95) | (0.98) | 13.15 | |||||||||||||||||||||||||||
Year Ended September 30, 2008 | 22.34 | 0.05(a) | (4.49) | (b) | (4.44) | (0.02) | (1.50) | (1.52) | 16.38 | |||||||||||||||||||||||||||
Class C | ||||||||||||||||||||||||||||||||||||
Year Ended September 30, 2012 | $13.57 | (0.04)(a) | 4.33 | (b) | 4.29 | — | — | — | $17.86 | |||||||||||||||||||||||||||
Year Ended September 30, 2011 | 13.93 | (0.08)(a) | (0.28) | (b) | (0.36) | — | — | — | 13.57 | |||||||||||||||||||||||||||
Year Ended September 30, 2010 | 12.64 | (0.08)(a) | 1.37 | (b) | 1.29 | — | — | — | 13.93 | |||||||||||||||||||||||||||
Year Ended September 30, 2009 | 15.86 | (0.03)(a) | (2.24) | (b) | (2.27) | — | (0.95) | (0.95) | 12.64 | |||||||||||||||||||||||||||
Year Ended September 30, 2008 | 21.82 | (0.08)(a) | (4.38) | (b) | (4.46) | — | (1.50) | (1.50) | 15.86 | |||||||||||||||||||||||||||
Class S | ||||||||||||||||||||||||||||||||||||
Year Ended September 30, 2012 | $14.33 | 0.13(a) | 4.58 | (b) | 4.71 | (0.11) | — | (0.11) | $18.93 | |||||||||||||||||||||||||||
Year Ended September 30, 2011 | 14.62 | 0.08(a) | (0.30) | (b) | (0.22) | (0.07) | — | (0.07) | 14.33 | |||||||||||||||||||||||||||
Year Ended September 30, 2010 | 13.19 | 0.05(a) | 1.44 | (b) | 1.49 | (0.06) | — | (0.06) | 14.62 | |||||||||||||||||||||||||||
Year Ended September 30, 2009 | 16.47 | 0.08(a) | (2.32) | (b) | (2.24) | (0.09) | (0.95) | (1.04) | 13.19 | |||||||||||||||||||||||||||
Year Ended September 30, 2008 | 22.47 | 0.10(a) | (4.52) | (b) | (4.42) | (0.08) | (1.50) | (1.58) | 16.47 | |||||||||||||||||||||||||||
| (a) | Per share net investment income (loss) has been calculated using the average daily shares method. |
| (b) | Less than $0.01 or $(0.01) per share. |
See notes to financial statements.
60
FINANCIAL HIGHLIGHTS |
| RBC Microcap Value Fund (cont.) | (Selected data for a share outstanding throughout the years indicated) |
| Ratios/Supplemental Data | ||||||||||||||||||||||||
| Total Return* | Net Assets, End of Period (000’s) | Ratio of Net Expenses to Average Net Assets | Ratio of Net Investment Income (Loss) to Average Net Assets | Ratio of Expenses to Average Net Assets** | Portfolio Turnover Rate*** | |||||||||||||||||||
Class A | ||||||||||||||||||||||||
Year Ended September 30, 2012 | 32.62% | $ 4,289 | 1.32% | 0.51% | 1.60% | 5% | ||||||||||||||||||
Year Ended September 30, 2011 | (1.85%) | 3,852 | 1.32% | 0.28% | 1.60% | 2% | ||||||||||||||||||
Year Ended September 30, 2010 | 11.12% | 6,968 | 1.32% | 0.12% | 1.64% | 9% | ||||||||||||||||||
Year Ended September 30, 2009 | (11.74%) | 8,358 | 1.32% | 0.50% | 1.87% | 17% | ||||||||||||||||||
Year Ended September 30, 2008 | (20.74%) | 19,641 | 1.31% | 0.29% | 1.74% | 18% | ||||||||||||||||||
Class C | ||||||||||||||||||||||||
Year Ended September 30, 2012 | 31.61% | $ 639 | 2.07% | (0.24%) | 2.35% | 5% | ||||||||||||||||||
Year Ended September 30, 2011 | (2.58%) | 613 | 2.07% | (0.51%) | 2.35% | 2% | ||||||||||||||||||
Year Ended September 30, 2010 | 10.21% | 850 | 2.07% | (0.63%) | 2.39% | 9% | ||||||||||||||||||
Year Ended September 30, 2009 | (12.36%) | 1,124 | 2.07% | (0.25%) | 2.37% | 17% | ||||||||||||||||||
Year Ended September 30, 2008 | (21.34%) | 1,723 | 2.06% | (0.45%) | 2.23% | 18% | ||||||||||||||||||
Class S | ||||||||||||||||||||||||
Year Ended September 30, 2012 | 32.97% | $ 126,432 | 1.07% | 0.76% | 1.35% | 5% | ||||||||||||||||||
Year Ended September 30, 2011 | (1.59%) | 105,991 | 1.07% | 0.51% | 1.35% | 2% | ||||||||||||||||||
Year Ended September 30, 2010 | 11.33% | 145,979 | 1.07% | 0.37% | 1.39% | 9% | ||||||||||||||||||
Year Ended September 30, 2009 | (11.47%) | 162,465 | 1.07% | 0.76% | 1.37% | 17% | ||||||||||||||||||
Year Ended September 30, 2008 | (20.53%) | 261,041 | 1.07% | 0.56% | 1.26% | 18% | ||||||||||||||||||
| * | Excludes sales charge. |
| ** | During the period, certain fees were contractually or voluntarily reduced and/or reimbursed. If such contractual/voluntary fee reductions and reimbursements had not occurred, the ratio would have been as indicated. |
| *** | Portfolio turnover rate is calculated on the basis of the fund as a whole without distinguishing between the classes of shares issued. |
See notes to financial statements.
61
FINANCIAL HIGHLIGHTS |
| RBC Mid Cap Value Fund | (Selected data for a share outstanding throughout the years indicated) |
| Investment Activities | Distributions | |||||||||||||||||||||||||||||||||||
| Net Asset Value, Beginning of Period | Net Investment Income/(Loss) | Net Realized and Unrealized Gains (Losses) on Investments | Redemption Fees | Total from Investment Activities | Net Investment Income | Net Realized Gains | Total Distributions | Net Asset Value, End of Period | ||||||||||||||||||||||||||||
Class I | ||||||||||||||||||||||||||||||||||||
| Year Ended September 30, 2012 | $9.42 | 0.09(a) | 2.69 | — | 2.78 | (0.10) | (1.76) | (1.86) | $ 10.34 | |||||||||||||||||||||||||||
Year Ended September 30, 2011 | 10.80 | 0.13(a) | (0.52) | — | (0.39) | (0.47) | (0.52) | (0.99) | 9.42 | |||||||||||||||||||||||||||
Period Ended September 30, 2010(b) | 10.00 | 0.02(a) | 0.78 | — | 0.80 | — | — | — | 10.80 | |||||||||||||||||||||||||||
| (a) | Per share net investment income (loss) has been calculated using the average daily shares method. |
| (b) | For the period from December 31, 2009 (commencement of operations) to September 30, 2010. |
See notes to financial statements.
62
FINANCIAL HIGHLIGHTS |
RBC Mid Cap Value Fund (cont.) | (Selected data for a share outstanding throughout the years indicated) |
| Ratios/Supplemental Data | ||||||||||||||||||||||||
| Total Return* | Net Assets, End of Period (000’s) | Ratio of Net Expenses to Average Net Assets | Ratio of Net Investment Income (Loss) to Average Net Assets | Ratio of Expenses to Average Net Assets** | Portfolio Turnover Rate | |||||||||||||||||||
Class I | ||||||||||||||||||||||||
Year Ended September 30, 2012 | 31.73% | $2,185 | 0.90% | 0.89% | 5.31% | 160% | ||||||||||||||||||
Year Ended September 30, 2011 | (5.35%) | 1,659 | 0.90% | 1.12% | 5.59% | 174% | ||||||||||||||||||
Period Ended September 30, 2010(a) | 8.00%(b) | 1,753 | 0.90%(c) | 0.26%(c) | 12.64%(c) | 161% | ||||||||||||||||||
| * | Excludes sales charge. |
| ** | During the period, certain fees were contractually or voluntarily reduced and/or reimbursed. If such contractual/voluntary fee reductions and reimbursements had not occurred, the ratio would have been as indicated. |
| (a) | For the period from December 31, 2009 (commencement of operations) to September 30, 2010. |
| (b) | Not Annualized. |
| (c) | Annualized. |
See notes to financial statements.
63
September 30, 2012
|
|
1.Organization
RBC Funds Trust (“the Trust”) is registered under the Investment Company Act of 1940 (as amended) as an open-end management investment company. The Trust was organized as a Delaware statutory trust on December 16, 2003 and currently consists of 13 portfolios. Predecessor funds to the Trust were reorganized as portfolios of the Trust effective April 16, 2004. This annual report includes the following five investment portfolios (“Funds”):
- RBC SMID Cap Growth Fund (“SMID Cap Growth Fund”)
- RBC Enterprise Fund (“Enterprise Fund”)
- RBC Small Cap Core Fund (“Small Cap Core Fund”)
- RBC Microcap Value Fund (“Microcap Value Fund”)
- RBC Mid Cap Value Fund (“Mid Cap Value Fund”)
The SMID Cap Growth and Enterprise Funds offer four share classes: Class A, Class C, Class I and Class S shares. The Small Cap Core and Microcap Value Funds offer three share classes: Class A, Class C, and Class S shares. The Mid Cap Value Fund offers Class I shares. Class A shares are offered with a 5.75% maximum front-end sales charge and a 1.00% contingent deferred sales charge (“CDSC”) for redemption within 12 months of a $1 million or greater purchase on which no front-end sales charge was paid. Class C shares are offered at net asset value (i.e. no front-end sales charge), but are subject to a CDSC of 1.00% for redemptions within 12 months of purchase. Class I shares (intended for investors meeting certain investment minimum thresholds) and Class S shares (available to investors purchasing shares directly from the Funds’ transfer agent) are not subject to either a front-end sales charge or a CDSC.
RBC Global Asset Management (U.S.) Inc. (“RBC GAM (US)” or “Advisor” or “Co-Administrator”) acts as the investment advisor for the Funds. The officers of the Trust (“Fund Management”) are also employees of RBC GAM (US) or its affiliates or of BNY Mellon Investment Servicing (US) Inc. (“BNY Mellon”) (“Co-Administrator”).
2. Significant Accounting Policies
Summarized below are the significant accounting policies of the Funds. These policies conform to accounting principles generally accepted in the United States of America (“US GAAP”). Fund Management follows these policies when preparing financial statements. Management may also be required to make estimates and assumptions that affect the reported amounts of assets and liabilities at the date of the financial statements and the reported amounts of income and expenses for the period. Actual results could differ from those estimates. The financial statements are as of the close of regular trading on the New York Stock Exchange.
Security Valuation:
Equity securities are generally valued on the basis of prices furnished by pricing services approved by the Trust’s Board of Trustees (the “Board”). Equity securities traded on one or more U.S. exchanges shall be valued at the last available quoted sale price on the primary trading exchange as of the close of regular trading on the New York Stock Exchange (“NYSE”) (usually 4:00 p.m. Eastern Standard Time). If there was no sale on the primary exchange on the day the net asset value is calculated, the most recent bid quotation generally will be used. In cases where neither closing prices nor bid prices are available, or where those prices do not accurately reflect the value of the security, a security will be valued in accordance with the Funds’ approved pricing and valuation procedures to determine a security’s fair value. These procedures are also used to determine the fair value of a security if a significant event occurs that materially affects the value of the security. Bonds and other fixed income securities, including TBA commitments, are generally valued on the basis of prices furnished by pricing services approved by the Trust’s Board. The pricing services utilize both dealer-supplied valuations and
64
NOTES TO FINANCIAL STATEMENTS |
|
electronic data processing techniques that take into account appropriate factors such as institutional-size trading in similar groups of securities yield, quality, coupon rate, maturity and type of issue. Investments in open-end investment companies are valued at net asset value. Short-term debt obligations, with less than 60 days to maturity at time of purchase, are valued at amortized cost unless Fund Management determines that amortized cost no longer approximates market value.
The Board has policies and procedures for the valuation of each Fund’s assets and has delegated to the Funds’ Pricing Committee (“Pricing Committee”) the responsibility for implementing the procedures, including the responsibility for determining the fair value of the Funds’ securities or other assets. The Pricing Committee includes representatives of the Funds’ Advisor, Co-Administrator and sub-advisor, including personnel from accounting and operations, investment management, trading, risk analytics, compliance and legal.
The Pricing Committee meets at least quarterly to review and approve Fund valuation matters, and includes a review of the Funds’ pricing activity and operations, fair value measurements, pricing vendors, policies and procedures and related controls. At least a quorum of the Pricing Committee meets more frequently, as needed, to consider and approve time-sensitive fair valuation actions. The Pricing Committee reports to the Valuation, Portfolio Management and Performance Committee (“Valuation Committee”) of the Board. Members of the Pricing Committee meet with the Valuation Committee and the Board at each of their regularly scheduled meetings to discuss valuation matters and actions taken during the period.
Fair value methods used include, but are not limited to, obtaining market quotations from secondary pricing services, broker-dealers, or widely used quotation systems. General factors used in determining the fair value of securities include fundamental analytical data, the nature and duration of any restrictions on disposition of the securities, and an evaluation of the forces that influenced the market in which the investments are purchased and sold. These securities are either categorized as Level 2 or 3 depending on the relevant inputs used.
In such cases where a security price is unavailable, the security or asset cannot be valued pursuant to one of the valuation methods established by the Board, or where Fund Management determines that the value provided by the pricing services does not approximate fair value, the value of the security or asset will be determined in good faith by the Pricing Committee as authorized by the Board, generally based upon recommendation provided by the Advisor. Fair valuation may also be used when a significant valuation event is determined to have occurred. Significant valuation events may include, but are not limited to, the following: an event affecting the value of a security traded on a foreign market occurs between the close of that market and the close of regular trading on the New York Stock Exchange; an extraordinary event like a natural disaster or terrorist act occurs; or an adverse development arises with respect to a specific issuer, such as a bankruptcy filing. Some of the factors which may be considered in determining fair value are fundamental analytical data relating to the security, the issuer and the market, such as duration, prepayment and default rates; general level of interest rates and changes in interest rates; information from broker-dealers; and trading in similar securities.
When the Funds use fair valuation methods that use significant unobservable inputs to determine their NAV, securities will be priced by a method that the Board or persons acting at their direction believe accurately reflect fair value and are categorized as Level 3 of the fair value hierarchy. These methods may require subjective determinations about the value of a security. While the Funds’ policy is intended to result in a calculation of a Fund’s NAV that fairly reflects security values as of the time of pricing, the Funds cannot guarantee that values determined by the Board or persons acting at their direction would accurately reflect the price that the Funds could obtain for a security if they were to dispose of that security as of the time of pricing (for instance, in a forced or distressed sale). The prices used by the Funds may differ from the value that would be realized if the securities were sold.
The Funds’ Pricing Committee employs various methods for calibrating the valuation approach related to securities categorized within Level 3 of fair value hierarchy. These methods may include regular due diligence of the Funds’ pricing vendors, a regular review of key inputs and assumptions, transaction
65
NOTES TO FINANCIAL STATEMENTS |
back-testing or disposition analysis to compare unrealized gains and losses to realized gains and losses, reviews of missing and stale prices and large movements in market value and reviews of any market related activities. Additionally, the pricing of all fair value holdings is subsequently reported to the Board.
Fair Value Measurements:
Various input Levels are used in determining the fair value of investments which are as follows:
— Level 1 - Inputs that reflect unadjusted quoted prices in active markets for identical assets or liabilities that the Funds have the ability to access at the measurement date.
— Level 2 - Inputs other than quoted prices that are observable for the asset or liability either directly or indirectly, including inputs in markets that are not considered to be active. Observable inputs may include quoted prices for similar securities, interest rates, spreads, prepayment spreads, etc.
— Level 3 - Unobservable inputs based on the best information available in the circumstances, to the extent observable inputs are not available (including the Fund’s own assumptions in determining the fair value of investments).
The inputs or methodology used for valuing investments are not necessarily an indication of the risk associated with investing in those securities.
Inputs used in determining fair value of an investment may include, but are not limited to, price information, volatility statistics, credit and market data, and other factors, all of which may be either observable or unobservable. Inputs can vary among investments and will be impacted by the investment type and volume of activity for the particular security or similar securities in the market. Investments in the Level 3 category are generally supported by transactions and quoted prices from dealers participating in the market for those investments. Investments may be included in the Level 3 category due to a lack of market activity or transparency. Internal valuation models may also be used as a pricing source for Level 3 investments. Internal valuation models may rely on one or more unobservable inputs, such as estimated cash flows, financial statement analysis and discount rates.
The summary of inputs used to determine the fair value of each Fund’s investments as of September 30, 2012 is as follows:
Funds | Level 1 Quoted Prices | Level 2 Significant Observable Inputs | Level 3 Significant Unobservable Inputs | Total | ||||||||||||
Investments in Securities | ||||||||||||||||
SMID Cap Growth Fund | $ 64,946,022(a) | $ — | $ — | $ 64,946,022 | ||||||||||||
Enterprise Fund | 109,034,667(a) | — | 592,946 | 109,627,613 | ||||||||||||
Small Cap Core Fund | 57,373,285(a) | — | — | 57,373,285 | ||||||||||||
Microcap Value Fund | 129,699,697(a) | 1,654,294(b) | 20,550 | 131,374,541 | ||||||||||||
Mid Cap Value Fund | 2,283,082(a) | — | — | 2,283,082 | ||||||||||||
(a) The breakdown of the Funds’ investments into major categories is disclosed in the Schedules of Portfolio Investments.
(b) Represents securities as disclosed in the Consumer Discretionary ($594,887), Consumer Staples ($292,000), Energy ($478,004), Financials ($106,513), Industrials ($58,240), Information Technology ($11,050) and Materials ($113,600) sections of the Schedule of Portfolio Investments.
The Funds did not have any liabilities that were measured at fair value on a recurring basis at September 30, 2012.
During the year ended September 30, 2012, the Funds except Microcap Value Fund recognized no transfers to/from Level 1 or 2. For the Microcap Value Fund, transfers to Level 2 from Level 1 in the
66
NOTES TO FINANCIAL STATEMENTS |
amount of $1,357,170 were due to the absence of an active trading market for the securities on September 28, 2012. The Funds’ policy is to recognize transfers between Level 1, Level 2 and Level 3 at the end of the year utilizing fair value at the beginning of the year.
Following is a reconciliation of Level 3 investments for which significant unobservable inputs were used to determine fair value:
Enterprise Fund | Microcap Value Fund | |||||||
(Common Stocks-Industrials) | (Common Stocks-Energy | |||||||
Balance as of 09/30/11 (value) | $601,862 | $ | — | |||||||||
Transfers in | — | 227,915(a) | ||||||||||
Change in unrealized appreciation (depreciation) * | (8,916) | (207,365) | ||||||||||
|
|
|
| |||||||||
Balance as of 09/30/12 (value) | $592,946 | $ | 20,550 | |||||||||
|
|
|
| |||||||||
| (a) | This security was transferred to Level 3 due to lack of a market quote. |
| * | Net change in unrealized appreciation/(depreciation) in Level 3 securities still held at September 30, 2012. |
The Funds’ assets assigned to the Level 3 category were valued using market data or trade information specific to the security or comparable issues. However, due to a lack of market activity or corroborating data to support the valuations, the investments were classified as Level 3.
The significant unobservable inputs used in fair value measurement of the Funds’ private investments are (i) an estimation of a normalized earnings level for the company; (ii) the discounts applied to the selection of comparable investments due to the private nature of the investment; and (iii) the likelihood of achieving normalized earnings. Significant changes in any of those inputs in isolation would result in a significantly lower or higher fair value measurement. Generally, a change in the assumptions used for the normalized earnings level will be accompanied by a directionally similar change in the discounts applied to the list of comparable investments.
In December 2011, the Financial Accounting Standards Board “FASB” issued Accounting Standards Update No. 2011-11 “Disclosures about Offsetting Assets and Liabilities” (“ASU 2011-11”). These disclosure requirements are intended to help investors and other financial statement users to better assess the effect or potential effect of offsetting arrangements on a company’s financial position. They also improve transparency in the reporting of how companies mitigate credit risk, including disclosure of related collateral pledged or received. In addition, ASU 2011-11 facilitates comparison between those entities that prepare their financial statements on the basis of US GAAP and those entities that prepare their financial statements on the basis of International Financial Reporting Standards (“IFRS”). ASU 2011-11 requires entities to: disclose both gross and net information about both instruments and transactions eligible for offset in the financial statements; and disclose instruments and transactions subject to an agreement similar to a master netting agreement. ASU 2011-11 is effective for fiscal years beginning on or after January 1, 2013, and interim periods within those annual periods. At this time, Fund Management is evaluating the implications of ASU 2011-11 and its impact on the Funds’ financial statement disclosures.
Repurchase Agreements:
The Funds may enter into repurchase agreements with counterparties whom the Advisor has deemed creditworthy, including primary dealers that report to the Federal Reserve Bank of New York or other large U.S. commercial banks or broker-dealers. These repurchase agreements are subject to the seller’s agreement to repurchase such securities at a mutually agreed upon date and price. The repurchase price generally equals the price paid by the Funds plus interest negotiated on the basis of current short-term rates.
67
NOTES TO FINANCIAL STATEMENTS |
Securities pledged as collateral for repurchase agreements are held by a custodian bank until maturity of the repurchase agreement. The Funds have procedures to monitor additional collateral, if needed, to ensure that the daily market value of the collateral remains in excess of the repurchase agreement in the event of a default. There were no Repurchase Agreements held at September 30, 2012.
Investment Transactions and Income:
Investment transactions are recorded on one business day after trade date, except on the last day of each fiscal quarter end, when they are recorded on trade date. Dividend income is recorded on the ex-dividend date. Realized gains and losses from investment transactions are calculated based on the cost of the specific security (also known as identified cost basis). Interest income is recognized on the accrual basis and includes, where applicable, the amortization or accretion of premium or discount using the effective yield method.
Expense, Investment Income and Gain/Loss Allocation:
Each Fund pays the expenses that are directly related to its operations, such as custodian fees or advisor fees. Expenses incurred by the Trust, such as trustee or legal fees, are allocated among each of the Funds in the Trust either proportionately based upon each Fund’s relative net assets or using another reasonable basis such as equally across all Funds in the Trust. Individual share classes within a Fund are charged expenses specific to that class, such as distribution fees. Within a Fund, expenses other than class specific expenses are allocated daily to each class based upon the proportion of relative net assets. Investment income and realized and unrealized gains or losses are allocated to each class of shares based on relative net assets.
Real Estate Investment Trusts:
The Funds may own shares of real estate investment trusts (“REITs”) which report information on the source of their distributions annually. Dividends paid by a REIT, other than capital gain distributions, will be taxable as ordinary income up to the amount of the REIT’s current and accumulated earnings and profits. Capital gain dividends paid by a REIT to a fund will be treated as long term capital gains by the fund and, in turn, may be distributed by the fund to its shareholders as a capital gain distribution. Distributions received from a REIT in excess of its income are recorded as a return of capital and a reduction to the cost basis of the REIT.
Distributions to Shareholders:
Each Fund pays out any income that it receives, less expenses, in the form of dividends and capital gain distributions to its shareholders. Income dividends and capital gain distributions for each Fund are declared and paid at least annually. Distributions to shareholders are recorded on the ex-dividend date. The amount of dividends and distributions are calculated based on federal income tax regulations, which may differ from US GAAP. These “book/tax” differences may be either temporary or permanent in nature. To the extent these differences are determined, as of the end of the tax year, to be permanent (e.g., net operating loss, foreign currency transactions, distribution redesignations and prior year spillbacks ), they are reclassified within a Fund’s capital accounts based on their federal tax basis treatment.
For the year ended September 30, 2012, permanent difference reclassification amounts were as follows:
| Increase/(Decrease) Paid in Capital | Increase/(Decrease) Accumulated Net Investment Income/(Loss) | Increase/(Decrease) Accumulated Realized Gain/(Loss) | ||||||||||
SMID Cap Growth Fund | $ — | $ 93,097 | $(93,097) | |||||||||
Enterprise Fund | (33,474) | (325,975) | 359,449 | |||||||||
Small Cap Core Fund | (22,200) | (143,929) | 166,129 | |||||||||
Microcap Value Fund | 35,185 | (152,754) | 117,569 | |||||||||
Mid Cap Value Fund | 58 | 3,312 | (3,370) | |||||||||
68
NOTES TO FINANCIAL STATEMENTS |
3. Agreements and Other Transactions with Affiliates
The Trust has entered into investment advisory agreements with RBC GAM (US) under which RBC GAM (US) manages each Fund’s assets and furnishes related office facilities, equipment, research and personnel. The agreements require each Fund to pay RBC GAM (US) a monthly fee based upon average daily net assets. Under the terms of the advisory contracts, RBC GAM (US) is entitled to receive fees based on a percentage of the average daily net assets of each of the Funds as follows:
| Average Daily Net Assets of Fund | Annual Rate | |||||
SMID Cap Growth Fund | All Net Assets | 0.70% | ||||
Enterprise Fund | Up to $30 million | 1.00% | ||||
| Over $30 million | 0.90% | |||||
Small Cap Core Fund | Up to $30 million | 1.00% | ||||
| Over $30 million | 0.90% | |||||
Microcap Value Fund | All Net Assets | 0.90% | ||||
Mid Cap Value Fund | All Net Assets | 0.70% | ||||
On September 25, 2012, the Board approved a revised investment advisory agreement with respect to Small Cap Core Fund. Effective November 27, 2012, this Fund will pay RBC GAM (US) a monthly fee of 0.85% of its average daily net assets.
RBC GAM (US) has contractually agreed to waive fees and/or make payments in order to keep total operating expenses of the Class S shares of each Fund and Class I shares of each Fund (except Small Cap Core Fund and Microcap Value Fund, which do not offer Class I shares) to the following levels. This expense limitation agreement is in place until January 31, 2014.
| Annual Rate | ||
SMID Cap Growth Fund | 1.10% | |
Enterprise Fund | 1.08% | |
Small Cap Core Fund | 1.05%* | |
Microcap Value Fund | 1.07% | |
Mid Cap Value Fund | 0.90% |
* Effective November 27, 2012, the annual rate for Small Cap Core Fund under the expense limitation agreement will be 0.90%.
Classes A and C vary from these limits only by the addition of class-specific 12b-1 fees. Each Fund will carry forward, for a period not to exceed 12 months from the date on which a waiver or reimbursement is made by RBC GAM (US), any expenses in excess of the expense limitation and repay RBC GAM (US) such amounts, provided the Fund is able to effect such repayment and remain in compliance with the expense limitation stated above. At September 30, 2012, the amounts subject to possible recoupment under the expense limitation agreement are $164,300, $253,414, $253,298, $348,549 and $91,030 for SMID Cap Growth Fund, Enterprise Fund, Small Cap Core Fund, Microcap Value Fund and Mid Cap Value Fund, respectively. There was no recoupment of expense reimbursements/waivers during the year. Amounts from prior years are no longer subject to recoupment.
RBC GAM (US) may also voluntarily waive and/or reimburse operating expenses of any Fund from time to time. Any such voluntary program may be changed or eliminated at any time without notice, and expenses waived under such program are not subject to recoupment.
RBC GAM (US) serves as co-administrator to the Funds. BNY Mellon serves as co-administrator and fund accounting agent. Services provided under the administrative services contract include providing day-to-day administration of matters related to the Funds, maintenance of their records and the preparation of reports. Under the terms of the administrative services contract, RBC GAM (US) receives from each Fund a fee, payable monthly, at the annual rate of 0.075% of each Fund’s average daily net
69
NOTES TO FINANCIAL STATEMENTS |
assets. BNY Mellon receives a fee for its services payable by each Fund based on each Funds’ average net assets. RBC GAM (US)’s fee is listed as “Administration fees” in the Statements of Operations. BNY Mellon’s fee is included with “Accounting fees” in the Statements of Operations.
Certain Officers and Trustees of the Trust are affiliated with the advisor or the co-administrator. Such Officers and Trustees receive no compensation from the Funds for serving in their respective roles.
The RBC Funds currently pay each of the independent Trustees (Trustees of the Trust who are not directors, officers or employees of the Advisor, administrator or Distributor) an annual retainer of $32,500. The Board Chairperson and Audit Committee Chairperson each receive an additional retainer of $2,500 annually, and all other trustees serving as Chair of a Board committee each receive an additional retainer of $1,000 annually. In addition, Independent Trustees receive a quarterly meeting fee of $5,000 ($5,500 effective October 1, 2012) for each in-person Board meeting attended, a meeting fee of $1,000 for each telephonic or Special Board meeting attended, and a $1,500 fee for each Board committee meeting attended and are reimbursed for all out-of-pocket expenses relating to attendance at such meetings.
4. Fund Distribution
Each of the Funds has adopted a Master Distribution 12b-1 Plan (the “Plan”) in which Quasar Distributors LLC (the “Distributor”) acts as the Funds’ distributor. The Plan permits each Fund to make payments for or to reimburse the Distributor monthly for distribution-related costs and expenses of marketing shares of each share class covered under the Plan; and/or for providing shareholder services. The following chart shows the current Plan fee rate for each class.
| Class A | Class C | |||||
| 12b-1 Plan Fee | 0.25%* | 1.00% |
* Under the 12b-1 plan, the maximum fee rate for Class A shares is 0.50%. Currently the Board of Trustees has approved an annual limit of 0.25%.
Plan fees are based on average daily net assets of the applicable class. Up to 0.25% of each Plan fee may be designated as a Service Fee, as defined by the applicable rules of the Financial Industry Regulatory Authority. The Distributor, subject to applicable legal requirements, may waive a Plan fee voluntarily, in whole or in part.
For the year ended September 30, 2012, the Distributor received commissions of $1,378 from front-end sales charges of Class A and Class C shares of the Funds, of which $51 was paid to affiliated broker-dealers, and the remainder was either paid to unaffiliated broker-dealers or retained by the Distributor.
The Distributor also received $172 from CDSC fees from Class A and Class C shares of the Funds during the year ended September 30, 2012.
5. Securities Transactions
The cost of securities purchased and proceeds from securities sold (excluding securities maturing less than one year from acquisition) for the year ended September 30, 2012 were as follows:
| Purchases | Sales | |||||||||
SMID Cap Growth Fund | $ | 6,543,217 | $ | 16,684,588 | ||||||
Enterprise Fund | 13,231,045 | 28,949,408 | ||||||||
Small Cap Core Fund | 18,658,496 | 19,873,658 | ||||||||
Microcap Value Fund | 6,558,707 | 14,519,280 | ||||||||
Mid Cap Value Fund | 3,269,185 | 3,331,114 | ||||||||
Within the guidelines established by the Funds to always seek best execution when entering into portfolio transactions, certain of the Funds use directed brokerage transactions through LJR Recapture
70
NOTES TO FINANCIAL STATEMENTS |
Services (“LJR”) and its correspondent brokers. A portion of the commissions paid for portfolio transactions under this program are reimbursed to the Funds and are recorded as net realized gains from investment transactions in the financial statements.
6. Capital Share Transactions
The Trust is authorized to issue an unlimited number of shares of beneficial interest (“shares outstanding”) without par value. Transactions in capital stock of the Funds are summarized on the following pages:
| SMID Cap Growth Fund | Enterprise Fund | |||||||||||||||
| For the Year Ended September 30, 2012 | For the Year Ended September 30, 2011 | For the Year Ended September 30, 2012 | For the Year Ended September 30, 2011 | |||||||||||||
CAPITAL TRANSACTIONS: | ||||||||||||||||
Class A | ||||||||||||||||
Proceeds from shares issued | $ | 3,649,188 | $ | 4,677,538 | $ | 25,337 | $ | 18,460 | ||||||||
Cost of shares redeemed | (4,088,727 | ) | (3,948,963 | ) | (390,716 | ) | (1,258,647 | ) | ||||||||
|
|
|
|
|
|
|
| |||||||||
Change in Class A | $ | (439,539 | ) | $ | 728,575 | $ | (365,379 | ) | $ | (1,240,187 | ) | |||||
|
|
|
|
|
|
|
| |||||||||
Class I | ||||||||||||||||
Proceeds from shares issued | $ | 736,237 | $ | 2,566,987 | $ | 15,674 | $ | 2,471,463 | ||||||||
Cost of shares redeemed | (10,826,058 | ) | (12,819,670 | ) | (4,040,056 | ) | (31,448,360 | ) | ||||||||
|
|
|
|
|
|
|
| |||||||||
Change in Class I | $ | (10,089,821 | ) | $ | (10,252,683 | ) | $ | (4,024,382 | ) | $ | (28,976,897 | ) | ||||
|
|
|
|
|
|
|
| |||||||||
Class C | ||||||||||||||||
Proceeds from shares issued | $ | 1,000 | $ | — | $ | 2,163 | $ | 3,534 | ||||||||
Cost of shares redeemed | (8,164 | ) | (30,520 | ) | (89,032 | ) | (163,037 | ) | ||||||||
|
|
|
|
|
|
|
| |||||||||
Change in Class C | $ | (7,164 | ) | $ | (30,520 | ) | $ | (86,869 | ) | $ | (159,503 | ) | ||||
|
|
|
|
|
|
|
| |||||||||
Class S | ||||||||||||||||
Proceeds from shares issued | $ | 330,080 | $ | 151,538 | $ | 705,402 | $ | 920,975 | ||||||||
Cost of shares redeemed | (86,787 | ) | (815,757 | ) | (11,353,446 | ) | (24,931,097 | ) | ||||||||
|
|
|
|
|
|
|
| |||||||||
Change in Class S | $ | 243,293 | $ | (664,219 | ) | $ | (10,648,044 | ) | $ | (24,010,122 | ) | |||||
|
|
|
|
|
|
|
| |||||||||
Change in net assets resulting from capital transactions | $ | (10,293,231 | ) | $ | (10,218,847 | ) | $ | (15,124,674 | ) | $ | (54,386,709 | ) | ||||
|
|
|
|
|
|
|
| |||||||||
SHARE TRANSACTIONS: | ||||||||||||||||
Class A | ||||||||||||||||
Issued | 272,105 | 380,703 | 1,378 | 1,143 | ||||||||||||
Redeemed | (302,731 | ) | (318,977 | ) | (22,550 | ) | (76,730 | ) | ||||||||
|
|
|
|
|
|
|
| |||||||||
Change in Class A | (30,626 | ) | 61,726 | (21,172 | ) | (75,587 | ) | |||||||||
|
|
|
|
|
|
|
| |||||||||
Class I | ||||||||||||||||
Issued | 49,928 | 209,055 | 822 | 147,155 | ||||||||||||
Redeemed | (742,826 | ) | (973,857 | ) | (231,882 | ) | (1,687,334 | ) | ||||||||
|
|
|
|
|
|
|
| |||||||||
Change in Class I | (692,898 | ) | (764,802 | ) | (231,060 | ) | (1,540,179 | ) | ||||||||
|
|
|
|
|
|
|
| |||||||||
Class C | ||||||||||||||||
Issued | 73 | | — | | 133 | 230 | ||||||||||
Redeemed | (592 | ) | (2,724 | ) | (5,702 | ) | (10,321 | ) | ||||||||
|
|
|
|
|
|
|
| |||||||||
Change in Class C | (519 | ) | (2,724 | ) | (5,569 | ) | (10,091 | ) | ||||||||
|
|
|
|
|
|
|
| |||||||||
Class S | ||||||||||||||||
Issued | 23,154 | 11,688 | 39,114 | 54,520 | ||||||||||||
Redeemed | (5,967 | ) | (68,328 | ) | (658,313 | ) | (1,515,262 | ) | ||||||||
|
|
|
|
|
|
|
| |||||||||
Change in Class S | 17,187 | (56,640 | ) | (619,199 | ) | (1,460,742 | ) | |||||||||
|
|
|
|
|
|
|
| |||||||||
71
NOTES TO FINANCIAL STATEMENTS |
| SMID Cap Growth Fund | Enterprise Fund | |||||||||||||||
| For the Year Ended September 30, 2012 | For the Year Ended September 30, 2011 | For the Year Ended September 30, 2012 | For the Year Ended September 30, 2011 | |||||||||||||
Change in shares resulting from capital transactions | (706,856 | ) | (762,440 | ) | (877,000 | ) | (3,086,599 | ) | ||||||||
|
|
|
|
|
|
|
| |||||||||
| Small Cap Core Fund | Microcap Value Fund | |||||||||||||||
| For the Year Ended September 30, 2012 | For the Year Ended September 30, 2011 | For the Year Ended September 30, 2012 | For the Year Ended September 30, 2011 | |||||||||||||
CAPITAL TRANSACTIONS: | ||||||||||||||||
Class A | ||||||||||||||||
Proceeds from shares issued | $ | 2,569,134 | $ | 1,186,176 | $ | 268,046 | $ | 407,665 | ||||||||
Distributions reinvested | 111,284 | — | 10,572 | 8,348 | ||||||||||||
Cost of shares redeemed | (458,588 | ) | (163,399 | ) | (989,798 | ) | (3,901,379 | ) | ||||||||
|
|
|
|
|
|
|
| |||||||||
Change in Class A | $ | 2,221,830 | $ | 1,022,777 | $ | (711,180 | ) | $ | (3,485,366 | ) | ||||||
|
|
|
|
|
|
|
| |||||||||
Class C | ||||||||||||||||
Proceeds from shares issued | $ | 92,400 | $ | — | $ | 14,592 | $ | 21,358 | ||||||||
Distributions reinvested | 2,164 | — | — | — | ||||||||||||
Cost of shares redeemed | (8,470 | ) | (62,360 | ) | (171,936 | ) | (270,146 | ) | ||||||||
|
|
|
|
|
|
|
| |||||||||
Change in Class C | $ | 86,094 | $ | (62,360 | ) | $ | (157,344 | ) | $ | (248,788 | ) | |||||
|
|
|
|
|
|
|
| |||||||||
Class S | ||||||||||||||||
Proceeds from shares issued | $ | 8,360,611 | $ | 8,444,857 | $ | 10,889,169 | $ | 19,339,282 | ||||||||
Distributions reinvested | 3,042,813 | — | 720,371 | 570,504 | ||||||||||||
Cost of shares redeemed | (10,792,292 | ) | (9,668,033 | ) | (23,480,881 | ) | (61,403,419 | ) | ||||||||
|
|
|
|
|
|
|
| |||||||||
Change in Class S | $ | 611,132 | $ | (1,223,176 | ) | $ | (11,871,341 | ) | $ | (41,493,633 | ) | |||||
|
|
|
|
|
|
|
| |||||||||
Change in net assets resulting from capital transactions | $ | 2,919,056 | $ | (262,759 | ) | $ | (12,739,865 | ) | $ | (45,227,787 | ) | |||||
|
|
|
|
|
|
|
| |||||||||
SHARE TRANSACTIONS: | ||||||||||||||||
Class A | ||||||||||||||||
Issued | 112,203 | 52,269 | 15,196 | 24,731 | ||||||||||||
Reinvested | 5,013 | — | 648 | 494 | ||||||||||||
Redeemed | (19,744 | ) | (7,296 | ) | (58,358 | ) | (233,524 | ) | ||||||||
|
|
|
|
|
|
|
| |||||||||
Change in Class A | 97,472 | 44,973 | (42,514 | ) | (208,299 | ) | ||||||||||
|
|
|
|
|
|
|
| |||||||||
Class C | ||||||||||||||||
Issued | 4,398 | — | 895 | 1,344 | ||||||||||||
Reinvested | 105 | — | — | — | ||||||||||||
Redeemed | (405 | ) | (2,827 | ) | (10,311 | ) | (17,148 | ) | ||||||||
|
|
|
|
|
|
|
| |||||||||
Change in Class C | 4,098 | (2,827 | ) | (9,416 | ) | (15,804 | ) | |||||||||
|
|
|
|
|
|
|
| |||||||||
Class S | ||||||||||||||||
Issued | 346,828 | 364,008 | 614,818 | 1,164,529 | ||||||||||||
Reinvested | 133,691 | — | 44,249 | 33,798 | ||||||||||||
Redeemed | (445,312 | ) | (411,447 | ) | (1,377,057 | ) | (3,787,473 | ) | ||||||||
|
|
|
|
|
|
|
| |||||||||
Change in Class S | 35,207 | (47,439 | ) | (717,990 | ) | (2,589,146 | ) | |||||||||
|
|
|
|
|
|
|
| |||||||||
Change in shares resulting from capital transactions | 136,777 | (5,293 | ) | (769,920 | ) | (2,813,249 | ) | |||||||||
|
|
|
|
|
|
|
| |||||||||
72
NOTES TO FINANCIAL STATEMENTS |
| Mid Cap Value Fund | ||||||||
| For the Year Ended September 30, 2012 | For the Year Ended September 30, 2011 | |||||||
CAPITAL TRANSACTIONS: | ||||||||
Class I | ||||||||
Proceeds from shares issued | $ | 75 | $ | — | ||||
Distributions reinvested | 327,014 | 160,268 | ||||||
Cost of shares redeemed | (66 | ) | — | |||||
|
|
|
| |||||
Change in net assets resulting from capital transactions | $ | 327,023 | $ | 160,268 | ||||
|
|
|
| |||||
SHARE TRANSACTIONS: | ||||||||
Class I | ||||||||
Issued | 7 | — | ||||||
Reinvested | 35,238 | 13,816 | ||||||
Redeemed | (7 | ) | — | |||||
|
|
|
| |||||
Change in shares resulting from capital transactions | 35,238 | 13,816 | ||||||
|
|
|
| |||||
7. Federal Income Taxes
It is the policy of each Fund to continue to qualify as a regulated investment company by complying with the provisions available to certain investment companies, as defined under Subchapter M of the Internal Revenue Code, and to distribute substantially all of its net investment income and net realized capital gains. Therefore, no federal tax liability is recorded in the financial statements of each Fund.
Management has analyzed the Funds’ tax positions taken or expected to be taken on federal income tax returns for all open tax years (the tax years ended September 30 of the years 2009, 2010, 2011 and 2012), and has concluded that no provision for federal income tax is required in the Funds’ financial statements. The Funds’ federal and state income and federal excise tax returns for tax years for which the applicable statutes of limitations have not expired are subject to examination by the Internal Revenue Service and state departments of revenue.
As of and during the period ended September 30, 2012, the Funds did not have a liability for any unrecognized tax benefits. The Funds recognize interest and penalities, if any, related to unrecognized tax benefits as income tax expense in the statement of operations. During the period, the Funds did not incur any interest or penalties.
As of September 30, 2012, the tax cost of securities and the breakdown of unrealized appreciation (depreciation) for each Fund were as follows:
| Tax Cost of Securities | Unrealized Appreciation | Unrealized Depreciation | Net Unrealized Appreciation (Depreciation) | |||||||||||||
SMID Cap Growth Fund | $ | 45,649,689 | $ | 22,139,888 | $ | (2,843,555 | ) | $ | 19,296,333 | |||||||
Enterprise Fund | 80,501,955 | 36,196,088 | (7,070,430 | ) | 29,125,658 | |||||||||||
Small Cap Core Fund | 42,949,162 | 16,947,587 | (2,523,464 | ) | 14,424,123 | |||||||||||
Microcap Value Fund | 135,479,252 | 36,226,287 | (40,330,998 | ) | (4,104,711 | ) | ||||||||||
Mid Cap Value Fund | 2,270,638 | 132,070 | (119,626 | ) | 12,444 | |||||||||||
The difference between book basis and tax basis unrealized appreciation/depreciation is attributable primarily to the tax deferral of losses on wash sales, Passive Foreign Investment Companies (PFICs) and the timing of income recognition in REIT’s and Partnerships.
73
NOTES TO FINANCIAL STATEMENTS |
The tax character of distributions during the fiscal year ended September 30, 2012 was as follows:
| Distributions Paid From | ||||||||||||||||
| Ordinary Income | Net Long Term Capital Gains | Total Taxable Distributions | Total Distributions Paid | |||||||||||||
SMID Cap Growth Fund | $ | — | $ | — | $ | — | $ | — | ||||||||
Enterprise Fund | — | — | — | — | ||||||||||||
Small Cap Core Fund | — | 3,250,157 | 3,250,157 | 3,250,157 | ||||||||||||
Microcap Value Fund | 759,669 | — | 759,669 | 759,669 | ||||||||||||
Mid Cap Value Fund | 281,975 | 45,053 | 327,028 | 327,028 | ||||||||||||
The tax character of distributions during the fiscal year ended September 30, 2011 was as follows:
| Distributions Paid From | ||||||||||||||||
| Ordinary Income | Net Long Term Capital Gains | Total Taxable Distributions | Total Distributions Paid | |||||||||||||
SMID Cap Growth Fund | $ | — | $— | $ | — | $ | — | |||||||||
Enterprise Fund | — | — | — | — | ||||||||||||
Small Cap Core Fund | — | — | — | — | ||||||||||||
Microcap Value Fund | 597,770 | — | 597,770 | 597,770 | ||||||||||||
Mid Cap Value Fund | 160,268 | — | 160,268 | 160,268 | ||||||||||||
As of September 30, 2012, the components of accumulated earnings/(losses) on a tax basis were as follows:
| Undistributed Ordinary Income | Undistributed Long Term Gain | Accumulated Earnings | Accumulated Capital Loss Carryforwards | Deferred Qualified Late-Year Losses | Unrealized Appreciation/ (Depreciation) | Total Accumulated Earnings/(Losses) | ||||||||||||||||||||||
SMID Cap Growth Fund | $ | 15,398 | $ | 7,238,700 | $ | 7,254,098 | $ | — | $ | (314,732) | $ | 19,296,333 | $ | 26,235,699 | ||||||||||||||
Enterprise Fund | — | — | — | (4,116,532) | (230,894) | 29,125,658 | 24,778,232 | |||||||||||||||||||||
Small Cap Core Fund | 744,794 | 3,649,119 | 4,393,913 | — | (165,592) | 14,424,123 | 18,652,444 | |||||||||||||||||||||
Microcap Value Fund | 912,857 | — | 912,857 | (17,632,206) | — | (4,104,711) | (20,824,060) | |||||||||||||||||||||
Mid Cap Value Fund | 115,385 | 1,070 | 116,455 | — | (991) | 12,444 | 127,908 | |||||||||||||||||||||
As of September 30, 2012, the Funds had capital loss carryforwards for federal income tax purposes as follows:
| Capital Loss Carryforward | Expires | |||||||
Enterprise Fund | $ | 4,116,532 | 2018 | |||||
Microcap Value Fund | 17,632,206 | 2018 | ||||||
During the year ended September 30, 2012, the Funds utilized capital loss carryforwards in the amounts of $43,316; $7,289,770; $2,738,899 for the SMID Cap Growth Fund, the Enterprise Fund, and the Microcap Value Fund, respectively.
Under current tax law, capital losses realized after October 31 and ordinary losses after December 31 of a Fund’s fiscal year may be deferred and treated as occurring on the first business day of the following fiscal year for tax purposes. The SMID Cap Growth Fund, Enterprise Fund and Small Cap Core Fund deferred qualified late-year ordinary losses of $314,732, $230,894, and $165,592, respectively and the Mid Cap Value Fund had deferred long-term qualified late-year capital losses of $991, which will be treated as arising on the first business day of the fiscal year ending September 30, 2013.
74
NOTES TO FINANCIAL STATEMENTS |
8. Market Timing
The Trust strongly discourages attempts at market timing by Fund shareholders. Each Fund charges a redemption fee of 2% of the value of the shares redeemed or exchanged within 30 days of purchase, and may also limit the number of exchanges that may be made between Funds to five (5) per calendar year. When assessed, the redemption fee is deducted from the redemption proceeds and retained by the Fund, not by the Advisor. This redemption fee is not charged in certain situations, such as where the redemption results from an automatic reinvestment or asset re-allocation not specifically directed by the shareholder. The Trust also reserves the right to reject any Fund purchase order made by persons deemed to be market timers. The Funds’ prospectus contains a full description of the Trust’s policies on market timing and/or excessive trading. The redemption fee is recorded as a credit to capital and is included in the capital transactions on the Statements of Changes in Net Assets.
During the year ended September 30, 2012, the redemption fees collected by the Funds which are included in the cost of shares redeemed on the Statement of Changes in Net Assets are as follows:
| Redemption Fees | ||||
SMID Cap Growth Fund | $ 25 | |||
Enterprise Fund | 329 | |||
Small Cap Core Fund | 78 | |||
Microcap Value Fund | 33,993 | |||
Mid Cap Value Fund | — | |||
9. Soft Dollars
The term soft dollars generally refers to arrangements in which services other than trade execution are received from a broker-dealer. Federal securities laws permit a fund advisor to incur commission charges on behalf of a Fund that are higher than another broker dealer would have charged if the advisor believes the charges are reasonable in relation to the brokerage and research services received. RBC GAM (US) has a fiduciary duty to the shareholders of the Funds to seek the best execution price for all of the Funds’ securities transactions. Fund management believes that using soft dollars to purchase brokerage and research services may, in certain cases, be in a Fund’s best interest. As of September 30, 2012, certain of the Funds used soft dollar arrangements on a limited basis. Fund management continues to closely monitor its current use of soft dollars, in addition to regulatory developments in this area for any possible impact on Fund policies.
10. Subsequent Events
Management has evaluated the impact of subsequent events of the Funds and has determined that there are no subsequent events that require recognition or disclosure in the financial statements except for the following.
On September 25, 2012, the Board approved the closure of Class C shares of SMID Cap Growth Fund, Enterprise Fund, Small Cap Core Fund and Microcap Value Fund and the conversion of Class C shares of each Fund into Class A shares of the same Fund. Each outstanding Class C shares will be automatically exchanged for Class A shares of the same Fund with an aggregate net asset value equal to the aggregate net asset value of the Class C shares so exchanged. The conversion is expected to take place on or before November 27, 2012.
75
NOTES TO FINANCIAL STATEMENTS |
On September 25, 2012, the Board also approved the closure of Class S shares of SMID Cap Growth Fund, Enterprise Fund, Small Cap Core Fund and Microcap Value Fund. In connection with such closure, the Board authorized the conversion of Class S shares of SMID Cap Growth Fund and Enterprise Fund into Class I shares of such funds and the redesignation of Class S shares of the Small Cap Core Fund and Microcap Value Fund (which currently do not have Class I shares) as Class I shares of such funds. As a result, holder of Class S shares will automatically become holders of Class I shares which have the same fee and expense structure with an aggregate net asset value equal to the value of the Class S shares previously held. The conversion and redesignation are expected to occur on or before November 27, 2012.
76
To the Shareholders and Board of Trustees of RBC Funds Trust
We have audited the accompanying statements of assets and liabilities, including the schedules of portfolio investments, of RBC SMID Cap Growth Fund, RBC Enterprise Fund, RBC Small Cap Core Fund, RBC Microcap Value Fund and RBC Mid Cap Value Fund (collectively the “Funds”), five of the portfolios constituting the RBC Funds Trust (the “Trust”), as of September 30, 2012, and the related statements of operations for the year then ended, the statements of changes in net assets for each of the two years in the period then ended, and the financial highlights for each of the periods presented. These financial statements and financial highlights are the responsibility of the Funds’ management. Our responsibility is to express an opinion on these financial statements and financial highlights based on our audits.
We conducted our audits in accordance with the standards of the Public Company Accounting Oversight Board (United States). Those standards require that we plan and perform the audits to obtain reasonable assurance about whether the financial statements and financial highlights are free of material misstatement. The Funds are not required to have, nor were we engaged to perform, an audit of their internal control over financial reporting. Our audits included consideration of internal control over financial reporting as a basis for designing audit procedures that are appropriate in the circumstances, but not for the purpose of expressing an opinion on the effectiveness of the Funds’ internal control over financial reporting. Accordingly, we express no such opinion. An audit also includes examining, on a test basis, evidence supporting the amounts and disclosures in the financial statements, assessing the accounting principles used and significant estimates made by management, as well as evaluating the overall financial statement presentation. Our procedures included confirmation of securities owned as of September 30, 2012, by correspondence with the Funds’ custodian and brokers; where replies were not received from brokers. We believe that our audits provide a reasonable basis for our opinion.
In our opinion, the financial statements and financial highlights referred to above present fairly, in all material respects, the financial position of each of the portfolios of RBC Funds Trust referred to above, as of September 30, 2012, the results of their operations for the year then ended, the changes in their net assets for each of the two years in the period then ended, and the financial highlights for the periods presented, in conformity with accounting principles generally accepted in the United States of America.
DELOITTE & TOUCHE LLP
Chicago, Illinois
November 27, 2012
77
For the fiscal year ended September 30, 2012, certain dividends paid by the Funds may be subject to a maximum tax rate of 15% as provided for by the Jobs and Growth Tax Reconciliation Act of 2003. The Funds intend to report the maximum amount allowable as taxed at a maximum rate of 15%. Complete information will be reported in conjunction with your 2012 Form 1099-DIV.
All reportings are based on financial information available as of the date of this annual report and, accordingly, are subject to change. For each item, it is the intention of the Funds to report the maximum amount permitted under the Internal Revenue Code and the regulations thereunder.
For the year ended September 30, 2012, the following Funds had a qualified dividend income percentage of:
| Qualified Dividend Income | ||||
Microcap Value Fund | 100% | |||
Mid Cap Value Fund | 8.40% | |||
For corporate shareholders, the following percentage of the total ordinary income distributions paid during the fiscal year ended September 30, 2012 qualify for the corporate dividends received deduction:
| Dividends Received Deduction | ||||
Microcap Value Fund | 100% | |||
Mid Cap Value Fund | 8.58% | |||
The following Funds report a portion of the income dividends distributed during the fiscal year ended September 30, 2012, as qualified interest income as defined in the Internal Revenue Code:
| Qualified Interest Income | ||||
Microcap Value Fund | 0.07% | |||
Mid Cap Value Fund | 0.20% | |||
The following Fund reports a portion of the income dividends distributed during the fiscal year ended September 30, 2012, as qualified short term gains:
| Qualified Short-term Gains | ||||
Mid Cap Value Fund | 100% | |||
78
Independent Trustees(1)(2)
T. Geron Bell (71)
Position, Term of Office and Length of Time Served with the Trust: Trustee since January 2004
Principal Occupation(s) During Past 5 Years: Chairman of the Executive Board of the Minnesota Twins (January 2011 to present); prior thereto President of Twins Sports, Inc. (parent company of the Minnesota Twins) (2002-2011); President of the Minnesota Twins Baseball Club Incorporated (1987-2002)
Number of Portfolios in Fund Complex Overseen by Trustee: 14
Other Director/Trustee Positions Held by Trustee During Past 5 Years: None
Lucy Hancock Bode (61)
Position, Term of Office and Length of Time Served with the Trust: Trustee since January 2004
Principal Occupation(s) During Past 5 Years: Healthcare consultant (self-employed)
Number of Portfolios in Fund Complex Overseen by Trustee: 14
Other Director/Trustee Positions Held by Trustee During Past 5 Years: BioSignia
Leslie H. Garner Jr. (62)
Position, Term of Office and Length of Time Served with the Trust: Trustee since January 2004
Principal Occupation(s) During Past 5 Years: President and CEO, The Greater Cedar Rapids Community Foundation (2010 to present); previously, President, Cornell College
Number of Portfolios in Fund Complex Overseen by Trustee: 14
Other Director/Trustee Positions Held by Trustee During Past 5 Years: None
Ronald James (61)
Position, Term of Office and Length of Time Served with the Trust: Trustee since January 2004
Principal Occupation(s) During Past 5 Years: President and Chief Executive Officer, Center for Ethical Business Cultures (2000 to present)
Number of Portfolios in Fund Complex Overseen by Trustee: 14
Other Director/Trustee Positions Held by Trustee During Past 5 Years: Best Buy Co. Inc.; Bremer Financial Corporation
John A. MacDonald (63)
Position, Term of Office and Length of Time Served with the Trust: Trustee since January 2004
Principal Occupation(s) During Past 5 Years: Vice President and Treasurer, Hall Family Foundation
Number of Portfolios in Fund Complex Overseen by Trustee: 14
Other Director/Trustee Positions Held by Trustee During Past 5 Years: None
H. David Rybolt (70)
Position, Term of Office and Length of Time Served with the Trust: Trustee since January 2004
Principal Occupation(s) During Past 5 Years: Consultant, HDR Associates (management consulting)
Number of Portfolios in Fund Complex Overseen by Trustee: 14
Other Director/Trustee Positions Held by Trustee During Past 5 Years: None
79
MANAGEMENT (Unaudited) |
Independent Trustees(1)(2)
|
|
James R. Seward (60)
Position, Term of Office and Length of Time Served with the Trust: Chairman of the Board and Trustee since January 2004
Principal Occupation(s) During Past 5 Years: Private investor (2000 to present); CFA
Number of Portfolios in Fund Complex Overseen by Trustee: 14
Other Director/Trustee Positions Held by Trustee During Past 5 Years: Syntroleum Corporation; Brookdale Senior Living Inc.
William B. Taylor (67)
Position, Term of Office and Length of Time Served with the Trust: Trustee since September 2005
Principal Occupation(s) During Past 5 Years: Consultant (2003 to present); prior thereto Partner (until 2003) Ernst & Young LLP
Number of Portfolios in Fund Complex Overseen by Trustee: 14
Other Director/Trustee Positions Held by Trustee During Past 5 Years: William Henry Insurance, LLC
Interested Trustees(1)(2)(3)
Kathleen A. Gorman (48)(5)
Position, Term of Office and Length of Time Served with the Trust: Trustee since September 2012
Principal Occupation(s) During Past 5 Years: President and Chief Executive Officer, RBC Funds (2012 to present); Chief Compliance Officer, RBC Funds (2006 to present); Director of Regulatory Administration, RBC Global Asset Management (U.S.) Inc. (2007 to present); Chief Compliance Officer, RBC Global Asset Management (U.S.) Inc. (2006-2009)
Number of Portfolios in Fund Complex Overseen by Trustee: 14
Other Director/Trustee Positions Held by Trustee During Past 5 Years: None
Executive Officers(1)(3)(4)
Kathleen A. Gorman (48)
Position, Term of Office and Length of Time Served with the Trust: President and Chief Executive Officer since September 2012; Chief Compliance Officer since April 2006 and Assistant Secretary since September 2006
Principal Occupation(s) During Past 5 Years: President and Chief Executive Officer, RBC Funds (2012 to present); Chief Compliance Officer, RBC Funds (2006 to present); Director of Regulatory Administration, RBC Global Asset Management (U.S.) Inc. (2007 to present); Chief Compliance Officer, RBC Global Asset Management (U.S.) Inc. (2006-2009)
James A. Gallo (48)
Address: BNY Mellon Investment Servicing (US) Inc., 760 Moore Road, King of Prussia, PA 19406
Position, Term of Office and Length of Time Served with the Trust: Treasurer since October 2007
Principal Occupation(s) During Past 5 Years: Senior Vice President and Managing Director, BNY Mellon Investment Servicing (US) Inc. (2002 to present)
80
MANAGEMENT (Unaudited) |
Executive Officers(1)(3)(4)
|
|
Kathleen A. Hegna (45)
Position, Term of Office and Length of Time Served with the Trust: Chief Financial Officer and Principal Accounting Officer since May 2009
Principal Occupation(s) During Past 5 Years: Associate Vice President and Director, Mutual Fund Accounting and Administration, RBC Global Asset Management (U.S.) Inc. (2009 to present); Senior Compliance Officer, RBC Global Asset Management (U.S.) Inc. (2006-2009); Director, Asset Management Compliance, RiverSource Investments (2005-2006)
Lee Thoresen (41)
Position, Term of Office and Length of Time Served with the Trust: Chief Legal Officer and Secretary since March 2008
Principal Occupation(s) During Past 5 Years: Associate General Counsel, RBC Capital Markets, LLC (2006-present); Asset Management Compliance, RiverSource Investments (2004-2006)
| (1) | Except as otherwise noted, the address of each Trustee/Officer is RBC Funds Trust, 100 South Fifth Street, Suite 2300, Minneapolis, Minnesota 55402. |
| (2) | All Trustees must retire on or before December 31 of the year in which they reach age 75. The Board may temporarily waive this requirement when necessary to avoid depriving the Board of a Trustee with critical skills. |
| (3) | On December 31, 2009, Voyageur Asset Management Inc. changed its name to RBC Global Asset Management (U.S.) Inc. Any references to RBC Global Asset Management (U.S.) Inc. for prior periods are deemed to be references to the prior entity. |
| (4) | Each officer serves in such capacity for an indefinite period of time until his or her removal, resignation or retirement. |
| (5) | Kathleen A. Gorman has been determined to be an interested Trustee by virtue of her position with the Advisor. |
The Funds’ Statement of Additional Information includes information about the Funds’ Trustees. To receive your free copy of the Statement of Additional Information, call toll free: 1-800-422-2766.
81
|
The RBC Equity Funds offer up to four share classes. These four share classes are the A, C, I, and S classes.
For an investor purchasing RBC Funds shares through a financial services intermediary, the question as to which share class, A or C, is the better choice is dependent on many factors, including the amount to be invested and the length of time an investor anticipates holding the shares. An investor should consult with his or her financial advisor about his or her personal financial situation to determine which share class is the best choice for his or her individual situation.
Class A
Class A shares of all Funds except Mid Cap Value are available for purchase primarily through investment advisors, broker-dealers, banks and other financial services intermediaries. Class A shares of the Funds are currently subject to a maximum up-front sales charge of 5.75% and a 1.00% CDSC for redemption within 12 months of a $1 million or greater purchase. Class A shares currently include a 0.25% (25 bps) annual 12b-1 service and distribution fee. Class A shares have a higher up-front sales charge (load) than Class C shares, but a lower annual expense ratio.
Class C
Class C shares of all Funds except Mid Cap Value are also available for purchase primarily through investment advisors, broker-dealers, banks and other financial services intermediaries. Class C shares redeemed within 12 months of purchase are subject to a CDSC of 1.00%. (No CDSC will be charged on shares acquired through reinvestment of dividends or capital gains.) C Class shares expenses include a 1.00% (100 bps) annual 12b-1 service and distribution fee. Class C shares have a lower up-front sales charge (load) than Class A shares, but due to the higher service and distribution fee, have higher annual expenses than A Class shares.
Class S
Class S shares of all Funds except Mid Cap Value are available to investors purchasing shares directly through the Fund or its agent, U.S. Bancorp Fund Services LLC, or through certain fee-based programs of broker-dealers or registered investment advisors. This share class does not have an up-front sales charge (load) or a 12b-1 service and distribution fee.
Class I
Class I shares are available in the SMID Cap Growth, Enterprise and Mid Cap Value Funds. This share class is intended for investors meeting certain minimum investment thresholds. This share class does not have an up-front sales charge (load) or a 12b-1 service and distribution fee.
82
Shareholder Expense Examples
As a shareholder of the RBC Funds, you incur two types of costs: (1) transaction costs, including sales charges (loads) and (2) ongoing costs, including management fees; 12b-1 distribution and service fees; and other Fund expenses. This example is intended to help you understand your ongoing costs (in dollars) of investing in the RBC Funds and to compare these costs with the ongoing costs of investing in other mutual funds.
The example is based on an investment of $1,000 invested at the beginning of the period and held for the entire period from April 1, 2012 through September 30, 2012.
Actual Expenses and Performance
The table below provides information about actual account values and actual expenses. You may use the information below, together with the amount you invested, to estimate the expenses that you paid over the period. Simply divide your account value by $1,000 (for example, an $8,600 account value divided by $1,000 = 8.6), then multiply the result by the number in the table under the heading entitled “Expenses Paid During Period” to estimate the expenses you paid on your account during this period.
| Beginning Account Value 4/1/2012 | Ending Account Value 9/30/2012 | Expenses Paid During Period* 4/1/12-9/30/12 | Annualized Expense Ratio During Period 4/1/12-9/30/12 | ||||||||||||||||||||||
SMID Cap Growth Fund | Class A | $ | 1,000.00 | $ | 1,009.70 | $ | 6.75 | 1.35 | % | ||||||||||||||||
| Class I | 1,000.00 | 1,010.50 | 5.50 | 1.10 | % | ||||||||||||||||||||
| Class C | 1,000.00 | 1,005.90 | 10.47 | 2.10 | % | ||||||||||||||||||||
| Class S | 1,000.00 | 1,011.20 | 5.50 | 1.10 | % | ||||||||||||||||||||
Enterprise Fund | Class A | 1,000.00 | 1,046.80 | 6.77 | 1.33 | % | |||||||||||||||||||
| Class I | 1,000.00 | 1,047.50 | 5.45 | 1.07 | % | ||||||||||||||||||||
| Class C | 1,000.00 | 1,042.40 | 10.56 | 2.08 | % | ||||||||||||||||||||
| Class S | 1,000.00 | 1,047.50 | 5.50 | 1.08 | % | ||||||||||||||||||||
Small Cap Core Fund | Class A | 1,000.00 | 996.30 | 6.45 | 1.30 | % | |||||||||||||||||||
| Class C | 1,000.00 | 992.50 | 10.16 | 2.05 | % | ||||||||||||||||||||
| Class S | 1,000.00 | 997.20 | 5.21 | 1.05 | % | ||||||||||||||||||||
Microcap Value Fund | Class A | 1,000.00 | 1,030.00 | 6.66 | 1.32 | % | |||||||||||||||||||
| Class C | 1,000.00 | 1,025.80 | 10.43 | 2.07 | % | ||||||||||||||||||||
| Class S | 1,000.00 | 1,031.60 | 5.40 | 1.07 | % | ||||||||||||||||||||
Mid Cap Value Fund | Class I | 1,000.00 | 968.20 | 4.40 | 0.90 | % | |||||||||||||||||||
*Expenses are equal to the average account value times the Fund’s annualized expense ratio multiplied by 182/366 (to reflect one-half year period).
83
SUPPLEMENTAL INFORMATION (UNAUDITED) |
|
Hypothetical Example for Comparison Purposes
The table below provides information about hypothetical account values and hypothetical expenses based on each RBC Funds’ actual expense ratio and an assumed rate of return of 5% per year before expenses, which is not the Fund’s actual return. The hypothetical account values and expenses may not be used to estimate the actual ending account balance or expenses you paid for the period. You may use this information to compare this 5% hypothetical example with the 5% hypothetical examples that appear in the shareholder reports of other funds.
Please note that the expenses shown in the table are meant to highlight your ongoing costs only and do not reflect any transactional costs, such as sales charges (loads), redemption fees, or exchange fees. Therefore, the table is useful in comparing ongoing costs only, and will not help you determine the relative total costs of owning different funds. In addition, if these transactional costs were included, your costs would have been higher.
| Beginning Account Value 4/1/2012 | Ending Account Value 9/30/2012 | Expenses Paid During Period* 4/1/12-9/30/12 | Annualized Expense Ratio During Period 4/1/12-9/30/12 | ||||||||||||||||||||||
SMID Cap Growth Fund | Class A | $ | 1,000.00 | $ | 1,018.15 | $ | 6.77 | 1.35 | % | ||||||||||||||||
| Class I | 1,000.00 | 1,019.39 | 5.52 | 1.10 | % | ||||||||||||||||||||
| Class C | 1,000.00 | 1,014.42 | 10.52 | 2.10 | % | ||||||||||||||||||||
| Class S | 1,000.00 | 1,019.39 | 5.52 | 1.10 | % | ||||||||||||||||||||
Enterprise Fund | Class A | 1,000.00 | 1,018.25 | 6.67 | 1.33 | % | |||||||||||||||||||
| Class I | 1,000.00 | 1,019.54 | 5.37 | 1.07 | % | ||||||||||||||||||||
| Class C | 1,000.00 | 1,014.52 | 10.42 | 2.08 | % | ||||||||||||||||||||
| Class S | 1,000.00 | 1,019.49 | 5.42 | 1.08 | % | ||||||||||||||||||||
Small Cap Core Fund | Class A | 1,000.00 | 1,018.40 | 6.52 | 1.30 | % | |||||||||||||||||||
| Class C | 1,000.00 | 1,014.67 | 10.27 | 2.05 | % | ||||||||||||||||||||
| Class S | 1,000.00 | 1,019.64 | 5.27 | 1.05 | % | ||||||||||||||||||||
Microcap Value Fund | Class A | 1,000.00 | 1,018.30 | 6.62 | 1.32 | % | |||||||||||||||||||
| Class C | 1,000.00 | 1,014.57 | 10.37 | 2.07 | % | ||||||||||||||||||||
| Class S | 1,000.00 | 1,019.54 | 5.37 | 1.07 | % | ||||||||||||||||||||
Mid Cap Value Fund | Class I | 1,000.00 | 1,020.39 | 4.52 | 0.90 | % | |||||||||||||||||||
*Expenses are equal to the average account value times the Fund’s annualized expense ratio multiplied by 182/366 (to reflect one-half year period).
84
|
|
Information Regarding the Approval of Investment Advisory Agreements
In September 2012, after evaluating the services provided by RBC Global Asset Management (U.S.), Inc. (the “Advisor”) and reviewing the performance, fees, and expenses of the Funds, the RBC Funds Board of Trustees (the “Trustees”) determined to approve the continuation of the investment advisory agreements (“Agreements”) with the Advisor for each Fund for an additional year.
As part of their review of the Agreements, the Trustees requested and considered information regarding the advisory services performed by the Advisor, the staffing and qualifications of the personnel responsible for operating and managing the Funds, and the Funds’ performance and expenses. The Trustees considered information provided at regular quarterly Board and Committee meetings throughout the year as well as information presented at both a special meeting held to review requested material related to the proposed renewals and a meeting held specifically to consider the proposed renewals. In connection with their deliberations, the independent Trustees were advised by their own independent legal counsel with regard to the materials and their responsibilities under relevant laws and regulations.
The Trustees met with representatives from the Advisor’s senior management team, as well as senior investment professionals, to discuss the information and the Advisor’s ongoing management of the Funds. The Trustees reviewed the nature, quality, and extent of the services provided to the Funds by the Advisor, including information as to each Fund’s performance relative to appropriate index benchmarks as well as fund peer group comparative information requested by the Board. The Trustees also reviewed supplemental information from the Advisor.
The Trustees noted that the 1 and 3 year performance of each of the Funds was favorable relative to each Fund’s Lipper peer group1 and peer universe for the fiscal year ended June 30, 2012, with the exception of the Mid Cap Value Fund, and recognized that both the SMID Cap Growth Fund and Mid Cap Value Fund had received four-star ratings from Morningstar.
The Trustees reviewed comparative fee and expense information on the services to be rendered to each Fund and the investment advisory fees payable to the Advisor. The Trustees also received reports from the Advisor regarding other investment companies it advised, including the advisory fees paid and the reasons for differences in fees. The Trustees reviewed profitability data — including year-over-year variances — for the Advisor and considered information regarding other benefits the Advisor and its affiliates derived from their relationships with the Funds, including soft dollars and other fall-out benefits and the Advisor’s role as co-administrator of the Funds and the fees paid by the Funds for such services. The Trustees also considered the Advisor’s contractual agreement to subsidize Fund expenses at competitive levels through expense limitation agreements and viewed such commitments favorably.
Based upon their review, the Trustees determined that the advisory fees proposed to be payable to the Advisor were fair and reasonable in light of the level and quality of services provided under all the circumstances and were within the range of what might have been negotiated at arms’ length. The Trustees concluded that it is in the interests of the Funds and their shareholders for the Trustees to approve the continuation of the Agreements and the expense limitation agreements for the Funds. In arriving at their collective decision to approve the renewal of the Agreements, the Trustees did not assign relative weights to the factors discussed above or deem any one or group of them to be controlling in and of itself.
1 Note that only Lipper peer universe information was available for the Microcap Value Fund.
85
|
This Page Intentionally Left Blank
|
|
86
|
This Page Intentionally Left Blank
|
|
87
|
This Page Intentionally Left Blank
|
|
88
|
This Page Intentionally Left Blank
|
|
89
|
This Page Intentionally Left Blank
|
|
90
|
This Page Intentionally Left Blank
|
|
91
|
This Page Intentionally Left Blank
|
|
92
RBC Funds
P.O. Box 701
Milwaukee, WI 53201-0701
800-422-2766
www.rbcgam.us
Performance data represents past performance and does not guarantee future results. The principal value of an investment and investment return will fluctuate so that an investor’s shares, when redeemed, may be worth more or less than their original cost.
This report and the financial statements contained herein are provided for the information of RBC Funds shareholders. This report is not authorized for distribution to prospective investors unless preceded or accompanied by a current prospectus, which contains information concerning investment objectives, risks, charges and expenses of the funds. Please read the prospectus carefully before investing.
This report and the financial statements contained herein are not intended to be a forecast of future events, a guarantee of future results, or investment advice. There is no assurance that certain securities will remain in or out of each fund’s portfolio. The views expressed in this report reflect those of the portfolio managers through the period ended September 30, 2012.
NOT FDIC INSURED l NO BANK GUARANTEE l MAY LOSE VALUE
RBC Global Asset Management, Inc. serves as investment adviser for the RBC Funds. RBC Funds are distributed by Quasar Distributors LLC.
| ||
| The RBC Funds are pleased to offer shareholder reports printed entirely on Forest Stewardship Council certified paper. FSC® certification ensures that the paper used in this report contains fiber from well-managed and responsibly harvested forests that meet strict environmental and socioeconomic standards. | ||
RBCF-EQ AR 09-12

Annual Report
For the year ended September 30, 2012
Prime Money Market Fund
U.S. Government Money Market Fund
Tax-Free Money Market Fund
RBC Global
Asset Management
| ||||||||
| RBC Funds | ||||||||
About Your |
This annual report includes detailed information about your Fund including financial statements, performance, and a complete list of holdings.
| |||||||
We hope the financial information presented will help you evaluate your investment in the RBC Funds. We also encourage you to read your Fund’s prospectus for further detail as to your Fund’s investment policies and risk profile. RBC Funds prospectuses and additional performance information are available on our website at www.rbcgam.us.
| ||||||||
A description of the policies and procedures that your Fund uses to determine how to vote proxies relating to portfolio securities is available (i) without charge, upon request, by calling 1-800-422-2766; (ii) on the Fund’s website at www.rbcgam.us; and (iii) on the Securities and Exchange Commission’s (“Commission”) website at http://www.sec.gov.
| ||||||||
Information regarding how your Fund voted proxies relating to portfolio securities during the most recent 12-month period ended June 30 is available (i) on the Fund’s website at www.rbcgam.us; and (ii) on the Commission’s website at http://www.sec.gov.
| ||||||||
| A schedule of each Fund’s portfolio holdings will be filed with the Commission for the first and third quarters of each fiscal year on Form N-Q. This information is available on the Commission’s website at http://www.sec.gov and may be reviewed and copied at the Commission’s Public Reference Room in Washington, D.C. Information on the operation of the Public Reference Room is available by calling 1-202-551-8090. | ||||||||
| ||||||||
| Letter from the Chief Investment Officer | 1 | |||||||
| Money Market Portfolio Managers | 3 | |||||||
| Performance Summary | 4 | |||||||
| Schedules of Portfolio Investments | 8 | |||||||
| Financial Statements | ||||||||
| - Statements of Assets and Liabilities | 36 | |||||||
| - Statements of Operations | 38 | |||||||
| - Statements of Changes in Net Assets | 39 | |||||||
| Financial Highlights | 42 | |||||||
| Notes to Financial Statements | 48 | |||||||
| Report of Independent Registered Public Accounting Firm | 59 | |||||||
| Other Federal Income Tax Information | 60 | |||||||
| Management | 61 | |||||||
| Supplemental Information | 64 | |||||||
| Approval of Investment Advisory Agreement | 66 | |||||||
1
LETTER FROM THE CHIEF INVESTMENT OFFICER
|
appropriate and effective solutions. As we face the simultaneous expiration of a series of stimulus programs and tax cuts on December 31, we approach the arrival of another limit on the size of the federal debt. While the odds of a conciliatory resolution are low, we believe that a more likely outcome is that several maturing provisions will be delayed and that the ceiling level will be raised.
| ||||||
Looking forward, we continue to believe that very low yields will prevail across the front-end of the curve and in particular for money market funds. Going forward, we will seek opportunities to positively impact performance using our conservative list of approved issuers, by investing in industrials and the strongest financial institutions, while maintaining appropriate levels of liquidity. We will also remain proactive in monitoring areas of risk across all market sectors. Our approved list of issuers will continue to reflect the thorough and conservative nature of our credit review process. Depending on how the efforts unfold in forming a resolution for the critical domestic fiscal matters, there may be an intermittent impact for short-term investors related to credit spreads, market rates, and the liquidity of certain short-term instruments. Through all these ups and downs, investors who have remained focused on their financial objectives within the appropriate broad context have generally been successful. Thank you for your continued confidence and trust in the RBC Funds.
| ||||||
Sincerely,
| ||||||
| ||||||
Michael Lee, CFA CEO, President and Chief Investment Officer RBC Global Asset Management (U.S.) Inc.
| ||||||
Past performance is not a guarantee of future results.
| ||||||
Opinions expressed are subject to change, are not guaranteed, and should not be considered a recommendation to buy or sell any security.
| ||||||
| An investment in a Money Market Fund is not insured or guaranteed by the Federal Deposit Insurance Corporation or any other government agency. Although Money Market Funds seek to preserve the value of your investment at $1.00 per share, it is possible to lose money by investing in them. These risks are more fully described in the prospectus. |
2


3
|
| RBC Money Market Funds | ||||||
RBC Money Market Funds | The RBC Money Market Funds seek to achieve the highest level of current income as is consistent with prudent investment management emphasizing the safety of principal and the maintenance of suitable liquidity. The Funds invest in a variety of highly rated money market instruments. In the Tax-Free Money Market Fund, investments are made in highly rated debt obligations that pay interest exempt from federal income taxes and the alternative minimum tax. | |||||
| The RBC Money Market Funds are not benchmarked to industry indices, although their performance is evaluated against each Fund’s respective peer group as reported by several service providers. | ||||||
Taxable Money Market Funds | The Federal Reserve continues to hold market yields at exceptionally low levels. Similar actions have been taken by central banks across the other developed economies in an effort to promote a sustainable economic recovery. Here in the U.S., this has been true both at the short end of the yield curve, where they typically exert their influence through monetary policy, and at the longer end of the curve through unconventional actions in recent years. Central banks remain resolute in their support of global economic growth, and this trend is unlikely to change in the near term. We do not foresee a change to current U.S. monetary policy until the year 2015. | |||||
| The impact of central bank policies on the money market fund industry continues to be dramatic. Investment yields on short term securities remain at ultra low levels. Throughout the past year, overnight repo rates ranged from near-zero through the early months to became somewhat elevated in relative terms during the summer and fall months. Higher repo rates were in part the result of the Federal Reserve activities of selling very short Treasury securities as a means to fund their purchases of longer term Treasury notes, bonds, and agency mortgage backed securities. In addition, we are in a relative calm period of European-induced flight to quality that would otherwise have placed downward pressure on Treasury yields. Credit spreads have generally declined across the various sectors used in short-term portfolios. There continues to be exceptionally high demand for high quality, short-term corporate, municipal, and agency instruments. | ||||||
| We observed that a number of money market fund managers increased their allocations in European and Japanese bank holdings as the year progressed, perhaps in response to further measures implemented by European Central Bank (ECB) to stabilize the Eurozone financial sector. Comparisons of portfolio composition across funds in the peer group reflect the differences in managers’ views of risk for the more volatile market segments. We have remained cautious in moving back into these sectors. Our exposures to European banks remained modest in concentration and limited to a select group of non-European Union banks. The market generally seems to be temporarily comforted by the cumulative measures although a lasting solution is still a work in progress. Our portfolios are managed with a high degree of liquidity in less than 30 days, while we extend our longer term investment activity using the highest quality issuers in a well diversified manner. Our more conservative view of risk, as reflected in mid-level performance figures, has contributed to keeping our institutional share classes to a relatively modest portion of overall fund balances. | ||||||
4
PERFORMANCE SUMMARY
| ||||||
| RBC Money Market Funds | ||||||
| As of this writing, there are ongoing concerns related to the degree to which the U.S. Congress can reach a meaningful resolution to a year-end ‘fiscal cliff’ when a menu of stimulus measures are due to expire. This has led to an elevated degree of uncertainty on the part of investors who have been cautious in extending their investment activity beyond a very short term horizon. Cash remains on the sidelines until more clarity on these matters become available. | ||||||
| Interest rates on securities with short maturities remained very low during the year. This was true including the short maturity tax-exempt securities held by the Fund. The great majority of the Fund’s assets have effective maturities of 7 days or less, which provides very strong liquidity. The balance of the portfolio is invested in high quality securities with maturities of 2 weeks to 13 months. The average maturity of the Fund generally ranged from 21 to 30 days during the year, which was a bit shorter than the average of other tax-exempt money market funds. We consider the portfolio to be well diversified among a large number of high quality issuers. | Tax-Free Money Market Fund | |||||
5
PERFORMANCE SUMMARY
| ||||||||||||||
Investment Objective | Each of the RBC Money Market Funds was managed to preserve principal. This means that the share price of each fund held steady at $1.00. A consistent share price of $1.00 is expected for a money market mutual fund. An investment in the Fund is not insured or guaranteed by the Federal Deposit Insurance Corporation or any other government agency. Although the Fund seeks to preserve the value of your investment at $1.00 per share, it is possible to lose money by investing in the Fund. These risks are more fully described in the prospectus.
| |||||||||||||
Total Return | SEC 7-Day Annualized Yield (1) | |||||||||||||
September 30, | September 30, | |||||||||||||
| Prime Money Market Fund | ||||||||||||||
| RBC Institutional Class 1 | 0.09% | 0.11% | 0.07% | |||||||||||
| RBC Institutional Class 2 | 0.01% | 0.01% | 0.01% | |||||||||||
| RBC Investor Class | 0.01% | 0.01% | 0.01% | |||||||||||
| RBC Reserve Class | 0.01% | 0.01% | 0.01% | |||||||||||
| RBC Select Class | 0.01% | 0.01% | 0.01% | |||||||||||
| U.S. Government Money Market Fund | ||||||||||||||
| RBC Institutional Class 1 | 0.01% | 0.01% | 0.01% | |||||||||||
| RBC Institutional Class 2 | 0.01% | 0.01% | 0.01% | |||||||||||
| RBC Investor Class | 0.01% | 0.01% | 0.01% | |||||||||||
| RBC Reserve Class | 0.01% | 0.01% | 0.01% | |||||||||||
| RBC Select Class | 0.01% | 0.01% | 0.01% | |||||||||||
| Tax-Free Money Market Fund | ||||||||||||||
| RBC Institutional Class 1 | 0.02% | 0.01% | 0.05% | |||||||||||
| RBC Institutional Class 2 | 0.01% | 0.01% | 0.01% | |||||||||||
| RBC Investor Class | 0.01% | 0.01% | 0.01% | |||||||||||
| RBC Reserve Class | 0.01% | 0.01% | 0.01% | |||||||||||
| RBC Select Class | 0.01% | 0.01% | 0.01% | |||||||||||
(1) As money market returns respond rapidly to market changes, such as in the Fed Funds rate, the 7-Day yield is a more accurate reflection of current earnings than the total return for the year. Prior year 7-Day yield information is provided for comparative purposes. | ||||||||||||||
| Performance data quoted represents past performance. Past performance is no guarantee of future results. Investment return and principal value of an investment will fluctuate so that an investor’s shares, when redeemed, may be worth more or less than their original cost. Current performance may be lower or higher than performance quoted. Performance shown reflects contractual fee waivers, without such fee waivers total returns would be reduced. For performance data current to most recent month-end go to www.rbcgam.us. | ||||||||||||||
6
PERFORMANCE SUMMARY
| ||||||||||||
| Asset Allocation | ||||||||||||
Money Market Maturity Schedules as a percentage of value of investments based on effective maturity as of September 30, 2012. | ||||||||||||
Prime | U.S. | Tax-Free | ||||||||||
Less than 8 days | 44.1% | 49.1% | 81.5% | |||||||||
8 to 14 Days | 7.0% | 2.1% | 0.7% | |||||||||
15 to 30 Days | 16.8% | 14.9% | 3.9% | |||||||||
31 to 180 Days | 25.5% | 25.3% | 10.5% | |||||||||
181 to 365 Days | 6.6% | 8.6% | 3.4% | |||||||||
7
SCHEDULE OF PORTFOLIO INVESTMENTS
| ||||||
| Prime Money Market Fund | ||||||
| ||||||
September 30, 2012 | ||||||
| Principal Amount | Value | |||||||||
| ||||||||||
Asset Backed Securities — 0.56% | ||||||||||
Asset Backed Auto Receivables — 0.04% | ||||||||||
| $ | 4,791,653 | Honda Auto Receivables Owner Trust Series 2012-1 Class A1, 0.41%, 3/15/13 | $ | 4,791,653 | ||||||
|
| |||||||||
Finance - Diversified Domestic — 0.52% |
| |||||||||
| 27,816,659 | CNH Equipment Trust Series 2012-A Class A1, 0.43%, 4/12/13 | 27,816,659 | ||||||||
| 14,824,462 | Enterprise Fleet Funding LLC, 0.46%, 5/20/13(a) | 14,824,462 | ||||||||
| 8,403,893 | Great America Leasing Receivables Series 2012-1 Class A1, 0.51%, 4/15/13(a) | 8,403,893 | ||||||||
| 13,068,478 | Volvo Financial Equipment LLC Series 2012-1A Class A1, 0.35%, 3/15/13(a) | 13,068,478 | ||||||||
|
| |||||||||
| 64,113,492 | ||||||||||
|
| |||||||||
Total Asset Backed Securities | 68,905,145 | |||||||||
|
| |||||||||
(Cost $68,905,145) | ||||||||||
Asset Backed Commercial Paper — 1.62% | ||||||||||
Finance - Diversified Domestic — 1.62% | ||||||||||
| 50,000,000 | Collateralized Commercial Paper II Co., LLC, 0.34%, 1/4/13, (JPMorgan)(b) | 49,955,139 | ||||||||
| 50,000,000 | Kells Funding LLC, 0.29%, 10/19/12(a)(b) | 49,992,750 | ||||||||
| 50,000,000 | Kells Funding LLC, 0.30%, 11/28/12(a)(b) | 49,975,833 | ||||||||
| 50,000,000 | Kells Funding LLC, 0.34%, 11/29/12(a)(b) | 49,972,139 | ||||||||
|
| |||||||||
Total Asset Backed Commercial Paper | 199,895,861 | |||||||||
|
| |||||||||
(Cost $199,895,861) | ||||||||||
Commercial Paper — 29.14% | ||||||||||
Agriculture — 0.95% | ||||||||||
| 85,000,000 | Archer-Daniels-Midland Co., 0.16%, 10/9/12(a)(b) | 84,996,978 | ||||||||
| 32,000,000 | Archer-Daniels-Midland Co., 0.17%, 10/11/12(a)(b) | 31,998,489 | ||||||||
|
| |||||||||
| 116,995,467 | ||||||||||
|
| |||||||||
Banks - Australia & New Zealand — 2.35% | ||||||||||
| 50,000,000 | Australia & New Zealand Banking Group Ltd., 0.54%, 2/25/13(a)(b) | 49,889,750 | ||||||||
| 40,000,000 | Commonwealth Bank Australia, 0.25%, 11/8/12(a)(b) | 40,001,439 | ||||||||
| 50,000,000 | Commonwealth Bank Australia, 0.34%, 10/15/12(a)(b) | 49,993,389 | ||||||||
| 50,000,000 | National Australia Funding Delaware, Inc., 0.32%, 10/25/12(a)(b) | 49,989,333 | ||||||||
| 50,000,000 | National Australia Funding Delaware, Inc., 0.35%, 11/5/12(a)(b) | 49,982,986 | ||||||||
| 50,000,000 | Westpac Banking Corp., 0.36%, 1/7/13(a)(b) | 50,000,000 | ||||||||
|
| |||||||||
| 289,856,897 | ||||||||||
|
| |||||||||
Banks - Domestic — 0.57% | ||||||||||
| 10,950,000 | John Deere Bank SA, 0.17%, 10/3/12(a)(b) | 10,949,897 | ||||||||
| 46,690,000 | John Deere Bank SA, 0.17%, 10/15/12(a)(b) | 46,686,913 | ||||||||
| 13,000,000 | John Deere Bank SA, 0.20%, 10/11/12(a)(b) | 12,999,278 | ||||||||
|
| |||||||||
| 70,636,088 | ||||||||||
|
| |||||||||
8
SCHEDULE OF PORTFOLIO INVESTMENTS
| ||||||
| Prime Money Market Fund (cont.) | ||||||
| ||||||
September 30, 2012 | ||||||
| Principal Amount | Value | |||||||||
| ||||||||||
Banks - Foreign — 10.68% |
| |||||||||
| $ | 50,000,000 | Bank of Tokyo-Mitsubishi UFJ NY, 0.30%, 12/12/12(b) | $ | 49,970,000 | ||||||
| 50,000,000 | Credit Suisse New York, 0.37%, 10/4/12(b) | 49,998,458 | ||||||||
| 50,000,000 | DnB NOR Bank ASA, 0.32%, 10/4/12(a)(b) | 49,998,667 | ||||||||
| 10,200,000 | DnB NOR Bank ASA, 0.35%, 10/10/12(a)(b) | 10,199,107 | ||||||||
| 75,000,000 | DnB NOR Bank ASA, 0.44%, 10/12/12(a)(b) | 75,006,364 | ||||||||
| 40,000,000 | DnB NOR Bank ASA, 0.52%, 1/9/13(a)(b) | 39,942,222 | ||||||||
| 75,000,000 | Mitsubishi UFJ Trust & Bank NY, 0.34%, 11/29/12(a)(b) | 74,958,208 | ||||||||
| 50,000,000 | Mitsubishi UFJ Trust & Bank NY, 0.37%, 10/3/12(a)(b) | 49,998,972 | ||||||||
| 100,000,000 | NRW Bank, 0.18%, 10/2/12(a)(b) | 99,999,500 | ||||||||
| 100,000,000 | NRW Bank, 0.20%, 10/4/12(a)(b) | 99,998,333 | ||||||||
| 100,000,000 | NRW Bank, 0.20%, 10/9/12(a)(b) | 99,995,556 | ||||||||
| 50,000,000 | Rabobank Nederland NY, 0.42%, 2/1/13(b) | 49,928,250 | ||||||||
| 35,000,000 | Rabobank USA Finance Corp., 0.22%, 10/31/12(b) | 34,993,583 | ||||||||
| 50,000,000 | Rabobank USA Finance Corp., 0.30%, 10/16/12(b) | 49,993,750 | ||||||||
| 65,000,000 | Rabobank USA Finance Corp., 0.49%, 3/1/13(b) | 64,866,407 | ||||||||
| 125,000,000 | Skandinaviska Enskilda Banken AB, 0.16%, 10/2/12(a)(b) | 124,999,444 | ||||||||
| 50,000,000 | Skandinaviska Enskilda Banken AB, 0.30%, 11/27/12(a)(b) | 49,976,250 | ||||||||
| 50,000,000 | Skandinaviska Enskilda Banken AB, 0.30%, 12/12/12(a)(b) | 49,970,000 | ||||||||
| 40,000,000 | Sumitomo Mitsui Banking Corp., 0.18%, 10/10/12(a)(b) | 39,998,200 | ||||||||
| 50,000,000 | Sumitomo Mitsui Banking Corp., 0.29%, 12/20/12(a)(b) | 49,968,333 | ||||||||
| 50,000,000 | Sumitomo Mitsui Banking Corp., 0.32%, 11/1/12(a)(b) | 49,986,222 | ||||||||
| 50,000,000 | Svenska Handelsbanken, Inc., 0.30%, 10/19/12(a)(b) | 49,992,500 | ||||||||
|
| |||||||||
| 1,314,738,326 | ||||||||||
|
| |||||||||
Banks - United Kingdom — 1.22% |
| |||||||||
| 50,000,000 | Barclays US Funding LLC, 0.35%, 11/14/12(b) | 49,978,611 | ||||||||
| 50,000,000 | Barclays US Funding LLC, 0.50%, 12/21/12(b) | 49,943,750 | ||||||||
| 50,000,000 | HSBC USA, Inc., 0.30%, 10/9/12(b) | 49,996,667 | ||||||||
|
| |||||||||
| 149,919,028 | ||||||||||
|
| |||||||||
Consumer Discretionary — 1.98% |
| |||||||||
| 55,650,000 | Coca-Cola Co., 0.22%, 11/13/12(a)(b) | 55,635,376 | ||||||||
| 25,000,000 | Coca-Cola Co., 0.22%, 11/19/12(a)(b) | 24,992,514 | ||||||||
| 40,000,000 | Coca-Cola Co., 0.23%, 10/2/12(a)(b) | 39,999,744 | ||||||||
| 26,700,000 | Coca-Cola Co., 0.25%, 2/1/13(a)(b) | 26,677,194 | ||||||||
| 25,000,000 | Coca-Cola Co., 0.26%, 12/3/12(a)(b) | 24,988,625 | ||||||||
| 50,000,000 | Coca-Cola Co., 0.26%, 1/7/13(a)(b) | 49,964,611 | ||||||||
| 22,000,000 | Coca-Cola Co., 0.32%, 2/27/13(a)(b) | 21,970,862 | ||||||||
|
| |||||||||
| 244,228,926 | ||||||||||
|
| |||||||||
Finance - Diversified Domestic — 7.42% |
| |||||||||
| 50,000,000 | BHP Billiton Finance USA Ltd., 0.19%, 11/19/12(a)(b) | 49,987,070 | ||||||||
| 50,000,000 | BHP Billiton Finance USA Ltd., 0.19%, 11/20/12(a)(b) | 49,986,806 | ||||||||
| 50,000,000 | BHP Billiton Finance USA Ltd., 0.21%, 12/3/12(a)(b) | 49,981,625 | ||||||||
| 25,000,000 | BHP Billiton Finance USA Ltd., 0.33%, 2/5/13(a)(b) | 24,970,896 | ||||||||
| 50,000,000 | BHP Billiton Finance USA Ltd., 0.35%, 11/13/12(a)(b) | 49,979,097 | ||||||||
9
SCHEDULE OF PORTFOLIO INVESTMENTS
| ||||||
| Prime Money Market Fund (cont.) | ||||||
| ||||||
September 30, 2012 | ||||||
| Principal Amount | Value | |||||||||
| ||||||||||
| $ | 50,000,000 | Erste Abwicklungsanstalt, 0.22%, 11/29/12(a)(b) | $ | 49,981,972 | ||||||
| 10,000,000 | John Deere Financial Ltd., 0.17%, 10/5/12(a)(b) | 9,999,811 | ||||||||
| 50,000,000 | Nestle Capital Corp., 0.27%, 10/16/12(a)(b) | 49,994,375 | ||||||||
| 50,000,000 | Nestle Capital Corp., 0.37%, 5/28/13(a)(b) | 49,877,181 | ||||||||
| 50,000,000 | Nestle Capital Corp., 0.37%, 8/26/13(a)(b) | 49,830,931 | ||||||||
| 100,000,000 | Nestle Finance International Ltd., 0.27%, 4/1/13(b) | 99,866,028 | ||||||||
| 50,000,000 | Reckitt Benckiser Treasury Services Plc, 0.33%, 10/19/12(a)(b) | 49,991,750 | ||||||||
| 30,000,000 | Reckitt Benckiser Treasury Services Plc, 0.50%, 6/13/13(a)(b) | 29,893,750 | ||||||||
| 25,000,000 | Toyota Motor Credit Corp., 0.26%, 1/7/13(b) | 24,982,306 | ||||||||
| 75,000,000 | Toyota Motor Credit Corp., 0.40%, 11/6/12(b) | 74,970,000 | ||||||||
| 25,000,000 | Toyota Motor Credit Corp., 0.45%, 4/29/13(b) | 24,934,375 | ||||||||
| 100,000,000 | Toyota Motor Credit Corp., 0.64%, 2/11/13(b) | 99,763,556 | ||||||||
| 75,000,000 | Unilever Capital Corp., 0.45%, 1/17/13(a)(b) | 74,898,750 | ||||||||
|
| |||||||||
| 913,890,279 | ||||||||||
|
| |||||||||
Health Care — 0.41% |
| |||||||||
| 25,000,000 | Dean Health Systems, Inc., 0.20%, 11/8/12(b) | 24,994,722 | ||||||||
| 25,000,000 | Trinity Health Corp., 0.19%, 11/8/12(b) | 24,994,986 | ||||||||
|
| |||||||||
| 49,989,708 | ||||||||||
|
| |||||||||
Insurance — 1.11% |
| |||||||||
| 9,600,000 | AXA Financial, Inc., 0.31%, 10/1/12(b) | 9,600,000 | ||||||||
| 22,500,000 | AXA Financial, Inc., 0.37%, 10/1/12(a)(b) | 22,500,000 | ||||||||
| 15,000,000 | Massachusetts Mutual Life Insurance Co., 0.16%, 10/9/12(a)(b) | 14,999,467 | ||||||||
| 15,000,000 | Massachusetts Mutual Life Insurance Co., 0.17%, 10/16/12(a)(b) | 14,998,937 | ||||||||
| 25,000,000 | Massachusetts Mutual Life Insurance Co., 0.17%, 10/22/12(a)(b) | 24,997,521 | ||||||||
| 25,000,000 | Massachusetts Mutual Life Insurance Co., 0.17%, 10/23/12(a)(b) | 24,997,403 | ||||||||
| 25,000,000 | Metlife Short Term Funding LLC, 0.37%, 10/9/12(a)(b) | 24,997,944 | ||||||||
|
| |||||||||
| 137,091,272 | ||||||||||
|
| |||||||||
Manufacturing — 1.37% |
| |||||||||
| 45,100,000 | Danaher Corp., 0.16%, 10/2/12(a)(b) | 45,099,800 | ||||||||
| 44,000,000 | Danaher Corp., 0.16%, 10/5/12(a)(b) | 43,999,218 | ||||||||
| 79,000,000 | Praxair, Inc., 0.16%, 10/1/12(b) | 79,000,000 | ||||||||
|
| |||||||||
| 168,099,018 | ||||||||||
|
| |||||||||
Utilities — 1.08% |
| |||||||||
| 50,000,000 | Electricite de France SA, 0.31%, 10/1/12(a)(b) | 50,000,000 | ||||||||
| 50,000,000 | Electricite de France SA, 0.40%, 10/31/12(a)(b) | 49,983,333 | ||||||||
| 33,479,000 | Electricite de France SA, 0.43%, 10/11/12(a)(b) | 33,475,001 | ||||||||
|
| |||||||||
| 133,458,334 | ||||||||||
|
| |||||||||
Total Commercial Paper | 3,588,903,343 | |||||||||
|
| |||||||||
(Cost $3,588,903,343) |
| |||||||||
10
SCHEDULE OF PORTFOLIO INVESTMENTS
| ||||||
| Prime Money Market Fund (cont.) | ||||||
| ||||||
September 30, 2012 | ||||||
| Principal Amount | Value | |||||||||
| ||||||||||
Certificates of Deposit, Domestic — 2.44% | ||||||||||
Banks - Domestic — 2.44% | ||||||||||
| $ | 300,000,000 | Citibank NA 0.17%, 10/1/12 | $ | 300,000,000 | ||||||
|
| |||||||||
Total Certificates of Deposit, Domestic | 300,000,000 | |||||||||
|
| |||||||||
(Cost $300,000,000) | ||||||||||
Certificates of Deposit, Yankee(c) — 8.57% |
| |||||||||
Banks - Canadian — 5.32% | ||||||||||
| 150,000,000 | Bank of Montreal Chicago, 0.13%, 10/5/12 | 150,000,000 | ||||||||
| 150,000,000 | Bank of Montreal Chicago, 0.18%, 10/9/12 | 150,000,000 | ||||||||
| 200,000,000 | Bank of Nova Scotia, 0.07%, 10/1/12 | 200,000,000 | ||||||||
| 55,000,000 | Toronto Dominion Bank NY, 0.17%, 10/9/12 | 55,000,000 | ||||||||
| 100,000,000 | Toronto Dominion Bank NY, 0.17%, 10/30/12 | 100,000,000 | ||||||||
|
| |||||||||
| 655,000,000 | ||||||||||
|
| |||||||||
Banks - Foreign — 1.62% | ||||||||||
| 50,000,000 | Credit Suisse New York, 0.35%, 10/1/12 | 50,000,000 | ||||||||
| 50,000,000 | DnB NOR Bank ASA, 0.31%, 10/11/12 | 50,000,000 | ||||||||
| 50,000,000 | Rabobank Nederland NY, 0.42%, 12/11/12 | 50,000,000 | ||||||||
| 50,000,000 | Skandinaviska Enskilda Banken AB, 0.27%, 1/3/13 | 50,000,000 | ||||||||
|
| |||||||||
| 200,000,000 | ||||||||||
|
| |||||||||
Banks - United Kingdom — 1.63% | ||||||||||
| 200,000,000 | Barclays Bank Plc, 0.05%, 10/1/12 | 200,000,000 | ||||||||
|
| |||||||||
Total Certificates of Deposit, Yankee | 1,055,000,000 | |||||||||
|
| |||||||||
(Cost $1,055,000,000) | ||||||||||
Corporate Bonds — 22.83% | ||||||||||
Banks - Australia & New Zealand — 1.57% | ||||||||||
| 25,000,000 | Australia & New Zealand Banking Group Ltd., 0.41%, 4/4/13(a)(d) | 25,001,793 | ||||||||
| 50,000,000 | Commonwealth Bank Australia, 2.75%, 10/15/12(a) | 50,045,589 | ||||||||
| 51,200,000 | National Australia Bank Ltd., 5.35%, 6/12/13(a) | 52,961,793 | ||||||||
| 65,078,000 | Westpac Banking Corp., 2.25%, 11/19/12(d) | 65,237,777 | ||||||||
|
| |||||||||
| 193,246,952 | ||||||||||
|
| |||||||||
Banks - Canadian — 5.25% | ||||||||||
| 50,000,000 | Bank of Nova Scotia, 0.29%, 10/3/12(d) | 50,000,000 | ||||||||
| 100,000,000 | Bank of Nova Scotia, 0.52%, 10/11/13(d) | 100,000,000 | ||||||||
| 8,000,000 | Bank of Nova Scotia, 0.66%, 10/1/12(d) | 8,000,000 | ||||||||
| 13,350,000 | Bank of Nova Scotia, 0.66%, 10/5/12(d) | 13,350,727 | ||||||||
| 15,500,000 | Bank of Nova Scotia, 0.71%, 7/19/13(d) | 15,524,944 | ||||||||
| 65,000,000 | Bank of Nova Scotia, 0.76%, 10/18/12(d) | 65,017,964 | ||||||||
| 100,000,000 | Canadian Imperial Bank of Commerce NY, 0.46%, 10/5/13(d) | 100,000,000 | ||||||||
| 100,000,000 | Canadian Imperial Bank of Commerce NY, 0.48%, 7/31/13(d) | 100,000,000 | ||||||||
| 50,000,000 | Canadian Imperial Bank of Commerce NY, 0.72%, 6/3/13(d) | 50,110,721 | ||||||||
11
SCHEDULE OF PORTFOLIO INVESTMENTS
| ||||||
| Prime Money Market Fund (cont.) | ||||||
| ||||||
September 30, 2012 | ||||||
| Principal Amount | Value | |||||||||
| ||||||||||
| $ | 120,000,000 | Toronto Dominion Bank NY, 0.45%, 7/26/13(d) | $ | 120,000,000 | ||||||
| 25,000,000 | Toronto-Dominion Bank, 0.63%, 7/26/13(d) | 25,047,353 | ||||||||
|
| |||||||||
| 647,051,709 | ||||||||||
|
| |||||||||
Banks - Domestic — 3.90% | ||||||||||
| 15,000,000 | Bank of New York Mellon Corp., 4.50%, 4/1/13 | 15,299,925 | ||||||||
| 100,000,000 | JPMorgan Chase Bank NA, 0.34%, 10/21/13(d) | 99,955,449 | ||||||||
| 75,000,000 | JPMorgan Chase Bank NA, 0.53%, 10/18/13(d) | 74,990,365 | ||||||||
| 81,414,000 | Wells Fargo & Co., 5.25%, 10/23/12 | 81,644,956 | ||||||||
| 41,858,000 | Wells Fargo & Co., 5.50%, 5/1/13 | 43,007,994 | ||||||||
| 165,000,000 | Wells Fargo Bank NA, 0.44%, 10/22/13(d) | 165,000,000 | ||||||||
|
| |||||||||
| 479,898,689 | ||||||||||
|
| |||||||||
Banks - Foreign — 2.52% | ||||||||||
| 125,000,000 | HSBC Bank Plc, 0.86%, 1/18/13(a)(d) | 125,129,226 | ||||||||
| 50,000,000 | Rabobank Nederland, 0.59%, 1/22/13(a) | 50,038,658 | ||||||||
| 75,000,000 | Svenska Handelsbanken AB, 0.44%, 10/29/13(d) | 75,000,000 | ||||||||
| 45,000,000 | Svenska Handelsbanken AB, 0.53%, 10/16/12(a)(d) | 45,005,331 | ||||||||
| 14,750,000 | Svenska Handelsbanken NY, 0.91%, 1/18/13(d) | 14,775,673 | ||||||||
|
| |||||||||
| 309,948,888 | ||||||||||
|
| |||||||||
Consumer Discretionary — 0.20% | ||||||||||
| 25,000,000 | Target Corp., 0.49%, 1/11/13(d) | 25,000,000 | ||||||||
|
| |||||||||
Consumer Staples — 1.44% | ||||||||||
| 31,511,000 | Wal-Mart Stores, Inc., 4.55%, 5/1/13 | 32,275,858 | ||||||||
| 140,000,000 | Wal-Mart Stores, Inc. STEP, 5.48%, 6/1/13(d) | 144,829,908 | ||||||||
|
| |||||||||
| 177,105,766 | ||||||||||
|
| |||||||||
Finance - Diversified Domestic — 3.68% | ||||||||||
| 10,640,000 | ETC Holdings LLC, 0.26%, 4/1/28, (LOC: U.S. Bank)(d) | 10,640,000 | ||||||||
| 3,615,000 | GBG LLC, 0.22%, 9/1/27, (LOC: Bank of New York)(a)(d) | 3,615,000 | ||||||||
| 50,000,000 | General Electric Capital Corp., 1.88%, 9/16/13 | 50,676,786 | ||||||||
| 45,000,000 | General Electric Capital Corp., 2.80%, 1/8/13 | 45,252,861 | ||||||||
| 26,000,000 | General Electric Capital Corp., 5.25%, 10/19/12 | 26,060,222 | ||||||||
| 42,446,000 | General Electric Capital Corp., 5.40%, 9/20/13 | 44,458,535 | ||||||||
| 9,605,000 | General Electric Capital Corp., 5.45%, 1/15/13 | 9,736,167 | ||||||||
| 12,166,000 | John Deere Capital Corp., 1.88%, 6/17/13 | 12,301,787 | ||||||||
| 50,000,000 | JPMorgan Chase & Co., 5.38%, 10/1/12 | 50,000,000 | ||||||||
| 50,000,000 | NGSP, Inc., 0.19%, 6/1/46, (LOC: Wells Fargo Bank)(d) | 50,000,000 | ||||||||
| 75,000,000 | Toyota Motor Credit Corp., 0.53%, 7/25/13(d) | 75,000,000 | ||||||||
| 75,000,000 | Twins Ballpark LLC, 0.22%, 10/1/34, (Assured GTY, Liquidity: JPMorgan, U.S. Bank)(a)(d) | 75,000,000 | ||||||||
|
| |||||||||
| 452,741,358 | ||||||||||
|
| |||||||||
Health Care — 0.09% | ||||||||||
| 11,330,000 | The Portland Clinic LLP, 0.22%, 11/20/33, (LOC: U.S. Bank)(d) | 11,330,000 | ||||||||
|
| |||||||||
Industrials — 1.08% | ||||||||||
| 30,250,000 | 3M Co., 4.65%, 12/15/12 | 30,520,552 | ||||||||
12
SCHEDULE OF PORTFOLIO INVESTMENTS
| ||||||
| Prime Money Market Fund (cont.) | ||||||
| ||||||
September 30, 2012 | ||||||
| Principal Amount | Value | |||||||||
| ||||||||||
| $101,711,000 | General Electric Co., 5.00%, 2/1/13 | $ | 103,219,992 | |||||||
|
| |||||||||
| 133,740,544 | ||||||||||
|
| |||||||||
Information Technology — 0.87% | ||||||||||
| 55,625,000 | IBM International Group Capital LLC, 5.05%, 10/22/12 | 55,773,492 | ||||||||
| 37,060,000 | International Business Machines Corp., 2.10%, 5/6/13 | 37,432,192 | ||||||||
| 14,400,000 | International Business Machines Corp., 4.75%, 11/29/12 | 14,498,487 | ||||||||
|
| |||||||||
| 107,704,171 | ||||||||||
|
| |||||||||
Insurance — 2.23% | ||||||||||
| 31,000,000 | Berkshire Hathaway Finance Corp., 2.13%, 2/11/13 | 31,203,139 | ||||||||
| 58,000,000 | Berkshire Hathaway Finance Corp., 4.50%, 1/15/13 | 58,684,750 | ||||||||
| 28,838,000 | Berkshire Hathaway Finance Corp., 4.60%, 5/15/13 | 29,579,069 | ||||||||
| 25,000,000 | MetLife Institutional Funding, Series II, 0.71%, 4/3/13(a)(d) | 25,000,000 | ||||||||
| 15,865,000 | Metropolitan Life Global Funding, Series I, 2.50%, 1/11/13(a) | 15,942,547 | ||||||||
| 25,000,000 | Metropolitan Life Global Funding, Series I, 5.13%, 4/10/13(a) | 25,613,452 | ||||||||
| 44,588,000 | New York Life Global Funding, 2.25%, 12/14/12(a) | 44,757,602 | ||||||||
| 19,305,000 | New York Life Global Funding, 4.65%, 5/9/13(a) | 19,793,670 | ||||||||
| 23,550,000 | New York Life Global Funding, 5.25%, 10/16/12(a) | 23,595,874 | ||||||||
|
| |||||||||
| 274,170,103 | ||||||||||
|
| |||||||||
Total Corporate Bonds | 2,811,938,180 | |||||||||
|
| |||||||||
| (Cost $2,811,938,180) | ||||||||||
Municipal Bonds — 12.22% | ||||||||||
California — 2.62% | ||||||||||
| 55,450,000 | Abag Finance Authority For Nonprofit Corps. Revenue, Series A, | |||||||||
| 0.18%, 12/15/37, (Credit Support: Fannie Mae)(d) | 55,450,000 | |||||||||
| 71,190,000 | California Housing Finance Agency Revenue, Series F, 0.18%, | |||||||||
| 2/1/38, (LOC: Freddie Mac, Fannie Mae)(d) | 71,190,000 | |||||||||
| 10,000,000 | University of California TECP, 0.17%, 10/10/12(b) | 9,999,575 | ||||||||
| 97,000,000 | University of California TECP, 0.19%, 10/3/12(b) | 96,998,976 | ||||||||
| 89,505,000 | University of California TECP, 0.19%, 10/4/12(b) | 89,503,583 | ||||||||
|
| |||||||||
| 323,142,134 | ||||||||||
|
| |||||||||
Florida — 0.73% | ||||||||||
| 90,345,000 | JP Morgan Chase Putters/Drivers Trust, Palm Beach School Board COP, Series 4078, 0.20%, 1/1/13, (LOC: JPMorgan Chase Bank NA)(a)(d) | 90,345,000 | ||||||||
|
| |||||||||
Georgia — 0.25% | ||||||||||
| 30,820,000 | Valdosta-Lowndes County Industrial Development Authority Revenue, Series B, 0.21%, 6/1/28, (LOC: Wells Fargo Bank)(d) | 30,820,000 | ||||||||
|
| |||||||||
Kentucky — 0.61% | ||||||||||
| 74,995,000 | JPMorgan Chase Putters Drivers Trust Refunding Revenue, Series 4012, 0.20%, 12/12/12, (LOC: JPMorgan Chase Bank NA)(a)(d) | 74,995,000 | ||||||||
|
| |||||||||
13
SCHEDULE OF PORTFOLIO INVESTMENTS
| ||||||
| Prime Money Market Fund (cont.) | ||||||
| ||||||
September 30, 2012 | ||||||
| Principal Amount | Value | |||||||||
| ||||||||||
Maryland — 0.09% |
| |||||||||
| $ | 10,475,000 | Montgomery County Housing Opportunities Commission Refunding Revenue, Series D, 0.18%, 7/1/39, (LOC: PNC Bank NA, Freddie Mac)(d) | $ | 10,475,000 | ||||||
|
| |||||||||
Michigan — 0.20% |
| |||||||||
| 25,000,000 | Michigan Finance Authority Taxable School Loan Refunding Revenue, 0.18%, 9/1/50, (LOC: PNC Bank NA)(d) | 25,000,000 | ||||||||
|
| |||||||||
New Jersey — 0.17% |
| |||||||||
| 21,495,000 | New Jersey Health Care Facilities Financing Authority Barnabas Health Refunding Revenue, 0.24%, 7/1/38, (LOC: JPMorgan Chase Bank NA)(d) | 21,495,000 | ||||||||
|
| |||||||||
New York — 1.07% |
| |||||||||
| 12,450,000 | JPMorgan Chase Putters Drivers Trust Public Improvement Revenue, Series 4043, 0.20%, 4/1/14(a)(d) | 12,450,000 | ||||||||
| 63,625,000 | Metropolitan Transportation Authority Refunding Revenue, Series G-1, 0.15%, 11/1/26, (LOC: Bank of Nova Scotia)(d) | 63,625,000 | ||||||||
| 39,735,000 | New York City Housing Development Corp. Multi Family Housing Revenue, Series B, 0.18%, 4/15/36, (Credit Support: Fannie Mae)(d) | 39,735,000 | ||||||||
| 16,400,000 | New York State Housing Finance Agency Revenue, West 37th St. Project, Series B, 0.34%, 5/1/42, (LOC: Wells Fargo Bank)(d) | 16,400,000 | ||||||||
|
| |||||||||
| 132,210,000 | ||||||||||
|
| |||||||||
Ohio — 0.31% |
| |||||||||
| 9,455,000 | City of Grove Multi Family Housing Regency Arms Apartment | |||||||||
| Revenue, 0.22%, 6/15/30, (Credit Support: Fannie Mae)(d) | 9,455,000 | |||||||||
| 29,000,000 | Cleveland Apartment System Revenue, Series F, 0.19%, 1/1/33, | |||||||||
| (LOC: JPMorgan Chase Bank NA)(d) | 29,000,000 | |||||||||
|
| |||||||||
| 38,455,000 | ||||||||||
|
| |||||||||
Pennsylvania — 0.61% |
| |||||||||
| 54,900,000 | Blair County Industrial Development Authority Refunding | |||||||||
| Revenue, 0.18%, 10/1/28, (LOC: PNC Bank NA)(d) | 54,900,000 | |||||||||
| 19,725,000 | Derry Township Industrial & Commercial Development Authority | |||||||||
| Revenue, 0.18%, 11/1/30, (LOC: PNC Bank NA)(d) | 19,725,000 | |||||||||
|
| |||||||||
| 74,625,000 | ||||||||||
|
| |||||||||
South Dakota — 0.45% |
| |||||||||
| 22,200,000 | South Dakota Housing Development Authority Home | |||||||||
| Ownership Mortgage Revenue, Series C, 0.19%, 5/1/37(d) | 22,200,000 | |||||||||
| 33,525,000 | South Dakota Housing Development Authority Home | |||||||||
| Ownership Mortgage Revenue, Series I, 0.19%, 5/1/38(d) | 33,525,000 | |||||||||
|
| |||||||||
| 55,725,000 | ||||||||||
|
| |||||||||
Tennessee — 0.16% |
| |||||||||
| 19,100,000 | Johnson City Health & Educational Facilities Board Revenue, | |||||||||
| Series B2, 0.18%, 7/1/33, (LOC: PNC Bank NA)(d) | 19,100,000 | |||||||||
|
| |||||||||
14
SCHEDULE OF PORTFOLIO INVESTMENTS
| ||||||
| Prime Money Market Fund (cont.) | ||||||
| ||||||
September 30, 2012 | ||||||
| Principal Amount | Value | |||||||||
| ||||||||||
Texas — 3.29% | ||||||||||
| $ | 44,010,000 | City of Houston Utilities System Refunding Revenue, Series D-1, 0.19%, 5/15/34, (Credit Support: AGM), (LOC: JPMorgan Chase Bank NA)(d) | $ | 44,010,000 | ||||||
| 300,000,000 | JP Morgan Chase Putters Drivers Trust, Cash Flow Management Revenue, Series 4262, 0.20%, 8/30/13(a)(d) | 300,000,000 | ||||||||
| 20,000,000 | Texas State Veteran’s Fund Housing GO, Series A-2, 0.18%, 12/1/29, (LOC: JP Morgan Chase & Co.)(d) | 20,000,000 | ||||||||
| 6,360,000 | Texas State Veteran’s Fund Refunding GO, Series I-C, 0.21%, 12/1/25, (LOC: JP Morgan Chase & Co.)(d) | 6,360,000 | ||||||||
| 6,250,000 | Texas State Veteran’s Fund Refunding GO, Series I-D, 0.21%, 6/1/20, (LOC: JP Morgan Chase & Co.)(d) | 6,250,000 | ||||||||
| 16,830,000 | Texas State Veteran’s Fund Refunding GO, Series II-C, 0.21%, 6/1/29, (LOC: JP Morgan Chase & Co.)(d) | 16,830,000 | ||||||||
| 12,055,000 | Texas State Veteran’s Refunding GO, 0.21%, 6/1/31, (LOC: JP Morgan Chase & Co.)(d) | 12,055,000 | ||||||||
|
| |||||||||
| 405,505,000 | ||||||||||
|
| |||||||||
Utah — 0.07% | ||||||||||
| 7,955,000 | Ogden City Redevelopment Agency Refunding Revenue, Series A, 0.21%, 6/1/31, (LOC: Wells Fargo Bank)(d) | 7,955,000 | ||||||||
|
| |||||||||
Virginia — 1.59% | ||||||||||
| 179,800,000 | Federal Home Loan Mortgage Corp., Multi Family Housing Revenue, Series M017, Class A, 0.23%, 9/15/50, (Credit Support: Freddie Mac)(d) | 179,800,000 | ||||||||
| 15,455,000 | Newport News Industrial Development Authority Industrial Improvement Revenue, Series B, 0.21%, 7/1/31, (LOC: JPMorgan Chase Bank NA)(d) | 15,455,000 | ||||||||
|
| |||||||||
| 195,255,000 | ||||||||||
|
| |||||||||
Total Municipal Bonds | 1,505,102,134 | |||||||||
|
| |||||||||
(Cost $1,505,102,134) | ||||||||||
U.S. Government Agency Obligations — 7.32% | ||||||||||
Fannie Mae — 2.64% | ||||||||||
| 150,000,000 | 0.19%, 11/14/13(d) | 149,949,581 | ||||||||
| 100,000,000 | 0.20%, 6/20/14(d) | 99,965,253 | ||||||||
| 50,000,000 | 0.34%, 12/3/12(d) | 50,006,974 | ||||||||
| 25,000,000 | 0.23%, 1/2/13(b) | 24,985,307 | ||||||||
|
| |||||||||
| 324,907,115 | ||||||||||
|
| |||||||||
Federal Home Loan Bank — 1.34% | ||||||||||
| 47,200,000 | 0.12%, 12/21/12(b) | 47,187,256 | ||||||||
| 17,750,000 | 0.15%, 3/18/13 | 17,748,272 | ||||||||
| 100,000,000 | 0.25%, 2/3/14(d) | 99,944,249 | ||||||||
|
| |||||||||
| 164,879,777 | ||||||||||
|
| |||||||||
15
SCHEDULE OF PORTFOLIO INVESTMENTS
| ||||||
| Prime Money Market Fund (cont.) | ||||||
| ||||||
September 30, 2012 | ||||||
| Principal Amount | Value | |||||||||
| ||||||||||
Freddie Mac — 3.34% | ||||||||||
| $ | 187,000,000 | 0.17%, 5/16/13(d) | $ | 187,009,294 | ||||||
| 100,000,000 | 0.17%, 6/17/13(d) | 99,986,242 | ||||||||
| 125,000,000 | 0.18%, 3/21/13(d) | 125,029,614 | ||||||||
|
| |||||||||
| 412,025,150 | ||||||||||
|
| |||||||||
Total U.S. Government Agency Obligations | 901,812,042 | |||||||||
|
| |||||||||
(Cost $901,812,042) | ||||||||||
U.S. Treasury Obligations — 0.61% | ||||||||||
U.S. Treasury Notes — 0.61% | ||||||||||
| 75,000,000 | 1.38%, 2/15/13 | 75,333,303 | ||||||||
|
| |||||||||
Total U.S. Treasury Obligations | 75,333,303 | |||||||||
|
| |||||||||
(Cost $75,333,303) | ||||||||||
Repurchase Agreements — 14.66% | ||||||||||
| 150,000,000 | BNP Paribas Securities Corp. dated 9/28/12; due 10/1/12 at 0.15% with maturity value of $150,001,875 (fully collateralized by a US Treasury Note with a maturity date of 2/15/13 at a rate of 1.375%) | 150,000,000 | ||||||||
| 220,000,000 | BNP Paribas Securities Corp. dated 9/28/12; due 10/1/12 at 0.25% with maturity value of $220,004,583 (fully collateralized by Fannie Mae and Freddie Mac securities with maturity dates ranging from 9/1/40 to 7/1/42 at rates ranging from 3.50% to 5.00%) | 220,000,000 | ||||||||
| 100,000,000 | Citibank N.A., dated 9/28/12; due 10/1/12 at 0.20% with maturity value of $100,001,667 (fully collateralized by US Treasury Notes with maturity dates ranging from 6/30/14 to 8/15/39 at rates ranging from 2.625% to 4.50%) | 100,000,000 | ||||||||
| 400,000,000 | Citibank N.A., dated 9/28/12; due 10/1/12 at 0.25% with maturity value of $400,008,333 (fully collateralized by Freddie Mac and Fannie Mae securities with maturity dates ranging from 8/1/23 to 9/1/42 at rates ranging from 3.00% to 5.00%) | 400,000,000 | ||||||||
| 5,000,000 | Deutsche Bank Securities, dated 9/28/12; due 10/1/12 at 0.20% with maturity value of $5,000,083 (fully collateralized by a Federal Home Loan Bank security with a maturity date of 11/27/13 at a rate of 0.375%) | 5,000,000 | ||||||||
| 100,000,000 | Goldman Sachs & Co. dated 9/28/12; due 10/1/12 at 0.19% with maturity value of $100,001,583 (fully collateralized by Fannie Mae and Freddie Mac securities with maturity dates ranging from 6/1/32 to 10/1/42 at rates ranging from 3.50% to 4.50%) | 100,000,000 | ||||||||
| 300,000,000 | Goldman Sachs & Co. dated 9/28/12; due 10/3/12 at 0.22% with maturity value of $300,009,167 (fully collateralized by Fannie Mae and Freddie Mac securities with maturity dates ranging from 9/1/25 to 10/1/42 at rates ranging from 3.00% to 6.00%) | 300,000,000 | ||||||||
16
SCHEDULE OF PORTFOLIO INVESTMENTS
| ||||||
| Prime Money Market Fund (cont.) | ||||||
| ||||||
September 30, 2012 | ||||||
| Principal Amount | Value | |||||||||
| ||||||||||
| $ | 175,000,000 | JP Morgan Securities dated 9/28/12; due 10/2/12 at 0.24% with maturity value of $175,004,667 (fully collateralized by Fannie Mae securities with maturity dates ranging from 9/1/32 to 10/1/32 at a rate of 3.00%) | $ | 175,000,000 | ||||||
| 10,000,000 | Merrill Lynch, Pierce, Fenner, Smith. dated 9/28/12; due 10/1/12 at 0.13% with maturity value of $10,000,108 (fully collateralized by a US Treasury Note with a maturity date of 7/15/13 at a rate of 1.875%) | 10,000,000 | ||||||||
| 45,000,000 | Merrill Lynch, Pierce, Fenner, Smith. dated 9/28/12; due 10/1/12 at 0.13% with maturity value of $45,000,487 (fully collateralized by a US Treasury Note with a maturity date of 7/15/13 at a rate of 1.875%) | 45,000,000 | ||||||||
| 100,000,000 | Merrill Lynch, Pierce, Fenner, Smith. dated 9/28/12; due 10/1/12 at 0.16% with maturity value of $100,001,333 (fully collateralized by Fannie Mae and Freddie Mac securities with maturity dates ranging from 2/01/26 to 9/01/42 a rates ranging from 2.50% to 6.50%) | 100,000,000 | ||||||||
| 200,000,000 | TD Securities (USA). dated 9/28/12; due 10/1/12 at 0.19% with maturity value of $200,003,167 (fully collateralized by a US Treasury Note and Fannie Mae securities with maturity dates ranging from 4/23/15 to 2/15/40 at rates ranging from 1.25% to 7.02%) | 200,000,000 | ||||||||
|
| |||||||||
Total Repurchase Agreements | 1,805,000,000 | |||||||||
|
| |||||||||
(Cost $1,805,000,000) | ||||||||||
Total Investments | $ | 12,311,890,008 | ||||||||
(Cost $12,311,890,008)(e) — 99.97% | ||||||||||
Other assets in excess of liabilities — 0.03% | 3,819,211 | |||||||||
|
| |||||||||
NET ASSETS — 100.00% | $ | 12,315,709,219 | ||||||||
|
| |||||||||
| (a) | Security exempt from registration under Rule 144A or Section 4(2) of the Securities Act of 1933, as amended. These securities may be resold in transactions exempt from registration, normally to qualified institutional buyers. Security has been deemed to be liquid based on procedures approved by the Board of Trustees. |
| (b) | Represents effective yield to maturity on date of purchase. |
| (c) | Issuer is a U.S. branch of a foreign domiciled bank. |
| (d) | Variable rate security. The rate reflected in the Schedule of Portfolio Investments is the rate in effect on September 30, 2012. The maturity date represents the actual maturity date. The security’s effective maturity resets periodically. |
| (e) | Tax cost of securities is equal to book cost of securities. |
17
SCHEDULE OF PORTFOLIO INVESTMENTS
| ||||||
| Prime Money Market Fund (cont.) | ||||||
| ||||||
September 30, 2012
Abbreviations used are defined below:
AGM - Assured Guaranty Municipal
COP - Certificate of Participation
GO - General Obligation
GTY - Guaranty
LOC - Letter of Credit
STEP - Step Coupon Bond
TECP - Tax Exempt Commercial Paper
See notes to financial statements.
18
SCHEDULE OF PORTFOLIO INVESTMENTS
| ||||||
| U.S. Government Money Market Fund | ||||||
| ||||||
September 30, 2012 | ||||||
| Principal Amount | Value | |||||||||
| ||||||||||
FDIC-TLGP Backed Corporate Bonds — 4.36% | ||||||||||
Banks - Domestic — 0.18% | ||||||||||
| $ | 9,500,000 | Citibank NA, 1.75%, 12/20/12 | $ | 9,534,995 | ||||||
|
| |||||||||
Finance - Diversified Domestic — 4.18% | ||||||||||
| 23,632,000 | Citigroup Funding, Inc., 1.88%, 10/22/12 | 23,655,372 | ||||||||
| 93,907,000 | Citigroup Funding, Inc., 1.88%, 11/15/12 | 94,100,796 | ||||||||
| 42,905,000 | Citigroup Funding, Inc., 2.25%, 12/10/12 | 43,075,668 | ||||||||
| 34,637,000 | General Electric Capital Corp., 2.13%, 12/21/12 | 34,784,627 | ||||||||
| 26,776,000 | General Electric Capital Corp., 2.63%, 12/28/12 | 26,932,212 | ||||||||
|
| |||||||||
| 222,548,675 | ||||||||||
|
| |||||||||
Total FDIC-TLGP Backed Corporate Bonds | 232,083,670 | |||||||||
|
| |||||||||
(Cost $232,083,670) | ||||||||||
U.S. Government Agency Backed Municipal Bonds — 11.59% | ||||||||||
California — 5.58% | ||||||||||
| 36,000,000 | Abag Finance Authority For Nonprofit Corps. Lakeside Village Apartments Revenue, 0.17%, 10/1/46, (Credit Support: Freddie Mac)(a) | 36,000,000 | ||||||||
| 62,600,000 | California Housing Finance Agency Revenue, Series B, 0.18%, 2/1/35, (LOC: Freddie Mac, Fannie Mae)(a) | 62,600,000 | ||||||||
| 50,395,000 | California Housing Finance Agency Revenue, Series F, 0.18%, 2/1/37, (LOC: Freddie Mac, Fannie Mae)(a) | 50,395,000 | ||||||||
| 26,020,000 | California Housing Finance Agency Revenue, Series J, 0.19%, 2/1/32, (LOC: Fannie Mae, Freddie Mac)(a) | 26,020,000 | ||||||||
| 14,600,000 | California Statewide Communities Development Agency Multi Family Revenue, Series DD, 0.17%, 10/15/36, (Credit Support: Fannie Mae)(a) | 14,600,000 | ||||||||
| 10,750,000 | California Statewide Communities Development Authority Multi Family Revenue, Series E, 0.18%, 12/15/35, (Credit Support: Fannie Mae)(a) | 10,750,000 | ||||||||
| 29,320,000 | California Statewide Communities Development Authority Single Family Revenue, Series NN-1, 0.17%, 11/15/37, (Credit Support: Fannie Mae)(a) | 29,320,000 | ||||||||
| 8,600,000 | City of San Jose Cinnabar Commons Revenue, Series C, 0.17%, 2/1/37, (Credit Support: Freddie Mac)(a) | 8,600,000 | ||||||||
| 12,595,000 | San Diego Housing Authority Hillside Garden Apartment Revenue, Series B, 0.17%, 1/15/35, (Credit Support: Fannie Mae)(a) | 12,595,000 | ||||||||
| 20,800,000 | San Francisco City & County Housing Authority City Heights Apartments Refunding Revenue, Series A, 0.17%, 6/15/25, (Credit Support: Fannie Mae)(a) | 20,800,000 | ||||||||
| 25,200,000 | San Francisco City and County Redevelopment Agency Revenue, Series C, 0.21%, 6/15/34, (Credit Support: Fannie Mae)(a) | 25,200,000 | ||||||||
|
| |||||||||
| 296,880,000 | ||||||||||
|
| |||||||||
Colorado — 0.46% | ||||||||||
| 14,700,000 | Colorado Housing & Finance Authority Refunding Revenue, Class I, Series B1, 0.18%, 5/1/38, (LOC: Fannie Mae, Freddie Mac)(a) | 14,700,000 | ||||||||
19
SCHEDULE OF PORTFOLIO INVESTMENTS
| ||||||
| U.S. Government Money Market Fund (cont.) | ||||||
| ||||||
September 30, 2012 | ||||||
| Principal Amount | Value | |||||||||
| ||||||||||
| $ | 9,535,000 | Colorado Housing & Finance Authority Refunding Revenue, Class I, Series C1, 0.18%, 11/1/32, (LOC: Fannie Mae, Freddie Mac)(a) | $ | 9,535,000 | ||||||
|
| |||||||||
| 24,235,000 | ||||||||||
|
| |||||||||
Indiana — 0.52% | ||||||||||
| 27,700,000 | City of Indianapolis Lakeside Pointe & Fox Club Refunding Revenue, 0.19%, 11/15/37, (Credit Support: Fannie Mae)(a) | 27,700,000 | ||||||||
|
| |||||||||
Louisiana — 0.24% | ||||||||||
| 12,600,000 | Louisiana Public Facilities Authority Refunding Revenue, 0.18%, 4/1/36, (Credit Support: Freddie Mac)(a) | 12,600,000 | ||||||||
|
| |||||||||
New York — 3.02% | ||||||||||
| 14,205,000 | New York City Housing Development Corp. First Avenue Development Revenue, Series A, 0.19%, 10/15/35, (Credit Support: Fannie Mae)(a) | 14,205,000 | ||||||||
| 22,370,000 | New York City Housing Development Corp. Related-Monterey Revenue, Series A, 0.17%, 11/15/19, (Credit Support: Fannie Mae)(a) | 22,370,000 | ||||||||
| 37,500,000 | New York City Housing Development Corp.West 61st. Street Apartments Revenue, Series A, 0.19%, 12/15/37, (Credit Support: Fannie Mae)(a) | 37,500,000 | ||||||||
| 20,000,000 | New York State Housing Finance Agency 150 East 44th Street Revenue, Series A, 0.19%, 5/15/32, (Credit Support: Fannie Mae)(a) | 20,000,000 | ||||||||
| 25,000,000 | New York State Housing Finance Agency Clinton Green North Revenue, Series A, 0.19%, 11/1/38, (Credit Support: Freddie Mac)(a) | 25,000,000 | ||||||||
| 41,750,000 | New York State Housing Finance Agency North End Revenue, Series A, 0.19%, 11/15/36, (Credit Support: Fannie Mae)(a) | 41,750,000 | ||||||||
|
| |||||||||
| 160,825,000 | ||||||||||
|
| |||||||||
Tennessee — 0.15% | ||||||||||
| 8,110,000 | Shelby County Health Educational & Housing Facilities Board Refunding Revenue, Series A-1, 0.18%, 12/15/37, (Credit Support: Fannie Mae)(a) | 8,110,000 | ||||||||
|
| |||||||||
Virginia — 1.62% | ||||||||||
| 53,400,000 | Federal Home Loan Mortgage Corp. Multi Family Housing Revenue, Series MO15, Class A, 0.23%, 5/15/46, (Credit Support: Freddie Mac)(a) | 53,400,000 | ||||||||
| 33,075,000 | Federal Home Loan Mortgage Corp. Multi Family Housing Revenue, Series MO21, Class A, 0.23%, 6/15/36, (Credit Support: Freddie Mac)(a) | 33,075,000 | ||||||||
|
| |||||||||
| 86,475,000 | ||||||||||
|
| |||||||||
Total U.S. Government Agency Backed Municipal Bonds | 616,825,000 | |||||||||
|
| |||||||||
(Cost $616,825,000) | ||||||||||
U.S. Government Agency Obligations — 59.56% | ||||||||||
Fannie Mae — 20.25% | ||||||||||
| 31,500,000 | 0.12%, 10/1/12(b) | 31,500,000 | ||||||||
20
SCHEDULE OF PORTFOLIO INVESTMENTS
| ||||||
| U.S. Government Money Market Fund (cont.) | ||||||
| ||||||
September 30, 2012 | ||||||
| Principal Amount | Value | |||||||||
| ||||||||||
| $ | 90,000,000 | 0.12%, 10/16/12(b) | $ | 89,995,500 | ||||||
| 67,032,607 | 0.14%, 10/1/12(b) | 67,032,607 | ||||||||
| 89,000,000 | 0.14%, 10/1/12(b) | 89,000,000 | ||||||||
| 37,415,000 | 0.14%, 10/1/12(b) | 37,415,000 | ||||||||
| 26,583,000 | 0.14%, 10/1/12(b) | 26,583,000 | ||||||||
| 18,902,500 | 0.15%, 10/1/12(b) | 18,902,500 | ||||||||
| 9,998,000 | 0.16%, 11/1/12(b) | 9,996,623 | ||||||||
| 49,250,000 | 0.16%, 11/1/12(b) | 49,243,108 | ||||||||
| 30,963,900 | 0.16%, 11/1/12(b) | 30,959,534 | ||||||||
| 15,750,000 | 0.16%, 11/1/12(b) | 15,747,796 | ||||||||
| 41,000,000 | 0.19%, 10/1/12(b) | 41,000,000 | ||||||||
| 25,000,000 | 0.19%, 10/1/12(b) | 25,000,000 | ||||||||
| 10,000,000 | 0.19%, 1/3/13(b) | 9,995,039 | ||||||||
| 12,710,000 | 0.19%, 1/8/13(b) | 12,703,359 | ||||||||
| 25,000,000 | 0.19%, 11/14/13(a) | 24,991,597 | ||||||||
| 39,200,000 | 0.19%, 1/4/13(b) | 39,180,346 | ||||||||
| 100,000,000 | 0.20%, 6/20/14(a) | 99,965,253 | ||||||||
| 25,000,000 | 0.22%, 8/12/13(a) | 25,002,264 | ||||||||
| 87,381,600 | 0.23%, 1/2/13(b) | 87,330,245 | ||||||||
| 122,420,000 | 0.34%, 12/3/12(a) | 122,437,074 | ||||||||
| 5,151,000 | 0.38%, 12/28/12 | 5,153,125 | ||||||||
| 40,000,000 | 0.50%, 8/9/13 | 40,100,029 | ||||||||
| 38,000,000 | 3.63%, 2/12/13 | 38,477,722 | ||||||||
| 12,922,000 | 4.38%, 7/17/13 | 13,341,062 | ||||||||
| 25,000,000 | 4.63%, 10/15/13 | 26,141,798 | ||||||||
|
| |||||||||
| 1,077,194,581 | ||||||||||
|
| |||||||||
Federal Farm Credit Bank — 4.04% | ||||||||||
| 10,000,000 | 0.11%, 10/9/12(b) | 9,999,756 | ||||||||
| 10,000,000 | 0.11%, 10/11/12(b) | 9,999,694 | ||||||||
| 17,750,000 | 0.19%, 7/24/13(a) | 17,756,682 | ||||||||
| 11,000,000 | 0.21%, 2/22/13(a) | 11,002,224 | ||||||||
| 75,000,000 | 0.21%, 7/22/13(a) | 75,037,349 | ||||||||
| 43,450,000 | 0.22%, 6/19/13 | 43,439,574 | ||||||||
| 48,000,000 | 0.25%, 10/12/12(a) | 48,001,488 | ||||||||
|
| |||||||||
| 215,236,767 | ||||||||||
|
| |||||||||
Federal Home Loan Bank — 21.96% | ||||||||||
| 50,000,000 | 0.10%, 10/1/12(b) | 50,000,000 | ||||||||
| 195,850,000 | 0.11%, 10/3/12(b) | 195,848,803 | ||||||||
| 51,900,000 | 0.11%, 10/4/12(b) | 51,899,524 | ||||||||
| 42,500,000 | 0.12%, 10/3/12(b) | 42,499,717 | ||||||||
| 52,800,000 | 0.12%, 12/21/12(b) | 52,785,744 | ||||||||
| 32,000,000 | 0.13%, 10/5/12(b) | 31,999,552 | ||||||||
| 149,000,000 | 0.13%, 10/19/12(b) | 148,990,315 | ||||||||
| 88,000,000 | 0.14%, 10/24/12(b) | 87,992,410 | ||||||||
| 10,000,000 | 0.15%, 3/18/13 | 9,999,026 | ||||||||
21
SCHEDULE OF PORTFOLIO INVESTMENTS
| ||||||
| U.S. Government Money Market Fund (cont.) | ||||||
| ||||||
September 30, 2012 | ||||||
| Principal Amount | Value | |||||||||
| ||||||||||
| $ | 50,000,000 | 0.15%, 4/5/13 | $ | 49,994,533 | ||||||
| 74,750,000 | 0.15%, 12/27/12(a) | 74,753,965 | ||||||||
| 20,000,000 | 0.21%, 9/24/13 | 19,997,450 | ||||||||
| 40,000,000 | 0.23%, 4/16/13 | 39,996,114 | ||||||||
| 50,000,000 | 0.24%, 5/21/13 | 49,995,514 | ||||||||
| 47,750,000 | 0.25%, 7/1/13 | 47,737,994 | ||||||||
| 100,000,000 | 0.25%, 2/3/14(a) | 99,944,249 | ||||||||
| 35,000,000 | 0.27%, 1/3/14(a) | 34,991,106 | ||||||||
| 13,550,000 | 0.28%, 7/26/13 | 13,558,088 | ||||||||
| 46,750,000 | 0.50%, 8/28/13 | 46,871,942 | ||||||||
| 18,000,000 | 4.00%, 9/6/13 | 18,633,821 | ||||||||
|
| |||||||||
| 1,168,489,867 | ||||||||||
|
| |||||||||
Freddie Mac — 13.22% |
| |||||||||
| 16,568,000 | 0.14%, 11/1/12(b) | 16,566,003 | ||||||||
| 20,000,000 | 0.14%, 10/9/12(b) | 19,999,378 | ||||||||
| 98,500,000 | 0.15%, 11/1/12(b) | 98,487,277 | ||||||||
| 22,950,000 | 0.17%, 11/2/12(a) | 22,950,841 | ||||||||
| 100,000,000 | 0.17%, 5/16/13(a) | 100,003,287 | ||||||||
| 40,000,000 | 0.17%, 6/17/13(a) | 39,994,497 | ||||||||
| 75,000,000 | 0.18%, 3/21/13(a) | 75,017,769 | ||||||||
| 14,700,000 | 0.19%, 1/7/13(b) | 14,692,397 | ||||||||
| 105,395,000 | 0.38%, 11/30/12 | 105,430,461 | ||||||||
| 8,456,000 | 0.75%, 12/28/12 | 8,467,104 | ||||||||
| 105,000,000 | 1.38%, 1/9/13 | 105,337,776 | ||||||||
| 95,000,000 | 4.50%, 1/15/13 | 96,176,621 | ||||||||
|
| |||||||||
| 703,123,411 | ||||||||||
|
| |||||||||
Overseas Private Investment Corp. — 0.09% |
| |||||||||
| 1,400,000 | 0.17%, 3/15/15(a) | 1,400,000 | ||||||||
| 3,301,472 | 0.17%, 11/15/13(a) | 3,301,472 | ||||||||
|
| |||||||||
| 4,701,472 | ||||||||||
|
| |||||||||
Total U.S. Government Agency Obligations | 3,168,746,098 | |||||||||
|
| |||||||||
(Cost $3,168,746,098) | ||||||||||
U.S. Treasury Obligations — 4.82% |
| |||||||||
U.S. Treasury Bills — 0.80% |
| |||||||||
| 42,700,000 | 0.10%, 10/4/12(b) | 42,699,644 | ||||||||
22
SCHEDULE OF PORTFOLIO INVESTMENTS
| ||||||
| U.S. Government Money Market Fund (cont.) | ||||||
| ||||||
September 30, 2012 | ||||||
| Principal Amount | Value | |||||||||
| ||||||||||
U.S. Treasury Notes — 4.02% |
| |||||||||
| $ | 87,000,000 | 0.50%, 11/30/12 | $ | 87,047,353 | ||||||
| 75,000,000 | 1.38%, 2/15/13 | 75,331,061 | ||||||||
| 30,000,000 | 1.75%, 4/15/13 | 30,239,598 | ||||||||
| 20,500,000 | 3.50%, 5/31/13 | 20,951,980 | ||||||||
|
| |||||||||
| 213,569,992 | ||||||||||
|
| |||||||||
Total U.S. Treasury Obligations | 256,269,636 | |||||||||
|
| |||||||||
(Cost $256,269,636) |
| |||||||||
Repurchase Agreements — 20.02% |
| |||||||||
| 40,000,000 | BNP Paribas Securities Corp. dated 9/28/12; due 10/1/12 at 0.25% with maturity value of $40,000,833 (fully collateralized by a Fannie Mae security with a maturity date of 9/1/27 at a rate of 3.00%) | 40,000,000 | ||||||||
| 400,000,000 | Citibank N.A., dated 9/28/12; due 10/1/12 at 0.25% with maturity value of $400,008,333 (fully collateralized by Freddie Mac and Fannie Mae securities with maturity dates ranging from 7/1/24 to 8/1/42 at rates ranging from 3.00% to 5.50%) | 400,000,000 | ||||||||
| 100,000,000 | Goldman Sachs & Co. dated 9/28/12; due 10/1/12 at 0.19% with maturity value of $100,001,583 (fully collateralized by Fannie Mae and Freddie Mac securities with maturity dates ranging from 7/1/31 to 4/1/42 at rates ranging from 4.00% to 5.00%) | 100,000,000 | ||||||||
| 150,000,000 | Goldman Sachs & Co. dated 9/28/12; due 10/3/12 at 0.22% with maturity value of $150,004,583 (fully collateralized by Fannie Mae and Freddie Mac securities with maturity dates ranging from 7/1/27 to 8/1/42 at rates ranging from 3.00% to 6.50%) | 150,000,000 | ||||||||
| 75,000,000 | JP Morgan Securities Corp. dated 9/28/12; due 10/2/12 at 0.24% with maturity value of $75,002,000 (fully collateralized by a Fannie Mae security with a maturity date of 9/1/32 at a rate of 3.00%) | 75,000,000 | ||||||||
| 150,000,000 | Merrill Lynch, Pierce, Fenner, Smith. dated 9/28/12; due 10/1/12 at 0.16% with maturity value of $150,002,000 (fully collateralized by Fannie Mae and Freddie Mac securities with maturity dates ranging from 1/1/19 to 9/1/42 at rates ranging from 2.50% to 7.00%) | 150,000,000 | ||||||||
| 150,000,000 | TD Securities (USA). dated 9/28/12; due 10/1/12 at 0.19% with maturity value of $150,002,375 (fully collateralized by Fannie Mae, Freddie Mac and Federal Home Loan Bank securities with maturity dates ranging from 4/30/15 to 5/23/22 at rates ranging from 0.50% to 2.36%) | 150,000,000 | ||||||||
|
| |||||||||
Total Repurchase Agreements | 1,065,000,000 | |||||||||
|
| |||||||||
(Cost $1,065,000,000) |
| |||||||||
23
SCHEDULE OF PORTFOLIO INVESTMENTS
| ||||||
| U.S. Government Money Market Fund (cont.) | ||||||
| ||||||
September 30, 2012 | ||||||
Total Investments | $ | 5,338,924,404 | ||||||
(Cost $5,338,924,404)(c) — 100.35% | ||||||||
Liabilities in excess of other assets — (0.35)% | (18,529,560 | ) | ||||||
|
| |||||||
NET ASSETS — 100.00% | $ | 5,320,394,844 | ||||||
|
| |||||||
| (a) | Variable rate security. The rate reflected in the Schedule of Portfolio Investments is the rate in effect on September 30, 2012. The maturity date represents the actual maturity date. The security’s effective maturity resets periodically. |
| (b) | Represents effective yield to maturity on date of purchase. |
| (c) | Tax cost of securities is equal to book cost of securities. |
Abbreviations used are defined below:
FDIC - Federal Deposit Insurance Corp.
LOC - Letter of Credit
TLGP - Temporary Liquidity Guaranty Program
See notes to financial statements.
24
SCHEDULE OF PORTFOLIO INVESTMENTS
| ||||||
| Tax-Free Money Market Fund | ||||||
| ||||||
September 30, 2012 | ||||||
| Principal Amount | Value | |||||||||
| ||||||||||
Municipal Bonds — 98.81% | ||||||||||
Alaska — 2.18% | ||||||||||
| $ | 10,000,000 | Alaska International Airports System Refunding Revenue, Series A, 0.17%, 10/1/30, (LOC: State Street Bank & Trust Co.)(a) | $ | 10,000,000 | ||||||
| 19,690,000 | City of Valdez Exxon Pipeline Co. Project Refunding Revenue, 0.18%, 10/1/25(a) | 19,690,000 | ||||||||
|
| |||||||||
| 29,690,000 | ||||||||||
|
| |||||||||
Arizona — 0.63% | ||||||||||
| 2,950,000 | Maricopa County Industrial Development Authority Gran Victoria Housing Revenue, Series A, 0.18%, 4/15/30, (Credit Support: Fannie Mae)(a) | 2,950,000 | ||||||||
| 5,600,000 | Pima County Industrial Development Authority Delaware Military Academy Revenue, 0.17%, 9/1/38, (LOC: PNC Bank NA)(a) | 5,600,000 | ||||||||
|
| |||||||||
| 8,550,000 | ||||||||||
|
| |||||||||
California — 5.10% | ||||||||||
| 10,000,000 | California Affordable Housing Agency Revenue, Series A, 0.18%, 9/15/33, (Credit Support: Fannie Mae)(a) | 10,000,000 | ||||||||
| 6,725,000 | California Health Facilities Financing Authority Revenue, 0.18%, 3/1/47, (LOC: Bank of Montreal)(a) | 6,725,000 | ||||||||
| 4,545,000 | California Statewide Communities Development Authority, Chevron USA Inc. Project Refunding Revenue, 0.08%, 5/15/24(a) | 4,545,000 | ||||||||
| 6,500,000 | City of Ontario Housing Authority, Park Centre Apartments Refunding Revenue, 0.18%, 12/1/35, (Credit Support: Freddie Mac)(a) | 6,500,000 | ||||||||
| 17,695,000 | City of Simi Valley Refunding Revenue, Series A, 0.18%, 7/1/23, (Credit Support: Freddie Mac)(a) | 17,695,000 | ||||||||
| 7,900,000 | City of Tracy Sycamores Apartments Refunding Revenue, Series A, 0.16%, 5/1/15, (LOC: Freddie Mac)(a) | 7,900,000 | ||||||||
| 5,675,000 | City of Vacaville Sycamores Apartments Refunding Revenue, Series A, 0.17%, 5/15/29, (Credit Support: Fannie Mae)(a) | 5,675,000 | ||||||||
| 5,600,000 | County of San Bernardino Sycamore Terrace Refunding Revenue, Series A, 0.24%, 5/15/29, (Credit Support: Fannie Mae)(a) | 5,600,000 | ||||||||
| 4,865,000 | Sacramento County Housing Authority Refunding Revenue, Series C, 0.17%, 7/15/29, (Credit Support: Fannie Mae)(a) | 4,865,000 | ||||||||
|
| |||||||||
| 69,505,000 | ||||||||||
|
| |||||||||
Colorado — 1.97% | ||||||||||
| 3,170,000 | Aurora Centretech Metropolitan District Refunding GO, Series C, 0.20%, 12/1/28, (LOC: U.S. Bank NA)(a) | 3,170,000 | ||||||||
| 1,250,000 | Colorado Health Facilities Authority Arapahoe Housing Project Revenue, Series A, 0.29%, 4/1/24, (LOC: Wells Fargo Bank)(a) | 1,250,000 | ||||||||
| 5,700,000 | Colorado Health Facilities Authority Crossroads Maranatha Project Refunding Revenue, 0.18%, 12/1/43, (LOC: U.S Bank NA)(a) | 5,700,000 | ||||||||
| 5,000,000 | Commerce City Northern Infrastructure General Improvement District GO, 0.20%, 12/1/28, (LOC: U.S. Bank NA)(a) | 5,000,000 | ||||||||
25
SCHEDULE OF PORTFOLIO INVESTMENTS
| ||||||
| Tax-Free Money Market Fund (cont.) | ||||||
| ||||||
September 30, 2012 | ||||||
| Principal Amount | Value | |||||||||
| ||||||||||
| $ | 3,475,000 | County of Pitkin Refunding Revenue, Series A, 0.19%, 12/1/24, (LOC: U.S. Bank NA)(a) | $ | 3,475,000 | ||||||
| 5,035,000 | Gateway Regional Metropolitan District Refunding GO, 0.29%, 12/1/37, (LOC: Wells Fargo Bank)(a) | 5,035,000 | ||||||||
| 2,795,000 | Meridian Ranch Metropolitan District Refunding GO, 0.20%, 12/1/38, (LOC: U.S. Bank NA)(a) | 2,795,000 | ||||||||
| 485,000 | Parker Automotive Metropolitan District GO, 0.20%, 12/1/34, (LOC: U.S. Bank NA)(a) | 485,000 | ||||||||
|
| |||||||||
| 26,910,000 | ||||||||||
|
| |||||||||
District Of Columbia — 0.72% | ||||||||||
| 3,880,000 | District of Columbia Children’s Defense Fund Refunding Revenue, 0.28%, 4/1/22, (LOC: Wells Fargo Bank)(a) | 3,880,000 | ||||||||
| 1,500,000 | District of Columbia Internships and Academic Revenue, 0.19%, 7/1/36, (LOC: Branch Banking & Trust)(a) | 1,500,000 | ||||||||
| 4,400,000 | District of Columbia Jesuit Conference Revenue, 0.19%, 10/1/37, (LOC: PNC Bank NA)(a) | 4,400,000 | ||||||||
|
| |||||||||
| 9,780,000 | ||||||||||
|
| |||||||||
Florida — 4.58% | ||||||||||
| 4,925,000 | Florida State Housing Finance Corp. South Pointe Project Refunding Revenue, Series J, 0.19%, 2/15/28, (Credit Support: Fannie Mae)(a) | 4,925,000 | ||||||||
| 5,245,000 | JP Morgan Chase Putters/Drivers Trust Seminole County Sales Tax Refunding Revenue, Series 3438Z, 0.21%, 4/1/27(a)(b) | 5,245,000 | ||||||||
| 2,225,000 | JP Morgan Chase Putters/Drivers Trust Tampa Water Revenue, Series 3617, 0.21%, 10/1/25(a)(b) | 2,225,000 | ||||||||
| 25,000,000 | JP Morgan Chase Putters/Drivers Trust, Palm Beach School Board COP, Series 4078, 0.20%, 1/1/13, (LOC: JPMorgan Chase Bank NA)(a)(b) | 25,000,000 | ||||||||
| 6,835,000 | Marion County Industrial Development Authority Refunding Revenue, 0.18%, 11/15/32, (Credit Support: Fannie Mae)(a) | 6,835,000 | ||||||||
| 4,500,000 | Orange County Health Facilities Authority Refunding Revenue, Series E, 0.17%, 10/1/26, (LOC: Branch Banking & Trust)(a) | 4,500,000 | ||||||||
| 8,615,000 | Orange County Housing Finance Authority Refunding Revenue, 0.18%, 6/1/25, (Credit Support: Fannie Mae)(a) | 8,615,000 | ||||||||
| 4,995,000 | Tallahassee Energy System Revenue, Putters Series 2069Z, 0.21%, 4/1/15(a) | 4,995,000 | ||||||||
|
| |||||||||
| 62,340,000 | ||||||||||
|
| |||||||||
Georgia — 2.65% | ||||||||||
| 7,215,000 | Clayton County Housing Authority Refunding Revenue, 0.18%, 9/1/26, (Credit Support: Fannie Mae)(a) | 7,215,000 | ||||||||
| 7,985,000 | Cobb County Development Authority Refunding Revenue, Series B, 0.17%, 7/1/34, (LOC: Branch Banking & Trust)(a) | 7,985,000 | ||||||||
| 8,490,000 | Cobb County Housing Authority Refunding Revenue, 0.18%, 3/1/24, (Credit Support: Freddie Mac)(a) | 8,490,000 | ||||||||
| 4,805,000 | Fulton County Development Authority School Improvement Revenue, 0.19%, 8/1/35, (LOC: Branch Banking & Trust)(a) | 4,805,000 | ||||||||
26
SCHEDULE OF PORTFOLIO INVESTMENTS
| ||||||
| Tax-Free Money Market Fund (cont.) | ||||||
| ||||||
September 30, 2012 | ||||||
| Principal Amount | Value | |||||||||
| ||||||||||
| $ | 7,625,000 | Marietta Housing Authority Refunding Revenue, 0.18%, 7/1/24, (Credit Support: Fannie Mae)(a) | $ | 7,625,000 | ||||||
|
| |||||||||
| 36,120,000 | ||||||||||
|
| |||||||||
Illinois — 1.45% |
| |||||||||
| 3,155,000 | City of Chicago Waterworks Refunding Revenue, Sub Series, 04-3, 0.19%, 11/1/31, (LOC: State Street Bank & Trust)(a) | 3,155,000 | ||||||||
| 2,600,000 | Illinois Finance Authority Cultural Pool Revenue, 0.21%, 12/1/25, (LOC: JP Morgan Chase Bank)(a) | 2,600,000 | ||||||||
| 7,400,000 | Illinois Finance Authority YMCA Metro Chicago Project Refunding Revenue, 0.19%, 6/1/29, (LOC: JP Morgan Chase Bank)(a) | 7,400,000 | ||||||||
| 6,645,000 | Village of Channahon Morris Hospital Refunding Revenue, Series A, 0.19%, 12/1/23, (LOC: U.S. Bank NA)(a) | 6,645,000 | ||||||||
|
| |||||||||
| 19,800,000 | ||||||||||
|
| |||||||||
Indiana — 4.16% |
| |||||||||
| 19,000,000 | Indiana Bond Bank Advance Funding Program Cash Flow Management Revenue, Series A, 1.25%, 1/3/13, (Credit Support: GO of Bond Bank) | 19,043,687 | ||||||||
| 23,600,000 | Indiana Finance Authority Ascension Health Refunding Revenue, Series E7, 0.18%, 11/15/33(a) | 23,600,000 | ||||||||
| 14,015,000 | Indiana Finance Authority Indiana University Healthcare Revenue, Series C, 0.15%, 3/1/33, (LOC: Northern Trust Co.)(a) | 14,015,000 | ||||||||
|
| |||||||||
| 56,658,687 | ||||||||||
|
| |||||||||
Iowa — 1.16% |
| |||||||||
| 5,700,000 | City of Urbandale Interstate Acres LP Refunding Revenue, 0.20%, 12/1/14, (LOC: Bankers Trust Co., Federal Home Loan Bank, Des Moines)(a) | 5,700,000 | ||||||||
| 1,700,000 | Iowa Higher Education Loan Authority Cash Flow Management Revenue, Series C, 2.00%, 5/16/13, (LOC: U.S. Bank NA) | 1,717,381 | ||||||||
| 7,270,000 | Iowa Higher Education Loan Authority University & College Revenue, 0.29%, 5/1/20, (LOC: Wells Fargo Bank)(a) | 7,270,000 | ||||||||
| 1,125,000 | Woodbury County Revenue, 0.29%, 11/1/16, (LOC: U.S. Bank NA)(a) | 1,125,000 | ||||||||
|
| |||||||||
| 15,812,381 | ||||||||||
|
| |||||||||
Kentucky — 0.36% |
| |||||||||
| 4,855,000 | County of Warren Refunding Revenue, 0.33%, 4/1/37, (Credit Support: AGM)(a) | 4,855,000 | ||||||||
|
| |||||||||
Louisiana — 3.88% |
| |||||||||
| 20,000,000 | East Baton Rouge Parish Industrial Development Board, Inc. Exxon Mobile Project Revenue, Series B, 0.18%, 12/1/40(a) | 20,000,000 | ||||||||
| 20,000,000 | East Baton Rouge Parish Industrial Development Board, Inc. Exxon Mobile Project Revenue, Series A, 0.18%, 8/1/35(a) | 20,000,000 | ||||||||
| 9,055,000 | Louisiana Local Government Environmental Facilities & Community Development Authority Revenue, Series A, 0.18%, 10/1/37, (LOC: First NBC Bank, Federal Home Loan Bank, Dallas)(a) | 9,055,000 | ||||||||
27
SCHEDULE OF PORTFOLIO INVESTMENTS
| ||||||
| Tax-Free Money Market Fund (cont.) | ||||||
| ||||||
September 30, 2012 | ||||||
| Principal Amount | Value | |||||||||
| ||||||||||
| $ | 3,810,000 | Shreveport Home Mortgage Authority Refunding Revenue, 0.18%, 2/15/23, (Credit Support: Fannie Mae)(a) | $ | 3,810,000 | ||||||
|
| |||||||||
| 52,865,000 | ||||||||||
|
| |||||||||
Maryland — 0.81% |
| |||||||||
| 5,540,000 | Maryland Health & Higher Educational Facilities Authority Refunding Revenue, Series D, 0.19%, 7/1/41, (LOC: TD Bank NA)(a) | 5,540,000 | ||||||||
| 5,530,000 | Montgomery County Housing Opportunities Commission Local Single Family Housing Revenue, Series A, 0.17%, 5/1/39, (LOC: PNC Bank NA)(a) | 5,530,000 | ||||||||
|
| |||||||||
| 11,070,000 | ||||||||||
|
| |||||||||
Massachusetts — 1.12% |
| |||||||||
| 11,180,000 | City of Worcester Cash Flow Management GO, 2.00%, 11/8/12 | 11,199,703 | ||||||||
| 4,000,000 | Massachusetts Industrial Finance Agency Refunding Revenue, 0.17%, 12/1/24, (LOC: TD Bank NA)(a) | 4,000,000 | ||||||||
|
| |||||||||
| 15,199,703 | ||||||||||
|
| |||||||||
Michigan — 3.85% |
| |||||||||
| 5,000,000 | Michigan State Finance Authority Cash Flow Management Revenue, Series B1, 2.00%, 8/20/13 | 5,070,485 | ||||||||
| 10,000,000 | Michigan State Hospital Finance Authority, Trinity Health Group Revenue TECP, 0.16%, 10/10/12(c) | 10,000,000 | ||||||||
| 10,340,000 | Michigan State Hospital Finance Authority, Trinity Health Group Revenue TECP, 0.16%, 11/5/12(c) | 10,340,000 | ||||||||
| 15,000,000 | Michigan State Hospital Finance Authority, Trinity Health Group Revenue TECP, 0.16%, 11/6/12(c) | 15,000,000 | ||||||||
| 12,000,000 | University of Michigan TECP, 0.15%, 10/15/12(c) | 11,999,770 | ||||||||
|
| |||||||||
| 52,410,255 | ||||||||||
|
| |||||||||
Minnesota — 11.03% |
| |||||||||
| 1,825,000 | City of Bloomington Bristol Village Apartments Project Refunding Revenue, Series A1, 0.19%, 11/15/32, (Credit Support: Fannie Mae)(a) | 1,825,000 | ||||||||
| 4,860,000 | City of Burnsville Berkshire Project Refunding Revenue, Series A, 0.18%, 7/15/30, (Credit Support: Fannie Mae)(a) | 4,860,000 | ||||||||
| 8,350,000 | City of Burnsville Southwind Apartments Project Refunding Revenue, 0.18%, 1/1/35, (Credit Support: Freddie Mac)(a) | 8,350,000 | ||||||||
| 12,235,000 | City of Inver Grove Heights Refunding Revenue, 0.18%, 5/15/35, (Credit Support: Fannie Mae)(a) | 12,235,000 | ||||||||
| 6,375,000 | City of Minnetonka Beacon Hill Refunding Revenue, 0.18%, 5/15/34, (Credit Support: Fannie Mae)(a) | 6,374,996 | ||||||||
| 3,865,000 | City of Minnetonka, Minnetonka Hills Apartments Refunding Revenue, 0.18%, 11/15/31, (Credit Support: Fannie Mae)(a) | 3,865,000 | ||||||||
| 12,980,000 | City of Oak Park Heights Boutwells Landing Refunding Revenue, 0.18%, 11/1/35, (Credit Support: Freddie Mac)(a) | 12,980,000 | ||||||||
| 3,820,000 | City of Saint Louis Park Parkshore Senior Project Refunding Revenue, 0.18%, 8/1/34, (Credit Support: Freddie Mac)(a) | 3,820,000 | ||||||||
| 5,565,000 | City of Saint Louis Park Westwind Apartments Project Refunding Revenue, 0.18%, 9/15/33, (Credit Support: Fannie Mae)(a) | 5,565,000 | ||||||||
28
SCHEDULE OF PORTFOLIO INVESTMENTS
| ||||||
| Tax-Free Money Market Fund (cont.) | ||||||
| ||||||
September 30, 2012 | ||||||
| Principal Amount | Value | |||||||||
| ||||||||||
| $ | 1,155,000 | City of Spring Lake Park Oak Crest Apartments Project Refunding Revenue, 0.18%, 2/15/33, (Credit Support: Fannie Mae)(a) | $ | 1,155,000 | ||||||
| 8,520,000 | Midwest Consortium of Municipal Utilities Refunding Revenue, Series B, 0.19%, 10/1/35, (LOC: U.S. Bank NA)(a) | 8,520,000 | ||||||||
| 3,590,000 | Monticello Independent School District Number 882 Refunding GO, Series B, 2.00%, 2/1/13, (Credit Support: School District Credit Program) | 3,610,975 | ||||||||
| 19,000,000 | Rochester Health Care Facilities TECP, 0.14%, 10/1/12, (Credit Support: Mayo Clinic Foundation)(c) | 19,000,000 | ||||||||
| 6,400,000 | Rochester Health Care Facilities TECP, 0.16%, 10/22/12, (Credit Support: Mayo Clinic Foundation)(c) | 6,400,000 | ||||||||
| 10,000,000 | Rochester Health Care Facilities TECP, 0.17%, 10/3/12, (Credit Support: Mayo Clinic Foundation)(c) | 10,000,000 | ||||||||
| 2,100,000 | Rochester Health Care Facilities TECP, 0.17%, 11/15/38, (Credit Support: Mayo Clinic Foundation)(c) | 2,100,000 | ||||||||
| 3,900,000 | Saint Cloud Independent School District No 742 Cash Flow Management GO, Series B, 1.50%, 8/13/13, (Credit Support: School District Credit Program) | 3,940,382 | ||||||||
| 4,050,000 | Saint Paul Housing & Redevelopment Authority Highland Ridge Project Refunding Revenue, 0.18%, 10/1/33, (Credit Support: Freddie Mac)(a) | 4,050,000 | ||||||||
| 7,745,000 | Saint Paul Port Authority Sibley Project Refunding Revenue, 0.18%, 2/1/34, (Credit Support: Freddie Mac)(a) | 7,744,995 | ||||||||
| 1,300,000 | State of Minnesota Public Improvement GO, Series A, 4.00%, 12/1/12 | 1,308,168 | ||||||||
| 2,000,000 | University of Minnesota Refunding Revenue, Series A, 4.00%, 12/1/12, (Credit Support: GO of University) | 2,012,521 | ||||||||
| 8,000,000 | University of Minnesota TECP, 0.14%, 10/15/12(c) | 8,000,000 | ||||||||
| 10,000,000 | University of Minnesota TECP, 0.14%, 10/22/12(c) | 10,000,000 | ||||||||
| 2,600,000 | University of Minnesota TECP, 0.15%, 10/22/12(c) | 2,600,000 | ||||||||
|
| |||||||||
| 150,317,037 | ||||||||||
|
| |||||||||
Mississippi — 2.43% | ||||||||||
| 4,900,000 | County of Jackson Chevron USA Inc. Project Refunding Revenue, 0.18%, 12/1/16(a) | 4,900,000 | ||||||||
| 18,000,000 | Mississippi Business Finance Corp., Chevron USA Inc. Project Revenue, Series F, 0.18%, 11/1/35(a) | 18,000,000 | ||||||||
| 3,030,000 | Mississippi Business Finance Corp., Chevron USA Inc. Project Revenue, Series F, 0.20%, 12/1/30(a) | 3,030,000 | ||||||||
| 7,140,000 | Mississippi Business Finance Corp., King Edward Hotel Project Revenue, 0.18%, 5/1/39, (LOC: Capital One NA, Federal Home Loan Bank, Atlanta)(a) | 7,140,000 | ||||||||
|
| |||||||||
| 33,070,000 | ||||||||||
|
| |||||||||
Missouri — 2.26% | ||||||||||
| 13,500,000 | Curators of University of Missouri TECP, 0.17%, 10/17/12(c) | 13,500,000 | ||||||||
| 15,285,000 | Missouri State Health & Educational Facilities Authority, Bethesda Health Group Revenue, 0.20%, 8/1/41, (LOC: U.S. Bank NA)(a) | 15,285,000 | ||||||||
29
SCHEDULE OF PORTFOLIO INVESTMENTS
| ||||||
| Tax-Free Money Market Fund (cont.) | ||||||
| ||||||
September 30, 2012 | ||||||
| Principal Amount | Value | |||||||||
| ||||||||||
| $ | 2,000,000 | St. Charles County Industrial Development Authority Refunding Revenue, 0.18%, 2/1/29, (Credit Support: Fannie Mae)(a) | $ | 2,000,000 | ||||||
|
| |||||||||
| 30,785,000 | ||||||||||
|
| |||||||||
Montana — 0.57% | ||||||||||
| 1,700,000 | Montana Board of Investment Public Improvements Revenue, 0.22%, 3/1/29(a) | 1,700,000 | ||||||||
| 6,000,000 | Montana Board of Investments Public Improvements Revenue, 0.22%, 3/1/35(a) | 6,000,000 | ||||||||
|
| |||||||||
| 7,700,000 | ||||||||||
|
| |||||||||
Nebraska — 0.44% | ||||||||||
| 6,000,000 | Madison County Hospital Authority No. 1 Revenue, Series B, 0.19%, 7/1/33, (LOC: U.S. Bank NA)(a) | 6,000,000 | ||||||||
|
| |||||||||
New York — 13.58% | ||||||||||
| 14,000,000 | City of New York GO, Sub-Series A-4, 0.17%, 8/1/31, (LOC: Bank of Nova Scotia)(a) | 14,000,000 | ||||||||
| 25,000,000 | City of New York Refunding GO, Sub-Series C-5, 0.17%, 8/1/20, (LOC: BNY Mellon)(a) | 25,000,000 | ||||||||
| 15,000,000 | Long Island Power Authority Refunding Revenue, Series C, 0.18%, 5/1/33, (LOC: Barclays Bank Plc)(a) | 15,000,000 | ||||||||
| 8,500,000 | New York City Public Improvement GO, Subseries C4, 0.18%, 8/1/20, (LOC: Bank of Tokyo-Mitsubishi UFJ)(a) | 8,500,000 | ||||||||
| 17,000,000 | New York City Transitional Finance Authority Refunding Revenue, 0.14%, 11/1/29(a) | 17,000,000 | ||||||||
| 13,000,000 | New York City Transitional Finance Authority Revenue, Series A2, 0.18%, 11/15/27(a) | 13,000,000 | ||||||||
| 10,000,000 | New York City Transitional Finance Authority Revenue, Subseries A4, 0.19%, 8/1/39(a) | 10,000,000 | ||||||||
| 10,000,000 | New York City Trust For Cultural Resources, Lincoln Center Refunding Revenue, Series A1, 0.23%, 12/1/35, (LOC: JPMorgan Chase & Co.)(a) | 10,000,000 | ||||||||
| 3,735,000 | New York State Dormitory Authority Wagner College Revenue, 0.16%, 7/1/38, (LOC: TD Bank NA)(a) | 3,735,000 | ||||||||
| 27,400,000 | New York State Energy Research & Development Authority Refunding Revenue, Series A, 0.29%, 8/1/15, (LOC: Wells Fargo Bank)(a) | 27,400,000 | ||||||||
| 19,000,000 | New York State Housing Finance Agency Gotham West Housing Revenue, Series A1, 0.17%, 5/1/45, (LOC: Wells Fargo Bank NA)(a) | 19,000,000 | ||||||||
| 9,000,000 | New York State Housing Finance Agency Revenue, Series A, 0.18%, 5/1/35, (Credit Support: Freddie Mac)(a) | 9,000,000 | ||||||||
| 10,000,000 | New York State Liberty Development Corp., World Trade Center Project Revenue, 0.25%, 12/1/50(a) | 10,000,000 | ||||||||
| 3,400,000 | Triborough Bridge & Tunnel Authority Refunding Revenue, Series B, 0.16%, 1/1/32, (LOC: State Street Bank & Trust Co.)(a) | 3,400,000 | ||||||||
|
| |||||||||
| 185,035,000 | ||||||||||
|
| |||||||||
30
SCHEDULE OF PORTFOLIO INVESTMENTS
| ||||||
| Tax-Free Money Market Fund (cont.) | ||||||
| ||||||
September 30, 2012 | ||||||
| Principal Amount | Value | |||||||||
| ||||||||||
North Carolina — 1.55% | ||||||||||
| $ | 3,100,000 | Guilford County Industrial Facilities & Pollution Control Financing Authority Revenue, 0.19%, 9/1/29, (LOC: Branch Banking & Trust)(a) | $ | 3,100,000 | ||||||
| 1,900,000 | North Carolina Capital Facilities Finance Agency Refunding Revenue, 0.19%, 7/1/19, (LOC: Branch Banking & Trust)(a) | 1,900,000 | ||||||||
| 9,935,000 | North Carolina Educational Facilities Finance Agency, Duke University Project Revenue, Series B, 0.15%, 12/1/21(a) | 9,935,000 | ||||||||
| 3,000,000 | North Carolina Medical Care Commission Lower Cape Fear Hospice Revenue, 0.19%, 11/1/27, (LOC: Branch Banking & Trust)(a) | 3,000,000 | ||||||||
| 3,245,000 | North Carolina Medical Care Commission Sisters of Mercy Services Corp. Revenue, 0.19%, 3/1/28, (LOC: Branch Banking & Trust)(a) | 3,245,000 | ||||||||
|
| |||||||||
| 21,180,000 | ||||||||||
|
| |||||||||
Oregon — 0.62% | ||||||||||
| 8,500,000 | Oregon State Health & Science University Revenue, Series B1, 0.18%, 7/1/42, (LOC: Union Bank NA)(a) | 8,500,000 | ||||||||
|
| |||||||||
Pennsylvania — 9.67% | ||||||||||
| 8,900,000 | Allegheny County Higher Education Building Authority Refunding Revenue, Series A, 0.19%, 3/1/38, (LOC: PNC Bank NA)(a) | 8,900,000 | ||||||||
| 7,300,000 | Allegheny County Hospital Development Authority Revenue, Series A, 0.19%, 6/1/30, (LOC: PNC Bank NA)(a) | 7,300,000 | ||||||||
| 12,200,000 | Butler County General Authority Iroquois School District Project Refunding Revenue, 0.24%, 8/1/31, (Credit Support: AGM)(a) | 12,200,000 | ||||||||
| 10,415,000 | Butler County General Authority South Park School District Project Refunding Revenue, 0.24%, 8/1/27, (Credit Support: AGM)(a) | 10,415,000 | ||||||||
| 5,000,000 | Delaware County Industrial Development Authority General Electric Capital Refunding Revenue, Series G, 0.18%, 12/1/31(a) | 5,000,000 | ||||||||
| 5,000,000 | Delaware County Industrial Development Authority General Electric Capital Refunding Revenue, Series G, 0.18%, 12/1/31(a) | 5,000,000 | ||||||||
| 46,020,000 | Delaware County Industrial Development Authority, United Parcel Service Project Revenue, 0.17%, 12/1/15(a) | 46,020,000 | ||||||||
| 3,100,000 | Emmaus General Authority Revenue, Series A11, 0.20%, 3/1/24, (LOC: U.S. Bank NA)(a) | 3,100,000 | ||||||||
| 4,700,000 | Emmaus General Authority Revenue, Series F, 0.20%, 3/1/24, (LOC: U.S. Bank NA)(a) | 4,700,000 | ||||||||
| 8,155,000 | JP Morgan Chase Putters/Drivers Trust Refunding GO, Series 3405, 0.20%, 11/15/14, (Credit Support: AGM, State Aid Withholding)(a)(b) | 8,155,000 | ||||||||
| 7,550,000 | Luzerne County Convention Center Authority Revenue, Series A, 0.19%, 9/1/28, (LOC: PNC Bank NA)(a) | 7,550,000 | ||||||||
| 3,730,000 | Pennsylvania Economic Development Financing Authority Revenue, 0.19%, 12/1/31, (LOC: PNC Bank NA)(a) | 3,730,000 | ||||||||
| 2,200,000 | Pennsylvania Higher Educational Facilities Authority Gannon University Refunding Revenue, 0.19%, 5/1/15, (LOC: PNC Bank NA)(a) | 2,200,000 | ||||||||
31
SCHEDULE OF PORTFOLIO INVESTMENTS
| ||||||
| Tax-Free Money Market Fund (cont.) | ||||||
| ||||||
September 30, 2012 | ||||||
| Principal Amount | Value | |||||||||
| ||||||||||
| $ | 7,515,000 | Pennsylvania Higher Educational Facilities Authority Holy Family College Refunding Revenue, Series B, 0.17%, 12/1/32, (LOC: TD Bank NA)(a) | $ | 7,515,000 | ||||||
|
| |||||||||
| 131,785,000 | ||||||||||
|
| |||||||||
South Carolina — 0.55% | ||||||||||
| 3,300,000 | South Carolina Jobs-Economic Development Authority Revenue, 0.22%, 5/1/29, (LOC: Branch Banking & Trust)(a) | 3,300,000 | ||||||||
| 4,250,000 | South Carolina Jobs-Economic Development Authority Revenue, 0.29%, 5/1/29, (LOC: Wells Fargo Bank)(a) | 4,250,000 | ||||||||
|
| |||||||||
| 7,550,000 | ||||||||||
|
| |||||||||
South Dakota — 1.29% | ||||||||||
| 12,640,000 | City of Sioux Falls Sales Tax Revenue, Series 2057, 0.21%, 5/15/15(a) | 12,640,000 | ||||||||
| 5,000,000 | South Dakota Housing Development Authority Revenue, Series C, 0.17%, 5/1/39(a) | 5,000,000 | ||||||||
|
| |||||||||
| 17,640,000 | ||||||||||
|
| |||||||||
Tennessee — 1.83% | ||||||||||
| 25,000,000 | Vanderbilt University TECP, 0.19%, 2/20/13(c) | 25,000,000 | ||||||||
|
| |||||||||
Texas — 10.14% | ||||||||||
| 14,000,000 | City of Houston Utility System Refunding Revenue, Series B-3, 0.17%, 5/15/34, (LOC: Sumitomo Mitsui Bank)(a) | 14,000,000 | ||||||||
| 7,500,000 | City of Houston Utility System Refunding Revenue, Series B-6, 0.17%, 5/15/34, (LOC: Sumitomo Mitsui Bank)(a) | 7,500,000 | ||||||||
| 2,360,000 | Crawford Education Facilities Corp. Revenue, 0.19%, 6/1/18, (LOC: U.S. Bank NA)(a) | 2,360,000 | ||||||||
| 7,050,000 | DeSoto Industrial Development Authority Caterpillar Refunding Revenue, 0.28%, 12/1/16(a) | 7,050,000 | ||||||||
| 9,000,000 | Harris County Cultural Educational Facilities TECP, 0.22%, 12/5/12, (Credit Support: Methodist Hospital)(c) | 9,000,000 | ||||||||
| 18,000,000 | Harris County Cultural Educational Facilities TECP, 0.24%, 4/3/13, (Credit Support: Methodist Hospital)(c) | 18,000,000 | ||||||||
| 8,000,000 | Harris County Cultural Educational Facilities TECP, 0.24%, 4/3/13, (Credit Support: Methodist Hospital)(c) | 8,000,000 | ||||||||
| 7,200,000 | Harris County Industrial Development Corp., Exxon Mobil Corp. Pollution Control Revenue, 0.18%, 3/1/24(a) | 7,200,000 | ||||||||
| 15,000,000 | JP Morgan Chase Putters Drivers Trust, Cash Flow Management Revenue, Series 4262, 0.20%, 8/30/13(a)(b) | 15,000,000 | ||||||||
| 9,000,000 | JP Morgan Chase Putters Drivers Trust, Cash Flow Management Revenue, Series 4263, 0.20%, 8/30/13(a)(b) | 9,000,000 | ||||||||
| 8,000,000 | JP Morgan Chase Putters Drivers Trust, Cash Flow Management Revenue, Series 4264, 0.20%, 8/30/13(a)(b) | 8,000,000 | ||||||||
| 11,065,000 | Lake Travis Independent School District Putters GO, Series 1882, 0.19%, 2/15/14, (Credit Support: PSF-GTD)(a)(b) | 11,065,000 | ||||||||
| 4,820,000 | Splendora Higher Education Facilities Corp. Revenue, Series A, 0.29%, 12/1/26, (LOC: Wells Fargo Bank)(a) | 4,820,000 | ||||||||
32
SCHEDULE OF PORTFOLIO INVESTMENTS
| ||||||
| Tax-Free Money Market Fund (cont.) | ||||||
| ||||||
September 30, 2012 | ||||||
| Principal Amount | Value | |||||||||
| ||||||||||
| $ | 17,195,000 | University of Texas, Financing System Refunding Revenue, Series B, 0.15%, 8/1/34(a) | $ | 17,195,000 | ||||||
|
| |||||||||
| 138,190,000 | ||||||||||
|
| |||||||||
Utah — 2.08% | ||||||||||
| 5,000,000 | County of Emery Refunding Revenue, 0.18%, 11/1/24, (LOC: Wells Fargo Bank)(a) | 5,000,000 | ||||||||
| 545,000 | County of Sanpete Private Primary Schools Revenue, 0.29%, 8/1/28, (LOC: U.S. Bank NA)(a) | 545,000 | ||||||||
| 3,450,000 | Duchesne County School District Revenue, 0.29%, 6/1/21, (LOC: U.S. Bank NA)(a) | 3,450,000 | ||||||||
| 2,905,000 | Ogden City Redevelopment Agency Tax Allocation Revenue, Series A, 0.29%, 4/1/25, (LOC: Wells Fargo Bank)(a) | 2,905,000 | ||||||||
| 4,435,000 | Salt Lake County Housing Authority Refunding Revenue, 0.22%, 2/15/31, (Credit Support: Fannie Mae)(a) | 4,435,000 | ||||||||
| 11,970,000 | Utah Associated Municipal Power Systems Horse Butte Wind Project Revenue, 0.18%, 9/1/32, (LOC: Bank of Montreal)(a) | 11,970,000 | ||||||||
|
| |||||||||
| 28,305,000 | ||||||||||
|
| |||||||||
Vermont — 0.24% | ||||||||||
| 3,295,000 | Vermont Educational & Health Buildings Financing Agency Springfield Project Refunding Revenue, Series A, 0.17%, 9/1/31, (LOC: TD Bank NA)(a) | 3,295,000 | ||||||||
|
| |||||||||
Virginia — 0.72% | ||||||||||
| 9,855,000 | Russell County Industrial Development Authority Revenue, Series B, 0.16%, 7/1/38, (LOC: U.S. Bank NA)(a) | 9,855,000 | ||||||||
|
| |||||||||
Washington — 2.82% | ||||||||||
| 5,000,000 | Everett Public Facilities District Refunding Revenue, 0.19%, 4/1/36, (LOC: BNY Mellon Bank)(a) | 5,000,000 | ||||||||
| 4,995,000 | JP Morgan Chase Putters/Drivers Trust Snohomish County School District No. 15 GO, Series 3542Z, 0.21%, 12/1/14, (Credit Support: School Board GTY)(a)(b) | 4,995,000 | ||||||||
| 23,000,000 | University of Washington TECP, 0.17%, 12/4/12(c) | 23,000,000 | ||||||||
| 4,680,000 | Washington State Housing Finance Commission Retirement Facilities Revenue, Series A, 0.22%, 8/1/44, (LOC: East West Bank, Federal Home Loan Bank, San Francisco)(a) | 4,680,000 | ||||||||
| 800,000 | Washington State Housing Finance Commission Revenue, 0.19%, 7/1/22, (LOC: U.S. Bank NA)(a) | 800,000 | ||||||||
|
| |||||||||
| 38,475,000 | ||||||||||
|
| |||||||||
Wisconsin — 2.37% | ||||||||||
| 15,000,000 | City of Milwaukee Cash Flow Management GO, Series R-1, 1.25%, 12/4/12 | 15,028,203 | ||||||||
| 7,630,000 | Wisconsin Health & Educational Facilities Authority Revenue, 0.29%, 6/1/28, (LOC: Wells Fargo Bank)(a) | 7,630,000 | ||||||||
| 7,500,000 | Wisconsin Health & Educational Facilities Authority, Aurora Health Care Refunding Revenue, Series C, 0.21%, 7/15/28, (LOC: Bank of Montreal)(a) | 7,500,000 | ||||||||
33
SCHEDULE OF PORTFOLIO INVESTMENTS
| ||||||
| Tax-Free Money Market Fund (cont.) | ||||||
| ||||||
September 30, 2012 | ||||||
| Principal Amount | Value | |||||||||
| ||||||||||
| $ | 2,100,000 | Wisconsin Municipalities Private School Finance Commission Revenue, 0.19%, 3/1/23, (LOC: U.S. Bank NA)(a) | $ | 2,100,000 | ||||||
|
| |||||||||
| 32,258,203 | ||||||||||
|
| |||||||||
Total Municipal Bonds | 1,346,506,266 | |||||||||
|
| |||||||||
(Cost $1,346,506,266) | ||||||||||
Shares | ||||||||||
Investment Company — 0.74% | ||||||||||
| 10,000,000 | Goldman Sachs Financial Square Tax Free Money Market Fund | 10,000,000 | ||||||||
|
| |||||||||
Total Investment Company | 10,000,000 | |||||||||
|
| |||||||||
(Cost $10,000,000) | ||||||||||
Total Investments | $ | 1,356,506,266 | ||||||||
(Cost $1,356,506,266)(d) — 99.55% | ||||||||||
Other assets in excess of liabilities — 0.45% | 6,166,573 | |||||||||
|
| |||||||||
NET ASSETS — 100.00% | $ | 1,362,672,839 | ||||||||
|
| |||||||||
| (a) | Variable rate demand security. The rate reflected in the Schedule of Portfolio Investments is the rate in effect on September 30, 2012. The maturity date represents the actual maturity date. The security’s effective maturity resets periodically. |
| (b) | Security exempt from registration under Rule 144A or Section 4(2) of the Securities Act of 1933, as amended. These securities may be resold in transactions exempt from registration, normally to qualified institutional buyers. Security has been deemed to be liquid based on procedures approved by the Board of Trustees. |
| (c) | Represents effective yield to maturity on date of purchase. |
| (d) | Tax cost of securities is equal to book cost of securities. |
Abbreviations used are defined below:
AGM – Assured Guaranty Municipal
COP – Certificate of Participation
GO – General Obligation
GTY – Guaranty
LOC – Letter of Credit
PSF-GTD – Permanent School Fund Guarantee
TECP – Tax Exempt Commercial Paper
See notes to financial statements.
34
| ||||||
This Page Intentionally Left Blank
35
| ||||||
| Statements of Assets and Liabilities | ||||||
| ||||||
September 30, 2012 | ||||||
| Prime Money Market Fund | U.S. Government Money Market Fund | Tax-Free Money Market Fund | ||||||||||
Assets: | ||||||||||||
Investments, at value (cost $12,311,890,008; $5,338,924,404; $1,356,506,266 respectively) | $ | 12,311,890,008* | $ | 5,338,924,404** | $ | 1,356,506,266 | ||||||
Cash | 112,428,854 | 57,408,216 | 5,544,164 | |||||||||
Interest and dividends receivable | 18,979,486 | 5,096,120 | 704,479 | |||||||||
Prepaid expenses and other assets | 43,387 | 105,462 | 95,589 | |||||||||
|
|
|
|
|
| |||||||
Total Assets | 12,443,341,735 | 5,401,534,202 | 1,362,850,498 | |||||||||
|
|
|
|
|
| |||||||
Liabilities: | ||||||||||||
Distributions payable | 76,382 | 1,265 | — | |||||||||
Payable for investments purchased | 124,981,972 | 80,420,418 | — | |||||||||
Accrued expenses and other payables: | ||||||||||||
Investment advisory fees | 903,419 | 396,073 | 102,211 | |||||||||
Audit fees | 26,801 | 26,801 | 26,801 | |||||||||
Trustee fees | 3,399 | 1,581 | 367 | |||||||||
Distribution fees | 1,228,319 | 150,757 | 17,801 | |||||||||
Shareholder reports | 222,145 | 50,085 | 9,211 | |||||||||
Shareholder servicing fees | 62,195 | 32,589 | 275 | |||||||||
Transfer Agent fees | 15,003 | 5,031 | 4,097 | |||||||||
Other | 112,881 | 54,758 | 16,896 | |||||||||
|
|
|
|
|
| |||||||
Total Liabilities | 127,632,516 | 81,139,358 | 177,659 | |||||||||
|
|
|
|
|
| |||||||
Net Assets | $ | 12,315,709,219 | $ | 5,320,394,844 | $ | 1,362,672,839 | ||||||
|
|
|
|
|
| |||||||
Net Assets Consist Of: | ||||||||||||
Capital | $ | 12,319,905,814 | $ | 5,320,374,875 | $ | 1,362,689,709 | ||||||
Undistributed (distributions in excess of) net investment income | (1,031 | ) | 3,719 | — | ||||||||
Accumulated net realized gains (losses) from investment transactions | (4,195,564 | ) | 16,250 | (16,870 | ) | |||||||
|
|
|
|
|
| |||||||
Net Assets | $ | 12,315,709,219 | $ | 5,320,394,844 | $ | 1,362,672,839 | ||||||
|
|
|
|
|
| |||||||
Net Assets: | ||||||||||||
RBC Institutional Class 1 | $ | 1,745,618,439 | $ | 1,046,082,797 | $ | 25,809,691 | ||||||
RBC Institutional Class 2 | 632,634,772 | 212,792,490 | 201,934,034 | |||||||||
RBC Investor Class | 2,816,298,131 | 856,913,665 | 162,169,326 | |||||||||
RBC Reserve Class | 5,453,131,293 | 1,895,655,733 | 599,513,735 | |||||||||
RBC Select Class | 1,668,026,584 | 1,308,950,159 | 373,246,053 | |||||||||
|
|
|
|
|
| |||||||
Total | $ | 12,315,709,219 | $ | 5,320,394,844 | $ | 1,362,672,839 | ||||||
|
|
|
|
|
| |||||||
36
FINANCIAL STATEMENTS
| ||||||
| Statements of Assets and Liabilities (cont.) | ||||||
| ||||||
| Prime Money Market Fund | U.S. Government Money Market Fund | Tax-Free Money Market Fund | ||||||||||
Shares Outstanding (Unlimited number of shares authorized, no par value): | ||||||||||||
RBC Institutional Class 1 | 1,745,480,636 | 1,046,060,280 | 25,823,504 | |||||||||
RBC Institutional Class 2 | 632,600,588 | 212,789,050 | 202,008,105 | |||||||||
RBC Investor Class | 2,818,266,653 | 856,923,351 | 162,162,462 | |||||||||
RBC Reserve Class | 5,455,119,196 | 1,895,673,874 | 599,504,699 | |||||||||
RBC Select Class | 1,668,558,708 | 1,308,962,707 | 373,238,139 | |||||||||
|
|
|
|
|
| |||||||
Total | 12,320,025,781 | 5,320,409,262 | 1,362,736,909 | |||||||||
|
|
|
|
|
| |||||||
Net Asset Values and Redemption Price per Share: | ||||||||||||
RBC Institutional Class 1 | $ | 1.00 | $ | 1.00 | $ | 1.00 | ||||||
|
|
|
|
|
| |||||||
RBC Institutional Class 2 | $ | 1.00 | $ | 1.00 | $ | 1.00 | ||||||
|
|
|
|
|
| |||||||
RBC Investor Class | $ | 1.00 | $ | 1.00 | $ | 1.00 | ||||||
|
|
|
|
|
| |||||||
RBC Reserve Class | $ | 1.00 | $ | 1.00 | $ | 1.00 | ||||||
|
|
|
|
|
| |||||||
RBC Select Class | $ | 1.00 | $ | 1.00 | $ | 1.00 | ||||||
|
|
|
|
|
| |||||||
| * | $1,805,000,000 of which are repurchase agreements. See Schedule of Portfolio Investments for details. |
| ** | $1,065,000,000 of which are repurchase agreements. See Schedule of Portfolio Investments for details. |
See notes to financial statements.
37
FINANCIAL STATEMENTS
| ||||||
| Statements of Operations | ||||||
| ||||||
For the Year Ended September 30, 2012 | ||||||
| Prime Money Market Fund | U.S. Government Money Market Fund | Tax-Free Money Market Fund | ||||||||||
Investment Income: | ||||||||||||
Interest income | $ | 32,932,293 | $ | 9,716,344 | $ | 2,362,818 | ||||||
Dividend income | — | — | 2,122 | |||||||||
|
|
|
|
|
| |||||||
Total Investment Income | 32,932,293 | 9,716,344 | 2,364,940 | |||||||||
|
|
|
|
|
| |||||||
Expenses: | ||||||||||||
Investment advisory fees | 12,396,423 | 5,751,632 | 1,341,239 | |||||||||
Distribution fees-RBC Institutional Class 2 | 972,827 | 280,712 | 321,837 | |||||||||
Distribution fees-RBC Investor Class | 29,775,051 | 9,093,160 | 1,674,845 | |||||||||
Distribution fees-RBC Reserve Class | 46,933,459 | 17,069,142 | 5,223,288 | |||||||||
Distribution fees-RBC Select Class | 13,061,014 | 10,749,113 | 2,804,640 | |||||||||
Shareholder servicing fee-RBC Institutional Class 1 | 961,455 | 707,482 | 14,126 | |||||||||
Accounting fees | 619,821 | 287,582 | 67,062 | |||||||||
Audit fees | 25,736 | 29,040 | 34,342 | |||||||||
Custodian fees | 171,923 | 104,742 | 16,011 | |||||||||
Insurance fees | 112,636 | 38,219 | 13,074 | |||||||||
Legal fees | 336,559 | 165,144 | 37,264 | |||||||||
Registration and filing fees | 355,762 | 222,511 | 218,768 | |||||||||
Shareholder reports | 310,639 | 32,153 | 12,264 | |||||||||
Transfer agent fees | 98,055 | 33,940 | 27,104 | |||||||||
Trustees’ fees | 306,249 | 142,308 | 33,674 | |||||||||
Other fees | 407,980 | 200,707 | 70,495 | |||||||||
|
|
|
|
|
| |||||||
Total expenses before fee reductions | 106,845,589 | 44,907,587 | 11,910,033 | |||||||||
Expenses reduced by: | ||||||||||||
Shareholder Servicing Agent - Class Specific | — | (234,290 | ) | (8,677 | ) | |||||||
Distributor - Class Specific | (76,685,376 | ) | (35,544,552 | ) | (9,672,453 | ) | ||||||
|
|
|
|
|
| |||||||
Net Expenses | 30,160,213 | 9,128,745 | 2,228,903 | |||||||||
|
|
|
|
|
| |||||||
Net Investment Income | 2,772,080 | 587,599 | 136,037 | |||||||||
|
|
|
|
|
| |||||||
Realized/Unrealized Gains (Losses) from Investment Transactions: | ||||||||||||
Net realized gains from investment transactions | 153,325 | 16,250 | 1,487 | |||||||||
|
|
|
|
|
| |||||||
Change in net assets resulting from operations | $ | 2,925,405 | $ | 603,849 | $ | 137,524 | ||||||
|
|
|
|
|
| |||||||
See notes to financial statements.
38
FINANCIAL STATEMENTS
| ||||
| Statements of Changes in Net Assets | ||||
| ||||
| Prime Money Market Fund | ||||||||
| For the Year Ended September 30, 2012 | For the Year Ended September 30, 2011 | |||||||
From Investment Activities: | ||||||||
Operations: | ||||||||
Net investment income | $ | 2,772,080 | $ | 6,158,942 | ||||
Net realized gains from investment transactions | 153,325 | 364,928 | ||||||
|
|
|
| |||||
Change in net assets resulting from operations | 2,925,405 | 6,523,870 | ||||||
|
|
|
| |||||
Distributions from Net Investment Income | ||||||||
RBC Institutional Class 1 Shareholders | (1,713,557 | ) | (4,715,323 | ) | ||||
RBC Institutional Class 2 Shareholders | (72,809 | ) | (371,207 | ) | ||||
RBC Investor Class Shareholders | (298,786 | ) | (367,403 | ) | ||||
RBC Reserve Class Shareholders | (523,151 | ) | (529,673 | ) | ||||
RBC Select Class Shareholders | (163,777 | ) | (175,336 | ) | ||||
|
|
|
| |||||
Change in net assets resulting from shareholder distributions | (2,772,080 | ) | (6,158,942 | ) | ||||
|
|
|
| |||||
Capital Transactions: | ||||||||
Proceeds from shares issued | 31,219,859,782 | 55,383,518,080 | ||||||
Distributions reinvested | 2,185,210 | 4,223,143 | ||||||
Cost of shares redeemed | (31,398,365,527 | ) | (58,508,859,963 | ) | ||||
|
|
|
| |||||
Change in net assets resulting from capital transactions | (176,320,535 | ) | (3,121,118,740 | ) | ||||
|
|
|
| |||||
Net decrease in net assets | (176,167,210 | ) | (3,120,753,812 | ) | ||||
Net Assets: | ||||||||
Beginning of year | 12,491,876,429 | 15,612,630,241 | ||||||
|
|
|
| |||||
End of year | $ | 12,315,709,219 | $ | 12,491,876,429 | ||||
|
|
|
| |||||
Distributions in excess of net investment income | $ | (1,031 | ) | $ | (1,031 | ) | ||
|
|
|
| |||||
Share Transactions: | ||||||||
Issued | 31,219,859,782 | 55,383,518,080 | ||||||
Reinvested | 2,185,210 | 4,223,143 | ||||||
Redeemed | (31,398,365,527 | ) | (58,508,859,963 | ) | ||||
|
|
|
| |||||
Change in shares resulting from capital transactions | (176,320,535 | ) | (3,121,118,740 | ) | ||||
|
|
|
| |||||
See notes to financial statements.
39
FINANCIAL STATEMENTS
| ||||
| Statements of Changes in Net Assets (cont.) | ||||
| ||||
| U.S. Government Money Market Fund | ||||||||
| For the Year Ended September 30, 2012 | For the Year Ended September 30, 2011 | |||||||
From Investment Activities: | ||||||||
Operations: | ||||||||
Net investment income | $ | 587,599 | $ | 1,007,107 | ||||
Net realized gains from investment transactions | 16,250 | 78,276 | ||||||
|
|
|
| |||||
Change in net assets resulting from operations | 603,849 | 1,085,383 | ||||||
Distributions from Net Investment Income | ||||||||
RBC Institutional Class 1 Shareholders | (152,689 | ) | (591,712 | ) | ||||
RBC Institutional Class 2 Shareholders | (18,769 | ) | (15,108 | ) | ||||
RBC Investor Class Shareholders | (91,193 | ) | (108,071 | ) | ||||
RBC Reserve Class Shareholders | (190,206 | ) | (175,362 | ) | ||||
RBC Select Class Shareholders | (134,742 | ) | (116,852 | ) | ||||
|
|
|
| |||||
Change in net assets resulting from Distributions of Net Investment Income | (587,599 | ) | (1,007,105 | ) | ||||
|
|
|
| |||||
Distributions from Net Realized Gains | ||||||||
RBC Institutional Class 1 Shareholders | (12,707 | ) | — | |||||
RBC Institutional Class 2 Shareholders | (1,173 | ) | — | |||||
RBC Investor Class Shareholders | (7,136 | ) | — | |||||
RBC Reserve Class Shareholders | (14,189 | ) | — | |||||
RBC Select Class Shareholders | (10,464 | ) | — | |||||
|
|
|
| |||||
Change in net assets resulting from Distributions of Net Realized Gains | (45,669 | ) | — | |||||
|
|
|
| |||||
Capital Transactions: | ||||||||
Proceeds from shares issued | 7,041,789,065 | 11,731,772,486 | ||||||
Distributions reinvested | 602,302 | 750,750 | ||||||
Cost of shares redeemed | (7,434,409,505 | ) | (10,957,608,972 | ) | ||||
|
|
|
| |||||
Change in net assets resulting from capital transactions | (392,018,138 | ) | 774,914,264 | |||||
|
|
|
| |||||
Net increase (decrease) in net assets | (392,047,557 | ) | 774,992,542 | |||||
Net Assets: | ||||||||
Beginning of year | 5,712,442,401 | 4,937,449,859 | ||||||
|
|
|
| |||||
End of year | $ | 5,320,394,844 | $ | 5,712,442,401 | ||||
|
|
|
| |||||
Undistributed net investment income | $ | 3,719 | $ | 3,719 | ||||
|
|
|
| |||||
Share Transactions: | ||||||||
Issued | 7,041,789,065 | 11,731,772,486 | ||||||
Reinvested | 602,302 | 750,750 | ||||||
Redeemed | (7,434,409,505 | ) | (10,957,608,972 | ) | ||||
|
|
|
| |||||
Change in shares resulting from capital transactions | (392,018,138 | ) | 774,914,264 | |||||
|
|
|
| |||||
See notes to financial statements.
40
FINANCIAL STATEMENTS
| ||||
| Statements of Changes in Net Assets (cont.) | ||||
| ||||
| Tax-Free Money Market Fund | ||||||||
| For the Year Ended September 30, 2012 | For the Year Ended September 30, 2011 | |||||||
From Investment Activities: | ||||||||
Operations: | ||||||||
Net investment income | $ | 136,037 | $ | 209,626 | ||||
Net realized gains (losses) from investment transactions | 1,487 | (18,807 | ) | |||||
|
|
|
| |||||
Change in net assets resulting from operations | 137,524 | 190,819 | ||||||
|
|
|
| |||||
Distributions from Net Investment Income | ||||||||
RBC Institutional Class 1 Shareholders | (4,341 | ) | (44,510 | ) | ||||
RBC Institutional Class 2 Shareholders | (21,528 | ) | (53,846 | ) | ||||
RBC Investor Class Shareholders | (16,802 | ) | (19,149 | ) | ||||
RBC Reserve Class Shareholders | (58,203 | ) | (60,382 | ) | ||||
RBC Select Class Shareholders | (35,163 | ) | (31,739 | ) | ||||
|
|
|
| |||||
Change in net assets resulting from Distributions of Net Investment Income | (136,037 | ) | (209,626 | ) | ||||
|
|
|
| |||||
Distributions from Net Realized Gains | ||||||||
RBC Institutional Class 1 Shareholders | — | (2,490 | ) | |||||
RBC Institutional Class 2 Shareholders | — | (15,077 | ) | |||||
RBC Investor Class Shareholders | — | (9,193 | ) | |||||
RBC Reserve Class Shareholders | — | (30,785 | ) | |||||
RBC Select Class Shareholders | — | (14,254 | ) | |||||
|
|
|
| |||||
Change in net assets resulting from Distributions of Net Realized Gains | — | (71,799 | ) | |||||
|
|
|
| |||||
Capital Transactions: | ||||||||
Proceeds from shares issued | 1,474,192,579 | 1,612,678,587 | ||||||
Distributions reinvested | 135,762 | 280,174 | ||||||
Cost of shares redeemed | (1,350,395,314 | ) | (1,834,297,551 | ) | ||||
|
|
|
| |||||
Change in net assets resulting from capital transactions | 123,933,027 | (221,338,790 | ) | |||||
|
|
|
| |||||
Net increase (decrease) in net assets | 123,934,514 | (221,429,396 | ) | |||||
Net Assets: | ||||||||
Beginning of year | 1,238,738,325 | 1,460,167,721 | ||||||
|
|
|
| |||||
End of year | $ | 1,362,672,839 | $ | 1,238,738,325 | ||||
|
|
|
| |||||
Distributions in excess of net investment income | $ | — | $ | (371 | ) | |||
|
|
|
| |||||
Share Transactions: | ||||||||
Issued | 1,474,192,579 | 1,612,678,587 | ||||||
Reinvested | 135,762 | 280,174 | ||||||
Redeemed | (1,350,395,314 | ) | (1,834,297,551 | ) | ||||
|
|
|
| |||||
Change in shares resulting from capital transactions | 123,933,027 | (221,338,790 | ) | |||||
|
|
|
| |||||
See notes to financial statements.
41
|
|
| Prime Money Market Fund | (Selected data for a share outstanding throughout the periods indicated) | |
| Net Asset Value, Beginning of Period | Investment Activities | Distributions | Net Asset Value, End of Period | |||||||||||||||||||||||||
| Net Investment Income | Net Realized / Unrealized Gain/(Loss) on Investments | Total from Investment Activities | Net Investment Income | Total Distributions | ||||||||||||||||||||||||
RBC Institutional Class 1 | ||||||||||||||||||||||||||||
Year Ended September 30, 2012 | $1.00 | (a) | (b) | (b) | (b) | (b) | (b) | $1.00 | ||||||||||||||||||||
Year Ended September 30, 2011 | 1.00 | (a) | (b) | (b) | (b) | (b) | (b) | 1.00 | ||||||||||||||||||||
Year Ended September 30, 2010 | 1.00 | (a) | (b) | (b) | (b) | (b) | (b) | 1.00 | ||||||||||||||||||||
Year Ended September 30, 2009 | 1.00 | 0.01 | (a) | (b) | 0.01 | (0.01) | (0.01) | 1.00 | ||||||||||||||||||||
Year Ended September 30, 2008 | 1.00 | 0.03 | (a) | (b) | 0.03 | (0.03) | (0.03) | 1.00 | ||||||||||||||||||||
RBC Institutional Class 2 | ||||||||||||||||||||||||||||
Year Ended September 30, 2012 | $1.00 | (a) | (b) | (b) | (b) | (b) | (b) | $1.00 | ||||||||||||||||||||
Year Ended September 30, 2011 | 1.00 | (a) | (b) | (b) | (b) | (b) | (b) | 1.00 | ||||||||||||||||||||
Year Ended September 30, 2010 | 1.00 | (a) | (b) | (b) | (b) | (b) | (b) | 1.00 | ||||||||||||||||||||
Period Ended September 30, 2009(c) | 1.00 | (a) | (b) | (b) | (b) | (b) | (b) | 1.00 | ||||||||||||||||||||
RBC Investor Class | ||||||||||||||||||||||||||||
Year Ended September 30, 2012 | $1.00 | (a) | (b) | (b) | (b) | (b) | (b) | $1.00 | ||||||||||||||||||||
Year Ended September 30, 2011 | 1.00 | (a) | (b) | (b) | (b) | (b) | (b) | 1.00 | ||||||||||||||||||||
Year Ended September 30, 2010 | 1.00 | (a) | (b) | (b) | (b) | (b) | (b) | 1.00 | ||||||||||||||||||||
Period Ended September 30, 2009(c) | 1.00 | (a) | (b) | (b) | (b) | (b) | (b) | 1.00 | ||||||||||||||||||||
RBC Reserve Class | ||||||||||||||||||||||||||||
Year Ended September 30, 2012 | $1.00 | (a) | (b) | (b) | (b) | (b) | (b) | $1.00 | ||||||||||||||||||||
Year Ended September 30, 2011 | 1.00 | (a) | (b) | (b) | (b) | (b) | (b) | 1.00 | ||||||||||||||||||||
Year Ended September 30, 2010 | 1.00 | (a) | (b) | (b) | (b) | (b) | (b) | 1.00 | ||||||||||||||||||||
Period Ended September 30, 2009(c) | 1.00 | (a) | (b) | (b) | (b) | (b) | (b) | 1.00 | ||||||||||||||||||||
RBC Select Class | ||||||||||||||||||||||||||||
Year Ended September 30, 2012 | $1.00 | (a) | (b) | (b) | (b) | (b) | (b) | $1.00 | ||||||||||||||||||||
Year Ended September 30, 2011 | 1.00 | (a) | (b) | (b) | (b) | (b) | (b) | 1.00 | ||||||||||||||||||||
Year Ended September 30, 2010 | 1.00 | (a) | (b) | (b) | (b) | (b) | (b) | 1.00 | ||||||||||||||||||||
Period Ended September 30, 2009(c) | 1.00 | (a) | (b) | (b) | (b) | (b) | (b) | 1.00 | ||||||||||||||||||||
| (a) | Per share net investment income has been calculated using the average daily shares method. | (c) | For the period from November 21, 2008 (commencement of operations) to September 30, 2009. | |||
| (b) | Less than $0.01 or $(0.01) per share. |
See notes to financial statements.
42
FINANCIAL HIGHLIGHTS
|
| Prime Money Market Fund (cont.) | (Selected data for a share outstanding throughout the periods indicated) | |
| Ratios/Supplemental Data | ||||||||||||||||||||
| Total Return | Net Assets, End of Period (millions) | Ratio of Net Expenses to Average Net Assets | Ratio of Net Investment Income to Average Net Assets | Ratio of Expenses to Average Net Assets* | ||||||||||||||||
RBC Institutional Class 1 | ||||||||||||||||||||
Year Ended September 30, 2012 | 0.09% | $1,746 | 0.17% | 0.09% | 0.17%(g) | |||||||||||||||
Year Ended September 30, 2011 | 0.13% | 1,978 | 0.17% | 0.14% | 0.17%(g) | |||||||||||||||
Year Ended September 30, 2010 | 0.19% | 4,051 | 0.17% | 0.19% | 0.17%(g) | |||||||||||||||
Year Ended September 30, 2009 | 0.95% | 4,426 | 0.55%(f) | 1.03% | 0.55% | |||||||||||||||
Year Ended September 30, 2008 | 3.02% | 10,591 | 0.84% | 2.94% | 0.87% | |||||||||||||||
RBC Institutional Class 2 | ||||||||||||||||||||
Year Ended September 30, 2012 | 0.01% | $633 | 0.25% | 0.01% | 0.27% | |||||||||||||||
Year Ended September 30, 2011 | 0.04% | 687 | 0.26% | 0.04% | 0.27% | |||||||||||||||
Year Ended September 30, 2010 | 0.09% | 830 | 0.27% | 0.07% | 0.27% | |||||||||||||||
Period Ended September 30, 2009(c) | 0.62%(d) | 19 | 0.31%(e) | 0.45%(e) | 0.32%(e) | |||||||||||||||
RBC Investor Class | ||||||||||||||||||||
Year Ended September 30, 2012 | 0.01% | $2,816 | 0.26% | 0.01% | 1.12% | |||||||||||||||
Year Ended September 30, 2011 | 0.01% | 3,199 | 0.30% | 0.01% | 1.12% | |||||||||||||||
Year Ended September 30, 2010 | 0.01% | 3,995 | 0.35% | 0.01% | 1.13% | |||||||||||||||
Period Ended September 30, 2009(c) | 0.15%(d) | 4,659 | 0.91%(e) | 0.16%(e) | 1.19%(e) | |||||||||||||||
RBC Reserve Class | ||||||||||||||||||||
Year Ended September 30, 2012 | 0.01% | $5,453 | 0.26% | 0.01% | 1.02% | |||||||||||||||
Year Ended September 30, 2011 | 0.01% | 5,032 | 0.29% | 0.01% | 1.01% | |||||||||||||||
Year Ended September 30, 2010 | 0.01% | 5,165 | 0.35% | 0.01% | 1.03% | |||||||||||||||
Period Ended September 30, 2009(c) | 0.22%(d) | 4,870 | 0.83%(e) | 0.24%(e) | 1.08%(e) | |||||||||||||||
RBC Select Class | ||||||||||||||||||||
Year Ended September 30, 2012 | 0.01% | $1,668 | 0.26% | 0.01% | 0.92% | |||||||||||||||
Year Ended September 30, 2011 | 0.01% | 1,595 | 0.29% | 0.01% | 0.92% | |||||||||||||||
Year Ended September 30, 2010 | 0.01% | 1,572 | 0.35% | 0.01% | 0.92% | |||||||||||||||
Period Ended September 30, 2009(c) | 0.27%(d) | 1,383 | 0.77%(e) | 0.29%(e) | 0.97%(e) | |||||||||||||||
| * | During the period, certain fees were contractually or voluntarily reduced and/or reimbursed. If such contractual/voluntary fee reductions and reimbursements had not occurred, the ratio would have been as indicated. |
| (c) | For the period from November 21, 2008 (commencement of operations) to September 30, 2009. |
| (d) | Not annualized. |
| (e) | Annualized. |
| (f) | Beginning November 21, 2008, the net operating expenses were contractually limited to 0.20% of average daily net assets. The ratio of net expenses to average net assets represents a blended percentage for the year ended September 30, 2009. |
| (g) | There were no waivers or reimbursements during the period. |
See notes to financial statements.
43
FINANCIAL HIGHLIGHTS
|
| U.S. Government Money Market Fund | (Selected data for a share outstanding throughout the periods indicated) | |
| Investment Activities | Distributions | |||||||||||||||||||||||||||
| Net Asset Value, Beginning of Period | Net Investment Income | Net Realized/ Unrealized Gain/(Loss) on Investments | Total from Investment Activities | Net Investment Income | Total Distributions | Net Asset Value, End of Period | ||||||||||||||||||||||
RBC Institutional Class 1 | ||||||||||||||||||||||||||||
Year Ended September 30, 2012 | $1.00 | (a)(b) | (b | ) | (b) | (b) | (b) | $1.00 | ||||||||||||||||||||
Year Ended September 30, 2011 | 1.00 | (a)(b) | (b | ) | (b) | (b) | (b) | 1.00 | ||||||||||||||||||||
Year Ended September 30, 2010 | 1.00 | (a)(b) | (b | ) | (b) | (b) | (b) | 1.00 | ||||||||||||||||||||
Year Ended September 30, 2009 | 1.00 | 0.01(a) | (b | ) | 0.01 | (0.01) | (0.01) | 1.00 | ||||||||||||||||||||
Year Ended September 30, 2008 | 1.00 | 0.03(a) | (b | ) | 0.03 | (0.03) | (0.03) | 1.00 | ||||||||||||||||||||
RBC Institutional Class 2 | ||||||||||||||||||||||||||||
Year Ended September 30, 2012 | $1.00 | (a)(b) | (b | ) | (b) | (b) | (b) | $1.00 | ||||||||||||||||||||
Year Ended September 30, 2011 | 1.00 | (a)(b) | (b | ) | (b) | (b) | (b) | 1.00 | ||||||||||||||||||||
Year Ended September 30, 2010 | 1.00 | (a)(b) | (b | ) | (b) | (b) | (b) | 1.00 | ||||||||||||||||||||
Period Ended September 30, 2009(c) | 1.00 | (a)(b) | (b | ) | (b) | (b) | (b) | 1.00 | ||||||||||||||||||||
RBC Investor Class | ||||||||||||||||||||||||||||
Year Ended September 30, 2012 | $1.00 | (a)(b) | (b | ) | (b) | (b) | (b) | $1.00 | ||||||||||||||||||||
Year Ended September 30, 2011 | 1.00 | (a)(b) | (b | ) | (b) | (b) | (b) | 1.00 | ||||||||||||||||||||
Year Ended September 30, 2010 | 1.00 | (a)(b) | (b | ) | (b) | (b) | (b) | 1.00 | ||||||||||||||||||||
Period Ended September 30, 2009(c) | 1.00 | (a)(b) | (b | ) | (b) | (b) | (b) | 1.00 | ||||||||||||||||||||
RBC Reserve Class | ||||||||||||||||||||||||||||
Year Ended September 30, 2012 | $1.00 | (a)(b) | (b | ) | (b) | (b) | (b) | $1.00 | ||||||||||||||||||||
Year Ended September 30, 2011 | 1.00 | (a)(b) | (b | ) | (b) | (b) | (b) | 1.00 | ||||||||||||||||||||
Year Ended September 30, 2010 | 1.00 | (a)(b) | (b | ) | (b) | (b) | (b) | 1.00 | ||||||||||||||||||||
Period Ended September 30, 2009(c) | 1.00 | (a)(b) | (b | ) | (b) | (b) | (b) | 1.00 | ||||||||||||||||||||
RBC Select Class | ||||||||||||||||||||||||||||
Year Ended September 30, 2012 | $1.00 | (a)(b) | (b | ) | (b) | (b) | (b) | $1.00 | ||||||||||||||||||||
Year Ended September 30, 2011 | 1.00 | (a)(b) | (b | ) | (b) | (b) | (b) | 1.00 | ||||||||||||||||||||
Year Ended September 30, 2010 | 1.00 | (a)(b) | (b | ) | (b) | (b) | (b) | 1.00 | ||||||||||||||||||||
Period Ended September 30, 2009(c) | 1.00 | (a)(b) | (b | ) | (b) | (b) | (b) | 1.00 | ||||||||||||||||||||
| (a) | Per share net investment income has been calculated using the average daily shares method. |
| (b) | Less than $0.01 or $(0.01) per share. |
| (c) | For the period from November 21, 2008 (commencement of operations) to September 30, 2009. |
See notes to financial statements.
44
FINANCIAL HIGHLIGHTS
|
| U.S. Government Money Market Fund (cont.) | (Selected data for a share outstanding throughout the periods indicated) | |
| Ratios/Supplemental Data | ||||||||||||||||||||
| Total Return | Net Assets, End of Period (millions) | Ratio of Net Expenses to Average Net Assets | Ratio of Net Investment Income to Average Net Assets | Ratio of Expenses to Average Net Assets* | ||||||||||||||||
RBC Institutional Class 1 | ||||||||||||||||||||
Year Ended September 30, 2012 | 0.01% | $1,046 | 0.16% | 0.01% | 0.17% | |||||||||||||||
Year Ended September 30, 2011 | 0.05% | 1,580 | 0.17% | 0.05% | 0.17% | |||||||||||||||
Year Ended September 30, 2010 | 0.11% | 662 | 0.17% | 0.11% | 0.17%(g) | |||||||||||||||
Year Ended September 30, 2009 | 0.73% | 848 | 0.49%(f) | 0.98% | 0.49%(g) | |||||||||||||||
Year Ended September 30, 2008 | 2.70% | 3,266 | 0.72% | 2.51% | 0.72%(g) | |||||||||||||||
RBC Institutional Class 2 | ||||||||||||||||||||
Year Ended September 30, 2012 | 0.01% | $213 | 0.16% | 0.01% | 0.27% | |||||||||||||||
Year Ended September 30, 2011 | 0.01% | 142 | 0.20% | 0.01% | 0.27% | |||||||||||||||
Year Ended September 30, 2010 | 0.02% | 124 | 0.27% | 0.02% | 0.27% | |||||||||||||||
Period Ended September 30, 2009(c) | 0.44%(d) | 14 | 0.30%(e) | 0.56%(e) | 0.30%(e) | |||||||||||||||
RBC Investor Class | ||||||||||||||||||||
Year Ended September 30, 2012 | 0.01% | $857 | 0.16% | 0.01% | 1.12% | |||||||||||||||
Year Ended September 30, 2011 | 0.01% | 981 | 0.21% | 0.01% | 1.12% | |||||||||||||||
Year Ended September 30, 2010 | 0.01% | 1,260 | 0.27% | 0.01% | 1.13% | |||||||||||||||
Period Ended September 30, 2009(c) | 0.11%(d) | 1,372 | 0.65%(e) | 0.07%(e) | 1.17%(e) | |||||||||||||||
RBC Reserve Class | ||||||||||||||||||||
Year Ended September 30, 2012 | 0.01% | $1,896 | 0.16% | 0.01% | 1.02% | |||||||||||||||
Year Ended September 30, 2011 | 0.01% | 1,748 | 0.21% | 0.01% | 1.02% | |||||||||||||||
Year Ended September 30, 2010 | 0.01% | 1,752 | 0.27% | 0.01% | 1.03% | |||||||||||||||
Period Ended September 30, 2009(c) | 0.14%(d) | 1,714 | 0.65%(e) | 0.15%(e) | 1.06%(e) | |||||||||||||||
RBC Select Class | ||||||||||||||||||||
Year Ended September 30, 2012 | 0.01% | $1,309 | 0.16% | 0.01% | 0.92% | |||||||||||||||
Year Ended September 30, 2011 | 0.01% | 1,262 | 0.21% | 0.01% | 0.92% | |||||||||||||||
Year Ended September 30, 2010 | 0.01% | 1,139 | 0.27% | 0.01% | 0.93% | |||||||||||||||
Period Ended September 30, 2009(c) | 0.17%(d) | 1,233 | 0.63%(e) | 0.18%(e) | 0.95%(e) | |||||||||||||||
| * | During the period, certain fees were contractually or voluntarily reduced and/or reimbursed. If such contractual/voluntary fee reductions and reimbursements had not occurred, the ratio would have been as indicated. |
| (c) | For the period from November 21, 2008 (commencement of operations) to September 30, 2009. |
| (d) | Not annualized. |
| (e) | Annualized. |
| (f) | Beginning November 21, 2008, the net operating expenses were contractually limited to 0.20% of average daily net assets. The ratio of net expenses to average net assets represents a blended percentage for the year ended September 30, 2009. |
| (g) | There were no waivers or reimbursements during the period. |
See notes to financial statements.
45
FINANCIAL HIGHLIGHTS
|
| Tax-Free Money Market Fund | (Selected data for a share outstanding throughout the periods indicated) | |
| Net Asset Value, Beginning of Period | Investment Activities | Distributions | Net Asset Value, End of Period | |||||||||||||||||||||||||
| Net Investment Income | Net Realized/ Unrealized Gain/(Loss) on Investments | Total from Investment Activities | Net Investment Income | Net Realized Gains | ||||||||||||||||||||||||
RBC Institutional Class 1 | ||||||||||||||||||||||||||||
Year Ended September 30, 2012 | $1.00 | (a)(b) | (b) | (b) | (b) | (b) | $1.00 | |||||||||||||||||||||
Year Ended September 30, 2011 | 1.00 | (a)(b) | (b) | (b) | (b) | (b) | 1.00 | |||||||||||||||||||||
Year Ended September 30, 2010 | 1.00 | (a)(b) | (b) | (b) | (b) | (b) | 1.00 | |||||||||||||||||||||
Year Ended September 30, 2009 | 1.00 | 0.01(a) | (b) | 0.01 | (0.01) | — | 1.00 | |||||||||||||||||||||
Year Ended September 30, 2008 | 1.00 | 0.02(a) | (b) | 0.02 | (0.02) | — | 1.00 | |||||||||||||||||||||
RBC Institutional Class 2 | ||||||||||||||||||||||||||||
Year Ended September 30, 2012 | $1.00 | (a)(b) | (b) | (b) | (b) | (b) | $1.00 | |||||||||||||||||||||
Year Ended September 30, 2011 | 1.00 | (a)(b) | (b) | (b) | (b) | (b) | 1.00 | |||||||||||||||||||||
Year Ended September 30, 2010 | 1.00 | (a)(b) | (b) | (b) | (b) | (b) | 1.00 | |||||||||||||||||||||
Period Ended September 30, 2009(c) | 1.00 | (a)(b) | (b) | (b) | (b) | — | 1.00 | |||||||||||||||||||||
RBC Investor Class | ||||||||||||||||||||||||||||
Year Ended September 30, 2012 | $1.00 | (a)(b) | (b) | (b) | (b) | (b) | $1.00 | |||||||||||||||||||||
Year Ended September 30, 2011 | 1.00 | (a)(b) | (b) | (b) | (b) | (b) | 1.00 | |||||||||||||||||||||
Year Ended September 30, 2010 | 1.00 | (a)(b) | (b) | (b) | (b) | (b) | 1.00 | |||||||||||||||||||||
Period Ended September 30, 2009(c) | 1.00 | (a)(b) | (b) | (b) | (b) | — | 1.00 | |||||||||||||||||||||
RBC Reserve Class | ||||||||||||||||||||||||||||
Year Ended September 30, 2012 | $1.00 | (a)(b) | (b) | (b) | (b) | (b) | $1.00 | |||||||||||||||||||||
Year Ended September 30, 2011 | 1.00 | (a)(b) | (b) | (b) | (b) | (b) | 1.00 | |||||||||||||||||||||
Year Ended September 30, 2010 | 1.00 | (a)(b) | (b) | (b) | (b) | (b) | 1.00 | |||||||||||||||||||||
Period Ended September 30, 2009(c) | 1.00 | (a)(b) | (b) | (b) | (b) | — | 1.00 | |||||||||||||||||||||
RBC Select Class | ||||||||||||||||||||||||||||
Year Ended September 30, 2012 | $1.00 | (a)(b) | (b) | (b) | (b) | (b) | $1.00 | |||||||||||||||||||||
Year Ended September 30, 2011 | 1.00 | (a)(b) | (b) | (b) | (b) | (b) | 1.00 | |||||||||||||||||||||
Year Ended September 30, 2010 | 1.00 | (a)(b) | (b) | (b) | (b) | (b) | 1.00 | |||||||||||||||||||||
Period Ended September 30, 2009(c) | 1.00 | (a)(b) | (b) | (b) | (b) | — | 1.00 | |||||||||||||||||||||
| (a) | Per share net investment income has been calculated using the average daily shares method. | (c) | For the period from November 21, 2008 (commencement of operations) to September 30, 2009. | |||
| (b) | Less than $0.01 or $(0.01) per share. |
See notes to financial statements.
46
FINANCIAL HIGHLIGHTS
|
| Tax-Free Money Market Fund (cont.) | (Selected data for a share outstanding throughout the periods indicated) | |
| Ratios/Supplemental Data | ||||||||||||||||||||
| Total Return | Net Assets, End of Period (millions) | Ratio of Net Expenses to Average Net Assets | Ratio of Net Investment Income to Average Net Assets | Ratio of Expenses to Average Net Assets* | ||||||||||||||||
RBC Institutional Class 1 | ||||||||||||||||||||
Year Ended September 30, 2012 | 0.02% | $26 | 0.16% | 0.02% | 0.19% | |||||||||||||||
Year Ended September 30, 2011 | 0.09% | 37 | 0.18% | 0.10% | 0.19% | |||||||||||||||
Year Ended September 30, 2010 | 0.25% | 71 | 0.18% | 0.22% | 0.18%(g) | |||||||||||||||
Year Ended September 30, 2009 | 0.74% | 51 | 0.71%(f) | 1.49% | 0.71% | |||||||||||||||
Year Ended September 30, 2008 | 1.95% | 904 | 0.80% | 1.90% | 0.84% | |||||||||||||||
RBC Institutional Class 2 | ||||||||||||||||||||
Year Ended September 30, 2012 | 0.01% | $202 | 0.17% | 0.01% | 0.29% | |||||||||||||||
Year Ended September 30, 2011 | 0.02% | 214 | 0.26% | 0.02% | 0.29% | |||||||||||||||
Year Ended September 30, 2010 | 0.15% | 282 | 0.28% | 0.09% | 0.28% | |||||||||||||||
Period Ended September 30, 2009(c) | 0.41%(d) | (h) | 0.34%(e) | 0.45%(e) | 0.34%(e) | |||||||||||||||
RBC Investor Class | ||||||||||||||||||||
Year Ended September 30, 2012 | 0.01% | $162 | 0.17% | 0.01% | 1.13% | |||||||||||||||
Year Ended September 30, 2011 | 0.02% | 167 | 0.26% | �� | 0.01% | 1.14% | ||||||||||||||
Year Ended September 30, 2010 | 0.02% | 210 | 0.42% | 0.01% | 1.15% | |||||||||||||||
Period Ended September 30, 2009(c) | 0.04%(d) | 202 | 0.76%(e) | 0.03%(e) | 1.19%(e) | |||||||||||||||
RBC Reserve Class | ||||||||||||||||||||
Year Ended September 30, 2012 | 0.01% | $600 | 0.17% | 0.01% | 1.04% | |||||||||||||||
Year Ended September 30, 2011 | 0.02% | 520 | 0.26% | 0.01% | 1.04% | |||||||||||||||
Year Ended September 30, 2010 | 0.02% | 612 | 0.40% | 0.01% | 1.04% | |||||||||||||||
Period Ended September 30, 2009(c) | 0.06%(d) | 432 | 0.74%(e) | 0.05%(e) | 1.09%(e) | |||||||||||||||
RBC Select Class | ||||||||||||||||||||
Year Ended September 30, 2012 | 0.01% | $373 | 0.17% | 0.01% | 0.94% | |||||||||||||||
Year Ended September 30, 2011 | 0.02% | 300 | 0.26% | 0.01% | 0.93% | |||||||||||||||
Year Ended September 30, 2010 | 0.02% | 286 | 0.40% | 0.01% | 0.94% | |||||||||||||||
Period Ended September 30, 2009(c) | 0.11%(d) | 242 | 0.68%(e) | 0.10%(e) | 0.99%(e) | |||||||||||||||
| * | During the period, certain fees were contractually or voluntarily reduced and/or reimbursed. If such contractual/voluntary fee reductions and reimbursements had not occurred, the ratio would have been as indicated. |
| (c) | For the period from November 21, 2008 (commencement of operations) to September 30, 2009. |
| (d) | Not annualized. |
| (e) | Annualized. |
| (f) | Beginning November 21, 2008, the net operating expenses were contractually limited to 0.20% of average daily net assets. The ratio of net expenses to average net assets represents a blended percentage for the year ended September 30, 2009. |
| (g) | There were no waivers or reimbursements during the period. |
| (h) | Less than $1,000,000. |
See notes to financial statements.
47
|
September 30, 2012
|
1. Organization
RBC Funds Trust (“the Trust”), is registered under the Investment Company Act of 1940 (as amended) as an open-end management investment company. The Trust was organized as a Delaware statutory trust on December 16, 2003 and currently consists of 13 portfolios. Predecessor funds to the Trust were reorganized as portfolios of the Trust effective April 16, 2004. This annual report includes the following three investment portfolios (“Funds”):
| - | Prime Money Market Fund |
| - | U.S. Government Money Market Fund |
| - | Tax-Free Money Market Fund |
The Prime Money Market Fund, U.S. Government Money Market Fund and Tax-Free Money Market Fund offer five share classes: RBC Institutional Class 1, RBC Institutional Class 2, RBC Investor Class, RBC Reserve Class and RBC Select Class.
RBC Global Asset Management (U.S.) Inc. (“RBC GAM (US)” or “Advisor” or “Co-Administrator”) acts as the investment advisor for the Funds. The officers of the Trust (“Fund Management”) are also employees of RBC GAM (US) or its affiliates or of BNY Mellon Investment Servicing (US) Inc.
(“BNYMellon”) (“Co-Administrator”).
2. Significant Accounting Policies
Summarized below are the significant accounting policies of the Funds. These policies conform to accounting principles generally accepted in the United States of America (“US GAAP”). Fund management follows these policies when preparing financial statements. Management may also be required to make estimates and assumptions that affect the reported amounts of assets and liabilities at the date of the financial statements and the reported amounts of income and expenses for the period. Actual results could differ from those estimates.
Security Valuation:
Securities held by the Funds are valued at amortized cost, which approximates fair value, in order to maintain a constant net asset value of $1.00 per share. If amortized cost no longer approximates fair value due to credit or other impairments of an issuer, the Fund will use pricing and valuation procedures approved by the Trust’s Board of Trustees (“Board”) to determine a security’s fair value.
Money market funds must invest exclusively in high quality securities. To be considered high quality, a security generally must be rated in one of the two highest short-term credit quality categories by at least two nationally recognized rating organizations such as Standard & Poors Corporation or Moody’s Investors Service or Fitch Investors Service. If unrated, a security must be determined by the Advisor to be of comparable quality.
The Funds’ Board has policies and procedures for the valuation of each Fund’s assets and has delegated to the Funds’ Pricing Committee (“Pricing Committee”) the responsibility for implementing the procedures, including the responsibility for determining the fair value of the Fund’s securities or other assets. The Pricing Committee includes representatives of the Funds’ Advisor, Co- Administrator and sub-advisor, including personnel from accounting and operations, investment management, trading, risk analytics, compliance and legal.
The Pricing Committee meets at least quarterly to review and approve Fund valuation matters, and includes a review of the Funds’ pricing activity and operations, fair value measurements, pricing vendors, policies and procedures and related controls. At least a quorum of the Committee meets more frequently, as needed, to consider and approve time-sensitive fair valuation actions. The Pricing Committee reports to the Valuation, Portfolio Management and Performance Committee (“Valuation Committee”) of the Board. Members of the Pricing Committee meet with the Valuation Committee
48
NOTES TO FINANCIAL STATEMENTS
| ||||||
and the Board at each of it’s regularly scheduled meetings to discuss valuation matters and actions taken during the period.
Fair value methods used include, but are not limited to, obtaining market quotations from secondary pricing services, broker-dealers, or widely used quotation systems. General factors used in determining the fair value of securities include fundamental analytical data, the nature and duration of any restrictions on disposition of the securities, and an evaluation of the forces that influenced the market in which the investments are purchased and sold. These securities are either categorized as Level 2 or 3 depending on the relevant inputs used.
In such cases where a security price is unavailable, the security or asset cannot be valued pursuant to one of the valuation methods established by the Board, or where Fund Management determines that the value provided by the pricing services does not approximate fair value, the value of the security or asset will be determined in good faith by the Pricing Committee as authorized by the Board, generally based upon recommendation provided by the Advisor. Fair valuation may also be used when a significant valuation event is determined to have occurred. Significant valuation events may include, but are not limited to, the following: an event affecting the value of a security traded on a foreign market occurs between the close of that market and the close of regular trading on the New York Stock Exchange; an extraordinary event like a natural disaster or terrorist act occurs; or an adverse development arises with respect to a specific issuer, such as a bankruptcy filing. Some of the factors which may be considered in determining fair value are fundamental analytical data relating to the security, the issuer and the market, such as duration, prepayment and default rates; general level of interest rates and changes in interest rates; information from broker-dealers; and trading in similar securities.
When the Funds use fair valuation methods that use significant unobservable inputs to determine their NAV, securities will be priced by a method that the Board or persons acting at their direction believe accurately reflect fair value and are categorized as Level 3 of the fair value hierarchy. These methods may require subjective determinations about the value of a security. While the Funds’ policy is intended to result in a calculation of each Fund’s NAV that fairly reflects security values as of the time of pricing, the Funds cannot guarantee that values determined by the Board or persons acting at their direction would accurately reflect the price that the Funds could obtain for a security if it were to dispose of that security as of the time of pricing (for instance, in a forced or distressed sale). The prices used by the Funds may differ from the value that would be realized if the securities were sold.
The Funds’ Pricing Committee employs various methods for calibrating the valuation approach related to securities categorized within Level 3 of fair value hierarchy. These methods may include regular due diligence of the Funds’ pricing vendors, a regular review of key inputs and assumptions, transaction back-testing or disposition analysis to compare unrealized gains and losses to realize gains and losses, reviews of missing and stale prices and large movements in market value and reviews of any market related activities. Additionally, the pricing of all fair value holdings is subsequently reported to the Funds’ Board.
Fair Value Measurements:
Various inputs are used in determining the fair value of investments which are as follows:
— Level 1 - Inputs that reflect unadjusted quoted prices in active markets for identical assets or liabilities that the Funds have the ability to access at the measurement date.
— Level 2 - Inputs other than quoted prices that are observable for the asset or liability either directly or indirectly, including inputs in markets that are not considered to be active. Generally, the types of securities included in Level 2 for the Funds are U.S. Treasury bills and certain money market instruments, including those valued at amortized cost under Rule 2a-7. Observable inputs may include quoted prices for similar securities, interest rates, prepayment spreads, etc. Amortized cost approximates the current fair value of a security, but is not obtained from a quoted price in an active market.
49
NOTES TO FINANCIAL STATEMENTS
| ||||||
— Level 3 - Unobservable inputs based on the best information available in the circumstances, to the extent observable inputs are not available (including the Funds’ own assumptions in determining the fair value of investments).
The inputs or methodology used for valuing securities are not necessarily an indication of the risk associated with investing in those securities.
Inputs used in determining fair value of an investment may include, but are not limited to, price information, volatility statistics, credit and market data, and other factors, all of which may be either observable or unobservable. Inputs can vary among investments and will be impacted by the investment type and volume of activity for the particular security or similar securities in the market. Investments in the Level 3 category are generally supported by transactions and quoted prices from dealers participating in the market for those investments. Investments may be included in the Level 3 category due to a lack of market activity or transparency. Internal valuation models may also be used as a pricing source for Level 3 investments. Internal valuation models may rely on one or more unobservable inputs, such as estimated cash flows, financial statement analysis and discount rates.
The summary of inputs used to determine the fair value of the Fund’s investments as of September 30, 2012 is as follows:
| Funds | Level 1 Quoted Prices | Level 2 Significant Observable Inputs | Level 3 Significant Unobservable Inputs | Total | ||||||||||||
Prime Money Market | $ | — | $ | 12,311,890,008(b)(c) | $— | $ | 12,311,890,008 | |||||||||
U.S. Government Money Market | — | 5,338,924,404(b)(c) | — | 5,338,924,404 | ||||||||||||
Tax-Free Money Market | 10,000,000(a) | 1,346,506,266(c) | — | 1,356,506,266 | ||||||||||||
(a) Level 1 investments consist of Investment Companies.
(b) The breakdown of the Fund’s investments by security type is disclosed in the Schedules of Portfolio Investments.
(c) The breakdown of the Fund’s investments by state classification or political subdivision is disclosed in the Schedules of Portfolio Investments.
During the year ended September 30, 2012, the Funds recognized no transfers to/from Level 1 or 2. The Fund’s policy is to recognize transfers between Level 1, Level 2 and Level 3 at the end of the year utilizing fair value at the beginning of the year.
In December 2011, the Financial Accounting Standards Board (“FASB”) issued Accounting Standards Update No. 2011-11 “Disclosures about Offsetting Assets and Liabilities” (“ASU 2011-11”). These disclosure requirements are intended to help investors and other financial statement users to better assess the effect or potential effect of offsetting arrangements on a company’s financial position. They also improve transparency in the reporting of how companies mitigate credit risk, including disclosure of related collateral pledged or received. In addition, ASU 2011-11 facilitates comparison between those entities that prepare their financial statements on the basis of US GAAP and those entities that prepare their financial statements on the basis of International Financial Reporting Standards (“IFRS”). ASU 2011-11 requires entities to: disclose both gross and net information about both instruments and transactions eligible for offset in the financial statements; and disclose instruments and transactions subject to an agreement similar to a master netting agreement. ASU 2011-11 is effective for fiscal years beginning on or after January 1, 2013, and interim periods within those annual periods. At this time, Fund Management is evaluating the implications of ASU 2011-11 and its impact on the Funds’ financial statement disclosures.
Investment Transactions and Income:
Investment transactions are accounted for on the date the security is bought or sold (“trade date”). Dividend income is recorded on the ex-dividend date. Realized gains and losses from investment transactions are calculated based on the costs of the specific security (also known as identified cost
50
NOTES TO FINANCIAL STATEMENTS
| ||||||
basis). Interest income is recognized on the accrual basis. The Funds amortize all premiums and discounts on debt securities.
When Issued Transactions:
The Funds may engage in when-issued transactions. The Funds record when-issued securities on the trade date and maintain sufficient liquidity so that cash will be available to make payment for the securities purchased. Securities purchased on a when-issued basis are valued daily beginning on trade date and begin earning interest on the settlement date. As of September 30, 2012, the Funds held no when-issued securities.
Repurchase Agreements:
The Funds may enter into repurchase agreements with counterparties whom the advisor has deemed creditworthy, including primary dealers that report to the Federal Reserve Bank of New York or other large U.S. commercial banks or broker-dealers. These repurchase agreements are subject to the seller’s agreement to repurchase such securities at a mutually agreed upon date and price. The repurchase price generally equals the price paid by the Funds plus interest negotiated on the basis of current short-term rates.
Securities pledged by the dealers as collateral for repurchase agreements are held by a custodian bank until maturity of the repurchase agreement. The Funds have procedures to monitor additional collateral, if needed, to ensure that the daily market value of the collateral remains in excess of the market value of the repurchase agreement in the event of a default.
Expense, Investment Income and Gain/Loss Allocation:
Each Fund pays the expenses that are directly related to its operations, such as custodian fees or investment advisory fees. Expenses incurred by the Trust, such as trustee or legal fees, are allocated among each of the Funds either proportionately based upon each Fund’s relative net assets or using another reasonable basis such as equally across all Funds, depending on the nature of the expense. Individual share classes within a Fund are charged expenses specific to that class, such as distribution fees. Within a Fund, expenses other than class specific expenses are allocated daily to each class based upon the proportion of relative net assets. Investment income and realized and unrealized gains or losses are allocated to each class of shares based on the proportion of relative net assets.
Distributions to Shareholders:
Each Fund pays out any income that it receives, less expenses, in the form of dividends and capital gain distributions to its shareholders. Income dividends are declared daily and paid monthly. Dividends will also be paid at any time during the month upon total redemption of shares in an account. Capital gains, if any, are declared and paid at least annually. Distributions to shareholders are recorded on the ex-dividend date. The amount of dividends and distributions are calculated based on federal income tax regulations, which may differ from US GAAP. These “book/tax” differences may be either temporary or permanent in nature. To the extent these differences are determined, as of the end of the tax year, to be permanent (e.g. distribution in excess of net investment income), they are reclassified within a Fund’s capital accounts based on their federal tax basis treatment.
For the year ended September 30, 2012, reclassifications for permanent differences were as follows:
| Increase Undistributed Net Investment Income | Increase Accumulated Realized Gains | Decrease Accumulated Paid-in-Capital | ||||||||||
Tax-Free Money Market Fund | $371 | $0 | $(371) | |||||||||
Credit Enhancement:
Certain obligations held in the Funds have credit enhancement or liquidity features that may, under certain circumstances, provide for repayment of principal and interest on the obligation upon demand date, interest rate reset date or final maturity. These enhancements may include: letters of credit;
51
NOTES TO FINANCIAL STATEMENTS
| ||||||
liquidity guarantees; security purchase agreements; tender option purchase agreements; and third party insurance (i.e., AMBAC and MBIA).
3. Agreements and Other Transactions with Affiliates
The Trust has entered into investment advisory agreements with RBC GAM (US) under which RBC GAM (US) manages the Funds’ assets and furnishes related office facilities, equipment, research and personnel. The agreements require the Funds to pay RBC GAM (US) a monthly fee based upon average daily net assets. Under the terms of the advisory contract RBC GAM (US) is entitled to receive fees based on a percentage of the average daily net assets as follows:
| Annual Rate | ||||
Prime Money Market Fund | 0.10% | |||
U.S. Government Money Market Fund | 0.10% | |||
Tax-Free Money Market Fund | 0.10% | |||
RBC Institutional Class 1 of Prime Money Market Fund, U.S. Government Money Market Fund and Tax-Free Money Market Fund pays the Advisor an annual shareholder services administration fee of 0.05% of the average daily net assets attributable to RBC Institutional Class 1 shares of a Fund that is used to compensate financial intermediaries for providing services to shareholders and maintaining shareholder accounts. This shareholder services administration fee is not paid pursuant to Rule 12b-1.
RBC GAM (US) has contractually agreed to waive fees and/or reimburse expenses under an Expense Limitation Agreement in order to maintain the net annual fund operating expenses at 0.20% for RBC Institutional Class 1 of the Prime Money Market Fund, U.S. Government Money Market Fund and Tax-Free Money Market Fund. During the year ended September 30, 2012, there were no fees waived under this agreement.
RBC GAM (US) and BNY Mellon serve as co-administrators to the Funds. Services provided under the administrative services contract include providing day-to-day administration of matters related to the Funds, maintenance of their records and the preparation of reports. RBC GAM (US) does not receive an administration services fee. BNY Mellon receives a fee for its services payable by the Funds based on the Fund’s average net assets. BNY Mellon’s fee is included with “Accounting fees” in the Statements of Operations.
Certain Officers and Trustees of the Trust are affiliated with the advisor or the co-administrator. Such Officers and Trustees receive no compensation from the Funds for serving in their respective roles.
The RBC Funds currently pay each of the independent Trustees (Trustees of the Trust who are not directors, officers or employees of the advisor, administrator or distributor) an annual retainer of $32,500. The Board Chairperson and Audit Committee Chairperson each receive an additional retainer of $2,500 annually, and all other trustees serving as Chair of a Board committee each receive an additional retainer of $1,000 annually. In addition, Independent Trustees receive a quarterly meeting fee of $5,000 ($5,500 effective October 1,2012) for each in-person Board meeting attended, a meeting fee of $1,000 for each telephonic or Special Board meeting attended, and a $1,500 fee for each Board committee meeting attended and are reimbursed for all out-of-pocket expenses relating to attendance at such meetings.
Security Transactions with Affiliated Funds
During the year ended September 30, 2012, the Prime Money Market Fund, U.S. Government Money Market Fund and Tax-Free Money Market Fund engaged in security purchase and sale transactions with other RBC Funds or investment advisory clients managed by RBC GAM (US). These purchase and sale transactions complied with Rule 17a-7 under the Investment Company Act of 1940 (as amended) and amounted to $0 and $148,725,000 for Prime Money Market Fund, respectively, $96,225,000 and $0 for U.S. Government Money Market Fund, respectively, and $42,225,000 and $0 for Tax-Free Money Market Fund, respectively.
52
NOTES TO FINANCIAL STATEMENTS
| ||||||
4. Fund Distribution
The Prime Money Market, U. S. Government Money Market and Tax-Free Money Market Funds have adopted a Shareholder Account and Distribution Services (12b-1) Plan (the “Plan”) with respect to RBC Institutional Class 2, RBC Investor Class, RBC Reserve Class and the RBC Select Class, in which Quasar Distributors LLC (the “Distributor”) acts as the Funds’ distributor. The Plan permits each Fund to make payments for or to reimburse the Distributor or others, including RBC Capital Markets, LLC monthly for distribution-related costs and expenses of marketing shares of each share class covered under the Plan, and/or for providing shareholder services. The following chart shows the current Plan fee rate for each class:
| RBC Institutional Class 2 | RBC Investor Class | RBC Reserve Class | RBC Select Class | |||||||||||||
12b-1 Plan Fee | 0.15% | 1.00% | 0.90% | 0.80% | ||||||||||||
Plan fees are based on average daily net assets of the applicable class. Up to 0.25% of each Plan fee may be designated as a Service Fee, as defined by the applicable rules of the Financial Industry Regulatory Authority.
Pursuant to a Shareholder Account and Distribution Services Agreement between the Distributor and RBC Capital Markets, LLC, the Distributor has agreed to compensate RBC Capital Markets for certain shareholder account servicing support provided to the Funds. RBC Capital Markets has agreed to waive fees and/or reimburse expenses in order to maintain the net annual fund operating expenses for each class listed below for each Fund to the following amounts:
Fund | Operating Expense Limit | |||
Prime Money Market Fund | ||||
RBC Institutional Class 2 | 0.30% | |||
RBC Investor Class | 1.05% | |||
RBC Reserve Class | 0.90% | |||
RBC Select Class | 0.80% | |||
U.S. Government Money Market Fund | ||||
RBC Institutional Class 2 | 0.30% | |||
RBC Investor Class | 1.00% | |||
RBC Reserve Class | 0.85% | |||
RBC Select Class | 0.77% | |||
Tax-Free Money Market Fund | ||||
RBC Institutional Class 2 | 0.30% | |||
RBC Investor Class | 1.00% | |||
RBC Reserve Class | 0.85% | |||
RBC Select Class | 0.70% | |||
This Expense Limitation Agreement is in place until January 31, 2014 and shall continue for additional one-year terms unless terminated by either party at any time. Each Fund will carry forward, for a period not to exceed 12 months from the date on which a waiver or reimbursement is made by RBC Capital Markets, any expenses in excess of the Expense Limitation and repay RBC Capital Markets such amounts, provided the Fund is able to effect such repayment and remain in compliance with the Expense Limitation. At September 30, 2012, the amounts subject to possible recoupment under the expense limitation agreement are $10,453,535, $6,307,484 and $2,169,159 for the Prime Money Market Fund, U.S. Government Money Market Fund and Tax-Free Money Market Fund, respectively.
RBC Capital Markets may voluntarily waive and/or reimburse additional fund operating expenses at any time, such as to maintain a minimum yield in a fund. Any such voluntary program may be modified or discontinued at any time without notice.
53
NOTES TO FINANCIAL STATEMENTS
| ||||||
For the year ended September 30, 2012, the following distribution fees were waived:
Fund | Distribution Fees Waived | |||
Prime Money Market Fund | ||||
RBC Institutional Class 2 | $ 130,776 | |||
RBC Investor Class | 25,727,002 | |||
RBC Reserve Class | 39,931,308 | |||
RBC Select Class | 10,896,290 | |||
U.S. Government Money Market Fund | ||||
RBC Institutional Class 2 | $ 213,152 | |||
RBC Investor Class | 8,713,047 | |||
RBC Reserve Class | 16,351,106 | |||
RBC Select Class | 10,267,247 | |||
Tax-Free Money Market Fund | ||||
RBC Institutional Class 2 | $ 267,027 | |||
RBC Investor Class | 1,620,806 | |||
RBC Reserve Class | 5,068,252 | |||
RBC Select Class | 2,716,368 | |||
For the year ended September 30, 2012, shareholder servicing fees were voluntarily waived for the RBC Institutional Class 1 in the amount of $234,290 and $8,677 for the U.S. Government Money Market Fund and the Tax-Free Money Market Fund, respectively.
54
NOTES TO FINANCIAL STATEMENTS
| ||||||
5. Capital Share Transactions
The number of shares sold, reinvested and redeemed correspond to the net proceeds from sale of shares, reinvestments of dividends and cost of shares redeemed, respectively, since shares are redeemed at $1.00 per share.
Transactions for the period were as follows:
| Prime Money Market Fund | U.S. Government Money Market Fund | |||||||||||||||
| For the Year Ended September 30, 2012 | For the Year Ended September 30, 2011 | For the Year Ended September 30, 2012 | For the Year Ended September 30, 2011 | |||||||||||||
CAPITAL TRANSACTIONS: | ||||||||||||||||
RBC Institutional Class 1 | ||||||||||||||||
Proceeds from shares issued | $ | 25,164,341,039 | $ | 47,958,836,084 | $ | 3,157,517,444 | $ | 8,471,837,355 | ||||||||
Distributions reinvested | 1,126,687 | 2,779,850 | 134,444 | 335,353 | ||||||||||||
Cost of shares redeemed | (25,398,322,531 | ) | (50,033,766,650 | ) | (3,691,676,658 | ) | (7,553,849,882 | ) | ||||||||
|
|
|
|
|
|
|
| |||||||||
Change in RBC Institutional Class 1 | $ | (232,854,805 | ) | $ | (2,072,150,716 | ) | $ | (534,024,770 | ) | $ | 918,322,826 | |||||
|
|
|
|
|
|
|
| |||||||||
RBC Institutional Class 2 | ||||||||||||||||
Proceeds from shares issued | $ | 801,609,519 | $ | 1,537,763,049 | $ | 836,793,426 | $ | 664,679,726 | ||||||||
Distributions reinvested | 72,815 | 370,876 | 19,944 | 15,107 | ||||||||||||
Cost of shares redeemed | (856,449,804 | ) | (1,680,872,073 | ) | (766,228,403 | ) | (646,731,961 | ) | ||||||||
|
|
|
|
|
|
|
| |||||||||
Change in RBC Institutional Class 2 | $ | (54,767,470 | ) | $ | (142,738,148 | ) | $ | 70,584,967 | $ | 17,962,872 | ||||||
|
|
|
|
|
|
|
| |||||||||
RBC Investor Class | ||||||||||||||||
Proceeds from shares issued | $ | 1,153,629,144 | $ | 1,487,557,623 | $ | 542,432,684 | $ | 470,599,974 | ||||||||
Distributions reinvested | 298,786 | 367,405 | 98,323 | 108,072 | ||||||||||||
Cost of shares redeemed | (1,537,077,816 | ) | (2,283,435,059 | ) | (666,444,357 | ) | (750,374,803 | ) | ||||||||
|
|
|
|
|
|
|
| |||||||||
Change in RBC Investor Class | $ | (383,149,886 | ) | $ | (795,510,031 | ) | $ | (123,913,350 | ) | $ | (279,666,757 | ) | ||||
|
|
|
|
|
|
|
| |||||||||
RBC Reserve Class | ||||||||||||||||
Proceeds from shares issued | $ | 2,523,866,545 | $ | 2,563,297,367 | $ | 1,148,674,713 | $ | 1,052,547,577 | ||||||||
Distributions reinvested | 523,147 | 529,679 | 204,387 | 175,364 | ||||||||||||
Cost of shares redeemed | (2,103,428,295 | ) | (2,696,929,651 | ) | (1,000,971,147 | ) | (1,056,632,356 | ) | ||||||||
|
|
|
|
|
|
|
| |||||||||
Change in RBC Reserve Class | $ | 420,961,397 | $ | (133,102,605 | ) | $ | 147,907,953 | $ | (3,909,415 | ) | ||||||
|
|
|
|
|
|
|
| |||||||||
RBC Select Class | ||||||||||||||||
Proceeds from shares issued | $ | 1,576,413,535 | $ | 1,836,063,957 | $ | 1,356,370,798 | $ | 1,072,107,854 | ||||||||
Distributions reinvested | 163,775 | 175,333 | 145,204 | 116,854 | ||||||||||||
Cost of shares redeemed | (1,503,087,081 | ) | (1,813,856,530 | ) | (1,309,088,940 | ) | (950,019,970 | ) | ||||||||
|
|
|
|
|
|
|
| |||||||||
Change in RBC Select Class | $ | 73,490,229 | $ | 22,382,760 | $ | 47,427,062 | $ | 122,204,738 | ||||||||
|
|
|
|
|
|
|
| |||||||||
Change in net assets resulting from capital transactions | $ | (176,320,535 | ) | $ | (3,121,118,740 | ) | $ | (392,018,138 | ) | $ | 774,914,264 | |||||
|
|
|
|
|
|
|
| |||||||||
55
NOTES TO FINANCIAL STATEMENTS
| ||||||
| Tax-Free Money Market Fund | ||||||||
| For the Year Ended September 30, 2012 | For the Year Ended September 30, 2011 | |||||||
CAPITAL TRANSACTIONS: | ||||||||
RBC Institutional Class 1 | ||||||||
Proceeds from shares issued | $ | 564 | $ | 47,748,219 | ||||
Distributions reinvested | 4,082 | 45,747 | ||||||
Cost of shares redeemed | (11,001,070 | ) | (81,866,423 | ) | ||||
|
|
|
| |||||
Change in RBC Institutional Class 1 | $ | (10,996,424 | ) | $ | (34,072,457 | ) | ||
|
|
|
| |||||
RBC Institutional Class 2 | ||||||||
Proceeds from shares issued | $ | 253,598,353 | $ | 310,679,168 | ||||
Distributions reinvested | 21,525 | 68,926 | ||||||
Cost of shares redeemed | (266,108,021 | ) | (378,104,024 | ) | ||||
|
|
|
| |||||
Change in RBC Institutional Class 2 | $ | (12,488,143 | ) | $ | (67,355,930 | ) | ||
|
|
|
| |||||
RBC Investor Class | ||||||||
Proceeds from shares issued | $ | 230,399,893 | $ | 201,253,242 | ||||
Distributions reinvested | 16,795 | 28,344 | ||||||
Cost of shares redeemed | (235,627,975 | ) | (243,457,745 | ) | ||||
|
|
|
| |||||
Change in RBC Investor Class | $ | (5,211,287 | ) | $ | (42,176,159 | ) | ||
|
|
|
| |||||
RBC Reserve Class | ||||||||
Proceeds from shares issued | $ | 502,337,412 | $ | 530,161,442 | ||||
Distributions reinvested | 58,202 | 91,163 | ||||||
Cost of shares redeemed | (423,287,442 | ) | (622,044,607 | ) | ||||
|
|
|
| |||||
Change in RBC Reserve Class | $ | 79,108,172 | $ | (91,792,002 | ) | |||
|
|
|
| |||||
RBC Select Class | ||||||||
Proceeds from shares issued | $ | 487,856,357 | $ | 522,836,516 | ||||
Distributions reinvested | 35,158 | 45,994 | ||||||
Cost of shares redeemed | (414,370,806 | ) | (508,824,752 | ) | ||||
|
|
|
| |||||
Change in RBC Select Class | $ | 73,520,709 | $ | 14,057,758 | ||||
|
|
|
| |||||
Change in net assets resulting from capital transactions | $ | 123,933,027 | $ | (221,338,790 | ) | |||
|
|
|
| |||||
6. Federal Income Taxes
It is the policy of each Fund to continue to qualify as a regulated investment company by complying with the provisions applicable to certain investment companies, as defined under Subchapter M of the Internal Revenue Code, and to distribute substantially all of its net investment income and net realized capital gains. Therefore, no federal tax liability is recorded in the financial statements of each Fund.
Management has analyzed the Funds’ tax positions taken or expected to be taken on federal income tax returns for all open tax years (current and prior three tax years) and has concluded that no provision for federal income tax is required in the Funds’ financial statements. The Funds’ federal and state income and federal excise tax returns for tax years for which the applicable statutes of limitations have not expired are subject to examination by the Internal Revenue Service and state departments of revenue.
56
NOTES TO FINANCIAL STATEMENTS
| ||||||
As of and during the year ended September 30, 2012, the Funds did not have a liability for any unrecognized tax benefits. The Funds recognize interest and penalties, if any, related to unrecognized tax benefits as income tax expense in the statement of operations. During the year, the Funds did not incur any interest or penalties.
The tax character of distributions during the year ended September 30, 2012 were as follows:
| Distributions Paid From | ||||||||||||||||||||||||
| Ordinary Income | Net Long Term Capital Gains | Net Short Term Capital Gains | Total Taxable Distributions | Tax Exempt Distributions | Total Distributions Paid* | |||||||||||||||||||
Prime Money Market Fund | $ | 2,737,620 | $— | $— | $2,737,620 | $ — | $2,737,620 | |||||||||||||||||
U.S. Government Money Market Fund | 634,851 | — | — | 634,851 | — | 634,851 | ||||||||||||||||||
Tax-Free Money Market Fund | 1,794 | — | — | 1,794 | 134,614 | 136,408 | ||||||||||||||||||
The tax character of distributions during the year ended September 30, 2011 were as follows:
| Distributions Paid From | ||||||||||||||||||||||||
| Ordinary Income | Net Long Term Capital Gains | Net Short Term Capital Gains | Total Taxable Distributions | Tax Exempt Distributions | Total Distributions Paid* | |||||||||||||||||||
Prime Money Market Fund | $6,289,029 | $ — | $ — | $6,289,029 | $ — | $6,289,029 | ||||||||||||||||||
U.S. Government Money Market Fund | 1,024,577 | — | — | 1,024,577 | — | 1,024,577 | ||||||||||||||||||
Tax-Free Money Market Fund | 841 | 50,212 | 21,587 | 72,640 | 208,414 | 281,054 | ||||||||||||||||||
*Total distributions paid may differ from the Statements of Changes in Net Assets because distributions are recognized when actually paid for tax purposes.
As of September 30, 2012, the components of accumulated earnings/(losses) on a tax basis were as follows:
| Undistributed Ordinary Income | Undistributed Short-Term Capital Gains | Undistributed Long-Term Capital Gains | Distributions Payable | Accumulated Capital Loss Carryforwards | Deferred Qualified Late-Year Losses | Unrealized Depreciation | Total Accumulated Earnings/(Losses) | |||||||||||||||||||||||||
Prime Money Market Fund | $75,351 | $— | $— | $(76,382) | $(4,195,564) | $ — | $— | $(4,196,595) | ||||||||||||||||||||||||
U.S. Government Money Market Fund | 21,234 | — | — | (1,265) | — | — | — | 19,969 | ||||||||||||||||||||||||
Tax-Free Money Market Fund | — | — | — | — | (10,264) | (6,606) | — | (16,870) | ||||||||||||||||||||||||
As of September 30, 2012, the following Funds had net capital loss carryforwards to offset future net capital gains, if any:
| Capital Loss Carryforward | Expires | |||||||||
Prime Money Market Fund | $4,195,564 | 2017 | ||||||||
Tax-Free Money Market Fund | 10,264 | 2019 | ||||||||
Capital loss carryforwards utilized in the current year were $151,314 and $1,996 for the Prime Money Market Fund and Tax-Free Money Market Fund, respectively.
57
NOTES TO FINANCIAL STATEMENTS
| ||||||
Under current tax law, capital losses realized after October 31 of a Fund’s fiscal year may be deferred and treated as occurring on the first business day of the following fiscal year for tax purposes. The Tax-Free Money Market Fund deferred short-term qualified late-year capital losses of $6,606, which will be treated as arising on the first business day of the year ending September 30, 2013.
7. Line of Credit
Tax-Free Money Market Fund is the sole participant in an uncommitted, unsecured $150,000,000 line of credit with U.S. Bank N.A. (the “Bank”), the Fund’s custodian, to be used only for liquidity and other purposes. Interest is charged on borrowings under this line of credit at the Bank’s prime lending rate – 1/2% per annum. There were no loans outstanding pursuant to this line of credit at September 30, 2012. During the year ended September 30, 2012, the Tax-Free Money Market Fund did not utilize this line of credit.
8. Subsequent Events
Management has evaluated the impact of subsequent events of the Funds and has determined that there are no subsequent events that require recognition or disclosure in the financial statements.
58
REPORT OF INDEPENDENT REGISTERED PUBLIC ACCOUNTING FIRM
|
To the Shareholders and Board of Trustees of RBC Funds Trust:
We have audited the accompanying statements of assets and liabilities, including the schedules of portfolio investments, of Prime Money Market Fund, U.S Government Money Market Fund and Tax-Free Money Market Fund (collectively the “Funds”), three of the portfolios constituting the RBC Funds Trust as of September 30, 2012, and the related statements of operations for the year then ended, the statements of changes in net assets for each of the two years in the period then ended and the financial highlights for each of the five years in the period then ended. These financial statements and financial highlights are the responsibility of the Funds’ management. Our responsibility is to express an opinion on these financial statements and financial highlights based on our audits.
We conducted our audits in accordance with the standards of the Public Company Accounting Oversight Board (United States). Those standards require that we plan and perform the audits to obtain reasonable assurance about whether the financial statements and financial highlights are free of material misstatement. The Funds were not required to have, nor were we engaged to perform, an audit of their internal control over financial reporting. Our audits included consideration of internal control over financial reporting as a basis for designing audit procedures that are appropriate in the circumstances, but not for the purpose of expressing an opinion on the effectiveness of the Funds’ internal control over financial reporting. Accordingly, we express no such opinion. An audit also includes examining, on a test basis, evidence supporting the amounts and disclosures in the financial statements, assessing the accounting principles used and significant estimates made by management, as well as evaluating the overall financial statement presentation. Our procedures included confirmation of securities owned as of September 30, 2012, by correspondence with the Funds’ custodian and brokers. We believe that our audits provide a reasonable basis for our opinion.
In our opinion, the financial statements and financial highlights referred to above present fairly, in all material respects, the financial position of each of the portfolios of RBC Funds Trust referred to above, as of September 30, 2012, the results of their operations for the year then ended, the changes in their net assets for each of the two years in the period then ended, and the financial highlights for each of the five years in the period then ended, in conformity with accounting principles generally accepted in the United States of America.
DELOITTE & TOUCHE LLP
Chicago, Illinois
November 27, 2012
59
OTHER FEDERAL INCOME TAX INFORMATION (UNAUDITED)
|
|
During the fiscal year ended September 30, 2012, the Tax-Free Money Market Fund declared tax-exempt distributions of $134,614.
The Funds report a portion of the income dividends distributed during the fiscal year ended September 30, 2012, as U.S. Government Income as follows:
Prime Money Market Fund | 3.50 | % | ||
U.S. Government Money Market Fund | 21.08 | % |
U.S. Government Income represents the amount of interest that was derived from direct U.S. Government obligations. Generally, such interest is exempt from state income tax. However, for residents of California, New York and Connecticut the statutory threshold requirements were not satisfied. Due to the diversity in state and local tax law, it is recommended you consult a tax adviser as to the applicability of the information provided for your specific situation.
The Funds report a portion of the income dividends distributed during the fiscal year ended September 30, 2012, as Qualified Interest Income as defined in the Internal Revenue Code as follows:
Prime Money Market Fund | 82.80 | % | ||
U.S. Government Money Market Fund | 100.00 | % | ||
Tax-Free Money Market Fund | 79.32 | % |
The Funds report a portion of the income dividends distributed during the fiscal year ended September 30, 2012, as Qualified Short-Term Gain as defined in the Internal Revenue Code as follows:
| U.S. Government Money Market Fund | 100.00% |
All reportings are based on financial information available as of the date of this annual report and, accordingly, are subject to change. For each item above, it is the intention of the Funds to report the maximum amount permitted under the Internal Revenue Code and the regulations thereunder.
60
|
| Independent Trustees(1)(2) |
|
T. Geron Bell (71)
Position, Term of Office and Length of Time Served with the Trust: Trustee since January 2004
Principal Occupation(s) During Past 5 Years: Chairman of the Executive Board of the Minnesota Twins (January 2011 to present); prior thereto President of Twins Sports, Inc. (parent company of the Minnesota Twins) (2002-2011); President of the Minnesota Twins Baseball Club Incorporated (1987-2002)
Number of Portfolios in Fund Complex Overseen by Trustee: 14
Other Director/Trustee Positions Held by Trustee During Past 5 Years: None
Lucy Hancock Bode (61)
Position, Term of Office and Length of Time Served with the Trust: Trustee since January 2004
Principal Occupation(s) During Past 5 Years: Healthcare consultant (self-employed)
Number of Portfolios in Fund Complex Overseen by Trustee: 14
Other Director/Trustee Positions Held by Trustee During Past 5 Years: BioSignia
Leslie H. Garner Jr. (62)
Position, Term of Office and Length of Time Served with the Trust: Trustee since January 2004
Principal Occupation(s) During Past 5 Years: President and CEO, The Greater Cedar Rapids Community Foundation (2010 to present); previously, President, Cornell College
Number of Portfolios in Fund Complex Overseen by Trustee: 14
Other Director/Trustee Positions Held by Trustee During Past 5 Years: None
Ronald James (61)
Position, Term of Office and Length of Time Served with the Trust: Trustee since January 2004
Principal Occupation(s) During Past 5 Years: President and Chief Executive Officer, Center for Ethical Business Cultures (2000 to present)
Number of Portfolios in Fund Complex Overseen by Trustee: 14
Other Director/Trustee Positions Held by Trustee During Past 5 Years: Best Buy Co. Inc.; Bremer Financial Corporation
John A. MacDonald (63)
Position, Term of Office and Length of Time Served with the Trust: Trustee since January 2004
Principal Occupation(s) During Past 5 Years: Vice President and Treasurer, Hall Family Foundation
Number of Portfolios in Fund Complex Overseen by Trustee: 14
Other Director/Trustee Positions Held by Trustee During Past 5 Years: None
H. David Rybolt (70)
Position, Term of Office and Length of Time Served with the Trust: Trustee since January 2004
Principal Occupation(s) During Past 5 Years: Consultant, HDR Associates (management consulting)
Number of Portfolios in Fund Complex Overseen by Trustee: 14
Other Director/Trustee Positions Held by Trustee During Past 5 Years: None
61
MANAGEMENT (Unaudited)
|
| Independent Trustees(1)(2) |
|
James R. Seward (60)
Position, Term of Office and Length of Time Served with the Trust: Chairman of the Board and Trustee since January 2004
Principal Occupation(s) During Past 5 Years: Private investor (2000 to present); CFA
Number of Portfolios in Fund Complex Overseen by Trustee: 14
Other Director/Trustee Positions Held by Trustee During Past 5 Years: Syntroleum Corporation; Brookdale Senior Living Inc.
William B. Taylor (67)
Position, Term of Office and Length of Time Served with the Trust: Trustee since September 2005
Principal Occupation(s) During Past 5 Years: Consultant (2003 to present); prior thereto Partner (until 2003) Ernst & Young LLP
Number of Portfolios in Fund Complex Overseen by Trustee: 14
Other Director/Trustee Positions Held by Trustee During Past 5 Years: William Henry Insurance, LLC
Interested Trustees(1)(2)(3)
Kathleen A. Gorman (48)(5)
Position, Term of Office and Length of Time Served with the Trust: Trustee since September 2012
Principal Occupation(s) During Past 5 Years: President and Chief Executive Officer, RBC Funds (2012 to present); Chief Compliance Officer, RBC Funds (2006 to present); Director of Regulatory Administration, RBC Global Asset Management (U.S.) Inc. (2007 to present); Chief Compliance Officer, RBC Global Asset Management (U.S.) Inc. (2006-2009)
Number of Portfolios in Fund Complex Overseen by Trustee: 14
Other Director/Trustee Positions Held by Trustee During Past 5 Years: None
Executive Officers(1)(3)(4)
Kathleen A. Gorman (48)
Position, Term of Office and Length of Time Served with the Trust: President and Chief Executive Officer since September 2012; Chief Compliance Officer since April 2006 and Assistant Secretary since September 2006
Principal Occupation(s) During Past 5 Years: President and Chief Executive Officer, RBC Funds (2012 to present) Chief Compliance Officer, RBC Funds (2006 to present); Director of Regulatory Administration, RBC Global Asset Management (U.S.) Inc. (2007 to present); Chief Compliance Officer, RBC Global Asset Management (U.S.) Inc. (2006-2009)
James A. Gallo (48)
Address: BNY Mellon Investment Servicing (US) Inc., 760 Moore Road, King of Prussia, PA 19406
Position, Term of Office and Length of Time Served with the Trust: Treasurer since October 2007
Principal Occupation(s) During Past 5 Years: Senior Vice President and Managing Director, BNY Mellon Investment Servicing (US) Inc. (2002 to present)
62
MANAGEMENT (Unaudited)
|
| Independent Trustees(1)(2) |
|
| Executive Officers(1)(3)(4) |
|
Kathleen A. Hegna (45)
Position, Term of Office and Length of Time Served with the Trust: Chief Financial Officer and Principal Accounting Officer since May 2009
Principal Occupation(s) During Past 5 Years: Associate Vice President and Director, Mutual Fund Accounting and Administration, RBC Global Asset Management (U.S.) Inc. (2009 to present); Senior Compliance Officer, RBC Global Asset Management (U.S.) Inc. (2006-2009); Director, Asset Management Compliance, RiverSource Investments (2005-2006)
Lee Thoresen (41)
Position, Term of Office and Length of Time Served with the Trust: Chief Legal Officer and Secretary since March 2008
Principal Occupation(s) During Past 5 Years: Associate General Counsel, RBC Capital Markets, LLC (2006-present); Asset Management Compliance, RiverSource Investments (2004-2006)
| (1) | Except as otherwise noted, the address of each Trustee/Officer is RBC Funds Trust, 100 South Fifth Street, Suite 2300, Minneapolis, Minnesota 55402. |
| (2) | All Trustees must retire on or before December 31 of the year in which they reach age 75. The Board may temporarily waive this requirement when necessary to avoid depriving the Board of a Trustee with critical skills. |
| (3) | On December 31, 2009, Voyageur Asset Management Inc. changed its name to RBC Global Asset Management (U.S.) Inc. Any references to RBC Global Asset Management (U.S.) Inc. for prior periods are deemed to be references to the prior entity. |
| (4) | Each officer serves in such capacity for an indefinite period of time until his or her removal, resignation or retirement. |
| (5) | Kathleen A. Gorman has been determined to be an interested Trustee by virtue of her position with the Advisor. |
The Funds’ Statement of Additional Information includes information about the Funds’ Trustees. To receive your free copy of the Statement of Additional Information, call toll free: 1-800-422-2766.
63
SUPPLEMENTAL INFORMATION (Unaudited)
|
Shareholder Expense Examples
As a shareholder of the RBC Funds, you incur two types of costs: (1) transaction costs, including sales charges (loads) and (2) ongoing costs, including management fees; 12b-1 distribution and service fees; and other Fund expenses. This example is intended to help you understand your ongoing costs (in dollars) of investing in the RBC Funds and to compare these costs with the ongoing costs of investing in other mutual funds.
The Example is based on an investment of $1,000 invested at the beginning of the period and held for the entire period from April 1, 2012 through September 30, 2012.
Actual Expenses and Performance
The table below provides information about actual account values and actual expenses. You may use the information below, together with the amount you invested, to estimate the expenses that you paid over the period. Simply divide your account value by $1,000 (for example, an $8,600 account value divided by $1,000 = 8.6), then multiply the result by the number in the table under the heading entitled “Expenses Paid During Period” to estimate the expenses you paid on your account during this period.
| Beginning Account Value 4/1/12 | Ending Account Value 9/30/12 | Expenses Paid During Period* 4/1/12-9/30/12 | Annualized Expense Ratio During Period 4/1/12-9/30/12 | |||||||||||||
Prime Money Market Fund | ||||||||||||||||
RBC Institutional Class 1 | $1,000.00 | $1,000.50 | $0.85 | 0.17% | ||||||||||||
RBC Institutional Class 2 | 1,000.00 | 1,000.10 | 1.34 | 0.27% | ||||||||||||
RBC Investor Class | 1,000.00 | 1,000.10 | 1.34 | 0.27% | ||||||||||||
RBC Reserve Class | 1,000.00 | 1,000.10 | 1.34 | 0.27% | ||||||||||||
RBC Select Class | 1,000.00 | 1,000.10 | 1.34 | 0.27% | ||||||||||||
U.S. Government Money Market Fund | ||||||||||||||||
RBC Institutional Class 1 | 1,000.00 | 1,000.10 | 0.85 | 0.17% | ||||||||||||
RBC Institutional Class 2 | 1,000.00 | 1,000.10 | 0.85 | 0.17% | ||||||||||||
RBC Investor Class | 1,000.00 | 1,000.10 | 0.85 | 0.17% | ||||||||||||
RBC Reserve Class | 1,000.00 | 1,000.10 | 0.85 | 0.17% | ||||||||||||
RBC Select Class | 1,000.00 | 1,000.10 | 0.85 | 0.17% | ||||||||||||
Tax-Free Money Market Fund | ||||||||||||||||
RBC Institutional Class 1 | 1,000.00 | 1,000.10 | 0.85 | 0.17% | ||||||||||||
RBC Institutional Class 2 | 1,000.00 | 1,000.10 | 0.94 | 0.19% | ||||||||||||
RBC Investor Class | 1,000.00 | 1,000.10 | 0.90 | 0.18% | ||||||||||||
RBC Reserve Class | 1,000.00 | 1,000.10 | 0.90 | 0.18% | ||||||||||||
RBC Select Class | 1,000.00 | 1,000.10 | 0.90 | 0.18% | ||||||||||||
| * | Expenses are equal to the average account value times the Fund’s annualized expense ratio multiplied by 182/366 (to reflect one-half year period). |
64
SUPPLEMENTAL INFORMATION (Unaudited)
|
Hypothetical Example for Comparison Purposes
The table below provides information about hypothetical account values and hypothetical expenses based on each RBC Funds’ actual expense ratio and an assumed rate of return of 5% per year before expenses, which is not the Fund’s actual return. The hypothetical account values and expenses may not be used to estimate the actual ending account balance or expenses you paid for the period. You may use this information to compare this 5% hypothetical example with the 5% hypothetical examples that appear in the shareholder reports of other funds.
Please note that the expenses shown in the table are meant to highlight your ongoing costs only and do not reflect any transactional costs, such as sales charges (loads), redemption fees, or exchange fees. Therefore, the table is useful in comparing ongoing costs only, and will not help you determine the relative total costs of owning different funds. In addition, if these transactional costs were included, your costs would have been higher.
| Beginning Account Value 4/1/12 | Ending Account Value 9/30/12 | Expenses Paid During Period* 4/1/12-9/30/12 | Annualized Expense Ratio During Period 4/1/12-9/30/12 | |||||||||||||
Prime Money Market Fund | ||||||||||||||||
RBC Institutional Class 1 | $1,000.00 | $1,024.02 | $0.86 | 0.17% | ||||||||||||
RBC Institutional Class 2 | 1,000.00 | 1,023.52 | 1.36 | 0.27% | ||||||||||||
RBC Investor Class | 1,000.00 | 1,023.52 | 1.36 | 0.27% | ||||||||||||
RBC Reserve Class | 1,000.00 | 1,023.52 | 1.36 | 0.27% | ||||||||||||
RBC Select Class | 1,000.00 | 1,023.52 | 1.36 | 0.27% | ||||||||||||
U.S. Government Money Market Fund | ||||||||||||||||
RBC Institutional Class 1 | 1,000.00 | 1,024.02 | 0.86 | 0.17% | ||||||||||||
RBC Institutional Class 2 | 1,000.00 | 1,024.02 | 0.86 | 0.17% | ||||||||||||
RBC Investor Class | 1,000.00 | 1,024.02 | 0.86 | 0.17% | ||||||||||||
RBC Reserve Class | 1,000.00 | 1,024.02 | 0.86 | 0.17% | ||||||||||||
RBC Select Class | 1,000.00 | 1,024.02 | 0.86 | 0.17% | ||||||||||||
Tax-Free Money Market Fund | ||||||||||||||||
RBC Institutional Class 1 | 1,000.00 | 1,024.02 | 0.86 | 0.17% | ||||||||||||
RBC Institutional Class 2 | 1,000.00 | 1,023.92 | 0.96 | 0.19% | ||||||||||||
RBC Investor Class | 1,000.00 | 1,023.97 | 0.91 | 0.18% | ||||||||||||
RBC Reserve Class | 1,000.00 | 1,023.97 | 0.91 | 0.18% | ||||||||||||
RBC Select Class | 1,000.00 | 1,023.97 | 0.91 | 0.18% | ||||||||||||
| * | Expenses are equal to the average account value times the Fund’s annualized expense ratio multiplied by 182/366 (to reflect one-half year period). |
65
APPROVAL OF INVESTMENT ADVISORY AGREEMENT (UNAUDITED)
|
Information Regarding the Approval of Investment Advisory Agreements
In September 2012, after evaluating the services provided by RBC Global Asset Management (U.S.), Inc. (the “Advisor”) and reviewing the performance, fees, and expenses of the Funds, the RBC Funds Board of Trustees (the “Trustees”) determined to approve the continuation of the investment advisory agreements (“Agreements”) with the Advisor for each Fund for an additional year.
As part of their review of the Agreements, the Trustees requested and considered information regarding the advisory services performed by the Advisor, the staffing and qualifications of the personnel responsible for operating and managing the Funds, and the Funds’ performance and expenses. The Trustees considered information provided at regular quarterly Board and Committee meetings throughout the year as well as information presented at both a special meeting held to review requested material related to the proposed renewals and a meeting held specifically to consider the proposed renewals. In connection with their deliberations, the independent Trustees were advised by their own independent legal counsel with regard to the materials and their responsibilities under relevant laws and regulations.
The Trustees met with representatives from the Advisor’s senior management team, as well as senior investment professionals, to discuss the information and the Advisor’s ongoing management of the Funds. The Trustees reviewed the nature, quality, and extent of the services provided to the Funds by the Advisor, including information as to each Fund’s performance. With regard to the Funds’ performance, the Trustees were provided with two comparisons: the Lipper information provided comparative data for institutional money market funds and supplemental data from Crane Data LLC provided more relevant comparative money market fund data, including information on other cash sweep options available to brokerage clients.
The Trustees reviewed the Funds’ performance data and noted that, although the low interest rate environment had made it difficult for money market funds in general, the Funds are performing competitively. The Trustees also noted that the Funds generally have a lower exposure to European securities than their competitors and are more conservative in their approach to liquidity and preservation of capital. The Trustees were satisfied with the quality and capabilities of the money market fund portfolio management and analyst team and with the overall investment performance of the Funds.
The Trustees reviewed the investment advisory fees payable to the Advisor and reviewed comparative fee and expense information for similarly situated funds. The Trustees evaluated profitability data for the Advisor and considered information regarding other benefits the Advisor and its affiliates derived from their relationships with the Funds, including the Advisor’s role as co-administrator of the Funds and the fees paid by the Funds for such services. The Trustees also considered the voluntary and contractual agreements by the Advisor and its affiliates to subsidize fund expenses at competitive levels through expense limitation agreements and viewed such commitments favorably.
Based upon their review, the Trustees determined that the advisory fees proposed to be payable to the Advisor were reasonable and fair in light of the nature and quality of services provided under all of the circumstances and were within the range of what might have been negotiated at arms’ length. The Trustees concluded that it is in the interests of the Funds and their shareholders for the Trustees to approve the continuation of the Agreements as well as the expense limitation arrangements for the Funds. In arriving at their collective decision to approve the renewal of the Agreements, the Trustees did not assign relative weights to the factors discussed above or deem any one or group of them to be controlling in and of itself.
66
| ||||||
This Page Intentionally Left Blank
67
| ||||||
This Page Intentionally Left Blank
68
RBC Funds
P.O. Box 701
Milwaukee, WI 53201-0701
800-422-2766
www.rbcgam.us
Performance data represents past performance and does not guarantee future results. The principal value of an investment and investment return will fluctuate so that an investor’s shares, when redeemed, may be worth more or less than their original cost.
This report and the financial statements contained herein are provided for the information of RBC Funds shareholders. This report is not authorized for distribution to prospective investors unless preceded or accompanied by a current prospectus, which contains information concerning investment objectives, risks, charges and expenses of the funds. Please read the prospectus carefully before investing.
This report and the financial statements contained herein are not intended to be a forecast of future events, a guarantee of future results, or investment advice. There is no assurance that certain securities will remain in or out of each fund’s portfolio. The views expressed in this report reflect those of the portfolio managers through the year ended September 30, 2012.
NOT FDIC INSURED — NO BANK GUARANTEE — MAY LOSE VALUE
RBC Global Asset Management (U.S.), Inc. serves as investment adviser for the RBC Funds.
RBC Funds are distributed by Quasar Distributors LLC.

The RBC Funds are pleased to offer shareholder reports printed entirely on Forest
Stewardship Council certified paper. FSC® certification ensures that the paper used
in this report contains fiber from well-managed and responsibly harvested forests
that meet strict environmental and socioeconomic standards.
RBCF-MM AR 09-12
Annual Report
For the year ended September 30, 2012
Access Capital Community Investment Fund RBC Global Asset Management TM
|
| |||||||||
RBC Funds
| ||||||||||
About Your Annual Report |
This annual report includes detailed information about the Access Capital Community Investment Fund (the “Fund”) including financial statements, performance, and a complete list of holdings.
The Fund compares its performance against the Barclays U.S. Securitized Index and the Barclays U.S. Aggregate Bond Index which are widely used market indices.
We hope the financial information presented will help you evaluate your investment in the Fund. We also encourage you to read your Fund’s prospectus for further detail as to the Fund’s investment policies and risk profile. Fund prospectuses and performance information subsequent to the date of this report are available on our website at www.rbcgam.us.
A description of the policies and procedures that your Fund uses to determine how to vote proxies relating to portfolio securities is available (i) without charge, upon request, by calling 1-800-422-2766; (ii) on the Fund’s website at www.rbcgam.us; and (iii) on the Securities and Exchange Commission’s (the “Commission”) website at http://www.sec.gov.
Information regarding how your Fund voted proxies relating to portfolio securities during the most recent 12 month period ended June 30 is available (i) on the Fund’s website at www.rbcgam.us; and (ii) on the Commission’s website at http://www.sec.gov.
A schedule of the Fund’s portfolio holdings will be filed with the Commission for the first and third quarters of each fiscal year on Form N-Q. This information is available on the Commission’s website at http://www.sec.gov and may be reviewed and copied at the Commission’s Public Reference Room in Washington, D.C. Information on the operation of the Public Reference Room is available by calling 1-202-551-8090.
|
| ||||||||
| Table of | ||||||||||
| Contents | ||||||||||
| Letter from the CIO | 1 | |||||||||
| Portfolio Managers | 4 | |||||||||
| Performance Summary | 5 | |||||||||
| Management Discussion and Analysis | 6 | |||||||||
| Schedule of Portfolio Investments | 9 | |||||||||
| Financial Statements | ||||||||||
| - Statement of Assets and Liabilities | 30 | |||||||||
| - Statement of Operations | 32 | |||||||||
| - Statements of Changes in Net Assets | 33 | |||||||||
| - Statement of Cash Flows | 34 | |||||||||
| Financial Highlights | 36 | |||||||||
| Notes to Financial Statements | 38 | |||||||||
| Report of Independent Registered Public Accounting Firm | 51 | |||||||||
| Other Federal Income Tax Information | 52 | |||||||||
| Management | 53 | |||||||||
| Share Class Information | 56 | |||||||||
| Supplemental Information | 57 | |||||||||
| Approval of Investment Advisory Agreement | 58 | |||||||||
| ||||||
Dear Shareholder: | ||||||
The Access Capital Community Investment Fund (the “Fund”) enjoyed another solid year of providing double bottom line returns (the combination of income and social impact) amid markets riddled with uncertainty and a dampened global economic environment. | ||||||
The Fund invests primarily in customized U.S. agency guaranteed mortgage-backed securities (MBS) targeted to low-and moderate-income homebuyers as well as a variety of government-backed loans and municipal securities supporting affordable rental housing, small businesses and other entities serving the needs of low and moderate income communities. In addition to increasing capital flows into underserved communities, over time the Fund’s investment process has provided investors with a competitive rate of return in a wide variety of market conditions. | ||||||
For the fiscal year ended September 30, 2012, the Fund had a net total return of 4.62% compared to a return of 4.17% for the Barclays U.S. Securitized Index, an unmanaged index that tracks the performance of mortgage-backed securities issued by Ginnie Mae, Fannie Mae and Freddie Mac as well as investment grade bonds and asset-backed securities. | ||||||
In addition to its yield, the Fund has also demonstrated the ability to preserve capital for shareholders as reflected in the highest overall Lipper Leader ranking we can achieve for principal preservation. For the trailing 3-year, 5- year and 10-year periods ending September 30, 2012,1 the Access Capital Community Investment Fund is designated as a Lipper Leader in the Preservation category among 4,396 U.S. fixed income funds. | ||||||
The Access Capital Community Investment Fund continues to have a positive impact in underserved communities by filling capital gaps. The Fund is concluding its fourteenth year of providing returns to shareholders that include both an economic and a social benefit (“double bottom line returns”). The Fund’s investments have promoted home ownership, affordable rental housing, education, community health centers and small businesses. As of September 30, 2012, eligible shareholders, as defined in the prospectus, had elected to have their investment amounts invested in 46 states, the District of Columbia, and one U.S. territory. Since inception, the Fund purchased 12,069 mortgages for low- and moderate-income individuals, 16,979 units of affordable rental housing and 346 loans for small business development. | ||||||
There are two distinct ways of looking at recent events in the global economy — one view that is more pessimistic, and another that holds more hope for the future. On the pessimistic side, a lack of clarity in Europe, slowing growth in China and uncertainty stemming from the approaching fiscal cliff continue to hang over the global economy. Consumer activity is slowing, prompting businesses to reduce inventories, stockpile cash and, for the time being, rein in capital investment and hiring. | ||||||
In our view, this bad news is primarily short term in nature and, thus, we tend toward a more optimistic interpretation of recent events. Several of the chronic dysfunctions that have long held back the economy are beginning to normalize. This is true of U.S. housing, credit, and, to a lesser extent, employment. Corporations continue to deliver strong earnings and valuations | ||||||
1
LETTER FROM THE CIO
| ||||||
have edged higher. Financial markets seem to agree with our more positive view. In any environment, however, we remain dedicated to our goal of preserving shareholder assets while striving to deliver the double bottom line results our investors expect—competitive income and meaningful social impact for underserved communities. Thank you for your continued confidence and trust in the Access Capital Community Investment Fund. | ||||||
Sincerely, | ||||||
| | ||||||
Michael Lee, CFA | ||||||
| CEO, President and Chief Investment Officer | ||||||
| RBC Global Asset Management (U.S.) Inc. | ||||||
Past performance is not a guarantee of future results. | ||||||
Fund holdings and sector allocations are subject to change at any time and should not be considered recommendations to buy or sell any security. Please refer to the Schedule of Investments in this report for a complete list of fund holdings. | ||||||
Investment in the Fund involves risks including, but not limited to: the effects of leveraging the Fund’s portfolio; concentration in the affordable housing market and related mortgage backed securities; competition for investments; interest rate risk; and use of derivatives. | ||||||
The information provided herein represents the opinions of the Fund Managers and is not intended to be a forecast of future results, nor investment advice. | ||||||
1Lipper Leader scores are subject to change every month and are calculated for the following time periods: 3-year, 5-year, 10-year, and overall. The overall calculation is based on an equal-weighted average of percentile rank for each category metric over three-, five-, and ten-year periods. The top 20% of funds in each classification are rated 5 and are named Lipper Leaders, the next 20% are rated 4, the middle 20% are rated 3, the next 20% are rated 2, and the lowest 20% are rated 1. For the three-year period, the Access Capital Community Investment Fund received a Lipper Leader rating of 5 in the Preservation category among 4,333 Fixed Income funds. For the five-year period, the Fund received a Lipper Leader rating of 5 in the Preservation category among 3,638 funds. For the ten-year period, the Fund received a Lipper Leader rating of 5 in the Preservation category among 2,559 funds. | ||||||
Lipper ratings for preservation reflect a fund’s historical loss avoidance relative to other funds within the same asset class, as of 9/30/2012. Preservation ratings are relative, rather than absolute measures, and funds named Lipper Leaders for Preservation may still experience losses periodically; those losses may be larger for equity and mixed equity funds than for fixed income funds.
| ||||||
2
LETTER FROM THE CIO
| ||||||
Lipper Analytical Services, Inc. is an independent mutual fund research and rating service. Each Lipper peer group represents a universe of Funds with similar investment objectives. Past performance does not guarantee future results. | ||||||
Investment in the Fund involves risks including, but not limited to: the effects of leveraging the Fund’s portfolio; concentration in the affordable housing market and related mortgage backed securities; competition for investments; interest rate risk; and use of derivatives. | ||||||
3
| ||||||||
|
RBC Global Asset Management (U.S.) Inc.(“RBC GAM (US)”) serves as the investment advisor to the Access Capital Community Investment Fund. RBC GAM (US) employs a team approach to the management of the Access Capital Community Investment Fund, with no individual team member being solely responsible for the investment decisions. The Fund’s management team has access to RBC GAM (US)’s investment research and other money management resources.
| |||||||
Brian Svendahl, CFA Managing Director, Co-Head, U.S. Fixed Income Brian Svendahl leads the rates research team in RBC GAM (US)’s fixed income group. He is a portfolio manager for many of RBC GAM (US)’s government mandates, researches agency commercial mortgage-backed securities and formulates the firm’s derivative/overlay strategies. Brian joined RBC GAM (US) in 2005. He held several risk management, research and trading positions at Wells Fargo, where he most recently served as senior vice president and risk manager. Brian’s previous responsibilities have also included managing liabilities and implementing balance sheet hedging strategies. He earned a BS in economics from the University of Minnesota and a BBA in finance and an MBA from the University of Minnesota Carlson School of Management. Brian is a CFA charterholder.
| ||||||||
Scott Kirby Vice President, Senior Portfolio Manager
Scott Kirby is a member of the rates research team in RBC GAM (US)’s fixed income group and serves as co-portfolio manager for the firm’s community investment strategy, including the Access Capital Community Investment Fund. Scott joined RBC GAM (US) in 2012 and most recently served as manager of investments of a broad-based asset portfolio for a large foundation, supporting its mission to reduce poverty. Previously he led the structured assets team of Ameriprise Financial/Riversource Investments, where he served as senior portfolio manager for more than $20 billion in agency and non-agency mortgage-backed, commercial mortgage-backed and asset-backed securities. He earned a BS in finance and an MBA in finance from the University of Minnesota Carlson School of Management. | ||||||||

4
| ||||||||||||||||||
Average Annual Total Returns as of September 30, 2012
| ||||||||||||||||||
Access Capital Community Investment Fund | ||||||||||||||||||
| 1 Year | 3 Year | 5 Year | 10 Year | Since Inception | Expense Ratio* | |||||||||||||
| Class A (a) | ||||||||||||||||||
| - Including Maximum Sales Charge of 3.75% | 0.44% | 3.13% | 4.63% | 4.03% | 4.68% | |||||||||||||
| - At Net Asset Value | 4.35% | 4.45% | 5.44% | 4.43% | 4.96% | 1.03% | ||||||||||||
| Class I (b) | ||||||||||||||||||
| - At Net Asset Value | 4.62% | 4.71% | 5.62% | 4.61% | 5.24% | 0.78% | ||||||||||||
| Barclays U. S. Securitized Index (c) | 4.17% | 5.56% | 6.25% | 5.17% | 5.90% | |||||||||||||
| Barclays U. S. Aggregate Bond Index (c) | 5.16% | 6.19% | 6.53% | 5.32% | 5.99% | |||||||||||||
Performance data quoted represents past performance. Past performance is no guarantee of future results. Investment return and principal value of an investment will fluctuate so that an investor’s shares, when redeemed, may be worth more or less than their original cost. Current performance may be lower or higher than performance quoted. For performance data current to most recent month-end go to www.rbcgam.us. | ||||||||||||||||||
The Barclays U.S. Securitized Index is an unmanaged index that tracks the performance of mortgage-backed pass-through securities issued by Ginnie Mae, Fannie Mae, and Freddie Mac, investment-grade bonds and asset-backed securities. | ||||||||||||||||||
The Barclays U.S. Aggregate Bond Index is an unmanaged index that tracks the performance of a representative list of government, corporate, asset-backed and mortgage-backed securities. | ||||||||||||||||||
(a) The inception date for Class A shares of the Fund is January 29, 2009. All performance shown for such class of shares prior to its inception date is based on the performance of the Class I shares of the Fund, adjusted to reflect the fees and expenses of Class A shares, as applicable. | ||||||||||||||||||
(b) Class I commenced operations on July 28, 2008. The performance in the table reflects the performance of Access Capital Strategies Community Investment Fund, Inc., the predecessor to the Fund. From its inception, June 23, 1998, until May 30, 2006, the predecessor fund elected status as a business development company. From May 31, 2006 until July 27, 2008, the predecessor fund operated as a continuously offered closed-end interval management company. If the predecessor fund had operated as an open-end management company, performance may have been adversely affected. Fund performance reflects applicable fee waivers/expense reimbursements which, if excluded, would cause performance to be lower. | ||||||||||||||||||
(c) You cannot invest directly into the index.
* The Fund’s expenses reflect the most recent year end (September 30, 2012). | ||||||||||||||||||
5
| ||||||
Access Capital Community Investment Fund
| ||||||
| Investment Strategy | Invests in geographically specific debt securities located in portions of the United States designated by Fund Shareholders. The Fund invests primarily in debt instruments supporting the affordable housing and economic development serving low- and moderate- income individuals and communities. Investment securities include government-guaranteed loans, asset-backed securities, particularly mortgage-backed securities, small business loans, and taxable municipal securities.
| |||||
| Performance | ||||||
For the twelve-month period ending September 30, 2012, the Fund had a total return of 4.62% (Class I). That compares to a total return of 4.17% for the Barclays U.S. Securitized Index and 5.16% for the Barclays U.S. Aggregate Bond Index.
| ||||||
Factors That | ||||||
| Made Positive Contributions | l The Fund’s holdings in agency mortgage-backed securities experienced pre-payments at a slower rate than benchmark agency mortgage-backed securities. As a result, the Fund earned interest at a higher coupon rate for a longer period of time.
l Spread compression in agency mortgage-backed securities contributed positively to relative performance.
l The Fund maintained an income advantage relative to the benchmark index during the past year.
| |||||
Factors That | ||||||
| Detracted from | l Maintaining a cash balance detracted from performance to a small extent | |||||
| Relative Returns | ||||||
Fund holdings and sector allocations are subject to change at any time and should not be considered recommendations to buy or sell any security.
Please refer to the Schedule of Portfolio Investments in this report for a complete list of Fund holdings. | ||||||
6
MANAGEMENT DISCUSSION AND ANALYSIS (UNAUDITED)
|
| |||||||||||||||||
Access Capital Community Investment Fund
| ||||||||||||||||||
Current income and capital appreciation |
| Investment Objective | ||||||||||||||||
Barclays U.S. Securitized Index
Barclays U.S. Aggregate Bond Index
|
Benchmark | |||||||||||||||||
| Asset Allocation (as of 9/30/12) (% of fund’s investments) | |||||||||||||||||
Fannie Mae Pool #AK2386, | 2.98 | % | Fannie Mae Pool #465537, | 1.45 | % |
Top Ten Holdings (as of 9/30/12) (% of fund’s net assets) | ||||||||||||
3.50%, 2/1/42 | 4.20%, 7/1/20 | |||||||||||||||||
Small Business Administration, | 2.65 | % | Fannie Mae Pool #466303, | 1.40 | % | |||||||||||||
1.45%, 3/25/36 | 3.54%, 11/1/20 | |||||||||||||||||
Fannie Mae Pool #463212, | 2.01 | % | Ginnie Mae Series 2012-58, | 1.37 | % | |||||||||||||
4.68%, 8/1/19 | Class B, 2.20%, 3/16/44 | |||||||||||||||||
Fannie Mae Series 2004-T7, | 1.88 | % | Fannie Mae Pool #AK6715, | 1.31 | % | |||||||||||||
Class A, 5.12%, 7/25/41 | 3.50%, 3/1/42 | |||||||||||||||||
Massachusetts Housing | 1.82 | % | Massachusetts Housing Finance | 1.25 | % | |||||||||||||
Investment Corp. Term Loan, | Agency Revenue, Series B, | |||||||||||||||||
8.25%, 1/31/35 | 6.53%, 12/1/27 | |||||||||||||||||
* A listing of all portfolio holdings can be found beginning on page 9.
|
| |||||||||||||||||
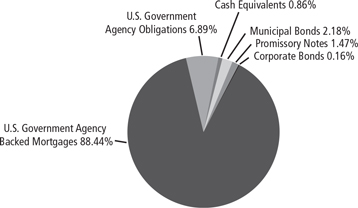
7
MANAGEMENT DISCUSSION AND ANALYSIS (UNAUDITED)
| ||||||
Access Capital Community Investment Fund
| ||||||
Growth of $10,000 Initial Investment Over 10 Years | 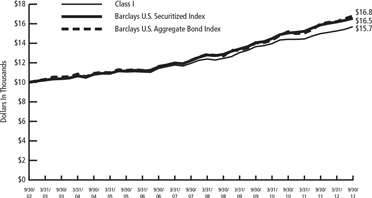 | |||||
The graph reflects an initial investment of $10,000 over a 10 year period and is based on Class I shares. The Fund’s total return includes reinvested dividends and capital gains. The Fund’s total return also includes operating expenses that reduce return, while the total return of the index do not. The graph does not reflect the deduction of taxes that a shareholder would pay on fund distributions or redemption of fund shares. Performance of other classes will vary due to differences in fee structures. | ||||||
8
SCHEDULE OF PORTFOLIO INVESTMENTS
|
Access Capital Community Investment Fund
September 30, 2012
Principal Amount | Value | |||||
Municipal Bonds — 2.71% | ||||||
California — 0.22% | ||||||
| $ 255,000 | California Rural Home Mortgage Finance Authority Revenue, Series C, 5.40%, 8/1/35, (Credit Support: Ginnie Mae, Fannie Mae, Freddie Mac), Callable 2/1/17 @ 104 | $ | 272,501 | |||
| 975,000 | California Statewide Communities Development Authority Revenue, Series B, 5.25%, 10/20/42, (Credit Support: Ginnie Mae), Callable 10/20/17 @ 102 | 1,014,721 | ||||
|
| |||||
| 1,287,222 | ||||||
|
| |||||
Delaware — 0.25% | ||||||
| 735,000 | Delaware State Housing Authority Revenue, Series 2, 1.50%, 1/1/15, (Credit Support: Ginnie Mae, Fannie Mae, Freddie Mac) | 741,005 | ||||
| 720,000 | Delaware State Housing Authority Revenue, Series 2, 0.95%, 1/1/14, (Credit Support: Ginnie Mae, Fannie Mae, Freddie Mac) | 722,225 | ||||
|
| |||||
| 1,463,230 | ||||||
|
| |||||
Guam — 0.02% | ||||||
| 140,000 | Guam Power Authority Revenue OID, Series A, 5.00%, 10/1/24, (Credit Support: AMBAC), Callable 10/29/12 @ 100 | 140,045 | ||||
|
| |||||
Massachusetts — 1.25% | ||||||
| 6,790,000 | Massachusetts Housing Finance Agency Revenue, Series B, 6.53%, 12/1/27, (Credit Support: NATL-RE,IBC), Callable 6/1/17 @ 100 | 7,362,329 | ||||
|
| |||||
Mississippi — 0.02% | ||||||
| 100,000 | Mississippi Home Corp. Multi Family Revenue OID, 5.35%, 8/20/48, (Credit Support: Ginnie Mae, FHA), Callable 9/1/18 @ 105 | 105,173 | ||||
|
| |||||
New York — 0.69% | ||||||
| 665,000 | New York City Housing Development Corp. Revenue, Series A, 4.15%, 7/15/15, (Credit Support: Fannie Mae) | 700,278 | ||||
| 700,000 | New York State Housing Finance Agency Revenue, 4.50%, 11/15/27, (Credit Support: Fannie Mae), Callable 11/15/16 @ 100 | 720,685 | ||||
| 1,000,000 | New York State Housing Finance Agency Revenue, Series A, 4.65%, 11/15/38, (Credit Support: Fannie Mae), Callable 11/15/16 @ 100 | 1,027,880 | ||||
9
SCHEDULE OF PORTFOLIO INVESTMENTS
|
Access Capital Community Investment Fund (cont.)
September 30, 2012
Principal Amount | Value | |||
| $1,620,000 | Suffolk County Industrial Development Agency Revenue, 5.70%, 12/1/26, (LOC: Bank of New York), Callable 10/29/12 @ 102 | $ 1,633,187 | ||
| ||||
| 4,082,030 | ||||
| ||||
Texas — 0.20% | ||||
| 1,085,000 | Texas Department of Housing & Community Affairs Revenue, 5.13%, 12/1/38, (Credit Support: Fannie Mae), Callable 6/01/21 @ 102(a) | 1,185,721 | ||
| ||||
Utah — 0.06% | ||||
| 377,000 | Utah Housing Corp. Multi Family Mortgage Revenue, 7.25%, 1/20/26, (Credit Support: Ginnie Mae), Callable 9/30/12 @ 102 | 380,909 | ||
| ||||
Total Municipal Bonds | 16,006,659 | |||
| ||||
(Cost $15,078,748) | ||||
Corporate Bonds — 0.20% | ||||
Diversified Financials — 0.20% | ||||
| 1,980,645 | Pacific Beacon LLC 0.87%, 7/15/51(Credit Support: MBIA)(a)(b)(c) | 1,163,906 | ||
| ||||
Total Corporate Bonds | 1,163,906 | |||
| ||||
(Cost $1,980,645) | ||||
U.S. Government Agency Backed Mortgages — 109.75% | ||||
Fannie Mae — 73.10% | ||||
| 1,700,000 | (TBA), 3.00%, 10/1/42(b) | 1,810,500 | ||
| 500,000 | (TBA), 2.55%, 11/1/22(b) | 503,871 | ||
| 24,537 | Pool #253174, 7.25%, 12/1/29 | 28,185 | ||
| 22,322 | Pool #253214, 7.00%, 1/1/15 | 23,411 | ||
| 109,015 | Pool #257611, 5.50%, 5/1/38 | 120,019 | ||
| 50,641 | Pool #257612, 5.00%, 5/1/38 | 56,087 | ||
| 379,121 | Pool #257613, 5.50%, 6/1/38 | 417,151 | ||
| 177,760 | Pool #257631, 6.00%, 7/1/38 | 199,098 | ||
| 392,696 | Pool #257632, 5.50%, 7/1/38 | 430,125 | ||
| 286,099 | Pool #257649, 5.50%, 7/1/38 | 314,709 | ||
| 83,752 | Pool #257656, 6.00%, 8/1/38 | 93,806 | ||
| 208,342 | Pool #257663, 5.50%, 8/1/38 | 229,177 | ||
| 519,979 | Pool #257857, 6.00%, 12/1/37 | 574,272 | ||
| 68,837 | Pool #257869, 5.50%, 12/1/37 | 76,430 | ||
| 372,465 | Pool #257890, 5.50%, 2/1/38 | 409,130 | ||
| 668,601 | Pool #257892, 5.50%, 2/1/38 | 734,416 | ||
| 52,720 | Pool #257897, 5.50%, 2/1/38 | 58,536 | ||
| 109,281 | Pool #257898, 6.00%, 2/1/38 | 122,485 | ||
| 97,043 | Pool #257899, 5.00%, 2/1/38 | 107,358 | ||
| 120,075 | Pool #257901, 5.50%, 2/1/38 | 132,008 | ||
| 53,847 | Pool #257902, 6.00%, 2/1/38 | 60,353 | ||
10
SCHEDULE OF PORTFOLIO INVESTMENTS
|
Access Capital Community Investment Fund (cont.)
September 30, 2012
Principal Amount | Value | |||
| $143,902 | Pool #257903, 5.50%, 2/1/38 | $157,663 | ||
| 198,745 | Pool #257904, 6.00%, 2/1/38 | 221,547 | ||
| 86,098 | Pool #257913, 5.50%, 1/1/38 | 95,192 | ||
| 111,339 | Pool #257919, 6.00%, 2/1/38 | 124,234 | ||
| 77,352 | Pool #257926, 5.50%, 3/1/38 | 85,039 | ||
| 166,115 | Pool #257942, 5.50%, 4/1/38 | 182,882 | ||
| 102,606 | Pool #257943, 6.00%, 4/1/38 | 114,746 | ||
| 82,649 | Pool #257995, 6.00%, 7/1/38 | 92,570 | ||
| 70,554 | Pool #258022, 5.50%, 5/1/34 | 78,381 | ||
| 95,043 | Pool #258027, 5.00%, 5/1/34 | 104,670 | ||
| 111,587 | Pool #258030, 5.00%, 5/1/34 | 122,751 | ||
| 256,942 | Pool #258070, 5.00%, 6/1/34 | 285,135 | ||
| 158,007 | Pool #258090, 5.00%, 6/1/34 | 174,209 | ||
| 56,553 | Pool #258093, 5.50%, 6/1/34 | 62,827 | ||
| 47,671 | Pool #258121, 5.50%, 6/1/34 | 52,960 | ||
| 158,213 | Pool #258152, 5.50%, 8/1/34 | 175,567 | ||
| 437,608 | Pool #258157, 5.00%, 8/1/34 | 479,881 | ||
| 185,061 | Pool #258163, 5.50%, 8/1/34 | 204,984 | ||
| 132,243 | Pool #258166, 5.50%, 9/1/34 | 146,211 | ||
| 82,718 | Pool #258171, 5.50%, 10/1/34 | 91,623 | ||
| 168,106 | Pool #258173, 5.50%, 10/1/34 | 185,442 | ||
| 154,361 | Pool #258180, 5.00%, 10/1/34 | 169,056 | ||
| 81,083 | Pool #258187, 5.50%, 11/1/34 | 89,812 | ||
| 416,751 | Pool #258188, 5.50%, 11/1/34 | 459,924 | ||
| 123,232 | Pool #258198, 5.50%, 10/1/34 | 136,172 | ||
| 88,348 | Pool #258199, 5.50%, 9/1/34 | 97,680 | ||
| 112,306 | Pool #258203, 5.50%, 10/1/34 | 124,098 | ||
| 105,790 | Pool #258221, 5.50%, 11/1/34 | 116,964 | ||
| 46,027 | Pool #258222, 5.00%, 11/1/34 | 50,854 | ||
| 126,445 | Pool #258224, 5.50%, 12/1/34 | 139,544 | ||
| 137,235 | Pool #258225, 5.50%, 11/1/34 | 151,452 | ||
| 289,054 | Pool #258238, 5.00%, 1/1/35 | 316,571 | ||
| 146,625 | Pool #258251, 5.50%, 1/1/35 | 162,112 | ||
| 50,620 | Pool #258252, 5.50%, 12/1/34 | 56,133 | ||
| 123,123 | Pool #258254, 5.50%, 12/1/34 | 135,877 | ||
| 128,504 | Pool #258258, 5.00%, 1/1/35 | 141,139 | ||
| 132,845 | Pool #258301, 5.50%, 2/1/35 | 146,794 | ||
| 185,368 | Pool #258302, 5.00%, 3/1/35 | 205,940 | ||
| 77,398 | Pool #258303, 5.00%, 2/1/35 | 85,298 | ||
| 386,844 | Pool #258305, 5.00%, 3/1/35 | 424,879 | ||
| 79,027 | Pool #258312, 5.50%, 2/1/35 | 87,535 | ||
| 152,581 | Pool #258324, 5.50%, 4/1/35 | 168,054 | ||
| 327,600 | Pool #258336, 5.00%, 4/1/35 | 359,451 | ||
| 246,329 | Pool #258339, 5.00%, 4/1/35 | 269,432 | ||
| 72,041 | Pool #258340, 5.00%, 3/1/35 | 79,541 | ||
| 96,306 | Pool #258342, 5.00%, 4/1/35 | 106,121 | ||
| 131,355 | Pool #258346, 5.00%, 3/1/35 | 144,270 | ||
| 600,259 | Pool #258347, 5.00%, 4/1/35 | 656,556 |
11
SCHEDULE OF PORTFOLIO INVESTMENTS
|
Access Capital Community Investment Fund (cont.)
September 30, 2012
Principal Amount | Value | |||
| $119,841 | Pool #258388, 5.50%, 6/1/35 | $132,181 | ||
| 65,767 | Pool #258392, 5.00%, 6/1/35 | 72,613 | ||
| 381,402 | Pool #258393, 5.00%, 5/1/35 | 420,272 | ||
| 140,222 | Pool #258394, 5.00%, 5/1/35 | 154,819 | ||
| 381,406 | Pool #258395, 5.50%, 6/1/35 | 419,904 | ||
| 73,007 | Pool #258402, 5.00%, 6/1/35 | 80,607 | ||
| 70,884 | Pool #258403, 5.00%, 6/1/35 | 78,264 | ||
| 95,418 | Pool #258404, 5.00%, 6/1/35 | 105,142 | ||
| 82,340 | Pool #258406, 5.50%, 5/1/35 | 91,038 | ||
| 91,609 | Pool #258409, 5.00%, 5/1/35 | 101,404 | ||
| 55,167 | Pool #258410, 5.00%, 4/1/35 | 60,910 | ||
| 114,441 | Pool #258411, 5.50%, 5/1/35 | 126,672 | ||
| 151,256 | Pool #258422, 5.00%, 6/1/35 | 165,962 | ||
| 377,838 | Pool #258448, 5.00%, 8/1/35 | 413,275 | ||
| 385,546 | Pool #258450, 5.50%, 8/1/35 | 424,642 | ||
| 105,929 | Pool #258456, 5.00%, 8/1/35 | 116,427 | ||
| 418,442 | Pool #258460, 5.00%, 8/1/35 | 457,229 | ||
| 156,499 | Pool #258470, 5.00%, 7/1/35 | 171,177 | ||
| 90,557 | Pool #258479, 5.50%, 7/1/35 | 99,938 | ||
| 255,842 | Pool #258552, 5.00%, 11/1/35 | 282,915 | ||
| 109,054 | Pool #258569, 5.00%, 10/1/35 | 119,845 | ||
| 649,788 | Pool #258571, 5.50%, 11/1/35 | 715,071 | ||
| 190,848 | Pool #258600, 6.00%, 1/1/36 | 212,982 | ||
| 625,987 | Pool #258627, 5.50%, 2/1/36 | 687,803 | ||
| 210,755 | Pool #258634, 5.50%, 2/1/36 | 232,060 | ||
| 372,292 | Pool #258644, 5.50%, 2/1/36 | 409,289 | ||
| 92,994 | Pool #258650, 5.50%, 1/1/36 | 102,700 | ||
| 452,428 | Pool #258658, 5.50%, 3/1/36 | 497,105 | ||
| 62,698 | Pool #258721, 5.50%, 4/1/36 | 69,271 | ||
| 125,963 | Pool #258737, 5.50%, 12/1/35 | 139,110 | ||
| 86,195 | Pool #258763, 6.00%, 5/1/36 | 96,273 | ||
| 51,139 | Pool #259004, 8.00%, 2/1/30 | 60,958 | ||
| 35,411 | Pool #259011, 8.00%, 3/1/30 | 42,210 | ||
| 59,415 | Pool #259030, 8.00%, 4/1/30 | 70,481 | ||
| 102,697 | Pool #259181, 6.50%, 3/1/31 | 118,557 | ||
| 21,553 | Pool #259187, 6.50%, 4/1/31 | 24,498 | ||
| 86,649 | Pool #259190, 6.50%, 4/1/31 | 100,291 | ||
| 83,365 | Pool #259201, 6.50%, 4/1/31 | 96,476 | ||
| 37,611 | Pool #259284, 6.50%, 8/1/31 | 43,406 | ||
| 42,402 | Pool #259306, 6.50%, 9/1/31 | 48,836 | ||
| 82,884 | Pool #259309, 6.50%, 10/1/31 | 95,652 | ||
| 208,633 | Pool #259316, 6.50%, 11/1/31 | 240,736 | ||
| 100,819 | Pool #259327, 6.00%, 11/1/31 | 112,759 | ||
| 65,804 | Pool #259369, 6.00%, 1/1/32 | 73,225 | ||
| 37,763 | Pool #259378, 6.00%, 12/1/31 | 42,239 | ||
| 106,598 | Pool #259393, 6.00%, 1/1/32 | 119,322 | ||
| 50,635 | Pool #259398, 6.50%, 2/1/32 | 58,457 | ||
| 77,157 | Pool #259440, 6.50%, 4/1/32 | 88,339 |
12
SCHEDULE OF PORTFOLIO INVESTMENTS
|
Access Capital Community Investment Fund (cont.)
September 30, 2012
Principal Amount | Value | |||
| $ 51,762 | Pool #259590, 5.50%, 11/1/32 | $ 57,553 | ||
| 38,365 | Pool #259599, 6.00%, 10/1/32 | 42,299 | ||
| 266,900 | Pool #259611, 5.50%, 11/1/32 | 295,883 | ||
| 72,720 | Pool #259612, 5.50%, 11/1/32 | 80,719 | ||
| 115,950 | Pool #259614, 6.00%, 11/1/32 | 129,905 | ||
| 95,459 | Pool #259634, 5.50%, 12/1/32 | 105,825 | ||
| 71,324 | Pool #259655, 5.50%, 2/1/33 | 79,304 | ||
| 165,794 | Pool #259659, 5.50%, 2/1/33 | 183,799 | ||
| 39,573 | Pool #259671, 5.50%, 2/1/33 | 44,000 | ||
| 97,261 | Pool #259686, 5.50%, 3/1/33 | 107,823 | ||
| 47,884 | Pool #259722, 5.00%, 5/1/33 | 52,966 | ||
| 145,052 | Pool #259723, 5.00%, 5/1/33 | 159,495 | ||
| 59,165 | Pool #259724, 5.00%, 5/1/33 | 65,444 | ||
| 153,920 | Pool #259725, 5.00%, 5/1/33 | 169,727 | ||
| 74,422 | Pool #259726, 5.00%, 5/1/33 | 82,064 | ||
| 127,520 | Pool #259729, 5.00%, 6/1/33 | 140,297 | ||
| 61,765 | Pool #259731, 5.00%, 6/1/33 | 68,320 | ||
| 134,440 | Pool #259733, 5.50%, 6/1/33 | 148,808 | ||
| 73,390 | Pool #259734, 5.50%, 5/1/33 | 81,463 | ||
| 123,530 | Pool #259748, 5.00%, 6/1/33 | 135,830 | ||
| 64,501 | Pool #259753, 5.00%, 7/1/33 | 71,044 | ||
| 76,537 | Pool #259757, 5.00%, 6/1/33 | 84,397 | ||
| 425,917 | Pool #259761, 5.00%, 6/1/33 | 473,117 | ||
| 155,856 | Pool #259764, 5.00%, 7/1/33 | 171,472 | ||
| 121,567 | Pool #259765, 5.00%, 7/1/33 | 133,748 | ||
| 79,481 | Pool #259776, 5.00%, 6/1/33 | 87,445 | ||
| 145,322 | Pool #259777, 5.00%, 7/1/33 | 159,815 | ||
| 98,675 | Pool #259781, 5.00%, 7/1/33 | 108,700 | ||
| 60,205 | Pool #259789, 5.00%, 7/1/33 | 66,604 | ||
| 110,617 | Pool #259807, 5.00%, 8/1/33 | 121,717 | ||
| 510,325 | Pool #259816, 5.00%, 8/1/33 | 560,102 | ||
| 33,409 | Pool #259819, 5.00%, 8/1/33 | 36,960 | ||
| 86,920 | Pool #259820, 5.00%, 8/1/33 | 95,860 | ||
| 240,312 | Pool #259821, 5.00%, 7/1/33 | 264,278 | ||
| 181,202 | Pool #259830, 5.00%, 8/1/33 | 199,386 | ||
| 40,872 | Pool #259848, 5.00%, 9/1/33 | 45,216 | ||
| 129,189 | Pool #259862, 5.50%, 9/1/33 | 142,996 | ||
| 85,781 | Pool #259867, 5.50%, 10/1/33 | 95,243 | ||
| 261,954 | Pool #259869, 5.50%, 10/1/33 | 290,237 | ||
| 137,010 | Pool #259875, 5.50%, 10/1/33 | 152,124 | ||
| 82,558 | Pool #259876, 5.50%, 10/1/33 | 91,665 | ||
| 47,796 | Pool #259879, 5.50%, 10/1/33 | 53,143 | ||
| 39,089 | Pool #259904, 5.50%, 11/1/33 | 43,462 | ||
| 150,185 | Pool #259906, 5.50%, 11/1/33 | 166,494 | ||
| 60,483 | Pool #259928, 5.50%, 12/1/33 | 67,222 | ||
| 221,132 | Pool #259930, 5.00%, 11/1/33 | 243,185 | ||
| 89,833 | Pool #259936, 5.50%, 11/1/33 | 99,743 | ||
| 96,305 | Pool #259938, 5.50%, 12/1/33 | 106,718 |
13
SCHEDULE OF PORTFOLIO INVESTMENTS
|
Access Capital Community Investment Fund (cont.)
September 30, 2012
Principal Amount | Value | |||
| $ 12,267 | Pool #259939, 5.50%, 11/1/33 | $ 13,640 | ||
| 45,341 | Pool #259961, 5.50%, 3/1/34 | 50,392 | ||
| 209,277 | Pool #259976, 5.00%, 3/1/34 | 232,339 | ||
| 137,309 | Pool #259977, 5.00%, 3/1/34 | 150,981 | ||
| 45,794 | Pool #259998, 5.00%, 3/1/34 | 50,654 | ||
| 694,961 | Pool #380307, 6.53%, 6/1/16 | 714,473 | ||
| 574,941 | Pool #381985, 7.97%, 9/1/17 | 623,523 | ||
| 536,616 | Pool #382373, 7.58%, 5/1/18 | 627,055 | ||
| 583,027 | Pool #383765, 6.70%, 6/1/19 | 680,708 | ||
| 2,578,587 | Pool #386602, 4.66%, 10/1/13 | 2,619,959 | ||
| 2,585,111 | Pool #386641, 5.80%, 12/1/33 | 3,008,773 | ||
| 682,999 | Pool #386674, 5.51%, 11/1/21 | 768,782 | ||
| 3,488,865 | Pool #387374, 5.60%, 5/1/23 | 4,301,690 | ||
| 845,370 | Pool #387446, 5.22%, 6/1/20 | 1,005,512 | ||
| 888,313 | Pool #387472, 4.89%, 6/1/15 | 978,394 | ||
| 3,600,418 | Pool #387590, 4.90%, 9/1/15 | 4,004,000 | ||
| 626,995 | Pool #462834, 4.70%, 2/1/17 | 681,634 | ||
| 10,109,759 | Pool #463212, 4.68%, 8/1/19 | 11,863,561 | ||
| 7,511,592 | Pool #465537, 4.20%, 7/1/20 | 8,562,901 | ||
| 739,039 | Pool #465946, 3.61%, 9/1/20 | 826,228 | ||
| 7,403,203 | Pool #466303, 3.54%, 11/1/20 | 8,240,927 | ||
| 5,912,574 | Pool #466934, 4.10%, 1/1/21 | 6,702,686 | ||
| 3,419,670 | Pool #467882, 4.24%, 6/1/21 | 3,894,857 | ||
| 2,460,317 | Pool #468104, 3.93%, 5/1/18 | 2,769,665 | ||
| 477,671 | Pool #470439, 2.91%, 5/1/22 | 504,985 | ||
| 3,501,825 | Pool #470561, 2.94%, 2/1/22 | 3,715,080 | ||
| 4,100,091 | Pool #471320, 2.96%, 5/1/22 | 4,351,143 | ||
| 4,974,235 | Pool #471372, 2.96%, 5/1/22 | 5,278,257 | ||
| 3,660,858 | Pool #471948, 2.86%, 7/1/22 | 3,850,913 | ||
| 243,108 | Pool #557295, 7.00%, 12/1/29 | 277,106 | ||
| 33,691 | Pool #575886, 7.50%, 1/1/31 | 39,627 | ||
| 90,500 | Pool #576445, 6.00%, 1/1/31 | 100,838 | ||
| 192,929 | Pool #579402, 6.50%, 4/1/31 | 222,813 | ||
| 167,074 | Pool #583728, 6.50%, 6/1/31 | 192,543 | ||
| 83,518 | Pool #585148, 6.50%, 7/1/31 | 96,348 | ||
| 42,017 | Pool #590931, 6.50%, 7/1/31 | 48,447 | ||
| 77,938 | Pool #590932, 6.50%, 7/1/31 | 89,886 | ||
| 58,112 | Pool #591063, 6.50%, 7/1/31 | 67,067 | ||
| 272,628 | Pool #601865, 6.50%, 4/1/31 | 312,366 | ||
| 150,655 | Pool #601868, 6.00%, 7/1/29 | 168,751 | ||
| 254,952 | Pool #607611, 6.50%, 11/1/31 | 293,892 | ||
| 232,011 | Pool #634271, 6.50%, 5/1/32 | 267,848 | ||
| 112,041 | Pool #640146, 5.00%, 12/1/17 | 121,538 | ||
| 149,540 | Pool #644232, 6.50%, 6/1/32 | 172,703 | ||
| 31,532 | Pool #644432, 6.50%, 7/1/32 | 36,347 | ||
| 50,912 | Pool #644437, 6.50%, 6/1/32 | 58,795 | ||
| 115,575 | Pool #657250, 6.00%, 10/1/32 | 129,635 | ||
| 3,778,409 | Pool #663159, 5.00%, 7/1/32 | 4,145,744 |
14
SCHEDULE OF PORTFOLIO INVESTMENTS
|
Access Capital Community Investment Fund (cont.)
September 30, 2012
Principal Amount | Value | |||
| $ 188,976 | Pool #670278, 5.50%, 11/1/32 | $ 210,118 | ||
| 55,706 | Pool #676702, 5.50%, 11/1/32 | 61,938 | ||
| 62,077 | Pool #677591, 5.50%, 12/1/32 | 68,818 | ||
| 626,050 | Pool #681883, 6.00%, 3/1/33 | 702,056 | ||
| 143,588 | Pool #683087, 5.00%, 1/1/18 | 155,759 | ||
| 197,903 | Pool #684570, 5.00%, 12/1/32 | 217,268 | ||
| 93,770 | Pool #684644, 4.50%, 6/1/18 | 101,026 | ||
| 323,448 | Pool #686542, 5.50%, 3/1/33 | 357,966 | ||
| 18,997 | Pool #689034, 5.00%, 5/1/33 | 20,853 | ||
| 166,820 | Pool #689667, 5.50%, 4/1/33 | 185,170 | ||
| 713,748 | Pool #695961, 5.50%, 1/1/33 | 790,030 | ||
| 153,567 | Pool #695962, 6.00%, 11/1/32 | 172,189 | ||
| 413,071 | Pool #696407, 5.50%, 4/1/33 | 458,509 | ||
| 1,137,390 | Pool #702478, 5.50%, 6/1/33 | 1,258,771 | ||
| 437,894 | Pool #702479, 5.00%, 6/1/33 | 480,674 | ||
| 370,540 | Pool #703210, 5.50%, 9/1/32 | 407,459 | ||
| 166,073 | Pool #705576, 5.50%, 5/1/33 | 183,796 | ||
| 703,420 | Pool #720025, 5.00%, 8/1/33 | 772,031 | ||
| 762,307 | Pool #723066, 5.00%, 4/1/33 | 836,781 | ||
| 400,635 | Pool #723067, 5.50%, 5/1/33 | 443,390 | ||
| 332,360 | Pool #723068, 4.50%, 5/1/33 | 359,091 | ||
| 407,041 | Pool #723070, 4.50%, 5/1/33 | 442,260 | ||
| 377,978 | Pool #723328, 5.00%, 9/1/33 | 414,845 | ||
| 672,257 | Pool #727311, 4.50%, 9/1/33 | 729,792 | ||
| 1,891,188 | Pool #727312, 5.00%, 9/1/33 | 2,083,336 | ||
| 367,651 | Pool #727315, 6.00%, 10/1/33 | 413,286 | ||
| 643,184 | Pool #738589, 5.00%, 9/1/33 | 705,920 | ||
| 308,373 | Pool #738683, 5.00%, 9/1/33 | 338,451 | ||
| 646,771 | Pool #739269, 5.00%, 9/1/33 | 709,857 | ||
| 279,600 | Pool #743595, 5.50%, 10/1/33 | 309,483 | ||
| 286,660 | Pool #748041, 4.50%, 10/1/33 | 310,746 | ||
| 508,553 | Pool #749891, 5.00%, 9/1/33 | 564,831 | ||
| 313,288 | Pool #749897, 4.50%, 9/1/33 | 339,612 | ||
| 206,697 | Pool #750984, 5.00%, 12/1/18 | 224,217 | ||
| 298,295 | Pool #751008, 5.00%, 12/1/18 | 323,580 | ||
| 307,727 | Pool #753533, 5.00%, 11/1/33 | 338,608 | ||
| 192,904 | Pool #755679, 6.00%, 1/1/34 | 216,909 | ||
| 122,337 | Pool #755745, 5.00%, 1/1/34 | 136,373 | ||
| 184,400 | Pool #755746, 5.50%, 12/1/33 | 204,944 | ||
| 275,216 | Pool #763551, 5.50%, 3/1/34 | 304,372 | ||
| 764,514 | Pool #763820, 5.50%, 1/1/34 | 845,505 | ||
| 340,917 | Pool #763824, 5.00%, 3/1/34 | 375,075 | ||
| 350,010 | Pool #765216, 5.00%, 1/1/19 | 379,679 | ||
| 155,543 | Pool #765217, 4.50%, 1/1/19 | 167,579 | ||
| 139,579 | Pool #765306, 5.00%, 2/1/19 | 151,410 | ||
| 107,599 | Pool #773084, 4.50%, 3/1/19 | 115,925 | ||
| 141,526 | Pool #773091, 4.00%, 3/1/19 | 151,159 | ||
| 21,356 | Pool #773096, 4.50%, 3/1/19 | 23,009 |
15
SCHEDULE OF PORTFOLIO INVESTMENTS
|
Access Capital Community Investment Fund (cont.)
September 30, 2012
Principal Amount | Value | |||
| $ 606,622 | Pool #773175, 5.00%, 5/1/34 | $ 665,223 | ||
| 394,445 | Pool #773476, 5.50%, 7/1/19 | 427,955 | ||
| 270,613 | Pool #773547, 5.00%, 5/1/34 | 296,755 | ||
| 368,278 | Pool #773553, 5.00%, 4/1/34 | 404,027 | ||
| 698,837 | Pool #773568, 5.50%, 5/1/34 | 772,870 | ||
| 80,719 | Pool #773575, 6.00%, 7/1/34 | 90,409 | ||
| 258,576 | Pool #776849, 5.00%, 11/1/34 | 283,191 | ||
| 383,575 | Pool #776850, 5.50%, 11/1/34 | 423,131 | ||
| 54,067 | Pool #776851, 6.00%, 10/1/34 | 60,574 | ||
| 304,168 | Pool #777444, 5.50%, 5/1/34 | 336,201 | ||
| 2,557,380 | Pool #777621, 5.00%, 2/1/34 | 2,806,825 | ||
| 446,576 | Pool #781437, 6.00%, 8/1/34 | 499,903 | ||
| 218,863 | Pool #781741, 6.00%, 9/1/34 | 244,998 | ||
| 324,983 | Pool #781907, 5.00%, 2/1/21 | 353,851 | ||
| 249,623 | Pool #781954, 5.00%, 6/1/34 | 274,439 | ||
| 488,069 | Pool #781959, 5.50%, 6/1/34 | 539,469 | ||
| 437,837 | Pool #781960, 5.50%, 6/1/34 | 484,221 | ||
| 513,439 | Pool #783893, 5.50%, 12/1/34 | 567,350 | ||
| 400,414 | Pool #783929, 5.50%, 10/1/34 | 441,894 | ||
| 119,660 | Pool #788329, 6.50%, 8/1/34 | 135,109 | ||
| 171,171 | Pool #790282, 6.00%, 7/1/34 | 191,932 | ||
| 374,481 | Pool #797623, 5.00%, 7/1/35 | 409,603 | ||
| 165,065 | Pool #797626, 5.50%, 7/1/35 | 181,726 | ||
| 142,643 | Pool #797627, 5.00%, 7/1/35 | 156,511 | ||
| 134,459 | Pool #797674, 5.50%, 9/1/35 | 148,178 | ||
| 683,992 | Pool #798725, 5.50%, 11/1/34 | 754,529 | ||
| 363,175 | Pool #799547, 5.50%, 9/1/34 | 402,273 | ||
| 123,546 | Pool #799548, 6.00%, 9/1/34 | 138,531 | ||
| 2,398,852 | Pool #806754, 4.50%, 9/1/34 | 2,596,289 | ||
| 549,780 | Pool #806757, 6.00%, 9/1/34 | 615,432 | ||
| 2,457,677 | Pool #806761, 5.50%, 9/1/34 | 2,716,501 | ||
| 85,266 | Pool #808185, 5.50%, 3/1/35 | 94,059 | ||
| 371,420 | Pool #808205, 5.00%, 1/1/35 | 406,778 | ||
| 87,105 | Pool #813942, 5.00%, 11/1/20 | 94,938 | ||
| 865,584 | Pool #815009, 5.00%, 4/1/35 | 946,767 | ||
| 842,777 | Pool #817641, 5.00%, 11/1/35 | 924,585 | ||
| 204,025 | Pool #820334, 5.00%, 9/1/35 | 223,703 | ||
| 615,228 | Pool #820335, 5.00%, 9/1/35 | 672,257 | ||
| 642,092 | Pool #820336, 5.00%, 9/1/35 | 704,421 | ||
| 578,982 | Pool #822008, 5.00%, 5/1/35 | 633,284 | ||
| 1,261,101 | Pool #829005, 5.00%, 8/1/35 | 1,377,999 | ||
| 212,161 | Pool #829006, 5.50%, 9/1/35 | 233,576 | ||
| 124,157 | Pool #829007, 4.50%, 8/1/35 | 134,880 | ||
| 95,088 | Pool #829117, 5.50%, 9/1/35 | 105,057 | ||
| 554,372 | Pool #829274, 5.00%, 8/1/35 | 605,760 | ||
| 683,805 | Pool #829275, 5.00%, 8/1/35 | 747,938 | ||
| 766,688 | Pool #829276, 5.00%, 8/1/35 | 837,757 | ||
| 579,771 | Pool #829277, 5.00%, 8/1/35 | 634,147 |
16
SCHEDULE OF PORTFOLIO INVESTMENTS
|
Access Capital Community Investment Fund (cont.)
September 30, 2012
Principal Amount | Value | |||||
| $ 111,537 | Pool #829356, 5.00%, 9/1/35 | $ | 123,339 | |||
| 1,096,836 | Pool #829649, 5.50%, 3/1/35 | 1,209,947 | ||||
| 240,223 | Pool #835287, 5.00%, 8/1/35 | 262,490 | ||||
| 89,540 | Pool #843586, 5.50%, 11/1/35 | 98,928 | ||||
| 1,420,045 | Pool #844361, 5.50%, 11/1/35 | 1,561,828 | ||||
| 618,865 | Pool #845245, 5.50%, 11/1/35 | 680,655 | ||||
| 407,729 | Pool #866969, 6.00%, 2/1/36 | 453,615 | ||||
| 181,363 | Pool #867569, 6.00%, 2/1/36 | 201,433 | ||||
| 345,776 | Pool #867574, 5.50%, 2/1/36 | 380,138 | ||||
| 341,016 | Pool #868788, 6.00%, 3/1/36 | 378,754 | ||||
| 125,537 | Pool #868849, 6.00%, 4/1/36 | 139,782 | ||||
| 224,256 | Pool #870599, 6.00%, 6/1/36 | 249,424 | ||||
| 172,842 | Pool #870684, 6.00%, 7/1/36 | 191,646 | ||||
| 539,759 | Pool #871072, 5.50%, 2/1/37 | 592,386 | ||||
| 740,545 | Pool #873819, 6.39%, 8/1/24 | 895,292 | ||||
| 3,150,182 | Pool #874900, 5.45%, 10/1/17 | 3,707,410 | ||||
| 100,829 | Pool #881425, 6.00%, 7/1/36 | 112,554 | ||||
| 268,558 | Pool #882044, 6.00%, 5/1/36 | 298,277 | ||||
| 337,077 | Pool #883589, 6.00%, 4/1/36 | 374,380 | ||||
| 285,448 | Pool #884693, 5.50%, 4/1/36 | 314,483 | ||||
| 2,141,909 | Pool #885724, 5.50%, 6/1/36 | 2,353,422 | ||||
| 514,464 | Pool #899800, 6.00%, 8/1/37 | 568,825 | ||||
| 160,922 | Pool #901412, 6.00%, 8/1/36 | 178,756 | ||||
| 74,063 | Pool #905438, 6.00%, 11/1/36 | 82,676 | ||||
| 486,905 | Pool #907646, 6.00%, 1/1/37 | 538,962 | ||||
| 292,207 | Pool #908671, 6.00%, 1/1/37 | 324,818 | ||||
| 565,471 | Pool #908672, 5.50%, 1/1/37 | 620,604 | ||||
| 740,811 | Pool #911730, 5.50%, 12/1/21 | 806,037 | ||||
| 308,815 | Pool #919368, 5.50%, 4/1/37 | 339,407 | ||||
| 798,240 | Pool #922582, 6.00%, 12/1/36 | 885,828 | ||||
| 1,817,179 | Pool #934941, 5.00%, 8/1/39 | 1,988,179 | ||||
| 957,626 | Pool #934942, 5.00%, 9/1/39 | 1,042,952 | ||||
| 729,412 | Pool #941204, 5.50%, 6/1/37 | 799,048 | ||||
| 340,222 | Pool #941206, 5.50%, 5/1/37 | 372,702 | ||||
| 117,722 | Pool #941487, 6.00%, 8/1/37 | 130,896 | ||||
| 550,752 | Pool #943394, 5.50%, 6/1/37 | 604,795 | ||||
| 898,119 | Pool #944502, 6.00%, 6/1/37 | 995,123 | ||||
| 281,848 | Pool #945853, 6.00%, 7/1/37 | 312,290 | ||||
| 708,828 | Pool #948600, 6.00%, 8/1/37 | 783,725 | ||||
| 696,978 | Pool #948672, 5.50%, 8/1/37 | 762,974 | ||||
| 1,057,008 | Pool #952598, 6.00%, 7/1/37 | 1,175,302 | ||||
| 479,535 | Pool #952623, 6.00%, 8/1/37 | 530,204 | ||||
| 1,250,376 | Pool #952632, 6.00%, 7/1/37 | 1,382,496 | ||||
| 93,161 | Pool #952649, 6.00%, 7/1/37 | 103,995 | ||||
| 825,783 | Pool #952659, 6.00%, 8/1/37 | 913,038 | ||||
| 143,830 | Pool #952665, 6.00%, 8/1/37 | 159,365 | ||||
| 520,810 | Pool #952678, 6.50%, 8/1/37 | 586,257 | ||||
| 285,319 | Pool #952693, 6.50%, 8/1/37 | 320,728 | ||||
17
SCHEDULE OF PORTFOLIO INVESTMENTS
|
Access Capital Community Investment Fund (cont.)
September 30, 2012
Principal Amount | Value | |||||
| $ 84,583 | Pool #956050, 6.00%, 12/1/37 | $ 94,472 | ||||
| 2,552,511 | Pool #957324, 5.43%, 5/1/18 | 3,033,588 | ||||
| 383,044 | Pool #958502, 5.07%, 5/1/19 | 453,890 | ||||
| 287,187 | Pool #959093, 5.50%, 11/1/37 | 315,996 | ||||
| 397,401 | Pool #960919, 5.00%, 2/1/38 | 434,301 | ||||
| 294,688 | Pool #965239, 5.84%, 9/1/38 | 328,663 | ||||
| 132,712 | Pool #975137, 5.00%, 5/1/38 | 146,113 | ||||
| 583,990 | Pool #975769, 5.50%, 3/1/38 | 639,286 | ||||
| 557,732 | Pool #982656, 5.50%, 6/1/38 | 612,633 | ||||
| 90,963 | Pool #982898, 5.00%, 5/1/38 | 100,489 | ||||
| 161,698 | Pool #983033, 5.00%, 5/1/38 | 177,521 | ||||
| 273,081 | Pool #984842, 5.50%, 6/1/38 | 299,237 | ||||
| 273,448 | Pool #986230, 5.00%, 7/1/38 | 302,085 | ||||
| 533,352 | Pool #986239, 6.00%, 7/1/38 | 590,291 | ||||
| 681,409 | Pool #986957, 5.50%, 7/1/38 | 745,930 | ||||
| 236,116 | Pool #986958, 5.50%, 7/1/38 | 259,580 | ||||
| 144,643 | Pool #986985, 5.00%, 7/1/23 | 157,763 | ||||
| 317,076 | Pool #990510, 5.50%, 8/1/38 | 348,784 | ||||
| 631,456 | Pool #990511, 6.00%, 8/1/38 | 696,402 | ||||
| 188,685 | Pool #990617, 5.50%, 9/1/38 | 206,669 | ||||
| 132,601 | Pool #AA0525, 5.50%, 12/1/38 | 145,861 | ||||
| 634,030 | Pool #AA0526, 5.00%, 12/1/38 | 697,062 | ||||
| 1,235,785 | Pool #AA0527, 5.50%, 12/1/38 | 1,362,067 | ||||
| 845,858 | Pool #AA0643, 4.00%, 3/1/39 | 910,057 | ||||
| 799,331 | Pool #AA0644, 4.50%, 3/1/39 | 863,620 | ||||
| 1,039,596 | Pool #AA0645, 4.50%, 3/1/39 | 1,138,480 | ||||
| 224,065 | Pool #AA0814, 5.50%, 12/1/38 | 246,891 | ||||
| 545,297 | Pool #AA2243, 4.50%, 5/1/39 | 595,290 | ||||
| 1,686,013 | Pool #AA3142, 4.50%, 3/1/39 | 1,834,263 | ||||
| 699,978 | Pool #AA3143, 4.00%, 3/1/39 | 753,105 | ||||
| 942,111 | Pool #AA3206, 4.00%, 4/1/39 | 1,013,616 | ||||
| 1,124,925 | Pool #AA3207, 4.50%, 3/1/39 | 1,215,403 | ||||
| 578,003 | Pool #AA4468, 4.00%, 4/1/39 | 627,111 | ||||
| 1,012,910 | Pool #AA7042, 4.50%, 6/1/39 | 1,098,176 | ||||
| 722,547 | Pool #AA7658, 4.00%, 6/1/39 | 788,225 | ||||
| 1,125,681 | Pool #AA7659, 4.50%, 6/1/39 | 1,235,918 | ||||
| 580,554 | Pool #AA7741, 4.50%, 6/1/24 | 633,280 | ||||
| 625,109 | Pool #AA8455, 4.50%, 6/1/39 | 686,326 | ||||
| 1,611,793 | Pool #AC1463, 5.00%, 8/1/39 | 1,778,576 | ||||
| 724,440 | Pool #AC1464, 5.00%, 8/1/39 | 791,706 | ||||
| 1,887,545 | Pool #AC2109, 4.50%, 7/1/39 | 2,039,360 | ||||
| 426,324 | Pool #AC4394, 5.00%, 9/1/39 | 464,310 | ||||
| 1,145,913 | Pool #AC4395, 5.00%, 9/1/39 | 1,274,515 | ||||
| 1,001,081 | Pool #AC5328, 5.00%, 10/1/39 | 1,112,803 | ||||
| 823,694 | Pool #AC5329, 5.00%, 10/1/39 | 901,205 | ||||
| 1,081,004 | Pool #AC6304, 5.00%, 11/1/39 | 1,182,728 | ||||
| 505,234 | Pool #AC6305, 5.00%, 11/1/39 | 561,618 | ||||
| 1,309,834 | Pool #AC6307, 5.00%, 12/1/39 | 1,433,091 | ||||
18
SCHEDULE OF PORTFOLIO INVESTMENTS
|
Access Capital Community Investment Fund (cont.)
September 30, 2012
Principal Amount | Value | |||||
| $1,135,475 | Pool #AC6790, 5.00%, 12/1/39 | $1,262,195 | ||||
| 4,326,309 | Pool #AC7199, 5.00%, 12/1/39 | 4,733,421 | ||||
| 2,046,944 | Pool #AD1470, 5.00%, 2/1/40 | 2,237,007 | ||||
| 2,800,694 | Pool #AD1471, 4.50%, 2/1/40 | 3,036,456 | ||||
| 1,720,022 | Pool #AD1560, 5.00%, 3/1/40 | 1,881,879 | ||||
| 3,427,403 | Pool #AD1585, 4.50%, 2/1/40 | 3,715,921 | ||||
| 1,249,038 | Pool #AD1586, 5.00%, 1/1/40 | 1,365,013 | ||||
| 718,461 | Pool #AD1638, 4.50%, 2/1/40 | 776,246 | ||||
| 1,148,437 | Pool #AD1640, 4.50%, 3/1/40 | 1,246,548 | ||||
| 2,547,174 | Pool #AD1942, 4.50%, 1/1/40 | 2,761,594 | ||||
| 1,131,272 | Pool #AD1943, 5.00%, 1/1/40 | 1,236,313 | ||||
| 4,148,476 | Pool #AD1988, 4.50%, 2/1/40 | 4,497,693 | ||||
| 823,301 | Pool #AD2896, 5.00%, 3/1/40 | 920,071 | ||||
| 2,117,690 | Pool #AD4456, 4.50%, 4/1/40 | 2,298,604 | ||||
| 603,526 | Pool #AD4457, 4.50%, 4/1/40 | 654,331 | ||||
| 2,184,373 | Pool #AD4458, 4.50%, 4/1/40 | 2,360,062 | ||||
| 1,142,805 | Pool #AD4940, 4.50%, 6/1/40 | 1,262,219 | ||||
| 1,044,869 | Pool #AD4946, 4.50%, 6/1/40 | 1,128,908 | ||||
| 892,488 | Pool #AD5728, 5.00%, 4/1/40 | 997,390 | ||||
| 1,214,499 | Pool #AD7239, 4.50%, 7/1/40 | 1,341,405 | ||||
| 1,189,054 | Pool #AD7242, 4.50%, 7/1/40 | 1,290,634 | ||||
| 786,889 | Pool #AD7256, 4.50%, 7/1/40 | 872,555 | ||||
| 2,352,826 | Pool #AD7271, 4.50%, 7/1/40 | 2,553,827 | ||||
| 1,236,618 | Pool #AD7272, 4.50%, 7/1/40 | 1,365,835 | ||||
| 1,313,725 | Pool #AD8960, 5.00%, 6/1/40 | 1,459,107 | ||||
| 1,830,861 | Pool #AD9613, 4.50%, 8/1/40 | 1,981,549 | ||||
| 2,055,762 | Pool #AD9614, 4.50%, 8/1/40 | 2,221,106 | ||||
| 864,166 | Pool #AE2011, 4.00%, 9/1/40 | 932,996 | ||||
| 2,770,976 | Pool #AE2012, 4.00%, 9/1/40 | 2,981,289 | ||||
| 1,406,559 | Pool #AE2023, 4.00%, 9/1/40 | 1,513,314 | ||||
| 1,886,007 | Pool #AE5432, 4.00%, 10/1/40 | 2,029,152 | ||||
| 1,005,636 | Pool #AE5435, 4.50%, 9/1/40 | 1,088,405 | ||||
| 1,045,776 | Pool #AE5806, 4.50%, 9/1/40 | 1,156,685 | ||||
| 1,578,515 | Pool #AE5861, 4.00%, 10/1/40 | 1,698,322 | ||||
| 1,914,524 | Pool #AE5862, 4.00%, 10/1/40 | 2,067,012 | ||||
| 1,562,285 | Pool #AE5863, 4.00%, 10/1/40 | 1,686,719 | ||||
| 1,087,638 | Pool #AE6850, 4.00%, 10/1/40 | 1,170,188 | ||||
| 1,157,200 | Pool #AE6851, 4.00%, 10/1/40 | 1,245,029 | ||||
| 1,343,943 | Pool #AE7699, 4.00%, 11/1/40 | 1,445,946 | ||||
| 1,000,959 | Pool #AE7703, 4.00%, 10/1/40 | 1,076,930 | ||||
| 1,878,290 | Pool #AE7707, 4.00%, 11/1/40 | 2,020,849 | ||||
| 929,143 | Pool #AH0300, 4.00%, 11/1/40 | 999,663 | ||||
| 1,340,628 | Pool #AH0301, 3.50%, 11/1/40 | 1,437,510 | ||||
| 618,160 | Pool #AH0302, 4.00%, 11/1/40 | 665,078 | ||||
| 1,208,338 | Pool #AH0306, 4.00%, 12/1/40 | 1,324,971 | ||||
| 1,862,991 | Pool #AH0508, 4.00%, 11/1/40 | 2,004,389 | ||||
| 1,901,356 | Pool #AH0537, 4.00%, 12/1/40 | 2,074,187 | ||||
| 1,261,289 | Pool #AH0914, 4.50%, 11/1/40 | 1,365,099 | ||||
19
SCHEDULE OF PORTFOLIO INVESTMENTS
|
Access Capital Community Investment Fund (cont.)
September 30, 2012
Principal Amount | Value | |||||
| $ 1,482,812 | Pool #AH0917, 4.00%, 12/1/40 | $ 1,595,355 | ||||
| 1,271,829 | Pool #AH1077, 4.00%, 1/1/41 | 1,407,309 | ||||
| 1,774,249 | Pool #AH2973, 4.00%, 12/1/40 | 1,908,912 | ||||
| 2,364,847 | Pool #AH2980, 4.00%, 1/1/41 | 2,544,335 | ||||
| 1,633,649 | Pool #AH5656, 4.00%, 1/1/41 | 1,782,145 | ||||
| 1,040,634 | Pool #AH5657, 4.00%, 2/1/41 | 1,119,617 | ||||
| 2,261,990 | Pool #AH5658, 4.00%, 2/1/41 | 2,433,671 | ||||
| 1,079,174 | Pool #AH5662, 4.00%, 2/1/41 | 1,161,082 | ||||
| 1,885,970 | Pool #AH5882, 4.00%, 2/1/26 | 2,014,304 | ||||
| 1,438,220 | Pool #AH6764, 4.00%, 3/1/41 | 1,547,379 | ||||
| 3,330,631 | Pool #AH6768, 4.00%, 3/1/41 | 3,583,421 | ||||
| 1,277,576 | Pool #AH7277, 4.00%, 3/1/41 | 1,379,333 | ||||
| 2,281,110 | Pool #AH7281, 4.00%, 3/1/41 | 2,462,796 | ||||
| 1,104,055 | Pool #AH7526, 4.50%, 3/1/41 | 1,212,864 | ||||
| 2,714,262 | Pool #AH7537, 4.00%, 3/1/41 | 2,930,448 | ||||
| 1,028,890 | Pool #AH7576, 4.00%, 3/1/41 | 1,106,982 | ||||
| 1,938,652 | Pool #AH8878, 4.50%, 4/1/41 | 2,101,241 | ||||
| 1,249,495 | Pool #AH8885, 4.50%, 4/1/41 | 1,354,287 | ||||
| 1,413,192 | Pool #AH9050, 3.50%, 2/1/26 | 1,502,841 | ||||
| 1,272,552 | Pool #AI0114, 4.00%, 3/1/41 | 1,373,909 | ||||
| 2,357,244 | Pool #AI1846, 4.50%, 5/1/41 | 2,554,939 | ||||
| 1,251,135 | Pool #AI1847, 4.50%, 5/1/41 | 1,356,064 | ||||
| 2,224,168 | Pool #AI1848, 4.50%, 5/1/41 | 2,410,703 | ||||
| 1,645,310 | Pool #AI1849, 4.50%, 5/1/41 | 1,809,005 | ||||
| 999,317 | Pool #AJ0651, 4.00%, 8/1/41 | 1,075,164 | ||||
| 1,244,073 | Pool #AJ7667, 3.50%, 12/1/41 | 1,333,976 | ||||
| 1,315,517 | Pool #AJ7668, 4.00%, 11/1/41 | 1,415,363 | ||||
| 1,651,437 | Pool #AJ9133, 4.00%, 1/1/42 | 1,776,779 | ||||
| 16,395,663 | Pool #AK2386, 3.50%, 2/1/42 | 17,580,505 | ||||
| 7,223,597 | Pool #AK6715, 3.50%, 3/1/42 | 7,745,614 | ||||
| 2,392,562 | Pool #AK6716, 3.50%, 3/1/42 | 2,565,462 | ||||
| 1,593,764 | Pool #AK6717, 3.50%, 3/1/42 | 1,708,939 | ||||
| 1,093,425 | Pool #AK6718, 3.50%, 2/1/42 | 1,172,441 | ||||
| 1,268,085 | Pool #AO0844, 3.50%, 4/1/42 | 1,359,724 | ||||
| 1,408,196 | Pool #AO2923, 3.50%, 5/1/42 | 1,509,960 | ||||
| 3,841,211 | Pool #AO8029, 3.50%, 7/1/42 | 4,119,399 | ||||
| 1,029,436 | Pool #AP7483, 3.50%, 9/1/42 | 1,103,990 | ||||
| 471,419 | Pool #MC0007, 5.50%, 12/1/38 | 519,592 | ||||
| 61,268 | Pool #MC0013, 5.50%, 12/1/38 | 68,544 | ||||
| 100,586 | Pool #MC0014, 5.50%, 12/1/38 | 111,651 | ||||
| 82,051 | Pool #MC0016, 5.50%, 11/1/38 | 91,076 | ||||
| 396,069 | Pool #MC0038, 4.50%, 3/1/39 | 434,113 | ||||
| 136,064 | Pool #MC0046, 4.00%, 4/1/39 | 147,624 | ||||
| 289,594 | Pool #MC0047, 4.50%, 4/1/39 | 312,886 | ||||
| 56,805 | Pool #MC0059, 4.00%, 4/1/39 | 62,341 | ||||
| 391,924 | Pool #MC0081, 4.00%, 5/1/39 | 427,059 | ||||
| 383,180 | Pool #MC0082, 4.50%, 5/1/39 | 420,705 | ||||
| 500,135 | Pool #MC0111, 4.00%, 6/1/39 | 545,284 | ||||
20
SCHEDULE OF PORTFOLIO INVESTMENTS
|
Access Capital Community Investment Fund (cont.)
September 30, 2012
Principal Amount | Value | |||||
| $ 191,251 | Pool #MC0112, 4.50%, 6/1/39 | $ 210,578 | ||||
| 365,981 | Pool #MC0127, 4.50%, 7/1/39 | 399,534 | ||||
| 75,828 | Pool #MC0135, 4.50%, 6/1/39 | 83,751 | ||||
| 1,053,028 | Pool #MC0137, 4.50%, 7/1/39 | 1,141,672 | ||||
| 1,665,447 | Pool #MC0154, 4.50%, 8/1/39 | 1,805,644 | ||||
| 103,414 | Pool #MC0155, 5.00%, 8/1/39 | 115,279 | ||||
| 638,317 | Pool #MC0160, 4.50%, 8/1/39 | 689,657 | ||||
| 1,089,239 | Pool #MC0171, 4.50%, 9/1/39 | 1,180,930 | ||||
| 487,851 | Pool #MC0177, 4.50%, 9/1/39 | 535,626 | ||||
| 423,827 | Pool #MC0270, 4.50%, 3/1/40 | 459,505 | ||||
| 876,289 | Pool #MC0325, 4.50%, 7/1/40 | 960,461 | ||||
| 278,937 | Pool #MC0422, 4.00%, 2/1/41 | 304,292 | ||||
| 104,827 | Pool #MC0426, 4.50%, 1/1/41 | 113,619 | ||||
| 985,255 | Pool #MC0584, 4.00%, 1/1/42 | 1,060,034 | ||||
| 1,237,053 | Pool #MC0585, 4.00%, 1/1/42 | 1,330,943 | ||||
| 73,768 | Pool #MC3344, 5.00%, 12/1/38 | 82,231 | ||||
| 9,432,755 | Series 2004-T7, Class A, 5.12%, 7/25/41 | 11,100,731 | ||||
|
| |||||
| 431,751,890 | ||||||
|
| |||||
Federal Agricultural Mortgage Corp. — 0.14% | ||||||
| 802,055 | Series #S0282, 5.63%, 6/10/36(b) | 847,363 | ||||
|
| |||||
Freddie Mac — 12.88% | ||||||
| 99,673 | Pool #A10124, 5.00%, 6/1/33 | 109,465 | ||||
| 254,552 | Pool #A10548, 5.00%, 6/1/33 | 279,242 | ||||
| 1,049,097 | Pool #A12237, 5.00%, 8/1/33 | 1,146,917 | ||||
| 420,168 | Pool #A12969, 4.50%, 8/1/33 | 452,567 | ||||
| 203,643 | Pool #A12985, 5.00%, 8/1/33 | 223,395 | ||||
| 278,553 | Pool #A12986, 5.00%, 8/1/33 | 305,918 | ||||
| 203,726 | Pool #A14028, 4.50%, 9/1/33 | 219,435 | ||||
| 666,440 | Pool #A14325, 5.00%, 9/1/33 | 728,580 | ||||
| 167,182 | Pool #A15268, 6.00%, 10/1/33 | 186,779 | ||||
| 763,631 | Pool #A15579, 5.50%, 11/1/33 | 841,247 | ||||
| 458,517 | Pool #A17393, 5.50%, 12/1/33 | 505,264 | ||||
| 458,503 | Pool #A17397, 5.50%, 1/1/34 | 505,320 | ||||
| 470,779 | Pool #A18617, 5.50%, 1/1/34 | 518,850 | ||||
| 328,798 | Pool #A19019, 5.50%, 2/1/34 | 363,399 | ||||
| 150,140 | Pool #A19362, 5.50%, 2/1/34 | 165,470 | ||||
| 250,327 | Pool #A20069, 5.00%, 3/1/34 | 274,802 | ||||
| 898,343 | Pool #A20070, 5.50%, 3/1/34 | 989,089 | ||||
| 761,259 | Pool #A20540, 5.50%, 4/1/34 | 838,158 | ||||
| 227,095 | Pool #A20541, 5.50%, 4/1/34 | 250,106 | ||||
| 144,005 | Pool #A21679, 5.50%, 4/1/34 | 158,552 | ||||
| 303,262 | Pool #A21681, 5.00%, 4/1/34 | 331,302 | ||||
| 489,006 | Pool #A23192, 5.00%, 5/1/34 | 533,838 | ||||
| 1,453,277 | Pool #A25310, 5.00%, 6/1/34 | 1,586,512 | ||||
| 402,387 | Pool #A25311, 5.00%, 6/1/34 | 440,661 | ||||
| 555,324 | Pool #A25600, 5.50%, 8/1/34 | 611,074 | ||||
21
SCHEDULE OF PORTFOLIO INVESTMENTS
|
Access Capital Community Investment Fund (cont.)
September 30, 2012
Principal Amount | Value | |||||
| $ 84,667 | Pool #A26270, 6.00%, 8/1/34 | $ 94,512 | ||||
| 50,016 | Pool #A26386, 6.00%, 9/1/34 | 55,895 | ||||
| 328,081 | Pool #A26395, 6.00%, 9/1/34 | 366,234 | ||||
| 312,793 | Pool #A26396, 5.50%, 9/1/34 | 344,586 | ||||
| 1,206,862 | Pool #A28241, 5.50%, 10/1/34 | 1,325,380 | ||||
| 376,469 | Pool #A30055, 5.00%, 11/1/34 | 411,748 | ||||
| 484,791 | Pool #A30591, 6.00%, 12/1/34 | 539,955 | ||||
| 503,504 | Pool #A31135, 5.50%, 12/1/34 | 553,106 | ||||
| 280,173 | Pool #A32976, 5.50%, 8/1/35 | 307,249 | ||||
| 752,982 | Pool #A33167, 5.00%, 1/1/35 | 823,544 | ||||
| 1,062,568 | Pool #A34999, 5.50%, 4/1/35 | 1,164,592 | ||||
| 582,819 | Pool #A35628, 5.50%, 6/1/35 | 638,779 | ||||
| 952,799 | Pool #A37185, 5.00%, 9/1/35 | 1,035,833 | ||||
| 807,310 | Pool #A38830, 5.00%, 5/1/35 | 881,829 | ||||
| 122,024 | Pool #A39561, 5.50%, 11/1/35 | 133,797 | ||||
| 577,266 | Pool #A40538, 5.00%, 12/1/35 | 627,574 | ||||
| 332,912 | Pool #A42095, 5.50%, 1/1/36 | 364,668 | ||||
| 807,666 | Pool #A42097, 5.00%, 1/1/36 | 881,587 | ||||
| 281,437 | Pool #A42098, 5.50%, 1/1/36 | 308,108 | ||||
| 114,294 | Pool #A42099, 6.00%, 1/1/36 | 126,835 | ||||
| 361,888 | Pool #A42802, 5.00%, 2/1/36 | 393,031 | ||||
| 853,422 | Pool #A42803, 5.50%, 2/1/36 | 934,297 | ||||
| 274,471 | Pool #A42804, 6.00%, 2/1/36 | 303,987 | ||||
| 564,144 | Pool #A42805, 6.00%, 2/1/36 | 623,577 | ||||
| 95,007 | Pool #A44637, 5.50%, 4/1/36 | 104,426 | ||||
| 253,156 | Pool #A44638, 6.00%, 4/1/36 | 281,725 | ||||
| 418,251 | Pool #A44639, 5.50%, 3/1/36 | 457,364 | ||||
| 719,813 | Pool #A45396, 5.00%, 6/1/35 | 783,331 | ||||
| 489,780 | Pool #A46321, 5.50%, 7/1/35 | 537,113 | ||||
| 548,253 | Pool #A46735, 5.00%, 8/1/35 | 596,633 | ||||
| 630,770 | Pool #A46746, 5.50%, 8/1/35 | 690,545 | ||||
| 144,677 | Pool #A46747, 5.50%, 8/1/35 | 158,478 | ||||
| 207,318 | Pool #A46748, 5.50%, 8/1/35 | 227,320 | ||||
| 104,210 | Pool #A46996, 5.50%, 9/1/35 | 114,395 | ||||
| 614,417 | Pool #A46997, 5.50%, 9/1/35 | 673,026 | ||||
| 781,298 | Pool #A47552, 5.00%, 11/1/35 | 849,386 | ||||
| 477,551 | Pool #A47553, 5.00%, 11/1/35 | 521,706 | ||||
| 437,817 | Pool #A47554, 5.50%, 11/1/35 | 479,581 | ||||
| 472,678 | Pool #A48788, 5.50%, 5/1/36 | 516,881 | ||||
| 610,435 | Pool #A48789, 6.00%, 5/1/36 | 674,746 | ||||
| 93,784 | Pool #A49013, 6.00%, 5/1/36 | 103,884 | ||||
| 338,291 | Pool #A49526, 6.00%, 5/1/36 | 373,930 | ||||
| 312,496 | Pool #A49843, 6.00%, 6/1/36 | 347,567 | ||||
| 565,616 | Pool #A49844, 6.00%, 6/1/36 | 623,967 | ||||
| 35,266 | Pool #A49845, 6.50%, 6/1/36 | 39,697 | ||||
| 411,260 | Pool #A50128, 6.00%, 6/1/36 | 454,843 | ||||
| 546,456 | Pool #A59530, 5.50%, 4/1/37 | 595,936 | ||||
| 315,796 | Pool #A59964, 5.50%, 4/1/37 | 345,772 | ||||
22
SCHEDULE OF PORTFOLIO INVESTMENTS
|
Access Capital Community Investment Fund (cont.)
September 30, 2012
Principal Amount | Value | |||||
| $ 201,725 | Pool #A61754, 5.50%, 5/1/37 | $ 220,180 | ||||
| 241,032 | Pool #A61779, 5.50%, 5/1/37 | 263,082 | ||||
| 407,261 | Pool #A61915, 5.50%, 6/1/37 | 444,137 | ||||
| 1,574,943 | Pool #A61916, 6.00%, 6/1/37 | 1,732,006 | ||||
| 784,510 | Pool #A63456, 5.50%, 6/1/37 | 859,835 | ||||
| 754,920 | Pool #A64012, 5.50%, 7/1/37 | 823,276 | ||||
| 386,724 | Pool #A64015, 6.00%, 7/1/37 | 425,291 | ||||
| 353,064 | Pool #A64016, 6.50%, 7/1/37 | 396,204 | ||||
| 200,422 | Pool #A64447, 6.00%, 8/1/37 | 220,911 | ||||
| 576,495 | Pool #A64450, 6.00%, 8/1/37 | 633,987 | ||||
| 94,492 | Pool #A65713, 6.00%, 9/1/37 | 105,008 | ||||
| 409,210 | Pool #A65837, 6.00%, 9/1/37 | 449,507 | ||||
| 349,849 | Pool #A66043, 5.50%, 7/1/37 | 381,527 | ||||
| 1,476,402 | Pool #A66061, 5.50%, 8/1/37 | 1,610,086 | ||||
| 1,052,470 | Pool #A66116, 6.00%, 9/1/37 | 1,157,429 | ||||
| 634,152 | Pool #A66122, 6.00%, 8/1/37 | 699,177 | ||||
| 333,172 | Pool #A66133, 6.00%, 6/1/37 | 366,815 | ||||
| 1,161,366 | Pool #A66156, 6.50%, 9/1/37 | 1,301,456 | ||||
| 239,360 | Pool #A67630, 6.00%, 11/1/37 | 263,829 | ||||
| 602,651 | Pool #A68766, 6.00%, 10/1/37 | 663,505 | ||||
| 259,429 | Pool #A70292, 5.50%, 7/1/37 | 283,365 | ||||
| 121,055 | Pool #A73816, 6.00%, 3/1/38 | 134,017 | ||||
| 777,330 | Pool #A75113, 5.00%, 3/1/38 | 844,465 | ||||
| 465,233 | Pool #A76187, 5.00%, 4/1/38 | 503,670 | ||||
| 571,111 | Pool #A78354, 5.50%, 11/1/37 | 623,805 | ||||
| 291,246 | Pool #A79561, 5.50%, 7/1/38 | 317,026 | ||||
| 873,332 | Pool #A91887, 5.00%, 4/1/40 | 962,951 | ||||
| 1,001,111 | Pool #A92388, 4.50%, 5/1/40 | 1,094,261 | ||||
| 1,011,655 | Pool #A93962, 4.50%, 9/1/40 | 1,114,954 | ||||
| 1,088,737 | Pool #A95573, 4.00%, 12/1/40 | 1,186,340 | ||||
| 984,592 | Pool #A96339, 4.00%, 12/1/40 | 1,072,859 | ||||
| 1,278,084 | Pool #A97099, 4.00%, 1/1/41 | 1,401,050 | ||||
| 1,018,916 | Pool #A97715, 4.00%, 3/1/41 | 1,093,703 | ||||
| 725,202 | Pool #A97716, 4.50%, 3/1/41 | 794,040 | ||||
| 85,465 | Pool #B31082, 6.00%, 3/1/31 | 96,977 | ||||
| 108,772 | Pool #B31128, 6.00%, 9/1/31 | 123,564 | ||||
| 182,606 | Pool #B31140, 6.50%, 10/1/31 | 208,729 | ||||
| 74,078 | Pool #B31150, 6.50%, 11/1/31 | 84,824 | ||||
| 147,754 | Pool #B31188, 6.00%, 1/1/32 | 167,384 | ||||
| 27,322 | Pool #B31206, 6.00%, 3/1/32 | 31,029 | ||||
| 25,714 | Pool #B31292, 6.00%, 9/1/32 | 29,227 | ||||
| 78,782 | Pool #B31493, 5.00%, 2/1/34 | 87,622 | ||||
| 244,964 | Pool #B31516, 5.00%, 4/1/34 | 272,437 | ||||
| 65,514 | Pool #B31532, 5.00%, 5/1/34 | 72,867 | ||||
| 97,229 | Pool #B31546, 5.50%, 5/1/34 | 108,682 | ||||
| 292,477 | Pool #B31547, 5.50%, 5/1/34 | 326,937 | ||||
| 224,995 | Pool #B31550, 5.00%, 6/1/34 | 250,237 | ||||
| 190,197 | Pool #B31551, 5.50%, 6/1/34 | 212,595 | ||||
23
SCHEDULE OF PORTFOLIO INVESTMENTS
|
Access Capital Community Investment Fund (cont.)
September 30, 2012
Principal Amount | Value | |||||
| $ 122,801 | Pool #B31587, 5.00%, 11/1/34 | $ 136,586 | ||||
| 131,897 | Pool #B31588, 5.50%, 11/1/34 | 147,454 | ||||
| 138,224 | Pool #B31642, 5.50%, 5/1/35 | 154,546 | ||||
| 109,004 | Pool #B50443, 5.00%, 11/1/18 | 118,770 | ||||
| 153,644 | Pool #B50450, 4.50%, 1/1/19 | 166,358 | ||||
| 78,345 | Pool #B50451, 5.00%, 1/1/19 | 85,063 | ||||
| 12,757 | Pool #B50470, 4.50%, 4/1/19 | 13,820 | ||||
| 147,415 | Pool #B50496, 5.50%, 9/1/19 | 162,795 | ||||
| 210,241 | Pool #B50499, 5.00%, 11/1/19 | 229,113 | ||||
| 47,754 | Pool #B50500, 5.50%, 10/1/19 | 52,822 | ||||
| 106,106 | Pool #B50501, 4.50%, 11/1/19 | 114,776 | ||||
| 153,848 | Pool #B50504, 5.50%, 11/1/19 | 169,891 | ||||
| 302,745 | Pool #B50506, 5.00%, 11/1/19 | 333,359 | ||||
| 85,410 | Pool #C35457, 7.50%, 1/1/30 | 99,031 | ||||
| 49,028 | Pool #C37233, 7.50%, 2/1/30 | 57,312 | ||||
| 85,106 | Pool #C48137, 7.00%, 1/1/31 | 97,367 | ||||
| 35,903 | Pool #C48138, 7.00%, 2/1/31 | 40,999 | ||||
| 312,056 | Pool #C51686, 6.50%, 5/1/31 | 355,200 | ||||
| 184,035 | Pool #C53210, 6.50%, 6/1/31 | 209,545 | ||||
| 62,320 | Pool #C53914, 6.50%, 6/1/31 | 70,890 | ||||
| 98,200 | Pool #C60020, 6.50%, 11/1/31 | 111,665 | ||||
| 63,530 | Pool #C60804, 6.00%, 11/1/31 | 70,845 | ||||
| 64,486 | Pool #C65616, 6.50%, 3/1/32 | 73,582 | ||||
| 59,296 | Pool #C68324, 6.50%, 6/1/32 | 67,712 | ||||
| 472,473 | Pool #C73273, 6.00%, 11/1/32 | 526,005 | ||||
| 285,678 | Pool #C73525, 6.00%, 11/1/32 | 318,677 | ||||
| 202,677 | Pool #C74672, 5.50%, 11/1/32 | 224,164 | ||||
| 562,357 | Pool #C77844, 5.50%, 3/1/33 | 619,691 | ||||
| 159,027 | Pool #C77845, 5.50%, 3/1/33 | 175,861 | ||||
| 402,247 | Pool #C78252, 5.50%, 3/1/33 | 443,571 | ||||
| 105,654 | Pool #C78380, 5.50%, 3/1/33 | 116,508 | ||||
| 143,299 | Pool #C79178, 5.50%, 4/1/33 | 158,469 | ||||
| 294,939 | Pool #J00980, 5.00%, 1/1/21 | 319,813 | ||||
| 155,058 | Pool #J05466, 5.50%, 6/1/22 | 167,487 | ||||
| 651,490 | Pool #N31468, 6.00%, 11/1/37 | 706,281 | ||||
| 1,315,248 | Pool #Q00462, 4.00%, 3/1/41 | 1,416,717 | ||||
| 1,235,143 | Pool #Q00465, 4.50%, 4/1/41 | 1,328,840 | ||||
| 1,050,554 | Pool #Q05867, 3.50%, 12/1/41 | 1,125,981 | ||||
| 1,044,101 | Pool #Q06239, 3.50%, 1/1/42 | 1,119,064 | ||||
| 1,223,376 | Pool #Q06406, 4.00%, 2/1/42 | 1,313,170 | ||||
|
| |||||
| 76,095,562 | ||||||
|
| |||||
Ginnie Mae — 23.63% | ||||||
| 419,502 | Pool #409117, 5.50%, 6/20/38 | 467,041 | ||||
| 550,176 | Pool #487643, 5.00%, 2/15/39 | 606,397 | ||||
| 459,858 | Pool #588448, 6.25%, 9/15/32 | 459,835 | ||||
| 1,137,583 | Pool #616936, 5.50%, 1/15/36 | 1,280,003 | ||||
| 535,854 | Pool #617904, 5.75%, 9/15/23 | 541,002 | ||||
24
SCHEDULE OF PORTFOLIO INVESTMENTS
|
Access Capital Community Investment Fund (cont.)
September 30, 2012
Principal Amount | Value | |||||
| $3,165,698 | Pool #618363, 4.00%, 9/20/41 | $3,486,843 | ||||
| 548,199 | Pool #624106, 5.13%, 3/15/34 | 554,732 | ||||
| 1,356,237 | Pool #654705, 4.00%, 9/20/41 | 1,493,821 | ||||
| 445,671 | Pool #664269, 5.85%, 6/15/38 | 470,665 | ||||
| 1,027,355 | Pool #675509, 5.50%, 6/15/38 | 1,143,775 | ||||
| 839,046 | Pool #685140, 5.90%, 4/15/38 | 882,262 | ||||
| 710,316 | Pool #697672, 5.50%, 12/15/38 | 790,809 | ||||
| 309,747 | Pool #697814, 5.00%, 2/15/39 | 342,561 | ||||
| 735,828 | Pool #697885, 4.50%, 3/15/39 | 807,197 | ||||
| 624,756 | Pool #698112, 4.50%, 5/15/39 | 685,353 | ||||
| 2,377,086 | Pool #698113, 4.50%, 5/15/39 | 2,632,159 | ||||
| 573,009 | Pool #699294, 5.63%, 9/20/38 | 640,478 | ||||
| 3,899,592 | Pool #713519, 6.00%, 7/15/39 | 4,433,805 | ||||
| 960,451 | Pool #714561, 4.50%, 6/15/39 | 1,063,512 | ||||
| 1,112,994 | Pool #716822, 4.50%, 4/15/39 | 1,220,946 | ||||
| 952,642 | Pool #716823, 4.50%, 4/15/39 | 1,054,865 | ||||
| 967,310 | Pool #717132, 4.50%, 5/15/39 | 1,071,107 | ||||
| 1,317,373 | Pool #717133, 4.50%, 5/15/39 | 1,445,148 | ||||
| 1,272,827 | Pool #720080, 4.50%, 6/15/39 | 1,428,698 | ||||
| 1,110,906 | Pool #720521, 5.00%, 8/15/39 | 1,228,593 | ||||
| 2,798,898 | Pool #726550, 5.00%, 9/15/39 | 3,095,406 | ||||
| 1,497,475 | Pool #729018, 4.50%, 2/15/40 | 1,648,334 | ||||
| 738,037 | Pool #729019, 5.00%, 2/15/40 | 816,223 | ||||
| 880,479 | Pool #729346, 4.50%, 7/15/41 | 982,112 | ||||
| 1,442,059 | Pool #737574, 4.00%, 11/15/40 | 1,592,124 | ||||
| 984,284 | Pool #738844, 3.50%, 10/15/41 | 1,079,291 | ||||
| 1,192,071 | Pool #738845, 3.50%, 10/15/41 | 1,307,134 | ||||
| 2,061,598 | Pool #738862, 4.00%, 10/15/41 | 2,274,845 | ||||
| 830,902 | Pool #747241, 5.00%, 9/20/40 | 930,026 | ||||
| 1,341,149 | Pool #748654, 3.50%, 9/15/40 | 1,470,601 | ||||
| 998,192 | Pool #748846, 4.50%, 9/20/40 | 1,126,319 | ||||
| 1,086,897 | Pool #757016, 3.50%, 11/15/40 | 1,191,808 | ||||
| 1,063,805 | Pool #757017, 4.00%, 12/15/40 | 1,174,507 | ||||
| 1,296,155 | Pool #759196, 3.50%, 1/15/41 | 1,421,264 | ||||
| 933,832 | Pool #762877, 4.00%, 4/15/41 | 1,032,760 | ||||
| 990,768 | Pool #763564, 4.50%, 5/15/41 | 1,105,132 | ||||
| 1,534,187 | Pool #770391, 4.50%, 6/15/41 | 1,711,277 | ||||
| 1,517,642 | Pool #770481, 4.00%, 8/15/41 | 1,674,623 | ||||
| 1,057,008 | Pool #770482, 4.50%, 8/15/41 | 1,162,172 | ||||
| 2,419,513 | Pool #770517, 4.00%, 8/15/41 | 2,669,781 | ||||
| 1,143,243 | Pool #770529, 4.00%, 8/15/41 | 1,261,498 | ||||
| 2,044,522 | Pool #770537, 4.00%, 8/15/41 | 2,256,002 | ||||
| 1,030,601 | Pool #770738, 4.50%, 6/20/41 | 1,139,056 | ||||
| 1,904,213 | Pool #779592, 4.00%, 11/20/41 | 2,097,386 | ||||
| 1,473,010 | Pool #779593, 4.00%, 11/20/41 | 1,622,440 | ||||
| 3,596,146 | Pool #791406, 3.50%, 6/15/37 | 3,859,239 | ||||
| 2,476,708 | Pool #AB2733, 3.50%, 8/15/42 | 2,715,768 | ||||
| 1,284,146 | Pool #AB2744, 3.00%, 8/15/42 | 1,376,845 | ||||
25
SCHEDULE OF PORTFOLIO INVESTMENTS
|
Access Capital Community Investment Fund (cont.)
September 30, 2012
Principal Amount | Value | |||||
| $2,804,970 | Pool #AB2745, 3.00%, 8/15/42 | $ 3,007,453 | ||||
| 2,913,400 | Pool #AB2841, 3.00%, 9/15/42 | 3,123,711 | ||||
| 1,029,321 | Pool #AB2842, 3.00%, 9/15/42 | 1,103,625 | ||||
| 1,623,843 | Pool #AB2843, 3.00%, 9/15/42 | 1,741,064 | ||||
| 1,024,393 | Pool #AB2852, 3.50%, 9/15/42 | 1,123,271 | ||||
| 700,000 | Series 2012-100, Class B, 2.31%, 11/1/51 | 686,105 | ||||
| 3,000,000 | Series 2012-107, Class A, 1.15%, 1/16/45 | 3,030,612 | ||||
| 1,600,000 | Series 2012-112, Class B, 2.70%, 1/16/53(b) | 1,617,368 | ||||
| 7,000,000 | Series 2012-114, Class A, 2.10%, 1/16/53(a)(b) | 7,207,485 | ||||
| 2,250,000 | Series 2012-115, Class A, 2.13%, 4/16/45 | 2,341,521 | ||||
| 6,000,000 | Series 2012-33, Class B, 2.89%, 3/16/46 | 6,238,481 | ||||
| 3,000,000 | Series 2012-35, Class C, 3.25%, 11/16/52(a) | 3,132,491 | ||||
| 6,349,480 | Series 2012-44, Class A, 2.17%, 4/16/41 | 6,577,979 | ||||
| 1,600,000 | Series 2012-45, Class C, 3.45%, 4/16/53(a) | 1,695,120 | ||||
| 2,629,440 | Series 2012-53, Class AC, 2.38%, 12/16/43 | 2,736,798 | ||||
| 8,000,000 | Series 2012-58, Class B, 2.20%, 3/16/44 | 8,113,680 | ||||
| 1,490,288 | Series 2012-70, Class A, 1.73%, 5/16/42 | 1,523,938 | ||||
| 3,873,927 | Series 2012-72, Class A, 1.71%, 5/16/42 | 3,959,424 | ||||
| 4,478,671 | Series 2012-78, Class A, 1.68%, 3/16/44 | 4,570,161 | ||||
|
| |||||
| 139,555,867 | ||||||
|
| |||||
Total U.S. Government Agency Backed Mortgages | 648,250,682 | |||||
|
| |||||
(Cost $603,029,580) | ||||||
U.S. Government Agency Obligations — 8.55% | ||||||
Community Reinvestment Revenue Notes — 0.09% | ||||||
| 528,941 | 3.98%, 8/1/35(b)(c) | 529,777 | ||||
|
| |||||
Small Business Administration — 7.75% | ||||||
| 4,158,477 | 0.53%, 3/25/21(a) | 4,128,225 | ||||
| 271,120 | 0.53%, 4/30/35(b) | 271,158 | ||||
| 157,482 | 0.53%, 10/14/20(b) | 157,674 | ||||
| 1,174,657 | 0.55%, 9/25/30(a) | 1,163,834 | ||||
| 236,198 | 0.55%, 4/25/28(a) | 234,134 | ||||
| 192,942 | 0.55%, 3/25/29(a) | 191,219 | ||||
| 393,608 | 0.60%, 11/25/29(a) | 390,821 | ||||
| 248,730 | 0.60%, 3/25/28(a) | 247,033 | ||||
| 1,052,686 | 0.63%, 3/19/32(b) | 1,055,149 | ||||
| 206,041 | 0.63%, 6/25/18(a) | 205,274 | ||||
| 66,066 | 0.65%, 3/25/14(a) | 65,951 | ||||
| 417,469 | 0.66%, 6/8/32(b) | 418,843 | ||||
| 189,214 | 0.66%, 3/8/26(b) | 190,133 | ||||
| 236,015 | 0.70%, 8/6/19(b) | 236,796 | ||||
| 235,607 | 0.70%, 3/30/20(b) | 236,441 | ||||
| 182,824 | 0.70%, 2/17/20(b) | 183,462 | ||||
| 76,359 | 0.70%, 2/13/20(b) | 76,627 | ||||
| 582,727 | 0.75%, 11/29/32(b) | 585,775 | ||||
| 1,252,543 | 0.80%, 3/27/33(b) | 1,259,846 | ||||
26
SCHEDULE OF PORTFOLIO INVESTMENTS
|
Access Capital Community Investment Fund (cont.)
September 30, 2012
Principal Amount | Value | |||||
| $ 238,425 | 0.80%, 2/21/33(b) | $ | 239,874 | |||
| 162,696 | 0.80%, 8/8/32(b) | 163,788 | ||||
| 4,772,664 | 0.88%, 5/25/37(a)(b) | 4,838,689 | ||||
| 1,292,682 | 0.88%, 8/1/32(b) | 1,304,407 | ||||
| 723,654 | 0.88%, 1/26/32(b) | 731,122 | ||||
| 162,797 | 0.88%, 12/1/19(b) | 163,888 | ||||
| 24,035 | 0.88%, 6/4/14(b) | 24,050 | ||||
| 913,102 | 0.90%, 3/14/18(b) | 917,485 | ||||
| 146,960 | 0.91%, 4/16/20(b) | 148,010 | ||||
| 2,368,990 | 1.00%, 5/25/22(a) | 2,380,244 | ||||
| 81,706 | 1.13%, 7/30/17(a)(b) | 82,328 | ||||
| 992,610 | 1.14%, 11/4/34(b) | 1,008,839 | ||||
| 15,896,806 | 1.26%, 7/18/30*(b) | 377,072 | ||||
| 15,217,733 | 1.45%, 3/25/36(a) | 15,645,814 | ||||
| 419,172 | 2.00%, 6/20/14(b) | 420,212 | ||||
| 392,775 | 3.13%, 10/25/15(a) | 403,220 | ||||
| 652,229 | 3.38%, 10/25/15(a) | 663,257 | ||||
| 173,159 | 3.38%, 5/25/16(a) | 176,645 | ||||
| 340,407 | 3.58%, 12/25/15(a) | 346,897 | ||||
| 58,742 | 5.70%, 7/30/17(b) | 59,916 | ||||
| 169,794 | 6.00%, 3/9/22(b) | 175,864 | ||||
| 518,594 | 6.03%, 10/31/32(b) | 550,296 | ||||
| 1,299,461 | 6.13%, 3/31/31(b) | 1,377,870 | ||||
| 160,168 | 6.25%, 8/30/27(b) | 169,204 | ||||
| 537,400 | 6.35%, 8/13/26(b) | 566,619 | ||||
| 953,718 | 6.45%, 2/19/32(b) | 1,016,224 | ||||
| 52,637 | 6.69%, 5/28/24(b) | 55,535 | ||||
| 162,265 | 7.33%, 6/29/16(b) | 167,832 | ||||
| 110,258 | 7.33%, 2/23/16(b) | 113,913 | ||||
| 32,549 | 7.38%, 1/1/15(b) | 33,478 | ||||
| 165,780 | 7.83%, 9/28/16(b) | 175,521 | ||||
| 85 | 8.08%, 2/15/14(b) | 87 | ||||
|
| |||||
| 45,796,595 | ||||||
|
| |||||
United States Department of Agriculture — 0.71% | ||||||
| 207,088 | 1.13%, 5/31/14(b) | 211,114 | ||||
| 301,132 | 5.38%, 10/26/22(b) | 311,997 | ||||
| 176,902 | 5.59%, 1/20/38(b) | 186,559 | ||||
| 214,955 | 5.73%, 4/20/37(b) | 227,167 | ||||
| 738,520 | 5.75%, 1/20/33(b) | 781,022 | ||||
| 216,177 | 6.01%, 1/20/38(b) | 229,353 | ||||
| 125,555 | 6.01%, 11/8/32(b) | 133,096 | ||||
| 168,646 | 6.05%, 1/5/26(b) | 177,161 | ||||
| 500,851 | 6.07%, 4/20/37(b) | 532,645 | ||||
| 138,759 | 6.08%, 7/1/32(b) | 147,249 | ||||
| 196,004 | 6.10%, 8/25/37(b) | 208,385 | ||||
| 211,650 | 6.12%, 4/20/37(b) | 225,322 | ||||
| 84,285 | 6.13%, 7/20/22(b) | 87,623 | ||||
27
SCHEDULE OF PORTFOLIO INVESTMENTS
|
Access Capital Community Investment Fund (cont.)
September 30, 2012
| Principal Amount | Value | |||||||
| $ 257,196 | 6.22%, 1/20/37(b) | $ | 274,197 | |||||
| 224,441 | 6.38%, 2/16/37(b) | 239,703 | ||||||
| 195,100 | 6.64%, 4/20/37(b) | 209,364 | ||||||
|
| |||||||
| 4,181,957 | ||||||||
|
| |||||||
| Total U.S. Government Agency Obligations | 50,508,329 | ||||||
|
| |||||||
| (Cost $50,944,849) | |||||||
| U.S. Treasury Obligations — 0.34% | |||||||
| U.S. Treasury Bills — 0.34% | |||||||
| 2,000,000 | 0.18%, 4/4/13(d)(e) | 1,998,588 | ||||||
|
| |||||||
| Total U.S. Treasury Obligations | 1,998,588 | ||||||
|
| |||||||
| (Cost $1,998,104) | |||||||
| Promissory Notes — 1.82% | |||||||
| 9,375,000 | Massachusetts Housing Investment Corp. Term Loan, 8.25%, 1/31/35(b)(c) | 10,749,797 | ||||||
|
| |||||||
| Total Promissory Notes | 10,749,797 | ||||||
|
| |||||||
| (Cost $9,375,000) | |||||||
| Shares | ||||||||
| Investment Company — 0.73% | |||||||
| 4,333,316 | JPMorgan Prime Money Market Fund | $ | 4,333,316 | |||||
|
| |||||||
| Total Investment Company | 4,333,316 | ||||||
|
| |||||||
| (Cost $4,333,316) | |||||||
| Total Investments | $ | 733,011,277 | |||||
| (Cost 686,740,242)(f) — 124.10% | |||||||
| Liabilities in excess of other assets — (24.10)% | (142,370,551 | ) | |||||
|
| |||||||
| NET ASSETS — 100.00% | $ | 590,640,726 | |||||
|
| |||||||
| * | Interest Only security represents the right to receive the monthly interest payment on an underlying pool of mortgage loans. The principal amount shown represents the par value on the underlying pool. |
| (a) | Floating rate note. Rate shown is as of report date. |
| (b) | The Pricing Committee fair valued security under procedures established by the Fund’s Board of Trustees. |
| (c) | This security is restricted and illiquid as the security may not be offered or sold within the United States or to U.S. persons except to qualified purchasers who are also either qualified institutional buyers or “accredited investors” (as defined in Rule 501 (a) of Regulation D under the Securities Act of 1933). |
The total investment in restricted and illiquid securities representing $12,443,480 or 2.11% of net assets are as follows:
28
SCHEDULE OF PORTFOLIO INVESTMENTS
|
Access Capital Community Investment Fund (cont.)
September 30, 2012
Acquisition Principal Amount | Issuer | Acquisition Date | Acquisition Cost | 9/30/2012 Carrying Value Per Unit | ||||||||||
$1,980,645 | Pacific Beacon LLC | 12/18/2006 | $1,980,645 | $0.59 | ||||||||||
$528,941 | Community Reinvestment Revenue Note | 3/24/2008 | $ 522,924 | $1.00 | ||||||||||
$9,375,000 | Massachusetts Housing Investment Corp. | 3/29/2005 | $9,375,000 | $1.15 | ||||||||||
| (d) | This security is pledged as collateral for financial futures contracts. |
| (e) | The rate represents the annualized yield at time of purchase. |
| (f) | See notes to financial statements for the tax cost of securities and the breakdown of unrealized appreciation (depreciation). |
Abbreviations used are defined below:
AMBAC – Insured by American Municipal Bond Insurance Assurance Corp.
FHA - Federal Housing Administration
IBC - Insured by International Bancshares Corp.
LOC - Letter of Credit
MBIA – Insured by MBIA
NATL-RE - Insured by National Public Guarantee Corp.
OID - Original Issue Discount
See notes to financial statements.
29
|
Statement of Assets and Liabilities
September 30, 2012
Assets: | ||
Investments in securities, at value (cost $686,740,242) | $733,011,277 | |
Segregated cash collateral for reverse repurchase agreements | 670,291 | |
Interest and dividends receivable | 2,768,876 | |
Receivable for Fund shares sold | 27,768 | |
Cash at broker for futures contracts | 2,604,278 | |
Prepaid expenses and other assets | 21,796 | |
| ||
Total Assets | 739,104,286 | |
| ||
Liabilities: | ||
Unrealized loss on futures contracts | 1,143,695 | |
Distributions payable | 1,053,274 | |
Payable for capital shares redeemed | 175,077 | |
Payable for investments purchased | 2,319,592 | |
Reverse repurchase agreements (including interest of $21,381) | 143,391,229 | |
Accrued expenses and other payables: | ||
Investment advisory fees | 268,555 | |
Accounting fees | 4,030 | |
Distribution fees | 33,063 | |
Trustee fees | 156 | |
Audit fees | 39,180 | |
Transfer Agent fees | 5,838 | |
Other | 29,871 | |
| ||
Total Liabilities | 148,463,560 | |
| ||
Net Assets | $590,640,726 | |
| ||
Net Assets Consist Of: | ||
Capital | $587,952,665 | |
Distributions in excess of net investment income | (1,324,103) | |
Accumulated net realized losses from investment transactions, futures contracts and sale commitments | (41,115,176) | |
Net unrealized appreciation on investments, futures contracts, and sale commitments | 45,127,340 | |
| ||
Net Assets | $590,640,726 | |
|
30
FINANCIAL STATEMENTS
|
Statement of Assets and Liabilities (cont.)
Net Assets: | ||||
Class A | $ | 14,457,994 | ||
Class I | 576,182,732 | |||
|
| |||
Total | $ | 590,640,726 | ||
|
| |||
Shares Outstanding (1,000,000,000 shares authorized, 100,000,000 shares registered at $.0000001 par value): | ||||
Class A | 1,480,106 | |||
Class I | 59,024,706 | |||
|
| |||
Total | 60,504,812 | |||
|
| |||
Net Asset Values and Redemption Price Per Share: | ||||
Class A(a) | $ | 9.77 | ||
Class I | $ | 9.76 | ||
Maximum Offering Price Per Share: | ||||
Class A | $ | 10.15 | ||
Maximum Sales Charge - Class A | 3.75 | % | ||
| (a) | For Class A shares, redemption price per share will be reduced by 1.00% for sales of shares within 12 months of purchase (only applicable on purchases of $1 million or more on which no initial sales charge was paid). Such reduction is not reflected in the net asset value and the redemption price per share. |
See notes to financial statements.
31
FINANCIAL STATEMENTS
|
For the Year Ended September 30, 2012
Investment Income: | ||||
Interest income | $ | 27,944,989 | ||
Dividend income | 9,703 | |||
|
| |||
Total Investment Income | 27,954,692 | |||
|
| |||
Expenses: | ||||
Management fees | 3,551,790 | |||
Interest expense | 478,111 | |||
Distribution fees - Class A | 32,005 | |||
Accounting services | 53,508 | |||
Audit fees | 40,923 | |||
Legal fees | 33,441 | |||
Custodian fees | 50,781 | |||
Insurance fees | 7,843 | |||
Trustees’ fees and expenses | 14,271 | |||
Transfer agent fees | 34,307 | |||
Printing and shareholder reports | 23,713 | |||
Registration fees | 47,051 | |||
Other fees and expenses | 121,845 | |||
|
| |||
Total expenses | 4,489,589 | |||
|
| |||
Net Investment Income | 23,465,103 | |||
|
| |||
Realized/Unrealized Gains (Losses) from Investment Transactions and Futures Contracts: | ||||
Net realized gains from investment transactions | 1,629,214 | |||
Net realized losses from futures contracts | (6,489,130 | ) | ||
|
| |||
| (4,859,916 | ) | |||
|
| |||
Net change in unrealized appreciation/depreciation on investments | 5,347,346 | |||
Net change in unrealized appreciation/depreciation on futures contracts | 1,834,950 | |||
|
| |||
| 7,182,296 | ||||
|
| |||
Net realized/unrealized gains from investments and futures contracts | 2,322,380 | |||
|
| |||
Change in net assets resulting from operations | $ | 25,787,483 | ||
|
| |||
See notes to financial statements.
32
FINANCIAL STATEMENTS
|
Statements of Changes in Net Assets
| For the Year Ended September 30, 2012 | For the Year Ended September 30, 2011 | |||||||
From Investment Activities: | ||||||||
Operations: | ||||||||
Net investment income | $ 23,465,103 | $ 25,463,089 | ||||||
Net realized losses from investments and futures contracts | (4,859,916 | ) | (7,812,804 | ) | ||||
Net change in unrealized appreciation/depreciation on investments and futures contracts | 7,182,296 | 4,973,653 | ||||||
|
|
|
| |||||
Change in net assets resulting from operations | 25,787,483 | 22,623,938 | ||||||
|
|
|
| |||||
Distributions to Class A Shareholders: | ||||||||
From net investment income | (513,174 | ) | (447,645 | ) | ||||
Distributions to Class I Shareholders: | ||||||||
From net investment income | (24,014,190 | ) | (25,633,188 | ) | ||||
|
|
|
| |||||
Change in net assets resulting from shareholder distributions | (24,527,364 | ) | (26,080,833 | ) | ||||
|
|
|
| |||||
Capital Transactions: | ||||||||
Proceeds from shares issued | 59,269,605 | 26,082,537 | ||||||
Distributions reinvested | 10,284,858 | 10,549,800 | ||||||
Cost of shares redeemed | (25,704,837 | ) | (35,983,586 | ) | ||||
|
|
|
| |||||
Change in net assets resulting from capital transactions | 43,849,626 | 648,751 | ||||||
|
|
|
| |||||
Net increase/(decrease) in net assets | 45,109,745 | (2,808,144 | ) | |||||
Net Assets: | ||||||||
Beginning of year | 545,530,981 | 548,339,125 | ||||||
|
|
|
| |||||
End of year | $590,640,726 | $545,530,981 | ||||||
|
|
|
| |||||
Distributions in excess of net investment income | $ (1,324,103 | ) | $ (1,324,828 | ) | ||||
|
|
|
| |||||
Share Transactions: | ||||||||
Issued | 6,098,530 | 2,688,679 | ||||||
Reinvested | 1,058,155 | 1,086,063 | ||||||
Redeemed | (2,640,117 | ) | (3,717,395 | ) | ||||
|
|
|
| |||||
Change in shares resulting from capital transactions | 4,516,568 | 57,347 | ||||||
|
|
|
| |||||
See notes to financial statements.
33
FINANCIAL STATEMENTS
|
For the Year Ended September 30, 2012
Cash Provided by Operating Activities: | ||||
Net increase in net assets resulting from operations | $ | 25,787,483 | ||
Adjustments to reconcile net increase in net assets resulting from operations to net cash provided by operating activities: | ||||
Purchases of long-term securities | (162,725,133 | ) | ||
Proceeds from sales and paydowns of long-term securities | 144,885,562 | |||
Proceeds from sales of short-term securities-net | 1,899,553 | |||
Net change in unrealized (appreciation)/depreciation on investment securities | (5,347,346 | ) | ||
Net realized gains from investment transactions | (1,629,214 | ) | ||
Amortization of premium and discount - net | 478,519 | |||
Decrease in interest and dividends receivable | 456,980 | |||
Decrease in unrealized loss on futures contracts | (1,835,055 | ) | ||
Decrease in interest due on reverse repurchase agreements | (11,422 | ) | ||
Decrease in cash at brokers for futures contracts | 2,139,442 | |||
Decrease in prepaid expenses and other assets | 720 | |||
Decrease in payable to investment adviser | (43,923 | ) | ||
Increase in accrued expenses and other liabilities | 2,998 | |||
|
| |||
Net Cash Provided by Operating Activities | 4,059,164 | |||
|
| |||
Cash Provided by Financing Activities: | ||||
Cash receipts/payments from reverse repurchase agreements | (23,207,289 | ) | ||
Proceeds from issuance of shares | 59,264,514 | |||
Cash payments on shares redeemed | (25,543,901 | ) | ||
Distributions paid to shareholders | (14,572,488 | ) | ||
|
| |||
Net Cash Used in Financing Activities | (4,059,164 | ) | ||
|
| |||
Cash: | ||||
Net change in cash | — | |||
Cash at beginning of year | — | |||
|
| |||
Cash at end of year | $ | — | ||
|
| |||
Cash Flow Information: | ||||
Cash paid for interest | $ | 489,533 | ||
|
| |||
Noncash Financing Activities: | ||||
Capital shares issued in reinvestment of distributions to shareholders | $ | 10,284,858 | ||
|
| |||
See notes to financial statements.
34
|
This Page Intentionally Left Blank
35
|
Access Capital Community Investment Fund
| (Selected data for a share outstanding throughout the years indicated) | ||||||||||||||||||||||||
| Investment Activities | Distributions | |||||||||||||||||||||||
| Net Asset Value, Beginning of Period | Net Investment Income(a) | Net Realized and Unrealized Gains (Losses) on Investments | Total from Investment Activities | Net Investment Income | Net Asset Value, End of Period | |||||||||||||||||||
Class A | ||||||||||||||||||||||||
Year Ended September 30, 2012 | $9.75 | 0.37 | 0.05 | 0.42 | (0.40) | $ 9.77 | ||||||||||||||||||
Year Ended September 30, 2011 | 9.81 | 0.43 | (0.05) | 0.38 | (0.44) | 9.75 | ||||||||||||||||||
Year Ended September 30, 2010 | 9.80 | 0.46 | 0.02 | 0.48 | (0.47) | 9.81 | ||||||||||||||||||
Period Ended September 30, 2009(b) | 9.47 | 0.31 | 0.34 | 0.65 | (0.32) | 9.80 | ||||||||||||||||||
Class I(c) | ||||||||||||||||||||||||
Year Ended September 30, 2012 | $9.74 | 0.40 | 0.04 | 0.44 | (0.42) | $ 9.76 | ||||||||||||||||||
Year Ended September 30, 2011 | 9.80 | 0.45 | (0.05) | 0.40 | (0.46) | 9.74 | ||||||||||||||||||
Year Ended September 30, 2010 | 9.79 | 0.49 | 0.02 | 0.51 | (0.50) | 9.80 | ||||||||||||||||||
Year Ended September 30, 2009 | 9.41 | 0.50 | 0.38 | 0.88 | (0.50) | 9.79 | ||||||||||||||||||
Period Ended September 30, 2008(d) | 9.48 | 0.16 | (0.07) | 0.09 | (0.16) | 9.41 | ||||||||||||||||||
Year Ended May 31, 2008 | 9.46 | 0.46 | 0.02 | 0.48 | (0.46) | 9.48 | ||||||||||||||||||
| (a) | Per share net investment income has been calculated using the average daily shares method. |
| (b) | For the period January 29, 2009 (commencement of operations) to September 30, 2009. |
| (c) | The existing share class was renamed Class I Shares with the commencement of Class A Shares on January 29, 2009. |
| (d) | Effective September 30, 2008, the Fund’s fiscal year end changed from May 31 to September 30. |
See notes to financial statements.
36
FINANCIAL HIGHLIGHTS
|
Access Capital Community Investment Fund (cont.)
| (Selected data for a share outstanding throughout the years indicated) | ||||||||||||||||||||||||||||||||||||||||||||
| Ratios to Average Net Assets(a) | Ratios to Average Net Assets Plus Average Borrowings(a)(b) | Supplemental Data | ||||||||||||||||||||||||||||||||||||||||||
| Total Return(c) | Total Expenses Net of Reimbursement and Excluding Interest Expense | Total Expenses Excluding Interest Expense | Net Expenses | Net Investment Income | Total Expenses Net of Reimbursement and Excluding Interest Expense and Investment Structuring Fees | Total Expenses Excluding Interest Expense | Net Expenses | Net Investment Income | Net Assets, End of Period (000’s) | Portfolio Turnover Rate | ||||||||||||||||||||||||||||||||||
Class A | ||||||||||||||||||||||||||||||||||||||||||||
Year Ended September 30, 2012(d) | 4.35% | 0.94% | 0.94% | 1.03% | 3.80% | 0.76% | 0.76% | 0.83% | 3.07% | $ 14,458 | 20% | |||||||||||||||||||||||||||||||||
Year Ended September 30, 2011(d) | 3.98% | 0.96% | 0.96% | 1.03% | 4.40% | 0.77% | 0.77% | 0.82% | 3.51% | 8,212 | 17% | |||||||||||||||||||||||||||||||||
Year Ended September 30, 2010(d) | 5.02% | 0.97% | 0.97% | 1.04% | 4.67% | 0.78% | 0.78% | 0.84% | 3.76% | 12,141 | 9% | |||||||||||||||||||||||||||||||||
Period Ended September 30, 2009(d) | 7.11% | 1.00% | 1.25% | 1.11% | 4.77% | 0.81% | 1.02% | 0.90% | 3.89% | 8,662 | 10% | |||||||||||||||||||||||||||||||||
Class I | ||||||||||||||||||||||||||||||||||||||||||||
Year Ended September 30, 2012(d) | 4.62% | 0.70% | 0.70% | 0.78% | 4.12% | 0.56% | 0.56% | 0.63% | 3.31% | $ 576,183 | 20% | |||||||||||||||||||||||||||||||||
Year Ended September 30, 2011(d) | 4.23% | 0.72% | 0.72% | 0.79% | 4.66% | 0.57% | 0.57% | 0.62% | 3.69% | 537,319 | 17% | |||||||||||||||||||||||||||||||||
Year Ended September 30, 2010(d) | 5.28% | 0.72% | 0.72% | 0.79% | 4.94% | 0.58% | 0.58% | 0.64% | 3.98% | 536,198 | 9% | |||||||||||||||||||||||||||||||||
Year Ended September 30, 2009(d) | 9.59% | 0.74% | 0.74% | 1.06% | 5.16% | 0.59% | 0.59% | 0.85% | 4.12% | 561,148 | 10% | |||||||||||||||||||||||||||||||||
Period Ended September 30, 2008 | 1.02% | 0.86% | 0.86% | 1.61% | 5.17% | 0.67% | 0.67% | 1.25% | 4.00% | 543,404 | 1% | |||||||||||||||||||||||||||||||||
Year Ended May 31, 2008 | 5.19% | 0.93%(e) | 0.93% | 1.99% | 4.83% | 0.75%(e) | 0.75% | 1.60% | 3.88% | 513,723 | 19% | |||||||||||||||||||||||||||||||||
| (a) | Annualized for those periods that are less than one year. |
| (b) | These ratios are calculated based upon the average net assets plus average borrowings. |
| (c) | Total investment returns exclude the effect of sales charge. |
| (d) | Total expenses of the Fund for the period ended September 30, 2009 is 1.36% and 1.09% for the Class A and Class I shares, respectively. Total expenses for all other periods would be the same as shown in the financial highlights as net expenses because there were no fee waivers during these periods. |
| (e) | To the extent that the Fund’s operating expenses (exclusive of management fees, distribution fees and interest expense) were less than 0.25% of the Fund’s monthly average net assets, the Fund repaid the Fund’s investment adviser and sub-adviser for operating expenses previously borne or reimbursed. |
See notes to financial statements.
37
|
September 30, 2012
1. Organization
RBC Funds Trust (the “Trust”) was organized as a Delaware statutory trust on December 16, 2003 and currently consists of 13 portfolios. Overall responsibility for the management of the Trust is vested in its Board of Trustees (the “Board”). This annual report includes the Access Capital Community Investment Fund (the “Fund”). At its inception in 1998, the Access Capital Strategies Community Investment Fund, Inc., the Fund’s predecessor, elected status as a business development company under the Investment Company Act of 1940 (the “1940 Act”), but withdrew its election on May 30, 2006, and registered as a continuously offered, closed-end interval management company under the 1940 Act. The predecessor fund was reorganized into a series of the Trust, a registered open-end management company under the 1940 Act, effective July 28, 2008.
The Fund offers two share classes: Class A and Class I shares. Class A shares are offered with a 3.75% maximum front-end sales charge and a 1.00% contingent deferred sales charge (“CDSC”) for redemption within 12 months of a $1 million or greater purchase on which no front-end sales charge was paid. Class I shares (intended for investors meeting certain investment minimum thresholds) are not subject to either a front-end sales charge or a CDSC.
RBC Global Asset Management (U.S.) Inc. (“RBC GAM (US)” or “Advisor” or “Co-Administrator”) acts as the investment advisor for the Funds. The officers of the Trust (“Fund Management”) are also employees of RBC GAM (US) or its affiliates or of BNY Mellon Investment Servicing (US) Inc. (“BNY Mellon”) (“Co-Administrator”).
The Fund’s investment objective is to invest in geographically specific debt securities located in portions of the United States designated by Fund investors. The Fund seeks to achieve its investment objective by investing primarily in debt securities specifically designed to support underlying economic activities such as affordable housing, education, small business lending, and job-creating activities in areas of the United States designated by Fund investors.
2. Significant Accounting Policies
Summarized below are the significant accounting policies of the Fund. The policies conform to accounting principles generally accepted in the United States of America (“US GAAP”). Fund Management follows these policies when preparing financial statements. Management may also be required to make estimates and assumptions that affect the reported amounts of assets and liabilities at the date of the financial statements and the reported amounts of income and expenses for the period. Actual results could differ from those estimates.
Security Valuation:
Bonds and other fixed income securities, including TBA commitments, are generally valued on the basis of prices furnished by pricing services approved by the Board. The pricing services utilize both dealer-supplied valuations and electronic data processing techniques that take into account appropriate factors such as institutional-size trading in similar groups of securities, yield, quality, coupon rate, maturity and type of issue. These valuation techniques take into account multiple factors, including fundamental security analytical data, counterparty valuation quotations, information from broker-dealers, market spreads and interest rates. Short-term debt obligations, with less than 60 days to maturity at time of purchase, are valued at amortized cost unless Fund Management determines that amortized cost no longer approximates market value. Futures are valued at their most recent sale price on the exchange on which they are primarily traded.
The Board has policies and procedures for the valuation of the Fund’s investment securities and financial instruments and has delegated to the Funds’ Pricing Committee (“Pricing Committee”) the responsibility for implementing the Procedures, including the responsibility for determining the fair value of the Fund’s investment securities and financial instruments. The Pricing Committee includes representatives of the Trust’s Advisor, Co-Administrator and sub-advisor, including personnel from accounting and operations, investment management, trading, risk analytics, compliance and legal.
38
NOTES TO FINANCIAL STATEMENTS
|
The Pricing Committee meets at least quarterly to review and approve Fund valuation matters, and includes a review of the Trust’s pricing activity and operations, fair value measurements, pricing vendors, policies and procedures and related controls. At least a quorum of the Committee meets more frequently, as needed, to consider and approve time-sensitive fair valuation actions. The Pricing Committee reports to the Valuation, Portfolio Management and Performance Committee (“Valuation Committee”) of the Board. Members of the Pricing Committee meet with the Valuation Committee and the Board at each of their regularly scheduled meetings to discuss valuation matters and actions taken during the period.
Fair value methods used include, but are not limited to, obtaining market quotations from secondary pricing services, broker-dealers, or widely used quotation systems. General factors used in determining the fair value of securities include fundamental analytical data, the nature and duration of any restrictions on disposition of the securities, and an evaluation of the forces that influenced the market in which the investments are purchased and sold. These securities are either categorized as Level 2 or 3 depending on the relevant inputs used.
In such cases where a security price is unavailable, the security or asset cannot be valued pursuant to one of the valuation methods established by the Board, or where Fund Management determines that the value provided by the pricing services does not approximate fair value, the value of the security or financial instrument will be determined in good faith by the Pricing Committee as authorized by the Board, generally based upon recommendation provided by the Advisor. Fair valuation may also be used when a significant valuation event is determined to have occurred. Significant valuation events may include, but are not limited to, the following: an event affecting the value of a security traded on a foreign market occurs between the close of that market and the close of regular trading on the New York Stock Exchange; an extraordinary event like a natural disaster or terrorist act occurs; or an adverse development arises with respect to a specific issuer, such as a bankruptcy filing. Some of the factors which may be considered in determining fair value are fundamental analytical data relating to the security, the issuer and the market, such as duration, prepayment and default rates; general level of interest rates and changes in interest rates; information from broker-dealers; and trading in similar securities.
When the Fund uses fair valuation methods that use significant unobservable inputs to determine its NAV, securities will be priced by a method that the Board or persons acting at their direction believe accurately reflect fair value and are categorized as Level 3 of the fair value hierarchy. These methods may require subjective determinations about the value of a security. While the Fund’s policy is intended to result in a calculation of the Fund’s NAV that fairly reflects security values as of the time of pricing, the Fund cannot guarantee that values determined by the Board or persons acting at their direction would accurately reflect the price that the Fund could obtain for a security if it were to dispose of that security as of the time of pricing (for instance, in a forced or distressed sale). The prices used by the Fund may differ from the value that would be realized if the securities were sold.
The Fund’s Pricing Committee employs various methods for calibrating the valuation approach related to fair valued securities categorized within Level 3 of fair value hierarchy. These methods may include regular due diligence of the Fund’s pricing vendors, a regular review of key inputs and assumptions, transaction back-testing or disposition analysis to compare unrealized gains and losses to realize gains and losses, reviews of missing and stale prices and large movements in market value and reviews of any market related activities. Additionally, the pricing of all fair value holdings is subsequently reported to the Fund’s Board.
Financial Instruments:
Reverse Repurchase Agreements
To obtain short-term financing, the Fund entered into reverse repurchase agreements with primary dealers that report to the Federal Reserve Bank of New York or the 100 largest U.S. commercial banks, who are deemed creditworthy under guidelines approved by the Board. Interest on the value of the reverse repurchase agreements is based upon competitive market rates at the time of issuance. At the time the Fund enters into a reverse repurchase agreement, it will establish and maintain a segregated account with the custodian containing qualifying assets having a value, including accrued interest, not
39
NOTES TO FINANCIAL STATEMENTS
|
less than the repurchase price. Based on requirements with certain exchanges and third party broker-dealers, the Fund may also be required to deliver or deposit securities or cash as collateral. If the counterparty to the transaction is rendered insolvent, the ultimate realization of the securities to be repurchased by the Fund may be delayed or limited. For the year ended September 30, 2012, the average amount borrowed was approximately $140,748,445 and the daily weighted average interest rate was 0.34%.
Details of open reverse repurchase agreements at September 30, 2012 were as follows:
| Rate | Trade Date | Maturity Date | Net Closing Amount | Par | ||||||||||||||||
Goldman Sachs | 0.39% | 9/04/12 | 10/02/12 | $(37,467,362) | $(37,456,000) | |||||||||||||||
Goldman Sachs | 0.37% | 9/17/12 | 10/15/12 | (46,164,296) | (46,151,015) | |||||||||||||||
Goldman Sachs | 0.38% | 9/25/12 | 10/25/12 | (59,781,758) | (59,762,833) | |||||||||||||||
Details of underlying collateral pledged for open reverse repurchase agreements in addition to the segregated cash collateral shown on the Statement of Assets and Liabilities at September 30, 2012 were as follows:
Description | Rate | Maturity Date | Par | Value | ||||||||||||||
Goldman Sachs 9/04/12 to 10/02/12 | ||||||||||||||||||
| Fannie Mae Pool #AK6715 | 3.50% | 3/01/42 | $ | 7,223,597 | $ | 7,745,614 | ||||||||||||
| Fannie Mae Pool #AK2386 | 3.50% | 2/01/42 | 16,395,663 | 17,580,505 | ||||||||||||||
| Fannie Mae Pool #AH6764 | 4.00% | 3/01/41 | 1,438,220 | 1,547,379 | ||||||||||||||
| Fannie Mae Pool #AH5662 | 4.00% | 2/01/41 | 1,079,174 | 1,161,082 | ||||||||||||||
| Fannie Mae Pool #AD4946 | 4.50% | 6/01/40 | 1,044,869 | 1,128,908 | ||||||||||||||
| Fannie Mae Pool #AE5806 | 4.50% | 9/01/40 | 1,045,776 | 1,156,685 | ||||||||||||||
| Fannie Mae Pool #AC7199 | 5.00% | 12/01/39 | 4,326,309 | 4,733,421 | ||||||||||||||
| Fannie Mae Pool #663159 | 5.00% | 7/01/32 | 3,778,409 | 4,145,744 | ||||||||||||||
|
| |||||||||||||||||
| $ | 39,199,338 | |||||||||||||||||
|
| |||||||||||||||||
|
| |||||||||||||||||
Goldman Sachs 9/17/12 to 10/15/12 | ||||||||||||||||||
| Fannie Mae Pool #AK6716 | 3.50% | 3/01/42 | $ | 2,392,562 | $ | 2,565,462 | ||||||||||||
| Fannie Mae Pool #AH0917 | 4.00% | 12/01/40 | 1,482,812 | 1,595,355 | ||||||||||||||
| Fannie Mae Pool #AA3206 | 4.00% | 4/01/39 | 942,111 | 1,013,616 | ||||||||||||||
| Fannie Mae Pool #AE2023 | 4.00% | 9/01/40 | 1,406,559 | 1,513,314 | ||||||||||||||
| Fannie Mae Pool #AE5432 | 4.00% | 10/01/40 | 1,886,007 | 2,029,152 | ||||||||||||||
| Fannie Mae Pool #AE5861 | 4.00% | 10/01/40 | 1,578,515 | 1,698,322 | ||||||||||||||
| Fannie Mae Pool #AE6851 | 4.00% | 10/01/40 | 1,157,200 | 1,245,029 | ||||||||||||||
| Fannie Mae Pool #AE7707 | 4.00% | 11/01/40 | 1,878,290 | 2,020,849 | ||||||||||||||
| Fannie Mae Pool #AH8878 | 4.50% | 4/01/41 | 1,938,652 | 2,101,241 | ||||||||||||||
| Fannie Mae Pool #AI1846 | 4.50% | 5/01/41 | 2,357,244 | 2,554,939 | ||||||||||||||
| Fannie Mae Pool #AA3142 | 4.50% | 3/01/39 | 1,686,013 | 1,834,263 | ||||||||||||||
| Fannie Mae Pool #AA7042 | 4.50% | 6/01/39 | 1,012,910 | 1,098,176 | ||||||||||||||
| Fannie Mae Pool #AD4458 | 4.50% | 4/01/40 | 2,184,373 | 2,360,062 | ||||||||||||||
| Fannie Mae Pool #AD7239 | 4.50% | 7/01/40 | 1,214,499 | 1,341,405 | ||||||||||||||
| Fannie Mae Pool #AD7272 | 4.50% | 7/01/40 | 1,236,618 | 1,365,835 | ||||||||||||||
40
NOTES TO FINANCIAL STATEMENTS
|
Description | Rate | Maturity Date | Par | Value | ||||||||||||||
| Fannie Mae Pool #AD9614 | 4.50% | 8/01/40 | $2,055,762 | $ | 2,221,106 | |||||||||||||
| Fannie Mae Pool #MC0154 | 4.50% | 8/01/39 | 1,665,447 | 1,805,644 | ||||||||||||||
| Fannie Mae Pool #727312 | 5.00% | 9/01/33 | 1,891,188 | 2,083,336 | ||||||||||||||
| Fannie Mae Pool #829005 | 5.00% | 8/01/35 | 1,261,101 | 1,377,999 | ||||||||||||||
| Fannie Mae Pool #934941 | 5.00% | 8/01/39 | 1,817,179 | 1,988,179 | ||||||||||||||
| Fannie Mae Pool #AC5328 | 5.00% | 10/01/39 | 1,001,081 | 1,112,803 | ||||||||||||||
| Fannie Mae Pool #AC5329 | 5.00% | 10/01/39 | 823,694 | 901,205 | ||||||||||||||
| Fannie Mae Pool #AC6304 | 5.00% | 11/01/39 | 1,081,004 | 1,182,728 | ||||||||||||||
| Fannie Mae Pool #AC6307 | 5.00% | 12/01/39 | 1,309,834 | 1,433,091 | ||||||||||||||
| Fannie Mae Pool #AD1470 | 5.00% | 2/01/40 | 2,046,944 | 2,237,007 | ||||||||||||||
| Fannie Mae Pool #AD8960 | 5.00% | 6/01/40 | 1,313,725 | 1,459,107 | ||||||||||||||
| Fannie Mae Pool #257892 | 5.50% | 2/01/38 | 668,601 | 734,416 | ||||||||||||||
| Fannie Mae Pool #829649 | 5.50% | 3/01/35 | 1,096,836 | 1,209,947 | ||||||||||||||
| Fannie Mae Pool #952598 | 6.00% | 7/01/37 | 1,057,008 | 1,175,302 | ||||||||||||||
| Fannie Mae Pool #952632 | 6.00% | 7/01/37 | 1,250,376 | 1,382,496 | ||||||||||||||
|
| |||||||||||||||||
| $ | 48,641,386 | |||||||||||||||||
|
| |||||||||||||||||
|
| |||||||||||||||||
Goldman Sachs 9/25/12 to 10/25/12 | ||||||||||||||||||
| Fannie Mae Pool #AH0306 | 4.00% | 12/01/40 | $1,208,338 | $ | 1,324,971 | |||||||||||||
| Fannie Mae Pool #AH1077 | 4.00% | 1/01/41 | 1,271,829 | 1,407,309 | ||||||||||||||
| Fannie Mae Pool #AH5657 | 4.00% | 2/01/41 | 1,040,634 | 1,119,617 | ||||||||||||||
| Fannie Mae Pool #AH7277 | 4.00% | 3/01/41 | 1,277,576 | 1,379,333 | ||||||||||||||
| Fannie Mae Pool #AE2012 | 4.00% | 9/01/40 | 2,770,976 | 2,981,289 | ||||||||||||||
| Fannie Mae Pool #AE5862 | 4.00% | 10/01/40 | 1,914,524 | 2,067,012 | ||||||||||||||
| Fannie Mae Pool #AE5863 | 4.00% | 10/01/40 | 1,562,285 | 1,686,719 | ||||||||||||||
| Fannie Mae Pool #AE7699 | 4.00% | 11/01/40 | 1,343,943 | 1,445,946 | ||||||||||||||
| Fannie Mae Pool #AE7703 | 4.00% | 10/01/40 | 1,000,959 | 1,076,930 | ||||||||||||||
| Fannie Mae Pool #AI1848 | 4.50% | 5/01/41 | 2,224,168 | 2,410,703 | ||||||||||||||
| Fannie Mae Pool #AA0645 | 4.50% | 3/01/39 | 1,039,596 | 1,138,480 | ||||||||||||||
| Fannie Mae Pool #AC2109 | 4.50% | 7/01/39 | 1,887,545 | 2,039,360 | ||||||||||||||
| Fannie Mae Pool #AD1471 | 4.50% | 2/01/40 | 2,800,694 | 3,036,456 | ||||||||||||||
| Fannie Mae Pool #AD1585 | 4.50% | 2/01/40 | 3,427,403 | 3,715,921 | ||||||||||||||
| Fannie Mae Pool #AD1640 | 4.50% | 3/01/40 | 1,148,437 | 1,246,548 | ||||||||||||||
| Fannie Mae Pool #AD1942 | 4.50% | 1/01/40 | 2,547,174 | 2,761,594 | ||||||||||||||
| Fannie Mae Pool #AD1988 | 4.50% | 2/01/40 | 4,148,476 | 4,497,693 | ||||||||||||||
| Fannie Mae Pool #AD4456 | 4.50% | 4/01/40 | 2,117,690 | 2,298,604 | ||||||||||||||
| Fannie Mae Pool #AD7256 | 4.50% | 7/01/40 | 786,889 | 872,555 | ||||||||||||||
| Fannie Mae Pool #AD7242 | 4.50% | 7/01/40 | 1,189,054 | 1,290,634 | ||||||||||||||
| Fannie Mae Pool #AD7271 | 4.50% | 7/01/40 | 2,352,826 | 2,553,827 | ||||||||||||||
| Fannie Mae Pool #AD9613 | 4.50% | 8/01/40 | 1,830,861 | 1,981,549 | ||||||||||||||
| Fannie Mae Pool #MC0171 | 4.50% | 9/01/39 | 1,089,239 | 1,180,930 | ||||||||||||||
| Fannie Mae Pool #AC1463 | 5.00% | 8/01/39 | 1,611,793 | 1,778,576 | ||||||||||||||
| Fannie Mae Pool #AC4395 | 5.00% | 9/01/39 | 1,145,913 | 1,274,515 | ||||||||||||||
| Fannie Mae Pool #AD1560 | 5.00% | 3/01/40 | 1,720,022 | 1,881,879 | ||||||||||||||
| Fannie Mae Pool #AD1586 | 5.00% | 1/01/40 | 1,249,038 | 1,365,013 | ||||||||||||||
41
NOTES TO FINANCIAL STATEMENTS
|
Description | Rate | Maturity Date | Par | Value | ||||||||||||
Fannie Mae Pool #AD1943 | 5.00% | 1/01/40 | $ | 1,131,272 | $ | 1,236,313 | ||||||||||
Fannie Mae Pool #AH0914 | 5.00% | 11/01/40 | 1,261,289 | 1,365,099 | ||||||||||||
Fannie Mae Pool #806761 | 5.50% | 9/01/34 | 2,457,677 | 2,716,501 | ||||||||||||
Fannie Mae Pool #844361 | 5.50% | 11/01/35 | 1,420,045 | 1,561,828 | ||||||||||||
Fannie Mae Pool #885724 | 5.50% | 6/01/36 | 2,141,909 | 2,353,422 | ||||||||||||
Fannie Mae Pool #990510 | 5.50% | 8/01/38 | 317,076 | 348,784 | ||||||||||||
Fannie Mae Pool #AA0527 | 5.50% | 12/01/38 | 1,235,785 | 1,362,067 | ||||||||||||
|
| |||||||||||||||
| $ | 62,757,977 | |||||||||||||||
|
| |||||||||||||||
Derivatives
The Fund may use derivative instruments, including futures, forwards, options, indexed securities, swaps and inverse securities for hedging purposes only. Derivatives allow the Fund to manage its risk exposure more quickly and efficiently than other types of instruments. Derivatives may be riskier than other types of investments and could result in losses that significantly exceed a Fund’s original investment. Derivatives are subject to the risk that changes in the value of a derivative may not correlate perfectly with the underlying asset, rate or index. The use of derivatives may not be successful, resulting in losses to a Fund, and the cost of such strategies may reduce the Fund’s returns. Derivatives may also expose a Fund to counterparty risk (the risk that the derivative counterparty will not fulfill its contractual obligations). To the extent amounts due to the Fund from their counterparties are not fully collateralized, contractually or otherwise, the Fund bears the risk of loss from counterparty non-performance. The Fund’s maximum risk of loss from counterparty credit risk on over-the-counter derivatives is generally the aggregate unrealized gain in excess of any collateral pledged by the counterparty to the Fund. For over-the-counter purchased options, the Fund bears the risk of loss in the amount of the premiums paid and change in value of the options should the counterparty not perform under the contracts. Written options by the Fund do not give rise to counterparty credit risk, as written options obligate the Fund to perform and not the counterparty. Counterparty risk related to exchange traded financial futures contracts and options is minimal because of the protection against defaults provided by the exchange on which they trade. Hedging also involves the risk that changes in the value of the derivative will not match those of the holdings being hedged as expected by the Fund, in which case any losses on the holdings being hedged may not be reduced and may be increased. There can be no assurance that the Fund’s hedging strategy will reduce risk or that hedging transactions will be available or cost effective. The Fund is subject to interest rate risk in the normal course of pursuing its investment objectives by investing in various derivative financial instruments, as described below. For open derivative instruments as of September 30, 2012, see the following section for financial futures contracts.
Financial Futures Contracts
The Fund entered into futures contracts in an effort to manage both the duration of the portfolio and hedge against certain market risk. A futures contract on a securities index is an agreement obligating one party to pay, and entitling the other party to receive, during the term of the contract, cash payments based on the level of a specified securities index. Futures transactions involve brokerage costs and require a Fund to segregate assets to cover contracts that would require it to purchase securities or currencies. A Fund may lose the expected benefit of futures transactions if interest rates, exchange rates or securities prices change in an unanticipated manner. Such unanticipated changes may also result in lower overall performance than if a Fund had not entered into any futures transactions.
Upon entering into a futures contract, a Fund is required to pledge to the broker an amount of cash, U.S. government securities, or other assets equal to a certain percentage of the contract amount. Subsequent payments are made or received by the Fund each day, depending on the daily fluctuations in the fair value of the underlying instrument. A Fund would record an unrealized gain or loss each day equal to these daily payments.
42
NOTES TO FINANCIAL STATEMENTS
|
The Fund had the following open futures contracts at September 30, 2012:
| Number of Contracts | Expiration Date | Unrealized Appreciation (Depreciation) | Notional Value | Counterparty | ||||||||||||||
Short Position: | ||||||||||||||||||
90 Day Euro | ||||||||||||||||||
Dollar | 25 | March, 2013 | $ | (75,000) | 6,154,688 | Barclays Capital | ||||||||||||
| 25 | March, 2014 | $ | (143,437) | 6,081,875 | Barclays Capital | |||||||||||||
| 25 | June, 2013 | $ | (86,250) | 6,142,500 | Barclays Capital | |||||||||||||
| 25 | June, 2014 | $ | (156,250) | 6,066,562 | Barclays Capital | |||||||||||||
| 25 | September, 2013 | $ | (97,812) | 6,130,313 | Barclays Capital | |||||||||||||
| 25 | September, 2014 | $ | (168,125) | 6,051,563 | Barclays Capital | |||||||||||||
| 25 | December, 2012 | $ | (65,312) | 6,164,688 | Barclays Capital | |||||||||||||
| 25 | December, 2013 | $ | (130,313) | 6,096,250 | Barclays Capital | |||||||||||||
Ten Year | ||||||||||||||||||
U.S. Treasury Notes | 310 | December, 2012 | $ | (238,266) | 41,141,891 | Barclays Capital | ||||||||||||
Thirty Year | ||||||||||||||||||
U.S. Treasury Bonds | 260 | December, 2012 | $ | 17,070 | 38,854,570 | Barclays Capital | ||||||||||||
Details of underlying collateral pledged for open futures contracts in addition to the cash at brokers shown on the Statement of Assets and Liabilities at September 30, 2012 is as follows:
Description | Yield | Maturity Date | Par | Market Value | ||||
U.S. Treasury Bill | 0.18% | 04/04/13 | $2,000,000 | $1,998,588 |
Options
The Fund may write (or sell) put and call options on the securities that the Fund is authorized to buy or already holds in its portfolio. A Fund may also purchase put and call options. A call option gives the purchaser the right to buy, and the writer the obligation to sell, the underlying security at the agreed-upon exercise (or “strike”) price during the option period. A put option gives the purchaser the right to sell, and the writer the obligation to buy, the underlying security at the strike price during the option period. Purchasers of options pay an amount, known as a premium, to the option writer in exchange for the right under the option contract. The Fund does not have any outstanding options as of September 30, 2012.
43
NOTES TO FINANCIAL STATEMENTS
|
Swaptions
The Fund may purchase or write swaptions in an attempt to gain additional protection against the effects of interest rate fluctuations. Swap options (swaptions) are similar to options on securities except that instead of selling or purchasing the right to buy or sell a security, the writer or purchaser of the swap option is granting or buying the right to enter into a previously agreed upon interest rate swap agreement at any time before the expiration of the option (interest rate risk). In purchasing and writing swaptions, the Fund bears the risk of an unfavorable change in the price of the underlying interest rate swap or the risk that the Fund may not be able to enter into a closing transaction due to an illiquid market. The Fund executes transactions in over-the-counter swaptions. Transactions in over-the-counter swaptions may expose the Fund to the risk of default by the counterparty to the transaction. In the event of default by the counterparty, the Fund’s maximum amount of loss is the premium paid (as purchaser) or the unrealized loss of the contract (as writer).The Fund does not have any outstanding call swaptions as of September 30, 2012.
The effect of Derivative Instruments on the Statement of Operations during the year ended September 30, 2012 is as follows:
Derivative Instruments Categorized by Risk Exposure | Net Realized Losses from Futures Contracts | Net Change in Unrealized Appreciation/Depreciation on Futures Contracts | ||||
Interest Rate Risk | $(6,489,659) | $1,835,479 | ||||
For the year ended September 30, 2012, the average volume of derivative activities are as follows:
Futures Short Positions (Contracts) |
824 |
TBA Commitments
The Fund may enter into to be announced (“TBA”) commitments to purchase or sell securities for a fixed price at a future date. TBA commitments are considered securities in themselves, and involve a risk of loss if the value of the security to be purchased/sold declines/increases prior to settlement date, which is in addition to the risk of decline in the value of a Fund’s other assets. Unsettled TBA commitments are valued at the current value of the underlying securities, according to the procedures described under “Security Valuation”. As of September 30, 2012, the Fund had outstanding TBA commitments.
Mortgage Backed Securities
Because the Fund will focus on community development investments, such as securities backed by commercial and/or residential mortgage loans, it will be affected by risks not typically associated with funds that do not specialize in community development investments. These risks include credit and prepayment risk and risk due to default on underlying loans within a security. Changes in economic conditions, including delinquencies and/or defaults or assets underlying these securities, can affect the value, income and/or liquidity of such positions.
In addition, the Fund invests in certain mortgage backed securities that qualify under the Community Reinvestment Act of 1977 (“CRA”) in which the Fund may pay a premium for the geographically or other targeted nature of the securities. There can be no guarantee, however, that a similar premium will be received if the security is sold by the Fund.
Credit Enhancement
Certain obligations held in the Fund have credit enhancement or liquidity features that may, under certain circumstances, provide for repayment of principal and interest on the obligation upon demand date, interest rate reset date or final maturity. These enhancements may include: letters of credit; liquidity guarantees; security purchase agreements; tender option purchase agreements; and third party insurance (i.e., AMBAC and MBIA).
44
NOTES TO FINANCIAL STATEMENTS
|
Fair Value Measurements:
Various inputs are used in determining the fair value of investments which are as follows:
• Level 1 - Inputs that reflect unadjusted quoted prices in active markets for identical assets or liabilities that the Funds have the ability to access at the measurement date.
• Level 2 - Inputs other than quoted prices that are observable for the asset or liability either directly or indirectly, including inputs in markets that are not considered to be active. Observable inputs may include quoted prices for similar securities, interest rates, spreads, prepayment spreads, etc.
• Level 3 - Unobservable inputs based on the best information available in the circumstances, to the extent observable inputs are not available (including the Fund’s own assumptions in determining the fair value of investments).
The inputs or methodology used for valuing securities are not necessarily an indication of the risk associated with investing in those securities.
Inputs used in determining fair value of an investment may include, but are not limited to, price information, volatility statistics, credit and market data, and other factors, all of which may be either observable or unobservable. Inputs can vary among investments and will be impacted by the investment type and volume of activity for the particular security or similar securities in the market. Investments in the Level 3 category are generally supported by transactions and quoted prices from dealers participating in the market for those investments. Investments may be included in the Level 3 category due to a lack of market activity or transparency. Internal valuation models may also be used as a pricing source for Level 3 investments. Internal valuation models may rely on one or more unobservable inputs, such as estimated cash flows, financial statement analysis and discount rates.
The summary of inputs used to determine the fair valuation of the Fund’s investments as of September 30, 2012 is as follows:
Level 1 | Level 2 Significant Observable Inputs | Level 3 Significant Unobservable Inputs | Total | |||||||||||||
Assets: | ||||||||||||||||
Investments in Securities | ||||||||||||||||
Investment Company | $ | 4,333,316 | $ | — | $ | — | $ | 4,333,316 | ||||||||
Municipal Bonds | — | 16,006,659 | — | 16,006,659 | ||||||||||||
Corporate Bonds | — | 1,163,906 | — | 1,163,906 | ||||||||||||
U.S. Government Agency Backed Mortgages | — | 648,250,682 | — | 648,250,682 | ||||||||||||
U.S. Government Agency Obligations | — | 50,508,329 | — | 50,508,329 | ||||||||||||
U.S. Treasury Obligations | — | 1,998,588 | — | 1,998,588 | ||||||||||||
Promissory Notes | — | 10,749,797 | — | 10,749,797 | ||||||||||||
|
|
|
|
|
|
|
| |||||||||
| $ | 4,333,316 | $ | 728,677,961 | $ | — | $ | 733,011,277 | |||||||||
|
|
|
|
|
|
|
| |||||||||
Other Financial Instruments(*) | ||||||||||||||||
Futures Contracts | $ | 17,070 | $ | — | $ | — | $ | 17,070 | ||||||||
|
|
|
|
|
|
|
| |||||||||
Total Assets | $ | 4,350,386 | $ | 728,677,961 | $ | — | $ | 733,028,347 | ||||||||
|
|
|
|
|
|
|
| |||||||||
|
|
|
|
|
|
|
| |||||||||
Liabilities: | ||||||||||||||||
Other Financial Instruments(*) | ||||||||||||||||
Futures Contracts | $(1,160,765) | $ | — | $ | — | $ | (1,160,765) | |||||||||
|
|
|
|
|
|
|
| |||||||||
|
|
|
|
|
|
|
| |||||||||
* Other financial instruments are futures contracts which are not reflected in the Schedule of Portfolio Investments and are shown at the unrealized appreciation/(depreciation) on the contracts.
During the year ended September 30, 2012, the Fund recognized no transfers to/from Level 1 or 2. The Fund’s policy is to recognize transfers to/from Level 1, Level 2 and Level 3 at the end of the year utilizing fair value at the beginning of the year.
45
NOTES TO FINANCIAL STATEMENTS
|
In December 2011, the Financial Accounting Standards Board (“FASB”) issued Accounting Standards Update No. 2011-11 “Disclosures about Offsetting Assets and Liabilities” (“ASU 2011-11”). These disclosure requirements are intended to help investors and other financial statement users to better assess the effect or potential effect of offsetting arrangements on a company’s financial position. They also improve transparency in the reporting of how companies mitigate credit risk, including disclosure of related collateral pledged or received. In addition, ASU 2011-11 facilitates comparison between those entities that prepare their financial statements on the basis of US GAAP and those entities that prepare their financial statements on the basis of International Financial Reportings Standards (“ IFRS”). ASU 2011-11 requires entities to: disclose both gross and net information about both instruments and transactions eligible for offset in the financial statements; and disclose instruments and transactions subject to an agreement similar to a master netting agreement. ASU 2011-11 is effective for fiscal years beginning on or after January 1, 2013, and interim periods within those annual periods. At this time, Fund Management is evaluating the implications of ASU 2011-11 and its impact on the Fund’s financial statement disclosures.
Investment Transactions and Income:
Investment transactions are recorded one business day after trade date, except on the last day of each fiscal quarter end, when they are recorded on trade date. Dividend income is recorded on the ex-dividend date. Realized gains and losses from investment transactions are calculated based on the costs of the specific security (also known as identified cost basis). Interest income is recognized on the accrual basis and includes, where applicable, the amortization and accretion of premium or discount using the effective yield method. Paydown gains and losses on mortgage and asset-backed securities are included in the financial statements as interest income.
Expense, Investment Income and Gain/Loss Allocation:
The Fund pays the expenses that are directly related to its operations, such as custodian fees or advisor fees. Expenses incurred by the Trust, such as trustee or legal fees, are allocated to the Fund either proportionately based upon the Fund’s relative net assets or using another reasonable basis such as equally across all Funds in the Trust, depending on the nature of the expense. Individual share classes within the Fund are charged expenses specific to that class, such as distribution fees. Within the Fund, expenses other than class specific expenses are allocated daily to each class based upon the proportion of relative net assets. Investment income and realized and unrealized gains or losses are allocated to each class of shares based upon the proportion of relative net assets.
Distributions to Shareholders:
The Fund pays out any income that it receives, less expenses, in the form of dividends and capital gains to its shareholders. Income dividends are declared daily and paid monthly. Dividends will also be paid to a redeeming shareholder at any time during the month upon total redemption of shares in an account. Capital gain distributions are declared and paid at least annually. Distributions to shareholders are recorded on the ex-dividend date. The amount of dividends and distributions are calculated based on federal income tax regulations, which may differ from GAAP. These “book/tax” differences may be either temporary or permanent in nature. To the extent these differences are determined, as of the end of the tax year, to be permanent (e.g., reclassification of paydown gains and losses, and expiring capital loss carryforward), they are reclassified within a Fund’s capital account based on their federal tax basis treatment.
For the year ended September 30, 2012, permanent difference reclassification amounts were as follows:
Increase Undistributed Net Investment Income | Increase Accumulated Realized Gain/Loss | Decrease Paid-in-Capital | ||||||
$1,062,986 | $2,693,348 | $(3,756,334) |
3. Agreements and Other Transactions with Affiliates
RBC GAM (US) serves as investment advisor to the Fund. The Advisor has agreed to waive or limit fees through January 31, 2014, to maintain expenses (excluding interest expense, management fees and distribution fees) at 0.20% of the Fund’s average monthly gross assets less liabilities, other than
46
NOTES TO FINANCIAL STATEMENTS
|
indebtness for borrowing. The Fund will carry forward, for a period not to exceed 12 months from the date on which a waiver or reimbursement is made by the Advisor, any expenses in excess of the expense limitation and repay the Advisor such amounts, provided the Fund is able to effect such repayment and remain in compliance with the expense limitation disclosed in the effective prospectus. During the year ended September 30, 2012, no reimbursements were made to the Advisor.
Under the terms of the Fund’s management agreement, the Advisor receives from the Fund an annual management fee, paid monthly, of 50 basis points (0.50%) of the Fund’s average daily total assets less liabilities, other than indebtedness for borrowing. For purposes of calculating the management fee, assets purchased with borrowed monies are included in the total that is subject to the management fee. As a result, the Advisor has an incentive to use leverage so as to increase the amount of assets upon which it may charge a fee. As of September 30, 2012, the impact of leverage raised the management fee to approximately 62 basis points (0.62%) of the Fund’s average net assets.
The RBC Funds currently pay each of the independent Trustees (Trustees of the Trust who are not directors, officers or employees of the advisor, administrator or distributor) an annual retainer of $32,500. The Board Chairperson and Audit Committee Chairperson each receive an additional retainer of $2,500 annually, and all other trustees serving as Chair of a Board committee each receive an additional retainer of $1,000 annually. In addition, Independent Trustees receive a quarterly meeting fee of $5,000 ($5,500 effective October 1, 2012) for each in-person Board meeting attended, a meeting fee of $1,000 for each telephonic or Special Board meeting attended, and a $1,500 fee for each Board committee meeting attended and are reimbursed for all out-of-pocket expenses relating to attendance at such meetings.
4. Fund Distribution:
The Fund has adopted a Master Distribution 12b-1 Plan (the “Plan”) in which Quasar Distributors LLC (the “Distributor”) acts as the Fund’s distributor. The Plan permits the Fund to make payments for, or to reimburse the Distributor for, distribution-related costs and expenses of marketing shares of Class A covered under the Plan, and/or for providing shareholder services. The Plan does not apply to Class I. The following chart shows the current Plan fee rate for Class A.
| Class A | ||||
12b-1 Plan Fee | 0.25% | |||
Plan fees are based on average daily net assets of Class A. The Distributor, subject to applicable legal requirements, may waive the Plan fee voluntarily, in whole or in part. For the year ended September 30, 2012, there were no fees waived by the Distributor.
5. Securities Transactions:
The cost of securities purchased and proceeds from securities sold (excluding securities maturing less than one year from acquisition) for the year ended September 30, 2012 were as follows:
Purchases(Excl. U.S. Gov’t.) | Sales(Excl. U.S. Gov’t.) | Purchases of U.S. Gov’t. | Sales of U.S. Gov’t. | |||
$ 163,566,937 | $143,822,576 | $— | $— |
47
NOTES TO FINANCIAL STATEMENTS
|
6. Capital Share Transactions:
The Trust is authorized to issue 1,000,000,000 shares of beneficial interest (“shares outstanding”) with par value of $.0000001. Transactions in shares of the Fund are summarized below:
| For the Year Ended September 30, 2012 | For the Year Ended September 30, 2011 | |||||||
CAPITAL TRANSACTIONS: | ||||||||
Class A | ||||||||
Proceeds from shares issued | $ | 12,344,520 | $ | 4,360,376 | ||||
Distributions reinvested | 385,258 | 205,393 | ||||||
Cost of shares redeemed | (6,519,356 | ) | (8,377,225 | ) | ||||
|
|
|
| |||||
Change in Class A | $ | 6,210,422 | $ | (3,811,456 | ) | |||
|
|
|
| |||||
Class I | ||||||||
Proceeds from shares issued | $ | 46,925,085 | $ | 21,722,161 | ||||
Distributions reinvested | 9,899,600 | 10,344,407 | ||||||
Cost of shares redeemed | (19,185,481 | ) | (27,606,361 | ) | ||||
|
|
|
| |||||
Change in Class I | $ | 37,639,204 | $ | 4,460,207 | ||||
|
|
|
| |||||
Change in net assets resulting from capital transactions | $ | 43,849,626 | $ | 648,751 | ||||
|
|
|
| |||||
SHARE TRANSACTIONS: | ||||||||
Class A | ||||||||
Issued | 1,268,788 | 450,086 | ||||||
Reinvested | 39,600 | 21,131 | ||||||
Redeemed | (670,465 | ) | (866,187 | ) | ||||
|
|
|
| |||||
Change in Class A | 637,923 | (394,970 | ) | |||||
|
|
|
| |||||
Class I | ||||||||
Issued | 4,829,742 | 2,238,593 | ||||||
Reinvested | 1,018,555 | 1,064,932 | ||||||
Redeemed | (1,969,652 | ) | (2,851,208 | ) | ||||
|
|
|
| |||||
Change in Class I | 3,878,645 | 452,317 | ||||||
|
|
|
| |||||
Change in shares resulting from capital transactions | 4,516,568 | 57,347 | ||||||
|
|
|
| |||||
7. Federal Income Taxes:
It is the policy of the Fund to continue to qualify as a regulated investment company by complying with the provisions available to certain investment companies, as defined under Subchapter M of the Internal Revenue Code, and to distribute substantially all of its net investment income and net realized capital gains. Therefore, no federal tax liability is recorded in the financial statements of the Fund.
As of September 30, 2012, the tax cost of securities and the breakdown of unrealized appreciation (depreciation) was as follows:
Tax Cost of Securities | Unrealized Appreciation | Unrealized Depreciation | Net Unrealized Appreciation | |||||||||
$ 686,740,242 | $48,050,690 | $(1,779,655) | $46,271,035 | |||||||||
48
NOTES TO FINANCIAL STATEMENTS
|
The tax character of distributions were as follows:
| Distributions Paid From | ||||||||
| Ordinary Income | Total Distributions Paid | |||||||
For the year ended September 30, 2012 | $ | 24,109,633 | $ | 24,109,633 | ||||
For the year ended September 30, 2011 | $ | 26,023,509 | $ | 26,023,509 | ||||
As of September 30, 2012, the components of accumulated earnings/(losses) and tax character of distributions paid are as follows:
Undistributed Ordinary Income | Accumulated | Distributions | Deferred Qualified Late-Year Losses | Accumulated Loss Carryforwards | Unrealized | Total Accumulated | ||||||
$ 476,884 | $— | $(1,800,987) | $(5,475,077) | $(36,783,794) | $46,271,035 | $2,688,061 |
As of September 30, 2012, the Fund had capital loss carryforwards for federal income tax purposes as follows:
Capital Loss | Expires | |||||||||
| $ | 659,184 | 2013 | ||||||||
| $ | 27,743 | 2014 | ||||||||
| $ | 2,484,167 | 2015 | ||||||||
| $ | 8,197,543 | 2016 | ||||||||
| $ | 11,587,282 | 2018 | ||||||||
| $ | 4,011,206 | 2019 | ||||||||
The Fund had capital loss carryforwards of $3,756,334 expire as of the end of the fiscal year ending September 30, 2012.
As of September 30, 2012, the Fund had a short-term capital loss carryforward of $3,615,809 and a long-term capital loss carryforward of $6,200,860 available to offset future realized capital gains in accordance with the Regulated Investment Company Modernization Act of 2010. These capital loss carryforwards are not subject to expiration and must first be utilized to offset future realized gains of the same character and must be utilized prior to the utilization of the loss carryforwards subject to expiration that are described above.
Under current tax law, capital losses realized after October 31 of a Fund’s fiscal year may be deferred and treated as occurring on the first business day of the following fiscal year for tax purposes. The Fund deferred short-term qualified late-year capital losses of $2,640,521 and long-term qualified late-year capital losses of $2,834,556 which will be treated as arising on the first business day of the fiscal year ending September 30, 2013.
Management has analyzed the Fund’s tax positions taken or expected to be taken on federal income tax returns for all open tax years (the tax years ended September 30 of the years 2009, 2010, 2011 and 2012) and has concluded that no provision for federal income tax is required in the Fund’s financial statements. The Fund’s federal and state income and federal excise tax returns for tax years for which the applicable statutes of limitations have not expired are subject to examination by the Internal Revenue Service and state departments of revenue.
As of and during the year ended September 30, 2012, the Fund did not have a liability for any unrecognized tax benefits. The Fund recognizes interest and penalties, if any, related to unrecognized tax benefits as income tax expense in the Statement of Operations. During the year, the Fund did not incur any interest or penalties.
49
NOTES TO FINANCIAL STATEMENTS
|
8. Subsequent Events.
Management has evaluated the impact of all subsequent events on the Fund and has determined that there were no subsequent events requiring recognition or disclosure in the financial statements.
50
REPORT OF INDEPENDENT REGISTERED PUBLIC ACCOUNTING FIRM
|
To the Shareholders of Access Capital Community Investment Fund and Board of Trustees of RBC Funds Trust.
We have audited the accompanying statement of assets and liabilities, including the schedule of portfolio investments, of Access Capital Community Investment Fund (the “Fund”), one of the portfolios constituting the RBC Funds Trust as of September 30, 2012, and the related statements of operations and cash flows for the year then ended, the statements of changes in net assets for each of the two years in the period then ended and the financial highlights for each of the periods presented. These financial statements and financial highlights are the responsibility of the Fund’s management. Our responsibility is to express an opinion on these financial statements and financial highlights based on our audits.
We conducted our audits in accordance with the standards of the Public Company Accounting Oversight Board (United States). Those standards require that we plan and perform the audit to obtain reasonable assurance about whether the financial statements and financial highlights are free of material misstatement. The Fund is not required to have, nor were we engaged to perform, an audit of its internal control over financial reporting. Our audits included consideration of internal control over financial reporting as a basis for designing audit procedures that are appropriate in the circumstances, but not for the purpose of expressing an opinion on the effectiveness of the Fund’s internal control over financial reporting. Accordingly, we express no such opinion. An audit also includes examining, on a test basis, evidence supporting the amounts and disclosures in the financial statements, assessing the accounting principles used and significant estimates made by management, as well as evaluating the overall financial statement presentation. Our procedures included confirmation of securities owned as of September 30, 2012, by correspondence with the Fund’s custodian and brokers; where replies were not received from brokers. We believe that our audit provides a reasonable basis for our opinion.
In our opinion, the financial statements and financial highlights referred to above present fairly, in all material respects, the financial position of Access Capital Community Investment Fund, as of September 30, 2012, the results of its operations and its cash flows for the year then ended, the changes in its net assets for each of the two years in the period then ended, and the financial highlights for the periods presented, in conformity with accounting principles generally accepted in the United States of America.
DELOITTE & TOUCHE LLP
Chicago, Illinois
November 27, 2012
51
OTHER FEDERAL INCOME TAX INFORMATION (UNAUDITED)
|
The Fund reports a portion of the income dividends distributed during the fiscal year ended September 30, 2012, as qualified interest income as defined in the Internal Revenue Code as 100%.
The reporting is based on financial information available as of the date of this annual report and, accordingly, is subject to change. It is the intention of the Fund to report the maximum amount permitted under the Internal Revenue Code and the regulations thereunder.
52
|
Independent Trustees(1)(2)
T. Geron Bell (71)
Position, Term of Office and Length of Time Served with the Trust: Trustee since January 2004
Principal Occupation(s) During Past 5 Years: Chairman of the Executive Board of the Minnesota Twins (January 2011 to present); prior thereto President of Twins Sports, Inc. (parent company of the Minnesota Twins) (2002-2011); President of the Minnesota Twins Baseball Club Incorporated (1987-2002)
Number of Portfolios in Fund Complex Overseen by Trustee: 14
Other Director/Trustee Positions Held by Trustee During Past 5 Years: None
Lucy Hancock Bode (61)
Position, Term of Office and Length of Time Served with the Trust: Trustee since January 2004
Principal Occupation(s) During Past 5 Years: Healthcare consultant (self-employed)
Number of Portfolios in Fund Complex Overseen by Trustee: 14
Other Director/Trustee Positions Held by Trustee During Past 5 Years: BioSignia
Leslie H. Garner Jr. (62)
Position, Term of Office and Length of Time Served with the Trust: Trustee since January 2004
Principal Occupation(s) During Past 5 Years: President and CEO, The Greater Cedar Rapids Community Foundation (2010 to present); previously, President, Cornell College
Number of Portfolios in Fund Complex Overseen by Trustee: 14
Other Director/Trustee Positions Held by Trustee During Past 5 Years: None
Ronald James (61)
Position, Term of Office and Length of Time Served with the Trust: Trustee since January 2004
Principal Occupation(s) During Past 5 Years: President and Chief Executive Officer, Center for Ethical Business Cultures (2000 to present)
Number of Portfolios in Fund Complex Overseen by Trustee: 14
Other Director/Trustee Positions Held by Trustee During Past 5 Years: Best Buy Co. Inc.; Bremer Financial Corporation
John A. MacDonald (63)
Position, Term of Office and Length of Time Served with the Trust: Trustee since January 2004
Principal Occupation(s) During Past 5 Years: Vice President and Treasurer, Hall Family Foundation
Number of Portfolios in Fund Complex Overseen by Trustee: 14
Other Director/Trustee Positions Held by Trustee During Past 5 Years: None
H. David Rybolt (70)
Position, Term of Office and Length of Time Served with the Trust: Trustee since January 2004
Principal Occupation(s) During Past 5 Years: Consultant, HDR Associates (management consulting)
Number of Portfolios in Fund Complex Overseen by Trustee: 14
Other Director/Trustee Positions Held by Trustee During Past 5 Years: None
53
MANAGEMENT (Unaudited)
|
Independent Trustees(1)(2)
James R. Seward (60)
Position, Term of Office and Length of Time Served with the Trust: Chairman of the Board and Trustee since January 2004
Principal Occupation(s) During Past 5 Years: Private investor (2000 to present); CFA
Number of Portfolios in Fund Complex Overseen by Trustee: 14
Other Director/Trustee Positions Held by Trustee During Past 5 Years: Syntroleum Corporation; Brookdale Senior Living Inc.
William B. Taylor (67)
Position, Term of Office and Length of Time Served with the Trust: Trustee since September 2005
Principal Occupation(s) During Past 5 Years: Consultant (2003 to present); prior thereto Partner (until 2003) Ernst & Young LLP
Number of Portfolios in Fund Complex Overseen by Trustee: 14
Other Director/Trustee Positions Held by Trustee During Past 5 Years: William Henry Insurance, LLC
Interested Trustees(1)(2)(3)
Kathleen A. Gorman (48)(5)
Position, Term of Office and Length of Time Served with the Trust: Trustee since September 2012
Principal Occupation(s) During Past 5 Years: President and Chief Executive Officer, RBC Funds (2012 to present); Chief Compliance Officer, RBC Funds (2006 to present); Director of Regulatory Administration, RBC Global Asset Management (U.S.) Inc. (2007 to present); Chief Compliance Officer, RBC Global Asset Management (U.S.) Inc. (2006-2009)
Number of Portfolios in Fund Complex Overseen by Trustee: 14
Other Director/Trustee Positions Held by Trustee During Past 5 Years: None
Executive Officers(1)(3)(4)
Kathleen A. Gorman (48)
Position, Term of Office and Length of Time Served with the Trust: President and Chief Executive Officer since September 2012; Chief Compliance Officer since April 2006 and Assistant Secretary since September 2006
Principal Occupation(s) During Past 5 Years:
President and Chief Executive Officer, RBC Funds (2012 to present); Chief Compliance Officer, RBC Funds (2006 to present); Director of Regulatory Administration, RBC Global Asset Management (U.S.) Inc. (2007 to present); Chief Compliance Officer, RBC Global Asset Management (U.S.) Inc. (2006-2009)
James A. Gallo (48)
Address: BNY Mellon Investment Servicing (US) Inc., 760 Moore Road, King of Prussia, PA 19406
Position, Term of Office and Length of Time Served with the Trust: Treasurer since October 2007
Principal Occupation(s) During Past 5 Years: Senior Vice President and Managing Director, BNY Mellon Investment Servicing (US) Inc. (2002 to present)
54
MANAGEMENT (Unaudited)
|
Executive Officers(1)(3)(4)
Kathleen A. Hegna (45)
Position, Term of Office and Length of Time Served with the Trust: Chief Financial Officer and Principal Accounting Officer since May 2009
Principal Occupation(s) During Past 5 Years: Associate Vice President and Director, Mutual Fund Accounting and Administration, RBC Global Asset Management (U.S.) Inc. (2009 to present); Senior Compliance Officer, RBC Global Asset Management (U.S.) Inc. (2006-2009); Director, Asset Management Compliance, RiverSource Investments (2005-2006)
Lee Thoresen (41)
Position, Term of Office and Length of Time Served with the Trust: Chief Legal Officer and Secretary since March 2008
Principal Occupation(s) During Past 5 Years: Associate General Counsel, RBC Capital Markets, LLC (2006-present); Asset Management Compliance, RiverSource Investments (2004-2006)
Ronald A. Homer (65)
Position, Term of Office and Length of Time Served with the Trust: President, Access Capital Community Investment Fund, since July 2008
Principal Occupation(s) During Past 5 Years: Managing Director, RBC Global Asset Management (U.S.) Inc. and President, Access Capital Community Investment Fund (July 2008 to present); Chief Executive Officer and Co-Managing Member, Access Capital Strategies LLC (1997-July 2008); Chairman, Access Capital Strategies Community Investment Fund (1998-July 2008)
| (1) | Except as otherwise noted, the address of each Trustee/Officer is RBC Funds Trust, 100 South Fifth Street, Suite 2300, Minneapolis, Minnesota 55402. |
| (2) | All Trustees must retire on or before December 31 of the year in which they reach age 75. The Board may temporarily waive this requirement when necessary to avoid depriving the Board of a Trustee with critical skills. |
| (3) | On December 31, 2009, Voyageur Asset Management Inc. changed its name to RBC Global Asset Management (U.S.) Inc. Any references to RBC Global Asset Management (U.S.) Inc. for prior periods are deemed to be references to the prior entity. |
| (4) | Each officer serves in such capacity for an indefinite period of time until his or her removal, resignation or retirement. |
| (5) | Kathleen A. Gorman has been determined to be an interested Trustee by virtue of her position with the Advisor. |
The Funds’ Statement of Additional Information includes information about the Funds’ Trustees. To receive your free copy of the Statement of Additional Information, call toll free: 1-800-422-2766.
55
SHARE CLASS INFORMATION (UNAUDITED)
|
The Access Capital Community Investment Fund offers Class A and Class I shares.
Class A
Class A shares are available for purchase primarily through investment advisors, broker-dealers, banks and other financial services intermediaries. Class A shares of the Fund are currently subject to a maximum up-front sales charge of 3.75% and a 1.00% CDSC for redemption within 12 months of a $1 million or greater purchase. Class A shares currently include a 0.25% annual 12b-1 service and distribution fee.
Class I
Class I shares are intended for investors meeting certain minimum investment thresholds. This share class does not have an up-front sales charge (load) or a 12b-1 service and distribution fee.
56
SUPPLEMENTAL INFORMATION (UNAUDITED)
|
Shareholder Expense Examples
As a shareholder of the Access Capital Community Investment Fund, you incur two types of costs: (1) transaction costs, and (2) ongoing costs, including management fees and other Fund expenses. This example is intended to help you understand your ongoing costs (in dollars) of investing in the Fund and to compare these costs with the ongoing costs of investing in other mutual funds.
The Example is based on an investment of $1,000 invested at the beginning of the period and held for the entire period from April 1, 2012 through September 30, 2012.
Actual Expenses
The table below provides information about actual account values and actual expenses. You may use the information below, together with the amount you invested, to estimate the expenses that you paid over the period. Simply divide your account value by $1,000 (for example, an $8,600 account value divided by $1,000 = 8.6), then multiply the result by the number in the table under the heading entitled “Expenses Paid During Period” to estimate the expenses you paid on your account during this period.
Beginning | Ending | Expenses Paid | Annualized | |||||
Class A | $ 1,000.00 | $1,025.90 | $5.14 | 1.02% | ||||
Class I | $ 1,000.00 | $1,027.20 | $3.93 | 0.78% |
Hypothetical Example for Comparison Purposes
The table below provides information about hypothetical account values and hypothetical expenses based on the Fund’s actual expense ratio and an assumed rate of return of 5% per year before expenses, which is not the Fund’s actual return. The hypothetical account values and expenses may not be used to estimate the actual ending account balance or expenses you paid for the period. You may use this information to compare this 5% hypothetical example with the 5% hypothetical examples that appear in the shareholder reports of other funds.
Please note that the expenses shown in the table are meant to highlight your ongoing costs only and do not reflect any transactional costs, such as sales charges (loads), redemption fees, or exchange fees. Therefore, the table is useful in comparing ongoing costs only, and will not help you determine the relative total costs of owning different funds. In addition, if these transactional costs were included, your costs would have been higher.
Beginning Account Value 4/1/12 | Ending | Expenses Paid | Annualized | |||||
Class A | $ 1,000.00 | $1,019.79 | $5.12 | 1.02% | ||||
Class I | $ 1,000.00 | $1,020.98 | $3.92 | 0.78% |
* Expenses are equal to the average account value times the Fund’s annualized expense ratio multiplied by 182/366 (to reflect one half-year period).
57
APPROVAL OF INVESTMENT ADVISORY AGREEMENT (UNAUDITED)
|
Information Regarding the Approval of Investment Advisory Agreement
In September 2012, after evaluating the services provided by RBC Global Asset Management (U.S.), Inc. (the “Advisor”) and reviewing the performance, fees, and expenses of the Fund, the RBC Funds Board of Trustees (the “Trustees”) determined to approve the continuation of the investment advisory agreement (“Agreement”) with the Advisor for the Fund for an additional year.
As part of their review of the Agreement, the Trustees requested and considered information regarding the advisory services performed by the Advisor, the staffing and qualifications of the personnel responsible for operating and managing the Fund, and the Fund’s performance and expenses. The Trustees considered information provided at regular quarterly Board and Committee meetings throughout the year as well as information presented at both a special meeting held to review requested material related to the proposed renewals and a meeting held specifically to consider the proposed renewals. In connection with their deliberations, the independent Trustees were advised by their own independent legal counsel with regard to the materials and their responsibilities under relevant laws and regulations.
The Trustees met with representatives from the Advisor’s senior management team, as well as the senior investment professionals responsible for managing the Fund, to discuss the information and the Advisor’s ongoing management of the Fund. The Trustees reviewed the nature, quality, and extent of the services provided to the Fund by the Advisor, including information as to the Fund’s performance relative to appropriate securities index benchmarks as well as fund peer group comparative information requested by the Board. The Trustees also requested information regarding other funds that focus particularly on investments eligible for regulatory credit under the Community Reinvestment Act of 1977 (“CRA”). The Trustees reviewed the investment advisory fees payable to the Advisor and reviewed comparative fee and expense information for similarly situated funds. The Trustees also received reports from the Advisor regarding the performance and fee levels for other advisory client accounts it advised in a similar strategy. The Trustees reviewed profitability data — including year-over-year variances — for the Advisor and considered information regarding other benefits the Advisor and its affiliates derived from their relationships with the Funds, including soft dollars and other fall-out benefits and the Advisor’s role as co-administrator of the Funds and the fees paid by the Funds for such services.
With regard to Fund performance, the Trustees reviewed information for the Fund as classified in a Lipper group of thirteen institutional U.S. mortgage funds and the Lipper universe of all other institutional U.S. mortgage funds. The Fund’s advisory fees and overall expense levels were higher than its peers, but the Trustees acknowledged that the Fund’s use of leverage contributed to its relatively higher expenses. The Trustees also considered the Advisor’s contractual agreement to subsidize fund expenses at competitive levels through expense limitation agreements and viewed such commitments favorably.
In considering the quality of services to be provided by the Advisor, the Trustees discussed the strong research, credit, and fundamental analysis capabilities; the specialized expertise in the area of fixed income investments eligible for regulatory credit under the CRA; and the extensive portfolio management experience of the Advisor’s staff as well as its operational and compliance structure and systems and financial strength.
58
APPROVAL OF INVESTMENT ADVISORY AGREEMENT (UNAUDITED)
|
Based upon their review, the Trustees determined that the advisory fees proposed to be payable to the Advisor were fair and reasonable in light of the nature and quality of services provided under all of the circumstances and were within the range of what might have been negotiated at arms’ length. The Trustees concluded that it is in the interests of the Fund and its shareholders for the Trustees to approve the continuation of the Agreement and expense limitation arrangement for the Fund. In arriving at their collective decision to approve the renewal of the Agreement, the Trustees did not assign relative weights to the factors discussed above or deem any one or group of them to be controlling in and of itself.
59
|
This Page Intentionally Left Blank
60
Access Capital
P.O. Box 701
Milwaukee, WI 53201-0701
800-422-2766
www.rbcgam.us
Performance data represents past performance and does not guarantee future results. The principal value of an investment and investment return will fluctuate so that an investor’s shares, when redeemed, may be worth more or less than their original cost.
This report and the financial statements contained herein are provided for the information of RBC Funds shareholders. This report is not authorized for distribution to prospective investors unless preceded or accompanied by a current prospectus, which contains information concerning investment objectives, risks, charges and expenses of the Fund. Please read the prospectus carefully before investing.
This report and the financial statements contained herein are not intended to be a forecast of future events, a guarantee of future results, or investment advice. There is no assurance that certain securities will remain in or out of the Fund’s portfolio. The views expressed in this report reflect those of the portfolio managers through the year ended September 30, 2012.
NOT FDIC INSURED • NO BANK GUARANTEE • MAY LOSE VALUE
RBC Global Asset Management U.S., Inc. serves as investment adviser to the Access Capital Community Investment Fund. The Fund is distributed by Quasar Distributors LLC.

The RBC Funds are pleased to offer shareholder reports printed entirely on Forest Stewardship Council certified paper. FSC® certification ensures that the paper used in this report contains fiber from well-managed and responsibly harvested forests that meet strict environmental and socioeconomic standards.
RBCF-AC AR 09-12

RBC Funds | ||||||||||
\ | ||||||||||
About Your Annual Report |
This annual report includes detailed information about your Fund including financial statements, performance, and a complete list of its holdings.
The RBC Funds compare their performance against various indices. Each of these indices is a widely recognized measure of return for the underlying category of securities. However, the indices are unmanaged, do not include fees, and cannot be invested in directly.
We hope the financial information presented will help you evaluate your investment in the RBC Funds. We also encourage you to read your Fund’s prospectus for further detail as to your Fund’s investment policies and risk profile. RBC Funds prospectuses and performance information subsequent to the date of this report are available on our website at www.rbcgam.us.
A description of the policies and procedures that your Fund uses to determine how to vote proxies relating to portfolio securities is available (i) without charge, upon request, by calling 1-800-422-2766; (ii) on the Fund’s website at www.rbcgam.us; and (iii) on the Securities and Exchange Commission’s (the “Commission”) website at http://www.sec.gov.
Information regarding how your Fund voted proxies relating to portfolio securities during the most recent 12-month period ended June 30 will be available (i) on the Fund’s website at www.rbcgam.us; and (ii) on the Commission’s website at http://www.sec.gov.
A schedule of each Fund’s portfolio holdings will be filed with the Commission for the first and third quarters of each fiscal year on Form N-Q. This information is available on the Commission’s website at http://www.sec.gov and may be reviewed and copied at the Commission’s Public Reference Room in Washington, D.C. Information on the operation of the Public Reference Room is available by calling 1-202-551-8090. |
| ||||||||
Contents | ||||||||||
| 1 | ||||||||||
| 3 | ||||||||||
| 5 | ||||||||||
| 8 | ||||||||||
| 10 | ||||||||||
| 12 | ||||||||||
| 14 | ||||||||||
| 16 | ||||||||||
| 39 | ||||||||||
| 40 | ||||||||||
| 41 | ||||||||||
| 42 | ||||||||||
| 46 | ||||||||||
| 60 | ||||||||||
| 61 | ||||||||||
| 62 | ||||||||||
| 65 | ||||||||||
| 66 | ||||||||||
| 67 | ||||||||||
In managing the RBC BlueBay Funds, we continued to take advantage of structural trends in global emerging market and corporate debt. However, it was a volatile year for risk assets as the ongoing crisis in the eurozone and fears surrounding the direction of global growth continued to impact markets. In such a challenging environment, we maintained our key focus on capital preservation for our investors. Our commitment to preserving investors’ capital meant that we adopted a more cautious strategy across all the RBC BlueBay Funds. We preferred to focus on more defensively-oriented sectors such as telecommunications, utilities and oil and gas, which are better-equipped to withstand exogenous shocks and less sensitive to fluctuations in the global economic environment.
As we enter the final months of 2012, we believe that the positive actions taken by both the U.S. and European central banks should continue to provide technical support for risk assets. Investors may increase their exposure to assets that should benefit from easier monetary conditions. Nevertheless, more fundamental risks remain. In our view a further deterioration in leading global macro data, disappointing earnings or developments around the U.S.fiscal cliff could spell trouble for risk assets. Within high yield, the strong technical support for the asset class, particularly from retail mutual funds and ETFs, could also reverse as yields have compressed to near-record-low levels.
Whilst overall we believe the underlying fundamental situation within emerging markets remains supportive, we need to remain alert to a more convincing recovery of emerging market growth indicators. The most recent set of economic data continues to present a mixed picture. We have seen some signs of improvement in places like China, although on the other side of that, export data in Taiwan and Indonesia remains disappointing. Looking at Asia as a leading indicator for a turn in the global growth cycle does not, at the moment, give us confidence to move into aggressively longer and higher-systemic risk positions. However, we continue to see opportunities in emerging market debt and believe that the return outlook overall should continue to be rewarding.
Within emerging market corporate debt, we are starting to see an increase in differentiation as a number of higher-yielding credits are downgraded or default on their debt. Nevertheless, while we continue to be concerned with the deterioration in the more cyclical, higher-yielding segment of the market, defensively- oriented corporates continue to perform well and offer attractive investment opportunities. The default rate on emerging market high yield corporates is also lower than their U.S. counterparts. Consequently, we remain constructive on the asset class although expect differentiation in performance to become more apparent, highlighting the need for bottom-up fundamental research to generate excess return.
As we move forward, despite what the return environment holds in store, we will continue to strive for strong absolute and risk-adjusted returns across all the RBC BlueBay Funds while maintaining our focus on capital preservation. Thank you for your continued confidence and trust in the RBC BlueBay Funds. | ||||||
Sincerely, | ||||||
| ||||||
Mark Poole | ||||||
Chief Investment Officer | ||||||
BlueBay Asset Management LLP | ||||||

1
LETTER FROM THE CIO TO RBC FUND SHAREHOLDERS
| ||||||
| Past performance is not a guarantee of future results. | ||||||
| Mutual fund investing involves risk. Principal loss is possible. | ||||||
| The RBC BlueBay Mutual Funds are distributed by Quasar Distributors, LLC, an affiliate of U.S. Bancorp Fund Services, LLC. | ||||||
| ||||||
2
| ||||||
RBC Global Asset Management (U.S.) Inc. (“RBC GAM (US)”) serves as the investment advisor and BlueBay Asset Management LLP (“BlueBay”) serves as the investment sub-advisor to the RBC BlueBay Funds and is responsible for the overall management of the Funds’ portfolios. The individuals primarily responsible for the day-to-day management of the Funds’ portfolios are set forth below. | ||||||
David Dowsett | ||||||
Senior Portfolio Manager | ||||||
David Dowsett is responsible for portfolio management of the RBC BlueBay Emerging Market Select Bond Fund. David joined BlueBay in April 2002. Previously he spent seven years at Deutsche Asset Management (formerly Morgan Grenfell Asset Management) where he was a Board Director with responsibility for emerging markets and a member of the Investment Policy Committee for all fixed income. David has a BA (Hons) degree in Politics and Economics from Durham University. | ||||||
Nick Shearn | ||||||
Portfolio Manager | ||||||
Nick Shearn is responsible for portfolio management of the RBC BlueBay Emerging Market Select Bond Fund. Nick joined BlueBay in June 2011 from The Royal Bank of Scotland, where he was Head of Local Markets Rates Trading for the CEEMEA region. Prior to this he spent ten years at Deutsche Bank in Johannesburg (1998-2002) and London (2002-2008) trading local markets products. Before trading emerging markets products, Nick focused on the Eurobond markets and was Head of Liquid Credit Trading at JP Morgan before joining DKB International as Head of Trading in 1995. He has a BSc Econ (Hons) from Queen Mary College, London University. | ||||||
Polina Kurdyavko | ||||||
Senior Portfolio Manager | ||||||
Polina Kurdyavko is head of the Emerging Market Corporate Debt team at BlueBay and is responsible for portfolio management of the RBC BlueBay Emerging Market Corporate Bond Fund. Polina joined BlueBay in July 2005 from UBS where she worked as a Credit Analyst in EMEA corporate research. Her role involved secondary coverage of CEEMEA issuers and research support for primary issuance of select corporates. Prior to this, Polina was with Alliance Capital where she started as an emerging markets equity analyst and then moved on to pioneer emerging markets quantitative research at Alliance. Polina holds an MSc (Hons) in Finance from the People’s Friendship University of Russia, Moscow and is a CFA charterholder. | ||||||
Adam Borneleit | ||||||
Portfolio Manager | ||||||
Adam Borneleit is responsible for portfolio management of the RBC BlueBay Emerging Market Corporate Bond Fund. Adam joined BlueBay in June 2008 from Pacific Investment Management Company (PIMCO) where he worked since 2000. He was part of the Emerging Markets Portfolio Management team with a focus on corporate bonds. Prior to that, he was a Credit Analyst in SunAmerica’s high-yield bond group, a manager at PriceWaterhouse Moscow’scorporate finance group in Russia, and an Analyst in Prudential’s private-placement group. Adam holds bachelor’s degrees in both economics and French from the University of Pennsylvania’s Wharton School and College of Arts and Sciences, and an MBA from Stanford University’s Graduate School of Business. |
3
PORTFOLIO MANAGERS | ||||||
Anthony Robertson | ||||||
| Head of Global Leveraged Finance Group | ||||||
| Senior Portfolio Manager | ||||||
| Anthony Robertson is responsible for portfolio management of the RBC BlueBay Global High Yield Bond Fund. Anthony joined BlueBay in August 2004 from Putnam Investments (formerly New Flag Asset Management) where he was a Senior Portfolio Manager responsible for European high yield portfolios. Prior to Putnam, Anthony held similar roles at Standard Asset Management, London & Capital Asset Management, and the West Merchant Bank (West LB). Anthony received his Bachelor of Commerce (Honours) from the University of Natal. | ||||||
Peter Higgins | ||||||
| Head of Leveraged Loans | ||||||
| Senior Portfolio Manager | ||||||
| Peter Higgins is responsible for portfolio management of the RBC BlueBay Global High Yield Bond Fund. Peter joined BlueBay in January 2008 as a Portfolio Manager with the High Yield team. Previously, he was Director of proprietary trading at Deutsche Bank within the Principal Strategies Group. Peter also spent four years at Goldman Sachs where he was a Desk Analyst in high yield trading. Prior to this, he was at Credit Suisse in high yield capital markets after beginning his career as an investment banker with Prudential Securities. Peter holds a BA from Columbia University. | ||||||
Michael Reed | ||||||
| Senior Portfolio Manager | ||||||
| Michael Reed is responsible for portfolio management of the RBC BlueBay Global Convertible Bond Fund. Michael joined BlueBay in October 2007 from Pendragon, where, as a Partner, he ran the company’s convertible arbitrage strategies. Prior to that, he was a Managing Director of Salomon Brothers, responsible for international convertible bond trading between 1994 and 2002. Michael joined the Japanese Warrant Arbitrage desk at Salomon in 1989 and spent two years trading Japanese Warrant Arbitrage in Tokyo. Michael holds a Bachelor of Engineering from Southampton University. | ||||||
Alessandro Esposito | ||||||
| Portfolio Manager | ||||||
| Alessandro Esposito is responsible for portfolio management of the RBC BlueBay Global Convertible Bond Fund. Alessandro joined BlueBay in December 2007 as a portfolio manager on the convertible arbitrage team. He began his career in 1998 at JP Morgan before moving to Intesa in 2000. He began trading hybrids and equity derivatives at Morgan Stanley in 2003 and ran the convertible arbitrage strategy at Peloton Partners since 2006. He has an MSc in Mathematical Trading and Finance and is a CFA charterholder. | ||||||
4
Aggregate Total Returns as of September 30, 2012
| Since Inception(a) | Net Expense Ratio(1)(2)(3)(4) | Gross Expense Ratio(1)(2)(3)(4) | ||||
RBC BlueBay Emerging Market Select Bond Fund | ||||||
Class I | 11.60% | 1.00% | 1.35% | |||
50% JPMorgan EMBI Global Diversified/50% JPMorgan | 12.97% | |||||
RBC BlueBay Emerging Market Corporate Bond Fund | ||||||
Class I | 13.06% | 1.15% | 2.27% | |||
JPMorgan CEMBI Diversified(b) | 14.70% | |||||
RBC BlueBay Global High Yield Bond Fund | ||||||
Class I | 13.16% | 0.95% | 1.76% | |||
BofA Merrill Lynch Global High Yield | 16.29% | |||||
RBC BlueBay Global Convertible Bond Fund | ||||||
Class I | 8.65% | 1.00% | 2.04% | |||
UBS Global Focus Convertible Index(b) | 8.66% | |||||
Performance data quoted represents past performance. Past performance is no guarantee of future results. Investment return and principal value of an investment will fluctuate so that an investor’s shares, when redeemed, may be worth more or less than their original cost. Current performance may be lower or higher than performance quoted. Performance shown reflects contractual fee waivers, without such fee waivers total returns would be reduced. Performance information does not reflect the 2% fee on shares redeemed or exchanged within 30 days of purchase. If such redemption fee was included, performance would be reduced. For performance data current to the most recent month-end go to www.rbcgam.us. Please see footnotes below.
(1) The Funds’ expenses reflect actual expenses from November 30, 2011 to September 30, 2012.
(2) The Adviser has contractually agreed to waive fees and/or make payments in order to keep total operating expenses of the Fund to the levels listed under net expense ratio until January 31, 2014.
(3) For the period from November 30, 2011 (commencement of operations) to September 30, 2012.
(4) Annualized.
(a) The inception date (commencement of operations) of each Fund is November 30, 2011.
(b) Each of the comparative indices is a widely recognized market value weighted measure of the return of securities, but do not include sales fees or operating expenses. You cannot invest directly in indices.
JPMorgan Emerging Markets Bond Index (“EMBI”) Global tracks total returns for US Dollar denominated debt instruments issued by emerging market sovereign and quasi-sovereign entities: Brady bonds, loans, Eurobonds and local market instruments.
5
PERFORMANCE SUMMARY |
JPMorgan Government Bond Index - Emerging Markets (“GBI-EM”) Global Diversified Index (Unhedged) is a comprehensive global local emerging markets index, and consists of regularly traded, liquid fixed-rate, domestic currency government bonds to which international investors can gain exposure.
The J.P. Morgan Corporate Emerging Markets Bond Index (“CEMBI”) Diversified limits the weights of those index countries with larger corporate debt stocks by only including a specified portion of these countries’ eligible current face amounts of debt outstanding. The CEMBI Diversified results in well-distributed, more balanced weightings for countries included in the index. The countries covered in the CEMBI Diversified are identical to those covered by the CEMBI.
The BofA Merrill Lynch Global High Yield Constrained Index tracks the performance of below investment grade bonds of corporate issuers domiciled in countries having an investment grade foreign currency long term debt rating.
The UBS Global Focus Convertible Index measures the size and performance of the most liquid convertible issues.
6
|
This Page Intentionally Left Blank
7
8
| MANAGEMENT DISCUSSION AND ANALYSIS (UNAUDITED) | ||||||||||
RBC BlueBay Emerging Market Select Bond Fund
| ||||||||||
Current income and capital appreciation.
| Investment Objective
| |||||||||
50% JPMorgan EMBI Global Diversified/50% JPMorgan GBI-EM Broad Diversified Index
| Benchmark
| |||||||||
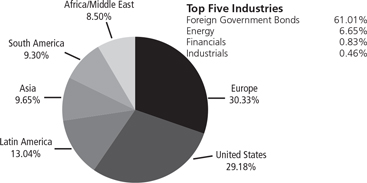 | Asset Allocation (as of 9/30/12) (% of fund’s investments) & Top Five Industries (as of 9/30/12) (% of fund’s net assets)
| |||||||||
| Russian Foreign Bond - Eurobond, 7.50%, 3/31/30 | 3.26% | Ukraine Government International Bond, 9.25%, 7/24/17 | 2.37% | Top Ten Holdings (as of 9/30/12) (% of fund’s net assets) | ||||||
| Poland Government Bond, 5.75%, 10/25/21 | 3.17% | Turkey Government International Bond, 6.88%, 3/17/36 | 2.13% | |||||||
| South Africa Government Bond, 10.50%, 12/21/26 | 3.14% | South Africa Government International Bond, 5.88%, 5/30/22 | 1.91% | |||||||
| Turkey Government Bond, 9.50%, 1/12/22 | 2.76% | Russian Federal Bond - OFZ, 7.40%, 4/19/17 | 1.87% | |||||||
| Mexico Government International Bond, 5.95%, 3/19/19 | 2.64% | Petrobras International Finance Co., 7.88%, 3/15/19 | 1.85% | |||||||
*A listing of all portfolio holdings can be found beginning on page 16.
| ||||||||||
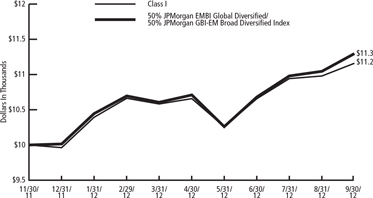 | Growth of $10,000 Initial Investment Since Inception (11/30/11) | |||||||||
The graph reflects an initial investment of $10,000 over the period from November 30, 2011 to September 30, 2012 and is based on Class I shares. The Fund’s total return includes reinvested dividends and capital gains. The Fund’s total return also includes operating expenses that reduce return, while the total return of the index does not. The graph does not reflect the deduction of taxes that a shareholder would pay on fund distributions or redemption of fund shares. | ||||||||||
9
10
MANAGEMENT DISCUSSION AND ANALYSIS (UNAUDITED) | ||||||||||||
RBC BlueBay Emerging Market Corporate Bond Fund
| ||||||||||||
Current income and capital appreciation.
| Investment Objective
| |||||||||||
JPMorgan CEMBI Diversified Index
| Benchmark
| |||||||||||
| Asset Allocation (as of 9/30/12) (% of fund’s investments) & Top Five Industries (as of 9/30/12) (% of fund’s net assets)
| |||||||||||
| Reliance Holdings USA, Inc., 5.40%, 2/14/22 | 3.05% | Myriad International Holding BV, 6.38%, 7/28/17 | 1.93 | % | Top Ten Holdings (as of 9/30/12) (% of fund’s net assets) | |||||||
Sun Hung Kai Properties Capital Market Ltd., 4.50%, 2/14/22 | 2.75% | Sigma Alimentos SA de CV, 5.63%, 4/14/18 | 1.89 | % | ||||||||
VTB Bank OJSC Via VTB Capital SA, 6.00%, 4/12/17 | 2.37% | QGOG Atlantic/Alaskan Rigs Ltd., 5.25%, 7/30/18 | 1.86 | % | ||||||||
Turkiye Halk Bankasi AS, 4.88%, 7/19/17 | 2.32% | Empresa de Energia de Bogota SA, | 1.85 | % | ||||||||
Indosat Palapa Co. BV, 7.38%, 7/29/20 | 1.94% | 6.13%, 11/10/21 | ||||||||||
Telemar Norte Leste SA, 5.50%, 10/23/20 | 1.79 | % | ||||||||||
*A listing of all portfolio holdings can be found beginning on page 24.
| ||||||||||||
| Growth of $10,000 Initial Investment Since Inception (11/30/11)
| |||||||||||
| The graph reflects an initial investment of $10,000 over the period from November 30, 2011 to September 30, 2012 and is based on Class I shares. The Fund’s total return includes reinvested dividends and capital gains. The Fund’s total return also includes operating expenses that reduce return, while the total return of the index does not. The graph does not reflect the deduction of taxes that a shareholder would pay on fund distributions or redemption of fund shares. | ||||||||||||
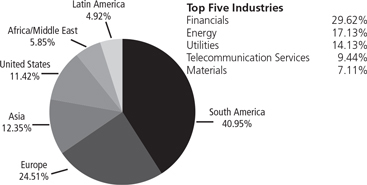
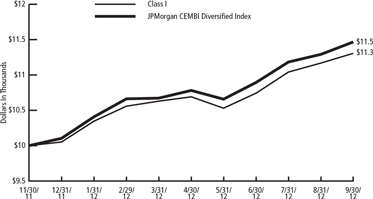
11
12
| MANAGEMENT DISCUSSION AND ANALYSIS (UNAUDITED) | ||||||||||
RBC BlueBay Global High Yield Bond Fund
| ||||||||||
Current income and capital appreciation. | Investment Objective
| |||||||||
BofA Merrill Lynch Global High Yield Constrained Index | Benchmark
| |||||||||
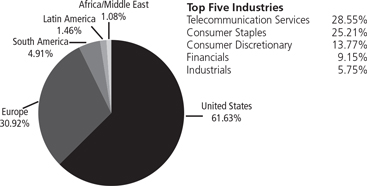 | Asset Allocation (as of 9/30/12) (% of fund’s (as of 9/30/12) (% of fund’s net assets)
| |||||||||
Columbus International, Inc., 11.50%, 11/20/14 | 2.99% | Tenet Healthcare Corp., 8.00%, 8/1/20 | 1.76% | Top Ten Holdings (as of 9/30/12) (% of fund’s net assets) | ||||||
US Telepacific Holdings Corp. Term Loan, | 2.14% | Level 3 Financing, Inc., 8.13%, 7/1/19 | 1.74% | |||||||
Biomet, Inc., 10.00%, 10/15/17 | 2.10% | BI-LO LLC/BI-LO Finance Corp., | 1.66% | |||||||
Cequel Communications Holdings I LLC/Cequel Capital Corp., 8.63%, 11/15/17 | 2.00% | Valeant Pharmaceuticals International, 6.88%, 12/1/18 | 1.64% | |||||||
MU Finance Plc, 8.75%, 2/1/17 | 1.87% | WOW Finance Term Loan, | 1.60% | |||||||
*A listing of all portfolio holdings can be found beginning on page 29.
| ||||||||||
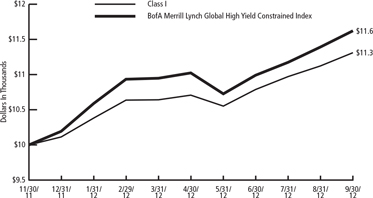 | Growth of $10,000 Since Inception (11/30/11) | |||||||||
The graph reflects an initial investment of $10,000 over the period from November 30, 2011 to September 30, 2012 and is based on Class I shares. The Fund’s total return includes reinvested dividends and capital gains. The Fund’s total return also includes operating expenses that reduce return, while the total return of the index does not. The graph does not reflect the deduction of taxes that a shareholder would pay on fund distributions or redemption of fund shares. | ||||||||||
13
14
MANAGEMENT DISCUSSION AND ANALYSIS (UNAUDITED) | ||||||||||||
RBC BlueBay Global Convertible Bond Fund
| ||||||||||||
Current income and capital appreciation.
| Investment Objective | |||||||||||
UBS Global Focus Convertible Index
| Benchmark | |||||||||||
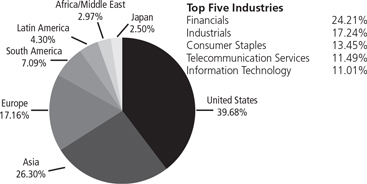 | Asset Allocation (as of 9/30/12) (% of fund’s investments) & Top Five Industries (as of 9/30/12) (% of fund’s net assets) | |||||||||||
Medivation, Inc., 2.63%, 4/1/17 | 4.01% |
Seadrill Ltd., 3.38%, 10/27/17 |
3.28% |
Top Ten Holdings (as of 9/30/12) (% of fund’s net assets) | ||||||||
| BNP Paribas SA, 0.25%, 9/21/15 | 3.85% | BTS Group Holdings PCL, 1.00%, | 3.09% | |||||||||
| VeriSign, Inc., 3.25%, 8/15/37 | 3.63% | 1/25/16 | ||||||||||
| Gilead Sciences, Inc., 1.00%, 5/1/14 | 3.59% | Western Areas NL, 6.40%, 7/2/15 | 3.09% | |||||||||
| Liberty Interactive LLC, 3.13%, 3/30/23 | 3.36% | Aabar Investments PJSC, 4.00%,5/27/16 | 3.07% | |||||||||
| Siemens Financieringsmaatschappij NV, | 2.99% | |||||||||||
1.05%, 8/16/17
| ||||||||||||
*A listing of all portfolio holdings can be found beginning on page 35.
| ||||||||||||
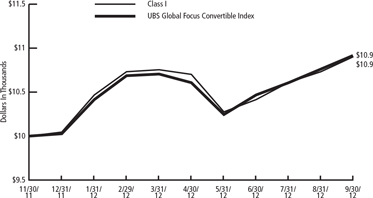 | Growth of $10,000 Initial Investment Since Inception (11/30/11) | |||||||||||
| The graph reflects an initial investment of $10,000 over the period from November 30, 2011 to September 30, 2012 and is based on Class I shares. The Fund’s total return includes reinvested dividends and capital gains. The Fund’s total return also includes operating expenses that reduce return, while the total return of the index does not. The graph does not reflect the deduction of taxes that a shareholder would pay on fund distributions or redemption of fund shares. | ||||||||||||
15
RBC BlueBay Emerging Market Select Bond Fund
|
|
September 30, 2012
Principal Amount | Value | |||||
| ||||||
Corporate Bonds — 9.20% | ||||||
British Virgin Islands — 0.90% | ||||||
$ 350,000 | CNOOC Finance 2012 Ltd., 3.88%, 5/2/22 | $ | 369,858 | |||
650,000 | Sinopec Group Overseas Development 2012 Ltd., 4.88%, 5/17/42 | 725,581 | ||||
|
| |||||
| 1,095,439 | ||||||
|
| |||||
Cayman Islands — 3.14% | ||||||
280,000 | Petrobras International Finance Co., 3.50%, 2/6/17 | 293,050 | ||||
930,000 | Petrobras International Finance Co., 5.38%, 1/27/19 | 1,050,098 | ||||
191,000 | Petrobras International Finance Co., 6.75%, 1/27/41 | 238,674 | ||||
1,800,000 | Petrobras International Finance Co., 7.88%, 3/15/19 | 2,253,779 | ||||
|
| |||||
| 3,835,601 | ||||||
|
| |||||
Columbia — 0.41% | ||||||
500,000 | Bancolombia SA, 5.13%, 9/11/22 | 507,390 | ||||
Indonesia — 0.43% | ||||||
480,000 | Pertamina Persero PT, 6.00%, 5/3/42 | 519,600 | ||||
Luxembourg — 0.52% | ||||||
600,000 | Gazprom OAO Via Gaz Capital SA, 4.95%, 7/19/22 | 630,000 | ||||
Malaysia — 0.42% | ||||||
500,000 | SSG Resources Ltd., 4.25%, 10/4/22 | 510,318 | ||||
Mexico — 0.25% | ||||||
279,000 | Petroleos Mexicanos, 5.50%, 6/27/44 | 306,180 | ||||
Qatar — 1.26% | ||||||
1,500,000 | SoQ Sukuk A Q.S.C, 3.24%, 1/18/23 | 1,539,300 | ||||
South Africa — 0.45% | ||||||
550,000 | Transnet SOC Ltd., 4.00%, 7/26/22 | 556,215 | ||||
Venezuela — 1.42% | ||||||
1,100,000 | Petroleos de Venezuela SA, 5.13%, 10/28/16 | 866,142 | ||||
1,000,000 | Petroleos de Venezuela SA, 9.00%, 11/17/21 | 862,461 | ||||
|
| |||||
| 1,728,603 | ||||||
|
| |||||
Total Corporate Bonds | 11,228,646 | |||||
|
| |||||
(Cost $10,801,943) | ||||||
Foreign Government Bonds — 59.75% | ||||||
Argentina — 0.54% | ||||||
620,494 | Argentine Republic Government International Bond, 8.28%, 12/31/33 | 657,836 | ||||
16
SCHEDULE OF PORTFOLIO INVESTMENTS |
RBC BlueBay Emerging Market Select Bond Fund (cont.)
|
|
September 30, 2012
Principal Amount | Value | |||||
| ||||||
Brazil — 1.20% | ||||||
$ 1,150,000 | Brazilian Government International Bond, 11.00%, 8/17/40 | $ | 1,469,125 | |||
Columbia — 0.89% | ||||||
247,000,000(a) | Colombia Government International Bond, 7.75%, 4/14/21 | 169,312 | ||||
1,335,000,000(a) | Colombia Government International Bond, 12.00%, 10/22/15 | 913,996 | ||||
|
| |||||
| 1,083,308 | ||||||
|
| |||||
Croatia (Hrvatska) — 1.72% | ||||||
1,900,000 | Croatia Government International Bond, 6.38%, 3/24/21 | 2,104,723 | ||||
El Salvador — 1.07% | ||||||
1,180,000 | El Salvador Government International Bond, 7.65%, 6/15/35 | 1,305,516 | ||||
Guatemala — 0.41% | ||||||
450,000 | Guatemala Government Bond, 5.75%, 6/6/22 | 501,805 | ||||
Hungary — 1.45% | ||||||
6,050,000(a) | Hungary Government Bond, 6.50%, 6/24/19 | 26,498 | ||||
259,280,000(a) | Hungary Government Bond, 6.75%, 8/22/14 | 1,171,281 | ||||
84,000,000(a) | Hungary Government Bond, 6.75%, 11/24/17 | 377,534 | ||||
36,890,000(a) | Hungary Government Bond, 7.00%, 6/24/22 | 162,663 | ||||
6,050,000(a) | Hungary Government Bond, 7.50%, 11/12/20 | 27,777 | ||||
|
| |||||
| 1,765,753 | ||||||
|
| |||||
Indonesia — 2.89% | ||||||
1,280,000 | Indonesia Government International Bond, 11.63%, 3/4/19 | 1,957,811 | ||||
14,000,000,000(a) | Indonesia Treasury Bond, 7.00%, 5/17/22 | 1,570,721 | ||||
|
| |||||
| 3,528,532 | ||||||
|
| |||||
Israel — 0.17% | ||||||
200,000 | Israel Government International Bond, 4.00%, 6/30/22 | 211,500 | ||||
Malaysia — 2.56% | ||||||
1,500,000(a) | Malaysia Government Bond, 3.21%, 5/31/13 | 491,335 | ||||
260,000(a) | Malaysia Government Bond, 3.58%, 9/28/18 | 85,758 | ||||
1,500,000(a) | Malaysia Government Bond, 4.16%, 7/15/21 | 513,005 | ||||
2,265,000(a) | Malaysia Government Bond, 4.26%, 9/15/16 | 768,333 | ||||
2,000,000(a) | Malaysia Government Bond, 4.38%, 11/29/19 | 690,725 | ||||
1,712,000(a) | Malaysia Government Bond, 5.09%, 4/30/14 | 577,874 | ||||
|
| |||||
| 3,127,030 | ||||||
|
| |||||
Mexico — 9.68% | ||||||
11,700,000(a) | Mexican Bonos, 6.25%, 6/16/16 | 952,136 | ||||
3,230,000(a) | Mexican Bonos, 6.50%, 6/10/21 | 274,327 | ||||
26,410,000(a) | Mexican Bonos, 6.50%, 6/9/22 | 2,237,219 | ||||
17
SCHEDULE OF PORTFOLIO INVESTMENTS |
RBC BlueBay Emerging Market Select Bond Fund (cont.)
|
|
September 30, 2012
Principal Amount | Value | |||||
| ||||||
9,050,000(a) | Mexican Bonos, 7.50%, 6/3/27 | $ | 819,964 | |||
8,130,000(a) | Mexican Bonos, 8.50%, 5/31/29 | 797,149 | ||||
9,800,000(a) | Mexican Bonos, 8.50%, 11/18/38 | 960,579 | ||||
360,000(a) | Mexican Bonos, 10.00%, 11/20/36 | 40,254 | ||||
$ 1,090,000 | Mexico Government International Bond, 5.13%, 1/15/20 | 1,305,352 | ||||
2,600,000 | Mexico Government International Bond, 5.95%, 3/19/19 | 3,227,449 | ||||
900,000 | Mexico Government International Bond, 6.05%, 1/11/40 | 1,202,096 | ||||
|
| |||||
| 11,816,525 | ||||||
|
| |||||
Panama — 1.29% | ||||||
1,121,000 | Panama Government International Bond, 6.70%, 1/26/36 | 1,575,882 | ||||
Peru — 0.40% | ||||||
1,013,000(a) | Peruvian Government International Bond, 7.84%, 8/12/20 | 482,638 | ||||
Poland — 6.02% | ||||||
190,000(a) | Poland Government Bond, 4.75%, 10/25/16 | 60,590 | ||||
5,000,000(a) | Poland Government Bond, 4.75%, 4/25/17 | 1,595,954 | ||||
1,614,000(a) | Poland Government Bond, 5.00%, 4/25/16 | 517,846 | ||||
240,000(a) | Poland Government Bond, 5.25%, 10/25/20 | 78,172 | ||||
440,000(a) | Poland Government Bond, 5.50%, 4/25/15 | 141,902 | ||||
11,532,000(a) | Poland Government Bond, 5.75%, 10/25/21 | 3,871,461 | ||||
1,100,000 | Poland Government International Bond, 3.00%, 3/17/23 | 1,080,750 | ||||
|
| |||||
| 7,346,675 | ||||||
|
| |||||
Russia — 7.05% | ||||||
71,060,000(a) | Russian Federal Bond - OFZ, 7.40%, 4/19/17 | 2,279,068 | ||||
35,000,000(a) | Russian Federal Bond - OFZ, 7.50%, 3/15/18 | 1,126,463 | ||||
38,470,000(a) | Russian Federal Bond - OFZ, 7.60%, 7/20/22 | 1,221,495 | ||||
3,159,784 | Russian Foreign Bond - Eurobond, 7.50%, 3/31/30(b) | 3,975,324 | ||||
|
| |||||
| 8,602,350 | ||||||
|
| |||||
Serbia — 0.52% | ||||||
600,000 | Republic of Serbia, 7.25%, 9/28/21 | 634,500 | ||||
South Africa — 6.38% | ||||||
3,800,000(a) | South Africa Government Bond, 6.25%, 3/31/36 | 368,838 | ||||
5,985,000(a) | South Africa Government Bond, 7.25%, 1/15/20 | 757,468 | ||||
3,790,000(a) | South Africa Government Bond, 8.00%, 12/21/18 | 500,726 | ||||
25,013,333(a) | South Africa Government Bond, 10.50%, 12/21/26 | 3,837,102 | ||||
2,684(a) | South Africa Government Bond, 13.50%, 9/15/15 | 394 | ||||
1,900,000 | South Africa Government International Bond, 5.88%, 5/30/22 | 2,330,506 | ||||
|
| |||||
| 7,795,034 | ||||||
|
| |||||
18
SCHEDULE OF PORTFOLIO INVESTMENTS |
RBC BlueBay Emerging Market Select Bond Fund (cont.)
|
|
September 30, 2012
Principal Amount | Value | |||||
| ||||||
Sri Lanka — 0.51% | ||||||
$ 300,000 | Sri Lanka Government International Bond, 5.88%, 7/25/22 | $ | 322,618 | |||
280,000 | Sri Lanka Government International Bond, 6.25%, 7/27/21 | 306,380 | ||||
|
| |||||
| 628,998 | ||||||
|
| |||||
Thailand — 2.58% | ||||||
4,500,000(a) | Thailand Government Bond, 1.20%, 7/14/21(c) | 152,605 | ||||
42,000,000(a) | Thailand Government Bond, 3.13%, 12/11/15 | 1,362,260 | ||||
3,880,000(a) | Thailand Government Bond, 3.63%, 6/16/23 | 125,268 | ||||
28,210,000(a) | Thailand Government Bond, 3.65%, 12/17/21 | 921,568 | ||||
760,000(a) | Thailand Government Bond, 4.25%, 3/13/13 | 24,815 | ||||
16,880,000(a) | Thailand Government Bond, 5.25%, 5/12/14 | 566,215 | ||||
|
| |||||
| 3,152,731 | ||||||
|
| |||||
Turkey — 9.89% | ||||||
3,850,000(a) | Turkey Government Bond, 9.00%, 3/8/17 | 2,244,985 | ||||
5,580,000(a) | Turkey Government Bond, 9.50%, 1/12/22 | 3,371,751 | ||||
100,000(a) | Turkey Government Bond, 10.50%, 1/15/20 | 63,096 | ||||
1,052,000 | Turkey Government International Bond, 6.25%, 9/26/22 | 1,262,956 | ||||
2,050,000 | Turkey Government International Bond, 6.88%, 3/17/36 | 2,606,645 | ||||
150,000 | Turkey Government International Bond, 7.25%, 3/15/15 | 166,994 | ||||
1,018,000 | Turkey Government International Bond, 7.50%, 7/14/17 | 1,227,143 | ||||
600,000 | Turkey Government International Bond, 11.88%, 1/15/30 | 1,132,500 | ||||
|
| |||||
| 12,076,070 | ||||||
|
| |||||
Ukraine — 2.37% | ||||||
2,750,000 | Ukraine Government International Bond, 9.25%, 7/24/17 | 2,893,276 | ||||
Uruguay — 0.16% | ||||||
3,190,000(a) | Uruguay Government International Bond, 4.38%, 12/15/28(c) | 190,389 | ||||
|
| |||||
Total Foreign Government Bonds | 72,950,196 | |||||
|
| |||||
(Cost $70,868,912) | ||||||
Shares | Value | |||||
| ||||||
Investment Company — 28.40% | ||||||
34,678,748 | JPMorgan 100% US Treasury Securities Money Market Fund | $ | 34,678,748 | |||
|
| |||||
Total Investment Company | 34,678,748 | |||||
|
| |||||
(Cost $34,678,748) | ||||||
19
SCHEDULE OF PORTFOLIO INVESTMENTS |
RBC BlueBay Emerging Market Select Bond Fund (cont.)
September 30, 2012
| Value | ||||
Total Investments | $ | 118,857,590 | ||
(Cost $116,349,603)(d) — 97.35% | ||||
Other assets in excess of liabilities — 2.65% | 3,239,071 | |||
|
| |||
NET ASSETS — 100.00% | $ | 122,096,661 | ||
|
| |||
| (a) | Investment in non-U.S. Dollars. Principal amount reflects local currency. |
| (b) | Represents a step-up bond that pays an initial coupon rate for the first period and then a higher coupon rate for the following periods. Rate shown is as of report date. |
| (c) | Inflation protected security. Principal amount reflects original security face amount. |
| (d) | See notes to financial statements for the tax cost of securities and the breakdown of unrealized appreciation (depreciation). |
Foreign currency exchange contracts as of September 30, 2012:
Currency Purchased | Currency Sold | Counterparty | Settlement Date | Unrealized Appreciation/ (Depreciation) | ||||||||||||
| USD | 379,444 | PLN | 1,223,327 | Citibank, N.A. | 10/1/12 | $ (2,410) | ||||||||||
| BRL | 3,446,768 | USD | 1,675,140 | Citibank, N.A. | 10/2/12 | 26,104 | ||||||||||
| BRL | 3,446,767 | USD | 1,675,995 | Citibank, N.A. | 10/2/12 | 25,248 | ||||||||||
| BRL | 3,446,768 | USD | 1,676,199 | Citibank, N.A. | 10/2/12 | 25,045 | ||||||||||
| BRL | 1,330,550 | USD | 650,000 | Citibank, N.A. | 10/2/12 | 6,728 | ||||||||||
| BRL | 900,020 | USD | 440,000 | Citibank, N.A. | 10/2/12 | 4,229 | ||||||||||
| BRL | 973,200 | USD | 480,000 | Citibank, N.A. | 10/2/12 | 349 | ||||||||||
| USD | 690,000 | BRL | 1,399,665 | Citibank, N.A. | 10/2/12 | (842) | ||||||||||
| USD | 420,000 | BRL | 853,440 | Citibank, N.A. | 10/2/12 | (1,238) | ||||||||||
| USD | 559,251 | BRL | 1,138,356 | Citibank, N.A. | 10/2/12 | (2,615) | ||||||||||
| USD | 1,663,000 | BRL | 3,384,204 | Citibank, N.A. | 10/2/12 | (7,364) | ||||||||||
| USD | 1,663,000 | BRL | 3,384,204 | Citibank, N.A. | 10/2/12 | (7,364) | ||||||||||
| USD | 1,663,000 | BRL | 3,384,204 | Citibank, N.A. | 10/2/12 | (7,364) | ||||||||||
| COP | 813,150,000 | USD | 450,000 | Citibank, N.A. | 10/25/12 | (106) | ||||||||||
| COP | 952,430,810 | USD | 528,014 | Citibank, N.A. | 10/25/12 | (1,059) | ||||||||||
| USD | 150,000 | COP | 270,750,000 | Citibank, N.A. | 10/25/12 | 201 | ||||||||||
| USD | 170,000 | COP | 309,270,800 | Citibank, N.A. | 10/25/12 | (1,111) | ||||||||||
| USD | 390,000 | COP | 717,990,000 | Citibank, N.A. | 10/25/12 | (7,245) | ||||||||||
| CLP | 111,677,000 | USD | 236,203 | Citibank, N.A. | 10/31/12 | (2,104) | ||||||||||
| EUR | 470,000 | USD | 604,500 | Citibank, N.A. | 10/31/12 | (321) | ||||||||||
| EUR | 480,000 | USD | 621,485 | Citibank, N.A. | 10/31/12 | (4,451) | ||||||||||
| EUR | 480,000 | USD | 622,346 | Citibank, N.A. | 10/31/12 | (5,313) | ||||||||||
| EUR | 460,000 | USD | 596,790 | Citibank, N.A. | 10/31/12 | (5,466) | ||||||||||
| EUR | 480,000 | USD | 622,968 | Citibank, N.A. | 10/31/12 | (5,934) | ||||||||||
| EUR | 960,000 | USD | 1,244,179 | Citibank, N.A. | 10/31/12 | (10,111) | ||||||||||
| IDR | 8,912,435,890 | USD | 929,541 | Citibank, N.A. | 10/31/12 | 4,770 | ||||||||||
| INR | 12,567,200 | USD | 230,000 | Citibank, N.A. | 10/31/12 | (3,939) | ||||||||||
| INR | 12,544,200 | USD | 230,000 | Citibank, N.A. | 10/31/12 | (4,352) | ||||||||||
| INR | 20,373,700 | USD | 380,000 | Citibank, N.A. | 10/31/12 | (13,514) | ||||||||||
| INR | 62,291,336 | USD | 1,162,586 | Citibank, N.A. | 10/31/12 | (42,077) | ||||||||||
20
SCHEDULE OF PORTFOLIO INVESTMENTS |
RBC BlueBay Emerging Market Select Bond Fund (cont.)
|
|
September 30, 2012
Currency Purchased | Currency Sold | Counterparty | Settlement | Unrealized Appreciation/ (Depreciation) | ||||||||||
INR | 62,291,336 | USD | 1,163,563 | Citibank, N.A. | 10/31/12 | $(43,054) | ||||||||
INR | 62,291,336 | USD | 1,164,052 | Citibank, N.A. | 10/31/12 | (43,543) | ||||||||
INR | 62,291,336 | USD | 1,164,368 | Citibank, N.A. | 10/31/12 | (43,859) | ||||||||
INR | 62,291,336 | USD | 1,166,395 | Citibank, N.A. | 10/31/12 | (45,886) | ||||||||
MXN | 6,093,409 | USD | 470,000 | Citibank, N.A. | 10/31/12 | 1,672 | ||||||||
MXN | 7,639,320 | USD | 590,000 | Citibank, N.A. | 10/31/12 | 1,336 | ||||||||
MXN | 12,281,362 | USD | 950,000 | Citibank, N.A. | 10/31/12 | 663 | ||||||||
MXN | 7,066,921 | USD | 549,591 | Citibank, N.A. | 10/31/12 | (2,563) | ||||||||
MXN | 6,295,520 | USD | 490,000 | Citibank, N.A. | 10/31/12 | (2,683) | ||||||||
PHP | 5,001,600 | USD | 119,713 | Citibank, N.A. | 10/31/12 | (1,155) | ||||||||
PLN | 1,223,327 | USD | 378,060 | Citibank, N.A. | 10/31/12 | 2,202 | ||||||||
PLN | 1,869,788 | USD | 580,000 | Citibank, N.A. | 10/31/12 | 1,210 | ||||||||
PLN | 530,846 | USD | 166,723 | Citibank, N.A. | 10/31/12 | (1,713) | ||||||||
PLN | 530,847 | USD | 166,729 | Citibank, N.A. | 10/31/12 | (1,719) | ||||||||
PLN | 1,525,276 | USD | 477,911 | Citibank, N.A. | 10/31/12 | (3,790) | ||||||||
RUB | 14,642,260 | USD | 460,000 | Citibank, N.A. | 10/31/12 | 6,824 | ||||||||
RUB | 13,133,400 | USD | 420,000 | Citibank, N.A. | 10/31/12 | (1,281) | ||||||||
RUB | 14,699,485 | USD | 470,000 | Citibank, N.A. | 10/31/12 | (1,351) | ||||||||
THB | 118,103 | USD | 3,832 | Citibank, N.A. | 10/31/12 | (5) | ||||||||
USD | 962,415 | HUF | 210,018,315 | Citibank, N.A. | 10/31/12 | 20,612 | ||||||||
USD | 1,255,646 | EUR | 970,000 | Citibank, N.A. | 10/31/12 | 8,723 | ||||||||
USD | 625,639 | EUR | 480,000 | Citibank, N.A. | 10/31/12 | 8,605 | ||||||||
USD | 426,149 | KRW | 474,751,050 | Citibank, N.A. | 10/31/12 | 8,047 | ||||||||
USD | 424,188 | KRW | 474,751,050 | Citibank, N.A. | 10/31/12 | 6,086 | ||||||||
USD | 490,000 | ZAR | 4,052,202 | Citibank, N.A. | 10/31/12 | 5,409 | ||||||||
USD | 357,648 | MYR | 1,093,616 | Citibank, N.A. | 10/31/12 | 4,925 | ||||||||
USD | 1,439,431 | TRY | 2,591,912 | Citibank, N.A. | 10/31/12 | 3,988 | ||||||||
USD | 1,438,352 | TRY | 2,591,911 | Citibank, N.A. | 10/31/12 | 2,910 | ||||||||
USD | 270,000 | ZAR | 2,239,056 | Citibank, N.A. | 10/31/12 | 2,238 | ||||||||
USD | 182,515 | RUB | 5,670,756 | Citibank, N.A. | 10/31/12 | 1,720 | ||||||||
USD | 260,000 | ZAR | 2,161,640 | Citibank, N.A. | 10/31/12 | 1,496 | ||||||||
USD | 363,267 | RUB | 11,351,187 | Citibank, N.A. | 10/31/12 | 1,369 | ||||||||
USD | 528,805 | RUB | 16,567,978 | Citibank, N.A. | 10/31/12 | 584 | ||||||||
USD | 377,778 | TRY | 681,964 | Citibank, N.A. | 10/31/12 | 95 | ||||||||
USD | 577,588 | THB | 17,825,345 | Citibank, N.A. | 10/31/12 | (100) | ||||||||
USD | 577,246 | THB | 17,825,346 | Citibank, N.A. | 10/31/12 | (442) | ||||||||
USD | 153,871 | THB | 4,767,246 | Citibank, N.A. | 10/31/12 | (627) | ||||||||
USD | 253,806 | ZAR | 2,129,177 | Citibank, N.A. | 10/31/12 | (816) | ||||||||
ZAR | 2,860,245 | USD | 344,525 | Citibank, N.A. | 10/31/12 | (2,476) | ||||||||
ZAR | 3,572,971 | USD | 430,000 | Citibank, N.A. | 10/31/12 | (2,718) | ||||||||
BRL | 3,384,204 | USD | 1,655,313 | Citibank, N.A. | 11/5/12 | 5,229 | ||||||||
BRL | 3,384,204 | USD | 1,655,394 | Citibank, N.A. | 11/5/12 | 5,148 | ||||||||
BRL | 3,384,204 | USD | 1,655,394 | Citibank, N.A. | 11/5/12 | 5,148 | ||||||||
BRL | 1,138,356 | USD | 556,789 | Citibank, N.A. | 11/5/12 | 1,772 | ||||||||
KRW | 251,222,700 | USD | 216,431 | Citibank, N.A. | 12/5/12 | 4,293 | ||||||||
USD | 280,000 | KRW | 333,480,000 | Citibank, N.A. | 12/5/12 | (12,996) | ||||||||
CNY | 3,595,200 | USD | 560,000 | Citibank, N.A. | 7/25/13 | (437) | ||||||||
21
SCHEDULE OF PORTFOLIO INVESTMENTS |
RBC BlueBay Emerging Market Select Bond Fund (cont.)
|
|
September 30, 2012
Currency Purchased | Currency Sold | Counterparty | Settlement Date | Unrealized Appreciation/ (Depreciation) | ||||||||||||||
CNY | 2,630,560 | USD | 410,000 | Citibank, N.A. | 7/25/13 | $ | (575 | ) | ||||||||||
CNY
| 12,924,298
| USD
|
| 2,016,114
|
| Citibank, N.A.
|
| 7/25/13
|
|
| (4,555
| )
| ||||||
|
| |||||||||||||||||
Total | $ | (149,666 | ) | |||||||||||||||
|
| |||||||||||||||||
Interest rate swaps as of September 30, 2012:
Fixed | Floating Rate | Counterparty | Expiration Date | Notional Amount (000) | Unrealized Appreciation (Depreciation) | |||||||||||||||
| 2.83 | % | CNY-CNREPOFIX=CFXS-Reuters | JPMorgan Chase Bank, N.A. | 8/21/14 | CNY | 13,710 | $ | (24,747 | ) | |||||||||||
| 7.71 | % | INR-MIBOR-OIS-COMPOUND | JPMorgan Chase Bank, N.A. | 3/30/14 | INR | 390,000 | 43,685 | |||||||||||||
| 6.05 | % | MXN-TIIE-Banxico | Deutsche Bank AG | 9/1/22 | MXN | 7,310 | (10,105 | ) | ||||||||||||
| 6.05 | % | MXN-TIIE-Banxico | JPMorgan Chase Bank, N.A. | 9/1/22 | MXN | 7,130 | (9,856 | ) | ||||||||||||
|
| |||||||||||||||||||
| Total | $ | (1,023 | ) | |||||||||||||||||
|
| |||||||||||||||||||
Total return swaps as of September 30, 2012:
Fixed | Reference Entity | Counterparty | Expiration Date | Notional Amount (000) | Value | |||||||||||||||
| 9.50 | % | Indonesia Treasury Bond | Citibank, N.A. | 7/15/31 | IDR | 1,161,000 | $ | 159,694 | ||||||||||||
| 11.50 | % | Indonesia Treasury Bond | Citigroup Global Markets, Inc. | 9/15/19 | IDR | 793,000 | 109,815 | |||||||||||||
| 12.80 | % | Indonesia Treasury Bond | Citigroup Global Markets, Inc. | 6/15/21 | IDR | 725,000 | 113,263 | |||||||||||||
| 7.35 | % | Russian Federal Bond - OFZ | Citibank, N.A. | 1/20/16 | RUB | 10,780 | 352,125 | |||||||||||||
|
| |||||||||||||||||||
| Total (Cost $732,745) | $ | 734,897 | |||||||||||||||||
|
| |||||||||||||||||||
22
SCHEDULE OF PORTFOLIO INVESTMENTS |
RBC BlueBay Emerging Market Select Bond Fund (cont.)
|
|
September 30, 2012
Abbreviations used are defined below:
BRL - Brazilian Real
CFXS - China Foreign Exchange Trade System
CLP - Chilean Peso
CNY - Chinese Yuan
COP - Colombian Peso
EUR - Euro
HUF - Hungarian Forint
IDR - Indonesian Rupiah
INR - Indian Rupee
INR-MIBOR-OIS-COMPOUND - Mumbai Interbank Offered Rate - Overnight Index Swap
KRW - South Korean Won
MXN - Mexican Peso
MXN-TIIE-Banxico - Mexican Interbank Equilibrium Interest Rate
MYR - Malaysian Ringgit
PHP - Philippine Peso
PLN - Polish Zloty
RUB - Russian Ruble
THB - Thai Baht
TRY - Turkish Lira
USD - United States Dollar
ZAR - South African Rand
Portfolio Diversification (Unaudited)
Industries | Percentage of Net Assets | |||
Foreign Government Bonds | 61.01 | % | ||
Energy | 6.65 | % | ||
Financials | 0.83 | % | ||
Industrials | 0.46 | % | ||
Other* | 31.05 | % | ||
|
| |||
| 100.00 | % | |||
|
| |||
| * | Includes cash, futures, Investment Company, interest and dividend receivable, pending trades and Fund share transactions, interest rate swaps, total return swaps, foreign currency exchange contracts and accrued expenses payable. |
See notes to financial statements.
23
| SCHEDULE OF PORTFOLIO INVESTMENTS |
RBC BlueBay Emerging Market Corporate Bond Fund
September 30, 2012
Principal Amount | Value | |||||
Corporate Bonds — 94.21% | ||||||
Bermuda — 1.23% | ||||||
$200,000 | China Resources Gas Group Ltd., 4.50%, 4/5/22 | $ | 216,350 | |||
Brazil — 4.23% | ||||||
104,000 | Banco BMG SA, 9.15%, 1/15/16 | 102,180 | ||||
200,000 | Hypermarcas SA, 6.50%, 4/20/21 | 212,500 | ||||
100,000 | NET Servicos de Comunicacao SA, 7.50%, 1/27/20 | 115,494 | ||||
300,000 | Telemar Norte Leste SA, 5.50%, 10/23/20 | 315,450 | ||||
|
| |||||
| 745,624 | ||||||
|
| |||||
British Virgin Islands — 7.80% | ||||||
200,000 | CNOOC Finance 2012 Ltd., 3.88%, 5/2/22 | 211,347 | ||||
200,000 | COSL Finance BVI Ltd., 3.25%, 9/6/22 | 198,972 | ||||
200,000 | FPC Finance Ltd., 6.00%, 6/28/19 | 216,000 | ||||
200,000 | Franshion Development Ltd., 6.75%, 4/15/21 | 207,400 | ||||
200,000 | PCCW Capital No. 4 Ltd., 5.75%, 4/17/22 | 214,542 | ||||
311,710 | QGOG Atlantic/Alaskan Rigs Ltd., 5.25%, 7/30/18 | 327,296 | ||||
|
| |||||
| 1,375,557 | ||||||
|
| |||||
Cayman Islands — 17.67% | ||||||
100,000 | Cosan Finance Ltd., 7.00%, 2/1/17 | 115,250 | ||||
200,000 | Country Garden Holdings Co. Ltd., 11.13%, 2/23/18 | 219,500 | ||||
200,000 | ENN Energy Holdings Ltd., 6.00%, 5/13/21 | 222,281 | ||||
200,000 | Fibria Overseas Finance Ltd., 6.75%, 3/3/21 | 214,179 | ||||
240,000 | Hutchison Whampoa International 10 Ltd., 6.00%, 12/29/49(a) | 248,100 | ||||
200,000 | MAF Global Securities Ltd., 5.25%, 7/5/19 | 207,000 | ||||
250,000 | MCE Finance Ltd., 10.25%, 5/15/18 | 283,450 | ||||
200,000 | Mongolian Mining Corp., 8.88%, 3/29/17 | 203,500 | ||||
200,000 | Odebrecht Finance Ltd., 7.13%, 6/26/42 | 223,288 | ||||
50,000 | Petrobras International Finance Co., 5.38%, 1/27/21 | 56,457 | ||||
200,000 | Sable International Finance Ltd., 8.75%, 2/1/20 | 223,000 | ||||
450,000 | Sun Hung Kai Properties Capital Market Ltd., 4.50%, 2/14/22 | 484,527 | ||||
200,000 | Tencent Holdings Ltd., 3.38%, 3/5/18 | 201,818 | ||||
100,000 | Vale Overseas Ltd., 4.38%, 1/11/22 | 105,305 | ||||
90,000 | Vale Overseas Ltd., 6.88%, 11/10/39 | 105,872 | ||||
|
| |||||
| 3,113,527 | ||||||
|
| |||||
Chile — 2.40% | ||||||
200,000 | Banco de Credito e Inversiones, 3.00%, 9/13/17 | 199,500 | ||||
200,000 | E.CL SA, 5.63%, 1/15/21 | 222,700 | ||||
|
| |||||
| 422,200 | ||||||
|
| |||||
Columbia — 5.66% | ||||||
200,000 | Bancolombia SA, 5.13%, 9/11/22 | 202,956 | ||||
300,000 | Empresa de Energia de Bogota SA, 6.13%, 11/10/21 | 325,867 | ||||
24
| SCHEDULE OF PORTFOLIO INVESTMENTS |
RBC BlueBay Emerging Market Corporate Bond Fund (cont.)
September 30, 2012
Principal Amount | Value | |||||
$200,000 | Empresas Publicas de Medellin ESP, 7.63%, 7/29/19 | $252,500 | ||||
200,000 | Transportadora de Gas Internacional SA ESP, 5.70%, 3/20/22 | 215,880 | ||||
|
| |||||
| 997,203 | ||||||
|
| |||||
Guernsey — 1.18% | ||||||
200,000 | Doric Nimrod Air Finance Alpha Ltd. 2012-1, Class A Pass | |||||
| Through Trust, 5.13%, 11/30/24 | 208,000 | |||||
Hong Kong — 2.46% | ||||||
200,000 | LS Finance 2017 Ltd., 5.25%, 1/26/17 | 215,360 | ||||
200,000 | Swire Properties MTN Financing Ltd., 4.38%, 6/18/22 | 217,444 | ||||
|
| |||||
| 432,804 | ||||||
|
| |||||
India — 1.78% | ||||||
100,000 | ICICI Bank Ltd., 5.75%, 11/16/20 | 106,230 | ||||
200,000 | ICICI Bank Ltd./Dubai, 4.70%, 2/21/18 | 207,618 | ||||
|
| |||||
| 313,848 | ||||||
|
| |||||
Indonesia — 1.38% | ||||||
225,000 | Star Energy Geothermal Wayang Windu Ltd., 11.50%, 2/12/15 | 242,437 | ||||
Ireland — 1.79% | ||||||
200,000 | Alfa Bank OJSC Via Alfa Bond Issuance Plc, 7.50%, 9/26/19 | 202,000 | ||||
100,000 | Vimpel Communications Via VIP Finance Ireland Ltd. OJSC, 9.13%, 4/30/18 | 114,035 | ||||
|
| |||||
| 316,035 | ||||||
|
| |||||
Isle of Man — 1.11% | ||||||
130,000 | AngloGold Ashanti Holdings Plc, 5.13%, 8/1/22 | 132,816 | ||||
60,000 | AngloGold Ashanti Holdings Plc, 5.38%, 4/15/20 | 63,193 | ||||
|
| |||||
| 196,009 | ||||||
|
| |||||
Jersey Channel Island — 1.09% | ||||||
200,000 | Vedanta Resources Jersey Ltd., 5.50%, 7/13/16 | 192,500 | ||||
Kazakhstan — 0.37% | ||||||
200,000 | BTA Bank JSC, 10.75%, 7/1/18(b) | 41,000 | ||||
300,000 | BTA Bank JSC, 36.82%, 6/30/20(b)(c) | 24,750 | ||||
|
| |||||
| 65,750 | ||||||
|
| |||||
Luxembourg — 8.82% | ||||||
200,000 | Gazprom Neft OAO Via GPN Capital SA, 4.38%, 9/19/22 | 199,400 | ||||
200,000 | Gazprom OAO Via Gaz Capital SA, 4.95%, 7/19/22 | 210,000 | ||||
100,000 | Gazprom OAO Via Gaz Capital SA, 6.51%, 3/7/22 | 117,380 | ||||
150,000 | Gazprom OAO Via Gaz Capital SA, 9.25%, 4/23/19 | 194,845 | ||||
25
| SCHEDULE OF PORTFOLIO INVESTMENTS |
RBC BlueBay Emerging Market Corporate Bond Fund (cont.)
September 30, 2012
Principal Amount | Value | |||||
$200,000 | Russian Agricultural Bank OJSC Via RSHB Capital SA, 5.30%, 12/27/17 | $ 211,000 | ||||
200,000 | Russian Agricultural Bank OJSC Via RSHB Capital SA, 6.00%, 6/3/21(a) | 203,500 | ||||
400,000 | VTB Bank OJSC Via VTB Capital SA, 6.00%, 4/12/17 | 418,000 | ||||
|
| |||||
| 1,554,125 | ||||||
|
| |||||
Mexico — 3.75% | ||||||
150,000 | BBVA Bancomer SA/Texas, 6.75%, 9/30/22 | 164,250 | ||||
150,000 | BBVA Bancomer SA/Texas, 6.75%, 9/30/22 | 164,250 | ||||
300,000 | Sigma Alimentos SA de CV, 5.63%, 4/14/18 | 332,752 | ||||
|
| |||||
| 661,252 | ||||||
|
| |||||
Netherlands — 5.04% | ||||||
300,000 | Indosat Palapa Co. BV, 7.38%, 7/29/20 | 341,250 | ||||
300,000 | Myriad International Holding BV, 6.38%, 7/28/17 | 339,777 | ||||
200,000 | OSX 3 Leasing BV, 9.25%, 3/20/15(d) | 207,408 | ||||
|
| |||||
| 888,435 | ||||||
|
| |||||
Peru — 1.56% | ||||||
99,000 | Banco de Credito del Peru/Panama, 6.88%, 9/16/26(a) | 111,870 | ||||
150,000 | Volcan Cia Minera SAA, 5.38%, 2/2/22 | 162,300 | ||||
|
| |||||
| 274,170 | ||||||
|
| |||||
Philippines — 0.63% | ||||||
100,000 | Energy Development Corp., 6.50%, 1/20/21 | 110,419 | ||||
Qatar — 1.61% | ||||||
251,940 | Ras Laffan Liquefied Natural Gas Co. Ltd. II, 5.30%, 9/30/20 | 284,062 | ||||
Saudi Arabia — 1.22% | ||||||
200,000 | Saudi Electricity Global Sukuk Co., 4.21%, 4/3/22 | 215,000 | ||||
Singapore — 2.42% | ||||||
200,000 | Oversea-Chinese Banking Corp. Ltd., 3.15%, 3/11/23(a) | 200,540 | ||||
225,000 | STATS ChipPAC Ltd., 5.38%, 3/31/16 | 226,895 | ||||
|
| |||||
| 427,435 | ||||||
|
| |||||
South Korea — 2.32% | ||||||
200,000 | Korea Hydro & Nuclear Power Co. Ltd., 3.00%, 9/19/22 | 198,978 | ||||
200,000 | Korea Western Power Co. Ltd., 3.13%, 5/10/17 | 209,099 | ||||
|
| |||||
| 408,077 | ||||||
|
| |||||
Spain — 1.16% | ||||||
200,000 | Cemex Espana Luxembourg, 9.88%, 4/30/19 | 205,067 | ||||
26
| SCHEDULE OF PORTFOLIO INVESTMENTS |
RBC BlueBay Emerging Market Corporate Bond Fund (cont.)
September 30, 2012
Principal Amount | Value | |||||
Thailand — 1.13% | ||||||
$200,000 | Bangkok Bank PCL/Hong Kong, 3.88%, 9/27/22 | $ 199,948 | ||||
Turkey — 4.59% | ||||||
200,000 | Turkiye Garanti Bankasi AS, 4.00%, 9/13/17 | 199,000 | ||||
200,000 | Turkiye Garanti Bankasi AS, 5.25%, 9/13/22 | 200,500 | ||||
400,000 | Turkiye Halk Bankasi AS, 4.88%, 7/19/17 | 409,000 | ||||
|
| |||||
| 808,500 | ||||||
|
| |||||
United Arab Emirates — 3.08% | ||||||
225,000 | Abu Dhabi National Energy Co., 7.25%, 8/1/18 | 273,907 | ||||
250,000 | DP World Ltd., 6.85%, 7/2/37 | 269,339 | ||||
|
| |||||
| 543,246 | ||||||
|
| |||||
United States — 4.63% | ||||||
500,000 | Reliance Holdings USA, Inc., 5.40%, 2/14/22 | 537,713 | ||||
225,000 | Southern Copper Corp., 7.50%, 7/27/35 | 277,448 | ||||
|
| |||||
| 815,161 | ||||||
|
| |||||
Venezuela — 2.10% | ||||||
100,000 | Corp. Andina de Fomento, 4.38%, 6/15/22 | 108,739 | ||||
290,000 | Petroleos de Venezuela SA, 4.90%, 10/28/14 | 261,492 | ||||
|
| |||||
| 370,231 | ||||||
|
| |||||
Total Corporate Bonds | 16,602,972 | |||||
|
| |||||
(Cost $15,896,464) | ||||||
Shares | Value | |||||
Investment Company — 6.92% | ||||||
1,219,662 | JPMorgan 100% US Treasury Securities Money Market Fund | $1,219,662 | ||||
|
| |||||
Total Investment Company | 1,219,662 | |||||
|
| |||||
(Cost $1,219,662) | ||||||
Total Investments | $17,822,634 | |||||
(Cost $17,116,126)(e) — 101.13% | ||||||
Liabilities in excess of other assets — (1.13)% | (199,432 | ) | ||||
|
| |||||
NET ASSETS — 100.00% | $17,623,202 | |||||
|
| |||||
27
| SCHEDULE OF PORTFOLIO INVESTMENTS |
RBC BlueBay Emerging Market Corporate Bond Fund (cont.)
September 30, 2012
| (a) | Variable rate security. The rate reflected in the Schedule of Portfolio Investments is the rate in effect on September 30, 2012. |
| (b) | Issuer filed for bankruptcy and/or is in default of interest payments. |
| (c) | Zero coupon bond. The rate represents the yield at time of purchase. |
| (d) | Security exempt from registration under Rule 144A or Section 4(2) of the Securities Act of 1933, as amended. These securities may be resold in transactions exempt from registration, normally to qualified institutional buyers. Security has been deemed to be liquid based on procedures approved by the Board of Trustees. |
| (e) | See notes to financial statements for the tax cost of securities and the breakdown of unrealized appreciation (depreciation). |
Portfolio Diversification (Unaudited)
Industries | Percentage of Net Assets | |||
Financials | 29.62 | % | ||
Energy | 17.13 | % | ||
Utilities | 14.13 | % | ||
Telecommunication Services | 9.44 | % | ||
Materials | 7.11 | % | ||
Consumer Staples | 6.50 | % | ||
Industrials | 3.61 | % | ||
Consumer Discretionary | 2.83 | % | ||
Information Technology | 2.43 | % | ||
Diversified | 1.41 | % | ||
Other* | 5.79 | % | ||
|
| |||
| 100.00 | % | |||
|
| |||
| * | Includes cash, futures, Investment Company, interest and dividend receivable, pending trades and Fund share transactions, foreign currency exchange contracts and accrued expenses payable. |
See notes to financial statements.
28
SCHEDULE OF PORTFOLIO INVESTMENTS |
RBC BlueBay Global High Yield Bond Fund
|
|
September 30, 2012
Principal Amount | Value | |||||
Bank Loans — 8.38% | ||||||
Denmark — 1.34% | ||||||
250,000(a) | ISS Holdings LLC Term Loan, 5.79%, 6/30/15(b) | $ | 301,987 | |||
United States — 7.04% | ||||||
$ 100,000 | BJ’s Wholesale Club, Inc. Term Loan 2nd Lien, 9.75%, 3/29/19 | 100,950 | ||||
296,853 | Clear Channel Communications, Inc. Term Loan, 3.87%, 1/29/16(b) | 242,511 | ||||
150,000 | Misys Plc Term Loan 2nd Lien, 12.00%, 6/12/19 | 154,875 | ||||
248,750 | Protection One Term Loan, 5.75%, 6/4/16 | 248,439 | ||||
496,614 | US Telepacific Holdings Corp. Term Loan, 5.75%, 2/23/17 | 484,198 | ||||
359,100 | WOW Finance Term Loan, 6.25%, 7/17/18 | 361,704 | ||||
|
| |||||
| 1,592,677 | ||||||
|
| |||||
Total Bank Loans | 1,894,664 | |||||
|
| |||||
(Cost $1,841,650) | ||||||
Corporate Bonds — 79.37% | ||||||
Barbados — 2.99% | ||||||
610,000 | Columbus International, Inc., 11.50%, 11/20/14 | 677,100 | ||||
Belgium — 0.72% | ||||||
30,000(a) | Ontex IV SA, 7.50%, 4/15/18 | 38,937 | ||||
100,000(a) | Ontex IV SA, 9.00%, 4/15/19 | 123,365 | ||||
|
| |||||
| 162,302 | ||||||
|
| |||||
Bermuda — 1.43% | ||||||
300,000 | Digicel Ltd., 8.25%, 9/1/17(c) | 322,500 | ||||
Cayman Islands — 1.81% | ||||||
200,000 | Sable International Finance Ltd., 8.75%, 2/1/20(c) | 223,000 | ||||
175,000 | UPCB Finance VI Ltd., 6.88%, 1/15/22(c) | 186,375 | ||||
|
| |||||
| 409,375 | ||||||
|
| |||||
Croatia (Hrvatska) — 0.96% | ||||||
120,000(a) | Agrokor DD, 9.88%, 5/1/19 | 163,458 | ||||
39,000(a) | Agrokor DD, 10.00%, 12/7/16 | 54,252 | ||||
|
| |||||
| 217,710 | ||||||
|
| |||||
Denmark — 1.18% | ||||||
260,000 | Welltec A/S, 8.00%, 2/1/19(c) | 267,818 | ||||
29
SCHEDULE OF PORTFOLIO INVESTMENTS |
RBC BlueBay Global High Yield Bond Fund (cont.)
|
|
September 30, 2012
Principal Amount | Value | |||||
| ||||||
Germany — 3.23% | ||||||
100,000(a) | Unitymedia Hessen GmbH & Co. KG/Unitymedia NRW GmbH, 5.50%, 9/15/22 | $ 125,939 | ||||
230,000(a) | Unitymedia Hessen GmbH & Co. KG/Unitymedia NRW GmbH, 8.13%, 12/1/17 | 315,551 | ||||
200,000(a) | Unitymedia KabelBW GmbH, 9.50%, 3/15/21 | 289,047 | ||||
|
| |||||
| 730,537 | ||||||
|
| |||||
Guernsey — 0.76% | ||||||
100,000(d) | Elli Investments Ltd., 12.25%, 6/15/20 | 171,169 | ||||
Italy — 0.67% | ||||||
180,000(a) | Seat Pagine Gialle SpA, 10.50%, 1/31/17 | 152,664 | ||||
Jersey Channel Island — 1.27% | ||||||
210,000(d) | Aston Martin Capital Ltd., 9.25%, 7/15/18 | 286,547 | ||||
Luxembourg — 7.50% | ||||||
$ 180,000 | Aguila 3 SA, 7.88%, 1/31/18(c) | 189,000 | ||||
100,000 | Intelsat Jackson Holdings SA, 6.63%, 12/15/22(c) | 99,375 | ||||
197,000 | Intelsat Jackson Holdings SA, 7.50%, 4/1/21 | 213,006 | ||||
142,000 | Intelsat Jackson Holdings SA, 11.25%, 6/15/16 | 148,390 | ||||
175,000 | Intelsat Luxembourg SA, 11.25%, 2/4/17 | 185,063 | ||||
180,000(e) | Matterhorn Mobile SA, 5.42%, 5/15/19(b) | 192,344 | ||||
60,000(a) | Sunrise Communications Holdings SA, 8.50%, 12/31/18 | 83,271 | ||||
150,000(e) | Sunrise Communications International SA, 5.63%, 12/31/17 | 163,876 | ||||
290,000(a) | Wind Acquisition Finance SA, 7.38%, 2/15/18 | 344,715 | ||||
100,000 | Wind Acquisition Holdings Finance SA, 12.25%, 7/15/17(c)(f) | 79,000 | ||||
|
| |||||
| 1,698,040 | ||||||
|
| |||||
Netherlands — 0.98% | ||||||
115,000(a) | Magyar Telecom BV, 9.50%, 12/15/16 | 93,102 | ||||
100,000(a) | Stork Technical Services Holdings BV, 11.00%, 8/15/17 | 129,469 | ||||
|
| |||||
| 222,571 | ||||||
|
| |||||
South Africa — 1.06% | ||||||
200,000(a) | Edcon Proprietary Ltd., 3.50%, 6/15/14(b) | 239,662 | ||||
Spain — 1.04% | ||||||
200,000(a) | Inaer Aviation Finance Ltd., 9.50%, 8/1/17 | 235,807 | ||||
Sweden — 1.97% | ||||||
200,000 | Eileme 2 AB, 11.63%, 1/31/20(c) | 222,000 | ||||
172,000(a) | TVN Finance Corp. III AB, 7.88%, 11/15/18 | 223,239 | ||||
|
| |||||
| 445,239 | ||||||
|
| |||||
30
SCHEDULE OF PORTFOLIO INVESTMENTS |
RBC BlueBay Global High Yield Bond Fund (cont.)
|
|
September 30, 2012
Principal Amount | Value | |||||
| ||||||
United Kingdom — 8.62% | ||||||
$ 320,000 | CEVA Group Plc, 8.38%, 12/1/17(c) | 309,200 | ||||
100,000(d) | Elli Finance UK Plc, 8.75%, 6/15/19 | 174,399 | ||||
130,000(a) | ISS A/S/UK, 11.00%, 6/15/14 | 174,574 | ||||
60,000 | Jaguar Land Rover Plc, 8.13%, 5/15/21(c) | 64,350 | ||||
90,000(a) | Kerling Plc, 10.63%, 2/1/17 | 109,293 | ||||
200,000(d) | Moto Finance Plc, 10.25%, 3/15/17 | 300,354 | ||||
240,000(d) | MU Finance Plc, 8.75%, 2/1/17 | 422,433 | ||||
140,000(d) | Priory Group No. 3 Plc, 7.00%, 2/15/18 | 235,116 | ||||
100,000(d) | Priory Group No. 3 Plc, 8.88%, 2/15/19 | 159,866 | ||||
|
| |||||
| 1,949,585 | ||||||
|
| |||||
United States — 43.18% | ||||||
70,000 | American Axle & Manufacturing, Inc., 6.63%, 10/15/22 | 70,875 | ||||
150,000 | Ameristar Casinos, Inc., 7.50%, 4/15/21 | 161,250 | ||||
322,000 | BakerCorp International, Inc., 8.25%, 6/1/19(c) | 326,025 | ||||
350,000 | BI-LO LLC/BI-LO Finance Corp., 9.25%, 2/15/19(c) | 374,937 | ||||
450,000 | Biomet, Inc., 10.00%, 10/15/17 | 474,750 | ||||
190,000 | Burger King Corp., 9.88%, 10/15/18 | 220,400 | ||||
150,000 | CDRT Holding Corp., 9.25%, 10/1/17(c)(f) | 144,750 | ||||
424,000 | Cequel Communications Holdings I LLC/Cequel Capital Corp., 8.63%, 11/15/17(c) | 452,620 | ||||
120,000 | Chaparral Energy, Inc., 7.63%, 11/15/22(c) | 126,000 | ||||
90,000 | Chaparral Energy, Inc., 9.88%, 10/1/20 | 101,700 | ||||
158,000 | CSC Holdings LLC, 6.75%, 11/15/21(c) | 174,195 | ||||
210,000 | DJO Finance LLC/DJO Finance Corp., 8.75%, 3/15/18(c) | 223,387 | ||||
329,000 | Emergency Medical Services Corp., 8.13%, 6/1/19 | 348,740 | ||||
270,000 | Epicor Software Corp., 8.63%, 5/1/19 | 284,850 | ||||
200,000 | GCI, Inc., 6.75%, 6/1/21 | 200,000 | ||||
120,000 | Gentiva Health Services, Inc., 11.50%, 9/1/18 | 113,250 | ||||
280,000 | HCA, Inc., 6.50%, 2/15/20 | 311,500 | ||||
250,000 | Integra Telecom Holdings, Inc., 10.75%, 4/15/16(c) | 255,625 | ||||
100,000 | Lawson Software, Inc., 9.38%, 4/1/19(c) | 111,000 | ||||
50,000 | Level 3 Financing, Inc., 7.00%, 6/1/20(c) | 50,500 | ||||
370,000 | Level 3 Financing, Inc., 8.13%, 7/1/19 | 393,125 | ||||
110,000 | Live Nation Entertainment, Inc., 7.00%, 9/1/20(c) | 114,400 | ||||
260,000 | Live Nation Entertainment, Inc., 8.13%, 5/15/18(c) | 279,500 | ||||
100,000 | MetroPCS Wireless, Inc., 6.63%, 11/15/20 | 104,750 | ||||
170,000 | National CineMedia LLC, 6.00%, 4/15/22(c) | 179,350 | ||||
250,000 | National Mentor Holdings, Inc., 12.50%, 2/15/18(c) | 255,000 | ||||
80,000 | NCR Corp., 5.00%, 7/15/22(c) | 80,800 | ||||
300,000 | PAETEC Holding Corp., 9.88%, 12/1/18 | 343,500 | ||||
259,000 | Palace Entertainment Holdings LLC/Palace Entertainment Holdings Corp., 8.88%, 4/15/17(c) | 273,892 | ||||
31
SCHEDULE OF PORTFOLIO INVESTMENTS |
RBC BlueBay Global High Yield Bond Fund (cont.)
|
|
September 30, 2012
Principal Amount | Value | |||||
| ||||||
$230,000 | PDC Energy, Inc., 7.75%, 10/15/22(c)(g) | $ | 230,000 | |||
200,000 | Physio-Control International, Inc., 9.88%, 1/15/19(c) | 219,000 | ||||
250,000 | Pinnacle Entertainment, Inc., 7.75%, 4/1/22 | 272,500 | ||||
156,000 | Rain CII Carbon LLC/CII Carbon Corp., 8.00%, 12/1/18(c) | 159,120 | ||||
330,000 | Sabre, Inc., 8.50%, 5/15/19(c) | 339,075 | ||||
37,000 | Spectrum Brands, Inc., 6.75%, 3/15/20(c) | 38,203 | ||||
250,000 | SUPERVALU, Inc., 8.00%, 5/1/16 | 223,125 | ||||
160,000 | Taylor Morrison Communities, Inc./Monarch Communities, Inc., 7.75%, 4/15/20(c) | 170,400 | ||||
50,000 | Taylor Morrison Communities, Inc./Monarch Communities, Inc., 7.75%, 4/15/20 | 53,250 | ||||
370,000 | Tenet Healthcare Corp., 8.00%, 8/1/20 | 397,287 | ||||
52,000 | Toys R Us, Inc., 7.38%, 10/15/18 | 46,670 | ||||
160,000 | Toys R Us, Inc., 10.38%, 8/15/17(c) | 163,600 | ||||
40,000 | TW Telecom Holdings, Inc., 5.38%, 10/1/22(c) | 40,800 | ||||
220,000 | United Surgical Partners International, Inc., 9.00%, 4/1/20(c) | 238,700 | ||||
352,000 | Valeant Pharmaceuticals International, 6.88%, 12/1/18(c) | 370,480 | ||||
100,000 | WideOpenWest Finance LLC/WideOpenWest Capital Corp., 10.25%, 7/15/19(c) | 105,500 | ||||
100,000 | WMG Acquisition Corp., 9.50%, 6/15/16 | 109,125 | ||||
40,000 | Wolverine World Wide, Inc., 6.13%, 10/15/20(c) | 41,200 | ||||
|
| |||||
| 9,768,706 | ||||||
|
| |||||
Total Corporate Bonds | 17,957,332 | |||||
|
| |||||
(Cost $17,097,263) | ||||||
Shares | Value | |||||
| ||||||
Investment Company — 10.06% | ||||||
2,276,642 | JPMorgan 100% US Treasury Securities Money Market Fund | $2,276,642 | ||||
|
| |||||
Total Investment Company | 2,276,642 | |||||
|
| |||||
(Cost $2,276,642) | ||||||
Total Investments | $ | 22,128,638 | ||||
(Cost $21,215,555)(h) — 97.81% | ||||||
Other assets in excess of liabilities — 2.19% | 495,807 | |||||
|
| |||||
NET ASSETS — 100.00% | $ | 22,624,445 | ||||
|
| |||||
| (a) | Principal amount denoted in Euros. |
| (b) | Floating rate note. Rate shown is as of report date. |
| (c) | Security exempt from registration under Rule 144A or Section 4(2) of the Securities Act of 1933, as amended. These securities may be resold in transactions exempt from registration, normally to qualified institutional buyers. Security has been deemed to be liquid based on procedures approved by the Board of Trustees. |
32
SCHEDULE OF PORTFOLIO INVESTMENTS |
RBC BlueBay Global High Yield Bond Fund (cont.)
|
|
September 30, 2012
| (d) | Principal amount denoted in British Pounds. |
| (e) | Principal amount denoted in Swiss Francs. |
| (f) | Represents a payment-in-kind security which may pay interest/dividends in additional face/shares. |
| (g) | Fair valued security under procedures established by the Pricing Committee of the Fund’s Board of Trustees. |
| (h) | See notes to financial statements for the tax cost of securities and the breakdown of unrealized appreciation (depreciation). |
Foreign currency exchange contracts as of September 30, 2012:
Currency Purchased | Currency Sold | Counterparty | Settlement Date | Unrealized Appreciation/ (Depreciation) | ||||||||||
EUR | 197,000 | USD | 258,578 | Citibank, N.A. | 10/4/12 | $ | (5,408 | ) | ||||||
GBP | 478,000 | USD | 777,307 | Citibank, N.A. | 10/4/12 | (5,446 | ) | |||||||
USD | 194,708 | CHF | 184,000 | Citibank, N.A. | 10/4/12 | (955 | ) | |||||||
USD | 162,992 | CHF | 157,000 | Citibank, N.A. | 10/4/12 | (3,960 | ) | |||||||
USD | 41,459 | EUR | 32,000 | Citibank, N.A. | 10/4/12 | 335 | ||||||||
USD | 3,863,719 | EUR | 3,100,000 | Citibank, N.A. | 10/4/12 | (120,180 | ) | |||||||
USD | 2,662,255 | GBP | 1,688,000 | Citibank, N.A. | 10/4/12 | (63,483 | ) | |||||||
|
| |||||||||||||
Total | $ | (199,097 | ) | |||||||||||
|
| |||||||||||||
Credit default swaps as of September 30, 2012:
Fixed | Issuer | Counterparty | Expiration Date | Buy/Sell | Notional Amount (000) | Value | ||||||||||||
| 1.00% | iTraxx Europe Senior Financials | JPMorgan Chase Bank, N.A. | 6/20/17 | Sell | EUR | 240(a) | $ | (15,757) | ||||||||||
| 5.00% | iTraxx Sub Financials, Series 17 | JPMorgan Chase Bank, N.A. | 6/20/17 | Buy | EUR | 100 | (7,074) | |||||||||||
|
| |||||||||||||||||
Total (Premiums received $(23,640)) | $ | (22,831) | ||||||||||||||||
|
| |||||||||||||||||
(a) The maximum potential amount the Fund may pay should a negative credit event take place as defined under the terms of the agreement.
Abbreviations used are defined below:
CHF - Swiss Franc
EUR - Euro
GBP - British Pound
USD - United States Dollar
33
SCHEDULE OF PORTFOLIO INVESTMENTS |
RBC BlueBay Global High Yield Bond Fund (cont.)
|
|
September 30, 2012
Portfolio Diversification (Unaudited) Industries | ||||||
Industries | Percentage of Net Assets | |||||
Telecommunication Services | 28.55 | % | ||||
Consumer Staples | 25.21 | % | ||||
Consumer Discretionary | 13.77 | % | ||||
Financials | 9.15 | % | ||||
Industrials | 5.75 | % | ||||
Information Technology | 2.11 | % | ||||
Energy | 2.02 | % | ||||
Materials | 1.19 | % | ||||
Other* | 12.25 | % | ||||
|
| |||||
| 100.00 | % | |||||
|
| |||||
| * | Includes cash, interest and dividend receivable, pending trades and Fund share transactions, Investment Company, commitments, credit default swaps, foreign currency exchange contracts and accrued expenses payable. |
See notes to financial statements.
34
SCHEDULE OF PORTFOLIO INVESTMENTS |
RBC BlueBay Global Convertible Bond Fund
|
|
September 30, 2012
Principal Amount | Value | |||||
| ||||||
Corporate Bonds — 95.60% | ||||||
Australia — 6.08% | ||||||
300,000(a) | Commonwealth Property Office Fund, 5.25%, 12/11/16 | $ | 329,084 | |||
$ 200,000 | Paladin Energy Ltd., 3.63%, 11/4/15 | 173,000 | ||||
500,000(a) | Western Areas NL, 6.40%, 7/2/15 | 518,651 | ||||
|
| |||||
| 1,020,735 | ||||||
|
| |||||
Bermuda — 4.43% | ||||||
300,000 | Aquarius Platinum Ltd., 4.00%, 12/18/15 | 192,750 | ||||
400,000 | Seadrill Ltd., 3.38%, 10/27/17 | 550,500 | ||||
|
| |||||
| 743,250 | ||||||
|
| |||||
British Virgin Islands — 4.97% | ||||||
400,000 | Billion Express Investments Ltd., 0.75%, 10/18/15 | 425,000 | ||||
420,000 | PB Issuer No. 3 Ltd., 1.88%, 10/22/18 | 409,328 | ||||
|
| |||||
| 834,328 | ||||||
|
| |||||
Cayman Islands — 2.33% | ||||||
400,000 | BES Finance Ltd., 1.63%, 4/15/13 | 391,000 | ||||
France — 3.85% | ||||||
500,000(b) | BNP Paribas SA, 0.25%, 9/21/15 | 646,540 | ||||
Germany — 2.35% | ||||||
300,000(b) | KFW, 3.25%, 6/27/13 | 393,611 | ||||
Isle of Man — 1.26% | ||||||
200,000 | AngloGold Ashanti Holdings Finance Plc, 3.50%, 5/22/14 | 212,250 | ||||
Japan — 2.58% | ||||||
30,000,000(a) | KDDI Corp., 1.00%, 12/14/15(c) | 432,547 | ||||
Jersey Channel Island — 1.65% | ||||||
250,000 | Shire Plc, 2.75%, 5/9/14(d) | 276,875 | ||||
Malaysia — 2.59% | ||||||
400,000 | YTL Corp. Finance Labuan Ltd., 1.88%, 3/18/15 | 434,000 | ||||
Netherlands — 4.49% | ||||||
500,000 | Siemens Financieringsmaatschappij NV, 1.05%, 8/16/17 | 501,875 | ||||
250,000 | Siemens Financieringsmaatschappij NV, 1.65%, 8/16/19 | 251,250 | ||||
|
| |||||
| 753,125 | ||||||
|
| |||||
Philippines — 2.44% | ||||||
400,000 | San Miguel Corp., 2.00%, 5/5/14 | 410,000 | ||||
35
SCHEDULE OF PORTFOLIO INVESTMENTS |
RBC BlueBay Global Convertible Bond Fund (cont.)
|
|
September 30, 2012
Principal Amount | Value | |||||
| ||||||
Singapore — 8.27% | ||||||
250,000(a) | CapitaLand Ltd., 2.88%, 9/3/16 | $ | 205,753 | |||
500,000(a) | CapitaMall Trust, 2.13%, 4/19/14 | 416,599 | ||||
500,000(a) | Temasek Financial III Pte Ltd., 0.12%, 10/24/14(c) | 413,543 | ||||
$ 300,000 | Wilmar International Ltd., 0.89%, 12/18/12(c) | 351,375 | ||||
|
| |||||
| 1,387,270 | ||||||
|
| |||||
Spain — 1.97% | ||||||
187,000(e) | International Consolidated Airlines Group SA, 5.80%, 8/13/14 | 329,900 | ||||
Sweden — 2.11% | ||||||
2,000,000(a) | Elekta AB, 2.75%, 4/25/17 | 353,946 | ||||
Taiwan — 4.63% | ||||||
600,000 | AU Optronics Corp., 10.19%, 10/13/15(c) | 490,500 | ||||
300,000 | Tatung Co. Ltd., 4.19%, 3/25/14(c) | 285,750 | ||||
|
| |||||
| 776,250 | ||||||
|
| |||||
Thailand — 3.09% | ||||||
15,000,000(a) | BTS Group Holdings PCL, 1.00%, 1/25/16 | 519,006 | ||||
United Arab Emirates — 3.07% | ||||||
400,000(b) | Aabar Investments PJSC, 4.00%, 5/27/16 | 514,277 | ||||
United States — 33.44% | ||||||
300,000 | Boston Properties LP, 3.63%, 2/15/14(d) | 326,250 | ||||
400,000 | Gilead Sciences, Inc., 1.00%, 5/1/14 | 602,000 | ||||
400,000 | Intel Corp., 3.25%, 8/1/39(d) | 493,000 | ||||
400,000 | Liberty Interactive LLC, 3.13%, 3/30/23 | 563,000 | ||||
500,000 | Medivation, Inc., 2.63%, 4/1/17 | 672,813 | ||||
350,000 | MGM Resorts International, 4.25%, 4/15/15 | 363,781 | ||||
250,000 | Microchip Technology, Inc., 2.13%, 12/15/37 | 314,063 | ||||
350,000 | NetApp, Inc., 1.75%, 6/1/13 | 398,562 | ||||
300,000 | priceline.com, Inc., 1.00%, 3/15/18(d) | 322,125 | ||||
250,000 | SanDisk Corp., 1.50%, 8/15/17 | 282,969 | ||||
300,000 | United States Steel Corp., 4.00%, 5/15/14 | 303,187 | ||||
400,000 | VeriSign, Inc., 3.25%, 8/15/37 | 609,750 | ||||
300,000 | Xilinx, Inc., 3.13%, 3/15/37 | 358,500 | ||||
|
| |||||
| 5,610,000 | ||||||
|
| |||||
Total Corporate Bonds | 16,038,910 | |||||
|
| |||||
(Cost $15,247,089) | ||||||
36
SCHEDULE OF PORTFOLIO INVESTMENTS |
RBC BlueBay Global Convertible Bond Fund (cont.)
|
|
September 30, 2012
Shares | Value | |||||
| ||||||
Investment Company — 7.46% | ||||||
1,251,685 | JPMorgan 100% US Treasury Securities Money Market Fund | $ | 1,251,685 | |||
|
| |||||
Total Investment Company | 1,251,685 | |||||
|
| |||||
(Cost $1,251,685) | ||||||
Total Investments | $ | 17,290,595 | ||||
(Cost $16,498,774)(f) — 103.06% | ||||||
Liabilities in excess of other assets — (3.06)% | (512,642 | ) | ||||
|
| |||||
NET ASSETS — 100.00% | $ | 16,777,953 | ||||
|
| |||||
| (a) | Investment in non-U.S. Dollars. Principal amount reflects local currency. |
| (b) | Principal amount denoted in Euros. |
| (c) | Zero coupon bond. The rate represents the yield at time of purchase. |
| (d) | Security exempt from registration under Rule 144A or Section 4(2) of the Securities Act of 1933, as amended. These securities may be resold in transactions exempt from registration, normally to qualified institutional buyers. Security has been deemed to be liquid based on procedures approved by the Board of Trustees. |
| (e) | Principal amount denoted in British Pounds. |
| (f) | See notes to financial statements for the tax cost of securities and the breakdown of unrealized appreciation (depreciation). |
Foreign currency exchange contracts as of September 30, 2012:
Currency Purchased | Currency Sold | Counterparty | Settlement | Unrealized Appreciation/ (Depreciation) | ||||||||||
USD | 866,163 | AUD | 828,000 | Citibank, N.A. | 10/4/12 | $ 7,778 | ||||||||
USD | 665,375 | EUR | 510,000 | Citibank, N.A. | 10/4/12 | 9,999 | ||||||||
USD | 891,204 | EUR | 714,000 | Citibank, N.A. | 10/4/12 | (26,378) | ||||||||
USD | 320,614 | GBP | 203,000 | Citibank, N.A. | 10/4/12 | (7,186) | ||||||||
USD | 406,677 | JPY | 32,300,000 | Citibank, N.A. | 10/4/12 | (7,235) | ||||||||
USD | 346,132 | SEK | 2,306,000 | Citibank, N.A. | 10/4/12 | (4,857) | ||||||||
USD | 1,026,029 | SGD | 1,284,000 | Citibank, N.A. | 10/4/12 | (20,247) | ||||||||
USD | 463,375 | THB | 14,800,000 | Citibank, N.A. | 10/18/12 | (16,734) | ||||||||
|
| |||||||||||||
Total | $ (64,860) | |||||||||||||
|
| |||||||||||||
37
SCHEDULE OF PORTFOLIO INVESTMENTS |
RBC BlueBay Global Convertible Bond Fund (cont.)
|
|
September 30, 2012
Abbreviations used are defined below:
AUD - Australian Dollar
EUR - Euro
GBP - British Pound
JPY - Japanese Yen
SEK - Swedish Krona
SGD - Singapore Dollar
THB - Thai Baht
USD - United States Dollar
Portfolio Diversification (Unaudited)
Industries | Percentage of Net Assets | |||
Financials | 24.21 | % | ||
Industrials | 17.24 | % | ||
Consumer Staples | 13.45 | % | ||
Telecommunication Services | 11.49 | % | ||
Information Technology | 11.01 | % | ||
Materials | 8.34 | % | ||
Consumer Discretionary | 4.14 | % | ||
Energy | 3.28 | % | ||
Diversified | 2.44 | % | ||
Other* | 4.40 | % | ||
|
| |||
| 100.00 | % | |||
|
| |||
| * | Includes cash, interest and dividend receivable, pending trades and Fund share transactions, Investment Company, foreign currency exchange contracts and accrued expenses payable. |
See notes to financial statements.
38
Statements of Assets and Liabilities
|
|
September 30, 2012
| RBC BlueBay Emerging Market Select Bond Fund | RBC BlueBay Emerging Market Corporate Bond Fund | RBC BlueBay Global High Yield Bond Fund | RBC BlueBay Global Convertible Bond Fund | |||||||||||||
Assets: | ||||||||||||||||
Investments, at value (cost $116,349,603, $17,116,126, $21,215,555 and $16,498,774, respectively) | $ | 118,857,590 | $ | 17,822,634 | $ | 22,128,638 | $ | 17,290,595 | ||||||||
Total return swaps at value (cost $732,745) | 734,897 | — | — | — | ||||||||||||
Cash | 7,533 | 166,776 | 7,299 | — | ||||||||||||
Cash at broker for futures contracts | 128,060 | 12,362 | 48,216 | — | ||||||||||||
Foreign currency, at value (cost $61,641, $0, $74,607 and $5,762, respectively) | 61,755 | — | 74,046 | 5,861 | ||||||||||||
Interest and dividends receivable | 1,389,047 | 235,998 | 407,776 | 94,753 | ||||||||||||
Receivable for capital shares issued | 4,299,970 | — | — | — | ||||||||||||
Receivable for investments sold | 2,503,247 | 234,946 | 961,552 | — | ||||||||||||
Unrealized appreciation on swap contracts | 43,685 | — | — | — | ||||||||||||
Unrealized appreciation on forward foreign exchange contracts | 204,978 | — | 335 | 17,777 | ||||||||||||
Prepaid expenses and other assets | 1,849 | 1,849 | 1,849 | 1,849 | ||||||||||||
|
|
|
|
|
|
|
| |||||||||
Total Assets | 128,232,611 | 18,474,565 | 23,629,711 | 17,410,835 | ||||||||||||
|
|
|
|
|
|
|
| |||||||||
Liabilities: | ||||||||||||||||
Payable to broker for foreign currency contracts | 560,000 | — | — | — | ||||||||||||
Payable for investments purchased | 4,934,319 | 712,527 | 652,939 | 420,000 | ||||||||||||
Distributions payable | 27,604 | 1,585 | — | 2 | ||||||||||||
Unrealized depreciation on forward foreign currency exchange contracts | 354,644 | — | 199,432 | 82,637 | ||||||||||||
Unrealized depreciation on swap contracts | 44,708 | — | — | — | ||||||||||||
Unrealized depreciation on futures contracts | 32,594 | — | — | — | ||||||||||||
Credit default swaps at value (premiums received $23,640) | — | — | 22,831 | — | ||||||||||||
Accrued expenses and other payables: | ||||||||||||||||
Investment advisory fees | 47,980 | 6,446 | 2,522 | 2,713 | ||||||||||||
Accounting fees | 3,575 | 3,238 | 3,256 | 3,235 | ||||||||||||
Audit fees | 33,410 | 33,410 | 33,410 | 33,410 | ||||||||||||
Trustee fees | 15 | 719 | 6 | 4 | ||||||||||||
Shareholder reports | 577 | 4,429 | 4,064 | 4,485 | ||||||||||||
Transfer agent fees | 1,992 | 626 | 599 | 615 | ||||||||||||
Offering costs | 79,568 | 79,568 | 79,568 | 79,568 | ||||||||||||
Other | 14,964 | 8,815 | 6,639 | 6,213 | ||||||||||||
|
|
|
|
|
|
|
| |||||||||
Total Liabilities | 6,135,950 | 851,363 | 1,005,266 | 632,882 | ||||||||||||
|
|
|
|
|
|
|
| |||||||||
Net Assets | $ | 122,096,661 | $ | 17,623,202 | $ | 22,624,445 | $ | 16,777,953 | ||||||||
|
|
|
|
|
|
|
| |||||||||
Net Assets Consist Of: | ||||||||||||||||
Capital | $ | 117,845,088 | $ | 16,128,813 | $ | 21,003,106 | $ | 15,740,949 | ||||||||
Undistributed net investment income and distributions in excess of net investment income | (32,324 | ) | 85,108 | 318,309 | 89,411 | |||||||||||
Accumulated net realized gains from investment transactions, futures contracts, swap contracts, written options and foreign currency | 1,933,824 | 702,773 | 589,129 | 220,087 | ||||||||||||
Net unrealized appreciation (depreciation) on investments, futures contracts, swap contracts, written options and foreign currency | 2,350,073 | 706,508 | 713,901 | 727,506 | ||||||||||||
|
|
|
|
|
|
|
| |||||||||
Net Assets | $ | 122,096,661 | $ | 17,623,202 | $ | 22,624,445 | $ | 16,777,953 | ||||||||
|
|
|
|
|
|
|
| |||||||||
Shares Outstanding (Unlimited number of shares authorized, no par value): | ||||||||||||||||
Class I | 11,222,784 | 1,615,938 | 2,103,478 | 1,579,069 | ||||||||||||
|
|
|
|
|
|
|
| |||||||||
Net Asset Values and Redemption Prices Per Share: | ||||||||||||||||
Class I | $ | 10.88 | $ | 10.91 | $ | 10.76 | $ | 10.63 | ||||||||
|
|
|
|
|
|
|
| |||||||||
See notes to financial statements.
39
FINANCIAL STATEMENTS |
|
|
For the Period Ended September 30, 2012(a)
| RBC BlueBay Emerging Market Select Bond Fund | RBC BlueBay Emerging Market Corporate Bond Fund | RBC BlueBay Global High Yield Bond Fund | RBC BlueBay Global Convertible Bond Fund | |||||||||||||
Investment Income: | ||||||||||||||||
Interest income | $ | 1,745,913 | $ | 732,188 | $ | 1,258,823 | $ | 465,844 | ||||||||
Dividend income | 772 | 27 | 9 | 10,653 | ||||||||||||
Foreign tax withholding | — | — | (103 | ) | — | |||||||||||
|
|
|
|
|
|
|
| |||||||||
Total Investment Income | 1,746,685 | 732,215 | 1,258,729 | 476,497 | ||||||||||||
|
|
|
|
|
|
|
| |||||||||
Expenses: | ||||||||||||||||
Investment advisory fees | 371,144 | 128,966 | 132,919 | 106,965 | ||||||||||||
Accounting fees | 38,154 | 36,513 | 36,721 | 36,503 | ||||||||||||
Audit fees | 41,500 | 41,500 | 41,500 | 41,500 | ||||||||||||
Custodian fees | 41,447 | 21,526 | 11,015 | 11,161 | ||||||||||||
Interest expense | 3 | — | — | 286 | ||||||||||||
Insurance fees | 5,006 | 5,006 | 5,006 | 5,006 | ||||||||||||
Legal fees | 146,728 | 101,561 | 114,751 | 101,937 | ||||||||||||
Registration and filing fees | 8,930 | 5,460 | 5,475 | 5,460 | ||||||||||||
Shareholder reports | 7,500 | 7,500 | 7,500 | 7,500 | ||||||||||||
Transfer agent fees | 9,327 | 4,611 | 4,493 | 4,558 | ||||||||||||
Offering costs | 79,568 | 79,568 | 79,568 | 79,568 | ||||||||||||
Trustees’ fees | 1,154 | 1,032 | 412 | 314 | ||||||||||||
Other fees | 13,155 | 10,811 | 9,602 | 8,628 | ||||||||||||
|
|
|
|
|
|
|
| |||||||||
Total expenses before fee waiver/reimbursement | 763,616 | 444,054 | 448,962 | 409,386 | ||||||||||||
Expenses waived/reimbursed by: | ||||||||||||||||
Adviser | (299,684 | ) | (287,937 | ) | (280,599 | ) | (275,394 | ) | ||||||||
|
|
|
|
|
|
|
| |||||||||
Net Expenses | 463,932 | 156,117 | 168,363 | 133,992 | ||||||||||||
|
|
|
|
|
|
|
| |||||||||
Net Investment Income | 1,282,753 | 576,098 | 1,090,366 | 342,505 | ||||||||||||
|
|
|
|
|
|
|
| |||||||||
Realized/Unrealized Gains (Losses): | ||||||||||||||||
Net realized gains/(losses) on: | ||||||||||||||||
Investment transactions | 1,874,367 | 729,660 | 632,084 | 248,139 | ||||||||||||
Foreign currency transactions | (213,892 | ) | (5,623 | ) | 158,891 | (10,195 | ) | |||||||||
Written options | 44,954 | — | — | — | ||||||||||||
Futures contracts | 18,772 | (7,638 | ) | (4,784 | ) | — | ||||||||||
Swap agreements | 201,689 | — | 32,987 | — | ||||||||||||
|
|
|
|
|
|
|
| |||||||||
Net realized gains | 1,925,890 | 716,399 | 819,178 | 237,944 | ||||||||||||
|
|
|
|
|
|
|
| |||||||||
Net change in unrealized appreciation/depreciation on: | ||||||||||||||||
Investments | 2,507,987 | 706,508 | 913,083 | 791,821 | ||||||||||||
Foreign currency | (126,449 | ) | — | (199,991 | ) | (64,315 | ) | |||||||||
Futures contracts | (32,594 | ) | — | — | — | |||||||||||
Swap contracts | 1,129 | — | 809 | — | ||||||||||||
|
|
|
|
|
|
|
| |||||||||
Net unrealized gains | 2,350,073 | 706,508 | 713,901 | 727,506 | ||||||||||||
|
|
|
|
|
|
|
| |||||||||
Change in net assets resulting from operations | $ | 5,558,716 | $ | 1,999,005 | $ | 2,623,445 | $ | 1,307,955 | ||||||||
|
|
|
|
|
|
|
| |||||||||
(a) For the period from November 30, 2011 (commencement of operations) to September 30, 2012.
See notes to the financial statements.
40
FINANCIAL STATEMENTS |
Statements of Changes in Net Assets
|
|
For the Period Ended September 30, 2012(a)
| RBC BlueBay Emerging Market Select Bond Fund | RBC BlueBay Emerging Market Corporate Bond Fund | RBC BlueBay Global High Yield Bond Fund | RBC BlueBay Global Convertible Bond Fund | |||||||||||||
From Investment Activities: | ||||||||||||||||
Operations: | ||||||||||||||||
Net investment income | $ | 1,282,753 | $ | 576,098 | $ | 1,090,366 | $ | 342,505 | ||||||||
Net realized gains from investments, foreign currency, futures contracts and swap contracts transactions | 1,925,890 | 716,399 | 819,178 | 237,944 | ||||||||||||
Net change in unrealized appreciation/depreciation on investments, foreign currency, futures contracts and swap contracts | 2,350,073 | 706,508 | 713,901 | 727,506 | ||||||||||||
|
|
|
|
|
|
|
| |||||||||
Change in net assets resulting from operations | 5,558,716 | 1,999,005 | 2,623,445 | 1,307,955 | ||||||||||||
|
|
|
|
|
|
|
| |||||||||
Distributions to Class I Shareholders: | ||||||||||||||||
From net investment income | (1,386,711 | ) | (584,184 | ) | (1,081,674 | ) | (350,592 | ) | ||||||||
|
|
|
|
|
|
|
| |||||||||
Change in net assets resulting from shareholder distributions | (1,386,711 | ) | (584,184 | ) | (1,081,674 | ) | (350,592 | ) | ||||||||
|
|
|
|
|
|
|
| |||||||||
Capital Transactions: | ||||||||||||||||
Proceeds from shares issued | 118,905,592 | 15,634,093 | 20,001,000 | 15,470,000 | ||||||||||||
Distributions reinvested | 1,290,771 | 574,288 | 1,081,674 | 350,590 | ||||||||||||
Cost of shares redeemed | (2,271,707 | ) | — | — | — | |||||||||||
|
|
|
|
|
|
|
| |||||||||
Change in net assets resulting from capital transactions | 117,924,656 | 16,208,381 | 21,082,674 | 15,820,590 | ||||||||||||
|
|
|
|
|
|
|
| |||||||||
Net increase in net assets | 122,096,661 | 17,623,202 | 22,624,445 | 16,777,953 | ||||||||||||
Net Assets: | ||||||||||||||||
Beginning of period | — | — | — | — | ||||||||||||
|
|
|
|
|
|
|
| |||||||||
End of period | $ | 122,096,661 | $ | 17,623,202 | $ | 22,624,445 | $ | 16,777,953 | ||||||||
|
|
|
|
|
|
|
| |||||||||
Undistributed net investment income and distributions in excess of net investment income | $ | (32,324 | ) | $ | 85,108 | $ | 318,309 | $ | 89,411 | |||||||
|
|
|
|
|
|
|
| |||||||||
Share Transactions: | ||||||||||||||||
Issued | 11,311,071 | 1,561,141 | 2,000,100 | 1,545,405 | ||||||||||||
Reinvested | 122,224 | 54,797 | 103,378 | 33,664 | ||||||||||||
Redeemed | (210,511 | ) | — | — | — | |||||||||||
|
|
|
|
|
|
|
| |||||||||
Change in shares resulting from capital transactions | 11,222,784 | 1,615,938 | 2,103,478 | 1,579,069 | ||||||||||||
|
|
|
|
|
|
|
| |||||||||
| (a) | For the period from November 30, 2011 (commencement of operations) to September 30, 2012. |
See notes to financial statements.
41
RBC BlueBay Emerging Market Select Bond Fund
|
|
(Selected data for a share outstanding throughout the period indicated)
| For the Period Ended September 30, 2012 (a) | ||||||
Per Share Operating Performance: | ||||||
Net asset value, beginning of period | $ | 10.00 | ||||
|
| |||||
Net investment income(b) | 0.24 | |||||
Realized and unrealized gains (losses) | 0.91 | |||||
|
| |||||
Total from investment activities | 1.15 | |||||
|
| |||||
Less distributions from net investment income | (0.27 | ) | ||||
|
| |||||
Net asset value, end of period | $ | 10.88 | ||||
|
| |||||
Total Return:(c) | 11.60 | % | ||||
Ratios to Average Net Assets:(d) | ||||||
Ratio of Net Expenses to Average Net Assets | 1.00 | % | ||||
Ratio of Net Investment Income to Average Net Assets | 2.76 | % | ||||
Ratio of Expenses to Average Net Assets* | 1.59 | % | ||||
Net assets, end of period (in thousands) | $ | 122,097 | ||||
Portfolio turnover | 110 | % | ||||
| * | During the period, certain fees were contractually or voluntarily reduced and/or reimbursed. If such contractual/voluntary fee reductions and reimbursements had not occurred, the ratio would have been as indicated. |
| (a) | For the period from November 30, 2011 (commencement of operations) to September 30, 2012. |
| (b) | Per share net investment income (loss) has been calculated using the average daily shares method. |
| (c) | Not Annualized. |
| (d) | Annualized. |
See notes to financial statements.
42
FINANCIAL HIGHLIGHTS |
RBC BlueBay Emerging Market Corporate Bond Fund
|
|
(Selected data for a share outstanding throughout the period indicated)
| For the Period Ended September 30, 2012(a) | ||||||
Per Share Operating Performance: | ||||||
Net asset value, beginning of period | $ | 10.00 | ||||
|
| |||||
Net investment income(b) | 0.37 | |||||
Realized and unrealized gains (losses) | 0.91 | |||||
|
| |||||
Total from investment activities | 1.28 | |||||
|
| |||||
Less distributions from net investment income | (0.37 | ) | ||||
|
| |||||
Net asset value, end of period | $ | 10.91 | ||||
|
| |||||
Total Return:(c) | 13.06 | % | ||||
Ratios to Average Net Assets:(d) | ||||||
Ratio of Net Expenses to Average Net Assets | 1.15 | % | ||||
Ratio of Net Investment Income to Average Net Assets | 4.24 | % | ||||
Ratio of Expenses to Average Net Assets* | 3.10 | % | ||||
Net assets, end of period (in thousands) | $ | 17,623 | ||||
Portfolio turnover | 151 | % | ||||
| * | During the period, certain fees were contractually or voluntarily reduced and/or reimbursed. If such contractual/voluntary fee reductions and reimbursements had not occurred, the ratio would have been as indicated. |
| (a) | For the period from November 30, 2011 (commencement of operations) to September 30, 2012. |
| (b) | Per share net investment income (loss) has been calculated using the average daily shares method. |
| (c) | Not Annualized. |
| (d) | Annualized. |
See notes to financial statements.
43
FINANCIAL HIGHLIGHTS |
RBC BlueBay Global High Yield Bond Fund
|
|
(Selected data for a share outstanding throughout the period indicated)
| For the Period Ended September 30, 2012(a) | ||||||
Per Share Operating Performance: | ||||||
Net asset value, beginning of period | $ | 10.00 | ||||
|
| |||||
Net investment income(b) | 0.53 | |||||
Realized and unrealized gains (losses) | 0.76 | |||||
|
| |||||
Total from investment activities | 1.29 | |||||
|
| |||||
Less distributions from net investment income | (0.53 | ) | ||||
|
| |||||
Net asset value, end of period | $ | 10.76 | ||||
|
| |||||
Total Return:(c) | 13.16 | % | ||||
Ratios to Average Net Assets:(d) | ||||||
Ratio of Net Expenses to Average Net Assets | 0.95 | % | ||||
Ratio of Net Investment Income to Average Net Assets | 6.15 | % | ||||
Ratio of Expenses to Average Net Assets* | 2.40 | % | ||||
Net assets, end of period (in thousands) | $ | 22,624 | ||||
Portfolio turnover | 87 | % | ||||
| * | During the period, certain fees were contractually or voluntarily reduced and/or reimbursed. If such contractual/voluntary fee reductions and reimbursements had not occurred, the ratio would have been as indicated. |
| (a) | For the period from November 30, 2011 (commencement of operations) to September 30, 2012. |
| (b) | Per share net investment income (loss) has been calculated using the average daily shares method. |
| (c) | Not Annualized. |
| (d) | Annualized. |
See notes to financial statements.
44
FINANCIAL HIGHLIGHTS |
RBC BlueBay Global Convertible Bond Fund
|
|
(Selected data for a share outstanding throughout the period indicated)
| For the Period Ended September 30, 2012(a) | ||||||
Per Share Operating Performance: | ||||||
Net asset value, beginning of period | $ | 10.00 | ||||
|
| |||||
Net investment income(b) | 0.22 | |||||
Realized and unrealized gains (losses) | 0.64 | |||||
|
| |||||
Total from investment activities | 0.86 | |||||
|
| |||||
Less distributions from net investment income | (0.23 | ) | ||||
|
| |||||
Net asset value, end of period | $ | 10.63 | ||||
|
| |||||
Total Return:(c) | 8.65 | % | ||||
Ratios to Average Net Assets:(d) | ||||||
Ratio of Net Expenses to Average Net Assets | 1.00 | % | ||||
Ratio of Net Investment Income to Average Net Assets | 2.56 | % | ||||
Ratio of Expenses to Average Net Assets* | 2.89 | % | ||||
Net assets, end of period (in thousands) | $ | 16,778 | ||||
Portfolio turnover | 25 | % | ||||
| * | During the period, certain fees were contractually or voluntarily reduced and/or reimbursed. If such contractual/voluntary fee reductions and reimbursements had not occurred, the ratio would have been as indicated. |
| (a) | For the period from November 30, 2011 (commencement of operations) to September 30, 2012. |
| (b) | Per share net investment income (loss) has been calculated using the average daily shares method. |
| (c) | Not Annualized. |
| (d) | Annualized. |
See notes to financial statements.
45
September 30, 2012
|
|
1. Organization
RBC Funds Trust (“the Trust”) is registered under the Investment Company Act of 1940 (as amended) as an open-end management investment company. The Trust was organized as a Delaware statutory trust on December 16, 2003 and currently consists of 13 portfolios. This annual report includes the following four investment portfolios (“Funds”):
- RBC BlueBay Emerging Market Select Bond Fund (“Emerging Market Select Bond Fund”)
- RBC BlueBay Emerging Market Corporate Bond Fund (“Emerging Market Corporate Bond Fund”)
- RBC BlueBay Global High Yield Bond Fund (“Global High Yield Bond Fund”)
- RBC BlueBay Global Convertible Bond Fund (“Global Convertible Bond Fund”)
The Funds offer Class I shares. Class I shares (intended for investors meeting certain investment minimum thresholds) are not subject to either a front-end sales charge or a contingent deferred sales charge (“CDSC”).
RBC Global Asset Management (U.S.) Inc. (“RBC GAM (US)” or “Advisor” or “Co-Administrator”) acts as the investment advisor for the Funds and BlueBay Asset Management LLP (“BlueBay” or “Sub-Advisor”) acts as the sub-advisor. The officers of the Trust (“Fund Management”) are also employees of RBC GAM (US) or its affiliates or of BNY Mellon Investment Servicing (US) Inc. (“BNY Mellon”) (“Co-Administrator”).
2. Significant Accounting Policies
Summarized below are the significant accounting policies of the Funds. These policies conform to accounting principles generally accepted in the United States of America (“U.S. GAAP”). Fund Management follows these policies when preparing financial statements. Management may also be required to make estimates and assumptions that affect the reported amounts of assets and liabilities at the date of the financial statements and the reported amounts of income and expenses for the period. Actual results could differ from those estimates.
Security Valuation:
Bonds and other fixed income securities are generally valued on the basis of prices furnished by pricing services approved by the Trust’s Board of Trustees (“Board”). The pricing services utilize both dealer-supplied valuations and electronic data processing techniques that take into account appropriate factors such as institutional-size trading in similar groups of securities, yield, quality, coupon rate, maturity and type of issue. Derivative contracts and agreements are fair valued using methodologies approved by the Trust’s Board. These valuation techniques take into account multiple factors, including fundamental security analytical data, counterparty valuation quotations, information from broker-dealers, market spreads and interest rates. Short-term debt obligations, with less than 60 days to maturity at time of purchase, are valued at amortized cost unless Fund Management determines that amortized cost no longer approximates market value.
Exchange traded options, futures, and options on futures are valued at their most recent sale price on the exchange on which they are primarily traded. Forward foreign currency exchange contracts are marked-to market daily based upon foreign currency exchange rates provided by an independent pricing service.
Swaps are valued by an independent pricing service using an industry standard pricing model. If a price is not available from a pricing service or is deemed unreliable or not reflective of current market value, the swap may be priced at fair value using procedures approved by the Board.
Investments initially valued in currencies other than the U.S. dollar are converted to the U.S. dollar using foreign exchange rate quotations received from a pricing vendor as of 4:00 p.m. Eastern time.
46
NOTES TO FINANCIAL STATEMENTS |
The value of securities traded in markets outside the United States may be affected on a day that the New York Stock Exchange (“NYSE”) is closed and an investor is not able to purchase, exchange or redeem shares of the Funds.
The Trust’s Board has policies and procedures for the valuation of each Fund’s assets and has delegated to the Funds’ Pricing Committee (“Pricing Committee”) the responsibility for implementing the Procedures, including the responsibility for determining the fair value of the Fund’s securities or other assets and liabilities. The Pricing Committee includes representatives of the Funds’ Advisor, Co-Administrator and Sub-Advisor, including personnel from accounting and operations, investment management, trading, risk analytics, compliance and legal.
The Pricing Committee meets at least quarterly to review and approve Fund valuation matters, and includes a review of the Funds’ pricing activity and operations, fair value measurements, pricing vendors, policies and procedures and related controls. At least a quorum of the Pricing Committee meets more frequently, as needed, to consider and approve time-sensitive fair valuation actions. The Pricing Committee reports to the Valuation, Portfolio Management and Performance Committee (“Valuation Committee”) of the Board. Members of the Pricing Committee meet with the Valuation Committee and the Board at each of it’s regularly scheduled meetings to discuss valuation matters and actions taken during the period.
Fair value methods used include, but are not limited to, obtaining market quotations from secondary pricing services, broker-dealers, or widely used quotation systems. General factors used in determining the fair value of securities include fundamental analytical data, the nature and duration of any restrictions on disposition of the securities, and an evaluation of the forces that influenced the market in which the investments are purchased and sold. These securities are either categorized as Level 2 or 3 depending on the relevant inputs used.
In such cases where a security price is unavailable, the security or asset cannot be valued pursuant to one of the valuation methods established by the Board, or where Fund Management determines that the value provided by the pricing services does not approximate fair value, the value of the security or asset will be determined in good faith by the Pricing Committee as authorized by the Board, generally based upon recommendation provided by the Advisor or Sub-Advisor. Fair valuation may also be used when a significant valuation event is determined to have occurred. Significant valuation events may include, but are not limited to, the following: an event affecting the value of a security traded on a foreign market occurs between the close of that market and the close of regular trading on the New York Stock Exchange; an extraordinary event like a natural disaster or terrorist act occurs; or an adverse development arises with respect to a specific issuer, such as a bankruptcy filing. Some of the factors which may be considered in determining fair value are fundamental analytical data relating to the security, the issuer and the market, such as duration, prepayment and default rates; general level of interest rates and changes in interest rates; information from broker-dealers; and trading in similar securities.
When Funds use fair valuation methods that use significant unobservable inputs to determine their NAV, securities will be priced by a method that the Board or persons acting at their direction believe accurately reflect fair value and are categorized as Level 3 of the fair value hierarchy. These methods may require subjective determinations about the value of a security. While the Funds’ policy is intended to result in a calculation of each Fund’s NAV that fairly reflects security values as of the time of pricing, the Funds cannot guarantee that values determined by the Board or persons acting at their direction would accurately reflect the price that the Funds could obtain for a security if it were to dispose of that security as of the time of pricing (for instance, in a forced or distressed sale). The prices used by the Funds may differ from the value that would be realized if the securities were sold.
The Funds’ Pricing Committee employs various methods for calibrating the valuation approach related to securities categorized within Level 3 of fair value hierarchy. These methods may include regular due diligence of the Funds’ pricing vendors, a regular review of key inputs and assumptions, transaction back-testing or disposition analysis to compare unrealized gains and losses to realize gains and losses,
47
NOTES TO FINANCIAL STATEMENTS |
|
reviews of missing and stale prices and large movements in market value and reviews of any market related activities. Additionally, the pricing of all fair value holdings is subsequently reported to the Funds’ Board.
Foreign Currency Transactions:
The values of foreign securities, foreign currencies and other assets and liabilities denominated in foreign currencies are translated into U.S. dollars using current exchange rates each business day. Fluctuations in the value of foreign currency holdings and other assets and liabilities resulting from movements in currency exchange rates are recorded as unrealized foreign currency gains or losses. The effects of changes in foreign currency exchange rates on investments in securities are not segregated from the effects of changes in market prices of those securities on the Statements of Operations. Such fluctuations are included with the net realized gains or losses and net change in unrealized appreciation/depreciation on investment transactions.
Financial Instruments:
Derivatives
The Funds may use derivative instruments, including futures, forwards, options, indexed securities, swaps and inverse securities for hedging purposes only. Derivatives allow a Fund to increase or decrease its risk exposure more quickly and efficiently than other types of instruments. Derivatives may be riskier than other types of investments and could result in losses that significantly exceed a Fund’s original investment. Derivatives are subject to the risk that changes in the value of a derivative may not correlate perfectly with the underlying asset, rate or index. The use of derivatives may not be successful, resulting in losses to a Fund, and the cost of such strategies may reduce the Fund’s returns.
Derivatives may also expose a Fund to counterparty risk (the risk that the derivative counterparty will not fulfill its contractual obligations). To the extent amounts due to the Funds from their counterparties are not fully collateralized contractually or otherwise, the Funds bear the risk of loss from counterparty non-performance. A Fund’s maximum risk of loss from counterparty credit risk on over-the-counter derivatives is generally the aggregate unrealized gain in excess of any collateral pledged by the counterparty to the Funds.
For foreign currency exchange contracts, risks may arise upon entering into these contracts from the potential inability of the counterparties to meet the terms of their contracts, or if the foreign currency rates change unfavorably.
For over-the-counter purchased options, the Funds bear the risk of loss in the amount of the premiums paid and change in market value of the options should the counterparty not perform under the contracts. Written options by the Funds do not give rise to counterparty credit risk, as written options obligate the Funds to perform and not the counterparty. Counterparty risk related to exchange traded financial futures contracts and options is minimal because of the protection against defaults provided by the exchange on which they trade.
Hedging also involves the risk that changes in the value of the derivative will not match those of the holdings being hedged as expected by the Funds, in which case any losses on the holdings being hedged may not be reduced and may be increased. There can be no assurance that a Fund’s hedging strategy will reduce risk or that hedging transactions will be available or cost effective. The Funds are subject to interest rate risk and foreign currency exchange risk in the normal course of pursuing its investment objectives by investing in various derivative financial instruments, as described below.
In addition to the risks associated with derivatives in general, the Funds will also be subject to risks related to swap agreements. Because swap agreements are not exchange-traded, but are private contracts into which a Fund and a swap counterparty enter as principals, a Fund may experience a loss or delay in recovering assets if the counterparty defaults on its obligations. Each Fund will segregate or earmark liquid assets in an amount sufficient to cover its obligations under swap agreements.
48
NOTES TO FINANCIAL STATEMENTS |
The Funds may mitigate counterparty risk on derivatives through master netting agreements included within an International Swaps and Derivatives Association, Inc. (“ISDA”) Master Agreement between a Fund and each of its counterparties. The ISDA Master Agreement allows each Fund to offset with its counterparty certain derivative financial instruments’ payables and/or receivables with collateral held with each counterparty. The amount of collateral moved to/from applicable counterparties is based upon minimum transfer amounts of up to $1,000,000. To the extent amounts due to the Funds from their counterparties are not fully collateralized contractually or otherwise, the Funds bear the risk of loss from counterparty non-performance.
Financial Futures Contracts
The Funds may enter into futures contracts in an effort to manage the duration of the portfolio and hedge against certain market risk. A futures contract on a securities index is an agreement obligating one party to pay, and entitling the other party to receive, during the term of the contract, cash payments based on the level of a specified securities index. Futures transactions involve brokerage costs and require a Fund to segregate assets to cover contracts that would require it to purchase securities or currencies. A Fund may lose the expected benefit of futures transactions if interest rates, exchange rates or securities prices change in an unanticipated manner. Such unanticipated changes may also result in lower overall performance than if a Fund had not entered into any futures transactions.
Upon entering into a futures contract, a Fund is required to pledge to the broker an amount of cash, U.S. government securities, or other assets equal to a certain percentage of the contract amount. Subsequent payments are made or received by the Funds each day, depending on the daily fluctuations in the fair value of the underlying instrument. A Fund would record an unrealized gain or loss each day equal to these daily payments.
The Emerging Market Select Bond Fund had the following open futures contracts at September 30, 2012:
Short Position | Number of Contracts | Expiration Date | Unrealized Depreciation | Notional Value | Counterparty | |||||||||
Ten Year U.S. Treasury Bond | 41 | December, 2012 | $(32,594) | $ | 5,440,266 | Citigroup Global Markets, Inc. | ||||||||
Collateral pledged for open futures contracts is included in the cash at brokers for futures contracts shown on the Statement of Assets and Liabilities at September 30, 2012.
Options
The Funds may write (or sell) put and call options on the securities that the Funds are authorized to buy or already hold in their portfolio. The Funds may also purchase put and call options. The Funds had no outstanding options as of September 30, 2012.
A call option gives the purchaser of the option the right (but not the obligation) to buy, and obligates the seller to sell (when the option is exercised), the underlying instrument at the exercise price at any time or at a specified time during the option period. A put option gives the holder the right to sell and obligates the writer to buy the underlying instrument at the exercise price at any time or at a specified time during the option period. When a Fund purchases (writes) an option, an amount equal to the premium paid (received) by a Fund is reflected as an asset (liability). The amount of the asset (liability) is subsequently
marked-to-market to reflect the current market value of the option purchased (written). When an instrument is purchased or sold through an exercise of an option, the related premium paid (or received) is added to (or deducted from) the basis of the instrument acquired or deducted from (or added to) the proceeds of the instrument sold. When an option expires (or a Fund enters into a closing transaction), a Fund realizes a gain or loss on the option to the extent of the premiums received or paid (or gain or loss to the extent the cost of the closing transaction exceeds the premium received or paid). When a Fund writes a call option, such option is “covered,” meaning that a Fund holds the underlying instrument subject to being called by the option counterparty, or cash in an amount sufficient to cover the obligation. When a Fund writes a put option, such option is covered by cash in an amount sufficient to cover the obligation.
49
NOTES TO FINANCIAL STATEMENTS |
In purchasing and writing options, a Fund bears the market risk of an unfavorable change in the price of the underlying instrument or the risk that a Fund may not be able to enter into a closing transaction due to an illiquid market. Exercise of a written option could result in a Fund purchasing or selling a security at a price different from the current market value.
A Fund may execute transactions in both listed and over-the-counter options. Listed options involve minimal counterparty risk since listed options are guaranteed against default by the exchange on which they trade. Transactions in certain over-the-counter options may expose a Fund to the risk of default by the counterparty to the transaction. In the event of default by the counterparty to the over-the-counter option transaction, a Fund’s maximum amount of loss is the premium paid (as purchaser) or the unrealized gain of the contract (as writer).
A summary of the Emerging Market Select Bond Fund written option transactions for the year is as follows:
| Number of Options Contracts | Premiums Received | |||||||||
Contracts outstanding at November 30, 2011* | — | $ | — | |||||||
Options written | 4,940 | 52,344 | ||||||||
Options terminated in closing purchase transactions | — | — | ||||||||
Options exercised | (4,310 | ) | (44,981 | ) | ||||||
Options expired | (630 | ) | (7,363 | ) | ||||||
|
|
|
| |||||||
Contracts outstanding at September 30, 2012 | — | $ | — | |||||||
|
|
|
| |||||||
* commencement of operations. | ||||||||||
Forward Foreign Currency Exchange Contracts
The Funds entered into forward foreign currency contracts (“Forward”) to hedge their exposure to changes in foreign currency exchange rates on foreign portfolio holdings (foreign currency exchange risk). In addition, certain Funds may use a Forward to provide exposure to the foreign currency market. A Forward is an agreement between two parties to purchase or sell a foreign currency at a future date at a negotiated forward rate. A Forward is marked-to-market daily and the change in market value is recorded by the Funds as unrealized appreciation or depreciation until the contract settlement date. The market value of the Forward is determined using the forward rate for the remainder of the outstanding period of the contract, through the delivery date. When a Forward is closed or settled, the Funds record a realized gain or loss equal to the fluctuation in rates during the period a Forward was open.
In the event of default by the counterparty to the transaction, the Fund’s maximum amount of loss, as either the buyer or seller, is the unrealized gain of the contract.
Details of forward contracts at period end are included in the Portfolio of Investments under the caption “Foreign currency exchange contracts.”
Swap Agreements
The Funds may enter into swap agreements, which are agreements involving two parties to exchange the return generated by a security, currency, commodity, interest rate, index, or other measures for the return generated by another instrument, for example, the agreement to pay interest in exchange for a market-linked return based on a notional amount. The Funds entered into total return, interest rate and other swap agreements.
Interest rate swap agreements generally involve the agreement by the Funds to pay a counterparty a fixed or floating rate on a fixed notional amount and to receive a fixed or floating rate on a fixed notional amount, but may also involve the agreement to pay or receive payments derived from changes in interest rates. Periodic payments are generally made during the life of the swap agreement according to the terms and conditions of the agreement and at termination or maturity.
50
NOTES TO FINANCIAL STATEMENTS |
|
The Funds enter into credit default swaps to manage their exposure to the market or certain sectors of the market, to reduce their risk exposure to defaults of corporate and/or sovereign issuers or to create exposure to corporate and/or sovereign issuers to which they are not otherwise exposed (credit risk). The Funds enter into credit default swap agreements to provide a measure of protection against the default of an issuer (as buyer of protection) and/or gain credit exposure to an issuer to which it is not otherwise exposed (as seller of protection). The Funds may either buy or sell (write) credit default swaps on single-name issuers (corporate or sovereign), a combination or basket of single-name issuers or traded indexes. Credit default swaps on single-name issuers are agreements in which the buyer pays fixed periodic payments to the seller in consideration for a guarantee from the seller to make a specific payment should a negative credit event take place with respect to the referenced entity (e.g., bankruptcy, failure to pay, obligation accelerators, repudiation, moratorium or restructuring). Credit default swaps on traded indexes are agreements in which the buyer pays fixed periodic payments to the seller in consideration for a guarantee from the seller to make a specific payment should a writedown, principal or interest shortfall or default of all or individual underlying securities included in the index occurs. As a buyer, if an underlying credit event occurs, the Funds will either receive from the seller an amount equal to the notional amount of the swap and deliver the referenced security or underlying securities comprising the index or receive a net settlement of cash equal to the notional amount of the swap less the recovery value of the security or underlying securities comprising the index. As a seller (writer), if an underlying credit event occurs, the Funds will either pay the buyer an amount equal to the notional amount of the swap and take delivery of the referenced security or underlying securities comprising the index or pay a net settlement of cash equal to the notional amount of the swap less the recovery value of the security or underlying securities comprising the index.
Total return swap agreements involve the commitments to pay or receive an amount generally determined by reference to a security, index or other measure in exchange for a specific market linked return, based on notional amounts. To the extent that the total return of the security, index or other measure underlying the transaction exceeds or falls short of the offsetting interest rate-based obligation, the Funds receive or make a payment to the counterparty. Interim payments and payments received or made by a Fund at the expiration or other termination of the swap agreements are recorded in the Statements of Operations as realized gains or losses, respectively. Swap agreements are marked-to-market daily based on dealer-supplied valuations, and changes in value, including the periodic amounts of interest to be paid or received on swaps, are recorded as unrealized appreciation/(depreciation). Risks may exceed amounts recognized on the Statements of Assets and Liabilities. These risks include changes in the returns of the underlying instruments, failure of the counterparties to perform under the contracts’ terms and the possible lack of liquidity with respect to the swap agreements. Details of swap agreements open at period end are included in the Schedule of Portfolio Investments under the caption “Interest Rate Swaps”, “Credit Default Swaps” and “Total Return Swaps”.
51
NOTES TO FINANCIAL STATEMENTS |
Fair Values of Derivative Instruments as of September 30, 2012 are as follows*:
Fair Values of Derivative Financial Instruments as of September 30, 2012
Statement of Assets and Liabilities Location
| ||||||||||||||||||
Asset Derivatives
| ||||||||||||||||||
| Emerging Market Select Bond Fund | Emerging Market Corporate Bond Fund | Global High Yield Bond Fund | Global Convertible Bond Fund | |||||||||||||||
Foreign currency exchange contracts | Unrealized appreciation on forward foreign currency exchange contracts | $ | 204,978 | $ | — | $ | 335 | $ | 17,777 | |||||||||
Interest rate contracts | Total return swaps at value | 734,897 | — | — | — | |||||||||||||
Interest rate contracts | Unrealized appreciation on swap contracts | 43,685 | — | — | — | |||||||||||||
|
|
|
|
|
|
|
| |||||||||||
Total | $ | 983,560 | $ | — | $ | 335 | $ | 17,777 | ||||||||||
|
|
|
|
|
|
|
| |||||||||||
Liability Derivatives | ||||||||||||||||||
| Emerging Market Select Bond Fund | Emerging Market Corporate Bond Fund | Global High Yield Bond Fund | Global Convertible Bond Fund | |||||||||||||||
Credit contracts | Credit default swaps at value | $ | — | $ | — | $ | 22,831 | $ | — | |||||||||
Foreign currency exchange contracts | Unrealized depreciation on forward foreign currency exchange contracts | 354,644 | — | 199,432 | 82,637 | |||||||||||||
Interest rate contracts | Unrealized depreciation on futures contracts | 32,594 | — | — | — | |||||||||||||
Interest rate contracts | Unrealized depreciation on swap contracts | 44,708 | — | — | — | |||||||||||||
|
|
|
|
|
|
|
| |||||||||||
Total | $ | 431,946 | $ | — | $ | 222,263 | $ | 82,637 | ||||||||||
|
|
|
|
|
|
|
| |||||||||||
52
NOTES TO FINANCIAL STATEMENTS |
The effect of Derivative Instruments on the Statement of Operations during the period ended September 30, 2012 is as follows:
Derivative Instruments Categorized by Risk Exposure | Emerging Market Select Bond Fund | Emerging Market Corporate Bond Fund | Global High Yield Bond Fund | Global Convertible Bond Fund | ||||||||||||
Net realized Gain (Loss) From: | ||||||||||||||||
Equity Risk: | ||||||||||||||||
Financial futures contracts | $ | — | $ | — | $ | (4,784) | $ | — | ||||||||
Credit Risk: | ||||||||||||||||
Credit default swaps | — | — | 32,987 | — | ||||||||||||
Interest Rate Risk: | ||||||||||||||||
Financial futures contracts | 18,772 | (7,638) | — | — | ||||||||||||
Interest rate swaps | 201,689 | — | — | — | ||||||||||||
Foreign currency exchange risk: | ||||||||||||||||
Forward foreign currency exchange contracts | (213,892) | (5,623) | 158,891 | (10,195) | ||||||||||||
Written options | 44,954 | — | — | — | ||||||||||||
Purchased options | (8,389) | — | — | — | ||||||||||||
|
|
|
|
|
|
|
| |||||||||
| $ | 43,134 | $ | (13,261) | $ | 187,094 | $ | (10,195) | |||||||||
|
|
|
|
|
|
|
| |||||||||
Net Change in Unrealized Appreciation/Depreciation | ||||||||||||||||
From: | ||||||||||||||||
Credit Risk: | ||||||||||||||||
Credit default swaps | $ | — | $ | — | $ | 809 | $ | — | ||||||||
Interest Rate Risk: | ||||||||||||||||
Financial futures contracts | (32,594) | — | — | — | ||||||||||||
Interest rate swaps | 1,129 | — | — | — | ||||||||||||
Foreign currency exchange risk: | ||||||||||||||||
Forward foreign currency exchange contracts | (126,449) | — | (199,992) | (64,315) | ||||||||||||
|
|
|
|
|
|
|
| |||||||||
| $ | (157,914) | $ | — | $ | (199,183) | $ | (64,315) | |||||||||
|
|
|
|
|
|
|
| |||||||||
* For open derivative instruments as of September 30, 2012, see the preceding tables on the Schedule of Portfolio Investments for credit contracts, foreign currency exchange contracts and interest rate contracts and the preceding section for financial futures contracts.
For the period ended September 30, 2012, the average volume of derivative activities are as follows:
| Emerging Market Select Bond Fund | Emerging Market Corporate Bond Fund | Global High Yield Bond Fund | Global Convertible Bond Fund | |||||||||||||
Futures short position (contracts) | 14 | 1 | — | — | ||||||||||||
Forward foreign currency exchange contracts purchased | ||||||||||||||||
(U.S. dollar amounts) | $11,249,196 | $256,585 | $6,286,960 | $4,760,347 | ||||||||||||
Forward foreign currency exchange contracts sold | ||||||||||||||||
(U.S. dollar amounts) | 20,284,847 | 95,917 | 258,971 | 72,262 | ||||||||||||
Purchased options (Cost $) | 8,920 | — | — | — | ||||||||||||
Written Options (Premium received $) | 12,556 | — | — | — | ||||||||||||
Interest rate swaps | ||||||||||||||||
(Notional Amount in U.S. Dollars) | 7,394,223 | — | — | — | ||||||||||||
Credit default swaps | ||||||||||||||||
(Notional Amount in U.S. Dollars) | — | — | 725,414 | — | ||||||||||||
Total return swaps | ||||||||||||||||
(Notional Amount in U.S. Dollars) | 633 | — | — | — | ||||||||||||
Credit Enhancement
Certain obligations held by the Funds have credit enhancement or liquidity features that may, under certain circumstances, provide for repayment of principal and interest on the obligation upon demand date, interest rate reset date or final maturity. These enhancements may include: letters of credit; liquidity guarantees; security purchase agreements; tender option purchase agreements and third party insurance (i.e., AMBAC and MBIA).
53
NOTES TO FINANCIAL STATEMENTS |
Offering Costs
Upon commencement of operations, offering costs associated with the establishment of the Funds were incurred by the Funds. Offering costs are amortized and included in expenses over a 12-month period beginning with the commencement of operations and are included in the Statement of Operations.
Fair Value Measurements:
Various input levels are used in determining the fair value of investments which are as follows:
Ÿ Level 1 - Inputs that reflect unadjusted quoted prices in active markets for identical assets or liabilities that the Funds have the ability to access at the measurement date.
Ÿ Level 2 - Inputs other than quoted prices that are observable for the asset or liability either directly or indirectly, including inputs in markets that are not considered to be active. Observable inputs may include quoted prices for similar securities, interest rates, spreads, prepayment speeds, etc.
Ÿ Level 3 - Unobservable inputs based on the best information available in the circumstances, to the extent observable inputs are not available (including the Fund’s own assumptions in determining the fair value of investments).
The inputs or methodology used for valuing investments are not necessarily an indication of the risk associated with investing in those securities.
Inputs used in determining fair value of an investment may include, but are not limited to, price information, volatility statistics, credit and market data, and other factors, all of which may be either observable or unobservable. Inputs can vary among investments and will be impacted by the investment type and volume of activity for the particular security or similar securities in the market. Investments in the Level 3 category are generally supported by transactions and quoted prices from dealers participating in the market for those investments. Investments may be included in the Level 3 category due to a lack of market activity or transparency. Internal valuation models may also be used as a pricing source for Level 3 investments. Internal valuation models may rely on one or more unobservable inputs, such as estimated cash flows, financial statement analysis and discount rates.
The summary of inputs used to determine the fair value of the Funds’ investments as of September 30, 2012 is as follows:
| Emerging Market Select Bond Fund | Level 1 Quoted Prices | Level 2 Significant Observable Inputs | Level 3 Significant Unobservable Inputs | Total | ||||||||||||
Assets: | ||||||||||||||||
Investments in Securities | ||||||||||||||||
Corporate Bonds(a) | $ | — | $ | 11,228,646 | $ | — | $ | 11,228,646 | ||||||||
Foreign Government Bonds(a) | — | 72,950,196 | — | 72,950,196 | ||||||||||||
Investment Company(a) | 34,678,748 | — | — | 34,678,748 | ||||||||||||
Other Financial Instruments* | ||||||||||||||||
Interest rate contracts | — | 43,685 | — | 43,685 | ||||||||||||
Foreign currency exchange contracts | — | 204,978 | — | 204,978 | ||||||||||||
Total return swaps | — | 734,897 | — | 734,897 | ||||||||||||
|
|
|
|
|
|
|
| |||||||||
Total Assets | $ | 34,678,748 | $ | 85,162,402 | $ | — | $ | 119,841,150 | ||||||||
|
|
|
|
|
|
|
| |||||||||
Liabilities: | ||||||||||||||||
Other Financial Instruments* | ||||||||||||||||
Interest rate contracts | $ | (32,594 | ) | $ | (44,708 | ) | $ | — | $ | (77,302 | ) | |||||
Foreign currency exchange contracts | — | (354,644 | ) | — | (354,644 | ) | ||||||||||
|
|
|
|
|
|
|
| |||||||||
Total Liabilities | $ | (32,594 | ) | $ | (399,352 | ) | $ | — | $ | (431,946 | ) | |||||
|
|
|
|
|
|
|
| |||||||||
54
NOTES TO FINANCIAL STATEMENTS |
| Emerging Market Corporate Bond Fund | Level 1 Quoted Prices | Level 2 Significant Observable Inputs | Level 3 Significant Unobservable Inputs | Total | ||||||||||||
Assets: | ||||||||||||||||
Investments in Securities | ||||||||||||||||
Corporate Bonds(a) | $ | — | $ | 16,602,972 | $ | — | $ | 16,602,972 | ||||||||
Investment Company(a) | 1,219,662 | — | — | 1,219,662 | ||||||||||||
|
|
|
|
|
|
|
| |||||||||
Total Assets | $ | 1,219,662 | $ | 16,602,972 | $ | — | $ | 17,822,634 | ||||||||
|
|
|
|
|
|
|
| |||||||||
| Global High Yield Bond Fund | Level 1 Quoted Prices | Level 2 Significant Observable Inputs | Level 3 Significant Unobservable Inputs | Total | ||||||||||||
Assets: | ||||||||||||||||
Investments in Securities | ||||||||||||||||
Bank Loans(a) | $ | — | $ | 1,894,664 | $ | — | $ | 1,894,664 | ||||||||
Corporate Bonds(a) | — | 17,957,332 | — | 17,957,332 | ||||||||||||
Investment Company(a) | 2,276,642 | — | — | 2,276,642 | ||||||||||||
Other Financial Instruments* | ||||||||||||||||
Foreign currency exchange contracts | — | 335 | — | 335 | ||||||||||||
|
|
|
|
|
|
|
| |||||||||
Total Assets | $ | 2,276,642 | $ | 19,852,331 | $ | — | $ | 22,128,973 | ||||||||
|
|
|
|
|
|
|
| |||||||||
Liabilities: | ||||||||||||||||
Other Financial Instruments* | ||||||||||||||||
Credit contracts | $ | — | $ | (22,831 | ) | $ | — | $ | (22,831 | ) | ||||||
Foreign currency exchange contracts | — | (199,432 | ) | — | (199,432 | ) | ||||||||||
|
|
|
|
|
|
|
| |||||||||
Total Liabilities | $ | — | $ | (222,263 | ) | $ | — | $ | (222,263 | ) | ||||||
|
|
|
|
|
|
|
| |||||||||
| Global Convertible Bond Fund | Level 1 Quoted Prices | Level 2 Significant Observable Inputs | Level 3 Significant Unobservable Inputs | Total | ||||||||||||
Assets: | ||||||||||||||||
Investments in Securities | ||||||||||||||||
Corporate Bonds(a) | $ | — | $ | 16,038,910 | $ | — | $ | 16,038,910 | ||||||||
Investment Company(a) | 1,251,685 | — | — | 1,251,685 | ||||||||||||
Other Financial Instruments* | ||||||||||||||||
Foreign currency exchange contracts | — | 17,777 | — | 17,777 | ||||||||||||
|
|
|
|
|
|
|
| |||||||||
Total Assets | $ | 1,251,685 | $ | 16,056,687 | $ | — | $ | 17,308,372 | ||||||||
|
|
|
|
|
|
|
| |||||||||
Liabilities: | ||||||||||||||||
Other Financial Instruments* | ||||||||||||||||
Foreign currency exchange contracts | $ | — | $ | (82,637 | ) | $ | — | $ | (82,637 | ) | ||||||
|
|
|
|
|
|
|
| |||||||||
Total Liabilities | $ | — | $ | (82,637 | ) | $ | — | $ | (82,637 | ) | ||||||
|
|
|
|
|
|
|
| |||||||||
(a) The breakdown of the Fund’s investments by country is disclosed in the Schedules of Portfolio Investments.
*Other financial instruments are instruments not reflected in the Schedule of Portfolio Investments, such as futures contracts, options, swaps and foreign currency exchange contracts which are valued at value.
During the period ended September 30, 2012, the Funds recognized no transfers to/from Level 1 or Level 2. The Fund’s policy is to recognize transfers to/from Level 1, Level 2 and Level 3 at the end of the year utilizing fair value at the beginning of the year.
In December 2011, the Financial Accounting Standards Board (“FASB”) issued Accounting Standards Update No. 2011-11 “Disclosures about Offsetting Assets and Liabilities” (“ASU 2011-11”). These disclosure requirements are intended to help investors and other financial statement users to better assess the effect or potential effect of offsetting arrangements on a company’s financial position. They also improve transparency in the reporting of how companies mitigate credit risk, including disclosure of related collateral pledged or received. In addition, ASU 2011-11 facilitates comparison between those entities that prepare their financial statements on the basis of US GAAP and those entities that prepare their financial statements on the basis of International Financial Reporting Standards (“IFRS”). ASU 2011-11 requires entities to: disclose both gross and net information about both instruments and
55
NOTES TO FINANCIAL STATEMENTS |
transactions eligible for offset in the financial statements; and disclose instruments and transactions subject to an agreement similar to a master netting agreement. ASU 2011-11 is effective for fiscal years beginning on or after January 1, 2013, and interim periods within those annual periods. At this time, management is evaluating the implications of ASU 2011-11 and its impact on the Funds’ financial statement disclosures.
Investment Transactions and Income:
Investment transactions are recorded on one business day after trade date, except on the last day of each fiscal quarter end, when they are recorded on trade date. Dividend income is recorded on the ex-dividend date. Realized gains and losses from investment transactions are calculated based on the cost of the specific security (also known as identified cost basis). Interest income is recognized on the accrual basis and includes, where applicable, the amortization or accretion of premium or discount using the effective yield method.
Expense, Investment Income and Gain/Loss Allocation:
Each Fund pays the expenses that are directly related to its operations, such as custodian fees or adviser fees. Expenses incurred by the Trust, such as trustee or legal fees, are allocated among each of the Funds either proportionately based upon each Fund’s relative net assets or using another reasonable basis such as equally across all Funds, depending on the nature of the expense.
Distributions to Shareholders:
Each Fund pays out any income that it receives, less expenses, in the form of dividends and capital gains to its shareholders. Income dividends are declared daily and paid monthly. Dividends will also be paid at any time during the month upon total redemption of shares in an account. Capital gain distributions are declared and paid at least annually. Distributions to shareholders are recorded on the ex-dividend date. The amount of dividends and distributions are calculated based on federal income tax regulations, which may differ from GAAP. These “book/tax” differences may be either temporary or permanent in nature. To the extent these differences are determined, as of the end of the tax year, to be permanent (e.g., expiring capital loss carryforward), they are reclassified within a Fund’s capital accounts based on their federal tax basis treatment.
For the period ended September 30, 2012, permanent differences and reclassification amounts due to non-deductible organizational costs and swap, currency and hybrid reclasses were as follows:
Increase/(Decrease) Paid in Capital | Increase/(Decrease) Accumulated Net Investment Income | Increase/(Decrease) Accumulated Realized Gain/(Loss) | ||||||||
Emerging Market Select Bond Fund | $(79,568) | $ 71,634 | $ 7,934 | |||||||
Emerging Market Corporate Bond Fund | (79,568) | 93,194 | (13,626) | |||||||
Global High Yield Bond Fund | (79,568) | 309,617 | (230,049) | |||||||
Global Convertible Bond Fund | (79,641) | 97,498 | (17,857) |
3. Agreements and Other Transactions with Affiliates
The Trust has entered into investment advisory agreements with RBC GAM (US) under which RBC GAM (US) manages each Fund’s assets and furnishes related office facilities, equipment, research and personnel. The agreements require each Fund to pay RBC GAM (US) a monthly fee based upon average daily net assets. Under the terms of the advisory contracts, RBC GAM (US) is entitled to receive fees based on a percentage of the average daily net assets of each of the Funds as follows:
| Annual Rate | |||||
Emerging Market Select Bond Fund | 0.80 | % | |||
Emerging Market Corporate Bond Fund | 0.95 | % | |||
Global High Yield Bond Fund | 0.75 | % | |||
Global Convertible Bond Fund | 0.80 | % | |||
RBC GAM (US) has contractually agreed to waive fees and/or make payments in order to keep total operating expenses of the Funds to the following levels.
56
NOTES TO FINANCIAL STATEMENTS |
| Annual Rate | ||
Emerging Market Select Bond Fund | 1.00% | |
Emerging Market Corporate Bond Fund | 1.15% | |
Global High Yield Bond Fund | 0.95% | |
Global Convertible Bond Fund | 1.00% |
This expense limitation agreement is in place until January 31, 2014 and shall continue for additional one-year terms unless terminated by either party at any time. Each Fund will carry forward, for a period not to exceed 12 months from the date on which a waiver or reimbursement is made by RBC GAM (US), any expenses in excess of the expense limitation and repay RBC GAM (US) such amounts, provided the Fund is able to effect such repayment and remain in compliance with the expense limitation. At September 30, 2012, the amounts subject to possible recoupment under the expense limitation agreement are $299,684, $287,937, $280,599 and $275,394 for the Emerging Market Select Bond Fund, Emerging Market Corporate Bond Fund, Global High Yield Bond Fund and Global Convertible Bond Fund, respectively.
The Funds are sub-advised by BlueBay, which is a wholly-owned subsidiary of Royal Bank of Canada, which is a parent company of the Advisor.
The Sub-Advisor is paid by the Advisor out of the advisory fee paid by the Funds to the Advisor.
RBC GAM (US) serves as co-administrator to the Funds. BNY Mellon serves as co-administrator and fund accounting agent. Services provided under the administrative services contract include providing day-to-day administration of matters related to the Funds, maintenance of their records and the preparation of reports. Under the terms of the administrative services contract, RBC GAM (US) does not receive a fee for its role as co-administrator. BNY Mellon receives a fee for its services payable by the Funds based on the Funds’ average net assets. BNY Mellon’s fee is included with “Accounting fees” in the Statements of Operations.
Certain Officers and Trustees of the Trust are affiliated with the Advisor or the co-administrator. Such Officers and Trustees receive no compensation from the Funds for serving in their respective roles.
The Trust currently pays each of the independent Trustees (Trustees of the Trust who are not directors, officers or employees of the adviser, administrator or distributor) an annual retainer of $32,500. The Board Chairperson and Audit Committee Chairperson each receive an additional retainer of $2,500 annually, and all other trustees serving as Chair of a Board committee each receive an additional retainer of $1,000 annually. In addition, Independent Trustees receive a quarterly meeting fee of $5,000 ($5,500 effective October 1, 2012) for each in-person Board meeting attended, a meeting fee of $1,000 for each telephonic or Special Board meeting attended, and a $1,500 fee for each Board committee meeting attended and are reimbursed for all out-of-pocket expenses relating to attendance at such meetings.
4. Securities Transactions
The cost of securities purchased and proceeds from securities sold (excluding securities maturing less than one year from acquisition) for the period from November 30, 2011 (commencement of operations) to September 30, 2012 were as follows:
| Purchases | Sales | |||||||
Emerging Market Select Bond Fund | $ | 125,995,698 | $ | 45,884,608 | ||||
Emerging Market Corporate Bond Fund | 38,497,715 | 23,293,722 | ||||||
Global High Yield Bond Fund | 34,716,255 | 15,798,757 | ||||||
Global Convertible Bond Fund | 18,837,279 | 3,976,787 | ||||||
5. Federal Income Taxes
It is the policy of each Fund to continue to qualify as a regulated investment company by complying with the provisions available to certain investment companies, as defined under Subchapter M of the
57
NOTES TO FINANCIAL STATEMENTS |
|
Internal Revenue Code, and to distribute substantially all of its net investment income and net realized capital gains. Therefore, no federal tax liability is recorded in the financial statements of each Fund.
As of September 30, 2012, the tax cost of securities and the breakdown of unrealized appreciation (depreciation) for each Fund were as follows:
| Tax Cost of Securities | Unrealized Appreciation | Unrealized Depreciation | Net Unrealized Appreciation (Depreciation) | |||||||||||||
Emerging Market Select Bond Fund | $116,349,603 | $2,733,672 | $(225,685) | $2,507,987 | ||||||||||||
Emerging Market Corporate Bond Fund | 17,116,126 | 712,058 | (5,550 | ) | 706,508 | |||||||||||
Global High Yield Bond Fund | 21,215,555 | 960,080 | (46,996 | ) | 913,084 | |||||||||||
Global Convertible Bond Fund | 16,498,774 | 1,156,298 | (364,477 | ) | 791,821 | |||||||||||
The tax character of distributions during the period ended September 30, 2012 was as follows:
| Distributions Paid From | ||||||||
| Ordinary Income | Total Distributions Paid | |||||||
Emerging Market Select Bond Fund | $1,359,107 | $1,359,107 | ||||||
Emerging Market Corporate Bond Fund | 582,599 | 582,599 | ||||||
Global High Yield Bond Fund | 1,081,674 | 1,081,674 | ||||||
Global Convertible Bond Fund | 350,590 | 350,590 | ||||||
As of September 30, 2012, the components of accumulated earnings/(losses) on a tax basis were as follows:
| Undistributed Ordinary Income | Undistributed Long Term Gain | Accumulated Earnings | Distributions Payable | Deferred Qualified Late-Year Losses | Unrealized Appreciation/ (Depreciation) | Total Accumulated Earnings/(Losses) | ||||||||||||||||||||||
Emerging Market Select Bond Fund | $1,975,891 | $13,646 | $1,989,537 | $(27,604) | $ — | $2,289,640 | $4,251,573 | |||||||||||||||||||||
Emerging Market Corporate Bond Fund | 794,049 | — | 794,049 | (1,585 | ) | (4,583 | ) | 706,508 | 1,494,389 | |||||||||||||||||||
Global High Yield Bond Fund | 711,109 | — | 711,109 | — | (2,870 | ) | 913,101 | 1,621,340 | ||||||||||||||||||||
Global Convertible Bond Fund | 281,621 | — | 281,621 | (2 | ) | — | 755,386 | 1,037,005 | ||||||||||||||||||||
Management has analyzed the Fund’s tax positions taken or expected to be taken on federal income tax returns for all open tax years (for the period ended September 30, 2012), and has concluded that no provision for federal income tax is required in the Funds’ financial statements. The Funds’ federal and state income and federal excise tax returns for tax years for which the applicable statutes of limitations have not expired are subject to examination by the Internal Revenue Service and state departments of revenue.
As of and during the period ended September 30, 2012, the Fund did not have a liability for any unrecognized tax benefits. The Fund recognizes interest and penalties, if any, related to unrecognized tax benefits as income tax expense in the Statement of Operations. During the period, the Fund did not incur any interest or penalties.
Under current tax law, capital losses realized after October 31 of a Fund’s fiscal year may be deferred and treated as occurring on the first business day of the following fiscal year for tax purposes. The Emerging Market Corporate Bond Fund and Global High Yield Bond Fund deferred long-term qualified late-year capital losses of $4,583 and $2,870, respectively, which will be treated as arising on the first business day of the fiscal year ending September 30, 2013.
6. Market Timing
The Trust strongly discourages attempts at market timing by Fund shareholders. Each Fund charges a redemption fee of 2% of the value of the shares redeemed or exchanged within 30 days of purchase,
58
NOTES TO FINANCIAL STATEMENTS |
in addition to limiting the number of exchanges that may be made between Funds to five (5) per calendar year. When assessed, the redemption fee is deducted from the redemption proceeds and retained by the Fund, not by the Adviser. This redemption fee is not charged in cases where, for example, the redemption results from an automatic reinvestment or asset re-allocation not specifically directed by the shareholder. The Trust also reserves the right to reject any Fund purchase order made by persons deemed to be market timers. The Funds’ prospectus contains a full description of the Trust’s policies on market timing and/or excessive trading. The redemption fee is recorded as a credit to capital and is included in the capital transactions on the Statement of Changes in Net Assets.
During the period ended September 30, 2012, there were no redemption fees collected by the Funds.
7. Commitments
Global High Yield Bond Fund may invest in floating rate loan interests. In connection with these investments, Global High Yield Bond may also enter into bridge loan commitments (“commitments”). Bridge loan commitments may obligate Global High Yield Bond to furnish temporary financing to a borrower until permanent financing can be arranged. As of September 30, 2012, Global High Yield Bond had outstanding bridge loan commitments of $560,000. In connection with these commitments, Global High Yield Bond earns a commitment fee, typically set as a percentage of the commitment amount. Such fee income, which is included in interest income in the Statements of Operations, is recognized ratably over the commitment period.
8. Line of Credit
Effective April 3, 2012, each Fund is a participant in a single committed, unsecured $4,000,000 line of credit with Bank of New York Mellon, the Funds’ custodian, to be used only for liquidity and other purposes. Interest is charged on borrowings made under this line of credit at the higher of (a) the Federal Funds Effective Rate plus 1.25% per annum, and (b) the Overnight Eurodollar Rate plus 1.25% per annum. A commitment fee of 0.12% per annum of the available line of credit is charged, of which each Fund shall pay its pro rata share based on the ratio of its individual net assets to the aggregate net assets of the Funds at the time the fee is due and payable. Accrued and unpaid commitment fees shall be payable on the last business day of each calendar quarter. An upfront fee equal to 0.02% of the commitment amount was paid by the Funds upon the effectiveness of the line of credit. Since each of the Funds participates in the line of credit, there is no assurance that an individual fund will have access to all or any part of the $4,000,000 at any particular time. There were no loans outstanding pursuant to this line of credit at September 30, 2012. During the year ended September 30, 2012, the Funds did not utilize this line of credit.
9. Subsequent Events
Management has evaluated the impact of subsequent events of the Funds and has determined that there are no subsequent events that require recognition or disclosure in the financial statements except for the following:
On September 13, 2012, the RBC Funds Trust filed with the Securities and Exchange Commission a post-effective amendment to its registration statement to create a new series under the Trust. This new Fund, the RBC BlueBay Absolute Return Fund is expected to become effective and commence operations on November 27, 2012. RBC Global Asset Management (U.S.) Inc. will be the Fund’s investment adviser, and BlueBay Asset Management LLP will serve as the Fund’s sub-adviser.
59
To the Shareholders and Board of Trustees of RBC Funds Trust
We have audited the accompanying statements of assets and liabilities, including the schedules of portfolio investments, of RBC BlueBay Emerging Market Select Bond Fund, RBC BlueBay Emerging Market Corporate Bond Fund, RBC BlueBay Global High Yield Bond Fund and RBC BlueBay Global Convertible Bond Fund (the “Funds”), four of the portfolios constituting the RBC Funds Trust, as of September 30, 2012, and the related statements of operations and changes in net assets and financial highlights for the period from November 30, 2011 (commencement of operations) through September 30, 2012. These financial statements and financial highlights are the responsibility of the Funds’ management. Our responsibility is to express an opinion on these financial statements and financial highlights based on our audits.
We conducted our audits in accordance with the standards of the Public Company Accounting Oversight Board (United States). Those standards require that we plan and perform the audits to obtain reasonable assurance about whether the financial statements and financial highlights are free of material misstatement. The Funds are not required to have, nor were we engaged to perform, an audit of their internal control over financial reporting. Our audits included consideration of internal control over financial reporting as a basis for designing audit procedures that are appropriate in the circumstances, but not for the purpose of expressing an opinion on the effectiveness of the Funds’ internal control over financial reporting. Accordingly, we express no such opinion. An audit also includes examining, on a test basis, evidence supporting the amounts and disclosures in the financial statements, assessing the accounting principles used and significant estimates made by management, as well as evaluating the overall financial statement presentation. Our procedures included confirmation of securities owned as of September 30, 2012, by correspondence with the Funds’ custodian and brokers; where replies were not received from brokers, we performed other auditing procedures. We believe that our audits provide a reasonable basis for our opinion.
In our opinion, the financial statements and financial highlights referred to above present fairly, in all material respects, the financial position of each of the portfolios of RBC Funds Trust referred to above as of September 30, 2012, and the results of their operations, changes in their net assets and the financial highlights for the period from November 30, 2011 (commencement of operations) through September 30, 2012, in conformity with accounting principles generally accepted in the United States of America.
DELOITTE & TOUCHE LLP
Chicago, Illinois
November 27, 2012
60
The following Funds report a portion of the income dividends distributed during the period ended September 30, 2012, as qualified interest income as defined in the Internal Revenue Code:
| Qualified Interest Income | |||||
Emerging Market Select Bond Fund | 0.36 | % | |||
Emerging Market Corporate Bond Fund | 1.01 | % | |||
Global High Yield Bond Fund | 49.88 | % | |||
Global Convertible Bond Fund | 25.46 | % | |||
All reportings are based on financial information available as of the date of this annual report and, accordingly, are subject to change. It is the intention of the Funds to report the maximum amount permitted under the Internal Revenue Code and the regulations thereunder.
61
Independent Trustees(1)(2)
|
|
T. Geron Bell (71)
Position, Term of Office and Length of Time Served with the Trust: Trustee since January 2004
Principal Occupation(s) During Past 5 Years: Chairman of the Executive Board of the Minnesota Twins (January 2011 to present); prior thereto President of Twins Sports, Inc. (parent company of the Minnesota Twins) (2002-2011); President of the Minnesota Twins Baseball Club Incorporated (1987-2002)
Number of Portfolios in Fund Complex Overseen by Trustee: 14
Other Director/Trustee Positions Held by Trustee During Past 5 Years: None
Lucy Hancock Bode (61)
Position, Term of Office and Length of Time Served with the Trust: Trustee since January 2004
Principal Occupation(s) During Past 5 Years: Healthcare consultant (self-employed)
Number of Portfolios in Fund Complex Overseen by Trustee: 14
Other Director/Trustee Positions Held by Trustee During Past 5 Years: BioSignia
Leslie H. Garner Jr. (62)
Position, Term of Office and Length of Time Served with the Trust: Trustee since January 2004
Principal Occupation(s) During Past 5 Years: President and CEO, The Greater Cedar Rapids Community Foundation (2010 to present); previously, President, Cornell College
Number of Portfolios in Fund Complex Overseen by Trustee: 14
Other Director/Trustee Positions Held by Trustee During Past 5 Years: None
Ronald James (61)
Position, Term of Office and Length of Time Served with the Trust: Trustee since January 2004
Principal Occupation(s) During Past 5 Years: President and Chief Executive Officer, Center for Ethical Business Cultures (2000 to present)
Number of Portfolios in Fund Complex Overseen by Trustee: 14
Other Director/Trustee Positions Held by Trustee During Past 5 Years: Best Buy Co. Inc.; Bremer Financial Corporation
John A. MacDonald (63)
Position, Term of Office and Length of Time Served with the Trust: Trustee since January 2004
Principal Occupation(s) During Past 5 Years: Vice President and Treasurer, Hall Family Foundation
Number of Portfolios in Fund Complex Overseen by Trustee: 14
Other Director/Trustee Positions Held by Trustee During Past 5 Years: None
H. David Rybolt (70)
Position, Term of Office and Length of Time Served with the Trust: Trustee since January 2004
Principal Occupation(s) During Past 5 Years: Consultant, HDR Associates (management consulting)
Number of Portfolios in Fund Complex Overseen by Trustee: 14
Other Director/Trustee Positions Held by Trustee During Past 5 Years: None
62
MANAGEMENT (Unaudited) |
Independent Trustees(1)(2)
|
|
James R. Seward (60)
Position, Term of Office and Length of Time Served with the Trust: Chairman of the Board and Trustee since January 2004
Principal Occupation(s) During Past 5 Years: Private investor (2000 to present); CFA
Number of Portfolios in Fund Complex Overseen by Trustee: 14
Other Director/Trustee Positions Held by Trustee During Past 5 Years: Syntroleum Corporation; Brookdale Senior Living Inc.
William B. Taylor (67)
Position, Term of Office and Length of Time Served with the Trust: Trustee since September 2005
Principal Occupation(s) During Past 5 Years: Consultant (2003 to present); prior thereto Partner (until 2003) Ernst & Young LLP
Number of Portfolios in Fund Complex Overseen by Trustee: 14
Other Director/Trustee Positions Held by Trustee During Past 5 Years: William Henry Insurance, LLC
Interested Trustees(1)(2)(3)
Kathleen A. Gorman (48)(5)
Position, Term of Office and Length of Time Served with the Trust: Trustee since September 2012
Principal Occupation(s) During Past 5 Years: President and Chief Executive Officer, RBC Funds (2012 to present); Chief Compliance Officer, RBC Funds (2006 to present); Director of Regulatory Administration, RBC Global Asset Management (U.S.) Inc. (2007 to present); Chief Compliance Officer, RBC Global Asset Management (U.S.) Inc. (2006-2009)
Number of Portfolios in Fund Complex Overseen by Trustee: 14
Other Director/Trustee Positions Held by Trustee During Past 5 Years: None
Executive Officers(1)(3)(4)
Kathleen A. Gorman (48)
Position, Term of Office and Length of Time Served with the Trust: President and Chief Executive Officer since September 2012;Chief Compliance Officer since April 2006 and Assistant Secretary since September 2006
Principal Occupation(s) During Past 5 Years: President and Chief Executive Officer, RBC Funds (2012 to present); Chief Compliance Officer, RBC Funds (2006 to present); Director of Regulatory Administration, RBC Global Asset Management (U.S.) Inc. (2007 to present); Chief Compliance Officer, RBC Global Asset Management (U.S.) Inc. (2006-2009)
James A. Gallo (48)
Address: BNY Mellon Investment Servicing (US) Inc., 760 Moore Road, King of Prussia, PA 19406
Position, Term of Office and Length of Time Served with the Trust: Treasurer since October 2007
Principal Occupation(s) During Past 5 Years: Senior Vice President and Managing Director, BNY Mellon Investment Servicing (US) Inc. (2002 to present)
63
MANAGEMENT (Unaudited) |
Executive Officers(1)(3)(4)
|
|
Kathleen A. Hegna (45)
Position, Term of Office and Length of Time Served with the Trust: Chief Financial Officer and Principal Accounting Officer since May 2009
Principal Occupation(s) During Past 5 Years: Associate Vice President and Director, Mutual Fund Accounting and Administration, RBC Global Asset Management (U.S.) Inc. (2009 to present); Senior Compliance Officer, RBC Global Asset Management (U.S.) Inc. (2006-2009); Director, Asset Management Compliance, RiverSource Investments (2005-2006)
Lee Thoresen (41)
Position, Term of Office and Length of Time Served with the Trust: Chief Legal Officer and Secretary since March 2008
Principal Occupation(s) During Past 5 Years: Associate General Counsel, RBC Capital Markets, LLC (2006-present); Asset Management Compliance, RiverSource Investments (2004-2006)
| (1) | Except as otherwise noted, the address of each Trustee/Officer is RBC Funds Trust, 100 South Fifth Street, Suite 2300, Minneapolis, Minnesota 55402. |
| (2) | All Trustees must retire on or before December 31 of the year in which they reach age 75. The Board may temporarily waive this requirement when necessary to avoid depriving the Board of a Trustee with critical skills. |
| (3) | On December 31, 2009, Voyageur Asset Management Inc. changed its name to RBC Global Asset Management (U.S.) Inc. Any references to RBC Global Asset Management (U.S.) Inc. for prior periods are deemed to be references to the prior entity. |
| (4) | Each officer serves in such capacity for an indefinite period of time until his or her removal, resignation or retirement. |
| (5) | Kathleen A. Gorman has been determined to be an interested Trustee by virtue of her position with the Advisor. |
The Funds’ Statement of Additional Information includes information about the Funds’ Trustees. To receive your free copy of the Statement of Additional Information, call toll free: 1-800-422-2766.
64
The Funds offer Class I shares.
Class I
This share class is intended for investors meeting certain minimum investment thresholds. This share class does not have an up-front sales charge (load) or a 12b-1 service and distribution fee.
65
Shareholder Expense Examples
As a shareholder of the RBC Funds, you incur two types of costs: (1) transaction costs and (2) ongoing costs, including management fees; and other Fund expenses. This example is intended to help you understand your ongoing costs (in dollars) of investing in the RBC Funds and to compare these costs with the ongoing costs of investing in other mutual funds.
The example is based on an investment of $1,000 invested at the beginning of the period and held for the entire period from April 1, 2012 through September 30, 2012.
Actual Expenses
The table below provides information about actual account values and actual expenses. You may use the information below, together with the amount you invested, to estimate the expenses that you paid over the period. Simply divide your account value by $1,000 (for example, an $8,600 account value divided by $1,000 = 8.6), then multiply the result by the number in the table under the heading entitled “Expenses Paid During Period” to estimate the expenses you paid on your account during this period.
| Beginning Account Value 4/1/2012 | Ending Account Value 9/30/2012 | Expenses Paid During Period* 4/1/12-9/30/12 | Annualized Expense Ratio During Period 4/1/12-9/30/12 | ||||||||||||||||||||||
Emerging Market Select Bond Fund | Class I | $ | 1,000.00 | $ | 1,054.40 | $ | 5.11 | 1.00 | % | ||||||||||||||||
Emerging Market Corporate Bond Fund | Class I | 1,000.00 | 1,063.40 | 5.90 | 1.15 | % | |||||||||||||||||||
Global High Yield Bond Fund | Class I | 1,000.00 | 1,063.00 | 4.87 | 0.95 | % | |||||||||||||||||||
Global Convertible Bond Fund | Class I | 1,000.00 | 1,009.80 | 5.00 | 1.00 | % | |||||||||||||||||||
Hypothetical Example for Comparison Purposes
The table below provides information about hypothetical account values and hypothetical expenses based on each RBC Funds’ actual expense ratio and an assumed rate of return of 5% per year before expenses, which is not the Fund’s actual return. The hypothetical account values and expenses may not be used to estimate the actual ending account balance or expenses you paid for the period. You may use this information to compare this 5% hypothetical example with the 5% hypothetical examples that appear in the shareholder reports of other funds.
Please note that the expenses shown in the table are meant to highlight your ongoing costs only and do not reflect any transactional costs, such as sales charges (loads), redemption fees, or exchange fees. Therefore, the table is useful in comparing ongoing costs only, and will not help you determine the relative total costs of owning different funds. In addition, if these transactional costs were included, your costs would have been higher.
| Beginning Account Value 4/1/2012 | Ending Account Value 9/30/12 | Expenses Paid During Period* 4/1/12-9/30/12 | Annualized Expense Ratio During Period 4/1/12-9/30/12 | ||||||||||||||||||||||
Emerging Market Select Bond Fund | Class I | $ | 1,000.00 | $ | 1,019.89 | $ | 5.02 | 1.00 | % | ||||||||||||||||
Emerging Market Corporate Bond Fund | Class I | 1,000.00 | 1,019.14 | 5.77 | 1.15 | % | |||||||||||||||||||
Global High Yield Bond Fund | Class I | 1,000.00 | 1,020.14 | 4.77 | 0.95 | % | |||||||||||||||||||
Global Convertible Bond Fund | Class I | 1,000.00 | 1,019.89 | 5.02 | 1.00 | % | |||||||||||||||||||
*Expenses are equal to the average account value times the Fund’s annualized expense ratio multiplied by 182/366 (to reflect one half year period).
66
APPROVAL OF INVESTMENT ADVISORY AND SUB-ADVISORY AGREEMENTS (UNAUDITED) |
Information Regarding the Approval of Investment Advisory and Sub-Advisory Agreements
In September 2012, after evaluating the services provided by RBC Global Asset Management (U.S.), Inc. (the “Advisor”) and BlueBay Asset Management LLP (the Sub-Advisor) and reviewing the performance, fees, and expenses of the Funds, the RBC Funds Board of Trustees (the “Trustees”) determined to approve the continuation of the investment advisory agreements with the Advisor and sub-advisory agreements with the Sub-Advisor (the investment advisory and
sub-advisory agreements, collectively, being the “Agreements”) for each Fund for an additional year.
As part of their review of the Agreements, the Trustees requested and considered information regarding the advisory services performed by the Advisor and
Sub-Advisor, the staffing and qualifications of the personnel responsible for operating and managing the Funds, and the Funds’ performance and expenses. The Trustees considered information provided at regular quarterly Board and Committee meetings throughout the year as well as information presented at both a special meeting held to review requested material related to the proposed renewals and a meeting held specifically to consider the proposed renewals. In connection with their deliberations, the independent Trustees were advised by their own independent legal counsel with regard to the materials and their responsibilities under relevant laws and regulations.
The Trustees met with representatives from the Advisor’s senior management team, as well as senior investment professionals, to discuss the information and the Advisor’s ongoing management of the Funds. The Trustees reviewed the nature, quality, and extent of the services provided to the Funds by the Advisor and Sub-Advisor, including information as to each Fund’s performance relative to appropriate index benchmarks as well as fund peer group comparative information requested by the Board. The Trustees reviewed the Funds’ performance data and noted that the number of peer funds was relatively small for each Fund. The Trustees also observed that because the Funds commenced operations on November 30, 2011, there was a short period of performance for comparison purposes.
In considering the quality of services to be provided by the Advisor, the Trustees discussed the strong research, credit, and fundamental analysis capabilities and specialized expertise in the area of emerging market debt instruments and the extensive portfolio management experience of the Sub-Advisor’s staff as well as its operational and compliance structure and systems. The Trustees indicated that they continue to have confidence in the portfolio management teams of the Advisor and Sub-Advisor and continue to be satisfied with the nature, extent, and quality of the advisory and other services provided to the Funds.
The Trustees reviewed the investment advisory fees payable to the Advisor and reviewed comparative fee and expense information for similarly situated funds. The Trustees evaluated profitability data for the Advisor and considered information regarding other benefits the Advisor and its affiliates derived from their relationships with the Funds, including soft dollars and other fall-out benefits as well as the Advisor’s role as co-administrator of the Funds and the fees paid by the Funds for such services. The Trustees noted that, because the Funds are relatively new, the Sub-Advisor did not develop profitability information regarding its management of the Funds in the normal course. The Trustees acknowledged that it was not necessary to evaluate such information at the time because the Funds were not likely to achieve economies of scale in the near term. The Trustees discussed the pricing strategy for the Funds and noted that the Sub-Advisor is a premium provider of investment management services and the management fees are based on the high quality of services provided to the Funds. The Trustees also considered the Advisor’s contractual agreement to subsidize fund expenses at competitive levels through expense limitation agreements and viewed such commitments favorably. Based upon their review, the Trustees determined that the advisory fees proposed to be payable to the Advisor and
Sub-Advisor were fair and reasonable.
67
APPROVAL OF INVESTMENT ADVISORY AND SUB-ADVISORY AGREEMENTS (UNAUDITED) |
Based upon their review, the Trustees determined that the nature and quality of the services provided by both the Advisor and Sub-Advisor were of a high quality and it is in the interests of the Funds and their shareholders for the Trustees to approve the Agreements and expense limitation arrangements for each Fund. In arriving at their collective decision to approve the renewal of the Agreements, the Trustees did not assign relative weights to the factors discussed above or deem any one or group of them to be controlling in and of itself.
68
RBC Funds
P.O. Box 701
Milwaukee, WI 53201-0701
800-422-2766
www.rbcgam.us
Performance data represents past performance and does not guarantee future results. The principal value of an investment and investment return will fluctuate so that an investor’s shares, when redeemed, may be worth more or less than their original cost.
This report and the financial statements contained herein are provided for the information of RBC Funds shareholders. This report is not authorized for distribution to prospective investors unless preceded or accompanied by a current prospectus, which contains information concerning investment objectives, risks, charges and expenses of the funds. Please read the prospectus carefully before investing.
This report and the financial statements contained herein are not intended to be a forecast of future events, a guarantee of future results, or investment advice. There is no assurance that certain securities will remain in or out of each fund’s portfolio. The views expressed in this report reflect those of the portfolio managers through the period ended September 30, 2012.
NOT FDIC INSURED • NO BANK GUARANTEE • MAY LOSE VALUE
RBC Global Asset Management, Inc. serves as investment adviser for the RBC Funds. RBC Funds are distributed by Quasar Distributors LLC.

| The RBC Funds are pleased to offer shareholder reports printed entirely on Forest Stewardship Council certified paper. FSC® certification ensures that the paper used in this report contains fiber from well-managed and responsibly harvested forests that meet strict environmental and socioeconomic standards. |
RBCF-BB AR 09-12
| Item 2. | Code of Ethics. |
| (a) | The registrant, as of the end of the period covered by this report, has adopted a code of ethics that applies to the registrant’s principal executive officer, principal financial officer, principal accounting officer or controller, or persons performing similar functions, regardless of whether these individuals are employed by the registrant or a third party. |
| (c) | There have been no amendments, during the period covered by this report, to a provision of the code of ethics that applies to the registrant’s principal executive officer, principal financial officer, principal accounting officer or controller, or persons performing similar functions, regardless of whether these individuals are employed by the registrant or a third party, and that relates to any element of the code of ethics description. |
| (d) | The registrant has not granted any waivers, including an implicit waiver, from a provision of the code of ethics that applies to the registrant’s principal executive officer, principal financial officer, principal accounting officer or controller, or persons performing similar functions, regardless of whether these individuals are employed by the registrant or a third party, that relates to one or more of the items set forth in paragraph (b) of this item’s instructions. |
| Item 3. | Audit Committee Financial Expert. |
As of the end of the period covered by the report, the registrant’s board of directors has determined that William B. Taylor is qualified to serve as an audit committee financial expert serving on its audit committee and that he is “independent,” as defined by Item 3 of Form N-CSR.
| Item 4. | Principal Accountant Fees and Services. |
Audit Fees
| (a) | The aggregate fees billed for each of the last two fiscal years for professional services rendered by the principal accountant for the audit of the registrant’s annual financial statements or services that are normally provided by the accountant in connection with statutory and regulatory filings or engagements for those fiscal years are $455,450 for 2012 and $317,450 for 2011. |
Audit-Related Fees
| (b) | The aggregate fees billed in each of the last two fiscal years for assurance and related services by the principal accountant that are reasonably related to the performance of the audit of the registrant’s financial statements and are not reported under paragraph (a) of this Item are $0 for 2012 and $0 for 2011. |
Tax Fees
| (c) | The aggregate fees billed in each of the last two fiscal years for professional services rendered by the principal accountant for tax compliance, tax advice, and tax planning are $52,500 for 2012 and $37,500 for 2011. |
Tax fees for both years relate to the review of the registrant’s tax returns. Amount requiring approval of the registrant’s audit committee is $0 and $0, respectively.
All Other Fees
| (d) | The aggregate fees billed in each of the last two fiscal years for products and services provided by the principal accountant, other than the services reported in paragraphs (a) through (c) of this Item are $0 for 2012 and $0 for 2011. |
| (e)(1) | Disclose the audit committee’s pre-approval policies and procedures described in paragraph (c)(7) of Rule 2-01 of Regulation S-X. |
The Audit Committee (“Committee”) will review and approve in advance any proposal (except as set forth in (1) through (3) below) that the Trust employ the Funds’ auditor to render “permissible non-audit services” to the Funds. A “permissible non-audit service” is defined as a non-audit service that is not prohibited by Rule 2-01(c)(4) of Regulation S-X or other applicable law or regulation. The Committee will also review and approve in advance any proposal (except as set forth in (1) through (3) below) that the Adviser, and any entity controlling, controlled by, or under common control with the Adviser that provides ongoing services to the Funds (an “Adviser-affiliated service provider”), employ the Funds’ auditor to render non-audit services, if such engagement would relate directly to the operations and financial reporting of the Funds. As a part of its review, the Committee shall consider whether the provision of such services is consistent with the auditor’s independence. (See also “Delegation” below.)
Pre-approval by the Committee of non-audit services is not required so long as:
(1) (A) with respect to the Funds, the aggregate amount of all such permissible non-audit services provided to the Funds constitutes no more than 5% of the total amount of revenues paid to the auditor by the Funds during the fiscal year in which the services are provided; or
(B) with respect to the Adviser and any Adviser-affiliated service provider, the aggregate amount of all such non-audit services provided constitutes no more than 5% of the total amount of revenues (of the type that would have to be pre-approved by the Committee) paid to the auditor by the Funds, the Adviser and any Adviser-affiliated service provider during the fiscal year in which the services are provided;
(2) such services were not recognized by the Funds at the time of the engagement to be non-audit services; and
(3) such services are promptly brought to the attention of the Committee and approved by the Committee or its delegate or delegates, as defined below, prior to the completion of the audit.
(c) Delegation
The Committee may delegate to one or more of its members and/or to officers of the Trust the authority to pre-approve the auditor’s provision of audit services or permissible non-audit services to the Funds up to a predetermined amount. Any pre-approval determination made by a delegate will be presented to the full Committee at its next meeting. The Committee will communicate any pre-approval made by a delegate to the Trust’s fund accounting agent, which will ensure that the appropriate disclosure is made in the Funds’ periodic reports and other documents as required under the Federal securities laws.
| (e)(2) | The percentage of services described in each of paragraphs (b) through (d) of this Item that were approved by the audit committee pursuant to paragraph (c)(7)(i)(C) of Rule 2-01 of Regulation S-X are as follows: |
| (b) | N/A |
| (c) | 100% |
| (d) | N/A |
| (f) | Not applicable. |
| (g) | The aggregate non-audit fees billed by the registrant’s accountant for services rendered to the registrant, and rendered to the registrant’s investment adviser (not including any sub-adviser whose role is primarily portfolio management and is subcontracted with or overseen by another investment adviser), and any entity controlling, controlled by, or under common control with the adviser that provides ongoing services to the registrant for each of the last two fiscal years of the registrant was $71,800 for 2012 and $71,800 for 2011. |
| (h) | The registrant’s audit committee of the board of directors has considered whether the provision of non-audit services that were rendered to the registrant’s investment adviser (not including any sub-adviser whose role is primarily portfolio management and is subcontracted with or overseen by another investment adviser), and any entity controlling, controlled by, or under common control with the investment adviser that provides ongoing services to the registrant that were not pre-approved pursuant to paragraph (c)(7)(ii) of Rule 2-01 of Regulation S-X is compatible with maintaining the principal accountant’s independence. |
| Item 5. | Audit Committee of Listed registrants. |
Not applicable.
| Item 6. | Investments. |
| (a) | Schedule of Investments in securities of unaffiliated issuers as of the close of the reporting period is included as part of the report to shareholders filed under Item 1 of this form. |
| (b) | Not applicable. |
| Item 7. | Disclosure of Proxy Voting Policies and Procedures for Closed-End Management Investment Companies. |
Not applicable.
| Item 8. | Portfolio Managers of Closed-End Management Investment Companies. |
Not applicable.
| Item 9. | Purchases of Equity Securities by Closed-End Management Investment Company and Affiliated Purchasers. |
Not applicable.
| Item 10. | Submission of Matters to a Vote of Security Holders. |
There have been no material changes to the procedures by which the shareholders may recommend nominees to the registrant’s board of directors, where those changes were implemented after the registrant last provided disclosure in response to the requirements of Item 407(c)(2)(iv) of Regulation S-K (17 CFR 229.407) (as required by Item 22(b)(15) of Schedule 14A (17 CFR 240.14a-101)), or this Item.
| Item 11. | Controls and Procedures. |
| (a) | The registrant’s principal executive and principal financial officers, or persons performing similar functions, have concluded that the registrant’s disclosure controls and procedures (as defined in Rule 30a-3(c) under the Investment Company Act of 1940, as amended (the “1940 Act”) (17 CFR 270.30a-3(c))) are effective, as of a date within 90 days of the filing date of the report that includes the disclosure required by this paragraph, based on their evaluation of these controls and procedures required by Rule 30a-3(b) under the 1940 Act (17 CFR 270.30a-3(b)) and Rules 13a-15(b) or 15d-15(b) under the Securities Exchange Act of 1934, as amended (17 CFR 240.13a-15(b) or 240.15d-15(b)). |
| (b) | There were no changes in the registrant’s internal control over financial reporting (as defined in Rule 30a-3(d) under the 1940 Act (17 CFR 270.30a-3(d)) that occurred during the registrant’s second fiscal quarter of the period covered by this report that has materially affected, or is reasonably likely to materially affect, the registrant’s internal control over financial reporting. |
| Item 12. | Exhibits. |
| (a)(1) | Code of ethics, or any amendment thereto, that is the subject of disclosure required by Item 2 is attached hereto. |
| (a)(2) | Certifications pursuant to Rule 30a-2(a) under the 1940 Act and Section 302 of the Sarbanes-Oxley Act of 2002 are attached hereto. |
| (a)(3) | Not applicable. |
| (b) | Certifications pursuant to Rule 30a-2(b) under the 1940 Act and Section 906 of the |
SIGNATURES
Pursuant to the requirements of the Securities Exchange Act of 1934 and the Investment Company Act of 1940, the registrant has duly caused this report to be signed on its behalf by the undersigned, thereunto duly authorized.
| (Registrant) | RBC Funds Trust |
| By (Signature and Title)* | /s/ Kathleen A. Gorman | |
| Kathleen A. Gorman, President and Chief Executive Officer | ||
| (principal executive officer) |
| Date | 11/26/12 |
Pursuant to the requirements of the Securities Exchange Act of 1934 and the Investment Company Act of 1940, this report has been signed below by the following persons on behalf of the registrant and in the capacities and on the dates indicated.
| By (Signature and Title)* | /s/ Kathleen A. Gorman | |
| Kathleen A. Gorman, President and Chief Executive Officer | ||
| (principal executive officer) |
| Date | 11/26/12 |
| By (Signature and Title)* | /s/ Kathleen A. Hegna | |
| Kathleen A. Hegna, Chief Financial Officer | ||
| (principal financial officer) |
| Date | 11/26/12 |
* Print the name and title of each signing officer under his or her signature.