UNITED STATES
SECURITIES AND EXCHANGE COMMISSION
Washington, D.C. 20549
FORM N-CSR
CERTIFIED SHAREHOLDER REPORT OF REGISTERED MANAGEMENT
INVESTMENT COMPANIES
Investment Company Act file number 811-21475
RBC Funds Trust
(Exact name of registrant as specified in charter)
50 South Sixth Street, Suite 2350
Minneapolis, MN 55402
(Address of principal executive offices) (Zip code)
Lee Thoresen, Esq.
RBC Plaza
60 South Sixth Street
Minneapolis, MN 55402
(Name and address of agent for service)
Registrant’s telephone number, including area code: (612)-313-1341
Date of fiscal year end: September 30
Date of reporting period: September 30, 2014
Item 1. Reports to Stockholders.
The Report to Shareholders is attached herewith.
RBC Funds | ||||||||||
About Your Annual Report |
This annual report includes detailed information about the Access Capital Community Investment Fund (the “Fund”) including financial statements, performance, and a complete list of holdings. | |||||||||
The Fund compares its performance against the Barclays U.S. Securitized Index and the Barclays U.S. Aggregate Bond Index which are widely used market indices. | ||||||||||
We hope the financial information presented will help you evaluate your investment in the Fund. We also encourage you to read your Fund’s prospectus for further detail as to the Fund’s investment policies and risk profile. Fund prospectuses and performance information subsequent to the date of this report are available on our website at www.rbcgam.us. | ||||||||||
A description of the policies and procedures that your Fund uses to determine how to vote proxies relating to portfolio securities is available (i) without charge, upon request, by calling 1-800-422-2766; (ii) on the Fund’s website at www.rbcgam.us; and (iii) on the Securities and Exchange Commission’s (the “Commission”) website at http://www.sec.gov. | ||||||||||
Information regarding how your Fund voted proxies relating to portfolio securities during the most recent 12 month period ended June 30 is available (i) on the Fund’s website at www.rbcgam.us; and (ii) on the Commission’s website at http://www.sec.gov. | ||||||||||
A schedule of the Fund’s portfolio holdings will be filed with the Commission for the first and third quarters of each fiscal year on Form N-Q. This information is available on the Commission’s website at http://www.sec.gov and may be reviewed and copied at the Commission’s Public Reference Room in Washington, D.C. Information on the operation of the Public Reference Room is available by calling 1-202-551-8090. | ||||||||||
Contents | ||||||||||
| Letter from the Chief Investment Officer | 1 | |||||||||
| Portfolio Managers | 3 | |||||||||
| Performance Summary | 4 | |||||||||
| Management Discussion and Analysis | 5 | |||||||||
| Schedule of Portfolio Investments | 8 | |||||||||
| Financial Statements | ||||||||||
| - Statement of Assets and Liabilities | 28 | |||||||||
| - Statement of Operations | 30 | |||||||||
| - Statements of Changes in Net Assets | 31 | |||||||||
| - Statement of Cash Flows | 32 | |||||||||
| Financial Highlights | 34 | |||||||||
| Notes to Financial Statements | 36 | |||||||||
| Report of Independent Registered Public Accounting Firm | 47 | |||||||||
| Other Federal Income Tax Information | 48 | |||||||||
| Management | 49 | |||||||||
| Share Class Information | 52 | |||||||||
| Supplemental Information | 53 | |||||||||
| Approval of Investment Advisory Agreement | 54 | |||||||||
Dear Shareholder:
The Access Capital Community Investment Fund (the “Fund”) continues to fulfill its double bottom line mission of generating a competitive risk-adjusted market rate of return while directing investment dollars to low-and- moderate income homeowners and rental properties, as well as underserved communities across 48 states, Puerto Rico, and the District of Columbia.
The Fund invests in customized U.S. agency guaranteed mortgage-backed securities (MBS) targeted to low- and moderate-income home buyers as well as a variety of government-backed loans and municipal securities supporting affordable rental housing, small businesses, and other entities serving the needs of low and moderate income communities. In addition to increasing capital flows to underserved communities, over time, the Fund’s investment process has provided investors with a competitive rate of return in a wide variety of market conditions.
For the fiscal year ending September 30, 2014, the Fund generated a total return of 3.76% (Class I shares net of fees) versus the Barclays U.S. Securitized Index which returned 3.70%. The effective duration on the Fund is 4.25 years versus the Index of 4.36, and the 30-day SEC yield of the Fund is 3.40%.
In 2014, fixed income funds faced challenging, volatile markets. Despite many and varied market cross currents caused by geopolitical events and speculation around changes in Federal Reserve policies, interest rate movements remained fairly contained. The 10 year Treasury yielded 2.5% on September 30, 2014 versus 2.6% the prior year. The U.S. Treasury curve flattened as two year Treasury rates rose about 25 basis points and 30 year U.S. Treasury rates rose about 50 basis points. A relatively stable interest rate environment has been favorable to the Access Capital strategy allowing investors to capture a favorable rate of return.
Access Capital remained focused on diligent security selection. The fund is populated with higher coupon mortgage-backed securities than is found in the benchmark. These securities performed well during the period, as muted prepayment levels allowed investors to capture higher levels of interest income than the benchmark index. The municipal securities in the portfolio outperformed during the year as a favorable technical environment and attractive valuations were supportive.
With the Fed’s ending this period of quantitative easing and with expectations that it is planning to raise interest rates in 2015, we may experience higher levels of volatility and will continue to focus on high quality securities with strong characteristics. Going forward, we will continue to seek opportunities to generate a competitive market rate of return.
On the impact side, Access continued to fulfill its community development mission. Since inception the Fund has supported:
14,502 Low - to moderate-income home buyers
49,413 Affordable rental units
5,062 Nursing home facility beds
27 Rural housing | ||||||
| 1 |
LETTER FROM THE CHIEF INVESTMENT OFFICER | ||||||
101 Rural enterprise
405 SBA loans
116 Community Economic development
14 Community-based not-for-profit organizations.
With increased market attention on impact investing strategies, we remain committed to our double-bottom line mission. Thank you for your continued confidence and trust in the Access Capital Community Investment Fund.
Sincerely,
Michael Lee, CFA CEO, President and Chief Investment Officer RBC Global Asset Management (U.S.) Inc.
Past performance is not a guarantee of future results.
Fund holdings and sector allocations are subject to change at any time and should not be considered recommendations to buy or sell any security. Please refer to the Schedule of Investments in this report for a complete list of fund holdings. The information provided herein represents the opinions of the Fund Managers and is not intended to be a forecast of future results, nor investment advice.
Investment in the Fund involves risks including, but not limited to: the effects of leveraging the Fund’s portfolio; concentration in the affordable housing market and related mortgage backed securities; competition for investments; interest rate risk; and use of derivatives.
Bond investments are subject to interest rate risk such that when interest rates rise, the prices of the bonds, and thus the value of the bond fund, can decline and the investor can lose principal value. In general, the risk of price fluctuation increases with the length of the bond’s maturity.
A basis point is a unit equal to 1/100 of a percentage point and is used to denote the change in a financial instrument.
Effective duration is a calculation for bonds with embedded options. Effective duration takes into account that expected cash flows will fluctuate as interest rates change.
The Barclay’s U.S. Securitized Index is an unmanaged index that tracks the performance of mortgage-backed pass-through securities issued by Ginnie Mae, Fannie Mae, and Freddie Mac, investment-grade bonds and asset-backed securities. One cannot invest directly in an Index. | ||||||

2 |
RBC Global Asset Management (U.S.) Inc.(“RBC GAM (US)”) serves as the investment advisor to the Access Capital Community Investment Fund. RBC GAM (US) employs a team approach to the management of the Access Capital Community Investment Fund, with no individual team member being solely responsible for the investment decisions. The Fund’s management team has access to RBC GAM (US)’s investment research and other money management resources.
| ||||||
Brian Svendahl, CFA Managing Director, Co-Head, U.S. Fixed Income Brian Svendahl oversees the fixed income research, portfolio management and trading at RBC GAM (US). In addition to shaping the firm’s overall fixed income philosophy and process, he is a portfolio manager for its community investment strategy, including the Access Capital Community Investment Fund, and many of RBC GAM (US)’s government mandates. Brian joined RBC GAM (US) in 2005 and most recently led the mortgage and government team before being promoted to Co-Head. Prior to joining RBC GAM (US), he held several risk management, research and trading positions at Wells Fargo. Brian’s experience also includes liability management and implementing balance sheet hedging strategies. He earned a BS in economics from the University of Minnesota and a BBA in finance and an MBA from the University of Minnesota Carlson School of Management. Brian is a CFA charterholder. |
Brian Svendahl, CFA | |||||
Scott Kirby Vice President, Senior Portfolio Manager Scott Kirby is a member of the government and mortgage research team in RBC GAM (US)’s fixed income group and serves as co-portfolio manager for the firm’s community investment strategy, including the Access Capital Community Investment Fund. Scott joined RBC GAM (US) in 2012 and most recently served as manager of investments of a broad-based asset portfolio for a large foundation, supporting its mission to reduce poverty. Previously he led the structured assets investment team of Ameriprise Financial/Riversource Investments, where he served as senior portfolio manager for more than $20 billion in agency and non-agency mortgage-backed, commercial mortgage-backed and asset-backed securities. He earned a BS in finance and an MBA in finance from the University of Minnesota Carlson School of Management. |
Scott Kirby | |||||


| 3 |
Average Annual Total Returns as of September 30, 2014
|
| |||||||||||||||||||||||||||||||||||
| Access Capital Community Investment Fund | ||||||||||||||||||||||||||||||||||||
| 1 Year | 3 Year | 5 Year | 10 Year | Since Inception | Expense Ratio* | |||||||||||||||||||||||||||||||
Class A (a) | ||||||||||||||||||||||||||||||||||||
- Including Maximum Sales Charge of 3.75% | (0.60 | )% | 0.57 | % | 2.13 | % | 3.44 | % | 4.17 | % | ||||||||||||||||||||||||||
- At Net Asset Value | 3.26 | % | 1.86 | % | 2.91 | % | 3.83 | % | 4.41 | % | 1.01 | % | ||||||||||||||||||||||||
Class I (b) | ||||||||||||||||||||||||||||||||||||
- At Net Asset Value | 3.76 | % | 2.19 | % | 3.21 | % | 4.05 | % | 4.71 | % | 0.65 | % | ||||||||||||||||||||||||
| Barclays U. S. Securitized Index (c) | 3.70 | % | 2.24 | % | 3.83 | % | 4.62 | % | 5.32 | % | ||||||||||||||||||||||||||
| Barclays U. S. Aggregate Bond Index (c) | 3.96 | % | 2.43 | % | 4.12 | % | 4.62 | % | 5.37 | % | ||||||||||||||||||||||||||
Performance data quoted represents past performance. Past performance is no guarantee of future results. Investment return and principal value of an investment will fluctuate so that an investor’s shares, when redeemed, may be worth more or less than their original cost. Current performance may be lower or higher than performance quoted. For performance data current to most recent month-end go to www.rbcgam.us.
The Barclays U.S. Securitized Index is an unmanaged index that tracks the performance of mortgage-backed pass-through securities issued by Ginnie Mae, Fannie Mae, and Freddie Mac, investment-grade bonds and asset-backed securities.
The Barclays U.S. Aggregate Bond Index is an unmanaged index that tracks the performance of a representative list of government, corporate, asset-backed and mortgage-backed securities.
(a) The inception date for Class A shares of the Fund is January 29, 2009. All performance shown for such class of shares prior to its inception date is based on the performance of the Class I shares of the Fund, adjusted to reflect the fees and expenses of Class A shares, as applicable.
(b) Class I commenced operations on July 28, 2008. The performance in the table reflects the performance of Access Capital Strategies Community Investment Fund, Inc., the predecessor to the Fund. From its inception, June 23, 1998, until May 30, 2006, the predecessor fund elected status as a business development company. From May 31, 2006 until July 27, 2008, the predecessor fund operated as a continuously offered closed-end interval management company. If the predecessor fund had operated as an open-end management company, performance may have been adversely affected. Fund performance reflects applicable fee waivers/expense reimbursements which, if excluded, would cause performance to be lower.
(c) You cannot invest directly into the index.
* The Fund’s expenses reflect the most recent year end (September 30, 2014). |
| |||||||||||||||||||||||||||||||||||
4 |
Access Capital Community Investment Fund
| ||||||
Invests in geographically specific debt securities located in portions of the United States designated by Fund Shareholders. The Fund invests primarily in debt instruments supporting the affordable housing and economic development serving low- and moderate- income individuals and communities. Investment securities include government-guaranteed loans, asset- backed securities, particularly mortgage-backed securities, small business loans, and taxable municipal securities.
| Investment Strategy | |||||
For the year ended September 30, 2014, the Fund had a total return of 3.76% (Class I). That compares to a total return of 3.70% for the Barclays Capital U.S. Securitized Index.
| Performance | |||||
• Security selections within the single-family mortgage pools performed well as muted prepayment experience maximized carry.
• Hedging strategies were beneficial as the curve flattened during the period.
• Security selections within the Fund’s municipal holdings were also a positive contributing factor.
| Factors That Made Positive Contributions | |||||
• Spread widening in agency collateralized mortgage backed securities detracted from the Fund’s relative returns.
• Agency mortgage backed security coupon stack positioning was also a minor detractor.
| Factors That Detracted from Relative Returns | |||||
Fund holdings and sector allocations are subject to change at any time and should not be considered recommendations to buy or sell any security.
Please refer to the Schedule of Portfolio Investments in this report for a complete list of Fund holdings. | ||||||
| 5 |
MANAGEMENT DISCUSSION AND ANALYSIS (UNAUDITED) |
| |||||||||||||||||
Access Capital Community Investment Fund
| ||||||||||||||||||
Investment Objective Benchmark | Current income and capital appreciation
|
| ||||||||||||||||
Barclays U.S. Securitized Index
Barclays U.S. Aggregate Bond Index
|
| |||||||||||||||||
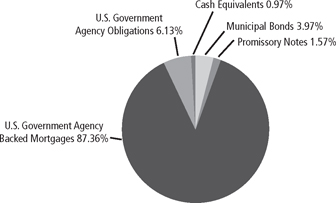
Asset Allocation (as of 9/30/14) (% of fund’s investments) |
|
| ||||||||||||||||
Top Ten Holdings (as of 9/30/14) (% of fund’s net assets) | Fannie Mae Pool #AK2386, | 2.62 | % | Massachusetts Housing Finance Agency Revenue, | 1.41 | % | ||||||||||||
Small Business Administration, | 2.19 | % | Ginnie Mae, Series 2012-114, | 1.27 | % | |||||||||||||
Massachusetts Housing | 1.87 | % | Fannie Mae Pool #466934, | 1.27 | % | |||||||||||||
Fannie Mae Pool #465537, | 1.60 | % | Ginnie Mae Pool #AC9541, | 1.17 | % | |||||||||||||
Ginnie Mae Series 2012-58, | 1.49 | % | Ginnie Mae, Series 2012-33, | 1.15 | % | |||||||||||||
*A listing of all portfolio holdings can be found beginning on page 8.
|
| |||||||||||||||||
6 |
MANAGEMENT DISCUSSION AND ANALYSIS (UNAUDITED) | ||||||
Access Capital Community Investment Fund
| ||||||
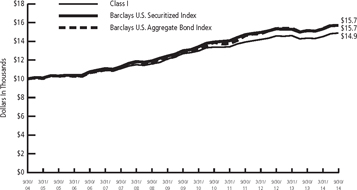
The graph reflects an initial investment of $10,000 over a 10 year period and is based on Class I shares. The Fund’s total return includes reinvested dividends and capital gains. The Fund’s total return also includes operating expenses that reduce return, while the total return of the index does not. The graph does not reflect the deduction of taxes that a shareholder would pay on fund distributions or redemption of fund shares. Performance of other classes will vary due to differences in fee structures. | Growth of $10,000 Initial Investment Over 10 Years | |||||
| 7 |
Access Capital Community Investment Fund
September 30, 2014
Principal Amount | Value | |||||
Municipal Bonds — 4.75% |
| |||||
California — 0.22% |
| |||||
$ 95,000 | California Rural Home Mortgage Finance Authority Revenue, Series C, 5.40%, 8/1/35, (Credit Support: Ginnie Mae, Fannie Mae, Freddie Mac), Callable 2/1/17 @ 104 | $ | 96,068 | |||
975,000 | California Statewide Communities Development Authority Revenue, Series B, 5.25%, 10/20/42, (Credit Support: Ginnie Mae), Callable 10/20/17 @ 102 | 995,777 | ||||
|
| |||||
| 1,091,845 | ||||||
|
| |||||
Delaware — 0.71% |
| |||||
55,000 | Delaware State Housing Authority Revenue, 4.50%, 7/1/15, (Credit Support: AGM), Callable 1/1/15 @ 100 | 55,576 | ||||
130,000 | Delaware State Housing Authority Revenue, 4.55%, 1/1/16, (Credit Support: AGM), Callable 1/1/15 @ 100 | 130,178 | ||||
135,000 | Delaware State Housing Authority Revenue, 4.55%, 7/1/16, (Credit Support: AGM), Callable 1/1/15 @ 100 | 135,185 | ||||
295,000 | Delaware State Housing Authority Revenue, 4.65%, 7/1/26, (Credit Support: AMBAC), Callable 7/1/15 @ 100 | 296,614 | ||||
645,000 | Delaware State Housing Authority Revenue, Series 2, 1.50%, 1/1/15, (Credit Support: Ginnie Mae, Fannie Mae, Freddie Mac) | 645,955 | ||||
740,000 | Delaware State Housing Authority Revenue, Series A, 5.05%, 7/1/23, (Credit Support: Ginnie Mae, Fannie Mae, Freddie Mac), Callable 1/1/18 @ 100 | 744,906 | ||||
860,000 | Delaware State Housing Authority Revenue, Series A, 5.25%, 7/1/28, (Credit Support: Ginnie Mae, Fannie Mae, Freddie Mac), Callable 1/1/18 @ 100 | 879,909 | ||||
620,000 | Delaware State Housing Authority Revenue, Series A, 5.35%, 7/1/31, (Credit Support: Ginnie Mae, Fannie Mae, Freddie Mac), Callable 1/1/18 @ 100 | 637,019 | ||||
|
| |||||
| 3,525,342 | ||||||
|
| |||||
Massachusetts — 1.83% |
| |||||
545,000 | Massachusetts Housing Finance Agency Revenue, Series 170, 1.51%, 12/1/17 | 540,030 | ||||
250,000 | Massachusetts Housing Finance Agency Revenue, Series 170, 2.21%, 6/1/18 | 250,000 | ||||
8 |
SCHEDULE OF PORTFOLIO INVESTMENTS |
Access Capital Community Investment Fund (cont.)
September 30, 2014
Principal Amount | Value | |||||
$ 330,000 | Massachusetts Housing Finance Agency Revenue, Series 170, 2.31%, 12/1/18 | $ | 329,673 | |||
160,000 | Massachusetts Housing Finance Agency Revenue, Series 170, 2.51%, 6/1/19 | 160,190 | ||||
575,000 | Massachusetts Housing Finance Agency Revenue, Series 170, 2.61%, 12/1/19 | 572,775 | ||||
205,000 | Massachusetts Housing Finance Agency Revenue, Series 170, 3.09%, 6/1/20 | 208,362 | ||||
6,790,000 | Massachusetts Housing Finance Agency Revenue, Series B, 6.53%, 12/1/27, (Credit Support: NATL-RE,IBC), Callable 6/1/17 @ 100 | 7,043,878 | ||||
|
| |||||
| 9,104,908 | ||||||
|
| |||||
Mississippi — 0.02% |
| |||||
100,000 | Mississippi Home Corp. Multi Family Revenue OID, 5.35%, 8/20/48, (Credit Support: Ginnie Mae, FHA), Callable 9/1/18 @ 105 | 102,271 | ||||
|
| |||||
New York — 1.91% |
| |||||
750,000 | New York City Housing Development Corp. Revenue, 1.54%, 2/1/17 | 750,427 | ||||
500,000 | New York City Housing Development Corp. Revenue, 1.73%, 8/1/17 | 503,100 | ||||
750,000 | New York City Housing Development Corp. Revenue, 1.94%, 2/1/18 | 755,917 | ||||
665,000 | New York City Housing Development Corp. Revenue, Series A, 4.15%, 7/15/15, (Credit Support: Fannie Mae) | 675,573 | ||||
700,000 | New York State Housing Finance Agency Revenue, 4.50%, 11/15/27, (Credit Support: Fannie Mae), Callable 11/15/16 @ 100 | 711,844 | ||||
1,000,000 | New York State Housing Finance Agency Revenue, Series A, 4.65%, 11/15/38, (Credit Support: Fannie Mae), Callable 11/15/16 @ 100 | 1,010,390 | ||||
1,335,000 | New York State Mortgage Agency Revenue, Series 184, 1.59%, 4/1/18 | 1,323,866 | ||||
1,335,000 | New York State Mortgage Agency Revenue, Series 184, 1.85%, 10/1/18 | 1,324,173 | ||||
| 9 |
SCHEDULE OF PORTFOLIO INVESTMENTS |
Access Capital Community Investment Fund (cont.)
September 30, 2014
Principal Amount | Value | |||||
$1,335,000 | New York State Mortgage Agency Revenue, Series 184, 2.10%, 4/1/19 | $ | 1,330,955 | |||
1,140,000 | New York State Mortgage Agency Revenue, Series 187, 1.59%, 4/1/18 | 1,136,626 | ||||
|
| |||||
| 9,522,871 | ||||||
|
| |||||
Vermont — 0.06% |
| |||||
160,000 | Vermont Housing Finance Agency Revenue, Series C, 1.20%, 8/15/16 | 159,544 | ||||
165,000 | Vermont Housing Finance Agency Revenue, Series C, 1.95%, 8/15/17 | 164,952 | ||||
|
| |||||
| 324,496 | ||||||
|
| |||||
Total Municipal Bonds | 23,671,733 | |||||
|
| |||||
(Cost $23,256,567) | ||||||
U.S. Government Agency Backed Mortgages — 104.52% |
| |||||
Fannie Mae — 66.49% |
| |||||
1,850 | Pool #253214, 7.00%, 1/1/15 | 1,854 | ||||
48,758 | Pool #257612, 5.00%, 5/1/38 | 54,436 | ||||
365,287 | Pool #257613, 5.50%, 6/1/38 | 404,113 | ||||
171,018 | Pool #257631, 6.00%, 7/1/38 | 193,037 | ||||
54,567 | Pool #257632, 5.50%, 7/1/38 | 61,424 | ||||
131,011 | Pool #257649, 5.50%, 7/1/38 | 146,389 | ||||
76,101 | Pool #257656, 6.00%, 8/1/38 | 85,899 | ||||
132,659 | Pool #257663, 5.50%, 8/1/38 | 148,397 | ||||
116,911 | Pool #257857, 6.00%, 12/1/37 | 131,963 | ||||
66,396 | Pool #257869, 5.50%, 12/1/37 | 74,636 | ||||
119,550 | Pool #257890, 5.50%, 2/1/38 | 133,676 | ||||
124,788 | Pool #257892, 5.50%, 2/1/38 | 138,052 | ||||
48,072 | Pool #257897, 5.50%, 2/1/38 | 54,120 | ||||
46,947 | Pool #257898, 6.00%, 2/1/38 | 52,992 | ||||
52,136 | Pool #257902, 6.00%, 2/1/38 | 58,848 | ||||
138,875 | Pool #257903, 5.50%, 2/1/38 | 154,916 | ||||
83,018 | Pool #257913, 5.50%, 1/1/38 | 93,152 | ||||
74,252 | Pool #257926, 5.50%, 3/1/38 | 83,594 | ||||
58,054 | Pool #257942, 5.50%, 4/1/38 | 65,358 | ||||
99,309 | Pool #257943, 6.00%, 4/1/38 | 112,095 | ||||
79,971 | Pool #257995, 6.00%, 7/1/38 | 90,267 | ||||
67,150 | Pool #258022, 5.50%, 5/1/34 | 76,186 | ||||
90,132 | Pool #258027, 5.00%, 5/1/34 | 99,965 | ||||
105,834 | Pool #258030, 5.00%, 5/1/34 | 117,348 | ||||
149,538 | Pool #258070, 5.00%, 6/1/34 | 166,764 | ||||
44,971 | Pool #258121, 5.50%, 6/1/34 | 51,023 | ||||
147,816 | Pool #258152, 5.50%, 8/1/34 | 167,014 | ||||
10 |
SCHEDULE OF PORTFOLIO INVESTMENTS |
Access Capital Community Investment Fund (cont.)
September 30, 2014
Principal Amount | Value | |||||
$208,564 | Pool #258157, 5.00%, 8/1/34 | $ | 231,319 | |||
175,840 | Pool #258163, 5.50%, 8/1/34 | 198,239 | ||||
125,850 | Pool #258166, 5.50%, 9/1/34 | 140,996 | ||||
78,925 | Pool #258171, 5.50%, 10/1/34 | 89,041 | ||||
159,791 | Pool #258173, 5.50%, 10/1/34 | 179,023 | ||||
147,112 | Pool #258180, 5.00%, 10/1/34 | 162,933 | ||||
43,736 | Pool #258222, 5.00%, 11/1/34 | 48,665 | ||||
114,699 | Pool #258224, 5.50%, 12/1/34 | 128,503 | ||||
213,960 | Pool #258238, 5.00%, 1/1/35 | 236,969 | ||||
100,855 | Pool #258251, 5.50%, 1/1/35 | 113,545 | ||||
117,368 | Pool #258258, 5.00%, 1/1/35 | 129,989 | ||||
237,304 | Pool #258305, 5.00%, 3/1/35 | 262,786 | ||||
103,170 | Pool #258336, 5.00%, 4/1/35 | 114,716 | ||||
68,326 | Pool #258340, 5.00%, 3/1/35 | 75,973 | ||||
68,869 | Pool #258393, 5.00%, 5/1/35 | 76,576 | ||||
70,210 | Pool #258394, 5.00%, 5/1/35 | 78,067 | ||||
265,070 | Pool #258395, 5.50%, 6/1/35 | 296,806 | ||||
67,657 | Pool #258403, 5.00%, 6/1/35 | 75,229 | ||||
90,955 | Pool #258404, 5.00%, 6/1/35 | 100,950 | ||||
52,678 | Pool #258410, 5.00%, 4/1/35 | 58,573 | ||||
55,653 | Pool #258411, 5.50%, 5/1/35 | 63,012 | ||||
126,869 | Pool #258448, 5.00%, 8/1/35 | 140,354 | ||||
215,703 | Pool #258450, 5.50%, 8/1/35 | 241,529 | ||||
100,936 | Pool #258456, 5.00%, 8/1/35 | 111,807 | ||||
74,070 | Pool #258479, 5.50%, 7/1/35 | 83,251 | ||||
90,988 | Pool #258552, 5.00%, 11/1/35 | 101,327 | ||||
404,184 | Pool #258571, 5.50%, 11/1/35 | 452,702 | ||||
97,583 | Pool #258600, 6.00%, 1/1/36 | 110,146 | ||||
382,625 | Pool #258627, 5.50%, 2/1/36 | 427,837 | ||||
112,619 | Pool #258634, 5.50%, 2/1/36 | 126,032 | ||||
60,507 | Pool #258658, 5.50%, 3/1/36 | 68,234 | ||||
59,156 | Pool #258737, 5.50%, 12/1/35 | 66,636 | ||||
82,971 | Pool #258763, 6.00%, 5/1/36 | 93,700 | ||||
48,334 | Pool #259004, 8.00%, 2/1/30 | 58,624 | ||||
54,767 | Pool #259030, 8.00%, 4/1/30 | 65,813 | ||||
51,381 | Pool #259181, 6.50%, 3/1/31 | 59,115 | ||||
18,190 | Pool #259187, 6.50%, 4/1/31 | 20,494 | ||||
81,135 | Pool #259190, 6.50%, 4/1/31 | 93,504 | ||||
78,764 | Pool #259201, 6.50%, 4/1/31 | 90,799 | ||||
39,808 | Pool #259306, 6.50%, 9/1/31 | 45,823 | ||||
92,345 | Pool #259316, 6.50%, 11/1/31 | 106,476 | ||||
35,310 | Pool #259378, 6.00%, 12/1/31 | 40,102 | ||||
39,214 | Pool #259393, 6.00%, 1/1/32 | 44,579 | ||||
48,875 | Pool #259590, 5.50%, 11/1/32 | 55,323 | ||||
201,727 | Pool #259611, 5.50%, 11/1/32 | 226,399 | ||||
109,125 | Pool #259614, 6.00%, 11/1/32 | 123,779 | ||||
61,990 | Pool #259634, 5.50%, 12/1/32 | 68,986 | ||||
67,482 | Pool #259655, 5.50%, 2/1/33 | 76,410 | ||||
| 11 |
SCHEDULE OF PORTFOLIO INVESTMENTS |
Access Capital Community Investment Fund (cont.)
September 30, 2014
Principal Amount | Value | |||||
$ 156,961 | Pool #259659, 5.50%, 2/1/33 | $ | 176,461 | |||
37,481 | Pool #259671, 5.50%, 2/1/33 | 42,440 | ||||
91,783 | Pool #259686, 5.50%, 3/1/33 | 103,163 | ||||
44,382 | Pool #259722, 5.00%, 5/1/33 | 49,294 | ||||
55,988 | Pool #259724, 5.00%, 5/1/33 | 62,254 | ||||
143,878 | Pool #259725, 5.00%, 5/1/33 | 159,448 | ||||
70,438 | Pool #259726, 5.00%, 5/1/33 | 78,112 | ||||
120,840 | Pool #259729, 5.00%, 6/1/33 | 133,986 | ||||
64,184 | Pool #259734, 5.50%, 5/1/33 | 71,676 | ||||
70,529 | Pool #259761, 5.00%, 6/1/33 | 78,731 | ||||
134,963 | Pool #259764, 5.00%, 7/1/33 | 149,646 | ||||
134,792 | Pool #259777, 5.00%, 7/1/33 | 149,456 | ||||
93,516 | Pool #259781, 5.00%, 7/1/33 | 103,807 | ||||
56,914 | Pool #259789, 5.00%, 7/1/33 | 63,417 | ||||
104,403 | Pool #259807, 5.00%, 8/1/33 | 115,760 | ||||
145,497 | Pool #259816, 5.00%, 8/1/33 | 161,326 | ||||
31,570 | Pool #259819, 5.00%, 8/1/33 | 35,177 | ||||
136,475 | Pool #259830, 5.00%, 8/1/33 | 151,321 | ||||
38,596 | Pool #259848, 5.00%, 9/1/33 | 43,006 | ||||
81,363 | Pool #259867, 5.50%, 10/1/33 | 92,006 | ||||
104,299 | Pool #259869, 5.50%, 10/1/33 | 117,031 | ||||
126,867 | Pool #259875, 5.50%, 10/1/33 | 143,345 | ||||
78,399 | Pool #259876, 5.50%, 10/1/33 | 88,582 | ||||
45,308 | Pool #259879, 5.50%, 10/1/33 | 51,405 | ||||
92,417 | Pool #259906, 5.50%, 11/1/33 | 103,917 | ||||
57,442 | Pool #259928, 5.50%, 12/1/33 | 65,226 | ||||
204,113 | Pool #259930, 5.00%, 11/1/33 | 226,318 | ||||
2,462 | Pool #259939, 5.50%, 11/1/33 | 2,793 | ||||
43,126 | Pool #259961, 5.50%, 3/1/34 | 48,930 | ||||
119,188 | Pool #259976, 5.00%, 3/1/34 | 132,676 | ||||
43,316 | Pool #259998, 5.00%, 3/1/34 | 48,265 | ||||
515,779 | Pool #381985, 7.97%, 9/1/17 | 514,775 | ||||
848,338 | Pool #387472, 4.89%, 6/1/15 | 851,253 | ||||
7,292,122 | Pool #465537, 4.20%, 7/1/20 | 7,968,964 | ||||
715,641 | Pool #465946, 3.61%, 9/1/20 | 760,332 | ||||
5,795,387 | Pool #466934, 4.10%, 1/1/21 | 6,306,065 | ||||
3,322,875 | Pool #467882, 4.24%, 6/1/21 | 3,647,165 | ||||
2,393,229 | Pool #468104, 3.93%, 5/1/18 | 2,568,996 | ||||
593,694 | Pool #469239, 2.69%, 10/1/18 | 611,328 | ||||
461,306 | Pool #470439, 2.91%, 5/1/22 | 468,650 | ||||
3,344,401 | Pool #470561, 2.94%, 2/1/22 | 3,408,946 | ||||
963,882 | Pool #471478, 2.61%, 8/1/22 | 957,806 | ||||
3,539,372 | Pool #471948, 2.86%, 7/1/22 | 3,578,488 | ||||
220,874 | Pool #557295, 7.00%, 12/1/29 | 255,580 | ||||
32,009 | Pool #575886, 7.50%, 1/1/31 | 38,179 | ||||
82,413 | Pool #576445, 6.00%, 1/1/31 | 93,057 | ||||
180,165 | Pool #579402, 6.50%, 4/1/31 | 207,233 | ||||
156,668 | Pool #583728, 6.50%, 6/1/31 | 180,425 | ||||
12 |
SCHEDULE OF PORTFOLIO INVESTMENTS |
Access Capital Community Investment Fund (cont.)
September 30, 2014
Principal Amount | Value | |||||
$ 78,496 | Pool #585148, 6.50%, 7/1/31 | $ | 90,492 | |||
39,649 | Pool #590931, 6.50%, 7/1/31 | 45,686 | ||||
70,546 | Pool #590932, 6.50%, 7/1/31 | 81,142 | ||||
175,525 | Pool #601865, 6.50%, 4/1/31 | 199,589 | ||||
139,529 | Pool #601868, 6.00%, 7/1/29 | 157,889 | ||||
124,262 | Pool #607611, 6.50%, 11/1/31 | 142,969 | ||||
219,463 | Pool #634271, 6.50%, 5/1/32 | 252,475 | ||||
46,067 | Pool #640146, 5.00%, 12/1/17 | 48,371 | ||||
141,863 | Pool #644232, 6.50%, 6/1/32 | 163,265 | ||||
29,572 | Pool #644432, 6.50%, 7/1/32 | 33,961 | ||||
48,270 | Pool #644437, 6.50%, 6/1/32 | 55,551 | ||||
3,149,099 | Pool #663159, 5.00%, 7/1/32(a) | 3,485,324 | ||||
177,571 | Pool #670278, 5.50%, 11/1/32 | 200,886 | ||||
49,798 | Pool #676702, 5.50%, 11/1/32 | 56,215 | ||||
58,778 | Pool #677591, 5.50%, 12/1/32 | 66,078 | ||||
299,569 | Pool #681883, 6.00%, 3/1/33 | 339,373 | ||||
73,902 | Pool #683087, 5.00%, 1/1/18 | 77,924 | ||||
48,930 | Pool #684644, 4.50%, 6/1/18 | 51,729 | ||||
281,507 | Pool #686542, 5.50%, 3/1/33 | 313,275 | ||||
429,303 | Pool #695961, 5.50%, 1/1/33 | 480,901 | ||||
335,375 | Pool #696407, 5.50%, 4/1/33 | 377,929 | ||||
737,056 | Pool #702478, 5.50%, 6/1/33 | 826,350 | ||||
230,186 | Pool #702479, 5.00%, 6/1/33 | 255,109 | ||||
79,346 | Pool #703210, 5.50%, 9/1/32 | 88,300 | ||||
351,861 | Pool #720025, 5.00%, 8/1/33 | 390,140 | ||||
286,855 | Pool #723066, 5.00%, 4/1/33 | 317,846 | ||||
289,590 | Pool #723067, 5.50%, 5/1/33 | 324,217 | ||||
253,220 | Pool #723068, 4.50%, 5/1/33 | 274,485 | ||||
312,266 | Pool #723070, 4.50%, 5/1/33 | 338,491 | ||||
427,932 | Pool #727311, 4.50%, 9/1/33 | 465,760 | ||||
1,005,536 | Pool #727312, 5.00%, 9/1/33 | 1,116,184 | ||||
250,730 | Pool #727315, 6.00%, 10/1/33 | 284,459 | ||||
307,136 | Pool #738589, 5.00%, 9/1/33 | 340,549 | ||||
184,397 | Pool #738683, 5.00%, 9/1/33 | 204,458 | ||||
343,906 | Pool #739269, 5.00%, 9/1/33 | 381,319 | ||||
183,702 | Pool #743595, 5.50%, 10/1/33 | 205,926 | ||||
189,914 | Pool #748041, 4.50%, 10/1/33 | 206,049 | ||||
238,706 | Pool #749891, 5.00%, 9/1/33 | 265,718 | ||||
293,810 | Pool #749897, 4.50%, 9/1/33 | 318,772 | ||||
52,104 | Pool #750984, 5.00%, 12/1/18 | 55,686 | ||||
171,753 | Pool #751008, 5.00%, 12/1/18 | 182,626 | ||||
280,540 | Pool #753533, 5.00%, 11/1/33 | 311,059 | ||||
99,442 | Pool #755679, 6.00%, 1/1/34 | 112,656 | ||||
115,663 | Pool #755745, 5.00%, 1/1/34 | 129,114 | ||||
166,899 | Pool #755746, 5.50%, 12/1/33 | 189,359 | ||||
46,303 | Pool #763551, 5.50%, 3/1/34 | 52,534 | ||||
328,404 | Pool #763820, 5.50%, 1/1/34 | 368,493 | ||||
111,108 | Pool #763824, 5.00%, 3/1/34 | 123,195 | ||||
| 13 |
SCHEDULE OF PORTFOLIO INVESTMENTS |
Access Capital Community Investment Fund (cont.)
September 30, 2014
Principal Amount | Value | |||||
$ 132,430 | Pool #765216, 5.00%, 1/1/19 | $ | 141,534 | |||
30,986 | Pool #765217, 4.50%, 1/1/19 | 32,758 | ||||
70,621 | Pool #765306, 5.00%, 2/1/19 | 75,090 | ||||
34,317 | Pool #773084, 4.50%, 3/1/19 | 36,279 | ||||
15,523 | Pool #773096, 4.50%, 3/1/19 | 16,411 | ||||
182,793 | Pool #773175, 5.00%, 5/1/34 | 202,679 | ||||
235,352 | Pool #773476, 5.50%, 7/1/19 | 252,047 | ||||
88,350 | Pool #773547, 5.00%, 5/1/34 | 97,989 | ||||
42,494 | Pool #773553, 5.00%, 4/1/34 | 47,488 | ||||
382,429 | Pool #773568, 5.50%, 5/1/34 | 428,694 | ||||
174,647 | Pool #776850, 5.50%, 11/1/34 | 195,666 | ||||
51,556 | Pool #776851, 6.00%, 10/1/34 | 58,322 | ||||
65,763 | Pool #777444, 5.50%, 5/1/34 | 74,612 | ||||
2,048,625 | Pool #777621, 5.00%, 2/1/34(a) | 2,271,493 | ||||
149,366 | Pool #781437, 6.00%, 8/1/34 | 168,878 | ||||
93,027 | Pool #781741, 6.00%, 9/1/34 | 105,374 | ||||
184,223 | Pool #781907, 5.00%, 2/1/21 | 199,012 | ||||
226,071 | Pool #781954, 5.00%, 6/1/34 | 250,665 | ||||
214,029 | Pool #781959, 5.50%, 6/1/34 | 239,921 | ||||
415,063 | Pool #781960, 5.50%, 6/1/34 | 465,275 | ||||
361,580 | Pool #783893, 5.50%, 12/1/34 | 405,436 | ||||
192,710 | Pool #783929, 5.50%, 10/1/34 | 216,083 | ||||
66,876 | Pool #788329, 6.50%, 8/1/34 | 74,839 | ||||
65,639 | Pool #790282, 6.00%, 7/1/34 | 74,380 | ||||
179,446 | Pool #797623, 5.00%, 7/1/35 | 198,519 | ||||
157,846 | Pool #797626, 5.50%, 7/1/35 | 176,646 | ||||
136,130 | Pool #797627, 5.00%, 7/1/35 | 150,599 | ||||
128,401 | Pool #797674, 5.50%, 9/1/35 | 143,774 | ||||
506,332 | Pool #798725, 5.50%, 11/1/34 | 567,270 | ||||
167,363 | Pool #799547, 5.50%, 9/1/34 | 188,264 | ||||
117,073 | Pool #799548, 6.00%, 9/1/34 | 132,200 | ||||
1,507,197 | Pool #806754, 4.50%, 9/1/34(a) | 1,635,250 | ||||
366,886 | Pool #806757, 6.00%, 9/1/34 | 414,884 | ||||
1,470,832 | Pool #806761, 5.50%, 9/1/34(a) | 1,648,768 | ||||
81,186 | Pool #808185, 5.50%, 3/1/35 | 91,008 | ||||
353,648 | Pool #808205, 5.00%, 1/1/35 | 391,679 | ||||
68,011 | Pool #813942, 5.00%, 11/1/20 | 73,373 | ||||
485,117 | Pool #815009, 5.00%, 4/1/35 | 536,983 | ||||
380,405 | Pool #817641, 5.00%, 11/1/35 | 421,967 | ||||
135,417 | Pool #820334, 5.00%, 9/1/35 | 149,810 | ||||
577,791 | Pool #820335, 5.00%, 9/1/35 | 639,203 | ||||
199,761 | Pool #820336, 5.00%, 9/1/35 | 221,587 | ||||
438,215 | Pool #822008, 5.00%, 5/1/35 | 485,066 | ||||
903,606 | Pool #829005, 5.00%, 8/1/35 | 999,649 | ||||
202,574 | Pool #829006, 5.50%, 9/1/35 | 226,828 | ||||
164,073 | Pool #829274, 5.00%, 8/1/35 | 181,512 | ||||
467,443 | Pool #829275, 5.00%, 8/1/35 | 517,127 | ||||
176,686 | Pool #829276, 5.00%, 8/1/35 | 195,466 | ||||
14 |
SCHEDULE OF PORTFOLIO INVESTMENTS |
Access Capital Community Investment Fund (cont.)
September 30, 2014
Principal Amount | Value | |||||
$ 132,314 | Pool #829277, 5.00%, 8/1/35 | $ | 146,378 | |||
613,683 | Pool #829649, 5.50%, 3/1/35 | 687,541 | ||||
431,330 | Pool #844361, 5.50%, 11/1/35 | 482,702 | ||||
182,284 | Pool #845245, 5.50%, 11/1/35 | 205,959 | ||||
64,675 | Pool #866969, 6.00%, 2/1/36 | 73,058 | ||||
174,009 | Pool #867569, 6.00%, 2/1/36 | 196,412 | ||||
181,558 | Pool #867574, 5.50%, 2/1/36 | 203,862 | ||||
154,850 | Pool #868788, 6.00%, 3/1/36 | 174,787 | ||||
214,122 | Pool #870599, 6.00%, 6/1/36 | 241,690 | ||||
166,146 | Pool #870684, 6.00%, 7/1/36 | 187,537 | ||||
519,205 | Pool #871072, 5.50%, 2/1/37 | 579,583 | ||||
3,044,455 | Pool #874900, 5.45%, 10/1/17 | 3,380,133 | ||||
258,206 | Pool #882044, 6.00%, 5/1/36 | 291,450 | ||||
193,732 | Pool #884693, 5.50%, 4/1/36 | 217,533 | ||||
1,053,330 | Pool #885724, 5.50%, 6/1/36(a) | 1,177,795 | ||||
84,946 | Pool #908671, 6.00%, 1/1/37 | 95,967 | ||||
274,859 | Pool #908672, 5.50%, 1/1/37 | 306,823 | ||||
593,313 | Pool #911730, 5.50%, 12/1/21 | 642,038 | ||||
189,055 | Pool #919368, 5.50%, 4/1/37 | 211,986 | ||||
474,000 | Pool #922582, 6.00%, 12/1/36 | 535,027 | ||||
1,057,928 | Pool #934941, 5.00%, 8/1/39(a) | 1,170,375 | ||||
820,570 | Pool #934942, 5.00%, 9/1/39(a) | 906,249 | ||||
295,120 | Pool #941204, 5.50%, 6/1/37 | 329,716 | ||||
164,602 | Pool #943394, 5.50%, 6/1/37 | 184,566 | ||||
475,363 | Pool #944502, 6.00%, 6/1/37 | 536,565 | ||||
134,386 | Pool #945853, 6.00%, 7/1/37 | 151,688 | ||||
371,947 | Pool #948600, 6.00%, 8/1/37 | 419,835 | ||||
166,042 | Pool #948672, 5.50%, 8/1/37 | 185,247 | ||||
463,045 | Pool #952598, 6.00%, 7/1/37 | 522,662 | ||||
239,613 | Pool #952623, 6.00%, 8/1/37 | 270,463 | ||||
349,279 | Pool #952632, 6.00%, 7/1/37 | 394,248 | ||||
138,675 | Pool #952665, 6.00%, 8/1/37 | 156,530 | ||||
392,043 | Pool #952678, 6.50%, 8/1/37 | 442,070 | ||||
110,560 | Pool #952693, 6.50%, 8/1/37 | 124,562 | ||||
2,469,709 | Pool #957324, 5.43%, 5/1/18 | 2,763,768 | ||||
371,070 | Pool #958502, 5.07%, 5/1/19 | 415,397 | ||||
212,197 | Pool #960919, 5.00%, 2/1/38 | 234,751 | ||||
249,744 | Pool #975769, 5.50%, 3/1/38 | 278,552 | ||||
140,418 | Pool #982656, 5.50%, 6/1/38 | 155,343 | ||||
86,229 | Pool #982898, 5.00%, 5/1/38 | 95,502 | ||||
155,918 | Pool #983033, 5.00%, 5/1/38 | 172,198 | ||||
155,162 | Pool #984842, 5.50%, 6/1/38 | 173,060 | ||||
81,677 | Pool #986230, 5.00%, 7/1/38 | 90,499 | ||||
387,211 | Pool #986239, 6.00%, 7/1/38 | 437,064 | ||||
421,595 | Pool #986957, 5.50%, 7/1/38 | 469,963 | ||||
82,298 | Pool #990510, 5.50%, 8/1/38 | 92,409 | ||||
379,039 | Pool #990511, 6.00%, 8/1/38 | 427,840 | ||||
181,863 | Pool #990617, 5.50%, 9/1/38 | 202,955 | ||||
| 15 |
SCHEDULE OF PORTFOLIO INVESTMENTS |
Access Capital Community Investment Fund (cont.)
September 30, 2014
Principal Amount | Value | |||||
$ 400,629 | Pool #AA0526, 5.00%, 12/1/38 | $ | 443,087 | |||
541,939 | Pool #AA0527, 5.50%, 12/1/38 | 599,542 | ||||
439,923 | Pool #AA0644, 4.50%, 3/1/39 | 477,093 | ||||
608,388 | Pool #AA0645, 4.50%, 3/1/39 | 661,408 | ||||
164,031 | Pool #AA2243, 4.50%, 5/1/39 | 179,146 | ||||
536,990 | Pool #AA3142, 4.50%, 3/1/39 | 580,264 | ||||
116,267 | Pool #AA3143, 4.00%, 3/1/39 | 123,166 | ||||
551,672 | Pool #AA3206, 4.00%, 4/1/39 | 583,544 | ||||
558,192 | Pool #AA3207, 4.50%, 3/1/39 | 603,523 | ||||
185,076 | Pool #AA4468, 4.00%, 4/1/39 | 195,768 | ||||
967,867 | Pool #AA7042, 4.50%, 6/1/39 | 1,045,864 | ||||
436,251 | Pool #AA7658, 4.00%, 6/1/39 | 461,318 | ||||
383,382 | Pool #AA7659, 4.50%, 6/1/39 | 416,972 | ||||
428,671 | Pool #AA7741, 4.50%, 6/1/24 | 459,080 | ||||
364,470 | Pool #AA8455, 4.50%, 6/1/39 | 396,403 | ||||
4,094,067 | Pool #AB7798, 3.00%, 1/1/43 | 4,043,371 | ||||
4,532,175 | Pool #AB9203, 3.00%, 4/1/43 | 4,476,054 | ||||
2,149,723 | Pool #AB9204, 3.00%, 4/1/43 | 2,123,104 | ||||
1,577,536 | Pool #AB9831, 3.00%, 6/1/43(a) | 1,557,509 | ||||
1,156,238 | Pool #AC1463, 5.00%, 8/1/39(a) | 1,281,301 | ||||
116,956 | Pool #AC1464, 5.00%, 8/1/39 | 129,387 | ||||
1,351,487 | Pool #AC2109, 4.50%, 7/1/39 | 1,461,031 | ||||
298,948 | Pool #AC4394, 5.00%, 9/1/39 | 331,284 | ||||
734,301 | Pool #AC4395, 5.00%, 9/1/39 | 814,644 | ||||
474,348 | Pool #AC5328, 5.00%, 10/1/39 | 526,841 | ||||
393,903 | Pool #AC5329, 5.00%, 10/1/39 | 434,540 | ||||
782,764 | Pool #AC6304, 5.00%, 11/1/39(a) | 865,964 | ||||
365,911 | Pool #AC6305, 5.00%, 11/1/39 | 406,404 | ||||
874,728 | Pool #AC6307, 5.00%, 12/1/39(a) | 967,702 | ||||
744,199 | Pool #AC6790, 5.00%, 12/1/39 | 826,556 | ||||
2,969,739 | Pool #AC7199, 5.00%, 12/1/39(a) | 3,285,390 | ||||
1,589,814 | Pool #AD1470, 5.00%, 2/1/40 | 1,758,794 | ||||
2,246,420 | Pool #AD1471, 4.50%, 2/1/40(a) | 2,427,450 | ||||
1,040,732 | Pool #AD1560, 5.00%, 3/1/40(a) | 1,151,350 | ||||
2,348,563 | Pool #AD1585, 4.50%, 2/1/40(a) | 2,537,824 | ||||
827,228 | Pool #AD1586, 5.00%, 1/1/40(a) | 915,153 | ||||
686,691 | Pool #AD1638, 4.50%, 2/1/40 | 742,243 | ||||
544,003 | Pool #AD1640, 4.50%, 3/1/40 | 587,842 | ||||
2,311,031 | Pool #AD1942, 4.50%, 1/1/40(a) | 2,497,267 | ||||
791,764 | Pool #AD1943, 5.00%, 1/1/40(a) | 875,920 | ||||
2,737,394 | Pool #AD1988, 4.50%, 2/1/40(a) | 2,957,989 | ||||
422,296 | Pool #AD2896, 5.00%, 3/1/40 | 469,359 | ||||
1,443,060 | Pool #AD4456, 4.50%, 4/1/40(a) | 1,559,350 | ||||
331,760 | Pool #AD4457, 4.50%, 4/1/40 | 358,495 | ||||
1,167,899 | Pool #AD4458, 4.50%, 4/1/40 | 1,262,380 | ||||
625,030 | Pool #AD4940, 4.50%, 6/1/40 | 680,184 | ||||
573,413 | Pool #AD4946, 4.50%, 6/1/40 | 624,012 | ||||
638,783 | Pool #AD5728, 5.00%, 4/1/40 | 709,972 | ||||
16 |
SCHEDULE OF PORTFOLIO INVESTMENTS |
Access Capital Community Investment Fund (cont.)
September 30, 2014
��
Principal Amount | Value | |||||
$ 908,715 | Pool #AD7239, 4.50%, 7/1/40 | $ | 989,328 | |||
623,375 | Pool #AD7242, 4.50%, 7/1/40 | 673,611 | ||||
554,681 | Pool #AD7256, 4.50%, 7/1/40 | 604,321 | ||||
1,228,125 | Pool #AD7271, 4.50%, 7/1/40 | 1,327,095 | ||||
699,650 | Pool #AD7272, 4.50%, 7/1/40 | 761,388 | ||||
961,218 | Pool #AD8960, 5.00%, 6/1/40 | 1,066,239 | ||||
1,003,507 | Pool #AD9613, 4.50%, 8/1/40 | 1,084,689 | ||||
1,727,198 | Pool #AD9614, 4.50%, 8/1/40(a) | 1,866,925 | ||||
499,856 | Pool #AE2011, 4.00%, 9/1/40 | 527,173 | ||||
2,067,625 | Pool #AE2012, 4.00%, 9/1/40(a) | 2,183,202 | ||||
1,286,208 | Pool #AE2023, 4.00%, 9/1/40(a) | 1,358,105 | ||||
1,370,167 | Pool #AE5432, 4.00%, 10/1/40(a) | 1,446,757 | ||||
566,827 | Pool #AE5435, 4.50%, 9/1/40 | 612,682 | ||||
454,500 | Pool #AE5806, 4.50%, 9/1/40 | 494,820 | ||||
1,199,244 | Pool #AE5861, 4.00%, 10/1/40 | 1,266,280 | ||||
580,877 | Pool #AE5862, 4.00%, 10/1/40 | 612,621 | ||||
1,001,836 | Pool #AE5863, 4.00%, 10/1/40 | 1,056,585 | ||||
899,154 | Pool #AE6850, 4.00%, 10/1/40 | 949,415 | ||||
674,007 | Pool #AE6851, 4.00%, 10/1/40 | 711,683 | ||||
651,308 | Pool #AE7699, 4.00%, 11/1/40 | 687,715 | ||||
932,609 | Pool #AE7703, 4.00%, 10/1/40 | 984,741 | ||||
1,798,318 | Pool #AE7707, 4.00%, 11/1/40(a) | 1,898,841 | ||||
772,563 | Pool #AH0300, 4.00%, 11/1/40 | 815,748 | ||||
1,240,832 | Pool #AH0301, 3.50%, 11/1/40 | 1,273,258 | ||||
562,905 | Pool #AH0302, 4.00%, 11/1/40 | 594,370 | ||||
775,623 | Pool #AH0306, 4.00%, 12/1/40(a) | 820,676 | ||||
1,064,423 | Pool #AH0508, 4.00%, 11/1/40 | 1,123,923 | ||||
1,631,195 | Pool #AH0537, 4.00%, 12/1/40 | 1,723,396 | ||||
1,211,966 | Pool #AH0914, 4.50%, 11/1/40(a) | 1,310,012 | ||||
1,277,571 | Pool #AH0917, 4.00%, 12/1/40(a) | 1,348,985 | ||||
1,131,709 | Pool #AH1077, 4.00%, 1/1/41 | 1,200,097 | ||||
1,414,778 | Pool #AH2973, 4.00%, 12/1/40 | 1,493,641 | ||||
1,237,013 | Pool #AH2980, 4.00%, 1/1/41 | 1,305,967 | ||||
1,297,305 | Pool #AH5656, 4.00%, 1/1/41(a) | 1,370,634 | ||||
865,668 | Pool #AH5657, 4.00%, 2/1/41(a) | 913,922 | ||||
1,414,827 | Pool #AH5658, 4.00%, 2/1/41 | 1,493,693 | ||||
905,686 | Pool #AH5662, 4.00%, 2/1/41(a) | 956,171 | ||||
1,255,659 | Pool #AH5882, 4.00%, 2/1/26 | 1,336,983 | ||||
1,203,922 | Pool #AH6764, 4.00%, 3/1/41(a) | 1,271,031 | ||||
2,715,877 | Pool #AH6768, 4.00%, 3/1/41(a) | 2,867,265 | ||||
735,413 | Pool #AH7277, 4.00%, 3/1/41 | 775,602 | ||||
1,593,623 | Pool #AH7281, 4.00%, 3/1/41(a) | 1,680,712 | ||||
660,764 | Pool #AH7526, 4.50%, 3/1/41 | 717,419 | ||||
1,898,059 | Pool #AH7537, 4.00%, 3/1/41(a) | 2,001,785 | ||||
1,024,928 | Pool #AH8878, 4.50%, 4/1/41 | 1,107,843 | ||||
923,783 | Pool #AH8885, 4.50%, 4/1/41 | 998,516 | ||||
1,054,303 | Pool #AH9050, 3.50%, 2/1/26 | 1,110,683 | ||||
612,492 | Pool #AI0114, 4.00%, 3/1/41 | 645,964 | ||||
| 17 |
SCHEDULE OF PORTFOLIO INVESTMENTS |
Access Capital Community Investment Fund (cont.)
September 30, 2014
Principal Amount | Value | |||||
$ 1,442,295 | Pool #AI1846, 4.50%, 5/1/41(a) | $ | 1,558,974 | |||
1,032,383 | Pool #AI1847, 4.50%, 5/1/41(a) | 1,115,901 | ||||
1,976,573 | Pool #AI1848, 4.50%, 5/1/41(a) | 2,136,475 | ||||
1,243,087 | Pool #AI1849, 4.50%, 5/1/41(a) | 1,352,974 | ||||
678,212 | Pool #AJ0651, 4.00%, 8/1/41 | 715,911 | ||||
877,921 | Pool #AJ7668, 4.00%, 11/1/41 | 926,721 | ||||
1,168,203 | Pool #AJ9133, 4.00%, 1/1/42(a) | 1,233,139 | ||||
12,718,700 | Pool #AK2386, 3.50%, 2/1/42(a) | 13,035,177 | ||||
5,363,386 | Pool #AK6715, 3.50%, 3/1/42(a) | 5,496,842 | ||||
1,913,341 | Pool #AK6716, 3.50%, 3/1/42(a) | 1,960,950 | ||||
748,034 | Pool #AK6718, 3.50%, 2/1/42 | 766,648 | ||||
484,452 | Pool #AM0635, 2.55%, 10/1/22 | 475,174 | ||||
3,634,042 | Pool #AM2935, 3.69%, 9/1/23 | 3,858,648 | ||||
5,068,028 | Pool #AM4392, 3.79%, 10/1/23 | 5,414,549 | ||||
513,704 | Pool #AM4590, 3.18%, 10/1/20 | 534,382 | ||||
2,412,144 | Pool #AM5335, 3.69%, 2/1/24 | 2,557,791 | ||||
1,984,303 | Pool #AM5486, 3.70%, 2/1/24 | 2,105,768 | ||||
1,206,058 | Pool #AO2923, 3.50%, 5/1/42 | 1,235,314 | ||||
3,519,614 | Pool #AO8029, 3.50%, 7/1/42(a) | 3,604,992 | ||||
989,855 | Pool #AP7483, 3.50%, 9/1/42 | 1,012,939 | ||||
1,197,262 | Pool #AQ6710, 2.50%, 10/1/27 | 1,208,440 | ||||
2,585,823 | Pool #AQ7193, 3.50%, 7/1/43 | 2,645,317 | ||||
2,876,646 | Pool #AR3088, 3.00%, 1/1/43 | 2,842,823 | ||||
1,056,957 | Pool #AR6712, 3.00%, 1/1/43 | 1,044,860 | ||||
1,269,070 | Pool #AR6928, 3.00%, 3/1/43 | 1,253,356 | ||||
982,450 | Pool #AR6933, 3.00%, 3/1/43 | 970,284 | ||||
1,132,305 | Pool #AS1916, 4.00%, 3/1/44(a) | 1,194,361 | ||||
1,014,830 | Pool #AS1917, 4.00%, 3/1/44 | 1,070,447 | ||||
1,417,099 | Pool #AS2129, 4.00%, 3/1/44 | 1,494,984 | ||||
1,939,555 | Pool #AS2439, 4.00%, 5/1/44(a) | 2,046,155 | ||||
4,779,179 | Pool #AS2784, 4.00%, 7/1/44 | 5,041,847 | ||||
2,897,741 | Pool #AS3244, 4.00%, 9/1/44 | 3,057,003 | ||||
2,991,055 | Pool #AS3494, 4.00%, 10/1/44 | 3,155,446 | ||||
1,894,330 | Pool #AT0536, 4.00%, 10/1/43(a) | 1,997,852 | ||||
2,028,788 | Pool #AT0542, 4.50%, 12/1/43(a) | 2,190,378 | ||||
1,550,056 | Pool #AT2688, 3.00%, 5/1/43 | 1,530,861 | ||||
2,023,088 | Pool #AT2689, 3.00%, 5/1/43 | 1,998,037 | ||||
1,190,294 | Pool #AT2690, 3.00%, 4/1/43 | 1,175,555 | ||||
892,469 | Pool #AT2691, 3.00%, 5/1/43 | 881,417 | ||||
1,282,845 | Pool #AT3963, 2.50%, 3/1/28 | 1,293,017 | ||||
1,031,962 | Pool #AT7873, 2.50%, 6/1/28 | 1,041,113 | ||||
869,519 | Pool #AT8051, 3.00%, 6/1/43 | 858,481 | ||||
1,527,640 | Pool #AU0971, 3.50%, 8/1/43(a) | 1,562,787 | ||||
1,360,405 | Pool #AU2165, 3.50%, 7/1/43(a) | 1,391,705 | ||||
1,233,105 | Pool #AU2188, 3.50%, 8/1/43 | 1,261,476 | ||||
1,057,855 | Pool #AU3700, 3.50%, 8/1/43 | 1,083,186 | ||||
1,001,368 | Pool #AU4653, 3.50%, 9/1/43 | 1,024,877 | ||||
1,832,470 | Pool #AU6054, 4.00%, 9/1/43 | 1,932,612 | ||||
18 |
SCHEDULE OF PORTFOLIO INVESTMENTS |
Access Capital Community Investment Fund (cont.)
September 30, 2014
Principal Amount | Value | |||||
$1,203,350 | Pool #AU6718, 4.00%, 10/1/43 | $ | 1,270,615 | |||
1,622,755 | Pool #AU7003, 4.00%, 11/1/43(a) | 1,717,522 | ||||
1,193,730 | Pool #AU7005, 4.00%, 11/1/43 | 1,261,577 | ||||
1,605,688 | Pool #AV0679, 4.00%, 12/1/43(a) | 1,699,458 | ||||
1,114,267 | Pool #AV9282, 4.00%, 2/1/44 | 1,175,334 | ||||
1,652,908 | Pool #AW0993, 4.00%, 5/1/44(a) | 1,749,435 | ||||
965,259 | Pool #AW1565, 4.00%, 4/1/44 | 1,018,311 | ||||
1,462,272 | Pool #AW3671, 4.00%, 4/1/44(a) | 1,542,640 | ||||
1,358,676 | Pool #AW5046, 4.00%, 7/1/44 | 1,433,350 | ||||
1,435,263 | Pool #AW5047, 4.00%, 7/1/44 | 1,514,146 | ||||
1,171,316 | Pool #AW7040, 4.00%, 6/1/44 | 1,235,692 | ||||
2,224,079 | Pool #AW8629, 3.50%, 5/1/44 | 2,275,250 | ||||
250,105 | Pool #MC0007, 5.50%, 12/1/38 | 276,688 | ||||
59,197 | Pool #MC0013, 5.50%, 12/1/38 | 66,608 | ||||
97,221 | Pool #MC0014, 5.50%, 12/1/38 | 109,210 | ||||
79,292 | Pool #MC0016, 5.50%, 11/1/38 | 88,971 | ||||
253,397 | Pool #MC0038, 4.50%, 3/1/39 | 277,618 | ||||
117,434 | Pool #MC0046, 4.00%, 4/1/39 | 124,182 | ||||
27,238 | Pool #MC0047, 4.50%, 4/1/39 | 29,748 | ||||
54,397 | Pool #MC0059, 4.00%, 4/1/39 | 57,846 | ||||
206,017 | Pool #MC0081, 4.00%, 5/1/39 | 217,984 | ||||
218,695 | Pool #MC0082, 4.50%, 5/1/39 | 237,857 | ||||
117,771 | Pool #MC0112, 4.50%, 6/1/39 | 129,507 | ||||
214,677 | �� | Pool #MC0127, 4.50%, 7/1/39 | 233,721 | |||
71,156 | Pool #MC0135, 4.50%, 6/1/39 | 78,069 | ||||
386,421 | Pool #MC0137, 4.50%, 7/1/39 | 417,562 | ||||
970,526 | Pool #MC0154, 4.50%, 8/1/39(a) | 1,048,737 | ||||
100,047 | Pool #MC0155, 5.00%, 8/1/39 | 111,322 | ||||
500,430 | Pool #MC0160, 4.50%, 8/1/39 | 540,993 | ||||
592,803 | Pool #MC0171, 4.50%, 9/1/39 | 640,575 | ||||
347,579 | Pool #MC0177, 4.50%, 9/1/39 | 378,032 | ||||
135,378 | Pool #MC0270, 4.50%, 3/1/40 | 146,288 | ||||
785,089 | Pool #MC0325, 4.50%, 7/1/40 | 854,489 | ||||
73,650 | Pool #MC0422, 4.00%, 2/1/41 | 78,170 | ||||
101,258 | Pool #MC0426, 4.50%, 1/1/41 | 109,449 | ||||
945,267 | Pool #MC0584, 4.00%, 1/1/42 | 997,811 | ||||
499,132 | Pool #MC0585, 4.00%, 1/1/42 | 526,877 | ||||
70,848 | Pool #MC3344, 5.00%, 12/1/38 | 78,788 | ||||
|
| |||||
| 331,149,733 | ||||||
|
| |||||
Freddie Mac — 9.55% | ||||||
94,300 | Pool #A10124, 5.00%, 6/1/33 | 104,477 | ||||
237,503 | Pool #A10548, 5.00%, 6/1/33 | 263,136 | ||||
518,436 | Pool #A12237, 5.00%, 8/1/33 | 574,391 | ||||
381,950 | Pool #A12969, 4.50%, 8/1/33 | 414,789 | ||||
79,908 | Pool #A12985, 5.00%, 8/1/33 | 88,533 | ||||
107,274 | Pool #A12986, 5.00%, 8/1/33 | 118,852 | ||||
45,207 | Pool #A14028, 4.50%, 9/1/33 | 49,433 | ||||
| 19 |
SCHEDULE OF PORTFOLIO INVESTMENTS |
Access Capital Community Investment Fund (cont.)
September 30, 2014
Principal Amount | Value | |||||
$373,231 | Pool #A14325, 5.00%, 9/1/33 | $ | 413,514 | |||
90,773 | Pool #A15268, 6.00%, 10/1/33 | 102,677 | ||||
300,987 | Pool #A15579, 5.50%, 11/1/33 | 337,176 | ||||
432,045 | Pool #A17393, 5.50%, 12/1/33 | 483,992 | ||||
244,995 | Pool #A17397, 5.50%, 1/1/34 | 275,064 | ||||
269,271 | Pool #A18617, 5.50%, 1/1/34 | 301,899 | ||||
289,320 | Pool #A19019, 5.50%, 2/1/34 | 325,824 | ||||
236,100 | Pool #A20069, 5.00%, 3/1/34 | 261,582 | ||||
698,654 | Pool #A20070, 5.50%, 3/1/34 | 782,656 | ||||
661,471 | Pool #A20540, 5.50%, 4/1/34 | 741,002 | ||||
133,684 | Pool #A20541, 5.50%, 4/1/34 | 149,758 | ||||
131,900 | Pool #A21679, 5.50%, 4/1/34 | 147,759 | ||||
145,888 | Pool #A21681, 5.00%, 4/1/34 | 161,634 | ||||
186,413 | Pool #A23192, 5.00%, 5/1/34 | 206,533 | ||||
782,402 | Pool #A25310, 5.00%, 6/1/34 | 866,847 | ||||
301,940 | Pool #A25311, 5.00%, 6/1/34 | 334,529 | ||||
47,250 | Pool #A26386, 6.00%, 9/1/34 | 53,244 | ||||
310,148 | Pool #A26395, 6.00%, 9/1/34 | 349,845 | ||||
92,473 | Pool #A26396, 5.50%, 9/1/34 | 104,299 | ||||
340,152 | Pool #A28241, 5.50%, 10/1/34 | 380,624 | ||||
38,015 | Pool #A30055, 5.00%, 11/1/34 | 42,237 | ||||
202,571 | Pool #A30591, 6.00%, 12/1/34 | 228,375 | ||||
357,588 | Pool #A31135, 5.50%, 12/1/34 | 400,135 | ||||
267,738 | Pool #A32976, 5.50%, 8/1/35 | 299,260 | ||||
343,240 | Pool #A33167, 5.00%, 1/1/35 | 379,857 | ||||
531,089 | Pool #A34999, 5.50%, 4/1/35 | 593,949 | ||||
261,969 | Pool #A35628, 5.50%, 6/1/35 | 292,975 | ||||
462,294 | Pool #A37185, 5.00%, 9/1/35 | 511,033 | ||||
375,759 | Pool #A38830, 5.00%, 5/1/35 | 415,610 | ||||
116,685 | Pool #A39561, 5.50%, 11/1/35 | 130,533 | ||||
397,683 | Pool #A40538, 5.00%, 12/1/35 | 439,611 | ||||
296,275 | Pool #A42095, 5.50%, 1/1/36 | 330,971 | ||||
385,617 | Pool #A42097, 5.00%, 1/1/36 | 426,272 | ||||
269,396 | Pool #A42098, 5.50%, 1/1/36 | 300,945 | ||||
109,866 | Pool #A42099, 6.00%, 1/1/36 | 123,861 | ||||
59,936 | Pool #A42802, 5.00%, 2/1/36 | 66,302 | ||||
362,350 | Pool #A42803, 5.50%, 2/1/36 | 404,784 | ||||
262,733 | Pool #A42804, 6.00%, 2/1/36 | 296,200 | ||||
113,810 | Pool #A42805, 6.00%, 2/1/36 | 128,308 | ||||
87,487 | Pool #A44638, 6.00%, 4/1/36 | 98,631 | ||||
258,760 | Pool #A44639, 5.50%, 3/1/36 | 289,063 | ||||
473,693 | Pool #A45396, 5.00%, 6/1/35 | 523,931 | ||||
222,706 | Pool #A46321, 5.50%, 7/1/35 | 249,727 | ||||
90,906 | Pool #A46735, 5.00%, 8/1/35 | 100,490 | ||||
328,453 | Pool #A46746, 5.50%, 8/1/35 | 367,123 | ||||
198,250 | Pool #A46748, 5.50%, 8/1/35 | 221,653 | ||||
99,514 | Pool #A46996, 5.50%, 9/1/35 | 111,261 | ||||
503,329 | Pool #A46997, 5.50%, 9/1/35 | 562,588 | ||||
20 |
SCHEDULE OF PORTFOLIO INVESTMENTS |
Access Capital Community Investment Fund (cont.)
September 30, 2014
Principal Amount | Value | |||||
$517,211 | Pool #A47552, 5.00%, 11/1/35 | $ | 571,740 | |||
354,463 | Pool #A47553, 5.00%, 11/1/35 | 391,834 | ||||
196,110 | Pool #A47554, 5.50%, 11/1/35 | 219,260 | ||||
112,421 | Pool #A48788, 5.50%, 5/1/36 | 125,587 | ||||
272,119 | Pool #A48789, 6.00%, 5/1/36 | 306,782 | ||||
90,036 | Pool #A49013, 6.00%, 5/1/36 | 101,505 | ||||
173,343 | Pool #A49526, 6.00%, 5/1/36 | 195,424 | ||||
174,805 | Pool #A49843, 6.00%, 6/1/36 | 197,072 | ||||
482,531 | Pool #A49844, 6.00%, 6/1/36 | 543,998 | ||||
29,465 | Pool #A49845, 6.50%, 6/1/36 | 32,421 | ||||
157,180 | Pool #A50128, 6.00%, 6/1/36 | 177,202 | ||||
302,866 | Pool #A59530, 5.50%, 4/1/37 | 337,577 | ||||
213,593 | Pool #A59964, 5.50%, 4/1/37 | 238,373 | ||||
89,184 | Pool #A61754, 5.50%, 5/1/37 | 99,684 | ||||
94,788 | Pool #A61779, 5.50%, 5/1/37 | 105,948 | ||||
104,165 | Pool #A61915, 5.50%, 6/1/37 | 116,250 | ||||
158,033 | Pool #A61916, 6.00%, 6/1/37 | 178,163 | ||||
237,799 | Pool #A63456, 5.50%, 6/1/37 | 265,053 | ||||
564,544 | Pool #A64012, 5.50%, 7/1/37 | 629,246 | ||||
213,499 | Pool #A64015, 6.00%, 7/1/37 | 240,695 | ||||
91,384 | Pool #A65713, 6.00%, 9/1/37 | 103,024 | ||||
517,376 | Pool #A66061, 5.50%, 8/1/37 | 576,672 | ||||
378,090 | Pool #A66122, 6.00%, 8/1/37 | 426,252 | ||||
216,981 | Pool #A66133, 6.00%, 6/1/37 | 244,620 | ||||
167,330 | Pool #A66156, 6.50%, 9/1/37 | 188,303 | ||||
222,772 | Pool #A68766, 6.00%, 10/1/37 | 251,150 | ||||
139,141 | Pool #A70292, 5.50%, 7/1/37 | 155,088 | ||||
111,291 | Pool #A73816, 6.00%, 3/1/38 | 125,468 | ||||
121,734 | Pool #A75113, 5.00%, 3/1/38 | 134,359 | ||||
180,113 | Pool #A76187, 5.00%, 4/1/38 | 199,215 | ||||
454,632 | Pool #A78354, 5.50%, 11/1/37 | 507,589 | ||||
113,021 | Pool #A79561, 5.50%, 7/1/38 | 126,539 | ||||
831,269 | Pool #A91887, 5.00%, 4/1/40 | 922,806 | ||||
317,843 | Pool #A92388, 4.50%, 5/1/40 | 346,213 | ||||
575,576 | Pool #A93962, 4.50%, 9/1/40 | 627,041 | ||||
892,780 | Pool #A95573, 4.00%, 12/1/40 | 942,824 | ||||
689,942 | Pool #A96339, 4.00%, 12/1/40 | 728,724 | ||||
821,649 | Pool #A97099, 4.00%, 1/1/41 | 868,733 | ||||
884,358 | Pool #A97715, 4.00%, 3/1/41 | 935,036 | ||||
564,716 | Pool #A97716, 4.50%, 3/1/41 | 613,268 | ||||
42,122 | Pool #B31140, 6.50%, 10/1/31 | 46,977 | ||||
72,887 | Pool #B31188, 6.00%, 1/1/32 | 79,883 | ||||
25,770 | Pool #B31206, 6.00%, 3/1/32 | 28,323 | ||||
23,661 | Pool #B31292, 6.00%, 9/1/32 | 26,001 | ||||
74,700 | Pool #B31493, 5.00%, 2/1/34 | 80,631 | ||||
44,586 | Pool #B31516, 5.00%, 4/1/34 | 48,123 | ||||
61,665 | Pool #B31532, 5.00%, 5/1/34 | 66,554 | ||||
92,430 | Pool #B31546, 5.50%, 5/1/34 | 101,004 | ||||
| 21 |
SCHEDULE OF PORTFOLIO INVESTMENTS |
Access Capital Community Investment Fund (cont.)
September 30, 2014
Principal Amount | Value | |||||
$ 171,592 | Pool #B31547, 5.50%, 5/1/34 | $ | 187,505 | |||
93,821 | Pool #B31551, 5.50%, 6/1/34 | 102,511 | ||||
65,643 | Pool #B31587, 5.00%, 11/1/34 | 70,879 | ||||
125,119 | Pool #B31588, 5.50%, 11/1/34 | 136,743 | ||||
90,469 | Pool #B31642, 5.50%, 5/1/35 | 98,126 | ||||
29,343 | Pool #B50443, 5.00%, 11/1/18 | 30,946 | ||||
65,546 | Pool #B50450, 4.50%, 1/1/19 | 69,270 | ||||
51,958 | Pool #B50451, 5.00%, 1/1/19 | 54,848 | ||||
9,128 | Pool #B50470, 4.50%, 4/1/19 | 9,646 | ||||
109,391 | Pool #B50496, 5.50%, 9/1/19 | 117,405 | ||||
128,048 | Pool #B50499, 5.00%, 11/1/19 | 135,935 | ||||
35,902 | Pool #B50500, 5.50%, 10/1/19 | 38,558 | ||||
28,456 | Pool #B50501, 4.50%, 11/1/19 | 29,928 | ||||
46,759 | Pool #B50504, 5.50%, 11/1/19 | 50,252 | ||||
194,836 | Pool #B50506, 5.00%, 11/1/19 | 208,117 | ||||
43,424 | Pool #C37233, 7.50%, 2/1/30 | 51,171 | ||||
80,163 | Pool #C48137, 7.00%, 1/1/31 | 93,136 | ||||
201,017 | Pool #C51686, 6.50%, 5/1/31 | 232,251 | ||||
173,363 | Pool #C53210, 6.50%, 6/1/31 | 200,532 | ||||
58,837 | Pool #C53914, 6.50%, 6/1/31 | 68,095 | ||||
48,865 | Pool #C60020, 6.50%, 11/1/31 | 56,584 | ||||
59,954 | Pool #C60804, 6.00%, 11/1/31 | 68,061 | ||||
59,391 | Pool #C65616, 6.50%, 3/1/32 | 68,448 | ||||
56,216 | Pool #C68324, 6.50%, 6/1/32 | 64,952 | ||||
207,888 | Pool #C73273, 6.00%, 11/1/32 | 234,300 | ||||
183,744 | Pool #C73525, 6.00%, 11/1/32 | 208,105 | ||||
61,333 | Pool #C74672, 5.50%, 11/1/32 | 68,934 | ||||
384,165 | Pool #C77844, 5.50%, 3/1/33 | 429,932 | ||||
64,286 | Pool #C77845, 5.50%, 3/1/33 | 72,575 | ||||
370,301 | Pool #C78252, 5.50%, 3/1/33 | 413,690 | ||||
166,200 | Pool #J00980, 5.00%, 1/1/21 | 179,552 | ||||
41,522 | Pool #J05466, 5.50%, 6/1/22 | 44,554 | ||||
1,074,903 | Pool #J21142, 2.50%, 11/1/27 | 1,084,938 | ||||
938,190 | Pool #J23532, 2.50%, 5/1/28 | 946,949 | ||||
123,346 | Pool #N31468, 6.00%, 11/1/37 | 137,249 | ||||
333,714 | Pool #Q00462, 4.00%, 3/1/41 | 352,055 | ||||
938,567 | Pool #Q00465, 4.50%, 4/1/41 | 1,013,982 | ||||
913,658 | Pool #Q05867, 3.50%, 12/1/41 | 935,000 | ||||
1,006,298 | Pool #Q06239, 3.50%, 1/1/42 | 1,029,804 | ||||
993,178 | Pool #Q06406, 4.00%, 2/1/42 | 1,047,144 | ||||
1,596,421 | Pool #Q13349, 3.00%, 11/1/42 | 1,579,521 | ||||
1,393,525 | Pool #Q17662, 3.00%, 4/1/43 | 1,377,902 | ||||
1,628,032 | Pool #Q18754, 3.00%, 6/1/43 | 1,609,780 | ||||
1,292,461 | Pool #Q18772, 3.00%, 6/1/43 | 1,277,971 | ||||
|
| |||||
| 47,591,824 | ||||||
|
| |||||
Ginnie Mae — 28.48% | ||||||
355,552 | Pool #409117, 5.50%, 6/20/38 | 394,162 | ||||
22 |
SCHEDULE OF PORTFOLIO INVESTMENTS |
Access Capital Community Investment Fund (cont.)
September 30, 2014
Principal Amount | Value | |||||
$ 242,395 | Pool #487643, 5.00%, 2/15/39 | $ | 268,746 | |||
436,548 | Pool #588448, 6.25%, 9/15/32 | 435,803 | ||||
663,736 | Pool #616936, 5.50%, 1/15/36 | 745,303 | ||||
463,634 | Pool #617904, 5.75%, 9/15/23 | 460,890 | ||||
2,808,588 | Pool #618363, 4.00%, 9/20/41 | 2,983,686 | ||||
520,396 | Pool #624106, 5.13%, 3/15/34 | 517,757 | ||||
1,132,902 | Pool #654705, 4.00%, 9/20/41 | 1,203,532 | ||||
432,406 | Pool #664269, 5.85%, 6/15/38 | 447,481 | ||||
336,539 | Pool #675509, 5.50%, 6/15/38 | 376,950 | ||||
438,779 | Pool #697672, 5.50%, 12/15/38 | 491,193 | ||||
298,664 | Pool #697814, 5.00%, 2/15/39 | 329,172 | ||||
537,771 | Pool #697885, 4.50%, 3/15/39 | 583,881 | ||||
121,817 | Pool #698112, 4.50%, 5/15/39 | 132,948 | ||||
1,159,963 | Pool #698113, 4.50%, 5/15/39 | 1,265,945 | ||||
369,445 | Pool #699294, 5.63%, 9/20/38 | 410,946 | ||||
3,156,983 | Pool #713519, 6.00%, 7/15/39 | 3,546,201 | ||||
695,144 | Pool #714561, 4.50%, 6/15/39 | 758,658 | ||||
557,513 | Pool #716822, 4.50%, 4/15/39 | 607,058 | ||||
623,798 | Pool #716823, 4.50%, 4/15/39 | 680,792 | ||||
687,567 | Pool #717132, 4.50%, 5/15/39 | 752,966 | ||||
856,474 | Pool #717133, 4.50%, 5/15/39 | 929,910 | ||||
1,167,519 | Pool #720080, 4.50%, 6/15/39 | 1,280,577 | ||||
918,871 | Pool #720521, 5.00%, 8/15/39 | 1,024,290 | ||||
942,877 | Pool #724629, 5.00%, 7/20/40 | 1,040,885 | ||||
2,068,466 | Pool #726550, 5.00%, 9/15/39 | 2,305,774 | ||||
1,118,559 | Pool #729018, 4.50%, 2/15/40 | 1,219,186 | ||||
457,712 | Pool #729019, 5.00%, 2/15/40 | 510,223 | ||||
651,313 | Pool #729346, 4.50%, 7/15/41 | 712,043 | ||||
688,960 | Pool #738844, 3.50%, 10/15/41 | 713,208 | ||||
700,759 | Pool #738845, 3.50%, 10/15/41 | 725,203 | ||||
1,669,678 | Pool #738862, 4.00%, 10/15/41 | 1,774,098 | ||||
611,628 | Pool #747241, 5.00%, 9/20/40 | 671,764 | ||||
1,284,447 | Pool #748654, 3.50%, 9/15/40 | 1,329,252 | ||||
480,478 | Pool #748846, 4.50%, 9/20/40 | 525,391 | ||||
996,385 | Pool #757016, 3.50%, 11/15/40 | 1,031,142 | ||||
745,262 | Pool #757017, 4.00%, 12/15/40 | 796,237 | ||||
954,570 | Pool #759297, 4.00%, 1/20/41 | 1,014,380 | ||||
1,036,019 | Pool #759298, 4.00%, 2/20/41 | 1,100,932 | ||||
695,590 | Pool #762877, 4.00%, 4/15/41 | 739,091 | ||||
486,820 | Pool #763564, 4.50%, 5/15/41 | 532,212 | ||||
913,000 | Pool #770391, 4.50%, 6/15/41 | 998,131 | ||||
1,374,907 | Pool #770481, 4.00%, 8/15/41 | 1,460,893 | ||||
602,317 | Pool #770482, 4.50%, 8/15/41 | 654,337 | ||||
1,565,295 | Pool #770517, 4.00%, 8/15/41 | 1,663,187 | ||||
793,694 | Pool #770529, 4.00%, 8/15/41 | 843,331 | ||||
1,600,547 | Pool #770537, 4.00%, 8/15/41 | 1,700,643 | ||||
753,634 | Pool #770738, 4.50%, 6/20/41 | 818,429 | ||||
1,446,640 | Pool #779592, 4.00%, 11/20/41 | 1,536,829 | ||||
| 23 |
SCHEDULE OF PORTFOLIO INVESTMENTS |
Access Capital Community Investment Fund (cont.)
September 30, 2014
Principal Amount | Value | |||||
$ 782,501 | Pool #779593, 4.00%, 11/20/41 | $ | 831,285 | |||
3,412,915 | Pool #791406, 3.50%, 6/15/37 | 3,491,606 | ||||
1,068,687 | Pool #AA6312, 3.00%, 4/15/43 | 1,077,370 | ||||
1,431,929 | Pool #AA6424, 3.00%, 5/15/43 | 1,443,564 | ||||
2,375,681 | Pool #AB2733, 3.50%, 8/15/42 | 2,458,551 | ||||
2,688,858 | Pool #AB2745, 3.00%, 8/15/42 | 2,719,009 | ||||
2,680,561 | Pool #AB2841, 3.00%, 9/15/42 | 2,702,340 | ||||
1,237,440 | Pool #AB2843, 3.00%, 9/15/42 | 1,247,494 | ||||
899,176 | Pool #AB2852, 3.50%, 9/15/42 | 930,541 | ||||
5,793,936 | Pool #AC9541, 2.12%, 2/15/48 | 5,847,732 | ||||
1,102,578 | Pool #AE6946, 3.00%, 6/15/43 | 1,111,536 | ||||
1,617,409 | Pool #AE8253, 4.00%, 2/20/44 | 1,716,728 | ||||
1,469,381 | Pool #AG8915, 4.00%, 2/20/44 | 1,559,610 | ||||
700,000 | Series 2012-100, Class B, 2.31%, 11/16/51(b) | 633,020 | ||||
2,876,542 | Series 2012-107, Class A, 1.15%, 1/16/45 | 2,721,827 | ||||
1,600,000 | Series 2012-112, Class B, 2.70%, 1/16/53 | 1,462,025 | ||||
6,574,487 | Series 2012-114, Class A, 2.10%, 1/16/53(b) | 6,317,230 | ||||
2,161,492 | Series 2012-115, Class A, 2.13%, 4/16/45 | 2,096,348 | ||||
3,774,225 | Series 2012-120, Class A, 1.90%, 2/16/53 | 3,603,777 | ||||
1,828,187 | Series 2012-131, Class A, 1.90%, 2/16/53 | 1,744,050 | ||||
948,235 | Series 2012-144 Class AD, 1.77%, 1/16/53 | 895,061 | ||||
6,000,000 | Series 2012-33, Class B, 2.89%, 3/16/46 | 5,726,124 | ||||
3,000,000 | Series 2012-35, Class C, 3.25%, 11/16/52(b) | 2,839,728 | ||||
1,600,000 | Series 2012-45, Class C, 3.45%, 4/16/53(b) | 1,526,796 | ||||
2,404,344 | Series 2012-53, Class AC, 2.38%, 12/16/43 | 2,353,079 | ||||
8,000,000 | Series 2012-58, Class B, 2.20%, 3/16/44 | 7,435,966 | ||||
1,398,909 | Series 2012-70, Class A, 1.73%, 5/16/42 | 1,381,579 | ||||
3,707,029 | Series 2012-72, Class A, 1.71%, 5/16/42 | 3,641,075 | ||||
4,227,043 | Series 2012-78, Class A, 1.68%, 3/16/44 | 4,162,327 | ||||
1,644,510 | Series 2013-101, Class AG, 1.76%, 4/16/38 | 1,627,564 | ||||
1,286,579 | Series 2013-105, Class A, 1.71%, 2/16/37 | 1,272,608 | ||||
1,840,065 | Series 2013-107, Class A, 2.00%, 5/16/40 | 1,824,369 | ||||
1,517,661 | Series 2013-126, Class BK, 2.45%, 10/16/47 | 1,482,115 | ||||
984,287 | Series 2013-127, Class A, 2.00%, 3/16/52 | 982,550 | ||||
958,692 | Series 2013-17, Class A, 1.13%, 1/16/49 | 920,790 | ||||
961,555 | Series 2013-29, Class AB, 1.77%, 10/16/45 | 935,419 | ||||
945,907 | Series 2013-33, Class A, 1.06%, 7/16/38 | 914,473 | ||||
2,913,079 | Series 2013-63, Class AB, 1.38%, 3/16/45 | 2,814,448 | ||||
1,561,304 | Series 2013-97, Class AC, 2.00%, 6/16/45 | 1,517,821 | ||||
989,524 | Series 2014-47, Class AB, 2.25%, 2/16/54 | 995,535 | ||||
1,489,062 | Series 2014-54, Class AB, 2.62%, 10/16/43 | 1,501,160 | ||||
1,191,111 | Series 2014-77, Class AC, 2.35%, 10/16/40 | 1,201,097 | ||||
1,117,148 | Series 2014-82, Class AB, 2.40%, 5/16/45 | 1,119,677 | ||||
|
| |||||
| 141,832,652 | ||||||
|
| |||||
Total U.S. Government Agency Backed Mortgages | 520,574,209 | |||||
|
| |||||
(Cost $505,799,048) | ||||||
24 |
SCHEDULE OF PORTFOLIO INVESTMENTS |
Access Capital Community Investment Fund (cont.)
September 30, 2014
Principal Amount | Value | |||||
U.S. Government Agency Obligations — 7.34% |
| |||||
Small Business Administration — 7.10% |
| |||||
$ 2,414,022 | 0.38%, 12/25/37(b) | $ | 2,337,602 | |||
1,752,177 | 0.38%, 11/7/36(c) | 1,758,752 | ||||
284,354 | 0.38%, 3/5/37(c) | 285,431 | ||||
2,907,002 | 0.53%, 3/25/21(b) | 2,878,432 | ||||
258,713 | 0.53%, 4/30/35(c) | 259,698 | ||||
1,001,472 | 0.55%, 9/25/30(b) | 984,636 | ||||
207,003 | 0.55%, 4/25/28(b) | 203,852 | ||||
170,477 | 0.55%, 3/25/29(b) | 167,775 | ||||
349,809 | 0.60%, 11/25/29(b) | 344,983 | ||||
217,921 | 0.60%, 3/25/28(b) | 215,118 | ||||
979,137 | 0.63%, 4/15/32(c) | 982,619 | ||||
119,206 | 0.63%, 6/25/18(b) | 118,623 | ||||
185,495 | 0.70%, 7/15/20(c) | 186,097 | ||||
142,890 | 0.70%, 2/17/20(c) | 143,358 | ||||
552,761 | 0.75%, 11/29/32(c) | 556,945 | ||||
1,177,480 | 0.80%, 4/15/33(c) | 1,188,308 | ||||
224,100 | 0.80%, 3/15/33(c) | 226,168 | ||||
4,079,164 | 0.88%, 5/25/37(b) | 4,080,488 | ||||
1,202,410 | 0.88%, 8/1/32(c) | 1,217,121 | ||||
600,937 | 0.88%, 1/26/32(c) | 608,412 | ||||
115,983 | 0.91%, 4/16/20(c) | 116,587 | ||||
1,670,708 | 1.00%, 5/25/22(b) | 1,670,859 | ||||
51,272 | 1.13%, 7/30/17(b)(c) | 51,505 | ||||
916,451 | 1.14%, 11/4/34(c) | 936,187 | ||||
11,050,591 | 1.26%, 7/18/30*(c)(d) | 216,592 | ||||
10,610,073 | 1.45%, 3/25/36(b) | 10,927,579 | ||||
12,016 | 2.00%, 6/20/14(b)(c)(e) | 12,016 | ||||
128,228 | 3.13%, 10/25/15(b) | 128,985 | ||||
205,051 | 3.38%, 10/25/15(b) | 206,369 | ||||
81,248 | 3.38%, 5/25/16(b) | 82,195 | ||||
115,197 | 3.58%, 12/25/15(b) | 116,157 | ||||
128,820 | 3.61%, 4/4/20(c) | 137,354 | ||||
136,484 | 3.83%, 7/23/16(c) | 138,599 | ||||
109,097 | 3.83%, 4/2/17(c) | 111,698 | ||||
31,938 | 4.13%, 7/18/17(c) | 32,794 | ||||
27,603 | 4.33%, 10/1/16(c) | 28,047 | ||||
125,870 | 4.88%, 6/24/24(c) | 144,436 | ||||
64,815 | 5.13%, 2/28/24(c) | 72,877 | ||||
496,773 | 6.03%, 10/31/32(c) | 512,300 | ||||
894,777 | 6.45%, 2/19/32(c) | 931,981 | ||||
42,712 | 6.69%, 5/28/24(c) | 45,329 | ||||
7,107 | 7.38%, 1/1/15(c) | 7,185 | ||||
|
| |||||
| 35,372,049 | ||||||
|
| |||||
United States Department of Agriculture — 0.24% | ||||||
256,952 | 5.38%, 10/26/22(c) | 262,234 | ||||
| 25 |
SCHEDULE OF PORTFOLIO INVESTMENTS |
Access Capital Community Investment Fund (cont.)
September 30, 2014
Principal Amount | Value | |||||
$ 120,301 | 6.01%, 11/8/32(c) | $ | 123,970 | |||
152,418 | 6.05%, 1/5/26(c) | 157,661 | ||||
132,163 | 6.08%, 7/1/32(c) | 136,640 | ||||
254,266 | 6.22%, 1/20/37(c) | 261,827 | ||||
211,599 | 6.38%, 2/16/37(c) | 218,584 | ||||
|
| |||||
| 1,160,916 | ||||||
|
| |||||
Total U.S. Government Agency Obligations | 36,532,965 | |||||
|
| |||||
(Cost $37,402,987) | ||||||
Promissory Notes — 1.87% | ||||||
8,946,962 | Massachusetts Housing Investment Corp. Term Loan, 6.67%, 1/31/35(c)(d) | 9,336,066 | ||||
|
| |||||
Total Promissory Notes | 9,336,066 | |||||
|
| |||||
(Cost $8,946,962) | ||||||
| Shares | ||||||
Investment Company — 1.16% | ||||||
5,774,970 | JPMorgan Prime Money Market Fund, Institutional Class | 5,774,970 | ||||
|
| |||||
Total Investment Company | 5,774,970 | |||||
|
| |||||
(Cost $5,774,970) | ||||||
Total Investments | $ | 595,889,943 | ||||
(Cost $581,180,534)(f) — 119.64% | ||||||
Liabilities in excess of other assets — (19.64)% | (97,830,854 | ) | ||||
|
| |||||
NET ASSETS — 100.00% | $ | 498,059,089 | ||||
|
| |||||
26 |
SCHEDULE OF PORTFOLIO INVESTMENTS |
Access Capital Community Investment Fund (cont.)
September 30, 2014
| * | Interest Only security represents the right to receive the monthly interest payment on an underlying pool of mortgage loans. The principal amount shown represents the par value on the underlying pool. |
| (a) | This security is either fully or partially pledged as collateral for reverse repurchase agreements. |
| (b) | Floating rate note. Rate shown is as of report date. |
| (c) | The Pricing Committee has fair valued this security under procedures established by the Fund’s Board of Trustees. |
| (d) | This security is restricted and illiquid as the security may not be offered or sold within the United States or to U.S. persons except to qualified purchasers who are also either qualified institutional buyers or “accredited investors” (as defined in Rule 501 (a) of Regulation D under the Securities Act of 1933). The total investment in restricted and illiquid securities representing $9,552,658 or 1.92% of net assets are as follows: |
Acquisition Principal Amount | Issuer | Acquisition Date | Acquisition Cost | 9/30/2014 Carrying Value Per Unit | ||||||||||
$11,050,591 | Small Business Administration | 01/10/2008 | $ | 860,184 | $ | 1.96 | ||||||||
$8,946,962 | Massachusetts Housing Investment Corp. | 03/29/2005 | $ | 8,946,962 | $ | 104.35 | ||||||||
| (e) | Security has matured and the Fund is awaiting receipt of final payment. |
| (f) | See notes to financial statements for the tax cost of securities and the breakdown of unrealized appreciation (depreciation). |
Abbreviations used are defined below:
AGM – Insured by Assured Guaranty Municipal Corp.
AMBAC – Insured by American Municipal Bond Insurance Assurance Corp.
FHA – Insured by Federal Housing Administration
IBC – Insured by International Bancshares Corp.
NATL – RE – Insured by National Public Guarantee Corp.
OID – Original Issue Discount
Financial futures contracts as of September 30, 2014:
| Number of Contracts | Expiration Date | Unrealized Appreciation | Notional Value | Clearinghouse | ||||||||||
Short Position: | ||||||||||||||
Five Year | ||||||||||||||
USD Interest Rate | ||||||||||||||
Swap | 450 | December, 2014 | $ | 260,156 | $ | 45,646,875 | Barclays Capital | |||||||
Thirty Year | ||||||||||||||
U.S. Treasury Bonds | 45 | December, 2014 | 70,313 | 6,276,094 | Barclays Capital | |||||||||
|
| |||||||||||||
Total | $ | 330,469 | ||||||||||||
|
| |||||||||||||
Abbreviations used are defined below:
USD – U.S. Dollar
See notes to financial statements.
| 27 |
Statement of Assets and Liabilities
September 30, 2014
Assets: | ||||
Investments in securities, at value (cost $581,180,534) | $ | 595,889,943 | ||
Interest and dividends receivable | 2,107,519 | |||
Receivable for Fund shares sold | 543,587 | |||
Receivable for investments sold | 3,550,850 | |||
Cash pledged for financial futures contracts | 3,225,934 | |||
Unrealized gain on futures contracts | 330,469 | |||
Prepaid expenses and other assets | 27,922 | |||
|
| |||
Total Assets | 605,676,224 | |||
|
| |||
Liabilities: | ||||
Distributions payable | 673,462 | |||
Payable for capital shares redeemed | 43,173 | |||
Payable for investments purchased | 3,162,897 | |||
Reverse repurchase agreements (including interest of $30,044) | 103,407,533 | |||
Accrued expenses and other payables: | ||||
Investment advisory fees | 198,015 | |||
Accounting fees | 3,985 | |||
Distribution fees | 35,926 | |||
Trustee fees | 187 | |||
Audit fees | 46,900 | |||
Transfer agent fees | 8,777 | |||
Other | 36,280 | |||
|
| |||
Total Liabilities | 107,617,135 | |||
|
| |||
Net Assets | $ | 498,059,089 | ||
|
| |||
Net Assets Consist Of: | ||||
Capital | $ | 524,656,441 | ||
Distributions in excess of net investment income | (1,328,491 | ) | ||
Accumulated net realized losses from investment transactions, futures contracts and sale commitments | (40,308,739 | ) | ||
Net unrealized appreciation on investments, futures contracts, and sale commitments | 15,039,878 | |||
|
| |||
Net Assets | $ | 498,059,089 | ||
|
|
28 |
FINANCIAL STATEMENTS |
Statement of Assets and Liabilities (cont.)
Net Assets: | ||||
Class A | $ | 19,453,843 | ||
Class I | 478,605,246 | |||
|
| |||
Total | $ | 498,059,089 | ||
|
| |||
Shares Outstanding (1,000,000,000 shares authorized, 100,000,000 shares registered at $.0000001 par value): | ||||
Class A | 2,099,014 | |||
Class I | 51,674,218 | |||
|
| |||
Total | 53,773,232 | |||
|
| |||
Net Asset Values and Redemption Price Per Share: | ||||
Class A(a) | $ | 9.27 | ||
Class I | $ | 9.26 | ||
Maximum Offering Price Per Share: | ||||
Class A | $ | 9.63 | ||
Maximum Sales Charge - Class A | 3.75 | % |
| (a) | For Class A shares, redemption price per share will be reduced by 1.00% for sales of shares within 12 months of purchase (only applicable on purchases of $1 million or more on which no initial sales charge was paid). Such reduction is not reflected in the net asset value and the redemption price per share. |
See notes to financial statements.
| 29 |
FINANCIAL STATEMENTS |
For the Year Ended September 30, 2014
Investment Income: | ||||
Interest income | $ | 20,539,465 | ||
Dividend income | 1,393 | |||
|
| |||
Total Investment Income | 20,540,858 | |||
|
| |||
Expenses: | ||||
Management fees | 2,575,774 | |||
Interest expense | 318,617 | |||
Distribution fees - Class A | 41,379 | |||
Accounting services | 50,760 | |||
Audit fees | 50,818 | |||
Legal fees | 32,871 | |||
Custodian fees | 47,038 | |||
Insurance fees | 7,126 | |||
Trustees’ fees and expenses | 14,120 | |||
Transfer agent fees - Class A | 28,370 | |||
Transfer agent fees - Class I | 34,156 | |||
Shareholder reports | 32,285 | |||
Registration and filing fees | 51,885 | |||
Other fees and expenses | 111,356 | |||
|
| |||
Total expenses before fee waiver/reimbursement | 3,396,555 | |||
Expenses reduced/waived by: | ||||
Advisor | (7,767 | ) | ||
|
| |||
Net Expenses | 3,388,788 | |||
|
| |||
Net Investment Income | 17,152,070 | |||
|
| |||
Realized/Unrealized Gains (Losses) from Investment Transactions and Futures Contracts: | ||||
Net realized gains from investment transactions | 18,021 | |||
Net realized losses from futures contracts | (2,789,739 | ) | ||
|
| |||
| (2,771,718 | ) | |||
|
| |||
Net change in unrealized appreciation/depreciation on investments | 1,956,444 | |||
Net change in unrealized appreciation/depreciation on futures contracts | 1,647,383 | |||
|
| |||
| 3,603,827 | ||||
|
| |||
Net realized/unrealized losses from investments and futures contracts | 832,109 | |||
|
| |||
Change in net assets resulting from operations | $ | 17,984,179 | ||
|
| |||
See notes to financial statements.
30 |
FINANCIAL STATEMENTS |
Statements of Changes in Net Assets
| For the | For the | |||||||||||||||
| Year | Year | |||||||||||||||
| Ended | Ended | |||||||||||||||
| September 30, 2014 | September 30, 2013 | |||||||||||||||
From Investment Activities: | ||||||||||||||||
Operations: | ||||||||||||||||
Net investment income | $ | 17,152,070 | $ | 18,707,190 | ||||||||||||
Net realized gains (losses) from investments and futures contracts | (2,771,718 | ) | 5,787,525 | |||||||||||||
Net change in unrealized appreciation/depreciation on investments and futures contracts | 3,603,827 | (33,691,289 | ) | |||||||||||||
|
|
|
| |||||||||||||
Change in net assets resulting from operations | 17,984,179 | (9,196,574 | ) | |||||||||||||
|
|
|
| |||||||||||||
Distributions to Class A Shareholders: | ||||||||||||||||
From net investment income | (531,396 | ) | (485,090 | ) | ||||||||||||
Distributions to Class I Shareholders: | ||||||||||||||||
From net investment income | (17,874,571 | ) | (19,868,888 | ) | ||||||||||||
|
|
|
| |||||||||||||
Change in net assets resulting from shareholder distributions | (18,405,967 | ) | (20,353,978 | ) | ||||||||||||
|
|
|
| |||||||||||||
Capital Transactions: | ||||||||||||||||
Proceeds from shares issued | 21,597,165 | 71,578,353 | ||||||||||||||
Distributions reinvested | 8,846,237 | 8,721,670 | ||||||||||||||
Cost of shares redeemed | (51,802,053 | ) | (121,550,669 | ) | ||||||||||||
|
|
|
| |||||||||||||
Change in net assets resulting from capital transactions | (21,358,651 | ) | (41,250,646 | ) | ||||||||||||
|
|
|
| |||||||||||||
Net decrease in net assets | (21,780,439 | ) | (70,801,198 | ) | ||||||||||||
Net Assets: | ||||||||||||||||
Beginning of year | 519,839,528 | 590,640,726 | ||||||||||||||
|
|
|
| |||||||||||||
End of year | $ | 498,059,089 | $ | 519,839,528 | ||||||||||||
|
|
|
| |||||||||||||
Distributions in excess of net investment income | $ | (1,328,491 | ) | $ | (1,323,365 | ) | ||||||||||
|
|
|
| |||||||||||||
Share Transactions: | ||||||||||||||||
Issued | 2,333,320 | 7,455,082 | ||||||||||||||
Reinvested | 955,144 | 918,995 | ||||||||||||||
Redeemed | (5,584,129 | ) | (12,809,992 | ) | ||||||||||||
|
|
|
| |||||||||||||
Change in shares resulting from capital transactions | (2,295,665 | ) | (4,435,915 | ) | ||||||||||||
|
|
|
| |||||||||||||
See notes to financial statements.
| 31 |
FINANCIAL STATEMENTS |
For the Year Ended September 30, 2014
Cash Provided by Operating Activities: | ||||
Net increase in net assets resulting from operations | $ | 17,984,179 | ||
Adjustments to reconcile net increase in net assets resulting from operations to net cash provided by operating activities: | ||||
Purchases of long-term securities | (72,418,543 | ) | ||
Proceeds from sales and paydowns of long-term securities | 117,065,313 | |||
Purchases/proceeds from sales of short-term securities-net | (5,120,675 | ) | ||
Net change in unrealized (appreciation)/depreciation on investment securities | (1,956,444 | ) | ||
Net realized gains from investment transactions | (18,021 | ) | ||
Amortization of premium and discount - net | 895,509 | |||
Decrease in interest and dividends receivable | 202,647 | |||
Increase in interest due on reverse repurchase agreements | 10,337 | |||
Decrease in cash pledged for financial futures contracts | 4,289,692 | |||
Decrease in net change in unrealized (appreciation)/depreciation on futures contracts | (1,647,383 | ) | ||
Increase in prepaid expenses and other assets | (5,750 | ) | ||
Decrease in payable to investment advisor | (12,382 | ) | ||
Increase in accrued expenses and other liabilities | 29,279 | |||
|
| |||
Net Cash Provided by Operating Activities | 59,297,758 | |||
|
| |||
Cash Used in Financing Activities: | ||||
Cash receipts/payments from reverse repurchase agreements - net | (17,898,566 | ) | ||
Proceeds from issuance of shares | 21,075,936 | |||
Cash payments on shares redeemed | (52,794,133 | ) | ||
Distributions paid to shareholders | (9,680,995 | ) | ||
|
| |||
Net Cash Used in Financing Activities | (59,297,758 | ) | ||
|
| |||
Cash: | ||||
Net change in cash | — | |||
Cash at beginning of year | — | |||
|
| |||
Cash at end of year | $ | — | ||
|
| |||
Cash Flow Information: | ||||
Cash paid for interest | $ | 308,280 | ||
|
| |||
Noncash Financing Activities: | ||||
Capital shares issued in reinvestment of distributions to shareholders | $ | 8,846,237 | ||
|
|
See notes to financial statements.
32 |
|
This Page Intentionally Left Blank
| 33 |
Access Capital Community Investment Fund
| (Selected data for a share outstanding throughout the years indicated) | ||||||||||||||||||||||||
| Investment Activities | Distributions | |||||||||||||||||||||||
| Net Asset Value, | Net | Net Realized and | Total from | Net | ||||||||||||||||||||
| Beginning | Investment | Unrealized Gains (Losses) | Investment | Investment | Net Asset Value, | |||||||||||||||||||
| of Year | Income(a) | on Investments | Activities | Income | End of Year | |||||||||||||||||||
Class A | ||||||||||||||||||||||||
Year Ended September 30, 2014 | $9.28 | 0.27 | 0.02 | 0.29 | (0.30) | $9.27 | ||||||||||||||||||
Year Ended September 30, 2013 | 9.77 | 0.28 | (0.46) | (0.18) | (0.31) | 9.28 | ||||||||||||||||||
Year Ended September 30, 2012 | 9.75 | 0.37 | 0.05 | 0.42 | (0.40) | 9.77 | ||||||||||||||||||
Year Ended September 30, 2011 | 9.81 | 0.43 | (0.05) | 0.38 | (0.44) | 9.75 | ||||||||||||||||||
Year Ended September 30, 2010 | 9.80 | 0.46 | 0.02 | 0.48 | (0.47) | 9.81 | ||||||||||||||||||
Class I (b) | ||||||||||||||||||||||||
Year Ended September 30, 2014 | $9.27 | 0.31 | 0.01 | 0.32 | (0.33) | $9.26 | ||||||||||||||||||
Year Ended September 30, 2013 | 9.76 | 0.31 | (0.46) | (0.15) | (0.34) | 9.27 | ||||||||||||||||||
Year Ended September 30, 2012 | 9.74 | 0.40 | 0.04 | 0.44 | (0.42) | 9.76 | ||||||||||||||||||
Year Ended September 30, 2011 | 9.80 | 0.45 | (0.05) | 0.40 | (0.46) | 9.74 | ||||||||||||||||||
Year Ended September 30, 2010 | 9.79 | 0.49 | 0.02 | 0.51 | (0.50) | 9.80 | ||||||||||||||||||
| (a) | Per share net investment income has been calculated using the average daily shares method. |
| (b) | The existing share class was renamed Class I Shares with the commencement of Class A Shares on January 29, 2009. |
See notes to financial statements.
34 |
FINANCIAL HIGHLIGHTS |
Access Capital Community Investment Fund (cont.)
| (Selected data for a share outstanding throughout the years indicated) | ||||||||||||||||||||||||||||
| Supplemental | ||||||||||||||||||||||||||||
| Ratios to Average Net Assets(a) | Data | |||||||||||||||||||||||||||
| Total Expenses | ||||||||||||||||||||||||||||
| After Fees | ||||||||||||||||||||||||||||
| Waived/Reimbursed | Net | Net Assets, | Portfolio | |||||||||||||||||||||||||
| Total | Total | Net | and Excluding | Investment | End of | Turnover | ||||||||||||||||||||||
| Return(b)(c) | Expenses | Expenses | Interest Expense | Income | Period (000’s) | Rate | ||||||||||||||||||||||
Class A | ||||||||||||||||||||||||||||
Year Ended September 30, 2014 | 3.26% | 1.06% | 1.01% | 2.91% | 2.91% | $ 19,454 | 10% | |||||||||||||||||||||
Year Ended September 30, 2013 | (1.92%) | 0.99% | 0.99% | 2.99% | 2.99% | 14,869 | 23% | |||||||||||||||||||||
Year Ended September 30, 2012 | 4.35% | 1.03% | 1.03% | 3.80% | 3.80% | 14,458 | 20% | |||||||||||||||||||||
Year Ended September 30, 2011 | 3.98% | 1.03% | 1.03% | 4.40% | 4.40% | 8,212 | 17% | |||||||||||||||||||||
Year Ended September 30, 2010 | 5.02% | 1.04% | 1.04% | 4.67% | 4.67% | 12,141 | 9% | |||||||||||||||||||||
Class I | ||||||||||||||||||||||||||||
Year Ended September 30, 2014 | 3.76% | 0.65% | 0.65% | 3.34% | 3.34% | $ 478,605 | 10% | |||||||||||||||||||||
Year Ended September 30, 2013 | (1.69%) | 0.74% | 0.74% | 3.28% | 3.28% | 504,970 | 23% | |||||||||||||||||||||
Year Ended September 30, 2012 | 4.62% | 0.78% | 0.78% | 4.12% | 4.12% | 576,183 | 20% | |||||||||||||||||||||
Year Ended September 30, 2011 | 4.23% | 0.79% | 0.79% | 4.66% | 4.66% | 537,319 | 17% | |||||||||||||||||||||
Year Ended September 30, 2010 | 5.28% | 0.79% | 0.79% | 4.94% | 4.94% | 536,198 | 9% | |||||||||||||||||||||
| (a) | Please see following page for total expenses net of reimbursement, excluding interest expense and ratios to average net assets plus average borrowings. |
| (b) | Assumes investment at net asset value at the beginning of the year, reinvestment of all dividends and distributions, and a complete redemption of the investment at net asset value at the end of the year. |
| (c) | Total investment returns exclude the effect of sales charge. |
See notes to financial statements.
| 35 |
September 30, 2014
1. Organization:
RBC Funds Trust (the “Trust”) was organized as a Delaware statutory trust on December 16, 2003 and currently consists of 18 portfolios. Overall responsibility for the management of the Trust is vested in its Board of Trustees (the “Board”). This report includes the Access Capital Community Investment Fund (the “Fund”). At its inception in 1998, the Access Capital Strategies Community Investment Fund, Inc., the Fund’s predecessor, elected status as a business development company under the Investment Company Act of 1940 (the “1940 Act”), but withdrew its election on May 30, 2006, and registered as a continuously offered, closed-end interval management company under the 1940 Act. The predecessor fund was reorganized into a series of the Trust, a registered open-end management company under the 1940 Act, effective July 28, 2008.
The Fund offers two share classes: Class A and Class I shares. Class A shares are offered with a 3.75% maximum front-end sales charge and a 1.00% contingent deferred sales charge (“CDSC”) for redemption within 12 months of a $1 million or greater purchase on which no front-end sales charge was paid. Class I shares (intended for investors meeting certain investment minimum thresholds) are not subject to either a front-end sales charge or a CDSC.
RBC Global Asset Management (U.S.) Inc. (“RBC GAM (US)” or “Advisor” or “Co-Administrator”) acts as the investment advisor for the Fund. The officers of the Trust (“Fund Management”) are also employees of RBC GAM (US) or its affiliates.
The Fund’s investment objective is to invest in geographically specific debt securities located in portions of the United States designated by Fund investors. The Fund seeks to achieve its investment objective by investing primarily in high quality debt securities and other debt instruments supporting the affordable housing industry in areas of the United States designated by Fund shareholders. The Fund’s investments generally support community development, for example by supporting job creation or local business development.
2. Significant Accounting Policies:
Summarized below are the significant accounting policies of the Fund. The policies conform to accounting principles generally accepted in the United States of America (“US GAAP”). Fund Management follows these policies when preparing financial statements. Management may also be required to make estimates and assumptions that affect the reported amounts of assets and liabilities at the date of the financial statements and the reported amounts of income and expenses for the period. Actual results could differ from those estimates.
Security Valuation:
The Board has adopted pricing and valuation procedures for determining the fair value of the Fund’s investments. Fair value of a security is considered to be the price that a fund might reasonably expect to receive upon its current sale in an orderly transaction between market participants.
Fixed income securities, including to be announced (“TBA”) commitments and municipal bonds, are generally valued based on evaluated prices received from third-party pricing services or from broker-dealers who make markets in the securities and are generally categorized as Level 2 in the fair value hierarchy. The pricing services utilize both dealer-supplied valuations and electronic data processing techniques that take into account multiple appropriate factors such as institutional-size trading in similar groups of securities, market spreads, interest rates, and fundamental security analytical data including yield, quality, coupon rate, maturity and type of issue. Short-term debt obligations with less than 60 days to maturity at the time of purchase are valued at amortized cost unless Fund management determines that amortized cost no longer approximates fair market value.
Mortgage-related securities represent direct or indirect participation in, or are secured by and payable from, mortgage loans secured by real property and include pass-through securities and collateralized mortgage obligations. These securities may be issued or guaranteed by U.S. Government agencies or instrumentalities, or private issuers, including commercial banks, savings and loan institutions, private
36 |
NOTES TO FINANCIAL STATEMENTS |
mortgage insurance bankers and other secondary market issuers. These mortgage-related securities are generally valued by pricing services that use broker-dealer quotations or valuation estimates from their internal pricing models. These pricing models generally consider such factors as current market data, estimated cash flows, market-based yield spreads, and estimated prepayment rates. Securities valued using such techniques and inputs are generally categorized as Level 2 in the fair value hierarchy. To the extent significant inputs are unobservable, the securities will be categorized as Level 3.
Exchange-traded futures are valued at the last sale price at the close of the market on the principal exchange on which they are traded and are categorized as Level 1 in the fair value hierarchy. Investments in open-end investment companies (mutual funds) are valued at net asset value and are categorized as Level 1 in the fair value hierarchy.
The Board has delegated to the Fund’s Pricing Committee (“Pricing Committee”) the responsibility for implementing the pricing and valuation procedures, including responsibility for determining the fair value of the Fund’s securities or other assets and liabilities. The Pricing Committee includes representatives of the Fund’s Advisor and Co-Administrator, including personnel from accounting and operations, investment management, trading, risk management, compliance and legal. The Pricing Committee meets at least quarterly to review and approve Fund valuation matters, including a review of the Fund’s pricing activity and operations, fair value measurements, pricing vendors, policies and procedures, and related controls. At least a quorum of the Pricing Committee shall meet more frequently, as needed, to consider and approve time-sensitive fair valuation matters. The Pricing Committee reports to the Valuation, Portfolio Management and Performance Committee (“Valuation Committee”) of the Board. Members of the Pricing Committee meet with the Valuation Committee and the Board at each of their regularly scheduled meetings to discuss valuation matters and actions taken during the period.
The Board has adopted procedures to determine the fair value of a security when a price is not available from a pricing service or broker-dealer or Fund management determines that a price provided by a pricing service or broker-dealer does not approximate fair value. Fair valuation may also be used when a significant valuation event affecting the value of a security or market sector is determined to have occurred between the time when a security’s market closes and the time the Fund’s net asset value is calculated. The fair value of the security will be determined in good faith by the Pricing Committee in accordance with procedures and methodologies adopted by the Board. General factors used in determining the fair value of securities include, but are not limited to, fundamental analytical data relating to the security, the issuer and the market, such as duration, prepayment and default rates; general level of interest rates and changes in interest rates; information from broker-dealers; trading in similar securities; any restrictions on disposition of the security; and an evaluation of the forces that influence the market in which the investments are traded. These securities are either categorized as Level 2 or 3 in the fair value hierarchy, depending on the relevant inputs used.
When the Fund utilizes fair valuation methods that use significant unobservable inputs to determine a security’s value, such securities will be categorized as Level 3 of the fair value hierarchy. These methods may require subjective determinations about the value of a security. While the Fund’s policy is intended to result in a calculation of a Fund’s net asset value that fairly reflects security values as of the time of pricing, the Fund cannot guarantee that values determined by the Board or persons acting at their direction would accurately reflect the price that the Fund could obtain for a security if they were to dispose of it as of the time of pricing (for instance, in a forced or distressed sale). The prices used by the Fund may differ from the value that would be realized if the securities were sold.
The Fund’s Pricing Committee employs various methods for calibrating the valuation approach related to securities categorized within Level 2 and Level 3 of the fair value hierarchy. These methods may include regular due diligence of the Fund’s pricing vendors, a regular review of key inputs and assumptions, transaction back-testing or disposition analysis to compare unrealized gains and losses to realized gains and losses, reviews of missing and stale prices and large movements in market value, and reviews of any market related activities. Additionally, the pricing of all fair value holdings is subsequently reported to the Valuation Committee and Board.
| 37 |
NOTES TO FINANCIAL STATEMENTS |
Fair Value Measurements:
The Fund discloses the fair value of its investments in a hierarchy that categorizes investments based on the inputs to valuation techniques used to measure fair value. The three levels of the fair value hierarchy are as follows:
— Level 1 - Inputs that reflect unadjusted quoted prices in active markets for identical assets or liabilities that the Fund has the ability to access at the measurement date.
— Level 2 - Significant inputs other than quoted prices that are observable for the asset or liability either directly or indirectly, including inputs in markets that are not considered to be active. Observable inputs may include quoted prices for similar securities, interest rates, spreads, prepayment speeds, etc.
— Level 3 - Significant unobservable inputs based on the best information available in the circumstances, to the extent observable inputs are not available (including the Fund’s own assumptions in determining the fair value of investments).
The inputs or methodology used for valuing investments are not necessarily an indication of the risk associated with investing in those securities.
Inputs used in determining fair value of an investment may include, but are not limited to, price information, volatility statistics, credit and market data, and other factors, all of which may be either observable or unobservable. Inputs can vary among investments and will be impacted by the investment type and volume of activity for the particular security or similar securities in the market. Investments in the Level 3 category are generally supported by transactions and quoted prices from dealers participating in the market for those investments. Investments may be included in the Level 3 category due to a lack of market activity or transparency. Internal valuation models may also be used as a pricing source for Level 3 investments. Internal valuation models may rely on one or more unobservable inputs, such as estimated cash flows, financial statement analysis and discount rates.
The summary of inputs used to determine the fair valuation of the Fund’s investments as of September 30, 2014 is as follows:
| Level 2 | Level 3 | |||||||||||||||||||
| Significant | Significant | |||||||||||||||||||
| Level 1 | Observable | Unobservable | ||||||||||||||||||
Quoted Prices | Inputs | Inputs | Total | |||||||||||||||||
Assets: | ||||||||||||||||||||
Investments in Securities | ||||||||||||||||||||
Investment Company | $ | 5,774,970 | $ | — | $ | — | $ | 5,774,970 | ||||||||||||
Municipal Bonds | — | 23,671,733 | — | 23,671,733 | ||||||||||||||||
U.S. Government Agency Backed Mortgages | — | 520,574,209 | — | 520,574,209 | ||||||||||||||||
U.S. Government Agency Obligations | — | 36,316,373 | 216,592 | 36,532,965 | ||||||||||||||||
Promissory Notes | — | — | 9,336,066 | 9,336,066 | ||||||||||||||||
Other Financial Instruments(*) | ||||||||||||||||||||
Interest Rate Contracts | 330,469 | — | — | 330,469 | ||||||||||||||||
|
|
|
|
|
|
|
| |||||||||||||
Total Assets | $ | 6,105,439 | $ | 580,562,315 | $ | 9,552,658 | $ | 596,220,412 | ||||||||||||
|
|
|
|
|
|
|
| |||||||||||||
Liabilities: | ||||||||||||||||||||
Other Financial Instruments(**) | ||||||||||||||||||||
Interest Rate Contracts | $ | — | $ | 103,407,533 | $ | — | $ | 103,407,533 | ||||||||||||
|
|
|
|
|
|
|
| |||||||||||||
* Other financial instruments are futures contracts which are reflected in the Schedule of Portfolio Investments and are shown at the unrealized appreciation/(depreciation) on the contracts.
** Other financial instruments are reverse repurchase agreements which are reflected in the Notes to Financial Statements and shown in the Statements of Assets and Liabilities at their par value plus accrued interest.
38 |
NOTES TO FINANCIAL STATEMENTS |
During the year ended September 30, 2014, the Fund recognized no transfers to/from Level 1 or 2. The Fund’s policy is to recognize transfers to/from Level 1, Level 2 and Level 3 at the end of the year utilizing fair value at the beginning of the year.
Following is a reconciliation of Level 3 investments for which significant unobservable inputs were used to determine fair value:
| U.S. Government Obligations | ||||||||||||||||||||
| (Small Business Administration) | Promissory Notes | |||||||||||||||||||
Balance as of 9/30/13(value) | $ | — | $ | 9,761,031 | ||||||||||||||||
Transfer in | 253,044(a) | — | ||||||||||||||||||
Sales (Paydowns) | — | (186,293) | ||||||||||||||||||
Change in unrealized appreciation (depreciation)* | (36,452) | (238,672) | ||||||||||||||||||
|
|
|
| |||||||||||||||||
Balance as of 9/30/14 (value) | $ | 216,592 | $ | 9,336,066 | ||||||||||||||||
|
|
|
| |||||||||||||||||
* Net change in unrealized appreciation/(depreciation) in Level 3 securities still held at September 30, 2014.
(a) This security was transferred to Level 3 from Level 2 due to lack of a current market quotation and was valued at fair market value as determined in good faith by the Board or persons acting at their direction using unobservable inputs.
The Fund’s assets assigned to the Level 3 category were valued using the valuation methodology and technique deemed most appropriate in the circumstances. The significant unobservable inputs used include assumptions regarding the particular security’s cash flow profile, prepayments and potential defaults which may not be generally observable for either the security or for assets of a similar type. Inputs with respect to variable rate securities may also include assumptions regarding future interest rate changes. Significant changes in any of these assumptions may result in a lower or higher fair value measurement.
Financial Instruments:
Reverse Repurchase Agreements:
To obtain short-term financing, the Fund entered into reverse repurchase agreements with primary dealers that report to the Federal Reserve Bank of New York or the 100 largest U.S. commercial banks, who are deemed creditworthy under guidelines approved by the Board. Interest on the value of the reverse repurchase agreements is based upon competitive market rates at the time of issuance. At the time the Fund enters into a reverse repurchase agreement, it will establish and maintain a segregated account with the custodian containing qualifying assets having a value, including accrued interest, not less than the repurchase price. Based on requirements with certain exchanges and third party broker-dealers, the Fund may also be required to deliver or deposit securities or cash as collateral. For the year ended September 30, 2014, the average amount borrowed was approximately $115,542,091 and the daily weighted average interest rate was 0.28%.
| 39 |
NOTES TO FINANCIAL STATEMENTS |
Details of open reverse repurchase agreements at September 30, 2014 were as follows:
| Trade | Maturity | Net Closing | Par | |||||||||||||||||
Counterparty | Rate | Date | Date | Amount | Value | |||||||||||||||
BNP Paribas | 0.28% | 7/16/14 | 10/02/14 | $ | (5,010,038) | $ | (5,007,000) | |||||||||||||
BNP Paribas | 0.28% | 9/03/14 | 11/26/14 | (26,416,247) | (26,399,000) | |||||||||||||||
BNP Paribas | 0.29% | 9/16/14 | 12/02/14 | (16,009,924) | (16,000,000) | |||||||||||||||
BNP Paribas | 0.28% | 9/26/14 | 1/05/15 | (10,797,965) | (10,789,489) | |||||||||||||||
Deutsche Bank AG | 0.27% | 7/28/14 | 10/16/14 | (16,665,994) | (16,656,000) | |||||||||||||||
Goldman Sachs | 0.29% | 8/04/14 | 10/27/14 | (10,055,800) | (10,049,000) | |||||||||||||||
Goldman Sachs | 0.29% | 8/18/14 | 11/04/14 | (11,949,504) | (11,942,000) | |||||||||||||||
Goldman Sachs | 0.29% | 8/26/14 | 11/18/14 | (6,539,422) | (6,535,000) | |||||||||||||||
Reverse repurchase transactions are entered into by the Fund under Master Repurchase Agreements (“MRA”), which permit the Fund, under certain circumstances, including an event of default (such as bankruptcy or insolvency), to offset payables and/or receivables under the MRA with collateral held and/or posted to the counterparty and create one single net payment due to or from the Fund. With reverse repurchase transactions, typically the Fund and the counterparties are permitted to sell, re-pledge, or use the collateral associated with the transaction. However, bankruptcy or insolvency laws of a particular jurisdiction may impose restrictions on or prohibitions against such a right of offset in the event of the MRA counterparty’s bankruptcy or insolvency. Pursuant to the terms of the MRA, the Fund receives or posts securities as collateral with a market value in excess of the repurchase price to be received or paid by the Fund upon the maturity of the transaction. Upon a bankruptcy or insolvency of the MRA counterparty, the Fund is considered an unsecured creditor with respect to excess collateral and, as such, the return of excess collateral may be delayed.
The following table is a summary of the Fund’s reverse repurchase agreements by counterparty, which are subject to offset under a MRA on a net basis as of September 30, 2014 :
| Fair Value of | ||||||||||||||||
| Reverse | Non-cash | Cash | ||||||||||||||
| Repurchase | Collateral | Collateral | ||||||||||||||
Counterparty | Agreements | Pledged1 | Pledged | Net Amount2 | ||||||||||||
BNP Paribas | $ | 58,206,590 | $ | (58,206,590) | $ | — | $ | — | ||||||||
Deutsche Bank AG | 16,664,120 | (16,664,120) | — | — | ||||||||||||
Goldman Sachs | 28,536,823 | (28,536,823) | — | — | ||||||||||||
|
|
|
|
|
|
|
| |||||||||
| $ | 103,407,533 | $ | (103,407,533) | $ | — | $ | — | |||||||||
|
|
|
|
|
|
|
| |||||||||
1 Collateral with a value of $108,106,900 has been pledged in connection with open reverse repurchase agreements. Excess of collateral pledged to the individual counterparty is not shown for financial reporting purposes.
2 Net amount represents the net amount payable due to the counterparty in the event of default.
In the event the buyer of securities under a MRA files for bankruptcy or becomes insolvent, the Fund’s use of the proceeds of the agreement may be restricted while the other party, or its trustee or receiver, determines whether or not to enforce the Fund’s obligation to repurchase the securities.
Derivatives:
The Fund may use derivative instruments, including futures, forwards, options, indexed securities, swaps and inverse securities for hedging purposes only. Derivatives allow the Fund to manage its risk exposure more quickly and efficiently than other types of instruments. Derivatives may be riskier than other types of investments and could result in losses that significantly exceed a Fund’s original investment. Derivatives are subject to the risk that changes in the value of a derivative may not correlate perfectly with the underlying asset, rate or index. The use of derivatives may not be successful, resulting in losses to a Fund, and the cost of such strategies may reduce the Fund’s returns.
Hedging also involves the risk that changes in the value of the derivative will not match those of the holdings being hedged as expected by the Fund, in which case any losses on the holdings being hedged may not be reduced and may be increased. There can be no assurance that the Fund’s
40 |
NOTES TO FINANCIAL STATEMENTS |
hedging strategy will reduce risk or that hedging transactions will be available or cost effective. The Fund is subject to interest rate risk in the normal course of pursuing its investment objectives by investing in various derivative financial instruments, as described below. For open derivative instruments as of September 30, 2014, see the following section for financial futures contracts.
Financial Futures Contracts:
The Fund entered into futures contracts in an effort to manage both the duration of the portfolio and hedge against certain market risk. A futures contract on a securities index is an agreement obligating one party to pay, and entitling the other party to receive, during the term of the contract, cash payments based on the level of a specified securities index. Futures transactions involve brokerage costs and require a Fund to segregate assets to cover contracts that would require it to purchase securities or currencies. A Fund may lose the expected benefit of futures transactions if interest rates, exchange rates or securities prices change in an unanticipated manner. Such unanticipated changes may also result in lower overall performance than if a Fund had not entered into any futures transactions.
Upon entering into a futures contract, a Fund is required to pledge to the broker an amount of cash, U.S. government securities, or other assets equal to a certain percentage of the contract amount. Subsequent payments are made or received by the Fund each day, depending on the daily fluctuations in the fair value of the underlying instrument. A Fund would record an unrealized gain or loss each day equal to these daily payments.
Open futures contracts are shown on the Schedule of Portfolio Investments. Underlying collateral pledged for open futures contracts is the cash at brokers shown on the Statement of Assets and Liabilities at September 30, 2014.
Fair value of derivative instruments as of September 30, 2014 are as follows:
Derivative Instruments Categorized by Risk Exposure | Statement of Assets and Liabilities Location | Amount | ||||
| Asset Derivatives | ||||||
Interest Rate Risk | Unrealized Gain on Future Contracts | $330,469 | ||||
The effect of Derivative Instruments on the Statement of Operations during the year ended September 30, 2014 is as follows:
| Net Realized Losses | Net Change in Unrealized | |||||||
| Derivative Instruments | from | Appreciation/Depreciation | ||||||
Categorized by Risk Exposure | Futures Contracts | on Futures Contracts | ||||||
Interest Rate Risk | $(2,789,739) | $1,647,383 | ||||||
For the year ended September 30, 2014, the average volume of derivative activities are as follows:
| Futures Short Positions | ||||
(Contracts) | ||||
528 |
Counterparty Credit Risk:
Derivatives may also expose a Fund to counterparty risk (the risk that the derivative counterparty will not fulfill its contractual obligations). To the extent amounts due to the Fund from their counterparties are not fully collateralized, contractually or otherwise, the Fund bears the risk of loss from counterparty non-performance. The Fund’s maximum risk of loss from counterparty credit risk on over-the-counter derivatives is generally the aggregate unrealized gain in excess of any collateral pledged by the counterparty to the Fund.
The Fund’s risk of loss from counterparty credit risk in over-the-counter (“OTC”) derivatives is generally limited to the aggregate unrealized gain netted against any collateral held by such Fund.
| 41 |
NOTES TO FINANCIAL STATEMENTS |
With exchange-traded futures, there is less counterparty credit risk to the Fund since the exchange or clearinghouse, as counterparty to such instruments, guarantees against a possible default. The clearinghouse stands between the buyer and the seller of the contract; therefore, credit risk is limited to failure of the clearinghouse. While offset rights may exist under applicable law, the Fund does not have a contractual right of offset against a clearing broker or clearinghouse in the event of a default (including the bankruptcy or insolvency) of the clearing broker or clearinghouse. Additionally, credit risk exists in exchange-traded futures with respect to initial and variation margin that is held in a clearing broker’s customer accounts. While clearing brokers are required to segregate customer margin from their own assets, in the event that a clearing broker becomes insolvent or goes into bankruptcy and at that time there is a shortfall in the aggregate amount of margin held by the clearing broker for all its clients, typically the shortfall would be allocated on a pro rata basis across all the clearing broker’s customers, potentially resulting in losses to the Fund.
TBA Commitments:
The Fund may enter into TBA commitments to purchase or sell securities for a fixed price at a future date. TBA commitments are considered securities in themselves, and involve a risk of loss if the value of the security to be purchased/sold declines/increases prior to settlement date, which is in addition to the risk of decline in the value of a Fund’s other assets. Unsettled TBA commitments are valued at the current value of the underlying securities, according to the procedures described under “Security Valuation”. As of September 30, 2014, the Fund had no outstanding TBA commitments.
Mortgage Backed Securities:
Because the Fund will focus on community development investments, such as securities backed by commercial and/or residential mortgage loans, it will be affected by risks not typically associated with funds that do not specialize in community development investments. These risks include credit and prepayment risk and risk due to default on underlying loans within a security. Changes in economic conditions, including delinquencies and/or defaults or assets underlying these securities, can affect the value, income and/or liquidity of such positions.
In addition, the Fund invests in certain mortgage backed securities that qualify under the Community Reinvestment Act of 1977 (“CRA”) in which the Fund may pay a premium for the geographically or other targeted nature of the securities. There can be no guarantee, however, that a similar premium will be received if the security is sold by the Fund.
Credit Enhancement:
Certain obligations held in the Fund have credit enhancement or liquidity features that may, under certain circumstances, provide for repayment of principal and interest on the obligation upon demand date, interest rate reset date or final maturity. These enhancements may include: letters of credit; liquidity guarantees; security purchase agreements; tender option purchase agreements; and third party insurance (i.e., AMBAC and AGM).
Investment Transactions and Income:
Investment transactions are recorded one business day after trade date, except on the last day of each fiscal quarter end, when they are recorded on trade date. Dividend income is recorded on the ex-dividend date. Realized gains and losses from investment transactions are calculated based on the costs of the specific security (also known as identified cost basis). Interest income is recognized on the accrual basis and includes, where applicable, the amortization and accretion of premium or discount using the effective yield method. Paydown gains and losses on mortgage and asset-backed securities are included in the financial statements as interest income.
Expense, Investment Income and Gain/Loss Allocation:
The Fund pays the expenses that are directly related to its operations, such as custodian fees or advisory fees. Expenses incurred by the Trust, such as trustee or legal fees, are allocated to the Fund either proportionately based upon the Fund’s relative net assets or using another reasonable basis such as equally across all Funds in the Trust, depending on the nature of the expense. Individual share classes within the Fund are charged expenses specific to that class, such as distribution fees and transfer agent fees. Within the Fund, expenses other than class specific expenses are allocated daily to
42 |
NOTES TO FINANCIAL STATEMENTS |
each class based upon the proportion of relative net assets. Investment income and realized and unrealized gains or losses are allocated to each class of shares based upon the proportion of relative net assets.
Distributions to Shareholders:
The Fund pays out any income that it receives, less expenses, in the form of dividends and capital gains to its shareholders. Income dividends are declared daily and paid monthly. Dividends will also be paid to a redeeming shareholder at any time during the month upon total redemption of shares in an account. Capital gain distributions are declared and paid at least annually. Distributions to shareholders are recorded on the ex-dividend date. The amount of dividends and distributions are calculated based on federal income tax regulations, which may differ from GAAP. These “book/tax” differences may be either temporary or permanent in nature. To the extent these differences are determined, as of the end of the tax year, to be permanent (e.g., reclassification of paydown gains and losses, and expiring capital loss carryforward), they are reclassified within a Fund’s capital account based on their federal tax basis treatment.
For the year ended September 30, 2014, permanent difference reclassification amounts were as follows:
Increase Undistributed Net Investment Income | Decrease Accumulated Realized Gain/Loss | Decrease Paid-in-Capital | ||||||||||||
$1,248,771 | $(1,221,028) | $(27,743) |
3. Agreements and Other Transactions with Affiliates:
RBC GAM (US) serves as investment advisor to the Fund and has agreed to waive or limit fees through January 31, 2016, to maintain expenses (excluding interest expense, management fees and distribution fees) at 0.20% of the Fund’s average daily net assets. The Fund will carry forward, for a period not to exceed 12 months from the date on which a waiver or reimbursement is made by the Advisor, any expenses in excess of the expense limitation and repay the Advisor such amounts, provided the Fund is able to effect such repayment and remain in compliance with the expense limitation disclosed in the effective prospectus. At September 30, 2014, the amount subject to possible recoupment under the expense limitation agreement is $7,767. During the year ended September 30, 2014, no reimbursements were made to the Advisor.
Under the terms of the Fund’s Investment Advisory Agreement, the Advisor receives from the Fund an annual management fee, paid monthly, of 50 basis points (0.50%) of the Fund’s daily average net assets.
The Trust currently pays each of the independent Trustees (Trustees of the Trust who are not directors, officers or employees of the Advisor, either Co-Administrator or Distributor) an annual retainer of $35,000 ($41,500 effective October 1, 2014). The Board Chairperson and Audit Committee Chairperson each receive an additional retainer of $2,500 annually, and all other trustees serving as Chair of a Board committee each receive an additional retainer of $1,000 annually. In addition, Independent Trustees receive a quarterly meeting fee of $5,500 for each in-person Board meeting attended, a meeting fee of $1,500 for each telephonic or Special Board meeting attended, a $1,500 fee for each Board committee meeting attended, and are reimbursed for all out-of-pocket expenses relating to attendance at such meetings.
| 43 |
NOTES TO FINANCIAL STATEMENTS |
4. Fund Distribution:
The Fund has adopted a Master Distribution 12b-1 Plan (the “Plan”) in which Quasar Distributors LLC (the “Distributor”) acts as the Fund’s distributor. The Plan permits the Fund to make payments for, or to reimburse the Distributor for, distribution-related costs and expenses of marketing shares of Class A covered under the Plan, and/or for providing shareholder services. The Plan does not apply to Class I. The following chart shows the current Plan fee rate for Class A.
| Class A | ||||
12b-1 Plan Fee | 0.25%* | |||
* Under the 12b-1 plan, the maximum fee rate for Class A shares is 0.50%. Currently the Board of Trustees has approved an annual limit of 0.25%.
Plan fees are based on average daily net assets of Class A. The Distributor, subject to applicable legal requirements, may waive the Plan fee voluntarily, in whole or in part. For the year ended September 30, 2014, there were no fees waived by the Distributor.
5. Securities Transactions:
The cost of securities purchased and proceeds from securities sold (excluding securities maturing less than one year from acquisition) for the year ended September 30, 2014 were as follows:
Purchases (Excl. U.S. Gov’t.) | Sales (Excl. U.S. Gov’t.) | Purchases of U.S. Gov’t. | Sales of U.S. Gov’t. | |||||||||
$61,808,886 | $105,229,357 | $— | $— | |||||||||
6. Capital Share Transactions:
The Trust is authorized to issue 1,000,000,000 shares of beneficial interest (“shares outstanding”) with par value of $.0000001. Transactions in shares of the Fund are summarized below:
| For the | For the | |||||||||||
| Year Ended | Year Ended | |||||||||||
| September 30, | September 30, | |||||||||||
| 2014 | 2013 | |||||||||||
CAPITAL TRANSACTIONS: | ||||||||||||
Class A | ||||||||||||
Proceeds from shares issued | $ | 7,021,233 | $ | 5,027,616 | ||||||||
Distributions reinvested | 438,285 | 388,095 | ||||||||||
Cost of shares redeemed | (2,860,921 | ) | (4,248,118 | ) | ||||||||
|
|
|
| |||||||||
Change in Class A | $ | 4,598,597 | $ | 1,167,593 | ||||||||
|
|
|
| |||||||||
Class I | ||||||||||||
Proceeds from shares issued | $ | 14,575,932 | $ | 66,550,737 | ||||||||
Distributions reinvested | 8,407,952 | 8,333,575 | ||||||||||
Cost of shares redeemed | (48,941,132 | ) | (117,302,551 | ) | ||||||||
|
|
|
| |||||||||
Change in Class I | $ | (25,957,248 | ) | $ | (42,418,239 | ) | ||||||
|
|
|
| |||||||||
Change in net assets resulting from capital transactions | $ | (21,358,651 | ) | $ | (41,250,646 | ) | ||||||
|
|
|
| |||||||||
44 |
NOTES TO FINANCIAL STATEMENTS |
| For the | For the | ||||||||||||||
| Year Ended | Year Ended | ||||||||||||||
| September 30, | September 30, | ||||||||||||||
| 2014 | 2013 | ||||||||||||||
SHARE TRANSACTIONS: | |||||||||||||||
Class A | |||||||||||||||
Issued | 758,018 | 529,633 | |||||||||||||
Reinvested | 47,283 | 40,885 | |||||||||||||
Redeemed | (309,068 | ) | (447,843 | ) | |||||||||||
|
|
|
| ||||||||||||
Change in Class A | 496,233 | 122,675 | |||||||||||||
|
|
|
| ||||||||||||
Class I | |||||||||||||||
Issued | 1,575,302 | 6,925,449 | |||||||||||||
Reinvested | 907,861 | 878,110 | |||||||||||||
Redeemed | (5,275,061 | ) | (12,362,149 | ) | |||||||||||
|
|
|
| ||||||||||||
Change in Class I | (2,791,898 | ) | (4,558,590 | ) | |||||||||||
|
|
|
| ||||||||||||
7. Federal Income Taxes:
It is the policy of the Fund to continue to qualify as a regulated investment company by complying with the provisions available to certain investment companies, as defined under Subchapter M of the Internal Revenue Code, and to distribute substantially all of its net investment income and net realized capital gains. Therefore, no federal tax liability is recorded in the financial statements of the Fund.
Management has analyzed the Fund’s tax positions taken or expected to be taken on federal income tax returns for all open tax years (the tax years ended September 30 of the years 2011, 2012, 2013 and 2014) and has concluded that no provision for federal income tax is required in the Fund’s financial statements. The Fund’s federal and state income and federal excise tax returns for tax years for which the applicable statutes of limitations have not expired are subject to examination by the Internal Revenue Service and state departments of revenue.
As of and during the year ended September 30, 2014, the Fund did not have a liability for any unrecognized tax benefits. The Fund recognizes interest and penalties, if any, related to unrecognized tax benefits as income tax expense in the Statement of Operations. During the year, the Fund did not incur any interest or penalties.
As of September 30, 2014, the tax cost of securities and the breakdown of unrealized appreciation (depreciation) was as follows:
Tax Cost of Securities | Unrealized | Unrealized | Net Unrealized | |||||||||
$581,180,534 | $21,919,574 | $(7,210,165) | $14,709,409 |
The tax characters of distributions were as follows:
| Distributions Paid From | ||||||||||||
| Total | ||||||||||||
| Ordinary | Distributions | |||||||||||
| Income | Paid | |||||||||||
For the year ended September 30, 2014 | $ | 18,476,222 | $ | 18,476,222 | ||||||||
For the year ended September 30, 2013 | $ | 20,694,614 | $ | 20,694,614 | ||||||||
| 45 |
NOTES TO FINANCIAL STATEMENTS |
As of September 30, 2014, the components of accumulated earnings/(losses) and tax character of distributions paid are as follows:
Undistributed Ordinary Income | Accumulated Earnings | Distributions Payable | Deferred Qualified Late-Year Losses | Accumulated Capital Loss Carryforwards | Unrealized Appreciation | Total Accumulated Losses | ||||||||||||||||||
$61,605 | $— | $(1,390,096) | $— | $(39,978,270) | $14,709,409 | $(26,597,352) | ||||||||||||||||||
As of September 30, 2014, the Fund had capital loss carryforwards for federal income tax purposes as follows:
Capital Loss Carryforward | Expires | |||||||
| $ 2,484,167 | 2015 | |||||||
| $ 8,197,543 | 2016 | |||||||
| $11,587,282 | 2018 | |||||||
| $ 4,011,206 | 2019 | |||||||
During the year ended September 30, 2014, the Fund did not utilize any capital loss carryforwards and had capital loss carryforwards of $27,743 expire as of the end of the fiscal year ending September 30, 2014.
As of September 30, 2014, the Fund had a short-term capital loss carryforward of $7,147,501 and a long-term capital loss carryforward of $6,550,571 available to offset future realized capital gains in accordance with the Regulated Investment Company Modernization Act of 2010. These capital loss carryforwards are not subject to expiration and must first be utilized to offset future realized gains of the same character and must be utilized prior to the utilization of the loss carryforwards subject to expiration that are described above.
Under current tax law, capital losses realized after October 31 of a Fund’s fiscal year may be deferred and treated as occurring on the first business day of the following fiscal year for tax purposes. The Fund did not have any deferred qualified late-year capital losses which will be treated as arising on the first business day of the fiscal year ending September 30, 2015.
8. Subsequent Events:
Management has evaluated the impact of all subsequent events on the Fund and has determined that there were no subsequent events requiring recognition or disclosure in the financial statements.
46 |
To the Shareholders of Access Capital Community Investment Fund and Board of Trustees of RBC Funds Trust.
We have audited the accompanying statement of assets and liabilities, including the schedule of portfolio investments, of Access Capital Community Investment Fund (the “Fund”), one of the portfolios constituting the RBC Funds Trust, as of September 30, 2014, and the related statements of operations and cash flows for the year then ended, the statements of changes in net assets for each of the two years in the period then ended and the financial highlights for each of the five years in the period then ended. These financial statements and financial highlights are the responsibility of the Fund’s management. Our responsibility is to express an opinion on these financial statements and financial highlights based on our audits.
We conducted our audits in accordance with the standards of the Public Company Accounting Oversight Board (United States). Those standards require that we plan and perform the audit to obtain reasonable assurance about whether the financial statements and financial highlights are free of material misstatement. The Fund is not required to have, nor were we engaged to perform, an audit of its internal control over financial reporting. Our audits included consideration of internal control over financial reporting as a basis for designing audit procedures that are appropriate in the circumstances, but not for the purpose of expressing an opinion on the effectiveness of the Fund’s internal control over financial reporting. Accordingly, we express no such opinion. An audit also includes examining, on a test basis, evidence supporting the amounts and disclosures in the financial statements, assessing the accounting principles used and significant estimates made by management, as well as evaluating the overall financial statement presentation. Our procedures included confirmation of securities owned as of September 30, 2014, by correspondence with the Fund’s custodian and brokers; where replies were not received from brokers, we performed other auditing procedures. We believe that our audit provides a reasonable basis for our opinion.
In our opinion, the financial statements and financial highlights referred to above present fairly, in all material respects, the financial position of Access Capital Community Investment Fund, as of September 30, 2014, the results of its operations and its cash flows for the year then ended, the changes in its net assets for each of the two years in the period then ended, and the financial highlights for each of the five years in the period then ended, in conformity with accounting principles generally accepted in the United States of America.
DELOITTE & TOUCHE LLP
Chicago, Illinois
November 26, 2014
| 47 |
The Fund reports a portion of the income dividends distributed during the fiscal year ended September 30, 2014, as qualified interest income as defined in the Internal Revenue Code as 100%.
The reporting is based on financial information available as of the date of this annual report and, accordingly, is subject to change. It is the intention of the Fund to report the maximum amount permitted under the Internal Revenue Code and the regulations thereunder.
48 |
Independent Trustees(1)(2)
T. Geron Bell (73)
Position, Term of Office and Length of Time Served with the Trust: Trustee since January 2004
Principal Occupation(s) During Past 5 Years: Chairman of the Executive Board of the Minnesota Twins (2011 to present); prior thereto President of Twins Sports, Inc. (parent company of the Minnesota Twins) (2002-2011); President of the Minnesota Twins Baseball Club Incorporated (1987-2002)
Number of Portfolios in Fund Complex Overseen by Trustee: 18
Other Director/Trustee Positions Held by Trustee During Past 5 Years: None
Lucy Hancock Bode (63)
Position, Term of Office and Length of Time Served with the Trust: Trustee since January 2004
Principal Occupation(s) During Past 5 Years: Healthcare consultant (self-employed) (1986 to present)
Number of Portfolios in Fund Complex Overseen by Trustee: 18
Other Director/Trustee Positions Held by Trustee During Past 5 Years: BioSignia; Franklin Street Partners
Leslie H. Garner Jr. (64)
Position, Term of Office and Length of Time Served with the Trust: Trustee since January 2004
Principal Occupation(s) During Past 5 Years: President and CEO, The Greater Cedar Rapids Community Foundation (2010 to present); previously, President, Cornell College (1994 to 2010)
Number of Portfolios in Fund Complex Overseen by Trustee: 18
Other Director/Trustee Positions Held by Trustee During Past 5 Years: None
Ronald James (63)
Position, Term of Office and Length of Time Served with the Trust: Trustee since January 2004
Principal Occupation(s) During Past 5 Years: President and Chief Executive Officer, Center for Ethical Business Cultures (2000 to present)
Number of Portfolios in Fund Complex Overseen by Trustee: 18
Other Director/Trustee Positions Held by Trustee During Past 5 Years: Best Buy Co. Inc.; Bremer Financial Corporation
John A. MacDonald (65)
Position, Term of Office and Length of Time Served with the Trust: Trustee since January 2004
Principal Occupation(s) During Past 5 Years: Vice President and Treasurer, Hall Family Foundation (1988 to present)
Number of Portfolios in Fund Complex Overseen by Trustee: 18
Other Director/Trustee Positions Held by Trustee During Past 5 Years: None
H. David Rybolt (72)
Position, Term of Office and Length of Time Served with the Trust: Trustee since January 2004
Principal Occupation(s) During Past 5 Years: Consultant, HDR Associates (management consulting) (1985 to present)
Number of Portfolios in Fund Complex Overseen by Trustee: 18
Other Director/Trustee Positions Held by Trustee During Past 5 Years: None
| 49 |
MANAGEMENT (Unaudited) |
Independent Trustees(1)(2)
James R. Seward (62)
Position, Term of Office and Length of Time Served with the Trust: Chairman of the Board and Trustee since January 2004
Principal Occupation(s) During Past 5 Years: Private investor (2000 to present); CFA (1987 to present)
Number of Portfolios in Fund Complex Overseen by Trustee: 18
Other Director/Trustee Positions Held by Trustee During Past 5 Years: Sooner Holdings (formerly Syntroleum Corporation); Brookdale Senior Living Inc.
William B. Taylor (69)
Position, Term of Office and Length of Time Served with the Trust: Trustee since September 2005
Principal Occupation(s) During Past 5 Years: Consultant (2003 to present); previously Partner, Ernst & Young LLP (1982 to 2003)
Number of Portfolios in Fund Complex Overseen by Trustee: 18
Other Director/Trustee Positions Held by Trustee During Past 5 Years: William Henry Insurance, LLC; Balance Innovations LLC; Kansas City Symphony
Interested Trustees(1)(2)(3)
Kathleen A. Gorman (50)(5)
Position, Term of Office and Length of Time Served with the Trust: Trustee since September 2012
Principal Occupation(s) During Past 5 Years: President and Chief Executive Officer, RBC Funds (2012 to present); Chief Compliance Officer, RBC Funds (2006 to 2012); Director of Regulatory Administration, RBC Global Asset Management (U.S.) Inc. (2007 to 2012); Chief Compliance Officer, RBC Global Asset Management (U.S.) Inc. (2006-2009)
Number of Portfolios in Fund Complex Overseen by Trustee: 18
Other Director/Trustee Positions Held by Trustee During Past 5 Years: None
Executive Officers(1)(3)(4)
Kathleen A. Gorman (50)
Position, Term of Office and Length of Time Served with the Trust: President and Chief Executive Officer since September 2012
Principal Occupation(s) During Past 5 Years: President and Chief Executive Officer, RBC Funds (2012 to present); Chief Compliance Officer, RBC Funds (2006 to 2012); Director of Regulatory Administration, RBC Global Asset Management (U.S.) Inc. (2007 to 2012); Chief Compliance Officer, RBC Global Asset Management (U.S.) Inc. (2006-2009)
50 |
MANAGEMENT (Unaudited) |
Executive Officers(1)(3)(4)
Kathleen A. Hegna (47)
Position, Term of Office and Length of Time Served with the Trust: Chief Financial Officer and Principal Accounting Officer since May 2009 and Treasurer since March 2014
Principal Occupation(s) During Past 5 Years: Associate Vice President and Director, Mutual Fund Accounting and Administration, RBC Global Asset Management (U.S.) Inc. (2009 to present); Senior Compliance Officer, RBC Global Asset Management (U.S.) Inc. (2006-2009)
Christina M. Moore (46)
Position, Term of Office and Length of Time Served with the Trust: Chief Compliance Officer since December 2012 and Assistant Secretary since March 2013
Principal Occupation(s) During Past 5 Years: Chief Compliance Officer, RBC Funds (2012-present); Senior Compliance Officer, RBC Funds (March 2012 to December 2012); Compliance Manager, Minnesota Life Insurance Company (2006-2012)
Lee Thoresen (43)
Position, Term of Office and Length of Time Served with the Trust: Chief Legal Officer and Secretary since March 2008
Principal Occupation(s) During Past 5 Years: Senior Associate General Counsel, RBC Capital Markets, LLC (2006-present)
Ronald A. Homer (67)
Position, Term of Office and Length of Time Served with the Trust: President, Access Capital Community Investment Fund, since July 2008
Principal Occupation(s) During Past 5 Years: Managing Director, RBC Global Asset Management (U.S.) Inc. and President, Access Capital Community Investment Fund (July 2008 to present); Chief Executive Officer and Co-Managing Member, Access Capital Strategies LLC (1997-July 2008); Chairman, Access Capital Strategies Community Investment Fund (1998-July 2008)
| (1) | Except as otherwise noted, the address of each Trustee/Officer is RBC Funds Trust, 50 South Sixth Street, Suite 2350, Minneapolis, Minnesota 55402. |
| (2) | All Trustees must retire on or before December 31 of the year in which they reach age 75. The Board may temporarily waive this requirement when necessary to avoid depriving the Board of a Trustee with critical skills. |
| (3) | On December 31, 2009, Voyageur Asset Management Inc. changed its name to RBC Global Asset Management (U.S.) Inc. Any references to RBC Global Asset Management (U.S.) Inc. for prior periods are deemed to be references to the prior entity. |
| (4) | Each officer serves in such capacity for an indefinite period of time until his or her removal, resignation or retirement. |
| (5) | Kathleen A. Gorman has been determined to be an interested Trustee by virtue of her position with the Advisor. |
The Funds’ Statement of Additional Information includes information about the Funds’ Trustees. To receive your free copy of the Statement of Additional Information, call toll free: 1-800-422-2766.
| 51 |
The Access Capital Community Investment Fund offers Class A and Class I shares.
Class A
Class A shares are available for purchase primarily through investment advisors, broker-dealers, banks and other financial services intermediaries. Class A shares of the Fund are currently subject to a maximum up-front sales charge of 3.75% and a 1.00% CDSC for redemption within 12 months of a $1 million or greater purchase. Class A shares currently include a 0.25% annual 12b-1 service and distribution fee.
Class I
Class I shares are intended for investors meeting certain minimum investment thresholds. This share class does not have an up-front sales charge (load) or a 12b-1 service and distribution fee.
52 |
Shareholder Expense Examples
As a shareholder of the Access Capital Community Investment Fund, you incur two types of costs: (1) transaction costs, and (2) ongoing costs, including management fees and other Fund expenses. This example is intended to help you understand your ongoing costs (in dollars) of investing in the Fund and to compare these costs with the ongoing costs of investing in other mutual funds.
The Example is based on an investment of $1,000 invested at the beginning of the period and held for the entire period from April 1, 2014 through September 30, 2014.
Actual Expenses
The table below provides information about actual account values and actual expenses. You may use the information below, together with the amount you invested, to estimate the expenses that you paid over the period. Simply divide your account value by $1,000 (for example, an $8,600 account value divided by $1,000 = 8.6), then multiply the result by the number in the table under the heading entitled “Expenses Paid During Period” to estimate the expenses you paid on your account during this period.
| Annualized | ||||||||
| Beginning | Ending | Expenses Paid | Expense Ratio | |||||
| Account Value | Account Value | During Period* | During Period | |||||
| 4/1/14 | 9/30/14 | 4/1/14-9/30/14 | 4/1/14-9/30/14 | |||||
Class A | $1,000.00 | $1,022.60 | $5.12 | 1.01% | ||||
Class I | $1,000.00 | $1,025.60 | $3.25 | 0.64% |
Hypothetical Example for Comparison Purposes
The table below provides information about hypothetical account values and hypothetical expenses based on the Fund’s actual expense ratio and an assumed rate of return of 5% per year before expenses, which is not the Fund’s actual return. The hypothetical account values and expenses may not be used to estimate the actual ending account balance or expenses you paid for the period. You may use this information to compare this 5% hypothetical example with the 5% hypothetical examples that appear in the shareholder reports of other funds.
Please note that the expenses shown in the table are meant to highlight your ongoing costs only and do not reflect any transactional costs, such as sales charges (loads), redemption fees, or exchange fees. Therefore, the table is useful in comparing ongoing costs only, and will not help you determine the relative total costs of owning different funds. In addition, if these transactional costs were included, your costs would have been higher.
| Annualized | ||||||||
| Beginning | Ending | Expenses Paid | Expense Ratio | |||||
| Account Value | Account Value | During Period* | During Period | |||||
4/1/14 | 9/30/14 | 4/1/14-9/30/14 | 4/1/14-9/30/14 | |||||
Class A | $1,000.00 | $1,020.00 | $5.11 | 1.01% | ||||
Class I | $1,000.00 | $1,021.86 | $3.24 | 0.64% |
*Expenses are equal to the average account value times the Fund’s annualized expense ratio multiplied by 183/365 (to reflect one half-year period).
| 53 |
Information Regarding the Approval of Investment Advisory Agreement
In September 2014, after evaluating the services provided by RBC Global Asset Management (U.S.) Inc. (the “Advisor”) and reviewing the performance, fees, and expenses of the Fund, the RBC Funds Board of Trustees determined to approve the continuation of the investment advisory agreement (“Agreement”) with the Advisor for the Fund for an additional year.
As part of their review of the Agreement, the Trustees requested and considered information regarding the advisory services performed by the Advisor, the staffing and qualifications of the personnel responsible for operating and managing the Fund, and the Fund’s performance, fees and expenses. The Trustees considered information provided at regular quarterly Board and Committee meetings throughout the year as well as information presented at both a special meeting held to review requested material related to the proposed renewal and a meeting held specifically to consider the proposed renewal. In connection with their deliberations, the independent Trustees were advised by their own independent legal counsel with regard to the materials and their responsibilities under relevant laws and regulations.
The Trustees met with representatives from the Advisor’s senior management team, as well as the senior investment professionals responsible for managing the Fund, to discuss the information and the Advisor’s ongoing management of the Fund. The Trustees reviewed the nature, quality, and extent of the services provided to the Fund by the Advisor, including information as to the Fund’s performance relative to appropriate securities index benchmarks as well as fund peer group comparative information requested by the Board. Because of the specialized nature of the Fund, the Trustees requested and reviewed comparative information for US mortgage-backed fixed income funds as well as other funds and products that focus particularly on investments eligible for regulatory credit under the Community Reinvestment Act of 1977 (“CRA”). The Trustees acknowledged slight underperformance versus the mortgage funds benchmark, favorable comparative performance versus relevant peers, and the Fund’s favorable positioning with respect to duration and quality of the portfolio holdings given market conditions.
In considering the nature and quality of services to be provided by the Advisor, the Trustees discussed the strong research, credit, and fundamental analysis capabilities; the specialized expertise in the area of fixed income investments eligible for regulatory credit under the CRA; and the extensive portfolio management experience of the Advisor’s staff as well as its operational and compliance structure and systems and financial strength.
The Trustees reviewed the Fund’s investment advisory fee and reviewed comparative fee and expense information for similarly situated funds, noting that the advisory fee and expenses were slightly above median, but Board recognized that the Advisor recently eliminated the advisory fee paid on leveraged assets. The Trustees also received reports from the Advisor regarding the performance and fee levels for other advisory client accounts it advises in a similar strategy, and discussed differences in services provided. The Trustees reviewed profitability data — including year-over-year variances — for the Advisor and considered information regarding other benefits the Advisor and its affiliates derived from their relationships with the Fund, including soft dollars and other fall-out benefits and the Advisor’s role as co-administrator of the Fund and the fees paid by the Fund for such services.
Based upon their review, the Trustees determined that the advisory fee proposed to be payable to the Advisor was fair and reasonable in light of the nature and quality of services provided under all of the circumstances and were within the range of what might have been negotiated at arms’ length. The Trustees concluded that it is in the interests of the Fund and its shareholders for the Trustees to approve the continuation of the Agreement and expense limitation arrangement for the Fund. In arriving at their collective decision to approve the renewal of the Agreement, the Trustees did not assign relative weights to the factors discussed above or deem any one or group of them to be controlling in and of itself.
54 |
|
This Page Intentionally Left Blank
| 55 |
|
This Page Intentionally Left Blank
56 |
|
This Page Intentionally Left Blank
| 57 |
|
This Page Intentionally Left Blank
58 |
Access Capital
P.O. Box 701
Milwaukee, WI 53201-0701
800-422-2766
www.rbcgam.us
Performance data represents past performance and does not guarantee future results. The principal value of an investment and investment return will fluctuate so that an investor’s shares, when redeemed, may be worth more or less than their original cost.
This report and the financial statements contained herein are provided for the information of RBC Funds shareholders. This report is not authorized for distribution to prospective investors unless preceded or accompanied by a current prospectus, which contains information concerning investment objectives, risks, charges and expenses of the Fund. Please read the prospectus carefully before investing.
This report and the financial statements contained herein are not intended to be a forecast of future events, a guarantee of future results, or investment advice. There is no assurance that certain securities will remain in or out of the Fund’s portfolio. The views expressed in this report reflect those of the portfolio managers through the period ended September 30, 2014.
NOT FDIC INSURED • NO BANK GUARANTEE • MAY LOSE VALUE
RBC Global Asset Management (U.S.) Inc. serves as investment advisor to the Access Capital Community Investment Fund. The Fund is distributed by Quasar Distributors LLC.

The RBC Funds are pleased to offer shareholder reports printed entirely on Forest Stewardship Council certified paper. FSC® certification ensures that the paper used in this report contains fiber from well-managed and responsibly harvested forests that meet strict environmental and socioeconomic standards.
RBCF-AC AR 09-14
RBC Funds | ||||||||||
About Your Annual Report | This annual report includes detailed information about your Fund including financial statements, performance, and a complete list of its holdings.
The RBC Funds compare their performance against various Russell equity indices. Each of these indices is a widely recognized measure of return for the underlying category of securities. However, the indices are unmanaged, do not include fees, and cannot be invested in directly.
We hope the financial information presented will help you evaluate your investment in the RBC Funds. We also encourage you to read your Fund’s prospectus for further detail as to your Fund’s investment policies and risk profile. RBC Funds prospectuses and performance information subsequent to the date of this report are available on our website at www.rbcgam.us.
A description of the policies and procedures that your Fund uses to determine how to vote proxies relating to portfolio securities is available (i) without charge, upon request, by calling 1-800-422-2766; (ii) on the Fund’s website at www.rbcgam.us; and (iii) on the Securities and Exchange Commission’s (the “Commission”) website at http://www.sec.gov.
Information regarding how your Fund voted proxies relating to portfolio securities during the most recent 12-month period ended June 30 is available (i) on the Fund’s website at www.rbcgam.us; and (ii) on the Commission’s website at http://www.sec.gov.
A schedule of each Fund’s portfolio holdings will be filed with the Commission for the first and third quarters of each fiscal year on Form N-Q. This information is available on the Commission’s website at http://www.sec.gov and may be reviewed and copied at the Commission’s Public Reference Room in Washington, D.C. Information on the operation of the Public Reference Room is available by calling 1-202-551-8090. | |||||||||
Contents | ||||||||||
| Letter from the Chief Investment Officer | 1 | |||||||||
| Equity Portfolio Managers | 4 | |||||||||
| Performance Summary | 6 | |||||||||
| RBC SMID Cap Growth Fund | 10 | |||||||||
| RBC Enterprise Fund | 12 | |||||||||
| RBC Small Cap Core Fund | 14 | |||||||||
| RBC Microcap Value Fund | 16 | |||||||||
| RBC Mid Cap Value Fund | 18 | |||||||||
| Schedules of Portfolio Investments | 20 | |||||||||
| Financial Statements | ||||||||||
| - Statements of Assets and Liabilities | 44 | |||||||||
| - Statements of Operations | 46 | |||||||||
| - Statements of Changes in Net Assets | 47 | |||||||||
| Financial Highlights | 52 | |||||||||
| Notes to Financial Statements | 62 | |||||||||
| Report of Independent Registered Public Accounting Firm | 75 | |||||||||
| Other Federal Income Tax Information | 76 | |||||||||
| Management | 78 | |||||||||
| Share Class Information | 81 | |||||||||
| Supplemental Information | 82 | |||||||||
| Approval of Investment Advisory Agreement | 84 | |||||||||
Which one of these is not like the others?
As we conclude our fiscal year and move into this, the sixth year of the post-financial crisis bull market, we are struck by the similarities to recent years. Investors once again find themselves fretting over equity return sustainability following another twelve month market rally of nearly 20%. Much as they did in 2012 and 2013, markets proved resilient in the face of significant economic and geopolitical headwinds (Ukraine, ISIS, 1Q’14 US GDP contraction), shrugging off such issues to reach new all-time highs on multiple occasions.
Over the year-ending September 30, 2014, broad equity market indices continued their run of strong returns as the S&P 500 and Russell 3000 Indexes returned 19.6% and 17.76%, respectively. However, these headline results masked a significant shift in market cap leadership as micro and small cap stocks, the one-time darlings of the market rally, ceded leadership to larger capped stocks during the time period. To this end, the Russell Microcap Index and the small cap Russell 2000 Index returned just 2.78% and 3.93% respectively, while the large cap Russell 1000 Index (+19.01%) and Russell Midcap Index (+15.83%) both provided returns in the mid to high teens. While this transition to perceived less risky (i.e. large caps) assets was not outside of our expectations given the extremely strong performance of smaller capitalization stocks over the prior two years and increased volatility as a result of burgeoning geopolitical crises in areas such as the Ukraine and Iraq, the speed and magnitude of the shift is notable and does bear monitoring.
Within this market backdrop, the RBC Funds have produced mixed results over the prior twelve months. For the year ended September 30, 2014, Class I shares of the Microcap Value Fund (+7.39%) and Mid Cap Value Fund (+20.14%) both significantly outperformed their respective benchmarks, the Russell 2000 Value Index (+4.13%) and the Russell Midcap Index (+17.46%), while the Enterprise Fund (-2.36%) and Small Cap Core Fund (+3.29%) trailed the Russell 2000 Index (+3.93%) and SMID Cap Growth Fund (+4.16%) trailed the Russell 2500 Growth Index (+8.05%).
As we look ahead to next year, initial returns in the first fiscal quarter have seen equity markets stumble out of the gate due to a litany of concerns - the sustainability of domestic and global economic growth; continued unrest in the Ukraine and Middle East; health crises such as the Ebola Virus outbreak in Western Africa; Fed monetary policy tightening and rising interest rates – all of which have driven investors to seek more defensive positioning in their portfolios. Despite these potential headwinds, we remain cautiously optimistic regarding the prospects for US equity markets over the next 12-18 months. We believe there are significant green shoots emerging that are supportive of further equity market advancement, the most notable of which is the increasing strength of the US economy. As recent results have demonstrated, the US continues to decouple from much of the rest of the developed world as the sharp, weather influenced -2.0% GDP contraction in the first quarter of 2014 gave way to a 4.6% rebound in the second quarter. This snap back, which represented the fastest rate of economic expansion since the fourth quarter of 2011, reinforces the notion that the US economy may now be reaching escape velocity. Couple the strong GDP result with industrial production in expansionary territory (Institute of Manufacturing, or ISM, manufacturing report registered 56.6% in September) despite industrial capacity utilization remaining at just 78.8%, and the stage is set for, at minimum, continued steady domestic economic expansion. Similarly, the labor market has shown significant signs of improvement as the headline unemployment rate declined from 7.2% a year ago, to 5.9% in September. This represents the lowest level in over six years as the economy has steadily added to the workforce at a rate of approximately 220,000 new jobs per
| ||||||
| 1 |
LETTER FROM THE CHIEF INVESTMENT OFFICER | ||||||
month over the prior 12 months. Labor market improvement, combined with signs of renewed strength in the housing market (new home sales increased 18.0% month/month in August) supports increasing consumer confidence (86.0 in September) and a corresponding wealth affect which has the potential to drive additional consumer spending, which accounts for nearly 75% of GDP.
The downside of these bullish signals however, remains the specter of monetary policy tightening with the Federal Reserve having set expectations to conclude the current bond buying program this fall and targeting 2015 for the first wave of interest rate hikes. While this represents a significant potential headwind for equity markets as seen in the “taper tantrum” of 2013, which saw equity markets plummet on such expectations, we would expect that the Federal Reserve will take a conservative approach to any interest rate hikes to ensure a smooth transition to a more normalized interest rate environment.
While the slow start to fiscal 2015 has undoubtedly induced increased investor skittishness, it has also served to bring valuations, previously considered rich, more in line with historic fair value and thus creating a more attractive investment environment. As stocks have fallen back in line with historic valuation levels, we expect increasing corporate profits, supported by all-time high company profit margins, to be the driver of the next leg of equity market returns. This more normalized market environment, versus the largely momentum or thematic driven results of the prior 12-18 months, should lead to more sustainable equity market returns rooted in earnings growth and strong fundamentals. It is within this dynamic that we believe, headline risks aside, that the patient equity investor will continue to be rewarded in the long term with spikes in volatility or short term market corrections representing buying opportunities.
As always, thank you for your continued confidence and trust in the RBC Funds.
Michael Lee, CFA CEO, President and Chief Investment Officer RBC Global Asset Management (U.S.) Inc.
Past performance is not a guarantee of future results.
Diversification does not assure a profit or protect against a loss in a declining market.
Mutual fund investing involves risk. Principal loss is possible. Investments in smaller companies involve more limited liquidity and greater volatility than larger companies.
Fund holdings and sector allocations are subject to change at any time and should not be considered recommendations to buy or sell any security. Please refer to the Schedule of Investments in this report for a complete list of fund holdings.
|

2 |
LETTER FROM THE CHIEF INVESTMENT OFFICER | ||||||
The information provided herein represents the opinions of the Fund Managers and is not intended to be a forecast of future events, a guarantee of future results, nor investment advice.
The S&P 500 Index is the Standard & Poor’s composite index of 500 stocks, a widely recognized, unmanaged index of common stock prices.
The Russell 3000 Index is an unmanaged index that measures the performance of the largest 3,000 U.S. companies representing approximately 98% of the investable U.S. equity market.
The Russell 1000 Index is an unmanaged index that measures the performance of the large-cap segment of the U.S. equity universe. It is a subset of the Russell 3000® Index and includes approximately 1,000 of the largest securities based on a combination of their market cap and current index membership.
The Russell Midcap Index measures the performance of the mid-cap segment of the U.S. equity universe. It is a subset of the Russell 1000® Index and includes approximately 800 of the smallest securities based on a combination of their market cap and current index membership.
The Russell Midcap Value Index measures the performance of the mid-cap value segment of the U.S. equity universe. It includes those Russell Midcap Index companies with lower price-to-book ratios and lower forecasted growth values.
The Russell 2500 Growth Index measures the performance of the small to mid cap growth segment of the U.S. equity universe. It includes those Russell 2500 Index companies with higher price-to-book ratios and higher forecasted growth values.
The Russell 2000 Index measures the performance of the small-cap segment of the U.S. equity universe. It is a subset of the Russell 3000 Index and represents approximately 10% of the total market capitalization of that index. It includes approximately 2,000 of the smallest securities based on a combination of their market cap and current index membership.
The Russell Microcap Index measures the performance of the microcap segment of the U.S. equity market. Microcap stocks make up less than 3% of the U.S. equity market (by market cap) and consist of the smallest 1,000 securities in the small-cap Russell 2000® Index, plus the next smallest eligible securities by market cap.
The Russell Microcap Value Index measures the performance of the microcap value segment of the U.S. Equity market. It includes those Russell Microcap Index companies with lower price-to-book ratios and lower forecasted growth values.
It is not possible to invest directly in an index.
| ||||||
| 3 |
RBC Global Asset Management (U.S.) Inc. (“RBC GAM (US)”) serves as the investment advisor to the RBC Funds. RBC GAM (US) employs a team approach to the management of the RBC Equity Funds, with no individual team member being solely responsible for the investment decisions.
| ||||||
Lance F. James |
Lance F. James
Managing Director, Senior Portfolio Manager
Lance James is responsible for portfolio management of the RBC Small Cap Core Fund, RBC Enterprise Fund, and RBC Microcap Value Fund. He is also co-manager of RBC Mid Cap Value Fund. Prior to joining RBC GAM (US) in 2006, Lance was an equity analyst and portfolio manager for OFI Institutional and Babson Capital Management, affiliated companies of Mass Mutual Life Insurance Company. During his tenure he served as head of the firm’s small/mid cap value investment team. Prior to joining Babson Capital in 1986, Lance worked at Rockwell International Corporation, EBF Associates of Boston and Hewitt Associates. Lance began his career in the investment industry in 1980. He received an AB in Economics from Princeton University and an MBA in Finance from the Wharton School of Business at the University of Pennsylvania. | |||||
George Prince |
George Prince
Vice President, Portfolio Manager, Senior Equity Analyst
George Prince serves as the co-portfolio manager for the RBC Enterprise Fund. George also provides research support for the RBC Small Cap Core Fund. He joined RBC GAM (US) in 2006 from Eagle Asset Management, where he was a senior equity analyst. Prior to his experience at Eagle Asset Management, George was an analyst at Babson Capital Management. George also has a great deal of entrepreneurial experience and founded SignStorey, a leader in place-based digital communications in retail stores and co-founded Cutting Edge Inc., a global CAD-CAM technology company. George has over 12 years of investment industry experience. He received a BA from Yale University. | |||||
Kenneth A. Tyszko, CPA, CFA |
Kenneth A. Tyszko, CPA, CFA
Managing Director, Senior Portfolio Manager
Ken Tyszko is responsible for portfolio management of the RBC SMID Cap Growth Fund, and is responsible for Small Cap Growth and SMID Cap Growth research and portfolio management at RBC GAM (US). Ken has been in the investment industry since 1984 and has been managing small cap growth and SMID cap growth portfolios since 1988. He joined RBC GAM (US) in 2001. Ken previously served as a portfolio manager for Oberweis Asset Management, ABN AMRO Asset Management (USA) Inc., ABN AMRO Incorporated, and Sears Investment Management Company. His background also includes experience at Main Hurdman, an international accounting and consulting firm. Ken earned a BS in Accountancy from the University of Illinois. He is a CFA charterholder. Ken is a member of the Illinois CPA Society, the CFA Society of Chicago, and the CFA Institute. He has been a guest on Bloomberg Television, Bloomberg Radio, CNBC, and WebFN.
| |||||


4 |
EQUITY PORTFOLIO MANAGERS | ||||||
Stephen E. Kylander
Vice President, Senior Portfolio Manager
Steve Kylander is responsible for portfolio management of the RBC Mid Cap Value Fund. Prior to joining RBC GAM (US) in 2006, he was a portfolio manager and research analyst for Babson Capital Management. Steve’s previous experience also includes strategy consulting, mergers and acquisitions work and investment banking for L.E.K. Consulting, The Yarmouth Group, and First Boston Corporation. He began working in the investment industry in 1986. Steve earned a BA from Dartmouth College and an MBA from Harvard Business School. |
Stephen E. Kylander | |||||

| 5 |
Average Annual Total Returns as of September 30, 2014 (Unaudited)
RBC SMID Cap Growth Fund (a)
| 1 Year | 3 Year | 5 Year | 10 Year | Since Inception(b) | Net Expense Ratio(1)(2) | Gross Expense Ratio(1)(2) | ||||||||||||||||||||||
Class A | ||||||||||||||||||||||||||||
- Including Maximum Sales Charge of 5.75% | (2.06)% | 16.21% | 15.02% | 7.40% | 10.75% | |||||||||||||||||||||||
- At Net Asset Value | 3.90% | 18.54% | 16.39% | 8.04% | 11.03% | 1.14% | 1.47% | |||||||||||||||||||||
Class I | 4.16% | 18.83% | 16.68% | 8.32% | 11.35% | 0.89% | 1.04% | |||||||||||||||||||||
Russell 2500 Growth Index* | 8.05% | 22.68% | 16.85% | 10.10% | 10.36% | |||||||||||||||||||||||
| ||||||||||||||||||||||||||||
| RBC Enterprise Fund (c) | ||||||||||||||||||||||||||||
| 1 Year | 3 Year | 5 Year | 10 Year | Since Inception(d) | Net Expense Ratio(1)(2) | Gross Expense Ratio(1)(2) | ||||||||||||||||||||||
Class A (f) | ||||||||||||||||||||||||||||
- Including Maximum Sales Charge of 5.75% | (8.23)% | 19.47% | 12.72% | 5.95% | 10.47% | |||||||||||||||||||||||
- At Net Asset Value | (2.62)% | 21.85% | 14.07% | 6.58% | 10.68% | 1.33% | 1.75% | |||||||||||||||||||||
Class I (f) | (2.36)% | 22.17% | 14.32% | 6.83% | 10.95% | 1.08% | 1.20% | |||||||||||||||||||||
Russell 2000 Index* | 3.93% | 21.26% | 14.29% | 8.19% | 9.31% | |||||||||||||||||||||||
| ||||||||||||||||||||||||||||
Performance data quoted represents past performance. Past performance is no guarantee of future results. Investment return and principal value of an investment will fluctuate so that an investor’s shares, when redeemed, may be worth more or less than their original cost. Current performance may be lower or higher than performance quoted. Performance shown reflects contractual fee waivers, without such fee waivers total returns would be reduced. Performance information does not reflect the 2% fee on shares redeemed or exchanged within 30 days of purchase. If such redemption fee was included, performance would be reduced. For performance data current to the most recent month-end go to www.rbcgam.us. Please see footnotes beginning on page 8.
6 |
PERFORMANCE SUMMARY |
RBC Small Cap Core Fund (g)
| 1 Year | 3 Year | 5 Year | 10 Year | Since Inception(h) | Net Expense Ratio(1)(2) | Gross Expense Ratio(1)(2) | ||||||||||||||||||||||
Class A (l) | ||||||||||||||||||||||||||||
- Including Maximum Sales Charge of 5.75% | (2.86)% | 18.96% | 14.62% | 7.75% | 10.26% | |||||||||||||||||||||||
- At Net Asset Value | 3.05% | 21.33% | 15.99% | 8.39% | 10.54% | 1.15% | 1.57% | |||||||||||||||||||||
Class I (l) | 3.29% | 21.64% | 16.28% | 8.69% | 10.83% | 0.90% | 1.13% | |||||||||||||||||||||
Russell 2000 Index* | 3.93% | 21.26% | 14.29% | 8.19% | 9.82% | |||||||||||||||||||||||
| RBC Microcap Value Fund (i) | ||||||||||||||||||||||||||||
| 1 Year | 3 Year | 5 Year | 10 Year | Since Inception(j) | Net Expense Ratio(1)(2) | Gross Expense Ratio(1)(2) | ||||||||||||||||||||||
Class A (e) | ||||||||||||||||||||||||||||
- Including Maximum Sales Charge of 5.75% | 0.94% | 21.41% | 14.31% | 7.08% | 9.16% | |||||||||||||||||||||||
- At Net Asset Value | 7.09% | 23.82% | 15.67% | 7.71% | 9.40% | 1.32% | 1.69% | |||||||||||||||||||||
Class I (e) | 7.39% | 24.13% | 15.95% | 7.99% | 9.67% | 1.07% | 1.23% | |||||||||||||||||||||
Russell 2000 Value Index* | 4.13% | 20.61% | 13.02% | 7.25% | 10.01% | |||||||||||||||||||||||
Performance data quoted represents past performance. Past performance is no guarantee of future results. Investment return and principal value of an investment will fluctuate so that an investor’s shares, when redeemed, may be worth more or less than their original cost. Current performance may be lower or higher than performance quoted. Performance shown reflects contractual fee waivers, without such fee waivers total returns would be reduced. Performance information does not reflect the 2% fee on shares redeemed or exchanged within 30 days of purchase. If such redemption fee was included, performance would be reduced. For performance data current to the most recent month-end go to www.rbcgam.us. Please see footnotes beginning on page 8.
| 7 |
PERFORMANCE SUMMARY |
RBC Mid Cap Value Fund
| 1 Year | 3 Year | Since Inception(k) | Net Expense Ratio(1)(2) | Gross Expense Ratio(1)(2) | ||||||||||||||||
Class I | ||||||||||||||||||||
- At Net Asset Value | 20.14% | 26.18% | 16.61% | 0.90% | 3.71% | |||||||||||||||
Russell Midcap Value Index* | 17.46% | 24.72% | 16.95% | |||||||||||||||||
Performance data quoted represents past performance. Past performance is no guarantee of future results. Investment return and principal value of an investment will fluctuate so that an investor’s shares, when redeemed, may be worth more or less than their original cost. Current performance may be lower or higher than performance quoted. Performance shown reflects contractual fee waivers, without such fee waivers total returns would be reduced. Performance information does not reflect the 2% fee on shares redeemed or exchanged within 30 days of purchase. If such redemption fee was included, performance would be reduced. For performance data current to the most recent month-end go to www.rbcgam.us. Please see footnotes below.
(1) The Funds’ expenses reflect the most recent fiscal year-end (September 30, 2014).
(2) The Advisor has contractually agreed to waive fees and/or make payments in order to keep total operating expenses of the Fund to the levels listed under net expense ratio until January 31, 2016. For SMID Cap Growth Fund, effective November 27, 2013, the annual rate under the expense limitation agreement is 1.10% for Class A and 0.85% for Class I. Prior to November 27, 2013, the annual rate was 1.35% for Class A and 1.10% for Class I. The ratio of net expenses to average net assets represents a blended percentage for the period ended September 30, 2014.
*Each of the comparative indices is a widely recognized market value weighted measure of the return of securities, but do not include sales fees or operating expenses. You cannot invest directly in indices.
| (a) | The performance in the table for the period from June 1, 1994 to April 19, 2004 reflects the performance of RBC Mid Cap Equity Fund, the predecessor to RBC SMID Cap Growth Fund. The performance of the Fund also includes the performance of a common trust fund (“CTF”) account advised by RBC GAM (US) (including its predecessor) and managed the same as the Fund in all material respects for the period from December 31, 1990 to June 1, 1994, as adjusted to reflect the full contractual rate of expenses associated with the Fund at its inception. The CTF account was not registered with the SEC under the 1940 Act and therefore was not subject to the investment restrictions imposed by law on registered mutual funds. If the CTF account had been registered, the CTF account’s performance may have been adversely affected. Fund performance reflects applicable fee waivers/expense reimbursements (which, if excluded, would cause performance to be lower). |
| (b) | The since inception date (commencement of operations) of the Fund is December 31, 1990. |
| (c) | The performance in the table for the period from December 2, 1983 to April 19, 2004 reflects the performance of Babson Enterprise Fund, the predecessor to RBC Enterprise Fund. Fund performance reflects applicable fee waivers/expense reimbursements (which, if excluded, would cause performance to be lower). |
| (d) | The since inception date (commencement of operations) of the Fund is December 2, 1983. The performance of the index since inception of the Fund is calculated from November 30, 1983. |
| (e) | Class I shares were previously designated Class S shares prior to November 27, 2012. The inception date of the Fund (Class S) is September 10, 1987. Performance shown for periods prior to the inception date of Class A (April 19, 2004) is based on the performance of Class S shares, adjusted to reflect the fees and expenses and any applicable sales charges of the applicable class. |
| (f) | Performance shown for periods prior to the inception date of Class A (April 19, 2004) and Class I (September 30, 2004) is based on the performance of a class of shares that is no longer offered, adjusted to reflect the fees and expenses and any applicable sales charges of the applicable class. The inception date of the Fund and the prior class of shares is December 2, 1983. |
8 |
PERFORMANCE SUMMARY |
| (g) | The performance in the table for the period from August 5, 1991 to April 19, 2004 reflects the performance of Babson Enterprise Fund II, the predecessor to RBC Small Cap Core Fund. Fund performance reflects applicable fee waivers/expense reimbursements (which, if excluded, would cause performance to be lower). |
| (h) | The since inception date (commencement of operations) of the Fund is August 5, 1991. The performance of the index since inception of the Fund is calculated from July 31, 1991. |
| (i) | The performance in the table for the period from September 10, 1987 to April 19, 2004 reflects the performance of Shadow Stock Fund, the predecessor to RBC Microcap Value Fund. Fund performance reflects applicable fee waivers/expense reimbursements (which, if excluded, would cause performance to be lower). |
| (j) | The since inception date (commencement of operations) of the Fund is September 10, 1987. The performance of the index since inception of the Fund is calculated from August 31, 1987. |
| (k) | The since inception date (commencement of operations) of the Fund is December 31, 2009. The performance of the index since inception of the Fund is calculated from December 31, 2009. |
| (l) | Class I shares were previously designated Class S shares prior to November 27, 2012. The inception date of the Fund (Class S) is August 5, 1991. Performance shown for periods prior to the inception date of Class A (April 19, 2004) is based on the performance of Class S shares, adjusted to reflect the fees and expenses and any applicable sales charges of the applicable class. |
The Russell 2500 Growth Index is an unmanaged index that measures the performance of those Russell 2500 companies with higher price-to-book ratios and higher forecasted growth values.
The Russell 2000 Value Index is an unmanaged index that measures the performance of those Russell 2000 companies with lower price-to-book ratios and lower forecasted growth values.
The Russell 2000 Index is an unmanaged index that measures the performance of approximately 2,000 of the smallest securities in the Russell 3000 Index based on a combination of their market cap and current index membership.
The Russell Midcap Value Index is an unmanaged, market-weighted total return index that tracks the performance of those Russell Midcap companies with lower price-to-book ratios and lower forecasted growth rates.
The Russell Microcap Index is an unmanaged index that measures the performance of 1000 of the smallest securities in the Russell 2000 Index based on a combination of their market cap and current index membership.
| 9 |
MANAGEMENT DISCUSSION AND ANALYSIS (UNAUDITED) | ||||||||
| ||||||||
| Investment Strategy | Seeks long-term growth by primarily investing in high quality, small and mid capitalization companies that display consistent revenue and earnings growth and superior financial characteristics. Utilizing fundamental research, the Fund employs a bottom-up approach and strict risk controls to build a diversified portfolio of stocks that offer above average expected growth with lower than average market risk.
| |||||||
| Performance |
For the year ended September 30, 2014, the Fund had a total return of 4.16% (Class I). That compares to a total return of 8.05% for the Russell 2500 Growth Index, the Fund’s primary benchmark.
| |||||||
Factors That Made Positive Contributions |
• Favorable stock selection in the information technology sector, particularly within the software and IT consulting and services industry, contributed positively to performance.
• Strong security selection in the financial sector also contributed positively to the Fund’s performance.
• The Fund’s underweight position in consumer discretionary, which was the worst performing sector for the period, was also a positive contributor to results during the year.
• Under Armour (athletic apparel), Sigma-Aldrich (specialty chemicals), and Open Text Corporation (enterprise content management software) were the top contributing stocks in the portfolio for the period.
| |||||||
Factors That Detracted From Relative Returns |
• Adverse security selection in the industrials sector detracted from the Fund’s performance.
• Adverse selection in the energy and health care sectors also negatively impacted relative performance.
• The Fund’s modest cash balance in an upward trending market was a headwind during the period.
• The worst contributing stocks in the portfolio were Volcano Corporation (medical devices), LKQ Corporation (automotive replacement parts), and TriMas Corporation (diversified industrial products).
| |||||||
Mutual fund investing involves risk. Principal loss is possible. Investing in small cap companies involves additional risks, including greater fluctuations in value and lack of liquidity. These risks are more fully described in the prospectus. The Fund invests in foreign securities which involve political, economic and currency risks, greater volatility and differences in accounting methods.
| ||||||||
10 |
MANAGEMENT DISCUSSION AND ANALYSIS (UNAUDITED) |
| |||||||||||||||
RBC SMID Cap Growth Fund
| ||||||||||||||||
| Long-term capital appreciation. | Investment Objective | |||||||||||||||
Russell 2500 Growth Index
|
|
Benchmark | ||||||||||||||
|
| Asset Allocation (as of 9/30/14) (% of fund’s investments) & Top Five Industries (as of 9/30/14) (% of fund’s net assets) | ||||||||||||||
Tractor Supply Co. |
|
2.38 |
% |
MWI Veterinary Supply, Inc. |
|
1.75 |
% | Top Ten Holdings (as of 9/30/14) (% of fund’s net assets) | ||||||||
LKQ Corp. | 1.97 | % | United Natural Foods, Inc. | 1.68 | % | |||||||||||
Henry Schein, Inc. | 1.88 | % | PAREXEL International Corp. | 1.66 | % | |||||||||||
Sigma-Aldrich Corp. | 1.84 | % | Open Text Corp. | 1.61 | % | |||||||||||
Raymond James Financial, Inc. | 1.78 | % | ||||||||||||||
Ultimate Software Group, Inc. | 1.75 | % | ||||||||||||||
| A listing of all portfolio holdings can be found beginning on page 20. | ||||||||||||||||
 | Growth of $10,000 Initial Investment Over 10 Years | |||||||||||||||
| The graph reflects an initial investment of $10,000 over a 10 year period and is based on Class I shares. The performance of the Fund for the period from September 30, 2001 to April 19, 2004 reflects the performance of RBC Mid Cap Equity Fund, the predecessor to RBC SMID Cap Growth Fund. The Fund’s total return includes reinvested dividends and capital gains. The Fund’s total return also includes operating expenses that reduce return, while the total return of the index does not. The graph does not reflect the deduction of taxes that a shareholder would pay on fund distributions or redemption of fund shares. Performance of other classes will vary due to differences in fee structures. | ||||||||||||||||
| 11 |
MANAGEMENT DISCUSSION AND TEST ANALYSIS (UNAUDITED) | ||||||||
| ||||||||
| Investment Strategy | Seeks to provide superior long-term growth of capital compared to the Russell 2000 Index while taking a low risk approach to small company investing. The Adviser believes that portfolios of neglected small cap companies with low valuations, long-term attractive business fundamentals and near-term profitability improvement potential should produce strong absolute and risk-adjusted returns over time.
| |||||||
| Performance |
For the year ended September 30, 2014, the Fund had a total return of - 2.36% (Class I). That compares to a total return of 3.93% for the Russell 2000 Index, the Fund’s primary benchmark.
| |||||||
Factors That Made Positive Contributions |
• Favorable stock selection in the industrials sector, especially among machinery companies, was a positive contributor to the Fund’s performance.
• Favorable stock selection in the financial sector, particularly in the banking industry, also contributed positively to the Fund’s relative performance.
| |||||||
Factors That Detracted From Relative Returns |
• The Fund’s relative performance was negatively impacted by an emphasis on microcap stocks, which generally provided lower returns than larger capitalization companies in the small cap index.
• Unfavorable stock selection in the information technology sector, especially among software and consulting companies, detracted from relative returns.
• Adverse sector overweight in the economically-sensitive industrial and consumer discretionary sectors also had a negative impact on the Fund’s relative performance.
| |||||||
Mutual fund investing involves risk. Principal loss is possible. Investing in small cap companies involves additional risks, including greater fluctuations in value and lack of liquidity. These risks are more fully described in the prospectus. Although the Fund does not generally invest in initial public offerings (IPO’s), it has the ability to. Investment in IPO’s typically involve greater price volatility resulting in increased turnover and expenses as well as the potential for taxable gains.
| ||||||||
12 |
MANAGEMENT DISCUSSION AND TEST ANALYSIS (UNAUDITED) |
| |||||||||||||||
RBC Enterprise Fund
| ||||||||||||||||
| Long-term growth of capital and income. | Investment Objective | |||||||||||||||
Russell 2000 Index
|
|
Benchmark | ||||||||||||||
|
| Asset Allocation (as of 9/30/14) (% of fund’s investments) & Top Five Industries (as of 9/30/14) (% of fund’s net assets) | ||||||||||||||
Universal Electronics, Inc. | 4.76 | % | Interactive Intelligence Group, Inc. | 2.46 | % | Top Ten Holdings (as of 9/30/14) (% of fund’s net assets) | ||||||||||
Tyler Technologies, Inc. | 3.77 | % | Tessco Technologies, Inc. | 2.38 | % | |||||||||||
Greenbrier Cos., Inc. (The) | 3.08 | % | US Physical Therapy, Inc. | 2.36 | % | |||||||||||
Compass Diversified Holdings | 2.87 | % | Libbey, Inc. | 2.15 | % | |||||||||||
Columbus McKinnon Corp. | 2.83 | % | ||||||||||||||
AZZ, Inc. | 2.60 | % | ||||||||||||||
A listing of all portfolio holdings can be found beginning on page 23.
|
| |||||||||||||||
 | Growth of $10,000 Initial Investment Over 10 Years | |||||||||||||||
| The graph reflects an initial investment of $10,000 over a 10 year period and is based on Class I shares. The performance of the Fund for the period from September 30, 2001 to April 19, 2004 reflects the performance of Babson Enterprise Fund, the predecessor to RBC Enterprise Fund. Performance shown for periods prior to the inception date of Class I (September 30, 2004) is based on the performance of a class of shares that is no longer offered. The Fund’s total return includes reinvested dividends and capital gains. The Fund’s total return also includes operating expenses that reduce return, while the total return of the index does not. The graph does not reflect the deduction of taxes that a shareholder would pay on fund distributions or redemption of fund shares. Performance of other classes will vary due to differences in fee structures. | ||||||||||||||||

| 13 |
MANAGEMENT DISCUSSION AND ANALYSIS (UNAUDITED) | ||||||||
| ||||||||
| Investment Strategy | Seeks to provide superior long-term growth of capital compared to the Russell 2000 Index while taking a low risk approach to small company investing. The Adviser believes that portfolios of neglected small cap companies with low valuations, long-term attractive business fundamentals and near-term profitability improvement potential should produce strong absolute and risk-adjusted returns over time.
| |||||||
| Performance |
For the year ended September 30, 2014, the Fund had a total return of 3.29% (Class I). That compares to a total return of 3.93% for the Russell 2000 Index, the Fund’s primary benchmark.
| |||||||
Factors That Made Positive Contributions |
• Favorable stock selection in the industrials sector, especially among machinery companies, was a positive contributor to the Funds’ performance.
• Favorable stock selection in the information technology sector, particularly among semiconductor and software companies, was also a positive contributor.
| |||||||
Factors That Detracted From Relative Returns |
• Adverse sector overweight in the economically-sensitive industrial and consumer discretionary sectors had a negative impact on the Fund’s relative performance.
• Unfavorable stock selection in the materials sector, especially in the chemicals industry, detracted from relative returns.
• Adverse stock selection in the health care sector, particularly among health care service companies, was also a negative contributing factor.
| |||||||
Mutual fund investing involves risk. Principal loss is possible. Investing in mid cap, small cap and micro cap companies involves additional risks, including greater fluctuations in value and lack of liquidity. These risks are more fully described in the prospectus. Although the Fund does not generally invest in initial public offerings (IPO’s), it has the ability to. Investment in IPO’s typically involve greater price volatility resulting in increased turnover and expenses as well as the potential for taxable gains.
| ||||||||
14 |
MANAGEMENT DISCUSSION AND ANALYSIS (UNAUDITED) |
| |||||||||||||||
RBC Small Cap Core Fund
| ||||||||||||||||
| Long-term growth of capital and income. | Investment Objective | |||||||||||||||
Russell 2000 Index
|
|
Benchmark | ||||||||||||||
|
| Asset Allocation (as of 9/30/14) (% of fund’s investments) & Top Five Industries (as of 9/30/14) (% of fund’s net assets) | ||||||||||||||
Universal Electronics, Inc. |
|
4.50 |
% |
West Pharmaceutical Services, Inc. |
|
2.30 |
% | Top Ten Holdings (as of 9/30/14) (% of fund’s net assets) | ||||||||
Synchronoss Technologies, Inc. | 3.40 | % | Compass Diversified Holdings | 2.29 | % | |||||||||||
Greenbrier Cos., Inc. (The) | 2.86 | % | AZZ, Inc. | 2.16 | % | |||||||||||
Tyler Technologies, Inc. | 2.85 | % | Columbus McKinnon Corp. | 2.04 | % | |||||||||||
Synaptics, Inc. | 2.60 | % | ||||||||||||||
EnerSys, Inc. | 2.50 | % | ||||||||||||||
| A listing of all portfolio holdings can be found beginning on page 27. | ||||||||||||||||
 | Growth of $10,000 Initial Investment Over 10 Years | |||||||||||||||
| The graph reflects an initial investment of $10,000 over a 10 year period and is based on Class I shares. The Fund’s total return includes reinvested dividends and capital gains. The Fund’s total return also includes operating expenses that reduce return, while the total return of the index does not. The graph does not reflect the deduction of taxes that a shareholder would pay on fund distributions or redemption of fund shares. Performance of other classes will vary due to differences in fee structures. | ||||||||||||||||
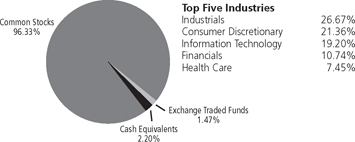
| 15 |
MANAGEMENT DISCUSSION AND ANALYSIS (UNAUDITED) | ||||||||
| ||||||||
| Investment Strategy | Invests in a diversified portfolio of the smallest companies that have been neglected by institutional shareholders. Utilizing a quantitative process to identify value-oriented investments, the Fund strives to achieve long-term growth while offering shareholders some protection from market declines and fluctuations.
| |||||||
| Performance |
For the year ended September 30, 2014, the Fund had a total return of 7.39% (Class I). That compares to a total return of 4.13% for the Russell 2000 Value Index, the Fund’s primary benchmark.
| |||||||
Factors That Made Positive Contributions |
• Favorable stock selection in the industrials sector, particularly in the commercial services and supplies and machinery industries, was a positive contributor to the Fund’s performance.
• Favorable stock selection in the health care sector, especially among pharmaceuticals companies, also was a key factor in the Fund’s performance.
• Another factor that made a positive contribution was favorable stock selection in the energy sector.
| |||||||
Factors That Detracted From Relative Returns |
• Adverse stock selection in the materials sector, especially among chemicals and metals companies, detracted from the Fund’s performance.
• An adverse underweight in the financial sector was also a negative contributor to the Fund’s relative performance.
| |||||||
Mutual fund investing involves risk. Principal loss is possible. Investing in micro cap companies involves additional risks, including greater fluctuations in value and lack of liquidity. These risks are more fully described in the prospectus. Although the Fund does not generally invest in initial public offerings (IPO’s), it has the ability to. Investment in IPO’s typically involve greater price volatility resulting in increased turnover and expenses as well as the potential for taxable gains.
| ||||||||
16 |
MANAGEMENT DISCUSSION AND ANALYSIS (UNAUDITED) |
| |||||||||||||||
RBC Microcap Value Fund
| ||||||||||||||||
| Long-term growth of capital. | Investment Objective | |||||||||||||||
Russell 2000 Value Index
|
|
Benchmark | ||||||||||||||
|
| Asset Allocation (as of 9/30/14) (% of fund’s investments) & Top Five Industries (as of 9/30/14) (% of fund’s net assets) | ||||||||||||||
Federated National Holding Co. |
|
1.18 |
% |
Patrick Industries, Inc. |
|
0.91 |
% | Top Ten Holdings (as of 9/30/14) (% of fund’s net assets) | ||||||||
PAM Transportation Services, Inc. | 1.18 | % | PharMerica Corp. | 0.83 | % | |||||||||||
Methode Electronics, Inc. | 1.01 | % | Strattec Security Corp. | 0.82 | % | |||||||||||
Measurement Specialties, Inc. | 0.93 | % | Allied Motion Technologies, Inc. | 0.80 | % | |||||||||||
REX American Resources Corp. | 0.92 | % | Lydall, Inc. | 0.76 | % | |||||||||||
A listing of all portfolio holdings can be found beginning on page 30.
|
| |||||||||||||||
|
| Growth of $10,000 Initial Investment Over 10 Years | ||||||||||||||
| The graph reflects an initial investment of $10,000 over a 10 year period and is based on Class I shares. The Fund’s total return includes reinvested dividends and capital gains. The Fund’s total return also includes operating expenses that reduce return, while the total return of the index does not. The graph does not reflect the deduction of taxes that a shareholder would pay on fund distributions or redemption of fund shares. Performance of other classes will vary due to differences in fee structures. | ||||||||||||||||
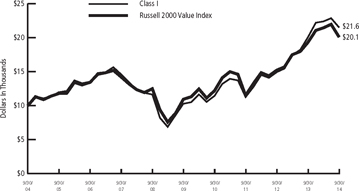
| 17 |
MANAGEMENT DISCUSSION AND ANALYSIS (UNAUDITED) | ||||||||
| ||||||||
| Investment Strategy | Seeks long-term capital appreciation by investing in common stocks of mid-sized companies that are considered to be undervalued in relation to earnings, dividends and/or assets. The Advisor uses a disciplined, bottom-up approach to select stocks for the Fund’s portfolio with a focus on fundamental research and qualitative analysis.
| |||||||
| Performance | For the year ended September 30, 2014, the Fund had a total return of 20.14%. That compares to a total return of 17.46% for the Russell Midcap Value Index, the Fund’s primary benchmark.
| |||||||
Factors That Made Positive Contributions |
• Positive stock selection and an overweight in the information technology sector contributed favorably to the Fund’s performance.
• Stock selection and an underweight in Financials relative to the benchmark, particularly an underweight in REITs, was a positive contributor to the Fund’s performance.
• Stock selection within the Industrials sector also made a positive contribution to the Fund’s relative performance.
| |||||||
Factors That Detracted From Relative Returns |
• The Fund’s stock selections in both the Energy and Materials sectors detracted from the Fund’s relative performance.
• An overweight in the Industrials sector compared to the benchmark also had a negative impact on the Fund’s relative performance.
| |||||||
Mutual fund investing involves risk. Principal loss is possible. Investing in mid cap companies involves additional risks, including greater fluctuations in value and lack of liquidity. These risks are more fully described in the prospectus. Although the Fund does not generally invest in initial public offerings (IPO’s), it has the ability to. Investment in IPO’s typically involve greater price volatility resulting in increased turnover and expenses as well as the potential for taxable gains.
| ||||||||
18 |
MANAGEMENT DISCUSSION AND ANALYSIS (UNAUDITED) |
| |||||||||||||||
RBC Mid Cap Value Fund
| ||||||||||||||||
| Long-term capital appreciation. | Investment Objective | |||||||||||||||
Russell Midcap Value Index
|
|
Benchmark | ||||||||||||||
|
| Asset Allocation (as of 9/30/14) (% of fund’s investments) & Top Five Industries (as of 9/30/14) (% of fund’s net assets) | ||||||||||||||
Hartford Financial Services Group, Inc. (The) |
|
3.40 |
% |
CMS Energy Corp. |
|
2.31 |
% | Top Ten Holdings (as of 9/30/14) (% of fund’s net assets) | ||||||||
NXP Semiconductor NV | 2.96 | % | Huntington Bancshares, Inc. | 2.20 | % | |||||||||||
Skyworks Solutions, Inc. | 2.43 | % | Jarden Corp. | 2.14 | % | |||||||||||
Fifth Third Bancorp | 2.43 | % | HCC Insurance Holdings, Inc. | 2.09 | % | |||||||||||
CIT Group, Inc. | 2.41 | % | Lincoln National Corp. | 2.06 | % | |||||||||||
A listing of all portfolio holdings can be found beginning on page 41.
|
| |||||||||||||||
 | Growth of $10,000 Initial Investment Since Inception (12/31/09) | |||||||||||||||
| The graph reflects an initial investment of $10,000 over the period from December 31, 2009 to September 30, 2014 and is based on Class I shares. The Fund’s total return includes reinvested dividends and capital gains. The Fund’s total return also includes operating expenses that reduce return, while the total return of the index does not. The graph does not reflect the deduction of taxes that a shareholder would pay on fund distributions or redemption of fund shares. | ||||||||||||||||
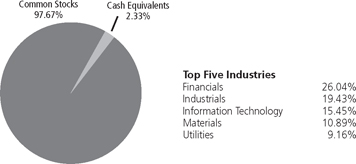
| 19 |
RBC SMID Cap Growth Fund
September 30, 2014
| Shares | Value | |||||
Common Stocks — 98.50% |
| |||||
Consumer Discretionary — 10.74% |
| |||||
15,200 | Dorman Products, Inc.* | $ | 608,912 | |||
26,500 | DSW, Inc., Class A | 797,915 | ||||
6,700 | Fossil Group, Inc.* | 629,130 | ||||
51,020 | LKQ Corp.* | 1,356,622 | ||||
17,800 | Monro Muffler Brake, Inc. | 863,834 | ||||
4,800 | Panera Bread Co., Class A* | 781,056 | ||||
26,600 | Tractor Supply Co. | 1,636,166 | ||||
16,300 | Vitamin Shoppe, Inc.* | 723,557 | ||||
|
| |||||
| 7,397,192 | ||||||
|
| |||||
Consumer Staples — 6.28% |
| |||||
7,900 | Casey’s General Stores, Inc. | 566,430 | ||||
13,800 | Church & Dwight Co., Inc. | 968,208 | ||||
10,500 | PriceSmart, Inc. | 899,220 | ||||
9,100 | TreeHouse Foods, Inc.* | 732,550 | ||||
18,800 | United Natural Foods, Inc.* | 1,155,448 | ||||
|
| |||||
| 4,321,856 | ||||||
|
| |||||
Energy — 3.86% |
| |||||
8,200 | Dril-Quip, Inc.* | 733,080 | ||||
15,480 | Oceaneering International, Inc. | 1,008,831 | ||||
15,600 | Unit Corp.* | 914,940 | ||||
|
| |||||
| 2,656,851 | ||||||
|
| |||||
Financials — 7.97% |
| |||||
5,200 | Affiliated Managers Group, Inc.* | 1,041,872 | ||||
16,000 | Eaton Vance Corp. | 603,680 | ||||
14,200 | First Cash Financial Services, Inc.* | 794,916 | ||||
20,000 | HCC Insurance Holdings, Inc. | 965,800 | ||||
22,900 | Raymond James Financial, Inc. | 1,226,982 | ||||
7,600 | Signature Bank* | 851,656 | ||||
|
| |||||
| 5,484,906 | ||||||
|
| |||||
Health Care — 19.66% |
| |||||
21,200 | Cantel Medical Corp. | 728,856 | ||||
20,340 | Catamaran Corp.* | 857,331 | ||||
15,500 | Cepheid, Inc.* | 682,465 | ||||
12,900 | Charles River Laboratories International, Inc.* | 770,646 | ||||
5,900 | Edwards Lifesciences Corp.* | 602,685 | ||||
11,100 | Henry Schein, Inc.* | 1,292,817 | ||||
8,900 | IDEXX Laboratories, Inc.* | 1,048,687 | ||||
9,300 | Integra LifeSciences Holdings Corp.* | 461,652 | ||||
5,000 | Laboratory Corp of America Holdings* | 508,750 | ||||
4,100 | Mettler-Toledo International, Inc.* | 1,050,133 | ||||
8,100 | MWI Veterinary Supply, Inc.* | 1,202,040 | ||||
20 |
SCHEDULE OF PORTFOLIO INVESTMENTS |
RBC SMID Cap Growth Fund (cont.)
September 30, 2014
| Shares | Value | |||||
18,400 | NuVasive, Inc.* | $ | 641,608 | |||
18,100 | PAREXEL International Corp.* | 1,141,929 | ||||
10,400 | Varian Medical Systems, Inc.* | 833,248 | ||||
2,900 | Volcano Corp.* | 30,856 | ||||
9,300 | Waters Corp.* | 921,816 | ||||
16,900 | West Pharmaceutical Services, Inc. | 756,444 | ||||
|
| |||||
| 13,531,963 | ||||||
|
| |||||
Industrials — 22.19% |
| |||||
5,900 | Alliant Techsystems, Inc. | 753,076 | ||||
10,700 | Chart Industries, Inc.* | 654,091 | ||||
14,800 | Clean Harbors, Inc.* | 798,016 | ||||
23,100 | Copart, Inc.* | 723,377 | ||||
19,740 | Donaldson Co., Inc. | 802,036 | ||||
14,300 | Flowserve Corp. | 1,008,436 | ||||
6,840 | Huron Consulting Group, Inc.* | 417,035 | ||||
10,200 | Jacobs Engineering Group, Inc.* | 497,964 | ||||
11,100 | Landstar System, Inc. | 801,309 | ||||
7,900 | Middleby Corp. (The)* | 696,227 | ||||
11,400 | MSC Industrial Direct Co., Inc., Class A | 974,244 | ||||
15,900 | Portfolio Recovery Associates, Inc.* | 830,457 | ||||
11,000 | Proto Labs, Inc.* | 759,000 | ||||
9,300 | Stericycle, Inc.* | 1,084,008 | ||||
9,200 | Teledyne Technologies, Inc.* | 864,892 | ||||
9,000 | Towers Watson & Co., Class A | 895,500 | ||||
20,600 | TriMas Corp.* | 501,198 | ||||
11,500 | WageWorks, Inc.* | 523,595 | ||||
15,000 | Waste Connections, Inc. | 727,800 | ||||
20,200 | Woodward, Inc. | 961,924 | ||||
|
| |||||
| 15,274,185 | ||||||
|
| |||||
Information Technology — 19.80% |
| |||||
9,320 | ANSYS, Inc.* | 705,244 | ||||
30,800 | Aruba Networks, Inc.* | 664,664 | ||||
19,510 | Autodesk, Inc.* | 1,075,001 | ||||
21,200 | Bottomline Technologies (de), Inc.* | 584,908 | ||||
24,300 | Cardtronics, Inc.* | 855,360 | ||||
6,400 | F5 Networks, Inc.* | 759,936 | ||||
14,400 | Global Payments, Inc. | 1,006,272 | ||||
13,200 | Informatica Corp.* | 451,968 | ||||
9,000 | Mercadolibre, Inc. | 977,850 | ||||
15,350 | Microchip Technology, Inc. | 724,981 | ||||
16,450 | National Instruments Corp. | 508,799 | ||||
20,000 | Open Text Corp. | 1,108,400 | ||||
36,700 | Riverbed Technology, Inc.* | 680,601 | ||||
9,100 | SPS Commerce, Inc.* | 483,665 | ||||
22,100 | Synopsys, Inc.* | 877,259 | ||||
| 21 |
SCHEDULE OF PORTFOLIO INVESTMENTS |
RBC SMID Cap Growth Fund (cont.)
September 30, 2014
| Shares | Value | |||||
8,500 | Ultimate Software Group, Inc. (The)* | $ | 1,202,836 | |||
8,700 | WEX, Inc.* | 959,784 | ||||
|
| |||||
| 13,627,528 | ||||||
|
| |||||
Materials — 8.00% |
| |||||
10,000 | Airgas, Inc. | 1,106,500 | ||||
14,000 | AptarGroup, Inc. | 849,800 | ||||
18,600 | Balchem Corp. | 1,052,202 | ||||
15,200 | HB Fuller Co. | 603,440 | ||||
9,200 | Reliance Steel & Aluminum Co. | 629,280 | ||||
9,300 | Sigma-Aldrich Corp. | 1,264,893 | ||||
|
| |||||
| 5,506,115 | ||||||
|
| |||||
Total Common Stocks | 67,800,596 | |||||
|
| |||||
(Cost $44,543,784) |
| |||||
Investment Company — 1.46% |
| |||||
1,000,893 | JPMorgan Prime Money Market Fund, Institutional Class | 1,000,893 | ||||
|
| |||||
Total Investment Company | 1,000,893 | |||||
|
| |||||
(Cost $1,000,893) |
| |||||
Total Investments | $ | 68,801,489 | ||||
(Cost $45,544,677)(a) — 99.96% |
| |||||
Other assets in excess of liabilities — 0.04% | 30,289 | |||||
|
| |||||
NET ASSETS — 100.00% | $ | 68,831,778 | ||||
|
| |||||
| * | Non-income producing security. |
| (a) | See notes to financial statements for the tax cost of securities and the breakdown of unrealized appreciation (depreciation). |
See notes to financial statements.
22 |
SCHEDULE OF PORTFOLIO INVESTMENTS |
RBC Enterprise Fund
September 30, 2014
| Shares | Value | |||||
Common Stocks — 98.14% |
| |||||
Consumer Discretionary — 20.74% |
| |||||
147,243 | Bridgepoint Education, Inc.* | $ | 1,643,232 | |||
85,938 | Delta Apparel, Inc.* | 781,176 | ||||
42,200 | Destination Maternity Corp. | 651,568 | ||||
456,618 | Destination XL Group, Inc.* | 2,155,237 | ||||
61,000 | Grand Canyon Education, Inc.* | 2,486,970 | ||||
67,600 | Jason Industries, Inc.* | 699,660 | ||||
89,100 | Kona Grill, Inc.* | 1,757,943 | ||||
103,700 | Libbey, Inc.* | 2,723,162 | ||||
46,000 | Malibu Boats, Inc., Class A* | 851,920 | ||||
23,100 | Red Robin Gourmet Burgers, Inc.* | 1,314,390 | ||||
158,800 | Smith & Wesson Holding Corp.* | 1,499,072 | ||||
32,500 | Sodastream International Ltd.* | 958,425 | ||||
150,670 | Tandy Leather Factory, Inc. | 1,423,831 | ||||
122,300 | Universal Electronics, Inc.* | 6,037,951 | ||||
240,300 | ZAGG, Inc.* | 1,340,874 | ||||
|
| |||||
| 26,325,411 | ||||||
|
| |||||
Consumer Staples — 0.86% |
| |||||
33,600 | John B Sanfilippo & Son, Inc. | 1,087,296 | ||||
|
| |||||
Energy — 5.40% |
| |||||
82,800 | Callon Petroleum Co.* | 729,468 | ||||
117,800 | Emerald Oil, Inc.* | 724,470 | ||||
32,108 | Geospace Technologies Corp.* | 1,128,596 | ||||
32,000 | Gulfport Energy Corp.* | 1,708,800 | ||||
115,600 | Ring Energy, Inc.* | 1,703,944 | ||||
70,900 | Synergy Resources Corp.* | 864,271 | ||||
|
| |||||
| 6,859,549 | ||||||
|
| |||||
Financials — 12.13% |
| |||||
205,300 | Asta Funding, Inc.* | 1,685,513 | ||||
27,700 | Atlas Financial Holdings, Inc.* | 383,368 | ||||
70,900 | Boston Private Financial Holdings, Inc. | 878,451 | ||||
91,059 | CoBiz Financial, Inc. | 1,018,040 | ||||
207,900 | Compass Diversified Holdings | 3,640,329 | ||||
22,234 | East West Bancorp, Inc. | 755,956 | ||||
58,900 | Gain Capital Holdings, Inc. | 375,193 | ||||
164,200 | Gramercy Property Trust, Inc. REIT | 945,792 | ||||
27,323 | Heritage Financial Corp. | 432,796 | ||||
57,400 | LaSalle Hotel Properties REIT | 1,965,376 | ||||
27,626 | Mercantile Bank Corp. | 526,275 | ||||
11,100 | National Interstate Corp. | 309,690 | ||||
71,174 | Northrim BanCorp, Inc. | 1,881,129 | ||||
74,400 | Performant Financial Corp.* | 601,152 | ||||
|
| |||||
| 15,399,060 | ||||||
|
| |||||
| 23 |
SCHEDULE OF PORTFOLIO INVESTMENTS |
RBC Enterprise Fund (cont.)
September 30, 2014
| Shares | Value | |||||
Health Care — 7.66% |
| |||||
274,000 | BioScrip, Inc.* | $ | 1,893,340 | |||
82,900 | Exactech, Inc.* | 1,897,581 | ||||
96,000 | iCAD, Inc.* | 945,600 | ||||
18,800 | Meridian Bioscience, Inc. | 332,572 | ||||
211,600 | Streamline Health Solutions, Inc.* | 979,708 | ||||
36,900 | SurModics, Inc.* | 670,104 | ||||
84,800 | US Physical Therapy, Inc. | 3,001,072 | ||||
|
| |||||
| 9,719,977 | ||||||
|
| |||||
Industrials — 25.26% |
| |||||
39,500 | Acacia Research Corp. | 611,460 | ||||
99,900 | Air Transport Services Group, Inc.* | 727,272 | ||||
111,456 | Allied Defense Group, Inc. (The)*(a)(b)(c) | 8,916 | ||||
79,000 | AZZ, Inc. | 3,299,830 | ||||
163,525 | Columbus McKinnon Corp. | 3,595,915 | ||||
16,335 | CTPartners Executive Search, Inc.* | 254,663 | ||||
63,400 | Ducommun, Inc.* | 1,737,794 | ||||
130,200 | Ennis, Inc. | 1,714,734 | ||||
69,000 | GP Strategies Corp.* | 1,981,680 | ||||
14,900 | Graham Corp. | 428,375 | ||||
53,300 | Greenbrier Cos., Inc. (The) | 3,911,154 | ||||
223,300 | Hudson Technologies, Inc.* | 739,123 | ||||
32,300 | Marten Transport Ltd. | 575,263 | ||||
32,800 | Mistras Group, Inc.* | 669,120 | ||||
80,800 | NN, Inc. | 2,158,976 | ||||
32,725 | Old Dominion Freight Line, Inc.* | 2,311,694 | ||||
50,900 | Orion Marine Group, Inc.* | 507,982 | ||||
38,000 | Patrick Industries, Inc.* | 1,609,680 | ||||
155,300 | PGT, Inc.* | 1,447,396 | ||||
76,800 | Sparton Corp.* | 1,893,120 | ||||
50,150 | Sun Hydraulics Corp. | 1,885,139 | ||||
|
| |||||
| 32,069,286 | ||||||
|
| |||||
Information Technology — 17.54% |
| |||||
22,382 | Aspen Technology, Inc.* | 844,249 | ||||
111,774 | Computer Task Group, Inc. | 1,240,691 | ||||
38,900 | comScore, Inc.* | 1,416,349 | ||||
275,300 | CYREN Ltd.* | 602,907 | ||||
307,700 | Glu Mobile, Inc.* | 1,590,809 | ||||
61,300 | GSI Group, Inc.* | 704,337 | ||||
74,800 | Interactive Intelligence Group, Inc.* | 3,126,640 | ||||
135,900 | KEYW Holding Corp. (The)* | 1,504,413 | ||||
68,500 | NIC, Inc. | 1,179,570 | ||||
67,300 | RMG Networks Holding Corp.* | 111,045 | ||||
111,100 | Sapiens International Corp.* | 822,140 | ||||
104,342 | Tessco Technologies, Inc. | 3,024,875 | ||||
54,100 | Tyler Technologies, Inc.* | 4,782,440 | ||||
24 |
SCHEDULE OF PORTFOLIO INVESTMENTS |
RBC Enterprise Fund (cont.)
September 30, 2014
| Shares | Value | |||||
87,675 | Vishay Precision Group, Inc.* | $ | 1,309,865 | |||
|
| |||||
| 22,260,330 | ||||||
|
| |||||
Materials — 6.40% |
| |||||
56,116 | Intertape Polymer Group, Inc. | 813,682 | ||||
58,400 | Koppers Holdings, Inc. | 1,936,544 | ||||
108,600 | Landec Corp.* | 1,330,350 | ||||
264,900 | OMNOVA Solutions, Inc.* | 1,422,513 | ||||
99,588 | Universal Stainless & Alloy Products, Inc.* | 2,625,140 | ||||
|
| |||||
| 8,128,229 | ||||||
|
| |||||
Telecommunication Services — 0.78% |
| |||||
42,200 | magicJack Vocaltec Ltd.* | 415,670 | ||||
385,700 | Towerstream Corp.* | 570,836 | ||||
|
| |||||
| 986,506 | ||||||
|
| |||||
Utilities — 1.37% |
| |||||
55,800 | Unitil Corp. | 1,734,822 | ||||
|
| |||||
Total Common Stocks | 124,570,466 | |||||
|
| |||||
(Cost $82,717,364) | ||||||
Rights/Warrants — 0.05% |
| |||||
6,203 | US Concrete, Inc. Warrants, Expire 8/31/17* | 42,490 | ||||
6,203 | US Concrete, Inc., Class B Warrants, Expire 8/31/17* | 28,534 | ||||
|
| |||||
Total Rights/Warrants | 71,024 | |||||
|
| |||||
(Cost $0) | ||||||
Exchange Traded Funds — 1.45% |
| |||||
48,600 | SPDR S&P Regional Banking | 1,839,996 | ||||
|
| |||||
Total Exchange Traded Funds | 1,839,996 | |||||
|
| |||||
(Cost $1,453,084) | ||||||
Investment Company — 1.06% |
| |||||
1,345,898 | JPMorgan Prime Money Market Fund, Institutional Class | 1,345,898 | ||||
|
| |||||
Total Investment Company | 1,345,898 | |||||
|
| |||||
(Cost $1,345,898) | ||||||
Total Investments | $ | 127,827,384 | ||||
(Cost $85,516,346)(d) — 100.70% | ||||||
Liabilities in excess of other assets — (0.70)% | (890,877 | ) | ||||
|
| |||||
NET ASSETS — 100.00% | $ | 126,936,507 | ||||
|
| |||||
| 25 |
SCHEDULE OF PORTFOLIO INVESTMENTS |
RBC Enterprise Fund (cont.)
September 30, 2014
| * | Non-income producing security. |
| (a) | Security delisted or issuer in bankruptcy. |
| (b) | The Pricing Committee has fair valued this security under procedures established by the Fund’s Board of Trustees. |
| (c) | This security is considered illiquid as to its marketability. |
| The total investment in restricted and illiquid securities representing $8,916 or 0.01% of net assets were as follows: |
Acquisition Shares | Issuer | Acquisition Date | Acquisition Cost | 9/30/14 Carrying Value Per Unit | ||||||||
111,456 | Allied Defense Group, Inc. (The) | 12/24/2013 | $— | $0.08 | ||||||||
| (d) | See notes to financial statements for the tax cost of securities and the breakdown of unrealized appreciation (depreciation). |
Abbreviations used are defined below:
REIT - Real Estate Investment Trust
See notes to financial statements.
26 |
SCHEDULE OF PORTFOLIO INVESTMENTS |
RBC Small Cap Core Fund
September 30, 2014
| Shares | Value | |||||
Common Stocks — 95.78% |
| |||||
Consumer Discretionary — 21.36% |
| |||||
41,500 | Core-Mark Holding Co., Inc. | $ | 2,201,160 | |||
63,800 | Destination Maternity Corp. | 985,072 | ||||
586,000 | Destination XL Group, Inc.* | 2,765,920 | ||||
71,600 | Drew Industries, Inc. | 3,020,804 | ||||
175,900 | Fox Factory Holding Corp.* | 2,726,450 | ||||
77,400 | Grand Canyon Education, Inc.* | 3,155,598 | ||||
67,240 | Helen of Troy Ltd.* | 3,531,445 | ||||
70,100 | Kona Grill, Inc.* | 1,383,073 | ||||
166,100 | Libbey, Inc.* | 4,361,786 | ||||
75,700 | Malibu Boats, Inc., Class A* | 1,401,964 | ||||
110,500 | Performance Sports Group Ltd.* | 1,775,735 | ||||
282,800 | Smith & Wesson Holding Corp.* | 2,669,632 | ||||
42,800 | Sodastream International Ltd.* | 1,262,172 | ||||
80,962 | Steven Madden Ltd.* | 2,609,405 | ||||
198,823 | Universal Electronics, Inc.* | 9,815,891 | ||||
64,200 | Vera Bradley, Inc.* | 1,327,656 | ||||
282,700 | ZAGG, Inc.* | 1,577,466 | ||||
|
| |||||
| 46,571,229 | ||||||
|
| |||||
Energy — 5.15% |
| |||||
39,700 | Geospace Technologies Corp.* | 1,395,455 | ||||
73,900 | Gulfport Energy Corp.* | 3,946,260 | ||||
211,400 | Ring Energy, Inc.* | 3,116,036 | ||||
108,700 | RSP Permian, Inc.* | 2,778,372 | ||||
|
| |||||
| 11,236,123 | ||||||
|
| |||||
Financials — 10.74% |
| |||||
93,300 | AMERISAFE, Inc. | 3,648,963 | ||||
19,400 | AmTrust Financial Services, Inc. | 772,508 | ||||
12,800 | BancFirst Corp. | 800,768 | ||||
59,800 | Chemical Financial Corp. | 1,608,022 | ||||
37,900 | Community Bank System, Inc. | 1,273,061 | ||||
285,300 | Compass Diversified Holdings | 4,995,603 | ||||
87,500 | FXCM, Inc., Class A | 1,386,875 | ||||
362,800 | Gramercy Property Trust, Inc. REIT | 2,089,728 | ||||
59,000 | LaSalle Hotel Properties REIT | 2,020,160 | ||||
63,400 | ProAssurance Corp. | 2,794,038 | ||||
110,100 | Safeguard Scientifics, Inc.* | 2,025,840 | ||||
|
| |||||
| 23,415,566 | ||||||
|
| |||||
Health Care — 7.45% |
| |||||
21,300 | Analogic Corp. | 1,362,348 | ||||
91,500 | Bio-Reference Labs, Inc.* | 2,567,490 | ||||
377,600 | BioScrip, Inc.* | 2,609,216 | ||||
37,600 | Hanger, Inc.* | 771,552 | ||||
65,200 | Masimo Corp.* | 1,387,456 | ||||
| 27 |
SCHEDULE OF PORTFOLIO INVESTMENTS |
RBC Small Cap Core Fund (cont.)
September 30, 2014
| Shares | Value | |||||
71,600 | US Physical Therapy, Inc. | $ | 2,533,924 | |||
112,100 | West Pharmaceutical Services, Inc. | 5,017,596 | ||||
|
| |||||
| 16,249,582 | ||||||
|
| |||||
Industrials — 26.67% |
| |||||
391,700 | ACCO Brands Corp.* | 2,702,730 | ||||
90,704 | Astronics Corp.* | 4,324,767 | ||||
112,622 | AZZ, Inc. | 4,704,221 | ||||
202,000 | Columbus McKinnon Corp. | 4,441,980 | ||||
91,700 | Ducommun, Inc.* | 2,513,497 | ||||
93,000 | EnerSys, Inc. | 5,453,520 | ||||
123,428 | GP Strategies Corp.* | 3,544,852 | ||||
24,200 | Graham Corp. | 695,750 | ||||
84,900 | Greenbrier Cos., Inc. (The) | 6,229,962 | ||||
83,100 | Hillenbrand, Inc. | 2,566,959 | ||||
112,000 | Insteel Industries, Inc. | 2,302,720 | ||||
145,700 | Interface, Inc. | 2,351,598 | ||||
41,900 | Mistras Group, Inc.* | 854,760 | ||||
43,350 | Old Dominion Freight Line, Inc.* | 3,062,244 | ||||
72,000 | Patrick Industries, Inc.* | 3,049,920 | ||||
23,400 | Powell Industries, Inc. | 956,124 | ||||
113,500 | Primoris Services Corp. | 3,046,340 | ||||
56,500 | Sun Hydraulics Corp. | 2,123,835 | ||||
40,000 | Wabtec Corp. | 3,241,600 | ||||
|
| |||||
| 58,167,379 | ||||||
|
| |||||
Information Technology — 19.20% |
| |||||
76,639 | Computer Task Group, Inc. | 850,693 | ||||
81,200 | Interactive Intelligence Group, Inc.* | 3,394,160 | ||||
62,000 | InterDigital, Inc. | 2,468,840 | ||||
44,500 | InvenSense, Inc.* | 877,985 | ||||
126,600 | KEYW Holding Corp. (The)* | 1,401,462 | ||||
119,600 | NIC, Inc. | 2,059,512 | ||||
74,600 | Skyworks Solutions, Inc. | 4,330,530 | ||||
77,600 | Synaptics, Inc.* | 5,680,320 | ||||
162,000 | Synchronoss Technologies, Inc.* | 7,416,360 | ||||
171,300 | Take-Two Interactive Software, Inc.* | 3,951,891 | ||||
111,200 | Tessco Technologies, Inc. | 3,223,688 | ||||
70,400 | Tyler Technologies, Inc.* | 6,223,360 | ||||
|
| |||||
| 41,878,801 | ||||||
|
| |||||
Materials — 4.11% |
| |||||
145,500 | FutureFuel Corp. | 1,729,995 | ||||
73,489 | Koppers Holdings, Inc. | 2,436,895 | ||||
88,200 | Landec Corp.* | 1,080,450 | ||||
311,500 | OMNOVA Solutions, Inc.* | 1,672,755 | ||||
77,091 | Universal Stainless & Alloy Products, Inc.* | 2,032,119 | ||||
|
| |||||
| 8,952,214 | ||||||
|
| |||||
28 |
SCHEDULE OF PORTFOLIO INVESTMENTS |
RBC Small Cap Core Fund (cont.)
September 30, 2014
| Shares | Value | |||||
Utilities — 1.10% | ||||||
51,500 | Laclede Group, Inc. (The) | $ | 2,389,600 | |||
|
| |||||
Total Common Stocks | 208,860,494 | |||||
|
| |||||
(Cost $173,398,608) | ||||||
Exchange Traded Funds — 1.46% | ||||||
29,100 | iShares Russell 2000 Index Fund | 3,182,085 | ||||
|
| |||||
Total Exchange Traded Funds | 3,182,085 | |||||
|
| |||||
(Cost $2,752,368) | ||||||
Investment Company — 2.19% | ||||||
4,779,904 | JPMorgan Prime Money Market Fund, Institutional Class | 4,779,904 | ||||
|
| |||||
Total Investment Company | 4,779,904 | |||||
|
| |||||
(Cost $4,779,904) | ||||||
Total Investments | $ | 216,822,483 | ||||
(Cost $180,930,880)(a) — 99.43% | ||||||
Other assets in excess of liabilities — 0.57% | 1,252,261 | |||||
|
| |||||
NET ASSETS — 100.00% | $ | 218,074,744 | ||||
|
| |||||
| * | Non-income producing security. |
| (a) | See notes to financial statements for the tax cost of securities and the breakdown of unrealized appreciation (depreciation). |
Abbreviations used are defined below:
REIT - Real Estate Investment Trust
See notes to financial statements.
| 29 |
SCHEDULE OF PORTFOLIO INVESTMENTS |
RBC Microcap Value Fund
September 30, 2014
| Shares | Value | |||||
Common Stocks — 92.38% |
| |||||
Consumer Discretionary — 17.85% |
| |||||
15,000 | ALCO Stores, Inc.* | $ | 30,000 | |||
3,725 | Ambassadors International, Inc.* | 28 | ||||
18,000 | Ambow Education Holding Ltd. ADR* | 1,260 | ||||
11,900 | America’s Car-Mart, Inc.* | 471,121 | ||||
6,400 | Arctic Cat, Inc. | 222,848 | ||||
700 | Biglari Holdings, Inc.* | 237,832 | ||||
8,600 | Blyth, Inc. | 69,832 | ||||
37,800 | Books-A-Million, Inc.* | 64,260 | ||||
13,427 | Bowl America, Inc., Class A | 197,377 | ||||
11,800 | Brown Shoe Co., Inc. | 320,134 | ||||
41,800 | Build-A-Bear Workshop, Inc.* | 546,744 | ||||
39,200 | Carriage Services, Inc. | 679,336 | ||||
17,800 | Core-Mark Holding Co., Inc. | 944,112 | ||||
29,600 | CSS Industries, Inc. | 717,800 | ||||
30,200 | Delta Apparel, Inc.* | 274,518 | ||||
12,800 | E.W. Scripps Co. (The), Class A* | 208,768 | ||||
33,500 | Entercom Communications Corp., Class A* | 269,005 | ||||
22,400 | Flexsteel Industries, Inc. | 755,552 | ||||
32,600 | Fred’s, Inc., Class A | 456,400 | ||||
11,400 | Haverty Furniture Cos., Inc. | 248,406 | ||||
12,800 | Helen of Troy Ltd.* | 672,256 | ||||
44,400 | hhgregg, Inc.* | 280,164 | ||||
27,100 | Hooker Furniture Corp. | 412,191 | ||||
46,300 | Isle of Capri Casinos, Inc.* | 347,250 | ||||
10,500 | JAKKS Pacific, Inc.* | 74,550 | ||||
20,500 | Johnson Outdoors, Inc., Class A | 530,950 | ||||
82,000 | Journal Communications, Inc., Class A* | 691,260 | ||||
23,500 | Kid Brands, Inc.* | 47 | ||||
47,910 | Lakeland Industries, Inc.* | 332,975 | ||||
95,270 | Lazare Kaplan International, Inc.* | 133,378 | ||||
15,700 | La-Z-Boy, Inc. | 310,703 | ||||
25,400 | Leapfrog Enterprises, Inc.* | 152,146 | ||||
28,300 | Lifetime Brands, Inc. | 433,273 | ||||
42,500 | Luby’s, Inc.* | 226,100 | ||||
10,000 | M/I Homes, Inc.* | 198,200 | ||||
45,900 | Marcus Corp. (The) | 725,220 | ||||
22,300 | MarineMax, Inc.* | 375,755 | ||||
2,140 | Matthews International Corp., Class A | 93,924 | ||||
7,500 | McRae Industries, Inc., Class A | 206,250 | ||||
22,600 | Media General, Inc.* | 296,286 | ||||
21,300 | Mestek, Inc.* | 410,238 | ||||
17,400 | Modine Manufacturing Co.* | 206,538 | ||||
14,300 | Movado Group, Inc. | 472,758 | ||||
4,700 | NACCO Industries, Inc., Class A | 233,731 | ||||
28,200 | Nautilus, Inc.* | 337,554 | ||||
10,300 | Nobility Homes, Inc.* | 108,150 | ||||
30 |
SCHEDULE OF PORTFOLIO INVESTMENTS |
RBC Microcap Value Fund (cont.)
September 30, 2014
| Shares | Value | |||||
41,000 | Orleans Homebuilders, Inc.*(a)(b)(c) | $ | 0 | |||
16,350 | Perry Ellis International, Inc.* | 332,723 | ||||
119,400 | Point.360* | 62,088 | ||||
41,200 | Radio One, Inc., Class D* | 131,016 | ||||
51,900 | Red Lion Hotels Corp.* | 295,311 | ||||
18,150 | REX American Resources Corp.* | 1,322,772 | ||||
35,200 | Rocky Brands, Inc. | 495,968 | ||||
61,500 | Ruby Tuesday, Inc.* | 362,235 | ||||
15,700 | Saga Communications, Inc., Class A | 527,206 | ||||
39,150 | Salem Communications Corp., Class A | 297,931 | ||||
39,000 | Shiloh Industries, Inc.* | 663,390 | ||||
82 | Sizmek, Inc.* | 635 | ||||
22,300 | Stage Stores, Inc. | 381,553 | ||||
21,800 | Standard Motor Products, Inc. | 750,574 | ||||
28,900 | Stein Mart, Inc. | 333,795 | ||||
16,900 | Stoneridge, Inc.* | 190,463 | ||||
14,600 | Strattec Security Corp. | 1,187,710 | ||||
29,500 | Superior Industries International, Inc. | 517,135 | ||||
28,200 | Systemax, Inc.* | 351,654 | ||||
65,200 | Trans World Entertainment Corp. | 238,632 | ||||
19,000 | TravelCenters of America LLC* | 187,720 | ||||
32,100 | Tuesday Morning Corp.* | 622,901 | ||||
32,100 | Unifi, Inc.* | 831,390 | ||||
30,000 | Universal Travel Group*(a)(b)(c) | 0 | ||||
45,600 | VOXX International Corp.* | 424,080 | ||||
1,397 | Walking Co. Holdings, Inc. (The) | 10,477 | ||||
11,000 | Weyco Group, Inc. | 276,210 | ||||
|
| |||||
| 25,772,749 | ||||||
|
| |||||
Consumer Staples — 2.63% |
| |||||
7,350 | Andersons, Inc. (The) | 462,168 | ||||
53,200 | Central Garden and Pet Co.* | 412,300 | ||||
16,700 | Chiquita Brands International, Inc.* | 237,140 | ||||
25,800 | Ingles Markets, Inc., Class A | 611,202 | ||||
12,200 | Oil-Dri Corp. of America | 318,054 | ||||
69,500 | Omega Protein Corp.* | 868,750 | ||||
39,200 | Roundy’s, Inc. | 117,208 | ||||
73,000 | Royal Hawaiian Orchards LP* | 195,640 | ||||
29,640 | SpartanNash Co. | 576,498 | ||||
| �� |
|
| ||||
| 3,798,960 | ||||||
|
| |||||
Energy — 3.06% |
| |||||
9,200 | Basic Energy Services, Inc.* | 199,548 | ||||
38,900 | Callon Petroleum Co.* | 342,709 | ||||
7,300 | Calumet Specialty Products Partners LP | 200,385 | ||||
12,300 | Constellation Energy Partners LLC* | 43,788 | ||||
7,500 | Global Partners LP | 312,525 | ||||
22,600 | Harvest Natural Resources, Inc.* | 82,942 | ||||
| 31 |
SCHEDULE OF PORTFOLIO INVESTMENTS |
RBC Microcap Value Fund (cont.)
September 30, 2014
| Shares | Value | |||||
27,900 | Knightsbridge Tankers Ltd. | $ | 246,915 | |||
19,300 | Natural Gas Services Group, Inc.* | 464,551 | ||||
26,800 | Newpark Resources, Inc.* | 333,392 | ||||
9,800 | Niska Gas Storage Partners LLC | 122,304 | ||||
53,100 | North American Energy Partners, Inc. | 341,964 | ||||
14,600 | PHI, Inc.* | 601,228 | ||||
11,900 | PHI, Inc., Non voting* | 489,685 | ||||
7,200 | Rose Rock Midstream LP | 425,880 | ||||
14,700 | Swift Energy Co.* | 141,120 | ||||
17,600 | Teekay Tankers, Ltd., Class A | 65,648 | ||||
110,300 | Trico Marine Services, Inc.*(a)(b)(c) | 0 | ||||
|
| |||||
| 4,414,584 | ||||||
|
| |||||
Financials — 23.37% |
| |||||
39,150 | Affirmative Insurance Holdings, Inc.* | 78,300 | ||||
12,800 | AG Mortgage Investment Trust, Inc. REIT | 227,840 | ||||
10,600 | Agree Realty Corp. REIT | 290,228 | ||||
24,000 | American Equity Investment Life Holding Co. | 549,120 | ||||
14,970 | American Independence Corp.* | 157,484 | ||||
29,990 | Ameris Bancorp | 658,281 | ||||
21,800 | Apollo Commercial Real Estate Finance, Inc. REIT | 342,478 | ||||
13,600 | Apollo Residential Mortgage, Inc. REIT | 209,848 | ||||
40,600 | Arbor Realty Trust, Inc. REIT | 273,644 | ||||
15,300 | Ares Commercial Real Estate Corp. REIT | 178,857 | ||||
8,100 | Arlington Asset Investment Corp., Class A | 205,821 | ||||
59,500 | Asta Funding, Inc.* | 488,495 | ||||
17,400 | Baldwin & Lyons, Inc., Class B | 429,780 | ||||
40,700 | Banc of California, Inc. | 473,341 | ||||
12,400 | Banco Latinoamericano de Comercio Exterior SA | 380,432 | ||||
49,900 | Bancorp, Inc.* | 428,641 | ||||
7,028 | Banner Corp. | 270,367 | ||||
100,000 | Beverly Hills Bancorp, Inc.* | 260 | ||||
33,600 | California First National Bancorp | 498,624 | ||||
4,211 | Capital Bank Financial Corp., Class A* | 100,559 | ||||
38,000 | Capitol Bancorp Ltd.*(a)(b)(c) | 0 | ||||
37,100 | Cedar Realty Trust, Inc. REIT | 218,890 | ||||
6,580 | CIM Commercial Trust Corp. REIT | 145,286 | ||||
49,950 | Citizens, Inc.* | 322,677 | ||||
101,200 | Consumer Portfolio Services* | 648,692 | ||||
15,756 | Cowen Group, Inc., Class A* | 59,085 | ||||
35,777 | Donegal Group, Inc., Class A | 549,535 | ||||
8,444 | Donegal Group, Inc., Class B | 180,955 | ||||
59,540 | Dynex Capital, Inc. REIT | 481,083 | ||||
22,700 | EMC Insurance Group, Inc. | 655,576 | ||||
24,800 | Federal Agricultural Mortgage Corp., Class C | 797,072 | ||||
60,900 | Federated National Holding Co. | 1,710,681 | ||||
29,500 | First Defiance Financial Corp. | 796,795 | ||||
9,400 | First Financial Corp. | 290,930 | ||||
32 |
SCHEDULE OF PORTFOLIO INVESTMENTS |
RBC Microcap Value Fund (cont.)
September 30, 2014
| Shares | Value | |||||
41,200 | First Merchants Corp. | $ | 832,652 | |||
38,000 | First Place Financial Corp.*(a)(b)(c) | 4 | ||||
42,000 | First State Bancorporation*(a)(b)(c) | 0 | ||||
660 | Flagstar Bancorp, Inc.* | 11,108 | ||||
2,250 | FRMO Corp.* | 20,250 | ||||
19,700 | Gain Capital Holdings, Inc. | 125,489 | ||||
11,200 | Getty Realty Corp. REIT | 190,400 | ||||
7,100 | Guaranty Bancorp. | 95,921 | ||||
33,300 | HF Financial Corp. | 447,552 | ||||
6,040 | HomeTrust Bancshares, Inc.* | 88,244 | ||||
9,459 | Hudson Valley Holding Corp. | 171,681 | ||||
12,006 | Huntington Bancshares, Inc. | 116,818 | ||||
45,700 | Independence Holding Co. | 607,353 | ||||
7,800 | Infinity Property & Casualty Corp. | 499,278 | ||||
26,400 | Intervest Bancshares Corp. | 252,384 | ||||
7,000 | Investors Title Co. | 512,400 | ||||
28,400 | JAVELIN Mortgage Investment Corp. REIT | 341,084 | ||||
41,600 | JMP Group, Inc. | 260,832 | ||||
16,500 | Kansas City Life Insurance Co. | 731,775 | ||||
21,600 | Manning & Napier, Inc. | 362,664 | ||||
30,890 | Marlin Business Services Corp. | 565,905 | ||||
60,150 | Meadowbrook Insurance Group, Inc. | 351,877 | ||||
79,100 | MicroFinancial, Inc. | 637,546 | ||||
13,100 | MidSouth Bancorp, Inc. | 244,970 | ||||
23,100 | Monmouth Real Estate Investment Corp. REIT, Class A | 233,772 | ||||
45,000 | MutualFirst Financial, Inc. | 1,012,500 | ||||
5,300 | National Security Group, Inc. (The) | 65,402 | ||||
3,500 | National Western Life Insurance Co., Class A | 864,535 | ||||
9,900 | Navigators Group, Inc. (The)* | 608,850 | ||||
39,788 | Nicholas Financial, Inc.* | 461,143 | ||||
29,900 | OFG Bancorp. | 447,902 | ||||
15,700 | One Liberty Properties, Inc. REIT | 317,611 | ||||
15,700 | Onebeacon Insurance Group, Ltd., Class A | 241,937 | ||||
4,800 | Oppenheimer Holdings, Inc., Class A | 97,200 | ||||
14,800 | Pacific Mercantile Bancorp* | 103,156 | ||||
2,468 | Park Sterling Corp. | 16,363 | ||||
25,200 | Peoples Bancorp, Inc. | 598,500 | ||||
7,300 | Piper Jaffray Cos.* | 381,352 | ||||
15,900 | Provident Financial Holdings, Inc. | 231,981 | ||||
17,400 | Ramco-Gershenson Properties Trust REIT | 282,750 | ||||
39,674 | Reis, Inc. | 935,910 | ||||
20,400 | Resource Capital Corp. REIT | 99,348 | ||||
9,100 | Safety Insurance Group, Inc. | 490,581 | ||||
12,300 | Simmons First National Corp., Class A | 473,796 | ||||
6,793 | South State Corp. | 379,864 | ||||
33,500 | Southwest Bancorp, Inc. | 549,400 | ||||
50,662 | Sterling Bancorp | 647,967 | ||||
10,600 | Stewart Information Services Corp. | 311,110 | ||||
| 33 |
SCHEDULE OF PORTFOLIO INVESTMENTS |
RBC Microcap Value Fund (cont.)
September 30, 2014
| Shares | Value | |||||
5,840 | Sun Bancorp, Inc.* | $ | 105,762 | |||
41,900 | SWS Group, Inc.* | 288,691 | ||||
54,000 | TierOne Corp.*(a)(b)(c) | 0 | ||||
22,000 | UMH Properties, Inc. REIT | 209,000 | ||||
52,000 | Unico American Corp.* | 628,160 | ||||
88,216 | United Community Financial Corp. | 412,851 | ||||
19,000 | United Western Bancorp, Inc.* | 475 | ||||
10,800 | Urstadt Biddle Properties, Inc. REIT, Class A | 219,240 | ||||
15,000 | Walker & Dunlop, Inc.* | 199,350 | ||||
14,041 | Western Asset Mortgage Capital Corp. REIT | 207,526 | ||||
15,300 | Whitestone REIT | 213,282 | ||||
31,800 | Winthrop Realty Trust REIT | 479,226 | ||||
12,100 | ZAIS Financial Corp. REIT | 208,846 | ||||
4,600 | Ziegler Cos., Inc. (The)*(a) | 147,200 | ||||
|
| |||||
| 33,740,383 | ||||||
|
| |||||
Health Care — 4.92% |
| |||||
30,800 | Albany Molecular Research, Inc.* | 679,756 | ||||
11,000 | American Shared Hospital Services* | 24,310 | ||||
34,900 | AngioDynamics, Inc.* | 478,828 | ||||
53,000 | BioScrip, Inc.* | 366,230 | ||||
18,200 | Cambrex Corp.* | 339,976 | ||||
15,200 | Capital Senior Living Corp.* | 322,696 | ||||
18,800 | CONMED Corp. | 692,592 | ||||
21,300 | Cross Country Healthcare, Inc.* | 197,877 | ||||
43,000 | CryoLife, Inc. | 424,410 | ||||
55,200 | Five Star Quality Care, Inc.* | 208,104 | ||||
20,370 | Hanger, Inc.* | 417,992 | ||||
8,600 | Invacare Corp. | 101,566 | ||||
6,300 | Kewaunee Scientific Corp. | 112,581 | ||||
9,662 | Kindred Healthcare, Inc. | 187,443 | ||||
12,800 | Lannett Co., Inc.* | 584,704 | ||||
15,000 | MedCath Corp.*(a)(b)(c) | 0 | ||||
49,300 | PharMerica Corp.* | 1,204,399 | ||||
44,500 | Symmetry Medical, Inc.* | 449,005 | ||||
15,900 | Triple-S Management Corp., Class B* | 316,410 | ||||
|
| |||||
| 7,108,879 | ||||||
|
| |||||
Industrials — 23.13% |
| |||||
39,339 | Aceto Corp. | 760,029 | ||||
27,100 | Aegean Marine Petroleum Network, Inc. | 248,507 | ||||
3,000 | Aegion Corp.* | 66,750 | ||||
14,800 | Alamo Group, Inc. | 606,800 | ||||
80,900 | Allied Motion Technologies, Inc. | 1,148,780 | ||||
7,100 | Altra Industrial Motion Corp. | 207,036 | ||||
47,700 | Ameresco, Inc., Class A* | 326,745 | ||||
11,400 | Ampco-Pittsburgh Corp. | 228,000 | ||||
8,100 | AMREP Corp.* | 37,746 | ||||
34 |
SCHEDULE OF PORTFOLIO INVESTMENTS |
RBC Microcap Value Fund (cont.)
September 30, 2014
| Shares | Value | |||||
9,100 | Argan, Inc. | $ | 303,758 | |||
19,200 | Baltic Trading Ltd. | 79,488 | ||||
14,900 | CAI International, Inc.* | 288,315 | ||||
35,400 | CBIZ, Inc.* | 278,598 | ||||
13,400 | CDI Corp. | 194,568 | ||||
8,774 | Ceco Environmental Corp. | 117,572 | ||||
30,400 | Celadon Group, Inc. | 591,280 | ||||
85,425 | Cenveo, Inc.* | 211,000 | ||||
2,400 | Chicago Rivet & Machine Co. | 74,400 | ||||
10,300 | Comfort Systems USA, Inc. | 139,565 | ||||
31,878 | Compx International, Inc. | 328,343 | ||||
30,800 | Dolan Co. (The)*(c) | 1,879 | ||||
13,600 | Douglas Dynamics, Inc. | 265,200 | ||||
27,500 | Ducommun, Inc.* | 753,775 | ||||
16,100 | Dycom Industries, Inc.* | 494,431 | ||||
4,150 | Eagle Bulk Shipping Inc* | 3,808 | ||||
13,100 | Eastern Co. (The) | 209,338 | ||||
8,480 | Ecology and Environment, Inc., Class A | 83,019 | ||||
13,600 | Encore Wire Corp. | 504,424 | ||||
34,100 | Ennis, Inc. | 449,097 | ||||
8,200 | EnPro Industries, Inc.* | 496,346 | ||||
20,100 | Espey Manufacturing & Electronics Corp. | 404,613 | ||||
27,000 | Federal Signal Corp. | 357,480 | ||||
19,900 | FLY Leasing Ltd. ADR | 254,919 | ||||
11,300 | G&K Services, Inc., Class A | 625,794 | ||||
22,300 | GenCorp, Inc.* | 356,131 | ||||
32,900 | Gibraltar Industries, Inc.* | 450,401 | ||||
8,600 | GP Strategies Corp.* | 246,992 | ||||
14,100 | Greenbrier Cos., Inc. (The) | 1,034,658 | ||||
29,000 | Griffon Corp. | 330,310 | ||||
22,250 | Hardinge, Inc. | 243,415 | ||||
7,600 | Hill International, Inc.* | 30,400 | ||||
23,350 | International Shipholding Corp. | 417,731 | ||||
23,500 | Jinpan International Ltd. | 186,120 | ||||
7,100 | Kadant, Inc. | 277,255 | ||||
11,700 | Key Technology, Inc.* | 153,270 | ||||
14,500 | Kforce, Inc. | 283,765 | ||||
34,800 | Kimball International, Inc., Class B | 523,740 | ||||
3,908 | Kratos Defense & Security Solutions, Inc.* | 25,636 | ||||
64,000 | LECG Corp.* | 109 | ||||
33,000 | LS Starrett Co. (The), Class A | 456,720 | ||||
44,250 | LSI Industries, Inc. | 268,597 | ||||
40,700 | Lydall, Inc.* | 1,099,307 | ||||
30,012 | Marten Transport Ltd. | 534,514 | ||||
44,100 | Meritor, Inc.* | 478,485 | ||||
72,000 | Mesa Air Group, Inc.*(a)(b)(c) | 0 | ||||
85,194 | MFC Industrial Ltd. | 605,729 | ||||
34,900 | Miller Industries, Inc. | 589,810 | ||||
| 35 |
SCHEDULE OF PORTFOLIO INVESTMENTS |
RBC Microcap Value Fund (cont.)
September 30, 2014
| Shares | Value | |||||
10,600 | Mistras Group, Inc.* | $ | 216,240 | |||
2,900 | National Presto Industries, Inc. | 176,059 | ||||
29,500 | NN, Inc. | 788,240 | ||||
15,800 | Northwest Pipe Co.* | 538,780 | ||||
23,400 | Orion Marine Group, Inc.* | 233,532 | ||||
46,900 | PAM Transportation Services, Inc.* | 1,700,125 | ||||
5,200 | Paragon Shipping, Inc., Class A* | 20,748 | ||||
31,160 | Patrick Industries, Inc.* | 1,319,938 | ||||
36,800 | Pike Corp.* | 437,552 | ||||
11,700 | PowerSecure International, Inc.* | 112,086 | ||||
25,000 | RCM Technologies, Inc.* | 189,250 | ||||
22,948 | RR Donnelley & Sons Co. | 377,724 | ||||
20,500 | Rush Enterprises, Inc., Class A* | 685,725 | ||||
39,700 | Safe Bulkers, Inc. | 264,402 | ||||
10,900 | Signature Group Holdings, Inc.* | 87,745 | ||||
11,500 | SL Industries, Inc.* | 561,430 | ||||
13,600 | Sparton Corp.* | 335,240 | ||||
9,700 | Standex International Corp. | 719,158 | ||||
37,900 | Superior Uniform Group, Inc. | 820,535 | ||||
53,820 | Supreme Industries, Inc., Class A | 420,334 | ||||
4,269 | SYKES Enterprises, Inc.* | 85,295 | ||||
22,200 | Tredegar Corp. | 408,702 | ||||
11,800 | Universal Forest Products, Inc. | 503,978 | ||||
13,900 | USA Truck, Inc.* | 243,667 | ||||
14,600 | Viad Corp. | 301,490 | ||||
43,200 | Volt Information Sciences, Inc.* | 395,280 | ||||
68,500 | Willdan Group, Inc.* | 990,510 | ||||
35,200 | Willis Lease Finance Corp.* | 722,304 | ||||
|
| |||||
| 33,390,567 | ||||||
|
| |||||
Information Technology — 10.06% |
| |||||
60,700 | Acorn Energy, Inc.* | 94,085 | ||||
10,800 | Black Box Corp. | 251,856 | ||||
26,000 | Blucora, Inc.* | 396,240 | ||||
59,200 | CIBER, Inc.* | 203,056 | ||||
50,000 | Comarco, Inc.* | 7,500 | ||||
18,400 | Communications Systems, Inc. | 205,344 | ||||
28,000 | CTS Corp. | 444,920 | ||||
25,600 | Digi International, Inc.* | 192,000 | ||||
24,700 | Edgewater Technology, Inc.* | 169,689 | ||||
30,600 | Electro Rent Corp. | 421,362 | ||||
14,400 | Electro Scientific Industries, Inc. | 97,776 | ||||
12,500 | ePlus, Inc.* | 700,625 | ||||
17,000 | Exar Corp.* | 152,150 | ||||
8,200 | Fabrinet* | 119,720 | ||||
23,200 | Global Cash Access Holdings, Inc.* | 156,600 | ||||
17,532 | GSI Group, Inc.* | 201,443 | ||||
33,400 | Insight Enterprises, Inc.* | 755,842 | ||||
36 |
SCHEDULE OF PORTFOLIO INVESTMENTS |
RBC Microcap Value Fund (cont.)
September 30, 2014
| Shares | Value | |||||
54,375 | Integrated Silicon Solution, Inc. | $ | 747,113 | |||
13,000 | JinkoSolar Holding Co. Ltd. ADR* | 357,370 | ||||
4,800 | Kemet Corp.* | 19,776 | ||||
18,300 | Magal Security Systems Ltd.* | 78,507 | ||||
15,700 | Measurement Specialties, Inc.* | 1,344,077 | ||||
2,285 | Mecklermedia Corp.* | 2,194 | ||||
39,700 | Methode Electronics, Inc. | 1,463,739 | ||||
33,500 | Newport Corp.* | 593,620 | ||||
26,100 | Oplink Communications, Inc. | 439,002 | ||||
70,415 | Optical Cable Corp. | 318,980 | ||||
7,600 | Park Electrochemical Corp. | 178,980 | ||||
45,200 | PC Connection, Inc. | 970,444 | ||||
58,700 | Perceptron, Inc. | 574,673 | ||||
31,730 | Photronics, Inc.* | 255,427 | ||||
40,600 | Richardson Electronics Ltd. | 405,594 | ||||
4,500 | Rosetta Stone, Inc.* | 36,225 | ||||
24,600 | Rudolph Technologies, Inc.* | 222,630 | ||||
60,100 | Sigmatron International, Inc.* | 436,927 | ||||
7,300 | STR Holdings, Inc.* | 10,585 | ||||
25,600 | Tessco Technologies, Inc. | 742,144 | ||||
23,200 | Vishay Precision Group, Inc.* | 346,608 | ||||
14,286 | WPCS International, Inc.* | 11,857 | ||||
35,300 | XO Group, Inc.* | 395,713 | ||||
|
| |||||
| 14,522,393 | ||||||
|
| |||||
Materials — 3.86% |
| |||||
37,000 | Blue Earth Refineries, Inc.*(a)(b)(c) | 0 | ||||
15,700 | China Green Agriculture, Inc.* | 31,086 | ||||
15,400 | Friedman Industries, Inc. | 122,430 | ||||
4,300 | Hawkins, Inc. | 154,628 | ||||
13,900 | Innospec, Inc. | 499,010 | ||||
15,300 | KMG Chemicals, Inc. | 249,084 | ||||
12,900 | Materion Corp. | 395,643 | ||||
21,600 | Myers Industries, Inc. | 381,024 | ||||
6,800 | Neenah Paper, Inc. | 363,664 | ||||
10,400 | North American Palladium Ltd.* | 2,018 | ||||
18,100 | Olympic Steel, Inc. | 372,317 | ||||
37,400 | OMNOVA Solutions, Inc.* | 200,838 | ||||
32,400 | Penford Corp.* | 426,708 | ||||
5,200 | Quaker Chemical Corp. | 372,788 | ||||
18,400 | Schulman (A), Inc. | 665,344 | ||||
4,700 | Stepan Co. | 208,586 | ||||
67,100 | Thompson Creek Metals Co., Inc.* | 147,620 | ||||
22,100 | Trecora Resources* | 273,598 | ||||
16,000 | Universal Stainless & Alloy Products, Inc.* | 421,760 | ||||
3,200 | Vulcan International Corp. | 126,560 | ||||
| 37 |
SCHEDULE OF PORTFOLIO INVESTMENTS |
RBC Microcap Value Fund (cont.)
September 30, 2014
| Shares | Value | |||||
11,000 | Zep, Inc. | $ | 154,220 | |||
|
| |||||
| 5,568,926 | ||||||
|
| |||||
Telecommunication Services — 0.52% |
| |||||
34,400 | Premiere Global Services, Inc.* | 411,768 | ||||
25,800 | Spok Holdings, Inc. | 335,658 | ||||
|
| |||||
| 747,426 | ||||||
|
| |||||
Utilities — 2.98% |
| |||||
15,500 | American States Water Co. | 471,510 | ||||
5,108 | California Water Service Group | 114,623 | ||||
20,085 | Chesapeake Utilities Corp. | 836,741 | ||||
18,700 | Connecticut Water Service, Inc. | 607,750 | ||||
16,100 | Delta Natural Gas Co., Inc. | 318,297 | ||||
16,600 | Empire District Electric Co. (The) | 400,890 | ||||
24,300 | Middlesex Water Co. | 476,280 | ||||
18,600 | SJW Corp. | 499,782 | ||||
18,876 | Unitil Corp. | 586,855 | ||||
|
| |||||
| 4,312,728 | ||||||
|
| |||||
Total Common Stocks | 133,377,595 | |||||
|
| |||||
(Cost $110,075,827) | ||||||
Preferred Stocks — 0.70% |
| |||||
3,122 | Alere, Inc. | 1,010,310 | ||||
|
| |||||
Total Preferred Stocks | 1,010,310 | |||||
|
| |||||
(Cost $504,723) | ||||||
Exchange Traded Funds — 0.28% |
| |||||
2,700 | iShares Russell Microcap Index Fund | 187,677 | ||||
13,400 | PowerShares Zacks Micro Cap Portfolio | 207,968 | ||||
|
| |||||
Total Exchange Traded Funds | 395,645 | |||||
|
| |||||
(Cost $210,668) | ||||||
Rights/Warrants — 0.03% |
| |||||
992 | Genco Shipping & Trading Ltd. Warrants, Expire 7/9/21* | 5,803 | ||||
32,000 | Southern Community Financial Corp. Rights*(a)(c) | 0 | ||||
3,585 | US Concrete, Inc. Warrants, Expire 8/31/17* | 24,557 | ||||
3,585 | US Concrete, Inc., Class B Warrants, Expire 8/31/17* | 16,491 | ||||
|
| |||||
Total Rights/Warrants | 46,851 | |||||
|
| |||||
(Cost $0) | ||||||
38 |
SCHEDULE OF PORTFOLIO INVESTMENTS |
RBC Microcap Value Fund (cont.)
September 30, 2014
Principal Amount | Value | |||||
Corporate Bonds — 0.00% |
| |||||
$1,947 | Trenwick America Corp.*(a)(b)(c) | $ | 0 | |||
1,625 | Trenwick America Corp.*(a)(b)(c) | 0 | ||||
|
| |||||
Total Corporate Bonds | 0 | |||||
|
| |||||
(Cost $0) | ||||||
Shares | ||||||
Investment Company — 6.63% |
| |||||
9,569,636 | JPMorgan Prime Money Market Fund, Institutional Class | 9,569,636 | ||||
|
| |||||
Total Investment Company | 9,569,636 | |||||
|
| |||||
(Cost $9,569,636) | ||||||
Total Investments | $ | 144,400,037 | ||||
(Cost $120,360,854)(d) — 100.02% | ||||||
Liabilities in excess of other assets — (0.02)% | (25,601 | ) | ||||
|
| |||||
NET ASSETS — 100.00% | $ | 144,374,436 | ||||
|
| |||||
| 39 |
SCHEDULE OF PORTFOLIO INVESTMENTS |
RBC Microcap Value Fund (cont.)
September 30, 2014
| * | Non-income producing security. |
| (a) | This security is considered illiquid as to its marketability. |
| The total investment in restricted and illiquid securities representing $147,204 or 0.10% of net assets was as follows: |
Acquisition | Issuer | Acquisition Date | Acquisition Cost | 9/30/14 Carrying Value Per Unit | ||||||||||
| 37,000 | Blue Earth Refineries, Inc. | 11/24/2003 | $ | — | $— | |||||||||
| 38,000 | Capitol Bancorp Ltd. | 09/27/2004 | $ | 1,137,893 | $— | |||||||||
| 38,000 | First Place Financial Corp. | 02/18/2004 | $ | 730,667 | $— | |||||||||
| 42,000 | First State Bancorporation | 09/28/2004 | $ | 668,082 | $— | |||||||||
| 15,000 | MedCath Corp. | 05/23/2008 | $ | 78,842 | $— | |||||||||
| 72,000 | Mesa Air Group, Inc. | 11/01/2006 | $ | 635,933 | $— | |||||||||
| 41,000 | Orleans Homebuilders, Inc. | 12/12/2006 | $ | 685,227 | $— | |||||||||
| 32,000 | Southern Community Financial Corp. Rights | 10/02/2012 | $ | — | $— | |||||||||
| 54,000 | TierOne Corp. | 02/18/2004 | $ | 1,223,407 | $— | |||||||||
| 110,300 | Trico Marine Services, Inc. | 02/03/2009 | $ | 518,857 | $— | |||||||||
| 30,000 | Universal Travel Group | 09/13/2010 | $ | 157,113 | $— | |||||||||
| 4,600 | Ziegler Cos., Inc. (The) | 01/04/1988 | $ | 72,899 | $32.00 | |||||||||
Acquisition | ||||||||||||||
| $1,947 | Trenwick America Corp. | 05/18/2006 | $ | — | $— | |||||||||
| $1,625 | Trenwick America Corp. | 05/18/2006 | $ | — | $— | |||||||||
| (b) | Security delisted or issuer in bankruptcy. |
| (c) | The Pricing Committee has fair valued this security under procedures established by the Fund’s Board of Trustees. |
| (d) | See notes to financial statements for the tax cost of securities and the breakdown of unrealized appreciation (depreciation). |
Abbreviations used are defined below:
ADR - American Depositary Receipt
REIT - Real Estate Investment Trust
See notes to financial statements.
40 |
SCHEDULE OF PORTFOLIO INVESTMENTS |
RBC Mid Cap Value Fund
September 30, 2014
| Shares | Value | |||||
Common Stocks — 99.55% |
| |||||
Consumer Discretionary — 9.07% |
| |||||
330 | ANN INC.* | $ | 13,573 | |||
1,620 | Ascena Retail Group, Inc.* | 21,546 | ||||
1,620 | Brunswick Corp. | 68,267 | ||||
1,640 | Jarden Corp.* | 98,580 | ||||
2,320 | Newell Rubbermaid, Inc. | 79,831 | ||||
1,590 | Penske Automotive Group, Inc. | 64,538 | ||||
1,361 | Tenneco, Inc.* | 71,194 | ||||
|
| |||||
| 417,529 | ||||||
|
| |||||
Energy — 3.99% |
| |||||
490 | Concho Resources, Inc.* | 61,441 | ||||
640 | Gulfport Energy Corp.* | 34,176 | ||||
460 | Range Resources Corp. | 31,192 | ||||
1,020 | Superior Energy Services, Inc. | 33,527 | ||||
380 | Tesoro Corp. | 23,172 | ||||
|
| |||||
| 183,508 | ||||||
|
| |||||
Financials — 26.04% |
| |||||
1,160 | American Financial Group, Inc. | 67,152 | ||||
1,530 | AmTrust Financial Services, Inc. | 60,925 | ||||
2,410 | CIT Group, Inc. | 110,764 | ||||
2,710 | Columbia Property Trust, Inc. REIT | 64,688 | ||||
5,580 | Fifth Third Bancorp | 111,712 | ||||
1,270 | First Republic Bank | 62,713 | ||||
4,200 | Hartford Financial Services Group, Inc. (The) | 156,450 | ||||
1,990 | HCC Insurance Holdings, Inc. | 96,097 | ||||
10,410 | Huntington Bancshares, Inc. | 101,289 | ||||
2,622 | KKR & Co. LP | 58,471 | ||||
510 | LaSalle Hotel Properties REIT | 17,462 | ||||
1,770 | Lincoln National Corp. | 94,837 | ||||
3,560 | National General Holdings Corp. | 60,128 | ||||
420 | Reinsurance Group of America, Inc. | 33,655 | ||||
520 | STAG Industrial, Inc. REIT | 10,769 | ||||
630 | Unum Group | 21,659 | ||||
2,100 | XL Group Plc | 69,657 | ||||
|
| |||||
| 1,198,428 | ||||||
|
| |||||
Health Care — 5.52% |
| |||||
310 | AmerisourceBergen Corp. | 23,963 | ||||
2,070 | Mylan, Inc.* | 94,164 | ||||
500 | Teleflex, Inc. | 52,520 | ||||
800 | Universal Health Services, Inc., Class B | 83,600 | ||||
|
| |||||
| 254,247 | ||||||
|
| |||||
Industrials — 19.43% |
| |||||
500 | Alaska Air Group, Inc. | 21,770 | ||||
| 41 |
SCHEDULE OF PORTFOLIO INVESTMENTS |
RBC Mid Cap Value Fund (cont.)
September 30, 2014
| Shares | Value | |||||
980 | Carlisle Cos., Inc. | $ | 78,772 | |||
800 | Fluor Corp. | 53,432 | ||||
1,560 | Herman Miller, Inc. | 46,566 | ||||
470 | Kirby Corp.* | 55,389 | ||||
2,230 | MRC Global, Inc.* | 52,004 | ||||
700 | Owens Corning | 22,225 | ||||
340 | Parker-Hannifin Corp. | 38,811 | ||||
1,750 | Quanta Services, Inc.* | 63,507 | ||||
870 | Ryder System, Inc. | 78,274 | ||||
900 | Spirit Airlines, Inc.* | 62,226 | ||||
650 | Stanley Black & Decker, Inc. | 57,713 | ||||
3,180 | Swift Transporation Co.* | 66,716 | ||||
610 | Triumph Group, Inc. | 39,681 | ||||
580 | United Rentals, Inc.* | 64,438 | ||||
1,910 | Waste Connections, Inc. | 92,673 | ||||
|
| |||||
| 894,197 | ||||||
|
| |||||
Information Technology — 15.45% |
| |||||
2,040 | AOL, Inc.* | 91,698 | ||||
1,220 | Arrow Electronics, Inc.* | 67,527 | ||||
970 | Coherent, Inc.* | 59,529 | ||||
2,620 | Freescale Semiconductor Ltd.* | 51,169 | ||||
2,820 | Integrated Device Technology, Inc.* | 44,979 | ||||
800 | Juniper Networks, Inc. | 17,720 | ||||
950 | Microchip Technology, Inc. | 44,869 | ||||
1,990 | NXP Semiconductor NV* | 136,176 | ||||
7,400 | RF Micro Devices, Inc.* | 85,396 | ||||
1,930 | Skyworks Solutions, Inc. | 112,037 | ||||
|
| |||||
| 711,100 | ||||||
|
| |||||
Materials — 10.89% |
| |||||
680 | Ashland, Inc. | 70,788 | ||||
1,850 | Avery Dennison Corp. | 82,603 | ||||
630 | Carpenter Technology Corp. | 28,445 | ||||
1,630 | Crown Holdings, Inc.* | 72,568 | ||||
1,988 | Cytec Industries, Inc. | 94,012 | ||||
3,140 | Ferro Corp.* | 45,499 | ||||
1,000 | Owens-Illinois, Inc.* | 26,050 | ||||
440 | Packaging Corp. of America | 28,081 | ||||
780 | Reliance Steel & Aluminum Co. | 53,352 | ||||
|
| |||||
| 501,398 | ||||||
|
| |||||
Utilities — 9.16% |
| |||||
2,860 | Calpine Corp.* | 62,062 | ||||
3,590 | CMS Energy Corp. | 106,479 | ||||
1,060 | Edison International | 59,275 | ||||
1,870 | Laclede Group, Inc. (The) | 86,768 | ||||
1,200 | NorthWestern Corp. | 54,432 | ||||
42 |
SCHEDULE OF PORTFOLIO INVESTMENTS |
RBC Mid Cap Value Fund (cont.)
September 30, 2014
| Shares | Value | |||||
1,630 | Portland General Electric Co. | $ | 52,356 | |||
|
| |||||
| 421,372 | ||||||
|
| |||||
Total Common Stocks | 4,581,779 | |||||
|
| |||||
(Cost $4,475,378) | ||||||
Investment Company — 2.38% | ||||||
109,362 | JPMorgan Prime Money Market Fund, Institutional Class | 109,362 | ||||
|
| |||||
Total Investment Company | 109,362 | |||||
|
| |||||
(Cost $109,362) | ||||||
Total Investments | $ | 4,691,141 | ||||
(Cost $4,584,740)(a) — 101.93% | ||||||
Liabilities in excess of other assets — (1.93)% | (88,780 | ) | ||||
|
| |||||
NET ASSETS — 100.00% | $ | 4,602,361 | ||||
|
| |||||
| * | Non-income producing security. |
| (a) | See notes to financial statements for the tax cost of securities and the breakdown of unrealized appreciation (depreciation). |
Abbreviations used are defined below:
REIT - Real Estate Investment Trust
See notes to financial statements.
| 43 |
Statements of Assets and Liabilities
September 30, 2014
| RBC | RBC | RBC | RBC | RBC | ||||||||||||||||
| SMID Cap | Enterprise | Small Cap | Microcap | Mid Cap | ||||||||||||||||
| Growth Fund | Fund | Core Fund | Value Fund | Value Fund | ||||||||||||||||
Assets: | ||||||||||||||||||||
Investments, at value (cost $45,544,677, $85,516,346, $180,930,880, $120,360,854 and $4,584,740, respectively) | $ | 68,801,489 | $ | 127,827,384 | $ | 216,822,483 | $ | 144,400,037 | $ | 4,691,141 | ||||||||||
Cash | — | 5,724 | — | 21 | 312 | |||||||||||||||
Interest and dividends receivable | 14,720 | 52,049 | 130,054 | 121,024 | 5,270 | |||||||||||||||
Receivable from advisor | — | — | — | — | 9,271 | |||||||||||||||
Receivable for capital shares issued | 754 | 558 | 380,342 | 25,269 | — | |||||||||||||||
Receivable for investments sold | 93,597 | 195,786 | 5,643,902 | — | 28,514 | |||||||||||||||
Prepaid expenses | 21,973 | 22,433 | 21,399 | 21,112 | 20,034 | |||||||||||||||
|
|
|
|
|
|
|
|
|
| |||||||||||
Total Assets | 68,932,533 | 128,103,934 | 222,998,180 | 144,567,463 | 4,754,542 | |||||||||||||||
|
|
|
|
|
|
|
|
|
| |||||||||||
Liabilities: | ||||||||||||||||||||
Payable for capital shares redeemed | 19,842 | 80,510 | 7,092 | 13,341 | — | |||||||||||||||
Payable for investments purchased | — | 927,771 | 4,713,446 | — | 111,478 | |||||||||||||||
Accrued expenses and other payables: | ||||||||||||||||||||
Investment advisory fees | 21,353 | 76,349 | 78,207 | 72,719 | — | |||||||||||||||
Administration fees | 4,219 | 7,961 | 13,548 | 8,961 | 283 | |||||||||||||||
Audit fees | 31,800 | 31,800 | 31,800 | 31,800 | 31,800 | |||||||||||||||
Trustees’ fees | 28 | 51 | 73 | 53 | 1 | |||||||||||||||
Distribution fees | 9,567 | 2,851 | 11,159 | 6,489 | — | |||||||||||||||
Shareholder reports | 4,633 | 8,806 | 6,462 | 15,263 | 15 | |||||||||||||||
Transfer agent fees | 2,495 | 23,772 | 52,355 | 35,002 | 950 | |||||||||||||||
Other | 6,818 | 7,556 | 9,294 | 9,399 | 7,654 | |||||||||||||||
|
|
|
|
|
|
|
|
|
| |||||||||||
Total Liabilities | 100,755 | 1,167,427 | 4,923,436 | 193,027 | 152,181 | |||||||||||||||
|
|
|
|
|
|
|
|
|
| |||||||||||
Net Assets | $ | 68,831,778 | $ | 126,936,507 | $ | 218,074,744 | $ | 144,374,436 | $ | 4,602,361 | ||||||||||
|
|
|
|
|
|
|
|
|
| |||||||||||
Net Assets Consist Of: | ||||||||||||||||||||
Capital | $ | 35,864,585 | $ | 70,221,637 | $ | 174,088,275 | $ | 117,259,786 | $ | 3,686,629 | ||||||||||
Undistributed net investment income (loss) | (274,742 | ) | (73,803 | ) | — | 414,733 | 2,155 | |||||||||||||
Accumulated net realized gains (losses) from investment transactions and foreign currency | 9,985,123 | 14,477,635 | 8,094,866 | 2,660,734 | 807,176 | |||||||||||||||
Net unrealized appreciation (depreciation) on investments and foreign currency | 23,256,812 | 42,311,038 | 35,891,603 | 24,039,183 | 106,401 | |||||||||||||||
|
|
|
|
|
|
|
|
|
| |||||||||||
Net Assets | $ | 68,831,778 | $ | 126,936,507 | $ | 218,074,744 | $ | 144,374,436 | $ | 4,602,361 | ||||||||||
|
|
|
|
|
|
|
|
|
| |||||||||||
Net Assets: | ||||||||||||||||||||
Class A | $ | 12,502,652 | $ | 2,707,765 | $ | 8,971,058 | $ | 10,029,340 | $ | N/A | ||||||||||
Class I | 56,329,126 | 124,228,742 | 209,103,686 | 134,345,096 | 4,602,361 | |||||||||||||||
|
|
|
|
|
|
|
|
|
| |||||||||||
Total | $ | 68,831,778 | $ | 126,936,507 | $ | 218,074,744 | $ | 144,374,436 | $ | 4,602,361 | ||||||||||
|
|
|
|
|
|
|
|
|
| |||||||||||
44 |
FINANCIAL STATEMENTS |
Statements of Assets and Liabilities (cont.)
| RBC | RBC | RBC | RBC | RBC | ||||||||||||||||||||
| SMID Cap | Enterprise | Small Cap | Microcap | Mid Cap | ||||||||||||||||||||
| Growth Fund | Fund | Core Fund | Value Fund | Value Fund | ||||||||||||||||||||
Shares Outstanding (Unlimited number of shares authorized, no par value): | ||||||||||||||||||||||||
Class A | 801,449 | 107,622 | 292,582 | 375,905 | N/A | |||||||||||||||||||
Class I | 3,382,897 | 4,821,032 | 6,600,228 | 5,026,742 | 341,295 | |||||||||||||||||||
|
|
|
|
|
|
|
|
|
| |||||||||||||||
Total | 4,184,346 | 4,928,654 | 6,892,810 | 5,402,647 | 341,295 | |||||||||||||||||||
|
|
|
|
|
|
|
|
|
| |||||||||||||||
Net Asset Values and Redemption Prices per Share: | ||||||||||||||||||||||||
Class A(a) | $ | 15.60 | $ | 25.16 | $ | 30.66 | $ | 26.68 | $ | N/A | ||||||||||||||
|
|
|
|
|
|
|
|
|
| |||||||||||||||
Class I | $ | 16.65 | $ | 25.77 | $ | 31.68 | $ | 26.73 | $ | 13.49 | ||||||||||||||
|
|
|
|
|
|
|
|
|
| |||||||||||||||
Maximum Offering Price Per Share: | ||||||||||||||||||||||||
Class A | $ | 16.55 | $ | 26.69 | $ | 32.53 | $ | 28.31 | $ | N/A | ||||||||||||||
|
|
|
|
|
|
|
|
|
| |||||||||||||||
Maximum Sales Charge - Class A | 5.75 | % | 5.75 | % | 5.75 | % | 5.75 | % | N/A | |||||||||||||||
|
|
|
|
|
|
|
|
|
| |||||||||||||||
| (a) | For Class A shares, redemption price per share will be reduced by 1.00% for sales of shares within 12 months of purchase (only applicable on purchases of $1 million or more on which no initial sales charge was paid). Such reduction is not reflected in the net asset value and the redemption price per share. |
See notes to financial statements.
| 45 |
FINANCIAL STATEMENTS |
For the Year Ended September 30, 2014
| RBC SMID Cap | RBC Enterprise | RBC Small Cap | RBC Microcap | RBC Mid Cap | ||||||||||||||||||||||||||||||||||||
| Growth Fund | Fund | Core Fund | Value Fund | Value Fund | ||||||||||||||||||||||||||||||||||||
Investment Income: | ||||||||||||||||||||||||||||||||||||||||
Dividend income | $ | 340,863 | $ | 1,241,069 | $ | 1,752,759 | $ | 2,383,695 | $ | 47,174 | ||||||||||||||||||||||||||||||
Foreign tax withholding | (2,350 | ) | (3,330 | ) | — | (3,337 | ) | — | ||||||||||||||||||||||||||||||||
|
|
|
|
|
|
|
|
|
| |||||||||||||||||||||||||||||||
Total Investment Income | 338,513 | 1,237,739 | 1,752,759 | 2,380,358 | 47,174 | |||||||||||||||||||||||||||||||||||
|
|
|
|
|
|
|
|
|
| |||||||||||||||||||||||||||||||
Expenses: | ||||||||||||||||||||||||||||||||||||||||
Investment advisory fees | 544,226 | 1,302,901 | 1,738,374 | 1,323,704 | 26,784 | |||||||||||||||||||||||||||||||||||
Distribution fees - Class A | 34,150 | 7,788 | 31,279 | 22,218 | — | |||||||||||||||||||||||||||||||||||
Accounting fees | 28,890 | 32,074 | 35,228 | 32,356 | 25,194 | |||||||||||||||||||||||||||||||||||
Administration fees | 58,310 | 106,075 | 153,386 | 110,309 | 2,870 | |||||||||||||||||||||||||||||||||||
Audit fees | 35,718 | 35,718 | 35,718 | 35,718 | 35,718 | |||||||||||||||||||||||||||||||||||
Custodian fees | 2,849 | 4,524 | 9,495 | 4,228 | 15,996 | |||||||||||||||||||||||||||||||||||
Insurance fees | 6,555 | 6,555 | 6,555 | 6,555 | 6,555 | |||||||||||||||||||||||||||||||||||
Legal fees | 3,003 | 2,714 | 7,669 | 2,795 | 616 | |||||||||||||||||||||||||||||||||||
Registration and filing fees | 47,142 | 46,252 | 46,571 | 49,506 | 16,315 | |||||||||||||||||||||||||||||||||||
Shareholder reports | 12,097 | 20,623 | 22,417 | 29,278 | 218 | |||||||||||||||||||||||||||||||||||
Transfer agent fees - Class A | 34,287 | 12,079 | 38,448 | 29,736 | — | |||||||||||||||||||||||||||||||||||
Transfer agent fees - Class I | 50,358 | 118,331 | 222,795 | 171,943 | 4,637 | |||||||||||||||||||||||||||||||||||
Trustees’ fees | 2,136 | 3,901 | 5,362 | 4,015 | 101 | |||||||||||||||||||||||||||||||||||
Other fees | 9,569 | 11,431 | 11,198 | 25,067 | 7,136 | |||||||||||||||||||||||||||||||||||
|
|
|
|
|
|
|
|
|
| |||||||||||||||||||||||||||||||
Total expenses before fee waiver/reimbursement | 869,290 | 1,710,966 | 2,364,495 | 1,847,428 | 142,140 | |||||||||||||||||||||||||||||||||||
Expenses waived/reimbursed by: | ||||||||||||||||||||||||||||||||||||||||
Advisor | (144,097 | ) | (175,695 | ) | (492,583 | ) | (251,472 | ) | (107,703 | ) | ||||||||||||||||||||||||||||||
|
|
|
|
|
|
|
|
|
| |||||||||||||||||||||||||||||||
Net Expenses | 725,193 | 1,535,271 | 1,871,912 | 1,595,956 | 34,437 | |||||||||||||||||||||||||||||||||||
|
|
|
|
|
|
|
|
|
| |||||||||||||||||||||||||||||||
Net Investment Income (Loss) | (386,680 | ) | (297,532 | ) | (119,153 | ) | 784,402 | 12,737 | ||||||||||||||||||||||||||||||||
|
|
|
|
|
|
|
|
|
| |||||||||||||||||||||||||||||||
Realized/Unrealized Gains (Losses) from Investment Transactions: | ||||||||||||||||||||||||||||||||||||||||
Net realized gains from investment transactions | 10,397,097 | 15,985,230 | 8,357,764 | 13,369,889 | 889,620 | |||||||||||||||||||||||||||||||||||
Net change in unrealized appreciation/depreciation on investments and foreign currency | (6,815,021 | ) | (18,244,181 | ) | (4,183,607 | ) | (3,873,913 | ) | (284,541 | ) | ||||||||||||||||||||||||||||||
|
|
|
|
|
|
|
|
|
| |||||||||||||||||||||||||||||||
Net realized/unrealized gains (losses) from investments | 3,582,076 | (2,258,951 | ) | 4,174,157 | 9,495,976 | 605,079 | ||||||||||||||||||||||||||||||||||
|
|
|
|
|
|
|
|
|
| |||||||||||||||||||||||||||||||
Change in net assets resulting from operations | $ | 3,195,396 | $ | (2,556,483 | ) | $ | 4,055,004 | $ | 10,280,378 | $ | 617,816 | |||||||||||||||||||||||||||||
|
|
|
|
|
|
|
|
|
| |||||||||||||||||||||||||||||||
See notes to financial statements.
46 |
FINANCIAL STATEMENTS |
Statements of Changes in Net Assets
| RBC SMID Cap | ||||||||||||||||
| Growth Fund | ||||||||||||||||
| For the | For the | |||||||||||||||
| Year Ended | Year Ended | |||||||||||||||
| September 30, 2014 | September 30, 2013 | |||||||||||||||
From Investment Activities: | ||||||||||||||||
Operations: | ||||||||||||||||
Net investment loss | $ | (386,680 | ) | $ | (347,466 | ) | ||||||||||
Net realized gains from investment transactions | 10,397,097 | 5,314,408 | ||||||||||||||
Net change in unrealized appreciation/depreciation on investments | (6,815,021 | ) | 10,388,736 | |||||||||||||
|
|
|
| |||||||||||||
Change in net assets resulting from operations | 3,195,396 | 15,355,678 | ||||||||||||||
|
|
|
| |||||||||||||
Distributions to Class A Shareholders: | ||||||||||||||||
From net realized gains | (975,004 | ) | (3,485,068 | ) | ||||||||||||
Distributions to Class I Shareholders: | ||||||||||||||||
From net realized gains | (4,316,659 | ) | (3,769,090 | ) | ||||||||||||
|
|
|
| |||||||||||||
Change in net assets resulting from shareholder distributions | (5,291,663 | ) | (7,254,158 | ) | ||||||||||||
|
|
|
| |||||||||||||
Capital Transactions: | ||||||||||||||||
Proceeds from shares issued | 4,665,975 | 32,715,374 | ||||||||||||||
Distributions reinvested | 5,273,833 | 7,233,484 | ||||||||||||||
Cost of shares redeemed | (14,177,804 | ) | (37,348,493 | ) | ||||||||||||
|
|
|
| |||||||||||||
Change in net assets resulting from capital transactions | (4,237,996 | ) | 2,600,365 | |||||||||||||
|
|
|
| |||||||||||||
Net increase (decrease) in net assets | (6,334,263 | ) | 10,701,885 | |||||||||||||
Net Assets: | ||||||||||||||||
Beginning of year | 75,166,041 | 64,464,156 | ||||||||||||||
|
|
|
| |||||||||||||
End of year | $ | 68,831,778 | $ | 75,166,041 | ||||||||||||
|
|
|
| |||||||||||||
Distributions in excess of net investment income | $ | (274,742 | ) | $ | (375,120 | ) | ||||||||||
|
|
|
| |||||||||||||
Share Transactions: | ||||||||||||||||
Issued | 265,083 | 2,007,523 | ||||||||||||||
Reinvested | 311,764 | 537,266 | ||||||||||||||
Redeemed | (844,567 | ) | (2,392,460 | ) | ||||||||||||
|
|
|
| |||||||||||||
Change in shares resulting from capital transactions | (267,720 | ) | 152,329 | |||||||||||||
|
|
|
| |||||||||||||
See notes to financial statements.
| 47 |
FINANCIAL STATEMENTS |
Statements of Changes in Net Assets (cont.)
| RBC Enterprise Fund | ||||||||||||||||
| For the Year Ended September 30, 2014 | For the Year Ended September 30, 2013 | |||||||||||||||
From Investment Activities: | ||||||||||||||||
Operations: | ||||||||||||||||
Net investment income (loss) | $ | (297,532 | ) | $ | 705,309 | |||||||||||
Net realized gains from investment transactions | 15,985,230 | 6,348,690 | ||||||||||||||
Net change in unrealized appreciation/depreciation on investments | (18,244,181 | ) | 31,397,215 | |||||||||||||
|
|
|
| |||||||||||||
Change in net assets resulting from operations | (2,556,483 | ) | 38,451,214 | |||||||||||||
|
|
|
| |||||||||||||
Distributions to Class A Shareholders: | ||||||||||||||||
From net investment income | — | (2,313 | ) | |||||||||||||
From net realized gains | (74,553 | ) | — | |||||||||||||
Distributions to Class I Shareholders: | ||||||||||||||||
From net investment income | (64,697 | ) | (334,648 | ) | ||||||||||||
From net realized gains | (3,481,882 | ) | — | |||||||||||||
|
|
|
| |||||||||||||
Change in net assets resulting from shareholder distributions | (3,621,132 | ) | (336,961 | ) | ||||||||||||
|
|
|
| |||||||||||||
Capital Transactions: | ||||||||||||||||
Proceeds from shares issued | 2,576,317 | 106,784,122 | ||||||||||||||
Distributions reinvested | 3,407,825 | 310,577 | ||||||||||||||
Cost of shares redeemed | (14,776,619 | ) | (113,188,122 | ) | ||||||||||||
|
|
|
| |||||||||||||
Change in net assets resulting from capital transactions | (8,792,477 | ) | (6,093,423 | ) | ||||||||||||
|
|
|
| |||||||||||||
Net increase (decrease) in net assets | (14,970,092 | ) | 32,020,830 | |||||||||||||
Net Assets: | ||||||||||||||||
Beginning of year | 141,906,599 | 109,885,769 | ||||||||||||||
|
|
|
| |||||||||||||
End of year | $ | 126,936,507 | $ | 141,906,599 | ||||||||||||
|
|
|
| |||||||||||||
Distributions in excess of net investment income/Undistributed net investment income | $ | (73,803 | ) | $ | 64,651 | |||||||||||
|
|
|
| |||||||||||||
Share Transactions: | ||||||||||||||||
Issued | 94,459 | 5,510,993 | ||||||||||||||
Reinvested | 121,845 | 15,219 | ||||||||||||||
Redeemed | (535,479 | ) | (5,817,313 | ) | ||||||||||||
|
|
|
| |||||||||||||
Change in shares resulting from capital transactions | (319,175 | ) | (291,101 | ) | ||||||||||||
|
|
|
| |||||||||||||
See notes to financial statements.
48 |
FINANCIAL STATEMENTS |
Statements of Changes in Net Assets (cont.)
| RBC Small Cap Core Fund | ||||||||||||||||
| For the Year Ended September 30, 2014 | For the Year Ended September 30, 2013 | |||||||||||||||
From Investment Activities: | ||||||||||||||||
Operations: | ||||||||||||||||
Net investment income | $ | (119,153 | ) | $ | 483,961 | |||||||||||
Net realized gains from investment transactions | 8,357,764 | 5,070,971 | ||||||||||||||
Net change in unrealized appreciation/depreciation on investments | (4,183,607 | ) | 25,513,582 | |||||||||||||
|
|
|
| |||||||||||||
Change in net assets resulting from operations | 4,055,004 | 31,068,514 | ||||||||||||||
|
|
|
| |||||||||||||
Distributions to Class A Shareholders: | ||||||||||||||||
From net investment income | — | (15,421 | ) | |||||||||||||
From net realized gains | (282,136 | ) | (306,540 | ) | ||||||||||||
Distributions to Class I Shareholders: | ||||||||||||||||
From net investment income | — | (355,306 | ) | |||||||||||||
From net realized gains | (4,284,423 | ) | (4,545,667 | ) | ||||||||||||
|
|
|
| |||||||||||||
Change in net assets resulting from shareholder distributions | (4,566,559 | ) | (5,222,934 | ) | ||||||||||||
|
|
|
| |||||||||||||
Capital Transactions: | ||||||||||||||||
Proceeds from shares issued | 105,186,260 | 123,286,270 | ||||||||||||||
Distributions reinvested | 4,485,112 | 5,099,117 | ||||||||||||||
Cost of shares redeemed | (38,696,913 | ) | (64,014,082 | ) | ||||||||||||
|
|
|
| |||||||||||||
Change in net assets resulting from capital transactions | 70,974,459 | 64,371,305 | ||||||||||||||
|
|
|
| |||||||||||||
Net increase in net assets | 70,462,904 | 90,216,885 | ||||||||||||||
Net Assets: | ||||||||||||||||
Beginning of year | 147,611,840 | 57,394,955 | ||||||||||||||
|
|
|
| |||||||||||||
End of year | $ | 218,074,744 | $ | 147,611,840 | ||||||||||||
|
|
|
| |||||||||||||
Undistributed net investment income | $ | — | $ | — | ||||||||||||
|
|
|
| |||||||||||||
Share Transactions: | ||||||||||||||||
Issued | 3,251,526 | 4,738,387 | ||||||||||||||
Reinvested | 138,999 | 208,833 | ||||||||||||||
Redeemed | (1,200,249 | ) | (2,535,144 | ) | ||||||||||||
|
|
|
| |||||||||||||
Change in shares resulting from capital transactions | 2,190,276 | 2,412,076 | ||||||||||||||
|
|
|
| |||||||||||||
See notes to financial statements.
| 49 |
FINANCIAL STATEMENTS |
Statements of Changes in Net Assets (cont.)
| RBC Microcap Value Fund | ||||||||||||||||
| For the | For the | |||||||||||||||
| Year Ended | Year Ended | |||||||||||||||
| September 30, 2014 | September 30, 2013 | |||||||||||||||
From Investment Activities: | ||||||||||||||||
Operations: | ||||||||||||||||
Net investment income | $ | 784,402 | $ | 1,358,389 | ||||||||||||
Net realized gains from investment transactions and foreign currency | 13,369,889 | 6,835,847 | ||||||||||||||
Net change in unrealized appreciation/depreciation on investments | (3,873,913 | ) | 31,945,681 | |||||||||||||
|
|
|
| |||||||||||||
Change in net assets resulting from operations | 10,280,378 | 40,139,917 | ||||||||||||||
|
|
|
| |||||||||||||
Distributions to Class A Shareholders: | ||||||||||||||||
From net investment income | (55,248 | ) | (34,892 | ) | ||||||||||||
Distributions to Class I Shareholders: | ||||||||||||||||
From net investment income | (1,284,232 | ) | (1,115,172 | ) | ||||||||||||
|
|
|
| |||||||||||||
Change in net assets resulting from shareholder distributions | (1,339,480 | ) | (1,150,064 | ) | ||||||||||||
|
|
|
| |||||||||||||
Capital Transactions: | ||||||||||||||||
Proceeds from shares issued | 21,721,063 | 127,187,420 | ||||||||||||||
Distributions reinvested | 1,252,611 | 1,084,994 | ||||||||||||||
Cost of shares redeemed | (38,872,261 | ) | (147,289,542 | ) | ||||||||||||
|
|
|
| |||||||||||||
Change in net assets resulting from capital transactions | (15,898,587 | ) | (19,017,128 | ) | ||||||||||||
|
|
|
| |||||||||||||
Net increase (decrease) in net assets | (6,957,689 | ) | 19,972,725 | |||||||||||||
Net Assets: | ||||||||||||||||
Beginning of year | 151,332,125 | 131,359,400 | ||||||||||||||
|
|
|
| |||||||||||||
End of year | $ | 144,374,436 | $ | 151,332,125 | ||||||||||||
|
|
|
| |||||||||||||
Undistributed net investment income | $ | 414,733 | $ | 928,047 | ||||||||||||
|
|
|
| |||||||||||||
Share Transactions: | ||||||||||||||||
Issued | 796,454 | 6,826,930 | ||||||||||||||
Reinvested | 46,085 | 56,070 | ||||||||||||||
Redeemed | (1,461,430 | ) | (7,804,172 | ) | ||||||||||||
|
|
|
| |||||||||||||
Change in shares resulting from capital transactions | (618,891 | ) | (921,172 | ) | ||||||||||||
|
|
|
| |||||||||||||
See notes to financial statements.
50 |
FINANCIAL STATEMENTS |
Statements of Changes in Net Assets (cont.)
| RBC Mid Cap | ||||||||||||||||
| Value Fund | ||||||||||||||||
| For the Year Ended September 30, 2014 | For the Year Ended September 30, 2013 | |||||||||||||||
From Investment Activities: | ||||||||||||||||
Operations: | ||||||||||||||||
Net investment income | $ | 12,737 | $ | 13,018 | ||||||||||||
Net realized gains from investment transactions | 889,620 | 261,787 | ||||||||||||||
Net change in unrealized appreciation/depreciation on investments | (284,541 | ) | 325,044 | |||||||||||||
|
|
|
| |||||||||||||
Change in net assets resulting from operations | 617,816 | 599,849 | ||||||||||||||
|
|
|
| |||||||||||||
Distributions to Class I Shareholders: | ||||||||||||||||
From net investment income | (10,724 | ) | (33,292 | ) | ||||||||||||
From net realized gains | (286,231 | ) | (99,652 | ) | ||||||||||||
|
|
|
| |||||||||||||
Change in net assets resulting from shareholder distributions | (296,955 | ) | (132,944 | ) | ||||||||||||
|
|
|
| |||||||||||||
Capital Transactions: | ||||||||||||||||
Proceeds from shares issued | 1,065,484 | 240,075 | ||||||||||||||
Distributions reinvested | 296,955 | 132,945 | ||||||||||||||
Cost of shares redeemed | (61,516 | ) | (43,947 | ) | ||||||||||||
|
|
|
| |||||||||||||
Change in net assets resulting from capital transactions | 1,300,923 | 329,073 | ||||||||||||||
|
|
|
| |||||||||||||
Net increase in net assets | 1,621,784 | 795,978 | ||||||||||||||
Net Assets | ||||||||||||||||
Beginning of year | 2,980,577 | 2,184,599 | ||||||||||||||
|
|
|
| |||||||||||||
End of year | $ | 4,602,361 | $ | 2,980,577 | ||||||||||||
|
|
|
| |||||||||||||
Undistributed net investment income | $ | 2,155 | $ | 1,124 | ||||||||||||
|
|
|
| |||||||||||||
Share Transactions: | ||||||||||||||||
Issued | 79,798 | 21,288 | ||||||||||||||
Reinvested | 24,521 | 12,983 | ||||||||||||||
Redeemed | (4,422 | ) | (4,201 | ) | ||||||||||||
|
|
|
| |||||||||||||
Change in shares resulting from capital transactions | 99,897 | 30,070 | ||||||||||||||
|
|
|
| |||||||||||||
See notes to financial statements.
| 51 |
RBC SMID Cap Growth Fund | (Selected data for a share outstanding throughout the periods indicated) | |||||||||||||||||||||||||||||||
| Investment Activities | Distributions | |||||||||||||||||||||||||||||||
| Net Asset Value, Beginning of Year | Net Investment Loss | Net Realized and Unrealized Gains (Losses) on Investments | Redemption Fees | Total from Investment Activities | Net Realized Gains | Total Distributions | Net Asset Value, End of Year | |||||||||||||||||||||||||
Class A | ||||||||||||||||||||||||||||||||
Year Ended September 30, 2014 | $16.10 | (0.11)(a) | 0.77 | (b) | 0.66 | (1.16) | (1.16) | $15.60 | ||||||||||||||||||||||||
Year Ended September 30, 2013 | 14.61 | (0.09)(a) | 3.35 | (b) | 3.26 | (1.77) | (1.77) | 16.10 | ||||||||||||||||||||||||
Year Ended September 30, 2012 | 11.41 | (0.10)(a) | 3.30 | (b) | 3.20 | — | — | 14.61 | ||||||||||||||||||||||||
Year Ended September 30, 2011 | 10.94 | (0.10)(a) | 0.57 | (b) | 0.47 | — | — | 11.41 | ||||||||||||||||||||||||
Year Ended September 30, 2010 | 8.89 | (0.08)(a) | 2.13 | (b) | 2.05 | — | — | 10.94 | ||||||||||||||||||||||||
Class I | ||||||||||||||||||||||||||||||||
Year Ended September 30, 2014 | $17.07 | (0.08)(a) | 0.82 | (b) | 0.74 | (1.16) | (1.16) | $16.65 | ||||||||||||||||||||||||
Year Ended September 30, 2013 | 15.34 | (0.06)(a) | 3.56 | (b) | 3.50 | (1.77) | (1.77) | 17.07 | ||||||||||||||||||||||||
Year Ended September 30, 2012 | 11.95 | (0.07)(a) | 3.46 | (b) | 3.39 | — | — | 15.34 | ||||||||||||||||||||||||
Year Ended September 30, 2011 | 11.43 | (0.07)(a) | 0.59 | (b) | 0.52 | — | — | 11.95 | ||||||||||||||||||||||||
Year Ended September 30, 2010 | 9.27 | (0.06)(a) | 2.22 | (b) | 2.16 | — | — | 11.43 | ||||||||||||||||||||||||
| (a) | Per share net investment income (loss) has been calculated using the average daily shares method. |
| (b) | Less than $0.01 or $(0.01) per share. |
See notes to financial statements.
52 |
FINANCIAL HIGHLIGHTS |
| RBC SMID Cap Growth Fund (cont.) | (Selected data for a share outstanding throughout the periods indicated) | |||||||||||||||||||||||
| Ratios/Supplemental Data | ||||||||||||||||||||||||
| Total Return*(a) | Net Assets, End of Year (000’s) | Ratio of Net Expenses to Average Net Assets | Ratio of Net Investment Loss to Average Net Assets | Ratio of Expenses to Average Net Assets** | Portfolio Turnover Rate*** | |||||||||||||||||||
Class A | ||||||||||||||||||||||||
Year Ended September 30, 2014 | 3.90% | $12,503 | 1.14%† | (0.70%) | 1.47% | 17% | ||||||||||||||||||
Year Ended September 30, 2013 | 25.08% | 13,620 | 1.35% | (0.65%) | 1.46% | 16% | ||||||||||||||||||
Year Ended September 30, 2012 | 28.16% | 29,755 | 1.35% | (0.77%) | 1.60% | 10% | ||||||||||||||||||
Year Ended September 30, 2011 | 4.21% | 23,593 | 1.35% | (0.75%) | 1.61% | 13% | ||||||||||||||||||
Year Ended September 30, 2010 | 23.06% | 21,940 | 1.35% | (0.81%) | 1.79% | 89% | ||||||||||||||||||
Class I | ||||||||||||||||||||||||
Year Ended September 30, 2014 | 4.16% | 56,329 | 0.89%† | (0.45%) | 1.04% | 17% | ||||||||||||||||||
Year Ended September 30, 2013 | 25.48% | 61,546 | 1.10% | (0.40%) | 1.20% | 16% | ||||||||||||||||||
Year Ended September 30, 2012 | 28.37% | 32,825 | 1.10% | (0.52%) | 1.35% | 10% | ||||||||||||||||||
Year Ended September 30, 2011 | 4.55% | 33,835 | 1.10% | (0.49%) | 1.35% | 13% | ||||||||||||||||||
Year Ended September 30, 2010 | 23.30% | 41,121 | 1.10% | (0.57%) | 1.54% | 89% | ||||||||||||||||||
| * | Excludes sales charge. |
| ** | During the year, certain fees were contractually or voluntarily reduced and/or reimbursed. If such contractual/voluntary fee reductions and reimbursements had not occurred, the ratio would have been as indicated. |
| *** | Portfolio turnover rate is calculated on the basis of the fund as a whole without distinguishing between the classes of shares issued. |
| † | Beginning November 27, 2013, the net operating expenses were contractually limited to 1.10% and 0.85% of average daily net assets for Class A and Class I respectively. The ratio of net expenses to average net assets represents a blended percentage for the period ended September 30, 2014. |
| (a) | Assumes investment at net asset value at the beginning of the year, reinvestment of all dividends and distributions, and a complete redemption of the investment at net asset value at the end of the year. |
See notes to financial statements.
| 53 |
FINANCIAL HIGHLIGHTS |
RBC Enterprise Fund | (Selected data for a share outstanding throughout the periods indicated) | |||||||||||||||||||||||||||||||||||
| Investment Activities | Distributions | |||||||||||||||||||||||||||||||||||
| Net Asset Value, Beginning of Year | Net Investment Income/(Loss) | Net Realized and Unrealized Gains (Losses) on Investments | Redemption Fees | Total from Investment Activities | Net Investment Income | Net Realized Gains | Total Distributions | Net Asset Value, End of Year | ||||||||||||||||||||||||||||
Class A | ||||||||||||||||||||||||||||||||||||
Year Ended September 30, 2014 | $26.48 | (0.12)(a) | (0.52) | (b) | (0.64) | — | (0.68) | (0.68) | $25.16 | |||||||||||||||||||||||||||
Year Ended September 30, 2013 | 19.45 | 0.06(a) | 6.99 | (b) | 7.05 | (0.02) | — | (0.02) | 26.48 | |||||||||||||||||||||||||||
Year Ended September 30, 2012 | 14.27 | (0.02)(a) | 5.20 | (b) | 5.18 | — | — | — | 19.45 | |||||||||||||||||||||||||||
Year Ended September 30, 2011 | 14.43 | (0.07)(a) | (0.09) | (b) | (0.16) | — | — | — | 14.27 | |||||||||||||||||||||||||||
Year Ended September 30, 2010 | 13.37 | (0.05)(a) | 1.11 | (b) | 1.06 | — | — | — | 14.43 | |||||||||||||||||||||||||||
Class I | ||||||||||||||||||||||||||||||||||||
Year Ended September 30, 2014 | $27.05 | (0.06)(a) | (0.53) | (b) | (0.59) | (0.01) | (0.68) | (0.69) | $25.77 | |||||||||||||||||||||||||||
Year Ended September 30, 2013 | 19.85 | 0.10(a) | 7.16 | (b) | 7.26 | (0.06) | — | (0.06) | 27.05 | |||||||||||||||||||||||||||
Year Ended September 30, 2012 | 14.53 | 0.12(a) | 5.20 | (b) | 5.32 | — | — | — | 19.85 | |||||||||||||||||||||||||||
Year Ended September 30, 2011 | 14.67 | (0.04)(a) | (0.10) | (b) | (0.14) | — | — | — | 14.53 | |||||||||||||||||||||||||||
Year Ended September 30, 2010 | 13.57 | (0.01)(a) | 1.11 | (b) | 1.10 | — | — | — | 14.67 | |||||||||||||||||||||||||||
| (a) | Per share net investment income (loss) has been calculated using the average daily shares method. |
| (b) | Less than $0.01 or $(0.01) per share. |
See notes to financial statements.
54 |
FINANCIAL HIGHLIGHTS |
RBC Enterprise Fund (cont.) | (Selected data for a share outstanding throughout the periods indicated) | |||||||||||||||||||||
| Ratios/Supplemental Data | ||||||||||||||||||||||
Total Return*(a) | Net Assets, End of Year (000’s) | Ratio of Net Expenses to Average Net Assets | Ratio of Net Investment Income (Loss) to Average Net Assets | Ratio of Expenses to Average Net Assets** | Portfolio Turnover Rate*** | |||||||||||||||||
Class A | ||||||||||||||||||||||
Year Ended September 30, 2014 | (2.62%) | $2,708 | 1.33% | (0.45%) | 1.75% | 19% | ||||||||||||||||
Year Ended September 30, 2013 | 36.31% | 3,025 | 1.33% | 0.25% | 1.54% | 16% | ||||||||||||||||
Year Ended September 30, 2012 | 36.30% | 1,387 | 1.33% | (0.12%) | 1.58% | 13% | ||||||||||||||||
Year Ended September 30, 2011 | (1.11%) | 1,320 | 1.33% | (0.44%) | 1.57% | 27% | ||||||||||||||||
Year Ended September 30, 2010 | 7.93% | 2,426 | 1.33% | (0.35%) | 1.76% | 22% | ||||||||||||||||
Class I | ||||||||||||||||||||||
Year Ended September 30, 2014 | (2.36%) | $124,229 | 1.08% | (0.20%) | 1.20% | 19% | ||||||||||||||||
Year Ended September 30, 2013 | 36.69% | 138,882 | 1.08% | 0.44% | 1.29% | 16% | ||||||||||||||||
Year Ended September 30, 2012 | 36.61% | 27 | 0.99% | 0.67% | 1.26% | 13% | ||||||||||||||||
Year Ended September 30, 2011 | (0.96%) | 3,378 | 1.08% | (0.25%) | 1.29% | 27% | ||||||||||||||||
Year Ended September 30, 2010 | 8.11% | 25,999 | 1.08% | (0.10%) | 1.51% | 22% | ||||||||||||||||
| * | Excludes sales charge. |
| ** | During the year, certain fees were contractually or voluntarily reduced and/or reimbursed. If such contractual/voluntary fee reductions and reimbursements had not occurred, the ratio would have been as indicated. |
| *** | Portfolio turnover rate is calculated on the basis of the fund as a whole without distinguishing between the classes of shares issued. |
| (a) | Assumes investment at net asset value at the beginning of the year, reinvestment of all dividends and distributions, and a complete redemption of the investment at net asset value at the end of the year. |
See notes to financial statements.
| 55 |
FINANCIAL HIGHLIGHTS |
RBC Small Cap Core Fund | (Selected data for a share outstanding throughout the periods indicated) | |||||||||||||||||||||||||||||||||||
| Investment Activities | Distributions | |||||||||||||||||||||||||||||||||||
| Net Asset Value, Beginning of Year | Net Investment Income (Loss) | Net Realized and Unrealized Gains (Losses) on Investments | Redemption Fees | Total from Investment Activities | Net Investment Income | Net Realized Gains | Total Distributions | Net Asset Value, End of Year | ||||||||||||||||||||||||||||
Class A | ||||||||||||||||||||||||||||||||||||
Year Ended September 30, 2014 | $30.53 | (0.09)(a) | 1.04 | (b) | 0.95 | — | (0.82) | (0.82) | $30.66 | |||||||||||||||||||||||||||
Year Ended September 30, 2013 | 24.45 | 0.09(a) | 7.65 | (b) | 7.74 | (0.08) | (1.58) | (1.66) | 30.53 | |||||||||||||||||||||||||||
Year Ended September 30, 2012 | 20.02 | (0.06)(a) | 5.89 | (b) | 5.83 | — | (1.40) | (1.40) | 24.45 | |||||||||||||||||||||||||||
Year Ended September 30, 2011 | 19.99 | (0.09)(a) | 0.12 | (b) | 0.03 | — | — | — | 20.02 | |||||||||||||||||||||||||||
Year Ended September 30, 2010 | 17.04 | (0.09)(a) | 3.04 | (b) | 2.95 | — | — | — | 19.99 | |||||||||||||||||||||||||||
Class I(c) | ||||||||||||||||||||||||||||||||||||
Year Ended September 30, 2014 | $31.45 | (0.01)(a) | 1.06 | (b) | 1.05 | — | (0.82) | (0.82) | $31.68 | |||||||||||||||||||||||||||
Year Ended September 30, 2013 | 25.11 | 0.12(a) | 7.92 | (b) | 8.04 | (0.12) | (1.58) | (1.70) | 31.45 | |||||||||||||||||||||||||||
Year Ended September 30, 2012 | 20.49 | —(a)(b) | 6.02 | (b) | 6.02 | — | (1.40) | (1.40) | 25.11 | |||||||||||||||||||||||||||
Year Ended September 30, 2011 | 20.41 | (0.02)(a) | 0.10 | (b) | 0.08 | — | — | — | 20.49 | |||||||||||||||||||||||||||
Year Ended September 30, 2010 | 17.35 | (0.04)(a) | 3.10 | (b) | 3.06 | — | — | — | 20.41 | |||||||||||||||||||||||||||
| (a) | Per share net investment income (loss) has been calculated using the average daily shares method. |
| (b) | Less than $0.01 or $(0.01) per share. |
| (c) | Effective November 27, 2012, Class S shares were redesignated as Class I shares. Performance information shown for Class I prior to that date reflects the performance of Class S, and all financial data shown for prior years is for Class S. |
See notes to financial statements.
56 |
FINANCIAL HIGHLIGHTS |
RBC Small Cap Core Fund (cont.) | (Selected data for a share outstanding throughout the periods indicated) | |||||||||||||||||||||
| Ratios/Supplemental Data | ||||||||||||||||||||||
Total Return*(a) | Net Assets, End of Year (000’s) | Ratio of Net Expenses to Average Net Assets | Ratio of Net Investment Income (Loss) to Average Net Assets | Ratio of Expenses to Average Net Assets** | Portfolio Turnover Rate*** | |||||||||||||||||
Class A | ||||||||||||||||||||||
Year Ended September 30, 2014 | 3.05% | $8,971 | 1.15% | (0.30%) | 1.57% | 29% | ||||||||||||||||
Year Ended September 30, 2013 | 33.57% | 9,186 | 1.17%†† | 0.34% | 1.48% | 26% | ||||||||||||||||
Year Ended September 30, 2012 | 29.76% | 4,117 | 1.30% | (0.27%) | 1.77% | 35% | ||||||||||||||||
Year Ended September 30, 2011 | 0.20% | 1,420 | 1.30% | (0.37%) | 1.80% | 40% | ||||||||||||||||
Year Ended September 30, 2010 | 17.31% | 519 | 1.47%† | (0.48%) | 2.28% | 31% | ||||||||||||||||
Class I(b) | ||||||||||||||||||||||
Year Ended September 30, 2014 | 3.29% | $209,104 | 0.90% | (0.04%) | 1.13% | 29% | ||||||||||||||||
Year Ended September 30, 2013 | 33.96% | 138,426 | 0.90%†† | 0.47% | 1.20% | 26% | ||||||||||||||||
Year Ended September 30, 2012 | 30.08% | 53,147 | 1.05% | (0.01%) | 1.52% | 35% | ||||||||||||||||
Year Ended September 30, 2011 | 0.39% | 42,647 | 1.05% | (0.09%) | 1.54% | 40% | ||||||||||||||||
Year Ended September 30, 2010 | 17.64% | 43,441 | 1.22%† | (0.21%) | 2.04% | 31% | ||||||||||||||||
| * | Excludes sales charge. |
| ** | During the year, certain fees were contractually or voluntarily reduced and/or reimbursed. If such contractual/voluntary fee reductions and reimbursements had not occurred, the ratio would have been as indicated. |
| *** | Portfolio turnover rate is calculated on the basis of the fund as a whole without distinguishing between the classes of shares issued. |
| † | Beginning May 26, 2010, the net operating expenses were contractually limited to 1.30% and 1.05% of average daily net assets for Class A and Class I (formerly Class S) respectively. The ratio of net expenses to average net assets represents a blended percentage for the year ended September 30, 2010. |
| †† | Beginning November 27, 2012, the net operating expenses were contractually limited to 1.15% and 0.90% of average daily net assets for Class A and Class I respectively. The ratio of net expenses to average net assets represents a blended percentage for the year ended September 30, 2013. |
| (a) | Assumes investment at net asset value at the beginning of the year, reinvestment of all dividends and distributions, and a complete redemption of the investment at net asset value at the end of the year. |
| (b) | Effective November 27, 2012, Class S shares were redesignated as Class I shares. Performance information shown for Class I prior to that date reflects the performance of Class S, and all financial data shown for prior years is for Class S. |
See notes to financial statements.
| 57 |
FINANCIAL HIGHLIGHTS |
RBC Microcap Value Fund | (Selected data for a share outstanding throughout the periods indicated) | |||||||||||||||||||||||||||||||||||
| Investment Activities | Distributions | |||||||||||||||||||||||||||||||||||
| Net Asset Value, Beginning of Year | Net Investment Income (Loss) | Net Realized and Unrealized Gains (Losses) on Investments | Redemption Fees | Total from Investment Activities | Net Investment Income | Net Realized Gains | Total Distributions | Net Asset Value, End of Year | ||||||||||||||||||||||||||||
Class A | ||||||||||||||||||||||||||||||||||||
Year Ended September 30, 2014 | $25.10 | 0.09(a) | 1.69 | (b) | 1.78 | (0.20) | — | (0.20) | $26.68 | |||||||||||||||||||||||||||
Year Ended September 30, 2013 | 18.91 | 0.15(a) | 6.18 | (b) | 6.33 | (0.14) | — | (0.14) | 25.10 | |||||||||||||||||||||||||||
Year Ended September 30, 2012 | 14.30 | 0.09(a) | 4.57 | (b) | 4.66 | (0.05) | — | (0.05) | 18.91 | |||||||||||||||||||||||||||
Year Ended September 30, 2011 | 14.59 | 0.05(a) | (0.32) | (b) | (0.27) | (0.02) | — | (0.02) | 14.30 | |||||||||||||||||||||||||||
Year Ended September 30, 2010 | 13.15 | 0.02(a) | 1.44 | (b) | 1.46 | (0.02) | — | (0.02) | 14.59 | |||||||||||||||||||||||||||
Class I(c) | ||||||||||||||||||||||||||||||||||||
Year Ended September 30, 2014 | $25.13 | 0.15(a) | 1.71 | (b) | 1.86 | (0.26) | — | (0.26) | $26.73 | |||||||||||||||||||||||||||
Year Ended September 30, 2013 | 18.93 | 0.20(a) | 6.18 | (b) | 6.38 | (0.18) | — | (0.18) | 25.13 | |||||||||||||||||||||||||||
Year Ended September 30, 2012 | 14.33 | 0.13(a) | 4.58 | (b) | 4.71 | (0.11) | — | (0.11) | 18.93 | |||||||||||||||||||||||||||
Year Ended September 30, 2011 | 14.62 | 0.08(a) | (0.30) | (b) | (0.22) | (0.07) | — | (0.07) | 14.33 | |||||||||||||||||||||||||||
Year Ended September 30, 2010 | 13.19 | 0.05(a) | 1.44 | (b) | 1.49 | (0.06) | — | (0.06) | 14.62 | |||||||||||||||||||||||||||
| (a) | Per share net investment income (loss) has been calculated using the average daily shares method. |
| (b) | Less than $0.01 or $(0.01) per share. |
| (c) | Effective November 27, 2012, Class S shares were redesignated as Class I shares. Performance information shown for Class I prior to that date reflects the performance of Class S, and all financial data shown for prior years is for Class S. |
See notes to financial statements.
58 |
FINANCIAL HIGHLIGHTS |
RBC Microcap Value Fund (cont.) | (Selected data for a share outstanding throughout the periods indicated) | |||||||||||||||||||||
| Ratios/Supplemental Data | ||||||||||||||||||||||
Total Return*(a) | Net Assets, End of Year (000’s) | Ratio of Net Expenses to Average Net Assets | Ratio of Net Investment Income (Loss) to Average Net Assets | Ratio of Expenses to Average Net Assets** | Portfolio Turnover Rate*** | |||||||||||||||||
Class A | ||||||||||||||||||||||
Year Ended September 30, 2014 | 7.09% | $10,029 | 1.32% | 0.32% | 1.69% | 11% | ||||||||||||||||
Year Ended September 30, 2013 | 33.66% | 6,417 | 1.32% | 0.69% | 1.52% | 4% | ||||||||||||||||
Year Ended September 30, 2012 | 32.62% | 4,289 | 1.32% | 0.51% | 1.60% | 5% | ||||||||||||||||
Year Ended September 30, 2011 | (1.85%) | 3,852 | 1.32% | 0.28% | 1.60% | 2% | ||||||||||||||||
Year Ended September 30, 2010 | 11.12% | 6,968 | 1.32% | 0.12% | 1.64% | 9% | ||||||||||||||||
Class I(b) | ||||||||||||||||||||||
Year Ended September 30, 2014 | 7.39% | $134,345 | 1.07% | 0.55% | 1.23% | 11% | ||||||||||||||||
Year Ended September 30, 2013 | 33.96% | 144,915 | 1.07% | 1.08% | 1.26% | 4% | ||||||||||||||||
Year Ended September 30, 2012 | 32.97% | 126,432 | 1.07% | 0.76% | 1.35% | 5% | ||||||||||||||||
Year Ended September 30, 2011 | (1.59%) | 105,991 | 1.07% | 0.51% | 1.35% | 2% | ||||||||||||||||
Year Ended September 30, 2010 | 11.33% | 145,979 | 1.07% | 0.37% | 1.39% | 9% | ||||||||||||||||
| * | Excludes sales charge. |
| ** | During the year, certain fees were contractually or voluntarily reduced and/or reimbursed. If such contractual/voluntary fee reductions and reimbursements had not occurred, the ratio would have been as indicated. |
| *** | Portfolio turnover rate is calculated on the basis of the fund as a whole without distinguishing between the classes of shares issued. |
| (a) | Assumes investment at net asset value at the beginning of the year, reinvestment of all dividends and distributions, and a complete redemption of the investment at net asset value at the end of the year. |
| (b) | Effective November 27, 2012, Class S shares were redesignated as Class I shares. Performance information shown for Class I prior to that date reflects the performance of Class S, and all financial data shown for prior years is for Class S. |
See notes to financial statements.
| 59 |
FINANCIAL HIGHLIGHTS |
RBC Mid Cap Value Fund | (Selected data for a share outstanding throughout the periods indicated) | |||||||||||||||||||||||||||||||||||
| Investment Activities | Distributions | |||||||||||||||||||||||||||||||||||
| Net Asset Value, Beginning of Period | Net Investment Income/(Loss) | Net Realized and Unrealized Gains (Losses) on Investments | Redemption Fees | Total from Investment Activities | Net Investment Income | Net Realized Gains | Total Distributions | Net Asset Value, End of Period | ||||||||||||||||||||||||||||
Class I | ||||||||||||||||||||||||||||||||||||
Year Ended September 30, 2014 | $12.35 | 0.04(a) | 2.31 | — | 2.35 | (0.04) | (1.17) | (1.21) | $13.49 | |||||||||||||||||||||||||||
Year Ended September 30, 2013 | 10.34 | 0.06(a) | 2.59 | — | 2.65 | (0.16) | (0.48) | (0.64) | 12.35 | |||||||||||||||||||||||||||
Year Ended September 30, 2012 | 9.42 | 0.09(a) | 2.69 | — | 2.78 | (0.10) | (1.76) | (1.86) | 10.34 | |||||||||||||||||||||||||||
Year Ended September 30, 2011 | 10.80 | 0.13(a) | (0.52) | — | (0.39) | (0.47) | (0.52) | (0.99) | 9.42 | |||||||||||||||||||||||||||
Period Ended September 30, 2010(b) | 10.00 | 0.02(a) | 0.78 | — | 0.80 | — | — | — | 10.80 | |||||||||||||||||||||||||||
| (a) | Per share net investment income (loss) has been calculated using the average daily shares method. |
| (b) | For the period from December 31, 2009 (commencement of operations) to September 30, 2010. |
See notes to financial statements.
60 |
FINANCIAL HIGHLIGHTS |
RBC Mid Cap Value Fund (cont.) | (Selected data for a share outstanding throughout the periods indicated) | |||||||||||||||||||||
| Ratios/Supplemental Data | ||||||||||||||||||||||
Total | Net Assets, End of Period (000’s) | Ratio of Net Expenses to Average Net Assets | Ratio of Net Investment Income (Loss) to Average Net Assets | Ratio of Expenses to Average Net Assets** | Portfolio Turnover Rate | |||||||||||||||||
Class I | ||||||||||||||||||||||
Year Ended September 30, 2014 | 20.14% | $4,602 | 0.90% | 0.33% | 3.71% | 162% | ||||||||||||||||
Year Ended September 30, 2013 | 26.93% | 2,981 | 0.90% | 0.51% | 4.66% | 113% | ||||||||||||||||
Year Ended September 30, 2012 | 31.73% | 2,185 | 0.90% | 0.89% | 5.31% | 160% | ||||||||||||||||
Year Ended September 30, 2011 | (5.35%) | 1,659 | 0.90% | 1.12% | 5.59% | 174% | ||||||||||||||||
Period Ended September 30, 2010(b) | 8.00%(c) | 1,753 | 0.90%(d) | 0.26%(d) | 12.64%(d) | 161% | ||||||||||||||||
| * | Excludes sales charge. |
| ** | During the year, certain fees were contractually or voluntarily reduced and/or reimbursed. If such contractual/voluntary fee reductions and reimbursements had not occurred, the ratio would have been as indicated. |
| (a) | Assumes investment at net asset value at the beginning of the year, reinvestment of all dividends and distributions, and a complete redemption of the investment at net asset value at the end of the year. |
| (b) | For the period from December 31, 2009 (commencement of operations) to September 30, 2010. |
| (c) | Not Annualized. |
| (d) | Annualized. |
See notes to financial statements.
| 61 |
September 30, 2014
1. Organization:
RBC Funds Trust (the “Trust”) is registered under the Investment Company Act of 1940 (as amended) as an open-end management investment company. The Trust was organized as a Delaware statutory trust on December 16, 2003 and currently consists of 18 portfolios. Predecessor funds to the Trust were reorganized as portfolios of the Trust effective April 16, 2004. This report includes the following five investment portfolios (each a “Fund” and collectively, the “Funds”):
- RBC SMID Cap Growth Fund (“SMID Cap Growth Fund”)
- RBC Enterprise Fund (“Enterprise Fund”)
- RBC Small Cap Core Fund (“Small Cap Core Fund”)
- RBC Microcap Value Fund (“Microcap Value Fund”)
- RBC Mid Cap Value Fund (“Mid Cap Value Fund”)
The SMID Cap Growth, Enterprise, Small Cap Core and Microcap Value Funds offer two share classes: Class A and Class I shares. On November 27, 2012, Class C shares were converted to Class A shares for the SMID Cap Growth, Enterprise, Small Cap Core and Microcap Value Funds and Class S shares were converted to Class I shares for SMID Cap Growth and Enterprise Funds. For the Small Cap Core and Microcap Value Funds, which did not previously have Class I shares, the Class S shares were redesignated as Class I shares. The Mid Cap Value Fund offers Class I shares. Class A shares are offered with a 5.75% maximum front-end sales charge and a 1.00% contingent deferred sales charge (“CDSC”) for redemption within 12 months of a $1 million or greater purchase on which no front-end sales charge was paid. Class I shares (intended for investors meeting certain investment minimum thresholds) are not subject to either a front-end sales charge or a CDSC.
RBC Global Asset Management (U.S.) Inc. (“RBC GAM (US)” or “Advisor” or “Co-Administrator”) acts as the investment advisor for the Funds. The officers of the Trust (“Fund Management”) are also employees of RBC GAM (US) or its affiliates.
2. Significant Accounting Policies:
Summarized below are the significant accounting policies of the Funds. These policies conform to accounting principles generally accepted in the United States of America (“US GAAP”). Fund Management follows these policies when preparing financial statements. Management may also be required to make estimates and assumptions that affect the reported amounts of assets and liabilities at the date of the financial statements and the reported amounts of income and expenses for the period. Actual results could differ from those estimates. The financial statements are as of the close of regular trading on the New York Stock Exchange (“NYSE”).
Security Valuation:
The Trust’s Board of Trustees (the “Board”) has adopted pricing and valuation procedures for determining the fair value of each Fund’s investments. Fair value of a security is considered to be the price that a fund might reasonably expect to receive upon its current sale in an orderly transaction between market participants.
Equity securities are generally valued on the basis of prices furnished by third-party pricing services approved by the Board. Equity securities listed on one or more exchanges shall be valued at the last available quoted sale price on the primary trading exchange as of the close of regular trading on the exchange and are categorized as Level 1 in the fair value hierarchy. An equity security not listed on an exchange but listed on NASDAQ shall be valued at the NASDAQ official closing price and is also categorized as Level 1. If there was no sale on the primary exchange on the day the net asset value is calculated or a NASDAQ official closing price is not available, the most recent bid quotation generally will be used and such securities will generally categorized as Level 2. Investments in open-end
62 |
NOTES TO FINANCIAL STATEMENTS |
investment companies (mutual funds) are valued at net asset value and are categorized as Level 1 in the fair value hierarchy.
Fixed income securities, including to-be-announced (“TBA”) commitments and municipal bonds, are generally valued based on evaluated prices received from third-party pricing services or from broker-dealers who make markets in the securities and are generally categorized as Level 2 in the fair value hierarchy. The pricing services utilize both dealer-supplied valuations and electronic data processing techniques that take into account multiple appropriate factors such as institutional-size trading in similar groups of securities, market spreads, interest rates, and fundamental security analytical data including yield, quality, coupon rate, maturity and type of issue. Short-term debt obligations with less than 60 days to maturity at the time of purchase are valued at amortized cost unless Fund management determines that amortized cost no longer approximates fair market value.
Foreign securities valued in non-U.S. dollars are valued in the foreign currency and then converted into the U.S. dollar equivalent using the foreign exchange rate in effect at the close of the NYSE on the day the security’s value is determined. The value of securities traded in markets outside the United States may be affected on a day that the NYSE is closed and an investor is not able to purchase, exchange or redeem shares of the Funds.
The Board has delegated to the Funds’ Pricing Committee (“Pricing Committee”) the responsibility for implementing the pricing and valuation procedures, including responsibility for determining the fair value of the Funds’ securities or other assets. The Pricing Committee includes representatives of the Funds’ Advisor and Co-Administrator, including personnel from accounting and operations, investment management, trading, risk management, compliance and legal. The Pricing Committee meets at least quarterly to review and approve Fund valuation matters, including a review of the Funds’ pricing activity and operations, fair value measurements, pricing vendors, policies and procedures, and related controls. At least a quorum of the Pricing Committee shall meet more frequently, as needed, to consider and approve time-sensitive fair valuation matters. The Pricing Committee reports to the Valuation, Portfolio Management and Performance Committee (“Valuation Committee”) of the Board. Members of the Pricing Committee meet with the Valuation Committee and the Board at each of their regularly scheduled meetings to discuss valuation matters and actions taken during the period.
The Board has adopted procedures to determine the fair value of a security when a price is not available from a pricing service or broker-dealer or Fund management determines that a price provided by a pricing service or broker-dealer does not approximate fair value. Fair valuation may also be used when a significant valuation event affecting the value of a security or market sector is determined to have occurred between the time when a security’s market closes and the time the Fund’s net asset value is calculated. The fair value of the security will be determined in good faith by the Pricing Committee in accordance with procedures and methodologies adopted by the Board. General factors used in determining the fair value of securities include, but are not limited to, fundamental analytical data relating to the security, the issuer and the market, such as duration, prepayment and default rates; general level of interest rates and changes in interest rates; information from broker-dealers; trading in similar securities; any restrictions on disposition of the security; and an evaluation of the forces that influence the market in which the investments are traded. These securities are either categorized as Level 2 or 3 in the fair value hierarchy, depending on the relevant inputs used.
When the Funds utilize fair valuation methods that use significant unobservable inputs to determine a security’s value, such securities will be categorized as Level 3 of the fair value hierarchy. These methods may require subjective determinations about the value of a security. While the Funds’ policy is intended to result in a calculation of a Fund’s net asset value that fairly reflects security values as of the time of pricing, the Funds cannot guarantee that values determined by the Board or persons acting at their direction would accurately reflect the price that the Funds could obtain for a security if they were to dispose of it as of the time of pricing (for instance, in a forced or distressed sale). The prices used by the Funds may differ from the value that would be realized if the securities were sold.
The Funds’ Pricing Committee employs various methods for calibrating the valuation approach related to securities categorized within Level 2 and Level 3 of the fair value hierarchy. These methods may
| 63 |
NOTES TO FINANCIAL STATEMENTS |
include regular due diligence of the Funds’ pricing vendors, a regular review of key inputs and assumptions, transaction back-testing or disposition analysis to compare unrealized gains and losses to realized gains and losses, reviews of missing and stale prices and large movements in market value, and reviews of any market related activities. Additionally, the pricing of all fair value holdings is subsequently reported to the Valuation Committee and Board.
Fair Value Measurements:
The Funds disclose the fair value of their investments in a hierarchy that categorizes investments based on the inputs to valuation techniques used to measure fair value. The three levels of the fair value hierarchy are as follows:
· Level 1 - Inputs that reflect unadjusted quoted prices in active markets for identical assets or liabilities that the Funds have the ability to access at the measurement date.
· Level 2 - Significant inputs other than quoted prices that are observable for the asset or liability either directly or indirectly, including inputs in markets that are not considered to be active. Observable inputs may include quoted prices for similar securities, interest rates, spreads, prepayment speeds, etc.
· Level 3 - Significant unobservable inputs based on the best information available in the circumstances, to the extent observable inputs are not available (including the Fund’s own assumptions in determining the fair value of investments).
The inputs or methodology used for valuing investments are not necessarily an indication of the risk associated with investing in those securities.
Inputs used in determining fair value of an investment may include, but are not limited to, price information, volatility statistics, credit and market data, and other factors, all of which may be either observable or unobservable. Inputs can vary among investments and will be impacted by the investment type and volume of activity for the particular security or similar securities in the market. Investments in the Level 3 category are generally supported by transactions and quoted prices from dealers participating in the market for those investments. Investments may be included in the Level 3 category due to a lack of market activity or transparency. Internal valuation models may also be used as a pricing source for Level 3 investments. Internal valuation models may rely on one or more unobservable inputs, such as estimated cash flows, financial statement analysis and discount rates.
The summary of inputs used to determine the fair value of each Fund’s investments as of September 30, 2014 is as follows:
Investments in Securities | Level 1 Quoted Prices | Level 2 Significant Observable Inputs | Level 3 Significant Unobservable Inputs | Total | ||||||||||||
SMID Cap Growth Fund | $ | 68,801,489 | (a) | $ | — | $ — | $ | 68,801,489 | ||||||||
Enterprise Fund | 127,747,444 | (a) | 71,024(c) | 8,916 | 127,827,384 | |||||||||||
Small Cap Core Fund | 216,822,483 | (a) | — | — | 216,822,483 | |||||||||||
Microcap Value Fund | 140,599,665 | (a) | 3,798,489(b) | 1,883 | 144,400,037 | |||||||||||
Mid Cap Value Fund | 4,691,141 | (a) | — | — | 4,691,141 | |||||||||||
(a) The breakdown of the Fund’s investments into major categories is disclosed in the Schedules of Portfolio Investments.
(b) Represents securities in the Consumer Discretionary ($947,318), Consumer Staples ($195,640), Financials ($1,470,004), Industrials ($109), Information Technology ($7,500), Materials ($126,560), Preferred Stock ($1,010,310) and Rights/Warrants ($41,048) sections of the Schedule of Portfolio Investments.
(c) Represents securities in the Rights/Warrants section of the Schedule of Portfolio Investments.
64 |
NOTES TO FINANCIAL STATEMENTS |
The Funds did not have any liabilities that were measured at fair value on a recurring basis at September 30, 2014.
During the year ended September 30, 2014, the Funds except Enterprise Fund and Microcap Value Fund recognized no transfers to/from Level 1 or Level 2. For the Enterprise Fund and Microcap Value Fund, transfers to Level 2 from Level 1 in the amount of $13,957 and $3,066,100, respectively were due to the absence of an active trading market for the securities on September 30, 2014. Microcap Value Fund securities were transferred from Level 2 to Level 1 in the amount of $12,573 since the trading market became active for the securities. The Funds’ policy is to recognize transfers between Level 1, Level 2 and Level 3 at the end of the period utilizing fair value at the beginning of the year.
Following is a reconciliation of Level 3 investments for which significant unobservable inputs were used to determine fair value:
| Enterprise Fund | ||||||||
| (Common Stocks-Industrials) | ||||||||
Balance as of 09/30/13 (value) | $ | 585,144 | ||||||
Sales | (569,940) | |||||||
Gain (loss) | (97,943) | |||||||
Change in unrealized | 91,655 | |||||||
|
| |||||||
Balance as of 09/30/14 (value) | $ | 8,916 | ||||||
|
| |||||||
| Microcap Value Fund | ||||||||||||||||||||||||||||||||
| (Common Stocks- Consumer Discretionary) | (Common Stocks- Financials) | (Common Stocks- Health Care) | (Common Stocks- Industrials) | |||||||||||||||||||||||||||||
Balance as of 09/30/13 (value) | $ | 17,100 | $ | — | $ | 20,550 | $ | — | ||||||||||||||||||||||||
Transfer in | — | 493(a) | — | — | ||||||||||||||||||||||||||||
Transfer out | (17,100)(c) | — | — | — | ||||||||||||||||||||||||||||
Purchases | — | — | — | 163,235(b) | ||||||||||||||||||||||||||||
Return of capital | — | — | — | (1,317) | ||||||||||||||||||||||||||||
Change in unrealized | — | (489) | (20,550) | (160,039) | ||||||||||||||||||||||||||||
|
|
|
|
|
|
|
| |||||||||||||||||||||||||
Balance as of 09/30/14 (value) | $ | — | $ | 4 | $ | — | $ | 1,879 | ||||||||||||||||||||||||
|
|
|
|
|
|
|
| |||||||||||||||||||||||||
(a) These securities were transferred to Level 3 due to lack of a current market quotation and was valued at fair market value as determined in good faith by the Board or persons acting at their direction using unobservable inputs.
| (b) | This security was acquired through corporate action. |
| (c) | This security was transferred to Level 1 due to an active current market quotation. |
| * | Net change in unrealized appreciation/(depreciation) in Level 3 securities still held at September 30, 2014. |
The Funds’ assets assigned to the Level 3 category were valued using market data or trade information specific to the security or comparable issues. However, due to a lack of market activity or corroborating data to support the valuations, the investments were classified as Level 3.
| 65 |
NOTES TO FINANCIAL STATEMENTS |
The significant unobservable inputs used in fair value measurement of the Funds’ investments are (i) an estimation of a normalized earnings level for the company and (ii) the likelihood of achieving normalized earnings. Significant changes in any of those inputs in isolation would result in a significantly lower or higher fair value measurement. Generally, a change in the assumptions used for the normalized earnings level will be accompanied by a directionally similar change in the discounts applied to the list of comparable investments.
Repurchase Agreements:
The Funds may enter into repurchase agreements with counterparties whom the Advisor has deemed creditworthy, including primary dealers that report to the Federal Reserve Bank of New York or other large U.S. commercial banks or broker-dealers. These repurchase agreements are subject to the seller’s agreement to repurchase such securities at a mutually agreed upon date and price. The repurchase price generally equals the price paid by the Funds plus interest negotiated on the basis of current short-term rates.
Securities pledged as collateral for repurchase agreements are held by a custodian bank until maturity of the repurchase agreement. The Funds have procedures to monitor additional collateral, if needed, to ensure that the daily market value of the collateral remains in excess of the repurchase agreement in the event of a default. There were no Repurchase Agreements held during the year ended September 30, 2014.
Investment Transactions and Income:
Investment transactions are recorded on one business day after trade date, except on the last day of each fiscal quarter end, when they are recorded on trade date. Dividend income is recorded on the ex-dividend date. Realized gains and losses from investment transactions are calculated based on the cost of the specific security (also known as identified cost basis). Interest income is recognized on the accrual basis and includes, where applicable, the amortization or accretion of premium or discount using the effective yield method.
Expense, Investment Income and Gain/Loss Allocation:
Each Fund pays the expenses that are directly related to its operations, such as custodian fees or investment advisory fees. Expenses incurred by the Trust, such as trustee or legal fees, are allocated among each of the Funds in the Trust either proportionately based upon each Fund’s relative net assets or using another reasonable basis such as equally across all Funds in the Trust. Individual share classes within a Fund are charged expenses specific to that class, such as distribution fees and transfer agent fees. Within a Fund, expenses other than class specific expenses are allocated daily to each class based upon the proportion of relative net assets. Investment income and realized and unrealized gains or losses are allocated to each class of shares based on relative net assets.
Real Estate Investment Trusts:
The Funds may own shares of real estate investment trusts (“REITs”) which report information on the source of their distributions annually. Dividends paid by a REIT, other than capital gain distributions, will be taxable as ordinary income up to the amount of the REIT’s current and accumulated earnings and profits. Capital gain dividends paid by a REIT to a fund will be treated as long term capital gains by the fund and, in turn, may be distributed by the fund to its shareholders as a capital gain distribution. Distributions received from a REIT in excess of its income are recorded as a return of capital and a reduction to the cost basis of the REIT.
Distributions to Shareholders:
Each Fund pays out any income that it receives, less expenses, in the form of dividends and capital gain distributions to its shareholders. Income dividends and capital gain distributions for each Fund are declared and paid at least annually. Distributions to shareholders are recorded on the ex-dividend date. The amount of dividends and distributions are calculated based on federal income tax regulations, which may differ from US GAAP. These “book/tax” differences may be either temporary or permanent in nature. To the extent these differences are determined, as of the end of the tax year, to be
66 |
NOTES TO FINANCIAL STATEMENTS |
permanent (e.g., net operating loss, foreign currency transactions, distribution redesignations and prior year spillbacks), they are reclassified within a Fund’s capital accounts based on their federal tax basis treatment.
For the year ended September 30, 2014, permanent difference reclassification amounts were as follows:
| Increase/(Decrease) Paid in Capital | Increase/(Decrease) Undistributed Net Investment Income/(Loss) | Increase/(Decrease) Accumulated Realized Gain/(Loss) | ||||||||||||||||||||||||||
SMID Cap Growth Fund | $ | (439,537) | $ | 487,058 | $ | (47,521) | ||||||||||||||||||||||
Enterprise Fund | — | 223,775 | (223,775) | |||||||||||||||||||||||||
Small Cap Core Fund | — | 119,153 | (119,153) | |||||||||||||||||||||||||
Microcap Value Fund | (661) | 41,764 | (41,103) | |||||||||||||||||||||||||
Mid Cap Value Fund | — | (982) | 982 | |||||||||||||||||||||||||
3. Agreements and Other Transactions with Affiliates:
The Trust has entered into Investment Advisory Agreements with RBC GAM (US) under which RBC GAM (US) manages each Fund’s assets and furnishes related office facilities, equipment, research and personnel. The agreements require each Fund to pay RBC GAM (US) a monthly fee based upon average daily net assets. Under the terms of the agreements, RBC GAM (US) is entitled to receive fees based on a percentage of the average daily net assets of each of the Funds as follows:
Average Daily Net Assets of Fund | Annual Rate | |||||||||
SMID Cap Growth Fund | All Net Assets | 0.70% | ||||||||
Enterprise Fund | Up to $30 million | 1.00% | ||||||||
| Over $30 million | 0.90% | |||||||||
Small Cap Core Fund | All Net Assets | 0.85% | ||||||||
Microcap Value Fund | All Net Assets | 0.90% | ||||||||
Mid Cap Value Fund | All Net Assets | 0.70% | ||||||||
RBC GAM (US) has contractually agreed to waive fees and/or make payments in order to keep total operating expenses of Class A and Class I shares of each Fund to the following levels. This Expense Limitation Agreement is in place until January 31, 2016.
Class A | Class I Annual Rate | |||||||||
SMID Cap Growth Fund | 1.10% | * | 0.85% | * | ||||||
Enterprise Fund | 1.33% | 1.08% | ||||||||
Small Cap Core Fund | 1.15% | 0.90% | ||||||||
Microcap Value Fund | 1.32% | 1.07% | ||||||||
Mid Cap Value Fund | N/A | 0.90% | ||||||||
* Prior to November 27, 2013, the annual rate for SMID Cap Growth Fund under the expense limitation agreement was 1.10% for Class I and 1.35% for Class A.
Each Fund will carry forward, for a period not to exceed 12 months from the date on which a waiver or reimbursement is made by RBC GAM (US), any expenses in excess of the expense limitation and repay RBC GAM (US) such amounts, provided the Fund is able to effect such repayment and remain in compliance with the expense limitation stated above. At September 30, 2014, the amounts subject to possible recoupment under the expense limitation agreement are $144,097, $175,695, $492,583, $251,472 and $107,703 for SMID Cap Growth, Enterprise, Small Cap Core, Microcap Value and Mid Cap Value Funds, respectively. There was no recoupment of expense reimbursements/waivers during the period. Amounts from prior years are no longer subject to recoupment.
| 67 |
NOTES TO FINANCIAL STATEMENTS |
RBC GAM (US) may also voluntarily waive and/or reimburse operating expenses of any Fund from time to time. Any such voluntary program may be changed or eliminated at any time without notice, and expenses waived under such program are not subject to recoupment.
RBC GAM (US) serves as co-administrator to the Funds. BNY Mellon serves as co-administrator and fund accounting agent. Services provided under the administrative services contract include providing day-to-day administration of matters related to the Funds, maintenance of their records and the preparation of reports. Under the terms of the administrative services contract, RBC GAM (US) receives from each Fund a fee, payable monthly, at the annual rate of 0.075% of each Fund’s average daily net assets. BNY Mellon receives a fee for its services payable by each Fund based on each Funds’ average net assets. RBC GAM (US)’s fee is listed as “Administration fees” in the Statements of Operations. BNY Mellon’s fee is included with “Accounting fees” in the Statements of Operations.
Certain Officers and Trustees of the Trust are affiliated with the Advisor or the Co-Administrator. Such Officers and Trustees receive no compensation from the Funds for serving in their respective roles.
The Trust currently pays each of the independent Trustees (Trustees of the Trust who are not directors, officers or employees of the Advisor, either Co-Administrator or Distributor) an annual retainer of $35,000 ($41,500 effective October 1, 2014). The Board Chairperson and Audit Committee Chairperson each receive an additional retainer of $2,500 annually, and all other trustees serving as Chair of a Board committee each receive an additional retainer of $1,000 annually. In addition, Independent Trustees receive a quarterly meeting fee of $5,500 for each in-person Board meeting attended, a meeting fee of $1,500 for each telephonic or Special Board meeting attended, a $1,500 fee for each Board committee meeting attended, and are reimbursed for all out-of-pocket expenses relating to attendance at such meetings.
In conjunction with the launch of the Mid Cap Value Fund, the Advisor invested seed capital to provide the Fund with its initial investment assets. The table below shows, as of September 30, 2014, the Fund’s net assets, the shares held by the Advisor, and the percent of total net assets represented by the Advisor’s investment.
| Net Assets | Shares held by Advisor | % of Fund | ||||||||||||||
Mid Cap Value Fund | $ | 4,602,361 | 228,326 | 66.9% | ||||||||||||
4. Fund Distribution:
Each of the Funds has adopted a Master Distribution 12b-1 Plan (the “Plan”) in which Quasar Distributors LLC (the ��Distributor”) acts as the Funds’ distributor. The Plan permits each Fund to make payments for or to reimburse the Distributor for distribution-related costs and expenses of marketing shares of Class A covered under the Plan, and/or for providing shareholder services. The Plan does not apply to Class I. The following chart shows the current Plan fee rate for Class A.
| Class A | ||||
12b-1 Plan Fee | 0.25%* | |||
* Under the 12b-1 plan, the maximum fee rate for Class A shares is 0.50%. Currently the Board of Trustees has approved an annual limit of 0.25%.
Plan fees are based on average daily net assets of Class A. Up to 0.25% of each Plan fee may be designated as a Service Fee, as defined by the applicable rules of the Financial Industry Regulatory Authority. The Distributor, subject to applicable legal requirements, may waive a Plan fee voluntarily, in whole or in part. For the year ended September 30, 2014, there were no fees waived by the Distributor.
For the year ended September 30, 2014, the Distributor received commissions of $79,266 from front-end sales charges of Class A shares of the Funds, of which $12,955 was paid to affiliated broker-dealers, and the remainder was either paid to unaffiliated broker-dealers or retained by the Distributor.
68 |
NOTES TO FINANCIAL STATEMENTS |
The Distributor also received $10 from CDSC fees from Class A shares of the Funds during the year ended September 30, 2014.
5. Securities Transactions:
The cost of securities purchased and proceeds from securities sold (excluding securities maturing less than one year from acquisition) for the year ended September 30, 2014 were as follows:
| Purchases | Sales | |||||||||
SMID Cap Growth Fund | $ | 13,062,140 | $ | 21,523,901 | ||||||
Enterprise Fund | 25,687,452 | 29,920,815 | ||||||||
Small Cap Core Fund | 126,603,251 | 57,057,637 | ||||||||
Microcap Value Fund | 15,025,633 | 32,389,172 | ||||||||
Mid Cap Value Fund | 7,174,503 | 6,052,101 | ||||||||
Within the guidelines established by the Funds to always seek best execution when entering into portfolio transactions, certain of the Funds use directed brokerage transactions through LJR Recapture Services (“LJR”) and its correspondent brokers. A portion of the commissions paid for portfolio transactions under this program are reimbursed to the Funds and are recorded as net realized gains from investment transactions in the financial statements.
6. Capital Share Transactions:
The Trust is authorized to issue an unlimited number of shares of beneficial interest (“shares outstanding”) without par value. Transactions in capital stock of the Funds are summarized on the following pages:
| SMID Cap Growth Fund | Enterprise Fund | |||||||||||||||||||||||||||||||||
| For the Year Ended September 30, 2014 | For the Year Ended September 30, 2013 | For the Year Ended September 30, 2014 | For the Year Ended September 30, 2013 | |||||||||||||||||||||||||||||||
CAPITAL TRANSACTIONS: | ||||||||||||||||||||||||||||||||||
Class A | ||||||||||||||||||||||||||||||||||
Proceeds from shares issued and automatic conversion of shares | $ | 429,973 | $ | 4,171,057 | $ | 1,263,574 | $ | 1,364,420 | ||||||||||||||||||||||||||
Distributions reinvested | 972,776 | 3,481,292 | 62,473 | 1,817 | ||||||||||||||||||||||||||||||
Cost of shares redeemed | (2,102,266 | ) | (27,571,388 | ) | (1,489,567 | ) | (428,084 | ) | ||||||||||||||||||||||||||
|
|
|
|
|
|
|
| |||||||||||||||||||||||||||
Change in Class A | $ | (699,517 | ) | $ | (19,919,039 | ) | $ | (163,520 | ) | $ | 938,153 | |||||||||||||||||||||||
|
|
|
|
|
|
|
| |||||||||||||||||||||||||||
Class I | ||||||||||||||||||||||||||||||||||
Proceeds from shares issued and automatic conversion of shares | $ | 4,236,002 | $ | 28,511,907 | $ | 1,312,743 | $ | 105,332,536 | ||||||||||||||||||||||||||
Distributions reinvested | 4,301,057 | 3,752,192 | 3,345,352 | 308,760 | ||||||||||||||||||||||||||||||
Cost of shares redeemed | (12,075,538 | ) | (7,897,027 | ) | (13,287,052 | ) | (7,324,115 | ) | ||||||||||||||||||||||||||
|
|
|
|
|
|
|
| |||||||||||||||||||||||||||
Change in Class I | $ | (3,538,479 | ) | $ | 24,367,072 | $ | (8,628,957 | ) | $ | 98,317,181 | ||||||||||||||||||||||||
|
|
|
|
|
|
|
| |||||||||||||||||||||||||||
Class C | ||||||||||||||||||||||||||||||||||
Proceeds from shares issued | $ | — | $ | — | $ | — | $ | 200 | ||||||||||||||||||||||||||
Cost of shares redeemed and automatic conversion of shares | — | (42,627 | ) | — | (458,829 | ) | ||||||||||||||||||||||||||||
|
|
|
|
|
|
|
| |||||||||||||||||||||||||||
Change in Class C | $ | — | $ | (42,627 | ) | $ | — | $ | (458,629 | ) | ||||||||||||||||||||||||
|
|
|
|
|
|
|
| |||||||||||||||||||||||||||
Class S | ||||||||||||||||||||||||||||||||||
Proceeds from shares issued | $ | — | $ | 32,410 | $ | — | $ | 86,966 | ||||||||||||||||||||||||||
Cost of shares redeemed and automatic conversion of shares | — | (1,837,451 | ) | — | (104,977,094 | ) | ||||||||||||||||||||||||||||
|
|
|
|
|
|
|
| |||||||||||||||||||||||||||
Change in Class S | $ | — | $ | (1,805,041 | ) | $ | — | $ | (104,890,128 | ) | ||||||||||||||||||||||||
|
|
|
|
|
|
|
| |||||||||||||||||||||||||||
Change in net assets resulting from capital transactions | $ | (4,237,996 | ) | $ | 2,600,365 | $ | (8,792,477 | ) | $ | (6,093,423 | ) | |||||||||||||||||||||||
|
|
|
|
|
|
|
| |||||||||||||||||||||||||||
| 69 |
NOTES TO FINANCIAL STATEMENTS |
| SMID Cap Growth Fund | Enterprise Fund | |||||||||||||||||||||||||||||||||
| For the Year Ended September 30, 2014 | For the Year Ended September 30, 2013 | For the Year Ended September 30, 2014 | For the Year Ended September 30, 2013 | |||||||||||||||||||||||||||||||
SHARE TRANSACTIONS: | ||||||||||||||||||||||||||||||||||
Class A | ||||||||||||||||||||||||||||||||||
Issued and automatic conversion of shares | 26,496 | 293,943 | 47,080 | 61,757 | ||||||||||||||||||||||||||||||
Reinvested | 60,534 | 266,154 | 2,283 | 91 | ||||||||||||||||||||||||||||||
Redeemed | (131,690 | ) | (1,751,257 | ) | (55,954 | ) | (18,979 | ) | ||||||||||||||||||||||||||
|
|
|
|
|
|
|
| |||||||||||||||||||||||||||
Change in Class A | (44,660 | ) | (1,191,160 | ) | (6,591 | ) | 42,869 | |||||||||||||||||||||||||||
|
|
|
|
|
|
|
| |||||||||||||||||||||||||||
Class I | ||||||||||||||||||||||||||||||||||
Issued and automatic conversion of shares | 238,587 | 1,711,459 | 47,379 | 5,444,648 | ||||||||||||||||||||||||||||||
Reinvested | 251,230 | 271,112 | 119,562 | 15,128 | ||||||||||||||||||||||||||||||
Redeemed | (712,877 | ) | (515,970 | ) | (479,525 | ) | (327,537 | ) | ||||||||||||||||||||||||||
|
|
|
|
|
|
|
| |||||||||||||||||||||||||||
Change in Class I | (223,060 | ) | 1,466,601 | (312,584 | ) | 5,132,239 | ||||||||||||||||||||||||||||
|
|
|
|
|
|
|
| |||||||||||||||||||||||||||
Class C | ||||||||||||||||||||||||||||||||||
Issued | — | — | — | 12 | ||||||||||||||||||||||||||||||
Redeemed and automatic conversion of shares | — | (3,189 | ) | — | (26,356 | ) | ||||||||||||||||||||||||||||
|
|
|
|
|
|
|
| |||||||||||||||||||||||||||
Change in Class C | — | (3,189 | ) | — | (26,344 | ) | ||||||||||||||||||||||||||||
|
|
|
|
|
|
|
| |||||||||||||||||||||||||||
Class S | ||||||||||||||||||||||||||||||||||
Issued | — | 2,121 | — | 4,576 | ||||||||||||||||||||||||||||||
Redeemed and automatic conversion of shares | — | (122,044 | ) | — | (5,444,441 | ) | ||||||||||||||||||||||||||||
|
|
|
|
|
|
|
| |||||||||||||||||||||||||||
Change in Class S | — | (119,923 | ) | — | (5,439,865 | ) | ||||||||||||||||||||||||||||
|
|
|
|
|
|
|
| |||||||||||||||||||||||||||
Change in shares resulting from capital transactions | (267,720 | ) | 152,329 | (319,175 | ) | (291,101 | ) | |||||||||||||||||||||||||||
|
|
|
|
|
|
|
| |||||||||||||||||||||||||||
| Small Cap Core Fund | Microcap Value Fund | |||||||||||||||||||||||||||||||||
| For the Year Ended September 30, 2014 | For the Year Ended September 30, 2013 | For the Year Ended September 30, 2014 | For the Year Ended September 30, 2013 | |||||||||||||||||||||||||||||||
CAPITAL TRANSACTIONS: | ||||||||||||||||||||||||||||||||||
Class A | ||||||||||||||||||||||||||||||||||
Proceeds from shares issued and automatic conversion of shares | $ | 9,702,806 | $ | 4,991,741 | $ | 4,715,644 | $ | 2,119,245 | ||||||||||||||||||||||||||
Distributions reinvested | 278,675 | 317,029 | 41,961 | 30,911 | ||||||||||||||||||||||||||||||
Cost of shares redeemed | (10,215,549 | ) | (1,734,788 | ) | (1,513,631 | ) | (1,676,190 | ) | ||||||||||||||||||||||||||
|
|
|
|
|
|
|
| |||||||||||||||||||||||||||
Change in Class A | $ | (234,068 | ) | $ | 3,573,982 | $ | 3,243,974 | $ | 473,966 | |||||||||||||||||||||||||
|
|
|
|
|
|
|
| |||||||||||||||||||||||||||
Class I | ||||||||||||||||||||||||||||||||||
Proceeds from shares issued and automatic conversion of shares | $ | 95,483,454 | $ | 116,533,690 | $ | 17,005,419 | $ | 123,550,649 | ||||||||||||||||||||||||||
Distributions reinvested | 4,206,437 | 4,782,088 | 1,210,650 | 1,054,083 | ||||||||||||||||||||||||||||||
Cost of shares redeemed | (28,481,364 | ) | (7,800,072 | ) | (37,358,630 | ) | (20,010,064 | ) | ||||||||||||||||||||||||||
|
|
|
|
|
|
|
| |||||||||||||||||||||||||||
Change in Class I | $ | 71,208,527 | $ | 113,515,706 | $ | (19,142,561 | ) | $ | 104,594,668 | |||||||||||||||||||||||||
|
|
|
|
|
|
|
| |||||||||||||||||||||||||||
Class C | ||||||||||||||||||||||||||||||||||
Proceeds from shares issued | $ | — | $ | — | $ | — | $ | 482 | ||||||||||||||||||||||||||
Cost of shares redeemed and automatic conversion of shares | — | (129,781 | ) | — | (623,403 | ) | ||||||||||||||||||||||||||||
|
|
|
|
|
|
|
| |||||||||||||||||||||||||||
Change in Class C | $ | — | $ | (129,781 | ) | $ | — | $ | (622,921 | ) | ||||||||||||||||||||||||
|
|
|
|
|
|
|
| |||||||||||||||||||||||||||
70 |
NOTES TO FINANCIAL STATEMENTS |
| Small Cap Core Fund | Microcap Value Fund | |||||||||||||||||||||||||||||||||
| For the Year Ended September 30, 2014 | For the Year Ended September 30, 2013 | For the Year Ended September 30, 2014 | For the Year Ended September 30, 2013 | |||||||||||||||||||||||||||||||
(cont.) | ||||||||||||||||||||||||||||||||||
Class S | ||||||||||||||||||||||||||||||||||
Proceeds from shares issued | $ | — | $ | 1,760,839 | $ | — | $ | 1,517,044 | ||||||||||||||||||||||||||
Cost of shares redeemed and automatic conversion of shares | — | (54,349,441 | ) | — | (124,979,885 | ) | ||||||||||||||||||||||||||||
|
|
|
|
|
|
|
| |||||||||||||||||||||||||||
Change in Class S | $ | — | $ | (52,588,602 | ) | $ | — | $ | (123,462,841 | ) | ||||||||||||||||||||||||
|
|
|
|
|
|
|
| |||||||||||||||||||||||||||
Change in net assets resulting from capital transactions | $ | 70,974,459 | $ | 64,371,305 | $ | (15,898,587 | ) | $ | (19,017,128 | ) | ||||||||||||||||||||||||
|
|
|
|
|
|
|
| |||||||||||||||||||||||||||
SHARE TRANSACTIONS: | ||||||||||||||||||||||||||||||||||
Class A | ||||||||||||||||||||||||||||||||||
Issued and automatic conversion of shares | 308,318 | 181,819 | 173,944 | 102,426 | ||||||||||||||||||||||||||||||
Reinvested | 8,889 | 13,326 | 1,543 | 1,596 | ||||||||||||||||||||||||||||||
Redeemed | (325,453 | ) | (62,716 | ) | (55,207 | ) | (75,205 | ) | ||||||||||||||||||||||||||
|
| �� |
|
|
|
|
| |||||||||||||||||||||||||||
Change in Class A | (8,246 | ) | 132,429 | 120,280 | 28,817 | |||||||||||||||||||||||||||||
|
|
|
|
|
|
|
| |||||||||||||||||||||||||||
Class I | ||||||||||||||||||||||||||||||||||
Issued and automatic conversion of shares | 2,943,208 | 4,485,646 | 622,510 | 6,642,749 | ||||||||||||||||||||||||||||||
Reinvested | 130,110 | 195,507 | 44,542 | 54,474 | ||||||||||||||||||||||||||||||
Redeemed | (874,796 | ) | (279,447 | ) | (1,406,223 | ) | (931,310 | ) | ||||||||||||||||||||||||||
|
|
|
|
|
|
|
| |||||||||||||||||||||||||||
Change in Class I | 2,198,522 | 4,401,706 | (739,171 | ) | 5,765,913 | |||||||||||||||||||||||||||||
|
|
|
|
|
|
|
| |||||||||||||||||||||||||||
Class C | ||||||||||||||||||||||||||||||||||
Issued | — | — | — | 28 | ||||||||||||||||||||||||||||||
Redeemed and automatic conversion of shares | — | (5,818 | ) | — | (35,792 | ) | ||||||||||||||||||||||||||||
|
|
|
|
|
|
|
| |||||||||||||||||||||||||||
Change in Class C | — | (5,818 | ) | — | (35,764 | ) | ||||||||||||||||||||||||||||
|
|
|
|
|
|
|
| |||||||||||||||||||||||||||
Class S | ||||||||||||||||||||||||||||||||||
Issued | — | 70,922 | — | 81,727 | ||||||||||||||||||||||||||||||
Redeemed and automatic conversion of shares | — | (2,187,163 | ) | — | (6,761,865 | ) | ||||||||||||||||||||||||||||
|
|
|
|
|
|
|
| |||||||||||||||||||||||||||
Change in Class S | — | (2,116,241 | ) | — | (6,680,138 | ) | ||||||||||||||||||||||||||||
|
|
|
|
|
|
|
| |||||||||||||||||||||||||||
Change in shares resulting from capital transactions | 2,190,276 | 2,412,076 | (618,891 | ) | (921,172 | ) | ||||||||||||||||||||||||||||
|
|
|
|
|
|
|
| |||||||||||||||||||||||||||
| Mid Cap Value Fund | ||||||||||||||||
| For the Year Ended September 30, 2014 | For the Year Ended September 30, 2013 | |||||||||||||||
CAPITAL TRANSACTIONS: | ||||||||||||||||
Class I | ||||||||||||||||
Proceeds from shares issued | $ | 1,065,484 | $ | 240,075 | ||||||||||||
Distributions reinvested | 296,955 | 132,945 | ||||||||||||||
Cost of shares redeemed | (61,516 | ) | (43,947 | ) | ||||||||||||
|
|
|
| |||||||||||||
Change in net assets resulting from capital transactions | $ | 1,300,923 | $ | 329,073 | ||||||||||||
|
|
|
| |||||||||||||
SHARE TRANSACTIONS: | ||||||||||||||||
Class I | ||||||||||||||||
Issued | 79,798 | 21,288 | ||||||||||||||
Reinvested | 24,521 | 12,983 | ||||||||||||||
Redeemed | (4,422 | ) | (4,201 | ) | ||||||||||||
|
|
|
| |||||||||||||
Change in shares resulting from capital transactions | 99,897 | 30,070 | ||||||||||||||
|
|
|
| |||||||||||||
7. Federal Income Taxes:
It is the policy of each Fund to continue to qualify as a regulated investment company by complying with the provisions available to certain investment companies, as defined under Subchapter M of the Internal Revenue Code, and to distribute substantially all of its net investment income and net realized capital gains. Therefore, no federal tax liability is recorded in the financial statements of each Fund.
| 71 |
NOTES TO FINANCIAL STATEMENTS |
Management has analyzed the Funds’ tax positions taken or expected to be taken on federal income tax returns for all open tax years (the tax years ended September 30 of the years 2011, 2012, 2013 and 2014), and has concluded that no provision for federal income tax is required in the Funds’ financial statements. The Funds’ federal and state income and federal excise tax returns for tax years for which the applicable statutes of limitations have not expired are subject to examination by the Internal Revenue Service and state departments of revenue.
As of and during the year ended September 30, 2014, the Funds did not have a liability for any unrecognized tax benefits. The Funds recognize interest and penalties, if any, related to unrecognized tax benefits as income tax expense in the statement of operations. During the year, the Funds did not incur any interest or penalties.
As of September 30, 2014, the tax cost of securities and the breakdown of unrealized appreciation (depreciation) for each Fund were as follows:
| Tax Cost of Securities | �� | Unrealized Appreciation | Unrealized Depreciation | Net Unrealized Appreciation (Depreciation) | ||||||||||||
SMID Cap Growth Fund | $ | 45,768,351 | $ | 24,938,702 | $ | (1,905,564 | ) | $ | 23,033,138 | |||||||
Enterprise Fund | 85,378,119 | 49,064,288 | (6,615,023 | ) | 42,449,265 | |||||||||||
Small Cap Core Fund | 181,378,891 | 45,121,505 | (9,677,913 | ) | 35,443,592 | |||||||||||
Microcap Value Fund | 120,576,494 | 49,522,267 | (25,698,724 | ) | 23,823,543 | |||||||||||
Mid Cap Value Fund | 4,611,168 | 242,060 | (162,087 | ) | 79,973 | |||||||||||
The difference between book basis and tax basis unrealized appreciation/depreciation is attributable primarily to the tax deferral of losses on wash sales, Passive Foreign Investment Companies (PFICs) and the timing of income recognition in Partnerships.
The tax character of distributions during the fiscal year ended September 30, 2014 was as follows:
| Distributions Paid From | ||||||||||||||||
| Ordinary Income | Net Long Term Capital Gains | Total Taxable Distributions | Total Distributions Paid | |||||||||||||
SMID Cap Growth Fund | $ | — | $5,291,663 | $ | 5,291,663 | $ | 5,291,663 | |||||||||
Enterprise Fund | 64,651 | 3,556,481 | 3,621,132 | 3,621,132 | ||||||||||||
Small Cap Core Fund | 1,427,473 | 3,139,086 | 4,566,559 | 4,566,559 | ||||||||||||
Microcap Value Fund | 1,339,480 | — | 1,339,480 | 1,339,480 | ||||||||||||
Mid Cap Value Fund | 149,648 | 147,307 | 296,955 | 296,955 | ||||||||||||
| The tax character of distributions during the fiscal year ended September 30, 2013 was as follows: | ||||||||||||||||
| Distributions Paid From | ||||||||||||||||
| Ordinary Income | Net Long Term Capital Gains | Total Taxable Distributions | Total Distributions Paid | |||||||||||||
SMID Cap Growth Fund | $ | 15,398 | $7,238,760 | $7,254,158 | $7,254,158 | |||||||||||
Enterprise Fund | 336,961 | — | 336,961 | 336,961 | ||||||||||||
Small Cap Core Fund | 1,115,602 | 4,107,332 | 5,222,934 | 5,222,934 | ||||||||||||
Microcap Value Fund | 1,150,064 | — | 1,150,064 | 1,150,064 | ||||||||||||
Mid Cap Value Fund | 131,308 | 1,636 | 132,944 | 132,944 | ||||||||||||
72 |
NOTES TO FINANCIAL STATEMENTS |
As of September 30, 2014, the components of accumulated earnings/(losses) on a tax basis were as follows:
| Undistributed Ordinary Income | Undistributed Long Term Gain | Accumulated Earnings | Accumulated Capital Loss Carryforwards | Deferred Qualified Late-Year Losses | Unrealized Appreciation/ (Depreciation) | Total Accumulated Earnings/(Losses) | ||||||||||||||||||||||
SMID Cap Growth Fund | $ — | $10,208,797 | $10,208,797 | $— | $ | (274,742 | ) | $23,033,138 | $32,967,193 | |||||||||||||||||||
Enterprise Fund | — | 14,339,408 | 14,339,408 | — | (73,803 | ) | 42,449,265 | 56,714,870 | ||||||||||||||||||||
Small Cap Core Fund | 1,478,926 | 7,063,951 | 8,542,877 | — | — | 35,443,592 | 43,986,469 | |||||||||||||||||||||
Microcap Value Fund | 599,731 | 2,691,376 | 3,291,107 | — | — | 23,823,543 | 27,114,650 | |||||||||||||||||||||
Mid Cap Value Fund | 600,513 | 235,246 | 835,759 | — | — | 79,973 | 915,732 | |||||||||||||||||||||
As of September 30, 2014, the Funds did not have any capital loss carryforwards for federal income tax purposes.
During the year ended September 30, 2014, the Microcap Value Fund utilized capital loss carryforwards in the amounts of $10,824,127.
Under current tax law, capital losses realized after October 31 and ordinary losses after December 31 of a Fund’s fiscal year may be deferred and treated as occurring on the first business day of the following fiscal year for tax purposes. The SMID Cap Growth Fund and Enterprise Fund had deferred qualified late-year ordinary losses of $274,742 and $73,803, respectively, which will be treated as arising on the first business day of the fiscal year ending September 30, 2015.
8. Market Timing:
The Trust strongly discourages attempts at market timing by Fund shareholders. Each Fund charges a redemption fee of 2% of the value of the shares redeemed or exchanged within 30 days of purchase, and may also limit the number of exchanges that may be made between Funds to five (5) per calendar year. When assessed, the redemption fee is deducted from the redemption proceeds and retained by the Fund, not by the Advisor. This redemption fee is not charged in certain situations, such as where the redemption results from an automatic reinvestment or asset re-allocation not specifically directed by the shareholder. The Trust also reserves the right to reject any Fund purchase order made by persons deemed to be market timers. The Funds’ prospectus contains a full description of the Trust’s policies on market timing and/or excessive trading. The redemption fee is recorded as a credit to capital and is included in the capital transactions on the Statements of Changes in Net Assets.
During the year ended September 30, 2014, the redemption fees collected by the Funds which are included in the cost of shares redeemed on the Statement of Changes in Net Assets are as follows:
| Redemption Fees | ||||
SMID Cap Growth Fund | $ 413 | |||
Enterprise Fund | 903 | |||
Small Cap Core Fund | 5,775 | |||
Microcap Value Fund | 15,003 | |||
9. Soft Dollars:
The term soft dollars generally refers to arrangements in which services other than trade execution are received from a broker-dealer. Federal securities laws permit a fund advisor to incur commission charges on behalf of a Fund that are higher than another broker dealer would have charged if the advisor believes the charges are reasonable in relation to the brokerage and research services received. RBC GAM (US) has a fiduciary duty to the shareholders of the Funds to seek the best execution price for all of the Funds’ securities transactions. Fund management believes that using soft dollars to purchase brokerage and research services may, in certain cases, be in a Fund’s best interest. As of September 30, 2014, certain of the Funds used soft dollar arrangements on a limited basis. Fund management continues to closely monitor its current use of soft dollars, in addition to regulatory developments in this area for any possible impact on Fund policies.
| 73 |
NOTES TO FINANCIAL STATEMENTS
|
10. Subsequent Events:
Management has evaluated the impact of subsequent events of the Funds and has determined that there are no subsequent events that require recognition or disclosure in the financial statements except for the following:
The RBC Funds Trust filed with the Securities and Exchange Commission a post-effective amendment to its registration statement to create a new series under the Trust. This new Fund, the RBC Small Cap Value Fund is expected to become effective and commence operations in December 2014. RBC GAM (U.S.) Inc. will be the Fund’s investment advisor.
74 |
To the Shareholders and Board of Trustees of RBC Funds Trust
We have audited the accompanying statements of assets and liabilities, including the schedules of portfolio investments, of RBC SMID Cap Growth Fund, RBC Enterprise Fund, RBC Small Cap Core Fund, RBC Microcap Value Fund and RBC Mid Cap Value Fund (collectively the “Funds”), five of the portfolios constituting the RBC Funds Trust (the “Trust”), as of September 30, 2014, and the related statements of operations for the year then ended, the statements of changes in net assets for each of the two years in the period then ended, and the financial highlights for each of the five years in the period then ended. These financial statements and financial highlights are the responsibility of the Funds’ management. Our responsibility is to express an opinion on these financial statements and financial highlights based on our audits.
We conducted our audits in accordance with the standards of the Public Company Accounting Oversight Board (United States). Those standards require that we plan and perform the audits to obtain reasonable assurance about whether the financial statements and financial highlights are free of material misstatement. The Funds are not required to have, nor were we engaged to perform, an audit of their internal control over financial reporting. Our audits included consideration of internal control over financial reporting as a basis for designing audit procedures that are appropriate in the circumstances, but not for the purpose of expressing an opinion on the effectiveness of the Funds’ internal control over financial reporting. Accordingly, we express no such opinion. An audit also includes examining, on a test basis, evidence supporting the amounts and disclosures in the financial statements, assessing the accounting principles used and significant estimates made by management, as well as evaluating the overall financial statement presentation. Our procedures included confirmation of securities owned as of September 30, 2014, by correspondence with the Funds’ custodian and brokers; where replies were not received from brokers, we performed other auditing procedures. We believe that our audits provide a reasonable basis for our opinion.
In our opinion, the financial statements and financial highlights referred to above present fairly, in all material respects, the financial position of each of the portfolios constituting the RBC Funds Trust referred to above, as of September 30, 2014, the results of their operations for the year then ended, the changes in their net assets for each of the two years in the period then ended, and the financial highlights for each of the five years in the period then ended, in conformity with accounting principles generally accepted in the United States of America.
DELOITTE & TOUCHE LLP
Chicago, Illinois
November 26, 2014
| 75 |
For the fiscal year ended September 30, 2014, certain dividends paid by the Funds may be subject to a maximum tax rate of 15% as provided for by the Jobs and Growth Tax Reconciliation Act of 2003. The Funds intend to report the maximum amount allowable as taxed at a maximum rate of 15%.
Complete information will be reported in conjunction with your 2013 Form 1099-DIV.
All reportings are based on financial information available as of the date of this annual report and, accordingly, are subject to change. For each item, it is the intention of the Funds to report the maximum amount permitted under the Internal Revenue Code and the regulations thereunder.
For the year ended September 30, 2014, the following Funds had a qualified dividend income percentage of:
| Qualified Dividend Income | ||||
Enterprise Fund | 100% | |||
Small Cap Core Fund | 42.36% | |||
Microcap Value Fund | 100% | |||
Mid Cap Value Fund | 16.43% | |||
For corporate shareholders, the following percentage of the total ordinary income distributions paid during the fiscal year ended September 30, 2014 qualify for the corporate dividends received deduction:
| Dividends Received Deduction | ||||
Enterprise Fund | 100% | |||
Small Cap Core Fund | 39.00% | |||
Microcap Value Fund | 100% | |||
Mid Cap Value Fund | 15.38% | |||
The following Funds report a portion of the income dividends distributed during the fiscal year ended September 30, 2014, as qualified interest income as defined in the Internal Revenue Code:
| Qualified Interest Income | ||||
Enterprise Fund | 0.09% | |||
Microcap Value Fund | 0.04% | |||
Mid Cap Value Fund | 0.18% | |||
76 |
OTHER FEDERAL INCOME TAX INFORMATION (UNAUDITED) |
The following Funds report a portion of the income dividends distributed during the fiscal year ended September 30, 2014, as qualified short term gains:
| Qualified Short-term Gains | ||||
Small Cap Core Fund | 100% | |||
Mid Cap Value Fund | 100% | |||
| 77 |
Independent Trustees(1)(2)
T. Geron Bell (73)
Position, Term of Office and Length of Time Served with the Trust: Trustee since January 2004
Principal Occupation(s) During Past 5 Years: Chairman of the Executive Board of the Minnesota Twins (2011 to present); prior thereto President of Twins Sports, Inc. (parent company of the Minnesota Twins) (2002-2011); President of the Minnesota Twins Baseball Club Incorporated (1987-2002)
Number of Portfolios in Fund Complex Overseen by Trustee: 18
Other Director/Trustee Positions Held by Trustee During Past 5 Years: None
Lucy Hancock Bode (63)
Position, Term of Office and Length of Time Served with the Trust: Trustee since January 2004
Principal Occupation(s) During Past 5 Years: Healthcare consultant (self-employed) (1986 to present)
Number of Portfolios in Fund Complex Overseen by Trustee: 18
Other Director/Trustee Positions Held by Trustee During Past 5 Years: BioSignia; Franklin Street Partners
Leslie H. Garner Jr. (64)
Position, Term of Office and Length of Time Served with the Trust: Trustee since January 2004
Principal Occupation(s) During Past 5 Years: President and CEO, The Greater Cedar Rapids Community Foundation (2010 to present); previously, President, Cornell College (1994 to 2010)
Number of Portfolios in Fund Complex Overseen by Trustee: 18
Other Director/Trustee Positions Held by Trustee During Past 5 Years: None
Ronald James (63)
Position, Term of Office and Length of Time Served with the Trust: Trustee since January 2004
Principal Occupation(s) During Past 5 Years: President and Chief Executive Officer, Center for Ethical Business Cultures (2000 to present)
Number of Portfolios in Fund Complex Overseen by Trustee: 18
Other Director/Trustee Positions Held by Trustee During Past 5 Years: Best Buy Co. Inc.; Bremer Financial Corporation
John A. MacDonald (65)
Position, Term of Office and Length of Time Served with the Trust: Trustee since January 2004
Principal Occupation(s) During Past 5 Years: Vice President and Treasurer, Hall Family Foundation (1988 to present)
Number of Portfolios in Fund Complex Overseen by Trustee: 18
Other Director/Trustee Positions Held by Trustee During Past 5 Years: None
H. David Rybolt (72)
Position, Term of Office and Length of Time Served with the Trust: Trustee since January 2004
Principal Occupation(s) During Past 5 Years: Consultant, HDR Associates (management consulting) (1985 to present)
Number of Portfolios in Fund Complex Overseen by Trustee: 18
Other Director/Trustee Positions Held by Trustee During Past 5 Years: None
78 |
MANAGEMENT (Unaudited) |
Independent Trustees(1)(2)
James R. Seward (62)
Position, Term of Office and Length of Time Served with the Trust: Chairman of the Board and Trustee since January 2004
Principal Occupation(s) During Past 5 Years: Private investor (2000 to present); CFA (1987 to present)
Number of Portfolios in Fund Complex Overseen by Trustee: 18
Other Director/Trustee Positions Held by Trustee During Past 5 Years: Sooner Holdings (formerly Syntroleum Corporation); Brookdale Senior Living Inc.
William B. Taylor (69)
Position, Term of Office and Length of Time Served with the Trust: Trustee since September 2005
Principal Occupation(s) During Past 5 Years: Consultant (2003 to present); previously Partner, Ernst & Young LLP (1982 to 2003)
Number of Portfolios in Fund Complex Overseen by Trustee: 18
Other Director/Trustee Positions Held by Trustee During Past 5 Years: William Henry Insurance, LLC; Balance Innovations LLC; Kansas City Symphony
Interested Trustees(1)(2)(3)
Kathleen A. Gorman (50)(5)
Position, Term of Office and Length of Time Served with the Trust: Trustee since September 2012
Principal Occupation(s) During Past 5 Years: President and Chief Executive Officer, RBC Funds (2012 to present); Chief Compliance Officer, RBC Funds (2006 to 2012); Director of Regulatory Administration, RBC Global Asset Management (U.S.) Inc. (2007 to 2012); Chief Compliance Officer, RBC Global Asset Management (U.S.) Inc. (2006-2009)
Number of Portfolios in Fund Complex Overseen by Trustee: 18
Other Director/Trustee Positions Held by Trustee During Past 5 Years: None
Executive Officers(1)(3)(4)
Kathleen A. Gorman (50)
Position, Term of Office and Length of Time Served with the Trust: President and Chief Executive Officer since September 2012
Principal Occupation(s) During Past 5 Years: President and Chief Executive Officer, RBC Funds (2012 to present); Chief Compliance Officer, RBC Funds (2006 to 2012); Director of Regulatory Administration, RBC Global Asset Management (U.S.) Inc. (2007 to 2012); Chief Compliance Officer, RBC Global Asset Management (U.S.) Inc. (2006-2009)
| 79 |
MANAGEMENT (Unaudited) |
Executive Officers(1)(3)(4)
Kathleen A. Hegna (47)
Position, Term of Office and Length of Time Served with the Trust: Chief Financial Officer and Principal Accounting Officer since May 2009 and Treasurer since March 2014
Principal Occupation(s) During Past 5 Years: Associate Vice President and Director, Mutual Fund Accounting and Administration, RBC Global Asset Management (U.S.) Inc. (2009 to present); Senior Compliance Officer, RBC Global Asset Management (U.S.) Inc. (2006-2009)
Christina M. Moore (46)
Position, Term of Office and Length of Time Served with the Trust: Chief Compliance Officer since December 2012 and Assistant Secretary since March 2013
Principal Occupation(s) During Past 5 Years: Chief Compliance Officer, RBC Funds (2012-present); Senior Compliance Officer, RBC Funds (March 2012 to December 2012); Compliance Manager, Minnesota Life Insurance Company (2006-2012)
Lee Thoresen (43)
Position, Term of Office and Length of Time Served with the Trust: Chief Legal Officer and Secretary since March 2008
Principal Occupation(s) During Past 5 Years: Senior Associate General Counsel, RBC Capital Markets, LLC (2006-present)
| (1) | Except as otherwise noted, the address of each Trustee/Officer is RBC Funds Trust, 50 South Sixth Street, Suite 2350, Minneapolis, Minnesota 55402. |
| (2) | All Trustees must retire on or before December 31 of the year in which they reach age 75. The Board may temporarily waive this requirement when necessary to avoid depriving the Board of a Trustee with critical skills. |
| (3) | On December 31, 2009, Voyageur Asset Management Inc. changed its name to RBC Global Asset Management (U.S.) Inc. Any references to RBC Global Asset Management (U.S.) Inc. for prior periods are deemed to be references to the prior entity. |
| (4) | Each officer serves in such capacity for an indefinite period of time until his or her removal, resignation or retirement. |
| (5) | Kathleen A. Gorman has been determined to be an interested Trustee by virtue of her position with the Advisor. |
The Funds’ Statement of Additional Information includes information about the Funds’ Trustees. To receive your free copy of the Statement of Additional Information, call toll free: 1-800-422-2766.
80 |
The RBC Equity Funds offer two share classes. These two share classes are the A and I classes.
Class A
Class A shares of all Funds except Mid Cap Value are available for purchase primarily through investment advisors, broker-dealers, banks and other financial services intermediaries. Class A shares of the Funds are currently subject to a maximum up-front sales charge of 5.75% and a 1.00% CDSC for redemption within 12 months of a $1 million or greater purchase. Class A shares currently include a 0.25% (25 bps) annual 12b-1 service and distribution fee.
Class I
Class I shares are available in all of the Equity Funds. This share class is intended for investors meeting certain minimum investment thresholds. This share class does not have an up-front sales charge (load) or a 12b-1 service and distribution fee.
| 81 |
Shareholder Expense Examples
As a shareholder of the RBC Funds, you incur two types of costs: (1) transaction costs, including sales charges (loads) and (2) ongoing costs, including management fees; 12b-1 distribution and service fees; and other Fund expenses. This example is intended to help you understand your ongoing costs (in dollars) of investing in the RBC Funds and to compare these costs with the ongoing costs of investing in other mutual funds.
The example is based on an investment of $1,000 invested at the beginning of the period and held for the entire period from April 1, 2014 through September 30, 2014.
Actual Expenses and Performance
The table below provides information about actual account values and actual expenses. You may use the information below, together with the amount you invested, to estimate the expenses that you paid over the period. Simply divide your account value by $1,000 (for example, an $8,600 account value divided by $1,000 = 8.6), then multiply the result by the number in the table under the heading entitled “Expenses Paid During Period” to estimate the expenses you paid on your account during this period.
| Beginning Account Value 4/1/2014 | Ending Account Value 9/30/2014 | Expenses Paid During Period* 4/1/14-9/30/14 | Annualized Expense Ratio During Period 4/1/14-9/30/14 | ||||||||||||||||||||||
SMID Cap Growth Fund | Class A | $1,000.00 | $ 972.60 | $5.44 | 1.10 | % | |||||||||||||||||||
| Class I | 1,000.00 | 973.70 | 4.21 | 0.85 | % | ||||||||||||||||||||
Enterprise Fund | Class A | 1,000.00 | 908.30 | 6.36 | 1.33 | % | |||||||||||||||||||
| Class I | 1,000.00 | 909.30 | 5.17 | 1.08 | % | ||||||||||||||||||||
Small Cap Core Fund | Class A | 1,000.00 | 950.70 | 5.62 | 1.15 | % | |||||||||||||||||||
| Class I | 1,000.00 | 951.90 | 4.40 | 0.90 | % | ||||||||||||||||||||
Microcap Value Fund | Class A | 1,000.00 | 958.30 | 6.48 | 1.32 | % | |||||||||||||||||||
| Class I | 1,000.00 | 959.40 | 5.26 | 1.07 | % | ||||||||||||||||||||
Mid Cap Value Fund | Class I | 1,000.00 | 1,031.40 | 4.58 | 0.90 | % | |||||||||||||||||||
*Expenses are equal to the average account value times the Fund’s annualized expense ratio multiplied by 183/365 (to reflect one-half year period).
82 |
SUPPLEMENTAL INFORMATION (UNAUDITED) |
Hypothetical Example for Comparison Purposes
The table below provides information about hypothetical account values and hypothetical expenses based on each RBC Funds’ actual expense ratio and an assumed rate of return of 5% per year before expenses, which is not the Fund’s actual return. The hypothetical account values and expenses may not be used to estimate the actual ending account balance or expenses you paid for the period. You may use this information to compare this 5% hypothetical example with the 5% hypothetical examples that appear in the shareholder reports of other funds.
Please note that the expenses shown in the table are meant to highlight your ongoing costs only and do not reflect any transactional costs, such as sales charges (loads), redemption fees, or exchange fees. Therefore, the table is useful in comparing ongoing costs only, and will not help you determine the relative total costs of owning different funds. In addition, if these transactional costs were included, your costs would have been higher.
| Beginning Account Value 4/1/2014 | Ending Account Value 9/30/2014 | Expenses Paid During Period* 4/1/14-9/30/14 | Annualized Expense Ratio During Period 4/1/14-9/30/14 | |||||||
SMID Cap Growth Fund | Class A | $1,000.00 | $1,019.55 | $5.57 | 1.10% | |||||
| Class I | 1,000.00 | 1,020.81 | 4.31 | 0.85% | ||||||
Enterprise Fund | Class A | 1,000.00 | 1,018.40 | 6.73 | 1.33% | |||||
| Class I | 1,000.00 | 1,019.65 | 5.47 | 1.08% | ||||||
Small Cap Core Fund | Class A | 1,000.00 | 1,019.30 | 5.82 | 1.15% | |||||
| Class I | 1,000.00 | 1,020.56 | 4.56 | 0.90% | ||||||
Microcap Value Fund | Class A | 1,000.00 | 1,018.45 | 6.68 | 1.32% | |||||
| Class I | 1,000.00 | 1,019.70 | 5.42 | 1.07% | ||||||
Mid Cap Value Fund | Class I | 1,000.00 | 1,020.56 | 4.56 | 0.90% | |||||
*Expenses are equal to the average account value times the Fund’s annualized expense ratio multiplied by 183/365 (to reflect one-half year period).
| 83 |
Information Regarding the Approval of Investment Advisory Agreements
In September 2014, after evaluating the services provided by RBC Global Asset Management (U.S.) Inc. (the “Advisor”) and reviewing the performance, fees, and expenses of the Funds, the RBC Funds Board of Trustees determined to approve the continuation of the investment advisory agreements (“Agreements”) with the Advisor for each Fund for an additional year.
As part of their review of the Agreements, the Trustees requested and considered information regarding the advisory services performed by the Advisor, the staffing and qualifications of the personnel responsible for operating and managing the Funds, and the Funds’ performance, fees and expenses. The Trustees considered information provided at regular quarterly Board and Committee meetings throughout the year as well as information presented at both a special meeting held to review requested material related to the proposed renewals and a meeting held specifically to consider the proposed renewals. In connection with their deliberations, the independent Trustees were advised by their own independent legal counsel with regard to the materials and their responsibilities under relevant laws and regulations.
The Trustees met with representatives from the Advisor’s senior management team, as well as senior investment professionals, to discuss the information and the Advisor’s ongoing management of the Funds. The Trustees reviewed the nature, quality, and extent of the services provided to the Funds by the Advisor, including information as to each Fund’s performance relative to appropriate securities index benchmarks as well as fund peer group comparative information provided by an independent third-party as requested by the Board. The Trustees also reviewed supplemental information from the Advisor.
The Trustees recognized the strong research and fundamental analysis capabilities of the Advisor’s investment staff and their extensive portfolio management experience, as well as the Advisor’s effective trading, operational and compliance structure and systems. The Trustees noted that the performance of the RBC Microcap Value Fund and RBC Mid Cap Value Fund was favorable relative to benchmarks for all periods ended June 30, 2014, and that performance of the RBC Enterprise Fund and RBC Small Cap Core Fund was generally favorable versus relevant micro cap benchmarks, with the Funds’ less favorable one year performance attributable to the underweighting of certain sectors that had performed well consistent with the portfolio team’s general high quality investment approach. For the RBC SMID Cap Growth Fund, the Trustees focused on performance since the portfolio management team commenced management in 2008, which was similarly favorable except for shorter term underperformance due to market conditions not favoring the team’s focus on high return on equity/high quality companies.
The Trustees reviewed comparative advisory fee and expense information for each Fund, together with information regarding the Advisor’s contractual agreement to subsidize Fund expenses at competitive levels through expense limitation agreements. The Trustees noted that advisory fees and expense ratios were competitive. The Trustees also reviewed reports from the Advisor regarding its management of other investment client accounts with similar strategies, including the advisory fees paid and the reasons for differences in fees. The Trustees reviewed profitability data — including year-over-year variances — for the Advisor and considered information regarding other benefits the Advisor and its affiliates derived from their relationships with the Funds, including soft dollar research and other benefits, including the Advisor’s role as co-administrator of the Funds and the fees paid by the Funds for such services.
84 |
APPROVAL OF INVESTMENT ADVISORY AGREEMENT (UNAUDITED) |
Based upon their review, the Trustees determined that the advisory fees proposed to be payable to the Advisor were fair and reasonable in light of the nature and quality of services provided under all the circumstances and were within the range of what might have been negotiated at arms’ length. The Trustees concluded that it is in the interests of the Funds and their shareholders for the Trustees to approve the continuation of the Agreements and the expense limitation agreements for the Funds. In arriving at their collective decision to approve the renewal of the Agreements, the Trustees did not assign relative weights to the factors discussed above or deem any one or group of them to be controlling in and of itself.
| 85 |
|
This Page Intentionally Left Blank
86 |
|
This Page Intentionally Left Blank
| 87 |
|
This Page Intentionally Left Blank
88 |
RBC Funds
P.O. Box 701
Milwaukee, WI 53201-0701
800-422-2766
www.rbcgam.us
Performance data represents past performance and does not guarantee future results. The principal value of an investment and investment return will fluctuate so that an investor’s shares, when redeemed, may be worth more or less than their original cost.
This report and the financial statements contained herein are provided for the information of RBC Funds shareholders. This report is not authorized for distribution to prospective investors unless preceded or accompanied by a current prospectus, which contains information concerning investment objectives, risks, charges and expenses of the funds. Please read the prospectus carefully before investing.
This report and the financial statements contained herein are not intended to be a forecast of future events, a guarantee of future results, or investment advice. There is no assurance that certain securities will remain in or out of each fund’s portfolio. The views expressed in this report reflect those of the portfolio managers through the period ended September 30, 2014.
NOT FDIC INSURED • NO BANK GUARANTEE • MAY LOSE VALUE
RBC Global Asset Management (U.S.) Inc. serves as investment advisor for the RBC Funds. RBC Funds are distributed by Quasar Distributors LLC.

The RBC Funds are pleased to offer shareholder reports printed entirely on Forest Stewardship Council certified paper. FSC® certification ensures that the paper used in this report contains fiber from well-managed and responsibly harvested forests that meet strict environmental and socioeconomic standards.
RBCF-EQ AR 09-14
| RBC Funds | ||||||||||||
About Your Annual Report |
This annual report includes detailed information about your Fund including financial statements, performance, and a complete list of holdings. |
| ||||||||||
We hope the financial information presented will help you evaluate your investment in the RBC Funds. We also encourage you to read your Fund’s prospectus for further detail as to your Fund’s investment policies and risk profile. RBC Funds prospectuses and additional performance information are available on our website at www.rbcgam.us. |
| |||||||||||
A description of the policies and procedures that your Fund uses to determine how to vote proxies relating to portfolio securities is available (i) without charge, upon request, by calling 1-800-422-2766; (ii) on the Fund’s website at www.rbcgam.us; and (iii) on the Securities and Exchange Commission’s (“Commission”) website at http://www.sec.gov. |
| |||||||||||
Information regarding how your Fund voted proxies relating to portfolio securities during the most recent 12-month period ended June 30 is available (i) on the Fund’s website at www.rbcgam.us; and (ii) on the Commission’s website at http://www.sec.gov. |
| |||||||||||
A schedule of each Fund’s portfolio holdings will be filed with the Commission for the first and third quarters of each fiscal year on Form N-Q. This information is available on the Commission’s website at http://www.sec.gov and may be reviewed and copied at the Commission’s Public Reference Room in Washington, D.C. Information on the operation of the Public Reference Room is available by calling 1-202-551-8090. |
| |||||||||||
Contents | ||||||||||||
| Letter from the Chief Investment Officer | 1 | |||||||||||
| Money Market Portfolio Managers | 3 | |||||||||||
| Performance Summary | 4 | |||||||||||
| Schedules of Portfolio Investments | 7 | |||||||||||
| Financial Statements | ||||||||||||
| - Statements of Assets and Liabilities | 38 | |||||||||||
| - Statements of Operations | 40 | |||||||||||
| - Statements of Changes in Net Assets | 41 | |||||||||||
| Financial Highlights | 44 | |||||||||||
| Notes to Financial Statements | 50 | |||||||||||
| Report of Independent Registered Public Accounting Firm | 61 | |||||||||||
| Other Federal Income Tax Information | 62 | |||||||||||
| Management | 63 | |||||||||||
| Supplemental Information | 66 | |||||||||||
| Approval of Investment Advisory Agreement | 68 | |||||||||||
At RBC, we understand the high priority that our shareholders place on ensuring their liquidity needs are met while striving to ensure their wealth is preserved. Throughout the past year, the RBC Funds continued to provide solid financial solutions for our shareholders. In this context, we are pleased to report that all components of our money market funds performed as expected during the past fiscal year and in a manner that was consistent with our benchmarks. In spite of the funds’ competitive performance, the broader money market fund industry continues to be challenged by ultra-low market yields. The Federal Reserve and central banks across the globe continue to hold interest rates at exceptionally low levels.
The outlook for monetary policy suggests that we are nearing a time when the central bank may begin a shift toward normalizing interest rates. The Federal Reserve has wound down its program of bond purchases over the past year and the Fed’s open Market Committee is closely monitoring economic factors as they contemplate the appropriate time to alter course for monetary policy. At this time, forecasts seem to predict that rate increases by the central bank are not likely to occur until midway into the year 2015, in our view.
Looking forward, the community of money fund managers is analyzing the many aspects of the SEC’s recently announced reforms to regulations that govern the operation and management of money funds. The new rules will be implemented over the next two years and will impact managers and investors alike. Throughout this period of transition, we will continue to maintain a family of highly diversified and liquid portfolios, and we will remain proactive in monitoring areas of risk across all market sectors. Our approved list of issuers will continue to reflect the thorough and conservative nature of our credit review process. We will seek opportunities to positively impact performance using our conservative list of approved issuers by investing in what we believe are the strongest issuers while maintaining appropriate levels of liquidity.
Through all these ups and downs in the market, investors who have remained focused on their financial objectives have generally been successful. Thank you for your continued confidence and trust in the RBC Funds.
Sincerely,
Michael Lee, CFA CEO, President and Chief Investment Officer RBC Global Asset Management (U.S.) Inc.
| ||||||

| 1 |
| LETTER FROM THE CHIEF INVESTMENT OFFICER | ||||
Past performance is not a guarantee of future results.
Opinions expressed are subject to change, are not guaranteed, and should not be considered a recommendation to buy or sell any security.
Diversification does not assure a profit or protect against a loss in a declining market.
An investment in a Money Market Fund is not insured or guaranteed by the Federal Deposit Insurance Corporation or any other government agency. Although Money Market Funds seek to preserve the value of your investment at $1.00 per share, it is possible to lose money by investing in them. These risks are more fully described in the prospectus.
|
2 |
RBC Global Asset Management (U.S.) Inc. (“RBC GAM (US)”), serves as the investment advisor to the RBC Funds. RBC GAM (US) employs a team approach to the management of each of the Money Market Funds, with no individual team member being solely responsible for the investment decisions. Each Fund’s management team has access to RBC GAM (US)’s investment research and other money management resources.
| ||||||
Raye C. Kanzenbach, CFA
Senior Managing Director, Senior Portfolio Manager
Raye Kanzenbach leads the municipal research team within RBC GAM (US)’s fixed income division. He researches various tax- and revenue-backed municipal bonds and is a portfolio manager for several of the firm’s tax-exempt and community investing mandates. Raye has worked in fixed income research and portfolio management since joining the firm in 1983 and helped launch the RBC Money Market Funds. He previously worked at First Bank System (now U.S. Bank), where he managed municipal bond and money market funds and supervised municipal and credit research. Raye was also an investment officer at The St. Paul Companies (now The Travelers Companies). He earned a BA in economics from Lawrence University and an MBA in finance from the University of Michigan. Raye is a CFA charterholder. |
Raye C. Kanzenbach, CFA | |||||
Brandon T. Swensen, CFA
Vice President, Co-Head, U.S. Fixed Income
Brandon Swensen oversees RBC GAM (US)’s fixed income research, portfolio management and trading. In addition to shaping the firm’s overall fixed income philosophy and process, he is a portfolio manager for several cash management and core solutions, including the Money Market Funds. Brandon joined RBC GAM (US) in 2000 and most recently was a portfolio manager on the mortgage and government team before being promoted to Co-Head. He also held research analyst positions covering asset-backed securities and credit and served as a financial analyst for the firm. Brandon earned a BS in finance from St. Cloud State University and an MBA in finance from the University of St. Thomas. He is a CFA charterholder and member of the CFA Society of Minnesota. |
Brandon T. Swensen, CFA | |||||
Chad Rice, CFA
Vice President, Portfolio Manager
Chad Rice is a member of the municipal research team within RBC GAM (US)’s fixed income group. He researches tax-exempt money market securities as well as various tax- and revenue-backed municipal bonds. Chad is also a portfolio manager for the firm’s tax-free cash management and intermediate municipal solutions, including the Tax-Free Money Market Fund. He joined RBC GAM-US in 2011 from a U.S. mutual insurance company, where he was a senior portfolio manager for its property/casualty and life insurance businesses. Chad earned a BS from the University of Wisconsin- Stevens Point and an MS in finance, investments, and banking at the University of Wisconsin-Madison School of Business, where he participated in the Applied Security Analysis Program. He is a CFA charterholder and member of the National Federation of Municipal Analysts. |
Chad Rice, CFA | |||||


| 3 |
RBC Money Market Funds
| ||||||
RBC Money Market Funds |
The RBC Money Market Funds seek to achieve the highest level of current income as is consistent with prudent investment management emphasizing the safety of principal and the maintenance of suitable liquidity. The Funds invest in a variety of highly rated money market instruments. In the Tax-Free Money Market Fund, investments are made in highly rated debt obligations that pay interest exempt from federal income taxes and the alternative minimum tax.
The RBC Money Market Funds are not benchmarked to industry indices, although their performance is evaluated against each Fund’s respective peer group as reported by several service providers.
| |||||
| Taxable Money Market Funds |
The Federal Reserve continues to hold interest rates at exceptionally low levels. Similar actions have been taken by central banks across the other developed economies in an effort to promote a sustainable economic recovery. Central banks remain resolute in their support of global economic growth, and this trend is unlikely to change in the near term.
The impact of these policies on the money market fund industry continues to be dramatic, where short-term interest rates remain near zero. As the Fed completes their tapering of its program of bond purchases, the outlook for monetary policy has shifted slightly toward an expectation for a gradual rise in interest rates. We do not foresee a change to current U.S. monetary policy through mid-year 2015.
The Funds’ portfolios remain well diversified in high quality securities with maturities that are structured to provide very strong levels of liquidity. The announcement by the SEC of additional money market reform measures has highlighted the continuing high priority placed on preserving the resiliency of funds in meeting large shareholder withdrawal demands. As we move forward, we will continue to manage the funds in a manner that meets those objectives.
| |||||
| Tax-Free Money Market Fund |
Interest rates on securities with short maturities remained extremely low during the year, including the short maturity tax-exempt securities held by the Fund. The great majority of the Fund’s assets have effective maturities of 7 days or less, which provide the Fund with very strong liquidity. The balance of the portfolio is invested in high quality securities with maturities of 2 weeks to 13 months. The average maturity of the Fund was a bit longer than the average of other tax-exempt money market funds. The portfolio has been constructed in a configuration which we expect will provide suitable yield in a majority of interest rate environments. Throughout the year we modestly increased the portfolio allocation to higher education and healthcare sectors. We consider the portfolio to be well diversified among a large number of high quality issuers.
|
4 |
PERFORMANCE SUMMARY | ||||||||||||
Each of the RBC Money Market Funds was managed to preserve principal. This means that the share price of each fund held steady at $1.00. A consistent share price of $1.00 is expected for a money market mutual fund. An investment in the Fund is not insured or guaranteed by the Federal Deposit Insurance Corporation or any other government agency. Although the Fund seeks to preserve the value of your investment at $1.00 per share, it is possible to lose money by investing in the Fund. These risks are more fully described in the prospectus.
| Investment Objective | |||||||||||
Total Return for the | SEC 7-Day Annualized Yield (1) | |||||||||||
| Year Ended September 30, 2014 | September 30, 2014 | September 30, 2013 | ||||||||||
Prime Money Market Fund | ||||||||||||
RBC Institutional Class 1 | 0.01% | 0.01% | 0.01% | |||||||||
RBC Institutional Class 2 | 0.01% | 0.01% | 0.01% | |||||||||
RBC Investor Class | 0.01% | 0.01% | 0.01% | |||||||||
RBC Reserve Class | 0.01% | 0.01% | 0.01% | |||||||||
RBC Select Class
| 0.01% | 0.01% | 0.01% | |||||||||
U.S. Government Money Market Fund | ||||||||||||
RBC Institutional Class 1 | 0.01% | 0.01% | 0.01% | |||||||||
RBC Institutional Class 2 | 0.01% | 0.01% | 0.01% | |||||||||
RBC Investor Class | 0.01% | 0.01% | 0.01% | |||||||||
RBC Reserve Class | 0.01% | 0.01% | 0.01% | |||||||||
RBC Select Class
| 0.01% | 0.01% | 0.01% | |||||||||
Tax-Free Money Market Fund | ||||||||||||
RBC Institutional Class 1(2) | 0.00% | 0.00% | 0.00% | |||||||||
RBC Institutional Class 2 | 0.01% | 0.01% | 0.01% | |||||||||
RBC Investor Class | 0.01% | 0.01% | 0.01% | |||||||||
RBC Reserve Class | 0.01% | 0.01% | 0.01% | |||||||||
RBC Select Class | 0.01% | 0.01% | 0.01% | |||||||||
(1) As money market returns respond rapidly to market changes, such as in the Fed Funds rate, the 7-Day yield is a more accurate reflection of current earnings than the total return for the year. Prior year 7-Day yield information is provided for comparative purposes. | ||||||||||||
(2) There were no RBC Institutional Class 1 shares outstanding during the period from October 29, 2012 to July 27, 2014. | ||||||||||||
Performance data quoted represents past performance. Past performance is no guarantee of future results. Investment return and principal value of an investment will fluctuate so that an investor’s shares, when redeemed, may be worth more or less than their original cost. Current performance may be lower or higher than performance quoted. Performance shown reflects contractual fee waivers, without such fee waivers total returns would be reduced. For performance data current to most recent month-end go to www.rbcgam.us.
| ||||||||||||
| 5 |
| PERFORMANCE SUMMARY | ||||||||||||||||
| Asset Allocation | ||||||||||||||||
| Money Market Maturity Schedules | ||||||||||||||||
As a percentage of value of investments based on effective maturity as of September 30, 2014.
|
| |||||||||||||||
| Prime Money Market Fund | U.S. Government Money Market Fund | Tax-Free Money Market Fund | ||||||||||||||
| Less than 8 days | 45.2% | 50.0% | 76.1% | |||||||||||||
| 8 to 14 Days | 6.4% | 6.0% | 0.0% | |||||||||||||
| 15 to 30 Days | 15.0% | 18.5% | 1.7% | |||||||||||||
| 31 to 180 Days | 29.8% | 18.6% | 13.9% | |||||||||||||
| Over 180 Days | 3.6% | 6.9% | 8.3% | |||||||||||||
6 |
Prime Money Market Fund
September 30, 2014
Principal Amount | Value | |||||
Asset Backed Commercial Paper — 3.19% |
| |||||
Finance - Diversified Domestic — 3.19% |
| |||||
$58,000,000 | Cancara Asset Securitisation LLC, 0.14%, 10/1/14(a)(b) | $ | 58,000,000 | |||
30,000,000 | Cancara Asset Securitisation LLC, 0.19%, 10/21/14(a)(b) | 29,996,833 | ||||
50,000,000 | Cancara Asset Securitisation LLC, 0.21%, 12/18/14(a)(b) | 49,977,250 | ||||
50,000,000 | Collateralized Commercial Paper II Co., LLC, 0.20%, 11/3/14(a)(b) | 49,990,833 | ||||
30,000,000 | Kells Funding LLC, 0.23%, 10/14/14(a) | 30,000,436 | ||||
15,000,000 | Kells Funding LLC, 0.23%, 10/27/14(a) | 15,000,342 | ||||
50,000,000 | Kells Funding LLC, 0.24%, 1/7/15(a) | 50,000,000 | ||||
35,000,000 | Kells Funding LLC, 0.24%, 2/5/15(a) | 35,000,103 | ||||
35,000,000 | Kells Funding LLC, 0.25%, 2/5/15(a) | 35,001,289 | ||||
|
| |||||
Total Asset Backed Commercial Paper | 352,967,086 | |||||
|
| |||||
(Cost $352,967,086) | ||||||
Commercial Paper — 28.79% |
| |||||
Banks - Australia & New Zealand — 2.26% |
| |||||
25,000,000 | Commonwealth Bank Australia, 0.22%, 3/19/15(a) | 24,998,834 | ||||
25,000,000 | Commonwealth Bank Australia, 0.23%, 5/15/15(a) | 25,001,726 | ||||
25,000,000 | Commonwealth Bank Australia, 0.24%, 2/6/15(a) | 25,000,000 | ||||
25,000,000 | Commonwealth Bank Australia, 0.24%, 7/8/15(a) | 25,000,000 | ||||
25,000,000 | Commonwealth Bank Australia, 0.24%, 8/14/15(a) | 25,000,000 | ||||
10,000,000 | Westpac Banking Corp., 0.17%, 4/29/15(a) | 10,000,940 | ||||
25,000,000 | Westpac Banking Corp., 0.24%, 4/24/15(a) | 25,000,000 | ||||
15,000,000 | Westpac Banking Corp., 0.26%, 7/8/15 | 15,001,957 | ||||
50,000,000 | Westpac Banking Corp., 0.28%, 10/31/14(a)(b) | 49,988,333 | ||||
25,000,000 | Westpac Banking Corp., 1.38%, 7/17/15(a) | 25,201,706 | ||||
|
| |||||
| 250,193,496 | ||||||
|
| |||||
Banks - Domestic — 0.51% |
| |||||
26,000,000 | John Deere Bank SA, 0.07%, 10/27/14(a)(b) | 25,998,686 | ||||
30,000,000 | JP Morgan Securities LLC, 0.28%, 1/16/15 | 30,000,000 | ||||
|
| |||||
| 55,998,686 | ||||||
|
| |||||
Banks - Foreign — 2.75% |
| |||||
50,000,000 | Credit Suisse New York, 0.26%, 10/1/14(b) | 50,000,000 | ||||
50,000,000 | DnB NOR Bank ASA, 0.21%, 10/10/14(a)(b) | 49,997,437 | ||||
50,000,000 | DnB NOR Bank ASA, 0.22%, 12/5/14(a)(b) | 49,980,139 | ||||
25,000,000 | DnB NOR Bank ASA, 0.27%, 11/25/14(a)(b) | 24,989,878 | ||||
50,000,000 | Nederlandse Waterschapsbank NV, 0.24%, 10/29/14(a) | 50,000,000 | ||||
30,000,000 | Nederlandse Waterschapsbank NV, 0.24%, 12/5/14(a) | 29,999,511 | ||||
50,000,000 | Rabobank USA Financial Corp., 0.17%, 10/7/14(b) | 49,998,583 | ||||
|
| |||||
| 304,965,548 | ||||||
|
| |||||
Banks - Japanese — 0.90% |
| |||||
50,000,000 | Mitsubishi UFJ Trust & Bank NY, 0.15%, 10/27/14(a)(b) | 49,994,583 | ||||
50,000,000 | Mitsubishi UFJ Trust & Bank NY, 0.20%, 12/1/14(a)(b) | 49,983,056 | ||||
|
| |||||
| 99,977,639 | ||||||
|
| |||||
| 7 |
SCHEDULES OF PORTFOLIO INVESTMENTS |
Prime Money Market Fund (cont.)
September 30, 2014
Principal Amount | Value | |||||
Banks - United Kingdom — 1.49% |
| |||||
$ 40,000,000 | Lloyds TSB Bank Plc NY, 0.18%, 12/8/14(b) | $ | 39,986,400 | |||
25,000,000 | Standard Chartered Bank, 0.27%, 1/7/15(a)(b) | 24,981,625 | ||||
50,000,000 | Standard Chartered Bank, 0.27%, 1/21/15(a)(b) | 49,958,000 | ||||
50,000,000 | Standard Chartered Bank, 0.28%, 11/21/14(a)(b) | 49,980,167 | ||||
|
| |||||
| 164,906,192 | ||||||
|
| |||||
Consumer Discretionary — 2.14% |
| |||||
41,750,000 | Coca-Cola Co., 0.20%, 10/10/14(a)(b) | 41,747,913 | ||||
25,000,000 | Coca-Cola Co., 0.20%, 11/10/14(a)(b) | 24,994,444 | ||||
70,000,000 | Coca-Cola Co., 0.20%, 1/14/15(a)(b) | 69,959,167 | ||||
100,000,000 | Procter & Gamble Co., 0.15%, 10/21/14(a)(b) | 99,991,667 | ||||
|
| |||||
| 236,693,191 | ||||||
|
| |||||
Finance - Diversified Domestic — 4.36% |
| |||||
10,600,000 | ABB Treasury Center USA, Inc, 0.08%, 10/7/14(a)(b) | 10,599,859 | ||||
96,000,000 | Cargill Global Funding Plc, 0.06%, 10/3/14(a)(b) | 95,999,680 | ||||
29,000,000 | John Deere Financial Ltd, 0.07%, 10/2/14(a)(b) | 28,999,944 | ||||
22,000,000 | John Deere Financial Ltd, 0.08%, 10/1/14(a)(b) | 22,000,000 | ||||
150,000,000 | Nestle Finance International Ltd, 0.03%, 10/1/14(b) | 150,000,000 | ||||
25,000,000 | Reckitt Benckiser Treasury Services Plc, 0.30%, 3/4/15(a)(b) | 24,967,917 | ||||
25,000,000 | Toyota Credit Canada Inc., 0.05%, 10/2/14(b) | 24,999,965 | ||||
25,000,000 | Toyota Motor Credit Corp., 0.21%, 4/9/15 | 25,000,000 | ||||
50,000,000 | Toyota Motor Credit Corp., 0.21%, 5/5/15 | 50,000,000 | ||||
25,000,000 | Toyota Motor Credit Corp., 0.22%, 2/12/15 | 25,000,000 | ||||
25,000,000 | Toyota Motor Credit Corp., 0.23%, 8/26/15 | 25,000,000 | ||||
|
| |||||
| 482,567,365 | ||||||
|
| |||||
Finance - Diversified Foreign — 5.97% |
| |||||
50,000,000 | Abbey National North America LLC, 0.05%, 10/1/14(b) | 50,000,000 | ||||
50,000,000 | Erste Abwicklungsanstalt, 0.17%, 10/16/14(a)(b) | 49,996,458 | ||||
50,000,000 | Nordea Bank AB, 0.18%, 1/20/15(a)(b) | 49,972,250 | ||||
50,000,000 | Nordea Bank AB, 0.21%, 2/26/15(a)(b) | 49,956,833 | ||||
25,000,000 | Nordea Bank AB, 0.22%, 10/14/14(a)(b) | 24,998,014 | ||||
50,000,000 | NRW Bank, 0.11%, 10/10/14(a)(b) | 49,998,625 | ||||
50,000,000 | PSP Capital Inc., 0.22%, 2/5/15(a)(b) | 49,961,194 | ||||
136,000,000 | Skandinaviska Enskilda Banken AB, 0.10%, 10/2/14(a)(b) | 135,999,622 | ||||
50,000,000 | Skandinaviska Enskilda Banken AB, 0.17%, 10/6/14(a)(b) | 49,998,854 | ||||
50,000,000 | Swedbank, 0.19%, 10/31/14(b) | 49,992,083 | ||||
50,000,000 | Swedbank, 0.19%, 11/21/14(b) | 49,986,542 | ||||
50,000,000 | Swedbank, 0.20%, 11/14/14(b) | 49,988,083 | ||||
|
| |||||
| 660,848,558 | ||||||
|
| |||||
Health Care — 2.44% |
| |||||
25,000,000 | Glaxosmithkline Finance Plc, 0.08%, 10/6/14(a)(b) | 24,999,722 | ||||
175,000,000 | Glaxosmithkline Finance Plc, 0.09%, 10/23/14(a)(b) | 174,990,375 | ||||
25,000,000 | Glaxosmithkline Finance Plc, 0.19%, 1/20/15(a)(b) | 24,985,354 | ||||
8 |
SCHEDULES OF PORTFOLIO INVESTMENTS |
Prime Money Market Fund (cont.)
September 30, 2014
Principal Amount | Value | |||||
$ 45,000,000 | Trinity Health Corp., 0.08%, 10/1/14(b) | $ | 45,000,000 | |||
|
| |||||
| 269,975,451 | ||||||
|
| |||||
Information Technology — 0.99% |
| |||||
60,000,000 | Apple Inc., 0.18%, 2/5/15(a)(b) | 59,961,900 | ||||
50,000,000 | Apple Inc., 0.21%, 5/19/15(a)(b) | 49,932,917 | ||||
|
| |||||
| 109,894,817 | ||||||
|
| |||||
Insurance — 1.78% |
| |||||
77,585,000 | Metlife Short Term Fund, 0.11%, 10/21/14(a)(b) | 77,580,259 | ||||
75,000,000 | Metlife Short Term Fund, 0.11%, 10/29/14(a)(b) | 74,993,583 | ||||
43,996,000 | Metlife Short Term Fund, 0.11%, 11/10/14(a)(b) | 43,990,623 | ||||
|
| |||||
| 196,564,465 | ||||||
|
| |||||
Manufacturing — 0.95% |
| |||||
105,000,000 | Illinois Tool Works Inc., 0.06%, 10/3/14(a)(b) | 104,999,650 | ||||
|
| |||||
Utilities — 2.25% |
| |||||
50,000,000 | Electricite de France SA, 0.16%, 12/4/14(a)(b) | 49,985,778 | ||||
40,000,000 | Electricite de France SA, 0.17%, 10/28/14(a)(b) | 39,994,900 | ||||
23,900,000 | Electricite de France SA, 0.18%, 10/3/14(a)(b) | 23,899,761 | ||||
25,000,000 | Electricite de France SA, 0.38%, 1/2/15(a)(b) | 24,975,458 | ||||
50,000,000 | Electricite de France SA, 0.44%, 1/5/15(a)(b) | 49,941,333 | ||||
60,000,000 | Electricite de France SA, 0.55%, 1/2/15(a)(b) | 59,914,750 | ||||
|
| |||||
| 248,711,980 | ||||||
|
| |||||
Total Commercial Paper | 3,186,297,038 | |||||
|
| |||||
(Cost $3,186,297,038) |
| |||||
Certificates of Deposit, Domestic — 2.71% |
| |||||
Banks - Domestic — 2.71% |
| |||||
50,000,000 | Bank of America NA 0.18%, 12/8/14 | 50,000,000 | ||||
100,000,000 | Citibank NA 0.08%, 10/1/14 | 100,000,000 | ||||
50,000,000 | Citibank NA 0.17%, 10/2/14 | 50,000,000 | ||||
100,000,000 | Citibank NA 0.18%, 10/6/14 | 100,000,000 | ||||
|
| |||||
Total Certificates of Deposit, Domestic | 300,000,000 | |||||
|
| |||||
(Cost $300,000,000) |
| |||||
Certificates of Deposit, Yankee(c) — 13.32% |
| |||||
Banks - Canadian — 4.88% |
| |||||
75,000,000 | Bank of Montreal Chicago, 0.18%, 10/14/14 | 75,000,000 | ||||
50,000,000 | Bank of Montreal Chicago, 0.18%, 11/21/14 | 50,000,000 | ||||
50,000,000 | Bank of Montreal Chicago, 0.20%, 12/8/14(d) | 50,000,000 | ||||
50,000,000 | Bank of Montreal Chicago, 0.21%, 2/12/15 | 50,000,000 | ||||
25,000,000 | Bank of Montreal Chicago, 0.23%, 1/8/15(d) | 25,000,764 | ||||
40,000,000 | Bank of Nova Scotia Houston, 0.48%, 1/14/15(d) | 40,029,927 | ||||
75,000,000 | Toronto Dominion Bank NY, 0.06%, 10/3/14 | 75,000,000 | ||||
75,000,000 | Toronto Dominion Bank NY, 0.14%, 10/1/14 | 75,000,000 | ||||
25,000,000 | Toronto Dominion Bank NY, 0.24%, 2/6/15(d) | 25,000,000 | ||||
| 9 |
SCHEDULES OF PORTFOLIO INVESTMENTS |
Prime Money Market Fund (cont.)
September 30, 2014
Principal Amount | Value | |||||
$ 25,000,000 | Toronto Dominion Bank NY, 0.25%, 5/4/15 | $ | 25,000,000 | |||
25,000,000 | Toronto Dominion Bank NY, 0.30%, 8/20/15 | 25,000,000 | ||||
25,000,000 | Toronto Dominion Bank NY, 0.42%, 5/1/15(d) | 25,026,654 | ||||
|
| |||||
| 540,057,345 | ||||||
|
| |||||
Banks - Foreign — 3.52% |
| |||||
225,000,000 | BNP Paribas NY, 0.01%, 10/1/14 | 225,000,000 | ||||
25,000,000 | Rabobank Nederland NY, 0.28%, 2/25/15(d) | 25,000,000 | ||||
90,000,000 | Skandinaviska Enskilda Banken NY, 0.80%, 10/10/14(d) | 90,013,798 | ||||
50,000,000 | Svenska Handelsbanken AB, 0.23%, 10/1/14 | 50,000,000 | ||||
|
| |||||
| 390,013,798 | ||||||
|
| |||||
Banks - Japanese — 4.07% |
| |||||
50,000,000 | Bank Tokyo-Mitsubishi UFJ NY, 0.12%, 10/7/14 | 50,000,000 | ||||
50,000,000 | Bank Tokyo-Mitsubishi UFJ NY, 0.15%, 10/16/14 | 50,000,000 | ||||
50,000,000 | Bank Tokyo-Mitsubishi UFJ NY, 0.16%, 10/2/14 | 50,000,000 | ||||
50,000,000 | Bank Tokyo-Mitsubishi UFJ NY, 0.16%, 10/7/14 | 50,000,000 | ||||
50,000,000 | Sumitomo Mitsui Bank NY, 0.16%, 11/19/14 | 50,000,000 | ||||
40,000,000 | Sumitomo Mitsui Bank NY, 0.20%, 10/14/14 | 40,000,000 | ||||
50,000,000 | Sumitomo Mitsui Bank NY, 0.20%, 11/7/14 | 50,000,000 | ||||
50,000,000 | Sumitomo Mitsui Bank NY, 0.20%, 12/17/14 | 50,000,000 | ||||
25,000,000 | Sumitomo Mitsui Bank NY, 0.21%, 10/1/14 | 25,000,000 | ||||
35,000,000 | Sumitomo Mitsui Bank NY, 0.21%, 10/2/14 | 35,000,000 | ||||
|
| |||||
| 450,000,000 | ||||||
|
| |||||
Banks - United Kingdom — 0.85% |
| |||||
19,000,000 | Lloyds TSB Bank Plc NY, 0.49%, 1/7/15 | 19,010,811 | ||||
25,000,000 | Standard Chartered Bank, 0.20%, 12/4/14 | 25,000,000 | ||||
50,000,000 | Standard Chartered Bank, 0.28%, 10/16/14(d) | 50,000,000 | ||||
|
| |||||
| 94,010,811 | ||||||
|
| |||||
Total Certificates of Deposit, Yankee | 1,474,081,954 | |||||
|
| |||||
(Cost $1,474,081,954) |
| |||||
Corporate Bonds — 24.67% |
| |||||
Banks - Australia & New Zealand — 4.56% |
| |||||
25,000,000 | Australia & New Zealand Banking Group Ltd., 0.43%, 10/3/14(a)(d) | 25,000,000 | ||||
73,600,000 | Australia & New Zealand Banking Group Ltd., 0.44%, 5/7/15(a)(d) | 73,693,458 | ||||
5,500,000 | Australia & New Zealand Banking Group Ltd., 1.38%, 3/16/15(a)(d) | 5,529,522 | ||||
37,710,000 | Australia & New Zealand Banking Group Ltd., 3.70%, 1/13/15(a) | 38,072,909 | ||||
46,975,000 | Commonwealth Bank Australia, 0.51%, 1/29/15(a) | 47,020,352 | ||||
32,400,000 | Commonwealth Bank Australia, 3.50%, 3/19/15(a) | 32,880,661 | ||||
60,352,000 | Commonwealth Bank Australia, 3.75%, 10/15/14(a) | 60,432,115 | ||||
10,800,000 | National Australia Bank Ltd., 0.44%, 5/28/15(a)(d) | 10,814,451 | ||||
83,855,000 | National Australia Bank Ltd., 0.53%, 1/22/15(a)(d) | 83,929,491 | ||||
10 |
SCHEDULES OF PORTFOLIO INVESTMENTS |
Prime Money Market Fund (cont.)
September 30, 2014
Principal Amount | Value | |||||
$ 10,000,000 | National Australia Bank Ltd., 1.60%, 8/7/15 | $ | 10,105,033 | |||
83,300,000 | National Australia Bank Ltd., 2.00%, 3/9/15 | 83,911,296 | ||||
25,000,000 | National Australia Funding, Inc., 0.22%, 3/13/15(a)(d) | 25,002,341 | ||||
7,650,000 | Westpac Banking Corp., 4.20%, 2/27/15 | 7,771,894 | ||||
|
| |||||
| 504,163,523 | ||||||
|
| |||||
Banks - Canadian — 3.35% |
| |||||
50,000,000 | Bank of Montreal, 1.30%, 10/31/14(a) | 50,040,859 | ||||
25,900,000 | Bank of Nova Scotia, 1.85%, 1/12/15 | 26,008,185 | ||||
58,251,000 | Bank of Nova Scotia, 3.40%, 1/22/15 | 58,799,471 | ||||
100,000,000 | Bank of Nova Scotia Houston, 0.39%, 10/9/15(d) | 100,000,000 | ||||
36,060,000 | Canadian Imperial Bank of Commerce Canada, 1.50%, 12/12/14(a) | 36,145,064 | ||||
100,000,000 | Canadian Imperial Bank of Commerce NY, 0.36%, 7/3/15(d) | 100,000,000 | ||||
|
| |||||
| 370,993,579 | ||||||
|
| |||||
Banks - Domestic — 4.24% |
| |||||
75,000,000 | JPMorgan Chase Bank NA, 0.35%, 9/22/15(d) | 75,000,000 | ||||
103,500,000 | JPMorgan Chase Bank NA, 0.41%, 12/21/14(d) | 103,500,000 | ||||
62,301,000 | Wells Fargo & Co., 1.25%, 2/13/15 | 62,506,095 | ||||
10,000,000 | Wells Fargo & Co., 3.63%, 4/15/15 | 10,173,074 | ||||
98,109,000 | Wells Fargo & Co., 3.75%, 10/1/14 | 98,109,000 | ||||
120,000,000 | Wells Fargo Bank NA, 0.37%, 9/22/15(d) | 120,000,000 | ||||
|
| |||||
| 469,288,169 | ||||||
|
| |||||
Banks - Foreign — 3.21% |
| |||||
50,000,000 | Nederlandse Waterschapsbank NV, 0.29%, 10/27/14(a)(d) | 50,001,501 | ||||
41,188,000 | Nordea Bank AB, 2.25%, 3/20/15(a) | 41,560,960 | ||||
47,055,000 | Nordea Bank AB, 3.70%, 11/13/14(a) | 47,242,933 | ||||
85,000,000 | Nordea Bank Finland Plc, 0.73%, 10/15/14(d) | 85,018,756 | ||||
75,000,000 | Svenska Handelsbanken AB, 0.36%, 10/2/15(d) | 75,000,000 | ||||
31,075,000 | Svenska Handelsbanken NY, 0.41%, 10/6/14(d) | 31,076,390 | ||||
25,000,000 | Svenska Handelsbanken NY, 0.52%, 1/16/15(d) | 25,021,595 | ||||
|
| |||||
| 354,922,135 | ||||||
|
| |||||
Banks - United Kingdom — 0.12% |
| |||||
13,351,000 | Standard Chartered Plc, 5.50%, 11/18/14(a) | 13,440,571 | ||||
|
| |||||
Consumer Discretionary — 0.12% |
| |||||
13,750,000 | Coca-Cola Co., 0.75%, 3/13/15 | 13,778,442 | ||||
|
| |||||
Consumer Staples — 0.78% |
| |||||
9,000,000 | Colgate-Palmolive Co., 0.60%, 11/15/14 | 9,004,668 | ||||
75,000,000 | Wal-Mart Stores, Inc., 5.32%, 6/1/15(e) | 77,559,674 | ||||
|
| |||||
| 86,564,342 | ||||||
|
| |||||
Finance - Diversified Domestic — 4.64% |
| |||||
45,000,000 | American Honda Finance Corp., 0.23%, 12/5/14(d) | 45,000,000 | ||||
30,000,000 | American Honda Finance Corp., 0.23%, 6/4/15(d) | 30,000,000 | ||||
18,200,000 | American Honda Finance Corp., 0.33%, 11/13/14(a)(d) | 18,203,165 | ||||
| 11 |
SCHEDULES OF PORTFOLIO INVESTMENTS |
Prime Money Market Fund (cont.)
September 30, 2014
Principal Amount | Value | |||||
$ 3,900,000 | American Honda Finance Corp., 0.46%, 11/3/14(a)(d) | $ | 3,900,944 | |||
13,945,000 | American Honda Finance Corp., 1.45%, 2/27/15(a) | 14,012,386 | ||||
9,000,000 | ETC Holdings LLC, 0.09%, 4/1/28, (LOC: U.S. Bank)(d) | 9,000,000 | ||||
50,000,000 | General Electric Capital Corp., 1.63%, 7/2/15 | 50,496,014 | ||||
85,780,000 | General Electric Capital Corp., 2.15%, 1/9/15 | 86,217,190 | ||||
10,000,000 | General Electric Capital Corp., 2.38%, 6/30/15 | 10,153,079 | ||||
36,335,000 | General Electric Capital Corp., 3.75%, 11/14/14 | 36,488,090 | ||||
17,800,000 | Jets Stadium Development LLC, 0.10%, 4/1/47(a)(d) | 17,800,000 | ||||
40,100,000 | John Deere Capital Corp., 0.30%, 1/12/15(d) | 40,110,315 | ||||
15,000,000 | John Deere Capital Corp., 0.33%, 10/8/14(d) | 15,000,395 | ||||
11,778,000 | John Deere Capital Corp., 0.88%, 4/17/15 | 11,818,290 | ||||
35,000,000 | NGSP, Inc., 0.13%, 6/1/46, (LOC: Wells Fargo Bank)(d) | 35,000,000 | ||||
40,000,000 | Toyota Motor Credit Corp., 0.23%, 1/14/15(d) | 40,000,000 | ||||
50,000,000 | Toyota Motor Credit Corp., 0.23%, 6/10/15(d) | 50,000,000 | ||||
|
| |||||
| 513,199,868 | ||||||
|
| |||||
Finance - Diversified Foreign — 1.25% |
| |||||
45,990,000 | BHP Billiton Finance USA Ltd., 1.00%, 2/24/15 | 46,120,680 | ||||
91,877,000 | BHP Billiton Finance USA Ltd., 1.13%, 11/21/14 | 91,985,558 | ||||
|
| |||||
| 138,106,238 | ||||||
|
| |||||
Health Care — 0.31% |
| |||||
13,425,000 | Keep Memory Alive, 0.11%, 5/1/37, (LOC: PNC Bank NA)(d) | 13,425,000 | ||||
20,620,000 | Novartis Capital Corp., 2.90%, 4/24/15 | 20,926,794 | ||||
|
| |||||
| 34,351,794 | ||||||
|
| |||||
Information Technology — 0.98% |
| |||||
15,000,000 | International Business Machines Corp., 0.22%, 2/4/15(d) | 15,000,897 | ||||
12,965,000 | International Business Machines Corp., 0.55%, 2/6/15 | 12,978,624 | ||||
25,000,000 | International Business Machines Corp., 0.75%, 5/11/15 | 25,075,225 | ||||
54,827,000 | Texas Instruments Inc, 0.45%, 8/3/15 | 54,903,761 | ||||
|
| |||||
| 107,958,507 | ||||||
|
| |||||
Insurance — 1.11% |
| |||||
57,083,000 | Berkshire Hathaway Inc., 3.20%, 2/11/15 | 57,690,052 | ||||
64,705,000 | Metropolitan Life Global Funding, Series I, 2.00%, 1/9/15(a) | 64,998,472 | ||||
|
| |||||
| 122,688,524 | ||||||
|
| |||||
Total Corporate Bonds | 2,729,455,692 | |||||
|
| |||||
(Cost $2,729,455,692) |
| |||||
Municipal Bonds — 17.31% |
| |||||
Alaska — 0.42% |
| |||||
46,850,000 | City of Valdez Exxon Pipeline Co. Project Refunding Revenue, 0.04%, 10/1/25(d) | 46,850,000 | ||||
|
| |||||
California — 5.09% |
| |||||
55,450,000 | Abag Finance Authority For Nonprofit Corps. Revenue, Series A, 0.06%, 12/15/37, (Credit Support: Fannie Mae)(d) | 55,450,000 | ||||
12 |
SCHEDULES OF PORTFOLIO INVESTMENTS |
Prime Money Market Fund (cont.)
September 30, 2014
Principal Amount | Value | |||||
$ 17,600,000 | Antelope Valley-East Kern Water Agency Refunding Revenue, Series A2, 0.03%, 6/1/37, (LOC: Wells Fargo Bank)(d) | $ | 17,600,000 | |||
19,625,000 | California Health Facilities Financing Authority Scripps Health Revenue, Series A, 0.04%, 10/1/19, (LOC: Wells Fargo Bank)(d) | 19,625,000 | ||||
35,560,000 | California Health Facilities Financing Authority St. Joseph Health System Revenue, Series G, 0.03%, 7/1/41, (LOC: Wells Fargo Bank)(d) | 35,560,000 | ||||
17,700,000 | California Municipal Finance Authority, Exxon Mobil Project Refunding Revenue, 0.03%, 12/1/29(d) | 17,700,000 | ||||
73,000,000 | California State School Improvments GO, 0.03%, 5/1/34, (LOC: Citibank N.A.)(d) | 73,000,000 | ||||
13,000,000 | California State, Series B, Subseries B2, GO, 0.03%, 5/1/40, (LOC: Bank Tokyo-Mitsubishi UFJ)(d) | 12,999,740 | ||||
71,160,000 | Sacramento County, Sanitation Districts Financing Authority Sewer Improvements Revenue, Series C, 0.04%, 12/1/30, (LOC: Bank Of America N.A.)(d) | 71,160,000 | ||||
17,300,000 | Sacramento Municipal Utility District Refunding Revenue, Series J, 0.04%, 8/15/28, (LOC: Bank of America N.A.) | 17,300,000 | ||||
38,620,000 | San Francisco City & County Airports Commission Refunding Revenue, Second Series 36B, 0.03%, 5/1/26, (LOC: Bank Tokyo-Mitsubishi UFJ)(d) | 38,620,000 | ||||
10,300,000 | Santa Clara County, Financing Authority Refunding Revenue, Series M, 0.03%, 5/15/35, (LOC: Bank Of America N.A.)(d) | 10,299,794 | ||||
35,810,000 | Southern California Public Power Authority Magnolia Power Project Refunding Revenue, 0.03%, 7/1/36, (LOC: Wells Fargo Bank)(d) | 35,810,000 | ||||
102,730,000 | University of California TECP, 0.07%, 10/2/14(b) | 102,729,800 | ||||
55,000,000 | University of California TECP, 0.08%, 10/1/14(b) | 55,000,000 | ||||
|
| |||||
| 562,854,334 | ||||||
|
| |||||
District of Columbia — 0.10% | ||||||
10,600,000 | District of Columbia American University Revenue, 0.04%, 6/1/33, (LOC: Wells Fargo Bank)(d) | 10,600,000 | ||||
|
| |||||
Florida — 0.33% | ||||||
23,725,000 | Halifax Hospital Medical Center Refunding Revenue, 0.04%, 6/1/48, (LOC: JP Morgan Chase Bank NA)(d) | 23,725,000 | ||||
12,500,000 | Miami-Dade County Industrial Development Authority, Miami Stadium Project Revenue, 0.12%, 7/1/37, (LOC: TD Bank N.A.)(d) | 12,500,000 | ||||
|
| |||||
| 36,225,000 | ||||||
|
| |||||
Georgia — 0.47% | ||||||
28,825,000 | Municipal Electric Authority TECP, 0.15%, 10/27/14 | 28,825,000 | ||||
23,000,000 | Valdosta-Lowndes County Industrial Development Authority Revenue, Series B, 0.15%, 6/1/28, (LOC: Wells Fargo Bank)(d) | 23,000,000 | ||||
|
| |||||
| 51,825,000 | ||||||
|
| |||||
Illinois — 0.91% | ||||||
48,195,000 | City of Chicago Refunding GO, Series B2, 0.05%, 1/1/34, (LOC: JP Morgan Chase Bank NA)(d) | 48,195,000 | ||||
| 13 |
SCHEDULES OF PORTFOLIO INVESTMENTS |
Prime Money Market Fund (cont.)
September 30, 2014
Principal Amount | Value | |||||
$ 24,000,000 | City of Chicago Refunding GO, Series B3, 0.05%, 1/1/34, (LOC: JP Morgan Chase Bank NA)(d) | $ | 24,000,000 | |||
18,550,000 | State of Illinois School Improvements GO, Series B-3, 0.03%, 10/1/33, (LOC: Wells Fargo Bank)(d) | 18,550,000 | ||||
10,000,000 | University of Illinois Facilities Revenue, Series S, 0.10%, 4/1/44, (LOC: Northern Trust Co.)(d) | 10,000,000 | ||||
|
| |||||
| 100,745,000 | ||||||
|
| |||||
Indiana — 0.14% |
| |||||
16,000,000 | Indiana Health Facility Financing Authority Revenue, Series A, 0.04%, 7/1/28, (LOC: Wells Fargo Bank)(d) | 16,000,000 | ||||
|
| |||||
Kentucky — 0.62% |
| |||||
17,000,000 | Kentucky Higher Education Student Loan Corp. Refunding Revenue, Series A1, 0.05%, 6/1/37, (Credit Support: GTY Student Loans), (LOC: State Street B&T Co.)(d) | 17,000,000 | ||||
9,000,000 | Kentucky Higher Education Student Loan Corp. Refunding Revenue, Series A2, 0.05%, 6/1/38, (Credit Support: GTY Student Loans), (LOC: State Street B&T Co.)(d) | 9,000,000 | ||||
42,600,000 | Louisville Regional Airport Authority Revenue, Series A, 0.05%, 11/1/36(d) | 42,600,000 | ||||
|
| |||||
| 68,600,000 | ||||||
|
| |||||
Louisiana — 1.23% |
| |||||
106,740,000 | East Baton Rouge Parish Industrial Development Board, Inc. Exxon Mobile Project Revenue, Series A, 0.04%, 8/1/35(d) | 106,740,000 | ||||
29,400,000 | East Baton Rouge Parish, Exxon Project Refunding Revenue, 0.04%, 3/1/22(d) | 29,400,000 | ||||
|
| |||||
| 136,140,000 | ||||||
|
| |||||
Maryland — 0.11% |
| |||||
12,325,000 | Montgomery County Housing Opportunites Commission Refunding Revenue, Series D, 0.11%, 7/1/39, (LOC: PNC Bank NA, Freddie Mac)(d) | 12,325,000 | ||||
|
| |||||
Massachusetts — 0.41% |
| |||||
30,000,000 | Commonwealth of Massachusetts TECP, 0.09%, 10/7/14 | 30,000,000 | ||||
15,000,000 | Massachusetts State Health & Educational Facilities Authority, Dana Farber Cancer Institute Revenue, Series L1, 0.04%, 12/1/46, (LOC: JP Morgan Chase Bank NA)(d) | 15,000,000 | ||||
|
| |||||
| 45,000,000 | ||||||
|
| |||||
Michigan — 0.45% |
| |||||
25,000,000 | Michigan Finance Authority Taxable School Loan Refunding Revenue, 0.11%, 9/1/50, (LOC: PNC Bank NA)(d) | 25,000,000 | ||||
25,000,000 | Michigan Finance Authority Taxable School Loan Revolving Fund, Series A, 0.09%, 9/1/53, (LOC: JP Morgan Chase Bank NA)(d) | 25,000,000 | ||||
|
| |||||
| 50,000,000 | ||||||
|
| |||||
14 |
SCHEDULES OF PORTFOLIO INVESTMENTS |
Prime Money Market Fund (cont.)
September 30, 2014
Principal Amount | Value | |||||
Mississippi — 0.32% |
| |||||
$ 23,225,000 | Mississippi Business Finance Corp., Chevron USA Inc. Project Revenue, Series F, 0.03%, 12/1/30(d) | $ | 23,225,000 | |||
12,000,000 | Mississippi Business Finance Corp., Chevron USA Inc. Project Revenue, Series J, 0.04%, 11/1/35(d) | 12,000,000 | ||||
|
| |||||
| 35,225,000 | ||||||
|
| |||||
New Jersey — 0.35% |
| |||||
21,495,000 | New Jersey Health Care Facilities Financing Authority, Barnabas Health Refunding Revenue, 0.08%, 7/1/38, (LOC: JP Morgan Chase Bank NA)(d) | 21,495,000 | ||||
17,410,000 | New Jersey Health Care Facilities Financing Authority, Virtua Health Revenue, 0.03%, 7/1/33, (LOC: Wells Fargo Bank)(d) | 17,410,000 | ||||
|
| |||||
| 38,905,000 | ||||||
|
| |||||
New York — 1.31% |
| |||||
12,765,000 | City of New York Public Improvements GO, Subseries D3, 0.03%, 10/1/39, (LOC: Bank of NY Mellon)(d) | 12,765,000 | ||||
15,400,000 | City of New York Public Improvements GO, Subseries D4, 0.03%, 8/1/40, (LOC: TD Bank N.A.)(d) | 15,400,000 | ||||
50,000,000 | Long Island Power Authority TECP, 0.15%, 11/3/14 | 50,000,000 | ||||
8,500,000 | Nassau Health Care Corp. Refunding Revenue, Series A, 0.12%, 8/1/22, (Credit Support: County GTY), (LOC: JP Morgan Chase Bank NA)(d) | 8,500,000 | ||||
21,000,000 | New York City Housing Development Corp. Multi-Family Rental Housing Revenue, Series A, 0.04%, 12/1/44, (LOC: Wells Fargo Bank)(d) | 21,000,000 | ||||
36,970,000 | New York City Housing Development Corp. Multi-Family Rental Housing Revenue, Series B, 0.07%, 4/15/36, (Credit Support: Fannie Mae)(d) | 36,970,000 | ||||
|
| |||||
| 144,635,000 | ||||||
|
| |||||
Pennsylvania — 0.84% |
| |||||
54,900,000 | Blair County Industrial Development Authority Refunding Revenue, 0.11%, 10/1/28, (LOC: PNC Bank NA)(d) | 54,900,000 | ||||
18,915,000 | Bucks County Industrial Development Authority, Grand View Hospital Refunding Revenue, Series A, 0.03%, 7/1/34, (LOC: TD Bank)(d) | 18,915,000 | ||||
19,055,000 | Derry Township Industrial & Commercial Development Authority Revenue, 0.11%, 11/1/30, (LOC: PNC Bank NA)(d) | 19,055,000 | ||||
|
| |||||
| 92,870,000 | ||||||
|
| |||||
South Dakota — 0.98% |
| |||||
45,000,000 | South Dakota Housing Development Authority Home Ownership Mortgage Revenue, Series C, 0.07%, 5/1/37(d) | 45,000,000 | ||||
29,000,000 | South Dakota Housing Development Authority Home Ownership Mortgage Revenue, Series F, 0.07%, 5/1/39(d) | 29,000,000 | ||||
34,000,000 | South Dakota Housing Development Authority Home Ownership Mortgage Revenue, Series I, 0.07%, 5/1/38(d) | 34,000,000 | ||||
|
| |||||
| 108,000,000 | ||||||
|
| |||||
| 15 |
SCHEDULES OF PORTFOLIO INVESTMENTS |
Prime Money Market Fund (cont.)
September 30, 2014
Principal Amount | Value | |||||
Texas — 0.94% |
| |||||
$ 10,600,000 | City of Houston Utility System Refunding Revenue, Series B-3, 0.03%, 5/15/34, (LOC: Sumitomo Mitsui Bank)(d) | $ | 10,599,894 | |||
39,750,000 | Gulf Coast Waste Disposal Authority Exxon Project Refunding Revenue, 0.04%, 6/1/20(d) | 39,750,000 | ||||
19,300,000 | Harris County Cultural Education Facilities Finance Corp. Baylor College Revenue, 0.03%, 11/15/45, (LOC: Barclays Bank Plc)(d) | 19,300,000 | ||||
35,000,000 | Port of Port Arthur Navigation District, Texaco Inc. Project Refunding Revenue, 0.04%, 10/1/24(d) | 35,000,000 | ||||
|
| |||||
| 104,649,894 | ||||||
|
| |||||
Utah — 0.06% |
| |||||
7,280,000 | Ogden City Redevelopment Agency Refunding Revenue, Series A, 0.15%, 6/1/31, (LOC: Wells Fargo Bank)(d) | 7,280,000 | ||||
|
| |||||
Virginia — 2.00% |
| |||||
207,700,000 | Federal Home Loan Mortgage Corp. Multi Family Housing Revenue, Series MO17, Class A, 0.08%, 9/15/50, (Credit Support: Freddie Mac)(d) | 207,700,000 | ||||
13,655,000 | Newport News Economic Development Authority Industrial Improvement Revenue, Series B, 0.15%, 7/1/31, (LOC: JP Morgan Chase Bank NA)(d) | 13,655,000 | ||||
|
| |||||
| 221,355,000 | ||||||
|
| |||||
Washington — 0.13% |
| |||||
14,650,000 | Washington Health Care Facilities Authority, Multicare Health System Revenue, Series D, 0.02%, 8/15/41, (LOC: Barclays Bank Plc)(d) | 14,650,000 | ||||
|
| |||||
West Virginia — 0.10% |
| |||||
10,800,000 | West Virginia Economic Development Authority, Appalachian Power Co. Revenue, Series A, 0.04%, 12/1/42, (LOC: Sumitomo Mitsui Bank)(d) | 10,800,000 | ||||
|
| |||||
Total Municipal Bonds | 1,915,534,228 | |||||
|
| |||||
(Cost $1,915,534,228) |
| |||||
U.S. Government Agency Obligations — 1.00% |
| |||||
Federal Home Loan Bank — 1.00% |
| |||||
40,000,000 | 0.08%, 10/10/14(b) | 39,999,300 | ||||
70,000,000 | 0.08%, 10/15/14(b) | 69,998,060 | ||||
|
| |||||
| 109,997,360 | ||||||
|
| |||||
Total U.S. Government Agency Obligations | 109,997,360 | |||||
|
| |||||
(Cost $109,997,360) |
| |||||
Repurchase Agreements — 9.44% |
| |||||
80,000,000 | BNP Paribas Securities Corp., dated 9/30/14; due 10/1/14 at 0.00% with maturity value of $80,000,000 (fully collateralized by a U.S. Treasury security with a maturity date of 12/31/18 at a rate of 1.50%, original par and fair value of $81,676,800 and $81,600,024, respectively) | 80,000,000 | ||||
16 |
SCHEDULES OF PORTFOLIO INVESTMENTS |
Prime Money Market Fund (cont.)
September 30, 2014
Principal Amount | Value | |||||
$ 85,000,000 | BNP Paribas Securities Corp., dated 9/30/14; due 10/1/14 at 0.00% with maturity value of $85,000,000 (fully collateralized by Fannie Mae and Freddie Mac securities with maturity dates ranging from 3/1/42 to 9/1/44 at rates ranging from 3.00% to 4.00%, aggregate original par and fair value of $98,738,202 and $86,700,000, respectively) | $ | 85,000,000 | |||
| ||||||
Total Value of BNP Paribas Securities Corp., (collateral value of $168,300,024) | 165,000,000 | |||||
| ||||||
100,000,000 | Citibank N.A., dated 9/25/14; due 10/2/14 at 0.05% with maturity value of $100,000,972 (fully collateralized by Fannie Mae and Federal Home Loan Bank securities with maturity dates ranging from 1/30/17 to 9/6/23 at rates ranging from 0.875% to 2.660%, aggregate original par and fair value of $102,905,970 and $102,000,166, respectively) | 100,000,000 | ||||
50,000,000 | Citibank N.A., dated 9/25/14; due 10/2/14 at 0.05% with maturity value of $50,000,486 (fully collateralized by a U.S. Treasury security with a maturity date of 9/15/15 at a rate of 0.25%, original par and fair value of $50,925,000 and $51,000,043, respectively) | 50,000,000 | ||||
10,000,000 | Citibank N.A., dated 9/30/14; due 10/1/14 at 0.00% with maturity value of $10,000,000 (fully collateralized by a U.S. Treasury security with a maturity date of 4/30/15 at a rate of 2.50%, original par and fair value of $9,955,000 and $10,200,023, respectively) | 10,000,000 | ||||
125,000,000 | Citibank N.A., dated 9/30/14; due 10/1/14 at 0.00% with maturity value of $125,000,000 (fully collateralized by Fannie Mae, Freddie Mac, Federal Home Loan Bank and Federal Farm Credit Bank securities with maturity dates ranging from 11/15/14 to 5/4/37 at rates ranging from 0.00% to 3.75%, aggregate original par and fair value of $173,460,000 and $127,500,131, respectively) | 125,000,000 | ||||
50,000,000 | Citibank N.A., dated 9/30/14; due 10/7/14 at 0.02% with maturity value of $50,000,194 (fully collateralized by a U.S. Treasury security with a maturity date of 2/29/16 at a rate of 2.625%, original par and fair value of $49,270,345 and $51,000,001, respectively) | 50,000,000 | ||||
50,000,000 | Citibank N.A., dated 9/30/14; due 10/7/14 at 0.03% with maturity value of $50,000,292 (fully collateralized by a U.S. Treasury security with a maturity date of 9/15/15 at a rate of 0.25%, original par and fair value of $50,925,000 and $51,000,043, respectively) | 50,000,000 | ||||
| ||||||
Total Value of Citibank N.A., (collateral value of $392,700,407) | 385,000,000 | |||||
| ||||||
100,000,000 | Goldman Sachs & Co., dated 9/30/14; due 10/1/14 at 0.01% with maturity value of $100,000,028 (fully collateralized by Fannie Mae and Freddie Mac securities with maturity dates ranging from 10/1/25 to 2/1/44 at rates ranging from 3.50% to 4.50%, aggregate original par and fair value of $143,806,470 and $102,000,000, respectively) | 100,000,000 | ||||
| 17 |
SCHEDULES OF PORTFOLIO INVESTMENTS |
Prime Money Market Fund (cont.)
September 30, 2014
Principal Amount | Value | |||||
$ 50,000,000 | Goldman Sachs & Co., dated 9/30/14; due 10/1/14 at 0.01% with maturity value of $50,000,014 (fully collateralized by Fannie Mae and Freddie Mac securities with maturity dates ranging from 11/20/14 to 12/29/14 at rates ranging from 0.625% to 2.625%, aggregate original par and fair value of $50,851,000 and $51,000,663, respectively) | $ | 50,000,000 | |||
| ||||||
Total Value of Goldman Sachs & Co., (collateral value of $153,000,663) | 150,000,000 | |||||
| ||||||
100,000,000 | JP Morgan Securities, dated 8/13/13 at 0.39% with maturity value of Principal Amount plus interest accrued until maturity (fully collateralized by Fannie Mae, Freddie Mac, Ginnie Mae and Federal Home Loan Bank securities with maturity dates ranging from 1/16/15 to 9/1/44 at rates ranging from 0.25% to 11.50%, aggregate original par and fair value of $247,747,778 and $102,004,539, respectively)(f)(g) | 100,000,000 | ||||
| ||||||
Total Value of JP Morgan Securities, (collateral value of $102,004,539) | 100,000,000 | |||||
| ||||||
95,000,000 | TD Securities (USA), dated 9/30/14; due 10/1/14 at 0.005% with maturity value of $95,000,013 (fully collateralized by Fannie Mae and Freddie Mac securities with maturity dates ranging from 9/1/26 to 7/1/44 at rates ranging from 2.50% to 4.50%, aggregate original par and fair value of $103,272,627 and $96,900,000, respectively) | 95,000,000 | ||||
| ||||||
Total Value of TD Securities (USA), (collateral value of $96,900,000) | 95,000,000 | |||||
| ||||||
100,000,000 | Wells Fargo Securities, dated 9/30/14; due 10/1/14 at 0.02% with maturity value of $100,000,056 (fully collateralized by a U.S. Treasury security with a maturity date of 12/31/18 at a rate of 1.50%, original par and fair value of $102,096,000 and $102,000,030, respectively) | 100,000,000 | ||||
50,000,000 | Wells Fargo Securities, dated 9/30/14; due 10/1/14 at 0.03% with maturity value of $50,000,042 (fully collateralized by a Freddie Mac security with a maturity date of 9/1/44 at a rate of 3.50%, original par and fair value of $49,743,556 and $51,000,001, respectively) | 50,000,000 | ||||
| ||||||
Total Value of Wells Fargo Securities, (collateral value of $153,000,031) | 150,000,000 | |||||
| ||||||
Total Repurchase Agreements | 1,045,000,000 | |||||
|
| |||||
(Cost $1,045,000,000) |
| |||||
18 |
SCHEDULES OF PORTFOLIO INVESTMENTS |
Prime Money Market Fund (cont.)
September 30, 2014
Total Investments | $ | 11,113,333,358 | ||||
(Cost $11,113,333,358)(h) — 100.43% |
| |||||
Liabilities in excess of other assets — (0.43)% | (47,103,238 | ) | ||||
|
| |||||
NET ASSETS — 100.00% | $ | 11,066,230,120 | ||||
|
| |||||
| (a) | Security exempt from registration under Rule 144A or Section 4(2) of the Securities Act of 1933, as amended. These securities may be resold in transactions exempt from registration, normally to qualified institutional buyers. Security has been deemed to be liquid based on procedures approved by the Board of Trustees. |
| (b) | Represents effective yield to maturity on date of purchase. |
| (c) | Issuer is a U.S. branch of a foreign domiciled bank. |
| (d) | Variable rate security. The rate reflected in the Schedule of Portfolio Investments is the rate in effect on September 30, 2014. The maturity date represents the actual maturity date. The security’s effective maturity resets periodically. |
| (e) | Represents a step-up bond that pays an initial coupon rate for the first period and then a higher coupon rate for the following periods. Rate shown is as of report date. |
| (f) | This security is considered illiquid as to its marketability. The total investment in restricted and illiquid securities representing $100,000,000 or 0.90% of net assets was as follows: |
Acquisition | Issuer | Acquisition Date | Acquisition Cost | 9/30/14 Carrying Value Per Unit | ||||||||||
| 100,000,000 | JP Morgan Securities (g) | 08/13/2013 | $ | 100,000,000 | $ | 100.00 | ||||||||
| (g) | Security is perpetual and thus does not have a predetermined maturity. This is a variable rate security. The rate reflected in the Schedule of Portfolio Investments is the rate in effect on September 30, 2014. The maturity date used for rule 2a-7 of the Investment Company Act of 1940 was November 12, 2014. |
| (h) | Tax cost of securities is equal to book cost of securities. |
Abbreviations used are defined below:
GO - General Obligation
GTY - Guaranty
LOC - Letter of Credit
TECP - Tax Exempt Commercial Paper
See notes to financial statements.
| 19 |
SCHEDULE OF PORTFOLIO INVESTMENTS |
U.S. Government Money Market Fund
September 30, 2014
Principal Amount | Value | |||||
U.S. Government Agency Backed Corporate Bonds — 0.27% |
| |||||
Information Technology — 0.27% |
| |||||
$15,200,000 | Net Magan Two LLC, 0.15%, 4/1/26, (LOC: Federal Home Loan Bank)(a) | $ | 15,200,000 | |||
|
| |||||
Total U.S. Government Agency Backed Corporate Bonds | 15,200,000 | |||||
|
| |||||
(Cost $15,200,000) |
| |||||
U.S. Government Agency Backed Municipal Bonds — 10.53% |
| |||||
California — 2.96% |
| |||||
13,610,000 | California Housing Finance Agency Revenue, Series C, 0.04%, 2/1/37, (LOC: Fannie Mae, Freddie Mac)(a) | 13,610,000 | ||||
14,600,000 | California Statewide Communities Development Agency Multi Family Revenue, Series DD, 0.06%, 10/15/36, (Credit Support: Fannie Mae)(a) | 14,600,000 | ||||
15,300,000 | California Statewide Communities Development Authority Multi Family Revenue, Series C, 0.06%, 5/15/35, (Credit Support: Fannie Mae)(a) | 15,300,000 | ||||
10,750,000 | California Statewide Communities Development Authority Multi Family Revenue, Series E, 0.06%, 12/15/35, (Credit Support: Fannie Mae)(a) | 10,750,000 | ||||
10,500,000 | California Statewide Communities Development Authority Multi Family Revenue, Series M, 0.06%, 12/1/34, (Credit Support: Freddie Mac)(a) | 10,500,000 | ||||
29,320,000 | California Statewide Communities Development Authority Single Family Revenue, Series NN-1, 0.06%, 11/15/37, (Credit Support: Fannie Mae)(a) | 29,320,000 | ||||
18,500,000 | City of Los Angeles Housing Beverly Park Apartments Revenue, Series A, 0.06%, 8/1/18, (Credit Support: Freddie Mac)(a) | 18,500,000 | ||||
8,500,000 | City of San Jose Cinnabar Commons Revenue, Series C, 0.06%, 2/1/37, (Credit Support: Freddie Mac)(a) | 8,500,000 | ||||
12,600,000 | Sacramento Housing & Redevelopment Agency 18th & L Apartments Revenue, Series E, 0.06%, 1/15/36, (Credit Support: Fannie Mae)(a) | 12,600,000 | ||||
12,595,000 | San Diego Housing Authority Hillside Garden Apartment Revenue, Series B, 0.07%, 1/15/35, (Credit Support: Fannie Mae)(a) | 12,595,000 | ||||
20,800,000 | San Francisco City & County Housing Authority City Heights Apartments Refunding Revenue, Series A, 0.06%, 6/15/25, (Credit Support: Fannie Mae)(a) | 20,800,000 | ||||
|
| |||||
| 167,075,000 | ||||||
|
| |||||
Indiana — 0.49% |
| |||||
27,700,000 | City of Indianapolis Lakeside Pointe & Fox Club Refunding Revenue, 0.05%, 11/15/37, (Credit Support: Fannie Mae)(a) | 27,700,000 | ||||
|
| |||||
Nevada — 0.91% |
| |||||
7,000,000 | Nevada Housing Division Multi Unit Housing, Apache Project, Series A, 0.05%, 10/15/32, (Credit Support: Fannie Mae)(a) | 7,000,000 | ||||
10,800,000 | Nevada Housing Division Multi Unit Housing, Silver Project, Series A, 0.06%, 10/15/35, (LOC: Fannie Mae)(a) | 10,800,000 | ||||
20 |
SCHEDULE OF PORTFOLIO INVESTMENTS |
U.S. Government Money Market Fund (cont.)
September 30, 2014
Principal Amount | Value | |||||
$16,300,000 | Nevada Housing Division Multi Unit Housing, Sonoma Palms, 0.05%, 4/15/39, (Credit Support: Fannie Mae)(a) | $ | 16,300,000 | |||
17,000,000 | Nevada Housing Division Multi Unit Housing, Southwest VLG Project, 0.05%, 10/15/38, (Credit Support: Fannie Mae)(a) | 17,000,000 | ||||
|
| |||||
| 51,100,000 | ||||||
|
| |||||
New York — 3.81% |
| |||||
37,500,000 | New York City Housing Development Corp. West 61st Street Apartments Revenue, Series A, 0.04%, 12/15/37, (Credit Support: Fannie Mae)(a) | 37,500,000 | ||||
20,000,000 | New York State Housing Finance Agency 150 East 44th Street Revenue, Series A, 0.05%, 5/15/32, (Credit Support: Fannie Mae)(a) | 20,000,000 | ||||
21,000,000 | New York State Housing Finance Agency 750 6th. Ave. Revenue, Series A, 0.04%, 5/15/31, (Credit Support: Fannie Mae)(a) | 21,000,000 | ||||
60,000,000 | New York State Housing Finance Agency Clinton Green North Revenue, Series A, 0.04%, 11/1/38, (Credit Support: Freddie Mac)(a) | 60,000,000 | ||||
13,000,000 | New York State Housing Finance Agency Clinton Green North Revenue, Series A, 0.04%, 11/1/38, (Credit Support: Freddie Mac)(a) | 13,000,000 | ||||
50,000,000 | New York State Housing Finance Agency Theater Row Revenue, Series A, 0.04%, 11/1/32, (Credit Support: Freddie Mac)(a) | 50,000,000 | ||||
13,000,000 | New York State Housing Finance Agency Victory Housing Revenue, Series 2002-A, 0.04%, 11/1/33, (Credit Support: Freddie Mac)(a) | 13,000,000 | ||||
|
| |||||
| 214,500,000 | ||||||
|
| |||||
Virginia — 1.91% |
| |||||
51,300,000 | Federal Home Loan Mortgage Corp. Multi Family Housing Revenue, Series MO15, Class A, 0.07%, 5/15/46, (Credit Support: Freddie Mac)(a) | 51,300,000 | ||||
32,180,000 | Federal Home Loan Mortgage Corp. Multi Family Housing Revenue, Series MO21, Class A, 0.07%, 6/15/36, (Credit Support: Freddie Mac)(a) | 32,180,000 | ||||
9,515,000 | Federal Home Loan Mortgage Corp. Multi Family Housing Revenue, Series MO25, Class A, 0.08%, 9/15/38, (Credit Support: Freddie Mac)(a) | 9,515,000 | ||||
14,865,000 | Federal Home Loan Mortgage Corp. Multi Family Housing Revenue, Series MO28, Class A, 0.06%, 9/15/24(a) | 14,865,000 | ||||
|
| |||||
| 107,860,000 | ||||||
|
| |||||
Washington — 0.45% |
| |||||
25,180,000 | Washington State Housing Finance Commission Queen Anne Project Revenue, Series A, 0.07%, 9/1/38, (Credit Support: Fannie Mae)(a) | 25,180,000 | ||||
|
| |||||
Total U.S. Government Agency Backed Municipal Bonds | 593,415,000 | |||||
|
| |||||
(Cost $593,415,000) |
| |||||
| 21 |
SCHEDULE OF PORTFOLIO INVESTMENTS |
U.S. Government Money Market Fund (cont.)
September 30, 2014
Principal Amount | Value | |||||
U.S. Government Agency Obligations — 71.91% |
| |||||
Fannie Mae — 27.44% |
| |||||
$ 55,827,000 | 0.05%, 1/2/15(b) | $ | 55,819,428 | |||
38,000,000 | 0.05%, 1/2/15(b) | 37,994,846 | ||||
10,000,000 | 0.06%, 11/3/14(b) | 9,999,473 | ||||
10,500,000 | 0.06%, 11/3/14(b) | 10,499,447 | ||||
10,250,000 | 0.06%, 11/3/14(b) | 10,249,460 | ||||
169,808,000 | 0.06%, 11/3/14(b) | 169,799,050 | ||||
35,044,000 | 0.06%, 11/3/14(b) | 35,042,153 | ||||
169,808,000 | 0.07%, 10/1/14(b) | 169,808,000 | ||||
73,318,683 | 0.07%, 10/1/14(b) | 73,318,683 | ||||
35,191,000 | 0.07%, 10/1/14(b) | 35,191,000 | ||||
25,179,000 | 0.07%, 1/2/15(b) | 25,174,284 | ||||
42,500,000 | 0.07%, 10/1/14(b) | 42,500,000 | ||||
51,000,000 | 0.09%, 12/1/14(b) | 50,992,006 | ||||
34,313,000 | 0.09%, 10/1/14(b) | 34,313,000 | ||||
141,696,500 | 0.09%, 10/1/14(b) | 141,696,500 | ||||
141,867,000 | 0.09%, 12/1/14(b) | 141,844,764 | ||||
16,317,300 | 0.10%, 10/1/14(b) | 16,317,300 | ||||
39,215,300 | 0.10%, 10/1/14(b) | 39,215,300 | ||||
164,800,000 | 0.12%, 2/27/15(a) | 164,795,350 | ||||
28,098,000 | 0.13%, 4/1/15(b) | 28,080,244 | ||||
16,400,000 | 0.13%, 8/5/15(a) | 16,402,184 | ||||
17,142,000 | 0.16%, 1/20/15(a) | 17,145,809 | ||||
25,000,000 | 0.17%, 12/1/14(b) | 24,992,799 | ||||
92,889,100 | 0.19%, 10/1/14(b) | 92,889,100 | ||||
16,898,000 | 0.38%, 3/16/15 | 16,913,695 | ||||
28,056,000 | 0.50%, 7/2/15 | 28,122,501 | ||||
30,830,000 | 2.63%, 11/20/14 | 30,936,143 | ||||
27,000,000 | 4.63%, 10/15/14 | 27,047,864 | ||||
|
| |||||
| 1,547,100,383 | ||||||
|
| |||||
Federal Farm Credit Bank — 4.20% |
| |||||
25,000,000 | 0.12%, 7/16/15(a) | 25,000,818 | ||||
58,000,000 | 0.12%, 2/11/16(a) | 57,988,155 | ||||
20,000,000 | 0.13%, 1/25/16(a) | 19,999,340 | ||||
17,500,000 | 0.15%, 1/19/16(a) | 17,504,708 | ||||
50,000,000 | 0.17%, 5/5/16(a) | 50,012,239 | ||||
25,000,000 | 0.18%, 10/3/16(a) | 25,012,696 | ||||
30,475,000 | 0.19%, 4/6/15(a) | 30,482,047 | ||||
8,120,000 | 0.23%, 7/15/16(a) | 8,132,163 | ||||
2,465,000 | 0.27%, 2/24/15 | 2,465,858 | ||||
|
| |||||
| 236,598,024 | ||||||
|
| |||||
Federal Home Loan Bank — 28.85% |
| |||||
75,000,000 | 0.07%, 10/10/14(b) | 74,998,646 | ||||
85,000,000 | 0.07%, 11/21/14(b) | 84,991,571 | ||||
21,000,000 | 0.08%, 10/15/14(b) | 20,999,331 | ||||
22 |
SCHEDULE OF PORTFOLIO INVESTMENTS |
U.S. Government Money Market Fund (cont.)
September 30, 2014
Principal Amount | Value | |||||
$ 42,000,000 | 0.08%, 10/15/14(b) | $ | 41,998,686 | |||
50,000,000 | 0.08%, 10/1/14(b) | 50,000,000 | ||||
150,000,000 | 0.08%, 10/3/14(b) | 149,999,358 | ||||
25,000,000 | 0.08%, 10/10/14(b) | 24,999,506 | ||||
40,000,000 | 0.08%, 10/15/14(b) | 39,998,896 | ||||
75,000,000 | 0.09%, 10/8/14(b) | 74,998,865 | ||||
33,000,000 | 0.09%, 10/17/14(b) | 32,998,753 | ||||
97,500,000 | 0.10%, 10/24/14(b) | 97,494,839 | ||||
45,000,000 | 0.10%, 11/26/14(a) | 45,001,125 | ||||
10,000,000 | 0.10%, 3/20/15(a) | 10,000,045 | ||||
50,000,000 | 0.10%, 3/26/15(a) | 50,000,000 | ||||
26,500,000 | 0.10%, 11/14/14(a) | 26,500,359 | ||||
50,000,000 | 0.11%, 2/23/15(a) | 50,000,000 | ||||
50,000,000 | 0.11%, 4/10/15(a) | 49,994,688 | ||||
35,000,000 | 0.12%, 7/21/15(a) | 35,003,063 | ||||
25,000,000 | 0.12%, 9/28/15(a) | 24,997,472 | ||||
50,000,000 | 0.12%, 10/14/15(a) | 49,994,827 | ||||
20,000,000 | 0.12%, 8/25/15(a) | 20,000,000 | ||||
25,000,000 | 0.13%, 12/19/14 | 24,996,365 | ||||
23,000,000 | 0.13%, 1/23/15 | 22,996,243 | ||||
50,000,000 | 0.13%, 9/17/15(a) | 49,992,532 | ||||
50,000,000 | 0.13%, 6/26/15(a) | 50,000,000 | ||||
20,000,000 | 0.13%, 9/21/15(a) | 20,000,915 | ||||
15,000,000 | 0.14%, 7/16/15(a) | 15,003,854 | ||||
40,000,000 | 0.16%, 11/20/15(a) | 40,000,000 | ||||
50,000,000 | 0.17%, 10/15/14(b) | 49,998,347 | ||||
25,000,000 | 0.17%, 1/13/15 | 24,999,117 | ||||
20,000,000 | 0.17%, 6/25/15 | 19,998,186 | ||||
16,275,000 | 0.17%, 12/11/14 | 16,274,447 | ||||
37,750,000 | 0.20%, 8/19/15 | 37,750,000 | ||||
30,000,000 | 0.20%, 8/28/15 | 29,996,580 | ||||
40,000,000 | 0.20%, 10/16/15 | 39,982,104 | ||||
25,000,000 | 0.21%, 8/21/15 | 25,000,000 | ||||
23,000,000 | 0.21%, 10/9/15 | 22,994,638 | ||||
19,400,000 | 0.25%, 2/20/15 | 19,405,062 | ||||
25,725,000 | 0.38%, 8/28/15 | 25,765,648 | ||||
25,000,000 | 1.25%, 12/12/14 | 25,059,465 | ||||
11,265,000 | 4.50%, 2/18/15 | 11,450,742 | ||||
|
| |||||
| 1,626,634,275 | ||||||
|
| |||||
Freddie Mac — 9.88% |
| |||||
145,000,000 | 0.14%, 7/16/15(a) | 145,038,452 | ||||
25,000,000 | 0.15%, 10/6/14(b) | 24,999,496 | ||||
10,000,000 | 0.15%, 11/3/14(b) | 9,998,625 | ||||
99,000,000 | 0.15%, 6/26/15(a) | 99,015,094 | ||||
50,000,000 | 0.15%, 11/25/15(a) | 50,000,000 | ||||
58,000,000 | 0.16%, 12/5/14(a) | 58,007,425 | ||||
25,000,000 | 0.17%, 1/6/15(b) | 24,988,549 | ||||
| 23 |
SCHEDULE OF PORTFOLIO INVESTMENTS |
U.S. Government Money Market Fund (cont.)
September 30, 2014
Principal Amount | Value | |||||
$ 17,209,000 | 0.75%, 11/25/14 | $ | 17,225,947 | |||
81,953,000 | 1.75%, 9/10/15 | 83,141,881 | ||||
2,606,000 | 2.88%, 2/9/15 | 2,631,004 | ||||
25,000,000 | 4.38%, 7/17/15 | 25,829,555 | ||||
16,031,000 | 4.50%, 1/15/15 | 16,232,207 | ||||
|
| |||||
| 557,108,235 | ||||||
|
| |||||
Overseas Private Investment Corp. — 1.54% | ||||||
60,000,000 | 0.11%, 9/15/20(a) | 60,000,000 | ||||
27,000,000 | 0.11%, 7/15/25(a) | 27,000,000 | ||||
|
| |||||
| 87,000,000 | ||||||
|
| |||||
Total U.S. Government Agency Obligations | 4,054,440,917 | |||||
|
| |||||
(Cost $4,054,440,917) |
| |||||
U.S. Treasury Obligations — 1.42% | ||||||
U.S. Treasury Notes — 1.42% | ||||||
30,000,000 | 0.25%, 2/28/15 | 30,007,990 | ||||
25,000,000 | 0.25%, 7/15/15 | 25,018,416 | ||||
25,000,000 | 1.75%, 7/31/15 | 25,326,833 | ||||
|
| |||||
| 80,353,239 | ||||||
|
| |||||
Total U.S. Treasury Obligations | 80,353,239 | |||||
|
| |||||
(Cost $80,353,239) |
| |||||
Repurchase Agreements — 22.26% | ||||||
100,000,000 | BNP Paribas Securities Corp., dated 9/30/14; due 10/1/14 at 0.00% with maturity value of $100,000,000 (fully collateralized by U.S. Treasury securities with maturity dates ranging from 4/15/15 to 2/15/41 at rates ranging from 0.500% to 2.125%, aggregate original par and fair value of $89,526,200 and $102,000,021, respectively) | 100,000,000 | ||||
115,000,000 | BNP Paribas Securities Corp., dated 9/30/14; due 10/1/14 at 0.00% with maturity value of $115,000,000 (fully collateralized by Fannie Mae and Freddie Mac securities with maturity dates ranging from 6/1/42 to 8/1/44 at rates ranging from 3.50% to 4.50%, aggregate original par and fair value of $113,045,043 and $117,300,000, respectively) | 115,000,000 | ||||
| ||||||
Total Value of BNP Paribas Securities Corp., (collateral value of $219,300,021) | 215,000,000 | |||||
| ||||||
100,000,000 | Citibank N.A., dated 9/25/14; due 10/2/14 at 0.04% with maturity value of $100,000,778 (fully collateralized by U.S. Treasury securities with maturity dates ranging from 7/15/17 to 1/15/24 at rates ranging from 0.625% to 2.625%, aggregate original par and fair value of $99,886,200 and $102,000,123, respectively) | 100,000,000 | ||||
24 |
SCHEDULE OF PORTFOLIO INVESTMENTS |
U.S. Government Money Market Fund (cont.)
September 30, 2014
Principal Amount | Value | |||||
$125,000,000 | Citibank N.A., dated 9/30/14; due 10/1/14 at 0.00% with maturity value of $125,000,000 (fully collateralized by Fannie Mae, Freddie Mac, Federal Home Loan Bank and Federal Farm Credit Bank securities with maturity dates ranging from 5/25/18 to 12/11/25 at rates of 0.00% to 3.50%, aggregate original par and fair value of $145,189,000 and $127,500,133, respectively) | $ | 125,000,000 | |||
20,000,000 | Citibank N.A., dated 9/30/14; due 10/1/14 at 0.00% with maturity value of $20,000,000 (fully collateralized by U.S. Treasury securities with maturity dates ranging from 1/15/15 to 5/15/15 at rates ranging from 0.250% to 1.625%, aggregate original par and fair value of $18,315,200 and $20,400,071, respectively) | 20,000,000 | ||||
25,000,000 | Citibank N.A., dated 9/30/14; due 10/1/14 at 0.00% with maturity value of $25,000,000 (fully collateralized by a U.S. Treasury security with a maturity date of 5/15/37 at a rate of 5.00%, original par and fair value of $18,974,500 and $25,500,020, respectively) | 25,000,000 | ||||
100,000,000 | Citibank N.A., dated 9/30/14; due 10/7/14 at 0.02% with maturity value of $100,000,389 (fully collateralized by U.S. Treasury securities with maturity dates ranging from 5/31/20 to 1/15/24 at rates ranging from 0.625% to 2.000%, aggregate original par and fair value of $102,912,300 and $102,000,074, respectively) | 100,000,000 | ||||
50,000,000 | Citibank N.A., dated 9/30/14; due 10/7/14 at 0.03% with maturity value of $50,000,292 (fully collateralized by U.S. Treasury securities with maturity dates ranging from 9/15/15 to 7/31/16 at rates ranging from 0.25% to 1.50%, aggregate original par and fair value of $50,108,300 and $51,000,033, respectively) | 50,000,000 | ||||
| ||||||
Total Value of Citibank N.A., (collateral value of $428,400,454) | 420,000,000 | |||||
| ||||||
100,000,000 | Goldman Sachs & Co., dated 9/30/14; due 10/1/14 at 0.01% with maturity value of $100,000,028 (fully collateralized by Fannie Mae securities with maturity dates ranging from 1/1/27 to 5/1/44 at rates ranging from 3.50% to 4.00%, aggregate original par and fair value of $123,574,030 and $102,000,001, respectively) | 100,000,000 | ||||
| ||||||
Total Value of Goldman Sachs & Co., (collateral value of $102,000,001) | 100,000,000 | |||||
| ||||||
20,000,000 | Merrill Lynch, Pierce, Fenner, Smith, dated 9/30/14; due 10/1/14 at 0.001% with maturity value of $20,000,001 (fully collateralized by Freddie Mac and Federal Home Loan Bank securities with maturity dates ranging from 8/28/15 to 8/8/22 at rates ranging from 0.50% to 2.35%, aggregate original par and fair value of $21,473,000 and $20,400,577, respectively) | 20,000,000 | ||||
| 25 |
SCHEDULE OF PORTFOLIO INVESTMENTS |
U.S. Government Money Market Fund (cont.)
September 30, 2014
Principal Amount | Value | |||||
$ 45,000,000 | Merrill Lynch, Pierce, Fenner, Smith, dated 9/30/14; due 10/1/14 at 0.001% with maturity value of $45,000,001 (fully collateralized by a Freddie Mac security with a maturity date of 8/1/42 at a rate of 3.50%, original par and fair value of $58,157,131 and $45,900,000, respectively) | $ | 45,000,000 | |||
| ||||||
Total Value of Merrill Lynch, Pierce, Fenner, Smith, (collateral value of $66,300,577) | 65,000,000 | |||||
| ||||||
80,000,000 | TD Securities (USA), dated 9/30/14; due 10/1/14 at 0.005% with maturity value of $80,000,011 (fully collateralized by Fannie Mae and Freddie Mac securities with maturity dates ranging from 3/1/26 to 7/1/44 at rates ranging from 3.00% to 4.50%, aggregate original par and fair value of $103,505,744 and $81,600,001, respectively) | 80,000,000 | ||||
| ||||||
Total Value of TD Securities (USA), (collateral value of $81,600,001) | 80,000,000 | |||||
| ||||||
275,000,000 | Wells Fargo Securities, dated 9/30/14; due 10/1/14 at 0.02% with maturity value of $275,000,153 (fully collateralized by U.S. Treasury securities with maturity dates ranging from 11/15/14 to 2/15/44 at rates ranging from 0.00% to 4.75%, aggregate original par and fair value of $275,170,900 and $280,521,012, respectively) | 275,000,000 | ||||
100,000,000 | Wells Fargo Securities, dated 9/30/14; due 10/1/14 at 0.03% with maturity value of $100,000,083 (fully collateralized by a U.S. Treasury security with a maturity date of 10/31/15 at a rate of 1.25%, original par and fair value of $100,291,400 and $102,000,066, respectively) | 100,000,000 | ||||
| ||||||
Total Value of Wells Fargo Securities, (collateral value of $382,521,078) | 375,000,000 | |||||
| ||||||
Total Repurchase Agreements | 1,255,000,000 | |||||
|
| |||||
(Cost $1,255,000,000) |
| |||||
Total Investments | $ | 5,998,409,156 | ||||
(Cost $5,998,409,156)(c) — 106.39% |
| |||||
Liabilities in excess of other assets — (6.39)% | (360,450,646 | ) | ||||
|
| |||||
NET ASSETS — 100.00% | $ | 5,637,958,510 | ||||
|
| |||||
26 |
SCHEDULE OF PORTFOLIO INVESTMENTS |
U.S. Government Money Market Fund (cont.)
September 30, 2014
| (a) | Variable rate security. The rate reflected in the Schedule of Portfolio Investments is the rate in effect on September 30, 2014. The maturity date represents the actual maturity date. The security’s effective maturity resets periodically. |
| (b) | Represents effective yield to maturity on date of purchase. |
| (c) | Tax cost of securities is equal to book cost of securities. |
| Abbreviations | used are defined below: |
LOC -Letter of Credit
See notes to financial statements.
| 27 |
SCHEDULE OF PORTFOLIO INVESTMENTS |
Tax-Free Money Market Fund
September 30, 2014
Principal Amount | Value | |||||
Municipal Bonds — 99.32% |
| |||||
California — 0.93% |
| |||||
$ 6,645,000 | California Municipal Finance Authority Pacific Meadows Apartments Revenue, 0.08%, 10/1/47, (Credit Support: Freddie Mac)(a)(b) | $ | 6,645,000 | |||
5,600,000 | County of San Bernardino Sycamore Terrace Refunding Revenue, Series A, 0.08%, 5/15/29, (Credit Support: Fannie Mae)(b) | 5,600,000 | ||||
|
| |||||
| 12,245,000 | ||||||
|
| |||||
Colorado — 2.40% |
| |||||
4,365,000 | Colorado Educational & Cultural Facilities Authority Private Primary Schools Revenue, 0.05%, 5/1/32, (LOC: U.S. Bank NA)(b) | 4,365,000 | ||||
4,390,000 | Colorado Educational & Cultural Facilities Authority Refunding Revenue, 0.05%, 11/1/33, (LOC: U.S. Bank NA)(b) | 4,390,000 | ||||
8,530,000 | Colorado Health Facilites Authority, Evangelical Nursing Home Revenue, 0.05%, 6/1/37, (LOC: U.S. Bank NA)(b) | 8,530,000 | ||||
1,130,000 | Colorado Health Facilities Authority Arapahoe Housing Project Revenue, Series A, 0.14%, 4/1/24, (LOC: Wells Fargo Bank)(b) | 1,130,000 | ||||
3,475,000 | County of Pitkin Refunding Revenue, Series A, 0.04%, 12/1/24, (LOC: U.S. Bank NA)(b) | 3,475,000 | ||||
4,910,000 | Gateway Regional Metropolitan District Refunding GO, 0.14%, 12/1/37, (LOC: Wells Fargo Bank)(b) | 4,910,000 | ||||
4,075,000 | Holland Creek Metropolitan District Revenue, 0.06%, 6/1/41, (LOC: Bank of America NA)(b) | 4,075,000 | ||||
485,000 | Parker Automotive Metropolitan District GO, 0.05%, 12/1/34, (LOC: U.S. Bank NA)(b) | 485,000 | ||||
|
| |||||
| 31,360,000 | ||||||
|
| |||||
Delaware — 0.36% |
| |||||
4,680,000 | Delaware State Economic Development Authority Revenue, 0.05%, 5/1/36, (LOC: PNC Bank NA)(b) | 4,680,000 | ||||
|
| |||||
District Of Columbia — 1.81% |
| |||||
1,400,000 | District of Columbia Internships and Academic Revenue, 0.04%, 7/1/36, (LOC: Branch Banking & Trust)(b) | 1,400,000 | ||||
22,300,000 | Metropolitan Washington Airports Authority Refunding Revenue, Subseries C2, 0.04%, 10/1/39, (LOC: Barclays Bank PLC)(b) | 22,300,000 | ||||
|
| |||||
| 23,700,000 | ||||||
|
| |||||
Florida — 2.10% |
| |||||
3,825,000 | Florida State Housing Finance Corp. South Pointe Project Refunding Revenue, Series J, 0.06%, 2/15/28, (Credit Support: Fannie Mae)(b) | 3,825,000 | ||||
7,465,000 | Hillsborough Community College Foundation Inc. Revenue, 0.04%, 12/1/33, (LOC: BMO Harris Bank NA)(b) | 7,465,000 | ||||
5,245,000 | JP Morgan Chase Putters/Drivers Trust Seminole County Sales Tax Refunding Revenue, Series 3438Z, 0.06%, 4/1/27(a)(b) | 5,245,000 | ||||
28 |
SCHEDULE OF PORTFOLIO INVESTMENTS |
Tax-Free Money Market Fund (cont.)
September 30, 2014
Principal Amount | Value | |||||
$ 2,225,000 | JP Morgan Chase Putters/Drivers Trust Tampa Water Revenue, Series 3617, 0.06%, 10/1/25(a)(b) | $ | 2,225,000 | |||
8,690,000 | Orange County Housing Finance Authority, Post Fountains Project Refunding Revenue, 0.04%, 6/1/25, (Credit Support: Fannie Mae)(b) | 8,690,000 | ||||
|
| |||||
| 27,450,000 | ||||||
|
| |||||
Georgia — 0.90% |
| |||||
7,215,000 | Clayton County Housing Authority Refunding Revenue, 0.04%, 9/1/26, (Credit Support: Fannie Mae)(b) | 7,215,000 | ||||
4,610,000 | Fulton County Development Authority School Improvement Revenue, 0.04%, 8/1/35, (LOC: Branch Banking & Trust)(b) | 4,610,000 | ||||
|
| |||||
| 11,825,000 | ||||||
|
| |||||
Illinois — 9.66% |
| |||||
14,495,000 | City of Chicago Refunding GO, Series D-2, 0.03%, 1/1/40, (LOC: Northern Trust Co.)(b) | 14,495,000 | ||||
2,985,000 | City of Chicago Waterworks Refunding Revenue, Sub Series, 04-3, 0.08%, 11/1/31, (LOC: State Street Bank & Trust)(b) | 2,985,000 | ||||
4,870,000 | City of Elmhurst Hospital Improvements Revenue, 0.04%, 7/1/18, (LOC: JP Morgan Chase Bank NA)(b) | 4,869,967 | ||||
20,000,000 | Illinois Educational Facilities Authority TECP, 0.08%, 11/3/14, (LOC: Northern Trust Co.)(c) | 20,000,000 | ||||
4,600,000 | Illinois Finance Authority, Healthcare Systems Refunding Revenue, Series B, 0.04%, 11/15/37, (LOC: PNC Bank NA)(b) | 4,600,000 | ||||
7,030,000 | Illinois Finance Authority, Robert Morris College Revenue, 0.05%, 6/1/24, (LOC: JP Morgan Chase Bank NA)(b) | 7,030,000 | ||||
5,650,000 | Illinois Finance Authority, Steppenwolf Theatre Co. Project Refunding Revenue, 0.05%, 3/1/43, (LOC: Northern Trust Co.)(b) | 5,650,000 | ||||
3,300,000 | Illinois Finance Authority, The Adler Planetarium Recreational Revenue, 0.04%, 4/1/31, (LOC: PNC Bank NA)(b) | 3,300,000 | ||||
12,900,000 | Illinois Finance Authority, Wesleyan University Refunding Revenue, 0.04%, 9/1/42, (LOC: PNC Bank NA)(b) | 12,900,000 | ||||
7,600,000 | Illinois Finance Authority, Wesleyan University Refunding Revenue, 0.05%, 9/1/23, (LOC: PNC Bank NA)(b) | 7,600,000 | ||||
8,700,000 | Illinois State Development Finance Authority, Oak Park Residence Corp. Project Revenue, 0.05%, 7/1/41, (LOC: PNC Bank NA)(b) | 8,700,000 | ||||
20,500,000 | Illinois State Toll Highway Authority Highway Improvement Revenue, Series A-2A, 0.04%, 7/1/30, (LOC: Bank of Tokyo-Mitsubishi UFJ)(b) | 20,500,000 | ||||
5,805,000 | Village of Channahon Morris Hospital Refunding Revenue, Series A, 0.04%, 12/1/23, (LOC: U.S. Bank NA)(b) | 5,805,000 | ||||
8,070,000 | Village of Channahon Morris Hospital Revenue, 0.04%, 12/1/34, (LOC: U.S. Bank NA)(b) | 8,070,000 | ||||
|
| |||||
| 126,504,967 | ||||||
|
| |||||
Indiana — 2.12% |
| |||||
4,100,000 | City of Rockport Pollution Control Refunding Revenue, 0.04%, 7/1/25, (LOC: Bank Tokyo-Mitsubishi UFJ)(b) | 4,100,000 | ||||
| 29 |
SCHEDULE OF PORTFOLIO INVESTMENTS |
Tax-Free Money Market Fund (cont.)
September 30, 2014
Principal Amount | Value | |||||
$23,600,000 | Indiana Finance Authority Ascension Health Refunding Revenue, Series E7, 0.04%, 11/15/33(b) | $ | 23,600,000 | |||
|
| |||||
| 27,700,000 | ||||||
|
| |||||
Iowa — 1.73% |
| |||||
9,000,000 | City of Des Moines, Methodist Medical Center Project Revenue, 0.05%, 8/1/15, (LOC: Wells Fargo Bank)(b) | 9,000,000 | ||||
5,300,000 | City of Urbandale Interstate Acres LP Refunding Revenue, 0.04%, 12/1/14, (LOC: Federal Home Loan Bank, Des Moines)(b) | 5,300,000 | ||||
1,125,000 | County of Woodbury Siouxland Medical Education Foundation Revenue, 0.14%, 11/1/16, (LOC: U.S. Bank NA)(b) | 1,125,000 | ||||
7,270,000 | Iowa Higher Education Loan Authority University & College Revenue, 0.14%, 5/1/20, (LOC: Wells Fargo Bank)(b) | 7,270,000 | ||||
|
| |||||
| 22,695,000 | ||||||
|
| |||||
Kansas — 1.15% |
| |||||
15,000,000 | City of Wichita Public Improvments Refunding GO, Series 268, 0.25%, 10/15/15 | 15,004,350 | ||||
|
| |||||
Louisiana — 5.01% |
| |||||
17,000,000 | East Baton Rouge Parish Industrial Development Board, Inc. Exxon Mobil Project Revenue, Series A, 0.04%, 8/1/35(b) | 17,000,000 | ||||
20,000,000 | East Baton Rouge Parish Industrial Development Board, Inc. Exxon Mobil Project Revenue, Series B, 0.04%, 12/1/40(b) | 20,000,000 | ||||
9,055,000 | Louisiana Local Government Environmental Facilities & Community Development Authority Revenue, Series A, 0.04%, 10/1/37, (LOC: Federal Home Loan Bank, Dallas)(b) | 9,055,000 | ||||
5,750,000 | Louisiana Public Facilities Authority, Community Health Care Project Revenue, 0.06%, 4/1/21, (LOC: Bank of NY Mellon, Capital One NA)(b) | 5,750,000 | ||||
12,600,000 | Louisiana Public Facilities Authority, Multifamily Housing Refunding Revenue, 0.05%, 4/1/36, (Credit Support: Freddie Mac)(b) | 12,600,000 | ||||
1,155,000 | Terrebonne Economic Development Authority, Buquet District Industrial Revenue, 0.27%, 9/1/29, (LOC: Community Bank, Federal Home Loan Bank)(b) | 1,155,000 | ||||
|
| |||||
| 65,560,000 | ||||||
|
| |||||
Maryland — 2.68% |
| |||||
10,000,000 | Johns Hopkins University TECP, 0.05%, 10/7/14(c) | 10,000,000 | ||||
5,100,000 | Maryland Health & Higher Educational Facilities Authority Refunding Revenue, Series A, 0.04%, 4/1/35, (LOC: TD Bank NA)(b) | 5,100,000 | ||||
20,000,000 | Maryland Health & Higher Educational Facilities Authority TECP, 0.08%, 10/1/14(c) | 20,000,000 | ||||
|
| |||||
| 35,100,000 | ||||||
|
| |||||
Massachusetts — 1.46% |
| |||||
1,560,000 | Commonwealth of Massachusetts Public Improvements Refunding GO, 5.50%, 11/1/14 | 1,567,054 | ||||
30 |
SCHEDULE OF PORTFOLIO INVESTMENTS |
Tax-Free Money Market Fund (cont.)
September 30, 2014
Principal Amount | Value | |||||
$17,595,000 | JP Morgan Chase Putters/Drivers Trust GO, Series 4320, 0.03%, 5/31/16(a)(b) | $ | 17,595,000 | |||
|
| |||||
| 19,162,054 | ||||||
|
| |||||
Michigan — 3.04% | ||||||
15,795,000 | Michigan State Hospital Finance Authority, Trinity Health Group Revenue TECP, 0.06%, 10/2/14(c) | 15,795,000 | ||||
12,000,000 | Oakland University Refunding Revenue, 0.04%, 3/1/31, (LOC: JP Morgan Chase Bank NA)(b) | 12,000,000 | ||||
12,010,000 | University of Michigan TECP, 0.07%, 10/1/14(c) | 12,010,000 | ||||
|
| |||||
| 39,805,000 | ||||||
|
| |||||
Minnesota — 12.43% | ||||||
8,895,000 | City of Andover Senior Housing Presbyterian Homes Inc. Project, Refunding Revenue, 0.05%, 11/15/33, (Credit Support: Fannie Mae)(b) | 8,895,000 | ||||
1,825,000 | City of Bloomington Bristol Village Apartments Project Refunding Revenue, Series A1, 0.05%, 11/15/32, (Credit Support: Fannie Mae)(b) | 1,825,000 | ||||
4,860,000 | City of Burnsville Berkshire Project Refunding Revenue, Series A, 0.05%, 7/15/30, (Credit Support: Fannie Mae)(b) | 4,860,000 | ||||
12,035,000 | City of Inver Grove Heights Refunding Revenue, 0.05%, 5/15/35, (Credit Support: Fannie Mae)(b) | 12,035,000 | ||||
6,300,000 | City of Minnetonka Beacon Hill Refunding Revenue, 0.05%, 5/15/34, (Credit Support: Fannie Mae)(b) | 6,299,994 | ||||
3,100,000 | City of Roseville Senior Housing Eaglecrest Project, Refunding Revenue, 0.05%, 7/1/39, (LOC: Freddie Mac)(b) | 3,100,000 | ||||
3,820,000 | City of Saint Louis Park Parkshore Senior Project Refunding Revenue, 0.04%, 8/1/34, (Credit Support: Freddie Mac)(b) | 3,820,000 | ||||
5,565,000 | City of Saint Louis Park Westwind Apartments Project Refunding Revenue, 0.04%, 9/15/33, (Credit Support: Fannie Mae)(b) | 5,565,000 | ||||
1,080,000 | City of Spring Lake Park Oak Crest Apartments Project Refunding Revenue, 0.05%, 2/15/33, (Credit Support: Fannie Mae)(b) | 1,080,000 | ||||
1,065,000 | Minnesota State Public Improvements GO, Series A, 5.00%, 6/1/15 | 1,099,332 | ||||
5,600,000 | Pine City Senior Housing Lakeview Commons Project Refunding Revenue, 0.05%, 4/15/36, (Credit Support: Fannie Mae)(b) | 5,600,000 | ||||
4,000,000 | Rochester Health Care Facilities Mayo Clinic Refunding Revenue, Series A, 0.04%, 11/15/38(b) | 4,000,000 | ||||
20,000,000 | Rochester Health Care Facilities TECP, 0.06%, 10/3/14, (Credit Support: Mayo Clinic Foundation)(c) | 20,000,000 | ||||
10,000,000 | Rochester Health Care Facilities TECP, 0.07%, 11/5/14, (Credit Support: Mayo Clinic Foundation)(c) | 10,000,000 | ||||
8,550,000 | Rochester Health Care Facilities TECP, 0.08%, 10/1/14, (Credit Support: Mayo Clinic Foundation)(c) | 8,550,000 | ||||
5,350,000 | Saint Paul Housing & Redevelopment Authority, Highland Ridge Project Refunding Revenue, 0.05%, 10/1/33, (Credit Support: Freddie Mac)(b) | 5,350,000 | ||||
| 31 |
SCHEDULE OF PORTFOLIO INVESTMENTS |
Tax-Free Money Market Fund (cont.)
September 30, 2014
Principal Amount | Value | |||||
$ 1,020,000 | Saint Paul Independent School District No. 625 School Improvements GO, Series A, 4.00%, 2/1/15, (Credit Support: MN School District Credit Program) | $ | 1,033,182 | |||
7,745,000 | Saint Paul Port Authority Sibley Project Refunding Revenue, 0.04%, 2/1/34, (Credit Support: Freddie Mac)(b) | 7,744,996 | ||||
21,295,000 | State of Minnesota Various Purpose GO, Series A, 5.00%, 8/1/15 | 22,160,296 | ||||
29,750,000 | University of Minnesota TECP, 0.07%, 10/1/14(c) | 29,750,000 | ||||
|
| |||||
| 162,767,800 | ||||||
|
| |||||
Mississippi — 5.16% |
| |||||
15,000,000 | Mississippi Business Finance Corp., Chevron USA Inc. Project Revenue, Series A, 0.04%, 12/1/30(b) | 15,000,000 | ||||
11,300,000 | Mississippi Business Finance Corp., Chevron USA Inc. Project Revenue, Series B, 0.03%, 11/1/35(b) | 11,300,000 | ||||
9,700,000 | Mississippi Business Finance Corp., Chevron USA Inc. Project Revenue, Series B, 0.05%, 12/1/30(b) | 9,700,000 | ||||
5,600,000 | Mississippi Business Finance Corp., Chevron USA Inc. Project Revenue, Series F, 0.04%, 11/1/35(b) | 5,600,000 | ||||
8,000,000 | Mississippi Business Finance Corp., Chevron USA Inc. Project Revenue, Series H, 0.03%, 11/1/35(b) | 8,000,000 | ||||
10,790,000 | Mississippi Business Finance Corp., Chevron USA Inc. Project Revenue, Series K, 0.03%, 11/1/35(b) | 10,790,000 | ||||
7,140,000 | Mississippi Business Finance Corp., King Edward Hotel Project Revenue, 0.04%, 5/1/39, (LOC: Federal Home Loan Bank, Atlanta)(b) | 7,140,000 | ||||
|
| |||||
| 67,530,000 | ||||||
|
| |||||
Missouri — 1.02% |
| |||||
3,400,000 | Kansas City, Roe Bartle Refunding Revenue, Series E, 0.06%, 4/15/34, (LOC: Sumitomo Mitsui Banking)(b) | 3,400,000 | ||||
5,000,000 | Kansas City, Roe Bartle Refunding Revenue, Series F, 0.06%, 4/15/25, (LOC: Sumitomo Mitsui Banking)(b) | 5,000,000 | ||||
4,980,000 | Nodaway County Industrial Development Authority Northwest Foundation Inc. Revenue, 0.04%, 11/1/28, (LOC: U.S. Bank NA)(b) | 4,980,000 | ||||
|
| |||||
| 13,380,000 | ||||||
|
| |||||
Montana — 2.33% |
| |||||
1,700,000 | Montana Board of Investment Cash Flow Management Public Improvements Refunding Revenue, 0.16%, 3/1/29(b) | 1,700,000 | ||||
14,775,000 | Montana Board of Investment Cash Flow Management Public Improvements Refunding Revenue, 0.16%, 3/1/32(b) | 14,774,531 | ||||
6,000,000 | Montana Board of Investment Cash Flow Management Public Improvements Refunding Revenue, 0.16%, 3/1/35(b) | 6,000,000 | ||||
8,000,000 | Montana Board of Investment Cash Flow Management Public Improvements Refunding Revenue, 0.16%, 3/1/38(b) | 8,000,000 | ||||
|
| |||||
| 30,474,531 | ||||||
|
| |||||
32 |
SCHEDULE OF PORTFOLIO INVESTMENTS |
Tax-Free Money Market Fund (cont.)
September 30, 2014
Principal Amount | Value | |||||
New York — 9.04% |
| |||||
$20,000,000 | City of Rochester Public Improvements GO, Series II, 2.00%, 8/10/15 | $ | 20,302,853 | |||
5,000,000 | New York City Housing Development Corp. 101 Avenue D Apartments Refunding Revenue, Series A, 0.05%, 7/1/43, (LOC: Bank of America N.A.)(b) | 5,000,000 | ||||
6,000,000 | New York City Transitional Finance Authority Future Tax Secured Refunding Revenue, 0.03%, 11/1/29(b) | 6,000,000 | ||||
19,025,000 | New York City Transitional Finance Authority Future Tax Secured Refunding Revenue, Subseries C, 2.50%, 11/1/14 | 19,063,357 | ||||
8,055,000 | New York State Dormitory Authority Refunding Revenue, Series A, 0.10%, 7/1/28, (LOC: TD Bank NA)(b) | 8,055,000 | ||||
27,400,000 | New York State Energy Research & Development Authority Refunding Revenue, Series A, 0.08%, 8/1/15, (LOC: Wells Fargo Bank)(b) | 27,400,000 | ||||
10,490,000 | New York State Housing Finance Agency, College Arms Revenue, Series A, 0.04%, 5/1/48, (Credit Support: Freddie Mac)(b) | 10,490,000 | ||||
17,000,000 | New York State Liberty Development Corp. 3 World Trade Center, Series A-1, 0.15%, 12/1/50(b) | 17,000,000 | ||||
5,000,000 | Triborough Bridge & Tunnel Authority Refunding Revenue, Series B, 0.03%, 1/1/32, (LOC: California State Teachers Retirement System)(b) | 5,000,000 | ||||
|
| |||||
| 118,311,210 | ||||||
|
| |||||
North Carolina — 1.58% |
| |||||
15,000,000 | Lower Cape Fear Water & Sewer Authority Water Utility Improvements Revenue, 0.03%, 12/1/34, (LOC: Rabobank Cooperative)(b) | 15,000,000 | ||||
1,300,000 | North Carolina Capital Facilities Finance Agency Refunding Revenue, 0.04%, 7/1/19, (LOC: Branch Banking & Trust)(b) | 1,300,000 | ||||
1,545,000 | North Carolina Capital Facilities Finance Agency Refunding Revenue, 0.04%, 10/1/33, (LOC: Wells Fargo Bank)(b) | 1,545,000 | ||||
2,860,000 | North Carolina Medical Care Commission Lower Cape Fear Hospice Revenue, 0.07%, 11/1/27, (LOC: Branch Banking & Trust)(b) | 2,860,000 | ||||
|
| |||||
| 20,705,000 | ||||||
|
| |||||
Ohio — 0.58% |
| |||||
4,935,000 | Cuyahoga County, Cleveland Health Educational Museum Revenue, 0.05%, 3/1/32, (LOC: PNC Bank N.A.)(b) | 4,935,000 | ||||
2,700,000 | Ohio Higher Educational Facility Commission, John Carroll Revenue, Series A, 0.05%, 11/15/31, (LOC: JP Morgan Chase Bank NA)(b) | 2,700,000 | ||||
|
| |||||
| 7,635,000 | ||||||
|
| |||||
Pennsylvania — 7.41% |
| |||||
6,800,000 | Allegheny County Hospital Development Authority Revenue, Series A, 0.05%, 6/1/30, (LOC: PNC Bank NA)(b) | 6,800,000 | ||||
22,375,000 | Commonwealth of Pennsylvania, 2nd Series Public Improvements GO, 3.00%, 10/15/14 | 22,399,300 | ||||
| 33 |
SCHEDULE OF PORTFOLIO INVESTMENTS |
Tax-Free Money Market Fund (cont.)
September 30, 2014
Principal Amount | Value | |||||
$ 3,600,000 | Delaware County Industrial Development Authority, Scott Paper Co. Project Revenue, Series B, 0.05%, 12/1/18, (Credit Support: Kimberly-Clark Corp.)(b) | $ | 3,600,000 | |||
32,020,000 | Delaware County Industrial Development Authority, United Parcel Service Project Revenue, 0.04%, 12/1/15(b) | 32,019,997 | ||||
8,700,000 | Emmaus General Authority Revenue, Subseries D-24, 0.04%, 3/1/24, (LOC: U.S. Bank NA)(b) | 8,700,000 | ||||
8,200,000 | Jackson Township Industrial Development Authority Stoneridge Retirement Revenue, 0.05%, 10/15/42, (LOC: PNC Bank NA)(b) | 8,200,000 | ||||
8,155,000 | JP Morgan Chase Putters/Drivers Trust Owen J Roberts School District Refunding GO, Series 3405, 0.06%, 11/15/14, (Credit Support: State Aid Withholding)(a)(b) | 8,155,000 | ||||
7,155,000 | Luzerne County Convention Center Authority Revenue, Series A, 0.05%, 9/1/28, (LOC: PNC Bank NA)(b) | 7,155,000 | ||||
|
| |||||
| 97,029,297 | ||||||
|
| |||||
South Carolina — 0.73% |
| |||||
2,695,000 | Florence School District GO, 1.00%, 3/1/15, (Credit Support: South Carolina School District) | 2,704,468 | ||||
1,200,000 | Horry County School District GO, Series A, 5.00%, 3/1/15, (Credit Support: South Carolina School District) | 1,223,769 | ||||
3,450,000 | South Carolina Jobs-Economic Development Authority Revenue, 0.14%, 5/1/29, (LOC: Wells Fargo Bank)(b) | 3,450,000 | ||||
2,155,000 | South Carolina State University & College Improvements GO, Series A, 5.00%, 11/1/14, (Credit Support: State of South Carolina) | 2,163,905 | ||||
|
| |||||
| 9,542,142 | ||||||
|
| |||||
South Dakota — 0.38% |
| |||||
5,000,000 | South Dakota Housing Development Authority Home Ownership Mortgage Revenue, Series C, 0.03%, 5/1/39(b) | 5,000,000 | ||||
|
| |||||
Tennessee — 2.36% |
| |||||
7,910,000 | Shelby County Health Educational & Housing Facilities Board, Hedgerow Apartments Refunding Revenue, Series A-1, 0.05%, 12/15/37, (Credit Support: Fannie Mae)(b) | 7,910,000 | ||||
23,000,000 | Vanderbilt University TECP, 0.12%, 12/16/14(c) | 23,000,000 | ||||
|
| |||||
| 30,910,000 | ||||||
|
| |||||
Texas — 11.63% |
| |||||
1,435,000 | Alvin Independent School District School Improvements GO, Series A, 2.00%, 2/15/15, (Credit Support: PSF-GTD) | 1,444,840 | ||||
3,300,000 | Arlington Independent School District Refunding GO, 5.00%, 2/15/15, (Credit Support: PSF-GTD) | 3,359,781 | ||||
2,275,000 | Birdville Independent School District Refunding GO, 3.00%, 2/15/15, (Credit Support: PSF-GTD) | 2,299,060 | ||||
5,090,000 | Calhoun County Independent School District Refunding GO, 2.00%, 2/15/15, (Credit Support: PSF-GTD) | 5,124,905 | ||||
4,330,000 | Conroe Independent School District Refunding GO, Series A, 3.00%, 2/15/15, (Credit Support: PSF-GTD) | 4,375,845 | ||||
34 |
SCHEDULE OF PORTFOLIO INVESTMENTS |
Tax-Free Money Market Fund (cont.)
September 30, 2014
Principal Amount | Value | |||||
$ 7,870,000 | Dallas Performing Arts Cultural Facilities Corp. Refunding Revenue, Series B, 0.05%, 9/1/41, (LOC: JP Morgan Chase Bank NA)(b) | $ | 7,870,000 | |||
7,050,000 | DeSoto Industrial Development Authority Caterpillar Refunding Revenue, 0.08%, 12/1/16(b) | 7,050,000 | ||||
1,770,000 | Dripping Springs Independent School District School Improvements Refunding GO, 2.00%, 2/15/15, (Credit Support: PSF-GTD) | 1,781,961 | ||||
2,655,000 | Falls City Independent School District School Improvements GO, 2.00%, 8/15/15, (Credit Support: PSF-GTD) | 2,696,783 | ||||
5,470,000 | Fort Worth Independent School District School Improvements GO, 2.00%, 2/15/15, (Credit Support: PSF-GTD) | 5,507,511 | ||||
1,000,000 | Frisco Independent School District School Improvments Refunding GO, Series A, 5.00%, 8/15/15, (Credit Support: PSF-GTD) | 1,042,287 | ||||
15,000,000 | Harris County Cultural Educational Facilities TECP, 0.03%, 12/1/24, (Credit Support: Methodist Hospital)(b)(c) | 15,000,000 | ||||
17,000,000 | Harris County Cultural Educational Facilities TECP, 0.14%, 12/3/14, (Credit Support: Methodist Hospital)(c) | 17,000,000 | ||||
18,000,000 | Harris County Cultural Educational Facilities TECP, 0.14%, 4/6/15, (Credit Support: Methodist Hospital)(c) | 18,000,000 | ||||
8,000,000 | Harris County Cultural Educational Facilities TECP, 0.14%, 4/6/15, (Credit Support: Methodist Hospital)(c) | 8,000,000 | ||||
1,250,000 | Houston Independent School District Refunding GO, Series A, 3.00%, 2/15/15, (Credit Support: PSF-GTD) | 1,263,298 | ||||
1,010,000 | Klein Independent School District School Improvements GO, 4.00%, 2/1/15, (Credit Support: PSF-GTD) | 1,022,884 | ||||
4,000,000 | Lower Neches Valley Authority Industrial Development Corp. Exxon Mobil Project Refunding Revenue, 0.03%, 5/1/46(b) | 4,000,000 | ||||
2,050,000 | Lower Neches Valley Authority Industrial Development Corp. Exxon Mobil Project Revenue, 0.04%, 11/1/38(b) | 2,050,000 | ||||
595,000 | Manor Independent School District School Improvements GO, 4.00%, 8/1/15, (Credit Support: PSF-GTD) | 613,969 | ||||
800,000 | Plano Independent School District Refunding GO, Series A, 4.00%, 2/15/15, (Credit Support: PSF-GTD) | 811,520 | ||||
785,000 | Reagan County Independent School District School Improvements GO, 2.00%, 2/15/15, (Credit Support: PSF-GTD) | 790,146 | ||||
750,000 | Rockwall Independent School District Refunding GO, 5.00%, 2/15/15, (Credit Support: PSF-GTD) | 763,637 | ||||
4,455,000 | Splendora Higher Education Facilities Corp. Revenue, Series A, 0.14%, 12/1/26, (LOC: Wells Fargo Bank)(b) | 4,455,000 | ||||
500,000 | Spring Independent School District School Improvements Refunding GO, Series 2008A, 5.00%, 8/15/15, (Credit Support: PSF-GTD) | 520,930 | ||||
20,000,000 | State of Texas Cash Flow Management GO, 1.50%, 8/31/15 | 20,249,577 | ||||
1,500,000 | State of Texas Public Finance Authority Refunding GO, 5.00%, 10/1/14 | 1,500,000 | ||||
5,700,000 | State of Texas Veterans Housing Assistance Fund GO, 0.04%, 12/1/38(c) | 5,700,000 | ||||
| 35 |
SCHEDULE OF PORTFOLIO INVESTMENTS |
Tax-Free Money Market Fund (cont.)
September 30, 2014
Principal Amount | Value | |||||
$ 7,965,000 | State of Texas Veterans Housing GO, Series B, 0.04%, 12/1/42(b) | $ | 7,965,000 | |||
|
| |||||
| 152,258,934 | ||||||
|
| |||||
Utah — 1.43% |
| |||||
350,000 | County of Sanpete Private Primary Schools Revenue, 0.14%, 8/1/28, (LOC: U.S. Bank NA)(b) | 350,000 | ||||
2,335,000 | Ogden City Redevelopment Agency Tax Allocation Revenue, Series A, 0.14%, 4/1/25, (LOC: Wells Fargo Bank)(b) | 2,335,000 | ||||
4,100,000 | Salt Lake County Housing Authority Refunding Revenue, 0.04%, 2/15/31, (Credit Support: Fannie Mae)(b) | 4,100,000 | ||||
11,970,000 | Utah Associated Municipal Power Systems Horse Butte Wind Project Revenue, 0.04%, 9/1/32, (LOC: Bank of Montreal)(b) | 11,970,000 | ||||
|
| |||||
| 18,755,000 | ||||||
|
| |||||
Vermont — 0.26% |
| |||||
3,355,000 | Vermont Educational & Health Buildings Financing Agency, Porter Nursing Home Project Refunding Revenue, Series A, 0.04%, 10/1/30, (LOC: TD Bank N.A.)(b) | 3,355,000 | ||||
|
| |||||
Virginia — 0.75% |
| |||||
9,830,000 | Norfolk Redevelopment & Housing Authority Old Dominion University Project, Refunding Revenue, 0.06%, 8/1/33, (LOC: Bank of America N.A.)(b) | 9,830,000 | ||||
|
| |||||
Washington — 2.97% |
| |||||
4,995,000 | JP Morgan Chase Putters/Drivers Trust Snohomish County School District No. 15 GO, Series 3542Z, 0.06%, 12/1/14, (Credit Support: School Board GTY)(a)(b) | 4,995,000 | ||||
1,100,000 | State of Washington Public Improvements GO, Series D, 5.00%, 1/1/15 | 1,113,400 | ||||
1,000,000 | State of Washington Public Improvements GO, Series D, 5.00%, 1/1/15, (Credit Support: Escrowed in U.S. Treasuries) | 1,012,106 | ||||
4,155,000 | State of Washington Refunding GO, 5.00%, 1/1/15 | 4,205,704 | ||||
2,105,000 | State of Washington, Motor Vehicle Fuel Tax GO, Series E, 5.00%, 1/1/15 | 2,130,441 | ||||
17,125,000 | Washington Health Care Facilities Authority Multicare Health System, Series D, 0.02%, 8/15/41, (LOC: Barclays Bank Plc)(b) | 17,125,000 | ||||
3,985,000 | Washington State Housing Finance Commission Living Care Centers Project Revenue, 0.06%, 10/1/31, (LOC: Wells Fargo Bank NA)(b) | 3,985,000 | ||||
4,330,000 | Washington State Housing Finance Commission Retirement Facilities Revenue, Series A, 0.07%, 8/1/44, (LOC: Federal Home Loan Bank, San Francisco)(b) | 4,330,000 | ||||
|
| |||||
| 38,896,651 | ||||||
|
| |||||
Wisconsin — 2.96% |
| |||||
6,720,000 | Wisconsin Health & Educational Facilities Authority Revenue, 0.14%, 6/1/28, (LOC: Wells Fargo Bank)(b) | 6,720,000 | ||||
30,250,000 | Wisconsin Health & Educational Facilities Authority, Aurora Health Care Refunding Revenue, Series C, 0.03%, 7/15/28, (LOC: Bank of Montreal)(b) | 30,250,000 | ||||
36 |
SCHEDULE OF PORTFOLIO INVESTMENTS |
Tax-Free Money Market Fund (cont.)
September 30, 2014
Principal Amount | Value | |||||
$ 1,730,000 | Wisconsin Municipalities Private School Finance Commission Revenue, 0.04%, 3/1/23, (LOC: U.S. Bank NA)(b) | $ | 1,730,000 | |||
|
| |||||
| 38,700,000 | ||||||
|
| |||||
Wyoming — 0.95% | ||||||
12,445,000 | County of Lincoln Exxon Project Pollution Control Revenue, Series D, 0.04%, 11/1/14(b) | 12,445,000 | ||||
|
| |||||
Total Municipal Bonds | 1,300,316,936 | |||||
|
| |||||
(Cost $1,300,316,936) |
| |||||
Shares | ||||||
Investment Company — 1.15% | ||||||
15,000,000 | Goldman Sachs Financial Square Tax Free Money Market Fund, Institutional Shares | 15,000,000 | ||||
|
| |||||
Total Investment Company | 15,000,000 | |||||
|
| |||||
(Cost $15,000,000) |
| |||||
Total Investments (Cost $1,315,316,936)(d) — 100.47% | $ | 1,315,316,936 | ||||
Liabilities in excess of other assets — (0.47)% | (6,099,742 | ) | ||||
|
| |||||
NET ASSETS — 100.00% | $ | 1,309,217,194 | ||||
|
| |||||
| (a) | Security exempt from registration under Rule 144A or Section 4(2) of the Securities Act of 1933, as amended. These securities may be resold in transactions exempt from registration, normally to qualified institutional buyers. Security has been deemed to be liquid based on procedures approved by the Board of Trustees. |
| (b) | Variable rate demand security. The rate reflected in the Schedule of Portfolio Investments is the rate in effect on September 30, 2014. The maturity date represents the actual maturity date. The security’s effective maturity resets periodically. |
| (c) | Represents effective yield to maturity on date of purchase. |
| (d) | Tax cost of securities is equal to book cost of securities. |
Abbreviations used are defined below:
GO - General Obligation
GTY - Guaranty
LOC - Letter of Credit
PSF-GTD - Permanent School Fund Guarantee
TECP - Tax Exempt Commercial Paper
See notes to financial statements.
| 37 |
Statements of Assets and Liabilities
September 30, 2014
| Prime | U.S. Government | Tax-Free | ||||||||||
| Money | Money | Money | ||||||||||
| Market Fund | Market Fund | Market Fund | ||||||||||
Assets: | ||||||||||||
Investments, at value (cost $11,113,333,358; $5,998,409,156; $1,315,316,936 respectively) | $ | 11,113,333,358 | * | $ | 5,998,409,156 | ** | $ | 1,315,316,936 | ||||
Cash | 30,430,288 | 20,683,838 | 7,692,348 | |||||||||
Interest and dividends receivable | 11,305,801 | 1,872,578 | 1,224,071 | |||||||||
Receivable for investments sold | 146,200,000 | — | — | |||||||||
Prepaid expenses and other assets | 146,571 | 98,656 | 96,196 | |||||||||
|
|
|
|
|
| |||||||
Total Assets | 11,301,416,018 | 6,021,064,228 | 1,324,329,551 | |||||||||
|
|
|
|
|
| |||||||
Liabilities: | ||||||||||||
Distributions payable | 2,096 | 1,146 | — | |||||||||
Payable for investments purchased | 233,343,905 | 382,658,385 | 15,004,350 | |||||||||
Accrued expenses and other payables: | ||||||||||||
Investment advisory fees | 878,483 | 247,019 | 32,713 | |||||||||
Audit fees | 31,900 | 31,900 | 31,900 | |||||||||
Trustee fees | 4,394 | 2,189 | 530 | |||||||||
Distribution fees | 399,616 | — | — | |||||||||
Shareholder reports | 326,460 | 70,506 | 13,825 | |||||||||
Shareholder servicing fees | 17,715 | — | — | |||||||||
Transfer Agent fees | 12,717 | 5,448 | 4,722 | |||||||||
Other | 168,612 | 89,125 | 24,317 | |||||||||
|
|
|
|
|
| |||||||
Total Liabilities | 235,185,898 | 383,105,718 | 15,112,357 | |||||||||
|
|
|
|
|
| |||||||
Net Assets | $ | 11,066,230,120 | $ | 5,637,958,510 | $ | 1,309,217,194 | ||||||
|
|
|
|
|
| |||||||
Net Assets Consist Of: | ||||||||||||
Capital | $ | 11,070,290,412 | $ | 5,637,942,117 | $ | 1,309,233,254 | ||||||
Distributions in excess of net investment income | (1,031 | ) | (270 | ) | — | |||||||
Accumulated net realized gains (losses) from investment transactions | (4,059,261 | ) | 16,663 | (16,060 | ) | |||||||
|
|
|
|
|
| |||||||
Net Assets | $ | 11,066,230,120 | $ | 5,637,958,510 | $ | 1,309,217,194 | ||||||
|
|
|
|
|
| |||||||
Net Assets: | ||||||||||||
RBC Institutional Class 1 | $ | 715,673,492 | $ | 1,173,146,595 | $ | 5,000 | ||||||
RBC Institutional Class 2 | 448,101,908 | 298,558,721 | 191,986,424 | |||||||||
RBC Investor Class | 2,199,570,981 | 671,741,664 | 129,466,416 | |||||||||
RBC Reserve Class | 5,908,611,825 | 2,140,330,002 | 597,870,958 | |||||||||
RBC Select Class | 1,794,271,914 | 1,354,181,528 | 389,888,396 | |||||||||
|
|
|
|
|
| |||||||
Total | $ | 11,066,230,120 | $ | 5,637,958,510 | $ | 1,309,217,194 | ||||||
|
|
|
|
|
| |||||||
38 |
FINANCIAL STATEMENTS |
Statements of Assets and Liabilities (cont.)
| Prime | U.S. Government | Tax-Free | ||||||||||
| Money | Money | Money | ||||||||||
| Market Fund | Market Fund | Market Fund | ||||||||||
Shares Outstanding (Unlimited number of shares authorized, no par value): | ||||||||||||
RBC Institutional Class 1 | 715,518,488 | 1,173,123,880 | 5,000 | |||||||||
RBC Institutional Class 2 | 448,061,259 | 298,554,822 | 192,058,180 | |||||||||
RBC Investor Class | 2,201,510,431 | 671,752,434 | 129,459,840 | |||||||||
RBC Reserve Class | 5,910,536,109 | 2,140,350,310 | 597,877,320 | |||||||||
RBC Select Class | 1,794,784,092 | 1,354,195,058 | 389,881,284 | |||||||||
|
|
|
|
|
| |||||||
Total | 11,070,410,379 | 5,637,976,504 | 1,309,281,624 | |||||||||
|
|
|
|
|
| |||||||
Net Asset Values and Redemption Price per Share: | ||||||||||||
RBC Institutional Class 1 | $ | 1.00 | $ | 1.00 | $ | 1.00 | ||||||
|
|
|
|
|
| |||||||
RBC Institutional Class 2 | $ | 1.00 | $ | 1.00 | $ | 1.00 | ||||||
|
|
|
|
|
| |||||||
RBC Investor Class | $ | 1.00 | $ | 1.00 | $ | 1.00 | ||||||
|
|
|
|
|
| |||||||
RBC Reserve Class | $ | 1.00 | $ | 1.00 | $ | 1.00 | ||||||
|
|
|
|
|
| |||||||
RBC Select Class | $ | 1.00 | $ | 1.00 | $ | 1.00 | ||||||
|
|
|
|
|
| |||||||
| * | $ 1,045,000,000 of which are repurchase agreements. See Schedule of Portfolio Investments for details. |
| ** | $ 1,255,000,000 of which are repurchase agreements. See Schedule of Portfolio Investments for details. |
See notes to financial statements.
| 39 |
FINANCIAL STATEMENTS |
For the Year Ended September 30, 2014
| Prime Money Market Fund | U.S. Government Money Market Fund | Tax-Free Money Market Fund | ||||||||||
Investment Income: | ||||||||||||
Interest income | $ | 22,618,678 | $ | 5,762,912 | $ | 1,196,211 | ||||||
Dividend income | — | — | 1,070 | |||||||||
|
|
|
|
|
| |||||||
Total Investment Income | 22,618,678 | 5,762,912 | 1,197,281 | |||||||||
|
|
|
|
|
| |||||||
Expenses: | ||||||||||||
Investment advisory fees | 12,049,972 | 6,016,402 | 1,451,579 | |||||||||
Distribution fees-RBC Institutional Class 2 | 813,257 | 754,065 | 460,056 | |||||||||
Distribution fees-RBC Investor Class | 24,594,203 | 7,118,413 | 1,460,823 | |||||||||
Distribution fees-RBC Reserve Class | 55,592,871 | 19,941,315 | 5,633,929 | |||||||||
Distribution fees-RBC Select Class | 15,396,440 | 10,919,405 | 2,979,941 | |||||||||
Shareholder services administration fees-RBC Institutional Class 1 | 473,420 | 610,612 | — | |||||||||
Accounting fees | 602,499 | 300,820 | 72,579 | |||||||||
Audit fees | 35,818 | 35,818 | 35,818 | |||||||||
Custodian fees | 186,810 | 111,685 | 18,325 | |||||||||
Insurance fees | 82,907 | 43,640 | 12,550 | |||||||||
Legal fees | 234,730 | 111,001 | 29,593 | |||||||||
Registration and filing fees | 362,135 | 374,408 | 208,942 | |||||||||
Shareholder reports | 582,950 | 135,276 | 31,370 | |||||||||
Transfer agent fees- RBC Institutional Class 1 | 49,379 | 7,979 | 3,549 | |||||||||
Transfer agent fees- RBC Institutional Class 2 | 5,192 | 5,703 | 5,990 | |||||||||
Transfer agent fees- RBC Investor Class | 6,055 | 6,055 | 6,055 | |||||||||
Transfer agent fees- RBC Reserve Class | 5,968 | 5,968 | 6,055 | |||||||||
Transfer agent fees-RBC Select Class | 8,425 | 6,055 | 6,055 | |||||||||
Trustees’ fees | 334,639 | 167,813 | 40,347 | |||||||||
Other fees | 308,791 | 173,067 | 65,046 | |||||||||
|
|
|
|
|
| |||||||
Total expenses before fee reductions | 111,726,461 | 46,845,500 | 12,528,602 | |||||||||
Expenses reduced by: | ||||||||||||
Advisor - Class Specific | — | (2,340,415 | ) | (941,741 | ) | |||||||
Shareholder Services | ||||||||||||
Administrator - Class Specific | (25,145 | ) | (610,612 | ) | — | |||||||
Distributor - Class Specific | (90,320,192 | ) | (38,733,198 | ) | (10,534,749 | ) | ||||||
|
|
|
|
|
| |||||||
Net Expenses | 21,381,124 | 5,161,275 | 1,052,112 | |||||||||
|
|
|
|
|
| |||||||
Net Investment Income | 1,237,554 | 601,637 | 145,169 | |||||||||
|
|
|
|
|
| |||||||
Realized/Unrealized Gains (Losses) from Investment Transactions: | ||||||||||||
Net realized gains from investment transactions | 13,174 | 16,663 | 26,146 | |||||||||
|
|
|
|
|
| |||||||
Change in net assets resulting from operations | $ | 1,250,728 | $ | 618,300 | $ | 171,315 | ||||||
|
|
|
|
|
| |||||||
See notes to financial statements.
40 |
FINANCIAL STATEMENTS |
Statements of Changes in Net Assets
| Prime Money Market Fund | ||||||||
| For the | For the | |||||||
| Year Ended | Year Ended | |||||||
| September 30, 2014 | September 30, 2013 | |||||||
From Investment Activities: | ||||||||
Operations: | ||||||||
Net investment income | $ | 1,237,554 | $ | 2,266,709 | ||||
Net realized gains from investment transactions | 13,174 | 123,129 | ||||||
|
|
|
| |||||
Change in net assets resulting from operations | 1,250,728 | 2,389,838 | ||||||
|
|
|
| |||||
Distributions from Net Investment Income | ||||||||
RBC Institutional Class 1 Shareholders | (126,773 | ) | (1,141,082 | ) | ||||
RBC Institutional Class 2 Shareholders | (54,213 | ) | (62,144 | ) | ||||
RBC Investor Class Shareholders | (246,155 | ) | (279,772 | ) | ||||
RBC Reserve Class Shareholders | (617,906 | ) | (599,004 | ) | ||||
RBC Select Class Shareholders | (192,507 | ) | (184,707 | ) | ||||
|
|
|
| |||||
Change in net assets resulting from shareholder distributions | (1,237,554 | ) | (2,266,709 | ) | ||||
|
|
|
| |||||
Capital Transactions: | ||||||||
Proceeds from shares issued | 17,971,896,479 | 31,396,170,483 | ||||||
Distributions reinvested | 1,181,199 | 1,563,490 | ||||||
Cost of shares redeemed | (19,950,583,437 | ) | (30,669,843,616 | ) | ||||
|
|
|
| |||||
Change in net assets resulting from capital transactions | (1,977,505,759 | ) | 727,890,357 | |||||
|
|
|
| |||||
Net increase (decrease) in net assets | (1,977,492,585 | ) | 728,013,486 | |||||
Net Assets: | ||||||||
Beginning of year | 13,043,722,705 | 12,315,709,219 | ||||||
|
|
|
| |||||
End of year | $ | 11,066,230,120 | $ | 13,043,722,705 | ||||
|
|
|
| |||||
Distributions in excess of net investment income | $ | (1,031 | ) | $ | (1,031 | ) | ||
|
|
|
| |||||
Share Transactions: | ||||||||
Issued | 17,971,896,479 | 31,396,170,483 | ||||||
Reinvested | 1,181,199 | 1,563,490 | ||||||
Redeemed | (19,950,583,437 | ) | (30,669,843,616 | ) | ||||
|
|
|
| |||||
Change in shares resulting from capital transactions | (1,977,505,759 | ) | 727,890,357 | |||||
|
|
|
| |||||
See notes to financial statements.
| 41 |
FINANCIAL STATEMENTS |
Statements of Changes in Net Assets (cont.)
| U.S. Government | ||||||||
| Money Market Fund | ||||||||
| For the | For the | |||||||
| Year Ended | Year Ended | |||||||
| September 30, 2014 | September 30, 2013 | |||||||
From Investment Activities: | ||||||||
Operations: | ||||||||
Net investment income | $ | 601,637 | $ | 573,081 | ||||
Net realized gains from investment transactions | 16,663 | 4,996 | ||||||
|
|
|
| |||||
Change in net assets resulting from operations | 618,300 | 578,077 | ||||||
|
|
|
| |||||
Distributions from Net Investment Income | ||||||||
RBC Institutional Class 1 Shareholders | (123,107 | ) | (90,204 | ) | ||||
RBC Institutional Class 2 Shareholders | (50,656 | ) | (30,879 | ) | ||||
RBC Investor Class Shareholders | (71,835 | ) | (84,601 | ) | ||||
RBC Reserve Class Shareholders | (223,585 | ) | (228,461 | ) | ||||
RBC Select Class Shareholders | (137,720 | ) | (138,936 | ) | ||||
|
|
|
| |||||
Change in net assets resulting from Distributions of Net Investment Income | (606,903 | ) | (573,081 | ) | ||||
|
|
|
| |||||
Distributions from Net Realized Gains | ||||||||
RBC Institutional Class 1 Shareholders | — | (2,751 | ) | |||||
RBC Institutional Class 2 Shareholders | — | (1,055 | ) | |||||
RBC Investor Class Shareholders | — | (3,109 | ) | |||||
RBC Reserve Class Shareholders | — | (8,200 | ) | |||||
RBC Select Class Shareholders | — | (4,854 | ) | |||||
|
|
|
| |||||
Change in net assets resulting from Distributions of Net Realized Gains | — | (19,969 | ) | |||||
|
|
|
| |||||
Capital Transactions: | �� | |||||||
Proceeds from shares issued | 5,266,489,871 | 6,278,401,994 | ||||||
Distributions reinvested | 588,816 | 574,246 | ||||||
Cost of shares redeemed | (5,754,230,322 | ) | (5,474,257,363 | ) | ||||
|
|
|
| |||||
Change in net assets resulting from capital transactions | (487,151,635 | ) | 804,718,877 | |||||
|
|
|
| |||||
Net increase (decrease) in net assets | (487,140,238 | ) | 804,703,904 | |||||
Net Assets: | ||||||||
Beginning of year | 6,125,098,748 | 5,320,394,844 | ||||||
|
|
|
| |||||
End of year | $ | 5,637,958,510 | $ | 6,125,098,748 | ||||
|
|
|
| |||||
Undistributed (distributions in excess of) net investment income | $ | (270 | ) | $ | 3,719 | |||
|
|
|
| |||||
Share Transactions: | ||||||||
Issued | 5,266,489,871 | 6,278,401,994 | ||||||
Reinvested | 588,816 | 574,246 | ||||||
Redeemed | (5,754,230,322 | ) | (5,474,257,363 | ) | ||||
|
|
|
| |||||
Change in shares resulting from capital transactions | (487,151,635 | ) | 804,718,877 | |||||
|
|
|
| |||||
See notes to financial statements.
42 |
FINANCIAL STATEMENTS |
Statements of Changes in Net Assets (cont.)
| Tax-Free | ||||||||
| Money Market Fund | ||||||||
| For the | For the | |||||||
| Year Ended | Year Ended | |||||||
| September 30, 2014 | September 30, 2013 | |||||||
From Investment Activities: | ||||||||
Operations: | ||||||||
Net investment income | $ | 145,169 | $ | 140,376 | ||||
Net realized gains (losses) from investment transactions | 26,146 | (25,606 | ) | |||||
|
|
|
| |||||
Change in net assets resulting from operations | 171,315 | 114,770 | ||||||
|
|
|
| |||||
Distributions from Net Investment Income | ||||||||
RBC Institutional Class 1 Shareholders | — | (271 | ) | |||||
RBC Institutional Class 2 Shareholders | (30,678 | ) | (22,636 | ) | ||||
RBC Investor Class Shareholders | (14,608 | ) | (16,101 | ) | ||||
RBC Reserve Class Shareholders | (62,634 | ) | (65,605 | ) | ||||
RBC Select Class Shareholders | (37,249 | ) | (36,663 | ) | ||||
|
|
|
| |||||
Change in net assets resulting from Distributions of Net Investment Income | (145,169 | ) | (141,276 | ) | ||||
|
|
|
| |||||
Capital Transactions: | ||||||||
Proceeds from shares issued | 1,792,046,707 | 1,841,785,596 | ||||||
Distributions reinvested | 145,194 | 141,008 | ||||||
Cost of shares redeemed | (1,845,621,176 | ) | (1,841,952,614 | ) | ||||
|
|
|
| |||||
Change in net assets resulting from capital transactions | (53,429,275 | ) | (26,010 | ) | ||||
|
|
|
| |||||
Net decrease in net assets | (53,403,129 | ) | (52,516 | ) | ||||
Net Assets: | ||||||||
Beginning of year | 1,362,620,323 | 1,362,672,839 | ||||||
|
|
|
| |||||
End of year | $ | 1,309,217,194 | $ | 1,362,620,323 | ||||
|
|
|
| |||||
Undistributed net investment income | $ | — | $ | — | ||||
|
|
|
| |||||
Share Transactions: | ||||||||
Issued | 1,792,046,707 | 1,841,785,596 | ||||||
Reinvested | 145,194 | 141,008 | ||||||
Redeemed | (1,845,621,176 | ) | (1,841,952,614 | ) | ||||
|
|
|
| |||||
Change in shares resulting from capital transactions | (53,429,275 | ) | (26,010 | ) | ||||
|
|
|
| |||||
See notes to financial statements.
| 43 |
| Prime Money Market Fund | (Selected data for a share outstanding throughout the years indicated) | |||||||||||||||||||||||||||
| Investment Activities | Distributions | |||||||||||||||||||||||||||
| Net Asset Value, | Net | Net Realized / | Total from | Net | ||||||||||||||||||||||||
| Beginning | Investment | Unrealized Gain/(Loss) | Investment | Investment | Total | Net Asset Value, | ||||||||||||||||||||||
| of Year | Income | on Investments | Activities | Income | Distributions | End of Year | ||||||||||||||||||||||
RBC Institutional Class 1 | ||||||||||||||||||||||||||||
Year Ended September 30, 2014 | $ 1.00 | (a)(b) | (b) | (b) | (b) | (b) | $ 1.00 | |||||||||||||||||||||
Year Ended September 30, 2013 | 1.00 | (a)(b) | (b) | (b) | (b) | (b) | 1.00 | |||||||||||||||||||||
Year Ended September 30, 2012 | 1.00 | (a)(b) | (b) | (b) | (b) | (b) | 1.00 | |||||||||||||||||||||
Year Ended September 30, 2011 | 1.00 | (a)(b) | (b) | (b) | (b) | (b) | 1.00 | |||||||||||||||||||||
Year Ended September 30, 2010 | 1.00 | (a)(b) | (b) | (b) | (b) | (b) | 1.00 | |||||||||||||||||||||
RBC Institutional Class 2 | ||||||||||||||||||||||||||||
Year Ended September 30, 2014 | $ 1.00 | (a)(b) | (b) | (b) | (b) | (b) | $ 1.00 | |||||||||||||||||||||
Year Ended September 30, 2013 | 1.00 | (a)(b) | (b) | (b) | (b) | (b) | 1.00 | |||||||||||||||||||||
Year Ended September 30, 2012 | 1.00 | (a)(b) | (b) | (b) | (b) | (b) | 1.00 | |||||||||||||||||||||
Year Ended September 30, 2011 | 1.00 | (a)(b) | (b) | (b) | (b) | (b) | 1.00 | |||||||||||||||||||||
Year Ended September 30, 2010 | 1.00 | (a)(b) | (b) | (b) | (b) | (b) | 1.00 | |||||||||||||||||||||
RBC Investor Class | ||||||||||||||||||||||||||||
Year Ended September 30, 2014 | $ 1.00 | (a)(b) | (b) | (b) | (b) | (b) | $ 1.00 | |||||||||||||||||||||
Year Ended September 30, 2013 | 1.00 | (a)(b) | (b) | (b) | (b) | (b) | 1.00 | |||||||||||||||||||||
Year Ended September 30, 2012 | 1.00 | (a)(b) | (b) | (b) | (b) | (b) | 1.00 | |||||||||||||||||||||
Year Ended September 30, 2011 | 1.00 | (a)(b) | (b) | (b) | (b) | (b) | 1.00 | |||||||||||||||||||||
Year Ended September 30, 2010 | 1.00 | (a)(b) | (b) | (b) | (b) | (b) | 1.00 | |||||||||||||||||||||
RBC Reserve Class | ||||||||||||||||||||||||||||
Year Ended September 30, 2014 | $ 1.00 | (a)(b) | (b) | (b) | (b) | (b) | $ 1.00 | |||||||||||||||||||||
Year Ended September 30, 2013 | 1.00 | (a)(b) | (b) | (b) | (b) | (b) | 1.00 | |||||||||||||||||||||
Year Ended September 30, 2012 | 1.00 | (a)(b) | (b) | (b) | (b) | (b) | 1.00 | |||||||||||||||||||||
Year Ended September 30, 2011 | 1.00 | (a)(b) | (b) | (b) | (b) | (b) | 1.00 | |||||||||||||||||||||
Year Ended September 30, 2010 | 1.00 | (a)(b) | (b) | (b) | (b) | (b) | 1.00 | |||||||||||||||||||||
RBC Select Class | ||||||||||||||||||||||||||||
Year Ended September 30, 2014 | $ 1.00 | (a)(b) | (b) | (b) | (b) | (b) | $ 1.00 | |||||||||||||||||||||
Year Ended September 30, 2013 | 1.00 | (a)(b) | (b) | (b) | (b) | (b) | 1.00 | |||||||||||||||||||||
Year Ended September 30, 2012 | 1.00 | (a)(b) | (b) | (b) | (b) | (b) | 1.00 | |||||||||||||||||||||
Year Ended September 30, 2011 | 1.00 | (a)(b) | (b) | (b) | (b) | (b) | 1.00 | |||||||||||||||||||||
Year Ended September 30, 2010 | 1.00 | (a)(b) | (b) | (b) | (b) | (b) | 1.00 | |||||||||||||||||||||
| (a) | Per share net investment income has been calculated using the average daily shares method. |
| (b) | Less than $0.01 or $(0.01) per share. |
See notes to financial statements.
44 |
FINANCIAL HIGHLIGHTS |
| Prime Money Market Fund (cont.) | (Selected data for a share outstanding throughout the years indicated) | |||||||||||||||||||
| Ratios/Supplemental Data | ||||||||||||||||||||
| Total | Net Assets, | Ratio of Net Expenses | Ratio of Net Investment Income | Ratio of Expenses | ||||||||||||||||
| Return(c) | End of Year (millions) | to Average Net Assets | to Average Net Assets | to Average Net Assets* | ||||||||||||||||
| RBC Institutional Class 1 | ||||||||||||||||||||
Year Ended September 30, 2014 | 0.01% | $ 716 | 0.18% | 0.01% | 0.18% | |||||||||||||||
Year Ended September 30, 2013 | 0.06% | 1,760 | 0.17% | 0.07% | 0.17% | |||||||||||||||
Year Ended September 30, 2012 | 0.09% | 1,746 | 0.17% | 0.09% | 0.17%(d) | |||||||||||||||
Year Ended September 30, 2011 | 0.13% | 1,978 | 0.17% | 0.14% | 0.17%(d) | |||||||||||||||
Year Ended September 30, 2010 | 0.19% | 4,051 | 0.17% | 0.19% | 0.17%(d) | |||||||||||||||
| RBC Institutional Class 2 | ||||||||||||||||||||
Year Ended September 30, 2014 | 0.01% | $ 448 | 0.18% | 0.01% | 0.27% | |||||||||||||||
Year Ended September 30, 2013 | 0.01% | 586 | 0.22% | 0.01% | 0.27% | |||||||||||||||
Year Ended September 30, 2012 | 0.01% | 633 | 0.25% | 0.01% | 0.27% | |||||||||||||||
Year Ended September 30, 2011 | 0.04% | 687 | 0.26% | 0.04% | 0.27% | |||||||||||||||
Year Ended September 30, 2010 | 0.09% | 830 | 0.27% | 0.07% | 0.27% | |||||||||||||||
| RBC Investor Class | ||||||||||||||||||||
Year Ended September 30, 2014 | 0.01% | $ 2,200 | 0.18% | 0.01% | 1.12% | |||||||||||||||
Year Ended September 30, 2013 | 0.01% | 2,658 | 0.22% | 0.01% | 1.12% | |||||||||||||||
Year Ended September 30, 2012 | 0.01% | 2,816 | 0.26% | 0.01% | 1.12% | |||||||||||||||
Year Ended September 30, 2011 | 0.01% | 3,199 | 0.30% | 0.01% | 1.12% | |||||||||||||||
Year Ended September 30, 2010 | 0.01% | 3,995 | 0.35% | 0.01% | 1.13% | |||||||||||||||
| RBC Reserve Class | ||||||||||||||||||||
Year Ended September 30, 2014 | 0.01% | $ 5,909 | 0.18% | 0.01% | 1.02% | |||||||||||||||
Year Ended September 30, 2013 | 0.01% | 6,213 | 0.22% | 0.01% | 1.02% | |||||||||||||||
Year Ended September 30, 2012 | 0.01% | 5,453 | 0.26% | 0.01% | 1.02% | |||||||||||||||
Year Ended September 30, 2011 | 0.01% | 5,032 | 0.29% | 0.01% | 1.01% | |||||||||||||||
Year Ended September 30, 2010 | 0.01% | 5,165 | 0.35% | 0.01% | 1.03% | |||||||||||||||
| RBC Select Class | ||||||||||||||||||||
Year Ended September 30, 2014 | 0.01% | $ 1,794 | 0.18% | 0.01% | 0.92% | |||||||||||||||
Year Ended September 30, 2013 | 0.01% | 1,826 | 0.22% | 0.01% | 0.92% | |||||||||||||||
Year Ended September 30, 2012 | 0.01% | 1,668 | 0.26% | 0.01% | 0.92% | |||||||||||||||
Year Ended September 30, 2011 | 0.01% | 1,595 | 0.29% | 0.01% | 0.92% | |||||||||||||||
Year Ended September 30, 2010 | 0.01% | 1,572 | 0.35% | 0.01% | 0.92% | |||||||||||||||
| * | During the year, certain fees were contractually or voluntarily reduced and/or reimbursed. If such contractual/voluntary fee reductions and reimbursements had not occurred, the ratio would have been as indicated. |
| (c) | Assumes investment at net asset value at the beginning of the year, reinvestment of all dividends and distributions, and a complete redemption of the investment at net asset value at the end of the year. |
| (d) | There were no waivers or reimbursements during the period. |
See notes to financial statements.
| 45 |
FINANCIAL HIGHLIGHTS |
| U.S. Government Money Market Fund | (Selected data for a share outstanding throughout the years indicated) |
| Investment Activities | Distributions | |||||||||||||||||||||||||||
| Net Asset Value, | Net | Net Realized/ | Total from | Net | ||||||||||||||||||||||||
| Beginning | Investment | Unrealized Gain/(Loss) | Investment | Investment | Total | Net Asset Value, | ||||||||||||||||||||||
| of Year | Income | on Investments | Activities | Income | Distributions | End of Year | ||||||||||||||||||||||
RBC Institutional Class 1 | ||||||||||||||||||||||||||||
Year Ended September 30, 2014 | $ 1.00 | (a)(b) | (b) | (b) | (b) | (b) | $ 1.00 | |||||||||||||||||||||
Year Ended September 30, 2013 | 1.00 | (a)(b) | (b) | (b) | (b) | (b) | 1.00 | |||||||||||||||||||||
Year Ended September 30, 2012 | 1.00 | (a)(b) | (b) | (b) | (b) | (b) | 1.00 | |||||||||||||||||||||
Year Ended September 30, 2011 | 1.00 | (a)(b) | (b) | (b) | (b) | (b) | 1.00 | |||||||||||||||||||||
Year Ended September 30, 2010 | 1.00 | (a)(b) | (b) | (b) | (b) | (b) | 1.00 | |||||||||||||||||||||
RBC Institutional Class 2 | ||||||||||||||||||||||||||||
Year Ended September 30, 2014 | $ 1.00 | (a)(b) | (b) | (b) | (b) | (b) | $ 1.00 | |||||||||||||||||||||
Year Ended September 30, 2013 | 1.00 | (a)(b) | (b) | (b) | (b) | (b) | 1.00 | |||||||||||||||||||||
Year Ended September 30, 2012 | 1.00 | (a)(b) | (b) | (b) | (b) | (b) | 1.00 | |||||||||||||||||||||
Year Ended September 30, 2011 | 1.00 | (a)(b) | (b) | (b) | (b) | (b) | 1.00 | |||||||||||||||||||||
Year Ended September 30, 2010 | 1.00 | (a)(b) | (b) | (b) | (b) | (b) | 1.00 | |||||||||||||||||||||
RBC Investor Class | ||||||||||||||||||||||||||||
Year Ended September 30, 2014 | $ 1.00 | (a)(b) | (b) | (b) | (b) | (b) | $ 1.00 | |||||||||||||||||||||
Year Ended September 30, 2013 | 1.00 | (a)(b) | (b) | (b) | (b) | (b) | 1.00 | |||||||||||||||||||||
Year Ended September 30, 2012 | 1.00 | (a)(b) | (b) | (b) | (b) | (b) | 1.00 | |||||||||||||||||||||
Year Ended September 30, 2011 | 1.00 | (a)(b) | (b) | (b) | (b) | (b) | 1.00 | |||||||||||||||||||||
Year Ended September 30, 2010 | 1.00 | (a)(b) | (b) | (b) | (b) | (b) | 1.00 | |||||||||||||||||||||
RBC Reserve Class | ||||||||||||||||||||||||||||
Year Ended September 30, 2014 | $ 1.00 | (a)(b) | (b) | (b) | (b) | (b) | $ 1.00 | |||||||||||||||||||||
Year Ended September 30, 2013 | 1.00 | (a)(b) | (b) | (b) | (b) | (b) | 1.00 | |||||||||||||||||||||
Year Ended September 30, 2012 | 1.00 | (a)(b) | (b) | (b) | (b) | (b) | 1.00 | |||||||||||||||||||||
Year Ended September 30, 2011 | 1.00 | (a)(b) | (b) | (b) | (b) | (b) | 1.00 | |||||||||||||||||||||
Year Ended September 30, 2010 | 1.00 | (a)(b) | (b) | (b) | (b) | (b) | 1.00 | |||||||||||||||||||||
RBC Select Class | ||||||||||||||||||||||||||||
Year Ended September 30, 2014 | $ 1.00 | (a)(b) | (b) | (b) | (b) | (b) | $ 1.00 | |||||||||||||||||||||
Year Ended September 30, 2013 | 1.00 | (a)(b) | (b) | (b) | (b) | (b) | 1.00 | |||||||||||||||||||||
Year Ended September 30, 2012 | 1.00 | (a)(b) | (b) | (b) | (b) | (b) | 1.00 | |||||||||||||||||||||
Year Ended September 30, 2011 | 1.00 | (a)(b) | (b) | (b) | (b) | (b) | 1.00 | |||||||||||||||||||||
Year Ended September 30, 2010 | 1.00 | (a)(b) | (b) | (b) | (b) | (b) | 1.00 | |||||||||||||||||||||
| (a) | Per share net investment income has been calculated using the average daily shares method. |
| (b) | Less than $0.01 or $(0.01) per share. |
See notes to financial statements.
46 |
FINANCIAL HIGHLIGHTS |
| U.S. Government Money Market Fund (cont.) | (Selected data for a share outstanding throughout the years indicated) |
| Ratios/Supplemental Data | ||||||||||||||||||||
| Total | Net Assets, | Ratio of Net Expenses | Ratio of Net Investment Income | Ratio of Expenses | ||||||||||||||||
| Return(c) | End of Year (millions) | to Average Net Assets | to Average Net Assets | to Average Net Assets* | ||||||||||||||||
RBC Institutional Class 1 | ||||||||||||||||||||
Year Ended September 30, 2014 | 0.01% | $ 1,173 | 0.09% | 0.01% | 0.17% | |||||||||||||||
Year Ended September 30, 2013 | 0.01% | 1,231 | 0.13% | 0.01% | 0.17% | |||||||||||||||
Year Ended September 30, 2012 | 0.01% | 1,046 | 0.16% | 0.01% | 0.17% | |||||||||||||||
Year Ended September 30, 2011 | 0.05% | 1,580 | 0.17% | 0.05% | 0.17% | |||||||||||||||
Year Ended September 30, 2010 | 0.11% | 662 | 0.17% | 0.11% | 0.17%(d) | |||||||||||||||
RBC Institutional Class 2 | ||||||||||||||||||||
Year Ended September 30, 2014 | 0.01% | $ 299 | 0.09% | 0.01% | 0.27% | |||||||||||||||
Year Ended September 30, 2013 | 0.01% | 497 | 0.12% | 0.01% | 0.27% | |||||||||||||||
Year Ended September 30, 2012 | 0.01% | 213 | 0.16% | 0.01% | 0.27% | |||||||||||||||
Year Ended September 30, 2011 | 0.01% | 142 | 0.20% | 0.01% | 0.27% | |||||||||||||||
Year Ended September 30, 2010 | 0.02% | 124 | 0.27% | 0.02% | 0.27% | |||||||||||||||
RBC Investor Class | ||||||||||||||||||||
Year Ended September 30, 2014 | 0.01% | $ 672 | 0.09% | 0.01% | 1.12% | |||||||||||||||
Year Ended September 30, 2013 | 0.01% | 795 | 0.13% | 0.01% | 1.12% | |||||||||||||||
Year Ended September 30, 2012 | 0.01% | 857 | 0.16% | 0.01% | 1.12% | |||||||||||||||
Year Ended September 30, 2011 | 0.01% | 981 | 0.21% | 0.01% | 1.12% | |||||||||||||||
Year Ended September 30, 2010 | 0.01% | 1,260 | 0.27% | 0.01% | 1.13% | |||||||||||||||
RBC Reserve Class | ||||||||||||||||||||
Year Ended September 30, 2014 | 0.01% | $ 2,140 | 0.09% | 0.01% | 1.02% | |||||||||||||||
Year Ended September 30, 2013 | 0.01% | 2,288 | 0.13% | 0.01% | 1.02% | |||||||||||||||
Year Ended September 30, 2012 | 0.01% | 1,896 | 0.16% | 0.01% | 1.02% | |||||||||||||||
Year Ended September 30, 2011 | 0.01% | 1,748 | 0.21% | 0.01% | 1.02% | |||||||||||||||
Year Ended September 30, 2010 | 0.01% | 1,752 | 0.27% | 0.01% | 1.03% | |||||||||||||||
RBC Select Class | ||||||||||||||||||||
Year Ended September 30, 2014 | 0.01% | $ 1,354 | 0.09% | 0.01% | 0.92% | |||||||||||||||
Year Ended September 30, 2013 | 0.01% | 1,313 | 0.13% | 0.01% | 0.92% | |||||||||||||||
Year Ended September 30, 2012 | 0.01% | 1,309 | 0.16% | 0.01% | 0.92% | |||||||||||||||
Year Ended September 30, 2011 | 0.01% | 1,262 | 0.21% | 0.01% | 0.92% | |||||||||||||||
Year Ended September 30, 2010 | 0.01% | 1,139 | 0.27% | 0.01% | 0.93% | |||||||||||||||
| * | During the year, certain fees were contractually or voluntarily reduced and/or reimbursed. If such contractual/voluntary fee reductions and reimbursements had not occurred, the ratio would have been as indicated. |
| (c) | Assumes investment at net asset value at the beginning of the year, reinvestment of all dividends and distributions, and a complete redemption of the investment at net asset value at the end of the year. |
| (d) | There were no waivers or reimbursements during the period. |
See notes to financial statements.
| 47 |
FINANCIAL HIGHLIGHTS |
| Tax-Free Money Market Fund | (Selected data for a share outstanding throughout the years indicated) |
| Investment Activities | Distributions | |||||||||||||||||||||||||||
| Net Asset Value, | Net | Net Realized/ | Total from | Net | Net | |||||||||||||||||||||||
| Beginning | Investment | Unrealized Gain/(Loss) | Investment | Investment | Realized | Net Asset Value, | ||||||||||||||||||||||
| of Year | Income | on Investments | Activities | Income | Gains | End of Year | ||||||||||||||||||||||
RBC Institutional Class 1 | ||||||||||||||||||||||||||||
Period Ended September 30, 2014(e) | $ 1.00 | (a)(b) | (b) | (b) | (b) | (b) | $ 1.00 | |||||||||||||||||||||
Period Ended October 28, 2012(f) | 1.00 | (a)(b) | (b) | (b) | (b) | (b) | 1.00 | |||||||||||||||||||||
Year Ended September 30, 2012 | 1.00 | (a)(b) | (b) | (b) | (b) | (b) | 1.00 | |||||||||||||||||||||
Year Ended September 30, 2011 | 1.00 | (a)(b) | (b) | (b) | (b) | (b) | 1.00 | |||||||||||||||||||||
Year Ended September 30, 2010 | 1.00 | (a)(b) | (b) | (b) | (b) | (b) | 1.00 | |||||||||||||||||||||
RBC Institutional Class 2 | ||||||||||||||||||||||||||||
Year Ended September 30, 2014 | $ 1.00 | (a)(b) | (b) | (b) | (b) | (b) | $ 1.00 | |||||||||||||||||||||
Year Ended September 30, 2013 | 1.00 | (a)(b) | (b) | (b) | (b) | (b) | 1.00 | |||||||||||||||||||||
Year Ended September 30, 2012 | 1.00 | (a)(b) | (b) | (b) | (b) | (b) | 1.00 | |||||||||||||||||||||
Year Ended September 30, 2011 | 1.00 | (a)(b) | (b) | (b) | (b) | (b) | 1.00 | |||||||||||||||||||||
Year Ended September 30, 2010 | 1.00 | (a)(b) | (b) | (b) | (b) | (b) | 1.00 | |||||||||||||||||||||
RBC Investor Class | ||||||||||||||||||||||||||||
Year Ended September 30, 2014 | $ 1.00 | (a)(b) | (b) | (b) | (b) | (b) | $ 1.00 | |||||||||||||||||||||
Year Ended September 30, 2013 | 1.00 | (a)(b) | (b) | (b) | (b) | (b) | 1.00 | |||||||||||||||||||||
Year Ended September 30, 2012 | 1.00 | (a)(b) | (b) | (b) | (b) | (b) | 1.00 | |||||||||||||||||||||
Year Ended September 30, 2011 | 1.00 | (a)(b) | (b) | (b) | (b) | (b) | 1.00 | |||||||||||||||||||||
Year Ended September 30, 2010 | 1.00 | (a)(b) | (b) | (b) | (b) | (b) | 1.00 | |||||||||||||||||||||
RBC Reserve Class | ||||||||||||||||||||||||||||
Year Ended September 30, 2014 | $ 1.00 | (a)(b) | (b) | (b) | (b) | (b) | $ 1.00 | |||||||||||||||||||||
Year Ended September 30, 2013 | 1.00 | (a)(b) | (b) | (b) | (b) | (b) | 1.00 | |||||||||||||||||||||
Year Ended September 30, 2012 | 1.00 | (a)(b) | (b) | (b) | (b) | (b) | 1.00 | |||||||||||||||||||||
Year Ended September 30, 2011 | 1.00 | (a)(b) | (b) | (b) | (b) | (b) | 1.00 | |||||||||||||||||||||
Year Ended September 30, 2010 | 1.00 | (a)(b) | (b) | (b) | (b) | (b) | 1.00 | |||||||||||||||||||||
RBC Select Class | ||||||||||||||||||||||||||||
Year Ended September 30, 2014 | $ 1.00 | (a)(b) | (b) | (b) | (b) | (b) | $ 1.00 | |||||||||||||||||||||
Year Ended September 30, 2013 | 1.00 | (a)(b) | (b) | (b) | (b) | (b) | 1.00 | |||||||||||||||||||||
Year Ended September 30, 2012 | 1.00 | (a)(b) | (b) | (b) | (b) | (b) | 1.00 | |||||||||||||||||||||
Year Ended September 30, 2011 | 1.00 | (a)(b) | (b) | (b) | (b) | (b) | 1.00 | |||||||||||||||||||||
Year Ended September 30, 2010 | 1.00 | (a)(b) | (b) | (b) | (b) | (b) | 1.00 | |||||||||||||||||||||
| (a) | Per share net investment income has been calculated using the average daily shares method. |
| (b) | Less than $0.01 or $(0.01) per share. |
| (e) | For the period from July 28, 2014 to September 30, 2014. |
| (f) | There were no RBC Institutional Class 1 shares outstanding during the period from October 29, 2012 to July 27, 2014. |
See notes to financial statements.
48 |
FINANCIAL HIGHLIGHTS |
| Tax-Free Money Market Fund (cont.) | (Selected data for a share outstanding throughout the years indicated) |
| Ratios/Supplemental Data | ||||||||||||||||||||
| Total | Net Assets, | Ratio of Net Expenses | Ratio of Net Investment Income | Ratio of Expenses | ||||||||||||||||
| Return(c) | End of Year (millions) | to Average Net Assets | to Average Net Assets | to Average Net Assets* | ||||||||||||||||
RBC Institutional Class 1 | ||||||||||||||||||||
Period Ended September 30, 2014(e) | 0.00%(g) | $—(i) | 0.09%(h) | 0.00%(h) | 71.03%(j) | |||||||||||||||
Period Ended October 28, 2012(f) | 0.00%(g) | — | 0.18%(h) | 0.01%(h) | 0.19%(h) | |||||||||||||||
Year Ended September 30, 2012 | 0.02% | 26 | 0.16% | 0.02% | 0.19% | |||||||||||||||
Year Ended September 30, 2011 | 0.09% | 37 | 0.18% | 0.10% | 0.19% | |||||||||||||||
Year Ended September 30, 2010 | 0.25% | 71 | 0.18% | 0.22% | 0.18%(d) | |||||||||||||||
RBC Institutional Class 2 | ||||||||||||||||||||
Year Ended September 30, 2014 | 0.01% | $192 | 0.07% | 0.01% | 0.29% | |||||||||||||||
Year Ended September 30, 2013 | 0.01% | 256 | 0.13% | 0.01% | 0.29% | |||||||||||||||
Year Ended September 30, 2012 | 0.01% | 202 | 0.17% | 0.01% | 0.29% | |||||||||||||||
Year Ended September 30, 2011 | 0.02% | 214 | 0.26% | 0.02% | 0.29% | |||||||||||||||
Year Ended September 30, 2010 | 0.15% | 282 | 0.28% | 0.09% | 0.28% | |||||||||||||||
RBC Investor Class | ||||||||||||||||||||
Year Ended September 30, 2014 | 0.01% | $129 | 0.07% | 0.01% | 1.14% | |||||||||||||||
Year Ended September 30, 2013 | 0.01% | 153 | 0.13% | 0.01% | 1.14% | |||||||||||||||
Year Ended September 30, 2012 | 0.01% | 162 | 0.17% | 0.01% | 1.13% | |||||||||||||||
Year Ended September 30, 2011 | 0.02% | 167 | 0.26% | 0.01% | 1.14% | |||||||||||||||
Year Ended September 30, 2010 | 0.02% | 210 | 0.42% | 0.01% | 1.15% | |||||||||||||||
RBC Reserve Class | ||||||||||||||||||||
Year Ended September 30, 2014 | 0.01% | $598 | 0.07% | 0.01% | 1.04% | |||||||||||||||
Year Ended September 30, 2013 | 0.01% | 607 | 0.13% | 0.01% | 1.04% | |||||||||||||||
Year Ended September 30, 2012 | 0.01% | 600 | 0.17% | 0.01% | 1.04% | |||||||||||||||
Year Ended September 30, 2011 | 0.02% | 520 | 0.26% | 0.01% | 1.04% | |||||||||||||||
Year Ended September 30, 2010 | 0.02% | 612 | 0.40% | 0.01% | 1.04% | |||||||||||||||
RBC Select Class | ||||||||||||||||||||
Year Ended September 30, 2014 | 0.01% | $390 | 0.07% | 0.01% | 0.94% | |||||||||||||||
Year Ended September 30, 2013 | 0.01% | 347 | 0.13% | 0.01% | 0.94% | |||||||||||||||
Year Ended September 30, 2012 | 0.01% | 373 | 0.17% | 0.01% | 0.94% | |||||||||||||||
Year Ended September 30, 2011 | 0.02% | 300 | 0.26% | 0.01% | 0.93% | |||||||||||||||
Year Ended September 30, 2010 | 0.02% | 286 | 0.40% | 0.01% | 0.94% | |||||||||||||||
| * | During the year, certain fees were contractually or voluntarily reduced and/or reimbursed. If such contractual/voluntary fee reductions and reimbursements had not occurred, the ratio would have been as indicated. |
| (c) | Assumes investment at net asset value at the beginning of the year, reinvestment of all dividends and distributions, and a complete redemption of the investment at net asset value at the end of the year. |
| (d) | There were no waivers or reimbursements during the period. |
| (e) | For the period from July 28, 2014 to September 30, 2014. |
| (f) | There were no RBC Institutional Class 1 shares outstanding during the period from October 29, 2012 to July 27, 2014. |
| (g) | Not annualized. |
| (h) | Annualized. |
| (i) | Less than $1,000,000. |
| (j) | Annual class specific transfer agent fees that were incurred upon the initial subscription into RBC Institutional Class 1 were not annualized. Had such expenses been annualized the expense ratio would have been 398.86%. |
See notes to financial statements.
| 49 |
September 30, 2014
1. Organization
RBC Funds Trust (the “Trust”) is registered under the Investment Company Act of 1940 (as amended) as an open-end management investment company. The Trust was organized as a Delaware statutory trust on December 16, 2003 and currently consists of 18 portfolios. Predecessor funds to the Trust were reorganized as portfolios of the Trust effective April 16, 2004. This report includes the following three investment portfolios (each a “Fund” and collectively, the “Funds”):
- Prime Money Market Fund
- U.S. Government Money Market Fund
- Tax-Free Money Market Fund
The Funds offer five share classes: RBC Institutional Class 1, RBC Institutional Class 2, RBC Investor Class, RBC Reserve Class and RBC Select Class.
RBC Global Asset Management (U.S.) Inc. (“RBC GAM (US)” or “Advisor” or “Co-Administrator”) acts as the investment advisor for the Funds. The officers of the Trust (“Fund Management”) are also employees of RBC GAM (US) or its affiliates.
2. Significant Accounting Policies
Summarized below are the significant accounting policies of the Funds. These policies conform to accounting principles generally accepted in the United States of America (“US GAAP”). Fund management follows these policies when preparing financial statements. Management may also be required to make estimates and assumptions that affect the reported amounts of assets and liabilities at the date of the financial statements and the reported amounts of income and expenses for the period. Actual results could differ from those estimates. The financial statements are as of the close of regular trading on the New York Stock Exchange (“NYSE”).
Security Valuation:
Each Fund has elected to use the amortized cost method to value its securities (other than other investment companies) pursuant to Rule 2a-7 of the Investment Company Act of 1940, as amended, which the Trust’s Board of Trustees (“Board”) believes approximates fair market value. The amortized cost method involves valuing a security initially at its cost and thereafter assuming a constant amortization to maturity of any discount or premium. Amortized cost approximates the current fair value of a security, but since the value is not obtained from a quoted price in an active market, securities valued at amortized cost are categorized as Level 2 in the fair value hierarchy. If amortized cost no longer approximates fair value due to credit or other impairments of an issuer, the Fund will determine the fair value of its securities by using pricing and valuation procedures approved by the Board. Investments in open-end investment companies (mutual funds) are valued at net asset value and are categorized as Level 1 in the fair value hierarchy.
The Board has delegated to the Funds’ Pricing Committee (“Pricing Committee”) the responsibility for implementing the pricing and valuation procedures, including responsibility for determining the fair value of the Funds’ securities and other assets. The Pricing Committee includes representatives of the Funds’ Advisor and Co-Administrator, including personnel from accounting and operations, investment management, trading, risk management, compliance and legal. The Pricing Committee meets at least quarterly to review and approve Fund valuation matters, including a review of the Funds’ pricing activity and operations, fair value measurements, pricing vendors, policies and procedures, and related controls. At least a quorum of the Pricing Committee shall meet more frequently, as needed, to consider and approve time-sensitive fair valuation matters. The Pricing Committee reports to the
50 |
NOTES TO FINANCIAL STATEMENTS |
Valuation, Portfolio Management and Performance Committee (“Valuation Committee”) of the Board. Members of the Pricing Committee meet with the Valuation Committee and the Board at each of their regularly scheduled meetings to discuss valuation matters and actions taken during the period.
In accordance with Rule 2a-7, the fair values of the securities held in the Funds are determined at least once per week using evaluated prices supplied by third-party pricing vendors approved by the Board. The pricing services utilize both dealer-supplied valuations and electronic data processing techniques that take into account appropriate factors such as institutional-sized trading in similar groups of securities, yield, quality, coupon rate, maturity and type of issue. These security values are then compared to the securities’ amortized cost. If a security price is not available from a pricing service or broker-dealer, or Fund management determines that a price provided by a pricing service or broker-dealer does not approximate fair value for purposes of this comparison, the security’s fair value will be determined in good faith by the Pricing Committee in accordance with procedures and methodologies adopted by the Board. General factors used in determining the fair value of securities include, but are not limited to, fundamental analytical data relating to the security, the issuer and the market, such as duration, prepayment and default rates; general level of interest rates and changes in interest rates; information from broker-dealers; trading in similar securities; any restrictions on disposition of the security; and an evaluation of the forces that influence the market in which the investments are traded.
Fair Value Measurements:
The Funds disclose the fair value of their investments in a hierarchy that categorizes investments based on the inputs to valuation techniques used to measure fair value. The three levels of the fair value hierarchy are as follows:
· Level 1 - Inputs that reflect unadjusted quoted prices in active markets for identical assets or liabilities that the Funds have the ability to access at the measurement date.
· Level 2 - Significant inputs other than quoted prices that are observable for the asset or liability either directly or indirectly, including inputs in markets that are not considered to be active. Observable inputs may include quoted prices for similar securities, interest rates, spreads, prepayment speeds, etc.
· Level 3 - Significant unobservable inputs based on the best information available in the circumstances, to the extent observable inputs are not available (including the Funds’ own assumptions in determining the fair value of investments).
The inputs or methodology used for valuing investments are not necessarily an indication of the risk associated with investing in those securities.
Inputs used in determining fair value of an investment may include, but are not limited to, price information, volatility statistics, credit and market data, and other factors, all of which may be either observable or unobservable. Inputs can vary among investments and will be impacted by the investment type and volume of activity for the particular security or similar securities in the market. Investments in the Level 3 category are generally supported by transactions and quoted prices from dealers participating in the market for those investments. Investments may be included in the Level 3 category due to a lack of market activity or transparency. Internal valuation models may also be used as a pricing source for Level 3 investments. Internal valuation models may rely on one or more unobservable inputs, such as estimated cash flows, financial statement analysis and discount rates.
The summary of inputs used to determine the fair value of the Funds’ investments as of September 30, 2014 is as follows:
Funds | Level 1 Quoted Prices | Level 2 Significant Observable Inputs | Level 3 Significant Unobservable Inputs | Total | ||||||||||||
Prime Money Market | $ | — | $ | 11,113,333,358(b)(c) | $— | $ | 11,113,333,358 | |||||||||
U.S. Government Money Market | — | 5,998,409,156(b)(c) | — | 5,998,409,156 | ||||||||||||
Tax-Free Money Market | 15,000,000(a) | 1,300,316,936(b)(c) | — | 1,315,316,936 | ||||||||||||
| 51 |
NOTES TO FINANCIAL STATEMENTS |
(a) Level 1 investments consist of Investment Companies.
(b) The breakdown of the Fund’s investments by security type is disclosed in the Schedules of Portfolio Investments.
(c) The breakdown of the Fund’s investments by state classification or political subdivision is disclosed in the Schedules of Portfolio Investments.
During the year ended September 30, 2014, the Funds recognized no transfers to/from Level 1 or 2. The Fund’s policy is to recognize transfers between Level 1, Level 2 and Level 3 at the end of the year utilizing fair value at the beginning of the year.
Investment Transactions and Income:
Investment transactions are accounted for on the date the security is bought or sold (“trade date”). Dividend income is recorded on the ex-dividend date. Realized gains and losses from investment transactions are calculated based on the costs of the specific security (also known as identified cost basis). Interest income is recognized on the accrual basis and includes, where applicable, the amortization or accretion of premium and discount using the effective yield method.
When Issued Transactions:
The Funds may engage in when-issued transactions. The Funds record when-issued securities on the trade date and maintain sufficient liquidity so that cash will be available to make payment for the securities purchased. Securities purchased on a when-issued basis are valued daily beginning on the trade date and begin earning interest on the settlement date. As of September 30, 2014, the Funds held no when-issued securities.
Repurchase Agreements:
The Funds may enter into repurchase agreements with counterparties whom the Advisor has deemed creditworthy, including primary dealers that report to the Federal Reserve Bank of New York or other large U.S. commercial banks or broker-dealers. These repurchase agreements are subject to the seller’s agreement to repurchase such securities at a mutually agreed upon date and price. The repurchase price generally equals the price paid by the Funds plus interest negotiated on the basis of current short-term rates.
Securities pledged by the dealers as collateral for repurchase agreements are held by a custodian bank until maturity of the repurchase agreement. The Funds have procedures to monitor additional collateral, if needed, to ensure that the daily market value of the collateral remains in excess of the market value of the repurchase agreement in the event of a default.
Master Repurchase Agreements (“MRA”) permit each Fund, under certain circumstances including an event of default (such as bankruptcy or insolvency), to offset payables and/or receivables under the MRA with collateral held and/or posted to the counterparty and create one single net payment due to or from the Fund. However, bankruptcy or insolvency laws of a particular jurisdiction may impose restrictions on or prohibitions against such a right of offset in the event of a MRA counterparty’s bankruptcy or insolvency. Pursuant to the terms of the MRA, each Fund receives securities as collateral with a market value in excess of the repurchase price to be received by each Fund upon the maturity of the repurchase transaction. Upon a bankruptcy or insolvency of the MRA counterparty, each Fund recognizes a liability with respect to such excess collateral to reflect each Fund’s obligation under bankruptcy law to return the excess to the counterparty. Details of the counterparties and collateral for repurchase agreements are shown on the Schedule of Portfolio Investments.
Expense, Investment Income and Gain/Loss Allocation:
Each Fund pays the expenses that are directly related to its operations, such as custodian fees or investment advisory fees. Expenses incurred by the Trust, such as trustee or legal fees, are allocated among each of the Funds either proportionately based upon each Fund’s relative net assets or using another reasonable basis such as equally across all Funds, depending on the nature of the expense. Individual share classes within a Fund are charged expenses specific to that class, such as distribution fees and transfer agent fees. Within a Fund, expenses other than class specific expenses are allocated
52 |
NOTES TO FINANCIAL STATEMENTS |
daily to each class based upon the proportion of relative net assets. Investment income and realized and unrealized gains or losses are allocated to each class of shares based on the proportion of relative net assets.
Distributions to Shareholders:
Each Fund pays out any income that it receives, less expenses, in the form of dividends and capital gain distributions to its shareholders. Income dividends are declared daily and paid monthly. Dividends will also be paid at any time during the month upon total redemption of shares in an account. Capital gains, if any, are declared and paid at least annually. Distributions to shareholders are recorded on the ex-dividend date. The amount of dividends and distributions are calculated based on federal income tax regulations, which may differ from US GAAP. These “book/tax” differences may be either temporary or permanent in nature. To the extent these differences are determined, as of the end of the tax year, to be permanent (e.g. distribution in excess of net investment income), they are reclassified within a Fund’s capital accounts based on their federal tax basis treatment.
For the year ended September 30, 2014, reclassifications for permanent differences were as follows:
| Increase | Increase | Decrease | ||||||||||
| Undistributed | Accumulated | Accumulated | ||||||||||
| Net Investment Income | Realized Gains | Paid-in-Capital | ||||||||||
U.S. Government Money Market Fund | $1,277 | $(1,277) | $ — | |||||||||
Tax Free Money Market Fund | $ — | $ 270 | $(270) | |||||||||
Credit Enhancement:
Certain obligations held in the Funds have credit enhancement or liquidity features that may, under certain circumstances, provide for repayment of principal and interest on the obligation upon demand date, interest rate reset date or final maturity. These enhancements may include: letters of credit; liquidity guarantees; security purchase agreements; tender option purchase agreements; and third party insurance (i.e., AMBAC and MBIA).
3. Agreements and Other Transactions with Affiliates
The Trust has entered into an Investment Advisory Agreement with RBC GAM (US) under which RBC GAM (US) manages the Funds’ assets and furnishes related office facilities, equipment, research and personnel. The Agreement requires the Funds to pay RBC GAM (US) a monthly fee based upon average daily net assets. Under the terms of the advisory contracts, RBC GAM (US) is entitled to receive fees based on a percentage of the average daily net assets as follows:
| Annual Rate | ||||
Prime Money Market Fund | 0.10% | |||
U.S. Government Money Market Fund | 0.10% | |||
Tax-Free Money Market Fund | 0.10% | |||
| 53 |
NOTES TO FINANCIAL STATEMENTS |
RBC Institutional Class 1 of the Prime Money Market Fund, U.S. Government Money Market Fund and Tax-Free Money Market Fund pays the Advisor an annual shareholder services administration fee of 0.05% of the average daily net assets attributable to RBC Institutional Class 1 shares of a Fund that is used to compensate financial intermediaries for providing services to shareholders and maintaining shareholder accounts. This shareholder services administration fee is not paid pursuant to Rule 12b-1.
RBC GAM (US) has contractually agreed to waive fees and/or reimburse expenses under an Expense Limitation Agreement in order to maintain the net annual fund operating expenses at 0.20% for RBC Institutional Class 1 of the Prime Money Market Fund, U.S. Government Money Market Fund and Tax-Free Money Market Fund. During the year ended September 30, 2014, there were no fees waived under this agreement.
RBC GAM (US) serves as co-administrator to the Funds. BNY Mellon serves as co-administrator and fund accounting agent. Services provided under the Administrative Services Agreement include providing day-to-day administration of matters related to the Funds, maintenance of their records and the preparation of reports. Under the terms of the Administrative Services Agreement, RBC GAM (US) does not receive an administration services fee. BNY Mellon receives a fee for its services payable by the Funds based on the Funds’ average net assets. BNY Mellon’s fee is included with “Accounting fees” in the Statements of Operations.
Certain Officers and Trustees of the Trust are affiliated with the Advisor. Such Officers and Trustees receive no compensation from the Funds for serving in their respective roles.
The Trust currently pays each of the independent Trustees (Trustees of the Trust who are not directors, officers or employees of the advisor, either co-administrator or distributor) an annual retainer of $35,000 ($41,500 effective October 1, 2014). The Board Chairperson and Audit Committee Chairperson each receive an additional retainer of $2,500 annually, and all other trustees serving as Chair of a Board committee each receive an additional retainer of $1,000 annually. In addition, Independent Trustees receive a quarterly meeting fee of $5,500 for each in-person Board meeting attended, a meeting fee of $1,500 for each telephonic or Special Board meeting attended, a $1,500 fee for each Board committee meeting attended, and are reimbursed for all out-of-pocket expenses relating to attendance at such meetings.
Security Transactions with Affiliated Funds
During the year ended September 30, 2014, the Prime Money Market Fund, U.S. Government Money Market Fund and Tax-Free Money Market Fund engaged in security purchase and sale transactions with other RBC Funds or investment advisory clients managed by RBC GAM (US). These purchase and sale transactions complied with Rule 17a-7 under the Investment Company Act of 1940 (as amended) and amounted to $19,800,000 and $17,595,000 for Prime Money Market Fund, respectively, $19,975,000 and $81,945,000 for U.S. Government Money Market Fund, respectively, and $116,095,000 and $19,800,000 for Tax-Free Money Market Fund, respectively.
54 |
NOTES TO FINANCIAL STATEMENTS |
4. Fund Distribution
The Prime Money Market, U. S. Government Money Market and Tax-Free Money Market Funds have adopted a Shareholder Account and Distribution Services (12b-1) Plan (the “Plan”) with respect to RBC Institutional Class 2, RBC Investor Class, RBC Reserve Class and the RBC Select Class, in which Quasar Distributors LLC (the “Distributor”) acts as the Funds’ distributor. The Plan permits each Fund to make payments for or to reimburse the Distributor or others, including RBC Capital Markets, LLC, monthly for distribution-related costs and expenses of marketing shares of each share class covered under the Plan, and/or for providing shareholder services. The following chart shows the current Plan fee rate for each class:
| RBC Institutional Class 2 | RBC Investor Class | RBC Reserve Class | RBC Select Class | |||||||||||||
12b-1 Plan Fee | 0.15% | 1.00% | 0.90% | 0.80% | ||||||||||||
Plan fees are based on average daily net assets of the applicable class. Up to 0.25% of each Plan fee may be designated as a Service Fee, as defined by the applicable rules of the Financial Industry Regulatory Authority.
Pursuant to a Shareholder Account and Distribution Services Agreement between the Distributor and RBC Capital Markets, LLC, the Distributor has agreed to compensate RBC Capital Markets for certain shareholder account servicing support provided to the Funds. RBC Capital Markets has agreed to waive fees and/or reimburse expenses in order to maintain the net annual fund operating expenses for each class listed below for each Fund to the following amounts:
Fund | Operating Expense Limit | |||
Prime Money Market Fund | ||||
RBC Institutional Class 2 | 0.30% | |||
RBC Investor Class | 1.05% | |||
RBC Reserve Class | 0.90% | |||
RBC Select Class | 0.80% | |||
U.S. Government Money Market Fund | ||||
RBC Institutional Class 2 | 0.30% | |||
RBC Investor Class | 1.00% | |||
RBC Reserve Class | 0.85% | |||
RBC Select Class | 0.77% | |||
Tax-Free Money Market Fund | ||||
RBC Institutional Class 2 | 0.30% | |||
RBC Investor Class | 1.00% | |||
RBC Reserve Class | 0.85% | |||
RBC Select Class | 0.70% | |||
This Expense Limitation Agreement is in place until January 31, 2016. Each Fund will carry forward, for a period not to exceed 12 months from the date on which a waiver or reimbursement is made by RBC Capital Markets, any expenses in excess of the Expense Limitation and repay RBC Capital Markets such amounts, provided the Fund is able to effect such repayment and remain in compliance with the Expense Limitation. At September 30, 2014, the amounts subject to possible recoupment under the expense limitation agreement are $11,715,874, $6,845,906 and $2,245,674 for the Prime Money Market Fund, U.S. Government Money Market Fund and Tax-Free Money Market Fund, respectively.
RBC Capital Markets and/or the Adviser may voluntarily waive and/or reimburse additional fund operating expenses at any time, such as to maintain a minimum yield in a fund. Any such voluntary program may be modified or discontinued at any time without notice.
| 55 |
NOTES TO FINANCIAL STATEMENTS |
For the year ended September 30, 2014, the following distribution fees were waived:
Fund | Distribution Fees Waived | |||
Prime Money Market Fund | ||||
RBC Institutional Class 2 | $ 519,878 | |||
RBC Investor Class | 23,245,763 | |||
RBC Reserve Class | 52,207,409 | |||
RBC Select Class | 14,347,142 | |||
U.S. Government Money Market Fund | ||||
RBC Institutional Class 2 | $ 754,065 | |||
RBC Investor Class | 7,118,413 | |||
RBC Reserve Class | 19,941,315 | |||
RBC Select Class | 10,919,405 | |||
Tax-Free Money Market Fund | ||||
RBC Institutional Class 2 | $ 460,056 | |||
RBC Investor Class | 1,460,823 | |||
RBC Reserve Class | 5,633,929 | |||
RBC Select Class | 2,979,941 | |||
For the year ended September 30, 2014, shareholder servicing fees were voluntarily waived for the RBC Institutional Class 1 in the amount of $25,145, $610,612 and $0 for the Prime Money Market Fund, U.S. Government Money Market Fund and the Tax-Free Money Market Fund, respectively and the Advisor voluntarily waived fees or reimbursed expenses totaling $2,340,415 for the U.S. Government Money Market Fund, which represented $476,515, $199,198, $278,128, $855,519 and $531,055 for RBC Institutional Class 1, RBC Institutional Class 2, RBC Investor Class, RBC Reserve Class and RBC Select Class, respectively and $941,741 for the Tax-Free Money Market Fund which represented $3,551, $200,333, $97,841, $399,459 and $240,557 for RBC Institutional Class 1, RBC Institutional Class 2, RBC Investor Class, RBC Reserve Class and RBC Select Class, respectively.
56 |
NOTES TO FINANCIAL STATEMENTS |
5. Capital Share Transactions
The number of shares sold, reinvested and redeemed correspond to the net proceeds from sale of shares, reinvestments of dividends and cost of shares redeemed, respectively, since shares are redeemed at $1.00 per share.
Transactions for the year were as follows:
| Prime | U.S. Government | |||||||||||||||
| Money Market Fund | Money Market Fund | |||||||||||||||
| For the Year | For the Year | For the Year | For the Year | |||||||||||||
| Ended | Ended | Ended | Ended | |||||||||||||
| September 30, | September 30, | September 30, | September 30, | |||||||||||||
| 2014 | 2013 | 2014 | 2013 | |||||||||||||
CAPITAL TRANSACTIONS: | ||||||||||||||||
RBC Institutional Class 1 | ||||||||||||||||
Proceeds from shares issued | $ | 12,650,090,214 | $ | 24,254,555,718 | $ | 1,467,650,462 | $ | 1,644,488,077 | ||||||||
Distributions reinvested | 70,358 | 437,904 | 104,988 | 74,159 | ||||||||||||
Cost of shares redeemed | (13,694,762,112 | ) | (24,240,354,230 | ) | (1,525,784,158 | ) | (1,459,469,928 | ) | ||||||||
|
|
|
|
|
|
|
| |||||||||
Change in RBC Institutional Class 1 | $ | (1,044,601,540 | ) | $ | 14,639,392 | $ | (58,028,708 | ) | $ | 185,092,308 | ||||||
|
|
|
|
|
|
|
| |||||||||
RBC Institutional Class 2 | ||||||||||||||||
Proceeds from shares issued | $ | 674,136,753 | $ | 659,464,581 | $ | 977,774,010 | $ | 1,502,436,908 | ||||||||
Distributions reinvested | 54,179 | 62,150 | 50,658 | 31,931 | ||||||||||||
Cost of shares redeemed | (811,907,284 | ) | (706,349,708 | ) | (1,176,690,100 | ) | (1,217,837,635 | ) | ||||||||
|
|
|
|
|
|
|
| |||||||||
Change in RBC Institutional Class 2 | $ | (137,716,352 | ) | $ | (46,822,977 | ) | $ | (198,865,432 | ) | $ | 284,631,204 | |||||
|
|
|
|
|
|
|
| |||||||||
RBC Investor Class | ||||||||||||||||
Proceeds from shares issued | $ | 996,493,420 | $ | 1,389,341,947 | $ | 452,272,374 | $ | 457,439,447 | ||||||||
Distributions reinvested | 246,166 | 279,770 | 71,844 | 87,709 | ||||||||||||
Cost of shares redeemed | (1,455,344,868 | ) | (1,547,772,657 | ) | (575,738,715 | ) | (519,303,576 | ) | ||||||||
|
|
|
|
|
|
|
| |||||||||
Change in RBC Investor Class | $ | (458,605,282 | ) | $ | (158,150,940 | ) | $ | (123,394,497 | ) | $ | (61,776,420 | ) | ||||
|
|
|
|
|
|
|
| |||||||||
RBC Reserve Class | ||||||||||||||||
Proceeds from shares issued | $ | 2,063,865,998 | $ | 2,983,974,804 | $ | 1,068,391,963 | $ | 1,488,004,532 | ||||||||
Distributions reinvested | 617,965 | 598,969 | 223,600 | 236,657 | ||||||||||||
Cost of shares redeemed | (2,368,930,778 | ) | (2,224,710,045 | ) | (1,216,454,661 | ) | (1,095,725,655 | ) | ||||||||
|
|
|
|
|
|
|
| |||||||||
Change in RBC Reserve Class | $ | (304,446,815 | ) | $ | 759,863,728 | $ | (147,839,098 | ) | $ | 392,515,534 | ||||||
|
|
|
|
|
|
|
| |||||||||
RBC Select Class | ||||||||||||||||
Proceeds from shares issued | $ | 1,587,310,094 | $ | 2,108,833,433 | $ | 1,300,401,062 | $ | 1,186,033,030 | ||||||||
Distributions reinvested | 192,531 | 184,697 | 137,726 | 143,790 | ||||||||||||
Cost of shares redeemed | (1,619,638,395 | ) | (1,950,656,976 | ) | (1,259,562,688 | ) | (1,181,920,569 | ) | ||||||||
Change in RBC Select Class | $ | (32,135,770 | ) | $ | 158,361,154 | $ | 40,976,100 | $ | 4,256,251 | |||||||
|
|
|
|
|
|
|
| |||||||||
Change in net assets resulting from capital transactions | $ | (1,977,505,759 | ) | $ | 727,890,357 | $ | (487,151,635 | ) | $ | 804,718,877 | ||||||
|
|
|
|
|
|
|
| |||||||||
| 57 |
NOTES TO FINANCIAL STATEMENTS |
| Tax-Free | ||||||||
| Money Market Fund | ||||||||
| For the Year | For the Year | |||||||
| Ended | Ended | |||||||
| September 30, | September 30, | |||||||
| 2014 | 2013 | |||||||
CAPITAL TRANSACTIONS: | ||||||||
RBC Institutional Class 1 | ||||||||
Proceeds from shares issued | $ | 5,000 | $ | — | ||||
Cost of shares redeemed | — | (25,823,504 | ) | |||||
|
|
|
| |||||
Change in RBC Institutional Class 1 | $ | 5,000 | $ | (25,823,504 | ) | |||
|
|
|
| |||||
RBC Institutional Class 2 | ||||||||
Proceeds from shares issued | $ | 720,535,621 | $ | 585,687,501 | ||||
Distributions reinvested | 30,690 | 22,634 | ||||||
Cost of shares redeemed | (784,694,782 | ) | (531,531,589 | ) | ||||
|
|
|
| |||||
Change in RBC Institutional Class 2 | $ | (64,128,471 | ) | $ | 54,178,546 | |||
|
|
|
| |||||
RBC Investor Class | ||||||||
Proceeds from shares issued | $ | 202,928,722 | $ | 204,252,145 | ||||
Distributions reinvested | 14,612 | 16,102 | ||||||
Cost of shares redeemed | (226,023,506 | ) | (213,890,697 | ) | ||||
|
|
|
| |||||
Change in RBC Investor Class | $ | (23,080,172 | ) | $ | (9,622,450 | ) | ||
|
|
|
| |||||
RBC Reserve Class | ||||||||
Proceeds from shares issued | $ | 437,756,662 | $ | 551,729,666 | ||||
Distributions reinvested | 62,636 | 65,607 | ||||||
Cost of shares redeemed | (447,064,830 | ) | (544,177,120 | ) | ||||
|
|
|
| |||||
Change in RBC Reserve Class | $ | (9,245,532 | ) | $ | 7,618,153 | |||
|
|
|
| |||||
RBC Select Class | ||||||||
Proceeds from shares issued | $ | 430,820,702 | $ | 500,116,284 | ||||
Distributions reinvested | 37,256 | 36,665 | ||||||
Cost of shares redeemed | (387,838,058 | ) | (526,529,704 | ) | ||||
|
|
|
| |||||
Change in RBC Select Class | $ | 43,019,900 | $ | (26,376,755 | ) | |||
|
|
|
| |||||
Change in net assets resulting from capital transactions | $ | (53,429,275 | ) | $ | (26,010 | ) | ||
|
|
|
| |||||
6. Federal Income Taxes
It is the policy of each Fund to continue to qualify as a regulated investment company by complying with the provisions applicable to certain investment companies, as defined under Subchapter M of the Internal Revenue Code, and to distribute substantially all of its net investment income and net realized capital gains. Therefore, no federal tax liability is recorded in the financial statements of each Fund.
Management has analyzed the Funds’ tax positions taken or expected to be taken on federal income tax returns for all open tax years (current and prior three tax years) and has concluded that no provision for federal income tax is required in the Funds’ financial statements. The Funds’ federal and state income and federal excise tax returns for tax years for which the applicable statutes of limitations have not expired are subject to examination by the Internal Revenue Service and state departments of revenue.
As of and during the year ended September 30, 2014, the Funds did not have a liability for any unrecognized tax benefits. The Funds recognize interest and penalties, if any, related to unrecognized tax benefits as income tax expense in the Statements of Operations. During the year, the Funds did not incur any interest or penalties.
58 |
NOTES TO FINANCIAL STATEMENTS |
The tax character of distributions during the year ended September 30, 2014 were as follows:
| Distributions Paid From | ||||||||||||||||||||||||
| Ordinary Income | Net Long Term Capital Gains | Net Short Term Capital Gains | Total Taxable Distributions | Tax Exempt Distributions | Total Distributions Paid* | |||||||||||||||||||
Prime Money Market Fund | $1,247,495 | $ — | $— | $1,247,495 | $— | $1,247,495 | ||||||||||||||||||
U.S. Government Money Market Fund | 606,716 | 362 | — | 607,078 | — | 607,078 | ||||||||||||||||||
Tax-Free Money Market Fund | 1,000 | — | — | 1,000 | 144,169 | 145,169 | ||||||||||||||||||
The tax character of distributions during the year ended September 30, 2013 were as follows:
| Distributions Paid From | ||||||||||||||||||||||||
| Ordinary Income | Net Long Term Capital Gains | Net Short Term Capital Gains | Total Taxable Distributions | Tax Exempt Distributions | Total Distributions Paid* | |||||||||||||||||||
Prime Money Market Fund | $2,331,054 | $— | $— | $2,331,054 | $— | $2,331,054 | ||||||||||||||||||
U.S. Government Money Market Fund | 592,994 | — | — | 592,994 | — | 592,994 | ||||||||||||||||||
Tax-Free Money Market Fund | 2,554 | — | — | 2,554 | 138,722 | 141,276 | ||||||||||||||||||
*Total distributions paid may differ from the Statements of Changes in Net Assets because distributions are recognized when actually paid for tax purposes.
As of September 30, 2014, the components of accumulated earnings/(losses) on a tax basis were as follows:
| Undistributed Ordinary Income | Undistributed Short-Term Capital Gains | Undistributed Long-Term Capital Gains | Distributions Payable | Accumulated Capital Loss Carryforwards | Deferred Qualified Late-Year Losses | Unrealized Depreciation | Total Accumulated Earnings/(Losses) | |||||||||||||||||||||||||
Prime Money Market Fund | $ 1,065 | $— | $— | $(2,096 | ) | $(4,059,261 | ) | $— | $— | $(4,060,292 | ) | |||||||||||||||||||||
U.S. Government Money Market Fund | 17,539 | — | — | (1,146) | — | — | — | 16,393 | ||||||||||||||||||||||||
Tax-Free Money Market Fund | — | — | — | — | (16,060) | — | — | (16,060) | ||||||||||||||||||||||||
As of September 30, 2014, the following Funds had net capital loss carryforwards to offset future net capital gains, if any:
| Capital Loss Carryforward | Expires | |||||||
Prime Money Market Fund | $ | 4,059,261 | 2017 | |||||
Tax-Free Money Market Fund | 10,264 | 2019 | ||||||
Capital loss carryforwards utilized in the current year were $13,174 and $26,416 for the Prime Money Market Fund and Tax-Free Money Market Fund, respectively.
As of September 30, 2014, the Tax-Free Money Market Fund had a short-term capital loss carryforward of $5,796 available to offset future realized capital gains in accordance with the Regulated Investment Company Modernization Act of 2010. This capital loss carryforward is not subject to expiration and must first be utilized to offset future realized gains of the same character and must be utilized prior to the utilization of the loss carryforwards subject to expiration that are described above.
| 59 |
NOTES TO FINANCIAL STATEMENTS |
Under current tax law, capital losses realized after October 31 of a Fund’s fiscal year may be deferred and treated as occurring on the first business day of the following fiscal year for tax purposes. The Funds did not have any deferred qualified late-year capital losses for the year ending September 30, 2014.
7. Line of Credit
The Tax-Free Money Market Fund is the sole participant in an uncommitted, unsecured $150,000,000 line of credit with U.S. Bank N.A. (the “Bank”), the Fund’s custodian, to be used to fund shareholder redemption requests and for other short-term temporary or emergency general business purposes. The line of credit has a scheduled termination date of February 14, 2015. Interest is charged on borrowings under this line of credit at the Bank’s prime lending rate – 1⁄2% per annum. There were no loans outstanding pursuant to this line of credit at September 30, 2014. During the year ended September 30, 2014, the Tax-Free Money Market Fund borrowed $25,000,000 at a weighted average rate of 2.75% for a period of one day and incurred interest expense of $1,910.
8. Regulatory Matters
On July 23, 2014, the SEC adopted amendments to the rules that govern money market mutual funds. In part, the amendments will require structural changes to most types of money market funds to one extent or another; however, the SEC provided for an extended 2-year transition period to comply with such structural requirements. At this time, management is evaluating the reforms adopted and the manner for implementing these reforms over time and its impact on the financial statements.
9. Subsequent Events
Management has evaluated the impact of subsequent events of the Funds and has determined that there are no subsequent events that require recognition or disclosure in the financial statements.
60 |
To the Shareholders and Board of Trustees of RBC Funds Trust:
We have audited the accompanying statements of assets and liabilities, including the schedules of portfolio investments, of Prime Money Market Fund, U.S Government Money Market Fund and Tax-Free Money Market Fund (collectively the “Funds”), three of the portfolios constituting the RBC Funds Trust (the “Trust”), as of September 30, 2014, and the related statements of operations for the year then ended, the statements of changes in net assets for each of the two years in the period then ended, and the financial highlights for each of the five years in the period then ended. These financial statements and financial highlights are the responsibility of the Funds’ management. Our responsibility is to express an opinion on these financial statements and financial highlights based on our audits.
We conducted our audits in accordance with the standards of the Public Company Accounting Oversight Board (United States). Those standards require that we plan and perform the audits to obtain reasonable assurance about whether the financial statements and financial highlights are free of material misstatement. The Funds are not required to have, nor were we engaged to perform, an audit of their internal control over financial reporting. Our audits included consideration of internal control over financial reporting as a basis for designing audit procedures that are appropriate in the circumstances, but not for the purpose of expressing an opinion on the effectiveness of the Funds’ internal control over financial reporting. Accordingly, we express no such opinion. An audit also includes examining, on a test basis, evidence supporting the amounts and disclosures in the financial statements, assessing the accounting principles used and significant estimates made by management, as well as evaluating the overall financial statement presentation. Our procedures included confirmation of securities owned as of September 30, 2014, by correspondence with the Funds’ custodian and brokers; where replies were not received from brokers, we performed other auditing procedures. We believe that our audits provide a reasonable basis for our opinion.
In our opinion, the financial statements and financial highlights referred to above present fairly, in all material respects, the financial position of each of the portfolios of RBC Funds Trust referred to above, as of September 30, 2014, the results of their operations for the year then ended, the changes in their net assets for each of the two years in the period then ended, and the financial highlights for each of the five years in the period then ended, in conformity with accounting principles generally accepted in the United States of America.
DELOITTE & TOUCHE LLP
Chicago, Illinois
November 26, 2014
| 61 |
During the fiscal year ended September 30, 2014, the Tax-Free Money Market Fund declared tax-exempt distributions of $144,169.
The Funds report a portion of the income dividends distributed during the fiscal year ended September 30, 2014, as U.S. Government Income as follows:
Prime Money Market Fund | 1.09 | % | ||
U.S. Government Money Market Fund | 44.82 | % |
U.S. Government Income represents the amount of interest that was derived from direct U.S. Government obligations. Generally, such interest is exempt from state income tax. However, for residents of California, New York and Connecticut the statutory threshold requirements were not satisfied. Due to the diversity in state and local tax law, it is recommended you consult a tax adviser as to the applicability of the information provided for your specific situation.
The Funds report a portion of the income dividends distributed during the fiscal year ended September 30, 2014, as Qualified Interest Income as defined in the Internal Revenue Code as follows:
Prime Money Market Fund | 80.53 | % | ||
U.S. Government Money Market Fund | 100.00 | % | ||
Tax-Free Money Market Fund | 67.80 | % |
The Funds report a portion of the income dividends distributed during the fiscal year ended September 30, 2014, as Qualified Short-Term Gain as defined in the Internal Revenue Code as follows:
U.S. Government Money Market Fund | 100.00 | % |
All reportings are based on financial information available as of the date of this annual report and, accordingly, are subject to change. For each item above, it is the intention of the Funds to report the maximum amount permitted under the Internal Revenue Code and the regulations thereunder.
62 |
Independent Trustees(1)(2)
T. Geron Bell (73)
Position, Term of Office and Length of Time Served with the Trust: Trustee since January 2004
Principal Occupation(s) During Past 5 Years: Chairman of the Executive Board of the Minnesota Twins (2011 to present); prior thereto President of Twins Sports, Inc. (parent company of the Minnesota Twins) (2002-2011); President of the Minnesota Twins Baseball Club Incorporated (1987-2002)
Number of Portfolios in Fund Complex Overseen by Trustee: 18
Other Director/Trustee Positions Held by Trustee During Past 5 Years: None
Lucy Hancock Bode (63)
Position, Term of Office and Length of Time Served with the Trust: Trustee since January 2004
Principal Occupation(s) During Past 5 Years: Healthcare consultant (self-employed) (1986 to present)
Number of Portfolios in Fund Complex Overseen by Trustee: 18
Other Director/Trustee Positions Held by Trustee During Past 5 Years: BioSignia; Franklin Street Partners
Leslie H. Garner Jr. (64)
Position, Term of Office and Length of Time Served with the Trust: Trustee since January 2004
Principal Occupation(s) During Past 5 Years: President and CEO, The Greater Cedar Rapids Community Foundation (2010 to present); previously, President, Cornell College (1994 to 2010)
Number of Portfolios in Fund Complex Overseen by Trustee: 18
Other Director/Trustee Positions Held by Trustee During Past 5 Years: None
Ronald James (63)
Position, Term of Office and Length of Time Served with the Trust: Trustee since January 2004
Principal Occupation(s) During Past 5 Years: President and Chief Executive Officer, Center for Ethical Business Cultures (2000 to present)
Number of Portfolios in Fund Complex Overseen by Trustee: 18
Other Director/Trustee Positions Held by Trustee During Past 5 Years: Best Buy Co. Inc.; Bremer Financial Corporation
John A. MacDonald (65)
Position, Term of Office and Length of Time Served with the Trust: Trustee since January 2004
Principal Occupation(s) During Past 5 Years: Vice President and Treasurer, Hall Family Foundation (1988 to present)
Number of Portfolios in Fund Complex Overseen by Trustee: 18
Other Director/Trustee Positions Held by Trustee During Past 5 Years: None
H. David Rybolt (72)
Position, Term of Office and Length of Time Served with the Trust: Trustee since January 2004
Principal Occupation(s) During Past 5 Years: Consultant, HDR Associates (management consulting) (1985 to present)
Number of Portfolios in Fund Complex Overseen by Trustee: 18
Other Director/Trustee Positions Held by Trustee During Past 5 Years: None
| 63 |
MANAGEMENT (Unaudited) |
Independent Trustees(1)(2)
James R. Seward (62)
Position, Term of Office and Length of Time Served with the Trust: Chairman of the Board and Trustee since January 2004
Principal Occupation(s) During Past 5 Years: Private investor (2000 to present); CFA (1987 to present)
Number of Portfolios in Fund Complex Overseen by Trustee: 18
Other Director/Trustee Positions Held by Trustee During Past 5 Years: Sooner Holdings (formerly Syntroleum Corporation); Brookdale Senior Living Inc.
William B. Taylor (69)
Position, Term of Office and Length of Time Served with the Trust: Trustee since September 2005
Principal Occupation(s) During Past 5 Years: Consultant (2003 to present); previously Partner, Ernst & Young LLP (1982 to 2003)
Number of Portfolios in Fund Complex Overseen by Trustee: 18
Other Director/Trustee Positions Held by Trustee During Past 5 Years: William Henry Insurance, LLC; Balance Innovations LLC; Kansas City Symphony
Interested Trustees(1)(2)(3)
Kathleen A. Gorman (50)(5)
Position, Term of Office and Length of Time Served with the Trust: Trustee since September 2012
Principal Occupation(s) During Past 5 Years: President and Chief Executive Officer, RBC
Funds (2012 to present); Chief Compliance Officer, RBC Funds (2006 to 2012); Director of Regulatory Administration, RBC Global Asset Management (U.S.) Inc. (2007 to 2012); Chief Compliance Officer, RBC Global Asset Management (U.S.) Inc. (2006-2009)
Number of Portfolios in Fund Complex Overseen by Trustee: 18
Other Director/Trustee Positions Held by Trustee During Past 5 Years: None
Executive Officers(1)(3)(4)
Kathleen A. Gorman (50)
Position, Term of Office and Length of Time Served with the Trust: President and Chief Executive Officer since September 2012
Principal Occupation(s) During Past 5 Years: President and Chief Executive Officer, RBC Funds (2012 to present) Chief Compliance Officer, RBC Funds (2006 to 2012); Director of Regulatory Administration, RBC Global Asset Management (U.S.) Inc. (2007 to 2012); Chief Compliance Officer, RBC Global Asset Management (U.S.) Inc. (2006-2009)
64 |
MANAGEMENT (Unaudited) |
Executive Officers(1)(3)(4)
Kathleen A. Hegna (47)
Position, Term of Office and Length of Time Served with the Trust: Chief Financial Officer and Principal Accounting Officer since May 2009 and Treasurer since March 2014
Principal Occupation(s) During Past 5 Years: Associate Vice President and Director, Mutual Fund Accounting and Administration, RBC Global Asset Management (U.S.) Inc. (2009 to present); Senior Compliance Officer, RBC Global Asset Management (U.S.) Inc. (2006-2009)
Christina M. Moore (46)
Position, Term of Office and Length of Time Served with the Trust: Chief Compliance Officer since December 2012 and Assistant Secretary since March 2013
Principal Occupation(s) During Past 5 Years: Chief Compliance Officer, RBC Funds (2012 to present); Senior Compliance Officer, RBC Funds (March 2012 to December 2012); Compliance Manager, Minnesota Life Insurance Company (2006 to 2012)
Lee Thoresen (43)
Position, Term of Office and Length of Time Served with the Trust: Chief Legal Officer and Secretary since March 2008
Principal Occupation(s) During Past 5 Years: Senior Associate General Counsel, RBC Capital Markets, LLC (2006-present)
| (1) | Except as otherwise noted, the address of each Trustee/Officer is RBC Funds Trust, 50 South Sixth Street, Suite 2350, Minneapolis, Minnesota 55402. |
| (2) | All Trustees must retire on or before December 31 of the year in which they reach age 75. The Board may temporarily waive this requirement when necessary to avoid depriving the Board of a Trustee with critical skills. |
| (3) | On December 31, 2009, Voyageur Asset Management Inc. changed its name to RBC Global Asset Management (U.S.) Inc. Any references to RBC Global Asset Management (U.S.) Inc. for prior periods are deemed to be references to the prior entity. |
| (4) | Each officer serves in such capacity for an indefinite period of time until his or her removal, resignation or retirement. |
| (5) | Kathleen A. Gorman has been determined to be an interested Trustee by virtue of her position with the Advisor. |
The Funds’ Statement of Additional Information includes information about the Funds’ Trustees. To receive your free copy of the Statement of Additional Information, call toll free: 1-800-422-2766.
| 65 |
Shareholder Expense Examples
As a shareholder of the RBC Funds, you incur two types of costs: (1) transaction costs, including sales charges (loads) and (2) ongoing costs, including management fees; 12b-1 distribution and service fees; and other Fund expenses. This example is intended to help you understand your ongoing costs (in dollars) of investing in the RBC Funds and to compare these costs with the ongoing costs of investing in other mutual funds.
The Example is based on an investment of $1,000 invested at the beginning of the period and held for the entire period from April 1, 2014 through September 30, 2014.
Actual Expenses and Performance
The table below provides information about actual account values and actual expenses. You may use the information below, together with the amount you invested, to estimate the expenses that you paid over the period. Simply divide your account value by $1,000 (for example, an $8,600 account value divided by $1,000 = 8.6), then multiply the result by the number in the table under the heading entitled “Expenses Paid During Period” to estimate the expenses you paid on your account during this period.
| Annualized | ||||||||||||||||
| Beginning | Ending | Expenses Paid | Expense Ratio | |||||||||||||
| Account Value | Account Value | During Period* | During Period | |||||||||||||
| 4/1/14 | 9/30/14 | 4/1/14-9/30/14 | 4/1/14-9/30/14 | |||||||||||||
Prime Money Market Fund | ||||||||||||||||
RBC Institutional Class 1 | $1,000.00 | $1,000.10 | $0.85 | 0.17% | ||||||||||||
RBC Institutional Class 2 | 1,000.00 | 1,000.10 | 0.85 | 0.17% | ||||||||||||
RBC Investor Class | 1,000.00 | 1,000.10 | 0.85 | 0.17% | ||||||||||||
RBC Reserve Class | 1,000.00 | 1,000.10 | 0.85 | 0.17% | ||||||||||||
RBC Select Class | 1,000.00 | 1,000.10 | 0.85 | 0.17% | ||||||||||||
U.S. Government | ||||||||||||||||
Money Market Fund | ||||||||||||||||
RBC Institutional Class 1 | 1,000.00 | 1,000.10 | 0.45 | 0.09% | ||||||||||||
RBC Institutional Class 2 | 1,000.00 | 1,000.10 | 0.45 | 0.09% | ||||||||||||
RBC Investor Class | 1,000.00 | 1,000.10 | 0.45 | 0.09% | ||||||||||||
RBC Reserve Class | 1,000.00 | 1,000.10 | 0.45 | 0.09% | ||||||||||||
RBC Select Class | 1,000.00 | 1,000.10 | 0.45 | 0.09% | ||||||||||||
Tax-Free Money Market Fund | ||||||||||||||||
RBC Institutional Class 1 | 1,000.00 | 1,000.00 | 0.45 | 0.09% | ||||||||||||
RBC Institutional Class 2 | 1,000.00 | 1,000.10 | 0.40 | 0.08% | ||||||||||||
RBC Investor Class | 1,000.00 | 1,000.10 | 0.35 | 0.07% | ||||||||||||
RBC Reserve Class | 1,000.00 | 1,000.10 | 0.35 | 0.07% | ||||||||||||
RBC Select Class | 1,000.00 | 1,000.10 | 0.35 | 0.07% | ||||||||||||
| * | Expenses are equal to the average account value times the Fund’s annualized expense ratio multiplied by 183/365 (to reflect one-half year period). |
66 |
SUPPLEMENTAL INFORMATION (Unaudited) |
Hypothetical Example for Comparison Purposes
The table below provides information about hypothetical account values and hypothetical expenses based on each RBC Funds’ actual expense ratio and an assumed rate of return of 5% per year before expenses, which is not the Fund’s actual return. The hypothetical account values and expenses may not be used to estimate the actual ending account balance or expenses you paid for the period. You may use this information to compare this 5% hypothetical example with the 5% hypothetical examples that appear in the shareholder reports of other funds.
Please note that the expenses shown in the table are meant to highlight your ongoing costs only and do not reflect any transactional costs, such as sales charges (loads), redemption fees, or exchange fees. Therefore, the table is useful in comparing ongoing costs only, and will not help you determine the relative total costs of owning different funds. In addition, if these transactional costs were included, your costs would have been higher.
| Annualized | ||||||||||||||||
| Beginning | Ending | Expenses Paid | Expense Ratio | |||||||||||||
| Account Value | Account Value | During Period* | During Period | |||||||||||||
| 4/1/14 | 9/30/14 | 4/1/14-9/30/14 | 4/1/14-9/30/14 | |||||||||||||
Prime Money Market Fund | ||||||||||||||||
RBC Institutional Class 1 | $1,000.00 | $1,024.22 | $0.86 | 0.17% | ||||||||||||
RBC Institutional Class 2 | 1,000.00 | 1,024.22 | 0.86 | 0.17% | ||||||||||||
RBC Investor Class | 1,000.00 | 1,024.22 | 0.86 | 0.17% | ||||||||||||
RBC Reserve Class | 1,000.00 | 1,024.22 | 0.86 | 0.17% | ||||||||||||
RBC Select Class | 1,000.00 | 1,024.22 | 0.86 | 0.17% | ||||||||||||
U.S. Government | ||||||||||||||||
Money Market Fund | �� | |||||||||||||||
RBC Institutional Class 1 | 1,000.00 | 1,024.62 | 0.46 | 0.09% | ||||||||||||
RBC Institutional Class 2 | 1,000.00 | 1,024.62 | 0.46 | 0.09% | ||||||||||||
RBC Investor Class | 1,000.00 | 1,024.62 | 0.46 | 0.09% | ||||||||||||
RBC Reserve Class | 1,000.00 | 1,024.62 | 0.46 | 0.09% | ||||||||||||
RBC Select Class | 1,000.00 | 1,024.62 | 0.46 | 0.09% | ||||||||||||
Tax-Free Money Market Fund | ||||||||||||||||
RBC Institutional Class 1 | 1,000.00 | 1,000.00 | 0.45 | 0.09% | ||||||||||||
RBC Institutional Class 2 | 1,000.00 | 1,024.67 | 0.41 | 0.08% | ||||||||||||
RBC Investor Class | 1,000.00 | 1,024.72 | 0.36 | 0.07% | ||||||||||||
RBC Reserve Class | 1,000.00 | 1,024.72 | 0.36 | 0.07% | ||||||||||||
RBC Select Class | 1,000.00 | 1,024.72 | 0.36 | 0.07% | ||||||||||||
| * | Expenses are equal to the average account value times the Fund’s annualized expense ratio multiplied by 183/365 (to reflect one-half year period). |
| 67 |
Information Regarding the Approval of Investment Advisory Agreements
In September 2014, after evaluating the services provided by RBC Global Asset Management (U.S.) Inc. (the “Advisor”) and reviewing the performance, fees, and expenses of the Funds, the RBC Funds Board of Trustees determined to approve the continuation of the investment advisory agreements (“Agreements”) with the Advisor for each Fund for an additional year.
As part of their review of the Agreements, the Trustees requested and considered information regarding the advisory services performed by the Advisor, the staffing and qualifications of the personnel responsible for operating and managing the Funds, and the Funds’ performance and expenses. The Trustees considered information provided at regular quarterly Board and Committee meetings throughout the year as well as information presented at both a special meeting held to review requested material related to the proposed renewals and a meeting held specifically to consider the proposed renewals. In connection with their deliberations, the independent Trustees were advised by their own independent legal counsel with regard to the materials and their responsibilities under relevant laws and regulations.
The Trustees met with representatives from the Advisor’s senior management team, as well as senior investment professionals, to discuss the information and the Advisor’s ongoing management of the Funds. The Trustees reviewed the nature, quality, and extent of the services provided to the Funds by the Advisor, including information as to each Fund’s performance.
The Trustees reviewed the Funds’ performance data and noted that, although the low interest rate environment had made it difficult for money market funds in general, the Funds are performing competitively. The Trustees also noted that the Funds generally are more conservative than competitors in their approach to liquidity and preservation of capital. The Trustees were satisfied with the quality and capabilities of the money market fund portfolio management and analyst team and with the overall investment performance of the Funds.
The Trustees reviewed the investment advisory fees payable to the Advisor and reviewed comparative fee and expense information for similarly situated funds. The Trustees considered comparative data from Lipper most relevant for institutional classes of the Funds, and supplemental data from Crane Data most relevant for retail classes of the Funds, as it included information on other cash sweep options available to brokerage clients. The Trustees evaluated profitability data for the Advisor and considered information regarding other benefits the Advisor and its affiliates derived from their relationships with the Funds, including the Advisor’s role as co-administrator of the Funds and the fees paid by the Funds for such services. The Trustees also considered the voluntary and contractual agreements by the Advisor and its affiliates to subsidize fund expenses at competitive levels through expense limitation agreements and viewed such commitments favorably.
Based upon their review, the Trustees determined that the advisory fees proposed to be payable to the Advisor were reasonable and fair in light of the nature and quality of services provided under all of the circumstances and were within the range of what might have been negotiated at arms’ length. The Trustees concluded that it is in the interests of the Funds and their shareholders for the Trustees to approve the continuation of the Agreements as well as the expense limitation arrangements for the Funds. In arriving at their collective decision to approve the renewal of the Agreements, the Trustees did not assign relative weights to the factors discussed above or deem any one or group of them to be controlling in and of itself.
68 |
|
This Page Intentionally Left Blank
| 69 |
|
This Page Intentionally Left Blank
70 |
|
This Page Intentionally Left Blank
| 71 |
|
This Page Intentionally Left Blank
72 |
RBC Funds
P.O. Box 701
Milwaukee, WI 53201-0701
800-422-2766
www.rbcgam.us
Performance data represents past performance and does not guarantee future results. The principal value of an investment and investment return will fluctuate so that an investor’s shares, when redeemed, may be worth more or less than their original cost.
This report and the financial statements contained herein are provided for the information of RBC Funds shareholders. This report is not authorized for distribution to prospective investors unless preceded or accompanied by a current prospectus, which contains information concerning investment objectives, risks, charges and expenses of the funds. Please read the prospectus carefully before investing.
This report and the financial statements contained herein are not intended to be a forecast of future events, a guarantee of future results, or investment advice. There is no assurance that certain securities will remain in or out of each fund’s portfolio. The views expressed in this report reflect those of the portfolio managers through the period ended September 30, 2014.
NOT FDIC INSURED • NO BANK GUARANTEE • MAY LOSE VALUE
RBC Global Asset Management (U.S.) Inc. serves as investment advisor for the RBC Funds.
RBC Funds are distributed by Quasar Distributors LLC.

The RBC Funds are pleased to offer shareholder reports printed entirely on Forest Stewardship Council certified paper. FSC® certification ensures that the paper used in this report contains fiber from well-managed and responsibly harvested forests that meet strict environmental and socioeconomic standards.
RBCF-MM AR 09-14
| RBC Funds | ||||||||||||
About Your Annual Report |
This annual report includes detailed information about your Fund including financial statements, performance, and a complete list of its holdings. |
| ||||||||||
The RBC Funds compare their performance against various indices. Each of these indices is a widely recognized measure of return for the underlying category of securities. However, the indices are unmanaged, do not include fees, and cannot be invested in directly. |
| |||||||||||
We hope the financial information presented will help you evaluate your investment in the RBC Funds. We also encourage you to read your Fund’s prospectus for further detail as to your Fund’s investment policies and risk profile. RBC Funds prospectuses and performance information subsequent to the date of this report are available on our website at www.rbcgam.us. |
| |||||||||||
A description of the policies and procedures that your Fund uses to determine how to vote proxies relating to portfolio securities is available (i) without charge, upon request, by calling 1-800-422-2766; (ii) on the Fund’s website at www.rbcgam.us; and (iii) on the Securities and Exchange Commission’s (the “Commission”) website at http://www.sec.gov. |
| |||||||||||
Information regarding how your Fund voted proxies relating to portfolio securities during the most recent 12-month period ended June 30 will be available (i) on the Fund’s website at www.rbcgam.us; and (ii) on the Commission’s website at http://www.sec.gov. |
| |||||||||||
A schedule of each Fund’s portfolio holdings will be filed with the Commission for the first and third quarters of each fiscal year on Form N-Q. This information is available on the Commission’s website at http://www.sec.gov and may be reviewed and copied at the Commission’s Public Reference Room in Washington, D.C. Information on the operation of the Public Reference Room is available by calling 1-202-551-8090.
|
| |||||||||||
Contents | ||||||||||||
| Letter from the Chief Investment Officer | 1 | |||||||||||
| Portfolio Managers | 3 | |||||||||||
| Performance Summary | 6 | |||||||||||
| Management Discussion and Analysis | ||||||||||||
| - RBC BlueBay Emerging Market Select Bond Fund | 8 | |||||||||||
| - RBC BlueBay Emerging Market Corporate Bond Fund | 10 | |||||||||||
| - RBC BlueBay Global High Yield Bond Fund | 12 | |||||||||||
| - RBC BlueBay Global Convertible Bond Fund | 14 | |||||||||||
| - RBC BlueBay Absolute Return Fund | 16 | |||||||||||
| Schedule of Portfolio Investments | 18 | |||||||||||
| Financial Statements | ||||||||||||
| - Statements of Assets and Liabilities | 61 | |||||||||||
| - Statements of Operations | 63 | |||||||||||
| - Statements of Changes in Net Assets | 64 | |||||||||||
| Financial Highlights | 69 | |||||||||||
| Notes to Financial Statements | 79 | |||||||||||
| Report of Independent Registered Public Accounting Firm | 106 | |||||||||||
| Other Federal Income Tax Information | 107 | |||||||||||
| Management | 108 | |||||||||||
| Share Class Information | 111 | |||||||||||
| Supplemental Information | 112 | |||||||||||
Approval of Investment Advisory and Sub-Advisory Agreements
| 114 | |||||||||||
It has been another largely positive year for risk assets, albeit interspersed with usual episodes of volatility, and the RBC BlueBay Funds produced positive absolute returns over the year ending September 30, 2014. Our ongoing commitment to preserving investor capital meant that in times of market adversity we adopted a more cautious strategy across the RBC BlueBay Funds. As such we focused on defensively-oriented sectors such as telecommunications and utilities, which are more able to withstand exogenous shocks and are less sensitive to fluctuations in the macroeconomic environment. While bond markets overall have been strong, the likelihood of rising rates in the US led us to be cautious on duration – particularly during the first half of 2014. Consequently, we looked to preserve capital through an underweight duration stance within some of the RBC BlueBay Funds over the year. Duration measures the sensitivity of a security’s price to changes in interest rates.
The end of 2013 was dominated by events in the US as the threat of a technical default was postponed until early 2014, while the debt ceiling was temporarily raised. However, this had a limited impact on the performance of risk assets and the market had an initially positive reaction to the US Federal Reserve’s (Fed) announcement of the tapering of its asset purchase program during December.
Nevertheless, the start of the new year saw increased volatility and the performance of risk assets was hampered by a number of issues. These included concerns over Fed tapering, disappointing data in the US and China and fears surrounding events in emerging markets such as market volatility in Turkey, macro instability in Argentina and political instability in Ukraine. However, there was increasing evidence that the US data was weather related, while emerging markets recovered as investors reacted more positively to monetary and fiscal adjustments in the Fragile Five. Geopolitical newsflow was dominated by the escalating events in Ukraine, with Russia annexing the Crimean region, although risks assets appeared relatively well insulated.
The Fed continued with its tapering program over the summer months on the back of strong data releases. The US consumer appeared to be remarkably resilient as unemployment continued to fall and lower mortgage rates and oil prices buoyed spending. Fed Chair Janet Yellen’s continued dovish tone helped calm worries over potential inflationary pressures, and she repeated her commitment to a sustained period of low rates following the completion of the quantitative easing program. However, Europe told a different story and the tepid recovery sparked expectations of a boost to growth by European Central Bank (ECB) president, Mario Draghi. This was announced at the June meeting and the package of measures aimed at stimulating the economy and averting deflation included cutting interest rates and reducing the ECB deposit rate to below zero. In addition, a new targeted longer-term refinancing operation package was announced and ECB president Mario Draghi left the door open for full quantitative-easing-style purchases at a later date. In China, the economy continued to strengthen in response to the stimulus measures introduced earlier in the year and showed the highest Purchasing Managers Index (PMI) reading all year in June. The People’s Bank of China acted to boost liquidity when required and the third-quarter Gross Domestic Product (“GDP”) growth announcement reassured investors that China is on course to meet its 7.2% target for the year.
|
| 1 |
LETTER FROM THE CHIEF INVESTMENT OFFICER | ||||||
However, the resurgence of geopolitical risks and the weakness of the core continental European economies began to cause concern. With the US program of quantitative easing to end in October, and no firm date for the launch of a European asset purchase program, the possibility of a liquidity vacuum was especially detrimental for equity market performance. Emerging markets were also weighed down by US dollar strength, which led to broad-based FX weakness, both in G10 and emerging market currencies.
Looking ahead, we maintain our view that growth in the US will continue to show positive signs over the near term. The US is a large and relatively closed economy driven by strong internal demand. Recent upward growth revisions underline that the US economy has the ability to expand when other regions are experiencing significant uncertainty, most notably in Europe. Downward inflationary pressures, driven by weaker commodity prices and a strong US dollar, provide a logical context for the Federal Open Market Committee members to keep rates lower for longer. Therefore we have a somewhat more constructive view on the overall rates outlook in the US.
Within emerging markets we believe differentiation is becoming increasingly apparent and periods of volatility will provide opportunities to take advantage of mispricings. Countries most likely to benefit from the current economic backdrop are those with exposure to US growth, commodity importers, and those with more orthodox central banks and well anchored inflation expectations. In our view a more benign US rates outlook should prove supportive for fixed income spread products generally.
As we move towards the end of 2014, we continue to maintain our focus on strong absolute and risk-adjusted returns with an underlying emphasis on capital preservation. Thank you for your continued confidence and trust in the RBC BlueBay Funds.
Sincerely,
David Dowsett and Raphael Robelin, Co-Chief Investment Officers BlueBay Asset Management LLP
Past performance is not a guarantee of future results.
Mutual fund investing involves risk. Principal loss is possible.
The RBC BlueBay Mutual Funds are distributed by Quasar Distributors, LLC, an affiliate of U.S. Bancorp Fund Services, LLC. | ||||||
| ||||||
| ||||||
| ||||||
| ||||||
| ||||||
| ||||||
| ||||||
| ||||||
| ||||||
| ||||||
| ||||||
| ||||||
| ||||||
| ||||||
| ||||||
| ||||||
| ||||||
| ||||||
| ||||||
| ||||||
| ||||||
| ||||||
| ||||||
| ||||||
| ||||||
| ||||||
| ||||||
|
2 |
RBC Global Asset Management (U.S.) Inc. (“RBC GAM (US)”) serves as the investment advisor and BlueBay Asset Management LLP (“BlueBay”) serves as an investment sub-advisor to each of the RBC BlueBay Funds and BlueBay Asset Management USA LLC (“BlueBay US”) serves as an investment sub-advisor (effective November 27, 2013) for the RBC BlueBay Global High Yield Bond Fund and the RBC BlueBay Absolute Return Fund. The sub-advisors are responsible for the overall management of the Funds’ portfolios. The individuals primarily responsible for the day-to-day management of the Funds’ portfolios are set forth below.
| ||||||
David Dowsett
Partner, Co-Chief Investment Officer & Co-Head of Emerging Market
Debt
David Dowsett is Co-Chief Investment Officer of BlueBay and Co-Head of the Emerging Market Debt team at the firm and is responsible for portfolio management of the RBC BlueBay Emerging Market Select Bond Fund. David joined BlueBay in April 2002. Previously he spent seven years at Deutsche Asset Management (formerly Morgan Grenfell Asset Management) where he was a Board Director with responsibility for emerging markets and a member of the Investment Policy Committee for all fixed income. David has a BA (Hons) degree in Politics and Economics from Durham University.
| ||||||
Nick Shearn
Portfolio Manager
Nick Shearn is responsible for portfolio management of the RBC BlueBay Emerging Market Select Bond Fund. Nick joined BlueBay in June 2011 from The Royal Bank of Scotland, where he was Head of Local Markets Rates Trading for the CEEMEA region. Prior to this he spent ten years at Deutsche Bank in Johannesburg (1998-2002) and London (2002-2008) trading local markets products. Before trading emerging markets products, Nick focused on the Eurobond markets and was Head of Liquid Credit Trading at JP Morgan before joining DKB International as Head of Trading in 1995. He has a BSc Econ (Hons) from Queen Mary College, London University.
| ||||||
Polina Kurdyavko
Partner, Senior Portfolio Manager
Polina Kurdyavko is Head of the Emerging Market Corporate Debt team at BlueBay and the lead portfolio manager for the BlueBay long only and alternative emerging market corporate bond portfolios, including the RBC BlueBay Emerging Market Corporate Bond Fund. Polina joined BlueBay in July 2005 from UBS where she worked as a Credit Analyst in EMEA corporate research. Her role involved secondary coverage of CEEMEA issuers and research support for primary issuance of select corporates. Prior to this, Polina was with Alliance Capital where she started as an emerging markets equity analyst and then moved on to pioneer emerging markets quantitative research at Alliance. Polina holds an MSc (Hons) in Finance from the People’s Friendship University of Russia, Moscow and is a CFA charterholder.
| ||||||
| 3 |
PORTFOLIO MANAGERS | ||||||
Adam Borneleit
Portfolio Manager
Adam Borneleit is responsible for portfolio management of the RBC BlueBay Emerging Market Corporate Bond Fund. Adam joined BlueBay in June 2008 from Pacific Investment Management Company (PIMCO) where he worked from 2000. He was part of the Emerging Markets Portfolio Management team with a focus on corporate bonds. Prior to that, he was a Credit Analyst in SunAmerica’s high-yield bond group, a Manager at PriceWaterhouse Moscow’s corporate finance group in Russia, and an Analyst in Prudential’s private-placement group. Adam holds bachelor’s degrees in both economics and French from the University of Pennsylvania’s Wharton School and College of Arts and Sciences, and an MBA from Stanford University’s Graduate School of Business.
| ||||||
Anthony Robertson
Partner, Head of Global Leveraged Finance Group
Senior Portfolio Manager
Anthony Robertson is responsible for portfolio management of the RBC BlueBay Global High Yield Bond Fund. Anthony joined BlueBay in August 2004 from Putnam Investments (formerly New Flag Asset Management) where he was a Senior Portfolio Manager responsible for European high yield portfolios. Prior to Putnam, Anthony held similar roles at Standard Asset Management, London & Capital Asset Management, and the West Merchant Bank (West LB). Anthony received his Bachelor of Commerce (Honours) from the University of Natal.
| ||||||
Peter Higgins
Partner, Global Head of Leveraged Finance Long Only Strategies
Senior Portfolio Manager
Peter Higgins is responsible for portfolio management of the RBC BlueBay Global High Yield Bond Fund. Peter joined BlueBay in January 2008 as a Portfolio Manager with the High Yield team. Previously, he was Director of proprietary trading at Deutsche Bank within the Principal Strategies Group. Peter also spent four years at Goldman Sachs where he was a Desk Analyst in high yield trading. Prior to this, he was at Credit Suisse in high yield capital markets after beginning his career as an investment banker with Prudential Securities. Peter holds a BA from Columbia University.
| ||||||
Michael Reed
Senior Portfolio Manager
Michael Reed is responsible for portfolio management of the RBC BlueBay Global Convertible Bond Fund. Michael joined BlueBay in October 2007 from Pendragon, where, as a Partner, he ran the company’s convertible arbitrage strategies. Prior to that, he was a Managing Director of Salomon Brothers, responsible for international convertible bond trading between 1994 and 2002. Michael joined the Japanese Warrant Arbitrage desk at Salomon in 1989 and spent two years trading Japanese Warrant Arbitrage in Tokyo. Michael holds a Bachelor of Engineering from Southampton University.
|
4 |
PORTFOLIO MANAGERS | ||||||
Mark Dowding
Partner, Co-Head Investment Grade
Senior Portfolio Manager
Mark Dowding Co-Heads the investment grade team at BlueBay, is a member of the asset allocation committee and is responsible for portfolio management of the RBC BlueBay Absolute Return Fund. Mark joined BlueBay in August 2010 from Deutsche Asset Management, where he was Head of Fixed Income in Europe. Prior to this, Mark was Head of Fixed Income in Europe for Invesco, where he managed a range of global fixed income portfolios for retail and institutional clients. Mark started his career as a Fixed Income Portfolio Manager at Morgan Grenfell in 1993 and holds a BA Hons in Economics from the University of Warwick.
| ||||||
Raphael Robelin
Partner, Co-Chief Investment Officer & Co-Head of Investment Grade
Debt
Raphael Robelin is Co-Chief Investment Officer of BlueBay, Co-Head of Investment Grade Debt at the firm and is responsible for portfolio management of the RBC BlueBay Absolute Return Fund. He joined BlueBay in August 2003 from Invesco where he was Portfolio Manager for Investment Grade Funds. Prior to that, he was a Portfolio Manager with BNP Group and Saudi International Bank. Raphael holds a degree in Engineering (IT) and Applied Mathematics from EFREI as well as a Masters in Management and International Finance from La Sorbonne, Paris.
| ||||||
Geraud Charpin
Portfolio Manager
Geraud Charpin is responsible for portfolio management of the RBC BlueBay Absolute Return Fund. Geraud has been working in credit markets since 1994 and joined BlueBay in August 2008 from UBS where he was Head of European Credit Strategy. Prior to that, he was a credit strategist with BNP Paribas and a credit analyst with Dresdner Kleinwort Benson and Natwest Markets. Geraud holds a degree in Engineering from ICPI Lyon, France as well as a Master of Finance from ESSEC International Management School, Paris.
| ||||||
Andrzej Skiba
Partner, Senior Portfolio Manager
Andrzej Skiba is responsible for BlueBay’s U.S.-based analyst and execution team and is a portfolio manager for the RBC BlueBay Absolute Return Fund. Andrzej joined BlueBay in February 2005 from Goldman Sachs where he worked as a Credit Analyst covering European investment grade Telecom, Media and Utility sectors. He spent his first four years at BlueBay as a credit analyst covering the TMT, Utilities and Retail sectors for the Investment Grade team. In 2009, he moved into a Portfolio Manager position, focusing on benchmarked portfolios. Andrzej has a BSc (Honors) in Management and International Business Economics from UMIST and is a CFA Charterholder.
|
| 5 |
Average Annual Total Returns as of September 30, 2014
1 Year | Since Inception(a) | Net Expense Ratio(1)(2) | Gross Expense Ratio(1)(2) | |||||||||||
RBC BlueBay Emerging Market Select Bond Fund | ||||||||||||||
Class A | ||||||||||||||
- Including Maximum Sales Charge of 4.25% | N/A | (1.89)% | ||||||||||||
- At Net Asset Value | N/A | 2.51% | 1.25%(3) | 53.32%(3) | ||||||||||
Class I | ||||||||||||||
- At Net Asset Value | 2.32% | 3.02% | 1.00% | 1.05% | ||||||||||
50% JPMorgan EMBI Global Diversified/50% JPMorgan | 5.21% | 4.83% | ||||||||||||
RBC BlueBay Emerging Market Corporate Bond Fund | ||||||||||||||
Class A | ||||||||||||||
- Including Maximum Sales Charge of 4.25% | N/A | 1.78% | ||||||||||||
- At Net Asset Value | N/A | 6.27% | 1.40%(3) | 53.53%(3) | ||||||||||
Class I | ||||||||||||||
- At Net Asset Value | 8.02% | 6.55% | 1.15% | 1.78% | ||||||||||
JPMorgan CEMBI Diversified(b) | 9.07% | 7.98% | ||||||||||||
RBC BlueBay Global High Yield Bond Fund | ||||||||||||||
Class A | ||||||||||||||
- Including Maximum Sales Charge of 4.25% | N/A | (0.04)% | ||||||||||||
- At Net Asset Value | N/A | 4.38% | 1.20%(3) | 25.84%(3) | ||||||||||
Class I | ||||||||||||||
- At Net Asset Value | 7.36% | 9.16% | 0.95% | 1.30% | ||||||||||
BofA Merrill Lynch Global High Yield | 7.64% | 11.42% | ||||||||||||
RBC BlueBay Global Convertible Bond Fund | ||||||||||||||
Class I | ||||||||||||||
- At Net Asset Value | 5.75% | 10.05% | 1.00% | 1.60% | ||||||||||
Thomson Reuters Convertible Global Focus USD Hedged Index(b) | 5.77% | 9.65% | ||||||||||||
RBC BlueBay Absolute Return Fund | ||||||||||||||
Class A | ||||||||||||||
- Including Maximum Sales Charge of 4.25% | N/A | (1.79)% | ||||||||||||
- At Net Asset Value | N/A | 2.61% | 1.20%(3) | 1.35%(3) | ||||||||||
Class C | ||||||||||||||
- At Net Asset Value | N/A | (1.16)% | 1.95%(3) | 1.96%(3) | ||||||||||
Class I | ||||||||||||||
- At Net Asset Value | 4.12% | 3.51% | 0.95% | 0.98% | ||||||||||
3-Month USD London Interbank Offering Rate (LIBOR) Index(b) | 0.24% | 0.26% | ||||||||||||
6 |
PERFORMANCE SUMMARY |
Performance data quoted represents past performance. Past performance is no guarantee of future results. Investment return and principal value of an investment will fluctuate so that an investor’s shares, when redeemed, may be worth more or less than their original cost. Current performance may be lower or higher than performance quoted. Performance shown reflects contractual fee waivers, without such fee waivers total returns would be reduced. Performance information does not reflect the 2% fee on shares redeemed or exchanged within 30 days of purchase. If such redemption fee was included, performance would be reduced. For performance data current to the most recent month-end go to www.rbcgam.us. Please see footnotes below.
(1) The Funds’ expenses reflect actual expenses from November 27, 2013 (commencement of operations) to September 30, 2014 for Class A shares, from June 24, 2014 (commencement of operations) to September 30, 2014 for Class C shares and the most recent year end (September 30, 2014) for all funds for Class I shares.
(2) The Advisor has contractually agreed to waive fees and/or make payments in order to keep total operating expenses of the Fund to the levels listed under net expense ratio until January 31, 2016.
(3) Annualized.
(a) The inception date (commencement of operations) for Class A shares is November 27, 2013 and November 30, 2011 for Class I shares for each Fund except Absolute Return Fund, which is June 24, 2014 for Class C shares and November 30, 2012 for Class I shares . The total returns for Class A and C shares are not annualized.
(b) Each of the comparative indices is a widely recognized market value weighted measure of the return of securities, but do not include sales fees or operating expenses. You cannot invest directly in indices.
JPMorgan Emerging Markets Bond Index (“EMBI”) Global Diversified tracks total returns for US Dollar denominated debt instruments issued by emerging market sovereign and quasi-sovereign entities: Brady bonds, loans, Eurobonds and local market instruments.
JPMorgan Government Bond Index - Emerging Markets (“GBI-EM”) Global Diversified Index (Unhedged) is a comprehensive global local emerging markets index, and consists of regularly traded, liquid fixed-rate, domestic currency government bonds to which international investors can gain exposure.
The J.P. Morgan Corporate Emerging Markets Bond Index (“CEMBI”) Diversified limits the weights of those index countries with larger corporate debt stocks by only including a specified portion of these countries’ eligible current face amounts of debt outstanding. The CEMBI Diversified results in well-distributed, more balanced weightings for countries included in the index. The countries covered in the CEMBI Diversified are identical to those covered by the CEMBI.
The BofA Merrill Lynch Global High Yield Constrained Index tracks the performance of below investment grade bonds of corporate issuers domiciled in countries having an investment grade foreign currency long term debt rating.
The Thomson Reuters Convertible Global Focus USD Hedged Index measures the performance of the liquid global convertible market. This index was formerly known as the UBS Global Focus Convertible Index.
The 3-Month USD London Interbank Offering Rate (LIBOR) Index is the average interest rate estimated by leading banks in London that they would be charged if borrowing from other banks.
| 7 |
8 |
| 9 |
10 |
MANAGEMENT DISCUSSION AND ANALYSIS (UNAUDITED) |
| |||||||||||||||
RBC BlueBay Emerging Market Corporate Bond Fund
| ||||||||||||||||
Current income and capital appreciation.
|
| Investment Objective | ||||||||||||||
JPMorgan CEMBI Diversified Index
|
|
Benchmark | ||||||||||||||
|
| Asset Allocation (as of 9/30/14) (% of fund’s investments) & Top Five Industries (as of 9/30/14) (% of fund’s net assets) | ||||||||||||||
DP World Ltd., 6.85%, 7/2/37 |
|
2.72 |
% |
Odebrecht Finance Ltd., 7.13%, 6/26/42 |
|
1.42 |
% | Top Ten Holdings (as of 9/30/14) (% of fund’s net assets) | ||||||||
Israel Electric Corp. Ltd., 6.88%, 6/21/23 | 2.02 | % | Empresa de Energia de Bogota SA, 6.13%, 11/10/21 | 1.41 | % | |||||||||||
Bharti Airtel International Netherlands BV, 5.13%, 3/11/23 | 1.85 | % | Petrobras Global Finance BV, 6.25%, 3/17/24 | 1.30 | % | |||||||||||
Hutchison Whampoa International 12 Ltd., 6.00%, 5/7/17 | 1.80 | % | Ras Laffan Liquefied Natural Gas Co. Ltd. III, 6.33%, 9/30/27 | 1.29 | % | |||||||||||
MCE Finance Ltd., 5.00%, 2/15/21 | 1.70 | % | BBVA Bancomer SA/Texas, 6.75%, 9/30/22 | 1.23 | % | |||||||||||
A listing of all portfolio holdings can be found beginning on page 29.
|
| |||||||||||||||
 | Growth of $10,000 Initial Investment Since Inception (11/30/11) | |||||||||||||||
| The graph reflects an initial investment of $10,000 over the period from November 30, 2011 to September 30, 2014 and is based on Class I shares. The Fund’s total return includes reinvested dividends and capital gains. The Fund’s total return also includes operating expenses that reduce return, while the total return of the index does not. The graph does not reflect the deduction of taxes that a shareholder would pay on fund distributions or redemption of fund shares. | ||||||||||||||||
| 11 |
12 |
MANAGEMENT DISCUSSION AND ANALYSIS (UNAUDITED) |
| |||||||||||||||
RBC BlueBay Global High Yield Bond Fund
| ||||||||||||||||
Current income and capital appreciation.
|
| Investment Objective | ||||||||||||||
BofA Merrill Lynch Global High Yield Constrained Index
|
|
Benchmark | ||||||||||||||
|
| Asset Allocation (as of 9/30/14) (% of fund’s investments) & Top Five Industries (as of 9/30/14) (% of fund’s net assets) | ||||||||||||||
Dunkin Brands Group, Inc. Term Loan B, 3.25%, 2/7/21 |
|
1.96 |
% |
Intelsat Jackson Holdings SA, 6.63%, 12/15/22 |
|
1.37 |
% | Top Ten Holdings (as of 9/30/14) (% of fund’s net assets) | ||||||||
HCA, Inc., 5.88%, 5/1/23 | 1.65 | % | AMC Entertainment, Inc., 5.88%, 2/15/22 | 1.37 | % | |||||||||||
LBC Tank Terminals Holding Netherlands BV, 6.88%, 5/15/23 | 1.54 | % | Taylor Morrison Communities, Inc./Monarch Communities, Inc., 5.63%, 3/1/24 | 1.36 | % | |||||||||||
Envision Healthcare Corp., 5.13%, 7/1/22 | 1.51 | % | Digicel Ltd., 7.00%, 2/15/20 | 1.34 | % | |||||||||||
Geo Group, Inc. (The), 5.13%, 4/1/23 | 1.45 | % | Epicor Software Corp., 8.63%, 5/1/19 | 1.28 | % | |||||||||||
A listing of all portfolio holdings can be found beginning on page 36.
|
| |||||||||||||||
 | Growth of $10,000 Initial Investment Since Inception (11/30/11) | |||||||||||||||
| The graph reflects an initial investment of $10,000 over the period from November 30, 2011 to September 30, 2014 and is based on Class I shares. The Fund’s total return includes reinvested dividends and capital gains. The Fund’s total return also includes operating expenses that reduce return, while the total return of the index does not. The graph does not reflect the deduction of taxes that a shareholder would pay on fund distributions or redemption of fund shares. | ||||||||||||||||
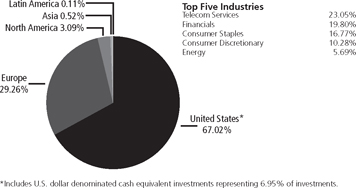
| 13 |
14 |
MANAGEMENT DISCUSSION AND ANALYSIS (UNAUDITED) |
| |||||||||||||||
RBC BlueBay Global Convertible Bond Fund
| ||||||||||||||||
Current income and capital appreciation.
|
| Investment Objective | ||||||||||||||
Thomson Reuters Convertible Global Focus USD Hedged Index
|
|
Benchmark | ||||||||||||||
|
| Asset Allocation (as of 9/30/14) (% of fund’s investments) & Top Five Industries (as of 9/30/14) (% of fund’s net assets) | ||||||||||||||
Yahoo!, Inc., 0.11%, 12/1/18 |
|
2.28 |
% |
International Consolidated Airlines Group SA, 1.75%, 5/31/18 |
|
1.54 |
% | Top Ten Holdings (as of 9/30/14) (% of fund’s net assets) | ||||||||
SanDisk Corp., 0.50%, 10/15/20 | 2.26 | % | Priceline Group, Inc. (The), 0.90%, 9/15/21 | 1.50 | % | |||||||||||
Steinhoff Finance Holding GmbH, 4.00%, 1/30/21 | 2.16 | % | China Daye Non-Ferrous Metals Mining Ltd., 0.50%, 5/30/18 | 1.45 | % | |||||||||||
DP World Ltd., 1.75%, 6/19/24 | 2.01 | % | Billion Express Investments Ltd., 0.75%, 10/18/15 | 1.45 | % | |||||||||||
Unibail-Rodamco SE, 0.00%, 7/1/21 | 1.79 | % | ||||||||||||||
Qihoo 360 Technology Co. Ltd., 1.75%, 8/15/21 | 1.66 | % | ||||||||||||||
A listing of all portfolio holdings can be found beginning on page 43.
|
| |||||||||||||||
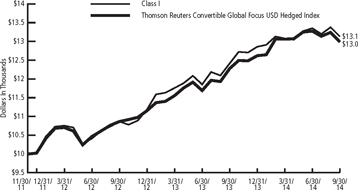 | Growth of $10,000 Initial Investment Since Inception (11/30/11) | |||||||||||||||
| The graph reflects an initial investment of $10,000 over the period from November 30, 2011 to September 30, 2014 and is based on Class I shares. The Fund’s total return includes reinvested dividends and capital gains. The Fund’s total return also includes operating expenses that reduce return, while the total return of the index does not. The graph does not reflect the deduction of taxes that a shareholder would pay on fund distributions or redemption of fund shares. | ||||||||||||||||
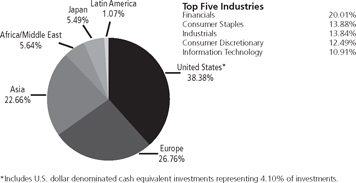
| 15 |
16 |
MANAGEMENT DISCUSSION AND ANALYSIS (UNAUDITED) |
| |||||||||||||||
RBC BlueBay Absolute Return Fund
| ||||||||||||||||
Current income and capital appreciation.
|
| Investment Objective | ||||||||||||||
3-Month USD London Interbank Offering Rate (LIBOR) Index
|
|
Benchmark | ||||||||||||||
|
| Asset Allocation (as of 9/30/14) (% of fund’s investments) & Top Five Industries (as of 9/30/14) (% of fund’s net assets) | ||||||||||||||
Romanian Government International Bond, 4.63%, 9/18/20 |
|
1.96 |
% |
Portugal Obrigacoes do Tesouro OT, 5.65%, 2/15/24 |
|
1.36 |
% | Top Ten Holdings (as of 9/30/14) (% of fund’s net assets) | ||||||||
Spain Government Bond, 3.80%, 4/30/24 | 1.67 | % | Hungary Government International Bond, 6.00%, 1/11/19 | 1.23 | % | |||||||||||
Slovenia Government Bond, 5.13%, 3/30/26 | 1.55 | % | BNP Paribas Fortis SA, 4.63%, 10/29/49 | 1.15 | % | |||||||||||
Iceland Government International Bond, 5.88%, 5/11/22 | 1.48 | % | Portugal Obrigacoes do Tesouro OT, 3.88%, 02/15/30 | 1.13 | % | |||||||||||
Hungary Government International Bond, 5.75%, 6/11/18 | 1.44 | % | Origin Energy Finance Ltd., 4.00%, 09/16/74 | 1.01 | % | |||||||||||
A listing of all portfolio holdings can be found beginning on page 50.
|
| |||||||||||||||
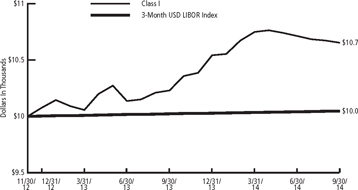 | Growth of $10,000 Initial Investment Since Inception (11/30/12) | |||||||||||||||
| The graph reflects an initial investment of $10,000 over the period from November 30, 2012 to September 30, 2014 and is based on Class I shares. The Fund’s total return includes reinvested dividends and capital gains. The Fund’s total return also includes operating expenses that reduce return, while the total return of the index does not. The graph does not reflect the deduction of taxes that a shareholder would pay on fund distributions or redemption of fund shares. | ||||||||||||||||
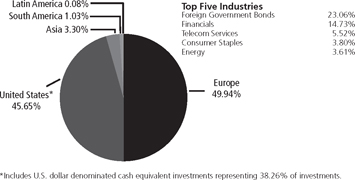
| 17 |
RBC BlueBay Emerging Market Select Bond Fund
September 30, 2014
Principal Amount | Value | |||||
Corporate Bonds — 10.79% |
| |||||
Brazil — 1.85% |
| |||||
$ 655,000 | Petrobras Global Finance BV, 4.38%, 5/20/23 | $ | 616,355 | |||
1,407,000 | Petrobras Global Finance BV, 4.88%, 3/17/20 | 1,425,728 | ||||
1,904,000 | Petrobras International Finance Co., 6.75%, 1/27/41 | 1,958,937 | ||||
|
| |||||
| 4,001,020 | ||||||
|
| |||||
Ecuador — 1.18% |
| |||||
2,600,000 | EP PetroEcuador Via Noble Sovereign Funding I Ltd., 5.86%, 9/24/19(a) | 2,554,500 | ||||
Hungary — 0.28% |
| |||||
600,000 | Magyar Export-Import Bank Zrt, 4.00%, 1/30/20 | 594,300 | ||||
Indonesia — 1.15% |
| |||||
595,000 | Pertamina Persero PT, 4.30%, 5/20/23 | 564,380 | ||||
440,000 | Pertamina Persero PT, 4.88%, 5/3/22 | 440,440 | ||||
450,000 | Pertamina Persero PT, 6.00%, 5/3/42 | 427,950 | ||||
1,030,000 | Pertamina Persero PT, 6.45%, 5/30/44 | 1,047,819 | ||||
|
| |||||
| 2,480,589 | ||||||
|
| |||||
Mexico — 3.49% |
| |||||
912,000 | Petroleos Mexicanos, 4.88%, 1/24/22 | 963,915 | ||||
3,575,000 | Petroleos Mexicanos, 4.88%, 1/18/24 | 3,755,613 | ||||
910,000 | Petroleos Mexicanos, 5.50%, 1/21/21 | 999,422 | ||||
1,782,000 | Petroleos Mexicanos, 5.50%, 6/27/44 | 1,821,204 | ||||
|
| |||||
| 7,540,154 | ||||||
|
| |||||
Morocco — 0.10% |
| |||||
200,000 | OCP SA, 5.63%, 4/25/24 | 208,250 | ||||
Venezuela — 2.74% |
| |||||
1,605,000 | Petroleos de Venezuela SA, 6.00%, 5/16/24 | 836,205 | ||||
5,740,916 | Petroleos de Venezuela SA, 6.00%, 11/15/26 | 2,961,739 | ||||
3,098,365 | Petroleos de Venezuela SA, 9.00%, 11/17/21 | 2,130,436 | ||||
|
| |||||
| 5,928,380 | ||||||
|
| |||||
Total Corporate Bonds | 23,307,193 | |||||
|
| |||||
(Cost $24,978,040) | ||||||
Foreign Government Bonds — 71.64% |
| |||||
Bahrain — 0.31% |
| |||||
675,000 | Bahrain Government International Bond, 6.00%, 9/19/44 | 679,451 | ||||
Brazil — 12.06% |
| |||||
27,990,000(b) | Brazil Notas do Tesouro Nacional, Series F, 10.00%, 1/1/17 | 10,907,677 | ||||
18 |
SCHEDULE OF PORTFOLIO INVESTMENTS |
RBC BlueBay Emerging Market Select Bond Fund (cont.)
September 30, 2014
Principal Amount | Value | |||||||
| 22,692,000(b | ) | Brazil Notas do Tesouro Nacional, Series F, 10.00%, 1/1/21 | $ | 8,325,863 | ||||
| 500,000(b | ) | Brazil Notas do Tesouro Nacional, Series F, 10.00%, 1/1/23 | 184,689 | |||||
| 2,525,000(b | ) | Brazil Notas do Tesouro Nacional, Series F, 10.00%, 1/1/25 | 917,308 | |||||
| $ | 2,415,000 | Brazilian Government International Bond, 2.63%, 1/5/23 | 2,193,210 | |||||
| 2,235,000 | Brazilian Government International Bond, 4.25%, 1/7/25 | 2,212,650 | ||||||
| 1,390,000 | Brazilian Government International Bond, 5.00%, 1/27/45 | 1,306,600 | ||||||
|
| |||||||
| 26,047,997 | ||||||||
|
| |||||||
| Bulgaria — 1.94% |
| ||||||
| 3,315,000(c | ) | Bulgaria Government International Bond, 2.95%, 9/3/24 | 4,192,267 | |||||
| Chile — 0.83% |
| ||||||
| 995,000,000(b | ) | Chile Government International Bond, 6.00%, 1/1/22 | 1,787,413 | |||||
| Colombia — 6.98% |
| ||||||
| 5,028,300,000(b | ) | Colombian TES, 5.00%, 11/21/18 | 2,410,622 | |||||
| 4,979,300,000(b | ) | Colombian TES, 6.00%, 4/28/28 | 2,178,541 | |||||
| 6,117,100,000(b | ) | Colombian TES, 7.00%, 9/11/19 | 3,134,760 | |||||
| 1,556,000,000(b | ) | Colombian TES, 8.00%, 10/28/15 | 793,334 | |||||
| 10,920,300,000(b | ) | Colombian TES, 10.00%, 7/24/24 | 6,561,913 | |||||
|
| |||||||
| 15,079,170 | ||||||||
|
| |||||||
| Croatia (Hrvatska) — 4.95% |
| ||||||
| 3,400,000(c | ) | Croatia Government International Bond, 3.88%, 5/30/22 | 4,308,559 | |||||
| 1,471,000 | Croatia Government International Bond, 5.50%, 4/4/23 | 1,515,836 | ||||||
| 3,474,000 | Croatia Government International Bond, 6.00%, 1/26/24 | 3,698,030 | ||||||
| 1,070,000 | Croatia Government International Bond, 6.75%, 11/5/19 | 1,178,343 | ||||||
|
| |||||||
| 10,700,768 | ||||||||
|
| |||||||
| Dominican Republic — 1.20% |
| ||||||
| 1,070,000 | Dominican Republic International Bond, 5.88%, 4/18/24 | 1,091,400 | ||||||
| 1,214,000 | Dominican Republic International Bond, 6.60%, 1/28/24 | 1,315,976 | ||||||
| 176,000 | Dominican Republic International Bond, 7.45%, 4/30/44 | 189,200 | ||||||
|
| |||||||
| 2,596,576 | ||||||||
|
| |||||||
| Ghana — 0.29% |
| ||||||
| 630,000 | Republic of Ghana, 8.13%, 1/18/26 | 631,575 | ||||||
| Guatemala — 0.20% |
| ||||||
| 335,000 | Guatemala Government Bond, 8.13%, 10/6/34 | 435,173 | ||||||
| Hungary — 6.41% |
| ||||||
| 87,760,000(b | ) | Hungary Government Bond, 6.00%, 11/24/23 | 395,928 | |||||
| 3,060,000 | Hungary Government International Bond, 4.00%, 3/25/19 | 3,121,200 | ||||||
| 2,820,000 | Hungary Government International Bond, 5.38%, 3/25/24 | 2,978,625 | ||||||
| 4,788,000 | Hungary Government International Bond, 5.75%, 11/22/23 | 5,200,965 | ||||||
| 19 |
SCHEDULE OF PORTFOLIO INVESTMENTS |
RBC BlueBay Emerging Market Select Bond Fund (cont.)
September 30, 2014
Principal Amount | Value | |||||||
| $ 1,680,000 | Hungary Government International Bond, 7.63%, 3/29/41 | $ | 2,152,500 | |||||
|
| |||||||
| 13,849,218 | ||||||||
|
| |||||||
| Indonesia — 2.79% |
| ||||||
| 715,000 | Indonesia Government International Bond, 3.38%, 4/15/23 | 662,305 | ||||||
| 610,000 | Indonesia Government International Bond, 5.88%, 1/15/24 | 671,865 | ||||||
| 1,410,000 | Indonesia Government International Bond, 11.63%, 3/4/19 | 1,876,812 | ||||||
| 242,000,000(b | ) | Indonesia Treasury Bond, 6.13%, 5/15/28 | 15,876 | |||||
| 5,594,000,000(b | ) | Indonesia Treasury Bond, 8.38%, 3/15/24 | 459,214 | |||||
| 8,400,000,000(b | ) | Indonesia Treasury Bond Credit Linked Note, 7.00%, 5/17/22 | 641,116 | |||||
| 20,855,000,000(b | ) | Indonesia Treasury Bond Credit Linked Note, 8.38%, 3/19/24 | 1,700,406 | |||||
|
| |||||||
| 6,027,594 | ||||||||
|
| |||||||
| Kenya — 0.62% |
| ||||||
| 1,273,000 | Kenya Government International Bond, 6.88%, 6/24/24 | 1,341,487 | ||||||
| Malaysia — 2.81% |
| ||||||
| 3,970,000(b | ) | Malaysia Government Bond, 3.26%, 3/1/18 | 1,197,296 | |||||
| 7,422,000(b | ) | Malaysia Government Bond, 3.39%, 3/15/17 | 2,258,726 | |||||
| 3,760,000(b | ) | Malaysia Government Bond, 3.42%, 8/15/22 | 1,108,956 | |||||
| 560,000(b | ) | Malaysia Government Bond, 3.49%, 3/31/20 | 168,389 | |||||
| 260,000(b | ) | Malaysia Government Bond, 3.58%, 9/28/18 | 79,131 | |||||
| 823,000(b | ) | Malaysia Government Bond, 3.84%, 4/15/33 | 235,022 | |||||
| 1,010,000(b | ) | Malaysia Government Bond, 3.89%, 3/15/27 | 300,857 | |||||
| 60,000(b | ) | Malaysia Government Bond, 4.05%, 9/30/21 | 18,532 | |||||
| 2,210,000(b | ) | Malaysia Government Bond, 4.38%, 11/29/19 | 694,438 | |||||
|
| |||||||
| 6,061,347 | ||||||||
|
| |||||||
| Mexico — 4.30% |
| ||||||
| 3,230,000(b | ) | Mexican Bonos, 6.50%, 6/10/21 | 250,292 | |||||
| 18,610,000(b | ) | Mexican Bonos, 7.50%, 6/3/27 | 1,508,548 | |||||
| 9,070,000(b | ) | Mexican Bonos, 7.75%, 11/13/42 | 735,313 | |||||
| 7,000,000(b | ) | Mexican Bonos, 8.00%, 12/7/23 | 588,974 | |||||
| 15,740,000(b | ) | Mexican Bonos, 8.50%, 5/31/29 | 1,376,248 | |||||
| 3,060,000(b | ) | Mexican Bonos, 10.00%, 11/20/36 | 306,036 | |||||
| 1,060,000 | Mexico Government International Bond, 3.50%, 1/21/21 | 1,079,080 | ||||||
| 406,000 | Mexico Government International Bond, 4.00%, 10/2/23 | 418,708 | ||||||
| 2,282,000 | Mexico Government International Bond, 4.75%, 3/8/44 | 2,264,885 | ||||||
| 778,000 | Mexico Government International Bond, 4.75%, 3/8/44 | 770,220 | ||||||
|
| |||||||
| 9,298,304 | ||||||||
|
| |||||||
| Morocco — 1.53% |
| ||||||
| 2,585,000(c) | Morocco Government International Bond, 3.50%, 6/19/24 | 3,313,347 | ||||||
20 |
SCHEDULE OF PORTFOLIO INVESTMENTS |
RBC BlueBay Emerging Market Select Bond Fund (cont.)
September 30, 2014
Principal Amount | Value | |||||||
| Mozambique — 1.36% |
| ||||||
| $ 2,930,000 | EMATUM Via Mozambique EMATUM Finance 2020 BV, 6.31%, 9/11/20 | $ | 2,937,325 | |||||
| Nigeria — 0.66% |
| ||||||
| 72,078,000(b | ) | Nigeria Government Bond, 15.10%, 4/27/17 | 470,317 | |||||
| 56,100,000(b | ) | Nigeria Government Bond, 16.00%, 6/29/19 | 392,331 | |||||
| 77,401,000(b | ) | Nigeria Government Bond, 16.39%, 1/27/22 | 563,986 | |||||
|
| |||||||
| 1,426,634 | ||||||||
|
| |||||||
| Pakistan — 0.96% |
| ||||||
| 675,000 | Pakistan Government International Bond, 6.88%, 6/1/17 | 683,438 | ||||||
| 565,000 | Pakistan Government International Bond, 7.25%, 4/15/19 | 565,000 | ||||||
| 830,000 | Pakistan Government International Bond, 8.25%, 4/15/24 | 830,000 | ||||||
|
| |||||||
| 2,078,438 | ||||||||
|
| |||||||
| Panama — 1.79% |
| ||||||
| 2,140,000 | Panama Government International Bond, 4.00%, 9/22/24 | 2,137,860 | ||||||
| 800,000 | Panama Government International Bond, 5.20%, 1/30/20 | 881,200 | ||||||
| 695,000 | Panama Government International Bond, 6.70%, 1/26/36 | 850,333 | ||||||
|
| |||||||
| 3,869,393 | ||||||||
|
| |||||||
| Paraguay — 1.02% |
| ||||||
| 765,000 | Republic of Paraguay, 4.63%, 1/25/23 | 770,737 | ||||||
| 1,350,000 | Republic of Paraguay, 6.10%, 8/11/44 | 1,424,250 | ||||||
|
| |||||||
| 2,194,987 | ||||||||
|
| |||||||
| Philippines — 0.10% |
| ||||||
| 10,000,000(b | ) | Philippine Government International Bond, 3.90%, 11/26/22 | 219,486 | |||||
| Poland — 1.84% |
| ||||||
| 722,000(b | ) | Poland Government Bond, 3.25%, 7/25/25 | 222,200 | |||||
| 2,736,000(b | ) | Poland Government Bond, 4.00%, 10/25/23 | 892,769 | |||||
| 1,480,000(b | ) | Poland Government Bond, 4.75%, 10/25/16 | 471,676 | |||||
| 890,000(b | ) | Poland Government Bond, 5.25%, 10/25/17 | 293,673 | |||||
| 440,000(b | ) | Poland Government Bond, 5.50%, 4/25/15 | 135,494 | |||||
| 5,422,000(b | ) | Poland Government Bond, 5.75%, 10/25/21 | 1,950,855 | |||||
|
| |||||||
| 3,966,667 | ||||||||
|
| |||||||
| Romania — 1.27% |
| ||||||
| 3,480,000(b | ) | Romania Government Bond, 5.90%, 7/26/17 | 1,072,380 | |||||
| 620,000(b | ) | Romania Government Bond, 5.95%, 6/11/21 | 197,756 | |||||
| 1,450,000 | Romanian Government International Bond, 4.38%, 8/22/23 | 1,482,988 | ||||||
|
| |||||||
| 2,753,124 | ||||||||
|
| |||||||
| 21 |
SCHEDULE OF PORTFOLIO INVESTMENTS |
RBC BlueBay Emerging Market Select Bond Fund (cont.)
September 30, 2014
Principal Amount | Value | |||||||
| Russia — 2.78% |
| ||||||
| 76,600,000(b | ) | Russian Federal Bond - OFZ, 6.20%, 1/31/18 | $ | 1,770,436 | ||||
| 20,342,000(b | ) | Russian Federal Bond - OFZ, 6.40%, 5/27/20 | 451,248 | |||||
| 36,330,000(b | ) | Russian Federal Bond - OFZ, 6.70%, 5/15/19 | 832,391 | |||||
| 31,966,000(b | ) | Russian Federal Bond - OFZ, 7.00%, 8/16/23 | 701,108 | |||||
| 6,905,000(b | ) | Russian Federal Bond - OFZ, 7.05%, 1/19/28 | 145,660 | |||||
| 10,780,000(b | ) | Russian Federal Bond - OFZ, 7.35%, 1/20/16 | 268,009 | |||||
| 23,009,000(b | ) | Russian Federal Bond - OFZ, 7.40%, 4/19/17 | 558,362 | |||||
| 45,464,000(b | ) | Russian Federal Bond - OFZ, 7.50%, 3/15/18 | 1,091,691 | |||||
| 7,502,000(b | ) | Russian Federal Bond - OFZ, 8.15%, 2/3/27 | 174,803 | |||||
|
| |||||||
| 5,993,708 | ||||||||
|
| |||||||
| Serbia — 0.79% |
| ||||||
| $ 1,629,000 | Republic of Serbia, 5.88%, 12/3/18 | 1,698,233 | ||||||
| Slovenia — 1.49% |
| ||||||
| 1,430,000 | Slovenia Government International Bond, 5.25%, 2/18/24 | 1,522,950 | ||||||
| 1,555,000 | Slovenia Government International Bond, 5.50%, 10/26/22 | 1,689,119 | ||||||
|
| |||||||
| 3,212,069 | ||||||||
|
| |||||||
| South Africa — 3.61% |
| ||||||
| 15,950,339(b | ) | South Africa Government Bond, 6.75%, 3/31/21 | 1,332,090 | |||||
| 5,190,000(b | ) | South Africa Government Bond, 7.00%, 2/28/31 | 389,148 | |||||
| 2,810,000(b | ) | South Africa Government Bond, 8.00%, 12/21/18 | 253,317 | |||||
| 27,418,650(b | ) | South Africa Government Bond, 10.50%, 12/21/26 | 2,824,097 | |||||
| 894(b | ) | South Africa Government Bond, 13.50%, 9/15/15 | 84 | |||||
| 894(b | ) | South Africa Government Bond, 13.50%, 9/15/16 | 88 | |||||
| 335,000 | South Africa Government International Bond, 4.67%, 1/17/24 | 338,749 | ||||||
| 2,420,000 | South Africa Government International Bond, 5.88%, 9/16/25 | 2,663,840 | ||||||
|
| |||||||
| 7,801,413 | ||||||||
|
| |||||||
| Sri Lanka — 1.46% |
| ||||||
| 1,885,000 | Sri Lanka Government International Bond, 5.88%, 7/25/22 | 1,942,117 | ||||||
| 1,145,000 | Sri Lanka Government International Bond, 6.25%, 7/27/21 | 1,209,739 | ||||||
|
| |||||||
| 3,151,856 | ||||||||
|
| |||||||
| Thailand — 2.79% |
| ||||||
| 12,100,000(b | ) | Thailand Government Bond, 1.20%, 7/14/21(d) | 389,915 | |||||
| 57,950,000(b | ) | Thailand Government Bond, 3.13%, 12/11/15 | 1,806,509 | |||||
| 61,918,000(b | ) | Thailand Government Bond, 3.45%, 3/8/19 | 1,944,211 | |||||
| 35,561,000(b | ) | Thailand Government Bond, 3.63%, 6/16/23 | 1,112,835 | |||||
| 18,910,000(b | ) | Thailand Government Bond, 3.65%, 12/17/21 | 597,680 | |||||
| 5,495,000(b | ) | Thailand Government Bond, 3.88%, 6/13/19 | 176,345 | |||||
|
| |||||||
| 6,027,495 | ||||||||
|
| |||||||
22 |
SCHEDULE OF PORTFOLIO INVESTMENTS |
RBC BlueBay Emerging Market Select Bond Fund (cont.)
September 30, 2014
Principal Amount | Value | |||||
Turkey — 1.32% |
| |||||
684,748(b) | Turkey Government Bond, 8.50%, 9/14/22 | $ | 279,127 | |||
1,950,000(c) | Turkey Government International Bond, 4.13%, 4/11/23 | 2,579,991 | ||||
|
| |||||
| 2,859,118 | ||||||
|
| |||||
Venezuela — 0.30% |
| |||||
$ 890,000 | Venezuela Government International Bond, 6.00%, 12/9/20 | 556,250 | ||||
134,500 | Venezuela Government International Bond, 8.25%, 10/13/24 | 87,761 | ||||
|
| |||||
| 644,011 | ||||||
|
| |||||
Zambia — 0.88% |
| |||||
1,660,000 | Zambia Government International Bond, 8.50%, 4/14/24 | 1,892,400 | ||||
|
| |||||
Total Foreign Government Bonds | 154,768,044 | |||||
|
| |||||
(Cost $161,978,407) | ||||||
Shares | ||||||
Investment Company — 10.01% |
| |||||
21,621,836 | JPMorgan 100% US Treasury Securities Money Market Fund, Capital Shares | 21,621,836 | ||||
Total Investment Company | 21,621,836 | |||||
|
| |||||
(Cost $21,621,836) | ||||||
Total Investments | $ | 199,697,073 | ||||
|
| |||||
(Cost $208,578,283)(e) — 92.44% | ||||||
Other assets in excess of liabilities — 7.56% | 16,326,810 | |||||
|
| |||||
NET ASSETS — 100.00% | $ | 216,023,883 | ||||
|
| |||||
| (a) | Variable rate security. The rate reflected in the Schedule of Portfolio Investments is the rate in effect on September 30, 2014. |
| (b) | Investment in non-U.S. Dollars. Principal amount reflects local currency. |
| (c) | Principal amount denoted in Euros. |
| (d) | Inflation protected security. Principal amount reflects original security face amount. |
| (e) | See notes to financial statements for the tax cost of securities and the breakdown of unrealized appreciation (depreciation). |
| 23 |
SCHEDULE OF PORTFOLIO INVESTMENTS |
RBC BlueBay Emerging Market Select Bond Fund (cont.)
September 30, 2014
Foreign currency exchange contracts as of September 30, 2014:
| Currency Purchased | Currency Sold | Counterparty | Settlement Date | Unrealized Appreciation/ (Depreciation) | ||||||||||||||||
| BRL | 3,669,488 | USD | 1,506,977 | Citibank, N.A. | 10/2/14 | $ | (8,943) | |||||||||||||
| BRL | 2,938,500 | USD | 1,250,000 | Citibank, N.A. | 10/2/14 | (50,385) | ||||||||||||||
| BRL | 2,920,000 | USD | 1,250,000 | Citibank, N.A. | 10/2/14 | (57,937) | ||||||||||||||
| BRL | 2,990,720 | USD | 1,280,000 | Citibank, N.A. | 10/2/14 | (59,067) | ||||||||||||||
| BRL | 2,608,605 | USD | 1,130,000 | Citibank, N.A. | 10/2/14 | (65,061) | ||||||||||||||
| BRL | 2,874,320 | USD | 1,240,000 | Citibank, N.A. | 10/2/14 | (66,586) | ||||||||||||||
| BRL | 2,602,390 | USD | 1,130,000 | Citibank, N.A. | 10/2/14 | (67,599) | ||||||||||||||
| USD | 3,828,929 | BRL | 8,799,261 | Citibank, N.A. | 10/2/14 | 236,713 | ||||||||||||||
| USD | 3,511,872 | BRL | 8,063,257 | Citibank, N.A. | 10/2/14 | 220,123 | ||||||||||||||
| USD | 832,819 | BRL | 1,886,085 | Citibank, N.A. | 10/2/14 | 62,842 | ||||||||||||||
| USD | 814,674 | BRL | 1,855,420 | Citibank, N.A. | 10/2/14 | 57,216 | ||||||||||||||
| EUR | 27,000 | USD | 34,683 | Citibank, N.A. | 10/22/14 | (575) | ||||||||||||||
| EUR | 205,000 | USD | 261,281 | Citibank, N.A. | 10/22/14 | (2,316) | ||||||||||||||
| EUR | 221,000 | USD | 284,795 | Citibank, N.A. | 10/22/14 | (5,619) | ||||||||||||||
| EUR | 1,181,000 | USD | 1,531,292 | Citibank, N.A. | 10/22/14 | (39,402) | ||||||||||||||
| USD | 10,052,384 | EUR | 7,663,000 | Citibank, N.A. | 10/22/14 | 372,154 | ||||||||||||||
| USD | 2,931,142 | EUR | 2,263,000 | Citibank, N.A. | 10/22/14 | 72,423 | ||||||||||||||
| USD | 1,128,069 | EUR | 859,000 | Citibank, N.A. | 10/22/14 | 42,943 | ||||||||||||||
| USD | 1,776,614 | EUR | 1,378,000 | Citibank, N.A. | 10/22/14 | 35,865 | ||||||||||||||
| USD | 789,691 | EUR | 600,000 | Citibank, N.A. | 10/22/14 | 31,745 | ||||||||||||||
| USD | 601,106 | EUR | 465,000 | Citibank, N.A. | 10/22/14 | 13,698 | ||||||||||||||
| CLP | 348,677,325 | USD | 583,932 | Citibank, N.A. | 10/30/14 | (2,585) | ||||||||||||||
| COP | 1,197,995,000 | USD | 590,000 | Citibank, N.A. | 10/30/14 | 74 | ||||||||||||||
| HUF | 162,635,103 | USD | 659,483 | Citibank, N.A. | 10/30/14 | 1,118 | ||||||||||||||
| HUF | 130,072,371 | USD | 527,586 | Citibank, N.A. | 10/30/14 | 750 | ||||||||||||||
| HUF | 87,610,493 | USD | 355,242 | Citibank, N.A. | 10/30/14 | 620 | ||||||||||||||
| HUF | 167,222,200 | USD | 680,000 | Citibank, N.A. | 10/30/14 | (767) | ||||||||||||||
| HUF | 332,639,093 | USD | 1,367,278 | Citibank, N.A. | 10/30/14 | (16,144) | ||||||||||||||
| IDR | 4,795,830,000 | USD | 390,000 | Citibank, N.A. | 10/30/14 | (1,052) | ||||||||||||||
| ILS | 64,809 | USD | 17,771 | Citibank, N.A. | 10/30/14 | (171) | ||||||||||||||
| INR | 21,131,306 | USD | 340,000 | Citibank, N.A. | 10/30/14 | (746) | ||||||||||||||
| INR | 704,521,333 | USD | 11,460,756 | Citibank, N.A. | 10/30/14 | (149,958) | ||||||||||||||
| MXN | 23,985,255 | USD | 1,817,111 | Citibank, N.A. | 10/30/14 | (35,212) | ||||||||||||||
| MXN | 24,787,287 | USD | 1,878,095 | Citibank, N.A. | 10/30/14 | (36,612) | ||||||||||||||
| MXN | 47,580,495 | USD | 3,611,478 | Citibank, N.A. | 10/30/14 | (76,654) | ||||||||||||||
| MYR | 1,850,770 | USD | 573,047 | Citibank, N.A. | 10/30/14 | (10,589) | ||||||||||||||
| MYR | 2,289,078 | USD | 709,000 | Citibank, N.A. | 10/30/14 | (13,338) | ||||||||||||||
| PEN | 3,170,941 | USD | 1,103,588 | Citibank, N.A. | 10/30/14 | (12,794) | ||||||||||||||
| PHP | 8,358,920 | USD | 188,476 | Citibank, N.A. | 10/30/14 | (2,702) | ||||||||||||||
| PLN | 2,272,413 | USD | 684,910 | Citibank, N.A. | 10/30/14 | 294 | ||||||||||||||
| PLN | 55,726 | USD | 16,853 | Citibank, N.A. | 10/30/14 | (49) | ||||||||||||||
| PLN | 223,872 | USD | 67,729 | Citibank, N.A. | 10/30/14 | (224) | ||||||||||||||
| PLN | 2,055,300 | USD | 620,000 | Citibank, N.A. | 10/30/14 | (263) | ||||||||||||||
| PLN | 223,894 | USD | 67,775 | Citibank, N.A. | 10/30/14 | (264) | ||||||||||||||
| PLN | 12,040,035 | USD | 3,631,252 | Citibank, N.A. | 10/30/14 | (805) | ||||||||||||||
| PLN | 8,598,314 | USD | 2,652,929 | Citibank, N.A. | 10/30/14 | (60,268) | ||||||||||||||
24 |
SCHEDULE OF PORTFOLIO INVESTMENTS |
RBC BlueBay Emerging Market Select Bond Fund (cont.)
September 30, 2014
| Currency Purchased | Currency Sold | Counterparty | Settlement Date | Unrealized Appreciation/ (Depreciation) | ||||||||||||||||
| THB | 12,017,600 | USD | 370,000 | Citibank, N.A. | 10/30/14 | $ | 68 | |||||||||||||
| TRY | 3,243,705 | USD | 1,410,000 | Citibank, N.A. | 10/30/14 | 2,905 | ||||||||||||||
| TRY | 1,605,730 | USD | 700,000 | Citibank, N.A. | 10/30/14 | (570) | ||||||||||||||
| TRY | 3,021,648 | USD | 1,360,000 | Citibank, N.A. | 10/30/14 | (43,819) | ||||||||||||||
| USD | 3,315,884 | COP | 6,583,355,217 | Citibank, N.A. | 10/30/14 | 73,243 | ||||||||||||||
| USD | 3,172,354 | COP | 6,297,122,382 | Citibank, N.A. | 10/30/14 | 70,697 | ||||||||||||||
| USD | 3,143,589 | COP | 6,240,966,578 | Citibank, N.A. | 10/30/14 | 69,592 | ||||||||||||||
| USD | 1,818,222 | ZAR | 19,990,216 | Citibank, N.A. | 10/30/14 | 55,719 | ||||||||||||||
| USD | 1,738,693 | ZAR | 19,099,024 | Citibank, N.A. | 10/30/14 | 54,766 | ||||||||||||||
| USD | 1,653,256 | ZAR | 18,172,923 | Citibank, N.A. | 10/30/14 | 50,981 | ||||||||||||||
| USD | 867,962 | RUB | 33,557,563 | Citibank, N.A. | 10/30/14 | 25,912 | ||||||||||||||
| USD | 2,093,397 | SGD | 2,644,379 | Citibank, N.A. | 10/30/14 | 20,537 | ||||||||||||||
| USD | 2,040,979 | SGD | 2,578,164 | Citibank, N.A. | 10/30/14 | 20,023 | ||||||||||||||
| USD | 1,230,000 | PLN | 4,015,704 | Citibank, N.A. | 10/30/14 | 19,139 | ||||||||||||||
| USD | 1,861,145 | SGD | 2,350,559 | Citibank, N.A. | 10/30/14 | 18,603 | ||||||||||||||
| USD | 1,030,000 | PLN | 3,364,546 | Citibank, N.A. | 10/30/14 | 15,484 | ||||||||||||||
| USD | 1,030,000 | PLN | 3,365,937 | Citibank, N.A. | 10/30/14 | 15,065 | ||||||||||||||
| USD | 660,000 | TRY | 1,487,178 | Citibank, N.A. | 10/30/14 | 12,210 | ||||||||||||||
| USD | 704,839 | PLN | 2,297,452 | Citibank, N.A. | 10/30/14 | 12,085 | ||||||||||||||
| USD | 324,718 | TRY | 722,449 | Citibank, N.A. | 10/30/14 | 10,031 | ||||||||||||||
| USD | 1,684,496 | THB | 54,386,473 | Citibank, N.A. | 10/30/14 | 9,726 | ||||||||||||||
| USD | 300,268 | RON | 1,027,005 | Citibank, N.A. | 10/30/14 | 6,872 | ||||||||||||||
| USD | 620,000 | MXN | 8,272,040 | Citibank, N.A. | 10/30/14 | 5,458 | ||||||||||||||
| USD | 232,623 | IDR | 2,812,413,677 | Citibank, N.A. | 10/30/14 | 4,533 | ||||||||||||||
| USD | 423,567 | HUF | 103,369,432 | Citibank, N.A. | 10/30/14 | 3,695 | ||||||||||||||
| USD | 622,538 | MXN | 8,330,123 | Citibank, N.A. | 10/30/14 | 3,681 | ||||||||||||||
| USD | 1,180,000 | COP | 2,390,208,000 | Citibank, N.A. | 10/30/14 | 2,700 | ||||||||||||||
| USD | 1,230,000 | PLN | 4,077,388 | Citibank, N.A. | 10/30/14 | 540 | ||||||||||||||
| USD | 680,000 | INR | 42,330,000 | Citibank, N.A. | 10/30/14 | 409 | ||||||||||||||
| USD | 190,000 | IDR | 2,339,090,000 | Citibank, N.A. | 10/30/14 | 297 | ||||||||||||||
| USD | 350,000 | TRY | 803,449 | Citibank, N.A. | 10/30/14 | 31 | ||||||||||||||
| USD | 180,000 | THB | 5,849,388 | Citibank, N.A. | 10/30/14 | (125) | ||||||||||||||
| USD | 1,493,544 | BRL | 3,669,488 | Citibank, N.A. | 11/4/14 | 9,526 | ||||||||||||||
| USD | 1,245,000 | BRL | 3,077,018 | Citibank, N.A. | 11/4/14 | 590 | ||||||||||||||
| USD | 1,210,811 | BRL | 2,993,730 | Citibank, N.A. | 11/4/14 | 84 | ||||||||||||||
| USD | 1,245,000 | BRL | 3,079,508 | Citibank, N.A. | 11/4/14 | (417) | ||||||||||||||
| CNY | 13,282,728 | USD | 2,148,266 | Citibank, N.A. | 1/14/15 | (25) | ||||||||||||||
| CNY | 13,282,728 | USD | 2,148,370 | Citibank, N.A. | 1/14/15 | (129) | ||||||||||||||
| CNY | 13,282,713 | USD | 2,148,437 | Citibank, N.A. | 1/14/15 | (199) | ||||||||||||||
| CNY | 2,471,440 | USD | 400,000 | Citibank, N.A. | 1/14/15 | (289) | ||||||||||||||
| CNY | 13,282,717 | USD | 2,148,785 | Citibank, N.A. | 1/14/15 | (546) | ||||||||||||||
| CNY | 13,282,728 | USD | 2,149,483 | Citibank, N.A. | 1/14/15 | (1,242) | ||||||||||||||
| CNY | 13,282,725 | USD | 2,149,621 | Citibank, N.A. | 1/14/15 | (1,381) | ||||||||||||||
| CNY | 13,282,714 | USD | 2,149,654 | Citibank, N.A. | 1/14/15 | (1,416) | ||||||||||||||
| CNY | 13,282,728 | USD | 2,149,831 | Citibank, N.A. | 1/14/15 | (1,590) | ||||||||||||||
| CNY | 38,485,825 | USD | 6,230,000 | Citibank, N.A. | 1/14/15 | (5,615) | ||||||||||||||
| USD | 3,080,000 | CNY | 19,006,680 | Citibank, N.A. | 1/14/15 | 6,014 | ||||||||||||||
| 25 |
SCHEDULE OF PORTFOLIO INVESTMENTS |
RBC BlueBay Emerging Market Select Bond Fund (cont.)
September 30, 2014
| Currency Purchased | Currency Sold | Counterparty | Settlement Date | Unrealized Appreciation/ (Depreciation) | ||||||||||||||||
| USD | 3,080,000 | CNY | 19,017,460 | Citibank, N.A. | 1/14/15 | $ | 4,270 | |||||||||||||
| USD | 3,004,850 | CNY | 18,560,958 | Citibank, N.A. | 1/14/15 | 2,951 | ||||||||||||||
| USD | 3,004,851 | CNY | 18,561,566 | Citibank, N.A. | 1/14/15 | 2,854 | ||||||||||||||
| USD | 340,299 | CNY | 2,102,708 | Citibank, N.A. | 1/14/15 | 224 | ||||||||||||||
| USD | 790,000 | CNY | 4,884,412 | Citibank, N.A. | 1/14/15 | 35 | ||||||||||||||
|
| |||||||||||||||||||
| Total | $ | 858,078 | ||||||||||||||||||
|
| |||||||||||||||||||
Interest rate swaps as of September 30, 2014:
Fixed | Floating Rate | Counterparty | Expiration Date | Notional Amount (000) | Unrealized Appreciation (Depreciation) | |||||||||||||||||||
8.72% | BRL-CDI | Deutsche Bank AG | 1/2/17 | BRL | 5,227(a) | $ | (346,467) | |||||||||||||||||
11.95% | BRL-CDI | Citibank, N.A. | 1/2/17 | BRL | 4,255(b) | 13,683 | ||||||||||||||||||
11.50% | BRL-CDI | JPMorgan Chase Bank, N.A. | 1/4/21 | BRL | 4,337(a) | (142,476) | ||||||||||||||||||
4.11% | CLP-ICP-CAMARA | BNP Paribas SA | 1/21/16 | CLP | 2,155,900(b) | (43,003) | ||||||||||||||||||
3.54% | HUF-BUBOR-Reuters | Citigroup Global Markets, Inc. | 3/17/16 | HUF | 630,000(b) | (96,854) | ||||||||||||||||||
7.46% | INR-MIBOR-OIS-COMPOUND | Citibank, N.A. | 7/15/15 | INR | 152,740(a) | (20,967) | ||||||||||||||||||
7.96% | INR-MIBOR-OIS-COMPOUND | Citibank, N.A. | 7/16/16 | INR | 1,091,200(a) | (60,424) | ||||||||||||||||||
7.97% | INR-MIBOR-OIS-COMPOUND | Deutsche Bank AG | 7/16/16 | INR | 272,700(a) | (14,832) | ||||||||||||||||||
7.01% | INR-MIBOR-OIS-COMPOUND | Citibank, N.A. | 6/17/18 | INR | 285,000(a) | (144,911) | ||||||||||||||||||
8.41% | INR-MIBOR-OIS-COMPOUND | Deutsche Bank AG | 9/9/18 | INR | 520,810(a) | 148,655 | ||||||||||||||||||
8.62% | INR-MIBOR-OIS-COMPOUND | JPMorgan Chase Bank, N.A. | 4/3/19 | INR | 452,080(a) | 195,058 | ||||||||||||||||||
4.64% | MXN-TIIE-Banxico | Citibank, N.A. | 2/9/15 | MXN | 44,660(b) | (16,512) | ||||||||||||||||||
4.53% | MXN-TIIE-Banxico | Deutsche Bank AG | 3/23/15 | MXN | 25,100(b) | (11,446) | ||||||||||||||||||
4.43% | MXN-TIIE-Banxico | Deutsche Bank AG | 3/18/16 | MXN | 50,160(b) | (35,229) | ||||||||||||||||||
5.27% | MXN-TIIE-Banxico | Citibank, N.A. | 5/5/23 | MXN | 12,360(a) | (63,371) | ||||||||||||||||||
5.27% | MXN-TIIE-Banxico | Deutsche Bank AG | 5/5/23 | MXN | 11,950(a) | (61,262) | ||||||||||||||||||
6.93% | MXN-TIIE-Banxico | Citibank, N.A. | 1/23/24 | MXN | 9,482(b) | (34,144) | ||||||||||||||||||
4.10% | MYR-KLIBOR-BNM | Deutsche Bank AG | 4/8/19 | MYR | 4,000(a) | 8,187 | ||||||||||||||||||
|
| |||||||||||||||||||||||
Total | $ | (726,315) | ||||||||||||||||||||||
|
| |||||||||||||||||||||||
26 |
SCHEDULE OF PORTFOLIO INVESTMENTS |
RBC BlueBay Emerging Market Select Bond Fund (cont.)
September 30, 2014
Total return swaps as of September 30, 2014:
Fixed | Reference Entity | Counterparty | Expiration Date | Notional Amount (000) | Value | ||||||||||||||
11.50% | Indonesia Treasury Bond | Citigroup Global Markets, Inc. | 9/15/19 | IDR | 793,000(a) | $ | 74,270 | ||||||||||||
12.80% | Indonesia Treasury Bond | Citigroup Global Markets, Inc. | 6/15/21 | IDR | 725,000(a) | 75,680 | |||||||||||||
7.00% | Indonesia Treasury Bond | Deutsche Bank AG | 5/15/27 | IDR | 4,680,000(a) | 342,757 | |||||||||||||
9.00% | Indonesia Treasury Bond | Merrill Lynch, Pierce, Fenner & Smith, Inc. | 3/15/29 | IDR | 19,230,090(a) | 1,596,387 | |||||||||||||
9.50% | Indonesia Treasury Bond | Citigroup Global Markets, Inc. | 7/15/31 | IDR | 1,161,000(a) | 102,401 | |||||||||||||
|
| ||||||||||||||||||
Total (Cost $2,637,021) | $ | 2,191,495 | |||||||||||||||||
|
| ||||||||||||||||||
| (a) | The Counterparty pays the fixed rate on these swaps. |
| (b) | The Fund pays the fixed rate on these swaps. |
Abbreviations used are defined below:
BRL - Brazilian Real
BRL-CDI - Brazil Cetip Interbank Deposit Rate
CLP - Chilean Peso
CLP-ICP-CAMARA - Indice Camara Promedia Rate for Chilean Pesos
CNY - Chinese Yuan
COP - Colombian Peso
EUR - Euro
HUF - Hungarian Forint
HUF-BUBOR Reuters - Budapest Interbank Offered Rate for Hungarian Forint
IDR - Indonesian Rupiah
ILS - Israeli New Shekel
INR - Indian Rupee
INR-MIBOR-OIS-COMPOUND - Mumbai Interbank Offered Rate - Overnight Index Swap
MXN - Mexican Peso
MXN-TIIE-Banxico - Mexican Interbank Equilibrium Interest Rate
MYR - Malaysian Ringgit
MYR-KLIBOR-BNM - Kuala Lumpur Interbank Offered Rate of Bank Negara Malaysia for Malaysian Ringgit
PEN - Peruvian Neuevo Sol
PHP - Philippine Peso
PLN - Polish Zloty
RON - Romanian Leu
RUB - Russian Ruble
SGD - Singapore Dollar
THB - Thai Baht
TRY - Turkish Lira
USD - United States Dollar
ZAR - South African Rand
| 27 |
SCHEDULE OF PORTFOLIO INVESTMENTS |
RBC BlueBay Emerging Market Select Bond Fund (cont.)
September 30, 2014
Portfolio Diversification (Unaudited)
Industries | Percentage of Net Assets | |||
Foreign Government Bonds | 71.92 | % | ||
Energy | 10.42 | % | ||
Materials | 0.09 | % | ||
Other* | 17.57 | % | ||
|
| |||
| 100.00 | % | |||
|
| |||
| * | Includes cash, Investment Company, interest and dividend receivable, pending trades and Fund share transactions, credit default swaps, interest rate swaps, total return swaps, foreign currency exchange contracts and accrued expenses payable. |
See notes to financial statements.
28 |
SCHEDULE OF PORTFOLIO INVESTMENTS |
RBC BlueBay Emerging Market Corporate Bond Fund
September 30, 2014
Principal Amount | Value | |||||
Corporate Bonds — 90.60% |
| |||||
Argentina — 0.19% |
| |||||
$ 42,000 | YPF SA, 8.75%, 4/4/24 | $ | 42,840 | |||
Barbados — 0.93% |
| |||||
200,000 | Columbus International, Inc., 7.38%, 3/30/21 | 210,000 | ||||
Brazil — 9.14% |
| |||||
200,000 | Centrais Eletricas Brasileiras SA, 5.75%, 10/27/21 | 202,600 | ||||
200,000 | Cosan Overseas Ltd., 8.25%, 11/29/49 | 201,000 | ||||
200,000 | Klabin Finance SA, 5.25%, 7/16/24 | 195,810 | ||||
200,000 | Marfrig Overseas Ltd., 9.50%, 5/4/20 | 211,500 | ||||
300,000 | Odebrecht Finance Ltd., 7.13%, 6/26/42 | 321,300 | ||||
200,000 | Odebrecht Oil & Gas Finance Ltd., 7.00%, 6/17/24(a) | 195,600 | ||||
200,000 | OI SA, 5.75%, 2/10/22 | 186,760 | ||||
75,000 | Petrobras Global Finance BV, 5.63%, 5/20/43 | 66,432 | ||||
280,000 | Petrobras Global Finance BV, 6.25%, 3/17/24 | 293,954 | ||||
50,000 | Petrobras International Finance Co., 6.75%, 1/27/41 | 51,443 | ||||
148,000 | Telemar Norte Leste SA, 5.50%, 10/23/20 | 144,145 | ||||
|
| |||||
| 2,070,544 | ||||||
|
| |||||
Bulgaria — 0.55% |
| |||||
100,000(b) | Vivacom, 6.63%, 11/15/18 | 125,043 | ||||
Chile — 2.92% |
| |||||
200,000 | Cencosud SA, 4.88%, 1/20/23 | 198,060 | ||||
200,000 | Colbun SA, 4.50%, 7/10/24 | 197,500 | ||||
250,000 | Guanay Finance Ltd., 6.00%, 12/15/20 | 265,625 | ||||
|
| |||||
| 661,185 | ||||||
|
| |||||
China — 8.05% |
| |||||
200,000 | Bank of Communications Co. Ltd., 4.50%, 10/3/24(a) | 198,300 | ||||
200,000 | China Overseas Finance Cayman VI Ltd., 6.45%, 6/11/34 | 204,445 | ||||
200,000 | China Resources Power East Foundation Co. Ltd., 7.25%, 5/9/16(a) | 208,000 | ||||
200,000 | CNOOC Finance 2013 Ltd., 3.00%, 5/9/23 | 185,988 | ||||
200,000 | ENN Energy Holdings Ltd., 6.00%, 5/13/21 | 221,318 | ||||
200,000 | Greenland Global Investment Ltd., 5.88%, 7/3/24 | 195,409 | ||||
200,000 | KWG Property Holding Ltd., 8.25%, 8/5/19 | 194,260 | ||||
200,000 | Wanda Properties International Co. Ltd., 7.25%, 1/29/24 | 212,306 | ||||
200,000 | Wanda Properties Overseas Ltd., 4.88%, 11/21/18 | 203,415 | ||||
|
| |||||
| 1,823,441 | ||||||
|
| |||||
Colombia — 7.14% |
| |||||
87,000 | Bancolombia SA, 5.13%, 9/11/22 | 87,226 | ||||
98,000 | Ecopetrol SA, 5.88%, 5/28/45 | 99,195 | ||||
300,000 | Empresa de Energia de Bogota SA, 6.13%, 11/10/21 | 319,500 | ||||
| 29 |
SCHEDULE OF PORTFOLIO INVESTMENTS |
RBC BlueBay Emerging Market Corporate Bond Fund (cont.)
September 30, 2014
Principal Amount | Value | |||||
126,000,000(c) | Empresa de Telecomunicaciones de Bogota, 7.00%, 1/17/23 | $ | 58,413 | |||
386,000,000(c) | Empresas Publicas de Medellin ESP, 7.63%, 9/10/24 | 189,619 | ||||
164,000,000(c) | Empresas Publicas de Medellin ESP, 8.38%, 2/1/21 | 85,475 | ||||
$ 200,000 | Pacific Rubiales Energy Corp., 5.38%, 1/26/19 | 204,500 | ||||
150,000 | Pacific Rubiales Energy Corp., 5.63%, 1/19/25 | 144,570 | ||||
200,000 | Pacific Rubiales Energy Corp., 7.25%, 12/12/21 | 217,940 | ||||
200,000 | Transportadora de Gas Internacional SA ESP, 5.70%, 3/20/22 | 211,240 | ||||
|
| |||||
| 1,617,678 | ||||||
|
| |||||
Guatemala — 0.94% |
| |||||
200,000 | Comcel Trust, 6.88%, 2/6/24 | 213,000 | ||||
Hong Kong — 2.68% |
| |||||
200,000 | Goodman HK Finance, 4.38%, 6/19/24 | 199,356 | ||||
380,000 | Hutchison Whampoa International 12 Ltd., 6.00%, 5/7/17(a) | 408,500 | ||||
|
| |||||
| 607,856 | ||||||
|
| |||||
India — 6.55% |
| |||||
400,000 | Bharti Airtel International Netherlands BV, 5.13%, 3/11/23 | 420,087 | ||||
200,000 | GCX Ltd., 7.00%, 8/1/19 | 204,500 | ||||
200,000 | Greenko Dutch BV, 8.00%, 8/1/19 | 195,760 | ||||
200,000 | ICICI Bank Ltd., 5.75%, 11/16/20 | 221,794 | ||||
200,000 | Oil India Ltd., 5.38%, 4/17/24 | 211,519 | ||||
200,000 | Vedanta Resources Plc, 9.50%, 7/18/18 | 229,876 | ||||
|
| |||||
| 1,483,536 | ||||||
|
| |||||
Indonesia — 1.83% |
| |||||
200,000 | Listrindo Capital BV, 6.95%, 2/21/19 | 211,500 | ||||
200,000 | Perusahaan Gas Negara Persero Tbk PT, 5.13%, 5/16/24 | 202,000 | ||||
|
| |||||
| 413,500 | ||||||
|
| |||||
Israel — 3.70% |
| |||||
200,000 | Altice Financing SA, 7.88%, 12/15/19 | 213,250 | ||||
100,000(b) | Altice SA, 7.25%, 5/15/22 | 130,654 | ||||
35,714 | Delek & Avner Tamar Bond Ltd., 5.41%, 12/30/25(d) | 36,114 | ||||
400,000 | Israel Electric Corp. Ltd., 6.88%, 6/21/23 | 458,000 | ||||
|
| |||||
| 838,018 | ||||||
|
| |||||
Jamaica — 0.88% |
| |||||
200,000 | Digicel Group Ltd., 7.13%, 4/1/22 | 199,500 | ||||
Macau — 1.70% |
| |||||
400,000 | MCE Finance Ltd., 5.00%, 2/15/21 | 384,520 | ||||
Mexico — 10.29% |
| |||||
200,000(b) | America Movil SAB de CV, 5.13%, 9/6/73(a) | 272,189 | ||||
30 |
SCHEDULE OF PORTFOLIO INVESTMENTS |
RBC BlueBay Emerging Market Corporate Bond Fund (cont.)
September 30, 2014
Principal Amount | Value | |||||
2,060,000(c) | America Movil SAB de CV, 6.45%, 12/5/22 | $ | 148,566 | |||
2,000,000(c) | America Movil SAB de CV, 7.13%, 12/9/24 | 147,738 | ||||
$ 200,000 | Banco Santander Mexico SA Institucion de Banca Multiple Grupo Financiero Santand, 5.95%, 1/30/24(a) | 211,000 | ||||
250,000 | BBVA Bancomer SA/Texas, 6.75%, 9/30/22 | 278,125 | ||||
240,000 | Cemex Finance LLC, 9.38%, 10/12/22 | 270,600 | ||||
200,000(b) | Cemex SAB de CV, 4.75%, 1/11/22 | 252,308 | ||||
100,000 | Controladora Mabe SA de CV, 7.88%, 10/28/19 | 113,700 | ||||
200,000 | Fermaca Enterprises S de RL de CV, 6.38%, 3/30/38 | 209,000 | ||||
200,000 | Mexico Generadora de Energia S de rl, 5.50%, 12/6/32 | 201,000 | ||||
100,000 | Petroleos Mexicanos, 5.50%, 6/27/44 | 102,200 | ||||
670,000(c) | Petroleos Mexicanos, 7.19%, 9/12/24 | 49,742 | ||||
600,000(c) | Petroleos Mexicanos, 7.65%, 11/24/21 | 47,055 | ||||
225,000 | Urbi Desarrollos Urbanos SAB de CV, 9.75%, 2/3/22(e) | 28,125 | ||||
|
| |||||
| 2,331,348 | ||||||
|
| |||||
Morocco — 0.92% |
| |||||
200,000 | OCP SA, 5.63%, 4/25/24 | 208,250 | ||||
Panama — 0.97% |
| |||||
200,000 | Sable International Finance Ltd., 8.75%, 2/1/20 | 219,000 | ||||
Paraguay — 0.92% |
| |||||
200,000 | Telefonica Celular del Paraguay SA, 6.75%, 12/13/22 | 207,600 | ||||
Peru — 3.87% |
| |||||
240,000 | Banco de Credito del Peru/Panama, 6.13%, 4/24/27(a) | 256,200 | ||||
200,000 | Banco de Credito del Peru/Panama, 6.88%, 9/16/26(a) | 222,980 | ||||
200,000 | Consorcio Transmantaro SA, 4.38%, 5/7/23 | 193,500 | ||||
200,000 | Corp. Financiera de Desarrollo SA, 5.25%, 7/15/29(a) | 203,500 | ||||
|
| |||||
| 876,180 | ||||||
|
| |||||
Philippines — 1.83% |
| |||||
200,000 | FPC Finance Ltd., 6.00%, 6/28/19 | 214,000 | ||||
200,000 | SM Investments Corp., 4.25%, 10/17/19 | 200,500 | ||||
|
| |||||
| 414,500 | ||||||
|
| |||||
Poland — 1.03% |
| |||||
200,000 | Eileme 2 AB, 11.63%, 1/31/20 | 232,750 | ||||
Qatar — 1.29% |
| |||||
250,000 | Ras Laffan Liquefied Natural Gas Co. Ltd. III, 6.33%, 9/30/27 | 292,500 | ||||
Russia — 4.99% |
| |||||
200,000 | Gazprom Neft OAO Via GPN Capital SA, 6.00%, 11/27/23 | 189,000 | ||||
200,000 | Gazprom OAO Via Gaz Capital SA, 4.95%, 7/19/22 | 186,500 | ||||
200,000 | Gazprom OAO Via Gaz Capital SA, 4.95%, 2/6/28 | 177,238 | ||||
| 31 |
SCHEDULE OF PORTFOLIO INVESTMENTS |
RBC BlueBay Emerging Market Corporate Bond Fund (cont.)
September 30, 2014
Principal Amount | Value | |||||
$ 200,000 | Lukoil International Finance BV, 4.56%, 4/24/23 | $ | 179,580 | |||
200,000 | Polyus Gold International Ltd., 5.63%, 4/29/20 | 192,500 | ||||
200,000 | Vimpel Communications Via VIP Finance Ireland Ltd. OJSC, 7.75%, 2/2/21 | 205,500 | ||||
|
| |||||
| 1,130,318 | ||||||
|
| |||||
Saudi Arabia — 0.87% |
| |||||
200,000 | Saudi Electricity Global Sukuk Co. 2, 5.06%, 4/8/43 | 197,260 | ||||
Singapore — 2.69% |
| |||||
200,000 | Oversea-Chinese Banking Corp. Ltd., 3.15%, 3/11/23(a) | 201,840 | ||||
200,000 | Puma International Financing SA, 6.75%, 2/1/21 | 206,000 | ||||
200,000 | United Overseas Bank Ltd., 3.75%, 9/19/24(a) | 201,260 | ||||
|
| |||||
| 609,100 | ||||||
|
| |||||
South Africa — 2.10% |
| |||||
250,000 | AngloGold Ashanti Holdings Plc, 8.50%, 7/30/20 | 275,000 | ||||
200,000 | Eskom Holdings SOC Ltd., 5.75%, 1/26/21 | 201,000 | ||||
|
| |||||
| 476,000 | ||||||
|
| |||||
South Korea — 0.89% |
| |||||
200,000 | Woori Bank Co. Ltd., 4.75%, 4/30/24 | 202,539 | ||||
Thailand — 0.91% |
| |||||
200,000 | Krung Thai Bank Public Co. Ltd., 5.20%, 12/26/24(a) | 205,940 | ||||
Turkey — 3.68% |
| |||||
200,000 | Turk Telekomunikasyon AS, 3.75%, 6/19/19 | 195,000 | ||||
200,000(b) | Turkiye Garanti Bankasi AS, 3.38%, 7/8/19 | 251,626 | ||||
200,000 | Turkiye Garanti Bankasi AS, 4.75%, 10/17/19 | 199,000 | ||||
200,000 | Turkiye Halk Bankasi AS, 3.88%, 2/5/20 | 187,000 | ||||
|
| |||||
| 832,626 | ||||||
|
| |||||
United Arab Emirates — 5.40% |
| |||||
181,348 | Doric Nimrod Air Finance Alpha Ltd. 2012-1, Class A Pass Through Trust, 5.13%, 11/30/22 | 191,322 | ||||
550,000 | DP World Ltd., 6.85%, 7/2/37 | 616,825 | ||||
200,000 | Emirates Airline, 4.50%, 2/6/25 | 198,250 | ||||
200,000 | MAF Global Securities Ltd., 7.13%, 10/29/49(a) | 217,750 | ||||
|
| |||||
| 1,224,147 | ||||||
|
| |||||
32 |
SCHEDULE OF PORTFOLIO INVESTMENTS |
RBC BlueBay Emerging Market Corporate Bond Fund (cont.)
September 30, 2014
Principal Amount | Value | |||||
Venezuela — 0.75% |
| |||||
$ 336,600 | Petroleos de Venezuela SA, 5.38%, 4/12/27 | $ | 169,848 | |||
|
| |||||
Total Corporate Bonds | 20,520,567 | |||||
|
| |||||
(Cost $20,545,755) | ||||||
| Shares | ||||||
Investment Company — 6.60% |
| |||||
1,495,899 | JPMorgan 100% US Treasury Securities Money Market Fund, Capital Shares | 1,495,899 | ||||
|
| |||||
Total Investment Company | 1,495,899 | |||||
|
| |||||
(Cost $1,495,899) | ||||||
Total Investments (Cost $22,041,654)(f) — 97.20% | $ | 22,016,466 | ||||
Other assets in excess of liabilities — 2.80% | 633,466 | |||||
|
| |||||
NET ASSETS — 100.00% | $ | 22,649,932 | ||||
|
| |||||
| (a) | Variable rate security. The rate reflected in the Schedule of Portfolio Investments is the rate in effect on September 30, 2014. |
| (b) | Principal amount denoted in Euros. |
| (c) | Investment in non-U.S. Dollars. Principal amount reflects local currency. |
| (d) | Security exempt from registration under Rule 144A or Section 4(2) of the Securities Act of 1933, as amended. These securities may be resold in transactions exempt from registration, normally to qualified institutional buyers. Security has been deemed to be liquid based on procedures approved by the Board of Trustees. |
| (e) | Issuer filed for bankruptcy and/or is in default of interest payments. |
| (f) | See notes to financial statements for the tax cost of securities and the breakdown of unrealized appreciation (depreciation). |
Financial futures contracts as of September 30, 2014:
| Unrealized | ||||||||||||||||||
| Long | Number of | Expiration | Appreciation | Notional | ||||||||||||||
Position | Contracts | Date | (Depreciation) | Value | Clearinghouse | |||||||||||||
Five Year U.S | 7 | December, 2014 | $ | 164 | USD | 827,641 | Citigroup Global | |||||||||||
Treasury Bonds | Markets, Inc. | |||||||||||||||||
Ten Year U.S. | 5 | December, 2014 | (781) | USD | 623,984 | Citigroup Global | ||||||||||||
Treasury Bonds | Markets, Inc. | |||||||||||||||||
Thirty Year U.S. | 2 | December, 2014 | 7,312 | USD | 297,688 | Citigroup Global | ||||||||||||
Treasury Bonds | Markets, Inc. | |||||||||||||||||
|
| |||||||||||||||||
Total | $ | 6,695 | ||||||||||||||||
|
| |||||||||||||||||
| 33 |
SCHEDULE OF PORTFOLIO INVESTMENTS |
RBC BlueBay Emerging Market Corporate Bond Fund (cont.)
September 30, 2014
| Short | Number of | Expiration | Unrealized | Notional | ||||||||||||||
Position | Contracts | Date | Appreciation | Value | Clearinghouse | |||||||||||||
90-Day Euro | Citigroup Global | |||||||||||||||||
Dollar | 18 | December, 2016 | $ | 3,775 | USD | 4,404,550 | Markets, Inc. | |||||||||||
|
| |||||||||||||||||
Foreign currency exchange contracts as of September 30, 2014:
| Currency Purchased | Currency Sold | Counterparty | Settlement Date | Unrealized Appreciation/ (Depreciation) | ||||||||||||||||
| COP | 221,018,300 | USD | 110,800 | Citibank, N.A. | 10/2/14 | $ | (1,674) | |||||||||||||
| MXN | 16,794 | USD | 1,267 | Citibank, N.A. | 10/2/14 | (17) | ||||||||||||||
| MXN | 262,260 | USD | 20,000 | Citibank, N.A. | 10/2/14 | (476) | ||||||||||||||
| MXN | 1,715,799 | USD | 130,000 | Citibank, N.A. | 10/2/14 | (2,265) | ||||||||||||||
| RUB | 35,500 | USD | 918 | Citibank, N.A. | 10/2/14 | (22) | ||||||||||||||
| RUB | 7,406,000 | USD | 200,000 | Citibank, N.A. | 10/2/14 | (13,042) | ||||||||||||||
| USD | 100,000 | RUB | 3,717,500 | Citibank, N.A. | 10/2/14 | 6,155 | ||||||||||||||
| USD | 100,000 | RUB | 3,724,000 | Citibank, N.A. | 10/2/14 | 5,991 | ||||||||||||||
| USD | 110,000 | COP | 218,097,000 | Citibank, N.A. | 10/2/14 | 2,316 | ||||||||||||||
| USD | 130,000 | MXN | 1,715,207 | Citibank, N.A. | 10/2/14 | 2,309 | ||||||||||||||
| USD | 21,338 | MXN | 279,646 | Citibank, N.A. | 10/2/14 | 520 | ||||||||||||||
| USD | 1,465 | COP | 2,921,300 | Citibank, N.A. | 10/2/14 | 22 | ||||||||||||||
| USD | 721,511 | EUR | 550,000 | Citibank, N.A. | 10/22/14 | 26,728 | ||||||||||||||
| USD | 451,242 | EUR | 350,000 | Citibank, N.A. | 10/22/14 | 9,107 | ||||||||||||||
| USD | 170,000 | MXN | 2,276,657 | Citibank, N.A. | 11/3/14 | 908 | ||||||||||||||
| USD | 90,000 | MXN | 1,211,796 | Citibank, N.A. | 11/3/14 | (2) | ||||||||||||||
| USD | 110,000 | MXN | 1,482,932 | Citibank, N.A. | 11/3/14 | (140) | ||||||||||||||
| USD | 110,000 | COP | 223,465,000 | Citibank, N.A. | 11/4/14 | (8) | ||||||||||||||
| USD | 50,000 | COP | 101,975,000 | Citibank, N.A. | 11/4/14 | (201) | ||||||||||||||
|
| |||||||||||||||||||
| Total | $ | 36,209 | ||||||||||||||||||
|
| |||||||||||||||||||
Credit default swaps as of September 30, 2014:
Fixed Rate | Issuer | Counterparty | Expiration | Buy/Sell | Notional | Value | |||||||||
1.00% | Brazilian Government International Bond | Citibank, N.A. | 12/20/19 | Buy | USD 140 | $ | 5,019 | ||||||||
1.00% | Mexico Government International Bond | BNP Paribas SA | 12/20/19 | Buy | USD 180 | (1,281) | |||||||||
1.00% | Mexico Government International Bond | Citibank, N.A. | 12/20/19 | Buy | USD 100 | (712) | |||||||||
1.00% | Turkey Government International Bond | BNP Paribas SA | 12/20/19 | Buy | USD 180 | 8,974 | |||||||||
1.00% | Turkey Government International Bond | Citibank, N.A. | 12/20/19 | Buy | USD 100 | 4,986 | |||||||||
|
| ||||||||||||||
Total (Premiums received $18,872) | $ | 16,986 | |||||||||||||
|
| ||||||||||||||
34 |
SCHEDULE OF PORTFOLIO INVESTMENTS |
RBC BlueBay Emerging Market Corporate Bond Fund (cont.)
September 30, 2014
Interest rate swaps as of September 30, 2014:
Fixed | Floating Rate | Counterparty | Expiration | Notional Amount (000) | Unrealized Depreciation | ||||||||
11.05% | BRL-CDI | Citibank, N.A. | 1/2/18 | BRL 354(a) | $ | (7,351) | |||||||
11.14% | BRL-CDI | Citibank, N.A. | 1/2/18 | BRL 338(a) | (6,566) | ||||||||
5.48% | MXN-TIIE-Banxico | Deutsche Bank AG | 9/23/19 | MXN 3,300(b) | (266) | ||||||||
3.27% | MXN-TIIE-Banxico | Deutsche Bank AG | 9/24/19 | MXN 2,400(b) | (898) | ||||||||
|
| ||||||||||||
Total | $ | (15,081) | |||||||||||
|
| ||||||||||||
| (a) | The Counterparty pays the fixed rate on these swaps. |
| (b) | The Fund pays the fixed rate on these swaps. |
Abbreviations used are defined below:
BRL - Brazilian Real
BRL-CDI - Brazil CETIP Interbank Deposit Rate
COP - Colombian Peso
EUR - Euro
MXN - Mexican Peso
MXN-TIIE-Banxico - Mexican Interbank Equilibrium Interest Rate
RUB - Russian Ruble
USD - United States Dollar
Portfolio Diversification (Unaudited)
| Percentage | ||||
Industries | of Net Assets | |||
Financials | 24.86 | % | ||
Energy | 15.72 | % | ||
Telecom Services | 15.54 | % | ||
Utilities | 14.56 | % | ||
Materials | 5.75 | % | ||
Consumer Staples | 5.05 | % | ||
Industrials | 4.73 | % | ||
Consumer Discretionary | 4.39 | % | ||
Other* | 9.40 | % | ||
|
| |||
| 100.00 | % | |||
|
| |||
| * | Includes cash, Investment Company, credit default swaps, interest rate swaps, interest and dividend receivable, pending trades and Fund share transactions, foreign currency exchange contracts and accrued expenses payable. |
See notes to financial statements.
| 35 |
SCHEDULE OF PORTFOLIO INVESTMENTS |
RBC BlueBay Global High Yield Bond Fund
September 30, 2014
Principal Amount | Value | |||||
Bank Loans — 10.02% |
| |||||
Croatia (Hrvatska) — 0.67% |
| |||||
190,000(a) | Agrokor, 9.50%, 6/4/18(b)(c) | $ | 233,681 | |||
Italy — 0.16% |
| |||||
250,000(a) | Seat Pagine Term Loan, 0.00%, 6/28/16(b)(d) | 53,967 | ||||
Netherlands — 0.35% |
| |||||
60,795(a) | Ziggo BV Term Loan B1, 3.50%, 1/15/22(b) | 75,614 | ||||
39,165(a) | Ziggo BV Term Loan B2, 3.50%, 1/15/22(b) | 44,794 | ||||
|
| |||||
| 120,408 | ||||||
|
| |||||
United Kingdom — 0.93% |
| |||||
$ 330,000 | Virgin Media Investment Holdings Ltd. Term Loan B, 3.50%, 6/5/20(b) | 321,001 | ||||
United States — 7.91% |
| |||||
228,571 | Ardent Medical Services, Inc. 2nd Lien Term Loan, 11.00%, 1/2/19(b) | 231,143 | ||||
231,000 | Burger King Holdings, Inc. Term Loan B, 0.00%, 9/25/21(b) | 229,267 | ||||
150,000 | CBS Outdoor Americas Capital LLC, 3.00%, 6/3/20(b) | 147,594 | ||||
160,000 | CCO Safari, LLC, 4.25%, 12/11/49(b) | 159,418 | ||||
109,450(a) | Darling International, Inc. Term B EUR Loan, 3.50%, 12/19/20(b) | 137,831 | ||||
697,462 | Dunkin Brands Group, Inc. Term Loan B, 3.25%, 2/7/21(b) | 677,954 | ||||
169,146 | HCA, Inc. Tranche Term Loan B4, 2.98%, 5/1/18(b) | 167,008 | ||||
184,775 | La Quinta Intermediate Holdings LLC, 4.00%, 2/24/21(b) | 182,543 | ||||
410,000 | Pharmedium 2nd Lien Term Loan, 7.75%, 1/23/22(b) | 404,875 | ||||
150,000 | Ranpak Corp. 2nd Lien Term Loan, 8.50%, 4/23/20(b) | 151,249 | ||||
259,350 | SBA Communications Corp. Term Loan B1A, 3.25%, 3/31/21(b) | 253,551 | ||||
|
| |||||
| 2,742,433 | ||||||
|
| |||||
Total Bank Loans | 3,471,490 | |||||
|
| |||||
(Cost $3,621,385) | ||||||
Corporate Bonds — 77.09% |
| |||||
Australia — 0.41% |
| |||||
130,000 | TFS Corp. Ltd., 11.00%, 7/15/18(e) | 142,350 | ||||
Belgium — 1.54% |
| |||||
500,000 | LBC Tank Terminals Holding Netherlands BV, 6.88%, 5/15/23(e) | 533,750 | ||||
Canada — 2.84% |
| |||||
67,000 | Baytex Energy Corp., 5.13%, 6/1/21(e) | 64,990 | ||||
130,000 | Baytex Energy Corp., 5.63%, 6/1/24(e) | 124,800 | ||||
210,000 | Cott Beverages, Inc., 5.38%, 7/1/22(e) | 203,175 | ||||
170,000(f) | Great Canadian Gaming Corp., 6.63%, 7/25/22(e) | 158,623 | ||||
36 |
SCHEDULE OF PORTFOLIO INVESTMENTS |
RBC BlueBay Global High Yield Bond Fund (cont.)
September 30, 2014
Principal Amount | Value | |||||
$ 319,000 | Mood Media Corp., 9.25%, 10/15/20(e) | $ | 263,175 | |||
168,068 | Videotron Ltd., 5.38%, 6/15/24(e) | 168,488 | ||||
|
| |||||
| 983,251 | ||||||
|
| |||||
France — 2.92% |
| |||||
200,000 | Albea Beauty Holdings SA, 8.38%, 11/1/19(e) | 213,500 | ||||
200,000 | Credit Agricole SA, 6.63%, 9/29/49(b) | 192,000 | ||||
200,000 | Credit Agricole SA, 7.88%, 1/23/24(b) | 203,000 | ||||
200,000 | Numericable Group SA, 6.00%, 5/15/22(e) | 201,000 | ||||
200,000 | Numericable Group SA, 6.25%, 5/15/24(e) | 201,000 | ||||
|
| |||||
| 1,010,500 | ||||||
|
| |||||
Germany — 2.49% |
| |||||
100,000(a) | Hypo Real Estate International Trust I, 5.86%, 6/14/17 | 107,676 | ||||
290,000(g) | UPC Holding BV, 6.75%, 3/15/23 | 331,858 | ||||
200,000(a) | UPCB Finance Ltd., 7.63%, 1/15/20 | 264,610 | ||||
150,000 | UPCB Finance V Ltd., 7.25%, 11/15/21(e) | 160,125 | ||||
|
| |||||
| 864,269 | ||||||
|
| |||||
Ireland — 1.17% |
| |||||
330,000(a) | Bank of Ireland, 4.25%, 6/11/24(b) | 406,388 | ||||
Israel — 0.62% |
| |||||
200,000 | Altice Financing SA, 7.88%, 12/15/19(e) | 213,250 | ||||
Italy — 1.18% |
| |||||
170,000(a) | Wind Acquisition Finance SA, 4.00%, 7/15/20 | 211,499 | ||||
150,000(a) | Wind Acquisition Finance SA, 7.00%, 4/23/21 | 195,426 | ||||
|
| |||||
| 406,925 | ||||||
|
| |||||
Jamaica — 2.70% |
| |||||
200,000 | Digicel Ltd., 6.00%, 4/15/21 | 198,000 | ||||
450,000 | Digicel Ltd., 7.00%, 2/15/20(e) | 463,500 | ||||
270,000 | Digicel Ltd., 8.25%, 9/1/17(e) | 275,063 | ||||
|
| |||||
| 936,563 | ||||||
|
| |||||
Luxembourg — 0.83% |
| |||||
230,000(a) | Monitchem HoldCo 3 SA, 5.25%, 6/15/21 | 286,872 | ||||
Mexico — 0.10% |
| |||||
280,000 | Urbi Desarrollos Urbanos SAB de CV, 9.75%, 2/3/22(d) | 35,000 | ||||
Netherlands — 1.94% |
| |||||
260,000 | InterGen NV, 7.00%, 6/30/23(e) | 254,150 | ||||
| 37 |
SCHEDULE OF PORTFOLIO INVESTMENTS |
RBC BlueBay Global High Yield Bond Fund (cont.)
September 30, 2014
Principal Amount | Value | |||||||
| 310,000(a | ) | Ziggo Bond Co. BV, 8.00%, 5/15/18 | $ | 418,956 | ||||
|
| |||||||
| 673,106 | ||||||||
|
| |||||||
| Spain — 0.77% |
| ||||||
| 220,000(a | ) | Grupo Isolux Corsan Finance BV, 6.63%, 4/15/21 | 268,147 | |||||
| Switzerland — 0.89% |
| ||||||
| $ 320,000 | Credit Suisse Group AG, 6.25%, 12/29/49(b)(e) | 309,200 | ||||||
| United Kingdom — 10.64% |
| ||||||
| 240,000(h | ) | Brakes Capital, 7.13%, 12/15/18 | 373,511 | |||||
| 200,000(h | ) | Brighthouse Group Plc, 7.88%, 5/15/18 | 320,986 | |||||
| 325,000 | CEVA Group Plc, 7.00%, 3/1/21(e) | 324,187 | ||||||
| 370,000 | EnQuest Plc, 7.00%, 4/15/22(e) | 348,956 | ||||||
| 100,000(h | ) | Equiniti Newco 2 Plc, 7.13%, 12/15/18 | 162,924 | |||||
| 110,000(h | ) | F&C Asset Management Plc, 6.75%, 12/20/26(b) | 190,273 | |||||
| 100,000(h | ) | Johnston Press Bond Plc, 8.63%, 6/1/19 | 153,198 | |||||
| 371,000 | Lloyds Banking Group Plc, 7.50%, 6/27/24(b) | 382,130 | ||||||
| 200,000(h | ) | Moto Finance Plc, 10.25%, 3/15/17 | 346,924 | |||||
| 200,000 | Royal Bank of Scotland Group Plc, 6.99%, 10/29/49(b)(e) | 229,000 | ||||||
| 220,000(h | ) | Stretford 79 Plc, 6.25%, 7/15/21 | 322,805 | |||||
| 200,000 | Virgin Media Secured Finance Plc, 5.50%, 1/15/25(e) | 198,819 | ||||||
| 200,000(h | ) | Virgin Media Secured Finance Plc, 6.00%, 4/15/21 | 334,765 | |||||
|
| |||||||
| 3,688,478 | ||||||||
|
| |||||||
| United States — 46.05% |
| ||||||
| 380,000 | ADT Corp. (The), 4.13%, 6/15/23 | 338,200 | ||||||
| 430,000 | Alliance Data Systems Corp., 5.38%, 8/1/22(e) | 417,100 | ||||||
| 470,000 | AMC Entertainment, Inc., 5.88%, 2/15/22 | 473,525 | ||||||
| 260,000 | Amsurg Corp., 5.63%, 7/15/22(e) | 257,400 | ||||||
| 180,000 | Apex Tool Group LLC, 7.00%, 2/1/21(e) | 165,600 | ||||||
| 229,000 | Athlon Holdings LP/Athlon Finance Corp., 6.00%, 5/1/22(e) | 245,603 | ||||||
| 290,000 | Audatex North America, Inc., 6.00%, 6/15/21(e) | 297,250 | ||||||
| 215,000 | Audatex North America, Inc., 6.13%, 11/1/23(e) | 220,375 | ||||||
| 292,000 | BakerCorp International, Inc., 8.25%, 6/1/19 | 287,620 | ||||||
| 421,000 | BI-LO LLC/BI-LO Finance Corp., 9.25%, 2/15/19(e) | 412,580 | ||||||
| 240,000 | Biomet, Inc., 6.50%, 8/1/20 | 254,400 | ||||||
| 320,000 | Blackboard, Inc., 7.75%, 11/15/19(e) | 316,800 | ||||||
| 320,000 | CEC Entertainment, Inc., 8.00%, 2/15/22(e) | 299,200 | ||||||
| 330,000 | Cequel Communications Holdings I LLC/Cequel Capital Corp., 6.38%, 9/15/20(e) | 339,487 | ||||||
| 281,000 | Chaparral Energy, Inc., 7.63%, 11/15/22 | 288,025 | ||||||
| 90,000 | Chaparral Energy, Inc., 9.88%, 10/1/20 | 96,300 | ||||||
| 320,000 | Chesapeake Energy Corp., 3.48%, 4/15/19(b) | 320,800 | ||||||
| 270,000 | Cinemark USA, Inc., 4.88%, 6/1/23 | 257,175 | ||||||
| 170,000 | Crown Castle International Corp., 5.25%, 1/15/23 | 168,513 | ||||||
| 240,000 | DJO Finance LLC/DJO Finance Corp., 8.75%, 3/15/18 | 253,200 | ||||||
38 |
SCHEDULE OF PORTFOLIO INVESTMENTS |
RBC BlueBay Global High Yield Bond Fund (cont.)
September 30, 2014
Principal Amount | Value | |||||
$530,000 | Envision Healthcare Corp., 5.13%, 7/1/22(e) | $ | 522,050 | |||
420,000 | Epicor Software Corp., 8.63%, 5/1/19 | 444,150 | ||||
60,000 | Gannett Co., Inc., 4.88%, 9/15/21(e) | 58,050 | ||||
60,000 | Gannett Co., Inc., 5.50%, 9/15/24(e) | 59,100 | ||||
522,000 | Geo Group, Inc. (The), 5.13%, 4/1/23 | 502,425 | ||||
80,000 | HCA Holdings, Inc., 6.25%, 2/15/21 | 83,600 | ||||
80,000 | HCA, Inc., 5.00%, 3/15/24 | 78,700 | ||||
560,000 | HCA, Inc., 5.88%, 5/1/23 | 572,600 | ||||
470,000 | Intelsat Jackson Holdings SA, 6.63%, 12/15/22 | 474,700 | ||||
160,000 | Kenan Advantage Group, Inc. (The), 8.38%, 12/15/18(e) | 167,000 | ||||
260,000 | Level 3 Escrow II, Inc., 5.38%, 8/15/22(e) | 256,100 | ||||
90,000 | Level 3 Financing, Inc., 6.13%, 1/15/21(e) | 92,700 | ||||
210,000 | Level 3 Financing, Inc., 7.00%, 6/1/20 | 221,287 | ||||
370,000 | Level 3 Financing, Inc., 8.13%, 7/1/19 | 394,050 | ||||
290,000 | Live Nation Entertainment, Inc., 5.38%, 6/15/22(e) | 288,550 | ||||
290,000 | Memorial Resource Development Corp., 5.88%, 7/1/22(e) | 283,475 | ||||
354,000 | National Mentor Holdings, Inc., 12.50%, 2/15/18(e) | 374,355 | ||||
255,000 | NCR Corp., 5.88%, 12/15/21 | 260,737 | ||||
255,000 | Nielsen Finance LLC/Nielsen Finance Co., 5.00%, 4/15/22(e) | 249,263 | ||||
270,000 | Onex York Acquisition Corp., 8.50%, 10/1/22(e) | 268,313 | ||||
111,000 | Overseas Shipholding Group, Inc., 8.13%, 3/30/18(d) | 112,942 | ||||
60,000 | Overseas Shipholding Group, Inc., Series N-II, 7.50%, 2/15/21 | 57,000 | ||||
259,000 | PAETEC Holding Corp., 9.88%, 12/1/18 | 273,892 | ||||
192,000 | Physio-Control International, Inc., 9.88%, 1/15/19(e) | 205,440 | ||||
230,000 | Pinnacle Entertainment, Inc., 7.75%, 4/1/22 | 250,125 | ||||
200,000 | Regency Energy Partners LP/Regency Energy Finance Corp., 5.00%, 10/1/22 | 197,000 | ||||
320,000 | Sinclair Television Group, Inc., 6.38%, 11/1/21 | 327,200 | ||||
110,000 | Spectrum Brands, Inc., 6.38%, 11/15/20 | 114,675 | ||||
240,000 | Spectrum Brands, Inc., 6.63%, 11/15/22 | 252,000 | ||||
140,000 | Sprint Corp., 7.25%, 9/15/21(e) | 145,775 | ||||
155,000 | Sprint Corp., 7.88%, 9/15/23(e) | 164,300 | ||||
490,000 | Taylor Morrison Communities, Inc./Monarch Communities, Inc., 5.63%, 3/1/24(e) | 471,625 | ||||
50,000 | Taylor Morrison Communities, Inc./Monarch Communities, Inc., 5.63%, 3/1/24 | 48,375 | ||||
187,000 | Tenet Healthcare Corp., 5.50%, 3/1/19(e) | 187,467 | ||||
130,000 | Tenet Healthcare Corp., 8.00%, 8/1/20 | 137,150 | ||||
250,000 | T-Mobile USA, Inc., 6.38%, 3/1/25 | 249,375 | ||||
210,000 | Toys R Us, Inc., 7.38%, 10/15/18 | 144,900 | ||||
160,000 | TW Telecom Holdings, Inc., 5.38%, 10/1/22 | 172,000 | ||||
230,000 | TW Telecom Holdings, Inc., 6.38%, 9/1/23 | 257,600 | ||||
230,000 | United Surgical Partners International, Inc., 9.00%, 4/1/20 | 247,825 | ||||
370,000 | Vertellus Specialties, Inc., 9.38%, 10/1/15(e) | 370,000 | ||||
| 39 |
SCHEDULE OF PORTFOLIO INVESTMENTS |
RBC BlueBay Global High Yield Bond Fund (cont.)
September 30, 2014
Principal Amount | Value | |||||
162,000(a) | WMG Acquisition Corp., 6.25%, 1/15/21 | $ | 214,089 | |||
|
| |||||
| 15,961,113 | ||||||
|
| |||||
Total Corporate Bonds | 26,719,162 | |||||
|
| |||||
(Cost $27,120,654) | ||||||
| Shares | ||||||
Common Stocks — 0.37% |
| |||||
United States — 0.37% |
| |||||
3,110 | ADT Corp. (The) | 110,281 | ||||
13 | CEVA Holdings LLC* | 16,175 | ||||
|
| |||||
Total Common Stocks | 126,456 | |||||
|
| |||||
(Cost $132,403) | ||||||
Warrants/Rights — 0.07% |
| |||||
Australia — 0.07% |
| |||||
48,100 | TFS Corp. Ltd. Warrants, Expire 7/15/18* | 25,058 | ||||
|
| |||||
Total Warrants/Rights | 25,058 | |||||
|
| |||||
(Cost $0) | ||||||
Investment Company — 6.61% |
| |||||
2,292,512 | JPMorgan 100% US Treasury Securities Money Market Fund, Capital Shares | 2,292,512 | ||||
|
| |||||
Total Investment Company | 2,292,512 | |||||
|
| |||||
(Cost $2,292,512) | ||||||
Preferred Stocks — 0.64% |
| |||||
United States — 0.64% |
| |||||
121 | CEVA Holdings LLC, Series A-2* | 150,204 | ||||
8,670 | Federal Home Loan Mortgage Corp. | 71,441 | ||||
|
| |||||
Total Preferred Stocks | 221,645 | |||||
|
| |||||
(Cost $184,545) | ||||||
40 |
SCHEDULE OF PORTFOLIO INVESTMENTS |
RBC BlueBay Global High Yield Bond Fund (cont.)
September 30, 2014
| Value | ||||
Total Investments | $ | 32,856,323 | ||
(Cost $33,351,499)(i) — 94.80% | ||||
Other assets in excess of liabilities — 5.20% | 1,803,851 | |||
|
| |||
NET ASSETS — 100.00% | $ | 34,660,174 | ||
|
| |||
| * | Non-income producing security. |
| (a) | Principal amount denoted in Euros. |
| (b) | Variable rate security. The rate reflected in the Schedule of Portfolio Investments is the rate in effect on September 30, 2014. |
| (c) | Represents a payment-in-kind security which may pay interest/dividends in additional face/shares. |
| (d) | Issuer filed for bankruptcy and/or is in default of interest payments. |
| (e) | Security exempt from registration under Rule 144A or Section 4(2) of the Securities Act of 1933, as amended. These securities may be resold in transactions exempt from registration, normally to qualified institutional buyers. Security has been deemed to be liquid based on procedures approved by the Board of Trustees. |
| (f) | Principal amount denoted in Canadian Dollars. |
| (g) | Principal amount denoted in Swiss Francs. |
| (h) | Principal amount denoted in British Pounds. |
| (i) | See notes to financial statements for the tax cost of securities and the breakdown of unrealized appreciation (depreciation). |
Foreign currency exchange contracts as of September 30, 2014:
| Currency Purchased | Currency Sold | Counterparty | Settlement Date | Unrealized Appreciation (Depreciation) | ||||||||||||||
| CHF | 21,000 | USD | 22,110 | Citibank, N.A. | 10/30/14 | $ (108) | ||||||||||||
| USD | 39,578 | AUD | 44,000 | Citibank, N.A. | 10/30/14 | 1,140 | ||||||||||||
| USD | 155,503 | CAD | 172,000 | Citibank, N.A. | 10/30/14 | 2,045 | ||||||||||||
| USD | 364,297 | CHF | 340,000 | Citibank, N.A. | 10/30/14 | 8,076 | ||||||||||||
| USD | 3,755,695 | EUR | 2,900,000 | Citibank, N.A. | 10/30/14 | 92,090 | ||||||||||||
| USD | 2,589,838 | GBP | 1,600,000 | Citibank, N.A. | 10/30/14 | (3,312) | ||||||||||||
|
| |||||||||||||||||
| Total | $ 99,931 | |||||||||||||||||
|
| |||||||||||||||||
Financial futures contracts as of September 30, 2014:
| Short | Number of | Expiration | Unrealized | Notional | ||||||||||||||||||
Position | Contracts | Date | Appreciation | Value | Clearinghouse | |||||||||||||||||
90-Day Euro Dollar | 14 | December, 2015 | $151 | USD | 3,461,476 | Citigroup Global Markets, Inc. | ||||||||||||||||
| 41 |
SCHEDULE OF PORTFOLIO INVESTMENTS |
RBC BlueBay Global High Yield Bond Fund (cont.)
September 30, 2014
Credit default swaps as of September 30, 2014:
Fixed | Issuer | Counterparty | Expiration | Buy/Sell | Notional | Value | |||||||||
1.00% | ArcelorMittal SA | Barclays Bank Plc | 9/20/19 | Buy | EUR 70 | $ 5,735 | |||||||||
1.00% | ArcelorMittal SA | Morgan Stanley & Co. | 9/20/19 | Buy | EUR 30 | 2,458 | |||||||||
1.00% | ArcelorMittal SA | JPMorgan Chase Bank, N.A. | 9/20/19 | Buy | EUR 20 | 1,638 | |||||||||
|
| ||||||||||||||
Total (Premiums received $10,714) | $ 9,831 | ||||||||||||||
|
| ||||||||||||||
Abbreviations used are defined below:
AUD - Australian Dollar
CAD - Canadian Dollar
CHF - Swiss Franc
EUR - Euro
GBP - British Pound
USD - United States Dollar
Portfolio Diversification (Unaudited)
Industries | Percentage of Net Assets | |||
Telecom Services | 23.05 | % | ||
Financials | 19.80 | % | ||
Consumer Staples | 16.77 | % | ||
Consumer Discretionary | 10.28 | % | ||
Energy | 5.69 | % | ||
Industrials | 4.74 | % | ||
Information Technology | 4.44 | % | ||
Utilities | 2.27 | % | ||
Materials | 1.48 | % | ||
Other* | 11.48 | % | ||
|
| |||
| 100.00 | % | |||
|
| |||
| * | Includes cash, interest and dividend receivable, pending trades and Fund share transactions, futures, Investment Company, credit default swaps, warrants, foreign currency exchange contracts and accrued expenses payable. |
See notes to financial statements.
42 |
SCHEDULE OF PORTFOLIO INVESTMENTS |
RBC BlueBay Global Convertible Bond Fund
September 30, 2014
Principal Amount | Value | |||||
Convertible Bonds — 89.94% |
| |||||
Australia — 4.22% |
| |||||
200,000(a) | Beach Energy Ltd., 3.95%, 4/3/17 | $ | 181,239 | |||
100,000(a) | CFS Retail Property Trust Group, 5.75%, 7/4/16 | 91,166 | ||||
$ 200,000 | Drillsearch Finance Pty. Ltd., 6.00%, 9/1/18 | 214,600 | ||||
200,000 | Paladin Energy Ltd., 3.63%, 11/4/15 | 184,760 | ||||
250,000(a) | Western Areas NL, 6.40%, 7/2/15 | 223,265 | ||||
|
| |||||
| 895,030 | ||||||
|
| |||||
Austria — 0.59% |
| |||||
100,000(b) | IMMOFINANZ AG, 1.50%, 9/11/19 | 125,308 | ||||
China — 7.23% |
| |||||
300,000 | Billion Express Investments Ltd., 0.75%, 10/18/15 | 306,375 | ||||
1,000,000(c) | China Singyes Solar Technologies Holdings Ltd., 5.00%, 8/8/19 | 178,027 | ||||
100,000 | Ctrip.com International Ltd., 1.25%, 10/15/18(d) | 106,875 | ||||
300,000(c) | Kaisa Group Holdings Ltd., 8.00%, 12/20/15 | 55,766 | ||||
2,000,000(e) | Logo Star Ltd., 1.50%, 11/22/18 | 280,752 | ||||
400,000 | Qihoo 360 Technology Co. Ltd., 1.75%, 8/15/21(d) | 352,000 | ||||
2,000,000(e) | Shenzhou International Group Holdings Ltd., 0.50%, 6/18/19 | 252,098 | ||||
|
| |||||
| 1,531,893 | ||||||
|
| |||||
France — 4.38% |
| |||||
11,259(b) | Air France-KLM, 2.03%, 2/15/23 | 159,344 | ||||
6,700(b) | Alcatel-Lucent, 0.13%, 1/30/20 | 30,939 | ||||
15,000(b) | Etablissements Maurel et Prom, 7.13%, 7/31/15 | 274,336 | ||||
2,348(b) | Faurecia, 3.25%, 1/1/18 | 84,076 | ||||
1,054(b) | Unibail-Rodamco SE, 0.00%, 7/1/21(f) | 379,343 | ||||
|
| |||||
| 928,038 | ||||||
|
| |||||
Germany — 4.56% |
| |||||
200,000(b) | Deutsche Wohnen AG, 0.88%, 9/8/21 | 250,969 | ||||
250,000 | Siemens Financieringsmaatschappij NV, 1.05%, 8/16/17 | 267,813 | ||||
250,000 | Siemens Financieringsmaatschappij NV, 1.65%, 8/16/19 | 277,500 | ||||
200,000(b) | TUI AG, 2.75%, 3/24/16 | 170,828 | ||||
|
| |||||
| 967,110 | ||||||
|
| |||||
Hong Kong — 4.74% |
| |||||
2,000,000(c) | China Daye Non-Ferrous Metals Mining Ltd., 0.50%, 5/30/18 | 307,191 | ||||
200,000 | China Overseas Finance Investment Cayman IV Ltd., 0.00%, 2/4/21(f) | 207,100 | ||||
220,000 | PB Issuer No. 3 Ltd., 1.88%, 10/22/18 | 244,200 | ||||
| 43 |
SCHEDULE OF PORTFOLIO INVESTMENTS |
RBC BlueBay Global Convertible Bond Fund (cont.)
September 30, 2014
Principal Amount | Value | |||||
2,000,000(e) | Shine Power International Ltd., 0.50%, 7/28/19(f) | $ | 246,624 | |||
|
| |||||
| 1,005,115 | ||||||
|
| |||||
Hungary — 1.24% |
| |||||
200,000(b) | Magyar Nemzeti Vagyonkezelo Zrt, 3.38%, 4/2/19 | 261,705 | ||||
Japan — 5.35% |
| |||||
$ 100,000 | Gunma Bank Ltd. (The), 0.49%, 10/11/19(f) | 100,950 | ||||
20,000,000(a) | Kawasaki Kisen Kaisha Ltd., 1.40%, 9/26/18(f) | 187,919 | ||||
10,000,000(a) | SBI Holdings, Inc., 0.62%, 11/2/17(f) | 96,102 | ||||
10,000,000(a) | Senshukai Co. Ltd., 0.49%, 4/23/19(f) | 91,270 | ||||
10,000,000(a) | Takashimaya Co. Ltd., 0.42%, 12/11/20(f) | 93,458 | ||||
20,000,000(a) | Toppan Printing Co. Ltd., 0.49%, 12/19/16(f) | 184,454 | ||||
10,000,000(a) | Toppan Printing Co. Ltd., 1.02%, 12/19/19(f) | 92,364 | ||||
10,000,000(a) | Toray Industries, Inc., 0.34%, 8/31/21(f) | 100,251 | ||||
10,000,000(a) | Toray Industries, Inc., 0.47%, 8/30/19(f) | 97,379 | ||||
10,000,000(a) | Yamada Denki Co. Ltd., 0.58%, 6/28/19(f) | 89,856 | ||||
|
| |||||
| 1,134,003 | ||||||
|
| |||||
Luxembourg — 0.69% |
| |||||
100,000(b) | Grand City Properties SA, 1.50%, 2/24/19 | 146,009 | ||||
Malaysia — 3.12% |
| |||||
200,000 | Cahaya Capital Ltd., 0.05%, 9/18/21(f) | 197,000 | ||||
300,000(g) | Indah Capital Ltd., 0.56%, 10/24/18(f) | 254,448 | ||||
200,000 | YTL Corp. Finance Labuan Ltd., 1.88%, 3/18/15 | 210,500 | ||||
|
| |||||
| 661,948 | ||||||
|
| |||||
Mexico — 1.04% |
| |||||
150,000 | Cemex SAB de CV, 3.75%, 3/15/18 | 220,687 | ||||
Netherlands — 1.17% |
| |||||
100,000(b) | ACS Actividades Finance 2 BV, 1.63%, 3/27/19 | 129,211 | ||||
100,000(b) | Air Berlin Finance BV, 6.00%, 3/6/19 | 118,412 | ||||
|
| |||||
| 247,623 | ||||||
|
| |||||
Norway — 2.14% |
| |||||
200,000 | Golden Ocean Group Ltd., 3.07%, 1/30/19 | 166,870 | ||||
200,000(b) | Marine Harvest ASA, 0.88%, 5/6/19 | 287,030 | ||||
|
| |||||
| 453,900 | ||||||
|
| |||||
Russia — 1.81% |
| |||||
300,000 | Lukoil International Finance BV, 2.63%, 6/16/15 | 295,500 | ||||
100,000 | Yandex NV, 1.13%, 12/15/18(d) | 87,188 | ||||
|
| |||||
| 382,688 | ||||||
|
| |||||
44 |
SCHEDULE OF PORTFOLIO INVESTMENTS |
RBC BlueBay Global Convertible Bond Fund (cont.)
September 30, 2014
Principal Amount | Value | |||||
Singapore — 2.83% |
| |||||
250,000(a) | CapitaLand Ltd., 1.85%, 6/19/20 | $ | 185,927 | |||
$ 200,000 | Olam International Ltd., 6.00%, 10/15/16 | 218,250 | ||||
250,000(a) | Suntec Real Estate Investment Trust, 1.40%, 3/18/18 | 195,677 | ||||
|
| |||||
| 599,854 | ||||||
|
| |||||
South Africa — 2.16% |
| |||||
300,000(b) | Steinhoff Finance Holding GmbH, 4.00%, 1/30/21 | 457,069 | ||||
Spain — 2.23% |
| |||||
100,000(b) | Caja de Ahorros y Pensiones de Barcelona, 1.00%, 11/25/17 | 147,588 | ||||
200,000(b) | International Consolidated Airlines Group SA, 1.75%, 5/31/18 | 325,553 | ||||
|
| |||||
| 473,141 | ||||||
|
| |||||
Switzerland — 1.14% |
| |||||
70,000(a) | BKW AG, 0.13%, 9/30/20 | 72,405 | ||||
155,000(a) | Schindler Holding AG, 0.38%, 6/5/17 | 168,240 | ||||
|
| |||||
| 240,645 | ||||||
|
| |||||
Taiwan — 1.59% |
| |||||
200,000 | Advanced Semiconductor Engineering, Inc., 0.00%, 9/5/18(f) | 238,000 | ||||
100,000 | Zhen Ding Technology Holding Ltd., 0.07%, 6/26/19(f) | 99,550 | ||||
|
| |||||
| 337,550 | ||||||
|
| |||||
United Arab Emirates — 3.34% |
| |||||
200,000(b) | Aabar Investments PJSC, 4.00%, 5/27/16 | 282,925 | ||||
400,000 | DP World Ltd., 1.75%, 6/19/24 | 425,500 | ||||
|
| |||||
| 708,425 | ||||||
|
| |||||
United Kingdom — 3.24% |
| |||||
100,000(h) | Helical Bar Jersey Ltd., 4.00%, 6/17/19 | 159,309 | ||||
100,000(h) | INTU Jersey Ltd., 2.50%, 10/4/18 | 175,286 | ||||
100,000(h) | St. Modwen Properties Securities Jersey Ltd., 2.88%, 3/6/19 | 159,520 | ||||
100,000(a) | Tui Travel Plc, 4.90%, 4/27/17 | 192,308 | ||||
|
| |||||
| 686,423 | ||||||
|
| |||||
United States — 31.13% |
| |||||
120,000 | Akamai Technologies, Inc., 0.20%, 2/15/19(d)(f) | 120,225 | ||||
110,000 | American Realty Capital Properties, Inc., 3.75%, 12/15/20 | 110,413 | ||||
200,000 | Ares Capital Corp., 4.38%, 1/15/19 | 205,750 | ||||
100,000 | BioMarin Pharmaceutical, Inc., 0.75%, 10/15/18 | 105,875 | ||||
105,000 | BioMarin Pharmaceutical, Inc., 1.50%, 10/15/20 | 114,975 | ||||
300,000 | Cardtronics, Inc., 1.00%, 12/1/20(d) | 287,813 | ||||
150,000 | Cepheid, Inc., 1.25%, 2/1/21(d) | 147,656 | ||||
200,000 | Cubist Pharmaceuticals, Inc., 1.88%, 9/1/20 | 222,500 | ||||
| 45 |
SCHEDULE OF PORTFOLIO INVESTMENTS |
RBC BlueBay Global Convertible Bond Fund (cont.)
September 30, 2014
Principal Amount | Value | |||||
$ 100,000 | Electronic Arts, Inc., 0.75%, 7/15/16 | $ | 123,345 | |||
100,000 | General Cable Corp., 4.50%, 11/15/29(i) | 72,250 | ||||
72,000 | Huron Consulting Group, Inc., 1.25%, 10/1/19(d) | 70,020 | ||||
119,000 | Intel Corp., 3.25%, 8/1/39 | 199,548 | ||||
155,000 | Jarden Corp., 1.13%, 3/15/34(d) | 154,516 | ||||
100,000 | JDS Uniphase Corp., 0.63%, 8/15/33 | 99,937 | ||||
160,000 | Liberty Interactive LLC, 0.75%, 3/30/43 | 211,900 | ||||
175,000 | Liberty Interactive LLC, 3.50%, 1/15/31 | 95,594 | ||||
180,000 | Liberty Media Corp., 1.38%, 10/15/23(d) | 176,625 | ||||
179,000 | Medidata Solutions, Inc., 1.00%, 8/1/18 | 192,425 | ||||
130,000 | Medivation, Inc., 2.63%, 4/1/17 | 253,500 | ||||
100,000 | Molina Healthcare, Inc., 1.13%, 1/15/20 | 117,750 | ||||
230,000 | NVIDIA Corp., 1.00%, 12/1/18(d) | 251,994 | ||||
337,000 | Priceline Group, Inc. (The), 0.90%, 9/15/21(d) | 317,833 | ||||
170,000 | Priceline Group, Inc. (The), 1.00%, 3/15/18 | 228,756 | ||||
100,000 | Prospect Capital Corp., 4.75%, 4/15/20(d) | 96,750 | ||||
200,000 | QIAGEN NV, 0.38%, 3/19/19 | 204,000 | ||||
200,000 | Salesforce.com, Inc., 0.25%, 4/1/18 | 223,000 | ||||
400,000 | SanDisk Corp., 0.50%, 10/15/20(d) | 478,750 | ||||
100,000 | ServiceNow, Inc., 0.39%, 11/1/18(d)(f) | 105,187 | ||||
130,000 | Ship Finance International Ltd., 3.25%, 2/1/18 | 140,296 | ||||
100,000 | Ship Finance International Ltd., 3.75%, 2/10/16 | 104,720 | ||||
103,000 | SolarCity Corp., 1.63%, 11/1/19(d) | 99,202 | ||||
110,000 | Starwood Property Trust, Inc., 4.55%, 3/1/18 | 117,769 | ||||
300,000 | SunEdison, Inc., 0.25%, 1/15/20(d) | 293,250 | ||||
54,000 | TESARO, Inc., 3.00%, 10/1/21 | 56,363 | ||||
130,000 | Tesla Motors, Inc., 0.25%, 3/1/19 | 123,500 | ||||
200,000 | Tesla Motors, Inc., 1.25%, 3/1/21 | 190,000 | ||||
465,000 | Yahoo!, Inc., 0.11%, 12/1/18(d)(f) | 483,309 | ||||
|
| |||||
| 6,597,296 | ||||||
|
| |||||
Total Convertible Bonds | 19,061,460 | |||||
|
| |||||
(Cost $19,160,319) | ||||||
Foreign Government Bonds — 1.01% |
| |||||
Portugal — 1.01% | ||||||
150,000(b) | Parpublica - Participacoes Publicas SGPS SA, 5.25%, 9/28/17 | 214,799 | ||||
|
| |||||
Total Foreign Government Bonds | 214,799 | |||||
|
| |||||
(Cost $237,703) | ||||||
46 |
SCHEDULE OF PORTFOLIO INVESTMENTS |
RBC BlueBay Global Convertible Bond Fund (cont.)
September 30, 2014
| Shares | Value | |||||
Common Stocks — 2.25% |
| |||||
France — 0.97% |
| |||||
380 | Eurazeo SA | $ | 27,348 | |||
506 | Kering | 102,033 | ||||
922 | Technip SA | 77,570 | ||||
|
| |||||
| 206,951 | ||||||
|
| |||||
Germany — 0.87% |
| |||||
5,727 | Deutsche Post AG | 183,659 | ||||
United States — 0.41% |
| |||||
1,500 | Salesforce.com, Inc.* | 86,295 | ||||
|
| |||||
Total Common Stocks | 476,905 | |||||
|
| |||||
(Cost $547,815) | ||||||
Contracts | ||||||
Call Options Purchased — 0.15% |
| |||||
14 | Adidas AG, Strike Price EUR 68.00, Expires 12/18/15 | 5,022 | ||||
54 | Citrix Systems, Inc., Strike Price USD 90.00, Expires 1/15/16 | 17,280 | ||||
14 | Daimler AG, Strike Price EUR 62.00, Expires 6/17/16 | 9,248 | ||||
|
| |||||
Total Call Options Purchased | 31,550 | |||||
|
| |||||
(Cost $39,893) | ||||||
Put Options Purchased — 0.11% |
| |||||
32 | S & P 500 Index, Strike Price USD 1,900, Expires 10/18/14 | 22,240 | ||||
|
| |||||
Total Put Options Purchased | 22,240 | |||||
|
| |||||
(Cost $48,000) | ||||||
Shares | ||||||
Investment Company — 3.99% |
| |||||
846,343 | JPMorgan 100% US Treasury Securities Money Market Fund, Capital Shares | 846,343 | ||||
|
| |||||
Total Investment Company | 846,343 | |||||
|
| |||||
(Cost $846,343) | ||||||
Total Investments | $ | 20,653,297 | ||||
(Cost $20,880,073)(j) — 97.45% | ||||||
Other assets in excess of liabilities — 2.55% | 539,865 | |||||
|
| |||||
NET ASSETS — 100.00% | $ | 21,193,162 | ||||
|
| |||||
| 47 |
SCHEDULE OF PORTFOLIO INVESTMENTS |
RBC BlueBay Global Convertible Bond Fund (cont.)
September 30, 2014
| * | Non-income producing security. |
| (a) | Investment in non-U.S. Dollars. Principal amount reflects local currency. |
| (b) | Principal amount denoted in Euros. |
| (c) | Principal amount denoted in Chinese Yuans. |
| (d) | Security exempt from registration under Rule 144A or Section 4(2) of the Securities Act of 1933, as amended. These securities may be resold in transactions exempt from registration, normally to qualified institutional buyers. Security has been deemed to be liquid based on procedures approved by the Board of Trustees. |
| (e) | Principal amount denoted in Hong Kong Dollars. |
| (f) | Zero coupon bond. The rate represents the yield at time of purchase. |
| (g) | Principal amount denoted in Singapore Dollars. |
| (h) | Principal amount denoted in British Pounds. |
| (i) | Represents a step-up bond that pays an initial coupon rate for the first period and then a higher coupon rate for the following periods. Rate shown is as of report date. |
| (j) | See notes to financial statements for the tax cost of securities and the breakdown of unrealized appreciation (depreciation). |
Foreign currency exchange contracts as of September 30, 2014:
Currency Purchased | Currency Sold | Counterparty | Settlement | Unrealized | ||||||||||||||||||||||||||
AUD | 59,000 | USD | 51,342 | Citibank, N.A. | 10/30/14 | $ | 199 | |||||||||||||||||||||||
EUR | 25,000 | USD | 31,721 | Citibank, N.A. | 10/30/14 | (138) | ||||||||||||||||||||||||
HKD | 1,215,000 | USD | 156,440 | Citibank, N.A. | 10/30/14 | 22 | ||||||||||||||||||||||||
USD | 569,188 | AUD | 633,000 | Citibank, N.A. | 10/30/14 | 16,215 | ||||||||||||||||||||||||
USD | 169,215 | CHF | 158,000 | Citibank, N.A. | 10/30/14 | 3,677 | ||||||||||||||||||||||||
USD | 73,857 | CHF | 70,000 | Citibank, N.A. | 10/30/14 | 518 | ||||||||||||||||||||||||
USD | 4,523,832 | EUR | 3,494,000 | Citibank, N.A. | 10/30/14 | 109,820 | ||||||||||||||||||||||||
USD | 164,004 | GBP | 100,000 | Citibank, N.A. | 10/30/14 | 1,932 | ||||||||||||||||||||||||
USD | 516,393 | GBP | 319,000 | Citibank, N.A. | 10/30/14 | (617) | ||||||||||||||||||||||||
USD | 944,176 | HKD | 7,318,000 | Citibank, N.A. | 10/30/14 | 1,797 | ||||||||||||||||||||||||
USD | 1,045,775 | JPY | 112,000,000 | Citibank, N.A. | 10/30/14 | 24,350 | ||||||||||||||||||||||||
USD | 638,267 | SGD | 805,000 | Citibank, N.A. | 10/30/14 |
| 7,248
|
| ||||||||||||||||||||||
Total | $ | 165,023 | ||||||||||||||||||||||||||||
Options written as of September 30, 2014:
Contracts | Put Options | Value | ||||
(32) | S & P 500 Index, Strike Price USD 1,800, Expires 10/18/14 | $ | (5,760 | ) | ||
|
| |||||
Total (Premiums received $(16,000)) | $ | (5,760 | ) | |||
|
| |||||
48 |
SCHEDULE OF PORTFOLIO INVESTMENTS |
RBC BlueBay Global Convertible Bond Fund (cont.)
September 30, 2014
Abbreviations used are defined below:
AUD - Australian Dollar
CHF - Swiss Franc
EUR - Euro
GBP - British Pound
HKD - Hong Kong Dollar
JPY - Japanese Yen
SGD - Singapore Dollar
USD - United States Dollar
Portfolio Diversification (Unaudited)
| Percentage | ||||
Industries | of Net Assets | |||
Financials | 20.01 | % | ||
Consumer Staples | 13.88 | % | ||
Industrials | 13.84 | % | ||
Consumer Discretionary | 12.49 | % | ||
Information Technology | 10.91 | % | ||
Telecom Services | 10.79 | % | ||
Energy | 5.73 | % | ||
Materials | 3.38 | % | ||
Utilities | 1.16 | % | ||
Foreign Government Bonds | 1.01 | % | ||
Other* | 6.80 | % | ||
|
| |||
| 100.00 | % | |||
|
| |||
| * | Includes cash, Investment Company, options, interest and dividend receivable, |
| pending trades and Fund share transactions, foreign currency exchange |
| contracts and accrued expenses payable. |
See notes to financial statements.
| 49 |
SCHEDULE OF PORTFOLIO INVESTMENTS |
RBC BlueBay Absolute Return Fund
September 30, 2014
Principal Amount | Value | |||||
Corporate Bonds — 35.03% |
| |||||
Australia — 1.50% |
| |||||
4,600,000(a) | Origin Energy Finance Ltd., 4.00%, 9/16/74(b) | $ | 5,708,385 | |||
1,900,000(a) | Santos Finance Ltd., 8.25%, 9/22/70(b) | 2,712,363 | ||||
|
| |||||
| 8,420,748 | ||||||
|
| |||||
Belgium — 1.15% |
| |||||
5,100,000(a) | BNP Paribas Fortis SA, 4.63%, 10/29/49(b) | 6,452,541 | ||||
Brazil — 0.97% |
| |||||
$ 752,000 | Oi SA, 5.75%, 2/10/22 | 702,218 | ||||
2,825,000(c) | Petrobras International Finance Co., 6.25%, 12/14/26 | 4,743,446 | ||||
|
| |||||
| 5,445,664 | ||||||
|
| |||||
Finland — 0.52% |
| |||||
2,113,000 | Nokia OYJ, 5.38%, 5/15/19 | 2,237,918 | ||||
631,000 | Nokia OYJ, 6.63%, 5/15/39 | 666,992 | ||||
|
| |||||
| 2,904,910 | ||||||
|
| |||||
France — 5.15% |
| |||||
3,800,000 | BNP Paribas SA, 5.19%, 6/29/49(b) | 3,838,000 | ||||
1,387,000 | BNP Paribas SA, 5.19%, 6/29/49(b)(d) | 1,404,338 | ||||
1,300,000(a) | BPCE SA, 6.12%, 10/29/49(b) | 1,812,411 | ||||
3,850,000 | Credit Agricole SA, 6.63%, 9/29/49(b) | 3,696,000 | ||||
2,500,000(a) | Crown European Holdings SA, 4.00%, 7/15/22 | 3,189,219 | ||||
2,000,000(a) | Electricite de France SA, 5.00%, 1/22/26(b) | 2,744,623 | ||||
2,400,000(a) | Groupama SA, 6.38%, 5/28/24(b) | 3,046,796 | ||||
900,000(a) | Natixis, 6.31%, 10/29/49(b) | 1,250,426 | ||||
2,000,000(a) | Orange SA, 4.00%, 10/29/49(b) | 2,502,116 | ||||
2,000,000(a) | Orange SA, 5.00%, 10/29/49(b) | 2,518,535 | ||||
2,400,000(a) | Total Capital Canada Ltd., 2.13%, 9/18/29 | 3,009,725 | ||||
|
| |||||
| 29,012,189 | ||||||
|
| |||||
Germany — 2.27% |
| |||||
2,200,000(a) | Allianz SE, 3.38%, 9/29/49(b) | 2,712,730 | ||||
3,069,000(a) | Bayer AG, 3.00%, 7/1/75(b) | 3,929,427 | ||||
1,124,000(a) | Bayer AG, 3.38%, 7/1/74(b) | 1,471,068 | ||||
4,444,000 | Continental Rubber of America Corp., 4.50%, 9/15/19(d) | 4,666,200 | ||||
|
| |||||
| 12,779,425 | ||||||
|
| |||||
India — 1.32% |
| |||||
3,588,000 | Bharti Airtel International Netherlands BV, 5.35%, 5/20/24 | 3,816,636 | ||||
600,000(a) | ONGC Videsh Ltd., 2.75%, 7/15/21 | 759,699 | ||||
1,600,000 | ONGC Videsh Ltd., 3.25%, 7/15/19 | 1,589,502 | ||||
50 |
SCHEDULE OF PORTFOLIO INVESTMENTS |
RBC BlueBay Absolute Return Fund (cont.)
September 30, 2014
Principal Amount | Value | |||||
$ 1,260,000 | ONGC Videsh Ltd., 4.63%, 7/15/24 | $ | 1,271,649 | |||
|
| |||||
| 7,437,486 | ||||||
|
| |||||
Ireland — 1.18% |
| |||||
1,750,000(a) | Baggot Securities Ltd., 10.24%, 12/29/49 | 2,342,970 | ||||
2,300,000(a) | Bank of Ireland, 4.25%, 6/11/24(b) | 2,832,405 | ||||
1,100,000(a) | LCH Clearnet SA Via Freshwater Finance Plc, 6.58%, 5/29/49(b) | 1,465,778 | ||||
|
| |||||
| 6,641,153 | ||||||
|
| |||||
Italy — 2.35% |
| |||||
1,500,000(a) | Assicurazioni Generali SpA, 7.75%, 12/12/42(b) | 2,337,539 | ||||
3,526,000(a) | Enel SpA, 5.00%, 1/15/75(b) | 4,647,267 | ||||
1,550,000(c) | Enel SpA, 6.63%, 9/15/76(b) | 2,613,278 | ||||
1,000,000 | Enel SpA, 8.75%, 9/24/73(b)(d) | 1,160,000 | ||||
2,000,000(a) | Intesa Sanpaolo SpA, 3.93%, 9/15/26 | 2,505,534 | ||||
|
| |||||
| 13,263,618 | ||||||
|
| |||||
Mexico — 0.07% |
| |||||
368,000 | Trust F/1401, 6.95%, 1/30/44(d) | 406,640 | ||||
Netherlands — 0.48% |
| |||||
2,100,000(a) | Gemalto NV, 2.13%, 9/23/21 | 2,681,331 | ||||
New Zealand — 0.29% |
| |||||
928,000(c) | Chorus Ltd., 6.75%, 4/6/20 | 1,656,985 | ||||
Portugal — 0.53% |
| |||||
2,700,000(a) | Banco Espirito Santo SA, 2.63%, 5/8/17 | 2,991,592 | ||||
Spain — 1.64% |
| |||||
3,600,000(a) | Bankia SA, 4.00%, 5/22/24(b) | 4,376,492 | ||||
1,200,000(a) | Telefonica Europe BV, 5.00%, 3/31/20(b) | 1,553,560 | ||||
2,400,000(a) | Telefonica Europe BV, 5.88%, 3/31/24(b) | 3,163,957 | ||||
100,000(a) | Telefonica Europe BV, 6.50%, 9/29/49(b) | 137,042 | ||||
|
| |||||
| 9,231,051 | ||||||
|
| |||||
Switzerland — 4.02% |
| |||||
2,690,000(a) | Credit Suisse AG, 5.75%, 9/18/25(b) | 3,737,385 | ||||
3,350,000(a) | Credit Suisse AG/London, 1.38%, 1/31/22 | 4,237,660 | ||||
1,323,000 | Credit Suisse Group AG, 6.25%, 12/29/49(b)(d) | 1,278,349 | ||||
2,150,000 | Credit Suisse Group AG, 7.50%, 12/11/49(b)(d) | 2,257,500 | ||||
3,750,000 | UBS AG, 4.75%, 5/22/23(b) | 3,750,000 | ||||
4,156,000(a) | UBS AG, 4.75%, 2/12/26(b) | 5,505,428 | ||||
1,950,000 | UBS AG, 5.13%, 5/15/24 | 1,901,250 | ||||
|
| |||||
| 22,667,572 | ||||||
|
| |||||
| 51 |
SCHEDULE OF PORTFOLIO INVESTMENTS |
RBC BlueBay Absolute Return Fund (cont.)
September 30, 2014
Principal Amount | Value | |||||
United Kingdom — 4.66% |
| |||||
2,300,000(c) | AA Bond Co. Ltd., 3.78%, 7/31/19 | $ | 3,784,924 | |||
500,000(c) | AA Bond Co. Ltd., 4.25%, 7/31/20 | 834,307 | ||||
1,500,000(c) | AA Bond Co. Ltd., 4.72%, 7/31/18 | 2,574,211 | ||||
1,500,000(c) | AA Bond Co. Ltd., 6.27%, 7/31/25 | 2,861,481 | ||||
1,800,000(c) | AA PIK Co. Ltd., 9.50% cash or 10.25% payment-in-kind interest, 11/7/19(e) | 2,998,298 | ||||
1,400,000(a) | British Sky Broadcasting Group Plc, 1.50%, 9/15/21 | 1,772,058 | ||||
1,400,000(a) | British Sky Broadcasting Group Plc, 2.50%, 9/15/26 | 1,798,519 | ||||
$3,087,000 | Inmarsat Finance Plc, 4.88%, 5/15/22(d) | 3,002,108 | ||||
2,095,000(a) | LBG Capital No. 2 Plc, 15.00%, 12/21/19 | 3,972,331 | ||||
1,128,000(c) | LBG Capital No. 2 Plc, 15.00%, 12/21/19 | 2,624,107 | ||||
|
| |||||
| 26,222,344 | ||||||
|
| |||||
United States — 6.93% |
| |||||
366,000 | Actavis Funding SCS, 4.85%, 6/15/44(d) | 346,597 | ||||
1,009,000 | Best Buy Co., Inc., 5.50%, 3/15/21 | 1,041,793 | ||||
3,834,000 | Forest Laboratories, Inc., 4.88%, 2/15/21(d) | 4,090,035 | ||||
1,386,000 | Forest Laboratories, Inc., 5.00%, 12/15/21(d) | 1,481,475 | ||||
118,000 | General Motors Co., 4.88%, 10/2/23 | 124,785 | ||||
3,800,000 | General Motors Co., 6.25%, 10/2/43 | 4,446,000 | ||||
1,400,000(a) | Goldman Sachs Group, Inc. (The), 2.13%, 9/30/24 | 1,769,638 | ||||
2,379,235 | Hewlett-Packard Co., 4.65%, 12/9/21 | 2,577,080 | ||||
2,500,000 | Marathon Petroleum Corp., 4.75%, 9/15/44 | 2,399,910 | ||||
1,750,000 | Martin Marietta Materials, Inc., 4.25%, 7/2/24(d) | 1,774,883 | ||||
3,550,000(a) | Morgan Stanley, 1.88%, 3/30/23 | 4,489,932 | ||||
943,000 | Morgan Stanley, 4.35%, 9/8/26 | 926,796 | ||||
1,500,000(a) | Priceline Group, Inc. (The), 2.38%, 9/23/24 | 1,909,969 | ||||
1,747,000 | Seagate HDD Cayman, 4.75%, 1/1/25(d) | 1,738,265 | ||||
1,700,000 | Sprint Corp., 7.13%, 6/15/24(d) | 1,712,750 | ||||
1,100,000 | Sprint Corp., 7.25%, 9/15/21(d) | 1,145,375 | ||||
750,000 | Sprint Corp., 7.88%, 9/15/23(d) | 795,000 | ||||
735,000 | Tyson Foods, Inc., 4.88%, 8/15/34 | 756,466 | ||||
1,610,000 | Tyson Foods, Inc., 5.15%, 8/15/44 | 1,666,018 | ||||
404,000 | Weatherford International Ltd., 6.50%, 8/1/36 | 458,954 | ||||
2,886,000 | Weatherford International Ltd., 6.75%, 9/15/40 | 3,388,269 | ||||
|
| |||||
| 39,039,990 | ||||||
|
| |||||
Total Corporate Bonds | 197,255,239 | |||||
|
| |||||
(Cost $199,513,447) | ||||||
Foreign Government Bonds — 23.05% |
| |||||
Bulgaria — 1.00% |
| |||||
4,450,000(a) | Bulgaria Government International Bond, 2.95%, 9/3/24 | 5,627,629 | ||||
52 |
SCHEDULE OF PORTFOLIO INVESTMENTS |
RBC BlueBay Absolute Return Fund (cont.)
September 30, 2014
Principal Amount | Value | |||||
Croatia (Hrvatska) — 0.43% |
| |||||
1,900,000(a) | Croatia Government International Bond, 3.88%, 5/30/22 | $ | 2,407,724 | |||
Germany — 1.74% |
| |||||
3,260,000(a) | Bundesrepublik Deutschland, 2.50%, 7/4/44 | 4,733,306 | ||||
2,807,000(a) | Bundesrepublik Deutschland, 4.75%, 7/4/28 | 5,064,676 | ||||
|
| |||||
| 9,797,982 | ||||||
|
| |||||
Hungary — 3.22% |
| |||||
2,298,000(a) | Hungary Government International Bond, 3.88%, 2/24/20 | 3,116,650 | ||||
5,666,000(a) | Hungary Government International Bond, 5.75%, 6/11/18 | 8,096,832 | ||||
4,731,000(a) | Hungary Government International Bond, 6.00%, 1/11/19 | 6,906,229 | ||||
|
| |||||
| 18,119,711 | ||||||
|
| |||||
Iceland — 2.37% |
| |||||
3,333,000(a) | Iceland Government International Bond, 2.50%, 7/15/20 | 4,304,488 | ||||
$ 7,342,000 | Iceland Government International Bond, 5.88%, 5/11/22 | 8,309,168 | ||||
650,000 | Iceland Government International Bond, 5.88%, 5/11/22(d) | 735,625 | ||||
|
| |||||
| 13,349,281 | ||||||
|
| |||||
Italy — 0.54% |
| |||||
2,010,000(a) | Italy Buoni Poliennali Del Tesoro, 4.75%, 9/1/44(d) | 3,060,329 | ||||
Latvia — 1.34% |
| |||||
2,692,000(a) | Republic of Latvia, 2.63%, 1/21/21 | 3,604,749 | ||||
2,950,000(a) | Republic of Latvia, 2.88%, 4/30/24 | 3,960,296 | ||||
|
| |||||
| 7,565,045 | ||||||
|
| |||||
Portugal — 3.18% |
| |||||
4,950,000(a) | Portugal Obrigacoes do Tesouro OT, 3.88%, 2/15/30(d) | 6,333,534 | ||||
1,540,000(a) | Portugal Obrigacoes do Tesouro OT, 4.10%, 4/15/37(d) | 1,964,559 | ||||
1,350,000(a) | Portugal Obrigacoes do Tesouro OT, 4.75%, 6/14/19(d) | 1,935,950 | ||||
5,050,000(a) | Portugal Obrigacoes do Tesouro OT, 5.65%, 2/15/24(d) | 7,652,083 | ||||
|
| |||||
| 17,886,126 | ||||||
|
| |||||
Romania — 2.43% |
| |||||
1,492,000(a) | Romanian Government International Bond, 3.63%, 4/24/24 | 2,003,474 | ||||
7,701,000(a) | Romanian Government International Bond, 4.63%, 9/18/20 | 11,023,909 | ||||
446,000(a) | Romanian Government International Bond, 4.88%, 11/7/19 | 638,865 | ||||
|
| |||||
| 13,666,248 | ||||||
|
| |||||
Slovak Republic — 0.74% |
| |||||
2,800,000(a) | Slovakia Government Bond, 3.63%, 1/16/29 | 4,153,701 | ||||
| 53 |
SCHEDULE OF PORTFOLIO INVESTMENTS |
RBC BlueBay Absolute Return Fund (cont.)
September 30, 2014
Principal Amount | Value | |||||
Slovenia — 1.54% |
| |||||
5,682,000(a) | Slovenia Government Bond, 5.13%, 3/30/26 | $ | 8,700,645 | |||
Spain — 4.52% |
| |||||
1,432,000(a) | Autonomous Community of Catalonia, 4.95%, 2/11/20 | 2,020,335 | ||||
1,103,000(a) | Comunidad Autonoma de Aragon, 8.25%, 1/17/27 | 2,101,365 | ||||
1,000,000(a) | Comunidad Autonoma de Murcia, 4.70%, 3/30/20 | 1,417,781 | ||||
2,500,000(a) | Comunidad Autonoma de Murcia, 4.73%, 11/5/18 | 3,469,459 | ||||
1,300,000(a) | Junta Comunidades de Castilla-La Mancha, 4.88%, 3/18/20 | 1,870,208 | ||||
6,450,000(a) | Spain Government Bond, 3.80%, 4/30/24(d) | 9,376,056 | ||||
1,750,000(a) | Spain Government Bond, 4.00%, 10/31/64 | 2,328,515 | ||||
900,000(a) | Spain Government Bond, 4.40%, 10/31/23(d) | 1,367,853 | ||||
928,000(a) | Spain Government Bond, 5.15%, 10/31/44(d) | 1,531,839 | ||||
|
| |||||
| 25,483,411 | ||||||
|
| |||||
Total Foreign Government Bonds | 129,817,832 | |||||
|
| |||||
(Cost $127,855,717) |
| |||||
Shares | ||||||
Investment Company — 36.01% |
| |||||
202,771,494 | JPMorgan 100% US Treasury Securities Money Market Fund, Capital Shares | 202,771,494 | ||||
|
| |||||
Total Investment Company | 202,771,494 | |||||
|
| |||||
(Cost $202,771,494) |
| |||||
Contracts | ||||||
Put Options Purchased — 0.02% |
| |||||
33,350 | CDX.NA.IG, Strike Price USD 65.00, Expires 11/19/14 | 100,050 | ||||
|
| |||||
Total Put Options Purchased | 100,050 | |||||
|
| |||||
(Cost $100,050) |
| |||||
Total Investments | $ | 529,944,615 | ||||
(Cost $530,240,708)(f) — 94.11% |
| |||||
Other assets in excess of liabilities — 5.89% | 33,188,058 | |||||
|
| |||||
NET ASSETS — 100.00% | $ | 563,132,673 | ||||
|
| |||||
| (a) | Principal amount denoted in Euros. |
| (b) | Variable rate security. The rate reflected in the Schedule of Portfolio Investments is the rate in effect on September 30, 2014. |
| (c) | Principal amount denoted in British Pounds. |
54 |
SCHEDULE OF PORTFOLIO INVESTMENTS |
RBC BlueBay Absolute Return Fund (cont.)
September 30, 2014
| (d) | Security exempt from registration under Rule 144A or Section 4(2) of the Securities Act of 1933, as amended. These securities may be resold in transactions exempt from registration, normally to qualified institutional buyers. Security has been deemed to be liquid based on procedures approved by the Board of Trustees. |
| (e) | Payment-in-kind (“PIK”) security. Income may be paid in additional securities or cash at the discretion of the issuer. |
| (f) | See notes to financial statements for the tax cost of securities and the breakdown of unrealized appreciation (depreciation). |
Foreign currency exchange contracts as of September 30, 2014:
Currency Purchased | Currency Sold | Counterparty | Settlement Date | Unrealized | ||||||||||||||||||||||||||
EUR | 10,550,000 | USD | 13,589,139 | Citibank, N.A. | 10/3/14 | $ | (263,622) | |||||||||||||||||||||||
EUR | 20,900,000 | USD | 27,492,280 | Citibank, N.A. | 10/3/14 | (1,093,862) | ||||||||||||||||||||||||
GBP | 6,834,875 | USD | 11,250,000 | Citibank, N.A. | 10/3/14 | (170,000) | ||||||||||||||||||||||||
GBP | 6,831,970 | USD | 11,250,000 | Citibank, N.A. | 10/3/14 | (174,710) | ||||||||||||||||||||||||
JPY | 1,189,573,600 | USD | 10,966,440 | Citibank, N.A. | 10/3/14 | (119,848) | ||||||||||||||||||||||||
NOK | 36,524,106 | SEK | 40,904,442 | Citibank, N.A. | 10/3/14 | 15,767 | ||||||||||||||||||||||||
NOK | 34,837,947 | SEK | 39,114,653 | Citibank, N.A. | 10/3/14 | 1,376 | ||||||||||||||||||||||||
NOK | 34,837,947 | SEK | 39,114,653 | Citibank, N.A. | 10/3/14 | 1,376 | ||||||||||||||||||||||||
SEK | 119,572,173 | NOK | 106,200,000 | Citibank, N.A. | 10/3/14 | 42,237 | ||||||||||||||||||||||||
USD | 27,508,792 | EUR | 20,900,000 | Citibank, N.A. | 10/3/14 | 1,110,374 | ||||||||||||||||||||||||
USD | 27,306,397 | EUR | 21,100,000 | Citibank, N.A. | 10/3/14 | 655,363 | ||||||||||||||||||||||||
USD | 11,300,000 | JPY | 1,189,573,600 | Citibank, N.A. | 10/3/14 | 453,408 | ||||||||||||||||||||||||
USD | 22,500,000 | GBP | 13,758,632 | Citibank, N.A. | 10/3/14 | 195,915 | ||||||||||||||||||||||||
USD | 13,956,164 | EUR | 10,900,000 | Citibank, N.A. | 10/3/14 | 188,568 | ||||||||||||||||||||||||
EUR | 220,000 | USD | 283,660 | Citibank, N.A. | 10/22/14 | (5,746) | ||||||||||||||||||||||||
GBP | 1,300,000 | USD | 2,118,246 | Citibank, N.A. | 10/22/14 | (11,165) | ||||||||||||||||||||||||
USD | 164,848,717 | EUR | 125,650,000 | Citibank, N.A. | 10/22/14 | 6,122,248 | ||||||||||||||||||||||||
USD | 28,010,780 | GBP | 16,945,000 | Citibank, N.A. | 10/22/14 | 545,788 | ||||||||||||||||||||||||
USD | 19,403,515 | EUR | 15,000,000 | Citibank, N.A. | 10/22/14 | 454,872 | ||||||||||||||||||||||||
USD | 11,664,401 | EUR | 9,000,000 | Citibank, N.A. | 10/22/14 | 295,215 | ||||||||||||||||||||||||
USD | 32,992,872 | EUR | 26,000,000 | Citibank, N.A. | 10/22/14 | 148,557 | ||||||||||||||||||||||||
USD | 5,137,310 | EUR | 4,000,000 | Citibank, N.A. | 10/22/14 | 84,338 | ||||||||||||||||||||||||
USD | 1,682,506 | EUR | 1,300,000 | Citibank, N.A. | 10/22/14 | 40,290 | ||||||||||||||||||||||||
USD | 1,934,478 | EUR | 1,500,000 | Citibank, N.A. | 10/22/14 | 39,614 | ||||||||||||||||||||||||
USD | 5,493,562 | KRW | 5,820,428,939 | Citibank, N.A. | 10/30/14 | 2,612 | ||||||||||||||||||||||||
USD | 5,706,438 | KRW | 6,045,971,061 | Citibank, N.A. | 11/3/14 | 2,713 | ||||||||||||||||||||||||
NOK | 71,887,833 | EUR | 8,773,828 | Citibank, N.A. | 11/7/14 | 88,921 | ||||||||||||||||||||||||
NOK | 35,393,927 | EUR | 4,326,172 | Citibank, N.A. | 11/7/14 |
| 35,716
|
| ||||||||||||||||||||||
Total | $ | 8,686,315 | ||||||||||||||||||||||||||||
| 55 |
SCHEDULE OF PORTFOLIO INVESTMENTS |
RBC BlueBay Absolute Return Fund (cont.)
September 30, 2014
Financial futures contracts as of September 30, 2014:
Long Position | Number of Contracts | Expiration Date | Unrealized Appreciation | Notional | Clearinghouse | |||||||||||||||||
Ten Year Euro-Bond | 155 | December, 2014 | $241,230 | EUR | 23,012,540 | Credit Suisse Securities (USA) LLC | ||||||||||||||||
Short Position | Number of Contracts | Expiration Date | Unrealized Appreciation (Depreciation) | Notional | Clearinghouse | |||||||||||||||||
Five Year Euro-Bobl | 63 | December, 2014 | $ | (23,675) | EUR | 8,040,219 | Credit Suisse Securities (USA) LLC | |||||||||||||||
Five Year U.S. Treasury Bonds | 146 | December, 2014 | 39,625 | USD | 17,305,266 | Credit Suisse Securities (USA) LLC | ||||||||||||||||
90-Day Euro Dollar | 1,071 | December, 2015 | 197,096 | USD | 264,988,458 | Credit Suisse Securities (USA) LLC | ||||||||||||||||
90-Day Euro Dollar | 1,686 | June, 2016 | 122,868 | USD | 414,604,893 | Credit Suisse Securities (USA) LLC | ||||||||||||||||
Ten Year British Bond | 63 | December, 2014 | (58,215) | GBP | 7,091,910 | Credit Suisse Securities (USA) LLC | ||||||||||||||||
Ten Year Euro-BTP | 181 | December, 2014 | (297,262) | EUR | 23,381,565 | Credit Suisse Securities (USA) LLC | ||||||||||||||||
Ten Year U.S. Treasury Bonds | 466 | December, 2014 | (2,604) | USD | 58,079,927 | Credit Suisse Securities (USA) LLC | ||||||||||||||||
Thirty Year Euro-Bond | 63 | December, 2014 | 30,242 | EUR | 8,995,140 | Credit Suisse Securities (USA) LLC | ||||||||||||||||
Thirty Year U.S. Treasury Bonds | 71 | December, 2014 | 90,320 | USD | 10,917,820 | Credit Suisse Securities (USA) LLC | ||||||||||||||||
Twenty Year U.S. Treasury Bonds | 22 | December, 2014 | 30,940 | USD | 3,064,877 | Credit Suisse Securities (USA) LLC | ||||||||||||||||
Two Year U.S. Treasury Bonds | 12 | December, 2014 | 188 | USD | 2,626,313 | Credit Suisse Securities (USA) LLC | ||||||||||||||||
|
| |||||||||||||||||||||
| Total | $ | 129,523 | ||||||||||||||||||||
|
| |||||||||||||||||||||
56 |
SCHEDULE OF PORTFOLIO INVESTMENTS |
RBC BlueBay Absolute Return Fund (cont.)
September 30, 2014
Interest rate swaps as of September 30, 2014:
Fixed | Floating Rate | Counterparty | Expiration Date | Notional Amount (000) | Unrealized Depreciation | ||||||||||||||
0.48% | EUR-EURIBOR-Reuters | JPMorgan Chase Bank, N.A. | 7/4/19 | EUR 9,660(a) | $ | (33,639) | |||||||||||||
1.10% | EUR-EURIBOR-Reuters | JPMorgan Chase Bank, N.A. | 8/15/23 | EUR 58,265(a) | (618,124) | ||||||||||||||
|
| ||||||||||||||||||
Total | $ | (651,763) | |||||||||||||||||
|
| ||||||||||||||||||
| (a) | The Fund pays the fixed rate on these swaps. |
Credit default swaps as of September 30, 2014:
Fixed | Issuer | Counterparty | Expiration Date | Buy/Sell | Notional Amount (000) | Value | ||||||||||||||
1.00% | Anglo American Capital Plc | BNP Paribas SA | 9/20/19 | Buy | EUR | 1,344 | $ | 33,470 | ||||||||||||
1.00% | Baker Hughes, Inc. | Deutsche Bank AG | 9/20/19 | Buy | USD | 4,300 | (99,701) | |||||||||||||
5.00% | Best Buy Co., Inc. | Morgan Stanley & Co. | 6/20/19 | Sell | USD | 2,300(a) | 229,958 | |||||||||||||
5.00% | Best Buy Co., Inc. | Barclays Bank Plc | 6/20/19 | Sell | USD | 477(a) | 47,691 | |||||||||||||
5.00% | Best Buy Co., Inc. | BNP Paribas SA | 6/20/19 | Sell | USD | 64(a) | 6,399 | |||||||||||||
5.00% | Best Buy Co., Inc. | Citibank, N.A. | 9/20/19 | Sell | USD | 383(a) | 36,756 | |||||||||||||
1.00% | BorgWarner, Inc. | Morgan Stanley & Co. | 12/20/19 | Buy | USD | 4,766 | (103,622) | |||||||||||||
1.00% | Boston Scientific Corp. | JPMorgan Chase Bank, N.A. | 12/20/19 | Buy | USD | 4,500 | (54,701) | |||||||||||||
1.00% | Cardinal Health, Inc. | JPMorgan Chase Bank, N.A. | 12/20/19 | Buy | USD | 3,720 | (110,678) | |||||||||||||
1.00% | CDX.NA.HY, Series 22 | JPMorgan Chase Bank, N.A. | 6/20/19 | Sell | USD | 4,000(a) | 245,672 | |||||||||||||
1.00% | CDX.NA.HY, Series 22 | JPMorgan Chase Bank, N.A. | 6/20/19 | Sell | USD | 3,775(a) | 231,790 | |||||||||||||
1.00% | CDX.NA.IG, Series 22 | JPMorgan Chase Bank, N.A. | 6/20/19 | Buy | USD | 31,267 | (512,977) | |||||||||||||
1.00% | CDX.NA.IG, Series 22 | JPMorgan Chase Bank, N.A. | 6/20/19 | Buy | USD | 31,267 | (512,978) | |||||||||||||
1.00% | CDX.NA.IG, Series 22 | JPMorgan Chase Bank, N.A. | 6/20/19 | Buy | USD | 31,266 | (505,348) | |||||||||||||
1.00% | CDX.NA.IG, Series 22 | JPMorgan Chase Bank, N.A. | 6/20/19 | Buy | USD | 23,790 | (390,307) | |||||||||||||
1.00% | CDX.NA.IG, Series 22 | JPMorgan Chase Bank, N.A. | 6/20/19 | Buy | USD | 22,837 | (374,672) | |||||||||||||
1.00% | CDX.NA.IG, Series 22 | JPMorgan Chase Bank, N.A. | 6/20/19 | Buy | USD | 20,486 | (336,101) | |||||||||||||
1.00% | CDX.NA.IG, Series 22 | JPMorgan Chase Bank, N.A. | 6/20/19 | Buy | USD | 19,032 | (312,246) | |||||||||||||
1.00% | CDX.NA.IG, Series 22 | JPMorgan Chase Bank, N.A. | 6/20/19 | Buy | USD | 11,419 | (187,344) | |||||||||||||
1.00% | CDX.NA.IG, Series 22 | JPMorgan Chase Bank, N.A. | 6/20/19 | Buy | USD | 9,610 | (157,665) | |||||||||||||
| 57 |
SCHEDULE OF PORTFOLIO INVESTMENTS |
RBC BlueBay Absolute Return Fund (cont.)
September 30, 2014
Fixed Rate | Issuer | Counterparty | Expiration Date | Buy/Sell | Notional Amount (000) | Value | ||||||||||||||
1.00% | CDX.NA.IG, Series 22 | JPMorgan Chase Bank, N.A. | 6/20/19 | Buy | USD | 7,613 | $ | (124,902) | ||||||||||||
1.00% | CDX.NA.IG, Series 22 | JPMorgan Chase Bank, N.A. | 6/20/19 | Buy | USD | 3,692 | (60,572) | |||||||||||||
5.00% | Chesapeake Energy Corp. | Barclays Bank Plc | 6/20/18 | Sell | USD | 750(a) | 96,794 | |||||||||||||
5.00% | Chesapeake Energy Corp. | Morgan Stanley & Co. | 3/20/19 | Sell | USD | 4,775(a) | 628,618 | |||||||||||||
5.00% | Chesapeake Energy Corp. | Morgan Stanley & Co. | 3/20/19 | Sell | USD | 1,741(a) | 229,199 | |||||||||||||
1.00% | Cytec Industries, Inc. | Morgan Stanley & Co. | 12/20/19 | Buy | USD | 2,360 | (34,205) | |||||||||||||
1.00% | Dover Corp. | JPMorgan Chase Bank, N.A. | 6/20/19 | Buy | USD | 1,200 | (32,151) | |||||||||||||
5.00% | Fiat Finance North America, Inc. | BNP Paribas SA | 9/20/19 | Buy | EUR | 1,700 | (231,280) | |||||||||||||
1.00% | Glencore Finance Europe SA | BNP Paribas SA | 9/20/19 | Buy | EUR | 5,700 | 101,146 | |||||||||||||
1.00% | HJ Heinz Co. | JPMorgan Chase Bank, N.A. | 12/20/19 | Buy | USD | 5,832 | 179,279 | |||||||||||||
1.00% | HJ Heinz Co. | JPMorgan Chase Bank, N.A. | 12/20/19 | Buy | USD | 93 | 2,859 | |||||||||||||
1.00% | Ingersoll-Rand Co. | Barclays Bank Plc | 9/20/19 | Buy | USD | 1,717 | (44,312) | |||||||||||||
1.00% | Ingersoll-Rand Co. | JPMorgan Chase Bank, N.A. | 12/20/19 | Buy | USD | 2,096 | (53,251) | |||||||||||||
5.00% | International Lease Finance Corp. | JPMorgan Chase Bank, N.A. | 6/20/19 | Sell | USD | 3,107(a) | 381,623 | |||||||||||||
5.00% | International Lease Finance Corp. | Deutsche Bank AG | 6/20/19 | Sell | USD | 1,503(a) | 184,191 | |||||||||||||
1.00% | iTraxx Europe Senior Financials, Series 21 | JPMorgan Chase Bank, N.A. | 6/20/19 | Sell | EUR | 36,000(a) | 770,396 | |||||||||||||
1.00% | iTraxx Europe Senior Financials, Series 21 | JPMorgan Chase Bank, N.A. | 6/20/19 | Buy | EUR | 10,753 | (230,096) | |||||||||||||
1.00% | iTraxx Europe Senior Financials, Series 21 | JPMorgan Chase Bank, N.A. | 6/20/19 | Buy | EUR | 10,600 | (226,822) | |||||||||||||
1.00% | Lafarge SA | BNP Paribas SA | 9/20/19 | Buy | EUR | 3,570 | (28,857) | |||||||||||||
1.00% | Mattel, Inc. | Citibank, N.A. | 12/20/19 | Buy | USD | 4,730 | (53,414) | |||||||||||||
1.00% | Mexico Government International Bond | Barclays Bank Plc | 9/20/19 | Buy | USD | 9,067 | (79,024) | |||||||||||||
1.00% | Mexico Government International Bond | BNP Paribas SA | 9/20/19 | Buy | USD | 770 | (6,711) | |||||||||||||
1.00% | Newell Rubbermaid, Inc. | BNP Paribas SA | 9/20/19 | Buy | USD | 493 | (8,654) | |||||||||||||
1.00% | Newell Rubbermaid, Inc. | Citibank, N.A. | 12/20/19 | Buy | USD | 3,252 | (53,259) | |||||||||||||
5.00% | Nokia Corp. | Barclays Bank Plc | 9/20/19 | Sell | EUR | 650(a) | 129,427 | |||||||||||||
1.00% | Nordstrom, Inc. | BNP Paribas SA | 9/20/19 | Buy | USD | 3,776 | (76,681) | |||||||||||||
1.00% | Nordstrom, Inc. | JPMorgan Chase Bank, N.A. | 9/20/19 | Buy | USD | 990 | (20,104) | |||||||||||||
58 |
SCHEDULE OF PORTFOLIO INVESTMENTS |
RBC BlueBay Absolute Return Fund (cont.)
September 30, 2014
Fixed Rate | Issuer | Counterparty | Expiration Date | Buy/Sell | Notional Amount (000) | Value | ||||||||||||||
1.00% | Packaging Corp. of America | BNP Paribas SA | 12/20/19 | Buy | USD | 3,437 | $ | (45,993) | ||||||||||||
1.00% | Quest Diagnostics, Inc. | Deutsche Bank AG | 9/20/19 | Buy | USD | 4,035 | 28,549 | |||||||||||||
1.00% | Quest Diagnostics, Inc. | JPMorgan Chase Bank, N.A. | 12/20/19 | Buy | USD | 940 | 10,296 | |||||||||||||
1.00% | Renault SA | BNP Paribas SA | 9/20/19 | Buy | EUR | 1,485 | 19,527 | |||||||||||||
1.00% | Renault SA | BNP Paribas SA | 9/20/19 | Buy | EUR | 330 | 4,339 | |||||||||||||
5.00% | Sprint Communications, Inc. | Deutsche Bank AG | 9/20/18 | Sell | USD | 700(a) | 70,277 | |||||||||||||
5.00% | Sprint Communications, Inc. | Deutsche Bank AG | 6/20/19 | Sell | USD | 1,560(a) | 127,159 | |||||||||||||
1.00% | Standard Chartered Bank Ltd. | Deutsche Bank AG | 9/20/19 | Buy | EUR | 8,570 | (92,640) | |||||||||||||
1.00% | Standard Chartered Bank Ltd. | Citibank, N.A. | 9/20/19 | Buy | EUR | 500 | (5,405) | |||||||||||||
1.00% | Stanley Black & Decker, Inc. | Morgan Stanley & Co. | 9/20/19 | Buy | USD | 4,500 | (87,355) | |||||||||||||
1.00% | Stanley Black & Decker, Inc. | BNP Paribas SA | 9/20/19 | Buy | USD | 230 | (4,465) | |||||||||||||
1.00% | Tyco International Finance SA | JPMorgan Chase Bank, N.A. | 9/20/19 | Buy | USD | 1,700 | (48,388) | |||||||||||||
1.00% | Waste Management, Inc. | JPMorgan Chase Bank, N.A. | 9/20/19 | Buy | USD | 2,357 | (64,624) | |||||||||||||
1.00% | Weatherford International Ltd. | Barclays Bank Plc | 6/20/18 | Sell | USD | 2,300(a) | 26,327 | |||||||||||||
1.00% | Weatherford International Ltd. | Barclays Bank Plc | 6/20/18 | Sell | USD | 2,200(a) | 25,183 | |||||||||||||
1.00% | Weatherford International Ltd. | Deutsche Bank AG | 6/20/18 | Sell | USD | 1,770(a) | 20,266 | |||||||||||||
1.00% | Weatherford International Ltd. | Morgan Stanley & Co. | 6/20/18 | Sell | USD | 600(a) | 6,870 | |||||||||||||
1.00% | Weatherford International Ltd. | Morgan Stanley & Co. | 6/20/19 | Sell | USD | 2,808(a) | (13,752) | |||||||||||||
|
| |||||||||||||||||||
Total (Premiums received $(1,470,751)) | $ | (1,511,196) | ||||||||||||||||||
|
| |||||||||||||||||||
| (a) | The maximum potential amount the Fund may pay should a negative credit event take place as defined under the terms of the agreement. |
| 59 |
SCHEDULE OF PORTFOLIO INVESTMENTS |
RBC BlueBay Absolute Return Fund (cont.)
September 30, 2014
Abbreviations used are defined below:
Bobl - German Bundesobligationen
BTP - Italian Buoni del Tesoro Poliannuali
EUR - Euro
EURIBOR-Reuters - Euro Interbank Offered Rate
GBP - British Pound
JPY - Japanese Yen
KRW - South Korean Won
NOK - Norwegian Kroner
SEK - Swedish Krona
USD - United States Dollar
Portfolio Diversification (Unaudited)
| Percentage | ||||
Industries | of Net Assets | |||
Foreign Government Bonds | 23.06 | % | ||
Financials | 14.73 | % | ||
Telecom Services | 5.52 | % | ||
Consumer Staples | 3.80 | % | ||
Energy | 3.61 | % | ||
Utilities | 3.00 | % | ||
Consumer Discretionary | 2.26 | % | ||
Information Technology | 1.24 | % | ||
Industrials | 0.88 | % | ||
Other* | 41.90 | % | ||
|
| |||
| 100.00 | % | |||
|
| |||
| * | Includes cash, futures, options, Investment Company, interest and dividend receivable, |
| pending trades and Fund share transactions, credit default swaps, interest rate swaps, |
| foreign currency exchange contracts and accrued expenses payable. |
See notes to financial statements.
60 |
Statements of Assets and Liabilities
September 30, 2014
| RBC | RBC | RBC | RBC | |||||||||||||||||||||||||
| BlueBay | BlueBay | BlueBay | BlueBay | RBC | ||||||||||||||||||||||||
| Emerging Market | Emerging Market | Global | Global | BlueBay | ||||||||||||||||||||||||
| Select | Corporate | High Yield | Convertible | Absolute | ||||||||||||||||||||||||
| Bond Fund | Bond Fund | Bond Fund | Bond Fund | Return Fund | ||||||||||||||||||||||||
Assets: | ||||||||||||||||||||||||||||
Investments, at value (cost $208,578,283, $22,041,654, $33,351,499, $20,880,073 and $530,240,708, respectively) | $ | 199,697,073 | $ | 22,016,466 | $ | 32,856,323 | $ | 20,653,297 | $ | 529,944,615 | ||||||||||||||||||
Total return swaps at value (cost $2,637,021, $0, $0, $0 and $0, respectively) | 2,191,495 | — | — | — | — | |||||||||||||||||||||||
Cash | — | — | 57,558 | 1,019 | — | |||||||||||||||||||||||
Cash at broker for financial futures contracts | 168,692 | 20,709 | 28,174 | 25,321 | 5,910,123 | |||||||||||||||||||||||
Segregated cash for options contracts and swap contracts | 223,481 | 110,711 | 403,861 | 12,938 | 10,821,955 | |||||||||||||||||||||||
Foreign currency, at value (cost $98,890, $132,188, $590,258, $154,963 and $6,879,346, respectively) | 97,088 | 129,262 | 580,014 | 151,481 | 6,839,437 | |||||||||||||||||||||||
Credit default swaps at value (premiums paid $0, $19,192, $10,714, $0 and $3,358,727, respectively) | — | 18,979 | 9,831 | — | 3,874,061 | |||||||||||||||||||||||
Interest and dividends receivable | 2,832,211 | 301,080 | 519,927 | 84,564 | 5,116,451 | |||||||||||||||||||||||
Receivable from advisor | — | — | — | — | 285,384 | |||||||||||||||||||||||
Receivable for capital shares issued | 424,330 | — | — | — | 5,689,332 | |||||||||||||||||||||||
Receivable for investments sold | 16,065,204 | 283,512 | 1,941,622 | 278,412 | 11,793,044 | |||||||||||||||||||||||
Unrealized appreciation on futures contracts | — | 11,251 | 151 | — | 752,509 | |||||||||||||||||||||||
Unrealized appreciation on interest rate swaps contracts | 365,583 | — | — | — | — | |||||||||||||||||||||||
Unrealized appreciation on forward foreign exchange contracts | 1,760,128 | 54,056 | 103,351 | 165,778 | 10,525,268 | |||||||||||||||||||||||
Prepaid expenses and other assets | 17,344 | 16,835 | 16,862 | 9,961 | 27,645 | |||||||||||||||||||||||
|
|
|
|
|
|
|
|
|
| |||||||||||||||||||
Total Assets | 223,842,629 | 22,962,861 | 36,517,674 | 21,382,771 | 591,579,824 | |||||||||||||||||||||||
|
|
|
|
|
|
|
|
|
| |||||||||||||||||||
Liabilities: | ||||||||||||||||||||||||||||
Cash overdraft | — | — | — | — | 5,515 | |||||||||||||||||||||||
Payable for capital shares redeemed | 12,468 | — | 851 | 199 | 357,294 | |||||||||||||||||||||||
Payable for investments purchased | 5,050,021 | 209,925 | 1,774,417 | 124,428 | 11,988,693 | |||||||||||||||||||||||
Payable to broker | 320,000 | — | — | — | 6,853,927 | |||||||||||||||||||||||
Distributions payable | 94,396 | 7,472 | 4,043 | 633 | 465,432 | |||||||||||||||||||||||
Unfunded commitment for term loans | — | — | 2,813 | — | — | |||||||||||||||||||||||
Written options, at value (premiums received $0, $0, $0, $16,000 and $0, respectively) | — | — | — | 5,760 | — | |||||||||||||||||||||||
Credit default swaps at value (premiums received $0, $320, $0, $0 and $4,829,478, respectively) | — | 1,993 | — | — | 5,385,257 | |||||||||||||||||||||||
Unrealized depreciation on forward foreign currency exchange contracts | 902,050 | 17,847 | 3,420 | 755 | 1,838,953 | |||||||||||||||||||||||
Unrealized depreciation on interest rate swaps contracts | 1,091,898 | 15,081 | — | — | 651,763 | |||||||||||||||||||||||
Unrealized depreciation on futures contracts | — | 781 | — | — | 381,756 | |||||||||||||||||||||||
Foreign witholding tax payable | 90,117 | 999 | — | 625 | 7,249 | |||||||||||||||||||||||
Accrued expenses and other payables: | ||||||||||||||||||||||||||||
Investment advisory fees | 143,760 | 4,485 | 14,196 | 325 | 295,292 | |||||||||||||||||||||||
Accounting fees | 4,298 | 3,509 | 3,557 | 3,504 | 5,641 | |||||||||||||||||||||||
Audit fees | 39,000 | 39,000 | 42,100 | 45,100 | 45,375 | |||||||||||||||||||||||
Trustee fees | 74 | 8 | 12 | 7 | 176 | |||||||||||||||||||||||
Distribution fees | 21 | 22 | 25 | — | 19,194 | |||||||||||||||||||||||
Shareholder reports | 748 | 38 | 57 | 38 | 5,095 | |||||||||||||||||||||||
Transfer agent fees | 19,845 | 1,256 | 696 | 692 | 78,464 | |||||||||||||||||||||||
Other | 50,050 | 10,513 | 11,313 | 7,543 | 62,075 | |||||||||||||||||||||||
|
|
|
|
|
|
|
|
|
| |||||||||||||||||||
Total Liabilities | 7,818,746 | 312,929 | 1,857,500 | 189,609 | 28,447,151 | |||||||||||||||||||||||
|
|
|
|
|
|
|
|
|
| |||||||||||||||||||
Net Assets | $ | 216,023,883 | $ | 22,649,932 | $ | 34,660,174 | $ | 21,193,162 | $ | 563,132,673 | ||||||||||||||||||
|
|
|
|
|
|
|
|
|
| |||||||||||||||||||
| 61 |
FINANCIAL STATEMENTS |
Statements of Assets and Liabilities (cont.)
September 30, 2014
| RBC BlueBay Emerging Market Select Bond Fund | RBC BlueBay Emerging Market Corporate Bond Fund | RBC BlueBay Global High Yield Bond Fund | RBC BlueBay Global Convertible Bond Fund | RBC BlueBay Absolute Return Fund | ||||||||||||||||||||||||
Net Assets Consist Of: | ||||||||||||||||||||||||||||
Capital | $ | 228,680,577 | $ | 22,554,141 | $ | 33,969,217 | $ | 19,322,197 | $ | 548,131,016 | ||||||||||||||||||
Undistributed net investment income and distributions in excess of net investment income | 350,316 | 1,802 | (4,043 | ) | (138,332 | ) | (465,432 | ) | ||||||||||||||||||||
Accumulated net realized gains (losses) from investment transactions, futures contracts, swap contracts, written options and foreign currency | (3,690,521 | ) | 86,643 | 1,110,017 | 2,064,654 | 7,573,667 | ||||||||||||||||||||||
Net unrealized appreciation (depreciation) on investments, futures contracts, swap contracts, written options and foreign currency | (9,316,489 | ) | 7,346 | (415,017 | ) | (55,357 | ) | 7,893,422 | ||||||||||||||||||||
|
|
|
|
|
|
|
|
|
| |||||||||||||||||||
Net Assets | $ | 216,023,883 | $ | 22,649,932 | $ | 34,660,174 | $ | 21,193,162 | $ | 563,132,673 | ||||||||||||||||||
|
|
|
|
|
|
|
|
|
| |||||||||||||||||||
Net Assets: | ||||||||||||||||||||||||||||
Class A | $ | 10,251 | $ | 10,631 | $ | 29,327 | N/A | $ | 6,365,074 | |||||||||||||||||||
Class C | N/A | N/A | N/A | N/A | 6,951,616 | |||||||||||||||||||||||
Class I | 216,013,632 | 22,639,301 | 34,630,847 | $ | 21,193,162 | 549,815,983 | ||||||||||||||||||||||
|
|
|
|
|
|
|
|
|
| |||||||||||||||||||
Total | $ | 216,023,883 | $ | 22,649,932 | $ | 34,660,174 | $ | 21,193,162 | $ | 563,132,673 | ||||||||||||||||||
|
|
|
|
|
|
|
|
|
| |||||||||||||||||||
Shares Outstanding (Unlimited number of shares authorized, no par value): | ||||||||||||||||||||||||||||
Class A | 1,051 | 1,060 | 2,816 | N/A | 611,704 | |||||||||||||||||||||||
Class C | N/A | N/A | N/A | N/A | 668,699 | |||||||||||||||||||||||
Class I | 22,165,178 | 2,255,917 | 3,324,558 | 1,904,576 | 52,866,265 | |||||||||||||||||||||||
|
|
|
|
|
|
|
|
|
| |||||||||||||||||||
Total | 22,166,229 | 2,256,977 | 3,327,374 | 1,904,576 | 54,146,668 | |||||||||||||||||||||||
|
|
|
|
|
|
|
|
|
| |||||||||||||||||||
Net Asset Values and Redemption Prices Per Share: | ||||||||||||||||||||||||||||
Class A | $ | 9.75 | $ | 10.03 | $ | 10.41 | N/A | $ | 10.41 | |||||||||||||||||||
|
|
|
|
|
|
|
|
|
| |||||||||||||||||||
Class C | N/A | N/A | N/A | N/A | $ | 10.40 | ||||||||||||||||||||||
|
|
|
|
|
|
|
|
|
| |||||||||||||||||||
Class I | $ | 9.75 | $ | 10.04 | $ | 10.42 | $ | 11.13 | $ | 10.40 | ||||||||||||||||||
|
|
|
|
|
|
|
|
|
| |||||||||||||||||||
Maximum Offering Prices Per Share: | ||||||||||||||||||||||||||||
Class A | $ | 10.18 | $ | 10.48 | $ | 10.87 | N/A | $ | 10.87 | |||||||||||||||||||
|
|
|
|
|
|
|
|
|
| |||||||||||||||||||
Maximum Sales Charge - Class A | 4.25 | % | 4.25 | % | 4.25 | % | N/A | 4.25 | % | |||||||||||||||||||
|
|
|
|
|
|
|
|
|
| |||||||||||||||||||
See notes to financial statements.
62 |
FINANCIAL STATEMENTS |
For the Year Ended September 30, 2014
| RBC BlueBay Emerging Market Select Bond Fund | RBC BlueBay Emerging Market Corporate Bond Fund | RBC BlueBay Global High Yield Bond Fund | RBC BlueBay Global Convertible Bond Fund | RBC BlueBay Absolute Return Fund | ||||||||||||||||||||||||
Investment Income: | ||||||||||||||||||||||||||||
Interest income | $ | 10,486,708 | $ | 1,093,236 | $ | 1,952,012 | $ | 224,608 | $ | 13,587,496 | ||||||||||||||||||
Dividend income | 52 | — | 2,008 | 62,548 | — | |||||||||||||||||||||||
Foreign tax withholding | (162,809 | ) | (788 | ) | — | (5,448 | ) | (76,937 | ) | |||||||||||||||||||
|
|
|
|
|
|
|
|
|
| |||||||||||||||||||
Total Investment Income | 10,323,951 | 1,092,448 | 1,954,020 | 281,708 | 13,510,559 | |||||||||||||||||||||||
|
|
|
|
|
|
|
|
|
| |||||||||||||||||||
Expenses: | ||||||||||||||||||||||||||||
Investment advisory fees | 1,638,949 | 197,105 | 244,364 | 160,310 | 3,643,047 | |||||||||||||||||||||||
Distribution fees - Class A | 21 | 22 | 46 | — | 5,380 | |||||||||||||||||||||||
Distribution fees - Class C | — | — | — | — | 17,799 | |||||||||||||||||||||||
Accounting fees | 53,244 | 44,038 | 44,630 | 44,003 | 67,288 | |||||||||||||||||||||||
Audit fees | 42,918 | 42,918 | 46,018 | 54,868 | 45,543 | |||||||||||||||||||||||
Custodian fees | 156,121 | 21,732 | 14,186 | 14,352 | 98,979 | |||||||||||||||||||||||
Insurance fees | 6,555 | 6,555 | 6,555 | 6,555 | 5,340 | |||||||||||||||||||||||
Legal fees | 5,051 | 989 | 1,947 | 8,137 | 89,959 | |||||||||||||||||||||||
Registration and filing fees | 39,079 | 34,926 | 35,272 | 15,866 | 47,870 | |||||||||||||||||||||||
Shareholder reports | 10,132 | 952 | 1,455 | 900 | 54,882 | |||||||||||||||||||||||
Transfer agent fees - Class A | 4,746 | 4,746 | 4,774 | — | 5,369 | |||||||||||||||||||||||
Transfer agent fees - Class I | 160,217 | 3,968 | 8,009 | 3,828 | 617,731 | |||||||||||||||||||||||
Transfer agent fees - Class C | — | — | — | — | 2,791 | |||||||||||||||||||||||
Offering costs | — | — | — | — | 17,015 | |||||||||||||||||||||||
Trustees’ fees | 5,488 | 558 | 879 | 543 | 13,064 | |||||||||||||||||||||||
Other fees | 23,959 | 15,370 | 19,854 | 11,573 | 54,441 | |||||||||||||||||||||||
|
|
|
|
|
|
|
|
|
| |||||||||||||||||||
Total expenses before fee waiver/reimbursement | 2,146,480 | 373,879 | 427,989 | 320,935 | 4,786,498 | |||||||||||||||||||||||
Expenses waived/reimbursed by: | ||||||||||||||||||||||||||||
Advisor | (97,769 | ) | (135,255 | ) | (118,413 | ) | (120,547 | ) | (148,755 | ) | ||||||||||||||||||
|
|
|
|
|
|
|
|
|
| |||||||||||||||||||
Net Expenses | 2,048,711 | 238,624 | 309,576 | 200,388 | 4,637,743 | |||||||||||||||||||||||
|
|
|
|
|
|
|
|
|
| |||||||||||||||||||
Net Investment Income | 8,275,240 | 853,824 | 1,644,444 | 81,320 | 8,872,816 | |||||||||||||||||||||||
|
|
|
|
|
|
|
|
|
| |||||||||||||||||||
Realized/Unrealized Gains (Losses): | ||||||||||||||||||||||||||||
Net realized gains/(losses) on: | ||||||||||||||||||||||||||||
Investment transactions | 672,574 | 267,506 | 843,013 | 2,043,665 | 26,318,006 | |||||||||||||||||||||||
Foreign currency transactions | (2,342,155 | ) | 5,591 | 165,843 | 162,922 | 2,781,194 | ||||||||||||||||||||||
Written options | — | (10,298 | ) | (3,940 | ) | (26,350 | ) | 4,250 | ||||||||||||||||||||
Futures contracts | (136,016 | ) | (17,868 | ) | (20,415 | ) | 11,109 | (12,430,215 | ) | |||||||||||||||||||
Swap agreements | (177,176 | ) | (24,992 | ) | (66,103 | ) | — | (12,288,725 | ) | |||||||||||||||||||
|
|
|
|
|
|
|
|
|
| |||||||||||||||||||
Net realized gains (losses) | (1,982,773 | ) | 219,939 | 918,398 | 2,191,346 | 4,384,510 | ||||||||||||||||||||||
|
|
|
|
|
|
|
|
|
| |||||||||||||||||||
Net change in unrealized appreciation/(depreciation) on: | ||||||||||||||||||||||||||||
Investments | (2,381,967 | ) | 490,282 | (703,429 | ) | (1,520,718 | ) | (8,737,629 | ) | |||||||||||||||||||
Foreign currency | 324,830 | 42,725 | 308,638 | 285,999 | 13,589,331 | |||||||||||||||||||||||
Written options | — | 234 | — | 10,240 | — | |||||||||||||||||||||||
Futures contracts | 23,484 | (4,876 | ) | 15,698 | — | 1,766,815 | ||||||||||||||||||||||
Swap contracts | (1,065 | ) | (21,558 | ) | 7,951 | — | (683,442 | ) | ||||||||||||||||||||
|
|
|
|
|
|
|
|
|
| |||||||||||||||||||
Net unrealized gains (losses) | (2,034,718 | ) | 506,807 | (371,142 | ) | (1,224,479 | ) | 5,935,075 | ||||||||||||||||||||
|
|
|
|
|
|
|
|
|
| |||||||||||||||||||
Change in net assets resulting from operations | $ | 4,257,749 | $ | 1,580,570 | $ | 2,191,700 | $ | 1,048,187 | $ | 19,192,401 | ||||||||||||||||||
|
|
|
|
|
|
|
|
|
| |||||||||||||||||||
See notes to financial statements.
| 63 |
FINANCIAL STATEMENTS |
Statements of Changes in Net Assets
| RBC BlueBay Emerging Market Select Bond Fund | ||||||||||||||||||||
| For the Year Ended September 30, 2014 | For the Year Ended September 30, 2013 | |||||||||||||||||||
From Investment Activities: | ||||||||||||||||||||
Operations: | ||||||||||||||||||||
Net investment income | $ | 8,275,240 | $ | 4,896,871 | ||||||||||||||||
Net realized losses from investments, foreign currency, futures contracts, written options and swap contracts transactions | (1,982,773 | ) | (7,702,341 | ) | ||||||||||||||||
Net change in unrealized appreciation/(depreciation) on investments, foreign currency, futures contracts and swap contracts | (2,034,718 | ) | (9,631,844 | ) | ||||||||||||||||
|
|
|
| |||||||||||||||||
Change in net assets resulting from operations | 4,257,749 | (12,437,314 | ) | |||||||||||||||||
|
|
|
| |||||||||||||||||
Distributions to Class A Shareholders: | ||||||||||||||||||||
From net investment income | (185 | ) | — | |||||||||||||||||
Return of capital | (154 | ) | — | |||||||||||||||||
Distributions to Class I Shareholders: | ||||||||||||||||||||
From net investment income | (4,940,029 | ) | (1,407,225 | ) | ||||||||||||||||
From net realized gains | — | (2,397,176 | ) | |||||||||||||||||
Return of capital | (3,355,683 | ) | (3,527,048 | ) | ||||||||||||||||
|
|
|
| |||||||||||||||||
Change in net assets resulting from shareholder distributions | (8,296,051 | ) | (7,331,449 | ) | ||||||||||||||||
|
|
|
| |||||||||||||||||
Capital Transactions: | ||||||||||||||||||||
Proceeds from shares issued | 59,340,955 | 115,860,846 | ||||||||||||||||||
Distributions reinvested | 6,954,853 | 6,153,471 | ||||||||||||||||||
Cost of shares redeemed | (32,115,324 | ) | (38,460,514 | ) | ||||||||||||||||
|
|
|
| |||||||||||||||||
Change in net assets resulting from capital transactions | 34,180,484 | 83,553,803 | ||||||||||||||||||
|
|
|
| |||||||||||||||||
Net increase in net assets | 30,142,182 | 63,785,040 | ||||||||||||||||||
Net Assets: | ||||||||||||||||||||
Beginning of year | 185,881,701 | 122,096,661 | ||||||||||||||||||
|
|
|
| |||||||||||||||||
End of year | $ | 216,023,883 | $ | 185,881,701 | ||||||||||||||||
|
|
|
| |||||||||||||||||
Undistributed net investment income/distributions in excess of net investment income | $ | 350,316 | $ | (282,510 | ) | |||||||||||||||
|
|
|
| |||||||||||||||||
Share Transactions: | ||||||||||||||||||||
Issued | 5,948,052 | 10,663,181 | ||||||||||||||||||
Reinvested | 698,218 | 581,271 | ||||||||||||||||||
Redeemed | (3,221,660 | ) | (3,725,617 | ) | ||||||||||||||||
|
|
|
| |||||||||||||||||
Change in shares resulting from capital transactions | 3,424,610 | 7,518,835 | ||||||||||||||||||
|
|
|
| |||||||||||||||||
See notes to financial statements.
64 |
FINANCIAL STATEMENTS |
Statements of Changes in Net Assets (cont.)
| RBC BlueBay Emerging Market Corporate Bond Fund | ||||||||||||||||||||
| For the Year Ended September 30, 2014 | For the Year Ended September 30, 2013 | |||||||||||||||||||
From Investment Activities: | ||||||||||||||||||||
Operations: | ||||||||||||||||||||
Net investment income | $ | 853,824 | $ | 757,340 | ||||||||||||||||
Net realized gains from investments, foreign currency, futures contracts, written options and swap contracts transactions | 219,939 | 94,317 | ||||||||||||||||||
Net change in unrealized appreciation/(depreciation) on investments, foreign currency, futures contracts, written options and swap contracts | 506,807 | (1,205,969 | ) | |||||||||||||||||
|
|
|
| |||||||||||||||||
Change in net assets resulting from operations | 1,580,570 | (354,312 | ) | |||||||||||||||||
|
|
|
| |||||||||||||||||
Distributions to Class A Shareholders: | ||||||||||||||||||||
From net investment income | (339 | ) | — | |||||||||||||||||
Distributions to Class I Shareholders: | ||||||||||||||||||||
From net investment income | (851,519 | ) | (767,798 | ) | ||||||||||||||||
From net realized gains | (14,865 | ) | (1,006,248 | ) | ||||||||||||||||
|
|
|
| |||||||||||||||||
Change in net assets resulting from shareholder distributions | (866,723 | ) | (1,774,046 | ) | ||||||||||||||||
|
|
|
| |||||||||||||||||
Capital Transactions: | ||||||||||||||||||||
Proceeds from shares issued | 2,665,426 | 2,023,812 | ||||||||||||||||||
Distributions reinvested | 806,816 | 1,728,269 | ||||||||||||||||||
Cost of shares redeemed | (462,871 | ) | (320,211 | ) | ||||||||||||||||
|
|
|
| |||||||||||||||||
Change in net assets resulting from capital transactions | 3,009,371 | 3,431,870 | ||||||||||||||||||
|
|
|
| |||||||||||||||||
Net increase in net assets | 3,723,218 | 1,303,512 | ||||||||||||||||||
Net Assets: | ||||||||||||||||||||
Beginning of year | 18,926,714 | 17,623,202 | ||||||||||||||||||
|
|
|
| |||||||||||||||||
End of year | $ | 22,649,932 | $ | 18,926,714 | ||||||||||||||||
|
|
|
| |||||||||||||||||
Undistributed net investment income | $ | 1,802 | $ | 1,873 | ||||||||||||||||
|
|
|
| |||||||||||||||||
Share Transactions: | ||||||||||||||||||||
Issued | 267,421 | 204,329 | ||||||||||||||||||
Reinvested | 80,832 | 164,943 | ||||||||||||||||||
Redeemed | (46,845 | ) | (29,641 | ) | ||||||||||||||||
|
|
|
| |||||||||||||||||
Change in shares resulting from capital transactions | 301,408 | 339,631 | ||||||||||||||||||
|
|
|
| |||||||||||||||||
See notes to financial statements.
| 65 |
FINANCIAL STATEMENTS |
Statements of Changes in Net Assets (cont.)
| RBC BlueBay Global High Yield Bond Fund | ||||||||||||||||||||||
| For the Year Ended September 30, 2014 | For the Year Ended September 30, 2013 | |||||||||||||||||||||
From Investment Activities: | ||||||||||||||||||||||
Operations: | ||||||||||||||||||||||
Net investment income | $ | 1,644,444 | $ | 1,599,783 | ||||||||||||||||||
Net realized gains from investments, foreign currency, futures contracts, written options and swap contracts transactions | 918,398 | 597,795 | ||||||||||||||||||||
Net change in unrealized appreciation/(depreciation) on investments, foreign currency, futures contracts and swap contracts | (371,142 | ) | (757,776 | ) | ||||||||||||||||||
|
|
|
| |||||||||||||||||||
Change in net assets resulting from operations | 2,191,700 | 1,439,802 | ||||||||||||||||||||
|
|
|
| |||||||||||||||||||
Distributions to Class A Shareholders: | ||||||||||||||||||||||
From net investment income | (880 | ) | — | |||||||||||||||||||
Distributions to Class I Shareholders: | ||||||||||||||||||||||
From net investment income | (1,728,882 | ) | (1,579,302 | ) | ||||||||||||||||||
From net realized gains | (327,407 | ) | (941,326 | ) | ||||||||||||||||||
|
|
|
| |||||||||||||||||||
Change in net assets resulting from shareholder distributions | (2,057,169 | ) | (2,520,628 | ) | ||||||||||||||||||
|
|
|
| |||||||||||||||||||
Capital Transactions: | ||||||||||||||||||||||
Proceeds from shares issued | 3,967,349 | 9,638,828 | ||||||||||||||||||||
Distributions reinvested | 2,024,604 | 2,514,122 | ||||||||||||||||||||
Cost of shares redeemed | (984,810 | ) | (4,178,069 | ) | ||||||||||||||||||
|
|
|
| |||||||||||||||||||
Change in net assets resulting from capital transactions | 5,007,143 | 7,974,881 | ||||||||||||||||||||
|
|
|
| |||||||||||||||||||
Net increase in net assets | 5,141,674 | 6,894,055 | ||||||||||||||||||||
Net Assets: | ||||||||||||||||||||||
Beginning of year | 29,518,500 | 22,624,445 | ||||||||||||||||||||
|
|
|
| |||||||||||||||||||
End of year | $ | 34,660,174 | $ | 29,518,500 | ||||||||||||||||||
|
|
|
| |||||||||||||||||||
Undistributed net investment income/distributions in excess of net investment income | $ | (4,043 | ) | $ | 264,209 | |||||||||||||||||
|
|
|
| |||||||||||||||||||
Share Transactions: | ||||||||||||||||||||||
Issued | 376,691 | 906,493 | ||||||||||||||||||||
Reinvested | 193,016 | 237,892 | ||||||||||||||||||||
Redeemed | (93,333 | ) | (396,863 | ) | ||||||||||||||||||
|
|
|
| |||||||||||||||||||
Change in shares resulting from capital transactions | 476,374 | 747,522 | ||||||||||||||||||||
|
|
|
| |||||||||||||||||||
See notes to financial statements.
66 |
FINANCIAL STATEMENTS |
Statements of Changes in Net Assets (cont.)
| RBC BlueBay Global Convertible Bond Fund | ||||||||||||||||||||
| For the Year Ended September 30, 2014 | For the Year Ended September 30, 2013 | |||||||||||||||||||
From Investment Activities: | ||||||||||||||||||||
Operations: | ||||||||||||||||||||
Net investment income | $ | 81,320 | $ | 387,365 | ||||||||||||||||
Net realized gains from investments, futures contracts, witten options and foreign currency transactions | 2,191,346 | 1,533,992 | ||||||||||||||||||
Net change in unrealized appreciation/(depreciation) on investments, foreign currency and written options | (1,224,479 | ) | 441,616 | |||||||||||||||||
|
|
|
| |||||||||||||||||
Change in net assets resulting from operations | 1,048,187 | 2,362,973 | ||||||||||||||||||
|
|
|
| |||||||||||||||||
Distributions to Class I Shareholders: | ||||||||||||||||||||
From net investment income | (741,593 | ) | (378,776 | ) | ||||||||||||||||
From net realized gains | (1,121,705 | ) | (352,720 | ) | ||||||||||||||||
|
|
|
| |||||||||||||||||
Change in net assets resulting from shareholder distributions | (1,863,298 | ) | (731,496 | ) | ||||||||||||||||
|
|
|
| |||||||||||||||||
Capital Transactions: | ||||||||||||||||||||
Proceeds from shares issued | 1,486,805 | 2,500 | ||||||||||||||||||
Distributions reinvested | 1,859,797 | 731,176 | ||||||||||||||||||
Cost of shares redeemed | (1,458 | ) | (479,977 | ) | ||||||||||||||||
|
|
|
| |||||||||||||||||
Change in net assets resulting from capital transactions | 3,345,144 | 253,699 | ||||||||||||||||||
|
|
|
| |||||||||||||||||
Net increase in net assets | 2,530,033 | 1,885,176 | ||||||||||||||||||
Net Assets | ||||||||||||||||||||
Beginning of year | 18,663,129 | 16,777,953 | ||||||||||||||||||
|
|
|
| |||||||||||||||||
End of year | $ | 21,193,162 | $ | 18,663,129 | ||||||||||||||||
|
|
|
| |||||||||||||||||
Undistributed net investment income/distributions in excess of net investment income | $ | (138,332 | ) | $ | 421,659 | |||||||||||||||
|
|
|
| |||||||||||||||||
Share Transactions: | ||||||||||||||||||||
Issued | 132,096 | 235 | ||||||||||||||||||
Reinvested | 169,004 | 67,229 | ||||||||||||||||||
Redeemed | (130 | ) | (42,927 | ) | ||||||||||||||||
|
|
|
| |||||||||||||||||
Change in shares resulting from capital transactions | 300,970 | 24,537 | ||||||||||||||||||
|
|
|
| |||||||||||||||||
See notes to financial statements.
| 67 |
FINANCIAL STATEMENTS |
Statements of Changes in Net Assets (cont.)
| RBC BlueBay Absolute Return Fund | ||||||||||||||||
| For the Year Ended September 30, 2014 | For the Period Ended September 30, 2013(a) | |||||||||||||||
From Investment Activities: | ||||||||||||||||
Operations: | ||||||||||||||||
Net investment income | $ | 8,872,816 | $ | 3,385,654 | ||||||||||||
Net realized losses from investments, foreign currency, futures contracts, written options and swap contracts transactions | 4,384,510 | (1,075,155 | ) | |||||||||||||
Net change in unrealized appreciation/(depreciation) on investments, foreign currency, futures contracts and swap contracts | 5,935,075 | 1,958,347 | ||||||||||||||
|
|
|
| |||||||||||||
Change in net assets resulting from operations | 19,192,401 | 4,268,846 | ||||||||||||||
|
|
|
| |||||||||||||
Distributions to Class A Shareholders: | ||||||||||||||||
From net investment income | (22,095 | ) | — | |||||||||||||
Distributions to Class C Shareholders: | ||||||||||||||||
From net investment income | (5,208 | ) | — | |||||||||||||
Distributions to Class I Shareholders: | ||||||||||||||||
From net investment income | (8,105,671 | ) | (413,992 | ) | ||||||||||||
From net realized gains | — | (5,959 | ) | |||||||||||||
Return of capital | — | (2,211,409 | ) | |||||||||||||
|
|
|
| |||||||||||||
Change in net assets resulting from shareholder distributions | (8,132,974 | ) | (2,631,360 | ) | ||||||||||||
|
|
|
| |||||||||||||
Capital Transactions: | ||||||||||||||||
Proceeds from shares issued | 267,410,143 | 659,568,220 | ||||||||||||||
Distributions reinvested | 617,172 | 111,739 | ||||||||||||||
Cost of shares redeemed | (224,824,785 | ) | (152,446,729 | ) | ||||||||||||
|
|
|
| |||||||||||||
Change in net assets resulting from capital transactions | 43,202,530 | 507,233,230 | ||||||||||||||
|
|
|
| |||||||||||||
Net increase in net assets | 54,261,957 | 508,870,716 | ||||||||||||||
Net Assets: | ||||||||||||||||
Beginning of period | 508,870,716 | — | ||||||||||||||
|
|
|
| |||||||||||||
End of period | $ | 563,132,673 | $ | 508,870,716 | ||||||||||||
|
|
|
| |||||||||||||
Undistributed net investment income/distributions in excess of net investment income | $ | (465,432 | ) | $ | 1,236,271 | |||||||||||
|
|
|
| |||||||||||||
Share Transactions: | ||||||||||||||||
Issued | 25,581,882 | 65,198,790 | ||||||||||||||
Reinvested | 59,198 | 11,016 | ||||||||||||||
Redeemed | (21,651,858 | ) | (15,052,360 | ) | ||||||||||||
|
|
|
| |||||||||||||
Change in shares resulting from capital transactions | 3,989,222 | 50,157,446 | ||||||||||||||
|
|
|
| |||||||||||||
| (a) | For the period from November 30, 2012 (commencement of operations) to September 30, 2013. |
See notes to financial statements.
68 |
RBC BlueBay Emerging Market Select Bond Fund
(Selected data for a share outstanding throughout the period indicated)
| For the Period Ended September 30, 2014(a) | ||||||||
Class A | ||||||||
Per Share Operating Performance: | ||||||||
Net asset value, beginning of period | $ | 9.83 | ||||||
|
| |||||||
Net investment income(b) | 0.33 | |||||||
Realized and unrealized gains | (0.08 | ) | ||||||
|
| |||||||
Total from investment activities | 0.25 | |||||||
|
| |||||||
Distributions: | ||||||||
Net investment income | (0.18 | ) | ||||||
Return of capital | (0.15 | ) | ||||||
|
| |||||||
Total distributions | (0.33 | ) | ||||||
|
| |||||||
Net asset value, end of period | $ | 9.75 | ||||||
|
| |||||||
Total Return:*(c) | 2.51%(d) | |||||||
Ratios to Average Net Assets: | ||||||||
Ratio of Net Expenses to Average Net Assets | 1.25%(e) | |||||||
Ratio of Net Investment Income to Average Net Assets | 3.91%(e) | |||||||
Ratio of Expenses to Average Net Assets** | 53.32%(e) | |||||||
Net assets, end of period (in thousands) | $ | 10 | ||||||
Portfolio turnover*** | 233 | % | ||||||
| * | Excludes sales charge. |
| ** | During the period, certain fees were contractually or voluntarily reduced and/or reimbursed. If such contractual/voluntary fee reductions and reimbursements had not occurred, the ratio would have been as indicated. |
| *** | Portfolio turnover rate is calculated on the basis of the fund as a whole without distinguishing between the classes of shares issued. |
| (a) | For the period from November 27, 2013 (commencement of operations) to September 30, 2014. |
| (b) | Per share net investment income (loss) has been calculated using the average daily shares method. |
| (c) | Assumes investment at net asset value at the beginning of the period, reinvestment of all dividends and distributions, and a complete redemption of the investment at net asset value at the end of the period. |
| (d) | Not Annualized. |
| (e) | Annualized. |
See notes to financial statements.
| 69 |
FINANCIAL HIGHLIGHTS |
RBC BlueBay Emerging Market Select Bond Fund
(Selected data for a share outstanding throughout the periods indicated)
| For the Year Ended September 30, 2014 | For the Year Ended September 30, 2013 | For the Period Ended September 30, 2012(a) | ||||||||||||||||||||||
Class I | ||||||||||||||||||||||||
Per Share Operating Performance: | ||||||||||||||||||||||||
Net asset value, beginning of period | $ | 9.92 | $ | 10.88 | $ | 10.00 | ||||||||||||||||||
|
|
|
|
|
| |||||||||||||||||||
Net investment income(b) | 0.40 | 0.30 | 0.24 | |||||||||||||||||||||
Realized and unrealized gains (losses) | (0.17 | ) | (0.78 | ) | 0.91 | |||||||||||||||||||
|
|
|
|
|
| |||||||||||||||||||
Total from investment activities | 0.23 | (0.48 | ) | 1.15 | ||||||||||||||||||||
|
|
|
|
|
| |||||||||||||||||||
Distributions: | ||||||||||||||||||||||||
Net investment income | (0.24 | ) | (0.11 | ) | (0.27 | ) | ||||||||||||||||||
Realized gains | — | (0.18 | ) | — | ||||||||||||||||||||
Return of capital | (0.16 | ) | (0.19 | ) | — | |||||||||||||||||||
|
|
|
|
|
| |||||||||||||||||||
Total distributions | (0.40 | ) | (0.48 | ) | (0.27 | ) | ||||||||||||||||||
|
|
|
|
|
| |||||||||||||||||||
Net asset value, end of period | $ | 9.75 | $ | 9.92 | $ | 10.88 | ||||||||||||||||||
|
|
|
|
|
| |||||||||||||||||||
Total Return:(c) | 2.32% | (4.70)% | 11.60%(d) | |||||||||||||||||||||
Ratios to Average Net Assets: | ||||||||||||||||||||||||
Ratio of Net Expenses to Average Net Assets | 1.00% | 1.00% | 1.00%(e) | |||||||||||||||||||||
Ratio of Net Investment Income to Average Net Assets | 4.04% | 2.79% | 2.76%(e) | |||||||||||||||||||||
Ratio of Expenses to Average Net Assets* | 1.05% | 1.10% | 1.59%(e) | |||||||||||||||||||||
Net assets, end of period (in thousands) | $ | 216,014 | $ | 185,882 | $ | 122,097 | ||||||||||||||||||
Portfolio turnover** | 233 | % | 203 | % | 110 | % | ||||||||||||||||||
| * | During the period, certain fees were contractually or voluntarily reduced and/or reimbursed. If such contractual/voluntary fee reductions and reimbursements had not occurred, the ratio would have been as indicated. |
| ** | Portfolio turnover rate is calculated on the basis of the fund as a whole without distinguishing between the classes of shares issued. |
| (a) | For the period from November 30, 2011 (commencement of operations) to September 30, 2012. |
| (b) | Per share net investment income (loss) has been calculated using the average daily shares method. |
| (c) | Assumes investment at net asset value at the beginning of the period, reinvestment of all dividends and distributions, and a complete redemption of the investment at net asset value at the end of the period. |
| (d) | Not Annualized. |
| (e) | Annualized. |
See notes to financial statements.
70 |
FINANCIAL HIGHLIGHTS |
RBC BlueBay Emerging Market Corporate Bond Fund
(Selected data for a share outstanding throughout the period indicated)
| For the Period Ended September 30, 2014(a) | ||||||||
Class A | ||||||||
Per Share Operating Performance: | ||||||||
Net asset value, beginning of period | $ | 9.75 | ||||||
|
| |||||||
Net investment income(b) | 0.32 | |||||||
Realized and unrealized gains | 0.29 | |||||||
|
| |||||||
Total from investment activities | 0.61 | |||||||
|
| |||||||
Distributions: | ||||||||
Net investment income | (0.33 | ) | ||||||
|
| |||||||
Total distributions | (0.33 | ) | ||||||
|
| |||||||
Net asset value, end of period | $ | 10.03 | ||||||
|
| |||||||
Total Return:*(c) | 6.27%(d) | |||||||
Ratios to Average Net Assets: | ||||||||
Ratio of Net Expenses to Average Net Assets | 1.40%(e) | |||||||
Ratio of Net Investment Income to Average Net Assets | 3.86%(e) | |||||||
Ratio of Expenses to Average Net Assets** | 53.53%(e) | |||||||
Net assets, end of period (in thousands) | $ | 11 | ||||||
Portfolio turnover*** | 180 | % | ||||||
| * | Excludes sales charge. |
| ** | During the period, certain fees were contractually or voluntarily reduced and/or reimbursed. If such contractual/voluntary fee reductions and reimbursements had not occurred, the ratio would have been as indicated. |
| *** | Portfolio turnover rate is calculated on the basis of the fund as a whole without distinguishing between the classes of shares issued. |
| (a) | For the period from November 27, 2013 (commencement of operations) to September 30, 2014. |
| (b) | Per share net investment income (loss) has been calculated using the average daily shares method. |
| (c) | Assumes investment at net asset value at the beginning of the period, reinvestment of all dividends and distributions, and a complete redemption of the investment at net asset value at the end of the period. |
| (d) | Not Annualized. |
| (e) | Annualized. |
See notes to financial statements.
| 71 |
FINANCIAL HIGHLIGHTS |
RBC BlueBay Emerging Market Corporate Bond Fund
(Selected data for a share outstanding throughout the periods indicated)
| For the Year Ended September 30, 2014 | For the Year Ended September 30, 2013 | For the Period Ended September 30, 2012(a) | ||||||||||||||||||||||
Class I | ||||||||||||||||||||||||
Per Share Operating Performance: | ||||||||||||||||||||||||
Net asset value, beginning of period | $ | 9.68 | $ | 10.91 | $ | 10.00 | ||||||||||||||||||
|
|
|
|
|
| |||||||||||||||||||
Net investment income(b) | 0.41 | 0.43 | 0.37 | |||||||||||||||||||||
Realized and unrealized gains (losses) | 0.37 | (0.60 | ) | 0.91 | ||||||||||||||||||||
|
|
|
|
|
| |||||||||||||||||||
Total from investment activities | 0.78 | (0.17 | ) | 1.28 | ||||||||||||||||||||
|
|
|
|
|
| |||||||||||||||||||
Distributions: | ||||||||||||||||||||||||
Net investment income | (0.41 | ) | (0.44 | ) | (0.37 | ) | ||||||||||||||||||
Realized gains | (0.01 | ) | (0.62 | ) | — | |||||||||||||||||||
|
|
|
|
|
| |||||||||||||||||||
Total distributions | (0.42 | ) | (1.06 | ) | (0.37 | ) | ||||||||||||||||||
|
|
|
|
|
| |||||||||||||||||||
Net asset value, end of period | $ | 10.04 | $ | 9.68 | $ | 10.91 | ||||||||||||||||||
|
|
|
|
|
| |||||||||||||||||||
Total Return:(c) | 8.02% | (1.98)% | 13.06%(d) | |||||||||||||||||||||
Ratios to Average Net Assets: | ||||||||||||||||||||||||
Ratio of Net Expenses to Average Net Assets | 1.15% | 1.15% | 1.15%(e) | |||||||||||||||||||||
Ratio of Net Investment Income to Average Net Assets | 4.12% | 4.18% | 4.24%(e) | |||||||||||||||||||||
Ratio of Expenses to Average Net Assets* | 1.78% | 1.96% | 3.10%(e) | |||||||||||||||||||||
Net assets, end of period (in thousands) | $ | 22,639 | $ | 18,927 | $ | 17,623 | ||||||||||||||||||
Portfolio turnover** | 180 | % | 182 | % | 151 | % | ||||||||||||||||||
| * | During the period, certain fees were contractually or voluntarily reduced and/or reimbursed. If such contractual/voluntary fee reductions and reimbursements had not occurred, the ratio would have been as indicated. |
| ** | Portfolio turnover rate is calculated on the basis of the fund as a whole without distinguishing between the classes of shares issued. |
| (a) | For the period from November 30, 2011 (commencement of operations) to September 30, 2012. |
| (b) | Per share net investment income (loss) has been calculated using the average daily shares method. |
| (c) | Assumes investment at net asset value at the beginning of the period, reinvestment of all dividends and distributions, and a complete redemption of the investment at net asset value at the end of the period. |
| (d) | Not Annualized. |
| (e) | Annualized. |
See notes to financial statements.
72 |
FINANCIAL HIGHLIGHTS |
RBC BlueBay Global High Yield Bond Fund
(Selected data for a share outstanding throughout the period indicated)
| For the Period Ended September 30, 2014(a) | ||||||||
Class A | ||||||||
Per Share Operating Performance: | ||||||||
Net asset value, beginning of period | $ | 10.41 | ||||||
|
| |||||||
Net investment income(b) | 0.41 | |||||||
Realized and unrealized gains | 0.04 | |||||||
|
| |||||||
Total from investment activities | 0.45 | |||||||
|
| |||||||
Distributions: | ||||||||
Net investment income | (0.45 | ) | ||||||
|
| |||||||
Total distributions | (0.45 | ) | ||||||
|
| |||||||
Net asset value, end of period | $ | 10.41 | ||||||
|
| |||||||
Total Return:*(c) | 4.38%(d) | |||||||
Ratios to Average Net Assets: | ||||||||
Ratio of Net Expenses to Average Net Assets | 1.20%(e) | |||||||
Ratio of Net Investment Income to Average Net Assets | 4.62%(e) | |||||||
Ratio of Expenses to Average Net Assets** | 25.84%(e) | |||||||
Net assets, end of period (in thousands) | $ | 29 | ||||||
Portfolio turnover*** | 116 | % | ||||||
| * | Excludes sales charge. |
| ** | During the period, certain fees were contractually or voluntarily reduced and/or reimbursed. If such contractual/voluntary fee reductions and reimbursements had not occurred, the ratio would have been as indicated. |
| *** | Portfolio turnover rate is calculated on the basis of the fund as a whole without distinguishing between the classes of shares issued. |
| (a) | For the period from November 27, 2013 (commencement of operations) to September 30, 2014. |
| (b) | Per share net investment income (loss) has been calculated using the average daily shares method. |
| (c) | Assumes investment at net asset value at the beginning of the period, reinvestment of all dividends and distributions, and a complete redemption of the investment at net asset value at the end of the period. |
| (d) | Not Annualized. |
| (e) | Annualized. |
See notes to financial statements.
| 73 |
FINANCIAL HIGHLIGHTS |
RBC BlueBay Global High Yield Bond Fund
(Selected data for a share outstanding throughout the periods indicated)
| For the Year Ended September 30, 2014 | For the Year Ended September 30, 2013 | For the Period Ended September 30, 2012(a) | ||||||||||||||||||||||
Class I | ||||||||||||||||||||||||
Per Share Operating Performance: | ||||||||||||||||||||||||
Net asset value, beginning of period | $ | 10.35 | $ | 10.76 | $ | 10.00 | ||||||||||||||||||
|
|
|
|
|
| |||||||||||||||||||
Net investment income(b) | 0.53 | 0.60 | 0.53 | |||||||||||||||||||||
Realized and unrealized gains (losses) | 0.21 | (0.02 | ) | 0.76 | ||||||||||||||||||||
|
|
|
|
|
| |||||||||||||||||||
Total from investment activities | 0.74 | 0.58 | 1.29 | |||||||||||||||||||||
|
|
|
|
|
| |||||||||||||||||||
Distributions: | ||||||||||||||||||||||||
Net investment income | (0.56 | ) | (0.60 | ) | (0.53 | ) | ||||||||||||||||||
Realized gains | (0.11 | ) | (0.39 | ) | — | |||||||||||||||||||
|
|
|
|
|
| |||||||||||||||||||
Total distributions | (0.67 | ) | (0.99 | ) | (0.53 | ) | ||||||||||||||||||
|
|
|
|
|
| |||||||||||||||||||
Net asset value, end of period | $ | 10.42 | $ | 10.35 | $ | 10.76 | ||||||||||||||||||
|
|
|
|
|
| |||||||||||||||||||
Total Return:(c) | 7.36% | 5.54% | 13.16%(d) | |||||||||||||||||||||
Ratios to Average Net Assets: | ||||||||||||||||||||||||
Ratio of Net Expenses to Average Net Assets | 0.95% | 0.95% | 0.95%(e) | |||||||||||||||||||||
Ratio of Net Investment Income to Average Net Assets | 5.05% | 5.64% | 6.15%(e) | |||||||||||||||||||||
Ratio of Expenses to Average Net Assets* | 1.30% | 1.52% | 2.40%(e) | |||||||||||||||||||||
Net assets, end of period (in thousands) | $ | 34,631 | $ | 29,519 | $ | 22,624 | ||||||||||||||||||
Portfolio turnover** | 116 | % | 117 | % | 87 | % | ||||||||||||||||||
| * | During the period, certain fees were contractually or voluntarily reduced and/or reimbursed. If such contractual/voluntary fee reductions and reimbursements had not occurred, the ratio would have been as indicated. |
| ** | Portfolio turnover rate is calculated on the basis of the fund as a whole without distinguishing between the classes of shares issued. |
| (a) | For the period from November 30, 2011 (commencement of operations) to September 30, 2012. |
| (b) | Per share net investment income (loss) has been calculated using the average daily shares method. |
| (c) | Assumes investment at net asset value at the beginning of the period, reinvestment of all dividends and distributions, and a complete redemption of the investment at net asset value at the end of the period. |
| (d) | Not Annualized. |
| (e) | Annualized. |
See notes to financial statements.
74 |
FINANCIAL HIGHLIGHTS |
RBC BlueBay Global Convertible Bond Fund
(Selected data for a share outstanding throughout the periods indicated)
| For the Year Ended September 30, 2014 | For the Year Ended September 30, 2013 | For the Period Ended September 30, 2012(a) | ||||||||||||||||||||||
Class I | ||||||||||||||||||||||||
Per Share Operating Performance: | ||||||||||||||||||||||||
Net asset value, beginning of period | $ | 11.64 | $ | 10.63 | $ | 10.00 | ||||||||||||||||||
|
|
|
|
|
| |||||||||||||||||||
Net investment income(b) | 0.05 | 0.24 | 0.22 | |||||||||||||||||||||
Realized and unrealized gains (losses) | 0.59 | 1.23 | 0.64 | |||||||||||||||||||||
|
|
|
|
|
| |||||||||||||||||||
Total from investment activities | 0.64 | 1.47 | 0.86 | |||||||||||||||||||||
|
|
|
|
|
| |||||||||||||||||||
Distributions: | ||||||||||||||||||||||||
Net investment income | (0.45 | ) | (0.24 | ) | (0.23 | ) | ||||||||||||||||||
Realized gains | (0.70 | ) | (0.22 | ) | — | |||||||||||||||||||
|
|
|
|
|
| |||||||||||||||||||
Total distributions | (1.15 | ) | (0.46 | ) | (0.23 | ) | ||||||||||||||||||
|
|
|
|
|
| |||||||||||||||||||
Net asset value, end of period | $ | 11.13 | $ | 11.64 | $ | 10.63 | ||||||||||||||||||
|
|
|
|
|
| |||||||||||||||||||
Total Return:(c) | 5.75% | 14.20% | 8.65%(d) | |||||||||||||||||||||
Ratios to Average Net Assets: | ||||||||||||||||||||||||
Ratio of Net Expenses to Average Net Assets | 1.00% | 1.00% | 1.00%(e) | |||||||||||||||||||||
Ratio of Net Investment Income to Average Net Assets | 0.41% | 2.18% | 2.56%(e) | |||||||||||||||||||||
Ratio of Expenses to Average Net Assets* | 1.60% | 1.77% | 2.89%(e) | |||||||||||||||||||||
Net assets, end of period (in thousands) | $ | 21,193 | $ | 18,663 | $ | 16,778 | ||||||||||||||||||
Portfolio turnover** | 139 | % | 91 | % | 25 | % | ||||||||||||||||||
| * | During the period, certain fees were contractually or voluntarily reduced and/or reimbursed. If such contractual/voluntary fee reductions and reimbursements had not occurred, the ratio would have been as indicated. |
| ** | Portfolio turnover rate is calculated on the basis of the fund as a whole without distinguishing between the classes of shares issued. |
| (a) | For the period from November 30, 2011 (commencement of operations) to September 30, 2012. |
| (b) | Per share net investment income (loss) has been calculated using the average daily shares method. |
| (c) | Assumes investment at net asset value at the beginning of the period, reinvestment of all dividends and distributions, and a complete redemption of the investment at net asset value at the end of the period. |
| (d) | Not Annualized. |
| (e) | Annualized. |
See notes to financial statements.
| 75 |
FINANCIAL HIGHLIGHTS |
RBC BlueBay Absolute Return Fund
(Selected data for a share outstanding throughout the period indicated)
| For the Period Ended September 30, 2014(a) | ||||||||
Class A | ||||||||
Per Share Operating Performance: | ||||||||
Net asset value, beginning of period | $ | 10.26 | ||||||
|
| |||||||
Net investment income(b) | 0.10 | |||||||
Realized and unrealized gains | 0.18 | |||||||
|
| |||||||
Total from investment activities | 0.28 | |||||||
|
| |||||||
Distributions: | ||||||||
Net investment income | (0.13 | ) | ||||||
|
| |||||||
Total distributions | (0.13 | ) | ||||||
|
| |||||||
Net asset value, end of period | $ | 10.41 | ||||||
|
| |||||||
Total Return:*(c) | 2.61%(d) | |||||||
Ratios to Average Net Assets: | ||||||||
Ratio of Net Expenses to Average Net Assets | 1.20%(e) | |||||||
Ratio of Net Investment Income to Average Net Assets | 1.16%(e) | |||||||
Ratio of Expenses to Average Net Assets** | 1.35%(e) | |||||||
Net assets, end of period (in thousands) | $ | 6,365 | ||||||
Portfolio turnover*** | 218 | % | ||||||
| * | Excludes sales charge. |
| ** | During the period, certain fees were contractually or voluntarily reduced and/or reimbursed. If such contractual/voluntary fee reductions and reimbursements had not occurred, the ratio would have been as indicated. |
| *** | Portfolio turnover rate is calculated on the basis of the fund as a whole without distinguishing between the classes of shares issued. |
| (a) | For the period from November 27, 2013 (commencement of operations) to September 30, 2014. |
| (b) | Per share net investment income (loss) has been calculated using the average daily shares method. |
| (c) | Assumes investment at net asset value at the beginning of the period, reinvestment of all dividends and distributions, and a complete redemption of the investment at net asset value at the end of the period. |
| (d) | Not Annualized. |
| (e) | Annualized. |
See notes to financial statements.
76 |
FINANCIAL HIGHLIGHTS |
RBC BlueBay Absolute Return Fund
(Selected data for a share outstanding throughout the period indicated)
| For the Period Ended September 30, 2014(a) | ||||||||
Class C | ||||||||
Per Share Operating Performance: | ||||||||
Net asset value, beginning of period | $ | 10.52 | ||||||
|
| |||||||
Net investment income(b) | 0.02 | |||||||
Realized and unrealized losses | (0.13 | ) | ||||||
|
| |||||||
Total from investment activities | (0.11 | ) | ||||||
|
| |||||||
Distributions: | ||||||||
Net investment income | (0.01 | ) | ||||||
|
| |||||||
Total distributions | (0.01 | ) | ||||||
|
| |||||||
Net asset value, end of period | $ | 10.40 | ||||||
|
| |||||||
Total Return:*(c) | (1.16)%(d) | |||||||
Ratios to Average Net Assets: | ||||||||
Ratio of Net Expenses to Average Net Assets | 1.95%(e) | |||||||
Ratio of Net Investment Income to Average Net Assets | 0.37%(e) | |||||||
Ratio of Expenses to Average Net Assets** | 1.96%(e) | |||||||
Net assets, end of period (in thousands) | $ | 6,952 | ||||||
Portfolio turnover*** | 218 | % | ||||||
| * | Excludes sales charge. |
| ** | During the period, certain fees were contractually or voluntarily reduced and/or reimbursed. If such contractual/voluntary fee reductions and reimbursements had not occurred, the ratio would have been as indicated. |
| *** | Portfolio turnover rate is calculated on the basis of the fund as a whole without distinguishing between the classes of shares issued. |
| (a) | For the period from June 24, 2014 (commencement of operations) to September 30, 2014. |
| (b) | Per share net investment income (loss) has been calculated using the average daily shares method. |
| (c) | Assumes investment at net asset value at the beginning of the period, reinvestment of all dividends and distributions, and a complete redemption of the investment at net asset value at the end of the period. |
| (d) | Not Annualized. |
| (e) | Annualized. |
See notes to financial statements.
| 77 |
FINANCIAL HIGHLIGHTS |
RBC BlueBay Absolute Return Fund
(Selected data for a share outstanding throughout the periods indicated)
| For the Year Ended September 30, 2014 | For the Period Ended September 30, 2013(a) | |||||||||||||||
Class I | ||||||||||||||||
Per Share Operating Performance: | ||||||||||||||||
Net asset value, beginning of period | $ | 10.15 | $ | 10.00 | ||||||||||||
|
|
|
| |||||||||||||
Net investment income(b) | 0.19 | 0.11 | ||||||||||||||
Realized and unrealized gains | 0.24 | 0.12 | ||||||||||||||
|
|
|
| |||||||||||||
Total from investment activities | 0.43 | 0.23 | ||||||||||||||
|
|
|
| |||||||||||||
Distributions: | ||||||||||||||||
Net investment income | (0.18 | ) | (0.02 | ) | ||||||||||||
Realized gains | — | — | (c) | |||||||||||||
Return of capital | — | (0.06 | ) | |||||||||||||
|
|
|
| |||||||||||||
Total distributions | (0.18 | ) | (0.08 | ) | ||||||||||||
|
|
|
| |||||||||||||
Net asset value, end of period | $ | 10.40 | $ | 10.15 | ||||||||||||
|
|
|
| |||||||||||||
Total Return:(d) | 4.12% | 2.31%(e) | ||||||||||||||
Ratios to Average Net Assets: | ||||||||||||||||
Ratio of Net Expenses to Average Net Assets | 0.95% | 0.95%(f) | ||||||||||||||
Ratio of Net Investment Income to Average Net Assets | 1.83% | 1.27%(f) | ||||||||||||||
Ratio of Expenses to Average Net Assets* | 0.98% | 0.97%(f) | ||||||||||||||
Net assets, end of period (in thousands) | $ | 549,816 | $ | 508,871 | ||||||||||||
Portfolio turnover** | 218 | % | 338 | % | ||||||||||||
| * | During the period, certain fees were contractually or voluntarily reduced and/or reimbursed. If such contractual/voluntary fee reductions and reimbursements had not occurred, the ratio would have been as indicated. |
| ** | Portfolio turnover rate is calculated on the basis of the fund as a whole without distinguishing between the classes of shares issued. |
| (a) | For the period from November 30, 2012 (commencement of operations) to September 30, 2013. |
| (b) | Per share net investment income (loss) has been calculated using the average daily shares method. |
| (c) | Less than $0.01 or $(0.01) per share. |
| (d) | Assumes investment at net asset value at the beginning of the period, reinvestment of all dividends and distributions, and a complete redemption of the investment at net asset value at the end of the period. |
| (e) | Not Annualized. |
| (f) | Annualized. |
See notes to financial statements.
78 |
September 30, 2014
1. Organization:
RBC Funds Trust (the “Trust”) is registered under the Investment Company Act of 1940 (as amended) as an open-end management investment company. The Trust was organized as a Delaware statutory trust on December 16, 2003 and currently consists of 18 portfolios. This report includes the following five investment portfolios (each a “Fund” and collectively, the “Funds”):
- RBC BlueBay Emerging Market Select Bond Fund (“Emerging Market Select Bond Fund”)
- RBC BlueBay Emerging Market Corporate Bond Fund (“Emerging Market Corporate Bond Fund”)
- RBC BlueBay Global High Yield Bond Fund (“Global High Yield Bond Fund”)
- RBC BlueBay Global Convertible Bond Fund (“Global Convertible Bond Fund”)
- RBC BlueBay Absolute Return Fund (“Absolute Return Fund”)
The Funds offer three share classes: Class I shares are offered by each fund; Class A shares are offered by each fund except Global Convertible Bond Fund and Class C shares are only offered by Absolute Return Fund. Class A shares are offered with a 4.25% maximum front-end sales charge and a 1.00% contingent deferred sales charge (“CDSC”) for redemption within 12 months of a $1 million or greater purchase on which no front-end sales charge was paid. Class C shares are offered with a 1.00% CDSC for redemption within 12 months of purchase. Class I shares (intended for investors meeting certain investment minimum thresholds) are not subject to either a front-end sales charge or a CDSC.
RBC Global Asset Management (U.S.) Inc. (“RBC GAM (US)” or “Advisor” or “Co-Administrator”) acts as the investment advisor for the Funds and BlueBay Asset Management LLP (“BlueBay“ or “Sub-Advisor”) acts as a sub-advisor for each of the BlueBay Funds. BlueBay Asset Management USA LLC (“BlueBay US”) also acts as a sub-advisor for the Global High Yield Bond Fund and the Absolute Return Fund (effective November 27, 2013). The officers of the Trust (“Fund Management”) are also employees of RBC GAM (US) or its affiliates.
2. Significant Accounting Policies:
Summarized below are the significant accounting policies of the Funds. These policies conform to accounting principles generally accepted in the United States of America (“U.S. GAAP”). Fund Management follows these policies when preparing financial statements. Management may also be required to make estimates and assumptions that affect the reported amounts of assets and liabilities at the date of the financial statements and the reported amounts of income and expenses for the period. Actual results could differ from those estimates. The financial statements are as of the close of regular trading on the New York Stock Exchange (“NYSE”).
Security Valuation:
The Trust’s Board of Trustees (the “Board”) has adopted pricing and valuation procedures for determining the fair value of the Funds’ investments. Fair value of a security is considered to be the price that a fund might reasonably expect to receive upon its current sale in an orderly transaction between market participants.
Equity securities are generally valued on the basis of prices furnished by third-party pricing services approved by the Board. Equity securities listed on one or more exchanges shall be valued at the last available quoted sale price on the primary trading exchange as of the close of regular trading on the exchange and are categorized as Level 1 in the fair value hierarchy. An equity security not listed on an exchange but listed on NASDAQ shall be valued at the NASDAQ official closing price and is also categorized as Level 1. If there was no sale on the primary exchange on the day the net asset value is calculated or a NASDAQ official closing price is not available, the most recent bid quotation generally will be used and such securities will generally be categorized as Level 2. Investments in open-end
| 79 |
NOTES TO FINANCIAL STATEMENTS |
investment companies (mutual funds) are valued at net asset value and are categorized as Level 1 in the fair value hierarchy.
Fixed income securities, including to-be-announced (“TBA”) commitments and municipal bonds, are generally valued based on evaluated prices received from third-party pricing services or from broker-dealers who make markets in the securities and are generally categorized as Level 2 in the fair value hierarchy. The pricing services utilize both dealer-supplied valuations and electronic data processing techniques that take into account multiple appropriate factors such as institutional-size trading in similar groups of securities, market spreads, interest rates, and fundamental security analytical data including yield, quality, coupon rate, maturity and type of issue. Short-term debt obligations with less then 60 days to maturity at the time of purchase are valued at amortized cost unless Fund management determines that amortized cost no longer approximates fair market value.
Exchange-traded options, futures and options on futures are valued at the last sale price at the close of the market on the principal exchange on which they are traded. In the absence of any transactions on that day, the closing bid price shall be used for purchased options, futures and options on futures, and the closing ask price shall be used for written options. Such instruments are categorized as Level 1 of the fair value hierarchy. Option contracts traded in the over-the-counter market shall be valued at the evaluated price provided by an independent pricing service or broker-dealer using a mathematical model which incorporates a number of market data factors, such as trades and prices of the underlying instruments. These contracts are categorized as Level 2 of the fair value hierarchy. Forward foreign currency exchange contracts are marked to market daily based upon foreign currency exchange rates provided by an independent pricing service as of the close of the NYSE, generally 4:00 p.m. EST, and are generally classified as Level 2 within the fair value hierarchy.
Swaps, including credit-default swaps, interest rate swaps and total return swaps, are generally valued by an independent pricing service using a discounted cash flow methodology. This technique is used to value both the fixed and variable components of the swap contracts and takes into account market data and inputs sourced from various institutions and market-makers and includes daily intra-day and closing spreads, credit index quotes, yield curves, and recovery rate assumptions. The Fund’s net benefit or obligation under the derivative contract, as measured by the fair market value of the contract, is included in the Fund’s net assets. These swap contracts are categorized as Level 2 in the fair valuation hierarchy.
Foreign securities valued in non-U.S. dollars are valued in the foreign currency and then converted into the U.S. dollar equivalent using the foreign exchange rate in effect at the close of the NYSE on the day the security’s value is determined. The value of securities traded in markets outside the United States may be affected on a day that the NYSE is closed and an investor is not able to purchase, exchange or redeem shares of the Funds.
The Board has delegated to the Funds’ Pricing Committee (“Pricing Committee”) the responsibility for implementing the pricing and valuation procedures, including responsibility for determining the fair value of the Funds’ securities or other assets and liabilities. The Pricing Committee includes representatives of the Funds’ Advisor, Co-Administrator and Sub-Advisor, including personnel from accounting and operations, investment management, trading, risk management, compliance, and legal. The Pricing Committee meets at least quarterly to review and approve Fund valuation matters, including a review of the Funds’ pricing activity and operations, fair value measurements, pricing vendors, policies and procedures, and related controls. At least a quorum of the Pricing Committee shall meet more frequently, as needed, to consider and approve time-sensitive fair valuation matters. The Pricing Committee reports to the Valuation, Portfolio Management and Performance Committee (“Valuation Committee”) of the Board. Members of the Pricing Committee meet with the Valuation Committee and the Board at each of their regularly scheduled meetings to discuss valuation matters and actions taken during the period.
The Board has adopted procedures to determine the fair value of a security when a price is not available from a pricing service or broker-dealer or Fund management determines that a price provided by a pricing service or broker-dealer does not approximate fair value. Fair valuation may also be used
80 |
NOTES TO FINANCIAL STATEMENTS |
when a significant valuation event affecting the value of a security or market sector is determined to have occurred between the time when a security’s market closes and the time the Fund’s net asset value is calculated. The fair value of the security will be determined in good faith by the Pricing Committee in accordance with procedures and methodologies adopted by the Board. General factors used in determining the fair value of securities include, but are not limited to, fundamental analytical data relating to the security, the issuer and the market, such as duration, prepayment and default rates; general level of interest rates and changes in interest rates; information from broker-dealers; trading in similar securities; any restrictions on disposition of the security; and an evaluation of the forces that influence the market in which the investments are traded. These securities are either categorized as Level 2 or 3 in the fair value hierarchy, depending on the relevant inputs used.
When the Funds utilize fair valuation methods that use significant unobservable inputs to determine a security’s value, such securities will be categorized as Level 3 of the fair value hierarchy. These methods may require subjective determinations about the value of a security. While the Funds’ policy is intended to result in a calculation of a Fund’s net asset value that fairly reflects security values as of the time of pricing, the Funds cannot guarantee that values determined by the Board or persons acting at their direction would accurately reflect the price that the Funds could obtain for a security if they were to dispose of it as of the time of pricing (for instance, in a forced or distressed sale). The prices used by the Funds may differ from the value that would be realized if the securities were sold.
The Pricing Committee employs various methods for calibrating the valuation approach related to securities categorized within Level 2 and Level 3 of the fair value hierarchy. These methods may include regular due diligence of the Funds’ pricing vendors, a regular review of key inputs and assumptions, transaction back-testing or disposition analysis to compare unrealized gains and losses to realized gains and losses, reviews of missing and stale prices and large movements in market value, and reviews of any market related activities. Additionally, the pricing of all fair value holdings is subsequently reported to the Valuation Committee and Board.
Fair Value Measurements:
The Funds disclose the fair value of its investments in a hierarchy that categorizes investments based on the inputs to valuation techniques used to measure fair value. The three levels of the fair value hierarchy are as follows:
· Level 1 - Inputs that reflect unadjusted quoted prices in active markets for identical assets or liabilities that the Funds have the ability to access at the measurement date.
· Level 2 - Significant inputs other than quoted prices that are observable for the asset or liability either directly or indirectly, including inputs in markets that are not considered to be active. Observable inputs may include quoted prices for similar securities, interest rates, spreads, prepayment speeds, etc.
· Level 3 - Significant unobservable inputs based on the best information available in the circumstances, to the extent observable inputs are not available (including the Fund’s own assumptions in determining the fair value of investments).
The inputs or methodology used for valuing investments are not necessarily an indication of the risk associated with investing in those securities.
Inputs used in determining fair value of an investment may include, but are not limited to, price information, volatility statistics, credit and market data, and other factors, all of which may be either observable or unobservable. Inputs can vary among investments and will be impacted by the investment type and volume of activity for the particular security or similar securities in the market. Investments in the Level 3 category are generally supported by transactions and quoted prices from dealers participating in the market for those investments. Investments may be included in the Level 3 category due to a lack of market activity or transparency. Internal valuation models may also be used as a pricing source for Level 3 investments. Internal valuation models may rely on one or more unobservable inputs, such as estimated cash flows, financial statement analysis and discount rates.
| 81 |
NOTES TO FINANCIAL STATEMENTS |
The summary of inputs used to determine the fair value of the Funds’ investments as of September 30, 2014 is as follows:
| Level 1 Quoted Prices | Level 2 Significant Observable Inputs | Level 3 Significant Unobservable Inputs | Total | |||||||||||||||||
Emerging Market Select Bond Fund Assets: | ||||||||||||||||||||
Investments in Securities(a) | ||||||||||||||||||||
Corporate Bonds | $ | — | $ | 23,307,193 | $ | — | $ | 23,307,193 | ||||||||||||
Foreign Government Bonds | — | 154,768,044 | — | 154,768,044 | ||||||||||||||||
Investment Company | 21,621,836 | — | — | 21,621,836 | ||||||||||||||||
Other Financial Instruments* | ||||||||||||||||||||
Interest rate contracts: | ||||||||||||||||||||
Interest rate swaps | — | 365,583 | — | 365,583 | ||||||||||||||||
Foreign currency exchange contracts - forward contracts | — | 1,760,128 | — | 1,760,128 | ||||||||||||||||
Credit contracts: | ||||||||||||||||||||
Total return swaps | — | 2,191,495 | 2,191,495 | |||||||||||||||||
|
|
|
|
|
|
|
| |||||||||||||
Total Assets | $ | 21,621,836 | $ | 182,392,443 | $ | — | $ | 204,014,279 | ||||||||||||
|
|
|
|
|
|
|
| |||||||||||||
Liabilities: | ||||||||||||||||||||
Other Financial Instruments* | ||||||||||||||||||||
Interest rate contracts: | ||||||||||||||||||||
Interest rate swaps | $ | — | $ | (1,091,898) | $ | — | $ | (1,091,898) | ||||||||||||
Foreign currency exchange contracts - forward contracts | — | (902,050) | — | (902,050) | ||||||||||||||||
|
|
|
|
|
|
|
| |||||||||||||
Total Liabilities | $ | — | $ | (1,993,948) | $ | — | $ | (1,993,948) | ||||||||||||
|
|
|
|
|
|
|
| |||||||||||||
Emerging Market Corporate Bond Fund Assets: | ||||||||||||||||||||
Investments in Securities(a) | ||||||||||||||||||||
Corporate Bonds | $ | — | $ | 20,520,567 | $ | — | $ | 20,520,567 | ||||||||||||
Investment Company | 1,495,899 | — | — | 1,495,899 | ||||||||||||||||
Other Financial Instruments* | ||||||||||||||||||||
Credit contracts: | ||||||||||||||||||||
Credit default swaps | — | 18,979 | — | 18,979 | ||||||||||||||||
Interest rate contracts: | ||||||||||||||||||||
Financial futures contracts | 11,251 | — | — | 11,251 | ||||||||||||||||
Foreign currency exchange contracts - forward contracts | — | 54,056 | — | 54,056 | ||||||||||||||||
|
|
|
|
|
|
|
| |||||||||||||
Total Assets | $ | 1,507,150 | $ | 20,593,602 | $ | — | $ | 22,100,752 | ||||||||||||
|
|
|
|
|
|
|
| |||||||||||||
Liabilities: | ||||||||||||||||||||
Other Financial Instruments* | ||||||||||||||||||||
Credit contracts: | ||||||||||||||||||||
Credit default swaps | $ | — | $ | (1,993) | $ | — | $ | (1,993) | ||||||||||||
Foreign currency exchange contracts - forward contracts | — | (17,847) | — | (17,847) | ||||||||||||||||
Interest rate contracts: | ||||||||||||||||||||
Financial futures contracts | (781) | — | — | (781) | ||||||||||||||||
Interest rate swaps | — | (15,081) | — | (15,081) | ||||||||||||||||
|
|
|
|
|
|
|
| |||||||||||||
Total Liabilities | $ | (781) | $ | (34,921) | $ | — | $ | (35,702) | ||||||||||||
|
|
|
|
|
|
|
| |||||||||||||
82 |
NOTES TO FINANCIAL STATEMENTS |
| Level 1 Quoted Prices | Level 2 Significant Observable Inputs | Level 3 Significant Unobservable Inputs | Total | |||||||||||||||||||
Global High Yield Bond Fund Assets: | ||||||||||||||||||||||
Investments in Securities(a) | ||||||||||||||||||||||
Bank Loans | $ | — | $ | 3,471,490 | $ | — | $ | 3,471,490 | ||||||||||||||
Corporate Bonds | — | 26,719,162 | — | 26,719,162 | ||||||||||||||||||
Common Stocks | 110,281 | 16,175 | — | 126,456 | ||||||||||||||||||
Investment Company | 2,292,512 | — | — | 2,292,512 | ||||||||||||||||||
Preferred Stock | — | 221,645 | — | 221,645 | ||||||||||||||||||
Warrants/Rights | — | 25,058 | — | 25,058 | ||||||||||||||||||
Other Financial Instruments* | ||||||||||||||||||||||
Credit contracts: | ||||||||||||||||||||||
Credit default swaps | — | 9,831 | — | 9,831 | ||||||||||||||||||
Foreign currency exchange contracts - forward contracts | — | 103,351 | — | 103,351 | ||||||||||||||||||
Interest rate contracts: | ||||||||||||||||||||||
Financial futures contracts | 151 | — | — | 151 | ||||||||||||||||||
|
|
|
|
|
|
|
| |||||||||||||||
Total Assets | $ | 2,402,944 | $ | 30,566,712 | $ | — | $ | 32,969,656 | ||||||||||||||
|
|
|
|
|
|
|
| |||||||||||||||
Liabilities: | ||||||||||||||||||||||
Other Financial Instruments* | ||||||||||||||||||||||
Foreign currency exchange contracts - forward contracts | $ | — | $ | (3,420) | $ | — | $ | (3,420) | ||||||||||||||
|
|
|
|
|
|
|
| |||||||||||||||
Total Liabilities | $ | — | $ | (3,420) | $ | — | $ | (3,420) | ||||||||||||||
|
|
|
|
|
|
|
| |||||||||||||||
Global Convertible Bond Fund Assets: | ||||||||||||||||||||||
Investments in Securities(a) | ||||||||||||||||||||||
Convertible Bonds | $ | — | $ | 19,061,460 | $ | — | $ | 19,061,460 | ||||||||||||||
Foreign Government Bonds | — | 214,799 | — | 214,799 | ||||||||||||||||||
Investment Company | 846,343 | — | — | 846,343 | ||||||||||||||||||
Common Stock | 476,905 | — | — | 476,905 | ||||||||||||||||||
Other Financial Instruments* | ||||||||||||||||||||||
Equity contracts: | ||||||||||||||||||||||
Purchased options | 53,790 | — | — | 53,790 | ||||||||||||||||||
Foreign currency exchange contracts - forward contracts | — | 165,778 | — | 165,778 | ||||||||||||||||||
|
|
|
|
|
|
|
| |||||||||||||||
Total Assets | $ | 1,377,038 | $ | 19,442,037 | $ | — | $ | 20,819,075 | ||||||||||||||
|
|
|
|
|
|
|
| |||||||||||||||
Liabilities: | ||||||||||||||||||||||
Other Financial Instruments* | ||||||||||||||||||||||
Equity contracts: | ||||||||||||||||||||||
Written options | $ | (5,760) | $ | — | $ | — | $ | (5,760) | ||||||||||||||
Foreign currency exchange contracts - forward contracts | — | (755) | — | (755) | ||||||||||||||||||
|
|
|
|
|
|
|
| |||||||||||||||
Total Liabilities | $ | (5,760) | $ | (755) | $ | — | $ | (6,515) | ||||||||||||||
|
|
|
|
|
|
|
| |||||||||||||||
| 83 |
NOTES TO FINANCIAL STATEMENTS |
| Level 1 Quoted Prices | Level 2 Significant Observable Inputs | Level 3 Significant Unobservable Inputs | Total | |||||||||||||||||
Absolute Return Fund Assets: | ||||||||||||||||||||
Investments in Securities(a) | ||||||||||||||||||||
Corporate Bonds | $ | — | $ | 197,255,239 | $ | — | $ | 197,255,239 | ||||||||||||
Foreign Government Bonds | — | 129,817,832 | — | 129,817,832 | ||||||||||||||||
Investment Company | 202,771,494 | — | — | 202,771,494 | ||||||||||||||||
Other Financial Instruments* | ||||||||||||||||||||
Interest rate contracts: | ||||||||||||||||||||
Financial futures contracts | 752,509 | — | — | 752,509 | ||||||||||||||||
Credit contracts: | ||||||||||||||||||||
Credit default swaps | — | 3,874,061 | — | 3,874,061 | ||||||||||||||||
Equity contracts: | ||||||||||||||||||||
Purchased options | 100,050 | — | — | 100,050 | ||||||||||||||||
Foreign currency exchange contracts - forward contracts | — | 10,525,268 | — | 10,525,268 | ||||||||||||||||
|
|
|
|
|
|
|
| |||||||||||||
Total Assets | $ | 203,624,053 | $ | 341,472,400 | $ | — | $ | 545,096,453 | ||||||||||||
|
|
|
|
|
|
|
| |||||||||||||
Liabilities: | ||||||||||||||||||||
Other Financial Instruments* | ||||||||||||||||||||
Interest rate contracts: | ||||||||||||||||||||
Financial futures contracts | $ | (381,756) | $ | — | $ | — | $ | (381,756) | ||||||||||||
Interest rate swaps | — | (651,763) | — | (651,763) | ||||||||||||||||
Credit contracts: | ||||||||||||||||||||
Credit default swaps | — | (5,385,257) | — | (5,385,257) | ||||||||||||||||
Foreign currency exchange contracts - forward contracts | — | (1,838,953) | — | (1,838,953) | ||||||||||||||||
|
|
|
|
|
|
|
| |||||||||||||
Total Liabilities | $ | (381,756) | $ | (7,875,973) | $ | — | $ | (8,257,729) | ||||||||||||
|
|
|
|
|
|
|
| |||||||||||||
(a) The breakdown of the Fund’s investments by country is disclosed in the Schedules of Portfolio Investments.
*Other financial instruments are instruments shown on the Schedule of Portfolio Investments, such as futures contracts, options, swaps and foreign currency exchange contracts which are valued at fair value.
During the year ended September 30, 2014, the Funds recognized no transfers to/from Level 1 or Level
2. The Fund’s policy is to recognize transfers to/from Level 1, Level 2 and Level 3 at the end of the year utilizing fair value at the beginning of the year.
Foreign Currency Transactions:
The values of foreign securities, foreign currencies and other assets and liabilities denominated in foreign currencies are translated into U.S. dollars using current exchange rates each business day. Fluctuations in the value of foreign currency holdings and other assets and liabilities resulting from movements in currency exchange rates are recorded as unrealized foreign currency gains or losses. The effects of changes in foreign currency exchange rates on investments in securities are not segregated from the effects of changes in market prices of those securities on the Statements of Operations. Such fluctuations are included with the net change in unrealized appreciation/depreciation on investment transactions. However, the effects of fluctuations in foreign currency exchange rates when determining the realized gain or loss upon the sale or maturity of foreign currency denominated debt obligations are segregated pursuant to US Federal income tax regulations; such amounts are categorized as foreign exchange gain or loss for both financial reporting and income tax reporting purposes.
84 |
NOTES TO FINANCIAL STATEMENTS |
Financial Instruments:
Payment-In-Kind Securities:
The Funds may invest in payment-in-kind securities (“PIKs”). PIKs give the issuer the option at each interest payment date of making interest payments in either cash or additional debt securities. Those additional debt securities usually have the same terms, including maturity dates and interest rates, and associated risks as the original bonds. The daily market quotations of the original bonds may include the accrued interest (referred to as a dirty price) and require a pro-rata adjustment from the unrealized appreciation or depreciation on investments to interest receivable on the Statement of Assets and Liabilities.
For the year ended September 30, 2014, the total in-kind payments received by the Global High Yield Bond Fund with respect to PIKs constituted less then 5% of the Fund’s total income and, therefore, such payments were not disclosed as a separate line item on the Statement of Operations.
Derivatives:
The Funds may use derivative instruments, including futures, forwards, options, indexed securities, swaps and inverse securities for hedging purposes only. Derivatives allow a Fund to increase or decrease its risk exposure more quickly and efficiently than other types of instruments. Derivatives may be riskier than other types of investments and could result in losses that significantly exceed a Fund’s original investment. Derivatives are subject to the risk that changes in the value of a derivative may not correlate perfectly with the underlying asset, rate or index. The use of derivatives may not be successful, resulting in losses to a Fund, and the cost of such strategies may reduce the Fund’s returns.
Hedging also involves the risk that changes in the value of the derivative will not match those of the holdings being hedged as expected by the Funds, in which case any losses on the holdings being hedged may not be reduced and may be increased. There can be no assurance that a Fund’s hedging strategy will reduce risk or that hedging transactions will be available or cost effective. The Funds are subject to interest rate risk and foreign currency exchange risk in the normal course of pursuing its investment objectives by investing in various derivative financial instruments, as described below.
In addition to the risks associated with derivatives in general, the Funds will also be subject to risks related to swap agreements. Because swap agreements are not exchange-traded, but are private contracts into which a Fund and a swap counterparty enter as principals, a Fund may experience a loss or delay in recovering assets if the counterparty defaults on its obligations. Each Fund will segregate or earmark liquid assets in an amount sufficient to cover its obligations under swap agreements.
Financial Futures Contracts:
The Funds may enter into futures contracts in an effort to manage the duration of the portfolio and hedge against certain market risk. A futures contract on a securities index is an agreement obligating one party to pay, and entitling the other party to receive, during the term of the contract, cash payments based on the level of a specified securities index. Futures transactions involve brokerage costs and require a Fund to segregate assets to cover contracts that would require it to purchase securities or currencies. A Fund may lose the expected benefit of futures transactions if interest rates, exchange rates or securities prices change in an unanticipated manner. Such unanticipated changes may also result in lower overall performance than if a Fund had not entered into any futures transactions.
Upon entering into a futures contract, a Fund is required to pledge to the broker an amount of cash, U.S. government securities, or other assets equal to a certain percentage of the contract amount. Subsequent payments are made or received by the Funds each day, depending on the daily fluctuations in the fair value of the underlying instrument. A Fund would record an unrealized gain or loss each day equal to these daily payments.
Open futures contracts are shown on the Schedule of Portfolio Investments. Collateral pledged for open futures contracts is included in the cash at broker for futures contracts shown on the Statement of Assets and Liabilities at September 30, 2014.
| 85 |
NOTES TO FINANCIAL STATEMENTS |
Options:
The Funds may write (or sell) put and call options on the securities that the Funds are authorized to buy or already hold in their portfolio. The Funds may also purchase put and call options. The Global Convertible Bond Fund and Absolute Return Fund had outstanding options as of September 30, 2014.
A call option gives the purchaser of the option the right (but not the obligation) to buy, and obligates the seller to sell (when the option is exercised), the underlying instrument at the exercise price at any time or at a specified time during the option period. A put option gives the holder the right to sell and obligates the writer to buy the underlying instrument at the exercise price at any time or at a specified time during the option period. When a Fund purchases (writes) an option, an amount equal to the premium paid (received) by a Fund is reflected as an asset (liability). The amount of the asset (liability) is subsequently marked-to-market to reflect the current market value of the option purchased (written). When an instrument is purchased or sold through an exercise of an option, the related premium paid (or received) is added to (or deducted from) the basis of the instrument acquired or deducted from (or added to) the proceeds of the instrument sold. When an option expires (or a Fund enters into a closing transaction), a Fund realizes a gain or loss on the option to the extent of the premiums received or paid (or gain or loss to the extent the cost of the closing transaction exceeds the premium received or paid). When a Fund writes a call option, such option is “covered,” meaning that a Fund holds the underlying instrument subject to being called by the option counterparty, or cash in an amount sufficient to cover the obligation. When a Fund writes a put option, such option is covered by cash in an amount sufficient to cover the obligation.
In purchasing and writing options, a Fund bears the market risk of an unfavorable change in the price of the underlying instrument or the risk that a Fund may not be able to enter into a closing transaction due to an illiquid market. Exercise of a written option could result in a Fund purchasing or selling a security at a price different from the current market value.
A Fund may execute transactions in both listed and over-the-counter (“OTC”) options. Listed options involve minimal counterparty risk since listed options are guaranteed against default by the exchange on which they trade. Transactions in certain OTC options may expose a Fund to the risk of default by the counterparty to the transaction. In the event of default by the counterparty to the over-the-counter option transaction, a Fund’s maximum amount of loss is the premium paid (as purchaser) or the unrealized gain on the contract (as writer).
86 |
NOTES TO FINANCIAL STATEMENTS |
A summary of the Emerging Market Corporate Bond Fund written option transactions for the period is as follows:
| Number of Options Contracts | Premiums Received | |||||||
Contracts outstanding at September 30, 2013 | 3 | $ | 188 | |||||
Options written | 109,846 | 35,970 | ||||||
Options terminated in closing purchase transactions | — | — | ||||||
Options exercised | (158) | (32,844) | ||||||
Options expired | (109,691) | (3,314) | ||||||
|
|
|
| |||||
Contracts outstanding at September 30, 2014 | — | $ | — | |||||
|
|
|
| |||||
A summary of the Global High Yield Bond Fund written option transactions for the period is as follows:
|
| |||||||
| Number of Options Contracts | Premiums Received | |||||||
Contracts outstanding at September 30, 2013 | — | $ | — | |||||
Options written | 344 | 42,607 | ||||||
Options terminated in closing purchase transactions | — | — | ||||||
Options exercised | (322) | (15,207) | ||||||
Options expired | (22) | (27,400) | ||||||
|
|
|
| |||||
Contracts outstanding at September 30, 2014 | — | $ | — | |||||
|
|
|
| |||||
A summary of the Global Convertible Bond Fund written option transactions for the period is as follows:
|
| |||||||
| Number of Options Contracts | Premiums Received | |||||||
Contracts outstanding at September 30, 2013 | — | $ | — | |||||
Options written | 63 | 50,100 | ||||||
Options terminated in closing purchase transactions | — | — | ||||||
Options exercised | (31) | (34,100) | ||||||
Options expired | — | — | ||||||
|
|
|
| |||||
Contracts outstanding at September 30, 2014 | 32 | $ | 16,000 | |||||
|
|
|
| |||||
A summary of the Absolute Return Fund written option transactions for the period is as follows:
| ||||||||
| Number of Options Contracts | Premiums Received | |||||||
Contracts outstanding at September 30, 2013 | — | $ | — | |||||
Options written | 272 | 63,750 | ||||||
Options terminated in closing purchase transactions | — | — | ||||||
Options exercised | (272) | (63,750) | ||||||
Options expired | — | — | ||||||
|
|
|
| |||||
Contracts outstanding at September 30, 2014 | — | $ | — | |||||
|
|
|
| |||||
| 87 |
NOTES TO FINANCIAL STATEMENTS |
Forward Foreign Currency Exchange Contracts:
The Funds entered into forward foreign currency contracts (“Forward”) to hedge their exposure to changes in foreign currency exchange rates on foreign portfolio holdings (foreign currency exchange risk). In addition, certain Funds may use a Forward to provide exposure to the foreign currency market. A Forward is an agreement between two parties to purchase or sell a foreign currency at a future date at a negotiated forward rate. A Forward is marked-to-market daily and the change in market value is recorded by the Funds as unrealized appreciation or depreciation until the contract settlement date. The market value of the Forward is determined using the forward rate for the remainder of the outstanding period of the contract, through the delivery date. When a Forward is closed or settled, the Funds record a realized gain or loss equal to the fluctuation in rates during the period a Forward was open.
In the event of default by the counterparty to the transaction, the Fund’s maximum amount of loss, as either the buyer or seller, is the unrealized gain of the contract.
Details of forward contracts at period end are included in the Schedule of Portfolio Investments under the caption “Foreign currency exchange contracts.”
Swap Agreements:
The Funds may enter into swap agreements, which are agreements involving two parties to exchange the return generated by a security, currency, commodity, interest rate, index, or other measures for the return generated by another instrument, for example, the agreement to pay interest in exchange for a market-linked return based on a notional amount. The Funds entered into total return, interest rate and other swap agreements as of September 30, 2014.
Interest rate swap agreements generally involve the agreement by the Funds to pay a counterparty a fixed or floating rate on a fixed notional amount and to receive a fixed or floating rate on a fixed notional amount, but may also involve the agreement to pay or receive payments derived from changes in interest rates. Periodic payments are generally made during the life of the swap agreement according to the terms and conditions of the agreement and at termination or maturity.
The Funds enter into cross-currency swaps to gain or reduce exposure to foreign currencies or as an economic hedge against either specific transactions or portfolio instruments (foreign currency exchange rate and/or interest rate risk). Cross-currency swaps are interest rate swaps in which one party pays a stream of interest payments, either fixed or floating, in exchange for another party’s stream of interest payments, either fixed or floating, based on the notional amounts of two different currencies. The notional amounts are typically determined based on the spot exchange rates at the inception of the trade. Cross-currency swaps may also involve an exchange of notional amounts at the start, during and/or at expiration of the contract, either at the current spot rate or another specified rate.
The Funds enter into credit default swaps to manage their exposure to the market or certain sectors of the market, to reduce their risk exposure to defaults of corporate and/or sovereign issuers or to create exposure to corporate and/or sovereign issuers to which they are not otherwise exposed (credit risk). The Funds enter into credit default swap agreements to provide a measure of protection against the default of an issuer (as buyer of protection) and/or gain credit exposure to an issuer to which it is not otherwise exposed (as seller of protection). The Funds may either buy or sell (write) credit default swaps on single-name issuers (corporate or sovereign), a combination or basket of single-name issuers or traded indexes. Credit default swaps on single-name issuers are agreements in which the buyer pays fixed periodic payments to the seller in consideration for a guarantee from the seller to make a specific payment should a negative credit event take place with respect to the referenced entity (e.g., bankruptcy, failure to pay, obligation accelerators, repudiation, moratorium or restructuring). Credit default swaps on traded indexes are agreements in which the buyer pays fixed periodic payments to the seller in consideration for a guarantee from the seller to make a specific payment should a writedown, principal or interest shortfall or default of all or individual underlying securities included in the index occurs. As a buyer, if an underlying credit event occurs, the Funds will either receive from the
88 |
NOTES TO FINANCIAL STATEMENTS |
seller an amount equal to the notional amount of the swap and deliver the referenced security or underlying securities comprising the index or receive a net settlement of cash equal to the notional amount of the swap less the recovery value of the security or underlying securities comprising the index. As a seller (writer), if an underlying credit event occurs, the Funds will either pay the buyer an amount equal to the notional amount of the swap and take delivery of the referenced security or underlying securities comprising the index or pay a net settlement of cash equal to the notional amount of the swap less the recovery value of the security or underlying securities comprising the index.
Total return swap agreements involve the commitments to pay or receive an amount generally determined by reference to a security, index or other measure in exchange for a specific market linked return, based on notional amounts. To the extent that the total return of the security, index or other measure underlying the transaction exceeds or falls short of the offsetting interest rate-based obligation, the Funds receive or make a payment to the counterparty. Interim payments and payments received or made by a Fund at the expiration or other termination of the swap agreements are recorded in the Statements of Operations as realized gains or losses, respectively. Swap agreements are marked-to-market daily based on dealer-supplied valuations, and changes in value, including the periodic amounts of interest to be paid or received on swaps, are recorded as unrealized appreciation/(depreciation). Risks may exceed amounts recognized on the Statements of Assets and Liabilities. These risks include changes in the returns of the underlying instruments, failure of the counterparties to perform under the contracts’ terms and the possible lack of liquidity with respect to the swap agreements. Details of swap agreements open at period end are included in the Schedule of Portfolio Investments under the caption “Interest rate swaps, “Cross currency swaps”, “Credit default swaps” and “Total return swaps”.
Fair Values of Derivative Instruments as of September 30, 2014 are as follows(1):
Fair Values of Derivative Financial Instruments as of September 30, 2014
Statement of Assets and Liabilities Location
Asset Derivatives
Emerging | Emerging Market Corporate Bond Fund | Global High Yield Bond Fund | Global Convertible Bond Fund | Absolute Return Fund | ||||||||||||||||||
Credit risk: | ||||||||||||||||||||||
Credit default swaps, at value | $ | — | $ | 18,979 | $ | 9,831 | $ | — | $ | 3,874,061 | ||||||||||||
Total return swaps, at value | 2,191,495 | — | — | — | — | |||||||||||||||||
Equity risk: | ||||||||||||||||||||||
Investments, at value (call options purchased) | — | — | — | 31,550 | — | |||||||||||||||||
Investments, at value (put options purchased) | — | — | — | 22,240 | 100,050 | |||||||||||||||||
Foreign currency exchange risk: | ||||||||||||||||||||||
Unrealized appreciation on forward foreign currency exchange contracts | 1,760,128 | 54,056 | 103,351 | 165,778 | 10,525,268 | |||||||||||||||||
Interest rate risk: | ||||||||||||||||||||||
Unrealized appreciation on futures contracts | — | 11,251 | 151 | — | 752,509 | |||||||||||||||||
Unrealized appreciation on interest rate swaps contracts | 365,583 | — | — | — | — | |||||||||||||||||
|
|
|
|
|
|
|
|
|
| |||||||||||||
Total | $ | 4,317,206 | $ | 84,286 | $ | 113,333 | $ | 219,568 | $ | 15,251,888 | ||||||||||||
|
|
|
|
|
|
|
|
|
| |||||||||||||
| 89 |
NOTES TO FINANCIAL STATEMENTS |
Liability Derivatives
Credit risk: | ||||||||||||||||||||
Credit default swaps, at value | $ | — | $ | 1,993 | $ | — | $ | — | $ | 5,385,257 | ||||||||||
Equity risk: | ||||||||||||||||||||
Written options, at value | — | — | — | 5,760 | — | |||||||||||||||
Foreign currency exchange risk: | ||||||||||||||||||||
Unrealized depreciation on forward foreign currency exchange contracts | 902,050 | 17,847 | 3,420 | 755 | 1,838,953 | |||||||||||||||
Interest rate risk: | ||||||||||||||||||||
Unrealized depreciation on futures contracts | — | 781 | — | — | 381,756 | |||||||||||||||
Unrealized depreciation on interest rate swaps contracts | 1,091,898 | 15,081 | — | — | 651,763 | |||||||||||||||
|
|
|
|
|
|
|
|
|
| |||||||||||
Total | $ | 1,993,948 | $ | 35,702 | $ | 3,420 | $ | 6,515 | $ | 8,257,729 | ||||||||||
|
|
|
|
|
|
|
|
|
|
The effect of Derivative Instruments on the Statement of Operations during the year ended September 30, 2014 is as follows:
Derivative Instruments Categorized by Risk Exposure | Emerging | Emerging Market Corporate Bond Fund | Global High Yield Bond Fund | Global Convertible Bond Fund | Absolute Return Fund | |||||||||||||||||
Net realized Gain (Loss) From: | ||||||||||||||||||||||
Credit Risk: | ||||||||||||||||||||||
Credit default swaps | $ | — | $ | (21,864) | $ | (66,103) | $ | — | $ | (2,798,107) | ||||||||||||
Equity Risk: | ||||||||||||||||||||||
Written options | — | — | (3,940) | (26,350) | — | |||||||||||||||||
Purchased options(2) | — | — | (35,115) | 3,429 | (110,798) | |||||||||||||||||
Interest Rate Risk: | ||||||||||||||||||||||
Financial futures contracts | (136,016) | (17,868) | (20,415) | 11,109 | (12,430,215) | |||||||||||||||||
Interest rate swaps | (41,107) | 1,048 | — | — | (9,490,618) | |||||||||||||||||
Total Return swaps | 126,262 | — | — | — | — | |||||||||||||||||
Written options | — | (10,298) | — | — | 4,250 | |||||||||||||||||
Purchased options(2) | — | (5,113) | — | — | — | |||||||||||||||||
Foreign currency exchange risk: | ||||||||||||||||||||||
Cross currency swaps | (262,331) | (4,176) | — | — | — | |||||||||||||||||
Forward foreign currency exchange contracts(3) | 2,112,555 | (3,103) | (69,562) | 179,561 | (5,394,643) | |||||||||||||||||
Purchased options(2) | — | — | — | — | 694,425 | |||||||||||||||||
|
|
|
|
|
|
|
|
|
| |||||||||||||
Total | $ | 1,799,363 | $ | (61,374) | $ | (195,135) | $ | 167,749 | $ | (29,525,706) | ||||||||||||
|
|
|
|
|
|
|
|
|
| |||||||||||||
90 |
NOTES TO FINANCIAL STATEMENTS |
Derivative Instruments Categorized by Risk Exposure | Emerging | Emerging Market Corporate Bond Fund | Global High Yield Bond Fund | Global Convertible Bond Fund | Absolute Return Fund | |||||||||||||||||
Net Change in Unrealized Appreciation/Depreciation From: | ||||||||||||||||||||||
Credit Risk: | ||||||||||||||||||||||
Credit default swaps | $ | — | $ | (6,477) | $ | 7,951 | $ | — | $ | (970,821) | ||||||||||||
Equity Risk: | ||||||||||||||||||||||
Call options purchased(4) | — | — | — | (8,343) | — | |||||||||||||||||
Put options purchased(4) | — | — | — | (25,760) | — | |||||||||||||||||
Written options | — | 234 | — | 10,240 | — | |||||||||||||||||
Interest Rate Risk: | ||||||||||||||||||||||
Call options purchased(4) | — | (7,719) | — | — | — | |||||||||||||||||
Financial futures contracts | 23,484 | (4,876) | 15,698 | — | 1,766,815 | |||||||||||||||||
Interest rate swaps | 151,651 | (15,081) | — | — | 287,379 | |||||||||||||||||
Total return swaps | (152,716) | — | — | — | — | |||||||||||||||||
Foreign currency exchange risk: | ||||||||||||||||||||||
Put options purchased(4) | — | — | — | — | — | |||||||||||||||||
Forward foreign currency exchange contracts(5) | 430,709 | 39,842 | 364,876 | 290,071 | 13,951,505 | |||||||||||||||||
|
|
|
|
|
|
|
|
|
| |||||||||||||
Total | $ | 453,128 | $ | 5,923 | $ | 388,525 | $ | 266,208 | $ | 15,034,878 | ||||||||||||
|
|
|
|
|
|
|
|
|
| |||||||||||||
(1) For open derivative instruments as of September 30, 2014, see the preceding tables on the Schedule of Portfolio Investments for credit contracts, foreign currency exchange contracts and interest rate contracts.
(2) Included in net realized gains/(losses) on investment transactions on Statement of Operations.
(3) Included in net realized gains/(losses) on foreign currency transactions on Statement of Operations.
(4) Included in net change in unrealized appreciation/(depreciation) on investments on Statement of Operations.
(5) Included in net change in unrealized appreciation/(depreciation) on foreign currency on Statement of Operations.
For the year ended September 30, 2014, the average volume of derivative activities are as follows:
| Emerging Market Select Bond Fund | Emerging Market Corporate Bond Fund | Global High Yield Bond Fund | Global Convertible Bond Fund | Absolute Return Fund | ||||||||||||||||
Futures short position (contracts) | 19 | 11 | 16 | — | 2,719 | |||||||||||||||
Futures long position (contracts) | — | 4 | — | — | 55 | |||||||||||||||
Forward foreign currency exchange contracts purchased (U.S. dollar amounts) | $77,533,294 | $1,338,362 | $7,034,688 | $7,457,024 | $306,356,387 | |||||||||||||||
Forward foreign currency exchange contracts sold (U.S. dollar amounts) | 87,169,030 | 341,273 | 142,948 | 140,128 | 48,307,552 | |||||||||||||||
Purchased options (Cost $) | — | 7,773 | 8,618 | 37,723 | 25,013 | |||||||||||||||
Written Options (Premium received $) | — | 2,048 | 3,600 | 4,000 | — | |||||||||||||||
Interest rate swaps (Notional Amount in U.S. Dollars) | 47,378,840 | 238,409 | — | — | 119,449,353 | |||||||||||||||
Credit default swaps (Notional Amount in U.S. Dollars) | 2,113,403 | 733,032 | 760,209 | — | 145,540,617 | |||||||||||||||
Cross currency swaps (Notional Amount in U.S. Dollars) | — | 16,500 | — | — | — | |||||||||||||||
Total return swaps (Notional Amount in U.S. Dollars) | 1,870,081 | — | — | — | — | |||||||||||||||
| 91 |
NOTES TO FINANCIAL STATEMENTS |
Counterparty Credit Risk:
Derivatives may also expose a Fund to counterparty risk (the risk that the derivative counterparty will not fulfill its contractual obligations). To the extent amounts due to the Funds from their counterparties are not fully collateralized contractually or otherwise, the Funds bear the risk of loss from counterparty non-performance. A Fund’s maximum risk of loss from counterparty credit risk on over-the-counter derivatives is generally the aggregate unrealized gain in excess of any collateral pledged by the counterparty to the Funds.
For foreign currency exchange contracts, risks may arise upon entering into these contracts from the potential inability of the counterparties to meet the terms of their contracts, or if the foreign currency rates change unfavorably.
The Funds’ risk of loss from counterparty credit risk on OTC derivatives is generally limited to the aggregate unrealized gain netted against any collateral held by the Funds. For OTC purchased options, the Funds bear the risk of loss in the amount of the premiums paid and change in market value of the options should the counterparty not perform under the contracts. Written options by the Funds do not give rise to counterparty credit risk, as written options obligate the Funds to perform and not the counterparty. Counterparty risk related to exchange traded financial futures contracts and options is minimal because of the protection against defaults provided by the exchange on which they trade.
With exchange-traded purchased options and futures and centrally cleared swaps, there is less counterparty credit risk to the Funds since the exchange or clearinghouse, as counterparty to such instruments, guarantees against a possible default. The clearinghouse stands between the buyer and the seller of the contract; therefore, credit risk is limited to failure of the clearinghouse. While offset rights may exist under applicable law, the Fund does not have a contractual right of offset against a clearing broker or clearinghouse in the event of a default (including the bankruptcy or insolvency) of the clearing broker or clearinghouse. Additionally, credit risk exists in exchange-traded futures and centrally cleared swaps with respect to initial and variation margin that is held in a clearing broker’s customer accounts. While clearing brokers are required to segregate customer margin from their own assets, in the event that a clearing broker becomes insolvent or goes into bankruptcy and at that time there is a shortfall in the aggregate amount of margin held by the clearing broker for all its clients, typically the shortfall would be allocated on a pro rata basis across all the clearing broker’s customers, potentially resulting in losses to the Funds.
In order to better define its contractual rights and to secure rights that will help the Funds mitigate its counterparty risk, the Funds may enter into an International Swaps and Derivatives Association, Inc. Master Agreement (“ISDA Master Agreement”) or similar agreement with its derivative contract counterparties. An ISDA Master Agreement is a bilateral agreement between a Fund and a counterparty that governs certain OTC derivatives and typically contains, among other things, collateral posting terms and netting provisions in the event of a default and/or termination event. Under an ISDA Master Agreement, a Fund may, under certain circumstances, offset with the counterparty certain derivative financial instruments’ payables and/or receivables with collateral held and/or posted and create one single net payment. The provisions of the ISDA Master Agreement typically permit a single net payment in the event of default including the bankruptcy or insolvency of the counterparty. However, bankruptcy or insolvency laws of a particular jurisdiction may impose restrictions on or prohibitions against the right of offset in bankruptcy, insolvency or other events. In addition, certain ISDA Master Agreements allow counterparties to OTC derivatives to terminate derivative contracts prior to maturity in the event a Fund’s net assets decline by a stated percentage or the Fund fails to meet the terms of its ISDA Master Agreements, which would cause the Fund to accelerate payment of any net liability owed to the counterparty.
Collateral Requirements:
For derivatives traded under an ISDA Master Agreement, the collateral requirements are typically calculated by netting the mark to market amount for each transaction under such agreement and comparing that amount to the value of any collateral currently pledged by the Fund and the counterparty.
92 |
NOTES TO FINANCIAL STATEMENTS |
Cash collateral that has been pledged to cover obligations of a Fund and cash collateral received from the counterparty, if any, is reported separately on the Statement of Assets and Liabilities as cash pledged as collateral and cash received as collateral, respectively. Non-cash collateral pledged by the Fund, if any, is noted in the Schedule of Investments. Generally, the amount of collateral due from or to a party has to exceed a minimum transfer amount threshold (e.g. $500,000) before a transfer is required, which is determined at the close of business of a Fund and any additional required collateral is delivered to/pledged by a Fund on the next business day. Typically, a Fund and its counterparties are not permitted to sell, re-pledge or use the collateral they receive. To the extent amounts due to a Fund from its counterparties are not fully collateralized, contractually or otherwise, a Fund bears the risk of loss from counterparty non-performance. The Funds attempt to mitigate counterparty risk by entering into agreements only with counterparties that it believes have the financial resources to honor their obligations and by monitoring the financial stability of those counterparties.
For financial reporting purposes, the Funds do not offset derivative assets and derivative liabilities that are subject to netting arrangements in the Statement of Assets and Liabilities.
At September 30, 2014, the Funds’ derivative assets and liabilities (by type) on a gross basis are as follows:
| Emerging Market Select Bond Fund | Assets | Liabilities | ||||||
Derivative Financial Instruments: | ||||||||
Swaps | $ | 2,557,078 | $ | 1,091,898 | ||||
Foreign Currency Exchange Contracts | 1,760,128 | 902,050 | ||||||
|
|
|
| |||||
Total derivative assets and liabilities in the Statement of Assets and Liabilities | 4,317,206 | 1,993,948 | ||||||
|
|
|
| |||||
Derivatives not subject to a master netting agreement or similar agreement (“MNA”) | (1,596,387 | ) | — | |||||
|
|
|
| |||||
Total derivative assets and liabilities subject to a MNA | $ | 2,720,819 | $ | 1,993,948 | ||||
|
|
|
| |||||
| Emerging Market Corporate Bond Fund | Assets | Liabilities | ||||||
Derivative Financial Instruments: | ||||||||
Swaps | $ | 18,979 | $ | 17,074 | ||||
Financial Futures Contracts | 11,251 | 781 | ||||||
Foreign Currency Exchange Contracts | 54,056 | 17,847 | ||||||
|
|
|
| |||||
Total derivative assets and liabilities in the Statement of Assets and Liabilities | 84,286 | 35,702 | ||||||
|
|
|
| |||||
Derivatives not subject to a MNA or similar agreement | — | — | ||||||
|
|
|
| |||||
Total derivative assets and liabilities subject to a MNA | $ | 84,286 | $ | 35,702 | ||||
|
|
|
| |||||
| Global High Yield Bond Fund | Assets | Liabilities | ||||||
Derivative Financial Instruments: | ||||||||
Swaps | $ | 9,831 | $ | — | ||||
Financial Futures Contracts | 151 | — | ||||||
Foreign Currency Exchange Contracts | 103,351 | 3,420 | ||||||
|
|
|
| |||||
Total derivative assets and liabilities in the Statement of Assets and Liabilities | 113,333 | 3,420 | ||||||
|
|
|
| |||||
Derivatives not subject to a MNA or similar agreement | — | — | ||||||
|
|
|
| |||||
Total derivative assets and liabilities subject to a MNA | $ | 113,333 | $ | 3,420 | ||||
|
|
|
| |||||
| 93 |
NOTES TO FINANCIAL STATEMENTS |
| Global Convertible Bond Fund | Assets | Liabilities | ||||||
Derivative Financial Instruments: | ||||||||
Call Options Purchased | $ | 31,550 | $ | — | ||||
Put Options Purchased | 22,240 | — | ||||||
Put Options Written | — | 5,760 | ||||||
Foreign Currency Exchange Contracts | 165,778 | 755 | ||||||
|
|
|
| |||||
Total derivative assets and liabilities in the Statement of Assets and Liabilities | 219,568 | 6,515 | ||||||
|
|
|
| |||||
Derivatives not subject to a MNA or similar agreement | — | — | ||||||
|
|
|
| |||||
Total derivative assets and liabilities subject to a MNA | $ | 219,568 | $ | 6,515 | ||||
|
|
|
| |||||
| Absolute Return Fund | Assets | Liabilities | ||||||
Derivative Financial Instruments: | ||||||||
Swaps | $ | 3,874,061 | $ | 6,037,020 | ||||
Financial Futures Contracts | 752,509 | 381,756 | ||||||
Put Options Purchased | 100,050 | — | ||||||
Foreign Currency Exchange Contracts | 10,525,268 | 1,838,953 | ||||||
|
|
|
| |||||
Total derivative assets and liabilities in the Statement of Assets and Liabilities | 15,251,888 | 8,257,729 | ||||||
|
|
|
| |||||
Derivatives not subject to a MNA or similar agreement | — | — | ||||||
|
|
|
| |||||
Total derivative assets and liabilities subject to a MNA | $ | 15,251,888 | $ | 8,257,729 | ||||
|
|
|
| |||||
The following tables present the Funds’ derivative assets by counterparty net of amounts available for offset under a MNA and net of the related collateral received by the Funds as of September 30, 2014:
| Amount of Assets | Derivatives | Non-cash | Cash | Net Amount | ||||||||||||||||||
| Subject to a MNA | �� | Available for | Collateral | Collateral | of Derivative | |||||||||||||||||
| Emerging Market Select Bond Fund | by Counterparty | Offset1 | Received2 | Received2 | Assets3 | |||||||||||||||||
Counterparty | ||||||||||||||||||||||
Citibank, N.A. | $ | 1,773,811 | $(1,242,379) | $ | — | $ | (320,000) | $ | 211,432 | |||||||||||||
Citigroup Global Markets, Inc. | 252,351 | (96,854) | — | — | 155,497 | |||||||||||||||||
Deutsche Bank AG | 499,599 | (469,236) | — | — | 30,363 | |||||||||||||||||
JPMorgan Chase Bank, N.A. | 195,058 | (142,476) | — | — | 52,582 | |||||||||||||||||
|
|
|
|
|
|
|
|
| ||||||||||||||
Total | $ | 2,720,819 | $(1,950,945) | $ | — | $ | (320,000) | $ | 449,874 | |||||||||||||
|
|
|
|
|
|
|
|
| ||||||||||||||
| Amount of Assets | Derivatives | Non-cash | Cash | Net Amount | ||||||||||||||||||||||
| Subject to a MNA | Available for | Collateral | Collateral | of Derivative | ||||||||||||||||||||||
| Emerging Market Corporate Bond Fund | by Counterparty | Offset1 | Received2 | Received2 | Assets3 | |||||||||||||||||||||
Counterparty | ||||||||||||||||||||||||||
BNP Paribas SA | $ | 8,974 | $ | (1,281) | $ | — | $ | — | $ | 7,693 | ||||||||||||||||
Citibank, N.A. | 64,061 | (32,476) | — | — | 31,585 | |||||||||||||||||||||
Citigroup Global Markets, Inc. | 11,251 | (781) | — | — | 10,470 | |||||||||||||||||||||
|
|
|
|
|
|
|
|
|
| |||||||||||||||||
Total | $ | 84,286 | $ | (34,538) | $ | — | $ | — | $ | 49,748 | ||||||||||||||||
|
|
|
|
|
|
|
|
|
| |||||||||||||||||
94 |
NOTES TO FINANCIAL STATEMENTS |
| Amount of Assets | Derivatives | Non-cash | Cash | Net Amount | ||||||||||||||||||||
| Subject to a MNA | Available for | Collateral | Collateral | of Derivative | ||||||||||||||||||||
| Global High Yield Bond Fund | by Counterparty | Offset1 | Received2 | Received2 | Assets3 | |||||||||||||||||||
Counterparty | ||||||||||||||||||||||||
Barclays Bank Plc | $ 5,735 | $ | — | $ | — | $ | — | $ | 5,735 | |||||||||||||||
Citibank, N.A. | 103,351 | (3,420) | — | — | 99,931 | |||||||||||||||||||
Citigroup Global Markets, Inc. | 151 | — | — | — | 151 | |||||||||||||||||||
JPMorgan Chase Bank, N.A. | 1,638 | — | — | — | 1,638 | |||||||||||||||||||
Morgan Stanley & Co. | 2,458 | — | — | — | 2,458 | |||||||||||||||||||
|
|
|
|
|
|
|
|
| ||||||||||||||||
Total | $ 113,333 | $ | (3,420) | $ | — | $ | — | $ | 109,913 | |||||||||||||||
|
|
|
|
|
|
|
|
| ||||||||||||||||
| Amount of Assets | Derivatives | Non-cash | Cash | Net Amount | ||||||||||||||||||||
| Subject to a MNA | Available for | Collateral | Collateral | of Derivative | ||||||||||||||||||||
| Global Convertible Bond Fund | by Counterparty | Offset1 | Received2 | Received2 | Assets3 | |||||||||||||||||||
Counterparty | ||||||||||||||||||||||||
Citibank, N.A. | $ 165,778 | $ | (755) | $ | — | $ | — | $ | 165,023 | |||||||||||||||
Credit Suisse Securities (USA) LLC | 53,790 | (5,760) | — | — | 48,030 | |||||||||||||||||||
|
|
|
|
|
|
|
|
| ||||||||||||||||
Total | $ 219,568 | $ | (6,515) | $ | — | $ | — | $ | 213,053 | |||||||||||||||
|
|
|
|
|
|
|
|
| ||||||||||||||||
| Amount of Assets | Derivatives | Non-cash | Cash | Net Amount | ||||||||||||||||||||
| Subject to a MNA | Available for | Collateral | Collateral | of Derivative | ||||||||||||||||||||
| Absolute Return Fund | by Counterparty | Offset1 | Received2 | Received2 | Assets3 | |||||||||||||||||||
Counterparty | ||||||||||||||||||||||||
Barclays Bank Plc | $ 325,422 | $ | (123,336) | $ | — | $ | (202,086) | $ | — | |||||||||||||||
BNP Paribas SA | 164,881 | (164,881) | — | — | — | |||||||||||||||||||
Citibank, N.A. | 10,562,024 | (1,951,031) | — | (3,966,000) | 4,644,993 | |||||||||||||||||||
Credit Suisse Securities (USA) LLC | 752,509 | (381,756) | — | — | 370,753 | |||||||||||||||||||
Deutsche Bank AG | 430,442 | (192,341) | — | (85,000) | 153,101 | |||||||||||||||||||
JPMorgan Chase Bank, N.A. | 1,921,965 | (1,921,965) | — | — | — | |||||||||||||||||||
Morgan Stanley & Co. | 1,094,645 | (238,934) | — | (855,711) | — | |||||||||||||||||||
|
|
|
|
|
|
|
|
| ||||||||||||||||
Total | $ 15,251,888 | $ | (4,974,244) | $ | — | $ | (5,108,797) | $ | 5,168,847 | |||||||||||||||
|
|
|
|
|
|
|
|
| ||||||||||||||||
1 The amount of derivatives for offset is limited to the amount of assets and/or liabilities that are subject to a MNA.
2 Excess of collateral received from the individual counterparty may not be shown for financial reporting purposes.
3 Net amount represents the net amount receivable from the counterparty in the event of default.
The following tables present the Funds’ derivative liabilities by counterparty net of amounts available for offset under a MNA and net of the related collateral pledged by the Funds as of September 30, 2014:
| Amount of Liabilities | Derivatives | Non-cash | Cash | Net Amount | ||||||||||||||||||
| Subject to a MNA | Available for | Collateral | Collateral | of Derivative | ||||||||||||||||||
| Emerging Market Select Bond Fund | by Counterparty | Offset1 | Pledged2 | Pledged2 | Liabilities3 | |||||||||||||||||
Counterparty | ||||||||||||||||||||||
| BNP Paribas SA | $ 43,003 | $ | — | $ | — | $ | — | $ | 43,003 | |||||||||||||
| Citigroup Global Markets, Inc. | 96,854 | (96,854) | — | — | — | |||||||||||||||||
| Citibank, N.A. | 1,242,379 | (1,242,379) | — | — | — | |||||||||||||||||
| Deutsche Bank AG | 469,236 | (469,236) | — | — | — | |||||||||||||||||
| JPMorgan Chase Bank, N.A. | 142,476 | (142,476) | — | — | — | |||||||||||||||||
|
|
|
|
|
|
|
|
| ||||||||||||||
Total | $1,993,948 | $ | (1,950,945) | $ | — | $ | — | $ | 43,003 | |||||||||||||
|
|
|
|
|
|
|
|
| ||||||||||||||
| 95 |
NOTES TO FINANCIAL STATEMENTS |
| Amount of Liabilities | Derivatives | Non-cash | Cash | Net Amount | ||||||||||||||||||||
| Subject to a MNA | Available for | Collateral | Collateral | of Derivative | ||||||||||||||||||||
| Emerging Market Corporate Bond Fund | by Counterparty | Offset1 | Pledged2 | Pledged2 | Liabilities3 | |||||||||||||||||||
Counterparty | ||||||||||||||||||||||||
| BNP Paribas SA | $ | 1,281 | $ | (1,281) | $ | — | $ | — | $ | — | ||||||||||||||
| Citibank, N.A. | 32,476 | (32,476) | — | — | — | |||||||||||||||||||
| Citigroup Global Markets, Inc. | 781 | (781) | — | — | — | |||||||||||||||||||
| Deutsche Bank AG | 1,164 | — | — | — | 1,164 | |||||||||||||||||||
|
|
|
|
|
|
|
|
|
| |||||||||||||||
Total | $ | 35,702 | $ | (34,538) | $ | — | $ | — | $ | 1,164 | ||||||||||||||
|
|
|
|
|
|
|
|
|
| |||||||||||||||
| Amount of Liabilities | Derivatives | Non-cash | Cash | Net Amount | ||||||||||||||||||||
| Subject to a MNA | Available for | Collateral | Collateral | of Derivative | ||||||||||||||||||||
| Global High Yield Bond Fund | by Counterparty | Offset1 | Pledged2 | Pledged2 | Liabilities3 | |||||||||||||||||||
Counterparty | ||||||||||||||||||||||||
Citibank, N.A. | $ | 3,420 | $ | (3,420) | $ | — | $ | — | $ | — | ||||||||||||||
|
|
|
|
|
|
|
|
|
| |||||||||||||||
Total | $ | 3,420 | $ | (3,420) | $ | — | $ | — | $ | — | ||||||||||||||
|
|
|
|
|
|
|
|
|
| |||||||||||||||
| Amount of Liabilities | Derivatives | Non-cash | Cash | Net Amount | ||||||||||||||||||||
| Subject to a MNA | Available for | Collateral | Collateral | of Derivative | ||||||||||||||||||||
| Global Convertible Bond Fund | by Counterparty | Offset1 | Pledged2 | Pledged2 | Liabilities3 | |||||||||||||||||||
Counterparty | ||||||||||||||||||||||||
Citibank, N.A. | $ | 755 | $ | (755) | $ | — | $ | — | $ | — | ||||||||||||||
Credit Suisse Securities (USA) LLC | 5,760 | (5,760) | — | — | — | |||||||||||||||||||
|
|
|
|
|
|
|
|
|
| |||||||||||||||
Total | $ | 6,515 | $ | (6,515) | $ | — | $ | — | $ | — | ||||||||||||||
|
|
|
|
|
|
|
|
|
| |||||||||||||||
| Amount of Liabilities | Derivatives | Non-cash | Cash | Net Amount | ||||||||||||||||||||
| Subject to a MNA | Available for | Collateral | Collateral | of Derivative | ||||||||||||||||||||
| Absolute Return Fund | by Counterparty | Offset1 | Pledged2 | Pledged2 | Liabilities3 | |||||||||||||||||||
Counterparty | ||||||||||||||||||||||||
Barclays Bank Plc | $ | 123,336 | $ | (123,336) | $ | — | $ | — | $ | — | ||||||||||||||
BNP Paribas SA | 402,641 | (164,881) | — | (237,760) | — | |||||||||||||||||||
Citibank, N.A. | 1,951,031 | (1,951,031) | — | — | — | |||||||||||||||||||
Credit Suisse Securities (USA) LLC | 381,756 | (381,756) | — | — | — | |||||||||||||||||||
Deutsche Bank AG | 192,341 | (192,341) | — | — | — | |||||||||||||||||||
JPMorgan Chase Bank, N.A. | 4,967,690 | (1,921,965) | — | (3,045,725) | — | |||||||||||||||||||
Morgan Stanley & Co. | 238,934 | (238,934) | — | — | — | |||||||||||||||||||
|
|
|
|
|
|
|
|
|
| |||||||||||||||
Total | $ | 8,257,729 | $ | (4,974,244) | $ | — | $ | (3,283,485) | $ | — | ||||||||||||||
|
|
|
|
|
|
|
|
|
| |||||||||||||||
1 The amount of derivatives for offset is limited to the amount of assets and/or liabilities that are subject to a MNA.
2 Excess of collateral pledged to the individual counterparty may not be shown for financial reporting purposes.
3 Net amount represents the net amount payable to the counterparty in the event of default.
Credit Enhancement:
Certain obligations held by the Funds have credit enhancement or liquidity features that may, under certain circumstances, provide for repayment of principal and interest on the obligation upon demand date, interest rate reset date or final maturity. These enhancements may include: letters of credit; liquidity guarantees; security purchase agreements; tender option purchase agreements and third party insurance (i.e., AMBAC and MBIA).
Offering Costs:
Upon commencement of operations, offering costs associated with the establishment of the Funds were incurred by the Funds. Offering costs are amortized and included in expenses over a 12-month period beginning with the commencement of operations and are included in the Statement of Operations.
96 |
NOTES TO FINANCIAL STATEMENTS |
Investment Transactions and Income:
Investment transactions are recorded on one business day after trade date, except on the last day of each fiscal quarter, when they are recorded on trade date. Dividend income is recorded on the ex-dividend date. Realized gains and losses from investment transactions are calculated based on the cost of the specific security (also known as identified cost basis). Interest income is recognized on the accrual basis and includes, where applicable, the amortization or accretion of premium or discount using the effective yield method.
Expense, Investment Income and Gain/Loss Allocation:
Each Fund pays the expenses that are directly related to its operations, such as custodian fees or advisory fees. Expenses incurred by the Trust, such as trustee or legal fees, are allocated among each of the Funds either proportionately based upon each Fund’s relative net assets or using another reasonable basis such as equally across all Funds, depending on the nature of the expense. Individual share classes within a Fund are charged expenses specific to that class, such as distribution fees and transfer agent fees. Within a Fund, expenses other than class specific expenses are allocated daily to each class based upon the proportion of relative net assets. Investment income and realized and unrealized gains or losses are allocated to each class of shares based on relative net assets.
Distributions to Shareholders:
Each Fund pays out any income that it receives, less expenses, in the form of dividends and capital gains to its shareholders. Income dividends are declared daily and paid monthly. Dividends will also be paid at any time during the month upon total redemption of shares in an account. Capital gain distributions are declared and paid at least annually. Distributions to shareholders are recorded on the ex-dividend date. The amount of dividends and distributions are calculated based on federal income tax regulations, which may differ from U.S. GAAP. These “book/tax” differences may be either temporary or permanent in nature. To the extent these differences are determined, as of the end of the tax year, to be permanent (e.g., expiring capital loss carryforward), they are reclassified within a Fund’s capital accounts based on their federal tax basis treatment.
For the period ended September 30, 2014, permanent differences and reclassification amounts due to non-deductible organizational costs and swap, currency and hybrid reclasses were as follows:
| Increase/(Decrease) | Increase/(Decrease) | |||||
| Increase/(Decrease) | Accumulated | Accumulated | ||||
Paid in Capital | Net Investment Income | Realized Gain/(Loss) | ||||
Emerging Market Select Bond Fund | $ — | $(2,702,200) | $2,702,200 | |||
Emerging Market Corporate Bond Fund | — | (2,037) | 2,037 | |||
Global High Yield Bond Fund | — | (182,934) | 182,934 | |||
Global Convertible Bond Fund | (1,681) | 100,282 | (98,601) | |||
Absolute Return Fund | (17,016) | (2,441,545) | 2,458,561 |
3. Agreements and Other Transactions with Affiliates:
The Trust has entered into an Investment Advisory Agreement with RBC GAM (US) under which RBC GAM (US) manages each Fund’s assets and furnishes related office facilities, equipment, research and personnel. The Agreement requires each Fund to pay RBC GAM (US) a monthly fee based upon average daily net assets. Under the terms of the Agreement, RBC GAM (US) is entitled to receive fees based on a percentage of the average daily net assets of each of the Funds as follows:
| Annual Rate | ||
Emerging Market Select Bond Fund | 0.80% | |
Emerging Market Corporate Bond Fund | 0.95% | |
Global High Yield Bond Fund | 0.75% | |
Global Convertible Bond Fund | 0.80% | |
Absolute Return Fund | 0.75% |
| 97 |
NOTES TO FINANCIAL STATEMENTS |
RBC GAM (US) has contractually agreed to waive fees and/or make payments in order to keep total operating expenses of the Funds to the following levels pursuant to an Expense Limitation Agreement.
| Class A | Class C | Class I | ||||||||||
| Annual Rate | Annual Rate | Annual Rate | ||||||||||
Emerging Market Select Bond Fund | 1.25% | N/A | 1.00% | |||||||||
Emerging Market Corporate Bond Fund | 1.40% | N/A | 1.15% | |||||||||
Global High Yield Bond Fund | 1.20% | N/A | 0.95% | |||||||||
Global Convertible Bond Fund | N/A | N/A | 1.00% | |||||||||
Absolute Return Fund | 1.20% | 1.95% | 0.95% | |||||||||
This Expense Limitation Agreement is in place until January 31, 2016 and shall continue for additional one-year terms unless terminated by either party at any time. Each Fund will carry forward, for a period not to exceed 3 years from the end of the fiscal year in which a waiver or reimbursement is made by RBC GAM (US), any expenses in excess of the expense limitation and repay RBC GAM (US) such amounts, provided the Fund is able to effect such repayment and remain in compliance with the expense limitation. At September 30, 2014, the amounts subject to possible recoupment under the Expense Limitation Agreement were $566,883, $570,181, $561,314, $533,553 and $211,925 for the Emerging Market Select Bond Fund, Emerging Market Corporate Bond Fund, Global High Yield Bond Fund, Global Convertible Bond Fund and Absolute Return Fund, respectively.
Each of the Funds are sub-advised by BlueBay and the Global High Yield Bond Fund and Absolute Return Fund are also sub-advised by BlueBay US (effective November 27, 2013), which are wholly-owned subsidiaries of Royal Bank of Canada, which is a parent company of the Advisor. The Sub-Advisors are paid by the Advisor out of the advisory fee paid by the Funds to the Advisor.
RBC GAM (US) serves as co-administrator to the Funds. BNY Mellon serves as co-administrator and fund accounting agent. Services provided under the Administrative Services Agreement include providing day-to-day administration of matters related to the Funds, maintenance of their records and the preparation of reports. Under the terms of the Administrative Services Agreement, RBC GAM (US) does not receive a fee for its role as co-administrator. BNY Mellon receives a fee for its services payable by the Funds based on the Funds’ average net assets. BNY Mellon’s fee is included with “Accounting fees” in the Statements of Operations.
Certain Officers and Trustees of the Trust are affiliated with the Advisor. Such Officers and Trustees receive no compensation from the Funds for serving in their respective roles.
The Trust currently pays each of the independent Trustees (Trustees of the Trust who are not directors, officers or employees of the Advisor, either Co-Administrator or Distributor) an annual retainer of $35,000 ($41,500 effective October 1, 2014). The Board Chairperson and Audit Committee Chairperson each receive an additional retainer of $2,500 annually, and all other trustees serving as Chair of a Board committee each receive an additional retainer of $1,000 annually. In addition, Independent Trustees receive a quarterly meeting fee of $5,500 for each in-person Board meeting attended, a meeting fee of $1,500 for each telephonic or Special Board meeting attended, a $1,500 fee for each Board committee meeting attended, and are reimbursed for all out-of-pocket expenses relating to attendance at such meetings.
98 |
NOTES TO FINANCIAL STATEMENTS |
In conjunction with the launch of each of the Funds, the Advisor invested seed capital in each Fund to provide each Fund with its initial investment assets. The table below shows, as of September 30, 2014, each Fund’s net assets, the shares (if any) of each Fund held by the Advisor, and the percent of total net assets represented by the Advisor’s investment.
| Net Assets | Shares held by Advisor | % of Fund | ||||||||||
Emerging Market Select Bond Fund | $ | 216,023,883 | 1,051 | 0.01% | ||||||||
Emerging Market Corporate Bond Fund | $ | 22,649,932 | 1,791,184 | 79.4% | ||||||||
Global High Yield Bond Fund | $ | 34,660,174 | 2,461,561 | 74.0% | ||||||||
Global Convertible Bond Fund | $ | 21,193,162 | 1,766,981 | 92.8% | ||||||||
4. Fund Distribution:
Each of the Funds except Global Convertible Bond Fund has adopted a Master Distribution 12b-1 Plan (the “Plan”) in which Quasar Distributors LLC (the “Distributor”) acts as the Funds’ distributor. The Plan permits each Fund to make payments for or to reimburse the Distributor for distribution-related costs and expenses of marketing shares of Class A covered under the Plan, and/or for providing shareholder services. The Plan does not apply to Class I. The following chart shows the current Plan fee rate for Class A and C.
| Class A | Class C | |||||||||
12b-1 Plan Fee | 0.25 | %* | 1.00 | % | ||||||
* Under the 12b-1 plan, the maximum fee rate for Class A shares is 0.50%. Currently the Board of Trustees has approved an annual limit of 0.25%.
Plan fees are based on average daily net assets of Class A and C. Up to 0.25% of each Plan fee may be designated as a Service Fee, as defined by the applicable rules of the Financial Industry Regulatory Authority. The Distributor, subject to applicable legal requirements, may waive a Plan fee voluntarily, in whole or in part. For the year ended September 30, 2014, there were no fees waived by the Distributor.
For the year ended September 30, 2014, the Distributor received commissions of $163,710 from front-end sales charges of Class A shares of the Funds, of which $5,471 was paid to affiliated broker-dealers, and the remainder was either paid to unaffiliated broker-dealers or retained by the Distributor.
The Distributor did not receive any CDSC fees from Class A shares or Class C shares of the Funds during the year ended September 30, 2014.
5. Securities Transactions:
The cost of securities purchased and proceeds from securities sold (excluding securities maturing less than one year from acquisition) for the year ended September 30, 2014 were as follows:
| Purchases | Sales | |||||||
Emerging Market Select Bond Fund | $ | 425,926,227 | $ | 390,695,046 | ||||
Emerging Market Corporate Bond Fund | 37,041,535 | 34,384,344 | ||||||
Global High Yield Bond Fund | 39,095,440 | 35,379,646 | ||||||
Global Convertible Bond Fund | 29,241,309 | 26,626,324 | ||||||
Absolute Return Fund | 624,019,539 | 620,533,327 | ||||||
| 99 |
NOTES TO FINANCIAL STATEMENTS |
6. Capital Share Transactions:
The Trust is authorized to issue an unlimited number of shares of beneficial interest (“shares outstanding”) without par value. Transactions in capital stock of the Funds are summarized below:
| Emerging | Emerging | |||||||||||||||
| Market Select | Market Corporate | |||||||||||||||
| Bond Fund | Bond Fund | |||||||||||||||
| For the | For the | For the | For the | |||||||||||||
| Year Ended | Year Ended | Year Ended | Year Ended | |||||||||||||
| September 30, | September 30, | September 30, | September 30, | |||||||||||||
| 2014(a) | 2013 | 2014(a) | 2013 | |||||||||||||
CAPITAL TRANSACTIONS: | ||||||||||||||||
Class A | ||||||||||||||||
Proceeds from shares issued | $ | 10,000 | $ | — | $ | 10,000 | $ | — | ||||||||
Distributions reinvested | 339 | — | 339 | — | ||||||||||||
Cost of shares redeemed | — | — | — | — | ||||||||||||
|
|
|
|
|
|
|
| |||||||||
Change in Class A | $ | 10,339 | $ | — | $ | 10,339 | $ | — | ||||||||
|
|
|
|
|
|
|
| |||||||||
Class I | ||||||||||||||||
Proceeds from shares issued | $ | 59,330,955 | $ | 115,860,846 | $ | 2,655,426 | $ | 2,023,812 | ||||||||
Distributions reinvested | 6,954,514 | 6,153,471 | 806,477 | 1,728,269 | ||||||||||||
Cost of shares redeemed | (32,115,324 | ) | (38,460,514 | ) | (462,871 | ) | (320,211 | ) | ||||||||
|
|
|
|
|
|
|
| |||||||||
Change in Class I | $ | 34,170,145 | $ | 83,553,803 | $ | 2,999,032 | $ | 3,431,870 | ||||||||
|
|
|
|
|
|
|
| |||||||||
Change in net assets resulting from capital transactions | $ | 34,180,484 | $ | 83,553,803 | $ | 3,009,371 | $ | 3,431,870 | ||||||||
|
|
|
|
|
|
|
| |||||||||
SHARE TRANSACTIONS: | ||||||||||||||||
Class A | ||||||||||||||||
Issued | 1,017 | — | 1,026 | — | ||||||||||||
Reinvested | 34 | — | 34 | — | ||||||||||||
Redeemed | — | — | — | — | ||||||||||||
|
|
|
|
|
|
|
| |||||||||
Change in Class A | 1,051 | — | 1,060 | — | ||||||||||||
|
|
|
|
|
|
|
| |||||||||
Class I | ||||||||||||||||
Issued | 5,947,035 | 10,663,181 | 266,395 | 204,329 | ||||||||||||
Reinvested | 698,184 | 581,271 | 80,798 | 164,943 | ||||||||||||
Redeemed | (3,221,660 | ) | (3,725,617 | ) | (46,845 | ) | (29,641 | ) | ||||||||
|
|
|
|
|
|
|
| |||||||||
Change in Class I | 3,423,559 | 7,518,835 | 300,348 | 339,631 | ||||||||||||
|
|
|
|
|
|
|
| |||||||||
Change in shares resulting from capital transactions | 3,424,610 | 7,518,835 | 301,408 | 339,631 | ||||||||||||
|
|
|
|
|
|
|
| |||||||||
| Global | Global | |||||||||||||||||||
| High Yield | Convertible | |||||||||||||||||||
| Bond Fund | Bond Fund | |||||||||||||||||||
| For the | For the | For the | For the | |||||||||||||||||
| Year Ended | Year Ended | Year Ended | Year Ended | |||||||||||||||||
| September 30, | September 30, | September 30, | September 30, | |||||||||||||||||
| 2014(a) | 2013 | 2014(a) | 2013 | |||||||||||||||||
CAPITAL TRANSACTIONS: | ||||||||||||||||||||
Class A | ||||||||||||||||||||
Proceeds from shares issued | $ | 29,148 | $ | — | ||||||||||||||||
Distributions reinvested | 879 | — | ||||||||||||||||||
Cost of shares redeemed | (438 | ) | — | |||||||||||||||||
|
|
|
| |||||||||||||||||
Change in Class A | $ | 29,589 | $ | — | ||||||||||||||||
|
|
|
| |||||||||||||||||
Class I | ||||||||||||||||||||
Proceeds from shares issued | $ | 3,938,201 | $ | 9,638,828 | $ | 1,486,805 | $ | 2,500 | ||||||||||||
Distributions reinvested | 2,023,725 | 2,514,122 | 1,859,797 | 731,176 | ||||||||||||||||
Cost of shares redeemed | (984,372 | ) | (4,178,069 | ) | (1,458 | ) | (479,977 | ) | ||||||||||||
|
|
|
|
|
|
|
| |||||||||||||
Change in Class I | $ | 4,977,554 | $ | 7,974,881 | $ | 3,345,144 | $ | 253,699 | ||||||||||||
|
|
|
|
|
|
|
| |||||||||||||
Change in net assets resulting from capital transactions | $ | 5,007,143 | $ | 7,974,881 | $ | 3,345,144 | $ | 253,699 | ||||||||||||
|
|
|
|
|
|
|
| |||||||||||||
100 |
NOTES TO FINANCIAL STATEMENTS |
| Global | Global | |||||||||||||||||||||||||||||||
| High Yield | Convertible | |||||||||||||||||||||||||||||||
| Bond Fund | Bond Fund | |||||||||||||||||||||||||||||||
| For the | For the | For the | For the | |||||||||||||||||||||||||||||
| Year Ended | Year Ended | Year Ended | Year Ended | |||||||||||||||||||||||||||||
| September 30, | September 30, | September 30, | September 30, | |||||||||||||||||||||||||||||
| 2014(a) | 2013 | 2014(a) | 2013 | |||||||||||||||||||||||||||||
SHARE TRANSACTIONS: | ||||||||||||||||||||||||||||||||
Class A | ||||||||||||||||||||||||||||||||
Issued | 2,774 | — | ||||||||||||||||||||||||||||||
Reinvested | 83 | — | ||||||||||||||||||||||||||||||
Redeemed | (41 | ) | — | |||||||||||||||||||||||||||||
|
|
|
| |||||||||||||||||||||||||||||
Change in Class A | 2,816 | — | ||||||||||||||||||||||||||||||
|
|
|
| |||||||||||||||||||||||||||||
Class I | ||||||||||||||||||||||||||||||||
Issued | 373,917 | 906,493 | 132,096 | 235 | ||||||||||||||||||||||||||||
Reinvested | 192,933 | 237,892 | 169,004 | 67,229 | ||||||||||||||||||||||||||||
Redeemed | (93,292 | ) | (396,863 | ) | (130 | ) | (42,927 | ) | ||||||||||||||||||||||||
|
|
|
|
|
|
|
| |||||||||||||||||||||||||
Change in Class I | 473,558 | 747,522 | 300,970 | 24,537 | ||||||||||||||||||||||||||||
|
|
|
|
|
|
|
| |||||||||||||||||||||||||
Change in shares resulting from capital transactions | 476,374 | 747,522 | 300,970 | 24,537 | ||||||||||||||||||||||||||||
|
|
|
|
|
|
|
| |||||||||||||||||||||||||
| Absolute | ||||||||
| Return Fund | ||||||||
| For the | For the | |||||||
| Year Ended | Period Ended | |||||||
| September 30, | September 30, | |||||||
| 2014 (a) | 2013 (b) | |||||||
CAPITAL TRANSACTIONS: | ||||||||
Class A | ||||||||
Proceeds from shares issued | $ | 6,554,520 | $ | — | ||||
Distributions reinvested | 21,435 | — | ||||||
Cost of shares redeemed | (144,631 | ) | — | |||||
|
|
|
| |||||
Change in Class A | $ | 6,431,324 | $ | — | ||||
|
|
|
| |||||
Class C | ||||||||
Proceeds from shares issued | $ | 7,027,500 | $ | — | ||||
Distributions reinvested | 5,208 | — | ||||||
Cost of shares redeemed | (9,874 | ) | — | |||||
|
|
|
| |||||
Change in Class C | $ | 7,022,834 | $ | — | ||||
|
|
|
| |||||
Class I | ||||||||
Proceeds from shares issued | $ | 253,828,123 | $ | 659,568,220 | ||||
Distributions reinvested | 590,529 | 111,739 | ||||||
Cost of shares redeemed | (224,670,280 | ) | (152,446,729 | ) | ||||
|
|
|
| |||||
Change in Class I | $ | 29,748,372 | $ | 507,233,230 | ||||
|
|
|
| |||||
Change in net assets resulting from capital transactions | $ | 43,202,530 | $ | 507,233,230 | ||||
|
|
|
| |||||
SHARE TRANSACTIONS: | ||||||||
Class A | ||||||||
Issued | 623,490 | — | ||||||
Reinvested | 2,051 | — | ||||||
Redeemed | (13,837 | ) | — | |||||
|
|
|
| |||||
Change in Class A | 611,704 | — | ||||||
|
|
|
| |||||
Class C | ||||||||
Issued | 669,151 | — | ||||||
Reinvested | 500 | — | ||||||
Redeemed | (952 | ) | — | |||||
|
|
|
| |||||
Change in Class C | 668,699 | — | ||||||
|
|
|
| |||||
| 101 |
NOTES TO FINANCIAL STATEMENTS |
| Absolute | ||||||||||||||||
| Return Fund | ||||||||||||||||
| For the | For the | |||||||||||||||
| Year Ended | Period Ended | |||||||||||||||
| September 30, | September 30, | |||||||||||||||
| 2014 (a) | 2013 (b) | |||||||||||||||
(cont.) | ||||||||||||||||
Class I | ||||||||||||||||
Issued | 24,289,241 | 65,198,790 | ||||||||||||||
Reinvested | 56,647 | 11,016 | ||||||||||||||
Redeemed | (21,637,069 | ) | (15,052,360 | ) | ||||||||||||
|
|
|
| |||||||||||||
Change in Class I | 2,708,819 | 50,157,446 | ||||||||||||||
|
|
|
| |||||||||||||
Change in shares resulting from capital transactions | 3,989,222 | 50,157,446 | ||||||||||||||
|
|
|
| |||||||||||||
(a) For the period from November 27, 2013 (commencement of operations) to September 30, 2014 for Class A shares, for the period from June 24, 2014 (commencement of operations) to September 30, 2014 for Class C shares and for the year ended September 30, 2014 for Class I shares.
(b) For the period from November 30, 2012 (commencement of operations) to September 30, 2013 for Class I shares.
7. Federal Income Taxes:
It is the policy of each Fund to continue to qualify as a regulated investment company by complying with the provisions available to certain investment companies, as defined under Subchapter M of the Internal Revenue Code, and to distribute substantially all of its net investment income and net realized capital gains. Therefore, no federal tax liability is recorded in the financial statements of each Fund.
Management has analyzed the Funds’ tax positions taken or expected to be taken on federal income tax returns for all open tax years (the tax years ended September 30 of the years 2012, 2013 and 2014 for all Funds, except Absolute Return Fund, which is the tax years ended September 30 of the years 2013 and 2014, and has concluded that no provision for federal income tax is required in the Funds’ financial statements. The Funds’ federal and state income and federal excise tax returns for tax years for which the applicable statutes of limitations have not expired are subject to examination by the Internal Revenue Service and state departments of revenue.
As of and during the year ended September 30, 2014, the Funds did not have a liability for any unrecognized tax benefits. The Funds recognize interest and penalties, if any, related to unrecognized tax benefits as income tax expense in the Statement of Operations. During the year ended September 30, 2014, the Funds did not incur any interest or penalties.
As of September 30, 2014, the tax cost of securities and the breakdown of unrealized appreciation (depreciation) for each Fund were as follows:
| Net Unrealized | ||||||||||||||||
| Tax Cost of | Unrealized | Unrealized | Appreciation | |||||||||||||
| Securities | Appreciation | Depreciation | (Depreciation) | |||||||||||||
Emerging Market Select Bond Fund | $ | 208,755,589 | $ | 1,394,185 | $ | (10,522,701) | $(9,128,516) | |||||||||
Emerging Market Corporate Bond Fund | 22,066,669 | 459,304 | (509,507) | (50,203) | ||||||||||||
Global High Yield Bond Fund | 33,354,733 | 577,170 | (1,075,580) | (498,410) | ||||||||||||
Global Convertible Bond Fund | 21,023,239 | 695,328 | (1,065,270) | (369,942) | ||||||||||||
Absolute Return Fund | 530,243,855 | 23,640,180 | (23,939,420) | (299,240) | ||||||||||||
102 |
NOTES TO FINANCIAL STATEMENTS |
The tax character of distributions during the year ended September 30, 2014 were as follows:
| Distributions Paid From | ||||||||||||||||||||
| Total | ||||||||||||||||||||
| Ordinary | Net Long Term | Total Taxable | Return of | Distributions | ||||||||||||||||
| Income | Capital Gains | Distributions | Capital | Paid* | ||||||||||||||||
Emerging Market Select Bond Fund | $ | 4,946,732 | $ — | $4,946,732 | $3,355,837 | $8,302,569 | ||||||||||||||
Emerging Market Corporate Bond Fund | 846,146 | 14,865 | 861,011 | — | 861,011 | |||||||||||||||
Global High Yield Bond Fund | 1,744,756 | 309,106 | 2,053,862 | — | 2,053,862 | |||||||||||||||
Global Convertible Bond Fund | 1,052,091 | 810,576 | 1,862,667 | — | 1,862,667 | |||||||||||||||
Absolute Return Fund | 8,056,394 | — | 8,056,394 | — | 8,056,394 | |||||||||||||||
The tax character of distributions during the year ended September 30, 2013 were as follows:
|
| |||||||||||||||||||
| Distributions Paid From | ||||||||||||||||||||
| Total | ||||||||||||||||||||
| Ordinary | Net Long Term | Total Taxable | Return of | Distributions | ||||||||||||||||
| Income | Capital Gains | Distributions | Capital | Paid* | ||||||||||||||||
Emerging Market Select Bond Fund | $3,720,245 | $10,846 | $3,731,091 | $3,527,048 | $7,258,139 | |||||||||||||||
Emerging Market Corporate Bond Fund | 1,744,474 | 29,397 | 1,773,871 | — | 1,773,871 | |||||||||||||||
Global High Yield Bond Fund | 2,510,719 | 9,173 | 2,519,892 | — | 2,519,892 | |||||||||||||||
Global Convertible Bond Fund | 731,496 | — | 731,496 | — | 731,496 | |||||||||||||||
Absolute Return Fund | 31,099 | — | 31,099 | 2,211,409 | 2,242,508 | |||||||||||||||
*Total distributions paid may differ from the Statements of Changes in Net Assets because distributions are recognized when actually paid for tax purposes. |
| |||||||||||||||||||
As of September 30, 2014, the components of accumulated earnings/(losses) on a tax basis were as follows:
|
| |||||||||||||||||||
| Emerging | ||||||||||||||||||||
| Emerging | Market | Global | Global | |||||||||||||||||
| Market Select | Corporate | High Yield | Convertible | Absolute | ||||||||||||||||
| Bond Fund | Bond Fund | Bond Fund | Bond Fund | Return Fund | ||||||||||||||||
Undistributed ordinary income | $ | — | $ | 174,674 | $ | 592,883 | $ | 378,139 | $ | 12,007,796 | ||||||||||
Undistributed long term gain | — | — | 620,402 | 1,832,417 | 4,588,509 | |||||||||||||||
|
|
|
|
|
|
|
|
|
| |||||||||||
Accumulated earnings | — | 174,674 | 1,213,285 | 2,210,556 | 16,596,305 | |||||||||||||||
Distributions payable | (94,396 | ) | (7,472 | ) | (4,043 | ) | (633 | ) | (465,432 | ) | ||||||||||
Accumulated capital loss carryforwards | (2,816,521 | ) | — | — | — | — | ||||||||||||||
Deferred qualified late-year losses | — | (7,063 | ) | — | — | — | ||||||||||||||
Unrealized appreciation/(depreciation) | (9,745,777 | ) | (64,348 | ) | (518,285 | ) | (338,958 | ) | (1,129,216 | ) | ||||||||||
|
|
|
|
|
|
|
|
|
| |||||||||||
Total accumulated earnings/(losses) | $ | (12,656,694 | ) | $ | 95,791 | $ | 690,957 | $ | 1,870,965 | $ | 15,001,657 | |||||||||
|
|
|
|
|
|
|
|
|
| |||||||||||
As of September 30, 2014, the Emerging Market Select Bond Fund had a short-term capital loss carryforward of $2,634,303 and a long-term capital loss carryforward of $182,218 available to offset future realized capital gains in accordance with the Regulated Investment Company Modernization Act of 2010. These capital loss carryforwards are not subject to expiration and must first be utilized to offset future realized gains of the same character.
During the year ended September 30, 2014, the Absolute Return Fund utilized capital loss carryforwards in the amount of $766,493.
Under current tax law, capital losses realized after October 31 of a Fund’s fiscal year may be deferred and treated as occurring on the first business day of the following fiscal year for tax purposes.
| 103 |
NOTES TO FINANCIAL STATEMENTS |
The Emerging Market Corporate Bond Fund deferred long-term qualified late-year capital losses of $7,063 which will be treated as arising on the first business day of the year ending September 30, 2015.
8. Market Timing:
The Trust strongly discourages attempts at market timing by Fund shareholders. Each Fund charges a redemption fee of 2% of the value of the shares redeemed or exchanged within 30 days of purchase, in addition to limiting the number of exchanges that may be made between Funds to five (5) per calendar year. When assessed, the redemption fee is deducted from the redemption proceeds and retained by the Fund, not by the Advisor. This redemption fee is not charged in cases where, for example, the redemption results from an automatic reinvestment or asset re-allocation not specifically directed by the shareholder. The Trust also reserves the right to reject any Fund purchase order made by persons deemed to be market timers. The Funds’ prospectus contains a full description of the Trust’s policies on market timing and/or excessive trading. The redemption fee is recorded as a credit to capital and is included in the capital transactions on the Statement of Changes in Net Assets.
During the year ended September 30, 2014, redemption fees were collected by the Emerging Market Select Bond Fund and Absolute Return Fund in the amount of $6,334 and $2,183, respectively. There were no redemption fees collected by the other Funds. Redemption fees collected by the Funds are included in the cost of shares redeemed on the Statement of Changes in Net Assets.
9. Commitments:
Global High Yield Bond Fund may invest in floating rate loan interests. In connection with these investments, Global High Yield Bond Fund may also enter into bridge loan commitments (“commitments”). Bridge loan commitments may obligate Global High Yield Bond Fund to furnish temporary financing to a borrower until permanent financing can be arranged. As of September 30, 2014, Global High Yield Bond Fund had no outstanding bridge loan commitments. In connection with these commitments, Global High Yield Bond Fund earns a commitment fee, typically set as a percentage of the commitment amount. Such fee income, which is included in interest income in the Statements of Operations, is recognized ratably over the commitment period.
10. Line of Credit:
Each Fund, except Absolute Return Fund, is a participant in a single committed, unsecured $4,000,000 line of credit with Bank of New York Mellon, the Funds’ custodian, to be used only to fund shareholder redemption requests and for other short-term temporary or emergency general business purposes. The line of credit has a scheduled termination date of March 31, 2015. Interest is charged on borrowings made under this line of credit at the higher of (a) the Federal Funds Effective Rate plus 1.25% per annum, and (b) the Overnight LIBOR Rate plus 1.25% per annum. A commitment fee of 0.12% per annum of the available line of credit is charged, of which each Fund, except Absolute Return Fund, shall pay its pro rata share based on the ratio of its individual net assets to the aggregate net assets of the Funds, except Absolute Return Fund, at the time the fee is due and payable. Accrued and unpaid commitment fees shall be payable on the last business day of each calendar quarter. An upfront fee equal to 0.02% of the commitment amount was paid by the Funds, except Absolute Return Fund, upon the effectiveness and upon each annual renewal of the line of credit. Since each of the Funds, except Absolute Return Fund, participates in the line of credit, there is no assurance that an individual fund will have access to all or any part of the $4,000,000 at any particular time. There were no loans outstanding pursuant to this line of credit at September 30, 2014. During the year ended September 30, 2014, the Funds did not utilize this line of credit.
104 |
NOTES TO FINANCIAL STATEMENTS |
11. Subsequent Events:
Management has evaluated the impact of subsequent events of the Funds and has determined that there are no subsequent events that require recognition or disclosure in the financial statements except the following:
The RBC Funds Trust filed with the Securities and Exchange Commission a post-effective amendment to its registration statement to create two new series under the Trust. These new Funds, the RBC BlueBay Emerging Market Unconstrained Fixed Income Fund and the RBC BlueBay Total Return Credit Fund are expected to become effective and commence operations in December 2014. RBC GAM (US) will be the Funds’ investment advisor, and BlueBay and BlueBay US will serve as the Funds’ sub-advisors.
On September 23, 2014, the Board approved the reduction of the contractual advisory fee rates and operating expense limits with respect to the Emerging Market Select Bond Fund, Emerging Market Corporate Bond Fund, Global High Yield Bond Fund and Global Convertible Bond Fund. Effective October 1, 2014, the contractual management fee rate and total operating expense limits as a percent of average net assets are as follows:
| Total Operating | ||||||||||||
| Expense Limit | ||||||||||||
| Management | ||||||||||||
| Fee | Class A | Class I | ||||||||||
Emerging Market Select Bond Fund | 0.75% | 1.15% | 0.90% | |||||||||
Emerging Market Corporate Bond Fund | 0.85% | 1.25% | 1.00% | |||||||||
Global High Yield Bond Fund | 0.70% | 1.05% | 0.80% | |||||||||
Global Convertible Bond Fund | 0.75% | N/A | 0.85% | |||||||||
| 105 |
| REPORT OF INDEPENDENT REGISTERED PUBLIC ACCOUNTING FIRM |
To the Shareholders and Board of Trustees of RBC Funds Trust
We have audited the accompanying statements of assets and liabilities, including the schedules of portfolio investments, of RBC BlueBay Emerging Market Select Bond Fund, RBC BlueBay Emerging Market Corporate Bond Fund, RBC BlueBay Global High Yield Bond Fund, RBC BlueBay Global Convertible Bond Fund and RBC BlueBay Absolute Return Fund (the “Funds”), five of the portfolios constituting the RBC Funds Trust (the “Trust”), as of September 30, 2014, and the related statements of operations for the year then ended, the statements of changes in net assets and financial highlights for each of the periods presented. These financial statements and financial highlights are the responsibility of the Funds’ management. Our responsibility is to express an opinion on these financial statements and financial highlights based on our audits.
We conducted our audits in accordance with the standards of the Public Company Accounting Oversight Board (United States). Those standards require that we plan and perform the audits to obtain reasonable assurance about whether the financial statements and financial highlights are free of material misstatement. The Funds are not required to have, nor were we engaged to perform, an audit of their internal control over financial reporting. Our audits included consideration of internal control over financial reporting as a basis for designing audit procedures that are appropriate in the circumstances, but not for the purpose of expressing an opinion on the effectiveness of the Funds’ internal control over financial reporting. Accordingly, we express no such opinion. An audit also includes examining, on a test basis, evidence supporting the amounts and disclosures in the financial statements, assessing the accounting principles used and significant estimates made by management, as well as evaluating the overall financial statement presentation. Our procedures included confirmation of securities owned as of September 30, 2014, by correspondence with the Funds’ custodian and brokers; where replies were not received from brokers, we performed other auditing procedures. We believe that our audits provide a reasonable basis for our opinion.
In our opinion, the financial statements and financial highlights referred to above present fairly, in all material respects, the financial position of each of the portfolios of RBC Funds Trust referred to above, as of September 30, 2014, the results of their operations for the year then ended, the changes in their net assets and the financial highlights for each of the periods presented, in conformity with accounting principles generally accepted in the United States of America.
DELOITTE & TOUCHE LLP
Chicago, Illinois
November 26, 2014
106 |
| OTHER FEDERAL INCOME TAX INFORMATION (UNAUDITED) |
The following Funds report a portion of the income dividends distributed during the year ended September 30, 2014, as qualified interest income as defined in the Internal Revenue Code:
| Qualified Interest Income | |||||
Emerging Market Corporate Bond Fund | 0.82 | % | |||
Global High Yield Bond Fund | 58.21 | % | |||
Global Convertible Bond Fund | 23.30 | % | |||
Absolute Return Fund | 22.29 | % | |||
The following Funds report a portion of the income dividends distributed during the year ended September 30, 2014, as qualified short term gains:
| Qualified Short-term Gains | |||||
Global High Yield Bond Fund | 100.00 | % | |||
Global Convertible Bond Fund | 100.00 | % | |||
Absolute Return Fund | 100.00 | % | |||
The following Fund reports a portion of the income dividends distributed during the year ended September 30, 2014, as qualified dividend income:
| Qualified Dividend Income | |||||
Global High Yield Bond Fund | 0.09 | % | |||
Global Convertible Bond Fund | 0.74 | % | |||
The following Fund reports a portion of the income dividends distributed during the year ended September 30, 2014, as dividends received deduction:
| Dividends Received Deduction | |||||
Global High Yield Bond Fund | 0.09 | % | |||
All reportings are based on financial information available as of the date of this annual report and, accordingly, are subject to change. It is the intention of the Funds to report the maximum amount permitted under the Internal Revenue Code and the regulations thereunder.
| 107 |
| MANAGEMENT (Unaudited) |
Independent Trustees(1)(2)
T. Geron Bell (73)
Position, Term of Office and Length of Time Served with the Trust: Trustee since January 2004
Principal Occupation(s) During Past 5 Years: Chairman of the Executive Board of the Minnesota Twins (2011 to present); prior thereto President of Twins Sports, Inc. (parent company of the Minnesota Twins) (2002-2011); President of the Minnesota Twins Baseball Club Incorporated (1987-2002)
Number of Portfolios in Fund Complex Overseen by Trustee: 18
Other Director/Trustee Positions Held by Trustee During Past 5 Years: None
Lucy Hancock Bode (63)
Position, Term of Office and Length of Time Served with the Trust: Trustee since January 2004
Principal Occupation(s) During Past 5 Years: Healthcare consultant (self-employed) (1986 to present)
Number of Portfolios in Fund Complex Overseen by Trustee: 18
Other Director/Trustee Positions Held by Trustee During Past 5 Years: BioSignia; Franklin Street Partners
Leslie H. Garner Jr. (64)
Position, Term of Office and Length of Time Served with the Trust: Trustee since January 2004
Principal Occupation(s) During Past 5 Years: President and CEO, The Greater Cedar Rapids Community Foundation (2010 to present); previously, President, Cornell College (1994 to 2010)
Number of Portfolios in Fund Complex Overseen by Trustee: 18
Other Director/Trustee Positions Held by Trustee During Past 5 Years: None
Ronald James (63)
Position, Term of Office and Length of Time Served with the Trust: Trustee since January 2004
Principal Occupation(s) During Past 5 Years: President and Chief Executive Officer, Center for Ethical Business Cultures (2000 to present)
Number of Portfolios in Fund Complex Overseen by Trustee: 18
Other Director/Trustee Positions Held by Trustee During Past 5 Years: Best Buy Co. Inc.; Bremer Financial Corporation
John A. MacDonald (65)
Position, Term of Office and Length of Time Served with the Trust: Trustee since January 2004
Principal Occupation(s) During Past 5 Years: Vice President and Treasurer, Hall Family Foundation (1988 to present)
Number of Portfolios in Fund Complex Overseen by Trustee: 18
Other Director/Trustee Positions Held by Trustee During Past 5 Years: None
H. David Rybolt (72)
Position, Term of Office and Length of Time Served with the Trust: Trustee since January 2004
Principal Occupation(s) During Past 5 Years: Consultant, HDR Associates (management consulting) (1985 to present)
Number of Portfolios in Fund Complex Overseen by Trustee: 18
Other Director/Trustee Positions Held by Trustee During Past 5 Years: None
108 |
| MANAGEMENT (Unaudited) |
Independent Trustees(1)(2)
James R. Seward (62)
Position, Term of Office and Length of Time Served with the Trust: Chairman of the Board and Trustee since January 2004
Principal Occupation(s) During Past 5 Years: Private investor (2000 to present); CFA (1987 to present)
Number of Portfolios in Fund Complex Overseen by Trustee: 18
Other Director/Trustee Positions Held by Trustee During Past 5 Years: Sooner Holdings (formerly Syntroleum Corporation); Brookdale Senior Living Inc.
William B. Taylor (69)
Position, Term of Office and Length of Time Served with the Trust: Trustee since September 2005
Principal Occupation(s) During Past 5 Years: Consultant (2003 to present); previously Partner, Ernst & Young LLP (1982 to 2003)
Number of Portfolios in Fund Complex Overseen by Trustee: 18
Other Director/Trustee Positions Held by Trustee During Past 5 Years: William Henry Insurance, LLC; Balance Innovations LLC; Kansas City Symphony
Interested Trustees(1)(2)(3)
Kathleen A. Gorman (50)(5)
Position, Term of Office and Length of Time Served with the Trust: Trustee since September 2012
Principal Occupation(s) During Past 5 Years: President and Chief Executive Officer, RBC Funds (2012 to present); Chief Compliance Officer, RBC Funds (2006 to 2012); Director of Regulatory Administration, RBC Global Asset Management (U.S.) Inc. (2007 to 2012); Chief Compliance Officer, RBC Global Asset Management (U.S.) Inc. (2006-2009)
Number of Portfolios in Fund Complex Overseen by Trustee: 18
Other Director/Trustee Positions Held by Trustee During Past 5 Years: None
Executive Officers(1)(3)(4)
Kathleen A. Gorman (50)
Position, Term of Office and Length of Time Served with the Trust: President and Chief Executive Officer since September 2012
Principal Occupation(s) During Past 5 Years: President and Chief Executive Officer, RBC Funds (2012 to present); Chief Compliance Officer, RBC Funds (2006 to 2012); Director of Regulatory Administration, RBC Global Asset Management (U.S.) Inc. (2007 to 2012); Chief Compliance Officer, RBC Global Asset Management (U.S.) Inc. (2006-2009)
Kathleen A. Hegna (47)
Position, Term of Office and Length of Time Served with the Trust: Chief Financial Officer and Principal Accounting Officer since May 2009 and Treasurer since March 2014
Principal Occupation(s) During Past 5 Years: Associate Vice President and Director, Mutual Fund Accounting and Administration, RBC Global Asset Management (U.S.) Inc. (2009 to present); Senior Compliance Officer, RBC Global Asset Management (U.S.) Inc. (2006-2009)
| 109 |
| MANAGEMENT (Unaudited) |
Executive Officers(1)(3)(4)
Christina M. Moore (46)
Position, Term of Office and Length of Time Served with the Trust: Chief Compliance Officer since December 2012 and Assistant Secretary since March 2013
Principal Occupation(s) During Past 5 Years: Chief Compliance Officer, RBC Funds (2012 to present); Senior Compliance Officer, RBC Funds (March 2012 to December 2012); Compliance Manager, Minnesota Life Insurance Company (2006-2012)
Lee Thoresen (43)
Position, Term of Office and Length of Time Served with the Trust: Chief Legal Officer and Secretary since March 2008
Principal Occupation(s) During Past 5 Years: Senior Associate General Counsel, RBC Capital Markets, LLC (2006-present)
| (1) | Except as otherwise noted, the address of each Trustee/Officer is RBC Funds Trust, 50 South Sixth Street, Suite 2350, Minneapolis, Minnesota 55402. |
| (2) | All Trustees must retire on or before December 31 of the year in which they reach age 75. The Board may temporarily waive this requirement when necessary to avoid depriving the Board of a Trustee with critical skills. |
| (3) | On December 31, 2009, Voyageur Asset Management Inc. changed its name to RBC Global Asset Management (U.S.) Inc. Any references to RBC Global Asset Management (U.S.) Inc. for prior periods are deemed to be references to the prior entity. |
| (4) | Each officer serves in such capacity for an indefinite period of time until his or her removal, resignation or retirement. |
| (5) | Kathleen A. Gorman has been determined to be an interested Trustee by virtue of her position with the Advisor. |
The Funds’ Statement of Additional Information includes information about the Funds’ Trustees. To receive your free copy of the Statement of Additional Information, call toll free: 1-800-422-2766.
110 |
The Funds offer Class A and Class I shares, except for Global Convertible Bond Fund, which only offers Class I shares. The Absolute Return Fund also offers Class C shares.
Class A
This share class is available for purchase primarily through investment advisors, broker-dealers, banks and other financial services intermediaries. Class A shares of the Funds are currently subject to a maximum up-front sales charge of 4.25% and a 1.00% CDSC for redemption within 12 months of a $1 million or greater purchase. Class A shares currently include a 0.25% (25 bps) annual 12b-1 service and distribution fee.
Class C
This share class is available for purchase primarily through investment advisors, broker-dealers, banks and other financial services intermediaries. Class C shares of the Funds are currently subject to a 1.00% CDSC for redemption within 12 months of purchase. Class C shares currently include a 1.00% (100 bps) annual 12b-1 service and distribution fee.
Class I
This share class is intended for investors meeting certain minimum investment thresholds. This share class does not have an up-front sales charge (load) or a 12b-1 service and distribution fee.
| 111 |
Shareholder Expense Examples
As a shareholder of the RBC Funds, you incur two types of costs: (1) transaction costs and (2) ongoing costs, including management fees; and other Fund expenses. This example is intended to help you understand your ongoing costs (in dollars) of investing in the RBC Funds and to compare these costs with the ongoing costs of investing in other mutual funds.
The example is based on an investment of $1,000 invested at the beginning of the period and held for the entire period from April 1, 2014 through September 30, 2014 for Class A and I shares and June 24, 2014 (commencement of operations) through September 30, 2014 for Class C shares.
Actual Expenses
The table below provides information about actual account values and actual expenses. You may use the information below, together with the amount you invested, to estimate the expenses that you paid over the period. Simply divide your account value by $1,000 (for example, an $8,600 account value divided by $1,000 = 8.6), then multiply the result by the number in the table under the heading entitled “Expenses Paid During Period” to estimate the expenses you paid on your account during this period.
| Beginning Account Value 4/1/14 | Ending Account Value 9/30/14 | Expenses Paid During Period* 4/1/14-9/30/14 | Annualized Expense Ratio During Period 4/1/14-9/30/14 | ||||||||||||||||||||||
Emerging Market Select Bond Fund | Class A | $ | 1,000.00 | $ | 1,003.20 | $ | 6.28 | 1.25 | % | ||||||||||||||||
| Class I | 1,000.00 | 1,004.40 | 5.02 | 1.00 | % | ||||||||||||||||||||
Emerging Market Corporate Bond Fund | Class A | 1,000.00 | 1,029.30 | 7.12 | 1.40 | % | |||||||||||||||||||
| Class I | 1,000.00 | 1,030.60 | 5.85 | 1.15 | % | ||||||||||||||||||||
Global High Yield Bond Fund | Class A | 1,000.00 | 1,006.00 | 6.03 | 1.20 | % | |||||||||||||||||||
| Class I | 1,000.00 | 1,008.20 | 4.78 | 0.95 | % | ||||||||||||||||||||
Global Convertible Bond Fund | Class I | 1,000.00 | 1,003.80 | 5.02 | 1.00 | % | |||||||||||||||||||
Absolute Return Fund | Class A | 1,000.00 | 990.00 | 5.99 | 1.20 | % | |||||||||||||||||||
| Class I | 1,000.00 | 991.20 | 4.74 | 0.95 | % | ||||||||||||||||||||
| Beginning Account Value 6/25/14 | Ending Account Value 9/30/14 | Expenses Paid During Period** 6/25/14-9/30/14 | Annualized Expense Ratio During Period 6/25/14-9/30/14 | ||||||||||||||||||||||
Absolute Return Fund | Class C | $ | 1,000.00 | $ | 988.40 | $ | 5.21 | 1.95 | % | ||||||||||||||||
*Expenses are equal to the average account value times the Fund’s annualized expense ratio multiplied by 183/365 (to reflect one half year period).
**Expenses are equal to the average account value times the Fund’s annualized expense ratio multiplied by 98/365 (to reflect period since inception).
112 |
SUPPLEMENTAL INFORMATION (UNAUDITED) |
Hypothetical Example for Comparison Purposes
The table below provides information about hypothetical account values and hypothetical expenses based on each RBC Funds’ actual expense ratio and an assumed rate of return of 5% per year before expenses, which is not the Fund’s actual return. The hypothetical account values and expenses may not be used to estimate the actual ending account balance or expenses you paid for the period. You may use this information to compare this 5% hypothetical example with the 5% hypothetical examples that appear in the shareholder reports of other funds.
Please note that the expenses shown in the table are meant to highlight your ongoing costs only and do not reflect any transactional costs, such as sales charges (loads), redemption fees, or exchange fees. Therefore, the table is useful in comparing ongoing costs only, and will not help you determine the relative total costs of owning different funds. In addition, if these transactional costs were included, your costs would have been higher.
| Beginning Account Value 4/1/14 | Ending Account Value 9/30/14 | Expenses Paid During Period* 4/1/14-9/30/14 | Annualized Expense Ratio During Period 4/1/14-9/30/14 | ||||||||||||||||||||||
Emerging Market Select Bond Fund | Class A | $ | 1,000.00 | $ | 1,018.80 | $ | 6.33 | 1.25 | % | ||||||||||||||||
| Class I | 1,000.00 | 1,020.05 | 5.06 | 1.00 | % | ||||||||||||||||||||
Emerging Market Corporate Bond Fund | Class A | 1,000.00 | 1,018.05 | 7.08 | 1.40 | % | |||||||||||||||||||
| Class I | 1,000.00 | 1,019.30 | 5.82 | 1.15 | % | ||||||||||||||||||||
Global High Yield Bond Fund | Class A | 1,000.00 | 1,019.05 | 6.07 | 1.20 | % | |||||||||||||||||||
| Class I | 1,000.00 | 1,020.31 | 4.81 | 0.95 | % | ||||||||||||||||||||
Global Convertible Bond Fund | Class I | 1,000.00 | 1,020.05 | 5.06 | 1.00 | % | |||||||||||||||||||
Absolute Return Fund | Class A | 1,000.00 | 1,019.05 | 6.07 | 1.20 | % | |||||||||||||||||||
| Class I | 1,000.00 | 1,020.31 | 4.81 | 0.95 | % | ||||||||||||||||||||
| Beginning Account Value 6/25/14 | Ending Account Value 9/30/14 | Expenses Paid During Period** 6/25/14-9/30/14 | Annualized Expense Ratio During Period 6/25/14-9/30/14 | ||||||||||||||||||||||
Absolute Return Fund | Class C | $ | 1,000.00 | $ | 1,008.19 | $ | 5.26 | 1.95 | % | ||||||||||||||||
*Expenses are equal to the average account value times the Fund’s annualized expense ratio multiplied by 183/365 (to reflect one half year period).
**Expenses are equal to the average account value times the Fund’s annualized expense ratio multiplied by 98/365 (to reflect period since inception).
| 113 |
| APPROVAL OF INVESTMENT ADVISORY AND SUB-ADVISORY AGREEMENTS (UNAUDITED) |
Information Regarding the Approval of Investment Advisory and Sub-Advisory Agreements
In September 2014, after evaluating the services provided by RBC Global Asset Management (U.S.) Inc. (the “Advisor”), BlueBay Asset Management USA LLC and BlueBay Asset Management LLP (together, the “Sub-Advisors”) and reviewing the performance, fees, and expenses of the Funds, the RBC Funds Board of Trustees determined to approve the continuation of the investment advisory agreements with the Advisor and sub-advisory agreements with the Sub-Advisors (the investment advisory and sub-advisory agreements, collectively, being the “Agreements”) for each Fund for an additional year.
As part of their review of the Agreements, the Trustees requested and considered information regarding the advisory services performed by the Advisor and Sub-Advisors, the staffing and qualifications of the personnel responsible for operating and managing the Funds, and the Funds’ performance and expenses. The Trustees considered information provided at regular quarterly Board and Committee meetings throughout the year as well as information presented at both a special meeting held to review requested material related to the proposed renewals and a meeting held specifically to consider the proposed renewals. In connection with their deliberations, the independent Trustees were advised by their own independent legal counsel with regard to the materials and their responsibilities under relevant laws and regulations.
The Trustees met with representatives from the Advisor’s senior management team, as well as senior investment professionals from the Advisor and Sub-Advisors, to discuss the information and the ongoing management of the Funds. The Trustees reviewed the nature, quality, and extent of the services provided to the Funds by the Advisor and Sub-Advisors, including information as to each Fund’s performance relative to appropriate index benchmarks as well as fund peer group comparative information requested by the Board.
In considering the nature and quality of services provided to the Funds, the Trustees discussed the strong research, credit, and fundamental analysis capabilities and specialized expertise in the area of emerging market debt instruments and absolute return strategies. The Trustees also considered the extensive portfolio management experience of the Sub-Advisors’ staff as well as its operational and compliance structure and systems, and the Advisor’s expertise in coordinating the investment management and related operations of the Funds. The Trustees noted that the shorter term performance of the Funds was below relevant benchmarks, but acknowledged that the performance was attributable to the defensive positioning of the portfolios based on the Sub-Advisors’ generally negative macro view regarding relevant economies/markets and defensive posture. The Absolute Return Fund’s performance was favorable versus peers and benchmarks. The Trustees indicated that they continue to have confidence in the portfolio management teams of the Advisor and Sub-Advisors and continue to be satisfied with the nature, extent, and quality of the advisory and other services provided to the Funds.
The Trustees reviewed the investment advisory fees payable to the Advisor and subadvisory fees payable to the Sub-Advisors and reviewed comparative fee and expense information for similarly situated funds, including management’s proposal of fee and expense limitation reductions approved by the Board. The Trustees evaluated profitability data for the Advisor and Sub-Advisors and considered information regarding other benefits the Advisor and its affiliates derived from their relationships with the Funds, including soft dollars and other fall-out benefits as well as the Advisor’s role as co-administrator of the Funds and the fees paid by the Funds for such services. The Trustees discussed the pricing strategy for the Funds and noted that the Sub-Advisors are premium providers of investment management services and the management fees are based on the high quality of services provided to the Funds. The Trustees also considered the Advisor’s contractual agreement to subsidize fund expenses at competitive levels through expense limitation agreements and viewed such commitments favorably. Based upon their review, the Trustees determined that the advisory fees proposed to be payable to the Advisor and Sub-Advisors were fair and reasonable.
114 |
| APPROVAL OF INVESTMENT ADVISORY AND SUB-ADVISORY AGREEMENTS (UNAUDITED) |
Based upon their review, the Trustees determined that the nature and quality of the services provided by both the Advisor and Sub-Advisors were of a high quality and it is in the interests of the Funds and their shareholders for the Trustees to approve the Agreements and expense limitation arrangements for each Fund. In arriving at their collective decision to approve the renewal of the Agreements, the Trustees did not assign relative weights to the factors discussed above or deem any one or group of them to be controlling in and of itself.
| 115 |
|
This Page Intentionally Left Blank
116 |
|
This Page Intentionally Left Blank
| 117 |
|
This Page Intentionally Left Blank
118 |
|
This Page Intentionally Left Blank
| 119 |
|
This Page Intentionally Left Blank
120 |
RBC Funds
P.O. Box 701
Milwaukee, WI 53201-0701
800-422-2766
www.rbcgam.us
Performance data represents past performance and does not guarantee future results. The principal value of an investment and investment return will fluctuate so that an investor’s shares, when redeemed, may be worth more or less than their original cost.
This report and the financial statements contained herein are provided for the information of RBC Funds shareholders. This report is not authorized for distribution to prospective investors unless preceded or accompanied by a current prospectus, which contains information concerning investment objectives, risks, charges and expenses of the funds. Please read the prospectus carefully before investing.
This report and the financial statements contained herein are not intended to be a forecast of future events, a guarantee of future results, or investment advice. There is no assurance that certain securities will remain in or out of each fund’s portfolio. The views expressed in this report reflect those of the portfolio managers through the year ended September 30, 2014.
NOT FDIC INSURED • NO BANK GUARANTEE • MAY LOSE VALUE
RBC Global Asset Management (U.S.) Inc. serves as investment advisor for the RBC Funds. RBC Funds are distributed by Quasar Distributors LLC.

The RBC Funds are pleased to offer shareholder reports printed entirely on Forest Stewardship Council certified paper. FSC® certification ensures that the paper used in this report contains fiber from well-managed and responsibly harvested forests that meet strict environmental and socioeconomic standards.
RBCF-BB AR 09-14
Item 2. Code of Ethics.
| (a) | The registrant, as of the end of the period covered by this report, has adopted a code of ethics that applies to the registrant’s principal executive officer, principal financial officer, principal accounting officer or controller, or persons performing similar functions, regardless of whether these individuals are employed by the registrant or a third party. |
| (c) | There have been no amendments, during the period covered by this report, to a provision of the code of ethics that applies to the registrant’s principal executive officer, principal financial officer, principal accounting officer or controller, or persons performing similar functions, regardless of whether these individuals are employed by the registrant or a third party, and that relates to any element of the code of ethics description. |
| (d) | The registrant has not granted any waivers, including an implicit waiver, from a provision of the code of ethics that applies to the registrant’s principal executive officer, principal financial officer, principal accounting officer or controller, or persons performing similar functions, regardless of whether these individuals are employed by the registrant or a third party, that relates to one or more of the items set forth in paragraph (b) of this item’s instructions. |
Item 3. Audit Committee Financial Expert.
As of the end of the period covered by the report, the registrant’s board of directors has determined that William B. Taylor is qualified to serve as an audit committee financial expert serving on its audit committee and that he is “independent,” as defined by Item 3 of Form N-CSR.
Item 4. Principal Accountant Fees and Services.
Audit Fees
| (a) | The aggregate fees billed for each of the last two fiscal years for professional services rendered by the principal accountant for the audit of the registrant’s annual financial statements or services that are normally provided by the accountant in connection with statutory and regulatory filings or engagements for those fiscal years are $669,200 for 2014 and $602,400 for 2013. |
Audit-Related Fees
| (b) | The aggregate fees billed in each of the last two fiscal years for assurance and related services by the principal accountant that are reasonably related to the performance of the audit of the registrant’s financial statements and are not reported under paragraph (a) of this Item are $0 for 2014 and $0 for 2013. |
Tax Fees
| (c) | The aggregate fees billed in each of the last two fiscal years for professional services rendered by the principal accountant for tax compliance, tax advice, and tax planning are $52,500 for 2014 and $53,550 for 2013. |
Tax fees for both years relate to the review of the registrant’s tax returns. Amount requiring approval of the registrant’s audit committee is $0 and $0, respectively.
All Other Fees
| (d) | The aggregate fees billed in each of the last two fiscal years for products and services provided by the principal accountant, other than the services reported in paragraphs (a) through (c) of this Item are $0 for 2014 and $0 for 2013. |
| (e)(1) | Disclose the audit committee’s pre-approval policies and procedures described in paragraph (c)(7) of Rule 2-01 of Regulation S-X. |
The Audit Committee (“Committee”) will review and approve in advance any proposal (except as set forth in (1) through (3) below) that the Trust employ the Funds’ auditor to render “permissible non-audit services” to the Funds. A “permissible non-audit service” is defined as a non-audit service that is not prohibited by Rule 2-01(c)(4) of Regulation S-X or other applicable law or regulation. The Committee will also review and approve in advance any proposal (except as set forth in (1) through (3) below) that the Adviser, and any entity controlling, controlled by, or under common control with the Adviser that provides ongoing services to the Funds (an “Adviser-affiliated service provider”), employ the Funds’ auditor to render non-audit services, if such engagement would relate directly to the operations and financial reporting of the Funds. As a part of its review, the Committee shall consider whether the provision of such services is consistent with the auditor’s independence. (See also “Delegation” below.)
Pre-approval by the Committee of non-audit services is not required so long as:
(1) (A) with respect to the Funds, the aggregate amount of all such permissible non-audit services provided to the Funds constitutes no more than 5% of the total amount of revenues paid to the auditor by the Funds during the fiscal year in which the services are provided; or
(B) with respect to the Adviser and any Adviser-affiliated service provider, the aggregate amount of all such non-audit services provided constitutes no more than 5% of the total amount of revenues (of the type that would have to be pre-approved by the Committee) paid to the auditor by the
Funds, the Adviser and any Adviser-affiliated service provider during the fiscal year in which the services are provided;
(2) such services were not recognized by the Funds at the time of the engagement to be non-audit services; and
(3) such services are promptly brought to the attention of the Committee and approved by the Committee or its delegate or delegates, as defined below, prior to the completion of the audit.
(c) Delegation
The Committee may delegate to one or more of its members and/or to officers of the Trust the authority to pre-approve the auditor’s provision of audit services or permissible non-audit services to the Funds up to a predetermined amount. Any pre-approval determination made by a delegate will be presented to the full Committee at its next meeting. The Committee will communicate any pre-approval made by a delegate to the Trust’s fund accounting agent, which will ensure that the appropriate disclosure is made in the Funds’ periodic reports and other documents as required under the Federal securities laws.
| (e)(2) | The percentage of services described in each of paragraphs (b) through (d) of this Item that were approved by the audit committee pursuant to paragraph (c)(7)(i)(C) of Rule 2-01 of Regulation S-X are as follows: |
(b) N/A
(c) 100%
(d) N/A
| (f) | Not applicable. |
| (g) | The aggregate non-audit fees billed by the registrant’s accountant for services rendered to the registrant, and rendered to the registrant’s investment adviser (not including any sub-adviser whose role is primarily portfolio management and is subcontracted with or overseen by another investment adviser), and any entity controlling, controlled by, or under common control with the adviser that provides ongoing services to the registrant for each of the last two fiscal years of the registrant was $115,000 for 2014 and $115,980 for 2013. |
| (h) | The registrant’s audit committee of the board of directors has considered whether the provision of non-audit services that were rendered to the registrant’s investment adviser (not including any sub-adviser whose role is primarily portfolio management and is subcontracted with or overseen by another investment adviser), and any entity controlling, controlled by, or under common control with the investment adviser that provides ongoing services to the registrant that were not pre-approved pursuant to paragraph (c)(7)(ii) of Rule 2-01 of Regulation S-X is compatible with maintaining the principal accountant’s independence. |
Item 5. Audit Committee of Listed Registrants.
Not applicable.
Item 6. Investments.
| (a) | Schedule of Investments in securities of unaffiliated issuers as of the close of the reporting period is included as part of the report to shareholders filed under Item 1 of this form. |
| (b) | Not applicable. |
Item 7. Disclosure of Proxy Voting Policies and Procedures for Closed-End Management
Investment Companies.
Not applicable.
Item 8. Portfolio Managers of Closed-End Management Investment Companies.
Not applicable.
Item 9. Purchases of Equity Securities by Closed-End Management Investment Company and
Affiliated Purchasers.
Not applicable.
Item 10. Submission of Matters to a Vote of Security Holders.
There have been no material changes to the procedures by which the shareholders may recommend nominees to the registrant’s board of directors, where those changes were implemented after the registrant last provided disclosure in response to the requirements of Item 407(c)(2)(iv) of Regulation S-K (17 CFR 229.407) (as required by Item 22(b)(15) of Schedule 14A (17 CFR 240.14a-101)), or this Item.
Item 11. Controls and Procedures.
| (a) | The registrant’s principal executive and principal financial officers, or persons performing similar functions, have concluded that the registrant’s disclosure controls and procedures (as defined in Rule 30a-3(c) under the Investment Company Act of 1940, as amended (the “1940 Act”) (17 CFR 270.30a-3(c))) are effective, as of a date within 90 days of the filing date of the report that includes the disclosure required by this paragraph, based on their evaluation of these controls and procedures required by Rule 30a-3(b) under the 1940 Act (17 CFR 270.30a-3(b)) |
and Rules 13a-15(b) or 15d-15(b) under the Securities Exchange Act of 1934, as amended (17 CFR 240.13a-15(b) or 240.15d-15(b)). |
| (b) | There were no changes in the registrant’s internal control over financial reporting (as defined in Rule 30a-3(d) under the 1940 Act (17 CFR 270.30a-3(d)) that occurred during the registrant’s second fiscal quarter of the period covered by this report that has materially affected, or is reasonably likely to materially affect, the registrant’s internal control over financial reporting. |
Item 12. Exhibits.
(a)(1) | Code of ethics, or any amendment thereto, that is the subject of disclosure required by Item 2 is attached hereto. | |
(a)(2) | Certifications pursuant to Rule 30a-2(a) under the 1940 Act and Section 302 of the Sarbanes-Oxley Act of 2002 are attached hereto. | |
(a)(3) | Not applicable. | |
(b) | Certifications pursuant to Rule 30a-2(b) under the 1940 Act and Section 906 of the Sarbanes- Oxley Act of 2002 are attached hereto. | |
(12.other) Not applicable.
SIGNATURES
Pursuant to the requirements of the Securities Exchange Act of 1934 and the Investment Company Act of 1940, the registrant has duly caused this report to be signed on its behalf by the undersigned, thereunto duly authorized.
(Registrant) | RBC Funds Trust |
By (Signature and Title)* | /s/ Kathleen A. Gorman | |||
Kathleen A. Gorman, President and Chief Executive Officer | ||||
(principal executive officer) | ||||
Date | December 1, 2014 |
Pursuant to the requirements of the Securities Exchange Act of 1934 and the Investment Company Act of 1940, this report has been signed below by the following persons on behalf of the registrant and in the capacities and on the dates indicated.
By (Signature and Title)* | /s/ Kathleen A. Gorman | |||
Kathleen A. Gorman, President and Chief Executive Officer | ||||
(principal executive officer) | ||||
Date | December 1, 2014 |
By (Signature and Title)* | /s/ Kathleen A. Hegna | |||
Kathleen A. Hegna, Treasurer and Chief Financial Officer | ||||
(principal financial officer) | ||||
Date | December 1, 2014 |
* Print the name and title of each signing officer under his or her signature.