UNITED STATES
SECURITIES AND EXCHANGE COMMISSION
Washington, D.C. 20549
FORMN-CSR
CERTIFIED SHAREHOLDER REPORT OF REGISTERED MANAGEMENT
INVESTMENT COMPANIES
Investment Company Act file number 811-21475
RBC Funds Trust
(Exact name of registrant as specified in charter)
50 South Sixth Street, Suite 2350
Minneapolis, MN 55402
(Address of principal executive offices) (Zip code)
Tara Tilbury
50 South Sixth Street, Suite 2350
Minneapolis, MN 55402
(Name and address of agent for service)
Registrant’s telephone number, including area code: (612)376-7132
Date of fiscal year end: September 30
Date of reporting period: March 31, 2020
Item 1. Reports to Stockholders.
The Report to Shareholders is attached herewith.
Semi-Annual Report For the six months ended March 31, 2020 Access Capital Community Investment Fund RBC Impact Bond Fund Beginning on January 1, 2021, as permitted by regulations adopted by the U.S. Securities and Exchange commission, paper copies of the Funds’ annual and semi-annual shareholder reports will no longer be sent by mail, unless you specifically request paper copies of the reports. Instead, the reports will be made available on the Funds’ website, and you will be notified by mail each time a report is posted and provided with a website link to access the report. If you already elected to receive shareholder reports electronically, you will not be affected by this change and you need not take any action. You may elect to receive shareholder reports and other communications from a Fund electronically anytime by contacting your financial intermediary (such as a broker-dealer or bank) or, if you are a direct investor, by calling800-422-2766. You may elect to receive all future reports in paper free of charge. If you invest through a financial intermediary, you can contact your financial intermediary to request that you continue to receive paper copies of your shareholder reports. If you invest directly with a Fund, you can call800-422-2766 to let the Fund know you wish to continue receiving paper copies of your shareholder reports. Your election to receive reports in paper will apply to all Funds held in your account if you invest through your financial intermediary or all Funds held with the fund complex if you invest directly with a Fund.
| | | | | | | | | | |
| | | | | | | | |
| | | | | | | | RBC Funds | | |
| | | | | | | | |
About your Semi Annual Report | | | | | | | | This semi-annual report (Unaudited) includes detailed information about your Fund including financial statements, performance, and a complete list of its holdings. |
| | | | | | | | The RBC Funds compare their performance against various indices. Each of these indices is a widely recognized measure of return for the underlying category of securities. However, the indices are unmanaged, do not include fees, and cannot be invested in directly. |
| | | | | | | | We hope the financial information presented will help you evaluate your investment in the RBC Funds. We also encourage you to read your Fund’s prospectus for further detail as to your Fund’s investment policies and risk profile. RBC Funds prospectuses and performance information subsequent to the date of this report are available on our website at www.rbcgam.us. |
| | | | | | | | A description of the policies and procedures that your Fund uses to determine how to vote proxies relating to portfolio securities is available (i) without charge, upon request, by calling1-800-422-2766; (ii) on the Fund’s website at www.rbcgam.us; and (iii) on the Securities and Exchange Commission’s (the “Commission”) website at http://www.sec.gov. |
| | | | | | | | Information regarding how your Fund voted proxies relating to portfolio securities during the most recent12-month period ended June 30 is available (i) on the Fund’s website at www.rbcgam.us; and (ii) on the Commission’s website at http://www.sec.gov. |
| | | | | | | | A schedule of each Fund’s portfolio holdings is filed with the Commission for the first and third quarters of each fiscal year on FormN-PORT. This information is available on the Commission’s website at http://www.sec.gov. |
| Table of | | | | | | | | Portfolio Managers | | 1 |
| Contents | | | | | | | | Performance Summary | | 2 |
| | | | | | | | Fund Statistics | | |
| | | | | | | | - Access Capital Community Investment Fund | | 4 |
| | | | | | | | - RBC Impact Bond Fund | | 5 |
| | | | | | | | Schedule of Portfolio Investments | | 6 |
| | | | | | | | Financial Statements | | |
| | | | | | | | - Statements of Assets and Liabilities | | 36 |
| | | | | | | | - Statements of Operations | | 38 |
| | | | | | | | - Statements of Changes in Net Assets | | 39 |
| | | | | | | | Financial Highlights | | 41 |
| | | | | | | | Notes to Financial Statements | | 46 |
| | | | | | | | Share Class Information | | 61 |
| | | | | | | | Supplemental Information | | 62 |
| | | | | | | | Liquidity Risk Disclosure (Unaudited) | | 64 |
| | | | | | | | | | |
| | | | | | | | | | |
| | | | | | | | | | |
| | | | | | | | | | |
| | | | | | | | | | |
| | | | | | | | | | |
| | | | | | | | | | |
| | | | | | | | | | |
| | | | | | | | | | |
| | | | | | |
PORTFOLIO MANAGERS | | | | | | |
| | | | | | | |
| | | |
RBC Global Asset Management (U.S.) Inc.(“RBCGAM-US”) serves as the investment advisor to the Funds. RBCGAM-US employs a team approach to the management of the Funds, with no individual team member being solely responsible for the investment decisions. The Funds’ management team has access to RBCGAM-US’s investment research and other money management resources. | | | | | | 
Brian Svendahl, CFA |
Brian Svendahl, CFA Managing Director, Co-Head, U.S. Fixed Income Brian Svendahl oversees the fixed income research, portfolio management and trading at RBCGAM-US. In addition to shaping the firm’s overall fixed income philosophy and process, he is a portfolio manager for the Funds and many of RBCGAM-US’s government mandates. Brian joined RBCGAM-US in 2005 and most recently led the mortgage and government team before being promoted toCo-Head in 2012. Prior to joining RBCGAM-US, he held several risk management, research and trading positions at Wells Fargo. Brian’s experience also includes liability management and implementing balance sheet hedging strategies. He earned a BS in economics from the University of Minnesota and a BBA in finance and an MBA from the University of Minnesota Carlson School of Management. Brian is a CFA charterholder. | | | | |
Scott Kirby Vice President, Senior Portfolio Manager Scott Kirby is a member of the government and mortgage research team in RBCGAM-US’s fixed income group and serves asco-portfolio manager for the firm’s community investment strategy, including the Access Capital Community Investment Fund. Scott joined RBCGAM-US in 2012 and most recently served as manager of investments of a broad-based asset portfolio for a large foundation, supporting its mission to reduce poverty. Previously he led the structured assets investment team of Ameriprise Financial/Riversource Investments, where he served as senior portfolio manager for more than $20 billion in agency andnon-agency mortgage-backed, commercial mortgage-backed and asset-backed securities. He earned a BS in finance and an MBA in finance from the University of Minnesota Carlson School of Management. | | | | | | 
Scott Kirby |
| | | | | | | |
| | | | | | | |
| | | | | | |
| | | | | | |
| | | | | | |
| | | | | | |
| | | | | | |
| | | | | | |
| | | | | | |
| | | | | | |
| | | | | | |
| | | | | | |
| | | | | | |
| | | | | | |
| | | | | | |
| | | | | | |
| | | | | | |
| | | | | | |
| | | | | | |
| | | | | | |
| | | | | | |
| | | | | | |
| | | | | | |
1
|
PERFORMANCE SUMMARY (UNAUDITED) |
| | | | | | | | | | | | | | | | | | | | | | | | | | | | |
| | | 1
Year | | | 3
Year | | | 5
Year | | | 10
Year | | | Since
Inception | | | Net
Expense
Ratio(a)(b) | | | Gross
Expense
Ratio(a)(b) | |
| Average Annual Total Returns as of March 31, 2020 (Unaudited) | | | | | | | | | | | | | | | | | |
| | | | | |
Access Capital Community Investment Fund | | | | | | | | | | | | | | | | | | | | | |
Class A(c) | | | | | | | | | | | | | | | | | | | | | | | | | | | | |
- Including Max Sales Charge of 3.75% | | | 2.09% | | | | 1.55% | | | | 1.18% | | | | 2.10% | | | | 3.68% | | | | | | | | | |
- At Net Asset Value | | | 6.03% | | | | 2.85% | | | | 1.96% | | | | 2.49% | | | | 3.86% | | | | 0.95% | | | | 1.11% | |
Class I(e) | | | | | | | | | | | | | | | | | | | | | | | | | | | | |
- At Net Asset Value | | | 6.28% | | | | 3.16% | | | | 2.32% | | | | 2.81% | | | | 4.17% | | | | 0.60% | | | | 0.66% | |
Class IS(f) | | | | | | | | | | | | | | | | | | | | | | | | | | | | |
- At Net Asset Value | | | 6.23% | | | | 3.29% | | | | 2.47% | | | | 3.02% | | | | 4.43% | | | | 0.40% | | | | 0.73% | |
| | | | | | | |
Bloomberg Barclays U.S. Securitized Index(g) | | | 6.89% | | | | 4.02% | | | | 2.93% | | | | 3.37% | | | | 4.78% | | | | | | | | | |
Bloomberg Barclays U.S. Aggregate Bond Index(g) | | | 8.93% | | | | 4.82% | | | | 3.36% | | | | 3.88% | | | | 4.94% | | | | | | | | | |
RBC Impact Bond Fund | | | | | | | | | | | | | | | | | | | | | | | | | | | | |
Class A(d) | | | | | | | | | | | | | | | | | | | | | | | | | | | | |
- Including Max Sales Charge of 3.75% | | | 4.53% | | | | N/A | | | | N/A | | | | N/A | | | | 2.58% | | | | | | | | | |
- At Net Asset Value | | | 8.56% | | | | N/A | | | | N/A | | | | N/A | | | | 4.13% | | | | 0.70% | | | | 1.07% | |
Class I | | | | | | | | | | | | | | | | | | | | | | | | | | | | |
- At Net Asset Value | | | 8.83% | | | | N/A | | | | N/A | | | | N/A | | | | 4.57% | | | | 0.45% | | | | 1.62% | |
Class R6 | | | | | | | | | | | | | | | | | | | | | | | | | | | | |
- At Net Asset Value | | | 8.87% | | | | N/A | | | | N/A | | | | N/A | | | | 4.67% | | | | 0.40% | | | | 1.52% | |
| | | | | | | |
Bloomberg Barclays U.S. Aggregate Bond Index(g) | | | 8.93% | | | | N/A | | | | N/A | | | | N/A | | | | 5.10% | | | | | | | | | |
Performance data quoted represents past performance. Past performance is no guarantee of future results. Investment return and principal value of an investment will fluctuate so that an investor’s shares, when redeemed, may be worth more or less than their original cost. Current performance may be lower or higher than performance quoted. Performance shown reflects contractual fee waivers, without such fee waivers total returns would be reduced. For performance data current to the most recentmonth-end go to www.rbcgam.us. Please see footnotes below.
| (a) | The Fund’s expenses reflect the most recent year end (September 30, 2019). For Class A of Impact Bond Fund, the expenses reflect the period from January 28, 2020 (commencement of operations) to March 31, 2020. |
| (b) | The advisor has contractually agreed to waive fees and/or pay operating expenses to keep total operating expenses (excluding certain fees such as brokerage costs, interest, taxes and acquired fund fees and expenses) at 0.80% for Class A shares, 0.45% for Class I shares and 0.40% for Class IS shares of the Access Capital Community Investment Fund and at 0.70% for Class A shares, 0.45% for Class I shares and 0.40% for Class R6 shares of the Impact Bond Fund until January 31, 2020 (January 31, 2021 for Class IS Shares). Prior to March 11, 2019, the rates were 0.95% for Class A Shares and 0.70% for Class I Shares of the Access Capital Community Investment Fund. |
| (c) | The inception date for Class A shares of the Fund is January 29, 2009. All performance shown for such class of shares prior to its inception date is based on the performance of the Class I shares of the Fund, adjusted to reflect the fees and expenses of Class A shares, as applicable. |
2
|
PERFORMANCE SUMMARY (UNAUDITED) |
| (d) | The inception date for Class A shares of the Fund is January 28,2020. All performance shown for such class of shares prior to its inception date is based on the performance of the Class I shares of the Fund, adjusted to reflect the fees and expenses of Class A shares, as applicable. |
| (e) | Class I commenced operations on July 28, 2008. The performance in the table reflects the performance of Access Capital Strategies Community Investment Fund, Inc., the predecessor to the Fund. From its inception, June 23, 1998, until May 30, 2006, the predecessor fund elected status as a business development company. From May 31, 2006 until July 27, 2008, the predecessor fund operated as a continuously offeredclosed-end interval management company. If the predecessor fund had operated as anopen-end management company, performance may have been adversely affected. Fund performance reflects applicable fee waivers/expense reimbursements which, if excluded, would cause performance to be lower. |
| (f) | The inception date for Class IS shares of the Fund is March 11, 2019. All performance shown for such class of shares prior to its inception date is based on the performance of the Class I shares of the Fund, adjusted to reflect the fees and expenses of Class IS shares, as applicable. |
| (g) | Each of the comparative indices is a widely recognized market value weighted measure of the return of securities, but do not include sales fees or operating expenses. You cannot invest directly in indices. |
The Bloomberg Barclays US Aggregate Bond Index measures the investment grade, U.S. dollar-denominated, fixed-rate taxable bond market. It includes Treasuries, government-related and corporate securities, mortgage-backed securities (agency fixed-rate and hybrid adjustable-rate mortgage pass-throughs), asset-backed securities, and commercial mortgage-backed securities (agency andnon-agency).
The Bloomberg Barclays US Securitized Index represents the securitized portion (mortgage-backed, asset-backed and commercial mortgage-backed securities) of the Bloomberg Barclays US Aggregate Bond Index. You cannot invest directly in an index.
3
| | | | | | | | | | | | | | |
| | | | | | FUND STATISTICS (UNAUDITED) | | | | |
| | | | | | Access Capital Community Investment Fund | |
Investment Objective | | | | | | Seeks to invest in geographically specific debt securities located in portions of the United States designated by Fund shareholders. | |
Benchmark | | | | | | Bloomberg Barclays U.S. Securitized Index Bloomberg Barclays U.S. Aggregate Bond Index | |
| | | |
Asset Allocation as of 3/31/20 (% of Fund’s investments) | | | | | | 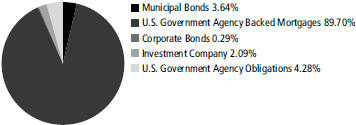
| |
Top Ten Holdings (excluding investment companies) (as of 3/31/20) (% of Fund’s net assets) | | | | | | Fannie Mae, Pool #BL4650, 2.30%, 10/1/31 Ginnie Mae, Series 2012-58, Class B, 2.20%, 3/16/44 Ginnie Mae, Series 2012-33, Class B, 2.89%, 3/16/46 Freddie Mac, Pool #ZA5238, 3.50%, 2/1/48 Fannie Mae, Pool #CA1507, 4.00%, 4/1/48 Ginnie Mae, Series 2017-94, Class AH, 2.60%, 2/16/59 | | 1.64% 1.46% 1.10% 0.79% 0.71% 0.68% | | Missouri Housing Development Commission, Revenue, Series 1, 3.75%, 3/1/42 Fannie Mae, Pool #AM4392, 3.79%, 10/1/23 Freddie Mac, Pool #RA1988, 3.00%, 1/1/50 Fannie Mae, Pool #CA0534, 3.50%, 10/1/47 | | | 0.64% 0.54% 0.53% 0.51% | |
| | | | | | *A listing of all portfolio holdings can be found beginning on page 6 | |
| | | |
Growth of $1,000,000 Initial Investment Over 10 Years | | | | | | 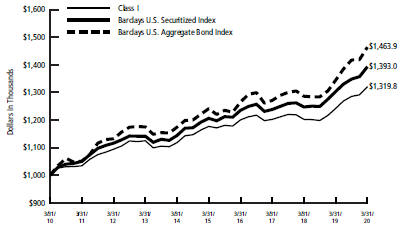
| |
| | | |
| | | | | | The graph reflects an initial investment of $1,000,000 over a 10 year period and is based on Class I shares. The Fund’s total return includes reinvested dividends and capital gains. The Fund’s total return also includes operating expenses that reduce return, while the total return of the index does not. The graph does not reflect the deduction of taxes that a shareholder would pay on fund distributions or redemption of fund shares. Performance of other classes will vary due to differences in fee structures. | |
| | | | | | |
| | | | | | | | | | | | | | |
| | | | | | |
| | | | | | | | | | | | | | |
| | | | | | |
| | | | | | | | | | | | | | |
| | | | | | |
| | | | | | | | | | | | | | |
| | | | | | |
| | | | | | | | | | | | | | |
| | | | | | |
| | | | | | | | | | | | | | |
4
| | | | | | | | | | | | | | | | |
FUND STATISTICS (UNAUDITED) | | | | | | | | | | | | | | | | |
RBC Impact Bond Fund | | | | | | | | |
Seeks to achieve a high level of current income consistent with preservation of capital. | | | | | | | | Investment Objective |
Bloomberg Barclays U.S. Aggregate Bond Index | | | | | | | | Benchmark |
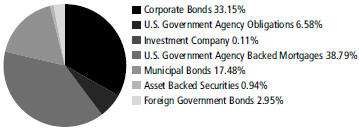
| | | | | | | | Asset Allocation
as of 3/31/20 (% of Fund’s investments) |
Fannie Mae, Pool #CA3451, 3.50%, 5/1/49 Fannie Mae, Pool #CA3405, 3.50%, 4/1/49 Freddie Mac, Pool #V85365, 3.50%, 4/1/49 NextEra Energy Capital Holdings, Inc., 3.55%, 5/1/27 Xcel Energy, Inc., 3.30%, 6/1/25 Providence Health & Services Obligated Group, 4.16%, 10/1/42 | | | 1.87% 1.50% 1.45% 1.42% 1.42% 1.36% | | | Freddie Mac, Pool #V85445, 3.50%, 4/1/49 Shire Acquisitions Investments Ireland DAC, 3.20%, 9/23/26 Fannie Mae, Pool #CA3456, 3.50%, 5/1/49 Fannie Mae, Pool #BO1263, 3.50%, 6/1/49 | | 1.29% 1.26% 1.24% 1.17% | | | | | | | | Top Ten Holdings (excluding investment companies) (as of 3/31/20) (% of Fund’s net
assets) |
*A listing of all portfolio holdings can be found beginning on page 27 | | | | | | | | | | |
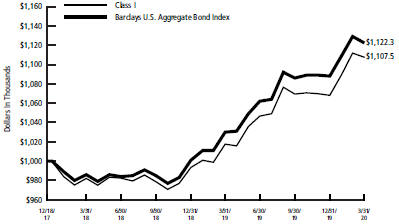
| | | | | | | | Growth of $1,000,000 Initial Investment Since Inception (12/18/17) |
| The graph reflects an initial investment of $1,000,000 over the period from December 18, 2017 (commencement of operations) to March 31, 2020 and is based on Class I shares. The Fund’s total return includes reinvested dividends and capital gains. The Fund’s total return also includes operating expenses that reduce return while the total return of the index does not. The graph does not reflect the deduction of taxes that a shareholder would pay on fund distributions or redemption of fund shares. | | | | | | | | |
| | | | | | | | | | | | | | | | |
| | | | | | | | | | | | | | | | |
| | | | | | | | | | | | | | | | |
| | | | | | | | | | | | | | | | |
| | | | | | | | | | | | | | | | |
| | | | | | | | | | | | | | | | |
5
|
SCHEDULE OF PORTFOLIO INVESTMENTS |
Access Capital Community Investment Fund
March 31, 2020 (Unaudited)
| | | | | | |
Principal Amount | | | | Value | |
U.S. Government Agency Backed Mortgages — 89.35% | | | | |
Fannie Mae — 49.81% | | | | |
$125,000 | | (TBA), 0.00%, 4/15/20(a),(b) | | $ | 140,801 | |
58,632 | | Pool #257656, 6.00%, 8/1/38 | | | 62,958 | |
116,193 | | Pool #257663, 5.50%, 8/1/38 | | | 130,121 | |
109,017 | | Pool #257892, 5.50%, 2/1/38 | | | 122,063 | |
72,376 | | Pool #257913, 5.50%, 1/1/38 | | | 81,037 | |
55,439 | | Pool #258022, 5.50%, 5/1/34 | | | 62,410 | |
118,588 | | Pool #258070, 5.00%, 6/1/34 | | | 131,718 | |
36,205 | | Pool #258121, 5.50%, 6/1/34 | | | 40,758 | |
46,936 | | Pool #258152, 5.50%, 8/1/34 | | | 52,837 | |
62,415 | | Pool #258157, 5.00%, 8/1/34 | | | 69,326 | |
59,100 | | Pool #258163, 5.50%, 8/1/34 | | | 66,531 | |
103,755 | | Pool #258166, 5.50%, 9/1/34 | | | 116,801 | |
70,481 | | Pool #258224, 5.50%, 12/1/34 | | | 79,344 | |
55,338 | | Pool #258238, 5.00%, 1/1/35 | | | 61,464 | |
84,087 | | Pool #258251, 5.50%, 1/1/35 | | | 94,660 | |
100,746 | | Pool #258305, 5.00%, 3/1/35 | | | 111,828 | |
50,917 | | Pool #258336, 5.00%, 4/1/35 | | | 56,518 | |
55,256 | | Pool #258340, 5.00%, 3/1/35 | | | 61,334 | |
59,015 | | Pool #258394, 5.00%, 5/1/35 | | | 65,507 | |
56,160 | | Pool #258403, 5.00%, 6/1/35 | | | 62,338 | |
75,317 | | Pool #258404, 5.00%, 6/1/35 | | | 83,602 | |
44,119 | | Pool #258410, 5.00%, 4/1/35 | | | 48,973 | |
87,246 | | Pool #258448, 5.00%, 8/1/35 | | | 96,843 | |
164,557 | | Pool #258450, 5.50%, 8/1/35 | | | 185,147 | |
68,662 | | Pool #258571, 5.50%, 11/1/35 | | | 77,253 | |
196,404 | | Pool #258627, 5.50%, 2/1/36 | | | 220,979 | |
51,448 | | Pool #258658, 5.50%, 3/1/36 | | | 57,634 | |
45,547 | | Pool #258737, 5.50%, 12/1/35 | | | 51,024 | |
39,161 | | Pool #259181, 6.50%, 3/1/31 | | | 41,931 | |
7,304 | | Pool #259187, 6.50%, 4/1/31 | | | 7,348 | |
63,552 | | Pool #259190, 6.50%, 4/1/31 | | | 69,397 | |
72,772 | | Pool #259316, 6.50%, 11/1/31 | | | 79,662 | |
26,952 | | Pool #259378, 6.00%, 12/1/31 | | | 28,327 | |
30,751 | | Pool #259393, 6.00%, 1/1/32 | | | 32,498 | |
38,995 | | Pool #259590, 5.50%, 11/1/32 | | | 43,949 | |
154,115 | | Pool #259611, 5.50%, 11/1/32 | | | 173,694 | |
33,167 | | Pool #259634, 5.50%, 12/1/32 | | | 37,380 | |
126,356 | | Pool #259659, 5.50%, 2/1/33 | | | 142,408 | |
30,182 | | Pool #259671, 5.50%, 2/1/33 | | | 34,016 | |
73,178 | | Pool #259686, 5.50%, 3/1/33 | | | 82,615 | |
32,912 | | Pool #259722, 5.00%, 5/1/33 | | | 36,780 | |
99,301 | | Pool #259725, 5.00%, 5/1/33 | | | 110,973 | |
92,789 | | Pool #259729, 5.00%, 6/1/33 | | | 103,695 | |
56,390 | | Pool #259761, 5.00%, 6/1/33 | | | 63,018 | |
99,004 | | Pool #259777, 5.00%, 7/1/33 | | | 110,641 | |
75,546 | | Pool #259781, 5.00%, 7/1/33 | | | 84,426 | |
6
|
SCHEDULE OF PORTFOLIO INVESTMENTS |
Access Capital Community Investment Fund (cont.)
March 31, 2020 (Unaudited)
| | | | | | |
Principal Amount | | | | Value | |
$ 45,788 | | Pool #259789, 5.00%, 7/1/33 | | $ | 51,170 | |
110,178 | | Pool #259816, 5.00%, 8/1/33 | | | 123,128 | |
25,351 | | Pool #259819, 5.00%, 8/1/33 | | | 28,331 | |
46,904 | | Pool #259830, 5.00%, 8/1/33 | | | 52,416 | |
31,031 | | Pool #259848, 5.00%, 9/1/33 | | | 34,678 | |
66,170 | | Pool #259867, 5.50%, 10/1/33 | | | 74,703 | |
51,137 | | Pool #259869, 5.50%, 10/1/33 | | | 57,731 | |
51,780 | | Pool #259875, 5.50%, 10/1/33 | | | 58,458 | |
84,515 | | Pool #259930, 5.00%, 11/1/33 | | | 94,449 | |
34,876 | | Pool #259998, 5.00%, 3/1/34 | | | 38,737 | |
637,109 | | Pool #465946, 3.61%, 9/1/20 | | | 637,109 | |
1,707,883 | | Pool #468226, 3.86%, 6/1/21 | | | 1,727,176 | |
261,018 | | Pool #469101, 3.75%, 2/1/27 | | | 291,674 | |
280,138 | | Pool #470828, 3.53%, 3/1/32 | | | 318,995 | |
76,828 | | Pool #557295, 7.00%, 12/1/29 | | | 84,180 | |
23,393 | | Pool #576445, 6.00%, 1/1/31 | | | 24,039 | |
64,886 | | Pool #579402, 6.50%, 4/1/31 | | | 71,878 | |
74,822 | | Pool #583728, 6.50%, 6/1/31 | | | 82,481 | |
30,325 | | Pool #590931, 6.50%, 7/1/31 | | | 33,880 | |
41,514 | | Pool #590932, 6.50%, 7/1/31 | | | 43,907 | |
27,103 | | Pool #601865, 6.50%, 4/1/31 | | | 27,816 | |
30,667 | | Pool #601868, 6.00%, 7/1/29 | | | 32,256 | |
45,501 | | Pool #607611, 6.50%, 11/1/31 | | | 49,227 | |
89,390 | | Pool #634271, 6.50%, 5/1/32 | | | 99,751 | |
38,680 | | Pool #644232, 6.50%, 6/1/32 | | | 41,811 | |
22,626 | | Pool #644432, 6.50%, 7/1/32 | | | 23,796 | |
37,891 | | Pool #644437, 6.50%, 6/1/32 | | | 40,789 | |
1,483,441 | | Pool #663159, 5.00%, 7/1/32 | | | 1,658,935 | |
68,076 | | Pool #670278, 5.50%, 11/1/32 | | | 76,725 | |
29,284 | | Pool #676702, 5.50%, 11/1/32 | | | 33,005 | |
47,276 | | Pool #677591, 5.50%, 12/1/32 | | | 53,282 | |
62,957 | | Pool #681883, 6.00%, 3/1/33 | | | 67,862 | |
99,512 | | Pool #686542, 5.50%, 3/1/33 | | | 112,345 | |
204,419 | | Pool #695961, 5.50%, 1/1/33 | | | 230,389 | |
175,017 | | Pool #696407, 5.50%, 4/1/33 | | | 197,587 | |
372,288 | | Pool #702478, 5.50%, 6/1/33 | | | 420,297 | |
110,513 | | Pool #702479, 5.00%, 6/1/33 | | | 123,503 | |
134,537 | | Pool #720025, 5.00%, 8/1/33 | | | 150,351 | |
140,295 | | Pool #723066, 5.00%, 4/1/33 | | | 156,785 | |
186,928 | | Pool #723067, 5.50%, 5/1/33 | | | 211,033 | |
199,063 | | Pool #723070, 4.50%, 5/1/33 | | | 220,402 | |
255,103 | | Pool #727311, 4.50%, 9/1/33 | | | 282,448 | |
122,611 | | Pool #727312, 5.00%, 9/1/33 | | | 137,022 | |
141,004 | | Pool #727315, 6.00%, 10/1/33 | | | 158,069 | |
35,984 | | Pool #738589, 5.00%, 9/1/33 | | | 40,214 | |
45,389 | | Pool #739269, 5.00%, 9/1/33 | | | 50,724 | |
47,558 | | Pool #743595, 5.50%, 10/1/33 | | | 53,691 | |
7
|
SCHEDULE OF PORTFOLIO INVESTMENTS |
Access Capital Community Investment Fund (cont.)
March 31, 2020 (Unaudited)
| | | | | | |
Principal Amount | | | | Value | |
$136,571 | | Pool #748041, 4.50%, 10/1/33 | | $ | 151,211 | |
82,433 | | Pool #749891, 5.00%, 9/1/33 | | | 92,122 | |
98,852 | | Pool #749897, 4.50%, 9/1/33 | | | 109,449 | |
191,526 | | Pool #753533, 5.00%, 11/1/33 | | | 214,037 | |
40,376 | | Pool #755679, 6.00%, 1/1/34 | | | 43,641 | |
37,234 | | Pool #763551, 5.50%, 3/1/34 | | | 41,916 | |
85,905 | | Pool #763820, 5.50%, 1/1/34 | | | 96,983 | |
42,427 | | Pool #776851, 6.00%, 10/1/34 | | | 45,894 | |
654,673 | | Pool #777621, 5.00%, 2/1/34 | | | 731,622 | |
76,907 | | Pool #781741, 6.00%, 9/1/34 | | | 84,336 | |
3,777 | | Pool #781907, 5.00%, 2/1/21 | | | 3,778 | |
128,234 | | Pool #781954, 5.00%, 6/1/34 | | | 142,431 | |
133,190 | | Pool #781959, 5.50%, 6/1/34 | | | 149,937 | |
239,453 | | Pool #783893, 5.50%, 12/1/34 | | | 269,562 | |
68,793 | | Pool #783929, 5.50%, 10/1/34 | | | 77,443 | |
11,347 | | Pool #788329, 6.50%, 8/1/34 | | | 11,483 | |
108,563 | | Pool #797627, 5.00%, 7/1/35 | | | 120,505 | |
102,242 | | Pool #798725, 5.50%, 11/1/34 | | | 115,098 | |
73,560 | | Pool #799548, 6.00%, 9/1/34 | | | 80,839 | |
701,025 | | Pool #806754, 4.50%, 9/1/34 | | | 776,754 | |
302,252 | | Pool #806757, 6.00%, 9/1/34 | | | 339,004 | |
486,864 | | Pool #806761, 5.50%, 9/1/34 | | | 548,082 | |
106,935 | | Pool #808205, 5.00%, 1/1/35 | | | 118,774 | |
183,565 | | Pool #815009, 5.00%, 4/1/35 | | | 203,757 | |
83,614 | | Pool #817641, 5.00%, 11/1/35 | | | 92,811 | |
112,880 | | Pool #820334, 5.00%, 9/1/35 | | | 125,297 | |
259,787 | | Pool #820335, 5.00%, 9/1/35 | | | 288,364 | |
167,903 | | Pool #820336, 5.00%, 9/1/35 | | | 186,372 | |
97,560 | | Pool #822008, 5.00%, 5/1/35 | | | 108,292 | |
162,018 | | Pool #829005, 5.00%, 8/1/35 | | | 179,840 | |
34,151 | | Pool #829006, 5.50%, 9/1/35 | | | 38,424 | |
154,333 | | Pool #829275, 5.00%, 8/1/35 | | | 171,310 | |
146,787 | | Pool #829276, 5.00%, 8/1/35 | | | 162,934 | |
326,278 | | Pool #829649, 5.50%, 3/1/35 | | | 367,305 | |
277,920 | | Pool #844361, 5.50%, 11/1/35 | | | 312,695 | |
104,575 | | Pool #845245, 5.50%, 11/1/35 | | | 117,660 | |
34,582 | | Pool #866969, 6.00%, 2/1/36 | | | 36,137 | |
176,879 | | Pool #871072, 5.50%, 2/1/37 | | | 198,047 | |
164,694 | | Pool #884693, 5.50%, 4/1/36 | | | 184,498 | |
417,804 | | Pool #885724, 5.50%, 6/1/36 | | | 468,043 | |
53,333 | | Pool #911730, 5.50%, 12/1/21 | | | 54,034 | |
70,185 | | Pool #919368, 5.50%, 4/1/37 | | | 78,584 | |
270,482 | | Pool #922582, 6.00%, 12/1/36 | | | 300,393 | |
209,454 | | Pool #934941, 5.00%, 8/1/39 | | | 230,566 | |
286,168 | | Pool #934942, 5.00%, 9/1/39 | | | 315,013 | |
150,976 | | Pool #941204, 5.50%, 6/1/37 | | | 169,043 | |
58,000 | | Pool #943394, 5.50%, 6/1/37 | | | 64,941 | |
325,732 | | Pool #948600, 6.00%, 8/1/37 | | | 365,339 | |
8
|
SCHEDULE OF PORTFOLIO INVESTMENTS |
Access Capital Community Investment Fund (cont.)
March 31, 2020 (Unaudited)
| | | | | | |
Principal Amount | | | | Value | |
$ 74,176 | | Pool #952678, 6.50%, 8/1/37 | | $ | 81,193 | |
86,214 | | Pool #952693, 6.50%, 8/1/37 | | | 94,626 | |
98,382 | | Pool #975769, 5.50%, 3/1/38 | | | 110,175 | |
71,935 | | Pool #982898, 5.00%, 5/1/38 | | | 79,191 | |
135,135 | | Pool #984842, 5.50%, 6/1/38 | | | 151,333 | |
107,871 | | Pool #986239, 6.00%, 7/1/38 | | | 118,074 | |
120,631 | | Pool #986957, 5.50%, 7/1/38 | | | 135,091 | |
67,131 | | Pool #990510, 5.50%, 8/1/38 | | | 75,178 | |
161,113 | | Pool #990511, 6.00%, 8/1/38 | | | 178,392 | |
160,094 | | Pool #990617, 5.50%, 9/1/38 | | | 179,284 | |
198,222 | | Pool #AA0645, 4.50%, 3/1/39 | | | 218,395 | |
134,852 | | Pool #AA2243, 4.50%, 5/1/39 | | | 148,576 | |
126,255 | | Pool #AA3142, 4.50%, 3/1/39 | | | 139,104 | |
251,825 | | Pool #AA3206, 4.00%, 4/1/39 | | | 273,398 | |
413,776 | | Pool #AA3207, 4.50%, 3/1/39 | | | 455,887 | |
114,052 | | Pool #AA4468, 4.00%, 4/1/39 | | | 123,822 | |
226,810 | | Pool #AA7042, 4.50%, 6/1/39 | | | 249,893 | |
362,683 | | Pool #AA7658, 4.00%, 6/1/39 | | | 393,752 | |
102,290 | | Pool #AA7659, 4.50%, 6/1/39 | | | 112,700 | |
95,728 | | Pool #AA7741, 4.50%, 6/1/24 | | | 99,058 | |
2,506,711 | | Pool #AB7798, 3.00%, 1/1/43 | | | 2,657,372 | |
1,246,489 | | Pool #AB9204, 3.00%, 4/1/43 | | | 1,319,649 | |
192,468 | | Pool #AC1463, 5.00%, 8/1/39 | | | 211,868 | |
102,608 | | Pool #AC1464, 5.00%, 8/1/39 | | | 112,950 | |
351,214 | | Pool #AC2109, 4.50%, 7/1/39 | | | 386,958 | |
35,634 | | Pool #AC4394, 5.00%, 9/1/39 | | | 39,226 | |
259,878 | | Pool #AC4395, 5.00%, 9/1/39 | | | 286,073 | |
116,806 | | Pool #AC5328, 5.00%, 10/1/39 | | | 128,580 | |
230,722 | | Pool #AC5329, 5.00%, 10/1/39 | | | 253,979 | |
195,128 | | Pool #AC6304, 5.00%, 11/1/39 | | | 214,796 | |
207,600 | | Pool #AC6305, 5.00%, 11/1/39 | | | 228,525 | |
138,902 | | Pool #AC6307, 5.00%, 12/1/39 | | | 152,903 | |
302,443 | | Pool #AC6790, 5.00%, 12/1/39 | | | 332,928 | |
939,095 | | Pool #AC7199, 5.00%, 12/1/39 | | | 1,033,753 | |
507,637 | | Pool #AD1470, 5.00%, 2/1/40 | | | 558,806 | |
1,077,668 | | Pool #AD1471, 4.50%, 2/1/40 | | | 1,187,342 | |
133,668 | | Pool #AD1560, 5.00%, 3/1/40 | | | 147,072 | |
767,706 | | Pool #AD1585, 4.50%, 2/1/40 | | | 845,836 | |
349,574 | | Pool #AD1586, 5.00%, 1/1/40 | | | 384,811 | |
450,674 | | Pool #AD1638, 4.50%, 2/1/40 | | | 496,262 | |
145,599 | | Pool #AD1640, 4.50%, 3/1/40 | | | 160,327 | |
1,440,407 | | Pool #AD1942, 4.50%, 1/1/40 | | | 1,586,998 | |
222,632 | | Pool #AD1943, 5.00%, 1/1/40 | | | 245,073 | |
758,671 | | Pool #AD1988, 4.50%, 2/1/40 | | | 835,413 | |
369,841 | | Pool #AD2896, 5.00%, 3/1/40 | | | 406,928 | |
216,857 | | Pool #AD4456, 4.50%, 4/1/40 | | | 238,793 | |
667,940 | | Pool #AD4458, 4.50%, 4/1/40 | | | 735,505 | |
9
|
SCHEDULE OF PORTFOLIO INVESTMENTS |
Access Capital Community Investment Fund (cont.)
March 31, 2020 (Unaudited)
| | | | | | |
Principal Amount | | | | Value | |
$ 368,377 | | Pool #AD4940, 4.50%, 6/1/40 | | $ | 405,640 | |
94,855 | | Pool #AD4946, 4.50%, 6/1/40 | | | 104,450 | |
288,405 | | Pool #AD5728, 5.00%, 4/1/40 | | | 317,326 | |
219,538 | | Pool #AD7239, 4.50%, 7/1/40 | | | 241,745 | |
117,774 | | Pool #AD7242, 4.50%, 7/1/40 | | | 129,687 | |
175,162 | | Pool #AD7256, 4.50%, 7/1/40 | | | 192,880 | |
387,578 | | Pool #AD7271, 4.50%, 7/1/40 | | | 426,783 | |
265,712 | | Pool #AD7272, 4.50%, 7/1/40 | | | 292,590 | |
272,438 | | Pool #AD8960, 5.00%, 6/1/40 | | | 299,758 | |
130,629 | | Pool #AD9613, 4.50%, 8/1/40 | | | 143,843 | |
887,773 | | Pool #AD9614, 4.50%, 8/1/40 | | | 977,575 | |
83,270 | | Pool #AE2011, 4.00%, 9/1/40 | | | 90,432 | |
1,309,590 | | Pool #AE2012, 4.00%, 9/1/40 | | | 1,422,231 | |
118,055 | | Pool #AE2023, 4.00%, 9/1/40 | | | 128,209 | |
648,700 | | Pool #AE5432, 4.00%, 10/1/40 | | | 704,496 | |
333,936 | | Pool #AE5435, 4.50%, 9/1/40 | | | 367,715 | |
334,783 | | Pool #AE5806, 4.50%, 9/1/40 | | | 368,647 | |
532,508 | | Pool #AE5861, 4.00%, 10/1/40 | | | 578,310 | |
509,225 | | Pool #AE5862, 4.00%, 10/1/40 | | | 553,024 | |
351,220 | | Pool #AE5863, 4.00%, 10/1/40 | | | 381,429 | |
284,214 | | Pool #AE6850, 4.00%, 10/1/40 | | | 308,660 | |
28,209 | | Pool #AE6851, 4.00%, 10/1/40 | | | 30,635 | |
155,321 | | Pool #AE7699, 4.00%, 11/1/40 | | | 168,680 | |
416,181 | | Pool #AE7703, 4.00%, 10/1/40 | | �� | 451,978 | |
667,358 | | Pool #AE7707, 4.00%, 11/1/40 | | | 724,759 | |
242,469 | | Pool #AH0300, 4.00%, 11/1/40 | | | 263,324 | |
410,397 | | Pool #AH0301, 3.50%, 11/1/40 | | | 440,091 | |
40,285 | | Pool #AH0302, 4.00%, 11/1/40 | | | 43,750 | |
426,095 | | Pool #AH0306, 4.00%, 12/1/40 | | | 462,744 | |
459,670 | | Pool #AH0508, 4.00%, 11/1/40 | | | 499,207 | |
876,792 | | Pool #AH0537, 4.00%, 12/1/40 | | | 952,206 | |
560,086 | | Pool #AH0914, 4.50%, 11/1/40 | | | 616,741 | |
444,580 | | Pool #AH0917, 4.00%, 12/1/40 | | | 482,819 | |
639,301 | | Pool #AH1077, 4.00%, 1/1/41 | | | 694,289 | |
723,066 | | Pool #AH2973, 4.00%, 12/1/40 | | | 785,259 | |
425,958 | | Pool #AH2980, 4.00%, 1/1/41 | | | 462,595 | |
954,283 | | Pool #AH5656, 4.00%, 1/1/41 | | | 1,036,363 | |
235,109 | | Pool #AH5657, 4.00%, 2/1/41 | | | 255,332 | |
484,816 | | Pool #AH5658, 4.00%, 2/1/41 | | | 526,517 | |
326,388 | | Pool #AH5662, 4.00%, 2/1/41 | | | 354,462 | |
446,990 | | Pool #AH5882, 4.00%, 2/1/26 | | | 471,775 | |
587,923 | | Pool #AH6764, 4.00%, 3/1/41 | | | 638,921 | |
1,108,993 | | Pool #AH6768, 4.00%, 3/1/41 | | | 1,205,189 | |
218,714 | | Pool #AH7277, 4.00%, 3/1/41 | | | 237,686 | |
814,171 | | Pool #AH7281, 4.00%, 3/1/41 | | | 884,794 | |
363,589 | | Pool #AH7526, 4.50%, 3/1/41 | | | 400,827 | |
583,665 | | Pool #AH7537, 4.00%, 3/1/41 | | | 634,294 | |
389,030 | | Pool #AH8878, 4.50%, 4/1/41 | | | 428,874 | |
10
|
SCHEDULE OF PORTFOLIO INVESTMENTS |
Access Capital Community Investment Fund (cont.)
March 31, 2020 (Unaudited)
| | | | | | |
Principal Amount | | | | Value | |
$ 288,398 | | Pool #AH8885, 4.50%, 4/1/41 | | $ | 317,935 | |
252,772 | | Pool #AH9050, 3.50%, 2/1/26 | | | 265,961 | |
526,380 | | Pool #AI0114, 4.00%, 3/1/41 | | | 572,040 | |
503,778 | | Pool #AI1846, 4.50%, 5/1/41 | | | 555,374 | |
416,951 | | Pool #AI1847, 4.50%, 5/1/41 | | | 459,655 | |
1,029,624 | | Pool #AI1848, 4.50%, 5/1/41 | | | 1,135,076 | |
655,887 | | Pool #AI1849, 4.50%, 5/1/41 | | | 723,062 | |
356,211 | | Pool #AJ0651, 4.00%, 8/1/41 | | | 387,109 | |
301,713 | | Pool #AJ7668, 4.00%, 11/1/41 | | | 327,884 | |
632,325 | | Pool #AJ9133, 4.00%, 1/1/42 | | | 687,174 | |
565,904 | | Pool #AK6715, 3.50%, 3/1/42 | | | 605,606 | |
725,962 | | Pool #AK6716, 3.50%, 3/1/42 | | | 776,892 | |
495,431 | | Pool #AK6718, 3.50%, 2/1/42 | | | 530,188 | |
430,009 | | Pool #AM0635, 2.55%, 10/1/22 | | | 430,009 | |
863,208 | | Pool #AM1750, 3.04%, 12/1/30 | | | 935,082 | |
2,837,534 | | Pool #AM4392, 3.79%, 10/1/23 | | | 3,036,901 | |
229,523 | | Pool #AM6907, 3.68%, 10/1/32 | | | 258,457 | |
1,442,512 | | Pool #AM7764, 3.05%, 1/1/27 | | | 1,571,373 | |
473,829 | | Pool #AM9780, 3.31%, 3/1/31 | | | 531,551 | |
350,000 | | Pool #AN0360, 3.95%, 12/1/45 | | | 397,863 | |
1,056,397 | | Pool #AN0915, 3.01%, 2/1/26 | | | 1,141,810 | |
309,867 | | Pool #AN1381, 2.56%, 8/1/26 | | | 328,748 | |
935,651 | | Pool #AN2066, 2.75%, 7/1/26 | | | 988,310 | |
953,085 | | Pool #AN2746, 2.30%, 9/1/26 | | | 997,458 | |
974,718 | | Pool #AN3157, 2.25%, 10/1/26 | | | 1,017,445 | |
472,229 | | Pool #AN3919, 2.82%, 12/1/26 | | | 508,537 | |
1,145,000 | | Pool #AN4045, 3.15%, 1/1/29 | | | 1,243,668 | |
855,140 | | Pool #AN5053, 3.34%, 4/1/27 | | | 945,096 | |
208,521 | | Pool #AN6580, 3.36%, 9/1/29 | | | 234,530 | |
959,426 | | Pool #AN7154, 3.21%, 10/1/32 | | | 1,070,619 | |
967,003 | | Pool #AN7904, 3.44%, 12/1/27 | | | 1,076,528 | |
483,582 | | Pool #AN7982, 2.80%, 1/1/26 | | | 513,736 | |
2,000,000 | | Pool #AN8055, 3.05%, 1/1/30 | | | 2,208,765 | |
1,500,000 | | Pool #AN8121, 3.16%, 1/1/35 | | | 1,653,969 | |
978,049 | | Pool #AN9057, 3.47%, 4/1/28 | | | 1,096,128 | |
976,476 | | Pool #AN9844, 3.80%, 7/1/30 | | | 1,128,379 | |
458,129 | | Pool #AO2923, 3.50%, 5/1/42 | | | 490,269 | |
1,560,849 | | Pool #AO8029, 3.50%, 7/1/42 | | | 1,670,352 | |
494,860 | | Pool #AP7483, 3.50%, 9/1/42 | | | 529,578 | |
415,613 | | Pool #AQ6710, 2.50%, 10/1/27 | | | 431,378 | |
1,566,538 | | Pool #AQ7193, 3.50%, 7/1/43 | | | 1,671,982 | |
388,518 | | Pool #AR6928, 3.00%, 3/1/43 | | | 411,321 | |
870,272 | | Pool #AS1916, 4.00%, 3/1/44 | | | 936,009 | |
469,814 | | Pool #AS1917, 4.00%, 3/1/44 | | | 507,163 | |
193,161 | | Pool #AS2129, 4.00%, 3/1/44 | | | 207,752 | |
880,017 | | Pool #AS2439, 4.00%, 5/1/44 | | | 949,975 | |
470,903 | | Pool #AS2784, 4.00%, 7/1/44 | | | 506,473 | |
11
|
SCHEDULE OF PORTFOLIO INVESTMENTS |
Access Capital Community Investment Fund (cont.)
March 31, 2020 (Unaudited)
| | | | | | |
Principal Amount | | | | Value | |
$1,416,382 | | Pool #AS3244, 4.00%, 9/1/44 | | $ | 1,523,370 | |
1,658,856 | | Pool #AS3494, 4.00%, 10/1/44 | | | 1,784,160 | |
1,351,655 | | Pool #AS3726, 4.00%, 11/1/44 | | | 1,453,754 | |
848,227 | | Pool #AS3728, 4.00%, 11/1/44 | | | 912,298 | |
639,585 | | Pool #AS3929, 4.00%, 12/1/44 | | | 687,896 | |
701,733 | | Pool #AS3930, 4.00%, 11/1/44 | | | 754,739 | |
1,000,194 | | Pool #AS4070, 4.00%, 12/1/44 | | | 1,076,329 | |
308,561 | | Pool #AS4390, 3.50%, 2/1/45 | | | 328,867 | |
975,732 | | Pool #AS4732, 3.50%, 4/1/45 | | | 1,038,785 | |
1,099,968 | | Pool #AS4905, 3.50%, 4/1/45 | | | 1,171,050 | |
1,032,804 | | Pool #AS5341, 3.50%, 7/1/45 | | | 1,099,545 | |
926,968 | | Pool #AS5576, 4.00%, 8/1/45 | | | 995,709 | |
700,366 | | Pool #AS5919, 3.50%, 9/1/45 | | | 745,625 | |
404,686 | | Pool #AS5922, 3.50%, 9/1/45 | | | 430,837 | |
989,321 | | Pool #AS6303, 4.00%, 11/1/45 | | | 1,062,686 | |
664,091 | | Pool #AS6469, 4.00%, 12/1/45 | | | 713,338 | |
247,715 | | Pool #AS6607, 4.00%, 1/1/46 | | | 266,085 | |
1,463,643 | | Pool #AS6778, 3.50%, 3/1/46 | | | 1,556,330 | |
632,178 | | Pool #AS6958, 3.50%, 4/1/46 | | | 672,540 | |
1,046,489 | | Pool #AS7138, 3.50%, 5/1/46 | | | 1,112,759 | |
762,907 | | Pool #AS7139, 3.50%, 5/1/46 | | | 811,219 | |
1,440,820 | | Pool #AS7334, 3.00%, 6/1/46 | | | 1,515,760 | |
1,332,747 | | Pool #AS7335, 3.00%, 5/1/46 | | | 1,402,067 | |
944,432 | | Pool #AS7336, 3.00%, 6/1/46 | | | 996,302 | |
2,474,194 | | Pool #AS7504, 3.00%, 7/1/46 | | | 2,602,883 | |
477,557 | | Pool #AS7516, 3.00%, 7/1/46 | | | 502,396 | |
1,583,544 | | Pool #AS7517, 3.00%, 6/1/46 | | | 1,665,908 | |
683,653 | | Pool #AS7518, 3.00%, 7/1/46 | | | 720,044 | |
382,749 | | Pool #AS7674, 3.00%, 8/1/46 | | | 402,657 | |
1,481,097 | | Pool #AS7676, 3.00%, 8/1/46 | | | 1,558,133 | |
690,728 | | Pool #AS8077, 3.00%, 10/1/46 | | | 727,039 | |
1,449,587 | | Pool #AS8289, 3.00%, 10/1/46 | | | 1,524,983 | |
1,812,051 | | Pool #AS8441, 3.00%, 11/1/46 | | | 1,906,300 | |
1,532,814 | | Pool #AS8633, 3.50%, 1/1/47 | | | 1,629,882 | |
993,071 | | Pool #AS8776, 3.50%, 2/1/47 | | | 1,055,959 | |
218,465 | | Pool #AS9308, 4.00%, 2/1/47 | | | 234,951 | |
1,262,125 | | Pool #AS9381, 4.00%, 4/1/47 | | | 1,349,655 | |
1,399,030 | | Pool #AS9549, 4.00%, 5/1/47 | | | 1,496,054 | |
2,132,305 | | Pool #AS9550, 4.00%, 5/1/47 | | | 2,280,183 | |
932,575 | | Pool #AS9727, 3.50%, 6/1/47 | | | 988,461 | |
764,432 | | Pool #AS9729, 4.00%, 6/1/47 | | | 817,446 | |
776,767 | | Pool #AS9825, 4.00%, 6/1/47 | | | 833,091 | |
718,916 | | Pool #AT2688, 3.00%, 5/1/43 | | | 761,111 | |
211,736 | | Pool #AT2691, 3.00%, 5/1/43 | | | 224,163 | |
627,789 | | Pool #AT3963, 2.50%, 3/1/28 | | | 652,200 | |
294,483 | | Pool #AT7873, 2.50%, 6/1/28 | | | 306,079 | |
439,617 | | Pool #AU0971, 3.50%, 8/1/43 | | | 469,207 | |
582,332 | | Pool #AU2165, 3.50%, 7/1/43 | | | 621,529 | |
12
|
SCHEDULE OF PORTFOLIO INVESTMENTS |
Access Capital Community Investment Fund (cont.)
March 31, 2020 (Unaudited)
| | | | | | |
Principal Amount | | | | Value | |
$ 814,830 | | Pool #AU2188, 3.50%, 8/1/43 | | $ | 869,677 | |
372,367 | | Pool #AU6054, 4.00%, 9/1/43 | | | 401,641 | |
316,370 | | Pool #AU6718, 4.00%, 10/1/43 | | | 341,550 | |
642,794 | | Pool #AU7003, 4.00%, 11/1/43 | | | 697,268 | |
487,538 | | Pool #AU7005, 4.00%, 11/1/43 | | | 526,343 | |
792,169 | | Pool #AV0679, 4.00%, 12/1/43 | | | 858,352 | |
449,327 | | Pool #AV9282, 4.00%, 2/1/44 | | | 480,468 | |
677,937 | | Pool #AW0993, 4.00%, 5/1/44 | | | 735,319 | |
242,581 | | Pool #AW1565, 4.00%, 4/1/44 | | | 261,583 | |
70,869 | | Pool #AW3671, 4.00%, 4/1/44 | | | 76,123 | |
819,555 | | Pool #AW5046, 4.00%, 7/1/44 | | | 881,520 | |
590,300 | | Pool #AW5047, 4.00%, 7/1/44 | | | 634,888 | |
315,731 | | Pool #AW7040, 4.00%, 6/1/44 | | | 338,353 | |
692,946 | | Pool #AW8629, 3.50%, 5/1/44 | | | 738,518 | |
805,675 | | Pool #AX2884, 3.50%, 11/1/44 | | | 858,661 | |
1,347,408 | | Pool #AX4860, 3.50%, 12/1/44 | | | 1,436,020 | |
631,406 | | Pool #AY0075, 3.50%, 11/1/44 | | | 672,930 | |
758,004 | | Pool #AY1389, 3.50%, 4/1/45 | | | 806,987 | |
740,378 | | Pool #AY3435, 3.50%, 5/1/45 | | | 788,222 | |
640,043 | | Pool #AY5571, 3.50%, 6/1/45 | | | 681,403 | |
1,172,310 | | Pool #BC0802, 3.50%, 4/1/46 | | | 1,246,548 | |
1,154,231 | | Pool #BC0804, 3.50%, 4/1/46 | | | 1,227,325 | |
693,855 | | Pool #BC1135, 3.00%, 6/1/46 | | | 730,789 | |
1,365,844 | | Pool #BD5021, 3.50%, 2/1/47 | | | 1,452,338 | |
2,054,226 | | Pool #BD7140, 4.00%, 4/1/47 | | | 2,196,689 | |
2,037,898 | | Pool #BE4232, 3.00%, 12/1/46 | | | 2,145,029 | |
942,112 | | Pool #BE9743, 3.50%, 4/1/47 | | | 1,000,149 | |
2,107,026 | | Pool #BH2665, 3.50%, 9/1/47 | | | 2,233,293 | |
951,067 | | Pool #BH4659, 4.00%, 6/1/47 | | | 1,019,952 | |
1,929,560 | | Pool #BJ0657, 4.00%, 2/1/48 | | | 2,057,039 | |
1,019,220 | | Pool #BJ2670, 4.00%, 4/1/48 | | | 1,086,556 | |
1,633,503 | | Pool #BJ5158, 4.00%, 4/1/48 | | | 1,741,422 | |
782,356 | | Pool #BK7685, 4.00%, 10/1/48 | | | 835,967 | |
1,296,468 | | Pool #BK7924, 4.00%, 11/1/48 | | | 1,382,120 | |
8,920,000 | | Pool #BL4650, 2.30%, 10/1/31 | | | 9,181,769 | |
2,400,000 | | Pool #BL4970, 2.80%, 11/1/36 | | | 2,519,948 | |
1,671,170 | | Pool #BO1263, 3.50%, 6/1/49 | | | 1,772,050 | |
1,486,188 | | Pool #BO3599, 3.00%, 9/1/49 | | | 1,558,598 | |
1,197,103 | | Pool #BO5263, 3.00%, 9/1/49 | | | 1,255,429 | |
2,108,072 | | Pool #CA0114, 3.50%, 8/1/47 | | | 2,234,402 | |
460,861 | | Pool #CA0268, 3.50%, 8/1/47 | | | 490,963 | |
2,279,220 | | Pool #CA0334, 3.50%, 9/1/47 | | | 2,415,805 | |
2,690,910 | | Pool #CA0534, 3.50%, 10/1/47 | | | 2,854,794 | |
1,157,539 | | Pool #CA0536, 3.50%, 10/1/47 | | | 1,226,906 | |
860,026 | | Pool #CA0551, 4.00%, 10/1/47 | | | 919,670 | |
915,981 | | Pool #CA0565, 3.50%, 10/1/47 | | | 971,820 | |
1,527,266 | | Pool #CA0742, 3.50%, 11/1/47 | | | 1,618,790 | |
13
|
SCHEDULE OF PORTFOLIO INVESTMENTS |
Access Capital Community Investment Fund (cont.)
March 31, 2020 (Unaudited)
| | | | | | |
Principal Amount | | | | Value | |
$1,015,478 | | Pool #CA0743, 3.50%, 11/1/47 | | $ | 1,079,506 | |
1,164,660 | | Pool #CA0825, 3.50%, 12/1/47 | | | 1,235,591 | |
1,024,100 | | Pool #CA0981, 3.50%, 12/1/47 | | | 1,085,470 | |
1,739,864 | | Pool #CA1070, 3.50%, 1/1/48 | | | 1,844,128 | |
700,635 | | Pool #CA1115, 3.50%, 1/1/48 | | | 742,622 | |
1,275,761 | | Pool #CA1130, 3.50%, 1/1/48 | | | 1,353,459 | |
1,509,733 | | Pool #CA1131, 3.50%, 2/1/48 | | | 1,600,206 | |
1,807,235 | | Pool #CA1132, 3.50%, 1/1/48 | | | 1,915,537 | |
1,454,601 | | Pool #CA1140, 3.50%, 1/1/48 | | | 1,541,770 | |
1,372,980 | | Pool #CA1144, 3.50%, 2/1/48 | | | 1,455,258 | |
496,793 | | Pool #CA1152, 3.50%, 2/1/48 | | | 526,564 | |
1,023,024 | | Pool #CA1160, 3.50%, 2/1/48 | | | 1,087,504 | |
1,096,748 | | Pool #CA1161, 3.50%, 2/1/48 | | | 1,163,015 | |
808,888 | | Pool #CA1162, 3.50%, 2/1/48 | | | 858,151 | |
851,551 | | Pool #CA1338, 4.00%, 3/1/48 | | | 910,744 | |
1,798,982 | | Pool #CA1339, 3.50%, 3/1/48 | | | 1,907,678 | |
1,151,406 | | Pool #CA1418, 4.00%, 3/1/48 | | | 1,230,200 | |
588,515 | | Pool #CA1420, 4.00%, 3/1/48 | | | 628,789 | |
1,081,702 | | Pool #CA1468, 4.00%, 3/1/48 | | | 1,153,166 | |
1,848,152 | | Pool #CA1469, 4.00%, 3/1/48 | | | 1,970,252 | |
869,132 | | Pool #CA1471, 4.00%, 3/1/48 | | | 928,690 | |
3,701,196 | | Pool #CA1507, 4.00%, 4/1/48 | | | 3,945,719 | |
1,058,452 | | Pool #CA1610, 3.50%, 3/1/48 | | | 1,122,404 | |
1,241,551 | | Pool #CA1611, 4.00%, 4/1/48 | | | 1,326,628 | |
1,054,039 | | Pool #CA1612, 3.50%, 4/1/48 | | | 1,116,956 | |
1,166,637 | | Pool #CA1613, 4.00%, 4/1/48 | | | 1,243,712 | |
474,793 | | Pool #CA2381, 4.00%, 9/1/48 | | | 507,328 | |
985,449 | | Pool #CA2440, 4.00%, 9/1/48 | | | 1,050,554 | |
796,517 | | Pool #CA2441, 4.00%, 10/1/48 | | | 851,099 | |
450,105 | | Pool #CA2442, 4.00%, 10/1/48 | | | 483,377 | |
1,058,084 | | Pool #CA2443, 4.00%, 10/1/48 | | | 1,130,589 | |
1,095,833 | | Pool #CA2468, 4.00%, 10/1/48 | | | 1,170,925 | |
765,525 | | Pool #CA2594, 4.00%, 11/1/48 | | | 824,901 | |
738,203 | | Pool #CA2913, 4.00%, 1/1/49 | | | 786,973 | |
1,252,941 | | Pool #CA2914, 4.00%, 1/1/49 | | | 1,335,718 | |
1,705,671 | | Pool #CA3042, 4.00%, 1/1/49 | | | 1,822,552 | |
1,138,087 | | Pool #CA3043, 4.00%, 2/1/49 | | | 1,213,275 | |
1,675,863 | | Pool #CA3044, 4.50%, 2/1/49 | | | 1,809,571 | |
1,149,240 | | Pool #CA3045, 4.50%, 1/1/49 | | | 1,242,629 | |
97,962 | | Pool #CA3132, 4.00%, 2/1/49 | | | 104,980 | |
703,082 | | Pool #CA3557, 3.50%, 5/1/49 | | | 743,231 | |
2,179,312 | | Pool #CA3628, 3.50%, 6/1/49 | | | 2,303,760 | |
1,160,692 | | Pool #CA3793, 3.50%, 6/1/49 | | | 1,228,448 | |
272,199 | | Pool #CA3936, 3.50%, 7/1/49 | | | 288,089 | |
540,645 | | Pool #CA4043, 3.00%, 8/1/49 | | | 566,987 | |
1,247,268 | | Pool #CA4320, 3.00%, 9/1/49 | | | 1,308,038 | |
1,789,690 | | Pool #CA5106, 3.00%, 1/1/50 | | | 1,876,887 | |
452,222 | | Pool #CA5132, 3.00%, 2/1/50 | | | 474,255 | |
14
|
SCHEDULE OF PORTFOLIO INVESTMENTS |
Access Capital Community Investment Fund (cont.)
March 31, 2020 (Unaudited)
| | | | | | |
Principal Amount | | | | Value | |
$2,226,718 | | Pool #CA5309, 3.00%, 3/1/50 | | $ | 2,337,464 | |
1,160,215 | | Pool #CA5312, 3.00%, 3/1/50 | | | 1,221,797 | |
52,119 | | Pool #MC0013, 5.50%, 12/1/38 | | | 58,366 | |
85,015 | | Pool #MC0014, 5.50%, 12/1/38 | | | 95,205 | |
69,763 | | Pool #MC0016, 5.50%, 11/1/38 | | | 78,125 | |
67,159 | | Pool #MC0038, 4.50%, 3/1/39 | | | 73,994 | |
46,544 | | Pool #MC0059, 4.00%, 4/1/39 | | | 50,531 | |
82,388 | | Pool #MC0081, 4.00%, 5/1/39 | | | 89,446 | |
43,724 | | Pool #MC0112, 4.50%, 6/1/39 | | | 48,174 | |
87,700 | | Pool #MC0127, 4.50%, 7/1/39 | | | 96,626 | |
487,766 | | Pool #MC0154, 4.50%, 8/1/39 | | | 537,406 | |
87,823 | | Pool #MC0160, 4.50%, 8/1/39 | | | 96,761 | |
205,453 | | Pool #MC0171, 4.50%, 9/1/39 | | | 226,362 | |
298,295 | | Pool #MC0177, 4.50%, 9/1/39 | | | 328,653 | |
119,504 | | Pool #MC0270, 4.50%, 3/1/40 | | | 131,592 | |
349,197 | | Pool #MC0325, 4.50%, 7/1/40 | | | 384,520 | |
326,151 | | Pool #MC0584, 4.00%, 1/1/42 | | | 354,442 | |
156,482 | | Pool #MC0585, 4.00%, 1/1/42 | | | 170,055 | |
61,622 | | Pool #MC3344, 5.00%, 12/1/38 | | | 67,838 | |
| | | | | | |
| | | | | 278,254,553 | |
| | | | | | |
Freddie Mac — 18.79% | | | | |
1,414,763 | | Pool #Q63813, 3.50%, 4/1/49 | | | 1,501,854 | |
2,102,985 | | Pool #RA1234, 3.50%, 8/1/49 | | | 2,225,748 | |
1,714,939 | | Pool #RA1382, 3.00%, 9/1/49 | | | 1,798,495 | |
1,983,886 | | Pool #RA1383, 3.00%, 9/1/49 | | | 2,080,546 | |
2,147,630 | | Pool #RA1470, 3.00%, 10/1/49 | | | 2,252,267 | |
1,566,075 | | Pool #RA1713, 3.00%, 11/1/49 | | | 1,642,378 | |
1,746,213 | | Pool #RA1714, 3.00%, 11/1/49 | | | 1,831,292 | |
1,605,344 | | Pool #RA1715, 3.00%, 10/1/49 | | | 1,683,560 | |
1,568,998 | | Pool #RA1716, 3.00%, 11/1/49 | | | 1,645,443 | |
627,113 | | Pool #RA1724, 2.50%, 10/1/49 | | | 650,059 | |
629,048 | | Pool #RA1979, 3.00%, 12/1/49 | | | 660,692 | |
1,189,895 | | Pool #RA1987, 3.00%, 12/1/49 | | | 1,252,558 | |
2,840,655 | | Pool #RA1988, 3.00%, 1/1/50 | | | 2,979,058 | |
1,883,444 | | Pool #RA2158, 3.00%, 2/1/50 | | | 1,976,064 | |
1,030,726 | | Pool #RA2162, 3.00%, 2/1/50 | | | 1,081,989 | |
2,136,478 | | Pool #RA2255, 3.00%, 3/1/50 | | | 2,242,736 | |
2,362,729 | | Pool #RA2256, 3.00%, 3/1/50 | | | 2,480,240 | |
1,220,209 | | Pool #RA2340, 3.00%, 3/1/50 | | | 1,280,897 | |
521,651 | | Pool #RA2395, 2.50%, 4/1/50 | | | 540,819 | |
1,568,609 | | Pool #WA3103, 3.30%, 2/1/27 | | | 1,729,368 | |
996,988 | | Pool #WA5002, 2.62%, 11/1/31 | | | 1,062,507 | |
1,957,264 | | Pool #WN3000, 3.14%, 1/1/28 | | | 2,151,836 | |
1,000,000 | | Pool #WN3049, 2.39%, 9/1/31 | | | 1,037,998 | |
984,359 | | Pool #ZA4828, 4.00%, 3/1/47 | | | 1,051,388 | |
762,319 | | Pool #ZA4891, 3.50%, 3/1/47 | | | 807,984 | |
1,763,442 | | Pool #ZA4892, 4.00%, 5/1/47 | | | 1,885,610 | |
15
|
SCHEDULE OF PORTFOLIO INVESTMENTS |
Access Capital Community Investment Fund (cont.)
March 31, 2020 (Unaudited)
| | | | | | |
Principal Amount | | | | Value | |
$ 888,588 | | Pool #ZA4893, 3.50%, 4/1/47 | | $ | 943,306 | |
1,445,646 | | Pool #ZA4912, 3.50%, 5/1/47 | | | 1,532,243 | |
1,810,200 | | Pool #ZA4913, 4.00%, 5/1/47 | | | 1,935,607 | |
1,300,824 | | Pool #ZA5036, 3.50%, 9/1/47 | | | 1,378,747 | |
2,048,843 | | Pool #ZA5070, 3.50%, 11/1/47 | | | 2,171,573 | |
853,314 | | Pool #ZA5090, 3.50%, 11/1/47 | | | 904,430 | |
1,602,954 | | Pool #ZA5174, 3.50%, 12/1/47 | | | 1,698,975 | |
4,143,542 | | Pool #ZA5238, 3.50%, 2/1/48 | | | 4,391,750 | |
1,119,605 | | Pool #ZA5245, 3.50%, 1/1/48 | | | 1,186,672 | |
2,475,372 | | Pool #ZA5253, 3.50%, 1/1/48 | | | 2,623,652 | |
2,294,386 | | Pool #ZA5254, 4.00%, 1/1/48 | | | 2,450,620 | |
993,466 | | Pool #ZA5308, 4.00%, 1/1/48 | | | 1,062,292 | |
900,240 | | Pool #ZA5575, 4.00%, 7/1/48 | | | 961,810 | |
1,053,454 | | Pool #ZA5637, 4.50%, 8/1/48 | | | 1,137,361 | |
944,608 | | Pool #ZA5645, 4.00%, 8/1/48 | | | 1,012,170 | |
425,276 | | Pool #ZA6576, 3.50%, 4/1/49 | | | 449,898 | |
115,374 | | Pool #ZI0238, 5.00%, 6/1/33 | | | 128,947 | |
200,754 | | Pool #ZI0412, 5.00%, 8/1/33 | | | 224,372 | |
75,766 | | Pool #ZI0543, 4.50%, 8/1/33 | | | 83,900 | |
31,613 | | Pool #ZI0548, 5.00%, 8/1/33 | | | 35,332 | |
53,255 | | Pool #ZI0549, 5.00%, 8/1/33 | | | 59,520 | |
36,080 | | Pool #ZI0743, 4.50%, 9/1/33 | | | 39,954 | |
121,015 | | Pool #ZI0807, 5.00%, 9/1/33 | | | 135,251 | |
74,872 | | Pool #ZI0959, 6.00%, 10/1/33 | | | 82,027 | |
245,634 | | Pool #ZI1023, 5.50%, 11/1/33 | | | 277,287 | |
40,134 | | Pool #ZI1352, 5.50%, 12/1/33 | | | 45,306 | |
100,633 | | Pool #ZI1353, 5.50%, 1/1/34 | | | 113,601 | |
219,052 | | Pool #ZI1493, 5.50%, 1/1/34 | | | 247,279 | |
160,786 | | Pool #ZI1524, 5.50%, 2/1/34 | | | 181,506 | |
76,558 | | Pool #ZI1630, 5.50%, 3/1/34 | | | 86,179 | |
171,972 | | Pool #ZI1689, 5.50%, 4/1/34 | | | 193,583 | |
90,476 | | Pool #ZI1802, 5.50%, 4/1/34 | | | 101,845 | |
152,108 | | Pool #ZI1991, 5.00%, 5/1/34 | | | 168,953 | |
274,308 | | Pool #ZI2332, 5.00%, 6/1/34 | | | 304,686 | |
160,428 | | Pool #ZI2333, 5.00%, 6/1/34 | | | 178,195 | |
168,712 | | Pool #ZI2888, 6.00%, 12/1/34 | | | 189,705 | |
223,558 | | Pool #ZI2939, 5.50%, 12/1/34 | | | 251,651 | |
161,999 | | Pool #ZI3102, 5.00%, 1/1/35 | | | 179,939 | |
90,786 | | Pool #ZI3254, 5.50%, 4/1/35 | | | 102,154 | |
192,645 | | Pool #ZI3507, 5.00%, 9/1/35 | | | 213,827 | |
170,253 | | Pool #ZI3713, 5.00%, 5/1/35 | | | 188,973 | |
87,498 | | Pool #ZI4118, 5.50%, 1/1/36 | | | 98,454 | |
103,001 | | Pool #ZI4119, 5.00%, 1/1/36 | | | 114,326 | |
155,735 | | Pool #ZI4120, 5.50%, 1/1/36 | | | 175,236 | |
223,465 | | Pool #ZI4200, 5.50%, 2/1/36 | | | 251,447 | |
93,781 | | Pool #ZI4201, 6.00%, 2/1/36 | | | 102,665 | |
250,911 | | Pool #ZI4429, 5.00%, 6/1/35 | | | 278,499 | |
135,600 | | Pool #ZI4521, 5.50%, 7/1/35 | | | 152,580 | |
16
|
SCHEDULE OF PORTFOLIO INVESTMENTS |
Access Capital Community Investment Fund (cont.)
March 31, 2020 (Unaudited)
| | | | | | |
Principal Amount | | | | Value | |
$ 188,164 | | Pool #ZI4572, 5.50%, 8/1/35 | | $ | 211,726 | |
83,348 | | Pool #ZI4605, 5.50%, 9/1/35 | | | 93,784 | |
134,922 | | Pool #ZI4606, 5.50%, 9/1/35 | | | 151,817 | |
123,223 | | Pool #ZI4704, 5.00%, 11/1/35 | | | 136,772 | |
130,946 | | Pool #ZI4705, 5.00%, 11/1/35 | | | 145,344 | |
78,579 | | Pool #ZI4706, 5.50%, 11/1/35 | | | 88,419 | |
138,894 | | Pool #ZI4855, 6.00%, 5/1/36 | | | 151,464 | |
76,963 | | Pool #ZI4882, 6.00%, 5/1/36 | | | 85,391 | |
247,414 | | Pool #ZI4979, 6.00%, 6/1/36 | | | 275,477 | |
6,746 | | Pool #ZI4980, 6.50%, 6/1/36 | | | 6,763 | |
66,965 | | Pool #ZI5006, 6.00%, 6/1/36 | | | 70,484 | |
177,498 | | Pool #ZI5896, 5.50%, 4/1/37 | | | 198,742 | |
185,769 | | Pool #ZI5912, 5.50%, 4/1/37 | | | 208,003 | |
77,260 | | Pool #ZI6164, 5.50%, 5/1/37 | | | 86,507 | |
134,999 | | Pool #ZI6186, 6.00%, 6/1/37 | | | 148,728 | |
96,312 | | Pool #ZI6311, 5.50%, 6/1/37 | | | 107,840 | |
142,255 | | Pool #ZI6352, 5.50%, 7/1/37 | | | 159,281 | |
203,592 | | Pool #ZI6583, 5.50%, 8/1/37 | | | 227,959 | |
124,460 | | Pool #ZI6598, 6.00%, 8/1/37 | | | 136,571 | |
64,544 | | Pool #ZI6814, 6.00%, 10/1/37 | | | 71,762 | |
58,465 | | Pool #ZI6976, 5.50%, 7/1/37 | | | 65,463 | |
84,763 | | Pool #ZI7383, 5.00%, 4/1/38 | | | 93,325 | |
360,012 | | Pool #ZI9925, 5.00%, 4/1/40 | | | 396,024 | |
149,782 | | Pool #ZJ0038, 4.50%, 5/1/40 | | | 164,922 | |
410,432 | | Pool #ZJ0482, 4.50%, 9/1/40 | | | 451,922 | |
389,221 | | Pool #ZJ0844, 4.00%, 12/1/40 | | | 422,691 | |
255,070 | | Pool #ZJ1058, 4.00%, 12/1/40 | | | 277,005 | |
197,095 | | Pool #ZJ1264, 4.00%, 1/1/41 | | | 214,044 | |
424,877 | | Pool #ZJ1444, 4.00%, 3/1/41 | | | 461,688 | |
359,325 | | Pool #ZJ1445, 4.50%, 3/1/41 | | | 396,100 | |
27,504 | | Pool #ZJ4162, 7.50%, 2/1/30 | | | 28,774 | |
92,382 | | Pool #ZJ5032, 6.50%, 5/1/31 | | | 102,290 | |
45,162 | | Pool #ZJ5104, 6.50%, 6/1/31 | | | 48,723 | |
38,141 | | Pool #ZJ5458, 6.50%, 11/1/31 | | | 40,904 | |
39,744 | | Pool #ZJ5928, 6.50%, 3/1/32 | | | 42,383 | |
145,187 | | Pool #ZJ6638, 6.00%, 11/1/32 | | | 163,159 | |
72,667 | | Pool #ZJ6955, 5.50%, 3/1/33 | | | 82,031 | |
52,163 | | Pool #ZJ6956, 5.50%, 3/1/33 | | | 58,885 | |
2,994 | | Pool #ZJ9911, 5.00%, 1/1/21 | | | 2,995 | |
279,375 | | Pool #ZK4661, 2.50%, 11/1/27 | | | 289,977 | |
141,781 | | Pool #ZL1284, 4.50%, 4/1/41 | | | 156,292 | |
475,942 | | Pool #ZL2630, 3.50%, 12/1/41 | | | 510,379 | |
355,867 | | Pool #ZL2708, 3.50%, 1/1/42 | | | 381,616 | |
297,431 | | Pool #ZL2750, 4.00%, 2/1/42 | | | 323,201 | |
1,153,051 | | Pool #ZL5676, 3.00%, 4/1/43 | | | 1,220,751 | |
803,813 | | Pool #ZL6090, 3.00%, 6/1/43 | | | 851,008 | |
658,184 | | Pool #ZL6097, 3.00%, 6/1/43 | | | 696,828 | |
17
|
SCHEDULE OF PORTFOLIO INVESTMENTS |
Access Capital Community Investment Fund (cont.)
March 31, 2020 (Unaudited)
| | | | | | |
Principal Amount | | | | Value | |
$ 899,428 | | Pool #ZL9372, 3.00%, 4/1/45 | | $ | 947,952 | |
555,903 | | Pool #ZL9669, 3.50%, 6/1/45 | | | 591,826 | |
396,390 | | Pool #ZM1422, 3.50%, 7/1/46 | | | 421,468 | |
999,307 | | Pool #ZM1423, 3.50%, 7/1/46 | | | 1,062,526 | |
1,234,180 | | Pool #ZM1736, 3.00%, 9/1/46 | | | 1,298,324 | |
1,358,823 | | Pool #ZM1738, 3.00%, 9/1/46 | | | 1,429,445 | |
887,122 | | Pool #ZM8750, 4.00%, 9/1/48 | | | 945,696 | |
1,070,743 | | Pool #ZN1022, 4.00%, 11/1/48 | | | 1,141,433 | |
24,494 | | Pool #ZN5269, 6.50%, 10/1/31 | | | 25,339 | |
49,797 | | Pool #ZN5316, 5.00%, 5/1/34 | | | 55,312 | |
76,004 | | Pool #ZN5321, 5.50%, 5/1/34 | | | 85,555 | |
46,290 | | Pool #ZN5322, 5.50%, 5/1/34 | | | 52,107 | |
76,470 | | Pool #ZN5323, 5.50%, 6/1/34 | | | 86,079 | |
54,394 | | Pool #ZN5332, 5.00%, 11/1/34 | | | 60,417 | |
49,018 | | Pool #ZN5333, 5.50%, 11/1/34 | | | 55,177 | |
911,635 | | Series 2017-SB42, Class A10F, 2.96%, 10/25/27(c) | | | 964,887 | |
2,556,891 | | Series 2018-SB47, Class A10F, 3.35%, 1/25/28(c) | | | 2,735,336 | |
470,136 | | Series 2018-SB52, Class A10F, 3.48%, 6/25/28(c) | | | 501,896 | |
1,036,043 | | Series 2018-SB53, Class A10F, 3.66%, 6/25/28(c) | | | 1,124,294 | |
482,457 | | Series 2018-SB56, Class A10F, 3.70%, 10/25/28(c) | | | 525,559 | |
1,993,271 | | Series 2019-SB63, Class A10F, 2.78%, 3/25/29(c) | | | 2,093,033 | |
786,839 | | Series 2019-SB64, Class A10F, 2.71%, 5/25/29(c) | | | 812,816 | |
2,593,304 | | Series 2019-SB65, Class A5F, 1.99%, 5/25/24(c) | | | 2,647,026 | |
996,516 | | Series 2019-SB66, Class A5H, 2.32%, 6/25/39(c) | | | 1,024,871 | |
1,000,000 | | Series-K158, Class A2, 3.90%, 12/25/30(c) | | | 1,159,137 | |
| | | | | | |
| | | | | 104,915,396 | |
| | | | | | |
Ginnie Mae — 20.75% | | | | |
80,946 | | Pool #409117, 5.50%, 6/20/38 | | | 87,201 | |
644,928 | | Pool #442423, 4.00%, 9/20/41 | | | 706,892 | |
91,379 | | Pool #487643, 5.00%, 2/15/39 | | | 98,374 | |
205,900 | | Pool #616936, 5.50%, 1/15/36 | | | 246,155 | |
211,657 | | Pool #617904, 5.75%, 9/15/23 | | | 211,921 | |
1,196,706 | | Pool #618363, 4.00%, 9/20/41 | | | 1,311,683 | |
425,702 | | Pool #624106, 5.13%, 3/15/34 | | | 426,136 | |
302,886 | | Pool #654705, 4.00%, 9/20/41 | | | 331,987 | |
384,760 | | Pool #664269, 5.85%, 6/15/38 | | | 384,239 | |
23,621 | | Pool #675509, 5.50%, 6/15/38 | | | 24,902 | |
155,375 | | Pool #697672, 5.50%, 12/15/38 | | | 174,449 | |
261,033 | | Pool #697814, 5.00%, 2/15/39 | | | 284,048 | |
344,624 | | Pool #697885, 4.50%, 3/15/39 | | | 380,360 | |
105,790 | | Pool #698112, 4.50%, 5/15/39 | | | 116,759 | |
493,832 | | Pool #698113, 4.50%, 5/15/39 | | | 545,040 | |
50,455 | | Pool #699294, 5.63%, 9/20/38 | | | 54,830 | |
1,225,909 | | Pool #713519, 6.00%, 7/15/39 | | | 1,459,920 | |
110,195 | | Pool #714561, 4.50%, 6/15/39 | | | 121,621 | |
263,155 | | Pool #716822, 4.50%, 4/15/39 | | | 291,820 | |
224,850 | | Pool #716823, 4.50%, 4/15/39 | | | 249,343 | |
18
|
SCHEDULE OF PORTFOLIO INVESTMENTS |
Access Capital Community Investment Fund (cont.)
March 31, 2020 (Unaudited)
| | | | | | |
Principal Amount | | | | Value | |
$ 113,510 | | Pool #717132, 4.50%, 5/15/39 | | $ | 125,281 | |
434,634 | | Pool #720080, 4.50%, 6/15/39 | | | 481,978 | |
273,506 | | Pool #724629, 5.00%, 7/20/40 | | | 304,895 | |
587,601 | | Pool #726550, 5.00%, 9/15/39 | | | 667,436 | |
263,559 | | Pool #729018, 4.50%, 2/15/40 | | | 290,888 | |
356,868 | | Pool #729346, 4.50%, 7/15/41 | | | 397,780 | |
396,480 | | Pool #738844, 3.50%, 10/15/41 | | | 431,056 | |
157,237 | | Pool #738845, 3.50%, 10/15/41 | | | 170,949 | |
998,471 | | Pool #738862, 4.00%, 10/15/41 | | | 1,092,543 | |
305,145 | | Pool #747241, 5.00%, 9/20/40 | | | 340,166 | |
732,036 | | Pool #748654, 3.50%, 9/15/40 | | | 785,396 | |
145,924 | | Pool #748846, 4.50%, 9/20/40 | | | 160,476 | |
389,132 | | Pool #757016, 3.50%, 11/15/40 | | | 417,497 | |
191,730 | | Pool #757017, 4.00%, 12/15/40 | | | 209,374 | |
524,803 | | Pool #759297, 4.00%, 1/20/41 | | | 575,880 | |
232,803 | | Pool #759298, 4.00%, 2/20/41 | | | 255,460 | |
157,274 | | Pool #762877, 4.00%, 4/15/41 | | | 172,092 | |
174,295 | | Pool #763564, 4.50%, 5/15/41 | | | 196,160 | |
373,189 | | Pool #770481, 4.00%, 8/15/41 | | | 409,137 | |
43,540 | | Pool #770482, 4.50%, 8/15/41 | | | 49,013 | |
445,191 | | Pool #770517, 4.00%, 8/15/41 | | | 487,135 | |
355,834 | | Pool #770529, 4.00%, 8/15/41 | | | 389,359 | |
181,517 | | Pool #770537, 4.00%, 8/15/41 | | | 198,619 | |
354,761 | | Pool #770738, 4.50%, 6/20/41 | | | 390,408 | |
497,451 | | Pool #779592, 4.00%, 11/20/41 | | | 545,245 | |
119,768 | | Pool #779593, 4.00%, 11/20/41 | | | 131,276 | |
448,472 | | Pool #AA6312, 3.00%, 4/15/43 | | | 482,227 | |
483,907 | | Pool #AA6424, 3.00%, 5/15/43 | | | 520,329 | |
1,023,458 | | Pool #AB2733, 3.50%, 8/15/42 | | | 1,111,525 | |
1,753,058 | | Pool #AB2745, 3.00%, 8/15/42 | | | 1,894,001 | |
1,302,019 | | Pool #AB2841, 3.00%, 9/15/42 | | | 1,406,699 | |
494,816 | | Pool #AB2843, 3.00%, 9/15/42 | | | 534,598 | |
118,001 | | Pool #AB2852, 3.50%, 9/15/42 | | | 128,887 | |
482,441 | | Pool #AE6946, 3.00%, 6/15/43 | | | 518,753 | |
176,376 | | Pool #AE8253, 4.00%, 2/20/44 | | | 192,375 | |
493,144 | | Pool #AG8915, 4.00%, 2/20/44 | | | 538,333 | |
926,547 | | Pool #AK6446, 3.00%, 1/15/45 | | | 996,515 | |
658,433 | | Pool #AK7036, 3.00%, 4/15/45 | | | 705,454 | |
440,473 | | Pool #AO3594, 3.50%, 8/20/45 | | | 468,773 | |
525,616 | | Pool #AP3887, 3.50%, 9/20/45 | | | 567,250 | |
612,657 | | Pool #AR4919, 3.50%, 3/20/46 | | | 650,452 | |
888,335 | | Pool #AR4970, 3.50%, 4/20/46 | | | 943,135 | |
1,076,939 | | Pool #AR9008, 3.00%, 5/20/46 | | | 1,151,818 | |
729,211 | | Pool #AS2921, 3.50%, 4/20/46 | | | 774,196 | |
386,339 | | Pool #AS4332, 3.00%, 6/20/46 | | | 413,201 | |
811,094 | | Pool #AS5511, 3.50%, 3/20/46 | | | 861,130 | |
1,153,546 | | Pool #AX7237, 3.50%, 11/20/46 | | | 1,224,707 | |
19
|
SCHEDULE OF PORTFOLIO INVESTMENTS |
Access Capital Community Investment Fund (cont.)
March 31, 2020 (Unaudited)
| | | | | | |
Principal Amount | | | | Value | |
$ 700,741 | | Pool #BO2104, 3.00%, 8/20/49 | | $ | 741,921 | |
1,586,172 | | Pool #BR3787, 3.00%, 12/20/49 | | | 1,679,384 | |
700,000 | | Series2012-100, Class B, 2.31%, 11/16/51(c) | | | 718,950 | |
1,574,861 | | Series2012-107, Class A, 1.15%, 1/16/45 | | | 1,550,401 | |
1,600,000 | | Series2012-112, Class B, 2.56%, 1/16/53(c) | | | 1,663,807 | |
1,879,412 | | Series2012-115, Class A, 2.13%, 4/16/45 | | | 1,909,611 | |
2,043,936 | | Series2012-120, Class A, 1.90%, 2/16/53 | | | 2,059,014 | |
1,032,968 | | Series2012-131, Class A, 1.90%, 2/16/53 | | | 1,040,790 | |
456,572 | | Series2012-144, Class AD, 1.77%, 1/16/53 | | | 457,492 | |
6,000,000 | | Series2012-33, Class B, 2.89%, 3/16/46 | | | 6,122,265 | |
107,937 | | Series2012-35, Class C, 3.25%, 11/16/52(c) | | | 113,388 | |
8,000,000 | | Series2012-58, Class B, 2.20%, 3/16/44 | | | 8,145,825 | |
218,195 | | Series2012-70, Class A, 1.73%, 5/16/42 | | | 217,907 | |
154,262 | | Series2012-72, Class A, 1.72%, 5/16/42 | | | 153,966 | |
1,025,213 | | Series2012-78, Class A, 1.68%, 3/16/44 | | | 1,023,444 | |
581,238 | | Series2013-101, Class AG, 1.76%, 4/16/38 | | | 580,634 | |
585,464 | | Series2013-105, Class A, 1.71%, 2/16/37 | | | 584,728 | |
631,972 | | Series2013-107, Class A, 2.00%, 5/16/40 | | | 635,731 | |
365,015 | | Series2013-126, Class BK, 2.45%, 10/16/47(c) | | | 376,864 | |
11,813 | | Series2013-127, Class A, 2.00%, 3/16/52 | | | 11,799 | |
476,961 | | Series2013-17, Class A, 1.13%, 1/16/49 | | | 474,743 | |
574,028 | | Series2013-29, Class AB, 1.77%, 10/16/45 | | | 574,439 | |
578,274 | | Series2013-33, Class A, 1.06%, 7/16/38 | | | 575,925 | |
1,772,853 | | Series2013-63, Class AB, 1.38%, 3/16/45 | | | 1,755,371 | |
825,966 | | Series2013-97, Class AC, 2.00%, 6/16/45 | | | 833,277 | |
519,349 | | Series2014-148, Class A, 2.65%, 11/16/43 | | | 524,408 | |
1,726,160 | | Series2014-172, Class AF, 2.50%, 9/16/41 | | | 1,742,821 | |
60,854 | | Series2014-54, Class AB, 2.62%, 10/16/43 | | | 60,869 | |
212,066 | | Series2014-77, Class AC, 2.35%, 10/16/40 | | | 212,888 | |
479,753 | | Series2014-82, Class AB, 2.40%, 5/16/45 | | | 487,040 | |
88,969 | | Series2015-107, Class AB, 2.50%, 11/16/49 | | | 91,870 | |
2,038,343 | | Series2015-114, Class AD, 2.50%, 11/15/51 | | | 2,099,351 | |
871,316 | | Series2015-128, Class AD, 2.50%, 12/16/50 | | | 898,512 | |
582,162 | | Series2015-130, Class AH, 2.90%, 8/16/47(c) | | | 596,683 | |
2,102,027 | | Series2015-135, Class AC, 2.35%, 4/16/49 | | | 2,157,077 | |
923,546 | | Series2015-136, Class AC, 2.50%, 3/16/47 | | | 952,035 | |
533,589 | | Series2015-15, Class A, 2.00%, 11/16/48 | | | 538,762 | |
1,262,894 | | Series2015-154, Class AD, 2.50%, 5/16/54 | | | 1,306,475 | |
664,295 | | Series2015-171, Class DA, 2.37%, 3/16/46 | | | 681,872 | |
560,810 | | Series2015-2, Class A, 2.50%, 12/16/44 | | | 565,440 | |
967,857 | | Series2015-22, Class A, 2.40%, 8/16/47 | | | 991,650 | |
1,620,432 | | Series2015-70, Class AB, 2.30%, 11/16/48 | | | 1,659,584 | |
299,239 | | Series2015-75, Class A, 3.00%, 2/16/44 | | | 304,979 | |
277,680 | | Series2015-98, Class AB, 2.20%, 11/16/43 | | | 282,106 | |
493,850 | | Series2016-11, Class AD, 2.25%, 11/16/43 | | | 501,921 | |
693,420 | | Series2016-14, Class AB, 2.15%, 8/16/42 | | | 703,336 | |
1,633,922 | | Series2016-152, Class EA, 2.20%, 8/15/58 | | | 1,672,295 | |
2,283,745 | | Series2016-157, Class AC, 2.00%, 11/16/50 | | | 2,308,109 | |
20
|
SCHEDULE OF PORTFOLIO INVESTMENTS |
Access Capital Community Investment Fund (cont.)
March 31, 2020 (Unaudited)
| | | | | | |
Principal Amount | | | | Value | |
$ 807,674 | | Series2016-26, Class A, 2.25%, 12/16/55 | | $ | 822,209 | |
656,529 | | Series2016-28, Class AB, 2.40%, 11/16/55 | | | 670,668 | |
597,006 | | Series2016-36, Class AB, 2.30%, 6/16/56 | | | 610,177 | |
768,078 | | Series2016-39, Class AH, 2.50%, 9/16/44 | | | 789,570 | |
846,384 | | Series2016-50, Class A, 2.30%, 7/16/52 | | | 864,317 | |
2,124,023 | | Series2016-64, Class CA, 2.30%, 3/16/45 | | | 2,169,661 | |
1,313,937 | | Series2016-67, Class A, 2.30%, 7/16/56 | | | 1,340,767 | |
748,450 | | Series2016-94, Class AC, 2.20%, 8/16/57 | | | 765,800 | |
759,833 | | Series2016-96, Class BA, 1.95%, 3/16/43 | | | 765,643 | |
1,307,496 | | Series2017-127, Class AB, 2.50%, 2/16/59 | | | 1,354,989 | |
1,425,223 | | Series2017-135, Class AE, 2.60%, 10/16/58 | | | 1,483,320 | |
930,959 | | Series2017-140, Class A, 2.50%, 2/16/59 | | | 965,003 | |
459,010 | | Series2017-157, Class AH, 2.55%, 2/16/53 | | | 474,735 | |
1,734,723 | | Series2017-41, Class AC, 2.25%, 3/16/57 | | | 1,769,350 | |
1,117,179 | | Series2017-46, Class A, 2.50%, 11/16/57 | | | 1,158,076 | |
2,030,487 | | Series2017-71, Class AS, 2.70%, 4/16/57 | | | 2,110,966 | |
809,904 | | Series2017-9, Class AE, 2.40%, 9/16/50 | | | 833,008 | |
3,673,201 | | Series2017-94, Class AH, 2.60%, 2/16/59 | | | 3,820,113 | |
1,067,414 | | Series2018-2, Class AD, 2.40%, 3/16/59 | | | 1,097,560 | |
890,162 | | Series2018-26, Class AD, 2.50%, 3/16/52 | | | 917,120 | |
2,315,668 | | Series2018-3, Class AG, 2.50%, 10/16/58 | | | 2,396,034 | |
| | | | | | |
| | | | | 115,788,382 | |
| | | | | | |
| |
Total U.S. Government Agency Backed Mortgages | | | 498,958,331 | |
| | | | | | |
(Cost $477,767,240) | | | | |
| |
U.S. Government Agency Obligations — 4.26% | | | | |
Small Business Administration — 4.26% | | | | |
217,764 | | 0.88%, 1/1/32(a) | | | 227,120 | |
3,640,806 | | 1.26%, 7/18/30(a),(d),(e) | | | 52,409 | |
218,922 | | (Prime Index - 2.600%), 2.15%, 7/25/41(f) | | | 215,547 | |
583,943 | | (Prime Index - 2.600%), 2.15%, 9/25/41(f) | | | 574,928 | |
312,196 | | (Prime Index - 2.600%), 2.15%, 9/25/41(f) | | | 307,331 | |
537,294 | | (Prime Index - 2.600%), 2.15%, 7/25/42(f) | | | 528,759 | |
1,476,537 | | (Prime Index - 2.550%), 2.20%, 7/25/42(f) | | | 1,453,868 | |
361,251 | | (Prime Index - 2.525%), 2.23%, 11/25/41(f) | | | 356,407 | |
725,913 | | (Prime Index - 2.500%), 2.25%, 2/25/28(f) | | | 718,348 | |
906,366 | | (Prime Index - 1.400%), 3.35%, 7/25/41(f) | | | 921,687 | |
19,076 | | 3.36%, 7/1/21(a) | | | 19,386 | |
778,319 | | 3.36%, 7/8/24(a),(g) | | | 813,687 | |
329,371 | | 3.85%, 9/16/34(a) | | | 349,367 | |
2,235,701 | | (Prime Index - 0.675%), 4.08%, 9/25/43(f) | | | 2,325,581 | |
398,924 | | (Prime Index - 0.421%), 4.33%, 11/25/27(f) | | | 408,443 | |
286,007 | | (Prime Index - 0.207%), 4.54%, 2/25/40(f) | | | 297,378 | |
605,692 | | (Prime Index - 0.059%), 4.69%, 7/25/29(f) | | | 630,108 | |
114,653 | | (Prime Index + 0.050%), 4.80%, 12/25/40(f) | | | 120,566 | |
868,932 | | (Prime Index + 0.107%), 4.86%, 8/25/29(f) | | | 904,698 | |
21
|
SCHEDULE OF PORTFOLIO INVESTMENTS |
Access Capital Community Investment Fund (cont.)
March 31, 2020 (Unaudited)
| | | | | | |
Principal Amount | | | | Value | |
$ 669,769 | | (Prime Index + 0.168%), 4.92%, 6/25/29(f) | | $ | 698,192 | |
680,133 | | (Prime Index + 0.190%), 4.94%, 11/25/28(f) | | | 705,998 | |
771,193 | | (Prime Index + 0.325%), 5.08%, 2/25/45(f) | | | 829,101 | |
158,152 | | (Prime Index + 0.355%), 5.11%, 2/25/26(f) | | | 163,353 | |
34,561 | | 5.13%, 2/28/24(a) | | | 36,049 | |
76,654 | | (Prime Index + 0.667%), 5.42%, 8/25/27(f) | | | 79,447 | |
109,649 | | (Prime Index + 0.700%), 5.45%, 2/25/28(f) | | | 114,502 | |
719,978 | | (Prime Index + 0.712%), 5.46%, 3/25/30(f) | | | 769,143 | |
468,975 | | (Prime Index + 0.785%), 5.54%, 9/25/28(f) | | | 495,687 | |
635,591 | | (Prime Index + 0.799%), 5.55%, 2/25/28(f) | | | 664,488 | |
1,041,096 | | (Prime Index + 0.801%), 5.55%, 6/25/29(f) | | | 1,105,530 | |
172,987 | | (Prime Index + 0.814%), 5.56%, 6/25/28(f) | | | 180,475 | |
850,751 | | (Prime Index + 0.820%), 5.57%, 5/25/29(f) | | | 896,114 | |
417,042 | | (Prime Index + 0.836%), 5.59%, 3/25/29(f) | | | 438,986 | |
249,240 | | (Prime Index + 0.846%), 5.60%, 2/25/30(f) | | | 266,467 | |
626,946 | | (Prime Index + 0.859%), 5.61%, 2/25/29(f) | | | 662,640 | |
214,885 | | (Prime Index + 0.905%), 5.66%, 1/25/29(f) | | | 225,772 | |
582,332 | | (Prime Index + 0.908%), 5.66%, 7/25/30(f) | | | 626,281 | |
336,598 | | (Prime Index + 0.925%), 5.68%, 5/25/29(f) | | | 359,241 | |
435,493 | | (Prime Index + 0.940%), 5.69%, 7/25/29(f) | | | 460,885 | |
113,760 | | (Prime Index + 0.936%), 5.69%, 7/25/29(f) | | | 122,124 | |
117,531 | | (Prime Index + 0.973%), 5.72%, 11/25/28(f) | | | 124,844 | |
240,815 | | (Prime Index + 1.054%), 5.80%, 9/25/29(f) | | | 260,058 | |
350,734 | | (Prime Index + 1.060%), 5.81%, 12/25/29(f) | | | 382,146 | |
871,726 | | (Prime Index + 1.144%), 5.89%, 9/25/28(f) | | | 917,442 | |
90,537 | | (Prime Index + 1.191%), 5.94%, 11/25/26(f) | | | 95,160 | |
475,527 | | (Prime Index + 1.202%), 5.95%, 5/25/29(f) | | | 505,810 | |
191,564 | | (Prime Index + 1.226%), 5.98%, 6/25/29(f) | | | 206,285 | |
53,955 | | (Prime Index + 1.602%), 6.35%, 7/25/28(f) | | | 57,363 | |
97,321 | | 9.08%, 9/25/29(a) | | | 118,195 | |
| | | | | | |
| | | | | 23,793,396 | |
| | | | | | |
| |
Total U.S. Government Agency Obligations | | | 23,793,396 | |
| | | | | | |
(Cost $24,731,845) | | | | |
22
|
SCHEDULE OF PORTFOLIO INVESTMENTS |
Access Capital Community Investment Fund (cont.)
March 31, 2020 (Unaudited)
| | | | | | |
Principal Amount | | | | Value | |
Municipal Bonds — 3.63% | | | | |
California — 1.14% | | | | |
$ 500,000 | | California Health Facilities Financing Authority Revenue, 1.90%, 6/1/21 | | $ | 499,335 | |
2,000,000 | | California Health Facilities Financing Authority Revenue, 2.93%, 6/1/32, Callable 6/1/29 @ 100 | | | 1,969,260 | |
890,000 | | California Statewide Communities Development Authority Revenue, Series B, 5.25%, 10/20/42, (Credit Support: Ginnie Mae), Callable 5/1/20 @ 100 | | | 891,549 | |
1,000,000 | | City & County of San Francisco Affordable Housing GO, Series F, 2.39%, 6/15/26 | | | 1,031,430 | |
200,000 | | City & County of San Francisco Housing GO, Series H, 1.95%, 6/15/27 | | | 199,930 | |
1,675,000 | | City of Los Angeles Housing GO, Series A, 2.95%, 9/1/28, Callable 9/1/27 @ 100 | | | 1,755,433 | |
| | | | | | |
| | | | | 6,346,937 | |
| | | | | | |
Colorado — 0.08% | |
402,661 | | Colorado Housing & Finance Authority Revenue, Series V, 3.40%, 11/1/45, (Credit Support: FHA) | | | 454,673 | |
| | | | | | |
|
District of Columbia — 0.14% | |
734,492 | | District of Columbia Housing Finance Agency Refunding Revenue, 3.24%, 3/1/49, (Credit Support: FHA) | | | 799,369 | |
| | | | | | |
|
Georgia — 0.19% | |
1,000,000 | | Atlanta Development Authority Revenue, 2.87%, 12/1/26 | | | 1,060,110 | |
| | | | | | |
|
Illinois — 0.17% | |
260,000 | | City of Chicago Multi Family Revenue, Mercy Preservation Project, 4.55%, 8/1/26, (Credit Support: Freddie Mac), Callable 8/1/20 @ 100 | | | 262,434 | |
685,400 | | Illinois State Housing Development Authority Revenue, Series A, 2.63%, 3/1/48, (Credit Support: FHA) | | | 709,320 | |
| | | | | | |
| | | | | 971,754 | |
| | | | | | |
Massachusetts — 0.04% | |
205,000 | | Massachusetts Housing Finance Agency Revenue, Series 170, 3.09%, 6/1/20 | | | 205,795 | |
| | | | | | |
|
Minnesota — 0.09% | |
485,267 | | City of Minnetonka Housing Revenue, Series A, 3.00%, 11/1/34, (Credit Support: Fannie Mae) | | | 521,546 | |
| | | | | | |
23
|
SCHEDULE OF PORTFOLIO INVESTMENTS |
Access Capital Community Investment Fund (cont.)
March 31, 2020 (Unaudited)
| | | | | | |
Principal Amount | | | | Value | |
Missouri — 0.64% | |
$3,009,628 | | Missouri Housing Development Commission Revenue, Series 1, 3.75%, 3/1/42, (Credit Support: FHA), Callable 3/1/25 @ 100 | | $ | 3,569,359 | |
| | | | | | |
|
New York — 0.96% | |
400,000 | | New York City Housing Development Corp. Revenue, Series G, 1.93%, 11/1/21 | | | 396,664 | |
170,000 | | New York City Housing Development Corp. Revenue, Series G, 2.04%, 5/1/22 | | | 168,482 | |
100,000 | | New York City Housing Development Corp. Revenue, Series G, 2.14%, 11/1/22 | | | 98,993 | |
200,000 | | New York City Housing Development Corp. Revenue, Series G, 2.37%, 5/1/24 | | | 197,320 | |
40,000 | | New York City Housing Development Corp. Revenue, Series G, 2.47%, 11/1/24 | | | 39,521 | |
300,000 | | New York City Housing Development Corp. Revenue, Series G, 2.62%, 5/1/26, Callable 11/1/25 @ 100 | | | 296,112 | |
500,000 | | New York City Housing Development Corp. Revenue, Series B, 3.56%, 11/1/26, Callable 2/1/26 @ 100 | | | 518,180 | |
1,000,000 | | New York City Housing Development Corp. Revenue, Series B, 3.61%, 11/1/27, Callable 2/1/26 @ 100 | | | 1,036,040 | |
500,000 | | New York City Housing Development Corp. Revenue, State of New York Mortgage Agency, 3.33%, 2/1/28, (Credit Support: SONYMA), Callable 8/1/25 @ 100 | | | 545,560 | |
500,000 | | New York City Housing Development Corp. Revenue, Series B, 3.81%, 11/1/29, Callable 2/1/26 @ 100 | | | 520,435 | |
540,000 | | New York State Housing Finance Agency Revenue, Series A, 4.50%, 11/15/27, Callable 5/1/20 @ 100 | | | 541,118 | |
1,000,000 | | New York State Housing Finance Agency Revenue, Series A, 4.65%, 11/15/38, Callable 5/1/20 @ 100 | | | 1,006,210 | |
| | | | | | |
| | | | | 5,364,635 | |
| | | | | | |
Vermont — 0.02% | |
100,000 | | Vermont Housing Finance Agency Revenue, 3.45%, 11/1/29 | | | 108,182 | |
| | | | | | |
|
Washington — 0.16% | |
800,000 | | City of Seattle WA GO, Series B, 3.38%, 12/1/28, Callable 12/1/27 @ 100 | | | 880,024 | |
| | | | | | |
| |
Total Municipal Bonds | | | 20,282,384 | |
| | | | | | |
(Cost $19,054,749) | | | | |
24
|
SCHEDULE OF PORTFOLIO INVESTMENTS |
Access Capital Community Investment Fund (cont.)
March 31, 2020 (Unaudited)
| | | | | | |
Principal Amount | | | | Value | |
Corporate Bonds — 0.29% | | | | |
Consumer,Non-cyclical — 0.06% | | | | |
$ 350,000 | | Montefiore Medical Center, 2.15%, 10/20/26 | | $ | 331,948 | |
| | | | | | |
| |
Financial — 0.23% | | | | |
1,250,000 | | Century Housing Corp., 4.00%, 11/1/21 | | | 1,275,006 | |
| | | | | | |
| |
Total Corporate Bonds | | | 1,606,954 | |
| | | | | | |
(Cost $1,600,000) | | | | |
| | |
| Shares | | | | | |
Investment Company — 2.08% | | | | |
11,610,931 | | U.S. Government Money Market Fund, RBC Institutional Class 1(h) | | | 11,610,931 | |
| | | | | | |
| |
Total Investment Company | | | 11,610,931 | |
| | | | | | |
(Cost $11,610,931) | | | | |
| |
Total Investments | | $ | 556,251,996 | |
(Cost $534,764,765)(i) — 99.61% | | | | |
Other assets in excess of liabilities — 0.39% | | | 2,169,212 | |
| | | | | | |
| |
NET ASSETS — 100.00% | | $ | 558,421,208 | |
| | | | | | |
| (a) | The Pricing Committee has fair valued this security under procedures established by the Fund’s Board of Trustees. |
| (b) | Zero Coupon Bond. The rate represents the yield at time of purchase. |
| (c) | Variable or floating rate security, which interest rate adjusts periodically based on changes in current interest rates and prepayments on the underlying pool of assets. Rate shown is the rate in effect as of period end. |
| (d) | Interest Only represents the right to receive the monthly interest payment on an underlying pool of mortgage loans. The principal amount shown represents the par value on the underlying pool. |
| (e) | Security is valued using significant unobservable inputs and is classified as Level 3 in the fair value hierarchy. |
| (f) | Floating rate note. Rate shown is as of report date. |
| (g) | Variable rate security. The rate reflected in the Schedule of Portfolio Investments is the rate in effect on March 31, 2020. |
| (h) | Affiliated investment. |
| (i) | See Notes to Schedules of Portfolio Investments for the tax cost of securities and the breakdown of unrealized appreciation (depreciation). |
25
|
SCHEDULE OF PORTFOLIO INVESTMENTS |
Access Capital Community Investment Fund (cont.)
March 31, 2020 (Unaudited)
Financial futures contracts as of March 31, 2020:
| | | | | | | | | | | | | | | | | | |
Long Position | | Number of
Contracts | | | Expiration
Date | | Value/Unrealized
Appreciation | | Notional Value | | Clearinghouse |
| Five Year U.S. Treasury Note | | | 70 | | | June 2020 | | | | | | $340,703 | | USD | | $ 8,775,157 | | Barclays Capital Group |
| Two Year U.S. Treasury Note | | | 135 | | | June 2020 | | | | | | 531,175 | | USD | | 29,751,680 | | Barclays Capital Group |
| | | | | | | | | | | | | | | | | | |
Total | | | | | | | | | | | | $871,878 | | | | | | |
| | | | | | | | | | | | | | | | | | |
| | | | | |
Short Position | | Number of
Contracts | | | Expiration
Date | | Value/Unrealized
Depreciation | | Notional Value | | Clearinghouse |
| 30 Year U.S. Ultra Treasury Bond | | | 11 | | | June 2020 | | | | | | $ (279,589) | | USD | | $ 2,440,625 | | Barclays Capital Group |
| Ten Year Ultra U.S. Treasury Bonds | | | 230 | | | June 2020 | | | | | | (1,952,717) | | USD | | 35,887,188 | | Barclays Capital Group |
| | | | | | | | | | | | | | | | | | |
Total | | | | | | | | | | | | $(2,232,306) | | | | | | |
| | | | | | | | | | | | | | | | | | |
Abbreviations used are defined below:
FHA - Insured by Federal Housing Administration
GO - General Obligations
TBA -To-be-announced
USD - United States Dollar
See Notes to the Financial Statements.
26
|
SCHEDULE OF PORTFOLIO INVESTMENTS |
RBC Impact Bond Fund
March 31, 2020 (Unaudited)
| | | | | | |
Principal Amount | | | | Value | |
U.S. Government Agency Backed Mortgages — 38.53% | | | | |
Fannie Mae — 19.32% | | | | |
$150,000 | | (TBA), 0.00%, 4/15/20(a),(b) | | $ | 168,961 | |
91,710 | | Pool #468942, 4.67%, 9/1/26 | | | 105,207 | |
91,193 | | Pool #AM4271, 4.41%, 9/1/28 | | | 106,112 | |
145,042 | | Pool #AM4668, 3.76%, 11/1/23 | | | 155,439 | |
136,174 | | Pool #AM4724, 3.95%, 11/1/25 | | | 151,197 | |
50,000 | | Pool #AN0360, 3.95%, 12/1/45 | | | 56,838 | |
250,000 | | Pool #AN0959, 2.92%, 5/1/31 | | | 272,898 | |
93,446 | | Pool #AN1381, 2.56%, 8/1/26 | | | 99,140 | |
50,000 | | Pool #AN6149, 3.14%, 7/1/32 | | | 55,028 | |
96,262 | | Pool #AN7354, 3.03%, 11/1/27 | | | 105,186 | |
96,401 | | Pool #AN7868, 3.06%, 12/1/27 | | | 105,664 | |
96,448 | | Pool #AN8300, 3.03%, 2/1/30 | | | 106,138 | |
98,029 | | Pool #AN8422, 3.71%, 4/1/33 | | | 112,603 | |
99,852 | | Pool #AN8458, 2.97%, 2/1/25 | | | 106,863 | |
245,016 | | Pool #AN9483, 3.43%, 6/1/28 | | | 275,856 | |
71,805 | | Pool #BJ0657, 4.00%, 2/1/48 | | | 76,549 | |
93,337 | | Pool #BJ2670, 4.00%, 4/1/48 | | | 99,503 | |
94,641 | | Pool #BJ3178, 4.00%, 11/1/47 | | | 102,424 | |
96,495 | | Pool #BJ3251, 4.00%, 1/1/48 | | | 103,484 | |
85,202 | | Pool #BJ4987, 4.00%, 3/1/48 | | | 91,621 | |
81,920 | | Pool #BJ5158, 4.00%, 4/1/48 | | | 87,332 | |
96,368 | | Pool #BJ9439, 4.00%, 2/1/48 | | | 103,265 | |
96,771 | | Pool #BJ9477, 4.00%, 4/1/48 | | | 103,924 | |
146,709 | | Pool #BK7924, 4.00%, 11/1/48 | | | 156,402 | |
98,445 | | Pool #BL1459, 3.84%, 2/1/29 | | | 113,567 | |
249,645 | | Pool #BL1581, 3.89%, 2/1/29 | | | 288,502 | |
358,371 | | Pool #BO1263, 3.50%, 6/1/49 | | | 380,004 | |
74,473 | | Pool #CA1066, 4.00%, 1/1/48 | | | 79,549 | |
86,689 | | Pool #CA1068, 3.50%, 1/1/48 | | | 91,884 | |
125,259 | | Pool #CA2595, 4.50%, 11/1/48 | | | 134,726 | |
115,917 | | Pool #CA2597, 4.00%, 11/1/48 | | | 123,575 | |
146,638 | | Pool #CA2912, 4.00%, 12/1/48 | | | 157,144 | |
159,417 | | Pool #CA3132, 4.00%, 2/1/49 | | | 170,839 | |
294,840 | | Pool #CA3174, 4.00%, 2/1/49 | | | 314,513 | |
460,155 | | Pool #CA3405, 3.50%, 4/1/49 | | | 487,719 | |
572,498 | | Pool #CA3451, 3.50%, 5/1/49 | | | 605,190 | |
379,682 | | Pool #CA3456, 3.50%, 5/1/49 | | | 402,969 | |
| | | | | | |
| | | | | 6,257,815 | |
| | | | | | |
Freddie Mac — 16.29% | | | | |
146,418 | | Pool #Q59453, 4.00%, 11/1/48 | | | 156,143 | |
297,705 | | Pool #RA1713, 3.00%, 11/1/49 | | | 312,210 | |
297,832 | | Pool #RA1714, 3.00%, 11/1/49 | | | 312,343 | |
297,601 | | Pool #RA1715, 3.00%, 10/1/49 | | | 312,101 | |
299,696 | | Pool #RA2256, 3.00%, 3/1/50 | | | 314,601 | |
299,919 | | Pool #RA2340, 3.00%, 3/1/50 | | | 314,835 | |
27
|
SCHEDULE OF PORTFOLIO INVESTMENTS |
RBC Impact Bond Fund (cont.)
March 31, 2020 (Unaudited)
| | | | | | |
Principal Amount | | | | Value | |
$300,000 | | Pool #RA2395, 2.50%, 4/1/50 | | $ | 311,024 | |
96,534 | | Pool #V84044, 4.00%, 1/1/48 | | | 103,260 | |
63,669 | | Pool #V84506, 4.00%, 7/1/48 | | | 68,048 | |
82,466 | | Pool #V84836, 4.00%, 11/1/48 | | | 88,147 | |
196,332 | | Pool #V85041, 4.50%, 1/1/49 | | | 212,040 | |
294,044 | | Pool #V85181, 4.00%, 2/1/49 | | | 314,279 | |
187,216 | | Pool #V85264, 3.50%, 3/1/49 | | | 198,131 | |
218,870 | | Pool #V85351, 4.00%, 3/1/49 | | | 234,614 | |
444,144 | | Pool #V85365, 3.50%, 4/1/49 | | | 470,038 | |
346,490 | | Pool #V85381, 3.50%, 4/1/49 | | | 366,254 | |
393,682 | | Pool #V85445, 3.50%, 4/1/49 | | | 416,634 | |
244,785 | | Series 2018-KF57, Class A, (LIBOR USD1-Month + 0.540%), 2.06%, 12/25/28(c) | | | 241,424 | |
78,170 | | Series 2018-SB45, Class A10F, 3.16%, 11/25/27(d) | | | 83,430 | |
88,169 | | Series 2018-SB47, Class A10F, 3.35%, 1/25/28(d) | | | 94,322 | |
91,407 | | Series 2018-SB48, Class A10F, 3.37%, 2/25/28(d) | | | 97,187 | |
244,331 | | Series 2019-SB59, Class A10F, 3.47%, 1/25/29(d) | | | 264,212 | |
| | | | | | |
| | | | | 5,285,277 | |
| | | | | | |
Ginnie Mae — 1.16% | | | | |
96,090 | | Pool #BB3740, 4.00%, 11/15/47 | | | 103,309 | |
96,604 | | Pool #BE3008, 4.00%, 4/20/48 | | | 104,185 | |
76,244 | | Series2018-2, Class AD, 2.40%, 3/16/59 | | | 78,397 | |
89,016 | | Series2018-26, Class AD, 2.50%, 3/16/52 | | | 91,712 | |
| | | | | | |
| | | | | 377,603 | |
| | | | | | |
Overseas Private Investment Corp. — 1.76% | | | | |
288,545 | | (US Treasury Bill Yield3-Month + 0.000%), 1.90%, 9/20/38(c) | | | 288,545 | |
281,250 | | (US Treasury Bill Yield3-Month + 0.000%), 1.90%, 11/15/23(c) | | | 281,250 | |
| | | | | | |
| | | | | 569,795 | |
| | | | | | |
| |
Total U.S. Government Agency Backed Mortgages | | | 12,490,490 | |
| | | | | | |
(Cost $11,930,453) | | | | |
| |
Corporate Bonds — 32.93% | | | | |
Communications — 1.50% | | | | |
250,000 | | Verizon Communications, Inc., 3.88%, 2/8/29 | | | 280,014 | |
175,000 | | Vodafone Group Plc, 5.25%, 5/30/48 | | | 207,625 | |
| | | | | | |
| | | | | 487,639 | |
| | | | | | |
Consumer, Cyclical — 0.92% | | | | |
300,000 | | Starbucks Corp., 2.45%, 6/15/26 | | | 296,970 | |
| | | | | | |
| |
Consumer,Non-cyclical — 19.24% | | | | |
300,000 | | AbbVie, Inc., 3.60%, 5/14/25 | | | 312,957 | |
250,000 | | Advocate Health Corp., 0.00%, 5/8/20(a),(b) | | | 249,718 | |
100,000 | | Amgen, Inc., 3.15%, 2/21/40 | | | 99,899 | |
275,000 | | Amgen, Inc., 3.20%, 11/2/27 | | | 284,256 | |
28
|
SCHEDULE OF PORTFOLIO INVESTMENTS |
RBC Impact Bond Fund (cont.)
March 31, 2020 (Unaudited)
| | | | | | |
Principal Amount | | | | Value | |
$350,000 | | Becton Dickinson and Co., 3.36%, 6/6/24 | | $ | 347,499 | |
150,000 | | Becton Dickinson and Co., 4.69%, 12/15/44 | | | 160,401 | |
200,000 | | Bristol-Myers Squibb Co., 3.20%, 6/15/26(e) | | | 212,562 | |
100,000 | | Bristol-Myers Squibb Co., 3.25%, 8/15/22(e) | | | 103,368 | |
50,000 | | Bristol-Myers Squibb Co., 4.25%, 10/26/49(e) | | | 63,138 | |
250,000 | | Cincinnati Childrens Health Medical Centre, 2.00%, 4/8/20(a) | | | 250,070 | |
100,000 | | DH Europe Finance II Sarl, 3.25%, 11/15/39 | | | 95,988 | |
150,000 | | EMD Finance LLC, 2.95%, 3/19/22(e) | | | 152,168 | |
350,000 | | EMD Finance LLC, 3.25%, 3/19/25(e) | | | 368,216 | |
150,000 | | GlaxoSmithKline Capital Plc, 2.88%, 6/1/22 | | | 154,491 | |
225,000 | | GlaxoSmithKline Capital, Inc., 3.38%, 5/15/23 | | | 236,553 | |
150,000 | | Kaiser Foundation Hospitals, 3.15%, 5/1/27 | | | 154,741 | |
300,000 | | Mead Johnson Nutrition Co., 4.13%, 11/15/25 | | | 320,395 | |
112,000 | | Medtronic, Inc., 3.50%, 3/15/25 | | | 120,313 | |
250,000 | | Medtronic, Inc., 4.38%, 3/15/35 | | | 307,650 | |
150,000 | | Partners Healthcare System, Inc., 3.19%, 7/1/49 | | | 149,264 | |
75,000 | | Pfizer, Inc., 2.63%, 4/1/30 | | | 78,482 | |
440,000 | | Providence Health & Services Obligated Group, 4.16%, 10/1/42(d) | | | 440,000 | |
250,000 | | Providence St. Joseph Health Obligated Group, 2.75%, 10/1/26 | | | 263,713 | |
100,000 | | Shire Acquisitions Investments Ireland DAC, 2.88%, 9/23/23 | | | 101,030 | |
400,000 | | Shire Acquisitions Investments Ireland DAC, 3.20%, 9/23/26 | | | 407,065 | |
300,000 | | Thermo Fisher Scientific, Inc., 2.60%, 10/1/29 | | | 293,265 | |
150,000 | | Trinity Health Corp., 0.00%, 7/2/20(b) | | | 149,519 | |
250,000 | | Trinity Health Corp., 1.76%, 4/2/20 | | | 249,994 | |
100,000 | | Trinity Health Corp., 4.13%, 12/1/45 | | | 109,941 | |
| | | | | | |
| | | | | 6,236,656 | |
| | | | | | |
Financial — 4.18% | | | | |
250,000 | | BlueHub Loan Fund, Inc., 2.89%, 1/1/27 | | | 239,094 | |
250,000 | | Century Housing Corp., 4.00%, 11/1/21 | | | 255,001 | |
250,000 | | Community Preservation Corp. (The), 2.87%, 2/1/30 | | | 242,247 | |
200,000 | | Kreditanstalt fuer Wiederaufbau, 2.00%, 9/29/22 | | | 207,115 | |
200,000 | | Low Income Investment Fund, 3.39%, 7/1/26 | | | 165,729 | |
245,000 | | Self-Help Federal Credit Union, 1.97%, 12/18/20(a) | | | 247,100 | |
| | | | | | |
| | | | | 1,356,286 | |
| | | | | | |
Industrial — 1.03% | | | | |
350,000 | | Agilent Technologies, Inc., 2.75%, 9/15/29 | | | 334,527 | |
| | | | | | |
| |
Technology — 0.65% | | | | |
200,000 | | Apple, Inc., 2.85%, 2/23/23 | | | 209,205 | |
| | | | | | |
| |
Utilities — 5.41% | | | | |
250,000 | | Avangrid, Inc., 3.15%, 12/1/24 | | | 250,034 | |
100,000 | | Avangrid, Inc., 3.80%, 6/1/29 | | | 102,919 | |
150,000 | | MidAmerican Energy Co., 3.10%, 5/1/27 | | | 154,261 | |
29
|
SCHEDULE OF PORTFOLIO INVESTMENTS |
RBC Impact Bond Fund (cont.)
March 31, 2020 (Unaudited)
| | | | | | |
Principal Amount | | | | Value | |
$300,000 | | MidAmerican Energy Co., 3.65%, 4/15/29 | | $ | 324,886 | |
450,000 | | NextEra Energy Capital Holdings, Inc., 3.55%, 5/1/27 | | | 460,379 | |
450,000 | | Xcel Energy, Inc., 3.30%, 6/1/25 | | | 460,301 | |
| | | | | | |
| | | | | 1,752,780 | |
| | | | | | |
| |
Total Corporate Bonds | | | 10,674,063 | |
| | | | | | |
(Cost $10,590,842) | | | | |
| |
Municipal Bonds — 17.37% | | | | |
Alabama — 0.48% | | | | |
150,000 | | Water Works Board of the City of Birmingham (The) Revenue, 2.60%, 1/1/27 | | | 155,895 | |
| | | | | | |
| |
California — 4.00% | | | | |
150,000 | | California Health Facilities. Financing Authority Revenue, 2.02%, 6/1/24 | | | 149,370 | |
135,000 | | City & County of San Francisco Housing GO, Series A, 2.82%, 6/15/24 | | | 141,503 | |
100,000 | | City & County of San Francisco Housing GO, Series H, 1.95%, 6/15/27 | | | 99,965 | |
100,000 | | City of Los Angeles Housing GO, Series A, 2.95%, 9/1/28, Callable 9/1/27 @ 100 | | | 104,802 | |
100,000 | | City of Sunnyvale Wastewater Revenue, Series A, 3.20%, 4/1/26 | | | 107,620 | |
50,000 | | County of Alameda Housing GO, Series A, 2.56%, 8/1/20 | | | 50,194 | |
150,000 | | Escondido Joint Powers Financing Authority Revenue, Series B, 2.44%, 9/1/25 | | | 151,539 | |
150,000 | | Kern Community College District GO, 2.54%, 11/1/26 | | | 162,786 | |
200,000 | | Rosemead School District GO, Series A, 2.17%, 8/1/25 | | | 202,912 | |
100,000 | | San Francisco City & County Public Utilities Commission Wastewater Revenue, 5.40%, 10/1/28 | | | 126,148 | |
| | | | | | |
| | | | | 1,296,839 | |
| | | | | | |
Colorado — 0.16% | | | | |
50,000 | | Denver City & County School District No 1 GO, Series B, 2.99%, 12/1/24, (Credit Support: State Aid Withholding) | | | 53,398 | |
| | | | | | |
| |
Connecticut — 0.48% | | | | |
150,000 | | South Central Connecticut Regional Water Authority Revenue, Series S, 2.86%, 8/1/30, Callable 8/1/29 @ 100 | | | 154,619 | |
| | | | | | |
| |
Georgia — 0.49% | | | | |
75,000 | | Atlanta Urban Residential Finance Authority Revenue, Series A, 2.39%, 12/1/22 | | | 76,899 | |
75,000 | | Macon-Bibb County Urban Development Authority Revenue, Series A, 3.00%, 12/1/24, (Credit Support: County Guaranteed) | | | 81,671 | |
| | | | | | |
| | | | | 158,570 | |
| | | | | | |
30
|
SCHEDULE OF PORTFOLIO INVESTMENTS |
RBC Impact Bond Fund (cont.)
March 31, 2020 (Unaudited)
| | | | | | |
Principal Amount | | | | Value | |
Hawaii — 1.25% | | | | |
$150,000 | | City & County Honolulu Wastewater System Revenue, Series A, 2.00%, 7/1/22 | | $ | 152,283 | |
250,000 | | Honolulu City & County Board of Water Supply Revenue, Series B, 1.98%, 7/1/27 | | | 252,412 | |
| | | | | | |
| | | | | 404,695 | |
| | | | | | |
Illinois — 0.93% | | | | |
300,000 | | Illinois Housing Development Authority Foxview I & II Apartments Revenue, Series I, 2.50%, 1/1/41, (Credit Support: Freddie Mac), Callable 4/10/20 @ 100(f) | | | 300,000 | |
| | | | | | |
| |
Iowa — 0.32% | | | | |
100,000 | | Northeast Iowa Community College GO, Series N, 3.45%, 6/1/26, Callable 6/1/24 @ 100 | | | 104,971 | |
| | | | | | |
| |
Massachusetts — 0.78% | | | | |
250,000 | | Massachusetts Water Resources Authority Revenue, Series F, 1.86%, 8/1/24 | | | 253,592 | |
| | | | | | |
| |
Michigan — 0.31% | | | | |
95,000 | | Marquette Brownfield Redevelopment Authority Revenue, 3.05%, 5/1/27, (Credit Support: Municipal Government Guaranteed), Callable 5/1/26 @ 100 | | | 99,612 | |
| | | | | | |
| |
Missouri — 0.32% | | | | |
100,000 | | Riverview Gardens School District GO, Series B, 3.15%, 4/1/22, (Credit Support: State Aid Direct Deposit) | | | 103,461 | |
| | | | | | |
| |
Nebraska — 0.75% | | | | |
250,000 | | Papio-Missouri River Natural Resource District Special Tax, 2.20%, 12/15/25, Callable 6/15/24 @ 100 | | | 241,992 | |
| | | | | | |
| |
New Jersey — 0.81% | | | | |
150,000 | | Mercer County Improvement Authority Revenue, Series A, 4.90%, 9/15/27, (Credit Support: County Guaranteed), Callable 9/15/21 @ 100 | | | 156,932 | |
100,000 | | Township of Brick GO, Series B, 3.00%, 9/1/22 | | | 103,976 | |
| | | | | | |
| | | | | 260,908 | |
| | | | | | |
New York — 0.62% | | | | |
200,000 | | Westchester County Healthcare Corp Revenue, Series D, 1.37%, 11/1/34, Callable 3/31/20 @ 100(f) | | | 200,000 | |
| | | | | | |
31
|
SCHEDULE OF PORTFOLIO INVESTMENTS |
RBC Impact Bond Fund (cont.)
March 31, 2020 (Unaudited)
| | | | | | |
Principal Amount | | | | Value | |
Ohio — 0.45% | | | | |
$130,000 | | City of Cincinnati Revenue, Series C, 3.95%, 11/1/28 | | $ | 146,972 | |
| | | | | | |
| |
Oregon — 0.29% | | | | |
90,000 | | State of Oregon GO, Series B, 2.77%, 5/1/23 | | | 94,057 | |
| | | | | | |
| |
Pennsylvania — 0.97% | | | | |
185,000 | | City of Philadelphia Water & Wastewater Revenue, Series A, 3.55%, 10/1/28 | | | 200,497 | |
100,000 | | Redevelopment Authority of the City of Philadelphia Revenue, 4.50%, 11/1/31, Callable 11/1/28 @ 100 | | | 114,652 | |
| | | | | | |
| | | | | 315,149 | |
| | | | | | |
Rhode Island — 0.97% | | | | |
150,000 | | Rhode Island Infrastructure Bank Revenue, Series R, 2.70%, 10/1/28 | | | 159,224 | |
150,000 | | State of Rhode Island GO, Series B, 3.00%, 5/1/23 | | | 155,481 | |
| | | | | | |
| | | | | 314,705 | |
| | | | | | |
Texas — 1.26% | | | | |
250,000 | | City of Houston TX Combined Utility System Revenue, Series C, 2.05%, 11/15/26 | | | 252,027 | |
150,000 | | State of Texas GO, Series B, 3.13%, 8/1/22 | | | 157,281 | |
| | | | | | |
| | | | | 409,308 | |
| | | | | | |
Vermont — 0.33% | | | | |
100,000 | | Vermont Housing Finance Agency Revenue, 3.45%, 11/1/29 | | | 108,182 | |
| | | | | | |
| |
Virginia — 0.48% | | | | |
150,000 | | Loudoun County Economic Development Authority Revenue, Series B, 2.05%, 12/1/22 | | | 155,601 | |
| | | | | | |
| |
Washington — 0.92% | | | | |
300,000 | | Grant County Public Utility District No 2 Revenue, 1.90%, 1/1/27 | | | 297,771 | |
| | | | | | |
| |
Total Municipal Bonds | | | 5,630,297 | |
| | | | | | |
(Cost $5,463,026) | | | | |
| |
U.S. Government Agency Obligations — 6.53% | | | | |
Overseas Private Investment Corp. — 3.74% | | | | |
220,385 | | (US Treasury Bill Yield3-Month + 0.000%), 1.90%, 10/10/25(c) | | | 220,384 | |
242,948 | | (US Treasury Bill Yield3-Month + 0.000%), 1.90%, 7/7/40(c) | | | 242,948 | |
250,000 | | (US Treasury Bill Yield3-Month + 0.000%), 2.00%, 9/15/26(a),(c) | | | 250,062 | |
32
|
SCHEDULE OF PORTFOLIO INVESTMENTS |
RBC Impact Bond Fund (cont.)
March 31, 2020 (Unaudited)
| | | | | | |
Principal Amount | | | | Value | |
$250,000 | | (US Treasury Bill Yield3-Month + 0.000%), 2.00%, 4/20/35(c) | | $ | 250,000 | |
250,000 | | (US Treasury Bill Yield3-Month + 0.000%), 2.00%, 7/5/38(c) | | | 250,000 | |
| | | | | | |
| | | | | 1,213,394 | |
| | | | | | |
Small Business Administration — 2.79% | | | | |
72,591 | | (Prime Index - 2.500%), 2.25%, 2/25/28(c) | | | 71,835 | |
109,372 | | (Prime Index - 2.500%), 2.25%, 4/25/44(c) | | | 107,950 | |
93,154 | | (Prime Index - 0.675%), 4.08%, 9/25/43(c) | | | 96,899 | |
145,138 | | (Prime Index + 0.325%), 5.08%, 9/25/44(c) | | | 156,054 | |
80,396 | | (Prime Index + 0.612%), 5.36%, 3/25/43(c) | | | 85,888 | |
63,546 | | (Prime Index + 0.700%), 5.45%, 2/25/28(c) | | | 66,359 | |
78,354 | | (Prime Index + 0.973%), 5.72%, 11/25/28(c) | | | 83,230 | |
109,597 | | (Prime Index + 1.226%), 5.98%, 6/25/29(c) | | | 118,019 | |
97,321 | | 9.08%, 9/25/29(a) | | | 118,195 | |
| | | | | | |
| | | | | 904,429 | |
| | | | | | |
| |
Total U.S. Government Agency Obligations | | | 2,117,823 | |
| | | | | | |
(Cost $2,140,049) | | | | |
| |
Foreign Government Bonds — 2.93% | | | | |
Ivory Coast — 0.93% | | | | |
300,000 | | African Development Bank, 0.75%, 4/3/23 | | | 301,320 | |
| | | | | | |
| |
Luxembourg — 2.00% | | | | |
300,000 | | European Investment Bank, 2.13%, 4/13/26 | | | 324,131 | |
300,000 | | European Investment Bank, 2.50%, 10/15/24 | | | 324,561 | |
| | | | | | |
| | | | | 648,692 | |
| | | | | | |
| |
Total Foreign Government Bonds | | | 950,012 | |
| | | | | | |
(Cost $886,875) | | | | |
| |
Asset Backed Securities — 0.94% | | | | |
300,000 | | Tesla Auto Lease Trust, Series2018-B, Class B, 4.12%, 10/20/21(e) | | | 302,995 | |
| | | | | | |
| |
Total Asset Backed Securities | | | 302,995 | |
| | | | | | |
(Cost $306,964) | | | | |
33
|
SCHEDULE OF PORTFOLIO INVESTMENTS |
RBC Impact Bond Fund (cont.)
March 31, 2020 (Unaudited)
| | | | | | |
| Shares | | | | Value | |
Investment Company — 0.11% | | | | |
36,695 | | U.S. Government Money Market Fund, RBC Institutional Class 1(g) | | $ | 36,695 | |
| | | | | | |
| |
Total Investment Company | | | 36,695 | |
| | | | | | |
(Cost $36,695) | | | | |
| |
Total Investments | | $ | 32,202,375 | |
(Cost $31,354,904)(h) — 99.34% | | | | |
Other assets in excess of liabilities — 0.66% | | | 212,744 | |
| | | | | | |
| |
NET ASSETS — 100.00% | | $ | 32,415,119 | |
| | | | | | |
| (a) | The Pricing Committee has fair valued this security under procedures established by the Fund’s Board of Trustees. |
| (b) | Zero Coupon Bond. The rate represents the yield at time of purchase. |
| (c) | Floating rate note. Rate shown is as of report date. |
| (d) | Variable or floating rate security, which interest rate adjusts periodically based on changes in current interest rates and prepayments on the underlying pool of assets. Rate shown is the rate in effect as of period end. |
| (e) | Security exempt from registration under Rule 144A or Section 4(2) of the Securities Act of 1933, as amended. These securities may be resold in transactions exempt from registration, normally to qualified institutional buyers. |
| (f) | Variable rate security. The rate reflected in the Schedule of Portfolio Investments is the rate in effect on March 31, 2020. |
| (g) | Affiliated investment. |
| (h) | See Notes to Schedules of Portfolio Investments for the tax cost of securities and the breakdown of unrealized appreciation (depreciation). |
Financial futures contracts as of March 31, 2020:
| | | | | | | | | | | | | | | | | | |
Long Position | | Number of
Contracts | | | Expiration
Date | | Value/Unrealized
Appreciation | | Notional Value | | Clearinghouse |
| 30 Year U.S. Treasury Bond | | | 3 | | | June 2020 | | | | | | $ 47,930 | | USD | | $ 537,188 | | Barclays Capital Group |
| 30 Year U.S. Ultra Treasury Bond | | | 15 | | | June 2020 | | | | | | 364,905 | | USD | | 3,328,125 | | Barclays Capital Group |
| Two Year U.S. Treasury Note | | | 20 | | | June 2020 | | | | | | 70,044 | | USD | | 4,407,656 | | Barclays Capital Group |
| | | | | | | | | | | | | | | | | | |
Total | | | | | | | | | | | | $482,879 | | | | | | |
| | | | | | | | | | | | | | | | | | |
34
|
SCHEDULE OF PORTFOLIO INVESTMENTS |
RBC Impact Bond Fund (cont.)
March 31, 2020 (Unaudited)
| | | | | | | | | | | | | | | | | | |
Short Position | | Number of
Contracts | | | Expiration
Date | | Value/Unrealized
Depreciation | | Notional Value | | Clearinghouse |
| Five Year U.S. Treasury Note | | | 10 | | | June 2020 | | | | | | $ (32,000) | | USD | | $1,253,594 | | Barclays Capital Group |
| Ten Year Ultra U.S. Treasury Bonds | | | 12 | | | June 2020 | | | | | | (107,380) | | USD | | 1,872,375 | | Barclays Capital Group |
| | | | | | | | | | | | | | | | | | |
Total | | | | | | | | | | | | $(139,380) | | | | | | |
| | | | | | | | | | | | | | | | | | |
Abbreviations used are defined below:
GO - General Obligations
LIBOR - London Interbank Offered Rate
TBA -To-be-announced
USD - United States Dollar
See Notes to the Financial Statements.
35
Statements of Assets and Liabilities
March 31, 2020 (Unaudited)
| | | | | | | | | | | | | | |
| | | Access Capital
Community
Investment Fund | | | RBC Impact
Bond Fund | |
Assets: | | | | | | | | | | | | | | |
Investments in securities, at value: | | | | | | | | | | | | | | |
Unaffiliated investments (cost $523,153,834 and $31,318,209, respectively) | | | | | | $ | 544,641,065 | | | | | $ | 32,165,680 | |
Affiliated investments (cost $11,610,931 and $36,695, respectively) | | | | | | | 11,610,931 | | | | | | 36,695 | |
Cash at broker for financial future contracts | | | | | | | 2,795,615 | | | | | | 432,686 | |
Interest and dividend receivable | | | | | | | 1,735,446 | | | | | | 173,607 | |
Receivable from advisor | | | | | | | — | | | | | | 1,984 | |
Receivable for capital shares issued | | | | | | | 283,506 | | | | | | 10 | |
Receivable for investments sold | | | | | | | 381,863 | | | | | | 11,779 | |
Unrealized appreciation on futures contracts | | | | | | | 871,878 | | | | | | 482,879 | |
Prepaid expenses and other assets | | | | | | | 25,712 | | | | | | 52,789 | |
| | | | | | | | | | | | | | |
Total Assets | | | | | | | 562,346,016 | | | | | | 33,358,109 | |
| | | | | | | | | | | | | | |
Liabilities: | | | | | | | | | | | | | | |
Foreign withholding tax payable | | | | | | | 4,283 | | | | | | — | |
Distributions payable | | | | | | | 510,946 | | | | | | — | |
Payable for capital shares redeemed | | | | | | | 207,168 | | | | | | 8,989 | |
Payable for investments purchased | | | | | | | 660,181 | | | | | | 767,387 | |
Unrealized depreciation on futures contracts | | | | | | | 2,232,306 | | | | | | 139,380 | |
Accrued expenses and other payables: | | | | | | | | | | | | | | |
Investment advisory fees | | | | | | | 139,061 | | | | | | — | |
Accounting fees | | | | | | | 4,370 | | | | | | 2,204 | |
Audit fees | | | | | | | 21,385 | | | | | | 17,296 | |
Trustees’ fees | | | | | | | 3,687 | | | | | | — | |
Distribution fees | | | | | | | 4,142 | | | | | | 4 | |
Custodian fees | | | | | | | 11,471 | | | | | | 709 | |
Shareholder reports | | | | | | | 12,857 | | | | | | — | |
Shareholder servicing fees | | | | | | | 22,207 | | | | | | — | |
Transfer agent fees | | | | | | | 21,006 | | | | | | — | |
Other | | | | | | | 69,738 | | | | | | 7,021 | |
| | | | | | | | | | | | | | |
Total Liabilities | | | | | | | 3,924,808 | | | | | | 942,990 | |
| | | | | | | | | | | | | | |
Net Assets | | | | | | $ | 558,421,208 | | | | | $ | 32,415,119 | |
| | | | | | | | | | | | | | |
Net Assets Consists of: | | | | | | | | | | | | | | |
Capital | | | | | | $ | 570,041,578 | | | | | $ | 31,005,703 | |
Accumulated earnings | | | | | | | (11,620,370 | ) | | | | | 1,409,416 | |
| | | | | | | | | | | | | | |
Net Assets | | | | | | $ | 558,421,208 | | | | | $ | 32,415,119 | |
| | | | | | | | | | | | | | |
36
Statements of Assets and Liabilities (cont.)
March 31, 2020 (Unaudited)
| | | | | | | | | | |
| | | Access Capital
Community
Investment Fund | | | RBC Impact
Bond Fund | |
Net Assets | | | | | | | | | | |
Class A | | | | $ | 17,442,749 | | | $ | 10,215 | |
Class I | | | | | 533,878,475 | | | | 16,827,240 | |
Class IS | | | | | 7,099,984 | | | | N/A | |
Class R6 | | | | | N/A | | | | 15,577,664 | |
| | | | | | | | | | |
Total | | | | $ | 558,421,208 | | | $ | 32,415,119 | |
| | | | | | | | | | |
Shares Outstanding (Unlimited number of shares authorized, no par value): | | | | | | | | | | |
Class A | | | | | 1,912,803 | | | | 989 | |
Class I | | | | | 58,579,292 | | | | 1,628,586 | |
Class IS | | | | | 779,827 | | | | N/A | |
Class R6 | | | | | N/A | | | | 1,505,858 | |
| | | | | | | | | | |
Total | | | | | 61,271,922 | | | | 3,135,433 | |
| | | | | | | | | | |
Net Asset Values and Redemption Prices Per Share: | | | | | | | | | | |
Class A | | | | $ | 9.12 | | | $ | 10.33 | |
| | | | | | | | | | |
Class I | | | | $ | 9.11 | | | $ | 10.33 | |
| | | | | | | | | | |
Class IS | | | | $ | 9.10 | | | $ | N/A | |
| | | | | | | | | | |
Class R6 | | | | $ | N/A | | | $ | 10.34 | |
| | | | | | | | | | |
Maximum Offering Price Per Share: | | | | | | | | | | |
Class A | | | | $ | 9.48 | | | $ | 10.73 | |
| | | | | | | | | | |
Maximum Sales Charge - Class A | | | | | 3.75 | % | | | 3.75 | % |
| | | | | | | | | | |
See Notes to the Financial Statements.
37
Statements of Operations
For the Six Months Ended March 31, 2020 (Unaudited)
| | | | | | | | | | | | |
| | | Access Capital
Community
Investment Fund | | | RBC Impact
Bond Fund | |
Investment Income: | | | | | | | | | | | | |
Interest income | | | | | | $ | 7,525,856 | | | $ | 383,366 | |
Dividend income - affiliated | | | | | | | 175,101 | | | | 5,841 | |
| | | | | | | | | | | | |
Total Investment Income | | | | | | | 7,700,957 | | | | 389,207 | |
Expenses: | | | | | | | | | | | | |
Investment advisory fees | | | | | | | 1,005,788 | | | | 49,490 | |
Distribution fees–Class A | | | | | | | 21,831 | | | | 4 | |
Accounting fees | | | | | | | 91,865 | | | | 24,231 | |
Audit fees | | | | | | | 19,203 | | | | 15,760 | |
Custodian fees | | | | | | | 24,817 | | | | 2,356 | |
Insurance fees | | | | | | | 2,152 | | | | 2,224 | |
Legal fees | | | | | | | 43,321 | | | | 1,434 | |
Registrations and filing fees | | | | | | | 34,592 | | | | 13,427 | |
Shareholder reports | | | | | | | 37,322 | | | | 10,952 | |
Transfer agent fees–Class A | | | | | | | 24,821 | | | | — | |
Transfer agent fees–Class I | | | | | | | 59,113 | | | | 3,411 | |
Transfer agent fees–Class IS | | | | | | | 5,726 | | | | — | |
Transfer agent fees–Class R6 | | | | | | | — | | | | 1,993 | |
Trustees’ fees and expenses | | | | | | | 24,087 | | | | 925 | |
Shareholder services administration fees–Class I | | | | | | | 137,592 | | | | — | |
Tax expense | | | | | | | 2,164 | | | | 2,213 | |
Other fees | | | | | | | 8,522 | | | | 2,766 | |
| | | | | | | | | | | | |
Total expenses before fee waiver/reimbursement | | | | | | | 1,542,916 | | | | 131,186 | |
Expenses waived/reimbursed by: | | | | | | | | | | | | |
Advisor | | | | | | | (220,921 | ) | | | (71,321 | ) |
| | | | | | | | | | | | |
Net expenses | | | | | | | 1,321,995 | | | | 59,865 | |
| | | | | | | | | | | | |
Net Investment Income | | | | | | | 6,378,962 | | | | 329,342 | |
| | | | | | | | | | | | |
Realized/Unrealized Gains/(Losses): | | | | | | | | | | | | |
Net realized gains/(losses) on: | | | | | | | | | | | | |
Investment transactions | | | | | | | 427,059 | | | | 84,229 | |
Futures contracts | | | | | | | 402,154 | | | | 244,576 | |
| | | | | | | | | | | | |
Net realized gains | | | | | | | 829,213 | | | | 328,805 | |
Net change in unrealized appreciation/ (depreciation) on: | | | | | | | | | | | | |
Investments | | | | | | | 10,066,995 | | | | 71,336 | |
Futures contracts | | | | | | | (1,804,170 | ) | | | 342,366 | |
| | | | | | | | | | | | |
Net unrealized gains | | | | | | | 8,262,825 | | | | 413,702 | |
| | | | | | | | | | | | |
Change in net assets resulting from operations | | | | | | $ | 15,471,000 | | | $ | 1,071,849 | |
| | | | | | | | | | | | |
See Notes to the Financial Statements.
38
Statements of Changes in Net Assets
| | | | | | | | | | | | | | | | | | | | |
| | | Access Capital
Community
Investment Fund | |
| | | For the
Six Months Ended
March 31, 2020
(Unaudited) | | | | | | For the
Year Ended
September 30, 2019 | |
From Investment Activities | | | | | | | | | | | | | | | | | | | | |
Operations: | | | | | | | | | | | | | | | | | | | | |
Net investment income | | | | | | $ | 6,378,962 | | | | | | | | | | | $ | 14,611,286 | |
Net realized gains/(losses) from investments and futures contracts | | | | | | | 829,213 | | | | | | | | | | | | (3,899,363 | ) |
Net change in unrealized appreciation on investments and futures contracts | | | | | | | 8,262,825 | | | | | | | | | | | | 30,369,116 | |
| | | | | | | | | | | | | | | | | | | | |
Change in net assets resulting from operations | | | | | | | 15,471,000 | | | | | | | | | | | | 41,081,039 | |
| | | | | | | | | | | | | | | | | | | | |
Distributions to Shareholders: | | | | | | | | | | | | | | | | | | | | |
Class A | | | | | | | (200,661 | ) | | | | | | | | | | | (487,012 | ) |
Class I | | | | | | | (7,287,967 | ) | | | | | | | | | | | (15,775,320 | ) |
Class IS | | | | | | | (93,324 | ) | | | | | | | | | | | (76,098 | ) |
| | | | | | | | | | | | | | | | | | | | |
Change in net assets resulting from shareholder distributions | | | | | | | (7,581,952 | ) | | | | | | | | | | | (16,338,430 | ) |
| | | | | | | | | | | | | | | | | | | | |
Capital Transactions: | | | | | | | | | | | | | | | | | | | | |
Proceeds from shares issued | | | | | | | 31,555,484 | | | | | | | | | | | | 75,626,375 | |
Distributions reinvested | | | | | | | 4,366,460 | | | | | | | | | | | | 8,400,049 | |
Cost of shares redeemed | | | | | | | (59,101,512 | ) | | | | | | | | | | | (125,907,118 | ) |
| | | | | | | | | | | | | | | | | | | | |
Change in net assets resulting from capital transactions | | | | | | | (23,179,568 | ) | | | | | | | | | | | (41,880,694 | ) |
| | | | | | | | | | | | | | | | | | | | |
Net decrease in net assets | | | | | | | (15,290,520 | ) | | | | | | | | | | | (17,138,085 | ) |
Net Assets: | | | | | | | | | | | | | | | | | | | | |
Beginning of period | | | | | | | 573,711,728 | | | | | | | | | | | | 590,849,813 | |
| | | | | | | | | | | | | | | | | | | | |
End of period | | | | | | $ | 558,421,208 | | | | | | | | | | | $ | 573,711,728 | |
| | | | | | | | | | | | | | | | | | | | |
| Share Transactions: | | | | | | | | | | | | | | | |
Issued | | | | | | | 3,490,478 | | | | | | | | | | | | 8,569,472 | |
Reinvested | | | | | | | 483,610 | | | | | | | | | | | | 953,424 | |
Redeemed | | | | | | | (6,498,588 | ) | | | | | | | | | | | (14,283,800 | ) |
| | | | | | | | | | | | | | | | | | | | |
Change in shares resulting from capital transactions | | | | | | | (2,524,500 | ) | | | | | | | | | | | (4,760,904 | ) |
| | | | | | | | | | | | | | | | | | | | |
See Notes to the Financial Statements.
39
Statements of Changes in Net Assets
| | | | | | | | | | | | | | | | | | | | |
| | | RBC Impact
Bond Fund | |
| | | For the
Six Months Ended
March 31, 2020
(Unaudited) | | | | | | For the
Year Ended
September 30, 2019 | |
From Investment Activities | | | | | | | | | | | | | | | | | | | | |
Operations: | | | | | | | | | | | | | | | | | | | | |
Net investment income | | | | | | $ | 329,342 | | | | | | | | | | | $ | 456,524 | |
Net realized gains from investments and futures contracts | | | | | | | 328,805 | | | | | | | | | | | | 351,596 | |
Net change in unrealized appreciation on investments and futures contracts | | | | | | | 413,702 | | | | | | | | | | | | 866,294 | |
| | | | | | | | | | | | | | | | | | | | |
Change in net assets resulting from operations | | | | | | | 1,071,849 | | | | | | | | | | | | 1,674,414 | |
| | | | | | | | | | | | | | | | | | | | |
Distributions to Shareholders: | | | | | | | | | | | | | | | | | | | | |
Class A | | | | | | | (36 | ) | | | | | | | | | | | — | |
Class I | | | | | | | (313,495 | ) | | | | | | | | | | | (132,166 | ) |
Class R6 | | | | | | | (355,573 | ) | | | | | | | | | | | (335,480 | ) |
| | | | | | | | | | | | | | | | | | | | |
Change in net assets resulting from shareholder distributions | | | | | | | (669,104 | ) | | | | | | | | | | | (467,646 | ) |
| | | | | | | | | | | | | | | | | | | | |
Capital Transactions: | | | | | | | | | | | | | | | | | | | | |
Proceeds from shares issued | | | | | | | 11,190,606 | | | | | | | | | | | | 16,988,575 | |
Distributions reinvested | | | | | | | 669,104 | | | | | | | | | | | | 467,646 | |
Cost of shares redeemed | | | | | | | (3,472,045 | ) | | | | | | | | | | | (114,580 | ) |
| | | | | | | | | | | | | | | | | | | | |
Change in net assets resulting from capital transactions | | | | | | | 8,387,665 | | | | | | | | | | | | 17,341,641 | |
| | | | | | | | | | | | | | | | | | | | |
Net increase in net assets | | | | | | | 8,790,410 | | | | | | | | | | | | 18,548,409 | |
Net Assets: | | | | | | | | | | | | | | | | | | | | |
Beginning of period | | | | | | | 23,624,709 | | | | | | | | | | | | 5,076,300 | |
| | | | | | | | | | | | | | | | | | | | |
End of period | | | | | | $ | 32,415,119 | | | | | | | | | | | $ | 23,624,709 | |
| | | | | | | | | | | | | | | | | | | | |
| Share Transactions: | | | | | | | | | | | | | | | |
Issued | | | | | | | 1,100,570 | | | | | | | | | | | | 1,747,146 | |
Reinvested | | | | | | | 66,074 | | | | | | | | | | | | 46,922 | |
Redeemed | | | | | | | (342,330 | ) | | | | | | | | | | | (11,384 | ) |
| | | | | | | | | | | | | | | | | | | | |
Change in shares resulting from capital transactions | | | | | | | 824,314 | | | | | | | | | | | | 1,782,684 | |
| | | | | | | | | | | | | | | | | | | | |
See Notes to the Financial Statements.
40
| | |
| Access Capital Community Investment Fund | | |
| | (Selected data for a share outstanding throughout the periods indicated) |
| | | | | | | | | | | | | | | | | | | | | | | | | | | | |
| | | | | | Investment Activities | | | Distributions | | | | |
| | | Net Asset
Value,
Beginning
of Period | | | Net
Investment
Income(a) | | | Net Realized
and Unrealized
Gains (Losses)
on Investments | | | Total from
Investment
Activities | | | Net
Investment
Income | | | Total
Distributions | | | Net Asset
Value, End
of Period | |
Class A | | | | | | | | | | | | | | | | | | | | | | | | | | | | |
Six Months Ended 3/31/20 (Unaudited) | | | $ 9.00 | | | | 0.08 | | | | 0.14 | | | | 0.22 | | | | (0.10) | | | | (0.10) | | | | $ 9.12 | |
Year Ended 9/30/19 | | | 8.62 | | | | 0.19 | | | | 0.41 | | | | 0.60 | | | | (0.22) | | | | (0.22) | | | | 9.00 | |
Year Ended 9/30/18 | | | 9.02 | | | | 0.18 | | | | (0.37 | ) | | | (0.19) | | | | (0.21) | | | | (0.21) | | | | 8.62 | |
Year Ended 9/30/17 | | | 9.26 | | | | 0.18 | | | | (0.20 | ) | | | (0.02) | | | | (0.22) | | | | (0.22) | | | | 9.02 | |
Year Ended 9/30/16 | | | 9.25 | | | | 0.22 | | | | 0.03 | | | | 0.25 | | | | (0.24) | | | | (0.24) | | | | 9.26 | |
Year Ended 9/30/15 | | | 9.27 | | | | 0.24 | | | | 0.01 | | | | 0.25 | | | | (0.27) | | | | (0.27) | | | | 9.25 | |
Class I | | | | | | | | | | | | | | | | | | | | | | | | | | | | |
Six Months Ended 3/31/20 (Unaudited) | | | $ 8.99 | | | | 0.10 | | | | 0.14 | | | | 0.24 | | | | (0.12) | | | | (0.12) | | | | $ 9.11 | |
Year Ended 9/30/19 | | | 8.62 | | | | 0.22 | | | | 0.40 | | | | 0.62 | | | | (0.25) | | | | (0.25) | | | | 8.99 | |
Year Ended 9/30/18 | | | 9.02 | | | | 0.21 | | | | (0.37 | ) | | | (0.16) | | | | (0.24) | | | | (0.24) | | | | 8.62 | |
Year Ended 9/30/17 | | | 9.25 | | | | 0.21 | | | | (0.19 | ) | | | 0.02 | | | | (0.25) | | | | (0.25) | | | | 9.02 | |
Year Ended 9/30/16 | | | 9.24 | | | | 0.25 | | | | 0.03 | | | | 0.28 | | | | (0.27) | | | | (0.27) | | | | 9.25 | |
Year Ended 9/30/15 | | | 9.26 | | | | 0.27 | | | | 0.01 | | | | 0.28 | | | | (0.30) | | | | (0.30) | | | | 9.24 | |
Class IS | | | | | | | | | | | | | | | | | | | | | | | | | | | | |
Six Months Ended 3/31/20 (Unaudited) | | | $ 8.98 | | | | 0.10 | | | | 0.14 | | | | 0.24 | | | | (0.12) | | | | (0.12) | | | | $ 9.10 | |
Period Ended 9/30/19(b) | | | 8.73 | | | | 0.13 | | | | 0.26 | | | | 0.39 | | | | (0.14) | | | | (0.14) | | | | 8.98 | |
| (a) | Per share net investment income (loss) has been calculated using the average daily shares method. |
| (b) | For the period from March 11, 2019, (commencement of operations) to September 30, 2019. |
41
| | |
| Access Capital Community Investment Fund | | |
| | (Selected data for a share outstanding throughout the periods indicated) |
| | | | | | | | | | | | | | | | | | | | | | | | | | | | |
| | | | | | Ratios/Supplemental Data | |
| | | Total
Return(a)(b) | | | Net Assets,
End of
Period (000’s) | | | Ratio of
Net Expenses
to Average
Net Assets | | | Ratio of
Expenses to
Average Net
Assets After
Fees Waived/
Reimbursed and
Excluding
Interest Expense | | | Ratio of
Net Investment
Income (Loss)
to Average
Net Assets | | | Ratio of
Expenses to
Average Net
Assets* | | | Portfolio
Turnover
Rate** | |
Class A | | | | | | | | | | | | | | | | | | | | | | | | | | | | |
Six Months Ended 3/31/20 (Unaudited) | | | 2.50% | (c) | | | $ 17,443 | | | | 0.80% | (d) | | | 0.80% | (d) | | | 1.88% | (d) | | | 0.98% | (d) | | | 7 | % |
Year Ended 9/30/19 | | | 7.03% | | | | 17,583 | | | | 0.95% | (e) | | | 0.87% | | | | 2.18% | | | | 1.11% | | | | 12 | % |
Year Ended 9/30/18 | | | (2.12)% | | | | 22,258 | | | | 1.06% | | | | 0.95% | | | | 2.10% | | | | 1.20% | | | | 20 | % |
Year Ended 9/30/17 | | | (0.24)% | | | | 24,568 | | | | 0.99% | | | | 0.95% | | | | 2.01% | | | | 1.09% | | | | 17 | % |
Year Ended 9/30/16 | | | 2.74% | | | | 21,269 | | | | 1.01% | | | | 0.95% | | | | 2.33% | | | | 1.10% | | | | 13 | % |
Year Ended 9/30/15 | | | 2.69% | | | | 21,135 | | | | 1.00% | | | | 0.95% | | | | 2.55% | | | | 1.06% | | | | 23 | % |
Class I | | | | | | | | | | | | | | | | | | | | | | | | | | | | |
Six Months Ended 3/31/20 (Unaudited) | | | 2.68% | (c) | | | $533,878 | | | | 0.45% | (d) | | | 0.45% | (d) | | | 2.23% | (d) | | | 0.52% | (d) | | | 7 | % |
Year Ended 9/30/19 | | | 7.27% | | | | 550,213 | | | | 0.60% | (e) | | | 0.53% | | | | 2.53% | | | | 0.66% | | | | 12 | % |
Year Ended 9/30/18 | | | (1.79)% | | | | 568,592 | | | | 0.73% | | | | 0.61% | | | | 2.44% | | | | 0.73% | | | | 20 | % |
Year Ended 9/30/17 | | | 0.23% | | | | 619,328 | | | | 0.63% | | | | 0.58% | | | | 2.38% | | | | 0.64% | | | | 17 | % |
Year Ended 9/30/16 | | | 3.12% | | | | 578,891 | | | | 0.64% | | | | 0.58% | | | | 2.67% | | | | 0.64% | | | | 13 | % |
Year Ended 9/30/15 | | | 2.95% | | | | 511,106 | | | | 0.63% | | | | 0.58% | | | | 2.91% | | | | 0.63% | | | | 23 | % |
Class IS | | | | | | | | | | | | | | | | | | | | | | | | | | | | |
Six Months Ended 3/31/20 (Unaudited) | | | 2.71% | (c) | | | $ 7,100 | | | | 0.40% | (d) | | | 0.40% | (d) | | | 2.30% | (d) | | | 0.62% | (d) | | | 7 | % |
Period Ended 9/30/19(f) | | | 4.33% | (c) | | | 5,916 | | | | 0.40% | (d) | | | 0.40% | (d) | | | 2.61% | (d) | | | 0.73% | (d) | | | 12 | % |
| * | During the period, certain fees were contractually or voluntarily reduced and/or reimbursed. If such contractual/voluntary fee reductions and reimbursements had not occurred, the ratio would have been as indicated. |
| ** | Portfolio turnover rate is calculated on the basis of the Fund as a whole without distinguishing between the classes of shares issued. |
| (a) | Excludes sales charge. |
| (b) | Assumes investment at net asset value at the beginning of the period, reinvestment of all dividends and distributions, and a complete redemption of the investment at net asset value at the end of the period. |
42
Access Capital Community Investment Fund
(Selected data for a share outstanding throughout the periods indicated)
| (e) | Beginning March 11, 2019, the net operating expenses were contractually limited to 0.80% and 0.45% for Class A and Class I respectively. The ratio of net expenses to average net assets represents a blended percentage for the period ended September 30 ,2019. |
| (f) | For the period from March 11, 2019, (commencement of operations) to September 30, 2019. |
See Notes to the Financial Statements.
43
RBC Impact Bond Fund
| | | | | | | | | | | | | | | | | | | | | | | | | | | | | | | | |
| | | (Selected data for a share outstanding throughout the periods indicated) | |
| | | | |
| | | | | | Investment Activities | | | Distributions | | | | |
| | | Net Asset
Value,
Beginning
of Period | | | Net
Investment
Income(a) | | | Net Realized
and Unrealized
Gains (Losses)
on Investments | | | Total from
Investment
Activities | | | Net
Investment
Income | | | Net
Realized
Gains | | | Total
Distributions | | | Net Asset
Value, End
of Period | |
Class A | | | | | | | | | | | | | | | | | | | | | | | | | | | | | | | | |
Period Ended 3/31/20 (Unaudited)(b) | | $ | 10.15 | | | | 0.03 | | | | 0.19 | | | | 0.22 | | | | (0.04 | ) | | | — | | | | (0.04 | ) | | $ | 10.33 | |
Class I | | | | | | | | | | | | | | | | | | | | | | | | | | | | | | | | |
Six Months Ended 3/31/20 (Unaudited) | | $ | 10.22 | | | | 0.12 | | | | 0.23 | | | | 0.35 | | | | (0.12 | ) | | | (0.12 | ) | | | (0.24 | ) | | $ | 10.33 | |
Year Ended 9/30/19 | | | 9.61 | | | | 0.26 | | | | 0.62 | | | | 0.88 | | | | (0.27 | ) | | | — | | | | (0.27 | ) | | | 10.22 | |
Period Ended 9/30/18(c) | | | 10.00 | | | | 0.17 | | | | (0.38 | ) | | | (0.21 | ) | | | (0.18 | ) | | | — | | | | (0.18 | ) | | | 9.61 | |
Class R6 | | | | | | | | | | | | | | | | | | | | | | | | | | | | | | | | |
Six Months Ended 3/31/20 (Unaudited) | | $ | 10.22 | | | | 0.12 | | | | 0.25 | | | | 0.37 | | | | (0.13 | ) | | | (0.12 | ) | | | (0.25 | ) | | $ | 10.34 | |
Year Ended 9/30/19 | | | 9.61 | | | | 0.27 | | | | 0.61 | | | | 0.88 | | | | (0.27 | ) | | | — | | | | (0.27 | ) | | | 10.22 | |
Period Ended 9/30/18(c) | | | 10.00 | | | | 0.18 | | | | (0.39 | ) | | | (0.21 | ) | | | (0.18 | ) | | | — | | | | (0.18 | ) | | | 9.61 | |
| (a) | Per share net investment income (loss) has been calculated using the average daily shares method. |
| (b) | For the period from January 28, 2020 (commencement of operations) to March 31, 2020. |
| (c) | For the period from December 18, 2017 (commencement of operations) to September 30, 2018. |
44
RBC Impact Bond Fund
(Selected data for a share outstanding throughout the periods indicated)
| | | | | | | | | | | | | | |
| | | | | Ratios/Supplemental Data |
| | | Total
Return(a)(b) | | Net Assets,
End of
Period (000’s) | | | Ratio of
Net Expenses
to Average
Net Assets | | Ratio of
Net Investment
Income (Loss)
to Average
Net Assets | | Ratio of
Expenses to
Average Net
Assets* | | Portfolio
Turnover
Rate** |
Class A | | | | | | | | | | | | | | |
Period Ended 3/31/20 (Unaudited)(c) | | 2.13%(d) | | | $ 10 | | | 0.70%(e) | | 1.89%(e) | | 1.07%(e) | | 22% |
Class I | | | | | | | | | | | | | | |
Six Months Ended 3/31/20 (Unaudited) | | 3.56%(d) | | | $16,827 | | | 0.45%(e) | | 2.29%(e) | | 0.94%(e) | | 22% |
Year Ended 9/30/19 | | 9.27% | | | 6,467 | | | 0.45% | | 2.67% | | 1.62% | | 175% |
Period Ended 9/30/18(f) | | (2.14)% | | | 2,630 | | | 0.45%(e) | | 2.29%(e) | | 3.82%(e) | | 329% |
Class R6 | | | | | | | | | | | | | | |
Six Months Ended 3/31/20 (Unaudited) | | 3.68%(d) | | | $15,578 | | | 0.40%(e) | | 2.37%(e) | | 0.92%(e) | | 22% |
Year Ended 9/30/19 | | 9.33% | | | 17,158 | | | 0.40% | | 2.73% | | 1.52% | | 175% |
Period Ended 9/30/18(f) | | (2.10)% | | | 2,447 | | | 0.40%(e) | | 2.33%(e) | | 3.70%(e) | | 329% |
| * | During the period, certain fees were contractually or voluntarily reduced and/or reimbursed. If such contractual/voluntary fee reductions and reimbursements had not occurred, the ratio would have been as indicated. |
| ** | Portfolio turnover rate is calculated on the basis of the Fund as a whole without distinguishing between the classes of shares issued. |
| (a) | Excludes sales charge. |
| (b) | Assumes investment at net asset value at the beginning of the period, reinvestment of all dividends and distributions, and a complete redemption of the investment at net asset value at the end of the period. |
| (c) | For the period from January 28, 2020 (commencement of operations) to March 31, 2020. |
| (f) | For the period from December 18, 2017 (commencement of operations) to September 30, 2018. |
See Notes to the Financial Statements.
45
|
NOTES TO FINANCIAL STATEMENTS |
March 31, 2020 (Unaudited)
1. Organization:
RBC Funds Trust (the “Trust”) is registered under the Investment Company Act of 1940 (as amended) as anopen-end management investment company. The Trust was organized as a Delaware statutory trust on December 16, 2003 and currently consists of 18 portfolios. Overall responsibility for the management of the Trust is vested in its Board of Trustees (the “Board”). The predecessor fund for the Access Capital Community Investment Fund was reorganized into a series of the Trust, effective July 28, 2008. This report includes the following two investment portfolios (each a “Fund” and collectively, the “Funds”):
- Access Capital Community Investment Fund
- RBC Impact Bond Fund (“Impact Bond Fund”)
The Access Capital Community Investment Fund offers three share classes: Class A, Class I and Class IS shares. The Impact Bond Fund offers three share classes: Class A, Class I and Class R6 shares. Class A shares are offered with a 3.75% maximumfront-end sales charge and a 1.00% contingent deferred sales charge (“CDSC”) for redemption within 12 months of a $1 million or greater purchase on which nofront-end sales charge was paid. Class I, Class IS and Class R6 shares (intended for investors meeting certain investment minimum thresholds) are not subject to either afront-end sales charge or a CDSC.
RBC Global Asset Management (U.S.) Inc. (“RBCGAM-US” or “Advisor” or“Co-Administrator”) acts as the investment advisor for the Fund. The officers of the Trust (“Fund Management”) are also employees of RBCGAM-US or its affiliates.
2. Significant Accounting Policies
Each Fund is an investment company that follows accounting and reporting guidance under the Financial Accounting Standards Board. Summarized below are the significant accounting policies of the Funds. These policies conform to accounting principles generally accepted in the United States of America (“U.S. GAAP”). Fund Management follows these policies when preparing financial statements. Fund Management may also be required to make estimates and assumptions that affect the reported amounts of assets and liabilities at the date of the financial statements and the reported amounts of income and expenses for the period. Actual results could differ from those estimates. The financial statements are as of the close of regular trading on the New York Stock Exchange (“NYSE”).
In March 2017, the Financial Accounting Standards Board (FASB) issued Accounting Standards Update (ASU)No. 2017-08, Receivables-Nonrefundable Fees and Other Costs (Subtopic310-20): Premium Amortization on Purchased Callable Debt Securities. The amendments in the ASU shorten the amortization period for certain callable debt securities, held at a premium, to be amortized to the earliest call date. The ASU does not require an accounting change for securities held at a discount; which continues to be amortized to maturity. The ASU is effective for fiscal years and interim periods within those fiscal years beginning after December 15, 2018.
In August 2018, the Financial Accounting Standards Board issued Accounting Standards Update2018-13 “Changes to the Disclosure Requirements for Fair Value Measurement” which modifies disclosure requirements for fair value measurements. The guidance is effective for fiscal years beginning after December 15, 2019 and for interim periods within those fiscal years. Management is currently evaluating the impact of this guidance to the Funds.
Security Valuation:
The Board has adopted pricing and valuation procedures for determining the fair value of each Fund’s investments. Fair value of a security is considered to be the price that a fund might reasonably expect to receive upon its current sale in an orderly transaction between market participants.
Fixed income securities, includingto-be-announced (“TBA”) commitments and municipal bonds, are generally valued based on evaluated prices received from third-party pricing services or from
46
|
NOTES TO FINANCIAL STATEMENTS |
broker-dealers who make markets in the securities and are generally categorized as Level 2 in the fair value hierarchy (see “Fair Value Measurements” below for additional information). The pricing services utilize both dealer-supplied valuations and electronic data processing techniques that take into account multiple appropriate factors such asinstitutional-size trading in similar groups of securities, market spreads, interest rates, and fundamental security analytical data including yield, quality, coupon rate, maturity and type of issue.
Mortgage-related securities represent direct or indirect participation in, or are secured by and payable from, mortgage loans secured by real property and include pass-through securities and collateralized mortgage obligations. These securities may be issued or guaranteed by U.S. Government agencies or instrumentalities, or private issuers, including commercial banks, savings and loan institutions, private mortgage insurance bankers and other secondary market issuers. These mortgage-related securities are generally valued by pricing services that use broker-dealer quotations or valuation estimates from their internal pricing models. These pricing models generally consider such factors as current market data, estimated cash flows, market-based yield spreads, and estimated prepayment rates. Securities valued using such techniques and inputs are generally categorized as Level 2 in the fair value hierarchy. To the extent significant inputs are unobservable, the securities will be categorized as Level 3.
Exchange-traded futures are valued at the last sale price at the close of the market on the principal exchange on which they are traded and are categorized as Level 1 in the fair value hierarchy. Investments inopen-end investment companies (mutual funds) are valued at net asset value and are categorized as Level 1 in the fair value hierarchy.
The Board has delegated to the Funds’ Pricing Committee (“Pricing Committee”) the responsibility for implementing the pricing and valuation procedures, including responsibility for determining the fair value of the Funds’ securities or other assets and liabilities. The Pricing Committee includes representatives of the Funds’ Advisor, andCo-Administrator, including personnel from accounting and operations, investment management, trading, risk management and compliance. The Pricing Committee meets at least quarterly to review and approve Fund valuation matters, including a review of the Funds’ pricing activity and operations, fair value measurements, pricing vendors, policies and procedures, and related controls. At least a quorum of the Pricing Committee shall meet more frequently, as needed, to consider and approve time-sensitive fair valuation matters. The Pricing Committee reports to the Valuation, Portfolio Management and Performance Committee (“Valuation Committee”) of the Board. Members of the Pricing Committee meet with the Valuation Committee and the Board at each of their regularly scheduled meetings to discuss valuation matters and actions taken during the period.
The Board has adopted procedures to determine the fair value of a security when a price is not available from a pricing service or broker- dealer or Fund Management determines that a price provided by a pricing service or broker-dealer does not approximate fair value. Fair valuation may also be used when a significant valuation event affecting the value of a security or market sector is determined to have occurred between the time when a security’s market closes and the time the Fund’s net asset value is calculated. The fair value of the security will be determined in good faith by the Pricing Committee in accordance with procedures and methodologies adopted by the Board. General factors used in determining the fair value of securities include, but are not limited to, fundamental analytical data relating to the security, the issuer and the market, such as duration, prepayment and default rates; general level of interest rates and changes in interest rates; information from broker-dealers; trading in similar securities; any restrictions on disposition of the security; and an evaluation of the forces that influence the market in which the investments are traded. These securities are either categorized as Level 2 or 3 in the fair value hierarchy, depending on the relevant inputs used.
When the Funds utilize fair valuation methods that use significant unobservable inputs to determine a security’s value, such securities will be categorized as Level 3 of the fair value hierarchy. These methods may require subjective determinations about the value of a security. While the Funds’ policy is intended to result in a calculation of a Fund’s net asset value that fairly reflects security values as of the time of pricing, the Funds cannot guarantee that values determined by the Board or persons acting at their direction would accurately reflect the price that the Funds could obtain for a security if they were to dispose of it as of the time of pricing (for instance, in a forced or distressed sale). The prices used by the Funds may differ from the value that would be realized if the securities were sold.
47
|
NOTES TO FINANCIAL STATEMENTS |
The Funds’ Pricing Committee employs various methods for calibrating the valuation approach related to securities categorized within Level 2 and Level 3 of the fair value hierarchy. These methods may include regular due diligence of the Funds’ pricing vendors, a regular review of key inputs and assumptions, transaction back-testing or disposition analysis to compare unrealized gains and losses to realized gains and losses, reviews of missing and stale prices and large movements in market value, and reviews of any market related activities. Additionally, the pricing of all fair value holdings is subsequently reported to the Valuation Committee and Board.
Fair Value Measurements:
The Funds disclose the fair value of their investments in a hierarchy that categorizes investments based on the inputs to valuation techniques used to measure fair value. The three levels of the fair value hierarchy are as follows:
• Level 1 - Inputs that reflect unadjusted quoted prices in active markets for identical assets or liabilities that the Funds have the ability to access at the measurement date.
• Level 2 - Significant inputs other than quoted prices that are observable for the asset or liability either directly or indirectly, including inputs in markets that are not considered to be active. Observable inputs may include quoted prices for similar securities, interest rates, spreads, prepayment spreads, etc.
• Level 3 - Significant unobservable inputs based on the best information available in the circumstances, to the extent observable inputs are not available (including the Fund’s own assumptions in determining the fair value of investments).
The inputs or methodology used for valuing investments are not necessarily an indication of the risk associated with investing in those securities.
Inputs used in determining fair value of an investment may include, but are not limited to, price information, volatility statistics, credit and market data, and other factors, all of which may be either observable or unobservable. Inputs can vary among investments and will be impacted by the investment type and volume of activity for the particular security or similar securities in the market. Investments in the Level 3 category are generally supported by transactions and quoted prices from dealers participating in the market for those investments. Investments may be included in the Level 3 category due to a lack of market activity or transparency. Internal valuation models may also be used as a pricing source for Level 3 investments. Internal valuation models may rely on one or more unobservable inputs, such as estimated cash flows, financial statement analysis and discount rates.
48
|
NOTES TO FINANCIAL STATEMENTS |
The summary of inputs used to determine the fair value of the Funds’ investments as of March 31, 2020 is as follows:
| | | | | | | | | | | | | | | | | | | | | | | | | | | | | | | | |
| | | Level 1
Quoted Prices | | | Level 2
Significant
Observable
Inputs | | | Level 3
Significant
Unobservable
Inputs | | | Total | |
Access Capital Community Investment Fund | | | | | | | | | | | | | | | | | | | | | | | | | | | | | | | | |
Assets: | | | | | | | | | | | | | | | | | | | | | | | | | | | | | | | | |
Investments in Securities | | | | | | | | | | | | | | | | | | | | | | | | | | | | | | | | |
Municipal Bonds | | | | | | $ | — | | | | | | | $ | 20,282,384 | | | | | | | $ | — | | | | | | | $ | 20,282,384 | |
U.S. Government Agency Backed Mortgages | | | | | | | — | | | | | | | | 498,958,331 | | | | | | | | — | | | | | | | | 498,958,331 | |
U.S. Government Agency Obligations | | | | | | | — | | | | | | | | 23,740,987 | | | | | | | | 52,409 | | | | | | | | 23,793,396 | |
Investment Company | | | | | | | 11,610,931 | | | | | | | | — | | | | | | | | — | | | | | | | | 11,610,931 | |
Corporate Bonds | | | | | | | — | | | | | | | | 1,606,954 | | | | | | | | — | | | | | | | | 1,606,954 | |
Other Financial Instruments* | | | | | | | | | | | | | | | | | | | | | | | | | | | | | | | | |
Financial futures contracts | | | | | | | 871,878 | | | | | | | | — | | | | | | | | — | | | | | | | | 871,878 | |
| | | | | | | | | | | | | | | | | | | | | | | | | | | | | | | | |
Total Assets | | | | | | $ | 12,482,809 | | | | | | | $ | 544,588,656 | | | | | | | $ | 52,409 | | | | | | | $ | 557,123,874 | |
| | | | | | | | | | | | | | | | | | | | | | | | | | | | | | | | |
Liabilities: | | | | | | | | | | | | | | | | | | | | | | | | | | | | | | | | |
Other Financial Instruments* | | | | | | | | | | | | | | | | | | | | | | | | | | | | | | | | |
Financial futures contracts | | | | | | $ | (2,232,306 | ) | | | | | | $ | — | | | | | | | $ | — | | | | | | | $ | (2,232,306 | ) |
| | | | | | | | | | | | | | | | | | | | | | | | | | | | | | | | |
Impact Bond Fund | | | | | | | | | | | | | | | | | | | | | | | | | | | | | | | | |
Assets: | | | | | | | | | | | | | | | | | | | | | | | | | | | | | | | | |
Investments in Securities | | | | | | | | | | | | | | | | | | | | | | | | | | | | | | | | |
Municipal Bonds | | | | | | | — | | | | | | | | 5,630,297 | | | | | | | | — | | | | | | | | 5,630,297 | |
U.S. Government Agency Obligations | | | | | | | — | | | | | | | | 2,117,823 | | | | | | | | — | | | | | | | | 2,117,823 | |
U.S. Government Agency Backed Mortgages | | | | | | | — | | | | | | | | 12,490,490 | | | | | | | | — | | | | | | | | 12,490,490 | |
Asset Backed Securities | | | | | | | — | | | | | | | | 302,995 | | | | | | | | — | | | | | | | | 302,995 | |
Foreign Government Bonds | | | | | | | — | | | | | | | | 950,012 | | | | | | | | — | | | | | | | | 950,012 | |
Investment Company | | | | | | | 36,695 | | | | | | | | — | | | | | | | | — | | | | | | | | 36,695 | |
Corporate Bonds | | | | | | | — | | | | | | | | 10,674,063 | | | | | | | | — | | | | | | | | 10,674,063 | |
Other Financial Instruments* | | | | | | | | | | | | | | | | | | | | | | | | | | | | | | | | |
Financial futures contracts | | | | | | | 482,879 | | | | | | | | — | | | | | | | | — | | | | | | | | 482,879 | |
| | | | | | | | | | | | | | | | | | | | | | | | | | | | | | | | |
Total Assets | | | | | | $ | 519,574 | | | | | | | $ | 32,165,680 | | | | | | | $ | — | | | | | | | $ | 32,685,254 | |
| | | | | | | | | | | | | | | | | | | | | | | | | | | | | | | | |
Liabilities: | | | | | | | | | | | | | | | | | | | | | | | | | | | | | | | | |
Other Financial Instruments* | | | | | | | | | | | | | | | | | | | | | | | | | | | | | | | | |
Financial futures contracts | | | | | | $ | (139,380 | ) | | | | | | $ | — | | | | | | | $ | — | | | | | | | $ | (139,380 | ) |
| | | | | | | | | | | | | | | | | | | | | | | | | | | | | | | | |
*Other financial instruments are instruments shown on the Schedule of Portfolio Investments, such as futures contracts which are valued at fair value.
During the period ended March 31, 2020, the Funds recognized no transfers to/from Level 1 or 2. The Funds’ policy is to recognize transfers between Level 1, Level 2 and Level 3 at the end of the year utilizing fair value at the beginning of the year.
49
|
NOTES TO FINANCIAL STATEMENTS |
The following is a reconciliation of Level 3 investments for which significant unobservable inputs were used to determine fair value:
| | | | | | | | |
| | | Access Capital
Community
Investment Fund | |
| | | U.S. Government Agency Obligations–
(Small Business Administration) | |
Balance as of 9/30/19(value) | | | | | | $ | 73,601 | |
Change in unrealized appreciation (depreciation) | | | | | | | (21,192 | ) |
| | | | | | | | |
Balance as of 3/31/20(value) | | | | | | $ | 52,409 | |
| | | | | | | | |
The Access Capital Community Investment Fund’s assets assigned to the Level 3 category were valued using the valuation methodology and technique deemed most appropriate in the circumstances. The significant unobservable inputs used include assumptions regarding the particular security’s cash flow profile, prepayments and potential defaults which may not be generally observable for either the security or for assets of a similar type. Inputs with respect to variable rate securities may also include assumptions regarding future interest rate changes. Significant changes in any of these assumptions may result in a lower or higher fair value measurement.
| | | | | | | | | | | | |
Quantitative Information about Level 3 Fair Value Measurements |
| | | Fair Value
at
March 31,
2020 | | | Valuation
Technique(s) | | | Unobservable Input | | Range (Weighted
Average) |
| U.S. Government Agency Obligations (Small Business Administration) | | $ | 73,601 | | |
| Discounted
Cash Flow |
| | Yield (Discount Rate of Cash Flows) Constant Default Rate Amortization Rate | | 3.23%-4.60%(4.23%)
0.00%(0.00%)
0.0037-0.0038(0.0038) |
Reverse Repurchase Agreements:
To obtain short-term financing, the Access Capital Community Investment Fund may enter into reverse repurchase agreements with primary dealers that report to the Federal Reserve Bank of New York or the 100 largest U.S. commercial banks, who are deemed creditworthy under guidelines approved by the Board. Interest on the value of the reverse repurchase agreements is based upon competitive market rates at the time of issuance. At the time the Fund enters into a reverse repurchase agreement, it will establish and maintain a segregated account with the custodian containing qualifying assets having a value, including accrued interest, not less than the repurchase price. Based on requirements with certain exchanges and third party broker-dealers, the Fund may also be required to deliver or deposit securities or cash as collateral.
As of March 31, 2020 there were no open reverse Repurchase Agreements.
Reverse repurchase transactions are entered into by the Fund under Master Repurchase Agreements (“MRA”), which permit the Fund, under certain circumstances, including an event of default (such as bankruptcy or insolvency), to offset payables and/or receivables under the MRA with collateral held and/or posted to the counterparty and create one single net payment due to or from the Fund. With reverse repurchase transactions, typically the Fund and the counterparties are permitted to sell, repledge, or use the collateral associated with the transaction. However, bankruptcy or insolvency laws of a particular jurisdiction may impose restrictions on or prohibitions against such a right of offset in the event of the MRA counterparty’s bankruptcy or insolvency. Pursuant to the terms of the MRA, the Fund receives or posts securities as collateral with a market value in excess of the repurchase price to be received or paid by the Fund upon the maturity of the transaction. Upon a bankruptcy or insolvency of the MRA counterparty, the Fund is considered an unsecured creditor with respect to excess collateral and, as such, the return of excess collateral may be delayed.
50
|
NOTES TO FINANCIAL STATEMENTS |
In the event the buyer of securities under a MRA files for bankruptcy or becomes insolvent, the Fund’s use of the proceeds of the agreement may be restricted while the other party, or its trustee or receiver, determines whether or not to enforce the Fund’s obligation to repurchase the securities.
TBA Commitments:
The Funds may enter into TBA commitments to purchase or sell securities for a fixed price at a future date. TBA commitments are considered securities in themselves, and involve a risk of loss if the value of the security to be purchased/sold declines/increases prior to settlement date, which is in addition to the risk of decline in the value of a Fund’s other assets. Unsettled TBA commitments are valued at the current value of the underlying securities, according to the procedures described under “Security Valuation”. As of March 31, 2020, the the Impact Bond Fund had outstanding TBA commitments.
Mortgage Backed Securities:
Because the Funds will focus on community development investments, such as securities backed by commercial and/or residential mortgage loans, it will be affected by risks not typically associated with funds that do not specialize in community development investments. These risks include credit and prepayment risk and risk due to default on underlying loans within a security. Changes in economic conditions, including delinquencies and/or defaults or assets underlying these securities, can affect the value, income and/or liquidity of such positions.
In addition, the Access Capital Community Investment Fund invests in certain mortgage backed securities that qualify under the Community Reinvestment Act of 1977 (“CRA”) in which the Fund may pay a premium for the geographically or other targeted nature of the securities. There can be no guarantee, however, that a similar premium will be received if the security is sold by the Fund.
Derivatives:
The Funds may use derivative instruments, including futures, forwards, options, indexed securities, swaps and inverse securities as tools in the management of portfolio assets. The Funds may use such derivatives through either the creation of long or short positions to hedge various investments, for investment purposes, for risk management and/or to increase income or gain to the Funds. Derivatives allow the Funds to manage their risk exposure more quickly and efficiently than other types of instruments. Derivatives may be riskier than other types of investments and could result in losses that significantly exceed a Fund’s original investment. Derivatives are subject to the risk that changes in the value of a derivative may not correlate perfectly with the underlying asset, rate or index. The use of derivatives may not be successful, resulting in losses to a Fund, and the cost of such strategies may reduce the Fund’s returns.
Hedging also involves the risk that changes in the value of the derivative will not match those of the holdings being hedged as expected by the Funds, in which case any losses on the holdings being hedged may not be reduced and may be increased. There can be no assurance that a Fund’s hedging strategy will reduce risk or that hedging transactions will be available or cost effective. The Funds are subject to interest rate risk in the normal course of pursuing their investment objectives by investing in various derivative financial instruments, as described below.
Financial Futures Contracts:
The Funds may enter into futures contracts in an effort to manage the duration of the portfolio and hedge against certain market risk. A futures contract on a securities index is an agreement obligating one party to pay, and entitling the other party to receive, during the term of the contract, cash payments based on the level of a specified securities index. Futures transactions involve brokerage costs and require a Fund to segregate assets to cover contracts that would require it to purchase securities or currencies. A Fund may lose the expected benefit of futures transactions if interest rates, exchange rates or securities prices change in an unanticipated manner. Such unanticipated changes may also result in lower overall performance than if a Fund had not entered into any futures transactions.
The Funds entered into U.S. Treasury Bond futures and U.S. Treasury Notes futures during the period ended March 31, 2020.
51
|
NOTES TO FINANCIAL STATEMENTS |
Upon entering into a futures contract, a Fund is required to pledge to the broker an amount of cash, U.S. government securities, or other assets equal to a certain percentage of the contract amount. Subsequent payments are made or received by the Funds each day, depending on the daily fluctuations in the fair value of the underlying instrument. A Fund would record an unrealized gain or loss each day equal to these daily payments.
Open futures contracts are shown on the Schedules of Portfolio Investments. Underlying collateral pledged for open futures contracts is the cash at brokers for financial futures contracts shown on the Statements of Assets and Liabilities at March 31, 2020.
| | | | | | | | |
| Fair Values of Derivative Financial Instrument as of March 31, 2020 | |
| Statement of Assets and Liabilities Location | |
| Asset Derivatives | |
| | | Access Capital
Community
Investment Fund | | | Impact
Bond Fund | |
Interest Rate Risk: | | | | | | | | |
Unrealized appreciation on futures contracts | | $ | 871,878 | | | $ | 482,879 | |
| | | | | | | | |
Total | | $ | 871,878 | | | $ | 482,879 | |
| | | | | | | | |
| | | | | | | | | |
| Liability Derivatives | |
| | | Access Capital
Community
Investment Fund | | | Impact
Bond Fund | |
Interest Rate Risk: | | | | | | | | |
Unrealized depreciation on futures contracts | | $ | 2,232,306 | | | $ | 139,380 | |
| | | | | | | | |
Total | | $ | 2,232,306 | | | $ | 139,380 | |
| | | | | | | | |
The effect of derivative instruments on the Statement of Operations during the period ended March 31, 2020 is as follows:
| | | | | | | | |
Derivative Instruments Categorized by Risk Exposure | | Access Capital
Community
Investment Fund | | | Impact
Bond Fund | |
Net realized Gain/(Loss) From: | | | | | | | | |
Interest Rate Risk: | | | | | | | | |
Financial futures contracts | | $ | 402,154 | | | $ | 244,576 | |
| | | | | | | | |
Total | | $ | 402,154 | | | $ | 244,576 | |
| | | | | | | | |
| | |
Derivative Instruments Categorized by Risk Exposure | | Access Capital
Community
Investment Fund | | | Impact
Bond Fund | |
Net Change in Unrealized Appreciation/(Depreciation) From: | | | | | | | | |
Interest Rate Risk: | | | | | | | | |
Financial futures contracts | | $ | (1,804,170 | ) | | $ | 342,366 | |
| | | | | | | | |
Total | | $ | (1,804,170 | ) | | $ | 342,366 | |
| | | | | | | | |
52
|
NOTES TO FINANCIAL STATEMENTS |
For the period ended March 31, 2020, the average volume of derivative activities based on ending quarterly outstanding amounts are as follows:
| | | | | | | | |
| | | Access Capital
Community
Investment Fund | | | Impact
Bond Fund | |
Futures long position (contracts) | | | 170 | | | | 38 | |
Futures short position (contracts) | | | 234 | | | | 22 | |
Counterparty Credit Risk:
Derivatives may also expose a Fund to counterparty risk (the risk that the derivative counterparty will not fulfill its contractual obligations). To the extent amounts due to the Funds from their counterparties are not fully collateralized contractually or otherwise, the Funds bear the risk of loss from counterpartynon-performance. A Fund’s maximum risk of loss from counterparty credit risk onover-the-counter (“OTC”) derivatives is generally the aggregate unrealized gain in excess of any collateral pledged by the counterparty to the Funds.
With exchange-traded futures, the exchange or clearinghouse, as counterparty to such instruments, guarantees against a possible default. The clearinghouse stands between the buyer and the seller of the contract; therefore, credit risk is limited to failure of the clearinghouse. While offset rights may exist under applicable law, the Fund does not have a contractual right of offset against a clearing broker or clearinghouse in the event of a default (including the bankruptcy or insolvency) of the clearing broker or clearinghouse. Additionally, credit risk exists in exchange-traded futures with respect to initial and variation margin that is held in a clearing broker’s customer accounts. While clearing brokers are required to segregate customer margin from their own assets, in the event that a clearing broker becomes insolvent or goes into bankruptcy and at that time there is a shortfall in the aggregate amount of margin held by the clearing broker for all its clients, typically the shortfall would be allocated on a pro rata basis across all the clearing broker’s customers, potentially resulting in losses to the Funds.
Affiliated Investments:
The Funds invest in another Fund of the Trust (an “Affiliated Fund”), U.S. Government Money MarketFund-RBC Institutional Class 1, as a cash sweep vehicle. The income earned by the Funds from the Affiliated Fund for the period is disclosed in the Statement of Operations. The table below details the transactions of the Funds in the Affiliated Fund.
| | | | | | | | | | | | | | | | | | | | |
| | | Value
September 30, 2019 | | | Purchases | | | Sales | | | Value
March 31, 2020 | | | Dividends | |
| Investments in U.S. Government Money Market Fund—RBC Institutional Class 1 | | | | | | | | | | | | | | | | | | | | |
Access Capital Community Investment Fund | | | $20,490,644 | | | | $75,402,590 | | | | $84,282,303 | | | | $11,610,931 | | | | $175,101 | |
Impact Bond Fund | | | 220,457 | | | | 17,872,267 | | | | 18,056,029 | | | | 36,695 | | | | 5,841 | |
Credit Enhancement:
Certain obligations held by the Funds have credit enhancement or liquidity features that may, under certain circumstances, provide for repayment of principal and interest on the obligation upon demand date, interest rate reset date or final maturity. These enhancements may include: letters of credit; liquidity guarantees; security purchase agreements; tender option purchase agreements and third party insurance.
Investment Transactions and Income:
Investment transactions are recorded on trade date. Dividend income is recorded on theex-dividend date. Realized gains and losses from investment transactions are calculated based on the cost of the
53
|
NOTES TO FINANCIAL STATEMENTS |
specific security (also known as identified cost basis). Interest income is recognized on the accrual basis and includes, where applicable, the amortization or accretion of premium or discount using the effective yield method. Paydown gains and losses on mortgage- and asset-backed securities are included in the financial statements as interest income.
Expense, Investment Income and Gain/Loss Allocation:
Each Fund pays the expenses that are directly related to its operations, such as custodian fees or advisory fees. Expenses incurred by the Trust, such as trustee or legal fees, are allocated among each of the Funds in the Trust either proportionately based upon each Fund’s relative net assets or using another reasonable basis such as equally across all Funds in the Trust, depending on the nature of the expense. Individual share classes within a Fund are charged expenses specific to that class, such as distribution fees and transfer agent fees. Within a Fund, expenses other than class specific expenses are allocated daily to each class based upon the proportion of relative net assets. Investment income and realized and unrealized gains or losses are allocated to each class of shares based on relative net assets.
Distributions to Shareholders:
Each Fund pays out any income that it receives, less expenses, in the form of dividends and capital gains to its shareholders. Income dividends are declared daily and paid monthly. Capital gain distributions are declared and paid at least annually. Distributions to shareholders are recorded on theex-dividend date. The amount of dividends and distributions are calculated based on federal income tax regulations, which may differ from US GAAP. These “book/tax” differences may be either temporary or permanent in nature. To the extent these differences are determined, as of the end of the tax year, to be permanent (e.g., reclassification of paydown gains and losses, and expiring capital loss carryforward), they are reclassified within a Fund’s capital account based on their federal tax basis treatment.
3. Agreements and Other Transactions with Affiliates:
The Trust has entered into an investment advisory agreement with RBCGAM-US under which RBCGAM-US manages each Funds’ assets and furnishes related office facilities, equipment, research and personnel. The agreement requires each Fund to pay RBCGAM-US a monthly fee based upon average daily net assets. Under the terms of the agreement, RBCGAM-US is entitled to receive fees based on a percentage of the average daily net assets of each of the Funds as follows:
| | | | |
| | | Annual Rate | |
Access Capital Community Investment Fund | | | 0.35% | |
Impact Bond Fund | | | 0.35% | |
RBCGAM-US has contractually agreed to waive fees and/or make payments in order to keep total operating expenses (excluding certain fees such as interest, taxes and acquired fund fees and expenses) of the Funds to the following levels pursuant to an expense limitation agreement.
| | | | | | | | | | | | | | | | |
| | | Class A | | | Class I | | | Class IS | | | Class R6 | |
| | | Annual Rate | | | Annual Rate | | | Annual Rate | | | Annual Rate | |
Access Capital Community Investment Fund | | | 0.80% | | | | 0.45% | | | | 0.40% | | | | N/A | |
Impact Bond Fund | | | 0.70% | | | | 0.45% | | | | N/A | | | | 0.40% | |
This expense limitation agreement is in place until January 31, 2021, and shall continue for additionalone-year terms unless terminated by either party at any time. The Advisor is entitled to recoup from the Fund or class the fees and/or operating expenses waived or reimbursed during any of the previous 12 months (3 years for the Impact Bond Fund), provided the Fund is able to do so and remain in compliance with the expense limitation in place at the time the fees were waived or expenses paid.
54
|
NOTES TO FINANCIAL STATEMENTS |
As of March 31, 2020, the amounts subject to possible recoupment under the expense limitation agreement were:
| | | | | | | | | | | | | | | | |
| | | FYE 9/30/18 | | | FYE 9/30/19 | | | FYE 9/30/20 | | | Total | |
Access Capital Community Investment Fund | | $ | — | | | $ | 286,770 | | | $ | 203,748 | | | $ | 490,518 | |
Impact Bond Fund | | | 129,537 | | | | 188,125 | | | | 70,773 | | | | 388,435 | |
RBCGAM-US may also voluntarily waive and/or reimburse operating expenses of any Fund from time to time. Any such voluntary program may be changed or eliminated at any time without notice, and expenses waived under such programs are not subject to recoupment.
RBCGAM-US voluntarily agreed to waive its investment advisory fees by the amount of investment advisory fees the Funds pay to RBCGAM-US indirectly through its investment in an affiliated money market fund. For the six months ended March 31, 2020, the amount waived was $17,173 and $548 for Access Capital Community Investment Fund and Impact Bond Fund, respectively, and is included in expenses waived/reimbursed by Advisor in the Statement of Operations.
RBCGAM-US serves asco-administrator to the Funds. BNY Mellon Investment Servicing (US) Inc. (“BNY Mellon”) serves asco-administrator and fund accounting agent. Services provided under the administrative services contract include providingday-to-day administration of matters related to the Funds, maintenance of their records and the preparation of reports. Under the terms of the administrative services contract, RBCGAM-US does not receive a fee for its role asco-administrator. BNY Mellon receives a fee for its services payable by each Fund based in part on each Fund’s average net assets. BNY Mellon’s fee is included with “Accounting fees” in the Statement of Operation.
RBCGAM-US also provides certainCRA-related administrative services to Class I shareholders of Access Capital Community Investment Fund pursuant to a Special Administrative Services Agreement with the Trust. Effective March 11, 2019, in consideration for such services and the assumption of related expenses, RBCGAM-US receives a fee of 0.05% of the average daily net assets of Class I shares of the Fund.
Certain Officers and Trustees of the Trust are affiliated with the Advisor. Such Officers and Trustees receive no compensation from the Funds for serving their respective roles.
The Trust currently pays each of the independent Trustees (Trustees of the Trust who are not directors, officers or employees of the Advisor, eitherCo-Administrator or Distributor) an annual retainer of $63,000. The Board Chairperson and Audit Committee Chairperson each receive an additional retainer of $2,500 annually, and all other trustees serving as Chair of a Board committee each receive an additional retainer of $1,000 annually. In addition, Independent Trustees receive a quarterly meeting fee of $6,500 for eachin-person Board meeting attended, a meeting fee of $1,500 for each telephonic or Special Board meeting attended, a $1,500 fee for each Board committee meeting attended, and are reimbursed for allout-of -pocket expenses relating to attendance at such meetings. These amounts are included in the Statements of Operations in “Trustee’ fees”.
In conjunction with the initial launch of the Impact Bond Fund and the subsequent launch of Class A shares, the Advisor invested seed capital in the Fund to provide the Fund with its initial investment assets. The table below shows, as of March 31, 2020, the Fund’s net assets, the shares held by the Advisor, and the percent of total net assets represented by the Advisor’s investment.
| | | | | | | | | | | | |
| | | | | | Shares held | | | % of Fund | |
| | | Net Assets | | | by Advisor | | | Net Assets | |
Impact Bond Fund | | $ | 32,415,119 | | | | 537,333 | | | | 8.6% | |
4. Fund Distribution:
Each of the Funds that offers Class A shares has adopted a Master Distribution12b-1 Plan (the “Plan”) in which Quasar Distributors LLC (the “Distributor”) acts as the Funds’ distributor. The Plan permits each Fund to make payments for, or to reimburse the Distributor for, distribution-related costs and expenses of marketing shares of Class A covered under the Plan, and/or for providing shareholder
55
|
NOTES TO FINANCIAL STATEMENTS |
services. The Plan does not apply to Class I and Class R6. The following chart shows the current Plan fee rate for Class A.
| | | | |
| | | Class A | |
12b-1 Plan Fee | | | 0.25%* | |
* Under the12b-1 plan, the maximum fee rate for Class A shares is 0.50%. Currently the Board has approved an annual limit of 0.25%.
Plan fees are based on average daily net assets of Class A. Up to 0.25% of each Plan fee may be designated as a service fee, as defined by the applicable rules of the Financial Industry Regulatory Authority. The Distributor, subject to applicable legal requirements, may waive the Plan fee voluntarily, in whole or in part. For the period ended March 31, 2020, there were no fees waived by the Distributor.
5. Securities Transactions:
The cost of securities purchased and proceeds from securities sold (excluding securities maturing less than one year from acquisition) for the period ended March 31, 2020 were as follows:
| | | | | | | | | | | | | | | | |
| | | Purchases | | | Sales | | | Purchases | | | Sales | |
| | | (Excl. U.S. Gov’t) | | | (Excl. U.S. Gov’t) | | | of U.S. Gov’t. | | | of U.S. Gov’t. | |
Access Capital Community Investment Fund | | | $ 2,700,140 | | | | $2,043,027 | | | | $45,180,370 | | | | $64,510,608 | |
Impact Bond Fund | | | 10,263,209 | | | | 4,393,792 | | | | 3,014,271 | | | | 1,326,002 | |
6. Capital Share Transactions:
The Trust is authorized to issue an unlimited number of shares of beneficial interest (“Shares Outstanding”) without par value. Transactions in capital stock of the Funds are summarized on the following pages:
| | | | | | | | | | | | | | | | | | | | | | | | |
| | | Access Capital Community Investment Fund | | | Impact Bond Fund | |
| | | For the
Six Months
Ended
March 31,
2020
(Unaudited) | | | For the
Year Ended
September 30,
2019 | | | For the
Six Months
Ended
March 31,
2020
(Unaudited) | | | For the
Year Ended
September 30,
2019 | |
CAPITAL TRANSACTIONS: | | | | | | | | | | | | | | | | | | | | | | | | |
Class A | | | | | | | | | | | | | | | | | | | | | | | | |
Proceeds from shares issued | | | | | | $ | 1,096,483 | | | | | | | $ | 3,909,455 | | | $ | 10,000 | | | $ | — | |
Distributions reinvested | | | | | | | 197,263 | | | | | | | | 464,307 | | | | 36 | | | | — | |
Cost of shares redeemed | | | | | | | (1,596,482 | ) | | | | | | | (9,888,061 | ) | | | — | | | | — | |
| | | | | | | | | | | | | | | | | | | | | | | | |
Change in Class A | | | | | | $ | (302,736 | ) | | | | | | $ | (5,514,299 | ) | | $ | 10,036 | | | $ | — | |
| | | | | | | | | | | | | | | | | | | | | | | | |
Class I | | | | | | | | | | | | | | | | | | | | | | | | |
Proceeds from shares issued | | | | | | $ | 28,701,528 | | | | | | | $ | 65,426,675 | | | $ | 10,180,606 | | | $ | 3,481,575 | |
Distributions reinvested | | | | | | | 4,075,874 | | | | | | | | 7,859,670 | | | | 313,495 | | | | 132,166 | |
Cost of shares redeemed | | | | | | | (56,738,031 | ) | | | | | | | (115,429,827 | ) | | | (372,045 | ) | | | (114,580 | ) |
| | | | | | | | | | | | | | | | | | | | | | | | |
Change in Class I | | | | | | $ | (23,960,629 | ) | | | | | | $ | (42,143,482 | ) | | $ | 10,122,056 | | | $ | 3,499,161 | |
| | | | | | | | | | | | | | | | | | | | | | | | |
56
|
NOTES TO FINANCIAL STATEMENTS |
| | | | | | | | | | | | | | | | | | | | | | | | |
| | | Access Capital Community Investment
Fund | | | Impact Bond Fund | |
| | | For the
Six Months
Ended
March 31,
2020
(Unaudited) | | | For the
Year Ended
September 30,
2019 | | | For the
Six Months
Ended
March 31,
2020
(Unaudited) | | | For the
Year Ended
September 30,
2019 | |
Class IS - Capital Transactions | | | | | | | | | | | | | | | | | | | | | | | | |
Class IS - Proceeds from shares issued | | | | | | $ | 1,757,473 | | | | | | | $ | 6,290,245 | | | $ | — | | | $ | — | |
Class IS - Distributions reinvested | | | | | | | 93,323 | | | | | | | | 76,072 | | | | — | | | | — | |
Class IS - Cost of shares redeemed | | | | | | | (766,999 | ) | | | | | | | (589,230 | ) | | | — | | | | — | |
| | | | | | | | | | | | | | | | | | | | | | | | |
Total Class IS - Capital Transactions | | | | | | $ | 1,083,797 | | | | | | | $ | 5,777,087 | | | $ | — | | | $ | — | |
| | | | | | | | | | | | | | | | | | | | | | | | |
Class R6 | | | | | | | | | | | | | | | | | | | | | | | | |
Proceeds from shares issued | | | | | | $ | — | | | | | | | $ | — | | | $ | 1,000,000 | | | $ | 13,507,000 | |
Distributions reinvested | | | | | | | — | | | | | | | | — | | | | 355,573 | | | | 335,480 | |
Cost of shares redeemed | | | | | | | — | | | | | | | | — | | | | (3,100,000 | ) | | | — | |
| | | | | | | | | | | | | | | | | | | | | | | | |
Change in Class R6 | | | | | | $ | — | | | | | | | $ | — | | | $ | (1,744,427 | ) | | $ | 13,842,480 | |
| | | | | | | | | | | | | | | | | | | | | | | | |
Change in net assets resulting from capital transactions | | | | | | $ | (23,179,568 | ) | | | | | | $ | (41,880,694 | ) | | $ | 8,387,665 | | | $ | 17,341,641 | |
| | | | | | | | | | | | | | | | | | | | | | | | |
SHARE TRANSACTIONS: | | | | | | | | | | | | | | | | | | | | | | | | |
Class A | | | | | | | | | | | | | | | | | | | | | | | | |
Issued | | | | | | | 113,459 | | | | | | | | 446,703 | | | | 985 | | | | — | |
Reinvested | | | | | | | 21,836 | | | | | | | | 52,744 | | | | 4 | | | | — | |
Redeemed | | | | | | | (176,698 | ) | | | | | | | (1,126,486 | ) | | | — | | | | — | |
| | | | | | | | | | | | | | | | | | | | | | | | |
Change in Class A | | | | | | | (41,403 | ) | | | | | | | (627,039 | ) | | | 989 | | | | — | |
| | | | | | | | | | | | | | | | | | | | | | | | |
Class I | | | | | | | | | | | | | | | | | | | | | | | | |
Issued | | | | | | | 3,181,290 | | | | | | | | 7,407,147 | | | | 1,001,256 | | | | 357,310 | |
Reinvested | | | | | | | 451,429 | | | | | | | | 892,174 | | | | 30,984 | | | | 13,289 | |
Redeemed | | | | | | | (6,237,057 | ) | | | | | | | (13,091,772 | ) | | | (36,610 | ) | | | (11,384 | ) |
| | | | | | | | | | | | | | | | | | | | | | | | |
Change in Class I | | | | | | | (2,604,338 | ) | | | | | | | (4,792,451 | ) | | | 995,630 | | | | 359,215 | |
| | | | | | | | | | | | | | | | | | | | | | | | |
Class IS - Share Transactions | | | | | | | | | | | | | | | | | | | | | | | | |
Class IS - Issued | | | | | | | 195,729 | | | | | | | | 715,622 | | | | — | | | | — | |
Class IS - Reinvested | | | | | | | 10,345 | | | | | | | | 8,506 | | | | — | | | | — | |
Class IS - Redeemed | | | | | | | (84,833 | ) | | | | | | | (65,542 | ) | | | — | | | | — | |
| | | | | | | | | | | | | | | | | | | | | | | | |
57
|
NOTES TO FINANCIAL STATEMENTS |
| | | | | | | | | | | | | | | | | | | | | | | | |
| | | Access Capital Community Investment
Fund | | | Impact Bond Fund | |
| | | For the
Six Months
Ended
March 31,
2020
(Unaudited) | | | For the
Year Ended
September 30,
2019 | | | For the
Six Months
Ended
March 31,
2020
(Unaudited) | | | For the
Year Ended
September 30,
2019 | |
Total Class IS - Share | | | | | | | | | | | | | | | | | | | | | | | | |
Transactions | | | | | | | 121,241 | | | | | | | | 658,586 | | | | — | | | | — | |
| | | | | | | | | | | | | | | | | | | | | | | | |
Class R6 | | | | | | | | | | | | | | | | | | | | | | | | |
Issued | | | | | | | — | | | | | | | | — | | | | 98,329 | | | | 1,389,836 | |
Reinvested | | | | | | | — | | | | | | | | — | | | | 35,086 | | | | 33,633 | |
Redeemed | | | | | | | — | | | | | | | | — | | | | (305,720 | ) | | | — | |
| | | | | | | | | | | | | | | | | | | | | | | | |
Change in Class R6 | | | | | | | — | | | | | | | | — | | | | (172,305 | ) | | | 1,423,469 | |
| | | | | | | | | | | | | | | | | | | | | | | | |
Change in shares resulting from capital transactions | | | | | | | (2,524,500 | ) | | | | | | | (4,760,904 | ) | | | 824,314 | | | | 1,782,684 | |
| | | | | | | | | | | | | | | | | | | | | | | | |
7. Federal Income Taxes:
It is the policy of each Fund to continue to qualify as a regulated investment company by complying with the provisions available to certain investment companies, as defined under Subchapter M of the Internal Revenue Code, and to distribute substantially all of its net investment income and net realized capital gains. Therefore, no federal tax liability is recorded in the financial statements of each Fund.
Fund Management has analyzed the Fund’s tax positions taken or expected to be taken on federal income tax returns for all open tax years (the tax years ended September 30 of the years, 2016, 2017, 2018 and 2019 for Access Capital Community Investment Fund) and 2018 and 2019 for Impact Bond Fund and has concluded that no provision for federal income tax is required in the Fund’s financial statements. The Fund’s federal and state income and federal excise tax returns for tax years for which the applicable statutes of limitations have not expired are subject to examination by the Internal Revenue Service and state departments of revenue.
As of March 31, 2020, the tax cost of investments and the breakdown of unrealized appreciation (depreciation) for each Fund was as follows:
| | | | | | | | | | | | | | | | |
| | | | | | | | | | | | Net Unrealized | |
| | | Tax Cost Of | | | Unrealized | | | Unrealized | | | Appreciation/ | |
| | | Investments | | | Appreciation | | | Depreciation | | | (Depreciation) | |
Access Capital Community Investment Fund | | $ | 534,963,787 | | | $ | 23,522,604 | | | $ | (3,395,800 | ) | | $ | 20,126,804 | |
Impact Bond Fund | | | 31,354,904 | | | | 1,058,517 | | | | (211,046 | ) | | | 847,471 | |
58
|
NOTES TO FINANCIAL STATEMENTS |
The difference between book basis and tax basis unrealized appreciation/depreciation is attributable primarily to the taxmark-to-market of derivatives, tax deferrals on wash sales, and mixed treasury straddle losses.
The tax character of distributions during the year ended September 30, 2019 were as follows:
| | | | | | | | | | | | |
| | | Distributions Paid From | |
| | | | | | | | | Total | |
| | | Ordinary | | | Total Taxable | | | Distributions | |
| | | Income | | | Distributions | | | Paid | |
Access Capital Community Investment Fund | | $ | 16,157,686 | | | $ | 16,157,686 | | | $ | 16,157,686 | |
Impact Bond Fund | | | 467,646 | | | | 467,646 | | | | 467,646 | |
Total distributions paid may differ from the Statements of Changes in Net Assets because distributions are recognized when actually paid for tax purposes.
The tax basis of components of accumulated earnings/(losses) and tax character of distributions are determined at fiscal year end, and will be included in the Annual Report dated September 30, 2020.
As of September 30, 2019, the Access Capital Fund had capital loss carryforwards expire in the amount of $4,011,206 and the Impact Bond Fund had capital loss carryforwards utilized in the amount of $120,961.
As of September 30, 2019, the Access Capital Community Investment Fund had a short-term capital loss carryforward of $10,313,220 and a long-term capital loss carryforward of $19,421,944 available to offset future realized capital gains in accordance with the Regulated Investment Company Modernization Act of 2010. These capital loss carryforwards are not subject to expiration and must first be utilized to offset future realized gains of the same character and must be utilized prior to the utilization of the loss carryforwards subject to expiration that are described above.
Under current tax law, Post-October Capital Losses and Late-Year Ordinary Losses may be deferred and treated as occurring on the first business day of the following fiscal year for tax purposes. The Funds did not have any Post-October Capital Losses or Late-Year Ordinary Losses for the year ending September 30, 2019.
8. Line of Credit
The Funds are participants in an uncommitted, unsecured $500,000,000 line of credit with U.S. Bank, N.A. (the “Bank”), the Funds’ custodian, to be used to fund shareholder redemption requests and for other short-term temporary or emergency general business purposes. The line of credit has a scheduled termination date of August 1, 2020. Interest is charged on borrowings under this line of credit at the Bank’s prime lending rate per annum. Since each Fund participates in this line of credit, there is no assurance that an individual fund will have access to all or any part of the $500,000,000 at any particular time. There were no loans outstanding pursuant to this line of credit at March 31, 2020. During the period ended March 31, 2020, the Funds did not utilize this line of credit.
9. Significant Risks
As of March 31, 2020, the Funds had omnibus accounts which owned more than 10% of a Fund’s outstanding shares as shown below:
| | | | | | | | |
| | | # of Omnibus Accounts | | | % of Fund | |
Access Capital Community Investment Fund | | | 1 | | | | 13.1% | |
Impact Bond Fund | | | 1 | | | | 17.0% | |
In addition, three unaffiliated shareholders owned in aggregate 64.4% of the Impact Bond Fund as of March 31, 2020. Significant transactions by these shareholders may impact the Funds’ performance.
59
|
NOTES TO FINANCIAL STATEMENTS |
Market risk:
One or more markets in which a Fund invests may go down in value, sometimes sharply and unpredictably, and the value of a Fund’s portfolio securities may fall or fail to rise. Market risk may affect a single issuer, sector of the economy, industry or the market as a whole. In addition, global economies and financial markets are becoming increasingly interconnected, and political, economic and other conditions and events (including, but not limited to, natural disasters, pandemics, epidemics, and social unrest) in one country, region, or financial market may adversely impact issuers in a different country, region or financial market. Furthermore, the occurrence of, among other events, natural orman-made disasters, severe weather or geological events, fires, floods, earthquakes, outbreaks of disease (such asCOVID-19, avian influenza or H1N1/09), epidemics, pandemics, malicious acts, cyber-attacks, terrorist acts or the occurrence of climate change, may also adversely impact the performance of a Fund. Such events could adversely impact issuers, markets and economies over the short- and long-term, including in ways that cannot necessarily be foreseen. A Fund could be negatively impacted if the value of a portfolio holding were harmed by such political or economic conditions or events. Moreover, such negative political and economic conditions and events could disrupt the processes necessary for a Fund’s operations.
10. Subsequent Events:
Fund Management has evaluated the impact of all subsequent events on the Funds and has determined that there were no subsequent events requiring recognition or disclosure in the financial statements.
60
|
SHARE CLASS INFORMATION (UNAUDITED) |
The Funds offer Class A, Class IS, Class I and Class R6 shares.
Class A
Class A shares are available for purchase primarily through investment advisors, broker-dealers, banks and other financial services intermediaries. Class A shares are currently subject to a maximumup-front sales charge of 3.75% and a 1.00% CDSC for redemption within 12 months of a $1 million or greater purchase. Class A shares currently include a 0.25% annual12b-1 service and distribution fee.
Class I
Class I shares are intended for investors meeting certain minimum investment thresholds. This share class does not have anup-front sales charge (load) or a12b-1 service and distribution fee.
Class IS
Class IS shares are offered in Access Capital Community Investment Fund and are available to investors who meet the $2,500 minimum initial investment requirement. This share class does not have anup-front sales charge (load) or a12b-1 service and distribution fee.
Class R6
Class R6 shares are available in Impact Bond Fund. This share class is intended for investors meeting certain minimum investment thresholds. This share class does not have anup-front sales charge (load) or a12b-1 service and distribution fee.
61
|
SUPPLEMENTAL INFORMATION (UNAUDITED) |
Shareholder Expense Examples
As a shareholder of the the RBC Funds, you incur two types of costs: (1) transaction costs and (2) ongoing costs, including management fees; and other Fund expenses. This example is intended to help you understand your ongoing costs (in dollars) of investing in the RBC Funds and to compare these costs with the ongoing costs of investing in other mutual funds.
The example is based on an investment of $1,000 invested at the beginning of the period and held for the entire period from October 1, 2019 through March 31, 2020.
Actual Expenses
The table below provides information about actual account values and actual expenses. You may use the information below, together with the amount you invested, to estimate the expenses that you paid over the period. Simply divide your account value by $1,000 (for example, an $8,600 account value divided by $1,000 = 8.6), then multiply the result by the number in the table under the heading entitled “Expenses Paid During Period” to estimate the expenses you paid on your account during this period.
| | | | | | | | | | | | | | | | |
| | | Beginning
Account Value
10/1/19 | | | Ending
Account Value
3/31/20 | | | Expenses Paid
During Period*
10/1/19–3/31/20 | | | Annualized
Expense Ratio
During Period
10/1/19–3/31/20 | |
Access Capital Community Investment Fund | | | | | | | | | | | | | |
Class A | | | $1,000.00 | | | | $1,025.00 | | | | $4.05 | | | | 0.80% | |
Class I | | | 1,000.00 | | | | 1,026.80 | | | | 2.28 | | | | 0.45% | |
Class IS | | | 1,000.00 | | | | 1,027.10 | | | | 2.03 | | | | 0.40% | |
Impact Bond Fund | | | | | | | | | | | | | | | | |
Class A | | | 1,000.00 | | | | 1,034.30 | | | | 3.56 | | | | 0.70% | |
Class I | | | 1,000.00 | | | | 1,035.60 | | | | 2.29 | | | | 0.45% | |
Class R6 | | | 1,000.00 | | | | 1,036.80 | | | | 2.04 | | | | 0.40% | |
*Expenses are equal to the average account value times the Fund’s annualized expense ratio multiplied by 183/366 (to reflect one half year period).
62
|
SUPPLEMENTAL INFORMATION (UNAUDITED) |
Hypothetical Example for Comparison Purposes
The table below provides information about hypothetical account values and hypothetical expenses based on each RBC Funds’ actual expense ratio and an assumed rate of return of 5% per year before expenses, which is not the Fund’s actual return. The hypothetical account values and expenses may not be used to estimate the actual ending account balance or expenses you paid for the period. You may use this information to compare this 5% hypothetical example with the 5% hypothetical examples that appear in the shareholder reports of other funds.
Please note that the expenses shown in the table are meant to highlight your ongoing costs only and do not reflect any transactional costs, such as sales charges (loads), redemption fees, or exchange fees. Therefore, the table is useful in comparing ongoing costs only, and will not help you determine the relative total costs of owning different funds. In addition, if these transactional costs were included, your costs would have been higher.
| | | | | | | | | | | | | | | | |
| | | Beginning
Account Value
10/1/19 | | | Ending
Account Value
3/31/20 | | | Expenses Paid
During Period*
10/1/19-3/31/20 | | | Annualized
Expense Ratio
During Period
10/1/19-3/31/20 | |
Access Capital Community Investment Fund | | | | | | | | | | | | | |
Class A | | | $1,000.00 | | | | $1,021.00 | | | | $4.04 | | | | 0.80% | |
Class I | | | 1,000.00 | | | | 1,022.75 | | | | 2.28 | | | | 0.45% | |
Class IS | | | 1,000.00 | | | | 1,023.00 | | | | 2.02 | | | | 0.40% | |
Impact Bond Fund | | | | | | | | | | | | | | | | |
Class A | | | 1,000.00 | | | | 1,021.50 | | | | 3.54 | | | | 0.70% | |
Class I | | | 1,000.00 | | | | 1,022.75 | | | | 2.28 | | | | 0.45% | |
Class R6 | | | 1,000.00 | | | | 1,023.00 | | | | 2.02 | | | | 0.40% | |
*Expenses are equal to the average account value times the Fund’s annualized expense ratio multiplied by 183/366 (to reflect one half year period).
63
|
LIQUIDITY RISK DISCLOSURE (UNAUDITED) |
Statement Regarding Liquidity Risk Management Program
This section discusses the operation and effectiveness of the Liquidity Risk Management Program (the “Program”) of RBC Funds Trust (the “Trust”), including each of its series (each, a “Fund” and collectively, the “Funds”), established in accordance with Rule22e-4 under the Investment Company Act of 1940, as amended (the “Liquidity Rule”). The Board of Trustees of the Trust (the “Board”), including a majority of the Trustees who are not “interested persons” as defined in the 1940 Act, approved the Program on behalf of each Fund, as required pursuant to the Liquidity Rule. The Board also approved the designation of RBC Global Asset Management (U.S.) Inc. (“RBC”), the investment adviser to each Fund, as the Program Administrator for the Program. RBC administersday-to-day implementation of the Program through a Liquidity Risk Committee (the “Committee”), as set forth in the Program.
RBC, as Program Administrator, provided the Board with a report addressing the operation of the Program and assessing its adequacy and effectiveness of implementation, including, if applicable, the operation of any highly liquid investments minimum (“HLIM”) and any material changes to the Program (the “Report”).
The Report covered the year ending December 31, 2019 (the “Review Period”).
I. Key Conclusions of the Report
The Program, as and implemented, is reasonably designed to assess and manage each Fund’s liquidity risk. During the Review Period, the Program was implemented and operated effectively to achieve the goal of assessing and managing each Fund’s liquidity risk. No Fund was required to set an HLIM and each Fund was able to meet requests for redemption without significant dilution of remaining investors’ interests in the Fund. There were no material changes to the Program implemented during the Review Period.
II. Summary of the Review
A. Liquidity Risk Assessment and Review
Throughout the Review Period, the Program Administrator, in consultation with investment personnel, monitored the Funds’ portfolio liquidity and liquidity risk on an ongoing basis, as described in the Program and in Board reporting throughout the Review Period.
The Program Administrator also conducted an annual review assessing each Fund’s liquidity risk as described in the Report, in accordance with the requirements of the Program and the Liquidity Rule, taking into account the following factors enumerated in the Liquidity Rule and identified in the Program, as applicable:
a. Each Fund’s investment strategy and liquidity of portfolio investments during both normal and reasonably foreseeable stressed conditions, including: (i) whether the Fund’s investment strategy is appropriate for anopen-end fund; (ii) the extent to which the Fund’s strategy involves a relatively concentrated portfolio or large positions in particular issuers; (iii) the Fund’s use of borrowings for investment purposes; and (iv) the Fund’s use of derivatives (including for hedging purposes);
b. Short-term and long-term cash flow projections during both normal and reasonably foreseeable stressed conditions; and
c. Holdings of cash and cash equivalents, as well as borrowing arrangements and other funding sources.
Investment Strategy and Portfolio Liquidity. The Program Administrator considered the factors identified above, among others, during both normal and reasonably foreseeable stressed conditions as provided in the Program. Pursuant to the review, the Program Administrator determined that Fund’s investment strategy and use of derivatives are appropriate for anopen-end fund.
Cash Flow. The Funds’ cash flows did not have a material effect on the ability to meet redemptions during the Review Period.
64
|
LIQUIDITY RISK DISCLOSURE (UNAUDITED) |
Holdings of Cash and Borrowing Arrangements. As described in the Report, the Program Administrator determined that the Funds’ holdings of cash and borrowing arrangements were adequate for meeting the Funds’ expected cash flow needs to meet redemptions during the Review Period.
In light of the assessment and review as discussed above, the Program Administrator did not recommend any material changes in the management of the Funds’ liquidity risks, including with respect to any of the above factors.
B. Portfolio Holdings Classifications
During the Review Period, each Fund’s portfolio holdings (including derivative investments) were classified monthly as Highly Liquid Investments, Moderately Liquid Investments, Less Liquid Investments and Illiquid Investments pursuant to the Program, as required by the Liquidity Rule.
During the Review Period, the Funds classified portfolio investments (including, as applicable, derivatives transactions) according to asset class when appropriate, as described in Section IV.B of the Program.
Market Depth—Reasonably Anticipated Trading Size. In classifying and reviewing its portfolio investments or asset classes (as applicable), the Funds must determine whether trading varying portions of a position in a particular portfolio investment or asset class, in sizes that the Fund would reasonably anticipate trading, is reasonably expected to significantly affect its liquidity, and if so, the Fund must take this determination into account when classifying the liquidity of that investment or asset class. There were no changes to the Reasonably Anticipated Trading Size assumptions for the Funds during the Review period.
Classification Review. As required by the Liquidity Rule, the Funds reviewed liquidity classifications on a monthly basis during the Review Period as described in Section IV of the Program. The Committee met monthly to review its portfolio investments’ classifications in connection with recording the liquidity classification for each portfolio investment for reporting on FormN-PORT. The Program Administrator oversaw the Funds’ process for classifying portfolio holdings under the Rule and reviewed the classifications, as described in the Program. This review included a review of the methodology and data inputs used. During the Review Period, the Program Administrator determined that there were no material operational issues with the process for classifying portfolio holdings.
C. HLIM
The Program Administrator reviewed the process and standards for determining that each Fund primarily holds investments that are highly liquid. There were no changes recommended in the Report with respect to the status of any Fund as a Primarily Highly Liquid Fund (“PHLF”) and each Fund qualified as a PHLF on an ongoing basis during the Review Period as described in the Report. Accordingly, an HLIM was not required for any Fund during the Review Period pursuant to the relevant provisions of the Program.
D. Compliance with the 15% Limitation on Illiquid Investments
Pursuant to the Liquidity Rule, no Fund may acquire any illiquid investment if, after the acquisition, the Fund would have invested more than 15% of its assets in illiquid investments that are assets (the “15% Limit”). The Program Administrator monitored compliance with the 15% Limit as described in the Program. During the Review Period, the Funds operated in accordance with the relevant provisions of the Program with respect to the 15% Limit.
E. Redemptions in Kind
There were no redemptionsin-kind effected by any Fund during the Review Period.
65
This Page Intentionally Left Blank
66
This Page Intentionally Left Blank
67
This Page Intentionally Left Blank
68
This Page Intentionally Left Blank
69
This Page Intentionally Left Blank
70
This Page Intentionally Left Blank
71
This Page Intentionally Left Blank
72
RBC Funds
P.O. Box 701
Milwaukee, WI 53201-0701
800-422-2766
www.rbcgam.us
Performance data represents past performance and does not guarantee future results. The principal value of an investment and investment return will fluctuate so that an investor’s shares, when redeemed, may be worth more or less than their original cost.
This report and the financial statements contained herein are provided for the information of RBC Funds shareholders. This report is not authorized for distribution to prospective investors unless preceded or accompanied by a current prospectus, which contains information concerning investment objectives, risks, charges and expenses of the funds. Please read the prospectus carefully before investing.
This report and the financial statements contained herein are not intended to be a forecast of future events, a guarantee of future results, or investment advice. There is no assurance that certain securities will remain in or out of each fund’s portfolio. The views expressed in this report reflect those of the portfolio managers through the period ended March 31, 2020.
NOT FDIC INSURED • NO BANK GUARANTEE • MAY LOSE VALUE
RBC Global Asset Management (U.S.) Inc. serves as investment advisor for the RBC Funds. RBC Funds are distributed by Quasar Distributors LLC.

The RBC Funds are pleased to offer shareholder reports printed entirely on Forest Stewardship Council® certified paper. FSC® certification ensures that the paper used in this report contains fiber from well-managed and responsibly harvested forests that meet strict environmental and socioeconomic standards.
RBCF-II SAR03-20
RBC Global Asset Management Semi-Annual Report For the six months ended March 31, 2020 RBC BlueBay Emerging Market Debt Fund RBC BlueBay Global Bond Fund RBC BlueBay High Yield Bond Fund Beginning on January 1, 2021, as permitted by regulations adopted by the U.S. Securities and Exchange commission, paper copies of the Funds’ annual and semi-annual shareholder reports will no longer be sent by mail, unless you specifically request paper copies of the reports. Instead, the reports will be made available on the Funds’ website, and you will be notified by mail each time a report is posted and provided with a website link to access the report. If you already elected to receive shareholder reports electronically, you will not be affected by this change and you need not take any action. You may elect to receive shareholder reports and other communications from a Fund electronically anytime by contacting your financial intermediary (such as a broker-dealer or bank) or, if you are a direct investor, by calling800-422-2766. You may elect to receive all future reports in paper free of charge. If you invest through a financial intermediary, you can contact your financial intermediary to request that you continue to receive paper copies of your shareholder reports. If you invest directly with a Fund, you can call800-422-2766 to let the Fund know you wish to continue receiving paper copies of your shareholder reports. Your election to receive reports in paper will apply to all Funds held in your account if you invest through your financial intermediary or all Funds held with the fund complex if you invest directly with a Fund.
| | | | | | | | |
PORTFOLIO MANAGERS | | | | | | | | |
| | | | | | | | | |
| RBC Global Asset Management (U.S.) Inc. (“RBCGAM-US”) serves as the investment advisor and BlueBay Asset Management LLP (“BlueBay”) serves as an investmentsub-advisor to each of the Funds and BlueBay Asset Management USA LLC (“BlueBay US”) serves as an investmentsub-advisor for the RBC BlueBay High Yield Bond Fund and RBC BlueBay Global Bond Fund. Thesub-advisors are responsible for the overall management of the Funds’ portfolios. The individuals primarily responsible for theday-to-day management of the Funds’ portfolios are set forth below. | | | | | | | | |
BlueBay Emerging Market Debt Fund | | | | | | | | |
Polina Kurdyavko | | | | | | | | |
| | | |
| Partner, Senior Portfolio Manager | | | | | | | | |
| | | |
| Polina is Head of Emerging Markets and Senior Portfolio Manager at BlueBay. Polina started her career in emerging markets after the Russian financial crisis in 1988 and has, since then, gained expertise across a broad range of emerging market financial assets. Polina joined BlueBay in July 2005 from UBS where she was a credit analyst in EM corporate research. Her role encompassed coverage of EM issuers as well as research support for primary issuance of corporate debt. Prior to this, Polina was with Alliance Capital where she was an emerging markets equity analyst and then moved on to pioneer emerging markets quantitative research at the firm. She started her career in a macro research boutique in Russia. Polina holds an MSc (Hons) in Finance from the people’s Friendship University of Russia, Moscow and is a CFA charterholder. | | | | | | | | |
BlueBay Global Bond Fund | | | | | | | | |
Kaspar Hense | | | | | | | | |
| Senior Portfolio Manager | | | | | | | | |
| | | |
| Kaspar Hense is a Senior portfolio Manager within BlueBay’s Investment Grade team. Prior to joining BlueBay, Kaspar worked for three years at Toronto Dominion Securities in their global fixed income, capital markets group covering German clients. Previously, Kaspar spent six years with Deutsche Asset and Wealth Management where he was responsible for the global aggregate bond strategy. Kaspar began his career at Merrill Lynch in 2005 as an analyst. He holds a Master’s degree in Financial Management from a joint programme of the Christian Albrechts University of Kiel and the University of San Diego; and a Master’s degree in Economics from the Christian Albrechts University of Kiel. Kaspar is also a CFA charterholder. | | | | | | | | |
Mark Dowding | | | | | | | | |
| | | |
Partner, Chief Investment Officer | | | | | | | | |
Senior Portfolio Manager | | | | | | | | |
| | | |
| Mark Dowding is Chief Investment Officer at BlueBay. He has over 25 years’ investment experience as a macro fixed income investor and has been a senior portfolio manager at BlueBay since 2010. As a macro risk taker, Mark actively pursues an open dialogue with policy makers and opinion formers, believing that proprietary research is key to gaining insights in order to generate strong investment returns. Prior to joining BlueBay, Mark was Head of Fixed Income in Europe for Deutsche Asset Management, a role he previously occupied at Invesco. He started his career as a fixed income portfolio manager at Morgan Grenfell in 1993 and holds a BSc (Hons) in Economics from the University of Warwick. | | | | | | | | |
1
| | | | | | |
| | | | | | PORTFOLIO MANAGERS |
| | | | | | |
| | | | | | Alexandria Sun |
| | | | | | Portfolio Manager |
| | | | | | Alexandria Sun is a Portfolio Manager within BlueBay’s Investment Grade team with a focus on government and global aggregate portfolios. She was a rotational associate at RBC Global Asset Management in Toronto, Canada, before joining BlueBay in July 2017. Prior to RBC, she was working as an analyst in the fixed income team at Deutsche Asset Management in New York. Alexandria earned a BA degree in Economics and English Literature from Cornell University. She also holds a Master’s degree in Economics from University of Toronto. Alexandria is a CFA charterholder. |
| | | | | | BlueBay High Yield Bond Fund |
| | | | | | Justin Jewell |
| | | |
| | | | | | Co-Head of Global Leveraged Finance |
| | | | | | Senior Portfolio Manager |
| | | |
| | | | | | Justin isCo-Head of BlueBay’s Global Leveraged Finance Long-Only Strategies and a senior portfolio manager within the Global Leveraged Finance Group. Justin joined BlueBay in April 2009, initially as Head of High Yield Trading, before moving into portfolio management at the beginning of 2012. He has over 17 years’ industry experience and spent a large part of his career at UBS where, most recently, he was Director of High Yield and Distressed Trading in Europe. Justin worked as a senior trader at MKM Longboat LLP between June and November 2008, though he returned to UBS after the fund wound down. Justin has a BSc in Economics from the London School of Economics and Political Science. |
| | | | | | Andrzej Skiba |
| | | |
| | | | | | Senior Portfolio Manager |
| | | |
| | | | | | Andrzej Skiba joined BlueBay in February 2005 and is a Senior Portfolio Manager responsible for the Developed Markets team and is based in BlueBay’s office in Stamford, Connecticut. Andrzej spent his first four years at BlueBay as a credit analyst covering the TMT, utilities and retail sectors for the Investment Grade team. Prior to BlueBay, Andrzej worked for Goldman Sachs as a credit analyst covering European investment grade telecom, media and utility sectors. Andrzej holds a BSc (Hons) in Management and International Business Economics from UMIST and is a CFA charterholder. |
| | | | | | Tim Leary |
| | | |
| | | | | | Portfolio Manager |
| | | |
| | | | | | Tim Leary is responsible for portfolio management of the RBC BlueBay High Yield Bond Fund. Tim joined BlueBay in January 2012 as Head of Trading, North America within the Global Leveraged Finance Group based in the Stamford, Connecticut, office before being promoted to his current role in January 2017. Prior to joining BlueBay, he was a director in high yield and distressed credit trading at the Royal Bank of Scotland. Before that, Tim spent three years as an analyst on the leveraged loan trading desk at Bear Stearns & Co. Tim holds a BS in Business Administration with Finance concentration from Fordham University. |
| | | |
| | | | | | |
| | | |
| | | | | | |
| | | |
| | | | | | |
2
|
PERFORMANCE SUMMARY (UNAUDITED) |
| | | | | | | | | | | | | | | | | | | | | | | | |
| | | | | | |
| | | 1
Year | | | 3
Year | | | 5
Year | | | Since
Inception(a) | | | Net
Expense
Ratio(b)(c) | | | Gross
Expense
Ratio(b)(c) | |
Average Annual Total Returns as of March 31, 2020 (Unaudited) | | | | | | | | | | | | | | | | | | | | | | | | |
RBC BlueBay Emerging Market Debt Fund | | | | | | | | | | | | | | | | | | | | | | | | |
Class A | | | | | | | | | | | | | | | | | | | | | | | | |
- Including Max Sales Charge of 4.25% | | | (13.83)% | | | | (2.19)% | | | | (0.52)% | | | | 0.13% | | | | | | | | | |
- At Net Asset Value | | | (10.03)% | | | | (0.76)% | | | | 0.35% | | | | 0.65% | | | | 1.12% | | | | 20.37% | |
Class I | | | | | | | | | | | | | | | | | | | | | | | | |
- At Net Asset Value | | | (9.64)% | | | | (0.51)% | | | | 0.60% | | | | 0.89% | | | | 0.87% | | | | 2.13% | |
Class R6 | | | | | | | | | | | | | | | | | | | | | | | | |
- At Net Asset Value | | | (9.56)% | | | | (0.43)% | | | | 0.67% | | | | 0.99% | | | | 0.82% | | | | 33.09% | |
| | | | | | |
JPMorgan EMBI Global Diversified Index(d) | | | (6.84)% | | | | 0.42% | | | | 2.82% | | | | 4.27% | | | | | | | | | |
RBC BlueBay Global Bond Fund | | | | | | | | | | | | | | | | | | | | | | | | |
Class A | | | | | | | | | | | | | | | | | | | | | | | | |
- Including Max Sales Charge of 4.25% | | | (0.79)% | | | | 1.44% | | | | 1.42% | | | | 1.78% | | | | | | | | | |
- At Net Asset Value | | | 3.59% | | | | 2.93% | | | | 2.30% | | | | (3.51)% | | | | 0.77% | | | | 2.12% | |
Class I | | | | | | | | | | | | | | | | | | | | | | | | |
- At Net Asset Value | | | 3.77% | | | | 2.99% | | | | 2.24% | | | | 2.54% | | | | 0.69% | | | | 1.10% | |
Class R6 | | | | | | | | | | | | | | | | | | | | | | | | |
- At Net Asset Value | | | 3.91% | | | | 3.05% | | | | 2.30% | | | | 2.59% | | | | 0.64% | | | | 33.79% | |
| | | | | | |
ICE LIBOR USD 3 Month(d) | | | 2.06% | | | | 2.00% | | | | 1.45% | | | | 1.38% | | | | | | | | | |
BBG Bar Global Aggregate Bond Index(d) | | | 6.59% | | | | 4.65% | | | | 3.48% | | | | 3.74% | | | | | | | | | |
RBC BlueBay High Yield Bond Fund | | | | | | | | | | | | | | | | | | | | | | | | |
Class A | | | | | | | | | | | | | | | | | | | | | | | | |
- Including Max Sales Charge of 4.25% | | | (4.57)% | | | | 1.66% | | | | 2.65% | | | | 4.83% | | | | | | | | | |
- At Net Asset Value | | | (0.31)% | | | | 3.14% | | | | 3.55% | | | | 5.37% | | | | 0.82% | | | | 2.50% | |
Class I | | | | | | | | | | | | | | | | | | | | | | | | |
- At Net Asset Value | | | (0.05)% | | | | 3.39% | | | | 3.85% | | | | 5.67% | | | | 0.57% | | | | 1.39% | |
| | | | | | |
ICE BofAML US High Yield Index(d) | | | (7.44)% | | | | 0.55% | | | | 2.67% | | | | 5.20% | | | | | | | | | |
Performance data quoted represents past performance. Past performance is no guarantee of future results. Investment return and principal value of an investment will fluctuate so that an investor’s shares, when redeemed, may be worth more or less than their original cost. Current performance may be lower or higher than performance quoted. Performance shown reflects contractual fee waivers, without such fee waivers total returns would be reduced. Performance information does not reflect the 2% fee on shares redeemed or exchanged within 30 days of purchase. If such redemption fee was included, performance would be reduced. For performance data current to the most recentmonth-end go to www.rbcgam.us. Please see footnotes below.
3
|
PERFORMANCE SUMMARY (UNAUDITED) |
| (a) | The inception date (commencement of operations) is November 27, 2013 for Class A shares of BlueBay Emerging Market Debt Fund and BlueBay High Yield Bond Fund, January 28, 2020, for Class A shares of BlueBay Global Bond Fund, December 27, 2016 for Class R6 shares and November 30, 2011 for Class I shares for each Fund except BlueBay Global Bond Fund, which is December 9, 2014 for Class I shares. The performance in the table for the Class A and Class R6 shares prior to the inception of those classes reflects the performance of the Class I shares since the Fund’s inception. |
| (b) | The Funds’ expenses reflect actual expenses for the most recent year end (September 30, 2019). For Class A shares of BlueBay Global Bond Fund, expenses reflect the period from January 28, 2020 (commencement of operations) to March 31, 2020. |
| (c) | The advisor has contractually agreed to waive fees and/or make payments in order to keep total operating expenses at annual ratios of 1.12% for Class A, 0.87% for Class I and 0.82% for Class R6 of BlueBay Emerging Market Debt Fund, 0.77% for Class A, 0.52% for Class I and 0.47% for Class R6 of BlueBay Global Bond Fund and 0.82% for Class A and 0.57% for Class I of BlueBay High Yield Bond Fund until January 31, 2021. |
| (d) | Each of the comparative indices is a widely recognized market value weighted measure of the return of securities, but do not include sales fees or operating expenses. You cannot invest directly in indices. |
JPMorgan Emerging Markets Bond Index (“EMBI”) Global Diversified Index is a subset of the JPMorgan EMBI. The JPMorgan EMBI tracks the performance of U.S. dollar-denominated Brady bonds, Eurobonds and traded loans issued by sovereign and quasi-sovereign entities in emerging markets. The JPMorgan EMBI Global Diversified limits the weights of countries with larger debt stocks by including only a specified portion of these countries’ eligible current face amounts of debt outstanding.
The ICE BofAML US High Yield Index tracks the performance of U.S. dollar--denominated below investment grade corporate debt publicly issued in the U.S. domestic market.
The ICE LIBOR USD 3 Month is a wholesale funding rate, for three-month maturities in U.S. dollars, anchored in LIBOR panel banks’ unsecured wholesale transactions to the greatest extent possible, with a waterfall to enable a rate to be published in all market circumstances. LIBOR panel banks’ submissions are ranked by ICE Benchmark Administration, and the upper and lower quartiles are excluded to remove outliers. The relevant rate is then calculated as the trimmed arithmetic mean of the remaining submissions, rounded to five decimal places. Each LIBOR panel bank’s submission carries an equal weight, subject to the trimming.
The Bloomberg Barclays Global Aggregate Bond Index is a flagship measure of global investment grade debt from twenty-four local currency markets. This multi-currency benchmark includes treasury, government-related, corporate and securitized fixed-rate bonds from both developed and emerging markets issuers.
4
| | | | | | | | | | | | | | | | | | |
FUND STATISTICS (UNAUDITED) | | | | | | | | | | | | |
| | | | |
RBC BlueBay Emerging Market Debt Fund | | | | | | | | | | | | |
High level of total return consisting of income and capital appreciation. | | | | | | | | | | | | Investment Objective |
JPMorgan EMBI Global Diversified Index | | | | | | | | | | | | Benchmark |
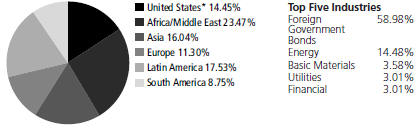
| | | | | | | | | Asset Allocation as of 3/31/20 (% of Fund’s investments) & Top Five Industries (as of 3/31/20) (% of Fund’s net assets) |
| | | | | | |
| | | | | | |
| | | | | | |
*Includes U.S. dollar denominated cash equivalent investments representing 13.81% of investments. | | | | | | | |
Qatar Government International Bond, 4.82%, 3/14/49 | | | 3.57 | % | | Bahamas Government International Bond, 6.00%, 11/21/28 | | | 1.93 | % | | | | | | | | Top Ten Holdings (excluding investment companies) (as of 3/31/20) (% of Fund’s net assets) |
Russian Foreign Bond - Eurobond, 5.10%, 3/28/35 | | | 2.54 | % | | Pertamina Persero PT, 4.15%, 2/25/60 | | | 1.84 | % | | | | | | |
Paraguay Government International Bond, 5.40%, 3/30/50 | | | 2.18 | % | | Saudi Government International Bond, 3.75%, 1/21/55 | | | 1.83 | % | | | | | | |
Trinidad & Tobago Government International Bond, 4.50%, 8/4/26 | | | 2.00 | % | | Banque Centrale de Tunisie International Bond, 5.75%, 1/30/25 | | | 1.74 | % | | | | | | |
Banque Centrale de Tunisie International Bond, 6.38%, 7/15/26 | | | 1.98 | % | | Dominican Republic International Bond, 4.50%, 1/30/30 | | | 1.65 | % | | | | | | |
*A listing of all portfolio holdings can be found beginning on page 8 | | | | | | | | | | | | |
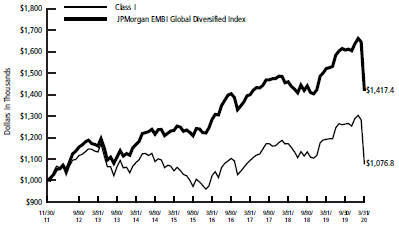 | | | | | | | | | | | | Growth of $1,000,000 Initial Investment Since Inception (11/30/11) |
| The graph reflects an initial investment of $1,000,000 over the period from November 30, 2011 (commencement of operations) to March 31, 2020 and is based on Class I shares. The Fund’s total return includes reinvested dividends and capital gains. The Fund’s total return also includes operating expenses that reduce return, while the total return of the index does not. The graph does not reflect the deduction of taxes that a shareholder would pay on fund distributions or redemption of fund shares. | | | | | | | | | |
| | | | | | | | | | | | | | | | | | |
| | | | | | | | | | | | | | | | | | |
| | | | | | | | | | | | | | | | | | |
| | | | | | | | | | | | | | | | | | |
| | | | | | | | | | | | | | | | | | |
5
| | | | | | | | | | | | | | | | | | | | | | | | | | |
| | | | | | | | | | | | FUND STATISTICS (UNAUDITED) | | | | | |
| | | | | |
| | | | | | | | | | | | RBC BlueBay Global Bond Fund | | | | | |
Investment Objective | | | | | | | | | | | | High level of total return consisting of income and capital appreciation. | | | | | |
| Benchmark | | | | | | | | | | | | 3-Month USD LIBOR Index | | | | | |
| | | | | |
Asset Allocation as of 3/31/20 (% of Fund’s investments) & Top Five Industries (as of 3/31/20) (% of Fund’s net assets) | | | | | | | | | | | | 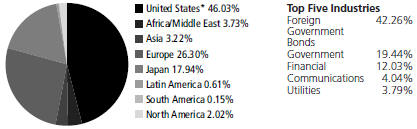
*Includes U.S. dollar denominated cash equivalent investments representing 6.72% of investments. | | | | | |
| | | | | | | | | | | | |
| | | | | | | | | | | | |
| | | | | | | | | | | | |
| | | | | | | | | | | | |
| | | | | | | | | | | | |
| | | | | | | | | | | | |
| | | | | | | | | | | | |
Top Ten Holdings (excluding investment companies) (as of 3/31/20) (% of Fund’s net assets) | | | | | | | | | | | | U.S. Treasury Notes, 1.50%, 9/30/21 | | | 7.53 | % | | Bundesrepublik Deutschland Bundesanleihe, 0.25%, 2/15/29 | | | 3.84 | % | | | | |
| | | | | | | | | | | | U.S. Treasury Notes, 1.50%, 2/15/30 | | | 5.97 | % | | U.S. Treasury Notes, 1.50%, 9/15/22 | | | 3.81 | % | | | | |
| | | | | | | | | | | | Ginnie Mae, Pool #MA6153, 3.00%, 9/20/49 | | | 5.00 | % | | Japan Government Ten Year Bond, 0.40%, 3/20/25 | | | 3.79 | % | | | | |
| | | | | | | | | | | | Freddie Mac, Pool #RA1353, 3.00%, 9/1/49 | | | 4.51 | % | | Japan Government Ten Year Bond, 0.10%, 9/20/28 | | | 3.53 | % | | | | |
| | | | | | | | | | | | Charter Communications Operating LLC / Charter Communications Operating Capital, 5.38%, 5/1/47 | | | 4.04 | % | | Hellenic Republic Government Bond, 4.20%, 1/30/42 | | | 3.36 | % | | | | |
| | | | | | | | | | | | *A listing of all portfolio holdings can be found beginning on page 20 | | | | | | | | |
Growth of $100,000 Initial Investment Since Inception (12/9/14) | | | | | | | | | | | | 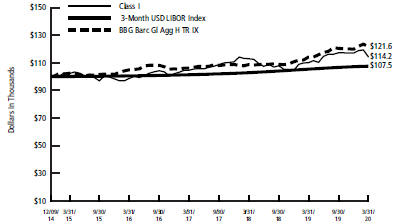
| | | | | |
| | | | | | | | | | | | | | |
| | | | | | | | | | | | | | |
| | | | | | | | | | | | | | |
| | | | | | | | | | | | | | |
| | | | | | | | | | | | The graph reflects an initial investment of $100,000 over the period from December 9, 2014 (commencement of operations) to March 31, 2020 and is based on Class I shares. The Fund’s total return includes reinvested dividends and capital gains. The Fund’s total return also includes operating expenses that reduce return, while the total return of the index does not. The graph does not reflect the deduction of taxes that a shareholder would pay on fund distributions or redemption of fund shares. | | | | | |
| | | | | | | | | | | | | | | | | | | | | | | | | | |
| | | | | | | | | | | | | | | | | | | | | | | | | | |
| | | | | | | | | | | | | | | | | | | | | | | | | | |
6
| | | | | | | | | | | | | | | | | | |
FUND STATISTICS (UNAUDITED) | | | | | | | | | | | | |
| | | | |
RBC BlueBay High Yield Bond Fund | | | | | | | | | | | | |
High level of total return consisting of income and capital appreciation. | | | | | | | | | | | | Investment Objective |
BofA Merrill Lynch High Yield Master II Index | | | | | | | | | | | | Benchmark |
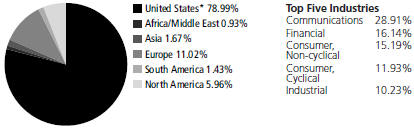
| | | | | | | | | Asset Allocation as of 3/31/20 (% of Fund’s investments) & Top Five Industries (as of 3/31/20) (% of Fund’s net assets) |
| | | | | | |
| | | | | | |
| | | | | | |
*Includes U.S. dollar denominated cash equivalent investments representing 3.87% of investments. | | | | | | | | | |
TEGNA, Inc., 5.00%, 9/15/29 | | | 1.84 | % | | 1011778 BC ULC / New Red Finance, Inc., | | | 1.51 | % | | | | | | | | Top Ten Holdings (excluding investment companies) (as of 3/31/20) (% of Fund’s net assets) |
T-Mobile USA, Inc., 6.00%, 3/1/23 | | | 1.76 | % | | 4.38%, 1/15/28 | | | | | | | | | | |
CSC Holdings LLC, 10.88%, 10/15/25 | | | 1.64 | % | | CenturyLink, Inc., Series V, 5.63%, 4/1/20 | | | 1.51 | % | | | | | | |
Dell International LLC / EMC Corp., 5.88%, 6/15/21 | | | 1.64 | % | | Springleaf Finance Corp., 8.25%, 12/15/20 | | | 1.48 | % | | | | | | |
Post Holdings, Inc., 5.50%, 12/15/29 | | | 1.59 | % | | CCO Holdings LLC / CCO Holdings Capital Corp., | | | 1.40 | % | | | | | | |
Sirius XM Radio, Inc., 3.88%, 8/1/22 | | | 1.54 | % | | 4.75%, 3/1/30 | | | | | | | | | | |
| | | | | | | | | | | | | | | | |
*A listing of all portfolio holdings can be found beginning on page 25 | | | | | | | | | | |
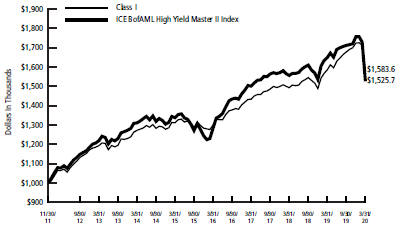 | | | | | | | | | | | | Growth of $1,000,000 Initial Investment Since Inception (11/30/11) |
| The graph reflects an initial investment of $1,000,000 over the period from November 30, 2011 (commencement of operations) to March 31, 2020 and is based on Class I shares. The Fund’s total return includes reinvested dividends and capital gains. The Fund’s total return also includes operating expenses that reduce return, while the total return of the index does not. The graph does not reflect the deduction of taxes that a shareholder would pay on fund distributions or redemption of fund shares. | | | | | | | | | |
| | | | | | | | | | | | | | | | | | |
| | | | | | | | | | | | | | | | | | |
| | | | | | | | | | | | | | | | | | |
| | | | | | | | | | | | | | | | | | |
| | | | | | | | | | | | | | | | | | |
7
|
SCHEDULE OF PORTFOLIO INVESTMENTS |
RBC BlueBay Emerging Market Debt Fund
March 31, 2020 (Unaudited)
| | | | | | |
Principal Amount | | | | Value | |
Foreign Government Bonds — 58.98% | | | | |
Angola — 0.44% | | | | | | |
$ 200,000 | | Angolan Government International Bond, 8.00%, 11/26/29 | | $ | 79,401 | |
| | | | | | |
| |
Argentina — 1.66% | | | | |
240,000(a) | | Argentine Republic Government International Bond, 3.88%, 1/15/22 | | | 68,600 | |
795,000 | | Argentine Republic Government International Bond, 6.88%, 4/22/21 | | | 233,315 | |
| | | | | | |
| | | | | 301,915 | |
| | | | | | |
Azerbaijan — 0.68% | | | | |
150,000 | | Republic of Azerbaijan International Bond, 3.50%, 9/1/32 | | | 124,200 | |
| | | | | | |
| |
Bahamas — 1.93% | | | | |
400,000 | | Bahamas Government International Bond, 6.00%, 11/21/28 | | | 350,500 | |
| | | | | | |
| |
Colombia — 1.08% | | | | |
200,000 | | Colombia Government International Bond, 3.88%, 4/25/27 | | | 195,800 | |
| | | | | | |
| |
Dominican Republic — 4.85% | | | | |
350,000 | | Dominican Republic International Bond, 4.50%, 1/30/30 | | | 299,797 | |
305,000 | | Dominican Republic International Bond, 5.50%, 1/27/25 | | | 288,663 | |
100,000 | | Dominican Republic International Bond, 5.95%, 1/25/27 | | | 93,139 | |
230,000 | | Dominican Republic International Bond, 6.40%, 6/5/49 | | | 198,479 | |
| | | | | | |
| | | | | 880,078 | |
| | | | | | |
Ecuador — 0.91% | | | | |
400,000 | | Ecuador Government International Bond, 7.88%, 1/23/28 | | | 110,800 | |
200,000 | | Ecuador Government International Bond, 8.88%, 10/23/27 | | | 54,100 | |
| | | | | | |
| | | | | 164,900 | |
| | | | | | |
Egypt — 1.89% | | | | |
200,000 | | Egypt Government International Bond, 4.55%, 11/20/23 | | | 176,719 | |
200,000 | | Egypt Government International Bond, 8.70%, 3/1/49 | | | 165,490 | |
| | | | | | |
| | | | | 342,209 | |
| | | | | | |
El Salvador — 1.01% | | | | |
150,000 | | El Salvador Government International Bond, 7.13%, 1/20/50 | | | 116,187 | |
78,000 | | El Salvador Government International Bond, 7.65%, 6/15/35 | | | 66,154 | |
| | | | | | |
| | | | | 182,341 | |
| | | | | | |
Ghana — 0.79% | | | | |
200,000 | | Ghana Government International Bond, 7.63%, 5/16/29 | | | 142,934 | |
| | | | | | |
| |
Guatemala — 1.06% | | | | |
200,000 | | Guatemala Government Bond, 4.90%, 6/1/30 | | | 192,125 | |
| | | | | | |
8
|
SCHEDULE OF PORTFOLIO INVESTMENTS |
RBC BlueBay Emerging Market Debt Fund (cont.)
March 31, 2020 (Unaudited)
| | | | | | |
Principal Amount | | | | Value | |
| |
Indonesia — 1.12% | | | | |
$ 200,000 | | Perusahaan Penerbit SBSN Indonesia III, 4.45%, 2/20/29 | | $ | 202,751 | |
| | | | | | |
| |
Israel — 2.21% | | | | |
200,000 | | Israel Government International Bond, 2.75%, 7/3/30 | | | 200,000 | |
200,000 | | Israel Government International Bond, 3.88%, 7/3/50 | | | 200,000 | |
| | | | | | |
| | | | | 400,000 | |
| | | | | | |
Kenya — 2.03% | | | | |
200,000 | | Kenya Government International Bond, 7.00%, 5/22/27 | | | 184,546 | |
200,000 | | Kenya Government International Bond, 8.00%, 5/22/32 | | | 183,783 | |
| | | | | | |
| | | | | 368,329 | |
| | | | | | |
Lebanon — 0.56% | | | | |
36,000 | | Lebanon Government International Bond, 5.80%, 4/14/20(b) | | | 6,795 | |
66,000 | | Lebanon Government International Bond, 6.00%, 1/27/23(b) | | | 12,257 | |
85,000 | | Lebanon Government International Bond, EMTN, 6.10%, 10/4/22(b) | | | 15,755 | |
106,000 | | Lebanon Government International Bond, GMTN, 6.15%, 6/19/20(b) | | | 19,691 | |
114,000 | | Lebanon Government International Bond, GMTN, 6.38%, 3/9/20(b) | | | 21,006 | |
36,000 | | Lebanon Government International Bond, 8.25%, 4/12/21(b) | | | 6,795 | |
126,000 | | Lebanon Government International Bond, 8.25%, 5/17/34(b) | | | 18,900 | |
| | | | | | |
| | | | | 101,199 | |
| | | | | | |
Mexico — 2.58% | | | | |
265,000 | | Mexico Government International Bond, 4.50%, 4/22/29 | | | 270,337 | |
200,000 | | Mexico Government International Bond, 4.50%, 1/31/50 | | | 197,197 | |
| | | | | | |
| | | | | 467,534 | |
| | | | | | |
Mongolia — 1.35% | | | | |
275,000 | | Mongolia Government International Bond, MTN, 5.13%, 12/5/22 | | | 244,577 | |
| | | | | | |
| |
Nigeria — 1.14% | | | | |
300,000 | | Nigeria Government International Bond, 7.88%, 2/16/32 | | | 206,748 | |
| | | | | | |
| |
Pakistan — 0.91% | | | | |
200,000 | | Pakistan Government International Bond, 6.88%, 12/5/27 | | | 164,602 | |
| | | | | | |
| |
Paraguay — 2.18% | | | | |
400,000 | | Paraguay Government International Bond, 5.40%, 3/30/50 | | | 396,000 | |
| | | | | | |
| |
Qatar — 3.57% | | | | |
550,000 | | Qatar Government International Bond, 4.82%, 3/14/49 | | | 646,527 | |
| | | | | | |
9
|
SCHEDULE OF PORTFOLIO INVESTMENTS |
RBC BlueBay Emerging Market Debt Fund (cont.)
March 31, 2020 (Unaudited)
| | | | | | |
Principal Amount | | | | Value | |
| |
Romania — 0.41% | | | | |
75,000(a) | | Romanian Government International Bond, 3.38%, 1/28/50 | | $ | 74,019 | |
| | | | | | |
| | |
Russia — 6.23% | | | | | | |
$ 200,000 | | Russian Foreign Bond - Eurobond, 4.25%, 6/23/27 | | | 209,707 | |
200,000 | | Russian Foreign Bond - Eurobond, 4.38%, 3/21/29 | | | 214,052 | |
400,000 | | Russian Foreign Bond - Eurobond, 5.10%, 3/28/35 | | | 461,238 | |
200,000 | | Russian Foreign Bond - Eurobond, 5.63%, 4/4/42 | | | 244,210 | |
| | | | | | |
| | | | | 1,129,207 | |
| | | | | | |
Saudi Arabia — 1.83% | | | | |
360,000 | | Saudi Government International Bond, 3.75%, 1/21/55 | | | 331,489 | |
| | | | | | |
| |
Sri Lanka — 0.73% | | | | |
200,000 | | Sri Lanka Government International Bond, 5.88%, 7/25/22 | | | 133,182 | |
| | | | | | |
| |
Trinidad & Tobago — 1.99% | | | | |
400,000 | | Trinidad & Tobago Government International Bond, 4.50%, 8/4/26 | | | 361,800 | |
| | | | | | |
| |
Tunisia — 4.22% | | | | |
100,000(a) | | Banque Centrale de Tunisie International Bond, 5.63%, 2/17/24 | | | 90,065 | |
400,000 | | Banque Centrale de Tunisie International Bond, 5.75%, 1/30/25 | | | 315,950 | |
400,000(a) | | Banque Centrale de Tunisie International Bond, 6.38%, 7/15/26 | | | 359,374 | |
| | | | | | |
| | | | | 765,389 | |
| | | | | | |
Turkey — 0.94% | | | | |
200,000 | | Turkey Government International Bond, 4.25%, 3/13/25 | | | 170,216 | |
| | | | | | |
| |
Ukraine — 3.66% | | | | |
245,000 | | Ukraine Government International Bond, 0.00%, 5/31/40(c) | | | 178,850 | |
200,000 | | Ukraine Government International Bond, 7.75%, 9/1/23 | | | 186,678 | |
125,000 | | Ukraine Government International Bond, 7.75%, 9/1/24 | | | 114,425 | |
200,000 | | Ukraine Government International Bond, 7.75%, 9/1/26 | | | 183,067 | |
| | | | | | |
| | | | | 663,020 | |
| | | | | | |
United Arab Emirates — 1.03% | | | | |
200,000 | | Abu Dhabi Government International Bond, 3.13%, 9/30/49 | | | 185,991 | |
| | | | | | |
| |
Uruguay — 1.64% | | | | |
262,599 | | Uruguay Government International Bond, 4.98%, 4/20/55 | | | 296,737 | |
| | | | | | |
10
|
SCHEDULE OF PORTFOLIO INVESTMENTS |
RBC BlueBay Emerging Market Debt Fund (cont.)
March 31, 2020 (Unaudited)
| | | | | | |
Principal Amount | | | | Value | |
Uzbekistan — 2.19% | | | | |
$ 205,000 | | Republic of Uzbekistan Bond, 4.75%, 2/20/24 | | $ | 200,572 | |
200,000 | | Republic of Uzbekistan Bond, 5.38%, 2/20/29 | | | 196,238 | |
| | | | | | |
| | | | | 396,810 | |
| | | | | | |
Venezuela — 0.16% | | | | |
85,000 | | Venezuela Government International Bond, 7.75%, 10/13/19(b) | | | 7,650 | |
73,800 | | Venezuela Government International Bond, 8.25%, 10/13/24(b) | | | 6,642 | |
170,000 | | Venezuela Government International Bond, 11.75%, 10/21/26(b) | | | 15,300 | |
| | | | | | |
| | | | | 29,592 | |
| | | | | | |
Total Foreign Government Bonds | | | 10,692,122 | |
| | | | | | |
(Cost $12,556,166) | | | | |
| |
Corporate Bonds — 26.71% | | | | |
Azerbaijan — 1.13% | | | | |
200,000 | | Southern Gas Corridor CJSC, 6.88%, 3/24/26 | | | 204,040 | |
| | | | | | |
| |
Brazil — 1.55% | | | | |
200,000 | | Cemig Geracao e Transmissao SA, 9.25%, 12/5/24 | | | 192,769 | |
97,000 | | Petrobras Global Finance BV, 5.09%, 1/15/30(d) | | | 88,027 | |
| | | | | | |
| | | | | 280,796 | |
| | | | | | |
China — 5.01% | | | | |
355,000 | | China Evergrande Group, 10.50%, 4/11/24 | | | 258,684 | |
200,000 | | CNAC HK Finbridge Co. Ltd., 3.50%, 7/19/22 | | | 198,710 | |
220,000 | | CNAC HK Finbridge Co. Ltd., 3.88%, 6/19/29 | | | 226,966 | |
200,000 | | CNAC HK Finbridge Co. Ltd., 5.13%, 3/14/28 | | | 224,674 | |
| | | | | | |
| | | | | 909,034 | |
| | | | | | |
Ecuador — 0.36% | | | | |
133,334 | | Petroamazonas EP, 4.63%, 11/6/20 | | | 65,333 | |
| | | | | | |
| |
Indonesia — 2.84% | | | | |
400,000 | | Pertamina Persero PT, 4.15%, 2/25/60(d) | | | 333,171 | |
200,000 | | Pertamina Persero PT, 4.70%, 7/30/49 | | | 181,931 | |
| | | | | | |
| | | | | 515,102 | |
| | | | | | |
Israel — 1.09% | | | | |
154,758 | | Delek & Avner Tamar Bond Ltd., 5.08%, 12/30/23(d) | | | 151,083 | |
50,242 | | Delek & Avner Tamar Bond Ltd., 5.41%, 12/30/25(d) | | | 47,060 | |
| | | | | | |
| | | | | 198,143 | |
| | | | | | |
Kazakhstan — 2.17% | | | | |
200,000 | | KazMunayGas National Co. JSC, 5.38%, 4/24/30 | | | 195,929 | |
200,000 | | KazMunayGas National Co. JSC, 5.75%, 4/19/47 | | | 198,428 | |
| | | | | | |
| | | | | 394,357 | |
| | | | | | |
11
|
SCHEDULE OF PORTFOLIO INVESTMENTS |
RBC BlueBay Emerging Market Debt Fund (cont.)
March 31, 2020 (Unaudited)
| | | | | | |
Principal Amount | | | | Value | |
Mexico — 7.06% | | | | |
$ 200,000 | | Mexico City Airport Trust, 5.50%, 7/31/47 | | $ | 171,900 | |
200,000 | | Petroleos Mexicanos, 5.95%, 1/28/31(d) | | | 137,520 | |
86,000 | | Petroleos Mexicanos, 6.35%, 2/12/48 | | | 53,750 | |
105,000 | | Petroleos Mexicanos, 6.50%, 3/13/27 | | | 77,711 | |
200,000 | | Petroleos Mexicanos, 6.84%, 1/23/30 | | | 144,000 | |
80,000 | | Petroleos Mexicanos, 6.95%, 1/28/60 | | | 53,000 | |
436,000 | | Petroleos Mexicanos, 6.95%, 1/28/60(d) | | | 288,850 | |
2,500,000(e) | | Petroleos Mexicanos, 7.19%, 9/12/24 | | | 82,611 | |
393,000 | | Petroleos Mexicanos, 7.69%, 1/23/50 | | | 270,089 | |
| | | | | | |
| | | | | 1,279,431 | |
| | | | | | |
| |
Peru — 1.04% | | | | |
200,000 | | Lima Metro Line 2 Finance Ltd., 4.35%, 4/5/36 | | | 189,083 | |
| | | | | | |
| |
South Africa — 0.97% | | | | |
205,000 | | Eskom Holdings SOC Ltd., MTN, 6.35%, 8/10/28 | | | 175,125 | |
| | | | | | |
| |
Trinidad & Tobago — 0.98% | | | | |
200,000 | | Trinidad Generation UnLtd, 5.25%, 11/4/27 | | | 177,000 | |
| | | | | | |
| |
United Arab Emirates — 1.58% | | | | |
310,000 | | MDGH - GMTN BV, 3.70%, 11/7/49 | | | 286,005 | |
| | | | | | |
| |
United States — 0.64% | | | | |
200,000 | | Rutas 2 and 7 Finance Ltd., 0.00%, 9/30/36(f) | | | 116,000 | |
| | | | | | |
| |
Venezuela — 0.29% | | | | |
173,584 | | Petroleos de Venezuela SA, 6.00%, 11/15/26(b) | | | 12,151 | |
260,000 | | Petroleos de Venezuela SA, 8.50%, 10/27/20 | | | 40,625 | |
| | | | | 52,776 | |
| | | | | | |
Total Corporate Bonds | | | 4,842,225 | |
| | | | | | |
(Cost $6,085,937) | | | | |
12
|
SCHEDULE OF PORTFOLIO INVESTMENTS |
RBC BlueBay Emerging Market Debt Fund (cont.)
March 31, 2020 (Unaudited)
| | | | | | |
| Shares | | | | Value | |
| |
Investment Company — 13.72% | | | | |
2,488,119 | | U.S. Government Money Market Fund, RBC Institutional Class 1 (g) | | $ | 2,488,119 | |
| | | | | | |
Total Investment Company | | | 2,488,119 | |
| | | | | | |
(Cost $2,488,119) | | | | |
| |
Total Investments | | $ | 18,022,466 | |
(Cost $21,130,222)(h) — 99.41% | | | | |
| |
Other assets in excess of liabilities — 0.59% | | | 106,687 | |
| | | | | | |
| |
NET ASSETS — 100.00% | | $ | 18,129,153 | |
| | | | | | |
| (a) | Principal amount denoted in Euros. |
| (b) | Issuer filed for bankruptcy and/or is in default of interest payments. |
| (c) | Variable or floating rate security, which interest rate adjusts periodically based on changes in current interest rates and prepayments on the underlying pool of assets. Rate shown is the rate in effect as of period end. |
| (d) | Security exempt from registration under Rule 144A or Section 4(2) of the Securities Act of 1933, as amended. These securities may be resold in transactions exempt from registration, normally to qualified institutional buyers. |
| (e) | Investment innon-U.S. Dollars. Principal amount reflects local currency. |
| (f) | Zero Coupon Bond. The rate represents the yield at time of purchase. |
| (g) | Affiliated investment. |
| (h) | See Notes to Schedules of Portfolio Investments for the tax cost of securities and the breakdown of unrealized appreciation (depreciation). |
13
|
SCHEDULE OF PORTFOLIO INVESTMENTS |
RBC BlueBay Emerging Market Debt Fund (cont.)
March 31, 2020 (Unaudited)
Foreign currency exchange contracts as of March 31, 2020:
| | | | | | | | | | | | | | | | | | | | | | |
Currency Purchased | | | | Currency Sold | | | | Counterparty | | | | Settlement Date | | | | Value/Unrealized
Appreciation
(Depreciation) |
USD | | 200,000 | | | | BRL | | 854,980 | | | | Citibank N.A. | | | | 5/5/20 | | | | | $ 35,851 | |
USD | | 207,816 | | | | BRL | | 932,638 | | | | Citibank N.A. | | | | 5/5/20 | | | | | 28,758 | |
EUR | | 39,000 | | | | USD | | 42,676 | | | �� | Citibank N.A. | | | | 5/14/20 | | | | | 412 | |
EUR | | 200,000 | | | | USD | | 218,075 | | | | Citibank N.A. | | | | 5/14/20 | | | | | 2,890 | |
EUR | | 100,000 | | | | USD | | 108,682 | | | | Citibank N.A. | | | | 5/14/20 | | | | | 1,800 | |
EUR | | 51,000 | | | | USD | | 55,295 | | | | Citibank N.A. | | | | 5/14/20 | | | | | 1,051 | |
ILS | | 732,794 | | | | USD | | 200,000 | | | | Citibank N.A. | | | | 5/14/20 | | | | | 7,295 | |
USD | | 109,358 | | | | IDR | | 1,565,960,000 | | | | Citibank N.A. | | | | 5/14/20 | | | | | 13,914 | |
USD | | 110,000 | | | | IDR | | 1,558,920,000 | | | | Citibank N.A. | | | | 5/14/20 | | | | | 14,985 | |
USD | | 126,600 | | | | INR | | 9,548,666 | | | | Citibank N.A. | | | | 5/14/20 | | | | | 1,702 | |
USD | | 200,704 | | | | INR | | 14,851,002 | | | | Citibank N.A. | | | | 5/14/20 | | | | | 6,450 | |
USD | | 100,000 | | | | INR | | 7,279,900 | | | | Citibank N.A. | | | | 5/14/20 | | | | | 4,777 | |
USD | | 110,000 | | | | MXN | | 2,132,139 | | | | Citibank N.A. | | | | 5/14/20 | | | | | 20,713 | |
USD | | 55,000 | | | | MXN | | 1,098,943 | | | | Citibank N.A. | | | | 5/14/20 | | | | | 8,980 | |
USD | | 55,000 | | | | MXN | | 1,098,431 | | | | Citibank N.A. | | | | 5/14/20 | | | | | 9,001 | |
USD | | 200,000 | | | | MXN | | 3,903,699 | | | | Citibank N.A. | | | | 5/14/20 | | | | | 36,526 | |
USD | | 233,654 | | | | PHP | | 11,949,058 | | | | Citibank N.A. | | | | 5/14/20 | | | | | 1,140 | |
USD | | 216,346 | | | | PHP | | 11,068,269 | | | | Citibank N.A. | | | | 5/14/20 | | | | | 971 | |
USD | | 115,000 | | | | RUB | | 7,754,019 | | | | Citibank N.A. | | | | 5/14/20 | | | | | 16,320 | |
USD | | 300,000 | | | | RUB | | 20,257,069 | | | | Citibank N.A. | | | | 5/14/20 | | | | | 42,203 | |
USD | | 2,508 | | | | RUB | | 196,279 | | | | Citibank N.A. | | | | 5/14/20 | | | | | 10 | |
USD | | 678,195 | | | | OMR | | 263,275 | | | | HSBC Bank Plc | | | | 10/28/20 | | | | | 10,212 | |
| | | | | | | | | | | | | | | | | | | | | $ 265,961 | |
| | | | | | | | | | |
BRL | | 1,787,618 | | | | USD | | 422,560 | | | | Citibank N.A. | | | | 5/5/20 | | | | | $ (79,353) | |
EUR | | 48,000 | | | | USD | | 53,305 | | | | Citibank N.A. | | | | 5/14/20 | | | | | (274) | |
EUR | | 80,000 | | | | USD | | 90,701 | | | | Citibank N.A. | | | | 5/14/20 | | | | | (2,315) | |
IDR | | 3,124,880,000 | | | | USD | | 226,507 | | | | Citibank N.A. | | | | 5/14/20 | | | | | (36,049) | |
INR | | 13,726,476 | | | | USD | | 188,696 | | | | Citibank N.A. | | | | 5/14/20 | | | | | (9,151) | |
INR | | 2,058,292 | | | | USD | | 28,304 | | | | Citibank N.A. | | | | 5/14/20 | | | | | (1,381) | |
INR | | 15,756,373 | | | | USD | | 218,993 | | | | Citibank N.A. | | | | 5/14/20 | | | | | (12,897) | |
INR | | 138,427 | | | | USD | | 1,820 | | | | Citibank N.A. | | | | 5/14/20 | | | | | (9) | |
MXN | | 5,889,000 | | | | USD | | 312,190 | | | | Citibank N.A. | | | | 5/14/20 | | | | | (65,578) | |
PHP | | 6,934,091 | | | | USD | | 136,364 | | | | Citibank N.A. | | | | 5/14/20 | | | | | (1,435) | |
PHP | | 9,146,418 | | | | USD | | 179,884 | | | | Citibank N.A. | | | | 5/14/20 | | | | | (1,906) | |
PHP | | 6,936,818 | | | | USD | | 136,364 | | | | Citibank N.A. | | | | 5/14/20 | | | | | (1,382) | |
RUB | | 7,099,748 | | | | USD | | 110,000 | | | | Citibank N.A. | | | | 5/14/20 | | | | | (19,646) | |
RUB | | 5,190,757 | | | | USD | | 80,836 | | | | Citibank N.A. | | | | 5/14/20 | | | | | (14,777) | |
RUB | | 15,916,862 | | | | USD | | 247,507 | | | | Citibank N.A. | | | | 5/14/20 | | | | | (44,944) | |
14
|
SCHEDULE OF PORTFOLIO INVESTMENTS |
RBC BlueBay Emerging Market Debt Fund (cont.)
March 31, 2020 (Unaudited)
| | | | | | | | | | | | | | | | | | | | | | |
Currency Purchased | | | | Currency Sold | | | | Counterparty | | | | Settlement Date | | | | Value/Unrealized
Appreciation
(Depreciation) |
USD | | 1,340,406 | | | | EUR | | 1,230,000 | | | | Citibank N.A. | | | | 5/14/20 | | | | | $ (18,524) | |
USD | | 206,881 | | | | ILS | | 732,794 | | | | Citibank N.A. | | | | 5/14/20 | | | | | (414) | |
| | | | | | | | | | | | | | | | | | | | | $(310,035) | |
| | | | | | | | | | |
| | | | | | | | | | | | | | | | | | | | | | |
Total | | | | | | | | | | | | | | | | | | | | | $ (44,074) | |
Interest rate swaps as of March 31, 2020:
| | | | | | | | | | | | | | | |
Fixed Rate | | Floating Rate | | Payment
Frequency | | Counterparty | | Expiration
Date | | Notional
Amount (000) | | Value/Unrealized
Appreciation
(Depreciation) |
6.33% | | MXN-GSLDN | | Expiration | | Citigroup Global Markets Inc. | | 5/8/25 | | MXN 2,192 | | | $ | 189 | |
3.13% | | CLP-GSLDN | | Expiration | | Citigroup Global Markets Inc. | | 5/14/30 | | CLP 195,979 | | | | (7,489) | |
4.24% | | COP-CSINTLN | | Expiration | | Citigroup Global Markets Inc. | | 5/14/25 | | COP 591,740 | | | | (2,979) | |
| | | | | | | | | | | | | | | |
| | | | | | | | | | | | | $ | (10,468) | |
| | | | | | |
| | | | | | | | | | | | | | | |
Total | | | | | | | | | | | | | $ | (10,279) | |
| | | | | | | | | | | | | | | |
Credit default swaps buy protection as of March 31, 2020:
| | | | | | | | | | | | | | | | | | | | | | | | | | |
Fixed
Rate | | Issuer | | Payment
Frequency | | Counterparty | | Expiration
Date | | | Notional
Amount
(000) | | | Premium
Paid/
(Received) | | | Unrealized
Appreciation
(Depreciation) | | Value |
| 1.00% | | Eskom Holdings SOC Ltd. | | Quarterly | | Barclays Bank Plc | | | 12/20/20 | | | USD | 84 | | | $ | 978 | | | $ | 3,672 | | | $ | 4,650 | |
| 1.00% | | Eskom Holdings SOC Ltd. | | Quarterly | | Barclays Bank Plc | | | 12/20/20 | | | USD | 71 | | | | 654 | | | | 3,277 | | | | 3,931 | |
| 1.00% | | Eskom Holdings SOC Ltd. | | Quarterly | | Barclays Bank Plc | | | 12/20/20 | | | USD | 70 | | | | 644 | | | | 3,231 | | | | 3,875 | |
| 5.00% | | Argentina Government International Bond | | Quarterly | | Morgan Stanley & Co. International Plc | | | 12/20/24 | | | USD | 39 | | | | 21,419 | | | | 7,294 | | | | 28,713 | |
15
|
SCHEDULE OF PORTFOLIO INVESTMENTS |
RBC BlueBay Emerging Market Debt Fund (cont.)
March 31, 2020 (Unaudited)
| | | | | | | | | | | | | | | | | | | | | | | | |
Fixed
Rate | | Issuer | | Payment
Frequency | | Counterparty | | Expiration
Date | | | Notional
Amount
(000) | | | Premium
Paid/
(Received) | | Unrealized
Appreciation
(Depreciation) | | Value |
| 5.00% | | Argentina Government International Bond | | Quarterly | | Barclays Bank Plc | | | 12/20/24 | | | USD | 58 | | | 31,004 | | | 11,697 | | | | 42,702 | |
| 5.00% | | Argentina Government International Bond | | Quarterly | | BNP Paribas Securities Corp. | | | 12/20/24 | | | USD | 19 | | | 10,362 | | | 3,627 | | | | 13,989 | |
| 5.00% | | Argentina Government International Bond | | Quarterly | | Citibank N.A. | | | 12/20/24 | | | USD | 21 | | | 11,533 | | | 3,928 | | | | 15,461 | |
| 5.00% | | Argentina Government International Bond | | Quarterly | | Barclays Bank Plc | | | 12/20/24 | | | USD | 18 | | | 9,924 | | | 3,328 | | | | 13,252 | |
| 5.00% | | Argentina Government International Bond | | Quarterly | | JP Morgan Chase Bank | | | 12/20/24 | | | USD | 35 | | | 19,256 | | | 6,513 | | | | 25,768 | |
| 1.00% | | Lebanon Government International Bond | | Quarterly | | Barclays Bank Plc | | | 6/20/20 | | | USD | 36 | | | 10,602 | | | 20,149 | | | | 30,751 | |
| 1.00% | | Lebanon Government International Bond | | Quarterly | | Barclays Bank Plc | | | 6/20/20 | | | USD | 36 | | | 10,885 | | | 19,866 | | | | 30,751 | |
| 5.00% | | Argentina Government International Bond | | Quarterly | | JP Morgan Chase Bank | | | 12/20/24 | | | USD | 9 | | | 5,257 | | | 1,369 | | | | 6,626 | |
| 5.00% | | Argentina Government International Bond | | Quarterly | | Barclays Bank Plc | | | 12/20/24 | | | USD | 17 | | | 9,888 | | | 2,628 | | | | 12,516 | |
| 5.00% | | Argentina Government International Bond | | Quarterly | | Citigroup Global Markets Ltd. | | | 12/20/24 | | | USD | 17 | | | 9,929 | | | 2,587 | | | | 12,516 | |
| 1.00% | | Lebanon Government International Bond | | Quarterly | | Merrill Lynch | | | 12/20/24 | | | USD | 58 | | | 40,507 | | | 9,037 | | | | 49,543 | |
| 5.00% | | Argentina Government International Bond | | Quarterly | | Barclays Bank Plc | | | 12/20/24 | | | USD | 125 | | | 73,160 | | | 18,870 | | | | 92,029 | |
16
|
SCHEDULE OF PORTFOLIO INVESTMENTS |
RBC BlueBay Emerging Market Debt Fund (cont.)
March 31, 2020 (Unaudited)
| | | | | | | | | | | | | | | | | | | | | | | | | | |
Fixed
Rate | | Issuer | | Payment
Frequency | | Counterparty | | Expiration
Date | | | Notional
Amount
(000) | | | Premium
Paid/
(Received) | | | Unrealized
Appreciation
(Depreciation) | | | Value | |
| 1.00% | | Turkey Government International Bond | | Quarterly | | Barclays Bank Plc | | | 6/20/25 | | | USD | 1,476 | | | | 132,309 | | | | (33,902) | | | | 98,408 | |
| 1.00% | | Malaysia Government International Bond | | Quarterly | | BNP Paribas Securities Corp. | | | 6/20/25 | | | USD | 210 | | | | 9,612 | | | | (8,184) | | | | 1,428 | |
| 1.00% | | Turkey Government International Bond | | Quarterly | | Citigroup Global Markets Ltd. | | | 12/20/24 | | | USD | 145 | | | | 27,095 | | | | (1,472) | | | | 25,623 | |
| 1.00% | | SOAF Government International Bond | | Quarterly | | JP Morgan Chase Bank | | | 6/20/25 | | | USD | 600 | | | | 84,298 | | | | 1,815 | | | | 86,114 | |
| | | | | | | | | | | | | | | | | | | | | | | | | | |
| Total | | | | | | | | | | | | | | | | $ | 519,316 | | | $ | 79,330 | | | $ | 598,646 | |
| | | | | | | | | | | | | | | | | | | | | | | | | | |
Credit default swaps sell protection as of March 31, 2020:
| | | | | | | | | | | | | | | | | | | | | | | | | | | | | | |
Fixed
Rate | | Issuer | | Payment
Frequency | | Counterparty | | Expiration
Date | | | ICS* | | | Notional
Amount
(000)(a) | | | Premium
Paid/
(Received) | | | Unreal.
App.
(Dep.) | | Value |
| 1.00% | | Lebanon Government International Bond | | Quarterly | | Barclays Bank Plc | | | 12/20/20 | | | | 126.166 | | | USD | 9 | | | $ | (3,598 | ) | | $ | (4,090 | ) | | $ | (7,688 | ) |
| 5.00% | | Argentina Government International Bond | | Quarterly | | Barclays Bank Plc | | | 12/20/20 | | | | 4.387 | | | USD | 17 | | | | (8,113 | ) | | | (3,697 | ) | | | (11,810 | ) |
| 1.00% | | Colombia Government International Bond | | Quarterly | | Barclays Bank Plc | | | 6/20/25 | | | | .027 | | | USD | 240 | | | | (30,170 | ) | | | 12,778 | | | | (17,392 | ) |
| 5.00% | | Argentina Government International Bond | | Quarterly | | Citibank N.A. | | | 12/20/20 | | | | 4.387 | | | USD | 17 | | | | (8,221 | ) | | | (3,589 | ) | | | (11,810 | ) |
| 1.00% | | Turkey Government International Bond | | Quarterly | | Citigroup Global Markets Ltd. | | | 6/20/25 | | | | .0605 | | | USD | 1,035 | | | | (211,439 | ) | | | 9,428 | | | | (202,010 | ) |
| 1.00% | | Russian Foreign Bond - Eurobond | | Quarterly | | Citigroup Global Markets Ltd. | | | 6/20/25 | | | | .0178 | | | USD | 200 | | | | (15,089 | ) | | | 6,027 | | | | (9,062 | ) |
17
|
SCHEDULE OF PORTFOLIO INVESTMENTS |
RBC BlueBay Emerging Market Debt Fund (cont.)
March 31, 2020 (Unaudited)
| | | | | | | | | | | | | | | | | | | | | | | | | | | | | | |
Fixed
Rate | | Issuer | | Payment
Frequency | | Counterparty | | Expiration
Date | | | ICS* | | | Notional
Amount
(000)(a) | | | Premium
Paid/
(Received) | | | Unreal.
App.
(Dep.) | | | Value | |
| 1.00% | | Turkey Government International Bond | | Quarterly | | Citigroup Global Markets Inc. | | | 12/20/24 | | | | .0604 | | | USD | 145 | | | $ | (13,949) | | | $ | (11,673) | | | $ | (25,623) | |
| 1.00% | | Markit CDX Emerging Markets Index, Series 33 | | Quarterly | | Citigroup Global Markets Inc. | | | 6/20/25 | | | | .0367 | | | USD | 195 | | | | (23,750) | | | | 1,380 | | | | (22,370) | |
| 1.00% | | Markit CDX Emerging Markets Index, Series 33 | | Quarterly | | Citigroup Global Markets Inc. | | | 6/20/25 | | | | .0367 | | | USD | 800 | | | | (89,013) | | | | (2,762) | | | | (91,775) | |
| 1.00% | | Markit CDX Emerging Markets Index, Series 33 | | Quarterly | | Citigroup Global Markets Inc. | | | 6/20/25 | | | | .0367 | | | USD | 180 | | | | (21,859) | | | | 1,209 | | | | (20,649) | |
| 1.00% | | Turkey Government International Bond | | Quarterly | | HSBC Securities | | | 6/20/25 | | | | .0605 | | | USD | 180 | | | | (37,435) | | | | 2,303 | | | | (35,132) | |
| 5.00% | | Argentina Government International Bond | | Quarterly | | JP Morgan Chase Bank | | | 12/20/20 | | | | 4.387 | | | USD | 9 | | | | (4,371) | | | | (1,881) | | | | (6,252) | |
| | | | | | | | | | | | | | | | | | | | | | |
| Total | | | | | | | | | | | | | | | | | | | | $ | (467,007) | | | $ | 5,433 | | | $ | (461,573) | |
| | | | | | | | | | | | | | | | | | | | | | |
| * | Implied credit spread, represented in absolute terms, utilized in determining the value of the credit default swap agreements as of period end will serve as an indicator of the current status of the payment/performance risk and represent the likelihood or risk of default or other credit event for the credit derivative. The implied credit spread of a referenced entity reflects the cost of buying/ selling protection and may include upfront payments required to be made to enter into the agreement. Generally, wider credit spreads represent a perceived deterioration of the referenced entity’s credit soundness and a greater likelihood or risk of default or other credit event occurring as defined under the terms of the swap agreement. |
| (a) | The maximum potential amount the Fund may pay should a negative credit event take place as defined under the terms of the agreement. |
18
|
SCHEDULE OF PORTFOLIO INVESTMENTS |
RBC BlueBay Emerging Market Debt Fund (cont.)
March 31, 2020 (Unaudited)
Abbreviations used are defined below:
BRL - Brazilian Real
CLP - Chilean Peso
COP - Colombian Peso
EMTN - Euro Medium Term Note
EUR - Euro
GMTN - Global Medium Term Note
IDR - Indonesian Rupiah
ILS - Israeli New Shekel
INR - Indian Rupee
MTN - Medium Term Note
MXN - Mexican Peso
OMR - Omani Rial
PHP - Philippine Peso
RUB - Russian Ruble
USD - United States Dollar
Portfolio Diversification (Unaudited)
| | | | | |
Industries | | Percentage
of Net Assets |
Foreign Government Bonds | | | | 58.98 | % |
Energy | | | | 14.48 | % |
Basic Materials | | | | 3.58 | % |
Utilities | | | | 3.01 | % |
Financial | | | | 3.01 | % |
Industrial | | | | 2.63 | % |
Other* | | | | 14.31 | % |
| | | | | |
| | | | 100.00 | % |
| | | | | |
* Includes cash, Investment Company, interest and dividend receivable, pending trades and Fund share transactions, interest rate swaps, credit default swaps, foreign currency exchange contracts and accrued expenses payable.
See Notes to the Financial Statements.
19
|
SCHEDULE OF PORTFOLIO INVESTMENTS |
RBC BlueBay Global Bond Fund
March 31, 2020 (Unaudited)
| | | | | | |
Principal Amount | | | | Value | |
Foreign Government Bonds — 42.26% | | | | |
Australia — 2.50% | | | | |
950,000(a) | | Australia Government Bond, 5.50%, 4/21/23 | | $ | 677,357 | |
| | | | | | |
| |
Canada — 1.87% | | | | |
147,000(a) | | Canadian Government Bond, 5.00%, 6/1/37 | | | 167,080 | |
300,000(a) | | Canadian Government Bond, 5.75%, 6/1/33 | | | 339,702 | |
| | | | | | |
| | | | | 506,782 | |
| | | | | | |
Germany — 7.24% | | | | |
880,000(b) | | Bundesrepublik Deutschland Bundesanleihe, 0.25%, 2/15/29 | | | 1,038,947 | |
169,000(b) | | Bundesrepublik Deutschland Bundesanleihe, 1.25%, 8/15/48 | | | 252,865 | |
323,000(b) | | Bundesrepublik Deutschland Bundesanleihe, 4.25%, 7/4/39 | | | 667,399 | |
| | | | | | |
| | | | | 1,959,211 | |
| | | | | | |
Greece — 3.36% | | | | |
590,000(b) | | Hellenic Republic Government Bond, 4.20%, 1/30/42 | | | 908,803 | |
| | | | | | |
| |
Italy — 2.05% | | | | |
384,000(b) | | Italy Buoni Poliennali Del Tesoro, 3.00%, 8/1/29 | | | 479,896 | |
51,000(b) | | Italy Buoni Poliennali Del Tesoro, 3.85%, 9/1/49(c) | | | 73,063 | |
| | | | | | |
| | | | | 552,959 | |
| | | | | | |
Japan — 16.64% | | | | |
101,200,000(a) | | Japan Government Ten Year Bond, 0.10%, 9/20/28 | | | 954,426 | |
107,500,000(a) | | Japan Government Ten Year Bond, 0.40%, 3/20/25 | | | 1,025,894 | |
90,400,000(a) | | Japan Government Ten Year Bond, 0.80%, 12/20/22 | | | 862,208 | |
52,400,000(a) | | Japan Government Thirty Year Bond, 0.80%, 12/20/47 | | | 537,873 | |
64,200,000(a) | | Japan Government Twenty Year Bond, 0.40%, 3/20/36 | | | 607,266 | |
46,650,000(a) | | Japan Government Twenty Year Bond, 1.60%, 12/20/33 | | | 514,863 | |
| | | | | | |
| | | | | 4,502,530 | |
| | | | | | |
Mexico — 0.57% | | | | |
159,000(a) | | Mexico Government International Bond, 4.00%, 3/15/15 | | | 153,725 | |
| | | | | | |
| |
New Zealand — 0.49% | | | | |
200,000(a) | | New Zealand Government Bond, 2.75%, 4/15/25 | | | 131,364 | |
| | | | | | |
Tunisia — 3.46% | | | | |
$ 400,000 | | Banque Centrale de Tunisie International Bond, 5.75%, 1/30/25 | | | 315,950 | |
690,000(a) | | Banque Centrale de Tunisie International Bond, 6.38%, 7/15/26 | | | 619,919 | |
| | | | | | |
| | | | | 935,869 | |
| | | | | | |
United Kingdom — 4.04% | | | | |
240,000(a) | | United Kingdom Gilt, 1.75%, 1/22/49 | | | 368,676 | |
400,000(a) | | United Kingdom Gilt, 4.75%, 12/7/30 | | | 724,883 | |
| | | | | | |
| | | | | 1,093,559 | |
| | | | | | |
20
|
SCHEDULE OF PORTFOLIO INVESTMENTS |
RBC BlueBay Global Bond Fund (cont.)
March 31, 2020 (Unaudited)
| | | | | | |
Principal Amount | | | | Value | |
Venezuela — 0.04% | | | | |
$ 121,000 | | Venezuela Government International Bond, 8.25%, 10/13/24(d) | | $ | 10,890 | |
| | | | | | |
| |
| Total Foreign Government Bonds | | | 11,433,049 | |
| | | | | | |
(Cost $11,720,270) | | | | |
| |
U.S. Treasury Obligations — 19.44% | | | | |
United States — 19.44% | | | | |
395,000 | | U.S. Treasury Bonds, 3.63%, 8/15/43 | | | 577,255 | |
2,000,000 | | U.S. Treasury Notes, 1.50%, 9/30/21 | | | 2,037,344 | |
1,000,000 | | U.S. Treasury Notes, 1.50%, 9/15/22 | | | 1,030,000 | |
1,500,000 | | U.S. Treasury Notes, 1.50%, 2/15/30 | | | 1,614,844 | |
| | | | | | |
| | | | | 5,259,443 | |
| | | | | | |
| |
| Total U.S. Treasury Obligations | | | 5,259,443 | |
| | | | | | |
(Cost $4,993,360) | | | | |
| |
Corporate Bonds — 15.33% | | | | |
France — 2.48% | | | | |
600,000(b) | | Electricite de France SA, (12 Year EUR Swap + 3.043%), EMTN, 5.00%, (e),(f),(g) | | | 670,323 | |
| | | | | | |
| |
Spain — 5.23% | | | | |
700,000(b) | | Abertis Infraestructuras SA, EMTN, 3.00%, 3/27/31 | | | 730,453 | |
600,000(b) | | Bankia SA, (5 Year EUR Swap + 5.819%), 6.00%, (e),(f),(g) | | | 504,170 | |
200,000(b) | | CaixaBank SA, (5 Year EUR Swap + 6.498%), 6.75%, (e),(f),(g) | | | 179,106 | |
| | | | | | |
| | | | | 1,413,729 | |
| | | | | | |
United States — 7.52% | | | | |
400,000 | | Broadcom, Inc., 4.25%, 4/15/26(c) | | | 395,411 | |
1,000,000 | | Charter Communications Operating LLC / Charter Communications Operating Capital, 5.38%, 5/1/47 | | | 1,094,360 | |
384,000 | | Enable Midstream Partners LP, 4.40%, 3/15/27 | | | 190,780 | |
400,000 | | Vistra Operations Co. LLC, 4.30%, 7/15/29(c) | | | 355,446 | |
| | | | | | |
| | | | | 2,035,997 | |
| | | | | | |
Venezuela — 0.10% | | | | |
172,500 | | Petroleos de Venezuela SA, 8.50%, 10/27/20 | | | 26,953 | |
| | | | | | |
| |
Total Corporate Bonds | | | 4,147,002 | |
| | | | | | |
(Cost $5,004,003) | | | | |
21
|
SCHEDULE OF PORTFOLIO INVESTMENTS |
RBC BlueBay Global Bond Fund (cont.)
March 31, 2020 (Unaudited)
| | | | | | |
| Shares | | | | Value | |
| |
U.S. Government Agency Backed Mortgages — 9.50% | | | | |
United States — 9.50% | | | | |
$1,160,713 | | Freddie Mac, Pool #RA1353, 3.00%, 9/1/49 | | $ | 1,219,121 | |
1,276,633 | | Ginnie Mae, Pool #MA6153, 3.00%, 9/20/49 | | | 1,351,655 | |
| | | | | | |
| | | | | 2,570,776 | |
| | | | | | |
Total U.S. Government Agency Backed Mortgages | | | 2,570,776 | |
| | | | | | |
(Cost $2,484,278) | | | | | | |
Investment Company — 6.23% | | | | |
1,686,124 | | U.S. Government Money Market Fund, RBC Institutional Class 1 (h) | | | 1,686,124 | |
| | | | | | |
Total Investment Company | | | 1,686,124 | |
| | | | | | |
(Cost $1,686,124) | | | | | | |
| |
Total Investments | | $ | 25,096,394 | |
(Cost $25,888,035)(i) — 92.76% | | | | |
| |
Other assets in excess of liabilities — 7.24% | | | 1,959,865 | |
| | | | | | |
| |
NET ASSETS — 100.00% | | $ | 27,056,259 | |
| | | | | | |
| (a) | Investment innon-U.S. Dollars. Principal amount reflects local currency. |
| (b) | Principal amount denoted in Euros. |
| (c) | Security exempt from registration under Rule 144A or Section 4(2) of the Securities Act of 1933, as amended. These securities may be resold in transactions exempt from registration, normally to qualified institutional buyers. |
| (d) | Issuer filed for bankruptcy and/or is in default of interest payments. |
| (e) | Security is afix-to-float security, which carries a fixed coupon until a certain date, upon which it switches to a floating rate. Reference rate and spread are provided if the rate is currently floating. |
| (f) | Perpetual security with no stated maturity date. |
| (g) | Variable rate security. The rate reflected in the Schedule of Portfolio Investments is the rate in effect on March 31, 2020. |
| (h) | Affiliated investment. |
| (i) | See Notes to Schedules of Portfolio Investments for the tax cost of securities and the breakdown of unrealized appreciation (depreciation). |
22
|
SCHEDULE OF PORTFOLIO INVESTMENTS |
RBC BlueBay Global Bond Fund (cont.)
March 31, 2020 (Unaudited)
Foreign currency exchange contracts as of March 31, 2020:
| | | | | | | | | | | | | | | | | | | | | | | | |
Currency Purchased | | | Currency Sold | | | | | Counterparty | | Settlement
Date | | | Value/Unrealized
Appreciation
(Depreciation) | |
EUR | | | 900,000 | | | | USD | | | | 980,646 | | | | | Citibank N.A. | | | 5/14/20 | | | $ | 13,693 | |
EUR | | | 206,000 | | | | USD | | | | 223,103 | | | | | Citibank N.A. | | | 5/14/20 | | | | 4,491 | |
GBP | | | 44,000 | | | | USD | | | | 51,914 | | | | | Citibank N.A. | | | 5/14/20 | | | | 2,788 | |
JPY | | | 6,639,000 | | | | USD | | | | 60,902 | | | | | Citibank N.A. | | | 5/14/20 | | | | 971 | |
USD | | | 762,047 | | | | AUD | | | | 1,130,000 | | | | | Citibank N.A. | | | 5/14/20 | | | | 66,853 | |
USD | | | 1,055,804 | | | | CAD | | | | 1,400,000 | | | | | Citibank N.A. | | | 5/14/20 | | | | 60,533 | |
USD | | | 338,236 | | | | EUR | | | | 306,000 | | | | | Citibank N.A. | | | 5/14/20 | | | | 161 | |
USD | | | 261,151 | | | | GBP | | | | 200,000 | | | | | Citibank N.A. | | | 5/14/20 | | | | 12,506 | |
USD | | | 26,182 | | | | GBP | | | | 20,000 | | | | | Citibank N.A. | | | 5/14/20 | | | | 1,317 | |
USD | | | 259,020 | | | | GBP | | | | 200,000 | | | | | Citibank N.A. | | | 5/14/20 | | | | 10,374 | |
USD | | | 773,612 | | | | GBP | | | | 600,000 | | | | | Citibank N.A. | | | 5/14/20 | | | | 27,675 | |
USD | | | 141,300 | | | | NZD | | | | 219,000 | | | | | Citibank N.A. | | | 5/14/20 | | | | 10,667 | |
| | | | | | | | | | | | | | | | | | | | | | | | |
| | | | | | | | | | | | | | | | | | | | | | $ | 212,029 | |
| | | | | | | |
CAD | | | 500,000 | | | | USD | | | | 374,733 | | | | | Citibank N.A. | | | 5/14/20 | | | $ | (19,279) | |
EUR | | | 150,000 | | | | USD | | | | 170,957 | | | | | Citibank N.A. | | | 5/14/20 | | | | (5,235) | |
EUR | | | 391,000 | | | | USD | | | | 434,148 | | | | | Citibank N.A. | | | 5/14/20 | | | | (2,163) | |
EUR | | | 310,000 | | | | USD | | | | 342,699 | | | | | Citibank N.A. | | | 5/14/20 | | | | (204) | |
USD | | | 8,378,287 | | | | EUR | | | | 7,680,900 | | | | | Citibank N.A. | | | 5/14/20 | | | | (107,733) | |
USD | | | 135,469 | | | | EUR | | | | 125,000 | | | | | Citibank N.A. | | | 5/14/20 | | | | (2,634) | |
USD | | | 92,138 | | | | EUR | | | | 86,000 | | | | | Citibank N.A. | | | 5/14/20 | | | | (2,877) | |
USD | | | 75,573 | | | | GBP | | | | 61,000 | | | | | Citibank N.A. | | | 5/14/20 | | | | (264) | |
USD | | | 4,510,103 | | | | JPY | | | | 492,544,000 | | | | | Citibank N.A. | | | 5/14/20 | | | | (80,217) | |
| | | | | | | | | | | | | | | | | | | | | | | | |
| | | | | | | | | | | | | | | | | | | | | | $ | (220,606) | |
| | | | | | | | | | | | | | | | | | | | | | | | |
| | | | | | | | | | | | | | | | | | | | | | | | |
Total | | | | | | | | | | | | | | | | | | | | | | $ | (8,577) | |
| | | | | | | | | | | | | | | | | | | | | | | | |
Financial futures contracts as of March 31, 2020:
| | | | | | | | | | | | | | | | | | | | | | |
Long Position | | Number of
Contracts | | | Expiration
Date | | | Value/Unrealized
Appreciation
(Depreciation) | | | Notional
Value | | | Clearinghouse |
10 Year Euro-Bund | | | 5 | | | | June 2020 | | | | | | | | $(9,047) | | | EUR | $951,307 | | | Credit Suisse Securities (USA) LLC |
Ten Year U.S. Treasury Note | | | 3 | | | | June 2020 | | | | | | | | 1,494 | | | USD | 416,063 | | | Credit Suisse Securities (USA) LLC |
| | | | | | | | | | | | | | | | | | | | | | |
Total | | | | | | | | | | | | | | | $(7,553) | | | | | | | |
| | | | | | | | | | | | | | | | | | | | | | |
23
|
SCHEDULE OF PORTFOLIO INVESTMENTS |
RBC BlueBay Global Bond Fund (cont.)
March 31, 2020 (Unaudited)
| | | | | | | | | | | | | | | | | | | | | | | | |
Short Position | | Number of
Contracts | | | Expiration
Date | | | Value/Unrealized
Appreciation | | | Notional
Value | | | Clearinghouse | |
30 Year Euro-Buxl Bund | | | 1 | | | | June 2020 | | | | | | | | $7,134 | | | EUR | $231,499 | | |
| Credit Suisse
Securities
(USA) LLC |
|
| | | | | | | | | | | | | | | | | | | | | | | | |
Total | | | | | | | | | | | | | | | $7,134 | | | | | | | | | |
| | | | | | | | | | | | | | | | | | | | | | | | |
Abbreviations used are defined below:
AUD - Australian Dollar
CAD - Canadian Dollar
EMTN - Euro Medium Term Note
EUR - Euro
GBP - United Kingdom Pound Sterling
JPY - Japanese Yen
NZD - New Zealand Dollar
USD - United States Dollar
Portfolio Diversification (Unaudited)
| | | | |
Industries | | Percentage
of Net Assets | |
Foreign Government Bonds | | | 42.26 | % |
Government | | | 19.44 | % |
Financial | | | 12.03 | % |
Communications | | | 4.04 | % |
Utilities | | | 3.79 | % |
Consumer,Non-cyclical | | | 2.70 | % |
Technology | | | 1.46 | % |
Energy | | | 0.81 | % |
Other* | | | 13.47 | % |
| | | 100.00 | % |
* Includes cash, Investment Company, interest and dividend receivable, pending trades and Fund share transactions, financial futures contracts, foreign currency exchange contracts and accrued expenses payable.
See Notes to Schedules of Portfolio Investments.
24
|
SCHEDULE OF PORTFOLIO INVESTMENTS |
RBC BlueBay High Yield Bond Fund
March 31, 2020 (Unaudited)
| | | | |
Principal Amount | | | | Value |
Corporate Bonds — 90.48% | | |
Australia — 0.39% | | |
$ 143,548 | | Quintis Australia Pty Ltd., PIK, 0.00%, 10/1/28(a),(b),(c) | | $ 74,358 |
181,625 | | Quintis Australia Pty Ltd., PIK, 7.50%, 10/1/26(a),(b),(c) | | 146,662 |
| | | | |
| | | | 221,020 |
| | | | |
Canada — 5.65% | | |
930,000 | | 1011778 BC ULC / New Red Finance, Inc., 4.38%, 1/15/28(a) | | 863,040 |
175,000 | | Bombardier, Inc., 6.13%, 1/15/23(a) | | 123,309 |
275,000 | | Bombardier, Inc., 8.75%, 12/1/21(a) | | 228,937 |
408,000 | | Brookfield Residential Properties, Inc. / Brookfield Residential US Corp., 4.88%, 2/15/30(a) | | 309,958 |
476,000 | | Cascades, Inc./Cascades USA, Inc., 5.13%, 1/15/26(a) | | 460,530 |
200,000 | | Intertape Polymer Group, Inc., 7.00%, 10/15/26(a) | | 189,125 |
401,000 | | Parkland Fuel Corp., 5.88%, 7/15/27(a) | | 370,925 |
413,000 | | Telesat Canada / Telesat LLC, 4.88%, 6/1/27(a) | | 394,332 |
290,000 | | Telesat Canada / Telesat LLC, 6.50%, 10/15/27(a) | | 278,264 |
| | | | |
| | | | 3,218,420 |
| | | | |
Cayman Islands — 1.35% | | |
1,196,000 | | Global Aircraft Leasing Co. Ltd., 6.50%, 9/15/24(a) | | 770,224 |
| | | | |
| |
France — 1.68% | | |
201,000 | | Altice France SA/France, 8.13%, 2/1/27(a) | | 209,548 |
245,000(d) | | Banijay Entertainment SASU, 3.50%, 3/1/25(a) | | 241,289 |
200,000 | | Banijay Entertainment SASU, 5.38%, 3/1/25(a) | | 186,000 |
372,000(d) | | Banijay Group SAS, 6.50%, 3/1/26(a) | | 320,277 |
| | | | |
| | | | 957,114 |
| | | | |
Italy — 2.14% | | |
503,000 | | F-Brasile SpA /F-Brasile US LLC, Series XR, 7.38%, 8/15/26(a) | | 476,140 |
300,000 | | Intesa Sanpaolo SpA, 7.70%, (a),(e),(f) | | 251,837 |
300,000 | | UniCredit SpA, 5.86%, 6/19/32(a),(e) | | 285,804 |
220,000 | | UniCredit SpA, 7.30%, 4/2/34(a),(e) | | 208,771 |
| | | | |
| | | | 1,222,552 |
| | | | |
Luxembourg — 3.42% | | |
423,000 | | Altice Financing SA, 5.00%, 1/15/28(a) | | 378,340 |
270,000 | | Altice Finco SA, 7.63%, 2/15/25(a) | | 259,200 |
441,000 | | Altice France Holding SA, 6.00%, 2/15/28(a) | | 379,260 |
562,000 | | Altice France Holding SA, 10.50%, 5/15/27(a) | | 592,910 |
264,000(d) | | Summer BC Holdco B SARL, 5.75%, 10/31/26 | | 242,272 |
105,000(d) | | Ypso Finance Bis SA, 4.00%, 2/15/28(a) | | 96,013 |
| | | | |
| | | | 1,947,995 |
| | | | |
Netherlands — 1.72% | | |
600,000 | | UPC Holding BV, 5.50%, 1/15/28(a) | | 567,660 |
205,000 | | Ziggo Bond Co. BV, 5.13%, 2/28/30(a) | | 195,539 |
220,000 | | Ziggo BV, 4.88%, 1/15/30(a) | | 218,350 |
| | | | |
| | | | 981,549 |
| | | | |
25
|
SCHEDULE OF PORTFOLIO INVESTMENTS |
RBC BlueBay High Yield Bond Fund (cont.)
March 31, 2020 (Unaudited)
| | | | |
Principal Amount | | | | Value |
Singapore — 1.10% | | |
$ 687,000 | | Avation Capital SA, MTN, 6.50%, 5/15/21(a) | | $ 629,223 |
| | | | |
| |
Spain — 0.20% | | |
160,000(d) | | Haya Finance 2017 SA, 5.25%, 11/15/22 | | 113,819 |
| | | | |
| |
Switzerland — 1.28% | | |
450,000 | | Credit Suisse Group AG, 4.19%, 4/1/31(a),(e) | | 455,962 |
300,000 | | Credit Suisse Group AG, 7.25%, (e),(f) | | 272,885 |
| | | | |
| | | | 728,847 |
| | | | |
United Arab Emirates — 0.88% | | |
513,000 | | DAE Funding LLC, 4.00%, 8/1/20(a) | | 502,650 |
| | | | |
| |
United States — 70.67% | | |
400,000 | | Adient Global Holdings Ltd., 4.88%, 8/15/26(a) | | 276,000 |
595,000 | | Adient US LLC, 7.00%, 5/15/26(a) | | 550,508 |
530,000 | | Advanced Drainage Systems, Inc., 5.00%, 9/30/27(a) | | 472,553 |
305,000 | | Albertsons Cos. LLC / Safeway, Inc. / New Albertsons LP / Albertson’s LLC, 4.63%, 1/15/27(a) | | 303,357 |
152,000 | | Albertsons Cos. LLC / Safeway, Inc. / New Albertsons LP / Albertson’s LLC, 4.88%, 2/15/30(a) | | 151,733 |
239,000 | | Albertsons Cos. LLC / Safeway, Inc. / New Albertsons LP / Albertson’s LLC, 7.50%, 3/15/26(a) | | 257,864 |
146,000 | | Albertsons Cos. LLC / Safeway, Inc. / New Albertson’s, Inc. / Albertson’s LLC, 5.75%, 3/15/25 | | 147,501 |
575,000 | | Allison Transmission, Inc., 5.00%, 10/1/24(a) | | 555,257 |
109,000 | | Asbury Automotive Group, Inc., 4.50%, 3/1/28(a) | | 93,068 |
107,000 | | Asbury Automotive Group, Inc., 4.75%, 3/1/30(a) | | 91,557 |
296,000 | | ASGN, Inc., 4.63%, 5/15/28(a) | | 277,842 |
310,000 | | Bausch Health Americas, Inc., 8.50%, 1/31/27(a) | | 324,150 |
179,000 | | Bausch Health Cos., Inc., 5.00%, 1/30/28(a) | | 169,459 |
632,000 | | Bausch Health Cos., Inc., 5.25%, 1/30/30(a) | | 597,240 |
600,000 | | Bausch Health Cos., Inc., 6.50%, 3/15/22(a) | | 606,000 |
541,000 | | Beacon Roofing Supply, Inc., 4.88%, 11/1/25(a) | | 489,088 |
762,000 | | Berry Global, Inc., 5.13%, 7/15/23 | | 764,642 |
184,000 | | Brookfield Property REIT, Inc. / BPR Cumulus LLC / BPR Nimbus LLC / GGSI Sellco LL, 5.75%, 5/15/26(a) | | 149,239 |
309,000 | | Builders FirstSource, Inc., 5.00%, 3/1/30(a) | | 281,666 |
512,000 | | Calpine Corp., 4.50%, 2/15/28(a) | | 495,981 |
395,000 | | Capitol Investment Merger Sub 2 LLC, 10.00%, 8/1/24(a) | | 359,976 |
274,000 | | Carriage Services, Inc., 6.63%, 6/1/26(a) | | 269,249 |
482,000 | | Carvana Co., 8.88%, 10/1/23(a) | | 460,489 |
804,000 | | CCO Holdings LLC / CCO Holdings Capital Corp., 4.75%, 3/1/30(a) | | 800,578 |
400,000 | | CCO Holdings LLC / CCO Holdings Capital Corp., 5.25%, 9/30/22 | | 402,988 |
26
|
SCHEDULE OF PORTFOLIO INVESTMENTS |
RBC BlueBay High Yield Bond Fund (cont.)
March 31, 2020 (Unaudited)
| | | | |
Principal Amount | | | | Value |
$292,000 | | Centene Corp., 4.25%, 12/15/27(a) | | $286,185 |
675,000 | | CenturyLink, Inc., 4.00%, 2/15/27(a) | | 654,646 |
860,000 | | CenturyLink, Inc., Series V, 5.63%, 4/1/20 | | 860,000 |
213,000 | | CenturyLink, Inc., Series S, 6.45%, 6/15/21 | | 216,195 |
500,000 | | Cheniere Energy Partners LP, 4.50%, 10/1/29(a) | | 431,917 |
100,000 | | Citigroup, Inc., 4.41%, 3/31/31(e) | | 109,831 |
310,000 | | Citigroup, Inc., 5.32%, 3/26/41(e) | | 389,606 |
296,000 | | Clear Channel Worldwide Holdings, Inc., 5.13%, 8/15/27(a) | | 283,484 |
403,000 | | Clearway Energy Operating LLC, 4.75%, 3/15/28(a) | | 375,024 |
313,000 | | Cleveland-Cliffs, Inc., 6.75%, 3/15/26(a) | | 278,798 |
571,000 | | CSC Holdings LLC, 5.75%, 1/15/30(a) | | 579,127 |
867,000 | | CSC Holdings LLC, 10.88%, 10/15/25(a) | | 937,444 |
467,000 | | Dealer Tire LLC / DT Issuer LLC, 8.00%, 2/1/28(a) | | 374,021 |
934,000 | | Dell International LLC / EMC Corp., 5.88%, 6/15/21(a) | | 934,185 |
588,000 | | DISH DBS Corp., 5.88%, 7/15/22 | | 577,742 |
134,000 | | EMC Corp., 2.65%, 6/1/20 | | 133,168 |
299,000 | | Encompass Health Corp., 4.50%, 2/1/28 | | 293,069 |
184,000 | | Encompass Health Corp., 4.75%, 2/1/30 | | 178,717 |
305,000 | | Fidelity & Guaranty Life Holdings, Inc., 5.50%, 5/1/25(a) | | 301,584 |
303,000 | | Frontier Communications Corp., 8.00%, 4/1/27(a) | | 298,785 |
301,000 | | Frontier Communications Corp., 8.50%, 4/1/26(a) | | 279,916 |
607,000 | | Global Partners LP / GLP Finance Corp., 7.00%, 8/1/27 | | 453,304 |
418,000 | | Gray Television, Inc., 7.00%, 5/15/27(a) | | 415,652 |
525,000 | | HCA, Inc., 3.50%, 9/1/30 | | 477,806 |
296,000 | | Herc Holdings, Inc., 5.50%, 7/15/27(a) | | 275,496 |
383,000 | | Intrepid Aviation Group Holdings LLC / Intrepid Finance Co., 8.50%, 8/15/21(a) | | 359,485 |
646,000 | | Iron Mountain, Inc., 4.38%, 6/1/21(a) | | 648,274 |
604,000 | | JPMorgan Chase & Co., (LIBOR USD3-Month + 3.470%), Series I, 5.24%, (f),(g) | | 541,386 |
648,000 | | KB Home, 4.80%, 11/15/29 | | 551,639 |
529,000 | | Laureate Education, Inc., 8.25%, 5/1/25(a) | | 525,732 |
646,000 | | LCPR Senior Secured Financing DAC, 6.75%, 10/15/27(a) | | 637,049 |
283,000 | | Level 3 Financing, Inc., 4.63%, 9/15/27(a) | | 282,958 |
162,000 | | LifePoint Health, Inc., 4.38%, 2/15/27(a) | | 154,476 |
315,000 | | Lithia Motors, Inc., 4.63%, 12/15/27(a) | | 283,532 |
170,000 | | Nationstar Mortgage Holdings, Inc., 6.00%, 1/15/27(a) | | 142,679 |
600,000 | | Netflix, Inc., 5.38%, 2/1/21 | | 606,433 |
404,000 | | Nexstar Escrow, Inc., 5.63%, 7/15/27(a) | | 394,848 |
468,000 | | Novelis Corp., 4.75%, 1/30/30(a) | | 419,573 |
545,000 | | Outfront Media Capital LLC / Outfront Media Capital Corp., 4.63%, 3/15/30(a) | | 488,044 |
600,000 | | Panther BF Aggregator 2 LP / Panther Finance Co., Inc., 6.25%, 5/15/26(a) | | 564,900 |
873,000 | | Post Holdings, Inc., 5.50%, 12/15/29(a) | | 906,585 |
266,000 | | Realogy Group LLC / RealogyCo-Issuer Corp., 9.38%, 4/1/27(a) | | 224,354 |
484,000 | | RegionalCare Hospital Partners Holdings, Inc. / LifePoint Health, Inc., 9.75%, 12/1/26(a) | | 464,003 |
582,000 | | Resolute Forest Products, Inc., 5.88%, 5/15/23 | | 464,959 |
27
|
SCHEDULE OF PORTFOLIO INVESTMENTS |
RBC BlueBay High Yield Bond Fund (cont.)
March 31, 2020 (Unaudited)
| | | | |
Principal Amount | | | | Value |
$ 306,000 | | SBA Communications Corp., 3.88%, 2/15/27(a) | | $ 307,062 |
128,000 | | Scientific Games International, Inc., 7.00%, 5/15/28(a) | | 80,314 |
337,000 | | Scientific Games International, Inc., 8.25%, 3/15/26(a) | | 215,828 |
457,000 | | Sealed Air Corp., 4.00%, 12/1/27(a) | | 424,932 |
269,000 | | Service Corp. International, 5.13%, 6/1/29 | | 273,454 |
463,000 | | Silgan Holdings, Inc., 4.13%, 2/1/28(a) | | 432,102 |
200,000 | | Sinclair Television Group, Inc., 5.63%, 8/1/24(a) | | 184,231 |
883,000 | | Sirius XM Radio, Inc., 3.88%, 8/1/22(a) | | 879,735 |
275,000 | | Springleaf Finance Corp., 5.38%, 11/15/29 | | 251,858 |
350,000 | | Springleaf Finance Corp., 6.88%, 3/15/25 | | 352,937 |
50,000 | | Springleaf Finance Corp., 7.13%, 3/15/26 | | 48,752 |
844,000 | | Springleaf Finance Corp., 8.25%, 12/15/20 | | 845,516 |
382,000 | | Sprint Communications, Inc., 11.50%, 11/15/21 | | 421,692 |
130,000 | | Sprint Corp., 7.25%, 9/15/21 | | 134,069 |
232,000 | | Sprint Corp., 7.63%, 3/1/26 | | 262,677 |
1,160,000 | | TEGNA, Inc., 5.00%, 9/15/29(a) | | 1,048,617 |
550,000 | | Tenet Healthcare Corp., 8.13%, 4/1/22 | | 524,250 |
563,000 | | Terrier Media Buyer, Inc., 8.88%, 12/15/27(a) | | 475,735 |
650,000 | | Tesla, Inc., 5.30%, 8/15/25(a) | | 608,678 |
1,000,000 | | T-Mobile USA, Inc., 6.00%, 3/1/23 | | 1,005,355 |
469,000 | | TransDigm, Inc., 5.50%, 11/15/27(a) | | 421,491 |
434,000 | | TransDigm, Inc., 6.25%, 3/15/26(a) | | 432,467 |
320,000 | | United Parcel Service, Inc., 4.45%, 4/1/30 | | 362,088 |
290,000 | | United Rentals North America, Inc., 3.88%, 11/15/27 | | 274,497 |
215,000 | | United Rentals North America, Inc., 5.25%, 1/15/30 | | 214,868 |
351,000 | | Verscend Escrow Corp., 9.75%, 8/15/26(a) | | 350,791 |
195,000 | | ViaSat, Inc., 5.63%, 4/15/27(a) | | 196,412 |
326,000 | | Viper Energy Partners LP, 5.38%, 11/1/27(a) | | 272,233 |
628,000 | | Wand Merger Corp., 9.13%, 7/15/26(a) | | 570,314 |
| | | | |
| | | | 40,277,551 |
| | | | |
Total Corporate Bonds | | 51,570,964 |
| | | | |
(Cost $54,928,197) | | |
| |
Bank Loans — 0.48% | | |
United States — 0.48% | | |
367,341 | | Granite US Holdings Corp.,(3-month LIBOR + 1.80%), 5.25%, 9/30/26(h) | | 257,139 |
15,981 | | Vertellus Holdings LLC , 2nd Lien Term Loan, (LIBOR1-Month + 12.000%), 12.00%, 10/29/21(b),(c),(g) | | 15,757 |
| | | | |
| | | | 272,896 |
| | | | |
Total Bank Loans | | 272,896 |
| | | | |
(Cost $367,630) | | |
| | | | |
| | |
| Shares | | | | |
Common Stocks — 0.12% | | |
Australia — 0.09% | | |
70,137 | | Quintis Ltd.(b),(c) | | 49,797 |
| | | | |
28
|
SCHEDULE OF PORTFOLIO INVESTMENTS |
RBC BlueBay High Yield Bond Fund (cont.)
March 31, 2020 (Unaudited)
| | | | |
| Shares | | | | Value |
United States — 0.03% | | |
12,785 | | Valencia Bidco LLC(b),(c) | | $ 17,132 |
| | | | |
Total Common Stocks | | 66,929 |
| | | | |
(Cost $20,834) | | |
| |
Rights/Warrants — 0.00% | | |
Mexico — 0.00% | | |
3,026 | | Urbi Desarrollos Urbanos SAB de CV Warrants, Expire 12/31/49* | | 3 |
| | | | |
| |
Total Rights/Warrants | | 3 |
| | | | |
(Cost $0) | | |
| |
Investment Company — 3.66% | | |
2,088,660 | | U.S. Government Money Market Fund, RBC Institutional Class 1 (i) | | 2,088,660 |
| | | | |
| |
Total Investment Company | | 2,088,660 |
| | | | |
(Cost $2,088,660) | | |
| |
Total Investments | | $53,999,452 |
(Cost $57,405,321)(j) — 94.74% | | |
| |
Other assets in excess of liabilities — 5.26% | | 2,997,707 |
| | | | |
| |
NET ASSETS — 100.00% | | $56,997,159 |
| | | | |
| | | | |
| * | Non-income producing security. |
| (a) | Security exempt from registration under Rule 144A or Section 4(2) of the Securities Act of 1933, as amended. These securities may be resold in transactions exempt from registration, normally to qualified institutional buyers. |
| (b) | The Pricing Committee has fair valued this security under procedures established by the Fund’s Board of Trustees. |
| (c) | Security is valued using significant unobservable inputs and is classified as Level 3 in the fair value hierarchy. |
| (d) | Principal amount denoted in Euros. |
| (e) | Security is afix-to-float security, which carries a fixed coupon until a certain date, upon which it switches to a floating rate. Reference rate and spread are provided if the rate is currently floating. |
| (f) | Perpetual security with no stated maturity date. |
| (g) | Variable rate security. The rate reflected in the Schedule of Portfolio Investments is the rate in effect on March 31, 2020. |
| (h) | Variable or floating rate security, which interest rate adjusts periodically based on changes in current interest rates and prepayments on the underlying pool of assets. Rate shown is the rate in effect as of period end. |
| (i) | Affiliated investment. |
| (j) | See Notes to Schedules of Portfolio Investments for the tax cost of securities and the breakdown of unrealized appreciation (depreciation). |
29
|
SCHEDULE OF PORTFOLIO INVESTMENTS |
RBC BlueBay High Yield Bond Fund (cont.)
March 31, 2020 (Unaudited)
Foreign currency exchange contracts as of March 31, 2020:
| | | | | | | | | | | | | | | | | | | | | | | | |
Currency Purchased | | | Currency Sold | | | Counterparty | | Settlement
Date | | | Value/Unrealized Appreciation (Depreciation) |
EUR | | | 162,000 | | | USD | | | 176,308 | | | Citibank N.A. | | | 5/14/20 | | | | | $ | 2,673 | | | |
USD | | | 528,645 | | | GBP | | | 405,000 | | | Citibank N.A. | | | 5/14/20 | | | | | | 25,137 | | | |
| | | | | | | | | | | | | | | | | | | | | | | | |
| | | | | | | | | | | | | | | | | | | | $ | 27,810 | | | |
| | | | | | | | |
USD | | | 1,654,525 | | | EUR | | | 1,518,000 | | | Citibank N.A. | | | 5/14/20 | | | | | $ | (22,594) | | | |
| | | | | | | | | | | | | | | | | | | | | | | | |
| | | | | | | | |
| | | | | | | | | | | | | | | | | | | | | | | | |
| | | | | | | | | | | | | | | | | | | | | | | | |
Total | | | | | | | | | | | | | | | | | | | | $ | 5,216 | | | |
| | | | | | | | | | | | | | | | | | | | | | | | |
Financial futures contracts as of March 31, 2020:
| | | | | | | | | | | | | | | | | | | | | | |
Long Position | | Number of
Contracts | | | Expiration
Date | | Value/Unrealized
Appreciation | | | Notional
Value | | | Clearinghouse | |
Ten Year U.S. Treasury Note | | | 9 | | | June 2020 | | | | | | $ | 2,653 | | | USD | $1,248,188 | | | | Citigroup Global Markets Inc. | |
| | | | | | | | | | | | | | | | | | | | | | |
Total | | | | | | | | | | | | $ | 2,653 | | | | | | | | | |
| | | | | | | | | | | | | | | | | | | | | | |
| | | | | |
Short Position | | Number of
Contracts | | | Expiration
Date | | Value/Unrealized
Depreciation | | | Notional
Value | | | Clearinghouse | |
30 Year U.S. Treasury Bond | | | 2 | | | June 2020 | | | | | | $ | (12,699) | | | USD | $358,125 | | | | Citigroup Global Markets Inc. | |
| | | | | | | | | | | | | | | | | | | | | | |
Total | | | | | | | | | | | | $ | (12,699) | | | | | | | | | |
| | | | | | | | | | | | | | | | | | | | | | |
Abbreviations used are defined below:
EUR - Euro
GBP - United Kingdom Pound Sterling
LIBOR - London Interbank Offered Rate
MTN - Medium Term Note
REIT - Real Estate Investment Trust
USD - United States Dollar
30
|
SCHEDULE OF PORTFOLIO INVESTMENTS |
RBC BlueBay High Yield Bond Fund (cont.)
March 31, 2020 (Unaudited)
Portfolio Diversification (Unaudited)
| | | | | |
Industries | | Percentage of Net Assets |
Communications | | | | 28.91 | % |
Financial | | | | 16.14 | % |
Consumer,Non-cyclical | | | | 15.19 | % |
Consumer, Cyclical | | | | 11.93 | % |
Industrial | | | | 10.23 | % |
Energy | | | | 2.69 | % |
Basic Materials | | | | 2.59 | % |
Technology | | | | 1.87 | % |
Utilities | | | | 1.53 | % |
Other* | | | | 8.92 | % |
| | | | | |
| | | | 100.00 | % |
| | | | | |
* Includes cash, Investment Company, interest and dividend receivable, pending trades and Fund share transactions, warrants, financial futures contracts, foreign currency exchange contracts and accrued expenses payable.
See Notes to the Financial Statements.
31
Statements of Assets and Liabilities
March 31, 2020 (Unaudited)
| | | | | | | | | | | | | | |
| | | RBC BlueBay
Emerging Market
Debt Fund | | | RBC BlueBay
Global
Bond Fund | | | RBC BlueBay
High Yield
Bond Fund | |
Assets: | | | | | | | | | | | | | | |
Investments in securities, at value: | | | | | | | | | | | | | | |
Unaffiliated investments (cost $18,642,103, $24,201,911 and $55,316,661, respectively) | | | | $ | 15,534,347 | | | $ | 23,410,270 | | | $ | 51,910,792 | |
Affiliated investments (cost $2,488,119, $1,686,124 and $2,088,660, respectively) | | | | | 2,488,119 | | | | 1,686,124 | | | | 2,088,660 | |
Cash | | | | | — | | | | 3,168 | | | | 33,921 | |
Cash at broker for financial future contracts | | | | | 11,783 | | | | 39,233 | | | | 90,146 | |
Segregated cash for swap contracts | | | | | 303,884 | | | | — | | | | — | |
Cash at broker for forward foreign currency exchange contracts | | | | | 47,453 | | | | 809,985 | | | | 49 | |
Foreign currency, at value (cost $214,796, $904,429 and $1,010,247, respectively) | | | | | 216,230 | | | | 886,725 | | | | 1,001,584 | |
Interest and dividend receivable | | | | | 268,579 | | | | 188,607 | | | | 863,206 | |
Receivable from advisor | | | | | 8,620 | | | | 15,376 | | | | — | |
Receivable for capital shares issued | | | | | — | | | | — | | | | 389,429 | |
Receivable for investments sold | | | | | 89,022 | | | | — | | | | 2,085,100 | |
Credit default swaps at value (premiums paid $519,316, $0 and $0, respectively) | | | | | 598,646 | | | | — | | | | — | |
Unrealized appreciation on futures contracts | | | | | — | | | | 8,628 | | | | 2,653 | |
Unrealized appreciation on interest rate swaps contracts | | | | | 189 | | | | — | | | | — | |
Unrealized appreciation on forward foreign currency exchange contracts | | | | | 265,961 | | | | 212,029 | | | | 27,810 | |
Prepaid expenses and other assets | | | | | 43,901 | | | | 63,981 | | | | 45,096 | |
| | | | | | | | | | | | | | |
Total Assets | | | | | 19,876,734 | | | | 27,324,126 | | | | 58,538,446 | |
| | | | | | | | | | | | | | |
Liabilities: | | | | | | | | | | | | | | |
Cash overdraft | | | | | 290,841 | | | | — | | | | — | |
Foreign withholding tax payable | | | | | 4,274 | | | | 4,273 | | | | 4,351 | |
Payable for capital shares redeemed | | | | | — | | | | — | | | | 236 | |
Payable for investments purchased | | | | | 636,061 | | | | — | | | | 1,465,112 | |
Credit default swaps at value (premiums received $467,007, $0 and $0, respectively) | | | | | 461,573 | | | | — | | | | — | |
Unrealized depreciation on forward foreign currency exchange contracts | | | | | 310,035 | | | | 220,606 | | | | 22,594 | |
Unrealized depreciation on interest rate swaps contracts | | | | | 10,468 | | | | — | | | | — | |
Unrealized depreciation on futures contracts | | | | | — | | | | 9,047 | | | | 12,699 | |
Accrued expenses and other payables: | | | | | | | | | | | | | | |
Investment advisory fees | | | | | — | | | | — | | | | 1,115 | |
Accounting fees | | | | | 3,605 | | | | 3,639 | | | | 3,765 | |
Audit fees | | | | | 18,322 | | | | 18,147 | | | | 19,674 | |
Trustees’ fees | | | | | 137 | | | | 808 | | | | 76 | |
Distribution fees | | | | | — | | | | 4 | | | | 140 | |
Shareholder reports | | | | | 9,277 | | | | 6,193 | | | | 4,005 | |
32
Statements of Assets and Liabilities (cont.)
March 31, 2020 (Unaudited)
| | | | | | | | | | | | | | |
| | | RBC BlueBay
Emerging Market
Debt Fund | | | RBC BlueBay
Global
Bond Fund | | | RBC BlueBay
High Yield
Bond Fund | |
Transfer agent fees | | | | $ | 501 | | | $ | 1,533 | | | $ | — | |
Other | | | | | 2,487 | | | | 3,617 | | | | 7,520 | |
| | | | | | | | | | | | | | |
Total Liabilities | | | | | 1,747,581 | | | | 267,867 | | | | 1,541,287 | |
| | | | | | | | | | | | | | |
Net Assets | | | | $ | 18,129,153 | | | $ | 27,056,259 | | | $ | 56,997,159 | |
| | | | | | | | | | | | | | |
| | | | |
Net Assets Consists of: | | | | | | | | | | | | | | |
Capital | | | | $ | 27,136,734 | | | $ | 28,072,528 | | | $ | 60,865,541 | |
Accumulated earnings | | | | | (9,007,581 | ) | | | (1,016,269 | ) | | | (3,868,382 | ) |
| | | | | | | | | | | | | | |
Net Assets | | | | $ | 18,129,153 | | | $ | 27,056,259 | | | $ | 56,997,159 | |
| | | | | | | | | | | | | | |
| | | | |
Net Assets | | | | | | | | | | | | | | |
Class A | | | | | 5,951 | | | | 9,653 | | | | 782,443 | |
Class I | | | | | 18,112,836 | | | | 27,035,404 | | | | 56,214,716 | |
Class R6 | | | | | 10,366 | | | | 11,202 | | | | N/A | |
| | | | | | | | | | | | | | |
Total | | | | $ | 18,129,153 | | | $ | 27,056,259 | | | $ | 56,997,159 | |
| | | | | | | | | | | | | | |
| | | | |
Shares Outstanding (Unlimited number of shares authorized, no par value): | | | | | | | | | | | | | | |
Class A | | | | | 722 | | | | 1,035 | | | | 81,981 | |
Class I | | | | | 2,172,786 | | | | 2,902,420 | | | | 5,849,855 | |
Class R6 | | | | | 1,238 | | | | 1,203 | | | | N/A | |
| | | | | | | | | | | | | | |
Total | | | | | 2,174,746 | | | | 2,904,658 | | | | 5,931,836 | |
| | | | | | | | | | | | | | |
| | | | |
Net Asset Values and Redemption Prices Per Share: | | | | | | | | | | | | | | |
Class A | | | | $ | 8.25 | (a) | | $ | 9.32 | (b) | | $ | 9.54 | |
| | | | | | | | | | | | | | |
Class I | | | | $ | 8.34 | | | $ | 9.31 | | | $ | 9.61 | |
| | | | | | | | | | | | | | |
Class R6 | | | | $ | 8.37 | | | $ | 9.32 | (c) | | $ | N/A | |
| | | | | | | | | | | | | | |
| | | | |
Maximum Offering Price Per Share: | | | | | | | | | | | | | | |
Class A | | | | $ | 8.62 | | | $ | 9.73 | | | $ | 9.96 | |
| | | | | | | | | | | | | | |
Maximum Sales Charge - Class A | | | | | 4.25 | % | | | 4.25 | % | | | 4.25 | % |
| | | | | | | | | | | | | | |
| (a) | Net asset value (“NAV”) is calculated using unrounded net assets of $5,951.37 divided by unrounded shares outstanding of 721.774. |
| (b) | Net asset value (“NAV”) is calculated using unrounded net assets of $9,653.40 divided by unrounded shares outstanding of 1,035.338. |
| (c) | Net asset value (“NAV”) is calculated using unrounded net assets of $11,202.29 divided by unrounded shares outstanding of 1,202.459. |
See Notes to the Financial Statements.
33
Statements of Operations
For the Six Months Ended March 31, 2020 (Unaudited)
| | | | | | | | | | | | | | |
| | | RBC BlueBay
Emerging Market
Debt Fund | | | RBC BlueBay
Global
Bond Fund | | | RBC BlueBay
High Yield
Bond Fund | |
Investment Income: | | | | | | | | | | | | | | |
Interest income | | | | $ | 656,448 | | | $ | 302,265 | | | $ | 1,463,677 | |
Dividend income - affiliated | | | | | 4,369 | | | | 10,372 | | | | 24,809 | |
Foreign tax withholding | | | | | — | | | | 1 | | | | — | |
| | | | | | | | | | | | | | |
Total Investment Income | | | | | 660,817 | | | | 312,638 | | | | 1,488,486 | |
Expenses: | | | | | | | | | | | | | | |
Investment advisory fees | | | | | 79,813 | | | | 65,705 | | | | 201,093 | |
Distribution fees–Class A | | | | | 27 | | | | 4 | | | | 1,015 | |
Accounting fees | | | | | 23,818 | | | | 26,460 | | | | 31,397 | |
Audit fees | | | | | 16,437 | | | | 21,044 | | | | 17,651 | |
Custodian fees | | | | | 45,026 | | | | 62,365 | | | | 40,700 | |
Insurance fees | | | | | 2,001 | | | | 1,999 | | | | 2,001 | |
Legal fees | | | | | 522 | | | | 33,408 | | | | 1 | |
Registrations and filing fees | | | | | 27,896 | | | | 16,200 | | | | 20,853 | |
Shareholder reports | | | | | 16,986 | | | | 27,468 | | | | 21,897 | |
Transfer agent fees–Class A | | | | | 1,960 | | | | — | | | | 2,927 | |
Transfer agent fees–Class I | | | | | 2,956 | | | | 2,079 | | | | 7,429 | |
Transfer agent fees–Class R6 | | | | | 1,919 | | | | 1,919 | | | | — | |
Trustees’ fees and expenses | | | | | 909 | | | | 1,956 | | | | 2,043 | |
Tax expense | | | | | 2,157 | | | | 2,156 | | | | 2,087 | |
Other fees | | | | | 2,725 | | | | 4,118 | | | | 2,623 | |
| | | | | | | | | | | | | | |
Total expenses before fee waiver/reimbursement | | | | | 225,152 | | | | 266,881 | | | | 353,717 | |
Expenses waived/reimbursed by: | | | | | | | | | | | | | | |
Advisor | | | | | (132,546 | ) | | | (190,954 | ) | | | (188,956 | ) |
| | | | | | | | | | | | | | |
Net expenses | | | | | 92,606 | | | | 75,927 | | | | 164,761 | |
| | | | | | | | | | | | | | |
Net Investment Income | | | | | 568,211 | | | | 236,711 | | | | 1,323,725 | |
| | | | | | | | | | | | | | |
Realized/Unrealized Gains/(Losses): | | | | | | | | | | | | | | |
Net realized gains/(losses) on: | | | | | | | | | | | | | | |
Investment transactions | | | | | (289,420 | ) | | | (95,698 | ) | | | (107,128 | ) |
Foreign currency transactions | | | | | (9,805 | ) | | | 47,273 | | | | 27,270 | |
Foreign currency exchange contracts | | | | | 18,503 | | | | 79,911 | | | | — | |
Futures contracts | | | | | (76,940 | ) | | | 15,728 | | | | (6,462 | ) |
Swap agreements | | | | | (34,689 | ) | | | — | | | | 156,133 | |
| | | | | | | | | | | | | | |
Net realized gains/(losses) | | | | | (392,351 | ) | | | 47,214 | | | | 69,813 | |
Net change in unrealized appreciation/(depreciation) on: | | | | | | | | | | | | | | |
Investments | | | | | (3,379,878 | ) | | | (888,457 | ) | | | (5,049,389 | ) |
Foreign currency | | | | | 3,855 | | | | (83,561 | ) | | | 3,976 | |
Foreign currency exchange contracts | | | | | (22,028 | ) | | | 17,394 | | | | (13,170 | ) |
Futures contracts | | | | | (6,957 | ) | | | (419 | ) | | | (17,999 | ) |
Swap agreements | | | | | 79,030 | | | | — | | | | (51,253 | ) |
| | | | | | | | | | | | | | |
Net unrealized losses | | | | | (3,325,978 | ) | | | (955,043 | ) | | | (5,127,835 | ) |
| | | | | | | | | | | | | | |
34
Statements of Operation (cont.)
For the Six Months Ended March 31, 2020 (Unaudited)
| | | | | | | | | | | | | | |
| | | RBC BlueBay
Emerging Market
Debt Fund | | | RBC BlueBay
Global
Bond Fund | | | RBC BlueBay
High Yield
Bond Fund | |
Change in net assets resulting from operations | | | | $ | (3,150,118 | ) | | $ | (671,118 | ) | | $ | (3,734,297 | ) |
| | | | | | | | | | | | | | |
See Notes to the Financial Statements.
35
Statements of Changes in Net Assets
| | | | | | | | | | | | | | | | |
| | | RBC BlueBay
Emerging Market
Debt Fund | |
| | | For the
Six Months Ended
March 31, 2020
(Unaudited) | | | For the
Year Ended
September 30, 2019 | |
From Investment Activities | | | | | | | | | | | | | | | | |
Operations: | | | | | | | | | | | | | | | | |
Net investment income | | | | | | $ | 568,211 | | | | | | | $ | 1,226,815 | |
Net realized gains/(losses) from investments, foreign currency, written options, futures contracts and swap contracts transactions | | | | | | | (392,351 | ) | | | | | | | 617,685 | |
Net change in unrealized appreciation/(depreciation) on investments, foreign currency, written options, futures contracts and swap contracts | | | | | | | (3,325,978 | ) | | | | | | | 504,322 | |
| | | | | | | | | | | | | | | | |
Change in net assets resulting from operations | | | | | | | (3,150,118 | ) | | | | | | | 2,348,822 | |
| | | | | | | | | | | | | | | | |
Distributions to Shareholders: | | | | | | | | | | | | | | | | |
Class A | | | | | | | (938 | ) | | | | | | | (1,059 | ) |
Class I | | | | | | | (953,650 | ) | | | | | | | (1,230,093 | ) |
Class R6 | | | | | | | (544 | ) | | | | | | | (626 | ) |
| | | | | | | | | | | | | | | | |
Change in net assets resulting from shareholder distributions | | | | | | | (955,132 | ) | | | | | | | (1,231,778 | ) |
| | | | | | | | | | | | | | | | |
Capital Transactions: | | | | | | | | | | | | | | | | |
Proceeds from shares issued | | | | | | | 21,600 | | | | | | | | 588,298 | |
Distributions reinvested | | | | | | | 944,152 | | | | | | | | 1,218,446 | |
Cost of shares redeemed | | | | | | | (294,133 | ) | | | | | | | (5,342,801 | ) |
| | | | | | | | | | | | | | | | |
Change in net assets resulting from capital transactions | | | | | | | 671,619 | | | | | | | | (3,536,057 | ) |
| | | | | | | | | | | | | | | | |
Net decrease in net assets | | | | | | | (3,433,631 | ) | | | | | | | (2,419,013 | ) |
Net Assets: | | | | | | | | | | | | | | | | |
| Beginning of period | | | | | | | 21,562,784 | | | | | | | | 23,981,797 | |
| | | | | | | | | | | | | | | | |
| End of period | | | | | | $ | 18,129,153 | | | | | | | $ | 21,562,784 | |
| | | | | | | | | | | | | | | | |
Share Transactions: | | | | | | | | | | | | | | | | |
Issued | | | | | | | 2,135 | | | | | | | | 61,712 | |
Reinvested | | | | | | | 94,602 | | | | | | | | 127,066 | |
Redeemed | | | | | | | (29,354 | ) | | | | | | | (551,225 | ) |
| | | | | | | | | | | | | | | | |
Change in shares resulting from capital transactions | | | | | | | 67,383 | | | | | | | | (362,447 | ) |
| | | | | | | | | | | | | | | | |
See Notes to the Financial Statements.
36
Statements of Changes in Net Assets
| | | | | | | | | | | | | | | | |
| | | RBC BlueBay
Global
Bond Fund | |
| | | For the
Six Months Ended
March 31, 2020
(Unaudited) | | | For the
Year Ended
September 30, 2019 | |
From Investment Activities | | | | | | | | | | | | | | | | |
Operations: | | | | | | | | | | | | | | | | |
Net investment income | | | | | | $ | 236,711 | | | | | | | $ | 2,503,336 | |
Net realized gains from investments, foreign currency, written options, futures contracts and swap contracts transactions | | | | | | | 47,214 | | | | | | | | 1,086,527 | |
Net change in unrealized appreciation/(depreciation) on investments, foreign currency, written options, futures contracts and swap contracts | | | | | | | (955,043 | ) | | | | | | | 2,728,915 | |
| | | | | | | | | | | | | | | | |
Change in net assets resulting from operations | | | | | | | (671,118 | ) | | | | | | | 6,318,778 | |
| | | | | | | | | | | | | | | | |
Distributions to Shareholders: | | | | | | | | | | | | | | | | |
Class A | | | | | | | (74 | ) | | | | | | | — | |
Class I | | | | | | | (1,524,330 | ) | | | | | | | (3,784,196 | ) |
Class R6 | | | | | | | (632 | ) | | | | | | | (557 | ) |
| | | | | | | | | | | | | | | | |
Change in net assets resulting from shareholder distributions | | | | | | | (1,525,036 | ) | | | | | | | (3,784,753 | ) |
| | | | | | | | | | | | | | | | |
Capital Transactions: | | | | | | | | | | | | | | | | |
Proceeds from shares issued | | | | | | | 14,331 | | | | | | | | 865,691 | |
Distributions reinvested | | | | | | | 1,525,037 | | | | | | | | 3,777,753 | |
Cost of shares redeemed | | | | | | | (25,001,590 | ) | | | | | | | (26,754,094 | ) |
| | | | | | | | | | | | | | | | |
Change in net assets resulting from capital transactions | | | | | | | (23,462,222 | ) | | | | | | | (22,110,650 | ) |
| | | | | | | | | | | | | | | | |
Net decrease in net assets | | | | | | | (25,658,376 | ) | | | | | | | (19,576,625 | ) |
Net Assets: | | | | | | | | | | | | | | | | |
Beginning of period | | | | | | | 52,714,635 | | | | | | | | 72,291,260 | |
| | | | | | | | | | | | | | | | |
End of period | | | | | | $ | 27,056,259 | | | | | | | $ | 52,714,635 | |
| | | | | | | | | | | | | | | | |
Share Transactions: | | | | | | | | | | | | | | | | |
Issued | | | | | | | 1,086 | | | | | | | | 89,971 | |
Reinvested | | | | | | | 157,160 | | | | | | | | 407,479 | |
Redeemed | | | | | | | (2,472,963 | ) | | | | | | | (2,657,532 | ) |
| | | | | | | | | | | | | | | | |
Change in shares resulting from capital transactions | | | | | | | (2,314,717 | ) | | | | | | | (2,160,082 | ) |
| | | | | | | | | | | | | | | | |
See Notes to the Financial Statements.
37
Statements of Changes in Net Assets
| | | | | | | | | | | | | | | | |
| | | RBC BlueBay
High Yield
Bond Fund | |
| | | For the
Six Months Ended
March 31, 2020
(Unaudited) | | | For the
Year Ended
September 30, 2019 | |
From Investment Activities | | | | | | | | | | | | | | | | |
Operations: | | | | | | | | | | | | | | | | |
Net investment income | | | | | | $ | 1,323,725 | | | | | | | $ | 2,448,583 | |
Net realized gains/(losses) from investments, foreign currency, written options, futures contracts and swap contracts transactions | | | | | | | 69,813 | | | | | | | | (366,258 | ) |
Net change in unrealized appreciation/(depreciation) on investments, foreign currency, futures contracts and swap contracts | | | | | | | (5,127,835 | ) | | | | | | | 1,662,171 | |
| | | | | | | | | | | | | | | | |
Change in net assets resulting from operations | | | | | | | (3,734,297 | ) | | | | | | | 3,744,496 | |
| | | | | | | | | | | | | | | | |
Distributions to Shareholders: | | | | | | | | | | | | | | | | |
Class A | | | | | | | (24,250 | ) | | | | | | | (52,866 | ) |
Class I | | | | | | | (1,834,455 | ) | | | | | | | (3,116,173 | ) |
| | | | | | | | | | | | | | | | |
Change in net assets resulting from shareholder distributions | | | | | | | (1,858,705 | ) | | | | | | | (3,169,039 | ) |
| | | | | | | | | | | | | | | | |
Capital Transactions: | | | | | | | | | | | | | | | | |
Proceeds from shares issued | | | | | | | 14,474,271 | | | | | | | | 10,594,009 | |
Distributions reinvested | | | | | | | 1,841,242 | | | | | | | | 3,145,760 | |
Cost of shares redeemed | | | | | | | (3,582,377 | ) | | | | | | | (3,483,315 | ) |
| | | | | | | | | | | | | | | | |
Change in net assets resulting from capital transactions | | | | | | | 12,733,136 | | | | | | | | 10,256,454 | |
| | | | | | | | | | | | | | | | |
Net increase in net assets | | | | | | | 7,140,134 | | | | | | | | 10,831,911 | |
Net Assets: | | | | | | | | | | | | | | | | |
Beginning of period | | | | | | | 49,857,025 | | | | | | | | 39,025,114 | |
| | | | | | | | | | | | | | | | |
End of period | | | | | | $ | 56,997,159 | | | | | | | $ | 49,857,025 | |
| | | | | | | | | | | | | | | | |
Share Transactions: | | | | | | | | | | | | | | | | |
Issued | | | | | | | 1,383,199 | | | | | | | | 1,043,914 | |
Reinvested | | | | | | | 175,705 | | | | | | | | 314,164 | |
Redeemed | | | | | | | (365,045 | ) | | | | | | | (347,139 | ) |
| | | | | | | | | | | | | | | | |
Change in shares resulting from capital transactions | | | | | | | 1,193,859 | | | | | | | | 1,010,939 | |
| | | | | | | | | | | | | | | | |
See Notes to the Financial Statements.
38
RBC BlueBay Emerging Market Debt Fund
(Selected data for a share outstanding throughout the periods indicated)
| | | | | | | | | | | | | | | | | | | | | | | | | | | | | | | | |
| | | | | | Investment Activities | | | Distributions | | | | |
| | | Net Asset
Value,
Beginning
of Period | | | Net
Investment
Income(a) | | | Net Realized
and Unrealized
Gains (Losses)
on Investments | | | Redemption
Fees | | | Total from
Investment
Activities | | | Net
Investment
Income | | | Total
Distributions | | | Net Asset
Value, End
of Period | |
Class A | | | | | | | | | | | | | | | | | | | | | | | | | | | | | | | | |
Six Months Ended 3/31/20 (Unaudited) | | | $10.14 | | | | 0.26 | | | | (1.71) | | | | — | | | | (1.45) | | | | (0.44) | | | | (0.44) | | | | $ 8.25 | |
Year Ended 9/30/19 | | | 9.63 | | | | 0.52 | | | | 0.51 | | | | — | | | | 1.03 | | | | (0.52) | | | | (0.52) | | | | 10.14 | |
Year Ended 9/30/18 | | | 10.36 | | | | 0.50 | | | | (0.85) | | | | — | | | | (0.35) | | | | (0.38) | | | | (0.38) | | | | 9.63 | |
Year Ended 9/30/17 | | | 9.78 | | | | 0.50 | | | | 0.08 | | | | — | | | | 0.58 | | | | — | | | | — | | | | 10.36 | |
Year Ended 9/30/16 | | | 8.64 | | | | 0.45 | | | | 0.69 | | | | — | | | | 1.14 | | | | — | | | | — | | | | 9.78 | |
Year Ended 9/30/15 | | | 9.75 | | | | 0.40 | | | | (1.44) | | | | — | | | | (1.04) | | | | (0.07) | | | | (0.07) | | | | 8.64 | |
Class I | | | | | | | | | | | | | | | | | | | | | | | | | | | | | | | | |
Six Months Ended 3/31/20 (Unaudited) | | | $10.23 | | | | 0.26 | | | | (1.70) | | | | — | | | | (1.44) | | | | (0.45) | | | | (0.45) | | | | $ 8.34 | |
Year Ended 9/30/19 | | | 9.71 | | | | 0.55 | | | | 0.52 | | | | — | | | | 1.07 | | | | (0.55) | | | | (0.55) | | | | 10.23 | |
Year Ended 9/30/18 | | | 10.41 | | | | 0.51 | | | | (0.84) | | | | — | | | | (0.33) | | | | (0.37) | | | | (0.37) | | | | 9.71 | |
Year Ended 9/30/17 | | | 9.81 | | | | 0.54 | | | | 0.06 | | | | — | | | | 0.60 | | | | — | | | | — | | | | 10.41 | |
Year Ended 9/30/16 | | | 8.64 | | | | 0.50 | | | | 0.67 | | | | — | | | | 1.17 | | | | — | | | | — | | | | 9.81 | |
Year Ended 9/30/15 | | | 9.75 | | | | 0.36 | | | | (1.39) | | | | — | | | | (1.03) | | | | (0.08) | | | | (0.08) | | | | 8.64 | |
Class R6 | | | | | | | | | | | | | | | | | | | | | | | | | | | | | | | | |
Six Months Ended 3/31/20 (Unaudited) | | | $10.27 | | | | 0.27 | | | | (1.72) | | | | — | | | | (1.45) | | | | (0.45) | | | | (0.45) | | | | $ 8.37 | |
Year Ended 9/30/19 | | | 9.74 | | | | 0.56 | | | | 0.52 | | | | — | | | | 1.08 | | | | (0.55) | | | | (0.55) | | | | 10.27 | |
Year Ended 9/30/18 | | | 10.42 | | | | 0.53 | | | | (0.86) | | | | — | | | | (0.33) | | | | (0.35) | | | | (0.35) | | | | 9.74 | |
Period Ended 9/30/17(b) | | | 9.25 | | | | 0.45 | | | | 0.72 | | | | — | | | | 1.17 | | | | — | | | | — | | | | 10.42 | |
| (a) | Per share net investment income (loss) has been calculated using the average daily shares method. |
| (b) | For the period from December 27, 2016 (commencement of operations) to September 30, 2017. |
39
RBC BlueBay Emerging Market Debt Fund
(Selected data for a share outstanding throughout the periods indicated)
| | | | | | | | | | | | | | | | | | | | | | | | |
| | | | | Ratios/Supplemental Data | |
| | | Total
Return(a)(b) | | Net Assets,
End of
Period (000’s) | | | Ratio of
Net Expenses
to Average
Net Assets | | Ratio of
Net Investment
Income (Loss)
to Average
Net Assets | | Ratio of
Expenses to
Average Net
Assets* | | Portfolio
Turnover
Rate** | |
Class A | | | | | | | | | | | | | | | | | | | | | | | | |
Six Months Ended 3/31/20 (Unaudited) | | | (14.99 | )%(c) | | | $ 6 | | | | 1.12 | %(d) | | | 5.21 | %(d) | | | 20.81 | %(d) | | | 92% | |
Year Ended 9/30/19 | | | 11.17 | % | | | 21 | | | | 1.12 | % | | | 5.38 | % | | | 20.37 | % | | | 236% | |
Year Ended 9/30/18 | | | (3.38 | )% | | | 19 | | | | 1.13 | % | | | 5.05 | % | | | 11.41 | % | | | 364% | |
Year Ended 9/30/17 | | | 5.94 | % | | | 63 | | | | 1.15 | % | | | 5.17 | % | | | 7.94 | % | | | 251% | |
Year Ended 9/30/16 | | | 13.08 | % | | | 112 | | | | 1.15 | % | | | 4.96 | % | | | 4.54 | % | | | 279% | |
Year Ended 9/30/15 | | | (10.72 | )% | | | 241 | | | | 1.15 | % | | | 4.32 | % | | | 3.84 | % | | | 282% | |
Class I | | | | | | | | | | | | | | | | | | | | | | | | |
Six Months Ended 3/31/20 (Unaudited) | | | (14.75 | )%(c) | | | $18,113 | | | | 0.87 | %(d) | | | 5.34 | %(d) | | | 2.08 | %(d) | | | 92% | |
Year Ended 9/30/19 | | | 11.48 | % | | | 21,529 | | | | 0.87 | % | | | 5.62 | % | | | 2.13 | % | | | 236% | |
Year Ended 9/30/18 | | | (3.26 | )% | | | 23,952 | | | | 0.88 | % | | | 5.21 | % | | | 2.18 | % | | | 364% | |
Year Ended 9/30/17 | | | 6.23 | % | | | 18,484 | | | | 0.90 | % | | | 5.54 | % | | | 2.24 | % | | | 251% | |
Year Ended 9/30/16 | | | 13.43 | % | | | 19,067 | | | | 0.90 | % | | | 5.44 | % | | | 1.79 | % | | | 279% | |
Year Ended 9/30/15 | | | (10.67 | )% | | | 26,588 | | | | 0.90 | % | | | 3.81 | % | | | 1.14 | % | | | 282% | |
Class R6 | | | | | | | | | | | | | | | | | | | | | | | | |
Six Months Ended 3/31/20 (Unaudited) | | | (14.74 | )%(c) | | | $ 10 | | | | 0.82 | %(d) | | | 5.39 | %(d) | | | 33.80 | %(d) | | | 92% | |
Year Ended 9/30/19 | | | 11.57 | % | | | 12 | | | | 0.82 | % | | | 5.67 | % | | | 33.09 | % | | | 236% | |
Year Ended 9/30/18 | | | (3.18 | )% | | | 11 | | | | 0.84 | % | | | 5.32 | % | | | 34.20 | % | | | 364% | |
Period Ended 9/30/17(e) | | | 12.65 | %(c) | | | 11 | | | | 0.85 | %(d) | | | 5.93 | %(d) | | | 53.42 | %(d) | | | 251% | |
| * | During the period, certain fees were contractually or voluntarily reduced and/or reimbursed. If such contractual/voluntary fee reductions and reimbursements had not occurred, the ratio would have been as indicated. |
| ** | Portfolio turnover rate is calculated on the basis of the Fund as a whole without distinguishing between the classes of shares issued. |
| (a) | Excludes sales charge. |
| (b) | Assumes investment at net asset value at the beginning of the period, reinvestment of all dividends and distributions, and a complete redemption of the investment at net asset value at the end of the period. |
40
RBC BlueBay Emerging Market Debt Fund
(Selected data for a share outstanding throughout the periods indicated)
| (e) | For the period from December 27, 2016 (commencement of operations) to September 30, 2017. |
See Notes to the Financial Statements.
41
RBC BlueBay Global Bond Fund
(Selected data for a share outstanding throughout the periods indicated)
| | | | | | | | | | | | | | | | | | | | | | | | | | | | | | | | | | | | | | | | |
| | | | | | Investment Activities | | | Distributions | | | | |
| | | Net Asset
Value,
Beginning
of Period | | | Net
Investment
Income(a) | | | Net Realized
and Unrealized
Gains (Losses)
on Investments | | | Redemption
Fees | | | Total from
Investment
Activities | | | Net
Investment
Income | | | Net
Realized
Gains | | | Return
of Capital | | | Total
Distributions | | | Net Asset
Value, End
of Period | |
Class A | | | | | | | | | | | | | | | | | | | | | | | | | | | | | | | | | | | | | | | | |
Period Ended 3/31/20 (Unaudited)(b) | | | $ 9.73 | | | | 0.02 | | | | (0.36) | | | | — | | | | (0.34) | | | | (0.07) | | | | — | | | | — | | | | (0.07) | | | | $ 9.32 | |
Class I | | | | | | | | | | | | | | | | | | | | | | | | | | | | | | | | | | | | | | | | |
Six Months Ended 3/31/20 (Unaudited) | | | $10.10 | | | | 0.08 | | | | (0.32) | | | | — | | | | (0.24) | | | | (0.34) | | | | (0.21) | | | | — | | | | (0.55) | | | | $ 9.31 | |
Year Ended 9/30/19 | | | 9.80 | | | | 0.33 | | | | 0.47 | | | | — | | | | 0.80 | | | | (0.43) | | | | (0.07) | | | | — | | | | (0.50) | | | | 10.10 | |
Year Ended 9/30/18 | | | 10.21 | | | | 0.39 | | | | (0.47) | | | | — | | | | (0.08) | | | | (0.33) | | | | — | | | | — | | | | (0.33) | | | | 9.80 | |
Year Ended 9/30/17 | | | 10.03 | | | | 0.36 | | | | 0.05 | | | | — | | | | 0.41 | | | | (0.23) | | | | — | | | | — | | | | (0.23) | | | | 10.21 | |
Year Ended 9/30/16 | | | 9.57 | | | | 0.40 | | | | 0.31 | | | | — | | | | 0.71 | | | | (0.14) | | | | (0.11) | | | | — | | | | (0.25) | | | | 10.03 | |
Period Ended 9/30/15(c) | | | 10.00 | | | | 0.24 | | | | (0.54) | | | | — | | | | (0.30) | | | | (0.13) | | | | — | | | | — | | | | (0.13) | | | | 9.57 | |
Class R6 | | | | | | | | | | | | | | | | | | | | | | | | | | | | | | | | | | | | | | | | |
Six Months Ended 3/31/20 (Unaudited) | | | $10.10 | | | | 0.08 | | | | (0.31) | | | | — | | | | (0.23) | | | | (0.34) | | | | (0.21) | | | | — | | | | (0.55) | | | | $ 9.32 | |
Year Ended 9/30/19 | | | 9.80 | | | | 0.36 | | | | 0.44 | | | | — | | | | 0.80 | | | | (0.43) | | | | (0.07) | | | | — | | | | (0.50) | | | | 10.10 | |
Year Ended 9/30/18 | | | 10.21 | | | | 0.40 | | | | (0.48) | | | | — | | | | (0.08) | | | | (0.33) | | | | — | | | | — | | | | (0.33) | | | | 9.80 | |
Period Ended 9/30/17(d) | | | 9.59 | | | | 0.26 | | | | 0.36 | | | | — | | | | 0.62 | | | | — | | | | — | | | | — | | | | — | | | | 10.21 | |
| (a) | Per share net investment income (loss) has been calculated using the average daily shares method. |
| (b) | For the period from January 28, 2020 (commencement of operations) to March 31, 2020. |
| (c) | For the period from December 9, 2014 (commencement of operations) to September 30, 2015. |
| (d) | For the period from December 27, 2016 (commencement of operations) to September 30, 2017. |
42
RBC BlueBay Global Bond Fund
(Selected data for a share outstanding throughout the periods indicated)
| | | | | | | | | | | | | | | | | | | | | | | | |
| | | | | | Ratios/Supplemental Data | |
| | | Total
Return(a)(b) | | | Net Assets,
End of
Period (000’s) | | | Ratio of
Net Expenses
to Average
Net Assets | | | Ratio of
Net Investment
Income (Loss)
to Average
Net Assets | | | Ratio of
Expenses to
Average Net
Assets* | | | Portfolio
Turnover
Rate** | |
Class A | | | | | | | | | | | | | | | | | | | | | | | | |
Period Ended 3/31/20 (Unaudited)(c) | | | (3.51)%(d) | | | | $ 10 | | | | 0.77%(e) | | | | 1.17%(e) | | | | 2.12%(e) | | | | 71% | |
Class I | | | | | | | | | | | | | | | | | | | | | | | | |
Six Months Ended 3/31/20 (Unaudited) | | | (2.55)%(d) | | | | $27,035 | | | | 0.52%(e) | | | | 1.62%(e) | | | | 1.81%(e) | | | | 71% | |
Year Ended 9/30/19 | | | 8.77% | | | | 52,703 | | | | 0.69% | | | | 3.40% | | | | 1.10% | | | | 232% | |
Year Ended 9/30/18 | | | (0.87)% | | | | 72,281 | | | | 0.69% | | | | 3.92% | | | | 1.03% | | | | 243% | |
Year Ended 9/30/17 | | | 4.28% | | | | 72,696 | | | | 1.00% | | | | 3.64% | | | | 1.32% | | | | 215% | |
Year Ended 9/30/16 | | | 7.56% | | | | 68,470 | | | | 1.00% | | | | 4.11% | | | | 1.29% | | | | 246% | |
Period Ended 9/30/15(f) | | | (3.08)%(d) | | | | 63,340 | | | | 1.00%(e) | | | | 2.99%(e) | | | | 1.34%(e) | | | | 193% | |
Class R6 | | | | | | | | | | | | | | | | | | | | | | | | |
Six Months Ended 3/31/20 (Unaudited) | | | (2.44)%(d) | | | | $ 11 | | | | 0.47%(e) | | | | 1.69%(e) | | | | 35.48%(e) | | | | 71% | |
Year Ended 9/30/19 | | | 8.80% | | | | 11 | | | | 0.64% | | | | 3.78% | | | | 33.79% | | | | 232% | |
Year Ended 9/30/18 | | | (0.83)% | | | | 11 | | | | 0.63% | | | | 3.95% | | | | 33.95% | | | | 243% | |
Period Ended 9/30/17(g) | | | 6.47%(d) | | | | 11 | | | | 0.95%(e) | | | | 3.42%(e) | | | | 54.27%(e) | | | | 215% | |
| * | During the period, certain fees were contractually or voluntarily reduced and/or reimbursed. If such contractual/voluntary fee reductions and reimbursements had not occurred, the ratio would have been as indicated. |
| ** | Portfolio turnover rate is calculated on the basis of the Fund as a whole without distinguishing between the classes of shares issued. |
| (a) | Excludes sales charge. |
| (b) | Assumes investment at net asset value at the beginning of the period, reinvestment of all dividends and distributions, and a complete redemption of the investment at net asset value at the end of the period. |
| (c) | For the period from January 28, 2020 (commencement of operations) to March 31, 2020. |
| (f) | For the period from December 9, 2014 (commencement of operations) to September 30, 2015. |
| (g) | For the period from December 27, 2016 (commencement of operations) to September 30, 2017. |
See Notes to the Financial Statements.
43
RBC BlueBay High Yield Bond Fund
(Selected data for a share outstanding throughout the periods indicated)
| | | | | | | | | | | | | | | | | | | | | | | | | | | | | | | | | | | | |
| | | | | | Investment Activities | | | Distributions | | | | |
| | | Net Asset
Value,
Beginning
of Period | | | Net
Investment
Income(a) | | | Net Realized
and Unrealized
Gains (Losses)
on Investments | | | Redemption
Fees | | | Total from
Investment
Activities | | | Net
Investment
Income | | | Net
Realized
Gains | | | Total
Distributions | | | Net Asset
Value, End
of Period | |
Class A | | | | | | | | | | | | | | | | | | | | | | | | | | | | | | | | | | | | |
Six Months Ended 3/31/20 (Unaudited) | | | $10.46 | | | | 0.22 | | | | (0.81) | | | | — | | | | (0.59) | | | | (0.33) | | | | — | | | | (0.33) | | | | $ 9.54 | |
Year Ended 9/30/19 | | | 10.42 | | | | 0.54 | | | | 0.26 | | | | — | | | | 0.80 | | | | (0.76) | | | | — | | | | (0.76) | | | | 10.46 | |
Year Ended 9/30/18 | | | 10.42 | | | | 0.47 | | | | (0.10) | | | | 0.01 | | | | 0.38 | | | | (0.38) | | | | — | | | | (0.38) | | | | 10.42 | |
Year Ended 9/30/17 | | | 9.98 | | | | 0.47 | | | | 0.26 | | | | — | | | | 0.73 | | | | (0.29) | | | | — | | | | (0.29) | | | | 10.42 | |
Year Ended 9/30/16 | | | 9.82 | | | | 0.48 | | | | 0.16 | | | | — | | | | 0.64 | | | | (0.41) | | | | (0.07) | | | | (0.48) | | | | 9.98 | |
Year Ended 9/30/15 | | | 10.41 | | | | 0.46 | | | | (0.44) | | | | — | | | | 0.02 | | | | (0.26) | | | | (0.35) | | | | (0.61) | | | | 9.82 | |
Class I | | | | | | | | | | | | | | | | | | | | | | | | | | | | | | | | | | | | |
Six Months Ended 3/31/20 (Unaudited) | | | $10.52 | | | | 0.24 | | | | (0.80) | | | | — | | | | (0.56) | | | | (0.35) | | | | — | | | | (0.35) | | | | $ 9.61 | |
Year Ended 9/30/19 | | | 10.47 | | | | 0.58 | | | | 0.25 | | | | — | | | | 0.83 | | | | (0.78) | | | | — | | | | (0.78) | | | | 10.52 | |
Year Ended 9/30/18 | | | 10.46 | | | | 0.47 | | | | (0.07) | | | | — | | | | 0.40 | | | | (0.39) | | | | — | | | | (0.39) | | | | 10.47 | |
Year Ended 9/30/17 | | | 9.98 | | | | 0.49 | | | | 0.28 | | | | — | | | | 0.77 | | | | (0.29) | | | | — | | | | (0.29) | | | | 10.46 | |
Year Ended 9/30/16 | | | 9.82 | | | | 0.50 | | | | 0.17 | | | | — | | | | 0.67 | | | | (0.44) | | | | (0.07) | | | | (0.51) | | | | 9.98 | |
Year Ended 9/30/15 | | | 10.42 | | | | 0.48 | | | | (0.45) | | | | — | | | | 0.03 | | | | (0.28) | | | | (0.35) | | | | (0.63) | | | | 9.82 | |
| (a) | Per share net investment income (loss) has been calculated using the average daily shares method. |
44
RBC BlueBay High Yield Bond Fund
(Selected data for a share outstanding throughout the periods indicated)
| | | | | | | | | | | | | | | | | | | | | | | | |
| | | | | | Ratios/Supplemental Data | |
| | | Total
Return(a)(b) | | | Net Assets,
End of
Period (000’s) | | | Ratio of
Net Expenses
to Average
Net Assets | | Ratio of
Net Investment
Income (Loss)
to Average
Net Assets | | | Ratio of
Expenses to
Average Net
Assets* | | | Portfolio
Turnover
Rate** | |
Class A | | | | | | | | | | | | | | | | | | | | | | | | |
Six Months Ended 3/31/20 (Unaudited) | | | (5.83)%(c) | | | | $ 782 | | | | 0.82 | %(d) | | | 4.36%(d) | | | | 2.17%(d) | | | | 92% | |
Year Ended 9/30/19 | | | 8.41% | | | | 460 | | | | 0.82 | % | | | 5.35% | | | | 2.50% | | | | 143% | |
Year Ended 9/30/18 | | | 3.71% | | | | 556 | | | | 0.82 | %(e) | | | 4.56% | | | | 2.82% | | | | 158% | |
Year Ended 9/30/17 | | | 7.37% | | | | 33 | | | | 0.70 | % | | | 4.59% | | | | 4.44% | | | | 101% | |
Year Ended 9/30/16 | | | 6.86% | | | | 831 | | | | 0.70 | % | | | 4.86% | | | | 2.25% | | | | 84% | |
Year Ended 9/30/15 | | | 0.15% | | | | 505 | | | | 0.98 | %(f) | | | 4.53% | | | | 2.38% | | | | 128% | |
Class I | | | | | | | | | | | | | | | | | | | | | | | | |
Six Months Ended 3/31/20 (Unaudited) | | | (5.59)%(c) | | | | $56,215 | | | | 0.57 | %(d) | | | 4.61%(d) | | | | 1.22%(d) | | | | 92% | |
Year Ended 9/30/19 | | | 8.58% | | | | 49,397 | | | | 0.57 | % | | | 5.66% | | | | 1.39% | | | | 143% | |
Year Ended 9/30/18 | | | 3.95% | | | | 38,469 | | | | 0.56 | %(e) | | | 4.56% | | | | 1.49% | | | | 158% | |
Year Ended 9/30/17 | | | 7.89% | | | | 37,349 | | | | 0.45 | % | | | 4.83% | | | | 1.44% | | | | 101% | |
Year Ended 9/30/16 | | | 7.14% | | | | 31,824 | | | | 0.45 | % | | | 5.13% | | | | 1.50% | | | | 84% | |
Year Ended 9/30/15 | | | 0.28% | | | | 29,662 | | | | 0.75 | %(f) | | | 4.76% | | | | 1.33% | | | | 128% | |
| * | During the period, certain fees were contractually or voluntarily reduced and/or reimbursed. If such contractual/voluntary fee reductions and reimbursements had not occurred, the ratio would have been as indicated. |
| ** | Portfolio turnover rate is calculated on the basis of the Fund as a whole without distinguishing between the classes of shares issued. |
| (a) | Excludes sales charge. |
| (b) | Assumes investment at net asset value at the beginning of the period, reinvestment of all dividends and distributions, and a complete redemption of the investment at net asset value at the end of the period. |
| (e) | Beginning November 1, 2017, the net operating expenses were contractually limited to 0.82% and 0.57% of average daily net assets for Class A and Class I, respectively. The ratio of net expenses to average net assets represents a blended percentage for the period ended September 30, 2018. |
45
RBC BlueBay High Yield Bond Fund
(Selected data for a share outstanding throughout the periods indicated)
| (f) | Beginning August 3, 2015, the net operating expenses were contractually limited to 0.975% and 0.725% of average daily net assets for Class A and Class I respectively. The ratio of net expenses to average net assets represents a blended percentage for the year ended September 30, 2015. |
See Notes to the Financial Statements.
46
|
NOTES TO FINANCIAL STATEMENTS |
March 31, 2020 (Unaudited)
1. Organization:
RBC Funds Trust (the “Trust”) is registered under the Investment Company Act of 1940 (as amended) as anopen-end management investment company. The Trust was organized as a Delaware statutory trust on December 16, 2003 and currently consists of 18 portfolios. Overall responsibility for the management of the Trust is vested in its Board of Trustees (the “Board”). This report includes the following three investment portfolios (each a “Fund” and collectively, the “Funds”):
- RBC BlueBay Emerging Market Debt Fund (“Emerging Market Debt Fund”)
- RBC BlueBay Global Bond Fund (“Global Bond Fund”) (formerly known as RBC BlueBay Diversified Credit Fund)
- RBC BlueBay High Yield Bond Fund (“ High Yield Bond Fund”)
Class A and Class I shares are offered by each Fund; Class R6 shares are offered by each Fund except High Yield Bond Fund. Class A shares are offered with a 4.25% maximumfront-end sales charge and a 1.00% contingent deferred sales charge (“CDSC”) for redemption within 12 months of a $1 million or greater purchase on which nofront-end sales charge was paid. Class I shares and Class R6 shares (intended for investors meeting certain investment minimum thresholds) are not subject to either afront-end sales charge or a CDSC.
RBC Global Asset Management (U.S.) Inc. (“RBCGAM-US)” or “Advisor” or“Co-Administrator”) acts as the investment advisor for the Funds and BlueBay Asset Management LLP (“BlueBay” or“Sub-Advisor”) acts as asub-advisor for each of the Funds. BlueBay Asset Management USA LLC (“BlueBay US”) also acts as asub-advisor for the High Yield Bond Fund and the Global Bond Fund. The officers of the Trust (“Fund Management”) are also employees of RBCGAM-US.
2. Significant Accounting Policies
Each Fund is an investment company that follows accounting and reporting guidance under the Financial Accounting Standards Board. Summarized below are the significant accounting policies of the Funds. These policies conform to accounting principles generally accepted in the United States of America (“U.S. GAAP”). Fund Management follows these policies when preparing financial statements. Fund Management may also be required to make estimates and assumptions that affect the reported amounts of assets and liabilities at the date of the financial statements and the reported amounts of income and expenses for the period. Actual results could differ from those estimates. The financial statements are as of the close of regular trading on the New York Stock Exchange (“NYSE”).
In March 2017, the Financial Accounting Standards Board (FASB) issued Accounting Standards Update (ASU)No. 2017-08, Receivables-Nonrefundable Fees and Other Costs (Subtopic310-20): Premium Amortization on Purchased Callable Debt Securities. The amendments in the ASU shorten the amortization period for certain callable debt securities, held at a premium, to be amortized to the earliest call date. The ASU does not require an accounting change for securities held at a discount; which continues to be amortized to maturity. The ASU is effective for fiscal years and interim periods within those fiscal years beginning after December 15, 2018.
In August 2018, the Financial Accounting Standards Board issued Accounting Standards Update2018-13 “Changes to the Disclosure Requirements for Fair Value Measurement” which modifies disclosure requirements for fair value measurements. The guidance is effective for fiscal years beginning after December 15, 2019 and for interim periods within those fiscal years. Management is currently evaluating the impact of this guidance to the Funds.
Security Valuation:
The Board has adopted pricing and valuation procedures for determining the fair value of each Fund’s investments. Fair value of a security is considered to be the price that a fund might reasonably expect to receive upon its current sale in an orderly transaction between market participants.
47
|
NOTES TO FINANCIAL STATEMENTS |
Equity securities are generally valued on the basis of prices furnished by third-party pricing services approved by the Board. Equity securities listed on one or more exchanges shall be valued at the last available quoted sale price on the primary trading exchange as of the regularly scheduled closing time of the exchange and are categorized as Level 1 in the fair value hierarchy. (See “Fair Value Measurements” below for additional information). An equity security not listed on an exchange but listed on NASDAQ shall be valued at the NASDAQ official closing price and is also categorized as Level 1. If there was no sale on the primary exchange on the day the net asset value is calculated or a NASDAQ official closing price is not available, the most recent bid quotation generally will be used and such securities will generally be categorized as Level 2. Investments inopen-end investment companies (mutual funds) are valued at net asset value and are categorized as Level 1 in the fair value hierarchy.
Fixed income securities, includingto-be-announced (“TBA”) commitments and municipal bonds, are generally valued based on evaluated prices received from third-party pricing services or from broker-dealers who make markets in the securities and are generally categorized as Level 2 in the fair value hierarchy (see “Fair Value Measurements” below for additional information). The pricing services utilize both dealer-supplied valuations and electronic data processing techniques that take into account multiple appropriate factors such asinstitutional-size trading in similar groups of securities, market spreads, interest rates, and fundamental security analytical data including yield, quality, coupon rate, maturity and type of issue.
Bank loans are valued based on evaluated prices received from third-party pricing services or fair valued using recently executed transactions, market price quotations, credit/market events, and cross-asset pricing. Inputs are generally observable market inputs obtained from independent sources. Bank Loans are generally categorized as Level 2 of the fair value hierarchy, unless key inputs are unobservable which would then be as Level 3.
Exchange-traded options, futures and options on futures are valued at the last sale price at the close of the market on the principal exchange on which they are traded. In the absence of any transactions on that day, the closing bid price shall be used for purchased options, futures and options on futures, and the closing ask price shall be used for written options. Such instruments are categorized as Level 1 of the fair value hierarchy. Options contracts traded in theover-the-counter (“OTC”) market shall be valued at the evaluated price provided by an independent pricing service or broker-dealer using a mathematical model which incorporates a number of market data factors, such as trades and prices of the underlying instruments. These contracts are categorized as Level 2 of the fair value hierarchy. Forward foreign currency exchange contracts are marked to market daily based upon foreign currency exchange rates provided by an independent pricing service as of the close of the NYSE, generally 4:00 p.m. EST, and are generally classified as Level 2 within the fair value hierarchy.
Swaps, including credit-default swaps, interest rate swaps and total return swaps, are generally valued by an independent pricing service using a discounted cash flow methodology. This technique is used to value both the fixed and variable components of the swap contracts and takes into account market data and inputs sourced from various institutions and market-makers and includes dailyintra-day and closing spreads, credit index quotes, yield curves, and recovery rate assumptions. The Fund’s net benefit or obligation under the derivative contract, as measured by the fair market value of the contract, is included in the Fund’s net assets. These swap contracts are categorized as Level 2 in the fair valuation hierarchy.
Foreign securities valued innon-U.S. dollars are valued in the foreign currency and then converted into the U.S. dollar equivalent using the foreign exchange rate in effect at the close of NYSE on the day the security’s value is determined. The value of securities traded in markets outside the United States may be affected on a day that the NYSE is closed and an investor is not able to purchase, exchange or redeem shares of the Funds.
The Board has delegated to the Funds’ Pricing Committee (“Pricing Committee”) the responsibility for implementing the pricing and valuation procedures, including responsibility for determining the fair value of the Funds’ securities or other assets and liabilities. The Pricing Committee includes representatives of the Funds’ Advisor,Co-Administrator andSub-Advisor, including personnel from accounting and operations, investment management, trading, risk management and compliance. The
48
|
NOTES TO FINANCIAL STATEMENTS |
Pricing Committee meets at least quarterly to review and approve Fund valuation matters, including a review of the Funds’ pricing activity and operations, fair value measurements, pricing vendors, policies and procedures, and related controls. At least a quorum of the Pricing Committee shall meet more frequently, as needed, to consider and approve time-sensitive fair valuation matters. The Pricing Committee reports to the Valuation, Portfolio Management and Performance Committee (“Valuation Committee”) of the Board. Members of the Pricing Committee meet with the Valuation Committee and the Board at each of their regularly scheduled meetings to discuss valuation matters and actions taken during the period.
The Board has adopted procedures to determine the fair value of a security when a price is not available from a pricing service or broker- dealer or Fund Management determines that a price provided by a pricing service or broker-dealer does not approximate fair value. Fair valuation may also be used when a significant valuation event affecting the value of a security or market sector is determined to have occurred between the time when a security’s market closes and the time the Fund’s net asset value is calculated. The fair value of the security will be determined in good faith by the Pricing Committee in accordance with procedures and methodologies adopted by the Board. General factors used in determining the fair value of securities include, but are not limited to, fundamental analytical data relating to the security, the issuer and the market, such as duration, prepayment and default rates; general level of interest rates and changes in interest rates; information from broker-dealers; trading in similar securities; any restrictions on disposition of the security; and an evaluation of the forces that influence the market in which the investments are traded. These securities are either categorized as Level 2 or 3 in the fair value hierarchy, depending on the relevant inputs used.
When the Funds utilize fair valuation methods that use significant unobservable inputs to determine a security’s value, such securities will be categorized as Level 3 of the fair value hierarchy. These methods may require subjective determinations about the value of a security. While the Funds’ policy is intended to result in a calculation of a Fund’s net asset value that fairly reflects security values as of the time of pricing, the Funds cannot guarantee that values determined by the Board or persons acting at their direction would accurately reflect the price that the Funds could obtain for a security if they were to dispose of it as of the time of pricing (for instance, in a forced or distressed sale). The prices used by the Funds may differ from the value that would be realized if the securities were sold.
The Funds’ Pricing Committee employs various methods for calibrating the valuation approach related to securities categorized within Level 2 and Level 3 of the fair value hierarchy. These methods may include regular due diligence of the Funds’ pricing vendors, a regular review of key inputs and assumptions, transaction back-testing or disposition analysis to compare unrealized gains and losses to realized gains and losses, reviews of missing and stale prices and large movements in market value, and reviews of any market related activities. Additionally, the pricing of all fair value holdings is subsequently reported to the Valuation Committee and Board.
Fair Value Measurements:
The Funds disclose the fair value of their investments in a hierarchy that categorizes investments based on the inputs to valuation techniques used to measure fair value. The three levels of the fair value hierarchy are as follows:
• Level 1 - Inputs that reflect unadjusted quoted prices in active markets for identical assets or liabilities that the Funds have the ability to access at the measurement date.
• Level 2 - Significant inputs other than quoted prices that are observable for the asset or liability either directly or indirectly, including inputs in markets that are not considered to be active. Observable inputs may include quoted prices for similar securities, interest rates, spreads, prepayment spreads, etc.
• Level 3 - Significant unobservable inputs based on the best information available in the circumstances, to the extent observable inputs are not available (including the Fund’s own assumptions in determining the fair value of investments).
The inputs or methodology used for valuing investments are not necessarily an indication of the risk associated with investing in those securities.
49
|
NOTES TO FINANCIAL STATEMENTS |
Inputs used in determining fair value of an investment may include, but are not limited to, price information, volatility statistics, credit and market data, and other factors, all of which may be either observable or unobservable. Inputs can vary among investments and will be impacted by the investment type and volume of activity for the particular security or similar securities in the market. Investments in the Level 3 category are generally supported by transactions and quoted prices from dealers participating in the market for those investments. Investments may be included in the Level 3 category due to a lack of market activity or transparency. Internal valuation models may also be used as a pricing source for Level 3 investments. Internal valuation models may rely on one or more unobservable inputs, such as estimated cash flows, financial statement analysis and discount rates.
The summary of inputs used to determine the fair value of the Funds’ investments as of March 31, 2020 is as follows:
| | | | | | | | | | | | | | | | | | | | | | | | | |
| | | Level 1
Quoted Prices | | Level 2
Significant
Observable
Inputs | | Level 3
Significant
Unobservable
Inputs | | Total |
Emerging Market Debt Fund | | | | | | | | | | | | | | | | | | | | | | | | | |
Assets: | | | | | | | | | | | | | | | | | | | | | | | | | |
Investments in Securities | | | | | | | | | | | | | | | | | | | | | | | | | |
Corporate Bonds | | | $ | — | | | | $ | 4,842,225 | | | | | | | | | | $— | | | | $ | 4,842,225 | |
Foreign Government Bonds | | | | — | | | | | 10,692,122 | | | | | | | | | | — | | | | | 10,692,122 | |
Investment Company | | | | 2,488,119 | | | | | — | | | | | | | | | | — | | | | | 2,488,119 | |
Other Financial Instruments* | | | | | | | | | | | | | | | | | | | | | | | | | |
Foreign currency exchange contracts - forward contracts | | | | — | | | | | 265,961 | | | | | | | | | | — | | | | | 265,961 | |
Credit default swaps | | | | — | | | | | 598,646 | | | | | | | | | | — | | | | | 598,646 | |
Interest rate swaps - Appreciation | | | | — | | | | | 189 | | | | | | | | | | — | | | | | 189 | |
| | | | | | | | | | | | | | | | | | | | | | | | | |
Total Assets | | | $ | 2,488,119 | | | | $ | 16,399,143 | | | | | | | | | | $— | | | | $ | 18,887,262 | |
| | | | | | | | | | | | | | | | | | | | | | | | | |
| | | | | |
Liabilities: | | | | | | | | | | | | | | | | | | | | | | | | | |
Other Financial Instruments* | | | | | | | | | | | | | | | | | | | | | | | | | |
Interest Rate Swaps | | | | $— | | | | | $ (10,468 | ) | | | | | | | | | $— | | | | | $ (10,468 | ) |
Foreign currency exchange contracts - forward contracts | | | | — | | | | | (310,035 | ) | | | | | | | | | — | | | | | (310,035 | ) |
Credit default swaps | | | | — | | | | | (461,573 | ) | | | | | | | | | — | | | | | (461,573 | ) |
| | | | | | | | | | | | | | | | | | | | | | | | | |
Total Liabilities | | | | $— | | | | | $(782,076 | ) | | | | | | | | | $— | | | | | $(782,076 | ) |
| | | | | | | | | | | | | | | | | | | | | | | | | |
50
|
NOTES TO FINANCIAL STATEMENTS |
| | | | | | | | | | | | | | | | | | | | | | | | | |
| | | Level 1
Quoted Prices | | Level 2
Significant
Observable
Inputs | | Level 3
Significant
Unobservable
Inputs | | Total |
Global Bond Fund | | | | | | | | | | | | | | | | | | | | | | | | | |
Assets: | | | | | | | | | | | | | | | | | | | | | | | | | |
Investments in Securities | | | | | | | | | | | | | | | | | | | | | | | | | |
Corporate Bonds | | | $ | — | | | | $ | 4,147,002 | | | | | | | | | | $— | | | | $ | 4,147,002 | |
U.S. Treasury Obligations | | | | — | | | | | 5,259,443 | | | | | | | | | | — | | | | | 5,259,443 | |
Foreign Government Bonds | | | | — | | | | | 11,433,049 | | | | | | | | | | — | | | | | 11,433,049 | |
U.S. Government Agency Backed Mortgages | | | | — | | | | | 2,570,776 | | | | | | | | | | — | | | | | 2,570,776 | |
Investment Company | | | | 1,686,124 | | | | | — | | | | | | | | | | — | | | | | 1,686,124 | |
Other Financial Instruments* | | | | | | | | | | | | | | | | | | | | | | | | | |
Foreign currency exchange contracts - forward contracts | | | | — | | | | | 212,029 | | | | | | | | | | — | | | | | 212,029 | |
Financial futures contracts | | | | 8,628 | | | | | — | | | | | | | | | | — | | | | | 8,628 | |
| | | | | | | | | | | | | | | | | | | | | | | | | |
Total Assets | | | $ | 1,694,752 | | | | $ | 23,622,299 | | | | | | | | | | $— | | | | $ | 25,317,051 | |
| | | | | | | | | | | | | | | | | | | | | | | | | |
| | | | | |
Liabilities: | | | | | | | | | | | | | | | | | | | | | | | | | |
Other Financial Instruments* | | | | | | | | | | | | | | | | | | | | | | | | | |
Financial futures contracts | | | | $(9,047) | | | | | $ — | | | | | | | | | | $— | | | | | $ (9,047 | ) |
Foreign currency exchange contracts - forward contracts | | | | — | | | | | (220,606 | ) | | | | | | | | | — | | | | | (220,606 | ) |
| | | | | | | | | | | | | | | | | | | | | | | | | |
Total Liabilities | | | | $(9,047) | | | | | $(220,606 | ) | | | | | | | | | $— | | | | | $(229,653 | ) |
| | | | | | | | | | | | | | | | | | | | | | | | | |
51
|
NOTES TO FINANCIAL STATEMENTS |
| | | | | | | | | | | | | | | | | | | | |
| | | Level 1
Quoted Prices | | Level 2
Significant
Observable
Inputs | | Level 3
Significant
Unobservable
Inputs | | Total |
High Yield Bond Fund | | | | | | | | | | | | | | | | | | | | |
Assets: | | | | | | | | | | | | | | | | | | | | |
Investments in Securities | | | | | | | | | | | | | | | | | | | | |
Bank Loans | | | | | | | | | | | | | | | | | | | | |
United States | | | $ | — | | | | $ | 257,139 | | | | $ | 15,757 | | | | $ | 272,896 | |
Corporate Bonds | | | | | | | | | | | | | | | | | | | | |
Australia | | | | — | | | | | — | | | | | 221,020 | | | | | 221,020 | |
Canada | | | | — | | | | | 3,218,420 | | | | | — | | | | | 3,218,420 | |
Cayman Islands | | | | — | | | | | 770,224 | | | | | — | | | | | 770,224 | |
France | | | | — | | | | | 957,114 | | | | | — | | | | | 957,114 | |
Italy | | | | — | | | | | 1,222,552 | | | | | — | | | | | 1,222,552 | |
Luxembourg | | | | — | | | | | 1,947,995 | | | | | — | | | | | 1,947,995 | |
Netherlands | | | | — | | | | | 981,549 | | | | | — | | | | | 981,549 | |
Singapore | | | | — | | | | | 629,223 | | | | | — | | | | | 629,223 | |
Spain | | | | — | | | | | 113,819 | | | | | — | | | | | 113,819 | |
Switzerland | | | | — | | | | | 728,847 | | | | | — | | | | | 728,847 | |
United Arab Emirates | | | | — | | | | | 502,650 | | | | | — | | | | | 502,650 | |
United States | | | | — | | | | | 40,277,551 | | | | | — | | | | | 40,277,551 | |
Rights/Warrants | | | | — | | | | | 3 | | | | | — | | | | | 3 | |
Common Stocks | | | | — | | | | | — | | | | | 66,929 | | | | | 66,929 | |
Investment Company | | | | 2,088,660 | | | | | — | | | | | — | | | | | 2,088,660 | |
Other Financial Instruments* | | | | | | | | | | | | | | | | | | | | |
Foreign currency exchange contracts - forward contracts | | | | — | | | | | 27,810 | | | | | — | | | | | 27,810 | |
Financial futures contracts | | | | 2,653 | | | | | — | | | | | — | | | | | 2,653 | |
| | | | | | | | | | | | | | | | | | | | |
Total Assets | | | $ | 2,091,313 | | | | $ | 51,634,896 | | | | $ | 303,706 | | | | $ | 54,029,915 | |
| | | | | | | | | | | | | | | | | | | | |
Liabilities: | | | | | | | | | | | | | | | | | | | | |
Other Financial Instruments* | | | | | | | | | | | | | | | | | | | | |
Financial futures contracts | | | | $(12,699 | ) | | | | $ — | | | | | $— | | | | | $(12,699 | ) |
Foreign currency exchange contracts - forward contracts | | | | — | | | | | (22,594 | ) | | | | — | | | | | (22,594 | ) |
| | | | | | | | | | | | | | | | | | | | |
Total Liabilities | | | | $(12,699 | ) | | | | $(22,594 | ) | | | | $— | | | | | $(35,293 | ) |
| | | | | | | | | | | | | | | | | | | | |
*Other financial instruments are instruments shown on the Schedule of Portfolio Investments, such as futures contracts, swaps and foreign currency contracts which are valued at fair value.
During the period ended March 31, 2020, the Funds recognized no transfers to/from Level 1 or Level 2. The Fund’s policy is to recognize transfers to/from Level 1, Level 2 and Level 3 at the end of the year utilizing fair value at the beginning of the year.
52
|
NOTES TO FINANCIAL STATEMENTS |
The following is a reconciliation of Level 3 investments for which significant unobservable inputs were used to determine fair value:
| | | | | | | | | | | | |
| | |
| | | | | | Global Bond Fund | |
| | | | | | Common Stocks–
(United States) | | | Corporate Bonds–
(Australia) | |
Balance as of 9/30/19 (value) | | | | | | | $ 88,208 | | | | $ 202,686 | |
Purchases | | | | | | | — | | | | 4,555 | |
Sales (Paydowns) | | | | | | | (39,589 | ) | | | (139,890 | ) |
Change in unrealized appreciation (depreciation) | | | | | | | (48,619 | ) | | | (67,351 | ) |
Balance as of 3/31/20 (value) | | | | | | | $ — | | | | $ — | |
| |
| | | High Yield
Bond Fund | |
| | | Bank Loans–
(United States) | | | Common Stocks | | | Corporate Bonds–
(Australia) | |
Balance as of 9/30/19 (value) | | | $15,981 | | | | $151,154 | | | | $320,028 | |
Purchases | | | — | | | | — | | | | 7,192 | |
Sales (Paydowns) | | | — | | | | (24,005 | ) | | | (42,357 | ) |
Change in unrealized appreciation (depreciation) | | | (224 | ) | | | (60,220 | ) | | | (63,843 | ) |
Balance as of 3/31/20 (value) | | | $15,757 | | | | $ 66,929 | | | | $221,020 | |
The Funds’ assets assigned to the Level 3 category are valued utilizing the valuation technique deemed the most appropriate in the circumstances. The significant unobservable inputs used include assumptions regarding the particular security’s cash flow profile and potential defaults that may not be generally observable for the security. The Bank Loans and Common Stock in High Yield Bond Fund were fair valued using a discounted cash flow model based on unobservable inputs that include estimated cash flows, implied credit spread and discount rate (weighted average cost of capital). The Corporate Bonds in High Yield Bond Fund and Global Bond Fund were fair valued at the estimated recovery amount to be received in anarm-length transaction. Significant changes in any of these assumptions may result in a lower or higher fair value measurement.
| | | | | | | | | | | | |
| | | Quantitative Information about Level 3 Fair Value Measurements | | |
| | | Fund | | Fair Value
at
March 31,
2020 | | | Valuation Technique(s) | | Unobservable Input | | Range (Weighted
Average) |
| Corporate Bonds (Australia) | | High Yield Bond Fund | | $ | 221,020 | | | Discounted Cash Flow | | Discount Rate of Cash Flows | | 8.0% — 10.0% (8.9%) |
| Common Stocks | | High Yield Bond Fund | | $ | 66,929 | | | Discounted Cash Flow | | Discount Rate of Cash Flows | | 15.0% |
Foreign Currency Transactions:
The values of foreign securities, foreign currencies and other assets and liabilities denominated in foreign currencies are translated into U.S. dollars using current exchange rates each business day. Fluctuations in the value of foreign currency holdings and other assets and liabilities resulting from movements in currency exchange rates are recorded as unrealized foreign currency gains or losses. The effects of changes in foreign currency exchange rates on investments in securities are not segregated from the effects of changes in market prices of those securities on the Statements of Operations. Such fluctuations are included with the net change in unrealized appreciation/depreciation on investment
53
|
NOTES TO FINANCIAL STATEMENTS |
transactions. However, for tax purposes, the effects of fluctuations in foreign currency exchange rates when determining the realized gain or loss upon the sale or maturity of foreign currency denominated debt obligations are segregated pursuant to U.S. Federal income tax regulations; such amounts are categorized as foreign exchange gain or loss for both financial reporting and income tax reporting purposes.
Bank Loans:
A Fund may invest in fixed and floating rate loans from one or more financial institutions (“lender(s)”) to a borrower by way of: (i) assignment/transfer of; or (ii) participation in the whole or part of the loan amount outstanding. In both instances, assignments or participations of such loans must be capable of being freely traded and transferred between investors in the loans. Participations typically will result in a Fund having a contractual relationship only with a lender as grantor of the participation but not with the borrower. A Fund acquires a participation interest only if the lender(s) positioned between the Fund and the borrower is determined by theSub-Advisor to be creditworthy. When purchasing loan participations, a Fund assumes the economic risk associated with the corporate borrower and the credit risk associated with an interposed bank or other financial intermediary. Loan assignments typically involve a transfer of debt from a lender to a third party. When purchasing loan assignments, a Fund assumes the credit risk associated with the corporate borrower only.
Such loans may be secured or unsecured. Loans that are fully secured offer a Fund more protection than an unsecured loan in the event ofnon-payment of scheduled interest or principal. However, there is no assurance that the liquidation of collateral from a secured loan would satisfy the corporate borrower’s obligation. In addition, investments in loans through a direct assignment include the risk that if a loan is terminated, a Fund could become part owner of any collateral, and would bear the costs and liabilities associated with owning and disposing of the collateral.
Loan participations typically represent direct participation in a loan to a corporate borrower, and generally are offered by banks or other financial institutions or lending syndicates.
A loan is often administered by an agent bank acting as agent for all holders. Unless, under the terms of the loan or other indebtedness, a Fund has direct recourse against the corporate borrower, the Fund may have to rely on the agent bank or other financial intermediary to apply appropriate credit remedies against a corporate borrower.
When a Fund purchases a floating rate loan interest, it may receive a facility fee and when it sells a floating rate loan interest, it may pay a facility fee. On an ongoing basis, the Funds may receive a commitment fee based on the undrawn portion of the underlying line of credit amount of a floating rate loan interest. Facility and commitment fees are typically amortized to income over the term of the loan or term of the commitment, respectively. Consent and amendment fees are recorded to income as earned. Prepayment penalty fees, which may be received by the Funds upon the prepayment of a floating rate loan interest by a borrower, are recorded as realized gains. The Funds may invest in multiple series or tranches of a loan. A different series or tranche may have varying terms and carry different associated risks.
In connection with floating rate loan interests, the Funds may also enter into unfunded floating rate loan interests (“commitments”). In connection with these commitments, the Funds earn a commitment fee, typically set as a percentage of the commitment amount. Such fee income, which is included in interest income in the Statement of Operations, is recognized ratably over the commitment period. Unfunded floating rate loan interests aremarked-to-market daily, and any unrealized appreciation or depreciation is included in the Statements of Assets and Liabilities and Statements of Operations.
As of March 31, 2020, the Funds did not have any unfunded floating rate loan interests.
Payment-in-Kind Securities:
The Funds may invest inpayment-in-kind securities (“PIKs”). PIKs give the issuer the option at each interest payment date of making interest payments in either cash or additional debt securities. Those additional debt securities usually have the same terms, including maturity dates and interest rates, and associated risks as the original bonds. The daily market quotations of the original bonds may include
54
|
NOTES TO FINANCIAL STATEMENTS |
the accrued interest (referred to as a dirty price) and require apro-rata adjustment from the unrealized appreciation or depreciation on investments to interest receivable on the Statement of Assets and Liabilities.
For the period ended March 31, 2020, the totalin-kind payments received by the Global High Yield Bond Fund and Global Bond Fund with respect to PIKs constituted less than 5% of the Fund’s total income and, therefore, such payments were not disclosed as a separate line item on the Statement of Operations.
Derivatives:
The Funds may use derivative instruments, including futures, forwards, options, indexed securities, swaps and inverse securities as tools in the management of portfolio assets. A Fund may use such derivatives through either the creation of long or short positions to hedge various investments, for investment purposes, for risk management and/or to increase income or gain to the Fund. Derivatives allow a Fund to increase or decrease its risk exposure more quickly and efficiently than other types of instruments. Derivatives may be riskier than other types of investments and could result in losses that significantly exceed a Fund’s original investment. Derivatives are subject to the risk that changes in the value of a derivative may not correlate perfectly with the underlying asset, rate or index. The use of derivatives may not be successful, resulting in losses to a Fund, and the cost of such strategies may reduce the Fund’s returns.
Hedging also involves the risk that changes in the value of the derivative will not match those of the holdings being hedged as expected by the Funds, in which case any losses on the holdings being hedged may not be reduced and may be increased. There can be no assurance that a Fund’s hedging strategy will reduce risk or that hedging transactions will be available or cost effective. The Funds are subject to interest rate risk and foreign currency exchange risk in the normal course of pursuing their investment objectives by investing in various derivative financial instruments, as described below.
In addition to the risks associated with derivatives in general, the Funds will also be subject to risks related to swap agreements. Because swap agreements are not exchange-traded, but are private contracts into which a Fund and a swap counterparty enter as principals, a Fund may experience a loss or delay in recovering assets if the counterparty defaults on its obligations. Each Fund will segregate or earmark liquid assets in an amount sufficient to cover its obligations under swap agreements.
Financial Futures Contracts:
The Funds may enter into futures contracts in an effort to manage the duration of the portfolio and hedge against certain market risk. A futures contract on a securities index is an agreement obligating one party to pay, and entitling the other party to receive, during the term of the contract, cash payments based on the level of a specified securities index. Futures transactions involve brokerage costs and require a Fund to segregate assets to cover contracts that would require it to purchase securities or currencies. A Fund may lose the expected benefit of futures transactions if interest rates, exchange rates or securities prices change in an unanticipated manner. Such unanticipated changes may also result in lower overall performance than if a Fund had not entered into any futures transactions.
The Funds entered into U.S. Treasury Bond futures, Euro Dollar futures and Euro-Bund futures during the period ended March 31, 2020.
Upon entering into a futures contract, a Fund is required to pledge to the broker an amount of cash, U.S. government securities, or other assets equal to a certain percentage of the contract amount. Subsequent payments are made or received by the Funds each day, depending on the daily fluctuations in the fair value of the underlying instrument. A Fund would record an unrealized gain or loss each day equal to these daily payments.
Open futures contracts are shown on the Schedules of Portfolio Investments. Underlying collateral pledged for open futures contracts is the cash at brokers for financial futures contracts shown on the Statements of Assets and Liabilities at March 31, 2020.
55
|
NOTES TO FINANCIAL STATEMENTS |
Options:
The Funds may write (or sell) put and call options on the securities that the Funds are authorized to buy or already hold in their portfolio. The Funds may also purchase put and call options.
A call option gives the purchaser of the option the right (but not the obligation) to buy, and obligates the seller to sell (when the option is exercised), the underlying instrument at the exercise price at any time or at a specified time during the option period. A put option gives the holder the right to sell and obligates the writer to buy the underlying instrument at the exercise price at any time or at a specified time during the option period. When a Fund purchases (writes) an option, an amount equal to the premium paid (received) by a Fund is reflected as an asset (liability). The amount of the asset (liability) is subsequentlymarked-to-market to reflect the current market value of the option purchased (written). When an instrument is purchased or sold through an exercise of an option, the related premium paid (or received) is added to (or deducted from) the basis of the instrument acquired or deducted from (or added to) the proceeds of the instrument sold. When an option expires (or a Fund enters into a closing transaction), a Fund realizes a gain or loss on the option to the extent of the premiums received or paid (or gain or loss to the extent the cost of the closing transaction exceeds the premium received or paid). When a Fund writes a call option, such option is “covered,” meaning that a Fund holds the underlying instrument subject to being called by the option counterparty, or cash in an amount sufficient to cover the obligation. When a Fund writes a put option, such option is covered by cash in an amount sufficient to cover the obligation.
In purchasing and writing options, a Fund bears the market risk of an unfavorable change in the price of the underlying instrument or the risk that a Fund may not be able to enter into a closing transaction due to an illiquid market. Exercise of a written option could result in a Fund purchasing or selling a security at a price different from the current market value.
A Fund may execute transactions in both listed (exchange-traded) and OTC options. Listed options involve minimal counterparty risk since listed options are guaranteed against default by the exchange on which they trade. Transactions in certain OTC options may expose a Fund to the risk of default by the counterparty to the transaction. In the event of default by the counterparty to the OTC option transaction, a Fund’s maximum amount of loss is the premium paid (as purchaser) or the unrealized gain of the contract (as writer).
Forward Foreign Currency Exchange Contracts:
The Funds enter into forward foreign currency contracts (“Forward”) to hedge their exposure to changes in foreign currency exchange rates on foreign portfolio holdings (foreign currency exchange risk). In addition, certain Funds may use a Forward to provide exposure to the foreign currency market. A Forward is an agreement between two parties to purchase or sell a foreign currency at a future date at a negotiated forward rate. A Forward ismarked-to-market daily and the change in market value is recorded by the Funds as unrealized appreciation or depreciation until the contract settlement date.
The market value of the Forward is determined using the forward rate for the remainder of the outstanding period of the contract, through the delivery date. When a Forward is closed or settled, the Funds record a realized gain or loss equal to the fluctuation in rates during the period a Forward was open.
In the event of default by the counterparty to the transaction, the Fund’s maximum amount of loss, as either the buyer or seller, is the unrealized gain of the contract.
Details of Forward contracts at period end are included in the Schedules of Portfolio Investments under the caption “Foreign currency exchange contracts.”
Swap Agreements:
The Funds may enter into swap agreements, which are agreements involving two parties to exchange the return generated by a security, currency, commodity, interest rate, index, or other measures for the return generated by another instrument, for example, the agreement to pay interest in exchange for a market-linked return based on a notional amount. The Funds entered into interest rate, credit default and other swap agreements as of March 31, 2020.
56
|
NOTES TO FINANCIAL STATEMENTS |
Interest rate swap agreements generally involve the agreement by a Fund to pay a counterparty a fixed or floating rate on a fixed notional amount and to receive a fixed or floating rate on a fixed notional amount, but may also involve the agreement to pay or receive payments derived from changes in interest rates. Periodic payments are generally made during the life of the swap agreement according to the terms and conditions of the agreement and at termination or maturity.
The Funds enter into cross-currency swaps to gain or reduce exposure to foreign currencies or as an economic hedge against either specific transactions or portfolio instruments (foreign currency exchange rate and/or interest rate risk). Cross-currency swaps are interest rate swaps in which one party pays a stream of interest payments, either fixed or floating, in exchange for another party’s stream of interest payments, either fixed or floating, based on the notional amounts of two different currencies. The notional amounts are typically determined based on the spot exchange rates at the inception of the trade. Cross-currency swaps may also involve an exchange of notional amounts at the start, during and/or at expiration of the contract, either at the current spot rate or another specified rate.
The Funds enter into credit default swaps to manage their exposure to the market or certain sectors of the market, to reduce their risk exposure to defaults of corporate and/or sovereign issuers or to create exposure to corporate and/or sovereign issuers to which they are not otherwise exposed (credit risk). The Funds enter into credit default swap agreements to provide a measure of protection against the default of an issuer (as buyer of protection) and/or gain credit exposure to an issuer to which it is not otherwise exposed (as seller of protection). The Funds may either buy or sell (write) credit default swaps on single-name issuers (corporate or sovereign), a combination or basket of single-name issuers or traded indexes. Credit default swaps on single-name issuers are agreements in which the buyer pays fixed periodic payments to the seller in consideration for a guarantee from the seller to make a specific payment should a negative credit event take place with respect to the referenced entity (e.g., bankruptcy, failure to pay, obligation accelerators, repudiation, moratorium or restructuring). Credit default swaps on traded indexes are agreements in which the buyer pays fixed periodic payments to the seller in consideration for a guarantee from the seller to make a specific payment should a writedown, principal or interest shortfall or default of all or individual underlying securities included in the index occurs. As a buyer, if an underlying credit event occurs, the Funds will either receive from the seller an amount equal to the notional amount of the swap and deliver the referenced security or underlying securities comprising the index or receive a net settlement of cash equal to the notional amount of the swap less the recovery value of the security or underlying securities comprising the index. As a seller (writer), if an underlying credit event occurs, the Funds will either pay the buyer an amount equal to the notional amount of the swap and take delivery of the referenced security or underlying securities comprising the index or pay a net settlement of cash equal to the notional amount of the swap less the recovery value of the security or underlying securities comprising the index.
Total return swap agreements involve the commitments to pay or receive an amount generally determined by reference to a security, index or other measure in exchange for a specific market linked return, based on notional amounts. To the extent that the total return of the security, index or other measure underlying the transaction exceeds or falls short of the offsetting interest rate-based obligation, the Funds receive or make a payment to the counterparty. Interim payments and payments received or made by a Fund at the expiration or other termination of the swap agreements are recorded in the Statement of Operations as realized gains or losses, respectively. Swap agreements aremarked-to-market daily based on dealer-supplied valuations, and changes in value, including the periodic amounts of interest to be paid or received on swaps, are recorded as unrealized appreciation/ (depreciation). Risks may exceed amounts recognized on the Statements of Assets and Liabilities. These risks include changes in the returns of the underlying instruments, failure of the counterparties to perform under the contracts’ terms and the possible lack of liquidity with respect to the swap agreements. Details of swap agreements open at period end are included in the Schedules of Portfolio Investments under the captions “Interest rate swaps” and “Credit default swaps”.
57
|
NOTES TO FINANCIAL STATEMENTS |
| | | | | | | | | | | | | | | | | | | | | | |
Fair Values of Derivative Financial Instrument as of March 31, 2020 | |
Statement of Assets and Liabilities Location | |
Asset Derivatives | |
| | | Emerging Market
Debt Fund | | | | | | Global
Bond Fund | | | | | | High Yield
Bond Fund | |
Credit Risk: | | | | | | | | | | | | | | | | | | | | | | |
Credit default swaps, at value | | | | $ | 598,646 | | | | | | | $ | — | | | | | | | $ | — | |
Interest Rate Risk: | | | | | | | | | | | | | | | | | | | | | | |
Unrealized appreciation on interest rate swaps contracts | | | | | 189 | | | | | | | | — | | | | | | | | — | |
Unrealized appreciation on futures contracts | | | | | — | | | | | | | | 8,628 | | | | | | | | 2,653 | |
Foreign currency exchange risk: | | | | | | | | | | | | | | | | | | | | | | |
Unrealized appreciation on forward foreign currency exchange contracts | | | | | 265,961 | | | | | | | | 212,029 | | | | | | | | 27,810 | |
| | | | | | | | | | | | | | | | | | | | | | |
Total | | | | $ | 864,796 | | | | | | | $ | 220,657 | | | | | | | $ | 30,463 | |
| | | | | | | | | | | | | | | | | | | | | | |
| | | | | | | | | | | | | | | | | | | | | | |
| | | | | | | | | | | | | | | | | | | | | | |
Liability Derivatives | |
| | | Emerging Market
Debt Fund | | | | | | Global
Bond Fund | | | | | | High Yield
Bond Fund | |
Credit Risk: | | | | | | | | | | | | | | | | | | | | | | |
Credit default swaps, at value | | | | $ | 461,573 | | | | | | | $ | — | | | | | | | $ | — | |
Interest Rate Risk: | | | | | | | | | | | | | | | | | | | | | | |
Unrealized depreciation on interest rate swaps | | | | | 10,468 | | | | | | | | — | | | | | | | | — | |
Unrealized depreciation on futures contracts | | | | | — | | | | | | | | 9,047 | | | | | | | | 12,699 | |
Foreign currency exchange risk: | | | | | | | | | | | | | | | | | | | | | | |
Unrealized depreciation on forward foreign currency exchange contracts | | | | | 310,035 | | | | | | | | 220,606 | | | | | | | | 22,594 | |
| | | | | | | | | | | | | | | | | | | | | | |
Total | | | | $ | 782,076 | | | | | | | $ | 229,653 | | | | | | | $ | 35,293 | |
| | | | | | | | | | | | | | | | | | | | | | |
The effect of derivative instruments on the Statement of Operations during the period ended March 31, 2020 is as follows:
| | | | | | | | | | | | | | | | | | | | | | |
Derivative Instruments Categorized by Risk Exposure | | Emerging Market
Debt Fund | | | | | Global
Bond Fund | | | | | | High Yield
Bond Fund |
Net realized Gain/(Loss) From: | | | | | | | | | | | | | | | | | | | | | | |
Credit Risk: | | | | | | | | | | | | | | | | | | | | | | |
Credit default swaps | | | | $ | 37,922 | | | | | | | $ | — | | | | | | | $ | 80,771 | |
Interest Rate Risk: | | | | | | | | | | | | | | | | | | | | | | |
Interest rate swaps | | | | | (72,611 | ) | | | | | | | — | | | | | | | | 75,362 | |
Financial futures contracts | | | | | (76,940 | ) | | | | | | | 15,728 | | | | | | | | (6,462 | ) |
Foreign currency exchange risk: | | | | | | | | | | | | | | | | | | | | | | |
Forward foreign currency exchange contracts | | | | | 18,503 | | | | | | | | 79,911 | | | | | | | | — | |
| | | | | | | | | | | | | | | | | | | | | | |
Total | | | | $ | (93,126 | ) | | | | | | $ | 95,639 | | | | | | | $ | 149,671 | |
| | | | | | | | | | | | | | | | | | | | | | |
58
|
NOTES TO FINANCIAL STATEMENTS |
| | | | | | | | | | | | | | | | |
| | | |
Derivative Instruments Categorized by Risk Exposure | | Emerging Market
Debt Fund | | | Global
Bond Fund | | High Yield
Bond Fund |
Net Change in Unrealized Appreciation/(Depreciation) From: | | | | | | | | | | | | | | | | |
Credit Risk: | | | | | | | | | | | | | | | | |
Credit default swaps | | | | | | $ | 89,309 | | | $ | — | | | $ | (51,253 | ) |
Interest Rate Risk: | | | | | | | | | | | | | | | | |
Interest rate swaps | | | | | | | (10,279 | ) | | | — | | | | — | |
Financial futures contracts | | | | | | | (6,957 | ) | | | (419 | ) | | | (17,999 | ) |
Foreign currency exchange risk: | | | | | | | | | | | | | | | | |
Forward foreign currency exchange contracts | | | | | | | (22,028 | ) | | | 17,394 | | | | (13,170 | ) |
| | | | | | | | | | | | | | | | |
Total | | | | | | $ | 50,045 | | | $ | 16,975 | | | $ | (82,422 | ) |
| | | | | | | | | | | | | | | | |
For the period ended March 31, 2020, the average volume of derivative activities based on ending quarterly outstanding amounts are as follows:
| | | | | | | | | | | | |
| | | Emerging Market
Debt Fund | | | Global
Bond Fund | | | High Yield
Bond Fund | |
Futures long position (contracts) | | | — | | | | 4 | | | | 5 | |
Futures short position (contracts) | | | 4 | | | | 3 | | | | 3 | |
Forward foreign currency exchange contracts purchased (U.S. dollar amounts) | | | $3,208,344,618 | | | | $ 19,915,359 | | | | $2,446,121 | �� |
Forward foreign currency exchange contracts sold (U.S. dollar amounts) | | | 1,659,076,791 | | | | 448,023,451 | | | | — | |
Interest rate swaps (Notional Amount in U.S. Dollars) | | | 492,945,500 | | | | — | | | | — | |
Credit default swaps (Notional Amount in U.S. Dollars) | | | 4,500,000 | | | | — | | | | 3,125,000 | |
Counterparty Credit Risk:
Derivatives may also expose a Fund to counterparty risk (the risk that the derivative counterparty will not fulfill its contractual obligations). To the extent amounts due to the Funds from their counterparties are not fully collateralized contractually or otherwise, the Funds bear the risk of loss from counterpartynon-performance. A Fund’s maximum risk of loss from counterparty credit risk onover-the-counter (“OTC”) derivatives is generally the aggregate unrealized gain in excess of any collateral pledged by the counterparty to the Funds.
For foreign currency exchange contracts, risks may arise upon entering into these contracts from the potential inability of the counterparties to meet the terms of their contracts, or if the foreign currency rates change unfavorably.
The Funds’ risk of loss from counterparty credit risk on OTC derivatives is generally limited to the aggregate unrealized gain netted against any collateral held by the Funds. For OTC purchased options, the Funds bear the risk of loss in the amount of the premiums paid and change in market value of the options should the counterparty not perform under the contracts. Written options by the Funds do not give rise to counterparty credit risk, as written options obligate the Funds to perform and not the counterparty. Counterparty risk related to exchange-traded financial futures contracts and options is minimal because of the protection against defaults provided by the exchange on which they trade.
With exchange-traded purchased options and futures and centrally cleared swaps, the exchange or clearinghouse, as counterparty to such instruments, guarantees against a possible default. The clearinghouse stands between the buyer and the seller of the contract; therefore, credit risk is limited to failure of the clearinghouse. While offset rights may exist under applicable law, the Fund does not have a contractual right of offset against a clearing broker or clearinghouse in the event of a default (including the bankruptcy or insolvency) of the clearing broker or clearinghouse. Additionally, credit risk
59
|
NOTES TO FINANCIAL STATEMENTS |
exists in exchange-traded futures and centrally cleared swaps with respect to initial and variation margin that is held in a clearing broker’s customer accounts. While clearing brokers are required to segregate customer margin from their own assets, in the event that a clearing broker becomes insolvent or goes into bankruptcy and at that time there is a shortfall in the aggregate amount of margin held by the clearing broker for all its clients, typically the shortfall would be allocated on a pro rata basis across all the clearing broker’s customers, potentially resulting in losses to the Funds.
In order to better define its contractual rights and to secure rights that will help the Funds mitigate its counterparty risk, the Funds may enter into an International Swaps and Derivatives Association, Inc. Master Agreement (“ISDA Master Agreement”) or similar agreement with its derivative contract counterparties. An ISDA Master Agreement is a bilateral agreement between a Fund and a counterparty that governs certain OTC derivatives and typically contains, among other things, collateral posting terms and netting provisions in the event of a default and/or termination event. Under an ISDA Master Agreement, a Fund may, under certain circumstances, offset with the counterparty certain derivative financial instruments’ payables and/or receivables with collateral held and/or posted and create one single net payment. The provisions of the ISDA Master Agreement typically permit a single net payment in the event of default including the bankruptcy or insolvency of the counterparty. However, bankruptcy or insolvency laws of a particular jurisdiction may impose restrictions on or prohibitions against the right of offset in bankruptcy, insolvency or other events. In addition, certain ISDA Master Agreements allow counterparties to OTC derivatives to terminate derivative contracts prior to maturity in the event a Fund’s net assets decline by a stated percentage or the Fund fails to meet the terms of its ISDA Master Agreements, which would cause the Fund to accelerate payment of any net liability owed to the counterparty.
Collateral Requirements:
For derivatives traded under an ISDA Master Agreement, the collateral requirements are typically calculated by netting themark-to-market amount for each transaction under such agreement and comparing that amount to the value of any collateral currently pledged by the Fund and the counterparty.
Cash collateral that has been pledged to cover obligations of a Fund and cash collateral received from the counterparty, if any, is reported separately on the Statements of Assets and Liabilities as cash due to broker for options contracts, cash at broker for financial futures contracts and segregated cash and foreign currency for options contracts and swap contracts and cash received as payable to broker, respectively.Non-cash collateral pledged by the Fund, if any, is noted in the Schedule of Portfolio Investments. Generally, the amount of collateral due from or to a party has to exceed a minimum transfer amount threshold (e.g. $500,000) before a transfer is required, which is determined at the close of business of a Fund and any additional required collateral is delivered to/pledged by a Fund on the next business day. Typically, a Fund and its counterparties are not permitted to sell,re-pledge or use the collateral they receive. To the extent amounts due to a Fund from its counterparties are not fully collateralized, contractually or otherwise, a Fund bears the risk of loss from counterpartynon-performance. The Funds attempt to mitigate counterparty risk by entering into agreements only with counterparties that it believes have the financial resources to honor their obligations and by monitoring the financial stability of those counterparties.
60
|
NOTES TO FINANCIAL STATEMENTS |
Emerging Market Debt Fund
| | | | | | | | | | | | | | | | | | | | | | | | | | | | | | | | | | | | |
| | | Citibank
N.A. | | Merrill
Lynch | | | Citigroup
Global
Markets | | Barclays
Bank Plc | | | JP
Morgan | | | BNP
Paribas | | | HSBC
Bank Plc | | Morgan
Stanley | | | Total | |
Assets: | | | | | | | | | | | | | | | | | | | | | | | | | | | | | | | | | | | | |
Forward Currency Exchange Contracts | | $ | 255,749 | | | $ | — | | | $ | — | | | $ | — | | | $ | — | | | $ | — | | | $ | 10,212 | | | $ | — | | | $ | 265,961 | |
Swaps | | | 15,461 | | | | 49,543 | | | | 38,328 | | | | 332,865 | | | | 118,508 | | | | 15,417 | | | | — | | | | 28,713 | | | | 598,835 | |
| | | | | | | | | | | | | | | | | | | | | | | | | | | | | | | | | | | | |
Total Assets | | | 271,210 | | | | 49,543 | | | | 38,328 | | | | 332,865 | | | | 118,508 | | | | 15,417 | | | | 10,212 | | | | 28,713 | | | | 864,796 | |
| | | | | | | | | | | | | | | | | | | | | | | | | | | | | | | | | | | | |
Liabilities: | | | | | | | | | | | | | | | | | | | | | | | | | | | | | | | | | | | | |
Forward Currency Exchange Contracts | | | 310,035 | | | | — | | | | — | | | | — | | | | — | | | | — | | | | — | | | | — | | | | 310,035 | |
Swaps | | | 11,810 | | | | — | | | | 381,957 | | | | 36,890 | | | | 6,252 | | | | — | | | | 35,132 | | | | — | | | | 472,041 | |
| | | | | | | | | | | | | | | | | | | | | | | | | | | | | | | | | | | | |
Total Liabilities | | | 321,845 | | | | — | | | | 381,957 | | | | 36,890 | | | | 6,252 | | | | — | | | | 35,132 | | | | — | | | | 782,076 | |
| | | | | | | | | | | | | | | | | | | | | | | | | | | | | | | | | | | | |
Total Financial and Derivative Net Assets1 | | | (50,635 | ) | | | 49,543 | | | | (343,629 | ) | | | 295,975 | | | | 112,256 | | | | 15,417 | | | | (24,920 | ) | | | 28,713 | | | | 82,720 | |
Total Collateral (Received) Pledged2 | | | — | | | | — | | | | 303,884 | | | | — | | | | — | | | | — | | | | — | | | | — | | | | 303,884 | |
| | | | | | | | | | | | | | | | | | | | | | | | | | | | | | | | | | | | |
Net Amount3 | | $ | (50,635 | ) | | $ | 49,543 | | | $ | (39,745 | ) | | $ | 295,975 | | | $ | 112,256 | | | $ | 15,417 | | | $ | (24,920 | ) | | $ | 28,713 | | | $ | 386,604 | |
| | | | | | | | | | | | | | | | | | | | | | | | | | | | | | | | | | | | |
Global Bond Fund
| | | | | | | | | | | | | | | | | | | | | | | | |
| | | | | | | | Credit Suisse | | | | | | |
| | | | | | | | Securities (USA) | | | | | | |
| | | Citibank N.A. | | | LLC | | | Total | |
Assets: | | | | | | | | | | | | | | | | | | | | | | | | |
Forward Currency Exchange Contracts | | | | | | $ | 212,029 | | | | | | | $ | — | | | | | | | $ | 212,029 | |
Financial Futures Contracts | | | | | | | — | | | | | | | | 8,628 | | | | | | | | 8,628 | |
| | | | | | | | | | | | | | | | | | | | | | | | |
Total Assets | | | | | | | 212,029 | | | | | | | | 8,628 | | | | | | | | 220,657 | |
| | | | | | | | | | | | | | | | | | | | | | | | |
Liabilities: | | | | | | | | | | | | | | | | | | | | | | | | |
Forward Currency Exchange Contracts | | | | | | | 220,606 | | | | | | | | — | | | | | | | | 220,606 | |
Financial Futures Contracts | | | | | | | — | | | | | | | | 9,047 | | | | | | | | 9,047 | |
| | | | | | | | | | | | | | | | | | | | | | | | |
Total Liabilities | | | | | | | 220,606 | | | | | | | | 9,047 | | | | | | | | 229,653 | |
| | | | | | | | | | | | | | | | | | | | | | | | |
Total Financial and Derivative Net Assets1 | | | | | | | (8,577 | ) | | | | | | | (419 | ) | | | | | | | (8,996 | ) |
| | | | | | | | | | | | | | | | | | | | | | | | |
Net Amount3 | | | | | | $ | (8,577 | ) | | | | | | $ | (419 | ) | | | | | | $ | (8,996 | ) |
| | | | | | | | | | | | | | | | | | | | | | | | |
61
|
NOTES TO FINANCIAL STATEMENTS |
High Yield Bond Fund
| | | | | | | | | | | | | | | | | | | | | | | | |
| | | | | | | | | Citigroup Global | | | | | | |
| | | Citibank N.A. | | | Markets, Inc. | | | Total | |
Assets: | | | | | | | | | | | | | | | | | | | | | | | | |
Forward Currency Exchange Contracts | | | | | | $ | 27,810 | | | | | | | $ | — | | | | | | | $ | 27,810 | |
Financial Futures Contracts | | | | | | | — | | | | | | | | 2,653 | | | | | | | | 2,653 | |
| | | | | | | | | | | | | | | | | | | | | | | | |
Total Assets | | | | | | | 27,810 | | | | | | | | 2,653 | | | | | | | | 30,463 | |
| | | | | | | | | | | | | | | | | | | | | | | | |
Liabilities: | | | | | | | | | | | | | | | | | | | | | | | | |
Forward Currency Exchange Contracts | | | | | | | 22,594 | | | | | | | | — | | | | | | | | 22,594 | |
Financial Futures Contracts | | | | | | | — | | | | | | | | 12,699 | | | | | | | | 12,699 | |
| | | | | | | | | | | | | | | | | | | | | | | | |
Total Liabilities | | | | | | | 22,594 | | | | | | | | 12,699 | | | | | | | | 35,293 | |
| | | | | | | | | | | | | | | | | | | | | | | | |
Total Financial and Derivative Net Assets1 | | | | | | | 5,216 | | | | | | | | (10,046 | ) | | | | | | | (4,830 | ) |
| | | | | | | | | | | | | | | | | | | | | | | | |
Net Amount3 | | | | | | $ | 5,216 | | | | | | | $ | (10,046 | ) | | | | | | $ | (4,830 | ) |
| | | | | | | | | | | | | | | | | | | | | | | | |
1 The amount of derivatives for offset is limited to the amount of assets and/or liabilities that are subject to a MNA.
2 Excess of collateral (received) pledged from/to the individual counterparty may not be shown for financial reporting purposes.
3 Net amount represents the net amount receivable (payable) from/to the individual counterparty in the event of default.
Affiliated Investments:
The Funds invest in another Fund of the Trust (an “Affiliated Fund”), U.S. Government Money MarketFund-RBC Institutional Class 1, as a cash sweep vehicle. The income earned by the Funds from the Affiliated Fund for the period is disclosed in the Statement of Operations. The table below details the transactions of the Funds in the Affiliated Fund.
| | | | | | | | | | | | | | | | | | | | |
| | | Value | | | | | | | | | Value | | | | |
| | | September 30, 2019 | | | Purchases | | | Sales | | | March 31, 2020 | | | Dividends | |
Investments in U.S. Government Money Market Fund—RBC Institutional Class 1 | | | | | | | | | | | | | | | | | |
Emerging Market Debt Fund | | | $ 1,015,751 | | | | $ 9,559,092 | | | | $ 8,086,724 | | | | $ 2,488,119 | | | | $ 4,369 | |
Global Bond Fund | | | 39,403,605 | | | | 19,214,026 | | | | 56,931,507 | | | | 1,686,124 | | | | 10,372 | |
High Yield Bond Fund | | | 3,852,712 | | | | 37,492,692 | | | | 39,256,744 | | | | 2,088,660 | | | | 24,809 | |
Credit Enhancement:
Certain obligations held by the Funds have credit enhancement or liquidity features that may, under certain circumstances, provide for repayment of principal and interest on the obligation upon demand date, interest rate reset date or final maturity. These enhancements may include: letters of credit; liquidity guarantees; security purchase agreements; tender option purchase agreements and third party insurance.
Investment Transactions and Income:
Investment transactions are recorded on trade date. Dividend income net ofnon-reclaimable withholding taxes is recorded on theex-dividend date. Realized gains and losses from investment transactions are calculated based on the cost of the specific security (also known as identified cost basis). Interest income is recognized on the accrual basis and includes, where applicable, the amortization or accretion of premium or discount using the effective yield method.
62
|
NOTES TO FINANCIAL STATEMENTS |
Expense, Investment Income and Gain/Loss Allocation:
Each Fund pays the expenses that are directly related to its operations, such as custodian fees or advisory fees. Expenses incurred by the Trust, such as trustee or legal fees, are allocated among each of the Funds in the Trust either proportionately based upon each Fund’s relative net assets or using another reasonable basis such as equally across all Funds in the Trust, depending on the nature of the expense. Individual share classes within a Fund are charged expenses specific to that class, such as distribution fees and transfer agent fees. Within a Fund, expenses other than class specific expenses are allocated daily to each class based upon the proportion of relative net assets. Investment income and realized and unrealized gains or losses are allocated to each class of shares based on relative net assets.
Distributions to Shareholders:
Each Fund pays out any income that it receives, less expenses, in the form of dividends and capital gains to its shareholders. Income dividends are declared and paid monthly. Capital gain distributions are declared and paid at least annually. Distributions to shareholders are recorded on theex-dividend date. The amount of dividends and distributions are calculated based on federal income tax regulations, which may differ from US GAAP. These “book/tax” differences may be either temporary or permanent in nature. To the extent these differences are determined, as of the end of the tax year, to be permanent, they are reclassified within a Fund’s capital accounts based on their federal tax basis treatment.
3. Agreements and Other Transactions with Affiliates:
The Trust has entered into an investment advisory agreement with RBCGAM-US under which RBCGAM-US manages each Funds’ assets and furnishes related office facilities, equipment, research and personnel. The agreement requires each Fund to pay RBCGAM-US a monthly fee based upon average daily net assets. Under the terms of the agreement, RBCGAM-US is entitled to receive fees based on a percentage of the average daily net assets of each of the Funds as follows:
| | | | |
| | | Annual Rate | |
Emerging Market Debt Fund | | | 0.75% | |
High Yield Bond Fund | | | 0.70% | |
Global Bond Fund | | | 0.45% | |
RBCGAM-US has contractually agreed to waive fees and/or make payments in order to keep total operating expenses (excluding certain fees such as interest, taxes and acquired fund fees and expenses) of the Funds to the following levels pursuant to an expense limitation agreement.
| | | | | | | | | | | | |
| | | Class A | | | Class I | | | Class R6 | |
| | | Annual Rate | | | Annual Rate | | | Annual Rate | |
Emerging Market Debt Fund | | | 1.12% | | | | 0.87% | | | | 0.82% | |
High Yield Bond Fund | | | 0.82% | | | | 0.57% | | | | N/A | |
Global Bond Fund | | | 0.77% | �� | | | 0.52% | | | | 0.47% | |
This expense limitation agreement is in place until January 31, 2021 and may not be terminated by RBCGAM-US prior to that date. The agreement shall continue for additionalone-year terms unless terminated or revised by the Board at any time or by RBCGAM-US at the expiration of anyone-year period. The Advisor is entitled to recoup from the Fund or class the fees and/or operating expenses waived or reimbursed during any of the previous 3 years, provided the Fund is able to do so and remain in compliance with the expense limitation in place at the time the fees were waived or expenses paid.
63
|
NOTES TO FINANCIAL STATEMENTS |
The amounts subject to possible recoupment under the expense limitation agreement were:
| | | | | | | | | | | | | | | | | | | | |
| | | FYE 9/30/17 | | | FYE 9/30/18 | | | FYE 9/30/19 | | | FYE 9/30/20 | | | Total | |
Emerging Market Debt Fund | | | $134,414 | | | | $276,178 | | | | $281,605 | | | | $132,089 | | | | $ 824,286 | |
Global Bond Fund | | | 129,115 | | | | 260,306 | | | | 292,155 | | | | 189,586 | | | | 871,162 | |
High Yield Bond Fund | | | 188,535 | | | | 364,804 | | | | 357,042 | | | | 186,445 | | | | 1,096,826 | |
There was no recoupment of expense reimbursement/waivers during the period. Amounts from years prior to those shown are no longer subject to recoupment
RBCGAM-US voluntarily agreed to waive its investment advisory fees by the amount of investment advisory fees the Funds pay to RBCGAM-US indirectly through its investment in an affiliated money market fund. For the six months ended March 31, 2020, the amount waived was $457, $1,369 and $2,512 for the Emerging Market Debt Fund, Global Bond Fund and High Yield Bond Fund, respectively, and is included in expenses waived/reimbursed by Advisory in the Statement of Operations.
RBCGAM-US may also voluntarily waive and/or reimburse operating expenses of any Fund from time to time. Any such voluntary program may be changed or eliminated at any time without notice, and expenses waived under such program are not subject to recoupment.
Each of the Funds aresub-advised by BlueBay, and the High Yield Bond Fund and Global Bond Fund are alsosub-advised by BlueBay US, which are wholly-owned subsidiaries of Royal Bank of Canada, which is also the parent company of the Advisor. TheSub-Advisors are paid by the Advisor out of the advisory fee paid by the Funds to the Advisor.
RBCGAM-US serves asco-administrator to the Funds. BNY Mellon serves asco-administrator and fund accounting agent. Services provided under the administrative services agreement include providingday-to-day administration of matters related to the Funds, maintenance of their records and the preparation of reports. Under the terms of the administrative services agreement, RBCGAM-US does not receive a fee for its role asco-administrator. BNY Mellon receives a fee for its services payable by the Funds based in part on the Funds’ average net assets. BNY Mellon’s fee is included with “Accounting fees” in the Statements of Operations.
Certain Officers and Trustees of the Trust are affiliated with the Advisor. Such Officers and Trustees receive no compensation from the Funds for serving in their respective roles.
The Trust currently pays each of the independent Trustees (Trustees of the Trust who are not directors, officers or employees of the Advisor, eitherCo-Administrator or Distributor) an annual retainer of $63,000. The Board Chairperson and Audit Committee Chairperson each receive an additional retainer of $2,500 annually, and all other trustees serving as Chair of a Board committee each receive an additional retainer of $1,000 annually. In addition, Independent Trustees receive a quarterly meeting fee of $6,500 for eachin-person Board meeting attended, a meeting fee of $1,500 for each telephonic or Special Board meeting attended, a $1,500 fee for each Board committee meeting attended, and are reimbursed for allout-of-pocket expenses relating to attendance at such meetings. These amounts are included in the Statement of Operations in “Trustees’ fees”.
In conjunction with the launch of each of the Funds or additional share classes, the Advisor invested seed capital in each Fund to provide each Fund or share class with its initial investment assets. The table below shows, as of March 31, 2020, each Fund’s net assets, the shares (if any) of each Fund held by the Advisor, and the percent of total net assets represented by the Advisor’s investment.
| | | | | | | | | | | | |
| | | | | | Shares held | | | % of Fund | |
| | | Net Assets | | | by Advisor | | | Net Assets | |
Emerging Market Debt Fund | | | $18,129,153 | | | | 1,238 | | | | 0.1% | |
64
|
NOTES TO FINANCIAL STATEMENTS |
| | | | | | | | | | | | |
| | | | | | Shares held | | | % of Fund | |
| | | Net Assets | | | by Advisor | | | Net Assets | |
Global Bond Fund | | | $27,056,259 | | | | 2,900,850 | | | | 99.8% | |
High Yield Bond Fund | | | $56,997,159 | | | | 3,295,417 | | | | 55.6% | |
4. Fund Distribution:
Each of the Funds that offers Class A shares has adopted a Master Distribution12b-1 Plan (the “Plan”) in which Quasar Distributors LLC (the “Distributor”) acts as the Funds’ distributor. The Plan permits each Fund to make payments for, or to reimburse the Distributor for, distribution-related costs and expenses of marketing shares of Class A covered under the Plan, and/or for providing shareholder services. The Plan does not apply to Class I and Class R6. The following chart shows the current Plan fee rate for Class A.
| | | | |
| | | Class A | |
12b-1 Plan Fee | | | 0.25%* | |
* Under the12b-1 plan, the maximum fee rate for Class A shares is 0.50%. Currently the Board has approved an annual limit of 0.25%.
Plan fees are based on average daily net assets of Class A. Up to 0.25% of each Plan fee may be designated as a service fee, as defined by the applicable rules of the Financial Industry Regulatory Authority. The Distributor, subject to applicable legal requirements, may waive the Plan fee voluntarily, in whole or in part. For the period ended March 31, 2020, there were no fees waived by the Distributor.
For the period ended March 31, 2020, the Distributor did not receive any commissions forfront-end sales charges of Class A shares of the Funds.
The Distributor did not receive any CDSC fees from Class A shares of the Funds during the period ended March 31, 2020.
5. Securities Transactions:
The cost of securities purchased and proceeds from securities sold (excluding securities maturing less than one year from acquisition) for the period ended March 31, 2020 were as follows:
| | | | | | | | |
| | | Purchases | | | Sales | |
Emerging Market Debt Fund | | | $17,951,658 | | | | $18,626,463 | |
Global Bond Fund | | | 21,469,989 | | | | 59,400,285 | |
High Yield Bond Fund | | | 58,136,619 | | | | 47,425,494 | |
65
|
NOTES TO FINANCIAL STATEMENTS |
6. Capital Share Transactions:
The Trust is authorized to issue an unlimited number of shares of beneficial interest (“shares outstanding”) without par value. Transactions in capital stock of the Funds are summarized on the following pages:
| | | | | | | | | | | | | | | | |
| | | Emerging Market Debt Fund | | | High Yield Bond Fund | |
| | | For the | | | | | | For the | | | | |
| | | Six Months | | | | | | Six Months | | | | |
| | | Ended | | | For the | | | Ended | | | For the | |
| | | March 31, | | | Year Ended | | | March 31, | | | Year Ended | |
| | | 2020 | | | September 30, | | | 2020 | | | September 30, | |
| | | (Unaudited) | | | 2019 | | | (Unaudited) | | | 2019 | |
CAPITAL TRANSACTIONS: | | | | | | | | | | | | | | | | |
Class A | | | | | | | | | | | | | | | | |
Proceeds from shares issued | | $ | — | | | $ | — | | | $ | 529,597 | | | $ | 593,317 | |
Distributions reinvested | | | 938 | | | | 1,068 | | | | 21,602 | | | | 50,996 | |
Cost of shares redeemed | | | (12,412 | ) | | | — | | | | (149,164 | ) | | | (712,379 | ) |
| | | | | | | | | | | | | | | | |
Change in Class A | | $ | (11,474 | ) | | $ | 1,068 | | | $ | 402,035 | | | $ | (68,066 | ) |
| | | | | | | | | | | | | | | | |
Class I | | | | | | | | | | | | | | | | |
Proceeds from shares issued | | $ | 21,600 | | | $ | 588,298 | | | $ | 13,944,674 | | | $ | 10,000,692 | |
Distributions reinvested | | | 942,670 | | | | 1,216,750 | | | | 1,819,640 | | | | 3,094,764 | |
Cost of shares redeemed | | | (281,721 | ) | | | (5,342,801 | ) | | | (3,433,213 | ) | | | (2,770,936 | ) |
| | | | | | | | | | | | | | | | |
Change in Class I | | $ | 682,549 | | | $ | (3,537,753 | ) | | $ | 12,331,101 | | | $ | 10,324,520 | |
| | | | | | | | | | | | | | | | |
Class R6 | | | | | | | | | | | | | | | | |
Distributions reinvested | | $ | 544 | | | $ | 628 | | | $ | — | | | $ | — | |
| | | | | | | | | | | | | | | | |
Change in Class R6 | | $ | 544 | | | $ | 628 | | | $ | — | | | $ | — | |
| | | | | | | | | | | | | | | | |
Change in net assets resulting from capital transactions | | $ | 671,619 | | | $ | (3,536,057 | ) | | $ | 12,733,136 | | | $ | 10,256,454 | |
| | | | | | | | | | | | | | | | |
SHARE TRANSACTIONS: | | | | | | | | | | | | | | | | |
Class A | | | | | | | | | | | | | | | | |
Issued | | | — | | | | — | | | | 51,010 | | | | 58,064 | |
Reinvested | | | 95 | | | | 112 | | | | 2,075 | | | | 5,165 | |
Redeemed | | | (1,486 | ) | | | — | | | | (15,104 | ) | | | (72,653 | ) |
| | | | | | | | | | | | | | | | |
Change in Class A | | | (1,391 | ) | | | 112 | | | | 37,981 | | | | (9,424 | ) |
| | | | | | | | | | | | | | | | |
Class I | | | | | | | | | | | | | | | | |
Issued | | | 2,135 | | | | 61,712 | | | | 1,332,189 | | | | 985,850 | |
Reinvested | | | 94,453 | | | | 126,889 | | | | 173,630 | | | | 308,999 | |
Redeemed | | | (27,868 | ) | | | (551,225 | ) | | | (349,941 | ) | | | (274,486 | ) |
| | | | | | | | | | | | | | | | |
Change in Class I | | | 68,720 | | | | (362,624 | ) | | | 1,155,878 | | | | 1,020,363 | |
| | | | | | | | | | | | | | | | |
Class R6 | | | | | | | | | | | | | | | | |
Reinvested | | | 54 | | | | 65 | | | | — | | | | — | |
| | | | | | | | | | | | | | | | |
Change in Class R6 | | | 54 | | | | 65 | | | | — | | | | — | |
| | | | | | | | | | | | | | | | |
Change in shares resulting from capital transactions | | | 67,383 | | | | (362,447 | ) | | | 1,193,859 | | | | 1,010,939 | |
| | | | | | | | | | | | | | | | |
66
|
NOTES TO FINANCIAL STATEMENTS |
| | | | | | | | |
| | | Global Bond Fund | |
| | | For the | | | | |
| | | Six Months | | | | |
| | | Ended | | | For the | |
| | | March 31, | | | Year Ended | |
| | | 2020 | | | September 30, | |
| | | (Unaudited) | | | 2019 | |
CAPITAL TRANSACTIONS: | | | | | | | | |
Class A | | | | | | | | |
Proceeds from shares issued | | $ | 10,000 | | | $ | — | |
Distributions reinvested | | | 74 | | | | — | |
| | | | | | | | |
Change in Class A | | $ | 10,074 | | | $ | — | |
| | | | | | | | |
Class I | | | | | | | | |
Proceeds from shares issued | | $ | 4,331 | | | $ | 865,691 | |
Distributions reinvested | | | 1,524,331 | | | | 3,777,197 | |
Cost of shares redeemed | | | (25,001,590 | ) | | | (26,754,094 | ) |
| | | | | | | | |
Change in Class I | | $ | (23,472,928 | ) | | $ | (22,111,206 | ) |
| | | | | | | | |
Class R6 | | | | | | | | |
Distributions reinvested | | $ | 632 | | | $ | 556 | |
| | | | | | | | |
Change in Class R6 | | $ | 632 | | | $ | 556 | |
| | | | | | | | |
Change in net assets resulting from capital transactions | | $ | (23,462,222 | ) | | $ | (22,110,650 | ) |
| | | | | | | | |
SHARE TRANSACTIONS: | | | | | | | | |
Class A | | | | | | | | |
Issued | | | 1,027 | | | | — | |
Reinvested | | | 8 | | | | — | |
| | | | | | | | |
Change in Class A | | | 1,035 | | | | — | |
| | | | | | | | |
Class I | | | | | | | | |
Issued | | | 59 | | | | 89,971 | |
Reinvested | | | 157,086 | | | | 407,419 | |
Redeemed | | | (2,472,963 | ) | | | (2,657,532 | ) |
| | | | | | | | |
Change in Class I | | | (2,315,818 | ) | | | (2,160,142 | ) |
| | | | | | | | |
Class R6 | | | | | | | | |
Reinvested | | | 66 | | | | 60 | |
| | | | | | | | |
Change in Class R6 | | | 66 | | | | 60 | |
| | | | | | | | |
Change in shares resulting from capital transactions | | | (2,314,717 | ) | | | (2,160,082 | ) |
| | | | | | | | |
7. Federal Income Taxes:
It is the policy of each Fund to continue to qualify as a regulated investment company by complying with the provisions available to certain investment companies, as defined under Subchapter M of the Internal Revenue Code, and to distribute substantially all of its net investment income and net realized capital gains. Therefore, no federal tax liability is recorded in the financial statements of each Fund.
Fund Management has analyzed the Funds’ tax positions taken or expected to be taken on federal income tax returns for all open tax years (current and prior three tax years) and has concluded that no provision for federal income tax is required in the Funds’ financial statements. The Funds’ federal and state income and federal excise tax returns for tax years for which the applicable statutes of limitations have not expired are subject to examination by the Internal Revenue Service and state departments of revenue.
67
|
NOTES TO FINANCIAL STATEMENTS |
As of March 31, 2020, the tax cost of investments and the breakdown of unrealized appreciation (depreciation) for each Fund was as follows:
| | | | | | | | | | | | | | | | |
| | | | | | | | | | | | Net Unrealized | |
| | | Tax Cost Of | | | Unrealized | | | Unrealized | | | Appreciation/ | |
| | | Investments | | | Appreciation | | | Depreciation | | | (Depreciation) | |
Emerging Market Debt Fund | | | $21,368,521 | | | | $219,447 | | | | $(3,565,502 | ) | | | $(3,346,055 | ) |
Global Bond Fund | | | 25,891,992 | | | | 458,009 | | | | (1,253,607 | ) | | | (795,598 | ) |
High Yield Bond Fund | | | 57,443,551 | | | | 441,241 | | | | (3,885,340 | ) | | | (3,444,099 | ) |
The difference between book basis and tax basis unrealized appreciation/depreciation is attributable primarily to the tax deferral of losses on wash sales, currency straddle losses mark to market on derivatives and the use of equalization.
The tax character of distributions during the year ended September 30, 2019 were as follows:
| | | | | | | | | | | | | | | | |
| | | Distributions Paid From | |
| | | | | | | | | | | | Total | |
| | | Ordinary | | | Net Long Term | | | Total Taxable | | | Distributions | |
| | | Income | | | Capital Gains | | | Distributions | | | Paid | |
Emerging Market Debt Fund | | | $1,231,778 | | | | $ — | | | | $1,231,778 | | | | $1,231,778 | |
Global Bond Fund | | | 3,046,431 | | | | 738,322 | | | | 3,784,753 | | | | 3,784,753 | |
High Yield Bond Fund | | | 3,169,039 | | | | — | | | | 3,169,039 | | | | 3,169,039 | |
The tax basis of components of accumulated earnings/(losses) and tax character of distributions are determined at fiscal year end, and will be included in the Annual Report dated September 30, 2020.
As of September 30, 2019, the Emerging Market Debt Fund and High Yield Bond Fund had a short-term capital loss carryforward of $5,380,291 and $233,263, respectively and a long-term capital loss carryforward of $275,426 and $563,676, respectively, available to offset future realized capital gains in accordance with the Regulated Investment Company Modernization Act of 2010. These capital loss carryforwards are not subject to expiration and must first be utilized to offset future realized gains of the same character.
Under current tax law, Post-October Capital Losses and Late-Year Ordinary Losses may be deferred and treated as occurring on the first business day of the following fiscal year for tax purposes. The Fund did not have any Post-October Capital Losses or Late-Year Ordinary Losses for the year ending September 30, 2020.
8. Market Timing:
The Trust strongly discourages attempts at market timing by Fund shareholders. Each Fund charges a redemption fee of 2% of the value of the shares redeemed or exchanged within 30 days of purchase, in addition to limiting the number of exchanges that may be made between Funds to five (5) per calendar year. When assessed, the redemption fee is deducted from the redemption proceeds and retained by the Fund, not by the Advisor. This redemption fee is not charged in cases where, for example, the redemption results from an automatic reinvestment or assetre-allocation not specifically directed by the shareholder. The Trust also reserves the right to reject any Fund purchase order made by persons deemed to be market timers. The Funds’ prospectus contains a full description of the Trust’s policies on market timing and/or excessive trading. The redemption fee is recorded as a credit to capital and is included in the capital transactions on the Statements of Changes in Net Assets.
68
|
NOTES TO FINANCIAL STATEMENTS |
During the six months ended March 31, 2020, the Funds had the following redemption fees collected by the Funds.
| | | | |
| | | Redemption Fees | |
High Yield Bond Fund | | | $424 | |
9. Commitments:
High Yield Bond Fund may invest in floating rate loan interests. In connection with these investments, High Yield Bond Fund may also enter into bridge loan commitments (“commitments”). Commitments may obligate High Yield Bond Fund to furnish temporary financing to a borrower until permanent financing can be arranged. As of March 31, 2020, High Yield Bond Fund had no outstanding commitments. In connection with these commitments, High Yield Bond Fund earns a commitment fee, typically set as a percentage of the commitment amount. Such fee income, which is included in interest income in the Statements of Operations, is recognized ratably over the commitment period.
10. Significant Risks
Shareholder concentration risk:
As of March 31, 2020, the following Funds had omnibus accounts which owned more than 10% of a Fund’s outstanding shares as shown below:
| | | | | | | | |
| | | # of Omnibus Accounts | | | % of Fund | |
Emerging Market Debt Fund | | | 1 | | | | 19.7% | |
High Yield Bond Fund | | | 2 | | | | 38.3% | |
In addition, two unaffiliated shareholders in aggregate owned 74.3% of the Emerging Market Debt Fund. Significant transactions by these shareholders may impact the Funds’ performance.
Market risk
One or more markets in which a Fund invests may go down in value, sometimes sharply and unpredictably, and the value of a Fund’s portfolio securities may fall or fail to rise. Market risk may affect a single issuer, sector of the economy, industry or the market as a whole. In addition, global economies and financial markets are becoming increasingly interconnected, and political, economic and other conditions and events (including, but not limited to, natural disasters, pandemics, epidemics, and social unrest) in one country, region, or financial market may adversely impact issuers in a different country, region or financial market. Furthermore, the occurrence of, among other events, natural orman-made disasters, severe weather or geological events, fires, floods, earthquakes, outbreaks of disease (such asCOVID-19, avian influenza or H1N1/09), epidemics, pandemics, malicious acts, cyber-attacks, terrorist acts or the occurrence of climate change, may also adversely impact the performance of a Fund. Such events could adversely impact issuers, markets and economies over the short- and long-term, including in ways that cannot necessarily be foreseen. A Fund could be negatively impacted if the value of a portfolio holding were harmed by such political or economic conditions or events. Moreover, such negative political and economic conditions and events could disrupt the processes necessary for a Fund’s operations.
11. Subsequent Events:
Fund Management has evaluated the impact of all subsequent events on the Funds and has determined that there were no subsequent events requiring recognition or disclosure in the financial statements.
69
|
SHARE CLASS INFORMATION (UNAUDITED) |
The Funds offer Class A, Class I and Class R6 shares.
Class A
Class A shares are available in all Funds. This share class is available for purchase primarily through investment advisors, broker-dealers, banks and other financial services intermediaries. Class A shares of the Funds are currently subject to a maximumup-front sales charge of 4.25% and a 1.00% CDSC for redemption within 12 months of a $1 million or greater purchase. Class A shares currently include a 0.25% (25 bps) annual12b-1 service and distribution fee.
Class I
Class I shares are available in all Funds. This share class is intended for investors meeting certain minimum investment thresholds. This share class does not have anup-front sales charge (load) or a12b-1 service and distribution fee.
Class R6
Class R6 shares are available in Emerging Market Debt Fund and Global Bond Fund. This share class is intended for investors meeting certain minimum investment thresholds. This share class does not have anup-front sales charge (load) or a12b-1 service and distribution fee.
70
|
SUPPLEMENTAL INFORMATION (UNAUDITED) |
Shareholder Expense Examples
As a shareholder of the the RBC Funds, you incur two types of costs: (1) transaction costs and (2) ongoing costs, including management fees; and other Fund expenses. This example is intended to help you understand your ongoing costs (in dollars) of investing in the RBC Funds and to compare these costs with the ongoing costs of investing in other mutual funds.
The example is based on an investment of $1,000 invested at the beginning of the period and held for the entire period from October 1, 2019 through March 31, 2020.
Actual Expenses
The table below provides information about actual account values and actual expenses. You may use the information below, together with the amount you invested, to estimate the expenses that you paid over the period. Simply divide your account value by $1,000 (for example, an $8,600 account value divided by $1,000 = 8.6), then multiply the result by the number in the table under the heading entitled “Expenses Paid During Period” to estimate the expenses you paid on your account during this period.
| | | | | | | | | | | | | | | | | | |
| | | | | | | | | | | | | | Annualized | |
| | | | | Beginning | | | Ending | | | Expenses Paid | | | Expense Ratio | |
| | | | | Account Value | | | Account Value | | | During Period* | | | During Period | |
| | | | | 10/1/19 | | | 3/31/20 | | | 10/1/19–3/31/20 | | | 10/1/19–3/31/20 | |
Emerging Market Debt Fund | | | | | | | | | | | | | | | | | | |
| | Class A | | | $1,000.00 | | | | $850.10 | | | | $5.18 | | | | 1.12% | |
| | Class I | | | 1,000.00 | | | | 852.50 | | | | 4.03 | | | | 0.87% | |
| | Class R6 | | | 1,000.00 | | | | 852.60 | | | | 3.80 | | | | 0.82% | |
Global Bond Fund | | | | | | | | | | | | | | | | | | |
| | Class A | | | 1,000.00 | | | | 973.30 | | | | 3.80 | | | | 0.77% | |
| | Class I | | | 1,000.00 | | | | 974.50 | | | | 2.57 | | | | 0.52% | |
| | Class R6 | | | 1,000.00 | | | | 975.60 | | | | 2.32 | | | | 0.47% | |
High Yield Bond Fund | | | | | | | | | | | | | | | | | | |
| | Class A | | | 1,000.00 | | | | 941.70 | | | | 3.98 | | | | 0.82% | |
| | Class I | | | 1,000.00 | | | | 944.10 | | | | 2.77 | | | | 0.57% | |
*Expenses are equal to the average account value times the Fund’s annualized expense ratio multiplied by 183/366 (to reflect one half-year period).
71
|
SUPPLEMENTAL INFORMATION (UNAUDITED) |
Hypothetical Example for Comparison Purposes
The table below provides information about hypothetical account values and hypothetical expenses based on each RBC Funds’ actual expense ratio and an assumed rate of return of 5% per year before expenses, which is not the Fund’s actual return. The hypothetical account values and expenses may not be used to estimate the actual ending account balance or expenses you paid for the period. You may use this information to compare this 5% hypothetical example with the 5% hypothetical examples that appear in the shareholder reports of other funds.
Please note that the expenses shown in the table are meant to highlight your ongoing costs only and do not reflect any transactional costs, such as sales charges (loads), redemption fees, or exchange fees. Therefore, the table is useful in comparing ongoing costs only, and will not help you determine the relative total costs of owning different funds. In addition, if these transactional costs were included, your costs would have been higher.
| | | | | | | | | | | | | | | | | | |
| | | | | | | | | | | | | | Annualized | |
| | | | | Beginning | | | Ending | | | Expenses Paid | | | Expense Ratio | |
| | | | | Account Value | | | Account Value | | | During Period* | | | During Period | |
| | | | | 10/1/19 | | | 3/31/20 | | | 10/1/19-3/31/20 | | | 10/1/19-3/31/20 | |
Emerging Market Debt Fund | | | | | | | | | | | | | | | | | | |
| | Class A | | | $1,000.00 | | | | $1,019.40 | | | | $5.65 | | | | 1.12% | |
| | Class I | | | 1,000.00 | | | | 1,020.65 | | | | 4.39 | | | | 0.87% | |
| | Class R6 | | | 1,000.00 | | | | 1,020.90 | | | | 4.14 | | | | 0.82% | |
Global Bond Fund | | | | | | | | | | | | | | | | | | |
| | Class A | | | 1,000.00 | | | | 1,021.15 | | | | 3.89 | | | | 0.77% | |
| | Class I | | | 1,000.00 | | | | 1,022.40 | | | | 2.63 | | | | 0.52% | |
| | Class R6 | | | 1,000.00 | | | | 1,022.65 | | | | 2.38 | | | | 0.47% | |
High Yield Bond Fund | | | | | | | | | | | | | | | | | | |
| | Class A | | | 1,000.00 | | | | 1,020.90 | | | | 4.14 | | | | 0.82% | |
| | Class I | | | 1,000.00 | | | | 1,022.15 | | | | 2.88 | | | | 0.57% | |
*Expenses are equal to the average account value times the Fund’s annualized expense ratio multiplied by 183/366 (to reflect one half-year period).
72
|
LIQUIDITY RISK DISCLOSURE (UNAUDITED) |
Statement Regarding Liquidity Risk Management Program
This section discusses the operation and effectiveness of the Liquidity Risk Management Program (the “Program”) of RBC Funds Trust (the “Trust”), including each of its series (each, a “Fund” and collectively, the “Funds”), established in accordance with Rule22e-4 under the Investment Company Act of 1940, as amended (the “Liquidity Rule”). The Board of Trustees of the Trust (the “Board”), including a majority of the Trustees who are not “interested persons” as defined in the 1940 Act, approved the Program on behalf of each Fund, as required pursuant to the Liquidity Rule. The Board also approved the designation of RBC Global Asset Management (U.S.) Inc. (“RBC”), the investment adviser to each Fund, as the Program Administrator for the Program. RBC administersday-to-day implementation of the Program through a Liquidity Risk Committee (the “Committee”), as set forth in the Program.
RBC, as Program Administrator, provided the Board with a report addressing the operation of the Program and assessing its adequacy and effectiveness of implementation, including, if applicable, the operation of any highly liquid investments minimum (“HLIM”) and any material changes to the Program (the “Report”).
The Report covered the year ending December 31, 2019 (the “Review Period”).
I. Key Conclusions of the Report
The Program, as and implemented, is reasonably designed to assess and manage each Fund’s liquidity risk. During the Review Period, the Program was implemented and operated effectively to achieve the goal of assessing and managing each Fund’s liquidity risk. No Fund was required to set an HLIM and each Fund was able to meet requests for redemption without significant dilution of remaining investors’ interests in the Fund. There were no material changes to the Program implemented during the Review Period.
II. Summary of the Review
A. Liquidity Risk Assessment and Review
Throughout the Review Period, the Program Administrator, in consultation with investment personnel, monitored the Funds’ portfolio liquidity and liquidity risk on an ongoing basis, as described in the Program and in Board reporting throughout the Review Period.
The Program Administrator also conducted an annual review assessing each Fund’s liquidity risk as described in the Report, in accordance with the requirements of the Program and the Liquidity Rule, taking into account the following factors enumerated in the Liquidity Rule and identified in the Program, as applicable:
a. Each Fund’s investment strategy and liquidity of portfolio investments during both normal and reasonably foreseeable stressed conditions, including: (i) whether the Fund’s investment strategy is appropriate for anopen-end fund; (ii) the extent to which the Fund’s strategy involves a relatively concentrated portfolio or large positions in particular issuers; (iii) the Fund’s use of borrowings for investment purposes; and (iv) the Fund’s use of derivatives (including for hedging purposes);
b. Short-term and long-term cash flow projections during both normal and reasonably foreseeable stressed conditions; and
c. Holdings of cash and cash equivalents, as well as borrowing arrangements and other funding sources.
Investment Strategy and Portfolio Liquidity. The Program Administrator considered the factors identified above, among others, during both normal and reasonably foreseeable stressed conditions as provided in the Program. Pursuant to the review, the Program Administrator determined that Fund’s investment strategy and use of derivatives are appropriate for anopen-end fund.
Cash Flow. The Funds’ cash flows did not have a material effect on the ability to meet redemptions during the Review Period.
73
|
LIQUIDITY RISK DISCLOSURE (UNAUDITED) |
Holdings of Cash and Borrowing Arrangements. As described in the Report, the Program Administrator determined that the Funds’ holdings of cash and borrowing arrangements were adequate for meeting the Funds’ expected cash flow needs to meet redemptions during the Review Period.
In light of the assessment and review as discussed above, the Program Administrator did not recommend any material changes in the management of the Funds’ liquidity risks, including with respect to any of the above factors.
B. Portfolio Holdings Classifications
During the Review Period, each Fund’s portfolio holdings (including derivative investments) were classified monthly as Highly Liquid Investments, Moderately Liquid Investments, Less Liquid Investments and Illiquid Investments pursuant to the Program, as required by the Liquidity Rule.
During the Review Period, the Funds classified portfolio investments (including, as applicable, derivatives transactions) according to asset class when appropriate, as described in Section IV.B of the Program.
Market Depth—Reasonably Anticipated Trading Size. In classifying and reviewing its portfolio investments or asset classes (as applicable), the Funds must determine whether trading varying portions of a position in a particular portfolio investment or asset class, in sizes that the Fund would reasonably anticipate trading, is reasonably expected to significantly affect its liquidity, and if so, the Fund must take this determination into account when classifying the liquidity of that investment or asset class. There were no changes to the Reasonably Anticipated Trading Size assumptions for the Funds during the Review period.
Classification Review. As required by the Liquidity Rule, the Funds reviewed liquidity classifications on a monthly basis during the Review Period as described in Section IV of the Program. The Committee met monthly to review its portfolio investments’ classifications in connection with recording the liquidity classification for each portfolio investment for reporting on FormN-PORT. The Program Administrator oversaw the Funds’ process for classifying portfolio holdings under the Rule and reviewed the classifications, as described in the Program. This review included a review of the methodology and data inputs used. During the Review Period, the Program Administrator determined that there were no material operational issues with the process for classifying portfolio holdings.
C. HLIM
The Program Administrator reviewed the process and standards for determining that each Fund primarily holds investments that are highly liquid. There were no changes recommended in the Report with respect to the status of any Fund as a Primarily Highly Liquid Fund (“PHLF”) and each Fund qualified as a PHLF on an ongoing basis during the Review Period as described in the Report. Accordingly, an HLIM was not required for any Fund during the Review Period pursuant to the relevant provisions of the Program.
D. Compliance with the 15% Limitation on Illiquid Investments
Pursuant to the Liquidity Rule, no Fund may acquire any illiquid investment if, after the acquisition, the Fund would have invested more than 15% of its assets in illiquid investments that are assets (the “15% Limit”). The Program Administrator monitored compliance with the 15% Limit as described in the Program. During the Review Period, the Funds operated in accordance with the relevant provisions of the Program with respect to the 15% Limit.
E. Redemptions in Kind
There were no redemptionsin-kind effected by any Fund during the Review Period.
74
This Page Intentionally Left Blank
75
This Page Intentionally Left Blank
76
This Page Intentionally Left Blank
77
This Page Intentionally Left Blank
78
This Page Intentionally Left Blank
79
This Page Intentionally Left Blank
80
RBC Funds
P.O. Box 701
Milwaukee, WI 53201-0701
800-422-2766
www.rbcgam.us
Performance data represents past performance and does not guarantee future results. The principal value of an investment and investment return will fluctuate so that an investor’s shares, when redeemed, may be worth more or less than their original cost.
This report and the financial statements contained herein are provided for the information of RBC Funds shareholders. This report is not authorized for distribution to prospective investors unless preceded or accompanied by a current prospectus, which contains information concerning investment objectives, risks, charges and expenses of the funds. Please read the prospectus carefully before investing.
This report and the financial statements contained herein are not intended to be a forecast of future events, a guarantee of future results, or investment advice. There is no assurance that certain securities will remain in or out of each fund’s portfolio. The views expressed in this report reflect those of the portfolio managers through the period ended March 31, 2020.
NOT FDIC INSURED • NO BANK GUARANTEE • MAY LOSE VALUE
RBC Global Asset Management (U.S.) Inc. serves as investment advisor for the RBC Funds. RBC Funds are distributed by Quasar Distributors LLC.
The RBC Funds are pleased to offer shareholder reports printed entirely on Forest
Stewardship Council® certified paper. FSC® certification ensures that the paper
used in this report contains fiber from well-managed and responsibly harvested
forests that meet strict environmental and socioeconomic standards.
RBCF-BB SAR03-20
Semi-Annual Report For the six months ended March 31, 2020 RBC SMID Cap Growth Fund RBC Enterprise Fund RBC Small Cap Core Fund RBC Microcap Value Fund RBC Small Cap Value Fund Beginning on January 1, 2021, as permitted by regulations adopted by the U.S. Securities and Exchange commission, paper copies of the Funds’ annual and semi-annual shareholder reports will no longer be sent by mail, unless you specifically request paper copies of the reports. Instead, the reports will be made available on the Funds’ website, and you will be notified by mail each time a report is posted and provided with a website link to access the report. If you already elected to receive shareholder reports electronically, you will not be affected by this change and you need not take any action. You may elect to receive shareholder reports and other communications from a Fund electronically anytime by contacting your financial intermediary (such as a broker-dealer or bank) or, if you are a direct investor, by calling 800-422-2766. You may elect to receive all future reports in paper free of charge. If you invest through a financial intermediary, you can contact your financial intermediary to request that you continue to receive paper copies of your shareholder reports. If you invest directly with a Fund, you can call 800-422-2766 to let the Fund know you wish to continue receiving paper copies of your shareholder reports. Your election to receive reports in paper will apply to all Funds held in your account if you invest through your financial intermediary or all Funds held with the fund complex if you invest directly with a Fund.
| | | | | | | | | | |
PORTFOLIO MANAGERS | | | | | | | | | | |
| | | | | | | | | | |
RBC Global Asset Management (U.S.) Inc. (“RBC GAM-US”) serves as the investment advisor to the RBC Funds. RBC GAM-US employs a team approach to the management of the Funds, with no individual team member being solely responsible for the investment decisions. | | | | | | | | | | |
Lance F. James Managing Director, Senior Portfolio Manager Lance James heads the team responsible for the Microcap Core/Enterprise, Small Cap Core, Small Cap Value and Mid Cap Value strategies at RBC GAM-US and is responsible for portfolio management of the RBC Small Cap Core Fund, RBC Enterprise Fund, RBC Microcap Value Fund, and RBC Small Cap Value Fund. Prior to joining RBC GAM-US in 2006, Lance was a research analyst and portfolio manager for OFI Institutional and Babson Capital Management, affiliated companies of Mass Mutual Life Insurance Company. During his tenure he served as head of the firm’s small/mid cap value investment team. Prior to joining Babson Capital in 1986, Lance worked at Rockwell International Corporation, EBF Associates of Boston and Hewitt Associates. Lance began his career in the investment industry in 1980. He received an AB in Economics from Princeton University and an MBA in Finance from the Wharton School of Business at the University of Pennsylvania. | | | | | | | | | | 
Lance F. James |
George Prince Vice President, Portfolio Manager, Senior Equity Analyst George Prince serves as the co-portfolio manager for the RBC Enterprise Fund. George also provides research support for the Small Cap Core, Small Cap Value and Mid Cap Value strategies. He joined RBC GAM-US in 2006 from Eagle Asset Management, where he was a senior equity analyst. Prior to his experience at Eagle Asset Management, George was an analyst at Babson Capital Management. George began his career in the investment industry in 1984 and held the head of trading position at Langdon P. Cook & Co. George also has a great deal of entrepreneurial experience and founded SignStorey, a leader in place-based digital communications in retail stores and co-founded Cutting Edge Inc., a global CAD-CAM technology company, which was sold to Gerber Scientific. He also holds patents for several items he developed in digital messaging, barcode scanning, and internet delivery. The skills George acquired as a business person translate to his investment research; he is especially proficient at evaluating a company’s operations during onsite visits. George earned a BA from Yale University. | | | | | | | | | | 
George Prince |
Kenneth A. Tyszko, CPA, CFA Managing Director, Senior Portfolio Manager Ken Tyszko is responsible for portfolio management of the RBC SMID Cap Growth Fund, and provides fundamental research and portfolio management for small, SMID and mid cap growth strategies at RBC GAM-US. Ken has been in the investment industry since 1984 and has been managing small cap growth and SMID cap growth portfolios since 1988. He joined RBC GAM-US in 2001. Ken previously served as a portfolio manager for Oberweis Asset Management, ABN AMRO Asset Management (USA) Inc., ABN AMRO Incorporated, and Sears Investment Management Company. His background also includes experience at Main Hurdman, an international accounting and consulting firm. Ken earned a BS in Accountancy from the University of Illinois. He is a CFA charterholder. Ken is a member of the Illinois CPA Society, the CFA Society of Chicago, and the CFA Institute. He has been a guest on Bloomberg Television, Bloomberg Radio, CNBC, and WebFN. | | | | | | | | | | 
Kenneth A. Tyszko, CPA, CFA |
| | | | | | | | | | |
1
| | | | | | |
| | | | | | PORTFOLIO MANAGERS |
| | | |
| | | | | | |
| | |

Eric Autio | | | | Eric Autio Senior Equity Analyst/Portfolio Manager Eric Autio serves as a co-portfolio manager for the RBC Small Cap Value Fund and provides research and analysis for the Microcap Core, Small Cap Core, Small Cap Value and Mid Cap Value strategies at RBC GAM-US. Prior to joining RBC GAM-US in 2014, he was Senior Equity Analyst and Partner at Buckhead Capital Management where he served as an industry generalist on the small and SMID cap value team. Previously, Eric was Research Analyst and Vice President at SunTrust Robinson Humphrey covering a diverse range of sectors including retail, industrials and business services. He also served as Director with Carolinas Real Data, managing the company’s North Carolina commercial real estate research and software products portfolio, and worked in the Capital Management Group at Wells Fargo. Eric holds a B.A. from Davidson College and an M.B.A. from the Kellogg School of Management at Northwestern University. |
| | | |
| | | | | | |
| | | |
| | | | | | |
| | | |
| | | | | | |
| | | |
| | | | | | |
| | | |
| | | | | | |
| | | |
| | | | | | |
| | | |
| | | | | | |
| | | |
| | | | | | |
2
| | | | | | | | | | | | | | |
PERFORMANCE SUMMARY (UNAUDITED) |
| | | | | | | | | | | | | | | | | | | | | | | | | | | | |
| | | 1
Year | | 3
Year | | 5
Year | | 10
Year | | Since
Inception | | Net
Expense
Ratio(a)(b) | | Gross
Expense
Ratio(a)(b) |
Average Annual Total Returns as of March 31, 2020 (Unaudited) | | | | | | | | | | | | | | | | | |
| | | | | | |
RBC SMID Cap Growth Fund(c)(d) | | | | | | | | | | | | | | | | | | | | | | | | | |
Class A | | | | | | | | | | | | | | | | | | | | | | | | | | | | |
- Including Max Sales Charge of 5.75% | | | (19.58 | )% | | | 0.76 | % | | | 2.93 | % | | | 9.10 | % | | | 9.78 | % | | | | | | | | |
- At Net Asset Value | | | (14.64 | )% | | | 2.77 | % | | | 4.16 | % | | | 9.75 | % | | | 10.01 | % | | | 1.07 | % | | | 1.38 | % |
Class I | | | | | | | | | | | | | | | | | | | | | | | | | | | | |
- At Net Asset Value | | | (14.38 | )% | | | 3.08 | % | | | 4.44 | % | | | 10.03 | % | | | 10.32 | % | | | 0.82 | % | | | 0.99 | % |
Class R6 | | | | | | | | | | | | | | | | | | | | | | | | | | | | |
- At Net Asset Value | | | (14.29 | )% | | | 3.13 | % | | | 4.51 | % | | | 10.19 | % | | | 10.57 | % | | | 0.77 | % | | | 27.43 | % |
| | | | | | | |
Russell 2500 Growth Index(h) | | | (14.40 | )% | | | 3.35 | % | | | 3.64 | % | | | 10.10 | % | | | 9.54 | % | | | | | | | | |
RBC Enterprise Fund(e)(f) | | | | | | | | | | | | | | | | | | | | | | | | | | | | |
Class A(g) | | | | | | | | | | | | | | | | | | | | | | | | | | | | |
- Including Max Sales Charge of 5.75% | | | (30.59 | )% | | | (9.74 | )% | | | (4.87 | )% | | | 4.31 | % | | | 8.47 | % | | | | | | | | |
- At Net Asset Value | | | (26.37 | )% | | | (7.95 | )% | | | (3.73 | )% | | | 4.93 | % | | | 8.65 | % | | | 1.33 | % | | | 2.13 | % |
Class I(g) | | | | | | | | | | | | | | | | | | | | | | | | | | | | |
- At Net Asset Value | | | (26.20 | )% | | | (7.74 | )% | | | (3.51 | )% | | | 5.18 | % | | | 8.92 | % | | | 1.08 | % | | | 1.30 | % |
| | | | | | | |
Russell Microcap Index(h) | | | (26.38 | )% | | | (6.55 | )% | | | (1.94 | )% | | | 6.05 | % | | | N/A | | | | | | | | | |
RBC Small Cap Core Fund(i)(j) | | | | | | | | | | | | | | | | | | | | | | | | | |
Class A | | | | | | | | | | | | | | | | | | | | | | | | | | | | |
- Including Max Sales Charge of 5.75% | | | (31.68 | )% | | | (13.64 | )% | | | (6.53 | )% | | | 3.98 | % | | | 7.73 | % | | | | | | | | |
- At Net Asset Value | | | (27.50 | )% | | | (11.92 | )% | | | (5.42 | )% | | | 4.60 | % | | | 7.95 | % | | | 1.15 | % | | | 1.46 | % |
Class I | | | | | | | | | | | | | | | | | | | | | | | | | | | | |
- At Net Asset Value | | | (27.35 | )% | | | (11.71 | )% | | | (5.19 | )% | | | 4.85 | % | | | 8.11 | % | | | 0.90 | % | | | 1.11 | % |
Class R6 | | | | | | | | | | | | | | | | | | | | | | | | | | | | |
- At Net Asset Value | | | (27.32 | )% | | | (11.72 | )% | | | (5.18 | )% | | | 4.91 | % | | | 8.48 | % | | | 0.87 | % | | | 11.85 | % |
| | | | | | | |
Russell 2000 Index(h) | | | (23.99 | )% | | | (4.64 | )% | | | (0.25 | )% | | | 6.90 | % | | | 8.33 | % | | | | | | | | |
3
| | | | | | | | | | | | | | |
PERFORMANCE SUMMARY (UNAUDITED) |
| | | | | | | | | | | | | | | | | | | | | | | | | | | | |
| | | 1
Year | | 3
Year | | 5
Year | | 10
Year | | Since
Inception | | Net
Expense
Ratio(a)(b) | | Gross
Expense
Ratio(a)(b) |
Average Annual Total Returns as of March 31, 2020 (Unaudited) | | | | | | | | | | | | | | | | | |
| | | | | | |
RBC Microcap Value Fund(k)(l) | | | | | | | | | | | | | | | | | | | | | | | | | |
Class A | | | | | | | | | | | | | | | | | | | | | | | | | | | | |
- Including Max Sales Charge of 5.75% | | | (34.42 | )% | | | (11.32 | )% | | | (5.16 | )% | | | 4.82 | % | | | 7.30 | % | | | | | | | | |
- At Net Asset Value | | | (30.42 | )% | | | (9.55 | )% | | | (4.04 | )% | | | 5.44 | % | | | 7.50 | % | | | 1.32 | % | | | 1.68 | % |
Class I | | | | | | | | | | | | | | | | | | | | | | | | | | | | |
- At Net Asset Value | | | (30.27 | )% | | | (9.32 | )% | | | (3.80 | )% | | | 5.71 | % | | | 7.77 | % | | | 1.07 | % | | | 1.20 | % |
| | | | | | | |
Russell Microcap Value Index(h) | | | (29.83 | )% | | | (8.51 | )% | | | (1.76 | )% | | | 5.39 | % | | | N/A | | | | | | | | | |
RBC Small Cap Value Fund(m) | | | | | | | | | | | | | | | | | | | | | | | | | |
Class I | | | | | | | | | | | | | | | | | | | | | | | | | | | | |
- At Net Asset Value | | | (26.44 | )% | | | (10.04 | )% | | | (1.71 | )% | | | N/A | | | | (0.71 | )% | | | 0.85 | % | | | 0.98 | % |
Class R6 | | | | | | | | | | | | | | | | | | | | | | | | | | | | |
- At Net Asset Value | | | (26.42 | )% | | | (9.99 | )% | | | (1.65 | )% | | | N/A | | | | (0.66 | )% | | | 0.80 | % | | | 0.95 | % |
| | | | | | | |
Russell 2000 Value Index(h) | | | (29.64 | )% | | | (9.51 | )% | | | (2.42 | )% | | | 4.79 | % | | | (1.42 | )% | | | | | | | | |
Performance data quoted represents past performance. Past performance is no guarantee of future results. Investment return and principal value of an investment will fluctuate so that an investor’s shares, when redeemed, may be worth more or less than their original cost. Current performance may be lower or higher than performance quoted. Performance shown reflects contractual fee waivers, without such fee waivers total returns would be reduced. Performance information does not reflect the 2% fee on shares redeemed or exchanged within 30 days of purchase. If such redemption fee was included, performance would be reduced. For performance data current to the most recentmonth-end go to www.rbcgam.us. Please see footnotes below.
| (a) | The Funds’ expenses reflect the most recent fiscal year ended September 30, 2019. |
| (b) | The advisor has contractually agreed to waive fees and/or make payments in order to keep total operating expenses at annual ratios of 1.07% for Class A, 0.82% for Class I and 0.77% for Class R6 of SMID Cap Growth Fund; 1.33% for Class A and 1.08% for Class I of Enterprise Fund; 1.15% for Class A, 0.90% for Class I and 0.87% for Class R6 of Small Cap Core Fund; 1.32% for Class A and 1.07% for Class I of Microcap Value Fund; and 0.85% for Class I and 0.80% for Class R6 of Small Cap Value Fund until January 31, 2021. |
4
|
PERFORMANCE SUMMARY (UNAUDITED) |
| (c) | The performance in the table for the period from June 1, 1994 to April 19, 2004 reflects the performance of RBC Mid Cap Equity Fund, the predecessor to RBC SMID Cap Growth Fund. The performance of the Fund also includes the performance of a common trust fund (“CTF”) account advised by RBCGAM-US (including its predecessor) and managed the same as the Fund in all material respects for the period from December 31, 1990 to June 1, 1994, as adjusted to reflect the full contractual rate of expenses associated with the Fund at its inception. The CTF account was not registered with the SEC under the 1940 Act and therefore was not subject to the investment restrictions imposed by law on registered mutual funds. If the CTF account had been registered, the CTF account’s performance may have been adversely affected. Fund performance reflects applicable fee waivers/expense reimbursements (which, if excluded, would cause performance to be lower). |
| (d) | The since inception date (commencement of operations) of the Fund is December 31, 1990 for Class I and Class A shares and November 21, 2016 for Class R6 shares. The performance in the table for the Class R6 shares prior to November 21, 2016 reflects the performance of the Class I shares since the Fund’s inception. |
| (e) | The performance in the table for the period from December 2, 1983 to April 19, 2004 reflects the performance of Babson Enterprise Fund, the predecessor to RBC Enterprise Fund. Fund performance reflects applicable fee waivers/expense reimbursements (which, if excluded, would cause performance to be lower). |
| (f) | The since inception date (commencement of operations) of the Fund is December 2, 1983. The performance of the index since inception of the Fund is calculated from November 30, 1983. |
| (g) | Performance shown for periods prior to the inception date of Class A (April 19, 2004) and Class I (September 30, 2004) is based on the performance of a class of shares that is no longer offered, adjusted to reflect the fees and expenses and any applicable sales charges of the applicable class. The inception date of the Fund and the prior class of shares is December 2, 1983. |
| (h) | Each of the comparative indices is a widely recognized market value weighted measure of the return of securities, but do not include sales fees or operating expenses. You cannot invest directly in indices. |
| (i) | The performance in the table for the period from August 5, 1991 to April 19, 2004 reflects the performance of Babson Enterprise Fund II, the predecessor to RBC Small Cap Core Fund. Fund performance reflects applicable fee waivers/expense reimbursements (which, if excluded, would cause performance to be lower). |
| (j) | The since inception date (commencement of operations) of the Fund is August 5, 1991 for Class I and Class A shares and November 21, 2016 for Class R6 shares. The performance in the table for the Class R6 shares prior to November 21, 2016 reflects the performance of the Class I shares since the Fund’s inception. The performance of the index since inception of the Fund is calculated from July 31, 1991. |
| (k) | The performance in the table for the period from September 10, 1987 to April 19, 2004 reflects the performance of Shadow Stock Fund, the predecessor to RBC Microcap Value Fund. Fund performance reflects applicable fee waivers/expense reimbursements (which, if excluded, would cause performance to be lower). |
| (l) | The since inception date (commencement of operations) of the Fund is September 10, 1987. The performance of the index since inception of the Fund is calculated from August 31, 1987. |
| (m) | The since inception date (commencement of operations) of the Fund is December 3, 2014 for Class I shares and November 21, 2016 for Class R6 shares. The performance in the table for the Class R6 shares prior to November 21, 2016 reflects the performance of the Class I shares since the Fund’s inception. The performance of the index since inception of the Fund is calculated from December 3, 2014. |
5
|
PERFORMANCE SUMMARY (UNAUDITED) |
The 2000 Index measures the performance of the small capitalization segment of the U.S. equity market. It comprises approximately 2,000 small capitalization companies in the Russell 3000® Index. You cannot invest directly in an index.
The Russell 2000 Value Index measures the performance of the small capitalization value segment of the U.S. equity market. It includes those companies with lowerprice-to-book ratios and lower forecasted growth rates in the Russell 2000® Index.
The Russell Microcap Index measures the performance of the micro capitalization segment of the U.S. equity market. It comprises the smallest 1,000 companies in the Russell 2000 Index plus 1,000 smaller U.S. equities.
The Russell Microcap Value Index measures the performance of the micro capitalization value segment of the U.S. equity market. It includes those companies with lowerprice-to-book ratios and lower forecasted growth rates in the Russell Microcap® Index.
The Russell 2500 Growth Index measures the performance of the small and mid capitalization growth segment of the U.S. equity market. It includes those companies with higherprice-to-book ratios and higher forecasted growth rates in the Russell 2500™ Index, which comprises the smallest 2,500 companies in the Russell 3000® Index.
You cannot invest directly in an index.
6
| | | | | | | | | | | | | | |
FUND STATISTICS (UNAUDITED) | | | | | | | | | | |
| | | | | | | | | | |
RBC SMID Cap Growth Fund | | | | | | | | | | |
Long-term capital appreciation. | | | | | | | | | | Investment |
| | | | | | | | | | | | | | | Objective |
Russell 2500 Growth Index | | | | | | | | | | Benchmark |
| | | |
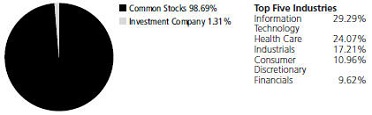
| | | | | | | Asset
Allocation as of 3/31/20 (% of Fund’s investments) & Top Five Industries (as of 3/31/20) (% of Fund’s net assets) |
West Pharmaceutical Services, Inc. | | 2.39% | | Bio-Techne Corp. | | | 2.02% | | | | | | | Top Ten Holdings (excluding investment companies) (as of 3/31/20) (% of Fund’s net assets) |
| Teledyne Technologies, Inc. | | 2.36% | | STERIS Plc | | | 1.98% | | | | | |
| Jack Henry & Associates, Inc. | | 2.21% | | Tyler Technologies, Inc. | | | 1.87% | | | | | |
| Kinsale Capital Group, Inc. | | 2.12% | | Charles River Laboratories International, Inc. | | | 1.87% | | | | | |
| Zebra Technologies Corp. | | 2.08% | | | | | | | | | | |
| Tractor Supply Co. | | 2.06% | | | | | | | | | | |
*A listing of all portfolio holdings can be found beginning on page 12 | | | | | | | | |
| | | |
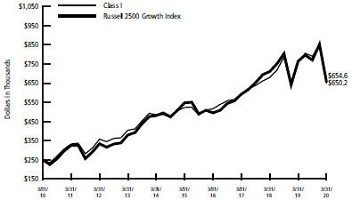 | | | | | | | Growth of $250,000 Initial Investment Over 10 Years |
| The graph reflects an initial investment of $250,000 over 10 year period and is based on Class I shares. The Fund’s total return includes reinvested dividends and capital gains. The Fund’s total return also includes operating expenses that reduce return, while the total return of the index does not. The graph does not reflect the deduction of taxes that a shareholder would pay on fund distributions or redemption of fund shares. Performance of other classes will vary due to differences in fee structures. | | | | | | | |
| | | |
| | | | | | | | |
| | | |
| | | | | | | | |
| | | |
| | | | | | | | |
| | | |
| | | | | | | | |

7
| | | | | | | | | | | | | | | | | | | | | | | | | | |
| | | | | | | | | | | | FUND STATISTICS (UNAUDITED) | |
| | | | | |
| | | | | | | | | | | | RBC Enterprise Fund | | | | | |
Investment Objective | | | | | | | | | | | | Long-term growth of capital and income. | |
Benchmark | | | | | | | | | | | | Russell Microcap Index | |
| | | | |
Asset Allocation as of 3/31/20 (% of Fund’s investments) & Top Five Industries (as of 3/31/20) (% of Fund’s net assets) | | | | | | | | | | | | 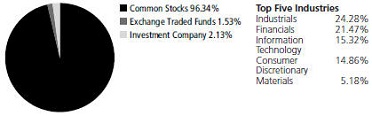
| |
Top Ten Holdings (excluding investment companies) (as of 3/31/20) (% of Fund’s net assets) | | | | | | | | | | | | Columbus McKinnon Corp. | | | 4.61 | % | | Amerisafe, Inc. | | | 3.33 | % | | | | |
| | | | | | | | | | Compass Diversified Holdings LP | | | 4.40 | % | | Grand Canyon Education, Inc. | | | 3.01 | % | | | | |
| | | | | | | | | | Novanta, Inc. | | | 3.71 | % | | Ducommun, Inc. | | | 2.92 | % | | | | |
| | | | | | | | | | Patrick Industries, Inc. | | | 3.58 | % | | Malibu Boats, Inc. | | | 2.87 | % | | | | |
| | | | | | | | | | Universal Electronics, Inc. | | | 3.55 | % | | Community Healthcare Trust, Inc. | | | 2.70 | % | | | | |
| | | | | | | | | | | | * A listing of all portfolio holdings can be found beginning on page 15 | |
| | | | |
Growth of $250,000 Initial Investment Over 10 Years | | | | | | | | | | | | 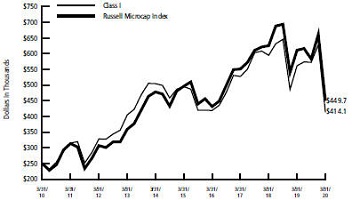 | |
| | | | | | | | | | | | The graph reflects an initial investment of $250,000 over 10 year period and is based on Class I shares. The Fund’s total return includes reinvested dividends and capital gains. The Fund’s total return also includes operating expenses that reduce return, while the total return of the index does not. The graph does not reflect the deduction of taxes that a shareholder would pay on fund distributions or redemption of fund shares. Performance of other classes will vary due to differences in fee structures. | |
| | | | | | | | | | | | | | | | | | | | | | | | | | |
| | | | | | | | | | | | | | | | | | | | | | | | | | |
| | | | | | | | | | | | | | | | | | | | | | | | | | |
| | | | | | | | | | | | | | | | | | | | | | | | | | |
| | | | | | | | | | | | | | | | | | | | | | | | | | |
| | | | | | | | | | | | | | | | | | | | | | | | | | |
8
| | | | | | | | | | | | | | |
FUND STATISTICS (UNAUDITED) | | | | | | | | | | |
| | | | | | | | | | |
RBC Small Cap Core Fund | | | | | | | | | | |
Long-term growth of capital and income. | | | | | | | | | | Investment |
| | | | | | | | | | | | | | | Objective |
Russell 2000 Index | | | | | | | | | | Benchmark |
| | | |
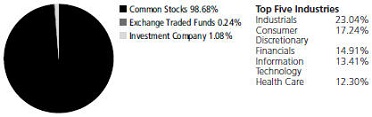
| | | | | | | Asset
Allocation as
of 3/31/20 (%
of Fund’s
investments)
& Top Five
Industries (as
of 3/31/20) (%
of Fund’s net
assets) |
Compass Diversified Holdings LP | | 4.93% | | ACCO Brands Corp. | | | 3.23% | | | | | | | Top Ten Holdings (excluding investment companies) (as of 3/31/20) (% of Fund’s net assets) |
Columbus McKinnon Corp. | | 4.63% | | Universal Electronics, Inc. | | | 3.15% | | | | | |
Emergent BioSolutions, Inc. | | 4.27% | | Amerisafe, Inc. | | | 3.05% | | | | | |
Patrick Industries, Inc. | | 4.08% | | Grand Canyon Education, Inc. | | | 2.86% | | | | | |
Ducommun, Inc. | | 3.25% | | MKS Instruments, Inc. | | | 2.76% | | | | | |
*A listing of all portfolio holdings can be found beginning on page 18 | | | | | | | | |
| | | |
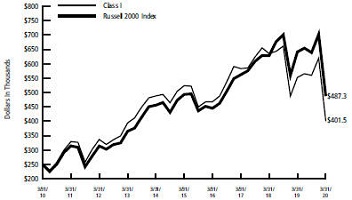 | | | | | | | Growth of $250,000 Initial Investment Over 10 Years |
| The graph reflects an initial investment of $250,000 over 10 year period and is based on Class I shares. The Fund’s total return includes reinvested dividends and capital gains. The Fund’s total return also includes operating expenses that reduce return, while the total return of the index does not. The graph does not reflect the deduction of taxes that a shareholder would pay on fund distributions or redemption of fund shares. Performance of other classes will vary due to differences in fee structures. | | | | | | | |
| | | |
| | | | | | | | |
| | | |
| | | | | | | | |
9
| | | | | | | | | | | | | | | | | | | | |
| | | | | | | | | | | | FUND STATISTICS (UNAUDITED) |
| | | | |
| | | | | | | | | | | | RBC Microcap Value Fund |
Investment Objective | | | | | | | | | | | | Long-term growth of capital. |
Benchmark | | | | | | | | | | | | Russell Microcap Value Index |
| | | | |
Asset Allocation as of 3/31/20 (% of fund’s investments) & Top Five Industries (as of 3/31/20) (% of Fund’s net assets) | | | | | | | | | | | | 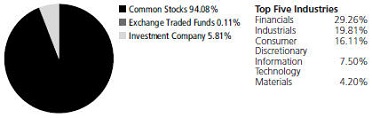 |
Top Ten Holdings (excluding investment companies) (as of 3/31/20) (% of Fund’s net assets) | | | | | | | | | | | | PC Connection, Inc. | | | 1.40 | % | | Miller Industries, Inc. | | 1.00% |
| | | | | | | | | | Unitil Corp. | | | 1.27 | % | | Independence Holding Co. | | 0.99% |
| | | | | | | | | | Ameresco, Inc. | | | 1.22 | % | | MutualFirst Financial, Inc. | | 0.97% |
| | | | | | | | | | First Defiance Financial Corp. | | | 1.21 | % | | Willis Lease Finance Corp. | | 0.93% |
| | | | | | | | | | Federal Agricultural Mortgage Corp. | | | 1.07 | % | | Ingles Markets, Inc. | | 0.93% |
| | | | | | | | | | | | * A listing of all portfolio holdings can be found beginning on page 21 |
| | | | |
Growth of $250,000 Initial Investment Over 10 Years | | | | | | | | | | | | 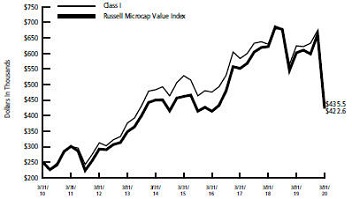 |
| | | | | | | | | | | | The graph reflects an initial investment of $250,000 over 10 year period and is based on Class I shares. The Fund’s total return includes reinvested dividends and capital gains. The Fund’s total return also includes operating expenses that reduce return, while the total return of the index does not. The graph does not reflect the deduction of taxes that a shareholder would pay on fund distributions or redemption of fund shares. Performance of other classes will vary due to differences in fee structures. |
| | | | | | | | | | | | | | | | | | | | |
| | | | | | | | | | | | | | | | | | | | |
| | | | | | | | | | | | | | | | | | | | |
10
| | | | | | | | | | | | | | |
FUND STATISTICS (UNAUDITED) | | | | | | | | | | |
| | | | | | | | | | |
RBC Small Cap Value Fund | | | | | | | | | | |
Long-term capital appreciation. | | | | | | | | | | Investment Objective |
| | | | | | | | | | | | | | | |
Russell 2000 Value Index | | | | | | | | | | Benchmark |
| | | |
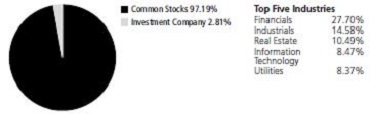
| | | | | | | Asset Allocation as of
3/31/20 (% of Fund’s investments) & Top Five Industries (as of
3/31/20) (% of Fund’s net assets) |
| Spire, Inc. | | 3.24% | | John B Sanfilippo & Son, Inc. | | | 2.20% | | | | | | | Top Ten Holdings (excluding investment companies) (as of 3/31/20) (% of Fund’s net assets) |
Compass Diversified Holdings LP | | 2.93% | | Emergent BioSolutions, Inc. | | | 2.16% | | | | | |
| Columbus McKinnon Corp. | | 2.63% | | Amerisafe, Inc. | | | 2.12% | | | | | |
| Southwest Gas Holdings, Inc. | | 2.58% | | Reliance Steel & Aluminum Co. | | | 1.94% | | | | | |
| Portland General Electric Co. | | 2.55% | | United Community Banks, Inc. | | | 1.92% | | | | | |
*A listing of all portfolio holdings can be found beginning on page 33 | | | | | | | | | | |
| | | |
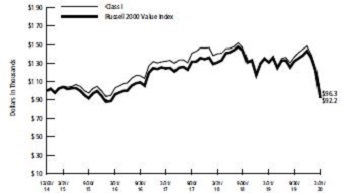 | | | | | | | Growth of $100,000 Initial Investment Since Inception (12/3/14) |
| The graph reflects an initial investment of $100,000 over the period from December 3, 2014 (commencement of operations) to March 31, 2020 and is based on Class I shares. The Fund’s total return includes reinvested dividends and capital gains. The Fund’s total return also includes operating expenses that reduce return, while the total return of the index does not. The graph does not reflect the deduction of taxes that a shareholder would pay on fund distributions or redemption of fund shares. Performance of other classes will vary due to differences in fee structures. | | | | | | | |
| | | |
| | | | | | | | |
| | | |
| | | | | | | | |
11
|
SCHEDULE OF PORTFOLIO INVESTMENTS |
RBC SMID Cap Growth Fund
March 31, 2020 (Unaudited)
| | | | | | |
| Shares | | | | Value | |
Common Stocks — 99.50% | | | | |
Consumer Discretionary — 10.96% | | | | |
| 11,040 | | Bright Horizons Family Solutions, Inc.* | | $ | 1,126,080 | |
| 12,190 | | Columbia Sportswear Co. | | | 850,496 | |
| 40,460 | | Core-Mark Holding Co., Inc. | | | 1,155,942 | |
| 12,820 | | Dorman Products, Inc.* | | | 708,561 | |
| 25,100 | | Gentherm, Inc.* | | | 788,140 | |
| 47,100 | | G-III Apparel Group Ltd.* | | | 362,670 | |
| 9,460 | | LCI Industries | | | 632,212 | |
| 26,790 | | LKQ Corp.* | | | 549,463 | |
| 14,550 | | Monro, Inc. | | | 637,436 | |
| 18,620 | | Tractor Supply Co. | | | 1,574,321 | |
| | | | | | |
| | | | | 8,385,321 | |
| | | | | | |
Consumer Staples — 1.58% | | | | |
| 9,110 | | Casey’s General Stores, Inc. | | | 1,206,984 | |
| | | | | | |
| |
Energy — 0.12% | | | | |
| 38,210 | | Matador Resources Co.* | | | 94,761 | |
| | | | | | |
| |
Financials — 9.62% | | | | |
| 16,970 | | Eagle Bancorp, Inc. | | | 512,664 | |
| 16,500 | | FirstCash, Inc. | | | 1,183,710 | |
| 15,520 | | Kinsale Capital Group, Inc. | | | 1,622,306 | |
| 34,050 | | PRA Group, Inc.* | | | 943,866 | |
| 20,550 | | Raymond James Financial, Inc. | | | 1,298,760 | |
| 13,710 | | RLI Corp. | | | 1,205,520 | |
| 7,380 | | Signature Bank | | | 593,278 | |
| | | | | | |
| | | | | 7,360,104 | |
| | | | | | |
Health Care — 24.07% | | | | |
| 8,150 | | Bio-Techne Corp. | | | 1,545,403 | |
| 19,560 | | Cantel Medical Corp. | | | 702,204 | |
| 11,340 | | Charles River Laboratories International, Inc.* | | | 1,431,221 | |
| 6,610 | | Haemonetics Corp.* | | | 658,753 | |
| 19,660 | | HealthEquity, Inc.* | | | 994,599 | |
| 14,860 | | Henry Schein, Inc.* | | | 750,727 | |
| 15,540 | | Integer Holdings Corp.* | | | 976,844 | |
| 24,590 | | Integra LifeSciences Holdings Corp.* | | | 1,098,435 | |
| 43,400 | | Merit Medical Systems, Inc.* | | | 1,356,250 | |
| 19,810 | | NuVasive, Inc.* | | | 1,003,575 | |
| 39,770 | | PetIQ, Inc.* | | | 923,857 | |
| 31,860 | | Prestige Brands Holdings, Inc.* | | | 1,168,625 | |
| 10,840 | | STERIS Plc | | | 1,517,275 | |
| 10,350 | | Varian Medical Systems, Inc.* | | | 1,062,531 | |
| 7,630 | | Waters Corp.* | | | 1,389,042 | |
| 12,000 | | West Pharmaceutical Services, Inc. | | | 1,827,000 | |
| | | | | | |
| | | | | 18,406,341 | |
| | | | | | |
12
|
SCHEDULE OF PORTFOLIO INVESTMENTS |
RBC SMID Cap Growth Fund (cont.)
March 31, 2020 (Unaudited)
| | | | | | |
| Shares | | | | Value | |
Industrials — 17.21% | | | | |
| 8,630 | | Acuity Brands, Inc. | | $ | 739,246 | |
| 20,240 | | Applied Industrial Technologies, Inc. | | | 925,373 | |
| 16,740 | | Clean Harbors, Inc.* | | | 859,431 | |
| 15,180 | | ESCO Technologies, Inc. | | | 1,152,314 | |
| 17,870 | | Helios Technologies, Inc. | | | 677,630 | |
| 21,660 | | IAA, Inc.* | | | 648,934 | |
| 15,070 | | ICF International, Inc. | | | 1,035,309 | |
| 10,350 | | Landstar System, Inc. | | | 992,151 | |
| 11,130 | | MSC Industrial Direct Co., Inc., Class A | | | 611,816 | |
| 6,070 | | Teledyne Technologies, Inc.* | | | 1,804,429 | |
| 38,560 | | TriMas Corp.* | | | 890,736 | |
| 6,980 | | WABCO Holdings, Inc.* | | | 942,649 | |
| 15,970 | | Wabtec Corp. | | | 768,636 | |
| 18,660 | | Woodward, Inc. | | | 1,109,150 | |
| | | | | | |
| | | | | 13,157,804 | |
| | | | | | |
Information Technology — 29.29% | | | | |
| 23,590 | | Altair Engineering, Inc., Class A* | | | 625,135 | |
| 18,510 | | Bottomline Technologies (DE), Inc.* | | | 678,392 | |
| 26,890 | | Brooks Automation, Inc. | | | 820,145 | |
| 29,560 | | Diodes, Inc.* | | | 1,201,171 | |
| 22,510 | | Envestnet, Inc.* | | | 1,210,588 | |
| 16,770 | | ePlus, Inc.* | | | 1,050,137 | |
| 50,700 | | Evo Payments, Inc.* | | | 775,710 | |
| 21,440 | | ExlService Holdings, Inc.* | | | 1,115,523 | |
| 6,210 | | F5 Networks, Inc.* | | | 662,172 | |
| 13,560 | | Globant SA* | | | 1,191,653 | |
| 15,210 | | Inphi Corp.* | | | 1,204,176 | |
| 10,910 | | Jack Henry & Associates, Inc. | | | 1,693,668 | |
| 6,650 | | Littelfuse, Inc. | | | 887,243 | |
| 14,200 | | Manhattan Associates, Inc.* | | | 707,444 | |
| 28,330 | | Mimecast Ltd.* | | | 1,000,049 | |
| 17,130 | | Novanta, Inc.* | | | 1,368,344 | |
| 20,690 | | RealPage, Inc.* | | | 1,095,122 | |
| 22,180 | | SPS Commerce, Inc.* | | | 1,031,592 | |
| 4,830 | | Tyler Technologies, Inc.* | | | 1,432,385 | |
| 10,130 | | WEX, Inc.* | | | 1,059,091 | |
| 8,650 | | Zebra Technologies Corp., Class A* | | | 1,588,140 | |
| | | | | | |
| | | | | 22,397,880 | |
| | | | | | |
Materials — 5.44% | | | | |
| 12,610 | | AptarGroup, Inc. | | | 1,255,199 | |
| 12,970 | | Balchem Corp. | | | 1,280,399 | |
| 19,930 | | HB Fuller Co. | | | 556,645 | |
| 12,210 | | Reliance Steel & Aluminum Co. | | | 1,069,474 | |
| | | | | | |
| | | | | 4,161,717 | |
| | | | | | |
13
|
SCHEDULE OF PORTFOLIO INVESTMENTS |
RBC SMID Cap Growth Fund (cont.)
March 31, 2020 (Unaudited)
| | | | | | | | |
| Shares | | | | | Value |
| | Real Estate — 1.21% | | | | |
| | 8,000 | | | CoreSite Realty Corp., REIT | | $ | 927,200 | |
| | | | | | | | |
| |
| | Total Common Stocks | | | 76,098,112 | |
| | | | | | | | |
| | (Cost $72,076,282) | | | | |
| |
| | Investment Company — 1.32% | | | | |
| | 1,007,732 | | | U.S. Government Money Market Fund, RBC Institutional Class 1(a) | | | 1,007,732 | |
| | | | | | | | |
| |
| | Total Investment Company | | | 1,007,732 | |
| | | | | | | | |
| | (Cost $1,007,732) | | | | |
| |
| | Total Investments | | $ | 77,105,844 | |
| | (Cost $73,084,014)(b) — 100.82% | | | | |
| |
| | Liabilities in excess of other assets — (0.82)% | | | (627,588) | |
| | | | | | | | |
| |
| | NET ASSETS — 100.00% | | $ | 76,478,256 | |
| | | | | | | | |
| * | Non-income producing security. |
| (a) | Affiliated investment. |
| (b) | See Notes to Schedules of Portfolio Investments for the tax cost of securities and the breakdown of unrealized appreciation (depreciation). |
Abbreviations used are defined below:
REIT - Real Estate Investment Trust
See Notes to the Financial Statements.
14
|
SCHEDULE OF PORTFOLIO INVESTMENTS |
RBC Enterprise Fund
March 31, 2020 (Unaudited)
| | | | | | |
| Shares | | | | Value | |
Common Stocks — 96.31% | | | | |
Communication Services — 3.34% | | | | |
| 98,401 | | Glu Mobile, Inc.* | | $ | 618,942 | |
| 81,132 | | Gray Television, Inc.* | | | 871,358 | |
| 62,350 | | Salem Media Group, Inc. | | | 54,494 | |
| | | | | | |
| | | | | 1,544,794 | |
| | | | | | |
Consumer Discretionary — 14.86% | | | | |
| 60,157 | | Delta Apparel, Inc.* | | | 626,234 | |
| 227,700 | | Destination XL Group, Inc.* | | | 79,741 | |
| 18,230 | | Grand Canyon Education, Inc.* | | | 1,390,676 | |
| 15,643 | | Lakeland Industries, Inc.* | | | 242,467 | |
| 46,124 | | Malibu Boats, Inc., Class A* | | | 1,327,910 | |
| 9,020 | | MasterCraft Boat Holdings, Inc.* | | | 65,846 | |
| 19,880 | | Perdoceo Education Corp.* | | | 214,505 | |
| 27,910 | | Stoneridge, Inc.* | | | 467,492 | |
| 32,820 | | Tilly’s, Inc., Class A | | | 135,547 | |
| 42,790 | | Universal Electronics, Inc.* | | | 1,641,852 | |
| 217,875 | | ZAGG, Inc.* | | | 677,591 | |
| | | | | | |
| | | | | 6,869,861 | |
| | | | | | |
Consumer Staples — 2.37% | | | | |
| 12,280 | | John B Sanfilippo & Son, Inc. | | | 1,097,832 | |
| | | | | | |
| |
Energy — 0.68% | | | | |
| 91,290 | | Callon Petroleum Co.* | | | 50,018 | |
| 36,980 | | Par Pacific Holdings, Inc.* | | | 262,558 | |
| | | | | | |
| | | | | 312,576 | |
| | | | | | |
Financials — 21.47% | | | | |
| 22,180 | | Allegiance Bancshares, Inc. | | | 534,760 | |
| 23,900 | | Amerisafe, Inc. | | | 1,540,833 | |
| 10,000 | | Carolina Financial Corp. | | | 258,700 | |
| 151,703 | | Compass Diversified Holdings LP | | | 2,032,820 | |
| 31,250 | | First Bancorp/Southern Pines, NC | | | 721,250 | |
| 36,650 | | German American Bancorp, Inc. | | | 1,006,042 | |
| 22,433 | | Heritage Financial Corp. | | | 448,660 | |
| 24,376 | | Mercantile Bank Corp. | | | 516,040 | |
| 30,830 | | Northrim BanCorp, Inc. | | | 832,410 | |
| 24,138 | | Pacific Premier Bancorp, Inc. | | | 454,760 | |
| 21,830 | | Preferred Bank/Los Angeles, CA | | | 738,290 | |
| 17,620 | | Stock Yards Bancorp, Inc. | | | 509,747 | |
| 12,800 | | Triumph Bancorp, Inc.* | | | 332,800 | |
| | | | | | |
| | | | | 9,927,112 | |
| | | | | | |
15
|
SCHEDULE OF PORTFOLIO INVESTMENTS |
RBC Enterprise Fund (cont.)
March 31, 2020 (Unaudited)
| | | | | | |
| Shares | | | | Value | |
Health Care — 2.25% | | | | |
| 32,470 | | Lantheus Holdings, Inc.* | | $ | 414,317 | |
| 18,830 | | Surmodics, Inc.* | | | 627,416 | |
| | | | | | |
| | | | | 1,041,733 | |
| | | | | | |
Industrials — 24.28% | | | | |
| 218,980 | | ACCO Brands Corp. | | | 1,105,849 | |
| 6,640 | | Air Transport Services Group, Inc.* | | | 121,379 | |
| 12,830 | | Barrett Business Services, Inc. | | | 508,581 | |
| 19,504 | | Blue Bird Corp.* | | | 213,179 | |
| 15,308 | | Casella Waste Systems, Inc., Class A* | | | 597,931 | |
| 28,880 | | CBIZ, Inc.* | | | 604,169 | |
| 85,249 | | Columbus McKinnon Corp. | | | 2,131,225 | |
| 54,261 | | Ducommun, Inc.* | | | 1,348,386 | |
| 16,890 | | Ennis, Inc. | | | 317,194 | |
| 8,390 | | Graham Corp. | | | 108,231 | |
| 35,386 | | Greenbrier Cos., Inc. (The) | | | 627,748 | |
| 13,230 | | Insteel Industries, Inc. | | | 175,297 | |
| 23,250 | | Lydall, Inc.* | | | 150,195 | |
| 23,533 | | Marten Transport Ltd. | | | 482,897 | |
| 18,493 | | NV5 Global, Inc.* | | | 763,576 | |
| 58,699 | | Patrick Industries, Inc. | | | 1,652,964 | |
| 14,699 | | Willdan Group, Inc.* | | | 314,118 | |
| | | | | | |
| | | | | 11,222,919 | |
| | | | | | |
Information Technology — 15.32% | | | | |
| 56,050 | | AXT, Inc.* | | | 179,921 | |
| 123,990 | | Mitek Systems, Inc.* | | | 977,041 | |
| 42,420 | | Model N, Inc.* | | | 942,148 | |
| 20,800 | | Napco Security Technologies, Inc.* | | | 315,536 | |
| 21,473 | | Novanta, Inc.* | | | 1,715,263 | |
| 19,362 | | PC Connection, Inc. | | | 797,908 | |
| 62,406 | | Sapiens International Corp. NV | | | 1,186,962 | |
| 1,460 | | Tyler Technologies, Inc.* | | | 432,978 | |
| 26,515 | | Vishay Precision Group, Inc.* | | | 532,421 | |
| | | | | | |
| | | | | 7,080,178 | |
| | | | | | |
Materials — 5.18% | | | | |
| 65,429 | | FutureFuel Corp. | | | 737,385 | |
| 32,537 | | Koppers Holdings, Inc.* | | | 402,483 | |
| 16,310 | | UFP Technologies, Inc.* | | | 621,248 | |
| 81,958 | | Universal Stainless & Alloy Products, Inc.* | | | 631,896 | |
| | | | | | |
| | | | | 2,393,012 | |
| | | | | | |
Real Estate — 4.15% | | | | |
| 32,600 | | Community Healthcare Trust, Inc., REIT | | | 1,247,928 | |
| 61,800 | | UMH Properties, Inc., REIT | | | 671,148 | |
| | | | | | |
| | | | | 1,919,076 | |
| | | | | | |
16
|
SCHEDULE OF PORTFOLIO INVESTMENTS |
RBC Enterprise Fund (cont.)
March 31, 2020 (Unaudited)
| | | | | | | | |
| Shares | | | | | Value | |
| | Utilities — 2.41% | | | | |
| | 21,340 | | | Unitil Corp. | | $ | 1,116,509 | |
| | | | | | | | |
| |
| | Total Common Stocks | | | 44,525,602 | |
| | | | | | | | |
| | (Cost $39,109,174) | | | | |
| |
| | Exchange Traded Funds — 1.53% | | | | |
| | 6,100 | | | iShares Nasdaq Biotechnology | | | 657,214 | |
| | 1,470 | | | SPDR S&P Regional Banking | | | 47,907 | |
| | | | | | | | |
| | Total Exchange Traded Funds | | | 705,121 | |
| | | | | | | | |
| | (Cost $693,186) | | | | |
| |
| | Investment Company — 2.13% | | | | |
| | 986,594 | | | U.S. Government Money Market Fund, RBC Institutional Class 1(a) | | | 986,594 | |
| | | | | | | | |
| |
| | Total Investment Company | | | 986,594 | |
| | | | | | | | |
| | (Cost $986,594) | | | | |
| |
| | Total Investments | | $ | 46,217,317 | |
| | (Cost $40,788,954)(b) — 99.97% | | | | |
| |
| | Other assets in excess of liabilities — 0.03% | | | 12,647 | |
| | | | | | | | |
| |
| | NET ASSETS — 100.00% | | $ | 46,229,964 | |
| | | | | | | | |
| * | Non-income producing security. |
| (a) | Affiliated investment. |
| (b) | See Notes to Schedules of Portfolio Investments for the tax cost of securities and the breakdown of unrealized appreciation (depreciation). |
Abbreviations used are defined below:
REIT - Real Estate Investment Trust
See Notes to the Financial Statements.
17
|
SCHEDULE OF PORTFOLIO INVESTMENTS |
RBC SMID Cap Growth Fund
March 31, 2020 (Unaudited)
| | | | | | |
| Shares | | | | Value | |
Common Stocks — 98.60% | | | | |
Communication Services — 3.78% | | | | |
| 50,740 | | Glu Mobile, Inc.* | | $ | 319,155 | |
| 77,388 | | Gray Television, Inc.* | | | 831,147 | |
| 15,650 | | Nexstar Media Group, Inc., Class A | | | 903,474 | |
| 30,200 | | Vonage Holdings Corp.* | | | 218,346 | |
| | | | | | |
| | | | | 2,272,122 | |
| | | | | | |
Consumer Discretionary — 17.24% | | | | |
| 3,770 | | Cavco Industries, Inc.* | | | 546,424 | |
| 15,820 | | Core-Mark Holding Co., Inc. | | | 451,977 | |
| 970 | | Deckers Outdoor Corp.* | | | 129,980 | |
| 346,302 | | Destination XL Group, Inc.* | | | 121,275 | |
| 28,490 | | G-III Apparel Group Ltd.* | | | 219,373 | |
| 22,539 | | Grand Canyon Education, Inc.* | | | 1,719,388 | |
| 3,470 | | Helen of Troy Ltd.* | | | 499,784 | |
| 15,960 | | LCI Industries | | | 1,066,607 | |
| 41,237 | | Malibu Boats, Inc., Class A* | | | 1,187,213 | |
| 36,070 | | Perdoceo Education Corp.* | | | 389,195 | |
| 14,798 | | Steven Madden Ltd. | | | 343,757 | |
| 11,465 | | Stoneridge, Inc.* | | | 192,039 | |
| 65,570 | | Taylor Morrison Home Corp., Class A* | | | 721,270 | |
| 34,910 | | Tilly’s, Inc., Class A | | | 144,178 | |
| 49,381 | | Universal Electronics, Inc.* | | | 1,894,749 | |
| 240,934 | | ZAGG, Inc.* | | | 749,305 | |
| | | | | | |
| | | | | 10,376,514 | |
| | | | | | |
Consumer Staples — 2.02% | | | | |
| 83,560 | | Hostess Brands, Inc.* | | | 890,750 | |
| 5,160 | | Medifast, Inc. | | | 322,500 | |
| | | | | | |
| | | | | 1,213,250 | |
| | | | | | |
Energy — 1.39% | | | | |
| 69,380 | | Callon Petroleum Co.* | | | 38,013 | |
| 51,920 | | Magnolia Oil & Gas Corp., Class A* | | | 207,680 | |
| 83,170 | | Par Pacific Holdings, Inc.* | | | 590,507 | |
| | | | | | |
| | | | | 836,200 | |
| | | | | | |
Financials — 14.91% | | | | |
| 28,512 | | Amerisafe, Inc. | | | 1,838,169 | |
| 7,941 | | BancFirst Corp. | | | 264,991 | |
| 18,980 | | CenterState Bank Corp. | | | 327,025 | |
| 221,277 | | Compass Diversified Holdings LP | | | 2,965,112 | |
| 14,230 | | First Interstate BancSystem, Inc., Class A | | | 410,393 | |
| 7,080 | | Independent Bank Group, Inc. | | | 167,654 | |
| 11,022 | | Pacific Premier Bancorp, Inc. | | | 207,655 | |
| 10,970 | | Preferred Bank/Los Angeles, CA | | | 371,005 | |
| 23,150 | | TCF Financial Corp. | | | 524,579 | |
| 15,840 | | TriCo Bancshares | | | 472,349 | |
18
|
SCHEDULE OF PORTFOLIO INVESTMENTS |
RBC Small Cap Core Fund (cont.)
March 31, 2020 (Unaudited)
| | | | | | |
| Shares | | | | Value | |
| 27,440 | | TriState Capital Holdings, Inc.* | | $ | 265,345 | |
| 47,837 | | United Community Banks, Inc. | | | 875,896 | |
| 8,570 | | Wintrust Financial Corp. | | | 281,610 | |
| | | | | | |
| | | | | 8,971,783 | |
| | | | | | |
Health Care — 12.30% | | | | |
| 44,372 | | Emergent BioSolutions, Inc.* | | | 2,567,364 | |
| 38,026 | | Globus Medical, Inc., Class A* | | | 1,617,246 | |
| 42,710 | | Lantheus Holdings, Inc.* | | | 544,980 | |
| 8,300 | | Masimo Corp.* | | | 1,470,096 | |
| 7,890 | | West Pharmaceutical Services, Inc. | | | 1,201,252 | |
| | | | | | |
| | | | | 7,400,938 | |
| | | | | | |
Industrials — 23.04% | | | | |
| 384,831 | | ACCO Brands Corp. | | | 1,943,396 | |
| 33,690 | | Arcosa, Inc. | | | 1,338,841 | |
| 52,036 | | Astronics Corp.* | | | 477,690 | |
| 111,575 | | Columbus McKinnon Corp. | | | 2,789,375 | |
| 78,735 | | Ducommun, Inc.* | | | 1,956,565 | |
| 13,340 | | EnerSys | | | 660,597 | |
| 46,544 | | Greenbrier Cos., Inc. (The) | | | 825,691 | |
| 23,618 | | Insteel Industries, Inc. | | | 312,938 | |
| 13,730 | | NV5 Global, Inc.* | | | 566,912 | |
| 87,253 | | Patrick Industries, Inc. | | | 2,457,044 | |
| 6,750 | | Trex Co., Inc.* | | | 540,945 | |
| | | | | | |
| | | | | 13,869,994 | |
| | | | | | |
Information Technology — 13.41% | | | | |
| 7,310 | | Ambarella, Inc.* | | | 354,974 | |
| 2,570 | | Cabot Microelectronics Corp. | | | 293,340 | |
| 2,530 | | Coherent, Inc.* | | | 269,217 | |
| 22,430 | | Cohu, Inc. | | | 277,683 | |
| 7,658 | | InterDigital, Inc. | | | 341,776 | |
| 122,830 | | Mitek Systems, Inc.* | | | 967,900 | |
| 20,408 | | MKS Instruments, Inc. | | | 1,662,232 | |
| 48,950 | | Model N, Inc.* | | | 1,087,179 | |
| 11,340 | | Novanta, Inc.* | | | 905,839 | |
| 19,310 | | Onto Innovation, Inc.* | | | 572,928 | |
| 11,180 | | SailPoint Technologies Holding, Inc.* | | | 170,160 | |
| 11,850 | | Sapiens International Corp. NV | | | 225,387 | |
| 2,146 | | Tyler Technologies, Inc.* | | | 636,418 | |
| 15,370 | | Vishay Precision Group, Inc.* | | | 308,630 | |
| | | | | | |
| | | | | 8,073,663 | |
| | | | | | |
Materials — 3.88% | | | | |
| 94,835 | | FutureFuel Corp. | | | 1,068,790 | |
| 39,957 | | Koppers Holdings, Inc.* | | | 494,268 | |
| 100,491 | | Universal Stainless & Alloy Products, Inc.* | | | 774,786 | |
| | | | | | |
| | | | | 2,337,844 | |
| | | | | | |
19
|
SCHEDULE OF PORTFOLIO INVESTMENTS |
RBC Small Cap Core Fund (cont.)
March 31, 2020 (Unaudited)
| | | | | | |
| Shares | | | | Value | |
Real Estate — 4.60% | | | | |
| 7,840 | | EastGroup Properties, Inc., REIT | | $ | 819,123 | |
| 52,470 | | Physicians Realty Trust, REIT | | | 731,432 | |
| 32,730 | | STAG Industrial, Inc., REIT | | | 737,079 | |
| 44,360 | | UMH Properties, Inc., REIT | | | 481,750 | |
| | | | | | |
| | | | | 2,769,384 | |
| | | | | | |
Utilities — 2.03% | | | | |
| 9,440 | | Southwest Gas Holdings, Inc. | | | 656,647 | |
| 7,590 | | Spire, Inc. | | | 565,303 | |
| | | | | | |
| | | | | 1,221,950 | |
| | | | | | |
| |
Total Common Stocks | | | 59,343,642 | |
| | | | | | |
(Cost $53,543,614) | | | | |
| |
Exchange Traded Funds — 0.23% | | | | |
| 1,100 | | iShares Nasdaq Biotechnology | | | 118,514 | |
| 210 | | iShares Russell 2000 Index Fund | | | 24,037 | |
| | | | | | |
Total Exchange Traded Funds | | | 142,551 | |
| | | | | | |
(Cost $137,510) | | | | |
| |
Investment Company — 1.08% | | | | |
| 648,015 | | U.S. Government Money Market Fund, RBC Institutional Class 1(a) | | | 648,015 | |
| | | | | | |
| |
Total Investment Company | | | 648,015 | |
| | | | | | |
(Cost $648,015) | | | | |
| |
Total Investments | | $ | 60,134,208 | |
(Cost $54,329,139)(b) — 99.91% | | | | |
| |
Other assets in excess of liabilities — 0.09% | | | 53,034 | |
| | | | | | |
| |
NET ASSETS — 100.00% | | $ | 60,187,242 | |
| | | | | | |
| * | Non-income producing security. |
| (a) | Affiliated investment. |
| (b) | See Notes to Schedules of Portfolio Investments for the tax cost of securities and the breakdown of unrealized appreciation (depreciation). |
Abbreviations used are defined below:
REIT - Real Estate Investment Trust
See Notes to the Financial Statements.
20
|
SCHEDULE OF PORTFOLIO INVESTMENTS |
RBC Microcap Value Fund
March 31, 2020 (Unaudited)
| | | | | | |
| Shares | | | | Value | |
Common Stocks — 93.96% | | | | |
Communication Services — 2.30% | | | | |
| 3,100 | | AH Belo Corp., Class A | | $ | 5,332 | |
| 11,800 | | AMC Entertainment Holdings, Inc., Class A | | | 37,288 | |
| 7,200 | | Cumulus Media, Inc., Class A* | | | 39,024 | |
| 44,050 | | DHI Group, Inc.* | | | 95,148 | |
| 53,000 | | Entercom Communications Corp., Class A | | | 90,630 | |
| 23,600 | | Entravision Communications Corp., Class A | | | 47,908 | |
| 35,000 | | Eros International Plc* | | | 57,750 | |
| 24,243 | | EW Scripps Co. (The), Class A | | | 182,792 | |
| 6,100 | | IDT Corp., Class B* | | | 33,062 | |
| 25,100 | | Marcus Corp. (The) | | | 309,232 | |
| 119,400 | | Point.360*,(a),(b),(c) | | | 0 | |
| 10,800 | | Reading International, Inc., Class A* | | | 42,012 | |
| 14,200 | | Saga Communications, Inc., Class A | | | 390,642 | |
| 39,150 | | Salem Media Group, Inc. | | | 34,217 | |
| 25,800 | | Spok Holdings, Inc. | | | 275,802 | |
| 39,700 | | Townsquare Media, Inc., Class A | | | 183,017 | |
| | | | | | |
| | | | | 1,823,856 | |
| | | | | | |
Consumer Discretionary — 16.11% | | | | |
| 4,500 | | American Public Education, Inc.* | | | 107,685 | |
| 8,400 | | America’sCar-Mart, Inc.* | | | 473,340 | |
| 21,300 | | Anemostat Door Products*,(a),(b),(c) | | | 0 | |
| 21,300 | | Anemostat, Inc.*,(a),(b),(c) | | | 0 | |
| 14,200 | | At Home Group, Inc.* | | | 28,684 | |
| 7,900 | | Bassett Furniture Industries, Inc. | | | 43,055 | |
| 34,100 | | BBX Capital Corp. | | | 78,771 | |
| 32,100 | | Beazer Homes USA, Inc.* | | | 206,724 | |
| 3 | | Biglari Holdings, Inc., Class B* | | | 154 | |
| 10,700 | | Boot Barn Holdings, Inc.* | | | 138,351 | |
| 3,227 | | Bowl America, Inc., Class A | | | 28,022 | |
| 30,030 | | Build-A-Bear Workshop, Inc.* | | | 42,943 | |
| 6,700 | | Caleres, Inc. | | | 34,840 | |
| 33,800 | | Carriage Services, Inc. | | | 545,870 | |
| 11,500 | | Cato Corp. (The), Class A | | | 122,705 | |
| 15,000 | | Century Casinos, Inc.* | | | 36,150 | |
| 26,703 | | Century Communities, Inc.* | | | 387,461 | |
| 4,200 | | Chuy’s Holdings, Inc.* | | | 42,294 | |
| 6,300 | | Citi Trends, Inc. | | | 56,070 | |
| 9,700 | | Clarus Corp. | | | 95,060 | |
| 90,400 | | Container Store Group, Inc. (The)* | | | 213,344 | |
| 4,200 | | Cooper-Standard Holdings, Inc.* | | | 43,134 | |
| 4,300 | | Core-Mark Holding Co., Inc. | | | 122,851 | |
| 17,800 | | Crown Crafts, Inc. | | | 85,084 | |
| 18,730 | | Culp, Inc. | | | 137,853 | |
| 16,100 | | Del Taco Restaurants, Inc.* | | | 55,223 | |
| 30,200 | | Delta Apparel, Inc.* | | | 314,382 | |
21
|
SCHEDULE OF PORTFOLIO INVESTMENTS |
RBC Microcap Value Fund (cont.)
March 31, 2020 (Unaudited)
| | | | | | |
| Shares | | | | Value | |
| 27 | | DropCar, Inc.* | | $ | 12 | |
| 13,200 | | Duluth Holdings, Inc., Class B* | | | 52,932 | |
| 10,900 | | Ethan Allen Interiors, Inc. | | | 111,398 | |
| 17,900 | | Express, Inc.* | | | 26,671 | |
| 14,800 | | Flexsteel Industries, Inc. | | | 162,208 | |
| 8,000 | | Funko, Inc., Class A* | | | 31,920 | |
| 5,300 | | Genesco, Inc.* | | | 70,702 | |
| 28,630 | | Haverty Furniture Cos., Inc. | | | 340,411 | |
| 10,400 | | hhgregg, Inc.* | | | 93 | |
| 4,000 | | Hibbett Sports, Inc.* | | | 43,740 | |
| 18,700 | | Hooker Furniture Corp. | | | 291,907 | |
| 33,200 | | J Alexander’s Holdings, Inc.* | | | 127,156 | |
| 39,300 | | J. Jill, Inc.* | | | 21,709 | |
| 10,820 | | Johnson Outdoors, Inc., Class A | | | 678,414 | |
| 37,100 | | K12, Inc.* | | | 699,706 | |
| 23,500 | | Kid Brands, Inc.* | | | 16 | |
| 45,700 | | Lakeland Industries, Inc.* | | | 708,350 | |
| 10,700 | | Lands’ End, Inc.* | | | 57,138 | |
| 95,270 | | Lazare Kaplan International, Inc.*,(a),(b),(c) | | | 0 | |
| 7,900 | | La-Z-Boy, Inc. | | | 162,345 | |
| 7,500 | | Legacy Housing Corp.* | | | 69,375 | |
| 13,200 | | Lifetime Brands, Inc. | | | 74,580 | |
| 18,200 | | M/I Homes, Inc.* | | | 300,846 | |
| 31,270 | | MarineMax, Inc.* | | | 325,833 | |
| 7,500 | | McRae Industries, Inc., Class A | | | 138,750 | |
| 2,285 | | Mecklermedia Corp.*,(a),(b),(c) | | | 0 | |
| 21,300 | | Mestek, Inc.* | | | 500,550 | |
| 9,600 | | Modine Manufacturing Co.* | | | 31,200 | |
| 18,500 | | Movado Group, Inc. | | | 218,670 | |
| 1,500 | | Nathan’s Famous, Inc. | | | 91,500 | |
| 8,200 | | Nautilus, Inc.* | | | 21,402 | |
| 42,100 | | New Home Co., Inc. (The)* | | | 57,677 | |
| 10,300 | | Nobility Homes, Inc. | | | 227,630 | |
| 41,000 | | Orleans Homebuilders, Inc.*,(a),(b),(c) | | | 0 | |
| 6,400 | | RCI Hospitality Holdings, Inc. | | | 63,808 | |
| 28,400 | | Red Lion Hotels Corp.* | | | 41,464 | |
| 27,500 | | Rocky Brands, Inc. | | | 532,125 | |
| 35,000 | | Shiloh Industries, Inc.* | | | 43,750 | |
| 13,300 | | Sonic Automotive, Inc., Class A | | | 176,624 | |
| 13,800 | | Standard Motor Products, Inc. | | | 573,666 | |
| 2,100 | | Stoneridge, Inc.* | | | 35,175 | |
| 14,600 | | Strattec Security Corp. | | | 211,262 | |
| 40,939 | | Superior Group of Cos, Inc. | | | 346,344 | |
| 32,500 | | Superior Industries International, Inc. | | | 39,000 | |
| 24,640 | | Taylor Morrison Home Corp., Class A* | | | 271,040 | |
| 49,300 | | Tilly’s, Inc., Class A | | | 203,609 | |
| 8,060 | | TravelCenters of America, Inc.* | | | 78,787 | |
| 13,600 | | Tupperware Brands Corp. | | | 22,032 | |
| 25,900 | | Unifi, Inc.* | | | 299,145 | |
22
|
SCHEDULE OF PORTFOLIO INVESTMENTS |
RBC Microcap Value Fund (cont.)
March 31, 2020 (Unaudited)
| | | | | | |
| Shares | | | | Value | |
| 30,000 | | Universal Travel Group*,(a),(b),(c) | | $ | 0 | |
| 10,500 | | Vera Bradley, Inc.* | | | 43,260 | |
| 11,600 | | VOXX International Corp.* | | | 33,060 | |
| 3,200 | | Vulcan International Corp.* | | | 368,640 | |
| 1,397 | | Walking Co. Holdings, Inc. (The)*,(a),(b),(c) | | | 0 | |
| 11,000 | | Weyco Group, Inc. | | | 221,870 | |
| 14,900 | | ZAGG, Inc.* | | | 46,339 | |
| 22,500 | | Zovio, Inc.* | | | 37,125 | |
| | | | | | |
| | | | | 12,773,016 | |
| | | | | | |
Consumer Staples — 3.93% | | | | |
| 3,500 | | Alico, Inc. | | | 108,640 | |
| 7,350 | | Andersons, Inc. (The) | | | 137,813 | |
| 17,515 | | Central Garden and Pet Co.* | | | 481,662 | |
| 8,300 | | elf Beauty, Inc.* | | | 81,672 | |
| 36 | | Hawaiian Macadamia Nut Orchards L.P.* | | | 126,000 | |
| 20,300 | | Ingles Markets, Inc., Class A | | | 734,048 | |
| 34,400 | | Natural Grocers By Vitamin Cottage, Inc. | | | 292,744 | |
| 19,300 | | Oil-Dri Corp. of America | | | 645,392 | |
| 12,990 | | Pyxus International, Inc.* | | | 40,399 | |
| 25,140 | | SpartanNash Co. | | | 360,005 | |
| 4,300 | | Village Super Market, Inc., Class A | | | 105,694 | |
| | | | | | |
| | | | | 3,114,069 | |
| | | | | | |
Energy — 2.08% | | | | |
| 45,500 | | Aegean Marine Petroleum Network, Inc.*,(a),(b),(c) | | | 0 | |
| 4,146 | | Amplify Energy Corp. | | | 2,346 | |
| 13,900 | | Ardmore Shipping Corp. | | | 72,975 | |
| 16 | | Basic Energy Services, Inc.* | | | 2 | |
| 5,300 | | Bonanza Creek Energy, Inc.* | | | 59,625 | |
| 19,100 | | California Resources Corp.* | | | 19,100 | |
| 12,540 | | Callon Petroleum Co.* | | | 6,871 | |
| 9,200 | | CONSOL Energy, Inc.* | | | 33,948 | |
| 16,700 | | Contura Energy, Inc.* | | | 39,245 | |
| 8,200 | | Dorian LPG Ltd.* | | | 71,422 | |
| 3,720 | | Era Group, Inc.* | | | 19,828 | |
| 23,000 | | Evolution Petroleum Corp. | | | 60,030 | |
| 18,500 | | Falcon Minerals Corp. | | | 39,775 | |
| 7,500 | | Global Partners LP | | | 66,150 | |
| 12,600 | | Goodrich Petroleum Corp.* | | | 53,676 | |
| 2,950 | | Harvest Natural Resources, Inc.*,(a),(b),(c) | | | 0 | |
| 8,200 | | Hornbeck Offshore Services, Inc.* | | | 545 | |
| 23,000 | | Montage Resources Corp.* | | | 51,750 | |
| 1,200 | | NACCO Industries, Inc., Class A | | | 33,576 | |
| 13,128 | | Natural Gas Services Group, Inc.* | | | 58,551 | |
| 13,100 | | Newpark Resources, Inc.* | | | 11,751 | |
| 63,600 | | North American Construction Group Ltd. | | | 323,088 | |
| 14,900 | | Panhandle Oil and Gas, Inc., Class A | | | 54,981 | |
| 4,700 | | Penn Virginia Corp.* | | | 14,523 | |
23
|
SCHEDULE OF PORTFOLIO INVESTMENTS |
RBC Microcap Value Fund (cont.)
March 31, 2020 (Unaudited)
| | | | | | |
| Shares | | | | Value | |
| 8,110 | | REX American Resources Corp.* | | $ | 377,196 | |
| 1,230 | | Sanchez Midstream Partners L.P. | | | 529 | |
| 131 | | SilverBow Resources, Inc.* | | | 323 | |
| 15,400 | | Solaris Oilfield Infrastructure, Inc., Class A | | | 80,850 | |
| 2,200 | | Teekay Tankers Ltd., Class A* | | | 48,928 | |
| 18,880 | | W&T Offshore, Inc.* | | | 32,096 | |
| 21,700 | | Whiting Petroleum Corp.* | | | 14,548 | |
| | | | | | |
| | | | | 1,648,228 | |
| | | | | | |
Financials — 29.26% | | | | |
| 39,150 | | Affirmative Insurance Holdings, Inc.*,(a),(b),(c) | | | 0 | |
| 44,850 | | AG Mortgage Investment Trust, Inc., REIT | | | 122,889 | |
| 3,100 | | American National Bankshares, Inc. | | | 74,090 | |
| 7,900 | | American River Bankshares | | | 68,098 | |
| 4,200 | | Ames National Corp. | | | 85,890 | |
| 30,700 | | Anworth Mortgage Asset Corp., REIT | | | 34,691 | |
| 5,968 | | Apollo Commercial Real Estate Finance, Inc., REIT | | | 44,283 | |
| 67,096 | | Arbor Realty Trust, Inc., REIT | | | 328,770 | |
| 49,900 | | Ares Commercial Real Estate Corp., REIT | | | 348,801 | |
| 2,200 | | Arlington Asset Investment Corp., Class A | | | 4,818 | |
| 101 | | Ashford, Inc.* | | | 581 | |
| 6,200 | | Atlantic Capital Bancshares, Inc.* | | | 73,594 | |
| 31,700 | | Banc of California, Inc. | | | 253,600 | |
| 12,400 | | Banco Latinoamericano de Comercio Exterior SA, Class E | | | 127,844 | |
| 25,400 | | Bancorp, Inc. (The)* | | | 154,178 | |
| 1,700 | | Bank First Corp. | | | 95,200 | |
| 4,100 | | Bankwell Financial Group, Inc. | | | 62,566 | |
| 4,928 | | Banner Corp. | | | 162,821 | |
| 4,500 | | Bar Harbor Bankshares | | | 77,760 | |
| 5,300 | | Baycom Corp.* | | | 63,865 | |
| 100,000 | | Beverly Hills Bancorp, Inc.*,(a),(b),(c) | | | 0 | |
| 15,000 | | Blucora, Inc.* | | | 180,750 | |
| 6,300 | | Blue Capital Reinsurance Holdings Ltd. | | | 5,450 | |
| 9,200 | | Bridgewater Bancshares, Inc.* | | | 89,700 | |
| 33,600 | | California First National Bancorp | | | 453,600 | |
| 1,500 | | Cambridge Bancorp | | | 78,000 | |
| 4,000 | | Capital City Bank Group, Inc. | | | 80,480 | |
| 38,000 | | Capitol Bancorp Ltd.*,(a),(b),(c) | | | 0 | |
| 6,900 | | Capstar Financial Holdings, Inc. | | | 68,241 | |
| 5,700 | | Central Valley Community Bancorp | | | 74,328 | |
| 1,300 | | Century Bancorp, Inc., Class A | | | 80,912 | |
| 39,900 | | Cherry Hill Mortgage Investment Corp., REIT | | | 247,380 | |
| 4,400 | | Citizens & Northern Corp. | | | 88,000 | |
| 71,550 | | Citizens, Inc.* | | | 466,506 | |
| 5,400 | | Civista Bancshares, Inc. | | | 80,784 | |
| 3,700 | | CNB Financial Corp. | | | 69,819 | |
| 101,200 | | Consumer Portfolio Services, Inc.* | | | 137,632 | |
| 2,189 | | Cowen Inc., Class A | | | 21,146 | |
| 800 | | Diamond Hill Investment Group, Inc. | | | 72,192 | |
24
|
SCHEDULE OF PORTFOLIO INVESTMENTS |
RBC Microcap Value Fund (cont.)
March 31, 2020 (Unaudited)
| | | | | | |
| Shares | | | | Value | |
| 15,777 | | Donegal Group, Inc., Class A | | $ | 239,810 | |
| 3,944 | | Donegal Group, Inc., Class B | | | 52,889 | |
| 11,900 | | Donnelley Financial Solutions, Inc.* | | | 62,713 | |
| 12,446 | | Dynex Capital, Inc., REIT | | | 129,936 | |
| 33,400 | | Ellington Residential Mortgage, REIT | | | 177,020 | |
| 41,100 | | Enova International, Inc.* | | | 595,539 | |
| 3,800 | | Enterprise Bancorp, Inc. | | | 102,562 | |
| 4,100 | | Equity Bancshares, Inc., Class A* | | | 70,725 | |
| 4,800 | | Esquire Financial Holdings, Inc.* | | | 72,240 | |
| 6,800 | | ESSA Bancorp, Inc. | | | 92,820 | |
| 6,900 | | Exantas Capital Corp., REIT | | | 19,044 | |
| 7,700 | | Farmers National Banc Corp. | | | 89,551 | |
| 15,300 | | Federal Agricultural Mortgage Corp., Class C | | | 851,139 | |
| 52,832 | | FedNat Holding Co. | | | 606,511 | |
| 4,200 | | First Bancorp, Inc. | | | 92,400 | |
| 4,800 | | First Business Financial Services, Inc. | | | 74,400 | |
| 1,800 | | First Capital, Inc. | | | 107,820 | |
| 5,100 | | First Choice Bancorp | | | 76,551 | |
| 3,800 | | First Community Bankshares, Inc. | | | 88,540 | |
| 65,304 | | First Defiance Financial Corp. | | | 962,581 | |
| 9,400 | | First Financial Corp. | | | 316,968 | |
| 5,200 | | First Internet Bancorp | | | 85,384 | |
| 6,700 | | First Merchants Corp. | | | 177,483 | |
| 38,000 | | First Place Financial Corp.*,(a),(b),(c) | | | 0 | |
| 360 | | Flagstar Bancorp, Inc. | | | 7,139 | |
| 19,500 | | Franklin Financial Network, Inc. | | | 397,605 | |
| 2,000 | | FS Bancorp, Inc. | | | 72,000 | |
| 6,900 | | FVCBankcorp, Inc.* | | | 91,908 | |
| 31,120 | | GAIN Capital Holdings, Inc. | | | 173,650 | |
| 33,327 | | Great Ajax Corp., REIT | | | 211,962 | |
| 1,426 | | Great Western Bancorp, Inc. | | | 29,204 | |
| 3,600 | | Guaranty Bancshares, Inc. | | | 83,304 | |
| 6,200 | | Hallmark Financial Services, Inc.* | | | 25,048 | |
| 15,900 | | HCI Group, Inc. | | | 639,975 | |
| 29,270 | | Heritage Insurance Holdings, Inc. | | | 313,482 | |
| 1,458 | | Hilltop Holdings, Inc. | | | 22,045 | |
| 600 | | Hingham Institution for Savings | | | 86,994 | |
| 3,100 | | Home Bancorp, Inc. | | | 75,702 | |
| 6,040 | | HomeTrust Bancshares, Inc. | | | 96,157 | |
| 1,200 | | Houlihan Lokey, Inc. | | | 62,544 | |
| 30,722 | | Independence Holding Co. | | | 785,254 | |
| 5,300 | | Independent Bank Corp. | | | 68,211 | |
| 1,695 | | Independent Bank Group, Inc. | | | 40,138 | |
| 4,900 | | Investar Holding Corp. | | | 62,573 | |
| 4,934 | | Investors Title Co. | | | 631,552 | |
| 41,600 | | JMP Group, Inc. | | | 99,840 | |
| 16,500 | | Kansas City Life Insurance Co. | | | 429,825 | |
| 6,400 | | LCNB Corp. | | | 80,640 | |
25
|
SCHEDULE OF PORTFOLIO INVESTMENTS |
RBC Microcap Value Fund (cont.)
March 31, 2020 (Unaudited)
| | | | | | |
| Shares | | | | Value | |
| 11,000 | | Macatawa Bank Corp. | | $ | 78,320 | |
| 5,100 | | Malvern Bancorp, Inc.* | | | 62,475 | |
| 69,200 | | Manning & Napier, Inc. | | | 86,500 | |
| 28,890 | | Marlin Business Services Corp. | | | 322,701 | |
| 13,000 | | Medley Management, Inc., Class A | | | 8,835 | |
| 6,500 | | Merchants Bancorp | | | 98,670 | |
| 5,700 | | Metropolitan Bank Holding Corp.* | | | 153,501 | |
| 27,300 | | MutualFirst Financial, Inc. | | | 769,860 | |
| 5,500 | | MVB Financial Corp. | | | 70,125 | |
| 2,600 | | National Bankshares, Inc. | | | 82,940 | |
| 2,500 | | National Security Group, Inc. (The) | | | 33,800 | |
| 2,600 | | National Western Life Group, Inc., Class A | | | 447,200 | |
| 11,567 | | Nicholas Financial, Inc.* | | | 67,551 | |
| 1,915 | | OceanFirst Financial Corp. | | | 30,468 | |
| 44,500 | | OFG Bancorp. | | | 497,510 | |
| 9,400 | | Old Second Bancorp, Inc. | | | 64,954 | |
| 11,400 | | Oppenheimer Holdings, Inc., Class A | | | 225,264 | |
| 6,200 | | Orchid Island Capital, Inc., REIT | | | 18,290 | |
| 7,900 | | Pacific Mercantile Bancorp* | | | 37,209 | |
| 5,500 | | Parke Bancorp, Inc. | | | 74,195 | |
| 5,700 | | PCSB Financial Corp. | | | 79,743 | |
| 20,800 | | PennyMac Financial Services, Inc. | | | 459,888 | |
| 21,000 | | Peoples Bancorp, Inc. | | | 465,150 | |
| 2,400 | | Peoples Financial Services Corp. | | | 95,376 | |
| 7,300 | | Piper Jaffray Cos. | | | 369,161 | |
| 6,600 | | Premier Financial Bancorp, Inc. | | | 81,840 | |
| 17,400 | | Protective Insurance Corp., Class B | | | 239,250 | |
| 15,900 | | Provident Financial Holdings, Inc. | | | 242,157 | |
| 5,900 | | RBB Bancorp | | | 80,948 | |
| 15,043 | | Ready Capital Corp., REIT | | | 108,610 | |
| 30,100 | | Regional Management Corp.* | | | 411,166 | |
| 3,050 | | S&T Bancorp, Inc. | | | 83,326 | |
| 8,500 | | Safety Insurance Group, Inc. | | | 717,655 | |
| 5,100 | | SB One Bancorp | | | 86,700 | |
| 7,100 | | Shore Bancshares, Inc. | | | 77,035 | |
| 4,400 | | Sierra Bancorp | | | 77,352 | |
| 7,400 | | Silvergate Capital Corp., Class A* | | | 70,596 | |
| 7,126 | | Simmons First National Corp., Class A | | | 131,118 | |
| 5,200 | | SmartFinancial, Inc. | | | 79,092 | |
| 6,200 | | South Plains Financial, Inc. | | | 96,038 | |
| 638 | | South State Corp. | | | 37,470 | |
| 2,700 | | Southern First Bancshares, Inc.* | | | 76,599 | |
| 3,200 | | Southern Missouri Bancorp, Inc. | | | 77,664 | |
| 7,500 | | Southern National Bancorp of Virginia, Inc. | | | 73,800 | |
| 5,300 | | Spirit of Texas Bancshares, Inc.* | | | 54,802 | |
| 11,900 | | Sterling Bancorp, Inc. | | | 51,170 | |
| 10,600 | | Stewart Information Services Corp. | | | 282,702 | |
| 3,800 | | Territorial Bancorp, Inc. | | | 93,290 | |
| 4,100 | | Timberland Bancorp, Inc. | | | 74,989 | |
26
|
SCHEDULE OF PORTFOLIO INVESTMENTS |
RBC Microcap Value Fund (cont.)
March 31, 2020 (Unaudited)
| | | | | | |
| Shares | | | | Value | |
| 3,200 | | Unico American Corp.* | | $ | 16,864 | |
| 19,000 | | United Western Bancorp, Inc.*,(a),(b),(c) | | | 0 | |
| 13,630 | | Walker & Dunlop, Inc. | | | 548,880 | |
| 6,300 | | Waterstone Financial, Inc. | | | 91,602 | |
| 4,800 | | West Bancorporation, Inc. | | | 78,480 | |
| 23,241 | | Western Asset Mortgage Capital Corp., REIT | | | 53,222 | |
| 5,200 | | Westwood Holdings Group, Inc. | | | 95,212 | |
| | | | | | |
| | | | | 23,199,952 | |
| | | | | | |
Health Care — 1.80% | | | | |
| 30,600 | | Adeptus Health, Inc., Class A*,(a),(b),(c) | | | 0 | |
| 11,000 | | American Shared Hospital Services* | | | 17,050 | |
| 17,900 | | AngioDynamics, Inc.* | | | 186,697 | |
| 4,300 | | Computer Programs & Systems, Inc. | | | 95,675 | |
| 3,000 | | Cross Country Healthcare, Inc.* | | | 20,220 | |
| 12,550 | | CryoLife, Inc.* | | | 212,346 | |
| 5,300 | | Kewaunee Scientific Corp. | | | 40,492 | |
| 15,000 | | MedCath Corp.*,(a),(b),(c) | | | 0 | |
| 13,300 | | Meridian Bioscience, Inc.* | | | 111,720 | |
| 10,665 | | Option Care Health, Inc.* | | | 100,998 | |
| 14,800 | | OraSure Technologies, Inc.* | | | 159,248 | |
| 33,950 | | Triple-S Management Corp., Class B* | | | 478,695 | |
| | | | | | |
| | | | | 1,423,141 | |
| | | | | | |
Industrials — 19.81% | | | | |
| 5,400 | | Acme United Corp. | | | 109,458 | |
| 3,000 | | Aegion Corp.* | | | 53,790 | |
| 8,000 | | Alamo Group, Inc. | | | 710,240 | |
| 4,383 | | Allied Motion Technologies, Inc. | | | 103,877 | |
| 56,600 | | Ameresco, Inc., Class A* | | | 963,898 | |
| 8,100 | | AMREP Corp.* | | | 38,880 | |
| 66,000 | | Arc Document Solutions, Inc. | | | 53,460 | |
| 2,300 | | Argan, Inc. | | | 79,511 | |
| 8,900 | | BlueLinx Holdings, Inc.* | | | 44,055 | |
| 29,500 | | CAI International, Inc.* | | | 417,130 | |
| 34,400 | | CBIZ, Inc.* | | | 719,648 | |
| 8,774 | | CECO Environmental Corp.* | | | 40,975 | |
| 50,680 | | Celadon Group, Inc.* | | | 304 | |
| 10,678 | | Cenveo, Inc.*,(a),(b),(c) | | | 0 | |
| 2,400 | | Chicago Rivet & Machine Co. | | | 50,880 | |
| 660 | | Comfort Systems USA, Inc. | | | 24,123 | |
| 16,500 | | Commercial Vehicle Group, Inc.* | | | 24,915 | |
| 28,878 | | Compx International, Inc. | | | 438,946 | |
| 40,000 | | Costamare, Inc. | | | 180,800 | |
| 8,800 | | Covenant Transportation Group, Inc., Class A* | | | 76,296 | |
| 16,500 | | CPI Aerostructures, Inc.* | | | 37,125 | |
| 2,300 | | CRA International, Inc. | | | 76,843 | |
| 900 | | Douglas Dynamics, Inc. | | | 31,959 | |
| 27,300 | | Ducommun, Inc.* | | | 678,405 | |
27
|
SCHEDULE OF PORTFOLIO INVESTMENTS |
RBC Microcap Value Fund (cont.)
March 31, 2020 (Unaudited)
| | | | | | |
| Shares | | | | Value | |
| 2 | | Eagle Bulk Shipping, Inc.* | | $ | 4 | |
| 13,100 | | Eastern Co. (The) | | | 255,450 | |
| 12,100 | | Encore Wire Corp. | | | 508,079 | |
| 38,340 | | Ennis, Inc. | | | 720,025 | |
| 1,300 | | EnPro Industries, Inc. | | | 51,454 | |
| 18,400 | | Espey Manufacturing & Electronics Corp. | | | 333,662 | |
| 11,200 | | Federal Signal Corp. | | | 305,536 | |
| 19,900 | | Fly Leasing Ltd., ADR* | | | 140,096 | |
| 22,300 | | Foundation Building Materials, Inc.* | | | 229,467 | |
| 414 | | Genco Shipping & Trading Ltd. | | | 2,658 | |
| 6,780 | | Gibraltar Industries, Inc.* | | | 290,998 | |
| 5,580 | | Golden Ocean Group Ltd. | | | 17,465 | |
| 19,460 | | GP Strategies Corp.* | | | 126,685 | |
| 15,100 | | Graham Corp. | | | 194,790 | |
| 10,610 | | Greenbrier Cos., Inc. (The) | | | 188,221 | |
| 33,200 | | Griffon Corp. | | | 419,980 | |
| 3,400 | | Hurco Cos., Inc. | | | 98,940 | |
| 5,500 | | Insteel Industries, Inc. | | | 72,875 | |
| 1,930 | | Kadant, Inc. | | | 144,074 | |
| 1,100 | | Kimball International, Inc., Class B | | | 13,101 | |
| 1,808 | | Kratos Defense & Security Solutions, Inc.* | | | 25,023 | |
| 16,200 | | LS Starrett Co. (The), Class A* | | | 52,488 | |
| 10,200 | | LSC Communications, Inc. | | | 918 | |
| 44,250 | | LSI Industries, Inc. | | | 167,265 | |
| 21,200 | | Lydall, Inc.* | | | 136,952 | |
| 35,120 | | Marten Transport Ltd. | | | 720,662 | |
| 16,700 | | Mesa Air Group, Inc.* | | | 54,943 | |
| 28,099 | | Miller Industries, Inc. | | | 794,640 | |
| 16,000 | | Mistras Group, Inc.* | | | 68,160 | |
| 3,900 | | National Presto Industries, Inc. | | | 276,159 | |
| 14,600 | | NN, Inc. | | | 25,258 | |
| 3,500 | | Northwest Pipe Co.* | | | 77,875 | |
| 8,800 | | Orion Group Holdings, Inc.* | | | 22,880 | |
| 2,000 | | PAM Transportation Services, Inc.* | | | 61,500 | |
| 2 | | Paragon Shipping, Inc., Class A* | | | 0 | |
| 33,100 | | Park Aerospace Corp. | | | 417,060 | |
| 3,700 | | Park-Ohio Holdings Corp. | | | 70,078 | |
| 13,505 | | Patrick Industries, Inc. | | | 380,301 | |
| 1,700 | | Preformed Line Products Co. | | | 84,711 | |
| 12,500 | | Quad/Graphics, Inc. | | | 31,500 | |
| 13,600 | | Quanex Building Products Corp. | | | 137,088 | |
| 23,000 | | Radiant Logistics, Inc.* | | | 89,010 | |
| 25,000 | | RCM Technologies, Inc.* | | | 31,250 | |
| 7,800 | | Resources Connection, Inc. | | | 85,566 | |
| 14,400 | | Rush Enterprises, Inc., Class A | | | 459,648 | |
| 22,000 | | Safe Bulkers, Inc.* | | | 26,180 | |
| 3,200 | | Standex International Corp. | | | 156,864 | |
| 8,300 | | Sterling Construction Co., Inc.* | | | 78,850 | |
| 2,182 | | Team, Inc.* | | | 14,183 | |
28
|
SCHEDULE OF PORTFOLIO INVESTMENTS |
RBC Microcap Value Fund (cont.)
March 31, 2020 (Unaudited)
| | | | | | | | |
| Shares | | | | | Value | |
| | 26,400 | | | Textainer Group Holdings Ltd.* | | $ | 217,008 | |
| | 6,500 | | | Titan Machinery, Inc.* | | | 56,485 | |
| | 11,500 | | | Twin Disc, Inc.* | | | 80,270 | |
| | 7,400 | | | USA Truck, Inc.* | | | 23,458 | |
| | 15,300 | | | Vectrus, Inc.* | | | 633,573 | |
| | 5,900 | | | Viad Corp. | | | 125,257 | |
| | 8,600 | | | Volt Information Sciences, Inc.* | | | 6,966 | |
| | 3,000 | | | VSE Corp. | | | 49,170 | |
| | 7,700 | | | Willdan Group, Inc.* | | | 164,549 | |
| | 27,634 | | | Willis Lease Finance Corp.* | | | 735,064 | |
| | | | | | | | |
| | | | | | | 15,707,890 | |
| | | | | | | | |
| | Information Technology — 7.50% | | | | |
| | 15,138 | | | Alithya Group, Inc., Class A* | | | 26,643 | |
| | 7,300 | | | Bel Fuse, Inc., Class B | | | 71,102 | |
| | 9,200 | | | Clearfield, Inc.* | | | 109,020 | |
| | 38,600 | | | CMTSU Liquidation, Inc.* | | | 38 | |
| | 25,400 | | | CTS Corp. | | | 632,206 | |
| | 6,900 | | | CyberOptics Corp.* | | | 118,059 | |
| | 25,600 | | | Digi International, Inc.* | | | 244,224 | |
| | 3,840 | | | ePlus, Inc.* | | | 240,461 | |
| | 40,800 | | | Everi Holdings, Inc.* | | | 134,640 | |
| | 2,100 | | | Fabrinet* | | | 114,576 | |
| | 10,200 | | | Insight Enterprises, Inc.* | | | 429,726 | |
| | 13,000 | | | JinkoSolar Holding Co. Ltd., ADR* | | | 193,050 | |
| | 4,800 | | | Kemet Corp. | | | 115,968 | |
| | 26,100 | | | Kimball Electronics, Inc.* | | | 285,012 | |
| | 8,600 | | | LGL Group, Inc. (The)* | | | 76,798 | |
| | 9,200 | | | Magal Security Systems Ltd.* | | | 27,048 | |
| | 17,800 | | | Methode Electronics, Inc. | | | 470,454 | |
| | 9,883 | | | Onto Innovation, Inc.* | | | 293,229 | |
| | 17,615 | | | Optical Cable Corp.* | | | 42,276 | |
| | 27,000 | | | PC Connection, Inc. | | | 1,112,670 | |
| | 28,700 | | | Perceptron, Inc.* | | | 82,656 | |
| | 31,730 | | | Photronics, Inc.* | | | 325,550 | |
| | 5,300 | | | Richardson Electronics Ltd. | | | 20,299 | |
| | 60,100 | | | Sigmatron International, Inc.* | | | 169,482 | |
| | 4,269 | | | Sykes Enterprises, Inc.* | | | 115,775 | |
| | 25,600 | | | TESSCO Technologies, Inc. | | | 125,184 | |
| | 18,600 | | | Vishay Precision Group, Inc.* | | | 373,488 | |
| | | | | | | | |
| | | | | | | 5,949,634 | |
| | | | | | | | |
| | Materials — 4.20% | | | | |
| | 43,290 | | | American Vanguard Corp. | | | 625,973 | |
| | 37,000 | | | Blue Earth Refineries, Inc.*,(a),(b),(c) | | | 0 | |
| | 4,229 | | | Centerra Gold, Inc.* | | | 25,116 | |
| | 1,308 | | | China Green Agriculture, Inc.* | | | 3,401 | |
| | 8,200 | | | Clearwater Paper Corp.* | | | 178,842 | |
| | 8,400 | | | Friedman Industries, Inc. | | | 37,044 | |
29
|
SCHEDULE OF PORTFOLIO INVESTMENTS |
RBC Microcap Value Fund (cont.)
March 31, 2020 (Unaudited)
| | | | | | | | |
| Shares | | | | | Value | |
| | 40,990 | | | FutureFuel Corp. | | $ | 461,957 | |
| | 4,300 | | | Hawkins, Inc. | | | 153,080 | |
| | 3,200 | | | Haynes International, Inc. | | | 65,952 | |
| | 2,600 | | | Innospec, Inc. | | | 180,674 | |
| | 9,500 | | | Materion Corp. | | | 332,595 | |
| | 16,100 | | | Olympic Steel, Inc. | | | 166,635 | |
| | 16,500 | | | Rayonier Advanced Materials, Inc. | | | 17,490 | |
| | 4,900 | | | Ryerson Holding Corp.* | | | 26,068 | |
| | 1,100 | | | Stepan Co. | | | 97,306 | |
| | 15,000 | | | Tecnoglass, Inc. | | | 57,900 | |
| | 47,800 | | | Trecora Resources* | | | 284,410 | |
| | 24,900 | | | Tredegar Corp. | | | 389,187 | |
| | 2,600 | | | UFP Technologies, Inc.* | | | 99,034 | |
| | 7,800 | | | Universal Stainless & Alloy Products, Inc.* | | | 60,138 | |
| | 3,470 | | | US Concrete, Inc.* | | | 62,946 | |
| | | | | | | | |
| | | | | | | 3,325,748 | |
| | | | | | | | |
| | Real Estate — 3.40% | | | | |
| | 10,800 | | | Braemar Hotels & Resorts, Inc., REIT | | | 18,360 | |
| | 37,100 | | | Cedar Realty Trust, Inc., REIT | | | 34,618 | |
| | 1 | | | CIM Commercial Trust Corp., REIT | | | 11 | |
| | 4,600 | | | Community Healthcare Trust, Inc., REIT | | | 176,088 | |
| | 1,800 | | | Consolidated-Tomoka Land Co. | | | 81,594 | |
| | 7,300 | | | CorEnergy Infrastructure Trust, Inc., REIT | | | 134,174 | |
| | 18,200 | | | Farmland Partners, Inc., REIT | | | 110,474 | |
| | 921 | | | Forestar Group, Inc.* | | | 9,532 | |
| | 2,300 | | | FRP Holdings, Inc.* | | | 98,900 | |
| | 11,342 | | | Getty Realty Corp., REIT | | | 269,259 | |
| | 8,800 | | | Global Medical REIT, Inc. | | | 89,056 | |
| | 12,900 | | | Jernigan Capital, Inc., REIT | | | 141,384 | |
| | 17,880 | | | Monmouth Real Estate Investment Corp., REIT | | | 215,454 | |
| | 33,900 | | | One Liberty Properties, Inc., REIT | | | 472,227 | |
| | 3,800 | | | Rafael Holdings, Inc., Class B* | | | 48,678 | |
| | 8,100 | | | RE/MAX Holdings, Inc., Class A | | | 177,552 | |
| | 17,400 | | | RPT Realty, REIT | | | 104,922 | |
| | 2,900 | | | UMH Properties, Inc., REIT | | | 31,494 | |
| | 8,000 | | | Urstadt Biddle Properties, Inc., REIT, Class A | | | 112,800 | |
| | 59,400 | | | Whitestone, REIT | | | 368,280 | |
| | | | | | | | |
| | | | | | | 2,694,857 | |
| | | | | | | | |
| | Utilities — 3.57% | | | | |
| | 3,200 | | | Artesian Resources Corp., Class A | | | 119,616 | |
| | 508 | | | California Water Service Group | | | 25,563 | |
| | 6,385 | | | Chesapeake Utilities Corp. | | | 547,258 | |
| | 11,100 | | | Middlesex Water Co. | | | 667,332 | |
30
|
SCHEDULE OF PORTFOLIO INVESTMENTS |
RBC Microcap Value Fund (cont.)
March 31, 2020 (Unaudited)
| | | | | | |
| Shares | | | | Value | |
| 8,100 | | SJW Corp. | | $ | 467,937 | |
| 19,226 | | Unitil Corp. | | | 1,005,904 | |
| | | | | | |
| | | | | 2,833,610 | |
| | | | | | |
| |
Total Common Stocks | | | 74,494,001 | |
| | | | | | |
| (Cost $92,674,100) | | | | |
Exchange Traded Funds — 0.12% | | | | |
| 1,350 | | iShares Russell Microcap Index Fund | | | 90,490 | |
| | | | | | |
| |
Total Exchange Traded Funds | | | 90,490 | |
| | | | | | |
| (Cost $111,030) | | | | |
| |
Rights/Warrants — 0.00% | | | | |
| 444 | | Basic Energy Services, Inc., Warrants, Expire 3/31/17* | | | 0 | |
| 724 | | Eagle Bulk Shipping, Inc., Warrants, Expire 10/15/14* | | | 4 | |
| 992 | | Genco Shipping & Trading Ltd., Warrants, Expire 7/11/14* | | | 59 | |
| 6,100 | | Media General, Inc. Rights, Expire 12/31/19*,(b),(c) | | | 0 | |
| 2,627 | | PHI Group, Inc., Warrants, Expire 9/4/22*,(b),(c) | | | 0 | |
| 703 | | SilverBow Resources, Inc., Warrants, Expire 12/31/49* | | | 1 | |
| | | | | | |
Total Rights/Warrants | | | 64 | |
| | | | | | |
| (Cost $73,487) | | | | |
| | | | | | | | |
| | |
Principal
Amount | | | | | | |
| | Corporate Bonds — 0.00% | | | | |
| | Financial — 0.00% | | | | |
| | $1,947 | | | Trenwick America Corp., 0.00%, *,(a),(b),(c) | | | 0 | |
| | 1,302 | | | Trenwick America Corp., 0.00%, *,(a),(b),(c) | | | 0 | |
| | | | | | | 0 | |
| Total Corporate Bonds | �� | | 0 | |
| | (Cost $0) | | | | |
31
|
SCHEDULE OF PORTFOLIO INVESTMENTS |
RBC Microcap Value Fund (cont.)
March 31, 2020 (Unaudited)
| | | | | | |
| Shares | | | | Value | |
Investment Company — 5.80% | |
| 4,597,695 | | U.S. Government Money Market Fund, RBC Institutional Class 1(d) | | $ | 4,597,695 | |
| | | | | | |
| |
Total Investment Company | | | 4,597,695 | |
| | | | | | |
| (Cost $4,597,695) | | | | |
| |
Total Investments | | $ | 79,182,250 | |
| (Cost $97,456,312)(e) — 99.88% | | | | |
| |
Other assets in excess of liabilities — 0.12% | | | 98,756 | |
| | | | | | |
| |
NET ASSETS — 100.00% | | $ | 79,281,006 | |
| | | | | | |
| * | Non-income producing security. |
| (a) | Security delisted or issuer in bankruptcy. |
| (b) | The Pricing Committee has fair valued this security under procedures established by the Fund’s Board of Trustees. |
| (c) | Security is valued using significant unobservable inputs and is classified as Level 3 in the fair value hierarchy. |
| (d) | Affiliated investment. |
| (e) | See Notes to Schedules of Portfolio Investments for the tax cost of securities and the breakdown of unrealized appreciation (depreciation). |
Abbreviations used are defined below:
ADR - American Depositary Receipt
FOR - Foreign Ownership Receipt
REIT - Real Estate Investment Trust
See Notes to the Financial Statements.
32
|
SCHEDULE OF PORTFOLIO INVESTMENTS |
RBC Small Cap Value Fund
March 31, 2020 (Unaudited)
| | | | | | |
| Shares | | | | Value | |
Common Stocks — 96.57% | | | | |
Communication Services — 2.31% | | | | |
| 48,407 | | Gray Television, Inc.* | | $ | 519,891 | |
| 9,620 | | Nexstar Media Group, Inc., Class A | | | 555,363 | |
| | | | | | |
| | | | | 1,075,254 | |
| | | | | | |
Consumer Discretionary — 7.74% | | | | |
| 47,820 | | Dana, Inc. | | | 373,474 | |
| 35,140 | | G-III Apparel Group Ltd.* | | | 270,578 | |
| 9,660 | | Grand Canyon Education, Inc.* | | | 736,913 | |
| 17,975 | | Steven Madden Ltd. | | | 417,559 | |
| 50,650 | | Taylor Morrison Home Corp., Class A* | | | 557,150 | |
| 77,044 | | Tilly’s, Inc., Class A | | | 318,192 | |
| 14,940 | | Universal Electronics, Inc.* | | | 573,248 | |
| 113,190 | | ZAGG, Inc.* | | | 352,021 | |
| | | | | | |
| | | | | 3,599,135 | |
| | | | | | |
Consumer Staples — 3.61% | | | | |
| 61,460 | | Hostess Brands, Inc.* | | | 655,164 | |
| 11,440 | | John B Sanfilippo & Son, Inc. | | | 1,022,736 | |
| | | | | | |
| | | | | 1,677,900 | |
| | | | | | |
Energy — 2.53% | | | | |
| 34,460 | | Delek US Holdings, Inc. | | | 543,090 | |
| 103,500 | | Magnolia Oil & Gas Corp., Class A* | | | 414,000 | |
| 30,890 | | Par Pacific Holdings, Inc.* | | | 219,319 | |
| | | | | | |
| | | | | 1,176,409 | |
| | | | | | |
Financials — 27.70% | | | | |
| 11,690 | | American Financial Group, Inc. | | | 819,235 | |
| 15,310 | | Amerisafe, Inc. | | | 987,036 | |
| 30,660 | | CenterState Bank Corp. | | | 528,272 | |
| 20,030 | | Columbia Banking System, Inc. | | | 536,804 | |
| 12,730 | | Community Bank System, Inc. | | | 748,524 | |
| 101,608 | | Compass Diversified Holdings LP | | | 1,361,547 | |
| 43,270 | | First Busey Corp. | | | 740,350 | |
| 36,090 | | Heritage Financial Corp. | | | 721,800 | |
| 29,570 | | Hilltop Holdings, Inc. | | | 447,098 | |
| 11,040 | | Independent Bank Group, Inc. | | | 261,427 | |
| 31,090 | | Mercantile Bank Corp. | | | 658,175 | |
| 15,547 | | Northrim BanCorp, Inc. | | | 419,769 | |
| 24,115 | | Pacific Premier Bancorp, Inc. | | | 454,327 | |
| 8,860 | | Reinsurance Group of America, Inc. | | | 745,480 | |
| 26,010 | | Sterling Bancorp | | | 271,805 | |
| 12,820 | | Stock Yards Bancorp, Inc. | | | 370,883 | |
| 32,650 | | TCF Financial Corp. | | | 739,849 | |
| 20,480 | | TriCo Bancshares | | | 610,714 | |
| 8,200 | | Triumph Bancorp, Inc.* | | | 213,200 | |
33
|
SCHEDULE OF PORTFOLIO INVESTMENTS |
RBC SMID Cap Growth Fund (cont.)
March 31, 2020 (Unaudited)
| | | | | | |
| Shares | | | | Value | |
| 48,830 | | United Community Banks, Inc. | | $ | 894,077 | |
| 13,670 | | WSFS Financial Corp. | | | 340,656 | |
| | | | | | |
| | | | | 12,871,028 | |
| | | | | | |
Health Care — 5.77% | |
| 17,352 | | Emergent BioSolutions, Inc.* | | | 1,003,987 | |
| 16,260 | | Globus Medical, Inc., Class A* | | | 691,538 | |
| 53,640 | | Invacare Corp. | | | 398,545 | |
| 31,290 | | Lantheus Holdings, Inc.* | | | 399,260 | |
| 16,050 | | MEDNAX, Inc.* | | | 186,822 | |
| | | | | | |
| | | | | 2,680,152 | |
| | | | | | |
Industrials — 14.58% | |
| 149,268 | | ACCO Brands Corp. | | | 753,803 | |
| 30,130 | | BMC Stock Holdings, Inc.* | | | 534,205 | |
| 16,530 | | Casella Waste Systems, Inc., Class A* | | | 645,662 | |
| 48,880 | | Columbus McKinnon Corp. | | | 1,222,000 | |
| 18,909 | | Ducommun, Inc.* | | | 469,889 | |
| 8,890 | | EnerSys | | | 440,233 | |
| 34,225 | | Greenbrier Cos., Inc. (The) | | | 607,151 | |
| 7,650 | | Herman Miller, Inc. | | | 169,830 | |
| 14,100 | | Kennametal, Inc. | | | 262,542 | |
| 5,755 | | Kirby Corp.* | | | 250,170 | |
| 40,366 | | Marten Transport Ltd. | | | 828,310 | |
| 33,000 | | NN, Inc. | | | 57,090 | |
| 18,970 | | Patrick Industries, Inc. | | | 534,195 | |
| | | | | | |
| | | | | 6,775,080 | |
| | | | | | |
Information Technology — 8.47% | |
| 41,470 | | AXT, Inc.* | | | 133,119 | |
| 2,290 | | Coherent, Inc.* | | | 243,679 | |
| 19,840 | | Cohu, Inc. | | | 245,619 | |
| 18,520 | | Model N, Inc.* | | | 411,329 | |
| 7,860 | | Novanta, Inc.* | | | 627,857 | |
| 20,097 | | PC Connection, Inc. | | | 828,197 | |
| 30,025 | | Sapiens International Corp. NV | | | 571,076 | |
| 61,000 | | Viavi Solutions, Inc.* | | | 683,810 | |
| 9,640 | | Vishay Precision Group, Inc.* | | | 193,571 | |
| | | | | | |
| | | | | 3,938,257 | |
| | | | | | |
Materials — 5.00% | |
| 53,770 | | FutureFuel Corp. | | | 605,988 | |
| 8,390 | | Kaiser Aluminum Corp. | | | 581,259 | |
| 19,059 | | Koppers Holdings, Inc.* | | | 235,760 | |
| 10,270 | | Reliance Steel & Aluminum Co. | | | 899,549 | |
| | | | | | |
| | | | | 2,322,556 | |
| | | | | | |
Real Estate — 10.49% | | | | |
| 84,210 | | Braemar Hotels & Resorts, Inc., REIT | | | 143,157 | |
| 42,540 | | CatchMark Timber Trust, Inc., REIT, Class A | | | 307,139 | |
34
|
SCHEDULE OF PORTFOLIO INVESTMENTS |
RBC Small Cap Value Fund (cont.)
March 31, 2020 (Unaudited)
| | | | | | | | |
| Shares | | | | | Value | |
| | 30,130 | | | Columbia Property Trust, Inc., REIT | | $ | 376,625 | |
| | 14,009 | | | Community Healthcare Trust, Inc., REIT | | | 536,264 | |
| | 18,710 | | | CubeSmart, REIT | | | 501,241 | |
| | 60,540 | | | DiamondRock Hospitality Co., REIT | | | 307,543 | |
| | 5,010 | | | EastGroup Properties, Inc., REIT | | | 523,445 | |
| | 10,934 | | | National Storage Affiliates Trust, REIT | | | 323,646 | |
| | 31,680 | | | Physicians Realty Trust, REIT | | | 441,619 | |
| | 25,540 | | | STAG Industrial, Inc., REIT | | | 575,161 | |
| | 4,920 | | | Terreno Realty Corp., REIT | | | 254,610 | |
| | 53,859 | | | UMH Properties, Inc., REIT | | | 584,909 | |
| | | | | | | | |
| | | | | | | 4,875,359 | |
| | | | | | | | |
| | Utilities — 8.37% | | | | |
| | 24,690 | | | Portland General Electric Co. | | | 1,183,639 | |
| | 17,260 | | | Southwest Gas Holdings, Inc. | | | 1,200,605 | |
| | 20,188 | | | Spire, Inc. | | | 1,503,602 | |
| | | | | | | | |
| | | | | | | 3,887,846 | |
| | | | | | | | |
| |
| | Total Common Stocks | | | 44,878,976 | |
| | | | | | | | |
| | (Cost $64,429,542) | | | | |
| |
| | Investment Company — 2.79% | | | | |
| | 1,298,147 | | | U.S. Government Money Market Fund,
RBC Institutional Class 1(a) | | | 1,298,147 | |
| | | | | | | | |
| |
| | Total Investment Company | | | 1,298,147 | |
| | | | | | | | |
| | (Cost $1,298,147) | | | | |
| |
| | Total Investments | | $ | 46,177,123 | |
| | (Cost $65,727,689)(b) — 99.36% | | | | |
| |
| | Other assets in excess of liabilities — 0.64% | | | 297,233 | |
| | | | | | | | |
| |
| | NET ASSETS — 100.00% | | $ | 46,474,356 | |
| | | | | | | | |
| * | Non-income producing security. |
| (a) | Affiliated investment. |
| (b) | See Notes to Schedules of Portfolio Investments for the tax cost of securities and the breakdown of unrealized appreciation (depreciation). |
Abbreviations used are defined below:
REIT - Real Estate Investment Trust
See Notes to the Financial Statements.
35
Statements of Assets and Liabilities
March 31, 2020 (Unaudited)
| | | | | | | | | | | | |
| | | RBC SMID Cap
Growth Fund | | | RBC Enterprise
Fund | | | RBC Small Cap
Core Fund | |
Assets: | | | | | | | | | | | | |
Investments in securities, at value: | | | | | | | | | | | | |
Unaffiliated investments (cost $72,076,282, $39,802,360 and $53,681,124, respectively) | | $ | 76,098,112 | | | $ | 45,230,723 | | | $ | 59,486,193 | |
Affiliated investments (cost $1,007,732, $986,594 and $648,015, respectively) | | | 1,007,732 | | | | 986,594 | | | | 648,015 | |
Cash | | | 29,787 | | | | — | | | | — | |
Interest and dividend receivable | | | 20,428 | | | | 12,894 | | | | 37,046 | |
Receivable for capital shares issued | | | 143,317 | | | | — | | | | 26,960 | |
Receivable for investments sold | | | — | | | | 107,968 | | | | 261,830 | |
Prepaid expenses and other assets | | | 23,003 | | | | 17,717 | | | | 27,975 | |
| | | | | | | | | | | | |
| | | |
Total Assets | | | 77,322,379 | | | | 46,355,896 | | | | 60,488,019 | |
| | | | | | | | | | | | |
Liabilities: | | | | | | | | | | | | |
Foreign withholding tax payable | | | 4,298 | | | | 4,354 | | | | 4,184 | |
Payable for capital shares redeemed | | | 12,014 | | | | — | | | | 7,632 | |
Payable for investments purchased | | | 716,280 | | | | 62,777 | | | | 180,278 | |
Accrued expenses and other payables: | | | | | | | | | | | | |
Investment advisory fees | | | 21,256 | | | | 24,408 | | | | 21,961 | |
Accounting fees | | | 2,375 | | | | 2,250 | | | | 2,323 | |
Audit fees | | | 18,056 | | | | 18,056 | | | | 18,056 | |
Trustees’ fees | | | 422 | | | | 471 | | | | 1,537 | |
Distribution fees | | | 14,348 | | | | 20 | | | | 1,284 | |
Custodian fees | | | 851 | | | | 1,204 | | | | 2,744 | |
Shareholder reports | | | 5,568 | | | | — | | | | 3,989 | |
Transfer agent fees | | | 42,964 | | | | 9,274 | | | | 41,996 | |
Other | | | 5,691 | | | | 3,118 | | | | 14,793 | |
| | | | | | | | | | | | |
| | | |
Total Liabilities | | | 844,123 | | | | 125,932 | | | | 300,777 | |
| | | | | | | | | | | | |
| | | |
Net Assets | | $ | 76,478,256 | | | $ | 46,229,964 | | | $ | 60,187,242 | |
| | | | | | | | | | | | |
Net Assets Consists of: | | | | | | | | | | | | |
Capital | | $ | 71,798,479 | | | $ | 37,975,323 | | | $ | 38,278,292 | |
Accumulated earnings | | | 4,679,777 | | | | 8,254,641 | | | | 21,908,950 | |
| | | | | | | | | | | | |
| | | |
Net Assets | | $ | 76,478,256 | | | $ | 46,229,964 | | | $ | 60,187,242 | |
| | | | | | | | | | | | |
36
Statements of Assets and Liabilities (cont.)
March 31, 2020 (Unaudited)
| | | | | | | | | | | | |
| | | RBC SMID Cap
Growth Fund | | | RBC Enterprise
Fund | | | RBC Small Cap
Core Fund | |
Net Assets | | | | | | | | | | | | |
Class A | | $ | 9,530,382 | | | $ | 502,632 | | | $ | 4,848,787 | |
Class I | | | 66,936,248 | | | | 45,727,332 | | | | 55,321,231 | |
Class R6 | | | 11,626 | | | | N/A | | | | 17,224 | |
| | | | | | | | | | | | |
| | | |
Total | | $ | 76,478,256 | | | $ | 46,229,964 | | | $ | 60,187,242 | |
| | | | | | | | | | | | |
Shares Outstanding (Unlimited number of shares authorized, no par value): | | | | | | | | | | | | |
Class A | | | 966,324 | | | | 42,324 | | | | 243,950 | |
Class I | | | 5,815,997 | | | | 3,639,976 | | | | 2,633,871 | |
Class R6 | | | 1,008 | | | | N/A | | | | 819 | |
| | | | | | | | | | | | |
| | | |
Total | | | 6,783,329 | | | | 3,682,300 | | | | 2,878,640 | |
| | | | | | | | | | | | |
Net Asset Values and Redemption Prices Per Share: | | | | | | | | | | | | |
Class A(a) | | $ | 9.86 | | | $ | 11.88 | | | $ | 19.88 | |
| | | | | | | | | | | | |
| | | |
Class I | | $ | 11.51 | | | $ | 12.56 | | | $ | 21.00 | |
| | | | | | | | | | | | |
| | | |
Class R6 | | $ | 11.53 | (b) | | $ | N/A | | | $ | 21.03 | |
| | | | | | | | | | | | |
Maximum Offering Price Per Share: | | | | | | | | | | | | |
| | | |
Class A | | $ | 10.46 | | | $ | 12.60 | | | $ | 21.09 | |
| | | | | | | | | | | | |
| | | |
Maximum Sales Charge - Class A | | | 5.75 | % | | | 5.75 | % | | | 5.75 | % |
| | | | | | | | | | | | |
| (a) | For Class A shares, redemption price per share will be reduced by 1.00% for sales of shares within 12 months of purchase (only applicable on purchases of $1 million or more on which no initial sales charge was paid). Such reduction is not reflected in the net asset value and the redemption price per share. |
| (b) | Net asset value is calculated using unrounded net assets of $11,626.12 divided by the unrounded shares outstanding of 1,007.822. |
37
Statements of Assets and Liabilities (cont.)
March 31, 2020 (Unaudited)
| | | | | | | | |
| | | RBC Microcap
Value Fund | | | RBC Small Cap
Value Fund | |
Assets: | | | | | | | | |
Investments in securities, at value: | | | | | | | | |
Unaffiliated investments (cost $92,858,617 and $64,429,542, respectively) | | $ | 74,584,555 | | | $ | 44,878,976 | |
Affiliated investments (cost $4,597,695 and $1,298,147, respectively) | | | 4,597,695 | | | | 1,298,147 | |
Cash | | | 37,800 | | | | — | |
Interest and dividend receivable | | | 130,536 | | | | 58,662 | |
Receivable for capital shares issued | | | 50,172 | | | | 340,297 | |
Prepaid expenses and other assets | | | 34,425 | | | | 43,242 | |
| | | | | | | | |
| | |
Total Assets | | | 79,435,183 | | | | 46,619,324 | |
| | | | | | | | |
Liabilities: | | | | | | | | |
Foreign withholding tax payable | | | 5,044 | | | | 4,271 | |
Payable for capital shares redeemed | | | 54,495 | | | | 64,708 | |
Accrued expenses and other payables: | | | | | | | | |
Investment advisory fees | | | 48,148 | | | | 16,744 | |
Accounting fees | | | 2,407 | | | | 2,260 | |
Audit fees | | | 18,056 | | | | 18,056 | |
Trustees’ fees | | | 745 | | | | 1,035 | |
Distribution fees | | | 2,562 | | | | — | |
Custodian fees | | | — | | | | 1,277 | |
Shareholder reports | | | — | | | | 5,132 | |
Transfer agent fees | | | 18,100 | | | | 21,080 | |
Other | | | 4,620 | | | | 10,405 | |
| | | | | | | | |
| | |
Total Liabilities | | | 154,177 | | | | 144,968 | |
| | | | | | | | |
| | |
Net Assets | | $ | 79,281,006 | | | $ | 46,474,356 | |
| | | | | | | | |
Net Assets Consists of: | | | | | | | | |
Capital | | $ | 92,250,631 | | | $ | 79,532,278 | |
Accumulated earnings | | | (12,969,625 | ) | | | (33,057,922 | ) |
| | | | | | | | |
| | |
Net Assets | | $ | 79,281,006 | | | $ | 46,474,356 | |
| | | | | | | | |
38
Statements of Assets and Liabilities (cont.)
March 31, 2020 (Unaudited)
| | | | | | | | |
| | | RBC Microcap
Value Fund | | | RBC Small Cap
Value Fund | |
Net Assets | | | | | | | | |
Class A | | $ | 2,038,422 | | | $ | N/A | |
Class I | | | 77,242,584 | | | | 41,294,056 | |
Class R6 | | | N/A | | | | 5,180,300 | |
| | | | | | | | |
| | |
Total | | $ | 79,281,006 | | | $ | 46,474,356 | |
| | | | | | | | |
Shares Outstanding (Unlimited number of shares authorized, no par value): | | | | | | | | |
Class A | | | 118,762 | | | | N/A | |
Class I | | | 4,503,371 | | | | 4,851,257 | |
Class R6 | | | N/A | | | | 604,868 | |
| | | | | | | | |
| | |
Total | | | 4,622,133 | | | | 5,456,125 | |
| | | | | | | | |
Net Asset Values and Redemption Prices Per Share: | | | | | | | | |
Class A(a) | | $ | 17.16 | | | $ | N/A | |
| | | | | | | | |
| | |
Class I | | $ | 17.15 | | | $ | 8.51 | |
| | | | | | | | |
| | |
Class R6 | | $ | N/A | | | $ | 8.56 | |
| | | | | | | | |
Maximum Offering Price Per Share: | | | | | | | | |
| | |
Class A | | $ | 18.21 | | | $ | N/A | |
| | | | | | | | |
| | |
Maximum Sales Charge - Class A | | | 5.75 | % | | | N/A | |
| | | | | | | | |
| (a) | For Class A shares, redemption price per share will be reduced by 1.00% for sales of shares within 12 months of purchase (only applicable on purchases of $1 million or more on which no initial sales charge was paid). Such reduction is not reflected in the net asset value and the redemption price per share. |
See Notes to the Financial Statements.
39
Statements of Operations
For the Six Months Ended March 31, 2020
(Unaudited)
| | | | | | | | | | | | |
| | | RBC SMID Cap
Growth Fund | | | RBC Enterprise
Fund | | | RBC Small Cap
Core Fund | |
Investment Income: | | | | | | | | | | | | |
Interest income | | $ | 12,976 | | | $ | 7,676 | | | $ | 15,342 | |
Dividend income - unaffiliated | | | 315,529 | | | | 373,906 | | | | 781,253 | |
Dividend income - affiliated | | | 13,010 | | | | 7,688 | | | | 15,374 | |
| | | | | | | | | | | | |
| | | |
Total Investment Income | | | 341,515 | | | | 389,270 | | | | 811,969 | |
Expenses: | | | | | | | | | | | | |
Investment advisory fees | | | 335,666 | | | | 316,073 | | | | 541,137 | |
Distribution fees–Class A | | | 15,092 | | | | 931 | | | | 8,740 | |
Accounting fees | | | 18,076 | | | | 16,920 | | | | 19,397 | |
Audit fees | | | 16,529 | | | | 16,529 | | | | 16,529 | |
Custodian fees | | | 1,552 | | | | 2,283 | | | | 4,442 | |
Insurance fees | | | 2,000 | | | | 2,000 | | | | 2,000 | |
Legal fees | | | 4,002 | | | | 3,148 | | | | 7,993 | |
Registrations and filing fees | | | 28,242 | | | | 19,473 | | | | 28,438 | |
Shareholder reports | | | 12,948 | | | | 17,696 | | | | 19,786 | |
Transfer agent fees–Class A | | | 13,563 | | | | 2,728 | | | | 8,640 | |
Transfer agent fees–Class I | | | 83,942 | | | | 39,947 | | | | 92,758 | |
Transfer agent fees–Class R6 | | | 1,918 | | | | — | | | | 1,941 | |
Trustees’ fees and expenses | | | 3,885 | | | | 2,927 | | | | 6,386 | |
Tax expense | | | 2,360 | | | | 2,251 | | | | 2,580 | |
Other fees | | | 3,541 | | | | 3,004 | | | | 4,567 | |
| | | | | | | | | | | | |
| | | |
Total expenses before fee waiver/reimbursement | | | 543,316 | | | | 445,910 | | | | 765,334 | |
Expenses waived/reimbursed by: | | | | | | | | | | | | |
Advisor | | | (135,018 | ) | | | (83,691 | ) | | | (183,630 | ) |
| | | | | | | | | | | | |
| | | |
Net expenses | | | 408,298 | | | | 362,219 | | | | 581,704 | |
| | | | | | | | | | | | |
| | | |
Net Investment Income (Loss) | | | (66,783 | ) | | | 27,051 | | | | 230,265 | |
| | | | | | | | | | | | |
Realized/Unrealized Gains/(Losses): | | | | | | | | | | | | |
Net realized gains from investment transactions | | | 1,153,786 | | | | 4,468,171 | | | | 21,044,936 | |
Net change in unrealized depreciation on investments | | | (17,967,224 | ) | | | (22,180,308 | ) | | | (42,397,057 | ) |
| | | | | | | | | | | | |
| | | |
Net realized/unrealized losses | | | (16,813,438 | ) | | | (17,712,137 | ) | | | (21,352,121 | ) |
| | | | | | | | | | | | |
| | | |
Change in net assets resulting from operations | | $ | (16,880,221 | ) | | $ | (17,685,086 | ) | | $ | (21,121,856 | ) |
| | | | | | | | | | | | |
40
|
FINANCIAL STATEMENTS |
Statements of Operations (cont.) |
For the Six Months Ended March 31, 2020 (Unaudited)
| | | | | | | | |
| | | RBC Microcap
Value Fund | | | RBC Small Cap
Value Fund | |
Investment Income: | | | | | | | | |
Interest income | | $ | 33,873 | | | $ | 9,559 | |
Dividend income - unaffiliated | | | 934,732 | | | | 555,307 | |
Dividend income - affiliated | | | 27,473 | | | | 9,560 | |
Foreign tax withholding | | | (1,203 | ) | | | — | |
| | | | | | | | |
| | |
Total Investment Income | | | 994,875 | | | | 574,426 | |
Expenses: | | | | | | | | |
Investment advisory fees | | | 510,650 | | | | 225,099 | |
Distribution fees–Class A | | | 4,183 | | | | — | |
Accounting fees | | | 26,636 | | | | 17,310 | |
Audit fees | | | 16,529 | | | | 16,529 | |
Custodian fees | | | 796 | | | | 4,555 | |
Insurance fees | | | 2,000 | | | | 2,001 | |
Legal fees | | | 5,196 | | | | 5,919 | |
Registrations and filing fees | | | 20,042 | | | | 20,464 | |
Shareholder reports | | | 22,149 | | | | 16,745 | |
Transfer agent fees–Class A | | | 6,995 | | | | — | |
Transfer agent fees–Class I | | | 74,608 | | | | 45,819 | |
Transfer agent fees–Class R6 | | | — | | | | 1,969 | |
Trustees’ fees and expenses | | | 4,893 | | | | 3,302 | |
Tax expense | | | 1,983 | | | | 2,340 | |
Other fees | | | 3,568 | | | | 3,108 | |
| | | | | | | | |
| | |
Total expenses before fee waiver/reimbursement | | | 700,228 | | | | 365,160 | |
Expenses waived/reimbursed by: | | | | | | | | |
Advisor | | | (88,939 | ) | | | (93,629 | ) |
| | | | | | | | |
| | |
Net expenses | | | 611,289 | | | | 271,531 | |
| | | | | | | | |
| | |
Net Investment Income | | | 383,586 | | | | 302,895 | |
| | | | | | | | |
Realized/Unrealized Gains/(Losses): | | | | | | | | |
Net realized gains/(losses) from investment transactions | | | 6,519,394 | | | | (1,484,416 | ) |
Net change in unrealized depreciation on investments | | | (43,443,719 | ) | | | (20,753,365 | ) |
| | | | | | | | |
| | |
Net realized/unrealized losses | | | (36,924,325 | ) | | | (22,237,781 | ) |
| | | | | | | | |
| | |
Change in net assets resulting from operations | | $ | (36,540,739 | ) | | $ | (21,934,886 | ) |
| | | | | | | | |
See Notes to the Financial Statements.
41
|
FINANCIAL STATEMENTS |
Statements of Changes in Net Assets |
| | | | | | | | | | | | | | | | |
| | | RBC SMID Cap Growth Fund | |
| | | For the Six Months Ended
March 31, 2020
(Unaudited) | | | | | For the
Year Ended
September 30, 2019 | |
From Investment Activities | | | | | | | | | | | | | | | | |
Operations: | | | | | | | | | | | | | | | | |
Net investment loss | | | | $ | (66,783) | | | | | | | | | $ | (269,213) | |
Net realized gains from investments | | | | | 1,153,786 | | | | | | | | | | 7,014,406 | |
Net change in unrealized depreciation on investments | | | | | (17,967,224 | ) | | | | | | | | | (5,964,386 | ) |
| | | | | | | | | | | | | | | | |
| | | | | |
Change in net assets resulting from operations | | | | | (16,880,221 | ) | | | | | | | | | 780,807 | |
| | | | | | | | | | | | | | | | |
Distributions to Shareholders: | | | | | | | | | | | | | | | | |
Class A | | | | | (997,220 | ) | | | | | | | | | (985,499 | ) |
Class I | | | | | (6,014,674 | ) | | | | | | | | | (5,713,741 | ) |
Class R6 | | | | | (1,031 | ) | | | | | | | | | (955 | ) |
| | | | | | | | | | | | | | | | |
| | | | | |
Change in net assets resulting from shareholder distributions | | | | | (7,012,925 | ) | | | | | | | | | (6,700,195 | ) |
| | | | | | | | | | | | | | | | |
Capital Transactions: | | | | | | | | | | | | | | | | |
Proceeds from shares issued | | | | | 12,013,824 | | | | | | | | | | 15,720,473 | |
Distributions reinvested | | | | | 6,994,739 | | | | | | | | | | 6,687,727 | |
Cost of shares redeemed | | | | | (11,903,677 | ) | | | | | | | | | (19,639,972 | ) |
| | | | | | | | | | | | | | | | |
| | | | | |
Change in net assets resulting from capital transactions | | | | | 7,104,886 | | | | | | | | | | 2,768,228 | |
| | | | | | | | | | | | | | | | |
Net decrease in net assets | | | | | (16,788,260 | ) | | | | | | | | | (3,151,160 | ) |
Net Assets: | | | | | | | | | | | | | | | | |
Beginning of period | | | | | 93,266,516 | | | | | | | | | | 96,417,676 | |
| | | | | | | | | | | | | | | | |
| | | | | |
End of period | | | | $ | 76,478,256 | | | | | | | | | $ | 93,266,516 | |
| | | | | | | | | | | | | | | | |
Share Transactions: | | | | | | | | | | | | | | | | |
Issued | | | | | 841,322 | | | | | | | | | | 1,125,695 | |
Reinvested | | | | | 478,885 | | | | | | | | | | 577,278 | |
Redeemed | | | | | (869,728 | ) | | | | | | | | | (1,381,438 | ) |
| | | | | | | | | | | | | | | | |
| | | | | |
Change in shares resulting from capital transactions | | | | | 450,479 | | | | | | | | | | 321,535 | |
| | | | | | | | | | | | | | | | |
See Notes to the Financial Statements.
42
|
FINANCIAL STATEMENTS |
Statements of Changes in Net Assets |
| | | | | | | | | | | | | | |
| | | RBC Enterprise Fund | |
| | | For the Six Months Ended
March 31, 2020
(Unaudited) | | | | | For the Year Ended
September 30, 2019 | |
From Investment Activities | | | | | | | | | | | | | | |
Operations: | | | | | | | | | | | | | | |
Net investment income/(loss) | | | | $ | 27,051 | | | | | | | $ | (39,259 | ) |
Net realized gains from investments | | | | | 4,468,171 | | | | | | | | 4,661,242 | |
Net change in unrealized depreciation on investments | | | | | (22,180,308 | ) | | | | | | | (14,775,845 | ) |
| | | | | | | | | | | | | | |
| | | | | |
Change in net assets resulting from operations | | | | | (17,685,086 | ) | | | | | | | (10,153,862 | ) |
| | | | | | | | | | | | | | |
Distributions to Shareholders: | | | | | | | | | | | | | | |
Class A | | | | | (51,458 | ) | | | | | | | (142,776 | ) |
Class I | | | | | (4,545,146 | ) | | | | | | | (8,792,654 | ) |
| | | | | | | | | | | | | | |
| | | | | |
Change in net assets resulting from shareholder distributions | | | | | (4,596,604 | ) | | | | | | | (8,935,430 | ) |
| | | | | | | | | | | | | | |
Capital Transactions: | | | | | | | | | | | | | | |
Proceeds from shares issued | | | | | 162,792 | | | | | | | | 676,918 | |
Distributions reinvested | | | | | 4,204,758 | | | | | | | | 8,231,031 | |
Cost of shares redeemed | | | | | (4,765,111 | ) | | | | | | | (7,422,671 | ) |
| | | | | | | | | | | | | | |
| | | | | |
Change in net assets resulting from capital transactions | | | | | (397,561 | ) | | | | | | | 1,485,278 | |
| | | | | | | | | | | | | | |
Net decrease in net assets | | | | | (22,679,251 | ) | | | | | | | (17,604,014 | ) |
Net Assets: | | | | | | | | | | | | | | |
Beginning of period | | | | | 68,909,215 | | | | | | | | 86,513,229 | |
| | | | | | | | | | | | | | |
| | | | | |
End of period | | | | $ | 46,229,964 | | | | | | | $ | 68,909,215 | |
| | | | | | | | | | | | | | |
Share Transactions: | | | | | | | | | | | | | | |
Issued | | | | | 9,496 | | | | | | | | 33,714 | |
Reinvested | | | | | 220,635 | | | | | | | | 537,376 | |
Redeemed | | | | | (270,637 | ) | | | | | | | (397,569 | ) |
| | | | | | | | | | | | | | |
| | | | | |
Change in shares resulting from capital transactions | | | | | (40,506 | ) | | | | | | | 173,521 | |
| | | | | | | | | | | | | | |
See Notes to the Financial Statements.
43
Statements of Changes in Net Assets
| | | | | | | | | | | | |
| | | RBC Small Cap Core Fund | |
| | | For the Six Months Ended March 31, 2020 (Unaudited) | | | For the Year Ended September 30, 2019 | |
From Investment Activities | | | | | | | | | | | | |
Operations: | | | | | | | | | | | | |
Net investment income | | | | $ | 230,265 | | | | | $ | 156,232 | |
Net realized gains from investments | | | | | 21,044,936 | | | | | | 8,284,197 | |
Net change in unrealized depreciation on investments | | | | | (42,397,057 | ) | | | | | (50,210,190 | ) |
| | | | | | | | | | | | |
| | | | |
Change in net assets resulting from operations | | | | | (21,121,856 | ) | | | | | (41,769,761 | ) |
| | | | | | | | | | | | |
| | | | |
Distributions to Shareholders: | | | | | | | | | | | | |
Class A | | | | | (371,626 | ) | | | | | (928,473 | ) |
Class I | | | | | (6,238,305 | ) | | | | | (20,302,793 | ) |
Class R6 | | | | | (1,783 | ) | | | | | (8,302 | ) |
| | | | | | | | | | | | |
| | | | |
Change in net assets resulting from shareholder distributions | | | | | (6,611,714 | ) | | | | | (21,239,568 | ) |
| | | | | | | | | | | | |
| | | | |
Capital Transactions: | | | | | | | | | | | | |
Proceeds from shares issued | | | | | 8,550,458 | | | | | | 18,862,361 | |
Distributions reinvested | | | | | 6,458,914 | | | | | | 20,827,321 | |
Cost of shares redeemed | | | | | (70,199,679 | ) | | | | | (95,351,191 | ) |
| | | | | | | | | | | | |
| | | | |
Change in net assets resulting from capital transactions | | | | | (55,190,307 | ) | | | | | (55,661,509 | ) |
| | | | | | | | | | | | |
| | | | |
Net decrease in net assets | | | | | (82,923,877 | ) | | | | | (118,670,838 | ) |
Net Assets: | | | | | | | | | | | | |
Beginning of period | | | | | 143,111,119 | | | | | | 261,781,957 | |
| | | | | | | | | | | | |
| | | | |
End of period | | | | $ | 60,187,242 | | | | | $ | 143,111,119 | |
| | | | | | | | | | | | |
| | | | |
Share Transactions: | | | | | | | | | | | | |
Issued | | | | | 278,500 | | | | | | 607,712 | |
Reinvested | | | | | 199,802 | | | | | | 794,304 | |
Redeemed | | | | | (2,273,413 | ) | | | | | (3,016,688 | ) |
| | | | | | | | | | | | |
| | | | |
Change in shares resulting from capital transactions | | | | | (1,795,111 | ) | | | | | (1,614,672 | ) |
| | | | | | | | | | | | |
See Notes to the Financial Statements.
44
Statements of Changes in Net Assets
| | | | | | | | | | | | |
| | | RBC Microcap Value Fund | |
| | | For the
Six Months Ended
March 31, 2020
(Unaudited) | | | For the
Year Ended
September 30, 2019 | |
From Investment Activities | | | | | | | | | | | | |
Operations: | | | | | | | | | | | | |
Net investment income | | | | $ | 383,586 | | | | | $ | 1,299,432 | |
Net realized gains from investments | | | | | 6,519,394 | | | | | | 6,777,595 | |
Net change in unrealized depreciation on investments | | | | | (43,443,719 | ) | | | | | (18,371,918 | ) |
| | | | | | | | | | | | |
| | | | |
Change in net assets resulting from operations | | | | | (36,540,739 | ) | | | | | (10,294,891 | ) |
| | | | | | | | | | | | |
| | | | |
Distributions to Shareholders: | | | | | | | | | | | | |
Class A | | | | | (216,383 | ) | | | | | (524,523 | ) |
Class I | | | | | (7,334,605 | ) | | | | | (11,298,153 | ) |
| | | | | | | | | | | | |
| | | | |
Change in net assets resulting from shareholder distributions | | | | | (7,550,988 | ) | | | | | (11,822,676 | ) |
| | | | | | | | | | | | |
| | | | |
Capital Transactions: | | | | | | | | | | | | |
Proceeds from shares issued | | | | | 10,185,384 | | | | | | 10,087,917 | |
Distributions reinvested | | | | | 6,833,581 | | | | | | 10,646,818 | |
Cost of shares redeemed | | | | | (10,163,378 | ) | | | | | (18,732,119 | ) |
| | | | | | | | | | | | |
| | | | |
Change in net assets resulting from capital transactions | | | | | 6,855,587 | | | | | | 2,002,616 | |
| | | | | | | | | | | | |
| | | | |
Net decrease in net assets | | | | | (37,236,140 | ) | | | | | (20,114,951 | ) |
Net Assets: | | | | | | | | | | | | |
Beginning of period | | | | | 116,517,146 | | | | | | 136,632,097 | |
| | | | | | | | | | | | |
| | | | |
End of period | | | | $ | 79,281,006 | | | | | $ | 116,517,146 | |
| | | | | | | | | | | | |
| | | | |
Share Transactions: | | | | | | | | | | | | |
Issued | | | | | 414,050 | | | | | | 384,167 | |
Reinvested | | | | | 257,668 | | | | | | 457,315 | |
Redeemed | | | | | (438,917 | ) | | | | | (720,720 | ) |
| | | | | | | | | | | | |
| | | | |
Change in shares resulting from capital transactions | | | | | 232,801 | | | | | | 120,762 | |
| | | | | | | | | | | | |
See Notes to the Financial Statements.
45
Statements of Changes in Net Assets
| | | | | | | | | | | | |
| | | RBC Small Cap Value Fund | |
| | | For the Six Months Ended
March 31, 2020
(Unaudited) | | | For the Year Ended
September 30, 2019 | |
From Investment Activities | | | | | | | | | | | | |
Operations: | | | | | | | | | | | | |
Net investment income | | | | $ | 302,895 | | | | | $ | 1,071,608 | |
Net realized losses from investments | | | | | (1,484,416 | ) | | | | | (11,346,761 | ) |
Net change in unrealized depreciation on investments | | | | | (20,753,365 | ) | | | | | (5,459,617 | ) |
| | | | | | | | | | | | |
| | | | |
Change in net assets resulting from operations | | | | | (21,934,886 | ) | | | | | (15,734,770 | ) |
| | | | | | | | | | | | |
| | | | |
Distributions to Shareholders: | | | | | | | | | | | | |
Class I | | | | | (767,953 | ) | | | | | (3,592,109 | ) |
Class R6 | | | | | (98,525 | ) | | | | | (225,065 | ) |
| | | | | | | | | | | | |
| | | | |
Change in net assets resulting from shareholder distributions | | | | | (866,478 | ) | | | | | (3,817,174 | ) |
| | | | | | | | | | | | |
| | | | |
Capital Transactions: | | | | | | | | | | | | |
Proceeds from shares issued | | | | | 19,036,730 | | | | | | 58,236,591 | |
Distributions reinvested | | | | | 385,721 | | | | | | 2,500,140 | |
Cost of shares redeemed | | | | | (13,110,957 | ) | | | | | (131,441,798 | ) |
| | | | | | | | | | | | |
| | | | |
Change in net assets resulting from capital transactions | | | | | 6,311,494 | | | | | | (70,705,067 | ) |
| | | | | | | | | | | | |
| | | | |
Net decrease in net assets | | | | | (16,489,870 | ) | | | | | (90,257,011 | ) |
Net Assets: | | | | | | | | | | | | |
Beginning of period | | | | | 62,964,226 | | | | | | 153,221,237 | |
| | | | | | | | | | | | |
| | | | |
End of period | | | | $ | 46,474,356 | | | | | $ | 62,964,226 | |
| | | | | | | | | | | | |
| | | | |
Share Transactions: | | | | | | | | | | | | |
Issued | | | | | 1,594,429 | | | | | | 5,045,518 | |
Reinvested | | | | | 29,182 | | | | | | 244,503 | |
Redeemed | | | | | (1,309,529 | ) | | | | | (11,386,517 | ) |
| | | | | | | | | | | | |
| | | | |
Change in shares resulting from capital transactions | | | | | 314,082 | | | | | | (6,096,496 | ) |
| | | | | | | | | | | | |
See Notes to the Financial Statements.
46
RBC SMID Cap Growth Fund
(Selected data for a share outstanding throughout the periods indicated)
| | | | | | | | | | | | | | | | | | | | | | | | | | | | | | | | | | | | |
| | | | | | Investment Activities | | | Distributions | | | | |
| | | Net Asset
Value,
Beginning
of Period | | | Net
Investment
Loss(a) | | | Net Realized
and Unrealized
Gains (Losses)
on Investments | | | Redemption
Fees | | | Total from
Investment
Activities | | | Net
Investment
Income | | | Net
Realized
Gains | | | Total
Distributions | | | Net Asset
Value, End
of Period | |
Class A | | | | | | | | | | | | | | | | | | | | | | | | | | | | | | | | | | | | |
Six Months Ended 3/31/20 (Unaudited) | | | $13.04 | | | | (0.02) | | | | (2.06) | | | | — | | | | (2.08) | | | | — | | | | (1.10) | | | | (1.10) | | | | $ 9.86 | |
Year Ended 9/30/19 | | | 14.39 | | | | (0.06) | | | | (0.18) | | | | —(b) | | | | (0.24) | | | | — | | | | (1.11) | | | | (1.11) | | | | 13.04 | |
Year Ended 9/30/18 | | | 14.72 | | | | (0.07) | | | | 2.85 | | | | —(b) | | | | 2.78 | | | | — | | | | (3.11) | | | | (3.11) | | | | 14.39 | |
Year Ended 9/30/17 | | | 13.92 | | | | (0.07) | | | | 1.91 | | | | —(b) | | | | 1.84 | | | | — | | | | (1.04) | | | | (1.04) | | | | 14.72 | |
Year Ended 9/30/16 | | | 13.57 | | | | (0.06) | | | | 1.95 | | | | —(b) | | | | 1.89 | | | | — | | | | (1.54) | | | | (1.54) | | | | 13.92 | |
Year Ended 9/30/15 | | | 15.60 | | | | (0.08) | | | | 0.53 | | | | —(b) | | | | 0.45 | | | | — | | | | (2.48) | | | | (2.48) | | | | 13.57 | |
Class I | | | | | | | | | | | | | | | | | | | | | | | | | | | | | | | | | | | | |
Six Months Ended 3/31/20 (Unaudited) | | | $15.02 | | | | (0.01) | | | | (2.40) | | | | — | | | | (2.41) | | | | — | | | | (1.10) | | | | (1.10) | | | | $11.51 | |
Year Ended 9/30/19 | | | 16.33 | | | | (0.04) | | | | (0.16) | | | | — | | | | (0.20) | | | | — | | | | (1.11) | | | | (1.11) | | | | 15.02 | |
Year Ended 9/30/18 | | | 16.26 | | | | (0.04) | | | | 3.22 | | | | —(b) | | | | 3.18 | | | | — | | | | (3.11) | | | | (3.11) | | | | 16.33 | |
Year Ended 9/30/17 | | | 15.24 | | | | (0.04) | | | | 2.10 | | | | —(b) | | | | 2.06 | | | | — | | | | (1.04) | | | | (1.04) | | | | 16.26 | |
Year Ended 9/30/16 | | | 14.68 | | | | (0.03) | | | | 2.13 | | | | —(b) | | | | 2.10 | | | | — | | | | (1.54) | | | | (1.54) | | | | 15.24 | |
Year Ended 9/30/15 | | | 16.65 | | | | (0.05) | | | | 0.56 | | | | —(b) | | | | 0.51 | | | | — | | | | (2.48) | | | | (2.48) | | | | 14.68 | |
Class R6 | | | | | | | | | | | | | | | | | | | | | | | | | | | | | | | | | | | | |
Six Months Ended 3/31/20 (Unaudited) | | | $15.05 | | | | — | | | | (2.42) | | | | — | | | | (2.42) | | | | — | | | | (1.10) | | | | (1.10) | | | | $11.53 | |
Year Ended 9/30/19 | | | 16.35 | | | | (0.03) | | | | (0.16) | | | | — | | | | (0.19) | | | | — | | | | (1.11) | | | | (1.11) | | | | 15.05 | |
Year Ended 9/30/18 | | | 16.27 | | | | (0.04) | | | | 3.23 | | | | — | | | | 3.19 | | | | — | | | | (3.11) | | | | (3.11) | | | | 16.35 | |
Period Ended 9/30/17(c) | | | 15.30 | | | | (0.03) | | | | 2.04 | | | | — | | | | 2.01 | | | | — | | | | (1.04) | | | | (1.04) | | | | 16.27 | |
| (a) | Per share net investment income (loss) has been calculated using the average daily shares method. |
| (b) | Less than $0.01 or $(0.01) per share. |
| (c) | For the period from November 21, 2016 (commencement of operations) to September 30, 2017. |
47
RBC SMID Cap Growth Fund
(Selected data for a share outstanding throughout the periods indicated)
| | | | | | | | | | | | | | | | | | | | | | | | |
| | | | | Ratios/Supplemental Data | |
| | | Total
Return(a)(b) | | Net Assets,
End of
Period (000’s) | | | Ratio of
Net Expenses
to Average
Net Assets | | Ratio of
Net Investment
Income (Loss)
to Average
Net Assets | | Ratio of
Expenses to
Average Net
Assets* | | Portfolio
Turnover
Rate** | |
Class A | | | | | | | | | | | | | | | | | | | | | | | | |
Six Months Ended 3/31/20 (Unaudited) | | | (17.91 | )%(c) | | | $ 9,530 | | | | 1.07 | %(d) | | | (0.36 | )%(d) | | | 1.37 | %(d) | | | 6% | |
Year Ended 9/30/19 | | | 0.41 | % | | | 12,059 | | | | 1.07 | % | | | (0.51 | )% | | | 1.38 | % | | | 17% | |
Year Ended 9/30/18 | | | 22.67 | % | | | 12,966 | | | | 1.07 | % | | | (0.53 | )% | | | 1.40 | % | | | 22% | |
Year Ended 9/30/17 | | | 14.18 | % | | | 11,600 | | | | 1.10 | % | | | (0.50 | )% | | | 1.50 | % | | | 18% | |
Year Ended 9/30/16 | | | 14.99 | % | | | 12,106 | | | | 1.10 | % | | | (0.43 | )% | | | 1.46 | % | | | 14% | |
Year Ended 9/30/15 | | | 2.20 | % | | | 12,070 | | | | 1.10 | % | | | (0.56 | )% | | | 1.45 | % | | | 18% | |
Class I | | | | | | | | | | | | | | | | | | | | | | | | |
Six Months Ended 3/31/20 (Unaudited) | | | (17.74 | )%(c) | | | $66,936 | | | | 0.82 | %(d) | | | (0.11 | )%(d) | | | 1.09 | %(d) | | | 6% | |
Year Ended 9/30/19 | | | 0.62 | % | | | 81,193 | | | | 0.82 | % | | | (0.26 | )% | | | 0.99 | % | | | 17% | |
Year Ended 9/30/18 | | | 23.04 | % | | | 83,437 | | | | 0.82 | % | | | (0.28 | )% | | | 0.98 | % | | | 22% | |
Year Ended 9/30/17 | | | 14.40 | % | | | 65,463 | | | | 0.85 | % | | | (0.26 | )% | | | 1.07 | % | | | 18% | |
Year Ended 9/30/16 | | | 15.32 | % | | | 86,067 | | | | 0.85 | % | | | (0.18 | )% | | | 1.05 | % | | | 14% | |
Year Ended 9/30/15 | | | 2.44 | % | | | 54,935 | | | | 0.85 | % | | | (0.31 | )% | | | 1.07 | % | | | 18% | |
Class R6 | | | | | | | | | | | | | | | | | | | | | | | | |
Six Months Ended 3/31/20 (Unaudited) | | | (17.70 | )%(c) | | | $ 12 | | | | 0.77 | %(d) | | | (0.06 | )%(d) | | | 27.50 | %(d) | | | 6% | |
Year Ended 9/30/19 | | | 0.69 | % | | | 14 | | | | 0.77 | % | | | (0.21 | )% | | | 27.43 | % | | | 17% | |
Year Ended 9/30/18 | | | 23.09 | % | | | 14 | | | | 0.77 | % | | | (0.23 | )% | | | 29.30 | % | | | 22% | |
Period Ended 9/30/17 | | | 14.03 | %(c) | | | 11 | | | | 0.80 | %(d) | | | (0.22 | )%(d) | | | 50.53 | %(d) | | | 18% | |
| * | During the period, certain fees were contractually or voluntarily reduced and/or reimbursed. If such contractual/voluntary fee reductions and reimbursements had not occurred, the ratio would have been as indicated. |
| ** | Portfolio turnover rate is calculated on the basis of the Fund as a whole without distinguishing between the classes of shares issued. |
| (a) | Excludes sales charge. |
| (b) | Assumes investment at net asset value at the beginning of the period, reinvestment of all dividends and distributions, and a complete redemption of the investment at net asset value at the end of the period. |
See Notes to the Financial Statements.
48
RBC Enterprise Fund
(Selected data for a share outstanding throughout the periods indicated)
| | | | | | | | | | | | | | | | | | | | | | | | | | | | | | | | | | | | |
| | | | | | Investment Activities | | | Distributions | | | | |
| | | Net Asset
Value,
Beginning
of Period | | | Net
Investment
Income/
(Loss)(a) | | | Net Realized
and Unrealized
Gains (Losses)
on Investments | | | Redemption
Fees | | | Total from
Investment
Activities | | | Net
Investment
Income | | | Net
Realized
Gains | | | Total
Distributions | | | Net Asset
Value, End
of Period | |
Class A | | | | | | | | | | | | | | | | | | | | | | | | | | | | | | | | | | | | |
Six Months Ended 3/31/20 (Unaudited) | | | $17.59 | | | | (0.01) | | | | (4.43) | | | | — | | | | (4.44) | | | | — | | | | (1.27) | | | | (1.27) | | | | $11.88 | |
Year Ended 9/30/19 | | | 23.38 | | | | (0.05) | | | | (3.17) | | | | — | | | | (3.22) | | | | — | | | | (2.57) | | | | (2.57) | | | | 17.59 | |
Year Ended 9/30/18 | | | 26.86 | | | | (0.13) | | | | 1.70 | | | | —(b) | | | | 1.57 | | | | — | | | | (5.05) | | | | (5.05) | | | | 23.38 | |
Year Ended 9/30/17 | | | 21.49 | | | | (0.09) | | | | 5.68 | | | | —(b) | | | | 5.59 | | | | (0.01) | | | | (0.21) | | | | (0.22) | | | | 26.86 | |
Year Ended 9/30/16 | | | 20.16 | | | | (0.07) | | | | 2.59 | | | | —(b) | | | | 2.52 | | | | — | | | | (1.19) | | | | (1.19) | | | | 21.49 | |
Year Ended 9/30/15 | | | 25.16 | | | | (0.07) | | | | (1.72) | | | | —(b) | | | | (1.79) | | | | — | | | | (3.21) | | | | (3.21) | | | | 20.16 | |
Class I | | | | | | | | | | | | | | | | | | | | | | | | | | | | | | | | | | | | |
Six Months Ended 3/31/20 (Unaudited) | | | $18.52 | | | | 0.01 | | | | (4.69) | | | | —(b) | | | | (4.68) | | | | (0.01) | | | | (1.27) | | | | (1.28) | | | | $12.56 | |
Year Ended 9/30/19 | | | 24.39 | | | | (0.01) | | | | (3.29) | | | | —(b) | | | | (3.30) | | | | — | | | | (2.57) | | | | (2.57) | | | | 18.52 | |
Year Ended 9/30/18 | | | 27.74 | | | | (0.07) | | | | 1.77 | | | | —(b) | | | | 1.70 | | | | — | | | | (5.05) | | | | (5.05) | | | | 24.39 | |
Year Ended 9/30/17 | | | 22.17 | | | | (0.03) | | | | 5.87 | | | | —(b) | | | | 5.84 | | | | (0.06) | | | | (0.21) | | | | (0.27) | | | | 27.74 | |
Year Ended 9/30/16 | | | 20.77 | | | | (0.02) | | | | 2.66 | | | | —(b) | | | | 2.64 | | | | (0.05) | | | | (1.19) | | | | (1.24) | | | | 22.17 | |
Year Ended 9/30/15 | | | 25.77 | | | | (0.02) | | | | (1.77) | | | | —(b) | | | | (1.79) | | | | — | | | | (3.21) | | | | (3.21) | | | | 20.77 | |
| (a) | Per share net investment income (loss) has been calculated using the average daily shares method. |
| (b) | Less than $0.01 or $(0.01) per share. |
49
RBC Enterprise Fund
(Selected data for a share outstanding throughout the periods indicated)
| | | | | | | | | | | | | | | | | | | | | | | | |
| | | | | Ratios/Supplemental Data | |
| | | Total
Return(a)(b) | | Net Assets,
End of
Period (000’s) | | | Ratio of
Net Expenses
to Average
Net Assets | | Ratio of
Net Investment
Income (Loss)
to Average
Net Assets | | Ratio of
Expenses to
Average Net
Assets* | | Portfolio
Turnover
Rate** | |
Class A | | | | | | | | | | | | | | | | | | | | | | | | |
Six Months Ended 3/31/20 (Unaudited) | | | (27.71 | )%(c) | | | $ 503 | | | | 1.33 | %(d) | | | (0.15 | )%(d) | | | 2.18 | %(d) | | | 12% | |
Year Ended 9/30/19 | | | (11.52 | )% | | | 787 | | | | 1.33 | % | | | (0.28 | )% | | | 2.13 | % | | | 20% | |
Year Ended 9/30/18 | | | 6.79 | % | | | 963 | | | | 1.33 | % | | | (0.54 | )% | | | 1.95 | % | | | 15% | |
Year Ended 9/30/17 | | | 26.15 | % | | | 1,445 | | | | 1.33 | % | | | (0.39 | )% | | | 1.96 | % | | | 26% | |
Year Ended 9/30/16 | | | 13.31 | % | | | 1,303 | | | | 1.33 | % | | | (0.35 | )% | | | 2.00 | % | | | 11% | |
Year Ended 9/30/15 | | | (8.73 | )% | | | 1,410 | | | | 1.33 | % | | | (0.30 | )% | | | 1.85 | % | | | 16% | |
Class I | | | | | | | | | | | | | | | | | | | | | | | | |
Six Months Ended 3/31/20 (Unaudited) | | | (27.64 | )%(c) | | | $ 45,727 | | | | 1.08 | %(d) | | | 0.08 | %(d) | | | 1.32 | %(d) | | | 12% | |
Year Ended 9/30/19 | | | (11.35 | )% | | | 68,122 | | | | 1.08 | % | | | (0.05 | )% | | | 1.30 | % | | | 20% | |
Year Ended 9/30/18 | | | 7.08 | % | | | 85,550 | | | | 1.08 | % | | | (0.30 | )% | | | 1.23 | % | | | 15% | |
Year Ended 9/30/17 | | | 26.51 | % | | | 89,379 | | | | 1.08 | % | | | (0.11 | )% | | | 1.28 | % | | | 26% | |
Year Ended 9/30/16 | | | 13.56 | % | | | 103,083 | | | | 1.08 | % | | | (0.09 | )% | | | 1.25 | % | | | 11% | |
Year Ended 9/30/15 | | | (8.50 | )% | | | 104,237 | | | | 1.08 | % | | | (0.09 | )% | | | 1.21 | % | | | 16% | |
| * | During the period, certain fees were contractually or voluntarily reduced and/or reimbursed. If such contractual/voluntary fee reductions and reimbursements had not occurred, the ratio would have been as indicated. |
| ** | Portfolio turnover rate is calculated on the basis of the Fund as a whole without distinguishing between the classes of shares issued. |
| (a) | Excludes sales charge. |
| (b) | Assumes investment at net asset value at the beginning of the period, reinvestment of all dividends and distributions, and a complete redemption of the investment at net asset value at the end of the period. |
See Notes to the Financial Statements.
50
RBC Small Cap Core Fund
(Selected data for a share outstanding throughout the periods indicated)
| | | | | | | | | | | | | | | | | | | | | | | | | | | | | | | | | | | | |
| | | | | | Investment Activities | | | Distributions | | | | |
| | | Net Asset
Value,
Beginning
of Period | | | Net
Investment
Income/
(Loss)(a) | | | Net Realized
and Unrealized
Gains (Losses)
on Investments | | | Redemption
Fees | | | Total from
Investment
Activities | | | Net
Investment
Income | | | Net
Realized
Gains | | | Total
Distributions | | | Net Asset
Value, End
of Period | |
Class A | | | | | | | | | | | | | | | | | | | | | | | | | | | | | | | | | | | | |
Six Months Ended 3/31/20 (Unaudited) | | | $29.14 | | | | 0.02 | | | | (7.74) | | | | — | | | | (7.72) | | | | — | | | | (1.54) | | | | (1.54) | | | | $19.88 | |
Year Ended 9/30/19 | | | 39.96 | | | | (0.05) | | | | (6.83) | | | | —(b) | | | | (6.88) | | | | — | | | | (3.94) | | | | (3.94) | | | | 29.14 | |
Year Ended 9/30/18 | | | 38.85 | | | | (0.12) | | | | 2.38 | | | | — | | | | 2.26 | | | | — | | | | (1.15) | | | | (1.15) | | | | 39.96 | |
Year Ended 9/30/17 | | | 33.53 | | | | (0.04) | | | | 5.36 | | | | —(b) | | | | 5.32 | | | | — | | | | — | | | | — | | | | 38.85 | |
Year Ended 9/30/16 | | | 28.55 | | | | (0.07) | | | | 5.46 | | | | —(b) | | | | 5.39 | | | | — | | | | (0.41) | | | | (0.41) | | | | 33.53 | |
Year Ended 9/30/15 | | | 30.66 | | | | (0.04) | | | | (0.91) | | | | —(b) | | | | (0.95) | | | | — | | | | (1.16) | | | | (1.16) | | | | 28.55 | |
Class I | | | | | | | | | | | | | | | | | | | | | | | | | | | | | | | | | | | | |
Six Months Ended 3/31/20 (Unaudited) | | | $30.70 | | | | 0.06 | | | | (8.20) | | | | —(b) | | | | (8.14) | | | | (0.02) | | | | (1.54) | | | | (1.56) | | | | $21.00 | |
Year Ended 9/30/19 | | | 41.71 | | | | 0.03 | | | | (7.10) | | | | —(b) | | | | (7.07) | | | | — | | | | (3.94) | | | | (3.94) | | | | 30.70 | |
Year Ended 9/30/18 | | | 40.42 | | | | (0.02) | | | | 2.48 | | | | — | | | | 2.46 | | | | (0.01) | | | | (1.16) | | | | (1.17) | | | | 41.71 | |
Year Ended 9/30/17 | | | 34.85 | | | | 0.04 | | | | 5.59 | | | | —(b) | | | | 5.63 | | | | (0.06) | | | | — | | | | (0.06) | | | | 40.42 | |
Year Ended 9/30/16 | | | 29.61 | | | | —(b) | | | | 5.67 | | | | —(b) | | | | 5.67 | | | | (0.02) | | | | (0.41) | | | | (0.43) | | | | 34.85 | |
Year Ended 9/30/15 | | | 31.68 | | | | 0.04 | | | | (0.95) | | | | —(b) | | | | (0.91) | | | | — | | | | (1.16) | | | | (1.16) | | | | 29.61 | |
Class R6 | | | | | | | | | | | | | | | | | | | | | | | | | | | | | | | | | | | | |
Six Months Ended 3/31/20 (Unaudited) | | | $30.72 | | | | 0.05 | | | | (8.19) | | | | — | | | | (8.14) | | | | (0.01) | | | | (1.54) | | | | (1.55) | | | | $21.03 | |
Year Ended 9/30/19 | | | 41.78 | | | | 0.08 | | | | (7.20) | | | | — | | | | (7.12) | | | | — | | | | (3.94) | | | | (3.94) | | | | 30.72 | |
Year Ended 9/30/18 | | | 40.46 | | | | —(b) | | | | 2.47 | | | | — | | | | 2.47 | | | | — | | | | (1.15) | | | | (1.15) | | | | 41.78 | |
Period Ended 9/30/17(c) | | | 37.08 | | | | (0.11) | | | | 3.52 | | | | — | | | | 3.41 | | | | (0.03) | | | | — | | | | (0.03) | | | | 40.46 | |
| (a) | Per share net investment income (loss) has been calculated using the average daily shares method. |
| (b) | Less than $0.01 or $(0.01) per share. |
| (c) | For the period from November 21, 2016 (commencement of operations) to March 31, 2017. |
51
RBC Small Cap Core Fund
(Selected data for a share outstanding throughout the periods indicated)
| | | | | | | | | | | | | | | | | | | | | | | | |
| | | | | Ratios/Supplemental Data | |
| | | Total
Return(a)(b) | | Net Assets,
End of
Period (000’s) | | | Ratio of
Net Expenses
to Average
Net Assets | | Ratio of
Net Investment
Income (Loss)
to Average
Net Assets | | Ratio of
Expenses to
Average Net
Assets* | | Portfolio
Turnover
Rate** | |
Class A | | | | | | | | | | | | | | | | | | | | | | | | |
Six Months Ended 3/31/20 (Unaudited) | | | (28.35 | )%(c) | | | $ 4,849 | | | | 1.15 | %(d) | | | 0.13 | %(d) | | | 1.53 | %(d) | | | 23% | |
Year Ended 9/30/19 | | | (15.57 | )% | | | 7,004 | | | | 1.15 | % | | | (0.16 | )% | | | 1.46 | % | | | 28% | |
Year Ended 9/30/18 | | | 5.80 | % | | | 12,012 | | | | 1.15 | % | | | (0.29 | )% | | | 1.37 | % | | | 24% | |
Year Ended 9/30/17 | | | 15.87 | % | | | 14,574 | | | | 1.15 | % | | | (0.11 | )% | | | 1.47 | % | | | 29% | |
Year Ended 9/30/16 | | | 19.07 | % | | | 12,960 | | | | 1.15 | % | | | (0.23 | )% | | | 1.47 | % | | | 20% | |
Year Ended 9/30/15 | | | (3.47 | )% | | | 7,303 | | | | 1.15 | % | | | (0.13 | )% | | | 1.34 | % | | | 36% | |
Class I | | | | | | | | | | | | | | | | | | | | | | | | |
Six Months Ended 3/31/20 (Unaudited) | | | (28.29 | )%(c) | | | $ 55,321 | | | | 0.90 | %(d) | | | 0.38 | %(d) | | | 1.18 | %(d) | | | 23% | |
Year Ended 9/30/19 | | | (15.35 | )% | | | 136,072 | | | | 0.90 | % | | | 0.10 | % | | | 1.11 | % | | | 28% | |
Year Ended 9/30/18 | | | 6.06 | % | | | 249,678 | | | | 0.90 | % | | | (0.05 | )% | | | 1.05 | % | | | 24% | |
Year Ended 9/30/17 | | | 16.18 | % | | | 274,434 | | | | 0.90 | % | | | 0.10 | % | | | 1.15 | % | | | 29% | |
Year Ended 9/30/16 | | | 19.35 | % | | | 244,713 | | | | 0.90 | % | | | (0.01 | )% | | | 1.13 | % | | | 20% | |
Year Ended 9/30/15 | | | (3.22 | )% | | | 226,237 | | | | 0.90 | % | | | 0.11 | % | | | 1.13 | % | | | 36% | |
Class R6 | | | | | | | | | | | | | | | | | | | | | | | | |
Six Months Ended 3/31/20 (Unaudited) | | | (28.27 | )%(c) | | | $ 17 | | | | 0.87 | %(d) | | | 0.35 | %(d) | | | 13.88 | %(d) | | | 23% | |
Year Ended 9/30/19 | | | (15.46 | )% | | | 35 | | | | 0.87 | % | | | 0.25 | % | | | 11.85 | % | | | 28% | |
Year Ended 9/30/18 | | | 6.10 | % | | | 92 | | | | 0.87 | % | | | (0.01 | )% | | | 1.30 | % | | | 24% | |
Period Ended 9/30/17(e) | | | 9.21 | %(c) | | | 1,041 | | | | 0.87 | %(d) | | | (0.33 | )%(d) | | | 6.88 | %(d) | | | 29% | |
| * | During the period, certain fees were contractually or voluntarily reduced and/or reimbursed. If such contractual/voluntary fee reductions and reimbursements had not occurred, the ratio would have been as indicated. |
| ** | Portfolio turnover rate is calculated on the basis of the Fund as a whole without distinguishing between the classes of shares issued. |
| (a) | Excludes sales charge. |
| (b) | Assumes investment at net asset value at the beginning of the period, reinvestment of all dividends and distributions, and a complete redemption of the investment at net asset value at the end of the period. |
| (e) | For the period from November 21, 2016 (commencement of operations) to March 31, 2017. |
See Notes to the Financial Statements.
52
RBC Microcap Value Fund
(Selected data for a share outstanding throughout the periods indicated)
| | | | | | | | | | | | | | | | | | | | | | | | | | | | | | | | | | | | |
| | | | | | Investment Activities | | | Distributions | | | | |
| | | Net Asset
Value,
Beginning
of Period | | | Net
Investment
Income(a) | | | Net Realized
and Unrealized
Gains (Losses)
on Investments | | | Redemption
Fees | | | Total from
Investment
Activities | | | Net
Investment
Income | | | Net
Realized
Gains | | | Total
Distributions | | | Net Asset
Value, End
of Period | |
Class A | | | | | | | | | | | | | | | | | | | | | | | | | | | | | | | | | | | | |
Six Months Ended 3/31/20 (Unaudited) | | | $26.52 | | | | 0.05 | | | | (7.74) | | | | — | | | | (7.69) | | | | (0.23) | | | | (1.44) | | | | (1.67) | | | | $17.16 | |
Year Ended 9/30/19 | | | 31.95 | | | | 0.23 | | | | (2.89) | | | | —(b) | | | | (2.66) | | | | (0.21) | | | | (2.56) | | | | (2.77) | | | | 26.52 | |
Year Ended 9/30/18 | | | 32.91 | | | | 0.16 | | | | 2.01 | | | | —(b) | | | | 2.17 | | | | (0.08) | | | | (3.05) | | | | (3.13) | | | | 31.95 | |
Year Ended 9/30/17 | | | 29.05 | | | | 0.09 | | | | 5.45 | | | | —(b) | | | | 5.54 | | | | (0.07) | | | | (1.61) | | | | (1.68) | | | | 32.91 | |
Year Ended 9/30/16 | | | 25.88 | | | | 0.04 | | | | 3.50 | | | | —(b) | | | | 3.54 | | | | (0.08) | | | | (0.29) | | | | (0.37) | | | | 29.05 | |
Year Ended 9/30/15 | | | 26.68 | | | | 0.06 | | | | (0.06) | | | | —(b) | | | | — | | | | (0.10) | | | | (0.70) | | | | (0.80) | | | | 25.88 | |
Class I | | | | | | | | | | | | | | | | | | | | | | | | | | | | | | | | | | | | |
Six Months Ended 3/31/20 (Unaudited) | | | $26.55 | | | | 0.09 | | | | (7.74) | | | | —(b) | | | | (7.65) | | | | (0.31) | | | | (1.44) | | | | (1.75) | | | | $17.15 | |
Year Ended 9/30/19 | | | 32.01 | | | | 0.30 | | | | (2.91) | | | | — | | | | (2.61) | | | | (0.29) | | | | (2.56) | | | | (2.85) | | | | 26.55 | |
Year Ended 9/30/18 | | | 32.97 | | | | 0.23 | | | | 2.03 | | | | —(b) | | | | 2.26 | | | | (0.17) | | | | (3.05) | | | | (3.22) | | | | 32.01 | |
Year Ended 9/30/17 | | | 29.10 | | | | 0.17 | | | | 5.46 | | | | —(b) | | | | 5.63 | | | | (0.15) | | | | (1.61) | | | | (1.76) | | | | 32.97 | |
Year Ended 9/30/16 | | | 25.92 | | | | 0.11 | | | | 3.51 | | | | —(b) | | | | 3.62 | | | | (0.15) | | | | (0.29) | | | | (0.44) | | | | 29.10 | |
Year Ended 9/30/15 | | | 26.73 | | | | 0.13 | | | | (0.07) | | | | —(b) | | | | 0.06 | | | | (0.17) | | | | (0.70) | | | | (0.87) | | | | 25.92 | |
| (a) | Per share net investment income (loss) has been calculated using the average daily shares method. |
| (b) | Less than $0.01 or $(0.01) per share. |
53
RBC Microcap Value Fund
(Selected data for a share outstanding throughout the periods indicated)
| | | | | | | | | | | | | | | | | | | | | | | | |
| | | | | Ratios/Supplemental Data | |
| | | Total
Return(a) | | Net Assets,
End of
Period (000’s) | | | Ratio of
Net Expenses
to Average
Net Assets | | Ratio of
Net Investment
Income (Loss)
to Average
Net Assets | | Ratio of
Expenses to
Average Net
Assets* | | Portfolio
Turnover
Rate** | |
Class A | | | | | | | | | | | | | | | | | | | | | | | | |
Six Months Ended 3/31/20 (Unaudited) | | | (31.23 | )%(b) | | | $ 2,038 | | | | 1.32 | %(c) | | | 0.42 | %(c) | | | 1.75 | %(c) | | | 15% | |
Year Ended 9/30/19 | | | (7.16 | )% | | | 3,597 | | | | 1.32 | % | | | 0.86 | % | | | 1.68 | % | | | 9% | |
Year Ended 9/30/18 | | | 7.12 | % | | | 6,477 | | | | 1.32 | % | | | 0.50 | % | | | 1.64 | % | | | 5% | |
Year Ended 9/30/17 | | | 19.32 | % | | | 7,276 | | | | 1.32 | % | | | 0.31 | % | | | 1.75 | % | | | 9% | |
Year Ended 9/30/16 | | | 13.80 | % | | | 9,136 | | | | 1.32 | % | | | 0.15 | % | | | 1.76 | % | | | 11% | |
Year Ended 9/30/15 | | | (0.18 | )% | | | 10,300 | | | | 1.32 | % | | | 0.20 | % | | | 1.69 | % | | | 5% | |
Class I | | | | | | | | | | | | | | | | | | | | | | | | |
Six Months Ended 3/31/20 (Unaudited) | | | (31.19 | )%(b) | | | $ 77,243 | | | | 1.07 | %(c) | | | 0.68 | %(c) | | | 1.22 | %(c) | | | 15% | |
Year Ended 9/30/19 | | | (6.92 | )% | | | 112,921 | | | | 1.07 | % | | | 1.12 | % | | | 1.20 | % | | | 9% | |
Year Ended 9/30/18 | | | 7.41 | % | | | 130,155 | | | | 1.07 | % | | | 0.74 | % | | | 1.18 | % | | | 5% | |
Year Ended 9/30/17 | | | 19.62 | % | | | 139,635 | | | | 1.07 | % | | | 0.56 | % | | | 1.25 | % | | | 9% | |
Year Ended 9/30/16 | | | 14.10 | % | | | 141,313 | | | | 1.07 | % | | | 0.40 | % | | | 1.24 | % | | | 11% | |
Year Ended 9/30/15 | | | 0.04 | % | | | 130,135 | | | | 1.07 | % | | | 0.47 | % | | | 1.22 | % | | | 5% | |
| * | During the period, certain fees were contractually or voluntarily reduced and/or reimbursed. If such contractual/voluntary fee reductions and reimbursements had not occurred, the ratio would have been as indicated. |
| ** | Portfolio turnover rate is calculated on the basis of the Fund as a whole without distinguishing between the classes of shares issued. |
| (a) | Assumes investment at net asset value at the beginning of the period, reinvestment of all dividends and distributions, and a complete redemption of the investment at net asset value at the end of the period. |
See Notes to the Financial Statements.
54
RBC Small Cap Value Fund
(Selected data for a share outstanding throughout the periods indicated)
| | | | | | | | | | | | | | | | | | | | | | | | | | | | | | | | | | | | |
| | | | | | Investment Activities | | | Distributions | | | | |
| | | Net Asset
Value,
Beginning
of Period | | | Net
Investment
Income(a) | | | Net Realized
and Unrealized
Gains (Losses)
on Investments | | | Redemption
Fees | | | Total from
Investment
Activities | | | Net
Investment
Income | | | Net
Realized
Gains | | | Total
Distributions | | | Net Asset
Value, End
of Period | |
Class I | | | | | | | | | | | | | | | | | | | | | | | | | | | | | | | | | | | | |
Six Months Ended 3/31/20 (Unaudited) | | | $12.24 | | | | 0.44 | | | | (4.02) | | | | 0.01 | | | | (3.57) | | | | (0.16) | | | | — | | | | (0.16) | | | | $ 8.51 | |
Year Ended 9/30/19 | | | 13.63 | | | | 0.11 | | | | (1.13) | | | | —(b) | | | | (1.02) | | | | (0.09) | | | | (0.28) | | | | (0.37) | | | | 12.24 | |
Year Ended 9/30/18 | | | 13.43 | | | | 0.10 | | | | 0.47 | | | | —(b) | | | | 0.57 | | | | (0.08) | | | | (0.29) | | | | (0.37) | | | | 13.63 | |
Year Ended 9/30/17 | | | 11.33 | | | | 0.06 | | | | 2.31 | | | | —(b) | | | | 2.37 | | | | (0.05) | | | | (0.22) | | | | (0.27) | | | | 13.43 | |
Year Ended 9/30/16 | | | 9.73 | | | | 0.08 | | | | 1.76 | | | | —(b) | | | | 1.84 | | | | (0.16) | | | | (0.08) | | | | (0.24) | | | | 11.33 | |
Period Ended 9/30/15(c) | | | 10.00 | | | | 0.06 | | | | (0.30) | | | | —(b) | | | | (0.24) | | | | (0.03) | | | | — | | | | (0.03) | | | | 9.73 | |
Class R6 | | | | | | | | | | | | | | | | | | | | | | | | | | | | | | | | | | | | |
Six Months Ended 3/31/20 (Unaudited) | | | $12.31 | | | | 0.01 | | | | (3.59) | | | | — | | | | (3.58) | | | | (0.17) | | | | — | | | | (0.17) | | | | $ 8.56 | |
Year Ended 9/30/19 | | | 13.71 | | | | 0.13 | | | | (1.15) | | | | — | | | | (1.02) | | | | (0.10) | | | | (0.28) | | | | (0.38) | | | | 12.31 | |
Year Ended 9/30/18 | | | 13.51 | | | | 0.11 | | | | 0.46 | | | | — | | | | 0.57 | | | | (0.08) | | | | (0.29) | | | | (0.37) | | | | 13.71 | |
Period Ended 9/30/17(d) | | | 12.26 | | | | 0.06 | | | | 1.41 | | | | — | | | | 1.47 | | | | — | | | | (0.22) | | | | (0.22) | | | | 13.51 | |
| (a) | Per share net investment income (loss) has been calculated using the average daily shares method. |
| (b) | Less than $0.01 or $(0.01) per share. |
| (c) | For the period from December 3, 2014 (commencement of operations) to September 30, 2015. |
| (d) | For the period from November 21, 2016 (commencement of operations) to September 30, 2017. |
55
RBC Small Cap Value Fund
(Selected data for a share outstanding throughout the periods indicated)
| | | | | | | | | | | | | | | | | | | | | | | | |
| | | | | Ratios/Supplemental Data | |
| | | Total
Return(a) | | Net Assets,
End of
Period (000’s) | | | Ratio of
Net Expenses
to Average
Net Assets | | Ratio of
Net Investment
Income (Loss)
to Average
Net Assets | | Ratio of
Expenses to
Average Net
Assets* | | Portfolio
Turnover
Rate** | |
Class I | | | | | | | | | | | | | | | | | | | | | | | | |
Six Months Ended 3/31/20 (Unaudited) | | | (29.62 | )%(b) | | | $ 41,294 | | | | 0.85 | %(c) | | | 0.93 | %(c) | | | 1.15 | %(c) | | | 46% | |
Year Ended 9/30/19 | | | (6.91 | )% | | | 55,686 | | | | 0.85 | % | | | 0.95 | % | | | 0.98 | % | | | 52% | |
Year Ended 9/30/18 | | | 4.24 | % | | | 144,979 | | | | 0.91 | %(d) | | | 0.75 | % | | | 0.99 | % | | | 29% | |
Year Ended 9/30/17 | | | 21.10 | % | | | 72,852 | | | | 1.00 | % | | | 0.48 | % | | | 1.19 | % | | | 35% | |
Year Ended 9/30/16 | | | 19.26 | % | | | 6,127 | | | | 1.00 | % | | | 0.79 | % | | | 2.71 | % | | | 47% | |
Period Ended 9/30/15(e) | | | (2.42 | )%(b) | | | 5,085 | | | | 1.00 | %(c) | | | 0.67 | %(c) | | | 3.50 | %(c) | | | 41% | |
Class R6 | | | | | | | | | | | | | | | | | | | | | | | | |
Six Months Ended 3/31/20 (Unaudited) | | | (29.59 | )%(b) | | | $ 5,180 | | | | 0.80 | %(c) | | | 1.01 | %(c) | | | 1.04 | %(c) | | | 46% | |
Year Ended 9/30/19 | | | (6.89 | )% | | | 7,278 | | | | 0.80 | % | | | 1.07 | % | | | 0.95 | % | | | 52% | |
Year Ended 9/30/18 | | | 4.22 | % | | | 8,242 | | | | 0.87 | %(d) | | | 0.83 | % | | | 0.98 | % | | | 29% | |
Period Ended 9/30/17(f) | | | 12.10 | %(b) | | | 5,956 | | | | 0.95 | %(c) | | | 0.56 | %(c) | | | 1.31 | %(c) | | | 35% | |
| * | During the period, certain fees were contractually or voluntarily reduced and/or reimbursed. If such contractual/voluntary fee reductions and reimbursements had not occurred, the ratio would have been as indicated. |
| ** | Portfolio turnover rate is calculated on the basis of the Fund as a whole without distinguishing between the classes of shares issued. |
| (a) | Assumes investment at net asset value at the beginning of the period, reinvestment of all dividends and distributions, and a complete redemption of the investment at net asset value at the end of the period. |
| (d) | Beginning July 2, 2018, the net operating expenses were contractually limited to 0.85% and 0.80% of average daily net assets for Class I and Class R6, respectively. The ratio of net expenses to average net assets represents a blended percentage for the period ended September 30, 2018. |
| (e) | For the period from December 3, 2014 (commencement of operations) to September 30, 2015. |
| (f) | For the period from November 21, 2016 (commencement of operations) to September 30, 2017. |
See Notes to the Financial Statements.
56
|
NOTES TO FINANCIAL STATEMENTS |
March 31, 2020 (Unaudited)
1. Organization:
RBC Funds Trust (the “Trust”) is registered under the Investment Company Act of 1940 (as amended) as anopen-end management investment company. The Trust was organized as a Delaware statutory trust on December 16, 2003 and currently consists of 18 portfolios. Overall responsibility for the management of the Trust is vested in its Board of Trustees (the “Board”). Predecessor funds to the Trust were reorganized as portfolios of the Trust effective April 16, 2004. This report includes the following five investment portfolios (each a “Fund” and collectively, the “Funds”):
– RBC SMID Cap Growth Fund (“SMID Cap Growth Fund”)
– RBC Enterprise Fund (“Enterprise Fund”)
– RBC Small Cap Core Fund (“Small Cap Core Fund”)
– RBC Microcap Value Fund (“Microcap Value Fund”)
– RBC Small Cap Value Fund (“Small Cap Value Fund”)
The SMID Cap Growth and Small Cap Core Funds offer three share classes: Class A, Class R6 and Class I shares. The Enterprise and Microcap Value Funds offer two share classes: Class A and Class I shares. The Small Cap Value Fund offers Class I and Class R6 shares. On November 27, 2012, Class C shares were converted to Class A shares for the SMID Cap Growth, Enterprise, Small Cap Core and Microcap Value Funds and Class S shares were converted to Class I shares for SMID Cap Growth and Enterprise Funds. For the Small Cap Core and Microcap Value Funds, which did not previously have Class I shares, the Class S shares were redesignated as Class I shares. Class A shares are offered with a 5.75% maximumfront-end sales charge and a 1.00% contingent deferred sales charge (“CDSC”) for redemption within 12 months of a $1 million or greater purchase on which nofront-end sales charge was paid. Class I and Class R6 shares (intended for investors meeting certain investment minimum thresholds) are not subject to either afront-end sales charge or a CDSC.
RBC Global Asset Management (U.S.) Inc. (”RBCGAM-US“ or ”Advisor“ or”Co-Administrator“) acts as the investment advisor for the Funds. The officers of the Trust (“Fund Management”) are also employees of RBCGAM-US.
2. Significant Accounting Policies
Each Fund is an investment company that follows accounting and reporting guidance under the Financial Accounting Standards Board. Summarized below are the significant accounting policies of the Funds. These policies conform to accounting principles generally accepted in the United States of America (“U.S. GAAP”). Fund Management follows these policies when preparing financial statements. Fund Management may also be required to make estimates and assumptions that affect the reported amounts of assets and liabilities at the date of the financial statements and the reported amounts of income and expenses for the period. Actual results could differ from those estimates. The financial statements are as of the close of regular trading on the New York Stock Exchange (“NYSE”).
Recent Accounting Standards:
In August 2018, the Financial Accounting Standards Board issued Accounting Standards Update2018-13 “Changes to the Disclosure Requirements for Fair Value Measurement” which modifies disclosure requirements for fair value measurements. The guidance is effective for fiscal years beginning after December 15, 2019 and for interim periods within those fiscal years. Management is currently evaluating the impact of this guidance to the Funds.
Security Valuation:
The Board has adopted pricing and valuation procedures for determining the fair value of each Fund’s investments. Fair value of a security is considered to be the price that a fund might reasonably expect to receive upon its current sale in an orderly transaction between market participants.
Equity securities are generally valued on the basis of prices furnished by third-party pricing services approved by the Board. Equity securities listed on one or more exchanges shall be valued at the last
57
|
NOTES TO FINANCIAL STATEMENTS |
available quoted sale price on the primary trading exchange as of the regularly scheduled closing time of the exchange and are categorized as Level 1 in the fair value hierarchy. (See “Fair Value Measurements” below for additional information). An equity security not listed on an exchange but listed on NASDAQ shall be valued at the NASDAQ official closing price and is also categorized as Level 1. If there was no sale on the primary exchange on the day the net asset value is calculated or a NASDAQ official closing price is not available, the most recent bid quotation generally will be used and such securities will generally be categorized as Level 2. Investments inopen-end investment companies (mutual funds) are valued at net asset value and are categorized as Level 1 in the fair value hierarchy.
Fixed income securities, includingto-be-announced (“TBA”) commitments and municipal bonds, are generally valued based on evaluated prices received from third-party pricing services or from broker-dealers who make markets in the securities and are generally categorized as Level 2 in the fair value hierarchy (see “Fair Value Measurements” below for additional information). The pricing services utilize both dealer-supplied valuations and electronic data processing techniques that take into account multiple appropriate factors such asinstitutional-size trading in similar groups of securities, market spreads, interest rates, and fundamental security analytical data including yield, quality, coupon rate, maturity and type of issue.
Foreign securities valued innon-U.S. dollars are valued in the foreign currency and then converted into the U.S. dollar equivalent using the foreign exchange rate in effect at the close of NYSE on the day the security’s value is determined. The value of securities traded in markets outside the United States may be affected on a day that the NYSE is closed and an investor is not able to purchase, exchange or redeem shares of the Funds.
The Board has delegated to the Funds’ Pricing Committee (“Pricing Committee”) the responsibility for implementing the pricing and valuation procedures, including responsibility for determining the fair value of the Funds’ securities or other assets and liabilities. The Pricing Committee includes representatives of the Funds’ Advisor, andCo-Administrator, including personnel from accounting and operations, investment management, trading, risk management and compliance. The Pricing Committee meets at least quarterly to review and approve Fund valuation matters, including a review of the Funds’ pricing activity and operations, fair value measurements, pricing vendors, policies and procedures, and related controls. At least a quorum of the Pricing Committee shall meet more frequently, as needed, to consider and approve time-sensitive fair valuation matters. The Pricing Committee reports to the Valuation, Portfolio Management and Performance Committee (“Valuation Committee”) of the Board. Members of the Pricing Committee meet with the Valuation Committee and the Board at each of their regularly scheduled meetings to discuss valuation matters and actions taken during the period.
The Board has adopted procedures to determine the fair value of a security when a price is not available from a pricing service or broker- dealer or Fund Management determines that a price provided by a pricing service or broker-dealer does not approximate fair value. Fair valuation may also be used when a significant valuation event affecting the value of a security or market sector is determined to have occurred between the time when a security’s market closes and the time the Fund’s net asset value is calculated. The fair value of the security will be determined in good faith by the Pricing Committee in accordance with procedures and methodologies adopted by the Board. General factors used in determining the fair value of securities include, but are not limited to, fundamental analytical data relating to the security, the issuer and the market, such as duration, prepayment and default rates; general level of interest rates and changes in interest rates; information from broker-dealers; trading in similar securities; any restrictions on disposition of the security; and an evaluation of the forces that influence the market in which the investments are traded. These securities are either categorized as Level 2 or 3 in the fair value hierarchy, depending on the relevant inputs used.
When the Funds utilize fair valuation methods that use significant unobservable inputs to determine a security’s value, such securities will be categorized as Level 3 of the fair value hierarchy. These methods may require subjective determinations about the value of a security. While the Funds’ policy is intended to result in a calculation of a Fund’s net asset value that fairly reflects security values as of the time of pricing, the Funds cannot guarantee that values determined by the Board or persons acting at their
58
|
NOTES TO FINANCIAL STATEMENTS |
direction would accurately reflect the price that the Funds could obtain for a security if they were to dispose of it as of the time of pricing (for instance, in a forced or distressed sale). The prices used by the Funds may differ from the value that would be realized if the securities were sold.
The Funds’ Pricing Committee employs various methods for calibrating the valuation approach related to securities categorized within Level 2 and Level 3 of the fair value hierarchy. These methods may include regular due diligence of the Funds’ pricing vendors, a regular review of key inputs and assumptions, transaction back-testing or disposition analysis to compare unrealized gains and losses to realized gains and losses, reviews of missing and stale prices and large movements in market value, and reviews of any market related activities. Additionally, the pricing of all fair value holdings is subsequently reported to the Valuation Committee and Board.
Fair Value Measurements:
The Funds disclose the fair value of their investments in a hierarchy that categorizes investments based on the inputs to valuation techniques used to measure fair value. The three levels of the fair value hierarchy are as follows:
• Level 1 - Inputs that reflect unadjusted quoted prices in active markets for identical assets or liabilities that the Funds have the ability to access at the measurement date.
• Level 2 - Significant inputs other than quoted prices that are observable for the asset or liability either directly or indirectly, including inputs in markets that are not considered to be active. Observable inputs may include quoted prices for similar securities, interest rates, spreads, prepayment spreads, etc.
• Level 3 - Significant unobservable inputs based on the best information available in the circumstances, to the extent observable inputs are not available (including the Fund’s own assumptions in determining the fair value of investments).
The inputs or methodology used for valuing investments are not necessarily an indication of the risk associated with investing in those securities.
Inputs used in determining fair value of an investment may include, but are not limited to, price information, volatility statistics, credit and market data, and other factors, all of which may be either observable or unobservable. Inputs can vary among investments and will be impacted by the investment type and volume of activity for the particular security or similar securities in the market. Investments in the Level 3 category are generally supported by transactions and quoted prices from dealers participating in the market for those investments. Investments may be included in the Level 3 category due to a lack of market activity or transparency. Internal valuation models may also be used as a pricing source for Level 3 investments. Internal valuation models may rely on one or more unobservable inputs, such as estimated cash flows, financial statement analysis and discount rates.
The summary of inputs used to determine the fair value of the Funds’ investments as of March 31, 2020 is as follows:
| | | | | | | | | | | | | | | | |
| Funds | | Level 1
Quoted Prices | | | Level 2
Significant
Observable
Inputs | | | Level 3
Significant
Unobservable
Inputs | | | Total | |
Assets: | | | | | | | | | | | | | | | | |
Investments in Securities | | | | | | | | | | | | | | | | |
SMID Cap Growth Fund | | | $77,105,844 | (a) | | | $ — | | | | $— | | | | $77,105,844 | |
Enterprise Fund | | | 46,217,317 | (a) | | | — | | | | — | | | | 46,217,317 | |
Small Cap Core Fund | | | 60,134,208 | (a) | | | — | | | | — | | | | 60,134,208 | |
Microcap Value Fund | | | 78,172,825 | (a) | | | 1,009,425 | (b) | | | — | | | | 79,182,250 | |
Small Cap Value Fund | | | 46,177,123 | (a) | | | — | | | | — | | | | 46,177,123 | |
| (a) | The breakdown of the Fund’s investments into major categories is disclosed in the Schedule of Portfolio Investments. |
| (b) | Represents securities in the Consumer Staples ($126,000) and Financial ($883,425) sections of the Schedule of Portfolio Investments. |
59
|
NOTES TO FINANCIAL STATEMENTS |
During the period ended March 31, 2020, the Funds, except Microcap Value Fund, recognized no transfers to/from Level 1 or Level 2. For Microcap Value Fund, securities were transferred from Level 2 to Level 1 in the amount of $820,749 since the trading market became active for the securities. The Funds’ policy is to recognize transfers between Level 1, Level 2 and Level 3 at the end of the year utilizing fair value at the beginning of the year.
The following is a reconciliation of Level 3 investments for which significant unobservable inputs were used to determine fair value:
| | | | | | | | |
| | | Microcap
Value Fund | |
| | | Common Stocks– (Financials) | |
Balance as of 9/30/19(value) | | | | | | $ | 16,968 | |
Sales (Paydowns) | | | | | | | (16,968 | ) |
| | | | | | | | |
Balance as of 3/31/20(value) | | | | | | $ | — | |
| | | | | | | | |
The Fund’s assets assigned to the Level 3 category were valued using the valuation methodology and technique deemed most appropriate in the circumstances. The significant unobservable inputs used may include assumptions regarding the particular security’s cash flow profile and potential defaults which may not be generally observable for either the security or for assets of a similar type. Significant changes in any of these assumptions may result in a lower or higher fair value.
Financial Instruments:
Repurchase Agreements:
The Funds, except SMID Cap Growth Fund, may enter into repurchase agreements with counterparties whom the Advisor has deemed creditworthy, including primary dealers that report to the Federal Reserve Bank of New York or other large U.S. commercial banks or broker-dealers. These repurchase agreements are subject to the seller’s agreement to repurchase such securities at a mutually agreed upon date and price. The repurchase price generally equals the price paid by the Funds plus interest negotiated on the basis of current short-term rates.
Securities pledged by the dealers as collateral for repurchase agreements are held by a custodian bank until maturity of the repurchase agreement. The Funds have procedures to monitor additional collateral, if needed, to ensure that the daily market value of the collateral remains in excess of the market value of the repurchase agreement in the event of a default.
There were no repurchase agreements held during the period ended March 31, 2020.
Affiliated Investments:
The Funds invest in another Fund of the Trust (an “Affiliated Fund”), U.S. Government Money MarketFund-RBC Institutional Class 1, as a cash sweep vehicle. The income earned by the Funds from the Affiliated Fund for the period is disclosed in the Statement of Operations. The table below details the transactions of the Funds in the Affiliated Fund.
60
|
NOTES TO FINANCIAL STATEMENTS |
| | | | | | | | | | | | | | | | | | | | |
| | | Value
September 30, 2019 | | | Purchases | | | Sales | | | Value
March 31, 2020 | | | Dividends | |
Investments in U.S. Government Money Market Fund —RBC Institutional Class 1 | | | | | | | | | | | | | | | | | |
SMID Cap Growth Fund | | | $1,040,102 | | | | $10,293,450 | | | | $10,325,820 | | | | $1,007,732 | | | | $13,010 | |
Enterprise Fund | | | 1,072,120 | | | | 6,688,885 | | | | 6,774,411 | | | | 986,594 | | | | 7,688 | |
Small Cap Core Fund | | | 540,071 | | | | 27,012,301 | | | | 26,904,357 | | | | 648,015 | | | | 15,374 | |
Microcap Value Fund | | | 3,404,692 | | | | 17,203,028 | | | | 16,010,025 | | | | 4,597,695 | | | | 27,473 | |
Small Cap Value Fund | | | 1,057,719 | | | | 23,673,636 | | | | 23,433,208 | | | | 1,298,147 | | | | 9,560 | |
Investment Transactions and Income:
Investment transactions are recorded on trade date. Dividend income is recorded on theex-dividend date. Realized gains and losses from investment transactions are calculated based on the cost of the specific security (also known as identified cost basis). Interest income is recognized on the accrual basis and includes, where applicable, the amortization or accretion of premium or discount using the effective yield method.
Expense, Investment Income and Gain/Loss Allocation:
Each Fund pays the expenses that are directly related to its operations, such as custodian fees or advisory fees. Expenses incurred by the Trust, such as trustee or legal fees, are allocated among each of the Funds in the Trust either proportionately based upon each Fund’s relative net assets or using another reasonable basis such as equally across all Funds in the Trust, depending on the nature of the expense. Individual share classes within a Fund are charged expenses specific to that class, such as distribution fees and transfer agent fees. Within a Fund, expenses other than class specific expenses are allocated daily to each class based upon the proportion of relative net assets. Investment income and realized and unrealized gains or losses are allocated to each class of shares based on relative net assets.
Real Estate Investment Trusts:
The Funds may own shares of real estate investment trusts (”REITs“) which report information on the source of their distributions annually. Dividends paid by a REIT, other than capital gain distributions, will be taxable as ordinary income up to the amount of the REIT’s current and accumulated earnings and profits. Capital gain dividends paid by a REIT to a Fund will be treated as long term capital gains by the Fund and, in turn, may be distributed by the Fund to its shareholders as a capital gain distribution. Distributions received from a REIT in excess of its income are recorded as a return of capital and a reduction to the cost basis of the REIT.
Distributions to Shareholders:
Each Fund pays out any income that it receives, less expenses, in the form of dividends and capital gain distributions to its shareholders. Income dividends and capital gain distributions for each Fund are declared and paid at least annually. Distributions to shareholders are recorded on theex-dividend date. The amount of dividends and distributions are calculated based on federal income tax regulations, which may differ from US GAAP. These “book/tax” differences may be either temporary or permanent in nature. To the extent these differences are determined, as of the end of the tax year, to be permanent (e.g., net operating loss, redesignation of distributions and basis adjustments on investments in passive foreign investment companies (PFICs) and partnerships.), they are reclassified within a Fund’s capital accounts based on their federal tax basis treatment.
3. Agreements and Other Transactions with Affiliates:
The Trust has entered into an investment advisory agreement with RBCGAM-US under which RBCGAM-US manages each Funds’ assets and furnishes related office facilities, equipment, research and personnel. The agreement requires each Fund to pay RBCGAM-US a monthly fee based upon average
61
|
NOTES TO FINANCIAL STATEMENTS |
daily net assets. Under the terms of the agreement, RBCGAM-US is entitled to receive fees based on a percentage of the average daily net assets of each of the Funds as follows:
| | | | | | |
| | | Average Daily Net Assets of Fund | | Annual Rate | |
SMID Cap Growth Fund | | All Net Assets | | | 0.70% | |
Enterprise Fund | | Up to $30 Million | | | 1.00% | |
| | Over $30 Million | | | 0.90% | |
Small Cap Core Fund | | All Net Assets | | | 0.85% | |
Microcap Value Fund | | All Net Assets | | | 0.90% | |
Small Cap Value Fund | | All Net Assets | | | 0.70% | |
RBCGAM-US has contractually agreed to waive fees and/or make payments in order to keep total operating expenses (excluding certain fees such as interest, taxes and acquired fund fees and expenses) of the Funds to the following levels pursuant to an expense limitation agreement.
| | | | | | | | | | | | |
| | | Class A
Annual Rate | | | Class I
Annual Rate | | | Class R6
Annual Rate | |
SMID Cap Growth Fund | | | 1.07% | | | | 0.82% | | | | 0.77% | |
Enterprise Fund | | | 1.33% | | | | 1.08% | | | | N/A | |
Small Cap Core Fund | | | 1.15% | | | | 0.90% | | | | 0.87% | |
Microcap Value Fund | | | 1.32% | | | | 1.07% | | | | N/A | |
Small Cap Value Fund | | | N/A | | | | 0.85% | | | | 0.80% | |
This expense limitation agreement is in place until January 31, 2021, and may not be terminated by RBCGAM-US prior to that date. The agreement shall continue for additionalone-year terms unless terminated or revised by the Board at any time or by RBCGAM-US at the expiration of anyone-year period. The Advisor is entitled to recoup from the Fund or class the fees and/or operating expenses waived or reimbursed during any of the previous 12 months (3 years for the Small Cap Value Fund), provided the Fund is able to do so and remain in compliance with the expense limitation in place at the time the fees were waived or expenses paid.
At March 31, 2020, the amounts subject to possible recoupment under the expense limitation agreement were:
| | | | | | | | | | | | | | | | | | | | |
| | | FYE 9/30/17 | | | FYE 9/30/18 | | | FYE 9/30/19 | | | FYE 9/30/20 | | | Total | |
SMID Cap Growth Fund | | $ | — | | | $ | — | | | $ | 89,195 | | | $ | 133,750 | | | $ | 222,945 | |
Enterprise Fund | | | — | | | | — | | | | 71,440 | | | | 82,931 | | | | 154,371 | |
Small Cap Core Fund | | | — | | | | — | | | | 119,071 | | | | 182,141 | | | | 301,212 | |
Microcap Value Fund | | | — | | | | — | | | | 53,958 | | | | 86,205 | | | | 140,163 | |
Small Cap Value Fund | | | 44,257 | | | | 77,233 | | | | 147,091 | | | | 92,579 | | | | 361,160 | |
There was no recoupment of expense reimbursements/waivers during the year. Amounts from years prior to those shown are no longer subject to recoupment.
RBCGAM-US voluntarily agreed to waive its investment advisory fees by the amount of investment advisory fees the Funds pay to RBCGAM-US indirectly through its investment in an affiliated money market fund. For the six months ended March 31, 2020, the amount waived was $1,269, $759, $1,489, $2,734 and $963 for the SMID Cap Growth Fund, Enterprise Fund, Small Cap Core Fund, Microcap Value Fund and Small Cap Value Fund, respectively, and is included in expenses waived/reimbursed by Advisor in the Statements of Operations.
RBCGAM-US may also voluntarily waive and/or reimburse operating expenses of any Fund from time to time. Any such voluntary program may be changed or eliminated at any time without notice, and expenses waived under such program are not subject to recoupment.
RBCGAM-US serves asco-administrator to the Funds. BNY Mellon serves asco-administrator and fund accounting agent. Services provided under the administrative services contract include providing
62
|
NOTES TO FINANCIAL STATEMENTS |
day-to-day administration of matters related to the Funds, maintenance of their records and the preparation of reports. Under the terms of the administrative services agreement, RBCGAM-US does not receive an administrative services fee. BNY Mellon receives a fee for its services payable by each Fund based in part on each Funds’ average net assets. RBCGAM-US’s fee is listed as ”Administration fees“ in the Statements of Operations. BNY Mellon’s fee is included with ”Accounting fees“ in the Statements of Operations.
Certain officers and trustees of the Trust are affiliated with the Advisor or theCo-Administrator. Such Officers and Trustees receive no compensation from the Funds for serving in their respective roles.
The Trust currently pays each of the independent trustees (trustees of the Trust who are not directors, officers or employees of the Advisor, eitherCo-Administrator or Distributor) an annual retainer of $63,000. The Board Chairperson and Audit Committee Chairperson each receive an additional retainer of $2,500 annually, and all other trustees serving as Chair of a Board committee each receive an additional retainer of $1,000 annually. In addition, independent trustees receive a quarterly meeting fee of $6,500 for eachin-person Board meeting attended, a meeting fee of $1,500 for each telephonic or special board meeting attended, a $1,500 fee for each Board committee meeting attended, and are reimbursed for allout-of-pocket expenses relating to attendance at such meetings. These amounts are included in the Statement of Operations in “Trustees’ fees”.
In conjunction with the launch of the Class R6 Shares, the Advisor invested seed capital to provide the share class its initial investment assets. The table below shows, as of March 31, 2020, the Fund’s net assets, the shares of the Fund held by the Advisor, and the percent of total net assets represented by the Advisor’s investment.
| | | | | | | | | | | | |
| | | Net Assets | | | Shares held
by Advisor | | | % of Fund
Net Assets | |
SMID Cap Growth Fund | | $ | 76,478,256 | | | | 1,008 | | | | 0.0% | |
Small Cap Core Fund | | $ | 60,187,242 | | | | 334 | | | | 0.0% | |
4. Fund Distribution:
Each of the Funds that offers Class A shares has adopted a Master Distribution12b-1 Plan (the “Plan”) in which Quasar Distributors LLC (the “Distributor”) acts as the Funds’ distributor. The Plan permits each Fund to make payments for, or to reimburse the Distributor for, distribution-related costs and expenses of marketing shares of Class A covered under the Plan, and/or for providing shareholder services. The Plan does not apply to Class I and Class R6. The following chart shows the current Plan fee rate for Class A.
| | | | |
| | | Class A | |
12b-1 Plan Fee | | | 0.25%* | |
* Under the12b-1 plan, the maximum fee rate for Class A shares is 0.50%. Currently the Board has approved an annual limit of 0.25%.
Plan fees are based on average daily net assets of Class A. Up to 0.25% of each Plan fee may be designated as a service fee, as defined by the applicable rules of the Financial Industry Regulatory Authority. The Distributor, subject to applicable legal requirements, may waive the Plan fee voluntarily, in whole or in part. For the period ended March 31, 2020, there were no fees waived by the Distributor.
For the period ended March 31, 2020, the Distributor received commissions of $54,998front-end sales charges of Class A shares, of the Funds, of which $53,131 was paid to affiliated broker-dealers, and the remainder was either paid to unaffiliated broker-dealers or retained by the Distributor.
The Distributor did not receive any CDSC fees from Class A shares of the Funds during the period ended March 31, 2020.
63
|
NOTES TO FINANCIAL STATEMENTS |
5. Securities Transactions:
The cost of securities purchased and proceeds from securities sold (excluding securities maturing less than one year from acquisition) for the period ended March 31, 2020 were as follows:
| | | | | | | | | | |
| | | Purchases | | | | | Sales | |
SMID Cap Growth Fund | | $ | 6,228,112 | | | | | $ | 5,635,031 | |
Enterprise Fund | | | 7,839,575 | | | | | | 12,563,976 | |
Small Cap Core Fund | | | 26,921,020 | | | | | | 88,484,982 | |
Microcap Value Fund | | | 15,903,930 | | | | | | 16,821,048 | |
Small Cap Value Fund | | | 33,686,620 | | | | | | 28,121,278 | |
Within the guidelines established by the Funds to always seek best execution when entering into portfolio transactions, the Funds participate in a “commission recapture” program under which brokerage transactions are directed to Cowen and Company, LLC and its correspondent brokers. A portion of the commissions paid under this program are reimbursed to the Funds and are recorded as net realized gains from investment transactions in the financial statements.
6. Capital Share Transactions:
The Trust is authorized to issue an unlimited number of shares of beneficial interest (“shares outstanding”) without par value. Transactions in capital stock of the Funds are summarized on the following pages:
| | | | | | | | | | | | | | | | |
| | | SMID Cap Growth Fund | | | Enterprise Fund | |
| | | For the
Six Months
Ended
March 31,
2020
(Unaudited) | | | For the
Year Ended
September 30,
2019 | | | For the
Six Months
Ended
March 31,
2020
(Unaudited) | | | For the
Year Ended
September 30,
2019 | |
CAPITAL TRANSACTIONS: | | | | | | | | | | | | | | | | |
Class A | | | | | | | | | | | | | | | | |
Proceeds from shares issued | | $ | 61,257 | | | $ | 183,906 | | | $ | 1,592 | | | $ | 332,753 | |
Distributions reinvested | | | 990,664 | | | | 984,818 | | | | 48,391 | | | | 134,860 | |
Cost of shares redeemed | | | (492,632 | ) | | | (1,080,072 | ) | | | (92,548 | ) | | | (378,090 | ) |
| | | | | | | | | | | | | | | | |
Change in Class A | | $ | 559,289 | | | $ | 88,652 | | | $ | (42,565 | ) | | $ | 89,523 | |
| | | | | | | | | | | | | | | | |
| | | | |
Class I | | | | | | | | | | | | | | | | |
Proceeds from shares issued | | $ | 11,952,567 | | | $ | 15,536,567 | | | $ | 161,200 | | | $ | 344,165 | |
Distributions reinvested | | | 6,003,044 | | | | 5,701,954 | | | | 4,156,367 | | | | 8,096,171 | |
Cost of shares redeemed | | | (11,411,045 | ) | | | (18,559,900 | ) | | | (4,672,563 | ) | | | (7,044,581 | ) |
| | | | | | | | | | | | | | | | |
Change in Class I | | $ | 6,544,566 | | | $ | 2,678,621 | | | $ | (354,996 | ) | | $ | 1,395,755 | |
| | | | | | | | | | | | | | | | |
| | | | |
Class R6 | | | | | | | | | | | | | | | | |
Distributions reinvested | | $ | 1,031 | | | $ | 955 | | | $ | — | | | $ | — | |
| | | | | | | | | | | | | | | | |
Change in Class R6 | | $ | 1,031 | | | $ | 955 | | | $ | — | | | $ | — | |
| | | | | | | | | | | | | | | | |
Change in net assets resulting from capital transactions | | $ | 7,104,886 | | | $ | 2,768,228 | | | $ | (397,561 | ) | | $ | 1,485,278 | |
| | | | | | | | | | | | | | | | |
64
|
NOTES TO FINANCIAL STATEMENTS |
| | | | | | | | | | | | | | | | |
| | | SMID Cap Growth Fund | | | Enterprise Fund | |
| | | For the
Six Months
Ended
March 31,
2020
(Unaudited) | | | For the
Year Ended
September 30,
2019 | | | For the
Six Months
Ended
March 31,
2020
(Unaudited) | | | For the
Year Ended
September 30,
2019 | |
SHARE TRANSACTIONS: | | | | | | | | | | | | | | | | |
Class A | | | | | | | | | | | | | | | | |
Issued | | | 4,700 | | | | 14,503 | | | | 100 | | | | 15,331 | |
Reinvested | | | 77,275 | | | | 95,613 | | | | 2,682 | | | | 9,250 | |
Redeemed | | | (40,753 | ) | | | (85,864 | ) | | | (5,233 | ) | | | (20,997 | ) |
| | | | | | | | | | | | | | | | |
Change in Class A | | | 41,222 | | | | 24,252 | | | | (2,451 | ) | | | 3,584 | |
| | | | | | | | | | | | | | | | |
| | | | |
Class I | | | | | | | | | | | | | | | | |
Issued | | | 836,622 | | | | 1,111,192 | | | | 9,396 | | | | 18,383 | |
Reinvested | | | 401,541 | | | | 481,584 | | | | 217,953 | | | | 528,126 | |
Redeemed | | | (828,975 | ) | | | (1,295,574 | ) | | | (265,404 | ) | | | (376,572 | ) |
| | | | | | | | | | | | | | | | |
Change in Class I | | | 409,188 | | | | 297,202 | | | | (38,055 | ) | | | 169,937 | |
| | | | | | | | | | | | | | | | |
| | | | |
Class R6 | | | | | | | | | | | | | | | | |
Reinvested | | | 69 | | | | 81 | | | | — | | | | — | |
| | | | | | | | | | | | | | | | |
Change in Class R6 | | | 69 | | | | 81 | | | | — | | | | — | |
| | | | | | | | | | | | | | | | |
Change in shares resulting from capital transactions | | | 450,479 | | | | 321,535 | | | | (40,506 | ) | | | 173,521 | |
| | | | | | | | | | | | | | | | |
65
|
NOTES TO FINANCIAL STATEMENTS |
| | | | | | | | | | | | | | | | |
| | | Small Cap Core Fund | | | Microcap Value Fund | |
| | | For the
Six Months
Ended
March 31,
2020
(Unaudited) | | | For the
Year Ended
September 30,
2019 | | | For the
Six Months
Ended
March 31,
2020
(Unaudited) | | | For the
Year Ended
September 30,
2019 | |
CAPITAL TRANSACTIONS: | | | | | | | | | | | | | | | | |
Class A | | | | | | | | | | | | | | | | |
Proceeds from shares issued | | $ | 659,620 | | | $ | 1,285,452 | | | $ | 52,382 | | | $ | 168,741 | |
Distributions reinvested | | | 371,626 | | | | 918,093 | | | | 202,889 | | | | 415,943 | |
Cost of shares redeemed | | | (930,552 | ) | | | (4,406,119 | ) | | | (581,455 | ) | | | (2,433,422 | ) |
| | | | | | | | | | | | | | | | |
Change in Class A | | $ | 100,694 | | | $ | (2,202,574 | ) | | $ | (326,184 | ) | | $ | (1,848,738 | ) |
| | | | | | | | | | | | | | | | |
| | | | |
Class I | | | | | | | | | | | | | | | | |
Proceeds from shares issued | | $ | 7,878,846 | | | $ | 17,549,245 | | | $ | 10,133,002 | | | $ | 9,919,176 | |
Distributions reinvested | | | 6,085,505 | | | | 19,900,926 | | | | 6,630,692 | | | | 10,230,875 | |
Cost of shares redeemed | | | (69,245,679 | ) | | | (90,883,883 | ) | | | (9,581,923 | ) | | | (16,298,697 | ) |
| | | | | | | | | | | | | | | | |
Change in Class I | | $ | (55,281,328 | ) | | $ | (53,433,712 | ) | | $ | 7,181,771 | | | $ | 3,851,354 | |
| | | | | | | | | | | | | | | | |
| | | | |
Class R6 | | | | | | | | | | | | | | | | |
Proceeds from shares issued | | $ | 11,992 | | | $ | 27,664 | | | $ | — | | | $ | — | |
Distributions reinvested | | | 1,783 | | | | 8,302 | | | | — | | | | — | |
Cost of shares redeemed | | | (23,448 | ) | | | (61,189 | ) | | | — | | | | — | |
| | | | | | | | | | | | | | | | |
Change in Class R6 | | $ | (9,673 | ) | | $ | (25,223 | ) | | $ | — | | | $ | — | |
| | | | | | | | | | | | | | | | |
Change in net assets resulting from capital transactions | | $ | (55,190,307 | ) | | $ | (55,661,509 | ) | | $ | 6,855,587 | | | $ | 2,002,616 | |
| | | | | | | | | | | | | | | | |
| | | | |
SHARE TRANSACTIONS: | | | | | | | | | | | | | | | | |
Class A | | | | | | | | | | | | | | | | |
Issued | | | 24,290 | | | | 43,610 | | | | 2,032 | | | | 6,293 | |
Reinvested | | | 12,097 | | | | 36,724 | | | | 7,642 | | | | 17,844 | |
Redeemed | | | (32,749 | ) | | | (140,609 | ) | | | (26,523 | ) | | | (91,232 | ) |
| | | | | | | | | | | | | | | | |
Change in Class A | | | 3,638 | | | | (60,275 | ) | | | (16,849 | ) | | | (67,095 | ) |
| | | | | | | | | | | | | | | | |
| | | | |
Class I | | | | | | | | | | | | | | | | |
Issued | | | 253,836 | | | | 563,216 | | | | 412,018 | | | | 377,874 | |
Reinvested | | | 187,650 | | | | 757,265 | | | | 250,026 | | | | 439,471 | |
Redeemed | | | (2,239,909 | ) | | | (2,873,827 | ) | | | (412,394 | ) | | | (629,488 | ) |
| | | | | | | | | | | | | | | | |
Change in Class I | | | (1,798,423 | ) | | | (1,553,346 | ) | | | 249,650 | | | | 187,857 | |
| | | | | | | | | | | | | | | | |
| | | | |
Class R6 | | | | | | | | | | | | | | | | |
Issued | | | 374 | | | | 886 | | | | — | | | | — | |
Reinvested | | | 55 | | | | 315 | | | | — | | | | — | |
Redeemed | | | (755 | ) | | | (2,252 | ) | | | — | | | | — | |
| | | | | | | | | | | | | | | | |
Change in Class R6 | | | (326 | ) | | | (1,051 | ) | | | — | | | | — | |
| | | | | | | | | | | | | | | | |
Change in shares resulting from capital transactions | | | (1,795,111 | ) | | | (1,614,672 | ) | | | 232,801 | | | | 120,762 | |
| | | | | | | | | | | | | | | | |
66
|
NOTES TO FINANCIAL STATEMENTS |
| | | | | | | | |
| | | Small Cap Value Fund | |
| | | For the
Six Months
Ended
March 31,
2020
(Unaudited) | | | For the
Year Ended
September 30,
2019 | |
CAPITAL TRANSACTIONS: | | | | | | | | |
Class I | | | | | | | | |
Proceeds from shares issued | | $ | 18,847,953 | | | $ | 57,936,162 | |
Distributions reinvested | | | 287,196 | | | | 2,275,076 | |
Cost of shares redeemed | | | (12,955,995 | ) | | | (130,759,096 | ) |
| | | | | | | | |
Change in Class I | | $ | 6,179,154 | | | $ | (70,547,858 | ) |
| | | | | | | | |
| | |
Class R6 | | | | | | | | |
Proceeds from shares issued | | $ | 188,777 | | | $ | 300,429 | |
Distributions reinvested | | | 98,525 | | | | 225,064 | |
Cost of shares redeemed | | | (154,962 | ) | | | (682,702 | ) |
| | | | | | | | |
Change in Class R6 | | $ | 132,340 | | | $ | (157,209 | ) |
| | | | | | | | |
Change in net assets resulting from capital transactions | | $ | 6,311,494 | | | $ | (70,705,067 | ) |
| | | | | | | | |
| | |
SHARE TRANSACTIONS: | | | | | | | | |
Class I | | | | | | | | |
Issued | | | 1,575,399 | | | | 5,019,995 | |
Reinvested | | | 21,757 | | | | 222,610 | |
Redeemed | | | (1,296,834 | ) | | | (11,329,093 | ) |
| | | | | | | | |
Change in Class I | | | 300,322 | | | | (6,086,488 | ) |
| | | | | | | | |
| | |
Class R6 | | | | | | | | |
Issued | | | 19,030 | | | | 25,523 | |
Reinvested | | | 7,425 | | | | 21,893 | |
Redeemed | | | (12,695 | ) | | | (57,424 | ) |
| | | | | | | | |
Change in Class R6 | | | 13,760 | | | | (10,008 | ) |
| | | | | | | | |
Change in shares resulting from capital transactions | | | 314,082 | | | | (6,096,496 | ) |
| | | | | | | | |
7. Federal Income Taxes:
It is the policy of each Fund to continue to qualify as a regulated investment company by complying with the provisions available to certain investment companies, as defined under Subchapter M of the Internal Revenue Code, and to distribute substantially all of its net investment income and net realized capital gains. Therefore, no federal tax liability is recorded in the financial statements of each Fund.
Fund Management has analyzed the Funds’ tax positions taken or expected to be taken on federal income tax returns for all open tax years (current and prior three tax years), and has concluded that no provision for federal income tax is required in the Funds’ financial statements. The Funds’ federal and state income and federal excise tax returns for tax years for which the applicable statutes of limitations have not expired are subject to examination by the Internal Revenue Service and state departments of revenue.
67
|
NOTES TO FINANCIAL STATEMENTS |
As of March 31, 2020, the tax cost of investments and the breakdown of unrealized appreciation (depreciation) for each Fund was as follows:
| | | | | | | | | | | | | | | | |
| | | Tax Cost Of
Investments | | | Unrealized
Appreciation | | | Unrealized
Depreciation | | | Net Unrealized
Appreciation/
(Depreciation) | |
SMID Cap Growth Fund | | $ | 73,293,450 | | | $ | 15,123,207 | | | $ | (11,310,814 | ) | | $ | 3,812,393 | |
Enterprise Fund | | | 40,962,278 | | | | 13,509,324 | | | | (8,254,286 | ) | | | 5,255,038 | |
Small Cap Core Fund | | | 55,637,645 | | | | 15,946,436 | | | | (11,449,873 | ) | | | 4,496,563 | |
Microcap Value Fund | | | 97,521,463 | | | | 21,760,608 | | | | (40,099,821 | ) | | | (18,339,213 | ) |
Small Cap Value Fund | | | 69,243,121 | | | | 421,539 | | | | (23,487,538 | ) | | | (23,065,999 | ) |
The difference between book basis and tax basis unrealized appreciation/depreciation is attributable primarily to the tax deferral of losses on wash sales, Passive Foreign Investment Companies (PFICs) and the timing of income recognition in partnerships.
The tax character of distributions during the year ended September 30, 2019 were as follows:
| | | | | | | | | | | | | | | | |
| | | Distributions Paid From | |
| | | Ordinary
Income | | | Net Long Term
Capital Gains | | | Total Taxable
Distributions | | | Total
Distributions
Paid | |
SMID Cap Growth Fund | | $ | — | | | $ | 6,700,195 | | | $ | 6,700,195 | | | $ | 6,700,195 | |
Enterprise Fund | | | — | | | | 8,935,430 | | | | 8,935,430 | | | | 8,935,430 | |
Small Cap Core Fund | | | — | | | | 21,239,568 | | | | 21,239,568 | | | | 21,239,568 | |
Microcap Value Fund | | | 1,290,895 | | | | 10,531,781 | | | | 11,822,676 | | | | 11,822,676 | |
Small Cap Value Fund | | | 1,172,021 | | | | 2,645,153 | | | | 3,817,174 | | | | 3,817,174 | |
The tax basis of components of accumulated earnings/(losses) and tax character of distributions are determined at fiscal year end, and will be included in the Annual Report dated September 30, 2020.
As of September 30, 2019, the Funds did not have any capital loss carryforwards for federal income tax purposes.
Under current tax law, Post-October Capital Losses and Late-Year Ordinary Losses may be deferred and treated as occurring on the first business day of the following fiscal year for tax purposes. The SMID Cap Growth Fund, Enterprise Fund and Small Cap Core Fund had deferred qualified late-year ordinary losses of $219,555, $67,131 and $44,922, respectively, and for the Small Cap Value Fund deferred long-term qualified late year capital losses of $2,853,986 and short-term qualified late year capital losses of $4,611,241, which will be treated as arising on the first business day of the fiscal year ending September 30, 2020.
8. Market Timing:
The Trust strongly discourages attempts at market timing by Fund shareholders. Each Fund charges a redemption fee of 2% of the value of the shares redeemed or exchanged within 30 days of purchase, in addition to limiting the number of exchanges that may be made between Funds to five (5) per calendar year. When assessed, the redemption fee is deducted from the redemption proceeds and retained by the Fund, not by the Advisor. This redemption fee is not charged in cases where, for example, the redemption results from an automatic reinvestment or assetre-allocation not specifically directed by the shareholder. The Trust also reserves the right to reject any Fund purchase order made by persons deemed to be market timers. The Funds’ prospectus contains a full description of the Trust’s policies on market timing and/or excessive trading. The redemption fee is recorded as a credit to capital and is included in the capital transactions on the Statements of Changes in Net Assets.
68
|
NOTES TO FINANCIAL STATEMENTS |
During the six months ended March 31, 2020, the redemption fees collected by the Funds which are offset in the cost of shares redeemed on the Statements of Changes in Net Assets are as follows:
| | |
| | | Redemption Fees |
Enterprise Fund | | $ 1 |
Small Cap Core Fund | | 53 |
Microcap Value Fund | | 3,355 |
Small Cap Value Fund | | 7,914 |
9. Soft Dollars:
Soft dollar arrangements and commission sharing arrangements (CSAs) are arrangements under which RBCGAM-US directs client brokerage transactions to a broker-dealer and obtains other products and services, such as research, in addition to trade execution. Federal securities laws permit a fund advisor to incur commission charges on behalf of a fund that are higher than another broker-dealer would have charged if the advisor believes the charges are reasonable in relation to the brokerage and research services received. RBCGAM-US has a fiduciary duty to the shareholders of the Funds to seek the best execution for all of the Funds’ securities transactions. Fund Management believes that using soft dollars to purchase brokerage and research services may, in certain cases, be in a Fund’s best interest. During the period ended March 31, 2020, the Funds used soft dollar and commission sharing arrangements. Fund Management continues to closely monitor its current use of soft dollars, in addition to regulatory developments in this area for any possible impact on Fund policies.
10. Line of Credit
The Funds are participants in an uncommitted, unsecured $500,000,000 line of credit with U.S. Bank, N.A. (the “Bank”), the Funds’ custodian, to be used to fund shareholder redemption requests and for other short-term temporary or emergency general business purposes. The line of credit has a scheduled termination date of August 1, 2020. Interest is charged on borrowings under this line of credit at the Bank’s prime lending rate per annum. Since each Fund participates in this line of credit, there is no assurance that an individual fund will have access to all or any part of the $500,000,000 at any particular time. There were no loans outstanding pursuant to this line of credit at March 31, 2020. During the period ended March 31, 2020, the Funds did not utilize this line of credit.
11. Significant Risks
Shareholder concentration risk:
As of March 31, 2020, the following Funds had omnibus accounts which owned more than 10% of a Fund’s outstanding shares as shown below:
| | | | |
| | | # of Omnibus Accounts | | % of Fund |
SMID Cap Growth Fund | | 2 | | 86.0% |
Small Cap Core Fund | | 3 | | 40.5% |
Microcap Value Fund | | 1 | | 26.5% |
Significant transactions by these shareholders may impact the Funds’ performance.
Market risk:
One or more markets in which a Fund invests may go down in value, sometimes sharply and unpredictably, and the value of a Fund’s portfolio securities may fall or fail to rise. Market risk may affect a single issuer, sector of the economy, industry or the market as a whole. In addition, global economies and financial markets are becoming increasingly interconnected, and political, economic and other conditions and events (including, but not limited to, natural disasters, pandemics, epidemics, and social unrest) in one country, region, or financial market may adversely impact issuers in a different country, region or financial market. Furthermore, the occurrence of, among other events, natural orman-made disasters, severe weather or geological events, fires, floods, earthquakes, outbreaks of disease (such asCOVID-19, avian influenza or H1N1/09), epidemics, pandemics, malicious acts,
69
|
NOTES TO FINANCIAL STATEMENTS |
cyber-attacks, terrorist acts or the occurrence of climate change, may also adversely impact the performance of a Fund. Such events could adversely impact issuers, markets and economies over the short- and long-term, including in ways that cannot necessarily be foreseen. A Fund could be negatively impacted if the value of a portfolio holding were harmed by such political or economic conditions or events. Moreover, such negative political and economic conditions and events could disrupt the processes necessary for a Fund’s operations.
Industry and sector focus risk:
At times the Funds may increase the relative emphasis of its investments in a particular industry or sector. The prices of securities of issuers in a particular industry or sector may be more susceptible to fluctuations due to changes in economic or business conditions, government regulations, availability of basic resources or supplies, or other events affect that industry or sector more than securities of issuers in other industries and sectors. To the extent that the Fund increases the relative emphasis of its investments in a particular industry or sector, its shares’ values may fluctuate in response to events affecting that industry or sector.
12. Subsequent Events:
Fund Management has evaluated the impact of all subsequent events on the Funds and has determined that there were no subsequent events requiring recognition or disclosure in the financial statements.
70
|
SHARE CLASS INFORMATION (UNAUDITED) |
The RBC Equity Funds offer three share classes. These three share classes are the A, R6 and I classes.
Class A
Class A shares, offered by all Funds except Small Cap Value Fund, are available for purchase primarily through investment advisors, broker-dealers, banks and other financial services intermediaries. Class A shares of the Funds are currently subject to a maximumup-front sales charge of 5.75% and a 1.00% CDSC for redemption within 12 months of a $1 million or greater purchase. Class A shares currently include a 0.25% (25 bps) annual12b-1 service and distribution fee.
Class I
Class I shares are available in all of the Funds. This share class is intended for investors meeting certain minimum investment thresholds. This share class does not have anup-front sales charge (load) or a12b-1 service and distribution fee.
Class R6
Class R6 shares are available in SMID Cap Growth Fund, Small Cap Core Fund and Small Cap Value Fund. This share class is intended for investors meeting certain minimum investment thresholds. This share class does not have anup-front sales charge (load) or a12b-1 service and distribution fee.
71
|
SUPPLEMENTAL INFORMATION (UNAUDITED) |
Shareholder Expense Examples
As a shareholder of the the RBC Funds, you incur two types of costs: (1) transaction costs and (2) ongoing costs, including management fees; and other Fund expenses. This example is intended to help you understand your ongoing costs (in dollars) of investing in the RBC Funds and to compare these costs with the ongoing costs of investing in other mutual funds.
The example is based on an investment of $1,000 invested at the beginning of the period and held for the entire period from October 1, 2019 through March 31, 2020.
Actual Expenses
The table below provides information about actual account values and actual expenses. You may use the information below, together with the amount you invested, to estimate the expenses that you paid over the period. Simply divide your account value by $1,000 (for example, an $8,600 account value divided by $1,000 = 8.6), then multiply the result by the number in the table under the heading entitled “Expenses Paid During Period” to estimate the expenses you paid on your account during this period.
| | | | | | | | | | | | | | | | | | | | |
| | | | | | Beginning
Account Value
10/1/19 | | | Ending
Account Value
3/31/20 | | | Expenses Paid
During Period*
10/1/19–3/31/20 | | | Annualized
Expense Ratio
During Period
10/1/19–3/31/20 | |
SMID Cap Growth Fund | | | | | | | | | | | | | | | | | | | | |
| | | Class A | | | | $1,000.00 | | | | $820.90 | | | | $4.87 | | | | 1.07% | |
| | | Class I | | | | 1,000.00 | | | | 822.60 | | | | 3.74 | | | | 0.82% | |
| | | Class R6 | | | | 1,000.00 | | | | 823.00 | | | | 3.51 | | | | 0.77% | |
Enterprise Fund | | | | | | | | | | | | | | | | | | | | |
| | | Class A | | | | 1,000.00 | | | | 722.90 | | | | 5.73 | | | | 1.33% | |
| | | Class I | | | | 1,000.00 | | | | 723.60 | | | | 4.65 | | | | 1.08% | |
Small Cap Core Fund | | | | | | | | | | | | | | | | | | | | |
| | | Class A | | | | 1,000.00 | | | | 716.50 | | | | 4.93 | | | | 1.15% | |
| | | Class I | | | | 1,000.00 | | | | 717.10 | | | | 3.86 | | | | 0.90% | |
| | | Class R6 | | | | 1,000.00 | | | | 717.30 | | | | 3.74 | | | | 0.87% | |
Microcap Value Fund | | | | | | | | | | | | | | | | | | | | |
| | | Class A | | | | 1,000.00 | | | | 687.70 | | | | 5.57 | | | | 1.32% | |
| | | Class I | | | | 1,000.00 | | | | 688.10 | | | | 4.52 | | | | 1.07% | |
Small Cap Value Fund | | | | | | | | | | | | | | | | | | | | |
| | | Class I | | | | 1,000.00 | | | | 703.80 | | | | 3.62 | | | | 0.85% | |
| | | Class R6 | | | | 1,000.00 | | | | 704.10 | | | | 3.41 | | | | 0.80% | |
*Expenses are equal to the average account value times the Fund’s annualized expense ratio multiplied by 183/366 (to reflect one half year period).
72
|
SUPPLEMENTAL INFORMATION (UNAUDITED) |
Hypothetical Example for Comparison Purposes
The table below provides information about hypothetical account values and hypothetical expenses based on each RBC Funds’ actual expense ratio and an assumed rate of return of 5% per year before expenses, which is not the Fund’s actual return. The hypothetical account values and expenses may not be used to estimate the actual ending account balance or expenses you paid for the period. You may use this information to compare this 5% hypothetical example with the 5% hypothetical examples that appear in the shareholder reports of other funds.
Please note that the expenses shown in the table are meant to highlight your ongoing costs only and do not reflect any transactional costs, such as sales charges (loads), redemption fees, or exchange fees. Therefore, the table is useful in comparing ongoing costs only, and will not help you determine the relative total costs of owning different funds. In addition, if these transactional costs were included, your costs would have been higher.
| | | | | | | | | | | | | | | | | | | | |
| | | | | | Beginning
Account Value
10/1/19 | | | Ending
Account Value
3/31/20 | | | Expenses Paid
During Period*
10/1/19-3/31/20 | | | Annualized
Expense Ratio
During Period
10/1/19-3/31/20 | |
SMID Cap Growth Fund | | | | | | | | | | | | | | | | | | | | |
| | | Class A | | | $ | 1,000.00 | | | $ | 1,019.65 | | | $ | 5.40 | | | | 1.07% | |
| | | Class I | | | | 1,000.00 | | | | 1,020.90 | | | | 4.14 | | | | 0.82% | |
| | | Class R6 | | | | 1,000.00 | | | | 1,021.15 | | | | 3.89 | | | | 0.77% | |
Enterprise Fund | | | | | | | | | | | | | | | | | | | | |
| | | Class A | | | | 1,000.00 | | | | 1,018.35 | | | | 6.71 | | | | 1.33% | |
| | | Class I | | | | 1,000.00 | | | | 1,019.60 | | | | 5.45 | | | | 1.08% | |
Small Cap Core Fund | | | | | | | | | | | | | | | | | | | | |
| | | Class A | | | | 1,000.00 | | | | 1,019.25 | | | | 5.81 | | | | 1.15% | |
| | | Class I | | | | 1,000.00 | | | | 1,020.50 | | | | 4.55 | | | | 0.90% | |
| | | Class R6 | | | | 1,000.00 | | | | 1,020.65 | | | | 4.39 | | | | 0.87% | |
Microcap Value Fund | | | | | | | | | | | | | | | | | | | | |
| | | Class A | | | | 1,000.00 | | | | 1,018.40 | | | | 6.66 | | | | 1.32% | |
| | | Class I | | | | 1,000.00 | | | | 1,019.65 | | | | 5.40 | | | | 1.07% | |
Small Cap Value Fund | | | | | | | | | | | | | | | | | | | | |
| | | Class I | | | | 1,000.00 | | | | 1,020.75 | | | | 4.29 | | | | 0.85% | |
| | | Class R6 | | | | 1,000.00 | | | | 1,021.00 | | | | 4.04 | | | | 0.80% | |
*Expenses are equal to the average account value times the Fund’s annualized expense ratio multiplied by 183/366 (to reflect one half year period).
73
|
LIQUIDITY RISK DISCLOSURE (UNAUDITED) |
Statement Regarding Liquidity Risk Management Program
This section discusses the operation and effectiveness of the Liquidity Risk Management Program (the “Program”) of RBC Funds Trust (the “Trust”), including each of its series (each, a “Fund” and collectively, the “Funds”), established in accordance with Rule22e-4 under the Investment Company Act of 1940, as amended (the “Liquidity Rule”). The Board of Trustees of the Trust (the “Board”), including a majority of the Trustees who are not “interested persons” as defined in the 1940 Act, approved the Program on behalf of each Fund, as required pursuant to the Liquidity Rule. The Board also approved the designation of RBC Global Asset Management (U.S.) Inc. (“RBC”), the investment adviser to each Fund, as the Program Administrator for the Program. RBC administersday-to-day implementation of the Program through a Liquidity Risk Committee (the “Committee”), as set forth in the Program.
RBC, as Program Administrator, provided the Board with a report addressing the operation of the Program and assessing its adequacy and effectiveness of implementation, including, if applicable, the operation of any highly liquid investments minimum (“HLIM”) and any material changes to the Program (the “Report”).
The Report covered the year ending December 31, 2019 (the “Review Period”).
I. Key Conclusions of the Report
The Program, as and implemented, is reasonably designed to assess and manage each Fund’s liquidity risk. During the Review Period, the Program was implemented and operated effectively to achieve the goal of assessing and managing each Fund’s liquidity risk. No Fund was required to set an HLIM and each Fund was able to meet requests for redemption without significant dilution of remaining investors’ interests in the Fund. There were no material changes to the Program implemented during the Review Period.
II. Summary of the Review
A. Liquidity Risk Assessment and Review
Throughout the Review Period, the Program Administrator, in consultation with investment personnel, monitored the Funds’ portfolio liquidity and liquidity risk on an ongoing basis, as described in the Program and in Board reporting throughout the Review Period.
The Program Administrator also conducted an annual review assessing each Fund’s liquidity risk as described in the Report, in accordance with the requirements of the Program and the Liquidity Rule, taking into account the following factors enumerated in the Liquidity Rule and identified in the Program, as applicable:
a. Each Fund’s investment strategy and liquidity of portfolio investments during both normal and reasonably foreseeable stressed conditions, including: (i) whether the Fund’s investment strategy is appropriate for anopen-end fund; (ii) the extent to which the Fund’s strategy involves a relatively concentrated portfolio or large positions in particular issuers; (iii) the Fund’s use of borrowings for investment purposes; and (iv) the Fund’s use of derivatives (including for hedging purposes);
b. Short-term and long-term cash flow projections during both normal and reasonably foreseeable stressed conditions; and
c. Holdings of cash and cash equivalents, as well as borrowing arrangements and other funding sources.
Investment Strategy and Portfolio Liquidity. The Program Administrator considered the factors identified above, among others, during both normal and reasonably foreseeable stressed conditions as provided in the Program. Pursuant to the review, the Program Administrator determined that Fund’s investment strategy and use of derivatives are appropriate for anopen-end fund.
Cash Flow. The Funds’ cash flows did not have a material effect on the ability to meet redemptions during the Review Period.
74
|
LIQUIDITY RISK DISCLOSURE (UNAUDITED) |
Holdings of Cash and Borrowing Arrangements. As described in the Report, the Program Administrator determined that the Funds’ holdings of cash and borrowing arrangements were adequate for meeting the Funds’ expected cash flow needs to meet redemptions during the Review Period.
In light of the assessment and review as discussed above, the Program Administrator did not recommend any material changes in the management of the Funds’ liquidity risks, including with respect to any of the above factors.
B. Portfolio Holdings Classifications
During the Review Period, each Fund’s portfolio holdings (including derivative investments) were classified monthly as Highly Liquid Investments, Moderately Liquid Investments, Less Liquid Investments and Illiquid Investments pursuant to the Program, as required by the Liquidity Rule.
During the Review Period, the Funds classified portfolio investments (including, as applicable, derivatives transactions) according to asset class when appropriate, as described in Section IV.B of the Program.
Market Depth—Reasonably Anticipated Trading Size. In classifying and reviewing its portfolio investments or asset classes (as applicable), the Funds must determine whether trading varying portions of a position in a particular portfolio investment or asset class, in sizes that the Fund would reasonably anticipate trading, is reasonably expected to significantly affect its liquidity, and if so, the Fund must take this determination into account when classifying the liquidity of that investment or asset class. There were no changes to the Reasonably Anticipated Trading Size assumptions for the Funds during the Review period.
Classification Review. As required by the Liquidity Rule, the Funds reviewed liquidity classifications on a monthly basis during the Review Period as described in Section IV of the Program. The Committee met monthly to review its portfolio investments’ classifications in connection with recording the liquidity classification for each portfolio investment for reporting on FormN-PORT. The Program Administrator oversaw the Funds’ process for classifying portfolio holdings under the Rule and reviewed the classifications, as described in the Program. This review included a review of the methodology and data inputs used. During the Review Period, the Program Administrator determined that there were no material operational issues with the process for classifying portfolio holdings.
C. HLIM
The Program Administrator reviewed the process and standards for determining that each Fund primarily holds investments that are highly liquid. There were no changes recommended in the Report with respect to the status of any Fund as a Primarily Highly Liquid Fund (“PHLF”) and each Fund qualified as a PHLF on an ongoing basis during the Review Period as described in the Report.
Accordingly, an HLIM was not required for any Fund during the Review Period pursuant to the relevant provisions of the Program.
D. Compliance with the 15% Limitation on Illiquid Investments
Pursuant to the Liquidity Rule, no Fund may acquire any illiquid investment if, after the acquisition, the Fund would have invested more than 15% of its assets in illiquid investments that are assets (the “15% Limit”). The Program Administrator monitored compliance with the 15% Limit as described in the Program. During the Review Period, the Funds operated in accordance with the relevant provisions of the Program with respect to the 15% Limit.
E. Redemptions in Kind
There were no redemptionsin-kind effected by any Fund during the Review Period.
75
This Page Intentionally Left Blank
76
This Page Intentionally Left Blank
77
This Page Intentionally Left Blank
78
RBC Funds
P.O. Box 701
Milwaukee, WI 53201-0701
800-422-2766
www.rbcgam.us
Performance data represents past performance and does not guarantee future results. The principal value of an investment and investment return will fluctuate so that an investor’s shares, when redeemed, may be worth more or less than their original cost.
This report and the financial statements contained herein are provided for the information of RBC Funds shareholders. This report is not authorized for distribution to prospective investors unless preceded or accompanied by a current prospectus, which contains information concerning investment objectives, risks, charges and expenses of the funds. Please read the prospectus carefully before investing.
This report and the financial statements contained herein are not intended to be a forecast of future events, a guarantee of future results, or investment advice. There is no assurance that certain securities will remain in or out of each fund’s portfolio. The views expressed in this report reflect those of the portfolio managers through the period ended March 31, 2020.
NOT FDIC INSURED • NO BANK GUARANTEE • MAY LOSE VALUE
RBC Global Asset Management (U.S.) Inc. serves as investment advisor for the RBC Funds.
RBC Funds are distributed by Quasar Distributors LLC.
The RBC Funds are pleased to offer shareholder reports printed entirely on Forest Stewardship Council® certified paper. FSC® certification ensures that the paper used in this report contains fiber from well-managed and responsibly harvested forests that meet strict environmental and socioeconomic standards.
RBCF-EQ SAR03-20
Semi-Annual Report For the six months ended March 31, 2020 U.S. Government Money Market Fund Beginning on January 1, 2021, as permitted by regulations adopted by the U.S. Securities and Exchange commission, paper copies of the Funds’ annual and semi-annual shareholder reports will no longer be sent by mail, unless you specifically request paper copies of the reports. Instead, the reports will be made available on the Funds’ website, and you will be notified by mail each time a report is posted and provided with a website link to access the report. If you already elected to receive shareholder reports electronically, you will not be affected by this change and you need not take any action. You may elect to receive shareholder reports and other communications from a Fund electronically anytime by contacting your financial intermediary (such as a broker-dealer or bank) or, if you are a direct investor, by calling800-422-2766. You may elect to receive all future reports in paper free of charge. If you invest through a financial intermediary, you can contact your financial intermediary to request that you continue to receive paper copies of your shareholder reports. If you invest directly with a Fund, you can call800-422-2766 to let the Fund know you wish to continue receiving paper copies of your shareholder reports. Your election to receive reports in paper will apply to all Funds held in your account if you invest through your financial intermediary or all Funds held with the fund complex if you invest directly with a Fund.
| | | | | | | | | | | | |
| | | | | | | | | |
| | | | | | | | RBC Funds | | | | |
| | | | | | | | | |
About your Semi Annual Report | | | | | | | | This semi-annual report (Unaudited) includes detailed information about your Fund including financial statements, performance, and a complete list of its holdings. | |
| | | | | | | | We hope the financial information presented will help you evaluate your investment in the RBC Funds. We also encourage you to read your Fund’s prospectus for further detail as to your Fund’s investment policies and risk profile. RBC Funds prospectuses and performance information subsequent to the date of this report are available on our website at www.rbcgam.us. | |
| | | | | | | | A description of the policies and procedures that your Fund uses to determine how to vote proxies relating to portfolio securities is available (i) without charge, upon request, by calling1-800-422-2766; (ii) on the Fund’s website at www.rbcgam.us; and (iii) on the Securities and Exchange Commission’s (the “Commission”) website at http://www.sec.gov. | |
| | | | | | | | Information regarding how your Fund voted proxies relating to portfolio securities during the most recent12-month period ended June 30 is available (i) on the Fund’s website at www.rbcgam.us; and (ii) on the Commission’s website at http://www.sec.gov. | |
| | | | | | | | A schedule of the Fund’s portfolio holdings is filed with the Commission for the first and third quarters of each fiscal year on FormN-PORT. This information is available on the Commission’s website at http://www.sec.gov. | |
| Table of | | | | | | | | Money Market Portfolio Managers | | | 1 | |
| Contents | | | | | | | | Performance Summary | | | 2 | |
| | | | | | | | Schedule of Portfolio Investments | | | 4 | |
| | | | | | | | Financial Statements | | | | |
| | | | | | | | - Statements of Assets and Liabilities | | | 27 | |
| | | | | | | | - Statements of Operations | | | 29 | |
| | | | | | | | - Statements of Changes in Net Assets | | | 30 | |
| | | | | | | | Financial Highlights | | | 31 | |
| | | | | | | | Notes to Financial Statements | | | 33 | |
| | | | | | | | Supplemental Information | | | 41 | |
| | | | | | | | Liquidity Risk Disclosure (Unaudited) | | | 43 | |
| | | | | | | | | | | | |
| | | | | | | | | | | | |
| | | | | | | | | | | | |
| | | | | | | | | | | | |
| | | | | | | | | | | | |
| | | | | | | | | | | | |
| | | | | | | | | | | | |
| | | | | | | | | | | | |
| | | | | | | | | | | | |
| | | | | | | | | | | | |
| | | | | | | | | | | | |
| | | | | | | | | | | | |
| | | | | | | | | | | | |
| | | | | | | | | | | | |
| | | | | | | | | | | | |
| | | | | | | | | | | | |
| | | | | | | | | | | | |
| | | | | | | | | | | | |
| | | | | | | | | | | | |
| | | | | | | | | | | | |
| | | | | | | | | | | | |
| | | | | | | | | | | | |
| | | | | | | | | | | | |
| | | | | | | | | | | | |
| | | | | | | | | | | | |
| | | | | | |
MONEY MARKET PORTFOLIO MANAGER | | | | | | |
| | | | | | | |
| | | |
RBC Global Asset Management (U.S.) Inc. (“RBCGAM-US”), serves as the investment advisor to the Fund. RBCGAM-US employs a team approach to the management of the U.S. Government Money Market Fund, with no individual team member being solely responsible for the investment decisions. The Fund’s management team has access to RBCGAM-US’s investment research and other money management resources. | | | | | | |
Brandon T. Swensen, CFA Vice President,Co-Head, U.S. Fixed Income Brandon Swensen oversees RBCGAM-US’s fixed income research, portfolio management and trading. In addition to shaping the firm’s overall fixed income philosophy and process, he is a portfolio manager for the Funds and several cash management and core solutions. Brandon joined RBCGAM-US in 2000 and most recently was a portfolio manager on the mortgage and government team before being promoted toCo-Head. He also held research analyst positions covering asset-backed securities and credit and served as a financial analyst for the firm. Brandon earned a BS in finance from St. Cloud State University and an MBA in finance from the University of St. Thomas. He is a CFA charterholder and member of the CFA Society of Minnesota. | | | | | | 
Brandon T. Swensen, CFA |
Brian Svendahl, CFA Managing Director,Co-Head, U.S. Fixed Income Brian Svendahl oversees the fixed income research, portfolio management and trading at RBCGAM-US. In addition to shaping the firm’s overall fixed income philosophy and process, he is a portfolio manager for the Funds and many of RBCGAM-US’s government mandates. Brian joined RBCGAM-US in 2005 and most recently led the mortgage and government team before being promoted toCo-Head in 2012. Prior to joining RBCGAM-US, he held several risk management, research and trading positions at Wells Fargo. Brian’s experience also includes liability management and implementing balance sheet hedging strategies. He earned a BS in economics from the University of Minnesota and a BBA in finance and an MBA from the University of Minnesota Carlson School of Management. Brian is a CFA charterholder. | | | | | | 
Brian Svendahl, CFA |
| | | | | | |
| | | | | | |
| | | | | | |
| | | | | | |
| | | | | | |
| | | | | | |
| | | | | | |
| | | | | | |
| | | | | | |
| | | | | | |
| | | | | | |
| | | | | | |
| | | | | | |
| | | | | | |
| | | | | | |
| | | | | | |
| | | | | | |
| | | | | | |
| | | | | | |
| | | | | | |
| | | | | | |
| | | | | | |
| | | | | | |
| | | | | | |
| | | | | | |
| | | | | | |
| | | | | | |
| | | | | | |
| | | | | | | | | | | | | | | | | | | | |
| | | | | | | | | PERFORMANCE SUMMARY (UNAUDITED) | |
| | | | | | | | | | |
| | | | | | | | | | |
| Investment Objective | | | | | | | | The U.S. Government Money Market Fund was managed to preserve principal. This means that the share price of the Fund held steady at $1.00. A consistent share price of $1.00 is expected for a money market mutual fund. An investment in the Fund is not insured or guaranteed by the Federal Deposit Insurance Corporation or any other government agency. Although the Fund seeks to preserve the value of your investment at $1.00 per share, it is possible to lose money by investing in the Fund. These risks are more fully described in the prospectus. | |
| | | | | | | | | | | | | | SEC7-Day Annualized Yield | |
| | | | | | | | | | | Total Return
for the
Six Months Ended
March 31, 2020
(Unaudited) | | | March 31,
2020
(Unaudited) | | | September 30,
2019 | |
| | | | | | | | RBC Institutional Class 1 | | | 0.77% | | | | 0.82% | | | | 1.76% | |
| | | | | | | | RBC Institutional Class 2 | | | 0.69% | | | | 0.67% | | | | 1.67% | |
| | | | | | | | RBC Investor Class | | | 0.33% | | | | 0.03% | | | | 0.95% | |
| | | | | | | |
| | | | | | | | | | | | | | | | | | | | |
| | | | | | | | Performance data quoted represents past performance. Past performance is no guarantee of future results. Investment return and principal value of an investment will fluctuate so that an investor’s shares, when redeemed, may be worth more or less than their original cost. Current performance may be lower or higher than performance quoted. Performance shown reflects contractual fee waivers, without such fee waivers total returns would be reduced. For performance data current to most recentmonth-end go to www.rbcgam.us. | |
| | | | | | | | | |
| | | | | | | | | |
| | | | | | | | | |
| | | | | | | | | |
| | | | | | | | | |
| | | | | | | | | |
| | | | | | | | | |
| | | | | | | | | |
| | | | | | | | | |
| | | | | | | | | |
| | | | | | | | | |
| | | | | | | | | |
| | | | | | | | | |
| | | | | | | | | |
| | | | | | | | | |
| | | | | | | | | |
| | | | | | | | | |
| | | | | | | | | |
| | | | | | | | | |
| | | | | | | | | |
| | | | | | | | | |
| | | | | | | | | | | | | | |
PERFORMANCE SUMMARY (UNAUDITED) | | | | | | | |
| | | | | | | | | | | | |
| Money Market Maturity Schedule | | | | | | | | | | | Asset Allocation | |
| As a percentage of value of investments based on effective maturity as of March 31, 2020. | | | | | | | | |
| | | | | |
| | | U.S. Government
Money Market Fund | | | | | | | | | | |
Less than 8 days | | | 67.0% | | | | | | | | | | | |
8 to 14 days | | | 0.6% | | | | | | | | | | | |
15 to 30 days | | | 2.4% | | | | | | | | | | | |
31 to 180 days | | | 25.3% | | | | | | | | | | | |
Over 180 days | | | 4.7% | | | | | | | | | | | |
| | | | | | | | | | | | | | |
| | | | | | | | | | | | | | |
| | | | | | | | | | | | | | |
| | | | | | | | | | | | | | |
| | | | | | | | | | | | | | |
| | | | | | | | | | | | | | |
| | | | | | | | | | | | | | |
| | | | | | | | | | | | | | |
| | | | | | | | | | | | | | |
| | | | | | | | | | | | | | |
| | | | | | | | | | | | | | |
| | | | | | | | | | | | | | |
| | | | | | | | | | | | | | |
| | | | | | | | | | | | | | |
| | | | | | | | | | | | | | |
| | | | | | | | | | | | | | |
| | | | | | | | | | | | | | |
| | | | | | | | | | | | | | |
| | | | | | | | | | | | | | |
| | | | | | | | | | | | | | |
| | | | | | | | | | | | | | |
| | | | | | | | | | | | | | |
| | | | | | | | | | | | | | |
| | | | | | | | | | | | | | |
| | | | | | | | | | | | | | |
| | | | | | | | | | | | | | |
| | | | | | | | | | | | | | |
| | | | | | | | | | | | | | |
| | | | | | | | | | | | | | |
| | | | | | | | | | | | | | |
| | | | | | | | | | | | | | |
| | | | | | | | | | | | | | |
| | | | | | | | | | | | | | |
| | | | | | | | | | | | | | |
| | | | | | | | | | | | | | |
| | | | | | | | | | | | | | |
|
SCHEDULE OF PORTFOLIO INVESTMENTS |
U.S. Government Money Market Fund
March 31, 2020 (Unaudited)
| | | | | | |
Principal
Amount | | | | Value | |
U.S. Government Agency Backed Mortgages — 31.43% | | | | |
Fannie Mae — 2.14% | | | | |
$ 77,406,000 | | 1.50%, 6/22/20 | | $ | 77,486,961 | |
9,501,000 | | 1.50%, 11/30/20 | | | 9,502,402 | |
79,015,000 | | 1.50%, 7/30/20 | | | 79,013,615 | |
15,000,000 | | 0.00%, 7/15/20(a) | | | 14,991,250 | |
30,324,000 | | 1.38%, 2/26/21 | | | 30,570,417 | |
6,513,078 | | (LIBOR USD1-Month + 0.300%), 1.96%, 10/25/21(b) | | | 6,504,711 | |
75,000,000 | | (SOFR RATE + 0.010%), 0.02%, 5/22/20(b) | | | 74,984,047 | |
10,000,000 | | (SOFR RATE + 0.025%), 0.04%, 9/4/20(b) | | | 10,000,000 | |
30,000,000 | | (SOFR RATE + 0.100%), 0.11%, 4/30/20(b) | | | 30,000,093 | |
25,000,000 | | (SOFR RATE + 0.120%), 0.13%, 3/16/21(b) | | | 25,000,000 | |
75,000,000 | | (SOFR RATE + 0.220%), 0.23%, 3/16/22(b) | | | 75,000,000 | |
50,000,000 | | (SOFR RATE + 0.270%), 0.28%, 6/24/21(b) | | | 50,000,000 | |
50,000,000 | | (SOFR RATE + 0.300%), 0.31%, 9/24/21(b) | | | 50,000,000 | |
| | | | | | |
| | | | | 533,053,496 | |
| | | | | | |
Federal Farm Credit — 4.25% | | | | |
50,000,000 | | 0.00%, 11/16/20(a) | | | 49,898,222 | |
50,000,000 | | 0.00%, 12/8/20(a) | | | 49,808,264 | |
97,795,000 | | 0.00%, 12/14/20(a) | | | 97,424,982 | |
13,170,000 | | 0.00%, 4/23/20(a) | | | 13,169,356 | |
10,000,000 | | 0.00%, 5/5/20(a) | | | 9,999,906 | |
150,000,000 | | 0.00%, 5/22/20(a) | | | 149,983,000 | |
50,000,000 | | 0.00%, 1/4/21(a) | | | 49,868,722 | |
60,000,000 | | 0.00%, 1/7/21(a) | | | 59,775,200 | |
13,178,000 | | 3.65%, 12/21/20 | | | 13,487,754 | |
10,000,000 | | 2.46%, 8/5/20 | | | 10,030,599 | |
10,000,000 | | 2.12%, 7/1/20 | | | 10,040,880 | |
25,000,000 | | 1.38%, 10/9/20 | | | 25,112,262 | |
20,000,000 | | 2.55%, 5/15/20 | | | 20,053,663 | |
25,000,000 | | 1.93%, 7/22/20 | | | 25,124,000 | |
37,000,000 | | (LIBOR USD1-Month + 0.080%), 1.02%, 9/30/20(b) | | | 36,999,079 | |
25,000,000 | | (LIBOR USD1-Month + 0.090%), 0.70%, 11/18/21(b) | | | 25,000,000 | |
50,000,000 | | (LIBOR USD1-Month + 0.100%), 1.02%, 10/22/21(b) | | | 50,000,000 | |
50,000,000 | | (LIBOR USD1-Month + 0.110%), 0.92%, 11/12/21(b) | | | 50,000,000 | |
50,000,000 | | (LIBOR USD1-Month + 0.130%), 1.51%, 11/5/21(b) | | | 50,000,000 | |
30,000,000 | | (LIBOR USD1-Month + 0.160%), 1.52%, 10/4/21(b) | | | 30,000,000 | |
25,000,000 | | (LIBOR USD3-Month - 0.080%), 1.75%, 1/15/21(b) | | | 24,999,751 | |
25,000,000 | | (LIBOR USD3-Month - 0.100%), 1.63%, 11/9/20(b) | | | 25,000,000 | |
50,000,000 | | (LIBOR USD3-Month - 0.130%), 1.70%, 10/19/20(b) | | | 49,999,145 | |
15,000,000 | | (LIBOR USD3-Month - 0.130%), 1.56%, 11/16/20(b) | | | 14,999,229 | |
25,000,000 | | (LIBOR USD3-Month - 0.135%), 1.64%, 10/29/20(b) | | | 24,999,176 | |
5,000,000 | | (SOFR RATE + 0.065%), 0.08%, 8/20/21(b) | | | 5,000,000 | |
19,000,000 | | (SOFR RATE + 0.075%), 0.09%, 7/9/21(b) | | | 19,000,000 | |
20,000,000 | | (SOFR RATE + 0.105%), 0.12%, 1/15/21(b) | | | 20,000,000 | |
5,000,000 | | (SOFR RATE + 0.120%), 0.13%, 3/18/21(b) | | | 5,000,000 | |
15,000,000 | | (SOFR RATE + 0.140%), 0.15%, 9/24/21(b) | | | 15,000,000 | |
|
SCHEDULE OF PORTFOLIO INVESTMENTS |
U.S. Government Money Market Fund (cont.)
March 31, 2020 (Unaudited)
| | | | | | |
Principal
Amount | | | | Value | |
$ 16,700,000 | | (SOFR RATE + 0.190%), 0.20%, 10/15/21(b) | | $ | 16,702,508 | |
15,000,000 | | (SOFR RATE + 0.210%), 0.22%, 10/28/21(b) | | | 15,000,000 | |
| | | | | | |
| | | | | 1,061,475,698 | |
| | | | | | |
Federal Home Loan Banks — 24.03% | | | | |
5,000,000 | | 1.38%, 9/28/20 | | | 4,992,954 | |
50,000,000 | | 1.60%, 4/1/20 | | | 50,000,000 | |
50,000,000 | | 1.59%, 6/17/20 | | | 49,998,826 | |
38,785,000 | | 1.75%, 6/12/20 | | | 38,842,108 | |
77,150,000 | | 0.00%, 4/24/20(a) | | | 77,094,466 | |
92,850,000 | | 0.00%, 4/29/20(a) | | | 92,781,097 | |
91,350,000 | | 0.00%, 5/29/20(a) | | | 91,132,260 | |
30,400,000 | | 0.00%, 4/8/20(a) | | | 30,399,823 | |
14,700,000 | | 0.00%, 4/17/20(a) | | | 14,692,253 | |
90,545,000 | | 0.00%, 4/22/20(a) | | | 90,489,728 | |
49,400,000 | | 0.00%, 4/13/20(a) | | | 49,396,773 | |
7,000,000 | | 0.00%, 4/15/20(a) | | | 6,999,728 | |
50,000,000 | | 0.00%, 4/30/20(a) | | | 49,937,167 | |
75,000,000 | | 0.00%, 5/20/20(a) | | | 74,988,975 | |
37,975,000 | | 0.00%, 4/1/20(a) | | | 37,975,000 | |
25,335,000 | | 1.38%, 2/18/21 | | | 25,552,068 | |
15,500,000 | | 1.70%, 5/15/20 | | | 15,502,495 | |
29,370,000 | | 2.63%, 5/28/20 | | | 29,462,184 | |
5,000,000 | | 1.50%, 2/18/21 | | | 5,051,493 | |
8,500,000 | | 1.38%, 2/24/21 | | | 8,579,672 | |
69,000,000 | | 0.50%, 9/10/20 | | | 69,011,994 | |
32,000,000 | | 0.50%, 3/16/21 | | | 31,991,910 | |
50,000,000 | | 0.49%, 9/18/20 | | | 49,989,838 | |
20,000,000 | | 3.38%, 6/12/20 | | | 20,107,527 | |
6,810,000 | | 3.13%, 12/11/20 | | | 6,941,438 | |
11,970,000 | | 1.75%, 3/12/21 | | | 12,102,155 | |
100,000,000 | | 0.00%, 7/31/20(a) | | | 99,949,583 | |
100,000,000 | | 0.00%, 8/3/20(a) | | | 99,917,333 | |
100,000,000 | | 0.00%, 8/4/20(a) | | | 99,916,666 | |
50,000,000 | | 0.00%, 8/14/20(a) | | | 49,902,500 | |
8,985,000 | | 0.00%, 8/17/20(a) | | | 8,978,111 | |
50,000,000 | | 0.00%, 8/21/20(a) | | | 49,952,666 | |
100,000,000 | | 0.00%, 9/1/20(a) | | | 99,876,750 | |
50,000,000 | | 0.00%, 9/2/20(a) | | | 49,937,972 | |
50,000,000 | | 0.00%, 9/8/20(a) | | | 49,935,556 | |
56,000,000 | | 0.00%, 9/11/20(a) | | | 55,886,443 | |
100,000,000 | | 0.00%, 10/26/20(a) | | | 99,826,667 | |
50,000,000 | | 0.00%, 10/30/20(a) | | | 49,846,889 | |
25,000,000 | | 0.00%, 11/12/20(a) | | | 24,918,750 | |
12,500,000 | | 0.00%, 11/17/20(a) | | | 12,477,639 | |
50,000,000 | | 0.00%, 11/27/20(a) | | | 49,826,667 | |
315,000,000 | | 0.00%, 12/15/20(a) | | | 314,205,933 | |
77,763,000 | | 0.00%, 12/16/20(a) | | | 77,583,972 | |
|
SCHEDULE OF PORTFOLIO INVESTMENTS |
U.S. Government Money Market Fund (cont.)
March 31, 2020 (Unaudited)
| | | | | | |
Principal
Amount | | | | Value | |
$ 50,000,000 | | 0.00%, 12/23/20(a) | | $ | 49,874,389 | |
46,375,000 | | 0.00%, 4/7/20(a) | | | 46,374,768 | |
62,000,000 | | 0.00%, 4/14/20(a) | | | 61,999,328 | |
43,000,000 | | 0.00%, 4/20/20(a) | | | 42,999,319 | |
2,200,000 | | 0.00%, 4/27/20(a) | | | 2,199,841 | |
4,200,000 | | 0.00%, 5/4/20(a) | | | 4,199,615 | |
30,000,000 | | 0.00%, 5/6/20(a) | | | 29,986,875 | |
100,000,000 | | 0.00%, 5/11/20(a) | | | 99,986,667 | |
100,000,000 | | 0.00%, 5/14/20(a) | | | 99,984,472 | |
100,000,000 | | 0.00%, 5/15/20(a) | | | 99,985,333 | |
10,000,000 | | 0.00%, 5/18/20(a) | | | 9,998,564 | |
200,000,000 | | 0.00%, 5/19/20(a) | | | 199,989,333 | |
57,935,000 | | 0.00%, 5/26/20(a) | | | 57,924,621 | |
50,000,000 | | 0.00%, 5/28/20(a) | | | 49,988,125 | |
50,000,000 | | 0.00%, 6/2/20(a) | | | 49,877,722 | |
2,800,000 | | 0.00%, 6/5/20(a) | | | 2,799,494 | |
200,000,000 | | 0.00%, 6/8/20(a) | | | 199,973,556 | |
250,000,000 | | 0.00%, 6/11/20(a) | | | 249,831,375 | |
100,000,000 | | 0.00%, 6/15/20(a) | | | 99,964,583 | |
50,000,000 | | 0.00%, 6/18/20(a) | | | 49,849,417 | |
126,600,000 | | 0.00%, 6/19/20(a) | | | 126,555,694 | |
15,000,000 | | 0.00%, 6/22/20(a) | | | 14,994,875 | |
100,000,000 | | 0.00%, 6/23/20(a) | | | 99,960,806 | |
50,000,000 | | 0.00%, 6/25/20(a) | | | 49,836,493 | |
50,000,000 | | 0.00%, 6/29/20(a) | | | 49,829,417 | |
98,500,000 | | 0.00%, 7/1/20(a) | | | 98,474,596 | |
115,850,000 | | 0.00%, 7/6/20(a) | | | 115,730,731 | |
300,000,000 | | 0.00%, 7/7/20(a) | | | 299,838,333 | |
200,000,000 | | 0.00%, 7/13/20(a) | | | 199,948,500 | |
25,000,000 | | 0.00%, 7/15/20(a) | | | 24,886,250 | |
15,000,000 | | 0.00%, 7/17/20(a) | | | 14,930,896 | |
50,000,000 | | 0.00%, 7/20/20(a) | | | 49,969,444 | |
20,000,000 | | 0.00%, 7/22/20(a) | | | 19,903,556 | |
100,000,000 | | 0.00%, 7/24/20(a) | | | 99,507,583 | |
50,000,000 | | 0.00%, 1/25/21(a) | | | 49,784,056 | |
100,000,000 | | 0.00%, 3/22/21(a) | | | 99,605,556 | |
35,000,000 | | (LIBOR USD3-Month - 0.105%), 1.61%, 2/12/21(b) | | | 35,000,000 | |
20,240,000 | | (LIBOR USD3-Month - 0.135%), 0.75%, 12/18/20(b) | | | 20,232,633 | |
18,285,000 | | (LIBOR USD3-Month - 0.175%), 1.56%, 5/8/20(b) | | | 18,286,560 | |
17,000,000 | | (SOFR RATE + 0.020%), 0.03%, 5/14/20(b) | | | 17,000,000 | |
26,000,000 | | (SOFR RATE + 0.030%), 0.04%, 8/21/20(b) | | | 26,000,000 | |
27,000,000 | | (SOFR RATE + 0.040%), 0.05%, 8/25/20(b) | | | 26,998,847 | |
24,000,000 | | (SOFR RATE + 0.040%), 0.05%, 2/9/21(b) | | | 24,000,000 | |
19,000,000 | | (SOFR RATE + 0.050%), 0.06%, 1/22/21(b) | | | 19,000,000 | |
20,200,000 | | (SOFR RATE + 0.050%), 0.06%, 1/28/21(b) | | | 20,199,106 | |
50,000,000 | | (SOFR RATE + 0.055%), 0.07%, 5/14/21(b) | | | 50,000,000 | |
55,000,000 | | (SOFR RATE + 0.065%), 0.08%, 2/26/21(b) | | | 55,000,000 | |
12,750,000 | | (SOFR RATE + 0.075%), 0.09%, 6/11/21(b) | | | 12,748,880 | |
|
SCHEDULE OF PORTFOLIO INVESTMENTS |
U.S. Government Money Market Fund (cont.)
March 31, 2020 (Unaudited)
| | | | | | |
Principal
Amount | | | | Value | |
$ 41,200,000 | | (SOFR RATE + 0.075%), 0.09%, 7/8/21(b) | | $ | 41,198,095 | |
41,000,000 | | (SOFR RATE + 0.075%), 0.09%, 7/23/21(b) | | | 41,000,000 | |
25,000,000 | | (SOFR RATE + 0.080%), 0.09%, 5/11/20(b) | | | 25,000,000 | |
65,000,000 | | (SOFR RATE + 0.085%), 0.10%, 9/10/21(b) | | | 65,000,000 | |
56,500,000 | | (SOFR RATE + 0.085%), 0.10%, 9/11/20(b) | | | 56,500,000 | |
27,000,000 | | (SOFR RATE + 0.100%), 0.11%, 12/23/20(b) | | | 27,000,000 | |
32,000,000 | | (SOFR RATE + 0.100%), 0.11%, 7/29/20(b) | | | 32,000,000 | |
15,000,000 | | (SOFR RATE + 0.105%), 0.12%, 10/1/20(b) | | | 15,000,000 | |
54,000,000 | | (SOFR RATE + 0.115%), 0.13%, 3/12/21(b) | | | 54,001,122 | |
40,000,000 | | (SOFR RATE + 0.135%), 0.15%, 6/4/21(b) | | | 40,000,000 | |
17,000,000 | | (SOFR RATE + 0.170%), 0.18%, 4/9/21(b) | | | 17,000,000 | |
| | | | | | |
| | | | | 5,986,663,455 | |
| | | | | | |
FHLMC Multifamily Structured Pass Through Certificates — 0.01% | | | | |
1,373,813 | | Series KF04, Class A, (LIBOR USD1-Month + 0.310%), 1.83%, 6/25/21(b) | | | 1,373,813 | |
| | | | | | |
Freddie Mac — 1.00% | | | | |
16,551,000 | | 2.38%, 2/16/21 | | | 16,843,662 | |
1,000,000 | | 0.00%, 5/19/20(a) | | | 999,867 | |
8,546,000 | | 0.00%, 6/8/20(a) | | | 8,544,063 | |
150,000,000 | | (SOFR RATE + 0.140%), 0.15%, 12/10/21(b) | | | 150,000,000 | |
50,000,000 | | (SOFR RATE + 0.320%), 0.33%, 9/23/21(b) | | | 50,000,000 | |
25,000,000 | | (SOFR RATE + 0.320%), 0.33%, 9/23/21(b) | | | 25,000,000 | |
| | | | | | |
| | | | | 251,387,592 | |
| | | | | | |
| |
Total U.S. Government Agency Backed Mortgages | | | 7,833,954,054 | |
| | | | | | |
(Cost $7,833,954,054) | | | | |
| |
U.S. Government Agency Obligations — 5.85% | | | | |
Federal Farm Credit Bank — 0.54% | | | | |
60,000,000 | | (LIBOR USD3-Month - 0.170%), 1.08%, 9/4/20(b) | | | 59,996,999 | |
25,000,000 | | (LIBOR USD1-Month - 0.040%), 1.54%, 5/1/20(b) | | | 25,000,000 | |
50,000,000 | | (LIBOR USD3-Month - 0.140%), 1.77%, 10/1/20(b) | | | 49,999,842 | |
| | | | | | |
| | | | | 134,996,841 | |
| | | | | | |
| |
Federal Home Loan Bank — 0.14% | | | | |
35,000,000 | | (SOFR RATE + 0.035%), 0.05%, 6/19/20(b) | | | 35,000,000 | |
| | |
| | | | | | |
Overseas Private Investment Corp. — 5.04% | | | | |
3,500,000 | | 0.00%, 9/30/20(a) | | | 3,538,676 | |
6,600,000 | | 0.00%, 11/15/20(a) | | | 6,648,557 | |
37,500,000 | | 0.00%, 11/17/20(a) | | | 37,763,733 | |
8,892,000 | | (US Treasury Bill Yield3-Month + 0.000%), 1.45%, 5/15/30(b) | | | 8,892,000 | |
9,679,487 | | (US Treasury Bill Yield3-Month + 0.000%), 1.45%, 10/15/32(b) | | | 9,679,487 | |
5,256,410 | | (US Treasury Bill Yield3-Month + 0.000%), 1.45%, 11/15/33(b) | | | 5,256,410 | |
10,961,539 | | (US Treasury Bill Yield3-Month + 0.000%), 1.45%, 6/15/34(b) | | | 10,961,539 | |
14,850,000 | | (US Treasury Bill Yield3-Month + 0.000%), 1.90%, 11/15/22(b) | | | 14,850,000 | |
8,926,315 | | (US Treasury Bill Yield3-Month + 0.000%), 1.90%, 3/15/24(b) | | | 8,926,315 | |
|
SCHEDULE OF PORTFOLIO INVESTMENTS |
U.S. Government Money Market Fund (cont.)
March 31, 2020 (Unaudited)
| | | | | | |
Principal Amount | | | | Value | |
| $ 701,754 | | (US Treasury Bill Yield3-Month + 0.000%), 1.90%, 3/15/24(b) | | $ | 701,754 | |
| 23,612,625 | | (US Treasury Bill Yield3-Month + 0.000%), 1.90%, 10/10/25(b) | | | 23,612,625 | |
| 10,137,687 | | (US Treasury Bill Yield3-Month + 0.000%), 1.90%, 10/10/25(b) | | | 10,137,687 | |
| 2,644,614 | | (US Treasury Bill Yield3-Month + 0.000%), 1.90%, 10/10/25(b) | | | 2,644,614 | |
| 21,166,439 | | (US Treasury Bill Yield3-Month + 0.000%), 1.90%, 6/20/27(b) | | | 21,166,439 | |
| 10,875,000 | | (US Treasury Bill Yield3-Month + 0.000%), 1.90%, 6/20/27(b) | | | 10,875,000 | |
| 7,733,333 | | (US Treasury Bill Yield3-Month + 0.000%), 1.90%, 6/20/27(b) | | | 7,733,333 | |
| 6,718,333 | | (US Treasury Bill Yield3-Month + 0.000%), 1.90%, 6/20/27(b) | | | 6,718,333 | |
| 6,380,000 | | (US Treasury Bill Yield3-Month + 0.000%), 1.90%, 6/20/27(b) | | | 6,380,000 | |
| 5,800,000 | | (US Treasury Bill Yield3-Month + 0.000%), 1.90%, 6/20/27(b) | | | 5,800,000 | |
| 4,833,333 | | (US Treasury Bill Yield3-Month + 0.000%), 1.90%, 6/20/27(b) | | | 4,833,333 | |
| 19,750,000 | | (US Treasury Bill Yield3-Month + 0.000%), 1.90%, 9/20/27(b) | | | 19,750,000 | |
| 9,941,000 | | (US Treasury Bill Yield3-Month + 0.000%), 1.90%, 6/15/28(b) | | | 9,941,000 | |
| 6,670,000 | | (US Treasury Bill Yield3-Month + 0.000%), 1.90%, 6/15/28(b) | | | 6,670,000 | |
| 1,201,962 | | (US Treasury Bill Yield3-Month + 0.000%), 1.90%, 6/28/32(b) | | | 1,201,963 | |
| 13,800,000 | | (US Treasury Bill Yield3-Month + 0.000%), 1.90%, 6/1/33(b) | | | 13,800,000 | |
| 11,388,785 | | (US Treasury Bill Yield3-Month + 0.000%), 1.90%, 6/15/34(b) | | | 11,388,785 | |
| 8,199,164 | | (US Treasury Bill Yield3-Month + 0.000%), 1.90%, 6/15/34(b) | | | 8,199,164 | |
| 11,827,500 | | (US Treasury Bill Yield3-Month + 0.000%), 1.90%, 10/15/39(b) | | | 11,827,500 | |
| 4,657,185 | | (US Treasury Bill Yield3-Month + 0.000%), 1.90%, 10/15/39(b) | | | 4,657,185 | |
| 4,000,000 | | (US Treasury Bill Yield3-Month + 0.000%), 1.90%, 10/15/39(b) | | | 4,000,000 | |
| 24,294,825 | | (US Treasury Bill Yield3-Month + 0.000%), 1.90%, 7/7/40(b) | | | 24,294,825 | |
| 14,576,895 | | (US Treasury Bill Yield3-Month + 0.000%), 1.90%, 7/7/40(b) | | | 14,576,895 | |
| 14,333,947 | | (US Treasury Bill Yield3-Month + 0.000%), 1.90%, 7/7/40(b) | | | 14,333,947 | |
| 13,896,640 | | (US Treasury Bill Yield3-Month + 0.000%), 1.90%, 7/7/40(b) | | | 13,896,640 | |
| 10,198,968 | | (US Treasury Bill Yield3-Month + 0.000%), 1.90%, 7/7/40(b) | | | 10,198,968 | |
| 6,632,254 | | (US Treasury Bill Yield3-Month + 0.000%), 1.90%, 7/7/40(b) | | | 6,632,254 | |
| 4,373,069 | | (US Treasury Bill Yield3-Month + 0.000%), 1.90%, 7/7/40(b) | | | 4,373,069 | |
| 18,925,000 | | (US Treasury Bill Yield3-Month + 0.000%), 1.90%, 10/15/40(b) | | | 18,925,000 | |
| 13,030,000 | | (US Treasury Bill Yield3-Month + 0.000%), 1.90%, 10/15/40(b) | | | 13,030,000 | |
| 8,500,000 | | (US Treasury Bill Yield3-Month + 0.000%), 1.90%, 10/15/40(b) | | | 8,500,000 | |
| 7,095,000 | | (US Treasury Bill Yield3-Month + 0.000%), 1.90%, 10/15/40(b) | | | 7,095,000 | |
| 6,665,000 | | (US Treasury Bill Yield3-Month + 0.000%), 1.90%, 10/15/40(b) | | | 6,665,000 | |
| 5,200,000 | | (US Treasury Bill Yield3-Month + 0.000%), 1.90%, 10/15/40(b) | | | 5,200,000 | |
| 109,729,000 | | (US Treasury Bill Yield3-Month + 0.000%), 2.00%, 9/15/20(b) | | | 109,729,000 | |
| 10,000,000 | | (US Treasury Bill Yield3-Month + 0.000%), 2.00%, 7/20/22(b) | | | 10,000,000 | |
| 6,362,000 | | (US Treasury Bill Yield3-Month + 0.000%), 2.00%, 9/15/22(b) | | | 6,362,000 | |
| 5,000,000 | | (US Treasury Bill Yield3-Month + 0.000%), 2.00%, 9/15/22(b) | | | 5,000,000 | |
| 4,347,826 | | (US Treasury Bill Yield3-Month + 0.000%), 2.00%, 9/15/22(b) | | | 4,347,826 | |
| 3,695,652 | | (US Treasury Bill Yield3-Month + 0.000%), 2.00%, 9/15/22(b) | | | 3,695,652 | |
| 10,000,000 | | (US Treasury Bill Yield3-Month + 0.000%), 2.00%, 3/20/24(b) | | | 10,000,000 | |
| 10,000,000 | | (US Treasury Bill Yield3-Month + 0.000%), 2.00%, 3/20/24(b) | | | 10,000,000 | |
| 4,250,000 | | (US Treasury Bill Yield3-Month + 0.000%), 2.00%, 5/15/24(b) | | | 4,250,000 | |
| 3,863,636 | | (US Treasury Bill Yield3-Month + 0.000%), 2.00%, 5/15/24(b) | | | 3,863,637 | |
| 3,541,667 | | (US Treasury Bill Yield3-Month + 0.000%), 2.00%, 5/15/24(b) | | | 3,541,667 | |
| 3,269,231 | | (US Treasury Bill Yield3-Month + 0.000%), 2.00%, 5/15/24(b) | | | 3,269,231 | |
| 10,000,000 | | (US Treasury Bill Yield3-Month + 0.000%), 2.00%, 6/15/25(b) | | | 10,000,000 | |
| 11,000,000 | | (US Treasury Bill Yield3-Month + 0.000%), 2.00%, 8/15/25(b) | | | 11,000,000 | |
|
SCHEDULE OF PORTFOLIO INVESTMENTS |
U.S. Government Money Market Fund (cont.)
March 31, 2020 (Unaudited)
| | | | | | |
Principal Amount | | | | Value | |
| $ 11,000,000 | | (US Treasury Bill Yield3-Month + 0.000%), 2.00%, 8/15/25(b) | | $ | 11,000,000 | |
| 10,521,739 | | (US Treasury Bill Yield3-Month + 0.000%), 2.00%, 8/15/25(b) | | | 10,521,739 | |
| 9,166,667 | | (US Treasury Bill Yield3-Month + 0.000%), 2.00%, 8/15/25(b) | | | 9,166,667 | |
| 14,000,000 | | (US Treasury Bill Yield3-Month + 0.000%), 2.00%, 9/15/25(b) | | | 14,000,000 | |
| 7,287,520 | | (US Treasury Bill Yield3-Month + 0.000%), 2.00%, 8/15/26(b) | | | 7,287,520 | |
| 13,000,000 | | (US Treasury Bill Yield3-Month + 0.000%), 2.00%, 9/15/26(b) | | | 13,000,000 | |
| 9,750,000 | | (US Treasury Bill Yield3-Month + 0.000%), 2.00%, 9/15/26(b) | | | 9,750,000 | |
| 35,000,000 | | (US Treasury Bill Yield3-Month + 0.000%), 2.00%, 1/20/27(b) | | | 35,000,000 | |
| 47,560,000 | | (US Treasury Bill Yield3-Month + 0.000%), 2.00%, 2/15/28(b) | | | 47,560,000 | |
| 12,090,960 | | (US Treasury Bill Yield3-Month + 0.000%), 2.00%, 2/15/28(b) | | | 12,090,960 | |
| 8,636,400 | | (US Treasury Bill Yield3-Month + 0.000%), 2.00%, 2/15/28(b) | | | 8,636,400 | |
| 6,563,664 | | (US Treasury Bill Yield3-Month + 0.000%), 2.00%, 2/15/28(b) | | | 6,563,664 | |
| 5,613,660 | | (US Treasury Bill Yield3-Month + 0.000%), 2.00%, 2/15/28(b) | | | 5,613,660 | |
| 4,318,200 | | (US Treasury Bill Yield3-Month + 0.000%), 2.00%, 2/15/28(b) | | | 4,318,200 | |
| 11,931,818 | | (US Treasury Bill Yield3-Month + 0.000%), 2.00%, 11/15/28(b) | | | 11,931,818 | |
| 18,500,000 | | (US Treasury Bill Yield3-Month + 0.070%), 2.00%, 8/15/29(b) | | | 18,500,000 | |
| 9,900,000 | | (US Treasury Bill Yield3-Month + 0.000%), 2.00%, 8/15/29(b) | | | 9,900,000 | |
| 21,207,547 | | (US Treasury Bill Yield3-Month + 0.000%), 2.00%, 1/15/30(b) | | | 21,207,547 | |
| 63,000,000 | | (US Treasury Bill Yield3-Month + 0.000%), 2.00%, 3/15/30(b) | | | 63,000,000 | |
| 13,000,000 | | (US Treasury Bill Yield3-Month + 0.000%), 2.00%, 10/15/30(b) | | | 13,000,000 | |
| 20,000,000 | | (US Treasury Bill Yield3-Month + 0.000%), 2.00%, 8/15/31(b) | | | 20,000,000 | |
| 1,315,303 | | (US Treasury Bill Yield3-Month + 0.000%), 2.00%, 12/15/33(b) | | | 1,315,303 | |
| 24,000,000 | | (US Treasury Bill Yield3-Month + 0.000%), 2.00%, 1/20/35(b) | | | 24,000,000 | |
| 19,100,000 | | (US Treasury Bill Yield3-Month + 0.000%), 2.00%, 1/20/35(b) | | | 19,100,000 | |
| 18,600,000 | | (US Treasury Bill Yield3-Month + 0.000%), 2.00%, 1/20/35(b) | | | 18,600,000 | |
| 18,000,000 | | (US Treasury Bill Yield3-Month + 0.000%), 2.00%, 1/20/35(b) | | | 18,000,000 | |
| 14,000,000 | | (US Treasury Bill Yield3-Month + 0.000%), 2.00%, 1/20/35(b) | | | 13,999,976 | |
| 8,400,000 | | (US Treasury Bill Yield3-Month + 0.000%), 2.00%, 1/20/35(b) | | | 8,400,000 | |
| 7,900,000 | | (US Treasury Bill Yield3-Month + 0.000%), 2.00%, 1/20/35(b) | | | 7,900,000 | |
| 5,000,000 | | (US Treasury Bill Yield3-Month + 0.000%), 2.00%, 1/20/35(b) | | | 5,000,000 | |
| 25,000,000 | | (US Treasury Bill Yield3-Month + 0.000%), 2.00%, 4/20/35(b) | | | 25,000,000 | |
| 20,800,000 | | (US Treasury Bill Yield3-Month + 0.000%), 2.00%, 4/20/35(b) | | | 20,800,000 | |
| 20,600,000 | | (US Treasury Bill Yield3-Month + 0.000%), 2.00%, 4/20/35(b) | | | 20,600,000 | |
| 15,500,000 | | (US Treasury Bill Yield3-Month + 0.000%), 2.00%, 4/20/35(b) | | | 15,500,000 | |
| 14,950,000 | | (US Treasury Bill Yield3-Month + 0.000%), 2.00%, 4/20/35(b) | | | 14,950,000 | |
| 9,400,000 | | (US Treasury Bill Yield3-Month + 0.000%), 2.00%, 4/20/35(b) | | | 9,400,000 | |
| 8,700,000 | | (US Treasury Bill Yield3-Month + 0.000%), 2.00%, 4/20/35(b) | | | 8,700,000 | |
| 8,200,000 | | (US Treasury Bill Yield3-Month + 0.000%), 2.00%, 4/20/35(b) | | | 8,200,000 | |
| 5,000,000 | | (US Treasury Bill Yield3-Month + 0.000%), 2.00%, 4/20/35(b) | | | 5,000,000 | |
| 6,323,200 | | (US Treasury Bill Yield3-Month + 0.000%), 2.00%, 3/30/37(b) | | | 6,323,200 | |
| 7,900,000 | | (US Treasury Bill Yield3-Month + 0.000%), 2.00%, 7/5/38(b) | | | 7,900,000 | |
| 2,800,000 | | (US Treasury Bill Yield3-Month + 0.000%), 2.00%, 7/5/38(b) | | | 2,800,000 | |
| | | | | | |
| | | | | 1,254,872,697 | |
| | | | | | |
U.S. International Development Finance Corp. — 0.13% | | | | |
| 3,500,000 | | 0.00%, 2/11/21(a) | | | 3,500,000 | |
| 2,027,550 | | (US Treasury Bill Yield3-Month + 0.000%), 1.90%, 10/15/39(b) | | | 2,027,550 | |
| 6,400,000 | | (US Treasury Bill Yield3-Month + 0.000%), 1.90%, 10/15/40(b) | | | 6,400,000 | |
|
SCHEDULE OF PORTFOLIO INVESTMENTS |
U.S. Government Money Market Fund (cont.)
March 31, 2020 (Unaudited)
| | | | | | |
Principal Amount | | | | Value | |
| $ 14,100,000 | | (US Treasury Bill Yield3-Month + 0.000%), 2.00%, 8/13/27(b) | | $ | 14,100,000 | |
| 5,795,647 | | (US Treasury Bill Yield3-Month + 0.000%), 2.00%, 2/15/28(b) | | | 5,795,647 | |
| | | | | | |
| | | | | 31,823,197 | |
| | | | | | |
| |
Total U.S. Government Agency Obligations | | | 1,456,692,735 | |
| | | | | | |
(Cost $1,456,692,735) | | | | |
| |
U.S. Treasury Obligations — 3.82% | | | | |
U.S. Treasury Notes — 3.82% | | | | |
| 100,000,000 | | (3 Month US Treasury Bill Yield + 0.220%), 0.31%, 7/31/21(b) | | | 99,954,147 | |
| 50,000,000 | | 1.38%, 9/15/20 | | | 49,945,289 | |
| 75,000,000 | | 1.50%, 7/15/20 | | | 74,978,624 | |
| 50,000,000 | | 1.63%, 10/15/20 | | | 50,005,723 | |
| 50,000,000 | | 1.75%, 12/31/20 | | | 50,050,418 | |
| 50,000,000 | | 1.75%, 11/15/20 | | | 50,042,558 | |
| 37,500,000 | | 2.13%, 8/31/20 | | | 37,577,412 | |
| 50,000,000 | | 2.50%, 12/31/20 | | | 50,326,831 | |
| 100,000,000 | | 2.63%, 7/31/20 | | | 100,336,243 | |
| 50,000,000 | | 2.63%, 8/31/20 | | | 50,252,292 | |
| 87,500,000 | | 2.63%, 8/15/20 | | | 87,873,771 | |
| 100,000,000 | | 2.75%, 9/30/20 | | | 100,561,047 | |
| 50,000,000 | | 2.75%, 11/30/20 | | | 50,364,134 | |
| 100,000,000 | | 2.88%, 10/31/20 | | | 100,715,534 | |
| | | | | | |
| | | | | 952,984,023 | |
| | | | | | |
| |
Total U.S. Treasury Obligations | | | 952,984,023 | |
| | | | | | |
(Cost $952,984,023) | | | | |
| |
Municipal Bonds — 0.02% | | | | |
Illinois — 0.02% | | | | |
| 4,975,000 | | Illinois Housing Development Authority Foxview I & II Apartments Revenue, Series I, 2.50%, 1/1/41, (Credit Support: Freddie Mac), Callable 4/10/20 @ 100(c) | | | 4,975,000 | |
| | | | | | |
| |
Total Municipal Bonds | | | 4,975,000 | |
| | | | | | |
(Cost $4,975,000) | | | | |
|
SCHEDULE OF PORTFOLIO INVESTMENTS |
U.S. Government Money Market Fund (cont.)
March 31, 2020 (Unaudited)
| | | | | | |
Principal Amount | | | | Value | |
Variable Rate Demand Note — 12.52% | | | | |
Municipal Bonds — 12.52% | | | | |
Arizona — 0.43% | | | | |
| $ 7,500,000 | | Maricopa County Industrial Development Authority Villas Solanas Apartments Revenue, Series A, 3.00%, 11/15/32, (Credit Support: Fannie Mae), Callable 4/15/20 @ 100(c) | | $ | 7,500,000 | |
| 12,775,000 | | Maricopa County Industrial Development Authority Las Gardenias Apartments Revenue, Series A, 3.00%, 4/15/33, (Credit Support: Fannie Mae), Callable 4/15/20 @ 100(c) | | | 12,775,000 | |
| 13,900,000 | | Maricopa County Industrial Development Authority San Martin Apartments Project Revenue, Series A, 3.00%, 6/15/35, (Credit Support: Fannie Mae), Callable 4/15/20 @ 100(c) | | | 13,900,000 | |
| 6,800,000 | | Maricopa County Industrial Development Authority San Remo Apartments Project Revenue, 3.00%, 9/15/35, (Credit Support: Fannie Mae), Callable 4/15/20 @ 100(c) | | | 6,800,000 | |
| 14,420,000 | | Maricopa County Industrial Development Authority San Miguel Apartments Project Revenue, 3.00%, 6/15/36, (Credit Support: Fannie Mae)(c) | | | 14,420,000 | |
| 13,500,000 | | Maricopa County Industrial Development Authority San Lucas Apartments Project Revenue, 3.00%, 10/15/36, (Credit Support: Fannie Mae), Callable 4/15/20 @ 100(c) | | | 13,500,000 | |
| 18,200,000 | | Maricopa County Industrial Development Authority San Clemente Apartments Project Revenue, 3.00%, 3/15/37, (Credit Support: Fannie Mae), Callable 4/16/20 @ 100(c) | | | 18,200,000 | |
| 10,260,000 | | Maricopa County Industrial Development Authority San Fernande Apartments Project Revenue, Series F, 3.00%, 5/15/37, (Credit Support: Fannie Mae), Callable 4/15/20 @ 100(c) | | | 10,260,000 | |
| 9,100,000 | | Maricopa County Industrial Development Authority San Angelin Apartments Project Revenue, Series A, 3.00%, 5/15/37, (Credit Support: Fannie Mae), Callable 4/15/20 @ 100(c) | | | 9,100,000 | |
| | | | | | |
| | | | | 106,455,000 | |
| | | | | | |
California — 1.38% | | | | |
| 48,445,000 | | Abag Finance Authority for Nonprofit Corps. Lakeside Village Apartments Revenue, Series A, 2.25%, 10/1/46, (Credit Support: Freddie Mac), Callable 4/13/20 @ 100(c) | | | 48,445,000 | |
| 5,195,000 | | California Municipal Finance Authority Pacific Meadows Apartments Revenue, Series A, 3.62%, 10/1/47, Callable 5/1/20 @ 100(c) | | | 5,195,000 | |
| 2,255,000 | | California Statewide Communities Development Authority Second Senior Apartments Revenue, 2.75%, 12/15/36, (Credit Support: Fannie Mae), Callable 4/15/20 @ 100(c) | | | 2,255,000 | |
| 3,100,000 | | California Statewide Communities Development Authority Wilshire Court Project Revenue, 2.75%, 5/15/37, (Credit Support: Fannie Mae), Callable 4/15/20 @ 100(c) | | | 3,100,000 | |
| 9,400,000 | | California Statewide Communities Development Authority Bristol Apartments Revenue, Series Z, 2.75%, 8/1/37, Callable 4/10/20 @ 100(c) | | | 9,400,000 | |
|
SCHEDULE OF PORTFOLIO INVESTMENTS |
U.S. Government Money Market Fund (cont.)
March 31, 2020 (Unaudited)
| | | | | | |
Principal Amount | | | | Value | |
| $ 12,700,000 | | California Statewide Communities Development Authority Wyndover Apartments Revenue, 2.75%, 11/15/37, (Credit Support: Fannie Mae), Callable 4/15/20 @ 100(c) | | $ | 12,700,000 | |
| 4,350,000 | | California Statewide Communities Development Authority Vista Development Monte Project Revenue, 2.75%, 12/15/37, (Credit Support: Fannie Mae), Callable 4/15/20 @ 100(c) | | | 4,350,000 | |
| 26,080,000 | | California Statewide Communities Development Authority Bridgeway Apartments Revenue, Series K, 2.25%, 9/1/39, Callable 4/10/20 @ 100(c) | | | 26,080,000 | |
| 8,630,000 | | California Statewide Communities Development Authority Crossing Phase II Revenue, 2.75%, 7/15/40, (Credit Support: Fannie Mae), Callable 4/15/20 @ 100(c) | | | 8,630,000 | |
| 4,625,000 | | California Statewide Communities Development Authority Kelvin Courts Revenue, Series B, 4.92%, 6/15/51, (Credit Support: Fannie Mae), Callable 4/15/20 @ 100(c) | | | 4,625,000 | |
| 37,940,000 | | City of Chula Vista Teresina Apartments Revenue, Series A, 2.75%, 5/15/36, (Credit Support: Fannie Mae), Callable 4/15/20 @ 100(c) | | | 37,940,000 | |
| 7,275,000 | | City of San Jose Kennedy Apartment Homes Revenue, Series K, 2.75%, 12/15/35, (Credit Support: Fannie Mae), Callable 4/15/20 @ 100(c) | | | 7,275,000 | |
| 7,400,000 | | City of San Jose Cinnabar Commons Revenue, Series C, 2.50%, 2/1/37, Callable 4/13/20 @ 100(c) | | | 7,400,000 | |
| 24,615,000 | | City of San Jose Almaden Family Apartments Project Revenue, Series D, 2.75%, 11/15/37, (Credit Support: Fannie Mae), Callable 4/15/20 @ 100(c) | | | 24,615,000 | |
| 10,000,000 | | City of San Jose Las Ventanas Apartments Revenue, Series B, 2.75%, 7/1/38, Callable 4/10/20 @ 100(c) | | | 10,000,000 | |
| 1,000,000 | | County of Contra Costa Creekview Apartments Revenue, Series B, 2.50%, 7/1/36, (Credit Support: Freddie Mac), Callable 4/13/20 @ 100(c) | | | 1,000,000 | |
| 17,200,000 | | County of Orange Ladera Apartments Revenue, Series B, 2.75%, 8/15/34, (Credit Support: Fannie Mae), Callable 4/15/20 @ 100(c) | | | 17,200,000 | |
| 16,000,000 | | County of Orange, Series I Wood Canyon Villas Revenue, Series I, 2.75%, 8/15/31, (Credit Support: Fannie Mae), Callable 4/15/20 @ 100(c) | | | 16,000,000 | |
| 1,900,000 | | County of San Bernardino Multi Family Housing Revenue, Series A, 2.75%, 2/15/27, (Credit Support: Fannie Mae), Callable 4/15/20 @ 100(c) | | | 1,900,000 | |
| 1,900,000 | | County of San Bernardino Sycamore Terrace Revenue, Series A, 2.75%, 5/15/29, (Credit Support: Fannie Mae), Callable 4/15/20 @ 100(c) | | | 1,900,000 | |
| 1,700,000 | | County of San Bernardino Evergreen Apartments Revenue, Series A, 2.75%, 5/15/29, (Credit Support: Fannie Mae), Callable 4/15/20 @ 100(c) | | | 1,700,000 | |
| 25,080,000 | | Los Angeles Community Redevelopment Agency Promenade Towers Project Revenue, Series L, 4.69%, 4/1/30, Callable 5/1/20 @ 100(c) | | | 25,080,000 | |
| 10,265,000 | | Sacramento Housing Authority Hurley Creek Senior Apartments Revenue, Series E, 2.75%, 8/1/39, (Credit Support: Federal Home Loan Mortgage), Callable 4/13/20 @ 100(c) | | | 10,265,000 | |
|
SCHEDULE OF PORTFOLIO INVESTMENTS |
U.S. Government Money Market Fund (cont.)
March 31, 2020 (Unaudited)
| | | | | | |
Principal Amount | | | | Value | |
| $ 24,190,000 | | San Diego Housing Authority Vista Apartments Project Revenue, Series A, 2.75%, 2/15/38, (Credit Support: Fannie Mae), Callable 4/15/20 @ 100(c) | | $ | 24,190,000 | |
| 2,850,000 | | San Francisco City & County Redevelopment Agency Successor Agency Mercy Terrace Project Revenue, Series A, 2.75%, 6/15/35, (Credit Support: Fannie Mae), Callable 4/15/20 @ 100(c) | | | 2,850,000 | |
| 29,225,000 | | Santa Cruz Redevelopment Agency, Series A Shaffer Road Apartments Revenue, Series A, 2.75%, 8/15/35, (Credit Support: Fannie Mae), Callable 4/15/20 @ 100(c) | | | 29,225,000 | |
| | | | | | |
| | | | | 343,320,000 | |
| | | | | | |
Colorado — 0.15% | | | | |
| 13,675,000 | | Adams County Housing Authority Village Apartments Revenue, Series A, 2.75%, 7/15/37, (Credit Support: Fannie Mae), Callable 4/15/20 @ 100(c) | | | 13,675,000 | |
| 13,325,000 | | Lakewood Housing Authority Ridgemoor Apartments Project Revenue, Series A, 2.75%, 1/15/37, (Credit Support: Fannie Mae), Callable 4/15/20 @ 100(c) | | | 13,325,000 | |
| 11,165,000 | | Lakewood Housing Authority Timberleaf Apartments Project Revenue, 2.75%, 7/15/37, (Credit Support: Fannie Mae), Callable 4/15/20 @ 100(c) | | | 11,165,000 | |
| | | | | | |
| | | | | 38,165,000 | |
| | | | | | |
Florida — 0.01% | | | | |
| 2,370,000 | | Collier County Housing Finance Authority Brittany Bay Apartments Project Revenue, Series A, 4.99%, 7/15/34, (Credit Support: Fannie Mae), Callable 4/15/20 @ 100(c) | | | 2,370,000 | |
| | | | | | |
Georgia — 0.02% | | | | |
| 5,235,000 | | Atlanta Urban Residential Finance Authority West End Housing Development Project Revenue, Series W, 3.90%, 9/1/27, (Credit Support: Fannie Mae)(c) | | | 5,235,000 | |
| | | | | | |
Idaho — 0.02% | | | | |
| 4,080,000 | | Idaho Housing & Finance Association Traditions at Boise Apartments Revenue, Series A, 3.50%, 9/1/44, Callable 4/13/20 @ 100(c) | | | 4,080,000 | |
| | | | | | |
Illinois — 0.08% | | | | |
| 2,400,000 | | County of Lake Whispering Oaks Apartments Project Revenue, 4.90%, 11/1/45, Callable 4/10/20 @ 100(c) | | | 2,400,000 | |
| 17,900,000 | | Illinois Housing Development Authority Revenue, 2.75%, 3/15/37, Callable 4/2/20 @ 100(c) | | | 17,900,000 | |
| | | | | | |
| | | | | 20,300,000 | |
| | | | | | |
Indiana — 0.01% | | | | |
| 3,375,000 | | City of Indianapolis Lakeside Pointe & Fox Club Refunding Revenue, 4.09%, 5/15/38, (Credit Support: Fannie Mae), Callable 4/15/20 @ 100(c) | | | 3,375,000 | |
| | | | | | |
|
SCHEDULE OF PORTFOLIO INVESTMENTS |
U.S. Government Money Market Fund (cont.)
March 31, 2020 (Unaudited)
| | | | | | |
Principal Amount | | | | Value | |
Kentucky — 0.00% | | | | |
| $ 290,000 | | Kentucky Housing Corp. Overlook Terraces Apartments Revenue, Series B, 4.51%, 11/15/40, (Credit Support: Fannie Mae), Callable 4/15/20 @ 100(c) | | $ | 290,000 | |
| | | | | | |
Maryland — 0.18% | | | | |
| 39,765,000 | | Maryland Community Development Administration Multifamily Barrington Revenue, Series A, 3.00%, 6/15/37, (Credit Support: Fannie Mae), Callable 4/15/20 @ 100(c) | | | 39,765,000 | |
| 3,995,000 | | Maryland Community Development Administration Multifamily Revenue, Series E, 4.91%, 3/1/41, (Credit Support: Freddie Mac), Callable 5/1/20 @ 100(c) | | | 3,995,000 | |
| | | | | | |
| | | | | 43,760,000 | |
| | | | | | |
Nevada — 0.05% | | | | |
| 11,800,000 | | Nevada Housing Division Multi Unit Housing Apache Project Revenue, Series A, 4.12%, 10/15/32, (Credit Support: Fannie Mae), Callable 4/15/20 @ 100(c) | | | 11,800,000 | |
| | | | | | |
New York — 8.06% | | | | |
| 5,820,000 | | Albany Industrial Development Agency South Mall Towers Project Revenue, Series A, 3.00%, 8/15/35, (Credit Support: Fannie Mae), Callable 4/15/20 @ 100(c) | | | 5,820,000 | |
| 19,780,000 | | FHLMC Multifamily VRD Certificates Revenue, Series A, 4.73%, 10/15/29(c),(d) | | | 19,780,000 | |
| 14,965,000 | | FHLMC Multifamily VRD Certificates Revenue, Series A, 4.95%, 9/15/38, Callable 4/10/20 @ 100(c),(d) | | | 14,965,000 | |
| 14,975,000 | | FHLMC Multifamily VRD Certificates Revenue, Series A, 4.95%, 9/15/38, Callable 4/10/20 @ 100(c),(d) | | | 14,975,000 | |
| 347,205,000 | | FHLMC Multifamily VRD Certificates Revenue, Series M, 2.00%, 9/15/50, Callable 5/1/20 @ 100(c),(d) | | | 347,205,000 | |
| 32,465,000 | | Housing Development Corp. Reniassance Revenue, Series A, 4.64%, 6/1/37, Callable 4/10/20 @ 100(c) | | | 32,465,000 | |
| 13,500,000 | | Nassau County Industrial Development Agency Clinton Plaza Housing Project Revenue, 4.50%, 9/1/34, (Credit Support: Fannie Mae), Callable 4/10/20 @ 100(c) | | | 13,500,000 | |
| 29,400,000 | | New York City Housing Development Corp. Brittany Development Revenue, Series A, 3.00%, 6/15/29, (Credit Support: Fannie Mae), Callable 4/15/20 @ 100(c) | | | 29,400,000 | |
| 2,750,000 | | New York City Housing Development Corp. West Port Development Revenue, Series B, 2.95%, 11/15/31, (Credit Support: Fannie Mae), Callable 4/15/20 @ 100(c) | | | 2,749,983 | |
| 38,700,000 | | New York City Housing Development Corp. Lyric Development Revenue, Series A, 3.00%, 11/15/31, (Credit Support: Fannie Mae), Callable 4/15/20 @ 100(c) | | | 38,700,000 | |
| 55,100,000 | | New York City Housing Development Corp. Revenue, Series A, 3.00%, 8/15/32, (Credit Support: Fannie Mae), Callable 4/15/20 @ 100(c) | | | 55,100,000 | |
| 2,700,000 | | New York City Housing Development Corp. Pearl Street Development Revenue, Series B, 2.95%, 6/15/34, (Credit Support: Fannie Mae), Callable 4/15/20 @ 100(c) | | | 2,699,975 | |
|
SCHEDULE OF PORTFOLIO INVESTMENTS |
U.S. Government Money Market Fund (cont.)
March 31, 2020 (Unaudited)
| | | | | | |
Principal Amount | | | | Value | |
| $ 39,000,000 | | New York City Housing Development Corp. Westport Development Revenue, Series A, 3.00%, 6/15/34, (Credit Support: Fannie Mae), Callable 4/15/20 @ 100(c) | | $ | 39,000,000 | |
| 44,865,000 | | New York City Housing Development Corp. 90 Washington Street Revenue, Series A, 4.67%, 2/15/35, (Credit Support: Fannie Mae), Callable 4/15/20 @ 100(c) | | | 44,865,000 | |
| 25,005,000 | | New York City Housing Development Corp. Royal Properties Revenue, Series A, 2.95%, 4/15/35, (Credit Support: Fannie Mae)(c) | | | 25,005,000 | |
| 29,450,000 | | New York City Housing Development Corp. Atlantic Court Apartment Revenue, Series A, 3.00%, 12/1/35, (Credit Support: Freddie Mac), Callable 4/10/20 @ 100(c) | | | 29,450,000 | |
| 5,050,000 | | New York City Housing Development Corp. 90 West Street Revenue, Series B, 4.25%, 3/15/36, (Credit Support: Fannie Mae), Callable 4/10/20 @ 100(c) | | | 5,050,000 | |
| 22,785,000 | | New York City Housing Development Corp. 90 West Street Revenue, Series A, 4.90%, 3/15/36, (Credit Support: Fannie Mae), Callable 4/10/20 @ 100(c) | | | 22,785,000 | |
| 1,300,000 | | New York City Housing Development Corp. Gold Street Revenue, Series A, 4.90%, 4/15/36, (Credit Support: Fannie Mae), Callable 4/15/20 @ 100(c) | | | 1,300,000 | |
| 24,525,000 | | New York City Housing Development Corp. Rivereast Apartments Revenue, Series A, 4.64%, 12/1/36, (Credit Support: Freddie Mac), Callable 4/10/20 @ 100(c) | | | 24,525,000 | |
| 6,900,000 | | New York City Housing Development Corp. West 21st Street Revenue, Series B, 4.25%, 11/15/37, (Credit Support: Fannie Mae), Callable 4/10/20 @ 100(c) | | | 6,900,000 | |
| 7,810,000 | | New York City Housing Development Corp. Markham Gardens Apartments Revenue, Series A, 3.00%, 1/1/40, (Credit Support: Freddie Mac), Callable 4/10/20 @ 100(c) | | | 7,810,000 | |
| 8,445,000 | | New York City Housing Development Corp. Ocean Gate Revenue, Series A, 4.60%, 8/1/40, Callable 5/1/20 @ 100(c) | | | 8,445,000 | |
| 23,800,000 | | New York City Housing Development Corp. 26th Street Development Revenue, Series A, 4.55%, 4/1/41, Callable 4/10/20 @ 100(c) | | | 23,800,000 | |
| 21,000,000 | | New York City Housing Development Corp. Lyric Development Revenue, Series B, 4.25%, 10/15/41, (Credit Support: Fannie Mae), Callable 4/10/20 @ 100(c) | | | 21,000,000 | |
| 22,465,000 | | New York City Housing Development Corp. Linden Plaza Revenue, Series A, 4.60%, 4/1/43, Callable 5/1/20 @ 100(c) | | | 22,465,000 | |
| 20,915,000 | | New York City Housing Development Corp. 26th Street Development Revenue, Series A, 4.40%, 4/1/45, Callable 4/10/20 @ 100(c) | | | 20,915,000 | |
| 7,400,000 | | New York City Housing Development Corp. Bruckner Revenue, Series A, 4.64%, 11/1/48, (Credit Support: Freddie Mac), Callable 4/10/20 @ 100(c) | | | 7,400,000 | |
| 46,950,000 | | New York State Housing Finance Agency Union Square South Housing Revenue, 3.00%, 11/1/24, (Credit Support: Fannie Mae), Callable 4/13/20 @ 100(c) | | | 46,950,000 | |
|
SCHEDULE OF PORTFOLIO INVESTMENTS |
U.S. Government Money Market Fund (cont.)
March 31, 2020 (Unaudited)
| | | | | | |
Principal Amount | | | | Value | |
| $ 20,000,000 | | New York State Housing Finance Agency Revenue, Series A, 3.00%, 5/1/29, (Credit Support: Fannie Mae), Callable 4/10/20 @ 100(c) | | $ | 20,000,000 | |
| 15,200,000 | | New York State Housing Finance Agency Revenue, Series A, 4.98%, 5/15/29, (Credit Support: Fannie Mae), Callable 4/10/20 @ 100(c) | | | 15,200,000 | |
| 31,400,000 | | New York State Housing Finance Agency Tribeca Revenue, Series A, 4.75%, 11/15/29, (Credit Support: Fannie Mae), Callable 4/10/20 @ 100(c) | | | 31,400,000 | |
| 103,700,000 | | New York State Housing Finance Agency 240 East 39th Street Revenue, Series E, 3.00%, 5/15/30, (Credit Support: Fannie Mae), Callable 4/13/20 @ 100(c) | | | 103,700,000 | |
| 22,600,000 | | New York State Housing Finance Agency Revenue, Series A, 4.98%, 5/15/31, (Credit Support: Fannie Mae), Callable 4/10/20 @ 100(c) | | | 22,600,000 | |
| 11,000,000 | | New York State Housing Finance Agency 39 th Street Housing Revenue, Series A, 4.95%, 11/15/31, (Credit Support: Fannie Mae)(c) | | | 11,000,000 | |
| 13,100,000 | | New York State Housing Finance Agency 39 th Street Housing Revenue, Series A, 4.95%, 11/15/31, (Credit Support: Fannie Mae)(c) | | | 13,100,000 | |
| 12,000,000 | | New York State Housing Finance Agency 363 West 30th Street, Series A, 3.00%, 11/1/32, (Credit Support: Federal Home Loan Mortgage), Callable 4/10/20 @ 100(c) | | | 12,000,000 | |
| 14,500,000 | | New York State Housing Finance Agency Theater Row Revenue, Series A, 4.95%, 11/1/32, Callable 4/10/20 @ 100(c) | | | 14,500,000 | |
| 11,300,000 | | New York State Housing Finance Agency Theater Row Revenue, Series A, 4.98%, 11/1/32, (Credit Support: Freddie Mac), Callable 4/10/20 @ 100(c) | | | 11,300,000 | |
| 30,900,000 | | New York State Housing Finance Agency West 23rd Street Revenue, Series A, 2.75%, 5/15/33, (Credit Support: Fannie Mae), Callable 4/10/20 @ 100(c) | | | 30,900,000 | |
| 1,435,000 | | New York State Housing Finance Agency Revenue, Series B, 2.98%, 5/15/33, (Credit Support: Fannie Mae), Callable 4/10/20 @ 100(c) | | | 1,435,000 | |
| 25,300,000 | | New York State Housing Finance Agency Revenue, Series E, 3.00%, 5/15/33, (Credit Support: Fannie Mae), Callable 4/10/20 @ 100(c) | | | 25,300,000 | |
| 28,875,000 | | New York State Housing Finance Agency Revenue, Series A, 4.60%, 5/15/33, (Credit Support: Fannie Mae), Callable 4/10/20 @ 100(c) | | | 28,875,000 | |
| 50,150,000 | | New York State Housing Finance Agency Revenue, Series A, 4.60%, 5/15/33, (Credit Support: Fannie Mae), Callable 4/10/20 @ 100(c) | | | 50,150,000 | |
| 20,000,000 | | New York State Housing Finance Agency 1500 Lexington Avenue, Series A, 4.75%, 5/15/34, (Credit Support: Fannie Mae), Callable 4/10/20 @ 100(c) | | | 20,000,000 | |
| 2,000,000 | | New York State Housing Finance Agency 1500 Lexington Avenue, Series A, 4.75%, 5/15/34, (Credit Support: Fannie Mae), Callable 4/10/20 @ 100(c) | | | 2,000,000 | |
|
SCHEDULE OF PORTFOLIO INVESTMENTS |
U.S. Government Money Market Fund (cont.)
March 31, 2020 (Unaudited)
| | | | | | |
Principal Amount | | | | Value | |
| $ 6,200,000 | | New York State Housing Finance Agency Revenue, Series A, 4.90%, 5/15/34, (Credit Support: Fannie Mae), Callable 4/10/20 @ 100(c) | | $ | 6,200,000 | |
| 24,945,000 | | New York State Housing Finance Agency Revenue, Series A, 2.95%, 5/1/35, (Credit Support: Freddie Mac), Callable 4/10/20 @ 100(c) | | | 24,945,000 | |
| 89,500,000 | | New York State Housing Finance Agency 900 8th Avenue Revenue, Series A, 4.60%, 5/15/35, (Credit Support: Fannie Mae), Callable 4/15/20 @ 100(c) | | | 89,500,000 | |
| 58,000,000 | | New York State Housing Finance Agency Helena Housing Revenue, Series A, 4.60%, 5/15/36, (Credit Support: Fannie Mae), Callable 4/10/20 @ 100(c) | | | 58,000,000 | |
| 42,000,000 | | New York State Housing Finance Agency Helena Housing Revenue, Series A, 4.60%, 5/15/36, (Credit Support: Fannie Mae), Callable 4/10/20 @ 100(c) | | | 42,000,000 | |
| 13,700,000 | | New York State Housing Finance Agency Revenue, Series A, 4.98%, 11/1/36, Callable 4/10/20 @ 100(c) | | | 13,700,000 | |
| 33,870,000 | | New York State Housing Finance Agency Revenue, Series A, 2.95%, 11/15/36, (Credit Support: Fannie Mae), Callable 4/15/20 @ 100(c) | | | 33,870,000 | |
| 30,900,000 | | New York State Housing Finance Agency North End Revenue, Series N, 4.90%, 11/15/36, (Credit Support: Fannie Mae), Callable 4/10/20 @ 100(c) | | | 30,900,000 | |
| 5,800,000 | | New York State Housing Finance Agency Mccarthy Manor Apartments Revenue, Series A, 4.60%, 5/15/37, (Credit Support: Fannie Mae), Callable 4/10/20 @ 100(c) | | | 5,800,000 | |
| 2,600,000 | | New York State Housing Finance Agency Weyant Green Apartments, Series A, 4.75%, 5/15/37, (Credit Support: Fannie Mae), Callable 4/10/20 @ 100(c) | | | 2,600,000 | |
| 43,120,000 | | New York State Housing Finance Agency Taconic Refunding Revenue, 4.75%, 5/15/39, (Credit Support: Fannie Mae), Callable 4/10/20 @ 100(c) | | | 43,120,000 | |
| 20,345,000 | | New York State Housing Finance Agency 600 West 42nd Street Revenue, Series A, 4.01%, 5/15/41, (Credit Support: Fannie Mae), Callable 4/10/20 @ 100(c) | | | 20,345,000 | |
| 22,640,000 | | New York State Housing Finance Agency 600 West 42nd Street Revenue, Series A, 4.05%, 5/15/41, (Credit Support: Fannie Mae), Callable 4/10/20 @ 100(c) | | | 22,640,000 | |
| 6,750,000 | | New York State Housing Finance Agency 316 11th Avenue Revenue, Series B, 4.25%, 5/15/41, (Credit Support: Fannie Mae), Callable 4/10/20 @ 100(c) | | | 6,750,000 | |
| 44,480,000 | | New York State Housing Finance Agency 600 West 42nd Street Revenue, 4.60%, 5/15/41, (Credit Support: Fannie Mae), Callable 4/10/20 @ 100(c) | | | 44,480,000 | |
| 33,270,000 | | New York State Housing Finance Agency 11th Avenue Housing Revenue, Series A, 4.95%, 5/15/41, (Credit Support: Fannie Mae), Callable 4/10/20 @ 100(c) | | | 33,270,000 | |
| 20,520,000 | | New York State Housing Finance Agency 42nd Street Revenue, Series A, 3.70%, 11/1/41, (Credit Support: Freddie Mac), Callable 4/10/20 @ 100(c) | | | 20,520,000 | |
|
SCHEDULE OF PORTFOLIO INVESTMENTS |
U.S. Government Money Market Fund (cont.)
March 31, 2020 (Unaudited)
| | | | | | |
Principal Amount | | | | Value | |
| $28,965,000 | | New York State Housing Finance Agency 42nd Street Revenue, Series A, 3.70%, 11/1/41, (Credit Support: Freddie Mac), Callable 4/10/20 @ 100(c) | | $ | 28,965,000 | |
| 66,275,000 | | New York State Housing Finance Agency 42nd & 10th Street Revenue, Series A, 3.72%, 11/1/41, (Credit Support: Freddie Mac), Callable 4/10/20 @ 100(c) | | | 66,275,000 | |
| 57,095,000 | | New York State Housing Finance Agency Clinton Park Housing Revenue, Series A, 4.60%, 11/1/44, Callable 4/10/20 @ 100(c) | | | 57,095,000 | |
| 9,950,000 | | Ramapo Housing Authority Spring VY Homes Project Revenue, Series A, 3.00%, 12/15/38, (Credit Support: Fannie Mae), Callable 4/15/20 @ 100(c) | | | 9,950,000 | |
| | | | | | |
| | | | | 2,009,409,958 | |
| | | | | | |
Texas — 0.52% | | | | |
| 4,760,000 | | Capital Area Housing Finance Corp. Marble Fals Vistas Apartments Revenue, 2.75%, 4/15/37, (Credit Support: Fannie Mae), Callable 4/15/20 @ 100(c) | | | 4,760,000 | |
| 6,515,000 | | Harris County Housing Finance Corp. Cornerstone Apartments Revenue, 2.75%, 8/15/37, (Credit Support: Fannie Mae), Callable 4/21/20 @ 100(c) | | | 6,515,000 | |
| 10,400,000 | | Houston Housing Finance Corp. Little Nell Apartments Revenue, 2.75%, 1/15/37, (Credit Support: Fannie Mae), Callable 4/15/20 @ 100(c) | | | 10,400,000 | |
| 4,560,000 | | Houston Housing Finance Corp. Mayfair Park Apartments Revenue, 2.75%, 4/15/37, (Credit Support: Fannie Mae), Callable 4/15/20 @ 100(c) | | | 4,560,000 | |
| 1,375,000 | | Houston Housing Finance Corp. Regency Park Apartments Revenue, 3.00%, 5/15/41, (Credit Support: Fannie Mae), Callable 4/15/20 @ 100(c) | | | 1,375,000 | |
| 12,135,000 | | Southeast Texas Housing Finance Corp. Piedmont Apartments Revenue, 2.75%, 8/15/39, (Credit Support: Fannie Mae), Callable 4/15/20 @ 100(c) | | | 12,135,000 | |
| 5,775,000 | | Southeast Texas Housing Finance Corp. Wyndham Park Aparments Revenue, Series S, 3.00%, 7/15/41, (Credit Support: Fannie Mae), Callable 4/15/20 @ 100(c) | | | 5,775,000 | |
| 9,105,000 | | Texas Department of Housing & Community Affairs Chisholm Trails Apartments Revenue, 2.75%, 4/15/37, (Credit Support: Fannie Mae), Callable 4/15/20 @ 100(c) | | | 9,105,000 | |
| 10,700,000 | | Texas Department of Housing & Community Affairs Bristol Apartments Revenue, 2.75%, 6/15/37, (Credit Support: Fannie Mae), Callable 4/15/20 @ 100(c) | | | 10,700,000 | |
| 12,365,000 | | Texas Department of Housing & Community Affairs Pinnacle Apartments Revenue, 2.75%, 6/15/37, (Credit Support: Fannie Mae), Callable 4/15/20 @ 100(c) | | | 12,365,000 | |
| 10,090,000 | | Texas Department of Housing & Community Affairs Pinnacle Apartments Revenue, 2.75%, 4/15/38, (Credit Support: Fannie Mae), Callable 4/15/20 @ 100(c) | | | 10,090,000 | |
| 5,380,000 | | Texas Department of Housing & Community Affairs St. Augustine Estate Revenue, 2.75%, 9/15/38, Callable 4/15/20 @ 100(c) | | | 5,380,000 | |
|
SCHEDULE OF PORTFOLIO INVESTMENTS |
U.S. Government Money Market Fund (cont.)
March 31, 2020 (Unaudited)
| | | | | | |
Principal Amount | | | | Value | |
| |
| $11,090,000 | | Texas Department of Housing & Community Affairs Idlewilde Apartments Revenue, 2.75%, 6/15/40, (Credit Support: Fannie Mae), Callable 4/15/20 @ 100(c) | | $ | 11,090,000 | |
| 12,480,000 | | Texas Department of Housing & Community Affairs Lancaster Revenue, 2.75%, 7/15/40, (Credit Support: Fannie Mae), Callable 4/15/20 @ 100(c) | | | 12,480,000 | |
| 2,500,000 | | Texas Department of Housing & Community Affairs Windshire Apartments Revenue, 2.75%, 1/15/41, (Credit Support: Fannie Mae), Callable 4/15/20 @ 100(c) | | | 2,500,000 | |
| 11,375,000 | | Texas Department of Housing & Community Affairs West Oak Senior Apartments Revenue, Series W, 2.75%, 7/1/41, Callable 4/10/20 @ 100(c) | | | 11,375,000 | |
| | | | | | |
| | | | | 130,605,000 | |
| | | | | | |
Washington — 1.56% | | | | |
| 1,900,000 | | District of Columbia Housing Finance Agency Park 7 Benning Revenue, 4.90%, 2/1/46, (Credit Support: Freddie Mac)(c) | | | 1,900,000 | |
| 8,100,000 | | Vancouver Housing Authority Multi Family Revenue, 3.73%, 12/1/38, (Credit Support: Freddie Mac), Callable 4/10/20 @ 100(c) | | | 8,100,000 | |
| 12,750,000 | | Washington State Housing Finance Commission Rainer Court Apartments Revenue, Series A, 2.75%, 12/15/36, (Credit Support: Fannie Mae), Callable 4/15/20 @ 100(c) | | | 12,750,000 | |
| 1,355,000 | | Washington State Housing Finance Commission Rainer Court Project Revenue, Series B, 3.00%, 12/15/36, (Credit Support: Fannie Mae), Callable 4/15/20 @ 100(c) | | | 1,355,000 | |
| 13,625,000 | | Washington State Housing Finance Commission Crestview Apartments Project Revenue, 2.75%, 12/15/37, (Credit Support: Fannie Mae), Callable 4/15/20 @ 100(c) | | | 13,625,000 | |
| 7,535,000 | | Washington State Housing Finance Commission Vintage Richland Revenue, Series A, 2.75%, 1/15/38, (Credit Support: Fannie Mae), Callable 4/15/20 @ 100(c) | | | 7,535,000 | |
| 15,750,000 | | Washington State Housing Finance Commission Everett Living Revenue, Series A, 2.75%, 1/15/38, (Credit Support: Fannie Mae), Callable 4/15/20 @ 100(c) | | | 15,750,000 | |
| 10,390,000 | | Washington State Housing Finance Commission Merrill Gardens Renton Revenue, Series A, 2.75%, 8/1/38, Callable 5/1/20 @ 100(c) | | | 10,390,000 | |
| 12,000,000 | | Washington State Housing Finance Commission Pinehurst Apartments Revenue, Series A, 2.75%, 3/15/39, (Credit Support: Fannie Mae), Callable 4/15/20 @ 100(c) | | | 12,000,000 | |
| 12,730,000 | | Washington State Housing Finance Commission Eagles Landing Apartments Project, Series A, 2.75%, 8/15/39, (Credit Support: Fannie Mae), Callable 4/16/20 @ 100(c) | | | 12,730,000 | |
| 8,190,000 | | Washington State Housing Finance Commission Vintage Chehalis Revenue, 2.75%, 6/15/40, (Credit Support: Fannie Mae), Callable 4/16/20 @ 100(c) | | | 8,190,000 | |
| 17,970,000 | | Washington State Housing Finance Commission Echo Lake Senior Apartments Project Revenue, 2.75%, 7/15/40, (Credit Support: Fannie Mae), Callable 4/15/20 @ 100(c) | | | 17,970,000 | |
|
SCHEDULE OF PORTFOLIO INVESTMENTS |
U.S. Government Money Market Fund (cont.)
March 31, 2020 (Unaudited)
| | | | | | |
Principal Amount | | | | Value | |
| |
| $ 9,985,000 | | Washington State Housing Finance Commission Barkley Ridge Apartments, Series A, 2.85%, 9/1/40, (Credit Support: Freddie Mac), Callable 4/13/20 @ 100(c) | | $ | 9,985,000 | |
| 17,640,000 | | Washington State Housing Finance Commission Merril Gardens University Village Revenue, Series A, 2.75%, 9/15/40, (Credit Support: Fannie Mae), Callable 4/15/20 @ 100(c) | | | 17,640,000 | |
| 48,540,000 | | Washington State Housing Finance Commission Merril Gardens University Village Revenue, Series A, 2.60%, 4/15/41, (Credit Support: Fannie Mae), Callable 4/15/20 @ 100(c) | | | 48,540,000 | |
| 4,600,000 | | Washington State Housing Finance Commission Fairwinds Redmon Revenue, 3.00%, 7/1/41, (Credit Support: Federal Home Loan Bank), Callable 4/13/20 @ 100(c) | | | 4,600,000 | |
| 3,045,000 | | Washington State Housing Finance Commission Fairwinds Project Revenue, Series B, 3.00%, 7/1/41, (Credit Support: Federal Home Loan Bank), Callable 4/13/20 @ 100(c) | | | 3,045,000 | |
| 3,425,000 | | Washington State Housing Finance Commission Lodge At Eagle Ridge Revenue, Series B, 3.00%, 8/1/41, (Credit Support: East West Bank), Callable 4/10/20 @ 100(c) | | | 3,425,000 | |
| 12,900,000 | | Washington State Housing Finance Commission Ballard Land Revenue, Series B, 2.75%, 12/15/41, (Credit Support: East West Bank), Callable 4/10/20 @ 100(c) | | | 12,899,875 | |
| 31,590,000 | | Washington State Housing Finance Commission Ballard Land Revenue, Series A, 3.25%, 12/15/41, (Credit Support: East West Bank), Callable 4/10/20 @ 100(c) | | | 31,590,000 | |
| 13,245,000 | | Washington State Housing Finance Commission Discovery Height Apartments, Series H, 4.90%, 12/1/43, Callable 4/10/20 @ 100(c) | | | 13,245,000 | |
| 17,700,000 | | Washington State Housing Finance Commission Revenue, 4.90%, 2/1/44, Callable 4/10/20 @ 100(c) | | | 17,700,000 | |
| 4,400,000 | | Washington State Housing Finance Commission Revenue, Series A, 3.25%, 8/1/44, (Credit Support: Freddie Mac), Callable 4/13/20 @ 100(c) | | | 4,400,000 | |
| 4,295,000 | | Washington State Housing Finance Commission Cambridge Apartments, 2.75%, 12/15/44, (Credit Support: Fannie Mae), Callable 4/15/20 @ 100(c) | | | 4,295,000 | |
| 26,235,000 | | Washington State Housing Finance Commission Urban Apartments Project Revenue, Series R, 3.00%, 7/1/47, (Credit Support: Freddie Mac), Callable 4/13/20 @ 100(c) | | | 26,235,000 | |
| 13,795,000 | | Washington State Housing Finance Commission Revenue, 3.25%, 8/1/49, (Credit Support: East West Bank), Callable 4/10/20 @ 100(c) | | | 13,795,000 | |
| 15,650,000 | | Washington State Housing Finance Commission Corner Apartments Revenue, 3.25%, 9/1/49, (Credit Support: East West Bank), Callable 4/10/20 @ 100(c) | | | 15,650,000 | |
| 5,690,000 | | Washington State Housing Finance Commission Inter Urban Revenue, 3.50%, 7/1/52, (Credit Support: Freddie Mac), Callable 4/13/20 @ 100(c) | | | 5,690,000 | |
| 33,000,000 | | Washington State Housing Finance Commission Seatac Apartments Revenue, Series P, 3.25%, 4/1/53, (Credit Support: Federal Home Loan Bank), Callable 4/10/20 @ 100(c) | | | 33,000,000 | |
| | | | | | |
| | | | | 388,029,875 | |
| | | | | | |
|
SCHEDULE OF PORTFOLIO INVESTMENTS |
U.S. Government Money Market Fund (cont.)
March 31, 2020 (Unaudited)
| | | | | | |
Principal Amount | | | | Value | |
| |
Wisconsin — 0.05% | | | | |
| $ 12,320,000 | | Public Finance Authority Brannan Park Revenue, 2.75%, 1/1/48, (Credit Support: East West Bank), Callable 4/13/20 @ 100(c) | | $ | 12,320,000 | |
| | | | | | |
| | | | | 3,119,514,833 | |
| | | | | | |
| |
Total Variable Rate Demand Note (Cost $3,119,514,833) | | | 3,119,514,833 | |
| | | | | | |
| |
Repurchase Agreements — 39.16% | | | | |
| 800,000,000 | | Bank of Montreal, dated 3/31/20; due 4/01/20 at 0.01% with maturity value of $800,000,222 (fully collateralized by Ginnie Mae, Fannie Mae and Freddie Mac securities with maturity dates ranging from 12/01/25 to 4/20/69 at rates ranging from 2.50% to 6.10%, aggregate original par and fair value of $812,752,537 and $816,000,103 respectively) | | | 800,000,000 | |
| 200,000,000 | | Bank of Montreal, dated 3/04/20; due 4/03/20 at 1.09% with maturity value of $200,181,667 (fully collateralized by U.S. Treasury securities with maturity dates ranging from 4/30/20 to 8/15/47 at rates ranging from 0.00% to 4.38%, aggregate original par and fair value of $188,378,200 and $204,000,072 respectively) | | | 200,000,000 | |
| 105,000,000 | | Bank of Montreal, dated 3/31/20; due 4/01/20 at 0.01% with maturity value of $105,000,029 (fully collateralized by U.S. Treasury securities with maturity dates ranging from 11/15/21 to 2/15/50 at rates ranging from 1.25% to 2.88%, aggregate original par and fair value of $92,007,700 and $107,100,070 respectively) | | | 105,000,000 | |
| 100,000,000 | | Bank of Montreal, dated 1/15/20; due 4/16/20 at 1.57% with maturity value of $100,401,222 (fully collateralized by U.S. Treasury securities with maturity dates ranging from 5/14/20 to 8/15/49 at rates ranging from 0.00% to 3.75%, aggregate original par and fair value of $77,994,300 and $102,000,006 respectively) | | | 100,000,000 | |
| 100,000,000 | | Bank of Montreal, dated 3/19/20; due 5/18/20 at 0.12% with maturity value of $100,020,000 (fully collateralized by Ginnie Mae, Fannie Mae and Freddie Mac securities with maturity dates ranging from 2/01/35 to 3/20/50 at rates ranging from 2.50% to 5.50%, aggregate original par and fair value of $98,389,990 and $102,000,000 respectively) | | | 100,000,000 | |
| 50,000,000 | | Bank of Montreal, dated 3/31/20; due 4/01/20 at 0.01% with maturity value of $50,000,014 (fully collateralized by U.S. Treasury, Ginnie Mae, Fannie Mae, Fidelity Canadian Short Term Corporate Bond and Freddie Mac securities with maturity dates ranging from 4/14/20 to 1/20/65 at rates ranging from 0.00% to 7.50%, aggregate original par and fair value of $75,162,682 and $51,000,041 respectively) | | | 50,000,000 | |
| | | |
| | Total Value of Bank of Montreal, (collateral value of $ 1,382,100,292) | | | 1,355,000,000 | |
| | | |
|
SCHEDULE OF PORTFOLIO INVESTMENTS |
U.S. Government Money Market Fund (cont.)
March 31, 2020 (Unaudited)
| | | | | | |
Principal Amount | | | | Value | |
| |
$300,000,000 | | BNP Paribas Securities Corp., dated 1/09/20; due 4/09/20 at 1.57% with maturity value of $301,190,583 (fully collateralized by U.S. Treasury securities with maturity dates ranging from 5/15/20 to 5/15/48 at rates ranging from 0.00% to 7.50%, aggregate original par and fair value of $207,072,829 and $306,000,000 respectively) | | $ | 300,000,000 | |
| 135,000,000 | | BNP Paribas Securities Corp., dated 3/31/20; due 4/01/20 at 0.01% with maturity value of $135,000,038 (fully collateralized by U.S. Treasury securities with maturity dates ranging from 11/15/27 to 11/15/49 at rates ranging from 0.00% to 3.38%, aggregate original par and fair value of $103,048,182 and $137,700,002 respectively) | | | 135,000,000 | |
| | | |
| | Total Value of BNP Paribas Securities Corp., (collateral value of $ 443,700,002) | | | 435,000,000 | |
| | | |
| | |
| 300,000,000 | | Citigroup Global Markets, Inc., dated 3/31/20; due 4/01/20 at 0.02% with maturity value of $300,000,167 (fully collateralized by U.S. Treasury, Ginnie Mae, Fannie Mae, Freddie Mac and Federal Home Loan Bank securities with maturity dates ranging from 9/28/20 to 7/15/61 at rates ranging from 0.00% to 7.00%, aggregate original par and fair value of $404,853,455 and $306,000,055 respectively) | | | 300,000,000 | |
| 300,000,000 | | Citigroup Global Markets, Inc., dated 3/31/20; due 4/01/20 at 0.01% with maturity value of $300,000,083 (fully collateralized by U.S. Treasury securities with maturity dates ranging from 5/15/24 to 2/15/42 at rates ranging from 0.13% to 2.50%, aggregate original par and fair value of $284,157,700 and $306,000,004 respectively) | | | 300,000,000 | |
| 250,000,000 | | Citigroup Global Markets, Inc., dated 3/31/20; due 4/01/20 at 0.01% with maturity value of $250,000,069 (fully collateralized by Freddie Mac, Fidelity Canadian Short Term Corporate Bond and Federal Home Loan Bank securities with maturity dates ranging from 6/05/20 to 12/04/34 at rates ranging from 0.00% to 3.00%, aggregate original par and fair value of $253,614,000 and $255,000,707 respectively) | | | 250,000,000 | |
| 50,000,000 | | Citigroup Global Markets, Inc., dated 3/26/20; due 4/02/20 at 0.02% with maturity value of $50,000,194 (fully collateralized by U.S. Treasury securities with maturity dates ranging from 4/30/25 to 2/15/42 at rates ranging from 0.38% to 2.88%, aggregate original par and fair value of $45,284,500 and $51,000,003 respectively) | | | 50,000,000 | |
| 50,000,000 | | Citigroup Global Markets, Inc., dated 3/26/20; due 4/02/20 at 0.03% with maturity value of $50,000,292 (fully collateralized by Fidelity Canadian Short Term Corporate Bond, Fannie Mae and Federal Home Loan Bank securities with maturity dates ranging from 5/15/20 to 10/01/41 at rates ranging from 0.00% to 7.13%, aggregate original par and fair value of $48,331,000 and $51,000,980 respectively) | | | 50,000,000 | |
|
SCHEDULE OF PORTFOLIO INVESTMENTS |
U.S. Government Money Market Fund (cont.)
March 31, 2020 (Unaudited)
| | | | | | |
Principal Amount | | | | Value | |
| $ 36,000,000 | | Citigroup Global Markets, Inc., dated 3/31/20; due 4/07/20 at 0.01% with maturity value of $36,000,070 (fully collateralized by Federal Home Loan Bank securities with maturity dates ranging from 6/05/20 to 10/09/20 at rates ranging from 0.00% to 1.67%, aggregate original par and fair value of $36,685,000 and $36,818,407 respectively) | | $ | 36,000,000 | |
| 33,000,000 | | Citigroup Global Markets, Inc., dated 3/31/20; due 4/07/20 at 0.01% with maturity value of $33,000,064 (fully collateralized by U.S. Treasury securities with maturity dates ranging from 5/15/24 to 2/15/42 at rates ranging from 0.75% to 2.50%, aggregate original par and fair value of $31,661,700 and $33,660,060 respectively) | | | 33,000,000 | |
| | | |
| | Total Value of Citigroup Global Markets, Inc., (collateral value of $ 1,039,480,216) | | | 1,019,000,000 | |
| | | |
| | |
| 300,000,000 | | Credit Agricole Corporate and Investment Bank, dated 2/04/20; due 4/06/20 at 1.57% with maturity value of $300,811,167 (fully collateralized by U.S. Treasury securities with maturity dates ranging from 7/31/22 to 11/15/47 at rates ranging from 0.75% to 2.75%, aggregate original par and fair value of $247,592,900 and $306,000,021 respectively) | | | 300,000,000 | |
| 300,000,000 | | Credit Agricole Corporate and Investment Bank, dated 3/20/20; due 4/20/20 at 0.15% with maturity value of $300,038,750 (fully collateralized by U.S. Treasury securities with maturity dates ranging from 7/31/22 to 2/15/44 at rates ranging from 2.00% to 3.63%, aggregate original par and fair value of $278,707,200 and $306,000,020 respectively) | | | 300,000,000 | |
| 100,000,000 | | Credit Agricole Corporate and Investment Bank, dated 3/31/20; due 4/01/20 at 0.02% with maturity value of $100,000,056 (fully collateralized by Ginnie Mae, Fannie Mae and Freddie Mac securities with maturity dates ranging from 8/20/48 to 7/01/49 at rates ranging from 3.50% to 4.00%, aggregate original par and fair value of $117,216,839 and $102,000,000 respectively) | | | 100,000,000 | |
| 100,000,000 | | Credit Agricole Corporate and Investment Bank, dated 3/31/20; due 4/01/20 at 0.01% with maturity value of $100,000,028 (fully collateralized by a U.S. Treasury security with a maturity date of 3/31/25 at a rate of 2.63%, original par and fair value of $91,957,100 and $102,000,011 respectively) | | | 100,000,000 | |
| | | |
| | Total Value of Credit Agricole Corporate and Investment Bank, (collateral value of $ 816,000,052) | | | 800,000,000 | |
| | | |
|
SCHEDULE OF PORTFOLIO INVESTMENTS |
U.S. Government Money Market Fund (cont.)
March 31, 2020 (Unaudited)
| | | | | | |
Principal Amount | | | | Value | |
| $ 500,000,000 | | Deutsche Bank Securities, dated 3/31/20; due 4/01/20 at 0.02% with maturity value of $500,000,278 (fully collateralized by Fannie Mae and Freddie Mac securities with maturity dates ranging from 5/01/27 to 1/01/50 at rates ranging from 3.00% to 7.00%, aggregate original par and fair value of $992,891,232 and $510,000,000 respectively) | | $ | 500,000,000 | |
| 100,000,000 | | Deutsche Bank Securities, dated 3/31/20; due 4/01/20 at 0.01% with maturity value of $100,000,028 (fully collateralized by a U.S. Treasury security with a maturity date of 3/31/21 at rate of 2.25%, original par and fair value of $99,884,900 and $102,000,063 respectively) | | | 100,000,000 | |
| | | |
| | Total Value of Deutsche Bank Securities, (collateral value of $ 612,000,063) | | | 600,000,000 | |
| | | |
| | |
| 3,300,000,000 | | Federal Reserve, dated 3/31/20; due 4/01/20 at 0% with maturity value of $3,300,000,000 (fully collateralized by a U.S. Treasury security with a maturity date of 8/15/39 at rate of 4.50%, original par and fair value of $2,040,560,000 and $3,300,000,135 respectively) | | | 3,300,000,000 | |
| | | |
| | Total Value of Federal Reserve, (collateral value of $ 3,300,000,135) | | | 3,300,000,000 | |
| | | |
| | |
| 1,500,000,000 | | Fixed Income Clearing Corp., dated 3/31/20; due 4/1/20 at 0.01% with maturity value of $1,500,000,417 (fully collateralized by U.S. Treasury security with a maturity date of 6/15/22 at a rate of 1.75%, aggregate original par and fair value of $1,472,620,000 and $1,530,004,001 respectively) | | | 1,500,000,000 | |
| | | |
| | Total Value of Fixed Income Clearing Corp., (collateral value of $ 1,530,004,001) | | | 1,500,000,000 | |
| | | |
| | |
| 50,000,000 | | Merrill Lynch, Pierce, Fenner, Smith, dated 3/31/20; due 4/01/20 at 0.01% with maturity value of $50,000,014 (fully collateralized by U.S. Treasury securities with maturity dates ranging from 2/25/21 to 6/30/22 at rates ranging from 0.00% to 2.13%, aggregate original par and fair value of $49,275,200 and $51,000,094 respectively) | | | 50,000,000 | |
| | | |
| | Total Value of Merrill Lynch, Pierce, Fenner, Smith, (collateral value of $ 51,000,094) | | | 50,000,000 | |
| | | |
| | |
| 200,000,000 | | National Australia Bank, dated 3/31/20; due 4/1/20 at 0.01% with maturity value of $200,000,056 (fully collateralized by U.S. Treasury securities with maturity dates ranging from 8/31/24 to 11/15/28 at rates ranging from 1.25% to 3.13, aggregate original par and fair value of $200,000,000 and $204,053,925 respectively) | | | 200,000,000 | |
| | | |
| | Total Value of National Australia Bank, (collateral value of $ 204,053,925) | | | 200,000,000 | |
| | | |
|
SCHEDULE OF PORTFOLIO INVESTMENTS |
U.S. Government Money Market Fund (cont.)
March 31, 2020 (Unaudited)
| | | | | | |
Principal
Amount | | | | Value | |
$ 200,000,000 | | TD Securities (USA), dated 3/31/20; due 4/07/20 at 0.03% with maturity value of $200,001,167 (fully collaterlized by Fannie Mae securities with maturity dates ranging from 3/01/47 to 5/01/49 at rates ranging from 3.50% to 4.00%, aggregate original par and fair value of $252,242,731 and $204,000,001 respectively) | | $ | 200,000,000 | |
| | | |
| | Total Value of TD Securities (USA), (collateral value of $ 204,000,001) | | | 200,000,000 | |
| | | |
150,000,000 | | Wells Fargo Securities, dated 3/31/20; due 4/01/20 at 0.01% with maturity value of $150,000,042 (fully collateralized by a U.S. Treasury security with a maturity date of 5/15/26 at rate of 1.63%, aggregate original par and fair value of $142,680,100 and $153,000,019 respectively) | | | 150,000,000 | |
| 150,000,000 | | Wells Fargo Securities, dated 3/31/20; due 4/01/20 at 0.02% with maturity value of $150,000,083 (fully collateralized by Fannie Mae securities with maturity dates ranging from 10/01/34 to 3/01/50 at rates ranging from 2.50% to 3.50%, aggregate original par and fair value of $146,251,631 and $153,000,001 respectively) | | | 150,000,000 | |
| | | |
| | Total Value of Wells Fargo Securities, (collateral value of $ 306,000,020) | | | 300,000,000 | |
| | | |
| |
Total Repurchase Agreements | | | 9,759,000,000 | |
| | | | | | |
(Cost $9,759,000,000) | | | | |
| | |
| Shares | | | | | |
U.S. Government Agency Obligations — 2.10% | | | | |
| 500,000,000 | | U.S. Treasury Bill(a) | | | 499,911,844 | |
| 25,000,000 | | U.S. Treasury Bill(a) | | | 24,900,408 | |
| | | | | | |
| | | | | | |
Total U.S. Government Agency Obligations | | | 524,812,252 | |
| | | | | | |
(Cost $524,812,252) | | | | |
| |
Total Investments | | $ | 23,651,932,897 | |
(Cost $23,651,932,897)(e) — 94.90% | | | | |
| |
Other assets in excess of liabilities — 5.10% | | | 1,271,073,901 | |
| | | | | | |
| |
NET ASSETS — 100.00% | | $ | 24,923,006,798 | |
| | | | | | |
|
SCHEDULE OF PORTFOLIO INVESTMENTS |
U.S. Government Money Market Fund (cont.)
March 31, 2020 (Unaudited)
| (a) | Represents effective yield to maturity on date of purchase. |
| (b) | Floating rate note. Rate shown is as of report date. |
| (c) | Variable or floating rate security, which interest rate adjusts periodically based on changes in current interest rates and prepayments on the underlying pool of assets. Rate shown is the rate in effect as of period end. |
| (d) | Security exempt from registration under Rule 144A or Section 4(2) of the Securities Act of 1933, as amended. These securities may be resold in transactions exempt from registration, normally to qualified institutional buyers. |
| (e) | Tax cost of securities is equal to book cost of securities. |
Abbreviations used are defined below:
FOR - Foreign Ownership Receipt
LIBOR - London Interbank Offered Rate
SOFR - Secured Overnight Financing Rate
See Notes to the Financial Statements.
Statements of Assets and Liabilities
March 31, 2020 (Unaudited)
| | | | | | | | |
| | | U.S. Government
Money Market Fund | |
Assets: | | | | | | | | |
Investments, at value (cost $13,892,932,897) | | | | | | $ | 13,892,932,897 | |
Repurchase agreements, at value (cost $9,759,000,000) | | | | | | | 9,759,000,000 | |
Cash | | | | | | | 852,796,714 | |
Interest and dividend receivable | | | | | | | 20,868,545 | |
Receivable from advisor | | | | | | | 363,236 | |
Receivable for capital shares issued | | | | | | | 1,478,970,457 | |
Prepaid expenses and other assets | | | | | | | 84,248 | |
| | | | | | | | |
Total Assets | | | | | | | 26,005,016,097 | |
| | | | | | | | |
Liabilities: | | | | | | | | |
Foreign withholding tax payable | | | | | | | 4,283 | |
Distributions payable | | | | | | | 3,428,643 | |
Payable for capital shares redeemed | | | | | | | 262,139,653 | |
Payable for investments purchased | | | | | | | 813,205,296 | |
Accrued expenses and other payables: | | | | | | | | |
Investment advisory fees | | | | | | | 1,145,523 | |
Accounting fees | | | | | | | 57,276 | |
Audit fees | | | | | | | 16,652 | |
Distribution fees | | | | | | | 1,432,206 | |
Custodian fees | | | | | | | 12,158 | |
Shareholder reports | | | | | | | 48,544 | |
Shareholder servicing fees | | | | | | | 388,831 | |
Transfer agent fees | | | | | | | 14,236 | |
Other | | | | | | | 115,998 | |
| | | | | | | | |
Total Liabilities | | | | | | | 1,082,009,299 | |
| | | | | | | | |
Net Assets | | | | | | $ | 24,923,006,798 | |
| | | | | | | | |
Net Assets Consists of: | | | | | | | | |
Capital | | | | | | $ | 24,922,939,431 | |
Accumulated earnings | | | | | | | 67,367 | |
| | | | | | | | |
Net Assets | | | | | | $ | 24,923,006,798 | |
| | | | | | | | |
Statements of Assets and Liabilities (cont.)
March 31, 2020 (Unaudited)
| | | | | | | | |
| | | U.S. Government | |
| | | Money Market Fund | |
Net Assets | | | | | | | | |
RBC Institutional Class 1 | | | | | | $ | 19,765,927,665 | |
RBC Institutional Class 2 | | | | | | | 3,428,771,598 | |
RBC Investor Class | | | | | | | 1,728,307,535 | |
| | | | | | | | |
Total | | | | | | $ | 24,923,006,798 | |
| | | | | | | | |
Shares Outstanding (Unlimited number of shares authorized, no par value): | | | | | | | | |
RBC Institutional Class 1 | | | | | | | 19,765,884,540 | |
RBC Institutional Class 2 | | | | | | | 3,428,682,972 | |
RBC Investor Class | | | | | | | 1,728,406,838 | |
| | | | | | | | |
Total | | | | | | | 24,922,974,350 | |
| | | | | | | | |
Net Asset Values and Redemption Prices Per Share: | | | | | | | | |
RBC Institutional Class 1 | | | | | | $ | 1.00 | |
| | | | | | | | |
RBC Institutional Class 2 | | | | | | $ | 1.00 | |
| | | | | | | | |
RBC Investor Class | | | | | | $ | 1.00 | |
| | | | | | | | |
See Notes to the Financial Statements.
Statements of Operations
For the Six Months Ended March 31, 2020 (Unaudited)
| | | | | | | | |
| | | U.S. Government
Money Market Fund | |
Investment Income: | | | | | | | | |
Interest income | | | | | | $ | 66,528,041 | |
Expenses: | | | | | | | | |
Investment advisory fees | | | | | | | 4,217,527 | |
Distribution fees–RBC Institutional Class 2 | | | | | | | 2,097,174 | |
Distribution fees–RBC Investor Class | | | | | | | 5,808,187 | |
Accounting fees | | | | | | | 270,557 | |
Audit fees | | | | | | | 15,122 | |
Custodian fees | | | | | | | 59,954 | |
Insurance fees | | | | | | | 32,335 | |
Legal fees | | | | | | | 201,736 | |
Registrations and filing fees | | | | | | | 44,008 | |
Shareholder reports | | | | | | | 185,092 | |
Transfer agent fees–RBC Institutional Class 1 | | | | | | | 13,278 | |
Transfer agent fees–RBC Institutional Class 2 | | | | | | | 2,074 | |
Transfer agent fees–RBC Investor Class | | | | | | | 3,572 | |
Trustees’ fees and expenses | | | | | | | 237,191 | |
Shareholder services administration fees–RBC Institutional Class 1 | | | | | | | 1,119,296 | |
Tax expense | | | | | | | 2,164 | |
Other fees | | | | | | | 94,535 | |
| | | | | | | | |
Total expenses before fee waiver/reimbursement | | | | | | | 14,403,802 | |
Expenses waived/reimbursed by: | | | | | | | | |
Distributor - Class Specific | | | | | | | (782,935 | ) |
Shareholder Services Administrator - RBC Institutional Class 1 | | | | | | | (1,056,274 | ) |
| | | | | | | | |
Net expenses | | | | | | | 12,564,593 | |
| | | | | | | | |
Net Investment Income | | | | | | | 53,963,448 | |
| | | | | | | | |
Realized/Unrealized Gains/(Losses): | | | | | | | | |
Net realized gains from investment transactions | | | | | | | 35,197 | |
| | | | | | | | |
Change in net assets resulting from operations | | | | | | $ | 53,998,645 | |
| | | | | | | | |
See Notes to the Financial Statements.
Statements of Changes in Net Assets
| | | | | | | | |
| | | U.S. Government | |
| | | Money Market Fund | |
| | | For the | | | | |
| | | Six Months Ended | | | For the | |
| | | March 31, 2020 | | | Year Ended | |
| | | (Unaudited) | | | September 30, 2019 | |
From Investment Activities | | | | | | | | |
Operations: | | | | | | | | |
Net investment income | | $ | 53,963,448 | | | $ | 92,430,043 | |
Net realized gains from investments | | | 35,197 | | | | 41,542 | |
| | | | | | | | |
Change in net assets resulting from operations | | | 53,998,645 | | | | 92,471,585 | |
| | | | | | | | |
Distributions to Shareholders: | | | | | | | | |
RBC Institutional Class 1 | | | (31,078,999 | ) | | | (33,770,497 | ) |
RBC Institutional Class 2 | | | (19,161,483 | ) | | | (44,300,942 | ) |
RBC Investor Class | | | (3,721,867 | ) | | | (14,283,965 | ) |
| | | | | | | | |
Change in net assets resulting from shareholder distributions | | | (53,962,349 | ) | | | (92,355,404 | ) |
| | | | | | | | |
Capital Transactions: | | | | | | | | |
Proceeds from shares issued | | | 45,301,792,665 | | | | 18,531,189,918 | |
Distributions reinvested | | | 40,036,173 | | | | 80,315,338 | |
Cost of shares redeemed | | | (25,884,869,706 | ) | | | (18,079,176,226 | ) |
| | | | | | | | |
Change in net assets resulting from capital transactions | | | 19,456,959,132 | | | | 532,329,030 | |
| | | | | | | | |
Net increase in net assets | | | 19,456,995,428 | | | | 532,445,211 | |
Net Assets: | | | | | | | | |
Beginning of period | | | 5,466,011,370 | | | | 4,933,566,159 | |
| | | | | | | | |
End of period | | $ | 24,923,006,798 | | | $ | 5,466,011,370 | |
| | | | | | | | |
Share Transactions: | | | | | | | | |
Issued | | | 45,301,792,665 | | | | 18,531,189,918 | |
Reinvested | | | 40,036,173 | | | | 80,315,338 | |
Redeemed | | | (25,884,869,706 | ) | | | (18,079,176,226 | ) |
| | | | | | | | |
Change in shares resulting from capital transactions | | | 19,456,959,132 | | | | 532,329,030 | |
| | | | | | | | |
See Notes to the Financial Statements.
U.S. Government Money Market Fund
(Selected data for a share outstanding throughout the periods indicated)
| | | | | | | | | | | | | | |
| | | | | Investment Activities | | Distributions |
| | | Net Asset
Value,
Beginning
of Period | | Net
Investment
Income(a) | | Net Realized
and Unrealized
Gains (Losses)
on Investments | | Total from
Investment
Activities | | Net
Investment
Income | | Total
Distributions | | Net Asset
Value, End
of Period |
RBC Institutional Class 1 | | | | | | | | | | | | | | |
Six Months Ended 3/31/20 (Unaudited) | | $1.00 | | 0.01 | | —(b) | | 0.01 | | (0.01) | | (0.01) | | $1.00 |
Year Ended 9/30/19 | | 1.00 | | 0.02 | | —(b) | | 0.02 | | (0.02) | | (0.02) | | 1.00 |
Year Ended 9/30/18 | | 1.00 | | 0.01 | | —(b) | | 0.01 | | (0.01) | | (0.01) | | 1.00 |
Year Ended 9/30/17 | | 1.00 | | —(b) | | —(b) | | —(b) | | —(b) | | —(b) | | 1.00 |
Year Ended 9/30/16 | | 1.00 | | —(b) | | —(b) | | —(b) | | —(b) | | —(b) | | 1.00 |
Year Ended 9/30/15 | | 1.00 | | —(b) | | —(b) | | —(b) | | —(b) | | —(b) | | 1.00 |
RBC Institutional Class 2 | | | | | | | | | | | | | | |
Six Months Ended 3/31/20 (Unaudited) | | $1.00 | | 0.01 | | —(b) | | 0.01 | | (0.01) | | (0.01) | | $1.00 |
Year Ended 9/30/19 | | 1.00 | | 0.02 | | —(b) | | 0.02 | | (0.02) | | (0.02) | | 1.00 |
Year Ended 9/30/18 | | 1.00 | | 0.01 | | —(b) | | 0.01 | | (0.01) | | (0.01) | | 1.00 |
Year Ended 9/30/17 | | 1.00 | | —(b) | | —(b) | | —(b) | | —(b) | | —(b) | | 1.00 |
Year Ended 9/30/16 | | 1.00 | | —(b) | | —(b) | | —(b) | | —(b) | | —(b) | | 1.00 |
Year Ended 9/30/15 | | 1.00 | | —(b) | | —(b) | | —(b) | | —(b) | | —(b) | | 1.00 |
RBC Investor Class | | | | | | | | | | | | | | |
Six Months Ended 3/31/20 (Unaudited) | | $1.00 | | — | | —(b) | | — | | — | | — | | $1.00 |
Year Ended 9/30/19 | | 1.00 | | 0.01 | | —(b) | | 0.01 | | (0.01) | | (0.01) | | 1.00 |
Year Ended 9/30/18 | | 1.00 | | 0.01 | | —(b) | | 0.01 | | (0.01) | | (0.01) | | 1.00 |
Year Ended 9/30/17 | | 1.00 | | —(b) | | —(b) | | —(b) | | —(b) | | —(b) | | 1.00 |
Year Ended 9/30/16 | | 1.00 | | —(b) | | —(b) | | —(b) | | —(b) | | —(b) | | 1.00 |
Year Ended 9/30/15 | | 1.00 | | —(b) | | —(b) | | —(b) | | —(b) | | —(b) | | 1.00 |
| (a) | Per share net investment income (loss) has been calculated using the average daily shares method. |
| (b) | Less than $0.01 or $(0.01) per share. |
U.S. Government Money Market Fund
(Selected data for a share outstanding throughout the periods indicated)
| | | | | | | | | | |
| | | | | Ratios/Supplemental Data |
| | | Total
Return(a) | | Net Assets,
End of Period
(milllions) | | Ratio of
Net Expenses
to Average
Net Assets | | Ratio of
Net Investment
Income (Loss)
to Average Net Assets | | Ratio of
Expenses to
Average Net
Assets* |
RBC Institutional Class 1 | | | | | | | | | | |
Six Months Ended 3/31/20 (Unaudited) | | 0.77%(b) | | $19,766 | | 0.13%(c) | | 1.39%(c) | | 0.18%(c) |
Year Ended 9/30/19 | | 2.19% | | 1,916 | | 0.19% | | 2.17% | | 0.19% |
Year Ended 9/30/18 | | 1.41% | | 2,106 | | 0.18% | | 1.35% | | 0.19% |
Year Ended 9/30/17 | | 0.60% | | 2,210 | | 0.18% | | 0.55% | | 0.18% |
Year Ended 9/30/16 | | 0.20% | | 2,074 | | 0.17% | | 0.23% | | 0.18% |
Year Ended 9/30/15 | | 0.01% | | 921 | | 0.11% | | 0.01% | | 0.17% |
RBC Institutional Class 2 | | | | | | | | | | |
Six Months Ended 3/31/20 (Unaudited) | | 0.69%(b) | | $ 3,429 | | 0.28%(c) | | 1.37%(c) | | 0.28%(c) |
Year Ended 9/30/19 | | 2.09% | | 2,510 | | 0.29% | | 2.08% | | 0.29% |
Year Ended 9/30/18 | | 1.31% | | 1,720 | | 0.29% | | 1.34% | | 0.29% |
Year Ended 9/30/17 | | 0.50% | | 1,224 | | 0.29% | | 0.54% | | 0.29% |
Year Ended 9/30/16 | | 0.12% | | 663 | | 0.26% | | 0.14% | | 0.28% |
Year Ended 9/30/15 | | 0.01% | | 329 | | 0.11% | | 0.01% | | 0.27% |
RBC Investor Class | | | | | | | | | | |
Six Months Ended 3/31/20 (Unaudited) | | 0.33%(b) | | $ 1,728 | | 0.99%(c) | | 0.64%(c) | | 1.13%(c) |
Year Ended 9/30/19 | | 1.37% | | 1,040 | | 1.00% | | 1.36% | | 1.14% |
Year Ended 9/30/18 | | 0.59% | | 1,107 | | 1.00% | | 0.50% | | 1.13% |
Year Ended 9/30/17 | | 0.02% | | 2,158 | | 0.87% | | 0.01% | | 1.15% |
Year Ended 9/30/16 | | 0.01% | | 728 | | 0.36% | | 0.01% | | 1.12% |
Year Ended 9/30/15 | | 0.01% | | 705 | | 0.12% | | 0.01% | | 1.12% |
| * | During the period, certain fees were contractually or voluntarily reduced and/or reimbursed. If such contractual/voluntary fee reductions and reimbursements had not occurred, the ratio would have been as indicated. |
| (a) | Assumes investment at net asset value at the beginning of the period, reinvestment of all dividends and distributions, and a complete redemption of the investment at net asset value at the end of the period. |
See Notes to the Financial Statements.
|
NOTES TO FINANCIAL STATEMENTS |
March 31, 2020 (Unaudited)
1. Organization:
RBC Funds Trust (the “Trust”) is registered under the Investment Company Act of 1940 (as amended) as anopen-end management investment company. The Trust was organized as a Delaware statutory trust on December 16, 2003 and currently consists of 18 portfolios. Overall responsibility for the management of the Trust is vested in its Board of Trustees (the “Board”).Predecessor funds to the Trust were reorganized as portfolios of the Trust effective April 16, 2004. This report includes the U.S. Government Money Market Fund (“Fund”).
The Fund offers three share classes: RBC Institutional Class 1, RBC Institutional Class 2 and RBC Investor Class. Prior to November 9, 2017, the Fund also offered shares in RBC Select Class and RBC Reserve Class.
RBC Global Asset Management (U.S.) Inc. (“RBCGAM-US” or “Advisor” or“Co-Administrator”) acts as the investment advisor for the Fund. The officers of the Trust (“Fund Management”) are also employees of RBCGAM-US.
2. Significant Accounting Policies
The Fund is an investment company that follows accounting and reporting guidance under the Financial Accounting Standards Board. Summarized below are the significant accounting policies of the Funds. These policies conform to accounting principles generally accepted in the United States of America (“U.S. GAAP”). Fund Management follows these policies when preparing financial statements. Fund Management may also be required to make estimates and assumptions that affect the reported amounts of assets and liabilities at the date of the financial statements and the reported amounts of income and expenses for the period. Actual results could differ from those estimates. The financial statements are as of the close of regular trading on the New York Stock Exchange (“NYSE”).
In March 2017, the Financial Accounting Standards Board (FASB) issued Accounting Standards Update (ASU)No. 2017-08, Receivables-Nonrefundable Fees and Other Costs (Subtopic310-20): Premium Amortization on Purchased Callable Debt Securities. The amendments in the ASU shorten the amortization period for certain callable debt securities, held at a premium, to be amortized to the earliest call date. The ASU does not require an accounting change for securities held at a discount; which continues to be amortized to maturity. The ASU is effective for fiscal years and interim periods within those fiscal years beginning after December 15, 2018.
In August 2018, the Financial Accounting Standards Board issued Accounting Standards Update2018-13 “Changes to the Disclosure Requirements for Fair Value Measurement” which modifies disclosure requirements for fair value measurements. The guidance is effective for fiscal years beginning after December 15, 2019 and for interim periods within those fiscal years. Management is currently evaluating the impact of this guidance to the Funds.
Security Valuation:
The Fund has elected to use the amortized cost method to value its securities (other than other investment companies) pursuant to Rule2a-7 of the Investment Company Act of 1940, as amended, which the Board believes approximates fair market value. The amortized cost method involves valuing a security initially at its cost, and, thereafter, a constant proportionate accretion of discounts and amortization of premiums are recorded until the maturity of the security. Amortized cost approximates the current fair value of a security, but since the value is not obtained from a quoted price in an active market, securities valued at amortized cost are categorized as Level 2 in the fair value hierarchy (see “Fair Value Measurements” below for additional information). If amortized cost no longer approximates fair value due to credit or other impairments of an issuer, the Fund will determine the fair value of its securities by using pricing and valuation procedures approved by the Board. Investments inopen-end investment companies (mutual funds) are valued at net asset value and are categorized as Level 1 in the fair value hierarchy.
|
NOTES TO FINANCIAL STATEMENTS |
The Board has delegated to the Fund’s Pricing Committee (“Pricing Committee”) the responsibility for implementing the pricing and valuation procedures, including responsibility for determining the fair value of the Fund’s securities or other assets and liabilities. The Pricing Committee includes representatives of the Fund’s Advisor, andCo-Administrator, including personnel from accounting and operations, investment management, trading, risk management and compliance. The Pricing Committee meets at least quarterly to review and approve Fund valuation matters, including a review of the Fund’s pricing activity and operations, fair value measurements, pricing vendors, policies and procedures, and related controls. At least a quorum of the Pricing Committee shall meet more frequently, as needed, to consider and approve time-sensitive fair valuation matters. The Pricing Committee reports to the Valuation, Portfolio Management and Performance Committee (“Valuation Committee”) of the Board. Members of the Pricing Committee meet with the Valuation Committee and the Board at each of their regularly scheduled meetings to discuss valuation matters and actions taken during the period.
In accordance with Rule2a-7, the fair values of the securities held in the Fund are determined at least once per week using evaluated prices supplied by third-party pricing vendors approved by the Board. The pricing services utilize both dealer-supplied valuations and electronic data processing techniques that take into account appropriate factors such asinstitutional-sized trading in similar groups of securities, yield, quality, coupon rate, maturity and type of issue. These security values are then compared to the securities’ amortized cost. If a security price is not available from a pricing service or broker-dealer, or Fund Management determines that a price provided by a pricing service or broker-dealer does not approximate fair value for purposes of this comparison, the security’s fair value will be determined in good faith by the Pricing Committee in accordance with procedures and methodologies adopted by the Board. General factors used in determining the fair value of securities include, but are not limited to, fundamental analytical data relating to the security, the issuer and the market, such as duration, prepayment and default rates; general level of interest rates and changes in interest rates; information from broker-dealers; trading in similar securities; any restrictions on disposition of the security; and an evaluation of the forces that influence the market in which the investments are traded.
Fair Value Measurements:
The Funds disclose the fair value of their investments in a hierarchy that categorizes investments based on the inputs to valuation techniques used to measure fair value. The three levels of the fair value hierarchy are as follows:
• Level 1 - Inputs that reflect unadjusted quoted prices in active markets for identical assets or liabilities that the Funds have the ability to access at the measurement date.
• Level 2 - Significant inputs other than quoted prices that are observable for the asset or liability either directly or indirectly, including inputs in markets that are not considered to be active. Observable inputs may include quoted prices for similar securities, interest rates, spreads, prepayment spreads, etc.
• Level 3 - Significant unobservable inputs based on the best information available in the circumstances, to the extent observable inputs are not available (including the Fund’s own assumptions in determining the fair value of investments).
The inputs or methodology used for valuing investments are not necessarily an indication of the risk associated with investing in those securities.
Inputs used in determining fair value of an investment may include, but are not limited to, price information, volatility statistics, credit and market data, and other factors, all of which may be either observable or unobservable. Inputs can vary among investments and will be impacted by the investment type and volume of activity for the particular security or similar securities in the market. Investments in the Level 3 category are generally supported by transactions and quoted prices from dealers participating in the market for those investments. Investments may be included in the Level 3 category due to a lack of market activity or transparency. Internal valuation models may also be used as a pricing source for Level 3 investments. Internal valuation models may rely on one or more unobservable inputs, such as estimated cash flows, financial statement analysis and discount rates.
|
NOTES TO FINANCIAL STATEMENTS |
The summary of inputs used to determine the fair value of the Fund’s investments as of March 31, 2020 is as follows:
| | | | | | | | | | | | | | | | |
| Funds | | Level 1
Quoted Prices | | | Level 2
Significant
Observable
Inputs | | | Level 3
Significant
Unobservable
Inputs | | | Total | |
Assets: | | | | | | | | | | | | | | | | |
Investments in Securities | | | | | | | | | | | | | | | | |
U.S. Government Money Market Fund | | | $— | | | | 23,651,932,897 | | | | $— | | | | 23,651,932,897 | |
(a) The breakdown of the Fund’s investments by major categories or state classification or political subdivision is disclosed in the Schedules of Portfolio Investments.
During the period ended March 31, 2020, the Fund recognized no transfers to/from Level 1 or 2. The Fund’s policy is to recognize transfers between Level 1, Level 2 and Level 3 at the end of the year utilizing fair value at the beginning of the year.
Financial Instruments:
Repurchase Agreements:
The Fund may enter into repurchase agreements with counterparties whom the Advisor has deemed creditworthy, including primary dealers that report to the Federal Reserve Bank of New York or other large U.S. commercial banks or broker-dealers. These repurchase agreements are subject to the seller’s agreement to repurchase such securities at a mutually agreed upon date and price. The repurchase price generally equals the price paid by the Fund plus interest negotiated on the basis of current short-term rates.
Securities pledged by the dealers as collateral for repurchase agreements are held by a custodian bank until maturity of the repurchase agreement. The Fund has procedures to monitor additional collateral, if needed, to ensure that the daily market value of the collateral remains in excess of the market value of the repurchase agreement in the event of a default.
Master Repurchase Agreements (“MRA”) permit the Fund, under certain circumstances, including an event of default (such as bankruptcy or insolvency), to offset payables and/or receivables under the MRA with collateral held and/or posted to the counterparty and create one single net payment due to or from the Fund. However, bankruptcy or insolvency laws of a particular jurisdiction may impose restrictions on or prohibitions against such a right of offset in the event of a MRA counterparty’s bankruptcy or insolvency. Pursuant to the terms of the MRA, the Fund receives securities as collateral with a market value in excess of the repurchase price to be received by the Fund upon the maturity of the repurchase transaction. Upon a bankruptcy or insolvency of the MRA counterparty, the Fund recognizes a liability with respect to such excess collateral to reflect the Fund’s obligation under bankruptcy law to return the excess to the counterparty. Details of the counterparties and collateral for repurchase agreements are shown on the Schedule of Portfolio Investments.
Credit Enhancement:
Certain obligations held by the Fund have credit enhancement or liquidity features that may, under certain circumstances, provide for repayment of principal and interest on the obligation upon demand date, interest rate reset date or final maturity. These enhancements may include: letters of credit; liquidity guarantees; security purchase agreements; tender option purchase agreements and third party insurance.
Investment Transactions and Income:
Investment transactions are accounted for on the date the security is bought or sold (“trade date”). Dividend income is recorded on theex-dividend date. Realized gains and losses from investment transactions are calculated based on the cost of the specific security (also known as identified cost basis). Interest income is recognized on the accrual basis and includes, where applicable, the amortization or accretion of premium or discount.
|
NOTES TO FINANCIAL STATEMENTS |
Expense, Investment Income and Gain/Loss Allocation:
The Fund pays the expenses that are directly related to its operations, such as custodian fees or advisory fees. Expenses incurred by the Trust, such as trustee or legal fees, are allocated among each of the Funds in the Trust either proportionately based upon the Fund’s relative net assets or using another reasonable basis such as equally across all Funds in the Trust, depending on the nature of the expense. Individual share classes within the Fund are charged expenses specific to that class, such as distribution fees and transfer agent fees. Within the Fund, expenses other than class specific expenses are allocated daily to each class based upon the proportion of relative net assets. Investment income and realized and unrealized gains or losses are allocated to each class of shares based on relative net assets.
Distributions to Shareholders:
The Fund pays out any income that it receives, less expenses, in the form of dividends and capital gain distributions to its shareholders. Income dividends are declared daily and paid monthly. Dividends will also be paid at any time during the month upon total redemption of shares in an account. Capital gains, if any, are declared and paid at least annually. Distributions to shareholders are recorded on theex-dividend date. The amount of dividends and distributions are calculated based on federal income tax regulations, which may differ from US GAAP. These “book/tax” differences may be either temporary or permanent in nature. To the extent these differences are determined, as of the end of the tax year, to be permanent (e.g. paydowns), they are reclassified within the Fund’s capital accounts based on their federal tax basis treatment.
When-Issued Transactions:
The Fund may engage in when-issued transactions. The Fund records when-issued securities on the trade date and maintain sufficient liquidity so that cash will be available to make payment for the securities purchased. Securities purchased on a when-issued basis are valued daily beginning on trade date and begin earning interest on the settlement date. As of March 31, 2020, the Fund held no when-issued securities.
3. Agreements and Other Transactions with Affiliates:
The Trust has entered into an investment advisory agreement with RBCGAM-US under which RBCGAM-US manages the Fund’s assets and furnishes related office facilities, equipment, research and personnel. The agreement requires the Fund to pay RBCGAM-US a monthly fee based upon average daily net assets. Under the terms of the agreement, RBCGAM-US is entitled to receive fees based on a percentage of the average daily net assets of the Fund as follows:
| | |
| | | Annual Rate |
U.S. Government Money Market Fund | | 0.10% |
RBC Institutional Class 1 of the Fund pays the Advisor an annual shareholder services administration fee of 0.05% of the average daily net assets attributable to RBC Institutional Class 1 shares that is used to compensate financial intermediaries for providing services to shareholders and maintaining shareholder accounts. This shareholder services administration fee is not paid pursuant to Rule12b-1.
RBCGAM-US has contractually agreed to waive fees and/or reimburse expenses under an expense limitation agreement in order to maintain the net annual Fund operating expenses (excluding certain fees such as interest, taxes and acquired fund fees and expenses) at 0.20% for RBC Institutional Class 1 until January 31, 2021. During the period ended March 31, 2020, there were no fees waived under this agreement.
RBCGAM-US serves asco-administrator to the Fund. BNY Mellon serves asco-administrator and fund accounting agent. Services provided under the administrative services agreement include providingday-to-day administration of matters related to the Fund, maintenance of the records and the preparation of reports. Under the terms of the administrative services agreement, RBCGAM-US does not receive an administration services fee. BNY Mellon receives a fee for its services payable by the Fund based in part on the Fund’s average net assets. BNY Mellon’s fee is included with “Accounting fees” in the Statement of Operations.
|
NOTES TO FINANCIAL STATEMENTS |
Certain Officers and Trustees of the Trust are affiliated with the Advisor. Such Officers and Trustees receive no compensation from the Fund for serving in their respective roles.
The Trust currently pays each of the independent Trustees (Trustees of the Trust who are not directors, officers or employees of the Advisor, eitherCo-Administrator or Distributor) an annual retainer of $63,000. The Board Chairperson and Audit Committee Chairperson each receive an additional retainer of $2,500 annually, and all other Trustees serving as Chair of a Board committee each receive an additional retainer of $1,000 annually. In addition, independent Trustees receive a quarterly meeting fee of $6,500 for eachin-person Board meeting attended, a meeting fee of $1,500 for each telephonic or special board meeting attended, a $1,500 fee for each Board committee meeting attended, and are reimbursed for allout-of-pocket expenses relating to attendance at such meetings. These amounts are included in the Statement of Operations in “Trustees’ fees”.
4. Fund Distribution:
The Fund has adopted a Shareholder Account and Distribution Services(12b-1) Plan (the “Plan”) with respect to RBC Institutional Class 2 and RBC Investor Class, in which Quasar Distributors LLC (the “Distributor”) acts as the Fund’s distributor. The Plan permits the Fund to make payments for or to reimburse the Distributor or others, including RBC Capital Markets, LLC, monthly for distribution-related costs and expenses of marketing shares of each share class covered under the Plan, and/or for providing shareholder services. The following chart shows the current Plan fee rate for each class:
| | | | | | | | |
| | | RBC Institutional Class 2 | | | RBC Investor Class | |
12b-1 Plan Fee | | | 0.15% | | | | 1.00% | |
Plan fees are based on average daily net assets of the applicable class. Up to 0.25% of each Plan fee may be designated as a service fee, as defined by the applicable rules of the Financial Industry Regulatory Authority.
Pursuant to a shareholder account and distribution services agreement between the Distributor and RBC Capital Markets, LLC, the Distributor has agreed to compensate RBC Capital Markets, LLC for certain shareholder account servicing support provided to the Fund. RBC Capital Markets, LLC has agreed to waive fees and/or reimburse expenses in order to maintain the net annual Fund operating expenses for each class listed below to the following amounts:
| | | | |
Share Class | | Operating Expense Limit | |
RBC Institutional Class 2 | | | 0.30% | |
RBC Investor Class | | | 1.00% | |
This expense limitation agreement is in place until January 31, 2021. The Fund will carry forward, for a period not to exceed 12 months from the date on which a waiver or reimbursement is made by RBC Capital Markets, LLC, any expenses in excess of the expense limitation and repay RBC Capital Markets, LLC such amounts, provided the Fund is able to effect such repayment and remain in compliance with the expense limitation. At March 31, 2020, the amount subject to possible recoupment under the expense limitation agreement is $1,424,642.
RBC Capital Markets, LLC and/or the Advisor may voluntarily waive and/or reimburse additional Fund operating expenses at any time, such as to maintain a minimum yield in the fund. Any such voluntary program may be modified or discontinued at any time without notice.
For the period ended March 31, 2020, the following distribution fees were waived:
| | | | |
Share Class | | Distribution Fees Waived | |
RBC Investor Class | | | $750,076 | |
During the six months ended March 31, 2020, shareholder servicing fees were voluntarily waived for RBC Institutional Class 1 in the amout of $1,056,274.
|
NOTES TO FINANCIAL STATEMENTS |
5. Capital Share Transactions
The number of shares sold, reinvested and redeemed correspond to the net proceeds from sale of shares, reinvestments of dividends and cost of shares redeemed, respectively, since shares are issued, reinvested and redeemed at $1.00 per share.
Transactions for the period were as follows:
| | | | | | | | |
| | | U.S. Government Money Market Fund | |
| | | For the | | | | |
| | | Six Months | | | | |
| | | Ended | | | For the | |
| | | March 31, 2020 | | | Year Ended | |
| | | (Unaudited) | | | September 30, 2019 | |
CAPITAL TRANSACTIONS: | | | | | | | | |
RBC Institutional Class 1 | | | | | | | | |
Proceeds from shares issued | | $ | 38,416,609,620 | | | $ | 11,011,527,996 | |
Distributions reinvested | | | 17,158,940 | | | | 21,750,750 | |
Cost of shares redeemed | | | (20,583,887,299 | ) | | | (11,223,616,131 | ) |
| | | | | | | | |
Change in RBC Institutional Class 1 | | $ | 17,849,881,261 | | | $ | (190,337,385 | ) |
| | | | | | | | |
RBC Institutional Class 2 | | | | | | | | |
Proceeds from shares issued | | $ | 4,999,043,121 | | | $ | 4,964,284,555 | |
Distributions reinvested | | | 19,155,363 | | | | 44,280,620 | |
Cost of shares redeemed | | | (4,099,913,332 | ) | | | (4,218,163,172 | ) |
| | | | | | | | |
Change in RBC Institutional Class 2 | | $ | 918,285,152 | | | $ | 790,402,003 | |
| | | | | | | | |
RBC Investor Class | | | | | | | | |
Proceeds from shares issued | | $ | 1,886,139,924 | | | $ | 2,555,377,367 | |
Distributions reinvested | | | 3,721,870 | | | | 14,283,968 | |
Cost of shares redeemed | | | (1,201,069,075 | ) | | | (2,637,396,923 | ) |
| | | | | | | | |
Change in RBC Investor Class | | $ | 688,792,719 | | | $ | (67,735,588 | ) |
| | | | | | | | |
Change in net assets resulting from capital transactions | | $ | 19,456,959,132 | | | $ | 532,329,030 | |
| | | | | | | | |
6. Federal Income Taxes:
It is the policy of the Fund to continue to qualify as a regulated investment company by complying with the provisions available to certain investment companies, as defined under Subchapter M of the Internal Revenue Code, and to distribute substantially all of its net investment income and net realized capital gains. Therefore, no federal tax liability is recorded in the financial statements of the Fund.
Fund Management has analyzed the Fund’s tax positions taken or expected to be taken on federal income tax returns for all open tax years (current and prior three tax years) and has concluded that no provision for federal income tax is required in the Fund’s financial statements. The Fund’s federal and
|
NOTES TO FINANCIAL STATEMENTS |
state income and federal excise tax returns for tax years for which the applicable statutes of limitations have not expired are subject to examination by the Internal Revenue Service and state departments of revenue.
The tax character of distributions during the year ended September 30, 2019 were as follows:
| | | | | | | | | | | | |
| | | Distributions Paid From | |
| | | | | | | | | Total | |
| | | Ordinary | | | Total Taxable | | | Distributions | |
| | | Income | | | Distributions | | | Paid | |
U.S. Government Money Market Fund | | $ | 90,428,984 | | | $ | 90,428,984 | | | $ | 90,428,984 | |
Total distributions paid may differ from the Statements of Changes in Net Assets because distributions are recognized when actually paid for tax purposes.
The tax basis of components of accumulated earnings/(losses) and tax character of distributions are determined at fiscal year end, and will be included in the Annual Report dated September 30, 2020.
During the year ended September 30, 2019, the Fund utilized capital loss carryforwards in the amount of $116,187.
As of September 30, 2019, the Fund had a short-term capital loss carryforward of $12,737 and a long-term capital loss carryforward of $444 available to offset future realized capital gains in accordance with the Regulated Investment Company Modernization Act of 2010. This capital loss carryforward is not subject to expiration and must first be utilized to offset future realized gains of the same character.
Under current tax law, Post-October Capital Losses and Late-Year Ordinary Losses may be deferred and treated as occurring on the first business day of the following fiscal year for tax purposes. The Fund did not have any Post-October Capital Losses or Late-Year Ordinary Losses for the year ending September 30, 2019.
7. Line of Credit
The Fund, along with other Funds within the Trust, participates in an uncommitted, unsecured $500,000,000 line of credit with U.S. Bank, N.A. (the “Bank”), the Funds’ custodian, to be used to fund shareholder redemption requests and for other short-term temporary or emergency general business purposes. The line of credit has a scheduled termination date of August 1, 2020. Interest is charged on borrowings under this line of credit at the Bank’s prime lending rate per annum. Since multiple funds within the Trust participate in this line of credit, there is no assurance that an individual fund will have access to all or any part of the $500,000,000 at any particular time. There were no loans outstanding pursuant to this line of credit at March 31, 2020 and there were no borrowings made by the Fund during the period.
8. Significant Risks
Shareholder concentration risk
As of March 31, 2020, an affiliated broker-dealer omnibus account owned 26.4% of the Fund’s outstanding shares, an unaffiliated omnibus account owned 15.3% of the Fund’s outstanding shares and an unaffiliated shareholder owned 11.2% of the Fund’s outstanding shares. Significant transactions by these shareholders may impact the Fund’s performance.
Market risk
One or more markets in which a Fund invests may go down in value, sometimes sharply and unpredictably, and the value of a Fund’s portfolio securities may fall or fail to rise. Market risk may affect a single issuer, sector of the economy, industry or the market as a whole. In addition, global economies and financial markets are becoming increasingly interconnected, and political, economic and other conditions and events (including, but not limited to, natural disasters, pandemics, epidemics,
|
NOTES TO FINANCIAL STATEMENTS |
and social unrest) in one country, region, or financial market may adversely impact issuers in a different country, region or financial market. Furthermore, the occurrence of, among other events, natural orman-made disasters, severe weather or geological events, fires, floods, earthquakes, outbreaks of disease (such asCOVID-19, avian influenza or H1N1/09), epidemics, pandemics, malicious acts, cyber-attacks, terrorist acts or the occurrence of climate change, may also adversely impact the performance of a Fund. Such events could adversely impact issuers, markets and economies over the short- and long-term, including in ways that cannot necessarily be foreseen. A Fund could be negatively impacted if the value of a portfolio holding were harmed by such political or economic conditions or events. Moreover, such negative political and economic conditions and events could disrupt the processes necessary for a Fund’s operations.
In a negative interest rate environment, debt instruments may trade at negative yields, which means the purchaser of the instrument may receive at maturity less than the total amount invested. In addition, in a negative interest rate environment, if a bank charges negative interest rates, instead of receiving interest on deposits, a depositor must pay the bank fees to keep money with the bank. To the extent a Fund holds a debt instrument or has a bank deposit with a negative interest rate, the Fund would generate a negative return on that investment.
In light of current market conditions, interest rates and bond yields in the United States and many other countries are at or near historic lows, and in some cases, such rates and yields are negative. During periods of very low or negative interest rates, the Fund’s susceptibility to interest rate risk (i.e., the risks associated with changes in interest rates) may be magnified, its yield and income may be diminished and its performance may be adversely affected (e.g., during periods of very low or negative interest rates, the Fund may be unable to maintain positive returns). These levels of interest rates (or negative interest rates) may magnify the risks associated with rising interest rates. Changing interest rates, including rates that fall below zero, may have unpredictable effects on markets, including market volatility and reduced liquidity, and may adversely affect a Fund’s yield, income and performance.
9. Subsequent Events:
Fund Management has evaluated the impact of all subsequent events on the Funds and has determined that there were no subsequent events requiring recognition or disclosure in the financial statements.
|
SUPPLEMENTAL INFORMATION (UNAUDITED) |
Shareholder Expense Examples
As a shareholder of the the RBC Funds, you incur two types of costs: (1) transaction costs and (2) ongoing costs, including management fees; and other Fund expenses. This example is intended to help you understand your ongoing costs (in dollars) of investing in the RBC Funds and to compare these costs with the ongoing costs of investing in other mutual funds.
The example is based on an investment of $1,000 invested at the beginning of the period and held for the entire period from October 1, 2019 through March 31, 2020.
Actual Expenses
The table below provides information about actual account values and actual expenses. You may use the information below, together with the amount you invested, to estimate the expenses that you paid over the period. Simply divide your account value by $1,000 (for example, an $8,600 account value divided by $1,000 = 8.6), then multiply the result by the number in the table under the heading entitled “Expenses Paid During Period” to estimate the expenses you paid on your account during this period.
| | | | | | | | | | | | | | | | |
| | | Beginning
Account Value
10/1/19 | | | Ending
Account Value
3/31/20 | | | Expenses Paid
During Period*
10/1/19–3/31/20 | | | Annualized
Expense Ratio
During Period
10/1/19–3/31/20 | |
U.S. Government Money Market Fund | | | | | | | | | | | | | |
RBC Institutional Class 1 | | | $1,000.00 | | | | $1,007.70 | | | | $0.65 | | | | 0.13% | |
RBC Institutional Class 2 | | | 1,000.00 | | | | 1,006.90 | | | | 1.40 | | | | 0.28% | |
RBC Investor Class | | | 1,000.00 | | | | 1,003.30 | | | | 4.96 | | | | 0.99% | |
*Expenses are equal to the average account value times the Fund’s annualized expense ratio multiplied by 183/366 (to reflect one half year period).
|
SUPPLEMENTAL INFORMATION (UNAUDITED) |
Hypothetical Example for Comparison Purposes
The table below provides information about hypothetical account values and hypothetical expenses based on the Fund’s actual expense ratio and an assumed rate of return of 5% per year before expenses, which is not the Fund’s actual return. The hypothetical account values and expenses may not be used to estimate the actual ending account balance or expenses you paid for the period. You may use this information to compare this 5% hypothetical example with the 5% hypothetical examples that appear in the shareholder reports of other funds.
Please note that the expenses shown in the table are meant to highlight your ongoing costs only and do not reflect any transactional costs, such as sales charges (loads), redemption fees, or exchange fees. Therefore, the table is useful in comparing ongoing costs only, and will not help you determine the relative total costs of owning different funds. In addition, if these transactional costs were included, your costs would have been higher.
| | | | | | | | | | | | | | | | |
| | | Beginning
Account Value
10/1/19 | | | Ending
Account Value
3/31/20 | | | Expenses Paid
During Period*
10/1/19-3/31/20 | | | Annualized
Expense Ratio
During Period
10/1/19-3/31/20 | |
U.S. Government Money Market Fund | | | | | | | | | | | | | |
RBC Institutional Class 1 | | | $1,000.00 | | | | $1,024.35 | | | | $0.66 | | | | 0.13% | |
RBC Institutional Class 2 | | | 1,000.00 | | | | 1,023.60 | | | | 1.42 | | | | 0.28% | |
RBC Investor Class | | | 1,000.00 | | | | 1,020.05 | | | | 5.00 | | | | 0.99% | |
*Expenses are equal to the average account value times the Fund’s annualized expense ratio multiplied by 183/366 (to reflect one half year period).
|
LIQUIDITY RISK DISCLOSURE (UNAUDITED) |
Statement Regarding Liquidity Risk Management Program
This section discusses the operation and effectiveness of the Liquidity Risk Management Program (the “Program”) of RBC Funds Trust (the “Trust”), including each of its series (each, a “Fund” and collectively, the “Funds”), established in accordance with Rule22e-4 under the Investment Company Act of 1940, as amended (the “Liquidity Rule”). The Board of Trustees of the Trust (the “Board”), including a majority of the Trustees who are not “interested persons” as defined in the 1940 Act, approved the Program on behalf of each Fund, as required pursuant to the Liquidity Rule. The Board also approved the designation of RBC Global Asset Management (U.S.) Inc. (“RBC”), the investment adviser to each Fund, as the Program Administrator for the Program. RBC administersday-to-day implementation of the Program through a Liquidity Risk Committee (the “Committee”), as set forth in the Program.
RBC, as Program Administrator, provided the Board with a report addressing the operation of the Program and assessing its adequacy and effectiveness of implementation, including, if applicable, the operation of any highly liquid investments minimum (“HLIM”) and any material changes to the Program (the “Report”).
The Report covered the year ending December 31, 2019 (the “Review Period”).
I. Key Conclusions of the Report
The Program, as and implemented, is reasonably designed to assess and manage each Fund’s liquidity risk. During the Review Period, the Program was implemented and operated effectively to achieve the goal of assessing and managing each Fund’s liquidity risk. No Fund was required to set an HLIM and each Fund was able to meet requests for redemption without significant dilution of remaining investors’ interests in the Fund. There were no material changes to the Program implemented during the Review Period.
II. Summary of the Review
A. Liquidity Risk Assessment and Review
Throughout the Review Period, the Program Administrator, in consultation with investment personnel, monitored the Funds’ portfolio liquidity and liquidity risk on an ongoing basis, as described in the Program and in Board reporting throughout the Review Period.
The Program Administrator also conducted an annual review assessing each Fund’s liquidity risk as described in the Report, in accordance with the requirements of the Program and the Liquidity Rule, taking into account the following factors enumerated in the Liquidity Rule and identified in the Program, as applicable:
a. Each Fund’s investment strategy and liquidity of portfolio investments during both normal and reasonably foreseeable stressed conditions, including: (i) whether the Fund’s investment strategy is appropriate for anopen-end fund; (ii) the extent to which the Fund’s strategy involves a relatively concentrated portfolio or large positions in particular issuers; (iii) the Fund’s use of borrowings for investment purposes; and (iv) the Fund’s use of derivatives (including for hedging purposes);
b. Short-term and long-term cash flow projections during both normal and reasonably foreseeable stressed conditions; and
c. Holdings of cash and cash equivalents, as well as borrowing arrangements and other funding sources.
Investment Strategy and Portfolio Liquidity. The Program Administrator considered the factors identified above, among others, during both normal and reasonably foreseeable stressed conditions as provided in the Program. Pursuant to the review, the Program Administrator determined that Fund’s investment strategy and use of derivatives are appropriate for anopen-end fund.
Cash Flow. The Funds’ cash flows did not have a material effect on the ability to meet redemptions during the Review Period.
|
LIQUIDITY RISK DISCLOSURE (UNAUDITED) |
Holdings of Cash and Borrowing Arrangements. As described in the Report, the Program Administrator determined that the Funds’ holdings of cash and borrowing arrangements were adequate for meeting the Funds’ expected cash flow needs to meet redemptions during the Review Period.
In light of the assessment and review as discussed above, the Program Administrator did not recommend any material changes in the management of the Funds’ liquidity risks, including with respect to any of the above factors.
B. Portfolio Holdings Classifications
During the Review Period, each Fund’s portfolio holdings (including derivative investments) were classified monthly as Highly Liquid Investments, Moderately Liquid Investments, Less Liquid Investments and Illiquid Investments pursuant to the Program, as required by the Liquidity Rule.
During the Review Period, the Funds classified portfolio investments (including, as applicable, derivatives transactions) according to asset class when appropriate, as described in Section IV.B of the Program.
Market Depth—Reasonably Anticipated Trading Size. In classifying and reviewing its portfolio investments or asset classes (as applicable), the Funds must determine whether trading varying portions of a position in a particular portfolio investment or asset class, in sizes that the Fund would reasonably anticipate trading, is reasonably expected to significantly affect its liquidity, and if so, the Fund must take this determination into account when classifying the liquidity of that investment or asset class. There were no changes to the Reasonably Anticipated Trading Size assumptions for the Funds during the Review period.
Classification Review. As required by the Liquidity Rule, the Funds reviewed liquidity classifications on a monthly basis during the Review Period as described in Section IV of the Program. The Committee met monthly to review its portfolio investments’ classifications in connection with recording the liquidity classification for each portfolio investment for reporting on FormN-PORT. The Program Administrator oversaw the Funds’ process for classifying portfolio holdings under the Rule and reviewed the classifications, as described in the Program. This review included a review of the methodology and data inputs used. During the Review Period, the Program Administrator determined that there were no material operational issues with the process for classifying portfolio holdings.
C. HLIM
The Program Administrator reviewed the process and standards for determining that each Fund primarily holds investments that are highly liquid. There were no changes recommended in the Report with respect to the status of any Fund as a Primarily Highly Liquid Fund (“PHLF”) and each Fund qualified as a PHLF on an ongoing basis during the Review Period as described in the Report. Accordingly, an HLIM was not required for any Fund during the Review Period pursuant to the relevant provisions of the Program.
D. Compliance with the 15% Limitation on Illiquid Investments
Pursuant to the Liquidity Rule, no Fund may acquire any illiquid investment if, after the acquisition, the Fund would have invested more than 15% of its assets in illiquid investments that are assets (the “15% Limit”). The Program Administrator monitored compliance with the 15% Limit as described in the Program. During the Review Period, the Funds operated in accordance with the relevant provisions of the Program with respect to the 15% Limit.
E. Redemptions in Kind
There were no redemptionsin-kind effected by any Fund during the Review Period.
This Page Intentionally Left Blank
This Page Intentionally Left Blank
This Page Intentionally Left Blank
This Page Intentionally Left Blank
RBC Funds
P.O. Box 701
Milwaukee, WI 53201-0701
800-422-2766
www.rbcgam.us
Performance data represents past performance and does not guarantee future results. The principal value of an investment and investment return will fluctuate so that an investor’s shares, when redeemed, may be worth more or less than their original cost.
This report and the financial statements contained herein are provided for the information of RBC Funds shareholders. This report is not authorized for distribution to prospective investors unless preceded or accompanied by a current prospectus, which contains information concerning investment objectives, risks, charges and expenses of the funds. Please read the prospectus carefully before investing.
This report and the financial statements contained herein are not intended to be a forecast of future events, a guarantee of future results, or investment advice. There is no assurance that certain securities will remain in or out of each fund’s portfolio. The views expressed in this report reflect those of the portfolio managers through the period ended March 31, 2020.
NOT FDIC INSURED • NO BANK GUARANTEE • MAY LOSE VALUE
RBC Global Asset Management (U.S.) Inc. serves as investment advisor for the RBC Funds. RBC Funds are distributed by Quasar Distributors LLC.
The RBC Funds are pleased to offer shareholder reports printed entirely on Forest
Stewardship Council® certified paper. FSC® certification ensures that the paper
used in this report contains fiber from well-managed and responsibly harvested
forests that meet strict environmental and socioeconomic standards.
RBCF-MM SAR03-20
Item 2. Code of Ethics.
Not applicable.
Item 3. Audit Committee Financial Expert.
Not applicable.
Item 4. Principal Accountant Fees and Services.
Not applicable.
Item 5. Audit Committee of Listed Registrants.
Not applicable.
Item 6. Investments.
| (a) | Schedule of Investments in securities of unaffiliated issuers as of the close of the reporting period is included as part of the report to shareholders filed under Item 1 of this form. |
Item 7. Disclosure of Proxy Voting Policies and Procedures forClosed-End Management
Investment Companies.
Not applicable.
Item 8. Portfolio Managers ofClosed-End Management Investment Companies.
Not applicable.
Item 9. Purchases of Equity Securities byClosed-End Management Investment Company
and Affiliated Purchasers.
Not applicable.
Item 10. Submission of Matters to a Vote of Security Holders.
There have been no material changes to the procedures by which the shareholders may recommend nominees to the registrant’s board of directors, where those changes were implemented after the registrant last provided disclosure in response to the requirements of Item 407(c)(2)(iv) of RegulationS-K (17 CFR 229.407) (as required by Item 22(b)(15) of Schedule 14A (17 CFR240.14a-101)), or this Item.
Item 11. Controls and Procedures.
| | (a) | The registrant’s principal executive and principal financial officers, or persons performing similar functions, have concluded that the registrant’s disclosure controls and procedures (as defined inRule 30a-3(c) under the Investment Company Act of 1940, as amended (the “1940 Act”) (17 CFR270.30a-3(c))) are effective, as of a date within 90 days of the filing date of the report that includes the disclosure required by this paragraph, based on their evaluation of these controls and procedures required by Rule30a-3(b) under the 1940 Act (17 CFR270.30a-3(b)) and Rules13a-15(b) or15d-15(b) under the Securities Exchange Act of 1934, as amended (17 CFR240.13a-15(b) or240.15d-15(b)). |
| | (b) | There were no changes in the registrant’s internal control over financial reporting (as defined inRule 30a-3(d) under the 1940 Act (17 CFR270.30a-3(d)) that occurred during the period covered by this report that has materially affected, or is reasonably likely to materially affect, the registrant’s internal control over financial reporting. |
Item 12. Disclosure of Securities Lending Activities forClosed-End Management Investment
Companies.
Not applicable.
Item 13. Exhibits.
SIGNATURES
Pursuant to the requirements of the Securities Exchange Act of 1934 and the Investment Company Act of 1940, the registrant has duly caused this report to be signed on its behalf by the undersigned, thereunto duly authorized.
| | |
(Registrant) RBC Funds Trust | | |
| |
By (Signature and Title)* /s/ Kathleen A. Gorman | | |
Kathleen A. Gorman, President and Chief Executive Officer (principal executive officer) | | |
| |
Date 5/28/2020 | | |
Pursuant to the requirements of the Securities Exchange Act of 1934 and the Investment Company Act of 1940, this report has been signed below by the following persons on behalf of the registrant and in the capacities and on the dates indicated.
| | |
By (Signature and Title)* /s/ Kathleen A. Gorman | | |
Kathleen A. Gorman, President and Chief Executive Officer (principal executive officer) | | |
| |
Date 5/28/2020 | | |
| |
By (Signature and Title)* /s/ Kathleen A. Hegna | | |
Kathleen A. Hegna, Treasurer and Chief Financial Officer (principal financial officer) | | |
| |
Date 5/28/2020 | | |
* Print the name and title of each signing officer under his or her signature.