UNITED STATES
SECURITIES AND EXCHANGE COMMISSION
Washington, D.C. 20549
FORM N-CSR
CERTIFIED SHAREHOLDER REPORT OF REGISTERED MANAGEMENT
INVESTMENT COMPANIES
Investment Company Act file number 811-21475
RBC Funds Trust
(Exact name of registrant as specified in charter)
50 South Sixth Street, Suite 2350
Minneapolis, MN 55402
(Address of principal executive offices) (Zip code)
Tara Tilbury
50 South Sixth Street, Suite 2350
Minneapolis, MN 55402
(Name and address of agent for service)
Registrant’s telephone number, including area code: (612) 376-7132
Date of fiscal year end: March 31
Date of reporting period: September 30, 2020
Item 1. Reports to Stockholders.
The Report to Shareholders is attached herewith.
| | | | | | |
PORTFOLIO MANAGERS | | | | | | |
| | | | | | | |
RBC Global Asset Management (U.S.) Inc. (“RBC GAM-US”) serves as the investment advisor and RBC Global Asset Management (UK) Limited (“RBC GAM-UK”) serves as the investment sub-advisor to the Funds and is responsible for the overall management of the Funds’ portfolios. The individual primarily responsible for the day-to-day management of each Fund’s portfolio is set forth below. | | | | | | |
Philippe Langham Senior Portfolio Manager and Head of Emerging Market Equities Philippe Langham is Head of Emerging Market Equities at RBC GAM-UK and is responsible for portfolio management of RBC Emerging Markets Equity Fund and RBC Emerging Markets Small Cap Equity Fund. Philippe joined RBC GAM-UK in November 2009 from Societe Generale Asset Management, where he was Head of Global Emerging Markets. He was previously Director and Head of Emerging Markets and Asia at Credit Suisse in Zurich. Prior to that, he managed Global Emerging Markets, Asian, Latin American and U.S. portfolios for nine years at the Kuwait Investment Office. Philippe holds a BSc in economics from the University of Manchester in England and is a Chartered Accountant. | | | | | | |
Laurence Bensafi Senior Portfolio Manager and Deputy Head of Emerging Markets Equity Laurence Bensafi is Deputy Head of Emerging Markets Equity at RBC GAM-UK and is responsible for portfolio management of RBC Emerging Markets Value Equity Fund. Prior to joining RBC GAM-UK in 2013, Laurence was the Head of Aviva Investors’ Emerging Markets team, where she was responsible for managing Global Emerging Markets income funds and for developing quantitative stock selection and analysis models. Laurence began her investment career as a Quantitative Analyst at Societe Generale Asset Management, supporting European and Global Equity portfolio management by developing quantitative models to assist in the portfolio construction and security selection process. In 1997, Laurence obtained a Magistere d’Economiste Statisticien & D.E.S.S. Statistique et Econometrie from Toulouse University in France. Laurence is a CFA charterholder. | | | | | | |
Habib Subjally Senior Portfolio Manager and Head of Global Equities Habib Subjally is Head of Global Equities at RBC GAM-UK and is responsible for portfolio management of RBC Global Opportunities Fund and RBC International Opportunities Fund. Prior to joining RBC GAM-UK in 2014 Habib and his team spent eight years together at First State managing global equities. Previously he was Head of Small & Mid Cap Research at Credit Suisse and Head of the Global equities team at Invesco. Habib began his fund management career at Merrill Lynch Investment Managers, where he was Head of North American and Global equities research. He holds a BSc (Hons) from the London School of Economics and holds Chartered Accountant and ASIP designations. | | | | | | |
| | | | | | |
| | | | | | |
| | | | | | |
| | | | | | |
| | | | | | |
| | | | | | |
1
|
PERFORMANCE SUMMARY (UNAUDITED) |
| | | | | | | | | | | | | | | | | | | | | | | | |
| | | 1
Year | | | 3
Year | | | 5
Year | | | Since
Inception(a) | | | Net
Expense
Ratio(b)(c) | | | Gross
Expense
Ratio(b)(c) | |
Average Annual Total Returns as of September 30, 2020 (Unaudited) | |
|
RBC Emerging Markets Equity Fund | |
Class A | | | | | | | | | | | | | | | | | | | | | | | | |
- Including Max Sales Charge of 5.75% | | | 2.41% | | | | 1.27% | | | | 6.70% | | | | 4.70% | | | | | | | | | |
- At Net Asset Value | | | 8.62% | | | | 3.30% | | | | 7.96% | | | | 5.62% | | | | 1.13% | | | | 1.36% | |
Class I | | | | | | | | | | | | | | | | | | | | | | | | |
- At Net Asset Value | | | 8.92% | | | | 3.57% | | | | 8.18% | | | | 5.86% | | | | 0.88% | | | | 1.02% | |
Class R6 | | | | | | | | | | | | | | | | | | | | | | | | |
- At Net Asset Value | | | 8.87% | | | | 3.56% | | | | 8.18% | | | | 5.98% | | | | 0.88% | | | | 0.91% | |
| | | | | | |
MSCI Emerging Markets
Net Total Return USD Index(d) | | | 10.54% | | | | 2.42% | | | | 8.97% | | | | 3.78% | | | | | | | | | |
RBC Emerging Markets Small Cap Equity Fund | | | | | | | | | | | | | | | | | |
Class A | | | | | | | | | | | | | | | | | | | | | | | | |
- Including Max Sales Charge of 5.75% | | | (11.74)% | | | | (6.33)% | | | | 0.88% | | | | (0.53)% | | | | | | | | | |
- At Net Asset Value | | | (6.35)% | | | | (4.45)% | | | | 2.07% | | | | 0.34% | | | | 1.70% | | | | 4.32% | |
Class I | | | | | | | | | | | | | | | | | | | | | | | | |
- At Net Asset Value | | | (6.06)% | | | | (4.22)% | | | | 2.33% | | | | 0.59% | | | | 1.45% | | | | 4.06% | |
| | | | | | |
MSCI Emerging Markets
Small Cap Net Total Return USD Index(d) | | | 6.89% | | | | (1.09)% | | | | 4.60% | | | | 2.29% | | | | | | | | | |
RBC Emerging Markets Value Equity Fund | | | | | | | | | | | | | | | | | |
Class I | | | | | | | | | | | | | | | | | | | | | | | | |
- At Net Asset Value | | | 3.48% | | | | N/A | | | | N/A | | | | (4.65)% | | | | 0.95% | | | | 6.68% | |
Class R6 | | | | | | | | | | | | | | | | | | | | | | | | |
- At Net Asset Value | | | 3.54% | | | | N/A | | | | N/A | | | | (4.57)% | | | | 0.88% | | | | 6.67% | |
| | | | | | |
MSCI Emerging Markets
Net Total Return USD Index(d) | | | 10.54% | | | | N/A | | | | N/A | | | | (0.47)% | | | | | | | | | |
RBC Global Opportunities Fund | | | | | | | | | | | | | | | | | | | | | | | | |
Class A | | | | | | | | | | | | | | | | | | | | | | | | |
- Including Max Sales Charge of 5.75% | | | 11.45% | | | | 9.58% | | | | 12.53% | | | | 10.11% | | | | | | | | | |
- At Net Asset Value | | | 18.26% | | | | 11.77% | | | | 13.86% | | | | 11.24% | | | | 1.11% | | | | 1.64% | |
Class I | | | | | | | | | | | | | | | | | | | | | | | | |
- At Net Asset Value | | | 18.57% | | | | 12.05% | | | | 14.06% | | | | 11.42% | | | | 0.86% | | | | 1.25% | |
Class R6 | | | | | | | | | | | | | | | | | | | | | | | | |
- At Net Asset Value | | | 18.65% | | | | 12.09% | | | | 14.11% | | | | 11.46% | | | | 0.81% | | | | 5.44% | |
| | | | | | |
MSCI ACWI Net
Total Return USD Index(d) | | | 10.44% | | | | 7.12% | | | | 10.30% | | | | 7.13% | | | | | | | | | |
2
|
PERFORMANCE SUMMARY (UNAUDITED) |
| | | | | | | | | | | | | | | | | | | | | | | | |
| | | 1
Year | | | 3
Year | | | 5
Year | | | Since
Inception(a) | | | Net
Expense
Ratio(b)(c) | | | Gross
Expense
Ratio(b)(c) | |
Average Annual Total Returns as of September 30, 2020 (Unaudited) | |
|
RBC International Opportunities Fund | |
Class A | | | | | | | | | | | | | | | | | | | | | | | | |
- Including Max Sales Charge of 5.75% | | | (0.15)% | | | | 1.90% | | | | 5.31% | | | | 3.21% | | | | | | | | | |
- At Net Asset Value | | | 5.93% | | | | 3.93% | | | | 6.57% | | | | 4.27% | | | | 1.14% | | | | 1.38% | |
Class I | | | | | | | | | | | | | | | | | | | | | | | | |
- At Net Asset Value | | | 7.19% | | | | 4.51% | | | | 6.99% | | | | 4.64% | | | | 0.89% | | | | 1.21% | |
Class R6 | | | | | | | | | | | | | | | | | | | | | | | | |
- At Net Asset Value | | | 7.41% | | | | 4.58% | | | | 7.05% | | | | 4.71% | | | | 0.84% | | | | 28.05% | |
| | | | | | |
MSCI ACWI ex US Index(d) | | | 3.00% | | | | 1.16% | | | | 6.23% | | | | 3.17% | | | | | | | | | |
Performance data quoted represents past performance. Past performance is no guarantee of future results. Investment return and principal value of an investment will fluctuate so that an investor’s shares, when redeemed, may be worth more or less than their original cost. Current performance may be lower or higher than performance quoted. Performance shown reflects contractual fee waivers, without such fee waivers total returns would be reduced. Performance information does not reflect the 2% fee on shares redeemed or exchanged within 30 days of purchase. If such redemption fee was included, performance would be reduced. For performance data current to the most recent month-end go to www.rbcgam.us. Please see footnotes below.
| (a) | The since inception date (commencement of operations) is December 20, 2013 for RBC Emerging Markets Equity Fund and RBC Emerging Markets Small Cap Equity Fund for Class A and Class I shares and November 22, 2016 for Class R6 shares, February 9, 2018 for RBC Emerging Markets Value Equity Fund for Class I and Class R6 shares and December 3, 2014 for RBC Global Opportunities Fund and RBC International Opportunities Fund for Class I shares, November 22,2016 for Class R6 shares and January 28, 2020 for Class A Shares. The performance in the table for Class R6 shares prior to November 22,2016 reflects the performance of the Class I shares since the Fund’s inception, adjusted to reflect the fees and expenses of Class R6 shares. The performance in the table for Class A shares of Global Opportunities Fund and International Opportunities Fund prior to January 28, 2020, reflects the performance of Class I shares since the Fund’s inception, adjusted to reflect the fees and expenses of Class A shares. |
| (b) | The Funds’ expenses reflect actual expenses for the most recent fiscal year ended March 31, 2020. |
| (c) | The Advisor has contractually agreed to waive fees and/or make payments in order to keep total operating expenses of the Fund to the levels listed under net expense ratio until July 31, 2022 (September 30, 2022 for RBC Emerging Markets Equity Fund). |
| (d) | Each of the comparative indices is a widely recognized market value weighted measure of the return of securities, but do not include sales fees or operating expenses. You cannot invest directly in indices. |
3
|
PERFORMANCE SUMMARY (UNAUDITED) |
The MSCI Emerging Markets Index is a free float-adjusted market capitalization index that is designed to measure equity market performance of emerging markets. It captures large and mid capitalization representation across emerging markets countries and covers approximately 85% of the free float-adjusted market capitalization in each country. The Net Index is net of any foreign withholding tax. You cannot invest directly in an index.
The MSCI Emerging Markets Small Cap Index includes small capitalization representation across emerging markets countries. It covers approximately 14% of the free float-adjusted market capitalization in each country. The Net Index is net of any foreign withholding tax. You cannot invest directly in an index.
The MSCI ACWI ex USA Index is a free float-adjusted market capitalization weighted index that is designed to measure the equity market performance of developed and emerging markets excluding the U.S. It captures large and mid capitalization representation across developed markets and emerging markets countries excluding the U.S. and covers approximately 85% the global investable equity opportunity set outside the U.S. The Net Index is net of any foreign withholding tax. You cannot invest directly in an index.
The MSCI ACWI Index is a free float-adjusted market capitalization weighted index that is designed to measure the equity performance of developed and emerging markets. It captures large and mid capitalization representation across developed markets and emerging markets countries and covers approximately 85% of the global investable equity opportunity set. The Net Index is net of any foreign withholding tax. You cannot invest directly in an index.
4
| | | | | | | | | | | | | | | | | | |
FUND STATISTICS (UNAUDITED) | | | | | | | | | | | |
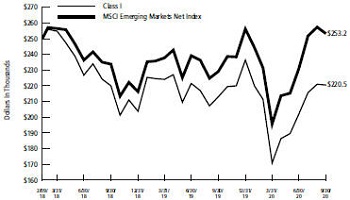
RBC Emerging Markets Equity Fund | | | | | | | | | | | |
Long-term growth of capital. | | | | | | | | | | | Investment Objective |
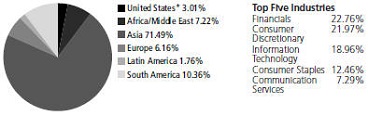
MSCI Emerging Markets Net Total Return USD Index | | | | | | | | | | | Benchmark |
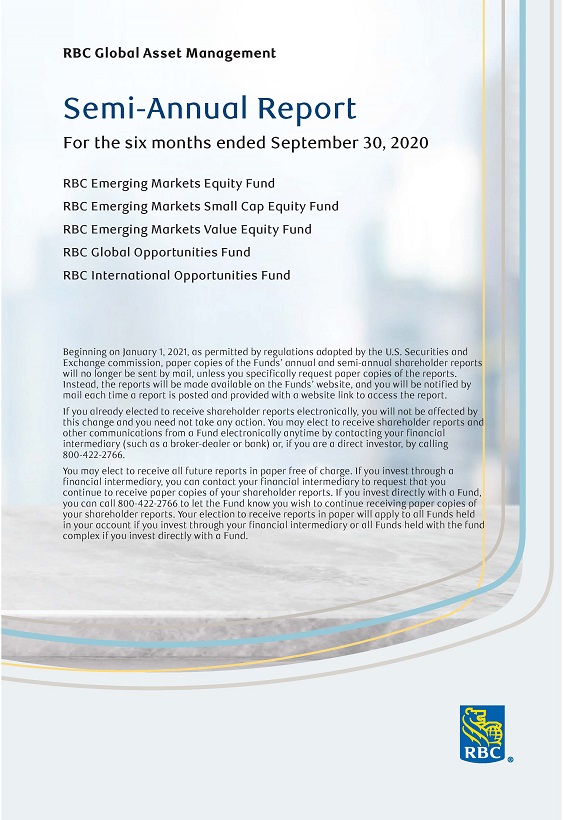
| | | | | | | | | Asset Allocation as of 9/30/20 (% of Fund’s investments) & Top Five Industries (as of 9/30/20) (% of
Fund’s net assets) |
| | | |
*Includes U.S. dollar denominated cash equivalent investments representing 3.01% of investments. | | | | | | | | | | | |
Taiwan Semiconductor | | 6.62% | | Unilever Plc | | | 3.72 | % | | | | | | | | | | Top Ten Holdings (excluding investment companies) (as of 9/30/20) (% of Fund’s net assets) |
Manufacturing Co. Ltd. | | | | Ping An Insurance Group Co. of | | | 3.55 | % | | | | | | | | |
Alibaba Group Holding Ltd. | | 6.42% | | China Ltd. | | | | | | | | | | | | |
Tencent Holdings Ltd. | | 5.01% | | Antofagasta Plc | | | 3.31 | % | | | | | | | | |
Naspers Ltd. | | 4.50% | | Dr Reddy’s Laboratories Ltd. | | | 3.13 | % | | | | | | | | |
Tata Consultancy Services Ltd. | | 4.27% | | AIA Group Ltd. | | | 2.96 | % | | | | | | | | |
| | | | | | | | | | | | | | | | |
*A listing of all portfolio holdings can be found beginning on page 10 | | | | | | | | | | | | |
The graph reflects an initial investment of $250,000 over the period from December 20, 2013 (commencement of operations) to September 30, 2020 and is based on Class I shares. The Fund’s total return includes reinvested dividends and capital gains. The Fund’s total return also includes operating expenses that reduce return while the total return of the index does not. The graph does not reflect the deduction of taxes that a shareholder would pay on fund distributions or redemption of fund shares. Performance of other classes will vary due to differences in fee structures. | | | | | | | | | | | | | | Growth of $250,000 Initial Investment Since Inception (12/20/13) |
5
| | | | | | | | | | | | | | | | | | |
| | | | | | | | | | FUND STATISTICS (UNAUDITED) | |
| | | | | | | | | | RBC Emerging Markets Small Cap Equity Fund | |
| Investment Objective | | | | | | | | | | Long-term growth of capital. | |
| Benchmark | | | | | | | | | | MSCI Emerging Markets Small Cap Net Total Return USD Index | |
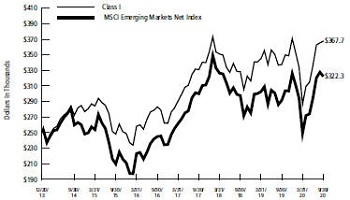
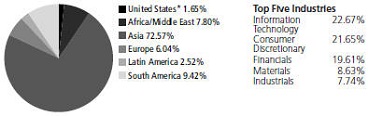
Asset Allocation as of 9/30/20 (% of Fund’s investments) & Top Five Industries (as of 9/30/20) (% of
Fund’s net assets) | | | | | | | | 
| |
| | | |
| | | | | | | | | | *Includes U.S. dollar denominated cash equivalent investments representing 2.98% of investments. | |
Top Ten Holdings (excluding investment companies) (as of 9/30/20) (% of Fund’s net assets) | | | | | | | | | | Voltronic Power Technology Corp. | | 4.85% | | AVI Ltd. | | | 3.29 | % |
| | Century Pacific Food, Inc. | | 4.53% | | Leeno Industrial, Inc. | | | 3.25 | % |
| | Chroma ATE, Inc. | | 4.47% | | JSE Ltd. | | | 3.09 | % |
| | Fleury SA | | 3.57% | | Giant Manufacturing Co. Ltd. | | | 3.05 | % |
| | Marico Ltd. | | 3.55% | | Bajaj Holdings & Investment Ltd. | | | 3.03 | % |
| | | | | | | | | | |
| | *A listing of all portfolio holdings can be found beginning on page 13 | |
| Growth of $250,000 Initial Investment Since Inception (12/20/13) | | | | | | | | | | 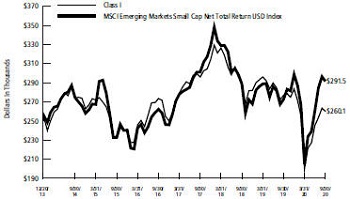
The graph reflects an initial investment of $250,000 over the period from December 20, 2013 (commencement of operations) to September 30, 2020 and is based on Class I shares. The Fund’s total return includes reinvested dividends and capital gains. The Fund’s total return also includes operating expenses that reduce return while the total return of the index does not. The graph does not reflect the deduction of taxes that a shareholder would pay on fund distributions or redemption of fund shares. Performance of other classes will vary due to differences in fee structures. | |
| | | | | | | | | | | | | | | | | | |
| | | | | | | | | | | | | | | | | | |
| | | | | | | | | | | | | | | | | | |
| | | | | | | | | | | | | | | | | | |
6
| | | | | | | | | | | | | | | | | | |
FUND STATISTICS (UNAUDITED) | | | | | | | | | | | |
RBC Emerging Markets Value Equity Fund | | | | | | | | | | | |
Long-term growth of capital. | | | | | | | | | | | Investment Objective |
MSCI Emerging Markets Net Total Return USD Index | | | | | | | | | | | Benchmark |
| | | | | | | | | Asset Allocation as of 9/30/20 (% of Fund’s investments) & Top Five Industries (as of 9/30/20) (% of
Fund’s net assets) |
| | | |
*Includes U.S. dollar denominated cash equivalent investments representing 0.82% of investments. | | | | | | | | | | | |
Alibaba Group Holding Ltd. | | 6.84% | | Ping An Bank Co. Ltd. | | | 2.23 | % | | | | | | | | | | Top Ten Holdings (excluding investment companies) (as of 9/30/20) (% of Fund’s net assets) |
Taiwan Semiconductor
Manufacturing Co. Ltd. | | 5.44% | | Ping An Insurance Group Co. of
China Ltd. | | | 2.15 | % | | | | | | | | |
Samsung Electronics Co. Ltd. | | 5.34% | | Hyundai Motor Co. | | | 2.04 | % | | | | | | | | |
Naspers Ltd. | | 2.44% | | Flat Glass Group Co. Ltd. | | | 1.71 | % | | | | | | | | |
Antofagasta Plc | | 2.38% | | E-MART, Inc. | | | 1.69 | % | | | | | | | | |
| | | | | | | | | | | | | | | | |
*A listing of all portfolio holdings can be found beginning on page 17 | | | | | | | | | | | | |
The graph reflects an initial investment of $250,000 over the period from February 9, 2018 (commencement of operations) to September 30, 2020 and is based on Class I shares. The Fund’s total return includes reinvested dividends and capital gains. The Fund’s total return also includes operating expenses that reduce return while the total return of the index does not. The graph does not reflect the deduction of taxes that a shareholder would pay on fund distributions or redemption of fund shares. Performance of other classes will vary due to differences in fee structures. | | | | | | | | | | | | | | Growth of $250,000 Initial Investment Since Inception (2/9/18) |
7
| | | | | | | | | | | | | | | | | | |
| | | | | | | | | | FUND STATISTICS (UNAUDITED) | |
| | | | | | | | | | RBC Global Opportunities Fund | |
| Investment Objective | | | | | | | | | | Long-term growth of capital. | |
| Benchmark | | | | | | | | | | MSCI ACWI Net Total Return USD Index | |
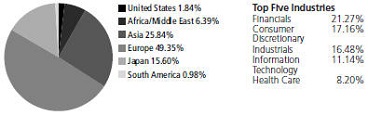
Asset Allocation as of 9/30/20 (% of Fund’s investments) & Top Five Industries (as of 9/30/20) (% of
Fund’s net assets) | | | | | | | | 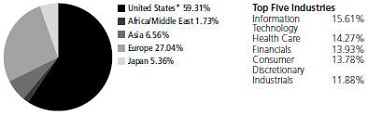
| |
| | | |
| | | | | | | | | | *Includes U.S. dollar denominated cash equivalent investments representing 0.86% of investments. | |
Top Ten Holdings (excluding investment companies) (as of 9/30/20) (% of Fund’s net assets) | | | | | | | | | | Microsoft Corp. | | 5.11% | | Alphabet, Inc. | | | 3.78 | % |
| | Amazon.com, Inc. | | 4.32% | | Nidec Corp. | | | 3.68 | % |
| | Roche Holding AG | | 4.26% | | American Water Works Co., Inc. | | | 3.64 | % |
| | Danaher Corp. | | 4.25% | | UnitedHealth Group, Inc. | | | 3.64 | % |
| | Deutsche Post AG | | 3.85% | | Orsted A/S | | | 3.53 | % |
| | *A listing of all portfolio holdings can be found beginning on page 22 | |
Growth of $100,000 Initial Investment Since Inception (12/3/14) | | | | | | | | | | 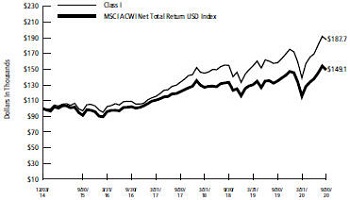
The graph reflects an initial investment of $100,000 over the period from December 3, 2014 (commencement of operations) to September 30, 2020 and is based on Class I shares. The Fund’s total return includes reinvested dividends and capital gains. The Fund’s total return also includes operating expenses that reduce return while the total return of the index does not. The graph does not reflect the deduction of taxes that a shareholder would pay on fund distributions or redemption of fund shares. Performance of other classes will vary due to differences in fee structures. | |
| | | | | | | | | | | | | | | | | | |
| | | | | | | | | | | | | | | | | | |
| | | | | | | | | | | | | | | | | | |
| | | | | | | | | | | | | | | | | | |
8
| | | | | | | | | | | | | | | | | | |
FUND STATISTICS (UNAUDITED) | | | | | | | | | | | |
RBC International Opportunities Fund | | | | | | | | | | | |
Long-term growth of capital. | | | | | | | | | | | Investment Objective |
MSCI ACWI ex USA Net Total Return USD Index | | | | | | | | | | | Benchmark |
| | | | | | | | | Asset Allocation as of 9/30/20 (% of Fund’s investments) & Top Five Industries (as of 9/30/20) (% of
Fund’s net assets) |
| | | |
| | | | | | | | | | | |
Taiwan Semiconductor | | 7.27% | | Deutsche Post AG
| | | 4.81 | % | | | | | | | | | | Top Ten Holdings (excluding investment companies) (as of 9/30/20) (% of Fund’s net assets) |
Manufacturing Co. Ltd. | | | | Orsted A/S | | | 4.43 | % | | | | | | | | |
Nidec Corp. | | 5.43% | | Neste Oyj | | | 3.97 | % | | | | | | | | |
Naspers Ltd. | | 5.39% | | Partners Group Holding AG | | | 3.57 | % | | | | | | | | |
Roche Holding AG | | 5.16% | | Croda International Plc | | | 3.54 | % | | | | | | | | |
AIA Group Ltd. | | 4.88% | | | | | | | | | | | | | | |
*A listing of all portfolio holdings can be found beginning on page 25 | | | | | | | | | | | | | | |
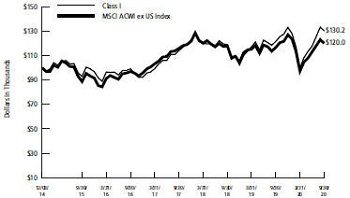
The graph reflects an initial investment of $100,000 over the period from December 3, 2014 (commencement of operations) to September 30, 2020 and is based on Class I shares. The Fund’s total return includes reinvested dividends and capital gains. The Fund’s total return also includes operating expenses that reduce return while the total return of the index does not. The graph does not reflect the deduction of taxes that a shareholder would pay on fund distributions or redemption of fund shares. Performance of other classes will vary due to differences in fee structures. | | | | | | | | | | | | | | Growth of $100,000 Initial Investment Since Inception (12/3/14) |
9
|
SCHEDULE OF PORTFOLIO INVESTMENTS |
RBC Emerging Markets Equity Fund |
|
| September 30, 2020 (Unaudited) |
| | | | | | |
| Shares | | | | Value | |
Common Stocks — 98.61% | | | | |
Argentina — 0.62% | | | | |
9,900 | | MercadoLibre, Inc.* | | $ | 10,716,552 | |
| | | | | | |
| |
Bangladesh — 0.04% | | | | |
1,343,153 | | BRAC Bank Ltd. | | | 642,527 | |
| | | | | | |
| | |
Brazil — 4.26% | | | | | | |
2,342,000 | | B3 SA - Brasil Bolsa Balcao | | | 22,986,705 | |
6,945,960 | | Banco Bradesco SA | | | 22,362,036 | |
6,804,930 | | Raia Drogasil SA | | | 28,548,256 | |
| | | | | | |
| | | | | 73,896,997 | |
| | | | | | |
Chile — 4.14% | | | | | | |
4,353,644 | | Antofagasta Plc | | | 57,456,326 | |
4,926,036 | | SACI Falabella | | | 14,431,777 | |
| | | | | | |
| | | | | 71,888,103 | |
| | | | | | |
China — 23.85% | | | | | | |
378,700 | | Alibaba Group Holding Ltd., ADR* | | | 111,330,226 | |
7,251,354 | | China Resources Land Ltd. | | | 33,072,154 | |
6,434,400 | | Fuyao Glass Industry Group Co. Ltd., Series H(a) | | | 23,715,405 | |
2,191,022 | | Midea Group Co. Ltd., Class A | | | 23,483,000 | |
5,927,912 | | Ping An Insurance Group Co. of China Ltd., Series H | | | 61,536,754 | |
1,639,077 | | Sunny Optical Technology Group Co. Ltd. | | | 25,458,677 | |
1,287,985 | | Tencent Holdings Ltd. | | | 86,994,873 | |
907,600 | | Yum China Holdings, Inc. | | | 48,057,420 | |
| | | | | | |
| | | | | 413,648,509 | |
| | | | | | |
Hong Kong — 4.08% | | | | |
5,158,190 | | AIA Group Ltd. | | | 51,272,912 | |
413,142 | | Hong Kong Exchanges & Clearing Ltd. | | | 19,448,036 | |
| | | | | | |
| | | | | 70,720,948 | |
| | | | | | |
India — 15.60% | | | | | | |
775,340 | | Dr Reddy’s Laboratories Ltd. | | | 54,299,169 | |
91,380 | | Dr. Reddy’s Laboratories Ltd., ADR | | | 6,356,393 | |
2,011,671 | | HDFC Bank Ltd.* | | | 29,530,954 | |
483,688 | | Hero MotoCorp Ltd. | | | 20,645,466 | |
2,109,950 | | Housing Development Finance Corp. Ltd. | | | 50,011,507 | |
4,321,176 | | Mahindra & Mahindra Ltd. | | | 35,726,210 | |
2,190,879 | | Tata Consultancy Services Ltd. | | | 74,122,765 | |
| | | | | | |
| | | | | 270,692,464 | |
| | | | | | |
Indonesia — 2.59% | | | | |
10,109,868 | | Bank Central Asia Tbk PT | | | 18,454,609 | |
253,938,200 | | Kalbe Farma Tbk PT | | | 26,532,685 | |
| | | | | | |
| | | | | 44,987,294 | |
| | | | | | |
10
|
SCHEDULE OF PORTFOLIO INVESTMENTS |
RBC Emerging Markets Equity Fund (cont.) |
|
| September 30, 2020 (Unaudited) |
| | | | | | |
| Shares | | | | Value | |
Korea — 9.16% | | | | | | |
90,183 | | Amorepacific Corp. | | $ | 12,572,466 | |
1,416,367 | | Hanon Systems | | | 14,956,346 | |
57,365 | | NCSoft Corp. | | | 39,532,140 | |
137,552 | | Samsung Fire & Marine Insurance Co. Ltd. | | | 21,428,440 | |
1,138,897 | | Shinhan Financial Group Co. Ltd. | | | 26,719,182 | |
609,898 | | SK Hynix, Inc. | | | 43,719,169 | |
| | | | | | |
| | | | | 158,927,743 | |
| | | | | | |
Mexico — 1.78% | | | | | | |
550,900 | | Fomento Economico Mexicano SAB de CV, ADR | | | 30,955,071 | |
| | | | | | |
| | |
Peru — 1.51% | | | | | | |
211,260 | | Credicorp Ltd. | | | 26,194,127 | |
| | | | | | |
| |
Philippines — 2.37% | | | | |
2,251,975 | | SM Investments Corp. | | | 41,069,852 | |
| | | | | | |
| |
South Africa — 7.34% | | | | |
2,181,676 | | Clicks Group Ltd. | | | 28,882,300 | |
2,690,955 | | Discovery Ltd. | | | 20,431,712 | |
442,185 | | Naspers Ltd., N Shares | | | 78,100,442 | |
| | | | | | |
| | | | | 127,414,454 | |
| | | | | | |
Taiwan — 14.49% | | | | |
16,742,644 | | E.Sun Financial Holding Co. Ltd. | | | 14,910,775 | |
197,000 | | Largan Precision Co. Ltd. | | | 23,070,579 | |
2,257,028 | | MediaTek, Inc. | | | 47,824,102 | |
6,811,530 | | Standard Foods Corp. | | | 14,369,289 | |
7,635,854 | | Taiwan Semiconductor Manufacturing Co. Ltd. | | | 114,874,386 | |
16,803,468 | | Uni-President Enterprises Corp. | | | 36,392,288 | |
| | | | | | |
| | | | | 251,441,419 | |
| | | | | | |
Thailand — 0.51% | | | | |
3,607,400 | | Kasikornbank Public Co. Ltd., NVDR | | | 8,806,239 | |
| | | | | | |
| | |
Turkey — 1.26% | | | | | | |
23,862,592 | | Enka Insaat ve Sanayi AS | | | 21,779,586 | |
| | | | | | |
| |
United Kingdom — 5.01% | | | | |
1,054,118 | | Mondi Plc | | | 22,343,954 | |
1,047,058 | | Unilever Plc | | | 64,554,812 | |
| | | | | | |
| | | | | 86,898,766 | |
| | | | | | |
Total Common Stocks | | | 1,710,680,651 | |
| | | | | | |
(Cost $1,601,117,544) | | | | |
11
|
SCHEDULE OF PORTFOLIO INVESTMENTS |
RBC Emerging Markets Equity Fund (cont.) |
|
| September 30, 2020 (Unaudited) |
| | | | | | |
| Shares | | | | Value | |
Investment Company — 3.06% | | | | |
53,107,826 | | U.S. Government Money Market Fund, RBC Institutional Class 1 (b) | | $ | 53,107,826 | |
| | | | | | |
Total Investment Company | | | 53,107,826 | |
| | | | | | |
(Cost $53,107,826) | | | | |
| |
Total Investments | | $ | 1,763,788,477 | |
(Cost $1,654,225,370)(c) — 101.67% | | | | |
| |
Liabilities in excess of other assets — (1.67)% | | | (29,050,478) | |
| | | | | | |
| |
NET ASSETS — 100.00% | | $ | 1,734,737,999 | |
| | | | | | |
| * | Non-income producing security. |
| (a) | Security exempt from registration under Rule 144A or Section 4(2) of the Securities Act of 1933, as amended. These securities may be resold in transactions exempt from registration, normally to qualified institutional buyers. |
| (b) | Affiliated investment. |
| (c) | See Notes to Schedules of Portfolio Investments for the tax cost of securities and the breakdown of unrealized appreciation (depreciation). |
Abbreviations used are defined below:
ADR - American Depositary Receipt
NVDR - Non-Voting Depository Receipt
Portfolio Diversification (Unaudited)
| | |
| Industries | | Percentage
of Net Assets |
| | | | |
Financials | | | 22.75 | % |
Consumer Discretionary | | | 21.97 | % |
Information Technology | | | 18.97 | % |
Consumer Staples | | | 12.47 | % |
Communication Services | | | 7.29 | % |
Health Care | | | 5.03 | % |
Materials | | | 4.60 | % |
Industrials | | | 3.62 | % |
Real Estate | | | 1.91 | % |
Other | | | 1.39 | % |
| | | | |
| | | 100.00 | % |
| | | | |
See Notes to the Financial Statements.
12
|
SCHEDULE OF PORTFOLIO INVESTMENTS |
RBC Emerging Markets Small Cap Equity Fund |
|
| September 30, 2020 (Unaudited) |
| | | | | | |
| Shares | | | | Value | |
Common Stocks — 96.07% | | | | |
Bangladesh — 3.58% | | | | |
269,098 | | BRAC Bank Ltd. | | $ | 128,729 | |
156,130 | | Delta Brac Housing Finance Corp Ltd. | | | 169,655 | |
| | | | | | |
| | | | | 298,384 | |
| | | | | | |
Brazil — 4.25% | | | | | | |
1,397 | | Arco Platform Ltd., Class A* | | | 57,054 | |
62,700 | | Fleury SA | | | 297,763 | |
| | | | | | |
| | | | | 354,817 | |
| | | | | | |
Chile — 5.23% | | | | | | |
170,111 | | Inversiones Aguas Metropolitanas SA | | | 123,293 | |
34,231 | | Inversiones La Construccion SA | | | 203,612 | |
78,118 | | Parque Arauco SA | | | 109,356 | |
| | | | | | |
| | | | | 436,261 | |
| | | | | | |
China — 8.30% | | | | | | |
264,000 | | Greatview Aseptic Packaging Co. Ltd. | | | 101,544 | |
20,899 | | Hongfa Technology Co. Ltd., Class A | | | 141,041 | |
94,972 | | InnoCare Pharma Ltd.*,(a) | | | 124,405 | |
124,743 | | Precision Tsugami China Corp. Ltd. | | | 105,877 | |
1,252 | | Silergy Corp. | | | 74,227 | |
105,000 | | SITC International Holdings Co. Ltd. | | | 145,474 | |
| | | | | | |
| | | | | 692,568 | |
| | | | | | |
Egypt — 0.98% | | | | | | |
22,721 | | Integrated Diagnostics Holdings Plc(a) | | | 81,732 | |
| | | | | | |
| |
Hong Kong — 2.80% | | | | |
60,000 | | Vitasoy International Holdings Ltd. | | | 233,969 | |
| | | | | | |
| | |
India — 16.91% | | | | | | |
7,660 | | Bajaj Holdings & Investment Ltd. | | | 252,685 | |
22,918 | | Cholamandalam Financial Holdings Ltd. | | | 122,967 | |
47,041 | | Cyient Ltd. | | | 245,523 | |
60,111 | | Marico Ltd. | | | 296,087 | |
9,679 | | Sundaram Finance Ltd. | | | 170,882 | |
24,524 | | Tata Consumer Products Ltd. | | | 166,382 | |
19,027 | | Tube Investments of India Ltd. | | | 156,029 | |
| | | | | | |
| | | | | 1,410,555 | |
| | | | | | |
Indonesia — 2.11% | | | | |
2,000,979 | | Sarimelati Kencana PT | | | 77,316 | |
1,227,100 | | Selamat Sempurna Tbk PT | | | 98,641 | |
| | | | | | |
| | | | | 175,957 | |
| | | | | | |
Korea — 8.56% | | | | | | |
17,709 | | DGB Financial Group, Inc. | | | 82,972 | |
13
|
SCHEDULE OF PORTFOLIO INVESTMENTS |
RBC Emerging Markets Small Cap Equity Fund (cont.) |
|
| September 30, 2020 (Unaudited) |
| | | | | | |
| Shares | | | | Value | |
2,759 | | Koh Young Technology, Inc. | | $ | 211,108 | |
2,573 | | Leeno Industrial, Inc. | | | 270,987 | |
15,805 | | Macquarie Korea Infrastructure Fund | | | 148,538 | |
| | | | | | |
| | | | | 713,605 | |
| | | | | | |
Malaysia — 1.48% | | | | |
136,600 | | Bermaz Auto Berhad | | | 45,548 | |
25,160 | | LPI Capital Berhad | | | 78,261 | |
| | | | | | |
| | | | | 123,809 | |
| | | | | | |
Mexico — 3.16% | | | | |
56,200 | | Bolsa Mexicana de Valores SAB de CV | | | 126,778 | |
90,800 | | Corp. Inmobiliaria Vesta SAB de CV | | | 136,417 | |
| | | | | | |
| | | | | 263,195 | |
| | | | | | |
Pakistan — 1.13% | | | | |
31,000 | | Packages Ltd. | | | 94,160 | |
| | | | | | |
| |
Peru — 1.32% | | | | |
3,231 | | InRetail Peru Corp.(a) | | | 109,822 | |
| | | | | | |
| |
Philippines — 6.74% | | | | |
1,066,850 | | Century Pacific Food, Inc. | | | 378,133 | |
558,794 | | Integrated Micro-Electronics, Inc.* | | | 65,731 | |
61,820 | | Security Bank Corp. | | | 118,252 | |
| | | | | | |
| | | | | 562,116 | |
| | | | | | |
South Africa — 6.38% | | | | |
62,034 | | AVI Ltd. | | | 274,694 | |
36,846 | | JSE Ltd. | | | 257,625 | |
| | | | | | |
| | | | | 532,319 | |
| | | | | | |
Sri Lanka — 1.28% | | | | |
155,189 | | Hatton National Bank Plc | | | 106,670 | |
| | | | | | |
Taiwan — 18.16% | | | | |
70,000 | | Chroma ATE, Inc. | | | 373,129 | |
26,835 | | Giant Manufacturing Co. Ltd. | | | 254,271 | |
16,274 | | Innodisk Corp. | | | 89,765 | |
28,373 | | Pacific Hospital Supply Co. Ltd. | | | 69,056 | |
5,337 | | Poya International Co. Ltd. | | | 102,080 | |
57,247 | | Standard Foods Corp. | | | 120,766 | |
11,916 | | Voltronic Power Technology Corp. | | | 404,771 | |
38,027 | | Wistron NeWeb Corp. | | | 101,022 | |
| | | | | | |
| | | | | 1,514,860 | |
| | | | | | |
Thailand — 0.90% | | | | |
21,100 | | Aeon Thana Sinsap Thailand Public Co. Ltd., NVDR | | | 74,662 | |
| | | | | | |
14
|
SCHEDULE OF PORTFOLIO INVESTMENTS |
RBC Emerging Markets Small Cap Equity Fund (cont.) |
|
| September 30, 2020 (Unaudited) |
| | | | | | |
| Shares | | | | Value | |
| |
United Arab Emirates — 2.80% | | | | |
200,246 | | Aramex PJSC | | $ | 233,182 | |
| | | | | | |
| |
Total Common Stocks | | | 8,012,643 | |
| | | | | | |
(Cost $8,565,172) | | | | |
| |
Preferred Stocks — 0.86% | | | | |
Korea — 0.86% | | | | |
1,451 | | Amorepacific Corp. | | | 71,441 | |
| | | | | | |
| |
Philippines — 0.00% | | | | |
58,000 | | Security Bank Corp.*,(b),(c) | | | 120 | |
| | | | | | |
| |
Total Preferred Stocks | | | 71,561 | |
| | | | | | |
(Cost $124,030) | | | | |
| |
Investment Company — 2.97% | | | | |
247,923 | | U.S. Government Money Market Fund, RBC Institutional Class 1 (d) | | | 247,923 | |
| | | | | | |
| |
Total Investment Company | | | 247,923 | |
| | | | | | |
(Cost $247,923) | | | | |
| |
Total Investments | | $ | 8,332,127 | |
(Cost $8,937,125)(e) — 99.90% | | | | |
| |
Other assets in excess of liabilities — 0.10% | | | 8,582 | |
| | | | | | |
| |
NET ASSETS — 100.00% | | $ | 8,340,709 | |
| | | | | | |
| * | Non-income producing security. |
| (a) | Security exempt from registration under Rule 144A or Section 4(2) of the Securities Act of 1933, as amended. These securities may be resold in transactions exempt from registration, normally to qualified institutional buyers. |
| (b) | The Pricing Committee has fair valued this security under procedures established by the Fund’s Board of Trustees. |
| (c) | Security is valued using significant unobservable inputs and is classified as Level 3 in the fair value hierarchy. |
| (d) | Affiliated investment. |
| (e) | See Notes to Schedules of Portfolio Investments for the tax cost of securities and the breakdown of unrealized appreciation (depreciation). |
Abbreviations used are defined below:
NVDR - Non-Voting Depository Receipt
15
|
SCHEDULE OF PORTFOLIO INVESTMENTS |
RBC Emerging Markets Small Cap Equity Fund (cont.) |
|
| September 30, 2020 (Unaudited) |
| | | | |
| Portfolio Diversification (Unaudited) | |
Industries | | Percentage
of Net Assets | |
Financials | | | 24.49% | |
Consumer Staples | | | 19.80% | |
Information Technology | | | 17.16% | |
Industrials | | | 12.35% | |
Consumer Discretionary | | | 9.48% | |
Health Care | | | 6.87% | |
Real Estate | | | 2.95% | |
Materials | | | 2.35% | |
Utilities | | | 1.48% | |
Other | | | 3.07% | |
| | | 100.00% | |
See Notes to the Financial Statements.
16
|
SCHEDULE OF PORTFOLIO INVESTMENTS |
RBC Emerging Markets Value Equity Fund |
|
| September 30, 2020 (Unaudited) |
| | | | | | |
| Shares | | | | Value | |
Common Stocks — 97.03% | | | | |
Brazil — 2.44% | | | | | | |
61,600 | | Banco do Brasil SA | | $ | 325,775 | |
87,000 | | CCR SA | | | 197,364 | |
44,000 | | Hypera SA | | | 232,775 | |
| | | | | | |
| | | | | 755,914 | |
| | | | | | |
Chile — 3.72% | | | | | | |
55,928 | | Antofagasta Plc | | | 738,099 | |
25,173 | | Inversiones La Construccion SA | | | 149,733 | |
89,608 | | SACI Falabella | | | 262,524 | |
| | | | | | |
| | | | | 1,150,356 | |
| | | | | | |
China — 29.97% | | | | | | |
7,200 | | Alibaba Group Holding Ltd., ADR* | | | 2,116,656 | |
3,800 | | Baidu, Inc., ADR* | | | 481,042 | |
142,000 | | China Resources Cement Holdings Ltd. | | | 195,215 | |
458,000 | | China Unicom Hong Kong Ltd. | | | 300,628 | |
412,000 | | Chinasoft International Ltd. | | | 300,822 | |
200,000 | | CSPC Pharmaceutical Group Ltd. | | | 390,409 | |
197,583 | | Flat Glass Group Co. Ltd., Class H | | | 529,932 | |
49,800 | | Gree Electric Appliances, Inc. of Zhuhai, Class A | | | 392,106 | |
642,000 | | Industrial & Commercial Bank of China Ltd., Class H | | | 334,415 | |
193,500 | | KWG Group Holdings Ltd. | | | 333,256 | |
701,000 | | Lee & Man Paper Manufacturing Ltd. | | | 510,060 | |
900 | | NetEase, Inc., ADR | | | 409,203 | |
534,000 | | Nexteer Automotive Group Ltd. | | | 374,111 | |
321,399 | | Ping An Bank Co. Ltd., Class A | | | 719,122 | |
64,000 | | Ping An Insurance Group Co. of China Ltd., Series H | | | 664,374 | |
82,970 | | Sany Heavy Industry Co. Ltd., Class A | | | 304,789 | |
68,000 | | Shimao Property Holdings Ltd. | | | 283,692 | |
289,000 | | SITC International Holdings Co. Ltd. | | | 400,399 | |
246,400 | | Zoomlion Heavy Industry Science and Technology Co. Ltd., Class H | | | 238,067 | |
| | | | | | |
| | | | | 9,278,298 | |
| | | | | | |
Egypt — 0.94% | | | | | | |
68,280 | | Commercial International Bank Egypt SAE, GDR | | | 292,673 | |
| | | | | | |
| | |
Greece — 0.64% | | | | | | |
327,783 | | Alpha Bank AE* | | | 198,198 | |
| | | | | | |
| |
Hong Kong — 2.25% | | | | |
1,665,000 | | Pacific Basin Shipping Ltd. | | | 256,495 | |
218,000 | | Xinyi Glass Holdings Ltd. | | | 440,889 | |
| | | | | | |
| | | | | 697,384 | |
| | | | | | |
17
|
SCHEDULE OF PORTFOLIO INVESTMENTS |
RBC Emerging Markets Value Equity Fund (cont.) |
|
| September 30, 2020 (Unaudited) |
| | | | | | |
| Shares | | | | Value | |
Hungary — 1.40% | | | | |
29,786 | | MOL Hungarian Oil & Gas Plc* | | $ | 162,129 | |
8,975 | | OTP Bank Plc* | | | 270,136 | |
| | | | | | |
| | | | | 432,265 | |
| | | | | | |
India — 8.01% | | | | | | |
189,977 | | Apollo Tyres Ltd. | | | 337,481 | |
72,346 | | Axis Bank Ltd.* | | | 418,693 | |
83,739 | | Indiabulls Housing Finance Ltd. | | | 180,097 | |
27,464 | | Infosys Ltd. | | | 377,634 | |
49,463 | | Mahindra & Mahindra Ltd. | | | 408,945 | |
126,927 | | Redington India Ltd. | | | 203,947 | |
10,091 | | Reliance Industries Ltd. | | | 306,039 | |
29,193 | | Shriram Transport Finance Co. Ltd. | | | 246,410 | |
| | | | | | |
| | | | | 2,479,246 | |
| | | | | | |
Indonesia — 0.64% | | | | |
656,700 | | Bank Negara Indonesia Persero Tbk PT | | | 196,992 | |
| | | | | | |
| | |
Korea — 16.90% | | | | | | |
1,711 | | Com2uSCorp | | | 167,493 | |
7,885 | | DB Insurance Co. Ltd. | | | 304,729 | |
4,340 | | E-MART, Inc. | | | 524,364 | |
9,341 | | Fila Holdings Corp. | | | 291,907 | |
17,440 | | Hana Financial Group, Inc. | | | 418,962 | |
4,139 | | Hyundai Motor Co. | | | 630,453 | |
6,334 | | LG Corp. | | | 402,170 | |
33,266 | | Samsung Electronics Co. Ltd. | | | 1,651,463 | |
7,103 | | SK Hynix, Inc. | | | 509,163 | |
4,692 | | SKC Co. Ltd. | | | 331,796 | |
| | | | | | |
| | | | | 5,232,500 | |
| | | | | | |
Mexico — 2.53% | | | | | | |
91,500 | | Cemex SAB de CV, ADR | | | 347,700 | |
560,050 | | Gentera SAB de CV* | | | 158,049 | |
199,700 | | PLA Administradora Industrial S de RL de CV, REIT | | | 277,538 | |
| | | | | | |
| | | | | 783,287 | |
| | | | | | |
Pakistan — 0.97% | | | | |
381,821 | | Habib Bank Ltd. | | | 300,957 | |
| | | | | | |
| | |
Peru — 0.66% | | | | | | |
96,093 | | Alicorp SAA | | | 204,527 | |
| | | | | | |
| |
Philippines — 1.40% | | | | |
340,300 | | Ayala Land, Inc. | | | 209,439 | |
116,800 | | Security Bank Corp. | | | 223,420 | |
| | | | | | |
| | | | | 432,859 | |
| | | | | | |
18
|
SCHEDULE OF PORTFOLIO INVESTMENTS |
RBC Emerging Markets Value Equity Fund (cont.) |
|
| September 30, 2020 (Unaudited) |
| | | | | | |
| Shares | | | | Value | |
Russia — 3.44% | | | | |
3,540 | | LUKOIL PJSC, ADR | | $ | 204,545 | |
11,812 | | MMC Norilsk Nickel PJSC, ADR | | | 284,943 | |
1,006,500 | | Sistema PJSFC | | | 272,865 | |
83,800 | | VEON Ltd., ADR | | | 105,588 | |
5,349 | | X5 Retail Group NV, GDR | | | 197,677 | |
| | | | | | |
| | | | | 1,065,618 | |
| | | | | | |
South Africa — 5.91% | | | | |
339,451 | | Growthpoint Properties Ltd. | | | 248,127 | |
123,513 | | Imperial Logistics Ltd. | | | 278,790 | |
939,937 | | KAP Industrial Holdings Ltd.* | | | 136,535 | |
22,565 | | Mr Price Group Ltd. | | | 176,942 | |
69,221 | | MTN Group Ltd. | | | 232,246 | |
4,283 | | Naspers Ltd., N Shares | | | 756,480 | |
| | | | | | |
| | | | | 1,829,120 | |
| | | | | | |
Taiwan — 11.52% | | | | |
61,498 | | Chailease Holding Co. Ltd. | | | 281,708 | |
38,000 | | FLEXium Interconnect, Inc. | | | 160,710 | |
50,979 | | Innodisk Corp. | | | 281,194 | |
13,000 | | Lotes Co. Ltd. | | | 208,503 | |
11,000 | | MediaTek, Inc. | | | 233,079 | |
31,000 | | Merida Industry Co. Ltd. | | | 251,251 | |
121,000 | | Primax Electronics Ltd. | | | 180,104 | |
55,000 | | Sercomm Corp. | | | 138,169 | |
112,000 | | Taiwan Semiconductor Manufacturing Co. Ltd. | | | 1,684,937 | |
38,000 | | Tripod Technology Corp. | | | 145,654 | |
| | | | | | |
| | | | | 3,565,309 | |
| | | | | | |
Thailand — 0.42% | | | | |
463,000 | | Krung Thai Bank Public Co. Ltd., FOR | | | 129,625 | |
| | | | | | |
| |
Turkey — 0.59% | | | | |
50,115 | | KOC Holding AS | | | 94,881 | |
44,243 | | TAV Havalimanlari Holding AS | | | 87,740 | |
| | | | | | |
| | | | | 182,621 | |
| | | | | | |
United Arab Emirates — 0.99% | | | | |
554,418 | | Aldar Properties PJSC | | | 305,984 | |
| | | | | | |
| |
United States — 0.84% | | | | |
255,900 | | Samsonite International SA*,(a) | | | 259,844 | |
| | | | | | |
19
|
SCHEDULE OF PORTFOLIO INVESTMENTS |
RBC Emerging Markets Value Equity Fund (cont.) |
|
| September 30, 2020 (Unaudited) |
| | | | | | |
| Shares | | | | Value | |
Vietnam — 0.85% | | | | |
229,205 | | Hoa Phat Group JSC | | $ | 262,939 | |
| | | | | | |
| |
Total Common Stocks | | | 30,036,516 | |
| | | | | | |
(Cost $29,908,250) | | | | |
| |
Preferred Stocks — 2.65% | | | | |
Brazil — 1.80% | | | | | | |
38,300 | | Centrais Eletricas Brasileiras SA, Class B | | | 213,532 | |
97,900 | | Petroleo Brasileiro SA | | | 343,423 | |
| | | | | | |
| | | | | 556,955 | |
| | | | | | |
Colombia — 0.85% | | | | |
36,637 | | Banco Davivienda SA | | | 262,308 | |
| | | | | | |
| |
Total Preferred Stocks | | | 819,263 | |
| | | | | | |
(Cost $1,020,749) | | | | | | |
| |
Rights/Warrants — 0.00% | | | | |
Taiwan — 0.00% | | | | | | |
651 | | Chailease Holding Co. Ltd., Rights* | | | 697 | |
| | | | | | |
| |
Total Rights/Warrants | | | 697 | |
| | | | | | |
(Cost $0) | | | | | | |
Investment Company — 0.83% | | | | |
254,941 | | U.S. Government Money Market Fund, RBC Institutional Class 1 (b) | | | 254,941 | |
| | | | | | |
Total Investment Company | | | 254,941 | |
| | | | | | |
(Cost $254,941) | | | | | | |
| |
Total Investments | | $ | 31,111,417 | |
(Cost $31,183,940)(c) — 100.51% | | | | |
| |
Liabilities in excess of other assets — (0.51)% | | | (156,609) | |
| | | | | | |
| |
NET ASSETS — 100.00% | | $ | 30,954,808 | |
| | | | | | |
| * | Non-income producing security. |
| (a) | Security exempt from registration under Rule 144A or Section 4(2) of the Securities Act of 1933, as amended. These securities may be resold in transactions exempt from registration, normally to qualified institutional buyers. |
| (b) | Affiliated investment. |
| (c) | See Notes to Schedules of Portfolio Investments for the tax cost of securities and the breakdown of unrealized appreciation (depreciation). |
20
|
SCHEDULE OF PORTFOLIO INVESTMENTS |
RBC Emerging Markets Value Equity Fund (cont.) |
|
| September 30, 2020 (Unaudited) |
Abbreviations used are defined below:
ADR - American Depositary Receipt
FOR - Foreign Ownership Receipt
GDR - Global Depositary Receipt
REIT - Real Estate Investment Trust
Portfolio Diversification (Unaudited)
| | |
Industries | | Percentage
of Net Assets |
| | | | |
Information Technology | | | 22.66 | % |
Consumer Discretionary | | | 21.64 | % |
Financials | | | 19.63 | % |
Materials | | | 8.63 | % |
Industrials | | | 7.75 | % |
Real Estate | | | 5.36 | % |
Communication Services | | | 5.04 | % |
Energy | | | 3.28 | % |
Consumer Staples | | | 2.99 | % |
Health Care | | | 2.01 | % |
Utilities | | | 0.69 | % |
Other | | | 0.32 | % |
| | | | |
| | | 100.00 | % |
| | | | |
See Notes to the Financial Statements.
21
|
SCHEDULE OF PORTFOLIO INVESTMENTS |
RBC Global Opportunities Fund |
|
| September 30, 2020 (Unaudited) |
| | | | | | |
| Shares | | | | Value | |
Common Stocks — 98.63% | | | | |
Belgium — 2.72% | | | | |
56,267 | | Anheuser-Busch InBev NV | | $ | 3,029,458 | |
| | | | | | |
| |
Denmark — 3.53% | | | | |
28,594 | | Orsted A/S(a) | | | 3,939,681 | |
| | | | | | |
| | |
Finland — 2.74% | | | | | | |
57,955 | | Neste Oyj | | | 3,051,912 | |
| | | | | | |
| |
Germany — 3.85% | | | | |
94,694 | | Deutsche Post AG | | | 4,296,819 | |
| | | | | | |
| |
Hong Kong — 3.17% | | | | |
355,694 | | AIA Group Ltd. | | | 3,535,633 | |
| | | | | | |
| | |
Japan — 5.33% | | | | | | |
65,398 | | MISUMI Group, Inc. | | | 1,833,559 | |
43,794 | | Nidec Corp. | | | 4,106,911 | |
| | | | | | |
| | | | | 5,940,470 | |
| | | | | | |
Netherlands — 1.69% | | | | |
1,024 | | Adyen NV*,(a) | | | 1,888,763 | |
| | | | | | |
| |
South Africa — 1.73% | | | | |
10,888 | | Naspers Ltd., N Shares | | | 1,923,081 | |
| | | | | | |
| | |
Spain — 2.27% | | | | | | |
91,528 | | Industria de Diseno Textil SA | | | 2,532,081 | |
| | | | | | |
| |
Switzerland — 4.26% | | | | |
13,869 | | Roche Holding AG | | | 4,750,695 | |
| | | | | | |
| | |
Taiwan — 3.36% | | | | | | |
46,200 | | Taiwan Semiconductor Manufacturing Co. Ltd., ADR | | | 3,745,434 | |
| | | | | | |
| |
United Kingdom — 5.83% | | | | |
34,352 | | Croda International Plc | | | 2,771,043 | |
49,207 | | InterContinental Hotels Group Plc* | | | 2,582,910 | |
94,852 | | St. James’s Place Plc | | | 1,141,112 | |
| | | | | | |
| | | | | 6,495,065 | |
| | | | | | |
United States — 58.15% | | | | |
2,878 | | Alphabet, Inc., Class A* | | | 4,217,997 | |
1,530 | | Amazon.com, Inc.* | | | 4,817,557 | |
22
|
SCHEDULE OF PORTFOLIO INVESTMENTS |
RBC Global Opportunities Fund (cont.) |
|
| September 30, 2020 (Unaudited) |
| | | | | | | | |
| Shares | | | | | Value | |
| | 28,000 | | | American Water Works Co., Inc. | | $ | 4,056,640 | |
| | 44,400 | | | Blackstone Group, Inc. (The), Class A | | | 2,317,680 | |
| | 20,400 | | | Bluebird Bio, Inc.* | | | 1,100,580 | |
| | 18,600 | | | CyberArk Software Ltd.* | | | 1,923,612 | |
| | 22,000 | | | Danaher Corp. | | | 4,737,260 | |
| | 16,700 | | | Ecolab, Inc. | | | 3,337,328 | |
| | 45,900 | | | EOG Resources, Inc. | | | 1,649,646 | |
| | 14,612 | | | Estee Lauder Cos, Inc. (The), Class A | | | 3,189,069 | |
| | 29,900 | | | First Republic Bank | | | 3,260,894 | |
| | 39,450 | | | Fortive Corp. | | | 3,006,484 | |
| | 14,100 | | | Incyte Corp.* | | | 1,265,334 | |
| | 5,500 | | | MarketAxess Holdings, Inc. | | | 2,648,745 | |
| | 27,100 | | | Microsoft Corp. | | | 5,699,943 | |
| | 4,800 | | | NVIDIA Corp. | | | 2,597,856 | |
| | 10,900 | | | SVB Financial Group* | | | 2,622,758 | |
| | 62,900 | | | TJX Cos, Inc. (The) | | | 3,500,385 | |
| | 28,600 | | | T-Mobile US, Inc.* | | | 3,270,696 | |
| | 13,000 | | | UnitedHealth Group, Inc. | | | 4,053,010 | |
| | 7,200 | | | Workday, Inc., Class A* | | | 1,548,936 | |
| | | | | | | | |
| | | | | | | 64,822,410 | |
| | | | | | | | |
| | Total Common Stocks | | | 109,951,502 | |
| | | | | | | | |
| | (Cost $94,809,909) | | | | |
| |
| | Investment Company — 0.85% | | | | |
| | 950,503 | | | U.S. Government Money Market Fund, RBC Institutional Class 1 (b) | | | 950,503 | |
| | | | | | | | |
| | Total Investment Company | | | 950,503 | |
| | | | | | | | |
| | (Cost $950,503) | | | | |
| |
| | Total Investments | | $ | 110,902,005 | |
| | (Cost $95,760,412)(c) — 99.48% | | | | |
| |
| | Other assets in excess of liabilities — 0.52% | | | 574,901 | |
| | | | | | | | |
| |
| | NET ASSETS — 100.00% | | $ | 111,476,906 | |
| | | | | | | | |
| * | Non-income producing security. |
| (a) | Security exempt from registration under Rule 144A or Section 4(2) of the Securities Act of 1933, as amended. These securities may be resold in transactions exempt from registration, normally to qualified institutional buyers. |
| (b) | Affiliated investment. |
| (c) | See Notes to Schedules of Portfolio Investments for the tax cost of securities and the breakdown of unrealized appreciation (depreciation). |
Abbreviations used are defined below:
ADR - American Depositary Receipt
23
|
SCHEDULE OF PORTFOLIO INVESTMENTS |
RBC Global Opportunities Fund (cont.) |
|
| September 30, 2020 (Unaudited) |
Portfolio Diversification (Unaudited)
| | |
Industries | | Percentage
of Net Assets |
| | | | |
Information Technology | | | 15.61 | % |
Health Care | | | 14.27 | % |
Financials | | | 13.93 | % |
Consumer Discretionary | | | 13.77 | % |
Industrials | | | 11.88 | % |
Utilities | | | 7.17 | % |
Communication Services | | | 6.72 | % |
Consumer Staples | | | 5.58 | % |
Materials | | | 5.48 | % |
Energy | | | 4.22 | % |
Other | | | 1.37 | % |
| | | | |
| | | 100.00 | % |
| | | | |
See Notes to the Financial Statements.
24
|
SCHEDULE OF PORTFOLIO INVESTMENTS |
RBC International Opportunities Fund |
|
| September 30, 2020 (Unaudited) |
| | | | | | |
| Shares | | | | Value | |
Common Stocks — 98.71% | | | | |
Argentina — 0.97% | | | | |
1,200 | | MercadoLibre, Inc.* | | $ | 1,298,976 | |
| | | | | | |
| |
Australia — 3.81% | | | | |
985,699 | | Oil Search Ltd. | | | 1,885,380 | |
27,284 | | Rio Tinto Plc | | | 1,641,754 | |
247,165 | | Treasury Wine Estates Ltd. | | | 1,588,100 | |
| | | | | | |
| | | | | 5,115,234 | |
| | | | | | |
Austria — 1.16% | | | | | | |
74,061 | | Erste Group Bank AG* | | | 1,550,876 | |
| | | | | | |
| |
Belgium — 2.45% | | | | |
61,139 | | Anheuser-Busch InBev NV | | | 3,291,770 | |
| | | | | | |
| |
Denmark — 4.43% | | | | |
43,098 | | Orsted A/S(a) | | | 5,938,042 | |
| | | | | | |
| | |
Finland — 3.97% | | | | | | |
101,043 | | Neste Oyj | | | 5,320,928 | |
| | | | | | |
| |
Germany — 4.81% | | | | |
142,381 | | Deutsche Post AG | | | 6,460,656 | |
| | | | | | |
| |
Hong Kong — 4.88% | | | | |
659,000 | | AIA Group Ltd. | | | 6,550,524 | |
| | | | | | |
| | |
India — 3.44% | | | | | | |
92,266 | | HDFC Bank Ltd., ADR* | | | 4,609,609 | |
| | | | | | |
| | |
Ireland — 1.57% | | | | | | |
16,500 | | Kerry Group Plc | | | 2,113,425 | |
| | | | | | |
| | |
Japan — 15.40% | | | | | | |
273,800 | | Astellas Pharma, Inc. | | | 4,081,426 | |
124,700 | | MISUMI Group, Inc. | | | 3,496,205 | |
77,702 | | Nidec Corp. | | | 7,286,734 | |
23,500 | | Oriental Land Co. Ltd | | | 3,295,763 | |
63,200 | | Recruit Holdings Co. Ltd. | | | 2,510,011 | |
| | | | | | |
| | | | | 20,670,139 | |
| | | | | | |
25
|
SCHEDULE OF PORTFOLIO INVESTMENTS |
RBC International Opportunities Fund (cont.) |
|
| September 30, 2020 (Unaudited) |
| | | | | | |
| Shares | | | | Value | |
Netherlands — 3.83% | | | | |
1,499 | | Adyen NV*,(a) | | $ | 2,764,898 | |
27,814 | | Wolters Kluwer NV | | | 2,372,616 | |
| | | | | | |
| | | | | 5,137,514 | |
| | | | | | |
Singapore — 1.79% | | | | |
163,300 | | DBS Group Holdings Ltd. | | | 2,400,731 | |
| | | | | | |
| |
South Africa — 5.39% | | | | |
40,959 | | Naspers Ltd., N Shares | | | 7,234,339 | |
| | | | | | |
| | |
Spain — 3.49% | | | | | | |
169,505 | | Industria de Diseno Textil SA | | | 4,689,279 | |
| | | | | | |
| |
Switzerland — 10.31% | | | | |
954 | | Barry Callebaut AG | | | 2,124,905 | |
5,215 | | Partners Group Holding AG | | | 4,796,778 | |
20,200 | | Roche Holding AG | | | 6,919,319 | |
| | | | | | |
| | | | | 13,841,002 | |
| | | | | | |
Taiwan — 9.32% | | | | | | |
3,084,208 | | E.Sun Financial Holding Co. Ltd. | | | 2,746,755 | |
120,318 | | Taiwan Semiconductor Manufacturing Co. Ltd., ADR | | | 9,754,180 | |
| | | | | | |
| | | | | 12,500,935 | |
| | | | | | |
Thailand — 2.26% | | | | |
515,900 | | Kasikornbank Pcl, NVDR | | | 1,260,049 | |
2,792,900 | | Minor International PCL* | | | 1,766,259 | |
| | | | | | |
| | | | | 3,026,308 | |
| | | | | | |
United Kingdom — 12.70% | | | | |
58,910 | | Croda International Plc | | | 4,752,042 | |
90,300 | | InterContinental Hotels Group Plc* | | | 4,739,910 | |
379,111 | | Legal & General Group Plc | | | 924,832 | |
12,423 | | Linde Plc | | | 2,937,197 | |
307,066 | | St. James’s Place Plc | | | 3,694,143 | |
| | | | | | |
| | | | | 17,048,124 | |
| | | | | | |
United States — 1.81% | | | | |
23,500 | | CyberArk Software Ltd.* | | | 2,430,370 | |
| | | | | | |
| | |
Zambia — 0.92% | | | | | | |
137,771 | | First Quantum Minerals Ltd. | | | 1,228,149 | |
| | | | | | |
| |
Total Common Stocks | | | 132,456,930 | |
| | | | | | |
(Cost $117,720,421) | | | | |
26
|
SCHEDULE OF PORTFOLIO INVESTMENTS |
RBC International Opportunities Fund (cont.) |
|
| September 30, 2020 (Unaudited) |
| | | | | | |
| Shares | | | | Value | |
Rights/Warrants — 0.03% | | | | |
Thailand — 0.03% | | | | | | |
160,923 | | Minor International Public Co. Ltd., Warrants, Expire 7/31/23* | | $ | 37,834 | |
| | | | | | |
| |
Total Rights/Warrants | | | 37,834 | |
| | | | | | |
(Cost $0) | | | | | | |
| | |
Total Investments | | | | $ | 132,494,764 | |
(Cost $117,720,421)(b) — 98.74% | | | | |
| |
Other assets in excess of liabilities — 1.26% | | | 1,694,814 | |
| | | | | | |
| |
NET ASSETS — 100.00% | | $ | 134,189,578 | |
| | | | | | |
| * | Non-income producing security. |
| (a) | Security exempt from registration under Rule 144A or Section 4(2) of the Securities Act of 1933, as amended. These securities may be resold in transactions exempt from registration, normally to qualified institutional buyers. |
| (b) | See Notes to Schedules of Portfolio Investments for the tax cost of securities and the breakdown of unrealized appreciation (depreciation). |
Abbreviations used are defined below:
ADR - American Depositary Receipt
NVDR - Non-Voting Depository Receipt
Portfolio Diversification (Unaudited)
| | |
Industries | | Percentage
of Net Assets |
| | | | |
Financials | | | 21.26 | % |
Consumer Discretionary | | | 17.16 | % |
Industrials | | | 16.49 | % |
Information Technology | | | 11.14 | % |
Health Care | | | 8.20 | % |
Materials | | | 7.87 | % |
Consumer Staples | | | 6.79 | % |
Energy | | | 5.37 | % |
Utilities | | | 4.43 | % |
Other* | | | 1.29 | % |
| | | | |
| | | 100.00 | % |
| | | | |
| * | Includes cash, interest and dividend receivable, pending trades and Fund share transactions, warrants, and accrued expenses payable. | |
See Notes to the Financial Statements.
27
|
FINANCIAL STATEMENTS |
Statements of Assets and Liabilities |
|
| September 30, 2020 (Unaudited) |
| | | | | | | | | | | | | | | | | | | | |
| | | RBC Emerging Markets
Equity Fund | | | RBC Emerging
Markets Small Cap
Equity Fund | | | RBC Emerging
Markets Value
Equity Fund | |
Assets: | | | | | | | | | | | | | | | | | | | | |
Investments in securities, at value: | | | | | | | | | | | | | | | | | | | | |
Unaffiliated investments (cost $1,601,117,544, $8,689,202 and $30,928,999, respectively) | | | | | | $ | 1,710,680,651 | | | | | | | $ | 8,084,204 | | | $ | 30,856,476 | |
Affiliated investments (cost $53,107,826, $247,923 and $254,941, respectively) | | | | | | | 53,107,826 | | | | | | | | 247,923 | | | | 254,941 | |
Foreign currency, at value (cost $9,497,715, $225 and $8,840, respectively) | | | | | | | 9,501,866 | | | | | | | | 205 | | | | 8,840 | |
Interest and dividend receivable | | | | | | | 2,071,599 | | | | | | | | 22,513 | | | | 49,925 | |
Receivable from advisor | | | | | | | — | | | | | | | | 13,372 | | | | — | |
Receivable for capital shares issued | | | | | | | 2,758,842 | | | | | | | | — | | | | — | |
Receivable for investments sold | | | | | | | 203,064 | | | | | | | | 84,739 | | | | — | |
Prepaid expenses and other assets | | | | | | | 55,489 | | | | | | | | 21,766 | | | | 26,325 | |
| | | | | | | | | | | | | | | | | | | | |
Total Assets | | | | | | | 1,778,379,337 | | | | | | | | 8,474,722 | | | | 31,196,507 | |
| | | | | | | | | | | | | | | | | | | | |
Liabilities: | | | | | | | | | | | | | | | | | | | | |
Foreign withholding tax payable | | | | | | | 31,793 | | | | | | | | 25,512 | | | | 7,824 | |
Payable for capital shares redeemed | | | | | | | 703,257 | | | | | | | | — | | | | — | |
Payable for investments purchased | | | | | | | 41,503,865 | | | | | | | | 53,193 | | | | 195,545 | |
Accrued expenses and other payables: | | | | | | | | | | | | | | | | | | | | |
Investment advisory fees | | | | | | | 979,839 | | | | | | | | — | | | | 824 | |
Accounting fees | | | | | | | 20,140 | | | | | | | | 7,019 | | | | 7,082 | |
Audit fees | | | | | | | 11,909 | | | | | | | | 11,908 | | | | 11,909 | |
Trustees’ fees | | | | | | | 20,186 | | | | | | | | 141 | | | | 95 | |
Distribution fees | | | | | | | 6,497 | | | | | | | | 8,114 | | | | — | |
Custodian fees | | | | | | | 81,233 | | | | | | | | 13,087 | | | | 1,860 | |
Shareholder reports | | | | | | | 15,217 | | | | | | | | 3,837 | | | | 5,188 | |
Transfer agent fees | | | | | | | 226,342 | | | | | | | | 3,747 | | | | 1,434 | |
Other | | | | | | | 41,060 | | | | | | | | 7,455 | | | | 9,938 | |
| | | | | | | | | | | | | | | | | | | | |
Total Liabilities | | | | | | | 43,641,338 | | | | | | | | 134,013 | | | | 241,699 | |
| | | | | | | | | | | | | | | | | | | | |
Net Assets | | | | | | $ | 1,734,737,999 | | | | | | | $ | 8,340,709 | | | $ | 30,954,808 | |
| | | | | | | | | | | | | | | | | | | | |
Net Assets Consists of: | | | | | | | | | | | | | | | | | | | | |
Capital | | | | | | $ | 1,642,445,324 | | | | | | | $ | 9,708,758 | | | $ | 31,876,615 | |
Accumulated earnings | | | | | | | 92,292,675 | | | | | | | | (1,368,049 | ) | | | (921,807 | ) |
| | | | | | | | | | | | | | | | | | | | |
Net Assets | | | | | | $ | 1,734,737,999 | | | | | | | $ | 8,340,709 | | | $ | 30,954,808 | |
| | | | | | | | | | | | | | | | | | | | |
28
|
FINANCIAL STATEMENTS |
Statements of Assets and Liabilities (cont.) |
|
| September 30, 2020 (Unaudited) |
| | | | | | | | | | | | | | | | | | | | | | | | |
| | | RBC Emerging Markets
Equity Fund | | | RBC Emerging
Markets Small Cap
Equity Fund | | | RBC Emerging
Markets Value
Equity Fund | |
Net Assets | | | | | | | | | | | | | | | | | | | | | | | | |
Class A | | | | | | $ | 18,835,013 | | | | | | | $ | 2,428,221 | | | | | | | $ | N/A | |
Class I | | | | | | | 1,504,590,472 | | | | | | | | 5,912,488 | | | | | | | | 28,745,820 | |
Class R6 | | | | | | | 211,312,514 | | | | | | | | N/A | | | | | | | | 2,208,988 | |
| | | | | | | | | | | | | | | | | | | | | | | | |
Total | | | | | | $ | 1,734,737,999 | | | | | | | $ | 8,340,709 | | | | | | | $ | 30,954,808 | |
| | | | | | | | | | | | | | | | | | | | | | | | |
Shares Outstanding (Unlimited number of shares authorized, no par value): | | | | | | | | | | | | | | | | | | | | | | | | |
Class A | | | | | | | 1,546,757 | | | | | | | | 282,875 | | | | | | | | N/A | |
Class I | | | | | | | 121,245,746 | | | | | | | | 682,996 | | | | | | | | 3,470,087 | |
Class R6 | | | | | | | 16,947,859 | | | | | | | | N/A | | | | | | | | 266,905 | |
| | | | | | | | | | | | | | | | | | | | | | | | |
Total | | | | | | | 139,740,362 | | | | | | | | 965,871 | | | | | | | | 3,736,992 | |
| | | | | | | | | | | | | | | | | | | | | | | | |
Net Asset Values and Redemption Prices Per Share: | | | | | | | | | | | | | | | | | | | | | | | | |
Class A | | | | | | $ | 12.18 | | | | | | | $ | 8.58 | | | | | | | $ | N/A | |
| | | | | | | | | | | | | | | | | | | | | | | | |
Class I | | | | | | $ | 12.41 | | | | | | | $ | 8.66 | | | | | | | $ | 8.28 | |
| | | | | | | | | | | | | | | | | | | | | | | | |
Class R6 | | | | | | $ | 12.47 | | | | | | | $ | N/A | | | | | | | $ | 8.28 | |
| | | | | | | | | | | | | | | | | | | | | | | | |
Maximum Offering Price Per Share: | | | | | | | | | | | | | | | | | | | | | | | | |
Class A | | | | | | $ | 12.92 | | | | | | | $ | 9.10 | | | | | | | $ | N/A | |
| | | | | | | | | | | | | | | | | | | | | | | | |
Maximum Sales Charge - Class A | | | | | | | 5.75 | % | | | | | | | 5.75 | % | | | | | | | N/A | |
| | | | | | | | | | | | | | | | | | | | | | | | |
29
|
FINANCIAL STATEMENTS |
Statements of Assets and Liabilities (cont.) |
|
| September 30, 2020 (Unaudited) |
| | | | | | | | | | | | | | | | |
| | | RBC Global
Opportunities Fund | | | RBC International
Opportunities Fund | |
Assets: | | | | | | | | | | | | | | | | |
Investments in securities, at value: | | | | | | | | | | | | | | | | |
Unaffiliated investments (cost $94,809,909 and $117,720,421, respectively) | | | | | | $ | 109,951,502 | | | | | | | $ | 132,494,764 | |
Affiliated investments (cost $950,503 and $0, respectively) | | | | | | | 950,503 | | | | | | | | — | |
Interest and dividend receivable | | | | | | | 105,561 | | | | | | | | 376,661 | |
Receivable for capital shares issued | | | | | | | 486,235 | | | | | | | | 4,075 | |
Receivable for investments sold | | | | | | | — | | | | | | | | 3,385,035 | |
Prepaid expenses and other assets | | | | | | | 50,542 | | | | | | | | 45,784 | |
| | | | | | | | | | | | | | | | |
Total Assets | | | | | | | 111,544,343 | | | | | | | | 136,306,319 | |
| | | | | | | | | | | | | | | | |
Liabilities: | | | | | | | | | | | | | | | | |
Foreign currency overdraft, at value (cost $51 and $174) | | | | | | | 62 | | | | | | | | 176 | |
Cash overdraft | | | | | | | — | | | | | | | | 1,978,255 | |
Foreign withholding tax payable | | | | | | | 720 | | | | | | | | 1,131 | |
Payable for capital shares redeemed | | | | | | | — | | | | | | | | 25,297 | |
Payable for investments purchased | | | | | | | — | | | | | | | | 13,722 | |
Accrued expenses and other payables: | | | | | | | | | | | | | | | | |
Investment advisory fees | | | | | | | 39,579 | | | | | | | | 58,754 | |
Accounting fees | | | | | | | 7,842 | | | | | | | | 7,988 | |
Audit fees | | | | | | | 7,920 | | | | | | | | 7,920 | |
Trustees’ fees | | | | | | | 730 | | | | | | | | 1,210 | |
Distribution fees | | | | | | | 16 | | | | | | | | 19 | |
Custodian fees | | | | | | | 981 | | | | | | | | 1,471 | |
Shareholder reports | | | | | | | 5,493 | | | | | | | | 4,202 | |
Transfer agent fees | | | | | | | 1,070 | | | | | | | | 10,984 | |
Other | | | | | | | 3,024 | | | | | | | | 5,612 | |
| | | | | | | | | | | | | | | | |
Total Liabilities | | | | | | | 67,437 | | | | | | | | 2,116,741 | |
| | | | | | | | | | | | | | | | |
Net Assets | | | | | | $ | 111,476,906 | | | | | | | $ | 134,189,578 | |
| | | | | | | | | | | | | | | | |
Net Assets Consists of: | | | | | | | | | | | | | | | | |
Capital | | | | | | $ | 93,185,263 | | | | | | | $ | 117,243,845 | |
Accumulated earnings | | | | | | | 18,291,643 | | | | | | | | 16,945,733 | |
| | | | | | | | | | | | | | | | |
Net Assets | | | | | | $ | 111,476,906 | | | | | | | $ | 134,189,578 | |
| | | | | | | | | | | | | | | | |
30
|
FINANCIAL STATEMENTS |
Statements of Assets and Liabilities (cont.) |
|
| September 30, 2020 (Unaudited) |
| | | | | | | | | | | | | | | | |
| | | RBC Global
Opportunities Fund | | | RBC International
Opportunities Fund | |
Net Assets | | | | | | | | | | | | | | | | |
Class A | | | | | | $ | 14,479 | | | | | | | $ | 9,952 | |
Class I | | | | | | | 79,474,862 | | | | | | | | 134,165,563 | |
Class R6 | | | | | | | 31,987,565 | | | | | | | | 14,063 | |
| | | | | | | | | | | | | | | | |
Total | | | | | | $ | 111,476,906 | | | | | | | $ | 134,189,578 | |
| | | | | | | | | | | | | | | | |
Shares Outstanding (Unlimited number of shares authorized, no par value): | | | | | | | | | | | | | | | | |
Class A | | | | | | | 874 | | | | | | | | 916 | |
Class I | | | | | | | 4,788,269 | | | | | | | | 12,203,389 | |
Class R6 | | | | | | | 1,924,126 | | | | | | | | 1,272 | |
| | | | | | | | | | | | | | | | |
Total | | | | | | | 6,713,269 | | | | | | | | 12,205,577 | |
| | | | | | | | | | | | | | | | |
Net Asset Values and Redemption Prices Per Share: | | | | | | | | | | | | | | | | |
Class A | | | | | | $ | 16.57 | | | | | | | $ | 10.87 | |
| | | | | | | | | | | | | | | | |
Class I | | | | | | $ | 16.60 | | | | | | | $ | 10.99 | |
| | | | | | | | | | | | | | | | |
Class R6 | | | | | | $ | 16.62 | | | | | | | $ | 11.06 | |
| | | | | | | | | | | | | | | | |
Maximum Offering Price Per Share: | | | | | | | | | | | | | | | | |
Class A | | | | | | $ | 17.58 | | | | | | | $ | 11.53 | |
| | | | | | | | | | | | | | | | |
Maximum Sales Charge - Class A | | | | | | | 5.75 | % | | | | | | | 5.75 | % |
| | | | | | | | | | | | | | | | |
| | | | |
See Notes to the Financial Statements. | | | | | | | | | | | | | | | | |
31
|
FINANCIAL STATEMENTS |
Statements of Operations |
|
For the Six Months Ended September 30, 2020 (Unaudited) |
| | | | | | | | | | | | | | | | | | | | | | | | |
| | | RBC Emerging Markets
Equity Fund | | | RBC Emerging
Markets Small Cap
Equity Fund | | | RBC Emerging
Markets Value
Equity Fund | |
Investment Income: | | | | | | | | | | | | | | | | | | | | | | | | |
Interest income | | | | | | $ | 5,973 | | | | | | | $ | 9 | | | | | | | $ | (1,314 | ) |
Dividend income - unaffiliated | | | | | | | 18,076,654 | | | | | | | | 130,298 | | | | | | | | 133,227 | |
Dividend income - affiliated | | | | | | | 5,474 | | | | | | | | 133 | | | | | | | | 3 | |
Foreign tax withholding | | | | | | | (1,979,774 | ) | | | | | | | (19,220 | ) | | | | | | | (12,669 | ) |
| | | | | | | | | | | | | | | | | | | | | | | | |
Total Investment Income | | | | | | | 16,108,327 | | | | | | | | 111,220 | | | | | | | | 119,247 | |
Expenses: | | | | | | | | | | | | | | | | | | | | | | | | |
Investment advisory fees | | | | | | | 5,897,064 | | | | | | | | 44,109 | | | | | | | | 31,998 | |
Distribution fees–Class A | | | | | | | 23,960 | | | | | | | | 2,825 | | | | | | | | — | |
Accounting fees | | | | | | | 74,095 | | | | | | | | 31,631 | | | | | | | | 36,085 | |
Audit fees | | | | | | | 18,903 | | | | | | | | 18,903 | | | | | | | | 18,903 | |
Custodian fees | | | | | | | 288,038 | | | | | | | | 24,235 | | | | | | | | 20,960 | |
Insurance fees | | | | | | | 9,984 | | | | | | | | 2,156 | | | | | | | | 840 | |
Legal fees | | | | | | | 48,837 | | | | | | | | 313 | | | | | | | | 121 | |
Registrations and filing fees | | | | | | | 43,864 | | | | | | | | 18,474 | | | | | | | | 19,946 | |
Shareholder reports | | | | | | | 48,960 | | | | | | | | 9,946 | | | | | | | | 9,695 | |
Transfer agent fees–Class A | | | | | | | 22,868 | | | | | | | | 2,104 | | | | | | | | — | |
Transfer agent fees–Class I | | | | | | | 651,031 | | | | | | | | 3,121 | | | | | | | | 1,845 | |
Transfer agent fees–Class R6 | | | | | | | 2,441 | | | | | | | | — | | | | | | | | 1,785 | |
Trustees’ fees and expenses | | | | | | | 42,973 | | | | | | | | 261 | | | | | | | | 141 | |
Tax expense | | | | | | | 21,088 | | | | | | | | 17,221 | | | | | | | | 6,520 | |
Other fees | | | | | | | 22,904 | | | | | | | | 2,233 | | | | | | | | 2,296 | |
| | | | | | | | | | | | | | | | | | | | | | | | |
Total expenses before fee waiver/reimbursement | | | | | | | 7,217,010 | | | | | | | | 177,532 | | | | | | | | 151,135 | |
Expenses waived/reimbursed by: | | | | | | | | | | | | | | | | | | | | | | | | |
Advisor | | | | | | | (706,279 | ) | | | | | | | (122,741 | ) | | | | | | | (113,852 | ) |
| | | | | | | | | | | | | | | | | | | | | | | | |
Net expenses | | | | | | | 6,510,731 | | | | | | | | 54,791 | | | | | | | | 37,283 | |
| | | | | | | | | | | | | | | | | | | | | | | | |
Net Investment Income | | | | | | | 9,597,596 | | | | | | | | 56,429 | | | | | | | | 81,964 | |
| | | | | | | | | | | | | | | | | | | | | | | | |
Realized/Unrealized Gains/(Losses): | | | | | | | | | | | | | | | | | | | | | | | | |
Net realized gains/(losses) on: | | | | | | | | | | | | | | | | | | | | | | | | |
Investment transactions | | | | | | | (10,465,038 | ) | | | | | | | (228,382 | ) | | | | | | | (126,647 | ) |
Foreign currency transactions | | | | | | | (744,214 | ) | | | | | | | (6,634 | ) | | | | | | | (56,179 | ) |
Foreign tax | | | | | | | (22,560 | ) | | | | | | | (1,024 | ) | | | | | | | — | |
| | | | | | | | | | | | | | | | | | | | | | | | |
Net realized losses | | | | | | | (11,231,812 | ) | | | | | | | (236,040 | ) | | | | | | | (182,826 | ) |
Net change in unrealized appreciation/(depreciation) on: | | | | | | | | | | | | | | | | | | | | | | | | |
Investments | | | | | | | 352,119,505 | | | | | | | | 2,144,711 | | | | | | | | 1,044,958 | |
Foreign currency | | | | | | | 53,622 | | | | | | | | 385 | | | | | | | | 208 | |
Foreign tax | | | | | | | 186,815 | | | | | | | | 1,826 | | | | | | | | — | |
| | | | | | | | | | | | | | | | | | | | | | | | |
Net unrealized gains | | | | | | | 352,359,942 | | | | | | | | 2,146,922 | | | | | | | | 1,045,166 | |
| | | | | | | | | | | | | | | | | | | | | | | | |
Change in net assets resulting from operations | | | | | | $ | 350,725,726 | | | | | | | $ | 1,967,311 | | | | | | | $ | 944,304 | |
| | | | | | | | | | | | | | | | | | | | | | | | |
32
|
FINANCIAL STATEMENTS |
Statements of Operations (cont.) |
|
| For the Six Months Ended September 30, 2020 (Unaudited) |
| | | | | | | | | | | | | | | | |
| | | RBC Global
Opportunities Fund | | | RBC International
Opportunities Fund | |
Investment Income: | | | | | | | | | | | | | | | | |
Interest income | | | | | | $ | 761 | | | | | | | $ | — | |
Dividend income - unaffiliated | | | | | | | 549,768 | | | | | | | | 1,147,425 | |
Dividend income - affiliated | | | | | | | 239 | | | | | | | | 492 | |
Foreign tax withholding | | | | | | | (36,844 | ) | | | | | | | (123,990 | ) |
| | | | | | | | | | | | | | | | |
Total Investment Income | | | | | | | 513,924 | | | | | | | | 1,023,927 | |
Expenses: | | | | | | | | | | | | | | | | |
Investment advisory fees | | | | | | | 337,803 | | | | | | | | 422,444 | |
Distribution fees–Class A | | | | | | | 13 | | | | | | | | 415 | |
Accounting fees | | | | | | | 27,211 | | | | | | | | 30,336 | |
Audit fees | | | | | | | 22,914 | | | | | | | | 22,914 | |
Custodian fees | | | | | | | 17,181 | | | | | | | | 19,480 | |
Insurance fees | | | | | | | 2,158 | | | | | | | | 2,156 | |
Legal fees | | | | | | | 7,094 | | | | | | | | 10,259 | |
Registrations and filing fees | | | | | | | 36,806 | | | | | | | | 33,665 | |
Shareholder reports | | | | | | | 12,859 | | | | | | | | 11,515 | |
Transfer agent fees–Class A | | | | | | | 1,663 | | | | | | | | 1,663 | |
Transfer agent fees–Class I | | | | | | | 20,203 | | | | | | | | 46,659 | |
Transfer agent fees–Class R6 | | | | | | | 1,859 | | | | | | | | 1,785 | |
Trustees’ fees and expenses | | | | | | | 2,196 | | | | | | | | 2,929 | |
Tax expense | | | | | | | 2,340 | | | | | | | | 2,489 | |
Other fees | | | | | | | 2,798 | | | | | | | | 3,867 | |
| | | | | | | | | | | | | | | | |
Total expenses before fee waiver/reimbursement | | | | | | | 495,098 | | | | | | | | 612,576 | |
Expenses waived/reimbursed by: | | | | | | | | | | | | | | | | |
Advisor | | | | | | | (114,669 | ) | | | | | | | (134,090 | ) |
| | | | | | | | | | | | | | | | |
Net expenses | | | | | | | 380,429 | | | | | | | | 478,486 | |
| | | | | | | | | | | | | | | | |
Net Investment Income | | | | | | | 133,495 | | | | | | | | 545,441 | |
| | | | | | | | | | | | | | | | |
Realized/Unrealized Gains/(Losses): | | | | | | | | | | | | | | | | |
Net realized gains/(losses) on: | | | | | | | | | | | | | | | | |
Investment transactions | | | | | | | 3,479,387 | | | | | | | | 681,659 | |
Foreign currency transactions | | | | | | | (98,241 | ) | | | | | | | (263,215 | ) |
| | | | | | | | | | | | | | | | |
Net realized gains | | | | | | | 3,381,146 | | | | | | | | 418,444 | |
Net change in unrealized appreciation/(depreciation) on: | | | | | | | | | | | | | | | | |
Investments | | | | | | | 23,277,291 | | | | | | | | 28,596,728 | |
Foreign currency | | | | | | | 2,635 | | | | | | | | 5,626 | |
| | | | | | | | | | | | | | | | |
Net unrealized gains | | | | | | | 23,279,926 | | | | | | | | 28,602,354 | |
| | | | | | | | | | | | | | | | |
Change in net assets resulting from operations | | | | | | $ | 26,794,567 | | | | | | | $ | 29,566,239 | |
| | | | | | | | | | | | | | | | |
See Notes to the Financial Statements.
33
|
FINANCIAL STATEMENTS |
Statements of Changes in Net Assets |
|
| |
| | | | | | | | | | | | |
| | | RBC Emerging Markets
Equity Fund | |
| | | For the
Six Months Ended
September 30, 2020
(Unaudited) | | | For the
Year Ended
March 31, 2020 | |
From Investment Activities | | | | | | | | | | | | |
Operations: | | | | | | | | | | | | |
Net investment income | | | | | | $ | 9,597,596 | | | $ | 45,574,782 | |
Net realized losses from investments and foreign currency | | | | | | | (11,231,812 | ) | | | (15,090,042 | ) |
Net change in unrealized appreciation/(depreciation) on investments and foreign currency | | | | | | | 352,359,942 | | | | (284,518,030 | ) |
| | | | | | | | | | | | |
Change in net assets resulting from operations | | | | | | | 350,725,726 | | | | (254,033,290 | ) |
| | | | | | | | | | | | |
Distributions to Shareholders: | | | | | | | | | | | | |
Class A | | | | | | | — | | | | (792,363 | ) |
Class I | | | | | | | — | | | | (39,879,351 | ) |
Class R6 | | | | | | | — | | | | (4,632,007 | ) |
| | | | | | | | | | | | |
Change in net assets resulting from shareholder distributions | | | | | | | — | | | | (45,303,721 | ) |
| | | | | | | | | | | | |
Capital Transactions: | | | | | | | | | | | | |
Proceeds from shares issued | | | | | | | 290,341,221 | | | | 767,468,173 | |
Distributions reinvested | | | | | | | — | | | | 41,681,053 | |
Cost of shares redeemed | | | | | | | (118,997,695 | ) | | | (177,297,013 | ) |
| | | | | | | | | | | | |
Change in net assets resulting from capital transactions | | | | | | | 171,343,526 | | | | 631,852,213 | |
| | | | | | | | | | | | |
Net increase in net assets | | | | | | | 522,069,252 | | | | 332,515,202 | |
Net Assets: | | | | | | | | | | | | |
Beginning of period | | | | | | | 1,212,668,747 | | | | 880,153,545 | |
| | | | | | | | | | | | |
End of period | | | | | | $ | 1,734,737,999 | | | $ | 1,212,668,747 | |
| | | | | | | | | | | | |
Share Transactions: | | | | | | | | | | | | |
Issued | | | | | | | 25,208,095 | | | | 64,026,033 | |
Reinvested | | | | | | | — | | | | 3,341,903 | |
Redeemed | | | | | | | (10,801,977 | ) | | | (15,290,238 | ) |
| | | | | | | | | | | | |
Change in shares resulting from capital transactions | | | | | | | 14,406,118 | | | | 52,077,698 | |
| | | | | | | | | | | | |
See Notes to the Financial Statements.
34
|
FINANCIAL STATEMENTS |
Statements of Changes in Net Assets |
|
| |
| | | | | | | | | | | | | | | | |
| | | RBC Emerging
Markets Small Cap
Equity Fund | |
| | | For the
Six Months Ended
September 30, 2020
(Unaudited) | | | For the
Year Ended
March 31, 2020 | |
From Investment Activities | | | | | | | | | | | | | | | | |
Operations: | | | | | | | | | | | | | | | | |
Net investment income | | | | | | $ | 56,429 | | | | | | | $ | 131,375 | |
Net realized losses from investments and foreign currency | | | | | | | (236,040 | ) | | | | | | | (241,611 | ) |
Net change in unrealized appreciation/(depreciation) on investments and foreign currency | | | | | | | 2,146,922 | | | | | | | | (3,047,975 | ) |
| | | | | | | | | | | | | | | | |
Change in net assets resulting from operations | | | | | | | 1,967,311 | | | | | | | | (3,158,211 | ) |
| | | | | | | | | | | | | | | | |
Distributions to Shareholders: | | | | | | | | | | | | | | | | |
Class A | | | | | | | — | | | | | | | | (135,440 | ) |
Class I | | | | | | | — | | | | | | | | (318,004 | ) |
| | | | | | | | | | | | | | | | |
Change in net assets resulting from shareholder distributions | | | | | | | — | | | | | | | | (453,444 | ) |
| | | | | | | | | | | | | | | | |
Capital Transactions: | | | | | | | | | | | | | | | | |
Proceeds from shares issued | | | | | | | 20,837 | | | | | | | | 725,547 | |
Distributions reinvested | | | | | | | — | | | | | | | | 452,240 | |
Cost of shares redeemed | | | | | | | (177,156 | ) | | | | | | | (284,449 | ) |
| | | | | | | | | | | | | | | | |
Change in net assets resulting from capital transactions | | | | | | | (156,319 | ) | | | | | | | 893,338 | |
| | | | | | | | | | | | | | | | |
Net increase/(decrease) in net assets | | | | | | | 1,810,992 | | | | | | | | (2,718,317 | ) |
Net Assets: | | | | | | | | | | | | | | | | |
Beginning of period | | | | | | | 6,529,717 | | | | | | | | 9,248,034 | |
| | | | | | | | | | | | | | | | |
End of period | | | | | | $ | 8,340,709 | | | | | | | $ | 6,529,717 | |
| | | | | | | | | | | | | | | | |
Share Transactions: | | | | | | | | | | | | | | | | |
Issued | | | | | | | 2,528 | | | | | | | | 75,212 | |
Reinvested | | | | | | | — | | | | | | | | 48,050 | |
Redeemed | | | | | | | (20,554 | ) | | | | | | | (34,117 | ) |
| | | | | | | | | | | | | | | | |
Change in shares resulting from capital transactions | | | | | | | (18,026 | ) | | | | | | | 89,145 | |
| | | | | | | | | | | | | | | | |
See Notes to the Financial Statements.
35
|
FINANCIAL STATEMENTS |
Statements of Changes in Net Assets |
|
| |
| | | | | | | | | | | | | | | | |
| | | RBC Emerging
Markets Value
Equity Fund | |
| | | For the
Six Months Ended
September 30, 2020
(Unaudited) | | | For the
Year Ended
March 31, 2020 | |
From Investment Activities | | | | | | | | | | | | | | | | |
Operations: | | | | | | | | | | | | | | | | |
Net investment income | | | | | | $ | 81,964 | | | | | | | $ | 172,858 | |
Net realized losses from investments and foreign currency | | | | | | | (182,826 | ) | | | | | | | (311,462 | ) |
Net change in unrealized appreciation/(depreciation) on investments and foreign currency | | | | | | | 1,045,166 | | | | | | | | (945,704 | ) |
| | | | | | | | | | | | | | | | |
Change in net assets resulting from operations | | | | | | | 944,304 | | | | | | | | (1,084,308 | ) |
| | | | | | | | | | | | | | | | |
Distributions to Shareholders: | | | | | | | | | | | | | | | | |
Class I | | | | | | | — | | | | | | | | (88,926 | ) |
Class R6 | | | | | | | — | | | | | | | | (90,889 | ) |
| | | | | | | | | | | | | | | | |
Change in net assets resulting from shareholder distributions | | | | | | | — | | | | | | | | (179,815 | ) |
| | | | | | | | | | | | | | | | |
Capital Transactions: | | | | | | | | | | | | | | | | |
Proceeds from shares issued | | | | | | | 26,537,125 | | | | | | | | 65,059 | |
Distributions reinvested | | | | | | | — | | | | | | | | 179,815 | |
Cost of shares redeemed | | | | | | | (1,149 | ) | | | | | | | — | |
| | | | | | | | | | | | | | | | |
Change in net assets resulting from capital transactions | | | | | | | 26,535,976 | | | | | | | | 244,874 | |
| | | | | | | | | | | | | | | | |
Payment by broker | | | | | | | — | | | | | | | | 6,425 | |
| | | | | | | | | | | | | | | | |
Net increase/(decrease) in net assets | | | | | | | 27,480,280 | | | | | | | | (1,012,824 | ) |
Net Assets: | | | | | | | | | | | | | | | | |
Beginning of period | | | | | | | 3,474,528 | | | | | | | | 4,487,352 | |
| | | | | | | | | | | | | | | | |
End of period | | | | | | $ | 30,954,808 | | | | | | | $ | 3,474,528 | |
| | | | | | | | | | | | | | | | |
Share Transactions: | | | | | | | | | | | | | | | | |
Issued | | | | | | | 3,195,838 | | | | | | | | 7,326 | |
Reinvested | | | | | | | — | | | | | | | | 20,469 | |
Redeemed | | | | | | | (143 | ) | | | | | | | — | |
| | | | | | | | | | | | | | | | |
Change in shares resulting from capital transactions | | | | | | | 3,195,695 | | | | | | | | 27,795 | |
| | | | | | | | | | | | | | | | |
See Notes to the Financial Statements.
36
|
FINANCIAL STATEMENTS |
Statements of Changes in Net Assets |
|
| |
| | | | | | | | | | | | | | | | |
| | | RBC Global
Opportunities Fund | |
| | | For the
Six Months Ended
September 30, 2020
(Unaudited) | | | For the
Year Ended
March 31, 2020 | |
From Investment Activities | | | | | | | | | | | | | | | | |
Operations: | | | | | | | | | | | | | | | | |
Net investment income | | | | | | $ | 133,495 | | | | | | | $ | 669,761 | |
Net realized gains from investments and foreign currency | | | | | | | 3,381,146 | | | | | | | | 202,957 | |
Net change in unrealized appreciation/(depreciation) on investments and foreign currency | | | | | | | 23,279,926 | | | | | | | | (10,071,883 | ) |
| | | | | | | | | | | | | | | | |
Change in net assets resulting from operations | | | | | | | 26,794,567 | | | | | | | | (9,199,165 | ) |
| | | | | | | | | | | | | | | | |
Distributions to Shareholders: | | | | | | | | | | | | | | | | |
Class I | | | | | | | — | | | | | | | | (1,745,323 | ) |
Class R6 | | | | | | | — | | | | | | | | (2,036 | ) |
| | | | | | | | | | | | | | | | |
Change in net assets resulting from shareholder distributions | | | | | | | — | | | | | | | | (1,747,359 | ) |
| | | | | | | | | | | | | | | | |
Capital Transactions: | | | | | | | | | | | | | | | | |
Proceeds from shares issued | | | | | | | 48,133,109 | | | | | | | | 58,909,583 | |
Distributions reinvested | | | | | | | — | | | | | | | | 1,721,944 | |
Cost of shares redeemed | | | | | | | (22,336,942 | ) | | | | | | | (9,727,463 | ) |
| | | | | | | | | | | | | | | | |
Change in net assets resulting from capital transactions | | | | | | | 25,796,167 | | | | | | | | 50,904,064 | |
| | | | | | | | | | | | | | | | |
Net increase in net assets | | | | | | | 52,590,734 | | | | | | | | 39,957,540 | |
Net Assets: | | | | | | | | | | | | | | | | |
Beginning of period | | | | | | | 58,886,172 | | | | | | | | 18,928,632 | |
| | | | | | | | | | | | | | | | |
End of period | | | | | | $ | 111,476,906 | | | | | | | $ | 58,886,172 | |
| | | | | | | | | | | | | | | | |
Share Transactions: | | | | | | | | | | | | | | | | |
Issued | | | | | | | 3,340,458 | | | | | | | | 4,063,741 | |
Reinvested | | | | | | | — | | | | | | | | 112,032 | |
Redeemed | | | | | | | (1,421,489 | ) | | | | | | | (730,135 | ) |
| | | | | | | | | | | | | | | | |
Change in shares resulting from capital transactions | | | | | | | 1,918,969 | | | | | | | | 3,445,638 | |
| | | | | | | | | | | | | | | | |
See Notes to the Financial Statements.
37
|
FINANCIAL STATEMENTS |
Statements of Changes in Net Assets |
|
| |
| | | | | | | | | | | | | | | | |
| | | RBC International
Opportunities Fund | |
| | | For the
Six Months Ended
September 30, 2020
(Unaudited) | | | For the
Year Ended
March 31, 2020 | |
From Investment Activities | | | | | | | | | | | | | | | | |
Operations: | | | | | | | | | | | | | | | | |
Net investment income | | | | | | $ | 545,441 | | | | | | | $ | 2,261,504 | |
Net realized gains from investments and foreign currency | | | | | | | 418,444 | | | | | | | | 2,986,409 | |
Net change in unrealized appreciation/(depreciation) on investments and foreign currency | | | | | | | 28,602,354 | | | | | | | | (18,175,306 | ) |
| | | | | | | | | | | | | | | | |
Change in net assets resulting from operations | | | | | | | 29,566,239 | | | | | | | | (12,927,393 | ) |
| | | | | | | | | | | | | | | | |
Distributions to Shareholders: | | | | | | | | | | | | | | | | |
Class I | | | | | | | — | | | | | | | | (3,638,795 | ) |
Class R6 | | | | | | | — | | | | | | | | (560 | ) |
| | | | | | | | | | | | | | | | |
Change in net assets resulting from shareholder distributions | | | | | | | — | | | | | | | | (3,639,355 | ) |
| | | | | | | | | | | | | | | | |
Capital Transactions: | | | | | | | | | | | | | | | | |
Proceeds from shares issued | | | | | | | 56,720,634 | | | | | | | | 32,071,054 | |
Distributions reinvested | | | | | | | — | | | | | | | | 3,015,673 | |
Cost of shares redeemed | | | | | | | (25,677,978 | ) | | | | | | | (11,153,729 | ) |
| | | | | | | | | | | | | | | | |
Change in net assets resulting from capital transactions | | | | | | | 31,042,656 | | | | | | | | 23,932,998 | |
| | | | | | | | | | | | | | | | |
Net increase in net assets | | | | | | | 60,608,895 | | | | | | | | 7,366,250 | |
Net Assets: | | | | | | | | | | | | | | | | |
Beginning of period | | | | | | | 73,580,683 | | | | | | | | 66,214,433 | |
| | | | | | | | | | | | | | | | |
End of period | | | | | | $ | 134,189,578 | | | | | | | $ | 73,580,683 | |
| | | | | | | | | | | | | | | | |
Share Transactions: | | | | | | | | | | | | | | | | |
Issued | | | | | | | 5,964,615 | | | | | | | | 3,163,928 | |
Reinvested | | | | | | | — | | | | | | | | 271,437 | |
Redeemed | | | | | | | (2,504,377 | ) | | | | | | | (1,134,844 | ) |
| | | | | | | | | | | | | | | | |
Change in shares resulting from capital transactions | | | | | | | 3,460,238 | | | | | | | | 2,300,521 | |
| | | | | | | | | | | | | | | | |
See Notes to the Financial Statements.
38
RBC Emerging Markets Equity Fund
(Selected data for a share outstanding throughout the periods indicated)
| | | | | | | | | | | | | | | | | | | | | | | | | | | | | | | | | | | | |
| | | | | | Investment Activities | | | Distributions | | | | |
| | | Net Asset
Value,
Beginning
of Period | | | Net
Investment
Income(a) | | | Net Realized
and Unrealized
Gains (Losses)
on Investments | | | Redemption
Fees | | | Total from
Investment
Activities | | | Net
Investment
Income | | | Net
Realized
Gains | | | Total
Distributions | | | Net Asset
Value, End
of Period | |
Class A | | | | | | | | | | | | | | | | | | | | | | | | | | | | | | | | | | | | |
Six Months Ended 9/30/20 (Unaudited) | | | $ 9.50 | | | | 0.06 | | | | 2.62 | | | | — | | | | 2.68 | | | | — | | | | — | | | | — | | | | $ 12.18 | |
Year Ended 3/31/20 | | | 11.82 | | | | 0.38(b | ) | | | (2.33 | ) | | | — | | | | (1.95 | ) | | | (0.36 | ) | | | (0.01 | ) | | | (0.37 | ) | | | 9.50 | |
Year Ended 3/31/19 | | | 13.05 | | | | 0.21 | | | | (0.56 | ) | | | — | | | | (0.35 | ) | | | (0.10 | ) | | | (0.78 | ) | | | (0.88 | ) | | | 11.82 | |
Year Ended 3/31/18 | | | 10.91 | | | | 0.10 | | | | 2.13 | | | | — | | | | 2.23 | | | | (0.09 | ) | | | —(c | ) | | | (0.09 | ) | | | 13.05 | |
Year Ended 3/31/17 | | | 9.81 | | | | 0.11 | | | | 1.10 | | | | — | | | | 1.21 | | | | (0.07 | ) | | | (0.04 | ) | | | (0.11 | ) | | | 10.91 | |
Year Ended 3/31/16 | | | 10.99 | | | | 0.07 | | | | (1.11 | ) | | | — | | | | (1.04 | ) | | | (0.10 | ) | | | (0.04 | ) | | | (0.14 | ) | | | 9.81 | |
Class I | | | | | | | | | | | | | | | | | | | | | | | | | | | | | | | | | | | | |
Six Months Ended 9/30/20 (Unaudited) | | | $ 9.67 | | | | 0.07 | | | | 2.67 | | | | — | | | | 2.74 | | | | — | | | | — | | | | — | | | | $ 12.41 | |
Year Ended 3/31/20 | | | 12.01 | | | | 0.44(b | ) | | | (2.39 | ) | | | — | | | | (1.95 | ) | | | (0.38 | ) | | | (0.01 | ) | | | (0.39 | ) | | | 9.67 | |
Year Ended 3/31/19 | | | 13.26 | | | | 0.18 | | | | (0.51 | ) | | | — | | | | (0.33 | ) | | | (0.14 | ) | | | (0.78 | ) | | | (0.92 | ) | | | 12.01 | |
Year Ended 3/31/18 | | | 11.07 | | | | 0.15 | | | | 2.16 | | | | — | | | | 2.31 | | | | (0.12 | ) | | | —(c | ) | | | (0.12 | ) | | | 13.26 | |
Year Ended 3/31/17 | | | 9.95 | | | | 0.12 | | | | 1.12 | | | | — | | | | 1.24 | | | | (0.08 | ) | | | (0.04 | ) | | | (0.12 | ) | | | 11.07 | |
Year Ended 3/31/16 | | | 11.01 | | | | 0.06 | | | | (1.07 | ) | | | — | | | | (1.01 | ) | | | (0.01 | ) | | | (0.04 | ) | | | (0.05 | ) | | | 9.95 | |
Class R6 | | | | | | | | | | | | | | | | | | | | | | | | | | | | | | | | | | | | |
Six Months Ended 9/30/20 (Unaudited) | | | $ 9.72 | | | | 0.07 | | | | 2.68 | | | | — | | | | 2.75 | | | | — | | | | — | | | | — | | | | $ 12.47 | |
Year Ended 3/31/20 | | | 12.07 | | | | 0.38(b | ) | | | (2.34 | ) | | | — | | | | (1.96 | ) | | | (0.38 | ) | | | (0.01 | ) | | | (0.39 | ) | | | 9.72 | |
Year Ended 3/31/19 | | | 13.31 | | | | 0.18 | | | | (0.50 | ) | | | — | | | | (0.32 | ) | | | (0.14 | ) | | | (0.78 | ) | | | (0.92 | ) | | | 12.07 | |
Year Ended 3/31/18 | | | 11.13 | | | | 0.15 | | | | 2.15 | | | | — | | | | 2.30 | | | | (0.12 | ) | | | —(c | ) | | | (0.12 | ) | | | 13.31 | |
Period Ended 3/31/17(d) | | | 10.08 | | | | 0.04 | | | | 1.08 | | | | — | | | | 1.12 | | | | (0.03 | ) | | | (0.04 | ) | | | (0.07 | ) | | | 11.13 | |
| (a) | Per share net investment income (loss) has been calculated using the average daily shares method. |
| (b) | Net investment income per share and the ratio of net investment income to average net assets include $0.27 and 2.30%, for Class A and $0.27 and 2.30% for Class I and $0.28 and 2.30% for the Class R6, respectively, resulting from the special dividend from Naspers LTD/Prosus in September 2019. |
| (c) | Less than $0.01 or $(0.01) per share. |
| (d) | For the period from November 22, 2016 (commencement of operations) to March 31, 2017. |
39
RBC Emerging Markets Equity Fund
(Selected data for a share outstanding throughout the periods indicated)
| | | | | | | | | | | | | | | | | | | | | | | | | | | | | | |
| | | | | Ratios/Supplemental Data |
| | | Total
Return(a)(b) | | Net Assets,
End of
Period (000’s) | | Ratio of
Net Expenses
to Average
Net Assets | | Ratio of
Net Investment
Income (Loss)
to Average
Net Assets | | Ratio of
Expenses to
Average Net
Assets* | | Portfolio
Turnover
Rate** |
Class A | | | | | | | | | | | | | | | | | | | | | | | | | | | | | | |
Six Months Ended 9/30/20 (Unaudited) | | | | 28.21 | %(c) | | | $ | 18,835 | | | | | 1.13 | %(d) | | | | 1.10 | %(d) | | | | 1.37 | %(d) | | | | 7 | % |
Year Ended 3/31/20 | | | | (17.22 | )% | | | | 19,435 | | | | | 1.13 | % | | | | 3.19 | %(e) | | | | 1.36 | % | | | | 20 | % |
Year Ended 3/31/19 | | | | (1.90 | )% | | | | 14,815 | | | | | 1.13 | % | | | | 1.74 | % | | | | 1.47 | % | | | | 19 | % |
Year Ended 3/31/18 | | | | 20.42 | %(f) | | | | 48,235 | | | | | 1.03 | %(g) | | | | 0.76 | % | | | | 1.55 | % | | | | 42 | % |
Year Ended 3/31/17 | | | | 12.42 | % | | | | 5,115 | | | | | 0.98 | % | | | | 1.09 | % | | | | 1.80 | % | | | | 19 | % |
Year Ended 3/31/16 | | | | (9.39 | )% | | | | 2,540 | | | | | 1.14 | %(h) | | | | 0.71 | % | | | | 2.74 | % | | | | 19 | % |
Class I | | | | | | | | | | | | | | | | | | | | | | | | | | | | | | |
Six Months Ended 9/30/20 (Unaudited) | | | | 28.34 | %(c) | | | $ | 1,504,590 | | | | | 0.88 | %(d) | | | | 1.31 | %(d) | | | | 0.99 | %(d) | | | | 7 | % |
Year Ended 3/31/20 | | | | (16.97 | )% | | | | 1,047,077 | | | | | 0.88 | % | | | | 3.65 | %(e) | | | | 1.02 | % | | | | 20 | % |
Year Ended 3/31/19 | | | | (1.71 | )% | | | | 766,141 | | | | | 0.88 | % | | | | 1.46 | % | | | | 1.08 | % | | | | 19 | % |
Year Ended 3/31/18 | | | | 20.81 | %(f) | | | | 556,822 | | | | | 0.78 | %(g) | | | | 1.20 | % | | | | 1.18 | % | | | | 42 | % |
Year Ended 3/31/17 | | | | 12.56 | % | | | | 223,971 | | | | | 0.73 | % | | | | 1.18 | % | | | | 1.30 | % | | | | 19 | % |
Year Ended 3/31/16 | | | | (9.18 | )% | | | | 75,250 | | | | | 0.75 | %(h) | | | | 0.62 | % | | | | 1.89 | % | | | | 19 | % |
Class R6 | | | | | | | | | | | | | | | | | | | | | | | | | | | | | | |
Six Months Ended 9/30/20 (Unaudited) | | | | 28.29 | %(c) | | | $ | 211,313 | | | | | 0.88 | %(d) | | | | 1.30 | %(d) | | | | 0.89 | %(d) | | | | 7 | % |
Year Ended 3/31/20 | | | | (16.97 | )% | | | | 146,156 | | | | | 0.88 | % | | | | 3.20 | %(e) | | | | 0.91 | % | | | | 20 | % |
Year Ended 3/31/19 | | | | (1.62 | )% | | | | 99,198 | | | | | 0.88 | % | | | | 1.47 | % | | | | 0.98 | % | | | | 19 | % |
Year Ended 3/31/18 | | | | 20.63 | %(f) | | | | 44,584 | | | | | 0.77 | %(g) | | | | 1.16 | % | | | | 1.09 | % | | | | 42 | % |
Period Ended 3/31/17(i) | | | | 11.20 | %(c) | | | | 23,224 | | | | | 0.73 | %(d) | | | | 0.95 | %(d) | | | | 1.28 | %(d) | | | | 19 | % |
| * | During the period, certain fees were contractually or voluntarily reduced and/or reimbursed. If such contractual/voluntary fee reductions and reimbursements had not occurred, the ratio would have been as indicated. |
| ** | Portfolio turnover rate is calculated on the basis of the Fund as a whole without distinguishing between the classes of shares issued. |
| (a) | Excludes sales charge. |
| (b) | Assumes investment at net asset value at the beginning of the period, reinvestment of all dividends and distributions, and a complete redemption of the investment at net asset value at the end of the period. |
40
RBC Emerging Markets Equity Fund
(Selected data for a share outstanding throughout the periods indicated)
| (e) | Net investment income per share and the ratio of net investment income to average net assets include $0.27 and 2.30%, for Class A and $0.27 and 2.30% for Class I and $0.28 and 2.30% for the Class R6, respectively, resulting from the special dividend from Naspers LTD/Prosus in September 2019. |
| (f) | Includes a payment made by the sub-advisor. The impact of the payment to total returns for each class is 0.17%. |
| (g) | Beginning January 2, 2018, the net operating expenses were contractually limited to 1.13%, 0.88% and 0.88% of average daily net assets for Class A, Class I and Class R6, respectively. The ratio of net expenses to average net assets represents a blended percentage for the period ended March 31, 2018. |
| (h) | Beginning August 3, 2015, the net operating expenses were contractually limited to 0.975% and 0.725% of average daily net assets for Class A and Class I respectively. The ratio of net expenses to average net assets represents a blended percentage for the year ended March 31, 2016. |
| (i) | For the period from November 22, 2016 (commencement of operations) to March 31, 2017. |
See Notes to the Financial Statements.
41
RBC Emerging Markets Small Cap Equity Fund
(Selected data for a share outstanding throughout the periods indicated)
| | | | | | | | | | | | | | | | | | | | | | | | | | | | | | | | | | | | | | | | |
| | | | | Investment Activities | | Distributions | | |
| | | Net Asset
Value,
Beginning
of Period | | Net
Investment
Income(a) | | Net Realized
and Unrealized
Gains (Losses)
on Investments | | Total from
Investment
Activities | | Net
Investment
Income | | Net
Realized
Gains | | Total
Distributions | | Net Asset
Value, End
of Period |
Class A | | | | | | | | | | | | | | | | | | | | | | | | | | | | | | | | | | | | | | | | |
Six Months Ended 9/30/20 (Unaudited) | | | | $ 6.60 | | | | | 0.05 | | | | | 1.93 | | | | | 1.98 | | | | | — | | | | | — | | | | | — | | | | | $ 8.58 | |
Year Ended 3/31/20 | | | | 10.33 | | | | | 0.13 | | | | | (3.36 | ) | | | | (3.23 | ) | | | | (0.31 | ) | | | | (0.19 | ) | | | | (0.50 | ) | | | | 6.60 | |
Year Ended 3/31/19 | | | | 11.48 | | | | | 0.11 | | | | | (1.16 | ) | | | | (1.05 | ) | | | | — | | | | | (0.10 | ) | | | | (0.10 | ) | | | | 10.33 | |
Year Ended 3/31/18 | | | | 10.15 | | | | | 0.06 | | | | | 1.54 | | | | | 1.60 | | | | | (0.26 | ) | | | | (0.01 | ) | | | | (0.27 | ) | | | | 11.48 | |
Year Ended 3/31/17 | | | | 9.35 | | | | | 0.06 | | | | | 1.14 | | | | | 1.20 | | | | | (0.40 | ) | | | | — | | | | | (0.40 | ) | | | | 10.15 | |
Year Ended 3/31/16 | | | | 10.49 | | | | | 0.12 | | | | | (1.16 | ) | | | | (1.04 | ) | | | | (0.02 | ) | | | | (0.08 | ) | | | | (0.10 | ) | | | | 9.35 | |
Class I | | | | | | | | | | | | | | | | | | | | | | | | | | | | | | | | | | | | | | | | |
Six Months Ended 9/30/20 (Unaudited) | | | | $ 6.65 | | | | | 0.06 | | | | | 1.95 | | | | | 2.01 | | | | | — | | | | | — | | | | | — | | | | | $ 8.66 | |
Year Ended 3/31/20 | | | | 10.34 | | | | | 0.14 | | | | | (3.37 | ) | | | | (3.23 | ) | | | | (0.27 | ) | | | | (0.19 | ) | | | | (0.46 | ) | | | | 6.65 | |
Year Ended 3/31/19 | | | | 11.49 | | | | | 0.13 | | | | | (1.16 | ) | | | | (1.03 | ) | | | | (0.02 | ) | | | | (0.10 | ) | | | | (0.12 | ) | | | | 10.34 | |
Year Ended 3/31/18 | | | | 10.15 | | | | | 0.09 | | | | | 1.55 | | | | | 1.64 | | | | | (0.29 | ) | | | | (0.01 | ) | | | | (0.30 | ) | | | | 11.49 | |
Year Ended 3/31/17 | | | | 9.35 | | | | | 0.08 | | | | | 1.15 | | | | | 1.23 | | | | | (0.43 | ) | | | | — | | | | | (0.43 | ) | | | | 10.15 | |
Year Ended 3/31/16 | | | | 10.49 | | | | | 0.14 | | | | | (1.15 | ) | | | | (1.01 | ) | | | | (0.05 | ) | | | | (0.08 | ) | | | | (0.13 | ) | | | | 9.35 | |
| (a) | Per share net investment income (loss) has been calculated using the average daily shares method. |
42
RBC Emerging Markets Small Cap Equity Fund
(Selected data for a share outstanding throughout the periods indicated)
| | | | | | | | | | | | | | | | | | | | | | | | | | | | | | |
| | | | | Ratios/Supplemental Data |
| | | Total
Return(a)(b) | | Net Assets,
End of
Period (000’s) | | Ratio of
Net Expenses
to Average
Net Assets | | Ratio of
Net Investment
Income (Loss)
to Average
Net Assets | | Ratio of
Expenses to
Average Net
Assets* | | Portfolio
Turnover
Rate** |
Class A | | | | | | | | | | | | | | | | | | | | | | | | | | | | | | |
Six Months Ended 9/30/20 (Unaudited) | | | | 30.15 | %(c) | | | $ | 2,428 | | | | | 1.57 | %(d)(e) | | | | 1.26 | %(d) | | | | 4.75 | %(d) | | | | 16 | % |
Year Ended 3/31/20 | | | | (32.71 | )% | | | | 1,876 | | | | | 1.70 | % | | | | 1.33 | % | | | | 4.32 | % | | | | 24 | % |
Year Ended 3/31/19 | | | | (9.47 | )% | | | | 2,865 | | | | | 1.70 | % | | | | 1.08 | % | | | | 5.64 | % | | | | 33 | % |
Year Ended 3/31/18 | | | | 16.53 | % | | | | 3,070 | | | | | 1.77 | %(f) | | | | 0.55 | % | | | | 4.66 | % | | | | 26 | % |
Year Ended 3/31/17 | | | | 13.24 | % | | | | 2,625 | | | | | 1.85 | % | | | | 0.57 | % | | | | 5.02 | % | | | | 38 | % |
Year Ended 3/31/16 | | | | (9.86 | )% | | | | 2,319 | | | | | 1.85 | % | | | | 1.25 | % | | | | 5.42 | % | | | | 34 | % |
Class I | | | | | | | | | | | | | | | | | | | | | | | | | | | | | | |
Six Months Ended 9/30/20 (Unaudited) | | | | 30.23 | %(c) | | | $ | 5,912 | | | | | 1.32 | %(d)(e) | | | | 1.51 | %(d) | | | | 4.43 | %(d) | | | | 16 | % |
Year Ended 3/31/20 | | | | (32.54 | )% | | | | 4,653 | | | | | 1.45 | % | | | | 1.52 | % | | | | 4.06 | % | | | | 24 | % |
Year Ended 3/31/19 | | | | (9.28 | )% | | | | 6,383 | | | | | 1.45 | % | | | | 1.27 | % | | | | 5.28 | % | | | | 33 | % |
Year Ended 3/31/18 | | | | 16.89 | % | | | | 3,766 | | | | | 1.52 | %(f) | | | | 0.81 | % | | | | 4.43 | % | | | | 26 | % |
Year Ended 3/31/17 | | | | 13.53 | % | | | | 2,907 | | | | | 1.60 | % | | | | 0.84 | % | | | | 4.76 | % | | | | 38 | % |
Year Ended 3/31/16 | | | | (9.60 | )% | | | | 2,347 | | | | | 1.60 | % | | | | 1.50 | % | | | | 5.17 | % | | | | 34 | % |
| * | During the period, certain fees were contractually or voluntarily reduced and/or reimbursed. If such contractual/voluntary fee reductions and reimbursements had not occurred, the ratio would have been as indicated. |
| ** | Portfolio turnover rate is calculated on the basis of the Fund as a whole without distinguishing between the classes of shares issued. |
| (a) | Excludes sales charge. |
| (b) | Assumes investment at net asset value at the beginning of the period, reinvestment of all dividends and distributions, and a complete redemption of the investment at net asset value at the end of the period. |
| (e) | Beginning June 18, 2020, the net operating expenses were contractually limited to 1.49% and 1.24% of average daily net assets for Class A and Class I, respectively. The ratio of net expenses to average net assets represents a blended percentage for the period ended September 30, 2020. |
43
RBC Emerging Markets Small Cap Equity Fund
(Selected data for a share outstanding throughout the periods indicated)
| (f) | Beginning October 2, 2017, the net operating expenses were contractually limited to 1.70% and 1.45% of average daily net assets for Class A and Class I, respectively. The ratio of net expenses to average net assets represents a blended percentage for the period ended March 31, 2018. |
See Notes to the Financial Statements.
44
RBC Emerging Markets Value Equity Fund
(Selected data for a share outstanding throughout the periods indicated)
| | | | | | | | | | | | | | | | | | | | | | | | | | | | | | | | | | | | | | | | |
| | | | | Investment Activities | | Distributions | | |
| | | Net Asset
Value,
Beginning
of Period | | Net
Investment
Income(a) | | Net Realized
and Unrealized
Gains (Losses)
on Investments | | Total from
Investment
Activities | | Net
Investment
Income | | Net
Realized
Gains | | Total
Distributions | | Net Asset
Value, End
of Period |
Class I | | | | | | | | | | | | | | | | | | | | | | | | | | | | | | | | | | | | | | | | |
Six Months Ended 9/30/20 (Unaudited) | | | $ | 6.42 | | | | | 0.07 | | | | | 1.79 | | | | | 1.86 | | | | | — | | | | | — | | | | | — | | | | $ | 8.28 | |
Year Ended 3/31/20 | | | | 8.74 | | | | | 0.33 | (b) | | | | (2.31 | ) | | | | (1.98 | ) | | | | (0.34 | ) | | | | — | | | | | (0.34 | ) | | | | 6.42 | |
Year Ended 3/31/19 | | | | 10.17 | | | | | 0.21 | | | | | (1.44 | ) | | | | (1.23 | ) | | | | (0.18 | ) | | | | (0.02 | ) | | | | (0.20 | ) | | | | 8.74 | |
Period Ended 3/31/18(c) | | | | 10.00 | | | | | 0.02 | | | | | 0.15 | | | | | 0.17 | | | | | — | | | | | — | | | | | — | | | | | 10.17 | |
Class R6 | | | | | | | | | | | | | | | | | | | | | | | | | | | | | | | | | | | | | | | | |
Six Months Ended 9/30/20 (Unaudited) | | | $ | 6.42 | | | | | 0.09 | | | | | 1.77 | | | | | 1.86 | | | | | — | | | | | — | | | | | — | | | | $ | 8.28 | |
Year Ended 3/31/20 | | | | 8.74 | | | | | 0.34 | (b) | | | | (2.31 | ) | | | | (1.97 | ) | | | | (0.35 | ) | | | | — | | | | | (0.35 | ) | | | | 6.42 | |
Year Ended 3/31/19 | | | | 10.17 | | | | | 0.21 | | | | | (1.43 | ) | | | | (1.22 | ) | | | | (0.19 | ) | | | | (0.02 | ) | | | | (0.21 | ) | | | | 8.74 | |
Period Ended 3/31/18(c) | | | | 10.00 | | | | | 0.02 | | | | | 0.15 | | | | | 0.17 | | | | | — | | | | | — | | | | | — | | | | | 10.17 | |
| (a) | Per share net investment income (loss) has been calculated using the average daily shares method. |
| (b) | Net investment income per share and the ratio of net investment income to average net assets include $0.14 and 1.63% for Class I and $0.14 and 1.63% for Class R6, respectively, resulting form the special dividend from Naspers LTD/Prosus in September 2019. |
| (c) | For the period from February 9, 2018 (commencement of operations) to March 31, 2018. |
45
RBC Emerging Markets Value Equity Fund
(Selected data for a share outstanding throughout the periods indicated)
| | | | | | | | | | | | | | | | | | | | | | | | | | | | | | |
| | | | | Ratios/Supplemental Data |
| | | Total
Return(a) | | Net Assets,
End of
Period (000’s) | | Ratio of
Net Expenses
to Average
Net Assets | | Ratio of
Net Investment
Income (Loss)
to Average
Net Assets | | Ratio of
Expenses to
Average Net
Assets* | | Portfolio
Turnover
Rate** |
Class I | | | | | | | | | | | | | | | | | | | | | | | | | | | | | | |
Six Months Ended 9/30/20 (Unaudited) | | | | 28.97 | %(b) | | | $ | 28,746 | | | | | 0.95 | %(c) | | | | 1.98 | %(c) | | | | 3.20 | %(c) | | | | 26 | % |
Year Ended 3/31/20 | | | | (23.71 | )% | | | | 1,762 | | | | | 0.95 | %(c) | | | | 3.91 | %(c)(d) | | | | 6.68 | %(c) | | | | 71 | % |
Year Ended 3/31/19 | | | | (12.04 | )% | | | | 2,245 | | | | | 0.77 | %(c)(e) | | | | 2.35 | %(c) | | | | 7.02 | %(c) | | | | 75 | % |
Period Ended 3/31/18(f) | | | | 1.90 | %(b) | | | | 2,543 | | | | | 1.11 | %(c) | | | | 1.75 | %(c) | | | | 9.98 | %(c) | | | | 27 | % |
Class R6 | | | | | | | | | | | | | | | | | | | | | | | | | | | | | | |
Six Months Ended 9/30/20 (Unaudited) | | | | 28.97 | %(b) | | | $ | 2,209 | | | | | 0.88 | %(c) | | | | 2.28 | %(c) | | | | 5.48 | %(c) | | | | 26 | % |
Year Ended 3/31/20 | | | | (23.58 | )% | | | | 1,712 | | | | | 0.88 | %(c) | | | | 3.99 | %(c)(d) | | | | 6.67 | %(c) | | | | 71 | % |
Year Ended 3/31/19 | | | | (11.98 | )% | | | | 2,242 | | | | | 0.71 | %(c)(e) | | | | 2.41 | %(c) | | | | 6.96 | %(c) | | | | 75 | % |
Period Ended 3/31/18(f) | | | | 1.90 | %(b) | | | | 2,543 | | | | | 1.06 | %(c) | | | | 1.80 | %(c) | | | | 9.60 | %(c) | | | | 27 | % |
| * | During the period, certain fees were contractually or voluntarily reduced and/or reimbursed. If such contractual/voluntary fee reductions and reimbursements had not occurred, the ratio would have been as indicated. |
| ** | Portfolio turnover rate is calculated on the basis of the Fund as a whole without distinguishing between the classes of shares issued. |
| (a) | Assumes investment at net asset value at the beginning of the period, reinvestment of all dividends and distributions, and a complete redemption of the investment at net asset value at the end of the period. |
| (d) | Net investment income per share and the ratio of net investment income to average net assets include $0.14 and 1.63% for Class I and $0.14 and 1.63% for Class R6, respectively, resulting form the special dividend from Naspers LTD/Prosus in September 2019. |
| (e) | Beginning July 2, 2018, the net operating expenses were contractually limited to 0.95% and 0.88% of average daily net assets for Class I and Class R6, respectively. The ratio of net expenses to average net assets represents a blended percentage for the year ended March 31, 2019. |
| (f) | For the period from February 9, 2018 (commencement of operations) to March 31, 2018. |
See Notes to the Financial Statements.
46
RBC Global Opportunities Fund
(Selected data for a share outstanding throughout the periods indicated)
| | | | | | | | | | | | | | | | | | | | | | | | | | | | | | | | | | | | | | | | | | | | | |
| | | | | Investment Activities | | Distributions | | |
| | | Net Asset
Value,
Beginning
of Period | | Net
Investment
Income(a) | | Net Realized
and Unrealized
Gains (Losses)
on Investments | | Redemption
Fees | | Total from
Investment
Activities | | Net
Investment
Income | | Net
Realized
Gains | | Total
Distributions | | Net Asset
Value, End
of Period |
Class A | | | | | | | | | | | | | | | | | | | | | | | | | | | | | | | | | | | | | | | | | | | | | |
Six Months Ended 9/30/20 (Unaudited) | | | $ | 12.28 | | | | | — | | | | | 4.29 | | | | | — | | | | | 4.29 | | | | | — | | | | | — | | | | | — | | | | $ | 16.57 | |
Period Ended 3/31/20(b) | | | | 15.50 | | | | | 0.02 | | | | | (3.24 | ) | | | | — | | | | | (3.22 | ) | | | | — | | | | | — | | | | | — | | | | | 12.28 | |
Class I | | | | | | | | | | | | | | | | | | | | | | | | | | | | | | | | | | | | | | | | | | | | | |
Six Months Ended 9/30/20 (Unaudited) | | | $ | 12.28 | | | | | 0.02 | | | | | 4.30 | | | | | — | | | | | 4.32 | | | | | — | | | | | — | | | | | — | | | | $ | 16.60 | |
Year Ended 3/31/20 | | | | 14.04 | | | | | 0.20(c) | | | | | (1.53 | ) | | | | — | | | | | (1.33 | ) | | | | (0.16 | ) | | | | (0.27 | ) | | | | (0.43 | ) | | | | 12.28 | |
Year Ended 3/31/19 | | | | 13.69 | | | | | 0.09 | | | | | 0.72 | | | | | — | | | | | 0.81 | | | | | (0.02 | ) | | | | (0.44 | ) | | | | (0.46 | ) | | | | 14.04 | |
Year Ended 3/31/18 | | | | 11.31 | | | | | 0.07 | | | | | 2.82 | | | | | — | | | | | 2.89 | | | | | (0.08 | ) | | | | (0.43 | ) | | | | (0.51 | ) | | | | 13.69 | |
Year Ended 3/31/17 | | | | 10.12 | | | | | 0.07 | | | | | 1.20 | | | | | — | | | | | 1.27 | | | | | (0.08 | ) | | | | — | | | | | (0.08 | ) | | | | 11.31 | |
Year Ended 3/31/16 | | | | 10.31 | | | | | 0.05 | | | | | (0.12 | ) | | | | — | | | | | (0.07 | ) | | | | (0.12 | ) | | | | — | | | | | (0.12 | ) | | | | 10.12 | |
Class R6 | | | | | | | | | | | | | | | | | | | | | | | | | | | | | | | | | | | | | | | | | | | | | |
Six Months Ended 9/30/20 (Unaudited) | | | $ | 12.30 | | | | | 0.02 | | | | | 4.30 | | | | | — | | | | | 4.32 | | | | | — | | | | | — | | | | | — | | | | $ | 16.62 | |
Year Ended 3/31/20 | | | | 14.08 | | | | | 0.16(c) | | | | | (1.48 | ) | | | | — | | | | | (1.32 | ) | | | | (0.19 | ) | | | | (0.27 | ) | | | | (0.46 | ) | | | | 12.30 | |
Year Ended 3/31/19 | | | | 13.77 | | | | | 0.13 | | | | | 0.68 | | | | | — | | | | | 0.81 | | | | | (0.06 | ) | | | | (0.44 | ) | | | | (0.50 | ) | | | | 14.08 | |
Year Ended 3/31/18 | | | | 11.39 | | | | | 0.07 | | | | | 2.85 | | | | | — | | | | | 2.92 | | | | | (0.11 | ) | | | | (0.43 | ) | | | | (0.54 | ) | | | | 13.77 | |
Period Ended 3/31/17(d) | | | | 10.42 | | | | | —(e) | | | | | 0.97 | | | | | — | | | | | 0.97 | | | | | — | | | | | — | | | | | — | | | | | 11.39 | |
| (a) | Per share net investment income (loss) has been calculated using the average daily shares method. |
| (b) | For the period from January 28, 2020 (commencement of operations) to March 31. 2020. |
| (c) | Net investment income per share and the ratio of net investment income to average net assets include $0.13 and 0.87% for Class I and $0.12 and 0.87% for Class R6, respectively, resulting from the special dividend from Naspers LTD/Prosus in September 2019. |
| (d) | For the period from November 22, 2016 (commencement of operations) to March 31, 2017. |
| (e) | Less than $0.01 or $(0.01) per share. |
47
RBC Global Opportunities Fund
(Selected data for a share outstanding throughout the periods indicated)
| | | | | | | | | | | | | | | | | | | | | | | | | | | | | | |
| | | | | Ratios/Supplemental Data |
| | | Total
Return(a) | | Net Assets,
End of
Period (000’s) | | Ratio of
Net Expenses
to Average
Net Assets | | Ratio of
Net Investment
Income (Loss)
to Average
Net Assets | | Ratio of
Expenses to
Average Net
Assets* | | Portfolio
Turnover
Rate** |
Class A | | | | | | | | | | | | | | | | | | | | | | | | | | | | | | |
Six Months Ended 9/30/20 (Unaudited) | | | | 34.93 | %(b) | | | $ | 14 | | | | | 1.04 | %(c)(d) | | | | 0.01 | %(c) | | | | 32.46 | %(c) | | | | 34% | |
Period Ended 3/31/20(e) | | | | (20.77 | )%(b) | | | | 8 | | | | | 1.11 | %(c) | | | | 0.82 | %(c) | | | | 1.64 | %(c) | | | | 23% | |
Class I | | | | | | | | | | | | | | | | | | | | | | | | | | | | | | |
Six Months Ended 9/30/20 (Unaudited) | | | | 35.18 | %(b) | | | $ | 79,475 | | | | | 0.79 | %(c)(d) | | | | 0.26 | %(c) | | | | 1.02 | %(c) | | | | 34% | |
Year Ended 3/31/20 | | | | (10.10 | )% | | | | 58,090 | | | | | 0.86 | % | | | | 1.35 | %(f) | | | | 1.25 | % | | | | 23% | |
Year Ended 3/31/19 | | | | 6.49 | % | | | | 18,873 | | | | | 0.86 | % | | | | 0.64 | % | | | | 1.94 | % | | | | 28% | |
Year Ended 3/31/18 | | | | 25.71 | % | | | | 11,236 | | | | | 0.94 | %(g) | | | | 0.50 | % | | | | 2.52 | % | | | | 30% | |
Year Ended 3/31/17 | | | | 12.58 | % | | | | 7,102 | | | | | 1.05 | % | | | | 0.65 | % | | | | 3.26 | % | | | | 36% | |
Year Ended 3/31/16 | | | | (0.63 | )% | | | | 5,197 | | | | | 1.05 | % | | | | 0.48 | % | | | | 3.97 | % | | | | 34% | |
Class R6 | | | | | | | | | | | | | | | | | | | | | | | | | | | | | | |
Six Months Ended 9/30/20 (Unaudited) | | | | 35.12 | %(b) | | | $ | 31,988 | | | | | 0.73 | %(c)(d) | | | | 0.32 | %(c) | | | | 0.95 | %(c) | | | | 34% | |
Year Ended 3/31/20 | | | | (10.01 | )% | | | | 788 | | | | | 0.81 | % | | | | 1.19 | %(f) | | | | 5.44 | % | | | | 23% | |
Year Ended 3/31/19 | | | | 6.54 | % | | | | 55 | | | | | 0.81 | % | | | | 0.95 | % | | | | 18.77 | % | | | | 28% | |
Year Ended 3/31/18 | | | | 25.80 | % | | | | 14 | | | | | 0.90 | %(g) | | | | 0.56 | % | | | | 30.59 | % | | | | 30% | |
Period Ended 3/31/17(h) | | | | 9.31 | %(b) | | | | 11 | | | | | 1.00 | %(c) | | | | 0.10 | %(c) | | | | 77.25 | %(c) | | | | 36% | |
| * | During the period, certain fees were contractually or voluntarily reduced and/or reimbursed. If such contractual/voluntary fee reductions and reimbursements had not occurred, the ratio would have been as indicated. |
| ** | Portfolio turnover rate is calculated on the basis of the Fund as a whole without distinguishing between the classes of shares issued. |
| (a) | Assumes investment at net asset value at the beginning of the period, reinvestment of all dividends and distributions, and a complete redemption of the investment at net asset value at the end of the period. |
| (d) | Beginning June 18, 2020, the net operating expenses were contractually limited to 1.00%, 0.75% and 0.70% of average daily net assets for Class A and Class I and Class R6, respectively. The ratio of net expenses to average net assets represents a blended percentage for the period ended September 30, 2020. |
| (e) | For the period from January 28, 2020 (commencement of operations) to March 31. 2020. |
48
RBC Global Opportunities Fund
(Selected data for a share outstanding throughout the periods indicated)
| (f) | Net investment income per share and the ratio of net investment income to average net assets include $0.13 and 0.87% for Class I and $0.12 and 0.87% for Class R6, respectively, resulting from the special dividend from Naspers LTD/Prosus in September 2019. |
| (g) | Beginning October 2, 2017, the net operating expenses were contractually limited to 0.86% and 0.81% of average daily net assets for Class I and Class R6, respectively. The ratio of net expenses to average net assets represents a blended percentage for the period ended March 31, 2018. |
| (h) | For the period from November 22, 2016 (commencement of operations) to March 31, 2017. |
See Notes to the Financial Statements.
49
RBC International Opportunities Fund
(Selected data for a share outstanding throughout the periods indicated)
| | | | | | | | | | | | | | | | | | | | | | | | | | | | | | | | | | | | |
| | | | | | Investment Activities | | | Distributions | | | | |
| | | Net Asset | | | | | | Net Realized | | | | | | | | | | | | | | | | | | | |
| | | Value, | | | Net | | | and Unrealized | | | | | | Total from | | | Net | | | Net | | | | | | Net Asset | |
| | | Beginning | | | Investment | | | Gains (Losses) | | | Redemption | | | Investment | | | Investment | | | Realized | | | Total | | | Value, End | |
| | | of Period | | | Income(a) | | | on Investments | | | Fees | | | Activities | | | Income | | | Gains | | | Distributions | | | of Period | |
Class A | | | | | | | | | | | | | | | | | | | | | | | | | | | | | | | | | | | | |
Six Months Ended 9/30/20 (Unaudited) | | | $ 8.41 | | | | 0.01 | | | | 2.45 | | | | — | | | | 2.46 | | | | — | | | | — | | | | — | | | | $10.87 | |
Period Ended 3/31/20(b) | | | 11.03 | | | | 0.02 | | | | (2.64) | | | | — | | | | (2.62) | | | | — | | | | — | | | | — | | | | 8.41 | |
Class I | | | | | | | | | | | | | | | | | | | | | | | | | | | | | | | | | | | | |
Six Months Ended 9/30/20 (Unaudited) | | | $ 8.41 | | | | 0.05 | | | | 2.53 | | | | — | | | | 2.58 | | | | — | | | | — | | | | — | | | | $10.99 | |
Year Ended 3/31/20 | | | 10.27 | | | | 0.29(c) | | | | (1.70) | | | | — | | | | (1.41) | | | | (0.31) | | | | (0.14) | | | | (0.45) | | | | 8.41 | |
Year Ended 3/31/19 | | | 11.39 | | | | 0.18 | | | | (0.56) | | | | — | | | | (0.38) | | | | (0.10) | | | | (0.64) | | | | (0.74) | | | | 10.27 | |
Year Ended 3/31/18 | | | 9.69 | | | | 0.11 | | | | 1.88 | | | | — | | | | 1.99 | | | | (0.12) | | | | (0.17) | | | | (0.29) | | | | 11.39 | |
Year Ended 3/31/17 | | | 9.47 | | | | 0.09 | | | | 0.18 | | | | — | | | | 0.27 | | | | (0.05) | | | | — | | | | (0.05) | | | | 9.69 | |
Year Ended 3/31/16 | | | 10.21 | | | | 0.12 | | | | (0.69) | | | | — | | | | (0.57) | | | | (0.17) | | | | — | | | | (0.17) | | | | 9.47 | |
Class R6 | | | | | | | | | | | | | | | | | | | | | | | | | | | | | | | | | | | | |
Six Months Ended 9/30/20 (Unaudited) | | | $ 8.46 | | | | 0.05 | | | | 2.55 | | | | — | | | | 2.60 | | | | — | | | | — | | | | — | | | | $11.06 | |
Year Ended 3/31/20 | | | 10.33 | | | | 0.29(c) | | | | (1.70) | | | | — | | | | (1.41) | | | | (0.32) | | | | (0.14) | | | | (0.46) | | | | 8.46 | |
Year Ended 3/31/19 | | | 11.44 | | | | 0.18 | | | | (0.55) | | | | — | | | | (0.37) | | | | (0.10) | | | | (0.64) | | | | (0.74) | | | | 10.33 | |
Year Ended 3/31/18 | | | 9.74 | | | | 0.13 | | | | 1.88 | | | | — | | | | 2.01 | | | | (0.14) | | | | (0.17) | | | | (0.31) | | | | 11.44 | |
Period Ended 3/31/17(d) | | | 9.11 | | | | 0.02 | | | | 0.61 | | | | — | | | | 0.63 | | | | —(e) | | | | — | | | | —(e) | | | | 9.74 | |
| (a) | Per share net investment income (loss) has been calculated using the average daily shares method. |
| (b) | For the period from January 28, 2020 (commencement of operations) to March 31. 2020. |
| (c) | Net investment income per share and the ratio of net investment income to average net assets include $0.17 and 1.58% for Class I and $0.17 and 1.58% for Class R6, respectively, resulting from the special dividend from Naspers LTD/Prosus in September 2019. |
| (d) | For the period from November 22, 2016 (commencement of operations) to March 31, 2017. |
| (e) | Less than $0.01 or $(0.01) per share. |
50
RBC International Opportunities Fund
(Selected data for a share outstanding throughout the periods indicated)
| | | | | | | | | | | | | | | | | | | | | | | | |
| | | | | | Ratios/Supplemental Data | |
| | | | | | | | | | | | Ratio of | | | | | | | |
| | | | | | | | | Ratio of | | | Net Investment | | | Ratio of | | | | |
| | | | | | Net Assets, | | | Net Expenses | | | Income (Loss) | | | Expenses to | | | Portfolio | |
| | | Total | | | End of | | | to Average | | | to Average | | | Average Net | | | Turnover | |
| | | Return(a) | | | Period (000’s) | | | Net Assets | | | Net Assets | | | Assets* | | | Rate** | |
Class A | | | | | | | | | | | | | | | | | | | | | | | | |
Six Months Ended 9/30/20 (Unaudited) | | | 29.25%(b) | | | $ | 10 | | | | 1.10%(c)(d) | | | | 0.15%(c) | | | | 2.21%(c) | | | | 27% | |
Period Ended 3/31/20(e) | | | (23.75)%(b) | | | | 8 | | | | 1.14%(c) | | | | 1.42%(c) | | | | 1.38%(c) | | | | 45% | |
Class I | | | | | | | | | | | | | | | | | | | | | | | | |
Six Months Ended 9/30/20 (Unaudited) | | | 30.52%(b) | | | $ | 134,166 | | | | 0.83%(c)(d) | | | | 0.95%(c) | | | | 1.06%(c) | | | | 27% | |
Year Ended 3/31/20 | | | (14.68)% | | | | 73,562 | | | | 0.89% | | | | 2.76%(f) | | | | 1.21% | | | | 45% | |
Year Ended 3/31/19 | | | (2.46)% | | | | 66,202 | | | | 0.89%(g) | | | | 1.71% | | | | 1.26%(g) | | | | 49% | |
Year Ended 3/31/18 | | | 20.82% | | | | 65,372 | | | | 0.94%(h) | | | | 1.03% | | | | 1.32% | | | | 45% | |
Year Ended 3/31/17 | | | 2.85% | | | | 25,145 | | | | 1.00% | | | | 0.99% | | | | 1.84% | | | | 38% | |
Year Ended 3/31/16 | | | (5.52)% | | | | 5,483 | | | | 1.00% | | | | 1.23% | | | | 3.92% | | | | 35% | |
Class R6 | | | | | | | | | | | | | | | | | | | | | | | | |
Six Months Ended 9/30/20 (Unaudited) | | | 30.73%(b) | | | $ | 14 | | | | 0.78%(c)(d) | | | | 1.06%(c) | | | | 28.73%(c) | | | | 27% | |
Year Ended 3/31/20 | | | (14.74)% | | | | 11 | | | | 0.84% | | | | 2.74%(f) | | | | 28.05% | | | | 45% | |
Year Ended 3/31/19 | | | (2.27)% | | | | 13 | | | | 0.84%(g) | | | | 1.69% | | | | 29.90%(g) | | | | 49% | |
Year Ended 3/31/18 | | | 20.75% | | | | 13 | | | | 0.89%(h) | | | | 1.14% | | | | 30.23% | | | | 45% | |
Period Ended 3/31/17(i) | | | 6.96%(b) | | | | 11 | | | | 0.95%(c) | | | | 0.46%(c) | | | | 77.08%(c) | | | | 38% | |
| * | During the period, certain fees were contractually or voluntarily reduced and/or reimbursed. If such contractual/voluntary fee reductions and reimbursements had not occurred, the ratio would have been as indicated. |
| ** | Portfolio turnover rate is calculated on the basis of the Fund as a whole without distinguishing between the classes of shares issued. |
| (a) | Assumes investment at net asset value at the beginning of the period, reinvestment of all dividends and distributions, and a complete redemption of the investment at net asset value at the end of the period. |
| (d) | Beginning June 18, 2020, the net operating expenses were contractually limited to 1.05%, 0.80% and 0.75% of average daily net assets for Class A and Class I and Class R6, respectively. The ratio of net expenses to average net assets represents a blended percentage for the period ended September 30, 2020.. |
| (e) | For the period from January 28, 2020 (commencement of operations) to March 31. 2020. |
51
RBC International Opportunities Fund
(Selected data for a share outstanding throughout the periods indicated)
| (f) | Net investment income per share and the ratio of net investment income to average net assets include $0.17 and 1.58% for Class I and $0.17 and 1.58% for Class R6, respectively, resulting from the special dividend from Naspers LTD/Prosus in September 2019. |
| (g) | Ratios include line of credit interest expense which is less than 0.01%. |
| (h) | Beginning October 2, 2017, the net operating expenses were contractually limited to 0.89% and 0.84% of average daily net assets for Class I and Class R6, respectively. The ratio of net expenses to average net assets represents a blended percentage for the period ended March 31, 2018. |
| (i) | For the period from November 22, 2016 (commencement of operations) to March 31, 2017. |
See Notes to the Financial Statements.
52
NOTES TO FINANCIAL STATEMENTS
September 30, 2020 (Unaudited)
1. Organization:
RBC Funds Trust (the “Trust”) is registered under the Investment Company Act of 1940 (as amended) as an open-end management investment company. The Trust was organized as a Delaware statutory trust on December 16, 2003 and currently consists of 18 portfolios. Overall responsibility for the management of the Trust is vested in its Board of Trustees (the “Board”). This report includes the following five investment portfolios (each a “Fund” and collectively, the “Funds”):
- RBC Emerging Markets Equity Fund (“Emerging Markets Equity Fund”)
- RBC Emerging Markets Small Cap Equity Fund (“Emerging Markets Small Cap Equity Fund”)
- RBC Emerging Markets Value Equity Fund (“Emerging Markets Value Equity Fund”)
- RBC Global Opportunities Fund (“Global Opportunities Fund”)
- RBC International Opportunities Fund (“International Opportunities Fund”)
Emerging Markets Equity Fund, Global Opportunities Fund and International Opportunities Fund each offer three share classes: Class A, Class R6 and Class I shares. Emerging Markets Small Cap Equity Fund offers two share classes: Class A and Class I shares. Emerging Markets Value Equity Fund offers two share classes: Class I and Class R6 shares. Class A shares are offered with a 5.75% maximum front-end sales charge and a 1.00% contingent deferred sales charge (“CDSC”) for redemption within 12 months of a $1 million or greater purchase on which no front-end sales charge was paid. Class I and Class R6 shares (intended for investors meeting certain investment minimum thresholds) are not subject to either a front-end sales charge or a CDSC.
RBC Global Asset Management (U.S.) Inc. (“RBC GAM-US” or “Advisor” or “Co-Administrator”) acts as the investment advisor for the Funds and RBC Global Asset Management (UK) Limited (“RBC GAM-UK” or “Sub-Advisor”) serves as the investment sub-advisor. The officers of the Trust (“Fund Management”) are also employees of RBC GAM-US.
2. Significant Accounting Policies
Each Fund is an investment company that follows accounting and reporting guidance under the Financial Accounting Standards Board. Summarized below are the significant accounting policies of the Funds. These policies conform to accounting principles generally accepted in the United States of America (“U.S. GAAP”). Fund Management follows these policies when preparing financial statements. Fund Management may also be required to make estimates and assumptions that affect the reported amounts of assets and liabilities at the date of the financial statements and the reported amounts of income and expenses for the period. Actual results could differ from those estimates. The financial statements are as of the close of regular trading on the New York Stock Exchange (“NYSE”).
Security Valuation:
The Board has adopted pricing and valuation procedures for determining the fair value of each Fund’s investments. Fair value of a security is considered to be the price that a fund might reasonably expect to receive upon its current sale in an orderly transaction between market participants.
Equity securities are generally valued on the basis of prices furnished by third-party pricing services approved by the Board. Equity securities listed on one or more exchanges shall be valued at the last available quoted sale price on the primary trading exchange as of the regularly scheduled closing time of the exchange and are categorized as Level 1 in the fair value hierarchy. (See “Fair Value Measurements” below for additional information). An equity security not listed on an exchange but listed on NASDAQ shall be valued at the NASDAQ official closing price and is also categorized as Level 1. If there was no sale on the primary exchange on the day the net asset value is calculated or a NASDAQ official closing price is not available, the most recent bid quotation generally will be used and such securities will generally be categorized as Level 2. Investments in open-end investment companies (mutual funds) are valued at net asset value and are categorized as Level 1 in the fair value hierarchy.
Fixed income securities, including to-be-announced (“TBA”) commitments and municipal bonds, are generally valued based on evaluated prices received from third-party pricing services or from
53
NOTES TO FINANCIAL STATEMENTS
broker-dealers who make markets in the securities and are generally categorized as Level 2 in the fair value hierarchy (see “Fair Value Measurements” below for additional information). The pricing services utilize both dealer-supplied valuations and electronic data processing techniques that take into account multiple appropriate factors such as institutional-size trading in similar groups of securities, market spreads, interest rates, and fundamental security analytical data including yield, quality, coupon rate, maturity and type of issue.
Foreign securities valued in non-U.S. dollars are valued in the foreign currency and then converted into the U.S. dollar equivalent using the foreign exchange rate in effect at the close of NYSE on the day the security’s value is determined. The value of securities traded in markets outside the United States may be affected on a day that the NYSE is closed and an investor is not able to purchase, exchange or redeem shares of the Funds.
Many securities markets and exchanges outside of North American and South American time zones close prior to the close of the NYSE; therefore, the closing prices for equity securities in such markets or on such exchanges may not fully reflect events that occur after such close but before the close of the NYSE. The Funds have procedures in place to fair value foreign equity securities traded in countries outside North American and South American time zones daily in order to take into account, among other things, any significant events occurring after the close of trading in a foreign market. The Funds receive adjusted fair value prices from a designated independent pricing vendor. In general, the vendor utilizes a multi-factor model to consider such information as the issue’s closing price, relevant general and sector indices and currency fluctuations to generate an evaluated adjustment factor for each security and provide an evaluated fair value price. The Funds generally categorize such evaluated fair value prices as Level 2 in the fair value hierarchy.
The Board has delegated to the Funds’ Pricing Committee (“Pricing Committee”) the responsibility for implementing the pricing and valuation procedures, including responsibility for determining the fair value of the Funds’ securities or other assets and liabilities. The Pricing Committee includes representatives of the Funds’ Advisor, and Co-Administrator, including personnel from accounting and operations, investment management, trading, risk management and compliance. The Pricing Committee meets at least quarterly to review and approve Fund valuation matters, including a review of the Funds’ pricing activity and operations, fair value measurements, pricing vendors, policies and procedures, and related controls. At least a quorum of the Pricing Committee shall meet more frequently, as needed, to consider and approve time-sensitive fair valuation matters. The Pricing Committee reports to the Valuation, Portfolio Management and Performance Committee (“Valuation Committee”) of the Board. Members of the Pricing Committee meet with the Valuation Committee and the Board at each of their regularly scheduled meetings to discuss valuation matters and actions taken during the period.
The Board has adopted procedures to determine the fair value of a security when a price is not available from a pricing service or broker- dealer or Fund Management determines that a price provided by a pricing service or broker-dealer does not approximate fair value. Fair valuation may also be used when a significant valuation event affecting the value of a security or market sector is determined to have occurred between the time when a security’s market closes and the time the Fund’s net asset value is calculated. The fair value of the security will be determined in good faith by the Pricing Committee in accordance with procedures and methodologies adopted by the Board. General factors used in determining the fair value of securities include, but are not limited to, fundamental analytical data relating to the security, the issuer and the market, such as duration, prepayment and default rates; general level of interest rates and changes in interest rates; information from broker-dealers; trading in similar securities; any restrictions on disposition of the security; and an evaluation of the forces that influence the market in which the investments are traded. These securities are either categorized as Level 2 or 3 in the fair value hierarchy, depending on the relevant inputs used.
When the Funds utilize fair valuation methods that use significant unobservable inputs to determine a security’s value, such securities will be categorized as Level 3 of the fair value hierarchy. These methods may require subjective determinations about the value of a security. While the Funds’ policy is intended to result in a calculation of a Fund’s net asset value that fairly reflects security values as of the time of
54
NOTES TO FINANCIAL STATEMENTS
pricing, the Funds cannot guarantee that values determined by the Board or persons acting at their direction would accurately reflect the price that the Funds could obtain for a security if they were to dispose of it as of the time of pricing (for instance, in a forced or distressed sale). The prices used by the Funds may differ from the value that would be realized if the securities were sold.
The Funds’ Pricing Committee employs various methods for calibrating the valuation approach related to securities categorized within Level 2 and Level 3 of the fair value hierarchy. These methods may include regular due diligence of the Funds’ pricing vendors, a regular review of key inputs and assumptions, transaction back-testing or disposition analysis to compare unrealized gains and losses to realized gains and losses, reviews of missing and stale prices and large movements in market value, and reviews of any market related activities. Additionally, the pricing of all fair value holdings is subsequently reported to the Valuation Committee and Board.
Fair Value Measurements:
The Funds disclose the fair value of their investments in a hierarchy that categorizes investments based on the inputs to valuation techniques used to measure fair value. The three levels of the fair value hierarchy are as follows:
• Level 1 - Inputs that reflect unadjusted quoted prices in active markets for identical assets or liabilities that the Funds have the ability to access at the measurement date.
• Level 2 - Significant inputs other than quoted prices that are observable for the asset or liability either directly or indirectly, including inputs in markets that are not considered to be active. Observable inputs may include quoted prices for similar securities, interest rates, spreads, prepayment spreads, etc.
• Level 3 - Significant unobservable inputs based on the best information available in the circumstances, to the extent observable inputs are not available (including the Fund’s own assumptions in determining the fair value of investments).
The inputs or methodology used for valuing investments are not necessarily an indication of the risk associated with investing in those securities.
Inputs used in determining fair value of an investment may include, but are not limited to, price information, volatility statistics, credit and market data, and other factors, all of which may be either observable or unobservable. Inputs can vary among investments and will be impacted by the investment type and volume of activity for the particular security or similar securities in the market. Investments in the Level 3 category are generally supported by transactions and quoted prices from dealers participating in the market for those investments. Investments may be included in the Level 3 category due to a lack of market activity or transparency. Internal valuation models may also be used as a pricing source for Level 3 investments. Internal valuation models may rely on one or more unobservable inputs, such as estimated cash flows, financial statement analysis and discount rates.
55
NOTES TO FINANCIAL STATEMENTS
The summary of inputs used to determine the fair value of the Funds’ investments as of September 30, 2020 is as follows:
| | | | | | | | | | | | | | | | |
| | | Level 1
Quoted Prices | | | Level 2
Significant
Observable
Inputs | | | Level 3
Significant
Unobservable
Inputs | | | Total | |
Emerging Markets Equity Fund Assets: | | | | | | | | | | | | |
Investments in Securities | | | | | | | | | | | | | | | | |
Common Stocks | | | | | | | | | | | | | | | | |
Argentina | | | $ 10,716,552 | | | | $ — | | | | $— | | | | $ 10,716,552 | |
Bangladesh | | | — | | | | 642,527 | | | | — | | | | 642,527 | |
Brazil | | | 73,896,997 | | | | — | | | | — | | | | 73,896,997 | |
Chile | | | 14,431,777 | | | | 57,456,326 | | | | — | | | | 71,888,103 | |
China | | | 159,387,646 | | | | 254,260,863 | | | | — | | | | 413,648,509 | |
Hong Kong | | | — | | | | 70,720,948 | | | | — | | | | 70,720,948 | |
India | | | 6,356,393 | | | | 264,336,071 | | | | — | | | | 270,692,464 | |
Indonesia | | | — | | | | 44,987,294 | | | | — | | | | 44,987,294 | |
Korea | | | — | | | | 158,927,743 | | | | — | | | | 158,927,743 | |
Mexico | | | 30,955,071 | | | | — | | | | — | | | | 30,955,071 | |
Peru | | | 26,194,127 | | | | — | | | | — | | | | 26,194,127 | |
Philippines | | | — | | | | 41,069,852 | | | | — | | | | 41,069,852 | |
South Africa | | | — | | | | 127,414,454 | | | | — | | | | 127,414,454 | |
Taiwan | | | — | | | | 251,441,419 | | | | — | | | | 251,441,419 | |
Thailand | | | — | | | | 8,806,239 | | | | — | | | | 8,806,239 | |
Turkey | | | — | | | | 21,779,586 | | | | — | | | | 21,779,586 | |
United Kingdom | | | — | | | | 86,898,766 | | | | — | | | | 86,898,766 | |
Investment Company | | | 53,107,826 | | | | — | | | | — | | | | 53,107,826 | |
Total Assets | | | $375,046,389 | | | | $1,388,742,088 | | | | $— | | | | $1,763,788,477 | |
56
NOTES TO FINANCIAL STATEMENTS
| | | | | | | | | | | | | | | | |
| | | Level 1
Quoted Prices | | | Level 2
Significant
Observable
Inputs | | | Level 3
Significant
Unobservable
Inputs | | | Total | |
Emerging Markets Small Cap Equity Fund Assets: | | | | | | | | | | | | |
Investments in Securities | | | | | | | | | | | | | | | | |
Common Stocks | | | | | | | | | | | | | | | | |
Bangladesh | | | $ — | | | | $ 298,384 | | | | $ — | | | | $ 298,384 | |
Brazil | | | 354,817 | | | | — | | | | — | | | | 354,817 | |
Chile | | | 436,261 | | | | — | | | | — | | | | 436,261 | |
China | | | — | | | | 692,568 | | | | — | | | | 692,568 | |
Egypt | | | — | | | | 81,732 | | | | — | | | | 81,732 | |
Hong Kong | | | — | | | | 233,969 | | | | — | | | | 233,969 | |
India | | | — | | | | 1,410,555 | | | | — | | | | 1,410,555 | |
Indonesia | | | — | | | | 175,957 | | | | — | | | | 175,957 | |
Korea | | | — | | | | 713,605 | | | | — | | | | 713,605 | |
Malaysia | | | — | | | | 123,809 | | | | — | | | | 123,809 | |
Mexico | | | 263,195 | | | | — | | | | — | | | | 263,195 | |
Pakistan | | | — | | | | 94,160 | | | | — | | | | 94,160 | |
Peru | | | — | | | | 109,822 | | | | — | | | | 109,822 | |
Philippines | | | — | | | | 562,116 | | | | — | | | | 562,116 | |
South Africa | | | — | | | | 532,319 | | | | — | | | | 532,319 | |
Sri Lanka | | | — | | | | 106,670 | | | | — | | | | 106,670 | |
Taiwan | | | — | | | | 1,514,860 | | | | — | | | | 1,514,860 | |
Thailand | | | — | | | | 74,662 | | | | — | | | | 74,662 | |
United Arab Emirates | | | — | | | | 233,182 | | | | — | | | | 233,182 | |
Preferred Stocks | | | — | | | | 71,441 | | | | 120 | | | | 71,561 | |
Investment Company | | | 247,923 | | | | — | | | | — | | | | 247,923 | |
Total Assets | | | $1,302,196 | | | | $7,029,811 | | | | $120 | | | | $8,332,127 | |
57
NOTES TO FINANCIAL STATEMENTS
| | | | | | | | | | | | | | | | |
| | | | |
| | | Level 1
Quoted Prices | | | Level 2
Significant
Observable
Inputs | | | Level 3
Significant
Unobservable
Inputs | | | Total | |
Emerging Markets Value Equity Fund Assets: | | | | |
Investments in Securities | | | | | | | | | | | | | | | | |
Rights/Warrants | | | $ — | | | | $ 697 | | | | $— | | | | $ 697 | |
Common Stocks | | | | | | | | | | | | | | | | |
Brazil | | | 755,914 | | | | — | | | | — | | | | 755,914 | |
Chile | | | 412,257 | | | | 738,099 | | | | — | | | | 1,150,356 | |
China | | | 3,006,901 | | | | 6,271,397 | | | | — | | | | 9,278,298 | |
Egypt | | | — | | | | 292,673 | | | | — | | | | 292,673 | |
Greece | | | — | | | | 198,198 | | | | — | | | | 198,198 | |
Hong Kong | | | — | | | | 697,384 | | | | — | | | | 697,384 | |
Hungary | | | — | | | | 432,265 | | | | — | | | | 432,265 | |
India | | | — | | | | 2,479,246 | | | | — | | | | 2,479,246 | |
Indonesia | | | — | | | | 196,992 | | | | — | | | | 196,992 | |
Korea | | | — | | | | 5,232,500 | | | | — | | | | 5,232,500 | |
Mexico | | | 783,287 | | | | — | | | | — | | | | 783,287 | |
Pakistan | | | — | | | | 300,957 | | | | — | | | | 300,957 | |
Peru | | | 204,527 | | | | — | | | | — | | | | 204,527 | |
Philippines | | | — | | | | 432,859 | | | | — | | | | 432,859 | |
Russia | | | 105,588 | | | | 960,030 | | | | — | | | | 1,065,618 | |
South Africa | | | — | | | | 1,829,120 | | | | — | | | | 1,829,120 | |
Taiwan | | | — | | | | 3,565,309 | | | | — | | | | 3,565,309 | |
Thailand | | | — | | | | 129,625 | | | | — | | | | 129,625 | |
Turkey | | | — | | | | 182,621 | | | | — | | | | 182,621 | |
United Arab Emirates | | | — | | | | 305,984 | | | | — | | | | 305,984 | |
United States | | | — | | | | 259,844 | | | | — | | | | 259,844 | |
Vietnam | | | — | | | | 262,939 | | | | — | | | | 262,939 | |
Preferred Stocks | | | 819,263 | | | | — | | | | — | | | | 819,263 | |
Investment Company | | | 254,941 | | | | — | | | | — | | | | 254,941 | |
Total Assets | | | $6,342,678 | | | | $24,768,739 | | | | $— | | | | $31,111,417 | |
| | | | | | | | | | | | | | | | |
| | | Level 1
Quoted Prices | | | Level 2 Significant
Observable
Inputs | | | Level 3
Significant
Unobservable
Inputs | | | Total | |
Global Opportunities Fund Assets: | | | | | | | | | | | | |
Investments in Securities | | | | | | | | | | | | | | | | |
Common Stocks | | | | | | | | | | | | | | | | |
Belgium | | | $ — | | | | $ 3,029,458 | | | | $— | | | | $ 3,029,458 | |
Denmark | | | — | | | | 3,939,681 | | | | — | | | | 3,939,681 | |
Finland | | | — | | | | 3,051,912 | | | | — | | | | 3,051,912 | |
Germany | | | — | | | | 4,296,819 | | | | — | | | | 4,296,819 | |
Hong Kong | | | — | | | | 3,535,633 | | | | — | | | | 3,535,633 | |
Japan | | | — | | | | 5,940,470 | | | | — | | | | 5,940,470 | |
Netherlands | | | — | | | | 1,888,763 | | | | — | | | | 1,888,763 | |
South Africa | | | — | | | | 1,923,081 | | | | — | | | | 1,923,081 | |
Spain | | | — | | | | 2,532,081 | | | | — | | | | 2,532,081 | |
Switzerland | | | — | | | | 4,750,695 | | | | — | | | | 4,750,695 | |
Taiwan | | | 3,745,434 | | | | — | | | | — | | | | 3,745,434 | |
United Kingdom | | | — | | | | 6,495,065 | | | | — | | | | 6,495,065 | |
United States | | | 64,822,410 | | | | — | | | | — | | | | 64,822,410 | |
Investment Company | | | 950,503 | | | | — | | | | — | | | | 950,503 | |
Total Assets | | | $69,518,347 | | | | $41,383,658 | | | | $— | | | | $110,902,005 | |
58
NOTES TO FINANCIAL STATEMENTS
| | | | | | | | | | | | | | | | | | | | | | | | | | | | | | | | |
| | | | |
| | | Level 1
Quoted Prices | | | Level 2
Significant
Observable
Inputs | | | Level 3
Significant
Unobservable
Inputs | | | Total | |
International Opportunities Fund Assets: | | | | | | | | | | | | | | | | | | | | | | | | |
Investments in Securities | | | | | | | | | | | | | | | | | | | | | | | | | | | | | | | | |
Rights/Warrants | | | | | | $ | 37,834 | | | | | | | $ | — | | | | | | | $ | — | | | | | | | $ | 37,834 | |
Common Stocks | | | | | | | | | | | | | | | | | | | | | | | | | | | | | | | | |
Argentina | | | | | | | 1,298,976 | | | | | | | | — | | | | | | | | — | | | | | | | | 1,298,976 | |
Australia | | | | | | | — | | | | | | | | 5,115,234 | | | | | | | | — | | | | | | | | 5,115,234 | |
Austria | | | | | | | — | | | | | | | | 1,550,876 | | | | | | | | — | | | | | | | | 1,550,876 | |
Belgium | | | | | | | — | | | | | | | | 3,291,770 | | | | | | | | — | | | | | | | | 3,291,770 | |
Denmark | | | | | | | — | | | | | | | | 5,938,042 | | | | | | | | — | | | | | | | | 5,938,042 | |
Finland | | | | | | | — | | | | | | | | 5,320,928 | | | | | | | | — | | | | | | | | 5,320,928 | |
Germany | | | | | | | — | | | | | | | | 6,460,656 | | | | | | | | — | | | | | | | | 6,460,656 | |
Hong Kong | | | | | | | — | | | | | | | | 6,550,524 | | | | | | | | — | | | | | | | | 6,550,524 | |
India | | | | | | | 4,609,609 | | | | | | | | — | | | | | | | | — | | | | | | | | 4,609,609 | |
Ireland | | | | | | | — | | | | | | | | 2,113,425 | | | | | | | | — | | | | | | | | 2,113,425 | |
Japan | | | | | | | — | | | | | | | | 20,670,139 | | | | | | | | — | | | | | | | | 20,670,139 | |
Netherlands | | | | | | | — | | | | | | | | 5,137,514 | | | | | | | | — | | | | | | | | 5,137,514 | |
Singapore | | | | | | | — | | | | | | | | 2,400,731 | | | | | | | | — | | | | | | | | 2,400,731 | |
South Africa | | | | | | | — | | | | | | | | 7,234,339 | | | | | | | | — | | | | | | | | 7,234,339 | |
Spain | | | | | | | — | | | | | | | | 4,689,279 | | | | | | | | — | | | | | | | | 4,689,279 | |
Switzerland | | | | | | | — | | | | | | | | 13,841,002 | | | | | | | | — | | | | | | | | 13,841,002 | |
Taiwan | | | | | | | 9,754,180 | | | | | | | | 2,746,755 | | | | | | | | — | | | | | | | | 12,500,935 | |
Thailand | | | | | | | — | | | | | | | | 3,026,308 | | | | | | | | — | | | | | | | | 3,026,308 | |
United Kingdom | | | | | | | — | | | | | | | | 17,048,124 | | | | | | | | — | | | | | | | | 17,048,124 | |
United States | | | | | | | 2,430,370 | | | | | | | | — | | | | | | | | — | | | | | | | | 2,430,370 | |
Zambia | | | | | | | 1,228,149 | | | | | | | | — | | | | | | | | — | | | | | | | | 1,228,149 | |
| | | | | | | | | | | | | | | | | | | | | | | | | | | | | | | | |
Total Assets | | | | | | $ | 19,359,118 | | | | | | | $ | 113,135,646 | | | | | | | $ | — | | | | | | | $ | 132,494,764 | |
| | | | | | | | | | | | | | | | | | | | | | | | | | | | | | | | |
During the period ended September 30, 2020, the Funds, except Emerging Markets Small Cap Equity Fund, recognized no transfers to/from Level 1 or Level 2. For Emerging Markets Small Cap Equity Fund, transfers to Level 2 from Level 1 in the amount of $109,822 were due to the absence of an active trading market for the securities on September 30, 2020. The Funds’ policy is to recognize transfers between Level 1, Level 2 and Level 3 at the end of the period utilizing fair value at the beginning of the period.
The following is a reconciliation of Level 3 investments for which significant unobservable inputs were used to determine fair value:
| | | | | | | | |
| | | Emerging
Markets Small Cap
Equity Fund | |
| | | Preferred Stocks–
(Philippines) | |
Balance as of 3/31/20(value) | | | | | | $ | 110 | |
Change in unrealized appreciation (depreciation) | | | | | | | 10 | |
| | | | | | | | |
Balance as of 9/30/20(value) | | | | | | $ | 120 | |
| | | | | | | | |
The Funds’ assets assigned to the Level 3 category were valued using market data or trade information specific to the security or comparable issues. However, due to a lack of market activity or corroborating data to support the valuations, the investments were classified as Level 3.
The significant unobservable inputs used in fair value measurement of the Level 3 security shown above include the subscription price paid by the Fund when the preferred shares were received and security-specific characteristics, including whether it may be converted into common shares. Significant changes in any of those inputs in isolation would result in a significantly lower or higher fair value measurement.
59
NOTES TO FINANCIAL STATEMENTS
Repurchase Agreements:
The Funds, may enter into repurchase agreements with counterparties whom the Advisor has deemed creditworthy, including primary dealers that report to the Federal Reserve Bank of New York or other large U.S. commercial banks or broker-dealers. These repurchase agreements are subject to the seller’s agreement to repurchase such securities at a mutually agreed upon date and price. The repurchase price generally equals the price paid by the Funds plus interest negotiated on the basis of current short-term rates.
Securities pledged by the dealers as collateral for repurchase agreements are held by a custodian bank until maturity of the repurchase agreement. The Funds have procedures to monitor additional collateral, if needed, to ensure that the daily market value of the collateral remains in excess of the market value of the repurchase agreement in the event of a default.
There were no repurchase agreements held during the period ended September 30, 2020.
Affiliated Investments:
The Funds invest in another Fund of the Trust (an “Affiliated Fund”), U.S. Government Money Market Fund-RBC Institutional Class 1, as a cash sweep vehicle. The income earned by the Funds from the Affiliated Fund for the period is disclosed in the Statement of Operations. The table below details the transactions of the Funds in the Affiliated Fund.
| | | | | | | | | | | | | | | | | | | | |
| | | Value
March 31, 2020 | | | Purchases | | | Sales | | | Value
September 30, 2020 | | | Dividends | |
Investments in U.S. Government Money Market Fund—RBC Institutional Class 1 | | | | | | | | | | | | | | | | | | | | |
Emerging Markets Equity Fund | | | $4,507,131 | | | | $193,408,602 | | | | $144,807,906 | | | | $53,107,826 | | | | $5,474 | |
Emerging Markets Small Cap Equity Fund | | | 272,478 | | | | 911,926 | | | | 936,481 | | | | 247,923 | | | | 133 | |
Emerging Markets Value Equity Fund | | | — | | | | 7,207,193 | | | | 6,952,252 | | | | 254,941 | | | | 3 | |
Global Opportunities Fund | | | 440,840 | | | | 50,062,692 | | | | 49,553,029 | | | | 950,503 | | | | 239 | |
International Opportunities Fund | | | 7,735 | | | | 27,435,605 | | | | 27,443,340 | | | | — | | | | 492 | |
Investment Transactions and Income:
Investment transactions are recorded on trade date. Dividend income is recorded on the ex- dividend date. In certain foreign markets where declaration of a dividend follows the ex-dividend date, the dividend will be recorded when the Fund is notified of the declaration date. Realized gains and losses from investment transactions are calculated based on the cost of the specific security (also known as identified cost basis). Interest income is recognized on the accrual basis and includes, where applicable, the amortization or accretion of premium or discount using the effective yield method.
60
NOTES TO FINANCIAL STATEMENTS
Expense, Investment Income and Gain/Loss Allocation:
Each Fund pays the expenses that are directly related to its operations, such as custodian fees or advisory fees. Expenses incurred by the Trust, such as trustee or legal fees, are allocated among each of the Funds in the Trust either proportionately based upon each Fund’s relative net assets or using another reasonable basis such as equally across all Funds in the Trust, depending on the nature of the expense. Individual share classes within a Fund are charged expenses specific to that class, such as distribution fees and transfer agent fees. Within a Fund, expenses other than class specific expenses are allocated daily to each class based upon the proportion of relative net assets. Investment income and realized and unrealized gains or losses are allocated to each class of shares based on relative net assets.
Real Estate Investment Trusts:
The Funds may own shares of real estate investment trusts (”REITs“) which report information on the source of their distributions annually. Dividends paid by a REIT, other than capital gain distributions, will be taxable as ordinary income up to the amount of the REIT’s current and accumulated earnings and profits. Capital gain dividends paid by a REIT to a Fund will be treated as long term capital gains by the Fund and, in turn, may be distributed by the Fund to its shareholders as a capital gain distribution. Distributions received from a REIT in excess of its income are recorded as a return of capital and a reduction to the cost basis of the REIT.
Distributions to Shareholders:
Each Fund pays out any income that it receives, less expenses, in the form of dividends and capital gain distributions to its shareholders. Income dividends and capital gain distributions for each Fund are declared and paid at least annually. Distributions to shareholders are recorded on the ex-dividend date. The amount of dividends and distributions are calculated based on federal income tax regulations, which may differ from US GAAP. These “book/tax” differences may be either temporary or permanent in nature. To the extent these differences are determined, as of the end of the tax year, to be permanent, they are reclassified within a Fund’s capital accounts based on their federal tax basis treatment. These differences are primarily due to differing book and tax treatments in the timing and/or treatment of the recognition of net investment income or gain and losses, including foreign currency gains and losses, foreign taxes and partnership transactions.
3. Agreements and Other Transactions with Affiliates:
The Trust has entered into investment advisory agreements with RBC GAM-US under which RBC GAM-US manages each Funds’ assets and furnishes related office facilities, equipment, research and personnel. The agreements require each Fund to pay RBC GAM-US a monthly fee based upon average daily net assets. Under the terms of the agreement, RBC GAM-US is entitled to receive fees based on a percentage of the average daily net assets of each of the Funds as follows:
| | | | |
Emerging Market Equity Fund | | | 0.80 | % |
Emerging Markets Small Cap Equity Fund* | | | 1.04 | % |
Emerging Markets Value Equity Fund | | | 0.80 | % |
Global Opportunities Fund* | | | 0.65 | % |
International Opportunities Fund* | | | 0.70 | % |
* Prior to June 18, 2020, the annual rates for Emerging Markets Small Cap Equity Fund, Global Opportunities Fund and International Opportunities Fund were 1.25%, 0.76% and 0.80%, respectively.
RBC GAM-US has contractually agreed to waive fees and/or make payments in order to keep total operating expenses (excluding certain fees such as interest, taxes and acquired fund fees and expenses) of Class A, Class I and Class R6 shares of each Fund to the following levels:
| | | | | | | | | | | | |
| | | Class A
Annual Rate | | | Class I
Annual Rate | | | Class R6
Annual Rate | |
Emerging Markets Equity Fund | | | 1.13% | | | | 0.88% | | | | 0.88% | |
Emerging Markets Small Cap Equity Fund* | | | 1.49% | | | | 1.24% | | | | N/A | |
61
NOTES TO FINANCIAL STATEMENTS
| | | | | | | | | | | | |
| | | |
| | | Class A
Annual Rate | | | Class I
Annual Rate | | | Class R6
Annual Rate | |
Emerging Markets Value Equity Fund | | | N/A | | | | 0.95% | | | | 0.88% | |
Global Opportunities Fund* | | | 1.00% | | | | 0.75% | | | | 0.70% | |
International Opportunities Fund* | | | 1.05% | | | | 0.80% | | | | 0.75% | |
* Prior to June 18, 2020, the annual rates under the expense limitation agreement were 1.70% for Class A and 1.45% for Class I of Emerging Markets Small Cap Equity Fund; 1.11% for Class A, 0.86% for Class I and 0.81% for Class R6 of Global Opportunities Fund; and 1.14% for Class A, 0.89% for Class I and 0.84% for Class R6 of International Opportunities Fund.
This expense limitation agreement is in place until July 31, 2022 (September 30, 2022 for Emerging Markets Equity Fund) and may not be terminated by RBC GAM-US prior to that date. The agreement shall continue for additional one-year terms unless terminated or revised by the Board at any time or by RBC GAM-US at the expiration of any one-year period. The Advisor is entitled to recoup from the Fund or class the fees and/or operating expenses waived or reimbursed during any of the previous 3 years, provided the Fund is able to do so and remain in compliance with the expense limitation in place at the time the fees were waived or expenses paid.
At September 30, 2020, the amounts subject to possible recoupment under the expense limitation agreement were:
| | | | | | | | | | | | | | | | | | | | |
| | | FYE 3/31/18 | | | FYE 3/31/19 | | | FYE 3/31/20 | | | FYE 3/31/21 | | | Total | |
Emerging Markets Equity Fund | | | $1,198,163 | | | | $1,340,210 | | | | $1,594,901 | | | | $696,796 | | | | $4,830,070 | |
Emerging Markets Small Cap Equity Fund | | | 94,172 | | | | 242,638 | | | | 234,001 | | | | 122,595 | | | | 693,406 | |
Emerging Markets Value Equity Fund | | | 57,844 | | | | 279,515 | | | | 252,132 | | | | 113,772 | | | | 703,263 | |
Global Opportunities Fund | | | 77,179 | | | | 170,557 | | | | 197,222 | | | | 113,595 | | | | 558,553 | |
International Opportunities Fund | | | 139,737 | | | | 231,471 | | | | 266,018 | | | | 133,336 | | | | 770,562 | |
RBC GAM-US voluntarily agreed to waive its investment advisory fees by the amount of investment advisory fees the Funds pay to RBC GAM-US indirectly through its investment in an affiliated money market fund. For the six months ended September 30, 2020, the amount waived was $9,483, $146, $80, $1,074 and $754 for the Emerging Markets Equity Fund, Emerging Markets Small Cap Equity Fund, Emerging Markets Value Equity Fund, Global Opportunities Fund and International Opportunities Fund, respectively, and is included in expenses waived/reimbursed by Advisor in the Statements of Operations.
RBC GAM-US may also voluntarily waive and/or reimburse operating expenses of any Fund from time to time. Any such voluntary program may be changed or eliminated at any time without notice, and expenses waived under such program are not subject to recoupment.
The Funds are sub-advised by RBC GAM-UK, which is a wholly-owned subsidiary of Royal Bank of Canada, which is the parent company of the Advisor. The Sub-Advisor is paid by the Advisor out of the advisory fee paid by the Funds to the Advisor.
RBC GAM-US serves as co-administrator to the Funds. BNY Mellon Investment Servicing (US) Inc. (”BNY Mellon“) serves as co-administrator and fund accounting agent. Services provided under the administrative services contract include providing day-to-day administration of matters related to the Funds, maintenance of their records and the preparation of reports. Under the terms of the administrative services contract, RBC GAM-US does not receive a fee for its role as co-administrator. BNY Mellon receives a fee for its services payable by each Fund based in part on each Fund’s average net assets. BNY Mellon’s fee is included with ”Accounting fees“ in the Statements of Operations.
62
NOTES TO FINANCIAL STATEMENTS
Certain Officers and Trustees of the Trust are affiliated with the Advisor. Such Officers and Trustees receive no compensation from the Funds for serving in their respective roles.
The Trust currently pays each of the independent Trustees (Trustees of the Trust who are not directors, officers or employees of the Advisor, either Co-Administrator or Distributor) an annual retainer of $63,000 ($68,000 effective October 1, 2020). The Board Chairperson and Audit Committee Chairperson each receive an additional retainer of $2,500 annually, and all other trustees serving as Chair of a Board committee each receive an additional retainer of $1,000 annually. In addition, Independent Trustees receive a quarterly meeting fee of $6,500 for each in-person Board meeting attended, a meeting fee of $1,500 for each telephonic or Special Board meeting attended, a $1,500 fee for each Board committee meeting attended, and are reimbursed for all out-of-pocket expenses relating to attendance at such meetings. These amounts are included in the Statement of Operations in ”Trustees’ fees“.
In conjunction with the launch of each of the Funds or additional share classes, the Advisor invested seed capital to provide each Fund or share class with its initial investment assets. The table below shows, as of September 30, 2020, each Fund’s net assets, the shares of each Fund held by the Advisor, and the percent of total net assets represented by the Advisor’s investment.
| | | | | | | | | | | | |
| | | Net Assets | | | Shares held by Advisor | | | % of Fund
Net Assets | |
Emerging Markets Small Cap Equity Fund | | $ | 8,340,709 | | | | 965,871 | | | | 100.0% | |
Emerging Markets Value Equity Fund | | $ | 30,954,808 | | | | 533,162 | | | | 14.3% | |
Global Opportunities Fund | | $ | 111,476,906 | | | | 1,778,467 | | | | 26.5% | |
International Opportunities Fund | | $ | 134,189,578 | | | | 2,179 | | | | 0.0% | |
4. Fund Distribution:
Each of the Funds that offers Class A shares has adopted a Master Distribution 12b-1 Plan (the “Plan”) in which Quasar Distributors LLC (the “Distributor”) acts as the Funds’ distributor. The Plan permits each Fund to make payments for, or to reimburse the Distributor for, distribution-related costs and expenses of marketing shares of Class A covered under the Plan, and/or for providing shareholder services. The Plan does not apply to Class I and Class R6. The following chart shows the current Plan fee rate for Class A.
| | |
| | | Class A |
12b-1 Plan Fee | | 0.25%* |
* Under the 12b-1 plan, the maximum fee rate for Class A shares is 0.50%. Currently the Board has approved an annual limit of 0.25%.
Plan fees are based on average daily net assets of Class A. Up to 0.25% of each Plan fee may be designated as a service fee, as defined by the applicable rules of the Financial Industry Regulatory Authority. The Distributor, subject to applicable legal requirements, may waive the Plan fee voluntarily, in whole or in part. For the period ended September 30, 2020, there were no fees waived by the Distributor.
For the period ended September 30, 2020, the Distributor received commissions of $1,169 front-end sales charges of Class A shares, of the Funds, of which $1,007 was paid to affiliated broker-dealers, and the remainder was either paid to unaffiliated broker-dealers or retained by the Distributor.
63
NOTES TO FINANCIAL STATEMENTS
5. Securities Transactions:
The cost of securities purchased and proceeds from securities sold (excluding securities maturing less than one year from acquisition) for the period ended September 30, 2020 were as follows:
| | | | | | | | | | | | |
| | | Purchases | | | | | | Sales | |
Emerging Markets Equity Fund | | $ | 265,327,482 | | | | | | | $ | 100,872,691 | |
Emerging Markets Small Cap Equity Fund | | | 1,194,850 | | | | | | | | 1,201,265 | |
Emerging Markets Value Equity Fund | | | 28,788,857 | | | | | | | | 2,289,587 | |
Global Opportunities Fund | | | 57,738,779 | | | | | | | | 32,157,167 | |
International Opportunities Fund | | | 60,998,314 | | | | | | | | 29,647,823 | |
64
NOTES TO FINANCIAL STATEMENTS
6. Capital Share Transactions:
The Trust is authorized to issue an unlimited number of shares of beneficial interest (“shares outstanding”) without par value. Transactions in capital stock of the Funds are summarized on the following pages:
| | | | | | | | | | | | | | | | | | | | | | | | |
| | | Emerging Markets Equity Fund | | | Emerging Markets Small Cap Equity Fund | |
| | | For the
Six Months
Ended
September 30,
2020
(Unaudited) | | | For the
Year Ended
March 31,
2020 | | | For the
Six Months
Ended
September 30,
2020 (Unaudited) | | | For the
Year Ended
March 31,
2020 | |
CAPITAL TRANSACTIONS: | | | | | | | | | | | | | | | | | | | | | | | | |
Class A | | | | | | | | | | | | | | | | | | | | | | | | |
Proceeds from shares issued | | $ | 4,256,781 | | | $ | 24,103,788 | | | | | | | $ | 5,837 | | | | | | | $ | 15,000 | |
Distributions reinvested | | | — | | | | 785,965 | | | | | | | | — | | | | | | | | 135,437 | |
Cost of shares redeemed | | | (9,530,243 | ) | | | (15,211,351 | ) | | | | | | | (15,808 | ) | | | | | | | (87,954 | ) |
| | | | | | | | | | | | | | | | | | | | | | | | |
Change in Class A | | $ | (5,273,462 | ) | | $ | 9,678,402 | | | | | | | $ | (9,971 | ) | | | | | | $ | 62,483 | |
| | | | | | | | | | | | | | | | | | | | | | | | |
Class I | | | | | | | | | | | | | | | | | | | | | | | | |
Proceeds from shares issued | | $ | 255,886,482 | | | $ | 656,629,075 | | | | | | | $ | 15,000 | | | | | | | $ | 710,547 | |
Distributions reinvested | | | — | | | | 36,510,102 | | | | | | | | — | | | | | | | | 316,803 | |
Cost of shares redeemed | | | (101,434,971 | ) | | | (155,294,389 | ) | | | | | | | (161,348 | ) | | | | | | | (196,495 | ) |
| | | | | | | | | | | | | | | | | | | | | | | | |
Change in Class I | | $ | 154,451,511 | | | $ | 537,844,788 | | | | | | | $ | (146,348 | ) | | | | | | $ | 830,855 | |
| | | | | | | | | | | | | | | | | | | | | | | | |
Class R6 | | | | | | | | | | | | | | | | | | | | | | | | |
Proceeds from shares issued | | $ | 30,197,958 | | | $ | 86,735,310 | | | | | | | $ | — | | | | | | | $ | — | |
Distributions reinvested | | | — | | | | 4,384,986 | | | | | | | | — | | | | | | | | — | |
Cost of shares redeemed | | | (8,032,481 | ) | | | (6,791,273 | ) | | | | | | | — | | | | | | | | — | |
| | | | | | | | | | | | | | | | | | | | | | | | |
Change in Class R6 | | $ | 22,165,477 | | | $ | 84,329,023 | | | | | | | $ | — | | | | | | | $ | — | |
| | | | | | | | | | | | | | | | | | | | | | | | |
Change in net assets resulting from capital transactions | | $ | 171,343,526 | | | $ | 631,852,213 | | | | | | | $ | (156,319 | ) | | | | | | $ | 893,338 | |
| | | | | | | | | | | | | | | | | | | | | | | | |
65
NOTES TO FINANCIAL STATEMENTS
| | | | | | | | | | | | | | | | | | | | | | | | |
| | |
| | | Emerging Markets Equity Fund | | | Emerging Markets Small Cap Equity Fund | |
| | | For the
Six Months
Ended
September 30,
2020
(Unaudited) | | | For the
Year Ended
March 31,
2020 | | | For the
Six Months
Ended
September 30,
2020
(Unaudited) | | | For the
Year Ended
March 31,
2020 | |
SHARE TRANSACTIONS: | | | | | | | | | | | | | | | | | | | | | | | | |
Class A | | | | | | | | | | | | | | | | | | | | | | | | |
Issued | | | 399,845 | | | | 2,035,999 | | | | | | | | 794 | | | | | | | | 1,504 | |
Reinvested | | | — | | | | 64,109 | | | | | | | | — | | | | | | | | 14,454 | |
Redeemed | | | (898,148 | ) | | | (1,308,819 | ) | | | | | | | (2,081 | ) | | | | | | | (9,123 | ) |
| | | | | | | | | | | | | | | | | | | | | | | | |
Change in Class A | | | (498,303 | ) | | | 791,289 | | | | | | | | (1,287 | ) | | | | | | | 6,835 | |
| | | | | | | | | | | | | | | | | | | | | | | | |
Class I | | | | | | | | | | | | | | | | | | | | | | | | |
Issued | | | 22,188,559 | | | | 54,951,716 | | | | | | | | 1,734 | | | | | | | | 73,708 | |
Reinvested | | | — | | | | 2,927,835 | | | | | | | | — | | | | | | | | 33,596 | |
Redeemed | | | (9,193,697 | ) | | | (13,410,810 | ) | | | | | | | (18,473 | ) | | | | | | | (24,994 | ) |
| | | | | | | | | | | | | | | | | | | | | | | | |
Change in Class I | | | 12,994,862 | | | | 44,468,741 | | | | | | | | (16,739 | ) | | | | | | | 82,310 | |
| | | | | | | | | | | | | | | | | | | | | | | | |
Class R6 | | | | | | | | | | | | | | | | | | | | | | | | |
Issued | | | 2,619,691 | | | | 7,038,318 | | | | | | | | — | | | | | | | | — | |
Reinvested | | | — | | | | 349,959 | | | | | | | | — | | | | | | | | — | |
Redeemed | | | (710,132 | ) | | | (570,609 | ) | | | | | | | — | | | | | | | | — | |
| | | | | | | | | | | | | | | | | | | | | | | | |
Change in Class R6 | | | 1,909,559 | | | | 6,817,668 | | | | | | | | — | | | | | | | | — | |
| | | | | | | | | | | | | | | | | | | | | | | | |
Change in shares resulting from capital transactions | | | 14,406,118 | | | | 52,077,698 | | | | | | | | (18,026 | ) | | | | | | | 89,145 | |
| | | | | | | | | | | | | | | | | | | | | | | | |
66
NOTES TO FINANCIAL STATEMENTS
| | | | | | | | | | | | | | | | | | | | | | | | |
| | |
| | | Emerging Markets Value Equity Fund | | | Global Opportunities Fund | |
| | | For the
Six Months
Ended
September 30,
2020
(Unaudited) | | | For the
Year Ended
March 31,
2020 | | | For the
Six Months
Ended
September 30,
2020
(Unaudited) | | | For the
Year Ended
March 31,
2020 | |
CAPITAL TRANSACTIONS: | | | | | | | | | | | | | | | | | | | | | | | | |
Class A | | | | | | | | | | | | | | | | | | | | | | | | |
Proceeds from shares issued | | | | | | $ | — | | | | | | | $ | — | | | $ | 3,709 | | | $ | 10,000 | |
| | | | | | | | | | | | | | | | | | | | | | | | |
Change in Class A | | | | | | $ | — | | | | | | | $ | — | | | $ | 3,709 | | | $ | 10,000 | |
| | | | | | | | | | | | | | | | | | | | | | | | |
Class I | | | | | | | | | | | | | | | | | | | | | | | | |
Proceeds from shares issued | | | | | | $ | 26,537,125 | | | | | | | $ | 65,059 | | | $ | 10,111,092 | | | $ | 58,189,118 | |
Distributions reinvested | | | | | | | — | | | | | | | | 88,926 | | | | — | | | | 1,719,908 | |
Cost of shares redeemed | | | | | | | (1,149 | ) | | | | | | �� | — | | | | (9,357,682 | ) | | | (9,726,601 | ) |
| | | | | | | | | | | | | | | | | | | | | | | | |
Change in Class I | | | | | | $ | 26,535,976 | | | | | | | $ | 153,985 | | | $ | 753,410 | | | $ | 50,182,425 | |
| | | | | | | | | | | | | | | | | | | | | | | | |
Class R6 | | | | | | | | | | | | | | | | | | | | | | | | |
Proceeds from shares issued | | | | | | $ | — | | | | | | | $ | — | | | $ | 38,018,308 | | | $ | 710,465 | |
Distributions reinvested | | | | | | | — | | | | | | | | 90,889 | | | | — | | | | 2,036 | |
Cost of shares redeemed | | | | | | | — | | | | | | | | — | | | | (12,979,260 | ) | | | (862 | ) |
| | | | | | | | | | | | | | | | | | | | | | | | |
Change in Class R6 | | | | | | $ | — | | | | | | | $ | 90,889 | | | $ | 25,039,048 | | | $ | 711,639 | |
| | | | | | | | | | | | | | | | | | | | | | | | |
Change in net assets resulting from capital transactions | | | | | | $ | 26,535,976 | | | | | | | $ | 244,874 | | | $ | 25,796,167 | | | $ | 50,904,064 | |
| | | | | | | | | | | | | | | | | | | | | | | | |
SHARE TRANSACTIONS: | | | | | | | | | | | | | | | | | | | | | | | | |
Class A | | | | | | | | | | | | | | | | | | | | | | | | |
Issued | | | | | | | — | | | | | | | | — | | | | 229 | | | | 645 | |
| | | | | | | | | | | | | | | | | | | | | | | | |
Change in Class A | | | | | | | — | | | | | | | | — | | | | 229 | | | | 645 | |
| | | | | | | | | | | | | | | | | | | | | | | | |
Class I | | | | | | | | | | | | | | | | | | | | | | | | |
Issued | | | | | | | 3,195,838 | | | | | | | | 7,326 | | | | 674,944 | | | | 4,002,984 | |
Reinvested | | | | | | | — | | | | | | | | 10,117 | | | | — | | | | 111,900 | |
Redeemed | | | | | | | (143 | ) | | | | | | | — | | | | (616,225 | ) | | | (730,076 | ) |
| | | | | | | | | | | | | | | | | | | | | | | | |
Change in Class I | | | | | | | 3,195,695 | | | | | | | | 17,443 | | | | 58,719 | | | | 3,384,808 | |
| | | | | | | | | | | | | | | | | | | | | | | | |
Class R6 | | | | | | | | | | | | | | | | | | | | | | | | |
Issued | | | | | | | — | | | | | | | | — | | | | 2,665,285 | | | | 60,112 | |
Reinvested | | | | | | | — | | | | | | | | 10,352 | | | | — | | | | 132 | |
Redeemed | | | | | | | — | | | | | | | | — | | | | (805,264 | ) | | | (59 | ) |
| | | | | | | | | | | | | | | | | | | | | | | | |
Change in Class R6 | | | | | | | — | | | | | | | | 10,352 | | | | 1,860,021 | | | | 60,185 | |
| | | | | | | | | | | | | | | | | | | | | | | | |
Change in shares resulting from capital transactions | | | | | | | 3,195,695 | | | | | | | | 27,795 | | | | 1,918,969 | | | | 3,445,638 | |
| | | | | | | | | | | | | | | | | | | | | | | | |
67
NOTES TO FINANCIAL STATEMENTS
| | | | | | | | |
| |
| | | International Opportunities Fund | |
| | | For the
Six Months
Ended
September 30,
2020
(Unaudited) | | | For the
Year Ended
March 31,
2020 | |
CAPITAL TRANSACTIONS: | | | | | | | | |
Class A | | | | | | | | |
Proceeds from shares issued | | $ | 1,982,961 | | | $ | 10,000 | |
Cost of shares redeemed | | | (2,088,550 | ) | | | — | |
| | | | | | | | |
Change in Class A | | $ | (105,589 | ) | | $ | 10,000 | |
| | | | | | | | |
Class I | | | | | | | | |
Proceeds from shares issued | | $ | 54,737,673 | | | $ | 32,061,054 | |
Distributions reinvested | | | — | | | | 3,015,113 | |
Cost of shares redeemed | | | (23,589,428 | ) | | | (11,153,729 | ) |
| | | | | | | | |
Change in Class I | | $ | 31,148,245 | | | $ | 23,922,438 | |
| | | | | | | | |
Class R6 | | | | | | | | |
Distributions reinvested | | $ | — | | | $ | 560 | |
| | | | | | | | |
Change in Class R6 | | $ | — | | | $ | 560 | |
| | | | | | | | |
Change in net assets resulting from capital transactions | | $ | 31,042,656 | | | $ | 23,932,998 | |
| | | | | | | | |
SHARE TRANSACTIONS: | | | | | | | | |
Class A | | | | | | | | |
Issued | | | 208,846 | | | | 907 | |
Redeemed | | | (208,837 | ) | | | — | |
| | | | | | | | |
Change in Class A | | | 9 | | | | 907 | |
| | | | | | | | |
Class I | | | | | | | | |
Issued | | | 5,755,769 | | | | 3,163,021 | |
Reinvested | | | — | | | | 271,387 | |
Redeemed | | | (2,295,540 | ) | | | (1,134,844 | ) |
| | | | | | | | |
Change in Class I | | | 3,460,229 | | | | 2,299,564 | |
| | | | | | | | |
Class R6 | | | | | | | | |
Reinvested | | | — | | | | 50 | |
| | | | | | | | |
Change in Class R6 | | | — | | | | 50 | |
| | | | | | | | |
Change in shares resulting from capital transactions | | | 3,460,238 | | | | 2,300,521 | |
| | | | | | | | |
7. Federal Income Taxes:
It is the policy of each Fund to continue to qualify as a regulated investment company by complying with the provisions available to certain investment companies, as defined under Subchapter M of the Internal Revenue Code, and to distribute substantially all of its net investment income and net realized capital gains. Therefore, no federal tax liability is recorded in the financial statements of each Fund.
Fund Management has analyzed the Funds’ tax positions taken or expected to be taken on federal income tax returns for all open tax years (current and prior three tax years, and has concluded that no provision for federal income tax is required in the Funds’ financial statements. The Funds’ federal and state income and federal excise tax returns for tax years for which the applicable statutes of limitations have not expired are subject to examination by the Internal Revenue Service and state departments of revenue.
68
NOTES TO FINANCIAL STATEMENTS
As of September 30, 2020, the tax cost of investments and the breakdown of unrealized appreciation (depreciation) for each Fund was as follows:
| | | | | | | | | | | | | | | | |
| | | Tax Cost Of
Investments | | | Unrealized
Appreciation | | | Unrealized
Depreciation | | | Net Unrealized
Appreciation/
(Depreciation) | |
Emerging Markets Equity Fund | | $ | 1,656,091,805 | | | $ | 243,313,450 | | | $ | (135,616,778 | ) | | $ | 107,696,672 | |
Emerging Markets Small Cap Equity Fund | | | 9,005,440 | | | | 984,406 | | | | (1,657,719 | ) | | | (673,313 | ) |
Emerging Markets Value Equity Fund | | | 31,295,482 | | | | 1,298,392 | | | | (1,482,457 | ) | | | (184,065 | ) |
Global Opportunities Fund | | | 97,102,117 | | | | 15,712,839 | | | | (1,912,951 | ) | | | 13,799,888 | |
International Opportunities Fund | | | 121,666,428 | | | | 19,721,353 | | | | (8,893,017 | ) | | | 10,828,336 | |
The difference between book basis and tax basis unrealized appreciation/depreciation is attributable to the tax deferral of losses on wash sales, passive foreign investment company mark-to-market adjustment and cumulative partnership basis adjustment.
The tax character of distributions during the year ended March 31, 2020 were as follows:
| | | | | | | | | | | | | | | | | | |
| | | Distributions Paid From | | | |
| | | Ordinary
Income | | | Net Long Term
Capital Gains | | | Total Taxable
Distributions | | | Total
Distributions
Paid | |
Emerging Markets Equity Fund | | $ | 43,979,625 | | | $ | 1,324,096 | | | $ | 45,303,721 | | | $ | 45,303,721 | |
Emerging Markets Small Cap Equity Fund | | | 314,203 | | | | 139,241 | | | | 453,444 | | | | 453,444 | |
Emerging Markets Value Equity Fund | | | 179,815 | | | | — | | | | 179,815 | | | | 179,815 | |
Global Opportunities Fund | | | 640,752 | | | | 1,106,607 | | | | 1,747,359 | | | | 1,747,359 | |
International Opportunities Fund | | | 2,518,100 | | | | 1,121,255 | | | | 3,639,355 | | | | 3,639,355 | |
Total distributions paid may differ from the Statements of Changes in Net Assets because distributions are recognized when actually paid for tax purposes.
The tax basis of components of accumulated earnings/(losses) and tax character of distributions are determined at fiscal year end, and will be included in the Annual Report dated March 31, 2021.
During the year ended March 31, 2020, the Funds did not utilize any capital losses.
As of March 31, 2020, the Funds did not have any capital loss carryforwards for federal income tax purposes except Emerging Markets Equity Fund had a short-term capital loss carryforward of $12,498,984 and a long-term capital loss carryforward of $2,156,041 and Emerging Markets Value Equity Fund had a short-term capital loss carryforward of $458,984, and a long-term capital loss carryforward of $221,082 available to offset future realized capital gains in accordance with the Regulated Investment Company Modernization Act of 2010. These capital loss carryforwards are not subject to expiration.
Under current tax law, capital losses realized after October 31 and ordinary losses after December 31 of a Fund’s fiscal year may be deferred and treated as occurring on the first business day of the following
69
NOTES TO FINANCIAL STATEMENTS
fiscal year for tax purposes. The Emerging Markets Small Cap Equity Fund deferred late year ordinary income losses of $146,300, long-term qualified late-year capital losses of $258,583 and short-term qualified late-year capital losses of $51,586 which will be treated as arising on the first business day of the year ended March 31, 2021.
8. Market Timing:
The Trust strongly discourages attempts at market timing by Fund shareholders. Each Fund charges a redemption fee of 2% of the value of the shares redeemed or exchanged within 30 days of purchase, in addition to limiting the number of exchanges that may be made between Funds to five (5) per calendar year. When assessed, the redemption fee is deducted from the redemption proceeds and retained by the Fund, not by the Advisor. This redemption fee is not charged in cases where, for example, the redemption results from an automatic reinvestment or asset re-allocation not specifically directed by the shareholder. The Trust also reserves the right to reject any Fund purchase order made by persons deemed to be market timers. The Funds’ prospectus contains a full description of the Trust’s policies on market timing and/or excessive trading. The redemption fee is recorded as a credit to capital and is included in the capital transactions on the Statements of Changes in Net Assets.
During the six months ended September 30, 2020, redemption fees were collected by the Emerging Markets Equity Fund, International Opportunities Fun and Global Opportunities Fund in the amount of $5,380, $800 and $837, respectively. There were no redemption fees collected by the other funds. Redemption fees collected by the Funds are included in the cost of shares redeemed on the Statements of Changes in Net Assets.
9. Significant Risks
Shareholder concentration risk:
As of September 30, 2020, the following Funds had omnibus accounts which owned more than 10% of a Fund’s outstanding shares as shown below:
| | | | | | | | |
| | | # of Omnibus Accounts | | | % of Fund | |
Emerging Markets Equity Fund | | | 2 | | | | 34.6% | |
Emerging Markets Small Cap Equity Fund | | | 1 | | | | 40.8% | |
Emerging Markets Value Equity Fund | | | 2 | | | | 78.9% | |
Global Opportunities Fund | | | 2 | | | | 22.5% | |
International Opportunities Fund | | | 3 | | | | 98.0% | |
In addition, an unaffiliated shareholder owned 12.4% of Global Opportunities Fund as of September 30, 2020. Significant transactions by these shareholders may impact the Funds’ performance.
Market risk:
One or more markets in which a Fund invests may go down in value, sometimes sharply and unpredictably, and the value of a Fund’s portfolio securities may fall or fail to rise. Market risk may affect a single issuer, sector of the economy, industry or the market as a whole. In addition, global economies and financial markets are becoming increasingly interconnected, and political, economic and other conditions and events (including, but not limited to, natural disasters, pandemics, epidemics, and social unrest) in one country, region, or financial market may adversely impact issuers in a different country, region or financial market. Furthermore, the occurrence of, among other events, natural or man-made disasters, severe weather or geological events, fires, floods, earthquakes, outbreaks of disease (such as COVID-19, avian influenza or H1N1/09), epidemics, pandemics, malicious acts, cyber-attacks, terrorist acts or the occurrence of climate change, may also adversely impact the performance of a Fund. Such events could adversely impact issuers, markets and economies over the short- and long-term, including in ways that cannot necessarily be foreseen. A Fund could be negatively impacted if the value of a portfolio holding were harmed by such political or economic conditions or events. Moreover, such negative political and economic conditions and events could disrupt the processes necessary for a Fund’s operations.
70
NOTES TO FINANCIAL STATEMENTS
Industry and sector focus risk:
At times the Funds may increase the relative emphasis of its investments in a particular industry or sector. The prices of securities of issuers in a particular industry or sector may be more susceptible to fluctuations due to changes in economic or business conditions, government regulations, availability of basic resources or supplies, or other events affect that industry or sector more than securities of issuers in other industries and sectors. To the extent that the Fund increases the relative emphasis of its investments in a particular industry or sector, its shares’ values may fluctuate in response to events affecting that industry or sector.
10. Subsequent Events:
Fund Management has evaluated the impact of all subsequent events on the Funds and has determined that there were no subsequent events requiring recognition or disclosure in the financial statements.
71
SHARE CLASS INFORMATION (UNAUDITED)
The Funds offer three share classes: Class A, Class I and Class R6.
Class A
Class A shares, offered by Emerging Markets Equity Fund, Emerging Markets Small Cap Equity Fund, Global Opportunities Fund and International Opportunities Fund are available for purchase primarily through investment advisors, broker-dealers, banks and other financial services intermediaries. Class A shares of the Funds are currently subject to a maximum upfront sales charge of 5.75% and a 1.00% CDSC for redemption within 12 months of a $1 million or greater purchase. Class A shares currently include a 0.25% (25 bps) annual 12b-1 service and distribution fee.
Class I
Class I shares are available in all of the Funds and are intended for investors meeting certain minimum investment thresholds. This share class does not have an up-front sales charge (load) or a 12b-1 service and distribution fee.
Class R6
Class R6 shares are available in all Funds except Emerging Markets Small Cap Equity Fund and are intended for investors meeting certain minimum investment thresholds. This share class does not have an up-front sales charge (load) or a 12b-1 service and distribution fee.
72
SUPPLEMENTAL INFORMATION (UNAUDITED)
Shareholder Expense Examples
As a shareholder of the the RBC Funds, you incur two types of costs: (1) transaction costs and (2) ongoing costs, including management fees; and other Fund expenses. This example is intended to help you understand your ongoing costs (in dollars) of investing in the RBC Funds and to compare these costs with the ongoing costs of investing in other mutual funds.
The example is based on an investment of $1,000 invested at the beginning of the period and held for the entire period from April 1, 2020 through September 30, 2020.
Actual Expenses
The table below provides information about actual account values and actual expenses. You may use the information below, together with the amount you invested, to estimate the expenses that you paid over the period. Simply divide your account value by $1,000 (for example, an $8,600 account value divided by $1,000 = 8.6), then multiply the result by the number in the table under the heading entitled “Expenses Paid During Period” to estimate the expenses you paid on your account during this period.
| | | | | | | | | | | | | | | | |
| | | Beginning
Account Value
4/1/20 | | | Ending
Account Value
9/30/20 | | | Expenses Paid
During Period*
4/1/20–9/30/20 | | | Annualized
Expense Ratio
During Period
4/1/20–9/30/20 | |
Emerging Markets Equity Fund | | | | | | | | | | | | | | | | |
Class A | | | $1,000.00 | | | | $1,282.10 | | | | $6.46 | | | | 1.13% | |
Class I | | | 1,000.00 | | | | 1,283.40 | | | | 5.04 | | | | 0.88% | |
Class R6 | | | 1,000.00 | | | | 1,282.90 | | | | 5.04 | | | | 0.88% | |
Emerging Markets Small Cap Equity Fund | | | | | | | | | | | | | |
Class A | | | 1,000.00 | | | | 1,301.50 | | | | 9.06 | | | | 1.57% | |
Class I | | | 1,000.00 | | | | 1,302.30 | | | | 7.62 | | | | 1.32% | |
Emerging Markets Value Equity Fund | | | | | | | | | | | | | | | | |
Class I | | | 1,000.00 | | | | 1,289.70 | | | | 5.45 | | | | 0.95% | |
Class R6 | | | 1,000.00 | | | | 1,289.70 | | | | 5.05 | | | | 0.88% | |
Global Opportunities Fund | | | | | | | | | | | | | | | | |
Class A | | | 1,000.00 | | | | 1,349.30 | | | | 6.12 | | | | 1.04% | |
Class I | | | 1,000.00 | | | | 1,351.80 | | | | 4.66 | | | | 0.79% | |
Class R6 | | | 1,000.00 | | | | 1,351.20 | | | | 4.30 | | | | 0.73% | |
International Opportunities Fund | | | | | | | | | | | | | | | | |
Class A | | | 1,000.00 | | | | 1,292.50 | | | | 6.32 | | | | 1.10% | |
Class I | | | 1,000.00 | | | | 1,305.20 | | | | 4.80 | | | | 0.83% | |
Class R6 | | | 1,000.00 | | | | 1,307.30 | | | | 4.51 | | | | 0.78% | |
*Expenses are equal to the average account value times the Fund’s annualized expense ratio multiplied by 183/365 (to reflect one half year period).
73
SUPPLEMENTAL INFORMATION (UNAUDITED)
Hypothetical Example for Comparison Purposes
The table below provides information about hypothetical account values and hypothetical expenses based on each RBC Funds’ actual expense ratio and an assumed rate of return of 5% per year before expenses, which is not the Fund’s actual return. The hypothetical account values and expenses may not be used to estimate the actual ending account balance or expenses you paid for the period. You may use this information to compare this 5% hypothetical example with the 5% hypothetical examples that appear in the shareholder reports of other funds.
Please note that the expenses shown in the table are meant to highlight your ongoing costs only and do not reflect any transactional costs, such as sales charges (loads), redemption fees, or exchange fees. Therefore, the table is useful in comparing ongoing costs only, and will not help you determine the relative total costs of owning different funds. In addition, if these transactional costs were included, your costs would have been higher.
| | | | | | | | | | | | | | | | |
| | | Beginning
Account Value
4/1/20 | | | Ending
Account Value
9/30/20 | | | Expenses Paid
During Period*
4/1/20-9/30/20 | | | Annualized
Expense Ratio
During Period
4/1/20-9/30/20 | |
Emerging Markets Equity Fund | | | | | | | | | | | | | | | | |
Class A | | | $1,000.00 | | | | $1,019.40 | | | | $5.72 | | | | 1.13% | |
Class I | | | 1,000.00 | | | | 1,020.66 | | | | 4.46 | | | | 0.88% | |
Class R6 | | | 1,000.00 | | | | 1,020.66 | | | | 4.46 | | | | 0.88% | |
Emerging Markets Small Cap Equity Fund | | | | | | | | | | | | | |
Class A | | | 1,000.00 | | | | 1,017.20 | | | | 7.94 | | | | 1.57% | |
Class I | | | 1,000.00 | | | | 1,018.45 | | | | 6.68 | | | | 1.32% | |
Emerging Markets Value Equity Fund | | | | | | | | | | | | | | | | |
Class I | | | 1,000.00 | | | | 1,020.31 | | | | 4.81 | | | | 0.95% | |
Class R6 | | | 1,000.00 | | | | 1,020.66 | | | | 4.46 | | | | 0.88% | |
Global Opportunities Fund | | | | | | | | | | | | | | | | |
Class A | | | 1,000.00 | | | | 1,019.85 | | | | 5.27 | | | | 1.04% | |
Class I | | | 1,000.00 | | | | 1,021.11 | | | | 4.00 | | | | 0.79% | |
Class R6 | | | 1,000.00 | | | | 1,021.41 | | | | 3.70 | | | | 0.73% | |
International Opportunities Fund | | | | | | | | | | | | | | | | |
Class A | | | 1,000.00 | | | | 1,019.55 | | | | 5.57 | | | | 1.10% | |
Class I | | | 1,000.00 | | | | 1,020.91 | | | | 4.20 | | | | 0.83% | |
Class R6 | | | 1,000.00 | | | | 1,021.16 | | | | 3.95 | | | | 0.78% | |
*Expenses are equal to the average account value times the Fund’s annualized expense ratio multiplied by 183/365 (to reflect one half year period).
74
APPROVAL OF INVESTMENT ADVISORY AGREEMENT (UNAUDITED)
Information Regarding the Approval of Investment Advisory and Sub-Advisory Agreements
In September 2020, after evaluating the services provided by RBC Global Asset Management (U.S.) Inc. (the “Advisor”) and RBC Global Asset Management (UK) Limited (the “Sub-Advisor”) and reviewing the performance, fees, and expenses of the Funds, the RBC Funds Board of Trustees determined to approve the continuation of the investment advisory agreements with the Advisor and sub-advisory agreements with the Sub-Advisor (the investment advisory and sub-advisory agreements, collectively, being the “Agreements”) for each Fund for an additional year.
As part of their review of the Agreements, the Trustees requested and considered information regarding the services performed by the Advisor and Sub-Advisor; the staffing and qualifications of the personnel responsible for operating and managing the Funds; and the Funds’ performance, fees, and expenses. The Trustees considered information provided at regular quarterly Board and Committee meetings throughout the year as well as information presented at both a special meeting held to review requested material related to the proposed renewals and a regular meeting at which the proposed renewals were considered. The information included material provided by the Advisor, as well as reports prepared by Broadridge Financial Solutions, Inc., an independent statistical compilation company providing comparative fee and expense information and comparative performance information for the Funds. The Board reviewed certain changes to the Funds that had been made in the prior year, including the launching of Class A shares for the RBC Global Opportunities Fund and RBC International Opportunities Fund, noting that the shares were launched to provide additional options for intermediary platforms. In connection with their deliberations, the independent Trustees were advised by independent legal counsel with regard to the materials and their responsibilities under relevant laws and regulations.
The Trustees met with representatives from the Advisor’s senior management teams, as well as senior investment professionals, to discuss the information and the ongoing management of the Funds. The Trustees reviewed the nature, quality, and extent of the services provided to the Funds by the Advisor and Sub-Advisor, including information as to each Fund’s performance relative to appropriate index benchmarks as well as their respective Morningstar categories. For several of the Funds, the Board also reviewed comparative information with respect to custom peer groups designed to align more closely with the Funds’ specific investment strategies.
The Trustees also reviewed information on the response to the COVID-19 pandemic by each of the Advisor and the Sub-Advisor and the measures taken to ensure that the services provided to the Funds were not impacted.
The Board then reviewed the performance of each Fund vs. relevant securities benchmarks and fund peer groups. It was noted that in most cases where a Fund had underperformed in comparison to its Morningstar category, the unfavorable performance comparison was generally the result of a Fund’s style characteristics not being in alignment with its assigned category. In particular, it was noted that the divergence in the Morningstar ratings of the RBC Global Opportunities Fund and RBC International Opportunities Fund was more attributable to the construction of the peer groups used to evaluate each Fund rather than one Fund’s specific performance relative to the other. With respect to the RBC Emerging Markets Value Equity Fund, the Trustees were informed that the Fund had suffered from the fact that it was launched during a period that was difficult for value-oriented funds with emerging market growth stocks performing almost nine percentage points better than value stocks for the period.
The Trustees reviewed the Funds’ expense structure and advisory fees, including information regarding other client accounts advised or sub-advised by the Sub-Advisor with investment objectives similar to those of the Funds, including advisory fees paid and the reasons for the differences in fees. The Trustees also noted that during the previous twelve month period, there had been reductions to the advisory fees and operating expense limits for the RBC Emerging Markets Small Cap Equity Fund, RBC Global Opportunities Fund and RBC International Opportunities Fund. The Trustees considered, and viewed favorably, the Advisor’s contractual agreement to subsidize Fund expenses. The Trustees evaluated profitability data for the Advisor and Sub-Advisor and considered information regarding
75
APPROVAL OF INVESTMENT ADVISORY AGREEMENT (UNAUDITED)
other benefits the Advisor and its affiliates derived from their relationships with the Funds, including soft dollars and other fall-out benefits. The Trustees noted that advisory fees and expense ratios were competitive and, in particular, that none of the Funds had total net expenses below the median of its peer group.
In considering the nature and quality of services provided by the Sub-Advisor to the Funds, the Trustees considered the Sub-Advisor’s investment strategies and demonstrated capabilities with respect to fundamental analysis, its significant expertise with regard to evaluating environmental, social and governance (ESG) factors, and geographic expertise. The Trustees also considered the qualifications and experience of the Sub-Advisor’s staff as well as its operational and compliance structure and systems, and the Advisor’s expertise in coordinating and overseeing the investment management and related operations of the Funds. The Trustees expressed confidence in the investment teams of the Advisor and Sub-Advisor and were satisfied with the nature, extent, and quality of the advisory and other services provided to the Funds. In addition, the Trustees reviewed favorably the Advisor management team’s initiative to institute portfolio engineering risk analytics as part of the investment process.
Based upon their review, the Trustees concluded that the Funds’ advisory and sub-advisory fees payable to the Advisor and Sub-Advisor, respectively, were fair and reasonable in light of: the nature and quality of the services provided; the fees charged with respect to other comparable funds sub-advised by the Sub-Advisor; the complex nature of the jurisdictions where the underlying investments originate, which span a number of emerging market countries; the value of the Funds to investors; and the size of the accounts. The Trustees determined that the fees were within the range of what might have been negotiated at arms’ length. The Trustees approved the Agreements and expense limitation arrangements for each Fund for an additional year. In arriving at their collective decision to approve the Agreements, the Trustees did not assign relative weights to the factors discussed above or deem any one or group of them to be controlling in and of itself.
76
This Page Intentionally Left Blank
77
This Page Intentionally Left Blank
78
This Page Intentionally Left Blank
79
This Page Intentionally Left Blank
80
RBC Funds
P.O. Box 701
Milwaukee, WI 53201-0701
800-422-2766
www.rbcgam.us
Performance data represents past performance and does not guarantee future results. The principal value of an investment and investment return will fluctuate so that an investor’s shares, when redeemed, may be worth more or less than their original cost.
This report and the financial statements contained herein are provided for the information of RBC Funds shareholders. This report is not authorized for distribution to prospective investors unless preceded or accompanied by a current prospectus, which contains information concerning investment objectives, risks, charges and expenses of the funds. Please read the prospectus carefully before investing.
This report and the financial statements contained herein are not intended to be a forecast of future events, a guarantee of future results, or investment advice. There is no assurance that certain securities will remain in or out of each fund’s portfolio. The views expressed in this report reflect those of the portfolio managers through the period ended September 30, 2020.
NOT FDIC INSURED • NO BANK GUARANTEE • MAY LOSE VALUE
RBC Global Asset Management (U.S.) Inc. serves as investment advisor for the RBC Funds. RBC Funds are distributed by Quasar Distributors LLC.

The RBC Funds are pleased to offer shareholder reports printed entirely on Forest Stewardship Council® certified paper. FSC® certification ensures that the paper used in this report contains fiber from well-managed and responsibly harvested forests that meet strict environmental and socioeconomic standards.
RBCF-EM SAR 09-20
| | | | | | | | | | |
| | | | | | | | |
| | | | |
| | | | | | | | RBC Funds |
About your Semi Annual Report | | | | | | | | This semi-annual report (Unaudited) includes detailed information about your Fund including financial statements, performance, and a complete list of its holdings. |
| | | | | | | | The RBC Funds compare their performance against various indices. Each of these indices is a widely recognized measure of return for the underlying category of securities. However, the indices are unmanaged, do not include fees, and cannot be invested in directly. |
| | | | |
| | | | | | | | We hope the financial information presented will help you evaluate your investment in the RBC Funds. We also encourage you to read your Fund’s prospectus for further detail as to your Fund’s investment policies and risk profile. RBC Funds prospectuses and performance information subsequent to the date of this report are available on our website at www.rbcgam.us. |
| | | | |
| | | | | | | | A description of the policies and procedures that your Fund uses to determine how to vote proxies relating to portfolio securities is available (i) without charge, upon request, by calling 1-800-422-2766; (ii) on the Fund’s website at www.rbcgam.us; and (iii) on the Securities and Exchange Commission’s (the “Commission”) website at http://www.sec.gov. |
| | | | |
| | | | | | | | Information regarding how your Fund voted proxies relating to portfolio securities during the most recent 12-month period ended June 30 is available (i) on the Fund’s website at www.rbcgam.us; and (ii) on the Commission’s website at http://www.sec.gov. |
| | | | |
| | | | | | | | A schedule of each Fund’s portfolio holdings is filed with the Commission for the first and third quarters of each fiscal year on Form N-PORT. This information is available on the Commission’s website at http://www.sec.gov. |
| | | | |
| | | | | | | | |
| Table of | | | | | | | | Portfolio Managers | | 1 |
| Contents | | | | | | | | Performance Summary | | 2 |
| | | | | | | | Fund Statistics | | |
| | | | | | | | - RBC Short Duration Fixed Income Fund | | 3 |
| | | | | | | | - RBC Ultra-Short Fixed Income Fund | | 4 |
| | | | | | | | Schedule of Portfolio Investments | | 5 |
| | | | | | | | Financial Statements | | |
| | | | | | | | - Statements of Assets and Liabilities | | 22 |
| | | | | | | | - Statements of Operations | | 24 |
| | | | | | | | - Statements of Changes in Net Assets | | 25 |
| | | | | | | | Financial Highlights | | 27 |
| | | | | | | | Notes to Financial Statements | | 31 |
| | | | | | | | Share Class Information | | 43 |
| | | | | | | | Supplemental Information | | 44 |
| | | | | | | | Approval of Investment Advisory Agreements (Unaudited) | | 46 |
| | | | | | | | | | |
| | | | | | | | | | |
| | | | | | | | | | |
| | | | | | | | | | |
| | | | | | | | | | |
| | | | | | | | | | |
| | | | | | | | | | |
| | | | | | | | | | |
| | | | | | | | | | |
| | | | | | | | | | |
| | | | | | | | | | | | |
PORTFOLIO MANAGERS | | | | | | |
| | | |
RBC Global Asset Management (U.S.) Inc.(“RBC GAM-US”) serves as the investment advisor to the RBC Funds. RBC GAM-US employs a team approach to the management of the Funds, with no individual team member being solely responsible for the investment decisions. Each Fund’s management team has access to RBC GAM-US’s investment research and other money management resources. | | | | | | |
Brian Svendahl, CFA Managing Director, Co-Head, U.S. Fixed Income Brian Svendahl oversees the fixed income research, portfolio management and trading at RBC GAM-US. In addition to shaping the firm’s overall fixed income philosophy and process, he is a portfolio manager for the Funds and many of RBC GAM-US’s government mandates. Brian joined RBC GAM-US in 2005 and most recently led the mortgage and government team before being promoted to Co-Head in 2012. Prior to joining RBC GAM-US, he held several risk management, research and trading positions at Wells Fargo. Brian’s experience also includes liability management and implementing balance sheet hedging strategies. He earned a BS in economics from the University of Minnesota and a BBA in finance and an MBA from the University of Minnesota Carlson School of Management. Brian is a CFA charterholder. | | | | | | 
Brian Svendahl, CFA |
Brandon T. Swensen, CFA Vice President, Co-Head, U.S. Fixed Income Brandon Swensen oversees RBC GAM-US’s fixed income research, portfolio management and trading. In addition to shaping the firm’s overall fixed income philosophy and process, he is a portfolio manager for the Funds and several cash management and core solutions. Brandon joined RBC GAM-US in 2000 and most recently was a portfolio manager on the mortgage and government team before being promoted to Co-Head. He also held research analyst positions covering asset-backed securities and credit and served as a financial analyst for the firm. Brandon earned a BS in finance from St. Cloud State University and an MBA in finance from the University of St. Thomas. He is a CFA charterholder and member of the CFA Society of Minnesota. | | | | | | 
Brandon T. Swensen, CFA |
| | | |
| | | | | | |
1
PERFORMANCE SUMMARY (UNAUDITED)
| | | | | | | | | | | | | | | | | | | | | | | | | | | | | | |
| | | 1
Year | | 3
Year | | 5
Year | | Since
Inception(a) | | Net
Expense
Ratio(b)(c) | | Gross
Expense
Ratio(b)(c) |
| Average Annual Total Returns as of September 30, 2020 (Unaudited) | | | | | | |
| | | | | | |
RBC Short Duration Fixed Income Fund | | | | | | | | | | | | | | | | | | | | | | | | | | | | | | |
Class A | | | | | | | | | | | | | | | | | | | | | | | | | | | | | | |
- At Net Asset Value | | | | 3.56% | | | | | 3.05% | | | | | 2.67% | | | | | 2.32% | | | | | 0.45% | | | | | 2.07% | |
Class I | | | | | | | | | | | | | | | | | | | | | | | | | | | | | | |
- At Net Asset Value | | | | 3.57% | | | | | 3.12% | | | | | 2.77% | | | | | 2.41% | | | | | 0.35% | | | | | 0.79% | |
| | | | | | |
ICE BofAML 1-3 | | | | | | | | | | | | | | | | | | | | | | | | | | | | | | |
Year U.S. Corporate & Government Index(d) | | | | 3.74% | | | | | 2.87% | | | | | 2.11% | | | | | 1.83% | | | | | | | | | | | |
RBC Ultra-Short Fixed Income Fund | | | | | | | | | | | |
Class A | | | | | | | | | | | | | | | | | | | | | | | | | | | | | | |
- At Net Asset Value | | | | 2.56% | | | | | 2.57% | | | | | 2.24% | | | | | 1.85% | | | | | 0.38% | | | | | 1.07% | |
Class I | | | | | | | | | | | | | | | | | | | | | | | | | | | | | | |
- At Net Asset Value | | | | 2.76% | | | | | 2.68% | | | | | 2.33% | | | | | 1.94% | | | | | 0.28% | | | | | 0.99% | |
| | | | | | |
ICE BofAML U.S. | | | | | | | | | | | | | | | | | | | | | | | | | | | | | | |
1-Year Treasury Bill Index(d) | | | | 2.25% | | | | | 2.18% | | | | | 1.57% | | | | | 1.24% | | | | | | | | | | | |
Performance data quoted represents past performance. Past performance is no guarantee of future results. Investment return and principal value of an investment will fluctuate so that an investor’s shares, when redeemed, may be worth more or less than their original cost. Current performance may be lower or higher than performance quoted. Performance shown reflects contractual fee waivers, without such fee waivers total returns would be reduced. For performance data current to the most recent month-end go to www.rbcgam.us. Please see footnotes below.
| (a) | The inception date (commencement date) is March 3, 2014 for Class A shares and December 30, 2013 for Class I shares. The performance in the table for the Class A shares prior to March 3, 2014 reflects the performance of the Class I shares since the Fund’s inception. |
| (b) | The advisor has contractually agreed to waive fees and/or make payments in order to keep total operating expenses of the Fund to the levels listed under net expense ratio until July 31, 2022. |
| (c) | The Fund’s expenses reflect the most recent year end (March 31, 2020). |
| (d) | Each of the comparative indices is a widely recognized market value weighted measure of the return of securities, but do not include sales fees or operating expenses. You cannot invest directly in indices. |
The ICE BofAML 1-3 Year US Corporate & Government Index tracks the performance of U.S. dollar-denominated, investment grade debt publicly issued in the U.S. domestic market, including U.S. Treasury, U.S. agency, foreign government, supranational, and corporate securities with a remaining term to final maturity less than three years. You cannot invest directly in an index.
The ICE BofAML US 1-Year Treasury Bill Index comprises a single issue purchased at the beginning of the month and held for a full month. At the end of the month that issue is sold and rolled into a newly selected issue. The issue selected at each month-end rebalancing is the outstanding Treasury Bill that matures closest to, but not beyond, one year from the rebalancing date. You cannot invest directly in an index.
2
| | | | | | | | | | | | | | | | | | | | |
FUND STATISTICS (UNAUDITED) | | | | | | | | | | | |
RBC Short Duration Fixed Income Fund | | | | | | | | | | | |
Current income consistent with preservation of capital. | | | | | | | | | | | Investment Objective |
ICE BofAML 1-3 Year US Corporate & Government Index | | | | | | | | | | | Benchmark |
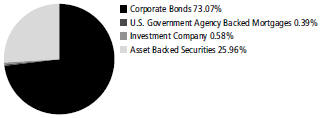
| | | | | | | | | | | Asset Allocation as of 9/30/20 (% of Fund’s investments) |
| | | | | | |
Drive Auto Receivables Trust, | | | 1.61 | % | | Drive Auto Receivables Trust, | | | 1.09 | % | | | | | | | | | | Top Ten Holdings (excluding investment companies) (as of 9/30/20) (% of Fund’s net assets) |
Series 2019-1, Class D, 4.09%, | | | | | | Series 2018-4, Class D, 4.09%, | | | | | | | | | | | | |
6/15/26 | | | | | | 1/15/26 | | | | | | | | | | | | |
Charter Communications | | | 1.48 | % | | Williams Cos., Inc. (The), 3.35%, | | | 1.09 | % | | | | | | | | |
Operating LLC / Charter | | | | | | 8/15/22 | | | | | | | | | | | | |
Communications Operating | | | | | | Becton Dickinson and Co., | | | 1.08 | % | | | | | | | | |
Capital, 4.46%, 7/23/22 | | | | | | 2.89%, 6/6/22 | | | | | | | | | | | | |
Bank of America Corp., 3.00%, | | | 1.46 | % | | Roper Technologies, Inc., 2.35%, | | | 1.07 | % | | | | | | | | |
12/20/23 | | | | | | 9/15/24 | | | | | | | | | | | | |
CVS Health Corp., 2.63%, | | | 1.19 | % | | Raytheon Technologies Corp., | | | 1.05 | % | | | | | | | | |
8/15/24 | | | | | | 3.20%, 3/15/24 | | | | | | | | | | | | | | |
Drive Auto Receivables Trust, | | | 1.11 | % | | | | | | | | | | | | | | | | |
Series 2018-5, Class D, 4.30%, | | | | | | | | | | | | | | | | | | | | |
4/15/26 | | | | | | | | | | | | | | | | | | | | |
*A listing of all portfolio holdings can be found beginning on page 5 | | | | | | | | | | | |
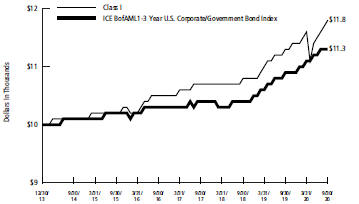
| | | | | | | | | | | Growth of $10,000 Initial Investment Since Inception (12/30/13) |
| The graph reflects an initial investment of $10,000 over the period from December 30, 2013 (commencement of operations) to September 30, 2020 and is based on Class I shares. The Fund’s total return includes reinvested dividends and capital gains. The Fund’s total return also includes operating expenses that reduce return while the total return of the index does not. The graph does not reflect the deduction of taxes that a shareholder would pay on fund distributions or redemption of fund shares. | | | | | | | | | | | |
| | | |
| | | | | | | | | | | |
3
| | | | | | | | | | | | | | | | | | |
| | | | | | | | | | FUND STATISTICS (UNAUDITED) | |
| | | | | | | | | | RBC Ultra-Short Fixed Income Fund | |
| Investment Objective | | | | | | | | | | Current income consistent with preservation of capital. | |
| Benchmark | | | | | | | | | | ICE BofAML US 1-Year Treasury Bill Index | |
Asset Allocation as of 9/30/20 (% of Fund’s investments) | | | | | | | | | | 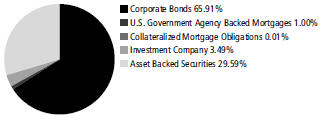
| |
| Top Ten Holdings | | | | | | | | | | Santander Drive Auto Receivables | | 1.88% | | American Honda Finance Corp., | | | 1.26 | % |
| (excluding | | | | | | | | | | Trust, Series 2018-3, Class D, | | | | (LIBOR USD 3-Month + | | | | |
| investment | | | | | | | | | | 4.07%, 8/15/24 | | | | 0.540%), MTN, 0.77%, | | | | |
| companies) (as | | | | | | | | | | Charter Communications | | 1.44% | | 6/27/22 | | | | |
| of 9/30/20) (% | | | | | | | | | | Operating LLC / Charter | | | | NXP BV / NXP Funding LLC, | | | 1.21 | % |
| of Fund’s net | | | | | | | | | | Communications Operating | | | | 3.88%, 9/1/22 | | | | |
| assets) | | | | | | | | | | Capital, 4.46%, 7/23/22 | | | | Credit Suisse Group Funding | | | 1.11 | % |
| | | | | | | | | | DuPont de Nemours, Inc., (LIBOR | | 1.27% | | Guernsey Ltd., 3.80%, 9/15/22 | | | | |
| | | | | | | | | | USD 3-Month + 1.110%), | | | | Bank of America Corp., 3.00%, | | | 1.10 | % |
| | | | | | | | | | 1.39%, 11/15/23 | | | | 12/20/23 | | | | |
| | | | | | | | | | Cigna Corp., (LIBOR USD 3-Month | | 1.27% | | Hyundai Auto Receivables Trust, | | | 1.10 | % |
| | | | | | | | | | + 0.890%), 1.17%, 7/15/23 | | | | Series 2019-A, Class C, 3.03%, | | | | |
| | | | | | | | | | John Deere Capital Corp., (LIBOR | | 1.26% | | 11/17/25 | | | | |
| | | | | | | | | | USD 3-Month + 0.490%), MTN, | | | | | | | | |
| | | | | | | | | | 0.74%, 6/13/22 | | | | | | | | |
| | | | | | | | | | *A listing of all portfolio holdings can be found beginning on page 14 | | | | |
Growth of $10,000 Initial Investment Since Inception (12/30/13) | | | | | | | | | | 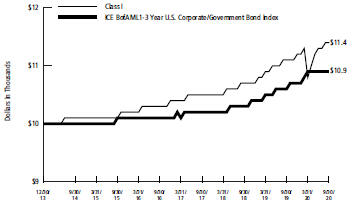
The graph reflects an initial investment of $10,000 over the period from December 30, 2013 (commencement of operations) to September 30, 2020 and is based on Class I shares. The Fund’s total return includes reinvested dividends and capital gains. The Fund’s total return also includes operating expenses that reduce return while the total return of the index does not. The graph does not reflect the deduction of taxes that a shareholder would pay on fund distributions or redemption of fund shares. | |
| | | | | | | | | | | | | | | | | | |
| | | | | | | | | | | | | | | | | | |
| | | | | | | | | | | | | | | | | | |
| | | | | | | | | | | | | | | | | | |
4
|
SCHEDULE OF PORTFOLIO INVESTMENTS |
RBC Short Duration Fixed Income Fund |
|
| September 30, 2020 (Unaudited) |
| | | | | | |
Principal
Amount | | | | Value | |
Corporate Bonds — 72.82% | | | | |
Basic Materials — 2.22% | | | | |
| $ 350,000 | | DuPont de Nemours, Inc., (LIBOR USD 3-Month + 1.110%), 1.39%, 11/15/23(a) | | $ | 354,112 | |
| 200,000 | | DuPont de Nemours, Inc., 4.21%, 11/15/23 | | | 219,692 | |
| 400,000 | | Nutrien Ltd., 3.15%, 10/1/22 | | | 417,449 | |
| 500,000 | | Nutrition & Biosciences, Inc., 0.70%, 9/15/22(b) | | | 500,778 | |
| 100,000 | | Nutrition & Biosciences, Inc., 1.23%, 10/1/25(b) | | | 99,928 | |
| | | | | | |
| | | | | 1,591,959 | |
| | | | | | |
Communications — 5.73% | | | | |
| 500,000 | | AT&T, Inc., 4.45%, 4/1/24 | | | 558,135 | |
| 1,000,000 | | Charter Communications Operating LLC / Charter Communications Operating Capital, 4.46%, 7/23/22 | | | 1,058,908 | |
| 150,000 | | Comcast Corp., (LIBOR USD 3-Month + 0.630%), 0.91%, 4/15/24(a) | | | 151,107 | |
| 395,000 | | Discovery Communications LLC, 2.95%, 3/20/23 | | | 416,271 | |
| 150,000 | | Fox Corp., 3.67%, 1/25/22 | | | 156,404 | |
| 300,000 | | Interpublic Group of Cos, Inc. (The), 3.50%, 10/1/20 | | | 300,000 | |
| 250,000 | | Qwest Corp., 6.75%, 12/1/21 | | | 263,553 | |
| 155,000 | | Rogers Communications, Inc., 3.00%, 3/15/23 | | | 163,651 | |
| 250,000 | | Videotron Ltd., 5.00%, 7/15/22 | | | 260,910 | |
| 500,000 | | Vodafone Group Plc, 3.75%, 1/16/24 | | | 546,052 | |
| 196,000 | | Walt Disney Co. (The), 7.75%, 1/20/24 | | | 238,186 | |
| | | | | | |
| | | | | 4,113,177 | |
| | | | | | |
Consumer, Cyclical — 4.07% | | | | |
| 400,000 | | American Honda Finance Corp., (LIBOR USD 3-Month + 0.540%), MTN, 0.77%, 6/27/22(a) | | | 401,384 | |
| 300,000 | | Delta Air Lines, Inc., 2.90%, 10/28/24 | | | 267,265 | |
| 250,000 | | General Motors Financial Co., Inc., 2.90%, 2/26/25 | | | 257,451 | |
| 350,000 | | General Motors Financial Co., Inc., 3.20%, 7/6/21 | | | 354,857 | |
| 200,000 | | General Motors Financial Co., Inc., 3.45%, 1/14/22 | | | 205,037 | |
| 300,000 | | Hyundai Capital America, 3.00%, 10/30/20(b) | | | 300,483 | |
| 250,000 | | Lennar Corp., 4.75%, 11/15/22(c) | | | 261,471 | |
| 400,000 | | Volkswagen Group of America Finance LLC, 2.70%, 9/26/22(b) | | | 414,789 | |
| 200,000 | | Volkswagen Group of America Finance LLC, 3.88%, 11/13/20(b) | | | 200,786 | |
| 250,000 | | Walgreens Boots Alliance, Inc., 3.30%, 11/18/21 | | | 256,621 | |
| | | | | | |
| | | | | 2,920,144 | |
| | | | | | |
Consumer, Non-cyclical — 10.45% | | | | |
| 250,000 | | AbbVie, Inc., 2.30%, 11/21/22(b) | | | 258,810 | |
| 400,000 | | AbbVie, Inc., 3.25%, 10/1/22(b) | | | 418,062 | |
| 250,000 | | AbbVie, Inc., 3.45%, 3/15/22(b) | | | 259,093 | |
| 150,000 | | Amgen, Inc., 2.65%, 5/11/22 | | | 155,067 | |
| 200,000 | | Bayer US Finance II LLC, 3.50%, 6/25/21(b) | | | 203,963 | |
| 125,000 | | Becton Dickinson and Co., (LIBOR USD 3-Month + 1.030%), 1.28%, 6/6/22(a) | | | 125,747 | |
| 750,000 | | Becton Dickinson and Co., 2.89%, 6/6/22 | | | 775,816 | |
5
|
SCHEDULE OF PORTFOLIO INVESTMENTS |
RBC Short Duration Fixed Income Fund (cont.) |
|
| September 30, 2020 (Unaudited) |
| | | | | | |
Principal
Amount | | | | Value | |
| $200,000 | | Bristol-Myers Squibb Co., 2.88%, 2/19/21 | | $ | 201,974 | |
| 200,000 | | Bristol-Myers Squibb Co., 2.90%, 7/26/24 | | | 216,812 | |
| 350,000 | | Cigna Corp., (LIBOR USD 3-Month + 0.890%), 1.17%, 7/15/23(a) | | | 353,690 | |
| 150,000 | | Conagra Brands, Inc., 3.80%, 10/22/21 | | | 155,175 | |
| 800,000 | | CVS Health Corp., 2.63%, 8/15/24 | | | 852,632 | |
| 27,000 | | CVS Health Corp., 3.35%, 3/9/21 | | | 27,352 | |
| 44,000 | | CVS Health Corp., 3.70%, 3/9/23 | | | 47,145 | |
| 400,000 | | EMD Finance LLC, 2.95%, 3/19/22(b) | | | 411,990 | |
| 250,000 | | EMD Finance LLC, 3.25%, 3/19/25(b) | | | 274,936 | |
| 140,000 | | Equifax, Inc., 2.60%, 12/1/24 | | | 149,407 | |
| 100,000 | | Equifax, Inc., 3.60%, 8/15/21 | | | 102,646 | |
| 450,000 | | Gilead Sciences, Inc., 0.75%, 9/29/23 | | | 450,831 | |
| 250,000 | | HCA, Inc., 5.88%, 5/1/23 | | | 272,026 | |
| 250,000 | | Health Care Service Corp. A Mutual Legal Reserve Co., 1.50%, 6/1/25(b) | | | 256,006 | |
| 150,000 | | Kroger Co. (The), 3.30%, 1/15/21 | | | 150,877 | |
| 250,000 | | Molson Coors Brewing Co., 2.10%, 7/15/21 | | | 252,619 | |
| 275,000 | | Mondelez International, Inc., 2.13%, 4/13/23 | | | 285,529 | |
| 134,000 | | Shire Acquisitions Investments Ireland DAC, 2.40%, 9/23/21 | | | 136,403 | |
| 250,000 | | Shire Acquisitions Investments Ireland DAC, 2.88%, 9/23/23 | | | 265,175 | |
| 200,000 | | Takeda Pharmaceutical Co. Ltd., 4.00%, 11/26/21 | | | 207,669 | |
| 225,000 | | Upjohn, Inc., 1.13%, 6/22/22(b) | | | 226,759 | |
| | | | | | |
| | | | | 7,494,211 | |
| | | | | | |
Energy — 9.50% | | | | |
| 200,000 | | Enbridge Energy Partners LP, 4.20%, 9/15/21 | | | 205,088 | |
| 500,000 | | Enbridge, Inc., 2.50%, 1/15/25 | | | 526,569 | |
| 500,000 | | Energy Transfer Operating LP, 4.50%, 4/15/24 | | | 529,424 | |
| 550,000 | | Energy Transfer Operating LP, 5.20%, 2/1/22 | | | 569,572 | |
| 150,000 | | Kinder Morgan Energy Partners LP, 3.50%, 3/1/21 | | | 151,076 | |
| 200,000 | | Kinder Morgan Energy Partners LP, 4.25%, 9/1/24 | | | 221,408 | |
| 400,000 | | Kinder Morgan Energy Partners LP, 5.80%, 3/1/21 | | | 408,397 | |
| 500,000 | | Kinder Morgan, Inc., 4.30%, 6/1/25 | | | 563,058 | |
| 300,000 | | Marathon Petroleum Corp., 5.13%, 3/1/21 | | | 305,588 | |
| 400,000 | | MPLX LP, (LIBOR USD 3-Month + 1.100%), 1.34%, 9/9/22(a) | | | 399,783 | |
| 250,000 | | ONEOK Partners LP, 3.38%, 10/1/22 | | | 259,808 | |
| 350,000 | | ONEOK, Inc., 4.25%, 2/1/22 | | | 361,388 | |
| 500,000 | | Plains All American Pipeline LP / PAA Finance Corp., 3.65%, 6/1/22 | | | 512,013 | |
| 200,000 | | Spectra Energy Partners LP, 4.60%, 6/15/21 | | | 203,598 | |
| 750,000 | | Williams Cos., Inc. (The), 3.35%, 8/15/22 | | | 779,304 | |
| 250,000 | | Williams Cos., Inc. (The), 4.00%, 11/15/21 | | | 257,159 | |
| 517,000 | | Williams Cos., Inc. (The), 4.30%, 3/4/24 | | | 565,065 | |
| | | | | | |
| | | | | 6,818,298 | |
| | | | | | |
Financial — 23.63% | | | | |
| 350,000 | | American Tower Corp., REIT, 3.50%, 1/31/23 | | | 372,097 | |
| 500,000 | | American Tower Corp., 5.00%, 2/15/24 | | | 566,611 | |
6
|
SCHEDULE OF PORTFOLIO INVESTMENTS |
RBC Short Duration Fixed Income Fund (cont.) |
|
| September 30, 2020 (Unaudited) |
| | | | | | |
Principal
Amount | | | | Value | |
| $ 450,000 | | Bank of America Corp., MTN, 2.33%, 10/1/21(d) | | $ | 450,000 | |
| 1,000,000 | | Bank of America Corp., 3.00%, 12/20/23(d) | | | 1,049,746 | |
| 600,000 | | Bank of Nova Scotia (The), 2.00%, 11/15/22 | | | 619,356 | |
| 250,000 | | Barclays Plc, 3.20%, 8/10/21 | | | 255,728 | |
| 500,000 | | Barclays Plc, 3.68%, 1/10/23 | | | 515,879 | |
| 200,000 | | BNP Paribas SA, 2.95%, 5/23/22(b) | | | 207,105 | |
| 550,000 | | BNP Paribas SA, 3.50%, 3/1/23(b) | | | 584,163 | |
| 149,000 | | Camden Property Trust, REIT, 4.88%, 6/15/23 | | | 163,414 | |
| 250,000 | | Canadian Imperial Bank of Commerce, (LIBOR USD 3-Month + 0.660%), 0.91%, 9/13/23(a) | | | 252,468 | |
| 675,000 | | Canadian Imperial Bank of Commerce, 0.95%, 6/23/23 | | | 681,036 | |
| 250,000 | | CIT Group, Inc., 4.75%, 2/16/24 | | | 257,578 | |
| 150,000 | | Citigroup, Inc., (LIBOR USD 3-Month + 1.190%), 1.44%, 8/2/21(a) | | | 151,221 | |
| 300,000 | | Citigroup, Inc., 2.75%, 4/25/22 | | | 310,059 | |
| 200,000 | | Citigroup, Inc., 2.90%, 12/8/21 | | | 205,454 | |
| 350,000 | | Citigroup, Inc., 4.04%, 6/1/24(d) | | | 378,772 | |
| 300,000 | | Cooperatieve Rabobank UA, (LIBOR USD 3-Month + 0.480%), 0.75%, 1/10/23(a) | | | 301,365 | |
| 250,000 | | Cooperatieve Rabobank UA, 3.95%, 11/9/22 | | | 265,915 | |
| 300,000 | | Credit Agricole SA, 3.25%, 10/4/24(b) | | | 323,943 | |
| 500,000 | | Credit Agricole SA, 3.75%, 4/24/23(b) | | | 535,986 | |
| 500,000 | | Credit Suisse Group Funding Guernsey Ltd., 3.80%, 9/15/22 | | | 529,311 | |
| 275,000 | | Crown Castle International Corp., REIT, 1.35%, 7/15/25 | | | 278,603 | |
| 350,000 | | Crown Castle International Corp., REIT, 5.25%, 1/15/23 | | | 385,096 | |
| 500,000 | | Goldman Sachs Group, Inc. (The), 2.91%, 7/24/23(d) | | | 518,606 | |
| 550,000 | | Goldman Sachs Group, Inc. (The), 3.63%, 2/20/24 | | | 597,562 | |
| 200,000 | | HSBC Holdings Plc, 2.65%, 1/5/22 | | | 205,016 | |
| 500,000 | | HSBC Holdings Plc, 3.60%, 5/25/23 | | | 532,575 | |
| 400,000 | | ING Groep NV, 3.15%, 3/29/22 | | | 414,946 | |
| 400,000 | | ING Groep NV, 4.10%, 10/2/23 | | | 438,516 | |
| 200,000 | | JPMorgan Chase & Co., (LIBOR USD 3-Month + 0.890%), 1.15%, 7/23/24(a) | | | 201,311 | |
| 330,000 | | JPMorgan Chase & Co., 1.51%, 6/1/24(d) | | | 336,840 | |
| 490,000 | | JPMorgan Chase & Co., 3.21%, 4/1/23(d) | | | 509,052 | |
| 375,000 | | Lloyds Banking Group Plc, 2.91%, 11/7/23(d) | | | 389,111 | |
| 250,000 | | Lloyds Banking Group Plc, 3.00%, 1/11/22 | | | 257,293 | |
| 200,000 | | Morgan Stanley, (LIBOR USD 3-Month + 0.930%), 1.19%, 7/22/22(a) | | | 200,958 | |
| 350,000 | | Morgan Stanley, (LIBOR USD 3-Month + 1.180%), 1.45%, 1/20/22(a) | | | 350,962 | |
| 400,000 | | Morgan Stanley, MTN, 2.75%, 5/19/22 | | | 414,501 | |
| 100,000 | | Regions Financial Corp., 2.75%, 8/14/22 | | | 103,924 | |
| 250,000 | | Santander UK Group Holdings Plc, 2.88%, 10/16/20 | | | 250,253 | |
| 243,000 | | Santander UK Plc, (LIBOR USD 3-Month + 0.620%), 0.87%, 6/1/21(a) | | | 243,734 | |
| 300,000 | | Skandinaviska Enskilda Banken AB, 0.55%, 9/1/23(b) | | | 299,932 | |
| 275,000 | | Toronto-Dominion Bank (The), MTN, 0.75%, 6/12/23 | | | 276,670 | |
7
|
SCHEDULE OF PORTFOLIO INVESTMENTS |
RBC Short Duration Fixed Income Fund (cont.) |
|
| September 30, 2020 (Unaudited) |
| | | | | | |
Principal
Amount | | | | Value | |
| $500,000 | | Wells Fargo & Co., MTN, 2.63%, 7/22/22 | | $ | 518,531 | |
| 250,000 | | Westpac Banking Corp., (LIBOR USD 3-Month + 0.710%), 0.94%, 6/28/22(a) | | | 252,280 | |
| | | | | | |
| | | | | 16,953,479 | |
| | | | | | |
Industrial — 6.79% | | | | |
| 350,000 | | Agilent Technologies, Inc., 3.88%, 7/15/23 | | | 379,596 | |
| 135,000 | | Burlington Northern Santa Fe LLC, 4.10%, 6/1/21 | | | 136,698 | |
| 600,000 | | Carrier Global Corp., 1.92%, 2/15/23(b) | | | 617,170 | |
| 341,000 | | Caterpillar Financial Services Corp., (LIBOR USD 3-Month + 0.200%), MTN, 0.46%, 11/12/21(a) | | | 341,375 | |
| 100,000 | | Caterpillar Financial Services Corp., (LIBOR USD 3-Month + 0.590%), MTN, 0.84%, 6/6/22(a) | | | 100,639 | |
| 250,000 | | Ingersoll-Rand Global Holding Co. Ltd., 4.25%, 6/15/23 | | | 274,661 | |
| 250,000 | | Ingersoll-Rand Luxembourg Finance SA, 3.55%, 11/1/24 | | | 275,167 | |
| 300,000 | | John Deere Capital Corp., (LIBOR USD 3-Month + 0.490%), MTN, 0.74%, 6/13/22(a) | | | 301,423 | |
| 300,000 | | Raytheon Technologies Corp., 2.80%, 3/15/22(b) | | | 309,300 | |
| 700,000 | | Raytheon Technologies Corp., 3.20%, 3/15/24(b) | | | 752,652 | |
| 250,000 | | Republic Services, Inc., 2.50%, 8/15/24 | | | 266,129 | |
| 725,000 | | Roper Technologies, Inc., 2.35%, 9/15/24 | | | 766,881 | |
| 50,000 | | Roper Technologies, Inc., 2.80%, 12/15/21 | | | 51,281 | |
| 275,000 | | Roper Technologies, Inc., 3.65%, 9/15/23 | | | 298,752 | |
| | | | | | |
| | | | | 4,871,724 | |
| | | | | | |
Technology — 3.96% | | | | |
| 255,000 | | Broadcom Corp. / Broadcom Cayman Finance Ltd., 2.20%, 1/15/21 | | | 256,139 | |
| 400,000 | | Broadcom Corp. / Broadcom Cayman Finance Ltd., 3.63%, 1/15/24 | | | 429,480 | |
| 400,000 | | Broadcom, Inc., 3.13%, 4/15/21 | | | 405,185 | |
| 250,000 | | Broadcom, Inc., 3.13%, 10/15/22 | | | 261,649 | |
| 50,000 | | Dell International LLC / EMC Corp., 4.42%, 6/15/21(b) | | | 51,091 | |
| 650,000 | | Dell International LLC / EMC Corp., 5.45%, 6/15/23(b) | | | 712,533 | |
| 325,000 | | Leidos, Inc., 2.95%, 5/15/23(b) | | | 341,937 | |
| 250,000 | | NXP BV / NXP Funding LLC, 4.63%, 6/1/23(b) | | | 273,390 | |
| 100,000 | | NXP BV / NXP Funding LLC / NXP USA, Inc., 2.70%, 5/1/25(b) | | | 105,830 | |
| | | | | | |
| | | | | 2,837,234 | |
| | | | | | |
Utilities — 6.47% | | | | |
| 275,000 | | American Electric Power Co., Inc., Series I, 3.65%, 12/1/21 | | | 284,797 | |
| 500,000 | | Avangrid, Inc., 3.15%, 12/1/24 | | | 545,622 | |
| 300,000 | | CenterPoint Energy, Inc., 3.85%, 2/1/24 | | | 328,807 | |
| 500,000 | | Evergy, Inc., 2.45%, 9/15/24 | | | 529,478 | |
| 350,000 | | Exelon Corp., 2.45%, 4/15/21 | | | 353,145 | |
| 250,000 | | FirstEnergy Corp., Series B, 4.25%, 3/15/23 | | | 265,471 | |
| 450,000 | | Florida Power & Light Co., (LIBOR USD 3-Month + 0.380%), 0.64%, 7/28/23(a) | | | 450,308 | |
| 270,000 | | Georgia Power Co., Series A, 2.10%, 7/30/23 | | | 281,885 | |
8
|
SCHEDULE OF PORTFOLIO INVESTMENTS |
RBC Short Duration Fixed Income Fund (cont.) |
|
| September 30, 2020 (Unaudited) |
| | | | | | |
Principal
Amount | | | | Value | |
| $550,000 | | Sempra Energy, 2.90%, 2/1/23 | | $ | 575,951 | |
| 175,000 | | Southern Co. Gas Capital Corp., 3.50%, 9/15/21 | | | 178,736 | |
| 275,000 | | WEC Energy Group, Inc., 0.55%, 9/15/23 | | | 275,428 | |
| 575,000 | | Xcel Energy, Inc., 0.50%, 10/15/23 | | | 574,782 | |
| | | | | | |
| | | | | 4,644,410 | |
| | | | | | |
| |
Total Corporate Bonds | | | 52,244,636 | |
| | | | | | |
(Cost $51,316,203) | | | | |
| |
Asset Backed Securities — 25.87% | | | | |
| 108,948 | | AmeriCredit Automobile Receivables Trust, Series 2016-1, Class D, 3.59%, 2/8/22 | | | 109,000 | |
| 100,926 | | AmeriCredit Automobile Receivables Trust, Series 2016-2, Class D, 3.65%, 5/9/22 | | | 100,980 | |
| 400,000 | | AmeriCredit Automobile Receivables Trust, Series 2017-1, Class D, 3.13%, 1/18/23 | | | 408,494 | |
| 395,000 | | AmeriCredit Automobile Receivables Trust, Series 2017-3, Class D, 3.18%, 7/18/23 | | | 406,288 | |
| 160,000 | | AmeriCredit Automobile Receivables Trust, Series 2018-1, Class C, 3.50%, 1/18/24 | | | 166,374 | |
| 240,000 | | AmeriCredit Automobile Receivables Trust, Series 2019-1, Class D, 3.62%, 3/18/25 | | | 252,246 | |
| 508,000 | | AmeriCredit Automobile Receivables Trust, Series 2019-2, Class B, 2.54%, 7/18/24 | | | 525,480 | |
| 125,000 | | AmeriCredit Automobile Receivables Trust, Series 2019-2, Class C, 2.74%, 4/18/25 | | | 130,380 | |
| 300,000 | | AmeriCredit Automobile Receivables Trust, Series 2019-3, Class B, 2.13%, 7/18/25 | | | 308,560 | |
| 455,000 | | AmeriCredit Automobile Receivables Trust, Series 2019-3, Class D, 2.58%, 9/18/25 | | | 467,540 | |
| 275,000 | | Capital Auto Receivables Asset Trust, Series 2017-1, Class D, 3.15%, 2/20/25(b) | | | 280,581 | |
| 570,000 | | Capital Auto Receivables Asset Trust, Series 2018-2, Class C, 3.69%, 12/20/23(b) | | | 583,076 | |
| 147,000 | | CarMax Auto Owner Trust, Series 2017-1, Class B, 2.54%, 9/15/22 | | | 148,338 | |
| 360,000 | | CarMax Auto Owner Trust, Series 2017-1, Class D, 3.43%, 7/17/23 | | | 364,309 | |
| 502,000 | | CarMax Auto Owner Trust, Series 2017-3, Class D, 3.46%, 10/16/23 | | | 512,796 | |
| 420,000 | | CarMax Auto Owner Trust, Series 2017-4, Class D, 3.30%, 5/15/24 | | | 429,569 | |
| 475,000 | | CarMax Auto Owner Trust, Series 2018-1, Class D, 3.37%, 7/15/24 | | | 486,667 | |
| 305,000 | | CarMax Auto Owner Trust, Series 2018-3, Class D, 3.91%, 1/15/25 | | | 315,389 | |
| 335,000 | | CarMax Auto Owner Trust, Series 2019-1, Class C, 3.74%, 1/15/25 | | | 354,151 | |
| 625,000 | | CarMax Auto Owner Trust, Series 2019-3, Class B, 2.50%, 4/15/25 | | | 650,662 | |
9
|
SCHEDULE OF PORTFOLIO INVESTMENTS |
RBC Short Duration Fixed Income Fund (cont.) |
|
| September 30, 2020 (Unaudited) |
| | | | | | |
Principal
Amount | | | | Value | |
| $ 250,000 | | CarMax Auto Owner Trust, Series 2019-3, Class C, 2.60%, 6/16/25 | | $ | 259,709 | |
| 310,000 | | CarMax Auto Owner Trust, Series 2019-4, Class C, 2.60%, 9/15/25 | | | 323,319 | |
| 175,000 | | CarMax Auto Owner Trust, Series 2020-1, Class C, 2.34%, 11/17/25 | | | 181,020 | |
| 400,000 | | Dell Equipment Finance Trust, Series 2018-1, Class C, 3.53%, 6/22/23(b) | | | 406,165 | |
| 300,000 | | Dell Equipment Finance Trust, Series 2018-2, Class C, 3.72%, 10/22/23(b) | | | 307,742 | |
| 175,000 | | Dell Equipment Finance Trust, Series 2019-2, Class D, 2.48%, 4/22/25(b) | | | 177,291 | |
| 144,764 | | Drive Auto Receivables Trust, Series 2016-CA, Class D, 4.18%, 3/15/24(b) | | | 146,954 | |
| 163,054 | | Drive Auto Receivables Trust, Series 2017-AA, Class D, 4.16%, 5/15/24(b) | | | 165,786 | |
| 48,843 | | Drive Auto Receivables Trust, Series 2017-BA, Class D, 3.72%, 10/17/22(b) | | | 49,123 | |
| 119,232 | | Drive Auto Receivables Trust, Series 2018-3, Class C, 3.72%, 9/16/24 | | | 120,307 | |
| 750,000 | | Drive Auto Receivables Trust, Series 2018-4, Class D, 4.09%, 1/15/26 | | | 780,864 | |
| 750,000 | | Drive Auto Receivables Trust, Series 2018-5, Class D, 4.30%, 4/15/26 | | | 793,127 | |
| 200,000 | | Drive Auto Receivables Trust, Series 2019-1, Class C, 3.78%, 4/15/25 | | | 205,538 | |
| 1,100,000 | | Drive Auto Receivables Trust, Series 2019-1, Class D, 4.09%, 6/15/26 | | | 1,153,477 | |
| 180,000 | | Drive Auto Receivables Trust, Series 2019-3, Class C, 2.90%, 8/15/25 | | | 185,814 | |
| 175,000 | | Drive Auto Receivables Trust, Series 2019-4, Class C, 2.51%, 11/17/25 | | | 179,020 | |
| 50,000 | | Drive Auto Receivables Trust, Series 2019-4, Class D, 2.70%, 2/16/27 | | | 51,158 | |
| 175,000 | | Drive Auto Receivables Trust, Series 2020-1, Class C, 2.36%, 3/16/26 | | | 179,351 | |
| 270,000 | | Ford Credit Auto Lease Trust, Series 2019-A, Class B, 3.25%, 7/15/22 | | | 276,462 | |
| 200,000 | | GM Financial Automobile Leasing Trust, Series 2019-1, Class D, 3.95%, 5/22/23 | | | 204,559 | |
| 180,000 | | GM Financial Automobile Leasing Trust, Series 2019-3, Class C, 2.35%, 7/20/23 | | | 183,515 | |
| 575,000 | | GM Financial Automobile Leasing Trust, Series 2020-1, Class C, 2.04%, 12/20/23 | | | 585,106 | |
| 370,000 | | GM Financial Consumer Automobile Receivables Trust, Series 2019-2, Class B, 2.87%, 10/16/24 | | | 387,049 | |
| 410,000 | | GM Financial Consumer Automobile Receivables Trust, Series 2019-3, Class B, 2.32%, 12/16/24 | | | 424,142 | |
| 120,000 | | GM Financial Consumer Automobile Receivables Trust, Series 2019-3, Class C, 2.62%, 1/16/25 | | | 123,993 | |
10
|
SCHEDULE OF PORTFOLIO INVESTMENTS |
RBC Short Duration Fixed Income Fund (cont.) |
|
| September 30, 2020 (Unaudited) |
| | | | | | |
Principal
Amount | | | | Value | |
| $ 80,000 | | GM Financial Consumer Automobile Receivables Trust, Series 2020-1, Class B, 2.03%, 4/16/25 | | $ | 82,336 | |
| 60,000 | | GM Financial Consumer Automobile Receivables Trust, Series 2020-1, Class C, 2.18%, 5/16/25 | | | 61,463 | |
| 129,169 | | Santander Drive Auto Receivables Trust, Series 2016-2, Class D, 3.39%, 4/15/22 | | | 129,557 | |
| 217,246 | | Santander Drive Auto Receivables Trust, Series 2017-1, Class D, 3.17%, 4/17/23 | | | 219,649 | |
| 175,000 | | Santander Drive Auto Receivables Trust, Series 2018-1, Class D, 3.32%, 3/15/24 | | | 179,904 | |
| 302,713 | | Santander Drive Auto Receivables Trust, Series 2018-3, Class C, 3.51%, 8/15/23 | | | 306,501 | |
| 600,000 | | Santander Drive Auto Receivables Trust, Series 2018-3, Class D, 4.07%, 8/15/24 | | | 625,122 | |
| 145,000 | | Santander Drive Auto Receivables Trust, Series 2019-1, Class C, 3.42%, 4/15/25 | | | 148,595 | |
| 300,000 | | Santander Drive Auto Receivables Trust, Series 2019-2, Class C, 2.90%, 10/15/24 | | | 308,403 | |
| 80,000 | | Santander Drive Auto Receivables Trust, Series 2019-3, Class D, 2.68%, 10/15/25 | | | 82,004 | |
| 500,000 | | Santander Retail Auto Lease Trust, Series 2019-B, Class C, 2.77%, 8/21/23(b) | | | 514,474 | |
| 310,000 | | Tesla Auto Lease Trust, Series 2020-A, Class B, 1.18%, 1/22/24(b) | | | 311,175 | |
| 100,000 | | Verizon Owner Trust, Series 2018-A, Class C, 3.55%, 4/20/23 | | | 103,468 | |
| 275,000 | | Verizon Owner Trust, Series 2019-C, Class B, 2.06%, 4/22/24 | | | 283,798 | |
| 350,000 | | World Omni Auto Receivables Trust, Series 2016-B, Class B, 1.73%, 7/15/23 | | | 350,546 | |
| | | | | | |
Total Asset Backed Securities | | | 18,558,466 | |
| | | | | | |
(Cost $18,264,791) | | | | |
| |
U.S. Government Agency Backed Mortgages — 0.39% | | | | |
Fannie Mae — 0.01% | | | | |
| 3,269 | | Series 2001-70, Class OF, (LIBOR USD 1-Month + 0.950%), 1.10%, 10/25/31(a) | | | 3,349 | |
| 2,392 | | Series 2009-87, Class FX, (LIBOR USD 1-Month + 0.750%), 0.90%, 11/25/39(a) | | | 2,435 | |
| | | | | | |
| | | | | 5,784 | |
| | | | | | |
Freddie Mac — 0.38% | | | | |
| 255,000 | | Series 2011-K13, Class B, 4.77%, 1/1/48(b),(c) | | | 257,378 | |
| 2,431 | | Series 2448, Class FT, (LIBOR USD 1-Month + 1.000%), 1.15%, 3/15/32(a) | | | 2,496 | |
| 2,583 | | Series 2488, Class FQ, (LIBOR USD 1-Month + 1.000%), 1.15%, 3/15/32(a) | | | 2,651 | |
11
|
SCHEDULE OF PORTFOLIO INVESTMENTS |
RBC Short Duration Fixed Income Fund (cont.) |
|
| September 30, 2020 (Unaudited) |
| | | | | | |
Principal
Amount | | | | Value | |
| $8,204 | | Series 2627, Class MW, 5.00%, 6/1/23 | | $ | 8,576 | |
| 1,112 | | Series 3770, Class FP, (LIBOR USD 1-Month + 0.500%), 0.65%, 11/15/40(a) | | | 1,116 | |
| | | | | | |
| | | | | 272,217 | |
| | | | | | |
| |
Total U.S. Government Agency Backed Mortgages | | | 278,001 | |
| | | | | | |
(Cost $288,986) | | | | |
| |
Collateralized Mortgage Obligations — 0.00% | | | | |
| 2,373 | | JP Morgan Resecuritization Trust Series, Series 2014-1, Class 9A3, (LIBOR USD 1-Month + 0.290%),
0.47%, 12/26/35(a),(b) | | | 2,365 | |
| | | | | | |
Total Collateralized Mortgage Obligations | | | 2,365 | |
| | | | | | |
(Cost $2,339) | | | | |
| | |
Shares | | | | | |
Investment Company — 0.58% | | | | |
| 412,818 | | U.S. Government Money Market Fund, RBC Institutional Class 1(e) | | | 412,818 | |
| | | | | | |
| |
Total Investment Company | | | 412,818 | |
| | | | | | |
(Cost $412,818) | | | | |
| |
Total Investments | | $ | 71,496,286 | |
(Cost $70,285,137)(f) — 99.66% | | | | |
Other assets in excess of liabilities — 0.34% | | | 244,335 | |
| | | | | | |
| |
NET ASSETS — 100.00% | | $ | 71,740,621 | |
| | | | | | |
| (a) | Floating rate note. Rate shown is as of report date. |
| (b) | Security exempt from registration under Rule 144A or Section 4(2) of the Securities Act of 1933, as amended. These securities may be resold in transactions exempt from registration, normally to qualified institutional buyers. |
| (c) | Variable or floating rate security, which interest rate adjusts periodically based on changes in current interest rates and prepayments on the underlying pool of assets. Rate shown is the rate in effect as of period end. |
| (d) | Security is a fix-to-float security, which carries a fixed coupon until a certain date, upon which it switches to a floating rate. Reference rate and spread are provided if the rate is currently floating. |
| (e) | Affiliated investment. |
| (f) | See Notes to Schedules of Portfolio Investments for the tax cost of securities and the breakdown of unrealized appreciation (depreciation). |
12
|
SCHEDULE OF PORTFOLIO INVESTMENTS |
RBC Short Duration Fixed Income Fund (cont.) |
|
| September 30, 2020 (Unaudited) |
Financial futures contracts as of September 30, 2020:
| | | | | | | | | | | | | | | | | | | | | | | | |
Long Position | | Number of
Contracts | | | Expiration
Date | | | Value/Unrealized
Appreciation | | | Notional
Value | | | Clearinghouse | |
Two Year U.S. Treasury Note | | | 46 | | | | December 2020 | | | | | | | $ | 4,715 | | | | USD $10,164,203 | | | | Barclays Capital Group | |
| | | | | | | | | | | | | | | | | | | | | | | | |
Total | | | | | | | | | | | | | | $ | 4,715 | | | | | | | | | |
| | | | | | | | | | | | | | | | | | | | | | | | |
| | | | | |
Short Position | | Number of
Contracts | | | Expiration
Date | | | Value/Unrealized
Depreciation | | | Notional
Value | | | Clearinghouse | |
Five Year U.S. Treasury Note | | | 15 | | | | December 2020 | | | | | | | $ | (2,739 | ) | | | USD $1,890,469 | | | | Barclays Capital Group | |
| | | | | | | | | | | | | | | | | | | | | | | | |
Total | | | | | | | | | | | | | | $ | (2,739 | ) | | | | | | | | |
| | | | | | | | | | | | | | | | | | | | | | | | |
Abbreviations used are defined below:
LIBOR - London Interbank Offered Rate
MTN - Medium Term Note
REIT - Real Estate Investment Trust
USD - United States Dollar
See Notes to the Financial Statements.
13
|
SCHEDULE OF PORTFOLIO INVESTMENTS |
RBC Ultra-Short Fixed Income Fund |
|
| September 30, 2020 (Unaudited) |
| | | | | | |
Principal
Amount | | | | Value | |
Corporate Bonds — 65.29% | | | | |
Basic Materials — 4.31% | | | | |
| $600,000 | | DuPont de Nemours, Inc., (LIBOR USD 3-Month + 1.110%), 1.39%, 11/15/23(a) | | $ | 607,050 | |
| 300,000 | | DuPont de Nemours, Inc., 4.21%, 11/15/23 | | | 329,538 | |
| 300,000 | | LyondellBasell Industries NV, 6.00%, 11/15/21 | | | 314,072 | |
| 300,000 | | Nutrien Ltd., 3.15%, 10/1/22 | | | 313,086 | |
| 500,000 | | Nutrition & Biosciences, Inc., 0.70%, 9/15/22(b) | | | 500,778 | |
| | | | | | |
| | | | | 2,064,524 | |
| | | | | | |
Communications — 2.72% | | | | |
| 650,000 | | Charter Communications Operating LLC / Charter Communications Operating Capital, 4.46%, 7/23/22 | | | 688,290 | |
| 150,000 | | Comcast Corp., (LIBOR USD 3-Month + 0.630%), 0.91%, 4/15/24(a) | | | 151,107 | |
| 250,000 | | Vodafone Group Plc, (LIBOR USD 3-Month + 0.990%), 1.26%, 1/16/24(a) | | | 251,701 | |
| 200,000 | | Vodafone Group Plc, 2.95%, 2/19/23 | | | 210,608 | |
| | | | | | |
| | | | | 1,301,706 | |
| | | | | | |
Consumer, Cyclical — 5.65% | | | | |
| 250,000 | | Alimentation Couche-Tard, Inc., 2.70%, 7/26/22(b) | | | 257,887 | |
| 600,000 | | American Honda Finance Corp., (LIBOR USD 3-Month + 0.540%), MTN, 0.77%, 6/27/22(a) | | | 602,075 | |
| 181,000 | | Delta Air Lines, Inc., 3.40%, 4/19/21 | | | 181,043 | |
| 250,000 | | General Motors Financial Co., Inc., 3.20%, 7/6/21 | | | 253,470 | |
| 250,000 | | General Motors Financial Co., Inc., 3.55%, 4/9/21 | | | 253,245 | |
| 424,000 | | Hyundai Capital America, 3.00%, 10/30/20(b) | | | 424,683 | |
| 325,000 | | Marriott International, Inc., (LIBOR USD 3-Month + 0.650%), 0.90%, 3/8/21(a) | | | 323,674 | |
| 150,000 | | Toyota Motor Credit Corp., MTN, 0.50%, 8/14/23 | | | 150,246 | |
| 250,000 | | Volkswagen Group of America Finance LLC, 2.70%, 9/26/22(b) | | | 259,243 | |
| | | | | | |
| | | | | 2,705,566 | |
| | | | | | |
Consumer, Non-cyclical — 8.71% | | | | |
| 250,000 | | AbbVie, Inc., 3.25%, 10/1/22(b) | | | 261,289 | |
| 300,000 | | AbbVie, Inc., 3.45%, 3/15/22(b) | | | 310,911 | |
| 125,000 | | Becton Dickinson and Co., (LIBOR USD 3-Month + 1.030%), 1.28%, 6/6/22(a) | | | 125,747 | |
| 450,000 | | Becton Dickinson and Co., 2.89%, 6/6/22 | | | 465,490 | |
| 150,000 | | Bristol-Myers Squibb Co., 2.88%, 2/19/21 | | | 151,480 | |
| 600,000 | | Cigna Corp., (LIBOR USD 3-Month + 0.890%), 1.17%, 7/15/23(a) | | | 606,326 | |
| 150,000 | | Conagra Brands, Inc., 3.80%, 10/22/21 | | | 155,175 | |
| 108,000 | | CVS Health Corp., 3.70%, 3/9/23 | | | 115,720 | |
| 350,000 | | EMD Finance LLC, 2.95%, 3/19/22(b) | | | 360,491 | |
| 250,000 | | Equifax, Inc., 3.60%, 8/15/21 | | | 256,614 | |
| 300,000 | | Gilead Sciences, Inc., 0.75%, 9/29/23 | | | 300,554 | |
| 250,000 | | HCA, Inc., 4.75%, 5/1/23 | | | 272,723 | |
14
|
SCHEDULE OF PORTFOLIO INVESTMENTS |
RBC Ultra-Short Fixed Income Fund (cont.) |
|
| September 30, 2020 (Unaudited) |
| | | | | | |
Principal
Amount | | | | Value | |
| $ 82,000 | | Shire Acquisitions Investments Ireland DAC, 2.40%, 9/23/21 | | $ | 83,470 | |
| 300,000 | | Shire Acquisitions Investments Ireland DAC, 2.88%, 9/23/23 | | | 318,210 | |
| 200,000 | | Takeda Pharmaceutical Co. Ltd., 4.00%, 11/26/21 | | | 207,669 | |
| 175,000 | | Upjohn, Inc., 1.13%, 6/22/22(b) | | | 176,368 | |
| | | | | | |
| | | | | 4,168,237 | |
| | | | | | |
Energy — 8.09% | | | | |
| 150,000 | | ConocoPhillips Co., (LIBOR USD 3-Month + 0.900%), 1.18%, 5/15/22(a) | | | 151,066 | |
| 250,000 | | Enbridge, Inc., 2.90%, 7/15/22 | | | 259,263 | |
| 300,000 | | Enbridge, Inc., 4.00%, 10/1/23 | | | 324,933 | |
| 200,000 | | Energy Transfer Operating LP, 3.60%, 2/1/23 | | | 206,058 | |
| 250,000 | | Energy Transfer Operating LP, 5.20%, 2/1/22 | | | 258,896 | |
| 300,000 | | Kinder Morgan Energy Partners LP, 5.00%, 10/1/21 | | | 309,111 | |
| 100,000 | | Kinder Morgan Energy Partners LP, 5.80%, 3/1/21 | | | 102,099 | |
| 300,000 | | Kinder Morgan, Inc., 5.63%, 11/15/23(b) | | | 338,070 | |
| 250,000 | | MPLX LP, (LIBOR USD 3-Month + 1.100%), 1.34%, 9/9/22(a) | | | 249,864 | |
| 200,000 | | ONEOK Partners LP, 3.38%, 10/1/22 | | | 207,846 | |
| 250,000 | | ONEOK, Inc., 4.25%, 2/1/22 | | | 258,134 | |
| 250,000 | | Plains All American Pipeline LP / PAA Finance Corp., 3.65%, 6/1/22 | | | 256,006 | |
| 300,000 | | Williams Cos., Inc. (The), 3.35%, 8/15/22 | | | 311,722 | |
| 300,000 | | Williams Cos., Inc. (The), 4.00%, 11/15/21 | | | 308,591 | |
| 300,000 | | Williams Cos., Inc. (The), 4.50%, 11/15/23 | | | 328,716 | |
| | | | | | |
| | | | | 3,870,375 | |
| | | | | | |
Financial — 22.76% | | | | |
| 250,000 | | Australia & New Zealand Banking Group Ltd., (LIBOR USD 3-Month + 0.710%), 0.98%, 5/19/22(a),(b) | | | 252,072 | |
| 250,000 | | Bank of America Corp., (LIBOR USD 3-Month + 0.960%), GMTN, 1.22%, 7/23/24(a) | | | 252,404 | |
| 500,000 | | Bank of America Corp., 3.00%, 12/20/23(c) | | | 524,873 | |
| 250,000 | | Bank of Nova Scotia (The), (LIBOR USD 3-Month + 0.620%), 0.85%, 9/19/22(a) | | | 251,993 | |
| 200,000 | | Bank of Nova Scotia (The), 1.63%, 5/1/23 | | | 205,339 | |
| 250,000 | | Barclays Plc, 3.20%, 8/10/21 | | | 255,728 | |
| 250,000 | | Barclays Plc, 3.25%, 1/12/21 | | | 251,957 | |
| 250,000 | | BNP Paribas SA, 2.95%, 5/23/22(b) | | | 258,881 | |
| 250,000 | | BNP Paribas SA, 3.50%, 3/1/23(b) | | | 265,529 | |
| 83,000 | | Camden Property Trust, REIT, 4.88%, 6/15/23 | | | 91,029 | |
| 300,000 | | Canadian Imperial Bank of Commerce, (LIBOR USD 3-Month + 0.660%), 0.91%, 9/13/23(a) | | | 302,961 | |
| 225,000 | | Canadian Imperial Bank of Commerce, 0.95%, 6/23/23 | | | 227,012 | |
| 250,000 | | Citigroup, Inc., (LIBOR USD 3-Month + 0.690%), 0.93%, 10/27/22(a) | | | 251,171 | |
| 200,000 | | Citigroup, Inc., (LIBOR USD 3-Month + 0.950%), 1.21%, 7/24/23(a) | | | 201,368 | |
| 300,000 | | Citigroup, Inc., (LIBOR USD 3-Month + 1.070%), 1.32%, 12/8/21(a) | | | 302,756 | |
15
|
SCHEDULE OF PORTFOLIO INVESTMENTS |
RBC Ultra-Short Fixed Income Fund (cont.) |
|
| September 30, 2020 (Unaudited) |
| | | | | | |
Principal
Amount | | | | Value | |
| $250,000 | | Citigroup, Inc., 2.88%, 7/24/23 | | $ | 259,476 | |
| 200,000 | | Commonwealth Bank of Australia, (LIBOR USD 3-Month + 0.700%), 0.94%, 3/16/23(a),(b) | | | 202,188 | |
| 250,000 | | Cooperatieve Rabobank UA, (LIBOR USD 3-Month + 0.480%), 0.75%, 1/10/23(a) | | | 251,138 | |
| 250,000 | | Cooperatieve Rabobank UA, 3.95%, 11/9/22 | | | 265,915 | |
| 250,000 | | Credit Agricole SA, 3.38%, 1/10/22(b) | | | 258,245 | |
| 250,000 | | Credit Agricole SA, 3.75%, 4/24/23(b) | | | 267,993 | |
| 500,000 | | Credit Suisse Group Funding Guernsey Ltd., 3.80%, 9/15/22 | | | 529,311 | |
| 300,000 | | Crown Castle International Corp., REIT, 5.25%, 1/15/23 | | | 330,083 | |
| 400,000 | | Goldman Sachs Group, Inc. (The), (LIBOR USD 3-Month + 0.750%), 1.01%, 2/23/23(a) | | | 401,653 | |
| 250,000 | | Goldman Sachs Group, Inc. (The), 2.91%, 7/24/23(c) | | | 259,303 | |
| 200,000 | | Goldman Sachs Group, Inc. (The), 3.63%, 2/20/24 | | | 217,295 | |
| 200,000 | | HSBC Holdings Plc, 2.65%, 1/5/22 | | | 205,016 | |
| 225,000 | | HSBC Holdings Plc, 3.60%, 5/25/23 | | | 239,659 | |
| 200,000 | | ING Groep NV, 3.15%, 3/29/22 | | | 207,473 | |
| 250,000 | | JPMorgan Chase & Co., (LIBOR USD 3-Month + 0.900%), 1.15%, 4/25/23(a) | | | 251,998 | |
| 250,000 | | JPMorgan Chase & Co., 3.56%, 4/23/24 | | | 267,870 | |
| 200,000 | | Lloyds Banking Group Plc, 2.91%, 11/7/23 | | | 207,526 | |
| 250,000 | | Lloyds Banking Group Plc, 3.00%, 1/11/22 | | | 257,293 | |
| 200,000 | | Morgan Stanley, (LIBOR USD 3-Month + 0.930%), 1.19%, 7/22/22(a) | | | 200,958 | |
| 250,000 | | Morgan Stanley, (LIBOR USD 3-Month + 1.180%), 1.45%, 1/20/22(a) | | | 250,687 | |
| 250,000 | | Morgan Stanley, (LIBOR USD 3-Month + 1.400%), MTN, 1.66%, 10/24/23(a) | | | 254,019 | |
| 200,000 | | Nordea Bank Abp, 1.00%, 6/9/23(b) | | | 202,667 | |
| 200,000 | | Santander UK Group Holdings Plc, 3.57%, 1/10/23 | | | 206,201 | |
| 300,000 | | Skandinaviska Enskilda Banken AB, (LIBOR USD 3-Month + 0.430%), 0.71%, 5/17/21(a),(b) | | | 300,401 | |
| 200,000 | | Swedbank AB, (LIBOR USD 3-Month + 0.700%), 0.95%, 3/14/22(a),(b) | | | 201,404 | |
| 100,000 | | Wells Fargo & Co., (LIBOR USD 3-Month + 0.930%), 1.18%, 2/11/22(a) | | | 100,227 | |
| 250,000 | | Westpac Banking Corp., (LIBOR USD 3-Month + 0.570%), 0.84%, 1/11/23(a) | | | 251,663 | |
| 150,000 | | Westpac Banking Corp., (LIBOR USD 3-Month + 0.710%), 0.94%, 6/28/22(a) | | | 151,368 | |
| | | | | | |
| | | | | 10,894,103 | |
| | | | | | |
Industrial — 2.88% | | | | |
| 250,000 | | Caterpillar Financial Services Corp., (LIBOR USD 3-Month + 0.200%), MTN, 0.46%, 11/12/21(a) | | | 250,275 | |
| 200,000 | | Ingersoll-Rand Global Holding Co. Ltd., 2.90%, 2/21/21 | | | 201,901 | |
16
|
SCHEDULE OF PORTFOLIO INVESTMENTS |
RBC Ultra-Short Fixed Income Fund (cont.) |
|
| September 30, 2020 (Unaudited) |
| | | | | | |
Principal
Amount | | | | Value | |
| $600,000 | | John Deere Capital Corp., (LIBOR USD 3-Month + 0.490%), MTN, 0.74%, 6/13/22(a) | | $ | 602,846 | |
| 325,000 | | Roper Technologies, Inc., 0.45%, 8/15/22 | | | 324,748 | |
| | | | | | |
| | | | | 1,379,770 | |
| | | | | | |
Technology — 4.43% | | | | |
| 375,000 | | Broadcom, Inc., 3.13%, 4/15/21 | | | 379,861 | |
| 400,000 | | Broadcom, Inc., 3.13%, 10/15/22 | | | 418,638 | |
| 57,000 | | Dell International LLC / EMC Corp., 4.42%, 6/15/21(b) | | | 58,244 | |
| 200,000 | | Dell International LLC / EMC Corp., 5.45%, 6/15/23(b) | | | 219,241 | |
| 200,000 | | Hewlett Packard Enterprise Co., (LIBOR USD 3-Month + 0.720%), 1.02%, 10/5/21(a) | | | 199,968 | |
| 250,000 | | Leidos, Inc., 2.95%, 5/15/23(b) | | | 263,028 | |
| 550,000 | | NXP BV / NXP Funding LLC, 3.88%, 9/1/22(b) | | | 580,966 | |
| | | | | | |
| | | | | 2,119,946 | |
| | | | | | |
Utilities — 5.74% | | | | |
| 301,000 | | American Electric Power Co., Inc., Series I, 3.65%, 12/1/21 | | | 311,723 | |
| 300,000 | | CenterPoint Energy, Inc., 3.85%, 2/1/24 | | | 328,807 | |
| 300,000 | | Evergy, Inc., 2.45%, 9/15/24 | | | 317,687 | |
| 250,000 | | FirstEnergy Corp., Series B, 4.25%, 3/15/23 | | | 265,471 | |
| 375,000 | | Florida Power & Light Co., (LIBOR USD 3-Month + 0.380%), 0.64%, 7/28/23(a) | | | 375,257 | |
| 180,000 | | Georgia Power Co., Series A, 2.10%, 7/30/23 | | | 187,924 | |
| 150,000 | | Sempra Energy, (LIBOR USD 3-Month + 0.500%), 0.78%, 1/15/21(a) | | | 150,003 | |
| 250,000 | | Sempra Energy, 2.90%, 2/1/23 | | | 261,796 | |
| 150,000 | | WEC Energy Group, Inc., 0.55%, 9/15/23 | | | 150,233 | |
| 400,000 | | Xcel Energy, Inc., 0.50%, 10/15/23 | | | 399,848 | |
| | | | | | |
| | | | | 2,748,749 | |
| | | | | | |
| |
Total Corporate Bonds | | | 31,252,976 | |
| | | | | | |
(Cost $30,910,091) | | | | |
| |
Asset Backed Securities — 29.31% | | | | |
| 160,000 | | AmeriCredit Automobile Receivables Trust, Series 2019-1, Class D, 3.62%, 3/18/25 | | | 168,164 | |
| 175,000 | | AmeriCredit Automobile Receivables Trust, Series 2019-3, Class B, 2.13%, 7/18/25 | | | 179,993 | |
| 300,000 | | AmeriCredit Automobile Receivables Trust, Series 2019-3, Class D, 2.58%, 9/18/25 | | | 308,268 | |
| 75,000 | | Capital Auto Receivables Asset Trust, Series 2017-1, Class B, 2.43%, 5/20/22(b) | | | 75,805 | |
| 405,000 | | Capital Auto Receivables Asset Trust, Series 2018-2, Class C, 3.69%, 12/20/23(b) | | | 414,291 | |
| 185,000 | | Carmax Auto Owner Trust, Series 2018-4, Class C, 3.85%, 7/15/24 | | | 195,230 | |
| 85,000 | | Carmax Auto Owner Trust, Series 2018-4, Class D, 4.15%, 4/15/25 | | | 88,326 | |
17
|
SCHEDULE OF PORTFOLIO INVESTMENTS |
RBC Ultra-Short Fixed Income Fund (cont.) |
|
| September 30, 2020 (Unaudited) |
| | | | | | |
Principal
Amount | | | | Value | |
| $145,000 | | Carmax Auto Owner Trust, Series 2019-1, Class D, 4.04%, 8/15/25 | | $ | 150,613 | |
| 195,000 | | Carmax Auto Owner Trust, Series 2019-3, Class D, 2.85%, 1/15/26 | | | 197,294 | |
| 130,000 | | CarMax Auto Owner Trust, Series 2016-4, Class D, 2.91%, 4/17/23 | | | 130,838 | |
| 250,000 | | CarMax Auto Owner Trust, Series 2017-3, Class D, 3.46%, 10/16/23 | | | 255,376 | |
| 350,000 | | CarMax Auto Owner Trust, Series 2018-1, Class C, 2.95%, 11/15/23 | | | 360,584 | |
| 310,000 | | CarMax Auto Owner Trust, Series 2018-1, Class D, 3.37%, 7/15/24 | | | 317,614 | |
| 205,000 | | CarMax Auto Owner Trust, Series 2018-3, Class D, 3.91%, 1/15/25 | | | 211,983 | |
| 300,000 | | CarMax Auto Owner Trust, Series 2019-3, Class C, 2.60%, 6/16/25 | | | 311,650 | |
| 100,000 | | CarMax Auto Owner Trust, Series 2019-4, Class C, 2.60%, 9/15/25 | | | 104,296 | |
| 125,000 | | CarMax Auto Owner Trust, Series 2020-1, Class C, 2.34%, 11/17/25 | | | 129,300 | |
| 410,000 | | CNH Equipment Trust, Series 2019-A, Class A3, 3.01%, 4/15/24 | | | 420,509 | |
| 350,000 | | Dell Equipment Finance Trust, Series 2018-1, Class B, 3.34%, 6/22/23(b) | | | 354,529 | |
| 300,000 | | Dell Equipment Finance Trust, Series 2018-1, Class C, 3.53%, 6/22/23(b) | | | 304,624 | |
| 275,000 | | Dell Equipment Finance Trust, Series 2018-2, Class B, 3.55%, 10/22/23(b) | | | 281,171 | |
| 98,519 | | Drive Auto Receivables Trust, Series 2017-2, Class D, 3.49%, 9/15/23 | | | 99,966 | |
| 201,535 | | Drive Auto Receivables Trust, Series 2017-AA, Class D, 4.16%, 5/15/24(b) | | | 204,912 | |
| 40,274 | | Drive Auto Receivables Trust, Series 2017-BA, Class D, 3.72%, 10/17/22(b) | | | 40,505 | |
| 65,413 | | Drive Auto Receivables Trust, Series 2018-2, Class C, 3.63%, 8/15/24 | | | 65,714 | |
| 110,060 | | Drive Auto Receivables Trust, Series 2018-3, Class C, 3.72%, 9/16/24 | | | 111,053 | |
| 291,000 | | Drive Auto Receivables Trust, Series 2018-3, Class D, 4.30%, 9/16/24 | | | 302,386 | |
| 460,000 | | Drive Auto Receivables Trust, Series 2018-5, Class D, 4.30%, 4/15/26 | | | 486,451 | |
| 225,000 | | Drive Auto Receivables Trust, Series 2019-1, Class C, 3.78%, 4/15/25 | | | 231,230 | |
| 400,000 | | Drive Auto Receivables Trust, Series 2019-1, Class D, 4.09%, 6/15/26 | | | 419,446 | |
| 130,000 | | Drive Auto Receivables Trust, Series 2019-3, Class C, 2.90%, 8/15/25 | | | 134,199 | |
| 105,000 | | Drive Auto Receivables Trust, Series 2019-4, Class C, 2.51%, 11/17/25 | | | 107,412 | |
| 125,000 | | Drive Auto Receivables Trust, Series 2020-1, Class C, 2.36%, 3/16/26 | | | 128,108 | |
18
|
SCHEDULE OF PORTFOLIO INVESTMENTS |
RBC Ultra-Short Fixed Income Fund (cont.) |
|
| September 30, 2020 (Unaudited) |
| | | | | | |
Principal
Amount | | | | Value | |
| $275,000 | | GM Financial Automobile Leasing Trust, Series 2018-3, Class C, 3.70%, 7/20/22 | | $ | 278,328 | |
| 300,000 | | GM Financial Automobile Leasing Trust, Series 2019-1, Class C, 3.56%, 12/20/22 | | | 307,046 | |
| 105,000 | | GM Financial Automobile Leasing Trust, Series 2019-3, Class C, 2.35%, 7/20/23 | | | 107,050 | |
| 425,000 | | GM Financial Automobile Leasing Trust, Series 2020-1, Class C, 2.04%, 12/20/23 | | | 432,470 | |
| 150,000 | | GM Financial Consumer Automobile Receivables Trust, Series 2018-3, Class B, 3.27%, 1/16/24 | | | 156,747 | |
| 60,000 | | GM Financial Consumer Automobile Receivables Trust, Series 2020-1, Class B, 2.03%, 4/16/25 | | | 61,752 | |
| 50,000 | | GM Financial Consumer Automobile Receivables Trust, Series 2020-1, Class C, 2.18%, 5/16/25 | | | 51,220 | |
| 425,000 | | GreatAmerica Leasing Receivables Funding LLC Series, Series 2017-1, Class C, 2.89%, 1/22/24(b) | | | 426,687 | |
| 500,000 | | Hyundai Auto Receivables Trust, Series 2019-A, Class C, 3.03%, 11/17/25 | | | 524,606 | |
| 192,652 | | Santander Drive Auto Receivables Trust, Series 2017-1, Class D, 3.17%, 4/17/23 | | | 194,783 | |
| 315,000 | | Santander Drive Auto Receivables Trust, Series 2018-2, Class D, 3.88%, 2/15/24 | | | 325,863 | |
| 865,000 | | Santander Drive Auto Receivables Trust, Series 2018-3, Class D, 4.07%, 8/15/24 | | | 901,217 | |
| 160,000 | | Santander Drive Auto Receivables Trust, Series 2019-1, Class C, 3.42%, 4/15/25 | | | 163,967 | |
| 300,000 | | Santander Drive Auto Receivables Trust, Series 2019-2, Class D, 3.22%, 7/15/25 | | | 310,020 | |
| 160,000 | | Santander Drive Auto Receivables Trust, Series 2019-3, Class D, 2.68%, 10/15/25 | | | 164,008 | |
| 505,000 | | Santander Retail Auto Lease Trust, Series 2019-A, Class B, 3.01%, 5/22/23(b) | | | 519,455 | |
| 300,000 | | Santander Retail Auto Lease Trust, Series 2019-A, Class C, 3.30%, 5/22/23(b) | | | 309,673 | |
| 240,000 | | Santander Retail Auto Lease Trust, Series 2019-B, Class C, 2.77%, 8/21/23(b) | | | 246,948 | |
| 500,000 | | Verizon Owner Trust, Series 2018-1A, Class B, 3.05%, 9/20/22(b) | | | 508,703 | |
| 220,000 | | Verizon Owner Trust, Series 2018-1A, Class C, 3.20%, 9/20/22(b) | | | 224,083 | |
| 170,000 | | Verizon Owner Trust, Series 2019-C, Class B, 2.06%, 4/22/24 | | | 175,439 | |
| 150,000 | | World Omni Auto Receivables Trust, Series 2016-B, Class B, 1.73%, 7/15/23 | | | 150,234 | |
| 198,084 | | World Omni Automobile Lease Securitization Trust, Series 2019-B, Class A2A, 2.05%, 7/15/22 | | | 199,467 | |
| | |
| | | | | | |
Total Asset Backed Securities | | | 14,031,606 | |
| | | | | | |
(Cost $13,857,281) | |
19
|
SCHEDULE OF PORTFOLIO INVESTMENTS |
RBC Ultra-Short Fixed Income Fund (cont.) |
|
| September 30, 2020 (Unaudited) |
| | | | | | |
Principal
Amount | | | | Value | |
U.S. Government Agency Backed Mortgages — 0.99% | | | | |
Fannie Mae — 0.06% | | | | |
| $ 8,346 | | Pool #888467, 6.00%, 6/1/22 | | $ | 8,528 | |
| 2,679 | | Pool #AL0202, 4.00%, 4/1/21 | | | 2,688 | |
| 5,582 | | Series 2003-55, Class CD, 5.00%, 6/25/23 | | | 5,796 | |
| 10,427 | | Series 2012-1, Class GB, 2.00%, 2/25/22 | | | 10,495 | |
| | | | | | |
| | | | | 27,507 | |
| | | | | | |
Freddie Mac — 0.93% | | | | |
| 250,000 | | Series 2011-K10, Class B, 4.69%, 11/25/49(b),(d) | | | 250,662 | |
| 195,000 | | Series 2011-K11, Class B, 4.61%, 12/25/48(b),(d) | | | 195,805 | |
| 173 | | Series 3852, Class EA, 4.50%, 12/15/21 | | | 174 | |
| | | | | | |
| | | | | 446,641 | |
| | | | | | |
| |
Total U.S. Government Agency Backed Mortgages | | | 474,148 | |
| | | | | | |
(Cost $486,511) | | | | |
| |
Collateralized Mortgage Obligations — 0.01% | | | | |
| 2,373 | | JP Morgan Resecuritization Trust Series, Series 2014-1, Class 9A3, (LIBOR USD 1-Month + 0.290%),
0.47%, 12/26/35(a),(b) | | | 2,365 | |
| | |
| | | | | | |
Total Collateralized Mortgage Obligations | | | 2,365 | |
| | | | | | |
(Cost $2,339) | | | | |
| | |
Shares | | | | | |
Investment Company — 3.46% | | | | |
| 1,656,796 | | U.S. Government Money Market Fund, RBC Institutional Class 1(e) | | | 1,656,796 | |
| | | | | | |
| |
Total Investment Company | | | 1,656,796 | |
| | | | | | |
(Cost $1,656,796) | | | | |
| |
Total Investments | | $ | 47,417,891 | |
(Cost $46,913,018)(f) — 99.06% | | | | |
| |
Other assets in excess of liabilities — 0.94% | | | 448,817 | |
| | | | | | |
| |
NET ASSETS — 100.00% | | $ | 47,866,708 | |
| | | | | | |
20
|
SCHEDULE OF PORTFOLIO INVESTMENTS |
RBC Ultra-Short Fixed Income Fund (cont.) |
|
| September 30, 2020 (Unaudited) |
| (a) | Floating rate note. Rate shown is as of report date. |
| (b) | Security exempt from registration under Rule 144A or Section 4(2) of the Securities Act of 1933, as amended. These securities may be resold in transactions exempt from registration, normally to qualified institutional buyers. |
| (c) | Security is a fix-to-float security, which carries a fixed coupon until a certain date, upon which it switches to a floating rate. Reference rate and spread are provided if the rate is currently floating. |
| (d) | Variable or floating rate security, which interest rate adjusts periodically based on changes in current interest rates and prepayments on the underlying pool of assets. Rate shown is the rate in effect as of period end. |
| (e) | Affiliated investment. |
| (f) | See Notes to Schedules of Portfolio Investments for the tax cost of securities and the breakdown of unrealized appreciation (depreciation). |
Financial futures contracts as of September 30, 2020:
| | | | | | | | | | | | | | | | | | | | |
Short Position | | Number of
Contracts | | | Expiration
Date | | | Value/Unrealized
Depreciation | | Notional Value | | Clearinghouse | |
Five Year U.S. Treasury Note | | | 5 | | | | December 2020 | | | | | | | $(845) | | USD $ 630,156 | |
| Barclays
Capital Group |
|
Two Year U.S. Treasury Note | | | 5 | | | | December 2020 | | | | | | | (561) | | USD 1,104,805 | |
| Barclays
Capital Group |
|
| | | | | | | | | | | | | | | | | | | | |
Total | | | | | | | | | | | | | | $(1,406) | | | | | | |
| | | | | | | | | | | | | | | | | | | | |
Abbreviations used are defined below:
GMTN - Global Medium Term Note
LIBOR - London Interbank Offered Rate
MTN - Medium Term Note
REIT - Real Estate Investment Trust
USD - United States Dollar
See Notes to the Financial Statements.
21
|
FINANCIAL STATEMENTS |
Statements of Assets and Liabilities |
|
September 30, 2020 (Unaudited) |
| | | | | | | | | | | | | | | | |
| | | RBC Short Duration
Fixed Income
Fund | | | RBC Ultra-Short
Fixed Income
Fund | |
Assets: | | | | | | | | | | | | | | | | |
Investments in securities, at value: | | | | | | | | | | | | | | | | |
Unaffiliated investments (cost $69,872,319 and $45,256,222, respectively) | | | | | | $ | 71,083,468 | | | | | | | $ | 45,761,095 | |
Affiliated investments (cost $412,818 and $1,656,796, respectively) | | | | | | | 412,818 | | | | | | | | 1,656,796 | |
Cash at broker for financial future contracts | | | | | | | 29,900 | | | | | | | | 21,703 | |
Interest and dividend receivable | | | | | | | 390,438 | | | | | | | | 210,762 | |
Receivable from advisor | | | | | | | — | | | | | | | | 12,659 | |
Receivable for capital shares issued | | | | | | | — | | | | | | | | 221,516 | |
Unrealized appreciation on futures contracts | | | | | | | 4,715 | | | | | | | | — | |
Prepaid expenses and other assets | | | | | | | 24,062 | | | | | | | | 33,097 | |
| | | | | | | | | | | | | | | | |
Total Assets | | | | | | | 71,945,401 | | | | | | | | 47,917,628 | |
| | | | | | | | | | | | | | | | |
Liabilities: | | | | | | | | | | | | | | | | |
Foreign withholding tax payable | | | | | | | 42 | | | | | | | | 42 | |
Distributions payable | | | | | | | 80 | | | | | | | | 5,371 | |
Payable for capital shares redeemed | | | | | | | 2,185 | | | | | | | | 6,535 | |
Payable for investments purchased | | | | | | | 165,735 | | | | | | | | — | |
Unrealized depreciation on futures contracts | | | | | | | 2,739 | | | | | | | | 1,406 | |
Accrued expenses and other payables: | | | | | | | | | | | | | | | | |
Investment advisory fees | | | | | | | 1,953 | | | | | | | | — | |
Accounting fees | | | | | | | 4,578 | | | | | | | | 4,378 | |
Audit fees | | | | | | | 12,748 | | | | | | | | 12,748 | |
Trustees’ fees | | | | | | | 794 | | | | | | | | 624 | |
Distribution fees | | | | | | | — | | | | | | | | 100 | |
Custodian fees | | | | | | | 128 | | | | | | | | 229 | |
Shareholder reports | | | | | | | 6,843 | | | | | | | | 8,408 | |
Transfer agent fees | | | | | | | 878 | | | | | | | | 7,631 | |
Other | | | | | | | 6,077 | | | | | | | | 3,448 | |
| | | | | | | | | | | | | | | | |
Total Liabilities | | | | | | | 204,780 | | | | | | | | 50,920 | |
| | | | | | | | | | | | | | | | |
Net Assets | | | | | | $ | 71,740,621 | | | | | | | $ | 47,866,708 | |
| | | | | | | | | | | | | | | | |
Net Assets Consists of: | | | | | | | | | | | | | | | | |
Capital | | | | | | $ | 70,771,904 | | | | | | | $ | 47,688,891 | |
Accumulated earnings | | | | | | | 968,717 | | | | | | | | 177,817 | |
| | | | | | | | | | | | | | | | |
Net Assets | | | | | | $ | 71,740,621 | | | | | | | $ | 47,866,708 | |
| | | | | | | | | | | | | | | | |
22
|
FINANCIAL STATEMENTS |
Statements of Assets and Liabilities (cont.) |
|
September 30, 2020 (Unaudited) |
| | | | | | | | | | | | | | | | |
| | | RBC Short Duration
Fixed Income
Fund | | | RBC Ultra-Short
Fixed Income
Fund | |
Net Assets | | | | | | | | | | | | | | | | |
Class A | | | | | | $ | 430,419 | | | | | | | $ | 10,176,492 | |
Class I | | | | | | | 71,310,202 | | | | | | | | 37,690,216 | |
| | | | | | | | | | | | | | | | |
Total | | | | | | $ | 71,740,621 | | | | | | | $ | 47,866,708 | |
| | | | | | | | | | | | | | | | |
Shares Outstanding (Unlimited number of shares authorized, no par value): | | | | | | | | | | | | | | | | |
Class A | | | | | | | 42,184 | | | | | | | | 1,018,553 | |
Class I | | | | | | | 6,999,352 | | | | | | | | 3,777,924 | |
| | | | | | | | | | | | | | | | |
Total | | | | | | | 7,041,536 | | | | | | | | 4,796,477 | |
| | | | | | | | | | | | | | | | |
Net Asset Values and Redemption Prices Per Share: | | | | | | | | | | | | | | | | |
Class A | | | | | | $ | 10.20 | | | | | | | $ | 9.99 | |
| | | | | | | | | | | | | | | | |
Class I | | | | | | $ | 10.19 | | | | | | | $ | 9.98 | |
| | | | | | | | | | | | | | | | |
See Notes to the Financial Statements.
23
|
FINANCIAL STATEMENTS |
Statements of Operations |
|
For the Six Months Ended September 30, 2020 (Unaudited) |
| | | | | | | | | | | | | | | | |
| | | RBC Short Duration
Fixed Income
Fund | | | RBC Ultra-Short
Fixed Income
Fund | |
Investment Income: | | | | | | | | | | | | | | | | |
Interest income | | | | | | $ | 733,080 | | | | | | | $ | 477,875 | |
Dividend income - affiliated | | | | | | | 640 | | | | | | | | 1,359 | |
| | | | | | | | | | | | | | | | |
Total Investment Income | | | | | | | 733,720 | | | | | | | | 479,234 | |
Expenses: | | | | | | | | | | | | | | | | |
Investment advisory fees | | | | | | | 92,957 | | | | | | | | 51,660 | |
Distribution fees–Class A | | | | | | | 218 | | | | | | | | 3,924 | |
Accounting fees | | | | | | | 31,292 | | | | | | | | 28,406 | |
Audit fees | | | | | | | 20,072 | | | | | | | | 20,072 | |
Custodian fees | | | | | | | 1,103 | | | | | | | | 1,395 | |
Insurance fees | | | | | | | 2,154 | | | | | | | | 2,154 | |
Legal fees | | | | | | | 1,343 | | | | | | | | 865 | |
Registrations and filing fees | | | | | | | 20,088 | | | | | | | | 23,180 | |
Shareholder reports | | | | | | | 15,363 | | | | | | | | 17,177 | |
Transfer agent fees–Class A | | | | | | | 1,851 | | | | | | | | 2,546 | |
Transfer agent fees–Class I | | | | | | | 10,288 | | | | | | | | 27,979 | |
Trustees’ fees and expenses | | | | | | | 1,749 | | | | | | | | 1,359 | |
Tax expense | | | | | | | 2,072 | | | | | | | | 2,072 | |
Other fees | | | | | | | 2,495 | | | | | | | | 2,389 | |
| | | | | | | | | | | | | | | | |
Total expenses before fee waiver/reimbursement | | | | | | | 203,045 | | | | | | | | 185,178 | |
Expenses waived/reimbursed by: | | | | | | | | | | | | | | | | |
Advisor | | | | | | | (94,378 | ) | | | | | | | (118,363 | ) |
| | | | | | | | | | | | | | | | |
Net expenses | | | | | | | 108,667 | | | | | | | | 66,815 | |
| | | | | | | | | | | | | | | | |
Net Investment Income | | | | | | | 625,053 | | | | | | | | 412,419 | |
| | | | | | | | | | | | | | | | |
Realized/Unrealized Gains/(Losses): | | | | | | | | | | | | | | | | |
Net realized gains/(losses) on: | | | | | | | | | | | | | | | | |
Investment transactions | | | | | | | 207,219 | | | | | | | | 223,886 | |
Futures contracts | | | | | | | (4,680 | ) | | | | | | | (88,728 | ) |
| | | | | | | | | | | | | | | | |
Net realized gains | | | | | | | 202,539 | | | | | | | | 135,158 | |
Net change in unrealized appreciation/ (depreciation) on: | | | | | | | | | | | | | | | | |
Investments | | | | | | | 2,506,823 | | | | | | | | 1,650,218 | |
Foreign currency | | | | | | | — | | | | | | | | (2 | ) |
Futures contracts | | | | | | | 303 | | | | | | | | 82,206 | |
| | | | | | | | | | | | | | | | |
Net unrealized gains | | | | | | | 2,507,126 | | | | | | | | 1,732,422 | |
| | | | | | | | | | | | | | | | |
Change in net assets resulting from operations | | | | | | $ | 3,334,718 | | | | | | | $ | 2,279,999 | |
| | | | | | | | | | | | | | | | |
See Notes to the Financial Statements.
24
|
FINANCIAL STATEMENTS |
Statements of Changes in Net Assets |
|
| |
| | | | | | | | | | | | |
| | | RBC Short Duration
Fixed Income
Fund | |
| | | For the
Six Months Ended
September 30, 2020
(Unaudited) | | | For the
Year Ended
March 31, 2020 | |
From Investment Activities | | | | | | | | | | | | |
Operations: | | | | | | | | | | | | |
Net investment income | | | | | | $ | 625,053 | | | $ | 1,048,630 | |
Net realized gains/(losses) from investments and futures contracts | | | | | | | 202,539 | | | | (270,595 | ) |
Net change in unrealized appreciation/(depreciation) on investments and futures contracts | | | | | | | 2,507,126 | | | | (1,370,390 | ) |
| | | | | | | | | | | | |
Change in net assets resulting from operations | | | | | | | 3,334,718 | | | | (592,355 | ) |
| | | | | | | | | | | | |
Distributions to Shareholders: | | | | | | | | | | | | |
Class A | | | | | | | (4,176 | ) | | | (7,644 | ) |
Class I | | | | | | | (622,803 | ) | | | (1,044,931 | ) |
| | | | | | | | | | | | |
Change in net assets resulting from shareholder distributions | | | | | | | (626,979 | ) | | | (1,052,575 | ) |
| | | | | | | | | | | | |
Capital Transactions: | | | | | | | | | | | | |
Proceeds from shares issued | | | | | | | 18,400,619 | | | | 32,255,714 | |
Distributions reinvested | | | | | | | 626,964 | | | | 1,052,522 | |
Cost of shares redeemed | | | | | | | (6,304,920 | ) | | | (3,226,315 | ) |
| | | | | | | | | | | | |
Change in net assets resulting from capital transactions | | | | | | | 12,722,663 | | | | 30,081,921 | |
| | | | | | | | | | | | |
Net increase in net assets | | | | | | | 15,430,402 | | | | 28,436,991 | |
Net Assets: | | | | | | | | | | | | |
Beginning of period | | | | | | | 56,310,219 | | | | 27,873,228 | |
| | | | | | | | | | | | |
End of period | | | | | | $ | 71,740,621 | | | $ | 56,310,219 | |
| | | | | | | | | | | | |
Share Transactions: | | | | | | | | | | | | |
Issued | | | | | | | 1,816,268 | | | | 3,203,863 | |
Reinvested | | | | | | | 61,986 | | | | 104,939 | |
Redeemed | | | | | | | (626,914 | ) | | | (322,035 | ) |
| | | | | | | | | | | | |
Change in shares resulting from capital transactions | | | | | | | 1,251,340 | | | | 2,986,767 | |
| | | | | | | | | | | | |
See Notes to the Financial Statements.
25
|
FINANCIAL STATEMENTS |
Statements of Changes in Net Assets |
|
| |
| | | | | | | | | | | | |
| | | RBC Ultra-Short
Fixed Income
Fund | |
| | | For the
Six Months Ended
September 30, 2020
(Unaudited) | | | For the
Year Ended
March 31, 2020 | |
From Investment Activities | | | | | | | | | | | | |
Operations: | | | | | | | | | | | | |
Net investment income | | | | | | $ | 412,419 | | | $ | 747,338 | |
Net realized gains/(losses) from investments and futures contracts | | | | | | | 135,158 | | | | (302,168 | ) |
Net change in unrealized appreciation/(depreciation) on investments, foreign currency and futures contracts | | | | | | | 1,732,422 | | | | (1,283,059 | ) |
| | | | | | | | | | | | |
Change in net assets resulting from operations | | | | | | | 2,279,999 | | | | (837,889 | ) |
| | | | | | | | | | | | |
Distributions to Shareholders: | | | | | | | | | | | | |
Class A | | | | | | | (68,015 | ) | | | (76,462 | ) |
Class I | | | | | | | (344,604 | ) | | | (675,480 | ) |
| | | | | | | | | | | | |
Change in net assets resulting from shareholder distributions | | | | | | | (412,619 | ) | | | (751,942 | ) |
| | | | | | | | | | | | |
Capital Transactions: | | | | | | | | | | | | |
Proceeds from shares issued | | | | | | | 21,665,362 | | | | 46,722,728 | |
Distributions reinvested | | | | | | | 378,297 | | | | 726,362 | |
Cost of shares redeemed | | | | | | | (16,737,077 | ) | | | (37,143,145 | ) |
| | | | | | | | | | | | |
Change in net assets resulting from capital transactions | | | | | | | 5,306,582 | | | | 10,305,945 | |
| | | | | | | | | | | | |
Net increase in net assets | | | | | | | 7,173,962 | | | | 8,716,114 | |
Net Assets: | | | | | | | | | | | | |
Beginning of period | | | | | | | 40,692,746 | | | | 31,976,632 | |
| | | | | | | | | | | | |
End of period | | | | | | $ | 47,866,708 | | | $ | 40,692,746 | |
| | | | | | | | | | | | |
Share Transactions: | | | | | | | | | | | | |
Issued | | | | | | | 2,195,937 | | | | 4,732,998 | |
Reinvested | | | | | | | 38,209 | | | | 73,432 | |
Redeemed | | | | | | | (1,688,983 | ) | | | (3,793,334 | ) |
| | | | | | | | | | | | |
Change in shares resulting from capital transactions | | | | | | | 545,163 | | | | 1,013,096 | |
| | | | | | | | | | | | |
See Notes to the Financial Statements.
26
RBC Short Duration Fixed Income Fund
(Selected data for a share outstanding throughout the periods indicated)
| | | | | | | | | | | | | | | | | | | | | | | | | | | | | | | | | | | |
| | | | | Investment Activities | | Distributions | | |
| | | Net Asset
Value,
Beginning
of Period | | Net
Investment
Income(a) | | Net Realized
and Unrealized
Gains (Losses)
on Investments | | Total from
Investment
Activities | | Net
Investment
Income | | Total
Distributions | | Net Asset
Value, End
of Period |
Class A | | | | | | | | | | | | | | | | | | | | | | | | | | | | | | | | | | | |
Six Months Ended 9/30/20 (Unaudited) | | | | $9.98 | | | | | 0.10 | | | | | 0.22 | | | | | 0.32 | | | | | (0.10 | ) | | | | (0.10 | ) | | | | $10.20 | |
Year Ended 3/31/20 | | | | 9.94 | | | | | 0.25 | | | | | 0.04 | | | | | 0.29 | | | | | (0.25 | ) | | | | (0.25 | ) | | | | 9.98 | |
Year Ended 3/31/19 | | | | 9.85 | | | | | 0.24 | | | | | 0.09 | | | | | 0.33 | | | | | (0.24 | ) | | | | (0.24 | ) | | | | 9.94 | |
Year Ended 3/31/18 | | | | 9.97 | | | | | 0.20 | | | | | (0.12 | ) | | | | 0.08 | | | | | (0.20 | ) | | | | (0.20 | ) | | | | 9.85 | |
Year Ended 3/31/17 | | | | 9.92 | | | | | 0.17 | | | | | 0.05 | | | | | 0.22 | | | | | (0.17 | ) | | | | (0.17 | ) | | | | 9.97 | |
Year Ended 3/31/16 | | | | 9.97 | | | | | 0.16 | | | | | (0.04 | ) | | | | 0.12 | | | | | (0.17 | ) | | | | (0.17 | ) | | | | 9.92 | |
Class I | | | | | | | | | | | | | | | | | | | | | | | | | | | | | | | | | | | |
Six Months Ended 9/30/20 (Unaudited) | | | | $9.98 | | | | | 0.10 | | | | | 0.21 | | | | | 0.31 | | | | | (0.10 | ) | | | | (0.10 | ) | | | | $10.19 | |
Year Ended 3/31/20 | | | | 9.94 | | | | | 0.25 | | | | | 0.05 | | | | | 0.30 | | | | | (0.26 | ) | | | | (0.26 | ) | | | | 9.98 | |
Year Ended 3/31/19 | | | | 9.84 | | | | | 0.25 | | | | | 0.10 | | | | | 0.35 | | | | | (0.25 | ) | | | | (0.25 | ) | | | | 9.94 | |
Year Ended 3/31/18 | | | | 9.97 | | | | | 0.21 | | | | | (0.13 | ) | | | | 0.08 | | | | | (0.21 | ) | | | | (0.21 | ) | | | | 9.84 | |
Year Ended 3/31/17 | | | | 9.92 | | | | | 0.18 | | | | | 0.05 | | | | | 0.23 | | | | | (0.18 | ) | | | | (0.18 | ) | | | | 9.97 | |
Year Ended 3/31/16 | | | | 9.97 | | | | | 0.17 | | | | | (0.04 | ) | | | | 0.13 | | | | | (0.18 | ) | | | | (0.18 | ) | | | | 9.92 | |
| (a) | Per share net investment income (loss) has been calculated using the average daily shares method. |
27
RBC Short Duration Fixed Income Fund
(Selected data for a share outstanding throughout the periods indicated)
| | | | | | | | | | | | | | | | | | | | | | | | | | | | | | |
| | | | | Ratios/Supplemental Data |
| | | Total
Return(a) | | Net Assets,
End of
Period (000’s) | | Ratio of
Net Expenses
to Average
Net Assets | | Ratio of
Net Investment
Income (Loss)
to Average
Net Assets | | Ratio of
Expenses to
Average Net
Assets* | | Portfolio
Turnover
Rate** |
Class A | | | | | | | | | | | | | | | | | | | | | | | | | | | | | | |
Six Months Ended 9/30/20 (Unaudited) | | | | 5.84 | %(b) | | | | $ 430 | | | | | 0.45 | %(c) | | | | 1.91 | %(c) | | | | 1.56 | %(c) | | | | 19 | % |
Year Ended 3/31/20 | | | | 0.34 | % | | | | 294 | | | | | 0.45 | % | | | | 2.48 | % | | | | 2.07 | % | | | | 33 | % |
Year Ended 3/31/19 | | | | 3.44 | % | | | | 310 | | | | | 0.45 | % | | | | 2.41 | % | | | | 1.99 | % | | | | 48 | % |
Year Ended 3/31/18 | | | | 0.78 | % | | | | 526 | | | | | 0.45 | % | | | | 1.98 | % | | | | 1.71 | % | | | | 55 | % |
Year Ended 3/31/17 | | | | 2.23 | % | | | | 666 | | | | | 0.45 | % | | | | 1.69 | % | | | | 1.53 | % | | | | 37 | % |
Year Ended 3/31/16 | | | | 1.18 | % | | | | 1,305 | | | | | 0.45 | % | | | | 1.60 | % | | | | 1.70 | % | | | | 50 | % |
Class I | | | | | | | | | | | | | | | | | | | | | | | | | | | | | | |
Six Months Ended 9/30/20 (Unaudited) | | | | 5.80 | %(b) | | | | $71,310 | | | | | 0.35 | %(c) | | | | 2.02 | %(c) | | | | 0.65 | %(c) | | | | 19 | % |
Year Ended 3/31/20 | | | | 0.45 | % | | | | 56,016 | | | | | 0.35 | % | | | | 2.53 | % | | | | 0.79 | % | | | | 33 | % |
Year Ended 3/31/19 | | | | 3.65 | % | | | | 27,563 | | | | | 0.35 | % | | | | 2.55 | % | | | | 1.04 | % | | | | 48 | % |
Year Ended 3/31/18 | | | | 0.78 | % | | | | 25,482 | | | | | 0.35 | % | | | | 2.10 | % | | | | 0.99 | % | | | | 55 | % |
Year Ended 3/31/17 | | | | 2.33 | % | | | | 18,366 | | | | | 0.35 | % | | | | 1.78 | % | | | | 1.12 | % | | | | 37 | % |
Year Ended 3/31/16 | | | | 1.28 | % | | | | 12,925 | | | | | 0.35 | % | | | | 1.70 | % | | | | 1.37 | % | | | | 50 | % |
| * | During the period, certain fees were contractually or voluntarily reduced and/or reimbursed. If such contractual/voluntary fee reductions and reimbursements had not occurred, the ratio would have been as indicated. |
| ** | Portfolio turnover rate is calculated on the basis of the Fund as a whole without distinguishing between the classes of shares issued. |
| (a) | Assumes investment at net asset value at the beginning of the period, reinvestment of all dividends and distributions, and a complete redemption of the investment at net asset value at the end of the period. |
See Notes to the Financial Statements.
28
RBC Ultra-Short Fixed Income Fund
(Selected data for a share outstanding throughout the periods indicated)
| | | | | | | | | | | | | | | | | | | | | | | | | | | | | | | | | | | |
| | | | | Investment Activities | | Distributions | | |
| | | Net Asset
Value,
Beginning
of Period | | Net
Investment
Income(a) | | Net Realized
and Unrealized
Gains (Losses)
on Investments | | Total from
Investment
Activities | | Net
Investment
Income | | Total
Distributions | | Net Asset
Value, End
of Period |
Class A | | | | | | | | | | | | | | | | | | | | | | | | | | | | | | | | | | | |
Six Months Ended 9/30/20 (Unaudited) | | | | $9.58 | | | | | 0.09 | | | | | 0.41 | | | | | 0.50 | | | | | (0.09 | ) | | | | (0.09 | ) | | | | $9.99 | |
Year Ended 3/31/20 | | | | 9.89 | | | | | 0.23 | | | | | (0.29 | ) | | | | (0.06 | ) | | | | (0.25 | ) | | | | (0.25 | ) | | | | 9.58 | |
Year Ended 3/31/19 | | | | 9.84 | | | | | 0.24 | | | | | 0.06 | | | | | 0.30 | | | | | (0.25 | ) | | | | (0.25 | ) | | | | 9.89 | |
Year Ended 3/31/18 | | | | 9.90 | | | | | 0.18 | | | | | (0.06 | ) | | | | 0.12 | | | | | (0.18 | ) | | | | (0.18 | ) | | | | 9.84 | |
Year Ended 3/31/17 | | | | 9.87 | | | | | 0.14 | | | | | 0.04 | | | | | 0.18 | | | | | (0.15 | ) | | | | (0.15 | ) | | | | 9.90 | |
Year Ended 3/31/16 | | | | 9.89 | | | | | 0.11 | | | | | — | | | | | 0.11 | | | | | (0.13 | ) | | | | (0.13 | ) | | | | 9.87 | |
Class I | | | | | | | | | | | | | | | | | | | | | | | | | | | | | | | | | | | |
Six Months Ended 9/30/20 (Unaudited) | | | | $9.57 | | | | | 0.09 | | | | | 0.41 | | | | | 0.50 | | | | | (0.09 | ) | | | | (0.09 | ) | | | | $9.98 | |
Year Ended 3/31/20 | | | | 9.87 | | | | | 0.25 | | | | | (0.29 | ) | | | | (0.04 | ) | | | | (0.26 | ) | | | | (0.26 | ) | | | | 9.57 | |
Year Ended 3/31/19 | | | | 9.83 | | | | | 0.25 | | | | | 0.04 | | | | | 0.29 | | | | | (0.25 | ) | | | | (0.25 | ) | | | | 9.87 | |
Year Ended 3/31/18 | | | | 9.88 | | | | | 0.19 | | | | | (0.05 | ) | | | | 0.14 | | | | | (0.19 | ) | | | | (0.19 | ) | | | | 9.83 | |
Year Ended 3/31/17 | | | | 9.87 | | | | | 0.15 | | | | | 0.02 | | | | | 0.17 | | | | | (0.16 | ) | | | | (0.16 | ) | | | | 9.88 | |
Year Ended 3/31/16 | | | | 9.89 | | | | | 0.12 | | | | | — | | | | | 0.12 | | | | | (0.14 | ) | | | | (0.14 | ) | | | | 9.87 | |
| (a) | Per share net investment income (loss) has been calculated using the average daily shares method. |
29
RBC Ultra-Short Fixed Income Fund
(Selected data for a share outstanding throughout the periods indicated)
| | | | | | | | | | | | | | | | | | | | | | | | | | | | | | |
| | | | | Ratios/Supplemental Data |
| | | Total
Return(a) | | Net Assets,
End of
Period (000’s) | | Ratio of
Net Expenses
to Average
Net Assets | | Ratio of
Net Investment
Income (Loss)
to Average
Net Assets | | Ratio of
Expenses to
Average Net
Assets* | | Portfolio
Turnover
Rate** |
Class A | | | | | | | | | | | | | | | | | | | | | | | | | | | | | | |
Six Months Ended 9/30/20 (Unaudited) | | | | 5.20 | %(b) | | | $ | 10,176 | | | | | 0.38 | %(c) | | | | 1.74 | %(c) | | | | 0.84 | %(c) | | | | 39 | % |
Year Ended 3/31/20 | | | | (0.67 | )% | | | | 5,745 | | | | | 0.38 | % | | | | 2.34 | % | | | | 1.07 | % | | | | 93 | % |
Year Ended 3/31/19 | | | | 3.04 | % | | | | 1,728 | | | | | 0.38 | % | | | | 2.41 | % | | | | 1.30 | % | | | | 57 | % |
Year Ended 3/31/18 | | | | 1.21 | % | | | | 1,978 | | | | | 0.39 | %(d) | | | | 1.83 | % | | | | 1.54 | % | | | | 68 | % |
Year Ended 3/31/17 | | | | 1.84 | % | | | | 667 | | | | | 0.40 | % | | | | 1.41 | % | | | | 1.30 | % | | | | 52 | % |
Year Ended 3/31/16 | | | | 1.16 | % | | | | 4,395 | | | | | 0.40 | % | | | | 1.09 | % | | | | 1.25 | % | | | | 41 | % |
Class I | | | | | | | | | | | | | | | | | | | | | | | | | | | | | | |
Six Months Ended 9/30/20 (Unaudited) | | | | 5.26 | %(b) | | | $ | 37,690 | | | | | 0.28 | %(c) | | | | 1.86 | %(c) | | | | 0.82 | %(c) | | | | 39 | % |
Year Ended 3/31/20 | | | | (0.47 | )% | | | | 34,948 | | | | | 0.28 | % | | | | 2.56 | % | | | | 0.99 | % | | | | 93 | % |
Year Ended 3/31/19 | | | | 3.04 | % | | | | 30,249 | | | | | 0.28 | % | | | | 2.57 | % | | | | 1.07 | % | | | | 57 | % |
Year Ended 3/31/18 | | | | 1.42 | % | | | | 21,577 | | | | | 0.29 | %(d) | | | | 1.89 | % | | | | 1.08 | % | | | | 68 | % |
Year Ended 3/31/17 | | | | 1.74 | % | | | | 14,011 | | | | | 0.30 | % | | | | 1.47 | % | | | | 1.14 | % | | | | 52 | % |
Year Ended 3/31/16 | | | | 1.24 | % | | | | 13,482 | | | | | 0.30 | % | | | | 1.22 | % | | | | 1.13 | % | | | | 41 | % |
| * | During the period, certain fees were contractually or voluntarily reduced and/or reimbursed. If such contractual/voluntary fee reductions and reimbursements had not occurred, the ratio would have been as indicated. |
| ** | Portfolio turnover rate is calculated on the basis of the Fund as a whole without distinguishing between the classes of shares issued. |
| (a) | Assumes investment at net asset value at the beginning of the period, reinvestment of all dividends and distributions, and a complete redemption of the investment at net asset value at the end of the period. |
| (d) | Beginning October 2, 2017, the net operating expenses were contractually limited to 0.38% and 0.28% of average daily net assets for Class A and Class I, respectively. The ratio of net expenses to average net assets represents a blended percentage for the period ended March 31, 2018. |
See Notes to the Financial Statements.
30
NOTES TO FINANCIAL STATEMENTS
September 30, 2020 (Unaudited)
1. Organization:
RBC Funds Trust (the “Trust”) is registered under the Investment Company Act of 1940 (as amended) as an open-end management investment company. The Trust was organized as a Delaware statutory trust on December 16, 2003 and currently consists of 18 portfolios. Overall responsibility for the management of the Trust is vested in its Board of Trustees (the “Board”). This report includes the following two investment portfolios (each a “Fund” and collectively, the “Funds”):
– RBC Short Duration Fixed Income Fund (“Short Duration Fixed Income Fund”)
– RBC Ultra-Short Fixed Income Fund (“Ultra-Short Fixed Income Fund”)
The Funds offer Class A (formerly Class F) and Class I shares. Class A and Class I shares (intended for investors meeting certain investment minimum thresholds) are not subject to either a front-end sales charge or a contingent deferred sales charge.
RBC Global Asset Management (U.S.) Inc. (“RBC GAM-US” or “Advisor” or “Co-Administrator”) acts as the investment advisor for the Funds. The officers of the Trust (“Fund Management”) are also employees of RBC GAM-US.
2. Significant Accounting Policies
Each Fund is an investment company that follows accounting and reporting guidance under the Financial Accounting Standards Board. Summarized below are the significant accounting policies of the Funds. These policies conform to accounting principles generally accepted in the United States of America (“U.S. GAAP”). Fund Management follows these policies when preparing financial statements. Fund Management may also be required to make estimates and assumptions that affect the reported amounts of assets and liabilities at the date of the financial statements and the reported amounts of income and expenses for the period. Actual results could differ from those estimates. The financial statements are as of the close of regular trading on the New York Stock Exchange (“NYSE”).
Security Valuation:
The Trust’s Board of Trustees (the ”Board“) has adopted pricing and valuation procedures for determining the fair value of each Fund’s investments. Fair value of a security is considered to be the price that a fund might reasonably expect to receive upon its current sale in an orderly transaction between market participants.
Fixed income securities, including to-be-announced (“TBA”) commitments and municipal bonds, are generally valued based on evaluated prices received from third-party pricing services or from broker-dealers who make markets in the securities and are generally categorized as Level 2 in the fair value hierarchy (see “Fair Value Measurements” below for additional information). The pricing services utilize both dealer-supplied valuations and electronic data processing techniques that take into account multiple appropriate factors such as institutional-size trading in similar groups of securities, market spreads, interest rates, and fundamental security analytical data including yield, quality, coupon rate, maturity and type of issue.
Mortgage-related securities represent direct or indirect participation in, or are secured by and payable from, mortgage loans secured by real property and include pass-through securities and collateralized mortgage obligations. These securities may be issued or guaranteed by U.S. Government agencies or instrumentalities, or private issuers, including commercial banks, savings and loan institutions, private mortgage insurance bankers and other secondary market issuers. These mortgage-related securities are generally valued by pricing services that use broker-dealer quotations or valuation estimates from their internal pricing models. These pricing models generally consider such factors as current market data, estimated cash flows, market-based yield spreads, and estimated prepayment rates. Securities valued using such techniques and inputs are generally categorized as Level 2 in the fair value hierarchy. To the extent significant inputs are unobservable, the securities will be categorized as Level 3.
31
NOTES TO FINANCIAL STATEMENTS
Exchange-traded futures are valued at the last sale price at the close of the market on the principal exchange on which they are traded and are categorized as Level 1 in the fair value hierarchy. Investments in open-end investment companies (mutual funds) are valued at net asset value and are categorized as Level 1 in the fair value hierarchy.
The Board has delegated to the Funds’ Pricing Committee (“Pricing Committee”) the responsibility for implementing the pricing and valuation procedures, including responsibility for determining the fair value of the Funds’ securities or other assets and liabilities. The Pricing Committee includes representatives of the Funds’ Advisor, and Co-Administrator, including personnel from accounting and operations, investment management, trading, risk management and compliance. The Pricing Committee meets at least quarterly to review and approve Fund valuation matters, including a review of the Funds’ pricing activity and operations, fair value measurements, pricing vendors, policies and procedures, and related controls. At least a quorum of the Pricing Committee shall meet more frequently, as needed, to consider and approve time-sensitive fair valuation matters. The Pricing Committee reports to the Valuation, Portfolio Management and Performance Committee (“Valuation Committee”) of the Board. Members of the Pricing Committee meet with the Valuation Committee and the Board at each of their regularly scheduled meetings to discuss valuation matters and actions taken during the period.
The Board has adopted procedures to determine the fair value of a security when a price is not available from a pricing service or broker- dealer or Fund Management determines that a price provided by a pricing service or broker-dealer does not approximate fair value. Fair valuation may also be used when a significant valuation event affecting the value of a security or market sector is determined to have occurred between the time when a security’s market closes and the time the Fund’s net asset value is calculated. The fair value of the security will be determined in good faith by the Pricing Committee in accordance with procedures and methodologies adopted by the Board. General factors used in determining the fair value of securities include, but are not limited to, fundamental analytical data relating to the security, the issuer and the market, such as duration, prepayment and default rates; general level of interest rates and changes in interest rates; information from broker-dealers; trading in similar securities; any restrictions on disposition of the security; and an evaluation of the forces that influence the market in which the investments are traded. These securities are either categorized as Level 2 or 3 in the fair value hierarchy, depending on the relevant inputs used.
When the Funds utilize fair valuation methods that use significant unobservable inputs to determine a security’s value, such securities will be categorized as Level 3 of the fair value hierarchy. These methods may require subjective determinations about the value of a security. While the Funds’ policy is intended to result in a calculation of a Fund’s net asset value that fairly reflects security values as of the time of pricing, the Funds cannot guarantee that values determined by the Board or persons acting at their direction would accurately reflect the price that the Funds could obtain for a security if they were to dispose of it as of the time of pricing (for instance, in a forced or distressed sale). The prices used by the Funds may differ from the value that would be realized if the securities were sold.
The Funds’ Pricing Committee employs various methods for calibrating the valuation approach related to securities categorized within Level 2 and Level 3 of the fair value hierarchy. These methods may include regular due diligence of the Funds’ pricing vendors, a regular review of key inputs and assumptions, transaction back-testing or disposition analysis to compare unrealized gains and losses to realized gains and losses, reviews of missing and stale prices and large movements in market value, and reviews of any market related activities. Additionally, the pricing of all fair value holdings is subsequently reported to the Valuation Committee and Board.
Fair Value Measurements:
The Funds disclose the fair value of their investments in a hierarchy that categorizes investments based on the inputs to valuation techniques used to measure fair value. The three levels of the fair value hierarchy are as follows:
• Level 1 - Inputs that reflect unadjusted quoted prices in active markets for identical assets or liabilities that the Funds have the ability to access at the measurement date.
32
NOTES TO FINANCIAL STATEMENTS
• Level 2 - Significant inputs other than quoted prices that are observable for the asset or liability either directly or indirectly, including inputs in markets that are not considered to be active. Observable inputs may include quoted prices for similar securities, interest rates, spreads, prepayment spreads, etc.
• Level 3 - Significant unobservable inputs based on the best information available in the circumstances, to the extent observable inputs are not available (including the Fund’s own assumptions in determining the fair value of investments).
The inputs or methodology used for valuing investments are not necessarily an indication of the risk associated with investing in those securities.
Inputs used in determining fair value of an investment may include, but are not limited to, price information, volatility statistics, credit and market data, and other factors, all of which may be either observable or unobservable. Inputs can vary among investments and will be impacted by the investment type and volume of activity for the particular security or similar securities in the market. Investments in the Level 3 category are generally supported by transactions and quoted prices from dealers participating in the market for those investments. Investments may be included in the Level 3 category due to a lack of market activity or transparency. Internal valuation models may also be used as a pricing source for Level 3 investments. Internal valuation models may rely on one or more unobservable inputs, such as estimated cash flows, financial statement analysis and discount rates. The summary of inputs used to determine the fair value of the Funds’ investments as of September 30, 2020 is as follows:
| | | | | | | | | | | | | | | | | | | | | | | | | | | | | | | | |
| | | Level 1
Quoted Prices | | | Level 2
Significant
Observable
Inputs | | | Level 3
Significant
Unobservable
Inputs | | | Total | |
Short Duration Fixed Income Fund Assets: | | | | | | | | | | | | | | | | | | | | | | | | |
Investments in Securities | | | | | | | | | | | | | | | | | | | | | | | | | | | | | | | | |
Corporate Bonds | | | | | | $ | — | | | | | | | $ | 52,244,636 | | | | | | | | $— | | | | | | | $ | 52,244,636 | |
U.S. Government Agency Backed Mortgages | | | | | | | — | | | | | | | | 278,001 | | | | | | | | — | | | | | | | | 278,001 | |
Collateralized Mortgage Obligations | | | | | | | — | | | | | | | | 2,365 | | | | | | | | — | | | | | | | | 2,365 | |
Asset Backed Securities | | | | | | | — | | | | | | | | 18,558,466 | | | | | | | | — | | | | | | | | 18,558,466 | |
Investment Company | | | | | | | 412,818 | | | | | | | | — | | | | | | | | — | | | | | | | | 412,818 | |
Other Financial Instruments* | | | | | | | | | | | | | | | | | | | | | | | | | | | | | | | | |
Financial futures contracts | | | | | | | 4,715 | | | | | | | | — | | | | | | | | — | | | | | | | | 4,715 | |
| | | | | | | | | | | | | | | | | | | | | | | | | | | | | | | | |
Total Assets | | | | | | $ | 417,533 | | | | | | | $ | 71,083,468 | | | | | | | | $— | | | | | | | $ | 71,501,001 | |
| | | | | | | | | | | | | | | | | | | | | | | | | | | | | | | | |
Liabilities: | | | | | | | | | | | | | | | | | | | | | | | | | | | | | | | | |
Other Financial Instruments* | | | | | | | | | | | | | | | | | | | | | | | | | | | | | | | | |
Financial futures contracts | | | | | | | $(2,739 | ) | | | | | | | $— | | | | | | | | $— | | | | | | | | $(2,739 | ) |
33
NOTES TO FINANCIAL STATEMENTS
| | | | | | | | | | | | | | | | | | | | | | | | | | | | | | | | |
| | | Level 1
Quoted Prices | | | Level 2
Significant
Observable
Inputs | | | Level 3
Significant
Unobservable
Inputs | | | Total | |
Ultra-Short Fixed Income Fund Assets: | | | | | | | | | | | | | | | | | | | | | | | | |
Investments in Securities | | | | | | | | | | | | | | | | | | | | | | | | | | | | | | | | |
Corporate Bonds | | | | | | $ | — | | | | | | | $ | 31,252,976 | | | | | | | | $— | | | | | | | $ | 31,252,976 | |
U.S. Government Agency Backed Mortgages | | | | | | | — | | | | | | | | 474,148 | | | | | | | | — | | | | | | | | 474,148 | |
Collateralized Mortgage Obligations | | | | | | | — | | | | | | | | 2,365 | | | | | | | | — | | | | | | | | 2,365 | |
Asset Backed Securities | | | | | | | — | | | | | | | | 14,031,606 | | | | | | | | — | | | | | | | | 14,031,606 | |
Investment Company | | | | | | | 1,656,796 | | | | | | | | — | | | | | | | | — | | | | | | | | 1,656,796 | |
| | | | | | | | | | | | | | | | | | | | | | | | | | | | | | | | |
Total Assets | | | | | | $ | 1,656,796 | | | | | | | $ | 45,761,095 | | | | | | | | $— | | | | | | | $ | 47,417,891 | |
| | | | | | | | | | | | | | | | | | | | | | | | | | | | | | | | |
Liabilities: | | | | | | | | | | | | | | | | | | | | | | | | | | | | | | | | |
Other Financial Instruments* | | | | | | | | | | | | | | | | | | | | | | | | | | | | | | | | |
Financial futures contracts | | | | | | | $(1,406 | ) | | | | | | | $— | | | | | | | | $— | | | | | | | | $(1,406 | ) |
*Other financial instruments are instruments shown on the Schedule of Portfolio Investments, such as futures contracts which are valued at fair value.
During the period ended September 30, 2020, the Funds recognized no transfers to/from Level 1 or 2. The Funds’ policy is to recognize transfers between Level 1, Level 2 and Level 3 at the end of the year utilizing fair value at the beginning of the year.
TBA Commitments:
The Funds may enter into TBA commitments to purchase or sell securities for a fixed price at a future date. TBA commitments are considered securities in themselves, and involve a risk of loss if the value of the security to be purchased/sold declines/increases prior to settlement date, which is in addition to the risk of decline in the value of a Fund’s other assets. Unsettled TBA commitments are valued at the current value of the underlying securities, according to the procedures described under “Security Valuation”. As of September 30, 2020, the Funds do not have any outstanding TBA commitments.
Derivatives:
The Funds may use derivative instruments, including futures, forwards, options, indexed securities, swaps and inverse securities for hedging purposes only. Derivatives allow the Funds to manage their risk exposure more quickly and efficiently than other types of instruments. Derivatives may be riskier than other types of investments and could result in losses that significantly exceed a Fund’s original investment. Derivatives are subject to the risk that changes in the value of a derivative may not correlate perfectly with the underlying asset, rate or index. The use of derivatives may not be successful, resulting in losses to a Fund, and the cost of such strategies may reduce the Fund’s returns.
Hedging also involves the risk that changes in the value of the derivative will not match those of the holdings being hedged as expected by the Funds, in which case any losses on the holdings being hedged may not be reduced and may be increased. There can be no assurance that a Fund’s hedging strategy will reduce risk or that hedging transactions will be available or cost effective. The Funds are subject to interest rate risk in the normal course of pursuing their investment objectives by investing in various derivative financial instruments, as described below.
Financial Futures Contracts:
The Funds entered into futures contracts in an effort to manage the duration of the portfolio and hedge against certain market risk. A futures contract on a securities index is an agreement obligating one party to pay, and entitling the other party to receive, during the term of the contract, cash payments based on the level of a specified securities index. Futures transactions involve brokerage costs and require a Fund to segregate assets to cover contracts that would require it to purchase securities or currencies. A Fund may lose the expected benefit of futures transactions if interest rates,
34
NOTES TO FINANCIAL STATEMENTS
exchange rates or securities prices change in an unanticipated manner. Such unanticipated changes may also result in lower overall performance than if a Fund had not entered into any futures transactions.
The Funds entered into U.S. Treasury Notes futures during the period ended September 30, 2020.
Upon entering into a futures contract, a Fund is required to pledge to the broker an amount of cash, U.S. government securities, or other assets equal to a certain percentage of the contract amount. Subsequent payments are made or received by the Funds each day, depending on the daily fluctuations in the fair value of the underlying instrument. A Fund would record an unrealized gain or loss each day equal to these daily payments.
Open futures contracts are shown on the Schedules of Portfolio Investments. Underlying collateral pledged for open futures contracts is the cash at brokers for financial futures contracts shown on the Statements of Assets and Liabilities at September 30, 2020.
| | | | | | | | | | | | | | | | |
Fair Values of Derivative Financial Instrument as of September 30, 2020 | |
Statement of Assets and Liabilities Location | |
Asset Derivatives | |
| | | Short Duration
Fixed Income
Fund | | | Ultra-Short
Fixed Income
Fund | |
Interest Rate Risk: | | | | | | | | | | | | | | | | |
Unrealized appreciation on futures contracts | | | | | | $ | 4,715 | | | | | | | | $— | |
| | | | | | | | | | | | | | | | |
Total | | | | | | $ | 4,715 | | | | | | | | $— | |
| | | | | | | | | | | | | | | | |
| |
Liability Derivatives | |
| | | Short Duration
Fixed Income
Fund | | | Ultra-Short
Fixed Income
Fund | |
Interest Rate Risk: | | | | | | | | | | | | | | | | |
Unrealized depreciation on futures contracts | | | | | | $ | 2,739 | | | | | | | $ | 1,406 | |
| | | | | | | | | | | | | | | | |
Total | | | | | | $ | 2,739 | | | | | | | $ | 1,406 | |
| | | | | | | | | | | | | | | | |
The effect of derivative instruments on the Statement of Operations during the period ended September 30, 2020 is as follows:
| | | | | | | | | | | | | | | | |
Derivative Instruments Categorized by Risk Exposure | | Short Duration
Fixed Income
Fund | | | Ultra-Short
Fixed Income
Fund | |
Net realized Gain/(Loss) From: | | | | | | | | | | | | | | | | |
Interest Rate Risk: | | | | | | | | | | | | | | | | |
Financial futures contracts | | | | | | $ | (4,680 | ) | | | | | | $ | (88,728 | ) |
| | | | | | | | | | | | | | | | |
Total | | | | | | $ | (4,680 | ) | | | | | | $ | (88,728 | ) |
| | | | | | | | | | | | | | | | |
35
NOTES TO FINANCIAL STATEMENTS
| | | | | | | | | | | | | | | | |
Derivative Instruments Categorized by Risk Exposure | | Short Duration
Fixed Income
Fund | | | Ultra-Short
Fixed Income
Fund | |
Net Change in Unrealized Appreciation/(Depreciation) From: | | | | | | | | | | | | | | | | |
Interest Rate Risk: | | | | | | | | | | | | | | | | |
Financial futures contracts | | | | | | $ | 303 | | | | | | | $ | 82,206 | |
| | | | | | | | | | | | | | | | |
Total | | | | | | $ | 303 | | | | | | | $ | 82,206 | |
| | | | | | | | | | | | | | | | |
For the period ended September 30, 2020, the average volume of derivative activities based on ending quarterly outstanding amounts are as follows:
| | | | | | | | |
| | | Short Duration
Fixed Income
Fund | | | Ultra-Short
Fixed Income
Fund | |
Futures long position (contracts) | | | 46 | | | | — | |
Futures short position (contracts) | | | 15 | | | | 10 | |
Counterparty Credit Risk:
Derivatives may also expose a Fund to counterparty risk (the risk that the derivative counterparty will not fulfill its contractual obligations). To the extent amounts due to the Funds from their counterparties are not fully collateralized contractually or otherwise, the Funds bear the risk of loss from counterparty non-performance. A Fund’s maximum risk of loss from counterparty credit risk on over-the-counter (“OTC”) derivatives is generally the aggregate unrealized gain in excess of any collateral pledged by the counterparty to the Funds.
With exchange-traded futures, the exchange or clearinghouse, as counterparty to such instruments, guarantees against a possible default. The clearinghouse stands between the buyer and the seller of the contract; therefore, credit risk is limited to failure of the clearinghouse. While offset rights may exist under applicable law, the Funds do not have a contractual right of offset against a clearing broker or clearinghouse in the event of a default (including the bankruptcy or insolvency) of the clearing broker or clearinghouse. Additionally, credit risk exists in exchange-traded futures with respect to initial and variation margin that is held in a clearing broker’s customer accounts. While clearing brokers are required to segregate customer margin from their own assets, in the event that a clearing broker becomes insolvent or goes into bankruptcy and at that time there is a shortfall in the aggregate amount of margin held by the clearing broker for all its clients, typically the shortfall would be allocated on a pro rata basis across all the clearing broker’s customers, potentially resulting in losses to the Funds.
Affiliated Investments:
The Funds invest in another Fund of the Trust (an “Affiliated Fund”), U.S. Government Money Market Fund-RBC Institutional Class 1, as a cash sweep vehicle. The income earned by the Funds from the Affiliated Fund for the period is disclosed in the Statement of Operations. The table below details the transactions of the Funds in the Affiliated Fund.
36
NOTES TO FINANCIAL STATEMENTS
| | | | | | | | | | | | | | | | | | | | | | | | | | | | |
| | | Value
March 31, 2020 | | | Purchases | | | Sales | | | Value
September 30, 2020 | | | Dividends | |
Investments in U.S. Government Money Market Fund—RBC Institutional Class 1 | | | | | | | | | | | | | | | | | | | | | | | | | | | | |
Short Duration Fixed Income Fund | | | $2,087,167 | | | $ | 23,200,128 | | | $ | (24,874,477 | ) | | | | | | $ | 412,818 | | | | | | | $ | 640 | |
Ultra-Short Fixed Income Fund | | | 6,371,232 | | | | 21,481,835 | | | | (26,196,271 | ) | | | | | | | 1,656,796 | | | | | | | | 1,359 | |
Credit Enhancement:
Certain obligations held by the Funds have credit enhancement or liquidity features that may, under certain circumstances, provide for repayment of principal and interest on the obligation upon demand date, interest rate reset date or final maturity. These enhancements may include: letters of credit; liquidity guarantees; security purchase agreements; tender option purchase agreements and third party insurance.
Investment Transactions and Income:
Investment transactions are recorded on trade date. Dividend income is recorded on the ex-dividend date. Realized gains and losses from investment transactions are calculated based on the cost of the specific security (also known as identified cost basis). Interest income is recognized on the accrual basis and includes, where applicable, the amortization or accretion of premium or discount using the effective yield method. Paydown gains and losses on mortgage- and asset-backed securities are included in the financial statements as interest income.
Expense, Investment Income and Gain/Loss Allocation:
Each Fund pays the expenses that are directly related to its operations, such as custodian fees or advisory fees. Expenses incurred by the Trust, such as trustee or legal fees, are allocated among each of the Funds in the Trust either proportionately based upon each Fund’s relative net assets or using another reasonable basis such as equally across all Funds in the Trust, depending on the nature of the expense. Individual share classes within a Fund are charged expenses specific to that class, such as distribution fees and transfer agent fees. Within a Fund, expenses other than class specific expenses are allocated daily to each class based upon the proportion of relative net assets. Investment income and realized and unrealized gains or losses are allocated to each class of shares based on relative net assets.
Distributions to Shareholders:
The Funds pay out any income that it receives, less expenses, in the form of dividends and capital gains to its shareholders. Income dividends are declared daily and paid monthly. Capital gain distributions are declared and paid at least annually. Distributions to shareholders are recorded on the ex-dividend date. The amount of dividends and distributions are calculated based on federal income tax regulations, which may differ from US GAAP. These ”book/tax“ differences may be either temporary or permanent in nature. To the extent these differences are determined, as of the end of the tax year, to be permanent (e.g., reclassification of paydown gains and losses), they are reclassified within a Fund’s capital account based on their federal tax basis treatment.
3. Agreements and Other Transactions with Affiliates:
The Trust has entered into an investment advisory agreement with RBC GAM-US under which RBC GAM-US manages each Funds’ assets and furnishes related office facilities, equipment, research and personnel. The agreement requires each Fund to pay RBC GAM-US a monthly fee based upon average
37
NOTES TO FINANCIAL STATEMENTS
daily net assets. Under the terms of the agreement, RBC GAM-US is entitled to receive fees based on a percentage of the average daily net assets of each of the Funds as follows:
| | |
| | | Annual Rate |
Short Duration Fixed Income Fund | | 0.30% |
Ultra-Short Fixed Income Fund | | 0.23% |
RBC GAM-US has contractually agreed to waive fees and/or make payments in order to keep total operating expenses (excluding certain fees such as interest, taxes and acquired fund fees and expenses) of Class A and Class I shares of each Fund to the following levels. This expense limitation agreement is in place until July 31, 2022.
| | | | | | | | |
| | | Class A
Annual Rate | | | Class I
Annual Rate | |
Short Duration Fixed Income Fund | | | 0.45% | | | | 0.35% | |
Ultra-Short Fixed Income Fund | | | 0.38% | | | | 0.28% | |
The Advisor is entitled to recoup from the Fund or class the fees and/or operating expenses waived or reimbursed during any of the previous 3 years, provided the Fund is able to do so and remain in compliance with the expense limitation in place at the time the fees were waived or expenses paid.
The amounts subject to possible recoupment under the expense limitation agreement as of September 30, 2020 were:
| | | | | | | | | | | | | | | | | | | | |
| | | FYE 3/31/18 | | | FYE 3/31/19 | | | FYE 3/31/20 | | | FYE 3/31/21 | | | Total | |
Short Duration Fixed Income Fund | | | $75,693 | | | | $178,075 | | | | $184,217 | | | | $ 93,469 | | | | $531,454 | |
Ultra-Short Fixed Income Fund | | | 85,187 | | | | 199,362 | | | | 206,451 | | | | 116,988 | | | | 607,988 | |
RBC GAM-US voluntarily agreed to waive its investment advisory fees by the amount of investment advisory fees each Fund pays to RBC GAM-US indirectly through its investment in an affiliated money market fund. These waivers are voluntary and not subject to recoupment. These amounts are included in expenses waived/reimbursed by Advisor in the Statements of Operations. For the period ended September 30, 2020, the amounts waived were as follows:
| | | | |
| | | Fees Waived | |
Short Duration Fixed Income Fund | | | $ 909 | |
Ultra-Short Fixed Income Fund | | | 1,375 | |
RBC GAM-US serves as co-administrator to the Funds. BNY Mellon Investment Servicing (US) Inc. (”BNY Mellon“) serves as co-administrator and fund accounting agent. Services provided under the administrative services contract include providing day-to-day administration of matters related to the Funds, maintenance of their records and the preparation of reports. Under the terms of the administrative services contract, RBC GAM-US does not receive a fee for its role as co-administrator. BNY Mellon receives a fee for its services payable by the Funds based in part on the Funds’ average net assets. BNY Mellon’s fee is included with “Accounting fees” in the Statements of Operations.
Certain Officers and Trustees of the Trust are affiliated with the Advisor. Such Officers and Trustees receive no compensation from the Funds for serving in their respective roles.
The Trust currently pays each of the independent trustees (trustees of the Trust who are not directors, officers or employees of the Advisor, either Co-Administrator or Distributor) an annual retainer of $63,000 ($68,000 effective October 1, 2020). The Board Chairperson and Audit Committee Chairperson each receive an additional retainer of $2,500 annually, and all other trustees serving as Chair of a Board committee each receive an additional retainer of $1,000 annually. In addition, independent trustees receive a quarterly meeting fee of $6,500, for each in-person Board meeting attended, a meeting fee of $1,500 for each telephonic or special board meeting attended, a $1,500
38
NOTES TO FINANCIAL STATEMENTS
fee for each Board committee meeting attended, and are reimbursed for all out-of-pocket expenses relating to attendance at such meetings. These amounts are included in the Statement of Operations in “Trustees’ fees”.
In conjunction with the launch of the Funds and additional share classes, the Advisor invested seed capital to provide each Fund or share class with its initial investment assets. The table below shows, as of September 30, 2020, each Fund’s net assets, the shares of each Fund held by the Advisor, and the percent of total net assets represented by the Advisor’s investment.
| | | | | | |
| | | Net Assets | | Shares held
by Advisor | | % of Fund
Net Assets |
Short Duration Fixed Income Fund | | $71,740,621 | | 983,830 | | 14.0% |
Ultra-Short Fixed Income Fund | | $47,866,708 | | 1,140,855 | | 23.8% |
4. Fund Distribution:
Each of the Funds has adopted a Master Distribution 12b-1 Plan (the “Plan”) in which Quasar Distributors LLC (the “Distributor”) acts as the Funds’ distributor. The Plan permits each Fund to make payments for or to reimburse the Distributor for distribution-related costs and expenses of marketing shares of Class A covered under the Plan, and/or for providing shareholder services. The Plan does not apply to Class I. The current Plan fee rate for Class A is 0.10%.
Plan fees are based on average daily net assets of Class A. The Distributor, subject to applicable legal requirements, may waive a Plan fee voluntarily, in whole or in part. For the period ended September 30, 2020, there were no fees waived by the Distributor.
5. Securities Transactions:
The cost of securities purchased and proceeds from securities sold (excluding securities maturing less than one year from acquisition) for the period ended September 30, 2020 were as follows:
| | | | | | |
| | | Purchases | | Sales
(Excl. U.S. Gov’t) | | Sales of U.S. Gov’t. |
Short Duration Fixed Income Fund | | $26,080,030 | | $11,083,659 | | $49,640 |
Ultra-Short Fixed Income Fund | | 25,765,426 | | 16,771,173 | | 71,108 |
39
NOTES TO FINANCIAL STATEMENTS
6. Capital Share Transactions:
The Trust is authorized to issue an unlimited number of shares of beneficial interest (“shares outstanding”) without par value. Transactions in capital stock of the Funds are summarized on the following pages:
| | | | | | | | | | | | | | | | |
| | | Short Duration Fixed Income Fund | | | Ultra-Short Fixed Income Fund | |
| | | For the
Six Months
Ended
September 30,
2020
(Unaudited) | | | For the
Year Ended
March 31,
2020 | | | For the
Six Months
Ended
September 30,
2020
(Unaudited) | | | For the
Year Ended
March 31,
2020 | |
CAPITAL TRANSACTIONS: | | | | | | | | | | | | | | | | |
Class A | | | | | | | | | | | | | | | | |
Proceeds from shares issued | | $ | 649,425 | | | $ | — | | | $ | 5,438,915 | | | $ | 9,113,603 | |
Distributions reinvested | | | 4,176 | | | | 7,644 | | | | 67,504 | | | | 76,462 | |
Cost of shares redeemed | | | (540,962 | ) | | | (17,672 | ) | | | (1,373,512 | ) | | | (4,903,474 | ) |
| | | | | | | | | | | | | | | | |
Change in Class A | | $ | 112,639 | | | $ | (10,028 | ) | | $ | 4,132,907 | | | $ | 4,286,591 | |
| | | | | | | | | | | | | | | | |
Class I | | | | | | | | | | | | | | | | |
Proceeds from shares issued | | $ | 17,751,194 | | | $ | 32,255,714 | | | $ | 16,226,447 | | | $ | 37,609,125 | |
Distributions reinvested | | | 622,788 | | | | 1,044,878 | | | | 310,793 | | | | 649,900 | |
Cost of shares redeemed | | | (5,763,958 | ) | | | (3,208,643 | ) | | | (15,363,565 | ) | | | (32,239,671 | ) |
| | | | | | | | | | | | | | | | |
Change in Class I | | $ | 12,610,024 | | | $ | 30,091,949 | | | $ | 1,173,675 | | | $ | 6,019,354 | |
| | | | | | | | | | | | | | | | |
Change in net assets resulting from capital transactions | | $ | 12,722,663 | | | $ | 30,081,921 | | | $ | 5,306,582 | | | $ | 10,305,945 | |
| | | | | | | | | | | | | | | | |
SHARE TRANSACTIONS: | | | | | | | | | | | | | | | | |
Class A | | | | | | | | | | | | | | | | |
Issued | | | 64,948 | | | | — | | | | 550,749 | | | | 917,015 | |
Reinvested | | | 413 | | | | 762 | | | | 6,806 | | | | 7,728 | |
Redeemed | | | (53,400 | ) | | | (1,753 | ) | | | (138,403 | ) | | | (500,067 | ) |
| | | | | | | | | | | | | | | | |
Change in Class A | | | 11,961 | | | | (991 | ) | | | 419,152 | | | | 424,676 | |
| | | | | | | | | | | | | | | | |
Class I | | | | | | | | | | | | | | | | |
Issued | | | 1,751,320 | | | | 3,203,863 | | | | 1,645,188 | | | | 3,815,983 | |
Reinvested | | | 61,573 | | | | 104,177 | | | | 31,403 | | | | 65,704 | |
Redeemed | | | (573,514 | ) | | | (320,282 | ) | | | (1,550,580 | ) | | | (3,293,267 | ) |
| | | | | | | | | | | | | | | | |
Change in Class I | | | 1,239,379 | | | | 2,987,758 | | | | 126,011 | | | | 588,420 | |
| | | | | | | | | | | | | | | | |
Change in shares resulting from capital transactions | | | 1,251,340 | | | | 2,986,767 | | | | 545,163 | | | | 1,013,096 | |
| | | | | | | | | | | | | | | | |
7. Federal Income Taxes:
It is the policy of each Fund to continue to qualify as a regulated investment company by complying with the provisions available to certain investment companies, as defined under Subchapter M of the Internal Revenue Code, and to distribute substantially all of its net investment income and net realized capital gains. Therefore, no federal tax liability is recorded in the financial statements of each Fund.
Fund Management has analyzed the Fund’s tax positions taken or expected to be taken on federal income tax returns for all open tax years (current and prior three tax years) and has concluded that no provision for federal income tax is required in the Funds’ financial statements. The Funds’ federal and
40
NOTES TO FINANCIAL STATEMENTS
state income and federal excise tax returns for tax years for which the applicable statutes of limitations have not expired are subject to examination by the Internal Revenue Service and state departments of revenue.
As of September 30, 2020, the tax cost of investments and the breakdown of unrealized appreciation (depreciation) for each Fund was as follows:
| | | | | | | | | | | | | | | | |
| | | Tax Cost Of
Investments | | | Unrealized
Appreciation | | | Unrealized
Depreciation | | | Net Unrealized
Appreciation/
(Depreciation) | |
Short Duration Fixed Income Fund | | | $70,285,137 | | | | $1,308,255 | | | | $(97,106 | ) | | | $1,211,149 | |
Ultra-Short Fixed Income Fund | | | 46,913,018 | | | | 539,191 | | | | (34,318 | ) | | | 504,873 | |
The difference between book basis and tax basis unrealized appreciation/depreciation is attributable to the tax deferral of losses on wash sales and mark to market on derivatives.
The tax character of distributions during the year ended March 31, 2020 were as follows:
| | | | | | | | | | | | |
| | | Distributions Paid From | |
| | | Ordinary
Income | | | Total Taxable
Distributions | | | Total
Distributions
Paid | |
Short Duration Fixed Income Fund | | $ | 1,052,576 | | | $ | 1,052,576 | | | $ | 1,052,576 | |
Ultra-Short Fixed Income Fund | | | 746,191 | | | | 746,191 | | | | 746,191 | |
Total distributions paid may differ from the Statements of Changes in Net Assets because distributions are recognized when actually paid for tax purposes.
The tax basis of components of accumulated earnings/(losses) and tax character of distributions are determined at fiscal year end, and will be included in the Annual Report dated March 31, 2021.
As of March 31, 2020, Short Duration Fixed Income Fund and Ultra-Short Fixed Income Fund had a short-term capital loss carryforward of $395,338 and $410,147, respectively, and a long-term capital loss carryforward of $73,687 and $134,059 respectively, available to offset future realized capital gains in accordance with the Regulated Investment Company Modernization Act of 2010. This capital loss carryforward is not subject to expiration.
During the year ended March 31, 2020 the Short Duration Fixed Income Fund utilized $37,792 of capital loss carryforwards.
Under current tax law, capital losses realized after October 31 and ordinary losses after December 31 of a Fund’s fiscal year may be deferred and treated as occurring on the first business day of the following fiscal year for tax purposes. The Short Duration Fixed Income Fund and Ultra-Short Fixed Income Fund did not have any deferred qualified late-year capital losses.
8. Line of Credit
The Funds, along with other Funds within the Trust, participate in an uncommitted, unsecured $500,000,000 line of credit with U.S. Bank, N.A. (the “Bank”), the Funds’ custodian, to be used to fund shareholder redemption requests and for other short-term temporary or emergency general business purposes. The line of credit has a scheduled termination date of July 31, 2021. Interest is charged on borrowings under this line of credit at the Bank’s prime lending rate per annum. Since multiple funds within the Trust participate in this line of credit, there is no assurance that an individual fund will have access to all or any part of the $500,000,000 at any particular time. There were no loans outstanding pursuant to this line of credit at September 30, 2020 and there were no borrowings made by the Funds during the period.
41
NOTES TO FINANCIAL STATEMENTS
9. Significant Risks
Shareholder concentration risk:
As of September 30, 2020, the following Funds had omnibus accounts which owned more than 10% of a Fund’s outstanding shares as shown below:
| | | | | | |
| | | # of Omnibus Accounts | | | % of Fund |
Short Duration Fixed Income Fund | | | 3 | | | 85.0% |
Ultra-Short Fixed Income Fund | | | 1 | | | 38.2% |
In addition, an unaffiliated shareholder owned 17.2% of the Ultra-Short Fixed Income Fund as of September 30, 2020. Significant transactions by these shareholders may impact the Funds’ performance.
Market risk
One or more markets in which a Fund invests may go down in value, sometimes sharply and unpredictably, and the value of a Fund’s portfolio securities may fall or fail to rise. Market risk may affect a single issuer, sector of the economy, industry or the market as a whole. In addition, global economies and financial markets are becoming increasingly interconnected, and political, economic and other conditions and events (including, but not limited to, natural disasters, pandemics, epidemics, and social unrest) in one country, region, or financial market may adversely impact issuers in a different country, region or financial market. Furthermore, the occurrence of, among other events, natural or man-made disasters, severe weather or geological events, fires, floods, earthquakes, outbreaks of disease (such as COVID-19, avian influenza or H1N1/09), epidemics, pandemics, malicious acts, cyber-attacks, terrorist acts or the occurrence of climate change, may also adversely impact the performance of a Fund. Such events could adversely impact issuers, markets and economies over the short- and long-term, including in ways that cannot necessarily be foreseen. A Fund could be negatively impacted if the value of a portfolio holding were harmed by such political or economic conditions or events. Moreover, such negative political and economic conditions and events could disrupt the processes necessary for a Fund’s operations.
10. Subsequent Events:
Fund Management has evaluated the impact of all subsequent events on the Funds and has determined that there were no subsequent events requiring recognition or disclosure in the financial statements.
42
SHARE CLASS INFORMATION (UNAUDITED)
The Funds offer Class A and Class I shares.
Class A
Class A shares are intended for investors meeting certain minimum investment thresholds. This share class does not have an up-front sales charge (load). Class A shares currently include a 0.10% (10 bps) annual 12b-1 service and distribution fee.
Class I
Class I shares are intended for investors meeting certain minimum investment thresholds. This share class does not have an up-front sales charge (load) or a 12b-1 service and distribution fee.
43
SUPPLEMENTAL INFORMATION (UNAUDITED)
Shareholder Expense Examples
As a shareholder of the the RBC Funds, you incur two types of costs: (1) transaction costs and (2) ongoing costs, including management fees; and other Fund expenses. This example is intended to help you understand your ongoing costs (in dollars) of investing in the RBC Funds and to compare these costs with the ongoing costs of investing in other mutual funds.
The example is based on an investment of $1,000 invested at the beginning of the period and held for the entire period from April 1, 2020 through September 30, 2020.
Actual Expenses
The table below provides information about actual account values and actual expenses. You may use the information below, together with the amount you invested, to estimate the expenses that you paid over the period. Simply divide your account value by $1,000 (for example, an $8,600 account value divided by $1,000 = 8.6), then multiply the result by the number in the table under the heading entitled “Expenses Paid During Period” to estimate the expenses you paid on your account during this period.
| | | | | | | | |
| | | Beginning
Account Value
4/1/20 | | Ending
Account Value
9/30/20 | | Expenses Paid
During Period*
4/1/20–9/30/20 | | Annualized
Expense Ratio
During Period
4/1/20–9/30/20 |
Short Duration Fixed Income Fund | | | | | | | | |
Class A | | $1,000.00 | | $1,058.40 | | $2.32 | | 0.45% |
Class I | | 1,000.00 | | 1,058.00 | | 1.81 | | 0.35% |
Ultra-Short Fixed Income Fund | | | | | | | | |
Class A | | 1,000.00 | | 1,052.00 | | 1.95 | | 0.38% |
Class I | | 1,000.00 | | 1,052.60 | | 1.44 | | 0.28% |
*Expenses are equal to the average account value times the Fund’s annualized expense ratio multiplied by 183/365 (to reflect one half year period).
44
SUPPLEMENTAL INFORMATION (UNAUDITED)
Hypothetical Example for Comparison Purposes
The table below provides information about hypothetical account values and hypothetical expenses based on each RBC Funds’ actual expense ratio and an assumed rate of return of 5% per year before expenses, which is not the Fund’s actual return. The hypothetical account values and expenses may not be used to estimate the actual ending account balance or expenses you paid for the period. You may use this information to compare this 5% hypothetical example with the 5% hypothetical examples that appear in the shareholder reports of other funds.
Please note that the expenses shown in the table are meant to highlight your ongoing costs only and do not reflect any transactional costs, such as sales charges (loads), redemption fees, or exchange fees. Therefore, the table is useful in comparing ongoing costs only, and will not help you determine the relative total costs of owning different funds. In addition, if these transactional costs were included, your costs would have been higher.
| | | | | | | | |
| | | Beginning
Account Value
4/1/20 | | Ending
Account Value
9/30/20 | | Expenses Paid
During Period*
4/1/20-9/30/20 | | Annualized
Expense Ratio
During Period
4/1/20-9/30/20 |
Short Duration Fixed Income Fund | | | | | | | | |
Class A | | $1,000.00 | | $1,022.81 | | $2.28 | | 0.45% |
Class I | | 1,000.00 | | 1,023.31 | | 1.78 | | 0.35% |
Ultra-Short Fixed Income Fund | | | | | | | | |
Class A | | 1,000.00 | | 1,023.16 | | 1.93 | | 0.38% |
Class I | | 1,000.00 | | 1,023.66 | | 1.42 | | 0.28% |
*Expenses are equal to the average account value times the Fund’s annualized expense ratio multiplied by 183/365 (to reflect one half year period).
45
APPROVAL OF INVESTMENT ADVISORY AGREEMENT (UNAUDITED)
Information Regarding the Approval of Investment Advisory Agreements
In September 2020, after evaluating the services provided by RBC Global Asset Management (U.S.) Inc. (the “Advisor”) and reviewing the performance, fees, and expenses of the Funds, the RBC Funds Board of Trustees determined to approve the continuation of the investment advisory agreements with the Advisor (the “Agreements”) for each Fund for an additional year
As part of their review of the Agreements, the Trustees requested and considered information regarding the services performed by the Advisor; the staffing and qualifications of the personnel responsible for operating and managing the Funds; and the Funds’ performance, fees, and expenses. The Trustees considered information provided at regular quarterly Board and Committee meetings throughout the year, information presented at both a special meeting held to review requested material related to the proposed renewals and a regular meeting at which the proposed renewals were considered, and their experience with the portfolio management team with regard to other products over the years. The information included material provided by the Advisor, as well as reports prepared by Broadridge Financial Solutions, Inc., an independent statistical compilation company providing comparative fee and expense information and comparative performance information for the Funds. In connection with their deliberations, the independent Trustees were advised by independent legal counsel with regard to the materials and their responsibilities under relevant laws and regulations.
The Trustees met with representatives from the Advisor’s senior management team, as well as senior investment professionals from the Advisor, to discuss the information and the ongoing management of the Funds. The Trustees reviewed the nature, quality, and extent of the services provided to the Funds by the Advisor, including information as to each Fund’s performance relative to appropriate index benchmarks and their respective Morningstar categories as well as information with respect to custom peer groups designed to align more closely with the Funds’ specific investment strategies. The Trustees noted that the performance of the RBC Ultra-Short Fixed Income Fund had ranked in the top quartile of its peers since its inception.
The Trustees reviewed the Funds’ expense structure and advisory fees. The Trustees also considered, and viewed favorably, the Advisor’s contractual agreement to subsidize Fund expenses. The Trustees continued to be satisfied with the Advisor’s approach of providing profitability information so that the Advisor and Trustees could evaluate possible future economies of scale that might warrant contractual advisory fee breakpoints. The Trustees’ considerations included other benefits derived by the Advisor from its relationship with the Funds.
In considering the nature and quality of services provided by the Advisor to the Funds, the Trustees considered the significant depth and experience of the Advisor’s team with regard to management of shorter duration portfolios, and their demonstrated capabilities with respect to research, credit, and fundamental analysis, as well as the Advisor’s operational and compliance structure and systems. The Trustees expressed confidence in the Advisor’s investment team and were satisfied with the nature, extent, and quality of the advisory and other services provided to the Funds.
Based upon their review, the Trustees determined that the advisory fees payable to the Advisor were reasonable and fair in view of the level and quality of the services to be provided by the Advisor under all the circumstances and were within the range of what might have been negotiated at arms’ length. The Trustees approved the Agreements and expense limitation arrangements for each Fund for an additional year. In arriving at their collective decision to approve the Agreements, the Trustees did not assign relative weights to the factors discussed above or deem any one or group of them to be controlling in and of it self.
46
This Page Intentionally Left Blank
47
RBC Funds
P.O. Box 701
Milwaukee, WI 53201-0701
800-422-2766
www.rbcgam.us
Performance data represents past performance and does not guarantee future results. The principal value of an investment and investment return will fluctuate so that an investor’s shares, when redeemed, may be worth more or less than their original cost.
This report and the financial statements contained herein are provided for the information of RBC Funds shareholders. This report is not authorized for distribution to prospective investors unless preceded or accompanied by a current prospectus, which contains information concerning investment objectives, risks, charges and expenses of the funds. Please read the prospectus carefully before investing.
This report and the financial statements contained herein are not intended to be a forecast of future events, a guarantee of future results, or investment advice. There is no assurance that certain securities will remain in or out of each fund’s portfolio. The views expressed in this report reflect those of the portfolio managers through the period ended September 30, 2020.
NOT FDIC INSURED • NO BANK GUARANTEE • MAY LOSE VALUE
RBC Global Asset Management (U.S.) Inc. serves as investment advisor for the RBC Funds. RBC Funds are distributed by Quasar Distributors LLC.
The RBC Funds are pleased to offer shareholder reports printed entirely on Forest Stewardship Council® certified paper. FSC® certification ensures that the paper used in this report contains fiber from well-managed and responsibly harvested forests that meet strict environmental and socioeconomic standards.
RBCF-FI SAR 09-20
Not applicable.
| Item 3. | Audit Committee Financial Expert. |
Not applicable.
| Item 4. | Principal Accountant Fees and Services. |
Not applicable.
| Item 5. | Audit Committee of Listed Registrants. |
Not applicable.
| (a) | Schedule of Investments in securities of unaffiliated issuers as of the close of the reporting period is included as part of the report to shareholders filed under Item 1 of this form. |
| Item 7. | Disclosure of Proxy Voting Policies and Procedures for Closed-End Management Investment Companies. |
Not applicable.
| Item 8. | Portfolio Managers of Closed-End Management Investment Companies. |
Not applicable.
| Item 9. | Purchases of Equity Securities by Closed-End Management Investment Company and Affiliated Purchasers. |
Not applicable.
| Item 10. | Submission of Matters to a Vote of Security Holders. |
There have been no material changes to the procedures by which the shareholders may recommend nominees to the registrant’s board of directors, where those changes were implemented after the registrant last provided disclosure in response to the requirements of Item 407(c)(2)(iv) of Regulation S-K (17 CFR 229.407) (as required by Item 22(b)(15) of Schedule 14A (17 CFR 240.14a-101)), or this Item.
| Item 11. | Controls and Procedures. |
| | (a) | The registrant’s principal executive and principal financial officers, or persons performing similar functions, have concluded that the registrant’s disclosure controls and procedures (as defined in Rule 30a-3(c) under the Investment Company Act of 1940, as amended (the “1940 Act”) (17 CFR 270.30a-3(c))) are effective, as of a date within 90 days of the filing date of the report that includes the disclosure required by this paragraph, based on their evaluation of these controls and procedures required by Rule 30a-3(b) under the 1940 Act (17 CFR 270.30a-3(b)) and Rules 13a-15(b) or 15d-15(b) under the Securities Exchange Act of 1934, as amended (17 CFR 240.13a-15(b) or 240.15d-15(b)). |
| | (b) | There were no changes in the registrant’s internal control over financial reporting (as defined in Rule 30a-3(d) under the 1940 Act (17 CFR 270.30a-3(d))) that occurred during the period covered by this report that has materially affected, or is reasonably likely to materially affect, the registrant’s internal control over financial reporting. |
| Item 12. | Disclosure of Securities Lending Activities for Closed-End Management Investment Companies. |
Not applicable.
SIGNATURES
Pursuant to the requirements of the Securities Exchange Act of 1934 and the Investment Company Act of 1940, the registrant has duly caused this report to be signed on its behalf by the undersigned, thereunto duly authorized.
| | |
| (Registrant) | | RBC Funds Trust |
| | |
| |
| By (Signature and Title)* | | /s/ Kathleen A. Gorman |
| | Kathleen A. Gorman, President and Chief Executive Officer |
| | (principal executive officer) |
Pursuant to the requirements of the Securities Exchange Act of 1934 and the Investment Company Act of 1940, this report has been signed below by the following persons on behalf of the registrant and in the capacities and on the dates indicated.
| | |
| By (Signature and Title)* | | /s/ Kathleen A. Gorman |
| | Kathleen A. Gorman, President and Chief Executive Officer |
| | (principal executive officer) |
| | |
| By (Signature and Title)* | | /s/ Kathleen A. Hegna |
| | Kathleen A. Hegna, Treasurer and Chief Financial Officer |
| | (principal financial officer) |
* Print the name and title of each signing officer under his or her signature.