UNITED STATES
SECURITIES AND EXCHANGE COMMISSION
Washington, D.C. 20549
FORM N-CSR
CERTIFIED SHAREHOLDER REPORT OF REGISTERED MANAGEMENT
INVESTMENT COMPANIES
Investment Company Act file number 811-21475
RBC Funds Trust
(Exact name of registrant as specified in charter)
50 South Sixth Street, Suite 2350
Minneapolis, MN 55402
(Address of principal executive offices) (Zip code)
Tara Tilbury
50 South Sixth Street, Suite 2350
Minneapolis, MN 55402
(Name and address of agent for service)
Registrant’s telephone number, including area code: (612) 376-7132
Date of fiscal year end: September 30
Date of reporting period: March 31, 2023
Item 1. Reports to Stockholders.
(a) The Report to Shareholders is attached herewith.

Semi-Annual Report For the six months ended March 31, 2023 Access Capital Community Investment Fund RBC Impact Bond Fund RBC ®
| | | | | | | | | | |
| | | | | | | |
| | | |
| | | | | | RBC Funds | |
| | | |
| | | |
About your Semi Annual Report | | | | | | This semi-annual report (Unaudited) includes detailed information about your Fund including financial statements, performance, and a complete list of its holdings. The RBC Funds compare their performance against various indices. Each of these indices is a widely recognized measure of return for the underlying category of securities. However, the indices are unmanaged, do not include fees, and cannot be invested in directly. We hope the financial information presented will help you evaluate your investment in the RBC Funds. We also encourage you to read your Fund’s prospectus for further detail as to your Fund’s investment policies and risk profile. RBC Funds prospectuses and performance information subsequent to the date of this report are available on our website at www.rbcgam.com. | |
| | | |
| | | | | | A description of the policies and procedures that your Fund uses to determine how to vote proxies relating to portfolio securities is available (i) without charge, upon request, by calling 1-800-422-2766; (ii) on the Fund’s website at www.rbcgam.com; and (iii) on the Securities and Exchange Commission’s (the “Commission”) website at http://www.sec.gov. | |
| | | | |
| | | | | | Each year the Trust files its proxy voting record for the twelve-month period ended June 30 with the SEC on Form N-PX no later than August 31. The records can be obtained on the SEC’s website at www.sec.gov and without charge by calling the Funds at 1-800-422-2766. | | | | |
| | | | |
| | | | | | A schedule of each Fund’s portfolio holdings is filed with the Commission for the first and third quarters of each fiscal year on Form N-PORT. This information is available on the Commission’s website at http://www.sec.gov and on the Funds’ website at www.dfinview.com/usrbcgam. | | | | |
| | | |
| | | | |
Table of | | | | | | Portfolio Managers | | | 1 | |
Contents | | | | | | Performance Summary | | | 2 | |
| | | | | | Fund Statistics | | | | |
| | | | | | - Access Capital Community Investment Fund | | | 4 | |
| | | | | | - RBC Impact Bond Fund | | | 5 | |
| | | | | | Schedules of Portfolio Investments | | | 6 | |
| | | | | | Financial Statements | | | | |
| | | | | | - Statements of Assets and Liabilities | | | 44 | |
| | | | | | - Statements of Operations | | | 46 | |
| | | | | | - Statements of Changes in Net Assets | | | 47 | |
| | | | | | Financial Highlights | | | 49 | |
| | | | | | Notes to Financial Statements | | | 55 | |
| | | | | | Share Class Information | | | 71 | |
| | | | | | Supplemental Information | | | 72 | |
| | | | | | Statement Regarding Liquidity Risk Management Program (Unaudited) | | | 74 | |
| | | | | | | | | | |
| | | | | | |
| | | |
| PORTFOLIO MANAGERS | | | | | | |
| | | |
RBC Global Asset Management (U.S.) Inc.(“RBC GAM-US”) serves as the investment advisor to the Funds. RBC GAM-US employs a team approach to the management of the Funds, with no individual team member being solely responsible for the investment decisions. The Funds’ management team has access to RBC GAM-US’s investment research and other money management resources. | | | | | | |
| | | |
Brian Svendahl, CFA Senior Portfolio Manager | | | | | | |
| Brian is a senior portfolio manager within the RBC GAM-US fixed income team. He has been the lead portfolio manager for RBC GAM-US’s impact investing strategies since 2006 along with many government and mortgage strategies. Brian joined RBC GAM-US in 2005 and has co-led the Minneapolis-based fixed income group since 2012. He had previously held several risk management, research, and trading positions with a large American multinational financial services company and first started in the investment industry in 1992. Brian earned a BS in economics from the University of Minnesota and a BBA in finance and MBA from the University of Minnesota Carlson School of Management. Brian is a CFA charterholder. | | | | | | 
Brian Svendahl, CFA |
| | | |
| | | | | | |
1
|
PERFORMANCE SUMMARY (UNAUDITED) |
| | | | | | | | | | | | | | | | | | | | | | | | |
| | | 1
Year | | 5
Year | | 10
Year | | Since
Inception | | Net
Expense
Ratio(a)(b) | | Gross
Expense
Ratio(a)(b) |
Average Annual Total Returns as of March 31, 2023 (Unaudited) | | | | | | | | | | | | | | | | | |
| | | | | |
Access Capital Community Investment Fund | | | | | | | | | | | | | | | | | | | | | |
Class A(c) | | | | | | | | | | | | | | | | | | | | | | | | |
- Including Max Sales Charge of 3.75% | | | (9.04 | )% | | | (1.14 | )% | | | (0.09 | )% | | | 2.78 | % | | | | | | | | |
- At Net Asset Value | | | (5.46 | )% | | | (0.38 | )% | | | 0.29 | % | | | 2.94 | % | | | 0.80 | % | | | 0.84 | % |
Class I(e) | | | | | | | | | | | | | | | | | | | | | | | | |
- At Net Asset Value | | | (5.13 | )% | | | (0.04 | )% | | | 0.65 | % | | | 3.26 | % | | | 0.45 | % | | | 0.51 | % |
Class IS(f) | | | | | | | | | | | | | | | | | | | | | | | | |
- At Net Asset Value | | | (4.96 | )% | | | 0.05 | % | | | 0.79 | % | | | 3.49 | % | | | 0.40 | % | | | 0.50 | % |
| | | | | | |
Bloomberg US Securitized Index(h) | | | (4.73 | )% | | | 0.30 | % | | | 1.05 | % | | | 3.79 | % | | | | | | | | |
RBC Impact Bond Fund | | | | | | | | | | | | | | | | | | | | | | | | |
Class A(d) | | | | | | | | | | | | | | | | | | | | | | | | |
- Including Max Sales Charge of 3.75% | | | (9.71 | )% | | | (0.65 | )% | | | N/A | | | | (0.97 | )% | | | | | | | | |
- At Net Asset Value | | | (6.15 | )% | | | 0.11 | % | | | N/A | | | | (0.25 | )% | | | 0.70 | % | | | 0.70 | % |
Class I | | | | | | | | | | | | | | | | | | | | | | | | |
- At Net Asset Value | | | (5.90 | )% | | | 0.41 | % | | | N/A | | | | 0.04 | % | | | 0.45 | % | | | 0.65 | % |
Class R6 | | | | | | | | | | | | | | | | | | | | | | | | |
- At Net Asset Value | | | (5.86 | )% | | | 0.46 | % | | | N/A | | | | 0.09 | % | | | 0.40 | % | | | 0.52 | % |
Class Y(g) | | | | | | | | | | | | | | | | | | | | | | | | |
- At Net Asset Value | | | (5.87 | )% | | | 0.19 | % | | | N/A | | | | (0.18 | )% | | | 0.40 | % | | | 0.50 | % |
| | | | | | |
Bloomberg US Aggregate Bond Index(h) | | | (4.78 | )% | | | 0.91 | % | | | N/A | | | | 0.59 | % | | | | | | | | |
Parentheses indicate negative performance returns.
Performance data quoted represents past performance. Past performance is no guarantee of future results. Investment return and principal value of an investment will fluctuate so that an investor’s shares, when redeemed, may be worth more or less than their original cost. Current performance may be lower or higher than performance quoted. Performance shown reflects contractual fee waivers, without such fee waivers total returns would be reduced. For performance data current to the most recent month-end go to www.rbcgam.com. Please see footnotes below.
| (a) | The Funds’ expenses are from the Funds’ most recent prospectus dated January 27, 2023. For current expense ratio information, please see the Financial Highlights starting on page 49. |
| (b) | The advisor has contractually agreed to waive fees and/or pay operating expenses to keep total operating expenses at 0.80% for Class A shares, 0.45% for Class I shares and 0.40% for Class IS shares of the Access Capital Community Investment Fund and at 0.70% for Class A shares, 0.45% for Class I shares, 0.40% for Class R6 shares and 0.40% for Class Y shares of the Impact Bond Fund until January 31, 2024. |
| (c) | The inception date for Class A shares of the Fund is January 29, 2009. All performance shown for such class of shares prior to its inception date is based on the performance of the Class I shares of the Fund, adjusted to reflect the fees and expenses of Class A shares, as applicable. |
2
|
PERFORMANCE SUMMARY (UNAUDITED) |
| (d) | The inception date for Class A shares of the Fund is January 28, 2020. All performance shown for such class of shares prior to its inception date is based on the performance of the Class I shares of the Fund, which has an inception date of December 18, 2017, adjusted to reflect the fees and expenses of Class A shares, as applicable. |
| (e) | Class I shares commenced operations on July 28, 2008. The performance in the table prior to that date reflects the performance of Access Capital Strategies Community Investment Fund, Inc., the predecessor to the Fund. From its inception, June 23, 1998, until May 30, 2006, the predecessor fund elected status as a business development company. From May 31, 2006 until July 27, 2008, the predecessor fund operated as a continuously offered closed-end interval management company. If the predecessor fund had operated as an open-end management company, performance may have been adversely affected. Fund performance reflects applicable fee waivers/expense reimbursements which, if excluded, would cause performance to be lower. |
| (f) | The inception date for Class IS shares of the Fund is March 11, 2019. All performance shown for such class of shares prior to its inception date is based on the performance of the Class I shares of the Fund, adjusted to reflect the fees and expenses of Class IS shares, as applicable. |
| (g) | The inception date for Class Y shares of the Fund is April 12, 2021. All performance shown for such class of shares prior to its inception date is based on the performance of the Class I shares of the Fund, which has an inception date of December 18, 2017, adjusted to reflect the fees and expenses of Class Y shares, as applicable. |
| (h) | Each of the comparative indices is a widely recognized market value weighted measure of the return of securities, but do not include sales fees or operating expenses. You cannot invest directly in indices. |
Fund holdings and/or sector allocations are subject to change at any time and are not recommendations to buy or sell any security.
The Bloomberg US Securitized Index represents the securitized portion (mortgage-backed, asset-backed and commercial mortgage-backed securities) of the Bloomberg US Aggregate Bond Index.
The Bloomberg US Aggregate Bond Index measures the investment grade, U.S. dollar-denominated, fixed-rate taxable bond market. It includes Treasuries, government-related and corporate securities, mortgage-backed securities (agency fixed-rate and hybrid adjustable-rate mortgage pass-throughs), asset-backed securities, and commercial mortgage-backed securities (agency and non-agency).
You cannot invest directly in index.
Mutual fund investing involves risk. Principal loss is possible.
3
| | | | | | | | | | | | | | | | | | | | |
| | | | |
| | | | | | | | FUND STATISTICS (UNAUDITED) |
| | | | | | | | Access Capital Community Investment Fund |
Investment Objective | | | | | | | | The Fund’s investment objective is to provide current income consistent with the preservation of capital by investing primarily in high quality debt securities and other debt instruments supporting community development, including investments deemed to be qualified under the Community Reinvestment Act of 1977, as amended (the “CRA”). |
Benchmark | | | | | | | | Bloomberg US Securitized Index |
Asset Allocation as of 3/31/23 (% of Fund’s investments) | | | | | | | | 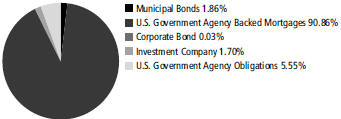
|
Top Ten Holdings (excluding investment companies) (as of 3/31/23) (% of Fund’s net assets) | | | | | | | | Fannie Mae, 2.00%, 4/15/53 | | | 4.94 | % | | Fannie Mae, Pool #CB3764, 4.00%, 6/1/52 | | | 1.07 | % | | |
| | | | Fannie Mae, Pool #CB4463, 4.50%, 8/1/52 | | | 1.71 | % | | Fannie Mae, Pool #CB3797, 4.00%, 6/1/52 | | | 1.05 | % | | |
| | | | Fannie Mae, Pool #CB5037, 5.50%, 11/1/52 | | | 1.50 | % | | Freddie Mac, Pool #RA5427, 2.50%, 6/1/51 | | | 0.95 | % | | |
| | | | Fannie Mae, Pool #CB4314, 4.50%, 8/1/52 | | | 1.33 | % | | Freddie Mac, Pool #RA5020, 2.00%, 4/1/51 | | | 0.92 | % | | |
| | | | Freddie Mac, Pool #RA7503, 4.50%, 7/1/52 | | | 1.30 | % | | | | | | | | |
| | | | | | Fannie Mae, Pool #BL4650, 2.30%, 10/1/31 | | | 1.07 | % | | | | | | | | |
| | | | | | *A listing of all portfolio holdings can be found beginning on page 6 |
Growth of $1,000,000 Initial Investment Over 10 Years | | | | | | | | 
| | | |
| | | | | | | | The graph reflects an initial hypothetical investment of $1,000,000 over a 10 year period and is based on Class I shares. The Fund’s total return includes reinvested dividends and capital gains. The Fund’s total return also includes operating expenses that reduce return, while the total return of the index does not. The graph does not reflect the deduction of taxes that a shareholder would pay on fund distributions or redemption of fund shares. Performance of other classes will vary due to differences in fee structures. This chart does not imply any future performance. |
4
| | | | | | | | | | | | | | | | | | |
| | | | |
| | FUND STATISTICS (UNAUDITED) | | | | | | | |
| | RBC Impact Bond Fund | | | | | | | |
| | The Fund seeks to achieve a high level of current income consistent with preservation of capital. | | | | | | | Investment Objective |
| | Bloomberg US Aggregate Bond Index | | | | | | | Benchmark |
| | | | |
| | 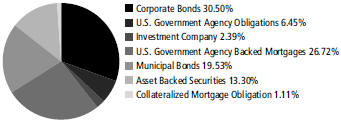
| | | | | | | Asset Allocation as of 3/31/23 (% of Fund’s investments) |
| | | | | | | |
| | Fannie Mae, 2.00%, 4/15/53 Becton Dickinson & Co., 4.69%, 2/13/28 Hertz Vehicle Financing III LLC,
5.49%, 6/25/27 Amgen, Inc., 5.25%, 3/2/33 American Water Capital Corp., 4.45%, 6/1/32 Tesla Auto Lease Trust, Series 2021-B, Class C, 1.12%, 9/22/25 | |
| 2.83%
1.80% 1.72% 1.54% 1.33% 1.29% |
| | Luminace Issuer LLC, Series 2022-1, Class B, 5.91%, 7/31/62 Tesla Auto Lease Trust, Series 2020-A, Class D, 2.33%, 2/20/24 Tesla Auto Lease Trust, Series 2021-A, Class D, 1.34%, 3/20/25 Fannie Mae, Pool #CB3764, 4.00%, 6/1/52 | | | 1.26% 1.26% 1.23% 1.15% | | | | | | | Top Ten Holdings (excluding investment companies) (as of 3/31/23) (% of Fund’s net assets) |
| | | | |
| | | | |
| | | | |
| | | | |
| | | | | | |
| | | | |
| | *A listing of all portfolio holdings can be found beginning on page 30 | | | | | | | |
| | 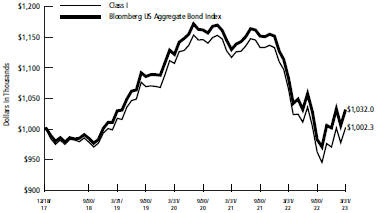
| | | | | | | Growth of $1,000,000 Initial Investment Since Inception (12/18/17) |
| | The graph reflects an initial hypothetical investment of $1,000,000 over the period from December 18, 2017 (commencement of operations) to March 31, 2023 and is based on Class I shares. The Fund’s total return includes reinvested dividends and capital gains. The Fund’s total return also includes operating expenses that reduce return while the total return of the index does not. The graph does not reflect the deduction of taxes that a shareholder would pay on fund distributions or redemption of fund shares. Classes will vary due to differences in fee structures. This chart does not imply any future performance. | | | | | | | |
5
|
SCHEDULE OF PORTFOLIO INVESTMENTS |
Access Capital Community Investment Fund
March 31, 2023 (Unaudited)
| | | | | | | | |
Principal Amount | | | | | Value | |
| | U.S. Government Agency Backed Mortgages — 95.27% | | | | |
| | Fannie Mae — 57.44% | | | | |
| | $43,000,000 | | | 2.00%, 4/15/53 | | $ | 35,529,180 | |
| | 64,913 | | | Pool #257913, 5.50%, 1/1/38 | | | 68,043 | |
| | 46,972 | | | Pool #258022, 5.50%, 5/1/34 | | | 48,800 | |
| | 42,587 | | | Pool #258070, 5.00%, 6/1/34 | | | 43,576 | |
| | 50,190 | | | Pool #258157, 5.00%, 8/1/34 | | | 51,356 | |
| | 49,916 | | | Pool #258163, 5.50%, 8/1/34 | | | 51,858 | |
| | 22,628 | | | Pool #258224, 5.50%, 12/1/34 | | | 23,509 | |
| | 72,404 | | | Pool #258251, 5.50%, 1/1/35 | | | 75,221 | |
| | 85,878 | | | Pool #258305, 5.00%, 3/1/35 | | | 88,108 | |
| | 51,135 | | | Pool #258394, 5.00%, 5/1/35 | | | 52,463 | |
| | 38,149 | | | Pool #258410, 5.00%, 4/1/35 | | | 39,140 | |
| | 60,315 | | | Pool #258448, 5.00%, 8/1/35 | | | 61,882 | |
| | 81,273 | | | Pool #258450, 5.50%, 8/1/35 | | | 84,697 | |
| | 153,678 | | | Pool #258627, 5.50%, 2/1/36 | | | 160,153 | |
| | 34,765 | | | Pool #258737, 5.50%, 12/1/35 | | | 36,442 | |
| | 7 | | | Pool #259187, 6.50%, 4/1/31 | | | 7 | |
| | 21,165 | | | Pool #259378, 6.00%, 12/1/31 | | | 22,062 | |
| | 20,684 | | | Pool #259393, 6.00%, 1/1/32 | | | 21,560 | |
| | 32,138 | | | Pool #259590, 5.50%, 11/1/32 | | | 33,357 | |
| | 80,495 | | | Pool #259611, 5.50%, 11/1/32 | | | 83,550 | |
| | 13,065 | | | Pool #259634, 5.50%, 12/1/32 | | | 13,561 | |
| | 102,237 | | | Pool #259659, 5.50%, 2/1/33 | | | 106,117 | |
| | 25,011 | | | Pool #259671, 5.50%, 2/1/33 | | | 25,960 | |
| | 60,390 | | | Pool #259686, 5.50%, 3/1/33 | | | 62,716 | |
| | 67,109 | | | Pool #259725, 5.00%, 5/1/33 | | | 68,531 | |
| | 46,628 | | | Pool #259761, 5.00%, 6/1/33 | | | 47,617 | |
| | 74,248 | | | Pool #259777, 5.00%, 7/1/33 | | | 75,822 | |
| | 38,149 | | | Pool #259789, 5.00%, 7/1/33 | | | 38,957 | |
| | 21,090 | | | Pool #259819, 5.00%, 8/1/33 | | | 21,537 | |
| | 39,046 | | | Pool #259830, 5.00%, 8/1/33 | | | 39,874 | |
| | 25,855 | | | Pool #259848, 5.00%, 9/1/33 | | | 26,403 | |
| | 55,571 | | | Pool #259867, 5.50%, 10/1/33 | | | 57,711 | |
| | 37,114 | | | Pool #259869, 5.50%, 10/1/33 | | | 38,544 | |
| | 37,939 | | | Pool #259875, 5.50%, 10/1/33 | | | 39,400 | |
| | 28,543 | | | Pool #259998, 5.00%, 3/1/34 | | | 29,206 | |
| | 241,667 | | | Pool #469101, 3.75%, 2/1/27 | | | 235,670 | |
| | 258,071 | | | Pool #470828, 3.53%, 3/1/32 | | | 246,659 | |
| | 8,841 | | | Pool #576445, 6.00%, 1/1/31 | | | 9,135 | |
| | 24,567 | | | Pool #579402, 6.50%, 4/1/31 | | | 25,944 | |
| | 25,186 | | | Pool #583728, 6.50%, 6/1/31 | | | 26,598 | |
| | 11,484 | | | Pool #590931, 6.50%, 7/1/31 | | | 12,128 | |
| | 8,629 | | | Pool #590932, 6.50%, 7/1/31 | | | 9,113 | |
| | 6,391 | | | Pool #601865, 6.50%, 4/1/31 | | | 6,379 | |
| | 35,567 | | | Pool #607611, 6.50%, 11/1/31 | | | 37,560 | |
| | 30,139 | | | Pool #644437, 6.50%, 6/1/32 | | | 32,119 | |
| | 786,545 | | | Pool #663159, 5.00%, 7/1/32 | | | 802,938 | |
6
|
SCHEDULE OF PORTFOLIO INVESTMENTS |
Access Capital Community Investment Fund (cont.)
March 31, 2023 (Unaudited)
| | | | | | | | |
Principal Amount | | | | | Value | |
| | $ 28,373 | | | Pool #670278, 5.50%, 11/1/32 | | $ | 29,450 | |
| | 14,823 | | | Pool #676702, 5.50%, 11/1/32 | | | 15,386 | |
| | 39,193 | | | Pool #677591, 5.50%, 12/1/32 | | | 40,680 | |
| | 34,770 | | | Pool #681883, 6.00%, 3/1/33 | | | 36,603 | |
| | 44,965 | | | Pool #686542, 5.50%, 3/1/33 | | | 46,697 | |
| | 165,109 | | | Pool #695961, 5.50%, 1/1/33 | | | 171,375 | |
| | 100,306 | | | Pool #696407, 5.50%, 4/1/33 | | | 104,169 | |
| | 309,308 | | | Pool #702478, 5.50%, 6/1/33 | | | 321,221 | |
| | 88,996 | | | Pool #702479, 5.00%, 6/1/33 | | | 90,883 | |
| | 34,537 | | | Pool #723066, 5.00%, 4/1/33 | | | 35,269 | |
| | 141,724 | | | Pool #723067, 5.50%, 5/1/33 | | | 147,183 | |
| | 117,142 | | | Pool #723070, 4.50%, 5/1/33 | | | 117,609 | |
| | 191,631 | | | Pool #727311, 4.50%, 9/1/33 | | | 192,395 | |
| | 102,360 | | | Pool #727312, 5.00%, 9/1/33 | | | 104,530 | |
| | 119,466 | | | Pool #727315, 6.00%, 10/1/33 | | | 125,763 | |
| | 30,066 | | | Pool #738589, 5.00%, 9/1/33 | | | 30,704 | |
| | 37,650 | | | Pool #739269, 5.00%, 9/1/33 | | | 38,448 | |
| | 74,071 | | | Pool #748041, 4.50%, 10/1/33 | | | 74,367 | |
| | 68,864 | | | Pool #749891, 5.00%, 9/1/33 | | | 70,324 | |
| | 109,782 | | | Pool #753533, 5.00%, 11/1/33 | | | 112,109 | |
| | 33,314 | | | Pool #755679, 6.00%, 1/1/34 | | | 35,070 | |
| | 303,154 | | | Pool #777621, 5.00%, 2/1/34 | | | 309,581 | |
| | 65,675 | | | Pool #781741, 6.00%, 9/1/34 | | | 69,174 | |
| | 64,222 | | | Pool #781959, 5.50%, 6/1/34 | | | 66,722 | |
| | 109,580 | | | Pool #783893, 5.50%, 12/1/34 | | | 113,844 | |
| | 58,791 | | | Pool #783929, 5.50%, 10/1/34 | | | 61,079 | |
| | 3,566 | | | Pool #788329, 6.50%, 8/1/34 | | | 3,824 | |
| | 20,048 | | | Pool #798725, 5.50%, 11/1/34 | | | 20,828 | |
| | 50,289 | | | Pool #799548, 6.00%, 9/1/34 | | | 52,968 | |
| | 573,472 | | | Pool #806754, 4.50%, 9/1/34 | | | 575,804 | |
| | 245,079 | | | Pool #806757, 6.00%, 9/1/34 | | | 258,135 | |
| | 302,250 | | | Pool #806761, 5.50%, 9/1/34 | | | 314,012 | |
| | 91,710 | | | Pool #808205, 5.00%, 1/1/35 | | | 93,841 | |
| | 157,499 | | | Pool #815009, 5.00%, 4/1/35 | | | 161,590 | |
| | 90,667 | | | Pool #820336, 5.00%, 9/1/35 | | | 93,022 | |
| | 83,798 | | | Pool #822008, 5.00%, 5/1/35 | | | 85,975 | |
| | 126,404 | | | Pool #829276, 5.00%, 8/1/35 | | | 129,687 | |
| | 118,195 | | | Pool #829649, 5.50%, 3/1/35 | | | 122,794 | |
| | 134,224 | | | Pool #844361, 5.50%, 11/1/35 | | | 139,879 | |
| | 51,422 | | | Pool #845245, 5.50%, 11/1/35 | | | 53,589 | |
| | 23,463 | | | Pool #866969, 6.00%, 2/1/36 | | | 24,754 | |
| | 67,399 | | | Pool #884693, 5.50%, 4/1/36 | | | 70,651 | |
| | 236,585 | | | Pool #885724, 5.50%, 6/1/36 | | | 248,000 | |
| | 61,077 | | | Pool #919368, 5.50%, 4/1/37 | | | 64,022 | |
| | 240,139 | | | Pool #922582, 6.00%, 12/1/36 | | | 254,004 | |
| | 85,912 | | | Pool #934941, 5.00%, 8/1/39 | | | 88,538 | |
| | 259,536 | | | Pool #934942, 5.00%, 9/1/39 | | | 267,468 | |
7
|
SCHEDULE OF PORTFOLIO INVESTMENTS |
Access Capital Community Investment Fund (cont.)
March 31, 2023 (Unaudited)
| | | | | | | | |
Principal Amount | | | | | Value | |
| | $ 51,708 | | | Pool #943394, 5.50%, 6/1/37 | | $ | 54,201 | |
| | 174,537 | | | Pool #948600, 6.00%, 8/1/37 | | | 184,795 | |
| | 64,711 | | | Pool #952678, 6.50%, 8/1/37 | | | 69,427 | |
| | 90,675 | | | Pool #986239, 6.00%, 7/1/38 | | | 96,006 | |
| | 108,517 | | | Pool #986957, 5.50%, 7/1/38 | | | 113,636 | |
| | 144,417 | | | Pool #990617, 5.50%, 9/1/38 | | | 151,231 | |
| | 147,759 | | | Pool #AA0645, 4.50%, 3/1/39 | | | 148,290 | |
| | 114,589 | | | Pool #AA2243, 4.50%, 5/1/39 | | | 115,001 | |
| | 76,895 | | | Pool #AA3206, 4.00%, 4/1/39 | | | 75,737 | |
| | 277,344 | | | Pool #AA3207, 4.50%, 3/1/39 | | | 278,339 | |
| | 201,242 | | | Pool #AA7042, 4.50%, 6/1/39 | | | 201,964 | |
| | 242,886 | | | Pool #AA7658, 4.00%, 6/1/39 | | | 238,384 | |
| | 28,308 | | | Pool #AA7741, 4.50%, 6/1/24 | | | 28,021 | |
| | 640,386 | | | Pool #AB7798, 3.00%, 1/1/43 | | | 590,360 | |
| | 833,096 | | | Pool #AB9204, 3.00%, 4/1/43 | | | 767,633 | |
| | 74,407 | | | Pool #AC1463, 5.00%, 8/1/39 | | | 76,681 | |
| | 242,769 | | | Pool #AC2109, 4.50%, 7/1/39 | | | 243,640 | |
| | 17,416 | | | Pool #AC4394, 5.00%, 9/1/39 | | | 17,948 | |
| | 234,492 | | | Pool #AC4395, 5.00%, 9/1/39 | | | 241,659 | |
| | 87,901 | | | Pool #AC5329, 5.00%, 10/1/39 | | | 90,587 | |
| | 182,244 | | | Pool #AC6305, 5.00%, 11/1/39 | | | 187,814 | |
| | 125,853 | | | Pool #AC6307, 5.00%, 12/1/39 | | | 129,700 | |
| | 269,575 | | | Pool #AC6790, 5.00%, 12/1/39 | | | 277,814 | |
| | 279,397 | | | Pool #AC7199, 5.00%, 12/1/39 | | | 287,936 | |
| | 267,135 | | | Pool #AD1470, 5.00%, 2/1/40 | | | 275,384 | |
| | 552,343 | | | Pool #AD1471, 4.50%, 2/1/40 | | | 554,325 | |
| | 522,801 | | | Pool #AD1585, 4.50%, 2/1/40 | | | 524,678 | |
| | 316,649 | | | Pool #AD1586, 5.00%, 1/1/40 | | | 326,327 | |
| | 210,051 | | | Pool #AD1638, 4.50%, 2/1/40 | | | 210,887 | |
| | 129,295 | | | Pool #AD1640, 4.50%, 3/1/40 | | | 129,810 | |
| | 665,532 | | | Pool #AD1942, 4.50%, 1/1/40 | | | 667,921 | |
| | 147,095 | | | Pool #AD1988, 4.50%, 2/1/40 | | | 147,623 | |
| | 168,265 | | | Pool #AD2896, 5.00%, 3/1/40 | | | 173,461 | |
| | 19,463 | | | Pool #AD4456, 4.50%, 4/1/40 | | | 19,562 | |
| | 390,074 | | | Pool #AD4458, 4.50%, 4/1/40 | | | 391,627 | |
| | 171,927 | | | Pool #AD4940, 4.50%, 6/1/40 | | | 172,612 | |
| | 73,341 | | | Pool #AD4946, 4.50%, 6/1/40 | | | 73,633 | |
| | 108,164 | | | Pool #AD5728, 5.00%, 4/1/40 | | | 111,504 | |
| | 110,748 | | | Pool #AD7239, 4.50%, 7/1/40 | | | 111,188 | |
| | 48,010 | | | Pool #AD7242, 4.50%, 7/1/40 | | | 48,256 | |
| | 82,963 | | | Pool #AD7256, 4.50%, 7/1/40 | | | 83,294 | |
| | 219,986 | | | Pool #AD7271, 4.50%, 7/1/40 | | | 220,862 | |
| | 239,910 | | | Pool #AD7272, 4.50%, 7/1/40 | | | 240,865 | |
| | 80,032 | | | Pool #AD8960, 5.00%, 6/1/40 | | | 82,503 | |
| | 301,725 | | | Pool #AD9614, 4.50%, 8/1/40 | | | 302,927 | |
| | 16,958 | | | Pool #AE2011, 4.00%, 9/1/40 | | | 16,602 | |
| | 910,569 | | | Pool #AE2012, 4.00%, 9/1/40 | | | 891,442 | |
| | 106,860 | | | Pool #AE2023, 4.00%, 9/1/40 | | | 104,943 | |
8
|
SCHEDULE OF PORTFOLIO INVESTMENTS |
Access Capital Community Investment Fund (cont.)
March 31, 2023 (Unaudited)
| | | | | | | | |
Principal Amount | | | | | Value | |
| | $ 234,263 | | | Pool #AE5432, 4.00%, 10/1/40 | | $ | 229,342 | |
| | 300,790 | | | Pool #AE5435, 4.50%, 9/1/40 | | | 301,988 | |
| | 118,113 | | | Pool #AE5806, 4.50%, 9/1/40 | | | 118,719 | |
| | 270,239 | | | Pool #AE5861, 4.00%, 10/1/40 | | | 264,563 | |
| | 118,666 | | | Pool #AE5862, 4.00%, 10/1/40 | | | 116,343 | |
| | 252,004 | | | Pool #AE6850, 4.00%, 10/1/40 | | | 246,711 | |
| | 140,205 | | | Pool #AE7699, 4.00%, 11/1/40 | | | 137,259 | |
| | 376,193 | | | Pool #AE7703, 4.00%, 10/1/40 | | | 368,290 | |
| | 143,134 | | | Pool #AE7707, 4.00%, 11/1/40 | | | 140,127 | |
| | 115,012 | | | Pool #AH0300, 4.00%, 11/1/40 | | | 112,760 | |
| | 186,873 | | | Pool #AH0301, 3.50%, 11/1/40 | | | 177,162 | |
| | 15,074 | | | Pool #AH0302, 4.00%, 11/1/40 | | | 14,779 | |
| | 218,582 | | | Pool #AH0306, 4.00%, 12/1/40 | | | 214,661 | |
| | 335,531 | | | Pool #AH0508, 4.00%, 11/1/40 | | | 328,483 | |
| | 532,429 | | | Pool #AH0537, 4.00%, 12/1/40 | | | 522,007 | |
| | 503,704 | | | Pool #AH0914, 4.50%, 11/1/40 | | | 505,710 | |
| | 244,962 | | | Pool #AH0917, 4.00%, 12/1/40 | | | 239,817 | |
| | 203,316 | | | Pool #AH1077, 4.00%, 1/1/41 | | | 200,393 | |
| | 180,564 | | | Pool #AH2973, 4.00%, 12/1/40 | | | 177,325 | |
| | 210,736 | | | Pool #AH2980, 4.00%, 1/1/41 | | | 206,611 | |
| | 581,431 | | | Pool #AH5656, 4.00%, 1/1/41 | | | 570,050 | |
| | 316,207 | | | Pool #AH5658, 4.00%, 2/1/41 | | | 309,564 | |
| | 227,505 | | | Pool #AH5662, 4.00%, 2/1/41 | | | 223,423 | |
| | 186,208 | | | Pool #AH5882, 4.00%, 2/1/26 | | | 183,004 | |
| | 147,887 | | | Pool #AH6764, 4.00%, 3/1/41 | | | 144,781 | |
| | 601,775 | | | Pool #AH6768, 4.00%, 3/1/41 | | | 589,138 | |
| | 292,200 | | | Pool #AH7281, 4.00%, 3/1/41 | | | 286,064 | |
| | 103,354 | | | Pool #AH7526, 4.50%, 3/1/41 | | | 103,739 | |
| | 416,778 | | | Pool #AH7537, 4.00%, 3/1/41 | | | 408,026 | |
| | 132,378 | | | Pool #AH8878, 4.50%, 4/1/41 | | | 132,871 | |
| | 136,562 | | | Pool #AH8885, 4.50%, 4/1/41 | | | 137,970 | |
| | 57,161 | | | Pool #AH9050, 3.50%, 2/1/26 | | | 55,811 | |
| | 336,843 | | | Pool #AI0114, 4.00%, 3/1/41 | | | 329,770 | |
| | 236,916 | | | Pool #AI1846, 4.50%, 5/1/41 | | | 237,799 | |
| | 263,062 | | | Pool #AI1847, 4.50%, 5/1/41 | | | 264,042 | |
| | 508,094 | | | Pool #AI1848, 4.50%, 5/1/41 | | | 509,987 | |
| | 329,540 | | | Pool #AI1849, 4.50%, 5/1/41 | | | 331,726 | |
| | 163,695 | | | Pool #AJ0651, 4.00%, 8/1/41 | | | 160,258 | |
| | 545,055 | | | Pool #AJ9133, 4.00%, 1/1/42 | | | 533,609 | |
| | 241,760 | | | Pool #AK6715, 3.50%, 3/1/42 | | | 229,769 | |
| | 328,816 | | | Pool #AK6716, 3.50%, 3/1/42 | | | 312,507 | |
| | 311,782 | | | Pool #AK6718, 3.50%, 2/1/42 | | | 296,318 | |
| | 215,380 | | | Pool #AM6907, 3.68%, 10/1/32 | | | 206,989 | |
| | 452,930 | | | Pool #AM9780, 3.31%, 3/1/31 | | | 426,025 | |
| | 350,000 | | | Pool #AN0360, 3.95%, 12/1/45 | | | 321,842 | |
| | 875,078 | | | Pool #AN2066, 2.75%, 7/1/26 | | | 825,821 | |
| | 225,515 | | | Pool #AN2444, 2.43%, 8/1/26 | | | 210,073 | |
9
|
SCHEDULE OF PORTFOLIO INVESTMENTS |
Access Capital Community Investment Fund (cont.)
March 31, 2023 (Unaudited)
| | | | | | | | |
Principal Amount | | | | | Value | |
| | $ 890,856 | | | Pool #AN2746, 2.30%, 9/1/26 | | $ | 825,899 | |
| | 442,936 | | | Pool #AN3919, 2.82%, 12/1/26 | | | 417,627 | |
| | 802,781 | | | Pool #AN5053, 3.34%, 4/1/27 | | | 771,059 | |
| | 196,962 | | | Pool #AN6580, 3.36%, 9/1/29 | | | 188,225 | |
| | 902,862 | | | Pool #AN7154, 3.21%, 10/1/32 | | | 835,830 | |
| | 2,000,000 | | | Pool #AN8055, 3.05%, 1/1/30 | | | 1,868,786 | |
| | 1,500,000 | | | Pool #AN8121, 3.16%, 1/1/35 | | | 1,343,024 | |
| | 190,468 | | | Pool #AO2923, 3.50%, 5/1/42 | | | 181,359 | |
| | 555,535 | | | Pool #AO8029, 3.50%, 7/1/42 | | | 527,981 | |
| | 130,008 | | | Pool #AP7483, 3.50%, 9/1/42 | | | 123,586 | |
| | 143,323 | | | Pool #AQ6710, 2.50%, 10/1/27 | | | 137,250 | |
| | 581,199 | | | Pool #AQ7193, 3.50%, 7/1/43 | | | 552,602 | |
| | 155,958 | | | Pool #AR6928, 3.00%, 3/1/43 | | | 143,703 | |
| | 672,798 | | | Pool #AS1916, 4.00%, 3/1/44 | | | 657,070 | |
| | 137,223 | | | Pool #AS1917, 4.00%, 3/1/44 | | | 134,536 | |
| | 407,522 | | | Pool #AS2439, 4.00%, 5/1/44 | | | 399,543 | |
| | 761,810 | | | Pool #AS3494, 4.00%, 10/1/44 | | | 744,001 | |
| | 181,152 | | | Pool #AS3726, 4.00%, 11/1/44 | | | 174,457 | |
| | 184,745 | | | Pool #AS3929, 4.00%, 12/1/44 | | | 177,916 | |
| | 470,374 | | | Pool #AS4070, 4.00%, 12/1/44 | | | 459,378 | |
| | 144,505 | | | Pool #AS4390, 3.50%, 2/1/45 | | | 137,357 | |
| | 166,579 | | | Pool #AS4732, 3.50%, 4/1/45 | | | 157,918 | |
| | 650,520 | | | Pool #AS4905, 3.50%, 4/1/45 | | | 615,022 | |
| | 933,572 | | | Pool #AS5341, 3.50%, 7/1/45 | | | 882,627 | |
| | 549,814 | | | Pool #AS5576, 4.00%, 8/1/45 | | | 536,549 | |
| | 409,106 | | | Pool #AS5919, 3.50%, 9/1/45 | | | 388,977 | |
| | 210,946 | | | Pool #AS6303, 4.00%, 11/1/45 | | | 205,857 | |
| | 231,496 | | | Pool #AS6607, 4.00%, 1/1/46 | | | 225,911 | |
| | 584,443 | | | Pool #AS6778, 3.50%, 3/1/46 | | | 553,749 | |
| | 263,262 | | | Pool #AS6958, 3.50%, 4/1/46 | | | 249,794 | |
| | 723,209 | | | Pool #AS7138, 3.50%, 5/1/46 | | | 681,559 | |
| | 376,014 | | | Pool #AS7139, 3.50%, 5/1/46 | | | 354,359 | |
| | 684,314 | | | Pool #AS7334, 3.00%, 6/1/46 | | | 626,328 | |
| | 820,138 | | | Pool #AS7335, 3.00%, 5/1/46 | | | 750,642 | |
| | 326,187 | | | Pool #AS7336, 3.00%, 6/1/46 | | | 298,547 | |
| | 1,440,653 | | | Pool #AS7504, 3.00%, 7/1/46 | | | 1,318,577 | |
| | 443,292 | | | Pool #AS7516, 3.00%, 7/1/46 | | | 405,729 | |
| | 351,590 | | | Pool #AS7517, 3.00%, 6/1/46 | | | 321,843 | |
| | 119,929 | | | Pool #AS7518, 3.00%, 7/1/46 | | | 110,105 | |
| | 149,758 | | | Pool #AS7674, 3.00%, 8/1/46 | | | 137,068 | |
| | 1,004,627 | | | Pool #AS7676, 3.00%, 8/1/46 | | | 919,498 | |
| | 628,284 | | | Pool #AS8077, 3.00%, 10/1/46 | | | 575,045 | |
| | 467,594 | | | Pool #AS8289, 3.00%, 10/1/46 | | | 427,971 | |
| | 476,024 | | | Pool #AS8441, 3.00%, 11/1/46 | | | 435,688 | |
| | 967,056 | | | Pool #AS8633, 3.50%, 1/1/47 | | | 911,362 | |
| | 309,522 | | | Pool #AS8776, 3.50%, 2/1/47 | | | 291,696 | |
| | 335,964 | | | Pool #AS9381, 4.00%, 4/1/47 | | | 326,398 | |
| | 158,588 | | | Pool #AS9549, 4.00%, 5/1/47 | | | 154,970 | |
10
|
SCHEDULE OF PORTFOLIO INVESTMENTS |
Access Capital Community Investment Fund (cont.)
March 31, 2023 (Unaudited)
| | | | | | | | | | | | |
Principal Amount | | | | | Value | |
| | $ 586,910 | | | Pool #AS9550, 4.00%, 5/1/47 | | | | | | $ | 570,199 | |
| | 236,085 | | | Pool #AS9729, 4.00%, 6/1/47 | | | | | | | 229,363 | |
| | 189,227 | | | Pool #AS9825, 4.00%, 6/1/47 | | | | | | | 183,839 | |
| | 425,027 | | | Pool #AT2688, 3.00%, 5/1/43 | | | | | | | 391,629 | |
| | 235,303 | | | Pool #AT3963, 2.50%, 3/1/28 | | | | | | | 226,602 | |
| | 93,917 | | | Pool #AT7873, 2.50%, 6/1/28 | | | | | | | 90,444 | |
| | 285,407 | | | Pool #AU0971, 3.50%, 8/1/43 | | | | | | | 271,364 | |
| | 359,500 | | | Pool #AU2165, 3.50%, 7/1/43 | | | | | | | 341,811 | |
| | 325,537 | | | Pool #AU2188, 3.50%, 8/1/43 | | | | | | | 309,520 | |
| | 40,994 | | | Pool #AU6054, 4.00%, 9/1/43 | | | | | | | 40,326 | |
| | 181,686 | | | Pool #AU6718, 4.00%, 10/1/43 | | | | | | | 178,721 | |
| | 338,783 | | | Pool #AU7003, 4.00%, 11/1/43 | | | | | | | 333,910 | |
| | 205,167 | | | Pool #AU7005, 4.00%, 11/1/43 | | | | | | | 201,485 | |
| | 189,916 | | | Pool #AV0679, 4.00%, 12/1/43 | | | | | | | 187,749 | |
| | 260,651 | | | Pool #AV9282, 4.00%, 2/1/44 | | | | | | | 253,042 | |
| | 193,490 | | | Pool #AW0993, 4.00%, 5/1/44 | | | | | | | 190,708 | |
| | 130,132 | | | Pool #AW1565, 4.00%, 4/1/44 | | | | | | | 126,711 | |
| | 682,929 | | | Pool #AW5046, 4.00%, 7/1/44 | | | | | | | 668,442 | |
| | 79,199 | | | Pool #AW5047, 4.00%, 7/1/44 | | | | | | | 78,060 | |
| | 103,869 | | | Pool #AW7040, 4.00%, 6/1/44 | | | | | | | 101,604 | |
| | 87,771 | | | Pool #AW8629, 3.50%, 5/1/44 | | | | | | | 83,064 | |
| | 656,266 | | | Pool #AX2884, 3.50%, 11/1/44 | | | | | | | 621,075 | |
| | 452,454 | | | Pool #AX4860, 3.50%, 12/1/44 | | | | | | | 429,408 | |
| | 552,047 | | | Pool #AY1389, 3.50%, 4/1/45 | | | | | | | 521,922 | |
| | 168,198 | | | Pool #AY3435, 3.50%, 5/1/45 | | | | | | | 159,922 | |
| | 591,140 | | | Pool #AY5571, 3.50%, 6/1/45 | | | | | | | 558,882 | |
| | 269,808 | | | Pool #BC0802, 3.50%, 4/1/46 | | | | | | | 255,638 | |
| | 236,686 | | | Pool #BC0804, 3.50%, 4/1/46 | | | | | | | 223,055 | |
| | 364,252 | | | Pool #BC1135, 3.00%, 6/1/46 | | | | | | | 333,434 | |
| | 702,087 | | | Pool #BD5021, 3.50%, 2/1/47 | | | | | | | 661,653 | |
| | 1,102,892 | | | Pool #BD7140, 4.00%, 4/1/47 | | | | | | | 1,071,489 | |
| | 1,231,927 | | | Pool #BE4232, 3.00%, 12/1/46 | | | | | | | 1,127,537 | |
| | 177,023 | | | Pool #BE9743, 3.50%, 4/1/47 | | | | | | | 167,633 | |
| | 479,020 | | | Pool #BH2665, 3.50%, 9/1/47 | | | | | | | 451,065 | |
| | 104,451 | | | Pool #BH4659, 4.00%, 6/1/47 | | | | | | | 102,544 | |
| | 258,860 | | | Pool #BJ0657, 4.00%, 2/1/48 | | | | | | | 251,110 | |
| | 355,297 | | | Pool #BJ2670, 4.00%, 4/1/48 | | | | | | | 344,660 | |
| | 741,265 | | | Pool #BJ5158, 4.00%, 4/1/48 | | | | | | | 719,073 | |
| | 300,503 | | | Pool #BK7685, 4.00%, 10/1/48 | | | | | | | 291,506 | |
| | 421,186 | | | Pool #BK7924, 4.00%, 11/1/48 | | | | | | | 411,571 | |
| | 8,920,000 | | | Pool #BL4650, 2.30%, 10/1/31 | | | | | | | 7,700,101 | |
| | 443,292 | | | Pool #BL5454, 2.77%, 1/1/35 | | | | | | | 385,797 | |
| | 500,000 | | | Pool #BL9633, 1.92%, 12/1/35 | | | | | | | 386,083 | |
| | 1,500,000 | | | Pool #BL9824, 1.56%, 12/1/30 | | | | | | | 1,231,297 | |
| | 100,992 | | | Pool #BO1263, 3.50%, 6/1/49 | | | | | | | 95,317 | |
| | 438,051 | | | Pool #BO3599, 3.00%, 9/1/49 | | | | | | | 396,466 | |
| | 564,323 | | | Pool #BO5263, 3.00%, 9/1/49 | | | | | | | 510,751 | |
11
|
SCHEDULE OF PORTFOLIO INVESTMENTS |
Access Capital Community Investment Fund (cont.)
March 31, 2023 (Unaudited)
| | | | | | | | | | | | |
Principal Amount | | | | | Value | |
| | $ 2,231,108 | | | Pool #BO6771, 2.50%, 5/1/51 | | | | | | $ | 1,930,533 | |
| | 752,355 | | | Pool #BP3417, 2.50%, 5/1/51 | | | | | | | 650,997 | |
| | 679,415 | | | Pool #BP8731, 2.50%, 6/1/50 | | | | | | | 590,507 | |
| | 888,680 | | | Pool #BP8741, 2.50%, 6/1/50 | | | | | | | 772,387 | |
| | 1,710,167 | | | Pool #BQ4469, 2.00%, 2/1/51 | | | | | | | 1,421,101 | |
| | 489,849 | | | Pool #BQ4493, 1.50%, 2/1/51 | | | | | | | 385,162 | |
| | 456,263 | | | Pool #BQ5723, 2.00%, 10/1/50 | | | | | | | 378,663 | |
| | 1,432,471 | | | Pool #BQ7523, 2.00%, 11/1/50 | | | | | | | 1,191,678 | |
| | 807,523 | | | Pool #BQ7524, 2.50%, 10/1/50 | | | | | | | 700,848 | |
| | 4,568,087 | | | Pool #BR0940, 2.00%, 4/1/51 | | | | | | | 3,792,554 | |
| | 854,191 | | | Pool #BR1037, 2.50%, 5/1/51 | | | | | | | 738,716 | |
| | 2,036,679 | | | Pool #BR1113, 2.00%, 11/1/50 | | | | | | | 1,693,688 | |
| | 846,438 | | | Pool #BR1114, 1.50%, 11/1/50 | | | | | | | 665,543 | |
| | 324,014 | | | Pool #BR1115, 2.50%, 12/1/50 | | | | | | | 281,111 | |
| | 1,260,189 | | | Pool #BR2051, 2.50%, 6/1/51 | | | | | | | 1,089,829 | |
| | 2,688,082 | | | Pool #BR2234, 2.50%, 8/1/51 | | | | | | | 2,322,187 | |
| | 1,021,283 | | | Pool #BR3565, 2.00%, 1/1/51 | | | | | | | 848,975 | |
| | 787,324 | | | Pool #BR3566, 2.50%, 12/1/50 | | | | | | | 682,829 | |
| | 220,136 | | | Pool #BR7088, 2.00%, 3/1/51 | | | | | | | 182,831 | |
| | 3,000,000 | | | Pool #BS0046, 1.23%, 12/1/27 | | | | | | | 2,595,126 | |
| | 4,288,905 | | | Pool #BS0345, 1.61%, 1/1/36 | | | | | | | 3,264,767 | |
| | 2,545,000 | | | Pool #BS0391, 1.63%, 1/1/33 | | | | | | | 2,017,318 | |
| | 3,700,000 | | | Pool #BS0915, 1.62%, 3/1/31 | | | | | | | 2,981,369 | |
| | 1,000,000 | | | Pool #BS1281, 1.59%, 3/1/31 | | | | | | | 815,653 | |
| | 690,000 | | | Pool #BS1326, 1.19%, 3/1/26 | | | | | | | 621,246 | |
| | 1,916,775 | | | Pool #BS1482, 1.61%, 3/1/31 | | | | | | | 1,599,352 | |
| | 700,000 | | | Pool #BS1524, 2.01%, 3/1/33 | | | | | | | 572,039 | |
| | 1,500,000 | | | Pool #BS1560, 2.03%, 4/1/31 | | | | | | | 1,274,014 | |
| | 1,983,250 | | | Pool #BS1877, 2.97%, 5/1/51 | | | | | | | 1,588,158 | |
| | 982,926 | | | Pool #BS4422, 2.59%, 3/1/32 | | | | | | | 868,886 | |
| | 1,000,000 | | | Pool #BS5203, 2.41%, 4/1/32 | | | | | | | 863,516 | |
| | 669,000 | | | Pool #BS6083, 4.38%, 7/1/32 | | | | | | | 677,254 | |
| | 400,000 | | | Pool #BS6178, 3.41%, 7/1/29 | | | | | | | 382,797 | |
| | 1,380,000 | | | Pool #BS6700, 4.09%, 9/1/32 | | | | | | | 1,333,109 | |
| | 884,000 | | | Pool #BS8032, 5.00%, 3/1/28 | | | | | | | 910,769 | |
| | 1,798,474 | | | Pool #BT6821, 2.50%, 10/1/51 | | | | | | | 1,551,994 | |
| | 1,298,349 | | | Pool #BT8237, 4.00%, 6/1/52 | | | | | | | 1,240,870 | |
| | 245,181 | | | Pool #BT8243, 4.00%, 6/1/52 | | | | | | | 234,327 | |
| | 1,873,064 | | | Pool #BT9419, 2.50%, 11/1/51 | | | | | | | 1,615,490 | |
| | 1,415,759 | | | Pool #BU1334, 2.50%, 2/1/52 | | | | | | | 1,219,775 | |
| | 1,813,557 | | | Pool #BU1337, 3.00%, 2/1/52 | | | | | | | 1,626,664 | |
| | 218,742 | | | Pool #BV4205, 3.00%, 2/1/52 | | | | | | | 196,190 | |
| | 1,304,522 | | | Pool #BV6760, 3.50%, 3/1/52 | | | | | | | 1,211,487 | |
| | 3,092,766 | | | Pool #BV8876, 3.50%, 4/1/52 | | | | | | | 2,871,720 | |
| | 567,111 | | | Pool #CA0114, 3.50%, 8/1/47 | | | | | | | 534,016 | |
| | 575,295 | | | Pool #CA0334, 3.50%, 9/1/47 | | | | | | | 541,722 | |
| | 584,594 | | | Pool #CA0534, 3.50%, 10/1/47 | | | | | | | 550,479 | |
| | 171,652 | | | Pool #CA0536, 3.50%, 10/1/47 | | | | | | | 161,635 | |
12
|
SCHEDULE OF PORTFOLIO INVESTMENTS |
Access Capital Community Investment Fund (cont.)
March 31, 2023 (Unaudited)
| | | | | | | | | | | | |
Principal Amount | | | | | Value | |
| | $ 593,988 | | | Pool #CA0551, 4.00%, 10/1/47 | | | | | | $ | 577,075 | |
| | 487,818 | | | Pool #CA0565, 3.50%, 10/1/47 | | | | | | | 459,351 | |
| | 1,056,154 | | | Pool #CA0742, 3.50%, 11/1/47 | | | | | | | 994,520 | |
| | 368,524 | | | Pool #CA0743, 3.50%, 11/1/47 | | | | | | | 348,976 | |
| | 650,423 | | | Pool #CA0825, 3.50%, 12/1/47 | | | | | | | 612,467 | |
| | 655,326 | | | Pool #CA0981, 3.50%, 12/1/47 | | | | | | | 617,083 | |
| | 187,446 | | | Pool #CA1070, 3.50%, 1/1/48 | | | | | | | 176,508 | |
| | 478,429 | | | Pool #CA1115, 3.50%, 1/1/48 | | | | | | | 450,509 | |
| | 981,029 | | | Pool #CA1130, 3.50%, 1/1/48 | | | | | | | 923,779 | |
| | 184,810 | | | Pool #CA1131, 3.50%, 2/1/48 | | | | | | | 174,025 | |
| | 293,125 | | | Pool #CA1132, 3.50%, 1/1/48 | | | | | | | 276,019 | |
| | 434,483 | | | Pool #CA1144, 3.50%, 2/1/48 | | | | | | | 409,128 | |
| | 105,986 | | | Pool #CA1152, 3.50%, 2/1/48 | | | | | | | 99,801 | |
| | 396,750 | | | Pool #CA1160, 3.50%, 2/1/48 | | | | | | | 375,704 | |
| | 495,880 | | | Pool #CA1161, 3.50%, 2/1/48 | | | | | | | 466,810 | |
| | 275,904 | | | Pool #CA1338, 4.00%, 3/1/48 | | | | | | | 267,643 | |
| | 557,025 | | | Pool #CA1339, 3.50%, 3/1/48 | | | | | | | 524,371 | |
| | 186,736 | | | Pool #CA1418, 4.00%, 3/1/48 | | | | | | | 181,145 | |
| | 240,231 | | | Pool #CA1420, 4.00%, 3/1/48 | | | | | | | 233,039 | |
| | 185,700 | | | Pool #CA1468, 4.00%, 3/1/48 | | | | | | | 180,141 | |
| | 473,899 | | | Pool #CA1469, 4.00%, 3/1/48 | | | | | | | 459,712 | |
| | 401,711 | | | Pool #CA1471, 4.00%, 3/1/48 | | | | | | | 389,685 | |
| | 1,083,551 | | | Pool #CA1507, 4.00%, 4/1/48 | | | | | | | 1,051,111 | |
| | 404,505 | | | Pool #CA1610, 3.50%, 3/1/48 | | | | | | | 380,792 | |
| | 427,677 | | | Pool #CA1611, 4.00%, 4/1/48 | | | | | | | 414,873 | |
| | 420,162 | | | Pool #CA1612, 3.50%, 4/1/48 | | | | | | | 395,531 | |
| | 504,263 | | | Pool #CA1613, 4.00%, 4/1/48 | | | | | | | 489,166 | |
| | 194,760 | | | Pool #CA2381, 4.00%, 9/1/48 | | | | | | | 188,930 | |
| | 212,610 | | | Pool #CA2440, 4.00%, 9/1/48 | | | | | | | 206,245 | |
| | 169,907 | | | Pool #CA2441, 4.00%, 10/1/48 | | | | | | | 163,941 | |
| | 164,289 | | | Pool #CA2442, 4.00%, 10/1/48 | | | | | | | 160,538 | |
| | 363,275 | | | Pool #CA2443, 4.00%, 10/1/48 | | | | | | | 352,399 | |
| | 192,560 | | | Pool #CA2468, 4.00%, 10/1/48 | | | | | | | 186,795 | |
| | 588,805 | | | Pool #CA2594, 4.00%, 11/1/48 | | | | | | | 576,260 | |
| | 246,297 | | | Pool #CA2913, 4.00%, 1/1/49 | | | | | | | 238,924 | |
| | 308,536 | | | Pool #CA3042, 4.00%, 1/1/49 | | | | | | | 299,299 | |
| | 353,494 | | | Pool #CA3043, 4.00%, 2/1/49 | | | | | | | 342,911 | |
| | 170,576 | | | Pool #CA3045, 4.50%, 1/1/49 | | | | | | | 169,791 | |
| | 27,611 | | | Pool #CA3132, 4.00%, 2/1/49 | | | | | | | 26,976 | |
| | 159,263 | | | Pool #CA3557, 3.50%, 5/1/49 | | | | | | | 150,576 | |
| | 356,536 | | | Pool #CA3628, 3.50%, 6/1/49 | | | | | | | 334,576 | |
| | 196,251 | | | Pool #CA3793, 3.50%, 6/1/49 | | | | | | | 184,163 | |
| | 138,729 | | | Pool #CA3936, 3.50%, 7/1/49 | | | | | | | 130,184 | |
| | 423,465 | | | Pool #CA4043, 3.00%, 8/1/49 | | | | | | | 383,264 | |
| | 499,191 | | | Pool #CA4320, 3.00%, 9/1/49 | | | | | | | 451,802 | |
| | 320,469 | | | Pool #CA5106, 3.00%, 1/1/50 | | | | | | | 290,046 | |
| | 422,682 | | | Pool #CA5132, 3.00%, 2/1/50 | | | | | | | 382,556 | |
13
|
SCHEDULE OF PORTFOLIO INVESTMENTS |
Access Capital Community Investment Fund (cont.)
March 31, 2023 (Unaudited)
| | | | | | | | | | | | |
Principal Amount | | | | | Value | |
| | $ 965,899 | | | Pool #CA5309, 3.00%, 3/1/50 | | | | | | $ | 874,355 | |
| | 540,205 | | | Pool #CA5312, 3.00%, 3/1/50 | | | | | | | 489,007 | |
| | 487,658 | | | Pool #CA6150, 2.50%, 6/1/50 | | | | | | | 423,994 | |
| | 1,161,484 | | | Pool #CA6151, 2.50%, 6/1/50 | | | | | | | 1,009,851 | |
| | 285,890 | | | Pool #CA6251, 3.00%, 6/1/50 | | | | | | | 258,629 | |
| | 1,462,158 | | | Pool #CA6253, 2.00%, 7/1/50 | | | | | | | 1,218,190 | |
| | 1,492,718 | | | Pool #CA6263, 2.50%, 7/1/50 | | | | | | | 1,297,379 | |
| | 837,032 | | | Pool #CA6285, 2.50%, 7/1/50 | | | | | | | 727,498 | |
| | 1,714,331 | | | Pool #CA6966, 2.00%, 9/1/50 | | | | | | | 1,423,030 | |
| | 2,289,214 | | | Pool #CA6967, 2.00%, 9/1/50 | | | | | | | 1,905,827 | |
| | 1,374,144 | | | Pool #CA6968, 2.00%, 9/1/50 | | | | | | | 1,140,648 | |
| | 1,072,235 | | | Pool #CA6969, 2.00%, 9/1/50 | | | | | | | 892,662 | |
| | 1,291,290 | | | Pool #CA6971, 2.50%, 9/1/50 | | | | | | | 1,121,109 | |
| | 1,396,597 | | | Pool #CA6972, 2.50%, 8/1/50 | | | | | | | 1,212,971 | |
| | 998,935 | | | Pool #CA6973, 2.50%, 9/1/50 | | | | | | | 867,594 | |
| | 1,121,513 | | | Pool #CA7258, 2.50%, 9/1/50 | | | | | | | 973,707 | |
| | 1,178,272 | | | Pool #CA7259, 2.50%, 9/1/50 | | | | | | | 1,022,986 | |
| | 1,631,520 | | | Pool #CA7317, 2.00%, 10/1/50 | | | | | | | 1,354,038 | |
| | 1,804,718 | | | Pool #CA7549, 2.00%, 10/1/50 | | | | | | | 1,497,779 | |
| | 1,705,193 | | | Pool #CA7917, 2.00%, 11/1/50 | | | | | | | 1,422,378 | |
| | 892,502 | | | Pool #CA8069, 1.50%, 12/1/50 | | | | | | | 701,764 | |
| | 1,085,084 | | | Pool #CA8070, 2.00%, 12/1/50 | | | | | | | 902,348 | |
| | 3,734,267 | | | Pool #CA8077, 2.00%, 12/1/50 | | | | | | | 3,105,391 | |
| | 3,675,463 | | | Pool #CA8337, 1.50%, 12/1/50 | | | | | | | 2,889,972 | |
| | 4,721,306 | | | Pool #CA8340, 2.00%, 12/1/50 | | | | | | | 3,926,205 | |
| | 644,385 | | | Pool #CA8425, 1.50%, 12/1/50 | | | | | | | 506,731 | |
| | 1,047,439 | | | Pool #CA8432, 2.00%, 12/1/50 | | | | | | | 870,718 | |
| | 2,303,672 | | | Pool #CA8518, 2.00%, 1/1/51 | | | | | | | 1,915,003 | |
| | 1,366,108 | | | Pool #CA8685, 1.50%, 1/1/51 | | | | | | | 1,074,154 | |
| | 3,979,326 | | | Pool #CA8811, 2.00%, 1/1/51 | | | | | | | 3,306,709 | |
| | 4,500,869 | | | Pool #CA9048, 2.00%, 2/1/51 | | | | | | | 3,740,097 | |
| | 286,434 | | | Pool #CB0245, 2.50%, 4/1/51 | | | | | | | 247,846 | |
| | 780,044 | | | Pool #CB0437, 2.50%, 5/1/51 | | | | | | | 674,956 | |
| | 629,759 | | | Pool #CB0480, 2.50%, 5/1/51 | | | | | | | 544,624 | |
| | 147,174 | | | Pool #CB0576, 2.50%, 5/1/51 | | | | | | | 127,278 | |
| | 265,620 | | | Pool #CB0582, 2.50%, 5/1/51 | | | | | | | 229,712 | |
| | 1,957,977 | | | Pool #CB0688, 2.50%, 6/1/51 | | | | | | | 1,693,286 | |
| | 430,520 | | | Pool #CB0689, 2.50%, 6/1/51 | | | | | | | 372,320 | |
| | 1,044,138 | | | Pool #CB0972, 2.50%, 6/1/51 | | | | | | | 902,499 | |
| | 486,491 | | | Pool #CB1003, 2.50%, 7/1/51 | | | | | | | 420,498 | |
| | 307,548 | | | Pool #CB1010, 2.50%, 7/1/51 | | | | | | | 265,829 | |
| | 1,384,368 | | | Pool #CB1060, 2.00%, 7/1/51 | | | | | | | 1,147,621 | |
| | 1,942,825 | | | Pool #CB1311, 2.50%, 8/1/51 | | | | | | | 1,678,372 | |
| | 1,912,502 | | | Pool #CB1444, 2.50%, 8/1/51 | | | | | | | 1,651,286 | |
| | 991,070 | | | Pool #CB1515, 2.50%, 8/1/51 | | | | | | | 855,707 | |
| | 1,740,228 | | | Pool #CB1532, 2.50%, 9/1/51 | | | | | | | 1,502,541 | |
| | 1,788,344 | | | Pool #CB1809, 2.50%, 10/1/51 | | | | | | | 1,543,253 | |
| | 1,056,915 | | | Pool #CB1956, 2.50%, 10/1/51 | | | | | | | 911,573 | |
14
|
SCHEDULE OF PORTFOLIO INVESTMENTS |
Access Capital Community Investment Fund (cont.)
March 31, 2023 (Unaudited)
| | | | | | | | | | | | |
Principal Amount | | | | | Value | |
| | $ 897,975 | | | Pool #CB2029, 2.50%, 11/1/51 | | | | | | $ | 774,490 | |
| | 1,878,055 | | | Pool #CB2205, 2.50%, 11/1/51 | | | | | | | 1,618,920 | |
| | 723,732 | | | Pool #CB2268, 2.50%, 12/1/51 | | | | | | | 623,871 | |
| | 502,576 | | | Pool #CB2467, 2.50%, 12/1/51 | | | | | | | 433,004 | |
| | 1,833,657 | | | Pool #CB2515, 2.50%, 12/1/51 | | | | | | | 1,579,823 | |
| | 2,885,978 | | | Pool #CB2761, 3.00%, 2/1/52 | | | | | | | 2,588,568 | |
| | 6,394,799 | | | Pool #CB2797, 3.00%, 2/1/52 | | | | | | | 5,735,793 | |
| | 5,979,608 | | | Pool #CB2938, 3.00%, 2/1/52 | | | | | | | 5,363,138 | |
| | 1,184,025 | | | Pool #CB3052, 3.00%, 2/1/52 | | | | | | | 1,061,958 | |
| | 1,265,112 | | | Pool #CB3249, 3.00%, 4/1/52 | | | | | | | 1,134,439 | |
| | 1,993,961 | | | Pool #CB3281, 3.50%, 4/1/52 | | | | | | | 1,851,448 | |
| | 432,483 | | | Pool #CB3413, 3.50%, 4/1/52 | | | | | | | 402,899 | |
| | 833,816 | | | Pool #CB3489, 2.50%, 4/1/52 | | | | | | | 723,018 | |
| | 653,348 | | | Pool #CB3490, 3.00%, 4/1/52 | | | | | | | 588,080 | |
| | 8,050,162 | | | Pool #CB3764, 4.00%, 6/1/52 | | | | | | | 7,693,773 | |
| | 7,832,589 | | | Pool #CB3797, 4.00%, 6/1/52 | | | | | | | 7,509,901 | |
| | 6,810,900 | | | Pool #CB3931, 4.00%, 6/1/52 | | | | | | | 6,530,189 | |
| | 5,529,066 | | | Pool #CB4056, 4.50%, 7/1/52 | | | | | | | 5,413,988 | |
| | 2,936,919 | | | Pool #CB4208, 4.50%, 7/1/52 | | | | | | | 2,875,792 | |
| | 2,536,002 | | | Pool #CB4272, 4.50%, 7/1/52 | | | | | | | 2,483,221 | |
| | 9,773,000 | | | Pool #CB4314, 4.50%, 8/1/52 | | | | | | | 9,569,600 | |
| | 12,468,946 | | | Pool #CB4463, 4.50%, 8/1/52 | | | | | | | 12,260,629 | |
| | 364,319 | | | Pool #CB4473, 4.50%, 8/1/52 | | | | | | | 358,904 | |
| | 4,843,958 | | | Pool #CB4539, 4.50%, 9/1/52 | | | | | | | 4,743,143 | |
| | 4,646,345 | | | Pool #CB4595, 4.00%, 9/1/52 | | | | | | | 4,440,647 | |
| | 6,267,953 | | | Pool #CB4767, 5.00%, 9/1/52 | | | | | | | 6,288,329 | |
| | 2,931,317 | | | Pool #CB4966, 5.50%, 10/1/52 | | | | | | | 2,961,692 | |
| | 1,730,931 | | | Pool #CB4967, 5.50%, 10/1/52 | | | | | | | 1,753,256 | |
| | 10,571,964 | | | Pool #CB5037, 5.50%, 11/1/52 | | | | | | | 10,777,328 | |
| | 4,502,936 | | | Pool #CB5048, 6.00%, 11/1/52 | | | | | | | 4,594,622 | |
| | 6,076,522 | | | Pool #CB5166, 6.00%, 11/1/52 | | | | | | | 6,200,249 | |
| | 3,030,578 | | | Pool #CB5199, 6.00%, 11/1/52 | | | | | | | 3,113,065 | |
| | 5,634,144 | | | Pool #CB5202, 6.50%, 11/1/52 | | | | | | | 5,813,401 | |
| | 446,822 | | | Pool #CB5220, 6.50%, 12/1/52 | | | | | | | 461,038 | |
| | 3,222,371 | | | Pool #CB5343, 6.00%, 12/1/52 | | | | | | | 3,287,983 | |
| | 342,819 | | | Pool #CB5344, 6.50%, 12/1/52 | | | | | | | 358,966 | |
| | 1,807,587 | | | Pool #CB5385, 6.00%, 12/1/52 | | | | | | | 1,867,579 | |
| | 2,408,928 | | | Pool #CB5392, 6.00%, 12/1/52 | | | | | | | 2,495,581 | |
| | 2,793,337 | | | Pool #CB5549, 6.00%, 1/1/53 | | | | | | | 2,872,595 | |
| | 1,098,031 | | | Pool #CB5586, 6.00%, 1/1/53 | | | | | | | 1,132,155 | |
| | 4,740,108 | | | Pool #CB5728, 5.50%, 2/1/53 | | | | | | | 4,838,208 | |
| | 1,450,815 | | | Pool #CB5732, 5.50%, 2/1/53 | | | | | | | 1,465,849 | |
| | 4,630,106 | | | Pool #CB5797, 5.50%, 3/1/53 | | | | | | | 4,725,296 | |
| | 2,272,521 | | | Pool #CB5804, 6.00%, 2/1/53 | | | | | | | 2,319,151 | |
| | 2,886,874 | | | Pool #CB5946, 5.50%, 3/1/53 | | | | | | | 2,948,085 | |
| | 2,193,848 | | | Pool #CB5980, 5.50%, 3/1/53 | | | | | | | 2,237,003 | |
| | 186,000 | | | Pool #CB6005, 5.50%, 4/1/53 | | | | | | | 189,838 | |
15
|
SCHEDULE OF PORTFOLIO INVESTMENTS |
Access Capital Community Investment Fund (cont.)
March 31, 2023 (Unaudited)
| | | | | | | | | | | | |
Principal Amount | | | | | Value | |
| | $1,933,814 | | | Pool #CB6126, 5.00%, 4/1/53 | | | | | | $ | 1,944,761 | |
| | 46,548 | | | Pool #MC0013, 5.50%, 12/1/38 | | | | | | | 48,744 | |
| | 76,106 | | | Pool #MC0014, 5.50%, 12/1/38 | | | | | | | 79,696 | |
| | 63,071 | | | Pool #MC0016, 5.50%, 11/1/38 | | | | | | | 66,047 | |
| | 60,330 | | | Pool #MC0038, 4.50%, 3/1/39 | | | | | | | 60,547 | |
| | 41,369 | | | Pool #MC0059, 4.00%, 4/1/39 | | | | | | | 40,866 | |
| | 73,524 | | | Pool #MC0081, 4.00%, 5/1/39 | | | | | | | 72,417 | |
| | 39,436 | | | Pool #MC0112, 4.50%, 6/1/39 | | | | | | | 39,578 | |
| | 78,978 | | | Pool #MC0127, 4.50%, 7/1/39 | | | | | | | 79,261 | |
| | 338,648 | | | Pool #MC0154, 4.50%, 8/1/39 | | | | | | | 339,863 | |
| | 79,356 | | | Pool #MC0160, 4.50%, 8/1/39 | | | | | | | 79,641 | |
| | 179,819 | | | Pool #MC0177, 4.50%, 9/1/39 | | | | | | | 180,465 | |
| | 108,656 | | | Pool #MC0270, 4.50%, 3/1/40 | | | | | | | 108,058 | |
| | 218,353 | | | Pool #MC0325, 4.50%, 7/1/40 | | | | | | | 219,222 | |
| | 138,087 | | | Pool #MC0584, 4.00%, 1/1/42 | | | | | | | 135,187 | |
| | | | | | | | | | | | |
| | | | | | | | | | | 412,828,613 | |
| | | | | | | | | | | | |
| | Freddie Mac — 33.70% | | | | | | | | |
| | 421,323 | | | Pool #Q63813, 3.50%, 4/1/49 | | | | | | | 395,809 | |
| | 747,242 | | | Pool #QB5148, 2.00%, 11/1/50 | | | | | | | 620,034 | |
| | 1,223,038 | | | Pool #QB5731, 2.00%, 11/1/50 | | | | | | | 1,017,443 | |
| | 1,877,163 | | | Pool #QB5732, 2.50%, 11/1/50 | | | | | | | 1,629,190 | |
| | 1,704,374 | | | Pool #QB6982, 2.00%, 11/1/50 | | | | | | | 1,417,337 | |
| | 482,993 | | | Pool #QB6992, 1.50%, 12/1/50 | | | | | | | 379,785 | |
| | 1,155,013 | | | Pool #QC4676, 2.50%, 7/1/51 | | | | | | | 998,333 | |
| | 778,147 | | | Pool #QC6090, 2.50%, 8/1/51 | | | | | | | 672,227 | |
| | 1,704,418 | | | Pool #QC6108, 2.50%, 8/1/51 | | | | | | | 1,471,622 | |
| | 1,033,412 | | | Pool #QC6643, 2.50%, 8/1/51 | | | | | | | 892,265 | |
| | 1,089,302 | | | Pool #QC9175, 2.50%, 10/1/51 | | | | | | | 940,014 | |
| | 1,744,029 | | | Pool #QD0152, 2.50%, 10/1/51 | | | | | | | 1,504,198 | |
| | 269,700 | | | Pool #QD1762, 2.00%, 11/1/51 | | | | | | | 223,327 | |
| | 2,607,711 | | | Pool #QD4183, 2.50%, 12/1/51 | | | | | | | 2,247,896 | |
| | 835,778 | | | Pool #QD7419, 3.00%, 2/1/52 | | | | | | | 749,583 | |
| | 388,221 | | | Pool #QE0994, 3.50%, 4/1/52 | | | | | | | 360,532 | |
| | 3,234,177 | | | Pool #QE2342, 4.00%, 5/1/52 | | | | | | | 3,090,966 | |
| | 4,851,493 | | | Pool #QE7866, 4.00%, 8/1/52 | | | | | | | 4,636,666 | |
| | 1,187,718 | | | Pool #QE9025, 4.00%, 8/1/52 | | | | | | | 1,135,125 | |
| | 606,948 | | | Pool #QE9026, 5.00%, 8/1/52 | | | | | | | 605,031 | |
| | 1,052,611 | | | Pool #QE9027, 4.50%, 8/1/52 | | | | | | | 1,030,706 | |
| | 1,412,366 | | | Pool #QF0539, 4.00%, 9/1/52 | | | | | | | 1,349,825 | |
| | 2,377,464 | | | Pool #QF3474, 6.00%, 11/1/52 | | | | | | | 2,425,822 | |
| | 244,445 | | | Pool #RA1234, 3.50%, 8/1/49 | | | | | | | 229,386 | |
| | 259,423 | | | Pool #RA1382, 3.00%, 9/1/49 | | | | | | | 234,799 | |
| | 1,347,416 | | | Pool #RA1383, 3.00%, 9/1/49 | | | | | | | 1,219,522 | |
| | 255,331 | | | Pool #RA1470, 3.00%, 10/1/49 | | | | | | | 231,096 | |
| | 458,387 | | | Pool #RA1713, 3.00%, 11/1/49 | | | | | | | 414,877 | |
| | 473,531 | | | Pool #RA1714, 3.00%, 11/1/49 | | | | | | | 428,584 | |
| | 632,711 | | | Pool #RA1716, 3.00%, 11/1/49 | | | | | | | 572,655 | |
16
|
SCHEDULE OF PORTFOLIO INVESTMENTS |
Access Capital Community Investment Fund (cont.)
March 31, 2023 (Unaudited)
| | | | | | | | | | | | |
Principal Amount | | | | | Value | |
| | $ 474,065 | | | Pool #RA1724, 2.50%, 10/1/49 | | | | | | $ | 413,284 | |
| | 377,738 | | | Pool #RA1979, 3.00%, 12/1/49 | | | | | | | 341,883 | |
| | 907,885 | | | Pool #RA1987, 3.00%, 12/1/49 | | | | | | | 821,710 | |
| | 1,414,201 | | | Pool #RA1988, 3.00%, 1/1/50 | | | | | | | 1,279,967 | |
| | 769,417 | | | Pool #RA2158, 3.00%, 2/1/50 | | | | | | | 696,647 | |
| | 741,207 | | | Pool #RA2162, 3.00%, 2/1/50 | | | | | | | 671,105 | |
| | 736,808 | | | Pool #RA2255, 3.00%, 3/1/50 | | | | | | | 667,122 | |
| | 1,085,485 | | | Pool #RA2256, 3.00%, 3/1/50 | | | | | | | 982,822 | |
| | 732,171 | | | Pool #RA2340, 3.00%, 3/1/50 | | | | | | | 662,782 | |
| | 295,754 | | | Pool #RA2395, 2.50%, 4/1/50 | | | | | | | 257,327 | |
| | 439,338 | | | Pool #RA3097, 2.50%, 7/1/50 | | | | | | | 381,983 | |
| | 1,377,692 | | | Pool #RA3207, 2.50%, 7/1/50 | | | | | | | 1,196,981 | |
| | 2,858,016 | | | Pool #RA3208, 2.50%, 7/1/50 | | | | | | | 2,483,133 | |
| | 826,715 | | | Pool #RA3339, 2.00%, 8/1/50 | | | | | | | 688,256 | |
| | 1,337,393 | | | Pool #RA3552, 2.00%, 9/1/50 | | | | | | | 1,113,406 | |
| | 1,153,054 | | | Pool #RA3553, 2.50%, 8/1/50 | | | | | | | 1,001,451 | |
| | 3,446,503 | | | Pool #RA3679, 2.00%, 9/1/50 | | | | | | | 2,868,211 | |
| | 1,664,662 | | | Pool #RA3680, 2.50%, 9/1/50 | | | | | | | 1,445,793 | |
| | 786,232 | | | Pool #RA3711, 2.00%, 9/1/50 | | | | | | | 654,309 | |
| | 596,907 | | | Pool #RA3712, 2.50%, 9/1/50 | | | | | | | 518,241 | |
| | 491,054 | | | Pool #RA3733, 2.00%, 10/1/50 | | | | | | | 408,659 | |
| | 719,490 | | | Pool #RA3734, 2.50%, 10/1/50 | | | | | | | 624,669 | |
| | 809,465 | | | Pool #RA3747, 2.00%, 9/1/50 | | | | | | | 673,895 | |
| | 1,686,615 | | | Pool #RA3751, 2.00%, 10/1/50 | | | | | | | 1,404,003 | |
| | 2,528,210 | | | Pool #RA3803, 1.50%, 12/1/50 | | | | | | | 1,987,969 | |
| | 394,691 | | | Pool #RA3861, 1.50%, 10/1/50 | | | | | | | 310,351 | |
| | 1,583,453 | | | Pool #RA3862, 2.00%, 10/1/50 | | | | | | | 1,317,764 | |
| | 1,618,127 | | | Pool #RA3917, 1.50%, 10/1/50 | | | | | | | 1,272,357 | |
| | 3,497,515 | | | Pool #RA3918, 2.00%, 10/1/50 | | | | | | | 2,909,577 | |
| | 807,874 | | | Pool #RA3928, 1.50%, 11/1/50 | | | | | | | 635,244 | |
| | 201,412 | | | Pool #RA3929, 2.00%, 10/1/50 | | | | | | | 167,845 | |
| | 566,179 | | | Pool #RA4018, 2.00%, 1/1/51 | | | | | | | 470,476 | |
| | 659,969 | | | Pool #RA4055, 2.00%, 11/1/50 | | | | | | | 548,823 | |
| | 708,114 | | | Pool #RA4056, 1.50%, 11/1/50 | | | | | | | 556,801 | |
| | 7,086,714 | | | Pool #RA4195, 2.00%, 12/1/50 | | | | | | | 5,893,225 | |
| | 5,005,077 | | | Pool #RA4254, 2.00%, 12/1/50 | | | | | | | 4,160,607 | |
| | 841,600 | | | Pool #RA4274, 1.50%, 12/1/50 | | | | | | | 661,763 | |
| | 1,073,385 | | | Pool #RA4357, 2.00%, 1/1/51 | | | | | | | 892,281 | |
| | 1,529,954 | | | Pool #RA4377, 2.00%, 2/1/51 | | | | | | | 1,271,692 | |
| | 2,224,115 | | | Pool #RA4420, 2.00%, 1/1/51 | | | | | | | 1,848,166 | |
| | 3,149,972 | | | Pool #RA4503, 2.00%, 2/1/51 | | | | | | | 2,617,523 | |
| | 872,503 | | | Pool #RA4548, 2.00%, 2/1/51 | | | | | | | 725,021 | |
| | 2,111,348 | | | Pool #RA4578, 2.00%, 2/1/51 | | | | | | | 1,753,569 | |
| | 347,993 | | | Pool #RA4590, 2.00%, 2/1/51 | | | | | | | 289,024 | |
| | 280,804 | | | Pool #RA4597, 2.00%, 2/1/51 | | | | | | | 233,339 | |
| | 247,556 | | | Pool #RA4618, 2.00%, 2/1/51 | | | | | | | 205,711 | |
| | 923,064 | | | Pool #RA4621, 2.00%, 2/1/51 | | | | | | | 766,646 | |
17
|
SCHEDULE OF PORTFOLIO INVESTMENTS |
Access Capital Community Investment Fund (cont.)
March 31, 2023 (Unaudited)
| | | | | | | | | | | | |
Principal Amount | | | | | Value | |
| | $1,371,747 | | | Pool #RA4738, 2.00%, 3/1/51 | | | | | | $ | 1,139,297 | |
| | 3,943,834 | | | Pool #RA4745, 2.00%, 3/1/51 | | | | | | | 3,275,531 | |
| | 1,402,975 | | | Pool #RA4775, 2.00%, 3/1/51 | | | | | | | 1,165,234 | |
| | 1,207,164 | | | Pool #RA4835, 2.50%, 3/1/51 | | | | | | | 1,045,097 | |
| | 2,253,125 | | | Pool #RA4872, 2.50%, 4/1/51 | | | | | | | 1,950,632 | |
| | 7,977,568 | | | Pool #RA5020, 2.00%, 4/1/51 | | | | | | | 6,623,250 | |
| | 3,275,848 | | | Pool #RA5021, 1.50%, 4/1/51 | | | | | | | 2,579,810 | |
| | 406,756 | | | Pool #RA5043, 2.50%, 4/1/51 | | | | | | | 351,958 | |
| | 646,907 | | | Pool #RA5045, 2.50%, 5/1/51 | | | | | | | 559,755 | |
| | 2,987,968 | | | Pool #RA5068, 2.00%, 4/1/51 | | | | | | | 2,479,785 | |
| | 1,664,659 | | | Pool #RA5173, 2.50%, 4/1/51 | | | | | | | 1,440,395 | |
| | 973,337 | | | Pool #RA5195, 2.50%, 5/1/51 | | | | | | | 838,899 | |
| | 771,352 | | | Pool #RA5197, 2.50%, 5/1/51 | | | | | | | 667,435 | |
| | 1,328,254 | | | Pool #RA5217, 2.50%, 5/1/51 | | | | | | | 1,159,052 | |
| | 1,930,581 | | | Pool #RA5234, 2.50%, 5/1/51 | | | | | | | 1,669,593 | |
| | 1,116,678 | | | Pool #RA5237, 2.50%, 5/1/51 | | | | | | | 966,239 | |
| | 2,079,417 | | | Pool #RA5350, 2.50%, 6/1/51 | | | | | | | 1,798,308 | |
| | 2,755,830 | | | Pool #RA5379, 2.50%, 6/1/51 | | | | | | | 2,383,279 | |
| | 1,611,273 | | | Pool #RA5387, 2.50%, 6/1/51 | | | | | | | 1,399,364 | |
| | 238,760 | | | Pool #RA5404, 2.50%, 6/1/51 | | | | | | | 206,372 | |
| | 7,914,816 | | | Pool #RA5427, 2.50%, 6/1/51 | | | | | | | 6,841,155 | |
| | 1,209,417 | | | Pool #RA5509, 2.50%, 7/1/51 | | | | | | | 1,045,357 | |
| | 471,184 | | | Pool #RA5525, 2.50%, 7/1/51 | | | | | | | 407,267 | |
| | 759,697 | | | Pool #RA5541, 2.50%, 7/1/51 | | | | | | | 656,642 | |
| | 2,094,922 | | | Pool #RA5621, 2.50%, 8/1/51 | | | | | | | 1,809,766 | |
| | 240,581 | | | Pool #RA5686, 2.50%, 7/1/51 | | | | | | | 207,834 | |
| | 1,882,006 | | | Pool #RA5701, 2.00%, 8/1/51 | | | | | | | 1,559,582 | |
| | 1,727,427 | | | Pool #RA5719, 2.50%, 10/1/51 | | | | | | | 1,489,880 | |
| | 3,222,744 | | | Pool #RA5726, 2.50%, 8/1/51 | | | | | | | 2,782,570 | |
| | 1,777,532 | | | Pool #RA5796, 2.50%, 8/1/51 | | | | | | | 1,534,750 | |
| | 1,897,527 | | | Pool #RA5873, 2.50%, 9/1/51 | | | | | | | 1,638,356 | |
| | 712,202 | | | Pool #RA5874, 2.50%, 9/1/51 | | | | | | | 614,595 | |
| | 2,616,733 | | | Pool #RA5948, 2.50%, 12/1/51 | | | | | | | 2,254,497 | |
| | 158,926 | | | Pool #RA5951, 2.50%, 9/1/51 | | | | | | | 137,145 | |
| | 3,771,185 | | | Pool #RA6030, 2.50%, 10/1/51 | | | | | | | 3,254,346 | |
| | 65,716 | | | Pool #RA6108, 3.50%, 3/1/52 | | | | | | | 61,039 | |
| | 1,299,546 | | | Pool #RA6117, 2.50%, 10/1/51 | | | | | | | 1,120,838 | |
| | 1,461,341 | | | Pool #RA6276, 2.50%, 11/1/51 | | | | | | | 1,260,385 | |
| | 390,967 | | | Pool #RA6305, 2.50%, 11/1/51 | | | | | | | 337,203 | |
| | 1,252,265 | | | Pool #RA6317, 2.50%, 11/1/51 | | | | | | | 1,080,060 | |
| | 87,413 | | | Pool #RA6389, 2.50%, 11/1/51 | | | | | | | 75,829 | |
| | 1,906,138 | | | Pool #RA6516, 2.50%, 12/1/51 | | | | | | | 1,642,270 | |
| | 1,528,359 | | | Pool #RA6687, 3.00%, 1/1/52 | | | | | | | 1,370,874 | |
| | 2,918,619 | | | Pool #RA6743, 2.50%, 1/1/52 | | | | | | | 2,514,593 | |
| | 2,073,894 | | | Pool #RA6760, 3.00%, 2/1/52 | | | | | | | 1,860,196 | |
| | 1,374,068 | | | Pool #RA6782, 3.00%, 2/1/52 | | | | | | | 1,237,621 | |
| | 2,540,159 | | | Pool #RA6801, 3.00%, 2/1/52 | | | | | | | 2,282,069 | |
| | 4,219,658 | | | Pool #RA6858, 3.00%, 3/1/52 | | | | | | | 3,784,478 | |
18
|
SCHEDULE OF PORTFOLIO INVESTMENTS |
Access Capital Community Investment Fund (cont.)
March 31, 2023 (Unaudited)
| | | | | | | | | | | | |
Principal Amount | | | | | Value | |
| | $1,548,440 | | | Pool #RA6930, 3.50%, 3/1/52 | | | | | | $ | 1,438,240 | |
| | 1,092,477 | | | Pool #RA6978, 3.50%, 3/1/52 | | | | | | | 1,021,097 | |
| | 1,782,490 | | | Pool #RA6983, 2.50%, 3/1/52 | | | | | | | 1,535,994 | |
| | 483,003 | | | Pool #RA7098, 3.50%, 3/1/52 | | | | | | | 448,553 | |
| | 172,112 | | | Pool #RA7146, 3.50%, 4/1/52 | | | | | | | 159,809 | |
| | 2,120,168 | | | Pool #RA7162, 3.50%, 4/1/52 | | | | | | | 1,968,619 | |
| | 211,609 | | | Pool #RA7284, 3.50%, 4/1/52 | | | | | | | 197,133 | |
| | 110,862 | | | Pool #RA7344, 4.00%, 4/1/52 | | | | | | | 106,377 | |
| | 6,386,236 | | | Pool #RA7454, 4.00%, 6/1/52 | | | | | | | 6,103,449 | |
| | 4,537,244 | | | Pool #RA7469, 4.00%, 5/1/52 | | | | | | | 4,336,333 | |
| | 9,574,397 | | | Pool #RA7503, 4.50%, 7/1/52 | | | | | | | 9,375,151 | |
| | 2,948,692 | | | Pool #RA7714, 4.50%, 7/1/52 | | | | | | | 2,887,329 | |
| | 2,664,654 | | | Pool #RA7872, 4.50%, 9/1/52 | | | | | | | 2,609,202 | |
| | 5,542,763 | | | Pool #RA7897, 4.50%, 9/1/52 | | | | | | | 5,427,417 | |
| | 3,299,983 | | | Pool #RA8627, 5.50%, 3/1/53 | | | | | | | 3,346,419 | |
| | 1,948,433 | | | Pool #RA8684, 5.00%, 3/1/53 | | | | | | | 1,942,467 | |
| | 975,007 | | | Pool #WA3211, 1.91%, 9/1/35 | | | | | | | 746,661 | |
| | 1,070,528 | | | Pool #WA3305, 1.75%, 6/1/37 | | | | | | | 776,939 | |
| | 941,020 | | | Pool #WA5002, 2.62%, 11/1/31 | | | | | | | 838,435 | |
| | 1,000,000 | | | Pool #WN3049, 2.39%, 9/1/31 | | | | | | | 867,072 | |
| | 429,383 | | | Pool #ZA4828, 4.00%, 3/1/47 | | | | | | | 417,151 | |
| | 64,049 | | | Pool #ZA4891, 3.50%, 3/1/47 | | | | | | | 60,992 | |
| | 433,112 | | | Pool #ZA4892, 4.00%, 5/1/47 | | | | | | | 420,773 | |
| | 468,188 | | | Pool #ZA4893, 3.50%, 4/1/47 | | | | | | | 443,980 | |
| | 671,536 | | | Pool #ZA4912, 3.50%, 5/1/47 | | | | | | | 632,359 | |
| | 617,964 | | | Pool #ZA4913, 4.00%, 5/1/47 | | | | | | | 600,359 | |
| | 611,471 | | | Pool #ZA5036, 3.50%, 9/1/47 | | | | | | | 575,798 | |
| | 923,261 | | | Pool #ZA5070, 3.50%, 11/1/47 | | | | | | | 869,398 | |
| | 157,123 | | | Pool #ZA5090, 3.50%, 11/1/47 | | | | | | | 148,791 | |
| | 679,581 | | | Pool #ZA5174, 3.50%, 12/1/47 | | | | | | | 639,934 | |
| | 1,445,979 | | | Pool #ZA5238, 3.50%, 2/1/48 | | | | | | | 1,361,620 | |
| | 413,458 | | | Pool #ZA5245, 3.50%, 1/1/48 | | | | | | | 389,337 | |
| | 966,567 | | | Pool #ZA5253, 3.50%, 1/1/48 | | | | | | | 910,177 | |
| | 400,416 | | | Pool #ZA5254, 4.00%, 1/1/48 | | | | | | | 391,275 | |
| | 589,569 | | | Pool #ZA5308, 4.00%, 1/1/48 | | | | | | | 572,773 | |
| | 763,859 | | | Pool #ZA5575, 4.00%, 7/1/48 | | | | | | | 740,994 | |
| | 623,002 | | | Pool #ZA5637, 4.50%, 8/1/48 | | | | | | | 619,392 | |
| | 520,485 | | | Pool #ZA5645, 4.00%, 8/1/48 | | | | | | | 504,905 | |
| | 59,210 | | | Pool #ZA6576, 3.50%, 4/1/49 | | | | | | | 56,124 | |
| | 87,504 | | | Pool #ZI0238, 5.00%, 6/1/33 | | | | | | | 89,358 | |
| | 152,599 | | | Pool #ZI0412, 5.00%, 8/1/33 | | | | | | | 155,833 | |
| | 62,781 | | | Pool #ZI0543, 4.50%, 8/1/33 | | | | | | | 63,033 | |
| | 44,495 | | | Pool #ZI0549, 5.00%, 8/1/33 | | | | | | | 45,438 | |
| | 19,498 | | | Pool #ZI0807, 5.00%, 9/1/33 | | | | | | | 19,911 | |
| | 107,283 | | | Pool #ZI1023, 5.50%, 11/1/33 | | | | | | | 111,414 | |
| | 84,115 | | | Pool #ZI1353, 5.50%, 1/1/34 | | | | | | | 87,354 | |
| | 126,865 | | | Pool #ZI1493, 5.50%, 1/1/34 | | | | | | | 131,749 | |
19
|
SCHEDULE OF PORTFOLIO INVESTMENTS |
Access Capital Community Investment Fund (cont.)
March 31, 2023 (Unaudited)
| | | | | | | | | | | | |
Principal Amount | | | | | Value | |
| | $100,576 | | | Pool #ZI1524, 5.50%, 2/1/34 | | | | | | $ | 104,448 | |
| | 64,705 | | | Pool #ZI1630, 5.50%, 3/1/34 | | | | | | | 67,216 | |
| | 146,060 | | | Pool #ZI1689, 5.50%, 4/1/34 | | | | | | | 151,729 | |
| | 61,725 | | | Pool #ZI1802, 5.50%, 4/1/34 | | | | | | | 64,122 | |
| | 128,686 | | | Pool #ZI1991, 5.00%, 5/1/34 | | | | | | | 131,678 | |
| | 105,936 | | | Pool #ZI2332, 5.00%, 6/1/34 | | | | | | | 108,398 | |
| | 137,303 | | | Pool #ZI2939, 5.50%, 12/1/34 | | | | | | | 142,633 | |
| | 84,707 | | | Pool #ZI3102, 5.00%, 1/1/35 | | | | | | | 86,676 | |
| | 78,485 | | | Pool #ZI3254, 5.50%, 4/1/35 | | | | | | | 81,803 | |
| | 166,720 | | | Pool #ZI3507, 5.00%, 9/1/35 | | | | | | | 171,047 | |
| | 94,656 | | | Pool #ZI3713, 5.00%, 5/1/35 | | | | | | | 97,113 | |
| | 76,406 | | | Pool #ZI4118, 5.50%, 1/1/36 | | | | | | | 79,636 | |
| | 136,435 | | | Pool #ZI4120, 5.50%, 1/1/36 | | | | | | | 142,203 | |
| | 187,388 | | | Pool #ZI4200, 5.50%, 2/1/36 | | | | | | | 195,310 | |
| | 80,069 | | | Pool #ZI4201, 6.00%, 2/1/36 | | | | | | | 84,459 | |
| | 216,847 | | | Pool #ZI4429, 5.00%, 6/1/35 | | | | | | | 222,474 | |
| | 55,381 | | | Pool #ZI4521, 5.50%, 7/1/35 | | | | | | | 57,722 | |
| | 157,532 | | | Pool #ZI4572, 5.50%, 8/1/35 | | | | | | | 164,192 | |
| | 64,037 | | | Pool #ZI4605, 5.50%, 9/1/35 | | | | | | | 66,745 | |
| | 57,408 | | | Pool #ZI4606, 5.50%, 9/1/35 | | | | | | | 59,835 | |
| | 38,725 | | | Pool #ZI4704, 5.00%, 11/1/35 | | | | | | | 39,730 | |
| | 113,986 | | | Pool #ZI4705, 5.00%, 11/1/35 | | | | | | | 116,944 | |
| | 48,102 | | | Pool #ZI4706, 5.50%, 11/1/35 | | | | | | | 50,135 | |
| | 202,889 | | | Pool #ZI4979, 6.00%, 6/1/36 | | | | | | | 214,618 | |
| | 36,922 | | | Pool #ZI5006, 6.00%, 6/1/36 | | | | | | | 39,056 | |
| | 165,940 | | | Pool #ZI5912, 5.50%, 4/1/37 | | | | | | | 173,947 | |
| | 85,906 | | | Pool #ZI6311, 5.50%, 6/1/37 | | | | | | | 90,051 | |
| | 57,882 | | | Pool #ZI6814, 6.00%, 10/1/37 | | | | | | | 61,291 | |
| | 51,954 | | | Pool #ZI6976, 5.50%, 7/1/37 | | | | | | | 54,461 | |
| | 200,977 | | | Pool #ZI9925, 5.00%, 4/1/40 | | | | | | | 207,198 | |
| | 67,049 | | | Pool #ZJ0038, 4.50%, 5/1/40 | | | | | | | 67,393 | |
| | 211,034 | | | Pool #ZJ0482, 4.50%, 9/1/40 | | | | | | | 212,118 | |
| | 220,028 | | | Pool #ZJ0844, 4.00%, 12/1/40 | | | | | | | 215,721 | |
| | 119,764 | | | Pool #ZJ1058, 4.00%, 12/1/40 | | | | | | | 117,419 | |
| | 88,310 | | | Pool #ZJ1264, 4.00%, 1/1/41 | | | | | | | 86,870 | |
| | 233,247 | | | Pool #ZJ1444, 4.00%, 3/1/41 | | | | | | | 229,061 | |
| | 99,134 | | | Pool #ZJ1445, 4.50%, 3/1/41 | | | | | | | 99,504 | |
| | 48,021 | | | Pool #ZJ5032, 6.50%, 5/1/31 | | | | | | | 50,711 | |
| | 29,316 | | | Pool #ZJ5458, 6.50%, 11/1/31 | | | | | | | 30,959 | |
| | 26,313 | | | Pool #ZJ5928, 6.50%, 3/1/32 | | | | | | | 28,043 | |
| | 74,151 | | | Pool #ZJ6638, 6.00%, 11/1/32 | | | | | | | 78,017 | |
| | 60,383 | | | Pool #ZJ6955, 5.50%, 3/1/33 | | | | | | | 62,708 | |
| | 43,531 | | | Pool #ZJ6956, 5.50%, 3/1/33 | | | | | | | 45,206 | |
| | 56,564 | | | Pool #ZK4661, 2.50%, 11/1/27 | | | | | | | 54,296 | |
| | 295,598 | | | Pool #ZL2630, 3.50%, 12/1/41 | | | | | | | 280,377 | |
| | 323,641 | | | Pool #ZL2708, 3.50%, 1/1/42 | | | | | | | 306,976 | |
| | 854,741 | | | Pool #ZL5676, 3.00%, 4/1/43 | | | | | | | 787,593 | |
| | 393,794 | | | Pool #ZL6090, 3.00%, 6/1/43 | | | | | | | 362,857 | |
20
|
SCHEDULE OF PORTFOLIO INVESTMENTS |
Access Capital Community Investment Fund (cont.)
March 31, 2023 (Unaudited)
| | | | | | | | | | | | |
Principal Amount | | | | | Value | |
| | $ 184,945 | | | Pool #ZL6097, 3.00%, 6/1/43 | | | | | | $ | 170,415 | |
| | 546,985 | | | Pool #ZL9372, 3.00%, 4/1/45 | | | | | | | 500,849 | |
| | 349,992 | | | Pool #ZL9669, 3.50%, 6/1/45 | | | | | | | 330,896 | |
| | 200,431 | | | Pool #ZM1422, 3.50%, 7/1/46 | | | | | | | 188,896 | |
| | 216,519 | | | Pool #ZM1423, 3.50%, 7/1/46 | | | | | | | 204,058 | |
| | 158,315 | | | Pool #ZM1736, 3.00%, 9/1/46 | | | | | | | 144,921 | |
| | 879,380 | | | Pool #ZM1738, 3.00%, 9/1/46 | | | | | | | 804,868 | |
| | 527,682 | | | Pool #ZM8750, 4.00%, 9/1/48 | | | | | | | 511,886 | |
| | 286,272 | | | Pool #ZN1022, 4.00%, 11/1/48 | | | | | | | 277,702 | |
| | 12,514 | | | Pool #ZN5269, 6.50%, 10/1/31 | | | | | | | 13,215 | |
| | 41,749 | | | Pool #ZN5316, 5.00%, 5/1/34 | | | | | | | 42,720 | |
| | 64,368 | | | Pool #ZN5321, 5.50%, 5/1/34 | | | | | | | 66,867 | |
| | 39,384 | | | Pool #ZN5322, 5.50%, 5/1/34 | | | | | | | 40,913 | |
| | 46,586 | | | Pool #ZN5332, 5.00%, 11/1/34 | | | | | | | 47,669 | |
| | 622,971 | | | Series 2017-SB42, Class A10F, 2.96%, 10/25/27(a) | | | | | | | 588,047 | |
| | 364,859 | | | Series 2018-SB52, Class A10F, 3.46%, 6/25/28(a) | | | | | | | 350,482 | |
| | 811,340 | | | Series 2018-SB53, Class A10F, 3.63%, 6/25/28(a) | | | | | | | 778,480 | |
| | 281,332 | | | Series 2018-SB56, Class A10F, 3.70%, 10/25/28(a) | | | | | | | 270,291 | |
| | 483,798 | | | Series 2019-SB64, Class A10F, 2.71%, 5/25/29(a) | | | | | | | 451,414 | |
| | 1,318,237 | | | Series 2019-SB65, Class A5F, 1.99%, 5/25/24(a) | | | | | | | 1,276,995 | |
| | 634,191 | | | Series 2019-SB66, Class A5H, 2.32%, 6/25/39(a) | | | | | | | 613,982 | |
| | 1,426,982 | | | Series 2020-SB81, Class A10H, 1.26%, 10/25/40(a) | | | | | | | 1,194,627 | |
| | 992,161 | | | Series 2022-SB100, Class A10F, 2.01%, 5/25/32(a) | | | | | | | 849,989 | |
| | 789,671 | | | Series 2022-SB96, Class A7F, 1.88%, 1/25/29(a) | | | | | | | 698,927 | |
| | 2,940,249 | | | Series Q014, Class A1, 1.56%, 1/25/36 | | | | | | | 2,383,057 | |
| | | | | | | | | | | | |
| | | | | | | | | | | 241,876,333 | |
| | | | | | | | | | | | |
| | Ginnie Mae — 4.10% | | | | | | | | |
| | 71,336 | | | Pool #409117, 5.50%, 6/20/38 | | | | | | | 74,353 | |
| | 187,167 | | | Pool #442423, 4.00%, 9/20/41 | | | | | | | 184,461 | |
| | 114,166 | | | Pool #616936, 5.50%, 1/15/36 | | | | | | | 121,173 | |
| | 704,464 | | | Pool #618363, 4.00%, 9/20/41 | | | | | | | 694,282 | |
| | 349,947 | | | Pool #664269, 5.85%, 6/15/38 | | | | | | | 349,947 | |
| | 21,200 | | | Pool #675509, 5.50%, 6/15/38 | | | | | | | 21,579 | |
| | 140,423 | | | Pool #697672, 5.50%, 12/15/38 | | | | | | | 146,829 | |
| | 61,417 | | | Pool #697814, 5.00%, 2/15/39 | | | | | | | 62,370 | |
| | 309,051 | | | Pool #697885, 4.50%, 3/15/39 | | | | | | | 311,588 | |
| | 95,053 | | | Pool #698112, 4.50%, 5/15/39 | | | | | | | 95,833 | |
| | 443,147 | | | Pool #698113, 4.50%, 5/15/39 | | | | | | | 446,784 | |
| | 705,357 | | | Pool #713519, 6.00%, 7/15/39 | | | | | | | 753,537 | |
| | 162,973 | | | Pool #716822, 4.50%, 4/15/39 | | | | | | | 164,310 | |
| | 58,335 | | | Pool #716823, 4.50%, 4/15/39 | | | | | | | 58,814 | |
| | 220,165 | | | Pool #720080, 4.50%, 6/15/39 | | | | | | | 221,972 | |
| | 247,362 | | | Pool #724629, 5.00%, 7/20/40 | | | | | | | 254,864 | |
| | 318,521 | | | Pool #726550, 5.00%, 9/15/39 | | | | | | | 325,467 | |
| | 144,499 | | | Pool #729346, 4.50%, 7/15/41 | | | | | | | 145,672 | |
| | 214,307 | | | Pool #738844, 3.50%, 10/15/41 | | | | | | | 205,796 | |
| | 142,605 | | | Pool #738845, 3.50%, 10/15/41 | | | | | | | 136,942 | |
21
|
SCHEDULE OF PORTFOLIO INVESTMENTS |
Access Capital Community Investment Fund (cont.)
March 31, 2023 (Unaudited)
| | | | | | | | | | | | |
Principal Amount | | | | | Value | |
| | $ 206,376 | | | Pool #738862, 4.00%, 10/15/41 | | | | | | $ | 203,472 | |
| | 175,941 | | | Pool #747241, 5.00%, 9/20/40 | | | | | | | 181,277 | |
| | 538,169 | | | Pool #748654, 3.50%, 9/15/40 | | | | | | | 516,807 | |
| | 99,499 | | | Pool #748846, 4.50%, 9/20/40 | | | | | | | 100,946 | |
| | 260,749 | | | Pool #757016, 3.50%, 11/15/40 | | | | | | | 250,399 | |
| | 165,211 | | | Pool #757017, 4.00%, 12/15/40 | | | | | | | 162,923 | |
| | 256,172 | | | Pool #759297, 4.00%, 1/20/41 | | | | | | | 253,296 | |
| | 148,070 | | | Pool #759298, 4.00%, 2/20/41 | | | | | | | 146,408 | |
| | 143,023 | | | Pool #762877, 4.00%, 4/15/41 | | | | | | | 141,011 | |
| | 79,707 | | | Pool #763564, 4.50%, 5/15/41 | | | | | | | 80,354 | |
| | 173,651 | | | Pool #770481, 4.00%, 8/15/41 | | | | | | | 171,208 | |
| | 39,824 | | | Pool #770482, 4.50%, 8/15/41 | | | | | | | 40,147 | |
| | 288,689 | | | Pool #770517, 4.00%, 8/15/41 | | | | | | | 284,627 | |
| | 117,627 | | | Pool #770529, 4.00%, 8/15/41 | | | | | | | 115,972 | |
| | 46,322 | | | Pool #770537, 4.00%, 8/15/41 | | | | | | | 45,670 | |
| | 139,752 | | | Pool #770738, 4.50%, 6/20/41 | | | | | | | 141,769 | |
| | 157,124 | | | Pool #779592, 4.00%, 11/20/41 | | | | | | | 154,853 | |
| | 103,608 | | | Pool #779593, 4.00%, 11/20/41 | | | | | | | 102,110 | |
| | 251,890 | | | Pool #AA6312, 3.00%, 4/15/43 | | | | | | | 233,281 | |
| | 335,849 | | | Pool #AA6424, 3.00%, 5/15/43 | | | | | | | 310,985 | |
| | 602,571 | | | Pool #AB2733, 3.50%, 8/15/42 | | | | | | | 578,732 | |
| | 291,926 | | | Pool #AB2745, 3.00%, 8/15/42 | | | | | | | 270,430 | |
| | 659,614 | | | Pool #AB2841, 3.00%, 9/15/42 | | | | | | | 611,044 | |
| | 43,646 | | | Pool #AB2843, 3.00%, 9/15/42 | | | | | | | 40,439 | |
| | 107,246 | | | Pool #AB2852, 3.50%, 9/15/42 | | | | | | | 103,003 | |
| | 390,337 | | | Pool #AE6946, 3.00%, 6/15/43 | | | | | | | 361,500 | |
| | 71,695 | | | Pool #AG8915, 4.00%, 2/20/44 | | | | | | | 70,506 | |
| | 325,839 | | | Pool #AK6446, 3.00%, 1/15/45 | | | | | | | 300,970 | |
| | 387,047 | | | Pool #AK7036, 3.00%, 4/15/45 | | | | | | | 355,665 | |
| | 289,411 | | | Pool #AO3594, 3.50%, 8/20/45 | | | | | | | 276,644 | |
| | 150,777 | | | Pool #AP3887, 3.50%, 9/20/45 | | | | | | | 144,126 | |
| | 322,109 | | | Pool #AR4919, 3.50%, 3/20/46 | | | | | | | 306,837 | |
| | 470,723 | | | Pool #AR4970, 3.50%, 4/20/46 | | | | | | | 448,404 | |
| | 443,270 | | | Pool #AS2921, 3.50%, 4/20/46 | | | | | | | 422,253 | |
| | 356,348 | | | Pool #AS4332, 3.00%, 6/20/46 | | | | | | | 329,612 | |
| | 412,016 | | | Pool #AS5511, 3.50%, 3/20/46 | | | | | | | 392,481 | |
| | 748,665 | | | Pool #AX7237, 3.50%, 11/20/46 | | | | | | | 713,168 | |
| | 557,038 | | | Pool #BO2104, 3.00%, 8/20/49 | | | | | | | 512,110 | |
| | 1,488,253 | | | Pool #BR3787, 3.00%, 12/20/49 | | | | | | | 1,366,974 | |
| | 700,000 | | | Series 2012-100, Class B, 2.31%, 11/16/51(a) | | | | | | | 656,356 | |
| | 314,055 | | | Series 2012-107, Class A, 1.15%, 1/16/45 | | | | | | | 296,156 | |
| | 900,654 | | | Series 2012-115, Class A, 2.13%, 4/16/45 | | | | | | | 831,660 | |
| | 898,694 | | | Series 2012-120, Class A, 1.90%, 2/16/53 | | | | | | | 825,250 | |
| | 388,688 | | | Series 2012-131, Class A, 1.90%, 2/16/53 | | | | | | | 357,237 | |
| | 151,883 | | | Series 2012-144, Class AD, 1.77%, 1/16/53 | | | | | | | 140,923 | |
| | 9,079 | | | Series 2012-35, Class C, 3.25%, 11/16/52(a) | | | | | | | 8,926 | |
| | 129,286 | | | Series 2013-105, Class A, 1.71%, 2/16/37 | | | | | | | 127,286 | |
| | 88,049 | | | Series 2013-126, Class BK, 2.45%, 10/16/47(a) | | | | | | | 81,319 | |
22
|
SCHEDULE OF PORTFOLIO INVESTMENTS |
Access Capital Community Investment Fund (cont.)
March 31, 2023 (Unaudited)
| | | | | | | | | | | | |
Principal Amount | | | | | Value | |
| | $191,248 | | | Series 2013-29, Class AB, 1.77%, 10/16/45 | | | | | | $ | 181,103 | |
| | 251,981 | | | Series 2013-63, Class AB, 1.38%, 3/16/45 | | | | | | | 243,130 | |
| | 307,910 | | | Series 2013-97, Class AC, 2.00%, 6/16/45 | | | | | | | 289,670 | |
| | 36,137 | | | Series 2015-107, Class AB, 2.50%, 11/16/49 | | | | | | | 32,977 | |
| | 480,190 | | | Series 2015-114, Class AD, 2.50%, 11/15/51 | | | | | | | 457,637 | |
| | 190,668 | | | Series 2015-128, Class AD, 2.50%, 12/16/50 | | | | | | | 181,074 | |
| | 153,575 | | | Series 2015-130, Class AH, 2.90%, 8/16/47(a) | | | | | | | 148,944 | |
| | 893,540 | | | Series 2015-135, Class AC, 2.35%, 4/16/49 | | | | | | | 802,631 | |
| | 357,754 | | | Series 2015-136, Class AC, 2.50%, 3/16/47 | | | | | | | 335,558 | |
| | 168,081 | | | Series 2015-15, Class A, 2.00%, 11/16/48 | | | | | | | 154,794 | |
| | 394,528 | | | Series 2015-154, Class AD, 2.50%, 5/16/54 | | | | | | | 351,153 | |
| | 335,399 | | | Series 2015-171, Class DA, 2.37%, 3/16/46 | | | | | | | 304,204 | |
| | 294,085 | | | Series 2015-22, Class A, 2.40%, 8/16/47 | | | | | | | 279,496 | |
| | 436,205 | | | Series 2015-70, Class AB, 2.30%, 11/16/48 | | | | | �� | | 399,250 | |
| | 22,795 | | | Series 2015-98, Class AB, 2.20%, 11/16/43 | | | | | | | 22,320 | |
| | 93,074 | | | Series 2016-11, Class AD, 2.25%, 11/16/43 | | | | | | | 90,216 | |
| | 169,162 | | | Series 2016-14, Class AB, 2.15%, 8/16/42 | | | | | | | 161,869 | |
| | 965,910 | | | Series 2016-152, Class EA, 2.20%, 8/15/58 | | | | | | | 821,471 | |
| | 967,136 | | | Series 2016-157, Class AC, 2.00%, 11/16/50 | | | | | | | 851,391 | |
| | 26,724 | | | Series 2016-26, Class A, 2.25%, 12/16/55 | | | | | | | 26,438 | |
| | 1,249 | | | Series 2016-28, Class AB, 2.40%, 11/16/55 | | | | | | | 1,249 | |
| | 16,385 | | | Series 2016-36, Class AB, 2.30%, 6/16/56 | | | | | | | 16,143 | |
| | 278,374 | | | Series 2016-39, Class AH, 2.50%, 9/16/44 | | | | | | | 264,360 | |
| | 107,188 | | | Series 2016-50, Class A, 2.30%, 7/16/52 | | | | | | | 103,302 | |
| | 415,252 | | | Series 2016-64, Class CA, 2.30%, 3/16/45 | | | | | | | 395,499 | |
| | 32,195 | | | Series 2016-67, Class A, 2.30%, 7/16/56 | | | | | | | 31,892 | |
| | 178,484 | | | Series 2016-94, Class AC, 2.20%, 8/16/57 | | | | | | | 154,574 | |
| | 125,413 | | | Series 2016-96, Class BA, 1.95%, 3/16/43 | | | | | | | 120,442 | |
| | 502,688 | | | Series 2017-127, Class AB, 2.50%, 2/16/59 | | | | | | | 433,565 | |
| | 841,334 | | | Series 2017-135, Class AE, 2.60%, 10/16/58 | | | | | | | 729,543 | |
| | 299,889 | | | Series 2017-140, Class A, 2.50%, 2/16/59 | | | | | | | 258,170 | |
| | 80,849 | | | Series 2017-157, Class AH, 2.55%, 2/16/53 | | | | | | | 75,796 | |
| | 233,900 | | | Series 2017-41, Class AC, 2.25%, 3/16/57 | | | | | | | 223,511 | |
| | 432,592 | | | Series 2017-46, Class A, 2.50%, 11/16/57 | | | | | | | 372,235 | |
| | 280,322 | | | Series 2017-71, Class AS, 2.70%, 4/16/57 | | | | | | | 261,434 | |
| | 176,005 | | | Series 2017-9, Class AE, 2.40%, 9/16/50 | | | | | | | 163,393 | |
| | 419,176 | | | Series 2018-2, Class AD, 2.40%, 3/16/59 | | | | | | | 379,855 | |
| | 219,792 | | | Series 2018-26, Class AD, 2.50%, 3/16/52 | | | | | | | 208,888 | |
| | | | | | | | | | | | |
| | | | | | | | | | | 29,673,276 | |
| | | | | | | | | | | | |
| | Small Business Administration — 0.03% | | | | | | | | |
| | 98,454 | | | Pool #510751, (Prime Index + 0.325%), 7.83%, 6/25/30(b) | | | | | | | 103,287 | |
| | 113,518 | | | Pool #530222, (Prime Index + 0.635%), 8.14%, 7/25/32(b) | | | | | | | 120,797 | |
| | | | | | | | | | | | |
| | | | | | | | | | | 224,084 | |
| | | | | | | | | | | | |
| | |
| | Total U.S. Government Agency Backed Mortgages | | | | | | | 684,602,306 | |
| | | | | | | | | | | | |
| | (Cost $759,908,457) | | | | | | | | |
23
|
SCHEDULE OF PORTFOLIO INVESTMENTS |
Access Capital Community Investment Fund (cont.)
March 31, 2023 (Unaudited)
| | | | | | | | | | | | |
Principal Amount | | | | | Value | |
| | U.S. Government Agency Obligations — 5.82% | | | | | | | | |
| | FNMA DUS TBA — 0.28% | | | | | | | | |
| | $ 1,000,000 | | | 4.61%, 4/1/28(b),(c) | | | | | | $ | 1,015,000 | |
| | 1,000,000 | | | 4.61%, 4/1/28(b),(c) | | | | | | | 1,015,000 | |
| | | | | | | | | | | | |
| | | | | | | | | | | 2,030,000 | |
| | | | | | | | | | | | |
| | Small Business Administration — 5.54% | | | | | | | | |
| | 135,965 | | | Certificate of Originator’s Fee, 0.23%, 4/15/31(b),(c) | | | | | | | 680 | |
| | 287,981 | | | Certificate of Originator’s Fee, 0.62%, 1/9/32(b),(c) | | | | | | | 2,781 | |
| | 200,734 | | | Certificate of Originator’s Fee, 0.70%, 4/23/32(b),(c) | | | | | | | 2,208 | |
| | 560,469 | | | Certificate of Originator’s Fee, 0.98%, 4/15/31(b),(c) | | | | | | | 11,951 | |
| | 304,864 | | | Certificate of Originator’s Fee, 1.23%, 3/15/31(b),(c) | | | | | | | 8,159 | |
| | 749,754 | | | Certificate of Originator’s Fee, 1.23%, 4/15/31(b),(c) | | | | | | | 20,066 | |
| | 404,145 | | | Certificate of Originator’s Fee, 1.23%, 5/15/31(b),(c) | | | | | | | 10,816 | |
| | 243,399 | | | Certificate of Originator’s Fee, 1.23%, 5/15/31(b),(c) | | | | | | | 6,514 | |
| | 373,275 | | | Certificate of Originator’s Fee, 1.68%, 9/11/32(b),(c) | | | | | | | 9,814 | |
| | 531,055 | | | Certificate of Originator’s Fee, 1.93%, 5/4/32(b),(c) | | | | | | | 16,039 | |
| | 339,564 | | | Certificate of Originator’s Fee, 2.22%, 2/20/29(b),(c) | | | | | | | 11,770 | |
| | 271,232 | | | 3.36%, 7/8/24(a),(c) | | | | | | | 286,102 | |
| | 279,719 | | | 3.85%, 9/16/34(a),(c) | | | | | | | 306,059 | |
| | 57,469 | | | 4.33%, 12/15/30(b),(c) | | | | | | | 64,849 | |
| | 316,124 | | | (Prime Index - 2.600%), 4.90%, 9/25/41(b) | | | | | | | 314,870 | |
| | 176,559 | | | (Prime Index - 2.600%), 4.90%, 9/25/41(b) | | | | | | | 175,847 | |
| | 259,242 | | | (Prime Index - 2.600%), 4.90%, 7/25/42(b) | | | | | | | 258,200 | |
| | 630,344 | | | (Prime Index -2.550%), 4.95%, 7/25/42(b) | | | | | | | 628,511 | |
| | 205,958 | | | (Prime Index - 2.525%), 4.98%, 11/25/41(b) | | | | | | | 205,472 | |
| | 273,596 | | | (Prime Index - 2.500%), 5.00%, 2/25/28(b) | | | | | | | 273,591 | |
| | 106,545 | | | 6.08%, 12/19/29(a),(c) | | | | | | | 123,559 | |
| | 479,070 | | | (Prime Index - 1.400%), 6.10%, 7/25/41(b) | | | | | | | 489,786 | |
| | 134,854 | | | 6.58%, 4/8/29(b),(c) | | | | | | | 154,234 | |
| | 1,186,463 | | | (Prime Index - 0.675%), 6.83%, 9/25/43(b) | | | | | | | 1,234,696 | |
| | 4,115,908 | | | (Prime Index - 0.675%), 6.83%, 11/25/45(b) | | | | | | | 4,301,039 | |
| | 2,891,204 | | | (Prime Index - 0.675%), 6.83%, 1/25/46(b) | | | | | | | 3,019,402 | |
| | 299,750 | | | 7.08%, 7/25/30 | | | | | | | 299,559 | |
| | 135,094 | | | (Prime Index - 0.384%), 7.12%, 11/25/27(b) | | | | | | | 137,412 | |
| | 993,453 | | | (Prime Index - 0.368%), 7.13%, 12/25/45(b) | | | | | | | 1,049,766 | |
| | 151,997 | | | (Prime Index - 0.215%), 7.29%, 2/25/40(b) | | | | | | | 156,991 | |
| | 307,481 | | | (Prime Index - 0.081%), 7.42%, 7/25/29(b) | | | | | | | 314,414 | |
| | 60,212 | | | (Prime Index + 0.075%), 7.58%, 12/25/40(b) | | | | | | | 62,865 | |
| | 219,741 | | | (Prime Index + 0.093%), 7.59%, 6/25/29(b) | | | | | | | 224,825 | |
| | 320,313 | | | (Prime Index + 0.102%), 7.60%, 8/25/29(b) | | | | | | | 327,923 | |
| | 533,700 | | | (Prime Index + 0.121%), 7.62%, 1/25/46(b) | | | | | | | 568,364 | |
| | 307,376 | | | (Prime Index + 0.194%), 7.69%, 11/25/28(b) | | | | | | | 313,512 | |
| | 80,664 | | | (Prime Index + 0.325%), 7.83%, 10/25/30(b) | | | | | | | 84,805 | |
| | 2,431,511 | | | (Prime Index + 0.325%), 7.83%, 11/25/30(b) | | | | | | | 2,557,212 | |
| | 1,278,869 | | | (Prime Index + 0.325%), 7.83%, 6/25/31(b) | | | | | | | 1,350,477 | |
| | 1,612,525 | | | (Prime Index + 0.325%), 7.83%, 7/25/31(b) | | | | | | | 1,702,658 | |
| | 578,937 | | | (Prime Index + 0.325%), 7.83%, 2/25/45(b) | | | | | | | 617,767 | |
24
|
SCHEDULE OF PORTFOLIO INVESTMENTS |
Access Capital Community Investment Fund (cont.)
March 31, 2023 (Unaudited)
| | | | | | | | | | | | |
Principal Amount | | | | | Value | |
| | $ 935,684 | | | (Prime Index + 0.325%), 7.83%, 8/25/46(b) | | | | | | $ | 1,004,560 | |
| | 58,307 | | | (Prime Index + 0.355%), 7.86%, 2/25/26(b) | | | | | | | 59,267 | |
| | 2,117,869 | | | (Prime Index + 0.375%), 7.88%, 5/25/31(b) | | | | | | | 2,232,011 | |
| | 283,553 | | | (Prime Index + 0.375%), 7.88%, 10/25/31(b) | | | | | | | 299,361 | |
| | 934,416 | | | (Prime Index + 0.375%), 7.88%, 8/25/46(b) | | | | | | | 996,543 | |
| | 2,327,794 | | | (Prime Index + 0.523%), 8.02%, 12/25/45(b) | | | | | | | 2,494,678 | |
| | 1,239,321 | | | (Prime Index + 0.575%), 8.08%, 4/25/31(b) | | | | | | | 1,306,901 | |
| | 778,255 | | | (Prime Index + 0.666%), 8.17%, 11/25/30(b) | | | | | | | 821,609 | |
| | 43,213 | | | (Prime Index + 0.700%), 8.20%, 2/25/28(b) | | | | | | | 44,589 | |
| | 383,007 | | | (Prime Index + 0.721%), 8.22%, 5/25/29(b) | | | | | | | 392,829 | |
| | 366,088 | | | (Prime Index + 0.761%), 8.26%, 3/25/30(b) | | | | | | | 379,378 | |
| | 172,307 | | | (Prime Index + 0.780%), 8.28%, 9/25/28(b) | | | | | | | 177,197 | |
| | 149,432 | | | (Prime Index + 0.787%), 8.29%, 3/25/29(b) | | | | | | | 153,280 | |
| | 372,591 | | | (Prime Index + 0.788%), 8.29%, 6/25/29(b) | | | | | | | 385,226 | |
| | 215,436 | | | (Prime Index + 0.821%), 8.32%, 2/25/28(b) | | | | | | | 222,862 | |
| | 282,403 | | | (Prime Index + 0.823%), 8.32%, 2/25/29(b) | | | | | | | 290,729 | |
| | 1,703,568 | | | (Prime Index + 0.825%), 8.33%, 9/25/31(b) | | | | | | | 1,816,207 | |
| | 56,529 | | | (Prime Index + 0.872%), 8.37%, 6/25/28(b) | | | | | | | 57,797 | |
| | 118,608 | | | (Prime Index + 0.866%), 8.37%, 3/25/31(b) | | | | | | | 125,485 | |
| | 216,775 | | | (Prime Index + 0.882%), 8.38%, 8/25/30(b) | | | | | | | 228,611 | |
| | 115,052 | | | (Prime Index + 0.887%), 8.39%, 2/25/30(b) | | | | | | | 119,452 | |
| | 294,390 | | | (Prime Index + 0.908%), 8.41%, 7/25/30(b) | | | | | | | 306,364 | |
| | 883,504 | | | (Prime Index + 0.919%), 8.42%, 12/25/30(b) | | | | | | | 934,121 | |
| | 33,900 | | | (Prime Index + 0.689%), 8.44%, 8/25/27(b) | | | | | | | 34,508 | |
| | 64,880 | | | (Prime Index + 0.942%), 8.44%, 7/25/29(b) | | | | | | | 67,952 | |
| | 141,113 | | | (Prime Index + 0.945%), 8.45%, 5/25/29(b) | | | | | | | 147,618 | |
| | 67,913 | | | (Prime Index + 0.958%), 8.46%, 1/25/29(b) | | | | | | | 69,744 | |
| | 155,736 | | | (Prime Index + 0.975%), 8.48%, 7/25/29(b) | | | | | | | 161,200 | |
| | 158,296 | | | (Prime Index + 1.000%), 8.50%, 1/25/31(b) | | | | | | | 167,745 | |
| | 38,870 | | | (Prime Index + 1.012%), 8.51%, 11/25/28(b) | | | | | | | 40,598 | |
| | 254,963 | | | (Prime Index + 1.030%), 8.53%, 2/25/31(b) | | | | | | | 270,819 | |
| | 126,133 | | | (Prime Index + 1.051%), 8.55%, 9/25/29(b) | | | | | | | 132,518 | |
| | 206,536 | | | (Prime Index + 1.062%), 8.56%, 12/25/29(b) | | | | | | | 217,562 | |
| | 126,731 | | | (Prime Index + 1.070%), 8.57%, 6/25/30(b) | | | | | | | 134,051 | |
| | 282,439 | | | (Prime Index + 1.154%), 8.65%, 9/25/28(b) | | | | | | | 290,145 | |
| | 26,405 | | | (Prime Index + 1.209%), 8.71%, 11/25/26(b) | | | | | | | 27,231 | |
| | 184,813 | | | (Prime Index + 1.213%), 8.71%, 5/25/29(b) | | | | | | | 191,056 | |
| | 93,953 | | | (Prime Index + 1.216%), 8.72%, 6/25/29(b) | | | | | | | 98,935 | |
| | 443,495 | | | (Prime Index + 1.264%), 8.76%, 6/25/31(b) | | | | | | | 474,601 | |
| | 80,751 | | | (Prime Index + 1.291%), 8.79%, 10/25/31(b) | | | | | | | 86,848 | |
| | 49,083 | | | 9.08%, 9/25/29 | | | | | | | 50,854 | |
| | 161,542 | | | (Prime Index + 1.575%), 9.08%, 7/25/30(b) | | | | | | | 171,485 | |
| | 23,981 | | | (Prime Index + 1.604%), 9.10%, 7/25/28(b) | | | | | | | 24,786 | |
| | 78,022 | | | (Prime Index + 2.325%), 9.83%, 10/25/30(b) | | | | | | | 84,302 | |
25
|
SCHEDULE OF PORTFOLIO INVESTMENTS |
Access Capital Community Investment Fund (cont.)
March 31, 2023 (Unaudited)
| | | | | | | | | | | | |
Principal Amount | | | | | Value | |
| | $189,667 | | | (Prime Index + 2.325%), 9.83%, 1/25/31(b) | | | | | | $ | 206,613 | |
| | 81,031 | | | 9.88%, 6/7/29(c) | | | | | | | 83,145 | |
| | | | | | | | | | | | |
| | | | | | | | | | | 39,788,938 | |
| | | | | | | | | | | | |
| | |
| | Total U.S. Government Agency Obligations | | | | | | | 41,818,938 | |
| | | | | | | | | | | | |
| | (Cost $43,247,873) | | | | | | | | |
| | |
| | Municipal Bonds — 1.95% | | | | | | | | |
| | California — 0.81% | | | | | | | | |
| | 2,000,000 | | | California Health Facilities Financing Authority Revenue, 2.93%, 6/1/32, Callable 6/1/29 @ 100 | | | | | | | 1,720,601 | |
| | 830,000 | | | California Statewide Communities Development Authority Revenue, Series B, 5.25%, 10/20/42, (Credit Support: Ginnie Mae), Callable 5/1/23 @ 100 | | | | | | | 830,285 | |
| | 200,000 | | | City & County of San Francisco GO, 1.95%, 6/15/27 | | | | | | | 182,753 | |
| | 1,790,000 | | | City & County of San Francisco GO, Series A, 1.78%, 6/15/29 | | | | | | | 1,553,376 | |
| | 1,675,000 | | | City of Los Angeles Housing GO, Series A, 2.95%, 9/1/28, Callable 9/1/27 @ 100 | | | | | | | 1,560,784 | |
| | | | | | | | | | | | |
| | | |
| | | | | | | | | | | 5,847,799 | |
| | | | | | | | | | | | |
| | |
| | Colorado — 0.02% | | | | | | | | |
| | 127,765 | | | Colorado Housing & Finance Authority Revenue, Series V, 3.40%, 11/1/45, (Credit Support: FHA) | | | | | | | 109,891 | |
| | | | | | | | | | | | |
| | |
| | District of Columbia — 0.07% | | | | | | | | |
| | 553,072 | | | District of Columbia Housing Finance Agency Series 2017 Revenue, Series A, 3.24%, 3/1/49, (Credit Support: FHA), Callable 1/1/70 @ 100 | | | | | | | 532,340 | |
| | | | | | | | | | | | |
| | |
| | Illinois — 0.07% | | | | | | | | |
| | 230,000 | | | City of Chicago Multi Family Revenue, Mercy Preservation Project, 4.55%, 8/1/26, (Credit Support: Freddie Mac), Callable 5/1/23 @ 100 | | | | | | | 230,251 | |
| | 317,834 | | | Illinois State Housing Development Authority Revenue, Series A, 2.63%, 3/1/48, (Credit Support: FHA) | | | | | | | 295,615 | |
| | | | | | | | | | | | |
| | | |
| | | | | | | | | | | 525,866 | |
| | | | | | | | | | | | |
| | |
| | Minnesota — 0.06% | | | | | | | | |
| | 464,112 | | | City of Minnetonka Housing Revenue, Series A, 3.00%, 11/1/34, (Credit Support: Fannie Mae) | | | | | | | 445,764 | |
| | | | | | | | | | | | |
| | |
| | Missouri — 0.09% | | | | | | | | |
| | 809,716 | | | Missouri Housing Development Commission Revenue, Series 1, 3.75%, 3/1/42, (Credit Support: FHA), Callable 3/1/25 @ 100 | | | | | | | 674,755 | |
| | | | | | | | | | | | |
| | |
| | New York — 0.71% | | | | | | | | |
| | 200,000 | | | New York City Housing Development Corp. Revenue, Series G, 2.37%, 5/1/24 | | | | | | | 194,488 | |
26
|
SCHEDULE OF PORTFOLIO INVESTMENTS |
Access Capital Community Investment Fund (cont.)
March 31, 2023 (Unaudited)
| | | | | | | | | | | | |
Principal Amount | | | | | Value | |
| | $ 40,000 | | | New York City Housing Development Corp. Revenue, Series G, 2.47%, 11/1/24 | | | | | | $ | 38,581 | |
| | 300,000 | | | New York City Housing Development Corp. Revenue, Series B, 1.02%, 5/1/26 | | | | | | | 269,165 | |
| | 300,000 | | | New York City Housing Development Corp. Revenue, Series G, 2.62%, 5/1/26, Callable 11/1/25 @ 100 | | | | | | | 282,707 | |
| | 200,000 | | | New York City Housing Development Corp. Revenue, Series B, 1.12%, 11/1/26 | | | | | | | 177,004 | |
| | 500,000 | | | New York City Housing Development Corp. Revenue, Series B, 3.56%, 11/1/26, Callable 2/1/26 @ 100 | | | | | | | 482,236 | |
| | 160,000 | | | New York City Housing Development Corp. Revenue, Series B, 1.38%, 5/1/27 | | | | | | | 140,724 | |
| | 250,000 | | | New York City Housing Development Corp. Revenue, Series B, 1.48%, 11/1/27 | | | | | | | 217,391 | |
| | 1,000,000 | | | New York City Housing Development Corp. Revenue, Series B, 3.61%, 11/1/27, Callable 2/1/26 @ 100 | | | | | | | 956,525 | |
| | 500,000 | | | New York City Housing Development Corp. Revenue, State of New York Mortgage Agency, 3.33%, 2/1/28, (Credit Support: SONYMA), Callable 8/1/25 @ 100 | | | | | | | 474,148 | |
| | 500,000 | | | New York City Housing Development Corp. Revenue, Series B, 3.81%, 11/1/29, Callable 2/1/26 @ 100 | | | | | | | 472,860 | |
| | 360,000 | | | New York State Housing Finance Agency Revenue, Series A, 4.50%, 11/15/27, Callable 5/1/23 @ 100 | | | | | | | 360,229 | |
| | 1,000,000 | | | New York State Housing Finance Agency Revenue, Series A, 4.65%, 11/15/38, Callable 5/1/23 @ 100 | | | | | | | 1,000,209 | |
| | | | | | | | | | | | |
| | | | | | | | | | | 5,066,267 | |
| | | | | | | | | | | | |
| | |
| | Vermont — 0.01% | | | | | | | | |
| | 100,000 | | | Vermont Housing Finance Agency Revenue, 3.45%, 11/1/29 | | | | | | | 92,941 | |
| | | | | | | | | | | | |
| | |
| | Washington — 0.11% | | | | | | | | |
| | 800,000 | | | City of Seattle WA GO, Series B, 3.38%, 12/1/28, Callable 12/1/27 @ 100 | | | | | | | 756,833 | |
| | | | | | | | | | | | |
| | |
| | Total Municipal Bonds | | | | | | | 14,052,456 | |
| | | | | | | | | | | | |
| | (Cost $15,087,149) | | | | | | | | |
| | |
| | Corporate Bond — 0.03% | | | | | | | | |
| | Consumer, Non-cyclical — 0.03% | | | | | | | | |
| | 210,000 | | | Montefiore Medical Center, 2.15%, 10/20/26 | | | | | | | 189,768 | |
| | | | | | | | | | | | |
| | |
| | Total Corporate Bond | | | | | | | 189,768 | |
| | | | | | | | | | | | |
| | (Cost $210,045) | | | | | | | | |
27
|
SCHEDULE OF PORTFOLIO INVESTMENTS |
Access Capital Community Investment Fund (cont.)
March 31, 2023 (Unaudited)
| | | | | | | | | | | | |
| | | | Shares | | Value | |
| | |
| | | | Investment Company — 1.79% | | | | | | | | |
| | | | 12,843,698 U.S. Government Money Market Fund, RBC Institutional Class 1(d) | | | | | | $ | 12,843,698 | |
| | | | | | | | | | | | |
| | | |
| | | | Total Investment Company | | | | | | | 12,843,698 | |
| | | | | | | | | | | | |
| | | | (Cost $12,843,698) | | | | | | | | |
| | | |
| | | | Total Investments | | | | | | $ | 753,507,166 | |
| | | | (Cost $831,297,222)(e) — 104.86% | | | | | | | | |
| | | |
| | | | Liabilities in excess of other assets — (4.86)% | | | | | | | (34,934,365) | |
| | | | | | | | | | | | |
| | | |
| | | | NET ASSETS — 100.00% | | | | | | $ | 718,572,801 | |
| | | | | | | | | | | | |
| (a) | Variable or floating rate security, which interest rate adjusts periodically based on changes in current interest rates and prepayments on the underlying pool of assets. Rate shown is the rate in effect as of period end. |
| (b) | Floating rate note. Rate shown is as of report date. |
| (c) | The Pricing Committee has fair valued this security under procedures established by the Fund’s Board of Trustees. |
| (d) | Affiliated investment. |
| (e) | See Notes to Schedules of Portfolio Investments for the tax cost of securities and the breakdown of unrealized appreciation (depreciation). |
Financial futures contracts as of March 31, 2023:
| | | | | | | | | | | | | | | | | | | | | | | | | | | | |
Long Position | | Number of
Contracts | | | Expiration
Date | | | Value/Unrealized
Appreciation | | | Notional
Value | | | Clearinghouse | |
2 Year U.S. Treasury Note | | | 100 | | | | June 2023 | | | | | | | | $226,276 | | | | USD | | | $ | 20,645,313 | | | | Barclays Capital Group | |
5 Year U.S. Treasury Note | | | 100 | | | | June 2023 | | | | | | | | 228,170 | | | | USD | | | | 10,950,781 | | | | Barclays Capital Group | |
| | | | | | | | | | | | | | | | | | | | | | | | | | | | |
Total | | | | | | | | | | | | | | | $454,446 | | | | | | | | | | | | | |
| | | | | | | | | | | | | | | | | | | | | | | | | | | | |
28
|
SCHEDULE OF PORTFOLIO INVESTMENTS |
Access Capital Community Investment Fund (cont.)
March 31, 2023 (Unaudited)
| | | | | | | | | | | | | | | | | | | | | | |
Short Position | | Number of
Contracts | | | Expiration
Date | | Value/Unrealized
Appreciation
(Depreciation) | | | Notional
Value | | | Clearinghouse |
| 10 Year U.S. Ultra Treasury Bond | | | 40 | | | June 2023 | | | | $ | 163,005 | | | | USD | | | $ | 4,845,625 | | | Barclays Capital Group |
| 30 Year U.S. Treasury Bond | | | 45 | | | June 2023 | | | | | (2,951) | | | | USD | | | | 5,902,031 | | | Barclays Capital Group |
| 30 Year U.S. Ultra Treasury Bond | | | 90 | | | June 2023 | | | | | 40,688 | | | | USD | | | | 12,701,250 | | | Barclays Capital Group |
| | | | | | | | | | | | | | | | | | | | | | |
| Total | | | | | | | | | | $ | 200,742 | | | | | | | | | | | |
| | | | | | | | | | | | | | | | | | | | | | |
Abbreviations used are defined below:
FHA - Insured by Federal Housing Administration
GO - General Obligations
SONYMA - State of New York Mortgage Agency
TBA - To-be-announced
USD - United States Dollar
See Notes to the Financial Statements.
29
|
SCHEDULE OF PORTFOLIO INVESTMENTS |
RBC Impact Bond Fund
March 31, 2023 (Unaudited)
| | | | | | |
Principal
Amount | | | | Value | |
| |
Corporate Bonds — 31.20% | | | | |
Communications — 0.97% | | | | |
$ 2,670,000 | | Vodafone Group Plc, 4.38%, 2/19/43 | | $ | 2,263,625 | |
| | | | | | |
| |
Consumer, Non-cyclical — 19.14% | | | | |
545,000 | | AbbVie, Inc., 3.60%, 5/14/25 | | | 534,630 | |
2,030,000 | | AbbVie, Inc., 3.80%, 3/15/25 | | | 1,997,261 | |
1,525,000 | | Amgen, Inc., 4.20%, 2/22/52 | | | 1,295,076 | |
3,500,000 | | Amgen, Inc., 5.25%, 3/2/33 | | | 3,594,609 | |
2,892,000 | | Astrazeneca Finance LLC, 1.75%, 5/28/28 | | | 2,565,815 | |
490,000 | | Astrazeneca Finance LLC, 2.25%, 5/28/31 | | | 421,060 | |
2,500,000 | | Baxalta, Inc., 4.00%, 6/23/25 | | | 2,447,494 | |
1,089,000 | | Becton Dickinson & Co., 4.67%, 6/6/47 | | | 1,015,575 | |
4,200,000 | | Becton Dickinson & Co., 4.69%, 2/13/28 | | | 4,218,644 | |
2,000,000 | | California Endowment (The), MTN, 2.50%, 4/1/51 | | | 1,319,387 | |
1,300,000 | | Children’s Hospital Medical Center, 2.82%, 11/15/50 | | | 861,396 | |
995,000 | | DH Europe Finance II Sarl, 2.60%, 11/15/29 | | | 890,175 | |
100,000 | | Doris Duke Charitable Foundation (The), Series 2020, 2.35%, 7/1/50 | | | 61,537 | |
1,850,000 | | EMD Finance LLC, 3.25%, 3/19/25(a) | | | 1,792,648 | |
1,750,000 | | Fairview Health Services, Series 2021, 2.56%, 11/15/31 | | | 1,383,253 | |
1,500,000 | | Gilead Sciences, Inc., 3.65%, 3/1/26 | | | 1,468,941 | |
2,114,000 | | Haleon US Capital LLC, 3.63%, 3/24/32 | | | 1,919,444 | |
1,725,000 | | HCA, Inc., 4.63%, 3/15/52(a) | | | 1,433,170 | |
400,000 | | John D and Catherine T MacArthur Foundation, 1.30%, 12/1/30 | | | 317,737 | |
2,000,000 | | Kaiser Foundation Hospitals, Series 2021, 2.81%, 6/1/41 | | | 1,474,412 | |
150,000 | | Kaiser Foundation Hospitals, 3.15%, 5/1/27 | | | 141,405 | |
2,500,000 | | Kenvue, Inc., 5.05%, 3/22/53(a) | | | 2,578,131 | |
1,200,000 | | Mary Free Bed Rehabilitation Hospital, Series 2021, 3.79%, 4/1/51 | | | 994,192 | |
150,000 | | Mass General Brigham, Inc., Series 2020, 3.19%, 7/1/49 | | | 110,865 | |
250,000 | | Medtronic, Inc., 4.38%, 3/15/35 | | | 246,279 | |
2,000,000 | | PerkinElmer, Inc., 3.63%, 3/15/51 | | | 1,458,766 | |
2,500,000 | | Reckitt Benckiser Treasury Services Plc, 3.00%, 6/26/27(a) | | | 2,332,958 | |
2,000,000 | | Southeast Alaska Regional Health Consortium, 2.26%, 7/1/31 | | | 1,554,989 | |
2,250,000 | | Thermo Fisher Scientific, Inc., 2.00%, 10/15/31 | | | 1,870,874 | |
100,000 | | Trinity Health Corp., 4.13%, 12/1/45 | | | 87,549 | |
2,350,000 | | UnitedHealth Group, Inc., 5.05%, 4/15/53 | | | 2,375,356 | |
| | | | | | |
| | | | | 44,763,628 | |
| | | | | | |
Financial — 5.77% | | | | |
350,000 | | Andrew W Mellon Foundation (The), Series 2020, 0.95%, 8/1/27 | | | 305,829 | |
250,000 | | BlueHub Loan Fund, Inc., Series 2020, 2.89%, 1/1/27 | | | 230,692 | |
2,375,000 | | BlueHub Loan Fund, Inc., Series 2020, 3.10%, 1/1/30 | | | 1,990,324 | |
1,600,000 | | Bridge Housing Corp., 3.25%, 7/15/30 | | | 1,410,025 | |
250,000 | | Community Preservation Corp. (The), Series 2020, 2.87%, 2/1/30 | | | 208,310 | |
30
|
SCHEDULE OF PORTFOLIO INVESTMENTS |
RBC Impact Bond Fund (cont.)
March 31, 2023 (Unaudited)
| | | | | | |
Principal
Amount | | | | Value | |
$2,100,000 | | Healthcare Realty Holdings LP, REIT, 2.40%, 3/15/30 | | $ | 1,689,119 | |
590,000 | | Low Income Investment Fund, Series 2019, 3.39%, 7/1/26 | | | 551,849 | |
1,300,000 | | Low Income Investment Fund, Series 2019, 3.71%, 7/1/29 | | | 1,148,313 | |
2,000,000 | | National Community Renaissance of California, Series 2022, 3.27%, 12/1/32 | | | 1,647,406 | |
2,160,000 | | Preservation of Affordable Housing, Inc., 4.48%, 12/1/32 | | | 2,083,121 | |
2,500,000 | | Reinvestment Fund, Inc. (The), 3.93%, 2/15/28 | | | 2,237,390 | |
| | | | | | |
| | | | | 13,502,378 | |
| | | | | | |
Industrial — 2.38% | | | | |
2,600,000 | | Agilent Technologies, Inc., 2.75%, 9/15/29 | | | 2,330,070 | |
1,500,000 | | Empresa de Transporte de Pasajeros Metro SA, 3.65%, 5/7/30(b) | | | 1,396,858 | |
1,000,000 | | Nature Conservancy (The), Series A, 0.94%, 7/1/26 | | | 884,160 | |
1,000,000 | | Nature Conservancy (The), Series A, 1.15%, 7/1/27 | | | 862,097 | |
70,000 | | Nature Conservancy (The), Series A, 1.51%, 7/1/29 | | | 57,560 | |
53,000 | | Nature Conservancy (The), Series A, 1.86%, 7/1/33 | | | 39,213 | |
| | | | | | |
| | | | | 5,569,958 | |
| | | | | | |
Utilities — 2.94% | | | | |
3,150,000 | | American Water Capital Corp., 4.45%, 6/1/32 | | | 3,099,505 | |
1,534,000 | | Avangrid, Inc., 3.15%, 12/1/24 | | | 1,486,866 | |
1,350,000 | | Avangrid, Inc., 3.80%, 6/1/29 | | | 1,268,412 | |
1,060,000 | | Essential Utilities, Inc., 5.30%, 5/1/52 | | | 1,027,009 | |
| | | | | | |
| | | | | 6,881,792 | |
| | | | | | |
| |
Total Corporate Bonds | | | 72,981,381 | |
| | | | | | |
(Cost $81,105,257) | | | | |
| |
U.S. Government Agency Backed Mortgages — 27.33% | | | | |
Fannie Mae — 16.46% | | | | |
8,000,000 | | 2.00%, 4/15/53 | | | 6,610,080 | |
50,000 | | Pool #AN0360, 3.95%, 12/1/45 | | | 45,977 | |
90,999 | | Pool #AN7868, 3.06%, 12/1/27 | | | 86,266 | |
9,633 | | Pool #BJ0657, 4.00%, 2/1/48 | | | 9,345 | |
32,537 | | Pool #BJ2670, 4.00%, 4/1/48 | | | 31,563 | |
58,991 | | Pool #BJ3178, 4.00%, 11/1/47 | | | 57,825 | |
37,174 | | Pool #BJ5158, 4.00%, 4/1/48 | | | 36,061 | |
42,634 | | Pool #BJ9439, 4.00%, 2/1/48 | | | 41,661 | |
49,250 | | Pool #BJ9477, 4.00%, 4/1/48 | | | 48,126 | |
47,662 | | Pool #BK7924, 4.00%, 11/1/48 | | | 46,574 | |
21,657 | | Pool #BO1263, 3.50%, 6/1/49 | | | 20,440 | |
802,027 | | Pool #BP3417, 2.50%, 5/1/51 | | | 693,978 | |
152,117 | | Pool #BP8741, 2.50%, 6/1/50 | | | 132,211 | |
301,198 | | Pool #BQ7523, 2.00%, 11/1/50 | | | 250,567 | |
343,270 | | Pool #BQ7524, 2.50%, 10/1/50 | | | 297,923 | |
1,586,476 | | Pool #BR2051, 2.50%, 6/1/51 | | | 1,372,006 | |
300,000 | | Pool #BS0915, 1.62%, 3/1/31 | | | 241,733 | |
1,559,145 | | Pool #BT8237, 4.00%, 6/1/52 | | | 1,490,120 | |
31
|
SCHEDULE OF PORTFOLIO INVESTMENTS |
RBC Impact Bond Fund (cont.)
March 31, 2023 (Unaudited)
| | | | | | |
Principal
Amount | | | | Value | |
$ 44,144 | | Pool #CA1066, 4.00%, 1/1/48 | | $ | 42,887 | |
21,992 | | Pool #CA1068, 3.50%, 1/1/48 | | | 20,708 | |
35,590 | | Pool #CA2595, 4.50%, 11/1/48 | | | 35,384 | |
67,154 | | Pool #CA2912, 4.00%, 12/1/48 | | | 65,723 | |
44,932 | | Pool #CA3132, 4.00%, 2/1/49 | | | 43,899 | |
44,545 | | Pool #CA3174, 4.00%, 2/1/49 | | | 43,528 | |
266,512 | | Pool #CA3451, 3.50%, 5/1/49 | | | 250,096 | |
192,402 | | Pool #CA3456, 3.50%, 5/1/49 | | | 180,551 | |
349,725 | | Pool #CA9048, 2.00%, 2/1/51 | | | 290,612 | |
1,015,474 | | Pool #CB0480, 2.50%, 5/1/51 | | | 878,196 | |
587,984 | | Pool #CB0576, 2.50%, 5/1/51 | | | 508,497 | |
1,528,325 | | Pool #CB2761, 3.00%, 2/1/52 | | | 1,370,825 | |
2,304,760 | | Pool #CB3227, 3.50%, 3/1/52 | | | 2,140,392 | |
2,816,049 | | Pool #CB3764, 4.00%, 6/1/52 | | | 2,691,380 | |
2,064,511 | | Pool #CB3797, 4.00%, 6/1/52 | | | 1,979,458 | |
2,235,814 | | Pool #CB4208, 4.50%, 7/1/52 | | | 2,189,279 | |
2,268,640 | | Pool #CB4272, 4.50%, 7/1/52 | | | 2,221,424 | |
2,057,136 | | Pool #CB4314, 4.50%, 8/1/52 | | | 2,014,322 | |
1,992,687 | | Pool #CB4463, 4.50%, 8/1/52 | | | 1,959,395 | |
2,131,624 | | Pool #CB4767, 5.00%, 9/1/52 | | | 2,138,553 | |
2,344,060 | | Pool #CB4967, 5.50%, 10/1/52 | | | 2,374,294 | |
1,609,383 | | Pool #CB5166, 6.00%, 11/1/52 | | | 1,642,153 | |
554,245 | | Pool #CB5202, 6.50%, 11/1/52 | | | 571,879 | |
1,230,428 | | Pool #CB5220, 6.50%, 12/1/52 | | | 1,269,576 | |
| | | | | | |
| | | | | 38,435,467 | |
| | | | | | �� |
Freddie Mac — 9.72% | | | | |
39,146 | | Pool #Q59453, 4.00%, 11/1/48 | | | 38,011 | |
200,318 | | Pool #QB5731, 2.00%, 11/1/50 | | | 166,644 | |
198,890 | | Pool #QB5732, 2.50%, 11/1/50 | | | 172,617 | |
891,767 | | Pool #QC3844, 2.00%, 6/1/51 | | | 739,545 | |
290,375 | | Pool #QC3845, 2.50%, 6/1/51 | | | 250,985 | |
1,297,636 | | Pool #QC7895, 2.00%, 9/1/51 | | | 1,075,327 | |
788,683 | | Pool #QE4428, 4.00%, 6/1/52 | | | 753,760 | |
1,985,219 | | Pool #QE6510, 4.50%, 7/1/52 | | | 1,943,906 | |
87,138 | | Pool #RA1713, 3.00%, 11/1/49 | | | 78,867 | |
80,765 | | Pool #RA1714, 3.00%, 11/1/49 | | | 73,099 | |
137,686 | | Pool #RA2256, 3.00%, 3/1/50 | | | 124,664 | |
179,962 | | Pool #RA2340, 3.00%, 3/1/50 | | | 162,907 | |
170,087 | | Pool #RA2395, 2.50%, 4/1/50 | | | 147,988 | |
401,461 | | Pool #RA2575, 2.50%, 5/1/50 | | | 349,175 | |
140,587 | | Pool #RA2727, 2.00%, 5/1/50 | | | 117,173 | |
140,003 | | Pool #RA2728, 2.50%, 5/1/50 | | | 121,726 | |
356,748 | | Pool #RA2740, 2.50%, 6/1/50 | | | 310,175 | |
299,217 | | Pool #RA3680, 2.50%, 9/1/50 | | | 259,876 | |
208,822 | | Pool #RA3751, 2.00%, 10/1/50 | | | 173,832 | |
342,814 | | Pool #RA4503, 2.00%, 2/1/51 | | | 284,867 | |
328,013 | | Pool #RA4927, 2.00%, 3/1/51 | | | 272,430 | |
32
|
SCHEDULE OF PORTFOLIO INVESTMENTS |
RBC Impact Bond Fund (cont.)
March 31, 2023 (Unaudited)
| | | | | | |
Principal
Amount | | | | Value | |
$ 479,946 | | Pool #RA5020, 2.00%, 4/1/51 | | $ | 398,468 | |
1,270,969 | | Pool #RA5195, 2.50%, 5/1/51 | | | 1,095,422 | |
895,789 | | Pool #RA5197, 2.50%, 5/1/51 | | | 775,108 | |
467,924 | | Pool #RA5237, 2.50%, 5/1/51 | | | 404,885 | |
1,480,745 | | Pool #RA5571, 2.50%, 7/1/51 | | | 1,279,189 | |
230,843 | | Pool #RA5621, 2.50%, 8/1/51 | | | 199,421 | |
785,740 | | Pool #RA5701, 2.00%, 8/1/51 | | | 651,128 | |
192,532 | | Pool #RA5874, 2.50%, 9/1/51 | | | 166,145 | |
2,331,686 | | Pool #RA6108, 3.50%, 3/1/52 | | | 2,165,743 | |
2,016,259 | | Pool #RA6760, 3.00%, 2/1/52 | | | 1,808,500 | |
2,278,144 | | Pool #RA7454, 4.00%, 6/1/52 | | | 2,177,266 | |
1,912,112 | | Pool #RA7714, 4.50%, 7/1/52 | | | 1,872,321 | |
54,023 | | Pool #V84506, 4.00%, 7/1/48 | | | 52,457 | |
42,778 | | Pool #V84836, 4.00%, 11/1/48 | | | 41,538 | |
61,837 | | Pool #V85365, 3.50%, 4/1/49 | | | 58,677 | |
179,643 | | Pool #V85381, 3.50%, 4/1/49 | | | 168,764 | |
40,346 | | Series 2018-SB45, Class A10F, 3.16%, 11/25/27(c) | | | 38,673 | |
57,293 | | Series 2018-SB47, Class A10F, 3.35%, 1/25/28(c) | | | 54,407 | |
54,780 | | Series 2018-SB48, Class A10F, 3.35%, 2/25/28(c) | | | 52,060 | |
145,446 | | Series 2019-SB59, Class A10F, 3.47%, 1/25/29(c) | | | 139,921 | |
1,355,683 | | Series 2021-SB87, Class A5H, 0.78%, 4/25/41(c) | | | 1,230,152 | |
75,840 | | Series KF57, Class A, (LIBOR USD 1-Month + 0.540%), 5.21%, 12/25/28(d) | | | 75,618 | |
323,511 | | Series Q014, Class A1, 1.56%, 1/25/36(d) | | | 262,204 | |
| | | | | | |
| | | | | 22,785,641 | |
| | | | | | |
Ginnie Mae — 0.11% | | | | |
149,991 | | Pool #AC3667, 1.66%, 8/15/26 | | | 149,991 | |
33,122 | | Pool #BB3740, 4.00%, 11/15/47 | | | 32,292 | |
57,341 | | Pool #BE3008, 4.00%, 4/20/48 | | | 55,883 | |
29,941 | | Series 2018-2, Class AD, 2.40%, 3/16/59 | | | 27,133 | |
21,979 | | Series 2018-26, Class AD, 2.50%, 3/16/52 | | | 20,889 | |
| | | | | | |
| | | | | 286,188 | |
| | | | | | |
U.S. International Development Finance Corp. — 1.04% | | | | |
2,425,000 | | Series **, (US Treasury Bill Yield 3-Month + 0.000%), 4.95%, 7/5/38(d) | | | 2,425,000 | |
| | | | | | |
| |
Total U.S. Government Agency Backed Mortgages | | | 63,932,296 | |
| | | | | | |
(Cost $69,125,479) | | | | |
| |
Municipal Bonds — 19.97% | | | | |
Alabama — 0.40% | | | | |
150,000 | | Water Works Board of the City of Birmingham Revenue, 2.60%, 1/1/27 | | | 140,709 | |
1,000,000 | | Water Works Board of the City of Birmingham Revenue, 2.39%, 1/1/35, Callable 7/1/31 @ 100 | | | 797,483 | |
| | | | | | |
| | | | | 938,192 | |
| | | | | | |
33
|
SCHEDULE OF PORTFOLIO INVESTMENTS |
RBC Impact Bond Fund (cont.)
March 31, 2023 (Unaudited)
| | | | | | |
Principal
Amount | | | | Value | |
| |
Arizona — 0.37% | | | | |
$ 750,000 | | City of Phoenix Civic Improvement Corp. Revenue, Series C, 1.38%, 7/1/27 | | $ | 662,638 | |
250,000 | | City of Tucson Water System Revenue, 1.88%, 7/1/30 | | | 209,521 | |
| | | | | | |
| | | | | 872,159 | |
| | | | | | |
Arkansas — 0.04% | | | | |
100,000 | | City of Russellville Water & Sewer Revenue, Series B, 1.23%, 7/1/26, (Credit Support: BAM) | | | 89,646 | |
| | | | | | |
| |
California — 6.35% | | | | |
150,000 | | California Health Facilities. Financing Authority Revenue, 2.02%, 6/1/24 | | | 145,158 | |
250,000 | | California Health Facilities. Financing Authority Revenue, 1.68%, 6/1/28 | | | 215,957 | |
815,000 | | California Health Facilities. Financing Authority Revenue, 1.98%, 6/1/30 | | | 678,607 | |
990,000 | | California Health Facilities. Financing Authority Revenue, 2.53%, 6/1/35 | | | 783,336 | |
460,000 | | Calleguas Municipal Water District Revenue, Series A, 2.52%, 7/1/36 | | | 359,706 | |
135,000 | | City & County of San Francisco GO, Series A, 2.82%, 6/15/24 | | | 132,192 | |
100,000 | | City & County of San Francisco GO, 1.95%, 6/15/27 | | | 91,376 | |
100,000 | | City of Los Angeles Housing GO, Series A, 2.95%, 9/1/28, Callable 9/1/27 @ 100 | | | 93,181 | |
350,000 | | City of San Buenaventura Revenue, 1.17%, 1/1/26 | | | 320,760 | |
1,580,000 | | City of San Francisco Public Utilities Commission Water Revenue, Series G, 1.79%, 11/1/30 | | | 1,312,000 | |
750,000 | | City of Santa Rosa Wastewater Revenue, Series B, Series B, 2.12%, 9/1/31 | | | 619,570 | |
300,000 | | City of Santa Rosa Wastewater Revenue, Series B, 2.32%, 9/1/33 | | | 241,214 | |
100,000 | | City of Sunnyvale Wastewater Revenue, Series A, 3.20%, 4/1/26 | | | 97,033 | |
210,000 | | Cucamonga Valley Water District Financing Authority Revenue, Series A, 1.54%, 9/1/27 | | | 187,265 | |
1,500,000 | | Cucamonga Valley Water District Financing Authority Revenue, Series B, 3.60%, 9/1/27 | | | 1,460,590 | |
150,000 | | Escondido Joint Powers Financing Authority Revenue, Series B, 2.44%, 9/1/25 | | | 143,576 | |
150,000 | | Kern Community College District GO, 2.54%, 11/1/26 | | | 140,807 | |
190,000 | | Lancaster Power Authority Revenue, 0.87%, 11/1/24, (Credit Support: AGM) | | | 178,616 | |
240,000 | | Lancaster Power Authority Revenue, 1.67%, 11/1/27, (Credit Support: AGM) | | | 211,223 | |
285,000 | | Lancaster Power Authority Revenue, 1.92%, 11/1/28, (Credit Support: AGM) | | | 247,487 | |
525,000 | | Lancaster Power Authority Revenue, 2.56%, 11/1/33, (Credit Support: AGM), Callable 11/1/31 @ 100 | | | 426,335 | |
525,000 | | Lancaster Power Authority Revenue, 2.68%, 11/1/34, (Credit Support: AGM), Callable 11/1/31 @ 100 | | | 423,181 | |
34
|
SCHEDULE OF PORTFOLIO INVESTMENTS |
RBC Impact Bond Fund (cont.)
March 31, 2023 (Unaudited)
| | | | | | |
Principal
Amount | | | | Value | |
$ 755,000 | | Lancaster Power Authority Revenue, 2.79%, 11/1/35, (Credit Support: AGM), Callable 11/1/31 @ 100 | | $ | 605,348 | |
300,000 | | Riverside Community College District GO, 0.82%, 8/1/25 | | | 276,345 | |
200,000 | | Rosemead School District GO, Series A, 2.17%, 8/1/25 | | | 189,683 | |
250,000 | | Rowland Water District Revenue, Series A, 1.61%, 12/1/29 | | | 209,112 | |
1,000,000 | | Rowland Water District Revenue, Series A, 1.91%, 12/1/31 | | | 809,494 | |
800,000 | | Rowland Water District Revenue, Series A, Series A, 2.56%, 12/1/36, Callable 12/1/31 @ 100 | | | 625,181 | |
125,000 | | San Diego County Water Authority Revenue, Series A, 1.17%, 5/1/27 | | | 110,266 | |
100,000 | | San Francisco City & County Public Utilities Commission Wastewater Revenue, 5.40%, 10/1/28 | | | 104,675 | |
400,000 | | Santa Clara Valley Water District Certificate Participation, Series D, 1.78%, 6/1/31, Callable 6/1/30 @ 100 | | | 328,955 | |
1,060,000 | | Santa Clara Valley Water District Certificate Participation, Series D, 1.88%, 6/1/32, Callable 6/1/30 @ 100 | | | 857,595 | |
950,000 | | Santa Clara Valley Water District Certificate Participation, Series D, 2.08%, 6/1/34, Callable 6/1/30 @ 100 | | | 749,652 | |
600,000 | | Sonoma-Marin Area Rail Transit District Revenue, Series A, 2.02%, 3/1/28 | | | 532,777 | |
100,000 | | State of California Department of Water Resources Revenue, 0.92%, 12/1/26 | | | 88,872 | |
315,000 | | Walnut Valley Water District Revenue, Series A, 0.96%, 6/1/26 | | | 283,816 | |
320,000 | | Walnut Valley Water District Revenue, Series A, 1.17%, 6/1/27 | | | 281,887 | |
325,000 | | Walnut Valley Water District Revenue, Series A, 1.37%, 6/1/28 | | | 280,528 | |
| | | | | | |
| | | | | 14,843,356 | |
| | | | | | |
Colorado — 0.12% | | | | |
50,000 | | Denver City & County School District No 1 GO, Series B, 2.99%, 12/1/24, (Credit Support: State Aid Withholding) | | | 48,371 | |
275,000 | | Parker Water & Sanitation District GO, 2.10%, 8/1/29 | | | 240,086 | |
| | | | | | |
| | | | | 288,457 | |
| | | | | | |
Connecticut — 0.17% | | | | |
325,000 | | Connecticut Green Bank Revenue, 1.95%, 11/15/28 | | | 280,767 | |
150,000 | | South Central Connecticut Regional Water Authority Revenue, Series B, 2.86%, 8/1/30, Callable 8/1/29 @ 100 | | | 128,861 | |
| | | | | | |
| | | | | 409,628 | |
| | | | | | |
District of Columbia — 0.88% | | | | |
340,000 | | District of Columbia Housing Finance Agency Revenue, Series A, 1.05%, 3/1/25, (Credit Support: FHA) | | | 319,494 | |
155,000 | | District of Columbia Housing Finance Agency Revenue, Series A, 1.15%, 9/1/25, (Credit Support: FHA) | | | 143,830 | |
350,000 | | District of Columbia Housing Finance Agency Revenue, Series A, 1.20%, 3/1/26, (Credit Support: FHA) | | | 320,475 | |
195,000 | | District of Columbia Housing Finance Agency Revenue, Series A, 1.50%, 3/1/27, (Credit Support: FHA) | | | 175,444 | |
195,000 | | District of Columbia Housing Finance Agency Revenue, Series A, 1.60%, 9/1/27, (Credit Support: FHA) | | | 173,837 | |
35
|
SCHEDULE OF PORTFOLIO INVESTMENTS |
RBC Impact Bond Fund (cont.)
March 31, 2023 (Unaudited)
| | | | | | |
Principal
Amount | | | | Value | |
$ 200,000 | | District of Columbia Housing Finance Agency Revenue, Series A, 1.70%, 3/1/28, (Credit Support: FHA) | | $ | 176,814 | |
135,000 | | District of Columbia Housing Finance Agency Revenue, Series A, 1.75%, 9/1/28, (Credit Support: FHA) | | | 118,142 | |
140,000 | | District of Columbia Housing Finance Agency Revenue, Series A, 1.95%, 9/1/29, (Credit Support: FHA) | | | 120,910 | |
590,000 | | District of Columbia Housing Finance Agency Revenue, Series A, 2.15%, 3/1/31, (Credit Support: FHA),
Callable 3/1/30 @ 100 | | | 498,825 | |
| | | | | | |
| | | | | 2,047,771 | |
| | | | | | |
Florida — 0.73% | | | | |
2,000,000 | | City of Palm Coast Utility Revenue, 1.44%, 10/1/28 | | | 1,703,061 | |
| | | | | | |
| |
Georgia — 0.30% | | | | |
285,000 | | Carroll County Water Authority Revenue, Series B, 1.51%, 7/1/27 | | | 252,831 | |
75,000 | | Macon-Bibb County Urban Development Authority Revenue, Series A, 3.00%, 12/1/24,
(Credit Support: County Guaranteed) | | | 72,934 | |
425,000 | | Tift County Hospital Authority Revenue, 1.05%, 12/1/25, (Credit Support: County Guaranteed) | | | 386,363 | |
| | | | | | |
| | | | | 712,128 | |
| | | | | | |
Hawaii — 0.35% | | | | |
695,000 | | City & County of Honolulu GO, Series C, 1.47%, 7/1/28 | | | 597,080 | |
250,000 | | Honolulu City & County Board of Water Supply Revenue, Series B, 1.98%, 7/1/27 | | | 226,815 | |
| | | | | | |
| | | | | 823,895 | |
| | | | | | |
Idaho — 0.16% | | | | |
500,000 | | Idaho Energy Resources Authority Revenue, 2.86%, 9/1/46 | | | 371,612 | |
| | | | | | |
| |
Iowa — 0.04% | | | | |
100,000 | | Northeast Iowa Community College GO, Series 1, 3.45%, 6/1/26, Callable 6/1/24 @ 100 | | | 97,437 | |
| | | | | | |
| |
Maryland — 0.08% | | | | |
225,000 | | City of Baltimore Revenue, Series B, 1.58%, 7/1/28 | | | 196,627 | |
| | | | | | |
| |
Massachusetts — 0.61% | | | | |
600,000 | | Boston Water & Sewer Commission Revenue, 1.37%, 11/1/27 | | | 523,631 | |
1,040,000 | | Massachusetts Bay Transportation Authority Sales Tax Revenue, Series B, 2.49%, 7/1/33, Callable 7/1/31 @ 100 | | | 896,585 | |
| | | | | | |
| | | | | 1,420,216 | |
| | | | | | |
Michigan — 0.96% | | | | |
750,000 | | City of Grand Rapids Sanitary Sewer System Revenue, 1.86%, 1/1/31 | | | 615,529 | |
36
|
SCHEDULE OF PORTFOLIO INVESTMENTS |
RBC Impact Bond Fund (cont.)
March 31, 2023 (Unaudited)
| | | | | | |
Principal
Amount | | | | Value | |
$1,330,000 | | City of Grand Rapids Sanitary Sewer System Revenue, 2.01%, 1/1/32, Callable 1/1/31 @ 100 | | $ | 1,075,450 | |
95,000 | | Marquette Brownfield Redevelopment Authority Revenue, 3.05%, 5/1/27, (Credit Support: Municipal Government Guaranteed), Callable 5/1/26 @ 100 | | | 89,380 | |
300,000 | | Romulus Community Schools GO, Series B, 1.00%, 5/1/25, (Credit Support: Q-SBLF) | | | 280,399 | |
225,000 | | State of Michigan GO, Series B, 1.54%, 5/15/30 | | | 187,408 | |
| | | | | | |
| | | | | 2,248,166 | |
| | | | | | |
Nebraska — 0.14% | | | | |
100,000 | | City of Omaha Sewer Revenue, Series B, 1.04%, 4/1/26 | | | 90,676 | |
250,000 | | Papio-Missouri River Natural Resource District Special Tax, 2.20%, 12/15/25, Callable 6/15/24 @ 100 | | | 229,459 | |
| | | | | | |
| | | | | 320,135 | |
| | | | | | |
Nevada — 0.10% | | | | |
250,000 | | City of Henderson GO, Series A, 2.23%, 6/1/28 | | | 225,502 | |
| | | | | | |
| |
New Jersey — 0.53% | | | | |
1,335,000 | | Morris County Improvement Authority Revenue, 0.89%, 6/15/25 | | | 1,230,679 | |
| | | | | | |
| |
New York — 0.59% | | | | |
570,000 | | New York State Housing Finance Agency Revenue, 1.13%, 11/1/25, (Credit Support: SONYMA), Callable 7/1/23 @ 100 | | | 521,377 | |
600,000 | | Western Nassau County Water Authority Revenue, Series B, 2.50%, 4/1/34 | | | 478,521 | |
500,000 | | Western Nassau County Water Authority Revenue, Series B, 2.58%, 4/1/35 | | | 392,693 | |
| | | | | | |
| | | | | 1,392,591 | |
| | | | | | |
Ohio — 0.08% | | | | |
130,000 | | City of Cincinnati Revenue, Series C, 3.95%, 11/1/28 | | | 126,490 | |
100,000 | | County of Franklin Revenue, 2.88%, 11/1/50, Callable 5/1/50 @ 100 | | | 64,982 | |
| | | | | | |
| | | | | 191,472 | |
| | | | | | |
Oklahoma — 0.56% | | | | |
715,000 | | Oklahoma Capitol Improvement Authority Revenue, Series A, Series A, 2.58%, 7/1/28 | | | 648,221 | |
745,000 | | Oklahoma Capitol Improvement Authority Revenue, Series A, Series A, 2.63%, 7/1/29 | | | 664,964 | |
| | | | | | |
| | | | | 1,313,185 | |
| | | | | | |
Oregon — 0.71% | | | | |
350,000 | | City of Portland GO, Series B, 1.51%, 6/15/28 | | | 303,907 | |
300,000 | | City of Tigard Water Revenue, 2.00%, 8/1/28, (Credit Support: BAM) | | | 268,078 | |
37
|
SCHEDULE OF PORTFOLIO INVESTMENTS |
RBC Impact Bond Fund (cont.)
March 31, 2023 (Unaudited)
| | | | | | |
Principal
Amount | | | | Value | |
$ 90,000 | | State of Oregon GO, Series B, 2.77%, 5/1/23 | | $ | 89,871 | |
345,000 | | State of Oregon GO, Series F, 1.32%, 6/1/27 | | | 310,197 | |
700,000 | | State of Oregon GO, Series B, Series B, 3.89%, 5/1/30 | | | 687,781 | |
| | | | | | |
| | | | | 1,659,834 | |
| | | | | | |
Pennsylvania — 1.81% | | | | |
1,750,000 | | City of Philadelphia Water & Wastewater Revenue, Series B, 1.49%, 7/1/27 | | | 1,535,796 | |
185,000 | | City of Philadelphia Water & Wastewater Revenue, Series A, 3.55%, 10/1/28 | | | 174,909 | |
825,000 | | Economy Borough Municipal Authority Revenue, Series A, 1.65%, 12/15/28, (Credit Support: BAM) | | | 702,759 | |
1,325,000 | | Redevelopment Authority of the City of Philadelphia Revenue, Series A, Series A, 1.03%, 9/1/24 | | | 1,256,080 | |
500,000 | | Redevelopment Authority of the City of Philadelphia Revenue, Series A, Series A, 1.38%, 9/1/25 | | | 462,930 | |
100,000 | | Redevelopment Authority of the City of Philadelphia Revenue, 4.50%, 11/1/31, Callable 11/1/28 @ 100 | | | 97,366 | |
| | | | | | |
| | | | | 4,229,840 | |
| | | | | | |
Rhode Island — 1.04% | | | | |
1,295,000 | | Narragansett Bay Commission Revenue, 2.09%, 9/1/30 | | | 1,101,487 | |
400,000 | | Narragansett Bay Commission Revenue, 2.26%, 9/1/32, Callable 9/1/30 @ 100 | | | 329,686 | |
150,000 | | Rhode Island Infrastructure Bank Revenue, 2.70%, 10/1/28 | | | 137,461 | |
1,000,000 | | Rhode Island Infrastructure Bank State Revolving Fund Revenue, Series A, 1.40%, 10/1/28 | | | 861,626 | |
| | | | | | |
| | | | | 2,430,260 | |
| | | | | | |
Tennessee — 0.06% | | | | |
160,000 | | Metropolitan Government of Nashville & Davidson County Water & Sewer Revenue, Series B, Series B, 1.47%, 7/1/27 | | | 141,193 | |
| | | | | | |
| |
Texas — 1.38% | | | | |
250,000 | | City of Houston Combined Utility System Revenue, Series C, 2.05%, 11/15/26 | | | 229,387 | |
170,000 | | City of Temple Utility System Revenue, 1.11%, 8/1/25 | | | 156,977 | |
300,000 | | City of Temple Utility System Revenue, 1.53%, 8/1/27 | | | 265,163 | |
690,000 | | City of Temple Utility System Revenue, 1.80%, 8/1/29 | | | 588,092 | |
800,000 | | Dallas Area Rapid Transit Revenue, 2.18%, 12/1/32 | | | 655,723 | |
335,000 | | Hidalgo County Drain District No 1 GO, Series A, 0.96%, 9/1/25 | | | 309,274 | |
275,000 | | Hidalgo County Drain District No 1 GO, Series A, 1.11%, 9/1/26 | | | 247,394 | |
225,000 | | Hidalgo County Drain District No 1 GO, Series A, 1.35%, 9/1/27 | | | 198,677 | |
130,000 | | Hidalgo County Drain District No 1 GO, Series A, 1.50%, 9/1/28 | | | 112,496 | |
300,000 | | Hidalgo County Drain District No 1 GO, Series A, 1.67%, 9/1/29 | | | 255,164 | |
200,000 | | United Independent School District GO, 5.00%, 8/15/24, (Credit Support: PSF-GTD) | | | 200,554 | |
| | | | | | |
| | | | | 3,218,901 | |
| | | | | | |
38
|
SCHEDULE OF PORTFOLIO INVESTMENTS |
RBC Impact Bond Fund (cont.)
March 31, 2023 (Unaudited)
| | | | | | |
Principal
Amount | | | | Value | |
Utah — 0.19% | | | | |
$ 520,000 | | Metropolitan Water District of Salt Lake & Sandy Revenue, Series B, 1.52%, 7/1/28 | | $ | 446,114 | |
| | | | | | |
| |
Vermont — 0.04% | | | | |
100,000 | | Vermont Housing Finance Agency Revenue, 3.45%, 11/1/29 | | | 92,941 | |
| | | | | | |
| |
Washington — 1.18% | | | | |
2,400,000 | | City of Tacoma Electric System Revenue, Series C, 5.64%, 1/1/27 | | | 2,489,596 | |
300,000 | | Grant County Public Utility District No 2 Priest Rapids Hydroelectric Project Revenue, 1.90%, 1/1/27 | | | 273,472 | |
| | | | | | |
| | | | | 2,763,068 | |
| | | | | | |
| |
Total Municipal Bonds | | | 46,718,066 | |
| | | | | | |
(Cost $54,232,223) | | | | |
| |
Asset Backed Securities — 13.61% | | | | |
2,065,000 | | DEXT ABS 2023-1 LLC, 7.13%, 9/15/32 | | | 2,064,412 | |
1,430,000 | | DEXT ABS 2023-1 LLC, 8.82%, 3/15/33 | | | 1,429,688 | |
800,818 | | GoodLeap Sustainable Home Solutions Trust, Series 2021-3CS, Class A, 2.10%, 5/20/48(a) | | | 629,036 | |
1,907,729 | | GoodLeap Sustainable Home Solutions Trust, Series 2021-5CS, Class B, 2.56%, 10/20/48(a) | | | 1,427,085 | |
1,441,761 | | GoodLeap Sustainable Home Solutions Trust, Series 2022-1GS, Class B, 2.94%, 1/20/49(a) | | | 1,090,800 | |
4,000,000 | | Hertz Vehicle Financing III LLC, 5.49%, 6/25/27(a) | | | 4,019,476 | |
718,953 | | Loanpal Solar Loan Ltd., Series 2021-2GS, Class A, 2.22%, 3/20/48(a) | | | 564,368 | |
3,391,438 | | Luminace Issuer LLC, Series 2022-1, Class B, 5.91%, 7/31/62(a) | | | 2,956,206 | |
1,200,000 | | Mosaic Solar Loan Trust, Series 2023-2A, Class A, 5.36%, 9/22/53(a) | | | 1,180,420 | |
1,041,894 | | Sunnova Helios II Issuer LLC, Series 2019-AA, Class A, 3.75%, 6/20/46(a) | | | 928,456 | |
986,694 | | Sunnova Helios II Issuer LLC, Series 2021-B, Class A, 1.62%, 7/20/48(a) | | | 834,004 | |
1,482,561 | | Sunnova Helios V Issuer LLC, Series 2021-A, Class A, 1.80%, 2/20/48(a) | | | 1,119,086 | |
900,879 | | Sunnova Helios VII Issuer LLC, Series 2021-C, Class A, 2.03%, 10/20/48(a) | | | 775,656 | |
1,604,656 | | Sunnova Sol IV Issuer LLC, Series 2022-A, Class C, 3.53%, 2/22/49(a) | | | 1,294,354 | |
800,000 | | Tesla Auto Lease Trust, 1.02%, 3/20/25(a) | | | 775,618 | |
2,955,000 | | Tesla Auto Lease Trust, Series 2020-A, Class D, 2.33%, 2/20/24(a) | | | 2,945,915 | |
3,000,000 | | Tesla Auto Lease Trust, Series 2021-A, Class D, 1.34%, 3/20/25(a) | | | 2,888,516 | |
39
|
SCHEDULE OF PORTFOLIO INVESTMENTS |
RBC Impact Bond Fund (cont.)
March 31, 2023 (Unaudited)
| | | | | | |
Principal
Amount | | | | Value | |
$3,200,000 | | Tesla Auto Lease Trust, Series 2021-B, Class C, 1.12%, 9/22/25(a) | | $ | 3,020,977 | |
2,000,000 | | Tesla Auto Lease Trust, Series 2021-B, Class D, 1.32%, 9/22/25(a) | | | 1,880,079 | |
| | | | | | |
Total Asset Backed Securities | | | 31,824,152 | |
| | | | | | |
(Cost $34,480,603) | | | | |
| |
U.S. Government Agency Obligations — 6.60% | | | | |
Small Business Administration — 2.80% | | | | |
244,717 | | Certificate of Originator’s Fee, 0.03%, 4/15/31(d),(e) | | | 139 | |
897,300 | | Certificate of Originator’s Fee, 0.03%, 7/15/31(d),(e) | | | 510 | |
143,106 | | Certificate of Originator’s Fee, 0.23%, 12/15/30(d),(e) | | | 623 | |
447,502 | | Certificate of Originator’s Fee, 0.23%, 3/15/31(d),(e) | | | 1,948 | |
344,250 | | Certificate of Originator’s Fee, 0.23%, 5/15/31(d),(e) | | | 1,499 | |
389,700 | | Certificate of Originator’s Fee, 0.28%, 5/17/46(d),(e) | | | 3,167 | |
450,000 | | Certificate of Originator’s Fee, 0.48%, 9/1/31(e) | | | 4,695 | |
443,934 | | Certificate of Originator’s Fee, 0.53%, 6/15/31(d),(e) | | | 4,454 | |
222,833 | | Certificate of Originator’s Fee, 0.78%, 4/15/31(d),(e) | | | 3,290 | |
1,350,000 | | Certificate of Originator’s Fee, 0.78%, 7/15/31(d),(e) | | | 19,933 | |
495,000 | | Certificate of Originator’s Fee, 0.78%, 8/15/31(d),(e) | | | 7,309 | |
315,000 | | Certificate of Originator’s Fee, 0.78%, 8/15/31(d),(e) | | | 4,651 | |
103,500 | | Certificate of Originator’s Fee, 0.78%, 8/15/31(d),(e) | | | 1,528 | |
494,802 | | Certificate of Originator’s Fee, 0.98%, 4/15/31(d),(e) | | | 10,551 | |
404,563 | | Certificate of Originator’s Fee, 1.03%, 4/15/46(d),(e) | | | 12,095 | |
346,986 | | Certificate of Originator’s Fee, 1.23%, 5/10/31(e) | | | 9,277 | |
270,000 | | Certificate of Originator’s Fee, 1.23%, 8/2/31(e) | | | 7,218 | |
180,000 | | Certificate of Originator’s Fee, 1.23%, 9/10/31(e) | | | 4,812 | |
139,500 | | Certificate of Originator’s Fee, 1.23%, 9/16/31(e) | | | 3,730 | |
940,950 | | Certificate of Originator’s Fee, 1.28%, 4/7/46(d),(e) | | | 34,960 | |
437,400 | | Certificate of Originator’s Fee, 1.28%, 6/23/46(d),(e) | | | 16,251 | |
1,226,700 | | Certificate of Originator’s Fee, 1.28%, 6/30/46(d),(e) | | | 45,577 | |
27,360 | | (Prime Index - 2.500%), 5.00%, 2/25/28(d) | | | 27,359 | |
70,807 | | (Prime Index - 2.500%), 5.00%, 4/25/44(d) | | | 70,691 | |
34,404 | | (TBA), 5.27%, 3/30/28(d),(e) | | | 38,057 | |
30,815 | | (TBA), 5.58%, 9/23/25(d),(e) | | | 33,822 | |
49,436 | | (Prime Index - 0.675%), 6.83%, 9/25/43(d) | | | 51,446 | |
185,228 | | (Prime Index - 0.675%), 6.83%, 11/25/45(d) | | | 193,559 | |
109,988 | | 7.08%, 7/25/30(d) | | | 109,918 | |
200,137 | | (Prime Index + 0.121%), 7.62%, 1/25/46(d) | | | 213,137 | |
380,141 | | (Prime Index + 0.325%), 7.83%, 6/25/31(d) | | | 401,426 | |
383,023 | | (Prime Index + 0.325%), 7.83%, 7/25/31(d) | | | 404,432 | |
447,170 | | (Prime Index + 0.325%), 7.83%, 2/25/32(d) | | | 474,191 | |
93,828 | | (Prime Index + 0.325%), 7.83%, 9/25/44(d) | | | 99,852 | |
806,071 | | (Prime Index + 0.325%), 7.83%, 8/25/46(d) | | | 865,406 | |
655,989 | | (Prime Index + 0.375%), 7.88%, 10/25/31(d) | | | 692,561 | |
611,066 | | (Prime Index + 0.375%), 7.88%, 8/25/46(d) | | | 651,694 | |
260,323 | | (Prime Index + 0.575%), 8.08%, 4/25/31(d) | | | 274,518 | |
40
|
SCHEDULE OF PORTFOLIO INVESTMENTS |
RBC Impact Bond Fund (cont.)
March 31, 2023 (Unaudited)
| | | | | | |
Principal
Amount | | | | Value | |
$ 32,432 | | (Prime Index + 0.646%), 8.15%, 3/25/43(d) | | $ | 34,663 | |
25,044 | | (Prime Index + 0.700%), 8.20%, 2/25/28(d) | | | 25,841 | |
853,210 | | (Prime Index + 0.825%), 8.33%, 9/25/31(d) | | | 909,624 | |
366,872 | | (Prime Index + 0.875%), 8.38%, 1/25/32(d) | | | 392,697 | |
25,914 | | (Prime Index + 1.012%), 8.51%, 11/25/28(d) | | | 27,065 | |
53,752 | | (Prime Index + 1.216%), 8.72%, 6/25/29(d) | | | 56,602 | |
49,083 | | 9.08%, 9/25/29 | | | 50,855 | |
54,365 | | (Prime Index + 1.575%), 9.08%, 7/25/30(d) | | | 57,712 | |
90,506 | | (Prime Index + 2.325%), 9.83%, 10/25/30(d) | | | 97,790 | |
85,031 | | (Prime Index + 2.325%), 9.83%, 1/25/31(d) | | | 92,628 | |
| | | | | | |
| | | | | 6,545,763 | |
| | | | | | |
U.S. International Development Finance Corp. — 3.80% | | | | |
1,000,000 | | 1.44%, 4/15/28 | | | 895,876 | |
500,000 | | 1.65%, 4/15/28 | | | 452,310 | |
2,204,230 | | (US Treasury Bill Yield 3-Month + 0.000%), 4.69%, 7/7/40(d) | | | 2,204,230 | |
2,619,000 | | (US Treasury Bill Yield 3-Month + 0.000%), 4.95%, 7/5/38(d),(e) | | | 2,619,000 | |
1,746,000 | | (US Treasury Bill Yield 3-Month + 0.000%), 4.95%, 7/5/38(d) | | | 1,746,000 | |
970,000 | | (US Treasury Bill Yield 3-Month + 0.000%), 4.95%, 7/5/38(d),(e) | | | 970,000 | |
| | | | | | |
| | | | | 8,887,416 | |
| | | | | | |
| |
Total U.S. Government Agency Obligations | | | 15,433,179 | |
| | | | | | |
(Cost $15,934,205) | | | | |
| |
Collateralized Mortgage Obligation — 1.14% | | | | |
2,800,000 | | BX Commercial Mortgage Trust, Series 2022-AHP, Class C, (Term SOFR 1M + 2.090%), 6.92%, 1/17/39(a),(d) | | | 2,659,131 | |
| | | | | | |
Total Collateralized Mortgage Obligation | | | 2,659,131 | |
| | | | | | |
(Cost $2,786,685) | | | | |
| | |
Shares | | | | | |
| | | | | | |
Investment Company — 2.45% | | | | |
5,720,754 | | U.S. Government Money Market Fund, RBC Institutional Class 1(f) | | | 5,720,754 | |
| | | | | | |
| |
Total Investment Company | | | 5,720,754 | |
| | | | | | |
(Cost $5,720,754) | | | | |
| |
Total Investments | | $ | 239,268,959 | |
(Cost $263,385,206)(g) — 102.30% | | | | |
| |
Liabilities in excess of other assets — (2.30)% | | | (5,379,114) | |
| | | | | | |
| |
NET ASSETS — 100.00% | | $ | 233,889,845 | |
| | | | | | |
41
|
SCHEDULE OF PORTFOLIO INVESTMENTS |
RBC Impact Bond Fund (cont.)
March 31, 2023 (Unaudited)
| (a) | Security exempt from registration under Rule 144A or Section 4(2) of the Securities Act of 1933, as amended. These securities may be resold in transactions exempt from registration, normally to qualified institutional buyers. |
| (b) | This security may be resold to qualified foreign investors and foreign institutional buyers under Regulation S of the Securities Act of 1933. |
| (c) | Variable or floating rate security, which interest rate adjusts periodically based on changes in current interest rates and prepayments on the underlying pool of assets. Rate shown is the rate in effect as of period end. |
| (d) | Floating rate note. Rate shown is as of report date. |
| (e) | The Pricing Committee has fair valued this security under procedures established by the Fund’s Board of Trustees. |
| (f) | Affiliated investment. |
| (g) | See Notes to Schedules of Portfolio Investments for the tax cost of securities and the breakdown of unrealized appreciation (depreciation). |
Financial futures contracts as of March 31, 2023:
| | | | | | | | | | | | | | | | | | | | | | | | | | |
Long Position | | Number of
Contracts | | | Expiration
Date | | | Value/Unrealized Appreciation | | | Notional
Value | | | Clearinghouse | |
2 Year U.S. Treasury Note | | | 100 | | | | June 2023 | | | | | $ | 227,192 | | | | USD | | | $ | 20,645,313 | | | | Barclays Capital Group | |
| | | | | | | | | | | | | | | | | | | | | | | | | | |
Total | | | | | | | | | | | | $ | 227,192 | | | | | | | | | | | | | |
| | | | | | | | | | | | | | | | | | | | | | | | | | |
| | | | | |
Short Position | | Number of
Contracts | | | Expiration
Date | | | Value/Unrealized Appreciation (Depreciation) | | | Notional
Value | | | Clearinghouse | |
10 Year U.S. Ultra Treasury Bond | | | 54 | | | | June 2023 | | | | | $ | (101,382) | | | | USD | | | $ | 6,541,594 | | | | Barclays Capital Group | |
30 Year U.S. Treasury Bond | | | 25 | | | | June 2023 | | | | | | 138,205 | | | | USD | | | | 3,278,906 | | | | Barclays Capital Group | |
30 Year U.S. Ultra Treasury Bond | | | 36 | | | | June 2023 | | | | | | 206,888 | | | | USD | | | | 5,080,500 | | | | Barclays Capital Group | |
Five Year U.S. Treasury Note | | | 95 | | | | June 2023 | | | | | | 216,307 | | | | USD | | | | 10,403,242 | | | | Barclays Capital Group | |
| | | | | | | | | | | | | | | | | | | | | | | | | | |
Total | | | | | | | | | | | | $ | 460,018 | | | | | | | | | | | | | |
| | | | | | | | | | | | | | | | | | | | | | | | | | |
42
|
SCHEDULE OF PORTFOLIO INVESTMENTS |
RBC Impact Bond Fund (cont.)
March 31, 2023 (Unaudited)
Abbreviations used are defined below:
AGM - Assured Guaranty Municipal Corp.
BAM - Bank of America
FHA - Insured by Federal Housing Administration
GO - General Obligations
LIBOR - London Interbank Offered Rate
MTN - Medium Term Note
PSF-GTD - Permanent School Fund Guarantee
Q-SBLF - Qualified School Bond Loan Fund
REIT - Real Estate Investment Trust
SOFR - Secured Overnight Financing Rate
SONYMA - State of New York Mortgage Agency
TBA - To-be-announced
USD - United States Dollar
See Notes to the Financial Statements.
43
Statements of Assets and Liabilities
March 31, 2023 (Unaudited)
| | | | | | | | | | | | |
| | | RBC Access Capital
Community
Investment Fund | | | RBC Impact
Bond Fund | |
Assets: | | | | | | | | | | | | |
Investments in securities, at value: | | | | | | | | | | | | |
Unaffiliated investments (cost $818,453,524 and $257,664,452, respectively) | | | | | | $ | 740,663,468 | | | $ | 233,548,205 | |
Affiliated investments (cost $12,843,698 and $5,720,754, respectively) | | | | | | | 12,843,698 | | | | 5,720,754 | |
Cash at broker for financial futures contracts | | | | | | | 1,572,443 | | | | 2,024,947 | |
Interest and dividend receivable | | | | | | | 2,790,013 | | | | 1,426,254 | |
Receivable for capital shares issued | | | | | | | 698,296 | | | | 723,858 | |
Receivable for investments sold | | | | | | | 561,319 | | | | 86,525 | |
Unrealized appreciation on futures contracts | | | | | | | 658,139 | | | | 788,592 | |
Prepaid expenses and other assets | | | | | | | 39,886 | | | | 18,398 | |
| | | | | | | | | | | | |
Total Assets | | | | | | | 759,827,262 | | | | 244,337,533 | |
| | | | | | | | | | | | |
Liabilities: | | | | | | | | | | | | |
Cash overdraft | | | | | | | 2,147 | | | | 8 | |
Professional fees payable | | | | | | | 4,148 | | | | 5,574 | |
Distributions payable | | | | | | | 705,732 | | | | 4,188 | |
Payable for capital shares redeemed | | | | | | | 400,869 | | | | 85,570 | |
Payable for investments purchased | | | | | | | 39,808,050 | | | | 10,125,350 | |
Unrealized depreciation on futures contracts | | | | | | | 2,951 | | | | 101,382 | |
Accrued expenses and other payables: | | | | | | | | | | | | |
Investment advisory fees | | | | | | | 155,294 | | | | 34,297 | |
Accounting fees | | | | | | | 14,800 | | | | 8,818 | |
Audit fees | | | | | | | 21,777 | | | | 22,425 | |
Distribution fees | | | | | | | 3,886 | | | | 293 | |
Custodian fees | | | | | | | 7,925 | | | | 2,088 | |
Shareholder reports | | | | | | | 12,830 | | | | 20,582 | |
Shareholder servicing fees | | | | | | | 29,299 | | | | — | |
Transfer agent fees | | | | | | | 38,896 | | | | 8,812 | |
Other | | | | | | | 45,857 | | | | 28,301 | |
| | | | | | | | | | | | |
Total Liabilities | | | | | | | 41,254,461 | | | | 10,447,688 | |
| | | | | | | | | | | | |
Net Assets | | | | | | $ | 718,572,801 | | | $ | 233,889,845 | |
| | | | | | | | | | | | |
Net Assets Consists of: | | | | | | | | | | | | |
Capital | | | | | | $ | 850,484,544 | | | $ | 269,401,481 | |
Accumulated earnings | | | | | | | (131,911,743 | ) | | | (35,511,636 | ) |
| | | | | | | | | | | | |
Net Assets | | | | | | $ | 718,572,801 | | | $ | 233,889,845 | |
| | | | | | | | | | | | |
44
Statements of Assets and Liabilities (cont.)
March 31, 2023 (Unaudited)
| | | | | | | | | | | | |
| | | RBC Access Capital
Community
Investment Fund | | | RBC Impact
Bond Fund | |
Net Assets | | | | | | | | | | | | |
Class A | | | | | | $ | 8,014,358 | | | $ | 1,027,299 | |
Class I | | | | | | | 655,453,084 | | | | 109,990,073 | |
Class IS | | | | | | | 55,105,359 | | | | N/A | |
Class R6 | | | | | | | N/A | | | | 69,448,956 | |
Class Y | | | | | | | N/A | | | | 53,423,517 | |
| | | | | | | | | | | | |
Total | | | | | | $ | 718,572,801 | | | $ | 233,889,845 | |
| | | | | | | | | | | | |
Shares Outstanding (Unlimited number of shares authorized, no par value): | | | | | | | | | | | | |
Class A | | | | | | | 1,035,208 | | | | 118,927 | |
Class I | | | | | | | 84,688,922 | | | | 12,697,923 | |
Class IS | | | | | | | 7,123,415 | | | | N/A | |
Class R6 | | | | | | | N/A | | | | 8,019,450 | |
Class Y | | | | | | | N/A | | | | 6,174,393 | |
| | | | | | | | | | | | |
Total | | | | | | | 92,847,545 | | | | 27,010,693 | |
| | | | | | | | | | | | |
Net Asset Values and Redemption Prices Per Share: | | | | | | | | | | | | |
Class A | | | | | | $ | 7.74 | | | $ | 8.64 | |
| | | | | | | | | | | | |
Class I | | | | | | $ | 7.74 | | | $ | 8.66 | |
| | | | | | | | | | | | |
Class IS | | | | | | $ | 7.74 | | | $ | N/A | |
| | | | | | | | | | | | |
Class R6 | | | | | | $ | N/A | | | $ | 8.66 | |
| | | | | | | | | | | | |
Class Y | | | | | | $ | N/A | | | $ | 8.65 | |
| | | | | | | | | | | | |
Maximum Offering Price Per Share: | | | | | | | | | | | | |
Class A | | | | | | $ | 8.04 | | | $ | 8.98 | |
| | | | | | | | | | | | |
Maximum Sales Charge - Class A | | | | | | | 3.75 | % | | | 3.75 | % |
| | | | | | | | | | | | |
See Notes to the Financial Statements.
45
Statements of Operations
| | | | | | | | | | | | |
| For the Six Months Ended March 31, 2023 (Unaudited) | | | | | | | | | | | | |
| | | Access Capital
Community
Investment Fund | | | RBC Impact
Bond Fund | |
Investment Income: | | | | | | | | | | | | |
Interest income | | | | | | $ | 11,478,852 | | | $ | 3,427,402 | |
Dividend income - affiliated | | | | | | | 223,466 | | | | 236,962 | |
| | | | | | | | | | | | |
Total Investment Income | | | | | | | 11,702,318 | | | | 3,664,364 | |
Expenses: | | | | | | | | | | | | |
Investment advisory fees | | | | | | | 1,236,376 | | | | 388,294 | |
Distribution fees–Class A | | | | | | | 10,677 | | | | 1,216 | |
Accounting fees | | | | | | | 97,289 | | | | 46,756 | |
Audit fees | | | | | | | 20,663 | | | | 21,039 | |
Custodian fees | | | | | | | 26,438 | | | | 5,415 | |
Insurance fees | | | | | | | 1,807 | | | | 1,787 | |
Legal fees | | | | | | | 13,763 | | | | 14,578 | |
Registrations and filing fees | | | | | | | 29,709 | | | | 39,222 | |
Shareholder reports | | | | | | | 64,771 | | | | 35,883 | |
Transfer agent fees–Class A | | | | | | | 9,997 | | | | 1,445 | |
Transfer agent fees–Class I | | | | | | | 172,023 | | | | 68,641 | |
Transfer agent fees–Class IS | | | | | | | 21,700 | | | | — | |
Transfer agent fees–Class R6 | | | | | | | — | | | | 2,018 | |
Transfer agent fees–Class Y | | | | | | | — | | | | 1,512 | |
Trustees’ fees and expenses | | | | | | | 18,098 | | | | 5,616 | |
Shareholder services administration fees–Class I | | | | | | | 161,244 | | | | — | |
Tax expense | | | | | | | 2,209 | | | | 2,685 | |
Other fees | | | | | | | 5,357 | | | | 3,539 | |
| | | | | | | | | | | | |
Total expenses before fee waiver/reimbursement | | | | | | | 1,892,121 | | | | 639,646 | |
Expenses waived/reimbursed by: | | | | | | | | | | | | |
Advisor | | | | | | | (309,529 | ) | | | (178,239 | ) |
| | | | | | | | | | | | |
Net expenses | | | | | | | 1,582,592 | | | | 461,407 | |
| | | | | | | | | | | | |
Net Investment Income | | | | | | | 10,119,726 | | | | 3,202,957 | |
| | | | | | | | | | | | |
Realized/Unrealized Gains/(Losses): | | | | | | | | | | | | |
Net realized gains/(losses) on: | | | | | | | | | | | | |
Investment transactions | | | | | | | (11,131,207 | ) | | | (4,121,463 | ) |
Futures contracts | | | | | | | (2,636,381 | ) | | | (1,173,127 | ) |
| | | | | | | | | | | | |
Net realized losses | | | | | | | (13,767,588 | ) | | | (5,294,590 | ) |
Net change in unrealized appreciation on: | | | | | | | | | | | | |
Investments | | | | | | | 28,086,779 | | | | 9,773,907 | |
Futures contracts | | | | | | | 2,412,418 | | | | 1,353,167 | |
| | | | | | | | | | | | |
Net unrealized gains | | | | | | | 30,499,197 | | | | 11,127,074 | |
| | | | | | | | | | | | |
Change in net assets resulting from operations | | | | | | $ | 26,851,335 | | | $ | 9,035,441 | |
| | | | | | | | | | | | |
See Notes to the Financial Statements.
46
Statements of Changes in Net Assets
| | | | | | | | | | | | |
| | | Access Capital Community Investment Fund | |
| | | For the Six Months Ended
March 31, 2023
(Unaudited) | | | For the Year Ended
September 30, 2022 | |
From Investment Activities | | | | | | | | | | | | |
Operations: | | | | | | | | | | | | |
Net investment income | | | | $ | 10,119,726 | | | | | $ | 12,765,081 | |
Net realized losses from investments and futures contracts | | | | | (13,767,588 | ) | | | | | (3,173,420 | ) |
Net change in unrealized appreciation/(depreciation) on investments and futures contracts | | | | | 30,499,197 | | | | | | (115,901,452 | ) |
| | | | | | | | | | | | |
Change in net assets resulting from operations | | | | | 26,851,335 | | | | | | (106,309,791 | ) |
| | | | | | | | | | | | |
| | | | |
Distributions to Shareholders: | | | | | | | | | | | | |
Class A | | | | | (115,176 | ) | | | | | (212,562 | ) |
Class I | | | | | (9,872,087 | ) | | | | | (14,190,687 | ) |
Class IS | | | | | (824,104 | ) | | | | | (882,785 | ) |
| | | | | | | | | | | | |
Change in net assets resulting from shareholder distributions | | | | | (10,811,367 | ) | | | | | (15,286,034 | ) |
| | | | | | | | | | | | |
| | | | |
Capital Transactions: | | | | | | | | | | | | |
Proceeds from shares issued | | | | | 59,502,958 | | | | | | 228,138,737 | |
Distributions reinvested | | | | | 6,980,873 | | | | | | 9,868,662 | |
Cost of shares redeemed | | | | | (68,094,300 | ) | | | | | (159,505,905 | ) |
| | | | | | | | | | | | |
Change in net assets resulting from capital transactions | | | | | (1,610,469 | ) | | | | | 78,501,494 | |
| | | | | | | | | | | | |
Net increase/(decrease) in net assets | | | | | 14,429,499 | | | | | | (43,094,331 | ) |
Net Assets: | | | | | | | | | | | | |
Beginning of period | | | | | 704,143,302 | | | | | | 747,237,633 | |
| | | | | | | | | | | | |
End of period | | | | $ | 718,572,801 | | | | | $ | 704,143,302 | |
| | | | | | | | | | | | |
| | | | |
Share Transactions: | | | | | | | | | | | | |
Issued | | | | | 7,732,126 | | | | | | 27,428,434 | |
Reinvested | | | | | 912,715 | | | | | | 1,191,228 | |
Redeemed | | | | | (8,947,888 | ) | | | | | (19,203,225 | ) |
| | | | | | | | | | | | |
Change in shares resulting from capital transactions | | | | | (303,047 | ) | | | | | 9,416,437 | |
| | | | | | | | | | | | |
See Notes to the Financial Statements.
47
Statements of Changes in Net Assets
| | | | | | | | | | | | | | | | |
| | | RBC Impact
Bond Fund | |
| | | For the
Six Months Ended
March 31, 2023
(Unaudited) | | | For the
Year Ended
September 30, 2022 | |
From Investment Activities | | | | | | | | | | | | | | | | |
Operations: | | | | | | | | | | | | | | | | |
Net investment income | | | | | | $ | 3,202,957 | | | | | | | $ | 3,760,899 | |
Net realized losses from investments and futures contracts | | | | | | | (5,294,590 | ) | | | | | | | (6,039,559 | ) |
Net change in unrealized appreciation/(depreciation) on investments and futures contracts | | | | | | | 11,127,074 | | | | | | | | (33,707,845 | ) |
| | | | | | | | | | | | | | | | |
Change in net assets resulting from operations | | | | | | | 9,035,441 | | | | | | | | (35,986,505 | ) |
| | | | | | | | | | | | | | | | |
Distributions to Shareholders: | | | | | | | | | | | | | | | | |
Class A | | | | | | | (13,056 | ) | | | | | | | (7,379 | ) |
Class I | | | | | | | (1,470,103 | ) | | | | | | | (2,186,798 | ) |
Class R6 | | | | | | | (1,015,258 | ) | | | | | | | (1,977,070 | ) |
Class Y | | | | | | | (782,675 | ) | | | | | | | (1,470,292 | ) |
| | | | | | | | | | | | | | | | |
Change in net assets resulting from shareholder distributions | | | | | | | (3,281,092 | ) | | | | | | | (5,641,539 | ) |
| | | | | | | | | | | | | | | | |
Capital Transactions: | | | | | | | | | | | | | | | | |
Proceeds from shares issued | | | | | | | 21,975,215 | | | | | | | | 50,109,379 | |
Distributions reinvested | | | | | | | 3,225,482 | | | | | | | | 5,661,624 | |
Cost of shares redeemed | | | | | | | (10,710,447 | ) | | | | | | | (20,446,633 | ) |
| | | | | | | | | | | | | | | | |
Change in net assets resulting from capital transactions | | | | | | | 14,490,250 | | | | | | | | 35,324,370 | |
| | | | | | | | | | | | | | | | |
Net increase/(decrease) in net assets | | | | | | | 20,244,599 | | | | | | | | (6,303,674 | ) |
Net Assets: | | | | | | | | | | | | | | | | |
Beginning of period | | | | | | | 213,645,246 | | | | | | | | 219,948,920 | |
| | | | | | | | | | | | | | | | |
End of period | | | | | | $ | 233,889,845 | | | | | | | $ | 213,645,246 | |
| | | | | | | | | | | | | | | | |
Share Transactions: | | | | | | | | | | | | | | | | |
Issued | | | | | | | 2,574,739 | | | | | | | | 5,352,276 | |
Reinvested | | | | | | | 378,741 | | | | | | | | 598,137 | |
Redeemed | | | | | | | (1,254,906 | ) | | | | | | | (2,222,132 | ) |
| | | | | | | | | | | | | | | | |
Change in shares resulting from capital transactions | | | | | | | 1,698,574 | | | | | | | | 3,728,281 | |
| | | | | | | | | | | | | | | | |
See Notes to the Financial Statements.
48
Access Capital Community Investment Fund
(Selected data for a share outstanding throughout the periods indicated)
| | | | | | | | | | | | | | |
| | | | | Investment Activities | | Distributions | | |
| | | Net Asset | | | | Net Realized | | | | | | | | |
| | | Value, | | Net | | and Unrealized | | Total from | | Net | | | | Net Asset |
| | | Beginning | | Investment | | Gains (Losses) | | Investment | | Investment | | Total | | Value, End |
| | | of Period | | Income(a) | | on Investments | | Activities | | Income | | Distributions | | of Period |
Class A | | | | | | | | | | | | | | |
Six Months Ended 3/31/23 (Unaudited) | | $7.56 | | 0.10 | | 0.18 | | 0.28 | | (0.10) | | (0.10) | | $7.74 |
Year Ended 9/30/22 | | 8.93 | | 0.11 | | (1.33) | | (1.22) | | (0.15) | | (0.15) | | 7.56 |
Year Ended 9/30/21 | | 9.13 | | 0.10 | | (0.15) | | (0.05) | | (0.15) | | (0.15) | | 8.93 |
Year Ended 9/30/20 | | 9.00 | | 0.16 | | 0.17 | | 0.33 | | (0.20) | | (0.20) | | 9.13 |
Year Ended 9/30/19 | | 8.62 | | 0.19 | | 0.41 | | 0.60 | | (0.22) | | (0.22) | | 9.00 |
Year Ended 9/30/18 | | 9.02 | | 0.18 | | (0.37) | | (0.19) | | (0.21) | | (0.21) | | 8.62 |
Class I | | | | | | | | | | | | | | |
Six Months Ended 3/31/23 (Unaudited) | | $7.56 | | 0.11 | | 0.19 | | 0.30 | | (0.12) | | (0.12) | | $7.74 |
Year Ended 9/30/22 | | 8.92 | | 0.15 | | (1.33) | | (1.18) | | (0.18) | | (0.18) | | 7.56 |
Year Ended 9/30/21 | | 9.13 | | 0.13 | | (0.16) | | (0.03) | | (0.18) | | (0.18) | | 8.92 |
Year Ended 9/30/20 | | 8.99 | | 0.19 | | 0.18 | | 0.37 | | (0.23) | | (0.23) | | 9.13 |
Year Ended 9/30/19 | | 8.62 | | 0.22 | | 0.40 | | 0.62 | | (0.25) | | (0.25) | | 8.99 |
Year Ended 9/30/18 | | 9.02 | | 0.21 | | (0.37) | | (0.16) | | (0.24) | | (0.24) | | 8.62 |
Class IS | | | | | | | | | | | | | | |
Six Months Ended 3/31/23 (Unaudited) | | $7.56 | | 0.11 | | 0.19 | | 0.30 | | (0.12) | | (0.12) | | $7.74 |
Year Ended 9/30/22 | | 8.92 | | 0.15 | | (1.33) | | (1.18) | | (0.18) | | (0.18) | | 7.56 |
Year Ended 9/30/21 | | 9.12 | | 0.13 | | (0.15) | | (0.02) | | (0.18) | | (0.18) | | 8.92 |
Year Ended 9/30/20 | | 8.98 | | 0.19 | | 0.18 | | 0.37 | | (0.23) | | (0.23) | | 9.12 |
Period Ended 9/30/19(b) | | 8.73 | | 0.13 | | 0.26 | | 0.39 | | (0.14) | | (0.14) | | 8.98 |
| (a) | Per share net investment income (loss) has been calculated using the average daily shares method. |
| (b) | For the period from March 11, 2019, (commencement of operations) to September 30, 2019. |
49
Access Capital Community Investment Fund
(Selected data for a share outstanding throughout the periods indicated)
| | | | | | | | | | | | | | | | | | | | | | | | | | | | | | | | |
| | | | | Ratios/Supplemental Data |
| | | | | | | | | Ratio of | | | | | | |
| | | | | | | | | Expenses to | | | | | | |
| | | | | | | | | Average Net | | | | | | |
| | | | | | | | | Assets After | | Ratio of | | | | |
| | | | | | | Ratio of | | Fees Waived/ | | Net Investment | | Ratio of | | |
| | | | | Net Assets, | | Net Expenses | | Reimbursed and | | Income (Loss) | | Expenses to | | Portfolio |
| | | Total | | End of | | to Average | | Excluding | | to Average | | Average Net | | Turnover |
| | | Return(a)(b) | | Period (000’s) | | Net Assets | | Interest Expense | | Net Assets | | Assets* | | Rate** |
Class A | | | | | | | | | | | | | | | | | | | | | | | | | | | | | | | | |
Six Months Ended 3/31/23 (Unaudited) | | 3.77%(c) | | | $ | 8,014 | | | | | 0.80 | %(d) | | | | 0.80 | %(d) | | | | 2.50 | %(d) | | | | 0.91 | %(d) | | | | 12 | % |
Year Ended 9/30/22 | | (13.84)% | | | | 9,515 | | | | | 0.80 | % | | | | 0.80 | % | | | | 1.36 | % | | | | 0.84 | % | | | | 21 | % |
Year Ended 9/30/21 | | (0.61)% | | | | 14,233 | | | | | 0.80 | % | | | | 0.80 | % | | | | 1.07 | % | | | | 0.86 | % | | | | 25 | % |
Year Ended 9/30/20 | | 3.65% | | | | 16,662 | | | | | 0.80 | % | | | | 0.80 | % | | | | 1.71 | % | | | | 0.90 | % | | | | 23 | % |
Year Ended 9/30/19 | | 7.03% | | | | 17,583 | | | | | 0.95 | %(e) | | | | 0.87 | % | | | | 2.18 | % | | | | 1.11 | % | | | | 12 | % |
Year Ended 9/30/18 | | (2.12)% | | | | 22,258 | | | | | 1.06 | % | | | | 0.95 | % | | | | 2.10 | % | | | | 1.20 | % | | | | 20 | % |
Class I | | | | | | | | | | | | | | | | | | | | | | | | | | | | | | | | |
Six Months Ended 3/31/23 (Unaudited) | | 3.96%(c) | | | $ | 655,453 | | | | | 0.45 | %(d) | | | | 0.45 | %(d) | | | | 2.87 | %(d) | | | | 0.53 | %(d) | | | | 12 | % |
Year Ended 9/30/22 | | (13.44)% | | | | 643,252 | | | | | 0.45 | % | | | | 0.45 | % | | | | 1.74 | % | | | | 0.51 | % | | | | 21 | % |
Year Ended 9/30/21 | | (0.37)% | | | | 701,768 | | | | | 0.45 | % | | | | 0.45 | % | | | | 1.42 | % | | | | 0.52 | % | | | | 25 | % |
Year Ended 9/30/20 | | 4.13% | | | | 562,573 | | | | | 0.45 | % | | | | 0.45 | % | | | | 2.06 | % | | | | 0.51 | % | | | | 23 | % |
Year Ended 9/30/19 | | 7.27% | | | | 550,213 | | | | | 0.60 | %(e) | | | | 0.53 | % | | | | 2.53 | % | | | | 0.66 | % | | | | 12 | % |
Year Ended 9/30/18 | | (1.79)% | | | | 568,592 | | | | | 0.73 | % | | | | 0.61 | % | | | | 2.44 | % | | | | 0.73 | % | | | | 20 | % |
Class IS | | | | | | | | | | | | | | | | | | | | | | | | | | | | | | | | |
Six Months Ended 3/31/23 (Unaudited) | | 3.98%(c) | | | $ | 55,105 | | | | | 0.40 | %(d) | | | | 0.40 | %(d) | | | | 2.92 | %(d) | | | | 0.51 | %(d) | | | | 12 | % |
Year Ended 9/30/22 | | (13.40)% | | | | 51,376 | | | | | 0.40 | % | | | | 0.40 | % | | | | 1.87 | % | | | | 0.50 | % | | | | 21 | % |
Year Ended 9/30/21 | | (0.21)% | | | | 31,237 | | | | | 0.40 | % | | | | 0.40 | % | | | | 1.47 | % | | | | 0.55 | % | | | | 25 | % |
Year Ended 9/30/20 | | 4.19% | | | | 15,566 | | | | | 0.40 | % | | | | 0.40 | % | | | | 2.06 | % | | | | 0.59 | % | | | | 23 | % |
Period Ended 9/30/19(f) | | 4.33%(c) | | | | 5,916 | | | | | 0.40 | %(d) | | | | 0.40 | %(d) | | | | 2.61 | %(d) | | | | 0.73 | %(d) | | | | 12 | % |
| * | During the period, certain fees were contractually or voluntarily reduced and/or reimbursed. If such contractual/voluntary fee reductions and reimbursements had not occurred, the ratio would have been as indicated. |
| ** | Portfolio turnover rate is calculated on the basis of the Fund as a whole without distinguishing between the classes of shares issued. |
| (a) | Excludes sales charge. |
50
Access Capital Community Investment Fund
(Selected data for a share outstanding throughout the periods indicated)
| (b) | Assumes investment at net asset value at the beginning of the period, reinvestment of all dividends and distributions, and a complete redemption of the investment at net asset value at the end of the period. |
| (e) | Beginning March 11, 2019, the net operating expenses were contractually limited to 0.80% and 0.45% for Class A and Class I respectively. The ratio of net expenses to average net assets represents a blended percentage for the period ended September 30, 2019. |
| (f) | For the period from March 11, 2019, (commencement of operations) to September 30, 2019. |
See Notes to the Financial Statements.
51
RBC Impact Bond Fund
(Selected data for a share outstanding throughout the periods indicated)
| | | | | | | | | | | | | | | | |
| | | | | Investment Activities | | Distributions | | |
| | | Net Asset | | | | Net Realized | | | | | | | | | | |
| | | Value, | | Net | | and Unrealized | | Total from | | Net | | Net | | | | Net Asset |
| | | Beginning | | Investment | | Gains (Losses) | | Investment | | Investment | | Realized | | Total | | Value, End |
| | | of Period | | Income(a) | | on Investments | | Activities | | Income | | Gains | | Distributions | | of Period |
Class A | | | | | | | | | | | | | | | | |
Six Months Ended 3/31/23 (Unaudited) | | $ 8.42 | | 0.11 | | 0.22 | | 0.33 | | (0.11) | | — | | (0.11) | | $ 8.64 |
Year Ended 9/30/22 | | 10.17 | | 0.17 | | (1.71) | | (1.54) | | (0.14) | | (0.07) | | (0.21) | | 8.42 |
Year Ended 9/30/21 | | 10.58 | | 0.09 | | (0.24) | | (0.15) | | (0.12) | | (0.14) | | (0.26) | | 10.17 |
Period Ended 9/30/20(b) | | 10.15 | | 0.11 | | 0.44 | | 0.55 | | (0.12) | | — | | (0.12) | | 10.58 |
Class I | | | | | | | | | | | | | | | | |
Six Months Ended 3/31/23 (Unaudited) | | $ 8.44 | | 0.12 | | 0.22 | | 0.34 | | (0.12) | | — | | (0.12) | | $ 8.66 |
Year Ended 9/30/22 | | 10.19 | | 0.16 | | (1.67) | | (1.51) | | (0.17) | | (0.07) | | (0.24) | | 8.44 |
Year Ended 9/30/21 | | 10.59 | | 0.12 | | (0.23) | | (0.11) | | (0.15) | | (0.14) | | (0.29) | | 10.19 |
Year Ended 9/30/20 | | 10.22 | | 0.20 | | 0.52 | | 0.72 | | (0.23) | | (0.12) | | (0.35) | | 10.59 |
Year Ended 9/30/19 | | 9.61 | | 0.26 | | 0.62 | | 0.88 | | (0.27) | | — | | (0.27) | | 10.22 |
Period Ended 9/30/18(c) | | 10.00 | | 0.17 | | (0.38) | | (0.21) | | (0.18) | | — | | (0.18) | | 9.61 |
Class R6 | | | | | | | | | | | | | | | | |
Six Months Ended 3/31/23 (Unaudited) | | $ 8.44 | | 0.12 | | 0.23 | | 0.35 | | (0.13) | | — | | (0.13) | | $ 8.66 |
Year Ended 9/30/22 | | 10.19 | | 0.16 | | (1.67) | | (1.51) | | (0.17) | | (0.07) | | (0.24) | | 8.44 |
Year Ended 9/30/21 | | 10.60 | | 0.12 | | (0.24) | | (0.12) | | (0.15) | | (0.14) | | (0.29) | | 10.19 |
Year Ended 9/30/20 | | 10.22 | | 0.21 | | 0.52 | | 0.73 | | (0.23) | | (0.12) | | (0.35) | | 10.60 |
Year Ended 9/30/19 | | 9.61 | | 0.27 | | 0.61 | | 0.88 | | (0.27) | | — | | (0.27) | | 10.22 |
Period Ended 9/30/18(c) | | 10.00 | | 0.18 | | (0.39) | | (0.21) | | (0.18) | | — | | (0.18) | | 9.61 |
Class Y | | | | | | | | | | | | | | | | |
Six Months Ended 3/31/23 (Unaudited) | | $ 8.43 | | 0.12 | | 0.23 | | 0.35 | | (0.13) | | — | | (0.13) | | $ 8.65 |
Year Ended 9/30/22 | | 10.19 | | 0.16 | | (1.68) | | (1.52) | | (0.17) | | (0.07) | | (0.24) | | 8.43 |
Period Ended 9/30/21(d) | | 10.15 | | 0.05 | | 0.04 | | 0.09 | | (0.05) | | — | | (0.05) | | 10.19 |
| (a) | Per share net investment income (loss) has been calculated using the average daily shares method. |
| (b) | For the period from January 28, 2020 (commencement of operations) to September 30, 2020. |
| (c) | For the period from December 18, 2017 (commencement of operations) to September 30, 2018. |
| (d) | For the period from April 12, 2021 (commencement of operations) to September 30, 2021. |
52
RBC Impact Bond Fund
(Selected data for a share outstanding throughout the periods indicated)
| | | | | | | | | | | | | | | | | | | | | | | | | | | | | | |
| | | | | Ratios/Supplemental Data |
| | | | | | | | | Ratio of | | | | |
| | | | | | | Ratio of | | Net Investment | | Ratio of | | |
| | | | | Net Assets, | | Net Expenses | | Income (Loss) | | Expenses to | | Portfolio |
| | | Total | | End of | | to Average | | to Average | | Average Net | | Turnover |
| | | Return(a) | | Period (000’s) | | Net Assets | | Net Assets | | Assets* | | Rate** |
Class A | | | | | | | | | | | | | | | | | | | | | | | | | | | | | | |
Six Months Ended 3/31/23 (Unaudited) | | | | 3.99 | %(b) | | | $ | 1,027 | | | | | 0.69 | %(c) | | | | 2.61 | %(c) | | | | 1.06 | %(c) | | | | 18 | % |
Year Ended 9/30/22 | | | | (15.30 | )% | | | | 941 | | | | | 0.70 | % | | | | 1.91 | % | | | | 0.70 | % | | | | 33 | % |
Year Ended 9/30/21 | | | | (1.47 | )% | | | | 21 | | | | | 0.70 | % | | | | 0.91 | % | | | | 54.43 | % | | | | 36 | % |
Period Ended 9/30/20(d) | | | | 5.48 | %(b) | | | | 11 | | | | | 0.70 | %(c) | | | | 1.56 | %(c) | | | | 85.65 | %(c) | | | | 31 | % |
Class I | | | | | | | | | | | | | | | | | | | | | | | | | | | | | | |
Six Months Ended 3/31/23 (Unaudited) | | | | 4.11 | %(b) | | | $ | 109,990 | | | | | 0.44 | %(c) | | | | 2.86 | %(c) | | | | 0.65 | %(c) | | | | 18 | % |
Year Ended 9/30/22 | | | | (15.05 | )% | | | | 95,006 | | | | | 0.45 | % | | | | 1.70 | % | | | | 0.65 | % | | | | 33 | % |
Year Ended 9/30/21 | | | | (1.13 | )% | | | | 77,793 | | | | | 0.45 | % | | | | 1.14 | % | | | | 0.73 | % | | | | 36 | % |
Year Ended 9/30/20 | | | | 7.18 | % | | | | 21,661 | | | | | 0.45 | % | | | | 1.94 | % | | | | 1.08 | % | | | | 31 | % |
Year Ended 9/30/19 | | | | 9.27 | % | | | | 6,467 | | | | | 0.45 | % | | | | 2.67 | % | | | | 1.62 | % | | | | 175 | % |
Period Ended 9/30/18(e) | | | | (2.14 | )%(b) | | | | 2,630 | | | | | 0.45 | %(c) | | | | 2.29 | %(c) | | | | 3.82 | %(c) | | | | 329 | % |
Class R6 | | | | | | | | | | | | | | | | | | | | | | | | | | | | | | |
Six Months Ended 3/31/23 (Unaudited) | | | | 4.14 | %(b) | | | $ | 69,449 | | | | | 0.39 | %(c) | | | | 2.91 | %(c) | | | | 0.52 | %(c) | | | | 18 | % |
Year Ended 9/30/22 | | | | (15.01 | )% | | | | 66,391 | | | | | 0.40 | % | | | | 1.69 | % | | | | 0.52 | % | | | | 33 | % |
Year Ended 9/30/21 | | | | (1.17 | )% | | | | 81,762 | | | | | 0.40 | % | | | | 1.14 | % | | | | 0.62 | % | | | | 36 | % |
Year Ended 9/30/20 | | | | 7.33 | % | | | | 16,113 | | | | | 0.40 | % | | | | 2.06 | % | | | | 0.97 | % | | | | 31 | % |
Year Ended 9/30/19 | | | | 9.33 | % | | | | 17,158 | | | | | 0.40 | % | | | | 2.73 | % | | | | 1.52 | % | | | | 175 | % |
Period Ended 9/30/18(e) | | | | (2.10 | )%(b) | | | | 2,447 | | | | | 0.40 | %(c) | | | | 2.33 | %(c) | | | | 3.70 | %(c) | | | | 329 | % |
Class Y | | | | | | | | | | | | | | | | | | | | | | | | | | | | | | |
Six Months Ended 3/31/23 (Unaudited) | | | | 4.14 | %(b) | | | $ | 53,424 | | | | | 0.39 | %(c) | | | | 2.91 | %(c) | | | | 0.52 | %(c) | | | | 18 | % |
Year Ended 9/30/22 | | | | (15.11 | )% | | | | 51,307 | | | | | 0.40 | % | | | | 1.70 | % | | | | 0.50 | % | | | | 33 | % |
Period Ended 9/30/21(f) | | | | 0.90 | %(b) | | | | 60,373 | | | | | 0.40 | %(c) | | | | 0.99 | %(c) | | | | 0.59 | %(c) | | | | 36 | % |
| * | During the period, certain fees were contractually or voluntarily reduced and/or reimbursed. If such contractual/voluntary fee reductions and reimbursements had not occurred, the ratio would have been as indicated. |
| ** | Portfolio turnover rate is calculated on the basis of the Fund as a whole without distinguishing between the classes of shares issued. |
| (a) | Assumes investment at net asset value at the beginning of the period, reinvestment of all dividends and distributions, and a complete redemption of the investment at net asset value at the end of the period. |
53
RBC Impact Bond Fund
(Selected data for a share outstanding throughout the periods indicated)
| (d) | For the period from January 28, 2020 (commencement of operations) to September 30, 2020. |
| (e) | For the period from December 18, 2017 (commencement of operations) to September 30, 2018. |
| (f) | For the period from April 12, 2021 (commencement of operations) to September 30, 2021. |
See Notes to the Financial Statements.
54
|
NOTES TO FINANCIAL STATEMENTS |
March 31, 2023 (Unaudited)
1. Organization:
RBC Funds Trust (the “Trust”) is registered under the Investment Company Act of 1940 (as amended) as an open-end management investment company. The Trust was organized as a Delaware statutory trust on December 16, 2003 and currently consists of 24 portfolios. Overall responsibility for the management of the Trust is vested in its Board of Trustees (the “Board”). The predecessor fund for the Access Capital Community Investment Fund was reorganized into a series of the Trust, effective July 28, 2008. This report includes the following two investment portfolios (each a “Fund” and collectively, the “Funds”):
- Access Capital Community Investment Fund
- RBC Impact Bond Fund (“Impact Bond Fund”)
The Access Capital Community Investment Fund offers three share classes: Class A, Class I and Class IS shares. The Impact Bond Fund offers four share classes: Class A, Class I, Class R6, and Class Y shares. Class A shares are offered with a 3.75% maximum front-end sales charge and a 1.00% contingent deferred sales charge (“CDSC”) for redemption within 12 months of a $1 million or greater purchase on which no front-end sales charge was paid. Class I, Class IS, Class R6 and Class Y shares (intended for investors meeting certain investment minimum thresholds) are not subject to either a front-end sales charge or a CDSC.
RBC Global Asset Management (U.S.) Inc. (“RBC GAM-US” or “Advisor” or “Co-Administrator”) acts as the investment advisor for the Fund. The officers of the Trust (“Fund Management”) are also employees of RBC GAM-US or its affiliates.
2. Significant Accounting Policies
Each Fund is an investment company that follows accounting and reporting guidance under the Financial Accounting Standards Board. Summarized below are the significant accounting policies of the Funds. These policies conform to accounting principles generally accepted in the United States of America (“U.S. GAAP”). Fund Management follows these policies when preparing financial statements. Fund Management may also be required to make estimates and assumptions that affect the reported amounts of assets and liabilities at the date of the financial statements and the reported amounts of income and expenses for the period. Actual results could differ from those estimates. The financial statements are as of the close of regular trading on the New York Stock Exchange (“NYSE”).
Security Valuation:
The Board has approved pricing and valuation procedures of the Advisor for determining the fair value of each Fund’s investments. Fair value of a security is considered to be the price that a fund might reasonably expect to receive upon its current sale in an orderly transaction between market participants.
Fixed income securities, including to-be-announced (“TBA”) commitments and municipal bonds, are generally valued based on evaluated prices received from third-party pricing services or from broker-dealers who make markets in the securities and are generally categorized as Level 2 in the fair value hierarchy (see “Fair Value Measurements” below for additional information). The pricing services utilize both dealer-supplied valuations and electronic data processing techniques that take into account multiple appropriate factors such as institutional-size trading in similar groups of securities, market spreads, interest rates, and fundamental security analytical data including yield, quality, coupon rate, maturity and type of issue.
Mortgage-related securities represent direct or indirect participation in, or are secured by and payable from, mortgage loans secured by real property and include pass-through securities and collateralized mortgage obligations. These securities may be issued or guaranteed by U.S. Government agencies or instrumentalities, or private issuers, including commercial banks, savings and loan institutions, private mortgage insurance bankers and other secondary market issuers. These mortgage-related securities are generally valued by pricing services that use broker-dealer quotations or valuation estimates from their
55
|
NOTES TO FINANCIAL STATEMENTS |
internal pricing models. These pricing models generally consider such factors as current market data, estimated cash flows, market-based yield spreads, and estimated prepayment rates. Securities valued using such techniques and inputs are generally categorized as Level 2 in the fair value hierarchy. To the extent significant inputs are unobservable, the securities will be categorized as Level 3.
Exchange-traded futures are valued at the last sale price at the close of the market on the principal exchange on which they are traded and are categorized as Level 1 in the fair value hierarchy. Investments in open-end investment companies (mutual funds) are valued at net asset value and are categorized as Level 1 in the fair value hierarchy.
The Board has designated the Advisor with the responsibility for implementing the pricing and valuation procedures, including responsibility for determining the fair value of the Funds’ securities or other assets and liabilities, and has established a Pricing Committee to assist in carrying out supervisory functions related to such responsibilities. The Pricing Committee includes representatives of the Funds’ Advisor, and Co-Administrator, including personnel from accounting and operations, trading, risk management and compliance. The Pricing Committee meets at least quarterly to review and approve Fund valuation matters, including a review of the Funds’ pricing activity and operations, fair value measurements, pricing vendors, policies and procedures, and related controls. At least a quorum of the Pricing Committee shall meet more frequently, as needed, to consider and approve time-sensitive fair valuation matters. The Pricing Committee provides periodic reports to the Valuation, Portfolio Management and Performance Committee (“Valuation Committee”) of the Board regarding pricing and valuation matters. Members of the Pricing Committee meet with the Valuation Committee and the Board at each of their regularly scheduled meetings to discuss valuation matters and actions taken during the period.
The Advisor has procedures to determine the fair value of a security when a price is not available from a pricing service or broker- dealer or the Advisor has determined that a price provided by a pricing service or broker-dealer does not approximate fair value. Fair valuation may also be used when a significant valuation event affecting the value of a security or market sector is determined to have occurred between the time when a security’s market closes and the time the Fund’s net asset value is calculated. The fair value of the security will be determined in good faith by the Advisor in accordance with procedures and methodologies approved by the Board. General factors used in determining the fair value of securities include, but are not limited to, fundamental analytical data relating to the security, the issuer and the market, such as duration, prepayment and default rates; general level of interest rates and changes in interest rates; information from broker-dealers; trading in similar securities; any restrictions on disposition of the security; and an evaluation of the forces that influence the market in which the investments are traded. These securities are either categorized as Level 2 or 3 in the fair value hierarchy, depending on the relevant inputs used.
When the Funds utilize fair valuation methods that use significant unobservable inputs to determine a security’s value, such securities will be categorized as Level 3 of the fair value hierarchy. These methods may require subjective determinations about the value of a security. While the Funds’ policy is intended to result in a calculation of a Fund’s net asset value that fairly reflects security values as of the time of pricing, the Funds cannot guarantee that values determined by the Advisor or persons acting at their direction would accurately reflect the price that the Funds could obtain for a security if they were to dispose of it as of the time of pricing (for instance, in a forced or distressed sale). The prices used by the Funds may differ from the value that would be realized if the securities were sold.
The Advisor employs various methods for calibrating the valuation approach related to securities categorized within Level 2 and Level 3 of the fair value hierarchy. These methods may include regular due diligence of the Funds’ pricing vendors, a regular review of key inputs and assumptions, transaction back-testing or disposition analysis to compare unrealized gains and losses to realized gains and losses, reviews of missing and stale prices and large movements in market value, and reviews of any market related activities. Additionally, the pricing of all fair value holdings is subsequently reported to the Valuation Committee and Board.
56
|
NOTES TO FINANCIAL STATEMENTS |
Foreign Taxes:
The Funds may be subject to foreign taxes on income, gains on investments or currency repatriation, a portion of which may be recoverable. The Funds will accrue such taxes and recoveries, as applicable, based upon its current interpretation of tax rules and regulations that exist in the markets in which it invests.
Realized gains in certain countries may be subject to foreign taxes at the Fund level, based on statutory rates. The Funds accrue for such foreign taxes on realized and unrealized gains at the appropriate rate for each jurisdiction, as applicable. The amount, if any, is disclosed as a liability in the Statement of Assets and Liabilities.
Fair Value Measurements:
The Funds disclose the fair value of their investments in a hierarchy that categorizes investments based on the inputs to valuation techniques used to measure fair value. The three levels of the fair value hierarchy are as follows:
• Level 1 - Inputs that reflect unadjusted quoted prices in active markets for identical assets or liabilities that the Funds have the ability to access at the measurement date.
• Level 2 - Significant inputs other than quoted prices that are observable for the asset or liability either directly or indirectly, including inputs in markets that are not considered to be active. Observable inputs may include quoted prices for similar securities, interest rates, spreads, prepayment spreads, etc.
• Level 3 - Significant unobservable inputs based on the best information available in the circumstances, to the extent observable inputs are not available (including the Fund’s own assumptions in determining the fair value of investments).
The inputs or methodology used for valuing investments are not necessarily an indication of the risk associated with investing in those securities.
Inputs used in determining fair value of an investment may include, but are not limited to, price information, volatility statistics, credit and market data, and other factors, all of which may be either observable or unobservable. Inputs can vary among investments and will be impacted by the investment type and volume of activity for the particular security or similar securities in the market. Investments in the Level 2 category are generally supported by transactions and quoted prices from dealers participating in the market for those investments. Investments may be included in the Level 3 category due to a lack of market activity or transparency. Internal valuation models may also be used as a pricing source for Level 3 investments. Internal valuation models may rely on one or more unobservable inputs, such as estimated cash flows, financial statement analysis and discount rates.
57
|
NOTES TO FINANCIAL STATEMENTS |
The summary of inputs used to determine the fair value of the Funds’ investments as of March 31, 2023 is as follows:
| | | | | | | | | | | | | | | | | | | | | | | | | | | | | | | | |
| | | | | | | | | | | | Level 2 | | | Level 3 | | | | | | | |
| | | | | | | | | | | | Significant | | | Significant | | | | | | | |
| | | Level 1 | | | Observable | | | Unobservable | | | | | | | |
| | | Quoted Prices | | | Inputs | | | Inputs | | | | | | Total | |
Access Capital Community Investment Fund | | | | | | | | | | | | | | | | | | | | | | | | | | | | | | | | |
Assets: | | | | | | | | | | | | | | | | | | | | | | | | | | | | | | | | |
Investments in Securities | | | | | | | | | | | | | | | | | | | | | | | | | | | | | | | | |
Municipal Bonds | | | | | | $ | — | | | | | | | $ | 14,052,456 | | | | | | | | $— | | | | | | | $ | 14,052,456 | |
U.S. Government Agency Backed Mortgages | | | | | | | — | | | | | | | | 684,602,306 | | | | | | | | — | | | | | | | | 684,602,306 | |
U.S. Government Agency Obligations | | | | | | | — | | | | | | | | 41,818,938 | | | | | | | | — | | | | | | | | 41,818,938 | |
Investment Company | | | | | | | 12,843,698 | | | | | | | | — | | | | | | | | — | | | | | | | | 12,843,698 | |
Corporate Bond | | | | | | | — | | | | | | | | 189,768 | | | | | | | | — | | | | | | | | 189,768 | |
Other Financial Instruments* | | | | | | | | | | | | | | | | | | | | | | | | | | | | | | | | |
Financial futures contracts | | | | | | | 658,139 | | | | | | | | — | | | | | | | | — | | | | | | | | 658,139 | |
| | | | | | | | | | | | | | | | | | | | | | | | | | | | | | | | |
Total Assets | | | | | | $ | 13,501,837 | | | | | | | $ | 740,663,468 | | | | | | | | $— | | | | | | | $ | 754,165,305 | |
| | | | | | | | | | | | | | | | | | | | | | | | | | | | | | | | |
Liabilities: | | | | | | | | | | | | | | | | | | | | | | | | | | | | | | | | |
Other Financial Instruments* | | | | | | | | | | | | | | | | | | | | | | | | | | | | | | | | |
Financial futures contracts | | | | | | $ | (2,951) | | | | | | | $ | — | | | | | | | | $— | | | | | | | $ | (2,951) | |
| | | | | | | | | | | | | | | | | | | | | | | | | | | | | | | | |
Impact Bond Fund | | | | | | | | | | | | | | | | | | | | | | | | | | | | | | | | |
Assets: | | | | | | | | | | | | | | | | | | | | | | | | | | | | | | | | |
Investments in Securities | | | | | | | | | | | | | | | | | | | | | | | | | | | | | | | | |
Municipal Bonds | | | | | | | — | | | | | | | | 46,718,066 | | | | | | | | — | | | | | | | | 46,718,066 | |
U.S. Government Agency Obligations | | | | | | | — | | | | | | | | 15,433,179 | | | | | | | | — | | | | | | | | 15,433,179 | |
U.S. Government Agency Backed Mortgages | | | | | | | — | | | | | | | | 63,932,296 | | | | | | | | — | | | | | | | | 63,932,296 | |
Asset Backed Securities | | | | | | | — | | | | | | | | 31,824,152 | | | | | | | | — | | | | | | | | 31,824,152 | |
Collateralized Mortgage Obligation | | | | | | | — | | | | | | | | 2,659,131 | | | | | | | | — | | | | | | | | 2,659,131 | |
Investment Company | | | | | | | 5,720,754 | | | | | | | | — | | | | | | | | — | | | | | | | | 5,720,754 | |
Corporate Bonds | | | | | | | — | | | | | | | | 72,981,381 | | | | | | | | — | | | | | | | | 72,981,381 | |
Other Financial Instruments* | | | | | | | | | | | | | | | | | | | | | | | | | | | | | | | | |
Financial futures contracts | | | | | | | 788,592 | | | | | | | | — | | | | | | | | — | | | | | | | | 788,592 | |
| | | | | | | | | | | | | | | | | | | | | | | | | | | | | | | | |
Total Assets | | | | | | $ | 6,509,346 | | | | | | | $ | 233,548,205 | | | | | | | $ | — | | | | | | | $ | 240,057,551 | |
| | | | | | | | | | | | | | | | | | | | | | | | | | | | | | | | |
Liabilities: | | | | | | | | | | | | | | | | | | | | | | | | | | | | | | | | |
Other Financial Instruments* | | | | | | | | | | | | | | | | | | | | | | | | | | | | | | | | |
Financial futures contracts | | | | | | $ | (101,382 | ) | | | | | | $ | — | | | | | | | $ | — | | | | | | | $ | (101,382 | ) |
| | | | | | | | | | | | | | | | | | | | | | | | | | | | | | | | |
*Other financial instruments are instruments shown on the Schedule of Portfolio Investments, such as futures contracts which are valued at fair value.
The Access Capital Community Investment Fund’s assets assigned to the Level 3 category were valued using the valuation methodology and technique deemed most appropriate in the circumstances. The significant unobservable inputs used include assumptions regarding the particular security’s cash flow profile, prepayments and potential defaults which may not be generally observable for either the security or for assets of a similar type. Inputs with respect to variable rate securities may also include assumptions regarding future interest rate changes. Significant changes in any of these assumptions may result in a lower or higher fair value measurement.
58
|
NOTES TO FINANCIAL STATEMENTS |
Reverse Repurchase Agreements:
To obtain short-term financing, the Access Capital Community Investment Fund may enter into reverse repurchase agreements with primary dealers that report to the Federal Reserve Bank of New York or the 100 largest U.S. commercial banks, who are deemed creditworthy under guidelines approved by the Board. Interest on the value of the reverse repurchase agreements is based upon competitive market rates at the time of issuance. At the time the Fund enters into a reverse repurchase agreement, it will establish and maintain a segregated account with the custodian containing qualifying assets having a value, including accrued interest, not less than the repurchase price. Based on requirements with certain exchanges and third party broker-dealers, the Fund may also be required to deliver or deposit securities or cash as collateral.
As of March 31, 2023 there were no open reverse Repurchase Agreements.
Reverse repurchase transactions are entered into by the Fund under Master Repurchase Agreements (“MRA”), which permit the Fund, under certain circumstances, including an event of default (such as bankruptcy or insolvency), to offset payables and/or receivables under the MRA with collateral held and/or posted to the counterparty and create one single net payment due to or from the Fund. With reverse repurchase transactions, typically the Fund and the counterparties are permitted to sell, repledge, or use the collateral associated with the transaction. However, bankruptcy or insolvency laws of a particular jurisdiction may impose restrictions on or prohibitions against such a right of offset in the event of the MRA counterparty’s bankruptcy or insolvency. Pursuant to the terms of the MRA, the Fund receives or posts securities as collateral with a market value in excess of the repurchase price to be received or paid by the Fund upon the maturity of the transaction. Upon a bankruptcy or insolvency of the MRA counterparty, the Fund is considered an unsecured creditor with respect to excess collateral and, as such, the return of excess collateral may be delayed.
In the event the buyer of securities under a MRA files for bankruptcy or becomes insolvent, the Fund’s use of the proceeds of the agreement may be restricted while the other party, or its trustee or receiver, determines whether or not to enforce the Fund’s obligation to repurchase the securities.
TBA Commitments:
The Funds may enter into TBA commitments to purchase or sell securities for a fixed price at a future date. TBA commitments are considered securities in themselves, and involve a risk of loss if the value of the security to be purchased/sold declines/increases prior to settlement date, which is in addition to the risk of decline in the value of a Fund’s other assets. Unsettled TBA commitments are valued at the current value of the underlying securities, according to the procedures described under “Security Valuation”.
Mortgage Backed Securities:
Because the Funds will focus on community development investments, such as securities backed by commercial and/or residential mortgage loans, it will be affected by risks not typically associated with funds that do not specialize in community development investments. These risks include credit and prepayment risk and risk due to default on underlying loans within a security. Changes in economic conditions, including delinquencies and/or defaults or assets underlying these securities, can affect the value, income and/or liquidity of such positions.
In addition, the Access Capital Community Investment Fund invests in certain mortgage backed securities that qualify under the Community Reinvestment Act of 1977 (“CRA”) in which the Fund may pay a premium for the geographically or other targeted nature of the securities. There can be no guarantee, however, that a similar premium will be received if the security is sold by the Fund.
Derivatives:
The Funds may use derivative instruments, including futures, forwards, options, indexed securities, swaps and inverse securities as tools in the management of portfolio assets. The Funds may use such derivatives through either the creation of long or short positions to hedge various investments, for investment purposes, for risk management and/or to increase income or gain to the Funds. Derivatives allow the Funds to manage their risk exposure more quickly and efficiently than other types of instruments. Derivatives may be riskier than other types of investments and could result in losses that significantly exceed a Fund’s original investment. Derivatives are subject to the risk that changes in the
59
|
NOTES TO FINANCIAL STATEMENTS |
value of a derivative may not correlate perfectly with the underlying asset, rate or index. The use of derivatives may not be successful, resulting in losses to a Fund, and the cost of such strategies may reduce the Fund’s returns.
Hedging also involves the risk that changes in the value of the derivative will not match those of the holdings being hedged as expected by the Funds, in which case any losses on the holdings being hedged may not be reduced and may be increased. There can be no assurance that a Fund’s hedging strategy will reduce risk or that hedging transactions will be available or cost effective. The Funds are subject to interest rate risk in the normal course of pursuing their investment objectives by investing in various derivative financial instruments, as described below.
Financial Futures Contracts:
The Funds may enter into futures contracts in an effort to manage the duration of the portfolio and hedge against certain market risk. A futures contract on a securities index is an agreement obligating one party to pay, and entitling the other party to receive, during the term of the contract, cash payments based on the level of a specified securities index. Futures transactions involve brokerage costs and require a Fund to segregate assets to cover contracts that would require it to purchase securities or currencies. A Fund may lose the expected benefit of futures transactions if interest rates, exchange rates or securities prices change in an unanticipated manner. Such unanticipated changes may also result in lower overall performance than if a Fund had not entered into any futures transactions.
The Funds entered into U.S. Treasury Bond futures and U.S. Treasury Notes futures during the period ended March 31, 2023.
Upon entering into a futures contract, a Fund is required to pledge to the broker an amount of cash, U.S. government securities, or other assets equal to a certain percentage of the contract amount. Subsequent payments are made or received by the Funds each day, depending on the daily fluctuations in the fair value of the underlying instrument. A Fund would record an unrealized gain or loss each day equal to these daily payments.
Open futures contracts are shown on the Schedules of Portfolio Investments. Underlying collateral pledged for open futures contracts is the cash at brokers for financial futures contracts shown on the Statements of Assets and Liabilities at March 31, 2023.
| | | | | | | | | | | | | | | | |
Fair Values of Derivative Financial Instrument as of March 31, 2023(1) | |
Statement of Assets and Liabilities Location | |
Asset Derivatives | |
| | |
| | | Access Capital
Community
Investment Fund | | | Impact
Bond Fund | |
Interest Rate Risk: | | | | | | | | | | | | | | | | |
Unrealized appreciation on futures contracts | | | | | | $ | 658,139 | | | | | | | $ | 788,592 | |
| | | | | | | | | | | | | | | | |
Total | | | | | | $ | 658,139 | | | | | | | $ | 788,592 | |
| | | | | | | | | | | | | | | | |
| |
| | | | | | | | | | | | | | | | |
|
Liability Derivatives | |
| | | |
| | | Access Capital
Community
Investment Fund | | | | | | Impact
Bond Fund | |
Interest Rate Risk: | | | | | | | | | | | | | | | | |
Unrealized depreciation on futures contracts | | | | | | $ | 2,951 | | | | | | | $ | 101,382 | |
| | | | | | | | | | | | | | | | |
Total | | | | | | $ | 2,951 | | | | | | | $ | 101,382 | |
| | | | | | | | | | | | | | | | |
60
|
NOTES TO FINANCIAL STATEMENTS |
The effect of derivative instruments on the Statement of Operations during the period ended March 31, 2023 is as follows:
| | | | | | | | | | | | |
| | | Access Capital | | | | |
| Derivative Instruments | | Community | | | Impact | |
Categorized by Risk Exposure | | Investment Fund | | | Bond Fund | |
Net realized Gain/(Loss) From: | | | | | | | | | | | | |
Interest Rate Risk: | | | | | | | | | | | | |
Financial futures contracts | | | | | | $ | (2,636,381) | | | $ | (1,173,127) | |
| | | | | | | | | | | | |
Total | | | | | | $ | (2,636,381) | | | $ | (1,173,127) | |
| | | | | | | | | | | | |
| | |
| | | Access Capital | | | | |
| Derivative Instruments | | Community | | | Impact | |
Categorized by Risk Exposure | | Investment Fund | | | Bond Fund | |
Net Change in Unrealized Appreciation/(Depreciation) From: | | | | | | | | | | | | |
Interest Rate Risk: | | | | | | | | | | | | |
Financial futures contracts | | | | | | $ | 2,412,418 | | | $ | 1,353,167 | |
| | | | | | | | | | | | |
Total | | | | | | $ | 2,412,418 | | | $ | 1,353,167 | |
| | | | | | | | | | | | |
(1) Not considered to be hedging instruments for accounting disclosure purposes.
For the period ended March 31, 2023, the average volume of derivative activities based on ending quarterly outstanding amounts are as follows:
| | | | | | | | |
| | | Access Capital | | | | |
| | | Community | | | Impact | |
| | | Investment Fund | | | Bond Fund | |
Futures long position (contracts) | | | 260 | | | | 109 | |
Futures short position (contracts) | | | 113 | | | | 244 | |
Counterparty Credit Risk:
Derivatives may also expose a Fund to counterparty risk (the risk that the derivative counterparty will not fulfill its contractual obligations). To the extent amounts due to the Funds from their counterparties are not fully collateralized contractually or otherwise, the Funds bear the risk of loss from counterparty non-performance. A Fund’s maximum risk of loss from counterparty credit risk on over-the-counter (“OTC”) derivatives is generally the aggregate unrealized gain in excess of any collateral pledged by the counterparty to the Funds.
With exchange-traded futures, the exchange or clearinghouse, as counterparty to such instruments, guarantees against a possible default. The clearinghouse stands between the buyer and the seller of the contract; therefore, credit risk is limited to failure of the clearinghouse. While offset rights may exist under applicable law, the Fund does not have a contractual right of offset against a clearing broker or clearinghouse in the event of a default (including the bankruptcy or insolvency) of the clearing broker or clearinghouse. Additionally, credit risk exists in exchange-traded futures with respect to initial and variation margin that is held in a clearing broker’s customer accounts. While clearing brokers are required to segregate customer margin from their own assets, in the event that a clearing broker becomes insolvent or goes into bankruptcy and at that time there is a shortfall in the aggregate amount of margin held by the clearing broker for all its clients, typically the shortfall would be allocated on a pro rata basis across all the clearing broker’s customers, potentially resulting in losses to the Funds.
Affiliated Investments:
The Funds invest in another Fund of the Trust (an “Affiliated Fund”), U.S. Government Money Market Fund-RBC Institutional Class 1, as a cash sweep vehicle. The income earned by the Funds from the
61
|
NOTES TO FINANCIAL STATEMENTS |
Affiliated Fund for the period is disclosed in the Statement of Operations. The table below details the transactions of the Funds in the Affiliated Fund. As the affiliated investment is a money market fund in which shares are issued and redeemed at $1.00 per share, the number of shares purchased and sold equal the dollar amount shown as purchased and sold, and no gain or loss was realized on the sale of shares of the money market fund.
| | | | | | | | | | | | | | | | | | | | |
| | | Value | | | | | �� | | | | Value | | | | |
| | | September 30, 2022 | | | Purchases | | | Sales | | | March 31, 2023 | | | Dividends | |
Investments in U.S. Government Money Market Fund
—RBC Institutional Class 1 | | | | | | | | | | | | | | | | | | | | |
Access Capital Community Investment Fund | | | $1,836,898 | | | | $97,471,655 | | | | $86,464,855 | | | | $12,843,698 | | | | $223,466 | |
Impact Bond Fund | | | 3,439,191 | | | | 39,657,617 | | | | 37,376,054 | | | | 5,720,754 | | | | 236,962 | |
Credit Enhancement:
Certain obligations held by the Funds have credit enhancement or liquidity features that may, under certain circumstances, provide for repayment of principal and interest on the obligation upon demand date, interest rate reset date or final maturity. These enhancements may include: letters of credit; liquidity guarantees; security purchase agreements; tender option purchase agreements and third party insurance.
Investment Transactions and Income:
Investment transactions are recorded on trade date. Dividend income is recorded on the ex-dividend date. Non-cash dividends, if any, are recorded on the ex-dividend date at fair value. Realized gains and losses from investment transactions are calculated based on the cost of the specific security (also known as identified cost basis). Realized gains and losses from investment transactions and the net change in unrealized appreciation/(depreciation) relating to movements in foreign currency exchange rates are reported as realized gains and losses on foreign currency transactions and net change in unrealized appreciation/(depreciation) on foreign currency, respectively, in the statements of operations. Interest income is recognized on the accrual basis and includes, where applicable, the amortization or accretion of premium or discount using the effective yield method. Paydown gains and losses on mortgage- and asset-backed securities are included in the financial statements as interest income.
Expense, Investment Income and Gain/Loss Allocation:
Each Fund pays the expenses that are directly related to its operations, such as custodian fees or advisory fees. Expenses incurred by the Trust, such as trustee or legal fees, are allocated among each of the Funds in the Trust either proportionately based upon each Fund’s relative net assets or using another reasonable basis such as equally across all Funds in the Trust, depending on the nature of the expense. Individual share classes within a Fund are charged expenses specific to that class, such as distribution fees and transfer agent fees. Within a Fund, expenses other than class specific expenses are allocated daily to each class based upon the proportion of relative net assets. Investment income and realized and unrealized gains or losses are allocated to each class of shares based on relative net assets.
Indemnifications:
Under the Trust’s organizational documents, each Trustee, officer, employee or other agent of the Trust is indemnified against certain liabilities that may arise out of their duties to the Funds. Additionally, in the normal course of business, the Funds enter into contracts, including the Funds’ servicing agreements, that contain a variety of indemnification clauses. The Funds’ maximum exposure under these arrangements is unknown as this would involve future claims that may be made against the Funds that have not yet occurred.
62
|
NOTES TO FINANCIAL STATEMENTS |
Distributions to Shareholders:
Each Fund pays out any income that it receives, less expenses, in the form of dividends and capital gains to its shareholders. Income dividends are declared daily and paid monthly. Capital gain distributions are declared and paid at least annually. Distributions to shareholders are recorded on the ex-dividend date. The amount of dividends and distributions are calculated based on federal income tax regulations, which may differ from US GAAP. These “book/tax” differences may be either temporary or permanent in nature. To the extent these differences are determined, as of the end of the tax year, to be permanent (e.g., reclassification of paydown gains and losses ), they are reclassified within a Fund’s capital account based on their federal tax basis treatment.
Indemnifications:
Under the Trust’s organizational documents, each Trustee, officer, employee or other agent of the Trust is indemnified against certain liabilities that may arise out of their duties to the Funds. Additionally, in the normal course of business, the Funds enter into contracts, including the Funds’ servicing agreements, that contain a variety of indemnification clauses. The Funds’ maximum exposure under these arrangements is unknown as this would involve future claims that may be made against the Funds that have not yet occurred.
3. Agreements and Other Transactions with Affiliates:
The Trust has entered into an investment advisory agreement with RBC GAM-US under which RBC GAM-US manages each Fund’s assets and furnishes related office facilities, equipment, research and personnel. The agreement requires each Fund to pay RBC GAM-US a monthly fee based upon average daily net assets. Under the terms of the agreement, RBC GAM-US is entitled to receive fees based on a percentage of the average daily net assets of each of the Funds as follows:
| | |
| | | Annual Rate |
Access Capital Community Investment Fund | | 0.35% |
Impact Bond Fund | | 0.35% |
RBC GAM-US has contractually agreed to waive fees and/or make payments in order to keep total operating expenses (excluding certain fees such as interest, taxes and acquired fund fees and expenses) of the Funds to the following levels pursuant to an expense limitation agreement.
| | | | | | | | | | |
| | | Class A | | Class I | | Class IS | | Class R6 | | Class Y |
| | | Annual Rate | | Annual Rate | | Annual Rate | | Annual Rate | | Annual Rate |
Access Capital Community Investment Fund | | 0.80% | | 0.45% | | 0.40% | | N/A | | N/A |
Impact Bond Fund | | 0.70% | | 0.45% | | N/A | | 0.40% | | 0.40% |
This expense limitation agreement is in place until January 31, 2024, and shall continue for additional one-year terms unless terminated by either party at any time. The Advisor is entitled to recoup from the Fund or class the fees and/or operating expenses waived or reimbursed during any of the previous 12 months (3 years for the Impact Bond Fund), provided the Fund is able to do so and remain in compliance with the expense limitation in place at the time the fees were waived or expenses paid.
As of March 31, 2023, the amounts subject to possible recoupment under the expense limitation agreement were:
| | | | | | | | | | | | | | | | | | | | |
| | | FYE 9/30/20 | | | FYE 9/30/21 | | | FYE 9/30/22 | | | FYE 9/30/23 | | | Total | |
Access Capital Community Investment Fund | | | $ 0 | | | | $ 0 | | | | $436,319 | | | | $300,792 | | | $ | 737,111 | |
Impact Bond Fund | | | 128,479 | | | | 243,047 | | | | 308,395 | | | | 169,359 | | | | 849,280 | |
There was no recoupment of expense reimbursements/waivers during the year. Amounts from years prior to those shown are no longer subject to recoupment.
63
|
NOTES TO FINANCIAL STATEMENTS |
RBC GAM-US may also voluntarily waive and/or reimburse operating expenses of any Fund from time to time. Any such voluntary program may be changed or eliminated at any time without notice, and expenses waived under such programs are not subject to recoupment.
RBC GAM-US voluntarily agreed to waive its investment advisory fees by the amount of investment advisory fees the Funds pay to RBC GAM-US indirectly through its investment in an affiliated money market fund. For the six months ended March 31, 2023, the amount waived was $8,737 and $8,880 for Access Capital Community Investment Fund and Impact Bond Fund, respectively, and is included in expenses waived/reimbursed by Advisor in the Statement of Operations.
RBC GAM-US serves as co-administrator to the Funds. Bank of New York Mellon (“BNY Mellon”) serves as co-administrator and fund accounting agent. Services provided under the administrative services contract include providing day-to-day administration of matters related to the Funds, maintenance of their records and the preparation of reports. Under the terms of the administrative services contract, RBC GAM-US does not receive a fee for its role as co-administrator. BNY Mellon receives a fee for its services payable by each Fund based in part on each Fund’s average net assets. BNY Mellon’s fee is included with “Accounting fees” in the Statement of Operation.
RBC GAM-US also provides certain CRA-related administrative services to Class I shareholders of Access Capital Community Investment Fund pursuant to a Special Administrative Services Agreement with the Trust. In consideration for such services and the assumption of related expenses, RBC GAM-US receives a fee of 0.05% of the average daily net assets of Class I shares of the Fund.
Certain Officers and Trustees of the Trust are affiliated with the Advisor. Such Officers and Trustees receive no compensation from the Funds for serving their respective roles.
The Trust currently pays each of the independent Trustees (Trustees of the Trust who are not directors, officers or employees of the Advisor, either Co-Administrator or Distributor) an annual retainer of $84,000. The Board Chairperson and Audit Committee Chairperson each receive an additional retainer of $2,500 annually, and all other trustees serving as Chair of a Board committee each receive an additional retainer of $1,000 annually. In addition, Independent Trustees receive a quarterly meeting fee of $6,500 for each in-person Board meeting attended, a meeting fee of $1,500 for each telephonic or Special Board meeting attended, a $1,500 fee for each Board committee meeting attended, and are reimbursed for all out-of -pocket expenses relating to attendance at such meetings. These amounts are included in the Statements of Operations in “Trustee’ fees”.
In conjunction with the initial launch of the Impact Bond Fund and the subsequent launch of Class A and Class Y shares, the Advisor invested seed capital in the Fund to provide the Fund or share class with its initial investment assets. The table below shows, as of March 31, 2023, the Fund’s net assets, the shares held by the Advisor, and the percent of total net assets represented by the Advisor’s investment.
| | | | | | | | | | | | |
| | | Net Assets | | | Shares held
by Advisor | | | % of Fund
Net Assets | |
Impact Bond Fund | | $ | 233,889,845 | | | | 6,755,012 | | | | 25.0% | |
4. Fund Distribution:
Each of the Funds that offers Class A shares has adopted a Master Distribution 12b-1 Plan (the “Plan”) in which Quasar Distributors LLC (the “Distributor”) acts as the Funds’ distributor. The Plan permits each Fund to make payments for, or to reimburse the Distributor for, distribution-related costs and expenses of marketing shares of Class A covered under the Plan, and/or for providing shareholder services. The Plan does not apply to Class I and Class R6. The following chart shows the current Plan fee rate for Class A.
| | |
| | | Class A |
12b-1 Plan Fee | | 0.25%* |
64
|
NOTES TO FINANCIAL STATEMENTS |
* Under the 12b-1 plan, the maximum fee rate for Class A shares is 0.50%. Currently the Board has approved an annual limit of 0.25%.
Plan fees are based on average daily net assets of Class A. Up to 0.25% of each Plan fee may be designated as a service fee, as defined by the applicable rules of the Financial Industry Regulatory Authority. The Distributor, subject to applicable legal requirements, may waive the Plan fee voluntarily, in whole or in part. For the period ended March 31, 2023, there were no fees waived by the Distributor.
For the six months ended March 31, 2023, the Distributor received commissions of $1,751 in front-end sales charges of Class A shares of the Funds, of which none was paid to affiliated broker-dealers, and the remainder was either paid to unaffiliated broker-dealers or retained by the Distributor.
The Distributor did not receive any CDSC fees from Class A shares of the Funds during the period ended March 31, 2023.
5. Securities Transactions:
The cost of securities purchased and proceeds from securities sold (excluding securities maturing less than one year from acquisition) for the period ended March 31, 2023 were as follows:
| | | | | | | | | | | | | | | | |
| | | Purchases | | | Sales | | | Purchases | | | Sales | |
| | | (Excl. U.S. Gov’t) | | | (Excl. U.S. Gov’t) | | | of U.S. Gov’t. | | | of U.S. Gov’t. | |
| | | | |
Access Capital Community Investment Fund | | | $ 2,030,000 | | | | $ 8,922,519 | | | | $113,365,956 | | | | $76,850,103 | |
Impact Bond Fund | | | 40,989,861 | | | | 25,174,548 | | | | 15,126,193 | | | | 12,844,504 | |
65
|
NOTES TO FINANCIAL STATEMENTS |
6. Capital Share Transactions:
The Trust is authorized to issue an unlimited number of shares of beneficial interest (“Shares Outstanding”) without par value. Transactions in capital stock of the Funds are summarized on the following pages:
| | | | | | | | | | | | | | | | | | | | | | | | |
| | | Access Capital Community Investment Fund | | | Impact Bond Fund | |
| | | For the
Six Months
Ended
March 31,
2023
(Unaudited) | | | For the
Year Ended
September 30,
2022 | | | For the
Six Months
Ended
March 31,
2023
(Unaudited) | | | For the
Year Ended
September 30,
2022 | |
CAPITAL TRANSACTIONS: | | | | | | | | | | | | | | | | | | | | | | | | |
Class A | | | | | | | | | | | | | | | | | | | | | | | | |
Proceeds from shares issued | | | | | | $ | 277,828 | | | | | | | $ | 968,891 | | | $ | 60,793 | | | $ | 1,000,000 | |
Distributions reinvested | | | | | | | 112,227 | | | | | | | | 213,449 | | | | 12,933 | | | | 7,501 | |
Cost of shares redeemed | | | | | | | (2,083,971 | ) | | | | | | | (3,939,878 | ) | | | (12,578 | ) | | | (16,171 | ) |
| | | | | | | | | | | | | | | | | | | | | | | | |
Change in Class A | | | | | | $ | (1,693,916 | ) | | | | | | $ | (2,757,538 | ) | | $ | 61,148 | | | $ | 991,330 | |
| | | | | | | | | | | | | | | | | | | | | | | | |
Class I | | | | | | | | | | | | | | | | | | | | | | | | |
Proceeds from shares issued | | | | | | $ | 49,311,497 | | | | | | | $ | 182,842,481 | | | $ | 21,353,503 | | | $ | 45,194,667 | |
Distributions reinvested | | | | | | | 6,053,106 | | | | | | | | 8,763,619 | | | | 1,433,981 | | | | 2,193,306 | |
Cost of shares redeemed | | | | | | | (57,824,980 | ) | | | | | | | (137,545,454 | ) | | | (10,450,160 | ) | | | (13,421,769 | ) |
| | | | | | | | | | | | | | | | | | | | | | | | |
Change in Class I | | | | | | $ | (2,460,377 | ) | | | | | | $ | 54,060,646 | | | $ | 12,337,324 | | | $ | 33,966,204 | |
| | | | | | | | | | | | | | | | | | | | | | | | |
Class IS | | | | | | | | | | | | | | | | | | | | | | | | |
Proceeds from shares issued | | | | | | $ | 9,913,633 | | | | | | | $ | 44,327,365 | | | $ | — | | | $ | — | |
Distributions reinvested | | | | | | | 815,540 | | | | | | | | 891,594 | | | | — | | | | — | |
Cost of shares redeemed | | | | | | | (8,185,349 | ) | | | | | | | (18,020,573 | ) | | | — | | | | — | |
| | | | | | | | | | | | | | | | | | | | | | | | |
Change in Class IS | | | | | | $ | 2,543,824 | | | | | | | $ | 27,198,386 | | | $ | — | | | $ | — | |
| | | | | | | | | | | | | | | | | | | | | | | | |
Class R6 | | | | | | | | | | | | | | | | | | | | | | | | |
Proceeds from shares issued | | | | | | $ | — | | | | | | | $ | — | | | $ | 560,919 | | | $ | 3,914,712 | |
Distributions reinvested | | | | | | | — | | | | | | | | — | | | | 1,003,455 | | | | 1,982,680 | |
Cost of shares redeemed | | | | | | | — | | | | | | | | — | | | | (247,709 | ) | | | (7,008,693 | ) |
| | | | | | | | | | | | | | | | | | | | | | | | |
Change in Class R6 | | | | | | $ | — | | | | | | | $ | — | | | $ | 1,316,665 | | | $ | (1,111,301 | ) |
| | | | | | | | | | | | | | | | | | | | | | | | |
66
|
NOTES TO FINANCIAL STATEMENTS |
| | | | | | | | | | | | | | | | | | | | | | | | |
| | | Access Capital Community Investment
Fund | | | Impact Bond Fund | |
| | | For the
Six Months
Ended
March 31,
2023
(Unaudited) | | | For the
Year Ended
September 30,
2022 | | | For the
Six Months
Ended
March 31,
2023
(Unaudited) | | | For the
Year Ended
September 30,
2022 | |
Class Y | | | | | | | | | | | | | | | | | | | | | | | | |
Distributions reinvested | | | | | | $ | — | | | | | | | $ | — | | | $ | 775,113 | | | $ | 1,478,137 | |
| | | | | | | | | | | | | | | | | | | | | | | | |
Change in Class Y | | | | | | $ | — | | | | | | | $ | — | | | $ | 775,113 | | | $ | 1,478,137 | |
| | | | | | | | | | | | | | | | | | | | | | | | |
Change in net assets resulting from capital transactions | | | | | | $ | (1,610,469 | ) | | | | | | $ | 78,501,494 | | | $ | 14,490,250 | | | $ | 35,324,370 | |
| | | | | | | | | | | | | | | | | | | | | | | | |
SHARE TRANSACTIONS: | | | | | | | | | | | | | | | | | | | | | | | | |
Class A | | | | | | | | | | | | | | | | | | | | | | | | |
Issued | | | | | | | 36,157 | | | | | | | | 113,890 | | | | 7,119 | | | | 110,619 | |
Reinvested | | | | | | | 14,678 | | | | | | | | 25,648 | | | | 1,522 | | | | 850 | |
Redeemed | | | | | | | (273,907 | ) | | | | | | | (475,290 | ) | | | (1,480 | ) | | | (1,815 | ) |
| | | | | | | | | | | | | | | | | | | | | | | | |
Change in Class A | | | | | | | (223,072 | ) | | | | | | | (335,752 | ) | | | 7,161 | | | | 109,654 | |
| | | | | | | | | | | | | | | | | | | | | | | | |
Class I | | | | | | | | | | | | | | | | | | | | | | | | |
Issued | | | | | | | 6,405,600 | | | | | | | | 21,919,539 | | | | 2,500,894 | | | | 4,828,785 | |
Reinvested | | | | | | | 791,383 | | | | | | | | 1,056,934 | | | | 168,296 | | | | 232,926 | |
Redeemed | | | | | | | (7,600,415 | ) | | | | | | | (16,520,924 | ) | | | (1,223,495 | ) | | | (1,442,934 | ) |
| | | | | | | | | | | | | | | | | | | | | | | | |
Change in Class I | | | | | | | (403,432 | ) | | | | | | | 6,455,549 | | | | 1,445,695 | | | | 3,618,777 | |
| | | | | | | | | | | | | | | | | | | | | | | | |
Class IS | | | | | | | | | | | | | | | | | | | | | | | | |
Issued | | | | | | | 1,290,369 | | | | | | | | 5,395,005 | | | | — | | | | — | |
Reinvested | | | | | | | 106,654 | | | | | | | | 108,646 | | | | — | | | | — | |
Redeemed | | | | | | | (1,073,566 | ) | | | | | | | (2,207,011 | ) | | | — | | | | — | |
| | | | | | | | | | | | | | | | | | | | | | | | |
Change in Class IS | | | | | | | 323,457 | | | | | | | | 3,296,640 | | | | — | | | | — | |
| | | | | | | | | | | | | | | | | | | | | | | | |
Class R6 | | | | | | | | | | | | | | | | | | | | | | | | |
Issued | | | | | | | — | | | | | | | | — | | | | 66,726 | | | | 412,872 | |
Reinvested | | | | | | | — | | | | | | | | — | | | | 117,812 | | | | 208,613 | |
Redeemed | | | | | | | — | | | | | | | | — | | | | (29,931 | ) | | | (777,383 | ) |
| | | | | | | | | | | | | | | | | | | | | | | | |
Change in Class R6 | | | | | | | — | | | | | | | | — | | | | 154,607 | | | | (155,898 | ) |
| | | | | | | | | | | | | | | | | | | | | | | | |
Class Y | | | | | | | | | | | | | | | | | | | | | | | | |
Reinvested | | | | | | | — | | | | | | | | — | | | | 91,111 | | | | 155,748 | |
| | | | | | | | | | | | | | | | | | | | | | | | |
Change in Class Y | | | | | | | — | | | | | | | | — | | | | 91,111 | | | | 155,748 | |
| | | | | | | | | | | | | | | | | | | | | | | | |
Change in shares resulting from capital transactions | | | | | | | (303,047 | ) | | | | | | | 9,416,437 | | | | 1,698,574 | | | | 3,728,281 | |
| | | | | | | | | | | | | | | | | | | | | | | | |
67
|
NOTES TO FINANCIAL STATEMENTS |
7. Federal Income Taxes:
It is the policy of each Fund to continue to qualify as a regulated investment company by complying with the provisions available to certain investment companies, as defined under Subchapter M of the Internal Revenue Code, and to distribute substantially all of its net investment income and net realized capital gains. Therefore, no federal tax liability is recorded in the financial statements of each Fund.
For all open tax years and all major taxing jurisdictions, management of the Funds has concluded that there are no significant uncertain tax positions that would require recognition in the financial statements. Open tax years are those that are open for examination by taxing authorities (i.e., generally the last three tax year ends and the interim tax period since then). Furthermore, management of the Funds is also not aware of any tax positions for which it is reasonably possible that the total amounts of unrecognized tax benefits will significantly change in the next twelve months.
As of March 31, 2023, the tax cost of investments and the breakdown of unrealized appreciation (depreciation) for each Fund was as follows:
| | | | | | | | | | | | | | | | |
| | | Tax Cost Of
Investments | | | Unrealized
Appreciation | | | Unrealized
Depreciation | | | Net Unrealized
Appreciation/
(Depreciation) | |
Access Capital Community Investment Fund | | $ | 831,297,223 | | | $ | 1,233,202 | | | $ | (79,023,259 | ) | | $ | (77,790,057 | ) |
Impact Bond Fund | | | 263,390,531 | | | | 373,543 | | | | (24,489,790 | ) | | | (24,116,247 | ) |
The difference between book basis and tax basis unrealized appreciation/depreciation is attributable primarily to the tax mark-to-market of derivatives.
The tax character of distributions during the year ended September 30, 2022 were as follows:
| | | | | | | | | | | | | | | | |
| | | Distributions Paid From | |
| | | Ordinary
Income | | | Net Long Term
Capital Gains | | | Total Taxable
Distributions | | | Total
Distributions
Paid | |
Access Capital Community Investment Fund | | $ | 14,770,525 | | | $ | — | | | $ | 14,770,525 | | | $ | 14,770,525 | |
Impact Bond Fund | | | 4,504,459 | | | | 1,115,095 | | | | 5,619,554 | | | | 5,619,554 | |
Total distributions paid may differ from the Statements of Changes in Net Assets because distributions are recognized when actually paid for tax purposes.
The tax basis of components of accumulated earnings/(losses) and tax character of distributions are determined at fiscal year end, and will be included in the Annual Report dated September 30, 2023.
As of September 30, 2022, the Access Capital Community Investment Fund had a short-term capital loss carryforward of $13,378,499 and a long-term capital loss carryforward of $27,653,509 available to offset future realized capital gains in accordance with the Regulated Investment Company Modernization Act of 2010. These capital loss carryforwards are not subject to expiration and must first be utilized to offset future realized gains of the same character.
Under current tax law, Post-October Capital Losses and Late-Year Ordinary Losses may be deferred and treated as occurring on the first business day of the following fiscal year for tax purposes. The RBC Impact Bond Fund had deferred qualified late-year short-term losses of $3,497,107 and qualified late-year long-term losses of $3,878,322 which will be treated as arising on the first business day of the fiscal year ending September 30, 2023.
8. Line of Credit
The Funds are participants in an uncommitted, secured $500,000,000 line of credit with U.S. Bank, N.A. (the “Bank”), the Funds’ custodian, to be used to fund shareholder redemption requests and for
68
|
NOTES TO FINANCIAL STATEMENTS |
other short-term temporary or emergency general business purposes. The line of credit has a scheduled termination date of July 29, 2023. Interest is charged on borrowings under this line of credit at the Bank’s prime lending rate per annum. Since each Fund participates in this line of credit, there is no assurance that an individual fund will have access to all or any part of the $500,000,000 at any particular time. There were no borrowings by the Funds during the six months ended March 31, 2023, and no loans outstanding pursuant to this line of credit at March 31, 2023.
9. Significant Risks:
Shareholder concentration risk
As of March 31, 2023, the Funds had broker-dealer omnibus accounts which each owned more than 10% of a Fund’s outstanding shares as shown below:
| | | | | | | | |
| | | # of Omnibus Accounts | | | % of Fund | |
Access Capital Community Investment Fund | | | 1 | | | | 16.8% | |
Impact Bond Fund | | | 1 | | | | 15.7% | |
In addition, an unaffiliated shareholder owned 22.8% of the Impact Bond Fund as of March 31, 2023. Significant transactions by these shareholders may impact the Funds’ performance.
Market risk
One or more markets in which a Fund invests may go down in value, sometimes sharply and unpredictably, and the value of a Fund’s portfolio securities may fall or fail to rise. Market risk may affect a single issuer, sector of the economy, industry or the market as a whole. In addition, global economies and financial markets are becoming increasingly interconnected, and political, economic and other conditions and events (including, but not limited to, natural disasters, pandemics, epidemics, and social unrest) in one country, region, or financial market may adversely impact issuers in a different country, region or financial market. Furthermore, the occurrence of, among other events, natural or man-made disasters, severe weather or geological events, fires, floods, earthquakes, outbreaks of disease (such as COVID-19, avian influenza or H1N1/09), epidemics, pandemics, malicious acts, cyber-attacks, terrorist acts or the occurrence of climate change, may also adversely impact the performance of a Fund. Such events could adversely impact issuers, markets and economies over the short- and long-term, including in ways that cannot necessarily be foreseen. A Fund could be negatively impacted if the value of a portfolio holding were harmed by such political or economic conditions or events. Moreover, such negative political and economic conditions and events could disrupt the processes necessary for a Fund’s operations.
Interest Rate Risk
A Fund’s yield and value will fluctuate as the general level of interest rates change. During periods when interest rates are low, a Fund’s yield may also be low. When interest rates increase, securities held by a Fund will generally decline in value. Interest rate changes are influenced by a number of factors including government policy, inflation expectations, and supply and demand. Municipal securities may be issued on a when-issued or delayed delivery basis, where payment and delivery take place at a future date. A Fund assumes the risk that the value of the security at delivery may be more or less than the purchase price.
Credit Spread Risk
A Fund’s investments may be adversely affected if any of the issuers it is invested in are subject to an actual or perceived (whether by market participants, rating agencies, pricing services or otherwise) deterioration to their credit quality. Any actual or perceived deterioration may lead to an increase in the credit spreads and a decline in price of the issuer’s securities.
69
|
NOTES TO FINANCIAL STATEMENTS |
Prepayment Risk
The value of some mortgage-backed and asset-backed securities in which a Fund invests also may fall because of unanticipated levels of principal prepayments that can occur when interest rates decline. Principal and interest payments on such securities depend on payment of the underlying loans, though issuers may support creditworthiness via letters of credit or other instruments.
10. Subsequent Events:
Fund Management has evaluated the impact of all subsequent events on the Funds and has determined that there were no subsequent events requiring recognition or disclosure in the financial statements.
70
|
SHARE CLASS INFORMATION (UNAUDITED) |
The Funds offer Class A, Class IS, Class I, Class R6 and Class Y shares.
Class A
Class A shares are available for purchase primarily through investment advisors, broker-dealers, banks and other financial services intermediaries. Class A shares are currently subject to a maximum up-front sales charge of 3.75% and a 1.00% CDSC for redemption within 12 months of a $1 million or greater purchase. Class A shares currently include a 0.25% annual 12b-1 service and distribution fee.
Class I
Class I shares are intended for investors meeting certain minimum investment thresholds. This share class does not have an up-front sales charge (load) or a 12b-1 service and distribution fee.
Class IS
Class IS shares are offered in Access Capital Community Investment Fund and are available to investors who meet the $2,500 minimum initial investment requirement. This share class does not have an up-front sales charge (load) or a 12b-1 service and distribution fee.
Class R6
Class R6 shares are available in Impact Bond Fund. This share class is intended for investors meeting certain minimum investment thresholds. This share class does not have an up-front sales charge (load) or a 12b-1 service and distribution fee.
Class Y
Class Y shares are offered in Impact Bond Fund for institutional investors that hold shares through an account held directly with the Fund and meet the $5,000,000 minimum requirement for initial investment. This share class does not have an upfront sales charge (load) or a 12b-1 distribution and servicing fee.
71
|
SUPPLEMENTAL INFORMATION (UNAUDITED) |
Shareholder Expense Examples
As a shareholder of the RBC Funds, you incur two types of costs: (1) transaction costs and (2) ongoing costs, including management fees; and other Fund expenses. This example is intended to help you understand your ongoing costs (in dollars) of investing in the RBC Funds and to compare these costs with the ongoing costs of investing in other mutual funds.
The example is based on an investment of $1,000 invested at the beginning of the period and held for the entire period from October 1, 2022 through March 31, 2023.
Actual Expenses
The table below provides information about actual account values and actual expenses. You may use the information below, together with the amount you invested, to estimate the expenses that you paid over the period. Simply divide your account value by $1,000 (for example, an $8,600 account value divided by $1,000 = 8.6), then multiply the result by the number in the table under the heading entitled “Expenses Paid During Period” to estimate the expenses you paid on your account during this period.
| | | | | | | | | | | | | | | | | | |
| | | | | Beginning
Account Value
10/1/22 | | | Ending
Account Value
3/31/23 | | | Expenses Paid
During Period*
10/1/22–3/31/23 | | | Annualized
Expense Ratio
During Period
10/1/22–3/31/23 | |
Access Capital Community Investment Fund | | | | | | | | | | | | | |
| | Class A | | | $1,000.00 | | | | $1,037.70 | | | | $4.11 | | | | 0.80% | |
| | Class I | | | 1,000.00 | | | | 1,039.60 | | | | 2.31 | | | | 0.45% | |
| | Class IS | | | 1,000.00 | | | | 1,039.80 | | | | 2.06 | | | | 0.40% | |
Impact Bond Fund | | | | | | | | | | | | | | | | | | |
| | Class A | | | 1,000.00 | | | | 1,039.90 | | | | 3.55 | | | | 0.69% | |
| | Class I | | | 1,000.00 | | | | 1,041.10 | | | | 2.26 | | | | 0.44% | |
| | Class R6 | | | 1,000.00 | | | | 1,041.10 | | | | 2.01 | | | | 0.39% | |
| | Class Y | | | 1,000.00 | | | | 1,041.40 | | | | 2.01 | | | | 0.39% | |
*Expenses are equal to the average account value times the Fund’s annualized expense ratio multiplied by 182/365 (to reflect one half year period).
72
|
SUPPLEMENTAL INFORMATION (UNAUDITED) |
Hypothetical Example for Comparison Purposes
The table below provides information about hypothetical account values and hypothetical expenses based on each RBC Funds’ actual expense ratio and an assumed rate of return of 5% per year before expenses, which is not the Fund’s actual return. The hypothetical account values and expenses may not be used to estimate the actual ending account balance or expenses you paid for the period. You may use this information to compare this 5% hypothetical example with the 5% hypothetical examples that appear in the shareholder reports of other funds.
Please note that the expenses shown in the table are meant to highlight your ongoing costs only and do not reflect any transactional costs, such as sales charges (loads), redemption fees, or exchange fees. Therefore, the table is useful in comparing ongoing costs only, and will not help you determine the relative total costs of owning different funds. In addition, if these transactional costs were included, your costs would have been higher.
| | | | | | | | | | | | | | | | | | |
| | | | | Beginning
Account Value
10/1/22 | | | Ending
Account Value
3/31/23 | | | Expenses Paid
During Period*
10/1/22-3/31/23 | | | Annualized
Expense Ratio
During Period
10/1/22-3/31/23 | |
Access Capital Community Investment Fund | | | | | | | | | | | | | |
| | Class A | | | $1,000.00 | | | | $1,021.17 | | | | $4.08 | | | | 0.80% | |
| | Class I | | | 1,000.00 | | | | 1,022.94 | | | | 2.29 | | | | 0.45% | |
| | Class IS | | | 1,000.00 | | | | 1,023.19 | | | | 2.04 | | | | 0.40% | |
Impact Bond Fund | | | | | | | | | | | | | | | | | | |
| | Class A | | | 1,000.00 | | | | 1,021.73 | | | | 3.52 | | | | 0.69% | |
| | Class I | | | 1,000.00 | | | | 1,022.99 | | | | 2.24 | | | | 0.44% | |
| | Class R6 | | | 1,000.00 | | | | 1,023.24 | | | | 1.99 | | | | 0.39% | |
| | Class Y | | | 1,000.00 | | | | 1,023.24 | | | | 1.99 | | | | 0.39% | |
*Expenses are equal to the average account value times the Fund’s annualized expense ratio multiplied by 182/365 (to reflect one half year period).
73
|
STATEMENT REGARDING LIQUIDITY RISK MANAGEMENT PROGRAM (UNAUDITED) |
Statement Regarding Liquidity Risk Management Program
This section discusses the operation and effectiveness of the Liquidity Risk Management Program for the RBC Funds established in accordance with Rule 22e-4 under the Investment Company Act of 1940 (the “Liquidity Rule”). RBC Global Asset Management (U.S.) Inc. (“RBC GAM”), the investment adviser to each Fund, serves as the Program Administrator and administers day-to-day implementation of the Program through a working group known as the Liquidity Risk Committee.
RBC GAM, as Program Administrator, provided the Board with a report addressing the operation of the Program during the year ending December 31, 2022 and assessing its adequacy and effectiveness of implementation, including, if applicable, the operation of any Fund’s highly liquid investments minimum and any material changes to the Program.
I. Key Conclusions of the Report
During the review period, the Program was implemented and operated effectively to achieve the goal of assessing and managing each Fund’s liquidity risk. Each Fund was able to meet requests for redemption without significant dilution of remaining investors’ interests in the Fund, and no Fund was required to set a highly liquid investments minimum. There were no material changes to the Program implemented during the review period.
II. Summary of the Review
A. Liquidity Risk Assessment and Review
Throughout the review period, the Program Administrator, in consultation with investment personnel, monitored the Funds’ portfolio liquidity and liquidity risk on an ongoing basis, as described in the Program, monthly in connection with recording the liquidity classification for each portfolio investment for reporting on Form N-PORT, and provided quarterly reports to the Board throughout the review period.
The Program Administrator also conducted an annual review assessing each Fund’s liquidity risk, in accordance with the requirements of the Program and the Liquidity Rule, taking into account the following factors, as applicable:
a. Each Fund’s investment strategy and liquidity of portfolio investments during both normal and reasonably foreseeable stressed conditions, including: (i) whether the Fund’s investment strategy is appropriate for an open-end fund; (ii) the extent to which the Fund’s strategy involves a relatively concentrated portfolio or large positions in particular issuers; (iii) the Fund’s use of borrowings for investment purposes; and (iv) the Fund’s use of derivatives (including for hedging purposes);
b. Short-term and long-term cash flow projections during both normal and reasonably foreseeable stressed conditions; and
c. Holdings of cash and cash equivalents, as well as borrowing arrangements and other funding sources.
Investment Strategy and Portfolio Liquidity. The Program Administrator considered the factors identified above, among others, during both normal and reasonably foreseeable stressed conditions as provided in the Program. Pursuant to the review, the Program Administrator determined that each Fund’s investment strategy and use of derivatives are appropriate for an open-end fund.
Cash Flow. The Funds’ cash flows did not have a material effect on the ability to meet redemptions during the review period.
Holdings of Cash and Borrowing Arrangements. As described in the Report, the Program Administrator determined that the Funds’ holdings of cash and borrowing arrangements were adequate for meeting the Funds’ expected cash flow needs to meet redemptions during the review period.
Cash Flow. The Funds’ cash flows did not have a material effect on the ability to meet redemptions during the Review Period.
74
|
STATEMENT REGARDING LIQUIDITY RISK MANAGEMENT PROGRAM (UNAUDITED) |
Holdings of Cash and Borrowing Arrangements. As described in the Report, the Program Administrator determined that the Funds’ holdings of cash and borrowing arrangements were adequate for meeting the Funds’ expected cash flow needs to meet redemptions during the Review Period.
In light of the assessment and review as discussed above, the Program Administrator did not recommend any material changes in the management of the Funds’ liquidity risks, including with respect to any of the above factors.
B. Review of Initial Liquidity Risk
During the review period, four new RBC Funds were launched. The Program Administrator conducted initial liquidity risk reviews for each of these Funds and concluded that there were no significant liquidity risk concerns.
C. Portfolio Holdings Classifications
During the review period, each Fund’s portfolio holdings (including derivative investments) were classified monthly as Highly Liquid Investments, Moderately Liquid Investments, Less Liquid Investments and Illiquid Investments pursuant to the Program, as required by the Liquidity Rule.
During the review period, the Funds also classified portfolio investments (including, as applicable, derivatives transactions) according to asset class when appropriate, as described in the Program. In addition, pursuant to the Program, each Fund must separately classify and review any investment within an asset class if any market, trading, or investment-specific considerations are reasonably expected to significantly affect the liquidity of the investment as compared the Fund’s other portfolio holdings within that asset class. During the review period, there were no circumstances in which a Fund was required to separately classify any investment within an asset class.
Market Depth—Reasonably Anticipated Trading Size (“RATS”). In classifying and reviewing its portfolio investments or asset classes (as applicable), each Fund must determine whether trading varying portions of a position in a particular portfolio investment or asset class, in sizes that the Fund would reasonably anticipate trading, is reasonably expected to significantly affect its liquidity. Each Fund must take this determination into account when classifying the liquidity of that investment or asset class. There were no material changes to the RATS assumptions for the Funds during the review period.
Classification Review. As required by the Liquidity Rule, the Program Administrator reviewed the Funds’ liquidity classifications on a monthly basis as described in the Program. The Committee met monthly to review its portfolio investments’ classifications in connection with recording the liquidity classification for each portfolio investment for reporting on Form N-PORT. The Program Administrator oversaw the Funds’ process for classifying portfolio holdings under the Liquidity Rule and reviewed the classifications, as described in the Program. This review included a review of the methodology and data inputs used. Due to the Russian-Ukrainian conflict, there were widespread sanctions against Russian-affiliated assets resulting in affected Russian holdings being classified as illiquid. During the review period, the Program Administrator determined that there were no material operational issues with the process for classifying portfolio holdings.
D. Highly Liquid Investments Minimum
The Program Administrator reviewed the process and standards for determining that each Fund primarily holds investments that are highly liquid. There were no changes recommended in the Report with respect to the status of any Fund as a Primarily Highly Liquid Fund (“PHLF”) and, with one exception, each Fund qualified as a PHLF on an ongoing basis during the review period as described in the Report. The newly launched RBC International Small Cap Equity Fund did not initially qualify as a PHLF, however, it was expected to meet the relevant threshold as soon as its access to all the relevant trading markets had been completed. Accordingly, a highly liquid investments minimum was not required for any Fund during the review period pursuant to the relevant provisions of the Program.
E. Compliance with the 15% Limitation on Illiquid Investments
Pursuant to the Liquidity Rule, no Fund may acquire any illiquid investment if, after the acquisition, the Fund would have invested more than 15% of its assets in illiquid investments that are assets (the
75
|
STATEMENT REGARDING LIQUIDITY RISK MANAGEMENT PROGRAM (UNAUDITED) |
“15% Limit”). The Program Administrator monitored compliance with the 15% Limit as described in the Program. At no time during the review period did any Fund breach the 15% limit.
F. Redemptions in Kind
There were no planned redemptions in-kind effected during the review period.
G. SEC Reporting
The Funds met their monthly Form N-PORT filing requirements during the period. No reports on Form N-LIQUID were required to be filed during the period and none were filed.
76
This Page Intentionally Left Blank
77
This Page Intentionally Left Blank
78
This Page Intentionally Left Blank
79
This Page Intentionally Left Blank
80
RBC Funds
P.O. Box 701
Milwaukee, WI 53201-0701
800-422-2766
www.rbcgam.com
Performance data represents past performance and does not guarantee future results. The principal value of an investment and investment return will fluctuate so that an investor’s shares, when redeemed, may be worth more or less than their original cost.
This report and the financial statements contained herein are provided for the information of RBC Funds shareholders. This report is not authorized for distribution to prospective investors unless preceded or accompanied by a current prospectus, which contains information concerning investment objectives, risks, charges and expenses of the funds. Please read the prospectus carefully before investing.
This report and the financial statements contained herein are not intended to be a forecast of future events, a guarantee of future results, or investment advice. There is no assurance that certain securities will remain in or out of each fund’s portfolio. The views expressed in this report reflect those of the portfolio managers through the period ended March 31, 2023.
NOT FDIC INSURED • NO BANK GUARANTEE • MAY LOSE VALUE
RBC Global Asset Management (U.S.) Inc. serves as investment advisor for the RBC Funds.
RBC Funds are distributed by Quasar Distributors LLC.

The RBC Funds are pleased to offer shareholder reports printed entirely on Forest
Stewardship Council® certified paper. FSC® certification ensures that the paper
used in this report contains fiber from well-managed and responsibly harvested
forests that meet strict environmental and socioeconomic standards.
RBCF-II SAR 03-23

RBC Global Asset Management Semi-Annual Report For the six months ended March 31, 2023 RBC BlueBay Emerging Market Debt Fund RBC BlueBay High Yield Bond Fund RBC BlueBay Core Plus Bond Fund RBC BlueBay Strategic Income Fund RBC
| | | | | | |
| | | |
PORTFOLIO MANAGERS | | | | | | |
| | | | | | | |
| | | |
| RBC Global Asset Management (U.S.) Inc. (“RBC GAM-US”) serves as the investment advisor to each of the Funds and BlueBay Asset Management LLP (“BlueBay”) serves as investment sub-advisor to RBC BlueBay Emerging Market Debt Fund and RBC BlueBay High Yield Bond Fund. The sub-advisor is responsible for the overall management of the portfolios of RBC BlueBay Emerging Market Debt Fund and RBC BlueBay High Yield Bond Fund. The individuals primarily responsible for the day-to-day management of the Funds’ portfolios are set forth below. | | | | | | |
| | | | |
| RBC BlueBay Emerging Market Debt Fund | | | | | | |
| | | |
| Polina Kurdyavko | | | | | | |
| | | |
| Partner, Senior Portfolio Manager | | | | | | |
| | | |
| Polina is Head of Emerging Markets and Senior Portfolio Manager at BlueBay. Polina started her career in emerging markets after the Russian financial crisis in 1988 and has, since then, gained expertise across a broad range of emerging market financial assets. Polina joined BlueBay in July 2005 from UBS where she was a credit analyst in EM corporate research. Her role encompassed coverage of EM issuers as well as research support for primary issuance of corporate debt. Prior to this, Polina was with Alliance Capital where she was an emerging markets equity analyst and then moved on to pioneer emerging markets quantitative research at the firm. She started her career in a macro research boutique in Russia. Polina holds an MSc (Hons) in Finance from the people’s Friendship University of Russia, Moscow and is a CFA charterholder. | | | | | | |
| | | | |
| RBC BlueBay High Yield Bond Fund | | | | | | |
| | | |
| Justin Jewell | | | | | | |
| | | |
Partner, Head of European High Yield Senior Portfolio Manager | | | | | | |
| | | |
| Justin is Co-Head of BlueBay’s Global Leveraged Finance Long-Only Strategies and a senior portfolio manager within the Global Leveraged Finance Group. Justin joined BlueBay in April 2009, initially as Head of High Yield Trading, before moving into portfolio management at the beginning of 2012. He started his career at UBS in 2002 where, most recently, he was Director of High Yield and Distressed Trading in Europe. Justin has a BSc in Economics from the London School of Economics. | | | | | | |
| | | | |
| Andrzej Skiba, CFA | | | | | | |
| | | |
| Head of U.S. Fixed Income, Senior Portfolio Manager | | | | | | |
| | | |
Andrzej Skiba joined BlueBay in February 2005 and, following the alignment of BlueBay’s U.S. business with RBC GAM-US in November 2021, is responsible for the U.S. fixed income investment team based in Minneapolis (MN) and Stamford (CT). In 2013, Andrzej moved to the U.S. from London to oversee the buildout of global investment grade capability. This followed a period from 2009, where he was a portfolio manager responsible for corporate investments within BlueBay’s investment grade strategies. Andrzej spent his first four years at BlueBay as a credit analyst covering the TMT, utilities and retail sectors for the Investment Grade team. Prior to BlueBay, Andrzej worked for Goldman Sachs as a credit analyst covering European investment grade telecom, media and utility sectors. Andrzej holds a BSc (Hons) in Management and International Business Economics from UMIST and is a CFA charterholder. | | | | | | |
1
| | | | | | |
| | | |
| | | | | | PORTFOLIO MANAGERS |
| | | | | | |
| | | | | | Tim Leary |
| | | |
| | | | | | Senior Portfolio Manager |
| | | |
| | | | | | Tim joined BlueBay in January 2012 and is a Senior Portfolio Manager across several global leveraged finance and ESG strategies based in the Stamford, Connecticut, office. Tim joined BlueBay as Head of Trading, North America within the Global Leveraged Finance Group based in the Stamford, Connecticut, office before being promoted to portfolio manager in January 2017. Prior to joining BlueBay, he was a director in high yield and distressed credit trading at the Royal Bank of Scotland. Before that, Tim spent three years as an analyst on the leveraged loan trading desk at Bear Stearns & Co. Tim holds a BS in Business Administration with Finance concentration from Fordham University. |
| | | |
| | | | | | RBC BlueBay Core Plus Bond Fund and RBC BlueBay Strategic Income Fund |
| | | |
| | | | | | Andrzej Skiba, CFA |
| | | |
| | | | | | Head of U.S. Fixed Income, Senior Portfolio Manager |
| | | |
| | | | | | Andrzej Skiba joined BlueBay in February 2005 and, following the alignment of BlueBay’s U.S. business with RBC GAM-US in November 2021, is responsible for the U.S. fixed income investment team based in Minneapolis (MN) and Stamford (CT). In 2013, Andrzej moved to the U.S. from London to oversee the buildout of global investment grade capability. This followed a period from 2009, where he was a portfolio manager responsible for corporate investments within BlueBay’s investment grade strategies. Andrzej spent his first four years at BlueBay as a credit analyst covering the TMT, utilities and retail sectors for the Investment Grade team. Prior to BlueBay, Andrzej worked for Goldman Sachs as a credit analyst covering European investment grade telecom, media and utility sectors. Andrzej holds a BSc (Hons) in Management and International Business Economics from UMIST and is a CFA charterholder. |
| | | |
| | | | | | Brian Svendahl, CFA |
| | | |
| | | | | | Senior Portfolio Manager |
| | | |
| | | | | | Brian is a senior portfolio manager within the RBC GAM-US fixed income team. He has been the lead portfolio manager for RBC GAM-US’s impact investing strategies since 2006 along with many government and mortgage strategies. Brian joined RBC GAM-US in 2005 and has co-led the Minneapolis-based fixed income group since 2012. He had previously held several risk management, research, and trading positions with a large American multinational financial services company and first started in the investment industry in 1992. Brian earned a BS in economics from the University of Minnesota and a BBA in finance and MBA from the University of Minnesota Carlson School of Management. Brian is a CFA charterholder. |
| | | |
| | | | | | Brandon T. Swensen, CFA |
| | | |
| | | | | | Senior Portfolio Manager |
| | | |
| | | | | | Brandon is a senior portfolio manager within the RBC GAM-US fixed income team. In addition to co-leading the fixed income group based in Minneapolis, he is a portfolio manager for several cash management and core solutions. Brandon joined the RBC GAM-US Mortgage and Government team in 2000, having earlier held positions as a research analyst covering asset-backed securities and credit, and as a financial analyst. Brandon began his career in |
2
| | | | | | |
| | | |
PORTFOLIO MANAGERS | | | | | | |
| | | | | | |
| | | |
| the investment industry in 1998. He earned a BS in finance from St. Cloud State University and an MBA in finance from the University of St. Thomas. He is a CFA charterholder and member of the CFA Society of Minnesota. | | | | | | |
| | | |
| | | | | | | |
| | | |
| | | | | | | |
| | | |
| | | | | | | |
| | | |
| | | | | | | |
| | | |
| | | | | | | |
| | | |
| | | | | | | |
| | | |
| | | | | | | |
| | | |
| | | | | | | |
| | | |
| | | | | | | |
| | | |
| | | | | | | |
| | | |
| | | | | | | |
| | | |
| | | | | | | |
| | | |
| | | | | | | |
| | | |
| | | | | | |
| | | |
| | | | | | |
| | | |
| | | | | | |
| | | |
| | | | | | |
| | | |
| | | | | | |
| | | |
| | | | | | |
| | | |
| | | | | | |
| | | |
| | | | | | |
| | | |
| | | | | | |
| | | |
| | | | | | |
| | | |
| | | | | | |
3
|
|
PERFORMANCE SUMMARY (UNAUDITED) |
| | | | | | | | | | | | | | | | | | | | | | | | |
| | | 1
Year | | 5
Year | | 10
Year | | Since
Inception(a) | | Net
Expense
Ratio(b)(c) | | Gross
Expense
Ratio(b)(c) |
Average Annual Total Returns as of March 31, 2023 (Unaudited) | | | | | | | | | | | | | | | | | | | | | | | | |
| | | | | | |
RBC BlueBay Emerging Market Debt Fund | | | | | | | | | | | | | | | | | | | | | | | | |
Class A | | | | | | | | | | | | | | | | | | | | | | | | |
- Including Max Sales Charge of 4.25% | | | (12.41 | )% | | | (1.27 | )% | | | (0.40 | )% | | | 0.72 | % | | | | | | | | |
- At Net Asset Value | | | (8.57 | )% | | | (0.41 | )% | | | 0.03 | % | | | 1.10 | % | | | 1.04 | % | | | 17.51 | % |
Class I | | | | | | | | | | | | | | | | | | | | | | | | |
- At Net Asset Value | | | (8.32 | )% | | | (0.13 | )% | | | 0.28 | % | | | 1.35 | % | | | 0.79 | % | | | 1.65 | % |
Class R6 | | | | | | | | | | | | | | | | | | | | | | | | |
- At Net Asset Value | | | (8.28 | )% | | | (0.08 | )% | | | 0.35 | % | | | 1.43 | % | | | 0.74 | % | | | 31.35 | % |
| | | | | | |
JPM EMBI Global Diversified Index(d) | | | (6.92 | )% | | | (0.60 | )% | | | 2.01 | % | | | 3.12 | % | | | | | | | | |
RBC BlueBay High Yield Bond Fund | | | | | | | | | | | | | | | | | | | | | | | | |
Class A | | | | | | | | | | | | | | | | | | | | | | | | |
- Including Max Sales Charge of 4.25% | | | (7.01 | )% | | | 3.18 | % | | | 3.73 | % | | | 4.88 | % | | | | | | | | |
- At Net Asset Value | | | (2.90 | )% | | | 4.08 | % | | | 4.18 | % | | | 5.27 | % | | | 0.82 | % | | | 1.16 | % |
Class I | | | | | | | | | | | | | | | | | | | | | | | | |
- At Net Asset Value | | | (2.63 | )% | | | 4.34 | % | | | 4.47 | % | | | 5.56 | % | | | 0.57 | % | | | 0.82 | % |
| | | | | | |
ICE BofA US High Yield Index(d) | | | (3.56 | )% | | | 3.06 | % | | | 4.03 | % | | | 5.37 | % | | | | | | | | |
RBC BlueBay Core Plus Bond Fund(e) | | | | | | | | | | | | | | | | | | | | | | | | |
Class A | | | | | | | | | | | | | | | | | | | | | | | | |
- Including Max Sales Charge of 3.75% | | | (9.41 | )% | | | N/A | | | | N/A | | | | (11.05 | )% | | | | | | | | |
- At Net Asset Value | | | (5.43 | )% | | | N/A | | | | N/A | | | | (8.30 | )% | | | 0.70 | % | | | 1.51 | % |
Class I | | | | | | | | | | | | | | | | | | | | | | | | |
- At Net Asset Value | | | (5.15 | )% | | | N/A | | | | N/A | | | | (8.06 | )% | | | 0.45 | % | | | 1.15 | % |
Class R6 | | | | | | | | | | | | | | | | | | | | | | | | |
- At Net Asset Value | | | (5.10 | )% | | | N/A | | | | N/A | | | | (8.02 | )% | | | 0.40 | % | | | 1.19 | % |
| | | | | | |
Bloomberg US Aggregate Bond Index(d) | | | (4.78 | )% | | | N/A | | | | N/A | | | | (7.41 | )% | | | | | | | | |
RBC BlueBay Strategic Income Fund(f) | | | | | | | | | | | | | | | | | | | | | | | | |
Class A | | | | | | | | | | | | | | | | | | | | | | | | |
- Including Max Sales Charge of 3.75% | | | (2.31 | )% | | | N/A | | | | N/A | | | | (2.56 | )% | | | | | | | | |
- At Net Asset Value | | | 2.07 | % | | | N/A | | | | N/A | | | | 0.46 | % | | | 0.89 | % | | | 1.63 | % |
Class I | | | | | | | | | | | | | | | | | | | | | | | | |
- At Net Asset Value | | | 2.39 | % | | | N/A | | | | N/A | | | | 0.74 | % | | | 0.64 | % | | | 1.29 | % |
Class R6 | | | | | | | | | | | | | | | | | | | | | | | | |
- At Net Asset Value | | | 2.44 | % | | | N/A | | | | N/A | | | | 0.78 | % | | | 0.59 | % | | | 1.33 | % |
| | | | | | |
ICE BofA US Dollar 3-Month Deposit Offered Rate Constant Maturity Index(d) | | | 2.39 | % | | | N/A | | | | N/A | | | | 1.65 | % | | | | | | | | |
Bloomberg US Aggregate Bond Index | | | (4.78 | )% | | | N/A | | | | N/A | | | | (7.41 | )% | | | | | | | | |
Parentheses indicate negative performance returns.
4
|
|
PERFORMANCE SUMMARY (UNAUDITED) |
Performance data quoted represents past performance. Past performance is no guarantee of future results. Investment return and principal value of an investment will fluctuate so that an investor’s shares, when redeemed, may be worth more or less than their original cost. Current performance may be lower or higher than performance quoted. Performance shown reflects contractual fee waivers, without such fee waivers total returns would be reduced. For performance data current to the most recent month-end go to www.rbcgam.com. Please see footnotes below.
| (a) | For BlueBay Emerging Market Debt Fund and BlueBay High Yield Bond Fund, the inception date (commencement of operations) is November 27, 2013 for Class A shares, November 30, 2011 for Class I shares, and December 27, 2016 for Class R6 shares of BlueBay Emerging Market Debt Fund. |
| | The performance in the table for the Class A and Class R6 shares prior to the inception of those classes reflects the performance of the Class I shares since the Fund’s inception, adjusted to reflect the fees and expenses of Class A shares and Class R6 shares, respectively. |
| (b) | The Funds’ expenses are from the Funds’ most recent prospectus dated January 27, 2023, and reflect actual expenses for the most recent fiscal year ended September 30, 2022. |
| (c) | The advisor has contractually agreed to waive fees and/or make payments in order to keep total operating expenses to the levels disclosed in the Funds’ prospectus until January 31, 2024. |
| (d) | Each of the comparative indices is a widely recognized market value weighted measure of the return of securities, but does not include sales fees or operating expenses. You cannot invest directly in indices. |
| (e) | The inception date for the RBC BlueBay Core Plus Bond Fund is November 1, 2021. |
| (f) | The inception date for the RBC BlueBay Strategic Income Fund is November 1, 2021. |
JPM EMBI Global Diversified Index is a subset of the JPMorgan EMBI. The JPMorgan EMBI tracks the performance of U.S. dollar-denominated Brady bonds, Eurobonds and traded loans issued by sovereign and quasi-sovereign entities in emerging markets. The JPMorgan EMBI Global Diversified limits the weights of countries with larger debt stocks by including only a specified portion of these countries’ eligible current face amounts of debt outstanding.
The ICE BofA US High Yield Index tracks the performance of U.S. dollar-denominated below investment grade corporate debt publicly issued in the U.S. domestic market.
The Bloomberg US Aggregate Bond Index is a broad-based benchmark that measures the investment grade, U.S. dollar-denominated, fixed-rate taxable bond market. This includes Treasuries, government-related and corporate securities, mortgage-backed securities, asset-backed securities and collateralised mortgage-backed securities.
ICE BofA US Dollar 3-Month Deposit Offered Rate Constant Maturity Index tracks the performance of a synthetic asset paying a deposit offered rate to a stated maturity. The index is based on the assumed purchase at par of a synthetic instrument having exactly its stated maturity and with a coupon equal to that day’s fixing rate. That issue is assumed to be sold the following business day (priced at a yield equal to the current day fixing rate) and rolled into a new instrument.
You cannot invest directly in an index.
Fund holdings and/or sector allocations are subject to change at any time and are not recommendations to buy or sell any security.
Mutual fund investing involves risk. Principal loss is possible.
5
| | | | | | | | | | | | | | | | | | | | | | |
| | | | | |
| | | | | | | | FUND STATISTICS (UNAUDITED) | | | | | |
| | | | | | | | RBC BlueBay Emerging Market Debt Fund | | | | | |
| | | | | |
Investment Objective | | | | | | | | The Fund seeks to achieve a high level of total return consisting of income and capital appreciation. | | | | | |
| | | | | |
Benchmark | | | | | | | | JPM EMBI Global Diversified Index | | | | | |
Asset Allocation as of 3/31/23 (% of Fund’s investments) & Top Five Industries (as of 3/31/23) (% of Fund’s net assets) | | | | | | | | 
| |
| | | | | | |
| | | | | | |
| | | | | | |
| | | | | | |
| | | | | | |
| | | | | | |
| | | | | | |
| | | | | | | | *Includes U.S. dollar denominated cash equivalent investments representing 1.89% of investments. | | | | | |
Top Ten Holdings (excluding investment companies) (as of 3/31/23) (% of Fund’s net assets) | | | | | | | | Oman Government International Bond,
6.75%, 1/17/48 | | | 2.66 | % | | Uruguay Government International Bond,
4.98%, 4/20/55 | | | 1.49 | % | | | | |
| | Petroleos Mexicanos,
5.63%, 1/23/46 | | | 2.10 | % | | Turkey Government International Bond,
4.88%, 4/16/43 | | | 1.49 | % | | | | |
| | Turkey Government International Bond,
5.75%, 5/11/47 | | | 1.90 | % | | Colombia Government International Bond,
8.00%, 4/20/33 | | | 1.45 | % | | | | |
| | Mexico Government International Bond,
3.77%, 5/24/61 | | | 1.87 | % | | Ecuador Government International Bond,
2.50%, 7/31/35 | | | 1.41 | % | | | | |
| | Argentine Republic Government International Bond,
3.50%, 7/9/41 | | | 1.70 | % | | | | | | | | | | |
| | | | | | | | Dominican Republic International Bond,
5.50%, 1/27/25 | | | 1.52 | % | | | | | | | | | | |
| | | | | | |
| | | | | | | | *A listing of all portfolio holdings can be found beginning on page 13 | | | | | | | | |
Growth of $1,000,000 Initial Investment over 10 Years | | | | | | | | 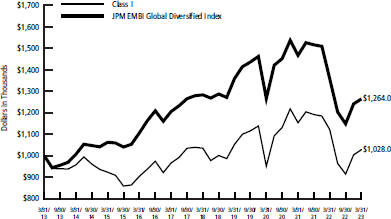
| | | | | |
| | | | | | | | | | |
| | | | | | | | | | |
| | | | | | | | | | |
| | | | | | | | | | |
| | | | | | | | | | |
| | | | | | | | | | | | | |
6
| | | | | | |
| | | |
FUND STATISTICS (UNAUDITED) | | | | | | |
RBC BlueBay Emerging Market Debt Fund | | | | | | |
| | | | | | |
| The graph reflects an initial hypothetical investment of $1,000,000 over the 10 year period and is based on Class I shares. The Fund’s total return includes reinvested dividends and capital gains. The Fund’s total return also includes operating expenses that reduce return, while the total return of the index does not. The graph does not reflect the deduction of taxes that a shareholder would pay on fund distributions or redemption of fund shares. Performance of other classes will vary due to differences in fee structures. This chart does not imply any future performance. | | | | | | |
| | | | | | |
| | | | | | |
| | | | | | |
| | | | | | |
| | | | | | |
| | | | | | |
| | | | | | |
7
| | | | | | | | | | | | | | | | | | | | | | |
| | | | | |
| | | | | | | | FUND STATISTICS (UNAUDITED) | | | | | |
| | | | | | | | RBC BlueBay High Yield Bond Fund | | | | | |
| | | | | |
Investment Objective | | | | | | | | The Fund seeks to achieve a high level of total return consisting of income and capital appreciation. | | | | | |
| | | | | |
Benchmark | | | | | | | | ICE BofA US High Yield Index | | | | | |
Asset Allocation as of 3/31/23 (% of Fund’s investments) & Top Five Industries (as of 3/31/23) (% of Fund’s net assets) | | | | | | | | 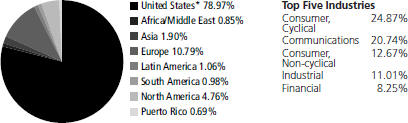
| |
| | | | | | |
| | | | | | |
| | | | | | |
| | | | | | |
| | | | | | |
| | | | | | |
| | | | | | |
| | | | | | | | *Includes U.S. dollar denominated cash equivalent investments representing 2.76% of investments. | | | | | |
Top Ten Holdings (excluding investment companies) (as of 3/31/23) (% of Fund’s net assets) | | | | | | | | U.S. Treasury Bill,
4.60%, 8/17/23 | | | 2.93 | % | | CQP Holdco LP / BIP-V Chinook Holdco LLC,
5.50%, 6/15/31 | | | 1.09 | % | | | | |
| | CCO Holdings LLC / CCO Holdings Capital Corp.,
7.38%, 3/1/31 | | | 1.29 | % | | TEGNA, Inc.,
5.00%, 9/15/29 | | | 1.05 | % | | | | |
| | Banijay Entertainment SASU,
5.38%, 3/1/25 | | | 1.24 | % | | Specialty Building Products Holdings LLC / SBP Finance Corp., 6.38%, 9/30/26 | | | 1.05 | % | | | | |
| | Smyrna Ready Mix Concrete LLC,
6.00%, 11/1/28 | | | 1.23 | % | | Intelligent Packaging Ltd. Finco, Inc. / Intelligent Packaging Ltd. Co-Issuer LLC, 6.00%, 9/15/28 | | | 1.04 | % | | | | |
| | Hanesbrands, Inc.,
9.00%, 2/15/31 | | | 1.18 | % | | | | | | | | | | |
| | | | | | | | Clarios Global LP / Clarios US Finance Co.,
6.25%, 5/15/26 | | | 1.09 | % | | | | | | | | | | |
| | | | | | |
| | | | | | | | *A listing of all portfolio holdings can be found beginning on page 25 | | | | | | | | |
Growth of $1,000,000 Initial Investment Over 10 Years | | | | | | | | 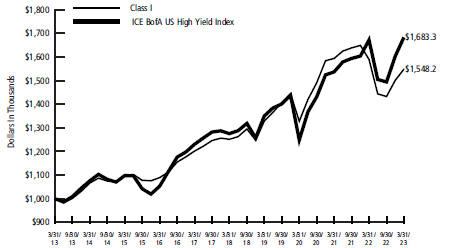
| | | | | |
| | | | | | | | | | |
| | | | | | | | | | |
| | | | | | | | | | |
| | | | | | | | | | |
| | | | | | | | | | |
| | | | | | | | The graph reflects an initial hypothetical investment of $ 1,000,000 over the ten year period and is based on Class I shares. The Fund’s total return includes reinvested dividends and capital gains. The Fund’s total return also includes operating expenses that reduce return, while the total return of the index does not. The graph does not reflect the deduction of taxes that a shareholder would pay on fund distributions or redemption of fund shares. Performance of other classes will vary due to differences in fee structures. This chart does not imply any future performance. | | | | | |
8
| | | | | | | | | | | | | | | | | | | | | | | | | | |
| | | | | | FUND STATISTICS (UNAUDITED) | | | | | | | | | | | |
| | | | | |
| | | | | | RBC BlueBay Core Plus Bond Fund | | | | | | | | | | | |
| | | | | |
| | | | | | The Fund seeks to provide total return. | | | | | | | | | | | Investment Objective Benchmark |
| | | | | | Bloomberg US Aggregate Bond Index | | | | | | | | | |
| | | | | |
| | | | | | 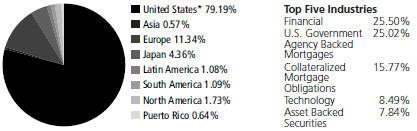
*Includes U.S. dollar denominated cash equivalent investments representing 1.64% of investments. | | | | | | | | | | | Asset Allocation as of 3/31/23 (% of Fund’s investments) & Top Five Industries (as of 3/31/23) (% of Fund’s net assets) |
| | | | | | | | | | | | |
| | | | | | | | | | | | |
| | | | | | | | | | | | |
| | | | | | | | | | | | | | | | | | | | | | | | | | |
| | | | | | Fannie Mae, 2.00%, 4/15/53 | | | 7.07 | % | | Fannie Mae, (TBA), 3.00%, 4/1/53 | | | 1.46 | % | | | | | | | | | | Top Ten Holdings (excluding investment companies) (as of 3/31/23) (% of Fund’s net assets) |
| | | | | | Fannie Mae, 2.50%, 4/15/53 | | | 5.82 | % | | Citigroup Commercial Mortgage Trust, Series 2013-GC11, Class D, 4.45%, 4/10/46 | | | 1.34 | % | | | | | | | | |
| | | | | | U.S. Treasury Bill- When Issued, 4.30%, 4/18/23 | | | 4.94 | % | | | | | | | | | | | | |
| | | | | | Freddie Mac, Pool #QE6931, 4.50%, 7/1/52 | | | 1.98 | % | | Credit Suisse Mortgage Capital Certificates, Series 2020-SPT1, Class A2, 2.23%, 4/25/65 | | | 1.31 | % | | | | | | | | |
| | | | | | Fannie Mae, Pool #BT8271, 4.00%, 7/1/52 | | | 1.92 | % | | | | | | | | | | | | |
| | | | | | Fannie Mae, (TBA), 3.50%, 4/15/53 | | | 1.83 | % | | | | | | | | | | | | | | | | |
| | | | | | Eagle RE Ltd., Series 2019-1, Class M1B, (LIBOR USD 1-Month + 1.800%), 6.65%, 4/25/29 | | | 1.55 | % | | | | | | | | | | | | | | | | |
| | | | | | *A listing of all portfolio holdings can be found beginning on page 33 | | | | | | | | | | | | | | |
| | | | | | 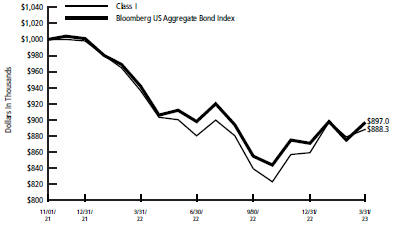
| | | | | | | | | | | Growth of $1,000,000 Initial Investment Since Inception (11/01/21) |
| | | | | | | | | | | | |
| | | | | | | | | | | | |
| | | | | | | | | | | | |
| | | | | | | | | | | | |
| | | | | | | | | | | | | | | | | |
| | | | | | | | | | | | | | | | | | | | | | | | | | |
| | | | | | | | | | | | | | | | | | | | | | | | | | |
| | | | | | | | | | | | | | | | | | | | | | | | | | |
| | | | | | | | | | | | | | | | | | | | | | | | | | |
9
| | | | | | | | | | | | | | | | | | | | | | |
| | | | | | | | | | | | | | FUND STATISTICS (UNAUDITED) |
| | | | | | |
| | | | | | | | | | | | | | RBC BlueBay Core Plus Bond Fund | | |
| | | | | | | | | | | | | | The graph reflects an initial hypothetical investment of $1,000,000 over theperiod from November 1, 2021 (commencement of operations) to March 31, 2023 and is based on Class I shares. The Fund’s total return includesreinvested dividends and capital gains. The Fund’s total return also includesoperating expenses that reduce return, while the total return of the indexdoes not. The graph does not reflect the deduction of taxes that a shareholderwould pay on fund distributions or redemption of fund shares. Performance ofother classes will vary due to differences in fee structures. This chart does notimply any future performance. | | |
| | | | | | | | | | | | | | | | | | | | | | |
| | | | | | | | | | | | | | | | | | | | | | |
| | | | | | | | | | | | | | | | | | | | | | |
| | | | | | | | | | | | | | | | | | | | | | |
| | | | | | | | | | | | | | | | | | | | | | |
| | | | | | | | | | | | | | | | | | | | | | |
| | | | | | | | | | | | | | | | | | | | | | |
| | | | | | | | | | | | | | | | | | | | | | |
| | | | | | | | | | | | | | | | | | | | | | |
| | | | | | | | | | | | | | | | | | | | | | |
| | | | | | | | | | | | | | | | | | | | | | |
| | | | | | | | | | | | | | | | | | | | | | |
10
| | | | | | | | | | | | | | | | | | | | | | | | | | |
| | | | | | FUND STATISTICS (UNAUDITED) | | | | | | | | | | | |
| | | | | |
| | | | | | RBC BlueBay Strategic Income Fund | | | | | | | | | | | |
| | | | | | The Fund seeks to provide total return (capital appreciation and income). | | | | | | | | | | | Investment Objective Benchmark |
| | | | | | ICE BofA US Dollar 3-Month Deposit Offered Rate Constant Maturity Index Bloomberg US Aggregate Bond Index | | | | | | | | | |
| | | | | |
| | | | | | 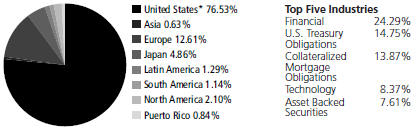
*Includes U.S. dollar denominated cash equivalent investments representing 4.42% of investments. | | | | | | | | | | | Asset Allocation as of 3/31/23 (% of Fund’s investments) & Top Five Industries (as of 3/31/23) (% of Fund’s net assets) |
| | | | | | | | | | | | |
| | | | | | | | | | | | |
| | | | | | | | | | | | |
| | | | | | | | | | | | | | | | | | | | | | | | | | |
| | | | | | U.S. Treasury Bill, 4.81%, 6/22/23 | | | 10.00 | % | | Avolon US LLC, 1st Lien Term Loan B5, (LIBOR 1-Month + 2.25%), 7.01%, 12/1/27 | | | 1.17 | % | | | | | | | | | | Top Ten Holdings (excluding investment companies) (as of 3/31/23) (% of Fund’s net assets) |
| | | | | | U.S. Treasury Notes, 4.13%, 1/31/25 | | | 4.75 | % | | Credit Suisse Mortgage Capital Certificates, Series 2020-SPT1, Class A2 2.23%, 4/25/65 | | | 1.15 | % | | | | | | | | |
| | | | | | Eagle RE Ltd., Series 2019-1, Class M1B, (LIBOR USD 1-Month + 1.800%), 6.65%, 4/25/29 | | | 1.36 | % | | Athene Global Funding, (Secured Overnight Financing Average Index + 0.700%), 5.46%, 5/24/24 | | | 1.05 | % | | | | | | | | |
| | | | | | | | | | Credit Suisse Group AG, 6.54%, 8/12/33 | | | 1.04 | % | | | | | | | | |
| | | | | | Hilton Worldwide Finance LLC, 1st Lien Term Loan B2, (LIBOR 1-Month + 1.75%), 6.64%, 6/21/26 | | | 1.19 | % | | Triton Container International Ltd., 1.15%, 6/7/24 | | | 1.00 | % | | | | | | | | |
| | | | | | Citigroup Commercial Mortgage Trust, Series 2013-GC11, Class D, 4.45%, 4/10/46 | | | 1.18 | % | | | | | | | | | | | | | | | | |
| | | | | | *A listing of all portfolio holdings can be found beginning on page 44 | | | | | | | | | | | | | | |
| | | | | | 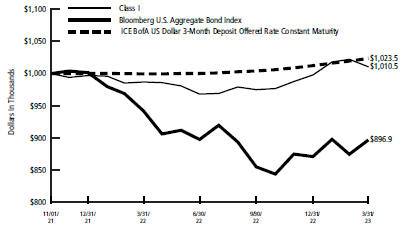
| | | | | | | | | | | Growth of $1,000,000 Initial Investment Since Inception (11/01/21) |
| | | | | | | | | | | | |
| | | | | | | | | | | | |
| | | | | | | | | | | | |
| | | | | | | | | | | | |
| | | | | | | | | | | | | | | | | |
| | | | | | | | | | | | | | | | | |
| | | | | | | | | | | | | | | | | |
| | | | | | | | | | | | | | | | | |
| | | | | | | | | | | | | | | | | |
| | | | | | | | | | | | | | | | | |
| | | | | | | | | | | | | | | | | |
| | | | | | | | | | | | | | | | | |
| | | | | | | | | | | | | | | | | |
| | | | | | | | | | | | | | | | | |
11
| | | | | | | | | | | | | | | | | | | | | | |
| | | | | | | | | | | | | | FUND STATISTICS (UNAUDITED) |
| | | | | | |
| | | | | | | | | | | | | | RBC BlueBay Strategic Income Fund | | |
| | | | | | |
| | | | | | | | | | | | | | The graph reflects an initial hypothetical investment of $1,000,000 over the period from November 1, 2021 (commencement of operations) to March 31, 2023 and is based on Class I shares. The Fund’s total return includes reinvested dividends and capital gains. The Fund’s total return also includes operating expenses that reduce return, while the total return of the index does not. The graph does not reflect the deduction of taxes that a shareholder would pay on fund distributions or redemption of fund shares. Performance of other classes will vary due to differences in fee structures. This chart does not imply any future performance. | | |
| | | | | | | | | | | | | | | | | | | | | | |
| | | | | | | | | | | | | | | | | | | | | | |
| | | | | | | | | | | | | | | | | | | | | | |
| | | | | | | | | | | | | | | | | | | | | | |
| | | | | | | | | | | | | | | | | | | | | | |
| | | | | | | | | | | | | | | | | | | | | | |
| | | | | | | | | | | | | | | | | | | | | | |
| | | | | | | | | | | | | | | | | | | | | | |
| | | | | | | | | | | | | | | | | | | | | | |
| | | | | | | | | | | | | | | | | | | | | | |
| | | | | | | | | | | | | | | | | | | | | | |
| | | | | | | | | | | | | | | | | | | | | | |
12
|
SCHEDULE OF PORTFOLIO INVESTMENTS |
RBC BlueBay Emerging Market Debt Fund
March 31, 2023 (Unaudited)
| | | | | | |
Principal Amount | | | | Value | |
| |
| |
Foreign Government Bonds — 74.77% | | | | |
Angola — 1.29% | | | | |
$ 260,000 | | Angolan Government International Bond, 8.25%, 5/9/28(a) | | $ | 230,220 | |
280,000 | | Angolan Government International Bond, 8.75%, 4/14/32(a) | | | 237,648 | |
| | | | | | |
| | | | | 467,868 | |
| | | | | | |
| |
Argentina — 2.92% | | | | |
205,137 | | Argentine Republic Government International Bond, 1.00%, 7/9/29 | | | 57,915 | |
827,095 | | Argentine Republic Government International Bond, 1.50%, 7/9/35 | | | 215,855 | |
2,185,816 | | Argentine Republic Government International Bond, 3.50%, 7/9/41 | | | 614,505 | |
475,000 | | Provincia de Buenos Aires/Government Bonds, EMTN, 5.25%, 9/1/37(a) | | | 168,660 | |
| | | | | | |
| | | | | 1,056,935 | |
| | | | | | |
| |
Armenia — 0.56% | | | | |
200,000 | | Republic of Armenia International Bond, 7.15%, 3/26/25(a) | | | 202,875 | |
| | | | | | |
| |
Bahrain — 0.43% | | | | |
200,000 | | Bahrain Government International Bond, 6.00%, 9/19/44(a) | | | 155,538 | |
| | | | | | |
| |
Brazil — 0.48% | | | | |
235,000 | | Brazilian Government International Bond, 4.75%, 1/14/50 | | | 174,101 | |
| | | | | | |
| |
Chile — 3.02% | | | | |
315,000(b) | | Chile Government International Bond, 1.25%, 1/22/51 | | | 182,732 | |
200,000 | | Chile Government International Bond, 2.75%, 1/31/27 | | | 188,802 | |
508,000 | | Chile Government International Bond, 3.10%, 5/7/41 | | | 382,795 | |
200,000 | | Chile Government International Bond, 4.00%, 1/31/52 | | | 162,879 | |
200,000 | | Chile Government International Bond, 4.34%, 3/7/42 | | | 177,069 | |
| | | | | | |
| | | | | 1,094,277 | |
| | | | | | |
| |
Colombia — 4.59% | | | | |
410,000 | | Colombia Government International Bond, 3.25%, 4/22/32 | | | 306,222 | |
200,000 | | Colombia Government International Bond, 3.88%, 2/15/61 | | | 116,064 | |
255,000 | | Colombia Government International Bond, 4.13%, 5/15/51 | | | 157,960 | |
460,000 | | Colombia Government International Bond, 5.00%, 6/15/45 | | | 323,135 | |
240,000 | | Colombia Government International Bond, 7.50%, 2/2/34 | | | 235,876 | |
510,000 | | Colombia Government International Bond, 8.00%, 4/20/33 | | | 524,212 | |
| | | | | | |
| | | | | 1,663,469 | |
| | | | | | |
| |
Costa Rica — 0.55% | | | | |
200,000 | | Costa Rica Government International Bond, 6.55%, 4/3/34(c) | | | 200,400 | |
| | | | | | |
13
|
SCHEDULE OF PORTFOLIO INVESTMENTS |
RBC BlueBay Emerging Market Debt Fund (cont.)
March 31, 2023 (Unaudited)
| | | | | | |
Principal
Amount | | | | Value | |
| |
Dominican Republic — 3.31% | | | | |
$ 556,000 | | Dominican Republic International Bond, 5.50%, 1/27/25(a) | | $ | 550,483 | |
620,000 | | Dominican Republic International Bond, 5.88%, 1/30/60(a) | | | 475,125 | |
170,000 | | Dominican Republic International Bond, 7.05%, 2/3/31(c) | | | 171,792 | |
| | | | | | |
| | | | | 1,197,400 | |
| | | | | | |
| |
Ecuador — 1.41% | | | | |
1,534,779 | | Ecuador Government International Bond, 2.50%, 7/31/35(a) | | | 509,222 | |
| | | | | | |
| |
Egypt — 1.78% | | | | |
211,000 | | Egypt Government International Bond, GMTN, 6.59%, 2/21/28(a) | | | 147,859 | |
400,000 | | Egypt Government International Bond, EMTN, 7.50%, 2/16/61(a) | | | 217,418 | |
500,000 | | Egypt Government International Bond, 7.90%, 2/21/48(a) | | | 278,051 | |
| | | | | | |
| | | | | 643,328 | |
| | | | | | |
| |
El Salvador — 0.80% | | | | |
313,000 | | El Salvador Government International Bond, 6.38%, 1/18/27(a) | | | 169,041 | |
255,000 | | El Salvador Government International Bond, 7.65%, 6/15/35(a) | | | 120,758 | |
| | | | | | |
| | | | | 289,799 | |
| | | | | | |
| |
Georgia — 0.49% | | | | |
200,000 | | Georgia Government International Bond, 2.75%, 4/22/26(a) | | | 178,060 | |
| | | | | | |
| |
Ghana — 0.20% | | | | |
215,000 | | Ghana Government International Bond, 8.95%, 3/26/51(a) | | | 73,079 | |
| | | | | | |
| |
Guatemala — 1.13% | | | | |
490,000 | | Guatemala Government Bond, 3.70%, 10/7/33(a) | | | 409,290 | |
| | | | | | |
| |
Hungary — 0.75% | | | | |
440,000 | | Hungary Government International Bond, 3.13%, 9/21/51(a) | | | 271,455 | |
| | | | | | |
| |
Indonesia — 2.86% | | | | |
250,000(b) | | Indonesia Government International Bond, 1.30%, 3/23/34 | | | 197,622 | |
600,000 | | Indonesia Government International Bond, 3.35%, 3/12/71 | | | 416,630 | |
270,000 | | Perusahaan Penerbit SBSN Indonesia III, 3.80%, 6/23/50(a) | | | 219,977 | |
200,000 | | Perusahaan Penerbit SBSN Indonesia III, 4.70%, 6/6/32(a) | | | 201,308 | |
| | | | | | |
| | | | | 1,035,537 | |
| | | | | | |
| |
Iraq — 0.81% | | | | |
312,500 | | Iraq International Bond, 5.80%, 1/15/28(a) | | | 292,102 | |
| | | | | | |
| |
Jordan — 0.47% | | | | |
200,000 | | Jordan Government International Bond, 7.38%, 10/10/47(a) | | | 168,763 | |
| | | | | | |
14
|
SCHEDULE OF PORTFOLIO INVESTMENTS |
RBC BlueBay Emerging Market Debt Fund (cont.)
March 31, 2023 (Unaudited)
| | | | | | |
Principal Amount | | | | Value | |
| |
| |
Kazakhstan — 0.74% | | | | |
$ 300,000 | | Kazakhstan Government International Bond, 4.88%, 10/14/44(a) | | $ | 268,402 | |
| | | | | | |
| | |
Lebanon — 0.34% | | | | | | |
36,000 | | Lebanon Government International Bond, GMTN, 5.80%, 4/14/20(a),(d) | | | 2,477 | |
166,000 | | Lebanon Government International Bond, 6.00%, 1/27/23(a),(d) | | | 11,086 | |
85,000 | | Lebanon Government International Bond, EMTN, 6.10%, 10/4/22(a),(d) | | | 5,716 | |
261,000 | | Lebanon Government International Bond, EMTN, 6.15%, 6/19/20(d) | | | 17,173 | |
930,000 | | Lebanon Government International Bond, GMTN, 6.38%, 3/9/20(d) | | | 62,147 | |
366,000 | | Lebanon Government International Bond, EMTN, 8.25%, 4/12/21(a),(d) | �� | | 23,912 | |
5,000 | | Lebanon Government International Bond, 8.25%, 5/17/34(d) | | | 334 | |
| | | | | | |
| | | | | 122,845 | |
| | | | | | |
Macedonia — 0.54% | | | | |
180,000(b) | | North Macedonia Government International Bond, 6.96%, 3/13/27(c) | | | 195,775 | |
| | | | | | |
| | |
Mexico — 4.07% | | | | | | |
1,000,000 | | Mexico Government International Bond, 3.77%, 5/24/61 | | | 677,225 | |
200,000 | | Mexico Government International Bond, 4.40%, 2/12/52 | | | 156,443 | |
200,000 | | Mexico Government International Bond, 4.88%, 5/19/33 | | | 191,756 | |
200,000 | | Mexico Government International Bond, 5.40%, 2/9/28 | | | 206,116 | |
230,000 | | Mexico Government International Bond, 6.35%, 2/9/35 | | | 244,488 | |
| | | | | | |
| | | | | 1,476,028 | |
| | | | | | |
Morocco — 0.56% | | | | | | |
200,000 | | Morocco Government International Bond, 5.95%, 3/8/28(c) | | | 204,266 | |
| | | | | | |
| | |
Nigeria — 2.91% | | | | | | |
500,000 | | Nigeria Government International Bond, EMTN, 6.13%, 9/28/28(a) | | | 390,172 | |
200,000 | | Nigeria Government International Bond, EMTN, 7.38%, 9/28/33(a) | | | 141,999 | |
220,000 | | Nigeria Government International Bond, EMTN, 7.63%, 11/28/47(a) | | | 140,832 | |
242,000 | | Nigeria Government International Bond, 7.70%, 2/23/38(a) | | | 163,037 | |
289,000 | | Nigeria Government International Bond, 7.88%, 2/16/32(a) | | | 218,746 | |
| | | | | | |
| | | | | 1,054,786 | |
| | | | | | |
Oman — 5.63% | | | | | | |
200,000 | | Oman Government International Bond, 4.75%, 6/15/26(a) | | | 195,759 | |
15
|
SCHEDULE OF PORTFOLIO INVESTMENTS |
RBC BlueBay Emerging Market Debt Fund (cont.)
March 31, 2023 (Unaudited)
| | | | | | |
Principal Amount | | | | Value | |
| |
$ 200,000 | | Oman Government International Bond, EMTN, 4.88%, 2/1/25(a) | | $ | 197,588 | |
465,000 | | Oman Government International Bond, 6.75%, 10/28/27(a) | | | 486,682 | |
1,015,000 | | Oman Government International Bond, 6.75%, 1/17/48(a) | | | 962,595 | |
200,000 | | Oman Government International Bond, 7.00%, 1/25/51(a) | | | 195,240 | |
| | | | | | |
| | | | | 2,037,864 | |
| | | | | | |
Pakistan — 1.10% | | | | | | |
290,000 | | Pakistan Government International Bond, EMTN, 6.00%, 4/8/26(a) | | | 106,386 | |
600,000 | | Pakistan Government International Bond, EMTN, 7.38%, 4/8/31(a) | | | 212,310 | |
200,000 | | Pakistan Government International Bond, 8.25%, 9/30/25(a) | | | 78,538 | |
| | | | | | |
| | | | | 397,234 | |
| | | | | | |
Panama — 2.49% | | | | | | |
615,000 | | Panama Government International Bond, 3.87%, 7/23/60 | | | 403,796 | |
280,000 | | Panama Government International Bond, 6.40%, 2/14/35 | | | 292,428 | |
200,000 | | Panama Government International Bond, 6.85%, 3/28/54 | | | 204,500 | |
| | | | | | |
| | | | | 900,724 | |
| | | | | | |
Paraguay — 1.84% | | | | |
500,000 | | Paraguay Government International Bond, 2.74%, 1/29/33(a) | | | 403,492 | |
305,000 | | Paraguay Government International Bond, 5.40%, 3/30/50(a) | | | 263,994 | |
| | | | | | |
| | | | | 667,486 | |
| | | | | | |
Philippines — 2.57% | | | | |
400,000 | | Philippine Government International Bond, 2.95%, 5/5/45 | | | 289,345 | |
200,000 | | Philippine Government International Bond, 5.00%, 7/17/33 | | | 203,786 | |
200,000 | | Philippine Government International Bond, 5.50%, 1/17/48 | | | 204,624 | |
220,000 | | Philippine Government International Bond, 5.61%, 4/13/33 | | | 234,704 | |
| | | | | | |
| | | | | 932,459 | |
| | | | | | |
Poland — 1.76% | | | | | | |
200,000(b) | | Republic of Poland Government International Bond, EMTN, 4.25%, 2/14/43(a) | | | 210,668 | |
210,000 | | Republic of Poland Government International Bond, 5.50%, 4/4/53 | | | 213,108 | |
200,000 | | Republic of Poland Government International Bond, 5.75%, 11/16/32 | | | 213,307 | |
| | | | | | |
| | | | | 637,083 | |
| | | | | | |
Qatar — 1.24% | | | | |
484,000 | | Qatar Government International Bond, 4.40%, 4/16/50(a) | | | 448,796 | |
| | | | | | |
| | |
Romania — 2.37% | | | | | | |
95,000(b) | | Romanian Government International Bond, EMTN, 2.00%, 4/14/33(a) | | | 69,992 | |
245,000(b) | | Romanian Government International Bond, 2.63%, 12/2/40(a) | | | 153,245 | |
460,000(b) | | Romanian Government International Bond, EMTN, 2.75%, 4/14/41(a) | | | 292,720 | |
16
|
SCHEDULE OF PORTFOLIO INVESTMENTS |
RBC BlueBay Emerging Market Debt Fund (cont.)
March 31, 2023 (Unaudited)
| | | | | | |
Principal Amount | | | | Value | |
| |
252,000(b) | | Romanian Government International Bond, EMTN, 3.38%, 2/8/38(a) | | $ | 189,472 | |
237,000(b) | | Romanian Government International Bond, EMTN, 3.38%, 1/28/50(a) | | | 154,683 | |
| | | | | | |
| | | | | 860,112 | |
| | | | | | |
Serbia — 1.07% | | | | |
285,000(b) | | Serbia International Bond, EMTN, 2.05%, 9/23/36(a) | | | 185,890 | |
$ 200,000 | | Serbia International Bond, 6.25%, 5/26/28(c) | | | 202,293 | |
| | | | | | |
| | | | | 388,183 | |
| | | | | | |
South Africa — 2.67% | | | | |
400,000 | | Republic of South Africa Government International Bond, 4.85%, 9/30/29 | | | 359,693 | |
400,000 | | Republic of South Africa Government International Bond, 5.00%, 10/12/46 | | | 277,470 | |
200,000 | | Republic of South Africa Government International Bond, 5.38%, 7/24/44 | | | 148,568 | |
200,000 | | Republic of South Africa Government International Bond, 5.88%, 4/20/32 | | | 182,125 | |
| | | | | | |
| | | | | 967,856 | |
| | | | | | |
Sri Lanka — 0.40% | | | | |
390,000 | | Sri Lanka Government International Bond, 6.83%, 7/18/26(a) | | | 144,411 | |
| | | | | | |
| | |
Tunisia — 1.26% | | | | | | |
200,000(b) | | Banque Centrale de Tunisie International Bond, 6.75%, 10/31/23(a) | | | 186,028 | |
344,000(b) | | Tunisian Republic, 5.63%, 2/17/24(a) | | | 272,156 | |
| | | | | | |
| | | | | 458,184 | |
| | | | | | |
Turkey — 4.79% | | | | |
810,000 | | Turkey Government International Bond, 4.88%, 4/16/43 | | | 538,847 | |
965,000 | | Turkey Government International Bond, 5.75%, 5/11/47 | | | 687,565 | |
500,000 | | Turkey Government International Bond, 9.38%, 1/19/33 | | | 508,965 | |
| | | | | | |
| | | | | 1,735,377 | |
| | | | | | |
Ukraine — 1.06% | | | | |
370,000 | | Ukraine Government International Bond, (N/A + 0.000%), 0.00%, 8/1/41(a),(e),(f) | | | 99,939 | |
1,193,000 | | Ukraine Government International Bond, 7.38%, 9/25/34(a) | | | 207,491 | |
175,000 | | Ukraine Government International Bond, 7.75%, 9/1/26(a) | | | 32,288 | |
230,000 | | Ukraine Government International Bond, 7.75%, 9/1/28(a) | | | 43,166 | |
| | | | | | |
| | | | | 382,884 | |
| | | | | | |
United Arab Emirates — 3.03% | | | | |
277,000 | | Abu Dhabi Government International Bond, EMTN, 2.70%, 9/2/70(a) | | | 173,938 | |
360,000 | | Abu Dhabi Government International Bond, 3.13%, 9/30/49(a) | | | 269,998 | |
17
|
SCHEDULE OF PORTFOLIO INVESTMENTS |
RBC BlueBay Emerging Market Debt Fund (cont.)
March 31, 2023 (Unaudited)
| | | | | | |
Principal Amount | | | | Value | |
| |
$ 515,000 | | Finance Department Government of Sharjah, GMTN, 4.00%, 7/28/50(a) | | $ | 327,063 | |
320,000 | | Finance Department Government of Sharjah, 6.50%, 11/23/32(c) | | | 325,826 | |
| | | | | | |
| | | | | 1,096,825 | |
| | | | | | |
Uruguay — 1.49% | |
547,599 | | Uruguay Government International Bond, 4.98%, 4/20/55 | | | 539,399 | |
| | | | | | |
| |
Uzbekistan — 2.30% | | | | |
200,000 | | Republic of Uzbekistan International Bond, 3.90%, 10/19/31(a) | | | 161,108 | |
340,000 | | Republic of Uzbekistan International Bond, EMTN, 4.75%, 2/20/24(a) | | | 334,479 | |
425,000 | | Uzbekneftegaz JSC, 4.75%, 11/16/28(a) | | | 338,775 | |
| | | | | | |
| | | | | 834,362 | |
| | | | | | |
Venezuela — 0.08% | |
85,000 | | Venezuela Government International Bond, 7.75%, 10/13/19(a),(d) | | | 5,950 | |
73,800 | | Venezuela Government International Bond, 8.25%, 10/13/24(a),(d) | | | 7,380 | |
170,000 | | Venezuela Government International Bond, 11.75%, 10/21/26(a),(d) | | | 17,000 | |
| | | | | | |
| | | | | 30,330 | |
| | | | | | |
Zambia — 0.61% | |
305,000 | | Zambia Government International Bond, 5.38%, 9/23/23(a) | | | 130,673 | |
200,000 | | Zambia Government International Bond, 8.97%, 7/30/27(a) | | | 89,757 | |
| | | | | | |
| | | | | 220,430 | |
| | | | | | |
Total Foreign Government Bonds | | | 27,085,599 | |
| | | | | | |
(Cost $29,815,473) | |
|
Corporate Bonds — 20.81% | |
Argentina — 1.47% | |
87,500 | | YPF SA, 8.50%, 3/23/25(a) | | | 81,736 | |
210,000 | | YPF SA, 8.50%, 7/28/25(a) | | | 185,797 | |
177,800 | | YPF SA, 8.75%, 4/4/24(a) | | | 172,709 | |
96,923 | | YPF SA, 9.00%, 2/12/26(a) | | | 93,973 | |
| | | | | | |
| | | | | 534,215 | |
| | | | | | |
Brazil — 0.87% | | | | |
342,600 | | MV24 Capital BV, 6.75%, 6/1/34(a) | | | 313,822 | |
| | | | | | |
| |
Chile — 1.04% | | | | |
200,000 | | Corp. Nacional del Cobre de Chile, 5.13%, 2/2/33(c) | | | 202,184 | |
250,000 | | Empresa de los Ferrocarriles del Estado, 3.83%, 9/14/61(a) | | | 174,050 | |
| | | | | | |
| | | | | 376,234 | |
| | | | | | |
18
|
SCHEDULE OF PORTFOLIO INVESTMENTS |
RBC BlueBay Emerging Market Debt Fund (cont.)
March 31, 2023 (Unaudited)
| | | | | | |
Principal Amount | | | | Value | |
| |
Colombia — 1.49% | | | | |
$ 255,000 | | Ecopetrol SA, 5.88%, 5/28/45 | | $ | 177,066 | |
285,000 | | Ecopetrol SA, 5.88%, 11/2/51 | | | 191,935 | |
170,000 | | Ecopetrol SA, 8.88%, 1/13/33 | | | 171,700 | |
| | | | | | |
| | | | | 540,701 | |
| | | | | | |
Mexico — 5.91% | | | | |
280,000 | | Comision Federal de Electricidad, 4.69%, 5/15/29(a) | | | 251,159 | |
490,000 | | Mexico City Airport Trust, 5.50%, 7/31/47(a) | | | 378,923 | |
1,277,000 | | Petroleos Mexicanos, 5.63%, 1/23/46 | | | 759,176 | |
524,000 | | Petroleos Mexicanos, 6.35%, 2/12/48 | | | 326,138 | |
285,000 | | Petroleos Mexicanos, GMTN, 8.75%, 6/2/29 | | | 265,426 | |
170,000 | | Petroleos Mexicanos, 10.00%, 2/7/33(c) | | | 161,925 | |
| | | | | | |
| | | | | 2,142,747 | |
| | | | | | |
Oman — 1.26% | | | | |
275,000 | | OQ SAOC, GMTN, 5.13%, 5/6/28(a) | | | 262,482 | |
200,000 | | Oryx Funding Ltd., 5.80%, 2/3/31(a) | | | 192,598 | |
| | | | | | |
| | | | | 455,080 | |
| | | | | | |
Paraguay — 0.82% | | | | |
180,000 | | Rutas 2 and 7 Finance Ltd., 0.00%, 9/30/36(a),(g) | | | 113,415 | |
200,000 | | Telefonica Celular del Paraguay SA, 5.88%, 4/15/27(a) | | | 183,822 | |
| | | | | | |
| | | | | 297,237 | |
| | | | | | |
Peru — 0.95% | | | | |
400,000 | | InRetail Consumer, 3.25%, 3/22/28(a) | | | 345,420 | |
| | | | | | |
| |
Qatar — 0.89% | | | | |
200,000 | | Qatar Energy, 3.13%, 7/12/41(a) | | | 157,032 | |
220,000 | | Qatar Energy, 3.30%, 7/12/51(a) | | | 165,234 | |
| | | | | | |
| | | | | 322,266 | |
| | | | | | |
Saudi Arabia — 2.48% | | | | |
240,000 | | Greensaif Pipelines Bidco Sarl, 6.13%, 2/23/38(c) | | | 247,029 | |
340,000 | | Greensaif Pipelines Bidco Sarl, 6.51%, 2/23/42(c) | | | 358,428 | |
280,000 | | TMS Issuer Sarl, 5.78%, 8/23/32(c) | | | 291,757 | |
| | | | | | |
| | | | | 897,214 | |
| | | | | | |
South Africa — 0.41% | | | | |
150,000 | | Eskom Holdings SOC Ltd., 7.13%, 2/11/25(a) | | | 147,484 | |
| | | | | | |
| |
United Arab Emirates — 3.03% | | | | |
300,000 | | DP World Salaam, 6.00%, (a),(h),(i) | | | 298,635 | |
206,694 | | Galaxy Pipeline Assets Bidco Ltd., 2.16%, 3/31/34(a) | | | 178,402 | |
504,370 | | Galaxy Pipeline Assets Bidco Ltd., 2.94%, 9/30/40(a) | | | 409,590 | |
200,000 | | MDGH GMTN RSC Ltd., 5.50%, 4/28/33(a) | | | 212,764 | |
| | | | | | |
| | | | | 1,099,391 | |
| | | | | | |
19
|
SCHEDULE OF PORTFOLIO INVESTMENTS |
RBC BlueBay Emerging Market Debt Fund (cont.)
March 31, 2023 (Unaudited)
| | | | | | |
Principal Amount | | | | Value | |
| |
| |
Venezuela — 0.19% | | | | |
$ 173,584 | | Petroleos de Venezuela SA, 6.00%, 11/15/26(a),(d) | | $ | 7,777 | |
260,000 | | Petroleos de Venezuela SA, 8.50%, 10/27/20(a),(d) | | | 60,450 | |
| | | | | | |
| | | | | 68,227 | |
| | | | | | |
Total Corporate Bonds | | | 7,540,038 | |
| | | | | | |
(Cost $8,158,142) | | | | |
| | |
Shares | | | | | |
Municipal Bond — 0.55% | | | | |
Turkey — 0.55% | | | | |
200,000 | | Istanbul Metropolitan Municipality(a) | | | 199,749 | |
| | | | | | |
| |
Total Municipal Bond | | | 199,749 | |
| | | | | | |
(Cost $194,833) | | | | | | |
| |
Investment Company — 1.86% | | | | |
672,520 | | U.S. Government Money Market Fund,
RBC Institutional Class 1 (j) | | | 672,520 | |
| | | | | | |
| |
Total Investment Company | | | 672,520 | |
| | | | | | |
(Cost $672,520) | | | | |
| |
Total Investments | | $ | 35,497,906 | |
(Cost $38,840,968) — 97.99% | | | | |
| |
Other assets in excess of liabilities — 2.01% | | | 729,463 | |
| | | | | | |
| |
NET ASSETS — 100.00% | | $ | 36,227,369 | |
| | | | | | |
| (a) | This security may be resold to qualified foreign investors and foreign institutional buyers under Regulation S of the Securities Act of 1933. |
| (b) | Principal amount denoted in Euros. |
| (c) | Security exempt from registration under Rule 144A or Section 4(2) of the Securities Act of 1933, as amended. These securities may be resold in transactions exempt from registration, normally to qualified institutional buyers. |
| (d) | Issuer filed for bankruptcy and/or is in default of interest payments. |
| (e) | Floating rate note. Rate shown is as of report date. |
| (f) | Variable or floating rate security, which interest rate adjusts periodically based on changes in current interest rates and prepayments on the underlying pool of assets. Rate shown is the rate in effect as of period end. |
| (g) | Zero Coupon Bond. The rate represents the yield at time of purchase. |
| (h) | Security is a fix-to-float security, which carries a fixed coupon until a certain date, upon which it switches to a floating rate. Reference rate and spread are provided if the rate is currently floating. |
| (i) | Perpetual security with no stated maturity date. |
| (j) | Affiliated investment. |
20
|
SCHEDULE OF PORTFOLIO INVESTMENTS |
RBC BlueBay Emerging Market Debt Fund (cont.)
March 31, 2023 (Unaudited)
Foreign currency exchange contracts as of March 31, 2023:
| | | | | | | | | | | | | | | | | | | | | | | | | | | | |
Currency Purchased | | | Currency Sold | | | Counterparty | | Settlement
Date | | Value/Unrealized
Appreciation
(Depreciation) | |
COP | | | 162,009,482 | | | | USD | | | | 32,467 | | | Citibank N.A. | | 4/19/23 | | | | | | $ | 2,185 | | | | | |
COP | | | 135,532,973 | | | | USD | | | | 27,192 | | | Citibank N.A. | | 4/19/23 | | | | | | | 1,797 | | | | | |
COP | | | 135,455,426 | | | | USD | | | | 27,192 | | | Citibank N.A. | | 4/19/23 | | | | | | | 1,781 | | | | | |
COP | | | 814,395,256 | | | | USD | | | | 163,150 | | | Citibank N.A. | | 4/19/23 | | | | | | | 11,039 | | | | | |
CZK | | | 3,244,427 | | | | EUR | | | | 135,767 | | | Citibank N.A. | | 4/19/23 | | | | | | | 1,190 | | | | | |
EUR | | | 215,000 | | | | USD | | | | 232,780 | | | Citibank N.A. | | 4/19/23 | | | | | | | 635 | | | | | |
EUR | | | 298,001 | | | | USD | | | | 320,000 | | | Citibank N.A. | | 4/19/23 | | | | | | | 3,526 | | | | | |
EUR | | | 410,000 | | | | USD | | | | 438,298 | | | Citibank N.A. | | 4/19/23 | | | | | | | 6,820 | | | | | |
HUF | | | 261,934,452 | | | | EUR | | | | 635,023 | | | Citibank N.A. | | 4/19/23 | | | | | | | 26,764 | | | | | |
ILS | | | 637,318 | | | | USD | | | | 176,748 | | | Citibank N.A. | | 4/19/23 | | | | | | | 559 | | | | | |
ILS | | | 661,195 | | | | USD | | | | 183,252 | | | Citibank N.A. | | 4/19/23 | | | | | | | 699 | | | | | |
INR | | | 29,705,760 | | | | USD | | | | 360,000 | | | Citibank N.A. | | 4/19/23 | | | | | | | 1,092 | | | | | |
INR | | | 29,740,500 | | | | USD | | | | 360,000 | | | Citibank N.A. | | 4/19/23 | | | | | | | 1,515 | | | | | |
JPY | | | 24,148,316 | | | | USD | | | | 181,206 | | | Citibank N.A. | | 4/19/23 | | | | | | | 1,233 | | | | | |
MXN | | | 6,657,336 | | | | USD | | | | 360,000 | | | Citibank N.A. | | 4/19/23 | | | | | | | 8,074 | | | | | |
MYR | | | 1,590,300 | | | | USD | | | | 360,000 | | | HSBC Bank Plc | | 4/19/23 | | | | | | | 1,225 | | | | | |
USD | | | 2,127,590 | | | | EUR | | | | 1,956,208 | | | Citibank N.A. | | 4/19/23 | | | | | | | 3,824 | | | | | |
USD | | | 370,000 | | | | THB | | | | 12,291,141 | | | Citibank N.A. | | 4/19/23 | | | | | | | 9,790 | | | | | |
USD | | | 200,000 | | | | THB | | | | 6,535,860 | | | Citibank N.A. | | 4/19/23 | | | | | | | 8,457 | | | | | |
| | | | | | | | | | | | | | | | | | | | | | | | | | | | |
| | | | | | | | | | | | | | | | | | | | | | $ | 92,205 | | | | | |
| | | | | | | | |
EUR | | | 93,273 | | | | CZK | | | | 2,243,056 | | | Citibank N.A. | | 4/19/23 | | | | | | $ | (1,143 | ) | | | | |
EUR | | | 161,227 | | | | CZK | | | | 3,872,259 | | | Citibank N.A. | | 4/19/23 | | | | | | | (1,862 | ) | | | | |
EUR | | | 378,916 | | | | CZK | | | | 9,118,291 | | | Citibank N.A. | | 4/19/23 | | | | | | | (4,784 | ) | | | | |
EUR | | | 97,936 | | | | CZK | | | | 2,352,298 | | | Citibank N.A. | | 4/19/23 | | | | | | | (1,133 | ) | | | | |
EUR | | | 676 | | | | HUF | | | | 270,006 | | | Citibank N.A. | | 4/19/23 | | | | | | | (16 | ) | | | | |
EUR | | | 396,334 | | | | HUF | | | | 157,035,450 | | | Citibank N.A. | | 4/19/23 | | | | | | | (7,565 | ) | | | | |
EUR | | | 113,941 | | | | HUF | | | | 45,167,391 | | | Citibank N.A. | | 4/19/23 | | | | | | | (2,206 | ) | | | | |
EUR | | | 149,725 | | | | HUF | | | | 59,461,605 | | | Citibank N.A. | | 4/19/23 | | | | | | | (3,053 | ) | | | | |
THB | | | 5,820,064 | | | | USD | | | | 177,005 | | | Citibank N.A. | | 4/19/23 | | | | | | | (6,439 | ) | | | | |
THB | | | 7,566,083 | | | | USD | | | | 229,590 | | | Citibank N.A. | | 4/19/23 | | | | | | | (7,855 | ) | | | | |
THB | | | 305,305 | | | | USD | | | | 9,083 | | | Citibank N.A. | | 4/19/23 | | | | | | | (136 | ) | | | | |
THB | | | 5,135,549 | | | | USD | | | | 157,242 | | | Citibank N.A. | | 4/19/23 | | | | | | | (6,737 | ) | | | | |
USD | | | 110,707 | | | | COP | | | | 523,975,994 | | | Citibank N.A. | | 4/19/23 | | | | | | | (1,365 | ) | | | | |
USD | | | 110,707 | | | | COP | | | | 522,536,757 | | | Citibank N.A. | | 4/19/23 | | | | | | | (1,057 | ) | | | | |
USD | | | 58,586 | | �� | | COP | | | | 276,995,128 | | | Citibank N.A. | | 4/19/23 | | | | | | | (659 | ) | | | | |
USD | | | 291,965 | | | | EUR | | | | 275,000 | | | Citibank N.A. | | 4/19/23 | | | | | | | (6,590 | ) | | | | |
USD | | | 386,540 | | | | EUR | | | | 360,000 | | | Citibank N.A. | | 4/19/23 | | | | | | | (4,296 | ) | | | | |
USD | | | 650,336 | | | | EUR | | | | 600,014 | | | Citibank N.A. | | 4/19/23 | | | | | | | (1,071 | ) | | | | |
USD | | | 357,695 | | | | ILS | | | | 1,298,513 | | | Citibank N.A. | | 4/19/23 | | | | | | | (3,563 | ) | | | | |
USD | | | 64,948 | | | | MXN | | | | 1,186,794 | | | Citibank N.A. | | 4/19/23 | | | | | | | (668 | ) | | | | |
USD | | | 103,474 | | | | MXN | | | | 1,889,950 | | | Citibank N.A. | | 4/19/23 | | | | | | | (1,019 | ) | | | | |
USD | | | 95,176 | | | | MXN | | | | 1,740,526 | | | Citibank N.A. | | 4/19/23 | | | | | | | (1,055 | ) | | | | |
21
|
SCHEDULE OF PORTFOLIO INVESTMENTS |
RBC BlueBay Emerging Market Debt Fund (cont.)
March 31, 2023 (Unaudited)
| | | | | | | | | | | | | | | | | | | | | | | | | | | | | | |
Currency Purchased | | | Currency Sold | | | Counterparty | | Settlement
Date | | | Value/Unrealized
Appreciation
(Depreciation) | |
USD | | | 96,402 | | | | MXN | | | | 1,762,141 | | | Citibank N.A. | | | 4/19/23 | | | | | | | $ | (1,024 | ) | | | | |
USD | | | 361,213 | | | | PHP | | | | 19,853,120 | | | Citibank N.A. | | | 4/19/23 | | | | | | | | (4,309 | ) | | | | |
| | | | | | | | | | | | | | | | | | | | | | | | | | | | | | |
| | | | | | | | | | | | | | | | | | | | | | | | $ | (69,605 | ) | | | | |
| | | | | | | | | | | | | | | | | | | | | | | | | | | | | | |
Total | | | | | | | | | | | | | | | | | | | | | | | | $ | 22,600 | | | | | |
| | | | | | | | | | | | | | | | | | | | | | | | | | | | | | |
Financial futures contracts as of March 31, 2023:
| | | | | | | | | | | | | | | | | | | | | | | | | | | | |
Short Position | | Number of
Contracts | | | Expiration
Date | | | Value/Unrealized
Depreciation | | | Notional
Value | | | Clearinghouse | |
10 Year Euro-Bund | | | 5 | | | | June 2023 | | | | | | | $ | (26,115 | ) | | | EUR | | | $ | 736,592 | | | | Morgan Stanley & Co. LLC | |
10 Year U.S. Ultra Treasury Bond | | | 9 | | | | June 2023 | | | | | | | | (34,580 | ) | | | USD | | | | 1,090,266 | | | | Morgan Stanley & Co. LLC | |
30 Year U.S. Ultra Treasury Bond | | | 1 | | | | June 2023 | | | | | | | | (5,506 | ) | | | USD | | | | 141,125 | | | | Morgan Stanley & Co. LLC | |
5 Year Euro-Bobl | | | 4 | | | | June 2023 | | | | | | | | (12,319 | ) | | | EUR | | | | 511,363 | | | | Morgan Stanley & Co. LLC | |
| | | | | | | | | | | | | | | | | | | | | | | | | | | | |
Total | | | | | | | | | | | | | | $ | (78,520 | ) | | | | | | | | | | | | |
| | | | | | | | | | | | | | | | | | | | | | | | | | | | |
Credit default swaps buy protection as of March 31, 2023:
| | | | | | | | | | | | | | | | | | | | | | | | | | | | | | | | | | | | | | |
Fixed Rate | | Issuer | | Payment
Frequency | | | Counterparty | | Expiration
Date | | Notional
Amount
(000) | | | Premium
Paid/
(Received) | | | Unrealized
Depreciation | | | Value | |
| 1.00% | | Turkey Government International Bond | | | Quarterly | | | Barclays Bank plc | | 6/20/24 | | | USD | | | | 1,886 | | | | | | | $ | 75,236 | | | | | | | | $(21,426) | | | $ | 53,810 | |
| 1.00% | | ICE - CDX EM S38 DEC-27 | | | Quarterly | | | Morgan Stanley & Co. LLC | | 12/20/27 | | | EUR | | | | 1,600 | | | | | | | | 21,608 | | | | | | | | (28,024) | | | | (6,416) | |
| | | | | | | | | | | | | | | | | | | | | | | | | | | | | | | | | | | | | | |
| Total | | | | | | | | | | | | | | | | | | | | | | | | $ | 96,844 | | | | | | | | $(49,450) | | | $ | 47,394 | |
| | | | | | | | | | | | | | | | | | | | | | | | | | | | | | | | | | | | | | |
22
|
SCHEDULE OF PORTFOLIO INVESTMENTS |
RBC BlueBay Emerging Market Debt Fund (cont.)
March 31, 2023 (Unaudited)
Credit default swaps sell protection as of March 31, 2023:
| | | | | | | | | | | | | | | | | | | | | | | | | | | | | | | | | | | | | | | | |
Fixed
Rate | | Issuer | | Payment
Frequency | | | Counterparty | | Expiration
Date | | | ICS | | | Notional
Amount
(000) | | | Premium
Paid/
(Received) | | | Unreal.
App. | | | Value | |
| 1.00% | | ICE - CDX EM S39 JUN-28 | | | Quarterly | | | Morgan Stanley & Co. LLC | | | 6/20/28 | | | | USD | | | | 402 | | | | | | | $ | (7,016 | ) | | | | | | $ | 1,573 | | | $ | (5,444 | ) |
| 1.00% | | ICE - CDX EM S39 JUN-28 | | | Quarterly | | | Morgan Stanley & Co. LLC | | | 6/20/28 | | | | USD | | | | 313 | | | | | | | | (5,393 | ) | | | | | | | 1,155 | | | | (4,238 | ) |
| 1.00% | | ICE - CDX EM S39 JUN-28 | | | Quarterly | | | Morgan Stanley & Co. LLC | | | 6/20/28 | | | | USD | | | | 885 | | | | | | | | (15,248 | ) | | | | | | | 3,264 | | | | (11,984 | ) |
| | | | | | | | | | | | | | | | | | | | | | | | | | | | | | | | | | | | | | | | |
| Total | | | | | | | | | | | | | | | | | | | | | | | | | | $ | (27,657 | ) | | | | | | $ | 5,992 | | | $ | (21,666 | ) |
| | | | | | | | | | | | | | | | | | | | | | | | | | | | | | | | | | | | | | | | |
Abbreviations used are defined below:
Bobl - German Bundesobligationen
COP - Colombian Peso
CZK - Czech Koruna
EMTN - Euro Medium Term Note
EUR - Euro
GMTN - Global Medium Term Note
HUF - Hungarian Forint
ILS - Israeli New Shekel
INR - Indian Rupee
JPY - Japanese Yen
MXN - Mexican Peso
MYR - Malaysian Ringgit
PHP - Philippine Peso
THB - Thai Baht
USD - United States Dollar
23
|
SCHEDULE OF PORTFOLIO INVESTMENTS |
RBC BlueBay Emerging Market Debt Fund (cont.)
March 31, 2023 (Unaudited)
Portfolio Diversification (Unaudited)
| | | | |
Industries | | Percentage
of Net Assets | |
Foreign Government Bonds | | | 74.77% | |
Energy | | | 13.04% | |
Industrial | | | 2.71% | |
Utilities | | | 1.63% | |
Consumer, Cyclical | | | 0.95% | |
Consumer, Non-cyclical | | | 0.82% | |
Financial | | | 0.59% | |
Basic Materials | | | 0.56% | |
Municipal Bond | | | 0.55% | |
Communications | | | 0.51% | |
Other* | | | 3.87% | |
| | | | |
| | | 100.00% | |
| | | | |
* Includes cash, Investment Company, interest and dividend receivable, pending trades and Fund share transactions, credit default swaps, financial futures contracts, foreign currency exchange contracts and accrued expenses payable.
See Notes to the Financial Statements.
24
|
SCHEDULE OF PORTFOLIO INVESTMENTS |
RBC BlueBay High Yield Bond Fund
March 31, 2023 (Unaudited)
| | | | | | |
Principal Amount | | | | Value | |
| |
|
Corporate Bonds — 91.34% | |
Australia — 1.52% | |
$2,550,000 | | FMG Resources August 2006 Pty Ltd., 6.13%, 4/15/32(a) | | $ | 2,471,426 | |
1,463,000 | | Mineral Resources Ltd., 8.00%, 11/1/27(a) | | | 1,498,844 | |
1,030,000 | | Mineral Resources Ltd., 8.50%, 5/1/30(a) | | | 1,052,969 | |
143,548 | | Quintis Australia Pty Ltd., PIK, 0.00%, 10/1/28(a),(b),(c) | | | 21,676 | |
220,972 | | Quintis Australia Pty Ltd., PIK, 7.50%, 10/1/26(a),(b),(c) | | | 147,609 | |
| | | | | | |
| | | | | 5,192,524 | |
| | | | | | |
Bermuda — 0.68% | | | | |
2,504,964 | | Highlands Holdings Bond Issuer Ltd. / Highlands Holdings Bond Co-Issuer, Inc., PIK, 7.63%, 10/15/25(a) | | | 2,325,181 | |
| | | | | | |
| |
Canada — 4.67% | | | | |
2,133,000 | | 1011778 BC ULC / New Red Finance, Inc., 4.38%, 1/15/28(a) | | | 1,967,373 | |
1,716,000 | | Bombardier, Inc., 6.00%, 2/15/28(a) | | | 1,672,474 | |
232,000 | | Bombardier, Inc., 7.50%, 3/15/25(a) | | | 232,290 | |
1,805,000 | | Bombardier, Inc., 7.50%, 2/1/29(a) | | | 1,836,588 | |
499,000 | | Bombardier, Inc., 7.88%, 4/15/27(a) | | | 504,389 | |
4,115,000 | | Intelligent Packaging Ltd. Finco, Inc. / Intelligent Packaging Ltd. Co-Issuer LLC, 6.00%, 9/15/28(a) | | | 3,538,900 | |
1,813,000 | | Kronos Acquisition Holdings, Inc. / KIK Custom Products, Inc., 5.00%, 12/31/26(a) | | | 1,660,378 | |
1,275,000 | | Kronos Acquisition Holdings, Inc. / KIK Custom Products, Inc., 7.00%, 12/31/27(a) | | | 1,109,795 | |
1,734,000 | | Primo Water Holdings, Inc., 4.38%, 4/30/29(a) | | | 1,523,007 | |
1,841,000 | | Ritchie Bros Holdings, Inc., 6.75%, 3/15/28(a) | | | 1,895,709 | |
| | | | | | |
| | | | | 15,940,903 | |
| | | | | | |
Cayman Islands — 0.96% | | | | |
3,633,804 | | Global Aircraft Leasing Co. Ltd., PIK, 6.50%, 9/15/24(a) | | | 3,287,330 | |
| | | | | | |
| | |
France — 3.25% | | | | | | |
1,150,000 | | Altice France SA, 5.13%, 7/15/29(a) | | | 869,149 | |
397,000 | | Altice France SA/France, 8.13%, 2/1/27(a) | | | 364,247 | |
4,328,000 | | Banijay Entertainment SASU, 5.38%, 3/1/25(a) | | | 4,230,620 | |
1,117,000 | | BNP Paribas SA, 7.75%, (a),(d),(e) | | | 1,065,702 | |
2,354,000 | | Iliad Holding SASU, 6.50%, 10/15/26(a) | | | 2,254,517 | |
2,431,000 | | Iliad Holding SASU, 7.00%, 10/15/28(a) | | | 2,306,768 | |
| | | | | | |
| | | | | 11,091,003 | |
| | | | | | |
Germany — 2.45% | | | | |
2,197,000 | | Cheplapharm Arzneimittel GmbH, 5.50%, 1/15/28(a) | | | 1,959,713 | |
2,000,000 | | Commerzbank AG, 7.00%, (d),(e),(f) | | | 1,687,120 | |
2,055,000 | | IHO Verwaltungs GmbH, PIK, 4.75%, 9/15/26(a) | | | 1,841,097 | |
25
|
SCHEDULE OF PORTFOLIO INVESTMENTS |
RBC BlueBay High Yield Bond Fund (cont.)
March 31, 2023 (Unaudited)
| | | | | | |
Principal Amount | | | | Value | |
| |
$1,432,904 | | IHO Verwaltungs GmbH, PIK, 6.00%, 5/15/27(a) | | $ | 1,307,525 | |
1,575,000 | | ZF North America Capital, Inc., 4.75%, 4/29/25(a) | | | 1,548,183 | |
| | | | | | |
| | | | | 8,343,638 | |
| | | | | | |
| | |
India — 0.34% | | | | | | |
1,314,000 | | CA Magnum Holdings, 5.38%, 10/31/26(a) | | | 1,164,861 | |
| | | | | | |
| | |
Italy — 1.13% | | | | | | |
2,320,000 | | Telecom Italia Capital SA, 6.38%, 11/15/33 | | | 2,099,020 | |
1,962,000 | | UniCredit SpA, 5.86%, 6/19/32(a),(d) | | | 1,740,911 | |
| | | | | | |
| | | | | 3,839,931 | |
| | | | | | |
Luxembourg — 0.99% | | | | |
1,823,000 | | Altice Financing SA, 5.00%, 1/15/28(a) | | | 1,481,187 | |
2,403,000 | | Altice Financing SA, 5.75%, 8/15/29(a) | | | 1,910,385 | |
| | | | | | |
| | | | | 3,391,572 | |
| | | | | | |
Mexico — 0.36% | | | | |
1,539,000 | | Banco Mercantil del Norte SA, 6.63%, (d),(e),(f) | | | 1,233,765 | |
| | | | | | |
| |
Netherlands — 0.26% | | | | |
1,000,000 | | UPC Holding BV, 5.50%, 1/15/28(a) | | | 892,722 | |
| | | | | | |
| |
Puerto Rico — 0.68% | | | | |
2,344,000 | | Popular, Inc., 7.25%, 3/13/28 | | | 2,308,367 | |
| | | | | | |
| |
United Arab Emirates — 0.83% | | | | |
2,922,000 | | GEMS MENASA Cayman Ltd. / GEMS Education Delaware LLC, 7.13%, 7/31/26(a) | | | 2,844,908 | |
| | | | | | |
| |
United Kingdom — 2.51% | | | | |
719,000 | | Barclays Plc, 8.00%, (d),(e) | | | 634,618 | |
1,000,000 | | Jaguar Land Rover Automotive Plc, 4.50%, 10/1/27(a) | | | 826,755 | |
1,000,000 | | Jaguar Land Rover Automotive Plc, 5.50%, 7/15/29(a) | | | 785,000 | |
1,446,000 | | Jaguar Land Rover Automotive Plc, 5.88%, 1/15/28(a) | | | 1,233,483 | |
4,053,000 | | Vmed O2 UK Financing I Plc, 4.75%, 7/15/31(a) | | | 3,469,246 | |
2,056,000 | | Vodafone Group Plc, 4.13%, 6/4/81(d) | | | 1,611,041 | |
| | | | | | |
| | | | | 8,560,143 | |
| | | | | | |
United States — 70.71% | | | | |
2,400,000 | | Adient Global Holdings Ltd., 4.88%, 8/15/26(a) | | | 2,313,000 | |
1,735,000 | | Adient Global Holdings Ltd., 8.25%, 4/15/31(a) | | | 1,792,342 | |
914,000 | | ADT Security Corp. (The), 4.13%, 8/1/29(a) | | | 815,625 | |
1,500,000 | | Akumin Escrow, Inc., 7.50%, 8/1/28(a) | | | 1,055,625 | |
650,000 | | Akumin, Inc., 7.00%, 11/1/25(a) | | | 511,736 | |
1,222,000 | | Albertsons Cos., Inc. / Safeway, Inc. / New Albertsons LP / Albertsons LLC, 3.50%, 3/15/29(a) | | | 1,063,245 | |
26
|
SCHEDULE OF PORTFOLIO INVESTMENTS |
RBC BlueBay High Yield Bond Fund (cont.)
March 31, 2023 (Unaudited)
| | | | | | |
Principal Amount | | | | Value | |
| |
| | |
$2,418,000 | | Albertsons Cos., Inc. / Safeway, Inc. / New Albertsons LP / Albertsons LLC, 7.50%, 3/15/26(a) | | $ | 2,500,576 | |
1,734,000 | | Ardagh Packaging Finance Plc / Ardagh Holdings USA, Inc., 5.25%, 4/30/25(a) | | | 1,712,022 | |
1,157,000 | | Asbury Automotive Group, Inc., 4.50%, 3/1/28 | | | 1,065,425 | |
1,333,000 | | Asbury Automotive Group, Inc., 5.00%, 2/15/32(a) | | | 1,168,506 | |
780,000 | | ASP Unifrax Holdings, Inc., 5.25%, 9/30/28(a) | | | 623,425 | |
2,005,333 | | BCPE Ulysses Intermediate, Inc., PIK, 7.75%, 4/1/27(a) | | | 1,570,693 | |
3,124,000 | | Boxer Parent Co., Inc., 7.13%, 10/2/25(a) | | | 3,142,847 | |
2,401,000 | | Bread Financial Holdings, Inc., 7.00%, 1/15/26(a) | | | 2,129,216 | |
2,281,000 | | Brundage-Bone Concrete Pumping Holdings, Inc., 6.00%, 2/1/26(a) | | | 2,137,675 | |
2,080,000 | | Builders FirstSource, Inc., 4.25%, 2/1/32(a) | | | 1,798,334 | |
1,219,000 | | Cablevision Lightpath LLC, 3.88%, 9/15/27(a) | | | 975,214 | |
2,333,000 | | Cablevision Lightpath LLC, 5.63%, 9/15/28(a) | | | 1,609,391 | |
2,952,000 | | Caesars Entertainment, Inc., 6.25%, 7/1/25(a) | | | 2,952,924 | |
1,250,000 | | Caesars Entertainment, Inc., 7.00%, 2/15/30(a) | | | 1,271,631 | |
3,236,000 | | Carriage Services, Inc., 4.25%, 5/15/29(a) | | | 2,663,703 | |
2,355,000 | | CCO Holdings LLC / CCO Holdings Capital Corp., 4.50%, 6/1/33(a) | | | 1,877,973 | |
1,666,000 | | CCO Holdings LLC / CCO Holdings Capital Corp., 4.75%, 3/1/30(a) | | | 1,443,784 | |
1,580,000 | | CCO Holdings LLC / CCO Holdings Capital Corp., 5.13%, 5/1/27(a) | | | 1,492,386 | |
4,462,000 | | CCO Holdings LLC / CCO Holdings Capital Corp., 7.38%, 3/1/31(a) | | | 4,397,872 | |
1,568,000 | | Cedar Fair LP / Canada’s Wonderland Co. / Magnum Management Corp. / Millennium Op, 5.50%, 5/1/25(a) | | | 1,566,736 | |
2,850,000 | | Central Garden & Pet Co., 4.13%, 4/30/31(a) | | | 2,462,328 | |
1,469,000 | | Chart Industries, Inc., 7.50%, 1/1/30(a) | | | 1,517,798 | |
2,206,000 | | Chart Industries, Inc., 9.50%, 1/1/31(a) | | | 2,328,044 | |
2,819,000 | | CHS/Community Health Systems, Inc., 8.00%, 3/15/26(a) | | | 2,725,665 | |
3,730,000 | | Clarios Global LP / Clarios US Finance Co., 6.25%, 5/15/26(a) | | | 3,725,530 | |
1,026,000 | | Clearway Energy Operating LLC, 3.75%, 2/15/31(a) | | | 884,906 | |
3,266,000 | | CMG Media Corp., 8.88%, 12/15/27(a) | | | 2,470,083 | |
2,479,000 | | Constellium SE, 3.75%, 4/15/29(a) | | | 2,144,335 | |
1,025,000 | | Constellium SE, 5.63%, 6/15/28(a) | | | 975,928 | |
2,471,000 | | Coty, Inc., 5.00%, 4/15/26(a) | | | 2,393,481 | |
4,126,000 | | CQP Holdco LP / BIP-V Chinook Holdco LLC, 5.50%, 6/15/31(a) | | | 3,708,043 | |
2,562,000 | | Crestwood Midstream Partners LP / Crestwood Midstream Finance Corp., 7.38%, 2/1/31(a) | | | 2,562,184 | |
1,049,000 | | CSC Holdings LLC, 7.50%, 4/1/28(a) | | | 668,131 | |
3,797,000 | | Dealer Tire LLC / DT Issuer LLC, 8.00%, 2/1/28(a) | | | 3,412,355 | |
1,992,000 | | Directv Financing LLC / Directv Financing Co-Obligor, Inc., 5.88%, 8/15/27(a) | | | 1,804,288 | |
2,214,000 | | DISH DBS Corp., 5.25%, 12/1/26(a) | | | 1,768,841 | |
1,699,000 | | DISH DBS Corp., 5.75%, 12/1/28(a) | | | 1,268,546 | |
1,708,000 | | DISH Network Corp., 11.75%, 11/15/27(a) | | | 1,642,332 | |
2,590,000 | | Domtar Corp., 6.75%, 10/1/28(a) | | | 2,305,869 | |
27
|
SCHEDULE OF PORTFOLIO INVESTMENTS |
RBC BlueBay High Yield Bond Fund (cont.)
March 31, 2023 (Unaudited)
| | | | | | |
Principal Amount | | | | Value | |
| |
$2,201,000 | | Ferrellgas LP / Ferrellgas Finance Corp., 5.38%, 4/1/26(a) | | $ | 2,059,471 | |
2,074,000 | | Ferrellgas LP / Ferrellgas Finance Corp., 5.88%, 4/1/29(a) | | | 1,775,283 | |
1,897,000 | | Ford Motor Co., 6.10%, 8/19/32 | | | 1,832,708 | |
1,766,000 | | Ford Motor Credit Co. LLC, 2.70%, 8/10/26 | | | 1,571,948 | |
2,260,000 | | Ford Motor Credit Co. LLC, 4.54%, 8/1/26 | | | 2,143,833 | |
2,068,000 | | Ford Motor Credit Co. LLC, 7.35%, 3/6/30 | | | 2,128,436 | |
3,402,000 | | Forestar Group, Inc., 3.85%, 5/15/26(a) | | | 3,085,118 | |
1,598,000 | | Freedom Mortgage Corp., 8.13%, 11/15/24(a) | | | 1,538,413 | |
2,030,000 | | Frontier Communications Holdings LLC, 8.75%, 5/15/30(a) | | | 2,020,892 | |
1,183,000 | | Gap, Inc. (The), 3.63%, 10/1/29(a) | | | 826,985 | |
517,000 | | Gap, Inc. (The), 3.88%, 10/1/31(a) | | | 350,848 | |
1,200,000 | | Gen Digital, Inc., 6.75%, 9/30/27(a) | | | 1,206,799 | |
1,483,000 | | Gen Digital, Inc., 7.13%, 9/30/30(a) | | | 1,475,685 | |
1,602,000 | | Global Partners LP / GLP Finance Corp., 6.88%, 1/15/29 | | | 1,478,960 | |
1,694,000 | | Global Partners LP / GLP Finance Corp., 7.00%, 8/1/27 | | | 1,628,241 | |
1,851,000 | | GPD Cos., Inc., 10.13%, 4/1/26(a) | | | 1,681,166 | |
1,100,000 | | Gray Television, Inc., 5.88%, 7/15/26(a) | | | 942,932 | |
2,446,000 | | Gray Television, Inc., 7.00%, 5/15/27(a) | | | 2,048,590 | |
2,601,000 | | Griffon Corp., 5.75%, 3/1/28 | | | 2,410,587 | |
3,945,000 | | Hanesbrands, Inc., 9.00%, 2/15/31(a) | | | 4,036,306 | |
3,055,000 | | International Game Technology Plc, 4.13%, 4/15/26(a) | | | 2,947,159 | |
560,000 | | International Game Technology Plc, 6.50%, 2/15/25(a) | | | 565,600 | |
3,362,000 | | IRB Holding Corp., 7.00%, 6/15/25(a) | | | 3,371,554 | |
2,832,000 | | Iron Mountain, Inc., REIT, 5.25%, 7/15/30(a) | | | 2,557,571 | |
4,127,000 | | ITT Holdings LLC, 6.50%, 8/1/29(a) | | | 3,481,085 | |
1,910,000 | | Jefferies Finance LLC / JFIN Co-Issuer Corp., 5.00%, 8/15/28(a) | | | 1,617,367 | |
1,860,000 | | KFC Holding Co./Pizza Hut Holdings LLC/Taco Bell of America LLC, 4.75%, 6/1/27(a) | | | 1,822,679 | |
1,103,000 | | LABL, Inc., 5.88%, 11/1/28(a) | | | 984,603 | |
2,278,000 | | LBM Acquisition LLC, 6.25%, 1/15/29(a) | | | 1,751,002 | |
2,000,000 | | LCPR Senior Secured Financing DAC, 5.13%, 7/15/29(a) | | | 1,690,779 | |
2,045,000 | | LCPR Senior Secured Financing DAC, 6.75%, 10/15/27(a) | | | 1,927,024 | |
1,567,000 | | Legacy LifePoint Health LLC, 4.38%, 2/15/27(a) | | | 1,282,163 | |
1,662,000 | | Macy’s Retail Holdings LLC, 5.88%, 3/15/30(a) | | | 1,470,927 | |
2,240,000 | | Macy’s Retail Holdings LLC, 6.13%, 3/15/32(a) | | | 1,970,549 | |
2,063,000 | | MasTec, Inc., 4.50%, 8/15/28(a) | | | 1,894,779 | |
3,659,000 | | Matthews International Corp., 5.25%, 12/1/25(a) | | | 3,503,926 | |
1,932,000 | | McAfee Corp., 7.38%, 2/15/30(a) | | | 1,613,825 | |
2,724,000 | | Medline Borrower LP, 3.88%, 4/1/29(a) | | | 2,363,474 | |
2,573,000 | | Metis Merger Sub LLC, 6.50%, 5/15/29(a) | | | 2,143,615 | |
1,447,000 | | MGM Resorts International, 4.75%, 10/15/28 | | | 1,349,289 | |
1,045,000 | | Nationstar Mortgage Holdings, Inc., 6.00%, 1/15/27(a) | | | 949,949 | |
3,292,000 | | Neptune Bidco US, Inc., 9.29%, 4/15/29(a) | | | 3,050,956 | |
3,014,000 | | NESCO Holdings II, Inc., 5.50%, 4/15/29(a) | | | 2,722,519 | |
1,091,000 | | Nexstar Media, Inc., 5.63%, 7/15/27(a) | | | 1,010,587 | |
1,897,000 | | NuStar Logistics LP, 5.75%, 10/1/25 | | | 1,851,178 | |
1,996,000 | | OT Merger Corp., 7.88%, 10/15/29(a) | | | 1,179,416 | |
2,754,000 | | Paramount Global, 6.38%, 3/30/62(d) | | | 2,205,817 | |
28
|
SCHEDULE OF PORTFOLIO INVESTMENTS |
RBC BlueBay High Yield Bond Fund (cont.)
March 31, 2023 (Unaudited)
| | | | | | |
Principal Amount | | | | Value | |
| |
| | |
$ 1,104,000 | | Pike Corp., 5.50%, 9/1/28(a) | | $ | 962,816 | |
1,464,000 | | Post Holdings, Inc., 5.75%, 3/1/27(a) | | | 1,437,157 | |
1,558,000 | | PRA Group, Inc., 8.38%, 2/1/28(a) | | | 1,557,591 | |
2,014,000 | | Railworks Holdings LP / Railworks Rally, Inc., 8.25%, 11/15/28(a) | | | 1,874,031 | |
3,724,000 | | Rayonier AM Products, Inc., 7.63%, 1/15/26(a) | | | 3,444,776 | |
2,140,000 | | Realogy Group LLC / Realogy Co.-Issuer Corp., 5.25%, 4/15/30(a) | | | 1,559,361 | |
963,000 | | RegionalCare Hospital Partners Holdings, Inc. / LifePoint Health, Inc., 9.75%, 12/1/26(a) | | | 778,409 | |
930,000 | | Rockies Express Pipeline LLC, 4.80%, 5/15/30(a) | | | 816,115 | |
1,917,000 | | Rockies Express Pipeline LLC, 4.95%, 7/15/29(a) | | | 1,716,531 | |
1,904,000 | | Scientific Games Holdings LP/Scientific Games US FinCo, Inc., 6.63%, 3/1/30(a) | | | 1,691,417 | |
3,542,000 | | Sinclair Television Group, Inc., 4.13%, 12/1/30(a) | | | 2,859,524 | |
550,000 | | Sinclair Television Group, Inc., 5.50%, 3/1/30(a) | | | 437,362 | |
3,333,000 | | Sirius XM Radio, Inc., 4.00%, 7/15/28(a) | | | 2,864,981 | |
4,466,000 | | Smyrna Ready Mix Concrete LLC, 6.00%, 11/1/28(a) | | | 4,189,944 | |
3,882,000 | | Specialty Building Products Holdings LLC / SBP Finance Corp., 6.38%, 9/30/26(a) | | | 3,568,389 | |
3,062,000 | | Sprint LLC, 7.13%, 6/15/24 | | | 3,115,952 | |
1,329,000 | | Standard Industries, Inc., 5.00%, 2/15/27(a) | | | 1,266,036 | |
1,817,000 | | Summer BC Bidco B LLC, 5.50%, 10/31/26(a) | | | 1,546,505 | |
1,566,000 | | Tallgrass Energy Partners LP / Tallgrass Energy Finance Corp., 6.00%, 3/1/27(a) | | | 1,489,478 | |
1,600,000 | | Tallgrass Energy Partners LP / Tallgrass Energy Finance Corp., 7.50%, 10/1/25(a) | | | 1,604,240 | |
1,053,000 | | Taylor Morrison Communities, Inc. / Taylor Morrison Holdings II, Inc., 5.63%, 3/1/24(a) | | | 1,057,030 | |
4,150,000 | | TEGNA, Inc., 5.00%, 9/15/29 | | | 3,589,620 | |
1,591,000 | | Tenet Healthcare Corp., 6.13%, 10/1/28 | | | 1,516,928 | |
1,441,000 | | Tenet Healthcare Corp., 6.25%, 2/1/27 | | | 1,417,453 | |
1,087,000(g) | | TI Automotive Finance Plc, 3.75%, 4/15/29(f) | | | 895,727 | |
2,925,000 | | TransDigm, Inc., 6.25%, 3/15/26(a) | | �� | 2,927,297 | |
1,287,000 | | U.S. Foods, Inc., 6.25%, 4/15/25(a) | | | 1,299,184 | |
1,572,000 | | Uniti Group LP / Uniti Group Finance, Inc. / CSL Capital LLC, REIT, 10.50%, 2/15/28(a) | | | 1,524,669 | |
2,713,000 | | Univision Communications, Inc., 6.63%, 6/1/27(a) | | | 2,577,345 | |
615,000 | | Univision Communications, Inc., 7.38%, 6/30/30(a) | | | 580,226 | |
1,870,000 | | Venture Global Calcasieu Pass LLC, 4.13%, 8/15/31(a) | | | 1,642,080 | |
1,337,000 | | Victoria’s Secret & Co., 4.63%, 7/15/29(a) | | | 1,081,901 | |
521,000 | | Voyager Aviation Holdings LLC, 8.50%, 5/9/26(a) | | | 422,054 | |
1,133,000 | | Western Midstream Operating LP, 5.45%, 4/1/44 | | | 988,946 | |
1,546,000 | | White Cap Buyer LLC, 6.88%, 10/15/28(a) | | | 1,343,222 | |
29
|
SCHEDULE OF PORTFOLIO INVESTMENTS |
RBC BlueBay High Yield Bond Fund (cont.)
March 31, 2023 (Unaudited)
| | | | | | |
Principal Amount | | | | Value | |
| |
| | |
$ 1,037,000 | | White Cap Parent LLC, PIK, 8.25%, 3/15/26(a) | | $ | 946,588 | |
2,876,000 | | Wynn Resorts Finance LLC / Wynn Resorts Capital Corp., 7.13%, 2/15/31(a) | | | 2,916,673 | |
| | | | | | |
| | | | | 241,450,744 | |
| | | | | | |
Total Corporate Bonds | | | 311,867,592 | |
| | | | | | |
(Cost $329,866,865) | | | | |
| |
U.S. Treasury Obligations — 3.95% | | | | |
United States — 3.95% | | | | |
10,200,000 | | U.S. Treasury Bill, 4.60%, 8/17/23(h) | | | 10,020,029 | |
3,500,000 | | U.S. Treasury Bill- When Issued, 0.00%, 5/16/23(h) | | | 3,480,598 | |
| | | | | | |
| | | | | 13,500,627 | |
| | | | | | |
Total U.S. Treasury Obligations | | | 13,500,627 | |
| | | | | | |
(Cost $13,491,361) | | | | |
| | | | | | |
| | |
Shares | | | | | |
Common Stocks — 0.05% | | | | |
United Kingdom — 0.00% | | | | |
12,023 | | AVTCAP WARR | | | 6,526 | |
| | | | | | |
| |
United States — 0.05% | | | | |
70,137 | | Quintis Ltd.*,(b),(c),(i) | | | 1,403 | |
1,445 | | Voyager Aviation Holdings LLC | | | 177,374 | |
241 | | Voyager Aviation Holdings LLC*,(b),(c) | | | 0 | |
12,785 | | W R Grace & Co.*,(b),(c),(i) | | | 1 | |
| | | | | | |
| | | | | 178,778 | |
| | | | | | |
Total Common Stocks | | | 185,304 | |
| | | | | | |
(Cost $2) | | | | |
| |
Rights/Warrants — 0.00% | | | | |
Mexico — 0.00% | | | | | | |
3,026 | | Urbi Desarrollos Urbanos SAB de CV Warrants, Expire 12/31/49 | | | 0 | |
| | | | | | |
| |
Total Rights/Warrants | | | 0 | |
| | | | | | |
(Cost $0) | | | | |
30
|
SCHEDULE OF PORTFOLIO INVESTMENTS |
RBC BlueBay High Yield Bond Fund (cont.)
March 31, 2023 (Unaudited)
| | | | | | |
| | |
| Shares | | | | Value | |
| |
| |
Investment Company — 2.71% | | | | |
9,238,870 | | U.S. Government Money Market Fund, RBC Institutional Class 1 (j) | | $ | 9,238,870 | |
| | | | | | |
| |
Total Investment Company | | | 9,238,870 | |
| | | | | | |
(Cost $9,238,870) | | | | |
| | |
Total Investments | | | | $ | 334,792,393 | |
(Cost $352,597,098)(k) — 98.05% | | | | |
| |
Other assets in excess of liabilities — 1.95% | | | 6,659,653 | |
| | | | | | |
| |
NET ASSETS — 100.00% | | $ | 341,452,046 | |
| | | | | | |
|
| |
| * | Non-income producing security. |
| (a) | Security exempt from registration under Rule 144A or Section 4(2) of the Securities Act of 1933, as amended. These securities may be resold in transactions exempt from registration, normally to qualified institutional buyers. |
| (b) | The Pricing Committee has fair valued this security under procedures established by the Fund’s Board of Trustees. |
| (c) | Security is valued using significant unobservable inputs and is classified as Level 3 in the fair value hierarchy. |
| (d) | Security is a fix-to-float security, which carries a fixed coupon until a certain date, upon which it switches to a floating rate. Reference rate and spread are provided if the rate is currently floating. |
| (e) | Perpetual security with no stated maturity date. |
| (f) | This security may be resold to qualified foreign investors and foreign institutional buyers under Regulation S of the Securities Act of 1933. |
| (g) | Principal amount denoted in Euros. |
| (h) | Zero Coupon Bond. The rate represents the yield at time of purchase. |
| (i) | Security delisted or issuer in bankruptcy. |
| (j) | Affiliated investment. |
| (k) | See Notes to Schedules of Portfolio Investments for the tax cost of securities and the breakdown of unrealized appreciation (depreciation). |
31
|
SCHEDULE OF PORTFOLIO INVESTMENTS |
RBC BlueBay High Yield Bond Fund (cont.)
March 31, 2023 (Unaudited)
Foreign currency exchange contracts as of March 31, 2023:
| | | | | | | | | | | | | | | | | | | | | | | | | | | | | | | | | | |
Currency Purchased | | | | | Currency Sold | | | | | Counterparty | | | | Settlement
Date | | | | Value/Unrealized Appreciation (Depreciation) | |
| | | | | | | | | | | | | | | | | | | | | | | | | | | | | | |
EUR | | | 2,610,000 | | | | | USD | | | 2,826,586 | | | | | Citibank N.A. | | | | 4/19/23 | | | | | | | | $ | 6,972 | | | | | |
| | | | | | | | | | | | | | | | | | | | | | | | | | | | | | | | | | |
| | | | | | | | | | | | |
USD | | | 1,431,608 | | | | | EUR | | | 1,325,244 | | | | | Citibank N.A. | | | | 4/19/23 | | | | | | | | | (7,149) | | | | | |
USD | | | 1,423,199 | | | | | EUR | | | 1,317,377 | | | | | Citibank N.A. | | | | 4/19/23 | | | | | | | | | (7,017) | | | | | |
USD | | | 1,216,337 | | | | | EUR | | | 1,126,379 | | | | | Citibank N.A. | | | | 4/19/23 | | | | | | | | | (6,522) | | | | | |
| | | | | | | | | | | | | | | | | | | | | | | | | | | | | | | | | | |
| | | | | | | | | | | | | | | | | | | | | | | | | | | | $ | (20,688) | | | | | |
| | | | | | | | | | | | | | | | | | | | | | | | | | | | | | | | | | |
Total | | | | | | | | | | | | | | | | | | | | | | | | | | | | $ | (13,716) | | | | | |
| | | | | | | | | | | | | | | | | | | | | | | | | | | | | | | | | | |
Abbreviations used are defined below:
EUR - Euro
REIT - Real Estate Investment Trust
USD - United States Dollar
Portfolio Diversification (Unaudited)
| | | | | | | | | | | | |
Industries | | Percentage of Net Assets | |
Consumer, Cyclical | | | | | | | 24.87 | % | | | | |
Communications | | | | | | | 20.74 | % | | | | |
Consumer, Non-cyclical | | | | | | | 12.67 | % | | | | |
Industrial | | | | | | | 11.01 | % | | | | |
Financial | | | | | | | 8.25 | % | | | | |
Energy | | | | | | | 6.73 | % | | | | |
Basic Materials | | | | | | | 4.80 | % | | | | |
U.S. Treasury Obligations | | | | | | | 3.95 | % | | | | |
Technology | | | | | | | 1.73 | % | | | | |
Utilities | | | | | | | 0.54 | % | | | | |
Common Stocks | | | | | | | 0.05 | % | | | | |
Other* | | | | | | | 4.66 | % | | | | |
| | | | | | | | | | | | |
| | | | | | | 100.00 | % | | | | |
| | | | | | | | | | | | |
* Includes cash, Investment Company, interest and dividend receivable, pending trades and Fund share transactions, warrants, foreign currency exchange contracts and accrued expenses payable.
See Notes to the Financial Statements.
32
|
SCHEDULE OF PORTFOLIO INVESTMENTS |
RBC BlueBay Core Plus Bond Fund
March 31, 2023 (Unaudited)
| | | | | | |
Principal Amount | | | | Value | |
| |
Corporate Bonds — 48.51% | |
Australia — 0.63% | |
$ 160,000 | | Santos Finance Ltd., 3.65%, 4/29/31(a) | | $ | 134,557 | |
160,000 | | South32 Treasury Ltd., 4.35%, 4/14/32(b) | | | 143,493 | |
| | | | | | |
| | | | | 278,050 | |
| | | | | | |
Bermuda — 0.97% | | | | | | |
458,000 | | Triton Container International Ltd., 1.15%, 6/7/24(b) | | | 430,930 | |
| | | | | | |
| | |
Canada — 1.90% | | | | | | |
190,000 | | Bank of Nova Scotia (The), 4.59%, 5/4/37(c) | | | 168,365 | |
190,000 | | Enbridge, Inc., 5.70%, 3/8/33 | | | 197,727 | |
320,000 | | Enbridge, Inc., 5.97%, 3/8/26 | | | 320,921 | |
192,000 | | Rogers Communications, Inc., 4.55%, 3/15/52(b) | | | 157,312 | |
| | | | | | |
| | | | | 844,325 | |
| | | | | | |
France — 1.05% | | | | | | |
200,000(d) | | Electricite de France SA, 3.00%, (a),(c),(e) | | | 177,136 | |
100,000(f) | | Electricite de France SA, EMTN, 5.88%, (a),(c),(e) | | | 101,641 | |
200,000 | | Societe Generale SA, 9.38%, (b),(c),(e) | | | 189,250 | |
| | | | | | |
| | | | | 468,027 | |
| | | | | | |
Germany — 0.80% | | | | | | |
200,000(d) | | Commerzbank AG, 6.13%, (a),(c),(e) | | | 182,925 | |
200,000(d) | | Deutsche Bank AG, EMTN, 1.75%, 11/19/30(a),(c) | | | 170,016 | |
| | | | | | |
| | | | | 352,941 | |
| | | | | | |
Ireland — 1.31% | | | | | | |
220,000 | | AerCap Ireland Capital DAC / AerCap Global Aviation Trust, 4.63%, 10/15/27 | | | 212,448 | |
160,000 | | Avolon Holdings Funding Ltd., 3.25%, 2/15/27(b) | | | 142,666 | |
230,000 | | Avolon Holdings Funding Ltd., 5.13%, 10/1/23(b) | | | 228,316 | |
| | | | | | |
| | | | | 583,430 | |
| | | | | | |
Italy — 0.84% | | | | | | |
204,000 | | Intesa Sanpaolo SpA, 8.25%, 11/21/33(b),(c) | | | 216,563 | |
200,000 | | UniCredit SpA, 3.13%, 6/3/32(b),(c) | | | 157,035 | |
| | | | | | |
| | | | | 373,598 | |
| | | | | | |
Japan — 4.80% | | | | | | |
220,000 | | Mitsubishi UFJ Financial Group, Inc., 5.13%, 7/20/33(c) | | | 217,570 | |
380,000 | | Mizuho Financial Group, Inc., 2.65%, 5/22/26(c) | | | 358,157 | |
200,000 | | Mizuho Financial Group, Inc., 5.75%, 5/27/34(c) | | | 204,495 | |
230,000 | | Nissan Motor Co. Ltd., 4.35%, 9/17/27(b) | | | 216,798 | |
200,000 | | Nomura Holdings, Inc., 5.61%, 7/6/29 | | | 198,293 | |
280,000 | | Nomura Holdings, Inc., 6.18%, 1/18/33 | | | 285,342 | |
210,000 | | Renesas Electronics Corp., 1.54%, 11/26/24(b) | | | 196,209 | |
33
|
SCHEDULE OF PORTFOLIO INVESTMENTS |
RBC BlueBay Core Plus Bond Fund (cont.)
March 31, 2023 (Unaudited)
| | | | | | |
Principal Amount | | | | Value | |
| |
| | |
$ 240,000 | | Sumitomo Mitsui Financial Group, Inc., 5.77%, 1/13/33 | | $ | 250,484 | |
200,000 | | Sumitomo Mitsui Trust Bank Ltd., 5.65%, 3/9/26(b) | | | 203,193 | |
| | | | | | |
| | | | | 2,130,541 | |
| | | | | | |
Norway — 0.72% | | | | | | |
300,000 | | Var Energi ASA, 8.00%, 11/15/32(b) | | | 321,546 | |
| | | | | | |
| |
Puerto Rico — 0.71% | | | | |
320,000 | | Popular, Inc., 7.25%, 3/13/28 | | | 315,135 | |
| | | | | | |
| |
Spain — 0.75% | | | | |
200,000(d) | | Abertis Infraestructuras Finance BV, 3.25%, (a),(c),(e) | | | 193,081 | |
160,000 | | Telefonica Emisiones SA, 5.21%, 3/8/47 | | | 139,636 | |
| | | | | | |
| | | | | 332,717 | |
| | | | | | |
Switzerland — 2.62% | | | | |
500,000 | | Credit Suisse Group AG, 6.54%, 8/12/33(b),(c) | | | 513,750 | |
300,000(d) | | Credit Suisse Group AG, 7.75%, 3/1/29(a),(c) | | | 354,945 | |
250,000 | | Credit Suisse Group AG, 9.02%, 11/15/33(b),(c) | | | 296,225 | |
| | | | | | |
| | | | | 1,164,920 | |
| | | | | | |
United Kingdom — 1.36% | | | | |
200,000 | | HSBC Holdings Plc, 4.76%, 6/9/28(c) | | | 193,572 | |
200,000 | | HSBC Holdings Plc, 5.40%, 8/11/33(c) | | | 197,749 | |
200,000 | | HSBC Holdings Plc, 6.33%, 3/9/44(c) | | | 211,441 | |
| | | | | | |
| | | | | 602,762 | |
| | | | | | |
United States — 30.05% | | | | |
153,000 | | Aircastle Ltd., 2.85%, 1/26/28(b) | | | 129,802 | |
260,000 | | American International Group, Inc., 5.13%, 3/27/33 | | | 258,060 | |
156,000 | | American Tower Corp., REIT, 4.05%, 3/15/32 | | | 142,785 | |
180,000 | | Amgen, Inc., 5.60%, 3/2/43 | | | 185,601 | |
200,000 | | Amgen, Inc., 5.65%, 3/2/53 | | | 208,147 | |
180,000 | | Amgen, Inc., 5.75%, 3/2/63 | | | 186,744 | |
160,000 | | Arrow Electronics, Inc., 6.13%, 3/1/26 | | | 160,327 | |
220,000 | | AT&T, Inc., 3.65%, 9/15/59 | | | 157,192 | |
465,000 | | Athene Global Funding, (Secured Overnight Financing Average Index + 0.700%), 5.46%, 5/24/24(b),(g) | | | 459,756 | |
260,000 | | Bank of America Corp., 2.48%, 9/21/36(c) | | | 196,961 | |
230,000 | | Bank of America Corp., 4.57%, 4/27/33(c) | | | 218,804 | |
186,000 | | Broadcom, Inc., 2.60%, 2/15/33(b) | | | 145,885 | |
321,000 | | Broadcom, Inc., 4.93%, 5/15/37(b) | | | 291,253 | |
250,000 | | Charter Communications Operating LLC / Charter Communications Operating Capital, 3.85%, 4/1/61 | | | 155,122 | |
220,000 | | Citigroup, Inc., 3.06%, 1/25/33(c) | | | 186,694 | |
180,000 | | Citizens Financial Group, Inc., 2.50%, 2/6/30 | | | 142,280 | |
140,000 | | Comerica, Inc., 3.70%, 7/31/23 | | | 134,819 | |
180,000 | | Dell International LLC / EMC Corp., 5.75%, 2/1/33 | | | 179,885 | |
34
|
SCHEDULE OF PORTFOLIO INVESTMENTS |
RBC BlueBay Core Plus Bond Fund (cont.)
March 31, 2023 (Unaudited)
| | | | | | |
Principal Amount | | | | Value | |
| |
| | |
$ 140,000 | | Energy Transfer LP, 6.25%, 4/15/49 | | $ | 138,644 | |
180,000 | | Equinix, Inc., REIT, 3.90%, 4/15/32 | | | 163,512 | |
150,000 | | Essential Utilities, Inc., 5.30%, 5/1/52 | | | 145,331 | |
190,000 | | Exelon Corp., 5.60%, 3/15/53 | | | 193,736 | |
142,000 | | Fifth Third Bancorp, 4.77%, 7/28/30(c) | | | 131,044 | |
180,000 | | Fifth Third Bancorp, 6.36%, 10/27/28(c) | | | 181,117 | |
150,000 | | Fiserv, Inc., 5.60%, 3/2/33 | | | 155,671 | |
170,000 | | Flex Intermediate Holdco LLC, 4.32%, 12/30/39(b) | | | 128,316 | |
133,000 | | General Motors Co., 5.40%, 4/1/48 | | | 114,927 | |
110,000 | | Global Payments, Inc., 5.30%, 8/15/29 | | | 108,788 | |
236,000 | | Global Payments, Inc., 5.95%, 8/15/52 | | | 225,344 | |
276,000 | | Goldman Sachs Group, Inc. (The), 2.38%, 7/21/32(c) | | | 224,526 | |
350,000 | | Hewlett Packard Enterprise Co., 6.10%, 4/1/26 | | | 352,928 | |
250,000 | | Huntington National Bank (The), 5.65%, 1/10/30 | | | 240,565 | |
300,000 | | Intel Corp., 4.90%, 8/5/52 | | | 279,364 | |
286,000 | | Intel Corp., 5.20%, 2/10/33 | | | 290,860 | |
187,000 | | Intel Corp., 5.70%, 2/10/53 | | | 190,513 | |
200,000 | | Intel Corp., 5.90%, 2/10/63 | | | 205,657 | |
190,000 | | JPMorgan Chase & Co., 4.91%, 7/25/33(c) | | | 188,912 | |
170,000 | | Keurig Dr Pepper, Inc., 4.50%, 4/15/52 | | | 151,106 | |
250,000 | | KeyBank NA, GMTN, 5.00%, 1/26/33 | | | 232,145 | |
148,000 | | Kinder Morgan, Inc., 4.80%, 2/1/33 | | | 142,784 | |
259,000 | | Kyndryl Holdings, Inc., 3.15%, 10/15/31 | | | 198,692 | |
200,000 | | Kyndryl Holdings, Inc., 4.10%, 10/15/41 | | | 133,793 | |
170,000 | | M&T Bank Corp., 3.55%, 7/26/23 | | | 167,055 | |
164,000 | | M&T Bank Corp., 5.05%, 1/27/34(c) | | | 151,745 | |
160,000 | | Meta Platforms, Inc., 3.85%, 8/15/32 | | | 149,854 | |
179,000 | | Meta Platforms, Inc., 4.45%, 8/15/52 | | | 157,580 | |
150,000 | | Metropolitan Life Global Funding I, 5.15%, 3/28/33(b) | | | 151,503 | |
210,000 | | Micron Technology, Inc., 5.88%, 2/9/33 | | | 212,371 | |
150,000 | | Micron Technology, Inc., 6.75%, 11/1/29 | | | 159,587 | |
260,000 | | Morgan Stanley, 2.48%, 9/16/36(c) | | | 196,632 | |
280,000 | | Morgan Stanley, GMTN, 4.89%, 7/20/33(c) | | | 274,834 | |
152,000 | | MPLX LP, 5.00%, 3/1/33 | | | 148,755 | |
200,000 | | NextEra Energy Capital Holdings, Inc., 5.25%, 2/28/53 | | | 197,277 | |
100,000 | | NextEra Energy Capital Holdings, Inc., 6.05%, 3/1/25 | | | 101,754 | |
180,000 | | Oracle Corp., 4.10%, 3/25/61 | | | 132,088 | |
160,000 | | Oracle Corp., 5.55%, 2/6/53 | | | 152,284 | |
150,000 | | Prologis LP, REIT, 5.25%, 6/15/53 | | | 149,619 | |
145,000 | | Regal Rexnord Corp., 6.30%, 2/15/30(b) | | | 145,668 | |
200,000 | | Royalty Pharma Plc, 3.55%, 9/2/50 | | | 138,103 | |
210,000 | | Santander Holdings USA, Inc., 4.26%, 6/9/25(c) | | | 202,662 | |
380,000 | | System Energy Resources, Inc., 6.00%, 4/15/28 | | | 389,535 | |
140,000(d) | | Upjohn Finance BV, 1.91%, 6/23/32(a) | | | 116,477 | |
200,000 | | Utah Acquisition Sub, Inc., 5.25%, 6/15/46 | | | 158,882 | |
196,000 | | Viatris, Inc., 4.00%, 6/22/50 | | | 128,923 | |
170,000 | | VICI Properties LP, REIT, 4.95%, 2/15/30 | | | 160,658 | |
35
|
SCHEDULE OF PORTFOLIO INVESTMENTS |
RBC BlueBay Core Plus Bond Fund (cont.)
March 31, 2023 (Unaudited)
| | | | | | |
Principal Amount | | | | Value | |
| |
| | |
$ 130,000 | | Warnermedia Holdings, Inc., 3.43%, 3/15/24(b) | | $ | 127,072 | |
145,000 | | Warnermedia Holdings, Inc., 4.05%, 3/15/29(b) | | | 134,840 | |
188,000 | | Warnermedia Holdings, Inc., 5.05%, 3/15/42(b) | | | 157,197 | |
410,000 | | Warnermedia Holdings, Inc., 5.14%, 3/15/52(b) | | | 332,624 | |
200,000 | | Warnermedia Holdings, Inc., 6.41%, 3/15/26 | | | 200,969 | |
150,000 | | Wells Fargo & Co., GMTN, 4.81%, 7/25/28(c) | | | 148,165 | |
130,000 | | Wells Fargo & Co., GMTN, 4.90%, 7/25/33(c) | | | 126,801 | |
110,000 | | Western Midstream Operating LP, 6.15%, 4/1/33 | | | 111,512 | |
| | | | | | |
| | | | | 13,341,418 | |
| | | | | | |
Total Corporate Bonds | | | 21,540,340 | |
| | | | | | |
(Cost $22,614,003) | | | | |
| |
U.S. Government Agency Backed Mortgages — 25.02% | | | | |
United States — 25.02% | | | | |
725,000 | | Fannie Mae, (TBA), 3.00%, 4/1/53 | | | 649,920 | |
875,000 | | Fannie Mae, (TBA), 3.50%, 4/15/53 | | | 812,390 | |
3,000,000 | | Fannie Mae, 2.50%, 4/15/53 | | | 2,584,887 | |
3,800,000 | | Fannie Mae, 2.00%, 4/15/53 | | | 3,139,788 | |
890,467 | | Fannie Mae, Pool #BT8271, 4.00%, 7/1/52 | | | 852,528 | |
193,679 | | Fannie Mae, Pool #CB4766, 5.00%, 9/1/52 | | | 195,423 | |
569,174 | | Fannie Mae, Pool #CB4768, 5.00%, 9/1/52 | | | 578,206 | |
223,897 | | Fannie Mae, Pool #BT7932, 5.50%, 10/1/52 | | | 229,505 | |
448,716 | | Fannie Mae, Pool #CB5344, 6.50%, 12/1/52 | | | 469,851 | |
99,471 | | Fannie Mae, Pool #CB4969, 5.50%, 10/1/52 | | | 101,962 | |
890,435 | | Freddie Mac, Pool #QE6931, 4.50%, 7/1/52 | | | 877,200 | |
445,380 | | Freddie Mac, Pool #RA7718, 4.50%, 7/1/52 | | | 436,984 | |
174,378 | | Freddie Mac, Pool #QF4133, 6.00%, 11/1/52 | | | 180,607 | |
| | | | | | |
| | | | | 11,109,251 | |
| | | | | | |
Total U.S. Government Agency Backed Mortgages | | | 11,109,251 | |
| | | | | | |
(Cost $11,041,398) | | | | |
| | |
Shares | | | | | |
Collateralized Mortgage Obligations — 15.77% | | | | |
United States — 15.77% | | | | |
330,000 | | AREIT Trust, Series 2022-CRE6, Class B, (Secured Overnight Financing Rate 30 Day Average + 1.850%), 6.41%, 1/16/37(b),(g) | | | 313,198 | |
4,623 | | Bellemeade Re Ltd., Series 2018-3A, Class M1B, (LIBOR USD 1-Month + 1.850%), 6.70%, 10/25/28(b),(g) | | | 4,622 | |
370,686 | | BX Commercial Mortgage Trust, Series 2021-XL2, Class D, (LIBOR USD 1-Month + 1.397%),
6.08%, 10/15/38(b),(g) | | | 346,647 | |
223,503 | | BX Commercial Mortgage Trust, Series 2021-21M, Class D, (LIBOR USD 1-Month + 1.426%),
6.11%, 10/15/36(b),(g) | | | 204,268 | |
500,000 | | BX Commercial Mortgage Trust, Series 2022-CSMO, Class C, (Term SOFR 1M + 3.889%), 8.72%, 6/15/27(b),(g) | | | 485,027 | |
400,000 | | BX Mortgage Trust, Series 2022-MVRK, Class D, (Term SOFR 1M + 2.864%), 7.52%, 3/15/39(b),(g) | | | 377,290 | |
36
|
SCHEDULE OF PORTFOLIO INVESTMENTS |
RBC BlueBay Core Plus Bond Fund (cont.)
March 31, 2023 (Unaudited)
| | | | | | |
| Shares | | | | Value | |
| |
$252,068 | | BX Trust, Series 2022-IND, Class D, (Term SOFR 1M + 2.839%), 7.67%, 4/15/37(b),(g) | | $ | 235,913 | |
600,000 | | Citigroup Commercial Mortgage Trust, Series 2013-GC11, Class D, 4.45%, 4/10/46(b),(h) | | | 595,112 | |
207,000 | | Connecticut Avenue Securities Trust, Series 2022-R01, Class 1M2, (Secured Overnight Financing Rate 30 Day Average + 1.900%), 6.46%, 12/25/41(b),(g) | | | 196,504 | |
88,000 | | Connecticut Avenue Securities Trust, Series 2022-R04, Class 1M2, (Secured Overnight Financing Rate 30 Day Average + 3.100%), 7.66%, 3/25/42(b),(g) | | | 87,184 | |
625,000 | | Credit Suisse Mortgage Capital Certificates, Series 2020-SPT1, Class A2, 2.23%, 4/25/65(b),(h) | | | 581,248 | |
688,190 | | Eagle RE Ltd., Series 2019-1, Class M1B, (LIBOR USD 1-Month + 1.800%), 6.65%, 4/25/29(b),(g) | | | 687,078 | |
235,987 | | Fannie Mae Connecticut Avenue Securities, Series 2021-R02, Class 2M1, (Secured Overnight Financing Rate 30 Day Average + 0.900%), 5.46%, 11/25/41(b),(g) | | | 233,051 | |
196,458 | | Freddie Mac STACR REMIC Trust, Series 2021-DNA6, Class M2, (Secured Overnight Financing Rate 30 Day Average + 1.500%), 6.06%, 10/25/41(b),(g) | | | 186,920 | |
125,000 | | Freddie Mac STACR REMIC Trust, (Secured Overnight Financing Rate 30 Day Average + 2.100%),
6.66%, 3/25/43(b),(g) | | | 125,116 | |
460,000 | | Freddie Mac STACR REMIC Trust, Series 2022-DNA2, Class M1B, (Secured Overnight Financing Rate 30 Day Average + 2.400%), 6.96%, 2/25/42(b),(g) | | | 444,120 | |
250,000 | | HONO Mortgage Trust, Series 2021-LULU, Class A, (LIBOR USD 1-Month + 1.150%), 5.83%, 10/15/36(b),(g) | | | 238,224 | |
306,794 | | MFA Trust, Series 2020-NQM3, Class A3, 1.63%, 1/26/65(b),(h) | | | 271,605 | |
400,000 | | SMRT, Series 2022-MINI, Class D, (Term SOFR 1M + 1.950%), 6.78%, 1/15/39(b),(g) | | | 364,577 | |
400,000 | | Verus Securitization Trust, Series 2019-INV3, Class M1, 3.28%, 11/25/59(b),(h) | | | 347,375 | |
400,000 | | Verus Securitization Trust, Series 2020-4, Class M1, 3.29%, 5/25/65(b),(h) | | | 334,920 | |
400,000 | | Vista Point Securitization Trust, Series 2020-2, Class M1, 3.40%, 4/25/65(b),(h) | | | 340,524 | |
| | | | | | |
| | | | | 7,000,523 | |
| | | | | | |
Total Collateralized Mortgage Obligations | | | 7,000,523 | |
| | | �� | | | |
(Cost $7,457,833) | | | | |
| |
Asset Backed Securities — 7.84% | | | | |
Cayman Islands — 1.20% | | | | |
300,000 | | OZLM VIII Ltd., Series 2014-8A, Class A2R3, (LIBOR USD 3-Month + 1.650%), 6.44%, 10/17/29(b),(g) | | | 292,530 | |
250,000 | | TCW CLO Ltd., Series 2018-1A, Class A2RB, (LIBOR USD 3-Month + 1.400%), 6.22%, 4/25/31(b),(g) | | | 241,425 | |
| | | | | | |
| | | | | 533,955 | |
| | | | | | |
| |
United Kingdom — 0.55% | | | | |
250,000 | | Newday Funding Master Issuer Plc, Series 2021-3A, Class A2, (SOFR RATE + 1.000%), 5.71%, 11/15/29(b),(g) | | | 245,615 | |
| | | | | | |
37
|
SCHEDULE OF PORTFOLIO INVESTMENTS |
RBC BlueBay Core Plus Bond Fund (cont.)
March 31, 2023 (Unaudited)
| | | | | | |
| Shares | | | | Value | |
| |
|
United States — 6.09% | |
$500,000 | | American Credit Acceptance Receivables Trust, Series 2020-1, Class E, 3.32%, 3/13/26(b) | | $ | 488,730 | |
500,000 | | Carvana Auto Receivables Trust, Series 2021-N4, Class D, 2.30%, 9/11/28 | | | 438,641 | |
500,000 | | Diamond Issuer, Series 2021-1A, Class B, 2.70%, 11/20/51(b) | | | 419,333 | |
450,000 | | Exeter Automobile Receivables Trust, Series 2021-4A, Class D, 1.96%, 1/17/28 | | | 410,998 | |
180,320 | | Jack in the Box Funding LLC, Series 2022-1A, Class A2I, 3.45%, 2/26/52(b) | | | 161,936 | |
259,054 | | MVW LLC, Series 2021-2A, Class B, 1.83%, 5/20/39(b) | | | 233,961 | |
360,000 | | Progress Residential Trust, Series 2020-SFR2, Class D, 3.87%, 6/17/37(b) | | | 341,820 | |
215,000 | | Progress Residential Trust, Series 2020-SFR2, Class E, 5.12%, 6/17/37(b) | | | 208,353 | |
| | | | | | |
| | | | | 2,703,772 | |
| | | | | | |
Total Asset Backed Securities | | | 3,483,342 | |
| | | | | | |
(Cost $3,786,958) | | | | |
| | |
Principal Amount | | | | | |
U.S. Treasury Obligations — 6.07% | | | | |
United States — 6.07% | | | | |
2,200,000 | | U.S. Treasury Bill- When Issued, 4.30%, 4/18/23(i) | | | 2,195,718 | |
500,000 | | U.S. Treasury Notes, 4.50%, 11/30/24 | | | 501,934 | |
| | | | | | |
| | | | | 2,697,652 | |
| | | | | | |
Total U.S. Treasury Obligations | | | 2,697,652 | |
| | | | | | |
(Cost $2,693,654) | | | | |
| |
Bank Loans — 4.41% | | | | |
Ireland — 2.01% | | | | | | |
393,955 | | Avolon US LLC, 1st Lien Term Loan B5, (LIBOR 1-Month + 2.25%), 7.01%, 12/1/27(g) | | | 393,789 | |
500,000 | | Setanta Aircraft Leasing DAC, 1st Lein Term Loan B, (LIBOR 3-Month + 2.00%), 6.73%, 11/5/28(g) | | | 499,500 | |
| | | | | | |
| | | | | 893,289 | |
| | | | | | |
| |
United States — 2.40% | | | | |
500,000 | | Entegris, Inc., (LIBOR 1-Month + 2.75%), 7.34%, 7/6/29(g) | | | 492,500 | |
400,000 | | Hilton Worldwide Finance LLC, 1st Lien Term Loan B2, (LIBOR 1-Month + 1.75%), 6.64%, 6/21/26(g) | | | 399,332 | |
173,950 | | Sensata Technologies, Inc., 1st Lein Term Loan B, (LIBOR 1-Month + 1.75%), 6.51%, 9/20/26(g) | | | 173,225 | |
| | | | | | |
| | | | | 1,065,057 | |
| | | | | | |
Total Bank Loans | | | 1,958,346 | |
| | | | | | |
(Cost $1,965,355) | | | | |
38
|
SCHEDULE OF PORTFOLIO INVESTMENTS |
RBC BlueBay Core Plus Bond Fund (cont.)
March 31, 2023 (Unaudited)
| | | | | | |
Principal Amount | | | | Value | |
| |
| |
Foreign Government Bonds — 0.69% | | | | |
Mexico — 0.23% | | | | |
130,000(d) | | Mexico Government International Bond, 4.00%, 3/15/2115 | | | $100,036 | |
| | | | | | |
| |
Romania — 0.46% | | | | |
$ 190,000 | | Romanian Government International Bond, 7.63%, 1/17/53(b) | | | 204,524 | |
| | | | | | |
| |
Total Foreign Government Bonds | | | 304,560 | |
| | | | | | |
(Cost $353,196) | | | | |
| | | | | | |
Shares | | | | | |
| |
Investment Company — 1.80% | | | | |
800,074 | | U.S. Government Money Market Fund,
RBC Institutional Class 1 (j) | | | 800,074 | |
| | | | | | |
| |
Total Investment Company | | | 800,074 | |
| | | | | | |
(Cost $800,074) | | | | |
| |
Total Investments | | $ | 48,894,088 | |
(Cost $50,712,471) — 110.11% | | | | |
| |
Liabilities in excess of other assets — (10.11)% | | | (4,489,396) | |
| | | | | | |
| |
NET ASSETS — 100.00% | | $ | 44,404,692 | |
| | | | | | |
|
| |
| (a) | This security may be resold to qualified foreign investors and foreign institutional buyers under Regulation S of the Securities Act of 1933. |
| (b) | Security exempt from registration under Rule 144A or Section 4(2) of the Securities Act of 1933, as amended. These securities may be resold in transactions exempt from registration, normally to qualified institutional buyers. |
| (c) | Security is a fix-to-float security, which carries a fixed coupon until a certain date, upon which it switches to a floating rate. Reference rate and spread are provided if the rate is currently floating. |
| (d) | Principal amount denoted in Euros. |
| (e) | Perpetual security with no stated maturity date. |
| (f) | Principal amount denoted in British Pounds. |
| (g) | Floating rate note. Rate shown is as of report date. |
| (h) | Variable or floating rate security, which interest rate adjusts periodically based on changes in current interest rates and prepayments on the underlying pool of assets. Rate shown is the rate in effect as of period end. |
| (i) | Zero Coupon Bond. The rate represents the yield at time of purchase. |
| (j) | Affiliated investment. |
39
|
SCHEDULE OF PORTFOLIO INVESTMENTS |
RBC BlueBay Core Plus Bond Fund (cont.)
March 31, 2023 (Unaudited)
Foreign currency exchange contracts as of March 31, 2023:
| | | | | | | | | | | | | | | | | | | | | | | | | | | | | | |
| Currency Purchased | | | Currency Sold | | | Counterparty | | Settlement Date | | | Value/Unrealized Appreciation (Depreciation) | |
| | | | | | | | |
| EUR | | | 630,000 | | | | NOK | | | | 7,136,890 | | | Citibank N.A. | | | 4/19/23 | | | | | | | $ | 1,693 | | | | | |
| EUR | | | 375,000 | | | | USD | | | | 400,357 | | | Citibank N.A. | | | 4/19/23 | | | | | | | | 6,764 | | | | | |
| GBP | | | 250,000 | | | | USD | | | | 302,788 | | | Citibank N.A. | | | 4/19/23 | | | | | | | | 5,734 | | | | | |
| JPY | | | 89,112,905 | | | | USD | | | | 670,000 | | | Citibank N.A. | | | 4/19/23 | | | | | | | | 3,244 | | | | | |
| USD | | | 160,000 | | | | JPY | | | | 21,058,080 | | | Citibank N.A. | | | 4/19/23 | | | | | | | | 907 | | | | | |
| | | | | | | | | | | | | | | | | | | | | | | | | | | | | | |
| | | | | | | | | | | | | | | | | | | | | | | | $ | 18,342 | | | | | |
| | | | | | | | |
| EUR | | | 420,000 | | | | CHF | | | | 418,343 | | | Citibank N.A. | | | 4/19/23 | | | | | | | $ | (2,192) | | | | | |
| EUR | | | 210,000 | | | | GBP | | | | 187,862 | | | Citibank N.A. | | | 4/19/23 | | | | | | | | (3,851) | | | | | |
| EUR | | | 278,369 | | | | GBP | | | | 248,056 | | | Citibank N.A. | | | 4/19/23 | | | | | | | | (3,909) | | | | | |
| EUR | | | 494,393 | | | | USD | | | | 540,000 | | | Citibank N.A. | | | 4/19/23 | | | | | | | | (3,260) | | | | | |
| NOK | | | 6,979,686 | | | | EUR | | | | 648,357 | | | Citibank N.A. | | | 4/19/23 | | | | | | | | (36,651) | | | | | |
| SEK | | | 1,944,188 | | | | EUR | | | | 174,425 | | | Citibank N.A. | | | 4/19/23 | | | | | | | | (1,843) | | | | | |
| SEK | | | 396,674 | | | | EUR | | | | 35,575 | | | Citibank N.A. | | | 4/19/23 | | | | | | | | (363) | | | | | |
| USD | | | 215,946 | | | | EUR | | | | 200,000 | | | Citibank N.A. | | | 4/19/23 | | | | | | | | (1,185) | | | | | |
| USD | | | 91,240 | | | | EUR | | | | 85,000 | | | Citibank N.A. | | | 4/19/23 | | | | | | | | (1,040) | | | | | |
| USD | | | 1,028,904 | | | | GBP | | | | 845,973 | | | Citibank N.A. | | | 4/19/23 | | | | | | | | (15,101) | | | | | |
| USD | | | 1,600,034 | | | | EUR | | | | 1,477,497 | | | Citibank N.A. | | | 4/19/23 | | | | | | | | (4,017) | | | | | |
| | | | | | | | | | | | | | | | | | | | | | | | | | | | | | |
| | | | | | | | | | | | | | | | | | | | | | | | $ | (73,412) | | | | | |
| | | | | | | | | | | | | | | | | | | | | | | | | | | | | | |
| Total | | | | | | | | | | | | | | | | | | | | | | | | $ | (55,070) | | | | | |
| | | | | | | | | | | | | | | | | | | | | | | | | | | | | | |
Financial futures contracts as of March 31, 2023:
| | | | | | | | | | | | | | | | | | | | | | |
Long Position | | Number of
Contracts | | | Expiration
Date | | Value/Unrealized
Appreciation | | | Notional
Value | | | Clearinghouse |
| | | | | | | |
10 Year Euro-Bund | | | 5 | | | June 2023 | | | | | | | $27,975 | | | EUR | | $ | 736,592 | | | Morgan Stanley & Co. LLC |
| | | | | | | | | | | | | | | | | | | | | | |
Total | | | | | | | | | | | | | $27,975 | | | | | | | | | |
| | | | | | | | | | | | | | | | | | | | | | |
40
|
SCHEDULE OF PORTFOLIO INVESTMENTS |
RBC BlueBay Core Plus Bond Fund (cont.)
March 31, 2023 (Unaudited)
| | | | | | | | | | | | | | | | | | | | | | | | |
Short Position | | Number of
Contracts | | | Expiration
Date | | Value/Unrealized
Appreciation
(Depreciation) | | | Notional
Value | | | Clearinghouse |
| | | | | | | |
10 Year Japan Treasury Bond | | | 1 | | | June 2023 | | | | | | $ | (20,721) | | | | JPY | | | $ | 1,115,571 | | | Morgan Stanley & Co. LLC |
10 Year U.S. Ultra Treasury Bond | | | 49 | | | June 2023 | | | | | | | (41,035) | | | | USD | | | | 5,935,891 | | | Morgan Stanley & Co. LLC |
30 Year Euro-Buxl | | | 1 | | | June 2023 | | | | | | | (10,271) | | | | EUR | | | | 152,763 | | | Morgan Stanley & Co. LLC |
30 Year U.S. Treasury Bond | | | 3 | | | June 2023 | | | | | | | (21,379) | | | | USD | | | | 393,469 | | | Morgan Stanley & Co. LLC |
30 Year U.S. Ultra Treasury Bond | | | 16 | | | June 2023 | | | | | | | 15,052 | | | | USD | | | | 2,258,000 | | | Morgan Stanley & Co. LLC |
5 Year Euro-Bobl | | | 4 | | | June 2023 | | | | | | | (4,133) | | | | EUR | | | | 511,363 | | | Morgan Stanley & Co. LLC |
Euro-BTP | | | 7 | | | June 2023 | | | | | | | (36,392) | | | | EUR | | | | 875,680 | | | Morgan Stanley & Co. LLC |
Euro-Schatz | | | 1 | | | June 2023 | | | | | | | (1,178) | | | | EUR | | | | 114,626 | | | Morgan Stanley & Co. LLC |
Five Year U.S. Treasury Note | | | 44 | | | June 2023 | | | | | | | 56,377 | | | | USD | | | | 4,818,344 | | | Morgan Stanley & Co. LLC |
Ten Year U.S. Treasury Note | | | 29 | | | June 2023 | | | | | | | 83,811 | | | | USD | | | | 3,332,735 | | | Morgan Stanley & Co. LLC |
Two Year U.S. Treasury Note | | | 18 | | | June 2023 | | | | | | | 20,351 | | | | USD | | | | 3,716,156 | | | Morgan Stanley & Co. LLC |
| | | | | | | | | | | | | | | | | | | | | | | | |
Total | | | | | | | | | | | | $ | 40,482 | | | | | | | | | | | |
| | | | | | | | | | | | | | | | | | | | | | | | |
Interest rate swaps as of March 31, 2023:
| | | | | | | | | | | | | | | | |
Fixed Rate | | Floating
Rate | | Payment
Frequency | | Counterparty | | Expiration
Date | | Notional
Amount
(000) | | | Value/Unrealized
Appreciation
(Depreciation) |
| | | | | | | |
| 0.83% | | JPY-BCAPLDN | | Daily | | Morgan Stanley &
Co. LLC | | 4/19/33 | | JPY | | | 100,000 | | | $(13,125) |
41
|
SCHEDULE OF PORTFOLIO INVESTMENTS |
RBC BlueBay Core Plus Bond Fund (cont.)
March 31, 2023 (Unaudited)
| | | | | | | | | | | | | | | | | | | | | | | | |
Fixed
Rate | | Floating Rate | | Payment
Frequency | | Counterparty | | Expiration
Date | | | Notional
Amount (000) | | | Value/Unrealized Appreciation (Depreciation) |
| | | | | | | | | |
| 0.90% | | JPY-BCAPLDN | | Daily | | Morgan Stanley & Co. LLC | | | 4/19/33 | | | JPY | | | 100,000 | | | | | $ | (17,861) | | | |
| 0.72% | | JPY-GSLDN | | Daily | | Morgan Stanley & Co. LLC | | | 4/19/33 | | | JPY | | | 60,000 | | | | | | (2,796) | | | |
| | | | | | | | | | | | | | | | | | | | | | | | |
| | | | | | | | | | | | | | | | | | | | $ | (33,782) | | | |
| | | | | | | | | | | | | | | | | | | | | | | | |
| Total | | | | | | | | | | | | | | | | | | | | $ | (33,782) | | | |
| | | | | | | | | | | | | | | | | | | | | | | | |
Credit default swaps buy protection as of March 31, 2023:
| | | | | | | | | | | | | | | | | | | | | | | | | | | | | | | | | | | | | | | | | | | | | | | | |
Fixed
Rate | | Issuer | | Payment
Frequency | | Counterparty | | Expiration
Date | | Notional
Amount
(000) | | | Premium
Paid/
(Received) | | | Unrealized
Depreciation | | | Value | |
| | | | | | | | | | | | | | |
| 1.00% | | Market CDX IG Index, Series 40 | | Quarterly | | Morgan Stanley & Co. LLC | | 6/20/28 | | USD | 2,792 | | | | | | | $ | (15,166) | | | | | | | | | | | $ | (17,852) | | | | | | | | | | | $ | (33,018) | | | | | |
| 1.00% | | Market CDX IG Index, Series 40 | | Quarterly | | Morgan Stanley & Co. LLC | | 6/20/28 | | USD | 4,582 | | | | | | | | (22,074) | | | | | | | | | | | | (32,113) | | | | | | | | | | | | (54,187) | | | | | |
| 1.00% | | Market CDX IG Index, Series 40 | | Quarterly | | Morgan Stanley & Co. LLC | | 6/20/28 | | USD | 3,632 | | | | | | | | (19,357) | | | | | | | | | | | | (23,595) | | | | | | | | | | | | (42,952) | | | | | |
| 1.00% | | Market CDX IG Index, Series 40 | | Quarterly | | Morgan Stanley & Co. LLC | | 6/20/28 | | USD | 4,187 | | | | | | | | (21,340) | | | | | | | | | | | | (28,175) | | | | | | | | | | | | (49,516) | | | | | |
| | | | | | | | | | | | | | | | | | | | | | | | | | | | | | | | | | | | | | | | | | | | | | | | |
| Total | | | | | | | | | | | | | | | | | | $ | (77,937) | | | | | | | | | | | $ | (101,735) | | | | | | | | | | | $ | (179,673) | | | | | |
| | | | | | | | | | | | | | | | | | | | | | | | | | | | | | | | | | | | | | | | | | | | | | | | |
42
|
SCHEDULE OF PORTFOLIO INVESTMENTS |
RBC BlueBay Core Plus Bond Fund (cont.)
March 31, 2023 (Unaudited)
Abbreviations used are defined below:
Bobl - German Bundesobligationen
BTP - Italian Buoni del Tesoro Poliannuali
CHF - Swiss Franc
EMTN - Euro Medium Term Note
EUR - Euro
GBP - United Kingdom Pound Sterling
GMTN - Global Medium Term Note
JPY - Japanese Yen
LIBOR - London Interbank Offered Rate
NOK - Norwegian Krone
REIT - Real Estate Investment Trust
SEK - Swedish Krona
SOFR - Secured Overnight Financing Rate
TBA - To-be-announced
USD - United States Dollar
Portfolio Diversification (Unaudited)
| | | | | | | | |
Industries | | Percentage of Net Assets | |
| | |
Financial | | | | | | | 25.50 | % |
U.S. Government Agency Backed Mortgages | | | | | | | 25.02 | % |
Collateralized Mortgage Obligations | | | | | | | 15.77 | % |
Technology | | | | | | | 8.49 | % |
Asset Backed Securities | | | | | | | 7.84 | % |
U.S. Treasury Obligations | | | | | | | 6.07 | % |
Consumer, Non-cyclical | | | | | | | 4.59 | % |
Consumer, Cyclical | | | | | | | 3.79 | % |
Energy | | | | | | | 3.71 | % |
Utilities | | | | | | | 2.94 | % |
Communications | | | | | | | 2.07 | % |
Industrial | | | | | | | 1.51 | % |
Foreign Government Bonds | | | | | | | 0.69 | % |
Basic Materials | | | | | | | 0.32 | % |
Other* | | | | | | | (8.31 | )% |
| | | | | | | | |
| | | | | | | 100.00 | % |
| | | | | | | | |
| * Includes cash, Investment Company, interest and dividend receivable, pending trades and Fund share transactions, interest rate swaps, credit default swaps, financial futures contracts, foreign currency exchange contracts and accrued expenses payable. | | | | | | | | |
See Notes to the Financial Statements.
43
|
SCHEDULE OF PORTFOLIO INVESTMENTS |
RBC BlueBay Strategic Income Fund
March 31, 2023 (Unaudited)
| | | | | | |
Principal Amount | | | | Value | |
| |
| |
Corporate Bonds — 47.02% | | | | |
Australia — 0.58% | | | | |
$ 180,000 | | Santos Finance Ltd., 3.65%, 4/29/31(a) | | $ | 151,376 | |
160,000 | | South32 Treasury Ltd., 4.35%, 4/14/32(b) | | | 143,493 | |
| | | | | | |
| | | | | 294,869 | |
| | | | | | |
| |
Bermuda — 1.00% | | | | |
536,000 | | Triton Container International Ltd., 1.15%, 6/7/24(b) | | | 504,320 | |
| | | | | | |
| |
Canada — 1.95% | | | | |
215,000 | | Bank of Nova Scotia (The), 4.59%, 5/4/37(c) | | | 190,518 | |
230,000 | | Enbridge, Inc., 5.70%, 3/8/33 | | | 239,354 | |
370,000 | | Enbridge, Inc., 5.97%, 3/8/26 | | | 371,065 | |
225,000 | | Rogers Communications, Inc., 4.55%, 3/15/52(b) | | | 184,350 | |
| | | | | | |
| | | | | 985,287 | |
| | | | | | |
| |
France — 0.93% | | | | |
200,000(d) | | Electricite de France SA, 3.00%, (a),(c),(e) | | | 177,136 | |
100,000(f) | | Electricite de France SA, EMTN, 5.88%, (a),(c),(e) | | | 101,641 | |
200,000 | | Societe Generale SA, 9.38%, (b),(c),(e) | | | 189,250 | |
| | | | | | |
| | | | | 468,027 | |
| | | | | | |
| |
Germany — 0.70% | | | | |
200,000(d) | | Commerzbank AG, 6.13%, (a),(c),(e) | | | 182,925 | |
200,000(d) | | Deutsche Bank AG, EMTN, 1.75%, 11/19/30(a),(c) | | | 170,016 | |
| | | | | | |
| | | | | 352,941 | |
| | | | | | |
| |
Ireland — 1.15% | | | | |
220,000 | | AerCap Ireland Capital DAC / AerCap Global Aviation Trust, 4.63%, 10/15/27 | | | 212,448 | |
160,000 | | Avolon Holdings Funding Ltd., 3.25%, 2/15/27(b) | | | 142,666 | |
230,000 | | Avolon Holdings Funding Ltd., 5.13%, 10/1/23(b) | | | 228,316 | |
| | | | | | |
| | | | | 583,430 | |
| | | | | | |
| |
Italy — 0.80% | | | | |
231,000 | | Intesa Sanpaolo SpA, 8.25%, 11/21/33(b),(c) | | | 245,226 | |
200,000 | | UniCredit SpA, 3.13%, 6/3/32(b),(c) | | | 157,035 | |
| | | | | | |
| �� | | | | 402,261 | |
| | | | | | |
| |
Japan — 4.51% | | | | |
220,000 | | Mitsubishi UFJ Financial Group, Inc., 5.13%, 7/20/33(c) | | | 217,570 | |
380,000 | | Mizuho Financial Group, Inc., 2.65%, 5/22/26(c) | | | 358,157 | |
220,000 | | Mizuho Financial Group, Inc., 5.75%, 5/27/34(c) | | | 224,945 | |
230,000 | | Nissan Motor Co. Ltd., 4.35%, 9/17/27(b) | | | 216,798 | |
200,000 | | Nomura Holdings, Inc., 5.61%, 7/6/29 | | | 198,293 | |
320,000 | | Nomura Holdings, Inc., 6.18%, 1/18/33 | | | 326,105 | |
260,000 | | Renesas Electronics Corp., 1.54%, 11/26/24(b) | | | 242,925 | |
44
|
SCHEDULE OF PORTFOLIO INVESTMENTS |
RBC BlueBay Strategic Income Fund (cont.)
March 31, 2023 (Unaudited)
| | | | | | |
Principal Amount | | | | Value | |
| |
| | |
$ 280,000 | | Sumitomo Mitsui Financial Group, Inc., 5.77%, 1/13/33 | | $ | 292,232 | |
200,000 | | Sumitomo Mitsui Trust Bank Ltd., 5.65%, 3/9/26(b) | | | 203,193 | |
| | | | | | |
| | | | | 2,280,218 | |
| | | | | | |
| |
Norway — 0.81% | | | | |
380,000 | | Var Energi ASA, 8.00%, 11/15/32(b) | | | 407,291 | |
| | | | | | |
| |
Puerto Rico — 0.78% | | | | |
400,000 | | Popular, Inc., 7.25%, 3/13/28 | | | 393,919 | |
| | | | | | |
| |
Spain — 0.71% | | | | |
200,000(d) | | Abertis Infraestructuras Finance BV, 3.25%, (a),(c),(e) | | | 193,081 | |
190,000 | | Telefonica Emisiones SA, 5.21%, 3/8/47 | | | 165,817 | |
| | | | | | |
| | | | | 358,898 | |
| | | | | | |
| |
Switzerland — 2.19% | | | | |
510,000 | | Credit Suisse Group AG, 6.54%, 8/12/33(b),(c) | | | 524,025 | |
241,000(d) | | Credit Suisse Group AG, 7.75%, 3/1/29(a),(c) | | | 285,139 | |
250,000 | | Credit Suisse Group AG, 9.02%, 11/15/33(b),(c) | | | 296,225 | |
| | | | | | |
| | | | | 1,105,389 | |
| | | | | | |
| |
United Kingdom — 1.29% | | | | |
250,000 | | HSBC Holdings Plc, 4.76%, 6/9/28(c) | | | 241,965 | |
200,000 | | HSBC Holdings Plc, 5.40%, 8/11/33(c) | | | 197,749 | |
200,000 | | HSBC Holdings Plc, 6.33%, 3/9/44(c) | | | 211,441 | |
| | | | | | |
| | | | | 651,155 | |
| | | | | | |
| |
United States — 29.62% | | | | |
165,000 | | Aircastle Ltd., 2.85%, 1/26/28(b) | | | 139,983 | |
290,000 | | American International Group, Inc., 5.13%, 3/27/33 | | | 287,836 | |
156,000 | | American Tower Corp., REIT, 4.05%, 3/15/32 | | | 142,785 | |
210,000 | | Amgen, Inc., 5.60%, 3/2/43 | | | 216,534 | |
230,000 | | Amgen, Inc., 5.65%, 3/2/53 | | | 239,369 | |
210,000 | | Amgen, Inc., 5.75%, 3/2/63 | | | 217,868 | |
200,000 | | Arrow Electronics, Inc., 6.13%, 3/1/26 | | | 200,409 | |
230,000 | | AT&T, Inc., 3.65%, 9/15/59 | | | 164,337 | |
535,000 | | Athene Global Funding, (Secured Overnight Financing Average Index + 0.700%), 5.46%, 5/24/24(b),(g) | | | 528,967 | |
260,000 | | Bank of America Corp., 2.48%, 9/21/36(c) | | | 196,961 | |
250,000 | | Bank of America Corp., 4.57%, 4/27/33(c) | | | 237,831 | |
209,000 | | Broadcom, Inc., 2.60%, 2/15/33(b) | | | 163,925 | |
375,000 | | Broadcom, Inc., 4.93%, 5/15/37(b) | | | 340,248 | |
250,000 | | Charter Communications Operating LLC / Charter Communications Operating Capital, 3.85%, 4/1/61 | | | 155,122 | |
220,000 | | Citigroup, Inc., 3.06%, 1/25/33(c) | | | 186,694 | |
207,000 | | Citizens Financial Group, Inc., 2.50%, 2/6/30 | | | 163,622 | |
160,000 | | Comerica, Inc., 3.70%, 7/31/23 | | | 154,079 | |
200,000 | | Dell International LLC / EMC Corp., 5.75%, 2/1/33 | | | 199,872 | |
45
|
SCHEDULE OF PORTFOLIO INVESTMENTS |
RBC BlueBay Strategic Income Fund (cont.)
March 31, 2023 (Unaudited)
| | | | | | |
Principal Amount | | | | Value | |
| |
| | |
$ 170,000 | | Energy Transfer LP, 6.25%, 4/15/49 | | $ | 168,354 | |
180,000 | | Equinix, Inc., REIT, 3.90%, 4/15/32 | | | 163,512 | |
160,000 | | Essential Utilities, Inc., 5.30%, 5/1/52 | | | 155,020 | |
220,000 | | Exelon Corp., 5.60%, 3/15/53 | | | 224,326 | |
160,000 | | Fifth Third Bancorp, 4.77%, 7/28/30(c) | | | 147,655 | |
210,000 | | Fifth Third Bancorp, 6.36%, 10/27/28(c) | | | 211,303 | |
180,000 | | Fiserv, Inc., 5.60%, 3/2/33 | | | 186,805 | |
170,000 | | Flex Intermediate Holdco LLC, 4.32%, 12/30/39(b) | | | 128,316 | |
155,000 | | General Motors Co., 5.40%, 4/1/48 | | | 133,938 | |
110,000 | | Global Payments, Inc., 5.30%, 8/15/29 | | | 108,788 | |
276,000 | | Global Payments, Inc., 5.95%, 8/15/52 | | | 263,537 | |
324,000 | | Goldman Sachs Group, Inc. (The), 2.38%, 7/21/32(c) | | | 263,574 | |
410,000 | | Hewlett Packard Enterprise Co., 6.10%, 4/1/26 | | | 413,430 | |
270,000 | | Huntington National Bank (The), 5.65%, 1/10/30 | | | 259,810 | |
320,000 | | Intel Corp., 4.90%, 8/5/52 | | | 297,988 | |
343,000 | | Intel Corp., 5.20%, 2/10/33 | | | 348,829 | |
225,000 | | Intel Corp., 5.70%, 2/10/53 | | | 229,227 | |
233,000 | | Intel Corp., 5.90%, 2/10/63 | | | 239,590 | |
210,000 | | JPMorgan Chase & Co., 4.91%, 7/25/33(c) | | | 208,797 | |
187,000 | | Keurig Dr Pepper, Inc., 4.50%, 4/15/52 | | | 166,217 | |
250,000 | | KeyBank NA, GMTN, 5.00%, 1/26/33 | | | 232,145 | |
166,000 | | Kinder Morgan, Inc., 4.80%, 2/1/33 | | | 160,150 | |
261,000 | | Kyndryl Holdings, Inc., 3.15%, 10/15/31 | | | 200,227 | |
200,000 | | Kyndryl Holdings, Inc., 4.10%, 10/15/41 | | | 133,793 | |
260,000 | | M&T Bank Corp., 3.55%, 7/26/23 | | | 255,496 | |
186,000 | | M&T Bank Corp., 5.05%, 1/27/34(c) | | | 172,102 | |
180,000 | | Meta Platforms, Inc., 3.85%, 8/15/32 | | | 168,585 | |
211,000 | | Meta Platforms, Inc., 4.45%, 8/15/52 | | | 185,750 | |
170,000 | | Metropolitan Life Global Funding I, 5.15%, 3/28/33(b) | | | 171,703 | |
245,000 | | Micron Technology, Inc., 5.88%, 2/9/33 | | | 247,766 | |
175,000 | | Micron Technology, Inc., 6.75%, 11/1/29 | | | 186,185 | |
260,000 | | Morgan Stanley, 2.48%, 9/16/36(c) | | | 196,632 | |
320,000 | | Morgan Stanley, GMTN, 4.89%, 7/20/33(c) | | | 314,096 | |
173,000 | | MPLX LP, 5.00%, 3/1/33 | | | 169,306 | |
240,000 | | NextEra Energy Capital Holdings, Inc., 5.25%, 2/28/53 | | | 236,733 | |
110,000 | | NextEra Energy Capital Holdings, Inc., 6.05%, 3/1/25 | | | 111,929 | |
180,000 | | Oracle Corp., 4.10%, 3/25/61 | | | 132,088 | |
180,000 | | Oracle Corp., 5.55%, 2/6/53 | | | 171,320 | |
160,000 | | Prologis LP, REIT, 5.25%, 6/15/53 | | | 159,594 | |
165,000 | | Regal Rexnord Corp., 6.30%, 2/15/30(b) | | | 165,761 | |
200,000 | | Royalty Pharma Plc, 3.55%, 9/2/50 | | | 138,103 | |
210,000 | | Santander Holdings USA, Inc., 4.26%, 6/9/25(c) | | | 202,662 | |
440,000 | | System Energy Resources, Inc., 6.00%, 4/15/28 | | | 451,040 | |
140,000(d) | | Upjohn Finance BV, 1.91%, 6/23/32(a) | | | 116,477 | |
200,000 | | Utah Acquisition Sub, Inc., 5.25%, 6/15/46 | | | 158,882 | |
221,000 | | Viatris, Inc., 4.00%, 6/22/50 | | | 145,367 | |
180,000 | | VICI Properties LP, REIT, 4.95%, 2/15/30 | | | 170,108 | |
140,000 | | Warnermedia Holdings, Inc., 3.43%, 3/15/24(b) | | | 136,847 | |
46
|
SCHEDULE OF PORTFOLIO INVESTMENTS |
RBC BlueBay Strategic Income Fund (cont.)
March 31, 2023 (Unaudited)
| | | | | | |
Principal Amount | | | | Value | |
| |
$ 169,000 | | Warnermedia Holdings, Inc., 4.05%, 3/15/29(b) | | $ | 157,158 | |
212,000 | | Warnermedia Holdings, Inc., 5.05%, 3/15/42(b) | | | 177,264 | |
500,000 | | Warnermedia Holdings, Inc., 5.14%, 3/15/52(b) | | | 405,640 | |
230,000 | | Warnermedia Holdings, Inc., 6.41%, 3/15/26 | | | 231,115 | |
170,000 | | Wells Fargo & Co., GMTN, 4.81%, 7/25/28(c) | | | 167,920 | |
150,000 | | Wells Fargo & Co., GMTN, 4.90%, 7/25/33(c) | | | 146,309 | |
120,000 | | Western Midstream Operating LP, 6.15%, 4/1/33 | | | 121,649 | |
| | | | | | |
| | | | | 14,953,360 | |
| | | | | | |
Total Corporate Bonds | | | 23,741,365 | |
| | | | | | |
(Cost $24,855,646) | | | | |
| |
U.S. Treasury Obligations — 14.75% | | | | |
United States — 14.75% | | | | |
5,100,000 | | U.S. Treasury Bill, 4.81%, 6/22/23(h) | | | 5,047,810 | |
2,400,000 | | U.S. Treasury Notes, 4.13%, 1/31/25 | | | 2,399,438 | |
| | | | | | |
| | | | | 7,447,248 | |
| | | | | | |
Total U.S. Treasury Obligations | | | 7,447,248 | |
| | | | | | |
(Cost $7,423,555) | | | | |
| | |
Shares | | | | | |
Collateralized Mortgage Obligations — 13.87% | | | | |
United States — 13.87% | | | | |
330,000 | | AREIT Trust, Series 2022-CRE6, Class B, (Secured Overnight Financing Rate 30 Day Average + 1.850%), 6.41%, 1/16/37(b),(g) | | | 313,198 | |
4,623 | | Bellemeade Re Ltd., Series 2018-3A, Class M1B, (LIBOR USD 1-Month + 1.850%), 6.70%, 10/25/28(b),(g) | | | 4,622 | |
370,686 | | BX Commercial Mortgage Trust, Series 2021-XL2, Class D, (LIBOR USD 1-Month + 1.397%), 6.08%, 10/15/38(b),(g) | | | 346,647 | |
223,503 | | BX Commercial Mortgage Trust, Series 2021-21M, Class D, (LIBOR USD 1-Month + 1.426%), 6.11%, 10/15/36(b),(g) | | | 204,268 | |
500,000 | | BX Commercial Mortgage Trust, Series 2022-CSMO, Class C, (Term SOFR 1M + 3.889%), 8.72%, 6/15/27(b),(g) | | | 485,027 | |
400,000 | | BX Mortgage Trust, Series 2022-MVRK, Class D, (Term SOFR 1M + 2.864%), 7.52%, 3/15/39(b),(g) | | | 377,290 | |
252,068 | | BX Trust, Series 2022-IND, Class D, (Term SOFR 1M + 2.839%), 7.67%, 4/15/37(b),(g) | | | 235,913 | |
600,000 | | Citigroup Commercial Mortgage Trust, Series 2013-GC11, Class D, 4.45%, 4/10/46(b),(i) | | | 595,112 | |
207,000 | | Connecticut Avenue Securities Trust, Series 2022-R01, Class 1M2, (Secured Overnight Financing Rate 30 Day Average + 1.900%), 6.46%, 12/25/41(b),(g) | | | 196,504 | |
88,000 | | Connecticut Avenue Securities Trust, Series 2022-R04, Class 1M2, (Secured Overnight Financing Rate 30 Day Average + 3.100%), 7.66%, 3/25/42(b),(g) | | | 87,184 | |
625,000 | | Credit Suisse Mortgage Capital Certificates, Series 2020-SPT1, Class A2, 2.23%, 4/25/65(b) | | | 581,248 | |
688,190 | | Eagle RE Ltd., Series 2019-1, Class M1B, (LIBOR USD 1-Month + 1.800%), 6.65%, 4/25/29(b),(g) | | | 687,078 | |
47
|
SCHEDULE OF PORTFOLIO INVESTMENTS |
RBC BlueBay Strategic Income Fund (cont.)
March 31, 2023 (Unaudited)
| | | | | | |
| Shares | | | | Value | |
| |
$235,987 | | Fannie Mae Connecticut Avenue Securities, Series 2021-R02, Class 2M1, (Secured Overnight Financing Rate 30 Day Average + 0.900%), 5.46%, 11/25/41(b),(g) | | $ | 233,051 | |
195,770 | | Freddie Mac STACR REMIC Trust, Series 2021-DNA5, Class M2, (Secured Overnight Financing Rate 30 Day Average + 1.650%), 6.21%, 1/25/34(b),(g) | | | 191,740 | |
125,000 | | Freddie Mac STACR REMIC Trust, (Secured Overnight Financing Rate 30 Day Average + 2.100%), 6.66%, 3/25/43(b),(g) | | | 125,116 | |
460,000 | | Freddie Mac STACR REMIC Trust, Series 2022-DNA2, Class M1B, (Secured Overnight Financing Rate 30 Day Average + 2.400%), 6.96%, 2/25/42(b),(g) | | | 444,120 | |
250,000 | | HONO Mortgage Trust, Series 2021-LULU, Class A, (LIBOR USD 1-Month + 1.150%), 5.83%, 10/15/36(b),(g) | | | 238,224 | |
306,794 | | MFA Trust, Series 2020-NQM3, Class A3, 1.63%, 1/26/65(b),(i) | | | 271,605 | |
400,000 | | SMRT, Series 2022-MINI, Class D, (Term SOFR 1M + 1.950%), 6.78%, 1/15/39(b),(g) | | | 364,577 | |
400,000 | | Verus Securitization Trust, Series 2019-INV3, Class M1, 3.28%, 11/25/59(b),(i) | | | 347,375 | |
400,000 | | Verus Securitization Trust, Series 2020-4, Class M1, 3.29%, 5/25/65(b),(i) | | | 334,920 | |
400,000 | | Vista Point Securitization Trust, Series 2020-2, Class M1, 3.40%, 4/25/65(b),(i) | | | 340,524 | |
| | | | | | |
| | | | | 7,005,343 | |
| | | | | | |
Total Collateralized Mortgage Obligations | | | 7,005,343 | |
| | | | | | |
(Cost $7,463,015) | | | | |
| |
Asset Backed Securities — 7.61% | | | | |
Cayman Islands — 1.06% | | | | |
300,000 | | OZLM VIII Ltd., Series 2014-8A, Class A2R3, (LIBOR USD 3-Month + 1.650%), 6.44%, 10/17/29(b),(g) | | | 292,530 | |
250,000 | | TCW CLO Ltd., Series 2018-1A, Class A2RB, (LIBOR USD 3-Month + 1.400%), 6.22%, 4/25/31(b),(g) | | | 241,425 | |
| | | | | | |
| | | | | 533,955 | |
| | | | | | |
United Kingdom — 0.49% | | | | |
250,000 | | Newday Funding Master Issuer Plc, Series 2021-3A, Class A2, (SOFR RATE + 1.000%), 5.71%, 11/15/29(b),(g) | | | 245,616 | |
| | | | | | |
| |
United States — 6.06% | | | | |
336,610 | | ACM Auto Trust, 6.61%, 1/22/30(b) | | | 336,739 | |
500,000 | | American Credit Acceptance Receivables Trust, Series 2020-1, Class E, 3.32%, 3/13/26(b) | | | 488,730 | |
500,000 | | Carvana Auto Receivables Trust, Series 2021-N4, Class D, 2.30%, 9/11/28 | | | 438,641 | |
500,000 | | Diamond Issuer, Series 2021-1A, Class B, 2.70%, 11/20/51(b) | | | 419,333 | |
450,000 | | Exeter Automobile Receivables Trust, Series 2021-4A, Class D, 1.96%, 1/17/28 | | | 410,998 | |
203,840 | | Jack in the Box Funding LLC, Series 2022-1A, Class A2I, 3.45%, 2/26/52(b) | | | 183,058 | |
259,054 | | MVW LLC, Series 2021-2A, Class B, 1.83%, 5/20/39(b) | | | 233,961 | |
48
|
SCHEDULE OF PORTFOLIO INVESTMENTS |
RBC BlueBay Strategic Income Fund (cont.)
March 31, 2023 (Unaudited)
| | | | | | |
| Shares | | | | Value | |
| |
| | |
$360,000 | | Progress Residential Trust, Series 2020-SFR2, Class D, 3.87%, 6/17/37(b) | | $ | 341,820 | |
215,000 | | Progress Residential Trust, Series 2020-SFR2, Class E, 5.12%, 6/17/37(b) | | | 208,353 | |
| | | | | | |
| | | | | 3,061,633 | |
| | | | | | |
Total Asset Backed Securities | | | 3,841,204 | |
| | | | | | |
(Cost $4,147,083) | | | | |
| | |
Principal Amount | | | | | |
| | | | | | |
Bank Loans — 4.84% | | | | |
Ireland — 2.16% | | | | |
590,932 | | Avolon US LLC, 1st Lien Term Loan B5, (LIBOR 1-Month + 2.25%), 7.01%, 12/1/27(g) | | | 590,684 | |
500,000 | | Setanta Aircraft Leasing DAC, 1st Lein Term Loan B, (LIBOR 3-Month + 2.00%), 6.73%, 11/5/28(g) | | | 499,500 | |
| | | | | | |
| | | | | 1,090,184 | |
| | | | | | |
United States — 2.68% | | | | |
500,000 | | Entegris, Inc., (LIBOR 1-Month + 2.75%), 7.34%, 7/6/29(g) | | | 492,500 | |
600,000 | | Hilton Worldwide Finance LLC, 1st Lien Term Loan B2, (LIBOR 1-Month + 1.75%), 6.64%, 6/21/26(g) | | | 598,998 | |
260,926 | | Sensata Technologies, Inc., 1st Lein Term Loan B, (LIBOR 1-Month + 1.75%), 6.51%, 9/20/26(g) | | | 259,837 | |
| | | | | | |
| | | | | 1,351,335 | |
| | | | | | |
Total Bank Loans | | | 2,441,519 | |
| | | | | | |
(Cost $2,448,573) | | | | |
| |
Foreign Government Bonds — 0.69% | | | | |
Mexico — 0.20% | | | | |
130,000(d) | | Mexico Government International Bond, 4.00%, 3/15/2115 | | | 100,036 | |
| | | | | | |
| |
Romania — 0.49% | | | | |
230,000 | | Romanian Government International Bond, 7.63%, 1/17/53(b) | | | 247,581 | |
| | | | | | |
| |
Total Foreign Government Bonds | | | 347,617 | |
| | | | | | |
(Cost $392,981) | | | | |
49
|
SCHEDULE OF PORTFOLIO INVESTMENTS |
RBC BlueBay Strategic Income Fund (cont.)
March 31, 2023 (Unaudited)
| | | | | | |
| Shares | | | | Value | |
| |
| |
Investment Company — 4.11% | | | | |
2,072,899 | | U.S. Government Money Market Fund, RBC Institutional Class 1 (j) | | $ | 2,072,899 | |
| | | | | | |
Total Investment Company | | | 2,072,899 | |
| | | | | | |
(Cost $2,072,899) | | | | |
| |
Total Investments | | $ | 46,897,195 | |
(Cost $48,803,752) — 92.89% | | | | |
| |
Other assets in excess of liabilities — 7.11% | | | 3,590,801 | |
| | | | | | |
| |
NET ASSETS — 100.00% | | $ | 50,487,996 | |
| | | | | | |
| | | | | | |
| |
| (a) | This security may be resold to qualified foreign investors and foreign institutional buyers under Regulation S of the Securities Act of 1933. |
| (b) | Security exempt from registration under Rule 144A or Section 4(2) of the Securities Act of 1933, as amended. These securities may be resold in transactions exempt from registration, normally to qualified institutional buyers. |
| (c) | Security is a fix-to-float security, which carries a fixed coupon until a certain date, upon which it switches to a floating rate. Reference rate and spread are provided if the rate is currently floating. |
| (d) | Principal amount denoted in Euros. |
| (e) | Perpetual security with no stated maturity date. |
| (f) | Principal amount denoted in British Pounds. |
| (g) | Floating rate note. Rate shown is as of report date. |
| (h) | Zero Coupon Bond. The rate represents the yield at time of purchase. |
| (i) | Variable or floating rate security, which interest rate adjusts periodically based on changes in current interest rates and prepayments on the underlying pool of assets. Rate shown is the rate in effect as of period end. |
| (j) | Affiliated investment. |
50
|
SCHEDULE OF PORTFOLIO INVESTMENTS |
RBC BlueBay Strategic Income Fund (cont.)
March 31, 2023 (Unaudited)
Foreign currency exchange contracts as of March 31, 2023:
| | | | | | | | | | | | | | | | | | | | | | | | | | | | | | |
Currency Purchased | | | | | Currency Sold | | | | Counterparty | | | | Settlement Date | | Value/Unrealized Appreciation (Depreciation) | |
| | | | | | | | | | | |
EUR | | | 1,480,000 | | | | | NOK | | 16,757,574 | | | | Citibank N.A. | | | | 4/19/23 | | | | | | $ | 2,393 | | | | | |
JPY | | | 101,157,968 | | | | | USD | | 760,000 | | | | Citibank N.A. | | | | 4/19/23 | | | | | | | 4,243 | | | | | |
JPY | | | 3,974,048 | | | | | USD | | 30,000 | | | | Citibank N.A. | | | | 4/19/23 | | | | | | | 24 | | | | | |
USD | | | 210,000 | | | | | JPY | | 27,638,730 | | | | Citibank N.A. | | | | 4/19/23 | | | | | | | 1,191 | | | | | |
| | | | | | | | | | | | | | | | | | | | | | | | | | | | | | |
| | | | | | | | | | | | | | | | | | | | | | | | $ | 7,851 | | | | | |
EUR | | | 940,000 | | | | | CHF | | 936,292 | | | | Citibank N.A. | | | | 4/19/23 | | | | | | $ | (2,452) | | | | | |
EUR | | | 460,000 | | | | | GBP | | 411,507 | | | | Citibank N.A. | | | | 4/19/23 | | | | | | | (4,217) | | | | | |
EUR | | | 778,617 | | | | | GBP | | 693,827 | | | | Citibank N.A. | | | | 4/19/23 | | | | | | | (5,467) | | | | | |
EUR | | | 622,569 | | | | | USD | | 680,000 | | | | Citibank N.A. | | | | 4/19/23 | | | | | | | (4,106) | | | | | |
NOK | | | 16,238,642 | | | | | EUR | | 1,508,439 | | | | Citibank N.A. | | | | 4/19/23 | | | | | | | (42,635) | | | | | |
SEK | | | 4,258,698 | | | | | EUR | | 382,073 | | | | Citibank N.A. | | | | 4/19/23 | | | | | | | (2,019) | | | | | |
SEK | | | 868,905 | | | | | EUR | | 77,927 | | | | Citibank N.A. | | | | 4/19/23 | | | | | | | (397) | | | | | |
USD | | | 70,000 | | | | | EUR | | 66,282 | | | | Citibank N.A. | | | | 4/19/23 | | | | | | | (1,959) | | | | | |
USD | | | 30,000 | | | | | GBP | | 24,892 | | | | Citibank N.A. | | | | 4/19/23 | | | | | | | (719) | | | | | |
USD | | | 1,169,920 | | | | | GBP | | 961,932 | | | | Citibank N.A. | | | | 4/19/23 | | | | | | | (17,189) | | | | | |
USD | | | 1,398,590 | | | | | EUR | | 1,291,481 | | | | Citibank N.A. | | | | 4/19/23 | | | | | | | (3,512) | | | | | |
| | | | | | | | | | | | | | | | | | | | | | | | | | | | | | |
| | | | | | | | | | | | | | | | | | | | | | | | $ | (84,672) | | | | | |
| | | | | | | | | | | |
| | | | | | | | | | | | | | | | | | | | | | | | | | | | | | |
| | | | | | | | | | | | | | | | | | | | | | | | | | | | | | |
Total | | | | | | | | | | | | | | | | | | | | | | | | $ | (76,821) | | | | | |
| | | | | | | | | | | | | | | | | | | | | | | | | | | | | | |
Financial futures contracts as of March 31, 2023:
| | | | | | | | | | | | | | | | | | | | | | | | | | |
Long Position | | Number of
Contracts | | | Expiration
Date | | | Value/Unrealized
Appreciation | | | Notional
Value | | | Clearinghouse |
| | | | | | | |
10 Year Euro-Bund | | | 5 | | | | June 2023 | | | | | | | $ | 27,975 | | | | EUR | | | $ | 736,592 | | | Morgan Stanley & Co. LLC |
| | | | | | | | | | | | | | | | | | | | | | | | | | |
Total | | | | | | | | | | | | | | $ | 27,975 | | | | | | | | | | | |
| | | | | | | | | | | | | | | | | | | | | | | | | | |
51
|
SCHEDULE OF PORTFOLIO INVESTMENTS |
RBC BlueBay Strategic Income Fund (cont.)
March 31, 2023 (Unaudited)
| | | | | | | | | | | | | | | | | | | | | | | | | | | | |
Short Position | | Number of
Contracts | | | Expiration
Date | | | Value/Unrealized
Appreciation
(Depreciation) | | | Notional
Value | | | Clearinghouse | |
| | | | | | | |
10 Year Japan Treasury Bond | | | 2 | | | | June 2023 | | | | | | | $ | (41,442) | | | | JPY | | | $ | 2,231,143 | | | | Morgan Stanley & Co. LLC | |
10 Year U.S. Ultra Treasury Bond | | | 106 | | | | June 2023 | | | | | | | | (283,026) | | | | USD | | | | 12,840,907 | | | | Morgan Stanley & Co. LLC | |
30 Year Euro-Buxl | | | 1 | | | | June 2023 | | | | | | | | (10,271) | | | | EUR | | | | 152,763 | | | | Morgan Stanley & Co. LLC | |
30 Year U.S. Treasury Bond | | | 41 | | | | June 2023 | | | | | | | | (262,180) | | | | USD | | | | 5,377,406 | | | | Morgan Stanley & Co. LLC | |
30 Year U.S. Ultra Treasury Bond | | | 7 | | | | June 2023 | | | | | | | | (11,605) | | | | USD | | | | 987,875 | | | | Morgan Stanley & Co. LLC | |
5 Year Euro-Bobl | | | 4 | | | | June 2023 | | | | | | | | (12,302) | | | | EUR | | | | 511,363 | | | | Morgan Stanley & Co. LLC | |
Euro-BTP | | | 8 | | | | June 2023 | | | | | | | | (39,427) | | | | EUR | | | | 1,000,777 | | | | Morgan Stanley & Co. LLC | |
Euro-Schatz | | | 1 | | | | June 2023 | | | | | | | | (1,178) | | | | EUR | | | | 114,626 | | | | Morgan Stanley & Co. LLC | |
Five Year U.S. Treasury Note | | | 45 | | | | June 2023 | | | | | | | | (118,042) | | | | USD | | | | 4,927,851 | | | | Morgan Stanley & Co. LLC | |
Ten Year U.S. Treasury Note | | | 54 | | | | June 2023 | | | | | | | | 167,774 | | | | USD | | | | 6,205,782 | | | | Morgan Stanley & Co. LLC | |
Two Year U.S. Treasury Note | | | 61 | | | | June 2023 | | | | | | | | 9,493 | | | | USD | | | | 12,593,641 | | | | Morgan Stanley & Co. LLC | |
| | | | | | | | | | | | | | | | | | | | | | | | | | | | |
Total | | | | | | | | | | | | | | $ | (602,206) | | | | | | | | | | | | | |
| | | | | | | | | | | | | | | | | | | | | | | | | | | | |
52
|
SCHEDULE OF PORTFOLIO INVESTMENTS |
RBC BlueBay Strategic Income Fund (cont.)
March 31, 2023 (Unaudited)
Interest rate swaps as of March 31, 2023:
| | | | | | | | | | | | | | | | | | | | | | | | |
Fixed Rate | | Floating Rate | | Payment Frequency | | Counterparty | | Expiration Date | | Notional
Amount
(000) | | | Value/Unrealized
Appreciation
(Depreciation) | |
| | | | | | | | | | | | | | | | | | | | | |
| | | | | | | | |
0.89% | | JPY-BNPLDN | | Daily | | Morgan Stanley & Co. LLC | | 4/19/33 | | JPY | 145,000 | | | | | | | $ | (24,896) | | | | | |
0.72% | | JPY-GSLDN | | Daily | | Morgan Stanley & Co. LLC | | 4/19/33 | | JPY | 70,000 | | | | | | | | (3,262) | | | | | |
| | | | | | | | | | | | | | | | | | | | | | | | |
| | | | | | | | | | | | | | | | | | $ | (28,158) | | | | | |
| | | | | | | | | | | | | | | | | | | | | | | | |
| | | | | | | | | | | | | | | | | | | | | | | | |
Total | | | | | | | | | | | | | | | | | | $ | (28,158) | | | | | |
| | | | | | | | | | | | | | | | | | | | | | | | |
Credit default swaps buy protection as of March 31, 2023:
| | | | | | | | | | | | | | | | | | | | | | | | | | | | |
Fixed
Rate | | Issuer | | Payment
Frequency | | | Counterparty | | Expiration
Date | | | Notional
Amount
(000) | | | Premium
Paid/
(Received) | | | Unrealized
Depreciation | | | Value | |
| | | | | | | | | | | | | | | | | | | | | | | |
| | | | | | | | |
| 1.00% | | Market CDX IG Index, Series 40 | | | | | | Morgan Stanley & Co. LLC | | | 6/20/28 | | | USD | 6,182 | | | $ | (33,581) | | | $ | (39,528) | | | $ | (73,108) | |
| 1.00% | | Market CDX IG Index, Series 40 | | | | | | Morgan Stanley & Co. LLC | | | 6/20/28 | | | USD | 10,145 | | | | (48,874) | | | | (71,101) | | | | (119,975) | |
| 1.00% | | Market CDX IG Index, Series 40 | | | | | | Morgan Stanley & Co. LLC | | | 6/20/28 | | | USD | 8,043 | | | | (42,866) | | | | (52,251) | | | | (95,117) | |
| 1.00% | | Market CDX IG Index, Series 40 | | | | | | Morgan Stanley & Co. LLC | | | 6/20/28 | | | USD | 9,272 | | | | (47,257) | | | | (62,393) | | | | (109,651) | |
| | | | | | | | | | | | | | | | | | | | | | | | | | | | |
| Total | | | | | | | | | | | | | | | | | | $ | (172,578) | | | $ | (225,273) | | | $ | (397,851) | |
| | | | | | | | | | | | | | | | | | | | | | | | | | | | |
53
|
SCHEDULE OF PORTFOLIO INVESTMENTS |
RBC BlueBay Strategic Income Fund (cont.)
March 31, 2023 (Unaudited)
Abbreviations used are defined below:
Bobl - German Bundesobligationen
BTP - Italian Buoni del Tesoro Poliannuali
CHF - Swiss Franc
EMTN - Euro Medium Term Note
EUR - Euro
GBP - United Kingdom Pound Sterling
GMTN - Global Medium Term Note
JPY - Japanese Yen
LIBOR - London Interbank Offered Rate
NOK - Norwegian Krone
REIT - Real Estate Investment Trust
SEK - Swedish Krona
SOFR - Secured Overnight Financing Rate
USD - United States Dollar
Portfolio Diversification (Unaudited)
| | | | | | | | | | | | |
Industries | | Percentage of Net Assets | |
| | | | | | | | | | |
| | | |
Financial | | | | | | | 24.29 | % | | | | |
U.S. Treasury Obligations | | | | | | | 14.75 | % | | | | |
Collateralized Mortgage Obligations | | | | | | | 13.87 | % | | | | |
Technology | | | | | | | 8.37 | % | | | | |
Asset Backed Securities | | | | | | | 7.61 | % | | | | |
Consumer, Non-cyclical | | | | | | | 4.51 | % | | | | |
Consumer, Cyclical | | | | | | | 4.08 | % | | | | |
Energy | | | | | | | 3.79 | % | | | | |
Utilities | | | | | | | 2.89 | % | | | | |
Communications | | | | | | | 2.03 | % | | | | |
Industrial | | | | | | | 1.62 | % | | | | |
Foreign Government Bonds | | | | | | | 0.69 | % | | | | |
Basic Materials | | | | | | | 0.28 | % | | | | |
Other | | | | | | | 11.22 | % | | | | |
| | | | | | | | | | | | |
| | | | | | | 100.00 | % | | | | |
| | | | | | | | | | | | |
See Notes to the Financial Statements.
54
Statements of Assets and Liabilities
March 31, 2023 (Unaudited)
| | | | | | | | | | | | | | | | | | | | |
| | | RBC BlueBay
Emerging Market
Debt Fund | | | RBC BlueBay
High Yield
Bond Fund | | | RBC BlueBay
Core Plus
Bond Fund | | | RBC BlueBay
Strategic
Income Fund | |
| | | | | |
Assets: | | | | | | | | | | | | | | | | | | | | |
Investments in securities, at value: | | | | | | | | | | | | | | | | | | | | |
Unaffiliated investments (cost $38,168,448, $343,358,228, $49,912,397 and $46,730,853, respectively) | | | | | | $ | 34,825,386 | | | $ | 325,553,523 | | | $ | 48,094,014 | | | $ | 44,824,296 | |
Affiliated investments (cost $672,520, $9,238,870, $800,074 and $2,072,899, respectively) | | | | | | | 672,520 | | | | 9,238,870 | | | | 800,074 | | | | 2,072,899 | |
Cash | | | | | | | 50,149 | | | | 51,208 | | | | 1,356,693 | | | | 1,572,042 | |
Cash at broker for financial futures contracts | | | | | | | 452,884 | | | | — | | | | 862,076 | | | | 2,165,073 | |
Cash at broker for forward foreign currency exchange contracts | | | | | | | 50,000 | | | | 40,000 | | | | 260,000 | | | | 250,000 | |
Foreign currency, at value (cost $61,572, $109,826, $232,593 and $649,146, respectively) | | | | | | | 58,047 | | | | 111,314 | | | | 232,900 | | | | 649,053 | |
Interest and dividend receivable | | | | | | | 567,428 | | | | 5,602,991 | | | | 313,594 | | | | 331,200 | |
Receivable from advisor | | | | | | | — | | | | — | | | | 2,014 | | | | — | |
Receivable for capital shares issued | | | | | | | — | | | | 1,339,731 | | | | — | | | | — | |
Receivable for investments sold | | | | | | | — | | | | 1,371,467 | | | | 4,801,120 | | | | 2,985,950 | |
Credit default swaps at value (premiums paid $96,844, $0, $0 and $0, respectively) | | | | | | | 53,810 | | | | — | | | | — | | | | — | |
Unrealized appreciation on futures contracts | | | | | | | — | | | | — | | | | 203,566 | | | | 205,242 | |
Unrealized appreciation on forward foreign currency exchange contracts | | | | | | | 92,205 | | | | 6,972 | | | | 18,342 | | | | 7,851 | |
Prepaid expenses and other assets | | | | | | | 58,613 | | | | 60,797 | | | | 61,170 | | | | 61,598 | |
| | | | | | | | | | | | | | | | | | | | |
Total Assets | | | | | | | 36,881,042 | | | | 343,376,873 | | | | 57,005,563 | | | | 55,125,204 | |
| | | | | | | | | | | | | | | | | | | | |
| | | | | |
Liabilities: | | | | | | | | | | | | | | | | | | | | |
Professional fees payable | | | | | | | 4,148 | | | | 4,148 | | | | 4,183 | | | | 3,859 | |
Payable for capital shares redeemed | | | | | | | — | | | | 1,705,199 | | | | — | | | | — | |
Payable for investments purchased | | | | | | | 416,071 | | | | — | | | | 12,094,931 | | | | 3,253,356 | |
Credit default swaps at value (premiums received $27,657, $0, $77,937 and $172,578, respectively) | | | | | | | 28,082 | | | | — | | | | 179,673 | | | | 397,851 | |
55
Statements of Assets and Liabilities (cont.)
March 31, 2023 (Unaudited)
| | | | | | | | | | | | | | | | | | | | |
| | | RBC BlueBay
Emerging Market
Debt Fund | | | RBC BlueBay
High Yield
Bond Fund | | | RBC BlueBay
Core Plus
Bond Fund | | | RBC BlueBay
Strategic
Income Fund | |
| | | | | |
Unrealized depreciation on forward foreign currency exchange contracts | | | | | | $ | 69,605 | | | $ | 20,688 | | | $ | 73,412 | | | $ | 84,672 | |
Unrealized depreciation on interest rate swaps contracts | | | | | | | — | | | | — | | | | 33,782 | | | | 28,158 | |
Unrealized depreciation on futures contracts | | | | | | | 78,520 | | | | — | | | | 135,109 | | | | 779,473 | |
Accrued expenses and other payables: | | | | | | | | | | | | | | | | | | | | |
Investment advisory fees | | | | | | | 2,262 | | | | 87,625 | | | | — | | | | 8,721 | |
Accounting fees | | | | | | | 10,875 | | | | 14,386 | | | | 11,619 | | | | 11,698 | |
Audit fees | | | | | | | 26,225 | | | | 26,137 | | | | 24,377 | | | | 24,362 | |
Distribution fees | | | | | | | — | | | | 1,125 | | | | 15,998 | | | | 17,465 | |
Shareholder reports | | | | | | | 13,466 | | | | 40,605 | | | | 4,286 | | | | 3,988 | |
Transfer agent fees | | | | | | | 1,888 | | | | 22,488 | | | | 2,997 | | | | 2,996 | |
Other | | | | | | | 2,531 | | | | 2,426 | | | | 20,504 | | | | 20,609 | |
| | | | | | | | | | | | | | | | | | | | |
Total Liabilities | | | | | | | 653,673 | | | | 1,924,827 | | | | 12,600,871 | | | | 4,637,208 | |
| | | | | | | | | | | | | | | | | | | | |
Net Assets | | | | | | $ | 36,227,369 | | | $ | 341,452,046 | | | $ | 44,404,692 | | | $ | 50,487,996 | |
| | | | | | | | | | | | | | | | | | | | |
Net Assets Consists of: | | | | | | | | | | | | | | | | | | | | |
Capital | | | | | | $ | 48,540,276 | | | $ | 375,125,950 | | | $ | 51,481,577 | | | $ | 52,505,108 | |
Accumulated earnings | | | | | | | (12,312,907 | ) | | | (33,673,904 | ) | | | (7,076,885 | ) | | | (2,017,112 | ) |
| | | | | | | | | | | | | | | | | | | | |
Net Assets | | | | | | $ | 36,227,369 | | | $ | 341,452,046 | | | $ | 44,404,692 | | | $ | 50,487,996 | |
| | | | | | | | | | | | | | | | | | | | |
56
Statements of Assets and Liabilities (cont.)
March 31, 2023 (Unaudited)
| | | | | | | | | | | | | | | | | | |
| | | RBC BlueBay
Emerging Market
Debt Fund | | | RBC BlueBay
High Yield
Bond Fund | | | RBC BlueBay
Core Plus
Bond Fund | | | RBC BlueBay
Strategic
Income Fund | |
| | | | | |
Net Assets | | | | | | | | | | | | | | | | | | |
Class A | | | | $ | 27,823 | | | $ | 3,089,758 | | | $ | 4,425,736 | | | $ | 5,032,054 | |
Class I | | | | | 36,188,318 | | | | 338,362,288 | | | | 31,089,857 | | | | 35,349,068 | |
Class R6 | | | | | 11,228 | | | | N/A | | | | 8,889,099 | | | | 10,106,874 | |
| | | | | | | | | | | | | | | | | | |
Total | | | | $ | 36,227,369 | | | $ | 341,452,046 | | | $ | 44,404,692 | | | $ | 50,487,996 | |
| | | | | | | | | | | | | | | | | | |
Shares Outstanding (Unlimited number of shares authorized, no par value): | | | | | | | | | | | | | | | | | | |
Class A | | | | | 3,632 | | | | 329,241 | | | | 516,315 | | | | 525,322 | |
Class I | | | | | 4,633,092 | | | | 35,690,536 | | | | 3,623,421 | | | | 3,687,912 | |
Class R6 | | | | | 1,430 | | | | N/A | | | | 1,035,878 | | | | 1,054,299 | |
| | | | | | | | | | | | | | | | | | |
Total | | | | | 4,638,154 | | | | 36,019,777 | | | | 5,175,614 | | | | 5,267,533 | |
| | | | | | | | | | | | | | | | | | |
Net Asset Values and Redemption Prices Per Share: | | | | | | | | | | | | | | | | | | |
Class A | | | | $ | 7.66 | | | $ | 9.38 | | | $ | 8.57 | | | $ | 9.58 | |
| | | | | | | | | | | | | | | | | | |
Class I | | | | $ | 7.81 | | | $ | 9.48 | | | $ | 8.58 | | | $ | 9.59 | |
| | | | | | | | | | | | | | | | | | |
Class R6 | | | | $ | 7.85 | | | $ | N/A | | | $ | 8.58 | | | $ | 9.59 | |
| | | | | | | | | | | | | | | | | | |
Maximum Offering Price Per Share: | | | | | | | | | | | | | | | | | | |
Class A | | | | $ | 8.00 | | | $ | 9.80 | | | $ | 8.90 | | | $ | 9.95 | |
| | | | | | | | | | | | | | | | | | |
Maximum Sales Charge - Class A | | | | | 4.25 | % | | | 4.25 | % | | | 3.75 | % | | | 3.75 | % |
| | | | | | | | | | | | | | | | | | |
See Notes to the Financial Statements.
57
Statements of Operations
For the Six Months Ended
March 31, 2023 (Unaudited)
| | | | | | | | | | | | | | | | | | | | |
| | | RBC BlueBay
Emerging Market
Debt Fund | | | RBC BlueBay
High Yield
Bond Fund | | | RBC BlueBay
Core Plus
Bond Fund | | | RBC BlueBay
Strategic
Income Fund | |
| | | | | |
Investment Income: | | | | | | | | | | | | | | | | | | | | |
Interest income | | | | | | $ | 1,368,766 | | | $ | 10,331,390 | | | $ | 994,437 | | | $ | 215,843 | |
Dividend income - affiliated | | | | | | | 14,346 | | | | 143,526 | | | | 40,422 | | | | 965,303 | |
Foreign tax withholding | | | | | | | — | | | | — | | | | (785 | ) | | | (785 | ) |
| | | | | | | | | | | | | | | | | | | | |
Total Investment Income | | | | | | | 1,383,112 | | | | 10,474,916 | | | | 1,034,074 | | | | 1,180,361 | |
Expenses: | | | | | | | | | | | | | | | | | | | | |
Investment advisory fees | | | | | | | 113,406 | | | | 850,470 | | | | 76,328 | | | | 133,333 | |
Distribution fees–Class A | | | | | | | 34 | | | | 3,698 | | | | 5,437 | | | | 6,272 | |
Accounting fees | | | | | | | 31,858 | | | | 42,954 | | | | 35,227 | | | | 35,280 | |
Audit fees | | | | | | | 24,395 | | | | 24,387 | | | | 23,383 | | | | 23,383 | |
Custodian fees | | | | | | | 30,426 | | | | 27,748 | | | | 27,071 | | | | 27,345 | |
Insurance fees | | | | | | | 1,788 | | | | 1,788 | | | | 1,787 | | | | 1,787 | |
Legal fees | | | | | | | 881 | | | | 4,096 | | | | 10,250 | | | | 10,502 | |
Registrations and filing fees | | | | | | | 24,157 | | | | 28,278 | | | | 12,687 | | | | 12,678 | |
Shareholder reports | | | | | | | 18,697 | | | | 66,231 | | | | 16,223 | | | | 16,361 | |
Transfer agent fees–Class A | | | | | | | 1,779 | | | | 4,021 | | | | 2,171 | | | | 2,173 | |
Transfer agent fees–Class I | | | | | | | 8,553 | | | | 210,401 | | | | 2,172 | | | | 2,174 | |
Transfer agent fees–Class R6 | | | | | | | 1,782 | | | | — | | | | 2,172 | | | | 2,172 | |
Trustees’ fees and expenses | | | | | | | 761 | | | | 7,336 | | | | 1,011 | | | | 1,153 | |
Tax expense | | | | | | | 2,209 | | | | 2,209 | | | | 2,647 | | | | 2,541 | |
Offering fees | | | | | | | — | | | | — | | | | 6,823 | | | | 6,834 | |
Other fees | | | | | | | 2,593 | | | | 3,012 | | | | 2,871 | | | | 2,877 | |
| | | | | | | | | | | | | | | | | | | | |
Total expenses before fee waiver/reimbursement | | | | | | | 263,319 | | | | 1,276,629 | | | | 228,260 | | | | 286,865 | |
Expenses waived/reimbursed by: | | | | | | | | | | | | | | | | | | | | |
Advisor | | | | | | | (126,084 | ) | | | (397,175 | ) | | | (128,466 | ) | | | (127,228 | ) |
| | | | | | | | | | | | | | | | | | | | |
Net expenses | | | | | | | 137,235 | | | | 879,454 | | | | 99,794 | | | | 159,637 | |
| | | | | | | | | | | | | | | | | | | | |
Net Investment Income | | | | | | | 1,245,877 | | | | 9,595,462 | | | | 934,280 | | | | 1,020,724 | |
| | | | | | | | | | | | | | | | | | | | |
| | | | | |
Realized/Unrealized Gains/(Losses): | | | | | | | | | | | | | | | | | | | | |
Net realized gains/(losses) on: | | | | | | | | | | | | | | | | | | | | |
Investment transactions | | | | | | | (1,078,464 | ) | | | (8,918,172 | ) | | | (1,402,585 | ) | | | (993,363 | ) |
Foreign currency transactions | | | | | | | (93,654 | ) | | | 27,296 | | | | (117,246 | ) | | | (107,093 | ) |
Futures contracts | | | | | | | 125,848 | | | | 174,245 | | | | (294,969 | ) | | | 697,900 | |
Swap agreements | | | | | | | (129,290 | ) | | | 95,841 | | | | (58,414 | ) | | | 1,256,155 | |
| | | | | | | | | | | | | | | | | | | | |
| | | | | |
Net realized gains/(losses) | | | | | | | (1,175,560 | ) | | | (8,620,790 | ) | | | (1,873,214 | ) | | | 853,599 | |
Net change in unrealized appreciation/ (depreciation) on: | | | | | | | | | | | | | | | | | | | | |
Investments | | | | | | | 4,131,963 | | | | 22,203,927 | | | | 3,465,971 | | | | 3,025,198 | |
Foreign currency | | | | | | | 7,197 | | | | (14,916 | ) | | | 6,049 | | | | 52,789 | |
Foreign currency exchange contracts | | | | | | | (7,647 | ) | | | (207,950 | ) | | | (122,052 | ) | | | (138,066 | ) |
58
Statements of Operations (cont.)
For the Six Months Ended
March 31, 2023 (Unaudited)
| | | | | | | | | | | | | | | | | | | | |
| | | RBC BlueBay
Emerging Market
Debt Fund | | | RBC BlueBay
High Yield
Bond Fund | | | RBC BlueBay
Core Plus
Bond Fund | | | RBC BlueBay
Strategic
Income Fund | |
Futures contracts | | | | | | $ | (143,125 | ) | | $ | — | | | $ | 272,955 | | | | (1,119,393 | ) |
Swap agreements | | | | | | | (84,377 | ) | | | — | | | | (247,078 | ) | | | (1,979,898 | ) |
| | | | | | | | | | | | | | | | | | | | |
Net unrealized gains/(losses) | | | | | | | 3,904,011 | | | | 21,981,061 | | | | 3,375,845 | | | | (159,370 | ) |
| | | | | | | | | | | | | | | | | | | | |
Change in net assets resulting from operations | | | | | | $ | 3,974,328 | | | $ | 22,955,733 | | | $ | 2,436,911 | | | $ | 1,714,953 | |
| | | | | | | | | | | | | | | | | | | | |
See Notes to the Financial Statements.
59
Statements of Changes in Net Assets
| | | | | | | | | | | | | | | | |
| | | RBC BlueBay
Emerging Market
Debt Fund | |
| | | For the Six Months Ended
March 31, 2023
(Unaudited) | | | For the
Year Ended
September 30, 2022 | |
From Investment Activities | | | | | | | | | | | | | | | | |
Operations: | | | | | | | | | | | | | | | | |
Net investment income | | | | | | $ | 1,245,877 | | | | | | | $ | 1,716,262 | |
Net realized losses from investments, foreign currency, written options, futures contracts and swap contracts transactions | | | | | | | (1,175,560 | ) | | | | | | | (2,818,617 | ) |
Net change in unrealized appreciation/(depreciation) on investments, foreign currency, futures contracts and swap contracts | | | | | | | 3,904,011 | | | | | | | | (6,642,251 | ) |
| | | | | | | | | | | | | | | | |
Change in net assets resulting from operations | | | | | | | 3,974,328 | | | | | | | | (7,744,606 | ) |
| | | | | | | | | | | | | | | | |
Distributions to Shareholders: | | | | | | | | | | | | | | | | |
Class A | | | | | | | (826 | ) | | | | | | | (1,321 | ) |
Class I | | | | | | | (1,070,832 | ) | | | | | | | (1,719,310 | ) |
Class R6 | | | | | | | (341 | ) | | | | | | | (663 | ) |
| | | | | | | | | | | | | | | | |
Change in net assets resulting from shareholder distributions | | | | | | | (1,071,999 | ) | | | | | | | (1,721,294 | ) |
| | | | | | | | | | | | | | | | |
Capital Transactions: | | | | | | | | | | | | | | | | |
Proceeds from shares issued | | | | | | | 4,062,077 | | | | | | | | 9,281,136 | |
Distributions reinvested | | | | | | | 1,066,759 | | | | | | | | 1,719,037 | |
Cost of shares redeemed | | | | | | | (2,011,262 | ) | | | | | | | (22,044 | ) |
| | | | | | | | | | | | | | | | |
Change in net assets resulting from capital transactions | | | | | | | 3,117,574 | | | | | | | | 10,978,129 | |
| | | | | | | | | | | | | | | | |
Net increase in net assets | | | | | | | 6,019,903 | | | | | | | | 1,512,229 | |
Net Assets: | | | | | | | | | | | | | | | | |
Beginning of period | | | | | | | 30,207,466 | | | | | | | | 28,695,237 | |
| | | | | | | | | | | | | | | | |
End of period | | | | | | $ | 36,227,369 | | | | | | | $ | 30,207,466 | |
| | | | | | | | | | | | | | | | |
Share Transactions: | | | | | | | | | | | | | | | | |
Issued | | | | | | | 562,424 | | | | | | | | 1,115,129 | |
Reinvested | | | | | | | 141,582 | | | | | | | | 201,298 | |
Redeemed | | | | | | | (280,423 | ) | | | | | | | (2,609 | ) |
| | | | | | | | | | | | | | | | |
Change in shares resulting from capital transactions | | | | | | | 423,583 | | | | | | | | 1,313,818 | |
| | | | | | | | | | | | | | | | |
See Notes to the Financial Statements.
60
Statements of Changes in Net Assets
| | | | | | | | | | | | | | | | |
| | | RBC BlueBay
High Yield
Bond Fund | |
| | | For the Six Months Ended
March 31, 2023
(Unaudited) | | | For the
Year Ended
September 30, 2022 | |
From Investment Activities | | | | | | | | | | | | | | | | |
Operations: | | | | | | | | | | | | | | | | |
Net investment income | | | | | | $ | 9,595,462 | | | | | | | $ | 13,784,773 | |
Net realized losses from investments, foreign currency, futures contracts and swap contracts transactions | | | | | | | (8,620,790 | ) | | | | | | | (9,066,133 | ) |
Net change in unrealized appreciation/(depreciation) on investments, foreign currency and futures contracts | | | | | | | 21,981,061 | | | | | | | | (44,456,103 | ) |
| | | | | | | | | | | | | | | | |
Change in net assets resulting from operations | | | | | | | 22,955,733 | | | | | | | | (39,737,463 | ) |
| | | | | | | | | | | | | | | | |
Distributions to Shareholders: | | | | | | | | | | | | | | | | |
Class A | | | | | | | (95,481 | ) | | | | | | | (202,455 | ) |
Class I | | | | | | | (9,617,979 | ) | | | | | | | (16,268,017 | ) |
| | | | | | | | | | | | | | | | |
Change in net assets resulting from shareholder distributions | | | | | | | (9,713,460 | ) | | | | | | | (16,470,472 | ) |
| | | | | | | | | | | | | | | | |
Capital Transactions: | | | | | | | | | | | | | | | | |
Proceeds from shares issued | | | | | | | 133,027,755 | | | | | | | | 259,560,711 | |
Distributions reinvested | | | | | | | 8,737,667 | | | | | | | | 14,827,024 | |
Cost of shares redeemed | | | | | | | (94,235,978 | ) | | | | | | | (185,870,515 | ) |
| | | | | | | | | | | | | | | | |
Change in net assets resulting from capital transactions | | | | | | | 47,529,444 | | | | | | | | 88,517,220 | |
| | | | | | | | | | | | | | | | |
Net increase in net assets | | | | | | | 60,771,717 | | | | | | | | 32,309,285 | |
Net Assets: | | | | | | | | | | | | | | | | |
Beginning of period | | | | | | | 280,680,330 | | | | | | | | 248,371,045 | |
| | | | | | | | | | | | | | | | |
End of period | | | | | | $ | 341,452,047 | | | | | | | $ | 280,680,330 | |
| | | | | | | | | | | | | | | | |
Share Transactions: | | | | | | | | | | | | | | | | |
Issued | | | | | | | 14,153,863 | | | | | | | | 25,540,716 | |
Reinvested | | | | | | | 938,462 | | | | | | | | 1,453,365 | |
Redeemed | | | | | | | (10,038,294 | ) | | | | | | | (18,659,416 | ) |
| | | | | | | | | | | | | | | | |
Change in shares resulting from capital transactions | | | | | | | 5,054,031 | | | | | | | | 8,334,665 | |
| | | | | | | | | | | | | | | | |
See Notes to the Financial Statements.
61
Statements of Changes in Net Assets
| | | | | | | | | | | | | | | | |
| | | RBC BlueBay
Core Plus
Bond Fund | |
| | | For the Six Months Ended
March 31, 2023
(Unaudited) | | | For the
Period Ended
September 30, 2022(a) | |
From Investment Activities | | | | | | | | | | | | | | | | |
Operations: | | | | | | | | | | | | | | | | |
Net investment income | | | | | | $ | 934,280 | | | | | | | $ | 989,744 | |
Net realized losses from investments, foreign currency, futures contracts and swap contracts transactions | | | | | | | (1,873,214 | ) | | | | | | | (3,695,964 | ) |
Net change in unrealized appreciation/(depreciation) on investments, foreign currency, futures contracts and swap contracts | | | | | | | 3,375,845 | | | | | | | | (5,326,000 | ) |
| | | | | | | | | | | | | | | | |
Change in net assets resulting from operations | | | | | | | 2,436,911 | | | | | | | | (8,032,220 | ) |
| | | | | | | | | | | | | | | | |
Distributions to Shareholders: | | | | | | | | | | | | | | | | |
Class A | | | | | | | (65,971 | ) | | | | | | | (75,065 | ) |
Class I | | | | | | | (481,884 | ) | | | | | | | (588,490 | ) |
Class R6 | | | | | | | (139,253 | ) | | | | | | | (171,927 | ) |
| | | | | | | | | | | | | | | | |
Change in net assets resulting from shareholder distributions | | | | | | | (687,108 | ) | | | | | | | (835,482 | ) |
| | | | | | | | | | | | | | | | |
Capital Transactions: | | | | | | | | | | | | | | | | |
Proceeds from shares issued | | | | | | | — | | | | | | | | 50,000,000 | |
Distributions reinvested | | | | | | | 687,108 | | | | | | | | 835,482 | |
Cost of shares redeemed | | | | | | | — | | | | | | | | — | |
| | | | | | | | | | | | | | | | |
Change in net assets resulting from capital transactions | | | | | | | 687,108 | | | | | | | | 50,835,482 | |
| | | | | | | | | | | | | | | | |
Net increase in net assets | | | | | | | 2,436,911 | | | | | | | | 41,967,780 | |
Net Assets: | | | | | | | | | | | | | | | | |
Beginning of period | | | | | | | 41,967,780 | | | | | | | | — | |
| | | | | | | | | | | | | | | | |
End of period | | | | | | $ | 44,404,691 | | | | | | | $ | 41,967,780 | |
| | | | | | | | | | | | | | | | |
Share Transactions: | | | | | | | | | | | | | | | | |
Issued | | | | | | | — | | | | | | | | 5,000,000 | |
Reinvested | | | | | | | 82,703 | | | | | | | | 92,912 | |
Redeemed | | | | | | | — | | | | | | | | — | |
| | | | | | | | | | | | | | | | |
Change in shares resulting from capital transactions | | | | | | | 82,703 | | | | | | | | 5,092,912 | |
| | | | | | | | | | | | | | | | |
(a)For the period from November 1, 2021 (commencement of operations) to September 30, 2022.
See Notes to the Financial Statements.
62
Statements of Changes in Net Assets
| | | | | | | | | | | | | | | | |
| | | RBC BlueBay
Strategic
Income Fund | |
| | | For the Six Months Ended
March 31, 2023
(Unaudited) | | | For the
Period Ended
September 30, 2022(a) | |
From Investment Activities | | | | | | | | | | | | | | | | |
Operations: | | | | | | | | | | | | | | | | |
Net investment income | | | | | | $ | 1,020,724 | | | | | | | $ | 940,642 | |
Net realized gains from investments, foreign currency, futures contracts and swap contracts transactions | | | | | | | 853,599 | | | | | | | | 488,421 | |
Net change in unrealized depreciation on investments, foreign currency, futures contracts and swap contracts | | | | | | | (159,370 | ) | | | | | | | (2,656,019 | ) |
| | | | | | | | | | | | | | | | |
Change in net assets resulting from operations | | | | | | | 1,714,953 | | | | | | | | (1,226,956 | ) |
| | | | | | | | | | | | | | | | |
Distributions to Shareholders: | | | | | | | | | | | | | | | | |
Class A | | | | | | | (175,366 | ) | | | | | | | (66,020 | ) |
Class I | | | | | | | (1,261,307 | ) | | | | | | | (531,813 | ) |
Class R6 | | | | | | | (362,301 | ) | | | | | | | (155,930 | ) |
| | | | | | | | | | | | | | | | |
Change in net assets resulting from shareholder distributions | | | | | | | (1,798,974 | ) | | | | | | | (753,763 | ) |
| | | | | | | | | | | | | | | | |
Capital Transactions: | | | | | | | | | | | | | | | | |
Proceeds from shares issued | | | | | | | — | | | | | | | | 50,000,000 | |
Distributions reinvested | | | | | | | 1,798,973 | | | | | | | | 753,763 | |
Cost of shares redeemed | | | | | | | — | | | | | | | | — | |
| | | | | | | | | | | | | | | | |
Change in net assets resulting from capital transactions | | | | | | | 1,798,973 | | | | | | | | 50,753,763 | |
| | | | | | | | | | | | | | | | |
Net increase in net assets | | | | | | | 1,714,952 | | | | | | | | 48,773,044 | |
Net Assets: | | | | | | | | | | | | | | | | |
Beginning of period | | | | | | | 48,773,044 | | | | | | | | — | |
| | | | | | | | | | | | | | | | |
End of period | | | | | | $ | 50,487,996 | | | | | | | $ | 48,773,044 | |
| | | | | | | | | | | | | | | | |
Share Transactions: | | | | | | | | | | | | | | | | |
Issued | | | | | | | — | | | | | | | | 5,000,000 | |
Reinvested | | | | | | | 190,064 | | | | | | | | 77,470 | |
Redeemed | | | | | | | — | | | | | | | | — | |
| | | | | | | | | | | | | | | | |
Change in shares resulting from capital transactions | | | | | | | 190,064 | | | | | | | | 5,077,470 | |
| | | | | | | | | | | | | | | | |
(a)For the period from November 1, 2021 (commencement of operations) to September 30, 2022.
See Notes to the Financial Statements.
63
RBC BlueBay Emerging Market Debt Fund
(Selected data for a share outstanding throughout the periods indicated)
| | | | | | | | | | | | | | | | | | | | | | | | | | | | | | | | | | | | |
| | | | | | | | | Investment Activities | | | Distributions | | | | | | | |
| | | Net Asset
Value,
Beginning
of Period | | | Net
Investment
Income(a) | | | Net Realized and Unrealized
Gains (Losses)
on Investments | | | Total from
Investment
Activities | | | Net
Investment
Income | | | Total
Distributions | | | Net Asset
Value, End
of Period | |
Class A | | | | | | | | | | | | | | | | | | | | | | | | | | | | | | | | | | | | |
Six Months Ended 3/31/23 (Unaudited) | | | | | | $ | 7.03 | | | | 0.26 | | | | 0.60 | | | | 0.86 | | | | (0.23 | ) | | | (0.23 | ) | | | | | | $ | 7.66 | |
Year Ended 9/30/22 | | | | | | | 9.77 | | | | 0.48 | | | | (2.70 | ) | | | (2.22 | ) | | | (0.52 | ) | | | (0.52 | ) | | | | | | | 7.03 | |
Year Ended 9/30/21 | | | | | | | 9.78 | | | | 0.45 | | | | 0.04(b | ) | | | 0.49 | | | | (0.50 | ) | | | (0.50 | ) | | | | | | | 9.77 | |
Year Ended 9/30/20 | | | | | | | 10.14 | | | | 0.48 | | | | (0.38 | ) | | | 0.10 | | | | (0.46 | ) | | | (0.46 | ) | | | | | | | 9.78 | |
Year Ended 9/30/19 | | | | | | | 9.63 | | | | 0.52 | | | | 0.51 | | | | 1.03 | | | | (0.52 | ) | | | (0.52 | ) | | | | | | | 10.14 | |
Year Ended 9/30/18 | | | | | | | 10.36 | | | | 0.50 | | | | (0.85 | ) | | | (0.35 | ) | | | (0.38 | ) | | | (0.38 | ) | | | | | | | 9.63 | |
Class I | | | | | | | | | | | | | | | | | | | | | | | | | | | | | | | | | | | | |
Six Months Ended 3/31/23 (Unaudited) | | | | | | $ | 7.17 | | | | 0.27 | | | | 0.61 | | | | 0.88 | | | | (0.24 | ) | | | (0.24 | ) | | | | | | $ | 7.81 | |
Year Ended 9/30/22 | | | | | | | 9.89 | | | | 0.50 | | | | (2.73 | ) | | | (2.23 | ) | | | (0.49 | ) | | | (0.49 | ) | | | | | | | 7.17 | |
Year Ended 9/30/21 | | | | | | | 9.90 | | | | 0.48 | | | | 0.03(b | ) | | | 0.51 | | | | (0.52 | ) | | | (0.52 | ) | | | | | | | 9.89 | |
Year Ended 9/30/20 | | | | | | | 10.23 | | | | 0.47 | | | | (0.33 | ) | | | 0.14 | | | | (0.47 | ) | | | (0.47 | ) | | | | | | | 9.90 | |
Year Ended 9/30/19 | | | | | | | 9.71 | | | | 0.55 | | | | 0.52 | | | | 1.07 | | | | (0.55 | ) | | | (0.55 | ) | | | | | | | 10.23 | |
Year Ended 9/30/18 | | | | | | | 10.41 | | | | 0.51 | | | | (0.84) | | | | (0.33 | ) | | | (0.37 | ) | | | (0.37 | ) | | | | | | | 9.71 | |
Class R6 | | | | | | | | | | | | | | | | | | | | | | | | | | | | | | | | | | | | |
Six Months Ended 3/31/23 (Unaudited) | | | | | | $ | 7.20 | | | | 0.28 | | | | 0.62 | | | | 0.90 | | | | (0.25 | ) | | | (0.25 | ) | | | | | | $ | 7.85 | |
Year Ended 9/30/22 | | | | | | | 9.94 | | | | 0.51 | | | | (2.76 | ) | | | (2.25 | ) | | | (0.49 | ) | | | (0.49 | ) | | | | | | | 7.20 | |
Year Ended 9/30/21 | | | | | | | 9.94 | | | | 0.49 | | | | 0.04(b | ) | | | 0.53 | | | | (0.53 | ) | | | (0.53 | ) | | | | | | | 9.94 | |
Year Ended 9/30/20 | | | | | | | 10.27 | | | | 0.48 | | | | (0.33 | ) | | | 0.15 | | | | (0.48 | ) | | | (0.48 | ) | | | | | | | 9.94 | |
Year Ended 9/30/19 | | | | | | | 9.74 | | | | 0.56 | | | | 0.52 | | | | 1.08 | | | | (0.55 | ) | | | (0.55 | ) | | | | | | | 10.27 | |
Year Ended 9/30/18 | | | | | | | 10.42 | | | | 0.53 | | | | (0.86 | ) | | | (0.33 | ) | | | (0.35 | ) | | | (0.35 | ) | | | | | | | 9.74 | |
| (a) | Per share net investment income (loss) has been calculated using the average daily shares method. |
| (b) | Calculation of the net gain per share (both realized and unrealized) does not correlate to the aggregate realized and unrealized losses presented in the Statement of Operations due to the timing of the sales and repurchases of Fund shares in relation to fluctuating market values of the investments of the Fund. |
64
RBC BlueBay Emerging Market Debt Fund
(Selected data for a share outstanding throughout the periods indicated)
| | | | | | | | | | | | | | | | | | | | | | | | | | | | |
| | | | | Ratios/Supplemental Data | |
| | | Total
Return(a)(b) | | Net Assets,
End of
Period (000’s) | | | Ratio of
Net Expenses
to Average
Net Assets | | Ratio of Net Investment
Income (Loss)
to Average
Net Assets | | Ratio of
Expenses to
Average Net
Assets* | | Portfolio
Turnover
Rate** | |
Class A | | | | | | | | | | | | | | | | | | | | | | | | | | | | |
Six Months Ended 3/31/23 (Unaudited) | | | 12.27% | (c) | | | | | | | $ 28 | | | | 1.04% | (d) | | | 6.96% | (d) | | | 14.81% | (d) | | | 44% | |
Year Ended 9/30/22 | | | (23.47)% | | | | | | | | 25 | | | | 1.04% | | | | 5.67% | | | | 17.51% | | | | 98% | |
Year Ended 9/30/21 | | | 5.06% | | | | | | | | 15 | | | | 1.04% | | | | 4.52% | | | | 43.25% | | | | 181% | |
Year Ended 9/30/20 | | | 1.06% | | | | | | | | 7 | | | | 1.11% | (e) | | | 4.95% | | | | 28.23% | | | | 249% | |
Year Ended 9/30/19 | | | 11.17% | | | | | | | | 21 | | | | 1.12% | | | | 5.38% | | | | 20.37% | | | | 236% | |
Year Ended 9/30/18 | | | (3.38)% | | | | | | | | 19 | | | | 1.13% | | | | 5.05% | | | | 11.41% | | | | 364% | |
Class I | | | | | | | | | | | | | | | | | | | | | | | | | | | | |
Six Months Ended 3/31/23 (Unaudited) | | | 12.47% | (c) | | | | | | | $36,188 | | | | 0.79% | (d) | | | 7.14% | (d) | | | 1.49% | (d) | | | 44% | |
Year Ended 9/30/22 | | | (23.27)% | | | | | | | | 30,173 | | | | 0.79% | | | | 5.82% | | | | 1.65% | | | | 98% | |
Year Ended 9/30/21 | | | 5.28% | | | | | | | | 28,667 | | | | 0.79% | | | | 4.76% | | | | 1.72% | | | | 181% | |
Year Ended 9/30/20 | | | 1.44% | | | | | | | | 21,356 | | | | 0.85% | (e) | | | 4.87% | | | | 2.14% | | | | 249% | |
Year Ended 9/30/19 | | | 11.48% | | | | | | | | 21,529 | | | | 0.87% | | | | 5.62% | | | | 2.13% | | | | 236% | |
Year Ended 9/30/18 | | | (3.26)% | | | | | | | | 23,952 | | | | 0.88% | | | | 5.21% | | | | 2.18% | | | | 364% | |
Class R6 | | | | | | | | | | | | | | | | | | | | | | | | | | | | |
Six Months Ended 3/31/23 (Unaudited) | | | 12.58% | (c) | | | | | | | $ 11 | | | | 0.74% | (d) | | | 7.27% | (d) | | | 33.97% | (d) | | | 44% | |
Year Ended 9/30/22 | | | (23.27)% | | | | | | | | 10 | | | | 0.74% | | | | 5.77% | | | | 31.35% | | | | 98% | |
Year Ended 9/30/21 | | | 5.35% | | | | | | | | 13 | | | | 0.74% | | | | 4.82% | | | | 28.96% | | | | 181% | |
Year Ended 9/30/20 | | | 1.40% | | | | | | | | 12 | | | | 0.79% | (e) | | | 4.91% | | | | 31.83% | | | | 249% | |
Year Ended 9/30/19 | | | 11.57% | | | | | | | | 12 | | | | 0.82% | | | | 5.67% | | | | 33.09% | | | | 236% | |
Year Ended 9/30/18 | | | (3.18)% | | | | | | | | 11 | | | | 0.84% | | | | 5.32% | | | | 34.20% | | | | 364% | |
| * | During the period, certain fees were contractually or voluntarily reduced and/or reimbursed. If such contractual/voluntary fee reductions and reimbursements had not occurred, the ratio would have been as indicated. |
| ** | Portfolio turnover rate is calculated on the basis of the Fund as a whole without distinguishing between the classes of shares issued. |
| (a) | Excludes sales charge. |
| (b) | Assumes investment at net asset value at the beginning of the period, reinvestment of all dividends and distributions, and a complete redemption of the investment at net asset value at the end of the period. |
65
RBC BlueBay Emerging Market Debt Fund
(Selected data for a share outstanding throughout the periods indicated)
| (e) | Beginning June 18, 2020, the net operating expenses were contractually limited to 1.04%, 0.79% and 0.74% of average daily net assets for Class A, Class I and Class R6, respectively. The ratio of net expenses to average net assets represents a blended percentage for the year ended September 30, 2020. |
|
| See Notes to the Financial Statements. |
66
RBC BlueBay High Yield Bond Fund
(Selected data for a share outstanding throughout the periods indicated)
| | | | | | | | | | | | | | | | | | | | | | | | | | | | | | | | | | | | |
| | | | | | Investment Activities | | | Distributions | | | | |
| | | Net Asset
Value,
Beginning
of Period | | | Net
Investment
Income(a) | | | Net Realized and Unrealized
Gains (Losses)
on Investments | | | Redemption
Fees | | | Total from
Investment
Activities | | | Net
Investment
Income | | | Net
Realized
Gains | | | Total
Distributions | | | Net Asset
Value, End
of Period | |
Class A | | | | | | | | | | | | | | | | | | | | | | | | | | | | | | | | | | | | |
Six Months Ended 3/31/23 (Unaudited) | | | $ 8.98 | | | | 0.28 | | | | 0.41 | | | | — | | | | 0.69 | | | | (0.29 | ) | | | — | | | | (0.29 | ) | | | $ 9.38 | |
Year Ended 9/30/22 | | | 10.89 | | | | 0.47 | | | | (1.94 | ) | | | — | | | | (1.47 | ) | | | (0.44 | ) | | | — | | | | (0.44 | ) | | | 8.98 | |
Year Ended 9/30/21 | | | 10.56 | | | | 0.47 | | | | 0.52 | | | | —(b) | | | | 0.99 | | | | (0.52 | ) | | | (0.14 | ) | | | (0.66 | ) | | | 10.89 | |
Year Ended 9/30/20 | | | 10.46 | | | | 0.48 | | | | 0.09 | | | | — | | | | 0.57 | | | | (0.47 | ) | | | — | | | | (0.47 | ) | | | 10.56 | |
Year Ended 9/30/19 | | | 10.42 | | | | 0.54 | | | | 0.26 | | | | — | | | | 0.80 | | | | (0.76 | ) | | | — | | | | (0.76 | ) | | | 10.46 | |
Year Ended 9/30/18 | | | 10.42 | | | | 0.47 | | | | (0.10 | ) | | | 0.01 | | | | 0.38 | | | | (0.38 | ) | | | — | | | | (0.38 | ) | | | 10.42 | |
Class I | | | | | | | | | | | | | | | | | | | | | | | | | | | | | | | | | | | | |
Six Months Ended 3/31/23 (Unaudited) | | | $ 9.07 | | | | 0.29 | | | | 0.42 | | | | — | | | | 0.71 | | | | (0.30 | ) | | | — | | | | (0.30 | ) | | | $ 9.48 | |
Year Ended 9/30/22 | | | 10.98 | | | | 0.48 | | | | (1.95 | ) | | | — | | | | (1.47 | ) | | | (0.44 | ) | | | — | | | | (0.44 | ) | | | 9.07 | |
Year Ended 9/30/21 | | | 10.64 | | | | 0.50 | | | | 0.53 | | | | —(b) | | | | 1.03 | | | | (0.55 | ) | | | (0.14 | ) | | | (0.69 | ) | | | 10.98 | |
Year Ended 9/30/20 | | | 10.52 | | | | 0.51 | | | | 0.10 | | | | — | | | | 0.61 | | | | (0.49 | ) | | | — | | | | (0.49 | ) | | | 10.64 | |
Year Ended 9/30/19 | | | 10.47 | | | | 0.58 | | | | 0.25 | | | | — | | | | 0.83 | | | | (0.78 | ) | | | — | | | | (0.78 | ) | | | 10.52 | |
Year Ended 9/30/18 | | | 10.46 | | | | 0.47 | | | | (0.07 | ) | | | — | | | | 0.40 | | | | (0.39 | ) | | | — | | | | (0.39 | ) | | | 10.47 | |
| (a) | Per share net investment income (loss) has been calculated using the average daily shares method. |
| (b) | Less than $0.01 or $(0.01) per share. |
67
RBC BlueBay High Yield Bond Fund
(Selected data for a share outstanding throughout the periods indicated)
| | | | | | | | | | | | | | | | | | | | | | | | |
| | | | | Ratios/Supplemental Data | |
| | | Total
Return(a)(b) | | Net Assets,
End of
Period (000’s) | | | Ratio of
Net Expenses
to Average
Net Assets | | Ratio of Net Investment
Income (Loss)
to Average
Net Assets | | Ratio of
Expenses to
Average Net
Assets* | | Portfolio
Turnover
Rate** | |
Class A | | | | | | | | | | | | | | | | | | | | | | | | |
Six Months Ended 3/31/23 (Unaudited) | | | 7.90 | %(c) | | | $ 3,090 | | | | 0.82 | %(d) | | | 5.93 | %(d) | | | 1.21 | %(d) | | | 42% | |
Year Ended 9/30/22 | | | (12.74 | )% | | | 2,983 | | | | 0.82 | % | | | 4.45 | % | | | 1.16 | % | | | 75% | |
Year Ended 9/30/21 | | | 9.60 | % | | | 3,727 | | | | 0.82 | % | | | 4.32 | % | | | 1.18 | % | | | 100% | |
Year Ended 9/30/20 | | | 5.64 | % | | | 1,586 | | | | 0.82 | % | | | 4.64 | % | | | 1.92 | % | | | 187% | |
Year Ended 9/30/19 | | | 8.41 | % | | | 460 | | | | 0.82 | % | | | 5.35 | % | | | 2.50 | % | | | 143% | |
Year Ended 9/30/18 | | | 3.71 | % | | | 556 | | | | 0.82 | %(e) | | | 4.56 | % | | | 2.82 | % | | | 158% | |
Class I | | | | | | | | | | | | | | | | | | | | | | | | |
Six Months Ended 3/31/23 (Unaudited) | | | 8.07 | %(c) | | | $338,362 | | | | 0.57 | %(d) | | | 6.21 | %(d) | | | 0.82 | %(d) | | | 42% | |
Year Ended 9/30/22 | | | (12.57 | )% | | | 277,697 | | | | 0.57 | % | | | 4.76 | % | | | 0.82 | % | | | 75% | |
Year Ended 9/30/21 | | | 9.89 | % | | | 244,644 | | | | 0.57 | % | | | 4.57 | % | | | 0.87 | % | | | 100% | |
Year Ended 9/30/20 | | | 6.03 | % | | | 128,846 | | | | 0.57 | % | | | 4.92 | % | | | 1.10 | % | | | 187% | |
Year Ended 9/30/19 | | | 8.58 | % | | | 49,397 | | | | 0.57 | % | | | 5.66 | % | | | 1.39 | % | | | 143% | |
Year Ended 9/30/18 | | | 3.95 | % | | | 38,469 | | | | 0.56 | %(e) | | | 4.56 | % | | | 1.49 | % | | | 158% | |
| * | During the period, certain fees were contractually or voluntarily reduced and/or reimbursed. If such contractual/voluntary fee reductions and reimbursements had not occurred, the ratio would have been as indicated. |
| ** | Portfolio turnover rate is calculated on the basis of the Fund as a whole without distinguishing between the classes of shares issued. |
| (a) | Excludes sales charge. |
| (b) | Assumes investment at net asset value at the beginning of the period, reinvestment of all dividends and distributions, and a complete redemption of the investment at net asset value at the end of the period. |
| (e) | Beginning November 1, 2017, the net operating expenses were contractually limited to 0.82% and 0.57% of average daily net assets for Class A and Class I, respectively. The ratio of net expenses to average net assets represents a blended percentage for the period ended September 30, 2018. |
See Notes to the Financial Statements.
68
RBC BlueBay Core Plus Bond Fund
(Selected data for a share outstanding throughout the periods indicated)
| | | | | | | | | | | | | | | | | | | | | | | | | | | | |
| | | | | | Investment Activities | | | Distributions | | | | |
| | | Net Asset
Value,
Beginning
of Period | | | Net
Investment
Income(a) | | | Net Realized and Unrealized
Gains (Losses)
on Investments | | | Total from
Investment
Activities | | | Net
Investment
Income | | | Total
Distributions | | | Net Asset
Value, End
of Period | |
Class A | | | | | | | | | | | | | | | | | | | | | | | | | | | | |
Six Months Ended 3/31/23 (Unaudited) | | | $ 8.24 | | | | 0.17 | | | | 0.29 | | | | 0.46 | | | | (0.13 | ) | | | (0.13 | ) | | | $8.57 | |
Period Ended 9/30/22(b) | | | 10.00 | | | | 0.18 | | | | (1.79 | ) | | | (1.61 | ) | | | (0.15 | ) | | | (0.15 | ) | | | 8.24 | |
Class I | | | | | | | | | | | | | | | | | | | | | | | | | | | | |
Six Months Ended 3/31/23 (Unaudited) | | | $ 8.24 | | | | 0.18 | | | | 0.29 | | | | 0.47 | | | | (0.13 | ) | | | (0.13 | ) | | | $8.58 | |
Period Ended 9/30/22(b) | | | 10.00 | | | | 0.20 | | | | (1.79 | ) | | | (1.59 | ) | | | (0.17 | ) | | | (0.17 | ) | | | 8.24 | |
Class R6 | | | | | | | | | | | | | | | | | | | | | | | | | | | | |
Six Months Ended 3/31/23 (Unaudited) | | | $ 8.24 | | | | 0.18 | | | | 0.30 | | | | 0.48 | | | | (0.14 | ) | | | (0.14 | ) | | | $8.58 | |
Period Ended 9/30/22(b) | | | 10.00 | | | | 0.20 | | | | (1.79 | ) | | | (1.59 | ) | | | (0.17 | ) | | | (0.17 | ) | | | 8.24 | |
| (a) | Per share net investment income (loss) has been calculated using the average daily shares method. |
| (b) | For the period from November 1, 2021 (commencement of operations) to September 30, 2022. |
69
RBC BlueBay Core Plus Bond Fund
(Selected data for a share outstanding throughout the periods indicated)
| | | | | | | | | | | | | | | | | | | | | | | | |
| | | | | | Ratios/Supplemental Data | |
| | | Total
Return(a)(b) | | | Net Assets,
End of
Period (000’s) | | | Ratio of
Net Expenses
to Average
Net Assets | | | Ratio of Net Investment
Income (Loss)
to Average
Net Assets | | | Ratio of
Expenses to
Average Net
Assets* | | | Portfolio
Turnover
Rate** | |
Class A | | | | | | | | | | | | | | | | | | | | | | | | |
Six Months Ended 3/31/23 (Unaudited) | | | 5.76%(c) | | | | $ 4,426 | | | | 0.69%(d) | | | | 4.05%(d) | | | | 1.34%(d) | | | | 405% | |
Period Ended 9/30/22(e) | | | (16.32)%(c) | | | | 4,188 | | | | 0.70%(d) | | | | 2.09%(d) | | | | 1.51%(d) | | | | 254% | |
Class I | | | | | | | | | | | | | | | | | | | | | | | | |
Six Months Ended 3/31/23 (Unaudited) | | | 5.82%(c) | | | | $31,090 | | | | 0.44%(d) | | | | 4.30%(d) | | | | 1.01%(d) | | | | 405% | |
Period Ended 9/30/22(e) | | | (16.06)%(c) | | | | 29,381 | | | | 0.45%(d) | | | | 2.34%(d) | | | | 1.15%(d) | | | | 254% | |
Class R6 | | | | | | | | | | | | | | | | | | | | | | | | |
Six Months Ended 3/31/23 (Unaudited) | | | 5.84%(c) | | | | $ 8,889 | | | | 0.39%(d) | | | | 4.35%(d) | | | | 1.04%(d) | | | | 405% | |
Period Ended 9/30/22(e) | | | (16.03)%(c) | | | | 8,399 | | | | 0.40%(d) | | | | 2.39%(d) | | | | 1.19%(d) | | | | 254% | |
| * | During the period, certain fees were contractually or voluntarily reduced and/or reimbursed. If such contractual/voluntary fee reductions and reimbursements had not occurred, the ratio would have been as indicated. |
| ** | Portfolio turnover rate is calculated on the basis of the Fund as a whole without distinguishing between the classes of shares issued. |
| (a) | Excludes sales charge. |
| (b) | Assumes investment at net asset value at the beginning of the period, reinvestment of all dividends and distributions, and a complete redemption of the investment at net asset value at the end of the period. |
| (e) | For the period from November 1, 2021 (commencement of operations) to September 30, 2022. |
See Notes to the Financial Statements.
70
RBC BlueBay Strategic Income Fund
(Selected data for a share outstanding throughout the periods indicated)
| | | | | | | | | | | | | | | | | | | | | | | | | | | | | | | | | | | | | | | | |
| | | | | | | | | Investment Activities | | | Distributions | | | | | |
| | | Net Asset
Value,
Beginning
of Period | | | Net
Investment
Income(a) | | | Net Realized
and Unrealized
Gains (Losses)
on Investments | | | Total from
Investment
Activities | | | Net
Investment
Income | | | Net
Realized
Gains | | | Total
Distributions | | | Net Asset
Value, End
of Period |
Class A | | | | | | | | | | | | | | | | | | | | | | | | | | | | | | | | | | | | | | | | |
Six Months Ended 3/31/23 (Unaudited) | | | | | | | $ 9.60 | | | | 0.19 | | | | 0.14 | | | | 0.33 | | | | (0.15 | ) | | | (0.20 | ) | | | (0.35 | ) | | | | | | | $9.58 | |
Period Ended 9/30/22(b) | | | | | | | 10.00 | | | | 0.17 | | | | (0.44 | ) | | | (0.27 | ) | | | (0.13 | ) | | | — | | | | (0.13 | ) | | | | | | | 9.60 | |
Class I | | | | | | | | | | | | | | | | | | | | | | | | | | | | | | | | | | | | | | | | |
Six Months Ended 3/31/23 (Unaudited) | | | | | | | $ 9.61 | | | | 0.20 | | | | 0.14 | | | | 0.34 | | | | (0.16 | ) | | | (0.20 | ) | | | (0.36 | ) | | | | | | | $9.59 | |
Period Ended 9/30/22(b) | | | | | | | 10.00 | | | | 0.19 | | | | (0.43 | ) | | | (0.24 | ) | | | (0.15 | ) | | | — | | | | (0.15 | ) | | | | | | | 9.61 | |
Class R6 | | | | | | | | | | | | | | | | | | | | | | | | | | | | | | | | | | | | | | | | |
Six Months Ended 3/31/23 (Unaudited) | | | | | | | $ 9.61 | | | | 0.20 | | | | 0.14 | | | | 0.34 | | | | (0.16 | ) | | | (0.20 | ) | | | (0.36 | ) | | | | | | | $9.59 | |
Period Ended 9/30/22(b) | | | | | | | 10.00 | | | | 0.19 | | | | (0.42 | ) | | | (0.23 | ) | | | (0.16 | ) | | | — | | | | (0.16 | ) | | | | | | | 9.61 | |
| (a) | Per share net investment income (loss) has been calculated using the average daily shares method. |
| (b) | For the period from November 1, 2021 (commencement of operations) to September 30, 2022. |
71
RBC BlueBay Strategic Income Fund
(Selected data for a share outstanding throughout the periods indicated)
| | | | | | | | | | | | | | | | | | | | | | | | |
| | | | | Ratios/Supplemental Data | |
| | | Total
Return(a)(b) | | Net Assets,
End of
Period (000’s) | | | Ratio of
Net Expenses
to Average
Net Assets | | | Ratio of Net Investment
Income (Loss)
to Average
Net Assets | | | Ratio of
Expenses to
Average Net
Assets* | | | Portfolio
Turnover
Rate** | |
Class A | | | | | | | | | | | | | | | | | | | | | | | | |
Six Months Ended 3/31/23 (Unaudited) | | | 3.44 | %(c) | | | $ 5,032 | | | | 0.87%(d) | | | | 3.82%(d) | | | | 1.43%(d) | | | | 427% | |
Period Ended 9/30/22(e) | | | (2.70 | )%(c) | | | 4,867 | | | | 0.88%(d) | | | | 1.85%(d) | | | | 1.62%(d) | | | | 159% | |
Class I | | | | | | | | | | | | | | | | | | | | | | | | |
Six Months Ended 3/31/23 (Unaudited) | | | 3.64 | %(c) | | | $35,349 | | | | 0.62%(d) | | | | 4.07%(d) | | | | 1.10%(d) | | | | 427% | |
Period Ended 9/30/22(e) | | | (2.50 | )%(c) | | | 34,146 | | | | 0.63%(d) | | | | 2.10%(d) | | | | 1.28%(d) | | | | 159% | |
Class R6 | | | | | | | | | | | | | | | | | | | | | | | | |
Six Months Ended 3/31/23 (Unaudited) | | | 3.66 | %(c) | | | $10,107 | | | | 0.57%(d) | | | | 4.12%(d) | | | | 1.13%(d) | | | | 427% | |
Period Ended 9/30/22(e) | | | (2.46 | )%(c) | | | 9,760 | | | | 0.58%(d) | | | | 2.15%(d) | | | | 1.32%(d) | | | | 159% | |
| * | During the period, certain fees were contractually or voluntarily reduced and/or reimbursed. If such contractual/voluntary fee reductions and reimbursements had not occurred, the ratio would have been as indicated. |
| ** | Portfolio turnover rate is calculated on the basis of the Fund as a whole without distinguishing between the classes of shares issued. |
| (a) | Excludes sales charge. |
| (b) | Assumes investment at net asset value at the beginning of the period, reinvestment of all dividends and distributions, and a complete redemption of the investment at net asset value at the end of the period. |
| (e) | For the period from November 1, 2021 (commencement of operations) to September 30, 2022. |
See Notes to the Financial Statements.
72
|
NOTES TO FINANCIAL STATEMENTS |
March 31, 2023 (Unaudited)
1. Organization:
RBC Funds Trust (the “Trust”) is registered under the Investment Company Act of 1940 (as amended) as an open-end management investment company. The Trust was organized as a Delaware statutory trust on December 16, 2003 and currently consists of 24 portfolios. Overall responsibility for the management of the Trust is vested in its Board of Trustees (the “Board”). This report includes the following four investment portfolios (each a “Fund” and collectively, the “Funds”):
- RBC BlueBay Emerging Market Debt Fund (“Emerging Market Debt Fund”)
- RBC BlueBay High Yield Bond Fund (“High Yield Bond Fund”)
- RBC BlueBay Core Plus Bond Fund (“Core Plus Bond Fund”)
- RBC BlueBay Strategic Income Fund (“Strategic Income Fund”)
Class A and Class I shares are offered by each Fund; Class R6 shares are offered by Emerging Market Debt Fund, Core Plus Bond Fund and the Strategic Income Fund. Class A shares are offered with a maximum front-end sales charge of 4.25% for Emerging Market Debt Fund and High Yield Bond Fund and 3.75% for Core Plus Bond Fund and Strategic Income Fund and a 1.00% contingent deferred sales charge (“CDSC”) for redemption within 12 months of a $1 million or greater purchase on which no front-end sales charge was paid. Class I shares and Class R6 shares (intended for investors meeting certain investment minimum thresholds) are not subject to either a front-end sales charge or a CDSC.
RBC Global Asset Management (U.S.) Inc. (“RBC GAM-US)” or “Advisor” or “Co-Administrator”) acts as the investment advisor for the Funds and BlueBay Asset Management LLP (“BlueBay” or “Sub-Advisor”) acts as a sub-advisor for Emerging Market Debt Fund and High Yield Bond Fund. The officers of the Trust (“Fund Management”) are also employees of RBC GAM-US.
2. Significant Accounting Policies
Each Fund is an investment company that follows accounting and reporting guidance under the Financial Accounting Standards Board. Summarized below are the significant accounting policies of the Funds. These policies conform to accounting principles generally accepted in the United States of America (“U.S. GAAP”). Fund Management follows these policies when preparing financial statements. Fund Management may also be required to make estimates and assumptions that affect the reported amounts of assets and liabilities at the date of the financial statements and the reported amounts of income and expenses for the period. Actual results could differ from those estimates. The financial statements are as of the close of regular trading on the New York Stock Exchange (“NYSE”).
Security Valuation:
The Board has approved pricing and valuation procedures of the Advisor for determining the fair value of each Fund’s investments. Fair value of a security is considered to be the price that a fund might reasonably expect to receive upon its current sale in an orderly transaction between market participants.
Equity securities are generally valued on the basis of prices furnished by third-party pricing services approved by the Board. Equity securities listed on one or more exchanges shall be valued at the last available quoted sale price on the primary trading exchange as of the regularly scheduled closing time of the exchange and are categorized as Level 1 in the fair value hierarchy. (See “Fair Value Measurements” below for additional information). An equity security not listed on an exchange but listed on NASDAQ shall be valued at the NASDAQ official closing price and is also categorized as Level 1. If there was no sale on the primary exchange on the day the net asset value is calculated or a NASDAQ official closing price is not available, the most recent bid quotation generally will be used and such securities will generally be categorized as Level 2. Investments in open-end investment companies (mutual funds) are valued at net asset value and are categorized as Level 1 in the fair value hierarchy.
Fixed income securities, including to-be-announced (“TBA”) commitments and municipal bonds, are generally valued based on evaluated prices received from third-party pricing services or from broker-dealers who make markets in the securities and are generally categorized as Level 2 in the fair
73
|
NOTES TO FINANCIAL STATEMENTS |
value hierarchy (see “Fair Value Measurements” below for additional information). The pricing services utilize both dealer-supplied valuations and electronic data processing techniques that take into account multiple appropriate factors such as institutional-size trading in similar groups of securities, market spreads, interest rates, and fundamental security analytical data including yield, quality, coupon rate, maturity and type of issue.
Bank loans are valued based on evaluated prices received from third-party pricing services or fair valued using recently executed transactions, market price quotations, credit/market events, and cross-asset pricing. Inputs are generally observable market inputs obtained from independent sources. Bank Loans are generally categorized as Level 2 of the fair value hierarchy, unless key inputs are unobservable which would then be as Level 3.
Exchange-traded options, futures and options on futures are valued at the last sale price at the close of the market on the principal exchange on which they are traded. In the absence of any transactions on that day, the closing bid price shall be used for purchased options, futures and options on futures, and the closing ask price shall be used for written options. Such instruments are categorized as Level 1 of the fair value hierarchy. Options contracts traded in the over-the-counter (“OTC”) market shall be valued at the evaluated price provided by an independent pricing service or broker-dealer using a mathematical model which incorporates a number of market data factors, such as trades and prices of the underlying instruments. These contracts are categorized as Level 2 of the fair value hierarchy. Forward foreign currency exchange contracts are marked to market daily based upon foreign currency exchange rates provided by an independent pricing service as of the close of the NYSE, generally 4:00 p.m. EST, and are generally classified as Level 2 within the fair value hierarchy.
Swaps, including credit-default swaps, interest rate swaps and total return swaps, are generally valued by an independent pricing service using a discounted cash flow methodology. This technique is used to value both the fixed and variable components of the swap contracts and takes into account market data and inputs sourced from various institutions and market-makers and includes daily intra-day and closing spreads, credit index quotes, yield curves, and recovery rate assumptions. The Fund’s net benefit or obligation under the derivative contract, as measured by the fair market value of the contract, is included in the Fund’s net assets. These swap contracts are categorized as Level 2 in the fair valuation hierarchy.
Foreign securities valued in non-U.S. dollars are valued in the foreign currency and then converted into the U.S. dollar equivalent using the foreign exchange rate in effect at the close of NYSE on the day the security’s value is determined. The value of securities traded in markets outside the United States may be affected on a day that the NYSE is closed and an investor is not able to purchase, exchange or redeem shares of the Funds.
The Board has designated the Advisor with the responsibility for implementing the pricing and valuation procedures, including responsibility for determining the fair value of the Funds’ securities or other assets and liabilities, and has established a Pricing Committee to assist in carrying out supervisory functions related to such responsibilities. The Pricing Committee includes representatives of the Funds’ Advisor, Co-Administrator and Sub-Advisor, including personnel from accounting and operations, trading, risk management and compliance. The Pricing Committee meets at least quarterly to review and approve Fund valuation matters, including a review of the Funds’ pricing activity and operations, fair value measurements, pricing vendors, policies and procedures, and related controls. At least a quorum of the Pricing Committee shall meet more frequently, as needed, to consider and approve time-sensitive fair valuation matters. The Pricing Committee provides periodic reports to the Valuation, Portfolio Management and Performance Committee (“Valuation Committee”) of the Board regarding pricing and valuation matters. Members of the Pricing Committee meet with the Valuation Committee and the Board at each of their regularly scheduled meetings to discuss valuation matters and actions taken during the period.
The Advisor has procedures to determine the fair value of a security when a price is not available from a pricing service or broker- dealer or the Advisor has determined that a price provided by a pricing service or broker-dealer does not approximate fair value. Fair valuation may also be used when a significant valuation event affecting the value of a security or market sector is determined to have
74
|
NOTES TO FINANCIAL STATEMENTS |
occurred between the time when a security’s market closes and the time the Fund’s net asset value is calculated. The fair value of the security will be determined in good faith by the Advisor in accordance with procedures and methodologies approved by the Board. General factors used in determining the fair value of securities include, but are not limited to, fundamental analytical data relating to the security, the issuer and the market, such as duration, prepayment and default rates; general level of interest rates and changes in interest rates; information from broker-dealers; trading in similar securities; any restrictions on disposition of the security; and an evaluation of the forces that influence the market in which the investments are traded. These securities are either categorized as Level 2 or 3 in the fair value hierarchy, depending on the relevant inputs used.
When the Funds utilize fair valuation methods that use significant unobservable inputs to determine a security’s value, such securities will be categorized as Level 3 of the fair value hierarchy. These methods may require subjective determinations about the value of a security. While the Funds’ policy is intended to result in a calculation of a Fund’s net asset value that fairly reflects security values as of the time of pricing, the Funds cannot guarantee that values determined by the Advisor or persons acting at their direction would accurately reflect the price that the Funds could obtain for a security if they were to dispose of it as of the time of pricing (for instance, in a forced or distressed sale). The prices used by the Funds may differ from the value that would be realized if the securities were sold.
The Advisor employs various methods for calibrating the valuation approach related to securities categorized within Level 2 and Level 3 of the fair value hierarchy. These methods may include regular due diligence of the Funds’ pricing vendors, a regular review of key inputs and assumptions, transaction back-testing or disposition analysis to compare unrealized gains and losses to realized gains and losses, reviews of missing and stale prices and large movements in market value, and reviews of any market related activities. Additionally, the pricing of all fair value holdings is subsequently reported to the Valuation Committee and Board.
Foreign Taxes:
The Funds may be subject to foreign taxes on income, gains on investments or currency repatriation, a portion of which may be recoverable. The Funds will accrue such taxes and recoveries, as applicable, based upon its current interpretation of tax rules and regulations that exist in the markets in which it invests.
Realized gains in certain countries may be subject to foreign taxes at the Fund level, based on statutory rates. The Funds accrue for such foreign taxes on realized and unrealized gains at the appropriate rate for each jurisdiction, as applicable. The amount, if any, is disclosed as a liability in the Statement of Assets and Liabilities.
Fair Value Measurements:
The Funds disclose the fair value of their investments in a hierarchy that categorizes investments based on the inputs to valuation techniques used to measure fair value. The three levels of the fair value hierarchy are as follows:
• Level 1 - Inputs that reflect unadjusted quoted prices in active markets for identical assets or liabilities that the Funds have the ability to access at the measurement date.
• Level 2 - Significant inputs other than quoted prices that are observable for the asset or liability either directly or indirectly, including inputs in markets that are not considered to be active. Observable inputs may include quoted prices for similar securities, interest rates, spreads, prepayment spreads, etc.
• Level 3 - Significant unobservable inputs based on the best information available in the circumstances, to the extent observable inputs are not available (including the Fund’s own assumptions in determining the fair value of investments).
The inputs or methodology used for valuing investments are not necessarily an indication of the risk associated with investing in those securities.
Inputs used in determining fair value of an investment may include, but are not limited to, price information, volatility statistics, credit and market data, and other factors, all of which may be either observable or unobservable. Inputs can vary among investments and will be impacted by the
75
|
NOTES TO FINANCIAL STATEMENTS |
investment type and volume of activity for the particular security or similar securities in the market. Investments in the Level 2 category are generally supported by transactions and quoted prices from dealers participating in the market for those investments. Investments may be included in the Level 3 category due to a lack of market activity or transparency. Internal valuation models may also be used as a pricing source for Level 3 investments. Internal valuation models may rely on one or more unobservable inputs, such as estimated cash flows, financial statement analysis and discount rates.
The summary of inputs used to determine the fair value of the Funds’ investments as of March 31, 2023 is as follows:
| | | | | | | | | | | | | | | | | | | | | | | | | | | | | | | | |
| | | Level 1
Quoted Prices | | | Level 2
Significant
Observable
Inputs | | | Level 3
Significant
Unobservable
Inputs | | | Total | |
Emerging Market Debt Fund | | | | | | | | | | | | | | | | | | | | | | | | | | | | | | | | |
Assets: | | | | | | | | | | | | | | | | | | | | | | | | |
Investments in Securities | | | | | | | | | | | | | | | | | | | | | | | | | | | | | | | | |
Foreign Government Bonds | | | | | | $ | — | | | | | | | $ | 27,085,599 | | | | | | | $ | — | | | | | | | $ | 27,085,599 | |
Corporate Bonds | | | | | | | — | | | | | | | | 7,540,038 | | | | | | | | — | | | | | | | | 7,540,038 | |
Investment Company | | | | | | | 672,520 | | | | | | | | — | | | | | | | | — | | | | | | | | 672,520 | |
Municipal Bond | | | | | | | — | | | | | | | | 199,749 | | | | | | | | — | | | | | | | | 199,749 | |
Other Financial Instruments* | | | | | | | | | | | | | | | | | | | | | | | | | | | | | | | | |
Foreign currency exchange contracts - forward contracts | | | | | | | — | | | | | | | | 92,205 | | | | | | | | — | | | | | | | | 92,205 | |
Credit default swaps | | | | | | | — | | | | | | | | 53,810 | | | | | | | | — | | | | | | | | 53,810 | |
| | | | | | | | | | | | | | | | | | | | | | | | | | | | | | | | |
Total Assets | | | | | | $ | 672,520 | | | | | | | $ | 34,971,401 | | | | | | | $ | — | | | | | | | $ | 35,643,921 | |
| | | | | | | | | | | | | | | | | | | | | | | | | | | | | | | | |
| | | | | | | | | | | | | | | | | | | | | | | | | | | | | | | | |
Liabilities: | | | | | | | | | | | | | | | | | | | | | | | | |
Other Financial Instruments* | | | | | | | | | | | | | | | | | | | | | | | | | | | | | | | | |
Credit default swaps | | | | | | $ | — | | | | | | | $ | (28,082 | ) | | | | | | $ | — | | | | | | | $ | (28,082 | ) |
Foreign currency exchange contracts - forward contracts | | | | | | | — | | | | | | | | (69,605 | ) | | | | | | | — | | | | | | | | (69,605 | ) |
Financial futures contracts | | | | | | | (78,520 | ) | | | | | | | — | | | | | | | | — | | | | | | | | (78,520 | ) |
| | | | | | | | | | | | | | | | | | | | | | | | | | | | | | | | |
Total Liabilities | | | | | | $ | (78,520 | ) | | | | | | $ | (97,687 | ) | | | | | | $ | — | | | | | | | $ | (176,207 | ) |
| | | | | | | | | | | | | | | | | | | | | | | | | | | | | | | | |
76
|
NOTES TO FINANCIAL STATEMENTS |
| | | | | | | | | | | | | | | | | | | | | | | | | | | | | | |
| | | Level 1
Quoted Prices | | | Level 2
Significant
Observable
Inputs | | | Level 3 Significant Unobservable Inputs | | | Total | |
High Yield Bond Fund | | | | | | | | | | | | | | | | | | | | | | | | | | | | | | |
Assets: | | | | | | | | | | | | | | | | | | | | | | | |
Investments in Securities | | | | | | | | | | | | | | | | | | | | | | | | | | | | | | |
Corporate Bonds | | | | | | | | | | | | | | | | | | | | | | | | | | | | | | |
Australia | | | | | | $ | — | | | | | | | $ | 5,023,239 | | | | | $ | 169,285 | | | | | | | $ | 5,192,524 | |
Bermuda | | | | | | | — | | | | | | | | 2,325,181 | | | | | | — | | | | | | | | 2,325,181 | |
Canada | | | | | | | — | | | | | | | | 15,940,903 | | | | | | — | | | | | | | | 15,940,903 | |
Cayman Islands | | | | | | | — | | | | | | | | 3,287,330 | | | | | | — | | | | | | | | 3,287,330 | |
France | | | | | | | — | | | | | | | | 11,091,003 | | | | | | — | | | | | | | | 11,091,003 | |
Germany | | | | | | | — | | | | | | | | 8,343,638 | | | | | | — | | | | | | | | 8,343,638 | |
India | | | | | | | — | | | | | | | | 1,164,861 | | | | | | — | | | | | | | | 1,164,861 | |
Italy | | | | | | | — | | | | | | | | 3,839,931 | | | | | | — | | | | | | | | 3,839,931 | |
Luxembourg | | | | | | | — | | | | | | | | 3,391,572 | | | | | | — | | | | | | | | 3,391,572 | |
Mexico | | | | | | | — | | | | | | | | 1,233,765 | | | | | | — | | | | | | | | 1,233,765 | |
Netherlands | | | | | | | — | | | | | | | | 892,722 | | | | | | — | | | | | | | | 892,722 | |
Puerto Rico | | | | | | | — | | | | | | | | 2,308,367 | | | | | | — | | | | | | | | 2,308,367 | |
United Arab Emirates | | | | | | | — | | | | | | | | 2,844,908 | | | | | | — | | | | | | | | 2,844,908 | |
United Kingdom | | | | | | | — | | | | | | | | 8,560,143 | | | | | | — | | | | | | | | 8,560,143 | |
United States | | | | | | | — | | | | | | | | 241,450,744 | | | | | | — | | | | | | | | 241,450,744 | |
U.S. Treasury Obligations | | | | | | | — | | | | | | | | 13,500,627 | | | | | | — | | | | | | | | 13,500,627 | |
Investment Company | | | | | | | 9,238,870 | | | | | | | | — | | | | | | — | | | | | | | | 9,238,870 | |
Common Stocks | | | | | | | | | | | | | | | | | | | | | | | | | | | | | | |
United Kingdom | | | | | | | — | | | | | | | | 6,526 | | | | | | — | | | | | | | | 6,526 | |
United States | | | | | | | — | | | | | | | | 177,375 | | | | | | 1,403 | | | | | | | | 178,778 | |
Rights/Warrants | | | | | | | | | | | | | | | | | | | | | | | | | | | | | | |
Mexico | | | | | | | — | | | | | | | | — | | | | | | — | | | | | | | | — | |
Other Financial Instruments* | | | | | | | | | | | | | | | | | | | | | | | | | | | | | | |
Foreign currency exchange contracts - forward contracts | | | | | | | — | | | | | | | | 6,972 | | | | | | — | | | | | | | | 6,972 | |
| | | | | | | | | | | | | | | | | | | | | | | | | | | | | | |
Total Assets | | | | | | $ | 9,238,870 | | | | | | | $ | 325,389,807 | | | | | $ | 170,688 | | | | | | | $ | 334,799,365 | |
| | | | | | | | | | | | | | | | | | | | | | | | | | | | | | |
Liabilities: | | | | | | | | | | | | | | | | | | | | | | | |
Other Financial Instruments* | | | | | | | | | | | | | | | | | | | | | | | | | | | | | | |
Foreign currency exchange contracts - forward contracts | | | | | | | $— | | | | | | | | $(20,688 | ) | | | | | $— | | | | | | | | $(20,688 | ) |
77
|
NOTES TO FINANCIAL STATEMENTS |
| | | | | | | | | | | | | | | | | | | | | | | | | | | | | | | | |
| | | Level 1
Quoted Prices | | | Level 2
Significant
Observable
Inputs | | | Level 3
Significant
Unobservable
Inputs | | | Total | |
Core Plus Bond Fund | | | | | | | | | | | | | | | | | | | | | | | | | | | | | | | | |
Assets: | | | | | | | | | | | | | | | | | | | | | | | | |
Investments in Securities | | | | | | | | | | | | | | | | | | | | | | | | | | | | | | | | |
Corporate Bonds | | | | | | $ | — | | | | | | | $ | 21,540,340 | | | | | | | $ | — | | | | | | | $ | 21,540,340 | |
U.S. Government Agency Backed Mortgages | | | | | | | — | | | | | | | | 11,109,251 | | | | | | | | — | | | | | | | | 11,109,251 | |
Collateralized Mortgage Obligations | | | | | | | — | | | | | | | | 7,000,523 | | | | | | | | — | | | | | | | | 7,000,523 | |
Asset Backed Securities | | | | | | | — | | | | | | | | 3,483,342 | | | | | | | | — | | | | | | | | 3,483,342 | |
U.S. Treasury Obligations | | | | | | | — | | | | | | | | 2,697,652 | | | | | | | | — | | | | | | | | 2,697,652 | |
Bank Loans | | | | | | | — | | | | | | | | 1,958,346 | | | | | | | | — | | | | | | | | 1,958,346 | |
Investment Company | | | | | | | 800,074 | | | | | | | | — | | | | | | | | — | | | | | | | | 800,074 | |
Foreign Government Bonds | | | | | | | — | | | | | | | | 304,560 | | | | | | | | — | | | | | | | | 304,560 | |
Other Financial Instruments* | | | | | | | | | | | | | | | | | | | | | | | | | | | | | | | | |
Foreign currency exchange contracts - forward contracts | | | | | | | — | | | | | | | | 18,342 | | | | | | | | — | | | | | | | | 18,342 | |
Financial futures contracts | | | | | | | 203,566 | | | | | | | | — | | | | | | | | — | | | | | | | | 203,566 | |
| | | | | | | | | | | | | | | | | | | | | | | | | | | | | | | | |
Total Assets | | | | | | $ | 1,003,640 | | | | | | | $ | 48,112,356 | | | | | | | $ | — | | | | | | | $ | 49,115,996 | |
| | | | | | | | | | | | | | | | | | | | | | | | | | | | | | | | |
| | | | | | | | | | | | | | | | | | | | | | | | | | | | | | | | |
Liabilities: | | | | | | | | | | | | | | | | | | | | | | | | |
Other Financial Instruments* | | | | | | | | | | | | | | | | | | | | | | | | | | | | | | | | |
Interest Rate Swaps | | | | | | $ | — | | | | | | | $ | (33,782 | ) | | | | | | $ | — | | | | | | | $ | (33,782 | ) |
Foreign currency exchange contracts - forward contracts | | | | | | | — | | | | | | | | (73,412 | ) | | | | | | | — | | | | | | | | (73,412 | ) |
Financial futures contracts | | | | | | | (135,109 | ) | | | | | | | — | | | | | | | | — | | | | | | | | (135,109 | ) |
Credit default swaps | | | | | | | — | | | | | | | | (179,673 | ) | | | | | | | — | | | | | | | | (179,673 | ) |
| | | | | | | | | | | | | | | | | | | | | | | | | | | | | | | | |
Total Liabilities | | | | | | $ | (135,109 | ) | | | | | | $ | (286,867 | ) | | | | | | $ | — | | | | | | | $ | (421,976 | ) |
| | | | | | | | | | | | | | | | | | | | | | | | | | | | | | | | |
78
|
NOTES TO FINANCIAL STATEMENTS |
| | | | | | | | | | | | | | | | | | | | | | | | | | | | | | | | |
| | | Level 1
Quoted Prices | | | Level 2
Significant
Observable
Inputs | | | Level 3
Significant
Unobservable
Inputs | | | Total | |
Strategic Income Fund | | | | | | | | | | | | | | | | | | | | | | | | | | | | | | | | |
Assets: | | | | | | | | | | | | | | | | | | | | | | | | |
Investments in Securities | | | | | | | | | | | | | | | | | | | | | | | | | | | | | | | | |
Corporate Bonds | | | | | | $ | — | | | | | | | $ | 23,741,365 | | | | | | | $ | — | | | | | | | $ | 23,741,365 | |
U.S. Treasury Obligations | | | | | | | — | | | | | | | | 7,447,248 | | | | | | | | — | | | | | | | | 7,447,248 | |
Collateralized Mortgage Obligations | | | | | | | — | | | | | | | | 7,005,343 | | | | | | | | — | | | | | | | | 7,005,343 | |
Asset Backed Securities | | | | | | | — | | | | | | | | 3,841,204 | | | | | | | | — | | | | | | | | 3,841,204 | |
Bank Loans | | | | | | | — | | | | | | | | 2,441,519 | | | | | | | | — | | | | | | | | 2,441,519 | |
Investment Company | | | | | | | 2,072,899 | | | | | | | | — | | | | | | | | — | | | | | | | | 2,072,899 | |
Foreign Government Bonds | | | | | | | — | | | | | | | | 347,617 | | | | | | | | — | | | | | | | | 347,617 | |
Other Financial Instruments* | | | | | | | | | | | | | | | | | | | | | | | | | | | | | | | | |
Foreign currency exchange contracts - forward contracts | | | | | | | — | | | | | | | | 7,851 | | | | | | | | — | | | | | | | | 7,851 | |
Financial futures contracts | | | | | | | 205,242 | | | | | | | | — | | | | | | | | — | | | | | | | | 205,242 | |
| | | | | | | | | | | | | | | | | | | | | | | | | | | | | | | | |
Total Assets | | | | | | $ | 2,278,141 | | | | | | | $ | 44,832,147 | | | | | | | $ | — | | | | | | | $ | 47,110,288 | |
| | | | | | | | | | | | | | | | | | | | | | | | | | | | | | | | |
| | | | | | | | | | | | | | | | | | | | | | | | | | | | | | | | |
Liabilities: | | | | | | | | | | | | | | | | | | | | | | | | |
Other Financial Instruments* | | | | | | | | | | | | | | | | | | | | | | | | | | | | | | | | |
Interest Rate Swaps | | | | | | $ | — | | | | | | | $ | (28,158 | ) | | | | | | $ | — | | | | | | | $ | (28,158 | ) |
Foreign currency exchange contracts - forward contracts | | | | | | | — | | | | | | | | (84,672 | ) | | | | | | | — | | | | | | | | (84,672 | ) |
Credit default swaps | | | | | | | — | | | | | | | | (397,851 | ) | | | | | | | — | | | | | | | | (397,851 | ) |
Financial futures contracts | | | | | | | (779,473 | ) | | | | | | | — | | | | | | | | — | | | | | | | | (779,473 | ) |
| | | | | | | | | | | | | | | | | | | | | | | | | | | | | | | | |
Total Liabilities | | | | | | $ | (779,473 | ) | | | | | | $ | (510,681 | ) | | | | | | $ | — | | | | | | | $ | (1,290,154 | ) |
| | | | | | | | | | | | | | | | | | | | | | | | | | | | | | | | |
*Other financial instruments are instruments shown on the Schedule of Portfolio Investments, such as futures contracts, swaps and foreign currency contracts which are valued at fair value.
| | | | | | | | | | | | | | | | |
| | | BlueBay
High Yield
Bond Fund | |
| | | Common Stocks | | | Corporate Bonds–
(Australia) | |
Balance as of 9/30/22(value) | | | | | | $ | 2,783 | | | | | | | $ | 231,956 | |
Change in unrealized appreciation (depreciation) | | | | | | | (1,380 | ) | | | | | | | (62,671 | ) |
| | | | | | | | | | | | | | | | |
Balance as of 3/31/23(value) | | | | | | $ | 1,403 | | | | | | | $ | 169,285 | |
| | | | | | | | | | | | | | | | |
The Funds’ assets assigned to the Level 3 category are valued utilizing the valuation technique deemed the most appropriate in the circumstances. The significant unobservable inputs used include assumptions regarding the particular security’s cash flow profile and potential defaults that may not be generally observable for the security. The Common Stock in High Yield Bond Fund were fair valued using a discounted cash flow model based on unobservable inputs that include estimated cash flows, implied credit spread and discount rate (weighted average cost of capital). The Corporate Bonds in High Yield Bond Fund were fair valued using discounted cash flows. Significant changes in any of these assumptions may result in a lower or higher fair value measurement.
79
|
NOTES TO FINANCIAL STATEMENTS |
| | | | | | | | | | | | | | | | | | | | | | | | |
Quantitative Information about Level 3 Fair Value Measurements |
| | | | | | | | | |
| | | Fund | | | | | Fair Value
at
March 31,
2023 | | | | | | Valuation
Technique(s) | | | | Unobservable
Input | | | | Range (Weighted
Average) |
Corporate Bonds (Australia) | | High Yield
BondFund | | | | | | $ | 169,285 | | | | | | | Discounted
Cash Flow | | | | Discount Rate of
Cash Flows | | | | 12.1% —18.6%
(15.8%) |
| | | | | | | | | | | | | | | | | | | | Liquidity
Discount | | | | 5.0% —7.5%
(5.7%) |
Common Stocks | | High Yield
BondFund | | | | | | $ | 1,403 | | | | | | | Discounted
Cash Flow | | | | Discount Rate of
Cash Flows | | | | 19.4% —21.9%
(20.6%) |
| | | | | | | | | | | | | | | | | | | | Liquidity
Discount | | | | 10%
|
Foreign Currency Transactions:
The values of foreign securities, foreign currencies and other assets and liabilities denominated in foreign currencies are translated into U.S. dollars using current exchange rates each business day. Fluctuations in the value of foreign currency holdings and other assets and liabilities resulting from movements in currency exchange rates are recorded as unrealized foreign currency gains or losses. The effects of changes in foreign currency exchange rates on investments in securities are not segregated from the effects of changes in market prices of those securities on the Statements of Operations. Such fluctuations are included with the net change in unrealized appreciation/depreciation on investment transactions. However, for tax purposes, the effects of fluctuations in foreign currency exchange rates when determining the realized gain or loss upon the sale or maturity of foreign currency denominated debt obligations are segregated pursuant to U.S. Federal income tax regulations; such amounts are categorized as foreign exchange gain or loss for both financial reporting and income tax reporting purposes.
Bank Loans:
A Fund may invest in fixed and floating rate loans from one or more financial institutions (“lender(s)”) to a borrower by way of: (i) assignment/transfer of; or (ii) participation in the whole or part of the loan amount outstanding. In both instances, assignments or participations of such loans must be capable of being freely traded and transferred between investors in the loans. Participations typically will result in a Fund having a contractual relationship only with a lender as grantor of the participation but not with the borrower. A Fund acquires a participation interest only if the lender(s) positioned between the Fund and the borrower is determined by the Sub-Advisor to be creditworthy. When purchasing loan participations, a Fund assumes the economic risk associated with the corporate borrower and the credit risk associated with an interposed bank or other financial intermediary. Loan assignments typically involve a transfer of debt from a lender to a third party. When purchasing loan assignments, a Fund assumes the credit risk associated with the corporate borrower only.
Such loans may be secured or unsecured. Loans that are fully secured offer a Fund more protection than an unsecured loan in the event of non-payment of scheduled interest or principal. However, there is no assurance that the liquidation of collateral from a secured loan would satisfy the corporate borrower’s obligation. In addition, investments in loans through a direct assignment include the risk that if a loan is terminated, a Fund could become part owner of any collateral, and would bear the costs and liabilities associated with owning and disposing of the collateral.
Loan participations typically represent direct participation in a loan to a corporate borrower, and generally are offered by banks or other financial institutions or lending syndicates.
A loan is often administered by an agent bank acting as agent for all holders. Unless, under the terms of the loan or other indebtedness, a Fund has direct recourse against the corporate borrower, the Fund may have to rely on the agent bank or other financial intermediary to apply appropriate credit remedies against a corporate borrower.
80
|
NOTES TO FINANCIAL STATEMENTS |
When a Fund purchases a floating rate loan interest, it may receive a facility fee and when it sells a floating rate loan interest, it may pay a facility fee. On an ongoing basis, the Funds may receive a commitment fee based on the undrawn portion of the underlying line of credit amount of a floating rate loan interest. Facility and commitment fees are typically amortized to income over the term of the loan or term of the commitment, respectively. Consent and amendment fees are recorded to income as earned. Prepayment penalty fees, which may be received by the Funds upon the prepayment of a floating rate loan interest by a borrower, are recorded as realized gains. The Funds may invest in multiple series or tranches of a loan. A different series or tranche may have varying terms and carry different associated risks.
In connection with floating rate loan interests, the Funds may also enter into unfunded floating rate loan interests (“commitments”). In connection with these commitments, the Funds earn a commitment fee, typically set as a percentage of the commitment amount. Such fee income, which is included in interest income in the Statement of Operations, is recognized ratably over the commitment period. Unfunded floating rate loan interests are marked-to-market daily, and any unrealized appreciation or depreciation is included in the Statements of Assets and Liabilities and Statements of Operations.
As of March 31, 2023, Core Plus Bond Fund and Strategic Income Fund held bank loans.
Payment-in-Kind Securities:
The Funds may invest in payment-in-kind securities (“PIKs”). PIKs give the issuer the option at each interest payment date of making interest payments in either cash or additional debt securities. Those additional debt securities usually have the same terms, including maturity dates and interest rates, and associated risks as the original bonds. The daily market quotations of the original bonds may include the accrued interest (referred to as a dirty price) and require a pro-rata adjustment from the unrealized appreciation or depreciation on investments to interest receivable on the Statement of Assets and Liabilities.
For the period ended March 31, 2023, the total in-kind payments received by the High Yield Bond Fund with respect to PIKs constituted less than 5% of the Fund’s total income and, therefore, such payments were not disclosed as a separate line item on the Statement of Operations.
Derivatives:
The Funds may use derivative instruments, including futures, forwards, options, indexed securities, swaps and inverse securities as tools in the management of portfolio assets. A Fund may use such derivatives through either the creation of long or short positions to hedge various investments, for investment purposes, for risk management and/or to increase income or gain to the Fund. Derivatives allow a Fund to increase or decrease its risk exposure more quickly and efficiently than other types of instruments. Derivatives may be riskier than other types of investments and could result in losses that significantly exceed a Fund’s original investment. Derivatives are subject to the risk that changes in the value of a derivative may not correlate perfectly with the underlying asset, rate or index. The use of derivatives may not be successful, resulting in losses to a Fund, and the cost of such strategies may reduce the Fund’s returns.
Hedging also involves the risk that changes in the value of the derivative will not match those of the holdings being hedged as expected by the Funds, in which case any losses on the holdings being hedged may not be reduced and may be increased. There can be no assurance that a Fund’s hedging strategy will reduce risk or that hedging transactions will be available or cost effective. The Funds are subject to interest rate risk and foreign currency exchange risk in the normal course of pursuing their investment objectives by investing in various derivative financial instruments, as described below.
In addition to the risks associated with derivatives in general, the Funds will also be subject to risks related to swap agreements. Because swap agreements are not exchange-traded, but are private contracts into which a Fund and a swap counterparty enter as principals, a Fund may experience a loss or delay in recovering assets if the counterparty defaults on its obligations. Each Fund will segregate or earmark liquid assets in an amount sufficient to cover its obligations under swap agreements.
81
|
NOTES TO FINANCIAL STATEMENTS |
Financial Futures Contracts:
The Funds may enter into futures contracts in an effort to manage the duration of the portfolio and hedge against certain market risk. A futures contract on a securities index is an agreement obligating one party to pay, and entitling the other party to receive, during the term of the contract, cash payments based on the level of a specified securities index. Futures transactions involve brokerage costs and require a Fund to segregate assets to cover contracts that would require it to purchase securities or currencies. A Fund may lose the expected benefit of futures transactions if interest rates, exchange rates or securities prices change in an unanticipated manner. Such unanticipated changes may also result in lower overall performance than if a Fund had not entered into any futures transactions.
The Funds entered into U.S. Treasury Bond futures, Japanese treasury bond futures, Euro Dollar futures and Euro-Bund futures during the period ended March 31, 2023.
Upon entering into a futures contract, a Fund is required to pledge to the broker an amount of cash, U.S. government securities, or other assets equal to a certain percentage of the contract amount. Subsequent payments are made or received by the Funds each day, depending on the daily fluctuations in the fair value of the underlying instrument. A Fund would record an unrealized gain or loss each day equal to these daily payments.
Open futures contracts are shown on the Schedules of Portfolio Investments. Underlying collateral pledged for open futures contracts is the cash at brokers for financial futures contracts shown on the Statements of Assets and Liabilities at March 31, 2023.
Options:
The Funds may write (or sell) put and call options on the securities that the Funds are authorized to buy or already hold in their portfolio. The Funds may also purchase put and call options.
A call option gives the purchaser of the option the right (but not the obligation) to buy, and obligates the seller to sell (when the option is exercised), the underlying instrument at the exercise price at any time or at a specified time during the option period. A put option gives the holder the right to sell and obligates the writer to buy the underlying instrument at the exercise price at any time or at a specified time during the option period. When a Fund purchases (writes) an option, an amount equal to the premium paid (received) by a Fund is reflected as an asset (liability). The amount of the asset (liability) is subsequently marked-to-market to reflect the current market value of the option purchased (written). When an instrument is purchased or sold through an exercise of an option, the related premium paid (or received) is added to (or deducted from) the basis of the instrument acquired or deducted from (or added to) the proceeds of the instrument sold. When an option expires (or a Fund enters into a closing transaction), a Fund realizes a gain or loss on the option to the extent of the premiums received or paid (or gain or loss to the extent the cost of the closing transaction exceeds the premium received or paid). When a Fund writes a call option, such option is “covered,” meaning that a Fund holds the underlying instrument subject to being called by the option counterparty, or cash in an amount sufficient to cover the obligation. When a Fund writes a put option, such option is covered by cash in an amount sufficient to cover the obligation.
In purchasing and writing options, a Fund bears the market risk of an unfavorable change in the price of the underlying instrument or the risk that a Fund may not be able to enter into a closing transaction due to an illiquid market. Exercise of a written option could result in a Fund purchasing or selling a security at a price different from the current market value.
A Fund may execute transactions in both listed (exchange-traded) and OTC options. Listed options involve minimal counterparty risk since listed options are guaranteed against default by the exchange on which they trade. Transactions in certain OTC options may expose a Fund to the risk of default by the counterparty to the transaction. In the event of default by the counterparty to the OTC option transaction, a Fund’s maximum amount of loss is the premium paid (as purchaser) or the unrealized gain of the contract (as writer).
82
|
NOTES TO FINANCIAL STATEMENTS |
Forward Foreign Currency Exchange Contracts:
The Funds enter into forward foreign currency contracts (“Forward”) to hedge their exposure to changes in foreign currency exchange rates on foreign portfolio holdings (foreign currency exchange risk). In addition, certain Funds may use a Forward to provide exposure to the foreign currency market. A Forward is an agreement between two parties to purchase or sell a foreign currency at a future date at a negotiated forward rate. A Forward is marked-to-market daily and the change in market value is recorded by the Funds as unrealized appreciation or depreciation until the contract settlement date.
The market value of the Forward is determined using the forward rate for the remainder of the outstanding period of the contract, through the delivery date. When a Forward is closed or settled, the Funds record a realized gain or loss equal to the fluctuation in rates during the period a Forward was open.
In the event of default by the counterparty to the transaction, the Fund’s maximum amount of loss, as either the buyer or seller, is the unrealized gain of the contract.
Details of Forward contracts at period end are included in the Schedules of Portfolio Investments under the caption “Foreign currency exchange contracts.”
Swap Agreements:
The Funds may enter into swap agreements, which are agreements involving two parties to exchange the return generated by a security, currency, commodity, interest rate, index, or other measures for the return generated by another instrument, for example, the agreement to pay interest in exchange for a market-linked return based on a notional amount. The Funds entered into interest rate, credit default and other swap agreements as of March 31, 2023.
Interest rate swap agreements generally involve the agreement by a Fund to pay a counterparty a fixed or floating rate on a fixed notional amount and to receive a fixed or floating rate on a fixed notional amount, but may also involve the agreement to pay or receive payments derived from changes in interest rates. Periodic payments are generally made during the life of the swap agreement according to the terms and conditions of the agreement and at termination or maturity.
The Funds enter into cross-currency swaps to gain or reduce exposure to foreign currencies or as an economic hedge against either specific transactions or portfolio instruments (foreign currency exchange rate and/or interest rate risk). Cross-currency swaps are interest rate swaps in which one party pays a stream of interest payments, either fixed or floating, in exchange for another party’s stream of interest payments, either fixed or floating, based on the notional amounts of two different currencies. The notional amounts are typically determined based on the spot exchange rates at the inception of the trade. Cross-currency swaps may also involve an exchange of notional amounts at the start, during and/or at expiration of the contract, either at the current spot rate or another specified rate.
The Funds enter into credit default swaps to manage their exposure to the market or certain sectors of the market, to reduce their risk exposure to defaults of corporate and/or sovereign issuers or to create exposure to corporate and/or sovereign issuers to which they are not otherwise exposed (credit risk). The Funds enter into credit default swap agreements to provide a measure of protection against the default of an issuer (as buyer of protection) and/or gain credit exposure to an issuer to which it is not otherwise exposed (as seller of protection). The Funds may either buy or sell (write) credit default swaps on single-name issuers (corporate or sovereign), a combination or basket of single-name issuers or traded indexes. Credit default swaps on single-name issuers are agreements in which the buyer pays fixed periodic payments to the seller in consideration for a guarantee from the seller to make a specific payment should a negative credit event take place with respect to the referenced entity (e.g., bankruptcy, failure to pay, obligation accelerators, repudiation, moratorium or restructuring). Credit default swaps on traded indexes are agreements in which the buyer pays fixed periodic payments to the seller in consideration for a guarantee from the seller to make a specific payment should a writedown, principal or interest shortfall or default of all or individual underlying securities included in the index occurs. As a buyer, if an underlying credit event occurs, the Funds will either receive from the seller an amount equal to the notional amount of the swap and deliver the referenced security or underlying securities comprising the index or receive a net settlement of cash equal to the notional
83
|
NOTES TO FINANCIAL STATEMENTS |
amount of the swap less the recovery value of the security or underlying securities comprising the index. As a seller (writer), if an underlying credit event occurs, the Funds will either pay the buyer an amount equal to the notional amount of the swap and take delivery of the referenced security or underlying securities comprising the index or pay a net settlement of cash equal to the notional amount of the swap less the recovery value of the security or underlying securities comprising the index.
Total return swap agreements involve the commitments to pay or receive an amount generally determined by reference to a security, index or other measure in exchange for a specific market linked return, based on notional amounts. To the extent that the total return of the security, index or other measure underlying the transaction exceeds or falls short of the offsetting interest rate-based obligation, the Funds receive or make a payment to the counterparty. Interim payments and payments received or made by a Fund at the expiration or other termination of the swap agreements are recorded in the Statement of Operations as realized gains or losses, respectively. Swap agreements are marked-to-market daily based on dealer-supplied valuations, and changes in value, including the periodic amounts of interest to be paid or received on swaps, are recorded as unrealized appreciation/ (depreciation). Risks may exceed amounts recognized on the Statements of Assets and Liabilities. These risks include changes in the returns of the underlying instruments, failure of the counterparties to perform under the contracts’ terms and the possible lack of liquidity with respect to the swap agreements. Details of swap agreements open at period end are included in the Schedules of Portfolio Investments under the captions “Interest rate swaps” and “Credit default swaps”.
| | | | | | | | | | | | | | | | | | | | | | | | | | | | | | | | | | |
Fair Values of Derivative Financial Instrument as of March 31, 2023(1) | |
|
Statement of Assets and Liabilities Location | |
|
Asset Derivatives | |
| | | | |
| | | BlueBay Emerging Market Debt Fund | | | BlueBay High Yield Bond Fund | | | BlueBay Core Plus Bond Fund | | BlueBay Strategic Income Fund | |
Credit Risk: | | | | | | | | | | | | | | | | | | | | | | | | | | | | | | | | | | |
Credit default swaps, at value | | | | | | $ | 53,810 | | | | | | | $ | — | | | | | | | | | $ | — | | | | | | | $ | — | |
Interest Rate Risk: | | | | | | | | | | | | | | | | | | | | | | | | | | | | | | | | | | |
Unrealized appreciation on futures contracts | | | | | | | — | | | | | | | | — | | | | | | | | | | 203,566 | | | | | | | | 205,242 | |
Foreign currency exchange risk: | | | | | | | | | | | | | | | | | | | | | | | | | | | | | | | | | | |
Unrealized appreciation on forward foreign currency exchange contracts | | | | | | | 92,205 | | | | | | | | 6,972 | | | | | | | | | | 18,342 | | | | | | | | 7,851 | |
| | | | | | | | | | | | | | | | | | | | | | | | | | | | | | | | | | |
Total | | | | | | $ | 146,015 | | | | | | | $ | 6,972 | | | | | | | | | $ | 221,908 | | | | | | | $ | 213,093 | |
| | | | | | | | | | | | | | | | | | | | | | | | | | | | | | | | | | |
| | | | | | | | | | |
| | | | | | | | | | | | | | | | | | | | | | | | | | | | |
| |
| Liability Derivatives | |
| | | | |
| | | BlueBay Emerging Market Debt Fund | | | BlueBay High Yield Bond Fund | | | BlueBay Core Plus Bond Fund | | BlueBay Strategic Income Fund | |
Credit Risk: | | | | | | | | | | | | | | | | | | | | | | | | | | | | | | | | | | |
Credit default swaps, at value | | | | | | $ | 28,082 | | | | | | | $ | — | | | | | | | | | $ | 179,673 | | | | | | | $ | 397,851 | |
Interest Rate Risk: | | | | | | | | | | | | | | | | | | | | | | | | | | | | | | | | | | |
Unrealized depreciation on interest rate swaps | | | | | | | — | | | | | | | | — | | | | | | | | | | 33,782 | | | | | | | | 28,158 | |
84
|
NOTES TO FINANCIAL STATEMENTS |
| | | | | | | | | | | | | | | | | | | | | | | | | | | | | | | | |
| |
Liability Derivatives | |
| | | | |
| | | BlueBay Emerging Market Debt Fund | | | BlueBay High Yield
Bond Fund | | | BlueBay Core Plus Bond Fund | | | BlueBay Strategic Income Fund | |
Unrealized depreciation on futures contracts | | | | | | $ | 78,520 | | | | | | | $ | — | | | | | | | $ | 135,109 | | | | | | | $ | 779,473 | |
Foreign currency exchange risk: | | | | | | | | | | | | | | | | | | | | | | | | | | | | | | | | |
Unrealized depreciation on forward foreign currency exchange contracts | | | | | | | 69,605 | | | | | | | | 20,688 | | | | | | | | 73,412 | | | | | | | | 84,672 | |
| | | | | | | | | | | | | | | | | | | | | | | | | | | | | | | | |
Total | | | | | | $ | 176,207 | | | | | | | $ | 20,688 | | | | | | | $ | 421,976 | | | | | | | $ | 1,290,154 | |
| | | | | | | | | | | | | | | | | | | | | | | | | | | | | | | | |
The effect of derivative instruments on the Statement of Operations during the period ended March 31, 2023 is as follows:
| | | | | | | | | | | | | | | | | | | | | | | | | | | | | | | | | | |
Derivative Instruments Categorized by Risk Exposure | | BlueBay Emerging Market Debt Fund | | | BlueBay
High Yield Bond Fund | | BlueBay
Core Plus Bond Fund | | | BlueBay Strategic Income Fund |
| | | | | | | | | | | |
Net realized Gain/(Loss) From: | | | | | | | | | | | | | | | | | | | | | | | | | | | | | | | | | | |
Credit Risk: | | | | | | | | | | | | | | | | | | | | | | | | | | | | | | | | | | |
Credit default swaps | | | | | | $ | (129,290) | | | | | $ | 95,841 | | | | | | | $ | (178,681 | ) | | | | | | | | $ | (70,972) | | | |
Interest Rate Risk: | | | | | | | | | | | | | | | | | | | | | | | | | | | | | | | | | | |
Interest rate swaps | | | | | | | — | | | | | | — | | | | | | | | 120,267 | | | | | | | | | | 1,327,127 | | | |
Financial futures contracts | | | | | | | 125,848 | | | | | | 174,245 | | | | | | | | (294,969 | ) | | | | | | | | | 697,900 | | | |
Foreign currency exchange risk: | | | | | | | | | | | | | | | | | | | | | | | | | | | | | | | | | | |
Forward foreign currency exchange contracts | | | | | | | (93,654) | | | | | | 27,296 | | | | | | | | (117,246 | ) | | | | | | | | | (107,093) | | | |
| | | | | | | | | | | | | | | | | | | | | | | | | | | | | | | | | | |
Total | | | | | | $ | (97,096) | | | | | $ | 297,382 | | | | | | | $ | (470,629 | ) | | | | | | | | $ | 1,846,962 | | | |
| | | | | | | | | | | | | | | | | | | | | | | | | | | | | | | | | | |
| | | | | | | | | | | | | | | | | | | | | | | | | | | | | | | | | | |
Derivative Instruments Categorized by Risk Exposure | | BlueBay Emerging Market Debt Fund | | | BlueBay High Yield Bond Fund | | BlueBay Core Plus Bond Fund | | | BlueBay Strategic Income Fund |
| | | | | | | | | | | |
Net Change in Unrealized Appreciation/(Depreciation) From: | | | | | | | | | | | | | | | | | | | | | | | | | | | | | | | | | | |
Credit Risk: | | | | | | | | | | | | | | | | | | | | | | | | | | | | | | | | | | |
Credit default swaps | | | | | | $ | (84,377) | | | | | $ | — | | | | | | | $ | (82,805) | | | | | | | | | $ | (195,031) | | | |
Interest Rate Risk: | | | | | | | | | | | | | | | | | | | | | | | | | | | | | | | | | | |
Interest rate swaps | | | | | | | — | | | | | | — | | | | | | | | (164,273) | | | | | | | | | | (1,784,867) | | | |
Financial futures contracts | | | | | | | (143,125) | | | | | | — | | | | | | | | 272,955 | | | | | | | | | | (1,119,393) | | | |
Foreign currency exchange risk: | | | | | | | | | | | | | | | | | | | | | | | | | | | | | | | | | | |
Forward foreign currency exchange contracts | | | | | | | (7,647) | | | | | | (207,950) | | | | | | | | (122,052) | | | | | | | | | | (138,066) | | | |
| | | | | | | | | | | | | | | | | | | | | | | | | | | | | | | | | | |
Total | | | | | | $ | (235,149) | | | | | $ | (207,950) | | | | | | | $ | (96,175) | | | | | | | | | $ | (3,237,357) | | | |
| | | | | | | | | | | | | | | | | | | | | | | | | | | | | | | | | | |
(1) Not considered to be hedging instruments for accounting disclosure purposes.
85
|
NOTES TO FINANCIAL STATEMENTS |
For the period ended March 31, 2023, the average volume of derivative activities based on ending quarterly outstanding amounts are as follows:
| | | | | | | | | | | | | | | | |
| | | BlueBay
Emerging Market
Debt Fund | | | BlueBay
High Yield
Bond Fund | | | BlueBay
Core Plus
Bond Fund | | | BlueBay
Strategic
Income Fund | |
Futures long position (contracts) | | | — | | | | — | | | | 108 | | | | 38 | |
Futures short position (contracts) | | | 18 | | | | — | | | | 34 | | | | 282 | |
Forward foreign currency exchange contracts purchased (U.S. dollar amounts) | | | $5,019,263 | | | $ | 4,765,000 | | | $ | 3,258,458 | | | $ | 3,658,257 | |
Forward foreign currency exchange contracts sold (U.S. dollar amounts) | | | 2,692,953 | | | | 2,227,342 | | | | 1,457,556 | | | | 1,388,532 | |
Interest rate swaps (Notional Amount in U.S. Dollars) | | | — | | | | — | | | | 134,681,000 | | | | 122,802,500 | |
Credit default swaps (Notional Amount in U.S. Dollars) | | | 4,051,000 | | | | — | | | | 12,943,000 | | | | 28,142,000 | |
Counterparty Credit Risk:
Derivatives may also expose a Fund to counterparty risk (the risk that the derivative counterparty will not fulfill its contractual obligations). To the extent amounts due to the Funds from their counterparties are not fully collateralized contractually or otherwise, the Funds bear the risk of loss from counterparty non-performance. A Fund’s maximum risk of loss from counterparty credit risk on over-the-counter (“OTC”) derivatives is generally the aggregate unrealized gain in excess of any collateral pledged by the counterparty to the Funds.
For foreign currency exchange contracts, risks may arise upon entering into these contracts from the potential inability of the counterparties to meet the terms of their contracts, or if the foreign currency rates change unfavorably.
The Funds’ risk of loss from counterparty credit risk on OTC derivatives is generally limited to the aggregate unrealized gain netted against any collateral held by the Funds. For OTC purchased options, the Funds bear the risk of loss in the amount of the premiums paid and change in market value of the options should the counterparty not perform under the contracts. Written options by the Funds do not give rise to counterparty credit risk, as written options obligate the Funds to perform and not the counterparty. Counterparty risk related to exchange-traded financial futures contracts and options is minimal because of the protection against defaults provided by the exchange on which they trade.
With exchange-traded purchased options and futures and centrally cleared swaps, the exchange or clearinghouse, as counterparty to such instruments, guarantees against a possible default. The clearinghouse stands between the buyer and the seller of the contract; therefore, credit risk is limited to failure of the clearinghouse. While offset rights may exist under applicable law, the Fund does not have a contractual right of offset against a clearing broker or clearinghouse in the event of a default (including the bankruptcy or insolvency) of the clearing broker or clearinghouse. Additionally, credit risk exists in exchange-traded futures and centrally cleared swaps with respect to initial and variation margin that is held in a clearing broker’s customer accounts. While clearing brokers are required to segregate customer margin from their own assets, in the event that a clearing broker becomes insolvent or goes into bankruptcy and at that time there is a shortfall in the aggregate amount of margin held by the clearing broker for all its clients, typically the shortfall would be allocated on a pro rata basis across all the clearing broker’s customers, potentially resulting in losses to the Funds.
In order to better define its contractual rights and to secure rights that will help the Funds mitigate its counterparty risk, the Funds may enter into an International Swaps and Derivatives Association, Inc.
86
|
NOTES TO FINANCIAL STATEMENTS |
Master Agreement (“ISDA Master Agreement”) or similar agreement with its derivative contract counterparties. An ISDA Master Agreement is a bilateral agreement between a Fund and a counterparty that governs certain OTC derivatives and typically contains, among other things, collateral posting terms and netting provisions in the event of a default and/or termination event. Under an ISDA Master Agreement, a Fund may, under certain circumstances, offset with the counterparty certain derivative financial instruments’ payables and/or receivables with collateral held and/or posted and create one single net payment. The provisions of the ISDA Master Agreement typically permit a single net payment in the event of default including the bankruptcy or insolvency of the counterparty. However, bankruptcy or insolvency laws of a particular jurisdiction may impose restrictions on or prohibitions against the right of offset in bankruptcy, insolvency or other events. In addition, certain ISDA Master Agreements allow counterparties to OTC derivatives to terminate derivative contracts prior to maturity in the event a Fund’s net assets decline by a stated percentage or the Fund fails to meet the terms of its ISDA Master Agreements, which would cause the Fund to accelerate payment of any net liability owed to the counterparty.
Collateral Requirements:
For derivatives traded under an ISDA Master Agreement, the collateral requirements are typically calculated by netting the mark-to-market amount for each transaction under such agreement and comparing that amount to the value of any collateral currently pledged by the Fund and the counterparty.
Cash collateral that has been pledged to cover obligations of a Fund and cash collateral received from the counterparty, if any, is reported separately on the Statements of Assets and Liabilities as cash due to broker for options contracts, cash at broker for financial futures contracts and segregated cash and foreign currency for options contracts and swap contracts and cash received as payable to broker, respectively. Non-cash collateral pledged by the Fund, if any, is noted in the Schedule of Portfolio Investments. Generally, the amount of collateral due from or to a party has to exceed a minimum transfer amount threshold (e.g. $500,000) before a transfer is required, which is determined at the close of business of a Fund and any additional required collateral is delivered to/pledged by a Fund on the next business day. Typically, a Fund and its counterparties are not permitted to sell, re-pledge or use the collateral they receive. To the extent amounts due to a Fund from its counterparties are not fully collateralized, contractually or otherwise, a Fund bears the risk of loss from counterparty non-performance. The Funds attempt to mitigate counterparty risk by entering into agreements only with counterparties that it believes have the financial resources to honor their obligations and by monitoring the financial stability of those counterparties.
87
|
NOTES TO FINANCIAL STATEMENTS |
Emerging Market Debt Fund
| | | | | | | | | | | | | | | | | | | | | | | | | | | | | | | | | | | | | | | | |
| | | Barclays
Bank Plc | | | Citibank
N.A | | | HSBC
Bank Plc | | | Morgan
Stanley | | | Total | |
| | | | | | | | | | |
Assets: | | | | | | | | | | | | | | | | | | | | | | | | | | | | | | | | | | | | | | | | |
Forward Currency Exchange Contracts | | | | | | $ | — | | | | | | | $ | 90,980 | | | | | | | $ | 1,225 | | | | | | | $ | — | | | | | | | $ | 92,205 | |
Swaps | | | | | | | 53,810 | | | | | | | | — | | | | | | | | — | | | | | | | | — | | | | | | | | 53,810 | |
| | | | | | | | | | | | | | | | | | | | | | | | | | | | | | | | | | | | | | | | |
| | | | | | | | | | |
Total Assets | | | | | | | 53,810 | | | | | | | | 90,980 | | | | | | | | 1,225 | | | | | | | | — | | | | | | | | 146,015 | |
| | | | | | | | | | | | | | | | | | | | | | | | | | | | | | | | | | | | | | | | |
| | | | | | | | | | |
Liabilities: | | | | | | | | | | | | | | | | | | | | | | | | | | | | | | | | | | | | | | | | |
Forward Currency Exchange Contracts | | | | | | | — | | | | | | | | 69,605 | | | | | | | | — | | | | | | | | — | | | | | | | | 69,605 | |
Financial Futures Contracts | | | | | | | — | | | | | | | | — | | | | | | | | — | | | | | | | | 78,520 | | | | | | | | 78,520 | |
Swaps | | | | | | | — | | | | | | | | — | | | | | | | | — | | | | | | | | 28,082 | | | | | | | | 28,082 | |
| | | | | | | | | | | | | | | | | | | | | | | | | | | | | | | | | | | | | | | | |
| | | | | | | | | | |
Total Liabilities | | | | | | | — | | | | | | | | 69,605 | | | | | | | | — | | | | | | | | 106,602 | | | | | | | | 176,207 | |
| | | | | | | | | | | | | | | | | | | | | | | | | | | | | | | | | | | | | | | | |
| | | | | | | | | | |
Total Financial and Derivative Net Assets1 | | | | | | | 53,810 | | | | | | | | 21,375 | | | | | | | | 1,225 | | | | | | | | (106,602) | | | | | | | | (30,192) | |
| | | | | | | | | | | | | | | | | | | | | | | | | | | | | | | | | | | | | | | | |
| | | | | | | | | | |
Net Amount2 | | | | | | $ | 53,810 | | | | | | | $ | 21,375 | | | | | | | $ | 1,225 | | | | | | | $ | (106,602) | | | | | | | $ | (30,192) | |
| | | | | | | | | | | | | | | | | | | | | | | | | | | | | | | | | | | | | | | | |
High Yield Bond Fund
| | | | | | | | | | | | | | | | |
| | | Citibank
N.A. | | | Total | |
Assets: | | | | | | | | | | | | | | | | |
Forward Currency Exchange Contracts | | | | | | $ | 6,972 | | | | | | | $ | 6,972 | |
| | | | | | | | | | | | | | | | |
| | | | |
Total Assets | | | | | | | 6,972 | | | | | | | | 6,972 | |
| | | | | | | | | | | | | | | | |
| | | | |
Liabilities: | | | | | | | | | | | | | | | | |
Forward Currency Exchange Contracts | | | | | | | 20,688 | | | | | | | | 20,688 | |
| | | | | | | | | | | | | | | | |
| | | | |
Total Liabilities | | | | | | | 20,688 | | | | | | | | 20,688 | |
| | | | | | | | | | | | | | | | |
| | | | |
Total Financial and Derivative Net Assets1 | | | | | | | (13,716) | | | | | | | | (13,716) | |
Total Collateral (Received) Pledged3 | | | | | | | 13,716 | | | | | | | | 13,716 | |
| | | | | | | | | | | | | | | | |
| | | | |
Net Amount2 | | | | | | $ | — | | | | | | | $ | — | |
| | | | | | | | | | | | | | | | |
88
|
NOTES TO FINANCIAL STATEMENTS |
Core Plus Bond Fund
| | | | | | | | | | | | | | | | | | | | | | | | |
| | | Citibank
N.A. | | | Morgan
Stanley | | | Total | |
| | | | | | |
Assets: | | | | | | | | | | | | | | | | | | | | | | | | |
Forward Currency Exchange Contracts | | | | | | $ | 18,342 | | | | | | | $ | — | | | | | | | $ | 18,342 | |
Financial Futures Contracts | | | | | | | — | | | | | | | | 203,566 | | | | | | | | 203,566 | |
| | | | | | | | | | | | | | | | | | | | | | | | |
| | | | | | |
Total Assets | | | | | | | 18,342 | | | | | | | | 203,566 | | | | | | | | 221,908 | |
| | | | | | | | | | | | | | | | | | | | | | | | |
| | | | | | |
Liabilities: | | | | | | | | | | | | | | | | | | | | | | | | |
Forward Currency Exchange Contracts | | | | | | | 73,412 | | | | | | | | — | | | | | | | | 73,412 | |
Financial Futures Contracts | | | | | | | — | | | | | | | | 135,109 | | | | | | | | 135,109 | |
Swaps | | | | | | | — | | | | | | | | 213,455 | | | | | | | | 213,455 | |
| | | | | | | | | | | | | | | | | | | | | | | | |
| | | | | | |
Total Liabilities | | | | | | | 73,412 | | | | | | | | 348,564 | | | | | | | | 421,976 | |
| | | | | | | | | | | | | | | | | | | | | | | | |
| | | | | | |
Total Financial and Derivative Net Assets1 | | | | | | | (55,070) | | | | | | | | (144,998) | | | | | | | | (200,068) | |
Total Collateral (Received) Pledged2 | | | | | | | 55,070 | | | | | | | | — | | | | | | | | 55,070 | |
| | | | | | | | | | | | | | | | | | | | | | | | |
| | | | | | |
Net Amount3 | | | | | | $ | — | | | | | | | $ | (144,998) | | | | | | | $ | (144,998) | |
| | | | | | | | | | | | | | | | | | | | | | | | |
| | | | | | |
| Strategic Income Fund | | | | | | | | | | | | | | | | | | | | | | | | |
| | | |
| | | Citibank
N.A. | | | Morgan
Stanley | | | Total | |
| | | | | | |
Assets: | | | | | | | | | | | | | | | | | | | | | | | | |
Forward Currency Exchange Contracts | | | | | | $ | 7,851 | | | | | | | $ | — | | | | | | | $ | 7,851 | |
Financial Futures Contracts | | | | | | | — | | | | | | | | 205,242 | | | | | | | | 205,242 | |
| | | | | | | | | | | | | | | | | | | | | | | | |
| | | | | | |
Total Assets | | | | | | | 7,851 | | | | | | | | 205,242 | | | | | | | | 213,093 | |
| | | | | | | | | | | | | | | | | | | | | | | | |
| | | | | | |
Liabilities: | | | | | | | | | | | | | | | | | | | | | | | | |
Forward Currency Exchange Contracts | | | | | | | 84,672 | | | | | | | | — | | | | | | | | 84,672 | |
Financial Futures Contracts | | | | | | | — | | | | | | | | 779,473 | | | | | | | | 779,473 | |
Swaps | | | | | | | — | | | | | | | | 426,009 | | | | | | | | 426,009 | |
| | | | | | | | | | | | | | | | | | | | | | | | |
| | | | | | |
Total Liabilities | | | | | | | 84,672 | | | | | | | | 1,205,482 | | | | | | | | 1,290,154 | |
| | | | | | | | | | | | | | | | | | | | | �� | | | |
| | | | | | |
Total Financial and Derivative Net Assets1 | | | | | | | (76,821) | | | | | | | | (1,000,240) | | | | | | | | (1,077,061) | |
Total Collateral (Received) Pledged2 | | | | | | | 76,821 | | | | | | | | — | | | | | | | | 76,821 | |
| | | | | | | | | | | | | | | | | | | | | | | | |
| | | | | | |
Net Amount3 | | | | | | $ | — | | | | | | | $ | (1,000,240) | | | | | | | $ | (1,000,240) | |
| | | | | | | | | | | | | | | | | | | | | | | | |
1 The amount of derivatives for offset is limited to the amount of assets and/or liabilities that are subject to a MNA.
2 Net amount represents the net amount receivable (payable) from/to the individual counterparty in the event of default.
3 Excess of collateral (received) pledged from/to the individual counterparty may not be shown for financial reporting purposes.
Affiliated Investments:
The Funds invest in another Fund of the Trust (an “Affiliated Fund”), U.S. Government Money Market Fund-RBC Institutional Class 1, as a cash sweep vehicle. The income earned by the Funds from the Affiliated Fund for the period is disclosed in the Statement of Operations. The table below details the transactions of the Funds in the Affiliated Fund.
As the affiliated investment is a money market fund in which shares are issued and redeemed at $1.00 per share, the number of shares purchased and sold equal the dollar amount shown as purchased and sold, and no gain or loss was realized on the sale of shares of the affiliated money market fund.
89
|
NOTES TO FINANCIAL STATEMENTS |
| | | | | | | | | | | | | | | | | | | | |
| | | Value
September 30, 2022 | | | Purchases | | | Sales | | | Value
March 31, 2023 | | | Dividends | |
Investments in U.S. Government Money Market Fund—RBC Institutional Class 1 | | | | | | | | | | | | | | | | | | | | |
Emerging Market Debt Fund | | | $2,571,521 | | | $ | 10,308,138 | | | $ | 12,207,139 | | | $ | 672,520 | | | $ | 14,346 | |
High Yield Bond Fund | | | 7,884,517 | | | | 121,750,992 | | | | 120,396,639 | | | | 9,238,870 | | | | 143,526 | |
Core Plus Bond Fund | | | 3,468,902 | | | | 49,940,238 | | | | 52,609,066 | | | | 800,074 | | | | 40,422 | |
Strategic Income Fund | | | 8,444,957 | | | | 61,381,415 | | | | 67,753,473 | | | | 2,072,899 | | | | 965,303 | |
Credit Enhancement:
Certain obligations held by the Funds have credit enhancement or liquidity features that may, under certain circumstances, provide for repayment of principal and interest on the obligation upon demand date, interest rate reset date or final maturity. These enhancements may include: letters of credit; liquidity guarantees; security purchase agreements; tender option purchase agreements and third party insurance.
Investment Transactions and Income:
Investment transactions are recorded on trade date. Dividend income net of non-reclaimable withholding taxes is recorded on the ex-dividend date. Non-cash dividends, if any, are recorded on the ex-dividend date at fair value. Realized gains and losses from investment transactions are calculated based on the cost of the specific security (also known as identified cost basis). Interest income is recognized on the accrual basis and includes, where applicable, the amortization or accretion of premium or discount using the effective yield method.
Expense, Investment Income and Gain/Loss Allocation:
Each Fund pays the expenses that are directly related to its operations, such as custodian fees or advisory fees. Expenses incurred by the Trust, such as trustee or legal fees, are allocated among each of the Funds in the Trust either proportionately based upon each Fund’s relative net assets or using another reasonable basis such as equally across all Funds in the Trust, depending on the nature of the expense. Individual share classes within a Fund are charged expenses specific to that class, such as distribution fees and transfer agent fees. Within a Fund, expenses other than class specific expenses are allocated daily to each class based upon the proportion of relative net assets. Investment income and realized and unrealized gains or losses are allocated to each class of shares based on relative net assets.
Indemnifications:
Under the Trust’s organizational documents, each Trustee, officer, employee or other agent of the Trust is indemnified against certain liabilities that may arise out of their duties to the Funds. Additionally, in the normal course of business, the Funds enter into contracts, including the Funds’ servicing agreements, that contain a variety of indemnification clauses. The Funds’ maximum exposure under these arrangements is unknown as this would involve future claims that may be made against the Funds that have not yet occurred.
Distributions to Shareholders:
Each Fund pays out any income that it receives, less expenses, in the form of dividends and capital gains to its shareholders. Income dividends are declared and paid monthly. Capital gain distributions are declared and paid at least annually. Distributions to shareholders are recorded on the ex-dividend date. The amount of dividends and distributions are calculated based on federal income tax regulations, which may differ from US GAAP. These “book/tax” differences may be either temporary or permanent in nature. To the extent these differences are determined, as of the end of the tax year, to be permanent, they are reclassified within a Fund’s capital accounts based on their federal tax basis treatment.
90
|
NOTES TO FINANCIAL STATEMENTS |
3. Agreements and Other Transactions with Affiliates:
The Trust has entered into an investment advisory agreement with RBC GAM-US under which RBC GAM-US manages each Fund’s assets and furnishes related office facilities, equipment, research and personnel. The agreement requires each Fund to pay RBC GAM-US a monthly fee based upon average daily net assets. Under the terms of the agreement, RBC GAM-US is entitled to receive fees based on a percentage of the average daily net assets of each of the Funds as follows:
| | | | |
| | | Annual Rate | |
Emerging Market Debt Fund | | | 0.65% | |
High Yield Bond Fund | | | 0.55% | |
Core Plus Bond Fund | | | 0.35% | |
Strategic Income Fund | | | 0.53% | |
RBC GAM-US has contractually agreed to waive fees and/or make payments in order to keep total operating expenses (excluding certain fees such as interest, taxes and acquired fund fees and expenses) of the Funds to the following levels pursuant to an expense limitation agreement.
| | | | | | | | | | | | |
| | | Class A
Annual Rate | | | Class I
Annual Rate | | | Class R6
Annual Rate | |
Emerging Market Debt Fund | | | 1.04% | | | | 0.79% | | | | 0.74% | |
High Yield Bond Fund | | | 0.82% | | | | 0.57% | | | | N/A | |
Core Plus Bond Fund | | | 0.70% | | | | 0.45% | | | | 0.40% | |
Strategic Income Fund | | | 0.88% | | | | 0.63% | | | | 0.58% | |
This expense limitation agreement is in place until January 31, 2024 and may not be terminated by RBC GAM-US prior to that date. The agreement shall continue for additional one-year terms unless terminated or revised by the Board at any time or by RBC GAM-US at the expiration of any one-year period. The Advisor is entitled to recoup from the Fund or class the fees and/or operating expenses waived or reimbursed during any of the previous 3 years, provided the Fund is able to do so and remain in compliance with the expense limitation in place at the time the fees were waived or expenses paid.
The amounts subject to possible recoupment under the expense limitation agreement were:
| | | | | | | | | | | | | | | | | | | | |
| | | FYE 9/30/20 | | | FYE 9/30/21 | | | FYE 9/30/22 | | | FYE 9/30/23 | | | Total | |
Emerging Market Debt Fund | | | $144,146 | | | | $262,011 | | | | $233,671 | | | | $125,453 | | | $ | 765,281 | |
High Yield Bond Fund | | | 232,251 | | | | 535,173 | | | | 704,969 | | | | 391,535 | | | | 1,863,928 | |
Core Plus Bond Fund | | | N/A | | | | N/A | | | | 304,698 | | | | 126,870 | | | | 431,568 | |
Strategic Income Fund | | | N/A | | | | N/A | | | | 300,597 | | | | 124,620 | | | | 425,217 | |
There was no recoupment of expense reimbursement/waivers during the year. Amounts from years prior to those shown are no longer subject to recoupment
RBC GAM-US may also voluntarily waive and/or reimburse operating expenses of any Fund from time to time. Any such voluntary program may be changed or eliminated at any time without notice, and expenses waived under such program are not subject to recoupment.
RBC GAM-US voluntarily agreed to waive its investment advisory fees by the amount of investment advisory fees the Funds pay to RBC GAM-US indirectly through its investment in an affiliated money market fund. For the period ended March 31, 2023, the amount waived was $631, $5,640, $1,596 and $2,608 for the Emerging Market Debt Fund, High Yield Bond Fund, Core Plus Bond Fund and Strategic Income Fund respectively, and is included in expenses waived/reimbursed by Advisory in the Statement of Operations.
91
|
NOTES TO FINANCIAL STATEMENTS |
Emerging Market Debt Fund and High Yield Bond Fund, Core Plus Bond Fund and Strategic Income Fund are sub-advised by BlueBay, a wholly-owned subsidiary of Royal Bank of Canada, which is also the parent company of the Advisor. The Sub-Advisor is paid by the Advisor out of the advisory fee paid by the Funds to the Advisor.
RBC GAM-US serves as co-administrator to the Funds. BNY Mellon serves as co-administrator and fund accounting agent. Services provided under the administrative services agreement include providing day-to-day administration of matters related to the Funds, maintenance of their records and the preparation of reports. Under the terms of the administrative services agreement, RBC GAM-US does not receive a fee for its role as co-administrator. BNY Mellon receives a fee for its services payable by the Funds based in part on the Funds’ average net assets. BNY Mellon’s fee is included with “Accounting fees” in the Statements of Operations.
Certain Officers and Trustees of the Trust are affiliated with the Advisor. Such Officers and Trustees receive no compensation from the Funds for serving in their respective roles.
The Trust currently pays each of the independent Trustees (Trustees of the Trust who are not directors, officers or employees of the Advisor, either Co-Administrator or Distributor) an annual retainer of $84,000. The Board Chairperson and Audit Committee Chairperson each receive an additional retainer of $2,500 annually, and all other trustees serving as Chair of a Board committee each receive an additional retainer of $1,000 annually. In addition, Independent Trustees receive a quarterly meeting fee of $6,500 for each in-person Board meeting attended, a meeting fee of $1,500 for each telephonic or Special Board meeting attended, a $1,500 fee for each Board committee meeting attended, and are reimbursed for all out-of-pocket expenses relating to attendance at such meetings. These amounts are included in the Statement of Operations in “Trustees’ fees”.
In conjunction with the launch of each of the Funds or additional share classes, the Advisor invested seed capital in each Fund to provide each Fund or share class with its initial investment assets. The table below shows, as of March 31, 2023, each Fund’s net assets, the shares (if any) of each Fund held by the Advisor, and the percent of total net assets represented by the Advisor’s investment.
| | | | | | | | | | | | |
| | | Net Assets | | | Shares held
by Advisor | | | % of Fund Net Assets | |
Emerging Market Debt Fund | | $ | 36,227,369 | | | | 1,437 | | | | 0.0% | |
Core Plus Bond Fund | | $ | 44,404,692 | | | | 5,175,614 | | | | 100.0% | |
Strategic Income Fund | | $ | 50,487,996 | | | | 5,267,533 | | | | 100.0% | |
4. Fund Distribution:
Each of the Funds that offers Class A shares has adopted a Master Distribution 12b-1 Plan (the “Plan”) in which Quasar Distributors LLC (the “Distributor”) acts as the Funds’ distributor. The Plan permits each Fund to make payments for, or to reimburse the Distributor for, distribution-related costs and expenses of marketing shares of Class A covered under the Plan, and/or for providing shareholder services. The Plan does not apply to Class I and Class R6. The following chart shows the current Plan fee rate for Class A.
| | | | |
| | | Class A | |
12b-1 Plan Fee | | | 0.25%* | |
* Under the 12b-1 plan, the maximum fee rate for Class A shares is 0.50%. Currently the Board has approved an annual limit of 0.25%.
Plan fees are based on average daily net assets of Class A. Up to 0.25% of each Plan fee may be designated as a service fee, as defined by the applicable rules of the Financial Industry Regulatory Authority. The Distributor, subject to applicable legal requirements, may waive the Plan fee voluntarily, in whole or in part. For the period ended March 31, 2023, there were no fees waived by the Distributor.
92
|
NOTES TO FINANCIAL STATEMENTS |
The Distributor did not receive any CDSC fees from Class A shares of the Funds during the period ended March 31, 2023.
For the period ended March 31, 2023, the Distributor received commissions of $3,700 for front-end sales charges of Class A shares of the Funds, of which $3,700 was paid to affiliated broker-dealers and the remainder was either paid to unaffiliated broker-dealers or retained by the Distributor.
5. Securities Transactions:
The cost of securities purchased and proceeds from securities sold (excluding securities maturing less than one year from acquisition) for the period ended March 31, 2023 were as follows:
| | | | | | | | | | | | | | | | |
| | | Purchases
(Excl. U.S. Gov’t) | | | Sales
(Excl. U.S. Gov’t) | | | Purchases
of U.S. Gov’t. | | | Sales
of U.S. Gov’t. | |
Emerging Market Debt Fund | | $ | 18,355,898 | | | $ | 11,462,084 | | | $ | 782,750 | | | $ | 2,403,538 | |
High Yield Bond Fund | | | 150,071,946 | | | | 110,054,962 | | | | 12,877,447 | | | | 12,888,742 | |
Core Plus Bond Fund | | | 139,368,259 | | | | 142,620,917 | | | | 49,062,293 | | | | 51,085,484 | |
Strategic Income Fund | | | 161,134,175 | | | | 163,448,158 | | | | 18,495,512 | | | | 18,452,346 | |
6. Capital Share Transactions:
The Trust is authorized to issue an unlimited number of shares of beneficial interest (“shares outstanding”) without par value. Transactions in capital stock of the Funds are summarized on the following pages:
| | | | | | | | | | | | | | | | | | | | | | | | | | | | | | |
| | | | | Emerging Market Debt Fund | | | | | | High Yield Bond Fund | |
| | | | | | | | |
| | | | | For the
Six Months
Ended
March 31,
2023
(Unaudited) | | | | | | For the
Year Ended
September 30,
2022 | | | | | | For the
Six Months
Ended
March 31,
2023
(Unaudited) | | | | | | For the
Year Ended
September 30,
2022 | |
CAPITAL TRANSACTIONS: | | | | | | | | | | | | | | | | | | | | | | | | | | | | | | |
Class A | | | | | | | | | | | | | | | | | | | | | | | | | | | | | | |
Proceeds from shares issued | | | | $ | — | | | | | | | $ | 21,622 | | | | | | | $ | 799,976 | | | | | | | $ | 1,434,024 | |
Distributions reinvested | | | | | 826 | | | | | | | | 1,321 | | | | | | | | 95,027 | | | | | | | | 198,485 | |
Cost of shares redeemed | | | | | (1 | ) | | | | | | | (4,893 | ) | | | | | | | (921,183 | ) | | | | | | | (1,720,571 | ) |
| | | | | | | | | | | | | | | | | | | | | | | | | | | | | | |
| | | | | | | | |
Change in Class A | | | | $ | 825 | | | | | | | $ | 18,050 | | | | | | | $ | (26,180 | ) | | | | | | $ | (88,062 | ) |
| | | | | | | | | | | | | | | | | | | | | | | | | | | | | | |
| | | | | | | | |
Class I | | | | | | | | | | | | | | | | | | | | | | | | | | | | | | |
Proceeds from shares issued | | | | $ | 4,062,077 | | | | | | | $ | 9,259,514 | | | | | | | $ | 132,227,779 | | | | | | | $ | 258,126,687 | |
Distributions reinvested | | | | | 1,065,592 | | | | | | | | 1,717,053 | | | | | | | | 8,642,640 | | | | | | | | 14,628,539 | |
Cost of shares redeemed | | | | | (2,011,261 | ) | | | | | | | (17,151 | ) | | | | | | | (93,314,795 | ) | | | | | | | (184,149,944 | ) |
| | | | | | | | | | | | | | | | | | | | | | | | | | | | | | |
| | | | | | | | |
Change in Class I | | | | $ | 3,116,408 | | | | | | | $ | 10,959,416 | | | | | | | $ | 47,555,624 | | | | | | | $ | 88,605,282 | |
| | | | | | | | | | | | | | | | | | | | | | | | | | | | | | |
| | | | | | | | |
Class R6 | | | | | | | | | | | | | | | | | | | | | | | | | | | | | | |
Distributions reinvested | | | | $ | 341 | | | | | | | $ | 663 | | | | | | | $ | — | | | | | | | $ | — | |
| | | | | | | | | | | | | | | | | | | | | | | | | | | | | | |
| | | | | | | | |
Change in Class R6 | | | | $ | 341 | | | | | | | $ | 663 | | | | | | | $ | — | | | | | | | $ | — | |
| | | | | | | | | | | | | | | | | | | | | | | | | | | | | | |
| | | | | | | | |
Change in net assets resulting from capital transactions | | | | $ | 3,117,574 | | | | | | | $ | 10,978,129 | | | | | | | $ | 47,529,444 | | | | | | | $ | 88,517,220 | |
| | | | | | | | | | | | | | | | | | | | | | | | | | | | | | |
93
|
NOTES TO FINANCIAL STATEMENTS |
| | | | | | | | | | | | | | | | | | | | | | | | | | | | | | |
| | | | | Emerging Market Debt Fund | | | | | | High Yield Bond Fund | |
| | | | | | | | |
| | | | | For the
Six Months
Ended
March 31,
2023
(Unaudited) | | | | | | For the
Year Ended
September 30,
2022 | | | | | | For the
Six Months
Ended
March 31,
2023
(Unaudited) | | | | | | For the
Year Ended
September 30,
2022 | |
| | | | | | | | |
SHARE TRANSACTIONS: | | | | | | | | | | | | | | | | | | | | | | | | | | | | | | |
Class A | | | | | | | | | | | | | | | | | | | | | | | | | | | | | | |
Issued | | | | | — | | | | | | | | 2,378 | | | | | | | | 86,224 | | | | | | | | 139,226 | |
Reinvested | | | | | — | | | | | | | | 158 | | | | | | | | 10,312 | | | | | | | | 19,447 | |
Redeemed | | | | | — | | | | | | | | (548 | ) | | | | | | | (99,639 | ) | | | | | | | (168,456 | ) |
| | | | | | | | | | | | | | | | | | | | | | | | | | | | | | |
| | | | | | | | |
Change in Class A | | | | | — | | | | | | | | 1,988 | | | | | | | | (3,103 | ) | | | | | | | (9,783 | ) |
| | | | | | | | | | | | | | | | | | | | | | | | | | | | | | |
| | | | | | | | |
Class I | | | | | | | | | | | | | | | | | | | | | | | | | | | | | | |
Issued | | | | | 562,424 | | | | | | | | 1,112,751 | | | | | | | | 14,067,639 | | | | | | | | 25,401,490 | |
Reinvested | | | | | 141,582 | | | | | | | | 201,064 | | | | | | | | 928,150 | | | | | | | | 1,433,918 | |
Redeemed | | | | | (280,423 | ) | | | | | | | (2,061 | ) | | | | | | | (9,938,655 | ) | | | | | | | (18,490,960 | ) |
| | | | | | | | | | | | | | | | | | | | | | | | | | | | | | |
| | | | | | | | |
Change in Class I | | | | | 423,583 | | | | | | | | 1,311,754 | | | | | | | | 5,057,134 | | | | | | | | 8,344,448 | |
| | | | | | | | | | | | | | | | | | | | | | | | | | | | | | |
| | | | | | | | |
Class R6 | | | | | | | | | | | | | | | | | | | | | | | | | | | | | | |
Reinvested | | | | | — | | | | | | | | 76 | | | | | | | | — | | | | | | | | — | |
| | | | | | | | | | | | | | | | | | | | | | | | | | | | | | |
| | | | | | | | |
Change in Class R6 | | | | | — | | | | | | | | 76 | | | | | | | | — | | | | | | | | — | |
| | | | | | | | | | | | | | | | | | | | | | | | | | | | | | |
| | | | | | | | |
Change in shares resulting from capital transactions | | | | | 423,583 | | | | | | | | 1,313,818 | | | | | | | | 5,054,031 | | | | | | | | 8,334,665 | |
| | | | | | | | | | | | | | | | | | | | | | | | | | | | | | |
| | | | | | | | | | | | | | | | | | | | | | | | | | | | | | | | |
| | | Core Plus Bond Fund | | | Strategic Income Fund | |
| | | | |
| | | For the
Six Months
Ended
March 31,
2023
(Unaudited) | | | For the
Period Ended
September 30,
2022(a) | | | For the
Six Months
Ended
March 31,
2023
(Unaudited) | | | For the
Period Ended
September 30,
2022(a) | |
CAPITAL TRANSACTIONS: | | | | | | | | | | | | | | | | | | | | | | | | | | | | | | | | |
Class A | | | | | | | | | | | | | | | | | | | | | | | | | | | | | | | | |
Proceeds from shares issued | | | | | | $ | — | | | | | | | $ | 5,000,000 | | | | | | | $ | — | | | | | | | $ | 5,000,000 | |
Distributions reinvested | | | | | | | 65,971 | | | | | | | | 75,065 | | | | | | | | 175,364 | | | | | | | | 66,020 | |
| | | | | | | | | | | | | | | | | | | | | | | | | | | | | | | | |
| | | | | | | | |
Change in Class A | | | | | | $ | 65,971 | | | | | | | $ | 5,075,065 | | | | | | | $ | 175,364 | | | | | | | $ | 5,066,020 | |
| | | | | | | | | | | | | | | | | | | | | | | | | | | | | | | | |
| | | | | | | | |
Class I | | | | | | | | | | | | | | | | | | | | | | | | | | | | | | | | |
Proceeds from shares issued | | | | | | $ | — | | | | | | | $ | 35,000,000 | | | | | | | $ | — | | | | | | | $ | 35,000,000 | |
Distributions reinvested | | | | | | | 481,884 | | | | | | | | 588,490 | | | | | | | | 1,261,308 | | | | | | | | 531,813 | |
| | | | | | | | | | | | | | | | | | | | | | | | | | | | | | | | |
| | | | | | | | |
Change in Class I | | | | | | $ | 481,884 | | | | | | | $ | 35,588,490 | | | | | | | $ | 1,261,308 | | | | | | | $ | 35,531,813 | |
| | | | | | | | | | | | | | | | | | | | | | | | | | | | | | | | |
| | | | | | | | |
Class R6 | | | | | | | | | | | | | | | | | | | | | | | | | | | | | | | | |
Proceeds from shares issued | | | | | | $ | — | | | | | | | $ | 10,000,000 | | | | | | | $ | — | | | | | | | $ | 10,000,000 | |
Distributions reinvested | | | | | | | 139,253 | | | | | | | | 171,927 | | | | | | | | 362,301 | | | | | | | | 155,930 | |
| | | | | | | | | | | | | | | | | | | | | | | | | | | | | | | | |
| | | | | | | | |
Change in Class R6 | | | | | | $ | 139,253 | | | | | | | $ | 10,171,927 | | | | | | | $ | 362,301 | | | | | | | $ | 10,155,930 | |
| | | | | | | | | | | | | | | | | | | | | | | | | | | | | | | | |
| | | | | | | | |
Change in net assets resulting from capital transactions | | | | | | $ | 687,108 | | | | | | | $ | 50,835,482 | | | | | | | $ | 1,798,973 | | | | | | | $ | 50,753,763 | |
| | | | | | | | | | | | | | | | | | | | | | | | | | | | | | | | |
94
|
NOTES TO FINANCIAL STATEMENTS |
| | | | | | | | | | | | | | | | | | | | | | | | | | | | | | | | |
| | | Core Plus Bond Fund | | | Strategic Income Fund | |
| | | | |
| | | For the
Six Months
Ended
March 31,
2023
(Unaudited) | | | For the
Period Ended
September 30,
2022(a) | | | For the
Six Months
Ended
March 31,
2023
(Unaudited) | | | For the
Period Ended
September 30,
2022(a) | |
| | | | | | | | |
SHARE TRANSACTIONS: | | | | | | | | | | | | | | | | | | | | | | | | | | | | | | | | |
Class A | | | | | | | | | | | | | | | | | | | | | | | | | | | | | | | | |
Issued | | | | | | | — | | | | | | | | 500,000 | | | | | | | | — | | | | | | | | 500,000 | |
Reinvested | | | | | | | 7,944 | | | | | | | | 8,371 | | | | | | | | 18,533 | | | | | | | | 6,790 | |
| | | | | | | | | | | | | | | | | | | | | | | | | | | | | | | | |
| | | | | | | | |
Change in Class A | | | | | | | 7,944 | | | | | | | | 508,371 | | | | | | | | 18,533 | | | | | | | | 506,790 | |
| | | | | | | | | | | | | | | | | | | | | | | | | | | | | | | | |
| | | | | | | | |
Class I | | | | | | | | | | | | | | | | | | | | | | | | | | | | | | | | |
Issued | | | | | | | — | | | | | | | | 3,500,000 | | | | | | | | — | | | | | | | | 3,500,000 | |
Reinvested | | | | | | | 57,988 | | | | | | | | 65,434 | | | | | | | | 133,256 | | | | | | | | 54,656 | |
| | | | | | | | | | | | | | | | | | | | | | | | | | | | | | | | |
| | | | | | | | |
Change in Class I | | | | | | | 57,988 | | | | | | | | 3,565,434 | | | | | | | | 133,256 | | | | | | | | 3,554,656 | |
| | | | | | | | | | | | | | | | | | | | | | | | | | | | | | | | |
| | | | | | | | |
Class R6 | | | | | | | | | | | | | | | | | | | | | | | | | | | | | | | | |
Issued | | | | | | | — | | | | | | | | 1,000,000 | | | | | | | | — | | | | | | | | 1,000,000 | |
Reinvested | | | | | | | 16,771 | | | | | | | | 19,107 | | | | | | | | 38,275 | | | | | | | | 16,024 | |
| | | | | | | | | | | | | | | | | | | | | | | | | | | | | | | | |
| | | | | | | | |
Change in Class R6 | | | | | | | 16,771 | | | | | | | | 1,019,107 | | | | | | | | 38,275 | | | | | | | | 1,016,024 | |
| | | | | | | | | | | | | | | | | | | | | | | | | | | | | | | | |
| | | | | | | | |
Change in shares resulting from capital transactions | | | | | | | 82,703 | | | | | | | | 5,092,912 | | | | | | | | 190,064 | | | | | | | | 5,077,470 | |
| | | | | | | | | | | | | | | | | | | | | | | | | | | | | | | | |
(a)For the period from November 1, 2021 (commencement of operations) to September 30, 2022.
7. Federal Income Taxes:
It is the policy of each Fund to continue to qualify as a regulated investment company by complying with the provisions available to certain investment companies, as defined under Subchapter M of the Internal Revenue Code, and to distribute substantially all of its net investment income and net realized capital gains. Therefore, no federal tax liability is recorded in the financial statements of each Fund.
For all open tax years and all major taxing jurisdictions, management of the Funds has concluded that there are no significant uncertain tax positions that would require recognition in the financial statements. Open tax years are those that are open for examination by taxing authorities (i.e., generally the last three tax year ends and the interim tax period since then). Furthermore, management of the Funds is also not aware of any tax positions for which it is reasonably possible that the total amounts of unrecognized tax benefits will significantly change in the next twelve months.
As of March 31, 2023, the tax cost of investments and the breakdown of unrealized appreciation (depreciation) for each Fund was as follows:
| | | | | | | | | | | | | | | | |
| | | Tax Cost Of
Investments | | | Unrealized
Appreciation | | | Unrealized
Depreciation | | | Net Unrealized
Appreciation/
(Depreciation) | |
Emerging Market Debt Fund | | $ | 40,355,418 | | | $ | 667,419 | | | $ | (5,524,932 | ) | | $ | (4,857,513 | ) |
High Yield Bond Fund | | | 353,587,232 | | | | 1,687,988 | | | | (20,482,827 | ) | | | (18,794,839 | ) |
Core Plus Bond Fund | | | 50,712,470 | | | | 519,808 | | | | (2,338,190 | ) | | | (1,818,382 | ) |
Strategic Income Fund | | | 48,838,967 | | | | 418,168 | | | | (2,359,940 | ) | | | (1,941,772 | ) |
95
|
NOTES TO FINANCIAL STATEMENTS |
The difference between book basis and tax basis unrealized appreciation/depreciation is attributable primarily to the tax deferral of losses on wash sales, currency straddle losses, significant debt modifications and mark to market on derivatives.
The tax character of distributions during the year ended September 30, 2022 were as follows:
| | | | | | | | | | | | | | | | |
| | | Distributions Paid From | |
| | | Ordinary
Income | | | Net Long Term
Capital Gains | | | Total Taxable
Distributions | | | Total
Distributions
Paid | |
Emerging Market Debt Fund | | $ | 1,721,294 | | | $ | — | | | $ | 1,721,294 | | | $ | 1,721,294 | |
High Yield Bond Fund | | | 15,858,016 | | | | 612,456 | | | | 16,470,472 | | | | 16,470,472 | |
Core Plus Bond Fund | | | 835,482 | | | | — | | | | 835,482 | | | | 835,482 | |
Strategic Income Fund | | | 753,763 | | | | — | | | | 753,763 | | | | 753,763 | |
The tax basis of components of accumulated earnings/(losses) and tax character of distributions are determined at fiscal year end, and will be included in the Annual Report dated September 30, 2023.
As of September 30, 2022, the Emerging Market Debt Fund and the Core Plus Bond Fund had short-term capital loss carryforwards of $6,287,066 and $2,774,814 and long-term capital loss carryforwards of $1,164,496 and $1,252,944 respectively, available to offset future realized capital gains in accordance with the Regulated Investment Company Modernization Act of 2010. These capital loss carryforwards are not subject to expiration and must first be utilized to offset future realized gains of the same character.
Under current tax law, Post-October Capital Losses and Late-Year Ordinary Losses may be deferred and treated as occurring on the first business day of the following fiscal year for tax purposes. The RBC Bluebay High Yield Bond Fund had deferred qualified late-year short-term losses of $6,302,190 and deferred qualified late-year long-term losses $3,261,756 which will be treated as arising on the first business day of the fiscal year ending September 30, 2023.
8. Market Timing:
The Trust strongly discourages attempts at market timing by Fund shareholders. Prior to June 11, 2021, each Fund charged a redemption fee of 2% of the value of the shares redeemed or exchanged within 30 days of purchase. In addition, the Trust may limit the number of exchanges that may be made between Funds to five (5) per calendar year. When assessed, the redemption fee was deducted from the redemption proceeds and retained by the Fund, not by the Advisor. This redemption fee was not charged in cases where, for example, the redemption resulted from an automatic reinvestment or asset re-allocation not specifically directed by the shareholder. The Trust also reserves the right to reject any Fund purchase order made by persons deemed to be market timers. The Funds’ prospectus contains a full description of the Trust’s policies on market timing and/or excessive trading. The redemption fee is recorded as a credit to capital and is included in the capital transactions on the Statements of Changes in Net Assets.
9. Commitments:
High Yield Bond Fund may invest in floating rate loan interests. In connection with these investments, High Yield Bond Fund may also enter into bridge loan commitments (“commitments”). Commitments may obligate the Fund to furnish temporary financing to a borrower until permanent financing can be arranged. As of March 31, 2023, High Yield Bond Fund had no outstanding commitments. In connection with these commitments, High Yield Bond Fund earns a commitment fee, typically set as a percentage of the commitment amount. Such fee income, which is included in interest income in the Statements of Operations, is recognized ratably over the commitment period.
96
|
NOTES TO FINANCIAL STATEMENTS |
10. Significant Risks
Shareholder concentration risk:
As of March 31, 2023, the Funds had broker-dealer omnibus accounts which each owned more than 10% of a Fund’s outstanding shares as shown below:
| | | | | | | | |
| | | # of Omnibus Accounts | | | % of Fund | |
High Yield Bond Fund | | | 2 | | | | 50.7% | |
In addition, three unaffiliated shareholders in aggregate owned 97.2% of the Emerging Market Debt Fund as of March, 31, 2023. Significant transactions by these shareholders may impact the Funds’ performance.
Market risk:
One or more markets in which a Fund invests may go down in value, sometimes sharply and unpredictably, and the value of a Fund’s portfolio securities may fall or fail to rise. Market risk may affect a single issuer, sector of the economy, industry or the market as a whole. In addition, global economies and financial markets are becoming increasingly interconnected, and political, economic and other conditions and events (including, but not limited to, natural disasters, pandemics, epidemics, and social unrest) in one country, region, or financial market may adversely impact issuers in a different country, region or financial market. Furthermore, the occurrence of, among other events, natural or man-made disasters, severe weather or geological events, fires, floods, earthquakes, outbreaks of disease (such as COVID-19, avian influenza or H1N1/09), epidemics, pandemics, malicious acts, cyber-attacks, terrorist acts or the occurrence of climate change, may also adversely impact the performance of a Fund. Such events could adversely impact issuers, markets and economies over the short- and long-term, including in ways that cannot necessarily be foreseen. A Fund could be negatively impacted if the value of a portfolio holding were harmed by such political or economic conditions or events. Moreover, such negative political and economic conditions and events could disrupt the processes necessary for a Fund’s operations.
Interest Rate Risk:
A Fund’s yield and value will fluctuate as the general level of interest rates change. During periods when interest rates are low, a Fund’s yield may also be low. When interest rates increase, securities held by a Fund will generally decline in value. Interest rate changes are influenced by a number of factors including government policy, inflation expectations, and supply and demand. Municipal securities may be issued on a when-issued or delayed delivery basis, where payment and delivery take place at a future date. A Fund assumes the risk that the value of the security at delivery may be more or less than the purchase price.
Credit Spread Risk:
A Fund’s investments may be adversely affected if any of the issuers it is invested in are subject to an actual or perceived (whether by market participants, rating agencies, pricing services or otherwise) deterioration to their credit quality. Any actual or perceived deterioration may lead to an increase in the credit spreads and a decline in price of the issuer’s securities.
Currency Risk:
Changes in foreign currency exchange rates will affect the value of a Fund’s securities and the price of a Fund’s shares. Generally, when the value of the U.S. Dollar rises in value relative to a foreign currency, an investment in that country loses value because that currency is worth fewer U.S. Dollars.
Devaluation of a currency by a country’s government or banking authority also may have a significant impact on the value of any investment denominated in that currency. Currency markets generally are not as regulated as securities markets.
11. Subsequent Events:
In July 2022, RBC Global Asset Management announced that it would be consolidating the operations of BlueBay Asset Management LLP with its UK-based asset management affiliate RBC Global Asset Management (UK) Limited (“RBC GAM UK”). The consolidation was completed on April 1, 2023, and
97
|
NOTES TO FINANCIAL STATEMENTS |
as a result, RBC GAM UK has become the sub-advisor to RBC BlueBay Emerging Market Debt Fund and RBC BlueBay High Yield Bond Fund. In conjunction with the consolidation, the Funds’ Board of Trustees approved a new sub-advisory agreement between the RBC BlueBay Emerging Market Debt Fund and RBC BlueBay High Yield Bond Fund and RBC GAM UK (the “New Agreement”). Shareholder approval was not required for the New Agreement. The New Agreement will not involve an increase in the fees payable by, or reductions in services rendered to the Funds.
98
|
SHARE CLASS INFORMATION (UNAUDITED) |
The Funds offer Class A, Class I and Class R6 shares.
Class A
Class A shares are available in all Funds. This share class is available for purchase primarily through investment advisors, broker-dealers, banks and other financial services intermediaries. Class A shares of the Funds are currently subject to a maximum up-front sales charge of 4.25% (3.75% for the Core Plus Bond Fund and Strategic Income Fund) and a 1.00% CDSC for redemption within 12 months of a $1 million or greater purchase. Class A shares currently include a 0.25% (25 bps) annual 12b-1 service and distribution fee.
Class I
Class I shares are available in all Funds. This share class is intended for investors meeting certain minimum investment thresholds. This share class does not have an up-front sales charge (load) or a 12b-1 service and distribution fee.
Class R6
Class R6 shares are available in Emerging Market Debt Fund, Core Plus Bond Fund and Strategic Income Fund. This share class is intended for investors meeting certain minimum investment thresholds. This share class does not have an up-front sales charge (load) or a 12b-1 service and distribution fee.
99
|
SUPPLEMENTAL INFORMATION (UNAUDITED) |
Shareholder Expense Examples
As a shareholder of the RBC Funds, you incur two types of costs: (1) transaction costs and (2) ongoing costs, including management fees; and other Fund expenses. This example is intended to help you understand your ongoing costs (in dollars) of investing in the RBC Funds and to compare these costs with the ongoing costs of investing in other mutual funds.
The example is based on an investment of $1,000 invested at the beginning of the period and held for the entire period from October 1, 2022 through March 31, 2023.
Actual Expenses
The table below provides information about actual account values and actual expenses. You may use the information below, together with the amount you invested, to estimate the expenses that you paid over the period. Simply divide your account value by $1,000 (for example, an $8,600 account value divided by $1,000 = 8.6), then multiply the result by the number in the table under the heading entitled “Expenses Paid During Period” to estimate the expenses you paid on your account during this period.
| | | | | | | | | | | | | | | | | | | | |
| | | | | | Beginning
Account Value
10/1/22 | | | Ending
Account Value
3/31/23 | | | Expenses Paid
During Period*
10/1/22–3/31/23 | | | Annualized
Expense Ratio
During Period
10/1/22–3/31/23 | |
Emerging Market Debt Fund | | | | | | | | | | | | | | | | | | | | |
| | | Class A | | | | $1,000.00 | | | | $1,122.70 | | | | $5.56 | | | | 1.04% | |
| | | Class I | | | | 1,000.00 | | | | 1,124.70 | | | | 4.23 | | | | 0.79% | |
| | | Class R6 | | | | 1,000.00 | | | | 1,125.80 | | | | 3.97 | | | | 0.74% | |
High Yield Bond Fund | | | | | | | | | | | | | | | | | | | | |
| | | Class A | | | | 1,000.00 | | | | 1,079.00 | | | | 4.30 | | | | 0.82% | |
| | | Class I | | | | 1,000.00 | | | | 1,080.70 | | | | 2.99 | | | | 0.57% | |
Core Plus Bond Fund | | | | | | | | | | | | | | | | | | | | |
| | | Class A | | | | 1,000.00 | | | | 1,057.60 | | | | 0.00 | | | | 0.00% | |
| | | Class I | | | | 1,000.00 | | | | 1,058.20 | | | | 0.00 | | | | 0.00% | |
| | | Class R6 | | | | 1,000.00 | | | | 1,058.40 | | | | 0.00 | | | | 0.00% | |
Strategic Income Fund | | | | | | | | | | | | | | | | | | | | |
| | | Class A | | | | 1,000.00 | | | | 1,034.40 | | | | 0.00 | | | | 0.00% | |
| | | Class I | | | | 1,000.00 | | | | 1,036.40 | | | | 0.00 | | | | 0.00% | |
| | | Class R6 | | | | 1,000.00 | | | | 1,036.60 | | | | 0.00 | | | | 0.00% | |
*Expenses are equal to the average account value times the Fund’s annualized expense ratio multiplied by 182/365 (to reflect one half year period).
100
|
SUPPLEMENTAL INFORMATION (UNAUDITED) |
Hypothetical Example for Comparison Purposes
The table below provides information about hypothetical account values and hypothetical expenses based on each RBC Funds’ actual expense ratio and an assumed rate of return of 5% per year before expenses, which is not the Fund’s actual return. The hypothetical account values and expenses may not be used to estimate the actual ending account balance or expenses you paid for the period. You may use this information to compare this 5% hypothetical example with the 5% hypothetical examples that appear in the shareholder reports of other funds.
Please note that the expenses shown in the table are meant to highlight your ongoing costs only and do not reflect any transactional costs, such as sales charges (loads), redemption fees, or exchange fees. Therefore, the table is useful in comparing ongoing costs only, and will not help you determine the relative total costs of owning different funds. In addition, if these transactional costs were included, your costs would have been higher.
| | | | | | | | | | | | | | | | | | |
| | | | | Beginning
Account Value
10/1/22 | | | Ending
Account Value
3/31/23 | | | Expenses Paid
During Period*
10/1/22-3/31/23 | | | Annualized
Expense Ratio
During Period
10/1/22-3/31/23 | |
Emerging Market Debt Fund | | | | | | | | | | | | | | | | | | |
| | Class A | | | $1,000.00 | | | | $1,019.96 | | | | $5.30 | | | | 1.04% | |
| | Class I | | | 1,000.00 | | | | 1,021.22 | | | | 4.02 | | | | 0.79% | |
| | Class R6 | | | 1,000.00 | | | | 1,021.48 | | | | 3.77 | | | | 0.74% | |
High Yield Bond Fund | | | | | | | | | | | | | | | | | | |
| | Class A | | | 1,000.00 | | | | 1,021.07 | | | | 4.18 | | | | 0.82% | |
| | Class I | | | 1,000.00 | | | | 1,022.33 | | | | 2.91 | | | | 0.57% | |
Core Plus Bond Fund | | | | | | | | | | | | | | | | | | |
| | Class A | | | 1,000.00 | | | | 1,025.21 | | | | 0.00 | | | | 0.00% | |
| | Class I | | | 1,000.00 | | | | 1,025.21 | | | | 0.00 | | | | 0.00% | |
| | Class R6 | | | 1,000.00 | | | | 1,025.21 | | | | 0.00 | | | | 0.00% | |
Strategic Income Fund | | | | | | | | | | | | | | | | | | |
| | Class A | | | 1,000.00 | | | | 1,025.21 | | | | 0.00 | | | | 0.00% | |
| | Class I | | | 1,000.00 | | | | 1,025.21 | | | | 0.00 | | | | 0.00% | |
| | Class R6 | | | 1,000.00 | | | | 1,025.21 | | | | 0.00 | | | | 0.00% | |
* Expenses are equal to the average account value times the Fund’s annualized expense ratio multiplied by 182/365 (to reflect one half year period).
101
|
STATEMENT REGARDING LIQUIDITY RISK MANAGEMENT PROGRAM (UNAUDITED) |
Statement Regarding Liquidity Risk Management Program
This section discusses the operation and effectiveness of the Liquidity Risk Management Program for the RBC Funds established in accordance with Rule 22e-4 under the Investment Company Act of 1940 (the “Liquidity Rule”). RBC Global Asset Management (U.S.) Inc. (“RBC GAM”), the investment adviser to each Fund, serves as the Program Administrator and administers day-to-day implementation of the Program through a working group known as the Liquidity Risk Committee.
RBC GAM, as Program Administrator, provided the Board with a report addressing the operation of the Program during the year ending December 31, 2022 and assessing its adequacy and effectiveness of implementation, including, if applicable, the operation of any Fund’s highly liquid investments minimum and any material changes to the Program.
I. Key Conclusions of the Report
During the review period, the Program was implemented and operated effectively to achieve the goal of assessing and managing each Fund’s liquidity risk. Each Fund was able to meet requests for redemption without significant dilution of remaining investors’ interests in the Fund, and no Fund was required to set a highly liquid investments minimum. There were no material changes to the Program implemented during the review period.
II. Summary of the Review
A. Liquidity Risk Assessment and Review
Throughout the review period, the Program Administrator, in consultation with investment personnel, monitored the Funds’ portfolio liquidity and liquidity risk on an ongoing basis, as described in the Program, monthly in connection with recording the liquidity classification for each portfolio investment for reporting on Form N-PORT, and provided quarterly reports to the Board throughout the review period.
The Program Administrator also conducted an annual review assessing each Fund’s liquidity risk, in accordance with the requirements of the Program and the Liquidity Rule, taking into account the following factors, as applicable:
a. Each Fund’s investment strategy and liquidity of portfolio investments during both normal and reasonably foreseeable stressed conditions, including: (i) whether the Fund’s investment strategy is appropriate for an open-end fund; (ii) the extent to which the Fund’s strategy involves a relatively concentrated portfolio or large positions in particular issuers; (iii) the Fund’s use of borrowings for investment purposes; and (iv) the Fund’s use of derivatives (including for hedging purposes);
b. Short-term and long-term cash flow projections during both normal and reasonably foreseeable stressed conditions; and
c. Holdings of cash and cash equivalents, as well as borrowing arrangements and other funding sources.
Investment Strategy and Portfolio Liquidity. The Program Administrator considered the factors identified above, among others, during both normal and reasonably foreseeable stressed conditions as provided in the Program. Pursuant to the review, the Program Administrator determined that each Fund’s investment strategy and use of derivatives are appropriate for an open-end fund.
Cash Flow. The Funds’ cash flows did not have a material effect on the ability to meet redemptions during the Review Period.
Holdings of Cash and Borrowing Arrangements. As described in the Report, the Program Administrator determined that the Funds’ holdings of cash and borrowing arrangements were adequate for meeting the Funds’ expected cash flow needs to meet redemptions during the review period.
In light of the assessment and review as discussed above, the Program Administrator did not recommend any material changes in the management of the Funds’ liquidity risks, including with respect to any of the above factors.
102
|
STATEMENT REGARDING LIQUIDITY RISK MANAGEMENT PROGRAM (UNAUDITED) |
B. Review of Initial Liquidity Risk
During the review period, four new RBC Funds were launched. The Program Administrator conducted initial liquidity risk reviews for each of these Funds and concluded that there were no significant liquidity risk concerns.
C. Portfolio Holdings Classifications
During the review period, each Fund’s portfolio holdings (including derivative investments) were classified monthly as Highly Liquid Investments, Moderately Liquid Investments, Less Liquid Investments and Illiquid Investments pursuant to the Program, as required by the Liquidity Rule.
During the review period, the Funds also classified portfolio investments (including, as applicable, derivatives transactions) according to asset class when appropriate, as described in the Program. In addition, pursuant to the Program, each Fund must separately classify and review any investment within an asset class if any market, trading, or investment-specific considerations are reasonably expected to significantly affect the liquidity of the investment as compared the Fund’s other portfolio holdings within that asset class. During the review period, there were no circumstances in which a Fund was required to separately classify any investment within an asset class.
Market Depth—Reasonably Anticipated Trading Size (“RATS”). In classifying and reviewing its portfolio investments or asset classes (as applicable), each Fund must determine whether trading varying portions of a position in a particular portfolio investment or asset class, in sizes that the Fund would reasonably anticipate trading, is reasonably expected to significantly affect its liquidity. Each Fund must take this determination into account when classifying the liquidity of that investment or asset class. There were no material changes to the RATS assumptions for the Funds during the review period.
Classification Review. As required by the Liquidity Rule, the Program Administrator reviewed the Funds’ liquidity classifications on a monthly basis as described in the Program. The Committee met monthly to review its portfolio investments’ classifications in connection with recording the liquidity classification for each portfolio investment for reporting on Form N-PORT. The Program Administrator oversaw the Funds’ process for classifying portfolio holdings under the Liquidity Rule and reviewed the classifications, as described in the Program. This review included a review of the methodology and data inputs used. Due to the Russian-Ukrainian conflict, there were widespread sanctions against Russian-affiliated assets resulting in affected Russian holdings being classified as illiquid. During the review period, the Program Administrator determined that there were no material operational issues with the process for classifying portfolio holdings.
D. Highly Liquid Investments Minimum
The Program Administrator reviewed the process and standards for determining that each Fund primarily holds investments that are highly liquid. There were no changes recommended in the Report with respect to the status of any Fund as a Primarily Highly Liquid Fund (“PHLF”) and, with one exception, each Fund qualified as a PHLF on an ongoing basis during the review period as described in the Report. The newly launched RBC International Small Cap Equity Fund did not initially qualify as a PHLF, however, it was expected to meet the relevant threshold as soon as its access to all the relevant trading markets had been completed. Accordingly, a highly liquid investments minimum was not required for any Fund during the review period pursuant to the relevant provisions of the Program.
E. Compliance with the 15% Limitation on Illiquid Investments
Pursuant to the Liquidity Rule, no Fund may acquire any illiquid investment if, after the acquisition, the Fund would have invested more than 15% of its assets in illiquid investments that are assets (the “15% Limit”). The Program Administrator monitored compliance with the 15% Limit as described in the Program. At no time during the review period did any Fund breach the 15% limit.
103
|
STATEMENT REGARDING LIQUIDITY RISK MANAGEMENT PROGRAM (UNAUDITED) |
F. Redemptions in Kind
There were no planned redemptions in-kind effected during the review period.
G. SEC Reporting
The Funds met their monthly Form N-PORT filing requirements during the period. No reports on Form N-LIQUID were required to be filed during the period and none were filed.
104
RBC Funds
P.O. Box 701
Milwaukee, WI 53201-0701
800-422-2766
www.rbcgam.com
Performance data represents past performance and does not guarantee future results. The principal value of an investment and investment return will fluctuate so that an investor’s shares, when redeemed, may be worth more or less than their original cost.
This report and the financial statements contained herein are provided for the information of RBC Funds shareholders. This report is not authorized for distribution to prospective investors unless preceded or accompanied by a current prospectus, which contains information concerning investment objectives, risks, charges and expenses of the funds. Please read the prospectus carefully before investing.
This report and the financial statements contained herein are not intended to be a forecast of future events, a guarantee of future results, or investment advice. There is no assurance that certain securities will remain in or out of each fund’s portfolio. The views expressed in this report reflect those of the portfolio managers through the period ended March 31, 2023.
NOT FDIC INSURED • NO BANK GUARANTEE • MAY LOSE VALUE
RBC Global Asset Management (U.S.) Inc. serves as investment advisor for the RBC Funds. RBC Funds are distributed by Quasar Distributors LLC.
The RBC Funds are pleased to offer shareholder reports printed entirely on Forest Stewardship Council® certified paper. FSC® certification ensures that the paper used in this report contains fiber from well-managed and responsibly harvested forests that meet strict environmental and socioeconomic standards.
105
Semi-Annual Report For the six months ended March 31, 2023 RBC SMID Cap Growth Fund RBC Enterprise Fund RBC Small Cap Core Fund RBC Microcap Value Fund RBC Small Cap Value Fund
| | | | | | |
PORTFOLIO MANAGERS | | | | | | |
| | | | | | |
| | | |
| RBC Global Asset Management (U.S.) Inc. (“RBC GAM-US”) serves as the investment advisor to the RBC Funds. RBC GAM-US employs a team approach to the management of the Funds, with no individual team member being solely responsible for the investment decisions. | | | | | | |
Lance James Senior Portfolio Manager Lance is Senior Equity Portfolio Manager, U.S. Equities Core and Value at RBC GAM-US and is responsible for portfolio management of the Small Cap Core Fund, Enterprise Fund, Microcap Value Fund and Small Cap Value Fund. He also conducts research for these strategies. Before joining the organization in 2006, Lance was a portfolio manager and research analyst for two large American asset management firms. During his tenure with these firms, he served as head of their small/mid cap value team. Lance began his career in the investment industry in 1980. | | | | | | 
Lance James |
Kenneth Tyszko, CFA Managing Director and Senior Portfolio Manager Ken is a senior portfolio manager and head of the U.S. Small and Mid-Cap Growth Team at RBC GAM-US and responsible for management of the SMID Cap Growth Fund. In this role, he provides fundamental research and portfolio management for small, SMID and mid cap growth strategies. Prior to joining the organization in 2001, Ken served as a portfolio manager for several U.S.-based asset management companies. His background also includes experience at an international accounting and consulting firm. Ken has been a guest on Bloomberg Television, Bloomberg Radio, CNBC and WebFN. He joined the investment industry in 1984. | | | | | | 
Kenneth Tyszko, CFA |
Rich Drage, CFA Portfolio Manager Rich is a member of RBC GAM-US’s U.S. Small and Mid-Cap Growth Team and is a portfolio manager for SMID Cap Growth Fund. In this role, he provides fundamental research and portfolio management for the firm’s small, SMID and mid cap growth strategies in the U.S. Rich joined the organization in 2009 from a global quantitative trading firm, where he was a senior research analyst. Before that, he worked as a senior equity analyst for a private investment management firm. Rich’s previous experience also includes various research and portfolio management responsibilities at several different investment management firms based in the U.S. He began his career in the investment industry in 1994. | | | | | | 
Richard Drage, CFA |
| | | | | | |
| | | | | | |
| | | | | | |
| | | | | | |
| | | | | | |
| | | | | | |
| | | | | | |
1
| | | | | | | | |
| | | | | | | | PORTFOLIO MANAGERS |
| | | | |
| | | | | | | | |
| | | | |

Eric Autio | | | | | | | | Eric Autio Portfolio Manager Eric is a senior equity analyst at RBC GAM-US. He provides research and analysis for the U.S. Microcap Core, Small Cap Core and Small Cap Value Strategies and serves as a co-portfolio manager for Small Cap Value Fund. Prior to joining the organization in 2014, he was senior equity analyst and partner at an Atlanta-based investment management boutique firm where he served as an industry generalist on the small and SMID cap value team. Previously, Eric was research analyst and vice president at an investment banking company covering a diverse range of sectors including retail, industrials and business services. He also served as director of a real estate firm based in Charlotte, managing its North Carolina commercial real estate research and software products portfolio. Eric’s experience also includes working in the capital management group of a large global financial services company. He began his career in the investment industry since 2002. |
| | | | |

Murphy O’Flaherty | | | | | | | | Murphy O’Flaherty Portfolio Manager Murphy is a portfolio manager and senior equity analyst at RBC GAM-US providing research for the U.S. Microcap Core, Small Cap Core and Small Cap Value investment strategies. She is also co-portfolio manager for the Enterprise Fund. Prior to joining the firm in 2015, she was executive director at a large global full-service brokerage and investment bank. In that role, she utilized fundamental equity research to advise and make stock recommendations to asset managers employing all major investment strategies within all market capitalizations. Previously, Murphy served in a similar role as director at a large Canadian financial institution. She also worked in equities and fixed income for two separate global financial services companies. Murphy has worked in the investment industry since 1995. |
| | | | | | | | |
| | | | | | | | |
| | | | | | | | |
| | | | | | | | |
| | | | | | | | |
| | | | | | | | |
| | | | | | | | |
| | | | | | | | |
| | | | | | | | |
| | | | | | | | |
| | | | | | | | |
| | | | | | | | |
| | | | | | | | |
| | | | | | | | |
| | | | | | | | |
| | | | | | | | |
| | | | | | | | |
| | | | | | | | |
| | | | | | | | |
| | | | | | | | |
| | | | | | | | |
| | | | | | | | |
| | | | | | | | |
2
|
PERFORMANCE SUMMARY (UNAUDITED) |
| | | | | | | | | | | | | | | | | | | | |
| | | 1
Year | | | 5
Year | | | 10
Year | | | Net
Expense
Ratio(a)(b) | | | Gross
Expense
Ratio(a)(b) | |
Average Annual Total Returns as of March 31, 2023 (Unaudited) | |
| | | | |
RBC SMID Cap Growth Fund(c) | | | | | | | | | | | | | | | | | |
Class A | | | | | | | | | | | | | | | | | | | | |
- Including Max Sales Charge of 5.75% | | | (8.39)% | | | | 8.91% | | | | 9.79% | | | | | | | | | |
- At Net Asset Value | | | (2.79)% | | | | 10.20% | | | | 10.45% | | | | 1.07% | | | | 1.27% | |
Class I | | | | | | | | | | | | | | | | | | | | |
- At Net Asset Value | | | (2.51)% | | | | 10.49% | | | | 10.72% | | | | 0.82% | | | | 1.04% | |
Class R6 | | | | | | | | | | | | | | | | | | | | |
- At Net Asset Value | | | (2.50)% | | | | 10.53% | | | | 10.80% | | | | 0.77% | | | | 18.45% | |
| | | | | |
Russell 2500 Growth Index(d) | | | (10.35)% | | | | 6.82% | | | | 10.05% | | | | | | | | | |
RBC Enterprise Fund | | | | | | | | | | | | | | | | | | | | |
Class A | | | | | | | | | | | | | | | | | | | | |
- Including Max Sales Charge of 5.75% | | | (12.84)% | | | | 2.01% | | | | 4.85% | | | | | | | | | |
- At Net Asset Value | | | (7.54)% | | | | 3.23% | | | | 5.47% | | | | 1.34% | | | | 2.03% | |
Class I | | | | | | | | | | | | | | | | | | | | |
- At Net Asset Value | | | (7.30)% | | | | 3.49% | | | | 5.73% | | | | 1.09% | | | | 1.28% | |
| | | | | |
Russell Microcap Index(d) | | | (17.93)% | | | | 2.96% | | | | 7.27% | | | | | | | | | |
RBC Small Cap Core Fund(e) | | | | | | | | | | | | | | | | | | | | |
Class A | | | | | | | | | | | | | | | | | | | | |
- Including Max Sales Charge of 5.75% | | | (10.34)% | | | | 1.01% | | | | 5.30% | | | | | | | | | |
- At Net Asset Value | | | (4.86)% | | | | 2.22% | | | | 5.93% | | | | 1.16% | | | | 1.69% | |
Class I | | | | | | | | | | | | | | | | | | | | |
- At Net Asset Value | | | (4.59)% | | | | 2.49% | | | | 6.20% | | | | 0.91% | | | | 1.29% | |
Class R6 | | | | | | | | | | | | | | | | | | | | |
- At Net Asset Value | | | (4.59)% | | | | 2.48% | | | | 6.21% | | | | 0.88% | | | | 1.45% | |
| | | | | |
Russell 2000 Index(d) | | | (11.61)% | | | | 4.71% | | | | 8.04% | | | | | | | | | |
RBC Microcap Value Fund | | | | | | | | | | | | | | | | | | | | |
Class A | | | | | | | | | | | | | | | | | | | | |
- Including Max Sales Charge of 5.75% | | | (12.10)% | | | | 4.16% | | | | 7.32% | | | | | | | | | |
- At Net Asset Value | | | (6.74)% | | | | 5.40% | | | | 7.96% | | | | 1.35% | | | | 1.60% | |
Class I | | | | | | | | | | | | | | | | | | | | |
- At Net Asset Value | | | (6.49)% | | | | 5.67% | | | | 8.23% | | | | 1.10% | | | | 1.21% | |
| | | | | |
Russell Microcap Value Index(d) | | | (18.18)% | | | | 3.78% | | | | 7.96% | | | | | | | | | |
3
|
PERFORMANCE SUMMARY (UNAUDITED) |
| | | | | | | | | | | | | | | | | | | | |
| | | 1
Year | | | 5
Year | | | Since
Inception | | | Net
Expense
Ratio(a)(b) | | | Gross
Expense
Ratio(a)(b) | |
Average Annual Total Returns as of March 31, 2023 (Unaudited) | | | | | | | | | |
| | | | |
RBC Small Cap Value Fund(f) | | | | | | | | | | | | | | | | | |
Class A | | | | | | | | | | | | | | | | | | | | |
- Including Max Sales Charge of 5.75% | | | (11.67)% | | | | 0.63% | | | | 4.50% | | | | | | | | | |
- At Net Asset Value | | | (6.29)% | | | | 1.82% | | | | 5.25% | | | | 1.11% | | | | 33.12% | |
Class I | | | | | | | | | | | | | | | | | | | | |
- At Net Asset Value | | | (6.57)% | | | | 1.97% | | | | 5.38% | | | | 0.86% | | | | 1.23% | |
Class R6 | | | | | | | | | | | | | | | | | | | | |
- At Net Asset Value | | | (5.94)% | | | | 2.13% | | | | 5.52% | | | | 0.81% | | | | 1.28% | |
| | | | | |
Russell 2000 Value Index(d) | | | (12.96)% | | | | 4.55% | | | | 6.07% | | | | | | | | | |
Parentheses indicate negative performance returns.
Performance data quoted represents past performance. Past performance is no guarantee of future results. Investment return and principal value of an investment will fluctuate so that an investor’s shares, when redeemed, may be worth more or less than their original cost. Current performance may be lower or higher than performance quoted. Performance shown reflects contractual fee waivers, without such fee waivers total returns would be reduced. For performance data current to the most recent month-end go to www.rbcgam.com. Please see footnotes below.
| (a) | The Funds’ expenses are from the Funds’ most recent prospectus dated January 27, 2023. For current expense ratio information, please see the Financial Highlights starting on page 47. |
| (b) | The advisor has contractually agreed to waive fees and/or make payments in order to keep total operating expenses at the levels shown in the Funds’ prospectus until January 31, 2024. |
| (c) | The since inception date (commencement of operations) of the Fund is December 31, 1990 for Class I and Class A shares and November 21, 2016 for Class R6 shares. The performance in the table for the Class R6 shares prior to November 21, 2016 reflects the performance of the Class I shares since the Fund’s inception and has been adjusted to reflect the fees and expenses of Class R6. |
| (d) | Each of the comparative indices is a widely recognized market value weighted measure of the return of securities, but does not include sales fees or operating expenses. You cannot invest directly in indices. |
| (e) | The since inception date (commencement of operations) of the Fund is August 5, 1991 for Class I and Class A shares and November 21, 2016 for Class R6 shares. The performance in the table for the Class R6 shares prior to November 21, 2016 reflects the performance of the Class I shares since the Fund’s inception and has been adjusted to reflect the fees and expenses of Class R6. |
| (f) | The since inception date (commencement of operations) of the Fund is December 3, 2014 for Class I shares, November 21, 2016 for Class R6 shares and January 28, 2021 for Class A shares. The performance in the table for the Class R6 shares prior to November 21, 2016 and for Class A shares prior to January 28, 2021 reflects the performance of the Class I shares since the Fund’s inception and has been adjusted to reflect the fees and expenses of Classes R6 and Class A, respectively. The performance of the index since inception of the Fund is calculated from December 3, 2014. |
4
|
PERFORMANCE SUMMARY (UNAUDITED) |
The Russell 2500 Growth Index measures the performance of the small and mid capitalization growth segment of the U.S. equity market. It includes those companies with higher price-to-book ratios and higher forecasted growth rates in the Russell 2500™ Index, which comprises the smallest 2,500 companies in the Russell 3000® Index.
The Russell Microcap Index measures the performance of the micro capitalization segment of the U.S. equity market. It comprises the smallest 1,000 companies in the Russell 2000 Index plus 1,000 smaller U.S. equities.
The Russell 2000 Index measures the performance of the small capitalization segment of the U.S. equity market. It comprises approximately 2,000 small capitalization companies in the Russell 3000® Index
The Russell Microcap Value Index measures the performance of the micro capitalization value segment of the U.S. equity market. It includes those companies with lower price-to-book ratios and lower forecasted growth rates in the Russell Microcap® Index.
The Russell 2000 Value Index measures the performance of the small capitalization value segment of the U.S. equity market. It includes those companies with lower price-to-book ratios and lower forecasted growth rates in the Russell 2000® Index.
You cannot invest directly in an index.
Fund holdings and/or sector allocations are subject to change at any time and are not recommendations to buy or sell any security.
Mutual Fund investing involves risk. Principal loss is possible.
5
| | | | | | | | | | | | | | |
| | | | | | | | FUND STATISTICS (UNAUDITED) |
| | | | | | | | RBC SMID Cap Growth Fund |
Investment Objective | | | | | | | | The Fund seeks long-term capital appreciation. |
Benchmark | | | | | | | | Russell 2500 Growth Index |
Asset Allocation as of 3/31/23 (% of Fund’s investments) & Top Five GICS sectors (as of 3/31/23) (% of Fund’s net assets) | | | | | | | | 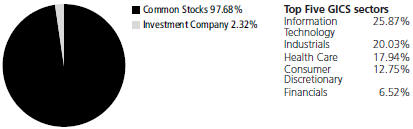
|
Top Ten Holdings (excluding investment companies) (as of 3/31/23) (% | | | | | | | | TechnipFMC Plc Merit Medical Systems, Inc. Diodes, Inc. Novanta, Inc. Applied Industrial Technologies, Inc. | | 2.35% 2.26% 1.93% 1.92% 1.78% | | Kinsale Capital Group, Inc. WEX, Inc. Silicon Laboratories, Inc. Bio-Techne Corp. Onto Innovation, Inc. | | 1.70% 1.67% 1.66% 1.66% 1.63% |
|
|
|
|
of Fund’s net assets) | | | | | | | | *A listing of all portfolio holdings can be found beginning on page 11 |
| Growth of $250,000 Initial Investment Over 10 Years | | | | | | | | 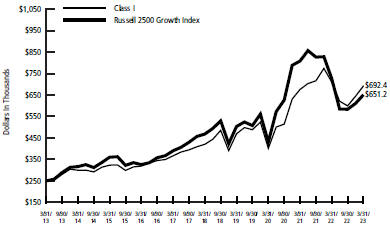
|
| | | | | | | | The graph reflects an initial hypothetical investment of $250,000 over 10 year period and is based on Class I shares. The Fund’s total return includes reinvested dividends and capital gains. The Fund’s total return also includes operating expenses that reduce return, while the total return of the index does not. The graph does not reflect the deduction of taxes that a shareholder would pay on fund distributions or redemption of fund shares. Performance of other classes will vary due to differences in fee structures. This chart does not imply any future performance. |
6
| | | | | | | | | | | | | | | | |
FUND STATISTICS (UNAUDITED) | | | | | | | | | | |
| | | | | | |
RBC Enterprise Fund | | | | | | | | | | | | | | | | |
The Fund seeks long-term growth of capital. | | | | | | | | | | Investment |
| | | | | | | | | | | | | | | | | Objective |
Russell Microcap Index | | | | | | | | | | Benchmark |

| | | | | | | Asset Allocation as of 3/31/23 (% of Fund’s investments) & Top Five GICS sectors (as of 3/31/23) (% of Fund’s net assets) |
| | | | | | |
Lantheus Holdings, Inc. Ducommun, Inc. Magnolia Oil & Gas Corp. Insteel Industries, Inc. Napco Security Technologies, Inc. | |
| 3.93%
3.78% 2.65% 2.63% 2.42% |
| | Allied Motion Technologies, Inc. Super Micro Computer, Inc. iShares Biotechnology ETF MGP Ingredients, Inc. Par Pacific Holdings, Inc. | |
| 2.35%
2.34% 2.30% 2.25% 2.22% |
| | | | | | Top Ten Holdings (excluding investment companies) (as of 3/31/23) (% of |
|
|
|
|
| | | | |
| *A listing of all portfolio holdings can be found beginning on page 14 | | | | | | | | | | Fund’s net assets) |
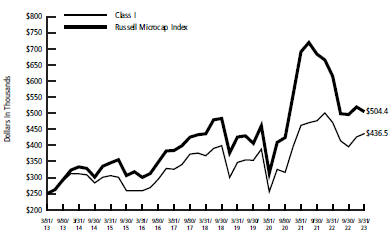
| | | | | | | Growth of $250,000 Initial Investment Over 10 Years |
The graph reflects an initial hypothetical investment of $250,000 over 10 year period and is based on Class I shares. The Fund’s total return includes reinvested dividends and capital gains. The Fund’s total return also includes operating expenses that reduce return, while the total return of the index does not. The graph does not reflect the deduction of taxes that a shareholder would pay on fund distributions or redemption of fund shares. Performance of other classes will vary due to differences in fee structures. This chart does not imply any future performance. | | | | | | | |
7
| | | | | | | | | | | | | | | | | | |
| | | | | | | | FUND STATISTICS (UNAUDITED) | |
| | | | | | | | RBC Small Cap Core Fund | |
Investment Objective | | | | | | | | The Fund seeks long-term growth of capital. | |
Benchmark | | | | | | | | Russell 2000 Index | |
| Asset Allocation as of 3/31/23 (% of Fund’s investments) & Top Five GICS sectors (as of 3/31/23) (% of Fund’s net assets) | | | | | | | | 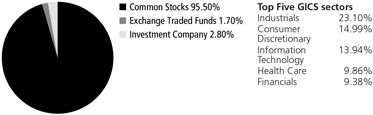
| |
| | | | | | | |
Top Ten Holdings (excluding investment companies) (as of 3/31/23) (% of | | | | | | | | Ducommun, Inc. Lantheus Holdings, Inc. Atkore, Inc. Compass Diversified Holdings Magnolia Oil & Gas Corp. | |
| 4.12%
3.79% 3.74% 3.25% 2.88% |
| | Barrett Business Services, Inc. Nexstar Media Group, Inc. PDC Energy, Inc. Par Pacific Holdings, Inc. Columbus McKinnon Corp. | |
| 2.66%
2.55% 2.50% 2.48% 2.47% |
|
|
|
|
|
Fund’s net assets) | | | | | | | | *A listing of all portfolio holdings can be found beginning on page 17 | |
Growth of $250,000 Initial Investment Over 10 Years | | | | | | | | 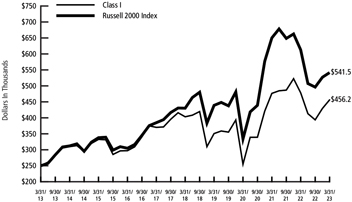
| |
| | | | | | | | The graph reflects an initial hypothetical investment of $250,000 over 10 year period and is based on Class I shares. The Fund’s total return includes reinvested dividends and capital gains. The Fund’s total return also includes operating expenses that reduce return, while the total return of the index does not. The graph does not reflect the deduction of taxes that a shareholder would pay on fund distributions or redemption of fund shares. Performance of other classes will vary due to differences in fee structures. This chart does not imply any future performance. | |
8
| | | | | | | | | | | | | | | | | | |
FUND STATISTICS (UNAUDITED) | | | | | | | | | |
| | | | |
RBC Microcap Value Fund | | | | | | | | | |
The Fund seeks long-term growth of capital. | | | | | | | | | Investment Objective |
Russell Microcap Value Index | | | | | | | | | Benchmark |
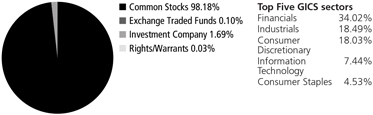
| | | | | | | | | Asset Allocation as of 3/31/23 (% of Fund’s investments) & Top Five GICS sectors (as of 3/31/23) (% of Fund’s net assets) |
| | | | | | | |
Ducommun, Inc. Federal Agricultural Mortgage Corp. Ingles Markets, Inc. Enova International, Inc. Consumer Portfolio Services, Inc. | |
| 1.42
1.10 0.96 0.94 0.89 | %
% % % % | | Stride, Inc. North American Construction Group Ltd. LSI Industries, Inc. Miller Industries, Inc. TravelCenters of America, Inc. | |
| 0.85
0.83 0.82 0.78 0.76 | %
% % % % | | | | | | | | Top Ten Holdings (excluding investment companies) (as of 3/31/23) (% of |
|
|
|
|
*A listing of all portfolio holdings can be found beginning on page 20 | | | | | | | | | Fund’s net assets) |
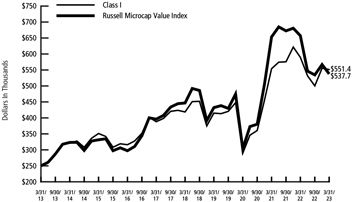
| | | | | | | | | Growth of $250,000 Initial Investment Over 10 Years |
The graph reflects an initial hypothetical investment of $250,000 over 10 year period and is based on Class I shares. The Fund’s total return includes reinvested dividends and capital gains. The Fund’s total return also includes operating expenses that reduce return, while the total return of the index does not. The graph does not reflect the deduction of taxes that a shareholder would pay on fund distributions or redemption of fund shares. Performance of other classes will vary due to differences in fee structures. This chart does not imply any future performance. | | | | | | | | | |
9
| | | | | | | | | | | | | | | | | | |
| | | | | | | | FUND STATISTICS (UNAUDITED) | |
| | | | | | | | RBC Small Cap Value Fund | |
Investment Objective | | | | | | | | The Fund seeks long-term capital appreciation. | |
Benchmark | | | | | | | | Russell 2000 Value Index | |
| Asset Allocation as of 3/31/23 (% of Fund’s investments) & Top Five GICS sectors (as of 3/31/23) (% of Fund’s net assets) | | | | | | | | 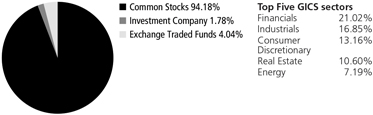
| |
| | | | | | | |
Top Ten Holdings (excluding investment companies) (as of 3/31/23) (% of | | | | | | | | Southwest Gas Holdings, Inc. Columbus McKinnon Corp. Ducommun, Inc. Compass Diversified Holdings Reliance Steel & Aluminum Co. Par Pacific Holdings, Inc. | |
| 3.78
2.42 2.34 2.20 2.16 2.11 | %
% % % % % | | Reinsurance Group of America, Inc. SPDR S&P Biotech ETF iShares Russell 2000 Value ETF Community Healthcare Trust, Inc. | |
| 2.03
2.02 2.01 1.96 | %
% % % |
|
|
|
| | |
| | | | | | |
| Fund’s net assets) | | | | | | | | *A listing of all portfolio holdings can be found beginning on page 33 | |
Growth of $100,000 Initial Investment Since Inception (12/3/14) | | | | | | | | 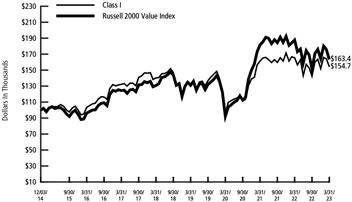
| |
| | | | | | | | The graph reflects an initial hypothetical investment of $100,000 over the period from December 3, 2014 (commencement of operations) to March 31, 2023 and is based on Class I shares. The Fund’s total return includes reinvested dividends and capital gains. The Fund’s total return also includes operating expenses that reduce return, while the total return of the index does not. The graph does not reflect the deduction of taxes that a shareholder would pay on fund distributions or redemption of fund shares. Performance of other classes will vary due to differences in fee structures. This chart does not imply any future performance. | |
10
|
SCHEDULE OF PORTFOLIO INVESTMENTS |
RBC SMID Cap Growth Fund
March 31, 2023 (Unaudited)
| | | | | | |
| Shares | | | | Value | |
| |
Common Stocks — 97.68% | | | | |
Communication Services — 3.19% | | | | |
| 8,577 | | Nexstar Media Group, Inc., Class A | | $ | 1,480,905 | |
| 51,048 | | PubMatic, Inc., Class A* | | | 705,483 | |
| 19,670 | | TechTarget, Inc.* | | | 710,480 | |
| | | | | | |
| | | | | 2,896,868 | |
| | | | | | |
Consumer Discretionary — 12.75% | | | | |
| 6,360 | | Burlington Stores, Inc.* | | | 1,285,356 | |
| 12,599 | | Columbia Sportswear Co. | | | 1,136,934 | |
| 10,782 | | Dorman Products, Inc.* | | | 930,055 | |
| 11,540 | | Fox Factory Holding Corp.* | | | 1,400,610 | |
| 16,039 | | Gentherm, Inc.* | | | 969,076 | |
| 9,806 | | Installed Building Products, Inc. | | | 1,118,178 | |
| 10,428 | | LCI Industries | | | 1,145,724 | |
| 23,110 | | Ollie’s Bargain Outlet Holdings, Inc.* | | | 1,338,994 | |
| 14,360 | | Planet Fitness, Inc., Class A* | | | 1,115,341 | |
| 10,630 | | Texas Roadhouse, Inc. | | | 1,148,678 | |
| | | | | | |
| | | | | 11,588,946 | |
| | | | | | |
Consumer Staples — 2.93% | | | | |
| 5,745 | | Casey’s General Stores, Inc. | | | 1,243,563 | |
| 23,471 | | Performance Food Group Co.* | | | 1,416,240 | |
| | | | | | |
| | | | | 2,659,803 | |
| | | | | | |
Energy — 2.35% | | | | |
| 156,600 | | TechnipFMC Plc* | | | 2,137,590 | |
| | | | | | |
| |
Financials — 6.52% | | | | |
| 11,226 | | FirstCash Holdings, Inc. | | | 1,070,624 | |
| 5,612 | | Jack Henry & Associates, Inc. | | | 845,841 | |
| 5,157 | | Kinsale Capital Group, Inc. | | | 1,547,873 | |
| 16,000 | | Stifel Financial Corp. | | | 945,440 | |
| 8,243 | | WEX, Inc.* | | | 1,515,805 | |
| | | | | | |
| | | | | 5,925,583 | |
| | | | | | |
Health Care — 17.94% | | | | |
| 18,691 | | Azenta, Inc.* | | | 833,992 | |
| 20,280 | | Bio-Techne Corp. | | | 1,504,573 | |
| 35,460 | | Certara, Inc.* | | | 854,941 | |
| 5,060 | | Charles River Laboratories International, Inc.* | | | 1,021,209 | |
| 13,947 | | Haemonetics Corp.* | | | 1,154,114 | |
| 14,434 | | HealthEquity, Inc.* | | | 847,420 | |
| 10,570 | | Henry Schein, Inc.* | | | 861,878 | |
| 15,790 | | Integer Holdings Corp.* | | | 1,223,725 | |
| 18,765 | | Integra LifeSciences Holdings Corp.* | | | 1,077,299 | |
| 5,980 | | Medpace Holdings, Inc.* | | | 1,124,539 | |
| 27,738 | | Merit Medical Systems, Inc.* | | | 2,051,225 | |
| 42,810 | | Neogen Corp.* | | | 792,841 | |
11
|
SCHEDULE OF PORTFOLIO INVESTMENTS |
RBC SMID Cap Growth Fund (cont.)
March 31, 2023 (Unaudited)
| | | | | | |
| Shares | | | | Value | |
| 19,760 | | Omnicell, Inc.* | | $ | 1,159,319 | |
| 6,200 | | Repligen Corp.* | | | 1,043,832 | |
| 11,790 | | STAAR Surgical Co.* | | | 753,971 | |
| | | | | | |
| | | | | 16,304,878 | |
| | | | | | |
Industrials — 20.03% | | | | |
| 6,830 | | AGCO Corp. | | | 923,416 | |
| 23,624 | | Ameresco, Inc., Class A* | | | 1,162,773 | |
| 11,383 | | Applied Industrial Technologies, Inc. | | | 1,617,866 | |
| 10,310 | | ASGN, Inc.* | | | 852,328 | |
| 3,290 | | CACI International, Inc., Class A* | | | 974,761 | |
| 7,965 | | ExlService Holdings, Inc.* | | | 1,288,976 | |
| 14,629 | | Helios Technologies, Inc. | | | 956,737 | |
| 12,722 | | ICF International, Inc. | | | 1,395,603 | |
| 8,530 | | John Bean Technologies Corp. | | | 932,244 | |
| 6,507 | | Landstar System, Inc. | | | 1,166,445 | |
| 27,554 | | Mercury Systems, Inc.* | | | 1,408,560 | |
| 7,691 | | MSC Industrial Direct Co., Inc., Class A | | | 646,044 | |
| 5,760 | | RBC Bearings, Inc.* | | | 1,340,525 | |
| 7,780 | | Tetra Tech, Inc. | | | 1,142,960 | |
| 11,359 | | Westinghouse Air Brake Technologies Corp. | | | 1,147,940 | |
| 12,829 | | Woodward, Inc. | | | 1,249,160 | |
| | | | | | |
| | | | | 18,206,338 | |
| | | | | | |
Information Technology — 25.87% | | | | |
| 15,057 | | Altair Engineering, Inc., Class A* | | | 1,085,760 | |
| 10,073 | | Badger Meter, Inc. | | | 1,227,093 | |
| 8,229 | | CyberArk Software Ltd.* | | | 1,217,727 | |
| 18,889 | | Diodes, Inc.* | | | 1,752,144 | |
| 24,740 | | Dynatrace, Inc.* | | | 1,046,502 | |
| 16,261 | | Envestnet, Inc.* | | | 954,033 | |
| 24,788 | | ePlus, Inc.* | | | 1,215,603 | |
| 3,995 | | F5, Inc.* | | | 582,032 | |
| 8,330 | | Five9, Inc.* | | | 602,176 | |
| 4,256 | | Globant SA* | | | 698,027 | |
| 4,238 | | Littelfuse, Inc. | | | 1,136,165 | |
| 8,253 | | Manhattan Associates, Inc.* | | | 1,277,977 | |
| 10,956 | | Novanta, Inc.* | | | 1,742,990 | |
| 16,880 | | Onto Innovation, Inc.* | | | 1,483,414 | |
| 5,480 | | Paylocity Holding Corp.* | | | 1,089,314 | |
| 17,470 | | Perficient, Inc.* | | | 1,261,159 | |
| 14,670 | | Plexus Corp.* | | | 1,431,352 | |
| 34,880 | | Sapiens International Corp. NV | | | 757,594 | |
| 8,630 | | Silicon Laboratories, Inc.* | | | 1,511,027 | |
| 9,432 | | SPS Commerce, Inc.* | | | 1,436,494 | |
| | | | | | |
| | | | | 23,508,583 | |
| | | | | | |
12
|
SCHEDULE OF PORTFOLIO INVESTMENTS |
RBC SMID Cap Growth Fund (cont.)
March 31, 2023 (Unaudited)
| | | | | | |
| Shares | | | | Value | |
Materials — 4.96% | | | | |
| 8,775 | | AptarGroup, Inc. | | $ | 1,037,117 | |
| 7,638 | | Balchem Corp. | | | 966,054 | |
| 16,933 | | HB Fuller Co. | | | 1,159,064 | |
| 5,222 | | Reliance Steel & Aluminum Co. | | | 1,340,697 | |
| | | | | | |
| | |
| | | | | 4,502,932 | |
| | | | | | |
Real Estate — 1.14% | | | | |
| 10,374 | | Lamar Advertising Co., REIT, Class A | | | 1,036,259 | |
| | | | | | |
| |
Total Common Stocks | | | 88,767,780 | |
| | | | | | |
(Cost $71,350,293) | | | | |
| |
Investment Company — 2.33% | | | | |
| 2,111,841 | | U.S. Government Money Market Fund, RBC Institutional Class 1(a) | | | 2,111,841 | |
| | | | | | |
| |
Total Investment Company | | | 2,111,841 | |
| | | | | | |
(Cost $2,111,841) | | | | |
| |
Total Investments | | $ | 90,879,621 | |
(Cost $73,462,134)(b) — 100.01% | | | | |
| |
Liabilities in excess of other assets — (0.01)% | | | (6,733 | ) |
| | | | | | |
| |
NET ASSETS — 100.00% | | $ | 90,872,888 | |
| | | | | | |
| * | Non-income producing security. |
| (a) | Affiliated investment. |
| (b) | See Notes to Schedules of Portfolio Investments for the tax cost of securities and the breakdown of unrealized appreciation (depreciation). |
Abbreviations used are defined below:
REIT - Real Estate Investment Trust
See Notes to the Financial Statements.
13
|
SCHEDULE OF PORTFOLIO INVESTMENTS |
RBC Enterprise Fund
March 31, 2023 (Unaudited)
| | | | | | |
| Shares | | | | Value | |
Common Stocks — 91.21% | | | | |
Communication Services — 0.26% | | | | |
| 18,022 | | Gray Television, Inc. | | $ | 157,152 | |
| | | | | | |
| |
Consumer Discretionary — 10.23% | | | | |
| 48,667 | | Delta Apparel, Inc.* | | | 535,337 | |
| 124,810 | | Destination XL Group, Inc.* | | | 687,703 | |
| 36,800 | | G-III Apparel Group Ltd.* | | | 572,240 | |
| 29,753 | | Lakeland Industries, Inc. | | | 434,394 | |
| 32,880 | | Lazydays Holdings, Inc.* | | | 383,710 | |
| 14,564 | | Malibu Boats, Inc., Class A* | | | 822,138 | |
| 8,600 | | Oxford Industries, Inc. | | | 908,074 | |
| 15,613 | | Patrick Industries, Inc. | | | 1,074,330 | |
| 48,490 | | Ruth’s Hospitality Group, Inc. | | | 796,206 | |
| | | | | | |
| | | | | 6,214,132 | |
| | | | | | |
| |
Consumer Staples — 3.71% | | | | |
| 9,180 | | John B Sanfilippo & Son, Inc. | | | 889,726 | |
| 14,130 | | MGP Ingredients, Inc. | | | 1,366,653 | |
| | | | | | |
| | | | | 2,256,379 | |
| | | | | | |
| |
Energy — 7.37% | | | | |
| 23,000 | | Delek US Holdings, Inc. | | | 527,850 | |
| 73,600 | | Magnolia Oil & Gas Corp., Class A | | | 1,610,368 | |
| 46,140 | | Par Pacific Holdings, Inc.* | | | 1,347,288 | |
| 15,500 | | PDC Energy, Inc. | | | 994,790 | |
| | | | | | |
| | | | | 4,480,296 | |
| | | | | | |
| |
Financials — 12.72% | | | | |
| 10,400 | | Amerisafe, Inc. | | | 509,080 | |
| 25,300 | | Banc of California, Inc. | | | 317,009 | |
| 6,000 | | Cambridge Bancorp | | | 388,860 | |
| 63,098 | | Compass Diversified Holdings | | | 1,203,910 | |
| 23,770 | | First Bancorp/Southern Pines, NC | | | 844,310 | |
| 13,250 | | German American Bancorp, Inc. | | | 442,153 | |
| 33,666 | | Mercantile Bank Corp. | | | 1,029,506 | |
| 11,930 | | Northrim BanCorp, Inc. | | | 562,857 | |
| 13,080 | | Preferred Bank/Los Angeles, CA | | | 716,915 | |
| 6,600 | | Silvercrest Asset Management Group, Inc., Class A | | | 119,988 | |
| 9,280 | | Southern First Bancshares, Inc.* | | | 284,896 | |
| 34,602 | | Stellar Bancorp, Inc. | | | 851,555 | |
| 8,340 | | Stock Yards Bancorp, Inc. | | | 459,868 | |
| | | | | | |
| | | | | 7,730,907 | |
| | | | | | |
| |
Health Care — 8.87% | | | | |
| 27,500 | | Apollo Medical Holdings, Inc.* | | | 1,002,925 | |
| 31,010 | | Inotiv, Inc.* | | | 134,273 | |
| 28,930 | | Lantheus Holdings, Inc.* | | | 2,388,461 | |
14
|
SCHEDULE OF PORTFOLIO INVESTMENTS |
RBC Enterprise Fund (cont.)
March 31, 2023 (Unaudited)
| | | | | | |
| Shares | | | | Value | |
| 27,840 | | Surmodics, Inc.* | | $ | 634,195 | |
| 9,500 | | UFP Technologies, Inc.* | | | 1,233,480 | |
| | | | | | |
| | | | | 5,393,334 | |
| | | | | | |
| |
Industrials — 23.81% | | | | |
| 145,210 | | ACCO Brands Corp. | | | 772,517 | |
| 36,955 | | Allied Motion Technologies, Inc. | | | 1,428,311 | |
| 13,930 | | Barrett Business Services, Inc. | | | 1,234,755 | |
| 10,358 | | Casella Waste Systems, Inc., Class A* | | | 856,192 | |
| 20,880 | | CBIZ, Inc.* | | | 1,033,351 | |
| 32,210 | | Columbus McKinnon Corp. | | | 1,196,924 | |
| 25,300 | | Douglas Dynamics, Inc. | | | 806,817 | |
| 41,988 | | Ducommun, Inc.* | | | 2,297,164 | |
| 27,646 | | Greenbrier Cos., Inc. (The) | | | 889,372 | |
| 57,433 | | Insteel Industries, Inc. | | | 1,597,786 | |
| 20,680 | | Northwest Pipe Co.* | | | 645,836 | |
| 6,053 | | NV5 Global, Inc.* | | | 629,331 | |
| 6,700 | | Standex International Corp. | | | 820,348 | |
| 16,599 | | Willdan Group, Inc.* | | | 259,276 | |
| | | | | | |
| | | | | 14,467,980 | |
| | | | | | |
| |
Information Technology — 15.73% | | | | |
| 93,670 | | AXT, Inc.* | | | 372,807 | |
| 26,700 | | Cohu, Inc.* | | | 1,025,013 | |
| 31,500 | | Model N, Inc.* | | | 1,054,305 | |
| 39,130 | | Napco Security Technologies, Inc.* | | | 1,470,505 | |
| 5,153 | | Novanta, Inc.* | | | 819,791 | |
| 14,890 | | Onto Innovation, Inc.* | | | 1,308,533 | |
| 15,962 | | PC Connection, Inc. | | | 717,652 | |
| 24,526 | | Sapiens International Corp. NV | | | 532,705 | |
| 13,370 | | Super Micro Computer, Inc.* | | | 1,424,573 | |
| 20,015 | | Vishay Precision Group, Inc.* | | | 835,826 | |
| | | | | | |
| | | | | 9,561,710 | |
| | | | | | |
| |
Materials — 4.66% | | | | |
| 93,479 | | FutureFuel Corp. | | | 689,875 | |
| 28,537 | | Koppers Holdings, Inc. | | | 997,939 | |
| 9,870 | | Materion Corp. | | | 1,144,920 | |
| | | | | | |
| | | | | 2,832,734 | |
| | | | | | |
| |
Real Estate — 3.05% | | | | |
| 112,910 | | Braemar Hotels & Resorts, Inc., REIT | | | 435,833 | |
| 60,100 | | Chatham Lodging Trust | | | 630,449 | |
| 11,700 | | Community Healthcare Trust, Inc., REIT | | | 428,220 | |
| 24,070 | | UMH Properties, Inc., REIT | | | 355,995 | |
| | | | | | |
| | | | | 1,850,497 | |
| | | | | | |
15
|
SCHEDULE OF PORTFOLIO INVESTMENTS |
RBC Enterprise Fund (cont.)
March 31, 2023 (Unaudited)
| | | | | | |
| Shares | | | | Value | |
Utilities — 0.80% | | | | |
| 8,510 | | Unitil Corp. | | $ | 485,410 | |
| | | | | | |
| |
Total Common Stocks | | | 55,430,531 | |
| | | | | | |
(Cost $36,679,269) | | | | |
| |
Exchange Traded Funds — 5.35% | | | | |
| 10,840 | | iShares Biotechnology ETF | | | 1,400,094 | |
| 5,920 | | iShares Russell Microcap Index Fund | | | 618,699 | |
| 16,200 | | SPDR S&P Biotech ETF* | | | 1,234,602 | |
| | | | | | | |
| | | | | | |
Total Exchange Traded Funds | | | 3,253,395 | |
| | | | | | |
(Cost $3,489,510) | | | | | | |
| |
Investment Company — 3.78% | | | | |
| 2,295,896 | | U.S. Government Money Market Fund, RBC Institutional Class 1(a) | | | 2,295,896 | |
| | | | | | |
| |
Total Investment Company | | | 2,295,896 | |
| | | | | | |
(Cost $2,295,896) | | | | | | |
| |
Total Investments | | $ | 60,979,822 | |
(Cost $42,464,675)(b) — 100.34% | | | | |
| |
Liabilities in excess of other assets — (0.34)% | | | (204,865) | |
| | | | | | |
| |
NET ASSETS — 100.00% | | $ | 60,774,957 | |
| | | | | | |
| * | Non-income producing security. |
| (a) | Affiliated investment. |
| (b) | See Notes to Schedules of Portfolio Investments for the tax cost of securities and the breakdown of unrealized appreciation (depreciation). |
Abbreviations used are defined below:
REIT - Real Estate Investment Trust
See Notes to the Financial Statements.
16
|
SCHEDULE OF PORTFOLIO INVESTMENTS |
RBC Small Cap Core Fund
March 31, 2023 (Unaudited)
| | | | | | |
| Shares | | | | Value | |
Common Stocks — 95.76% | | | | |
Communication Services — 2.55% | | | | |
| 6,204 | | Nexstar Media Group, Inc., Class A | | $ | 1,071,183 | |
| | | | | | |
| |
Consumer Discretionary — 14.99% | | | | |
| 1,781 | | Deckers Outdoor Corp.* | | | 800,649 | |
| 5,130 | | Fox Factory Holding Corp.* | | | 622,628 | |
| 11,373 | | G-III Apparel Group Ltd.* | | | 176,850 | |
| 3,530 | | Group 1 Automotive, Inc. | | | 799,263 | |
| 3,902 | | LCI Industries | | | 428,713 | |
| 8,102 | | Malibu Boats, Inc., Class A* | | | 457,358 | |
| 5,840 | | Oxford Industries, Inc. | | | 616,646 | |
| 9,894 | | Patrick Industries, Inc. | | | 680,806 | |
| 24,087 | | Ruth’s Hospitality Group, Inc. | | | 395,508 | |
| 18,230 | | Taylor Morrison Home Corp.* | | | 697,480 | |
| 28,596 | | Topgolf Callaway Brands Corp.* | | | 618,245 | |
| | | | | | |
| | | | | 6,294,146 | |
| | | | | | |
| |
Consumer Staples — 3.63% | | | | |
| 25,838 | | Hostess Brands, Inc.* | | | 642,850 | |
| 2,237 | | Medifast, Inc. | | | 231,910 | |
| 6,720 | | MGP Ingredients, Inc. | | | 649,958 | |
| | | | | | |
| | | | | 1,524,718 | |
| | | | | | |
| |
Energy — 7.86% | | | | |
| 55,266 | | Magnolia Oil & Gas Corp., Class A | | | 1,209,220 | |
| 35,619 | | Par Pacific Holdings, Inc.* | | | 1,040,075 | |
| 16,330 | | PDC Energy, Inc. | | | 1,048,059 | |
| | | | | | |
| | | | | 3,297,354 | |
| | | | | | |
| |
Financials — 9.38% | | | | |
| 71,512 | | Compass Diversified Holdings | | | 1,364,449 | |
| 7,560 | | Independent Bank Group, Inc. | | | 350,406 | |
| 5,400 | | Pinnacle Financial Partners, Inc. | | | 297,864 | |
| 7,564 | | Preferred Bank/Los Angeles, CA | | | 414,583 | |
| 16,520 | | Stellar Bancorp, Inc. | | | 406,557 | |
| 9,517 | | TriCo Bancshares | | | 395,812 | |
| 10,236 | | United Community Banks, Inc. | | | 287,836 | |
| 5,740 | | Wintrust Financial Corp. | | | 418,733 | |
| | | | | | |
| | | | | 3,936,240 | |
| | | | | | |
| |
Health Care — 9.86% | | | | |
| 17,841 | | Apollo Medical Holdings, Inc.* | | | 650,662 | |
| 11,114 | | Globus Medical, Inc., Class A* | | | 629,497 | |
| 19,296 | | Lantheus Holdings, Inc.* | | | 1,593,078 | |
| 3,043 | | Masimo Corp.* | | | 561,555 | |
17
|
SCHEDULE OF PORTFOLIO INVESTMENTS |
RBC Small Cap Core Fund (cont.)
March 31, 2023 (Unaudited)
| | | | | | |
| Shares | | | | Value | |
| 3,081 | | Omnicell, Inc.* | | $ | 180,762 | |
| 1,511 | | West Pharmaceutical Services, Inc. | | | 523,516 | |
| | | | | | |
| | | | | 4,139,070 | |
| | | | | | |
Industrials — 23.10% | | | | |
| 155,535 | | ACCO Brands Corp. | | | 827,446 | |
| 7,620 | | Arcosa, Inc. | | | 480,898 | |
| 11,189 | | Atkore, Inc.* | | | 1,571,831 | |
| 12,590 | | Barrett Business Services, Inc. | | | 1,115,978 | |
| 20,736 | | CBIZ, Inc.* | | | 1,026,225 | |
| 27,941 | | Columbus McKinnon Corp. | | | 1,038,288 | |
| 31,581 | | Ducommun, Inc.* | | | 1,727,796 | |
| 19,015 | | Greenbrier Cos., Inc. (The) | | | 611,712 | |
| 32,931 | | Insteel Industries, Inc. | | | 916,140 | |
| 3,668 | | NV5 Global, Inc.* | | | 381,362 | |
| | | | | | |
| | | | | 9,697,676 | |
| | | | | | |
Information Technology — 13.94% | | | | |
| 4,703 | | Ambarella, Inc.* | | | 364,106 | |
| 47,732 | | AXT, Inc.* | | | 189,973 | |
| 16,680 | | Cohu, Inc.* | | | 640,345 | |
| 4,264 | | MKS Instruments, Inc. | | | 377,876 | |
| 17,559 | | Model N, Inc.* | | | 587,700 | |
| 3,416 | | Novanta, Inc.* | | | 543,451 | |
| 10,341 | | Onto Innovation, Inc.* | | | 908,767 | |
| 13,169 | | Sapiens International Corp. NV | | | 286,031 | |
| 8,920 | | Super Micro Computer, Inc.* | | | 950,426 | |
| 10,060 | | Tenable Holdings, Inc.* | | | 477,951 | |
| 12,540 | | Vishay Precision Group, Inc.* | | | 523,670 | |
| | | | | | |
| | | | | 5,850,296 | |
| | | | | | |
Materials — 5.31% | | | | |
| 49,046 | | FutureFuel Corp. | | | 361,960 | |
| 7,553 | | Ingevity Corp.* | | | 540,191 | |
| 17,851 | | Koppers Holdings, Inc. | | | 624,249 | |
| 6,050 | | Materion Corp. | | | 701,800 | |
| | | | | | |
| | | | | 2,228,200 | |
| | | | | | |
Real Estate — 4.40% | | | | |
| 72,840 | | DiamondRock Hospitality Co., REIT | | | 592,189 | |
| 3,180 | | EastGroup Properties, Inc., REIT | | | 525,717 | |
| 15,928 | | STAG Industrial, Inc., REIT | | | 538,685 | |
| 12,949 | | UMH Properties, Inc., REIT | | | 191,516 | |
| | | | | | |
| | | | | 1,848,107 | |
| | | | | | |
18
|
SCHEDULE OF PORTFOLIO INVESTMENTS |
RBC Small Cap Core Fund (cont.)
March 31, 2023 (Unaudited)
| | | | | | |
| Shares | | | | Value | |
Utilities — 0.74% | |
| 4,970 | | Southwest Gas Holdings, Inc. | | $ | 310,376 | |
| | | | | | |
| |
Total Common Stocks | | | 40,197,366 | |
| | | | | | |
(Cost $25,530,989) | | | | |
| |
Exchange Traded Funds — 1.70% | | | | |
| 168 | | iShares Russell 2000 Index Fund | | | 29,971 | |
| 8,990 | | SPDR S&P Biotech ETF* | | | 685,128 | |
| | | | | | |
| |
Total Exchange Traded Funds | | | 715,099 | |
| | | | | | |
| (Cost $1,153,213) | | | | |
| |
Investment Company — 2.81% | | | | |
| 1,179,115 | | U.S. Government Money Market Fund, RBC Institutional Class 1(a) | | | 1,179,115 | |
| | | | | | |
| |
Total Investment Company | | | 1,179,115 | |
| | | | | | |
| (Cost $1,179,115) | | | | |
| |
Total Investments | | $ | 42,091,580 | |
| (Cost $27,863,317)(b) — 100.27% | | | | |
| |
Liabilities in excess of other assets — (0.27)% | | | (111,591) | |
| | | | | | |
| |
NET ASSETS — 100.00% | | $ | 41,979,989 | |
| | | | | | |
| * | Non-income producing security. |
| (a) | Affiliated investment. |
| (b) | See Notes to Schedules of Portfolio Investments for the tax cost of securities and the breakdown of unrealized appreciation (depreciation). |
Abbreviations used are defined below:
REIT - Real Estate Investment Trust
See Notes to the Financial Statements.
19
|
SCHEDULE OF PORTFOLIO INVESTMENTS |
RBC Microcap Value Fund
March 31, 2023 (Unaudited)
| | | | | | |
| Shares | | | | Value | |
Common Stocks — 98.05% | | | | |
Communication Services — 1.65% | | | | |
| 14,300 | | Cumulus Media, Inc., Class A* | | $ | 52,767 | |
| 35,450 | | DHI Group, Inc.* | | | 137,546 | |
| 33,900 | | Entravision Communications Corp., Class A | | | 205,095 | |
| 23,643 | | EW Scripps Co. (The), Class A* | | | 222,481 | |
| 8,700 | | Harte-Hanks, Inc.* | | | 81,867 | |
| 4,300 | | Marcus Corp. (The) | | | 68,800 | |
| 23,400 | | Outbrain, Inc.* | | | 96,642 | |
| 119,400 | | Point.360*,(a),(b),(c) | | | 0 | |
| 14,900 | | Reservoir Media, Inc.* | | | 97,148 | |
| 15,600 | | Saga Communications, Inc., Class A | | | 346,788 | |
| 39,150 | | Salem Media Group, Inc.* | | | 42,673 | |
| 12,500 | | Spok Holdings, Inc. | | | 126,625 | |
| 19,200 | | Townsquare Media, Inc., Class A | | | 153,600 | |
| 40,000 | | Zedge, Inc., Class B* | | | 78,000 | |
| | | | | | |
| | | | | 1,710,032 | |
| | | | | | |
Consumer Discretionary — 18.03% | | | | |
| 10,800 | | 1-800-Flowers.com, Inc., Class A* | | | 124,200 | |
| 6,400 | | Aaron’s Co., Inc. (The) | | | 61,824 | |
| 5,000 | | American Public Education, Inc.* | | | 27,100 | |
| 6,400 | | America’s Car-Mart, Inc.* | | | 506,944 | |
| 21,300 | | Anemostat Door Products*,(a),(b),(c) | | | 0 | |
| 21,300 | | Anemostat, Inc.*,(a),(b),(c) | | | 0 | |
| 11,000 | | Bassett Furniture Industries, Inc. | | | 195,800 | |
| 33,400 | | Beazer Homes USA, Inc.* | | | 530,392 | |
| 17,800 | | Big 5 Sporting Goods Corp. | | | 136,882 | |
| 2,320 | | Bluegreen Vacations Holding Corp. | | | 63,522 | |
| 6,530 | | Build-A-Bear Workshop, Inc. | | | 151,757 | |
| 3,200 | | Canterbury Park Holding Corp. | | | 78,352 | |
| 4,550 | | Carriage Services, Inc. | | | 138,866 | |
| 8,500 | | Cato Corp. (The), Class A | | | 75,140 | |
| 14,200 | | Century Casinos, Inc.* | | | 104,086 | |
| 12,093 | | Century Communities, Inc. | | | 772,985 | |
| 4,200 | | Chuy’s Holdings, Inc.* | | | 150,570 | |
| 4,800 | | Citi Trends, Inc.* | | | 91,296 | |
| 9,042 | | Clarus Corp. | | | 85,447 | |
| 64,330 | | Container Store Group, Inc. (The)* | | | 220,652 | |
| 28,600 | | Crown Crafts, Inc. | | | 165,308 | |
| 34,500 | | Delta Apparel, Inc.* | | | 379,500 | |
| 9,900 | | Dream Finders Homes, Inc., Class A* | | | 131,175 | |
| 19,000 | | Duluth Holdings, Inc., Class B* | | | 121,220 | |
| 10,000 | | El Pollo Loco Holdings, Inc. | | | 95,900 | |
| 8,000 | | Escalade, Inc. | | | 116,800 | |
| 11,100 | | Ethan Allen Interiors, Inc. | | | 304,806 | |
| 4,900 | | Flanigan’s Enterprises, Inc. | | | 138,552 | |
| 9,600 | | Flexsteel Industries, Inc. | | | 184,896 | |
| 8,700 | | Funko, Inc., Class A* | | | 82,041 | |
20
|
SCHEDULE OF PORTFOLIO INVESTMENTS |
RBC Microcap Value Fund (cont.)
March 31, 2023 (Unaudited)
| | | | | | |
| Shares | | | | Value | |
| 2,800 | | Genesco, Inc.* | | $ | 103,264 | |
| 18,280 | | Haverty Furniture Cos., Inc. | | | 583,315 | |
| 10,400 | | hhgregg, Inc.* | | | 2 | |
| 1,500 | | Hibbett, Inc. | | | 88,470 | |
| 39,400 | | Holley, Inc.* | | | 107,956 | |
| 20,900 | | Hooker Furnishings Corp. | | | 380,171 | |
| 2,800 | | Hovnanian Enterprises, Inc., Class A* | | | 189,952 | |
| 7,100 | | Inspired Entertainment, Inc.* | | | 90,809 | |
| 4,100 | | J Jill, Inc.* | | | 106,764 | |
| 20,900 | | Jerash Holdings US, Inc. | | | 98,648 | |
| 6,740 | | Johnson Outdoors, Inc., Class A | | | 424,687 | |
| 23,500 | | Kid Brands, Inc.*,(a),(b) | | | 0 | |
| 37,620 | | Lakeland Industries, Inc. | | | 549,252 | |
| 10,300 | | Lands’ End, Inc.* | | | 100,116 | |
| 28,900 | | Latham Group, Inc.* | | | 82,654 | |
| 95,270 | | Lazare Kaplan International, Inc.*,(a),(b),(c) | | | 0 | |
| 7,400 | | La-Z-Boy, Inc. | | | 215,192 | |
| 10,800 | | Lazydays Holdings, Inc.* | | | 126,036 | |
| 14,100 | | Legacy Housing Corp.* | | | 320,916 | |
| 11,300 | | Lifetime Brands, Inc. | | | 66,444 | |
| 29,900 | | Lincoln Educational Services Corp.* | | | 169,234 | |
| 5,000 | | Live Ventures, Inc.* | | | 158,350 | |
| 11,780 | | M/I Homes, Inc.* | | | 743,200 | |
| 18,780 | | MarineMax, Inc.* | | | 539,925 | |
| 8,100 | | McRae Industries, Inc., Class A | | | 336,879 | |
| 2,285 | | Mecklermedia Corp.*,(a),(b),(c) | | | 0 | |
| 16,109 | | Mestek, Inc.* | | | 322,986 | |
| 10,100 | | Modine Manufacturing Co.* | | | 232,805 | |
| 6,800 | | Motorcar Parts of America, Inc.* | | | 50,592 | |
| 14,340 | | Movado Group, Inc. | | | 412,562 | |
| 3,700 | | Nathan’s Famous, Inc. | | | 279,720 | |
| 10,100 | | Nobility Homes, Inc. | | | 275,225 | |
| 2,500 | | OneWater Marine, Inc., Class A* | | | 69,925 | |
| 41,000 | | Orleans Homebuilders, Inc.*,(a),(b),(c) | | | 0 | |
| 8,425 | | Patrick Industries, Inc. | | | 579,724 | |
| 1,300 | | RCI Hospitality Holdings, Inc. | | | 101,621 | |
| 22,800 | | Rocky Brands, Inc. | | | 525,996 | |
| 12,400 | | RumbleON, Inc., Class B* | | | 75,144 | |
| 10,160 | | Sonic Automotive, Inc., Class A | | | 552,094 | |
| 9,300 | | Sportsman’s Warehouse Holdings, Inc.* | | | 78,864 | |
| 13,000 | | Standard Motor Products, Inc. | | | 479,830 | |
| 13,430 | | Strattec Security Corp.* | | | 305,533 | |
| 22,510 | | Stride, Inc.* | | | 883,518 | |
| 24,489 | | Superior Group of Cos., Inc. | | | 192,728 | |
| 27,200 | | Superior Industries International, Inc.* | | | 134,640 | |
| 4,440 | | Taylor Morrison Home Corp.* | | | 169,874 | |
| 32,000 | | Tilly’s, Inc., Class A* | | | 246,720 | |
| 41,000 | | Torrid Holdings, Inc.* | | | 178,760 | |
21
|
SCHEDULE OF PORTFOLIO INVESTMENTS |
RBC Microcap Value Fund (cont.)
March 31, 2023 (Unaudited)
| | | | | | |
| Shares | | | | Value | |
| 9,160 | | TravelCenters of America, Inc.* | | $ | 792,340 | |
| 23,200 | | Tupperware Brands Corp.* | | | 58,000 | |
| 23,800 | | Unifi, Inc.* | | | 194,446 | |
| 6,100 | | Universal Electronics, Inc.* | | | 61,854 | |
| 12,700 | | Universal Technical Institute, Inc.* | | | 93,726 | |
| 30,000 | | Universal Travel Group*,(a),(b),(c) | | | 0 | |
| 7,100 | | VOXX International Corp.* | | | 87,543 | |
| 1,397 | | Walking Co. Holdings, Inc. (The)*,(a),(b),(c) | | | 0 | |
| 13,500 | | Weyco Group, Inc. | | | 341,550 | |
| 4,800 | | Zumiez, Inc.* | | | 88,512 | |
| | | | | | |
| | | | | 18,685,081 | |
| | | | | | |
Consumer Staples — 4.53% | | | | |
| 3,000 | | Alico, Inc. | | | 72,600 | |
| 4,350 | | Andersons, Inc. (The) | | | 179,742 | |
| 13,425 | | Central Garden & Pet Co.* | | | 551,231 | |
| 36 | | Hawaiian Macadamia Nut Orchards L.P.*,(b) | | | 82,800 | |
| 11,260 | | Ingles Markets, Inc., Class A | | | 998,762 | |
| 16,200 | | Lifevantage Corp. | | | 58,158 | |
| 10,400 | | Natural Alternatives International, Inc.* | | | 95,992 | |
| 41,860 | | Natural Grocers by Vitamin Cottage, Inc. | | | 491,855 | |
| 13,900 | | Nature’s Sunshine Products, Inc.* | | | 141,919 | |
| 18,430 | | Oil-Dri Corp. of America | | | 766,872 | |
| 4,400 | | Seneca Foods Corp., Class A* | | | 229,988 | |
| 21,460 | | SpartanNash Co. | | | 532,208 | |
| 22,500 | | Thorne HealthTech, Inc.* | | | 103,950 | |
| 12,200 | | Village Super Market, Inc., Class A | | | 279,136 | |
| 41,000 | | Whole Earth Brands, Inc.* | | | 104,960 | |
| | | | | | |
| | | | | 4,690,173 | |
| | | | | | |
Energy — 3.35% | | | | |
| 6,300 | | Adams Resources & Energy, Inc. | | | 242,046 | |
| 45,500 | | Aegean Marine Petroleum Network, Inc.*,(a),(b),(c) | | | 0 | |
| 38,000 | | Alto Ingredients, Inc.* | | | 57,000 | |
| 11,200 | | Amplify Energy Corp.* | | | 76,944 | |
| 1 | | Bristow Group, Inc.* | | | 22 | |
| 1,430 | | Civitas Resources, Inc. | | | 97,726 | |
| 3,400 | | CONSOL Energy, Inc. | | | 198,118 | |
| 8,800 | | Dorian LPG Ltd. | | | 175,472 | |
| 7,700 | | Global Partners LP | | | 238,854 | |
| 2,950 | | Harvest Natural Resources, Inc.*,(a),(b),(c) | | | 0 | |
| 3,000 | | NACCO Industries, Inc., Class A | | | 108,210 | |
| 51,740 | | North American Construction Group Ltd. | | | 864,058 | |
| 12,100 | | PermRock Royalty Trust | | | 84,216 | |
| 39,800 | | PHX Minerals, Inc. | | | 104,276 | |
| 1,200 | | PrimeEnergy Resources Corp.* | | | 100,920 | |
| 9,900 | | Ranger Energy Services, Inc.* | | | 100,881 | |
| 4,900 | | Ranger Oil Corp., Class A | | | 200,116 | |
| 12,930 | | REX American Resources Corp.* | | | 369,669 | |
22
|
SCHEDULE OF PORTFOLIO INVESTMENTS |
RBC Microcap Value Fund (cont.)
March 31, 2023 (Unaudited)
| | | | | | |
| Shares | | | | Value | |
| 54,000 | | Ring Energy, Inc.* | | $ | 102,600 | |
| 8,050 | | Sitio Royalties Corp., Class A | | | 181,930 | |
| 8,400 | | Solaris Oilfield Infrastructure, Inc., Class A | | | 71,736 | |
| 18,880 | | W&T Offshore, Inc.* | | | 95,911 | |
| | | | | | |
| | | | | 3,470,705 | |
| | | | | | |
Financials — 34.02% | | | | |
| 25,000 | | Acacia Research Corp.* | | | 96,500 | |
| 4,700 | | ACNB Corp. | | | 152,985 | |
| 6,200 | | AFC Gamma, Inc., REIT | | | 75,392 | |
| 39,150 | | Affirmative Insurance Holdings, Inc.*,(a),(b),(c) | | | 0 | |
| 9,200 | | Amalgamated Financial Corp. | | | 162,748 | |
| 8,900 | | Amerant Bancorp, Inc. | | | 193,664 | |
| 3,900 | | American Business Bank* | | | 128,700 | |
| 7,300 | | American National Bankshares, Inc. | | | 231,410 | |
| 7,600 | | Ames National Corp. | | | 158,080 | |
| 5,968 | | Apollo Commercial Real Estate Finance, Inc., REIT | | | 55,562 | |
| 15,826 | | Arbor Realty Trust, Inc., REIT | | | 181,841 | |
| 44,870 | | Ares Commercial Real Estate Corp., REIT | | | 407,868 | |
| 2,200 | | Arlington Asset Investment Corp., REIT, Class A* | | | 6,292 | |
| 1,300 | | Associated Capital Group, Inc., Class A | | | 48,035 | |
| 3,300 | | Atlanticus Holdings Corp.* | | | 89,529 | |
| 7,500 | | Avantax, Inc.* | | | 197,400 | |
| 31,450 | | Banc of California, Inc. | | | 394,068 | |
| 13,200 | | Banco Latinoamericano de Comercio Exterior SA, Class E | | | 229,416 | |
| 9,300 | | Bancorp, Inc. (The)* | | | 259,005 | |
| 2,800 | | Bank First Corp. | | | 206,024 | |
| 5,142 | | Bank of Marin Bancorp | | | 112,558 | |
| 6,000 | | Bank7 Corp. | | | 147,300 | |
| 14,400 | | BankFinancial Corp. | | | 126,000 | |
| 7,000 | | Bankwell Financial Group, Inc. | | | 174,020 | |
| 2,628 | | Banner Corp. | | | 142,884 | |
| 9,200 | | Bar Harbor Bankshares | | | 243,340 | |
| 5,300 | | BayCom Corp. | | | 90,524 | |
| 10,500 | | BCB Bancorp, Inc. | | | 137,865 | |
| 100,000 | | Beverly Hills Bancorp, Inc.*,(a),(b),(c) | | | 0 | |
| 8,100 | | Blue Ridge Bankshares, Inc. | | | 82,620 | |
| 16,500 | | BM Technologies, Inc.* | | | 58,080 | |
| 3,500 | | BNCCORP, Inc. | | | 78,190 | |
| 8,000 | | Bogota Financial Corp.* | | | 81,120 | |
| 19,000 | | Bridgewater Bancshares, Inc.* | | | 205,960 | |
| 10,174 | | Brookline Bancorp, Inc. | | | 106,827 | |
| 5,500 | | Business First Bancshares, Inc. | | | 94,215 | |
| 1,700 | | C&F Financial Corp. | | | 87,907 | |
| 3,800 | | California BanCorp* | | | 74,138 | |
| 32,800 | | California First Leasing Corp.* | | | 510,040 | |
| 1,500 | | Cambridge Bancorp | | | 97,215 | |
| 6,200 | | Capital Bancorp, Inc. | | | 103,168 | |
23
|
SCHEDULE OF PORTFOLIO INVESTMENTS |
RBC Microcap Value Fund (cont.)
March 31, 2023 (Unaudited)
| | | | | | |
| Shares | | | | Value | |
| 9,400 | | Capital City Bank Group, Inc. | | $ | 275,514 | |
| 38,000 | | Capitol Bancorp Ltd.*,(a),(b),(c) | | | 0 | |
| 10,300 | | Capstar Financial Holdings, Inc. | | | 156,045 | |
| 5,700 | | Central Valley Community Bancorp | | | 117,306 | |
| 6,500 | | CF Bankshares, Inc. | | | 126,750 | |
| 1,900 | | Chemung Financial Corp. | | | 78,850 | |
| 22,597 | | Cherry Hill Mortgage Investment Corp., REIT | | | 124,735 | |
| 5,700 | | Chicago Atlantic Real Estate Finance, Inc. | | | 77,007 | |
| 8,200 | | Citizens & Northern Corp. | | | 175,316 | |
| 6,300 | | Citizens Community Bancorp, Inc. | | | 66,843 | |
| 1,300 | | Citizens Financial Services, Inc. | | | 108,615 | |
| 12,200 | | Civista Bancshares, Inc. | | | 205,936 | |
| 10,000 | | CNB Financial Corp. | | | 192,000 | |
| 2,000 | | Coastal Financial Corp.* | | | 72,020 | |
| 3,800 | | Codorus Valley Bancorp, Inc. | | | 78,850 | |
| 6,300 | | Cohen & Co., Inc. | | | 43,200 | |
| 6,600 | | Colony Bankcorp, Inc. | | | 67,320 | |
| 86,343 | | Consumer Portfolio Services, Inc.* | | | 923,007 | |
| 7,300 | | Crescent Capital BDC, Inc. | | | 99,426 | |
| 1,400 | | Croghan Bancshares, Inc. | | | 72,800 | |
| 11,048 | | Dime Community Bancshares, Inc. | | | 251,011 | |
| 6,577 | | Donegal Group, Inc., Class A | | | 100,497 | |
| 2,300 | | Donnelley Financial Solutions, Inc.* | | | 93,978 | |
| 13,346 | | Dynex Capital, Inc., REIT | | | 161,754 | |
| 15,500 | | Ellington Residential Mortgage, REIT | | | 113,150 | |
| 8,000 | | Embassy Bancorp, Inc. | | | 135,840 | |
| 21,940 | | Enova International, Inc.* | | | 974,794 | |
| 8,300 | | Enterprise Bancorp, Inc. | | | 261,118 | |
| 5,878 | | Enterprise Financial Services Corp. | | | 262,100 | |
| 4,700 | | Equity Bancshares, Inc., Class A | | | 114,539 | |
| 5,300 | | Esquire Financial Holdings, Inc. | | | 207,230 | |
| 6,800 | | ESSA Bancorp, Inc. | | | 106,896 | |
| 4,400 | | Evans Bancorp, Inc. | | | 147,686 | |
| 16,500 | | Farmers National Banc Corp. | | | 208,560 | |
| 6,987 | | FB Financial Corp. | | | 217,156 | |
| 8,590 | | Federal Agricultural Mortgage Corp., Class C | | | 1,144,102 | |
| 2,800 | | Fidelity D&D Bancorp, Inc. | | | 127,848 | |
| 8,000 | | Financial Institutions, Inc. | | | 154,240 | |
| 2,800 | | Finward Bancorp | | | 81,480 | |
| 6,700 | | First Bancorp, Inc. (The) | | | 173,463 | |
| 10,400 | | First Bank | | | 105,040 | |
| 7,700 | | First Business Financial Services, Inc. | | | 234,927 | |
| 6,700 | | First Community Bankshares, Inc. | | | 167,835 | |
| 9,200 | | First Financial Corp. | | | 344,816 | |
| 10,000 | | First Financial Northwest, Inc. | | | 127,700 | |
| 9,200 | | First Internet Bancorp | | | 153,180 | |
| 3,423 | | First Merchants Corp. | | | 112,788 | |
| 9,800 | | First of Long Island Corp. (The) | | | 132,300 | |
| 38,000 | | First Place Financial Corp.*,(a),(b),(c) | | | 0 | |
24
|
SCHEDULE OF PORTFOLIO INVESTMENTS |
RBC Microcap Value Fund (cont.)
March 31, 2023 (Unaudited)
| | | | | | |
| Shares | | | | Value | |
| 10,100 | | First Reliance Bancshares, Inc.* | | $ | 75,154 | |
| 5,400 | | First Savings Financial Group, Inc. | | | 86,886 | |
| 5,300 | | First Western Financial, Inc.* | | | 104,940 | |
| 8,600 | | Flushing Financial Corp. | | | 128,054 | |
| 8,400 | | FS Bancorp, Inc. | | | 252,084 | |
| 13,250 | | FVCBankcorp, Inc.* | | | 141,113 | |
| 10,400 | | GCM Grosvenor, Inc., Class A | | | 81,224 | |
| 11,000 | | Gladstone Capital Corp. | | | 103,400 | |
| 8,000 | | Gladstone Investment Corp. | | | 106,000 | |
| 11,100 | | Granite Point Mortgage Trust, Inc. | | | 55,056 | |
| 33,528 | | Great Ajax Corp., REIT | | | 220,614 | |
| 8,550 | | Guaranty Bancshares, Inc. | | | 238,289 | |
| 8,700 | | Guild Holdings Co., Class A* | | | 90,480 | |
| 11,700 | | Hanmi Financial Corp. | | | 217,269 | |
| 12,300 | | HBT Financial, Inc. | | | 242,556 | |
| 1,440 | | HCI Group, Inc. | | | 77,184 | |
| 700 | | Hingham Institution for Savings (The), FOR | | | 163,408 | |
| 5,000 | | Home Bancorp, Inc. | | | 165,150 | |
| 11,340 | | HomeTrust Bancshares, Inc. | | | 278,851 | |
| 3,500 | | HV Bancorp, Inc.* | | | 105,105 | |
| 11,600 | | Independent Bank Corp. | | | 206,132 | |
| 8,500 | | Investar Holding Corp. | | | 118,660 | |
| 3,604 | | Investors Title Co. | | | 544,204 | |
| 2,900 | | Kansas City Life Insurance Co. | | | 64,525 | |
| 7,874 | | Lakeland Bancorp, Inc. | | | 123,149 | |
| 6,400 | | LCNB Corp. | | | 104,576 | |
| 3,500 | | Limestone Bancorp, Inc. | | | 78,085 | |
| 28,000 | | Macatawa Bank Corp. | | | 286,160 | |
| 3,100 | | MainStreet Bancshares, Inc. | | | 72,819 | |
| 24,300 | | Manhattan Bridge Capital, Inc., REIT | | | 125,874 | |
| 12,800 | | Medallion Financial Corp. | | | 98,176 | |
| 5,000 | | Mercantile Bank Corp. | | | 152,900 | |
| 10,050 | | Merchants Bancorp | | | 261,702 | |
| 13,000 | | Meridian Corp. | | | 163,800 | |
| 8,000 | | Metrocity Bankshares, Inc. | | | 136,720 | |
| 5,900 | | Metropolitan Bank Holding Corp.* | | | 199,951 | |
| 5,500 | | Mid Penn Bancorp, Inc. | | | 140,855 | |
| 8,700 | | Midland States Bancorp, Inc. | | | 186,354 | |
| 6,700 | | MidWestOne Financial Group, Inc. | | | 163,614 | |
| 7,200 | | MVB Financial Corp. | | | 148,608 | |
| 6,200 | | National Bankshares, Inc. | | | 195,052 | |
| 2,560 | | National Western Life Group, Inc., Class A | | | 621,107 | |
| 7,900 | | Nexpoint Real Estate Finance, Inc., REIT | | | 123,793 | |
| 8,367 | | Nicholas Financial, Inc.* | | | 49,700 | |
| 7,100 | | Northeast Bank | | | 238,986 | |
| 14,600 | | Northeast Community Bancorp, Inc. | | | 191,552 | |
| 5,100 | | Northrim BanCorp, Inc. | | | 240,618 | |
| 38,510 | | Northwest Bancshares, Inc. | | | 463,275 | |
25
|
SCHEDULE OF PORTFOLIO INVESTMENTS |
RBC Microcap Value Fund (cont.)
March 31, 2023 (Unaudited)
| | | | | | |
| Shares | | | | Value | |
| 2,700 | | Ocwen Financial Corp.* | | $ | 73,224 | |
| 21,600 | | OFG Bancorp | | | 538,704 | |
| 20,400 | | Old Second Bancorp, Inc. | | | 286,824 | |
| 13,200 | | OP Bancorp | | | 117,612 | |
| 12,200 | | Oppenheimer Holdings, Inc., Class A | | | 477,630 | |
| 4,000 | | Orange County Bancorp, Inc. | | | 176,000 | |
| 10,200 | | Orrstown Financial Services, Inc. | | | 202,572 | |
| 8,500 | | Pacific Financial Corp. | | | 91,375 | |
| 9,300 | | Parke Bancorp, Inc. | | | 165,354 | |
| 16,200 | | Partners Bancorp | | | 126,846 | |
| 6,600 | | PCB Bancorp | | | 95,634 | |
| 5,500 | | Peapack-Gladstone Financial Corp. | | | 162,910 | |
| 1,800 | | PennyMac Financial Services, Inc. | | | 107,298 | |
| 18,398 | | Peoples Bancorp, Inc. | | | 473,748 | |
| 3,900 | | Peoples Financial Services Corp. | | | 169,065 | |
| 7,300 | | Pinnacle Bank/Gilroy CA* | | | 88,841 | |
| 1,030 | | Piper Sandler Cos. | | | 142,768 | |
| 36,364 | | Premier Financial Corp. | | | 753,826 | |
| 18,400 | | Primis Financial Corp. | | | 177,192 | |
| 5,500 | | Princeton Bancorp, Inc. | | | 174,460 | |
| 17,000 | | Priority Technology Holdings, Inc.* | | | 61,030 | |
| 5,900 | | Private Bancorp of America, Inc.* | | | 171,100 | |
| 15,500 | | Provident Financial Holdings, Inc. | | | 211,265 | |
| 7,220 | | Provident Financial Services, Inc. | | | 138,480 | |
| 12,400 | | RBB Bancorp | | | 192,200 | |
| 16,781 | | Ready Capital Corp., REIT | | | 170,663 | |
| 3,700 | | Red River Bancshares, Inc. | | | 178,007 | |
| 18,160 | | Regional Management Corp. | | | 473,794 | |
| 19,100 | | Riverview Bancorp, Inc. | | | 101,994 | |
| 3,050 | | S&T Bancorp, Inc. | | | 95,923 | |
| 26,200 | | Sachem Capital Corp., REIT | | | 97,464 | |
| 6,120 | | Safety Insurance Group, Inc. | | | 456,062 | |
| 4,100 | | Saratoga Investment Corp. | | | 103,648 | |
| 6,300 | | SB Financial Group, Inc. | | | 89,019 | |
| 5,716 | | Seacoast Banking Corp. of Florida | | | 135,469 | |
| 9,300 | | Seven Hills Realty Trust, REIT | | | 92,907 | |
| 11,000 | | Shore Bancshares, Inc. | | | 157,080 | |
| 10,300 | | Sierra Bancorp | | | 177,366 | |
| 4,600 | | Silvercrest Asset Management Group, Inc., Class A | | | 83,628 | |
| 5,545 | | Simmons First National Corp., Class A | | | 96,982 | |
| 11,500 | | SmartFinancial, Inc. | | | 266,110 | |
| 6,300 | | South Atlantic Bancshares, Inc. | | | 82,719 | |
| 12,400 | | South Plains Financial, Inc. | | | 265,484 | |
| 5,900 | | Southern First Bancshares, Inc.* | | | 181,130 | |
| 6,900 | | Southern Missouri Bancorp, Inc. | | | 258,129 | |
| 1,436 | | SouthState Corp. | | | 102,329 | |
| 7,500 | | Stellus Capital Investment Corp. | | | 105,675 | |
| 9,300 | | Stewart Information Services Corp. | | | 375,255 | |
| 6,100 | | Summit Financial Group, Inc. | | | 126,575 | |
26
|
SCHEDULE OF PORTFOLIO INVESTMENTS |
RBC Microcap Value Fund (cont.)
March 31, 2023 (Unaudited)
| | | | | | |
| Shares | | | | Value | |
| 8,700 | | SWK Holdings Corp.* | | $ | 155,382 | |
| 6,200 | | Territorial Bancorp, Inc. | | | 119,722 | |
| 4,700 | | Third Coast Bancshares, Inc.* | | | 73,837 | |
| 6,900 | | Timberland Bancorp, Inc. | | | 186,438 | |
| 18,200 | | Trean Insurance Group, Inc.* | | | 111,384 | |
| 1,947 | | Trenwick America Corp.*,(a),(b),(c) | | | 0 | |
| 1,098 | | Trenwick America Corp.*,(a),(b),(c) | | | 0 | |
| 8,400 | | Trinity Capital, Inc. | | | 106,932 | |
| 2,844 | | United Bankshares, Inc. | | | 100,109 | |
| 2,305 | | United Community Banks, Inc. | | | 64,817 | |
| 19,000 | | United Western Bancorp, Inc.*,(a),(b),(c) | | | 0 | |
| 5,900 | | Unity Bancorp, Inc. | | | 134,579 | |
| 9,900 | | Waterstone Financial, Inc. | | | 149,787 | |
| 10,100 | | West BanCorp, Inc. | | | 184,527 | |
| 26,300 | | Western New England Bancorp, Inc. | | | 215,923 | |
| 5,200 | | Westwood Holdings Group, Inc. | | | 58,292 | |
| | | | | | |
| | | | | 35,250,921 | |
| | | | | | |
Health Care — 1.46% | | | | |
| 4,450 | | Artivion, Inc.* | | | 58,295 | |
| 16,100 | | Assertio Holdings, Inc.* | | | 102,557 | |
| 23,900 | | Biote Corp., Class A* | | | 147,941 | |
| 4,600 | | Computer Programs and Systems, Inc.* | | | 138,920 | |
| 4,300 | | Eagle Pharmaceuticals, Inc.* | | | 121,991 | |
| 13,000 | | FONAR Corp.* | | | 210,600 | |
| 48,700 | | Organogenesis Holdings, Inc.* | | | 103,731 | |
| 7,200 | | Phibro Animal Health Corp., Class A | | | 110,304 | |
| 10,500 | | Sensus Healthcare, Inc.* | | | 54,705 | |
| 1,000 | | UFP Technologies, Inc.* | | | 129,840 | |
| 17,600 | | Vanda Pharmaceuticals, Inc.* | | | 119,504 | |
| 10,500 | | Viemed Healthcare, Inc.* | | | 101,430 | |
| 5,300 | | XOMA Corp.* | | | 111,883 | |
| | | | | | |
| | | | | 1,511,701 | |
| | | | | | |
Industrials — 18.49% | | | | |
| 7,300 | | Acme United Corp. | | | 167,900 | |
| 3,450 | | Alamo Group, Inc. | | | 635,352 | |
| 2,424 | | Allied Motion Technologies, Inc. | | | 93,688 | |
| 69,700 | | ARC Document Solutions, Inc. | �� | | 220,949 | |
| 14,900 | | BGSF, Inc. | | | 158,685 | |
| 5,000 | | BlueLinx Holdings, Inc.* | | | 339,800 | |
| 3,600 | | Bowman Consulting Group Ltd.* | | | 103,356 | |
| 11,790 | | CBIZ, Inc.* | | | 583,487 | |
| 25,774 | | CECO Environmental Corp.* | | | 360,578 | |
| 10,678 | | Cenveo, Inc.*,(a),(b),(c) | | | 0 | |
| 2,400 | | Chicago Rivet & Machine Co. | | | 71,328 | |
| 11,800 | | Commercial Vehicle Group, Inc.* | | | 86,140 | |
| 27,978 | | CompX International, Inc. | | | 505,842 | |
| 14,500 | | Concrete Pumping Holdings, Inc.* | | | 98,600 | |
27
|
SCHEDULE OF PORTFOLIO INVESTMENTS |
RBC Microcap Value Fund (cont.)
March 31, 2023 (Unaudited)
| | | | | | |
| Shares | | | | Value | |
| 38,300 | | Costamare, Inc. | | $ | 360,403 | |
| 9,500 | | Covenant Logistics Group, Inc. | | | 336,490 | |
| 30,100 | | CPI Aerostructures, Inc.* | | | 114,380 | |
| 700 | | CRA International, Inc. | | | 75,474 | |
| 6,700 | | DLH Holdings Corp.* | | | 76,849 | |
| 26,960 | | Ducommun, Inc.* | | | 1,474,982 | |
| 15,900 | | Eastern Co. (The) | | | 309,732 | |
| 1,900 | | Encore Wire Corp. | | | 352,127 | |
| 31,360 | | Ennis, Inc. | | | 661,382 | |
| 550 | | EnPro Industries, Inc. | | | 57,140 | |
| 9,690 | | Espey Mfg. & Electronics Corp. | | | 196,222 | |
| 3,600 | | EVI Industries, Inc.* | | | 71,280 | |
| 414 | | Genco Shipping & Trading Ltd. | | | 6,483 | |
| 7,500 | | Gencor Industries, Inc.* | | | 115,275 | |
| 3,180 | | Gibraltar Industries, Inc.* | | | 154,230 | |
| 11,210 | | Greenbrier Cos., Inc. (The) | | | 360,626 | |
| 10,950 | | Griffon Corp. | | | 350,509 | |
| 4,400 | | Hudson Global, Inc.* | | | 98,164 | |
| 3,400 | | Hurco Cos., Inc. | | | 86,088 | |
| 7,800 | | Insteel Industries, Inc. | | | 216,996 | |
| 9,200 | | L B Foster Co., Class A* | | | 105,616 | |
| 26,100 | | Laser Photonics Corp.* | | | 121,887 | |
| 21,200 | | Limbach Holdings, Inc.* | | | 366,760 | |
| 22,500 | | LS Starrett Co. (The), Class A* | | | 252,450 | |
| 61,350 | | LSI Industries, Inc. | | | 854,605 | |
| 7,200 | | Manitowoc Co., Inc. (The)* | | | 123,048 | |
| 23,640 | | Marten Transport Ltd. | | | 495,258 | |
| 6,400 | | Mastech Digital, Inc.* | | | 78,880 | |
| 7,300 | | Mayville Engineering Co., Inc.* | | | 108,916 | |
| 22,979 | | Miller Industries, Inc. | | | 812,308 | |
| 16,000 | | Mistras Group, Inc.* | | | 108,480 | |
| 3,800 | | National Presto Industries, Inc. | | | 273,942 | |
| 9,800 | | Northwest Pipe Co.* | | | 306,054 | |
| 3,400 | | PAM Transportation Services, Inc.* | | | 97,342 | |
| 30,200 | | Park Aerospace Corp. | | | 406,190 | |
| 5,200 | | Park-Ohio Holdings Corp. | | | 62,816 | |
| 9,100 | | Powell Industries, Inc. | | | 387,569 | |
| 3,000 | | Preformed Line Products Co. | | | 384,120 | |
| 24,800 | | Quad/Graphics, Inc.* | | | 106,392 | |
| 12,900 | | Quanex Building Products Corp. | | | 277,737 | |
| 15,000 | | Quest Resource Holding Corp.* | | | 92,100 | |
| 34,400 | | Radiant Logistics, Inc.* | | | 225,664 | |
| 5,600 | | RCM Technologies, Inc.* | | | 64,736 | |
| 13,600 | | Resources Connection, Inc. | | | 232,016 | |
| 5,240 | | Rush Enterprises, Inc., Class A | | | 286,104 | |
| 22,000 | | Safe Bulkers, Inc. | | | 81,180 | |
| 13,500 | | Southland Holdings, Inc.* | | | 113,400 | |
| 2,400 | | Standex International Corp. | | | 293,856 | |
| 11,700 | | Sterling Infrastructure, Inc.* | | | 443,196 | |
28
|
SCHEDULE OF PORTFOLIO INVESTMENTS |
RBC Microcap Value Fund (cont.)
March 31, 2023 (Unaudited)
| | | | | | |
| Shares | | | | Value | |
| 6,800 | | Taylor Devices, Inc.* | | $ | 136,272 | |
| 3,200 | | Tecnoglass, Inc. | | | 134,272 | |
| 21,710 | | Textainer Group Holdings Ltd. | | | 697,108 | |
| 10,500 | | Titan Machinery, Inc.* | | | 319,725 | |
| 10,000 | | Twin Disc, Inc.* | | | 96,200 | |
| 10,730 | | V2X, Inc.* | | | 426,196 | |
| 3,400 | | VSE Corp. | | | 152,660 | |
| 13,338 | | Willis Lease Finance Corp.* | | | 730,656 | |
| | | | | | |
| | | | | 19,156,248 | |
| | | | | | |
| |
Information Technology — 7.44% | | | | |
| 8,600 | | Amtech Systems, Inc.* | | | 82,044 | |
| 8,800 | | AstroNova, Inc.* | | | 123,992 | |
| 6,400 | | Aviat Networks, Inc.* | | | 220,544 | |
| 25,400 | | AXT, Inc.* | | | 101,092 | |
| 14,800 | | Bel Fuse, Inc., Class B | | | 556,184 | |
| 1,100 | | Clearfield, Inc.* | | | 51,238 | |
| 18,100 | | CompoSecure, Inc.* | | | 133,216 | |
| 11,200 | | Computer Task Group, Inc.* | | | 81,200 | |
| 6,200 | | CPI Card Group, Inc.* | | | 279,062 | |
| 10,550 | | CTS Corp. | | | 521,803 | |
| 14,750 | | Digi International, Inc.* | | | 496,780 | |
| 7,580 | | ePlus, Inc.* | | | 371,723 | |
| 13,200 | | Franklin Wireless Corp.* | | | 65,736 | |
| 30,000 | | Immersion Corp. | | | 268,200 | |
| 1,000 | | Insight Enterprises, Inc.* | | | 142,960 | |
| 9,200 | | inTEST Corp.* | | | 190,808 | |
| 1,400 | | JinkoSolar Holding Co. Ltd., ADR* | | | 71,428 | |
| 16,900 | | Key Tronic Corp.* | | | 122,863 | |
| 22,400 | | Kimball Electronics, Inc.* | | | 539,840 | |
| 11,400 | | KVH Industries, Inc.* | | | 129,732 | |
| 12,840 | | Methode Electronics, Inc. | | | 563,419 | |
| 4,800 | | M-Tron Industries, Inc.* | | | 51,600 | |
| 6,300 | | Nortech Systems, Inc.* | | | 67,095 | |
| 31,000 | | Park City Group, Inc. | | | 196,230 | |
| 11,920 | | PC Connection, Inc. | | | 535,923 | |
| 31,700 | | PCTEL, Inc. | | | 134,091 | |
| 30,330 | | Photronics, Inc.* | | | 502,872 | |
| 12,500 | | Richardson Electronics Ltd. | | | 279,000 | |
| 49,900 | | SigmaTron International, Inc.* | | | 131,237 | |
| 16,680 | | Vishay Precision Group, Inc.* | | | 696,557 | |
| | | | | | |
| | | | | 7,708,469 | |
| | | | | | |
| |
Materials — 3.94% | | | | |
| 34,600 | | American Vanguard Corp. | | | 757,048 | |
| 37,000 | | Blue Earth Refineries, Inc.*,(a),(b),(c) | | | 0 | |
| 8,400 | | Clearwater Paper Corp.* | | | 280,728 | |
| 15,500 | | Core Molding Technologies, Inc.* | | | 278,845 | |
| 30,000 | | Fortitude Gold Corp. | | | 213,900 | |
29
|
SCHEDULE OF PORTFOLIO INVESTMENTS |
RBC Microcap Value Fund (cont.)
March 31, 2023 (Unaudited)
| | | | | | |
| Shares | | | | Value | |
| 12,300 | | Friedman Industries, Inc. | | $ | 139,482 | |
| 58,090 | | FutureFuel Corp. | | | 428,704 | |
| 6,600 | | Hawkins, Inc. | | | 288,948 | |
| 3,400 | | Haynes International, Inc. | | | 170,306 | |
| 800 | | Innospec, Inc. | | | 82,136 | |
| 3,600 | | Intrepid Potash, Inc.* | | | 99,360 | |
| 3,440 | | Materion Corp. | | | 399,040 | |
| 9,400 | | Olympic Steel, Inc. | | | 490,774 | |
| 11,100 | | Ramaco Resources, Inc. | | | 97,791 | |
| 5,200 | | Ryerson Holding Corp. | | | 189,176 | |
| 17,700 | | Tredegar Corp. | | | 161,601 | |
| | | | | | |
| | | | | 4,077,839 | |
| | | | | | |
| |
Real Estate — 3.89% | | | | |
| 13,800 | | Alpine Income Property Trust, Inc., REIT | | | 232,254 | |
| 4,300 | | American Realty Investors, Inc.* | | | 113,176 | |
| 9,000 | | AMREP Corp.* | | | 125,910 | |
| 5,200 | | BRT Apartments Corp., REIT | | | 102,544 | |
| 4,800 | | Community Healthcare Trust, Inc., REIT | | | 175,680 | |
| 20,600 | | Comstock Holding Cos., Inc.* | | | 104,236 | |
| 9,875 | | CTO Realty Growth, Inc., REIT | | | 170,442 | |
| 27,000 | | Douglas Elliman, Inc. | | | 83,970 | |
| 20,000 | | Farmland Partners, Inc., REIT | | | 214,000 | |
| 52,400 | | Franklin Street Properties Corp., REIT | | | 82,268 | |
| 3,900 | | FRP Holdings, Inc.* | | | 225,732 | |
| 11,242 | | Getty Realty Corp., REIT | | | 405,049 | |
| 8,800 | | Global Medical REIT, Inc. | | | 80,168 | |
| 14,500 | | Hersha Hospitality Trust, REIT, Class A | | | 97,440 | |
| 5,200 | | Newlake Capital Partners, Inc., REIT | | | 64,220 | |
| 23,032 | | One Liberty Properties, Inc., REIT | | | 528,124 | |
| 5,700 | | Postal Realty Trust, Inc., Class A | | | 86,754 | |
| 7,700 | | RE/MAX Holdings, Inc., Class A | | | 144,452 | |
| 3,000 | | RMR Group, Inc. (The), Class A | | | 78,720 | |
| 19,000 | | RPT Realty, REIT | | | 180,690 | |
| 12,700 | | Urstadt Biddle Properties, Inc., REIT, Class A | | | 223,139 | |
| 55,810 | | Whitestone, REIT | | | 513,452 | |
| | | | | | |
| | | | | 4,032,420 | |
| | | | | | |
| |
Utilities — 1.25% | | | | |
| 1,200 | | Artesian Resources Corp., Class A | | | 66,432 | |
| 1,485 | | Chesapeake Utilities Corp. | | | 190,065 | |
| 1,100 | | Middlesex Water Co. | | | 85,932 | |
| 6,800 | | Pure Cycle Corp.* | | | 64,260 | |
| 3,700 | | RGC Resources, Inc. | | | 85,803 | |
30
|
SCHEDULE OF PORTFOLIO INVESTMENTS |
RBC Microcap Value Fund (cont.)
March 31, 2023 (Unaudited)
| | | | | | |
| Shares | | | | Value | |
| 2,000 | | SJW Group | | $ | 152,260 | |
| 11,466 | | Unitil Corp. | | | 654,021 | |
| | | | | | |
| | | | | 1,298,773 | |
| | | | | | |
| |
Total Common Stocks | | | 101,592,362 | |
| | | | | | |
(Cost $83,824,952) | | | | |
| |
Exchange Traded Funds — 0.10% | | | | |
| 1,000 | | iShares Russell Microcap Index Fund | | | 104,510 | |
| | | | | | |
| | | | | | |
Total Exchange Traded Funds | | | 104,510 | |
| | | | | | |
(Cost $110,563) | | | | |
| |
Rights/Warrants — 0.03% | | | | |
| 1,136 | | Chord Energy Corp, * | | | 20,198 | |
| 568 | | Chord Energy Corp, * | | | 8,066 | |
| 8,600 | | LGL Group, Inc. (The), Warrants, Expire 11/16/25* | | | 1,375 | |
| | | | | | |
| | | | | | |
Total Rights/Warrants | | | 29,639 | |
| | | | | | |
(Cost $95,622) | | | | |
| |
Investment Company — 1.69% | | | | |
| 1,751,001 | | U.S. Government Money Market Fund, RBC Institutional Class 1(d) | | | 1,751,001 | |
| | | | | | |
| |
Total Investment Company | | | 1,751,001 | |
| | | | | | |
(Cost $1,751,001) | | | | |
| |
Total Investments | | $ | 103,477,512 | |
(Cost $85,782,138)(e) — 99.87% | | | | |
| |
Other assets in excess of liabilities — 0.13% | | | 136,991 | |
| | | | | | |
| |
NET ASSETS — 100.00% | | $ | 103,614,503 | |
| | | | | | |
| * | Non-income producing security. |
| (a) | Security delisted or issuer in bankruptcy. |
| (b) | The Pricing Committee has fair valued this security under procedures established by the Fund’s Board of Trustees. |
| (c) | Security is valued using significant unobservable inputs and is classified as Level 3 in the fair value hierarchy. |
| (d) | Affiliated investment. |
| (e) | See Notes to Schedules of Portfolio Investments for the tax cost of securities and the breakdown of unrealized appreciation (depreciation). |
31
|
SCHEDULE OF PORTFOLIO INVESTMENTS |
RBC Microcap Value Fund (cont.)
March 31, 2023 (Unaudited)
Abbreviations used are defined below:
ADR - American Depositary Receipt
FOR - Foreign Ownership Receipt
REIT - Real Estate Investment Trust
See Notes to the Financial Statements.
32
|
SCHEDULE OF PORTFOLIO INVESTMENTS |
RBC Small Cap Value Fund
March 31, 2023 (Unaudited)
| | | | | | |
| Shares | | | | Value | |
Common Stocks — 94.06% | | | | |
Communication Services — 1.72% | | | | |
| 3,040 | | Nexstar Media Group, Inc., Class A | | $ | 524,886 | |
| | | | | | |
| |
Consumer Discretionary — 13.16% | | | | |
| 18,140 | | Dana, Inc. | | | 273,007 | |
| 30,810 | | G-III Apparel Group Ltd.* | | | 479,096 | |
| 2,600 | | Group 1 Automotive, Inc. | | | 588,692 | |
| 5,770 | | Malibu Boats, Inc., Class A* | | | 325,717 | |
| 3,800 | | Oxford Industries, Inc. | | | 401,243 | |
| 6,510 | | Patrick Industries, Inc. | | | 447,953 | |
| 20,170 | | Ruth’s Hospitality Group, Inc. | | | 331,191 | |
| 12,315 | | Steven Madden Ltd. | | | 443,340 | |
| 14,590 | | Taylor Morrison Home Corp.* | | | 558,213 | |
| 22,884 | | Tilly’s, Inc., Class A* | | | 176,436 | |
| | | | | | |
| | | | | 4,024,888 | |
| | | | | | |
Consumer Staples — 3.86% | | | | |
| 15,800 | | Hostess Brands, Inc.* | | | 393,104 | |
| 4,780 | | John B Sanfilippo & Son, Inc. | | | 463,278 | |
| 3,350 | | MGP Ingredients, Inc. | | | 324,012 | |
| | | | | | |
| | | | | 1,180,394 | |
| | | | | | |
Energy — 7.19% | | | | |
| 22,690 | | Delek US Holdings, Inc. | | | 520,735 | |
| 26,070 | | Magnolia Oil & Gas Corp., Class A | | | 570,412 | |
| 22,140 | | Par Pacific Holdings, Inc.* | | | 646,488 | |
| 7,200 | | PDC Energy, Inc. | | | 462,096 | |
| | | | | | |
| | | | | 2,199,731 | |
| | | | | | |
Financials — 21.02% | | | | |
| 3,620 | | American Financial Group, Inc. | | | 439,830 | |
| 6,710 | | Amerisafe, Inc. | | | 328,455 | |
| 26,150 | | Brookline Bancorp, Inc. | | | 274,575 | |
| 24,370 | | Columbia Banking System, Inc. | | | 522,006 | |
| 35,252 | | Compass Diversified Holdings | | | 672,608 | |
| 10,780 | | Independent Bank Group, Inc. | | | 499,653 | |
| 19,177 | | Mercantile Bank Corp. | | | 586,433 | |
| 15,465 | | Pacific Premier Bancorp, Inc. | | | 371,469 | |
| 6,100 | | Pinnacle Financial Partners, Inc. | | | 336,476 | |
| 4,670 | | Reinsurance Group of America, Inc. | | | 619,989 | |
| 11,360 | | Seacoast Banking Corp. of Florida | | | 269,232 | |
| 5,170 | | Stock Yards Bancorp, Inc. | | | 285,074 | |
| 9,070 | | TriCo Bancshares | | | 377,221 | |
| 10,060 | | United Community Banks, Inc. | | | 282,887 | |
| 6,390 | | Veritex Holdings, Inc. | | | 116,681 | |
| 11,790 | | WSFS Financial Corp. | | | 443,422 | |
| | | | | | |
| | | | | 6,426,011 | |
| | | | | | |
33
|
SCHEDULE OF PORTFOLIO INVESTMENTS |
RBC Small Cap Value Fund (cont.)
March 31, 2023 (Unaudited)
| | | | | | |
| Shares | | | | Value | |
Health Care — 3.86% | | | | |
| 7,820 | | Globus Medical, Inc., Class A* | | $ | 442,925 | |
| 6,300 | | Lantheus Holdings, Inc.* | | | 520,128 | |
| 3,710 | | Omnicell, Inc.* | | | 217,665 | |
| | | | | | |
| | | | | 1,180,718 | |
| | | | | | |
Industrials — 16.85% | | | | |
| 110,088 | | ACCO Brands Corp. | | | 585,668 | |
| 7,150 | | Arcosa, Inc. | | | 451,236 | |
| 3,515 | | Atkore, Inc.* | | | 493,787 | |
| 6,590 | | Barrett Business Services, Inc. | | | 584,138 | |
| 5,454 | | Builders FirstSource, Inc.* | | | 484,206 | |
| 19,910 | | Columbus McKinnon Corp. | | | 739,856 | |
| 13,096 | | Ducommun, Inc.* | | | 716,482 | |
| 15,148 | | Greenbrier Cos., Inc. (The) | | | 487,311 | |
| 14,290 | | Insteel Industries, Inc. | | | 397,548 | |
| 2,040 | | NV5 Global, Inc.* | | | 212,099 | |
| | | | | | |
| | | | | 5,152,331 | |
| | | | | | |
Information Technology — 5.43% | | | | |
| 5,470 | | MKS Instruments, Inc. | | | 484,751 | |
| 4,483 | | Model N, Inc.* | | | 150,046 | |
| 990 | | Novanta, Inc.* | | | 157,499 | |
| 5,630 | | Onto Innovation, Inc.* | | | 494,764 | |
| 3,490 | | Super Micro Computer, Inc.* | | | 371,860 | |
| | | | | | |
| | | | | 1,658,920 | |
| | | | | | |
Materials — 6.59% | | | | |
| 3,120 | | Kaiser Aluminum Corp. | | | 232,846 | |
| 17,019 | | Koppers Holdings, Inc. | | | 595,154 | |
| 4,540 | | Materion Corp. | | | 526,640 | |
| 2,570 | | Reliance Steel & Aluminum Co. | | | 659,822 | |
| | | | | | |
| | | | | 2,014,462 | |
| | | | | | |
Real Estate — 10.60% | | | | |
| 11,700 | | Braemar Hotels & Resorts, Inc., REIT | | | 45,162 | |
| 16,399 | | Community Healthcare Trust, Inc., REIT | | | 600,204 | |
| 8,750 | | CubeSmart, REIT | | | 404,425 | |
| 39,940 | | DiamondRock Hospitality Co., REIT | | | 324,712 | |
| 2,890 | | EastGroup Properties, Inc., REIT | | | 477,775 | |
| 8,704 | | National Storage Affiliates Trust, REIT | | | 363,653 | |
| 33,670 | | RLJ Lodging Trust, REIT | | | 356,902 | |
| 12,010 | | STAG Industrial, Inc., REIT | | | 406,178 | |
| 17,801 | | UMH Properties, Inc., REIT | | | 263,277 | |
| | | | | | |
| | | | | 3,242,288 | |
| | | | | | |
34
|
SCHEDULE OF PORTFOLIO INVESTMENTS |
RBC Small Cap Value Fund (cont.)
March 31, 2023 (Unaudited)
| | | | | | |
| Shares | | | | Value | |
Utilities — 3.78% | | | | |
| 18,490 | | Southwest Gas Holdings, Inc. | | $ | 1,154,700 | |
| | | | | | |
| |
Total Common Stocks | | | 28,759,329 | |
| | | | | | |
| (Cost $29,954,222) | | | | |
| |
Exchange Traded Funds — 4.03% | | | | |
| 4,490 | | iShares Russell 2000 Value ETF | | | 615,220 | |
| 8,110 | | SPDR S&P Biotech ETF* | | | 618,063 | |
| | | | | | |
| |
Total Exchange Traded Funds | | | 1,233,283 | |
| | | | | | |
| (Cost $1,384,754) | | | | |
| |
Investment Company — 1.78% | | | | |
| 542,947 | | U.S. Government Money Market Fund, RBC Institutional Class 1(a) | | | 542,947 | |
| | | | | | |
| |
Total Investment Company | | | 542,947 | |
| | | | | | |
| (Cost $542,947) | | | | | | |
| |
Total Investments | | $ | 30,535,559 | |
| (Cost $31,881,923)(b) — 99.87% | | | | |
| |
Other assets in excess of liabilities — 0.13% | | | 39,487 | |
| | | | | | |
| |
NET ASSETS — 100.00% | | $ | 30,575,046 | |
| | | | | | |
| * | Non-income producing security. |
| (a) | Affiliated investment. |
| (b) | See Notes to Schedules of Portfolio Investments for the tax cost of securities and the breakdown of unrealized appreciation (depreciation). |
Abbreviations used are defined below:
REIT - Real Estate Investment Trust
See Notes to the Financial Statements.
35
Statements of Assets and Liabilities
March 31, 2023 (Unaudited)
| | | | | | | | | | | | | | | | | | | | | | | | | | | | | | | | | | | | |
| | | RBC SMID Cap Growth Fund | | | RBC Enterprise Fund | | | RBC Small Cap Core Fund | |
Assets: | | | | | | | | | | | | | | | | | | | | | | | | | | | | | | | | | | | | |
Investments in securities, at value: | | | | | | | | | | | | | | | | | | | | | | | | | | | | | | | | | | | | |
Unaffiliated investments (cost $71,350,293, $40,168,779 and $26,684,202, respectively) | | | | | | $ | 88,767,780 | | | | | | | | | | | $ | 58,683,926 | | | | | | | | | | | $ | 40,912,465 | | | | | |
Affiliated investments (cost $2,111,841, $2,295,896 and $1,179,115, respectively) | | | | | | | 2,111,841 | | | | | | | | | | | | 2,295,896 | | | | | | | | | | | | 1,179,115 | | | | | |
Interest and dividend receivable | | | | | | | 15,965 | | | | | | | | | | | | 38,788 | | | | | | | | | | | | 32,079 | | | | | |
Receivable for capital shares issued | | | | | | | 111,423 | | | | | | | | | | | | — | | | | | | | | | | | | 100 | | | | | |
Receivable for investments sold | | | | | | | — | | | | | | | | | | | | — | | | | | | | | | | | | 95,158 | | | | | |
Prepaid expenses and other assets | | | | | | | 29,295 | | | | | | | | | | | | 21,547 | | | | | | | | | | | | 31,227 | | | | | |
| | | | | | | | | | | | | | | | | | | | | | | | | | | | | | | | | | | | |
Total Assets | | | | | | | 91,036,304 | | | | | | | | | | | | 61,040,157 | | | | | | | | | | | | 42,250,144 | | | | | |
| | | | | | | | | | | | | | | | | | | | | | | | | | | | | | | | | | | | |
Liabilities: | | | | | | | | | | | | | | | | | | | | | | | | | | | | | | | | | | | | |
Professional fees payable | | | | | | | 4,313 | | | | | | | | | | | | 4,266 | | | | | | | | | | | | 4,406 | | | | | |
Payable for capital shares redeemed | | | | | | | 3,864 | | | | | | | | | | | | 31,309 | | | | | | | | | | | | 1,146 | | | | | |
Payable for investments purchased | | | | | | | — | | | | | | | | | | | | 120,309 | | | | | | | | | | | | 178,116 | | | | | |
Accrued expenses and other payables: | | | | | | | | | | | | | | | | | | | | | | | | | | | | | | | | | | | | |
Investment advisory fees | | | | | | | 35,754 | | | | | | | | | | | | 37,598 | | | | | | | | | | | | 14,097 | | | | | |
Accounting fees | | | | | | | 7,166 | | | | | | | | | | | | 6,828 | | | | | | | | | | | | 6,584 | | | | | |
Audit fees | | | | | | | 21,483 | | | | | | | | | | | | 21,539 | | | | | | | | | | | | 21,706 | | | | | |
Distribution fees | | | | | | | 62,717 | | | | | | | | | | | | 419 | | | | | | | | | | | | 1,661 | | | | | |
Custodian fees | | | | | | | 437 | | | | | | | | | | | | 566 | | | | | | | | | | | | 1,341 | | | | | |
Shareholder reports | | | | | | | 25,061 | | | | | | | | | | | | 33,391 | | | | | | | | | | | | 31,095 | | | | | |
Transfer agent fees | | | | | | | 1,370 | | | | | | | | | | | | 7,054 | | | | | | | | | | | | 8,113 | | | | | |
Other | | | | | | | 1,251 | | | | | | | | | | | | 1,921 | | | | | | | | | | | | 1,890 | | | | | |
| | | | | | | | | | | | | | | | | | | | | | | | | | | | | | | | | | | | |
Total Liabilities | | | | | | | 163,416 | | | | | | | | | | | | 265,200 | | | | | | | | | | | | 270,155 | | | | | |
| | | | | | | | | | | | | | | | | | | | | | | | | | | | | | | | | | | | |
Net Assets | | | | | | $ | 90,872,888 | | | | | | | | | | | $ | 60,774,957 | | | | | | | | | | | $ | 41,979,989 | | | | | |
| | | | | | | | | | | | | | | | | | | | | | | | | | | | | | | | | | | | |
Net Assets Consists of: | | | | | | | | | | | | | | | | | | | | | | | | | | | | | | | | | | | | |
Capital | | | | | | $ | 73,832,927 | | | | | | | | | | | $ | 43,515,113 | | | | | | | | | | | $ | 29,988,588 | | | | | |
Accumulated earnings | | | | | | | 17,039,961 | | | | | | | | | | | | 17,259,844 | | | | | | | | | | | | 11,991,401 | | | | | |
| | | | | | | | | | | | | | | | | | | | | | | | | | | | | | | | | | | | |
Net Assets | | | | | | $ | 90,872,888 | | | | | | | | | | | $ | 60,774,957 | | | | | | | | | | | $ | 41,979,989 | | | | | |
| | | | | | | | | | | | | | | | | | | | | | | | | | | | | | | | | | | | |
36
Statements of Assets and Liabilities (cont.)
March 31, 2023 (Unaudited)
| | | | | | | | | | | | | | | | | | | | | | | | |
| | | RBC SMID Cap
Growth Fund | | | RBC Enterprise
Fund | | | RBC Small Cap
Core Fund | |
Net Assets | | | | | | | | | | | | | | | | | | | | | | | | |
Class A | | | | | | $ | 12,501,517 | | | | | | | $ | 684,782 | | | | | | | $ | 7,371,925 | |
Class I | | | | | | | 78,351,310 | | | | | | | | 60,090,175 | | | | | | | | 34,598,733 | |
Class R6 | | | | | | | 20,061 | | | | | | | | N/A | | | | | | | | 9,331 | |
| | | | | | | | | | | | | | | | | | | | | | | | |
Total | | | | | | $ | 90,872,888 | | | | | | | $ | 60,774,957 | | | | | | | $ | 41,979,989 | |
| | | | | | | | | | | | | | | | | | | | | | | | |
Shares Outstanding (Unlimited number of shares authorized, no par value): | | | | | | | | | | | | | | | | | | | | | | | | |
Class A | | | | | | | 1,104,092 | | | | | | | | 49,765 | | | | | | | | 618,854 | |
Class I | | | | | | | 5,490,613 | | | | | | | | 4,013,860 | | | | | | | | 2,478,972 | |
Class R6 | | | | | | | 1,399 | | | | | | | | N/A | | | | | | | | 666 | |
| | | | | | | | | | | | | | | | | | | | | | | | |
Total | | | | | | | 6,596,104 | | | | | | | | 4,063,625 | | | | | | | | 3,098,492 | |
| | | | | | | | | | | | | | | | | | | | | | | | |
Net Asset Values and Redemption Prices Per Share: | | | | | | | | | | | | | | | | | | | | | | | | |
Class A | | | | | | $ | 11.32 | | | | | | | $ | 13.76 | | | | | | | $ | 11.91 | |
| | | | | | | | | | | | | | | | | | | | | | | | |
Class I | | | | | | $ | 14.27 | | | | | | | $ | 14.97 | | | | | | | $ | 13.96 | |
| | | | | | | | | | | | | | | | | | | | | | | | |
Class R6 | | | | | | $ | 14.34 | | | | | | | $ | N/A | | | | | | | $ | 14.02 | |
| | | | | | | | | | | | | | | | | | | | | | | | |
Maximum Offering Price Per Share: | | | | | | | | | | | | | | | | | | | | | | | | |
Class A | | | | | | $ | 12.01 | | | | | | | $ | 14.60 | | | | | | | $ | 12.64 | |
| | | | | | | | | | | | | | | | | | | | | | | | |
Maximum Sales Charge - Class A | | | | | | | 5.75 | % | | | | | | | 5.75 | % | | | | | | | 5.75 | % |
| | | | | | | | | | | | | | | | | | | | | | | | |
37
Statements of Assets and Liabilities (cont.)
March 31, 2023 (Unaudited)
| | | | | | | | | | | | | | | | |
| | | RBC Microcap
Value Fund | | | RBC Small Cap
Value Fund | |
Assets: | | | | | | | | | | | | | | | | |
Investments in securities, at value: | | | | | | | | | | | | | | | | |
Unaffiliated investments (cost $84,031,137 and $31,338,976, respectively) | | $ | 101,726,511 | | | | | | | $ | 29,992,612 | | | | | |
Affiliated investments (cost $1,751,001 and $542,947, respectively) | | | 1,751,001 | | | | | | | | 542,947 | | | | | |
Interest and dividend receivable | | | 204,280 | | | | | | | | 26,551 | | | | | |
Receivable from advisor | | | — | | | | | | | | 7,359 | | | | | |
Receivable for capital shares issued | | | 88,316 | | | | | | | | 2,392 | | | | | |
Prepaid expenses and other assets | | | 24,604 | | | | | | | | 67,630 | | | | | |
| | | | | | | | | | | | | | | | |
Total Assets | | | 103,794,712 | | | | | | | | 30,639,491 | | | | | |
| | | | | | | | | | | | | | | | |
| | | | |
Liabilities: | | | | | | | | | | | | | | | | |
Professional fees payable | | | 4,342 | | | | | | | | 4,277 | | | | | |
Payable for capital shares redeemed | | | 4,816 | | | | | | | | 176 | | | | | |
Accrued expenses and other payables: | | | | | | | | | | | | | | | | |
Investment advisory fees | | | 65,928 | | | | | | | | — | | | | | |
Accounting fees | | | 7,417 | | | | | | | | 6,463 | | | | | |
Audit fees | | | 21,422 | | | | | | | | 21,608 | | | | | |
Trustees’ fees | | | — | | | | | | | | 4 | | | | | |
Distribution fees | | | 3,539 | | | | | | | | 60 | | | | | |
Custodian fees | | | — | | | | | | | | 2,367 | | | | | |
Shareholder reports | | | 43,815 | | | | | | | | 23,889 | | | | | |
Transfer agent fees | | | 23,077 | | | | | | | | 1,311 | | | | | |
Other | | | 5,853 | | | | | | | | 4,290 | | | | | |
| | | | | | | | | | | | | | | | |
Total Liabilities | | | 180,209 | | | | | | | | 64,445 | | | | | |
| | | | | | | | | | | | | | | | |
Net Assets | | $ | 103,614,503 | | | | | | | $ | 30,575,046 | | | | | |
| | | | | | | | | | | | | | | | |
Net Assets Consists of: | | | | | | | | | | | | | | | | |
Capital | | $ | 81,265,714 | | | | | | | $ | 36,197,518 | | | | | |
Accumulated earnings | | | 22,348,789 | | | | | | | | (5,622,472 | ) | | | | |
| | | | | | | | | | | | | | | | |
Net Assets | | $ | 103,614,503 | | | | | | | $ | 30,575,046 | | | | | |
| | | | | | | | | | | | | | | | |
38
Statements of Assets and Liabilities (cont.)
March 31, 2023 (Unaudited)
| | | | | | | | | | | | |
| | | RBC Microcap Value Fund | | | RBC Small Cap
Value Fund | |
Net Assets | | | | | | | | | | | | |
Class A | | | | | | $ | 2,613,445 | | | $ | 10,699 | |
Class I | | | | | | | 101,001,058 | | | | 30,554,115 | |
Class R6 | | | | | | | N/A | | | | 10,232 | |
| | | | | | | | | | | | |
Total | | | | | | $ | 103,614,503 | | | $ | 30,575,046 | |
| | | | | | | | | | | | |
| | | |
Shares Outstanding (Unlimited number of shares authorized, no par value): | | | | | | | | | | | | |
Class A | | | | | | | 105,540 | | | | 839 | |
Class I | | | | | | | 4,082,570 | | | | 2,412,327 | |
Class R6 | | | | | | | N/A | | | | 799 | |
| | | | | | | | | | | | |
Total | | | | | | | 4,188,110 | | | | 2,413,965 | |
| | | | | | | | | | | | |
| | | |
Net Asset Values and Redemption Prices Per Share: | | | | | | | | | | | | |
Class A | | | | | | $ | 24.76 | | | $ | 12.75 | |
| | | | | | | | | | | | |
Class I | | | | | | $ | 24.74 | | | $ | 12.67 | |
| | | | | | | | | | | | |
Class R6 | | | | | | $ | N/A | | | $ | 12.81 | |
| | | | | | | | | | | | |
| | | |
Maximum Offering Price Per Share: | | | | | | | | | | | | |
Class A | | | | | | $ | 26.27 | | | $ | 13.53 | |
| | | | | | | | | | | | |
Maximum Sales Charge - Class A | | | | | | | 5.75 | % | | | 5.75 | % |
| | | | | | | | | | | | |
See Notes to the Financial Statements.
39
Statements of Operations
| | | | | | | | | | | | | | | | | | |
For the Six Months Ended March 31, 2023 (Unaudited) | | | | | | | | | | | | | | | |
| | | RBC SMID Cap
Growth Fund | | | RBC Enterprise
Fund | | | RBC Small Cap
Core Fund | |
Investment Income: | | | | | | | | | | | | | | | | | | |
Interest income | | | | $ | 22,022 | | | | | $ | — | | | | | $ | — | |
Dividend income - unaffiliated | | | | | 228,354 | | | | | | 420,734 | | | | | | 287,164 | |
Dividend income - affiliated | | | | | 35,226 | | | | | | 30,440 | | | | | | 19,270 | |
| | | | | | | | | | | | | | | | | | |
Total Investment Income | | | | | 285,602 | | | | | | 451,174 | | | | | | 306,434 | |
Expenses: | | | | | | | | | | | | | | | | | | |
Investment advisory fees | | | | | 306,250 | | | | | | 296,940 | | | | | | 178,406 | |
Distribution fees–Class A | | | | | 15,484 | | | | | | 892 | | | | | | 9,036 | |
Accounting fees | | | | | 17,192 | | | | | | 16,261 | | | | | | 15,654 | |
Audit fees | | | | | 19,773 | | | | | | 19,772 | | | | | | 19,889 | |
Custodian fees | | | | | 2,111 | | | | | | 1,706 | | | | | | 2,222 | |
Insurance fees | | | | | 1,788 | | | | | | 1,787 | | | | | | 1,787 | |
Legal fees | | | | | 1,669 | | | | | | 1,244 | | | | | | 651 | |
Registrations and filing fees | | | | | 25,549 | | | | | | 17,721 | | | | | | 23,910 | |
Shareholder reports | | | | | 25,365 | | | | | | 32,452 | | | | | | 27,436 | |
Transfer agent fees–Class A | | | | | 6,468 | | | | | | 2,526 | | | | | | 7,738 | |
Transfer agent fees–Class I | | | | | 55,931 | | | | | | 19,659 | | | | | | 11,431 | |
Transfer agent fees–Class R6 | | | | | 1,782 | | | | | | — | | | | | | 1,854 | |
Trustees’ fees and expenses | | | | | 2,160 | | | | | | 1,634 | | | | | | 1,084 | |
Tax expense | | | | | 2,265 | | | | | | 2,248 | | | | | | 2,295 | |
Other fees | | | | | 2,849 | | | | | | 2,333 | | | | | | 2,707 | |
| | | | | | | | | | | | | | | | | | |
Total expenses before fee waiver/reimbursement | | | | | 486,636 | | | | | | 417,175 | | | | | | 306,100 | |
Expenses waived/reimbursed by: | | | | | | | | | | | | | | | | | | |
Advisor | | | | | (113,770 | ) | | | | | (79,282 | ) | | | | | (108,931 | ) |
| | | | | | | | | | | | | | | | | | |
Net expenses | | | | | 372,866 | | | | | | 337,893 | | | | | | 197,169 | |
| | | | | | | | | | | | | | | | | | |
Net Investment Income (Loss) | | | | | (87,264 | ) | | | | | 113,281 | | | | | | 109,265 | |
| | | | | | | | | | | | | | | | | | |
Realized/Unrealized Gains/(Losses): | | | | | | | | | | | | | | | | | | |
Net realized gains from investment transactions | | | | | 299,775 | | | | | | 64,684 | | | | | | 1,478,106 | |
Net change in unrealized appreciation on investments | | | | | 11,803,196 | | | | | | 5,806,378 | | | | | | 4,362,638 | |
| | | | | | | | | | | | | | | | | | |
Net realized/unrealized gains | | | | | 12,102,971 | | | | | | 5,871,062 | | | | | | 5,840,744 | |
| | | | | | | | | | | | | | | | | | |
Change in net assets resulting from operations | | | | $ | 12,015,707 | | | | | $ | 5,984,343 | | | | | $ | 5,950,009 | |
| | | | | | | | | | | | | | | | | | |
40
Statements of Operations (cont.)
| | | | | | | | | | | | |
| For the Six Months Ended March 31, 2023 (Unaudited) | | | | | | | | | | |
| | | RBC Microcap
Value Fund | | | RBC Small Cap
Value Fund | |
Investment Income: | | | | | | | | | | | | |
Interest income | | | | $ | 9,658 | | | | | $ | — | |
Dividend income - unaffiliated | | | | | 1,281,136 | | | | | | 335,824 | |
Dividend income - affiliated | | | | | 29,479 | | | | | | 9,904 | |
Foreign tax withholding | | | | | (1,990 | ) | | | | | — | |
| | | | | | | | | | | | |
Total Investment Income | | | | | 1,318,283 | | | | | | 345,728 | |
Expenses: | | | | | | | | | | | | |
Investment advisory fees | | | | | 494,269 | | | | | | 116,662 | |
Distribution fees–Class A | | | | | 3,557 | | | | | | 14 | |
Accounting fees | | | | | 25,861 | | | | | | 15,538 | |
Audit fees | | | | | 19,772 | | | | | | 19,774 | |
Custodian fees | | | | | 2,710 | | | | | | 3,716 | |
Insurance fees | | | | | 1,788 | | | | | | 1,788 | |
Legal fees | | | | | 2,272 | | | | | | 2,244 | |
Registrations and filing fees | | | | | 18,124 | | | | | | 47,338 | |
Shareholder reports | | | | | 43,302 | | | | | | 22,186 | |
Transfer agent fees–Class A | | | | | 3,924 | | | | | | 1,803 | |
Transfer agent fees–Class I | | | | | 60,361 | | | | | | 23,207 | |
Transfer agent fees–Class R6 | | | | | — | | | | | | 1,855 | |
Trustees’ fees and expenses | | | | | 2,839 | | | | | | 979 | |
Tax expense | | | | | 2,272 | | | | | | 2,252 | |
Other fees | | | | | 2,508 | | | | | | 2,989 | |
| | | | | | | | | | | | |
Total expenses before fee waiver/reimbursement | | | | | 683,559 | | | | | | 262,345 | |
Expenses waived/reimbursed by: | | | | | | | | | | | | |
Advisor | | | | | (93,559 | ) | | | | | (121,098 | ) |
| | | | | | | | | | | | |
Net expenses | | | | | 590,000 | | | | | | 141,247 | |
| | | | | | | | | | | | |
Net Investment Income | | | | | 728,283 | | | | | | 204,481 | |
| | | | | | | | | | | | |
Realized/Unrealized Gains/(Losses): | | | | | | | | | | | | |
Net realized gains/(losses) on: | | | | | | | | | | | | |
Investment transactions | | | | | 4,742,645 | | | | | | (1,177,575 | ) |
Foreign currency transactions | | | | | (155 | ) | | | | | — | |
| | | | | | | | | | | | |
Net realized gains/(losses) | | | | | 4,742,490 | | | | | | (1,177,575 | ) |
Net change in unrealized appreciation on: | | | | | | | | | | | | |
Investments | | | | | 4,884,823 | | | | | | 3,818,390 | |
Foreign currency | | | | | 192 | | | | | | — | |
| | | | | | | | | | | | |
Net unrealized gains | | | | | 4,885,015 | | | | | | 3,818,390 | |
| | | | | | | | | | | | |
Net realized/unrealized gains | | | | | 9,627,505 | | | | | | 2,640,815 | |
| | | | | | | | | | | | |
Change in net assets resulting from operations | | | | $ | 10,355,788 | | | | | $ | 2,845,296 | |
| | | | | | | | | | | | |
See Notes to the Financial Statements.
41
Statements of Changes in Net Assets
| | | | | | | | | | | | |
| | | RBC SMID Cap Growth Fund | |
| | | For the Six Months Ended
March 31, 2023
(Unaudited) | | | For the Year Ended
September 30, 2022 | |
From Investment Activities | | | | | | | | | | | | |
Operations: | | | | | | | | | | | | |
Net investment loss | | | | $ | (87,264 | ) | | | | $ | (282,566 | ) |
Net realized gains from investments | | | | | 299,775 | | | | | | 5,973,308 | |
Net change in unrealized appreciation/(depreciation) on investments | | | | | 11,803,196 | | | | | | (20,671,816 | ) |
| | | | | | | | | | | | |
Change in net assets resulting from operations | | | | | 12,015,707 | | | | | | (14,981,074 | ) |
| | | | | | | | | | | | |
Distributions to Shareholders: | | | | | | | | | | | | |
Class A | | | | | (1,069,066 | ) | | | | | (3,541,196 | ) |
Class I | | | | | (5,152,780 | ) | | | | | (16,697,691 | ) |
Class R6 | | | | | (1,350 | ) | | | | | (4,389 | ) |
| | | | | | | | | | | | |
Change in net assets resulting from shareholder distributions | | | | | (6,223,196 | ) | | | | | (20,243,276 | ) |
| | | | | | | | | | | | |
Capital Transactions: | | | | | | | | | | | | |
Proceeds from shares issued | | | | | 7,163,181 | | | | | | 23,276,342 | |
Distributions reinvested | | | | | 6,199,042 | | | | | | 20,170,357 | |
Cost of shares redeemed | | | | | (6,551,921 | ) | | | | | (25,529,899 | ) |
| | | | | | | | | | | | |
Change in net assets resulting from capital transactions | | | | | 6,810,302 | | | | | | 17,916,800 | |
| | | | | | | | | | | | |
Net increase/(decrease) in net assets | | | | | 12,602,813 | | | | | | (17,307,550 | ) |
Net Assets: | | | | | | | | | | | | |
Beginning of period | | | | | 78,270,075 | | | | | | 95,577,625 | |
| | | | | | | | | | | | |
End of period | | | | $ | 90,872,888 | | | | | $ | 78,270,075 | |
| | | | | | | | | | | | |
Share Transactions: | | | | | | | | | | | | |
Issued | | | | | 506,769 | | | | | | 1,449,636 | |
Reinvested | | | | | 481,767 | | | | | | 1,269,460 | |
Redeemed | | | | | (471,651 | ) | | | | | (1,550,770 | ) |
| | | | | | | | | | | | |
Change in shares resulting from capital transactions | | | | | 516,885 | | | | | | 1,168,326 | |
| | | | | | | | | | | | |
See Notes to the Financial Statements.
42
Statements of Changes in Net Assets
| | | | | | | | | | | | |
| | | RBC Enterprise Fund | |
| | | For the Six Months Ended March 31, 2023 (Unaudited) | | | For the Year Ended September 30, 2022 | |
From Investment Activities | | | | | | | | | | | | |
Operations: | | | | | | | | | | | | |
Net investment income | | | | $ | 113,281 | | | | | $ | 51,246 | |
Net realized gains from investments | | | | | 64,684 | | | | | | 9,022,114 | |
Net change in unrealized appreciation/(depreciation) on investments | | | | | 5,806,378 | | | | | | (20,953,488 | ) |
| | | | | | | | | | | | |
Change in net assets resulting from operations | | | | | 5,984,343 | | | | | | (11,880,128 | ) |
| | | | | | | | | | | | |
Distributions to Shareholders: | | | | | | | | | | | | |
Class A | | | | | (100,032 | ) | | | | | (96,604 | ) |
Class I | | | | | (8,190,700 | ) | | | | | (8,428,370 | ) |
| | | | | | | | | | | | |
Change in net assets resulting from shareholder distributions | | | | | (8,290,732 | ) | | | | | (8,524,974 | ) |
| | | | | | | | | �� | | | |
Capital Transactions: | | | | | | | | | | | | |
Proceeds from shares issued | | | | | 210,099 | | | | | | 337,429 | |
Distributions reinvested | | | | | 7,908,506 | | | | | | 8,011,273 | |
Cost of shares redeemed | | | | | (2,684,243 | ) | | | | | (5,095,608 | ) |
| | | | | | | | | | | | |
Change in net assets resulting from capital transactions | | | | | 5,434,362 | | | | | | 3,253,094 | |
| | | | | | | | | | | | |
Net increase/(decrease) in net assets | | | | | 3,127,973 | | | | | | (17,152,008 | ) |
Net Assets: | | | | | | | | | | | | |
Beginning of period | | | | | 57,646,984 | | | | | | 74,798,992 | |
| | | | | | | | | | | | |
End of period | | | | $ | 60,774,957 | | | | | $ | 57,646,984 | |
| | | | | | | | | | | | |
Share Transactions: | | | | | | | | | | | | |
Issued | | | | | 13,425 | | | | | | 17,578 | |
Reinvested | | | | | 541,164 | | | | | | 418,026 | |
Redeemed | | | | | (166,044 | ) | | | | | (268,045 | ) |
| | | | | | | | | | | | |
Change in shares resulting from capital transactions | | | | | 388,545 | | | | | | 167,559 | |
| | | | | | | | | | | | |
See Notes to the Financial Statements.
43
Statements of Changes in Net Assets
| | | | | | | | | | | | |
| | | RBC Small Cap Core Fund | |
| | | For the Six Months Ended March 31, 2023
(Unaudited) | | | For the Year Ended
September 30, 2022 | |
From Investment Activities | | | | | | | | | | | | |
Operations: | | | | | | | | | | | | |
Net investment income | | | | $ | 109,265 | | | | | $ | 77,837 | |
Net realized gains from investments | | | | | 1,478,106 | | | | | | 9,784,564 | |
Net change in unrealized appreciation/(depreciation) on investments | | | | | 4,362,638 | | | | | | (18,177,694 | ) |
| | | | | | | | | | | | |
Change in net assets resulting from operations | | | | | 5,950,009 | | | | | | (8,315,293 | ) |
| | | | | | | | | | | | |
Distributions to Shareholders: | | | | | | | | | | | | |
Class A | | | | | (1,827,174 | ) | | | | | (3,564,899 | ) |
Class I | | | | | (7,940,427 | ) | | | | | (19,265,009 | ) |
Class R6 | | | | | (2,075 | ) | | | | | (4,378 | ) |
| | | | | | | | | | | | |
Change in net assets resulting from shareholder distributions | | | | | (9,769,676 | ) | | | | | (22,834,286 | ) |
| | | | | | | | | | | | |
Capital Transactions: | | | | | | | | | | | | |
Proceeds from shares issued | | | | | 466,300 | | | | | | 3,311,183 | |
Distributions reinvested | | | | | 9,477,777 | | | | | | 21,704,430 | |
Cost of shares redeemed | | | | | (2,092,407 | ) | | | | | (21,993,835 | ) |
| | | | | | | | | | | | |
Change in net assets resulting from capital transactions | | | | | 7,851,670 | | | | | | 3,021,778 | |
| | | | | | | | | | | | |
Net increase/(decrease) in net assets | | | | | 4,032,003 | | | | | | (28,127,801 | ) |
Net Assets: | | | | | | | | | | | | |
Beginning of period | | | | | 37,947,986 | | | | | | 66,075,787 | |
| | | | | | | | | | | | |
End of period | | | | $ | 41,979,989 | | | | | $ | 37,947,986 | |
| | | | | | | | | | | | |
Share Transactions: | | | | | | | | | | | | |
Issued | | | | | 34,641 | | | | | | 157,928 | |
Reinvested | | | | | 742,582 | | | | | | 1,096,661 | |
Redeemed | | | | | (135,542 | ) | | | | | (777,116 | ) |
| | | | | | | | | | | | |
Change in shares resulting from capital transactions | | | | | 641,681 | | | | | | 477,473 | |
| | | | | | | | | | | | |
See Notes to the Financial Statements.
44
Statements of Changes in Net Assets
| | | | | | | | | | | | |
| | | RBC Microcap Value Fund | |
| | | For the Six Months Ended March 31, 2023 (Unaudited) | | | For the Year Ended
September 30, 2022 | |
From Investment Activities | | | | | | | | | | | | |
Operations: | | | | | | | | | | | | |
Net investment income | | | | $ | 728,283 | | | | | $ | 1,451,244 | |
Net realized gains from investments and foreign currency | | | | | 4,742,490 | | | | | | 14,251,978 | |
Net change in unrealized appreciation/(depreciation) on investments and foreign currency | | | | | 4,885,015 | | | | | | (31,543,865 | ) |
| | | | | | | | | | | | |
Change in net assets resulting from operations | | | | | 10,355,788 | | | | | | (15,840,643 | ) |
| | | | | | | | | | | | |
Distributions to Shareholders: | | | | | | | | | | | | |
Class A | | | | | (386,707 | ) | | | | | (210,055 | ) |
Class I | | | | | (14,533,878 | ) | | | | | (8,194,361 | ) |
| | | | | | | | | | | | |
Change in net assets resulting from shareholder distributions | | | | | (14,920,585 | ) | | | | | (8,404,416 | ) |
| | | | | | | | | | | | |
Capital Transactions: | | | | | | | | | | | | |
Proceeds from shares issued | | | | | 2,174,573 | | | | | | 16,531,713 | |
Distributions reinvested | | | | | 13,551,024 | | | | | | 7,608,831 | |
Cost of shares redeemed | | | | | (6,966,694 | ) | | | | | (23,286,745 | ) |
| | | | | | | | | | | | |
Change in net assets resulting from capital transactions | | | | | 8,758,903 | | | | | | 853,799 | |
| | | | | | | | | | | | |
Net increase/(decrease) in net assets | | | | | 4,194,106 | | | | | | (23,391,260 | ) |
Net Assets: | | | | | | | | | | | | |
Beginning of period | | | | | 99,420,397 | | | | | | 122,811,657 | |
| | | | | | | | | | | | |
End of period | | | | $ | 103,614,503 | | | | | $ | 99,420,397 | |
| | | | | | | | | | | | |
Share Transactions: | | | | | | | | | | | | |
Issued | | | | | 82,167 | | | | | | 546,186 | |
Reinvested | | | | | 541,368 | | | | | | 243,552 | |
Redeemed | | | | | (262,423 | ) | | | | | (799,352 | ) |
| | | | | | | | | | | | |
Change in shares resulting from capital transactions | | | | | 361,112 | | | | | | (9,614 | ) |
| | | | | | | | | | | | |
See Notes to the Financial Statements.
45
Statements of Changes in Net Assets
| | | | | | | | | | | | |
| | | RBC Small Cap Value Fund | |
| | | For the Six Months Ended March 31, 2023
(Unaudited) | | | For the Year Ended
September 30, 2022 | |
From Investment Activities | | | | | | | | | | | | |
Operations: | | | | | | | | | | | | |
Net investment income | | | | $ | 204,481 | | | | | $ | 353,769 | |
Net realized gains/(losses) from investments | | | | | (1,177,575 | ) | | | | | 11,629,799 | |
Net change in unrealized appreciation/(depreciation) on investments | | | | | 3,818,390 | | | | | | (17,274,873 | ) |
Net increase from payment by affiliate (Note 3) | | | | | — | | | | | | 862,113 | |
| | | | | | | | | | | | |
Change in net assets resulting from operations | | | | | 2,845,296 | | | | | | (4,429,192 | ) |
| | | | | | | | | | | | |
Distributions to Shareholders: | | | | | | | | | | | | |
Class A | | | | | (498 | ) | | | | | (132 | ) |
Class I | | | | | (1,724,866 | ) | | | | | (822,863 | ) |
Class R6 | | | | | (527 | ) | | | | | (361 | ) |
| | | | | | | | | | | | |
Change in net assets resulting from shareholder distributions | | | | | (1,725,891 | ) | | | | | (823,356 | ) |
| | | | | | | | | | | | |
Capital Transactions: | | | | | | | | | | | | |
Proceeds from shares issued | | | | | 15,189,037 | | | | | | 33,968,192 | |
Distributions reinvested | | | | | 773,690 | | | | | | 359,470 | |
Cost of shares redeemed | | | | | (17,328,412 | ) | | | | | (82,213,221 | ) |
| | | | | | | | | | | | |
Change in net assets resulting from capital transactions | | | | | (1,365,685 | ) | | | | | (47,885,559 | ) |
| | | | | | | | | | | | |
Net decrease in net assets | | | | | (246,280 | ) | | | | | (53,138,107 | ) |
Net Assets: | | | | | | | | | | | | |
Beginning of period | | | | | 30,821,326 | | | | | | 83,959,433 | |
| | | | | | | | | | | | |
End of period | | | | $ | 30,575,046 | | | | | $ | 30,821,326 | |
| | | | | | | | | | | | |
Share Transactions: | | | | | | | | | | | | |
Issued | | | | | 1,160,201 | | | | | | 2,375,706 | |
Reinvested | | | | | 62,043 | | | | | | 25,279 | |
Redeemed | | | | | (1,318,071 | ) | | | | | (5,892,447 | ) |
| | | | | | | | | | | | |
Change in shares resulting from capital transactions | | | | | (95,827 | ) | | | | | (3,491,462 | ) |
| | | | | | | | | | | | |
See Notes to the Financial Statements.
46
RBC SMID Cap Growth Fund
(Selected data for a share outstanding throughout the periods indicated)
| | | | | | | | | | | | | | | | | | | | | | | | | | | | | | | | | | | | |
| | | | | | Investment Activities | | | Distributions | | | | |
| | | Net Asset
Value,
Beginning
of Period | | | Net
Investment
Loss(a) | | | Net Realized
and Unrealized
Gains (Losses)
on Investments | | | Redemption
Fees | | | Total from
Investment
Activities | | | Net
Investment
Income | | | Net
Realized
Gains | | | Total
Distributions | | | Net Asset
Value, End
of Period | |
Class A | | | | | | | | | | | | | | | | | | | | | | | | | | | | | | | | | | | | |
Six Months Ended 3/31/23 (Unaudited) | | | $10.77 | | | | (0.02 | ) | | | 1.61 | | | | — | | | | 1.59 | | | | — | | | | (1.04 | ) | | | (1.04 | ) | | | $11.32 | |
Year Ended 9/30/22 | | | 16.98 | | | | (0.07 | ) | | | (1.90 | ) | | | — | | | | (1.97 | ) | | | — | | | | (4.24 | ) | | | (4.24 | ) | | | 10.77 | |
Year Ended 9/30/21 | | | 12.60 | | | | (0.09 | ) | | | 4.93 | | | | —(b) | | | | 4.84 | | | | — | | | | (0.46 | ) | | | (0.46 | ) | | | 16.98 | |
Year Ended 9/30/20 | | | 13.04 | | | | (0.06 | ) | | | 0.72 | | | | —(b) | | | | 0.66 | | | | — | | | | (1.10 | ) | | | (1.10 | ) | | | 12.60 | |
Year Ended 9/30/19 | | | 14.39 | | | | (0.06 | ) | | | (0.18 | ) | | | —(b) | | | | (0.24 | ) | | | — | | | | (1.11 | ) | | | (1.11 | ) | | | 13.04 | |
Year Ended 9/30/18 | | | 14.72 | | | | (0.07 | ) | | | 2.85 | | | | —(b) | | | | 2.78 | | | | — | | | | (3.11 | ) | | | (3.11 | ) | | | 14.39 | |
Class I | | | | | | | | | | | | | | | | | | | | | | | | | | | | | | | | | | | | |
Six Months Ended 3/31/23 (Unaudited) | | | $13.31 | | | | (0.01 | ) | | | 2.01 | | | | — | | | | 2.00 | | | | — | | | | (1.04 | ) | | | (1.04 | ) | | | $14.27 | |
Year Ended 9/30/22 | | | 19.98 | | | | (0.04 | ) | | | (2.39 | ) | | | — | | | | (2.43 | ) | | | — | | | | (4.24 | ) | | | (4.24 | ) | | | 13.31 | |
Year Ended 9/30/21 | | | 14.73 | | | | (0.05 | ) | | | 5.76 | | | | —(b) | | | | 5.71 | | | | — | | | | (0.46 | ) | | | (0.46 | ) | | | 19.98 | |
Year Ended 9/30/20 | | | 15.02 | | | | (0.03 | ) | | | 0.84 | | | | —(b) | | | | 0.81 | | | | — | | | | (1.10 | ) | | | (1.10 | ) | | | 14.73 | |
Year Ended 9/30/19 | | | 16.33 | | | | (0.04 | ) | | | (0.16 | ) | | | — | | | | (0.20 | ) | | | — | | | | (1.11 | ) | | | (1.11 | ) | | | 15.02 | |
Year Ended 9/30/18 | | | 16.26 | | | | (0.04 | ) | | | 3.22 | | | | —(b) | | | | 3.18 | | | | — | | | | (3.11 | ) | | | (3.11 | ) | | | 16.33 | |
Class R6 | | | | | | | | | | | | | | | | | | | | | | | | | | | | | | | | | | | | |
Six Months Ended 3/31/23 (Unaudited) | | | $13.38 | | | | (0.01 | ) | | | 2.01 | | | | — | | | | 2.00 | | | | — | | | | (1.04 | ) | | | (1.04 | ) | | | $14.34 | |
Year Ended 9/30/22 | | | 20.04 | | | | (0.04 | ) | | | (2.38 | ) | | | — | | | | (2.42 | ) | | | — | | | | (4.24 | ) | | | (4.24 | ) | | | 13.38 | |
Year Ended 9/30/21 | | | 14.76 | | | | (0.05 | ) | | | 5.79 | | | | — | | | | 5.74 | | | | — | | | | (0.46 | ) | | | (0.46 | ) | | | 20.04 | |
Year Ended 9/30/20 | | | 15.05 | | | | (0.02 | ) | | | 0.83 | | | | — | | | | 0.81 | | | | — | | | | (1.10 | ) | | | (1.10 | ) | | | 14.76 | |
Year Ended 9/30/19 | | | 16.35 | | | | (0.03 | ) | | | (0.16 | ) | | | — | | | | (0.19 | ) | | | — | | | | (1.11 | ) | | | (1.11 | ) | | | 15.05 | |
Year Ended 9/30/18 | | | 16.27 | | | | (0.04 | ) | | | 3.23 | | | | — | | | | 3.19 | | | | — | | | | (3.11 | ) | | | (3.11 | ) | | | 16.35 | |
| (a) | Per share net investment income (loss) has been calculated using the average daily shares method. |
| (b) | Less than $0.01 or $(0.01) per share. |
47
RBC SMID Cap Growth Fund
(Selected data for a share outstanding throughout the periods indicated)
| | | | | | | | | | | | | | | | | | | | | | | | |
| | | | | Ratios/Supplemental Data | |
| | | Total
Return(a)(b) | | Net Assets,
End of
Period (000’s) | | | Ratio of
Net Expenses
to Average
Net Assets | | Ratio of
Net Investment
Income (Loss)
to Average
Net Assets | | Ratio of
Expenses to
Average Net
Assets* | | Portfolio
Turnover
Rate** |
Class A | | | | | | | | | | | | | | | | | | | | | | | | |
Six Months Ended 3/31/23 (Unaudited) | | | 15.35 | %(c) | | | $12,502 | | | | 1.07 | %(d) | | | (0.42 | )%(d) | | | 1.28 | %(d) | | | 11 | % |
Year Ended 9/30/22 | | | (16.50 | )% | | | 11,259 | | | | 1.07 | % | | | (0.52 | )% | | | 1.27 | % | | | 25 | % |
Year Ended 9/30/21 | | | 38.95 | % | | | 14,318 | | | | 1.07 | % | | | (0.54 | )% | | | 1.26 | % | | | 28 | %(e) |
Year Ended 9/30/20 | | | 4.90 | % | | | 11,553 | | | | 1.07 | % | | | (0.45 | )% | | | 1.37 | % | | | 15 | % |
Year Ended 9/30/19 | | | 0.41 | % | | | 12,059 | | | | 1.07 | % | | | (0.51 | )% | | | 1.38 | % | | | 17 | % |
Year Ended 9/30/18 | | | 22.67 | % | | | 12,966 | | | | 1.07 | % | | | (0.53 | )% | | | 1.40 | % | | | 22 | % |
Class I | | | | | | | | | | | | | | | | | | | | | | | | |
Six Months Ended 3/31/23 (Unaudited) | | | 15.51 | %(c) | | | $78,351 | | | | 0.82 | %(d) | | | (0.16 | )%(d) | | | 1.08 | %(d) | | | 11 | % |
Year Ended 9/30/22 | | | (16.30 | )% | | | 66,994 | | | | 0.82 | % | | | (0.27 | )% | | | 1.04 | % | | | 25 | % |
Year Ended 9/30/21 | | | 39.23 | % | | | 81,239 | | | | 0.82 | % | | | (0.29 | )% | | | 0.99 | % | | | 28 | %(e) |
Year Ended 9/30/20 | | | 5.27 | % | | | 83,211 | | | | 0.82 | % | | | (0.20 | )% | | | 1.03 | % | | | 15 | % |
Year Ended 9/30/19 | | | 0.62 | % | | | 81,193 | | | | 0.82 | % | | | (0.26 | )% | | | 0.99 | % | | | 17 | % |
Year Ended 9/30/18 | | | 23.04 | % | | | 83,437 | | | | 0.82 | % | | | (0.28 | )% | | | 0.98 | % | | | 22 | % |
Class R6 | | | | | | | | | | | | | | | | | | | | | | | | |
Six Months Ended 3/31/23 (Unaudited) | | | 15.51 | %(c) | | | $ 20 | | | | 0.77 | %(d) | | | (0.12 | )%(d) | | | 19.20 | %(d) | | | 11 | % |
Year Ended 9/30/22 | | | (16.24 | )% | | | 17 | | | | 0.77 | % | | | (0.23 | )% | | | 18.45 | % | | | 25 | % |
Year Ended 9/30/21 | | | 39.36 | % | | | 21 | | | | 0.77 | % | | | (0.25 | )% | | | 19.28 | % | | | 28 | %(e) |
Year Ended 9/30/20 | | | 5.26 | % | | | 15 | | | | 0.77 | % | | | (0.16 | )% | | | 25.69 | % | | | 15 | % |
Year Ended 9/30/19 | | | 0.69 | % | | | 14 | | | | 0.77 | % | | | (0.21 | )% | | | 27.43 | % | | | 17 | % |
Year Ended 9/30/18 | | | 23.09 | % | | | 14 | | | | 0.77 | % | | | (0.23 | )% | | | 29.30 | % | | | 22 | % |
| * | During the period, certain fees were contractually or voluntarily reduced and/or reimbursed. If such contractual/voluntary fee reductions and reimbursements had not occurred, the ratio would have been as indicated. |
| ** | Portfolio turnover rate is calculated on the basis of the Fund as a whole without distinguishing between the classes of shares issued. |
| (a) | Excludes sales charge. |
| (b) | Assumes investment at net asset value at the beginning of the period, reinvestment of all dividends and distributions, and a complete redemption of the investment at net asset value at the end of the period. |
48
RBC SMID Cap Growth Fund
(Selected data for a share outstanding throughout the periods indicated)
|
(c) Not annualized. (d) Annualized. (e) Portfolio turnover rate excludes in-kind transactions. See Notes to the Financial Statements. |
49
RBC Enterprise Fund
(Selected data for a share outstanding throughout the periods indicated)
| | | | | | | | | | | | | | | | | | | | | | | | | | | | | | | | | | | | |
| | | | | | Investment Activities | | | Distributions | | | | |
| | | Net Asset
Value,
Beginning
of Period | | | Net
Investment
Income/
(Loss)(a) | | | Net Realized
and Unrealized
Gains (Losses)
on Investments | | | Redemption
Fees | | | Total from
Investment
Activities | | | Net
Investment
Income | | | Net
Realized
Gains | | | Total
Distributions | | | Net Asset
Value, End
of Period | |
Class A | | | | | | | | | | | | | | | | | | | | | | | | | | | | | | | | | | | | |
Six Months Ended 3/31/23 (Unaudited) | | | $14.62 | | | | 0.01 | | | | 1.43 | | | | — | | | | 1.44 | | �� | | — | | | | (2.30 | ) | | | (2.30 | ) | | | $13.76 | |
Year Ended 9/30/22 | | | 20.04 | | | | (0.03 | ) | | | (2.97 | ) | | | — | | | | (3.00 | ) | | | (0.02) | | | | (2.40 | ) | | | (2.42 | ) | | | 14.62 | |
Year Ended 9/30/21 | | | 14.65 | | | | 0.04 | | | | 6.98 | | | | —(b) | | | | 7.02 | | | | —(b) | | | | (1.63 | ) | | | (1.63 | ) | | | 20.04 | |
Year Ended 9/30/20 | | | 17.59 | | | | 0.03 | | | | (1.70 | ) | | | —(b) | | | | (1.67 | ) | | | — | | | | (1.27 | ) | | | (1.27 | ) | | | 14.65 | |
Year Ended 9/30/19 | | | 23.38 | | | | (0.05 | ) | | | (3.17 | ) | | | — | | | | (3.22 | ) | | | — | | | | (2.57 | ) | | | (2.57 | ) | | | 17.59 | |
Year Ended 9/30/18 | | | 26.86 | | | | (0.13 | ) | | | 1.70 | | | | —(b) | | | | 1.57 | | | | — | | | | (5.05 | ) | | | (5.05 | ) | | | 23.38 | |
Class I | | | | | | | | | | | | | | | | | | | | | | | | | | | | | | | | | | | | |
Six Months Ended 3/31/23 (Unaudited) | | | $15.70 | | | | 0.03 | | | | 1.54 | | | | — | | | | 1.57 | | | | — | | | | (2.30 | ) | | | (2.30 | ) | | | $14.97 | |
Year Ended 9/30/22 | | | 21.34 | | | | 0.01 | | | | (3.18 | ) | | | — | | | | (3.17 | ) | | | (0.07) | | | | (2.40 | ) | | | (2.47 | ) | | | 15.70 | |
Year Ended 9/30/21 | | | 15.51 | | | | 0.09 | | | | 7.41 | | | | —(b) | | | | 7.50 | | | | (0.04) | | | | (1.63 | ) | | | (1.67 | ) | | | 21.34 | |
Year Ended 9/30/20 | | | 18.52 | | | | 0.07 | | | | (1.79 | ) | | | —(b) | | | | (1.72 | ) | | | (0.01) | | | | (1.28 | ) | | | (1.29 | ) | | | 15.51 | |
Year Ended 9/30/19 | | | 24.39 | | | | (0.01 | ) | | | (3.29 | ) | | | —(b) | | | | (3.30 | ) | | | — | | | | (2.57 | ) | | | (2.57 | ) | | | 18.52 | |
Year Ended 9/30/18 | | | 27.74 | | | | (0.07 | ) | | | 1.77 | | | | —(b) | | | | 1.70 | | | | — | | | | (5.05 | ) | | | (5.05 | ) | | | 24.39 | |
| (a) | Per share net investment income (loss) has been calculated using the average daily shares method. |
| (b) | Less than $0.01 or $(0.01) per share. |
50
RBC Enterprise Fund
(Selected data for a share outstanding throughout the periods indicated)
| | | | | | | | | | | | | | | | | | | | | | | | |
| | | | | Ratios/Supplemental Data | |
| | | Total
Return(a)(b) | | Net Assets,
End of
Period (000’s) | | | Ratio of
Net Expenses
to Average
Net Assets | | Ratio of
Net Investment
Income (Loss)
to Average
Net Assets | | Ratio of
Expenses to
Average Net
Assets* | | Portfolio
Turnover
Rate** |
Class A | | | | | | | | | | | | | | | | | | | | | | | | |
Six Months Ended 3/31/23 (Unaudited) | | | 10.23 | %(c) | | | $ 685 | | | | 1.33 | %(d) | | | 0.11 | %(d) | | | 2.22 | %(d) | | | 6 | % |
Year Ended 9/30/22 | | | (17.18 | )% | | | 683 | | | | 1.33 | % | | | (0.19 | )% | | | 2.02 | % | | | 43 | % |
Year Ended 9/30/21 | | | 50.27 | % | | | 803 | | | | 1.33 | % | | | 0.21 | % | | | 2.15 | % | | | 19 | % |
Year Ended 9/30/20 | | | (10.85 | )% | | | 553 | | | | 1.33 | % | | | 0.19 | % | | | 2.35 | % | | | 25 | % |
Year Ended 9/30/19 | | | (11.52 | )% | | | 787 | | | | 1.33 | % | | | (0.28 | )% | | | 2.13 | % | | | 20 | % |
Year Ended 9/30/18 | | | 6.79 | % | | | 963 | | | | 1.33 | % | | | (0.54 | )% | | | 1.95 | % | | | 15 | % |
Class I | | | | | | | | | | | | | | | | | | | | | | | | |
Six Months Ended 3/31/23 (Unaudited) | | | 10.35 | %(c) | | | $60,090 | | | | 1.08 | %(d) | | | 0.36 | %(d) | | | 1.32 | %(d) | | | 6 | % |
Year Ended 9/30/22 | | | (16.94 | )% | | | 56,964 | | | | 1.08 | % | | | 0.08 | % | | | 1.27 | % | | | 43 | % |
Year Ended 9/30/21 | | | 50.67 | % | | | 73,996 | | | | 1.08 | % | | | 0.45 | % | | | 1.25 | % | | | 19 | % |
Year Ended 9/30/20 | | | (10.64 | )% | | | 53,380 | | | | 1.08 | % | | | 0.44 | % | | | 1.38 | % | | | 25 | % |
Year Ended 9/30/19 | | | (11.35 | )% | | | 68,122 | | | | 1.08 | % | | | (0.05 | )% | | | 1.30 | % | | | 20 | % |
Year Ended 9/30/18 | | | 7.08 | % | | | 85,550 | | | | 1.08 | % | | | (0.30 | )% | | | 1.23 | % | | | 15 | % |
| * | During the period, certain fees were contractually or voluntarily reduced and/or reimbursed. If such contractual/voluntary fee reductions and reimbursements had not occurred, the ratio would have been as indicated. |
| ** | Portfolio turnover rate is calculated on the basis of the Fund as a whole without distinguishing between the classes of shares issued. |
| (a) | Excludes sales charge. |
| (b) | Assumes investment at net asset value at the beginning of the period, reinvestment of all dividends and distributions, and a complete redemption of the investment at net asset value at the end of the period. |
See Notes to the Financial Statements.
51
RBC Small Cap Core Fund
(Selected data for a share outstanding throughout the periods indicated)
| | | | | | | | | | | | | | | | | | | | | | | | | | | | | | | | | | | | |
| | | | | | Investment Activities | | | Distributions | | | | |
| | | Net Asset
Value,
Beginning
of Period | | | Net
Investment
Income/
(Loss)(a) | | | Net Realized
and Unrealized
Gains (Losses)
on Investments | | | Redemption
Fees | | | Total from
Investment
Activities | | | Net
Investment
Income | | | Net
Realized
Gains | | | Total
Distributions | | | Net Asset
Value, End
of Period | |
Class A | | | | | | | | | | | | | | | | | | | | | | | | | | | | | | | | | | | | |
Six Months Ended 3/31/23 (Unaudited) | | | $14.01 | | | | 0.02 | | | | 1.94 | | | | — | | | | 1.96 | | | | — | | | | (4.06 | ) | | | (4.06 | ) | | | $11.91 | |
Year Ended 9/30/22 | | | 31.43 | | | | (0.02) | | | | (2.85 | ) | | | — | | | | (2.87 | ) | | | — | | | | (14.55 | ) | | | (14.55 | ) | | | 14.01 | |
Year Ended 9/30/21 | | | 26.44 | | | | 0.07 | | | | 10.46 | | | | 0.01 | | | | 10.54 | | | | (0.01 | ) | | | (5.54 | ) | | | (5.55 | ) | | | 31.43 | |
Year Ended 9/30/20 | | | 29.14 | | | | 0.11 | | | | (1.27 | ) | | | — | | | | (1.16 | ) | | | — | | | | (1.54 | ) | | | (1.54 | ) | | | 26.44 | |
Year Ended 9/30/19 | | | 39.96 | | | | (0.05) | | | | (6.83 | ) | | | —(b) | | | | (6.88 | ) | | | — | | | | (3.94 | ) | | | (3.94 | ) | | | 29.14 | |
Year Ended 9/30/18 | | | 38.85 | | | | (0.12) | | | | 2.38 | | | | — | | | | 2.26 | | | | — | | | | (1.15 | ) | | | (1.15 | ) | | | 39.96 | |
Class I | | | | | | | | | | | | | | | | | | | | | | | | | | | | | | | | | | | | |
Six Months Ended 3/31/23 (Unaudited) | | | $15.78 | | | | 0.04 | | | | 2.22 | | | | — | | | | 2.26 | | | | (0.02 | ) | | | (4.06 | ) | | | (4.08 | ) | | | $13.96 | |
Year Ended 9/30/22 | | | 33.65 | | | | 0.04 | | | | (3.27 | ) | | | — | | | | (3.23 | ) | | | (0.09 | ) | | | (14.55 | ) | | | (14.64 | ) | | | 15.78 | |
Year Ended 9/30/21 | | | 27.97 | | | | 0.12 | | | | 11.16 | | | | 0.01 | | | | 11.29 | | | | (0.07 | ) | | | (5.54 | ) | | | (5.61 | ) | | | 33.65 | |
Year Ended 9/30/20 | | | 30.70 | | | | 0.17 | | | | (1.34 | ) | | | —(b) | | | | (1.17 | ) | | | (0.02 | ) | | | (1.54 | ) | | | (1.56 | ) | | | 27.97 | |
Year Ended 9/30/19 | | | 41.71 | | | | 0.03 | | | | (7.10 | ) | | | —(b) | | | | (7.07 | ) | | | — | | | | (3.94 | ) | | | (3.94 | ) | | | 30.70 | |
Year Ended 9/30/18 | | | 40.42 | | | | (0.02) | | | | 2.48 | | | | — | | | | 2.46 | | | | (0.01 | ) | | | (1.16 | ) | | | (1.17 | ) | | | 41.71 | |
Class R6 | | | | | | | | | | | | | | | | | | | | | | | | | | | | | | | | | | | | |
Six Months Ended 3/31/23 (Unaudited) | | | $15.82 | | | | 0.04 | | | | 2.24 | | | | — | | | | 2.28 | | | | (0.02 | ) | | | (4.06 | ) | | | (4.08 | ) | | | $14.02 | |
Year Ended 9/30/22 | | | 33.70 | | | | 0.41 | | | | (3.66 | ) | | | — | | | | (3.25 | ) | | | (0.08 | ) | | | (14.55 | ) | | | (14.63 | ) | | | 15.82 | |
Year Ended 9/30/21 | | | 28.01 | | | | 0.21 | | | | 11.11 | | | | — | | | | 11.32 | | | | (0.09 | ) | | | (5.54 | ) | | | (5.63 | ) | | | 33.70 | |
Year Ended 9/30/20 | | | 30.72 | | | | 0.15 | | | | (1.31 | ) | | | — | | | | (1.16 | ) | | | (0.01 | ) | | | (1.54 | ) | | | (1.55 | ) | | | 28.01 | |
Year Ended 9/30/19 | | | 41.78 | | | | 0.08 | | | | (7.20 | ) | | | — | | | | (7.12 | ) | | | — | | | | (3.94 | ) | | | (3.94 | ) | | | 30.72 | |
Year Ended 9/30/18 | | | 40.46 | | | | —(b) | | | | 2.47 | | | | — | | | | 2.47 | | | | — | | | | (1.15 | ) | | | (1.15 | ) | | | 41.78 | |
| (a) | Per share net investment income (loss) has been calculated using the average daily shares method. |
| (b) | Less than $0.01 or $(0.01) per share. |
52
RBC Small Cap Core Fund
(Selected data for a share outstanding throughout the periods indicated)
| | | | | | | | | | | | | | | | | | | | | | | | |
| | | | | Ratios/Supplemental Data | |
| | | Total
Return(a)(b) | | Net Assets,
End of
Period (000’s) | | | Ratio of
Net Expenses
to Average
Net Assets | | Ratio of
Net Investment
Income (Loss)
to Average
Net Assets | | Ratio of
Expenses to
Average Net
Assets* | | Portfolio
Turnover
Rate** |
Class A | | | | | | | | | | | | | | | | | | | | | | | | |
Six Months Ended 3/31/23 (Unaudited) | | | 15.65 | %(c) | | | $7,372 | | | | 1.15 | %(d) | | | 0.31 | %(d) | | | 1.78 | %(d) | | | 17 | % |
Year Ended 9/30/22 | | | (19.32 | )% | | | 6,430 | | | | 1.15 | % | | | (0.12 | )% | | | 1.68 | % | | | 29 | % |
Year Ended 9/30/21 | | | 43.04 | % | | | 7,692 | | | | 1.15 | % | | | 0.24 | % | | | 1.52 | % | | | 81 | %(e) |
Year Ended 9/30/20 | | | (4.71 | )% | | | 6,200 | | | | 1.15 | % | | | 0.40 | % | | | 1.55 | % | | | 40 | % |
Year Ended 9/30/19 | | | (15.57 | )% | | | 7,004 | | | | 1.15 | % | | | (0.16 | )% | | | 1.46 | % | | | 28 | % |
Year Ended 9/30/18 | | | 5.80 | % | | | 12,012 | | | | 1.15 | % | | | (0.29 | )% | | | 1.37 | % | | | 24 | % |
Class I | | | | | | | | | | | | | | | | | | | | | | | | |
Six Months Ended 3/31/23 (Unaudited) | | | 15.85 | %(c) | | | $34,599 | | | | 0.90 | %(d) | | | 0.57 | %(d) | | | 1.38 | %(d) | | | 17 | % |
Year Ended 9/30/22 | | | (19.12 | )% | | | 31,510 | | | | 0.90 | % | | | 0.18 | % | | | 1.28 | % | | | 29 | % |
Year Ended 9/30/21 | | | 43.46 | % | | | 53,689 | | | | 0.90 | % | | | 0.38 | % | | | 1.16 | % | | | 81 | %(e) |
Year Ended 9/30/20 | | | (4.49 | )% | | | 68,845 | | | | 0.90 | % | | | 0.59 | % | | | 1.18 | % | | | 40 | % |
Year Ended 9/30/19 | | | (15.35 | )% | | | 136,072 | | | | 0.90 | % | | | 0.10 | % | | | 1.11 | % | | | 28 | % |
Year Ended 9/30/18 | | | 6.06 | % | | | 249,678 | | | | 0.90 | % | | | (0.05 | )% | | | 1.05 | % | | | 24 | % |
Class R6 | | | | | | | | | | | | | | | | | | | | | | | | |
Six Months Ended 3/31/23 (Unaudited) | | | 15.85 | %(c) | | | $9 | | | | 0.87 | %(d) | | | 0.58 | %(d) | | | 41.81 | %(d) | | | 17 | % |
Year Ended 9/30/22 | | | (19.10 | )% | | | 8 | | | | 0.83 | % | | | 1.12 | % | | | 1.44 | % | | | 29 | % |
Year Ended 9/30/21 | | | 43.52 | % | | | 4,695 | | | | 0.87 | % | | | 0.61 | % | | | 1.25 | % | | | 81 | %(e) |
Year Ended 9/30/20 | | | (4.46 | )% | | | 52 | | | | 0.87 | % | | | 0.52 | % | | | 10.94 | % | | | 40 | % |
Year Ended 9/30/19 | | | (15.46 | )% | | | 35 | | | | 0.87 | % | | | 0.25 | % | | | 11.85 | % | | | 28 | % |
Year Ended 9/30/18 | | | 6.10 | % | | | 92 | | | | 0.87 | % | | | (0.01 | )% | | | 1.30 | % | | | 24 | % |
| * | During the period, certain fees were contractually or voluntarily reduced and/or reimbursed. If such contractual/voluntary fee reductions and reimbursements had not occurred, the ratio would have been as indicated. |
| ** | Portfolio turnover rate is calculated on the basis of the Fund as a whole without distinguishing between the classes of shares issued. |
| (a) | Excludes sales charge. |
| (b) | Assumes investment at net asset value at the beginning of the period, reinvestment of all dividends and distributions, and a complete redemption of the investment at net asset value at the end of the period. |
53
RBC Small Cap Core Fund
(Selected data for a share outstanding throughout the periods indicated)
|
(c) Not annualized. (d) Annualized. (e) Portfolio turnover rate excludes in-kind transactions. See Notes to the Financial Statements. |
54
RBC Microcap Value Fund
(Selected data for a share outstanding throughout the periods indicated)
| | | | | | | | | | | | | | | | | | | | | | | | | | | | | | | | | | | | |
| | | | | | Investment Activities | | | Distributions | | | | |
| | | Net Asset
Value,
Beginning
of Period | | | Net
Investment
Income(a) | | | Net Realized
and Unrealized
Gains (Losses)
on Investments | | | Redemption
Fees | | | Total from
Investment
Activities | | | Net
Investment
Income | | | Net
Realized
Gains | | | Total
Distributions | | | Net Asset
Value, End
of Period | |
Class A | | | | | | | | | | | | | | | | | | | | | | | | | | | | | | | | | | | | |
Six Months Ended 3/31/23 (Unaudited) | | | $25.96 | | | | 0.15 | | | | 2.53 | | | | — | | | | 2.68 | | | | (0.31 | ) | | | (3.57 | ) | | | (3.88 | ) | | | $24.76 | |
Year Ended 9/30/22 | | | 31.99 | | | | 0.29 | | | | (4.20 | ) | | | — | | | | (3.91 | ) | | | (0.12 | ) | | | (2.00 | ) | | | (2.12 | ) | | | 25.96 | |
Year Ended 9/30/21 | | | 21.34 | | | | 0.20 | | | | 12.02 | | | | —(b) | | | | 12.22 | | | | (0.20 | ) | | | (1.37 | ) | | | (1.57 | ) | | | 31.99 | |
Year Ended 9/30/20 | | | 26.52 | | | | 0.14 | | | | (3.65 | ) | | | —(b) | | | | (3.51 | ) | | | (0.23 | ) | | | (1.44 | ) | | | (1.67 | ) | | | 21.34 | |
Year Ended 9/30/19 | | | 31.95 | | | | 0.23 | | | | (2.89 | ) | | | —(b) | | | | (2.66 | ) | | | (0.21 | ) | | | (2.56 | ) | | | (2.77 | ) | | | 26.52 | |
Year Ended 9/30/18 | | | 32.91 | | | | 0.16 | | | | 2.01 | | | | —(b) | | | | 2.17 | | | | (0.08 | ) | | | (3.05 | ) | | | (3.13 | ) | | | 31.95 | |
Class I | | | | | | | | | | | | | | | | | | | | | | | | | | | | | | | | | | | | |
Six Months Ended 3/31/23 (Unaudited) | | | $25.98 | | | | 0.18 | | | | 2.53 | | | | — | | | | 2.71 | | | | (0.38 | ) | | | (3.57 | ) | | | (3.95 | ) | | | $24.74 | |
Year Ended 9/30/22 | | | 32.01 | | | | 0.37 | | | | (4.19 | ) | | | — | | | | (3.82 | ) | | | (0.21 | ) | | | (2.00 | ) | | | (2.21 | ) | | | 25.98 | |
Year Ended 9/30/21 | | | 21.35 | | | | 0.29 | | | | 12.00 | | | | —(b) | | | | 12.29 | | | | (0.26 | ) | | | (1.37 | ) | | | (1.63 | ) | | | 32.01 | |
Year Ended 9/30/20 | | | 26.55 | | | | 0.20 | | | | (3.65 | ) | | | —(b) | | | | (3.45 | ) | | | (0.31 | ) | | | (1.44 | ) | | | (1.75 | ) | | | 21.35 | |
Year Ended 9/30/19 | | | 32.01 | | | | 0.30 | | | | (2.91 | ) | | | — | | | | (2.61 | ) | | | (0.29 | ) | | | (2.56 | ) | | | (2.85 | ) | | | 26.55 | |
Year Ended 9/30/18 | | | 32.97 | | | | 0.23 | | | | 2.03 | | | | —(b) | | | | 2.26 | | | | (0.17 | ) | | | (3.05 | ) | | | (3.22 | ) | | | 32.01 | |
| (a) | Per share net investment income (loss) has been calculated using the average daily shares method. |
| (b) | Less than $0.01 or $(0.01) per share. |
55
RBC Microcap Value Fund
(Selected data for a share outstanding throughout the periods indicated)
| | | | | | | | | | | | | | | | | | | | | | | | |
| | | | | Ratios/Supplemental Data | |
| | | Total
Return(a)(b) | | Net Assets,
End of
Period (000’s) | | | Ratio of
Net Expenses
to Average
Net Assets | | Ratio of
Net Investment
Income (Loss)
to Average
Net Assets | | Ratio of
Expenses to
Average Net
Assets* | | Portfolio
Turnover
Rate** |
Class A | | | | | | | | | | | | | | | | | | | | | | | | |
Six Months Ended 3/31/23 (Unaudited) | | | 10.12 | %(c) | | | $ 2,613 | | | | 1.32 | %(d) | | | 1.08 | %(d) | | | 1.65 | %(d) | | | 14 | % |
Year Ended 9/30/22 | | | (13.35 | )% | | | 2,673 | | | | 1.32 | % | | | 0.93 | % | | | 1.57 | % | | | 26 | % |
Year Ended 9/30/21 | | | 59.29 | % | | | 3,420 | | | | 1.32 | % | | | 0.70 | % | | | 1.62 | % | | | 11 | % |
Year Ended 9/30/20 | | | (14.48 | )% | | | 2,293 | | | | 1.32 | % | | | 0.60 | % | | | 1.80 | % | | | 20 | % |
Year Ended 9/30/19 | | | (7.16 | )% | | | 3,597 | | | | 1.32 | % | | | 0.86 | % | | | 1.68 | % | | | 9 | % |
Year Ended 9/30/18 | | | 7.12 | % | | | 6,477 | | | | 1.32 | % | | | 0.50 | % | | | 1.64 | % | | | 5 | % |
Class I | | | | | | | | | | | | | | | | | | | | | | | | |
Six Months Ended 3/31/23 (Unaudited) | | | 10.25 | %(c) | | | $101,001 | | | | 1.07 | %(d) | | | 1.33 | %(d) | | | 1.23 | %(d) | | | 14 | % |
Year Ended 9/30/22 | | | (13.11 | )% | | | 96,748 | | | | 1.07 | % | | | 1.20 | % | | | 1.18 | % | | | 26 | % |
Year Ended 9/30/21 | | | 59.69 | % | | | 119,392 | | | | 1.07 | % | | | 1.00 | % | | | 1.19 | % | | | 11 | % |
Year Ended 9/30/20 | | | (14.29 | )% | | | 92,886 | | | | 1.07 | % | | | 0.87 | % | | | 1.27 | % | | | 20 | % |
Year Ended 9/30/19 | | | (6.92 | )% | | | 112,921 | | | | 1.07 | % | | | 1.12 | % | | | 1.20 | % | | | 9 | % |
Year Ended 9/30/18 | | | 7.41 | % | | | 130,155 | | | | 1.07 | % | | | 0.74 | % | | | 1.18 | % | | | 5 | % |
| * | During the period, certain fees were contractually or voluntarily reduced and/or reimbursed. If such contractual/voluntary fee reductions and reimbursements had not occurred, the ratio would have been as indicated. |
| ** | Portfolio turnover rate is calculated on the basis of the Fund as a whole without distinguishing between the classes of shares issued. |
| (a) | Excludes sales charge. |
| (b) | Assumes investment at net asset value at the beginning of the period, reinvestment of all dividends and distributions, and a complete redemption of the investment at net asset value at the end of the period. |
See Notes to the Financial Statements.
56
RBC Small Cap Value Fund
(Selected data for a share outstanding throughout the periods indicated)
| | | | | | | | | | | | | | | | | | | | | | | | | | | | | | | | | | | | |
| | | | | | Investment Activities | | | Distributions | | | | |
| | | Net Asset
Value,
Beginning
of Period | | | Net
Investment
Income(a) | | | Net Realized
and Unrealized
Gains (Losses)
on Investments | | | Redemption
Fees | | | Total from
Investment
Activities | | | Net
Investment
Income | | | Net
Realized
Gains | | | Total
Distributions | | | Net Asset
Value, End
of Period | |
Class A | | | | | | | | | | | | | | | | | | | | | | | | | | | | | | | | | | | | |
Six Months Ended 3/31/23 (Unaudited) | | | $12.27 | | | | 0.06 | | | | 1.04 | | | | — | | | | 1.10 | | | | (0.40 | ) | | | (0.22 | ) | | | (0.62 | ) | | | $12.75 | |
Year Ended 9/30/22 | | | 13.96 | | | | 0.06 | | | | (1.58 | ) | | | — | | | | (1.52 | ) | | | (0.17 | ) | | | — | | | | (0.17 | ) | | | 12.27 | |
Period Ended 9/30/21(b) | | | 12.61 | | | | 0.09 | | | | 1.26 | | | | — | | | | 1.35 | | | | — | | | | — | | | | — | | | | 13.96 | |
Class I | | | | | | | | | | | | | | | | | | | | | | | | | | | | | | | | | | | | |
Six Months Ended 3/31/23 (Unaudited) | | | $12.28 | | | | 0.08 | | | | 0.97 | | | | — | | | | 1.05 | | | | (0.44 | ) | | | (0.22 | ) | | | (0.66 | ) | | | $12.67 | |
Year Ended 9/30/22 | | | 13.98 | | | | 0.10 | | | | (1.59 | ) | | | — | | | | (1.49 | ) | | | (0.21 | ) | | | — | | | | (0.21 | ) | | | 12.28 | |
Year Ended 9/30/21 | | | 9.84 | | | | 0.15 | | | | 4.11 | | | | — | | | | 4.26 | | | | (0.12 | ) | | | — | | | | (0.12 | ) | | | 13.98 | |
Year Ended 9/30/20 | | | 12.24 | | | | 0.15 | | | | (2.39 | ) | | | —(c) | | | | (2.24 | ) | | | (0.16 | ) | | | — | | | | (0.16 | ) | | | 9.84 | |
Year Ended 9/30/19 | | | 13.63 | | | | 0.11 | | | | (1.13 | ) | | | —(c) | | | | (1.02 | ) | | | (0.09 | ) | | | (0.28 | ) | | | (0.37 | ) | | | 12.24 | |
Year Ended 9/30/18 | | | 13.43 | | | | 0.10 | | | | 0.47 | | | | —(c) | | | | 0.57 | | | | (0.08 | ) | | | (0.29 | ) | | | (0.37 | ) | | | 13.63 | |
Class R6 | | | | | | | | | | | | | | | | | | | | | | | | | | | | | | | | | | | | |
Six Months Ended 3/31/23 (Unaudited) | | | $12.38 | | | | 0.08 | | | | 1.04 | | | | — | | | | 1.12 | | | | (0.47 | ) | | | (0.22 | ) | | | (0.69 | ) | | | $12.81 | |
Year Ended 9/30/22 | | | 14.07 | | | | 0.22 | | | | (1.70 | ) | | | — | | | | (1.48 | ) | | | (0.21 | ) | | | — | | | | (0.21 | ) | | | 12.38 | |
Year Ended 9/30/21 | | | 9.90 | | | | 0.16 | | | | 4.14 | | | | — | | | | 4.30 | | | | (0.13 | ) | | | — | | | | (0.13 | ) | | | 14.07 | |
Year Ended 9/30/20 | | | 12.31 | | | | 0.16 | | | | (2.40 | ) | | | — | | | | (2.24 | ) | | | (0.17 | ) | | | — | | | | (0.17 | ) | | | 9.90 | |
Year Ended 9/30/19 | | | 13.71 | | | | 0.13 | | | | (1.15 | ) | | | — | | | | (1.02 | ) | | | (0.10 | ) | | | (0.28 | ) | | | (0.38 | ) | | | 12.31 | |
Year Ended 9/30/18 | | | 13.51 | | | | 0.11 | | | | 0.46 | | | | — | | | | 0.57 | | | | (0.08 | ) | | | (0.29 | ) | | | (0.37 | ) | | | 13.71 | |
| (a) | Per share net investment income (loss) has been calculated using the average daily shares method. |
| (b) | For the period from January 28, 2021 (commencement of operations) to September 30, 2021. |
| (c) | Less than $0.01 or $(0.01) per share. |
57
RBC Small Cap Value Fund
(Selected data for a share outstanding throughout the periods indicated)
| | | | | | | | | | | | | | | | | | | | | | | | |
| | | | | Ratios/Supplemental Data | |
| | | Total
Return(a)(b) | | Net Assets,
End of
Period (000’s) | | | Ratio of
Net Expenses
to Average
Net Assets | | Ratio of
Net Investment
Income (Loss)
to Average
Net Assets | | Ratio of
Expenses to
Average Net
Assets* | | Portfolio
Turnover
Rate** |
Class A | | | | | | | | | | | | | | | | | | | | | | | | |
Six Months Ended 3/31/23 (Unaudited) | | | 9.07 | %(c) | | | $ 11 | | | | 1.10 | %(d) | | | 0.94 | %(d) | | | 34.59 | %(d) | | | 28 | % |
Year Ended 9/30/22 | | | (11.07 | )%(e) | | | 10 | | | | 1.10 | % | | | 0.43 | % | | | 33.11 | % | | | 83 | % |
Period Ended 9/30/21(f) | | | 10.71 | %(c) | | | 11 | | | | 1.10 | %(d) | | | 1.01 | %(d) | | | 37.36 | %(d) | | | 61 | % |
Class I | | | | | | | | | | | | | | | | | | | | | | | | |
Six Months Ended 3/31/23 (Unaudited) | | | 8.65 | %(c) | | | $ 30,554 | | | | 0.85 | %(d) | | | 1.23 | %(d) | | | 1.55 | %(d) | | | 28 | % |
Year Ended 9/30/22 | | | (10.85 | )%(e) | | | 30,802 | | | | 0.85 | % | | | 0.70 | % | | | 1.22 | % | | | 83 | % |
Year Ended 9/30/21 | | | 43.48 | % | | | 77,582 | | | | 0.85 | % | | | 1.17 | % | | | 1.09 | % | | | 61 | % |
Year Ended 9/30/20 | | | (18.62 | )% | | | 52,496 | | | | 0.85 | % | | | 1.34 | % | | | 1.15 | % | | | 77 | % |
Year Ended 9/30/19 | | | (6.91 | )% | | | 55,686 | | | | 0.85 | % | | | 0.95 | % | | | 0.98 | % | | | 52 | % |
Year Ended 9/30/18 | | | 4.24 | % | | | 144,979 | | | | 0.91 | %(g) | | | 0.75 | % | | | 0.99 | % | | | 29 | % |
Class R6 | | | | | | | | | | | | | | | | | | | | | | | | |
Six Months Ended 3/31/23 (Unaudited) | | | 9.18 | %(c) | | | $ 10 | | | | 0.80 | %(d) | | | 1.24 | %(d) | | | 36.85 | %(d) | | | 28 | % |
Year Ended 9/30/22 | | | (10.72 | )%(e) | | | 9 | | | | 0.76 | % | | | 1.45 | % | | | 1.27 | % | | | 83 | % |
Year Ended 9/30/21 | | | 43.64 | % | | | 6,366 | | | | 0.80 | % | | | 1.21 | % | | | 1.03 | % | | | 61 | % |
Year Ended 9/30/20 | | | (18.56 | )% | | | 4,423 | | | | 0.80 | % | | | 1.40 | % | | | 1.07 | % | | | 77 | % |
Year Ended 9/30/19 | | | (6.89 | )% | | | 7,278 | | | | 0.80 | % | | | 1.07 | % | | | 0.95 | % | | | 52 | % |
Year Ended 9/30/18 | | | 4.22 | % | | | 8,242 | | | | 0.87 | %(g) | | | 0.83 | % | | | 0.98 | % | | | 29 | % |
| * | During the period, certain fees were contractually or voluntarily reduced and/or reimbursed. If such contractual/voluntary fee reductions and reimbursements had not occurred, the ratio would have been as indicated. |
| ** | Portfolio turnover rate is calculated on the basis of the Fund as a whole without distinguishing between the classes of shares issued. |
| (a) | Excludes sales charge. |
| (b) | Assumes investment at net asset value at the beginning of the period, reinvestment of all dividends and distributions, and a complete redemption of the investment at net asset value at the end of the period. |
58
RBC Small Cap Value Fund
(Selected data for a share outstanding throughout the periods indicated)
|
(e) The Advisor reimbursed the Fund $862,113 for Losses from a trading policy error. The payment had an impact of 2.4% to the total return of each share class. (f) For the period from January 28, 2021 (commencement of operations) to September 30, 2021. (g) Beginning July 2, 2018, the net operating expenses were contractually limited to 0.85% and 0.80% of average daily net assets for Class I and Class R6, respectively. The ratio of net expenses to average net assets represents a blended percentage for the period ended September 30, 2018. See Notes to the Financial Statements. |
59
|
NOTES TO FINANCIAL STATEMENTS |
March 31, 2023 (Unaudited)
1. Organization:
RBC Funds Trust (the “Trust”) is registered under the Investment Company Act of 1940 (as amended) as an open-end management investment company. The Trust was organized as a Delaware statutory trust on December 16, 2003 and currently consists of 24 portfolios. Overall responsibility for the management of the Trust is vested in its Board of Trustees (the “Board”). Predecessor funds to the Trust were reorganized as portfolios of the Trust effective April 16, 2004. This report includes the following five investment portfolios (each a “Fund” and collectively, the “Funds”):
- RBC SMID Cap Growth Fund (“SMID Cap Growth Fund”)
- RBC Enterprise Fund (“Enterprise Fund”)
- RBC Small Cap Core Fund (“Small Cap Core Fund”)
- RBC Microcap Value Fund (“Microcap Value Fund”)
- RBC Small Cap Value Fund (“Small Cap Value Fund”)
The SMID Cap Growth, Small Cap Core and Small Cap Value Funds offer three share classes: Class A, Class R6 and Class I shares. The Enterprise and Microcap Value Funds offer two share classes: Class A and Class I shares. Class A shares are offered with a 5.75% maximum front-end sales charge and a 1.00% contingent deferred sales charge (“CDSC”) for redemption within 12 months of a $1 million or greater purchase on which no front-end sales charge was paid. Class I and Class R6 shares (intended for investors meeting certain investment minimum thresholds) are not subject to either a front-end sales charge or a CDSC.
RBC Global Asset Management (U.S.) Inc. (”RBC GAM-US“ or ”Advisor“ or ”Co-Administrator“) acts as the investment advisor for the Funds. The officers of the Trust (“Fund Management”) are also employees of RBC GAM-US.
2. Significant Accounting Policies
Each Fund is an investment company that follows accounting and reporting guidance under the Financial Accounting Standards Board. Summarized below are the significant accounting policies of the Funds. These policies conform to accounting principles generally accepted in the United States of America (“U.S. GAAP”). Fund Management follows these policies when preparing financial statements. Fund Management may also be required to make estimates and assumptions that affect the reported amounts of assets and liabilities at the date of the financial statements and the reported amounts of income and expenses for the period. Actual results could differ from those estimates. The financial statements are as of the close of regular trading on the New York Stock Exchange (“NYSE”).
Security Valuation:
The Board has approved pricing and valuation procedures of the Advisor for determining the fair value of each Fund’s investments. Fair value of a security is considered to be the price that a fund might reasonably expect to receive upon its current sale in an orderly transaction between market participants.
Equity securities are generally valued on the basis of prices furnished by third-party pricing services approved by the Board. Equity securities listed on one or more exchanges shall be valued at the last available quoted sale price on the primary trading exchange as of the regularly scheduled closing time of the exchange and are categorized as Level 1 in the fair value hierarchy. (See “Fair Value Measurements” below for additional information). An equity security not listed on an exchange but listed on NASDAQ shall be valued at the NASDAQ official closing price and is also categorized as Level 1. If there was no sale on the primary exchange on the day the net asset value is calculated or a NASDAQ official closing price is not available, the most recent bid quotation generally will be used and such securities will generally be categorized as Level 2. Investments in open-end investment companies (mutual funds) are valued at net asset value and are categorized as Level 1 in the fair value hierarchy.
Fixed income securities, including to-be-announced (“TBA”) commitments and municipal bonds, are generally valued based on evaluated prices received from third-party pricing services or from
60
|
NOTES TO FINANCIAL STATEMENTS |
broker-dealers who make markets in the securities and are generally categorized as Level 2 in the fair value hierarchy (see “Fair Value Measurements” below for additional information). The pricing services utilize both dealer-supplied valuations and electronic data processing techniques that take into account multiple appropriate factors such as institutional-size trading in similar groups of securities, market spreads, interest rates, and fundamental security analytical data including yield, quality, coupon rate, maturity and type of issue.
Foreign securities valued in non-U.S. dollars are valued in the foreign currency and then converted into the U.S. dollar equivalent using the foreign exchange rate in effect at the close of NYSE on the day the security’s value is determined. The value of securities traded in markets outside the United States may be affected on a day that the NYSE is closed and an investor is not able to purchase, exchange or redeem shares of the Funds.
The Board has designated the Advisor with the responsibility for implementing the pricing and valuation procedures, including responsibility for determining the fair value of the Funds’ securities or other assets and liabilities, and has established a Pricing Committee to assist in carrying out supervisory functions related to such responsibilities. The Pricing Committee includes representatives of the Funds’ Advisor, and Co-Administrator, including personnel from accounting and operations, trading, risk management and compliance. The Pricing Committee meets at least quarterly to review and approve Fund valuation matters, including a review of the Funds’ pricing activity and operations, fair value measurements, pricing vendors, policies and procedures, and related controls. At least a quorum of the Pricing Committee shall meet more frequently, as needed, to consider and approve time-sensitive fair valuation matters. The Pricing Committee provides periodic reports to the Valuation, Portfolio Management and Performance Committee (“Valuation Committee”) of the Board regarding pricing and valuation matters. Members of the Pricing Committee meet with the Valuation Committee and the Board at each of their regularly scheduled meetings to discuss valuation matters and actions taken during the period.
The Advisor has procedures to determine the fair value of a security when a price is not available from a pricing service or broker- dealer or the Advisor has determined that a price provided by a pricing service or broker-dealer does not approximate fair value. Fair valuation may also be used when a significant valuation event affecting the value of a security or market sector is determined to have occurred between the time when a security’s market closes and the time the Fund’s net asset value is calculated. The fair value of the security will be determined in good faith by the Advisor in accordance with procedures and methodologies approved by the Board. General factors used in determining the fair value of securities include, but are not limited to, fundamental analytical data relating to the security, the issuer and the market, such as duration, prepayment and default rates; general level of interest rates and changes in interest rates; information from broker-dealers; trading in similar securities; any restrictions on disposition of the security; and an evaluation of the forces that influence the market in which the investments are traded. These securities are either categorized as Level 2 or 3 in the fair value hierarchy, depending on the relevant inputs used.
When the Funds utilize fair valuation methods that use significant unobservable inputs to determine a security’s value, such securities will be categorized as Level 3 of the fair value hierarchy. These methods may require subjective determinations about the value of a security. While the Funds’ policy is intended to result in a calculation of a Fund’s net asset value that fairly reflects security values as of the time of pricing, the Funds cannot guarantee that values determined by the Advisor or persons acting at their direction would accurately reflect the price that the Funds could obtain for a security if they were to dispose of it as of the time of pricing (for instance, in a forced or distressed sale). The prices used by the Funds may differ from the value that would be realized if the securities were sold.
The Advisor employs various methods for calibrating the valuation approach related to securities categorized within Level 2 and Level 3 of the fair value hierarchy. These methods may include regular due diligence of the Funds’ pricing vendors, a regular review of key inputs and assumptions, transaction back-testing or disposition analysis to compare unrealized gains and losses to realized gains and losses, reviews of missing and stale prices and large movements in market value, and reviews of any market related activities. Additionally, the pricing of all fair value holdings is subsequently reported to the Valuation Committee and Board.
61
|
NOTES TO FINANCIAL STATEMENTS |
Fair Value Measurements:
The Funds disclose the fair value of their investments in a hierarchy that categorizes investments based on the inputs to valuation techniques used to measure fair value. The three levels of the fair value hierarchy are as follows:
• Level 1 - Inputs that reflect unadjusted quoted prices in active markets for identical assets or liabilities that the Funds have the ability to access at the measurement date.
• Level 2 - Significant inputs other than quoted prices that are observable for the asset or liability either directly or indirectly, including inputs in markets that are not considered to be active. Observable inputs may include quoted prices for similar securities, interest rates, spreads, prepayment spreads, etc.
• Level 3 - Significant unobservable inputs based on the best information available in the circumstances, to the extent observable inputs are not available (including the Fund’s own assumptions in determining the fair value of investments).
The inputs or methodology used for valuing investments are not necessarily an indication of the risk associated with investing in those securities.
Inputs used in determining fair value of an investment may include, but are not limited to, price information, volatility statistics, credit and market data, and other factors, all of which may be either observable or unobservable. Inputs can vary among investments and will be impacted by the investment type and volume of activity for the particular security or similar securities in the market. Investments in the Level 2 category are generally supported by transactions and quoted prices from dealers participating in the market for those investments. Investments may be included in the Level 3 category due to a lack of market activity or transparency. Internal valuation models may also be used as a pricing source for Level 3 investments. Internal valuation models may rely on one or more unobservable inputs, such as estimated cash flows, financial statement analysis and discount rates. The summary of inputs used to determine the fair value of the Funds’ investments as of March 31, 2023 is as follows:
| | | | | | | | | | | | | | | | |
| Funds | | Level 1
Quoted Prices | | | Level 2
Significant
Observable
Inputs | | | Level 3
Significant
Unobservable
Inputs | | | Total | |
| | | | |
Assets: | | | | | | | | | | | | | | | | |
Investments in Securities | | | | | | | | | | | | | | | | |
SMID Cap Growth Fund | | $ | 90,879,621 | (a) | | | $ — | | | | $— | | | $ | 90,879,621 | |
Enterprise Fund | | | 60,979,822 | (a) | | | — | | | | — | | | | 60,979,822 | |
Small Cap Core Fund | | | 42,091,580 | (a) | | | — | | | | — | | | | 42,091,580 | |
Microcap Value Fund | | | 102,103,754 | (a) | | | 1,373,758 | (b) | | | — | (c) | | | 103,477,512 | |
Small Cap Value Fund | | | 30,535,559 | (a) | | | — | | | | — | | | | 30,535,559 | |
| (a) | The breakdown of the Fund’s investments into major categories is disclosed in the Schedule of Portfolio Investments. |
| (b) | Represents securities in the Consumer Discretionary ($322,988), Financials ($967,970) and Consumer Staples ($82,800) sections of the Schedule of Portfolio Investments. |
| (c) | Includes securities fair valued at zero. |
The Fund’s assets assigned to the Level 3 category were valued using the valuation methodology and technique deemed most appropriate in the circumstances. The significant unobservable inputs used may include assumptions regarding the particular security’s cash flow profile and potential defaults which may not be generally observable for either the security or for assets of a similar type. Significant changes in any of these assumptions may result in a lower or higher fair value.
62
|
NOTES TO FINANCIAL STATEMENTS |
Repurchase Agreements:
The Funds, except SMID Cap Growth Fund, may enter into repurchase agreements with counterparties whom the Advisor has deemed creditworthy, including primary dealers that report to the Federal Reserve Bank of New York or other large U.S. commercial banks or broker-dealers. These repurchase agreements are subject to the seller’s agreement to repurchase such securities at a mutually agreed upon date and price. The repurchase price generally equals the price paid by the Funds plus interest negotiated on the basis of current short-term rates.
Securities pledged by the dealers as collateral for repurchase agreements are held by a custodian bank until maturity of the repurchase agreement. The Funds have procedures to monitor additional collateral, if needed, to ensure that the daily market value of the collateral remains in excess of the market value of the repurchase agreement in the event of a default.
There were no repurchase agreements held during the period ended March 31, 2023.
Affiliated Investments:
The Funds invest in another Fund of the Trust (an “Affiliated Fund”), U.S. Government Money Market Fund-RBC Institutional Class 1, as a cash sweep vehicle. The income earned by the Funds from the Affiliated Fund for the period is disclosed in the Statement of Operations. The table below details the transactions of the Funds in the Affiliated Fund. As the affiliated investment is a money market fund in which shares are issued and redeemed at $1.00 per share, the number of shares purchased and sold equal the dollar amount shown as purchased and sold, and no gain or loss was realized on the sale of shares of the money market fund.
| | | | | | | | | | | | | | | | | | | | |
| | | Value
September 30, 2022 | | | Purchases | | | Sales | | | Value
March 31, 2023 | | | Dividends | |
Investments in U.S. Government Money Market Fund—RBC Institutional Class 1 | | | | | | | | | | | | | | | | | |
SMID Cap Growth Fund | | | $1,812,271 | | | | $7,115,901 | | | | $6,816,331 | | | | $2,111,841 | | | | $35,226 | |
Enterprise Fund | | | 870,444 | | | | 4,641,538 | | | | 3,216,086 | | | | 2,295,896 | | | | 30,440 | |
Small Cap Core Fund | | | 900,374 | | | | 3,593,600 | | | | 3,314,859 | | | | 1,179,115 | | | | 19,270 | |
Microcap Value Fund | | | 1,735,997 | | | | 7,323,132 | | | | 7,308,128 | | | | 1,751,001 | | | | 29,479 | |
Small Cap Value Fund | | | 233,786 | | | | 6,385,391 | | | | 6,076,230 | | | | 542,947 | | | | 9,904 | |
Investment Transactions and Income:
Investment transactions are recorded on trade date. Dividend income is recorded on the ex-dividend date. Non-cash dividends, if any, are recorded on the ex-dividend date at fair value. Realized gains and losses from investment transactions are calculated based on the cost of the specific security (also known as identified cost basis). Interest income is recognized on the accrual basis and includes, where applicable, the amortization or accretion of premium or discount using the effective yield method.
Expense, Investment Income and Gain/Loss Allocation:
Each Fund pays the expenses that are directly related to its operations, such as custodian fees or advisory fees. Expenses incurred by the Trust, such as trustee or legal fees, are allocated among each of the Funds in the Trust either proportionately based upon each Fund’s relative net assets or using another reasonable basis such as equally across all Funds in the Trust, depending on the nature of the expense. Individual share classes within a Fund are charged expenses specific to that class, such as distribution fees and transfer agent fees. Within a Fund, expenses other than class specific expenses are allocated daily to each class based upon the proportion of relative net assets. Investment income and realized and unrealized gains or losses are allocated to each class of shares based on relative net assets.
63
|
NOTES TO FINANCIAL STATEMENTS |
Real Estate Investment Trusts:
The Funds may own shares of real estate investment trusts (”REITs“) which report information on the source of their distributions annually. Dividends paid by a REIT, other than capital gain distributions, will be taxable as ordinary income up to the amount of the REIT’s current and accumulated earnings and profits. Capital gain dividends paid by a REIT to a Fund will be treated as long term capital gains by the Fund and, in turn, may be distributed by the Fund to its shareholders as a capital gain distribution. Distributions received from a REIT in excess of its income are recorded as a return of capital and a reduction to the cost basis of the REIT.
Indemnifications:
Under the Trust’s organizational documents, each Trustee, officer, employee or other agent of the Trust is indemnified against certain liabilities that may arise out of their duties to the Funds. Additionally, in the normal course of business, the Funds enter into contracts, including the Funds’ servicing agreements, that contain a variety of indemnification clauses. The Funds’ maximum exposure under these arrangements is unknown as this would involve future claims that may be made against the Funds that have not yet occurred.
Distributions to Shareholders:
Each Fund pays out any income that it receives, less expenses, in the form of dividends and capital gain distributions to its shareholders. Income dividends and capital gain distributions for each Fund are declared and paid at least annually. Distributions to shareholders are recorded on the ex-dividend date. The amount of dividends and distributions are calculated based on federal income tax regulations, which may differ from US GAAP. These “book/tax” differences may be either temporary or permanent in nature. To the extent these differences are determined, as of the end of the tax year, to be permanent (e.g., net operating loss, redesignation of distributions, basis adjustments on investments in passive foreign investment companies (PFICs) and partnerships), they are reclassified within a Fund’s capital accounts based on their federal tax basis treatment.
3. Agreements and Other Transactions with Affiliates:
The Trust has entered into an investment advisory agreement with RBC GAM-US under which RBC GAM-US manages each Fund’s assets and furnishes related office facilities, equipment, research and personnel. The agreement requires each Fund to pay RBC GAM-US a monthly fee based upon average daily net assets. Under the terms of the agreement, RBC GAM-US is entitled to receive fees based on a percentage of the average daily net assets of each of the Funds as follows:
| | | | | | |
| | | Average Daily Net Assets of Fund | | Annual Rate | |
SMID Cap Growth Fund | | All Net Assets | | | 0.70% | |
Enterprise Fund | | Up to $30 Million | | | 1.00% | |
| | Over $30 Million | | | 0.90% | |
Small Cap Core Fund | | All Net Assets | | | 0.85% | |
Microcap Value Fund | | All Net Assets | | | 0.90% | |
Small Cap Value Fund | | All Net Assets | | | 0.70% | |
RBC GAM-US has contractually agreed to waive fees and/or make payments in order to keep total operating expenses (excluding certain fees such as interest, taxes and acquired fund fees and expenses) of the Funds to the following levels pursuant to an expense limitation agreement.
| | | | | | | | | | | | |
| | | Class A
Annual Rate | | | Class I
Annual Rate | | | Class R6
Annual Rate | |
SMID Cap Growth Fund | | | 1.07% | | | | 0.82% | | | | 0.77% | |
Enterprise Fund | | | 1.33% | | | | 1.08% | | | | N/A | |
Small Cap Core Fund | | | 1.15% | | | | 0.90% | | | | 0.87% | |
Microcap Value Fund | | | 1.32% | | | | 1.07% | | | | N/A | |
Small Cap Value Fund | | | 1.10% | | | | 0.85% | | | | 0.80% | |
64
|
NOTES TO FINANCIAL STATEMENTS |
This expense limitation agreement is in place until January 31, 2024, and may not be terminated by RBC GAM-US prior to that date. The agreement shall continue for additional one-year terms unless terminated or revised by the Board at any time or by RBC GAM-US at the expiration of any one-year period. The Advisor is entitled to recoup from the Fund or class the fees and/or operating expenses waived or reimbursed during any of the previous 12 months (3 years for the Small Cap Value Fund), provided the Fund is able to do so and remain in compliance with the expense limitation in place at the time the fees were waived or expenses paid.
At March 31, 2023, the amounts subject to possible recoupment under the expense limitation agreement were:
| | | | | | | | | | | | | | | | | | | | |
| | | FYE 9/30/20 | | | FYE 9/30/21 | | | FYE 9/30/22 | | | FYE 9/30/23 | | | Total | |
SMID Cap Growth Fund | | $ | N/A | | | $ | N/A | | | $ | 103,460 | | | $ | 112,407 | | | $ | 215,867 | |
Enterprise Fund | | | N/A | | | | N/A | | | | 70,080 | | | | 78,104 | | | | 148,184 | |
Small Cap Core Fund | | | N/A | | | | N/A | | | | 83,538 | | | | 108,165 | | | | 191,703 | |
Microcap Value Fund | | | N/A | | | | N/A | | | | 67,028 | | | | 92,372 | | | | 159,400 | |
Small Cap Value Fund | | | 81,839 | | | | 190,586 | | | | 186,786 | | | | 120,672 | | | | 579,883 | |
There was no recoupment of expense reimbursements/waivers during the year. Amounts from years prior to those shown are no longer subject to recoupment.
RBC GAM-US may also voluntarily waive and/or reimburse operating expenses of any Fund from time to time. Any such voluntary program may be changed or eliminated at any time without notice, and expenses waived under such program are not subject to recoupment.
RBC GAM-US voluntarily agreed to waive its investment advisory fees by the amount of investment advisory fees the Funds pay to RBC GAM-US indirectly through its investment in an affiliated money market fund. For the six months ended March 31, 2023, the amount waived was $1,363, $1,178, $766, $1,187 and $426 for the SMID Cap Growth Fund, Enterprise Fund, Small Cap Core Fund, Microcap Value Fund and Small Cap Value Fund, respectively, and is included in expenses waived/reimbursed by Advisor in the Statements of Operations.
RBC GAM-US serves as co-administrator to the Funds. BNY Mellon serves as co-administrator and fund accounting agent. Services provided under the administrative services contract include providing day-to-day administration of matters related to the Funds, maintenance of their records and the preparation of reports. Under the terms of the administrative services agreement, RBC GAM-US does not receive an administrative services fee. BNY Mellon receives a fee for its services payable by each Fund based in part on each Funds’ average net assets. BNY Mellon’s fee is included with ”Accounting fees“ in the Statements of Operations.
Certain officers and trustees of the Trust are affiliated with the Advisor or the Co-Administrator. Such Officers and Trustees receive no compensation from the Funds for serving in their respective roles.
The Trust currently pays each of the independent trustees (trustees of the Trust who are not directors, officers or employees of the Advisor, either Co-Administrator or Distributor) an annual retainer of $84,000. The Board Chairperson and Audit Committee Chairperson each receive an additional retainer of $2,500 annually, and all other trustees serving as Chair of a Board committee each receive an additional retainer of $1,000 annually. In addition, independent trustees receive a quarterly meeting fee of $6,500 for each in-person Board meeting attended, a meeting fee of $1,500 for each telephonic or special board meeting attended, a $1,500 fee for each Board committee meeting attended, and are reimbursed for all out-of-pocket expenses relating to attendance at such meetings. These amounts are included in the Statement of Operations in “Trustees’ fees”.
In conjunction with the launch of the Class A shares of Small Cap Value Fund and Class R6 Shares, the Advisor invested seed capital to provide the share class its initial investment assets. In addition, the Advisor has purchased Class R6 shares of Small Cap Core Fund. The table below shows, as of March 31, 2023, the Fund’s net assets, the shares of the Fund held by the Advisor, and the percent of total net assets represented by the Advisor’s investment.
65
|
NOTES TO FINANCIAL STATEMENTS |
| | | | | | | | | | | | |
| | | Net Assets | | | Shares held
by Advisor | | | % of Fund
Net Assets | |
SMID Cap Growth Fund | | $ | 90,872,888 | | | | 1,399 | | | | 0.0% | |
Small Cap Core Fund | | $ | 41,979,989 | | | | 666 | | | | 0.0% | |
Small Cap Value Fund | | $ | 30,575,046 | | | | 1,638 | | | | 0.1% | |
4. Fund Distribution:
Each of the Funds that offers Class A shares has adopted a Master Distribution 12b-1 Plan (the “Plan”) in which Quasar Distributors LLC (the “Distributor”) acts as the Funds’ distributor. The Plan permits each Fund to make payments for, or to reimburse the Distributor for, distribution-related costs and expenses of marketing shares of Class A covered under the Plan, and/or for providing shareholder services. The Plan does not apply to Class I and Class R6. The following chart shows the current Plan fee rate for Class A.
| | | | |
| | | Class A | |
12b-1 Plan Fee | | | 0.25%* | |
* Under the 12b-1 plan, the maximum fee rate for Class A shares is 0.50%. Currently the Board has approved an annual limit of 0.25%.
Plan fees are based on average daily net assets of Class A. Up to 0.25% of each Plan fee may be designated as a service fee, as defined by the applicable rules of the Financial Industry Regulatory Authority. The Distributor, subject to applicable legal requirements, may waive the Plan fee voluntarily, in whole or in part. For the period ended March 31, 2023, there were no fees waived by the Distributor.
The Distributor did not receive any CDSC fees from Class A shares of the Funds during the period ended March 31, 2023.
For the period ended March 31, 2023, the Distributor received commissions of $4,988 front-end sales charges of Class A shares of the Funds, of which $506 was paid to affiliated broker-dealers, and the remainder was either paid to unaffiliated broker-dealers or retained by the Distributor.
The Distributor did not receive any CDSC fees from Class A shares of the Funds during the period ended March 31, 2023.
5. Securities Transactions:
The cost of securities purchased and proceeds from securities sold (excluding securities maturing less than one year from acquisition) for the period ended March 31, 2023 were as follows:
| | | | | | | | | | | | |
| | | Purchases | | | | | | Sales | |
SMID Cap Growth Fund | | $ | 9,681,734 | | | | | | | $ | 9,630,336 | |
Enterprise Fund | | | 3,375,107 | | | | | | | | 7,580,608 | |
Small Cap Core Fund | | | 7,161,575 | | | | | | | | 9,202,018 | |
Microcap Value Fund | | | 14,567,080 | | | | | | | | 20,005,830 | |
Small Cap Value Fund | | | 9,177,313 | | | | | | | | 11,291,489 | |
Within the guidelines established by the Funds to always seek best execution when entering into portfolio transactions, the Funds participated in a “commission recapture” program until January 13, 2023, under which brokerage transactions are directed to Cowen and Company, LLC and its correspondent brokers. A portion of the commissions paid under this program were reimbursed to the Funds and recorded as net realized gains from investment transactions in the financial statements.
66
|
NOTES TO FINANCIAL STATEMENTS |
6. Capital Share Transactions:
The Trust is authorized to issue an unlimited number of shares of beneficial interest (“shares outstanding”) without par value. Transactions in capital stock of the Funds are summarized on the following pages:
| | | | | | | | | | | | | | | | |
| | | SMID Cap Growth Fund | | | Enterprise Fund | |
| | | For the
Six Months
Ended
March 31,
2023
(Unaudited) | | | For the
Year Ended
September 30,
2022 | | | For the
Six Months
Ended
March 31,
2023
(Unaudited) | | | For the
Year Ended
September 30,
2022 | |
CAPITAL TRANSACTIONS: | | | | | | | | | | | | | | | | |
Class A | | | | | | | | | | | | | | | | |
Proceeds from shares issued | | $ | 245,061 | | | $ | 127,690 | | | $ | 1,425 | | | $ | 44,790 | |
Distributions reinvested | | | 1,062,780 | | | | 3,541,196 | | | | 99,368 | | | | 90,539 | |
Cost of shares redeemed | | | (707,016 | ) | | | (926,884 | ) | | | (67,690 | ) | | | (16,420 | ) |
| | | | | | | | | | | | | | | | |
Change in Class A | | $ | 600,825 | | | $ | 2,742,002 | | | $ | 33,103 | | | $ | 118,909 | |
| | | | | | | | | | | | | | | | |
Class I | | | | | | | | | | | | | | | | |
Proceeds from shares issued | | $ | 6,918,120 | | | $ | 23,148,652 | | | $ | 208,674 | | | $ | 292,639 | |
Distributions reinvested | | | 5,134,912 | | | | 16,624,772 | | | | 7,809,138 | | | | 7,920,734 | |
Cost of shares redeemed | | | (5,844,905 | ) | | | (24,603,015 | ) | | | (2,616,553 | ) | | | (5,079,188 | ) |
| | | | | | | | | | | | | | | | |
Change in Class I | | $ | 6,208,127 | | | $ | 15,170,409 | | | $ | 5,401,259 | | | $ | 3,134,185 | |
| | | | | | | | | | | | | | | | |
Class R6 | | | | | | | | | | | | | | | | |
Distributions reinvested | | $ | 1,350 | | | $ | 4,389 | | | $ | — | | | $ | — | |
| | | | | | | | | | | | | | | | |
Change in Class R6 | | $ | 1,350 | | | $ | 4,389 | | | $ | — | | | $ | — | |
| | | | | | | | | | | | | | | | |
Change in net assets resulting from capital transactions | | $ | 6,810,302 | | | $ | 17,916,800 | | | $ | 5,434,362 | | | $ | 3,253,094 | |
| | | | | | | | | | | | | | | | |
SHARE TRANSACTIONS: | | | | | | | | | | | | | | | | |
Class A | | | | | | | | | | | | | | | | |
Issued | | | 21,976 | | | | 9,981 | | | | 96 | | | | 2,461 | |
Reinvested | | | 99,604 | | | | 264,071 | | | | 7,388 | | | | 5,058 | |
Redeemed | | | (62,604 | ) | | | (72,177 | ) | | | (4,448 | ) | | | (865 | ) |
| | | | | | | | | | | | | | | | |
Change in Class A | | | 58,976 | | | | 201,875 | | | | 3,036 | | | | 6,654 | |
| | | | | | | | | | | | | | | | |
Class I | | | | | | | | | | | | | | | | |
Issued | | | 484,793 | | | | 1,439,655 | | | | 13,329 | | | | 15,117 | |
Reinvested | | | 382,062 | | | | 1,005,125 | | | | 533,776 | | | | 412,968 | |
Redeemed | | | (409,047 | ) | | | (1,478,593 | ) | | | (161,596 | ) | | | (267,180 | ) |
| | | | | | | | | | | | | | | | |
Change in Class I | | | 457,808 | | | | 966,187 | | | | 385,509 | | | | 160,905 | |
| | | | | | | | | | | | | | | | |
Class R6 | | | | | | | | | | | | | | | | |
Reinvested | | | 101 | | | | 264 | | | | — | | | | — | |
| | | | | | | | | | | | | | | | |
Change in Class R6 | | | 101 | | | | 264 | | | | — | | | | — | |
| | | | | | | | | | | | | | | | |
Change in shares resulting from capital transactions | | | 516,885 | | | | 1,168,326 | | | | 388,545 | | | | 167,559 | |
| | | | | | | | | | | | | | | | |
67
|
NOTES TO FINANCIAL STATEMENTS |
| | | | | | | | | | | | | | | | |
| | | Small Cap Core Fund | | | Microcap Value Fund | |
| | | For the
Six Months
Ended
March 31,
2023
(Unaudited) | | | For the
Year Ended
September 30,
2022 | | | For the
Six Months
Ended
March 31,
2023
(Unaudited) | | | For the
Year Ended
September 30,
2022 | |
CAPITAL TRANSACTIONS: | | | | | | | | | | | | | | | | |
Class A | | | | | | | | | | | | | | | | |
Proceeds from shares issued | | $ | 303,334 | | | $ | 2,554,737 | | | $ | 66,910 | | | $ | 164,622 | |
Distributions reinvested | | | 1,814,942 | | | | 3,521,048 | | | | 372,237 | | | | 202,078 | |
Cost of shares redeemed | | | (358,498 | ) | | | (2,207,350 | ) | | | (389,594 | ) | | | (515,984 | ) |
| | | | | | | | | | | | | | | | |
Change in Class A | | $ | 1,759,778 | | | $ | 3,868,435 | | | $ | 49,553 | | | $ | (149,284 | ) |
| | | | | | | | | | | | | | | | |
Class I | | | | | | | | | | | | | | | | |
Proceeds from shares issued | | $ | 162,966 | | | $ | 358,109 | | | $ | 2,107,663 | | | $ | 16,367,091 | |
Distributions reinvested | | | 7,660,760 | | | | 18,179,003 | | | | 13,178,787 | | | | 7,406,753 | |
Cost of shares redeemed | | | (1,733,909 | ) | | | (14,437,123 | ) | | | (6,577,100 | ) | | | (22,770,761 | ) |
| | | | | | | | | | | | | | | | |
Change in Class I | | $ | 6,089,817 | | | $ | 4,099,989 | | | $ | 8,709,350 | | | $ | 1,003,083 | |
| | | | | | | | | | | | | | | | |
Class R6 | | | | | | | | | | | | | | | | |
Proceeds from shares issued | | $ | — | | | $ | 398,337 | | | $ | — | | | $ | — | |
Distributions reinvested | | | 2,075 | | | | 4,379 | | | | — | | | | — | |
Cost of shares redeemed | | | — | | | | (5,349,362 | ) | | | — | | | | — | |
| | | | | | | | | | | | | | | | |
Change in Class R6 | | $ | 2,075 | | | $ | (4,946,646 | ) | | $ | — | | | $ | — | |
| | | | | | | | | | | | | | | | |
Change in net assets resulting from capital transactions | | $ | 7,851,670 | | | $ | 3,021,778 | | | $ | 8,758,903 | | | $ | 853,799 | |
| | | | | | | | | | | | | | | | |
SHARE TRANSACTIONS: | | | | | | | | | | | | | | | | |
Class A | | | | | | | | | | | | | | | | |
Issued | | | 23,824 | | | | 129,777 | | | | 2,479 | | | | 5,318 | |
Reinvested | | | 161,185 | | | | 196,049 | | | | 14,848 | | | | 6,460 | |
Redeemed | | | (25,217 | ) | | | (111,469 | ) | | | (14,735 | ) | | | (15,740 | ) |
| | | | | | | | | | | | | | | | |
Change in Class A | | | 159,792 | | | | 214,357 | | | | 2,592 | | | | (3,962 | ) |
| | | | | | | | | | | | | | | | |
Class I | | | | | | | | | | | | | | | | |
Issued | | | 10,817 | | | | 17,165 | | | | 79,688 | | | | 540,868 | |
Reinvested | | | 581,240 | | | | 900,396 | | | | 526,520 | | | | 237,092 | |
Redeemed | | | (110,325 | ) | | | (515,625 | ) | | | (247,688 | ) | | | (783,612 | ) |
| | | | | | | | | | | | | | | | |
Change in Class I | | | 481,732 | | | | 401,936 | | | | 358,520 | | | | (5,652 | ) |
| | | | | | | | | | | | | | | | |
Class R6 | | | | | | | | | | | | | | | | |
Issued | | | — | | | | 10,986 | | | | — | | | | — | |
Reinvested | | | 157 | | | | 216 | | | | — | | | | — | |
Redeemed | | | — | | | | (150,022 | ) | | | — | | | | — | |
| | | | | | | | | | | | | | | | |
Change in Class R6 | | | 157 | | | | (138,820 | ) | | | — | | | | — | |
| | | | | | | | | | | | | | | | |
Change in shares resulting from capital transactions | | | 641,681 | | | | 477,473 | | | | 361,112 | | | | (9,614 | ) |
| | | | | | | | | | | | | | | | |
68
|
NOTES TO FINANCIAL STATEMENTS |
| | | | | | | | |
| | | Small Cap Value Fund | |
| | | For the
Six Months
Ended
March 31,
2023
(Unaudited) | | | For the
Year Ended
September 30,
2022 | |
CAPITAL TRANSACTIONS: | | | | | | | | |
Class A | | | | | | | | |
Distributions reinvested | | $ | 498 | | | $ | 132 | |
| | | | | | | | |
Change in Class A | | $ | 498 | | | $ | 132 | |
| | | | | | | | |
Class I | | | | | | | | |
Proceeds from shares issued | | $ | 15,189,037 | | | $ | 33,939,527 | |
Distributions reinvested | | | 772,665 | | | | 358,977 | |
Cost of shares redeemed | | | (17,328,412 | ) | | | (75,657,975 | ) |
| | | | | | | | |
Change in Class I | | $ | (1,366,710 | ) | | $ | (41,359,471 | ) |
| | | | | | | | |
Class R6 | | | | | | | | |
Proceeds from shares issued | | $ | — | | | $ | 28,665 | |
Distributions reinvested | | | 527 | | | | 361 | |
Cost of shares redeemed | | | — | | | | (6,555,246 | ) |
| | | | | | | | |
Change in Class R6 | | $ | 527 | | | $ | (6,526,220 | ) |
| | | | | | | | |
Change in net assets resulting from capital transactions | | $ | (1,365,685 | ) | | $ | (47,885,559 | ) |
| | | | | | | | |
SHARE TRANSACTIONS: | | | | | | | | |
Class A | | | | | | | | |
Reinvested | | | 39 | | | | 10 | |
| | | | | | | | |
Change in Class A | | | 39 | | | | 10 | |
| | | | | | | | |
Class I | | | | | | | | |
Issued | | | 1,160,201 | | | | 2,373,648 | |
Reinvested | | | 61,962 | | | | 25,244 | |
Redeemed | | | (1,318,071 | ) | | | (5,438,605 | ) |
| | | | | | | | |
Change in Class I | | | (95,908 | ) | | | (3,039,713 | ) |
| | | | | | | | |
Class R6 | | | | | | | | |
Issued | | | — | | | | 2,058 | |
Reinvested | | | 42 | | | | 25 | |
Redeemed | | | — | | | | (453,842 | ) |
| | | | | | | | |
Change in Class R6 | | | 42 | | | | (451,759 | ) |
| | | | | | | | |
Change in shares resulting from capital transactions | | | (95,827 | ) | | | (3,491,462 | ) |
| | | | | | | | |
7. Federal Income Taxes:
It is the policy of each Fund to continue to qualify as a regulated investment company by complying with the provisions available to certain investment companies, as defined under Subchapter M of the Internal Revenue Code, and to distribute substantially all of its net investment income and net realized capital gains. Therefore, no federal tax liability is recorded in the financial statements of each Fund.
Fund Management has analyzed the Funds’ tax positions taken or expected to be taken on federal income tax returns for all open tax years (current and prior three tax years), and has concluded that no
69
|
NOTES TO FINANCIAL STATEMENTS |
provision for federal income tax is required in the Funds’ financial statements. The Funds’ federal and state income and federal excise tax returns for tax years for which the applicable statutes of limitations have not expired are subject to examination by the Internal Revenue Service and state departments of revenue.
As of March 31, 2023, the tax cost of investments and the breakdown of unrealized appreciation (depreciation) for each Fund was as follows:
| | | | | | | | | | | | | | | | |
| | | Tax Cost Of
Investments | | | Unrealized
Appreciation | | | Unrealized
Depreciation | | | Net Unrealized
Appreciation/
(Depreciation) | |
SMID Cap Growth Fund | | $ | 73,869,517 | | | $ | 21,563,973 | | | $ | (4,553,869 | ) | | $ | 17,010,104 | |
Enterprise Fund | | | 42,593,687 | | | | 21,217,954 | | | | (2,831,819 | ) | | | 18,386,135 | |
Small Cap Core Fund | | | 28,646,549 | | | | 14,930,298 | | | | (1,485,267 | ) | | | 13,445,031 | |
Microcap Value Fund | | | 85,825,943 | | | | 35,016,576 | | | | (17,365,007 | ) | | | 17,651,569 | |
Small Cap Value Fund | | | 34,776,012 | | | | 2,009,237 | | | | (6,249,690 | ) | | | (4,240,453 | ) |
The difference between book basis and tax basis unrealized appreciation/depreciation is attributable primarily to the tax deferral of losses on wash sales, Passive Foreign Investment Companies (PFICs) mark to market adjustment, and cumulative partnership basis adjustment.
The tax character of distributions during the year ended September 30, 2022 were as follows:
| | | | | | | | | | | | | | | | |
| | | Distributions Paid From | |
| | | Ordinary
Income | | | Net Long Term
Capital Gains | | | Total Taxable
Distributions | | | Total
Distributions
Paid | |
SMID Cap Growth Fund | | $ | — | | | $ | 20,243,276 | | | $ | 20,243,276 | | | $ | 20,243,276 | |
Enterprise Fund | | | 944,170 | | | | 7,580,804 | | | | 8,524,974 | | | | 8,524,974 | |
Small Cap Core Fund | | | 5,104,506 | | | | 17,729,780 | | | | 22,834,286 | | | | 22,834,286 | |
Microcap Value Fund | | | 1,130,992 | | | | 7,273,424 | | | | 8,404,416 | | | | 8,404,416 | |
Small Cap Value Fund | | | 823,356 | | | | — | | | | 823,356 | | | | 823,356 | |
The tax basis of components of accumulated earnings/(losses) and tax character of distributions are determined at fiscal year end, and will be included in the Annual Report dated September 30, 2023.
During the year ended September 30, 2022, the Small Cap Value Fund utilized $11,553,372 of capital loss carryforwards. As of September 30, 2022, the Funds did not have any capital loss carryforward for federal income tax purposes.
Under current tax law, Post-October Capital Losses and Late-Year Ordinary Losses may be deferred and treated as occurring on the first business day of the following fiscal year for tax purposes. The SMID Cap Growth Fund and the Enterprise Fund had deferred qualified late-year ordinary losses of $220,053 and $154,762 respectively which will be treated as arising on the first business day of the fiscal year ending September 30, 2023.
8. Market Timing:
The Trust strongly discourages attempts at market timing by Fund shareholders. Prior to June 11, 2021, each Fund charged a redemption fee of 2% of the value of the shares redeemed or exchanged within 30 days of purchase. In addition, the Trust may limit the number of exchanges that may be made between Funds to five (5) per calendar year. When assessed, the redemption fee was deducted from the redemption proceeds and retained by the Fund, not by the Advisor. This redemption fee was not charged in cases where, for example, the redemption resulted from an automatic reinvestment or asset re-allocation not specifically directed by the shareholder. The Trust also reserves the right to reject any Fund purchase order made by persons deemed to be market timers. The Funds’ prospectus contains a full description of the Trust’s policies on market timing and/or excessive trading. The redemption fee is recorded as a credit to capital and is included in the capital transactions on the Statements of Changes in Net Assets.
70
|
NOTES TO FINANCIAL STATEMENTS |
9. Soft Dollars:
Soft dollar arrangements and commission sharing arrangements (CSAs) are arrangements under which RBC GAM-US directs client brokerage transactions to a broker-dealer and obtains other products and services, such as research, in addition to trade execution. Federal securities laws permit a fund advisor to incur commission charges on behalf of a fund that are higher than another broker-dealer would have charged if the advisor believes the charges are reasonable in relation to the brokerage and research services received. RBC GAM-US has a fiduciary duty to the shareholders of the Funds to seek the best execution for all of the Funds’ securities transactions. Fund Management believes that using soft dollars to purchase brokerage and research services may, in certain cases, be in a Fund’s best interest. During the period ended March 31, 2023, the Funds used soft dollar and commission sharing arrangements. Fund Management continues to closely monitor its current use of soft dollars, in addition to regulatory developments in this area for any possible impact on Fund policies.
10. Line of Credit
The Funds are participants in an uncommitted, secured $500,000,000 line of credit with U.S. Bank, N.A. (the “Bank”), the Funds’ custodian, to be used to fund shareholder redemption requests and for other short-term temporary or emergency general business purposes. The line of credit has a scheduled termination date of July 29, 2023. Interest is charged on borrowings under this line of credit at the Bank’s prime lending rate per annum. Since each Fund participates in this line of credit, there is no assurance that an individual fund will have access to all or any part of the $500,000,000 at any particular time. There were no loans outstanding pursuant to this line of credit at March 31, 2023. There were no borrowings made by the Funds under the line of credit during the six months ended March 31, 2023.
11. Significant Risks
Shareholder concentration risk:
As of March 31, 2023, the Funds had broker-dealer omnibus accounts which each owned more than 10% of a Fund’s outstanding shares as shown below:
| | | | | | | | |
| | | # of Omnibus Accounts | | | % of Fund | |
SMID Cap Growth Fund | | | 1 | | | | 71.5% | |
Small Cap Core Fund | | | 2 | | | | 22.7% | |
Microcap Value Fund | | | 1 | | | | 19.7% | |
Small Cap Value Fund | | | 1 | | | | 21.0% | |
In addition, one unaffiliated shareholder owned 17.0% of Small Cap Core Fund as of March 31, 2023. Significant transactions by these shareholders may impact the Funds’ performance.
Market risk
One or more markets in which a Fund invests may go down in value, sometimes sharply and unpredictably, and the value of a Fund’s portfolio securities may fall or fail to rise. Market risk may affect a single issuer, sector of the economy, industry or the market as a whole. In addition, global economies and financial markets are becoming increasingly interconnected, and political, economic and other conditions and events (including, but not limited to, natural disasters, pandemics, epidemics, and social unrest) in one country, region, or financial market may adversely impact issuers in a different country, region or financial market. Furthermore, the occurrence of, among other events, natural or man-made disasters, severe weather or geological events, fires, floods, earthquakes, outbreaks of disease (such as COVID-19, avian influenza or H1N1/09), epidemics, pandemics, malicious acts, cyber-attacks, terrorist acts or the occurrence of climate change, may also adversely impact the performance of a Fund. Such events could adversely impact issuers, markets and economies over the short- and long-term, including in ways that cannot necessarily be foreseen. A Fund could be
71
|
NOTES TO FINANCIAL STATEMENTS |
negatively impacted if the value of a portfolio holding were harmed by such political or economic conditions or events. Moreover, such negative political and economic conditions and events could disrupt the processes necessary for a Fund’s operations.
Industry and sector focus risk
At times the Funds may increase the relative emphasis of its investments in a particular industry or sector. The prices of securities of issuers in a particular industry or sector may be more susceptible to fluctuations due to changes in economic or business conditions, government regulations, availability of basic resources or supplies, or other events affect that industry or sector more than securities of issuers in other industries and sectors. To the extent that the Fund increases the relative emphasis of its investments in a particular industry or sector, its shares’ values may fluctuate in response to events affecting that industry or sector.
12. Subsequent Events:
Fund Management has evaluated the impact of all subsequent events on the Funds and has determined that there were no subsequent events requiring recognition or disclosure in the financial statements.
72
|
SHARE CLASS INFORMATION (UNAUDITED) |
The RBC Equity Funds offer three share classes. These three share classes are the A, R6 and I classes.
Class A
Class A shares are offered by all Funds and are available for purchase primarily through investment advisors, broker-dealers, banks and other financial services intermediaries. Class A shares of the Funds are currently subject to a maximum up-front sales charge of 5.75% and a 1.00% CDSC for redemption within 12 months of a $1 million or greater purchase. Class A shares currently include a 0.25% (25 bps) annual 12b-1 service and distribution fee.
Class I
Class I shares are available in all Funds. This share class is intended for investors meeting certain minimum investment thresholds. This share class does not have an up-front sales charge (load) or a 12b-1 service and distribution fee.
Class R6
Class R6 shares are available in SMID Cap Growth Fund, Small Cap Core Fund and Small Cap Value Fund. This share class is intended for investors meeting certain minimum investment thresholds. This share class does not have an up-front sales charge (load) or a 12b-1 service and distribution fee.
73
|
SUPPLEMENTAL INFORMATION (UNAUDITED) |
Shareholder Expense Examples
As a shareholder of the RBC Funds, you incur two types of costs: (1) transaction costs and (2) ongoing costs, including management fees; and other Fund expenses. This example is intended to help you understand your ongoing costs (in dollars) of investing in the RBC Funds and to compare these costs with the ongoing costs of investing in other mutual funds.
The example is based on an investment of $1,000 invested at the beginning of the period and held for the entire period from October 1, 2022 through March 31, 2023.
Actual Expenses
The table below provides information about actual account values and actual expenses. You may use the information below, together with the amount you invested, to estimate the expenses that you paid over the period. Simply divide your account value by $1,000 (for example, an $8,600 account value divided by $1,000 = 8.6), then multiply the result by the number in the table under the heading entitled “Expenses Paid During Period” to estimate the expenses you paid on your account during this period.
| | | | | | | | | | | | | | | | | | |
| | | | | | Beginning
Account Value
10/1/22 | | | Ending
Account Value
3/31/23 | | | Expenses Paid
During Period*
10/1/22–3/31/23 | | | Annualized Expense Ratio During Period 10/1/22–3/31/23 |
SMID Cap Growth Fund | | | | | | | | | | | | | | | | | | |
| | | Class A | | | | $1,000.00 | | | | $1,153.49 | | | | $5.74 | | | 1.07% |
| | | Class I | | | | 1,000.00 | | | | 1,155.06 | | | | 4.41 | | | 0.82% |
| | | Class R6 | | | | 1,000.00 | | | | 1,155.09 | | | | 4.14 | | | 0.77% |
Enterprise Fund | | | | | | | | | | | | | | | | | | |
| | | Class A | | | | 1,000.00 | | | | 1,102.27 | | | | 6.97 | | | 1.33% |
| | | Class I | | | | 1,000.00 | | | | 1,103.54 | | | | 5.66 | | | 1.08% |
Small Cap Core Fund | | | | | | | | | | | | | | | | | | |
| | | Class A | | | | 1,000.00 | | | | 1,156.51 | | | | 6.18 | | | 1.15% |
| | | Class I | | | | 1,000.00 | | | | 1,158.50 | | | | 4.84 | | | 0.90% |
| | | Class R6 | | | | 1,000.00 | | | | 1,158.46 | | | | 4.68 | | | 0.87% |
Microcap Value Fund | | | | | | | | | | | | | | | | | | |
| | | Class A | | | | 1,000.00 | | | | 1,101.15 | | | | 6.91 | | | 1.32% |
| | | Class I | | | | 1,000.00 | | | | 1,102.51 | | | | 5.61 | | | 1.07% |
Small Cap Value Fund | | | | | | | | | | | | | | | | | | |
| | | Class A | | | | 1,000.00 | | | | 1,090.65 | | | | 5.73 | | | 1.10% |
| | | Class I | | | | 1,000.00 | | | | 1,086.52 | | | | 4.42 | | | 0.85% |
| | | Class R6 | | | | 1,000.00 | | | | 1,091.80 | | | | 4.17 | | | 0.80% |
* Expenses are equal to the average account value times the Fund’s annualized expense ratio multiplied by 182/365 (to reflect one half year period).
74
|
SUPPLEMENTAL INFORMATION (UNAUDITED) |
Hypothetical Example for Comparison Purposes
The table below provides information about hypothetical account values and hypothetical expenses based on each RBC Funds’ actual expense ratio and an assumed rate of return of 5% per year before expenses, which is not the Fund’s actual return. The hypothetical account values and expenses may not be used to estimate the actual ending account balance or expenses you paid for the period. You may use this information to compare this 5% hypothetical example with the 5% hypothetical examples that appear in the shareholder reports of other funds.
Please note that the expenses shown in the table are meant to highlight your ongoing costs only and do not reflect any transactional costs, such as sales charges (loads), redemption fees, or exchange fees. Therefore, the table is useful in comparing ongoing costs only, and will not help you determine the relative total costs of owning different funds. In addition, if these transactional costs were included, your costs would have been higher.
| | | | | | | | | | | | | | | | |
| | | | | Beginning
Account Value
10/1/22 | | | Ending
Account Value
3/31/23 | | | Expenses Paid
During Period*
10/1/22-3/31/23 | | | Annualized
Expense Ratio During Period 10/1/22-3/31/23 |
SMID Cap Growth Fund | | | | | | | | | | | | | | | | |
| | Class A | | | $1,000.00 | | | | $1,019.81 | | | | $5.39 | | | 1.07% |
| | Class I | | | 1,000.00 | | | | 1,021.07 | | | | 4.13 | | | 0.82% |
| | Class R6 | | | 1,000.00 | | | | 1,021.32 | | | | 3.88 | | | 0.77% |
Enterprise Fund | | | | | | | | | | | | | | | | |
| | Class A | | | 1,000.00 | | | | 1,018.50 | | | | 6.69 | | | 1.33% |
| | Class I | | | 1,000.00 | | | | 1,019.76 | | | | 5.44 | | | 1.08% |
Small Cap Core Fund | | | | | | | | | | | | | | | | |
| | Class A | | | 1,000.00 | | | | 1,019.41 | | | | 5.79 | | | 1.15% |
| | Class I | | | 1,000.00 | | | | 1,020.67 | | | | 4.53 | | | 0.90% |
| | Class R6 | | | 1,000.00 | | | | 1,020.82 | | | | 4.38 | | | 0.87% |
Microcap Value Fund | | | | | | | | | | | | | | | | |
| | Class A | | | 1,000.00 | | | | 1,018.55 | | | | 6.64 | | | 1.32% |
| | Class I | | | 1,000.00 | | | | 1,019.81 | | | | 5.39 | | | 1.07% |
Small Cap Value Fund | | | | | | | | | | | | | | | | |
| | Class A | | | 1,000.00 | | | | 1,019.66 | | | | 5.54 | | | 1.10% |
| | Class I | | | 1,000.00 | | | | 1,020.92 | | | | 4.28 | | | 0.85% |
| | Class R6 | | | 1,000.00 | | | | 1,021.17 | | | | 4.03 | | | 0.80% |
* Expenses are equal to the average account value times the Fund’s annualized expense ratio multiplied by 182/365 (to reflect one half year period).
75
|
STATEMENT REGARDING LIQUIDITY RISK MANAGEMENT PROGRAM |
Statement Regarding Liquidity Risk Management Program
This section discusses the operation and effectiveness of the Liquidity Risk Management Program for the RBC Funds established in accordance with Rule 22e-4 under the Investment Company Act of 1940 (the “Liquidity Rule”). RBC Global Asset Management (U.S.) Inc. (“RBC GAM”), the investment adviser to each Fund, serves as the Program Administrator and administers day-to-day implementation of the Program through a working group known as the Liquidity Risk Committee.
RBC GAM, as Program Administrator, provided the Board with a report addressing the operation of the Program during the year ending December 31, 2022 and assessing its adequacy and effectiveness of implementation, including, if applicable, the operation of any Fund’s highly liquid investments minimum and any material changes to the Program.
I. Key Conclusions of the Report
During the review period, the Program was implemented and operated effectively to achieve the goal of assessing and managing each Fund’s liquidity risk. Each Fund was able to meet requests for redemption without significant dilution of remaining investors’ interests in the Fund, and no Fund was required to set a highly liquid investments minimum. There were no material changes to the Program implemented during the review period.
II. Summary of the Review
A. Liquidity Risk Assessment and Review
Throughout the review period, the Program Administrator, in consultation with investment personnel, monitored the Funds’ portfolio liquidity and liquidity risk on an ongoing basis, as described in the Program, monthly in connection with recording the liquidity classification for each portfolio investment for reporting on Form N-PORT, and provided quarterly reports to the Board throughout the review period.
The Program Administrator also conducted an annual review assessing each Fund’s liquidity risk, in accordance with the requirements of the Program and the Liquidity Rule, taking into account the following factors, as applicable:
a. Each Fund’s investment strategy and liquidity of portfolio investments during both normal and reasonably foreseeable stressed conditions, including: (i) whether the Fund’s investment strategy is appropriate for an open-end fund; (ii) the extent to which the Fund’s strategy involves a relatively concentrated portfolio or large positions in particular issuers; (iii) the Fund’s use of borrowings for investment purposes; and (iv) the Fund’s use of derivatives (including for hedging purposes);
b. Short-term and long-term cash flow projections during both normal and reasonably foreseeable stressed conditions; and
c. Holdings of cash and cash equivalents, as well as borrowing arrangements and other funding sources.
Investment Strategy and Portfolio Liquidity. The Program Administrator considered the factors identified above, among others, during both normal and reasonably foreseeable stressed conditions as provided in the Program. Pursuant to the review, the Program Administrator determined that each Fund’s investment strategy and use of derivatives are appropriate for an open-end fund.
Cash Flow. The Funds’ cash flows did not have a material effect on the ability to meet redemptions during the review period.
Holdings of Cash and Borrowing Arrangements. As described in the Report, the Program Administrator determined that the Funds’ holdings of cash and borrowing arrangements were adequate for meeting the Funds’ expected cash flow needs to meet redemptions during the review period.
Cash Flow. The Funds’ cash flows did not have a material effect on the ability to meet redemptions during the Review Period.
76
|
STATEMENT REGARDING LIQUIDITY RISK MANAGEMENT PROGRAM |
Holdings of Cash and Borrowing Arrangements. As described in the Report, the Program Administrator determined that the Funds’ holdings of cash and borrowing arrangements were adequate for meeting the Funds’ expected cash flow needs to meet redemptions during the Review Period.
In light of the assessment and review as discussed above, the Program Administrator did not recommend any material changes in the management of the Funds’ liquidity risks, including with respect to any of the above factors.
B. Review of Initial Liquidity Risk
During the review period, four new RBC Funds were launched. The Program Administrator conducted initial liquidity risk reviews for each of these Funds and concluded that there were no significant liquidity risk concerns.
C. Portfolio Holdings Classifications
During the review period, each Fund’s portfolio holdings (including derivative investments) were classified monthly as Highly Liquid Investments, Moderately Liquid Investments, Less Liquid Investments and Illiquid Investments pursuant to the Program, as required by the Liquidity Rule.
During the review period, the Funds also classified portfolio investments (including, as applicable, derivatives transactions) according to asset class when appropriate, as described in the Program. In addition, pursuant to the Program, each Fund must separately classify and review any investment within an asset class if any market, trading, or investment-specific considerations are reasonably expected to significantly affect the liquidity of the investment as compared the Fund’s other portfolio holdings within that asset class. During the review period, there were no circumstances in which a Fund was required to separately classify any investment within an asset class.
Market Depth—Reasonably Anticipated Trading Size (“RATS”). In classifying and reviewing its portfolio investments or asset classes (as applicable), each Fund must determine whether trading varying portions of a position in a particular portfolio investment or asset class, in sizes that the Fund would reasonably anticipate trading, is reasonably expected to significantly affect its liquidity. Each Fund must take this determination into account when classifying the liquidity of that investment or asset class. There were no material changes to the RATS assumptions for the Funds during the review period.
Classification Review. As required by the Liquidity Rule, the Program Administrator reviewed the Funds’ liquidity classifications on a monthly basis as described in the Program. The Committee met monthly to review its portfolio investments’ classifications in connection with recording the liquidity classification for each portfolio investment for reporting on Form N-PORT. The Program Administrator oversaw the Funds’ process for classifying portfolio holdings under the Liquidity Rule and reviewed the classifications, as described in the Program. This review included a review of the methodology and data inputs used. Due to the Russian-Ukrainian conflict, there were widespread sanctions against Russian-affiliated assets resulting in affected Russian holdings being classified as illiquid. During the review period, the Program Administrator determined that there were no material operational issues with the process for classifying portfolio holdings.
D. Highly Liquid Investments Minimum
The Program Administrator reviewed the process and standards for determining that each Fund primarily holds investments that are highly liquid. There were no changes recommended in the Report with respect to the status of any Fund as a Primarily Highly Liquid Fund (“PHLF”) and, with one exception, each Fund qualified as a PHLF on an ongoing basis during the review period as described in the Report. The newly launched RBC International Small Cap Equity Fund did not initially qualify as a PHLF, however, it was expected to meet the relevant threshold as soon as its access to all the relevant trading markets had been completed. Accordingly, a highly liquid investments minimum was not required for any Fund during the review period pursuant to the relevant provisions of the Program.
77
|
STATEMENT REGARDING LIQUIDITY RISK MANAGEMENT PROGRAM |
E. Compliance with the 15% Limitation on Illiquid Investments
Pursuant to the Liquidity Rule, no Fund may acquire any illiquid investment if, after the acquisition, the Fund would have invested more than 15% of its assets in illiquid investments that are assets (the “15% Limit”). The Program Administrator monitored compliance with the 15% Limit as described in the Program. At no time during the review period did any Fund breach the 15% limit.
F. Redemptions in Kind
There were no planned redemptions in-kind effected during the review period.
G. SEC Reporting
The Funds met their monthly Form N-PORT filing requirements during the period. No reports on Form N-LIQUID were required to be filed during the period and none were filed.
78
This Page Intentionally Left Blank
79
This Page Intentionally Left Blank
80
This Page Intentionally Left Blank
81
This Page Intentionally Left Blank
82
This Page Intentionally Left Blank
83
This Page Intentionally Left Blank
84
This Page Intentionally Left Blank
85
RBC Funds
P.O. Box 701
Milwaukee, WI 53201-0701
800-422-2766
www.rbcgam.com
Performance data represents past performance and does not guarantee future results. The principal value of an investment and investment return will fluctuate so that an investor’s shares, when redeemed, may be worth more or less than their original cost.
This report and the financial statements contained herein are provided for the information of RBC Funds shareholders. This report is not authorized for distribution to prospective investors unless preceded or accompanied by a current prospectus, which contains information concerning investment objectives, risks, charges and expenses of the funds. Please read the prospectus carefully before investing.
This report and the financial statements contained herein are not intended to be a forecast of future events, a guarantee of future results, or investment advice. There is no assurance that certain securities will remain in or out of each fund’s portfolio. The views expressed in this report reflect those of the portfolio managers through the period ended March 31, 2023.
NOT FDIC INSURED • NO BANK GUARANTEE • MAY LOSE VALUE
RBC Global Asset Management (U.S.) Inc. serves as investment advisor for the RBC Funds.
RBC Funds are distributed by Quasar Distributors LLC.
The RBC Funds are pleased to offer shareholder reports printed entirely on Forest Stewardship Council® certified paper. FSC® certification ensures that the paper used in this report contains fiber from well-managed and responsibly harvested forests that meet strict environmental and socioeconomic standards.
RBCF-EQ SAR 03-23

Semi-Annual Report For the six months ended March 31, 2023 U.S. Government Money Market Fund
| | | | | | | | | | |
| | | | | | | | |
| | | | | | | | RBC Funds | | |
| | | | | | | | |
About your Semi Annual��Report | | | | | | | | This semi-annual report (Unaudited) includes detailed information about your Fund including financial statements, performance, and a complete list of its holdings. |
| | | | |
| | | | | | | | We hope the financial information presented will help you evaluate your investment in the RBC Funds. We also encourage you to read your Fund’s prospectus for further detail as to your Fund’s investment policies and risk profile. RBC Funds prospectuses and performance information subsequent to the date of this report are available on our website at www.rbcgam.com. |
| | | | | | | | A description of the policies and procedures that your Fund uses to determine how to vote proxies relating to portfolio securities is available (i) without charge, upon request, by calling 1-800-422-2766; (ii) on the Fund’s website at www.rbcgam.com; and (iii) on the Securities and Exchange Commission’s (the “Commission”) website at http://www.sec.gov. |
| | | | | | | | Each year the Trust files its proxy voting record for the twelve-month period ended June 30 with the SEC on Form N-PX no later than August 31. The records can be obtained on the SEC’s website at www.sec.gov and without charge by calling the Funds at 1-800-422-2766. |
| | | | | | | | A schedule of theFund’s portfolio holdings is filed with the Commission for the first and third quarters of each fiscal year on Form N-PORT. This information is available on the Commission’s website at http://www.sec.gov and on the Funds’ website at www.dfinview.com/usrbcgam. |
| | | | | |
| Table of | | | | | | | | Money Market Portfolio Managers | | 1 |
| Contents | | | | | | | | Performance Summary | | 2 |
| | | | | | | | Schedules of Portfolio Investments | | 4 |
| | | | | | | | Financial Statements | | |
| | | | | | | | - Statement of Assets and Liabilities | | 13 |
| | | | | | | | - Statement of Operations | | 15 |
| | | | | | | | - Statements of Changes in Net Assets | | 16 |
| | | | | | | | Financial Highlights | | 17 |
| | | | | | | | Notes to Financial Statements | | 20 |
| | | | | | | | Supplemental Information | | 28 |
| | | | | | | | | | |
| | | | | | | | | | |
| | | | | | | | | | |
| | | | | | | | | | |
| | | | | | | | | | |
| | | | | | | | | | |
| | | | | | | | | | |
| | | | | | | | | | |
| | | | | | | | | | |
| | | | | | | | | | |
| | | | | | | | | | |
| | | | | | | | | | |
| | | | | | | | | | |
| | | | | | | | | | |
| | | | | | | | | | |
| | | | | | | | | | |
| | | | | | | | | | |
| | | | | | | | | | |
| | | | | | | | | | |
| | | | | | | | | | |
| | | | | | | | | | |
| | | | | | | | | | |
| | | | | | | | | | |
| | | | | | | | | | |
| | | | | | | | | | |
| | | | | | | | | | |
| | | | | | | | | | |
| | | | | | | | | | |
| | | | | | | | | | |
| | | | | | | | | | |
| | | | | | |
MONEY MARKET PORTFOLIO MANAGERS | | | | | | |
RBC Global Asset Management (U.S.) Inc. (“RBC GAM-US”), serves as the investment advisor to the Fund. RBC GAM-US employs a team approach to the management of the U.S. Government Money Market Fund, with no individual team member being solely responsible for the investment decisions. The Fund’s management team has access to RBC GAM-US’s investment research and other money management resources. | | | | | | |
| | | |
Brandon T. Swensen, CFA Senior Portfolio Manager Brandon is a senior portfolio manager within the RBC GAM-US fixed income team. In addition to co-leading the fixed income group based in Minneapolis, he is a portfolio manager for several cash management and core solutions. Brandon joined the RBC GAM-US Mortgage and Government team in 2000, having earlier held positions as a research analyst covering asset-backed securities and credit, and as a financial analyst. Brandon began his career in the investment industry in 1998. He earned a BS in finance from St. Cloud State University and an MBA in finance from the University of St. Thomas. He is a CFA charterholder and member of the CFA Society of Minnesota. | | | | | | 
Brandon T. Swensen, CFA |
| | | |
Brian Svendahl, CFA Senior Portfolio Manager Brian is a senior portfolio manager within the RBC GAM-US fixed income team. He has been the lead portfolio manager for RBC GAM-US’s impact investing strategies since 2006 along with many government and mortgage strategies. Brian joined RBC GAM-US in 2005 and has co-led the Minneapolis-based fixed income group since 2012. He had previously held several risk management, research, and trading positions with a large American multinational financial services company and first started in the investment industry in 1992. Brian earned a BS in economics from the University of Minnesota and a BBA in finance and MBA from the University of Minnesota Carlson School of Management. Brian is a CFA charterholder. | | | | | | 
Brian Svendahl, CFA |
| | | |
| | | | | | | |
| | | |
| | | | | | | |
| | | | | | | | | | | | | | | | | | | | |
| | | | | | | | | PERFORMANCE SUMMARY (UNAUDITED) | |
| | | | | | | | | | |
| | | | | | | | | | |
| | | | |
Investment Objective | | | | | | | | The Fund is a money market fund that seeks to achieve as high a level of current income obtainable from investments in short-term securities as is consistent with prudent investment management, the preservation of capital and the maintenance of liquidity. | |
| | | | | | |
| | | | | | | | | | | | | | SEC 7-Day Annualized Yield | |
| | | | | | | | | | | Total Return
for the
Six Months Ended March 31, 2023 (Unaudited) | | | March 31,
2023
(Unaudited) | | | September 30,
2022 | |
| | | | | | | | RBC Institutional Class 1 | | | 1.93% | | | | 4.75% | | | | 2.55% | |
| | | | | | | | RBC Institutional Class 2 | | | 1.86% | | | | 4.60% | | | | 2.40% | |
| | | | | | | | RBC Investor Class | | | 1.49% | | | | 3.87% | | | | 1.67% | |
| | | | | | | |
| | | | | | | | | | | | | | | | | | | | |
| | | | |
| | | | | | | | Performance data quoted represents past performance. Past performance is no guarantee of future results. Investment return and principal value of an investment will fluctuate so that an investor’s shares, when redeemed, may be worth more or less than their original cost. Current performance may be lower or higher than performance quoted. Performance shown reflects contractual fee waivers, without such fee waivers total returns would be reduced. For performance data current to most recent month-end go to www.rbcgam.us. You could lose money by investing in the Fund. Although the Fund seeks to preserve the value of your investment at $1.00 per share, it cannot guarantee it will do so. An investment in the Fund is not insured or guaranteed by the Federal Deposit Insurance Corporation or any other government agency. The Fund’s sponsor has no legal obligation to provide financial support to the Fund, and you should not expect that the sponsor will provide financial support to the Fund at any time. | |
| | | | | | | | | |
| | | | | | | | | |
| | | | | | | | | |
| | | | | | | | | |
| | | | | | | | | |
| | | | | | | | | |
| | | | | | | | | |
| | | | | | | | | |
| | | | | | | | | |
| | | | | | | | | |
| | | | | | | | | |
| | | | | | | | | |
| | | | | | | | | |
| | | | | | | | | |
| | | | | | | | | |
| | | | | | | | | |
| | | | | | | | | |
| | | | | | | | | |
| | | | | | | | | |
| | | | | | | | | |
| | | | | | | | | |
| | | | | | | | | | | | |
PERFORMANCE SUMMARY (UNAUDITED) | | | | | |
| | | | | | | | | | | |
| Money Market Maturity Schedule | | | | | | | | | Asset Allocation | |
| As a percentage of value of investments based on effective maturity as of March 31, 2023. | | | | | | |
| | | | |
| | | U.S. Government
Money Market Fund | | | | | | | | |
Less than 8 days | | | 95.8% | | | | | | | | | |
8 to 14 days | | | 0.4% | | | | | | | | | |
15 to 30 days | | | 0.2% | | | | | | | | | |
31 to 180 days | | | 3.3% | | | | | | | | | |
Over 180 days | | | 0.3% | | | | | | | | | |
| | | | | | | | | | | | |
| | | | | | | | | | | | |
| | | | | | | | | | | | |
| | | | | | | | | | | | |
| | | | | | | | | | | | |
| | | | | | | | | | | | |
| | | | | | | | | | | | |
| | | | | | | | | | | | |
| | | | | | | | | | | | |
| | | | | | | | | | | | |
| | | | | | | | | | | | |
| | | | | | | | | | | | |
| | | | | | | | | | | | |
| | | | | | | | | | | | |
| | | | | | | | | | | | |
| | | | | | | | | | | | |
| | | | | | | | | | | | |
| | | | | | | | | | | | |
| | | | | | | | | | | | |
| | | | | | | | | | | | |
| | | | | | | | | | | | |
| | | | | | | | | | | | |
| | | | | | | | | | | | |
| | | | | | | | | | | | |
| | | | | | | | | | | | |
| | | | | | | | | | | | |
| | | | | | | | | | | | |
| | | | | | | | | | | | |
| | | | | | | | | | | | |
| | | | | | | | | | | | |
| | | | | | | | | | | | |
| | | | | | | | | | | | |
| | | | | | | | | | | | |
| | | | | | | | | | | | |
| | | | | | | | | | | | |
| | | | | | | | | | | | |
|
SCHEDULE OF PORTFOLIO INVESTMENTS |
U.S. Government Money Market Fund
March 31, 2023 (Unaudited)
| | | | | | |
Principal
Amount | | | | Value | |
| |
| |
U.S. Government Agency Backed Mortgages — 17.64% | | | | |
Federal Farm Credit — 10.12% | | | | |
$ 25,000,000 | | (3 mo. U.S. Treasury Money Market Yield - 0.015%), 4.72%, 1/29/24(a) | | $ | 25,018,465 | |
100,000,000 | | (SOFR RATE + 0.018%), 4.84%, 7/13/23(a) | | | 100,000,000 | |
75,000,000 | | (SOFR RATE + 0.020%), 4.84%, 4/10/23(a) | | | 74,999,970 | |
60,000,000 | | (SOFR RATE + 0.023%), 4.84%, 9/15/23(a) | | | 60,000,000 | |
270,000,000 | | (SOFR RATE + 0.025%), 4.85%, 8/28/23(a) | | | 270,000,000 | |
141,000,000 | | (SOFR RATE + 0.025%), 4.85%, 9/8/23(a) | | | 140,997,803 | |
61,000,000 | | (SOFR RATE + 0.025%), 4.85%, 9/27/23(a) | | | 60,999,360 | |
90,000,000 | | (SOFR RATE + 0.025%), 4.85%, 8/4/23(a) | | | 90,000,000 | |
90,000,000 | | (SOFR RATE + 0.025%), 4.85%, 8/10/23(a) | | | 90,000,000 | |
99,000,000 | | (SOFR RATE + 0.025%), 4.85%, 10/27/23(a) | | | 99,000,000 | |
85,000,000 | | (SOFR RATE + 0.030%), 4.85%, 10/13/23(a) | | | 85,000,000 | |
87,000,000 | | (SOFR RATE + 0.030%), 4.85%, 10/20/23(a) | | | 87,000,000 | |
150,000,000 | | (SOFR RATE + 0.030%), 4.85%, 10/27/23(a) | | | 150,000,000 | |
100,000,000 | | (SOFR RATE + 0.040%), 4.86%, 11/2/23(a) | | | 100,000,000 | |
87,000,000 | | (SOFR RATE + 0.045%), 4.87%, 10/16/23(a) | | | 87,000,000 | |
64,000,000 | | (SOFR RATE + 0.055%), 4.88%, 1/10/24(a) | | | 64,000,000 | |
35,000,000 | | (SOFR RATE + 0.150%), 4.97%, 3/17/25(a) | | | 34,966,949 | |
11,000,000 | | (SOFR RATE + 0.150%), 4.97%, 1/3/25(a) | | | 11,000,000 | |
6,000,000 | | (SOFR RATE + 0.320%), 5.14%, 6/9/23(a) | | | 6,003,317 | |
| | | | |
| | | | | 1,635,985,864 | |
| | | | |
Federal Home Loan Banks — 7.48% | | | | |
150,000,000 | | 0.00%, 5/3/23(b),(c) | | | 149,403,125 | |
175,000,000 | | 0.00%, 6/7/23(b),(c) | | | 173,489,202 | |
10,000,000 | | 3.38%, 9/1/23 | | | 9,988,974 | |
10,000,000 | | 4.30%, 9/26/23 | | | 9,998,017 | |
70,000,000 | | 0.00%, 5/10/23(b),(c) | | | 69,652,436 | |
25,000,000 | | 5.30%, 3/6/24 | | | 25,000,000 | |
70,000,000 | | 0.00%, 4/12/23(b),(c) | | | 69,916,700 | |
45,000,000 | | 0.00%, 9/6/23(b),(c) | | | 44,026,950 | |
12,000,000 | | 0.00%, 3/1/24(b),(c) | | | 11,442,225 | |
40,000,000 | | (SOFR RATE + 0.035%), 4.86%, 5/19/23(a) | | | 40,000,000 | |
450,000,000 | | (SOFR RATE + 0.100%), 4.92%, 6/22/23(a) | | | 450,000,000 | |
160,000,000 | | (SOFR RATE + 0.120%), 4.94%, 9/6/23(a) | | | 160,000,000 | |
| | | | |
| | | | | 1,212,917,629 | |
| | | | |
U.S. International Development Finance Corp. — 0.04% | | | | |
1,673,077 | | (US Treasury Bill Yield 3-Month + 0.000%), 4.69%, 12/15/26(a) | | | 1,673,077 | |
|
SCHEDULE OF PORTFOLIO INVESTMENTS |
U.S. Government Money Market Fund (cont.)
March 31, 2023 (Unaudited)
| | | | | | |
Principal
Amount | | | | Value | |
| |
| | |
$ 1,052,632 | | Series 10, (US Treasury Bill Yield 3-Month + 0.000%), 5.10%, 8/15/25(a) | | $ | 1,052,632 | |
3,395,000 | | Series 5, (US Treasury Bill Yield 3-Month + 0.000%), 4.95%, 7/5/38(a) | | | 3,395,000 | |
| | | | | | |
| | | | | 6,120,709 | |
| | | | | | |
| |
Total U.S. Government Agency Backed Mortgages | | | 2,855,024,202 | |
| | | | | | |
(Cost $2,855,024,202) | | | | |
| |
U.S. Government Agency Obligations — 5.23% | | | | |
U.S. International Development Finance Corp. — 5.23% | | | | |
2,231,579 | | (US Treasury Bill Yield 3-Month + 0.000%), 4.69%, 3/15/24(a) | | | 2,231,579 | |
7,515,790 | | (US Treasury Bill Yield 3-Month + 0.000%), 4.69%, 9/15/25(a) | | | 7,515,790 | |
2,888,889 | | (US Treasury Bill Yield 3-Month + 0.000%), 4.69%, 5/15/26(a) | | | 2,888,889 | |
9,240,000 | | (US Treasury Bill Yield 3-Month + 0.000%), 4.69%, 9/15/26(a) | | | 9,240,000 | |
12,406,439 | | (US Treasury Bill Yield 3-Month + 0.000%), 4.69%, 6/20/27(a) | | | 12,406,439 | |
7,366,668 | | (US Treasury Bill Yield 3-Month + 0.000%), 4.69%, 6/20/27(a) | | | 7,366,668 | |
6,375,001 | | (US Treasury Bill Yield 3-Month + 0.000%), 4.69%, 6/20/27(a) | | | 6,375,001 | |
4,590,002 | | (US Treasury Bill Yield 3-Month + 0.000%), 4.69%, 6/20/27(a) | | | 4,590,002 | |
3,938,335 | | (US Treasury Bill Yield 3-Month + 0.000%), 4.69%, 6/20/27(a) | | | 3,938,335 | |
3,740,001 | | (US Treasury Bill Yield 3-Month + 0.000%), 4.69%, 6/20/27(a) | | | 3,740,001 | |
2,833,334 | | (US Treasury Bill Yield 3-Month + 0.000%), 4.69%, 6/20/27(a) | | | 2,833,334 | |
12,696,428 | | (US Treasury Bill Yield 3-Month + 0.000%), 4.69%, 9/20/27(a) | | | 12,696,428 | |
6,363,636 | | (US Treasury Bill Yield 3-Month + 0.000%), 4.69%, 6/15/28(a) | | | 6,363,636 | |
4,244,545 | | (US Treasury Bill Yield 3-Month + 0.000%), 4.69%, 6/15/28(a) | | | 4,244,545 | |
5,000,000 | | (US Treasury Bill Yield 3-Month + 0.000%), 4.69%, 8/15/29(a) | | | 5,000,000 | |
35,000,000 | | (US Treasury Bill Yield 3-Month + 0.000%), 4.69%, 3/15/30(a) | | | 35,000,000 | |
11,194,445 | | (US Treasury Bill Yield 3-Month + 0.000%), 4.69%, 10/15/30(a) | | | 11,194,445 | |
33,705,207 | | (US Treasury Bill Yield 3-Month + 0.000%), 4.69%, 9/20/32(a) | | | 33,705,207 | |
9,236,239 | | (US Treasury Bill Yield 3-Month + 0.000%), 4.69%, 6/15/34(a) | | | 9,236,239 | |
6,426,076 | | (US Treasury Bill Yield 3-Month + 0.000%), 4.69%, 6/15/34(a) | | | 6,426,076 | |
18,863,520 | | (US Treasury Bill Yield 3-Month + 0.000%), 4.69%, 4/20/35(a) | | | 18,863,520 | |
18,682,140 | | (US Treasury Bill Yield 3-Month + 0.000%), 4.69%, 4/20/35(a) | | | 18,682,140 | |
14,056,950 | | (US Treasury Bill Yield 3-Month + 0.000%), 4.69%, 4/20/35(a) | | | 14,056,950 | |
13,784,880 | | (US Treasury Bill Yield 3-Month + 0.000%), 4.69%, 4/20/35(a) | | | 13,784,880 | |
6,620,370 | | (US Treasury Bill Yield 3-Month + 0.000%), 4.69%, 4/20/35(a) | | | 6,620,370 | |
5,413,760 | | (US Treasury Bill Yield 3-Month + 0.000%), 4.69%, 3/30/37(a) | | | 5,413,760 | |
24,687,376 | | (US Treasury Bill Yield 3-Month + 0.000%), 4.69%, 7/7/40(a) | | | 24,687,376 | |
23,629,346 | | (US Treasury Bill Yield 3-Month + 0.000%), 4.69%, 7/7/40(a) | | | 23,629,346 | |
13,225,380 | | (US Treasury Bill Yield 3-Month + 0.000%), 4.69%, 7/7/40(a) | | | 13,225,380 | |
13,004,957 | | (US Treasury Bill Yield 3-Month + 0.000%), 4.69%, 7/7/40(a) | | | 13,004,957 | |
9,253,358 | | (US Treasury Bill Yield 3-Month + 0.000%), 4.69%, 7/7/40(a) | | | 9,253,357 | |
6,017,336 | | (US Treasury Bill Yield 3-Month + 0.000%), 4.69%, 7/7/40(a) | | | 6,017,336 | |
3,967,614 | | (US Treasury Bill Yield 3-Month + 0.000%), 4.69%, 7/7/40(a) | | | 3,967,614 | |
23,333,332 | | (US Treasury Bill Yield 3-Month + 0.000%), 4.90%, 1/20/27(a) | | | 23,333,332 | |
21,544,800 | | (US Treasury Bill Yield 3-Month + 0.000%), 4.90%, 1/20/35(a) | | | 21,544,800 | |
17,146,070 | | (US Treasury Bill Yield 3-Month + 0.000%), 4.90%, 1/20/35(a) | | | 17,146,070 | |
16,697,220 | | (US Treasury Bill Yield 3-Month + 0.000%), 4.90%, 1/20/35(a) | | | 16,697,220 | |
|
SCHEDULE OF PORTFOLIO INVESTMENTS |
U.S. Government Money Market Fund (cont.)
March 31, 2023 (Unaudited)
| | | | | | |
Principal
Amount | | | | Value | |
| |
$16,158,600 | | (US Treasury Bill Yield 3-Month + 0.000%), 4.90%, 1/20/35(a) | | $ | 16,158,600 | |
12,567,800 | | (US Treasury Bill Yield 3-Month + 0.000%), 4.90%, 1/20/35(a) | | | 12,567,780 | |
7,540,680 | | (US Treasury Bill Yield 3-Month + 0.000%), 4.90%, 1/20/35(a) | | | 7,540,680 | |
7,091,830 | | (US Treasury Bill Yield 3-Month + 0.000%), 4.90%, 1/20/35(a) | | | 7,091,830 | |
4,488,500 | | (US Treasury Bill Yield 3-Month + 0.000%), 4.90%, 1/20/35(a) | | | 4,488,500 | |
1,436,320 | | (US Treasury Bill Yield 3-Month + 0.000%), 4.90%, 1/20/35(a) | | | 1,436,320 | |
22,672,500 | | (US Treasury Bill Yield 3-Month + 0.000%), 4.90%, 4/20/35(a) | | | 22,672,500 | |
8,524,860 | | (US Treasury Bill Yield 3-Month + 0.000%), 4.90%, 4/20/35(a) | | | 8,524,860 | |
7,890,030 | | (US Treasury Bill Yield 3-Month + 0.000%), 4.90%, 4/20/35(a) | | | 7,890,030 | |
7,436,580 | | (US Treasury Bill Yield 3-Month + 0.000%), 4.90%, 4/20/35(a) | | | 7,436,580 | |
4,534,500 | | (US Treasury Bill Yield 3-Month + 0.000%), 4.90%, 4/20/35(a) | | | 4,534,500 | |
14,779,800 | | (US Treasury Bill Yield 3-Month + 0.000%), 4.90%, 11/20/37(a) | | | 14,779,800 | |
6,734,000 | | (US Treasury Bill Yield 3-Month + 0.000%), 4.95%, 5/15/30(a) | | | 6,734,000 | |
7,371,795 | | (US Treasury Bill Yield 3-Month + 0.000%), 4.95%, 10/15/32(a) | | | 7,371,795 | |
4,102,564 | | (US Treasury Bill Yield 3-Month + 0.000%), 4.95%, 11/15/33(a) | | | 4,102,564 | |
8,653,846 | | (US Treasury Bill Yield 3-Month + 0.000%), 4.95%, 6/15/34(a) | | | 8,653,846 | |
7,665,370 | | (US Treasury Bill Yield 3-Month + 0.000%), 4.95%, 7/5/38(a) | | | 7,665,370 | |
5,433,680 | | (US Treasury Bill Yield 3-Month + 0.000%), 4.95%, 7/5/38(a) | | | 5,433,680 | |
4,171,000 | | (US Treasury Bill Yield 3-Month + 0.000%), 4.95%, 7/5/38(a) | | | 4,171,000 | |
2,134,000 | | (US Treasury Bill Yield 3-Month + 0.000%), 4.95%, 7/5/38(a) | | | 2,134,000 | |
1,940,000 | | (US Treasury Bill Yield 3-Month + 0.000%), 4.95%, 7/5/38(a) | | | 1,940,000 | |
3,333,333 | | (US Treasury Bill Yield 3-Month + 0.000%), 5.05%, 3/20/24(a) | | | 3,333,333 | |
3,333,333 | | (US Treasury Bill Yield 3-Month + 0.000%), 5.05%, 3/20/24(a) | | | 3,333,333 | |
4,500,000 | | (US Treasury Bill Yield 3-Month + 0.000%), 5.05%, 6/15/25(a) | | | 4,500,000 | |
5,833,333 | | (US Treasury Bill Yield 3-Month + 0.000%), 5.05%, 9/15/26(a) | | | 5,833,333 | |
7,077,273 | | (US Treasury Bill Yield 3-Month + 0.000%), 5.05%, 9/30/27(a) | | | 7,077,273 | |
66,835,000 | | (US Treasury Bill Yield 3-Month + 0.000%), 5.05%, 2/15/28(a) | | | 66,835,000 | |
20,515,385 | | (US Treasury Bill Yield 3-Month + 0.000%), 5.05%, 6/20/28(a) | | | 20,515,385 | |
8,625,000 | | (US Treasury Bill Yield 3-Month + 0.000%), 5.05%, 11/15/28(a) | | | 8,625,000 | |
24,194,445 | | (US Treasury Bill Yield 3-Month + 0.070%), 5.05%, 8/15/29(a) | | | 24,194,445 | |
9,900,000 | | (US Treasury Bill Yield 3-Month + 0.000%), 5.05%, 8/15/29(a) | | | 9,900,000 | |
44,100,000 | | (US Treasury Bill Yield 3-Month + 0.000%), 5.05%, 3/15/30(a) | | | 44,100,000 | |
3,167,413 | | (US Treasury Bill Yield 3-Month + 0.000%), 5.05%, 12/15/33(a) | | | 3,167,413 | |
1,250,000 | | (US Treasury Bill Yield 3-Month + 0.000%), 5.10%, 5/15/24(a) | | | 1,250,000 | |
1,153,846 | | (US Treasury Bill Yield 3-Month + 0.000%), 5.10%, 5/15/24(a) | | | 1,153,846 | |
1,136,364 | | (US Treasury Bill Yield 3-Month + 0.000%), 5.10%, 5/15/24(a) | | | 1,136,364 | |
1,041,667 | | (US Treasury Bill Yield 3-Month + 0.000%), 5.10%, 5/15/24(a) | | | 1,041,667 | |
5,238,095 | | (US Treasury Bill Yield 3-Month + 0.000%), 5.10%, 8/15/25(a) | | | 5,238,095 | |
5,000,001 | | (US Treasury Bill Yield 3-Month + 0.000%), 5.10%, 8/15/25(a) | | | 5,000,001 | |
4,782,609 | | (US Treasury Bill Yield 3-Month + 0.000%), 5.10%, 8/15/25(a) | | | 4,782,609 | |
4,166,666 | | (US Treasury Bill Yield 3-Month + 0.000%), 5.10%, 8/15/25(a) | | | 4,166,666 | |
3,763,158 | | (US Treasury Bill Yield 3-Month + 0.000%), 5.10%, 5/15/26(a) | | | 3,763,158 | |
|
SCHEDULE OF PORTFOLIO INVESTMENTS |
U.S. Government Money Market Fund (cont.)
March 31, 2023 (Unaudited)
| | | | | | |
Principal
Amount | | | | Value | |
| |
| | |
$ 1,430,000 | | (US Treasury Bill Yield 3-Month + 0.000%), 5.10%, 5/15/26(a) | | $ | 1,430,000 | |
16,430,188 | | (US Treasury Bill Yield 3-Month + 0.000%), 5.10%, 1/15/30(a) | | | 16,430,188 | |
| | | | | | |
| | | | | 847,056,366 | |
| | | | | | |
| |
Total U.S. Government Agency Obligations | | | 847,056,366 | |
| | | | | | |
(Cost $847,056,366) | | | | |
| |
U.S. Treasury Obligations — 1.76% | | | | |
U.S. Treasury Floating Rate Notes — 1.26% | | | | |
150,000,000 | | (3 mo. U.S. Treasury Money Market Yield - 0.075%), 4.66%, 4/30/24(a) | | | 149,946,089 | |
25,000,000 | | (3 mo. U.S. Treasury Money Market Yield + 0.037%), 4.77%, 7/31/24(a) | | | 25,008,887 | |
30,000,000 | | (3 mo. U.S. Treasury Money Market Yield + 0.140%), 4.87%, 10/31/24(a) | | | 29,957,955 | |
| | | | | | |
| | | | | 204,912,931 | |
| | | | | | |
| |
U.S. Treasury Notes — 0.50% | | | | |
40,000,000 | | 2.75%, 5/31/23 | | | 39,983,776 | |
40,000,000 | | 2.75%, 7/31/23 | | | 39,964,225 | |
| | | | | | |
| | | | | 79,948,001 | |
| | | | | | |
| |
Total U.S. Treasury Obligations | | | 284,860,932 | |
| | | | | | |
(Cost $284,860,932) | | | | |
| |
U.S. Government Agency Backed Corporate Bonds — 0.62% | | | | |
Government — 0.62% | | | | |
100,000,000 | | Federal Home Loan Banks, 4.90%, 6/2/23, (LOC: Citibank N.A.)(a) | | | 100,000,000 | |
| | | | | | |
| |
Total U.S. Government Agency Backed Corporate Bonds | | | 100,000,000 | |
| | | | | | |
(Cost $100,000,000) | | | | |
|
SCHEDULE OF PORTFOLIO INVESTMENTS |
U.S. Government Money Market Fund (cont.)
March 31, 2023 (Unaudited)
| | | | | | |
Principal
Amount | | | | Value | |
| |
| |
Variable Rate Demand Note — 0.26% | | | | |
Municipal Bonds — 0.26% | | | | |
New York — 0.06% | | | | |
$ 3,900,000 | | New York City Housing Development Corp. 90 West Street Revenue, Series B, 4.90%, 3/15/36, (Credit Support: Fannie Mae), Callable 3/31/23 @ 100(d) | | $ | 3,900,000 | |
95,000 | | New York State Dormitory Authority Royal Revenue, Series A, 4.00%, 11/15/36, (Credit Support: Fannie Mae), Callable 4/15/23 @ 100(d) | | | 95,000 | |
6,500,000 | | New York State Housing Finance Agency 316 11th Avenue Housing Revenue, Series B, 4.90%, 5/15/41, (Credit Support: Fannie Mae), Callable 3/31/23 @ 100(d) | | | 6,500,000 | |
| | | | | | |
| | | | | 10,495,000 | |
| | | | | | |
| |
Washington — 0.12% | | | | |
4,600,000 | | Washington State Housing Finance Commission Fairwinds Redmon Revenue, 4.83%, 7/1/41, (Credit Support: Federal Home Loan Bank), Callable 3/31/23 @ 100(d) | | | 4,600,000 | |
3,145,000 | | Washington State Housing Finance Commission Fairwinds Project Revenue, Series B, 4.83%, 7/1/41, (Credit Support: Federal Home Loan Bank), Callable 3/31/23 @ 100(d) | | | 3,145,000 | |
3,425,000 | | Washington State Housing Finance Commission Lodge at Eagle Ridge Revenue, Series B, 4.83%, 8/1/41, (Credit Support: East West Bank), Callable 3/31/23 @ 100(d) | | | 3,425,000 | |
9,200,000 | | Washington State Housing Finance Commission Ballard Land Revenue, Series B, 4.83%, 12/15/41, (Credit Support: East West Bank), Callable 3/31/23 @ 100(d) | | | 9,200,000 | |
| | | | | | |
| | | | | 20,370,000 | |
| | | | | | |
| |
Wisconsin — 0.08% | | | | |
12,320,000 | | Public Finance Authority Brannan Park Project Revenue, 4.83%, 1/1/48, (Credit Support: East West Bank), Callable 3/31/23 @ 100(d) | | | 12,320,000 | |
| | | | | | |
| | |
| | | | | 43,185,000 | |
| | | | | | |
| |
Total Variable Rate Demand Note | | | 43,185,000 | |
| | | | | | |
(Cost $43,185,000) | | | | |
| |
Repurchase Agreements — 71.79% | | | | |
350,000,000 | | Citigroup Global Markets, Inc., dated 3/31/23; due 4/3/23 at 4.80% with maturity value of $350,140,000 (fully collateralized by Ginnie Mae and U.S. Treasury securities with maturity dates ranging from 5/15/24 to 1/20/47 at rates ranging from 0.25% to 5.75%, aggregate original par and fair value of $2,503,643,181 and $357,000,059, respectively) | | | 350,000,000 | |
|
SCHEDULE OF PORTFOLIO INVESTMENTS |
U.S. Government Money Market Fund (cont.)
March 31, 2023 (Unaudited)
| | | | | | |
Principal Amount | | | | Value | |
| |
| | |
| $ 250,000,000 | | Citigroup Global Markets, Inc., dated 3/31/23; due 4/3/23 at 4.80% with maturity value of $ 250,100,000.00 (fully collateralized by Federal Home Loan Bank , Federal Farm Credit Bank and U.S. Treasury securities with maturity dates ranging from 9/18/23 to 5/15/41 at rates ranging from 0.00% to 4.94%, aggregate original par and fair value of $302,301,380 and $255,000,042, respectively) | | $ | 250,000,000 | |
| 200,000,000 | | Citigroup Global Markets, Inc., dated 3/31/23; due 4/4/23 at 4.80% with maturity value of $200,186,667 (fully collateralized by Ginnie Mae and U.S. Treasury securities with maturity dates ranging from 10/31/24 to 12/20/43 at rates ranging from 2.00% to 6.50%, aggregate original par and fair value of $2,123,791,384 and $204,000,030, respectively) | | | 200,000,000 | |
| | | |
| | |
| | Total Value of Citigroup Global Markets, Inc., (collateral value of $ 816,000,131) | | | 800,000,000 | |
| | | |
| | |
| 50,000,000 | | Credit Agricole Corporate and Investment Bank, dated 3/31/23; due 4/3/23 at 4.72% with maturity value of $50,019,667 (fully collateralized by Fannie Mae security with a maturity date of 2/1/52 at a rate of 2.00%, aggregate original par and fair value of $65,382,686 and $51,000,000, respectively) | | | 50,000,000 | |
| 50,000,000 | | Credit Agricole Corporate and Investment Bank, dated 3/31/23; due 4/3/23 at 4.75% with maturity value of $50,019,792 (fully collateralized by Fannie Mae and U.S. Treasury securities with maturity dates ranging from 5/15/30 to 2/1/52 at rates ranging from 0.63% to 2.00%, aggregate original par and fair value of $63,842,408 and $51,000,012, respectively) | | | 50,000,000 | |
| | | |
| | |
| | Total Value of Credit Agricole Corporate and Investment Bank, (collateral value of $ 102,000,012) | | | 100,000,000 | |
| | | |
| | |
| 100,000,000 | | Deutsche Bank Securities, dated 3/31/23; due 4/3/23 at 4.82% with maturity value of $100,040,167 (fully collateralized by Fannie Mae security with maturity dates ranging from 7/1/52 to 2/1/53 at rates ranging from 4.00% to 5.50%, aggregate original par and fair value of $103,055,412 and $102,000,000, respectively) | | | 100,000,000 | |
| | | |
| | |
| | Total Value of Deutsche Bank Securities, (collateral value of $ 102,000,000) | | | 100,000,000 | |
| | | |
| | |
| 8,670,000,000 | | Federal Reserve, dated 3/31/23; due 4/3/23 at 4.80% with maturity value of $ 8,673,468,000 (fully collateralized by U.S. Treasury security with maturity dates ranging from 5/31/23 to 5/15/41 at rates ranging from 0.13% to 4.38%, aggregate original par and fair value of $9,104,005,800 and $8,673,468,031, respectively) | | | 8,670,000,000 | |
| | | |
| | |
| | Total Value of Federal Reserve, (collateral value of $ 8,673,468,031) | | | 8,670,000,000 | |
| | | |
|
SCHEDULE OF PORTFOLIO INVESTMENTS |
U.S. Government Money Market Fund (cont.)
March 31, 2023 (Unaudited)
| | | | | | |
Principal Amount | | | | Value | |
| |
$500,000,000 | | Fixed Income Clearing Corporation, dated 3/31/23; due 4/3/23 at 4.81% with maturity value of $ 100,040,083 (fully collateralized by U.S. Treasury securities with maturity dates ranging from 5/15/51 to 5/15/52 at rates ranging from 2.25% to 2.88%, aggregate original par and fair value of $642,942,400 and $510,000,074, respectively) | | $ | 500,000,000 | |
100,000,000 | | Fixed Income Clearing Corporation, dated 3/31/23; due 4/3/23 at 4.70% with maturity value of $100,039,167 (fully collateralized by U.S. Treasury security with a maturity date of 8/15/24 at a rate of 2.38%, aggregate original par and fair value of $104,582,300 and $102,000,031, respectively) | | | 100,000,000 | |
| | | |
| | Total Value of Fixed Income Clearing Corporation, (collateral value of $ 612,000,105) | | | 600,000,000 | |
| | | |
| | |
100,000,000 | | ING Financial Markets LLC, dated 3/31/23; due 4/3/23 at 4.81% with maturity value of $ 100,040,083 (fully collateralized by U.S. Treasury security with a maturity date of 8/15/25 at a rate of 3.13%, aggregate original par and fair value of $100,000,000 and $102,039,357, respectively) | | | 100,000,000 | |
| | | |
| | Total Value of ING Financial Markets LLC, (collateral value of $ 102,039,357) | | | 100,000,000 | |
| | | |
| | |
300,000,000 | | Merrill Lynch, Pierce, Fenner, Smith, dated 3/31/23; due 4/3/23 at 4.82% with maturity value of $300,120,500 (fully collateralized by U.S. Treasury securities with maturity dates ranging from 10/15/26 to 1/15/33 at rates ranging from 0.13% to 1.13%, aggregate original par and fair value of $272,175,500 and $306,000,069, respectively) | | | 300,000,000 | |
200,000,000 | | Merrill Lynch, Pierce, Fenner, Smith, dated 3/31/23; due 4/4/23 at 4.86% with maturity value of $200,189,000 (fully collateralized by U.S. Treasury security with maturity date of 11/30/27 at a rate of 3.88%, aggregate original par and fair value of $199,989,400 and $204,000,024, respectively) | | | 200,000,000 | |
100,000,000 | | Merrill Lynch, Pierce, Fenner, Smith, dated 3/31/23; due 4/3/23 at 4.80% with maturity value of $100,040,000 (fully collateralized by U.S. Treasury securities with maturity dates ranging from 11/15/28 to 8/31/29 at a rate of 3.13%, aggregate original par and fair value of $104,237,900 and $102,000,064, respectively) | | | 100,000,000 | |
| | | |
| | Total Value of Merrill Lynch, Pierce, Fenner, Smith, (collateral value of $ 612,000,157) | | | 600,000,000 | |
| | | |
|
SCHEDULE OF PORTFOLIO INVESTMENTS |
U.S. Government Money Market Fund (cont.)
March 31, 2023 (Unaudited)
| | | | | | |
Principal Amount | | | | Value | |
| |
$300,000,000 | | National Australia Bank, dated 3/31/23; due 4/3/23 at 4.80% with maturity value of $300,120,000 (fully collateralized by U.S. Treasury security with maturity date of 3/31/25 at a rate of 3.88%, aggregate original par and fair value of $300,000,000 and $306,209,581, respectively) | | $ | 300,000,000 | |
| | | |
| | Total Value of National Australia Bank, (collateral value of $ 306,209,581) | | | 300,000,000 | |
| | | |
| | |
200,000,000 | | TD Securities (USA), dated 3/31/23; due 4/4/23 at 4.81% with maturity value of $200,187,056 (fully collateralized by Freddie Mac securities with maturity dates ranging from 9/1/51 to 1/1/53 at rates ranging from 2.50% to 6.00%, aggregate original par and fair value of $226,502,197 and $204,000,000, respectively) | | | 200,000,000 | |
| | | |
| | Total Value of TD Securities (USA), (collateral value of $ 204,000,000) | | | 200,000,000 | |
| | | |
| | |
150,000,000 | | Wells Fargo Securities, dated 3/31/23; due 4/3/23 at 4.81% with maturity value of $150,060,125 (fully collateralized by Fannie Mae securities with maturity dates ranging from 5/1/37 to 10/1/42 at rates ranging from 3.50% to 5.50%, aggregate original par and fair value of $165,278,689 and $153,000,000, respectively) | | | 150,000,000 | |
| | | |
| | Total Value of Wells Fargo Securities, (collateral value of $ 153,000,000) | | | 150,000,000 | |
| | | |
| |
Total Repurchase Agreements | | | 11,620,000,000 | |
| | | | | | |
(Cost $11,620,000,000) | | | | |
| |
Total Investments | | $ | 15,750,126,500 | |
(Cost $15,750,126,500)(e) — 97.30% | | | | |
| |
Other assets in excess of liabilities — 2.70% | | | 436,679,133 | |
| | | | | | |
| |
NET ASSETS — 100.00% | | $ | 16,186,805,633 | |
| | | | | | |
|
| |
| (a) | Floating rate note. Rate shown is as of report date. |
| (b) | Represents effective yield to maturity on date of purchase. |
| (c) | Zero Coupon Bond. The rate represents the yield at time of purchase. |
| (d) | Variable or floating rate security, which interest rate adjusts periodically based on changes in current interest rates and prepayments on the underlying pool of assets. Rate shown is the rate in effect as of period end. |
| (e) | Tax cost of securities is equal to book cost of securities. |
|
SCHEDULE OF PORTFOLIO INVESTMENTS |
U.S. Government Money Market Fund (cont.)
March 31, 2023 (Unaudited)
Abbreviations used are defined below:
SOFR - Secured Overnight Financing Rate
See Notes to the Financial Statements.
Statement of Assets and Liabilities
March 31, 2023 (Unaudited)
| | | | | | |
| | | U.S. Government Money Market Fund | |
| | |
Assets: | | | | | | |
Investments, at value (cost $4,130,126,500) | | | | $ | 4,130,126,500 | |
Repurchase agreements, at value (cost $11,620,000,000) | | | | | 11,620,000,000 | |
Cash | | | | | 317,787,858 | |
Interest and dividend receivable | | | | | 26,707,448 | |
Receivable from advisor | | | | | 283,963 | |
Receivable for capital shares issued | | | | | 589,285,103 | |
Prepaid expenses and other assets | | | | | 601,651 | |
| | | | | | |
Total Assets | | | | | 16,684,792,523 | |
| | | | | | |
Liabilities: | | | | | | |
Professional fees payable | | | | | 4,148 | |
Distributions payable | | | | | 19,370,584 | |
Payable for capital shares redeemed | | | | | 461,692,903 | |
Payable for investments purchased | | | | | 13,659,849 | |
Accrued expenses and other payables: | | | | | | |
Investment advisory fees | | | | | 811,246 | |
Accounting fees | | | | | 142,242 | |
Trustees’ fees | | | | | 52,014 | |
Distribution fees | | | | | 1,747,395 | |
Custodian fees | | | | | 58,154 | |
Shareholder servicing fees | | | | | 402,218 | |
Transfer agent fees | | | | | 8,768 | |
Other | | | | | 37,369 | |
| | | | | | |
Total Liabilities | | | | | 497,986,890 | |
| | | | | | |
Net Assets | | | | $ | 16,186,805,633 | |
| | | | | | |
Net Assets Consists of: | | | | | | |
Capital | | | | $ | 16,186,357,995 | |
Accumulated earnings | | | | | 447,638 | |
| | | | | | |
Net Assets | | | | $ | 16,186,805,633 | |
| | | | | | |
Statement of Assets and Liabilities (cont.)
March 31, 2023 (Unaudited)
| | | | | | |
| | | U.S. Government Money Market Fund | |
| | |
Net Assets | | | | | | |
RBC Institutional Class 1 | | | | $ | 11,187,216,829 | |
RBC Institutional Class 2 | | | | | 3,386,475,534 | |
RBC Investor Class | | | | | 1,613,113,270 | |
| | | | | | |
Total | | | | $ | 16,186,805,633 | |
| | | | | | |
Shares Outstanding (Unlimited number of shares authorized, no par value): | | | | | | |
RBC Institutional Class 1 | | | | | 11,186,955,906 | |
RBC Institutional Class 2 | | | | | 3,386,298,435 | |
RBC Investor Class | | | | | 1,613,138,572 | |
| | | | | | |
Total | | | | | 16,186,392,913 | |
| | | | | | |
Net Asset Values and Redemption Prices Per Share: | | | | | | |
RBC Institutional Class 1 | | | | $ | 1.00 | |
| | | | | | |
| | |
RBC Institutional Class 2 | | | | $ | 1.00 | |
| | | | | | |
| | |
RBC Investor Class | | | | $ | 1.00 | |
| | | | | | |
See Notes to the Financial Statements.
Statement of Operations
For the Six Months Ended March 31, 2023 (Unaudited)
| | | | | | | | |
| | | U.S. Government
Money Market Fund | |
Investment Income: | | | | | | | | |
Interest income | | | | | | $ | 204,956,559 | |
| | | | | | | | |
| | |
Expenses: | | | | | | | | |
Investment advisory fees | | | | | | | 5,004,194 | |
Distribution fees–RBC Institutional Class 2 | | | | | | | 2,310,733 | |
Distribution fees–RBC Investor Class | | | | | | | 11,372,716 | |
Accounting fees | | | | | | | 311,550 | |
Audit fees | | | | | | | 20,703 | |
Custodian fees | | | | | | | 97,427 | |
Insurance fees | | | | | | | 23,867 | |
Legal fees | | | | | | | 195,122 | |
Registrations and filing fees | | | | | | | 49,245 | |
Shareholder reports | | | | | | | 284,576 | |
Transfer agent fees–RBC Institutional Class 1 | | | | | | | 13,405 | |
Transfer agent fees–RBC Institutional Class 2 | | | | | | | 3,407 | |
Transfer agent fees–RBC Investor Class | | | | | | | 2,918 | |
Trustees’ fees and expenses | | | | | | | 297,174 | |
Shareholder services administration fees–RBC Institutional Class 1 | | | | | | | 1,163,217 | |
Tax expense | | | | | | | 2,209 | |
Other fees | | | | | | | 237,998 | |
| | | | | | | | |
Total expenses before fee waiver/reimbursement | | | | | | | 21,390,461 | |
Expenses waived/reimbursed by: | | | | | | | | |
Distributor - Class Specific | | | | | | | (1,508,417 | ) |
Shareholder Services Administrator - RBC Institutional Class 1 | | | | | | | (1,163,217 | ) |
| | | | | | | | |
Net expenses | | | | | | | 18,718,827 | |
| | | | | | | | |
Net Investment Income | | | | | | | 186,237,732 | |
| | | | | | | | |
| | |
Realized/Unrealized Gains/(Losses): | | | | | | | | |
Net realized gains from investment transactions | | | | | | | 275,963 | |
| | | | | | | | |
Change in net assets resulting from operations | | | | | | $ | 186,513,695 | |
| | | | | | | | |
See Notes to the Financial Statements.
Statements of Changes in Net Assets
| | | | | | | | |
| | | U.S. Government
Money Market Fund | |
| | |
| | | For the
Six Months Ended
March 31, 2023
(Unaudited) | | | For the
Year Ended
September 30, 2022 | |
From Investment Activities | | | | | | | | |
Operations: | | | | | | | | |
Net investment income | | $ | 186,237,732 | | | $ | 48,994,711 | |
Net realized gains from investments | | | 275,963 | | | | 113,246 | |
| | | | | | | | |
Change in net assets resulting from operations | | | 186,513,695 | | | | 49,107,957 | |
| | | | | | | | |
| | |
Distributions to Shareholders: | | | | | | | | |
RBC Institutional Class 1 | | | (96,206,403 | ) | | | (23,625,621 | ) |
RBC Institutional Class 2 | | | (57,581,470 | ) | | | (16,098,055 | ) |
RBC Investor Class | | | (32,427,551 | ) | | | (9,278,908 | ) |
| | | | | | | | |
Change in net assets resulting from shareholder distributions | | | (186,215,424 | ) | | | (49,002,584 | ) |
| | | | | | | | |
| | |
Capital Transactions: | | | | | | | | |
Proceeds from shares issued | | | 42,862,956,151 | | | | 60,873,552,818 | |
Distributions reinvested | | | 137,902,910 | | | | 38,732,508 | |
Cost of shares redeemed | | | (35,517,469,127 | ) | | | (72,563,871,364 | ) |
| | | | | | | | |
Change in net assets resulting from capital transactions | | | 7,483,389,934 | | | | (11,651,586,038 | ) |
| | | | | | | | |
| | |
Net increase/(decrease) in net assets | | | 7,483,688,205 | | | | (11,651,480,665 | ) |
Net Assets: | | | | | | | | |
Beginning of period | | | 8,703,117,428 | | | | 20,354,598,093 | |
| | | | | | | | |
End of period | | $ | 16,186,805,633 | | | $ | 8,703,117,428 | |
| | | | | | | | |
Share Transactions: | | | | | | | | |
Issued | | | 42,862,956,151 | | | | 60,873,552,818 | |
Reinvested | | | 137,902,910 | | | | 38,732,508 | |
Redeemed | | | (35,517,469,127 | ) | | | (72,563,871,364 | ) |
| | | | | | | | |
Change in shares resulting from capital transactions | | | 7,483,389,934 | | | | (11,651,586,038 | ) |
| | | | | | | | |
See Notes to the Financial Statements.
U.S. Government Money Market Fund
(Selected data for a share outstanding throughout the periods indicated)
| | | | | | | | | | | | | | | | | | | | | | | | | | | | |
| | | | | | Investment Activities | | | Distributions | | | | |
| | | | | | | |
| | | Net Asset
Value,
Beginning
of Period | | | Net
Investment
Income(a) | | | Net Realized
and Unrealized
Gains (Losses)
on Investments | | | Total from
Investment
Activities | | | Net
Investment
Income | | | Total
Distributions | | | Net Asset
Value, End
of Period | |
| | | | | | | |
RBC Institutional Class 1 | | | | | | | | | | | | | | | | | | | | | | | | | | | | |
Six Months Ended 3/31/23 (Unaudited) | | | $1.00 | | | | 0.02 | | | | —(b) | | | | 0.02 | | | | (0.02) | | | | (0.02) | | | | $1.00 | |
Year Ended 9/30/22 | | | 1.00 | | | | —(b) | | | | 0.01 | | | | 0.01 | | | | (0.01) | | | | (0.01) | | | | 1.00 | |
Year Ended 9/30/21 | | | 1.00 | | | | —(b) | | | | —(b) | | | | —(b) | | | | —(b) | | | | —(b) | | | | 1.00 | |
Year Ended 9/30/20 | | | 1.00 | | | | 0.01 | | | | —(b) | | | | 0.01 | | | | (0.01) | | | | (0.01) | | | | 1.00 | |
Year Ended 9/30/19 | | | 1.00 | | | | 0.02 | | | | —(b) | | | | 0.02 | | | | (0.02) | | | | (0.02) | | | | 1.00 | |
Year Ended 9/30/18 | | | 1.00 | | | | 0.01 | | | | —(b) | | | | 0.01 | | | | (0.01) | | | | (0.01) | | | | 1.00 | |
RBC Institutional Class 2 | | | | | | | | | | | | | | | | | | | | | | | | | | | | |
Six Months Ended 3/31/23 (Unaudited) | | | $1.00 | | | | 0.02 | | | | —(b) | | | | 0.02 | | | | (0.02) | | | | (0.02) | | | | $1.00 | |
Year Ended 9/30/22 | | | 1.00 | | | | —(b) | | | | 0.01 | | | | 0.01 | | | | (0.01) | | | | (0.01) | | | | 1.00 | |
Year Ended 9/30/21 | | | 1.00 | | | | —(b) | | | | —(b) | | | | —(b) | | | | —(b) | | | | —(b) | | | | 1.00 | |
Year Ended 9/30/20 | | | 1.00 | | | | 0.01 | | | | —(b) | | | | 0.01 | | | | (0.01) | | | | (0.01) | | | | 1.00 | |
Year Ended 9/30/19 | | | 1.00 | | | | 0.02 | | | | —(b) | | | | 0.02 | | | | (0.02) | | | | (0.02) | | | | 1.00 | |
Year Ended 9/30/18 | | | 1.00 | | | | 0.01 | | | | —(b) | | | | 0.01 | | | | (0.01) | | | | (0.01) | | | | 1.00 | |
RBC Investor Class | | | | | | | | | | | | | | | | | | | | | | | | | | | | |
Six Months Ended 3/31/23 (Unaudited) | | | $1.00 | | | | 0.01 | | | | —(b) | | | | 0.01 | | | | (0.01) | | | | (0.01) | | | | $1.00 | |
Year Ended 9/30/22 | | | 1.00 | | | | —(b) | | | | — | | | | — | | | | —(b) | | | | —(b) | | | | 1.00 | |
Year Ended 9/30/21 | | | 1.00 | | | | —(b) | | | | —(b) | | | | —(b) | | | | —(b) | | | | —(b) | | | | 1.00 | |
Year Ended 9/30/20 | | | 1.00 | | | | —(b) | | | | —(b) | | | | —(b) | | | | —(b) | | | | —(b) | | | | 1.00 | |
Year Ended 9/30/19 | | | 1.00 | | | | 0.01 | | | | —(b) | | | | 0.01 | | | | (0.01) | | | | (0.01) | | | | 1.00 | |
Year Ended 9/30/18 | | | 1.00 | | | | 0.01 | | | | —(b) | | | | 0.01 | | | | (0.01) | | | | (0.01) | | | | 1.00 | |
| (a) | Per share net investment income (loss) has been calculated using the average daily shares method. |
| (b) | Less than $0.01 or $(0.01) per share. |
U.S. Government Money Market Fund
(Selected data for a share outstanding throughout the periods indicated)
| | | | | | | | | | | | | | | | | | | | |
| | | | | | Ratios/Supplemental Data | |
| | | Total
Return | | | Net Assets,
End of Period
(millions) | | | Ratio of
Net Expenses
to Average
Net Assets | | | Ratio of
Net Investment
Income (Loss)
to Average
Net Assets | | | Ratio of
Expenses to
Average Net
Assets* | |
RBC Institutional Class 1 | | | | | | | | | | | | | | | | | | | | |
Six Months Ended 3/31/23 (Unaudited) | | | 1.93%(a) | | | | $11,187 | | | | 0.13%(b)(c) | | | | 4.14%(c) | | | | 0.18%(c) | |
Year Ended 9/30/22 | | | 0.60% �� | | | | 2,724 | | | | 0.07%(b) | | | | 0.29% | | | | 0.17% | |
Year Ended 9/30/21 | | | 0.02% | | | | 11,201 | | | | 0.09%(b) | | | | 0.02% | | | | 0.17% | |
Year Ended 9/30/20 | | | 0.83% | | | | 10,821 | | | | 0.16%(b) | | | | 0.43% | | | | 0.17% | |
Year Ended 9/30/19 | | | 2.19% | | | | 1,916 | | | | 0.19% | | | | 2.17% | | | | 0.19% | |
Year Ended 9/30/18 | | | 1.41% | | | | 2,106 | | | | 0.18% | | | | 1.35% | | | | 0.19% | |
RBC Institutional Class 2 | | | | | | | | | | | | | | | | | | | | |
Six Months Ended 3/31/23 (Unaudited) | | | 1.86%(a) | | | | $ 3,386 | | | | 0.28%(c) | | | | 3.74%(c) | | | | 0.28%(c) | |
Year Ended 9/30/22 | | | 0.52% | | | | 2,967 | | | | 0.15%(d) | | | | 0.43% | | | | 0.27% | |
Year Ended 9/30/21 | | | 0.02% | | | | 3,935 | | | | 0.09%(d) | | | | 0.02% | | | | 0.27% | |
Year Ended 9/30/20 | | | 0.71% | | | | 3,358 | | | | 0.26%(d) | | | | 0.62% | | | | 0.27% | |
Year Ended 9/30/19 | | | 2.09% | | | | 2,510 | | | | 0.29% | | | | 2.08% | | | | 0.29% | |
Year Ended 9/30/18 | | | 1.31% | | | | 1,720 | | | | 0.29% | | | | 1.34% | | | | 0.29% | |
RBC Investor Class | | | | | | | | | | | | | | | | | | | | |
Six Months Ended 3/31/23 (Unaudited) | | | 1.49%(a) | | | | $ 1,613 | | | | 1.00%(c)(e) | | | | 2.85%(c) | | | | 1.13%(c) | |
Year Ended 9/30/22 | | | 0.25% | | | | 3,012 | | | | 0.36%(e) | | | | 0.18% | | | | 1.12% | |
Year Ended 9/30/21 | | | 0.02% | | | | 5,218 | | | | 0.08%(e) | | | | 0.02% | | | | 1.12% | |
Year Ended 9/30/20 | | | 0.34% | | | | 2,394 | | | | 0.54%(e) | | | | 0.25% | | | | 1.12% | |
Year Ended 9/30/19 | | | 1.37% | | | | 1,040 | | | | 1.00% | | | | 1.36% | | | | 1.14% | |
Year Ended 9/30/18 | | | 0.59% | | | | 1,107 | | | | 1.00% | | | | 0.50% | | | | 1.13% | |
| * | During the period, certain fees were contractually or voluntarily reduced and/or reimbursed. If such contractual/voluntary fee reductions and reimbursements had not occurred, the ratio would have been as indicated. |
U.S. Government Money Market Fund
(Selected data for a share outstanding throughout the periods indicated)
| (b) | During the periods ended March 31,2023, September 30, 2022, September 30, 2021 and September 30, 2020, the Advisor voluntarily waived a portion of its fees. The Fund’s net expense ratio would increase by an amount of 0.05%, 0.09%, 0.08% and 0.01%, respectively, if such voluntary waivers were excluded for the periods ended March31,2023, September 30, 2022, September 30, 2021 and September 30, 2020. See Note 3 – Agreements and Other Transactions with Affiliates and Note4 – Fund Distribution for more information. |
| (d) | During the periods ended September 30, 2022, September 30, 2021 and September 30, 2020, the Advisor and/or Distributor voluntarily waived a portion of its fees. The Fund’s net expense ratio would increase by an amount of 0.11%, 0.18% and 0.01%, respectively, if such voluntary waivers were excluded for the periods ended September 30, 2022, September 30, 2021 and September 30, 2020. See Note 3 – Agreements and Other Transactions with Affiliates and Note4 – Fund Distribution for more information. |
| (e) | During the periods ended March 31, 2023, September 30, 2022, September 30, 2021 and September 30, 2020, the Advisor and/or Distributor voluntarily waived a portion of its fees. The Fund’s net expense ratio would increase by an amount of 0.13%, 0.65%, 0.92% and 0.46%, respectively, if such voluntary waivers were excluded for the periods ended March 31, 2023, September 30, 2022, September 30, 2021 and September 30, 2020. See Note 3 – Agreements and Other Transactions with Affiliates and Note 4 – Fund Distribution for more information. |
|
| See Notes to the Financial Statements. |
|
NOTES TO FINANCIAL STATEMENTS |
March 31, 2023 (Unaudited)
1. Organization:
RBC Funds Trust (the “Trust”) is registered under the Investment Company Act of 1940 (as amended) as an open-end management investment company. The Trust was organized as a Delaware statutory trust on December 16, 2003 and currently consists of 24 portfolios. Overall responsibility for the management of the Trust is vested in its Board of Trustees (the “Board”).Predecessor funds to the Trust were reorganized as portfolios of the Trust effective April 16, 2004. This report includes the U.S. Government Money Market Fund (“Fund”).
The Fund offers three share classes: RBC Institutional Class 1, RBC Institutional Class 2 and RBC Investor Class. Prior to November 9, 2017, the Fund also offered shares in RBC Select Class and RBC Reserve Class.
RBC Global Asset Management (U.S.) Inc. (“RBC GAM-US” or “Advisor” or “Co-Administrator”) acts as the investment advisor for the Fund. The officers of the Trust (“Fund Management”) are also employees of RBC GAM-US.
2. Significant Accounting Policies
The Fund is an investment company that follows accounting and reporting guidance under the Financial Accounting Standards Board. Summarized below are the significant accounting policies of the Funds. These policies conform to accounting principles generally accepted in the United States of America (“U.S. GAAP”). Fund Management follows these policies when preparing financial statements. Fund Management may also be required to make estimates and assumptions that affect the reported amounts of assets and liabilities at the date of the financial statements and the reported amounts of income and expenses for the period. Actual results could differ from those estimates. The financial statements are as of the close of regular trading on the New York Stock Exchange (“NYSE”).
Security Valuation:
The Fund has elected to use the amortized cost method to value its securities (other than other investment companies) pursuant to Rule 2a-7 of the Investment Company Act of 1940, as amended, which the Board believes approximates fair market value. The amortized cost method involves valuing a security initially at its cost, and, thereafter, a constant proportionate accretion of discounts and amortization of premiums are recorded until the maturity of the security. Amortized cost approximates the current fair value of a security, but since the value is not obtained from a quoted price in an active market, securities valued at amortized cost are categorized as Level 2 in the fair value hierarchy (see “Fair Value Measurements” below for additional information). If amortized cost no longer approximates fair value due to credit or other impairments of an issuer, the Fund will determine the fair value of its securities by using pricing and valuation procedures approved by the Board. Investments in open-end investment companies (mutual funds) are valued at net asset value and are categorized as Level 1 in the fair value hierarchy.
The Board has designated the Advisor with the responsibility for implementing the pricing and valuation procedures, including responsibility for determining the fair value of the Fund’s securities or other assets and liabilities, and has established a Pricing Committee to assist in carrying out supervisory functions related to such responsibilities. The Pricing Committee includes representatives of the Fund’s Advisor, and Co-Administrator, including personnel from accounting and operations, trading, risk management and compliance. The Pricing Committee meets at least quarterly to review and approve Fund valuation matters, including a review of the Fund’s pricing activity and operations, fair value measurements, pricing vendors, policies and procedures, and related controls. At least a quorum of the Pricing Committee shall meet more frequently, as needed, to consider and approve time-sensitive fair valuation matters. The Pricing Committee provides periodic reports to the Valuation, Portfolio Management and Performance Committee (“Valuation Committee”) of the Board regarding pricing and valuation matters. Members of the Pricing Committee meet with the Valuation Committee and the Board at each of their regularly scheduled meetings to discuss valuation matters and actions taken during the period.
|
NOTES TO FINANCIAL STATEMENTS |
In accordance with Rule 2a-7, the fair values of the securities held in the Fund are determined at least once per week using evaluated prices supplied by third-party pricing vendors approved by the Board. The pricing services utilize both dealer-supplied valuations and electronic data processing techniques that take into account appropriate factors such as institutional-sized trading in similar groups of securities, yield, quality, coupon rate, maturity and type of issue. These security values are then compared to the securities’ amortized cost. If a security price is not available from a pricing service or broker-dealer, or the Advisor determines that a price provided by a pricing service or broker-dealer does not approximate fair value for purposes of this comparison, the security’s fair value will be determined in good faith by the Pricing Committee in accordance with procedures and methodologies approved by the Board. General factors used in determining the fair value of securities include, but are not limited to, fundamental analytical data relating to the security, the issuer and the market, such as duration, prepayment and default rates; general level of interest rates and changes in interest rates; information from broker-dealers; trading in similar securities; any restrictions on disposition of the security; and an evaluation of the forces that influence the market in which the investments are traded.
Fair Value Measurements:
The Funds disclose the fair value of their investments in a hierarchy that categorizes investments based on the inputs to valuation techniques used to measure fair value. The three levels of the fair value hierarchy are as follows:
• Level 1 - Inputs that reflect unadjusted quoted prices in active markets for identical assets or liabilities that the Funds have the ability to access at the measurement date.
• Level 2 - Significant inputs other than quoted prices that are observable for the asset or liability either directly or indirectly, including inputs in markets that are not considered to be active. Observable inputs may include quoted prices for similar securities, interest rates, spreads, prepayment spreads, etc.
• Level 3 - Significant unobservable inputs based on the best information available in the circumstances, to the extent observable inputs are not available (including the Fund’s own assumptions in determining the fair value of investments).
The inputs or methodology used for valuing investments are not necessarily an indication of the risk associated with investing in those securities.
Inputs used in determining fair value of an investment may include, but are not limited to, price information, volatility statistics, credit and market data, and other factors, all of which may be either observable or unobservable. Inputs can vary among investments and will be impacted by the investment type and volume of activity for the particular security or similar securities in the market. Investments in the Level 3 category are generally supported by transactions and quoted prices from dealers participating in the market for those investments. Investments may be included in the Level 3 category due to a lack of market activity or transparency. Internal valuation models may also be used as a pricing source for Level 3 investments. Internal valuation models may rely on one or more unobservable inputs, such as estimated cash flows, financial statement analysis and discount rates.
The summary of inputs used to determine the fair value of the Fund’s investments as of March 31, 2023 is as follows:
| | | | | | | | | | | | | | | | |
| | | | | | Level 2 | | | Level 3 | | | | |
| | | | | | Significant | | | Significant | | | | |
| | | Level 1 | | | Observable | | | Unobservable | | | | |
| Funds | | Quoted Prices | | | Inputs | | | Inputs | | | Total | |
| | | | |
Assets: | | | | | | | | | | | | | | | | |
Investments in Securities | | | | | | | | | | | | | | | | |
U.S. Government Money Market Fund | | | $— | | | | 15,750,126,500 | | | | $— | | | | 15,750,126,500 | |
Repurchase Agreements:
The Fund may enter into repurchase agreements with counterparties whom the Advisor has deemed creditworthy, including primary dealers that report to the Federal Reserve Bank of New York or other large U.S. commercial banks or broker-dealers. These repurchase agreements are subject to the seller’s agreement to repurchase such securities at a mutually agreed upon date and price. The repurchase price generally equals the price paid by the Fund plus interest negotiated on the basis of current short-term rates.
|
NOTES TO FINANCIAL STATEMENTS |
Securities pledged by the dealers as collateral for repurchase agreements are held by a custodian bank until maturity of the repurchase agreement. The Fund has procedures to monitor additional collateral, if needed, to ensure that the daily market value of the collateral remains in excess of the market value of the repurchase agreement in the event of a default.
Master Repurchase Agreements (“MRA”) permit the Fund, under certain circumstances, including an event of default (such as bankruptcy or insolvency), to offset payables and/or receivables under the MRA with collateral held and/or posted to the counterparty and create one single net payment due to or from the Fund. However, bankruptcy or insolvency laws of a particular jurisdiction may impose restrictions on or prohibitions against such a right of offset in the event of a MRA counterparty’s bankruptcy or insolvency. Pursuant to the terms of the MRA, the Fund receives securities as collateral with a market value in excess of the repurchase price to be received by the Fund upon the maturity of the repurchase transaction. Upon a bankruptcy or insolvency of the MRA counterparty, the Fund recognizes a liability with respect to such excess collateral to reflect the Fund’s obligation under bankruptcy law to return the excess to the counterparty. Details of the counterparties and collateral for repurchase agreements are shown on the Schedule of Portfolio Investments.
Credit Enhancement:
Certain obligations held by the Fund have credit enhancement or liquidity features that may, under certain circumstances, provide for repayment of principal and interest on the obligation upon demand date, interest rate reset date or final maturity. These enhancements may include: letters of credit; liquidity guarantees; security purchase agreements; tender option purchase agreements and third party insurance.
Investment Transactions and Income:
Investment transactions are accounted for on the date the security is bought or sold (“trade date”). Dividend income is recorded on the ex-dividend date. Realized gains and losses from investment transactions are calculated based on the cost of the specific security (also known as identified cost basis). Interest income is recognized on the accrual basis and includes, where applicable, the amortization or accretion of premium or discount.
Expense, Investment Income and Gain/Loss Allocation:
The Fund pays the expenses that are directly related to its operations, such as custodian fees or advisory fees. Expenses incurred by the Trust, such as trustee or legal fees, are allocated among each of the Funds in the Trust either proportionately based upon the Fund’s relative net assets or using another reasonable basis such as equally across all Funds in the Trust, depending on the nature of the expense. Individual share classes within the Fund are charged expenses specific to that class, such as distribution fees and transfer agent fees. Within the Fund, expenses other than class specific expenses are allocated daily to each class based upon the proportion of relative net assets. Investment income and realized and unrealized gains or losses are allocated to each class of shares based on relative net assets.
Distributions to Shareholders:
The Fund pays out any income that it receives, less expenses, in the form of dividends and capital gain distributions to its shareholders. Income dividends are declared daily and paid monthly. Dividends will also be paid at any time during the month upon total redemption of shares in an account. Capital gains, if any, are declared and paid at least annually. Distributions to shareholders are recorded on the ex-dividend date. The amount of dividends and distributions are calculated based on federal income tax regulations, which may differ from US GAAP. These “book/tax” differences may be either temporary or permanent in nature. To the extent these differences are determined, as of the end of the tax year, to be permanent (e.g. paydowns), they are reclassified within the Fund’s capital accounts based on their federal tax basis treatment.
When-Issued Transactions:
The Fund may engage in when-issued transactions. The Fund records when-issued securities on the trade date and maintains sufficient liquidity so that cash will be available to make payment for the securities purchased. Securities purchased on a when-issued basis are valued daily beginning on trade date and begin earning interest on the settlement date. As of March 31, 2023, the Fund held no when-issued securities.
|
NOTES TO FINANCIAL STATEMENTS |
Indemnifications:
Under the Trust’s organizational documents, each Trustee, officer, employee or other agent of the Trust is indemnified against certain liabilities that may arise out of the performance of their duties to the Fund. Additionally in the normal course of business, the Fund enters into contracts, including the Fund’s servicing agreements, that contain a variety of indemnification clauses. The Fund’s maximum exposure under these arrangements is unknown as this would involve future claims that may be made against the Fund that have not yet occurred. The Fund has not had prior claims or losses pursuant to these contracts.
3. Agreements and Other Transactions with Affiliates:
The Trust has entered into an investment advisory agreement with RBC GAM-US under which RBC GAM-US manages the Fund’s assets and furnishes related office facilities, equipment, research and personnel. The agreement requires the Fund to pay RBC GAM-US a monthly fee based upon average daily net assets. Under the terms of the agreement, RBC GAM-US is entitled to receive fees based on a percentage of the average daily net assets of the Fund as follows:
| | | | |
| | | Annual Rate | |
| |
U.S. Government Money Market Fund | | | 0.10% | |
RBC Institutional Class 1 of the Fund pays the Advisor and other shareholder servicing agents an annual shareholder services administration fee of 0.05% of the average daily net assets attributable to RBC Institutional Class 1 shares that is used to further compensate financial intermediaries for providing services to shareholders and maintaining shareholder accounts. This shareholder services administration fee is not paid pursuant to Rule 12b-1.
RBC GAM-US has contractually agreed to waive fees and/or reimburse expenses under an expense limitation agreement in order to maintain the net annual Fund operating expenses (excluding certain fees such as interest, taxes and acquired fund fees and expenses) at 0.20% for RBC Institutional Class 1 until January 31, 2023. During the period ended March 31, 2023, there were no fees waived under this agreement.
RBC GAM-US serves as co-administrator to the Fund. BNY Mellon serves as co-administrator and fund accounting agent. Services provided under the administrative services agreement include providing day-to-day administration of matters related to the Fund, maintenance of the records and the preparation of reports. Under the terms of the administrative services agreement, RBC GAM-US does not receive an administration services fee. BNY Mellon receives a fee for its services payable by the Fund based in part on the Fund’s average net assets. BNY Mellon’s fee is included with “Accounting fees” in the Statement of Operations.
Certain Officers and Trustees of the Trust are affiliated with the Advisor. Such Officers and Trustees receive no compensation from the Fund for serving in their respective roles.
The Trust currently pays each of the independent Trustees (Trustees of the Trust who are not directors, officers or employees of the Advisor, either Co-Administrator or Distributor) an annual retainer of $84,000. The Board Chairperson and Audit Committee Chairperson each receive an additional retainer of $2,500 annually, and all other Trustees serving as Chair of a Board committee each receive an additional retainer of $1,000 annually. In addition, independent Trustees receive a quarterly meeting fee of $6,500 for each in-person Board meeting attended, a meeting fee of $1,500 for each telephonic or special board meeting attended, a $1,500 fee for each Board committee meeting attended, and are reimbursed for all out-of-pocket expenses relating to attendance at such meetings. These amounts are included in the Statement of Operations in “Trustees’ fees”.
The Advisor has invested in and, as of March 31, 2023, owns 22,049,831 shares of the Fund, representing 0.1% of total Fund net assets.
|
NOTES TO FINANCIAL STATEMENTS |
4. Fund Distribution:
The Fund has adopted a Shareholder Account and Distribution Services (12b-1) Plan (the “Plan”) with respect to RBC Institutional Class 2 and RBC Investor Class, in which Quasar Distributors LLC (the “Distributor”) acts as the Fund’s distributor. The Plan permits the Fund to make payments for or to reimburse the Distributor or others, including RBC Capital Markets, LLC, monthly for distribution-related costs and expenses of marketing shares of each share class covered under the Plan, and/or for providing shareholder services. The following chart shows the current Plan fee rate for each class:
| | | | | | | | |
| | | RBC Institutional Class 2 | | | RBC Investor Class | |
| | |
12b-1 Plan Fee | | | 0.15% | | | | 1.00% | |
Plan fees are based on average daily net assets of the applicable class. Up to 0.25% of each Plan fee may be designated as a service fee, as defined by the applicable rules of the Financial Industry Regulatory Authority.
Pursuant to a shareholder account and distribution services agreement between the Distributor and RBC Capital Markets, LLC, the Distributor has agreed to compensate RBC Capital Markets, LLC for certain shareholder account servicing support provided to the Fund. RBC Capital Markets, LLC has agreed to waive fees and/or reimburse expenses in order to maintain the net annual Fund operating expenses for each class listed below to the following amounts:
| | | | |
Share Class | | Operating Expense Limit | |
| |
RBC Institutional Class 2 | | | 0.30% | |
RBC Investor Class | | | 1.00% | |
This expense limitation agreement is in place until January 31, 2024. The Fund will carry forward, for a period not to exceed 12 months from the date on which a waiver or reimbursement is made by RBC Capital Markets, LLC, any expenses in excess of the expense limitation and repay RBC Capital Markets, LLC such amounts, provided the Fund is able to effect such repayment and remain in compliance with the expense limitation. At March 31, 2023, the amount subject to possible recoupment under the expense limitation agreement is $3,781,728.
RBC Capital Markets, LLC and/or the Advisor may voluntarily waive and/or reimburse additional Fund operating expenses at any time, such as to maintain a minimum yield in the fund. Any such voluntary program may be modified or discontinued at any time without notice.
For the periodended March 31, 2023, the following distribution fees were waived either contractually or voluntarily:
| | | | |
Share Class | | Distribution Fees Waived | |
| |
RBC Investor Class | | | $1,508,417 | |
During the six months ended March 31, 2023, shareholder servicing fees were voluntarily waived for RBC Institutional Class 1 in the amount of $1,163,217.
|
NOTES TO FINANCIAL STATEMENTS |
5. Capital Share Transactions
The number of shares sold, reinvested and redeemed correspond to the net proceeds from sale of shares, reinvestments of dividends and cost of shares redeemed, respectively, since shares are issued, reinvested and redeemed at $1.00 per share.
Transactions for the period were as follows:
| | | | | | | | |
| | | U.S. Government Money Market Fund | |
| | | For the Six Months
Ended
March 31, 2023
(Unaudited) | | | For the
Year Ended
September 30, 2022 | |
CAPITAL TRANSACTIONS: | | | | | | | | |
RBC Institutional Class 1 | | | | | | | | |
Proceeds from shares issued | | $ | 37,843,230,613 | | | $ | 47,378,176,192 | |
Distributions reinvested | | | 48,573,905 | | | | 12,673,306 | |
Cost of shares redeemed | | | (29,429,007,954 | ) | | | (55,867,762,410 | ) |
| | | | | | | | |
| | |
Change in RBC Institutional Class 1 | | $ | 8,462,796,564 | | | $ | (8,476,912,912 | ) |
| | | | | | | | |
| | |
RBC Institutional Class 2 | | | | | | | | |
Proceeds from shares issued | | $ | 3,501,356,478 | | | $ | 7,552,972,925 | |
Distributions reinvested | | | 57,196,723 | | | | 16,496,567 | |
Cost of shares redeemed | | | (3,138,847,454 | ) | | | (8,538,063,178 | ) |
| | | | | | | | |
| | |
Change in RBC Institutional Class 2 | | $ | 419,705,747 | | | $ | (968,593,686 | ) |
| | | | | | | | |
| | |
RBC Investor Class | | | | | | | | |
Proceeds from shares issued | | $ | 1,518,369,060 | | | $ | 5,942,403,701 | |
Distributions reinvested | | | 32,132,282 | | | | 9,562,635 | |
Cost of shares redeemed | | | (2,949,613,719 | ) | | | (8,158,045,776 | ) |
| | | | | | | | |
| | |
Change in RBC Investor Class | | $ | (1,399,112,377 | ) | | $ | (2,206,079,440 | ) |
| | | | | | | | |
| | |
Change in net assets resulting from capital transactions | | $ | 7,483,389,934 | | | $ | (11,651,586,038 | ) |
| | | | | | | | |
6. Federal Income Taxes:
It is the policy of the Fund to continue to qualify as a regulated investment company by complying with the provisions available to certain investment companies, as defined under Subchapter M of the Internal Revenue Code, and to distribute substantially all of its net investment income and net realized capital gains. Therefore, no federal tax liability is recorded in the financial statements of the Fund.
For all open tax years and all major taxing jurisdictions, management of the Funds has concluded that there are no significant uncertain tax positions that would require recognition in the financial statements. Open tax years are those that are open for examination by taxing authorities (i.e., generally the last three tax year ends and the interim tax period since then). Furthermore, management of the Funds is also not aware of any tax positions for which it is reasonably possible that the total amounts of unrecognized tax benefits will significantly change in the next twelve months.
|
NOTES TO FINANCIAL STATEMENTS |
The tax character of distributions during the year ended September 30, 2022 were as follows:
| | | | | | | | | | | | |
| | | Distributions Paid From | |
| | | | | | | | | Total | |
| | | Ordinary | | | Total Taxable | | | Distributions | |
| | | Income | | | Distributions | | | Paid | |
| | | |
U.S. Government Money Market Fund | | $ | 35,754,236 | | | $ | 35,754,236 | | | $ | 35,754,236 | |
Total distributions paid may differ from the Statements of Changes in Net Assets because distributions are recognized when actually paid for tax purposes.
The tax basis of components of accumulated earnings/(losses) and tax character of distributions are determined at fiscal year end, and will be included in the Annual Report dated September 30, 2023.
As of September 30, 2022, the Fund does not have any capital loss carryforward.
Under current tax law, Post-October Capital Losses and Late-Year Ordinary Losses may be deferred and treated as occurring on the first business day of the following fiscal year for tax purposes. The Fund did not have any Post-October Capital Losses or Late-Year Ordinary Losses for the year ending September 30, 2022.
7. Line of Credit
The Fund, along with other Funds within the Trust, participates in an uncommitted, secured $500,000,000 line of credit with U.S. Bank, N.A. (the “Bank”), the Funds’ custodian, to be used to fund shareholder redemption requests and for other short-term temporary or emergency general business purposes. The line of credit has a scheduled termination date of July 29, 2023. Interest is charged on borrowings under this line of credit at the Bank’s prime lending rate per annum. Since multiple funds within the Trust participate in this line of credit, there is no assurance that an individual fund will have access to all or any part of the $500,000,000 at any particular time. There were no loans outstanding pursuant to this line of credit at March 31, 2023 and there were no borrowings made by the Fund during the period.
8. Significant Risks
Shareholder concentration risk:
As of March 31, 2023, affiliated broker-dealer omnibus accounts owned 30.6% of the Fund’s outstanding shares and an unaffiliated omnibus account owned 18.7% of the Fund’s outstanding shares. Significant transactions by these shareholders may impact the Fund’s performance.
Market risk:
One or more markets in which a Fund invests may go down in value, sometimes sharply and unpredictably, and the value of a Fund’s portfolio securities may fall or fail to rise. Market risk may affect a single issuer, sector of the economy, industry or the market as a whole. In addition, global economies and financial markets are becoming increasingly interconnected, and political, economic and other conditions and events (including, but not limited to, natural disasters, pandemics, epidemics, and social unrest) in one country, region, or financial market may adversely impact issuers in a different country, region or financial market. Furthermore, the occurrence of, among other events, natural or man-made disasters, severe weather or geological events, fires, floods, earthquakes, outbreaks of disease (such as COVID-19, avian influenza or H1N1/09), epidemics, pandemics, malicious acts, cyber-attacks, terrorist acts or the occurrence of climate change, may also adversely impact the performance of a Fund. Such events could adversely impact issuers, markets and economies over the short- and long-term, including in ways that cannot necessarily be foreseen. A Fund could be negatively impacted if the value of a portfolio holding were harmed by such political or economic conditions or events. Moreover, such negative political and economic conditions and events could disrupt the processes necessary for a Fund’s operations.
|
NOTES TO FINANCIAL STATEMENTS |
9. Subsequent Events:
Fund Management has evaluated the impact of all subsequent events on the Fund and has determined that there were no subsequent events requiring recognition or disclosure in the financial statements.
|
SUPPLEMENTAL INFORMATION (UNAUDITED) |
Shareholder Expense Examples
As a shareholder of the RBC Funds, you incur two types of costs: (1) transaction costs and (2) ongoing costs, including management fees; and other Fund expenses. This example is intended to help you understand your ongoing costs (in dollars) of investing in the RBC Funds and to compare these costs with the ongoing costs of investing in other mutual funds.
The example is based on an investment of $1,000 invested at the beginning of the period and held for the entire period from October 1, 2022 through March 31, 2023.
Actual Expenses
The table below provides information about actual account values and actual expenses. You may use the information below, together with the amount you invested, to estimate the expenses that you paid over the period. Simply divide your account value by $1,000 (for example, an $8,600 account value divided by $1,000 = 8.6), then multiply the result by the number in the table under the heading entitled “Expenses Paid During Period” to estimate the expenses you paid on your account during this period.
| | | | | | | | | | | | | | | | |
| | | Beginning
Account Value
10/1/22 | | | Ending
Account Value
3/31/23 | | | Expenses Paid
During Period*
10/1/22–3/31/23 | | | Annualized
Expense Ratio
During Period
10/1/22–3/31/23 | |
U.S. Government Money Market Fund | | | | | | | | | | | | | | | | |
RBC Institutional Class 1 | | | $1,000.00 | | | | $1,019.30 | | | | $0.66 | | | | 0.13% | |
RBC Institutional Class 2 | | | 1,000.00 | | | | 1,018.60 | | | | 1.42 | | | | 0.28% | |
RBC Investor Class | | | 1,000.00 | | | | 1,014.90 | | | | 5.08 | | | | 1.00% | |
*Expenses are equal to the average account value times the Fund’s annualized expense ratio multiplied by 182/365 (to reflect one half year period).
|
SUPPLEMENTAL INFORMATION (UNAUDITED) |
Hypothetical Example for Comparison Purposes
The table below provides information about hypothetical account values and hypothetical expenses based on the Fund’s actual expense ratio and an assumed rate of return of 5% per year before expenses, which is not the Fund’s actual return. The hypothetical account values and expenses may not be used to estimate the actual ending account balance or expenses you paid for the period. You may use this information to compare this 5% hypothetical example with the 5% hypothetical examples that appear in the shareholder reports of other funds.
Please note that the expenses shown in the table are meant to highlight your ongoing costs only and do not reflect any transactional costs, such as sales charges (loads), redemption fees, or exchange fees. Therefore, the table is useful in comparing ongoing costs only, and will not help you determine the relative total costs of owning different funds. In addition, if these transactional costs were included, your costs would have been higher.
| | | | | | | | | | | | | | | | |
| | | Beginning
Account Value
10/1/22 | | | Ending
Account Value
3/31/23 | | | Expenses Paid
During Period*
10/1/22-3/31/23 | | | Annualized
Expense Ratio
During Period
10/1/22-3/31/23 | |
U.S. Government Money Market Fund | | | | | | | | | | | | | | | | |
RBC Institutional Class 1 | | | $1,000.00 | | | | $1,024.55 | | | | $0.66 | | | | 0.13% | |
RBC Institutional Class 2 | | | 1,000.00 | | | | 1,023.79 | | | | 1.43 | | | | 0.28% | |
RBC Investor Class | | | 1,000.00 | | | | 1,020.16 | | | | 5.09 | | | | 1.00% | |
*Expenses are equal to the average account value times the Fund’s annualized expense ratio multiplied by 182/365 (to reflect one half year period).
This Page Intentionally Left Blank
This Page Intentionally Left Blank
This Page Intentionally Left Blank
RBC Funds
P.O. Box 701
Milwaukee, WI 53201-0701
800-422-2766
www.rbcgam.com
Performance data represents past performance and does not guarantee future results. The principal value of an investment and investment return will fluctuate so that an investor’s shares, when redeemed, may be worth more or less than their original cost.
This report and the financial statements contained herein are provided for the information of RBC Funds shareholders. This report is not authorized for distribution to prospective investors unless preceded or accompanied by a current prospectus, which contains information concerning investment objectives, risks, charges and expenses of the funds. Please read the prospectus carefully before investing.
This report and the financial statements contained herein are not intended to be a forecast of future events, a guarantee of future results, or investment advice. There is no assurance that certain securities will remain in or out of each fund’s portfolio. The views expressed in this report reflect those of the portfolio managers through the period ended March 31, 2023.
NOT FDIC INSURED • NO BANK GUARANTEE • MAY LOSE VALUE
RBC Global Asset Management (U.S.) Inc. serves as investment advisor for the RBC Funds.
RBC Funds are distributed by Quasar Distributors LLC.
The RBC Funds are pleased to offer shareholder reports printed entirely on Forest
Stewardship Council® certified paper. FSC® certification ensures that the paper
used in this report contains fiber from well-managed and responsibly harvested
forests that meet strict environmental and socioeconomic standards.
RBCF-MM SAR 03-23
(b) Not applicable.
Not applicable.
| Item 3. | Audit Committee Financial Expert. |
Not applicable.
| Item 4. | Principal Accountant Fees and Services. |
Not applicable.
| Item 5. | Audit Committee of Listed Registrants. |
Not applicable.
| (a) | Schedule of Investments in securities of unaffiliated issuers as of the close of the reporting period is included as part of the report to shareholders filed under Item 1 of this form. |
| Item 7. | Disclosure of Proxy Voting Policies and Procedures for Closed-End Management Investment Companies. |
Not applicable.
| Item 8. | Portfolio Managers of Closed-End Management Investment Companies. |
Not applicable.
| Item 9. | Purchases of Equity Securities by Closed-End Management Investment Company and Affiliated Purchasers. |
Not applicable.
| Item 10. | Submission of Matters to a Vote of Security Holders. |
There have been no material changes to the procedures by which the shareholders may recommend nominees to the registrant’s board of directors, where those changes were implemented after the registrant last provided disclosure in response to the requirements of Item 407(c)(2)(iv) of Regulation S-K (17 CFR 229.407) (as required by Item 22(b)(15) of Schedule 14A (17 CFR 240.14a-101)), or this Item.
| Item 11. | Controls and Procedures. |
| | (a) | The registrant’s principal executive and principal financial officers, or persons performing similar functions, have concluded that the registrant’s disclosure controls and procedures (as defined in Rule 30a-3(c) under the Investment Company Act of 1940, as amended (the “1940 Act”) (17 CFR 270.30a-3(c))) are effective, as of a date within 90 days of the filing date of the report that includes the disclosure required by this paragraph, based on their evaluation of these controls and procedures required by Rule 30a-3(b) under the 1940 Act (17 CFR 270.30a-3(b)) and Rules 13a-15(b) or 15d-15(b) under the Securities Exchange Act of 1934, as amended (17 CFR 240.13a-15(b) or 240.15d-15(b)). |
| | (b) | There were no changes in the registrant’s internal control over financial reporting (as defined in Rule 30a-3(d) under the 1940 Act (17 CFR 270.30a-3(d)) that occurred during the period covered by this report that has materially affected, or is reasonably likely to materially affect, the registrant’s internal control over financial reporting. |
| Item 12. | Disclosure of Securities Lending Activities for Closed-End Management Investment Companies. |
Not applicable.
SIGNATURES
Pursuant to the requirements of the Securities Exchange Act of 1934 and the Investment Company Act of 1940, the registrant has duly caused this report to be signed on its behalf by the undersigned, thereunto duly authorized.
| | |
| (Registrant) RBC Funds Trust | | |
| |
| By (Signature and Title)* /s/ David Eikenberg | | |
| David Eikenberg, President and Chief Executive Officer | | |
| (principal executive officer) | | |
| |
| Date 5/25/23 | | |
Pursuant to the requirements of the Securities Exchange Act of 1934 and the Investment Company Act of 1940, this report has been signed below by the following persons on behalf of the registrant and in the capacities and on the dates indicated.
| | |
| By (Signature and Title)* /s/ David Eikenberg | | |
| David Eikenberg, President and Chief Executive Officer | | |
| (principal executive officer) | | |
| |
| Date 5/25/23 | | |
| | |
| By (Signature and Title)* /s/ Kathleen A. Hegna | | |
| Kathleen A. Hegna, Treasurer and Chief Financial Officer | | |
| (principal financial officer) | | |
| |
| Date 5/25/23 | | |
* Print the name and title of each signing officer under his or her signature.