UNITED STATES
SECURITIES AND EXCHANGE COMMISSION
WASHINGTON, D.C. 20549
FORM N-CSR
CERTIFIED SHAREHOLDER REPORT OF REGISTERED
MANAGEMENT INVESTMENT COMPANIES
Investment Company Act file number: 811-21497
ALLIANCEBERNSTEIN CORPORATE SHARES
(Exact name of registrant as specified in charter)
1345 Avenue of the Americas, New York, New York 10105
(Address of principal executive offices) (Zip code)
Joseph J. Mantineo
AllianceBernstein L.P.
1345 Avenue of the Americas
New York, New York 10105
(Name and address of agent for service)
Registrant’s telephone number, including area code: (800) 221-5672
Date of fiscal year end: April 30, 2011
Date of reporting period: October 31, 2011
| ITEM 1. | REPORTS TO STOCKHOLDERS. |
SEMI-ANNUAL REPORT
AllianceBernstein
Corporate Income Shares

October 31, 2011
Semi-Annual Report
Investment Products Offered
| • | Are Not FDIC Insured |
| • | May Lose Value |
| • | Are Not Bank Guaranteed |
Investors should consider the investment objectives, risks, charges and expenses of the Fund carefully before investing. For copies of our prospectus or summary prospectus, which contain this and other information, visit us online at www.alliancebernstein.com or contact your AllianceBernstein Investments representative. Please read the prospectus and/or summary prospectus carefully before investing.
This shareholder report must be preceded or accompanied by the Fund’s prospectus for individuals who are not current shareholders of the Fund.
You may obtain a description of the Fund’s proxy voting policies and procedures, and information regarding how the Fund voted proxies relating to portfolio securities during the most recent 12-month period ended June 30, without charge. Simply visit AllianceBernstein’s website at www.alliancebernstein.com, or go to the Securities and Exchange Commission’s (the “Commission”) website at www.sec.gov, or call AllianceBernstein at (800) 227-4618.
The Fund files its complete schedule of portfolio holdings with the Commission for the first and third quarters of each fiscal year on Form N-Q. The Fund’s Forms N-Q are available on the Commission’s website at www.sec.gov. The Fund’s Forms N-Q may also be reviewed and copied at the Commission’s Public Reference Room in Washington, DC; information on the operation of the Public Reference Room may be obtained by calling (800) SEC-0330.
AllianceBernstein Investments, Inc. (ABI) is the distributor of the AllianceBernstein family of mutual funds. ABI is a member of FINRA and is an affiliate of AllianceBernstein L.P., the manager of the funds.
AllianceBernstein® and the AB Logo are registered trademarks and service marks used by permission of the owner, AllianceBernstein L.P.
December 14, 2011
Semi-Annual Report
This report provides management’s discussion of fund performance for AllianceBernstein Corporate Income Shares (the “Fund”) for the semi-annual reporting period ended October 31, 2011. Please note, shares of this Fund are offered exclusively through registered investment advisers approved by AllianceBernstein L.P. (the “Adviser”).
Investment Objective and Policies
The Fund’s investment objective is high current income.
The Fund invests, under normal circumstances, at least 80% of its net assets in U.S. corporate bonds. The Fund may also invest in U.S. government securities (other than U.S. government securities that are mortgage-backed or asset-backed securities), repurchase agreements and forward contracts relating to U.S. government securities. The Fund normally invests all of its assets in securities that are rated, at the time of purchase, at least BBB- or the equivalent. The Fund will not invest in unrated corporate debt securities. The Fund has the flexibility to invest in long- and short-term fixed income securities. In making decisions about whether to buy or sell securities, the Fund will consider, among other things, the strength of certain sectors of the fixed income market relative to others, interest rates and other general market conditions and the credit quality of individual issuers. The Fund also may invest in convertible debt securities; invest up to 10% of its assets in inflation-protected securities; invest up to 5% of its net assets in preferred
stock; purchase and sell interest rate futures contracts and options; enter into swap transactions; invest in zero coupon securities and “payment-in-kind” debentures; make secured loans of portfolio securities; and invest in U.S. dollar-denominated fixed income securities issued by non-U.S. companies.
Investment Results
The table on page 4 shows the Fund’s performance compared to its benchmark, the Barclays Capital U.S. Credit Bond Index, for the six- and 12-month periods ended October 31, 2011.
The Fund underperformed its benchmark for both the six- and 12-month periods. The Fund’s overweight and security selection in financial sectors (banks and insurance), which recently underperformed, was the primary detractor from relative performance for the six-month period. An underweight to consumer non-cyclicals and supranationals, as well as modest exposure to high yield corporates also detracted. An underweight to sovereigns and an allocation to Treasuries contributed positively. For the 12-month period, overall security selection was the primary detractor, particularly within the Fund’s bank holdings. A modest position in U.S. Treasury securities, as government yields declined, was positive for both periods.
The Fund did not utilize derivatives during the six- or 12-month periods.
Market Review and Investment Strategy
The global economic recovery that was underway slowed early in the year,
| ALLIANCEBERNSTEIN CORPORATE INCOME SHARES • | 1 |
resulting from a myriad of global events. Social unrest in North Africa and the Middle East, supply disruptions from the natural disaster in Japan and a spike in commodity prices, particularly oil, all provided headwinds for the global economy early in the year. During the six-month period ended October 31, 2011, renewed fears of a double-dip recession roiled the global capital markets, driving up risk aversion, sending equities sharply lower and widening credit spreads. Fiscal challenges—ranging from the contentious debate over the U.S. debt ceiling to the ongoing sovereign debt woes of Greece and the peripheral European nations—were at the forefront of investors’ worries. The mounting fear and uncertainty led to a spike in financial market volatility.
The benchmark posted solid returns for the six-month period, with the non-corporate part of the credit index outperforming the corporate sector. Within the corporate market, lower rated debt and longer maturity debt outperformed. Almost all corporate industries posted solid positive returns for the period. Corporate securities overall were helped by continued strong revenue and earnings growth as well as investor preference for fixed income securities over equity. By industry, utilities, consumer cyclicals, energy and consumer non-cyclicals all outperformed. Financial industries underperformed as banks, real estate investment trusts and insurance provided less robust returns than the broader corporate market. Corporates could not keep pace with the rally in Treasuries, and spreads widened by 56
basis points to end the period at 202 basis points over duration neutral Treasuries. Average yields on corporate securities declined modestly to 3.61%.
Improved financial positions of consumers, businesses and banks, along with the reduction in the housing overhang, has created conditions for a more normal growth cycle for the first time since the economic recovery started in mid-2009. Fundamentals in the U.S. corporate sector continue to be supportive. Profitability remains strong, and with near-record amounts of cash on hand, U.S. corporations have strong balance sheets. Tight post-crisis underwriting has continued to lead to improvements in corporate balance sheets. Of the 491 U.S. Standard & Poor’s (“S&P”) 500 companies that have reported Q3 earnings to date, 73% beat estimates. The blended earnings growth rate for the S&P 500 for Q3 2011 was 15.7%.
Over the past several months, however, the Corporate Income Shares Investment Team (the “Team”) has generally reduced risk in the Fund, moving closer to the benchmark as global uncertainties have risen and financial market volatility has increased. The Fund’s corporate positions are well diversified in order to mitigate idiosyncratic risk. The Team is keeping portfolio duration close to neutral and is maintaining a concentration in intermediate-maturity securities, where the steepness in yield curves is most extreme. As risk aversion abates and markets stabilize, the Team will be ready to move quickly to seize potential opportunities.
| 2 | • ALLIANCEBERNSTEIN CORPORATE INCOME SHARES |
HISTORICAL PERFORMANCE
An Important Note About Historical Performance
The investment return and principal value of an investment in the Fund will fluctuate, so that shares, when redeemed, may be worth more or less than their original cost. Performance shown on the following pages represents past performance and does not guarantee future results. Current performance may be lower or higher than the performance information shown. You may obtain performance information current to the most recent month-end by calling (800) 227-4618.
Benchmark Disclosure
The unmanaged Barclays Capital U.S. Credit Bond Index does not reflect fees and expenses associated with the active management of a fund portfolio. The Barclays Capital U.S. Credit Bond Index represents the performance of the U.S. credit securities within the U.S. fixed income market. An investor cannot invest directly in an index, and its results are not indicative of the performance for any specific investment, including the Fund.
A Word About Risk
Market Risk: The value of the Fund’s assets will fluctuate as the stock or bond market fluctuates. The value of the Fund’s investments may decline, sometimes rapidly and unpredictably, simply because of economic changes or other events that affect large portions of the market.
Credit Risk: An issuer or guarantor of a fixed income security, or the counterparty to a derivatives or other contract, may be unable or unwilling to make timely payments of interest or principal, or to otherwise honor its obligations. The issuer or guarantor may default, causing a loss of the full principal amount of a security. The degree of risk for a particular security may be reflected in its credit rating. There is the possibility that the credit rating of a fixed income security may be downgraded after purchase, which may adversely affect the value of the security. Investments in fixed income securities with lower ratings tend to have a higher probability that an issuer will default or fail to meet its payment obligations.
Interest Rate Risk: Changes in interest rates will affect the value of investments in fixed income securities. When interest rates rise, the value of investments in fixed income securities tends to fall and this decrease in value may not be offset by higher income from new investments. Interest rate risk is generally greater for fixed income securities with longer maturities or durations.
Inflation Risk: This is the risk that the value of assets or income from investments will be less in the future as inflation decreases the value of money. As inflation increases, the value of the Fund’s assets can decline as can the value of the Fund’s distributions. This risk is significantly greater for fixed income securities with longer maturities.
Foreign (Non-U.S.) Risk: Investments in securities of non-U.S. issuers may involve more risk than those of U.S. issuers. These securities may fluctuate more widely in price and may be less liquid due to adverse market, economic, political, regulatory or other factors.
Derivatives Risk: Investments in derivatives may be illiquid, difficult to price, and leveraged so that small changes may produce disproportionate losses for the Fund, and may be subject to counterparty risk to a greater degree than more traditional investments.
Management Risk: The Fund is subject to management risk because it is an actively managed investment fund. The Adviser will apply its investment techniques and risk analyses in making investment decisions, but there is no guarantee that its techniques will produce the intended results.
These risks are fully discussed in the Fund’s prospectus.
(Historical Performance continued on next page)
| ALLIANCEBERNSTEIN CORPORATE INCOME SHARES • | 3 |
Historical Performance
HISTORICAL PERFORMANCE
(continued from previous page)
| THE FUND VS. ITS BENCHMARK PERIODS ENDED OCTOBER 31, 2011 | NAV Returns | |||||||||
| 6 Months | 12 Months | |||||||||
AllianceBernstein Corporate Income Shares | 3.28% | 5.41% | ||||||||
| ||||||||||
Barclays Capital U.S. Credit Bond Index | 5.36% | 5.95% | ||||||||
| ||||||||||
| AVERAGE ANNUAL RETURNS AS OF OCTOBER 31, 2011 | ||||
| NAV Returns | ||||
1 Year | 5.41 | % | ||
Since Inception* | 7.37 | % | ||
| SEC AVERAGE ANNUAL RETURNS (WITH ANY APPLICABLE SALES CHARGES) AS OF THE MOST RECENT CALENDAR QUARTER-END (SEPTEMBER 30, 2011) | ||||
| SEC Returns | ||||
1 Year | 4.57 | % | ||
Since Inception* | 7.29 | % | ||
The prospectus fee table shows the fees and the total fund operating expenses of the Fund as 0.00% because the Adviser does not charge any fees or expenses and reimburses Fund operating expenses. Participants in a wrap fee program eligible to invest in the Fund pay fees to the program sponsor and should review the wrap program brochure provided by the sponsor for a discussion of fees and expenses charged.
| * | Inception date: 12/11/06. |
See Historical Performance and Benchmark disclosures on previous page.
(Historical Performance continued on next page)
| 4 | • ALLIANCEBERNSTEIN CORPORATE INCOME SHARES |
Historical Performance
FUND EXPENSES
(unaudited)
As a shareholder of the Fund, you may incur various ongoing non-operating and extraordinary costs. This example is intended to help you understand your ongoing costs (in dollars) of investing in the Fund and to compare these costs with the ongoing costs of investing in other mutual funds.
The Example is based on an investment of $1,000 invested at the beginning of the period and held for the entire period as indicated below.
Actual Expenses
The table below provides information about actual account values and actual expenses. You may use the information in this line, together with the amount you invested, to estimate the expenses that you paid over the period. Simply divide your account value by $1,000 (for example, an $8,600 account value divided by $1,000 = 8.6), then multiply the result by the number in the first line under the heading entitled “Expenses Paid During Period” to estimate the expenses you paid on your account during this period.
Hypothetical Example for Comparison Purposes
The table below provides information about hypothetical account values and hypothetical expenses based on the Fund’s actual expense ratio and an assumed annual rate of return of 5% before expenses, which is not the Fund’s actual return. The hypothetical account values and expenses may not be used to estimate the actual ending account balance or expenses you paid for the period. You may use this information to compare the ongoing costs of investing in the Fund and other funds by comparing this 5% hypothetical example with the 5% hypothetical examples that appear in the shareholder reports of other funds.
Please note that the expenses shown in the table are meant to highlight your ongoing costs only and do not reflect any transactional costs, such as sales charges (loads), or contingent deferred sales charges on redemptions. Therefore, the hypothetical example is useful in comparing ongoing costs only, and will not help you determine the relative total costs of owning different funds. In addition, if these transactional costs were included, your costs would have been higher.
| Beginning Account Value May 1, 2011 | Ending Account Value October 31, 2011 | Expenses Paid During Period* | Annualized Expense Ratio* | |||||||||||||||
Actual | $ | 1,000 | $ | 1,032.80 | $ | 0.00 | 0.00 | % | ||||||||||
Hypothetical** | $ | 1,000 | $ | 1,025.14 | $ | 0.00 | 0.00 | % | ||||||||||
| * | Expenses are equal to the Fund’s annualized expense ratio multiplied by the average account value over the period, multiplied by 184/366 (to reflect the one-half year period). The Fund’s operating expenses are borne by the Adviser or its affiliates. |
| ** | Assumes 5% return before expenses. |
| ALLIANCEBERNSTEIN CORPORATE INCOME SHARES • | 5 |
Fund Expenses
PORTFOLIO SUMMARY
October 31, 2011 (unaudited)
PORTFOLIO STATISTICS
Net Assets ($mil): $28.4
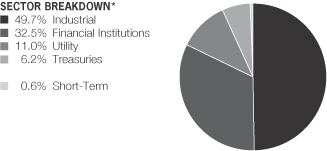
| * | All data are as of October 31, 2011. The Portfolio’s sector breakdown is expressed as a percentage of total investments and may vary over time. |
Please note: The issuer classifications presented herein are based on the Barclays Capital Fixed Income Indices developed by Barclays Capital. The Portfolio components are divided either into duration, country, bond ratings or corporate sectors as classified by Barclays Capital. These sector classifications are broadly defined. The “Portfolio of Investments” section of the report reflects more specific industry information and is consistent with the investment restrictions discussed in the Portfolio’s prospectus.
| 6 | • ALLIANCEBERNSTEIN CORPORATE INCOME SHARES |
Portfolio Summary
PORTFOLIO OF INVESTMENTS
October 31, 2011 (unaudited)
| Principal Amount (000) | U.S. $ Value | |||||||
| ||||||||
CORPORATES - INVESTMENT GRADES – 87.2% | ||||||||
Industrial – 46.0% | ||||||||
Basic – 4.6% | ||||||||
Air Products & Chemicals, Inc. | $ | 40 | $ | 39,976 | ||||
AngloGold Ashanti Holdings PLC | 90 | 88,393 | ||||||
ArcelorMittal | 145 | 148,932 | ||||||
Commercial Metals Co. | 80 | 81,157 | ||||||
Dow Chemical Co. (The) | 95 | 120,111 | ||||||
EI du Pont de Nemours & Co. | 60 | 69,086 | ||||||
International Paper Co. | 150 | 180,033 | ||||||
Lubrizol Corp. | 95 | 129,055 | ||||||
Mosaic Co. (The) | 80 | 83,262 | ||||||
Packaging Corp. of America | 95 | 101,903 | ||||||
PPG Industries, Inc. | 45 | 54,964 | ||||||
Teck Resources Ltd. | 90 | 98,317 | ||||||
Vale Overseas Ltd. | 100 | 111,530 | ||||||
|
| |||||||
| 1,306,719 | ||||||||
|
| |||||||
Capital Goods – 4.8% | ||||||||
BAE Systems PLC | 30 | 30,295 | ||||||
Boeing Capital Corp. | 50 | 50,948 | ||||||
Boeing Co. (The) | 20 | 23,088 | ||||||
Caterpillar, Inc. | 280 | 405,415 | ||||||
CRH America, Inc. | 130 | 135,743 | ||||||
General Electric Co. | 150 | 170,897 | ||||||
Honeywell International, Inc. | 40 | 46,964 | ||||||
Ingersoll-Rand Global Holding Co., Ltd. | 85 | 99,921 | ||||||
| ALLIANCEBERNSTEIN CORPORATE INCOME SHARES • | 7 |
Portfolio of Investments
| Principal Amount (000) | U.S. $ Value | |||||||
| ||||||||
John Deere Capital Corp. | $ | 89 | $ | 91,181 | ||||
Owens Corning | 70 | 82,798 | ||||||
Republic Services, Inc. | 145 | 166,667 | ||||||
United Technologies Corp. | 50 | 61,032 | ||||||
|
| |||||||
| 1,364,949 | ||||||||
|
| |||||||
Communications - Media – 5.9% | ||||||||
CBS Corp. | 4 | 4,139 | ||||||
7.875%, 7/30/30 | 85 | 112,241 | ||||||
Comcast Cable Communications Holdings, Inc. | 110 | 158,128 | ||||||
COX Communications, Inc. | 135 | 155,485 | ||||||
DirecTV Holdings LLC/DirecTV Financing Co., Inc. | 155 | 168,199 | ||||||
Grupo Televisa SAB | 100 | 111,550 | ||||||
News America, Inc. | 125 | 161,493 | ||||||
Omnicom Group, Inc. | 115 | 132,365 | ||||||
Reed Elsevier Capital, Inc. | 75 | 93,447 | ||||||
TCI Communications, Inc. | 150 | 196,262 | ||||||
Time Warner Cable, Inc. | 100 | 103,667 | ||||||
6.75%, 7/01/18 | 125 | 148,903 | ||||||
WPP Finance UK | 100 | 114,321 | ||||||
|
| |||||||
| 1,660,200 | ||||||||
|
| |||||||
Communications - Telecommunications – 7.3% | ||||||||
American Tower Corp. | 100 | 118,280 | ||||||
Ameritech Capital Funding Corp. | 280 | 303,962 | ||||||
Bellsouth Capital Funding Corp. | 395 | 481,637 | ||||||
British Telecommunications PLC | 75 | 109,787 | ||||||
Cellco Partnership/Verizon Wireless Capital LLC | 55 | 74,364 | ||||||
| 8 | • ALLIANCEBERNSTEIN CORPORATE INCOME SHARES |
Portfolio of Investments
| Principal Amount (000) | U.S. $ Value | |||||||
| ||||||||
Deutsche Telekom International Finance BV | $ | 190 | $ | 203,409 | ||||
Embarq Corp. | 29 | 31,429 | ||||||
France Telecom SA | 30 | 30,907 | ||||||
Qwest Corp. | 55 | 61,050 | ||||||
Telecom Italia Capital SA | 170 | 172,686 | ||||||
United States Cellular Corp. | 65 | 62,951 | ||||||
Verizon New York, Inc. | 290 | 352,890 | ||||||
Vodafone Group PLC | 60 | 66,049 | ||||||
|
| |||||||
| 2,069,401 | ||||||||
|
| |||||||
Consumer Cyclical - Automotive – 0.8% | ||||||||
Harley-Davidson Funding Corp. | 60 | 65,401 | ||||||
Johnson Controls, Inc. | 105 | 117,525 | ||||||
Toyota Motor Credit Corp. | 50 | 50,208 | ||||||
|
| |||||||
| 233,134 | ||||||||
|
| |||||||
Consumer Cyclical - Entertainment – 1.4% | ||||||||
Time Warner, Inc. | 60 | 64,810 | ||||||
Turner Broadcasting System, Inc. | 165 | 183,356 | ||||||
Viacom, Inc. | 125 | 144,224 | ||||||
|
| |||||||
| 392,390 | ||||||||
|
| |||||||
Consumer Cyclical - Restaurants – 0.2% | ||||||||
McDonald’s Corp. | 50 | 59,662 | ||||||
|
| |||||||
Consumer Cyclical - Retailers – 2.7% | ||||||||
AutoZone, Inc. | 110 | 122,317 | ||||||
CVS Caremark Corp. | 160 | 195,149 | ||||||
Home Depot, Inc. | 80 | 87,440 | ||||||
Kohl’s Corp. | 85 | 101,061 | ||||||
| ALLIANCEBERNSTEIN CORPORATE INCOME SHARES • | 9 |
Portfolio of Investments
| Principal Amount (000) | U.S. $ Value | |||||||
| ||||||||
Wal-Mart Stores, Inc. | $ | 240 | $ | 269,883 | ||||
|
| |||||||
| 775,850 | ||||||||
|
| |||||||
Consumer Non-Cyclical – 7.2% | ||||||||
Abbott Laboratories | 65 | 71,440 | ||||||
Ahold Finance USA LLC | 75 | 93,475 | ||||||
Altria Group, Inc. | 65 | 86,408 | ||||||
9.70%, 11/10/18 | 75 | 100,802 | ||||||
Anheuser-Busch InBev Worldwide, Inc. | 120 | 134,674 | ||||||
Beam, Inc. | 18 | 19,299 | ||||||
Bristol-Myers Squibb Co. | 20 | 23,721 | ||||||
Coca-Cola Co. (The) | 75 | 77,709 | ||||||
ConAgra Foods, Inc. | 100 | 136,178 | ||||||
Delhaize Group SA | 100 | 103,153 | ||||||
Eli Lilly & Co. | 20 | 23,120 | ||||||
GlaxoSmithKline Capital, Inc. | 70 | 83,891 | ||||||
Johnson & Johnson | 70 | 76,980 | ||||||
Kimberly-Clark Corp. | 30 | 36,302 | ||||||
Kraft Foods, Inc. | 150 | 172,885 | ||||||
McKesson Corp. | 105 | 135,653 | ||||||
Merck & Co., Inc. | 100 | 109,299 | ||||||
Novartis Securities Investment Ltd. | 45 | 52,887 | ||||||
PepsiCo, Inc./NC | 160 | 163,346 | ||||||
Pfizer, Inc. | 140 | 175,452 | ||||||
Procter & Gamble Co. (The) | 50 | 58,277 | ||||||
6.45%, 1/15/26 | 20 | 25,915 | ||||||
Reynolds American, Inc. | 70 | 80,968 | ||||||
| 10 | • ALLIANCEBERNSTEIN CORPORATE INCOME SHARES |
Portfolio of Investments
| Principal Amount (000) | U.S. $ Value | |||||||
| ||||||||
Whirlpool Corp. | $ | 10 | $ | 11,332 | ||||
|
| |||||||
| 2,053,166 | ||||||||
|
| |||||||
Energy – 5.1% | ||||||||
Anadarko Petroleum Corp. | 105 | 120,668 | ||||||
ConocoPhillips | 100 | 123,668 | ||||||
Encana Corp. | 130 | 137,541 | ||||||
Hess Corp. | 64 | 87,078 | ||||||
Marathon Petroleum Corp. | 10 | 10,258 | ||||||
5.125%, 3/01/21(a) | 17 | 18,373 | ||||||
Nabors Industries, Inc. | 64 | 80,601 | ||||||
Nexen, Inc. | 20 | 24,211 | ||||||
Noble Energy, Inc. | 98 | 128,929 | ||||||
Noble Holding International Ltd. | 90 | 97,616 | ||||||
Petro-Canada | 135 | 159,131 | ||||||
Shell International Finance BV | 75 | 85,374 | ||||||
Talisman Energy, Inc. | 40 | 49,765 | ||||||
Transocean, Inc. | 100 | 111,525 | ||||||
Valero Energy Corp. | 65 | 84,938 | ||||||
Weatherford International Ltd./Bermuda | 90 | 117,362 | ||||||
|
| |||||||
| 1,437,038 | ||||||||
|
| |||||||
Services – 0.4% | ||||||||
Western Union Co. (The) | 100 | 111,782 | ||||||
|
| |||||||
Technology – 4.1% | ||||||||
Agilent Technologies, Inc. | 13 | 14,171 | ||||||
Cisco Systems, Inc. | 70 | 78,762 | ||||||
4.95%, 2/15/19 | 35 | 40,211 | ||||||
Computer Sciences Corp. | 125 | 129,948 | ||||||
| ALLIANCEBERNSTEIN CORPORATE INCOME SHARES • | 11 |
Portfolio of Investments
| Principal Amount (000) | U.S. $ Value | |||||||
| ||||||||
Harris Corp. | $ | 90 | $ | 99,714 | ||||
Hewlett-Packard Co. | 60 | 60,807 | ||||||
4.375%, 9/15/21 | 75 | 78,676 | ||||||
Intel Corp. | 70 | 72,242 | ||||||
International Business Machines Corp. | 100 | 101,084 | ||||||
8.375%, 11/01/19 | 85 | 119,290 | ||||||
Microsoft Corp. | 70 | 79,070 | ||||||
Oracle Corp. | 105 | 122,479 | ||||||
Science Applications International Corp. | 50 | 51,623 | ||||||
Xerox Corp. | 105 | 117,813 | ||||||
|
| |||||||
| 1,165,890 | ||||||||
|
| |||||||
Transportation - Airlines – 0.3% | ||||||||
Southwest Airlines Co. | 65 | 69,577 | ||||||
|
| |||||||
Transportation - Railroads – 0.5% | ||||||||
Canadian Pacific Railway Co. | 80 | 98,079 | ||||||
Union Pacific Corp. | 40 | 42,296 | ||||||
|
| |||||||
| 140,375 | ||||||||
|
| |||||||
Transportation - Services – 0.7% | ||||||||
Asciano Finance Ltd. | 39 | 41,463 | ||||||
FedEx Corp. | 40 | 51,943 | ||||||
Ryder System, Inc. | 28 | 32,166 | ||||||
United Parcel Service, Inc. | 70 | 72,842 | ||||||
|
| |||||||
| 198,414 | ||||||||
|
| |||||||
| 13,038,547 | ||||||||
|
| |||||||
Financial Institutions – 30.9% | ||||||||
Banking – 16.3% | ||||||||
American Express Bank FSB | 135 | 142,706 | ||||||
Bank of America Corp. | 200 | 188,086 | ||||||
| 12 | • ALLIANCEBERNSTEIN CORPORATE INCOME SHARES |
Portfolio of Investments
| Principal Amount (000) | U.S. $ Value | |||||||
| ||||||||
Bank of New York Mellon Corp. (The) | $ | 70 | $ | 70,143 | ||||
Barclays Bank PLC | 110 | 114,464 | ||||||
BB&T Corp. | 30 | 32,819 | ||||||
6.85%, 4/30/19 | 80 | 97,028 | ||||||
Bear Stearns Cos. LLC (The) | 260 | 273,048 | ||||||
Capital One Financial Corp. | 168 | 178,400 | ||||||
Citigroup, Inc. | 170 | 171,280 | ||||||
5.00%, 9/15/14 | 305 | 310,792 | ||||||
6.125%, 8/25/36 | 115 | 112,042 | ||||||
Countrywide Financial Corp. | 253 | 247,201 | ||||||
Fifth Third Bancorp | 105 | 111,391 | ||||||
Goldman Sachs Group, Inc. (The) | 285 | 300,148 | ||||||
6.125%, 2/15/33 | 205 | 207,270 | ||||||
HSBC Bank USA NA/New York NY | 145 | 150,157 | ||||||
JPMorgan Chase & Co. | 175 | 180,261 | ||||||
4.95%, 3/25/20 | 145 | 152,045 | ||||||
Merrill Lynch & Co., Inc. | 100 | 87,901 | ||||||
Morgan Stanley | 350 | 348,173 | ||||||
7.25%, 4/01/32 | 105 | 115,962 | ||||||
Royal Bank of Scotland PLC (The) | 145 | 153,114 | ||||||
SouthTrust Corp. | 145 | 155,832 | ||||||
State Street Corp. | 95 | 108,249 | ||||||
SunTrust Banks, Inc. | 95 | 97,317 | ||||||
UBS AG/Stamford CT | 170 | 186,105 | ||||||
Unicredit Luxembourg Finance SA | 100 | 81,367 | ||||||
Wells Fargo & Co. | 240 | 252,128 | ||||||
|
| |||||||
| 4,625,429 | ||||||||
|
| |||||||
| ALLIANCEBERNSTEIN CORPORATE INCOME SHARES • | 13 |
Portfolio of Investments
| Principal Amount (000) | U.S. $ Value | |||||||
| ||||||||
Brokerage – 0.7% | ||||||||
Jefferies Group, Inc. | $ | 95 | $ | 102,331 | ||||
Schwab Capital Trust I | 95 | 96,371 | ||||||
|
| |||||||
| 198,702 | ||||||||
|
| |||||||
Finance – 3.0% | ||||||||
GE Capital Trust I | 345 | 340,474 | ||||||
General Electric Capital Corp. | 235 | 261,627 | ||||||
HSBC Finance Capital Trust IX | 170 | 149,600 | ||||||
SLM Corp. | 110 | 107,525 | ||||||
|
| |||||||
| 859,226 | ||||||||
|
| |||||||
Insurance – 8.8% | ||||||||
Aflac, Inc. | 15 | 15,353 | ||||||
Allstate Corp. (The) | 28 | 25,830 | ||||||
American International Group, Inc. | 40 | 41,894 | ||||||
AON Corp. | 65 | 66,011 | ||||||
Assurant, Inc. | 70 | 72,893 | ||||||
Berkshire Hathaway Finance Corp. | 165 | 188,597 | ||||||
Berkshire Hathaway, Inc. | 200 | 203,556 | ||||||
Chubb Corp. (The) | 80 | 94,131 | ||||||
CIGNA Corp. | 65 | 79,205 | ||||||
Coventry Health Care, Inc. | 95 | 104,329 | ||||||
Genworth Financial, Inc. | 55 | 49,635 | ||||||
Guardian Life Insurance Co. of America | 75 | 95,181 | ||||||
Hartford Financial Services Group, Inc. | 45 | 42,574 | ||||||
Lincoln National Corp. | 82 | 100,048 | ||||||
Markel Corp. | 90 | 103,152 | ||||||
| 14 | • ALLIANCEBERNSTEIN CORPORATE INCOME SHARES |
Portfolio of Investments
| Principal Amount (000) | U.S. $ Value | |||||||
| ||||||||
Metlife Capital Trust IV | $ | 150 | $ | 158,797 | ||||
Nationwide Mutual Insurance Co. | 80 | 98,155 | ||||||
OneBeacon US Holdings, Inc. | 38 | 38,936 | ||||||
Principal Financial Group, Inc. | 60 | 68,238 | ||||||
Prudential Financial, Inc. | 195 | 204,739 | ||||||
Swiss Re Solutions Holding Corp. | 90 | 98,133 | ||||||
Travelers Cos., Inc. (The) | 120 | 142,094 | ||||||
UnitedHealth Group, Inc. | 140 | 154,434 | ||||||
WellPoint, Inc. | 20 | 23,051 | ||||||
7.00%, 2/15/19 | 110 | 136,353 | ||||||
XL Group PLC | 75 | 77,636 | ||||||
|
| |||||||
| 2,482,955 | ||||||||
|
| |||||||
REITS – 2.1% | ||||||||
Duke Realty LP | 55 | 59,844 | ||||||
ERP Operating LP | 115 | 124,067 | ||||||
HCP, Inc. | 105 | 110,967 | ||||||
Health Care REIT, Inc. | 85 | 91,060 | ||||||
Kimco Realty Corp. | 80 | 80,300 | ||||||
Regency Centers LP | 110 | 120,800 | ||||||
|
| |||||||
| 587,038 | ||||||||
|
| |||||||
| 8,753,350 | ||||||||
|
| |||||||
Utility – 10.3% | ||||||||
Electric – 6.0% | ||||||||
Allegheny Energy Supply Co. LLC | 40 | 41,194 | ||||||
Ameren Corp. | 85 | 96,165 | ||||||
Carolina Power & Light Co. | 70 | 82,460 | ||||||
| ALLIANCEBERNSTEIN CORPORATE INCOME SHARES • | 15 |
Portfolio of Investments
| Principal Amount (000) | U.S. $ Value | |||||||
| ||||||||
Consolidated Edison Co. of New York, Inc. | $ | 40 | $ | 50,013 | ||||
Constellation Energy Group, Inc. | 90 | 94,556 | ||||||
Consumers Energy Co. | 105 | 111,263 | ||||||
Dominion Resources, Inc./VA | 235 | 199,014 | ||||||
DTE Energy Co. | 130 | 150,240 | ||||||
Enersis SA/Cayman Island | 70 | 82,277 | ||||||
FirstEnergy Corp. | 107 | 134,491 | ||||||
Integrys Energy Group, Inc. | 120 | 114,600 | ||||||
Nevada Power Co. | 85 | 105,632 | ||||||
Nisource Finance Corp. | 105 | 113,763 | ||||||
Oncor Electric Delivery Co. LLC | 115 | 139,224 | ||||||
Potomac Electric Power Co. | 65 | 84,686 | ||||||
PSEG Power LLC | 23 | 23,609 | ||||||
Teco Finance, Inc. | 70 | 83,371 | ||||||
|
| |||||||
| 1,706,558 | ||||||||
|
| |||||||
Natural Gas – 4.3% | ||||||||
AGL Capital Corp. | 105 | 117,154 | ||||||
CenterPoint Energy Resources Corp. | 99 | 104,137 | ||||||
Colorado Interstate Gas Co. | 15 | 17,298 | ||||||
Enbridge Energy Partners LP | 100 | 104,730 | ||||||
Energy Transfer Partners LP | 120 | 132,568 | ||||||
Enterprise Products Operating LLC | 150 | 167,337 | ||||||
EQT Corp. | 80 | 95,187 | ||||||
| 16 | • ALLIANCEBERNSTEIN CORPORATE INCOME SHARES |
Portfolio of Investments
| Principal Amount (000) | U.S. $ Value | |||||||
| ||||||||
Kinder Morgan Energy Partners LP | $ | 50 | $ | 52,268 | ||||
7.40%, 3/15/31 | 95 | 114,908 | ||||||
Plains All American Pipeline LP/PAA | 25 | 32,017 | ||||||
Spectra Energy Capital LLC | 70 | 87,932 | ||||||
Spectra Energy Partners LP | 75 | 76,902 | ||||||
Williams Partners LP | 115 | 127,067 | ||||||
|
| |||||||
| 1,229,505 | ||||||||
|
| |||||||
| 2,936,063 | ||||||||
|
| |||||||
Total Corporates - Investment Grades | 24,727,960 | |||||||
|
| |||||||
GOVERNMENTS - TREASURIES – 6.0% | ||||||||
United States – 6.0% | ||||||||
U.S. Treasury Bonds | 70 | 77,350 | ||||||
4.625%, 2/15/40 | 930 | 1,183,715 | ||||||
5.375%, 2/15/31 | 330 | 448,852 | ||||||
|
| |||||||
Total Governments - Treasuries | 1,709,917 | |||||||
|
| |||||||
CORPORATES - NON-INVESTMENT GRADES – 3.2% | ||||||||
Industrial – 2.2% | ||||||||
Basic – 0.7% | ||||||||
United States Steel Corp. | 105 | 97,650 | ||||||
Weyerhaeuser Co. | 90 | 100,871 | ||||||
|
| |||||||
| 198,521 | ||||||||
|
| |||||||
Capital Goods – 0.7% | ||||||||
Mohawk Industries, Inc. | 100 | 104,750 | ||||||
Textron Financial Corp. | 95 | 97,360 | ||||||
|
| |||||||
| 202,110 | ||||||||
|
| |||||||
Consumer Cyclical - Other – 0.6% | ||||||||
Toll Brothers Finance Corp. | 155 | 158,712 | ||||||
|
| |||||||
| ALLIANCEBERNSTEIN CORPORATE INCOME SHARES • | 17 |
Portfolio of Investments
| Principal Amount (000) | U.S. $ Value | |||||||
| ||||||||
Consumer Non-Cyclical – 0.2% | ||||||||
Universal Health Services, Inc. | $ | 65 | $ | 70,200 | ||||
|
| |||||||
| 629,543 | ||||||||
|
| |||||||
Financial Institutions – 0.7% | ||||||||
Banking – 0.5% | ||||||||
BankAmerica Capital II | 137 | 124,670 | ||||||
|
| |||||||
Finance – 0.2% | ||||||||
International Lease Finance Corp. | 65 | 64,025 | ||||||
|
| |||||||
| 188,695 | ||||||||
|
| |||||||
Utility – 0.3% | ||||||||
Electric – 0.3% | ||||||||
PPL Capital Funding, Inc. | 105 | 101,325 | ||||||
|
| |||||||
Total Corporates - Non-Investment Grades | 919,563 | |||||||
|
| |||||||
SHORT-TERM INVESTMENTS – 0.6% | ||||||||
Time Deposit – 0.6% | ||||||||
State Street Time Deposit | 159 | 159,257 | ||||||
|
| |||||||
Total Investments – 97.0% | 27,516,697 | |||||||
Other assets less liabilities – 3.0% | 858,508 | |||||||
|
| |||||||
Net Assets – 100.0% | $ | 28,375,205 | ||||||
|
| |||||||
| (a) | Security is exempt from registration under Rule 144A of the Securities Act of 1933. These securities are considered liquid and may be resold in transactions exempt from registration, normally to qualified institutional buyers. At October 31, 2011, the aggregate market value of these securities amounted to $956,940 or 3.4% of net assets. |
| (b) | Coupon rate adjusts periodically based upon a predetermined schedule. Stated interest rate in effect at October 31, 2011. |
| (c) | Floating Rate Security. Stated interest rate was in effect at October 31, 2011. |
Glossary:
REIT – Real Estate Investment Trust
See notes to financial statements.
| 18 | • ALLIANCEBERNSTEIN CORPORATE INCOME SHARES |
Portfolio of Investments
STATEMENT OF ASSETS & LIABILITIES
October 31, 2011 (unaudited)
| Assets | ||||
Investments in securities, at value (cost $26,117,567) | $ | 27,516,697 | ||
Receivable for investment securities sold | 617,993 | |||
Interest receivable | 389,536 | |||
Receivable for shares of beneficial interest sold | 49,178 | |||
|
| |||
Total assets | 28,573,404 | |||
|
| |||
| Liabilities | ||||
Payable for investment securities purchased | 139,041 | |||
Dividends payable | 38,908 | |||
Payable for shares of beneficial interest redeemed | 20,250 | |||
|
| |||
Total liabilities | 198,199 | |||
|
| |||
Net Assets | $ | 28,375,205 | ||
|
| |||
| Composition of Net Assets | ||||
Shares of beneficial interest, at par | $ | 27 | ||
Additional paid-in capital | 30,097,464 | |||
Undistributed net investment income | 74,130 | |||
Accumulated net realized loss on investment transactions | (3,195,546 | ) | ||
Net unrealized appreciation on investments | 1,399,130 | |||
|
| |||
| $ | 28,375,205 | |||
|
| |||
Net Asset Value Per Share—unlimited shares of beneficial interest authorized, $.00001 par value (based on 2,658,309 common shares outstanding) | $ | 10.67 | ||
|
|
See notes to financial statements.
| ALLIANCEBERNSTEIN CORPORATE INCOME SHARES • | 19 | �� |
Statement of Assets & Liabilities
STATEMENT OF OPERATIONS
Six Months Ended October 31, 2011 (unaudited)
| Investment Income | ||||
Interest | $ | 717,567 | ||
|
| |||
| Realized and Unrealized Gain (Loss) on Investment Transactions | ||||
Net realized gain on investment transactions | 455,571 | |||
Net change in unrealized appreciation/depreciation of investments | (214,101 | ) | ||
|
| |||
Net gain on investment transactions | 241,470 | |||
|
| |||
Net Increase in Net Assets from Operations | $ | 959,037 | ||
|
|
See notes to financial statements.
| 20 | • ALLIANCEBERNSTEIN CORPORATE INCOME SHARES |
Statement of Operations
STATEMENT OF CHANGES IN NET ASSETS
| Six Months Ended October 31, 2011 (unaudited) | Year Ended April 30, 2011 | |||||||
| Increase (Decrease) in Net Assets from Operations | ||||||||
Net investment income | $ | 717,567 | $ | 1,634,477 | ||||
Net realized gain on investment transactions | 455,571 | 544,041 | ||||||
Net change in unrealized appreciation/depreciation of investments | (214,101 | ) | 335,843 | |||||
|
|
|
| |||||
Net increase in net assets from operations | 959,037 | 2,514,361 | ||||||
| Dividends to Shareholders from | ||||||||
Net investment income | (717,567 | ) | (1,634,477 | ) | ||||
| Transactions in Shares of Beneficial Interest | ||||||||
Net decrease | (1,385,991 | ) | (5,401,097 | ) | ||||
|
|
|
| |||||
Total decrease | (1,144,521 | ) | (4,521,213 | ) | ||||
| Net Assets | ||||||||
Beginning of period | 29,519,726 | 34,040,939 | ||||||
|
|
|
| |||||
End of period (including undistributed net investment income of $74,130 and $74,130, respectively) | $ | 28,375,205 | $ | 29,519,726 | ||||
|
|
|
| |||||
See notes to financial statements.
| ALLIANCEBERNSTEIN CORPORATE INCOME SHARES • | 21 |
Statement of Changes in Net Assets
NOTES TO FINANCIAL STATEMENTS
October 31, 2011 (unaudited)
NOTE A
Significant Accounting Policies
AllianceBernstein Corporate Shares (the “Trust”) was organized as a Massachusetts business trust under the laws of The Commonwealth of Massachusetts by an Agreement and Declaration of Trust (“Declaration of Trust”) dated January 26, 2004. The Trust is registered under the Investment Company Act of 1940, as an open-end, diversified management investment company. The Trust operates as a “series” company currently having five separate portfolios: AllianceBernstein Corporate Income Shares (the “Portfolio”), AllianceBernstein Municipal Income Shares, AllianceBernstein Taxable Multi-Sector Income Shares, AllianceBernstein Tax-Aware Real Return Income Shares and AllianceBernstein International Focus Shares. Each Portfolio is considered to be a separate entity for financial reporting and tax purposes. AllianceBernstein Corporate Income Shares commenced operations on December 11, 2006. AllianceBernstein Municipal Income Shares commenced operations on September 1, 2010. AllianceBernstein Taxable Multi-Sector Income Shares commenced operations on September 15, 2010. AllianceBernstein Tax-Aware Real Return Income Shares commenced operations on May 2, 2011. AllianceBernstein International Focus Shares commenced operations on June 20, 2011. This report relates only to AllianceBernstein Corporate Income Shares. Prior to the commencement of investment operations on December 11, 2006, the Portfolio had no operations other than the sale to the Adviser of 10,000 Portfolio shares for $10 each for the aggregate amount of $100,000 on May 17, 2006.
Shares of the Portfolio are offered exclusively to holders of accounts established under wrap-fee programs sponsored and maintained by certain registered investment advisers approved by AllianceBernstein L.P. (the “Adviser”). The Portfolio’s shares may be purchased at the relevant net asset value without a sales charge or other fee. The financial statements have been prepared in conformity with U.S. generally accepted accounting principles (“U.S. GAAP”) which require management to make certain estimates and assumptions that affect the reported amounts of assets and liabilities in the financial statements and amounts of income and expenses during the reporting period. Actual results could differ from those estimates. The following is a summary of significant accounting policies followed by the Portfolio.
1. Security Valuation
Portfolio securities are valued at their current market value determined on the basis of market quotations or, if market quotations are not readily available or are deemed unreliable, at “fair value” as determined in accordance with procedures established by and under the general supervision of the Trust’s Board of Trustees.
In general, the market value of securities which are readily available and deemed reliable are determined as follows: Securities listed on a national securities exchange (other than securities listed on the NASDAQ Stock Market, Inc.
| 22 | • ALLIANCEBERNSTEIN CORPORATE INCOME SHARES |
Notes to Financial Statements
(“NASDAQ”)) or on a foreign securities exchange are valued at the last sale price at the close of the exchange or foreign securities exchange. If there has been no sale on such day, the securities are valued at the mean of the closing bid and ask prices on such day. Securities listed on more than one exchange are valued by reference to the principal exchange on which the securities are traded; securities listed only on NASDAQ are valued in accordance with the NASDAQ Official Closing Price; listed or over the counter market (“OTC”) put or call options are valued at the mid level between the current bid and ask prices. If either a current bid or current ask price is unavailable, AllianceBernstein L.P. (the “Adviser”) will have discretion to determine the best valuation (e.g. last trade price); open futures contracts and options thereon are valued using the closing settlement price or, in the absence of such a price, the most recent quoted bid price. If there are no quotations available for the day of valuation, the last available closing settlement price is used; U.S. government securities and other debt instruments having 60 days or less remaining until maturity are valued at amortized cost if their original maturity was 60 days or less; or by amortizing their fair value as of the 61st day prior to maturity if their original term to maturity exceeded 60 days; fixed-income securities, including mortgage backed and asset backed securities, may be valued on the basis of prices provided by a pricing service or at a price obtained from one or more of the major broker/dealers. In cases where broker/dealer quotes are obtained, the Adviser may establish procedures whereby changes in market yields or spreads are used to adjust, on a daily basis, a recently obtained quoted price on a security; and swaps and other derivatives are valued daily, primarily using independent pricing services, independent pricing models using market inputs, as well as third party broker-dealers or counterparties, which are approved by the Board of Trustees. Investments in money market funds are valued at their net asset value each day.
Securities for which market quotations are not readily available (including restricted securities) or are deemed unreliable are valued at fair value. Factors considered in making this determination may include, but are not limited to, information obtained by contacting the issuer, analysts, analysis of the issuer’s financial statements or other available documents. In addition, the Portfolio may use fair value pricing for securities primarily traded in non-U.S. markets because most foreign markets close well before the Portfolio values its securities at 4:00 p.m., Eastern Time. The earlier close of these foreign markets gives rise to the possibility that significant events, including broad market moves, may have occurred in the interim and may materially affect the value of those securities.
2. Fair Value Measurements
In accordance with U.S. GAAP regarding fair value measurements, fair value is defined as the price that the Portfolio would receive to sell an asset or pay to transfer a liability in an orderly transaction between market participants at the measurement date. The U.S. GAAP disclosure requirements establish a framework for measuring fair value, and a three-level hierarchy for fair value
| ALLIANCEBERNSTEIN CORPORATE INCOME SHARES • | 23 |
Notes to Financial Statements
measurements based upon the transparency of inputs to the valuation of an asset or liability. Inputs may be observable or unobservable and refer broadly to the assumptions that market participants would use in pricing the asset or liability. Observable inputs reflect the assumptions market participants would use in pricing the asset or liability based on market data obtained from sources independent of the Portfolio. Unobservable inputs reflect the Portfolio’s own assumptions about the assumptions that market participants would use in pricing the asset or liability based on the best information available in the circumstances. Each investment is assigned a level based upon the observability of the inputs which are significant to the overall valuation. The three-tier hierarchy of inputs is summarized below.
| • | Level 1—quoted prices in active markets for identical investments |
| • | Level 2—other significant observable inputs (including quoted prices for similar investments, interest rates, prepayment speeds, credit risk, etc.) |
| • | Level 3—significant unobservable inputs (including the Portfolio’s own assumptions in determining the fair value of investments) |
The following table summarizes the valuation of the Portfolio’s investments by the above fair value hierarchy levels as of October 31, 2011:
Investments in Securities | Level 1 | Level 2 | Level 3 | Total | ||||||||||||
Assets: | ||||||||||||||||
Corporates – Investment Grades | $ | – 0 | – | $ | 24,727,960 | $ | – 0 | – | $ | 24,727,960 | ||||||
Governments – Treasuries | – 0 | – | 1,709,917 | – 0 | – | 1,709,917 | ||||||||||
Corporates – Non-Investment Grades | – 0 | – | 919,563 | – 0 | – | 919,563 | ||||||||||
Short-Term Investments | – 0 | – | 159,257 | – 0 | – | 159,257 | ||||||||||
|
|
|
|
|
|
|
| |||||||||
Total Investments in Securities | – 0 | – | 27,516,697 | – 0 | – | 27,516,697 | ||||||||||
Other Financial Instruments* | – 0 | – | – 0 | – | – 0 | – | – 0 | – | ||||||||
|
|
|
|
|
|
|
| |||||||||
Total | $ | – 0 | – | $ | 27,516,697 | $ | – 0 | – | $ | 27,516,697 | ||||||
|
|
|
|
|
|
|
| |||||||||
| * | Other financial instruments are derivative instruments, such as futures, forwards and swap contracts, which are valued at the unrealized appreciation/depreciation on the instrument. |
3. Taxes
It is the Portfolio’s policy to meet the requirements of the Internal Revenue Code applicable to regulated investment companies and to distribute all of its investment company taxable income and net realized gains, if any, to shareholders. Therefore, no provisions for federal income or excise taxes are required.
In accordance with U.S. GAAP requirements regarding accounting for uncertainties in income taxes, management has analyzed the Portfolio’s tax positions taken or expected to be taken on federal and state income tax returns for all open tax years (the current and the prior three tax years) and has concluded that no provision for income tax is required in the Portfolio’s financial statements.
| 24 | • ALLIANCEBERNSTEIN CORPORATE INCOME SHARES |
Notes to Financial Statements
4. Investment Income and Investment Transactions
Dividend income is recorded on the ex-dividend date or as soon as the Portfolio is informed of the dividend. Interest income is accrued daily. Investment transactions are accounted for on the date the securities are purchased or sold. Investment gains or losses are determined on the identified cost basis. The Portfolio amortizes premiums and accretes discounts as adjustments to interest income.
5. Dividends and Distributions
Dividends and distributions to shareholders, if any, are recorded on the ex-dividend date. Income dividends and capital gains distributions are determined in accordance with federal tax regulations and may differ from those determined in accordance with U.S. GAAP. To the extent these differences are permanent, such amounts are reclassified within the capital accounts based on their federal tax basis treatment; temporary differences do not require such reclassification.
NOTE B
Advisory Fee and Other Transactions with Affiliates
Under the terms of the Advisory Agreement, the Portfolio pays no advisory fee to the Adviser and the Adviser reimburses or pays for the Portfolio’s operating expenses. The Portfolio is an integral part of separately managed accounts in wrap-fee programs. Typically, participants in these programs pay a fee to their investment adviser for all costs and expenses of the separately managed account, including costs and expenses associated with the Portfolio. The Adviser serves as investment manager and adviser of the Portfolio and continuously furnishes an investment program for the Portfolio and manages, supervises and conducts the affairs of the Portfolio, subject to the supervisions of the Portfolio’s Board of Trustees. The Advisory Agreement provides that the Adviser or an affiliate will furnish, or pay the expenses of the Portfolio for, office space, facilities and equipment, services of executive and other personnel of the Portfolio and certain administrative services.
The Portfolio has entered into a Distribution Agreement (the “Agreement”) with AllianceBernstein Investments, Inc., the Portfolio’s principal underwriter (the “Underwriter”), to permit the Underwriter to distribute the Portfolio’s shares, which are sold at their net asset value without any sales charge. The Portfolio does not pay a fee for this service. The Underwriter is a wholly owned subsidiary of the Adviser.
AllianceBernstein Investor Services, Inc. (“ABIS”), a wholly-owned subsidiary of the Adviser, acts as the Portfolios’ registrar, transfer agent and dividend-disbursing agent. ABIS registers the transfer, issuance and redemption of Portfolio shares and disburses dividends and other distributions to Portfolio shareholders. The Portfolio does not pay a fee for this service.
| ALLIANCEBERNSTEIN CORPORATE INCOME SHARES • | 25 |
Notes to Financial Statements
NOTE C
Investment Transactions
Purchases and sales of investment securities (excluding short-term investments) for the six months ended October 31, 2011 were as follows:
| Purchases | Sales | |||||||
Investment securities (excluding U.S. government securities) | $ | 5,810,216 | $ | 7,366,317 | ||||
U.S. government securities | 3,118,616 | 2,213,077 | ||||||
The cost of investments for federal income tax purposes was substantially the same as the cost for financial reporting purposes. Accordingly, gross unrealized appreciation and unrealized depreciation are as follows:
Gross unrealized appreciation | $ | 1,589,723 | ||
Gross unrealized depreciation | (190,593 | ) | ||
|
| |||
Net unrealized appreciation | $ | 1,399,130 | ||
|
|
NOTE D
Shares of Beneficial Interest
Transactions in shares of beneficial interest were as follows:
| Shares | Amount | |||||||||||||||||||
| Six Months Ended October 31, 2011 (unaudited) | Year Ended April 30, 2011 | Six Months Ended October 31, 2011 (unaudited) | Year Ended April 30, 2011 | |||||||||||||||||
|
| |||||||||||||||||||
| Class A | ||||||||||||||||||||
Shares sold | 147,716 | 210,476 | $ | 1,574,536 | $ | 2,195,110 | ||||||||||||||
| ||||||||||||||||||||
Shares redeemed | (277,032 | ) | (727,554 | ) | (2,960,527 | ) | (7,596,207 | ) | ||||||||||||
| ||||||||||||||||||||
Net decrease | (129,316 | ) | (517,078 | ) | $ | (1,385,991 | ) | $ | (5,401,097 | ) | ||||||||||
|
|
| ||||||||||||||||||
NOTE E
Risks Involved in Investing in the Portfolio
Interest Rate Risk and Credit Risk—Interest rate risk is the risk that changes in interest rates will affect the value of an Underlying Portfolio’s investments in fixed-income debt securities such as bonds or notes. Increases in interest rates may cause the value of the Portfolio’s investments to decline. Credit risk is the risk that the issuer or guarantor of a debt security, or the counterparty to a derivative contract, will be unable or unwilling to make timely principal and/or interest payments, or to otherwise honor its obligations. The degree of risk for a particular security may be reflected in its credit risk rating. Credit risk is greater for medium quality and lower-rated securities. Lower-rated debt securities and similar unrated securities (commonly known as “junk bonds”) have speculative elements or are predominantly speculative risks.
Indemnification Risk—In the ordinary course of business, the Portfolio enters into contracts that contain a variety of indemnifications. The Portfolio’s
| 26 | • ALLIANCEBERNSTEIN CORPORATE INCOME SHARES |
Notes to Financial Statements
maximum exposure under these arrangements is unknown. However, the Portfolio has not had prior claims or losses pursuant to these indemnification provisions and expects the risk of loss thereunder to be remote. Therefore, the Portfolio has not accrued any liability in connection with these indemnification provisions.
NOTE F
Distributions to Shareholders
The tax character of distributions to be paid for the year ending April 30, 2012 will be determined at the end of the current fiscal year. The tax character of distributions paid during the fiscal years ended April 30, 2011 and April 30, 2010 were as follows:
| 2011 | 2010 | |||||||
Distributions paid from: | ||||||||
Ordinary income | $ | 1,634,477 | $ | 3,087,579 | ||||
|
|
|
| |||||
Total taxable distributions | 1,634,477 | 3,087,579 | ||||||
|
|
|
| |||||
Total distributions paid | $ | 1,634,477 | $ | 3,087,579 | ||||
|
|
|
| |||||
As of April 30, 2011, the components of accumulated earnings/(deficit) on a tax basis were as follows:
Undistributed ordinary income | $ | 115,839 | ||
Accumulated capital and other losses | (3,647,728 | )(a) | ||
Unrealized appreciation/(depreciation) | 1,609,842 | (b) | ||
|
| |||
Total accumulated earnings/(deficit) | $ | (1,922,047 | )(c) | |
|
|
| (a) | On April 30, 2011, the Fund had capital loss carryforwards of $3,647,728 of which $53,807expires in 2016, $2,193,148 expires in 2017 and $1,400,773 expires in 2018. To the extent future capital gains are offset by capital loss carryforwards, such gains will not be distributed. During the fiscal year, the Fund utilized capital loss carryforwards of $537,351. |
| (b) | The difference between book-basis and tax-basis unrealized appreciation/(depreciation) is attributable primarily to the tax deferral of losses on wash sales. |
| (c) | The difference between book-basis and tax-basis components of accumulated earnings/(deficit) is attributable primarily to dividends payable. |
On December 22, 2010, the Regulated Investment Company Modernization Act of 2010 (the “Act”) was enacted, which changed various technical rules governing the tax treatment of regulated investment companies. One important change addresses the recognition of capital loss carryforwards. Under the Act, the Portfolio will be permitted to carry forward capital losses incurred in taxable years beginning after December 22, 2010 for an unlimited period. However, any losses incurred during those future taxable years will be required to be utilized prior to the losses incurred in pre-enactment taxable years, which carry an expiration date. As a result, pre-enactment capital loss carryforwards may be more likely to expire unused. Additionally, post-enactment capital loss carryforwards will retain their character as either short-term or long-term capital
| ALLIANCEBERNSTEIN CORPORATE INCOME SHARES • | 27 |
Notes to Financial Statements
losses rather than being considered all short-term capital loss (as permitted under previous regulation).
NOTE G
Recent Accounting Pronouncement
In May 2011, the Financial Accounting Standards Board (“FASB”) issued an Accounting Standards Update (“ASU”) to develop common requirements for measuring fair value and for disclosing information about fair value measurements in U.S. GAAP and International Financial Reporting Standards (“IFRS”). The amendments are intended to improve the comparability of fair value measurements presented and disclosed in the financial statements prepared in accordance with U.S. GAAP and IFRS. The ASU is effective during interim or annual periods beginning after December 15, 2011. At this time, management is evaluating the implication of this ASU and its impact on the financial statements has not been determined.
NOTE H
Subsequent Events
Management has evaluated subsequent events for possible recognition or disclosure in the financial statements through the date the financial statements are issued. Management has determined that there are no material events that would require disclosure in the Portfolio’s financial statements through this date.
| 28 | • ALLIANCEBERNSTEIN CORPORATE INCOME SHARES |
Notes to Financial Statements
FINANCIAL HIGHLIGHTS
Selected Data For A Share Of Beneficial Interest Outstanding Throughout Each Period
| Six Months Ended October 31, 2011 (unaudited) | Year Ended April 30, | December 11, 2006(a) to April 30, 2007 | ||||||||||||||||||||||
| 2011 | 2010 | 2009 | 2008 | |||||||||||||||||||||
|
| |||||||||||||||||||||||
Net asset value, beginning of period | $ 10.59 | $ 10.30 | $ 8.25 | $ 9.56 | $ 9.89 | $ 10.00 | ||||||||||||||||||
|
| |||||||||||||||||||||||
Income From Investment Operations | ||||||||||||||||||||||||
Net investment income(b) | .26 | .54 | .59 | .57 | .56 | .21 | ||||||||||||||||||
Net realized and unrealized gain (loss) on investment transactions | .08 | .29 | 2.05 | (1.31 | ) | (.33 | ) | (.11 | ) | |||||||||||||||
|
| |||||||||||||||||||||||
Net increase (decrease) in net asset value from operations | .34 | .83 | 2.64 | (.74 | ) | .23 | .10 | |||||||||||||||||
|
| |||||||||||||||||||||||
Less: Dividends | ||||||||||||||||||||||||
Dividends from net investment income | (.26 | ) | (.54 | ) | (.59 | ) | (.57 | ) | (.56 | ) | (.21 | ) | ||||||||||||
|
| |||||||||||||||||||||||
Net asset value, end of period | $ 10.67 | $ 10.59 | $ 10.30 | $ 8.25 | $ 9.56 | $ 9.89 | ||||||||||||||||||
|
| |||||||||||||||||||||||
Total Return | ||||||||||||||||||||||||
Total investment return based on net asset value(c) | 3.28 | % | 8.28 | % | 32.72 | % | (7.76 | )% | 2.38 | % | 1.02 | % | ||||||||||||
Ratios/Supplemental Data | ||||||||||||||||||||||||
Net assets, end of period (000’s omitted) | $28,375 | $29,520 | $34,041 | $56,994 | $86,830 | $89,127 | ||||||||||||||||||
Ratio to average net assets of: | ||||||||||||||||||||||||
Net investment income | 4.94 | %(d) | 5.20 | % | 6.22 | % | 6.56 | % | 5.73 | % | 5.58 | %(d) | ||||||||||||
Portfolio turnover rate. | 32 | % | 33 | % | 21 | % | 26 | % | 58 | % | 33 | % | ||||||||||||
| (a) | Commencement of operations. |
| (b) | Based on average shares outstanding. |
| (c) | Total investment return is calculated assuming an initial investment made at the net asset value at the beginning of the period, reinvestment of all dividends and distributions at net asset value during the period, and redemption on the last day of the period. Total return does not reflect the deduction of taxes that a shareholder would pay on fund distributions or the redemption of fund shares. Total investment return calculated for a period of less than one year is not annualized. |
| (d) | Annualized. |
See notes to financial statements.
| ALLIANCEBERNSTEIN CORPORATE INCOME SHARES • | 29 |
Financial Highlights
BOARD OF TRUSTEES
| William H. Foulk, Jr.(1), Chairman | Robert M. Keith, President and Chief Executive Officer Garry L. Moody(1) Marshall C. Turner, Jr.(1) Earl D. Weiner(1) | |
| John H. Dobkin(1) | ||
| Michael J. Downey(1) | ||
D. James Guzy(1) Nancy P. Jacklin(1) |
OFFICERS
Philip L. Kirstein, Senior Vice President and Independent Compliance Officer Douglas J. Peebles, Senior Vice President Shawn E. Keegan(2), Vice President | Joel J. McKoan(2), Vice President Ashish C. Shah(2), Vice President Emilie D. Wrapp, Secretary Joseph J. Mantineo, Treasurer and Chief Financial Officer Phyllis J. Clarke, Controller |
Custodian and Accounting Agent State Street Bank and Trust Company
Principal Underwriter AllianceBernstein Investments, Inc.
Transfer Agent AllianceBernstein Investor Services, Inc. | Legal Counsel Seward & Kissel LLP One Battery Park Plaza New York, NY 10004
Independent Registered Public Accounting Firm Ernst & Young LLP 5 Times Square New York, NY 10036 |
| (1) | Member of the Audit Committee, the Governance and Nominating Committee and the Independent Directors Committee. Mr. Foulk is the sole member of the Fair Value Pricing Committee. |
| (2) | The day-to-day management of, and investment decisions for, the Trust’s portfolio are made by the Corporate Income Shares Investment Team. Messrs. Shawn E. Keegan, Joel J. McKoan and Ashish C. Shah are the investment professionals primarily responsible for the day-to-day management of the Trust’s portfolio. |
| 30 | • ALLIANCEBERNSTEIN CORPORATE INCOME SHARES |
Board of Trustees
THE FOLLOWING IS NOT PART OF THE SHAREHOLDER REPORT OR THE FINANCIAL STATEMENTS
SUMMARY OF SENIOR OFFICER’S EVALUATION OF INVESTMENT ADVISORY AGREEMENT1
The following is a summary of the evaluation of the Investment Advisory Agreement between AllianceBernstein L.P. (the “Adviser”) and The AllianceBernstein Corporate Shares (the “Trust”) with respect to AllianceBernstein Corporate Income Shares (the “Portfolio”).2 The evaluation of the Investment Advisory Agreement was prepared by Philip L. Kirstein, the Senior Officer of the Trust, for the Trustees of the Trust, as required by the September 1, 2004 Assurance of Discontinuance (“AoD”) between the Adviser and the New York State Attorney General (the “NYAG”). The Senior Officer’s evaluation of the Investment Advisory Agreement is not meant to diminish the responsibility or authority of the Board of Trustees to perform its duties pursuant to Section 15 of the Investment Company Act of 1940 Act (the “40 Act”) and applicable state law. The purpose of the summary is to provide shareholders with a synopsis of the independent evaluation of the reasonableness of the advisory fees proposed to be paid by the Portfolio which was provided to the Trustees in connection with their review of the proposed approval of the continuance of the Investment Advisory Agreement.
The Senior Officer’s evaluation considered the following factors:
| 1. | Advisory fees charged to institutional and other clients of the Adviser for like services; |
| 2. | Advisory fees charged by other mutual fund companies for like services; |
| 3. | Costs to the Adviser and its affiliates of supplying services pursuant to the advisory agreement, excluding any intra-corporate profit; |
| 4. | Profit margins of the Adviser and its affiliates from supplying such services; |
| 5. | Possible economies of scale as the Portfolio grows larger; and |
| 6. | Nature and quality of the Adviser’s services including the performance of the Portfolio. |
These factors, with the exception of the first factor, are generally referred to as the “Gartenberg factors,” which were articulated by the United States Court of Appeals for the Second Circuit in 1982. Gartenberg v. Merrill Lynch Asset Management, Inc., 694 F. 2d 923 (2d Cir. 1982). On March 30, 2010, the Supreme Court held the Gartenberg decision was correct in its basic formulation
| 1 | The Senior Officer’s fee evaluation was completed on October 20, 2011 and discussed with the Board of Trustees on November 1-3, 2011. |
| 2 | Future references to the Portfolio do not include “AllianceBernstein.” |
| ALLIANCEBERNSTEIN CORPORATE INCOME SHARES • | 31 |
of what §36(b) requires: to face liability under §36(b), “an investment adviser must charge a fee that is so disproportionately large that it bears no reasonable relationship to the services rendered and could not have been the product of arm’s length bargaining” Jones v. Harris Associates L.P., 130 S. Ct. 1418 (2010). In Jones, the Court stated the Gartenberg approach fully incorporates the correct understanding of fiduciary duty within the context of section 36(b) and noted with approval that “Gartenberg insists that all relevant circumstances be taken into account” and “uses the range of fees that might result from arm’s-length bargaining as the benchmark for reviewing challenged fees.”3
PORTFOLIO’S EXEMPTION FROM ADVISORY FEES OR EXPENSES
The Adviser proposed that the Portfolio pays no advisory fee to the Adviser for receiving the services to be provided pursuant to the Investment Advisory Agreement. The Portfolio is designed to serve the needs of the Adviser’s separately managed account (“SMA”) clients.4 Since SMA clients pay their wrap program provider a unitary fee for managing all investments of their portfolio, the Portfolio will not pay an advisory fee. The Adviser will also reimburse the Portfolio for all of its other operating expenses, except certain extraordinary expenses, taxes, brokerage costs and the interest on borrowed money.
The Portfolio’s net assets on September 30, 2011 are set forth below:
| Portfolio | 9/30/11 Net Assets ($MM) | |||
| Corporate Income Shares | $ | 28.3 | ||
The Portfolio, which offers only one no-load class of shares, is distributed through its principal underwriter, AllianceBernstein Investments, Inc. (“ABI”). Since the Portfolio is reimbursed by the Adviser for its operating expenses, the Portfolio does not have a distribution plan pursuant to Rule 12b-1 under the 40 Act.
| I. | ADVISORY FEES CHARGED TO INSTITUTIONAL AND OTHER CLIENTS |
The advisory fees charged to investment companies which the Adviser manages and sponsors are normally higher than those charged to similar sized institutional accounts, including pension plans and sub-advised investment companies. The fee differential reflects, among other things, different services provided to such clients, and different liabilities assumed. Services provided by the Adviser to the Portfolio that are not provided to non-investment company clients include providing office space and personnel to serve as Fund Officers, who among other responsibilities make the certifications required under the Sarbanes-Oxley Act of
| 3 | Jones v. Harris at 1427. |
| 4 | The SMA clients currently employ the Adviser as one of several investment managers, and compensate the Adviser on the basis of all SMA assets managed, which would include assets of Corporate Income Shares. |
| 32 | • ALLIANCEBERNSTEIN CORPORATE INCOME SHARES |
2002, and coordinating with and monitoring the Portfolio’s third party service providers such as Fund counsel, auditors, custodians, transfer agents and pricing services. The accounting, administrative, legal and compliance requirements for the Portfolio are more costly than those for institutional client assets due to the greater complexities and time required for investment companies. The Adviser also believes that it incurs substantial entrepreneurial risk when offering a new mutual fund since establishing a new mutual fund requires a large upfront investment and it may take a long time for the fund to achieve profitability since the fund must be priced to scale from inception in order to be competitive and assets are acquired one account at a time. In addition, managing the cash flow of an investment company may be more difficult than that of a stable pool of assets, such as an institutional account with little cash movement in either direction, particularly if the Portfolio is in net redemption and the Adviser is frequently forced to sell securities to raise cash for redemptions. However, managing a fund with positive cash flow may be easier at times than managing a stable pool of assets. Finally, in recent years, investment advisers have been sued by institutional clients and have suffered reputational damage both by the attendant publicity and outcomes other than complete victories. Accordingly, the legal and reputational risks associated with institutional accounts are greater than previously thought, although arguably still not equal to those related to the mutual fund industry.
Notwithstanding the Adviser’s view that managing an investment company is not comparable to managing other institutional accounts because the services provided are different, the Supreme Court has indicated consideration should be given to the advisory fees charged to institutional accounts with a similar investment style as the Portfolio.5 However, with respect to the Portfolio, the Adviser represented that there is no institutional product in the Adviser’s Form ADV that has a similar investment style as the Portfolio.
The Adviser represented that it does not sub-advise any registered investment company with a substantially similar investment style as the Portfolio.
| II. | MANAGEMENT FEES CHARGED BY OTHER MUTUAL FUND COMPANIES FOR LIKE SERVICES. |
Lipper, Inc., an analytical service that is not affiliated with the Adviser, compared the fees charged to the Portfolio to the fees charged to other investment
| 5 | The Supreme Court stated that “courts may give such comparisons the weight that they merit in light of the similarities and differences between the services that the clients in question require, but the courts must be wary of inapt comparisons.” Among the significant differences the Supreme Court noted that may exist between services provided to mutual funds and institutional accounts are “higher marketing costs.” Jones v. Harris at 1428. |
| ALLIANCEBERNSTEIN CORPORATE INCOME SHARES • | 33 |
companies for similar services by other investment advisers.6,7 Each peer selected by Lipper had a similar fee arrangement as the Portfolio, which is to say that with respect to the Portfolio’s peers, all of their fund expenses, including management fees,8 were reimbursed by their respective investment advisers.
As previously noted, the Portfolio does not pay an advisory fee to the Adviser since its SMA clients pay their wrap program provider a unitary fee for managing all investments of their portfolios. In addition, the Adviser reimburses the Portfolio for all of its operating expenses, except certain extraordinary expenses, taxes, brokerage costs and interest on borrowed money.
| III. | COSTS TO THE ADVISER AND ITS AFFILIATES OF SUPPLYING SERVICES PURSUANT TO THE ADVISORY FEE ARRANGEMENT, EXCLUDING ANY INTRA-CORPORATE PROFIT. |
The Adviser utilizes two profitability reporting systems, which operate independently but are aligned with each other, to estimate the Adviser’s profitability in connection with investment advisory services provided to the Portfolio. The Senior Officer has retained a consultant to provide independent advice regarding the alignment of the two profitability systems as well as the methodologies and allocations utilized by both profitability systems. See Section IV for additional discussion.
| IV. | PROFIT MARGINS OF THE ADVISER AND ITS AFFILIATES FOR SUPPLYING SUCH SERVICES. |
The profitability information for the Portfolio, prepared by the Adviser for the Board of Trustees, was reviewed by the Senior Officer and the consultant. The Portfolio does not pay an advisory fee to the Adviser. However, the Adviser does profit indirectly through the advisory fees that it receives from SMA clients that invest in the Portfolio. The Adviser’s profitability with respect to the Portfolio, which decreased in 2010 relative to 2009, was calculated using a weighted average of the profitability of the SMA clients, in addition to any fund specific revenue or expense items.
| 6 | The Supreme Court cautioned against accepting mutual fund fee comparisons without careful scrutiny since “these comparisons are problematic because these fees, like those challenged, may not be the product of negotiations conducted at arm’s length.” Jones v. Harris at 1429. |
| 7 | Only zero fee no-load funds that participated in a wrap fee program were considered for inclusion in the Portfolio’s EG, regardless of the Lipper investment classification/objective of the Funds’ peers. The Portfolio’s EG includes the Portfolio, which is classified by Lipper as “A-rated Corporate Debt”, two U.S. Mortgage funds, two General Bond funds, two Global Income funds and one TIPS fund. |
| 8 | “Management Fee” is the fee attributable to the management and bearing of expenses of the funds (not the management of the wrap fee program). In each case, the advisory contract provides for an advisory or management fee of zero. |
| 34 | • ALLIANCEBERNSTEIN CORPORATE INCOME SHARES |
AllianceBernstein Investments, Inc. (“ABI”) and AllianceBernstein Investor Services, Inc. (“ABIS”), affiliates of the Adviser, serve as the Portfolio’s underwriter and transfer agent, respectively. The courts have referred to this type of business relationships as “fall-out benefits” to the Adviser and indicated that such benefits should be factored into the evaluation of the total relationship between the Portfolio and the Adviser. Neither case law nor common business practice precludes the Adviser’s affiliates from earning a reasonable profit on this type of relationship provided the affiliates’ charges and services are competitive. However, neither ABI nor ABIS receive a fee for serving as the Portfolio’s underwriter and transfer agent.
| V. | POSSIBLE ECONOMIES OF SCALE |
The Adviser has indicated that economies of scale are being shared with shareholders through fee structures,9 subsidies and enhancement to services. Based on some of the professional literature that has considered economies of scale in the mutual fund industry, it is thought that to the extent economies of scale exist, they may more often exist across a fund family as opposed to a specific fund. This is because the costs incurred by the Adviser, such as investment research or technology for trading or compliance systems, can be spread across a greater asset base as the fund family increases in size. It is also possible that as the level of services required to operate a successful investment company has increased over time, and advisory firms have made such investments in their business to provide services, there may be a sharing of economies of scale without a reduction in advisory fees.
In February 2008, an independent consultant, retained by the Senior Officer, provided the Board of Trustees an update of the Deli10 study on advisory fees and various fund characteristics.11 The independent consultant first reiterated the results of his previous two dimensional comparison analysis (fund size and family size) with the Board of Trustees.12 The independent consultant then discussed the results of the regression model that was utilized to study the effects of various factors on advisory fees. The regression model output indicated that the bulk
| 9 | Fee structures include fee reductions, pricing at scale and breakpoints in advisory fee schedules. |
| 10 | The Deli study, originally published in 2002 based on 1997 data and updated for the February 2008 presentation, may be of diminished value due to the age of the data used in the presentation and the changes experienced in the industry over the last four years. |
| 11 | As mentioned previously, the Supreme Court cautioned against accepting mutual fund fee comparisons without careful scrutiny since the fees may not be the product of negotiations conducted at arm’s length. See Jones V. Harris at 1429. |
| 12 | The two dimensional analysis showed patterns of lower advisory fees for funds with larger asset sizes and funds from larger family sizes compared to funds with smaller asset sizes and funds from smaller family sizes, which according to the independent consultant is indicative of a sharing of economies of scale and scope. However, in less liquid and active markets, such is not the case, as the empirical analysis showed potential for diseconomies of scale in those markets. The empirical analysis also showed diminishing economies of scale and scope as funds surpassed a certain high level of assets. |
| ALLIANCEBERNSTEIN CORPORATE INCOME SHARES • | 35 |
of the variation in fees predicted were explained by various factors, but substantially by fund assets under management (“AUM”), family AUM, index fund indicator and investment style. The independent consultant also compared the advisory fees of the AllianceBernstein Mutual Funds to similar funds managed by 19 other large asset managers, regardless of fund size and the large asset manager’s proportion of mutual fund assets to non-mutual fund assets.
| VI. | NATURE AND QUALITY OF THE ADVISER’S SERVICES INCLUDING THE PERFORMANCE OF THE PORTFOLIO. |
With assets under management of $402 billion as of September 30, 2011, the Adviser has the investment experience to manage the portfolio assets of the Portfolio and provide non-investment services (described in Section II) to the Portfolio.
The information below, prepared by Lipper, shows the 1 and 3 year gross performance returns of the Portfolio relative to its Lipper Performance Universe (“PU”)13 for the period ended July 31, 2011:
Portfolio Return | PU Median (%) | PU Rank | ||||||||||
| Corporate Income Shares | ||||||||||||
1 Year | 8.32 | 6.36 | 2/14 | |||||||||
3 Year | 11.73 | 8.32 | 1/13 | |||||||||
| 13 | The Portfolio’s PU includes peers with the same Lipper investment classification/objective and load type as the Portfolio. |
| 36 | • ALLIANCEBERNSTEIN CORPORATE INCOME SHARES |
Set forth below are the 1 and 3 year and since inception net performance returns of the Portfolio (in bold)14 versus its benchmark.15 Portfolio and benchmark volatility and reward-to-variability ratio (“Sharpe Ratio”) information is also shown.16
| Periods Ending July 31, 2011 Annualized Net Performance | ||||||||||||||||||||||||
1 Year (%) | 3 Year (%) | Since (%) | Annualized | Risk Period (Year) | ||||||||||||||||||||
Volatility (%) | Sharpe (%) | |||||||||||||||||||||||
| Corporate Income Shares | 8.33 | 11.73 | 7.64 | 9.19 | 1.21 | 3 | ||||||||||||||||||
| Barclays Capital U.S. Credit Index | 6.70 | 9.30 | 6.63 | 8.05 | 1.08 | 3 | ||||||||||||||||||
| Inception Date: December 11, 2006 | ||||||||||||||||||||||||
CONCLUSION:
Based on the factors discussed above the Senior Officer’s conclusion is that the Investment Advisory Agreement for the Portfolio is reasonable and within the range of what would have been negotiated at arm’s-length in light of all the surrounding circumstances. This conclusion with respect to the Portfolio is based on an evaluation of all of these factors and no single factor was dispositive.
Dated: November 28, 2011
| 14 | The performance returns and risk measures shown in the table are for the Class A shares of the Portfolio. The performance returns of the Portfolio were provided Lipper. Lipper maintains its own database that includes the Portfolio’s performance returns. |
| 15 | The Adviser provided Portfolio and benchmark performance return information for the periods through July 31, 2011. |
| 16 | Portfolio and benchmark volatility and Sharpe Ratio information was obtained through Lipper LANA, a database maintained by Lipper. Volatility is a statistical measure of the tendency of a market price or yield to vary over time. A Sharpe Ratio is a risk adjusted measure of return that divides a fund’s return in excess of the riskless return by the fund’s standard deviation. A portfolio with a greater volatility would be viewed as more risky than a portfolio with equivalent performance but lower volatility; for that reason, a greater return would be demanded for the more risky fund. A portfolio with a higher Sharpe Ratio would be regarded as better performing than a fund with a lower Sharpe Ratio. |
| ALLIANCEBERNSTEIN CORPORATE INCOME SHARES • | 37 |
THIS PAGE IS NOT PART OF THE SHAREHOLDER REPORT OR THE FINANCIAL STATEMENTS
ALLIANCEBERNSTEIN FAMILY OF FUNDS
Wealth Strategies Funds
Balanced Wealth Strategy
Conservative Wealth Strategy
Wealth Appreciation Strategy
Tax-Managed Balanced Wealth Strategy
Tax-Managed Conservative Wealth Strategy
Tax-Managed Wealth Appreciation Strategy
Asset Allocation/Multi-Asset
Emerging Markets Multi-Asset
International Portfolio
Real Asset Strategy
Tax-Managed International Portfolio
Growth Funds
Domestic
Growth Fund
Large Cap Growth Fund
Small Cap Growth Portfolio
Small/Mid Cap Growth Fund
U.S. Strategic Research Portfolio
Global & International
Global Thematic Growth Fund
Greater China ’97 Fund
International Discovery Equity Portfolio
International Focus 40 Portfolio
International Growth Fund
Value Funds
Domestic
Core Opportunities Fund
Equity Income Fund
Growth & Income Fund
Small/Mid Cap Value Fund
Value Fund
Global & International
Global Real Estate Investment Fund
Global Value Fund
International Value Fund
Taxable Bond Funds
Bond Inflation Strategy
Global Bond Fund
High Income Fund
Intermediate Bond Portfolio
Short Duration Portfolio
Unconstrained Bond Fund*
Municipal Bond Funds
Arizona California High Income Massachusetts Michigan Minnesota Municipal Bond Inflation Strategy | National New Jersey New York Ohio Pennsylvania Virginia |
Intermediate Municipal Bond Funds
Intermediate California
Intermediate Diversified
Intermediate New York
Closed-End Funds
Alliance California Municipal Income Fund
Alliance New York Municipal Income Fund
AllianceBernstein Global High Income Fund
AllianceBernstein Income Fund
AllianceBernstein National Municipal Income Fund
Alternatives
Market Neutral Strategy-Global
Market Neutral Strategy-U.S.
Balanced
Balanced Shares
Retirement Strategies Funds
2000 Retirement Strategy | 2020 Retirement Strategy | 2040 Retirement Strategy | ||
2005 Retirement Strategy | 2025 Retirement Strategy | 2045 Retirement Strategy | ||
2010 Retirement Strategy | 2030 Retirement Strategy | 2050 Retirement Strategy | ||
2015 Retirement Strategy | 2035 Retirement Strategy | 2055 Retirement Strategy |
We also offer Exchange Reserves,** which serves as the money market fund exchange vehicle for the AllianceBernstein mutual funds.
You should consider the investment objectives, risks, charges and expenses of any AllianceBernstein fund/portfolio carefully before investing. For free copies of our prospectuses, which contain this and other information, visit us online at www.alliancebernstein.com or contact your financial advisor. Please read the prospectus carefully before investing.
| * | Prior to February 3, 2011, Unconstrained Bond Fund was named Diversified Yield Fund. |
| ** | An investment in the Fund is not a deposit in a bank and is not insured or guaranteed by the Federal Deposit Insurance Corporation or any other government agency. Although the Fund seeks to preserve the value of your investment at $1.00 per share, it is possible to lose money by investing in the Fund. |
| 38 | • ALLIANCEBERNSTEIN CORPORATE INCOME SHARES |
AllianceBernstein Family of Funds
NOTES
| ALLIANCEBERNSTEIN CORPORATE INCOME SHARES • | 39 |
NOTES
| 40 | • ALLIANCEBERNSTEIN CORPORATE INCOME SHARES |
NOTES
| ALLIANCEBERNSTEIN CORPORATE INCOME SHARES • | 41 |
NOTES
| 42 | • ALLIANCEBERNSTEIN CORPORATE INCOME SHARES |
NOTES
| ALLIANCEBERNSTEIN CORPORATE INCOME SHARES • | 43 |
NOTES
| 44 | • ALLIANCEBERNSTEIN CORPORATE INCOME SHARES |
ALLIANCEBERNSTEIN CORPORATE INCOME SHARES
1345 Avenue of the Americas
New York, NY 10105
800.221.5672
| CIS-0152-1011 |  | |
SEMI-ANNUAL REPORT
AllianceBernstein
Taxable Multi-Sector Income Shares
October 31, 2011
Semi-Annual Report

Investment Products Offered
| • | Are Not FDIC Insured |
| • | May Lose Value |
| • | Are Not Bank Guaranteed |
Investors should consider the investment objectives, risks, charges and expenses of the Fund carefully before investing. For copies of our prospectus or summary prospectus, which contain this and other information, visit us online at www.alliancebernstein.com or contact your AllianceBernstein Investments representative. Please read the prospectus and/or summary prospectus carefully before investing.
This shareholder report must be preceded or accompanied by the Fund’s prospectus for individuals who are not current shareholders of the Fund.
You may obtain a description of the Fund’s proxy voting policies and procedures, and information regarding how the Fund voted proxies relating to portfolio securities during the most recent 12-month period ended June 30, without charge. Simply visit AllianceBernstein’s website at www.alliancebernstein.com, or go to the Securities and Exchange Commission’s (the “Commission”) website at www.sec.gov, or call AllianceBernstein at (800) 227-4618.
The Fund files its complete schedule of portfolio holdings with the Commission for the first and third quarters of each fiscal year on Form N-Q. The Fund’s Forms N-Q are available on the Commission’s website at www.sec.gov. The Fund’s Forms N-Q may also be reviewed and copied at the Commission’s Public Reference Room in Washington, DC; information on the operation of the Public Reference Room may be obtained by calling (800) SEC-0330.
AllianceBernstein Investments, Inc. (ABI) is the distributor of the AllianceBernstein family of mutual funds. ABI is a member of FINRA and is an affiliate of AllianceBernstein L.P., the manager of the funds.
AllianceBernstein® and the AB Logo are registered trademarks and service marks used by permission of the owner, AllianceBernstein L.P.
December 15, 2011
Semi-Annual Report
This report provides management’s discussion of fund performance for AllianceBernstein Taxable Multi-Sector Income Shares (the “Fund”) for the semi-annual reporting period ended October 31, 2011. Please note, shares of this Fund are offered exclusively through registered investment advisers approved by AllianceBernstein L.P. (the “Adviser”).
Investment Objective and Policies
The investment objective of the Fund is to generate income and price appreciation. The Fund invests, under normal circumstances, at least 80% of its net assets in fixed-income securities. The Fund may invest in a broad range of securities in both developed and emerging markets. The Fund may invest across all fixed-income sectors, including corporate and U.S. and non-U.S. government securities. The Fund may invest up to 50% of its assets in below investment grade bonds (“junk bonds”). The Fund expects to invest in readily marketable fixed-income securities with a range of maturities from short- to long-term.
The Fund may invest without limit in U.S. dollar-denominated foreign fixed-income securities and may invest up to 50% of its assets in non-U.S. dollar-denominated foreign fixed-income securities. These investments may include, in each case, developed and emerging market debt securities.
The Fund may invest in mortgage-related and other asset-backed securities, loan participations, inflation-protected securities, structured securities, variable, floating, and
inverse floating rate instruments and preferred stock, and may use other investment techniques. The Fund may use leverage for investment purposes. The Fund intends, among other things, to enter into transactions such as reverse repurchase agreements, forward contracts, and dollar rolls. The Fund may invest, without limit, in derivatives, such as options, futures, forwards, or swap agreements. Currencies can have a dramatic effect on returns of non-U.S. dollar-denominated fixed-income securities, significantly adding to returns in some years and greatly diminishing them in others. The Adviser evaluates currency and fixed-income positions separately and may seek to hedge the currency exposure resulting from the Fund’s fixed-income securities positions when it finds the currency exposure unattractive. To hedge a portion of its currency risk, the Fund may from time to time invest in currency-related derivatives, including forward currency exchange contracts, futures, options on futures, swaps and options. The Adviser may also seek investment opportunities by taking long or short positions in currencies through the use of currency-related derivatives.
The Adviser selects securities for purchase or sale based on its assessment of the securities’ risk and return characteristics as well as the securities’ impact on the overall risk and return characteristics of the Fund. In making this assessment, the Adviser takes into account various factors including the credit quality and sensitivity to interest rates of the securities under consideration and of the Fund’s other holdings.
| ALLIANCEBERNSTEIN TAXABLE MULTI-SECTOR INCOME SHARES • | 1 |
Investment Results
The table on page 6 shows the Fund’s performance compared to its benchmark, the Barclays Capital U.S. Aggregate ex Government Bond Index, for the six- and 12-month periods ended October 31, 2011.
The Fund underperformed its benchmark for both the six- and 12- month periods ended October 31, 2011. For the six-month period, an overweight to commercial mortgage-backed securities (CMBS) and investment-grade corporates, as well as exposure to high yield corporates detracted as did security selection within CMBS and investment grade corporates. An underweight to agency mortgage pass-throughs (“MBS”) also detracted, however security selection in MBS was positive.
For the 12-month period, the Fund’s investment grade corporate overweight and exposure to high yield corporates detracted, as did security selection in both. An overweight to CMBS and security selection within the Fund’s MBS holdings contributed positively. Yield curve positioning for both the six- and 12- month periods detracted, specifically the Fund’s underweight in the longer part of the curve.
The Fund did not utilize derivatives during the six- or 12-month periods ended October 31, 2011.
Market Review and Investment Strategy
The global economic recovery that was underway slowed early in 2011, resulting from a myriad of global events. Social unrest in North Africa
and the Middle East, supply disruptions from the natural disaster in Japan and a spike in commodity prices, particularly oil, all provided headwinds for the global economy early in the year. During the six-month period ended October 31, 2011, renewed fears of a double-dip recession roiled the global capital markets, driving up risk aversion, sending equities sharply lower and widening credit spreads. Fiscal challenges—ranging from the contentious debate over the U.S. debt ceiling to the ongoing sovereign debt woes of Greece and the peripheral European nations—were at the forefront of investors’ worries. The mounting fear and uncertainty led to a spike in financial market volatility.
Improved financial positions of consumers, businesses and banks, along with the reduction in the housing overhang, have created conditions for a more normal growth cycle for the first time since the economic recovery started in mid-2009. Fundamentals in the U.S. corporate sector continue to be supportive. Profitability remains strong, and with near-record amounts of cash on hand, U.S. corporations have strong balance sheets. Tight post-crisis underwriting has continued to lead to improvements in corporate balance sheets. Of the 491 U.S. Standard & Poor’s (“S&P”) 500 companies that have reported Q3 earnings to date, 73% beat estimates. The blended earnings growth rate for the S&P 500 for Q3 2011 was 15.7%.
Over the past several months, however, the Core Fixed Income Team (the “Team”) has generally reduced
| 2 | • ALLIANCEBERNSTEIN TAXABLE MULTI-SECTOR INCOME SHARES |
risk in the Fund, moving closer to its benchmark as global uncertainties have risen and financial market volatility has increased. The Fund’s corporate positions are well diversified in order to mitigate idiosyncratic risk. The Team is keeping portfolio duration close to neutral and is
maintaining a concentration in intermediate-maturity securities, where the steepness in yield curves is most extreme. As risk aversion abates and markets stabilize, the Team will be ready to move quickly to seize potential opportunities.
| ALLIANCEBERNSTEIN TAXABLE MULTI-SECTOR INCOME SHARES • | 3 |
HISTORICAL PERFORMANCE
An Important Note About Historical Performance
The investment return and principal value of an investment in the Fund will fluctuate, so that shares, when redeemed, may be worth more or less than their original cost. Performance shown on the following pages represents past performance and does not guarantee future results. Current performance may be lower or higher than the performance information shown. You may obtain performance information current to the most recent month-end by calling (800) 227-4618.
Benchmark Disclosure
The unmanaged Barclays Capital U.S. Aggregate ex Government Bond Index does not reflect fees and expenses associated with the active management of a fund. The Barclays Capital U.S. Aggregate ex Government Bond Index represents the performance of securities within the U.S. investment grade fixed rate bond market, with index components for corporate securities, mortgage pass-through securities, asset-backed securities, and commercial mortgage backed securities. An investor cannot invest directly in an index, and its results are not indicative of the performance for any specific investment, including the Fund.
A Word About Risk
Market Risk: The value of the portfolio’s assets will fluctuate as the stock or bond market fluctuates. The value of the Fund’s investments may decline, sometimes rapidly and unpredictably, simply because of economic changes or other events that affect large portions of the market.
Interest Rate Risk: Changes in interest rates will affect the value of investments in fixed-income securities. When interest rates rise, the value of investments in fixed-income securities tend to fall and this decrease in value may not be offset by higher income from new investments. Interest rate risk is generally greater for fixed-income securities with longer maturities or durations.
Credit Risk: An issuer or guarantor of a fixed-income security, or the counterparty to a derivatives or other contract, may be unable or unwilling to make timely payments of interest or principal, or to otherwise honor its obligations. The issuer or guarantor may default causing a loss of the full principal amount of a security. The degree of risk for a particular security may be reflected in its credit rating. There is the possibility that the credit rating of a fixed-income security may be downgraded after purchase, which may adversely affect the value of the security. Investments in fixed-income securities with lower ratings tend to have a higher probability that an issuer will default or fail to meet its payment obligations.
Below Investment Grade Securities: Investments in fixed-income securities with lower ratings (commonly known as “junk bonds”) tend to have a higher probability that an issuer will default or fail to meet its payment obligations. These securities may be subject to greater price volatility due to such factors as specific corporate developments, interest rate sensitivity, negative perceptions of the junk bond market generally and less secondary market liquidity.
Inflation Risk: This is the risk that the value of assets or income from investments will be less in the future as inflation decreases the value of money. As inflation increases, the value of the portfolio’s assets can decline as can the value of the portfolio’s distributions. This risk is significantly greater for fixed-income securities with longer maturities.
Foreign (Non-U.S.) Risk: Investment in securities of non-U.S. issuers may involve more risk than those of U.S. issuers. These securities may fluctuate more widely in price and may be less liquid due to adverse market, economic, political, regulatory or other factors.
(Historical Performance continued on next page)
| 4 | • ALLIANCEBERNSTEIN TAXABLE MULTI-SECTOR INCOME SHARES |
Historical Performance
HISTORICAL PERFORMANCE
(continued from previous page)
Emerging Market Risk: Investments in emerging market countries may have more risk because the markets are less developed and less liquid as well as being subject to increased economic, political, regulatory or other uncertainties.
Currency Risk: Fluctuations in currency exchange risk may negatively affect the value of the Fund’s investments or reduce its returns.
Prepayment Risk: The value of mortgage-related or asset-backed securities may be particularly sensitive to changes in prevailing interest rates. Early payments of principal on some mortgage-related securities may occur during periods of falling mortgage interest rates and expose the Fund to a lower rate of return upon reinvestment of principal. Early payments associated with mortgage-related securities cause these securities to experience significantly greater price and yield volatility than is experienced by traditional fixed-income securities. During periods of rising interest rates, a reduction in prepayments may increase the effective life of mortgage-related securities, subjecting them to greater risk of decline in market value in response to rising interest rates. If the life of a mortgage-related security is inaccurately predicted, the Fund may not be able to realize the rate of return it expected.
Derivatives Risk: Investments in derivatives may be illiquid, difficult to price, and leveraged so that small changes may produce disproportionate losses for the Fund, and may be subject to counterparty risk to a greater degree than more traditional investments.
Leverage Risk: To the extent the Fund uses leveraging techniques, its net asset value (“NAV”) may be more volatile because leverage tends to exaggerate the effect of changes in interest rates and any increase or decrease in the value of the Fund’s investments.
Management Risk: The Fund is subject to management risk because it is an actively managed investment fund. The Adviser will apply its investment techniques and risk analyses in making investment decisions, but there is no guarantee that its techniques will produce the intended results.
These risks are fully discussed in the Fund’s prospectus.
(Historical Performance continued on next page)
| ALLIANCEBERNSTEIN TAXABLE MULTI-SECTOR INCOME SHARES • | 5 |
Historical Performance
HISTORICAL PERFORMANCE
(continued from previous page)
THE FUND VS. ITS BENCHMARK PERIODS ENDED OCTOBER 31, 2011 | NAV Returns | |||||||||
| 6 Months | 12 Months | |||||||||
AllianceBernstein Taxable Multi-Sector Income Shares | 0.83% | 3.42% | ||||||||
|
| |||||||||
Barclays Capital U.S. Aggregate ex Government Bond Index | 4.16% | 5.13% | ||||||||
| ||||||||||
| AVERAGE ANNUAL RETURNS AS OF OCTOBER 31, 2011 | ||||
| NAV Returns | ||||
1 Year | 3.42 | % | ||
Since Inception* | 3.69 | % | ||
SEC AVERAGE ANNUAL RETURNS (WITH ANY APPLICABLE SALES CHARGES) AS OF THE MOST RECENT CALENDAR QUARTER-END (SEPTEMBER 30, 2011) | ||||
| SEC Returns | ||||
1 Year | 3.19 | % | ||
Since Inception* | 2.97 | % | ||
The prospectus fee table shows the fees and the total fund operating expenses as 0.00% because the Adviser does not charge any fees or expenses and reimburses or pays Fund operating expenses. Participants in a wrap fee program eligible to invest in the Fund pay fees to the program sponsor and should review the wrap program brochure provided by the sponsor for a discussion of fees and expenses charged.
| * | Inception Date: 9/15/10. |
See Historical Performance disclosures on pages 4-5.
| 6 | • ALLIANCEBERNSTEIN TAXABLE MULTI-SECTOR INCOME SHARES |
Historical Performance
FUND EXPENSES
(unaudited)
As a shareholder of the Fund, you may incur various ongoing non-operating and extraordinary costs. This example is intended to help you understand your ongoing costs (in dollars) of investing in the Fund and to compare these costs with the ongoing costs of investing in other mutual funds.
The Example is based on an investment of $1,000 invested at the beginning of the period and held for the entire period as indicated below.
Actual Expenses
The table below provides information about actual account values and actual expenses. You may use the information in this line, together with the amount you invested, to estimate the expenses that you paid over the period. Simply divide your account value by $1,000 (for example, an $8,600 account value divided by $1,000 = 8.6), then multiply the result by the number in the first line under the heading entitled “Expenses Paid During Period” to estimate the expenses you paid on your account during this period.
Hypothetical Example for Comparison Purposes
The table below provides information about hypothetical account values and hypothetical expenses based on the Fund’s actual expense ratio and an assumed annual rate of return of 5% before expenses, which is not the Fund’s actual return. The hypothetical account values and expenses may not be used to estimate the actual ending account balance or expenses you paid for the period. You may use this information to compare the ongoing costs of investing in the Fund and other funds by comparing this 5% hypothetical example with the 5% hypothetical examples that appear in the shareholder reports of other funds.
Please note that the expenses shown in the table are meant to highlight your ongoing costs only and do not reflect any transactional costs, such as sales charges (loads), or contingent deferred sales charges on redemptions. Therefore, the hypothetical example is useful in comparing ongoing costs only, and will not help you determine the relative total costs of owning different funds. In addition, if these transactional costs were included, your costs would have been higher.
| Beginning Account Value May 1, 2011 | Ending Account Value October 31, 2011 | Expenses Paid During Period* | Annualized Expense Ratio* | |||||||||||||
Actual | $ | 1,000 | $ | 1,008.30 | $ | – 0 | – | 0.00 | % | |||||||
Hypothetical** | $ | 1,000 | $ | 1,025.14 | $ | – 0 | – | 0.00 | % | |||||||
| * | Expenses are equal to the Fund’s annualized expense ratio, multiplied by the average account value over the period multiplied by 184/366 (to reflect the one-half year period). The Fund’s operating expenses are borne by the Adviser or its affiliates. |
| ** | Assumes 5% return before expenses. |
| ALLIANCEBERNSTEIN TAXABLE MULTI-SECTOR INCOME SHARES • | 7 |
Fund Expenses
PORTFOLIO SUMMARY
October 31, 2011 (unaudited)
PORTFOLIO STATISTICS
Net Assets ($mil): $10.0
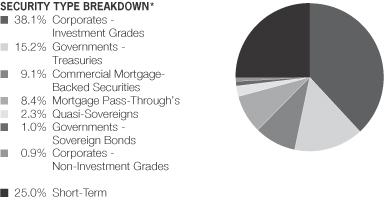
| * | All data are as of October 31, 2011. The Portfolio’s security type breakdown is expressed as a percentage of total investments and may vary over time. |
| 8 | • ALLIANCEBERNSTEIN TAXABLE MULTI-SECTOR INCOME SHARES |
Portfolio Summary
PORTFOLIO OF INVESTMENTS
October 31, 2011 (unaudited)
| Principal Amount (000) | U.S. $ Value | |||||||
| ||||||||
CORPORATES - INVESTMENT GRADES – 40.5% | ||||||||
Industrial – 18.2% | ||||||||
Basic – 3.1% | ||||||||
AngloGold Ashanti Holdings PLC | $ | 25 | $ | 24,554 | ||||
ArcelorMittal | 35 | 35,949 | ||||||
ArcelorMittal USA, Inc. | 10 | 10,521 | ||||||
BHP Billiton Finance USA Ltd. | 35 | 42,273 | ||||||
Dow Chemical Co. (The) | 40 | 41,134 | ||||||
8.55%, 5/15/19 | 12 | 15,589 | ||||||
International Paper Co. | 20 | 21,401 | ||||||
7.95%, 6/15/18 | 30 | 36,007 | ||||||
Packaging Corp. of America | 15 | 16,090 | ||||||
PPG Industries, Inc. | 18 | 19,102 | ||||||
Rio Tinto Finance USA Ltd. | 45 | 53,994 | ||||||
|
| |||||||
| 316,614 | ||||||||
|
| |||||||
Capital Goods – 1.4% | ||||||||
General Electric Co. | 55 | 62,662 | ||||||
Owens Corning | 30 | 32,329 | ||||||
Republic Services, Inc. | 15 | 17,102 | ||||||
5.50%, 9/15/19 | 25 | 28,736 | ||||||
|
| |||||||
| 140,829 | ||||||||
|
| |||||||
Communications - Media – 2.2% | ||||||||
CBS Corp. | 25 | 32,302 | ||||||
Comcast Cable Communications Holdings, Inc. | 25 | 35,938 | ||||||
DirecTV Holdings LLC/DirecTV Financing Co., Inc. | 15 | 16,277 | ||||||
News America, Inc. | 25 | 27,199 | ||||||
Reed Elsevier Capital, Inc. | 20 | 24,919 | ||||||
Time Warner Cable, Inc. | 20 | 22,705 | ||||||
| ALLIANCEBERNSTEIN TAXABLE MULTI-SECTOR INCOME SHARES • | 9 |
Portfolio of Investments
| Principal Amount (000) | U.S. $ Value | |||||||
| ||||||||
Time Warner Entertainment Co. LP | $ | 45 | $ | 59,173 | ||||
|
| |||||||
| 218,513 | ||||||||
|
| |||||||
Communications - Telecommunications – 1.8% |
| |||||||
American Tower Corp. | 35 | 36,975 | ||||||
AT&T Corp. | 10 | 14,251 | ||||||
AT&T, Inc. | 19 | 20,653 | ||||||
Telecom Italia Capital SA | 35 | 35,553 | ||||||
7.175%, 6/18/19 | 20 | 21,014 | ||||||
United States Cellular Corp. | 50 | 48,423 | ||||||
|
| |||||||
| 176,869 | ||||||||
|
| |||||||
Consumer Cyclical - Automotive – 0.3% | ||||||||
Harley-Davidson Funding Corp. | 30 | 32,701 | ||||||
|
| |||||||
Consumer Cyclical - Entertainment – 1.4% | ||||||||
Time Warner, Inc. | 45 | 48,607 | ||||||
Turner Broadcasting System, Inc. | 45 | 50,007 | ||||||
Viacom, Inc. | 40 | 45,903 | ||||||
|
| |||||||
| 144,517 | ||||||||
|
| |||||||
Consumer Cyclical - Other – 0.5% | ||||||||
Marriott International, Inc./DE | 45 | 46,669 | ||||||
|
| |||||||
Consumer Cyclical - Retailers – 0.2% | ||||||||
CVS Caremark Corp. | 20 | 24,394 | ||||||
|
| |||||||
Consumer Non-Cyclical – 2.0% | ||||||||
Ahold Finance USA LLC | 45 | 56,085 | ||||||
Beam, Inc. | 25 | 25,303 | ||||||
Bunge Ltd. Finance Corp. | 40 | 41,903 | ||||||
5.875%, 5/15/13 | 30 | 31,550 | ||||||
Delhaize Group SA | 10 | 10,957 | ||||||
| 10 | • ALLIANCEBERNSTEIN TAXABLE MULTI-SECTOR INCOME SHARES |
Portfolio of Investments
| Principal Amount (000) | U.S. $ Value | |||||||
| ||||||||
Diageo Capital PLC | $ | 35 | $ | 39,845 | ||||
|
| |||||||
| 205,643 | ||||||||
|
| |||||||
Energy – 2.9% | ||||||||
Anadarko Petroleum Corp. | 15 | 17,238 | ||||||
6.45%, 9/15/36 | 10 | 11,592 | ||||||
Canadian Natural Resources Ltd. | 15 | 15,781 | ||||||
Marathon Petroleum Corp. | 4 | 4,103 | ||||||
5.125%, 3/01/21(a) | 15 | 16,211 | ||||||
Nabors Industries, Inc. | 38 | 47,857 | ||||||
Noble Energy, Inc. | 45 | 59,202 | ||||||
Noble Holding International Ltd. | 70 | 75,923 | ||||||
Weatherford International Ltd./Bermuda | 30 | 39,121 | ||||||
|
| |||||||
| 287,028 | ||||||||
|
| |||||||
Technology – 0.6% | ||||||||
Agilent Technologies, Inc. | 5 | 5,450 | ||||||
Xerox Corp. | 45 | 51,233 | ||||||
|
| |||||||
| 56,683 | ||||||||
|
| |||||||
Transportation - Airlines – 0.4% | ||||||||
Southwest Airlines Co. | 20 | 21,408 | ||||||
5.75%, 12/15/16 | 15 | 16,561 | ||||||
|
| |||||||
| 37,969 | ||||||||
|
| |||||||
Transportation - Railroads – 0.1% | ||||||||
Canadian Pacific Railway Co. | 10 | 11,818 | ||||||
|
| |||||||
Transportation - Services – 1.3% | ||||||||
Asciano Finance Ltd. | 70 | 70,677 | ||||||
Con-way, Inc. | 22 | 21,474 | ||||||
Ryder System, Inc. | 15 | 17,232 | ||||||
7.20%, 9/01/15 | 15 | 17,737 | ||||||
|
| |||||||
| 127,120 | ||||||||
|
| |||||||
| 1,827,367 | ||||||||
|
| |||||||
| ALLIANCEBERNSTEIN TAXABLE MULTI-SECTOR INCOME SHARES • | 11 |
Portfolio of Investments
| Principal Amount (000) | U.S. $ Value | |||||||
| ||||||||
Financial Institutions – 17.6% | ||||||||
Banking – 10.5% | ||||||||
American Express Co. | $ | 45 | $ | 57,921 | ||||
Bank of America Corp. | 25 | 26,723 | ||||||
Series L | 45 | 45,060 | ||||||
Bear Stearns Cos. LLC (The) | 70 | 73,513 | ||||||
5.70%, 11/15/14 | 75 | 82,044 | ||||||
Citigroup, Inc. | 15 | 15,615 | ||||||
5.50%, 4/11/13 | 30 | 31,128 | ||||||
6.50%, 8/19/13 | 55 | 58,264 | ||||||
Compass Bank | 75 | 69,849 | ||||||
Countrywide Financial Corp. | 20 | 19,542 | ||||||
Goldman Sachs Group, Inc. (The) | 8 | 8,075 | ||||||
6.00%, 6/15/20 | 75 | 78,986 | ||||||
7.50%, 2/15/19 | 35 | 39,542 | ||||||
Macquarie Group Ltd. | 45 | 43,471 | ||||||
Morgan Stanley | 100 | 99,478 | ||||||
National Capital Trust II | 10 | 9,046 | ||||||
Nationwide Building Society | 100 | 103,892 | ||||||
Royal Bank of Scotland PLC (The) | 25 | 26,399 | ||||||
Societe Generale SA | 100 | 95,616 | ||||||
Wachovia Corp. | 65 | 69,116 | ||||||
|
| |||||||
| 1,053,280 | ||||||||
|
| |||||||
Brokerage – 0.3% | ||||||||
Jefferies Group, Inc. | 14 | 12,640 | ||||||
6.875%, 4/15/21 | 20 | 19,274 | ||||||
|
| |||||||
| 31,914 | ||||||||
|
| |||||||
Finance – 1.4% | ||||||||
General Electric Capital Corp. | 70 | 73,666 | ||||||
Series A | 20 | 20,040 | ||||||
| 12 | • ALLIANCEBERNSTEIN TAXABLE MULTI-SECTOR INCOME SHARES |
Portfolio of Investments
| Principal Amount (000) | U.S. $ Value | |||||||
| ||||||||
SLM Corp. | $ | 40 | $ | 39,800 | ||||
|
| |||||||
| 133,506 | ||||||||
|
| |||||||
Insurance – 4.1% | ||||||||
Allied World Assurance Co. Ltd. | 10 | 11,424 | ||||||
Allstate Corp. (The) | 29 | 26,752 | ||||||
Coventry Health Care, Inc. | 30 | 33,707 | ||||||
6.30%, 8/15/14 | 25 | 27,455 | ||||||
Genworth Financial, Inc. | 35 | 31,586 | ||||||
Hartford Financial Services Group, Inc. | 10 | 10,019 | ||||||
5.50%, 3/30/20 | 38 | 38,961 | ||||||
Humana, Inc. | 20 | 22,917 | ||||||
7.20%, 6/15/18 | 10 | 11,679 | ||||||
Lincoln National Corp. | 10 | 12,201 | ||||||
Markel Corp. | 25 | 28,653 | ||||||
Massachusetts Mutual Life Insurance Co. | 25 | 37,723 | ||||||
MetLife, Inc. | 10 | 12,540 | ||||||
Nationwide Mutual Insurance Co. | 40 | 49,078 | ||||||
Principal Financial Group, Inc. | 25 | 28,432 | ||||||
XL Group PLC | 25 | 26,521 | ||||||
|
| |||||||
| 409,648 | ||||||||
|
| |||||||
Other Finance – 0.4% | ||||||||
ORIX Corp. | 40 | 41,032 | ||||||
|
| |||||||
REITS – 0.9% | ||||||||
HCP, Inc. | 44 | 45,189 | ||||||
Simon Property Group LP | 45 | 46,567 | ||||||
|
| |||||||
| 91,756 | ||||||||
|
| |||||||
| 1,761,136 | ||||||||
|
| |||||||
| ALLIANCEBERNSTEIN TAXABLE MULTI-SECTOR INCOME SHARES • | 13 |
Portfolio of Investments
| Principal Amount (000) | U.S. $ Value | |||||||
| ||||||||
Utility – 4.2% | ||||||||
Electric – 2.0% | ||||||||
Allegheny Energy Supply Co. LLC | $ | 40 | $ | 43,555 | ||||
Ameren Corp. | 25 | 28,284 | ||||||
FirstEnergy Corp. | 25 | 31,423 | ||||||
Nisource Finance Corp. | 50 | 59,802 | ||||||
TECO Finance, Inc. | 10 | 10,528 | ||||||
5.15%, 3/15/20 | 10 | 10,941 | ||||||
Wisconsin Energy Corp. | 20 | 19,800 | ||||||
|
| |||||||
| 204,333 | ||||||||
|
| |||||||
Natural Gas – 2.2% | ||||||||
DCP Midstream LLC | 10 | 10,822 | ||||||
Energy Transfer Partners LP | 30 | 33,441 | ||||||
7.50%, 7/01/38 | 30 | 34,441 | ||||||
EQT Corp. | 25 | 29,746 | ||||||
Kinder Morgan Energy Partners LP | 28 | 28,696 | ||||||
TransCanada PipeLines Ltd. | 40 | 40,767 | ||||||
Williams Partners LP | 35 | 38,673 | ||||||
|
| |||||||
| 216,586 | ||||||||
|
| |||||||
| 420,919 | ||||||||
|
| |||||||
Non Corporate Sectors – 0.5% | ||||||||
Agencies - Not Government | ||||||||
Petrobras International Finance Co. - Pifco | 45 | 48,328 | ||||||
|
| |||||||
Total Corporates - Investment Grades | 4,057,750 | |||||||
|
| |||||||
GOVERNMENTS - TREASURIES – 16.2% | ||||||||
United States – 16.2% | ||||||||
U.S. Treasury Bonds | 20 | 25,456 | ||||||
5.375%, 2/15/31 | 105 | 142,817 | ||||||
| 14 | • ALLIANCEBERNSTEIN TAXABLE MULTI-SECTOR INCOME SHARES |
Portfolio of Investments
| Principal Amount (000) | U.S. $ Value | |||||||
| ||||||||
U.S. Treasury Notes | $ | 715 | $ | 716,344 | ||||
2.625%, 4/30/16-11/15/20 | 700 | 736,178 | ||||||
|
| |||||||
Total Governments - Treasuries | 1,620,795 | |||||||
|
| |||||||
COMMERCIAL MORTGAGE-BACKED SECURITIES – 9.6% | ||||||||
Non-Agency Fixed Rate CMBS – 9.6% | ||||||||
Banc of America Merrill Lynch Commercial Mortgage, Inc. | 250 | 268,915 | ||||||
Commercial Mortgage Pass Through Certificates | 220 | 235,982 | ||||||
GS Mortgage Securities Corp. II | 215 | 231,829 | ||||||
Merrill Lynch/Countrywide Commercial | 220 | 229,459 | ||||||
|
| |||||||
Total Commercial Mortgage-Backed Securities | 966,185 | |||||||
|
| |||||||
MORTGAGE PASS-THROUGH’S – 9.0% | ||||||||
Agency Fixed Rate 30-Year – 6.6% | ||||||||
Federal National Mortgage Association | 635 | 660,152 | ||||||
|
| |||||||
Agency Fixed Rate 15-Year – 2.4% | ||||||||
Federal National Mortgage Association | 40 | 42,581 | ||||||
4.50%, 6/01/26 | 185 | 196,584 | ||||||
|
| |||||||
| 239,165 | ||||||||
|
| |||||||
Total Mortgage Pass-Through’s | 899,317 | |||||||
|
| |||||||
QUASI-SOVEREIGNS – 2.4% | ||||||||
Quasi-Sovereign Bonds – 2.4% | ||||||||
Malaysia – 1.1% | ||||||||
Petronas Capital Ltd. | 100 | 113,088 | ||||||
|
| |||||||
| ALLIANCEBERNSTEIN TAXABLE MULTI-SECTOR INCOME SHARES • | 15 |
Portfolio of Investments
| Principal Amount (000) | U.S. $ Value | |||||||
| ||||||||
Russia – 1.3% | ||||||||
Russian Agricultural Bank OJSC Via | $ | 115 | $ | 126,931 | ||||
|
| |||||||
Total Quasi-Sovereigns | 240,019 | |||||||
|
| |||||||
GOVERNMENTS - SOVEREIGN BONDS – 1.1% |
| |||||||
Poland – 0.6% | ||||||||
Poland Government International Bond | 55 | 56,375 | ||||||
|
| |||||||
Russia – 0.5% | ||||||||
Russian Foreign Bond - Eurobond | 46 | 54,490 | ||||||
|
| |||||||
Total Governments - Sovereign Bonds | 110,865 | |||||||
|
| |||||||
CORPORATES - NON-INVESTMENT GRADES – 0.9% | ||||||||
Financial Institutions – 0.8% | ||||||||
Banking – 0.2% | ||||||||
BankAmerica Capital II | 20 | 18,200 | ||||||
|
| |||||||
Insurance – 0.6% | ||||||||
ING Capital Funding Trust III | 40 | 33,889 | ||||||
XL Group PLC | 35 | 29,400 | ||||||
|
| |||||||
| 63,289 | ||||||||
|
| |||||||
| 81,489 | ||||||||
|
| |||||||
Industrial – 0.1% | ||||||||
Basic – 0.1% | ||||||||
United States Steel Corp. | 16 | 14,880 | ||||||
|
| |||||||
Total Corporates - Non-Investment Grades | 96,369 | |||||||
|
| |||||||
| 16 | • ALLIANCEBERNSTEIN TAXABLE MULTI-SECTOR INCOME SHARES |
Portfolio of Investments
| Principal Amount (000) | U.S. $ Value | |||||||
| ||||||||
SHORT-TERM INVESTMENTS – 26.5% | ||||||||
Time Deposit – 26.5% | ||||||||
State Street Time Deposit | $ | 2,661 | $ | 2,660,588 | ||||
|
| |||||||
Total Investments – 106.2% | 10,651,888 | |||||||
Other assets less liabilities – (6.2)% | (623,967 | ) | ||||||
|
| |||||||
Net Assets – 100.0% | $ | 10,027,921 | ||||||
|
| |||||||
| (a) | Security is exempt from registration under Rule 144A of the Securities Act of 1933. These securities are considered liquid and may be resold in transactions exempt from registration, normally to qualified institutional buyers. At October 31, 2011, the aggregate market value of these securities amounted to $811,404 or 8.1% of net assets. |
| (b) | Floating Rate Security. Stated interest rate was in effect at October 31, 2011. |
Glossary:
CMBS – Commercial Mortgage-Backed Securities
OJSC – Open Joint Stock Company
REIT – Real Estate Investment Trust
TBA – To Be Announced
See notes to financial statements.
| ALLIANCEBERNSTEIN TAXABLE MULTI-SECTOR INCOME SHARES • | 17 |
Portfolio of Investments
STATEMENT OF ASSETS & LIABILITIES
October 31, 2011 (unaudited)
| Assets | ||||
Investments in securities, at value (cost $10,639,697) | $ | 10,651,888 | ||
Interest receivable | 90,788 | |||
|
| |||
Total assets | 10,742,676 | |||
|
| |||
| Liabilities | ||||
Payable for investment securities purchased | 706,737 | |||
Dividends payable | 8,018 | |||
|
| |||
Total liabilities | 714,755 | |||
|
| |||
Net Assets | $ | 10,027,921 | ||
|
| |||
| Composition of Net Assets | ||||
Shares of beneficial interest, at par | $ | 10 | ||
Additional paid-in capital | 10,036,992 | |||
Distributions in excess of net investment income | (154 | ) | ||
Accumulated net realized loss on investment transactions | (21,118 | ) | ||
Net unrealized appreciation on investments | 12,191 | |||
|
| |||
| $ | 10,027,921 | |||
|
| |||
Net Asset Value Per Share—unlimited shares of beneficial interest authorized, $.00001 par value (based on 1,003,704 common shares outstanding) | $ | 9.99 | ||
|
|
See notes to financial statements.
| 18 | • ALLIANCEBERNSTEIN TAXABLE MULTI-SECTOR INCOME SHARES |
Statement of Assets & Liabilities
STATEMENT OF OPERATIONS
Six Months Ended October 31, 2011 (unaudited)
| Investment Income | ||||
Interest | $ | 183,345 | ||
|
| |||
| Realized and Unrealized Gain (Loss) on Investment Transactions | ||||
Net realized gain on investment transactions | 1,574 | |||
Net change in unrealized appreciation/depreciation of investments | (96,621 | ) | ||
|
| |||
Net loss on investment transactions | (95,047 | ) | ||
|
| |||
Net Increase in Net Assets from Operations | $ | 88,298 | ||
|
|
See notes to financial statements.
| ALLIANCEBERNSTEIN TAXABLE MULTI-SECTOR INCOME SHARES • | 19 |
Statement of Operations
STATEMENT OF CHANGES IN NET ASSETS
| Six Months Ended October 31, 2011 (unaudited) | September 15, 2010(a) to April 30, 2011 | |||||||
| Increase (Decrease) in Net Assets from Operations | ||||||||
Net investment income | $ | 183,345 | $ | 236,262 | ||||
Net realized gain/(loss) on investment transactions | 1,574 | (22,092 | ) | |||||
Net change in unrealized appreciation/depreciation of investments | (96,621 | ) | 108,812 | |||||
|
|
|
| |||||
Net increase in net assets from operations | 88,298 | 322,982 | ||||||
| Dividends to Shareholders from | ||||||||
Net investment income | (184,099 | ) | (236,262 | ) | ||||
| Transactions in Shares of Beneficial Interest | ||||||||
Net increase | 2 | 10,037,000 | ||||||
|
|
|
| |||||
Total increase (decrease) | (95,799 | ) | 10,123,720 | |||||
| Net Assets | ||||||||
Beginning of period | 10,123,720 | – 0 | – | |||||
|
|
|
| |||||
End of period (including distributions in excess of net investment income of ($154) and undistributed net investment income of $600, respectively) | $ | 10,027,921 | $ | 10,123,720 | ||||
|
|
|
| |||||
| (a) | Commencement of operations. |
See notes to financial statements.
| 20 | • ALLIANCEBERNSTEIN TAXABLE MULTI-SECTOR INCOME SHARES |
Statement of Changes in Net Assets
NOTES TO FINANCIAL STATEMENTS
October 31, 2011 (unaudited)
NOTE A
Significant Accounting Policies
AllianceBernstein Corporate Shares (the “Trust”) was organized as a Massachusetts business trust under the laws of The Commonwealth of Massachusetts by an Agreement and Declaration of Trust (“Declaration of Trust”) dated January 26, 2004. The Trust is registered under the Investment Company Act of 1940, as an open-end, diversified management investment company. The Trust operates as a “series” company currently having five separate portfolios: AllianceBernstein Corporate Income Shares, AllianceBernstein Municipal Income Shares, AllianceBernstein Taxable Multi-Sector Income Shares (the “Portfolio”), AllianceBernstein Tax-Aware Real Return Income Shares and AllianceBernstein International Focus Shares. Each Portfolio is considered to be a separate entity for financial reporting and tax purposes. AllianceBernstein Corporate Income Shares commenced operations on December 11, 2006. AllianceBernstein Municipal Income Shares commenced operations on September 1, 2010. AllianceBernstein Taxable Multi-Sector Income Shares commenced operations on September 15, 2010. AllianceBernstein Tax-Aware Real Return Income Shares commenced operations on May 2, 2011. AllianceBernstein International Focus Shares commenced operations on June 20, 2011. This report relates only to AllianceBernstein Taxable Multi-Sector Income Shares.
Shares of the Portfolio are offered exclusively to holders of accounts established under wrap-fee programs sponsored and maintained by certain registered investment advisers approved by AllianceBernstein L.P. (the “Adviser”). The Portfolio’s shares may be purchased at the relevant net asset value without a sales charge or other fee. The financial statements have been prepared in conformity with U.S. generally accepted accounting principles (“U.S. GAAP”) which require management to make certain estimates and assumptions that affect the reported amounts of assets and liabilities in the financial statements and amounts of income and expenses during the reporting period. Actual results could differ from those estimates. The following is a summary of significant accounting policies followed by the Portfolio.
1. Security Valuation
Portfolio securities are valued at their current market value determined on the basis of market quotations or, if market quotations are not readily available or are deemed unreliable, at “fair value” as determined in accordance with procedures established by and under the general supervision of the Trust’s Board of Trustees.
In general, the market value of securities which are readily available and deemed reliable are determined as follows: Securities listed on a national securities exchange (other than securities listed on the NASDAQ Stock Market, Inc. (“NASDAQ”)) or on a foreign securities exchange are valued at the last sale price at the close of the exchange or foreign securities exchange. If there has
| ALLIANCEBERNSTEIN TAXABLE MULTI-SECTOR INCOME SHARES • | 21 |
Notes to Financial Statements
been no sale on such day, the securities are valued at the mean of the closing bid and ask prices on such day. Securities listed on more than one exchange are valued by reference to the principal exchange on which the securities are traded; securities listed only on NASDAQ are valued in accordance with the NASDAQ Official Closing Price; listed or over the counter market (“OTC”) put or call options are valued at the mid level between the current bid and ask prices. If either a current bid or current ask price is unavailable, AllianceBernstein L.P. (the “Adviser”) will have discretion to determine the best valuation (e.g. last trade price); open futures contracts and options thereon are valued using the closing settlement price or, in the absence of such a price, the most recent quoted bid price. If there are no quotations available for the day of valuation, the last available closing settlement price is used; U.S. government securities and other debt instruments having 60 days or less remaining until maturity are valued at amortized cost if their original maturity was 60 days or less; or by amortizing their fair value as of the 61st day prior to maturity if their original term to maturity exceeded 60 days; fixed-income securities, including mortgage backed and asset backed securities, may be valued on the basis of prices provided by a pricing service or at a price obtained from one or more of the major broker/dealers. In cases where broker/dealer quotes are obtained, the Adviser may establish procedures whereby changes in market yields or spreads are used to adjust, on a daily basis, a recently obtained quoted price on a security; and swaps and other derivatives are valued daily, primarily using independent pricing services, independent pricing models using market inputs, as well as third party broker-dealers or counterparties, which are approved by the Board of Trustees. Investments in money market funds are valued at their net asset value each day.
Securities for which market quotations are not readily available (including restricted securities) or are deemed unreliable are valued at fair value. Factors considered in making this determination may include, but are not limited to, information obtained by contacting the issuer, analysts, analysis of the issuer’s financial statements or other available documents. In addition, the Portfolio may use fair value pricing for securities primarily traded in non-U.S. markets because most foreign markets close well before the Portfolio values its securities at 4:00 p.m., Eastern Time. The earlier close of these foreign markets gives rise to the possibility that significant events, including broad market moves, may have occurred in the interim and may materially affect the value of those securities.
2. Fair Value Measurements
In accordance with U.S. GAAP regarding fair value measurements, fair value is defined as the price that the Portfolio would receive to sell an asset or pay to transfer a liability in an orderly transaction between market participants at the measurement date. The U.S. GAAP disclosure requirements establish a framework for measuring fair value, and a three-level hierarchy for fair value measurements based upon the transparency of inputs to the valuation of an asset or liability. Inputs may be observable or unobservable and refer broadly to the
| 22 | • ALLIANCEBERNSTEIN TAXABLE MULTI-SECTOR INCOME SHARES |
Notes to Financial Statements
assumptions that market participants would use in pricing the asset or liability. Observable inputs reflect the assumptions market participants would use in pricing the asset or liability based on market data obtained from sources independent of the Portfolio. Unobservable inputs reflect the Portfolio’s own assumptions about the assumptions that market participants would use in pricing the asset or liability based on the best information available in the circumstances. Each investment is assigned a level based upon the observability of the inputs which are significant to the overall valuation. The three-tier hierarchy of inputs is summarized below.
| • | Level 1—quoted prices in active markets for identical investments |
| • | Level 2—other significant observable inputs (including quoted prices for similar investments, interest rates, prepayment speeds, credit risk, etc.) |
| • | Level 3—significant unobservable inputs (including the Portfolio’s own assumptions in determining the fair value of investments) |
The following table summarizes the valuation of the Portfolio’s investments by the above fair value hierarchy levels as of October 31, 2011:
Investments in Securities: | Level 1 | Level 2 | Level 3 | Total | ||||||||||||
Assets: | ||||||||||||||||
Corporates – Investment Grades | $ | – 0 | – | $ | 4,057,750 | $ | – 0 | – | $ | 4,057,750 | ||||||
Governments – Treasuries | – 0 | – | 1,620,795 | – 0 | – | 1,620,795 | ||||||||||
Commercial Mortgage-Backed Securities | – 0 | – | 504,897 | 461,288 | 966,185 | |||||||||||
Mortgage Pass-Through’s | – 0 | – | 899,317 | – 0 | – | 899,317 | ||||||||||
Quasi-Sovereigns | – 0 | – | 240,019 | – 0 | – | 240,019 | ||||||||||
Governments – Sovereign Bonds | – 0 | – | 110,865 | – 0 | – | 110,865 | ||||||||||
Corporates – Non-Investment Grades | – 0 | – | 96,369 | – 0 | – | 96,369 | ||||||||||
Short-Term Investments | – 0 | – | 2,660,588 | – 0 | – | 2,660,588 | ||||||||||
|
|
|
|
|
|
|
| |||||||||
Total Investments in Securities | – 0 | – | 10,190,600 | 461,288 | 10,651,888 | |||||||||||
Other Financial Instruments* | – 0 | – | – 0 | – | – 0 | – | – 0 | – | ||||||||
|
|
|
|
|
|
|
| |||||||||
Total | $ | – 0 | – | $ | 10,190,600 | $ | 461,288 | $ | 10,651,888 | |||||||
|
|
|
|
|
|
|
| |||||||||
| * | Other financial instruments are derivative instruments, such as futures, forwards and swap contracts, which are valued at the unrealized appreciation/depreciation on the instrument. |
| ALLIANCEBERNSTEIN TAXABLE MULTI-SECTOR INCOME SHARES • | 23 |
Notes to Financial Statements
Following is a reconciliation of investments in which significant unobservable inputs (Level 3) were used in determining fair value. The transfers between levels of the fair value hierarchy assumes the financial instrument was transferred at the beginning of the reporting period.
| Corporates - Investment Grades | Commercial Mortgage-Backed Securities | Total | ||||||||||
Balance as of 4/30/10 | $ | 19,125 | $ | 1,195,035 | $ | 1,214,160 | ||||||
Accrued discounts/(premiums) | – 0 | – | (915 | ) | (915 | ) | ||||||
Realized gain (loss) | – 0 | – | 5,984 | 5,984 | ||||||||
Change in unrealized appreciation/depreciation | – 0 | – | (37,887 | ) | (37,887 | ) | ||||||
Purchases | – 0 | – | – 0 | – | – 0 | – | ||||||
Sales | – 0 | – | (700,929 | ) | (700,929 | ) | ||||||
Transfers in to Level 3 | – 0 | – | – 0 | – | – 0 | – | ||||||
Transfers out of Level 3 | (19,125 | ) | – 0 | – | (19,125 | ) | ||||||
|
|
|
|
|
| |||||||
Balance as of 10/31/11 | $ | – 0 | – | $ | 461,288 | $ | 461,288 | |||||
|
|
|
|
|
| |||||||
Net change in unrealized appreciation/depreciation from Investments held as of 10/31/11* | $ | – 0 | – | $ | (12,296 | ) | $ | (12,296 | ) | |||
|
|
|
|
|
| |||||||
| * | The unrealized appreciation/depreciation is included in net change in unrealized appreciation/depreciation of investments in the accompanying statement of operations. |
3. Taxes
It is the Portfolio’s policy to meet the requirements of the Internal Revenue Code applicable to regulated investment companies and to distribute all of its investment company taxable income and net realized gains, if any, to shareholders. Therefore, no provisions for federal income or excise taxes are required.
In accordance with U.S. GAAP requirements regarding accounting for uncertainties in income taxes, management has analyzed the Portfolio’s tax positions taken or expected to be taken on federal and state income tax returns for all open tax years and has concluded that no provision for income tax is required in the Portfolio’s financial statements.
4. Investment Income and Investment Transactions
Dividend income is recorded on the ex-dividend date or as soon as the Portfolio is informed of the dividend. Interest income is accrued daily. Investment transactions are accounted for on the date the securities are purchased or sold. Investment gains or losses are determined on the identified cost basis. The Portfolio amortizes premiums and accretes discounts as adjustments to interest income.
5. Dividends and Distributions
Dividends and distributions to shareholders, if any, are recorded on the ex-dividend date. Income dividends and capital gains distributions are
| 24 | • ALLIANCEBERNSTEIN TAXABLE MULTI-SECTOR INCOME SHARES |
Notes to Financial Statements
determined in accordance with federal tax regulations and may differ from those determined in accordance with U.S. GAAP. To the extent these differences are permanent, such amounts are reclassified within the capital accounts based on their federal tax basis treatment; temporary differences do not require such reclassification.
NOTE B
Advisory Fee and Other Transactions with Affiliates
Under the terms of the Advisory Agreement, the Portfolio pays no advisory fee to the Adviser and the Adviser reimburses or pays for the Portfolio’s operating expenses. The Portfolio is an integral part of separately managed accounts in wrap-fee programs. Typically, participants in these programs pay a fee to their investment adviser for all costs and expenses of the separately managed account, including costs and expenses associated with the Portfolio. The Adviser serves as investment manager and adviser of the Portfolio and continuously furnishes an investment program for the Portfolio and manages, supervises and conducts the affairs of the Portfolio, subject to the supervisions of the Portfolio’s Board of Trustees. The Advisory Agreement provides that the Adviser or an affiliate will furnish, or pay the expenses of the Portfolio for, office space, facilities and equipment, services of executive and other personnel of the Portfolio and certain administrative services.
The Portfolio has entered into a Distribution Agreement (the “Agreement”) with AllianceBernstein Investments, Inc., the Portfolio’s principal underwriter (the “Underwriter”), to permit the Underwriter to distribute the Portfolio’s shares, which are sold at their net asset value without any sales charge. The Portfolio does not pay a fee for this service. The Underwriter is a wholly owned subsidiary of the Adviser.
AllianceBernstein Investor Services, Inc. (“ABIS”), a wholly-owned subsidiary of the Adviser, acts as the Portfolios’ registrar, transfer agent and dividend-disbursing agent. ABIS registers the transfer, issuance and redemption of Portfolio shares and disburses dividends and other distributions to Portfolio shareholders. The Portfolio does not pay a fee for this service.
NOTE C
Investment Transactions
Purchases and sales of investment securities (excluding short-term investments) for the six months ended October 31, 2011 were as follows:
| Purchases | Sales | |||||||
Investment securities (excluding | $ | 93,100 | $ | 3,748,330 | ||||
U.S. government securities | 5,752,522 | 3,217,596 | ||||||
| ALLIANCEBERNSTEIN TAXABLE MULTI-SECTOR INCOME SHARES • | 25 |
Notes to Financial Statements
The cost of investments for federal income tax purposes was substantially the same as the cost for financial reporting purposes. Accordingly, gross unrealized appreciation and unrealized depreciation are as follows:
Gross unrealized appreciation | $ | 87,169 | ||
Gross unrealized depreciation | (74,978 | ) | ||
|
| |||
Net unrealized appreciation | $ | 12,191 | ||
|
|
NOTE D
Shares of Beneficial Interest
Transactions in shares of beneficial interest were as follows:
| Shares | Amount | |||||||||||||||||||
| Six Months Ended October 31, 2011 (unaudited) | September 15, 2010(a) to April 30, 2011 | Six Months Ended October 31, 2011 (unaudited) | September 15, 2010(a) to April 30, 2011 | |||||||||||||||||
|
| |||||||||||||||||||
| Class A | ||||||||||||||||||||
Shares sold | – 0 | –(b) | 1,003,704 | $ | 2 | $ | 10,037,000 | |||||||||||||
| ||||||||||||||||||||
Net increase | – 0 | –(b) | 1,003,704 | $ | 2 | $ | 10,037,000 | |||||||||||||
| ||||||||||||||||||||
| (a) | Commencement of operations. |
| (b) | Share amount is less than one full share. |
NOTE E
Risks Involved in Investing in the Portfolio
Interest Rate Risk and Credit Risk—Interest rate risk is the risk that changes in interest rates will affect the value of the Portfolio’s investments in fixed-income debt securities such as bonds or notes. Increases in interest rates may cause the value of the Portfolio’s investments to decline. Credit risk is the risk that the issuer or guarantor of a debt security, or the counterparty to a derivative contract, will be unable or unwilling to make timely principal and/or interest payments, or to otherwise honor its obligations. The degree of risk for a particular security may be reflected in its credit risk rating. Credit risk is greater for medium quality and lower-rated securities. Lower-rated debt securities and similar unrated securities (commonly known as “junk bonds”) have speculative elements or are predominantly speculative risks.
Indemnification Risk—In the ordinary course of business, the Portfolio enters into contracts that contain a variety of indemnifications. The Portfolio’s maximum exposure under these arrangements is unknown. However, the Portfolio has not had prior claims or losses pursuant to these indemnification provisions and expects the risk of loss thereunder to be remote. Therefore, the Portfolio has not accrued any liability in connection with these indemnification provisions.
| 26 | • ALLIANCEBERNSTEIN TAXABLE MULTI-SECTOR INCOME SHARES |
Notes to Financial Statements
NOTE F
Distributions to Shareholders
The tax character of distributions to be paid for the year ending April 30, 2012 will be determined at the end of the current fiscal year. The tax character of distributions paid during the period ended April 30, 2011 was as follows:
| 2011 | ||||
Distributions paid from: | ||||
Ordinary income | $ | 236,262 | ||
Total taxable distributions | 236,262 | |||
|
| |||
Total distributions paid | $ | 236,262 | ||
|
| |||
As of April 30, 2011, the components of accumulated earnings/(deficit) on a tax basis were as follows:
Undistributed ordinary income | $ | 12,192 | ||
Accumulated capital and other gains/losses | (22,692 | )(a) | ||
Unrealized appreciation/(depreciation) | 108,812 | |||
|
| |||
Total accumulated earnings/(deficit) | $ | 98,312 | (b) | |
|
|
| (a) | As of April 30, 2011, the Fund had a net capital loss carryforward of $610 which expires in the year 2019. To the extent future capital gains are offset by capital loss carryforwards, such gains will not be distributed. At April 30, 2011, the Fund had a post-October capital loss deferral of $22,082. For tax purposes, this loss is deemed to arise on May 1, 2011. |
| (b) | The difference between book-basis and tax-basis components of accumulated earnings/(deficit) is attributable primarily to dividends payable. |
On December 22, 2010, the Regulated Investment Company Modernization Act of 2010 (the “Act”) was enacted, which changed various technical rules governing the tax treatment of regulated investment companies. One important change addresses the recognition of capital loss carryforwards. Under the Act, the Portfolio will be permitted to carry forward capital losses incurred in taxable years beginning after December 22, 2010 for an unlimited period. However, any losses incurred during those future taxable years will be required to be utilized prior to the losses incurred in pre-enactment taxable years, which carry an expiration date. As a result, pre-enactment capital loss carryforwards may be more likely to expire unused. Additionally, post-enactment capital loss carryforwards will retain their character as either short-term or long-term capital losses rather than being considered all short-term capital loss (as permitted under previous regulation).
NOTE G
Recent Accounting Pronouncement
In May 2011, the Financial Accounting Standards Board (“FASB”) issued an Accounting Standards Update (“ASU”) to develop common requirements for measuring fair value and for disclosing information about fair value measurements in U.S. GAAP and International Financial Reporting Standards (“IFRS”). The amendments are intended to improve the comparability of fair value
| ALLIANCEBERNSTEIN TAXABLE MULTI-SECTOR INCOME SHARES • | 27 |
Notes to Financial Statements
measurements presented and disclosed in the financial statements prepared in accordance with U.S. GAAP and IFRS. The ASU is effective during interim or annual periods beginning after December 15, 2011. At this time, management is evaluating the implication of this ASU and its impact on the financial statements has not been determined.
NOTE H
Subsequent Events
Management has evaluated subsequent events for possible recognition or disclosure in the financial statements through the date the financial statements are issued. Management has determined that there are no material events that would require disclosure in the Portfolio’s financial statements through this date.
| 28 | • ALLIANCEBERNSTEIN TAXABLE MULTI-SECTOR INCOME SHARES |
Notes to Financial Statements
FINANCIAL HIGHLIGHTS
Selected Data For A Share Of Beneficial Interest Outstanding Throughout Each Period
| Six Months Ended October 31, 2011 | September 15, 2010(a) to April 30, 2011 | |||||||
|
| |||||||
Net asset value, beginning of period | $ 10.09 | $ 10.00 | ||||||
|
| |||||||
Income From Investment Operations | ||||||||
Net investment income(b) | .18 | .24 | ||||||
Net realized and unrealized gain (loss) on investment transactions | (.10 | ) | .09 | |||||
|
| |||||||
Net increase (decrease) in net asset value from operations | .08 | .33 | ||||||
|
| |||||||
Less: Dividends | ||||||||
Dividends from net investment income | (.18 | ) | (.24 | ) | ||||
|
| |||||||
Net asset value, end of period | $ 9.99 | $ 10.09 | ||||||
|
| |||||||
Total Return | ||||||||
Total investment return based on net asset value(c) | .83 | % | 3.31 | % | ||||
Ratios/Supplemental Data | ||||||||
Net assets, end of period (000’s omitted) | $10,028 | $10,124 | ||||||
Ratio to average net assets of: | ||||||||
Net investment income(d) | 3.61 | % | 3.79 | % | ||||
Portfolio turnover rate | 66 | % | 10 | % | ||||
| (a) | Commencement of operations. |
| (b) | Based on average shares outstanding. |
| (c) | Total investment return is calculated assuming an initial investment made at the net asset value at the beginning of the period, reinvestment of all dividends and distributions at net asset value during the period, and redemption on the last day of the period. Total return does not reflect the deduction of taxes that a shareholder would pay on portfolio distributions or the redemption of portfolio shares. Total investment return calculated for a period of less than one year is not annualized. |
| (d) | Annualized. |
See notes to financial statements.
| ALLIANCEBERNSTEIN TAXABLE MULTI-SECTOR INCOME SHARES • | 29 |
Financial Highlights
BOARD OF TRUSTEES
William H. Foulk, Jr.(1) , Chairman John H. Dobkin(1) Michael J. Downey(1) D. James Guzy(1) Nancy P. Jacklin(1) | Robert M. Keith, President and Chief Executive Officer Garry L. Moody(1) Marshall C. Turner, Jr.(1) Earl D. Weiner(1) |
OFFICERS
Philip L. Kirstein, Douglas J. Peebles(2), Paul J. DeNoon(2), Vice President Scott A. DiMaggio(2), Vice President | Shawn E. Keegan(2), Vice President Greg J. Wilensky(2), Vice President Emilie D. Wrapp, Secretary Joseph J. Mantineo, Treasurer and Chief Financial Officer Phyllis J. Clarke, Controller |
Custodian and Accounting Agent State Street Bank and Trust Company
Principal Underwriter AllianceBernstein Investments, Inc.
Transfer Agent AllianceBernstein Investor Services, Inc. | Legal Counsel Seward & Kissel LLP One Battery Park Plaza New York, NY 10004
Independent Registered Public Accounting Firm Ernst & Young LLP 5 Times Square New York, NY 10036 |
| (1) | Member of the Audit Committee, the Governance and Nominating Committee and the Independent Directors Committee. Mr. Foulk is the sole member of the Fair Value Pricing Committee. |
| (2) | The day-to-day management of, and investment decisions for, the Trust’s portfolio are made by the Core Fixed-Income Team. Messrs. Paul J. DeNoon, Scott A. DiMaggio, Shawn E. Keegan, Douglas J. Peebles, and Greg J. Wilensky are the investment professionals primarily responsible for the day-to-day management of the Trust’s portfolio. |
| 30 | • ALLIANCEBERNSTEIN TAXABLE MULTI-SECTOR INCOME SHARES |
Board of Trustees
THE FOLLOWING IS NOT PART OF THE SHAREHOLDER REPORT OR THE FINANCIAL STATEMENTS
SUMMARY OF SENIOR OFFICER’S EVALUATION OF INVESTMENT ADVISORY AGREEMENT1
The following is a summary of the evaluation of the Investment Advisory Agreement between AllianceBernstein L.P. (the “Adviser”) and The AllianceBernstein Corporate Shares (the “Trust”) with respect to AllianceBernstein Taxable Multi-Sector Income Shares (the “Portfolio”).2 The evaluation of the Investment Advisory Agreement was prepared by Philip L. Kirstein, the Senior Officer of the Trust, for the Trustees of the Trust, as required by the September 1, 2004 Assurance of Discontinuance (“AoD”) between the Adviser and the New York State Attorney General (the “NYAG”). The Senior Officer’s evaluation of the Investment Advisory Agreement is not meant to diminish the responsibility or authority of the Board of Trustees to perform its duties pursuant to Section 15 of the Investment Company Act of 1940 Act (the “40 Act”) and applicable state law. The purpose of the summary is to provide shareholders with a synopsis of the independent evaluation of the reasonableness of the advisory fees proposed to be paid by the Portfolio which was provided to the Trustees in connection with their review of the proposed approval of the continuance of the Investment Advisory Agreement.
The Senior Officer’s evaluation considered the following factors:
| 1. | Advisory fees charged to institutional and other clients of the Adviser for like services; |
| 2. | Advisory fees charged by other mutual fund companies for like services; |
| 3. | Costs to the Adviser and its affiliates of supplying services pursuant to the advisory agreement, excluding any intra-corporate profit; |
| 4. | Profit margins of the Adviser and its affiliates from supplying such services; |
| 5. | Possible economies of scale as the Portfolio grows larger; and |
| 6. | Nature and quality of the Adviser’s services including the performance of the Portfolio. |
These factors, with the exception of the first factor, are generally referred to as the “Gartenberg factors,” which were articulated by the United States Court of Appeals for the Second Circuit in 1982. Gartenberg v. Merrill Lynch Asset Management, Inc., 694 F. 2d 923 (2d Cir. 1982). On March 30, 2010, the Supreme Court held the Gartenberg decision was correct in its basic formulation of what §36(b) requires: to face liability under §36(b), “an investment adviser
| 1 | The Senior Officer’s fee evaluation was completed on October 20, 2011 and discussed with the Board of Trustees on November 1-3, 2011. |
| 2 | Future references to the Portfolio do not include “AllianceBernstein.” |
| ALLIANCEBERNSTEIN TAXABLE MULTI-SECTOR INCOME SHARES • | 31 |
must charge a fee that is so disproportionately large that it bears no reasonable relationship to the services rendered and could not have been the product of arm’s length bargaining” Jones v. Harris Associates L.P., 130 S. Ct. 1418 (2010). In Jones, the Court stated the Gartenberg approach fully incorporates the correct understanding of fiduciary duty within the context of section 36(b) and noted with approval that “Gartenberg insists that all relevant circumstances be taken into account” and “uses the range of fees that might result from arm’s-length bargaining as the benchmark for reviewing challenged fees.”3
PORTFOLIO’S EXEMPTION FROM ADVISORY FEES OR EXPENSES
The Adviser proposed that the Portfolio pays no advisory fee to the Adviser for receiving the services to be provided pursuant to the Investment Advisory Agreement. The Portfolio is designed to serve the needs of the Adviser’s separately managed account (“SMA”) clients.4 Since SMA clients pay their wrap program provider a unitary fee for managing all investments of their portfolio, the Portfolio will not pay an advisory fee. The Adviser will also reimburse the Portfolio for all of its other operating expenses, except certain extraordinary expenses, taxes, brokerage costs and the interest on borrowed money.
The Portfolio’s net assets on September 30, 2011 are set forth below:
| Portfolio | 9/30/11 Net Assets ($MM) | |||
| Taxable Multi-Sector Income Shares | $ | 9.9 | ||
The Portfolio, which offers only one no-load class of shares, is distributed through its principal underwriter, AllianceBernstein Investments, Inc. (“ABI”). Since the Portfolio is reimbursed by the Adviser for its operating expenses, the Portfolio does not have a distribution plan pursuant to Rule 12b-1 under the 40 Act.
| I. | ADVISORY FEES CHARGED TO INSTITUTIONAL AND OTHER CLIENTS |
The advisory fees charged to investment companies which the Adviser manages and sponsors are normally higher than those charged to similar sized institutional accounts, including pension plans and sub-advised investment companies. The fee differential reflects, among other things, different services provided to such clients, and different liabilities assumed. Services provided by the Adviser to the Portfolio that are not provided to non-investment company clients include providing office space and personnel to serve as Fund Officers, who among other responsibilities make the certifications required under the Sarbanes-Oxley Act of 2002, and coordinating with and monitoring the Portfolio’s third party service providers such as Fund counsel, auditors, custodians, transfer agents and
| 3 | Jones v. Harris at 1427. |
| 4 | The SMA clients currently employ the Adviser as one of several investment managers, and compensate the Adviser on the basis of all SMA assets managed, which would include assets of Corporate Income Shares. |
| 32 | • ALLIANCEBERNSTEIN TAXABLE MULTI-SECTOR INCOME SHARES |
pricing services. The accounting, administrative, legal and compliance requirements for the Portfolio are more costly than those for institutional client assets due to the greater complexities and time required for investment companies. The Adviser also believes that it incurs substantial entrepreneurial risk when offering a new mutual fund since establishing a new mutual fund requires a large upfront investment and it may take a long time for the fund to achieve profitability since the fund must be priced to scale from inception in order to be competitive and assets are acquired one account at a time. In addition, managing the cash flow of an investment company may be more difficult than that of a stable pool of assets, such as an institutional account with little cash movement in either direction, particularly if the Portfolio is in net redemption and the Adviser is frequently forced to sell securities to raise cash for redemptions. However, managing a fund with positive cash flow may be easier at times than managing a stable pool of assets. Finally, in recent years, investment advisers have been sued by institutional clients and have suffered reputational damage both by the attendant publicity and outcomes other than complete victories. Accordingly, the legal and reputational risks associated with institutional accounts are greater than previously thought, although arguably still not equal to those related to the mutual fund industry.
Notwithstanding the Adviser’s view that managing an investment company is not comparable to managing other institutional accounts because the services provided are different, the Supreme Court has indicated consideration should be given to the advisory fees charged to institutional accounts with a similar investment style as the Portfolio.5 In addition to the AllianceBernstein Institutional fee schedule, set forth below is what would have been the effective advisory fee for the Portfolio had the AllianceBernstein Institutional fee schedule been applicable to the Portfolio versus the Portfolio’s advisory fees based on September 30, 2011 net assets.6
| Portfolio | Net Assets 09/30/11 ($MM) | AllianceBernstein (“AB”) Fee Schedule | Effective AB Inst. Adv. Fee | Portfolio Advisory Fee | ||||||||
| Taxable Multi-Sector Income Shares | $9.9 | U.S. Strategic Core Plus Schedule 50 bp on 1st $30 million 20 bp on the balance Minimum acct size: $150 million | 0.500% | 0.000% | ||||||||
| 5 | The Supreme Court stated that “courts may give such comparisons the weight that they merit in light of the similarities and differences between the services that the clients in question require, but the courts must be wary of inapt comparisons.” Among the significant differences the Supreme Court noted that may exist between services provided to mutual funds and institutional accounts are “higher marketing costs.” Jones v. Harris at 1428. |
| 6 | The Adviser has indicated that with respect to institutional accounts with assets greater than $300 million, it will negotiate a fee schedule. Discounts that are negotiated vary based upon each client relationship. |
| ALLIANCEBERNSTEIN TAXABLE MULTI-SECTOR INCOME SHARES • | 33 |
The Adviser manages Sanford C. Bernstein Fund, Inc. (“SCB Fund”), an open-end management investment company. The Intermediate Duration Portfolio of SCB Fund has a similar investment style as the Portfolio. Set forth below is Intermediate Duration Portfolio’s advisory fee schedule and what would have been the effective advisory fee of the Portfolio had the fee schedule of Intermediate Duration Portfolio been applicable to the Portfolio versus the Portfolio’s advisory fees based on September 30, 2011 net assets:
| Portfolio | SCB Fund Portfolio | Fee Schedule | SCB Fund Effective Fee | Portfolio Advisory Fee | ||||||
| Taxable Multi-Sector Income Shares | Intermediate Duration Portfolio | 50 bp on 1st $1 billion 45 bp on next $2 billion 40 bp on next $2 billion 35 bp on next $2 billion 30 bp thereafter | 0.500% | 0.000% | ||||||
The adviser also manages the AllianceBernstein Variable Products Series Fund, Inc. (“AVPS”), which is available through variable annuity and variable life contracts offered by other financial institutions and offers policyholders the option to utilize certain AVPS portfolios as the investment option underlying their insurance contracts. Set forth below is the fee schedule of the AVPS portfolio that has a similar investment style as the Portfolio.7 Also shown is what would have been the effective advisory fee of the Portfolio had the AVPS fee schedule been applicable to the Portfolio and the Portfolio’s advisory fees based on September 30, 2011 net assets:
| Portfolio | AVPS Portfolio | Fee Schedule | AVPS Effective Fee | Portfolio Advisory Fee | ||||||
| Taxable Multi-Sector Income Shares | Intermediate Bond Portfolio | 0.45% on first $2.5 billion 0.40% on next $2.5 billion 0.35% on the balance | 0.450% | 0.000% | ||||||
The Adviser represented that it does not sub-advise any registered investment company with a substantially similar investment style as the Portfolio.
| II. | MANAGEMENT FEES CHARGED BY OTHER MUTUAL FUND COMPANIES FOR LIKE SERVICES. |
Lipper, Inc., an analytical service that is not affiliated with the Adviser, compared the fees charged to the Portfolio to the fees charged to other investment
| 7 | It should be noted that the AVPS portfolio was also affected by the settlement between the Adviser and the NYAG. As a result, the Portfolio has the same breakpoints in its advisory fee schedule as the AVPS portfolio. |
| 34 | • ALLIANCEBERNSTEIN TAXABLE MULTI-SECTOR INCOME SHARES |
companies for similar services by other investment advisers.8,9 Each peer selected by Lipper had a similar fee arrangement as the Portfolio, which is to say that with respect to the Portfolio’s peers, all of their fund expenses, including management fees,10 were reimbursed by their respective investment advisers.
As previously noted, the Portfolio does not pay an advisory fee to the Adviser since its SMA clients pay their wrap program provider a unitary fee for managing all investments of their portfolios. In addition, the Adviser reimburses the Portfolio for all of its operating expenses, except certain extraordinary expenses, taxes, brokerage costs and interest on borrowed money.
| III. | COSTS TO THE ADVISER AND ITS AFFILIATES OF SUPPLYING SERVICES PURSUANT TO THE ADVISORY FEE ARRANGEMENT, EXCLUDING ANY INTRA-CORPORATE PROFIT. |
The Adviser utilizes two profitability reporting systems, which operate independently but are aligned with each other, to estimate the Adviser’s profitability in connection with investment advisory services provided to the Portfolio. The Senior Officer has retained a consultant to provide independent advice regarding the alignment of the two profitability systems as well as the methodologies and allocations utilized by both profitability systems. See Section IV for additional discussion.
| IV. | PROFIT MARGINS OF THE ADVISER AND ITS AFFILIATES FOR SUPPLYING SUCH SERVICES. |
The profitability information for the Portfolio, prepared by the Adviser for the Board of Trustees, was reviewed by the Senior Officer and the consultant. The Portfolio does not pay an advisory fee to the Adviser. However, the Adviser does profit indirectly through the advisory fees that it receives from SMA clients that invest in the Portfolio. The Adviser’s profitability with respect to the Portfolio, which was negative in 2010, was calculated using a weighted average of the profitability of the SMA clients, in addition to any fund specific revenue or expense items.
| 8 | The Supreme Court cautioned against accepting mutual fund fee comparisons without careful scrutiny since “these comparisons are problematic because these fees, like those challenged, may not be the product of negotiations conducted at arm’s length.” Jones v. Harris at 1429. |
| 9 | Only zero fee no-load funds that participated in a wrap fee program were considered for inclusion in the Portfolio’s EG, regardless of the Lipper investment classification/objective of the Funds’ peers. The Portfolio’s EG includes the Portfolio, three other General Bond Funds, two BBB-rated corporate debt funds, one Multi-sector Income fund, one short-intermediate investment-grade fund, two U.S. Mortgage funds, one TIPS fund and two Global Income funds. |
| 10 | “Management Fee” is the fee attributable to the management and bearing of expenses of the funds (not the management of the wrap fee program). In each case, the advisory contract provides for an advisory or management fee of zero. |
| ALLIANCEBERNSTEIN TAXABLE MULTI-SECTOR INCOME SHARES • | 35 |
AllianceBernstein Investments, Inc. (“ABI”) and AllianceBernstein Investor Services, Inc. (“ABIS”), affiliates of the Adviser, serve as the Portfolio’s underwriter and transfer agent, respectively. The courts have referred to this type of business relationships as “fall-out benefits” to the Adviser and indicated that such benefits should be factored into the evaluation of the total relationship between the Portfolio and the Adviser. Neither case law nor common business practice precludes the Adviser’s affiliates from earning a reasonable profit on this type of relationship provided the affiliates’ charges and services are competitive. However, neither ABI nor ABIS receive a fee for serving as the Portfolio’s underwriter and transfer agent.
| V. | POSSIBLE ECONOMIES OF SCALE |
The Adviser has indicated that economies of scale are being shared with shareholders through fee structures,11 subsidies and enhancement to services. Based on some of the professional literature that has considered economies of scale in the mutual fund industry, it is thought that to the extent economies of scale exist, they may more often exist across a fund family as opposed to a specific fund. This is because the costs incurred by the Adviser, such as investment research or technology for trading or compliance systems, can be spread across a greater asset base as the fund family increases in size. It is also possible that as the level of services required to operate a successful investment company has increased over time, and advisory firms have made such investments in their business to provide services, there may be a sharing of economies of scale without a reduction in advisory fees.
In February 2008, an independent consultant, retained by the Senior Officer, provided the Board of Trustees an update of the Deli12 study on advisory fees and various fund characteristics.13 The independent consultant first reiterated the results of his previous two dimensional comparison analysis (fund size and family size) with the Board of Trustees.14 The independent consultant then discussed the results of the regression model that was utilized to study the effects of
| 11 | Fee structures include fee reductions, pricing at scale and breakpoints in advisory fee schedules. |
| 12 | The Deli study, originally published in 2002 based on 1997 data and updated for the February 2008 presentation, may be of diminished value due to the age of the data used in the presentation and the changes experienced in the industry over the last four years. |
| 13 | As mentioned previously, the Supreme Court cautioned against accepting mutual fund fee comparisons without careful scrutiny since the fees may not be the product of negotiations conducted at arm’s length. See Jones V. Harris at 1429. |
| 14 | The two dimensional analysis showed patterns of lower advisory fees for funds with larger asset sizes and funds from larger family sizes compared to funds with smaller asset sizes and funds from smaller family sizes, which according to the independent consultant is indicative of a sharing of economies of scale and scope. However, in less liquid and active markets, such is not the case, as the empirical analysis showed potential for diseconomies of scale in those markets. The empirical analysis also showed diminishing economies of scale and scope as funds surpassed a certain high level of assets. |
| 36 | • ALLIANCEBERNSTEIN TAXABLE MULTI-SECTOR INCOME SHARES |
various factors on advisory fees. The regression model output indicated that the bulk of the variation in fees predicted were explained by various factors, but substantially by fund assets under management (“AUM”), family AUM, index fund indicator and investment style. The independent consultant also compared the advisory fees of the AllianceBernstein Mutual Funds to similar funds managed by 19 other large asset managers, regardless of fund size and the large asset manager’s proportion of mutual fund assets to non-mutual fund assets.
| VI. | NATURE AND QUALITY OF THE ADVISER’S SERVICES INCLUDING THE PERFORMANCE OF THE PORTFOLIO. |
With assets under management of $402 billion as of September 30, 2011, the Adviser has the investment experience to manage the portfolio assets of the Portfolio and provide non-investment services (described in Section II) to the Portfolio.
The information below, prepared by Lipper, shows the since inception gross performance returns of the Portfolio15 relative to its Lipper Performance Universe (“PU”)16 for the period ended July 31, 2011:
Portfolio Return (%) | PU Median (%) | PU Rank | ||||||||||
| Taxable Multi-Sector Income Shares Since Inception | 5.19 | 3.10 | 8/22 | |||||||||
| (September 15, 2010) | ||||||||||||
Set forth below is the since inception net performance return of the Portfolio (in bold) versus its benchmark.17
| Periods Ending July 31, 2011 | ||||
| Annualized Net Performance (%) | ||||
| Since Inception (%) | ||||
| Taxable Multi-Sector Income Shares | 5.10 | |||
| Barclays Capital US Aggregate ex Govt. Index | 4.64 | |||
| Inception Date: September 15, 2010 | ||||
| 15 | The performance returns and risk measures shown in the table are for the Class A shares of the Portfolio. The performance returns of the Portfolio were provided Lipper. Lipper maintains its own database that includes the Portfolio’s performance returns. |
| 16 | The Portfolio’s PU includes peers with the same Lipper investment classification/objective and load type as the Portfolio. |
| 17 | The Adviser provided Portfolio and benchmark performance return information for the periods through July 31, 2011. |
| ALLIANCEBERNSTEIN TAXABLE MULTI-SECTOR INCOME SHARES • | 37 |
CONCLUSION:
Based on the factors discussed above the Senior Officer’s conclusion is that the Investment Advisory Agreement for the Portfolio is reasonable and within the range of what would have been negotiated at arm’s-length in light of all the surrounding circumstances. This conclusion with respect to the Portfolio is based on an evaluation of all of these factors and no single factor was dispositive.
Dated: November 28, 2011
| 38 | • ALLIANCEBERNSTEIN TAXABLE MULTI-SECTOR INCOME SHARES |
THIS PAGE IS NOT PART OF THE SHAREHOLDER REPORT OR THE FINANCIAL STATEMENTS
ALLIANCEBERNSTEIN FAMILY OF FUNDS
Wealth Strategies Funds
Balanced Wealth Strategy
Conservative Wealth Strategy
Wealth Appreciation Strategy
Tax-Managed Balanced Wealth Strategy
Tax-Managed Conservative Wealth Strategy
Tax-Managed Wealth Appreciation Strategy
Asset Allocation/Multi-Asset
Emerging Markets Multi-Asset
International Portfolio
Real Asset Strategy
Tax-Managed International Portfolio
Growth Funds
Domestic
Growth Fund
Large Cap Growth Fund
Small Cap Growth Portfolio
Small/Mid Cap Growth Fund
U.S. Strategic Research Portfolio
Global & International
Global Thematic Growth Fund
Greater China ’97 Fund
International Discovery Equity Portfolio
International Focus 40 Portfolio
International Growth Fund
Value Funds
Domestic
Core Opportunities Fund
Equity Income Fund
Growth & Income Fund
Small/Mid Cap Value Fund
Value Fund
Global & International
Global Real Estate Investment Fund
Global Value Fund
International Value Fund
Taxable Bond Funds
Bond Inflation Strategy
Global Bond Fund
High Income Fund
Intermediate Bond Portfolio
Short Duration Portfolio
Unconstrained Bond Fund*
Municipal Bond Funds
Arizona California High Income Massachusetts Michigan Minnesota Municipal Bond Inflation Strategy | National New Jersey New York Ohio Pennsylvania Virginia |
Intermediate Municipal Bond Funds
Intermediate California
Intermediate Diversified
Intermediate New York
Closed-End Funds
Alliance California Municipal Income Fund
Alliance New York Municipal Income Fund
AllianceBernstein Global High Income Fund
AllianceBernstein Income Fund
AllianceBernstein National Municipal Income Fund
Alternatives
Market Neutral Strategy-Global
Market Neutral Strategy-U.S.
Balanced
Balanced Shares
Retirement Strategies Funds
2000 Retirement Strategy | 2020 Retirement Strategy | 2040 Retirement Strategy | ||
2005 Retirement Strategy | 2025 Retirement Strategy | 2045 Retirement Strategy | ||
2010 Retirement Strategy | 2030 Retirement Strategy | 2050 Retirement Strategy | ||
2015 Retirement Strategy | 2035 Retirement Strategy | 2055 Retirement Strategy |
We also offer Exchange Reserves,** which serves as the money market fund exchange vehicle for the AllianceBernstein mutual funds.
You should consider the investment objectives, risks, charges and expenses of any AllianceBernstein fund/portfolio carefully before investing. For free copies of our prospectuses, which contain this and other information, visit us online at www.alliancebernstein.com or contact your financial advisor. Please read the prospectus carefully before investing.
| * | Prior to February 3, 2011, Unconstrained Bond Fund was named Diversified Yield Fund. |
| ** | An investment in the Fund is not a deposit in a bank and is not insured or guaranteed by the Federal Deposit Insurance Corporation or any other government agency. Although the Fund seeks to preserve the value of your investment at $1.00 per share, it is possible to lose money by investing in the Fund. |
| ALLIANCEBERNSTEIN TAXABLE MULTI-SECTOR INCOME SHARES • | 39 |
AllianceBernstein Family of Funds
NOTES
| 40 | • ALLIANCEBERNSTEIN TAXABLE MULTI-SECTOR INCOME SHARES |
NOTES
| ALLIANCEBERNSTEIN TAXABLE MULTI-SECTOR INCOME SHARES • | 41 |
NOTES
| 42 | • ALLIANCEBERNSTEIN TAXABLE MULTI-SECTOR INCOME SHARES |
NOTES
| ALLIANCEBERNSTEIN TAXABLE MULTI-SECTOR INCOME SHARES • | 43 |
NOTES
| 44 | • ALLIANCEBERNSTEIN TAXABLE MULTI-SECTOR INCOME SHARES |
ALLIANCEBERNSTEIN TAXABLE MULTI-SECTOR INCOME SHARES
1345 Avenue of the Americas
New York, NY 10105
800.221.5672
| TMSIS-0152-1011 |  | |
SEMI-ANNUAL REPORT
AllianceBernstein
Tax-Aware Real Return Income Shares
October 31, 2011
Semi-Annual Report

Investment Products Offered
| • | Are Not FDIC Insured |
| • | May Lose Value |
| • | Are Not Bank Guaranteed |
Investors should consider the investment objectives, risks, charges and expenses of the Fund carefully before investing. For copies of our prospectus or summary prospectus, which contain this and other information, visit us online at www.alliancebernstein.com or contact your AllianceBernstein Investments representative. Please read the prospectus and/or summary prospectus carefully before investing.
This shareholder report must be preceded or accompanied by the Fund’s prospectus for individuals who are not current shareholders of the Fund.
You may obtain a description of the Fund’s proxy voting policies and procedures, and information regarding how the Fund voted proxies relating to portfolio securities during the most recent 12-month period ended June 30, without charge. Simply visit AllianceBernstein’s website at www.alliancebernstein.com, or go to the Securities and Exchange Commission’s (the “Commission”) website at www.sec.gov, or call AllianceBernstein at (800) 227-4618.
The Fund files its complete schedule of portfolio holdings with the Commission for the first and third quarters of each fiscal year on Form N-Q. The Fund’s Forms N-Q are available on the Commission’s website at www.sec.gov. The Fund’s Forms N-Q may also be reviewed and copied at the Commission’s Public Reference Room in Washington, DC; information on the operation of the Public Reference Room may be obtained by calling (800) SEC-0330.
AllianceBernstein Investments, Inc. (ABI) is the distributor of the AllianceBernstein family of mutual funds. ABI is a member of FINRA and is an affiliate of AllianceBernstein L.P., the manager of the funds.
AllianceBernstein® and the AB Logo are registered trademarks and service marks used by permission of the owner, AllianceBernstein L.P.
December 15, 2011
Semi-Annual Report
This report provides management’s discussion of fund performance for AllianceBernstein Tax-Aware Real Return Shares (the “Fund”) for the semi-annual reporting period ended October 31, 2011. Please note, shares of this Fund are offered exclusively through registered investment advisers approved by AllianceBernstein L.P. (the “Adviser”). The Fund commenced operations on May 2, 2011.
Investment Objective and Policies
The investment objective of the Fund is to maximize real after-tax return for investors subject to federal income taxation. The Fund pursues its objective by investing primarily in municipal securities that pay interest exempt from federal taxation and by using inflation protection derivatives instruments, such as inflation swap agreements. Municipal securities may pay interest that is subject to the federal alternative minimum tax (“AMT”) for certain taxpayers.
The Adviser selects securities for purchase or sale based on its assessment of the securities’ risk and return characteristics as well as the securities’ impact on the overall risk and return characteristics of the Fund. In making this assessment, the Adviser takes into account various factors including the credit quality and sensitivity to interest rates of the securities under consideration and of the Fund’s other holdings.
The Fund may invest in fixed-income securities with any maturity or duration and investment-grade bonds sub-
ject to taxation if the Adviser determines that they offer higher after-tax returns than comparable municipal bonds. While the Fund currently expects to invest principally in investment grade securities, the Fund may invest without limit in fixed-income securities that are not investment grade (“junk bonds”).
The Fund may make significant use of derivatives, including swaps, futures, options and forwards. To provide inflation protection, the Fund will enter into various kinds of inflation swap agreements. The Fund may use other inflation-protected instruments as well. Payments to the Fund pursuant to swap agreements will result in taxable income, either ordinary income or capital gains, rather than income exempt from federal taxation. Because the Fund is expected to be a significant vehicle for Separately Managed Account investors to achieve inflation protection for some or all of their overall accounts, the Fund may at times seek a substantial amount of inflation protection and, consequently, may generate substantial taxable income. It is expected that the Fund’s primary use of derivatives will be for the purposes of inflation protection.
The Fund may also invest in tender option bond transactions (“TOBs”); forward commitments; zero coupon municipal securities and variable, floating and inverse floating rate municipal securities; and certain types of mortgage related securities.
The Fund may make short sales of securities or maintain a short position,
| ALLIANCEBERNSTEIN TAX-AWARE REAL RETURN INCOME SHARES • | 1 |
and may use other investment techniques. The Fund may use leverage for investment purposes to increase income through the use of the cash made available by TOBs and derivative instruments, such as interest rate swaps, to make other investments in accordance with its investment objective.
Investment Results
The table on page 6 shows the Fund’s performance compared to its benchmark, the Barclays Capital 1-10 Year Treasury Inflation-Protected Securities (“TIPS”) Index, for the one month period ended October 31, 2011, and the period since inception (May 2, 2011) through October 31, 2011.
The Fund declined and underperformed its benchmark for the one-month period ended October 31, 2011, and underperformed for the period since inception (May 2, 2011) through October 31, 2011. The objective of the Fund is to maximize real (net of inflation) after-tax return without undue risk to principal. In pursuit of this objective, the Fund invests in municipal bonds that are exempt from federal income tax and typically enters into derivatives, such as inflation swap agreements, in order to provide inflation protection. The result of this is generally less overall interest rate exposure.
Since the Fund’s inception, U.S. Treasuries have had higher returns than municipal securities, causing the Fund to underperform its benchmark. Furthermore, the Fund has had less interest rate risk than its benchmark, which detracted from performance as
yields generally fell. This was especially true during the initial investment period for the Fund, as yields were falling during a period where the Fund was not fully invested.
The Fund has generally been slightly less exposed to inflation hedges relative to its benchmark since its inception. This has been modestly positive for performance as recent market turmoil lowered the forecast of inflation implied by securities in the market and therefore caused inflation-protected securities to underperform nominal bonds. Interest rate swaps were used for hedging purposes, which detracted from returns for the since inception period.
Market Review and Investment Strategy
Municipal bond markets drew strength from very tight supply and continued improved tax collections and having risen over the six-month period ended October 31, 2011, as investor panic about defaults sweeping the nation appeared finally to have subsided. New municipal bond issuance fell sharply in the first nine months of 2011, to the lowest level in a decade. Mayors and governors were reluctant to commit to large capital expenditures while they were slashing their operating budgets. Nevertheless, the need to issue bonds to fund critical capital improvements grew, which points to increased issuance ahead.
The Municipal Bond Investment Team (the “Team”) estimates that state tax revenues climbed to the point where they are 70% of their peak reached in September 2008 after the
| 2 | • ALLIANCEBERNSTEIN TAX-AWARE REAL RETURN INCOME SHARES |
largest drop ever seen. For fiscal year 2012, revenues were conservatively projected by the states to increase by about 2% on average; a growth rate that the Team expects could easily be exceeded. State and local tax collections are highly correlated with the rate of economic growth. Uncertainty surrounding the domestic economic outlook due to the deteriorating economic outlook for Europe coupled with the fallout of their debt crisis worked together during the summer to cloud the outlook for tax collections going forward.
While the change in the tax collections of state and local governments is highly uncertain at the moment, the Team doesn’t envision a rash of defaults should tax collections be less than expected. Most state and local governments made progress this summer in addressing their budget shortfalls going forward. States and municipalities continued to face their most serious fiscal difficulties since the Great Depression, but, in general, substantial progress was made during the summer to balance their budgets, reducing the risk of widespread defaults.
The Fund may purchase municipal securities that are insured under policies issued by certain insurance companies. Historically, insured municipal securities typically received a higher credit rating, which meant that the issuer of the securities paid a lower interest rate. As a result of declines in the credit quality and associated downgrades of most fund insurers, insurance has less value than it did in the past. The market now values insured municipal securities primarily based on the credit quality of the issuer of the security with little value given to the insurance feature. In purchasing such insured securities, the Adviser evaluates the risk and return of municipal securities through its own research. The ratings of most insurance companies have been downgraded and it is possible that some insurers may become insolvent. If an insurance company’s rating is downgraded or the company becomes insolvent, the prices of municipal securities insured by the insurance company may decline. As of October 31, 2011, 14.1% of the Fund’s total investments were in insured bonds and 0.0% of total investments were in insured pre-refunded/escrowed to maturity bonds.
| ALLIANCEBERNSTEIN TAX-AWARE REAL RETURN INCOME SHARES • | 3 |
HISTORICAL PERFORMANCE
An Important Note About Historical Performance
The investment return and principal value of an investment in the Fund will fluctuate, so that shares, when redeemed, may be worth more or less than their original cost. Performance shown on the following pages represents past performance and does not guarantee future results. Current performance may be lower or higher than the performance information shown. You may obtain performance information current to the most recent month-end by calling (800) 227-4618.
Benchmark Disclosure
The unmanaged Barclays Capital 1-10 Year TIPS Index does not reflect fees and expenses associated with the active management of a fund. The Barclays Capital 1-10 Year TIPS Index represents the performance of Inflation-Protection securities issued by the U.S. Treasury. An investor cannot invest directly in an index, and its results are not indicative of the performance for any specific investment, including the Fund.
A Word About Risk
Market Risk: The value of the Fund’s assets will fluctuate as the stock or bond market fluctuates. The value of the Fund’s investments may decline, sometimes rapidly and unpredictably, simply because of economic changes or other events that affect large portions of the market.
Credit Risk: An issuer or guarantor of a fixed-income security, or the counterparty to a derivatives or other contract, may be unable or unwilling to make timely payments of interest or principal, or to otherwise honor its obligations. The issuer or guarantor may default causing a loss of the full principal amount of a security. The degree of risk for a particular security may be reflected in its credit rating. There is the possibility that the credit rating of a fixed-income security may be downgraded after purchase, which may adversely affect the value of the security. Investments in fixed-income securities with lower ratings (commonly referred to as “junk bonds”) tend to have a higher probability that an issuer will default or fail to meet its payment obligations.
Municipal Market Risk: This is the risk that special factors may adversely affect the value of municipal securities and have a significant effect on the yield or value of the Fund’s investments in municipal securities. These factors include economic conditions, political or legislative changes, uncertainties related to the tax status of municipal securities, or the rights of investors in these securities. To the extent that the Fund invests more of its assets in a particular state’s municipal securities, the Fund may be vulnerable to events adversely affecting that state, including economic, political and regulatory occurrences, court decisions, terrorism and catastrophic natural disasters, such as hurricanes or earthquakes. The Fund’s investments in certain municipal securities with principal and interest payments that are made from the revenues of a specific project or facility, and not general tax revenues, may have increased risks. Factors affecting the project or facility, such as local business or economic conditions, could have a significant effect on the project’s ability to make payments of principal and interest on these securities.
Interest Rate Risk: Changes in interest rates will affect the value of investments in fixed-income securities. When interest rates rise, the value of investments in fixed-income securities tends to fall and this decrease in value may not be offset by higher income from new investments. Interest rate risk is generally greater for fixed-income securities with longer maturities or durations.
(Historical Performance continued on next page)
| 4 | • ALLIANCEBERNSTEIN TAX-AWARE REAL RETURN INCOME SHARES |
Historical Performance
HISTORICAL PERFORMANCE
(continued from previous page)
Inflation Risk: This is the risk that the value of assets or income from investments will be less in the future as inflation decreases the value of money. As inflation increases, the value of the Fund’s assets can decline as can the value of the Fund’s distributions. This risk is significantly greater for fixed-income securities with longer maturities.
Derivatives Risk: The Fund’s investments in derivatives, such as swaps, futures, options and forwards, may be illiquid, difficult to price, and leveraged so that small changes may produce disproportionate losses for the Fund, and may be subject to counter-party risk to a greater degree than more traditional investments. The use of inflation protection derivatives to help meet the Fund’s investment objective may not be successful.
Leverage Risk: To the extent the Fund uses leveraging techniques, its NAV may be more volatile because leverage tends to exaggerate the effect of changes in interest rates and any increase or decrease in the value of the Fund’s investments.
Liquidity Risk: Liquidity risk exists when particular investments, such as lower-rated securities, are difficult to purchase or sell, possibly preventing the Fund from selling out of these illiquid securities at an advantageous price. The Fund is subject to liquidity risk because the market for municipal securities is generally smaller than many other markets. Derivatives and securities involving substantial market and credit risk tend to involve greater liquidity risk.
Management Risk: The Fund is subject to management risk because it is an actively managed investment fund. The Adviser will apply its investment techniques and risk analyses in making investment decisions, but there is no guarantee that its techniques will produce the intended results.
These and other risks are more fully discussed in the Fund’s prospectus.
(Historical Performance continued on next page)
| ALLIANCEBERNSTEIN TAX-AWARE REAL RETURN INCOME SHARES • | 5 |
Historical Performance
HISTORICAL PERFORMANCE
(continued from previous page)
THE FUND VS. ITS BENCHMARK PERIODS ENDED OCTOBER 31, 2011 | NAV Returns | |||||||||
| 1 Month | Since Inception* | |||||||||
AllianceBernstein Tax-Aware Real Return Income Shares | -0.49% | 1.46% | ||||||||
| ||||||||||
Barclays Capital 1-10 Year TIPS Index | 1.44% | 3.91% | ||||||||
| ||||||||||
| AVERAGE ANNUAL RETURNS AS OF OCTOBER 31, 2011 | ||||
| NAV Returns | ||||
1 Month | -0.49 | % | ||
Since Inception* | 1.46 | % | ||
| SEC AVERAGE ANNUAL RETURNS (WITH ANY APPLICABLE SALES CHARGES) AS OF THE MOST RECENT CALENDAR QUARTER-END (SEPTEMBER 30, 2011) | ||||
| SEC Returns | ||||
1 Month | 0.88 | % | ||
Since Inception* | 1.96 | % | ||
The prospectus fee table shows the fees and the total fund operating expenses of the Fund as 0.00% because the Adviser does not charge any fees or expenses and reimburses Fund operating expenses. Participants in a wrap fee program eligible to invest in the Fund pay fees to the program sponsor and should review the wrap program brochure provided by the sponsor for a discussion of fees and expenses charged.
| * | Inception date: 5/02/2011. |
See Historical Performance and Benchmark disclosures on pages 4 and 5.
| 6 | • ALLIANCEBERNSTEIN TAX-AWARE REAL RETURN INCOME SHARES |
Historical Performance
FUND EXPENSES
(unaudited)
As a shareholder of the Fund, you may incur various ongoing non-operating and extraordinary costs. This example is intended to help you understand your ongoing costs (in dollars) of investing in the Fund and to compare these costs with the ongoing costs of investing in other mutual funds.
The Example is based on an investment of $1,000 invested at the beginning of the period and held for the entire period as indicated below.
Actual Expenses
The table below provides information about actual account values and actual expenses. You may use the information in this line, together with the amount you invested, to estimate the expenses that you paid over the period. Simply divide your account value by $1,000 (for example, an $8,600 account value divided by $1,000 = 8.6), then multiply the result by the number in the first line under the heading entitled “Expenses Paid During Period” to estimate the expenses you paid on your account during this period.
Hypothetical Example for Comparison Purposes
The table below provides information about hypothetical account values and hypothetical expenses based on the Fund’s actual expense ratio and an assumed annual rate of return of 5% before expenses, which is not the Fund’s actual return. The hypothetical account values and expenses may not be used to estimate the actual ending account balance or expenses you paid for the period. You may use this information to compare the ongoing costs of investing in the Fund and other funds by comparing this 5% hypothetical example with the 5% hypothetical examples that appear in the shareholder reports of other funds.
Please note that the expenses shown in the table are meant to highlight your ongoing costs only and do not reflect any transactional costs, such as sales charges (loads), or contingent deferred sales charges on redemptions. Therefore, the hypothetical example is useful in comparing ongoing costs only, and will not help you determine the relative total costs of owning different funds. In addition, if these transactional costs were included, your costs would have been higher.
| Beginning Account Value May 2, 2011(a) | Ending Account Value October 31, 2011 | Expenses Paid During Period* | Annualized Expense Ratio* | |||||||||||||
Actual | $ | 1,000 | $ | 1,016.60 | $ | 0.00 | 0.00 | % | ||||||||
Hypothetical** | $ | 1,000 | $ | 1,025.00 | $ | 0.00 | 0.00 | % | ||||||||
| (a) | Commencement of operations. |
| * | Actual expenses paid are based on the period from May 2, 2011 (commencement of operations) and are equal to the Fund’s annualized expense ratio, multiplied by the average account value over the period, multiplied by 183/366 (to reflect the since inception period). Hypothetical expenses are equal to the Fund’s annualized expense ratio, multiplied by the average account value over the period, multiplied by 184/366 (to reflect the one-half year period). The Fund’s operating expenses are borne by the Adviser or its affiliates. |
| ** | Assumes 5% return before expenses. |
| ALLIANCEBERNSTEIN TAX-AWARE REAL RETURN INCOME SHARES • | 7 |
Fund Expenses
PORTFOLIO SUMMARY
October 31, 2011 (unaudited)
PORTFOLIO STATISTICS
Net Assets ($mil): $5.1
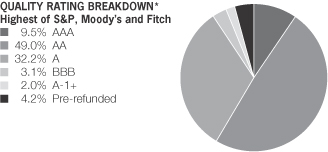
| * | All data are as of October 31, 2011. The Portfolio’s quality rating breakdown is expressed as a percentage of the Portfolio’s total investments in municipal securities and may vary over time. The Portfolio also enters into derivative transactions, which may be used for hedging or investment purposes (see “Portfolio of Investments” section of the report for additional details). The quality ratings are determined by using the Standard & Poor’s Ratings Services, Moody’s Investors Services, Inc. and Fitch Ratings, Ltd. A measure of the quality and safety of a bond or portfolio, based on the issuer’s financial condition. AAA is highest (best) and D is lowest (worst). If applicable, the pre-refunded category includes bonds which are secured by U.S. Government Securities and therefore have been deemed high-quality investment grade by the Adviser. If applicable, Not Applicable (N/A) includes non credit worthy investments; such as, equities, currency contracts, futures and options. If applicable, the Not Rated category includes bonds that are not rated by a Nationally Recognized Statistical Rating Organization. |
| 8 | • ALLIANCEBERNSTEIN TAX-AWARE REAL RETURN INCOME SHARES |
Portfolio Summary
PORTFOLIO OF INVESTMENTS
October 31, 2011 (unaudited)
| Principal Amount (000) | U.S. $ Value | |||||||
| ||||||||
MUNICIPAL OBLIGATIONS – 95.5% | ||||||||
Long-Term Municipal Bonds – 93.6% | ||||||||
Alabama – 3.9% | ||||||||
Alabama GO | $ | 190 | $ | 200,437 | ||||
|
| |||||||
Alaska – 2.2% | ||||||||
Valdez AK Marine Terminal | 100 | 111,791 | ||||||
|
| |||||||
California – 5.5% | ||||||||
California Dept Wtr Res Pwr | 185 | 197,236 | ||||||
San Francisco City/Cnty CA Arpt Commn | 80 | 85,097 | ||||||
|
| |||||||
| 282,333 | ||||||||
|
| |||||||
Florida – 12.2% | ||||||||
Broward Cnty FL Sch Brd COP | 135 | 149,546 | ||||||
Citizens Ppty Ins Corp. FL | 145 | 155,585 | ||||||
Florida Mun Pwr Agy | 140 | 155,966 | ||||||
Florida Ports Fin Commn | 100 | 109,113 | ||||||
Jacksonville FL Sales Tax | 50 | 53,759 | ||||||
|
| |||||||
| 623,969 | ||||||||
|
| |||||||
Georgia – 0.9% | ||||||||
Georgia Mun Elec Auth | 45 | 49,037 | ||||||
|
| |||||||
Hawaii – 4.1% | ||||||||
Honolulu HI City & Cnty GO | 185 | 211,017 | ||||||
|
| |||||||
| ALLIANCEBERNSTEIN TAX-AWARE REAL RETURN INCOME SHARES • | 9 |
Portfolio of Investments
| Principal Amount (000) | U.S. $ Value | |||||||
| ||||||||
Indiana – 3.2% | ||||||||
Indianapolis IN Loc Bond Bank | $ | 100 | $ | 106,904 | ||||
Indianapolis IN Loc Bond Bank | 55 | 57,249 | ||||||
|
| |||||||
| 164,153 | ||||||||
|
| |||||||
Louisiana – 1.4% | ||||||||
Louisiana Citizens Ppty Ins Corp. | 70 | 73,158 | ||||||
|
| |||||||
Massachusetts – 3.0% | ||||||||
Metropolitan Boston Trnsp Pkg Corp. MA | 140 | 151,704 | ||||||
|
| |||||||
New Jersey – 2.8% | ||||||||
New Jersey Trnsp Trust FD Auth | 135 | 145,213 | ||||||
|
| |||||||
New York – 14.9% | ||||||||
Long Island Pwr Auth NY NPFGC | 100 | 99,508 | ||||||
New York NY Mun Wtr Fin Auth | 185 | 208,291 | ||||||
New York St Dormitory Auth | ||||||||
4.00%, 3/15/13 | 190 | 199,365 | ||||||
Series 2011C 5.00%, 3/15/25 | 50 | 56,627 | ||||||
New York St Thruway Auth | ||||||||
Series 2011A | 190 | 199,367 | ||||||
|
| |||||||
| 763,158 | ||||||||
|
| |||||||
North Carolina – 3.9% | ||||||||
North Carolina Cap Impt Lease | ||||||||
Series 2008A | 185 | 202,231 | ||||||
|
| |||||||
Oregon – 3.0% | ||||||||
Tri-Cnty Met Trnsp Dist OR Grant Prog | ||||||||
Series 2011A | 140 | 153,884 | ||||||
|
| |||||||
| 10 | • ALLIANCEBERNSTEIN TAX-AWARE REAL RETURN INCOME SHARES |
Portfolio of Investments
| Principal Amount (000) | U.S. $ Value | |||||||
| ||||||||
Pennsylvania – 4.0% | ||||||||
Pennsylvania GO | ||||||||
Series 2010A | $ | 155 | $ | 165,901 | ||||
Philadelphia PA Gas Works | ||||||||
Series 2011-1975 | 35 | 38,097 | ||||||
|
| |||||||
| 203,998 | ||||||||
|
| |||||||
Puerto Rico - 4.6% | ||||||||
Puerto Rico Elec Pwr Auth | ||||||||
Series 2007TT | 120 | 125,957 | ||||||
Puerto Rico GO | ||||||||
NPFGC 6.00%, 7/01/14 | 60 | 65,275 | ||||||
Puerto Rico Pub Bldgs Auth | 45 | 46,028 | ||||||
|
| |||||||
| 237,260 | ||||||||
|
| |||||||
Texas – 10.1% | ||||||||
Conroe TX ISD GO | 180 | 207,220 | ||||||
Houston TX Arpt Sys | 100 | 108,114 | ||||||
Houston TX Util Sys | 185 | 201,544 | ||||||
|
| |||||||
| 516,878 | ||||||||
|
| |||||||
Virginia – 7.9% | ||||||||
Fairfax Cnty VA Econ Dev Dist | 185 | 208,945 | ||||||
Virginia Lease Pub Fac | 180 | 194,247 | ||||||
|
| |||||||
| 403,192 | ||||||||
|
| |||||||
Washington – 2.0% | ||||||||
Chelan Cnty WA PUD #1 | 90 | 100,419 | ||||||
|
| |||||||
Wisconsin – 4.0% | ||||||||
Badger Tob Asset Sec Corp. WI | 200 | 206,696 | ||||||
|
| |||||||
Total Long-Term Municipal Bonds | 4,800,528 | |||||||
|
| |||||||
| ALLIANCEBERNSTEIN TAX-AWARE REAL RETURN INCOME SHARES • | 11 |
Portfolio of Investments
| Principal Amount (000) | U.S. $ Value | |||||||
| ||||||||
Short-Term Municipal Notes – 1.9% | ||||||||
Missouri – 1.9% | ||||||||
North Kansas City MO Hosp | $ | 100 | $ | 100,000 | ||||
|
| |||||||
Total Municipal Obligations | 4,900,528 | |||||||
|
| |||||||
| Shares | ||||||||
SHORT-TERM INVESTMENT – 0.4% | ||||||||
Investment Companies – 0.4% | ||||||||
AllianceBernstein Fixed-Income Shares, Inc. – Government STIF Portfolio, 0.09%(c) | 20,648 | 20,648 | ||||||
|
| |||||||
Total Investments – 95.9% | 4,921,176 | |||||||
Other assets less liabilities – 4.1% | 209,405 | |||||||
|
| |||||||
Net Assets – 100.0% | $ | 5,130,581 | ||||||
|
| |||||||
INTEREST RATE SWAP TRANSACTIONS (see Note C)
| Rate Type | ||||||||||||||||||||
| Swap Counterparty | Notional Amount (000) | Termination Date | Payments made by the Portfolio | Payments received by the Portfolio | Unrealized Appreciation/ (Depreciation) | |||||||||||||||
Deutsche Bank AG | $ | 4,600 | 6/2/13 | 2.094 | % | CPI | # | $ | (13,253 | ) | ||||||||||
Deutsche Bank AG | 700 | 6/30/14 | 1.998 | % | CPI | # | (2,627 | ) | ||||||||||||
Deutsche Bank AG | 800 | 7/21/14 | 2.155 | % | CPI | # | (7,836 | ) | ||||||||||||
Deutsche Bank AG | 300 | 6/20/21 | 2.655 | % | CPI | # | (7,391 | ) | ||||||||||||
Deutsche Bank AG | 200 | 9/7/21 | 2.4 | % | CPI | # | 572 | |||||||||||||
JPMorgan Chase Bank, N.A. | 100 | 6/30/26 | 2.89 | % | CPI | # | (5,418 | ) | ||||||||||||
JPMorgan Chase Bank, N.A. | 200 | 7/21/26 | 2.935 | % | CPI | # | (12,399 | ) | ||||||||||||
|
| |||||||||||||||||||
| $ | (48,352 | ) | ||||||||||||||||||
|
| |||||||||||||||||||
| # | Variable interest rate based on the rate of inflation as determined by the Consumer Price Index (CPI). |
| (a) | Variable rate coupon, rate shown as of October 31, 2011. |
| (b) | Variable Rate Demand Notes (VRDN) are instruments whose interest rates change on a specific date (such as coupon date or interest payment date) or whose interest rates vary with changes in a designated base rate (such as the prime interest rate). This instrument is payable on demand and is secured by letters of credit or other credit support agreements from major banks. |
| (c) | Investment in affiliated money market mutual fund. The rate shown represents the 7-day yield as of period end. |
| 12 | • ALLIANCEBERNSTEIN TAX-AWARE REAL RETURN INCOME SHARES |
Portfolio of Investments
As of October 31, 2011, the Fund held 13.5% of net assets in insured bonds (of this amount 0.0% represents the Fund’s holding in pre-refunded or escrowed to maturity bonds).
Glossary:
AMBAC – Ambac Assurance Corporation
COP – Certificate of Participation
ETM – Escrowed to Maturity
GO – General Obligation
ISD – Independent School District
NPFGC – National Public Finance Guarantee Corporation
NPFGC-RE – National Public Finance Guarantee Corporation Reinsuring FGIC
PUD – Public Utility District
See notes to financial statements.
| ALLIANCEBERNSTEIN TAX-AWARE REAL RETURN INCOME SHARES • | 13 |
Portfolio of Investments
STATEMENT OF ASSETS & LIABILITIES
October 31, 2011 (unaudited)
| Assets | ||||
Investments in securities, at value | ||||
Unaffiliated issuers (cost $4,822,519) | $ | 4,900,528 | ||
Affiliated issuers (cost $20,648) | 20,648 | |||
Receivable for investment securities sold | 199,306 | |||
Interest and dividends receivable | 62,183 | |||
Unrealized appreciation on interest rate swap contracts | 572 | |||
|
| |||
Total assets | 5,183,237 | |||
|
| |||
| Liabilities | ||||
Unrealized depreciation on interest rate swap contracts | 48,924 | |||
Dividends payable | 3,732 | |||
|
| |||
Total liabilities | 52,656 | |||
|
| |||
Net Assets | $ | 5,130,581 | ||
|
| |||
| Composition of Net Assets | ||||
Shares of beneficial interest, at par | $ | 5 | ||
Additional paid-in capital | 5,099,997 | |||
Accumulated net realized gain on investment transactions | 922 | |||
Net unrealized appreciation on investments | 29,657 | |||
|
| |||
| $ | 5,130,581 | |||
|
| |||
Net Asset Value Per Share—unlimited shares of beneficial interest authorized, $.00001 par value (based on 510,000 common shares outstanding) | $ | 10.06 | ||
|
|
See notes to financial statements.
| 14 | • ALLIANCEBERNSTEIN TAX-AWARE REAL RETURN INCOME SHARES |
Statement of Assets & Liabilities
STATEMENT OF OPERATIONS
For the Period May 2, 2011(a) to October 31, 2011 (unaudited)
| Investment Income | ||||||||
Interest | $ | 44,113 | ||||||
Dividends—Affiliated issuers | 30 | |||||||
|
| |||||||
Total Income | $ | 44,143 | ||||||
|
| |||||||
| Realized and Unrealized Gain (Loss) on Investment Transactions | ||||||||
Net realized gain on investment transactions | 922 | |||||||
Net change in unrealized appreciation/depreciation of: | ||||||||
Investments | 78,009 | |||||||
Swap contracts | (48,352 | ) | ||||||
|
| |||||||
Net gain on investment transactions | 30,579 | |||||||
|
| |||||||
Net Increase in Net Assets from Operations | $ | 74,722 | ||||||
|
|
| (a) | Commencement of operations. |
See notes to financial statements.
| ALLIANCEBERNSTEIN TAX-AWARE REAL RETURN INCOME SHARES • | 15 |
Statement of Operations
STATEMENT OF CHANGES IN NET ASSETS
| May 2, 2011(a) to October 31, 2011 (unaudited) | ||||
| Increase in Net Assets from Operations | ||||
Net investment income | $ | 44,143 | ||
Net realized gain on investment transactions | 922 | |||
Net change in unrealized appreciation/depreciation of investments | 29,657 | |||
|
| |||
Net increase in net assets from operations | 74,722 | |||
| Dividends to Shareholders from | ||||
Net investment income | (44,143 | ) | ||
| Transactions in Shares of Beneficial Interest | ||||
Net increase | 5,100,002 | |||
|
| |||
Total increase | 5,130,581 | |||
| Net Assets | ||||
Beginning of period | – 0 | – | ||
|
| |||
End of period | $ | 5,130,581 | ||
|
| |||
| (a) | Commencement of operations. |
See notes to financial statements.
| 16 | • ALLIANCEBERNSTEIN TAX-AWARE REAL RETURN INCOME SHARES |
Statement of Changes in Net Assets
NOTES TO FINANCIAL STATEMENTS
October 31, 2011 (unaudited)
NOTE A
Significant Accounting Policies
AllianceBernstein Corporate Shares (the “Trust”) was organized as a Massachusetts business trust under the laws of The Commonwealth of Massachusetts by an Agreement and Declaration of Trust (“Declaration of Trust”) dated January 26, 2004. The Trust is registered under the Investment Company Act of 1940, as an open-end, diversified management investment company. The Trust operates as a “series” company currently having five separate portfolios: AllianceBernstein Corporate Income Shares, AllianceBernstein Municipal Income Shares, AllianceBernstein Taxable Multi-Sector Income Shares, AllianceBernstein Tax-Aware Real Return Income Shares (the “Portfolio”) and AllianceBernstein International Focus Shares. Each Portfolio is considered to be a separate entity for financial reporting and tax purposes. AllianceBernstein Corporate Income Shares commenced operations on December 11, 2006. AllianceBernstein Municipal Income Shares commenced operations on September 1, 2010. AllianceBernstein Taxable Multi-Sector Income Shares commenced operations on September 15, 2010. AllianceBernstein Tax-Aware Real Return Income Shares commenced operations on May 2, 2011. AllianceBernstein International Focus Shares commenced operations on June 20, 2011. This report relates only to AllianceBernstein Tax-Aware Real Return Income Shares.
Shares of the Portfolio are offered exclusively to holders of accounts established under wrap-fee programs sponsored and maintained by certain registered investment advisers approved by AllianceBernstein L.P. (the “Adviser”). The Portfolio’s shares may be purchased at the relevant net asset value without a sales charge or other fee. The financial statements have been prepared in conformity with U.S. generally accepted accounting principles (“U.S. GAAP”) which require management to make certain estimates and assumptions that affect the reported amounts of assets and liabilities in the financial statements and amounts of income and expenses during the reporting period. Actual results could differ from those estimates. The following is a summary of significant accounting policies followed by the Portfolio.
1. Security Valuation
Portfolio securities are valued at their current market value determined on the basis of market quotations or, if market quotations are not readily available or are deemed unreliable, at “fair value” as determined in accordance with procedures established by and under the general supervision of the Trust’s Board of Trustees.
In general, the market value of securities which are readily available and deemed reliable are determined as follows: Securities listed on a national securities exchange (other than securities listed on the NASDAQ Stock Market, Inc. (“NASDAQ”)) or on a foreign securities exchange are valued at the last sale price at the close of the exchange or foreign securities exchange. If there has been no sale on such day, the securities are valued at the mean of the closing bid
| ALLIANCEBERNSTEIN TAX-AWARE REAL RETURN INCOME SHARES • | 17 |
Notes to Financial Statements
and ask prices on such day. Securities listed on more than one exchange are valued by reference to the principal exchange on which the securities are traded; securities listed only on NASDAQ are valued in accordance with the NASDAQ Official Closing Price; listed or over the counter market (“OTC”) put or call options are valued at the mid level between the current bid and ask prices. If either a current bid or current ask price is unavailable, AllianceBernstein L.P. (the “Adviser”) will have discretion to determine the best valuation (e.g. last trade price); open futures contracts and options thereon are valued using the closing settlement price or, in the absence of such a price, the most recent quoted bid price. If there are no quotations available for the day of valuation, the last available closing settlement price is used; U.S. government securities and other debt instruments having 60 days or less remaining until maturity are valued at amortized cost if their original maturity was 60 days or less; or by amortizing their fair value as of the 61st day prior to maturity if their original term to maturity exceeded 60 days; fixed-income securities, including mortgage backed and asset backed securities, may be valued on the basis of prices provided by a pricing service or at a price obtained from one or more of the major broker/dealers. In cases where broker/dealer quotes are obtained, the Adviser may establish procedures whereby changes in market yields or spreads are used to adjust, on a daily basis, a recently obtained quoted price on a security; and swaps and other derivatives are valued daily, primarily using independent pricing services, independent pricing models using market inputs, as well as third party broker-dealers or counterparties, which are approved by the Board of Trustees. Investments in money market funds are valued at their net asset value each day.
Securities for which market quotations are not readily available (including restricted securities) or are deemed unreliable are valued at fair value. Factors considered in making this determination may include, but are not limited to, information obtained by contacting the issuer, analysts, analysis of the issuer’s financial statements or other available documents. In addition, the Portfolio may use fair value pricing for securities primarily traded in non-U.S. markets because most foreign markets close well before the Portfolio values its securities at 4:00 p.m., Eastern Time. The earlier close of these foreign markets gives rise to the possibility that significant events, including broad market moves, may have occurred in the interim and may materially affect the value of those securities.
2. Fair Value Measurements
In accordance with U.S. GAAP regarding fair value measurements, fair value is defined as the price that the Portfolio would receive to sell an asset or pay to transfer a liability in an orderly transaction between market participants at the measurement date. The U.S. GAAP disclosure requirements establish a framework for measuring fair value, and a three-level hierarchy for fair value measurements based upon the transparency of inputs to the valuation of an asset or liability. Inputs may be observable or unobservable and refer broadly to the assumptions that market participants would use in pricing the asset or liability.
| 18 | • ALLIANCEBERNSTEIN TAX-AWARE REAL RETURN INCOME SHARES |
Notes to Financial Statements
Observable inputs reflect the assumptions market participants would use in pricing the asset or liability based on market data obtained from sources independent of the Portfolio. Unobservable inputs reflect the Portfolio’s own assumptions about the assumptions that market participants would use in pricing the asset or liability based on the best information available in the circumstances. Each investment is assigned a level based upon the observability of the inputs which are significant to the overall valuation. The three-tier hierarchy of inputs is summarized below.
| • | Level 1—quoted prices in active markets for identical investments |
| • | Level 2—other significant observable inputs (including quoted prices for similar investments, interest rates, prepayment speeds, credit risk, etc.) |
| • | Level 3—significant unobservable inputs (including the Portfolio’s own assumptions in determining the fair value of investments) |
The following table summarizes the valuation of the Portfolio’s investments by the above fair value hierarchy levels as of October 31, 2011:
Investments in Securities: | Level 1 | Level 2 | Level 3 | Total | ||||||||||||
Assets: | ||||||||||||||||
Long-Term Municipal Bonds | $ | – 0 | – | $ | 4,800,528 | $ | – 0 | – | $ | 4,800,528 | ||||||
Short-Term Municipal Notes | – 0 | – | 100,000 | – 0 | – | 100,000 | ||||||||||
Short-Term Investment | 20,648 | – 0 | – | –0 | – | 20,648 | ||||||||||
|
|
|
|
|
|
|
| |||||||||
Total Investments in Securities | 20,648 | 4,900,528 | –0 | – | 4,921,176 | |||||||||||
Other Financial Instruments*: | ||||||||||||||||
Assets: | ||||||||||||||||
Interest Rate Swap Contracts | – 0 | – | 572 | – 0 | – | 572 | ||||||||||
Liabilities: | ||||||||||||||||
Interest Rate Swap Contracts | – 0 | – | (48,924 | ) | – 0 | – | (48,924 | ) | ||||||||
|
|
|
|
|
|
|
| |||||||||
Total | $ | 20,648 | $ | 4,852,176 | $ | – 0 | – | $ | 4,872,824 | |||||||
|
|
|
|
|
|
|
| |||||||||
| * | Other financial instruments are derivative instruments, such as futures, forwards and swap contracts, which are valued at the unrealized appreciation/depreciation on the instrument. |
3. Taxes
It is the Portfolio’s policy to meet the requirements of the Internal Revenue Code applicable to regulated investment companies and to distribute all of its investment company taxable income and net realized gains, if any, to shareholders. Therefore, no provisions for federal income or excise taxes are required.
In accordance with U.S. GAAP requirements regarding accounting for uncertainties in income taxes, management has analyzed the Portfolio’s tax positions taken or expected to be taken on federal and state income tax returns for all open tax years and has concluded that no provision for income tax is required in the Portfolio’s financial statements.
| ALLIANCEBERNSTEIN TAX-AWARE REAL RETURN INCOME SHARES • | 19 |
Notes to Financial Statements
4. Investment Income and Investment Transactions
Dividend income is recorded on the ex-dividend date or as soon as the Portfolio is informed of the dividend. Interest income is accrued daily. Investment transactions are accounted for on the date the securities are purchased or sold. Investment gains or losses are determined on the identified cost basis. The Portfolio amortizes premiums and accretes discounts as adjustments to interest income.
5. Dividends and Distributions
Dividends and distributions to shareholders, if any, are recorded on the ex-dividend date. Income dividends and capital gains distributions are determined in accordance with federal tax regulations and may differ from those determined in accordance with U.S. GAAP. To the extent these differences are permanent, such amounts are reclassified within the capital accounts based on their federal tax basis treatment; temporary differences do not require such reclassification.
NOTE B
Advisory Fee and Other Transactions with Affiliates
Under the terms of the Advisory Agreement, the Portfolio pays no advisory fee to the Adviser and the Adviser reimburses or pays for the Portfolio’s operating expenses. The Portfolio is an integral part of separately managed accounts in wrap-fee programs. Typically, participants in these programs pay a fee to their investment adviser for all costs and expenses of the separately managed account, including costs and expenses associated with the Portfolio. The Adviser serves as investment manager and adviser of the Portfolio and continuously furnishes an investment program for the Portfolio and manages, supervises and conducts the affairs of the Portfolio, subject to the supervisions of the Portfolio’s Board of Trustees. The Advisory Agreement provides that the Adviser or an affiliate will furnish, or pay the expenses of the Portfolio for, office space, facilities and equipment, services of executive and other personnel of the Portfolio and certain administrative services.
The Portfolio has entered into a Distribution Agreement (the “Agreement”) with AllianceBernstein Investments, Inc., the Portfolio’s principal underwriter (the “Underwriter”), to permit the Underwriter to distribute the Portfolio’s shares, which are sold at their net asset value without any sales charge. The Portfolio does not pay a fee for this service. The Underwriter is a wholly owned subsidiary of the Adviser.
AllianceBernstein Investor Services, Inc. (“ABIS”), a wholly-owned subsidiary of the Adviser, acts as the Portfolios’ registrar, transfer agent and dividend-disbursing agent. ABIS registers the transfer, issuance and redemption of Portfolio shares and disburses dividends and other distributions to Portfolio shareholders. The Portfolio does not pay a fee for this service.
| 20 | • ALLIANCEBERNSTEIN TAX-AWARE REAL RETURN INCOME SHARES |
Notes to Financial Statements
The Portfolio may invest in the AllianceBernstein Fixed-Income Shares, Inc.—Government STIF Portfolio (“Government STIF Portfolio”), an open-end management investment company managed by the Adviser. The Government STIF Portfolio is offered as a cash management option to mutual funds and other institutional accounts of the Adviser, and is not available for direct purchase by members of the public. The Government STIF Portfolio pays no investment management fees but does bear its own expenses. A summary of the Portfolio’s transactions in shares of the Government STIF Portfolio for the period ended October 31, 2011 is as follows:
Market Value May 2, 2011(a) (000) | Purchases at Cost (000) | Sales Proceeds (000) | Market Value October 31, 2011 (000) | Dividend Income (000) | ||||||||||
$ – 0 – | $ | 2,690 | $ | 2,669 | $ | 21 | $ – 0 –* | |||||||
| (a) | Commencement of operations |
| * | Amount is less than $500. |
NOTE C
Investment Transactions
Purchases and sales of investment securities (excluding short-term investments) for the period ended October 31, 2011 were as follows:
| Purchases | Sales | |||||||
Investment securities (excluding | $ | 4,954,767 | $ | 196,202 | ||||
U.S. government securities | 508,887 | 509,162 | ||||||
The cost of investments for federal income tax purposes was substantially the same as the cost for financial reporting purposes. Accordingly, gross unrealized appreciation and unrealized depreciation (excluding swap transactions) are as follows:
Gross unrealized appreciation | $ | 79,688 | ||
Gross unrealized depreciation | (1,679 | ) | ||
|
| |||
Net unrealized appreciation | $ | 78,009 | ||
|
|
1. Derivative Financial Instruments
The Portfolio may use derivatives to earn income and enhance returns, to hedge or adjust the risk profile of its portfolio, to replace more traditional direct investments, or to obtain exposure to otherwise inaccessible markets.
The principal type of derivatives utilized by the Portfolio, as well as the methods in which they may be used are:
| • | Swap Agreements |
The Portfolio may enter into swaps to hedge its exposure to interest rates or credit risk. A swap is an agreement that obligates two parties to
| ALLIANCEBERNSTEIN TAX-AWARE REAL RETURN INCOME SHARES • | 21 |
Notes to Financial Statements
exchange a series of cash flows at specified intervals based upon or calculated by reference to changes in specified prices or rates for a specified amount of an underlying asset. The payment flows are usually netted against each other, with the difference being paid by one party to the other. In addition, collateral may be pledged or received by the Portfolio in accordance with the terms of the respective swap agreements to provide value and recourse to the Portfolio or its counterparties in the event of default, bankruptcy or insolvency by one of the parties to the swap agreement.
Risks may arise as a result of the failure of the counterparty to the swap contract to comply with the terms of the swap contract. The loss incurred by the failure of a counterparty is generally limited to the net interim payment to be received by the Portfolio, and/or the termination value at the end of the contract. Therefore, the Portfolio considers the creditworthiness of each counterparty to a swap contract in evaluating potential counterparty risk. This risk is mitigated by having a netting arrangement between the Portfolio and the counterparty and by the posting of collateral by the counterparty to the Portfolio to cover the Portfolio exposure to the counterparty. Additionally, risks may arise from unanticipated movements in interest rates or in the value of the underlying securities. The Portfolio accrues for the interim payments on swap contracts on a daily basis, with the net amount recorded within unrealized appreciation/depreciation of swap contracts on the statement of assets and liabilities, where applicable. Once the interim payments are settled in cash, the net amount is recorded as realized gain/(loss) on swaps on the statement of operations, in addition to any realized gain/(loss) recorded upon the termination of swap contracts. Fluctuations in the value of swap contracts are recorded as a component of net change in unrealized appreciation/depreciation of swap contracts on the statement of operations.
Interest Rate Swaps:
The Portfolio is subject to interest rate risk exposure in the normal course of pursuing its investment objectives. Because the Portfolio holds fixed rate bonds, the value of these bonds may decrease if interest rates rise. To help hedge against this risk and to maintain its ability to generate income at prevailing market rates, the Portfolio may enter into interest rate swap contracts. Interest rate swaps are agreements between two parties to exchange cash flows based on a notional amount. The Portfolio may elect to pay a fixed rate and receive a floating rate, or, receive a fixed rate and pay a floating rate on a notional amount.
In addition, a Portfolio may also enter into interest rate swap transactions to preserve a return or spread on a particular investment or portion of its portfolio, or protecting against an increase in the price of securities the Portfolio anticipates purchasing at a later date. Interest rate swaps involve the exchange by the Portfolio with another party of their respective
| 22 | • ALLIANCEBERNSTEIN TAX-AWARE REAL RETURN INCOME SHARES |
Notes to Financial Statements
commitments to pay or receive interest (e.g., an exchange of floating rate payments for fixed rate payments) computed based on a contractually-based principal (or “notional”) amount. Interest rate swaps are entered into on a net basis (i.e., the two payment streams are netted out, with the Portfolio receiving or paying, as the case may be, only the net amount of the two payments).
During the period ended October 31, 2011, the Portfolio held interest rate swap contracts for hedging purposes.
Documentation governing the Portfolio’s swap transactions may contain provisions for early termination of a swap in the event the net assets of the Portfolio decline below specific levels set forth in the documentation (“net asset contingent features”). If these levels are triggered, the Portfolio’s counterparty has the right to terminate the swap and require the Portfolio to pay or receive a settlement amount in connection with the terminated swap transaction. As of October 31, 2011, the Portfolio had interest rate swap contracts in liability positions with net asset contingent features. The fair value of such contracts amounted to $48,924 at October 31, 2011.
At October 31, 2011, the Portfolio had entered into the following derivatives:
Asset Derivatives | Liability Derivatives | |||||||||||
Derivative Type | Statement of | Fair Value | Statement of | Fair Value | ||||||||
Interest rate contracts | Unrealized appreciation on interest rate swap contracts | $ | 572 | | Unrealized depreciation on interest rate swap contracts | $ | 48,924 | | ||||
|
|
|
| |||||||||
Total | $ | 572 | $ | 48,924 | ||||||||
|
|
|
| |||||||||
The effect of derivative instruments on the statement of operations for the period ended October 31, 2011:
Derivative Type | Location of Gain | Realized Gain or (Loss) on Derivatives | Change in Unrealized Appreciation or (Depreciation) | |||||||
Interest rate contracts | Net realized gain (loss) on swap contracts; Net change in unrealized appreciation/depreciation of swap contracts | $ | – 0 | – | $ | (48,352 | ) | |||
|
|
|
| |||||||
Total | $ | – 0 | – | $ | (48,352 | ) | ||||
|
|
|
| |||||||
For five months of the period, the average monthly notional amount of interest rate swaps was $6,580,000.
| ALLIANCEBERNSTEIN TAX-AWARE REAL RETURN INCOME SHARES • | 23 |
Notes to Financial Statements
NOTE D
Shares of Beneficial Interest
Transactions in shares of beneficial interest were as follows:
| Shares | Amount | |||||||||||||
| May 2, 2011(a) to October 31, 2011 (unaudited) | May 2, 2011(a) to October 31, 2011 (unaudited) | |||||||||||||
|
| |||||||||||||
Shares sold | 510,000 | $ | 5,100,002 | |||||||||||
| ||||||||||||||
Net increase | 510,000 | $ | 5,100,002 | |||||||||||
| ||||||||||||||
| (a) | Commencement of operations. |
NOTE E
Risks Involved in Investing in the Portfolio
Municipal Market Risk and Concentration of Credit Risk—This is the risk that special factors may adversely affect the value of municipal securities and have a significant effect on the yield or value of the Portfolio’s investments in municipal securities. These factors include economic conditions, political or legislative changes, uncertainties related to the tax status of municipal securities, or the rights of investors in these securities. To the extent that the Portfolio invests more of its assets in a particular state’s municipal securities, the Portfolio may be vulnerable to events adversely affecting that state, including economic, political and regulatory occurrences, court decisions, terrorism and catastrophic natural disasters, such as hurricanes or earthquakes. The Portfolio’s investments in certain municipal securities with principal and interest payments that are made from the revenues of a specific project or facility, and not general tax revenues, may have increased risks. Factors affecting the project or facility, such as local business or economic conditions, could have a significant effect on the project’s ability to make payments of principal and interest on these securities.
Derivatives Risk—The Portfolio may enter into derivative transactions such as forwards, options, futures and swaps. Derivatives may be illiquid, difficult to price, and leveraged so that small changes may produce disproportionate losses for the Portfolio, and subject to counterparty risk to a greater degree than more traditional investments. Derivatives may result in significant losses, including losses that are far greater than the value of the derivatives reflected in the statement of assets and liabilities.
Indemnification Risk—In the ordinary course of business, the Portfolio enters into contracts that contain a variety of indemnifications. The Portfolio’s maximum exposure under these arrangements is unknown. However, the Portfolio has not had prior claims or losses pursuant to these indemnification provisions and expects the risk of loss thereunder to be remote. Therefore, the Portfolio has not accrued any liability in connection with these indemnification provisions.
| 24 | • ALLIANCEBERNSTEIN TAX-AWARE REAL RETURN INCOME SHARES |
Notes to Financial Statements
NOTE F
Distributions to Shareholders
The tax character of distributions to be paid for the period ending April 30, 2012 will be determined at the end of the current fiscal period.
On December 22, 2010, the Regulated Investment Company Modernization Act of 2010 (the “Act”) was enacted, which changed various technical rules governing the tax treatment of regulated investment companies. One important change addresses the recognition of capital loss carryforwards. Under the Act, the Portfolio will be permitted to carry forward capital losses incurred in taxable years beginning after December 22, 2010 for an unlimited period. However, any losses incurred during those future taxable years will be required to be utilized prior to the losses incurred in pre-enactment taxable years, which carry an expiration date. As a result, pre-enactment capital loss carryforwards may be more likely to expire unused. Additionally, post-enactment capital loss carryforwards will retain their character as either short-term or long-term capital losses rather than being considered all short-term capital loss (as permitted under previous regulation).
NOTE G
Recent Accounting Pronouncement
In May 2011, the Financial Accounting Standards Board (“FASB”) issued an Accounting Standards Update (“ASU”) to develop common requirements for measuring fair value and for disclosing information about fair value measurements in U.S. GAAP and International Financial Reporting Standards (“IFRS”). The amendments are intended to improve the comparability of fair value measurements presented and disclosed in the financial statements prepared in accordance with U.S. GAAP and IFRS. The ASU is effective during interim or annual periods beginning after December 15, 2011. At this time, management is evaluating the implication of this ASU and its impact on the financial statements has not been determined.
NOTE H
Subsequent Events
Management has evaluated subsequent events for possible recognition or disclosure in the financial statements through the date the financial statements are issued. Management has determined that there are no material events that would require disclosure in the Portfolio’s financial statements through this date.
| ALLIANCEBERNSTEIN TAX-AWARE REAL RETURN INCOME SHARES • | 25 |
Notes to Financial Statements
FINANCIAL HIGHLIGHTS
Selected Data For A Share Of Beneficial Interest Outstanding Throughout Each Period
| May 2, 2011(a) to October 31, 2011 (unaudited) | ||||
|
| |||
Net asset value, beginning of period | $ 10.00 | |||
|
| |||
Income From Investment Operations | ||||
Net investment income(b) | .09 | |||
Net realized and unrealized gain on investment transactions | .06 | |||
|
| |||
Net increase in net asset value from operations | .15 | |||
|
| |||
Less: Dividends | ||||
Dividends from net investment income | (.09 | ) | ||
|
| |||
Net asset value, end of period | $ 10.06 | |||
|
| |||
Total Return | ||||
Total investment return based on net asset value(c) | 1.46 | % | ||
Ratios/Supplemental Data | ||||
Net assets, end of period (000’s omitted) | $5,131 | |||
Ratio to average net assets of: | ||||
Net investment income(d) | 1.72 | % | ||
Portfolio turnover rate | 17 | % | ||
| (a) | Commencement of operations. |
| (b) | Based on average shares outstanding. |
| (c) | Total investment return is calculated assuming an initial investment made at the net asset value at the beginning of the period, reinvestment of all dividends and distributions at net asset value during the period, and redemption on the last day of the period. Total return does not reflect the deduction of taxes that a shareholder would pay on fund distributions or the redemption of fund shares. Total investment return calculated for a period of less than one year is not annualized. |
| (d) | Annualized. |
See notes to financial statements.
| 26 | • ALLIANCEBERNSTEIN TAX-AWARE REAL RETURN INCOME SHARES |
Financial Highlights
BOARD OF TRUSTEES
| William H. Foulk, Jr.(1), Chairman | Robert M. Keith, President and Chief Executive Officer | |
| John H. Dobkin(1) | ||
| Michael J. Downey(1) | Garry L. Moody(1) | |
| D. James Guzy(1) | Marshall C. Turner, Jr.(1) | |
| Nancy P. Jacklin(1) | Earl D. Weiner(1) |
OFFICERS
Philip L. Kirstein, Senior Vice President and Independent Compliance Officer Michael G. Brooks(2), Vice President Fred S. Cohen(2) , Vice President Robert B. Davidson III(2) , Senior Vice President | Wayne D. Godlin(2), Vice President Terrance T. Hults(2), Vice President Emilie D. Wrapp, Secretary Joseph J. Mantineo, Treasurer and Chief Financial Officer Phyllis J. Clarke, Controller |
Custodian and Accounting Agent State Street Bank and Trust Company
Principal Underwriter AllianceBernstein Investments, Inc.
Transfer Agent AllianceBernstein Investor Services, Inc. | Legal Counsel Seward & Kissel LLP One Battery Park Plaza New York, NY 10004
Independent Registered Public Accounting Firm Ernst & Young LLP 5 Times Square New York, NY 10036 |
| (1) | Member of the Audit Committee, the Governance and Nominating Committee and the Independent Directors Committee. Mr. Foulk is the sole member of the Fair Value Pricing Committee. |
| (2) | The day-to-day management of, and investment decisions for, the Trust’s portfolio are made by the Municipal Bond Investment Team. Messrs. Michael G. Brooks, Fred S. Cohen, Robert B. Davidson III, Wayne D. Godlin and Terrance T. Hults are the investment professionals primarily responsible for the day-to-day management of the Trust’s portfolio. |
| ALLIANCEBERNSTEIN TAX-AWARE REAL RETURN INCOME SHARES • | 27 |
Board of Trustees
Information Regarding the Review and Approval of the Portfolio’s Advisory Agreement
The disinterested trustees (the “trustees”) of AllianceBernstein Corporate Shares (the “Fund”) unanimously approved the application of the Fund’s Advisory Agreement with the Adviser in respect of AllianceBernstein Tax-Aware Real Return Income Shares (the “Portfolio”) for an initial two-year period at a meeting held on February 1-2, 2011.
Prior to approval of the Advisory Agreement in respect of the Portfolio, the trustees had requested from the Adviser, and received and evaluated, extensive materials. They reviewed the proposed approval of the Advisory Agreement with the Adviser and with experienced counsel who are independent of the Adviser, who advised on the relevant legal standards. The trustees also reviewed an independent evaluation prepared by the Fund’s Senior Officer (who is also the Fund’s Independent Compliance Officer) of the reasonableness of the advisory fee in the Advisory Agreement, in which the Senior Officer concluded that the contractual fee (zero) for the Portfolio was reasonable. The trustees also discussed the proposed approval in private sessions with counsel and the Fund’s Senior Officer.
The trustees noted that the Portfolio is designed as a completion vehicle for the wrap fee account market (where investors pay fees to a wrap fee sponsor which pays investment fees and expenses from such fee). The trustees also noted that no advisory fee is payable by the Portfolio, that the Advisory Agreement does not include the reimbursement provision for certain administrative expenses included in the advisory agreements of most of the open-end AllianceBernstein Funds, and that the Adviser is responsible for payment of the Portfolio’s ordinary expenses. The trustees noted that the Fund acknowledges in the Advisory Agreement that the Adviser and its affiliates expect to receive compensation from third parties in connection with services provided under the Advisory Agreement. The trustees further noted that the Adviser would receive payments from the wrap fee program sponsors (the “Sponsors”) that use the Portfolio as an investment vehicle for their clients.
The trustees considered their knowledge of the nature and quality of the services to be provided by the Adviser to the Portfolio gained from their experience as trustees or directors of most of the registered investment companies advised by the Adviser, including the Fund, their overall confidence in the Adviser’s integrity and competence they have gained from that experience, the Adviser’s initiative in identifying and raising potential issues with the trustees and its responsiveness, frankness and attention to concerns raised by the trustees in the past, including the Adviser’s willingness to consider and implement organizational and operational changes designed to improve investment results and the services provided to the AllianceBernstein Funds. The trustees noted that they have four regular meetings each year, at each of which they receive presentations from the Adviser on the investment results of the AllianceBernstein Funds and review extensive materials and information presented by the Adviser.
| 28 | • ALLIANCEBERNSTEIN TAX-AWARE REAL RETURN INCOME SHARES |
The trustees also considered all other factors they believed relevant, including the specific matters discussed below. In their deliberations, the trustees did not identify any particular information that was all-important or controlling, and different trustees may have attributed different weights to the various factors. The trustees determined that the selection of the Adviser to manage the Portfolio, and the overall arrangements between the Portfolio and the Adviser, as provided in the Advisory Agreement, including the advisory fee, were fair and reasonable in light of the services to be performed, expenses to be incurred and such other matters as the trustees considered relevant in the exercise of their business judgment. The material factors and conclusions that formed the basis for the trustees’ determination included the following:
Nature, Extent and Quality of Services To Be Provided
The trustees considered the scope and quality of services to be provided by the Adviser under the Advisory Agreement, including the quality of the investment research capabilities of the Adviser and the other resources it has dedicated to performing services for the AllianceBernstein Funds. They also noted the professional experience and qualifications of the Portfolio’s portfolio management team and other senior personnel of the Adviser. The quality of administrative and other services, including the Adviser’s role in coordinating the activities of the Portfolio’s other service providers, also were considered. The trustees concluded that, overall, they were satisfied with the nature, extent and quality of services to be provided to the Portfolio under the Advisory Agreement.
Costs of Services To Be Provided and Profitability
Because the Portfolio had not yet commenced operations, the trustees were unable to consider historical information about the profitability of the Portfolio. However, the Adviser agreed to provide the trustees with profitability information in connection with future proposed continuances of the Advisory Agreement in respect of the Portfolio. They also considered the costs to be borne by the Adviser in providing services to the Portfolio and that the Portfolio was unlikely to be profitable to the Adviser unless it achieves a material level of net assets.
Fall-Out Benefits
The trustees considered the benefits to the Adviser and its affiliates from their proposed relationships with the Portfolio other than the fees payable to it by the Sponsors whose clients invest in the Portfolio. The trustees also noted that the Adviser would be compensated by the Sponsors whose clients invest in the Portfolio. The trustees understood that the Adviser might also derive reputational and other benefits from its association with the Portfolio.
Investment Results
Since the Portfolio had not yet commenced operations and there were no existing AllianceBernstein funds with the same investment style as the Portfolio, no
| ALLIANCEBERNSTEIN TAX-AWARE REAL RETURN INCOME SHARES • | 29 |
performance or other historical information for the Portfolio was available. The trustees noted that the Portfolio’s investment strategy would be similar to that of the retail AllianceBernstein Bond Fund, Inc.—AllianceBernstein Municipal Bond Inflation Strategy, which commenced operations on January 26, 2010. The trustees reviewed the 1-month, 3-month and the since inception returns for the period ended December 31, 2010 of the Class A Shares of the retail fund against its benchmark and the Lipper Intermediate Municipal Debt Funds Average (the “Lipper Average”). The trustees noted that the retail fund was above the Barclays Capital 1-10 Year Treasury Inflation Protected Securities (TIPS) Index, the proposed benchmark for the Portfolio, in the 1-month period but lagged that benchmark in the 3-month and the since inception periods. The retail fund was above the Lipper Average in the 1- and 3-month periods but lagged the Lipper Average in the since inception period. The trustees did not assign great weight to this performance information due to the very short period for which the retail fund had been operational. The trustees noted the special issues in evaluating the investment performance of “completion vehicles” for separately managed accounts (“SMAs”), such as the Portfolio. Since they are not designed as “stand alone” investments, and will not be sold except as part of the SMA, the performance of such completion vehicles compared to stated benchmarks may be less informative than for other funds. The trustees agreed that performance presentations from the Adviser to the Board with respect to completion vehicles such as the Portfolio should include both information about the performance of the Portfolio against its Lipper peer group and benchmark, as well as the performance of the model SMA the Portfolio is a component of, so that the trustees have a basis for evaluating the performance of the Portfolio in the context of its intended use. Based on the Adviser’s written and oral presentations regarding the management of the Portfolio, and their general knowledge and confidence in the Adviser’s expertise in managing mutual funds, the trustees concluded that the Adviser was capable of providing high quality portfolio management services to the Portfolio.
Advisory Fees
The trustees considered the proposed advisory fee rate payable by the Portfolio to the Adviser (zero) and information provided by Lipper showing the fees paid by other fund families under a wrap fee program similar to that of the Portfolio. The trustees recognized that it is difficult to make comparisons of advisory fees because there are variations in the services that are included in the fees paid by other funds.
The trustees noted the unusual arrangements in the Advisory Agreement providing for no advisory fee but were cognizant that the Adviser would be indirectly compensated by the Sponsors for its services to the Portfolio. While the fees to be paid by the Sponsors to the Adviser would vary, the trustees acknowledged that a portion of those fees (less the expenses of the Portfolio to be paid by the Adviser) might reasonably be viewed as compensating the Adviser for advisory
| 30 | • ALLIANCEBERNSTEIN TAX-AWARE REAL RETURN INCOME SHARES |
services it provides to the Portfolio (the “implied fee”) and that the Adviser believes that while the Sponsors would pay the Adviser different fee rates, the rate of fee attributable to portfolio management at the Portfolio level would be the same for all Sponsors. Based on their review, the trustees concluded that the advisory arrangements for the Portfolio, including the zero fee aspect of the Advisory Agreement with the Adviser, were satisfactory.
The Adviser informed the trustees that there were no institutional products managed by it that have a substantially similar investment style. The trustees reviewed the relevant fee information from the Adviser’s Form ADV and the evaluation from the Fund’s Senior Officer. The trustees recognized that comparisons of the institutional fee rate with the portion of the implied fee attributable to portfolio management were not practicable. The Adviser reviewed with the trustees the significantly greater scope of the services it provides the AllianceBernstein Funds relative to institutional clients. The Adviser also noted that because mutual funds are constantly issuing and redeeming shares, they are more difficult to manage than an institutional account, where the assets tend to be relatively stable. In light of the substantial differences in services rendered by the Adviser to institutional clients as compared to funds such as the Portfolio, and the unusual fee structure for the other portfolios of the Fund and the Portfolio, the trustees considered these fee comparisons inapt and did not place significant weight on them in their deliberations.
Since the Portfolio does not bear ordinary expenses, the trustees did not consider comparative expense information.
Economies of Scale
Since the Advisory Agreement does not provide for any compensation to be paid to the Adviser by the Portfolio and the Portfolio’s expense ratio is zero, the trustees did not consider the extent to which fee levels in the Advisory Agreement reflect economies of scale. They did note, however, that the fee payable to the Adviser by each of the current Sponsors declines at a breakpoint based on total assets managed by the Adviser for the Sponsors.
| ALLIANCEBERNSTEIN TAX-AWARE REAL RETURN INCOME SHARES • | 31 |
THE FOLLOWING IS NOT A PART OF THE SHAREHOLDER REPORT OR THE FINANCIAL STATEMENTS
SUMMARY OF SENIOR OFFICER’S EVALUATION OF INVESTMENT ADVISORY AGREEMENT1
The following is a summary of the evaluation of the Investment Advisory Agreement between AllianceBernstein L.P., (the “Adviser”) and AllianceBernstein Corporate Shares (the “Trust”) with respect to AllianceBernstein Tax-Aware Real Return Income Shares (the “Portfolio”).2
The Portfolio is designed to serve the needs of the Adviser’s separately managed account (“SMA”) or “wrap fee” clients. Since SMA clients pay their wrap program provider a unitary fee for managing all investments in their portfolio, the Portfolio will not pay an advisory fee. The Adviser will also reimburse the Portfolio for all of its other operating expenses, except certain extraordinary expenses, taxes, brokerage costs and the interest on borrowed money and on other leveraging methods.
The Portfolio’s investment objective is to maximize real after-tax return for investors subject to federal income taxes. The Portfolio will pursue its investment objective by investing at least 80% of its net assets in a diversified portfolio of municipal securities.3 The Portfolio will seek inflation protection by entering into derivative transactions known as Consumer Price Index (“CPI”) swap agreements. The Portfolio expects to seek additional inflation protection by other means, such as entering into total return swaps involving Treasury Inflation Protected Securities (“TIPS”) and interest rate swaps.4 The Portfolio may utilize leverage by entering into tender option bond (“TOB”) transactions. While the Portfolio will have the right to make conventional bank borrowings to obtain leverage, the Adviser has no current intention of doing so.
The evaluation of the Investment Advisory Agreement was prepared by Philip L. Kirstein, the Senior Officer of the Fund, for the Trustees of the Fund, as required by a September 2004 agreement between the Adviser and the New York State Attorney General (the “NYAG”). The Senior Officer’s evaluation of the Investment Advisory Agreement is not meant to diminish the responsibility or authority of the Board of Trustees of the Fund to perform its duties pursuant to Section 15 of the Investment Company Act of 1940 (the “40 Act”) and applicable state law. The purpose of this summary is to provide shareholders with
| 1 | It should be noted that the information in the Senior Officer’s fee evaluation was completed on January 21, 2011 and presented to the Board of Trustees on February 1-3, 2011. |
| 2 | Future references to the various Trust/Portfolio do not include “AllianceBernstein.” |
| 3 | These securities pay interest exempt from federal income tax. These securities may also pay interest that is subject to the federal alternative minimum tax. |
| 4 | Payments to the Portfolio pursuant to any swap agreements will result in taxable income, either ordinary income or capital gains, rather than income exempt from federal income taxation. |
| 32 | • ALLIANCEBERNSTEIN TAX-AWARE REAL RETURN INCOME SHARES |
a synopsis of the independent evaluation of the reasonableness of the advisory fees proposed to be paid by the Portfolio which was provided to the Trustees in connection with their review of the proposed approval of the initial Investment Advisory Agreement. The Senior Officer’s evaluation considered the following factors:
| 1. | Advisory fees charged to institutional and other clients of the Adviser for like services; |
| 2. | Advisory fees charged by other mutual fund companies for like services; |
| 3. | Costs to the Adviser and its affiliates of supplying services pursuant to the advisory agreement, excluding any intra-corporate profit; |
| 4. | Profit margins of the Adviser and its affiliates from supplying such services; |
| 5. | Possible economies of scale as the Portfolio grows larger; and |
| 6. | Nature and quality of the Adviser’s services including the performance of the Portfolio. |
These factors, with the exception of the first factor, are generally referred to as the “Gartenberg factors,” which were articulated by the United States Court of Appeals for the Second Circuit in 1982. The first factor is an additional factor required to be considered by the AoD. The Supreme Court recently held the Gartenberg decision was correct in its basic formulation of what Section 36(b) of the 40 Act requires: to face liability under Section 36(b), “an investment adviser must charge a fee that is so disproportionately large that it bears no reasonable relationship to the services rendered and could not have been the product of arms length bargaining.” Jones v. Harris Associates L.P., (No. 08-586), 130 U.S. 1418 (1210). In the Jones decision, the Court stated the Gartenberg approach fully incorporates the correct understanding of fiduciary duty within the context of Section 36(b) and noted with approval that “Gartenberg insists that all relevant circumstances be taken into account” and “uses the range of fees that might result from arms-length bargaining as the benchmark for reviewing challenged fees.”
PORTFOLIO ADVISORY FEES, NET ASSETS & EXPENSE RATIOS
The Adviser proposed that the Portfolio pays no advisory fee to the Adviser for receiving the services to be provided pursuant to the Investment Advisory Agreement. As previously mentioned, the Portfolio is designed to serve the needs of the Adviser’s separately managed account (“SMA”) clients. Since SMA clients pay their wrap program provider a unitary fee for managing all investments of their portfolio, the Portfolio will not pay an advisory fee. The Adviser will also reimburse the Portfolio for all of its other operating expenses, except certain extraordinary expenses, taxes, brokerage costs and the interest on borrowed money or alternative sources of leverage.
The Portfolio will offer only one no-load class of shares, which will be distributed through its principal underwriter, AllianceBernstein Investments, Inc.
| ALLIANCEBERNSTEIN TAX-AWARE REAL RETURN INCOME SHARES • | 33 |
(“ABI”). The Portfolio will not have a distribution plan pursuant to Rule 12b-1 under the 40 Act. Set forth below is the Portfolio’s anticipated annual operating expenses in percentages:
| Annual Operating Expenses | % | |||
| Management Fees5 | 0.35 | % | ||
| Distribution Fees | 0.00 | % | ||
| Other Expenses | 0.00 | % | ||
| Fee Waiver / Reimbursements | -0.35 | % | ||
|
| |||
| Net Expenses | 0.00 | % | ||
| I. | MANAGEMENT FEES CHARGED TO INSTITUTIONAL AND OTHER CLIENTS |
The advisory fees charged to investment companies which the Adviser manages and sponsors are normally higher than those charged to similar sized institutional accounts, including pension plans and sub-advised investment companies. The fee differential reflects, among other things, different services provided to such clients, and different liabilities assumed. Services to be provided by the Adviser to the Portfolio that are not provided to non-investment company clients include providing office space and personnel to serve as Fund Officers, who among other responsibilities make the certifications required under the Sarbanes–Oxley Act of 2002, and coordinating with and monitoring the Portfolio’s third party service providers such as Fund counsel, auditors, custodians, transfer agents and pricing services. The accounting, administrative, legal and compliance requirements for the Portfolio will be more costly than those for institutional client assets due to the greater complexities and time required for investment companies. The Adviser also believes that it incurs substantial entrepreneurial risk when offering a new mutual fund since establishing a new mutual fund requires a large upfront investment and it may take a long time for the fund to achieve profitability since the fund must be priced to scale from inception in order to be competitive and assets are acquired one account at a time. In addition, managing the cash flow of an investment company may be more difficult than managing that of a stable pool of assets, such as an institutional account with little cash movement in either direction, particularly, if a fund is in net redemption and the Adviser is frequently forced to sell securities to raise cash for redemptions. However, managing a fund with positive cash flow may be easier at times than managing a stable pool of assets. Finally, in recent years, investment advisers have been sued by institutional clients and have suffered reputational damage both by the attendant publicity and outcomes other than complete victories. Accordingly, the legal and reputational risks associated with institutional accounts are greater than previously thought, although still not equal to those related to the mutual fund industry.
| 5 | This amount reflects the portion of the wrap fee attributable to the management of the Portfolio. This amount also includes estimated operating expenses of the Portfolio that are paid by the Adviser. |
| 34 | • ALLIANCEBERNSTEIN TAX-AWARE REAL RETURN INCOME SHARES |
Notwithstanding the Adviser’s view that managing an investment company is not comparable to managing other institutional accounts because the services provided are different, the Supreme Court has indicated consideration should be given to the advisory fee charged to institutional accounts that have a similar investment style as the Portfolio.6 Although, the Adviser represented that there is no category in the Form ADV for institutional products that have a substantially similar investment style as the Portfolio, the Portfolio consist of investments in various asset classes for which the Adviser does have institutional counterparts. It should be noted that in addition to investing in multiple asset classes as opposed to a single asset class, the Portfolio will use derivatives with greater frequency than the institutional counterparts. Set forth below are the institutional fee schedules of the various institutional asset classes represented in the Portfolio. Also shown below are what would have been the effective advisory fees of the Portfolio had the advisory fee schedules of the institutional accounts been applicable to the Strategies based on the initial estimate of the Strategies net assets at $100 million:
| AB Institutional Account Category | Initial ($MIL) | Fee Schedule | Effective AB Adv. Fee | |||||
| U.S. Inflation-Linked Bonds (TIPs) | $ | 100.0 | 25 bp | 0.250% | ||||
| Short Duration Municipal | $ | 100.0 | 30 bp on 1st $20 million 20 bp on next $80 million 15 bp on next $150 million 12.5 bp on next $250 million 10 bp on the balance Minimum Account Size: $5 m | 0.220% | ||||
| Intermediate Duration Municipal | $ | 100.0 | 50 bp on 1st $5 million 37.5 bp on next $15 million 25 bp on next $80 million 18.75 bp on the balance Minimum Account Size: $3 m | 0.281% | ||||
The Adviser manages AllianceBernstein Municipal Bond Inflation Strategy, a retail mutual fund that has a similar investment style as the anticipated Portfolio.7 Set forth in the table below is the advisory fee schedule of the retail mutual fund and
| 6 | It should be noted that the Supreme Court stated that “courts may give such comparisons the weight that they merit in light of the similarities and differences between the services that the clients in question require, but the courts must be wary of inapt comparisons.” Among the significant differences the Supreme Court noted that may exist between services provided to mutual funds and institutional accounts are “higher marketing costs.” Jones v. Harris at 1428. |
| 7 | The advisory fee schedule of Municipal Bond Inflation Strategy is consistent with the NYAG related High Income category advisory fee schedule. The NYAG related master fee schedule, implemented in January 2004, contemplates eight categories with almost all of the AllianceBernstein funds in each category having the same advisory fee schedule. |
| ALLIANCEBERNSTEIN TAX-AWARE REAL RETURN INCOME SHARES • | 35 |
what would have been the effective advisory fee of the Portfolio had the advisory fee schedule of the retail mutual fund been applicable to the Portfolio based on an initial estimate of the Portfolio’s net assets at $100 million:
| Portfolio | AllianceBernstein Mutual Funds (“ABMF”) | Fee Schedule | Effective Fee | |||
| Tax-Aware Real Return Income Shares | Municipal Bond Inflation Strategy | 0.50% on first $2.5 billion 0.45% on next $2.5 billion 0.40% on the balance | 0.500% |
The Adviser has represented that there are no offshore funds or sub-advisory relationships managed by the Adviser that have a substantially similar investment style as the Portfolio.
| II. | MANAGEMENT FEES CHARGED BY OTHER MUTUAL FUND COMPANIES FOR LIKE SERVICES. |
Lipper, Inc. (“Lipper”), an analytical service that is not affiliated with the Adviser, compared the fee arrangements of the Portfolio with those of other investment companies receiving similar services from other investment advisers.8 Each peer selected by Lipper had a similar fee arrangement as the Portfolio, which is to say that with respect to the Portfolio’s peers, all fund expenses, including management fees9 were reimbursed by the investment adviser.10
| III. | COSTS TO THE ADVISER AND ITS AFFILIATES OF SUPPLYING SERVICES PURSUANT TO THE MANAGEMENT FEE ARRANGEMENT, EXCLUDING ANY INTRA-CORPORATE PROFIT. |
The Adviser will utilize two profitability reporting systems, which operate independently but are aligned with each other, to estimate the Adviser’s profitability in connection with investment advisory services to be provided to the Portfolio. The Senior Officer has retained an independent consultant to provide independent advice regarding the alignment of the two profitability systems as well as the methodologies and allocations utilized by both profitability systems. See Section IV for additional discussion.
| 8 | Only zero fee no-load funds that participated in a wrap fee program were considered for inclusion in the Portfolio’s EG, regardless of the Lipper investment classification/objective of the Portfolio’s peers. The Portfolio’s EG includes the Portfolio, which is classified by Lipper as “General Municipal Debt”, two U.S. Mortgage Funds, one Treasury Inflation-Protected Securities (“TIPS”) Fund, two General Bond Funds, and two Global Income Funds. |
| 9 | “Management Fee” is the fee attributable to the management and bearing of expenses of the funds (not the management of the wrap fee program). In each case the advisory contract provides for an advisory or management fee of zero. |
| 10 | In considering this section, it should be noted that the Supreme Court cautioned against accepting mutual fund fee comparisons without careful scrutiny since “these comparisons are problematic because these fees, like those challenged, may not be the product of the negotiations conducted at arms length.” Jones v. Harris at 1429. |
| 36 | • ALLIANCEBERNSTEIN TAX-AWARE REAL RETURN INCOME SHARES |
| IV. | PROFIT MARGINS OF THE ADVISER AND ITS AFFILIATES FOR SUPPLYING SUCH SERVICES. |
The Portfolio has not yet commenced operations. Therefore, there is no historic profitability data with respect to the Adviser’s investment services to the Portfolio. A weighted average of the Adviser’s profitability in respect to the Portfolio’s SMA clients, in addition to any fund specific revenue or expense item, will be used to calculate the Portfolio’s profitability.
| V. | POSSIBLE ECONOMIES OF SCALE |
Although the Portfolio will not pay the Adviser an advisory fee, it is still worth considering information on possible economies of scale. The Adviser has indicated that economies of scale are being shared with shareholders through fee structures,11 subsidies and enhancement to services. Based on some of the professional literature that has considered economies of scale in the mutual fund industry, it is thought that to the extent economies of scale exist, they may more often exist across a fund family as opposed to a specific fund. This is because the costs incurred by the Adviser, such as investment research or technology for trading or compliance systems can be spread across a greater asset base as the fund family increases in size. It is also possible that as the level of services required to operate a successful investment company has increased over time, and advisory firms make such investments in their business to provide services, there may be a sharing of economies of scale without a reduction in advisory fees.
An independent consultant, retained by the Senior Officer, provided the Board of Trustees an update of the Deli12 study on advisory fees and various fund characteristics.13 The independent consultant first reiterated the results of his previous two dimensional comparison analysis (fund size and family size) with the Board of Trustees.14 The independent consultant then discussed the results of the regression model that was utilized to study the effects of various factors on advisory fees. The regression model output indicated that the bulk of the variation in fees predicted were explained by various factors, but substantially by fund AUM, family AUM, index fund indicator and investment style. The independent consultant also compared the advisory fees of the AllianceBernstein Mutual
| 11 | Fee structures include fee reductions, pricing at scale and breakpoints in advisory fee schedules. |
| 12 | The Deli study was originally published in 2002 based on 1997 data. |
| 13 | As mentioned previously, the Supreme Court cautioned against accepting mutual fund fee comparisons without careful scrutiny since the fees may not be the product of negotiations conducted at arms length. See Jones V. Harris at 1429. |
| 14 | The two dimensional analysis showed patterns of lower advisory fees for funds with larger asset sizes and funds from larger family sizes compared to funds with smaller asset sizes and funds from smaller family sizes, which according to the independent consultant is indicative of a sharing of economies of scale and scope. However, in less liquid and active markets, such is not the case, as the empirical analysis showed potential for diseconomies of scale in those markets. The empirical analysis also showed diminishing economies of scale and scope as funds surpassed a certain high level of assets. |
| ALLIANCEBERNSTEIN TAX-AWARE REAL RETURN INCOME SHARES • | 37 |
Funds to similar funds managed by 19 other large asset managers, regardless of the fund size and each Adviser’s proportion of mutual fund assets to non-mutual fund assets.
| VI. | NATURE AND QUALITY OF THE ADVISER’S SERVICES, INCLUDING THE PERFORMANCE OF THE FUND |
With assets under management of approximately $486 billion as of December 31, 2010, the Adviser has the investment experience to manage and provide non-investment services (described in Section I) to the Portfolio.
Since the Portfolio has not yet commenced operations, the Portfolio has no performance history. However, the Adviser manages Municipal Bond Inflation Strategy, which has a similar investment style as the anticipated Portfolio, and the retail mutual fund’s 1, 3 month and since inception net performance returns as of December 31, 2010, along with the fund’s benchmark and Lipper average are set forth in the table below:
Period Ending December 31, 2010 Annualized Net Performance (%) | ||||||||||||
1 Month (%) | 3 Month (%) | Since Inception (%) | ||||||||||
Municipal Bond Inflation Strategy | -0.54 | -0.91 | 0.36 | |||||||||
| Barclays Capital 1-10 Yr TIPS Index | -0.76 | 0.06 | 3.76 | |||||||||
| Lipper Intermediate Municipal Debt funds Average / # Funds | -1.45 | -3.20 | 1.82 | |||||||||
Inception Date: January 26, 2010 | ||||||||||||
CONCLUSION:
Based on the factors discussed above the Senior Officer’s conclusion is that the proposed fee for the Portfolio is reasonable and within the range of what would have been negotiated at arm’s-length in light of all the surrounding circumstances. This conclusion in respect of the Portfolio is based on an evaluation of all of these factors and no single factor was dispositive.
Dated: March 4, 2011
| 38 | • ALLIANCEBERNSTEIN TAX-AWARE REAL RETURN INCOME SHARES |
THIS PAGE IS NOT PART OF THE SHAREHOLDER REPORT OR THE FINANCIAL STATEMENTS
ALLIANCEBERNSTEIN FAMILY OF FUNDS
Wealth Strategies Funds
Balanced Wealth Strategy
Conservative Wealth Strategy
Wealth Appreciation Strategy
Tax-Managed Balanced Wealth Strategy
Tax-Managed Conservative Wealth Strategy
Tax-Managed Wealth Appreciation Strategy
Asset Allocation/Multi-Asset
Emerging Markets Multi-Asset
International Portfolio
Real Asset Strategy
Tax-Managed International Portfolio
Growth Funds
Domestic
Growth Fund
Large Cap Growth Fund
Small Cap Growth Portfolio
Small/Mid Cap Growth Fund
U.S. Strategic Research Portfolio
Global & International
Global Thematic Growth Fund
Greater China ’97 Fund
International Discovery Equity Portfolio
International Focus 40 Portfolio
International Growth Fund
Value Funds
Domestic
Core Opportunities Fund
Equity Income Fund
Growth & Income Fund
Small/Mid Cap Value Fund
Value Fund
Global & International
Global Real Estate Investment Fund
Global Value Fund
International Value Fund
Taxable Bond Funds
Bond Inflation Strategy
Global Bond Fund
High Income Fund
Intermediate Bond Portfolio
Short Duration Portfolio
Unconstrained Bond Fund*
Municipal Bond Funds
Arizona California High Income Massachusetts Michigan Minnesota Municipal Bond Inflation Strategy | National New Jersey New York Ohio Pennsylvania Virginia |
Intermediate Municipal Bond Funds
Intermediate California
Intermediate Diversified
Intermediate New York
Closed-End Funds
Alliance California Municipal Income Fund
Alliance New York Municipal Income Fund
AllianceBernstein Global High Income Fund
AllianceBernstein Income Fund
AllianceBernstein National Municipal Income Fund
Alternatives
Market Neutral Strategy-Global
Market Neutral Strategy-U.S.
Balanced
Balanced Shares
Retirement Strategies Funds
2000 Retirement Strategy | 2020 Retirement Strategy | 2040 Retirement Strategy | ||
2005 Retirement Strategy | 2025 Retirement Strategy | 2045 Retirement Strategy | ||
2010 Retirement Strategy | 2030 Retirement Strategy | 2050 Retirement Strategy | ||
2015 Retirement Strategy | 2035 Retirement Strategy | 2055 Retirement Strategy |
We also offer Exchange Reserves,** which serves as the money market fund exchange vehicle for the AllianceBernstein mutual funds.
You should consider the investment objectives, risks, charges and expenses of any AllianceBernstein fund/portfolio carefully before investing. For free copies of our prospectuses, which contain this and other information, visit us online at www.alliancebernstein.com or contact your financial advisor. Please read the prospectus carefully before investing.
| * | Prior to February 3, 2011, Unconstrained Bond Fund was named Diversified Yield Fund. |
| ** | An investment in the Fund is not a deposit in a bank and is not insured or guaranteed by the Federal Deposit Insurance Corporation or any other government agency. Although the Fund seeks to preserve the value of your investment at $1.00 per share, it is possible to lose money by investing in the Fund. |
| ALLIANCEBERNSTEIN TAX-AWARE REAL RETURN INCOME SHARES • | 39 |
AllianceBernstein Family of Funds
NOTES
| 40 | • ALLIANCEBERNSTEIN TAX-AWARE REAL RETURN INCOME SHARES |
NOTES
| ALLIANCEBERNSTEIN TAX-AWARE REAL RETURN INCOME SHARES • | 41 |
NOTES
| 42 | • ALLIANCEBERNSTEIN TAX-AWARE REAL RETURN INCOME SHARES |
NOTES
| ALLIANCEBERNSTEIN TAX-AWARE REAL RETURN INCOME SHARES • | 43 |
NOTES
| 44 | • ALLIANCEBERNSTEIN TAX-AWARE REAL RETURN INCOME SHARES |
ALLIANCEBERNSTEIN TAX-AWARE REAL RETURN INCOME SHARES
1345 Avenue of the Americas
New York, NY 10105
800.221.5672
| TARRIS-0152-1011 |  | |
SEMI-ANNUAL REPORT
AllianceBernstein
International Focus Shares
October 31, 2011
Semi-Annual Report

Investment Products Offered
| • | Are Not FDIC Insured |
| • | May Lose Value |
| • | Are Not Bank Guaranteed |
Investors should consider the investment objectives, risks, charges and expenses of the Fund carefully before investing. For copies of our prospectus or summary prospectus, which contain this and other information, visit us online at www.alliancebernstein.com or contact your AllianceBernstein Investments representative. Please read the prospectus and/or summary prospectus carefully before investing.
This shareholder report must be preceded or accompanied by the Fund’s prospectus for individuals who are not current shareholders of the Fund.
You may obtain a description of the Fund’s proxy voting policies and procedures, and information regarding how the Fund voted proxies relating to portfolio securities during the most recent 12-month period ended June 30, without charge. Simply visit AllianceBernstein’s website at www.alliancebernstein.com, or go to the Securities and Exchange Commission’s (the “Commission”) website at www.sec.gov, or call AllianceBernstein at (800) 227-4618.
The Fund files its complete schedule of portfolio holdings with the Commission for the first and third quarters of each fiscal year on Form N-Q. The Fund’s Forms N-Q are available on the Commission’s website at www.sec.gov. The Fund’s Forms N-Q may also be reviewed and copied at the Commission’s Public Reference Room in Washington, DC; information on the operation of the Public Reference Room may be obtained by calling (800) SEC-0330.
AllianceBernstein Investments, Inc. (ABI) is the distributor of the AllianceBernstein family of mutual funds. ABI is a member of FINRA and is an affiliate of AllianceBernstein L.P., the manager of the funds.
AllianceBernstein® and the AB Logo are registered trademarks and service marks used by permission of the owner, AllianceBernstein L.P.
December 19, 2011
Semi-Annual Report
This report provides management’s discussion of fund performance for AllianceBernstein International Focus Shares (the “Fund”) for the semi-annual reporting period ended October 31, 2011. The Fund commenced operations on June 20, 2011.
Investment Objectives and Policies
The Fund’s investment objective is long-term growth of capital. The Fund pursues its objective by investing primarily in a focused portfolio of approximately 20-30 equity securities of non-U.S. companies. Although the Fund intends to invest substantially all of its assets in non-U.S. issuers under normal circumstances, the Fund may at times invest in U.S. issuers, particularly U.S. issuers whose growth prospects depend, in AllianceBernstein L.P.’s (the “Adviser’s”) view, on non-U.S. factors. Under normal market conditions, the Fund invests significantly (at least 40%—unless market conditions are not deemed favorable by the Adviser) in securities of non-U.S. companies. In addition, the Fund invests, under normal circumstances, in the equity securities of companies located in at least three countries (and normally substantially more) other than the United States. In choosing investments, the Fund pursues an opportunistic investment strategy and is unconstrained by considerations of capitalization range, industry sector or country. The Fund may invest in any company, in any type of industry (including real-estate related issuers) and in any type of equity security, listed or unlisted, with the potential for capital appreciation.
The Fund may use derivatives, such as options, futures and forwards, to gain exposure to certain non-U.S. markets. The Fund may also invest in synthetic equity securities, such as various types of warrants used internationally that entitle a holder to buy or sell underlying securities and convertible securities.
The Fund invests in both developed and emerging market countries. The Fund may invest in established companies, but also in new and less-seasoned companies. The Fund’s investments in companies with smaller capitalizations may offer more reward but may also entail greater risk than is generally true of larger, more established companies. When selecting securities, the Adviser typically looks for companies that have strong, experienced management teams and the potential to support greater than expected earnings growth rates. In making specific investment decisions for the Fund, the Adviser combines fundamental analysis and quantitative tools in its stock selection process.
Currencies can have a dramatic impact on equity returns, significantly adding to returns in some years and greatly diminishing them in others. Currency and equity positions are evaluated separately. The Adviser may seek to hedge the currency exposure resulting from the Fund’s securities positions when it finds the currency exposure unattractive. The Adviser may also decide not to hedge this exposure. To hedge all or a portion of its currency risk, the Fund may from time to time invest in currency-related derivatives,
| ALLIANCEBERNSTEIN INTERNATIONAL FOCUS SHARES • | 1 |
including forward currency exchange contracts, futures, options on futures, swaps and options. The Adviser may also seek investment opportunities by taking long or short positions in currencies through the use of currency-related derivatives.
The Fund may make short sales of securities or maintain a short position, and may use other investment techniques. The Fund may use leverage for investment purposes to increase return by using the cash made available by derivative instruments to make other investments in accordance with its investment objective.
The Fund is non-diversified, meaning that it may invest more of its assets in a smaller number of issuers.
Investment Results
The table on page 6 shows the Fund’s performance compared to its benchmark, the Morgan Stanley Capital International (“MSCI”) All Country (“AC”) World ex-U.S. Index. From its inception on June 20, 2011 to the period ended October 31, 2011, the Fund underperformed its benchmark, due to its tilt toward less-liquid, emerging market, and smaller-cap stocks during a period of rising volatility and flight to safety.
The Fund utilized derivatives during the reporting period, including forward currency exchange contracts for hedging and non-hedging purposes, which detracted from performance; and equity swaps for hedging and non-hedging purposes, which added to performance.
Market Review and Investment Strategy
Global equity markets contracted early in the second quarter 2011 as a flight to safety sparked a sell-off in risk assets. The catalysts were fundamental concerns about slowing economic growth in developed markets and further restrictive monetary policy to reduce inflation in China, combined with rising fear of systemic financial risk in Europe. In the downturn, cyclical sectors and financials fared worst while consumer staples and telecommunications sectors preserved value. At the trough, equities were deeply undervalued relative to less-risky securities by many traditional valuation measures, and the market subsequently rallied. The rebound in October was sparked by several sources of increased confidence: more constructive rhetoric around actions to stem contagion of the sovereign debt crisis in Europe, the release of several economic indicators which signaled stabilization in the global economy, and the flow of generally in-line earnings reports for the third quarter of 2011.
The Fund was positioned in companies with, in the investment management team’s (the “Team’s”) view, strong and stable earnings growth, high and sustainable return on equity, and robust free cash flow generation. The Team’s research focuses on finding such companies with valuations which discount a growth trajectory, margin level, or reinvestment rate lower than the Team forecasts based on its knowledge of industries, companies, and competitive dynamics. On a regional level, the Fund is tilted
| 2 | • ALLIANCEBERNSTEIN INTERNATIONAL FOCUS SHARES |
toward emerging markets which the Team’s analysis suggests are positioned favorably versus their developed counterparts. The Team remains concerned that Europe, particularly its periphery, will struggle to reignite growth. In contrast, developing markets such as China, India and Brazil have the macroeconomic tailwinds of growing populations,
urbanization, rising wages, high savings ratios and low financial leverage, broadly speaking. This contrasts with overstretched European economies struggling with fiscal deficits and high public debt levels. The Fund’s overweights, versus its benchmark, in emerging markets and the UK is offset by a significant underweight in continental Europe.
| ALLIANCEBERNSTEIN INTERNATIONAL FOCUS SHARES • | 3 |
HISTORICAL PERFORMANCE
An Important Note About Historical Performance
The investment return and principal value of an investment in the Fund will fluctuate, so that shares, when redeemed, may be worth more or less than their original cost. Performance shown on the following pages represents past performance and does not guarantee future results. Current performance may be lower or higher than the performance information shown. You may obtain performance information current to the most recent month-end by calling (800) 227-4618.
Benchmark Disclosure
The unmanaged MSCI AC World ex-U.S. Index does not reflect fees and expenses associated with the active management of a mutual fund portfolio. The MSCI AC World ex-U.S. Index is a free float-adjusted, market capitalization weighted index that represents the equity market performance of developed and emerging markets, excluding the United States. MSCI makes no express or implied warranties or representations, and shall have no liability whatsoever with respect to any MSCI data contained herein. The MSCI data may not be further redistributed or used as a basis for other indices, any securities or financial products. This report is not approved, reviewed or produced by MSCI. An investor cannot invest directly in an index, and its results are not indicative of the performance for any specific investment, including the Fund.
A Word About Risk
Market Risk: The value of the Fund’s assets will fluctuate as the equity markets fluctuate. The value of the Fund’s investments may decline, sometimes rapidly and unpredictably, simply because of economic changes or other events that affect large portions of the market.
Foreign (Non-U.S.) Risk: Investments in securities of non-U.S. issuers may involve more risk than those of U.S. issuers. These securities may fluctuate more widely in price and may be less liquid due to adverse market, economic, political, regulatory or other factors.
Emerging Market Risk: Investments in emerging market countries may have more risk because these markets are less developed and less liquid as well as being subject to increased economic, political, regulatory, or other uncertainties.
Currency Risk: Fluctuations in currency exchange risk may negatively affect the value of the Fund’s investments or reduce its returns.
Focused Portfolio Risk: Investments in a limited number of companies may have more risk because changes in the value of a single security may have a more significant effect, either negative or positive, on the Fund’s net asset value (“NAV”).
Derivatives Risk: Investments in derivatives may be illiquid, difficult to price, and leveraged so that small changes may produce disproportionate losses for the Fund, and may be subject to counterparty risk to a greater degree than more traditional investments.
Leverage Risk: To the extent the Fund uses leveraging techniques, its NAV may be more volatile because leverage tends to exaggerate the effect of changes in interest rates and any increase or decrease in the value of the Fund’s shares.
Capitalization Risk: Investments in small- and mid-capitalization companies may be more volatile than investments in large-cap companies. Investments in small-cap companies may have additional risks because these companies have limited product lines, markets or financial resources.
(Historical Performance continued on next page)
| 4 | • ALLIANCEBERNSTEIN INTERNATIONAL FOCUS SHARES |
Historical Performance
HISTORICAL PERFORMANCE
(continued from previous page)
Real Estate Risk: The Fund’s investments in the real estate market have many of the same risks as direct ownership of real estate, including the risk that the value of real estate could decline due to a variety of factors that affect the real estate market generally. Investments in real estate investment trusts (“REITs”) may have additional risks. REITs are dependent on the capability of their managers, may have limited diversification, and could be significantly affected by changes in tax laws.
Diversification Risk: The Fund may have more risk because it is “non-diversified”, meaning that it can invest more of its assets in a smaller number of issuers and that adverse changes in the value of one security could have a more significant effect on the Fund’s NAV.
Management Risk: The Fund is subject to management risk because it is an actively managed investment fund. The Adviser will apply its investment techniques and risk analyses in making investment decisions, but there is no guarantee that its techniques will produce the intended results.
These risks are fully discussed in the Fund’s prospectus.
(Historical Performance continued on next page)
| ALLIANCEBERNSTEIN INTERNATIONAL FOCUS SHARES • | 5 |
Historical Performance
HISTORICAL PERFORMANCE
(continued from previous page)
THE FUND VS. ITS BENCHMARK PERIODS ENDED OCTOBER 31, 2011 | NAV Returns | |||||||||
| 1 Month | Since Inception* | |||||||||
AllianceBernstein International Focus Shares | 12.92% | -16.10% | ||||||||
| ||||||||||
MSCI AC World ex-U.S. Index | 10.53% | -7.52% | ||||||||
| ||||||||||
* Inception date: June 20, 2011. | ||||||||||
Please keep in mind that high, double-digit returns are highly unusual and cannot be sustained. Investors should also be aware that these returns were primarily achieved during favorable market conditions. | ||||||||||
| AVERAGE ANNUAL RETURNS AS OF OCTOBER 31, 2011 | ||||
| NAV Returns | ||||
1 Month | -12.92 | % | ||
Since Inception* | -16.10 | % | ||
| SEC AVERAGE ANNUAL RETURNS (WITH ANY APPLICABLE SALES CHARGES) AS OF THE MOST RECENT CALENDAR QUARTER-END (SEPTEMBER 30, 2011) | ||||
| SEC Returns | ||||
1 Month | -16.42 | % | ||
Since Inception* | -25.70 | % | ||
The prospectus fee table shows the fees and the total fund operating expenses of the Fund as 0.00% because the Adviser does not charge any fees or expenses, and reimburses, or pays for, the Fund’s operating expenses. Participants in a wrap fee program eligible to invest in the Fund pay fees to the program sponsor and should review the wrap program brochure provided by the sponsor for a discussion of fees and expenses charged.
| * | Inception date: June 20, 2011. |
See Historical Performance and Benchmark disclosures on pages 4-5.
| 6 | • ALLIANCEBERNSTEIN INTERNATIONAL FOCUS SHARES |
Historical Performance
FUND EXPENSES
(unaudited)
As a shareholder of the Fund, you may incur various ongoing non-operating and extraordinary costs. This example is intended to help you understand your ongoing costs (in dollars) of investing in the Fund and to compare these costs with the ongoing costs of investing in other mutual funds.
The Example is based on an investment of $1,000 invested at the beginning of the period and held for the entire period as indicated below.
Actual Expenses
The table below provides information about actual account values and actual expenses. You may use the information in this line, together with the amount you invested, to estimate the expenses that you paid over the period. Simply divide your account value by $1,000 (for example, an $8,600 account value divided by $1,000 = 8.6), then multiply the result by the number in the first line under the heading entitled “Expenses Paid During Period” to estimate the expenses you paid on your account during this period.
Hypothetical Example for Comparison Purposes
The table below provides information about hypothetical account values and hypothetical expenses based on the Fund’s actual expense ratio and an assumed annual rate of return of 5% before expenses, which is not the Fund’s actual return. The hypothetical account values and expenses may not be used to estimate the actual ending account balance or expenses you paid for the period. You may use this information to compare the ongoing costs of investing in the Fund and other funds by comparing this 5% hypothetical example with the 5% hypothetical examples that appear in the shareholder reports of other funds.
Please note that the expenses shown in the table are meant to highlight your ongoing costs only and do not reflect any transactional costs, such as sales charges (loads), or contingent deferred sales charges on redemptions. Therefore, the hypothetical example is useful in comparing ongoing costs only, and will not help you determine the relative total costs of owning different funds. In addition, if these transactional costs were included, your costs would have been higher.
| Beginning Account Value June 20, 2011(a) | Ending Account Value October 31, 2011 | Expenses Paid During Period* | Annualized Expense Ratio* | |||||||||||||
| Class A | ||||||||||||||||
Actual | $ | 1,000 | $ | 839.00 | $ | 0.00 | 0.00 | % | ||||||||
Hypothetical** | $ | 1,000 | $ | 1,018.03 | $ | 0.00 | 0.00 | % | ||||||||
| (a) | Commencement of operations. |
| * | Actual expenses paid are based on the period from June 20, 2011 (commencement of operations) and are equal to the Fund’s annualized expense ratio, multiplied by the average account value over the period, multiplied by 134/366 (to reflect the since inception period). Hypothetical expenses are equal to the Fund’s annualized expense ratio, multiplied by the average account value over the period, multiplied by 184/366 (to reflect the one-half year period). The Portfolio’s operating expenses are borne by the Adviser or its affiliates. |
| ** | Assumes 5% return before expenses. |
| ALLIANCEBERNSTEIN INTERNATIONAL FOCUS SHARES • | 7 |
Fund Expenses
PORTFOLIO SUMMARY
October 31, 2011 (unaudited)
PORTFOLIO STATISTICS
Net Assets ($mil): $1.3

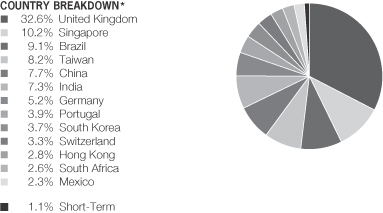
| * | All data are as of October 31, 2011. Portfolio’s sector and country breakdowns are expressed as a percentage of total investments and may vary over time. The Portfolio also enters into derivative transactions, which may be used for hedging or investment purposes (see “Portfolio of Investments” section of the report for additional details). |
| Please note: The sector classifications presented herein are based on the Global Industry Classification Standard (“GICS”) which was developed by Morgan Stanley Capital International and Standard & Poor’s. The components are divided into sector, industry group, and industry sub-indices as classified by the GICS for each of the market capitalization indices in the broad market. These sector classifications are broadly defined. The “Portfolio of Investments” section of the report reflects more specific industry information and is consistent with the investment restrictions discussed in the Portfolio’s prospectus. |
| 8 | �� | • ALLIANCEBERNSTEIN INTERNATIONAL FOCUS SHARES |
Portfolio Summary
TEN LARGEST HOLDINGS*
October 31, 2011 (unaudited)
| Company | U.S. $ Value | Percent of Net Assets | ||||||
Capita Group PLC (The) | $ | 135,925 | 10.5 | % | ||||
Olam International Ltd. | 132,205 | 10.2 | ||||||
Petrofac Ltd. | 101,991 | 7.9 | ||||||
HTC Corp., Macquarie Bank Ltd. | 84,231 | 6.5 | ||||||
Golden Eagle Retail Group Ltd. | 68,405 | 5.3 | ||||||
K&S AG | 67,168 | 5.2 | ||||||
Telecity Group PLC | 59,016 | 4.6 | ||||||
Standard Chartered PLC | 53,902 | 4.2 | ||||||
Estacio Participacoes SA | 51,359 | 4.0 | ||||||
Jeronimo Martins SGPS SA | 50,243 | 3.9 | ||||||
| $ | 804,445 | 62.3 | % | |||||
| * | Long-term investments. |
| ALLIANCEBERNSTEIN INTERNATIONAL FOCUS SHARES • | 9 |
Ten Largest Holdings
PORTFOLIO OF INVESTMENTS
October 31, 2011 (unaudited)
| Company | Shares | U.S. $ Value | ||||||
| ||||||||
COMMON STOCKS – 85.0% | ||||||||
Consumer Discretionary – 17.2% | ||||||||
Diversified Consumer Services – 6.8% | ||||||||
Anhanguera Educacional Participacoes SA | 2,440 | $ | 35,886 | |||||
Estacio Participacoes SA | 4,400 | 51,359 | ||||||
|
| |||||||
| 87,245 | ||||||||
|
| |||||||
Household Durables – 2.3% | ||||||||
MRV Engenharia e Participacoes SA | 4,300 | 30,305 | ||||||
|
| |||||||
Multiline Retail – 5.3% | ||||||||
Golden Eagle Retail Group Ltd. | 27,000 | 68,405 | ||||||
|
| |||||||
Textiles, Apparel & Luxury Goods – 2.8% | ||||||||
Trinity Ltd. | 40,000 | 36,153 | ||||||
|
| |||||||
| 222,108 | ||||||||
|
| |||||||
Consumer Staples – 16.5% | ||||||||
Food & Staples Retailing – 14.1% | ||||||||
Jeronimo Martins SGPS SA | 2,930 | 50,243 | ||||||
Olam International Ltd. | 66,000 | 132,205 | ||||||
|
| |||||||
| 182,448 | ||||||||
|
| |||||||
Food Products – 2.4% | ||||||||
China Yurun Food Group Ltd. | 18,000 | 30,971 | ||||||
|
| |||||||
| 213,419 | ||||||||
|
| |||||||
Industrials – 14.1% | ||||||||
Construction & Engineering – 3.6% | ||||||||
Larsen & Toubro Ltd. (GDR)(a) | 1,640 | 45,625 | ||||||
|
| |||||||
Professional Services – 10.5% | ||||||||
Capita Group PLC (The) | 11,650 | 135,925 | ||||||
|
| |||||||
| 181,550 | ||||||||
|
| |||||||
Financials – 10.0% | ||||||||
Commercial Banks – 4.2% | ||||||||
Standard Chartered PLC | 2,310 | 53,902 | ||||||
|
| |||||||
Consumer Finance – 2.3% | ||||||||
Compartamos SAB de CV | 19,240 | 29,740 | ||||||
|
| |||||||
Insurance – 3.5% | ||||||||
Admiral Group PLC | 2,400 | 45,266 | ||||||
|
| |||||||
| 128,908 | ||||||||
|
| |||||||
Energy – 9.8% | ||||||||
Energy Equipment & Services – 7.9% | ||||||||
Petrofac Ltd. | 4,440 | 101,991 | ||||||
|
| |||||||
Oil, Gas & Consumable Fuels – 1.9% | ||||||||
Afren PLC(b) | 15,940 | 25,211 | ||||||
|
| |||||||
| 127,202 | ||||||||
|
| |||||||
| 10 | • ALLIANCEBERNSTEIN INTERNATIONAL FOCUS SHARES |
Portfolio of Investments
| Company | Shares | U.S. $ Value | ||||||
| ||||||||
Information Technology – 9.6% | ||||||||
Communications Equipment – 1.7% | ||||||||
HTC Corp. | 1,000 | $ | 22,474 | |||||
|
| |||||||
Internet Software & Services – 4.6% | ||||||||
Telecity Group PLC(b) | 6,160 | 59,016 | ||||||
|
| |||||||
Software – 3.3% | ||||||||
Temenos Group AG(b) | 2,220 | 42,222 | ||||||
|
| |||||||
| 123,712 | ||||||||
|
| |||||||
Materials – 5.2% | ||||||||
Chemicals – 5.2% | ||||||||
K&S AG | 1,060 | 67,168 | ||||||
|
| |||||||
Health Care – 2.6% | ||||||||
Pharmaceuticals – 2.6% | ||||||||
Aspen Pharmacare Holdings Ltd.(b) | 2,790 | 33,435 | ||||||
|
| |||||||
Total Common Stocks | 1,097,502 | |||||||
|
| |||||||
WARRANTS – 13.9% | ||||||||
Information Technology – 6.5% | ||||||||
Communications Equipment – 6.5% | ||||||||
HTC Corp., Macquarie Bank Ltd., expiring 9/06/12(b) | 3,675 | 84,231 | ||||||
|
| |||||||
Financials – 3.7% | ||||||||
Consumer Finance – 3.7% | ||||||||
Shriram Transport Finance Co., Ltd., Merrill Lynch Intl & Co., expiring 1/22/15(a)(b) | 3,830 | 48,253 | ||||||
|
| |||||||
Industrials – 3.7% | ||||||||
Construction & Engineering – 3.7% | ||||||||
Samsung Engineering Co., Ltd., Macquarie Bank Ltd., expiring 3/02/15(b) | 230 | 47,640 | ||||||
|
| |||||||
Total Warrants | 180,124 | |||||||
|
| |||||||
SHORT-TERM INVESTMENTS – 1.1% | ||||||||
Investment Companies – 1.1% | ||||||||
AllianceBernstein Fixed-Income Shares, Inc. – Government STIF Portfolio, 0.09%(c) | 14,271 | 14,271 | ||||||
|
| |||||||
Total Investments – 100.0% | 1,291,897 | |||||||
Other assets less liabilities – 0.0% | (81 | ) | ||||||
|
| |||||||
Net Assets – 100.0% | $ | 1,291,816 | ||||||
|
| |||||||
| ALLIANCEBERNSTEIN INTERNATIONAL FOCUS SHARES • | 11 |
Portfolio of Investments
FORWARD CURRENCY EXCHANGE CONTRACTS (see Note C)
| Counterparty & Description | Contract Amount (000) | U.S. $ Value on Origination Date | U.S. $ Value at October 31, 2011 | Unrealized Appreciation/ (Depreciation) | ||||||||||||
Buy Contracts | ||||||||||||||||
State Street Bank and Trust Co. | ||||||||||||||||
Euro settling 12/15/11 | 24 | $ | 32,758 | $ | 33,197 | $ | 439 | |||||||||
Japanese Yen settling 12/15/11 | 3,041 | 39,617 | 38,930 | (687 | ) | |||||||||||
Japanese Yen settling 12/15/11 | 7,850 | 101,651 | 100,492 | (1,159 | ) | |||||||||||
Japanese Yen settling 12/15/11 | 6,928 | 89,921 | 88,688 | (1,233 | ) | |||||||||||
Singapore Dollar settling 12/15/11 | 59 | 45,746 | 47,020 | 1,274 | ||||||||||||
Singapore Dollar settling 12/15/11 | 29 | 23,476 | 23,111 | (365 | ) | |||||||||||
Swiss Franc settling 12/15/11 | 24 | 27,263 | 27,360 | 97 | ||||||||||||
Sale Contracts | ||||||||||||||||
State Street Bank and Trust Co. | ||||||||||||||||
Great British Pound settling 12/15/11 | 48 | 76,798 | 77,145 | (347 | ) | |||||||||||
Great British Pound settling 12/15/11 | 44 | 68,376 | 70,715 | (2,339 | ) | |||||||||||
|
| |||||||||||||||
| $ | (4,320 | ) | ||||||||||||||
|
| |||||||||||||||
TOTAL RETURN SWAP CONTRACTS ON EQUITIES (see Note C)
| Receive/Pay Total Return on Reference Equities | Equities | # of Shares or Units | Rate Paid/ Received by the Fund | Notional Amount (000) | Maturity Date | Counterparty | Unrealized Appreciation/ (Depreciation) | |||||||||||||||||
Receive Total Return on Reference Equities |
| |||||||||||||||||||||||
Receive | Apple, Inc. | 33 | 0.08 | % | $ | 13 | 8/2/12 | Morgan Stanley & Co. International PLC | $ | 6 | ||||||||||||||
Receive | Goldman Sachs Group, Inc. | 126 | 0.09 | % | 14 | 10/31/12 | Morgan Stanley & Co. International PLC | (184 | ) | |||||||||||||||
Receive | Google, Inc. | 63 | 0.08 | % | 38 | 8/23/12 | Morgan Stanley & Co. International PLC | (387 | ) | |||||||||||||||
Receive | Google, Inc. | 13 | 0.08 | % | 8 | 8/23/12 | Morgan Stanley & Co. International PLC | 131 | ||||||||||||||||
Receive | Potash Corp. | 399 | 0.08 | % | 20 | 8/23/12 | Morgan Stanley & Co. International PLC | (1,398 | ) | |||||||||||||||
| 12 | • ALLIANCEBERNSTEIN INTERNATIONAL FOCUS SHARES |
Portfolio of Investments
| Receive/Pay Total Return on Reference Equities | Equities | # of Shares or Units | Rate Paid/ Received by the Fund | Notional Amount (000) | Maturity Date | Counterparty | Unrealized Appreciation/ (Depreciation) | |||||||||||||||||
Pay Total Return on Reference Equities |
| |||||||||||||||||||||||
Pay | Salesforce.com Inc. | 92 | 0.07 | % | $ | 12 | 4/16/13 | Morgan Stanley & Co. International PLC | $ | (597 | ) | |||||||||||||
Pay | Salesforce.com Inc. | 180 | 0.07 | % | 23 | 8/23/12 | Morgan Stanley & Co. International PLC | (1,167 | ) | |||||||||||||||
Pay | LinkedIn Corp. | 72 | 0.09 | % | 6 | 8/8/12 | Morgan Stanley & Co. International PLC | (380 | ) | |||||||||||||||
Pay | LinkedIn Corp. | 225 | 0.07 | % | 19 | 8/8/12 | Morgan Stanley & Co. International PLC | (1,180 | ) | |||||||||||||||
Pay | LinkedIn Corp. | 100 | 0.08 | % | 9 | 8/8/12 | Morgan Stanley & Co. International PLC | (526 | ) | |||||||||||||||
Pay | Netflix, Inc. | 90 | 0.07 | % | 11 | 4/16/13 | Morgan Stanley & Co. International PLC | 3,173 | ||||||||||||||||
Pay | Netflix, Inc. | 54 | 0.09 | % | 6 | 4/16/13 | Morgan Stanley & Co. International PLC | 1,902 | ||||||||||||||||
Pay | Netflix, Inc. | 160 | 0.08 | % | 13 | 4/16/13 | Morgan Stanley & Co. International PLC | (69 | ) | |||||||||||||||
Pay | Netflix, Inc. | 57 | 0.17 | % | 7 | 4/16/13 | Morgan Stanley & Co International PLC | 2,008 | ||||||||||||||||
Pay | Netflix, Inc. | 50 | 0.07 | % | 4 | 4/16/13 | Morgan Stanley & Co. International PLC | (141 | ) | |||||||||||||||
Pay | Netflix, Inc. | 50 | 0.07 | % | 4 | 4/16/13 | Morgan Stanley & Co. International PLC | (299 | ) | |||||||||||||||
Pay | Netflix, Inc. | 50 | 0.07 | % | 4 | 4/16/13 | Morgan Stanley & Co. International PLC | (302 | ) | |||||||||||||||
|
| |||||||||||||||||||||||
| $ | 590 | |||||||||||||||||||||||
|
| |||||||||||||||||||||||
| ALLIANCEBERNSTEIN INTERNATIONAL FOCUS SHARES • | 13 |
Portfolio of Investments
| (a) | Security is exempt from registration under Rule 144A of the Securities Act of 1933. These securities are considered liquid and may be resold in transactions exempt from registration, normally to qualified institutional buyers. At October 31, 2011, the aggregate market value of these securities amounted to $93,878 or 7.3% of net assets. |
| (b) | Non-income producing security. |
| (c) | Investment in affiliated money market mutual fund. The rate shown represents the 7-day yield as of period end. |
Glossary:
GDR – Global Depositary Receipt
See notes to financial statements.
| 14 | • ALLIANCEBERNSTEIN INTERNATIONAL FOCUS SHARES |
Portfolio of Investments
STATEMENT OF ASSETS & LIABILITIES
October 31, 2011 (unaudited)
| Assets | ||||
Investments in securities, at value | ||||
Unaffiliated issuers (cost $1,469,134) | $ | 1,277,626 | ||
Affiliated issuers (cost $14,271) | 14,271 | |||
Foreign currencies, at value (cost $3,610) | 3,647 | |||
Unrealized appreciation on total return swap contracts | 7,220 | |||
Unrealized appreciation of forward currency exchange contracts | 1,810 | |||
Dividends receivable | 2 | |||
|
| |||
Total assets | 1,304,576 | |||
|
| |||
| Liabilities | ||||
Unrealized depreciation on total return swap contracts | 6,630 | |||
Unrealized depreciation of forward currency exchange contracts | 6,130 | |||
|
| |||
Total liabilities | 12,760 | |||
|
| |||
Net Assets | $ | 1,291,816 | ||
|
| |||
| Composition of Net Assets | ||||
Shares of beneficial interest, at par | $ | 15 | ||
Additional paid-in capital | 1,540,457 | |||
Accumulated net investment income | 9,954 | |||
Accumulated net realized loss on investment | (63,410 | ) | ||
Net unrealized depreciation on investments and foreign currency denominated assets and liabilities | (195,200 | ) | ||
|
| |||
| $ | 1,291,816 | |||
|
| |||
Net Asset Value Per Share—unlimited shares of beneficial interest authorized, $.00001 par value (based on 154,060 common shares outstanding) | $ | 8.39 | ||
|
|
See notes to financial statements.
| ALLIANCEBERNSTEIN INTERNATIONAL FOCUS SHARES • | 15 |
Statement of Assets & Liabilities
STATEMENT OF OPERATIONS
For the Period Ended June 20, 2011(a) to October 31, 2011 (unaudited)
| Investment Income | ||||||||
Dividends | ||||||||
Unaffiliated issuers | $ | 9,937 | ||||||
Affiliated issuers | 17 | |||||||
|
| |||||||
Total income | $ | 9,954 | ||||||
| Realized and Unrealized Gain (Loss) on Investment and Foreign Currency Transactions | ||||||||
Net realized gain (loss) on: | ||||||||
Investment transactions | (66,487 | ) | ||||||
Swap contracts | 8,507 | |||||||
Foreign currency transactions | (5,430 | ) | ||||||
Net change in unrealized appreciation/depreciation of: | ||||||||
Investments | (191,508 | ) | ||||||
Swap contracts | 590 | |||||||
Foreign currency denominated assets and liabilities | (4,282 | ) | ||||||
|
| |||||||
Net loss on investment and foreign currency transactions | (258,610 | ) | ||||||
|
| |||||||
Net Decrease in Net Assets from Operations | $ | (248,656 | ) | |||||
|
|
| (a) | Commencement of operations. |
See notes to financial statements.
| 16 | • ALLIANCEBERNSTEIN INTERNATIONAL FOCUS SHARES |
Statement of Operations
STATEMENT OF CHANGES IN NET ASSETS
| June 20, 2011(a) to October 31, 2011 (unaudited) | ||||
| Increase (Decrease) in Net Assets from Operations | ||||
Net investment income | $ | 9,954 | ||
Net realized loss on investment and foreign currency transactions | (63,410 | ) | ||
Net change in unrealized appreciation/depreciation of investments and foreign currency denominated assets and liabilities | (195,200 | ) | ||
|
| |||
Net decrease in net assets from operations | (248,656 | ) | ||
| Transactions in Shares of Beneficial Interest | ||||
Net increase | 1,540,472 | |||
|
| |||
Total increase | 1,291,816 | |||
| Net Assets | ||||
Beginning of period | – 0 | – | ||
|
| |||
End of period (including undistributed net investment income of $9,954) | $ | 1,291,816 | ||
|
| |||
| (a) | Commencement of operations. |
See notes to financial statements.
| ALLIANCEBERNSTEIN INTERNATIONAL FOCUS SHARES • | 17 |
Statement of Changes in Net Assets
NOTES TO FINANCIAL STATEMENTS
October 31, 2011 (unaudited)
NOTE A
Significant Accounting Policies
AllianceBernstein Corporate Shares (the “Trust”) was organized as a Massachusetts business trust under the laws of The Commonwealth of Massachusetts by an Agreement and Declaration of Trust (“Declaration of Trust”) dated January 26, 2004. The Trust is registered under the Investment Company Act of 1940, as an open-end, diversified management investment company. The Trust operates as a “series” company currently having five separate portfolios: AllianceBernstein Corporate Income Shares, AllianceBernstein Municipal Income Shares, AllianceBernstein Taxable Multi-Sector Income Shares, AllianceBernstein Tax-Aware Real Return Income Shares and AllianceBernstein International Focus Shares (the “Portfolio”). Each Portfolio is considered to be a separate entity for financial reporting and tax purposes. AllianceBernstein Corporate Income Shares commenced operations on December 11, 2006. AllianceBernstein Municipal Income Shares commenced operations on September 1, 2010. AllianceBernstein Taxable Multi-Sector Income Shares commenced operations on September 15, 2010. AllianceBernstein Tax-Aware Real Return Income Shares commenced operations on May 2, 2011. AllianceBernstein International Focus Shares commenced operations on June 20, 2011. This report relates only to AllianceBernstein International Focus Shares.
Shares of the Portfolio are offered exclusively to holders of accounts established under wrap-fee programs sponsored and maintained by certain registered investment advisers approved by AllianceBernstein L.P. (the “Adviser”). The Portfolio’s shares may be purchased at the relevant net asset value without a sales charge or other fee. The financial statements have been prepared in conformity with U.S. generally accepted accounting principles (“U.S. GAAP”) which require management to make certain estimates and assumptions that affect the reported amounts of assets and liabilities in the financial statements and amounts of income and expenses during the reporting period. Actual results could differ from those estimates. The following is a summary of significant accounting policies followed by the Portfolio.
1. Security Valuation
Portfolio securities are valued at their current market value determined on the basis of market quotations or, if market quotations are not readily available or are deemed unreliable, at “fair value” as determined in accordance with procedures established by and under the general supervision of the Trust’s Board of Trustees.
In general, the market value of securities which are readily available and deemed reliable are determined as follows: Securities listed on a national securities exchange (other than securities listed on the NASDAQ Stock Market, Inc. (“NASDAQ”)) or on a foreign securities exchange are valued at the last sale price at the close of the exchange or foreign securities exchange. If there has been no sale on such day, the securities are valued at the mean of the closing bid
| 18 | • ALLIANCEBERNSTEIN INTERNATIONAL FOCUS SHARES |
Notes to Financial Statements
and ask prices on such day. Securities listed on more than one exchange are valued by reference to the principal exchange on which the securities are traded; securities listed only on NASDAQ are valued in accordance with the NASDAQ Official Closing Price; listed or over the counter market (“OTC”) put or call options are valued at the mid level between the current bid and ask prices. If either a current bid or current ask price is unavailable, AllianceBernstein L.P. (the “Adviser”) will have discretion to determine the best valuation (e.g. last trade price); open futures contracts and options thereon are valued using the closing settlement price or, in the absence of such a price, the most recent quoted bid price. If there are no quotations available for the day of valuation, the last available closing settlement price is used; U.S. government securities and other debt instruments having 60 days or less remaining until maturity are valued at amortized cost if their original maturity was 60 days or less; or by amortizing their fair value as of the 61st day prior to maturity if their original term to maturity exceeded 60 days; fixed-income securities, including mortgage backed and asset backed securities, may be valued on the basis of prices provided by a pricing service or at a price obtained from one or more of the major broker/dealers. In cases where broker/dealer quotes are obtained, the Adviser may establish procedures whereby changes in market yields or spreads are used to adjust, on a daily basis, a recently obtained quoted price on a security; and swaps and other derivatives are valued daily, primarily using independent pricing services, independent pricing models using market inputs, as well as third party broker-dealers or counterparties, which are approved by the Board of Trustees. Investments in money market funds are valued at their net asset value each day.
Securities for which market quotations are not readily available (including restricted securities) or are deemed unreliable are valued at fair value. Factors considered in making this determination may include, but are not limited to, information obtained by contacting the issuer, analysts, analysis of the issuer’s financial statements or other available documents. In addition, the Portfolio may use fair value pricing for securities primarily traded in non-U.S. markets because most foreign markets close well before the Portfolio values its securities at 4:00 p.m., Eastern Time. The earlier close of foreign markets gives rise to the possibility that significant events, including broad market moves, may have occurred between the close of the foreign markets and the time at which the Portfolio values its securities which may materially affect the value of securities trading in such markets. To account for this, the Portfolio may frequently value many of its foreign equity securities using fair value prices based on third party vendor modeling tools to the extent available.
2. Fair Value Measurements
In accordance with U.S. GAAP regarding fair value measurements, fair value is defined as the price that the Portfolio would receive to sell an asset or pay to transfer a liability in an orderly transaction between market participants at the measurement date. The U.S. GAAP disclosure requirements establish a
| ALLIANCEBERNSTEIN INTERNATIONAL FOCUS SHARES • | 19 |
Notes to Financial Statements
framework for measuring fair value, and a three-level hierarchy for fair value measurements based upon the transparency of inputs to the valuation of an asset or liability. Inputs may be observable or unobservable and refer broadly to the assumptions that market participants would use in pricing the asset or liability. Observable inputs reflect the assumptions market participants would use in pricing the asset or liability based on market data obtained from sources independent of the Portfolio. Unobservable inputs reflect the Portfolio’s own assumptions about the assumptions that market participants would use in pricing the asset or liability based on the best information available in the circumstances. Each investment is assigned a level based upon the observability of the inputs which are significant to the overall valuation. The three-tier hierarchy of inputs is summarized below.
| • | Level 1—quoted prices in active markets for identical investments |
| • | Level 2—other significant observable inputs (including quoted prices for similar investments, interest rates, prepayment speeds, credit risk, etc.) |
| • | Level 3—significant unobservable inputs (including the Portfolio’s own assumptions in determining the fair value of investments) |
The following table summarizes the valuation of the Portfolio’s investments by the above fair value hierarchy levels as of October 31, 2011:
Investments in Securities: | Level 1 | Level 2 | Level 3 | Total | ||||||||||||
Assets: | ||||||||||||||||
Common Stocks | ||||||||||||||||
Consumer Discretionary | $ | 117,550 | $ | 104,558 | $ | – 0 | – | $ | 222,108 | |||||||
Consumer Staples | – 0 | – | 213,419 | – 0 | – | 213,419 | ||||||||||
Industrials | 45,625 | 135,925 | – 0 | – | 181,550 | |||||||||||
Financials | 29,740 | 99,168 | – 0 | – | 128,908 | |||||||||||
Energy | – 0 | – | 127,202 | – 0 | – | 127,202 | ||||||||||
Information Technology | – 0 | – | 123,712 | – 0 | – | 123,712 | ||||||||||
Materials | – 0 | – | 67,168 | – 0 | – | 67,168 | ||||||||||
Health Care | – 0 | – | 33,435 | – 0 | – | 33,435 | ||||||||||
Warrants | – 0 | – | – 0 | – | 180,124 | 180,124 | ||||||||||
Short-Term Investments | 14,271 | – 0 | – | – 0 | – | 14,271 | ||||||||||
|
|
|
|
|
|
|
| |||||||||
Total Investments in Securities | 207,186 | 904,587 | + | 180,124 | 1,291,897 | |||||||||||
Other Financial Instruments*: | ||||||||||||||||
Assets: | ||||||||||||||||
Forward Currency Exchange Contracts | – 0 | – | 1,810 | – 0 | – | 1,810 | ||||||||||
Total Return Swap Contracts | – 0 | – | 7,220 | – 0 | – | 7,220 | ||||||||||
Liabilities: | ||||||||||||||||
Forward Currency Exchange Contracts | – 0 | – | (6,130 | ) | – 0 | – | (6,130 | ) | ||||||||
Total Return Swap Contracts | – 0 | – | (6,630 | ) | – 0 | – | (6,630 | ) | ||||||||
|
|
|
|
|
|
|
| |||||||||
Total | $ | 207,186 | $ | 900,857 | $ | 180,124 | $ | 1,288,167 | ||||||||
|
|
|
|
|
|
|
| |||||||||
| * | Other financial instruments are derivative instruments, such as futures, forwards and swap contracts, which are valued at the unrealized appreciation/depreciation on the instrument. |
| + | A significant portion of the Portfolio’s foreign equity investments are categorized as Level 2 investments since they are valued using fair value prices based on third party vendor modeling tools to the extent available, see Note A.1. |
| 20 | • ALLIANCEBERNSTEIN INTERNATIONAL FOCUS SHARES |
Notes to Financial Statements
Following is a reconciliation of investments in which significant unobservable inputs (Level 3) were used in determining fair value. The transfers between levels of the fair value hierarchy assumes the financial instrument was transferred at the beginning of the reporting period.
| Warrants | Total | |||||||
Balance as of 6/20/11(a) | $ | – 0 | – | $ | – 0 | – | ||
Accrued discounts/(premiums) | – 0 | – | – 0 | – | ||||
Realized gain (loss) | (247 | ) | (247 | ) | ||||
Change in unrealized appreciation/depreciation | (47,973 | ) | (47,973 | ) | ||||
Purchases | 232,771 | 232,771 | ||||||
Sales | (4,427 | ) | (4,427 | ) | ||||
Transfers in to Level 3 | – 0 | – | – 0 | – | ||||
Transfers out of Level 3 | – 0 | – | – 0 | – | ||||
|
|
|
| |||||
Balance as of 10/31/11 | $ | 180,124 | $ | 180,124 | ||||
|
|
|
| |||||
Net change in unrealized appreciation/depreciation from Investments held as of 10/31/11* | $ | (47,973 | ) | $ | (47,973 | ) | ||
|
|
|
| |||||
| (a) | Commencement of operations. |
| * | The unrealized appreciation/depreciation is included in net change in unrealized appreciation/depreciation of investments in the accompanying statement of operations. |
3. Currency Translation
Assets and liabilities denominated in foreign currencies and commitments under forward currency exchange contracts are translated into U.S. dollars at the mean of the quoted bid and asked prices of such currencies against the U.S. dollar. Purchases and sales of portfolio securities are translated into U.S. dollars at the rates of exchange prevailing when such securities were acquired or sold. Income and expenses are translated into U.S. dollars at rates of exchange prevailing when accrued.
Net realized gain or loss on foreign currency transactions represents foreign exchange gains and losses from sales and maturities of foreign fixed income investments, foreign currency exchange contracts, holding of foreign currencies, currency gains or losses realized between the trade and settlement dates on foreign investment transactions, and the difference between the amounts of dividends, interest and foreign withholding taxes recorded on the Portfolio’s books and the U.S. dollar equivalent amounts actually received or paid. Net unrealized currency gains and losses from valuing foreign currency denominated assets and liabilities at period end exchange rates are reflected as a component of net unrealized appreciation or depreciation of investments and foreign currency denominated assets and liabilities.
4. Taxes
It is the Portfolio’s policy to meet the requirements of the Internal Revenue Code applicable to regulated investment companies and to distribute all of its investment company taxable income and net realized gains, if any, to shareholders. Therefore, no provisions for federal income or excise taxes are required.
| ALLIANCEBERNSTEIN INTERNATIONAL FOCUS SHARES • | 21 |
Notes to Financial Statements
The Portfolio may be subject to taxes imposed by countries in which it invests. Such taxes are generally based on income and/or capital gains earned or repatriated. Taxes are accrued and applied to net investment income, net realized gains and net unrealized appreciation/depreciation as such income and/or gains are earned.
In accordance with U.S. GAAP requirements regarding accounting for uncertainties in income taxes, management has analyzed the Portfolio’s tax positions taken or expected to be taken on federal and state income tax returns for all open tax years and has concluded that no provision for income tax is required in the Portfolio’s financial statements.
5. Investment Income and Investment Transactions
Dividend income is recorded on the ex-dividend date or as soon as the Portfolio is informed of the dividend. Interest income is accrued daily. Investment transactions are accounted for on the date the securities are purchased or sold. Investment gains or losses are determined on the identified cost basis. The Portfolio amortizes premiums and accretes discounts as adjustments to interest income.
6. Dividends and Distributions
Dividends and distributions to shareholders, if any, are recorded on the ex-dividend date. Income dividends and capital gains distributions are determined in accordance with federal tax regulations and may differ from those determined in accordance with U.S. GAAP. To the extent these differences are permanent, such amounts are reclassified within the capital accounts based on their federal tax basis treatment; temporary differences do not require such reclassification.
NOTE B
Advisory Fee and Other Transactions with Affiliates
Under the terms of the Advisory Agreement, the Portfolio pays no advisory fee to the Adviser and the Adviser reimburses or pays for the Portfolio’s operating expenses. The Portfolio is an integral part of separately managed accounts in wrap-fee programs. Typically, participants in these programs pay a fee to their investment adviser for all costs and expenses of the separately managed account, including costs and expenses associated with the Portfolio. The Adviser serves as investment manager and adviser of the Portfolio and continuously furnishes an investment program for the Portfolio and manages, supervises and conducts the affairs of the Portfolio, subject to the supervisions of the Portfolio’s Board of Trustees. The Advisory Agreement provides that the Adviser or an affiliate will furnish, or pay the expenses of the Portfolio for, office space, facilities and equipment, services of executive and other personnel of the Portfolio and certain administrative services.
| 22 | • ALLIANCEBERNSTEIN INTERNATIONAL FOCUS SHARES |
Notes to Financial Statements
The Portfolio has entered into a Distribution Agreement (the “Agreement”) with AllianceBernstein Investments, Inc., the Portfolio’s principal underwriter (the “Underwriter”), to permit the Underwriter to distribute the Portfolio’s shares, which are sold at their net asset value without any sales charge. The Portfolio does not pay a fee for this service. The Underwriter is a wholly owned subsidiary of the Adviser.
AllianceBernstein Investor Services, Inc. (“ABIS”), a wholly-owned subsidiary of the Adviser, acts as the Portfolios’ registrar, transfer agent and dividend-disbursing agent. ABIS registers the transfer, issuance and redemption of Portfolio shares and disburses dividends and other distributions to Portfolio shareholders. The Portfolio does not pay a fee for this service.
The Portfolio may invest in the AllianceBernstein Fixed-Income Shares, Inc.—Government STIF Portfolio (“Government STIF Portfolio”), an open-end management investment company managed by the Adviser. The Government STIF Portfolio is offered as a cash management option to mutual funds and other institutional accounts of the Adviser, and is not available for direct purchase by members of the public. The Government STIF Portfolio pays no investment management fees but does bear its own expenses. A summary of the Portfolio’s transactions in shares of the Government STIF Portfolio for the period ended October 31, 2011 is as follows:
Market Value | Purchases at Cost (000) | Sales Proceeds (000) | Market Value October 31, 2011 (000) | Dividend Income (000) | ||||||||||||
| $ – 0 – | $ | 1,658 | $ | 1,644 | $ | 14 | $ | – 0 | –* | |||||||
| (a) | Commencement of operations. |
| * | Amount is less than $500. |
NOTE C
Investment Transactions
Purchases and sales of investment securities (excluding short-term investments) for the period ended October 31, 2011 were as follows:
| Purchases | Sales | |||||||
Investment securities (excluding | $ | 1,679,467 | $ | 143,847 | ||||
U.S. government securities | – 0 | – | – 0 | – | ||||
The cost of investments for federal income tax purposes was substantially the same as the cost for financial reporting purposes. Accordingly, gross unrealized appreciation and unrealized depreciation (excluding foreign currency and swap transactions) are as follows:
Gross unrealized appreciation | $ | 15,622 | ||
Gross unrealized depreciation | (207,130 | ) | ||
|
| |||
Net unrealized depreciation | $ | (191,508 | ) | |
|
|
| ALLIANCEBERNSTEIN INTERNATIONAL FOCUS SHARES • | 23 |
Notes to Financial Statements
1. Derivative Financial Instruments
The Portfolio may use derivatives to earn income and enhance returns, to hedge or adjust the risk profile of its portfolio, to replace more traditional direct investments, or to obtain exposure to otherwise inaccessible markets.
The principal types of derivatives utilized by the Portfolio, as well as the methods in which they may be used are:
| • | Forward Currency Exchange Contracts |
The Portfolio may enter into forward currency exchange contracts in order to hedge its exposure to changes in foreign currency exchange rates on its foreign portfolio holdings, to hedge certain firm purchase and sale commitments denominated in foreign currencies and for non-hedging purposes as a means of making direct investments in foreign currencies, as described below under “Currency Transactions”.
A forward currency exchange contract is a commitment to purchase or sell a foreign currency at a future date at a negotiated forward rate. The gain or loss arising from the difference between the original contract and the closing of such contract would be included in net realized gain or loss on foreign currency transactions. Fluctuations in the value of open forward currency exchange contracts are recorded for financial reporting purposes as unrealized appreciation and/or depreciation by the Portfolio. Risks may arise from the potential inability of a counterparty to meet the terms of a contract and from unanticipated movements in the value of a foreign currency relative to the U.S. dollar. The face or contract amount, in U.S. dollars reflects the total exposure the Portfolio has in that particular currency contract.
During the period ended October 31, 2011, the Portfolio held forward currency exchange contracts for hedging and non-hedging purposes.
| • | Swap Agreements |
The Portfolio may enter into swaps to hedge its exposure to interest rates, credit risk, equity markets and currencies. The Portfolio may also enter into swaps for non-hedging purposes as a means of gaining market exposures including by making direct investments in foreign currencies, as described below under “Currency Transactions” or in order to take a “long” or “short” position with respect to an underlying referenced asset described below under “Total Return Swaps”. A swap is an agreement that obligates two parties to exchange a series of cash flows at specified intervals based upon or calculated by reference to changes in specified prices or rates for a specified amount of an underlying asset. The payment flows are usually netted against each other, with the difference being paid by one party to the other. In addition, collateral may be pledged or received by the Portfolio in accordance with the terms of the respective swap agreements to provide value and recourse to the Portfolio or its
| 24 | • ALLIANCEBERNSTEIN INTERNATIONAL FOCUS SHARES |
Notes to Financial Statements
counterparties in the event of default, bankruptcy or insolvency by one of the parties to the swap agreement.
Risks may arise as a result of the failure of the counterparty to the swap contract to comply with the terms of the swap contract. The loss incurred by the failure of a counterparty is generally limited to the net interim payment to be received by the Portfolio, and/or the termination value at the end of the contract. Therefore, the Portfolio considers the creditworthiness of each counterparty to a swap contract in evaluating potential counterparty risk. This risk is mitigated by having a netting arrangement between the Portfolio and the counterparty and by the posting of collateral by the counterparty to the Portfolio to cover the Portfolio’s exposure to the counterparty. Additionally, risks may arise from unanticipated movements in interest rates or in the value of the underlying securities. The Portfolio accrues for the interim payments on swap contracts on a daily basis, with the net amount recorded within unrealized appreciation/depreciation of swap contracts on the statement of assets and liabilities, where applicable. Once the interim payments are settled in cash, the net amount is recorded as realized gain/(loss) on swaps on the statement of operations, in addition to any realized gain/(loss) recorded upon the termination of swap contracts. Fluctuations in the value of swap contracts are recorded as a component of net change in unrealized appreciation/depreciation of swap contracts on the statement of operations.
Total Return Swaps:
The Portfolio may enter into total return swaps in order take a “long” or “short” position with respect to an underlying referenced asset. The Portfolio is subject to market price volatility of the underlying referenced asset. A total return swap involves commitments to pay interest in exchange for a market linked return based on a notional amount. To the extent that the total return of the security, group of securities or index underlying the transaction exceeds or falls short of the offsetting interest obligation, the Portfolio will receive a payment from or make a payment to the counterparty.
During the period ended October 31, 2011, the Portfolio held total return swaps for hedging and non-hedging purposes.
Documentation governing the Portfolio’s swap transactions may contain provisions for early termination of a swap in the event the net assets of the Portfolio decline below specific levels set forth in the documentation (“net asset contingent features”). If these levels are triggered, the Portfolio’s counterparty has the right to terminate the swap and require the Portfolio to pay or receive a settlement amount in connection with the terminated swap transaction. As of October 31, 2011, the Portfolio had total return swap contracts in liability positions with net asset contingent features. The
| ALLIANCEBERNSTEIN INTERNATIONAL FOCUS SHARES • | 25 |
Notes to Financial Statements
fair value of such total return swap contracts amounted to $6,630 at October 31, 2011.
At October 31, 2011, the Portfolio had entered into the following derivatives:
Asset Derivatives | Liability Derivatives | |||||||||||
Derivative Type | Statement of | Fair Value | Statement of | Fair Value | ||||||||
Foreign exchange contracts | Unrealized appreciation of forward currency exchange contracts | $ | 1,810 | | Unrealized depreciation of forward currency exchange contracts | $ | 6,130 | | ||||
Equity contracts | Unrealized appreciation on total return swap agreements | 7,220 | Unrealized depreciation on total return swap agreements | 6,630 | ||||||||
|
|
|
| |||||||||
Total | $ | 9,030 | $ | 12,760 | ||||||||
|
|
|
| |||||||||
The effect of derivative instruments on the statement of operations for the period ended October 31, 2011:
Derivative Type | Location of Gain | Realized Gain or (Loss) on Derivatives | Change in Unrealized Appreciation or (Depreciation) | |||||||
Foreign exchange contracts | Net realized gain (loss) on foreign currency transactions; Net change in unrealized appreciation/depreciation of foreign currency denominated assets and liabilities | $ | (3,307 | ) | $ | (4,320 | ) | |||
Equity contracts | Net realized gain (loss) on swap contracts; Net change in unrealized appreciation/depreciation of swap contracts | 8,507 | 590 | |||||||
|
|
|
| |||||||
Total | $ | 5,200 | $ | (3,730 | ) | |||||
|
|
|
| |||||||
For five months of the period, the average monthly principal amount of foreign currency exchange contracts was $581,310. For four months of the period, the average monthly notional amount of total return swaps was $15,773.
2. Currency Transactions
The Portfolio may invest in non-U.S. Dollar securities on a currency hedged or unhedged basis. The Portfolio may seek investment opportunities by taking long
| 26 | • ALLIANCEBERNSTEIN INTERNATIONAL FOCUS SHARES |
Notes to Financial Statements
or short positions in currencies through the use of currency-related derivatives, including forward currency exchange contracts, futures and options on futures, swaps, and other options. The Portfolio may enter into transactions for investment opportunities when it anticipates that a foreign currency will appreciate or depreciate in value but securities denominated in that currency are not held by the Portfolio and do not present attractive investment opportunities. Such transactions may also be used when the Adviser believes that it may be more efficient than a direct investment in a foreign currency-denominated security. The Portfolio may also conduct currency exchange contracts on a spot basis (i.e., for cash at the spot rate prevailing in the currency exchange market for buying or selling currencies).
NOTE D
Shares of Beneficial Interest
Transactions in shares of beneficial interest were as follows:
| Shares | Amount | |||||||||||
| June 20, 2011(a) to October 31, 2011 (unaudited) | June 20, 2011(a) to October 31, 2011 (unaudited) | |||||||||||
|
| |||||||||||
Shares sold | 154,060 | $ | 1,540,472 | |||||||||
| ||||||||||||
Net increase | 154,060 | $ | 1,540,472 | |||||||||
| ||||||||||||
| (a) | Commencement of operations. |
NOTE E
Risks Involved in Investing in the Portfolio
Foreign Securities Risk—Investing in securities of foreign companies or foreign governments involve special risks which include changes in foreign currency exchange rates and the possibility of future political and economic developments which could adversely affect the value of such securities. Moreover, securities of many foreign companies or foreign governments and their markets may be less liquid and their prices more volatile than those of comparable U.S. companies or of the U.S. government.
Currency Risk—This is the risk that changes in foreign currency exchange rates may negatively affect the value of the Portfolio’s investments or reduce the returns of the Portfolio. For example, the value of the Portfolio’s investments in foreign currency-denominated securities or currencies may decrease if the U.S. Dollar is strong (i.e., gaining value relative to other currencies) and other currencies are weak (i.e., losing value relative to the U.S. Dollar). Currency markets are generally not as regulated as securities markets. Independent of the Portfolio’s investments denominated in foreign currencies, the Portfolio’s positions in various foreign currencies may cause the Portfolio to experience investment losses due to the changes in exchange rates and interest rates.
| ALLIANCEBERNSTEIN INTERNATIONAL FOCUS SHARES • | 27 |
Notes to Financial Statements
Derivatives Risk—The Portfolio may enter into derivative transactions such as forwards, options, futures and swaps. Derivatives may be illiquid, difficult to price, and leveraged so that small changes may produce disproportionate losses for the Portfolio, and subject to counterparty risk to a greater degree than more traditional investments. Derivatives may result in significant losses, including losses that are far greater than the value of the derivatives reflected in the statement of assets and liabilities.
Indemnification Risk—In the ordinary course of business, the Portfolio enters into contracts that contain a variety of indemnifications. The Portfolio’s maximum exposure under these arrangements is unknown. However, the Portfolio has not had prior claims or losses pursuant to these indemnification provisions and expects the risk of loss thereunder to be remote. Therefore, the Portfolio has not accrued any liability in connection with these indemnification provisions.
NOTE F
Tax Information
On December 22, 2010, the Regulated Investment Company Modernization Act of 2010 (the “Act”) was enacted, which changed various technical rules governing the tax treatment of regulated investment companies. One important change addresses the recognition of capital loss carryforwards. Under the Act, the Portfolio will be permitted to carry forward capital losses incurred in taxable years beginning after December 22, 2010 for an unlimited period. However, any losses incurred during those future taxable years will be required to be utilized prior to the losses incurred in pre-enactment taxable years, which carry an expiration date. As a result, pre-enactment capital loss carryforwards may be more likely to expire unused. Additionally, post-enactment capital loss carryforwards will retain their character as either short-term or long-term capital losses rather than being considered all short-term capital loss (as permitted under previous regulation).
NOTE G
Recent Accounting Pronouncement
In May 2011, the Financial Accounting Standards Board (“FASB”) issued an Accounting Standards Update (“ASU”) to develop common requirements for measuring fair value and for disclosing information about fair value measurements in U.S. GAAP and International Financial Reporting Standards (“IFRS”). The amendments are intended to improve the comparability of fair value measurements presented and disclosed in the financial statements prepared in accordance with U.S. GAAP and IFRS. The ASU is effective during interim or annual periods beginning after December 15, 2011. At this time, management is evaluating the implication of this ASU and its impact on the financial statements has not been determined.
| 28 | • ALLIANCEBERNSTEIN INTERNATIONAL FOCUS SHARES |
Notes to Financial Statements
NOTE H
Subsequent Events
Management has evaluated subsequent events for possible recognition or disclosure in the financial statements through the date the financial statements are issued. Management has determined that there are no material events that would require disclosure in the Portfolio’s financial statements through this date.
| ALLIANCEBERNSTEIN INTERNATIONAL FOCUS SHARES • | 29 |
Notes to Financial Statements
FINANCIAL HIGHLIGHTS
Selected Data For A Share Of Beneficial Interest Outstanding Throughout Each Period
| June 20, 2011(a) to October 31, 2011 (unaudited) | ||||
Net asset value, beginning of period | $ 10.00 | |||
|
| |||
Income From Investment Operations | ||||
Net investment income(b) | .06 | |||
Net realized and unrealized loss on investment and foreign currency transactions | (1.67 | ) | ||
|
| |||
Net decrease in net asset value from operations | (1.61 | ) | ||
|
| |||
Net asset value, end of period | $ 8.39 | |||
|
| |||
Total Return | ||||
Total investment return based on net asset value(c) | (16.10 | )% | ||
Ratios/Supplemental Data | ||||
Net assets, end of period (000’s omitted) | $1,292 | |||
Ratio to average net assets of: | ||||
Net investment income(d) | 2.03 | % | ||
Portfolio turnover rate | 11 | % | ||
| (a) | Commencement of operations. |
| (b) | Based on average shares outstanding. |
| (c) | Total investment return is calculated assuming an initial investment made at the net asset value at the beginning of the period, reinvestment of all dividends and distributions at net asset value during the period, and redemption on the last day of the period. Total return does not reflect the deduction of taxes that a shareholder would pay on portfolio distributions or the redemption of portfolio shares. Total investment return calculated for a period of less than one year is not annualized. |
| (d) | Annualized. |
See notes to financial statements.
| 30 | • ALLIANCEBERNSTEIN INTERNATIONAL FOCUS SHARES |
Financial Highlights
BOARD OF TRUSTEES
| William H. Foulk, Jr.(1), Chairman | Robert M. Keith, President and Chief Executive Officer | |
| John H. Dobkin(1) | ||
| Michael J. Downey(1) | Garry L. Moody(1) | |
| D. James Guzy(1) | Marshall C. Turner, Jr.(1) | |
| Nancy P. Jacklin(1) | Earl D. Weiner(1) |
OFFICERS
Philip L. Kirstein, Senior Vice President and Independent Compliance Officer Laurent Saltiel(2), Senior Vice President | Emilie D. Wrapp, Secretary Joseph J. Mantineo, Treasurer and Chief Financial Officer Phyllis J. Clarke, Controller |
Custodian and Accounting Agent State Street Bank and Trust Company
Principal Underwriter AllianceBernstein Investments, Inc.
Transfer Agent AllianceBernstein Investor Services, Inc. | Legal Counsel Seward & Kissel LLP One Battery Park Plaza New York, NY 10004
Independent Registered Public Accounting Firm Ernst & Young LLP 5 Times Square New York, NY 10036 |
| (1) | Member of the Audit Committee, the Governance and Nominating Committee and the Independent Directors Committee. Mr. Foulk is the sole member of the Fair Value Pricing Committee. |
| (2) | The day-to-day management of, and investment decisions for, the Trust’s portfolio are made by Mr. Laurent Saltiel. |
| ALLIANCEBERNSTEIN INTERNATIONAL FOCUS SHARES • | 31 |
Board of Trustees
Information Regarding the Review and Approval of the Portfolio’s Advisory Agreement
The disinterested trustees (the “trustees”) of AllianceBernstein Corporate Shares (the “Fund”) unanimously approved the application of the Fund’s Advisory Agreement with the Adviser in respect of AllianceBernstein International Focus Shares (the “Portfolio”) for an initial two-year period at a meeting held on March 9, 2011.
Prior to approval of the Advisory Agreement in respect of the Portfolio, the trustees had requested from the Adviser, and received and evaluated, extensive materials. They reviewed the proposed approval of the Advisory Agreement with the Adviser and with experienced counsel who are independent of the Adviser, who advised on the relevant legal standards. The trustees also reviewed an independent evaluation prepared by the Fund’s Senior Officer (who is also the Fund’s Independent Compliance Officer) of the reasonableness of the advisory fee in the Advisory Agreement, in which the Senior Officer concluded that the contractual fee (zero) for the Portfolio was reasonable. The trustees also discussed the proposed approval in private sessions with counsel and the Fund’s Senior Officer.
The trustees noted that the Portfolio is designed as a “completion vehicle” for the wrap fee account market (where investors pay fees to a wrap fee sponsor which pays investment fees and expenses from such fee). The trustees also noted that no advisory fee is payable by the Portfolio, that the Advisory Agreement does not include the reimbursement provision for certain administrative expenses included in the advisory agreements of most of the open-end AllianceBernstein Funds, and that the Adviser is responsible for payment of the Portfolio’s ordinary expenses. The trustees noted that the Fund acknowledges in the Advisory Agreement that the Adviser and its affiliates expect to receive compensation from third parties in connection with services provided under the Advisory Agreement. The trustees further noted that the Adviser would receive payments from the wrap fee program sponsors (the “Sponsors”) that use the Portfolio as an investment vehicle for their clients.
The trustees considered their knowledge of the nature and quality of the services to be provided by the Adviser to the Portfolio gained from their experience as trustees or directors of most of the registered investment companies advised by the Adviser, including the Fund, their overall confidence in the Adviser’s integrity and competence they have gained from that experience, the Adviser’s initiative in identifying and raising potential issues with the trustees and its responsiveness, frankness and attention to concerns raised by the trustees in the past, including the Adviser’s willingness to consider and implement organizational and operational changes designed to improve investment results and the services provided to the AllianceBernstein Funds. The trustees noted that they have four regular meetings each year, at each of which they receive presentations
| 32 | • ALLIANCEBERNSTEIN INTERNATIONAL FOCUS SHARES |
from the Adviser on the investment results of the AllianceBernstein Funds and review extensive materials and information presented by the Adviser.
The trustees also considered all other factors they believed relevant, including the specific matters discussed below. In their deliberations, the trustees did not identify any particular information that was all-important or controlling, and different trustees may have attributed different weights to the various factors. The trustees determined that the selection of the Adviser to manage the Portfolio, and the overall arrangements between the Portfolio and the Adviser, as provided in the Advisory Agreement, including the advisory fee, were fair and reasonable in light of the services to be performed, expenses to be incurred and such other matters as the trustees considered relevant in the exercise of their business judgment. The material factors and conclusions that formed the basis for the trustees’ determination included the following:
Nature, Extent and Quality of Services To Be Provided
The trustees considered the scope and quality of services to be provided by the Adviser under the Advisory Agreement, including the quality of the investment research capabilities of the Adviser and the other resources it has dedicated to performing services for the AllianceBernstein Funds. They also noted the professional experience and qualifications of the Portfolio’s portfolio management team and other senior personnel of the Adviser. The quality of administrative and other services, including the Adviser’s role in coordinating the activities of the Portfolio’s other service providers, also were considered. The trustees concluded that, overall, they were satisfied with the nature, extent and quality of services to be provided to the Portfolio under the Advisory Agreement.
Costs of Services To Be Provided and Profitability
Because the Portfolio had not yet commenced operations, the trustees were unable to consider historical information about the profitability of the Portfolio. However, the Adviser agreed to provide the trustees with profitability information in connection with future proposed continuances of the Advisory Agreement in respect of the Portfolio. They also considered the costs to be borne by the Adviser in providing services to the Portfolio and that the Portfolio was unlikely to be profitable to the Adviser unless it achieves a material level of net assets.
Fall-Out Benefits
The trustees considered the benefits to the Adviser and its affiliates from their proposed relationships with the Portfolio other than the fees payable to it by the Sponsors whose clients invest in the Portfolio. The trustees also noted that the Adviser would be compensated by the Sponsors whose clients invest in the Portfolio. The trustees understood that the Adviser might also derive reputational and other benefits from its association with the Portfolio.
| ALLIANCEBERNSTEIN INTERNATIONAL FOCUS SHARES • | 33 |
Investment Results
Since the Portfolio had not yet commenced operations and there were no existing AllianceBernstein funds with the same investment style as the Portfolio, no performance or other historical information for the Portfolio was available. The trustees noted the special issues in evaluating the investment performance of “completion vehicles” for separately managed accounts (“SMAs”), such as the Portfolio. Since they are not designed as “stand alone” investments, and will not be sold except as part of the SMA, the performance of such completion vehicles compared to stated benchmarks may be less informative than for other funds. The trustees agreed that performance presentations from the Adviser to the Board with respect to completion vehicles such as the Portfolio should include both information about the performance of the Portfolio against its Lipper peer group and benchmark, as well as the performance of the model SMA the Portfolio is a component of, so that the trustees have a basis for evaluating the performance of the Portfolio in the context of its intended use. Based on the Adviser’s written and oral presentations regarding the management of the Portfolio, and their general knowledge and confidence in the Adviser’s expertise in managing mutual funds, the trustees concluded that the Adviser was capable of providing high quality portfolio management services to the Portfolio.
Advisory Fees
The trustees considered the proposed advisory fee rate payable by the Portfolio to the Adviser (zero) and information provided by Lipper showing the fees paid by other fund families under a wrap fee program similar to that of the Portfolio. The trustees recognized that it is difficult to make comparisons of advisory fees because there are variations in the services that are included in the fees paid by other funds.
The trustees noted the unusual arrangements in the Advisory Agreement providing for no advisory fee but were cognizant that the Adviser would be indirectly compensated by the Sponsors for its services to the Portfolio. While the fees to be paid by the Sponsors to the Adviser would vary, the trustees acknowledged that a portion of those fees (less the expenses of the Portfolio to be paid by the Adviser) might reasonably be viewed as compensating the Adviser for advisory services it provides to the Portfolio (the “implied fee”) and that the Adviser believes that while the Sponsors would pay the Adviser different fee rates, the rate of fee attributable to portfolio management at the Portfolio level would be the same for all Sponsors. Based on their review, the trustees concluded that the advisory arrangements for the Portfolio, including the zero fee aspect of the Advisory Agreement with the Adviser, were satisfactory.
The Adviser informed the trustees that there were no institutional products managed by it that have a substantially similar investment style. The trustees reviewed the relevant fee information from the Adviser’s Form ADV and the evaluation from the Fund’s Senior Officer. The trustees recognized that
| 34 | • ALLIANCEBERNSTEIN INTERNATIONAL FOCUS SHARES |
comparisons of the institutional fee rate with the portion of the implied fee attributable to portfolio management were not practicable. The Adviser reviewed with the trustees the significantly greater scope of the services it provides the AllianceBernstein Funds relative to institutional clients. The Adviser also noted that because mutual funds are constantly issuing and redeeming shares, they are more difficult to manage than an institutional account, where the assets tend to be relatively stable. In light of the substantial differences in services rendered by the Adviser to institutional clients as compared to funds such as the Portfolio, and the unusual fee structure for the other portfolios of the Fund and the Portfolio, the trustees considered these fee comparisons inapt and did not place significant weight on them in their deliberations.
The trustees also discussed with the Adviser the difference in the proposed advisory fee rate for a proposed AllianceBernstein retail fund (the “Retail Fund”) with a similar investment style and the implied fee that the Adviser would earn for managing the Portfolio, which would be substantially lower, although in some respects the Portfolio, as a completion vehicle, could prove more challenging to manage. The Adviser explained that it was willing to accept a lower fee for its services to the Portfolio due to the strategic importance of participating in the SMA market.
Since the Portfolio does not bear ordinary expenses, the trustees did not consider comparative expense information.
Economies of Scale
Since the Advisory Agreement does not provide for any compensation to be paid to the Adviser by the Portfolio and the Portfolio’s expense ratio is zero, the trustees did not consider the extent to which fee levels in the Advisory Agreement reflect economies of scale. They did note, however, that the fee payable to the Adviser by each of the current Sponsors declines at a breakpoint based on total assets managed by the Adviser for the Sponsors.
| ALLIANCEBERNSTEIN INTERNATIONAL FOCUS SHARES • | 35 |
THE FOLLOWING IS NOT PART OF THE SHAREHOLDER REPORT OR THE FINANCIAL STATEMENTS
SUMMARY OF SENIOR OFFICER’S EVALUATION OF INVESTMENT ADVISORY AGREEMENT1
The following is a summary of the evaluation of the Investment Advisory Agreement between AllianceBernstein L.P., (the “Adviser”) and AllianceBernstein Corporate Shares (the “Fund”) in respect of AllianceBernstein International Focus Shares (the “Portfolio”).2
The Portfolio is designed as a “completion vehicle” to serve the needs of the Adviser’s separately managed account (“SMA”) or “wrap fee” clients. Since SMA clients pay their wrap program provider a unitary fee for managing all investments in their portfolio, the Portfolio will not pay an advisory fee. The Adviser will also reimburse the Portfolio for all of its other operating expenses, except certain extraordinary expenses, taxes, brokerage costs and the interest on borrowed money and on other leveraging methods.
The Portfolio, which is designed as a completion vehicle, not as a stand-alone investment, will focus its investments on securities and derivatives difficult or impossible for SMA clients,3 to hold directly in their SMA account. The Portfolio’s investment objective is long-term growth of capital. The Portfolio will pursue its investment objective by investing in a concentrated portfolio of non-U.S. equity securities.4 Under normal circumstances, the Portfolio will hold between 20 and 30 positions. Although the Portfolio intends to invest substantially all of its assets in non-U.S. issuers under normal circumstances, the Portfolio may at times invest in U.S. issuers, particularly U.S. issuers whose growth prospects depend on non-U.S. factors. In choosing investments, the Portfolio will pursue an opportunistic strategy and will not be constrained by considerations of capitalization range, industry sector or country. The Portfolio may also hold large individual positions. While international in scope, the Portfolio will not seek to obtain geographic or industry diversification. The Portfolio may utilize derivatives, including futures and forwards, to hedge market risk or currency exposure, or to obtain market or currency exposure, or to adjust market or currency exposure.
The evaluation of the Investment Advisory Agreement was prepared by Philip L. Kirstein, the Senior Officer of the Fund, for the Trustees of the Fund, as
| 1 | It should be noted that the information in the fee summary was completed on February 24, 2011 and presented to the Board of Trustees on March 9, 2011. |
| 2 | Future references to the various Fund/Portfolio do not include “AllianceBernstein.” |
| 3 | SMA client accounts will be typically comprised of 20 to 40 American Depository Receipts or ADRs. |
| 4 | In addition to common and preferred stock, equity securities may include convertible securities, warrants and derivatives related to equity securities. |
| 36 | • ALLIANCEBERNSTEIN INTERNATIONAL FOCUS SHARES |
required by the September 1, 2004 Assurance of Discontinuance (“AoD”) between the Adviser and the New York State Attorney General (the “NYAG”). The Senior Officer’s evaluation of the Investment Advisory Agreement is not meant to diminish the responsibility or authority of the Board of Trustees of the Fund to perform its duties pursuant to Section 15 of the Investment Company Act of 1940 (the “40 Act”) and applicable state law. The purpose of this summary is to provide shareholders with a synopsis of the independent evaluation of the reasonableness of the advisory fees proposed to be paid by the Portfolio which was provided to the Trustees in connection with their review of the proposed approval of the initial Investment Advisory Agreement. The Senior Officer’s evaluation considered the following factors:
| 1. | Advisory fees charged to institutional and other clients of the Adviser for like services; |
| 2. | Advisory fees charged by other mutual fund companies for like services; |
| 3. | Costs to the Adviser and its affiliates of supplying services pursuant to the advisory agreement, excluding any intra-corporate profit; |
| 4. | Profit margins of the Adviser and its affiliates from supplying such services; |
| 5. | Possible economies of scale as the Portfolio grows larger; and |
| 6. | Nature and quality of the Adviser’s services including the performance of the Portfolio. |
These factors, with the exception of the first factor, are generally referred to as the “Gartenberg factors,” which were articulated by the United States Court of Appeals for the Second Circuit in 1982. The first factor is an additional factor required to be considered by the AoD. The Supreme Court recently held the Gartenberg decision was correct in its basic formulation of what Section 36(b) of the 40 Act requires: to face liability under Section 36(b), “an investment adviser must charge a fee that is so disproportionately large that it bears no reasonable relationship to the services rendered and could not have been the product of arms length bargaining.” Jones v. Harris Associates L.P., (No. 08-586), 130 U.S. 1418 (1210). In the Jones decision, the Court stated the Gartenberg approach fully incorporates the correct understanding of fiduciary duty within the context of Section 36(b) and noted with approval that “Gartenberg insists that all relevant circumstances be taken into account” and “uses the range of fees that might result from arms-length bargaining as the benchmark for reviewing challenged fees.”
PORTFOLIO ADVISORY FEES, NET ASSETS & EXPENSE RATIOS
The Adviser proposed that the Portfolio pays no advisory fee to the Adviser for receiving the services to be provided pursuant to the Investment Advisory Agreement. As previously mentioned, the Portfolio is designed to serve the
| ALLIANCEBERNSTEIN INTERNATIONAL FOCUS SHARES • | 37 |
needs of the Adviser’s SMA clients. Since SMA clients pay their wrap program provider a unitary fee for managing all investments of their portfolio, the Portfolio will not pay an advisory fee. The Adviser will also reimburse the Portfolio for all of its other operating expenses, except certain extraordinary expenses, taxes, brokerage costs and the interest on borrowed money or alternative sources of leverage.
The Portfolio will offer only one no-load class of shares, which will be distributed through its principal underwriter, AllianceBernstein Investments, Inc. (“ABI”). The Portfolio will not have a distribution plan pursuant to Rule 12b-1 under the 40 Act. Set forth below is the Portfolio’s anticipated annual operating expenses in percentages:
| Annual Operating Expenses | % | |||
| Management Fees5 | 0.40 | % | ||
| Distribution Fees | 0.00 | % | ||
| Other Expenses | 0.00 | % | ||
| Fee Waiver/Reimbursements | -0.40 | % | ||
|
| |||
| Net Expenses | 0.00 | % | ||
| I. | ADVISORY FEES CHARGED TO INSTITUTIONAL AND OTHER CLIENTS |
The advisory fees charged to investment companies which the Adviser manages and sponsors are normally higher than those charged to similar sized institutional accounts, including pension plans and sub-advised investment companies. The fee differential reflects, among other things, different services provided to such clients, and different liabilities assumed. Services to be provided by the Adviser to the Portfolio that are not provided to non-investment company clients include providing office space and personnel to serve as Fund Officers, who among other responsibilities make the certifications required under the Sarbanes–Oxley Act of 2002, and coordinating with and monitoring the Portfolio’s third party service providers such as Fund counsel, auditors, custodians, transfer agents and pricing services. The accounting, administrative, legal and compliance requirements for the Portfolio will be more costly than those for institutional client assets due to the greater complexities and time required for investment companies. The Adviser also believes that it incurs substantial entrepreneurial risk when offering a new mutual fund, since establishing a new mutual fund requires a large upfront investment and it may take a long time for the fund to achieve profitability since the fund must be priced to scale from inception in order to be competitive and assets are acquired one account at a time. In addition, managing the cash flow of an investment company may be more difficult than managing that of a stable pool of assets, such as an institutional account with little cash movement in either direction, particularly, if a fund is in
| 5 | This amount reflects the portion of the wrap fee attributable to the management of the Portfolio. This amount also includes estimated operating expenses of the Portfolio that are paid by the Adviser. |
| 38 | • ALLIANCEBERNSTEIN INTERNATIONAL FOCUS SHARES |
net redemption and the Adviser is frequently forced to sell securities to raise cash for redemptions. However, managing a fund with positive cash flow may be easier at times than managing a stable pool of assets. Finally, in recent years, investment advisers have been sued by institutional clients and have suffered reputational damage both by the attendant publicity and outcomes other than complete victories. Accordingly, the legal and reputational risks associated with institutional accounts are greater than previously thought, although still not equal to those related to the mutual fund industry.
Notwithstanding the Adviser’s view that managing an investment company is not comparable to managing other institutional accounts because the services provided are different, the Supreme Court has indicated that consideration should be given to the advisory fee charged to institutional accounts that have a similar investment style as the Portfolio6. The Adviser has represented that there is no category in the Form ADV for institutional products that have a substantially similar investment style as the Portfolio.
The Adviser manages AllianceBernstein Cap Fund, Inc.—International Focus 40 Portfolio (“Retail—International Focus 40”),7 a retail mutual fund that has a similar investment style as the Portfolio. Set forth in the table below is the advisory fee schedule of the retail mutual fund and what would have been the effective advisory fee of the Portfolio had the advisory fee schedule of the retail mutual fund been applicable to the Portfolio based on an initial estimate of the Portfolio’s net assets at $100 million:
| Portfolio | AllianceBernstein Mutual Funds (“ABMF”) | Advisory Fee Schedule Based on the Average Daily Net Assets of the Portfolio | ||
International Focus Portfolio | Retail – International Focus 40 | 100 bp on 1st $1 billion 95 bp on the next $1 billion 90 bp on the next $1 billion 85 bp on the balance |
The Adviser has represented that there are no offshore funds or sub-advisory relationships managed by the Adviser that have a substantially similar investment style of the Portfolio.
| 6 | It should be noted that the Supreme Court stated that “courts may give such comparisons the weight that they merit in light of the similarities and differences between the services that the clients in question require, but the courts must be wary of inapt comparisons.” Among the significant differences the Supreme Court noted that may exist between services provided to mutual funds and institutional accounts are “higher marketing costs.” Jones v. Harris at 1428. |
| 7 | The advisory fee schedule of Retail—International Focus 40 reflects the amended fee schedule that resulted from the negotiations conducted recently between the retail mutual fund’s Board of Directors and the Adviser. The Adviser had proposed that the retail mutual fund pay a fee based on average daily net assets: 100 bp on the first $2.5 billion, 90 bp on the next $2.5 billion, and 85 bp on the balance. |
| ALLIANCEBERNSTEIN INTERNATIONAL FOCUS SHARES • | 39 |
| II. | MANAGEMENT FEES CHARGED BY OTHER MUTUAL FUND COMPANIES FOR LIKE SERVICES. |
Lipper, Inc., an analytical service that is not affiliated with the Adviser, compared the fee arrangement of the Portfolio with those of other investment companies receiving similar services by other investment advisers.8 Each peer selected by Lipper had a similar fee structure as the Portfolio, which is to say that with respect to the Portfolio’s peers, all fund expenses, including management fees9 were reimbursed by the investment adviser.10
| III. | COSTS TO THE ADVISER AND ITS AFFILIATES OF SUPPLYING SERVICES PURSUANT TO THE MANAGEMENT FEE ARRANGEMENT, EXCLUDING ANY INTRA-CORPORATE PROFIT. |
The Adviser will utilize two profitability reporting systems, which operate independently but are aligned with each other, to estimate the Adviser’s profitability in connection with investment advisory services to be provided to the Portfolio. The Senior Officer has retained an independent consultant to provide independent advice regarding the alignment of the two profitability systems as well as the methodologies and allocations utilized by both profitability systems. See Section IV for additional discussion.
| IV. | PROFIT MARGINS OF THE ADVISER AND ITS AFFILIATES FOR SUPPLYING SUCH SERVICES. |
The Portfolio has not yet commenced operations. Therefore, there is no historic profitability data with respect to the Adviser’s investment services to the Portfolio. A weighted average of the Adviser’s profitability in respect to the Portfolio’s SMA clients, in addition to any fund specific revenue or expense item, will be used to calculate the Portfolio’s profitability.
| V. | POSSIBLE ECONOMIES OF SCALE |
Although the Portfolio will not pay the Adviser an advisory fee, it is still worth considering information on possible economies of scale. The Adviser has indicated that economies of scale are being shared with shareholders through fee
| 8 | Only zero fee no-load funds that participated in a wrap fee program were considered for inclusion in the Portfolio’s EG, regardless of the Lipper investment classification/objective of the Portfolio’s peers. The Portfolio’s EG includes the Portfolio, which is classified by Lipper as “General Municipal Debt”, two U.S. Mortgage Funds, one Treasury Inflation-Protected Securities (“TIPS”) Fund, two General Bond Funds, two Global Income Funds, and one International Multi-Cap Growth Fund. |
| 9 | “Management Fee” is the fee attributable to the management and bearing of expenses of the funds (not the management of the wrap fee program). In each case the advisory contract provides for an advisory or management fee of zero. |
| 10 | As previously mentioned, it should be noted that the Supreme Court cautioned against accepting mutual fund fee comparisons without careful scrutiny since “these comparisons are problematic because these fees, like those challenged, may not be the product of the negotiations conducted at arms length.” Jones v. Harris at 1429. |
| 40 | • ALLIANCEBERNSTEIN INTERNATIONAL FOCUS SHARES |
structures,11 subsidies and enhancement to services. Based on some of the professional literature that has considered economies of scale in the mutual fund industry, it is thought that to the extent economies of scale exist, they may more often exist across a fund family as opposed to a specific fund. This is because the costs incurred by the Adviser, such as investment research or technology for trading or compliance systems can be spread across a greater asset base as the fund family increases in size. It is also possible that as the level of services required to operate a successful investment company has increased over time, and advisory firms make such investments in their business to provide services, there may be a sharing of economies of scale without a reduction in advisory fees.
An independent consultant, retained by the Senior Officer, provided the Board of Trustees an update of the Deli12 study on advisory fees and various fund characteristics.13 The independent consultant first reiterated the results of his previous two dimensional comparison analysis (fund size and family size) with the Board of Trustees.14 The independent consultant then discussed the results of the regression model that was utilized to study the effects of various factors on advisory fees. The regression model output indicated that the bulk of the variation in fees predicted were explained by various factors, but substantially by fund AUM, family AUM, index fund indicator and investment style. The independent consultant also compared the advisory fees of the AllianceBernstein Mutual Funds to similar funds managed by 19 other large asset managers, regardless of the fund size and each Adviser’s proportion of mutual fund assets to non-mutual fund assets.
| VI. | NATURE AND QUALITY OF THE ADVISER’S SERVICES, INCLUDING THE PERFORMANCE OF THE FUND |
With assets under management of approximately $482 billion as of January 31, 2011, the Adviser has the investment experience to manage and provide non-investment services (described in Section I) to the Portfolio.
Since the Portfolio has not yet commenced operations, the Portfolio has no performance history.
| 11 | Fee structures include fee reductions, pricing at scale and breakpoints in advisory fee schedules. |
| 12 | The Deli study was originally published in 2002 based on 1997 data. |
| 13 | As mentioned previously, the Supreme Court cautioned against accepting mutual fund fee comparisons without careful scrutiny since the fees may not be the product of negotiations conducted at arms length. See Jones V. Harris at 1429. |
| 14 | The two dimensional analysis showed patterns of lower advisory fees for funds with larger asset sizes and funds from larger family sizes compared to funds with smaller asset sizes and funds from smaller family sizes, which according to the independent consultant is indicative of a sharing of economies of scale and scope. However, in less liquid and active markets, such is not the case, as the empirical analysis showed potential for diseconomies of scale in those markets. The empirical analysis also showed diminishing economies of scale and scope as funds surpassed a certain high level of assets. |
| ALLIANCEBERNSTEIN INTERNATIONAL FOCUS SHARES • | 41 |
CONCLUSION:
Based on the factors discussed above, the Senior Officer’s conclusion is that the proposed fee for the Portfolio is reasonable and within the range of what would have been negotiated at arm’s-length in light of all the surrounding circumstances. This conclusion in respect of the Portfolio is based on an evaluation of all of these factors and no single factor was dispositive.
Dated: April 1, 2011
| 42 | • ALLIANCEBERNSTEIN INTERNATIONAL FOCUS SHARES |
THIS PAGE IS NOT PART OF THE SHAREHOLDER REPORT OR THE FINANCIAL STATEMENTS
ALLIANCEBERNSTEIN FAMILY OF FUNDS
Wealth Strategies Funds
Balanced Wealth Strategy
Conservative Wealth Strategy
Wealth Appreciation Strategy
Tax-Managed Balanced Wealth Strategy
Tax-Managed Conservative Wealth Strategy
Tax-Managed Wealth Appreciation Strategy
Asset Allocation/Multi-Asset
Emerging Markets Multi-Asset
International Portfolio
Real Asset Strategy
Tax-Managed International Portfolio
Growth Funds
Domestic
Growth Fund
Large Cap Growth Fund
Small Cap Growth Portfolio
Small/Mid Cap Growth Fund
U.S. Strategic Research Portfolio
Global & International
Global Thematic Growth Fund
Greater China ’97 Fund
International Discovery Equity Portfolio
International Focus 40 Portfolio
International Growth Fund
Value Funds
Domestic
Core Opportunities Fund
Equity Income Fund
Growth & Income Fund
Small/Mid Cap Value Fund
Value Fund
Global & International
Global Real Estate Investment Fund
Global Value Fund
International Value Fund
Taxable Bond Funds
Bond Inflation Strategy
Global Bond Fund
High Income Fund
Intermediate Bond Portfolio
Short Duration Portfolio
Unconstrained Bond Fund*
Municipal Bond Funds
Arizona California High Income Massachusetts Michigan Minnesota Municipal Bond Inflation Strategy | National New Jersey New York Ohio Pennsylvania Virginia |
Intermediate Municipal Bond Funds
Intermediate California
Intermediate Diversified
Intermediate New York
Closed-End Funds
Alliance California Municipal Income Fund
Alliance New York Municipal Income Fund
AllianceBernstein Global High Income Fund
AllianceBernstein Income Fund
AllianceBernstein National Municipal Income Fund
Alternatives
Market Neutral Strategy-Global
Market Neutral Strategy-U.S.
Balanced
Balanced Shares
Retirement Strategies Funds
2000 Retirement Strategy | 2020 Retirement Strategy | 2040 Retirement Strategy | ||
2005 Retirement Strategy | 2025 Retirement Strategy | 2045 Retirement Strategy | ||
2010 Retirement Strategy | 2030 Retirement Strategy | 2050 Retirement Strategy | ||
2015 Retirement Strategy | 2035 Retirement Strategy | 2055 Retirement Strategy |
We also offer Exchange Reserves,** which serves as the money market fund exchange vehicle for the AllianceBernstein mutual funds.
You should consider the investment objectives, risks, charges and expenses of any AllianceBernstein fund/portfolio carefully before investing. For free copies of our prospectuses, which contain this and other information, visit us online at www.alliancebernstein.com or contact your financial advisor. Please read the prospectus carefully before investing.
| * | Prior to February 3, 2011, Unconstrained Bond Fund was named Diversified Yield Fund. |
| ** | An investment in the Fund is not a deposit in a bank and is not insured or guaranteed by the Federal Deposit Insurance Corporation or any other government agency. Although the Fund seeks to preserve the value of your investment at $1.00 per share, it is possible to lose money by investing in the Fund. |
| ALLIANCEBERNSTEIN INTERNATIONAL FOCUS SHARES • | 43 |
AllianceBernstein Family of Funds
NOTES
| 44 | • ALLIANCEBERNSTEIN INTERNATIONAL FOCUS SHARES |
ALLIANCEBERNSTEIN INTERNATIONAL FOCUS SHARES
1345 Avenue of the Americas
New York, NY 10105
800.221.5672
| IFS-0152-1011 |  | |
SEMI-ANNUAL REPORT
AllianceBernstein
Municipal Income Shares
October 31, 2011
Semi-Annual Report

Investment Products Offered
| • | Are Not FDIC Insured |
| • | May Lose Value |
| • | Are Not Bank Guaranteed |
Investors should consider the investment objectives, risks, charges and expenses of the Fund carefully before investing. For copies of our prospectus or summary prospectus, which contain this and other information, visit us online at www.alliancebernstein.com or contact your AllianceBernstein Investments representative. Please read the prospectus and/or summary prospectus carefully before investing.
This shareholder report must be preceded or accompanied by the Fund’s prospectus for individuals who are not current shareholders of the Fund.
You may obtain a description of the Fund’s proxy voting policies and procedures, and information regarding how the Fund voted proxies relating to portfolio securities during the most recent 12-month period ended June 30, without charge. Simply visit AllianceBernstein’s website at www.alliancebernstein.com, or go to the Securities and Exchange Commission’s (the “Commission”) website at www.sec.gov, or call AllianceBernstein at (800) 227-4618.
The Fund files its complete schedule of portfolio holdings with the Commission for the first and third quarters of each fiscal year on Form N-Q. The Fund’s Forms N-Q are available on the Commission’s website at www.sec.gov. The Fund’s Forms N-Q may also be reviewed and copied at the Commission’s Public Reference Room in Washington, DC; information on the operation of the Public Reference Room may be obtained by calling (800) SEC-0330.
AllianceBernstein Investments, Inc. (ABI) is the distributor of the AllianceBernstein family of mutual funds. ABI is a member of FINRA and is an affiliate of AllianceBernstein L.P., the manager of the funds.
AllianceBernstein® and the AB Logo are registered trademarks and service marks used by permission of the owner, AllianceBernstein L.P.
December 15, 2011
Semi-Annual Report
This report provides management’s discussion of fund performance for AllianceBernstein Municipal Income Shares (the “Fund”) for the semi-annual reporting period ended October 31, 2011. Please note, shares of this Fund are offered exclusively through registered investment advisers approved by AllianceBernstein L.P. (the “Adviser”).
Investment Objective and Policies
The investment objective of the Fund is to earn the highest level of current income, exempt from federal taxation, that is available consistent with what the Adviser considers to be an appropriate level of risk. The Fund pursues its objective by investing principally in high-yielding municipal securities that may be non-investment grade or investment grade. As a matter of fundamental policy, the Fund invests, under normal circumstances, at least 80% of its net assets in municipal securities that pay interest that is exempt from federal income tax. These securities may pay interest that is subject to the federal alternative minimum tax (“AMT”) for certain taxpayers.
The Adviser selects securities for purchase or sale based on its assessment of the securities’ risk and return characteristics as well as the securities’ impact on the overall risk and return characteristics of the Fund. In making this assessment, the Adviser takes into account various factors including the credit quality and sensitivity to interest rates of the securities under consideration and of the Fund’s other holdings.
The Fund may invest without limit in lower-rated securities (“junk bonds”), which may include securities having the lowest rating, and in unrated securities that, in the Adviser’s judgment, would be lower-rated securities if rated. The Fund may invest in fixed income securities with any maturity or duration. The Fund will seek to increase income for shareholders by investing in longer maturity bonds. Consistent with its objective of seeking a higher level of income, the Fund may experience greater volatility and a higher risk of loss of principal than other municipal funds.
The Fund may also invest in tender option bond transactions (“TOBs”); forward commitments; zero coupon municipal securities and variable, floating and inverse floating rate municipal securities; certain types of mortgage related securities; and derivatives, such as options, futures, forwards and swaps.
The Fund may make short sales of securities or maintain a short position, and may use other investment techniques. The Fund may use leverage for investment purposes to increase income through the use of TOBs and derivative instruments, such as interest rate swaps.
Investment Results
The table on page 5 shows the Fund’s performance compared to its benchmark, the Barclays Capital Municipal Bond Index, for the six- and 12-month periods ended October 31, 2011.
| ALLIANCEBERNSTEIN MUNICIPAL INCOME SHARES • | 1 |
The Fund outperformed its benchmark for the six- and 12-month periods ended October 31, 2011. Yield curve positioning was beneficial during both periods. For the 12-month period, security selection detracted in the health care and special tax sectors. For the six-month period, security selection contributed in the health care sector and detracted in the transportation sector.
Market Review and Investment Strategy
Municipal bond markets drew strength from a very tight supply of issuance and continued improved tax collections, and having risen over the six-month period ended October 31, 2011, as investor panic concerning the perceived risk of defaults sweeping the nation appeared to have subsided. New municipal bond issuance fell sharply in the first nine months of 2011, to the lowest level in a decade. Mayors and governors were reluctant to commit to large capital expenditures while they were slashing their operating budgets. Nevertheless, the need to issue bonds to fund critical capital improvements grew, which points to the likelihood of increased issuance ahead.
The Municipal Bond Investment Team (the “Team”) estimates that state tax revenues climbed to approximately 70% of their peak reached in September 2008 after the largest drop ever seen. For fiscal year 2012, revenues were conservatively projected by the states to increase by about 2% on average, a growth rate that the Team expects could be exceeded. State and local tax collections are highly correlated with the rate of economic growth. Uncertainty surrounding the domestic economic outlook due to the deteriorating economic outlook for Europe coupled with the fallout of the European debt crisis worked together
during the summer to cloud the outlook for tax collections going forward.
While the change in the tax collections of state and local governments is highly uncertain at the moment, the Team does not envision a rash of defaults should tax collections be less than expected. Most state and local governments made progress this summer in addressing their budget shortfalls going forward. States and municipalities continued to face their most serious fiscal difficulties since the Great Depression, but, in general, substantial progress was made during the summer to balance their budgets, reducing the risk of widespread defaults.
The Fund may purchase municipal securities that are insured under policies issued by certain insurance companies. Historically, insured municipal securities typically received a higher credit rating, which meant that the issuer of the securities paid a lower interest rate. As a result of declines in the credit quality and associated downgrades of most fund insurers, insurance has less value than it did in the past. The market now values insured municipal securities primarily based on the credit quality of the issuer of the security with little value given to the insurance feature. In purchasing such insured securities, the Adviser evaluates the risk and return of municipal securities through its own research. The ratings of most insurance companies have been downgraded and it is possible that some insurers may become insolvent. If an insurance company’s rating is downgraded or the company becomes insolvent, the prices of municipal securities insured by the insurance company may decline. As of October 31, 2011, 5.6% of the Fund’s total investments were in insured bonds and 0.0% of total investments were in pre-refunded/escrowed to maturity bonds).
| 2 | • ALLIANCEBERNSTEIN MUNICIPAL INCOME SHARES |
HISTORICAL PERFORMANCE
An Important Note About Historical Performance
The investment return and principal value of an investment in the Fund will fluctuate, so that shares, when redeemed, may be worth more or less than their original cost. Performance shown on the following pages represents past performance and does not guarantee future results. Current performance may be lower or higher than the performance information shown. You may obtain performance information current to the most recent month-end by calling (800) 227-4618.
Benchmark Disclosure
The unmanaged Barclays Capital Municipal Bond Index does not reflect fees and expenses associated with the active management of a fund portfolio. The Barclays Capital Municipal Bond Index represents the performance of the long-term tax-exempt bond market consisting of investment grade bonds. An investor cannot invest directly in an index, and its results are not indicative of the performance for any specific investment, including the Fund.
A Word About Risk
Market Risk: The value of the Fund’s assets will fluctuate as the stock or bond market fluctuates. The value of the Fund’s investments may decline, sometimes rapidly and unpredictably, simply because of economic changes or other events that affect large portions of the market.
Credit Risk: An issuer or guarantor of a fixed-income security, or the counterparty to a derivatives or other contract, may be unable or unwilling to make timely payments of interest or principal, or to otherwise honor its obligations. The issuer or guarantor may default, causing a loss of the full principal amount of a security. The degree of risk for a particular security may be reflected in its credit rating. There is the possibility that the credit rating of a fixed-income security may be downgraded after purchase, which may adversely affect the value of the security. Investments in fixed-income securities with lower ratings tend to have a higher probability that an issuer will default or fail to meet its payment obligations.
Municipal Market Risk: This is the risk that special factors may adversely affect the value of municipal securities and have a significant effect on the yield or value of the Fund’s investments in municipal securities. These factors include economic conditions, political or legislative changes, uncertainties related to the tax status of municipal securities, or the rights of investors in these securities. To the extent that the Fund invests more of its assets in a particular state’s municipal securities, the Fund may be vulnerable to events adversely affecting that state, including economic, political and regulatory occurrences, court decisions, terrorism and catastrophic natural disasters, such as hurricanes or earthquakes. The Fund’s investments in certain municipal securities with principal and interest payments that are made from the revenues of a specific project or facility, and not general tax revenues, may have increased risks. Factors affecting the project or facility, such as local business or economic conditions, could have a significant effect on the project’s ability to make payments of principal and interest on these securities.
Interest Rate Risk: Changes in interest rates will affect the value of investments in fixed-income securities. When interest rates rise, the value of investments in fixed-income securities tends to fall and this decrease in value may not be offset by higher income from new investments. Interest rate risk is generally greater for fixed-income securities with longer maturities or durations.
(Historical Performance continued on next page)
| ALLIANCEBERNSTEIN MUNICIPAL INCOME SHARES • | 3 |
Historical Performance
HISTORICAL PERFORMANCE
(continued from previous page)
Inflation Risk: This is the risk that the value of assets or income from investments will be less in the future as inflation decreases the value of money. As inflation increases, the value of the Fund’s assets can decline as can the value of the Fund’s distributions. This risk is significantly greater for fixed-income securities with longer maturities.
Leverage Risk: To the extent the Fund uses leveraging techniques, its net asset value (“NAV”) may be more volatile because leverage tends to exaggerate the effect of changes in interest rates and any increase or decrease in the value of the Fund’s investments.
Liquidity Risk: Liquidity risk exists when particular investments, such as lower-rated securities, are difficult to purchase or sell, possibly preventing the Fund from selling out of these illiquid securities at an advantageous price. The Fund is subject to liquidity risk because the market for municipal securities is generally smaller than many other markets. Derivatives and securities involving substantial market and credit risk tend to involve greater liquidity risk.
Derivatives Risk: Investments in derivatives may be illiquid, difficult to price, and leveraged so that small changes may produce disproportionate losses for the Fund, and may be subject to counterparty risk to a greater degree than more traditional investments.
Management Risk: The Fund is subject to management risk because it is an actively managed investment fund. The Adviser will apply its investment techniques and risk analyses in making investment decisions, but there is no guarantee that its techniques will produce the intended results.
These risks are more fully discussed in the Fund’s prospectus.
(Historical Performance continued on next page)
| 4 | • ALLIANCEBERNSTEIN MUNICIPAL INCOME SHARES |
Historical Performance
HISTORICAL PERFORMANCE
(continued from previous page)
THE FUND VS. ITS BENCHMARK PERIODS ENDED OCTOBER 31, 2011 | NAV Returns | |||||||||
| 6 Months | 12 Months | |||||||||
AllianceBernstein Municipal Income Shares | 10.15% | 4.64% | ||||||||
| ||||||||||
Barclays Capital Municipal Bond Index | 5.56% | 3.78% | ||||||||
| ||||||||||
| Please keep in mind that high, double-digit returns are highly unusual and cannot be sustained. Investors should also be aware that these returns were primarily achieved during favorable market conditions. |
| AVERAGE ANNUAL RETURNS AS OF OCTOBER 31, 2011 | ||||
| NAV Returns | ||||
1 Year | 4.64 | % | ||
Since Inception* | 4.52 | % | ||
| SEC AVERAGE ANNUAL RETURNS (WITH ANY APPLICABLE SALES CHARGES) AS OF THE MOST RECENT CALENDAR QUARTER-END (SEPTEMBER 30, 2011) | ||||
| SEC Returns | ||||
1 Year | 4.90 | % | ||
Since Inception* | 4.76 | % | ||
The prospectus fee table shows the fees and the total fund operating expenses of the Fund as 0.00% because the Adviser does not charge any fees or expenses and reimburses Fund operating expenses. Participants in a wrap fee program eligible to invest in the Fund pay fees to the program sponsor and should review the wrap program brochure provided by the sponsor for a discussion of fees and expenses charged.
| * | Inception date: 9/1/10. |
See Historical Performance disclosures on pages 3-4.
| ALLIANCEBERNSTEIN MUNICIPAL INCOME SHARES • | 5 |
Historical Performance
FUND EXPENSES
(unaudited)
As a shareholder of the Fund, you may incur various ongoing non-operating and extraordinary costs. This example is intended to help you understand your ongoing costs (in dollars) of investing in the Fund and to compare these costs with the ongoing costs of investing in other mutual funds.
The Example is based on an investment of $1,000 invested at the beginning of the period and held for the entire period as indicated below.
Actual Expenses
The table below provides information about actual account values and actual expenses. You may use the information in this line, together with the amount you invested, to estimate the expenses that you paid over the period. Simply divide your account value by $1,000 (for example, an $8,600 account value divided by $1,000 = 8.6), then multiply the result by the number in the first line under the heading entitled “Expenses Paid During Period” to estimate the expenses you paid on your account during this period.
Hypothetical Example for Comparison Purposes
The table below provides information about hypothetical account values and hypothetical expenses based on the Fund’s actual expense ratio and an assumed annual rate of return of 5% before expenses, which is not the Fund’s actual return. The hypothetical account values and expenses may not be used to estimate the actual ending account balance or expenses you paid for the period. You may use this information to compare the ongoing costs of investing in the Fund and other funds by comparing this 5% hypothetical example with the 5% hypothetical examples that appear in the shareholder reports of other funds.
Please note that the expenses shown in the table are meant to highlight your ongoing costs only and do not reflect any transactional costs, such as sales charges (loads), or contingent deferred sales charges on redemptions. Therefore, the hypothetical example is useful in comparing ongoing costs only, and will not help you determine the relative total costs of owning different funds. In addition, if these transactional costs were included, your costs would have been higher.
| Beginning Account Value May 1, 2011 | Ending Account Value October 31, 2011 | Expenses Paid During Period* | Annualized Expense Ratio* | |||||||||||||
Actual | $ | 1,000 | $ | 1,101.50 | $ | 0.26 | 0.05 | % | ||||||||
Hypothetical** | $ | 1,000 | $ | 1,024.89 | $ | 0.25 | 0.05 | % | ||||||||
| * | Expenses equal to the Fund’s annualized expense ratio (interest expense incurred) multiplied by the average account value over the period, multiplied by 184/366 (to reflect the one-half year period). The Fund’s operating expenses are borne by the Adviser or its affiliates. |
| ** | Assumes 5% return before expenses. |
| 6 | • ALLIANCEBERNSTEIN MUNICIPAL INCOME SHARES |
Fund Expenses
PORTFOLIO SUMMARY
October 31, 2011 (unaudited)
PORTFOLIO STATISTICS
Net Assets ($mil): $10.3
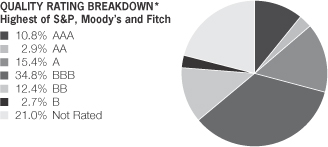
| * | All data are as of October 31, 2011. The Portfolio’s quality rating breakdown is expressed as a percentage of the Portfolio’s total investments in municipal securities and may vary over time. The Portfolio also enters into derivative transactions, which may be used for hedging or investment purposes (see “Portfolio of Investments” section of the report for additional details). The quality ratings are determined by using the Standard & Poor’s Ratings Services, Moody’s Investors Services, Inc. and Fitch Ratings, Ltd. A measure of the quality and safety of a bond or portfolio, based on the issuer’s financial condition. AAA is highest (best) and D is lowest (worst). If applicable, the pre-refunded category includes bonds which are secured by U.S. Government Securities and therefore have been deemed high-quality investment grade by the Adviser. If applicable, Not Applicable (N/A) includes non credit worthy investments; such as, equities, currency contracts, futures and options. If applicable, the Not Rated category includes bonds that are not rated by a Nationally Recognized Statistical Rating Organization. |
| ALLIANCEBERNSTEIN MUNICIPAL INCOME SHARES • | 7 |
Portfolio Summary
PORTFOLIO OF INVESTMENTS
October 31, 2011 (unaudited)
| Principal Amount (000) | U.S. $ Value | |||||||
| ||||||||
MUNICIPAL OBLIGATIONS – 103.7% | ||||||||
Long-Term Municipal Bonds – 103.7% | ||||||||
Alabama – 3.9% | ||||||||
Phenix City AL IDB | $ | 200 | $ | 198,066 | ||||
Selma AL IDB | 200 | 204,708 | ||||||
|
| |||||||
| 402,774 | ||||||||
|
| |||||||
Alaska – 1.0% | ||||||||
Koyukuk AK Hlth Care Fac | 100 | 100,987 | ||||||
|
| |||||||
Arizona – 4.0% | ||||||||
Downtown Phoenix Hotel Corp. AZ | 150 | 116,742 | ||||||
Mohave Cnty AZ IDA | 100 | 111,675 | ||||||
Salt Verde Fin Corp. Gas | 200 | 180,600 | ||||||
|
| |||||||
| 409,017 | ||||||||
|
| |||||||
California – 9.8% | ||||||||
Assn Bay Area Govt CA Non-Prof | 100 | 99,651 | ||||||
California Mun Fin Auth | 85 | 91,026 | ||||||
California Statewide CDA | 100 | 100,930 | ||||||
California Statewide CDA | 140 | 141,830 | ||||||
California Statewide CDA | 100 | 101,233 | ||||||
| 8 | • ALLIANCEBERNSTEIN MUNICIPAL INCOME SHARES |
Portfolio of Investments
| Principal Amount (000) | U.S. $ Value | |||||||
| ||||||||
Golden St Tobacco Sec CA | $ | 100 | $ | 64,801 | ||||
Los Angeles CA Dept Arpts | 300 | 311,604 | ||||||
San Buenaventura CA Hosp | 100 | 102,115 | ||||||
|
| |||||||
| 1,013,190 | ||||||||
|
| |||||||
Colorado – 5.5% | ||||||||
Denver CO City & Cnty Arpt | 160 | 177,725 | ||||||
Park Creek Met Dist CO | 200 | 189,152 | ||||||
Regional Trnsp Dist CO | 200 | 202,138 | ||||||
|
| |||||||
| 569,015 | ||||||||
|
| |||||||
District of Columbia – 2.0% | ||||||||
District of Columbia | 100 | 102,823 | ||||||
District of Columbia (Howard Univ) | 100 | 105,072 | ||||||
|
| |||||||
| 207,895 | ||||||||
|
| |||||||
Florida – 6.0% | ||||||||
Alachua Cnty FL Hlth Fac Auth | 100 | 98,908 | ||||||
Capital Trust Agency FL | 100 | 102,417 | ||||||
Miami Beach FL Hlth Fac Auth | 200 | 208,932 | ||||||
Mid-Bay Brdg Auth FL | 100 | 105,185 | ||||||
Palm Beach Cnty FL Hlth Fac Auth | 100 | 101,083 | ||||||
|
| |||||||
| 616,525 | ||||||||
|
| |||||||
| ALLIANCEBERNSTEIN MUNICIPAL INCOME SHARES • | 9 |
Portfolio of Investments
| Principal Amount (000) | U.S. $ Value | |||||||
| ||||||||
Georgia – 2.0% | ||||||||
De Kalb Cnty GA Hosp Auth | $ | 200 | $ | 202,356 | ||||
|
| |||||||
Idaho – 2.0% | ||||||||
Idaho Hsg & Fin Assn | 200 | 203,506 | ||||||
|
| |||||||
Illinois – 6.7% | ||||||||
Illinois Finance Auth | 100 | 100,002 | ||||||
Illinois Finance Auth | 100 | 89,167 | ||||||
Illinois Finance Auth | 100 | 103,071 | ||||||
Illinois Finance Auth | 100 | 99,756 | ||||||
Illinois Finance Auth | 200 | 202,202 | ||||||
Illinois Finance Auth | 100 | 100,853 | ||||||
|
| |||||||
| 695,051 | ||||||||
|
| |||||||
Indiana – 1.8% | ||||||||
Indiana Finance Auth | 200 | 183,292 | ||||||
|
| |||||||
Louisiana – 3.8% | ||||||||
Louisiana Loc Govt Envrn Fac & CDA | 200 | 202,464 | ||||||
St John Baptist Parish LA | 200 | 195,120 | ||||||
|
| |||||||
| 397,584 | ||||||||
|
| |||||||
| 10 | • ALLIANCEBERNSTEIN MUNICIPAL INCOME SHARES |
Portfolio of Investments
| Principal Amount (000) | U.S. $ Value | |||||||
| ||||||||
Massachusetts – 1.9% | ||||||||
Massachusetts Port Auth | $ | 205 | $ | 201,673 | ||||
|
| |||||||
Michigan – 4.8% | ||||||||
Michigan Hosp Fin Auth | 200 | 200,170 | ||||||
Wayne Cnty MI Arpt Auth | 300 | 291,594 | ||||||
|
| |||||||
| 491,764 | ||||||||
|
| |||||||
Missouri – 0.9% | ||||||||
Missouri Hlth & Ed Fac Auth | 100 | 93,314 | ||||||
|
| |||||||
New Jersey – 3.7% | ||||||||
New Jersey EDA | 100 | 93,762 | ||||||
6.40%, 9/15/23 | 100 | 97,640 | ||||||
New Jersey Hlth Care Fac Fin Auth | 100 | 97,103 | ||||||
Tobacco Settlement Fin Corp. NJ | 150 | 99,633 | ||||||
|
| |||||||
| 388,138 | ||||||||
|
| |||||||
New York – 1.8% | ||||||||
Nassau Cnty NY IDA | 100 | 93,505 | ||||||
New York NY IDA | 100 | 93,141 | ||||||
|
| |||||||
| 186,646 | ||||||||
|
| |||||||
North Carolina – 0.8% | ||||||||
North Carolina Med Care Comm | 100 | 81,138 | ||||||
|
| |||||||
| ALLIANCEBERNSTEIN MUNICIPAL INCOME SHARES • | 11 |
Portfolio of Investments
| Principal Amount (000) | U.S. $ Value | |||||||
| ||||||||
Ohio – 4.0% | ||||||||
Buckeye OH Tob Stlmnt Fin Auth | $ | 150 | $ | 106,559 | ||||
Erie Cnty OH Hosp | 210 | 185,705 | ||||||
Lorain Cnty OH Port Auth | 120 | 120,961 | ||||||
|
| |||||||
| 413,225 | ||||||||
|
| |||||||
Pennsylvania – 4.4% | ||||||||
Allegheny Cnty PA Hosp Dev Auth | 105 | 86,150 | ||||||
Cumberland Cnty PA Mun Auth | 180 | 168,302 | ||||||
Montgomery Cnty PA IDA | 200 | 201,750 | ||||||
|
| |||||||
| 456,202 | ||||||||
|
| |||||||
Rhode Island – 2.4% | ||||||||
Rhode Island Hlth & Ed Bldg Corp. | 150 | 153,383 | ||||||
Tobacco Settlement Fin Corp. RI | 100 | 91,403 | ||||||
|
| |||||||
| 244,786 | ||||||||
|
| |||||||
South Dakota – 0.8% | ||||||||
Sioux Falls SD Hlth Fac | 100 | 85,485 | ||||||
|
| |||||||
Tennessee – 1.9% | ||||||||
Johnson City TN Hlth & Ed | 200 | 196,802 | ||||||
|
| |||||||
Texas – 9.9% | ||||||||
Brazos River TX Hbr Nav Dist | 200 | 201,324 | ||||||
Central TX Regl Mobility Auth | 120 | 120,744 | ||||||
| 12 | • ALLIANCEBERNSTEIN MUNICIPAL INCOME SHARES |
Portfolio of Investments
| Principal Amount (000) | U.S. $ Value | |||||||
| ||||||||
Tarrant Cnty TX Cult Ed Fac Fin Corp. | $ | 200 | $ | 193,260 | ||||
Texas Private Acvty Bond Srfc Trnsp Corp. | 200 | 215,290 | ||||||
Texas Private Acvty Bond Srfc Trnsp Corp. | 200 | 213,400 | ||||||
Viridian Mun Mgmt Dist TX | 75 | 78,529 | ||||||
|
| |||||||
| 1,022,547 | ||||||||
|
| |||||||
Utah – 3.9% | ||||||||
Timber Lakes UT Wtr Spl Svc Dist | 100 | 101,684 | ||||||
Utah St Charter Sch Fin Auth | 100 | 101,944 | ||||||
Utah St Charter Sch Fin Auth | 100 | 101,215 | ||||||
Utah St Charter Sch Fin Auth | 100 | 101,218 | ||||||
|
| |||||||
| 406,061 | ||||||||
|
| |||||||
Virginia – 1.8% | ||||||||
Tobacco Settlement Fin Corp. VA | 300 | 183,279 | ||||||
|
| |||||||
Washington – 12.2% | ||||||||
Washington St GO | 1,000 | 1,157,290 | ||||||
Washington St HFC | 140 | 103,440 | ||||||
|
| |||||||
| 1,260,730 | ||||||||
|
| |||||||
Total Long-Term Municipal Bonds | 10,712,982 | |||||||
|
| |||||||
| ALLIANCEBERNSTEIN MUNICIPAL INCOME SHARES • | 13 |
Portfolio of Investments
| Shares | U.S. $ Value | |||||||
| ||||||||
SHORT-TERM INVESTMENTS – 0.9% | ||||||||
Investment Companies – 0.9% | ||||||||
AllianceBernstein Fixed-Income Shares, Inc. – Government STIF Portfolio, 0.09%(d) | 94,410 | $ | 94,410 | |||||
|
| |||||||
Total Investments – 104.6% | 10,807,392 | |||||||
Other assets less liabilities – (4.6)% | (474,895 | ) | ||||||
|
| |||||||
Net Assets – 100.0% | $ | 10,332,497 | ||||||
|
| |||||||
| (a) | Security is exempt from registration under Rule 144A of the Securities Act of 1933. This security is considered liquid and may be resold in transactions exempt from registration, normally to qualified institutional buyers. At October 31, 2011, the market value of this security amounted to $101,233 or 1.0% of net assets. |
| (b) | When-Issued or delayed delivery security. |
| (c) | Security represents the underlying municipal obligation of an inverse floating rate obligation held by the Fund (see Note G). |
| (d) | Investment in affiliated money market mutual fund. The rate shown represents the 7-day yield as of period end. |
As of October 31, 2011, the Portfolio held 5.9% of net assets in insured bonds (of this amount 0.0% represents the Portfolio’s holding in pre-refunded or escrowed to maturity bonds).
Glossary:
AMBAC – Ambac Assurance Corporation
CDA – Community Development Authority
EDA – Economic Development Agency
FGIC – Financial Guaranty Insurance Company
GO – General Obligation
HFC – Housing Finance Corporation
IDA – Industrial Development Authority/Agency
IDB – Industrial Development Board
NPFGC-RE – National Public Finance Guarantee Corporation Reinsuring FGIC
SD – School District
See notes to financial statements.
| 14 | • ALLIANCEBERNSTEIN MUNICIPAL INCOME SHARES |
Portfolio of Investments
STATEMENT OF ASSETS & LIABILITIES
October 31, 2011 (unaudited)
| Assets | ||||
Investments in securities, at value | ||||
Unaffiliated issuers (cost $10,653,523) | $ | 10,712,982 | ||
Affiliated issuers (cost $94,410) | 94,410 | |||
Interest and dividends receivable | 208,722 | |||
|
| |||
Total assets | 11,016,114 | |||
|
| |||
| Liabilities | ||||
Payable for floating rate notes issued* | 565,000 | |||
Payable for investment securities purchased | 98,568 | |||
Dividends payable | 19,150 | |||
Interest payable | 899 | |||
|
| |||
Total liabilities | 683,617 | |||
|
| |||
Net Assets | $ | 10,332,497 | ||
|
| |||
| Composition of Net Assets | ||||
Shares of beneficial interest, at par | $ | 10 | ||
Additional paid-in capital | 10,468,127 | |||
Accumulated net realized loss on investment transactions | (195,099 | ) | ||
Net unrealized appreciation on investments | 59,459 | |||
|
| |||
| $ | 10,332,497 | |||
|
| |||
| Net Asset Value Per Share—unlimited shares of beneficial interest authorized, $.00001 par value (based on 1,048,002 common shares outstanding) | $ | 9.86 | ||
|
|
| * | Represents short-term floating rate certificates issued by tender option bond trusts (see Note G). |
See notes to financial statements.
| ALLIANCEBERNSTEIN MUNICIPAL INCOME SHARES • | 15 |
Statement of Assets & Liabilities
STATEMENT OF OPERATIONS
Six Months Ended October 31, 2011 (unaudited)
| Investment Income | ||||||||
Interest | $ | 320,416 | ||||||
Dividends – Affiliated issuers | 79 | |||||||
|
| |||||||
Total income | $ | 320,495 | ||||||
| Expenses | ||||||||
Interest expense | 2,532 | |||||||
|
| |||||||
Total expenses | 2,532 | |||||||
|
| |||||||
Net investment income | 317,963 | |||||||
|
| |||||||
| Realized and Unrealized Gain (Loss) on Investment Transactions | ||||||||
Net realized loss on investment transactions | (64,796 | ) | ||||||
Net change in unrealized appreciation/depreciation of investments | 702,894 | |||||||
|
| |||||||
Net gain on investment transactions | 638,098 | |||||||
|
| |||||||
Net Increase in Net Assets from Operations | $ | 956,061 | ||||||
|
|
See notes to financial statements.
| 16 | • ALLIANCEBERNSTEIN MUNICIPAL INCOME SHARES |
Statement of Operations
STATEMENT OF CHANGES IN NET ASSETS
| Six Months Ended October 31, 2011 (unaudited) | September 1, 2010(a) to April 30, 2011 | |||||||
| Increase (Decrease) in Net Assets from Operations | ||||||||
Net investment income | $ | 317,963 | $ | 319,898 | ||||
Net realized loss on investment transactions | (64,796 | ) | (130,303 | ) | ||||
Net change in unrealized appreciation/depreciation of investments | 702,894 | (643,435 | ) | |||||
|
|
|
| |||||
Net increase (decrease) in net assets from operations | 956,061 | (453,840 | ) | |||||
| Dividends to Shareholders from | ||||||||
Net investment income | (317,963 | ) | (319,898 | ) | ||||
| Transactions in Shares of Beneficial Interest | ||||||||
Net increase | 275,869 | 10,192,268 | ||||||
|
|
|
| |||||
Total increase | 913,967 | 9,418,530 | ||||||
| Net Assets | ||||||||
Beginning of period | 9,418,530 | – 0 | – | |||||
|
|
|
| |||||
End of period (including undistributed net investment income of $0 and $0, respectively) | $ | 10,332,497 | $ | 9,418,530 | ||||
|
|
|
| |||||
| (a) | Commencement of operations. |
See notes to financial statements.
| ALLIANCEBERNSTEIN MUNICIPAL INCOME SHARES • | 17 |
Statement of Changes in Net Assets
NOTES TO FINANCIAL STATEMENTS
October 31, 2011 (unaudited)
NOTE A
Significant Accounting Policies
AllianceBernstein Corporate Shares (the “Trust”) was organized as a Massachusetts business trust under the laws of The Commonwealth of Massachusetts by an Agreement and Declaration of Trust (“Declaration of Trust”) dated January 26, 2004. The Trust is registered under the Investment Company Act of 1940, as an open-end, diversified management investment company. The Trust operates as a “series” company currently having five separate portfolios: AllianceBernstein Corporate Income Shares, AllianceBernstein Municipal Income Shares (the “Portfolio”), AllianceBernstein Taxable Multi-Sector Income Shares, AllianceBernstein Tax-Aware Real Return Income Shares and AllianceBernstein International Focus Shares. Each Portfolio is considered to be a separate entity for financial reporting and tax purposes. AllianceBernstein Corporate Income Shares commenced operations on December 11, 2006. AllianceBernstein Municipal Income Shares commenced operations on September 1, 2010. AllianceBernstein Taxable Multi-Sector Income Shares commenced operations on September 15, 2010. AllianceBernstein Tax-Aware Real Return Income Shares commenced operations on May 2, 2011. AllianceBernstein International Focus Shares commenced operations on June 20, 2011. This report relates only to AllianceBernstein Municipal Income Shares.
Shares of the Portfolio are offered exclusively to holders of accounts established under wrap-fee programs sponsored and maintained by certain registered investment advisers approved by AllianceBernstein L.P. (the “Adviser”). The Portfolio’s shares may be purchased at the relevant net asset value without a sales charge or other fee. The financial statements have been prepared in conformity with U.S. generally accepted accounting principles (“U.S. GAAP”) which require management to make certain estimates and assumptions that affect the reported amounts of assets and liabilities in the financial statements and amounts of income and expenses during the reporting period. Actual results could differ from those estimates. The following is a summary of significant accounting policies followed by the Portfolio.
1. Security Valuation
Portfolio securities are valued at their current market value determined on the basis of market quotations or, if market quotations are not readily available or are deemed unreliable, at “fair value” as determined in accordance with procedures established by and under the general supervision of the Trust’s Board of Trustees.
In general, the market value of securities which are readily available and deemed reliable are determined as follows: Securities listed on a national securities exchange (other than securities listed on the NASDAQ Stock Market, Inc. (“NASDAQ”)) or on a foreign securities exchange are valued at the last sale price at the close of the exchange or foreign securities exchange. If there has
| 18 | • ALLIANCEBERNSTEIN MUNICIPAL INCOME SHARES |
Notes to Financial Statements
been no sale on such day, the securities are valued at the mean of the closing bid and ask prices on such day. Securities listed on more than one exchange are valued by reference to the principal exchange on which the securities are traded; securities listed only on NASDAQ are valued in accordance with the NASDAQ Official Closing Price; listed or over the counter market (“OTC”) put or call options are valued at the mid level between the current bid and ask prices. If either a current bid or current ask price is unavailable, AllianceBernstein L.P. (the “Adviser”) will have discretion to determine the best valuation (e.g. last trade price); open futures contracts and options thereon are valued using the closing settlement price or, in the absence of such a price, the most recent quoted bid price. If there are no quotations available for the day of valuation, the last available closing settlement price is used; U.S. government securities and other debt instruments having 60 days or less remaining until maturity are valued at amortized cost if their original maturity was 60 days or less; or by amortizing their fair value as of the 61st day prior to maturity if their original term to maturity exceeded 60 days; fixed-income securities, including mortgage backed and asset backed securities, may be valued on the basis of prices provided by a pricing service or at a price obtained from one or more of the major broker/dealers. In cases where broker/dealer quotes are obtained, the Adviser may establish procedures whereby changes in market yields or spreads are used to adjust, on a daily basis, a recently obtained quoted price on a security; and swaps and other derivatives are valued daily, primarily using independent pricing services, independent pricing models using market inputs, as well as third party broker-dealers or counterparties, which are approved by the Board of Trustees. Investments in money market funds are valued at their net asset value each day.
Securities for which market quotations are not readily available (including restricted securities) or are deemed unreliable are valued at fair value. Factors considered in making this determination may include, but are not limited to, information obtained by contacting the issuer, analysts, analysis of the issuer’s financial statements or other available documents. In addition, the Portfolio may use fair value pricing for securities primarily traded in non-U.S. markets because most foreign markets close well before the Portfolio values its securities at 4:00 p.m., Eastern Time. The earlier close of these foreign markets gives rise to the possibility that significant events, including broad market moves, may have occurred in the interim and may materially affect the value of those securities.
2. Fair Value Measurements
In accordance with U.S. GAAP regarding fair value measurements, fair value is defined as the price that the Portfolio would receive to sell an asset or pay to transfer a liability in an orderly transaction between market participants at the measurement date. The U.S. GAAP disclosure requirements establish a framework for measuring fair value, and a three-level hierarchy for fair value measurements based upon the transparency of inputs to the valuation of an asset or liability. Inputs may be observable or unobservable and refer broadly to the
| ALLIANCEBERNSTEIN MUNICIPAL INCOME SHARES • | 19 |
Notes to Financial Statements
assumptions that market participants would use in pricing the asset or liability. Observable inputs reflect the assumptions market participants would use in pricing the asset or liability based on market data obtained from sources independent of the Portfolio. Unobservable inputs reflect the Portfolio’s own assumptions about the assumptions that market participants would use in pricing the asset or liability based on the best information available in the circumstances. Each investment is assigned a level based upon the observability of the inputs which are significant to the overall valuation. The three-tier hierarchy of inputs is summarized below.
| • | Level 1—quoted prices in active markets for identical investments |
| • | Level 2—other significant observable inputs (including quoted prices for similar investments, interest rates, prepayment speeds, credit risk, etc.) |
| • | Level 3—significant unobservable inputs (including the Portfolio’s own assumptions in determining the fair value of investments) |
The following table summarizes the valuation of the Portfolio’s investments by the above fair value hierarchy levels as of October 31, 2011:
| Investments in Securities: | Level 1 | Level 2 | Level 3 | Total | ||||||||||||
Assets: | ||||||||||||||||
Long-Term Municipal Bonds | $ | – 0 | – | $ | 10,712,982 | $ | – 0 | – | $ | 10,712,982 | ||||||
Short-Term Investments | 94,410 | – 0 | – | – 0 | – | 94,410 | ||||||||||
|
|
|
|
|
|
|
| |||||||||
Total Investments in Securities | 94,410 | 10,712,982 | – 0 | – | 10,807,392 | |||||||||||
Other Financial Instruments* | – 0 | – | – 0 | – | – 0 | – | – 0 | – | ||||||||
|
|
|
|
|
|
|
| |||||||||
Total | $ | 94,410 | $ | 10,712,982 | $ | – 0 | – | $ | 10,807,392 | |||||||
|
|
|
|
|
|
|
| |||||||||
| * | Other financial instruments are derivative instruments, such as futures, forwards and swap contracts, which are valued at the unrealized appreciation/depreciation on the instrument. |
3. Taxes
It is the Portfolio’s policy to meet the requirements of the Internal Revenue Code applicable to regulated investment companies and to distribute all of its investment company taxable income and net realized gains, if any, to shareholders. Therefore, no provisions for federal income or excise taxes are required.
In accordance with U.S. GAAP requirements regarding accounting for uncertainties in income taxes, management has analyzed the Portfolio’s tax positions taken or expected to be taken on federal and state income tax returns for all open tax years and has concluded that no provision for income tax is required in the Portfolio’s financial statements.
4. Investment Income and Investment Transactions
Dividend income is recorded on the ex-dividend date or as soon as the Portfolio is informed of the dividend. Interest income is accrued daily. Investment transactions are accounted for on the date the securities are purchased or sold.
| 20 | • ALLIANCEBERNSTEIN MUNICIPAL INCOME SHARES |
Notes to Financial Statements
Investment gains or losses are determined on the identified cost basis. The Portfolio amortizes premiums and accretes discounts as adjustments to interest income.
5. Dividends and Distributions
Dividends and distributions to shareholders, if any, are recorded on the ex-dividend date. Income dividends and capital gains distributions are determined in accordance with federal tax regulations and may differ from those determined in accordance with U.S. GAAP. To the extent these differences are permanent, such amounts are reclassified within the capital accounts based on their federal tax basis treatment; temporary differences do not require such reclassification.
NOTE B
Advisory Fee and Other Transactions with Affiliates
Under the terms of the Advisory Agreement, the Portfolio pays no advisory fee to the Adviser and the Adviser reimburses or pays for the Portfolio’s operating expenses. The Portfolio is an integral part of separately managed accounts in wrap-fee programs. Typically, participants in these programs pay a fee to their investment adviser for all costs and expenses of the separately managed account, including costs and expenses associated with the Portfolio. The Adviser serves as investment manager and adviser of the Portfolio and continuously furnishes an investment program for the Portfolio and manages, supervises and conducts the affairs of the Portfolio, subject to the supervisions of the Portfolio’s Board of Trustees. The Advisory Agreement provides that the Adviser or an affiliate will furnish, or pay the expenses of the Portfolio for, office space, facilities and equipment, services of executive and other personnel of the Portfolio and certain administrative services.
The Portfolio has entered into a Distribution Agreement (the “Agreement”) with AllianceBernstein Investments, Inc., the Portfolio’s principal underwriter (the “Underwriter”), to permit the Underwriter to distribute the Portfolio’s shares, which are sold at their net asset value without any sales charge. The Portfolio does not pay a fee for this service. The Underwriter is a wholly owned subsidiary of the Adviser.
AllianceBernstein Investor Services, Inc. (“ABIS”), a wholly-owned subsidiary of the Adviser, acts as the Portfolios’ registrar, transfer agent and dividend-disbursing agent. ABIS registers the transfer, issuance and redemption of Portfolio shares and disburses dividends and other distributions to Portfolio shareholders. The Portfolio does not pay a fee for this service.
The Portfolio may invest in the AllianceBernstein Fixed-Income Shares, Inc. – Government STIF Portfolio (“Government STIF Portfolio”), an open-end management investment company managed by the Adviser. The Government
| ALLIANCEBERNSTEIN MUNICIPAL INCOME SHARES • | 21 |
Notes to Financial Statements
STIF Portfolio is offered as a cash management option to mutual funds and other institutional accounts of the Adviser, and is not available for direct purchase by members of the public. The Government STIF Portfolio pays no investment management fees but does bear its own expenses. A summary of the Portfolio’s transactions in shares of the Government STIF Portfolio for the six months ended October 31, 2011 is as follows:
Market Value April 30, 2011 (000) | Purchases at Cost (000) | Sales Proceeds (000) | Market Value October 31, 2011 (000) | Dividend Income (000) | ||||||||||||
| $ – 0 – | $ | 1,727 | $ | 1,633 | $ | 94 | $ | – 0 – | * | |||||||
| * | Amount is less than $500. |
NOTE C
Investment Transactions
Purchases and sales of investment securities (excluding short-term investments) for the six months ended October 31, 2011 were as follows:
| Purchases | Sales | |||||||
Investment securities (excluding | $ | 1,963,820 | $ | 1,757,345 | ||||
U.S. government securities | – 0 | – | – 0 | – | ||||
The cost of investments for federal income tax purposes was substantially the same as the cost for financial reporting purposes. Accordingly, gross unrealized appreciation and unrealized depreciation are as follows:
Gross unrealized appreciation | $ | 251,050 | ||
Gross unrealized depreciation | (191,591 | ) | ||
|
| |||
Net unrealized appreciation | $ | 59,459 | ||
|
|
NOTE D
Shares of Beneficial Interest
Transactions in shares of beneficial interest were as follows:
| Shares | Amount | |||||||||||||||||||
| Six Months Ended October 31, 2011 (unaudited) | September 1, April 30, 2011 | Six Months Ended October 31, 2011 (unaudited) | September 1, 2010(a) to April 30, 2011 | |||||||||||||||||
|
| |||||||||||||||||||
Shares sold | 28,315 | 1,019,687 | $ | 275,869 | $ | 10,192,268 | ||||||||||||||
| ||||||||||||||||||||
Net increase | 28,315 | 1,019,687 | $ | 275,869 | $ | 10,192,268 | ||||||||||||||
| ||||||||||||||||||||
| (a) | Commencement of operations. |
NOTE E
Risks Involved in Investing in the Portfolio
Municipal Market Risk and Concentration of Credit Risk—This is the risk that special factors may adversely affect the value of municipal securities and have a
| 22 | • ALLIANCEBERNSTEIN MUNICIPAL INCOME SHARES |
Notes to Financial Statements
significant effect on the yield or value of the Portfolio’s investments in municipal securities. These factors include economic conditions, political or legislative changes, uncertainties related to the tax status of municipal securities, or the rights of investors in these securities. To the extent that the Portfolio invests more of its assets in a particular state’s municipal securities, the Portfolio may be vulnerable to events adversely affecting that state, including economic, political and regulatory occurrences, court decisions, terrorism and catastrophic natural disasters, such as hurricanes or earthquakes. The Portfolio’s investments in certain municipal securities with principal and interest payments that are made from the revenues of a specific project or facility, and not general tax revenues, may have increased risks. Factors affecting the project or facility, such as local business or economic conditions, could have a significant effect on the project’s ability to make payments of principal and interest on these securities.
Financing and Related Transactions; Leverage and Other Risks—The Portfolio may utilize financial leverage, including tender option bond transactions, to seek to enhance the yield and net asset value. These objectives may not be achieved in all interest rate environments. Leverage creates certain risks for shareholders, including the likelihood of greater volatility of the net asset value. If income from the securities purchased from the funds made available by leverage is not sufficient to cover the cost of leverage, the Portfolio’s return will be less than if leverage had not been used. As a result, the amounts available for distribution as dividends and other distributions will be reduced. During periods of rising short-term interest rates, the interest paid on the floaters in tender option bond transactions would increase, which may adversely affect the Portfolio’s income and distribution to shareholders. A decline in distributions would adversely affect the Portfolio’s yield and possibly the market value of its shares. If rising short-term rates coincide with a period of rising long-term rates, the value of the long-term municipal bonds purchased with the proceeds of leverage would decline, adversely affecting the net asset value and possibly the market value of the shares.
In a tender option bond transaction, the Portfolio may transfer a highly rated fixed-rate municipal security to a broker, which, in turn, deposits the bond into a special purpose vehicle (typically, a trust) usually sponsored by the broker. The Portfolio receives cash and a residual interest security (sometimes referred to as an “inverse floater”) issued by the trust in return. The trust simultaneously issues securities, which pay an interest rate that is reset each week based on an index of high-grade short-term seven-day demand notes. These securities, sometimes referred to as “floaters”, are bought by third parties, including tax-exempt money market funds, and can be tendered by these holders to a liquidity provider at par, unless certain events occur. The Portfolio continues to earn all the interest from the transferred bond less the amount of interest paid on the floaters and the expenses of the trust, which include payments to the trustee and the liquidity provider and organizational costs. The Portfolio also uses the cash received from the transaction for investment purposes or to retire other forms of
| ALLIANCEBERNSTEIN MUNICIPAL INCOME SHARES • | 23 |
Notes to Financial Statements
leverage. Under certain circumstances, the trust may be terminated and collapsed, either by the Portfolio or upon the occurrence of certain events, such as a downgrade in the credit quality of the underlying bond, or in the event holders of the floaters tender their securities to the liquidity provider. See Note G to the Financial Statements “Floating Rate Notes Issued in Connection with Securities Held” for more information about tender option bond transactions.
The Portfolio may also purchase inverse floaters from a tender option bond trust in a secondary market transaction without first owning the underlying bond. The income received from an inverse floater varies inversely with the short-term interest rate paid on the floaters issued by the trust. The prices of inverse floaters are subject to greater volatility than the prices of fixed-income securities that are not inverse floaters. Investments in inverse floaters may amplify the risks of leverage. If short-term interest rates rise, the interest payable on the floaters would increase and income from the inverse floaters decrease.
Indemnification Risk—In the ordinary course of business, the Portfolio enters into contracts that contain a variety of indemnifications. The Portfolio’s maximum exposure under these arrangements is unknown. However, the Portfolio has not had prior claims or losses pursuant to these indemnification provisions and expects the risk of loss thereunder to be remote. Therefore, the Portfolio has not accrued any liability in connection with these indemnification provisions.
NOTE F
Distributions to Shareholders
The tax character of distributions to be paid for the year ending April 30, 2012 will be determined at the end of the current fiscal year. The tax character of distributions paid during the period ended April 30, 2011 was as follows:
| 2011 | ||||
Distributions paid from: | ||||
Ordinary income | $ | 4,156 | ||
Tax-exempt income | 315,742 | |||
|
| |||
Total distributions paid | $ | 319,898 | ||
|
| |||
As of April 30, 2011, the components of accumulated earnings/(deficit) on a tax basis were as follows:
Undistributed tax-exempt income | $ | 16,982 | ||
Accumulated capital and other gains/losses | (129,356 | )(a) | ||
Unrealized appreciation/(depreciation) | (644,382 | )(b) | ||
|
| |||
Total accumulated earnings/(deficit) | $ | (756,756 | )(c) | |
|
|
| (a) | At April 30, 2011, the Fund had a post-October capital loss deferral of $129,356. For tax purposes, this loss is deemed to arise on May 1, 2011. |
| (b) | The difference between book-basis and tax-basis unrealized appreciation/(depreciation) is attributable primarily to the tax treatment of tender option bonds. |
| (c) | The difference between book-basis and tax-basis components of accumulated earnings/(deficit) is attributable primarily to dividends payable. |
| 24 | • ALLIANCEBERNSTEIN MUNICIPAL INCOME SHARES |
Notes to Financial Statements
On December 22, 2010, the Regulated Investment Company Modernization Act of 2010 (the “Act”) was enacted, which changed various technical rules governing the tax treatment of regulated investment companies. One important change addresses the recognition of capital loss carryforwards. Under the Act, the Portfolio will be permitted to carry forward capital losses incurred in taxable years beginning after December 22, 2010 for an unlimited period. However, any losses incurred during those future taxable years will be required to be utilized prior to the losses incurred in pre-enactment taxable years, which carry an expiration date. As a result, pre-enactment capital loss carryforwards may be more likely to expire unused. Additionally, post-enactment capital loss carryforwards will retain their character as either short-term or long-term capital losses rather than being considered all short-term capital loss (as permitted under previous regulation).
NOTE G
Floating Rate Notes Issued in Connection with Securities Held
The Portfolio may engage in tender option bond transactions in which the Portfolio may transfer a fixed rate bond to a broker for cash. The broker deposits the fixed rate bond into a Special Purpose Vehicle (the “SPV”, which is generally organized as a trust), organized by the broker. The Portfolio buys a residual interest in the assets and cash flows of the SPV, often referred to as an inverse floating rate obligation (“Inverse Floater”). The SPV also issues floating rate notes (Floating Rate Notes) which are sold to third parties. The Floating Rate Notes pay interest at rates that generally reset weekly and their holders have the option to tender their notes to a liquidity provider for redemption at par. The Inverse Floater held by the Portfolio gives the Portfolio the right (1) to cause the holders of the Floating Rate Notes to tender their notes at par, and (2) to have the trustee transfer the Fixed Rate Bond held by the SPV to the Portfolio, thereby collapsing the SPV. The SPV may also be collapsed in certain other circumstances. In accordance with U.S. GAAP disclosure requirements regarding accounting for transfers and servicing of financial assets and extinguishments of liabilities, the Portfolio accounts for the transaction described above as a secured borrowing by including the Fixed Rate Bond in its portfolio of investments and the Floating Rate Notes as a liability under the caption “Payable for floating rate notes issued” in its statement of assets and liabilities. Interest expense related to the Portfolio’s liability with respect to Floating Rate Notes is recorded as incurred. The interest expense is also included in the Portfolio’s expense ratio. At October 31, 2011, the amount of the Portfolio’s Floating Rate Notes outstanding was $565,000 and the related interest rate was 0.14%.
The Portfolio may also purchase Inverse Floaters in the secondary market without first owning the underlying bond. Such an Inverse Floater is included in the Portfolio’s portfolio of investments but is not required to be treated as a secured borrowing and reflected in the Portfolio’s financial statements as a secured borrowing.
| ALLIANCEBERNSTEIN MUNICIPAL INCOME SHARES • | 25 |
Notes to Financial Statements
NOTE H
Recent Accounting Pronouncement
In May 2011, the Financial Accounting Standards Board (“FASB”) issued an Accounting Standards Update (“ASU”) to develop common requirements for measuring fair value and for disclosing information about fair value measurements in U.S. GAAP and International Financial Reporting Standards (“IFRS”). The amendments are intended to improve the comparability of fair value measurements presented and disclosed in the financial statements prepared in accordance with U.S. GAAP and IFRS. The ASU is effective during interim or annual periods beginning after December 15, 2011. At this time, management is evaluating the implication of this ASU and its impact on the financial statements has not been determined.
NOTE I
Subsequent Events
Management has evaluated subsequent events for possible recognition or disclosure in the financial statements through the date the financial statements are issued. Management has determined that there are no material events that would require disclosure in the Portfolio’s financial statements through this date.
| 26 | • ALLIANCEBERNSTEIN MUNICIPAL INCOME SHARES |
Notes to Financial Statements
FINANCIAL HIGHLIGHTS
Selected Data For A Share Of Beneficial Interest Outstanding Throughout Each Period
| Six Months Ended October 31, 2011 (unaudited) | September 1, 2010(a) to April 30, 2011 | |||||||
|
| |||||||
Net asset value, beginning of period | $ 9.24 | $ 10.00 | ||||||
|
| |||||||
Income From Investment Operations | ||||||||
Net investment income(b) | .31 | .32 | ||||||
Net realized and unrealized gain (loss) on | .62 | (.77 | ) | |||||
|
| |||||||
Net increase (decrease) in net asset value from operations | .93 | (.45 | ) | |||||
|
| |||||||
Less: Dividends | ||||||||
Dividends from net investment income | (.31 | ) | (.31 | ) | ||||
|
| |||||||
Net asset value, end of period | $ 9.86 | $ 9.24 | ||||||
|
| |||||||
Total Return | ||||||||
Total investment return based on net asset value(c) | 10.15 | % | (4.42 | )% | ||||
Ratios/Supplemental Data | ||||||||
Net assets, end of period (000’s omitted) | $10,332 | $9,419 | ||||||
Ratio to average net assets of: | ||||||||
Expenses(d) | .05 | % | .02 | % | ||||
Expenses, excluding interest expense(d) | .00 | % | .00 | % | ||||
Net investment income(d) | 6.35 | % | 5.03 | % | ||||
Portfolio turnover rate | 18 | % | 14 | % | ||||
| (a) | Commencement of operations. |
| (b) | Based on average shares outstanding. |
| (c) | Total investment return is calculated assuming an initial investment made at the net asset value at the beginning of the period, reinvestment of all dividends and distributions at net asset value during the period, and redemption on the last day of the period. Total return does not reflect the deduction of taxes that a shareholder would pay on fund distributions or the redemption of fund shares. Total investment return calculated for a period of less than one year is not annualized. |
| (d) | Annualized. |
See notes to financial statements.
| ALLIANCEBERNSTEIN MUNICIPAL INCOME SHARES • | 27 |
Financial Highlights
BOARD OF TRUSTEES
| William H. Foulk, Jr.(1), Chairman | Robert M. Keith, President and Chief Executive Officer | |
| John H. Dobkin(1) | ||
| Michael J. Downey(1) | Garry L. Moody(1) | |
| D. James Guzy(1) | Marshall C. Turner, Jr.(1) | |
| Nancy P. Jacklin(1) | Earl D. Weiner(1) |
OFFICERS
Philip L. Kirstein, Senior Vice President and Independent Compliance Officer Robert B. Davidson III(2), Vice President Michael G. Brooks(2), Vice President | Wayne D. Godlin(2), Vice President Terrance T. Hults(2), Vice President Emilie D. Wrapp, Secretary Joseph J. Mantineo, Treasurer and Chief Financial Officer Phyllis J. Clarke, Controller |
Custodian and Accounting Agent State Street Bank and Trust Company
Principal Underwriter AllianceBernstein Investments, Inc.
Transfer Agent AllianceBernstein Investor Services, Inc. | Legal Counsel Seward & Kissel LLP One Battery Park Plaza New York, NY 10004
Independent Registered Public Accounting Firm Ernst & Young LLP 5 Times Square New York, NY 10036 |
| (1) | Member of the Audit Committee, the Governance and Nominating Committee and the Independent Directors Committee. Mr. Foulk is the sole member of the Fair Value Pricing Committee. |
| (2) | The day-to-day management of, and investment decisions for, the Trust’s portfolio are made by the Municipal Bond Investment Team. Messrs. Michael G. Brooks, Robert B. Davidson III, Wayne D. Godlin and Terrance T. Hults are the investment professionals primarily responsible for the day-to-day management of the Trust’s portfolio. |
| 28 | • ALLIANCEBERNSTEIN MUNICIPAL INCOME SHARES |
Board of Trustees
THE FOLLOWING IS NOT PART OF THE SHAREHOLDER REPORT OR THE FINANCIAL STATEMENTS
SUMMARY OF SENIOR OFFICER’S EVALUATION OF INVESTMENT ADVISORY AGREEMENT1
The following is a summary of the evaluation of the Investment Advisory Agreement between AllianceBernstein L.P. (the “Adviser”) and The AllianceBernstein Corporate Shares (the “Trust”) with respect to AllianceBernstein Municipal Income Shares (the “Portfolio”).2 The evaluation of the Investment Advisory Agreement was prepared by Philip L. Kirstein, the Senior Officer of the Trust, for the Trustees of the Trust, as required by the September 1, 2004 Assurance of Discontinuance (“AoD”) between the Adviser and the New York State Attorney General (the “NYAG”). The Senior Officer’s evaluation of the Investment Advisory Agreement is not meant to diminish the responsibility or authority of the Board of Trustees to perform its duties pursuant to Section 15 of the Investment Company Act of 1940 Act (the “40 Act”) and applicable state law. The purpose of the summary is to provide shareholders with a synopsis of the independent evaluation of the reasonableness of the advisory fees proposed to be paid by the Portfolio which was provided to the Trustees in connection with their review of the proposed approval of the continuance of the Investment Advisory Agreement.
The Senior Officer’s evaluation considered the following factors:
| 1. | Advisory fees charged to institutional and other clients of the Adviser for like services; |
| 2. | Advisory fees charged by other mutual fund companies for like services; |
| 3. | Costs to the Adviser and its affiliates of supplying services pursuant to the advisory agreement, excluding any intra-corporate profit; |
| 4. | Profit margins of the Adviser and its affiliates from supplying such services; |
| 5. | Possible economies of scale as the Portfolio grows larger; and |
| 6. | Nature and quality of the Adviser’s services including the performance of the Portfolio. |
These factors, with the exception of the first factor, are generally referred to as the “Gartenberg factors,” which were articulated by the United States Court of Appeals for the Second Circuit in 1982. Gartenberg v. Merrill Lynch Asset Management, Inc., 694 F. 2d 923 (2d Cir. 1982). On March 30, 2010, the Supreme Court held the Gartenberg decision was correct in its basic formulation of what §36(b) requires: to face liability under §36(b), “an investment adviser must charge a fee that is so disproportionately large that it bears no reasonable
| 1 | The Senior Officer’s fee evaluation was completed on October 20, 2011 and discussed with the Board of Trustees on November 1-3, 2011. |
| 2 | Future references to the Portfolio do not include “AllianceBernstein.” |
| ALLIANCEBERNSTEIN MUNICIPAL INCOME SHARES • | 29 |
relationship to the services rendered and could not have been the product of arm’s length bargaining” Jones v. Harris Associates L.P., 130 S. Ct. 1418 (2010). In Jones, the Court stated the Gartenberg approach fully incorporates the correct understanding of fiduciary duty within the context of section 36(b) and noted with approval that “Gartenberg insists that all relevant circumstances be taken into account” and “uses the range of fees that might result from arm’s-length bargaining as the benchmark for reviewing challenged fees.”3
PORTFOLIO’S EXEMPTION FROM ADVISORY FEES OR EXPENSES
The Adviser proposed that the Portfolio pays no advisory fee to the Adviser for receiving the services to be provided pursuant to the Investment Advisory Agreement. The Portfolio is designed to serve the needs of the Adviser’s separately managed account (“SMA”) clients.4 Since SMA clients pay their wrap program provider a unitary fee for managing all investments of their portfolio, the Portfolio will not pay an advisory fee. The Adviser will also reimburse the Portfolio for all of its other operating expenses, except certain extraordinary expenses, taxes, brokerage costs and the interest on borrowed money.
The Portfolio’s net assets on September 30, 2011 are set forth below:
| Portfolio | 09/30/11 Net Assets ($MM) | |||
| Municipal Income Shares | $ | 10.4 | ||
The Portfolio, which offers only one no-load class of shares, is distributed through its principal underwriter, AllianceBernstein Investments, Inc. (“ABI”). Since the Portfolio is reimbursed by the Adviser for its operating expenses, the Portfolio does not have a distribution plan pursuant to Rule 12b-1 under the 40 Act.
| I. | ADVISORY FEES CHARGED TO INSTITUTIONAL AND OTHER CLIENTS |
The advisory fees charged to investment companies which the Adviser manages and sponsors are normally higher than those charged to similar sized institutional accounts, including pension plans and sub-advised investment companies. The fee differential reflects, among other things, different services provided to such clients, and different liabilities assumed. Services provided by the Adviser to the Portfolio that are not provided to non-investment company clients include providing office space and personnel to serve as Fund Officers, who among other responsibilities make the certifications required under the Sarbanes–Oxley Act of 2002, and coordinating with and monitoring the Portfolio’s third party service providers such as Fund counsel, auditors, custodians, transfer agents and pricing services. The accounting, administrative, legal and compliance requirements for the Portfolio are more costly than those for institutional client assets due to the
| 3 | Jones v. Harris at 1427. |
| 4 | The SMA clients currently employ the Adviser as one of several investment managers, and compensate the Adviser on the basis of all SMA assets managed, which would include assets of Corporate Income Shares. |
| 30 | • ALLIANCEBERNSTEIN MUNICIPAL INCOME SHARES |
greater complexities and time required for investment companies. The Adviser also believes that it incurs substantial entrepreneurial risk when offering a new mutual fund since establishing a new mutual fund requires a large upfront investment and it may take a long time for the fund to achieve profitability since the fund must be priced to scale from inception in order to be competitive and assets are acquired one account at a time. In addition, managing the cash flow of an investment company may be more difficult than that of a stable pool of assets, such as an institutional account with little cash movement in either direction, particularly if the Portfolio is in net redemption and the Adviser is frequently forced to sell securities to raise cash for redemptions. However, managing a fund with positive cash flow may be easier at times than managing a stable pool of assets. Finally, in recent years, investment advisers have been sued by institutional clients and have suffered reputational damage both by the attendant publicity and outcomes other than complete victories. Accordingly, the legal and reputational risks associated with institutional accounts are greater than previously thought, although arguably still not equal to those related to the mutual fund industry.
Notwithstanding the Adviser’s view that managing an investment company is not comparable to managing other institutional accounts because the services provided are different, the Supreme Court has indicated consideration should be given to the advisory fees charged to institutional accounts with a similar investment style as the Portfolio.5 However, with respect to the Portfolio, the Adviser represented that there is no institutional product in the Adviser’s Form ADV that has a similar investment style as the Portfolio.
The Adviser represented that it does not sub-advise any registered investment company with a substantially similar investment style as the Portfolio.
| II. | MANAGEMENT FEES CHARGED BY OTHER MUTUAL FUND COMPANIES FOR LIKE SERVICES. |
Lipper, Inc., an analytical service that is not affiliated with the Adviser, compared the fees charged to the Portfolio to the fees charged to other investment
| 5 | The Supreme Court stated that “courts may give such comparisons the weight that they merit in light of the similarities and differences between the services that the clients in question require, but the courts must be wary of inapt comparisons.” Among the significant differences the Supreme Court noted that may exist between services provided to mutual funds and institutional accounts are “higher marketing costs.” Jones v. Harris at 1428. |
| ALLIANCEBERNSTEIN MUNICIPAL INCOME SHARES • | 31 |
companies for similar services by other investment advisers.6,7 Each peer selected by Lipper had a similar fee arrangement as the Portfolio, which is to say that with respect to the Portfolio’s peers, all of their fund expenses, including management fees,8 were reimbursed by their respective investment advisers.
As previously noted, the Portfolio does not pay an advisory fee to the Adviser since its SMA clients pay their wrap program provider a unitary fee for managing all investments of their portfolios. In addition, the Adviser reimburses the Portfolio for all of its operating expenses, except certain extraordinary expenses, taxes, brokerage costs and interest on borrowed money.
| III. | COSTS TO THE ADVISER AND ITS AFFILIATES OF SUPPLYING SERVICES PURSUANT TO THE ADVISORY FEE ARRANGEMENT, EXCLUDING ANY INTRA-CORPORATE PROFIT. |
The Adviser utilizes two profitability reporting systems, which operate independently but are aligned with each other, to estimate the Adviser’s profitability in connection with investment advisory services provided to the Portfolio. The Senior Officer has retained a consultant to provide independent advice regarding the alignment of the two profitability systems as well as the methodologies and allocations utilized by both profitability systems. See Section IV for additional discussion.
| IV. | PROFIT MARGINS OF THE ADVISER AND ITS AFFILIATES FOR SUPPLYING SUCH SERVICES. |
The profitability information for the Portfolio, prepared by the Adviser for the Board of Trustees, was reviewed by the Senior Officer and the consultant. The Portfolio does not pay an advisory fee to the Adviser. However, the Adviser does profit indirectly through the advisory fees that it receives from SMA clients that invest in the Portfolio. The Adviser’s profitability with respect to the Portfolio, which was negative in 2010, was calculated using a weighted average of the profitability of the SMA clients, in addition to any fund specific revenue or expense items.
| 6 | The Supreme Court cautioned against accepting mutual fund fee comparisons without careful scrutiny since “these comparisons are problematic because these fees, like those challenged, may not be the product of negotiations conducted at arm’s length.” Jones v. Harris at 1429. |
| 7 | Only zero fee no-load funds that participated in a wrap fee program were considered for inclusion in the Portfolio’s EG, regardless of the Lipper investment classification/objective of the Funds’ peers. The Portfolio’s EG includes the Portfolio, which is classified by Lipper as “General Municipal Debt”, two BBB-rated Corporate Debt funds, one Multi-sector Income fund, one Short-intermediate Investment Grade fund, two U.S. Mortgage funds, three General Bond funds, one TIPS fund and two Global Income funds. |
| 8 | “Management Fee” is the fee attributable to the management and bearing of expenses of the funds (not the management of the wrap fee program). In each case, the advisory contract provides for an advisory or management fee of zero. |
| 32 | • ALLIANCEBERNSTEIN MUNICIPAL INCOME SHARES |
AllianceBernstein Investments, Inc. (“ABI”) and AllianceBernstein Investor Services, Inc. (“ABIS”), affiliates of the Adviser, serve as the Portfolio’s underwriter and transfer agent, respectively. The courts have referred to this type of business relationships as “fall-out benefits” to the Adviser and indicated that such benefits should be factored into the evaluation of the total relationship between the Portfolio and the Adviser. Neither case law nor common business practice precludes the Adviser’s affiliates from earning a reasonable profit on this type of relationship provided the affiliates’ charges and services are competitive. However, neither ABI nor ABIS receive a fee for serving as the Portfolio’s underwriter and transfer agent.
| V. | POSSIBLE ECONOMIES OF SCALE |
The Adviser has indicated that economies of scale are being shared with shareholders through fee structures,9 subsidies and enhancement to services. Based on some of the professional literature that has considered economies of scale in the mutual fund industry, it is thought that to the extent economies of scale exist, they may more often exist across a fund family as opposed to a specific fund. This is because the costs incurred by the Adviser, such as investment research or technology for trading or compliance systems, can be spread across a greater asset base as the fund family increases in size. It is also possible that as the level of services required to operate a successful investment company has increased over time, and advisory firms have made such investments in their business to provide services, there may be a sharing of economies of scale without a reduction in advisory fees.
In February 2008, an independent consultant, retained by the Senior Officer, provided the Board of Trustees an update of the Deli10 study on advisory fees and various fund characteristics.11 The independent consultant first reiterated the results of his previous two dimensional comparison analysis (fund size and family size) with the Board of Trustees.12 The independent consultant then discussed the results of the regression model that was utilized to study the effects of various factors on advisory fees. The regression model output indicated that the bulk of the variation in fees predicted were explained by various factors, but substantially
| 9 | Fee structures include fee reductions, pricing at scale and breakpoints in advisory fee schedules. |
| 10 | The Deli study, originally published in 2002 based on 1997 data and updated for the February 2008 presentation, may be of diminished value due to the age of the data used in the presentation and the changes experienced in the industry over the last four years. |
| 11 | As mentioned previously, the Supreme Court cautioned against accepting mutual fund fee comparisons without careful scrutiny since the fees may not be the product of negotiations conducted at arm’s length. See Jones V. Harris at 1429. |
| 12 | The two dimensional analysis showed patterns of lower advisory fees for funds with larger asset sizes and funds from larger family sizes compared to funds with smaller asset sizes and funds from smaller family sizes, which according to the independent consultant is indicative of a sharing of economies of scale and scope. However, in less liquid and active markets, such is not the case, as the empirical analysis showed potential for diseconomies of scale in those markets. The empirical analysis also showed diminishing economies of scale and scope as funds surpassed a certain high level of assets. |
| ALLIANCEBERNSTEIN MUNICIPAL INCOME SHARES • | 33 |
by fund assets under management (“AUM”), family AUM, index fund indicator and investment style. The independent consultant also compared the advisory fees of the AllianceBernstein Mutual Funds to similar funds managed by 19 other large asset managers, regardless of fund size and the large asset manager’s proportion of mutual fund assets to non-mutual fund assets.
| VI. | NATURE AND QUALITY OF THE ADVISER’S SERVICES INCLUDING THE PERFORMANCE OF THE PORTFOLIO. |
With assets under management of $402 billion as of September 30, 2011, the Adviser has the investment experience to manage the portfolio assets of the Portfolio and provide non-investment services (described in Section II) to the Portfolio.
The information below, prepared by Lipper, shows the since inception gross performance returns of the Portfolio relative to its Lipper Performance Universe (“PU”)13 for the period ended July 31, 2011:
Portfolio Return (%) | PU Median (%) | PU Rank | ||||||||
| Municipal Income Shares | ||||||||||
| Since Inception | 1.63 | 0.75 | 6/35 | |||||||
| (September 1, 2010) | ||||||||||
Set forth below is the since inception net performance return of the Portfolio (in bold)14 versus its benchmark.15
| Periods Ending July 31, 2011 Annualized Net Performance (%) | ||||
| Since Inception (%) | ||||
Municipal Income Shares | 1.87 | |||
| Barclays Capital Municipal Bond Index | 1.00 | |||
| Inception Date: September 1, 2010 | ||||
CONCLUSION:
Based on the factors discussed above the Senior Officer’s conclusion is that the Investment Advisory Agreement for the Portfolio is reasonable and within the range of what would have been negotiated at arm’s-length in light of all the surrounding circumstances. This conclusion with respect to the Portfolio is based on an evaluation of all of these factors and no single factor was dispositive.
Dated: November 28, 2011
| 13 | The Portfolio’s PU includes peers with the same Lipper investment classification/objective and load type as the Portfolio. |
| 14 | The performance returns and risk measures shown in the table are for the Class A shares of the Portfolio. The performance returns of the Portfolio were provided Lipper. Lipper maintains its own database that includes the Portfolio’s performance returns. |
| 15 | The Adviser provided Portfolio and benchmark performance return information for the periods through July 31, 2011. |
| 34 | • ALLIANCEBERNSTEIN MUNICIPAL INCOME SHARES |
THIS PAGE IS NOT PART OF THE SHAREHOLDER REPORT OR THE FINANCIAL STATEMENTS
ALLIANCEBERNSTEIN FAMILY OF FUNDS
Wealth Strategies Funds
Balanced Wealth Strategy
Conservative Wealth Strategy
Wealth Appreciation Strategy
Tax-Managed Balanced Wealth Strategy
Tax-Managed Conservative Wealth Strategy
Tax-Managed Wealth Appreciation Strategy
Asset Allocation/Multi-Asset
Emerging Markets Multi-Asset
International Portfolio
Real Asset Strategy
Tax-Managed International Portfolio
Growth Funds
Domestic
Growth Fund
Large Cap Growth Fund
Small Cap Growth Portfolio
Small/Mid Cap Growth Fund
U.S. Strategic Research Portfolio
Global & International
Global Thematic Growth Fund
Greater China ’97 Fund
International Discovery Equity Portfolio
International Focus 40 Portfolio
International Growth Fund
Value Funds
Domestic
Core Opportunities Fund
Equity Income Fund
Growth & Income Fund
Small/Mid Cap Value Fund
Value Fund
Global & International
Global Real Estate Investment Fund
Global Value Fund
International Value Fund
Taxable Bond Funds
Bond Inflation Strategy
Global Bond Fund
High Income Fund
Intermediate Bond Portfolio
Short Duration Portfolio
Unconstrained Bond Fund*
Municipal Bond Funds
Arizona California High Income Massachusetts Michigan Minnesota Municipal Bond Inflation Strategy | National New Jersey New York Ohio Pennsylvania Virginia |
Intermediate Municipal Bond Funds
Intermediate California
Intermediate Diversified
Intermediate New York
Closed-End Funds
Alliance California Municipal Income Fund
Alliance New York Municipal Income Fund
AllianceBernstein Global High Income Fund
AllianceBernstein Income Fund
AllianceBernstein National Municipal Income Fund
Alternatives
Market Neutral Strategy-Global
Market Neutral Strategy-U.S.
Balanced
Balanced Shares
Retirement Strategies Funds
2000 Retirement Strategy | 2020 Retirement Strategy | 2040 Retirement Strategy | ||
2005 Retirement Strategy | 2025 Retirement Strategy | 2045 Retirement Strategy | ||
2010 Retirement Strategy | 2030 Retirement Strategy | 2050 Retirement Strategy | ||
2015 Retirement Strategy | 2035 Retirement Strategy | 2055 Retirement Strategy |
We also offer Exchange Reserves,** which serves as the money market fund exchange vehicle for the AllianceBernstein mutual funds.
You should consider the investment objectives, risks, charges and expenses of any AllianceBernstein fund/portfolio carefully before investing. For free copies of our prospectuses, which contain this and other information, visit us online at www.alliancebernstein.com or contact your financial advisor. Please read the prospectus carefully before investing.
| * | Prior to February 3, 2011, Unconstrained Bond Fund was named Diversified Yield Fund. |
| ** | An investment in the Fund is not a deposit in a bank and is not insured or guaranteed by the Federal Deposit Insurance Corporation or any other government agency. Although the Fund seeks to preserve the value of your investment at $1.00 per share, it is possible to lose money by investing in the Fund. |
| ALLIANCEBERNSTEIN MUNICIPAL INCOME SHARES • | 35 |
AllianceBernstein Family of Funds
NOTES
| 36 | • ALLIANCEBERNSTEIN MUNICIPAL INCOME SHARES |
ALLIANCEBERNSTEIN MUNICIPAL INCOME SHARES
1345 Avenue of the Americas
New York, NY 10105
800.221.5672
| MIS-0152-1011 |  | |
| ITEM 2. | CODE OF ETHICS. |
Not applicable when filing a semi-annual report to shareholders.
| ITEM 3. | AUDIT COMMITTEE FINANCIAL EXPERT. |
Not applicable when filing a semi-annual report to shareholders.
| ITEM 4. | PRINCIPAL ACCOUNTANT FEES AND SERVICES. |
Not applicable when filing a semi-annual report to shareholders.
| ITEM 5. | AUDIT COMMITTEE OF LISTED REGISTRANTS. |
Not applicable to the registrant.
| ITEM 6. | SCHEDULE OF INVESTMENTS. |
Please see Schedule of Investments contained in the Report to Shareholders included under Item 1 of this Form N-CSR.
| ITEM 7. | DISCLOSURE OF PROXY VOTING POLICIES AND PROCEDURES FOR CLOSED-END MANAGEMENT INVESTMENT COMPANIES. |
Not applicable to the registrant.
| ITEM 8. | PORTFOLIO MANAGERS OF CLOSED-END MANAGEMENT INVESTMENT COMPANIES. |
Not applicable to the registrant.
| ITEM 9. | PURCHASES OF EQUITY SECURITIES BY CLOSED-END MANAGEMENT INVESTMENT COMPANY AND AFFILIATED PURCHASERS. |
Not applicable to the registrant.
| ITEM 10. | SUBMISSION OF MATTERS TO A VOTE OF SECURITY HOLDERS. |
There have been no material changes to the procedures by which shareholders may recommend nominees to the Fund’s Board of Directors since the Fund last provided disclosure in response to this item.
| ITEM 11. | CONTROLS AND PROCEDURES. |
(a) The registrant’s principal executive officer and principal financial officer have concluded that the registrant’s disclosure controls and procedures (as defined in Rule 30a-2(c) under the Investment Company Act of 1940, as amended) are effective at the reasonable assurance level based on their evaluation of these controls and procedures as of a date within 90 days of the filing date of this document.
(b) There were no changes in the registrant’s internal controls over financial reporting that occurred during the second fiscal quarter of the period that has materially affected, or is reasonably likely to materially affect, the registrant’s internal control over financial reporting.
| ITEM 12. | EXHIBITS. |
The following exhibits are attached to this Form N-CSR:
EXHIBIT NO. | DESCRIPTION OF EXHIBIT | |
| 12 (b) (1) | Certification of Principal Executive Officer Pursuant to Section 302 of the Sarbanes-Oxley Act of 2002 | |
| 12 (b) (2) | Certification of Principal Financial Officer Pursuant to Section 302 of the Sarbanes-Oxley Act of 2002 | |
| 12 (c) | Certification of Principal Executive Officer and Principal Financial Officer Pursuant to Section 906 of the Sarbanes-Oxley Act of 2002 | |
SIGNATURES
Pursuant to the requirements of the Securities Exchange Act of 1934 and the Investment Company Act of 1940, the registrant has duly caused this report to be signed on its behalf by the undersigned, thereunto duly authorized.
(Registrant): AllianceBernstein Corporate Shares
| By: | /s/ Robert M. Keith | |
| Robert M. Keith | ||
| President | ||
Date: | December 22, 2011 | |
Pursuant to the requirements of the Securities Exchange Act of 1934 and the Investment Company Act of 1940, this report has been signed below by the following persons on behalf of the registrant and in the capacities and on the dates indicated.
| By: | /s/ Robert M. Keith | |
| Robert M. Keith | ||
| President | ||
| Date: | December 22, 2011 | |
| By: | /s/ Joseph J. Mantineo | |
| Joseph J. Mantineo | ||
| Treasurer and Chief Financial Officer | ||
| Date: | December 22, 2011 | |