UNITED STATES
SECURITIES AND EXCHANGE COMMISSION
WASHINGTON, D.C. 20549
FORM N-CSR
CERTIFIED SHAREHOLDER REPORT OF REGISTERED
MANAGEMENT INVESTMENT COMPANIES
Investment Company Act file number: 811-21497
AB CORPORATE SHARES
(Exact name of registrant as specified in charter)
66 Hudson Boulevard East
New York, New York 10005
(Address of principal executive offices) (Zip code)
Stephen M. Woetzel
AllianceBernstein L.P.
66 Hudson Boulevard East
New York, New York 10005
(Name and address of agent for service)
Registrant’s telephone number, including area code: (800) 221-5672
Date of fiscal year end: April 30, 2025
Date of reporting period: October 31, 2024
ITEM 1. REPORTS TO STOCKHOLDERS.
AB Corporate Income Shares: ACISX
Please scan QR code for
Fund Information
AB Corporate Income Shares
Semi-Annual Shareholder Report
This semi-annual shareholder report contains important information about the AB Corporate Income Shares (the “Fund”) for the period of May 1, 2024 to October 31, 2024. You can find additional information about the Fund at https://www.abfunds.com/link/BWM/ACISX-S. You can also request this information by contacting us at (800) 227 4618.
What were the Fund costs for the last six months?
(Based on a hypothetical $10,000 investment)
| Class Name | Cost of a $10,000 investment | Costs paid as a percentage of a $10,000 investment |
|---|
| AB Corporate Income Shares | $0 | 0.00% |
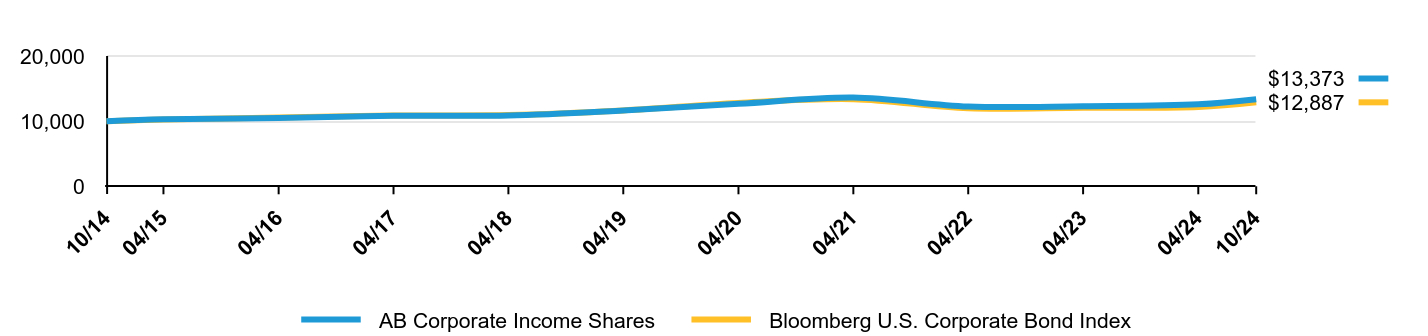
The following graph shows the performance of hypothetical $10,000 investments in the Fund and a broad-based securities market index over the most recently completed 10 fiscal years of the Fund, or since inception, if shorter. The Fund's performance reflects applicable sales charges and assumes the reinvestment of dividends.
| AB Corporate Income Shares | Bloomberg U.S. Corporate Bond Index |
|---|
| 10/14 | $10,000 | $10,000 |
| 04/15 | $10,285 | $10,235 |
| 04/16 | $10,473 | $10,544 |
| 04/17 | $10,827 | $10,861 |
| 04/18 | $10,880 | $10,933 |
| 04/19 | $11,645 | $11,643 |
| 04/20 | $12,653 | $12,794 |
| 04/21 | $13,619 | $13,365 |
| 04/22 | $12,242 | $11,971 |
| 04/23 | $12,297 | $12,052 |
| 04/24 | $12,585 | $12,172 |
| 10/24 | $13,373 | $12,887 |
Average Annual Total Returns
| 6 Months | 1 Year | 5 Years | 10 Years |
|---|
| AB Corporate Income Shares | 6.26% | 15.08% | 1.19% | 2.95% |
| Bloomberg U.S. Corporate Bond Index | 5.87% | 13.63% | 0.54% | 2.57% |
The addition of the Bloomberg U.S. Corporate Bond Index broad-based benchmark provides a comparison of the Fund's performance against the broader market as regulatorily required.
The graph and table do not reflect the deduction of taxes that a shareholder would pay on Fund distributions or the redemption or sale of Fund shares.
Visit https://www.abfunds.com/link/BWM/ACISX-S for the most recent performance information.
AB Corporate Income Shares: ACISX
1
| FUND STATISTICS | Fund Stats |
|---|
| Net Assets | $215,795,462 |
| # of Portfolio Holdings | 311 |
| Portfolio Turnover Rate | 62% |
| Total Advisory Fees Paid | $0 |
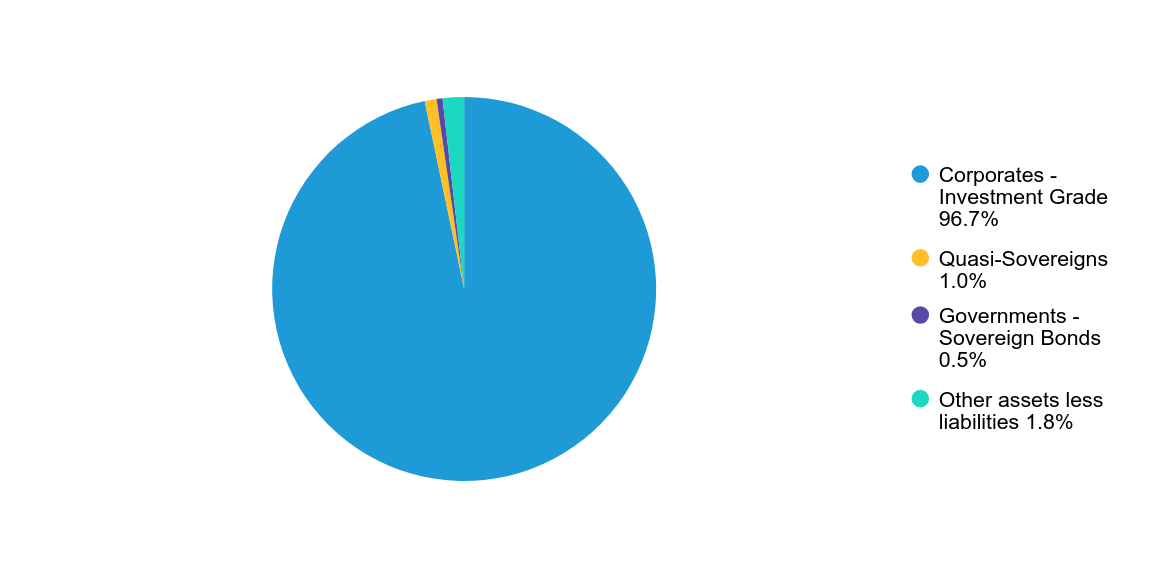
Graphical Representation of Holdings
| Value | Value |
|---|
| Corporates - Investment Grade | 96.7% |
| Quasi-Sovereigns | 1.0% |
| Governments - Sovereign Bonds | 0.5% |
| Other assets less liabilities | 1.8% |
Availability of Additional Information
You can find additional information on the Fund’s website at https://www.abfunds.com/link/BWM/ACISX-S, including the Fund's:
• Prospectus
• Financial information
• Fund holdings
• Proxy voting information
You can also request this information by contacting us at (800) 227 4618.
Shareholders who have consented to receive a single annual or semi-annual shareholder report at a shared address may revoke this consent by contacting us at (800) 227 4618.
AB Corporate Income Shares: ACISX
2
Information Regarding the Review and Approval of the Fund’s Advisory Agreement
Information regarding the Fund’s Board of Directors’/Trustees’ review of the advisory agreement is available on the Fund’s website https://www.abfunds.com/link/BWM/ACISX-S. You can request this information, free of charge, by contacting us at (800) 227 4618 or by scanning the QR code below.
The [A/B] logo and AllianceBernstein® are registered trademarks used by permission of the owner, AllianceBernstein L.P.
Please scan QR code for
Fund Information
AB Corporate Income Shares: ACISX
3
AB Impact Municipal Income Shares: ABIMX
Please scan QR code for
Fund Information
AB Impact Municipal Income Shares
Semi-Annual Shareholder Report
This semi-annual shareholder report contains important information about the AB Impact Municipal Income Shares (the “Fund”) for the period of May 1, 2024 to October 31, 2024. You can find additional information about the Fund at https://www.abfunds.com/link/AB/ABIMX-S. You can also request this information by contacting us at (800) 227 4618.
What were the Fund costs for the last six months?
(Based on a hypothetical $10,000 investment)
| Class Name | Cost of a $10,000 investment | Costs paid as a percentage of a $10,000 investment |
|---|
| AB Impact Municipal Income Shares | $0 | 0.00% |
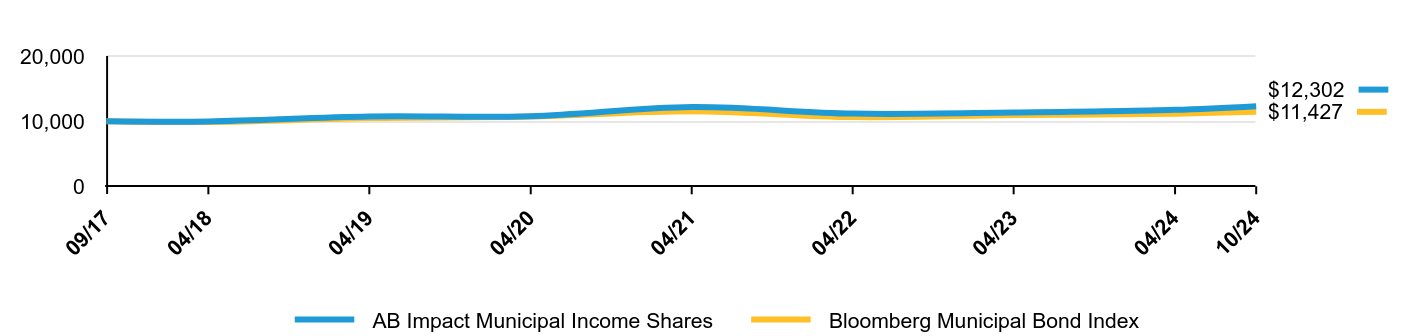
The following graph shows the performance of hypothetical $10,000 investments in the Fund and a broad-based securities market index over the most recently completed 10 fiscal years of the Fund, or since inception, if shorter. The Fund's performance reflects applicable sales charges and assumes the reinvestment of dividends.
| AB Impact Municipal Income Shares | Bloomberg Municipal Bond Index |
|---|
| 09/17 | $10,000 | $10,000 |
| 04/18 | $9,956 | $9,866 |
| 04/19 | $10,709 | $10,473 |
| 04/20 | $10,752 | $10,700 |
| 04/21 | $12,158 | $11,528 |
| 04/22 | $11,154 | $10,619 |
| 04/23 | $11,316 | $10,925 |
| 04/24 | $11,734 | $11,152 |
| 10/24 | $12,302 | $11,427 |
Average Annual Total Returns
| 6 Months | 1 Year | 5 Years | Since Inception 9/12/2017 |
|---|
| AB Impact Municipal Income Shares | 4.84% | 16.24% | 1.75% | 2.95% |
| Bloomberg Municipal Bond Index | 2.46% | 9.70% | 1.05% | 1.89% |
The graph and table do not reflect the deduction of taxes that a shareholder would pay on Fund distributions or the redemption or sale of Fund shares.
Visit https://www.abfunds.com/link/AB/ABIMX-S for the most recent performance information.
AB Impact Municipal Income Shares: ABIMX
1
| FUND STATISTICS | Fund Stats |
|---|
| Net Assets | $585,360,577 |
| # of Portfolio Holdings | 251 |
| Portfolio Turnover Rate | 11% |
| Total Advisory Fees Paid | $0 |
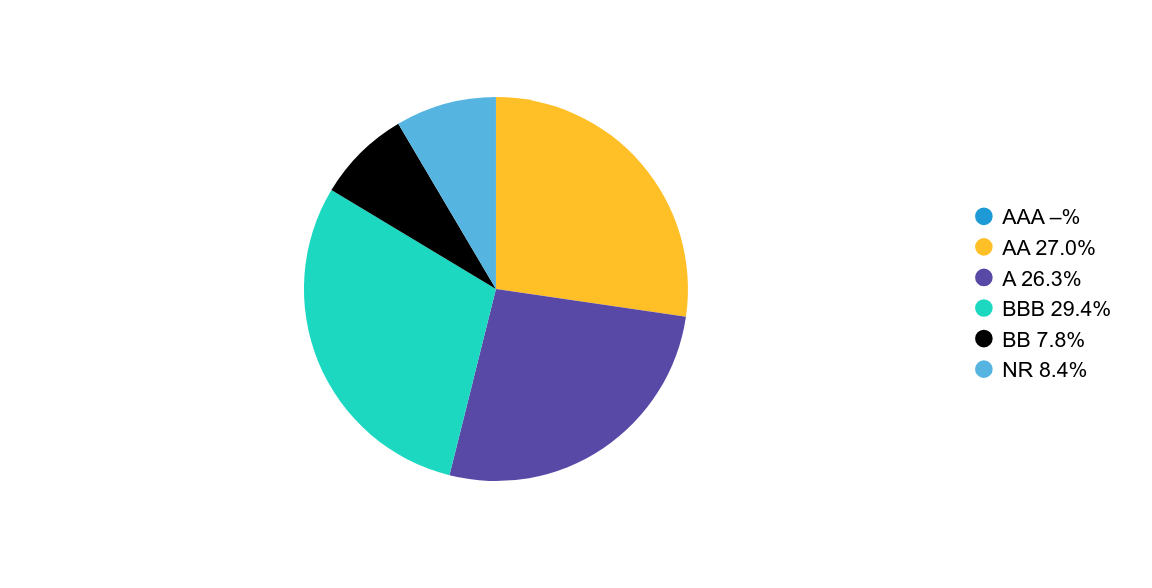
Graphical Representation of Holdings
Credit Rating BreakdownFootnote Reference*
| Value | Value |
|---|
| AAA | -% |
| AA | 27.0% |
| A | 26.3% |
| BBB | 29.4% |
| BB | 7.8% |
| NR | 8.4% |
| Footnote | Description |
Footnote* | The Fund’s quality rating breakdown is expressed as a percentage of the Fund’s total investments in municipal securities and may vary over time. The quality ratings are determined by using the S&P Global Ratings (“S&P”), Moody’s Investors Services, Inc. (“Moody’s”) and Fitch Ratings, Ltd. (“Fitch”). The Fund considers the credit ratings issued by S&P, Moody’s and Fitch and uses the highest rating issued by the agencies. These ratings are a measure of the quality and safety of a bond or portfolio, based on the issuer’s financial condition. AAA is the highest (best) and D is the lowest (worst). If applicable, the pre-refunded category includes bonds which are secured by U.S. Government securities and therefore are deemed high-quality investment grade by AllianceBernstein L.P.(the "Adviser"). If applicable, Not Applicable (N/A) includes non-credit worthy investments; such as, equities, currency contracts, futures and options. If applicable, the Not Rated category includes bonds that are not rated by a nationally recognized statistical rating organization. The Adviser evaluates the creditworthiness of non-rated securities based on a number of factors including, but not limited to, cash flows, enterprise value and economic environment. |
Availability of Additional Information
You can find additional information on the Fund’s website at https://www.abfunds.com/link/AB/ABIMX-S, including the Fund's:
• Prospectus
• Financial information
• Fund holdings
• Proxy voting information
You can also request this information by contacting us at (800) 227 4618.
Shareholders who have consented to receive a single annual or semi-annual shareholder report at a shared address may revoke this consent by contacting us at (800) 227 4618.
AB Impact Municipal Income Shares: ABIMX
2
Information Regarding the Review and Approval of the Fund’s Advisory Agreement
Information regarding the Fund’s Board of Directors’/Trustees’ review of the advisory agreement is available on the Fund’s website https://www.abfunds.com/link/AB/ABIMX-S. You can request this information, free of charge, by contacting us at (800) 227 4618 or by scanning the QR code below.
The [A/B] logo and AllianceBernstein® are registered trademarks used by permission of the owner, AllianceBernstein L.P.
Please scan QR code for
Fund Information
AB Impact Municipal Income Shares: ABIMX
3
AB Municipal Income Shares: MISHX
Please scan QR code for
Fund Information
AB Municipal Income Shares
Semi-Annual Shareholder Report
This semi-annual shareholder report contains important information about the AB Municipal Income Shares (the “Fund”) for the period of May 1, 2024 to October 31, 2024. You can find additional information about the Fund at https://www.abfunds.com/link/BWM/MISHX-S. You can also request this information by contacting us at (800) 227 4618.
What were the Fund costs for the last six months?
(Based on a hypothetical $10,000 investment)
| Class Name | Cost of a $10,000 investment | Costs paid as a percentage of a $10,000 investment |
|---|
| AB Municipal Income Shares | $0 | 0.00% |
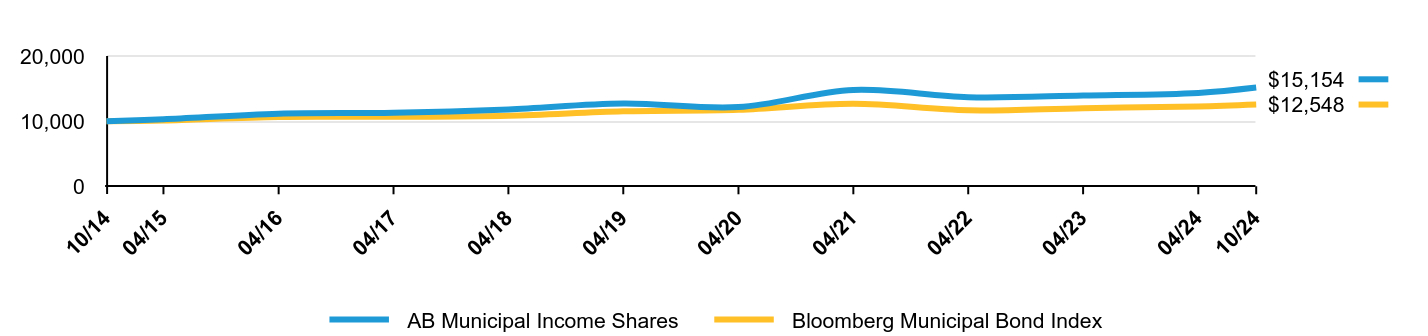
The following graph shows the performance of hypothetical $10,000 investments in the Fund and a broad-based securities market index over the most recently completed 10 fiscal years of the Fund, or since inception, if shorter. The Fund's performance reflects applicable sales charges and assumes the reinvestment of dividends.
| AB Municipal Income Shares | Bloomberg Municipal Bond Index |
|---|
| 10/14 | $10,000 | $10,000 |
| 04/15 | $10,295 | $10,117 |
| 04/16 | $11,153 | $10,652 |
| 04/17 | $11,288 | $10,667 |
| 04/18 | $11,802 | $10,833 |
| 04/19 | $12,690 | $11,501 |
| 04/20 | $12,153 | $11,749 |
| 04/21 | $14,786 | $12,659 |
| 04/22 | $13,673 | $11,661 |
| 04/23 | $13,935 | $11,996 |
| 04/24 | $14,326 | $12,246 |
| 10/24 | $15,154 | $12,548 |
Average Annual Total Returns
| 6 Months | 1 Year | 5 Years | 10 Years |
|---|
| AB Municipal Income Shares | 5.78% | 17.27% | 2.59% | 4.24% |
| Bloomberg Municipal Bond Index | 2.46% | 9.70% | 1.05% | 2.30% |
The graph and table do not reflect the deduction of taxes that a shareholder would pay on Fund distributions or the redemption or sale of Fund shares.
Visit https://www.abfunds.com/link/BWM/MISHX-S for the most recent performance information.
AB Municipal Income Shares: MISHX
1
| FUND STATISTICS | Fund Stats |
|---|
| Net Assets | $13,865,709,106 |
| # of Portfolio Holdings | 2,087 |
| Portfolio Turnover Rate | 5% |
| Total Advisory Fees Paid | $0 |
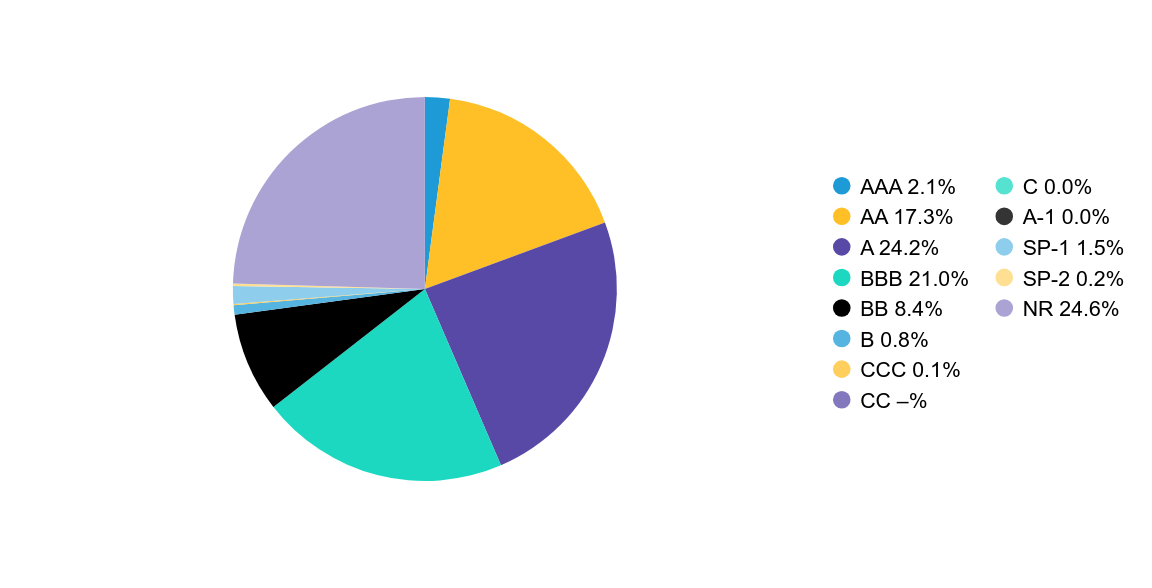
Graphical Representation of Holdings
Credit Rating BreakdownFootnote Reference*
| Value | Value |
|---|
| AAA | 2.1% |
| AA | 17.3% |
| A | 24.2% |
| BBB | 21.0% |
| BB | 8.4% |
| B | 0.8% |
| CCC | 0.1% |
| CC | -% |
| C | 0.0% |
| A-1 | 0.0% |
| SP-1 | 1.5% |
| SP-2 | 0.2% |
| NR | 24.6% |
| Footnote | Description |
Footnote* | The Fund’s quality rating breakdown is expressed as a percentage of the Fund’s total investments in municipal securities and may vary over time. The quality ratings are determined by using the S&P Global Ratings (“S&P”), Moody’s Investors Services, Inc. (“Moody’s”) and Fitch Ratings, Ltd. (“Fitch”). The Fund considers the credit ratings issued by S&P, Moody’s and Fitch and uses the highest rating issued by the agencies. These ratings are a measure of the quality and safety of a bond or portfolio, based on the issuer’s financial condition. AAA is the highest (best) and D is the lowest (worst). If applicable, the pre-refunded category includes bonds which are secured by U.S. Government securities and therefore are deemed high-quality investment grade by AllianceBernstein L.P.(the "Adviser"). If applicable, Not Applicable (N/A) includes non-credit worthy investments; such as, equities, currency contracts, futures and options. If applicable, the Not Rated category includes bonds that are not rated by a nationally recognized statistical rating organization. The Adviser evaluates the creditworthiness of non-rated securities based on a number of factors including, but not limited to, cash flows, enterprise value and economic environment. |
Availability of Additional Information
You can find additional information on the Fund’s website at https://www.abfunds.com/link/BWM/MISHX-S, including the Fund's:
• Prospectus
• Financial information
• Fund holdings
• Proxy voting information
You can also request this information by contacting us at (800) 227 4618.
Shareholders who have consented to receive a single annual or semi-annual shareholder report at a shared address may revoke this consent by contacting us at (800) 227 4618.
AB Municipal Income Shares: MISHX
2
Information Regarding the Review and Approval of the Fund’s Advisory Agreement
Information regarding the Fund’s Board of Directors’/Trustees’ review of the advisory agreement is available on the Fund’s website https://www.abfunds.com/link/BWM/MISHX-S. You can request this information, free of charge, by contacting us at (800) 227 4618 or by scanning the QR code below.
The [A/B] logo and AllianceBernstein® are registered trademarks used by permission of the owner, AllianceBernstein L.P.
Please scan QR code for
Fund Information
AB Municipal Income Shares: MISHX
3
AB Taxable Multi-Sector Income Shares: CSHTX
Please scan QR code for
Fund Information
AB Taxable Multi-Sector Income Shares
Semi-Annual Shareholder Report
This semi-annual shareholder report contains important information about the AB Taxable Multi-Sector Income Shares (the “Fund”) for the period of May 1, 2024 to October 31, 2024. You can find additional information about the Fund at https://www.abfunds.com/link/AB/CSHTX-S. You can also request this information by contacting us at (800) 227 4618.
What were the Fund costs for the last six months?
(Based on a hypothetical $10,000 investment)
| Class Name | Cost of a $10,000 investment | Costs paid as a percentage of a $10,000 investment |
|---|
| AB Taxable Multi-Sector Income Shares | $0 | 0.00% |
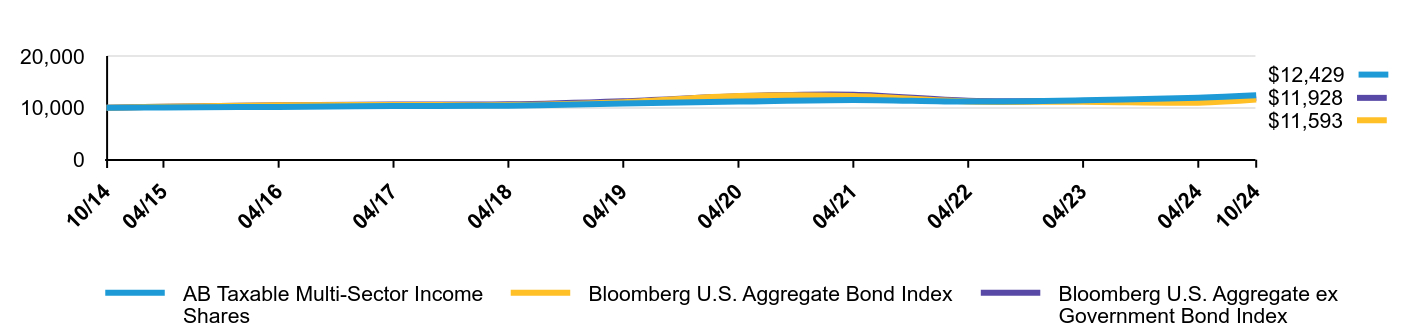
The following graph shows the performance of hypothetical $10,000 investments in the Fund, a broad-based securities market index and an additional index that corresponds to the Fund's investment strategies, over the most recently completed 10 fiscal years of the Fund, or since inception, if shorter. The Fund's performance reflects applicable sales charges and assumes the reinvestment of dividends.
| AB Taxable Multi-Sector Income Shares | Bloomberg U.S. Aggregate Bond Index | Bloomberg U.S. Aggregate ex Government Bond Index |
|---|
| 10/14 | $10,000 | $10,000 | $10,000 |
| 04/15 | $10,074 | $10,206 | $10,208 |
| 04/16 | $10,188 | $10,483 | $10,482 |
| 04/17 | $10,352 | $10,570 | $10,662 |
| 04/18 | $10,419 | $10,536 | $10,677 |
| 04/19 | $10,836 | $11,094 | $11,281 |
| 04/20 | $11,207 | $12,297 | $12,242 |
| 04/21 | $11,534 | $12,264 | $12,521 |
| 04/22 | $11,203 | $11,220 | $11,353 |
| 04/23 | $11,451 | $11,172 | $11,343 |
| 04/24 | $11,956 | $11,008 | $11,279 |
| 10/24 | $12,429 | $11,593 | $11,928 |
Average Annual Total Returns
| 6 Months | 1 Year | 5 Years | 10 Years |
|---|
| AB Taxable Multi-Sector Income Shares | 3.95% | 7.23% | 2.23% | 2.20% |
| Bloomberg U.S. Aggregate Bond Index | 5.31% | 10.55% | -0.23% | 1.49% |
| Bloomberg U.S. Aggregate ex Government Bond Index | 5.75% | 12.20% | 0.02% | 1.78% |
The addition of the Bloomberg U.S. Aggregate Bond Index broad-based benchmark provides a comparison of the Fund's performance against the broader market as regulatorily required.
The graph and table do not reflect the deduction of taxes that a shareholder would pay on Fund distributions or the redemption or sale of Fund shares.
Visit https://www.abfunds.com/link/AB/CSHTX-S for the most recent performance information.
| FUND STATISTICS | Fund Stats |
|---|
| Net Assets | $446,556,905 |
| # of Portfolio Holdings | 251 |
| Portfolio Turnover Rate | 28% |
| Total Advisory Fees Paid | $0 |
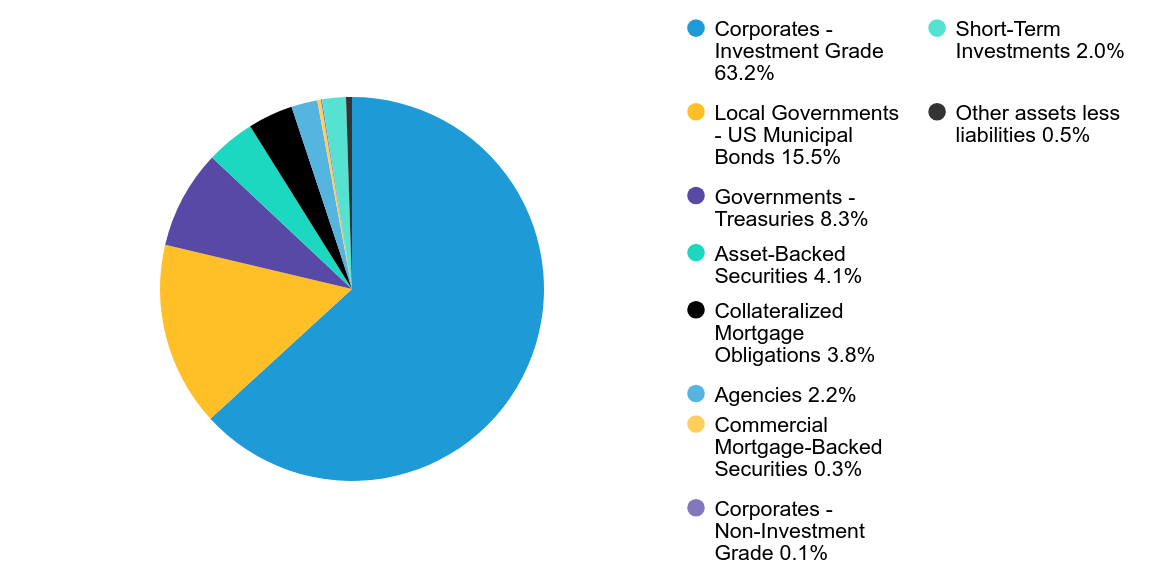
Graphical Representation of Holdings
| Value | Value |
|---|
| Corporates - Investment Grade | 63.2% |
| Local Governments - US Municipal Bonds | 15.5% |
| Governments - Treasuries | 8.3% |
| Asset-Backed Securities | 4.1% |
| Collateralized Mortgage Obligations | 3.8% |
| Agencies | 2.2% |
| Commercial Mortgage-Backed Securities | 0.3% |
| Corporates - Non-Investment Grade | 0.1% |
| Short-Term Investments | 2.0% |
| Other assets less liabilities | 0.5% |
Availability of Additional Information
You can find additional information on the Fund’s website at https://www.abfunds.com/link/AB/CSHTX-S, including the Fund's:
• Prospectus
• Financial information
• Fund holdings
• Proxy voting information
You can also request this information by contacting us at (800) 227 4618.
Shareholders who have consented to receive a single annual or semi-annual shareholder report at a shared address may revoke this consent by contacting us at (800) 227 4618.
Information Regarding the Review and Approval of the Fund’s Advisory Agreement
Information regarding the Fund’s Board of Directors’/Trustees’ review of the advisory agreement is available on the Fund’s website https://www.abfunds.com/link/AB/CSHTX-S. You can request this information, free of charge, by contacting us at (800) 227 4618 or by scanning the QR code below.
The [A/B] logo and AllianceBernstein® are registered trademarks used by permission of the owner, AllianceBernstein L.P.
Please scan QR code for
Fund Information
ITEM 2. CODE OF ETHICS.
Not applicable when filing a semi-annual report to shareholders.
ITEM 3. AUDIT COMMITTEE FINANCIAL EXPERT.
Not applicable when filing a semi-annual report to shareholders.
ITEM 4. PRINCIPAL ACCOUNTANT FEES AND SERVICES.
Not applicable when filing a semi-annual report to shareholders.
ITEM 5. AUDIT COMMITTEE OF LISTED REGISTRANTS.
Not applicable to the registrant.
ITEM 6. INVESTMENTS.
Please see Schedule of Investments contained in the Financial Statements included under Item 7 of this Form N-CSR.
ITEM 7. FINANCIAL STATEMENTS AND FINANCIAL HIGHLIGHTS FOR OPEN-END MANAGEMENT INVESTMENT COMPANIES.
OCT 10.31.24

SEMI-ANNUAL FINANCIAL STATEMENTS AND ADDITIONAL INFORMATION
AB CORPORATE INCOME SHARES

| | |
| |
| Investment Products Offered | | • Are Not FDIC Insured • May Lose Value • Are Not Bank Guaranteed |
Investors should consider the investment objectives, risks, charges and expenses of the Fund carefully before investing. For copies of our prospectus or summary prospectus, which contain this and other information, visit us online at www.abfunds.com or contact your AB representative. Please read the prospectus and/or summary prospectus carefully before investing.
This shareholder report must be preceded or accompanied by the Fund’s prospectus for individuals who are not current shareholders of the Fund.
You may obtain a description of the Fund’s proxy voting policies and procedures, and information regarding how the Fund voted proxies relating to portfolio securities during the most recent 12-month period ended June 30, without charge. Simply visit AB’s website at www.abfunds.com, or go to the Securities and Exchange Commission’s (the “Commission”) website at www.sec.gov, or call AB at (800) 227 4618.
The Fund files its complete schedule of portfolio holdings with the Commission for the first and third quarters of each fiscal year as an exhibit to its reports on Form N-PORT. The Fund’s Form N-PORT reports are available on the Commission’s website at www.sec.gov. AB publishes full portfolio holdings for the Fund monthly at www.abfunds.com.
AllianceBernstein Investments, Inc. (ABI) is the distributor of the AB family of mutual funds. ABI is a member of FINRA and is an affiliate of AllianceBernstein L.P., the Adviser of the funds.
The [A/B] logo and AllianceBernstein® are registered trademarks used by permission of the owner, AllianceBernstein L.P.
PORTFOLIO OF INVESTMENTS
October 31, 2024 (unaudited)
| | | | | | | | |
| | | Principal
Amount
(000) | | | U.S. $ Value | |
| |
CORPORATES - INVESTMENT GRADE – 96.7% | | | | | | | | |
Industrial – 59.4% | |
Basic – 2.4% | |
AngloGold Ashanti Holdings PLC
3.375%, 11/01/2028 | | $ | 1,705 | | | $ | 1,572,845 | |
Ecolab, Inc.
2.70%, 11/01/2026 | | | 190 | | | | 183,464 | |
Glencore Funding LLC
5.70%, 05/08/2033(a) | | | 590 | | | | 604,036 | |
6.50%, 10/06/2033(a) | | | 750 | | | | 805,778 | |
Inversiones CMPC SA
3.85%, 01/13/2030(a) | | | 210 | | | | 194,250 | |
6.125%, 02/26/2034(a) | | | 207 | | | | 210,933 | |
Sherwin-Williams Co. (The)
3.45%, 06/01/2027 | | | 1,493 | | | | 1,449,106 | |
Suzano Austria GmbH
6.00%, 01/15/2029 | | | 253 | | | | 256,083 | |
| | | | | | | | |
| | | | | | | 5,276,495 | |
| | | | | | | | |
Capital Goods – 4.8% | |
Boeing Co. (The)
2.196%, 02/04/2026 | | | 1,477 | | | | 1,422,676 | |
3.25%, 02/01/2028 | | | 136 | | | | 127,714 | |
3.625%, 02/01/2031 | | | 1,169 | | | | 1,055,327 | |
5.15%, 05/01/2030 | | | 52 | | | | 51,371 | |
6.528%, 05/01/2034(a) | | | 212 | | | | 223,497 | |
Caterpillar Financial Services Corp.
4.45%, 10/16/2026 | | | 1,096 | | | | 1,097,041 | |
5.00%, 05/14/2027 | | | 505 | | | | 512,090 | |
GE Capital International Funding Co. Unlimited Co.
4.418%, 11/15/2035 | | | 443 | | | | 417,359 | |
General Electric Co.
5.875%, 01/14/2038 | | | 1,317 | | | | 1,383,943 | |
John Deere Capital Corp.
4.40%, 09/08/2031 | | | 658 | | | | 642,340 | |
Parker-Hannifin Corp.
3.25%, 06/14/2029 | | | 999 | | | | 938,261 | |
4.25%, 09/15/2027 | | | 1,408 | | | | 1,395,919 | |
Waste Management, Inc.
4.50%, 03/15/2028 | | | 1,084 | | | | 1,082,157 | |
| | | | | | | | |
| | | | | | | 10,349,695 | |
| | | | | | | | |
Communications - Media – 5.0% | |
Charter Communications Operating LLC/Charter Communications Operating Capital
6.384%, 10/23/2035 | | | 765 | | | | 764,801 | |
6.484%, 10/23/2045 | | | 936 | | | | 886,036 | |
| | |
| |
| abfunds.com | | AB CORPORATE INCOME SHARES | 1 |
PORTFOLIO OF INVESTMENTS (continued)
| | | | | | | | |
| | | Principal
Amount
(000) | | | U.S. $ Value | |
| |
Discovery Communications LLC
5.30%, 05/15/2049 | | $ | 82 | | | $ | 63,848 | |
Fox Corp.
6.50%, 10/13/2033 | | | 610 | | | | 649,534 | |
Meta Platforms, Inc.
5.55%, 08/15/2064 | | | 764 | | | | 773,428 | |
5.75%, 05/15/2063 | | | 1,304 | | | | 1,358,351 | |
Paramount Global
4.20%, 05/19/2032 | | | 267 | | | | 232,407 | |
4.375%, 03/15/2043 | | | 1,601 | | | | 1,150,431 | |
5.90%, 10/15/2040 | | | 310 | | | | 268,119 | |
Thomson Reuters Corp.
5.85%, 04/15/2040 | | | 69 | | | | 71,180 | |
Time Warner Cable LLC
6.55%, 05/01/2037 | | | 360 | | | | 345,701 | |
6.75%, 06/15/2039 | | | 918 | | | | 892,985 | |
Warnermedia Holdings, Inc.
3.755%, 03/15/2027 | | | 1,394 | | | | 1,342,157 | |
4.279%, 03/15/2032 | | | 1,607 | | | | 1,409,660 | |
5.141%, 03/15/2052 | | | 757 | | | | 570,097 | |
| | | | | | | | |
| | | | | | | 10,778,735 | |
| | | | | | | | |
Communications - Telecommunications – 0.7% | | | | | | | | |
AT&T, Inc.
6.55%, 01/15/2028 | | | 100 | | | | 104,259 | |
T-Mobile USA, Inc.
2.625%, 04/15/2026 | | | 1,465 | | | | 1,420,361 | |
| | | | | | | | |
| | | | | | | 1,524,620 | |
| | | | | | | | |
Consumer Cyclical - Automotive – 5.0% | |
Aptiv PLC/Aptiv Global Financing DAC
5.15%, 09/13/2034 | | | 774 | | | | 733,295 | |
Ford Motor Co.
3.25%, 02/12/2032 | | | 1,509 | | | | 1,263,606 | |
Ford Motor Credit Co., LLC
4.00%, 11/13/2030 | | | 626 | | | | 565,960 | |
6.05%, 03/05/2031 | | | 826 | | | | 831,055 | |
6.125%, 03/08/2034 | | | 238 | | | | 235,601 | |
General Motors Co.
5.15%, 04/01/2038 | | | 52 | | | | 48,765 | |
6.60%, 04/01/2036 | | | 522 | | | | 553,383 | |
General Motors Financial Co., Inc.
3.10%, 01/12/2032 | | | 566 | | | | 486,471 | |
3.60%, 06/21/2030 | | | 540 | | | | 495,056 | |
5.95%, 04/04/2034 | | | 1,114 | | | | 1,134,587 | |
Harley-Davidson Financial Services, Inc.
5.95%, 06/11/2029(a) | | | 558 | | | | 559,189 | |
| | |
| |
2 | AB CORPORATE INCOME SHARES | | abfunds.com |
PORTFOLIO OF INVESTMENTS (continued)
| | | | | | | | |
| | | Principal
Amount
(000) | | | U.S. $ Value | |
| |
Hyundai Capital America
5.30%, 03/19/2027(a) | | $ | 385 | | | $ | 389,008 | |
5.65%, 06/26/2026(a) | | | 1,125 | | | | 1,137,499 | |
5.68%, 06/26/2028(a) | | | 566 | | | | 577,297 | |
Nissan Motor Acceptance Co., LLC
5.30%, 09/13/2027(a) | | | 302 | | | | 296,999 | |
Toyota Motor Credit Corp.
4.55%, 08/09/2029 | | | 663 | | | | 658,538 | |
5.10%, 03/21/2031 | | | 772 | | | | 782,808 | |
| | | | | | | | |
| | | | | | | 10,749,117 | |
| | | | | | | | |
Consumer Cyclical - Entertainment – 0.3% | |
Mattel, Inc.
3.375%, 04/01/2026(a) | | | 588 | | | | 574,141 | |
| | | | | | | | |
|
Consumer Cyclical - Other – 1.1% | |
DR Horton, Inc.
5.00%, 10/15/2034 | | | 462 | | | | 450,885 | |
Marriott International, Inc./MD
Series GG
3.50%, 10/15/2032 | | | 1,629 | | | | 1,448,751 | |
Series R
3.125%, 06/15/2026 | | | 482 | | | | 470,721 | |
| | | | | | | | |
| | | | | | | 2,370,357 | |
| | | | | | | | |
Consumer Cyclical - Restaurants – 1.0% | |
McDonald’s Corp.
3.50%, 03/01/2027 | | | 1,435 | | | | 1,401,722 | |
6.30%, 10/15/2037 | | | 622 | | | | 679,554 | |
| | | | | | | | |
| | | | | | | 2,081,276 | |
| | | | | | | | |
Consumer Cyclical - Retailers – 1.4% | |
CK Hutchison International 23 Ltd.
4.875%, 04/21/2033(a) | | | 1,396 | | | | 1,375,967 | |
Costco Wholesale Corp.
1.60%, 04/20/2030 | | | 586 | | | | 501,452 | |
Ross Stores, Inc.
4.70%, 04/15/2027 | | | 160 | | | | 159,291 | |
4.80%, 04/15/2030 | | | 115 | | | | 112,866 | |
5.45%, 04/15/2050 | | | 175 | | | | 163,947 | |
VF Corp.
2.80%, 04/23/2027 | | | 727 | | | | 685,365 | |
| | | | | | | | |
| | | | | | | 2,998,888 | |
| | | | | | | | |
Consumer Non-Cyclical – 14.4% | |
AbbVie, Inc.
2.95%, 11/21/2026 | | | 1,450 | | | | 1,406,079 | |
Altria Group, Inc.
2.45%, 02/04/2032 | | | 1,740 | | | | 1,444,826 | |
3.40%, 02/04/2041 | | | 462 | | | | 344,185 | |
| | |
| |
| abfunds.com | | AB CORPORATE INCOME SHARES | 3 |
PORTFOLIO OF INVESTMENTS (continued)
| | | | | | | | |
| | | Principal
Amount
(000) | | | U.S. $ Value | |
| |
Archer-Daniels-Midland Co.
2.50%, 08/11/2026 | | $ | 469 | | | $ | 452,308 | |
2.90%, 03/01/2032 | | | 1,473 | | | | 1,293,839 | |
3.25%, 03/27/2030 | | | 121 | | | | 112,390 | |
4.50%, 08/15/2033 | | | 476 | | | | 461,154 | |
Bunge Ltd. Finance Corp.
2.75%, 05/14/2031 | | | 1,637 | | | | 1,434,781 | |
Cargill, Inc.
3.625%, 04/22/2027(a) | | | 560 | | | | 547,238 | |
4.375%, 04/22/2052(a) | | | 350 | | | | 300,797 | |
5.125%, 10/11/2032(a) | | | 166 | | | | 168,736 | |
Cencora, Inc.
3.45%, 12/15/2027 | | | 1,501 | | | | 1,448,870 | |
Cencosud SA
5.95%, 05/28/2031(a) | | | 650 | | | | 658,190 | |
Coca-Cola Co. (The)
5.40%, 05/13/2064 | | | 748 | | | | 754,268 | |
CVS Health Corp.
2.875%, 06/01/2026 | | | 1,468 | | | | 1,422,360 | |
4.78%, 03/25/2038 | | | 1,557 | | | | 1,386,882 | |
5.125%, 07/20/2045 | | | 505 | | | | 442,143 | |
5.70%, 06/01/2034 | | | 133 | | | | 133,616 | |
Eli Lilly & Co.
3.375%, 03/15/2029 | | | 1,468 | | | | 1,404,025 | |
5.20%, 08/14/2064 | | | 421 | | | | 410,707 | |
General Mills, Inc.
4.70%, 01/30/2027 | | | 304 | | | | 304,231 | |
HCA, Inc.
5.25%, 06/15/2026 | | | 1,266 | | | | 1,270,887 | |
5.375%, 09/01/2026 | | | 1,418 | | | | 1,425,203 | |
Imperial Brands Finance PLC
5.875%, 07/01/2034(a) | | | 873 | | | | 880,333 | |
Philip Morris International, Inc.
0.875%, 05/01/2026 | | | 767 | | | | 725,743 | |
5.25%, 02/13/2034 | | | 875 | | | | 878,063 | |
5.375%, 02/15/2033 | | | 960 | | | | 972,874 | |
6.375%, 05/16/2038 | | | 86 | | | | 94,327 | |
Pilgrim’s Pride Corp.
3.50%, 03/01/2032 | | | 1,351 | | | | 1,182,963 | |
6.25%, 07/01/2033 | | | 1,062 | | | | 1,100,551 | |
Procter & Gamble Co. (The)
4.15%, 10/24/2029 | | | 1,096 | | | | 1,088,635 | |
Roche Holdings, Inc.
4.203%, 09/09/2029(a) | | | 835 | | | | 820,863 | |
4.909%, 03/08/2031(a) | | | 774 | | | | 782,065 | |
Stryker Corp.
3.50%, 03/15/2026 | | | 692 | | | | 681,440 | |
| | |
| |
4 | AB CORPORATE INCOME SHARES | | abfunds.com |
PORTFOLIO OF INVESTMENTS (continued)
| | | | | | | | |
| | | Principal
Amount
(000) | | | U.S. $ Value | |
| |
Sysco Corp.
3.30%, 07/15/2026 | | $ | 1,451 | | | $ | 1,417,598 | |
Tyson Foods, Inc.
4.00%, 03/01/2026 | | | 1,404 | | | | 1,388,654 | |
| | | | | | | | |
| | | | | | | 31,041,824 | |
| | | | | | | | |
Energy – 8.8% | |
ConocoPhillips Co.
5.05%, 09/15/2033 | | | 1,356 | | | | 1,362,156 | |
5.30%, 05/15/2053 | | | 1,182 | | | | 1,136,564 | |
Continental Resources, Inc./OK
2.875%, 04/01/2032(a) | | | 384 | | | | 317,476 | |
4.375%, 01/15/2028 | | | 677 | | | | 656,717 | |
5.75%, 01/15/2031(a) | | | 1,261 | | | | 1,261,441 | |
Devon Energy Corp.
5.20%, 09/15/2034 | | | 754 | | | | 724,994 | |
5.60%, 07/15/2041 | | | 1,077 | | | | 1,019,208 | |
Diamondback Energy, Inc.
3.25%, 12/01/2026 | | | 1,463 | | | | 1,420,310 | |
5.90%, 04/18/2064 | | | 112 | | | | 108,834 | |
EQT Corp.
3.125%, 05/15/2026(a) | | | 492 | | | | 476,699 | |
Hess Corp.
4.30%, 04/01/2027 | | | 1,414 | | | | 1,398,870 | |
Marathon Oil Corp.
5.70%, 04/01/2034 | | | 447 | | | | 463,324 | |
6.60%, 10/01/2037 | | | 1,211 | | | | 1,331,870 | |
Occidental Petroleum Corp.
5.375%, 01/01/2032 | | | 334 | | | | 329,581 | |
6.625%, 09/01/2030 | | | 823 | | | | 864,800 | |
ONEOK Partners LP
6.65%, 10/01/2036 | | | 645 | | | | 697,497 | |
ONEOK, Inc.
5.05%, 11/01/2034 | | | 701 | | | | 679,451 | |
Pioneer Natural Resources Co.
5.10%, 03/29/2026 | | | 1,411 | | | | 1,421,794 | |
Saudi Arabian Oil Co.
5.75%, 07/17/2054(a) | | | 257 | | | | 247,273 | |
5.875%, 07/17/2064(a) | | | 545 | | | | 523,369 | |
Suncor Energy, Inc.
6.85%, 06/01/2039 | | | 181 | | | | 198,638 | |
TotalEnergies Capital SA
5.425%, 09/10/2064 | | | 877 | | | | 845,744 | |
Var Energi ASA
8.00%, 11/15/2032(a) | | | 1,300 | | | | 1,473,732 | |
| | | | | | | | |
| | | | | | | 18,960,342 | |
| | | | | | | | |
| | |
| |
| abfunds.com | | AB CORPORATE INCOME SHARES | 5 |
PORTFOLIO OF INVESTMENTS (continued)
| | | | | | | | |
| | | Principal
Amount
(000) | | | U.S. $ Value | |
| |
Other Industrial – 0.3% | |
Hutchison Whampoa International 03/33 Ltd.
7.45%, 11/24/2033(a) | | $ | 636 | | | $ | 737,385 | |
| | | | | | | | |
|
Services – 3.6% | |
Amazon.com, Inc.
3.25%, 05/12/2061 | | | 2,087 | | | | 1,414,088 | |
Booking Holdings, Inc.
3.55%, 03/15/2028 | | | 1,151 | | | | 1,115,446 | |
Mastercard, Inc.
2.95%, 11/21/2026 | | | 677 | | | | 658,545 | |
3.35%, 03/26/2030 | | | 1,532 | | | | 1,439,176 | |
4.10%, 01/15/2028 | | | 369 | | | | 366,022 | |
4.875%, 05/09/2034 | | | 88 | | | | 87,964 | |
Moody’s Corp.
5.00%, 08/05/2034 | | | 567 | | | | 563,485 | |
S&P Global, Inc.
2.45%, 03/01/2027 | | | 1,482 | | | | 1,413,887 | |
4.25%, 05/01/2029 | | | 793 | | | | 778,996 | |
4.75%, 08/01/2028 | | | 20 | | | | 20,081 | |
| | | | | | | | |
| | | | | | | 7,857,690 | |
| | | | | | | | |
Technology – 9.3% | |
Apple, Inc.
2.85%, 08/05/2061 | | | 1,172 | | | | 739,239 | |
4.10%, 08/08/2062 | | | 1,699 | | | | 1,407,061 | |
Applied Materials, Inc.
1.75%, 06/01/2030 | | | 529 | | | | 453,337 | |
3.30%, 04/01/2027 | | | 1,439 | | | | 1,401,643 | |
4.80%, 06/15/2029 | | | 467 | | | | 470,876 | |
Autodesk, Inc.
2.85%, 01/15/2030 | | | 1,536 | | | | 1,397,775 | |
Broadcom Corp./Broadcom Cayman Finance Ltd.
3.875%, 01/15/2027 | | | 654 | | | | 643,301 | |
Broadcom, Inc.
4.15%, 02/15/2028 | | | 194 | | | | 190,467 | |
CDW LLC/CDW Finance Corp.
2.67%, 12/01/2026 | | | 1,280 | | | | 1,221,978 | |
Hewlett Packard Enterprise Co.
4.40%, 09/25/2027 | | | 361 | | | | 357,978 | |
Intel Corp.
1.60%, 08/12/2028 | | | 998 | | | | 878,839 | |
Jabil, Inc.
3.00%, 01/15/2031 | | | 540 | | | | 475,751 | |
3.95%, 01/12/2028 | | | 584 | | | | 565,902 | |
Lam Research Corp.
1.90%, 06/15/2030 | | | 1,676 | | | | 1,442,684 | |
| | |
| |
6 | AB CORPORATE INCOME SHARES | | abfunds.com |
PORTFOLIO OF INVESTMENTS (continued)
| | | | | | | | |
| | | Principal
Amount
(000) | | | U.S. $ Value | |
| |
Microsoft Corp.
2.675%, 06/01/2060 | | $ | 791 | | | $ | 483,072 | |
3.041%, 03/17/2062 | | | 2,022 | | | | 1,351,303 | |
NXP BV/NXP Funding LLC
5.55%, 12/01/2028 | | | 1,124 | | | | 1,148,211 | |
Oracle Corp.
3.85%, 07/15/2036 | | | 1,634 | | | | 1,415,289 | |
QUALCOMM, Inc.
1.30%, 05/20/2028 | | | 1,582 | | | | 1,416,127 | |
SK Hynix, Inc.
2.375%, 01/19/2031(a) | | | 390 | | | | 330,743 | |
Tyco Electronics Group SA
4.625%, 02/01/2030 | | | 438 | | | | 434,960 | |
VMware LLC
1.40%, 08/15/2026 | | | 1,537 | | | | 1,448,930 | |
3.90%, 08/21/2027 | | | 436 | | | | 425,981 | |
| | | | | | | | |
| | | | | | | 20,101,447 | |
| | | | | | | | |
Transportation - Airlines – 0.7% | |
AS Mileage Plan IP Ltd.
5.021%, 10/20/2029(a) | | | 278 | | | | 269,746 | |
5.308%, 10/20/2031(a) | | | 359 | | | | 346,887 | |
Delta Air Lines, Inc./SkyMiles IP Ltd.
4.75%, 10/20/2028(a) | | | 812 | | | | 802,522 | |
| | | | | | | | |
| | | | | | | 1,419,155 | |
| | | | | | | | |
Transportation - Services – 0.6% | |
ENA Master Trust
4.00%, 05/19/2048(a) | | | 370 | | | | 278,732 | |
TTX Co.
5.50%, 09/25/2026(a) | | | 1,105 | | | | 1,118,293 | |
| | | | | | | | |
| | | | | | | 1,397,025 | |
| | | | | | | | |
| | | | | | | 128,218,192 | |
| | | | | | | | |
Financial Institutions – 27.5% | |
Banking – 21.9% | |
AIB Group PLC
5.871%, 03/28/2035(a) | | | 778 | | | | 795,653 | |
Ally Financial, Inc.
6.848%, 01/03/2030 | | | 256 | | | | 266,079 | |
6.992%, 06/13/2029 | | | 430 | | | | 448,688 | |
American Express Co.
5.645%, 04/23/2027 | | | 756 | | | | 765,579 | |
Banco Bilbao Vizcaya Argentaria SA
7.883%, 11/15/2034 | | | 200 | | | | 223,836 | |
Banco de Credito del Peru SA
3.125%, 07/01/2030(a) | | | 274 | | | | 266,931 | |
| | |
| |
| abfunds.com | | AB CORPORATE INCOME SHARES | 7 |
PORTFOLIO OF INVESTMENTS (continued)
| | | | | | | | |
| | | Principal
Amount
(000) | | | U.S. $ Value | |
| |
Banco Santander SA
1.722%, 09/14/2027 | | $ | 600 | | | $ | 564,630 | |
6.921%, 08/08/2033 | | | 1,000 | | | | 1,076,150 | |
9.625%, 05/21/2033(b) | | | 200 | | | | 231,032 | |
Bank of America Corp.
3.846%, 03/08/2037 | | | 1,605 | | | | 1,439,460 | |
5.518%, 10/25/2035 | | | 655 | | | | 650,160 | |
Series N
1.658%, 03/11/2027 | | | 1,368 | | | | 1,309,805 | |
Bank of Ireland Group PLC
5.601%, 03/20/2030(a) | | | 332 | | | | 337,910 | |
Barclays PLC
5.088%, 06/20/2030 | | | 490 | | | | 482,312 | |
5.335%, 09/10/2035 | | | 653 | | | | 640,064 | |
5.674%, 03/12/2028 | | | 287 | | | | 291,477 | |
7.119%, 06/27/2034 | | | 1,275 | | | | 1,381,016 | |
BBVA Bancomer SA/Texas
5.875%, 09/13/2034(a) | | | 330 | | | | 310,613 | |
BNP Paribas SA
4.625%, 02/25/2031(a)(b) | | | 434 | | | | 365,215 | |
CaixaBank SA
6.037%, 06/15/2035(a) | | | 894 | | | | 916,913 | |
6.84%, 09/13/2034(a) | | | 390 | | | | 421,929 | |
Capital One Financial Corp.
5.463%, 07/26/2030 | | | 763 | | | | 769,730 | |
Citibank NA
4.838%, 08/06/2029 | | | 601 | | | | 602,863 | |
Citigroup, Inc.
3.52%, 10/27/2028 | | | 1,293 | | | | 1,245,392 | |
4.542%, 09/19/2030 | | | 776 | | | | 760,185 | |
Series VAR
3.07%, 02/24/2028 | | | 1,362 | | | | 1,310,012 | |
Series W
4.00%, 12/10/2025(b) | | | 368 | | | | 358,852 | |
Series X
3.875%, 02/18/2026(b) | | | 344 | | | | 332,593 | |
Credit Agricole SA
4.00%, 01/10/2033(a) | | | 1,343 | | | | 1,273,339 | |
Danske Bank A/S
4.613%, 10/02/2030(a) | | | 407 | | | | 397,305 | |
Deutsche Bank AG/New York NY
4.999%, 09/11/2030 | | | 178 | | | | 175,264 | |
7.079%, 02/10/2034 | | | 1,098 | | | | 1,152,120 | |
DNB Bank ASA
4.875%, 11/12/2024(a)(b) | | | 331 | | | | 330,805 | |
Goldman Sachs Bank USA/New York NY
5.414%, 05/21/2027 | | | 767 | | | | 774,202 | |
| | |
| |
8 | AB CORPORATE INCOME SHARES | | abfunds.com |
PORTFOLIO OF INVESTMENTS (continued)
| | | | | | | | |
| | | Principal
Amount
(000) | | | U.S. $ Value | |
| |
Goldman Sachs Group, Inc. (The)
1.542%, 09/10/2027 | | $ | 881 | | | $ | 829,884 | |
1.948%, 10/21/2027 | | | 340 | | | | 321,484 | |
HSBC Holdings PLC
5.733%, 05/17/2032 | | | 1,092 | | | | 1,118,186 | |
Intesa Sanpaolo SpA
6.625%, 06/20/2033(a) | | | 368 | | | | 390,680 | |
7.20%, 11/28/2033(a) | | | 422 | | | | 466,234 | |
7.778%, 06/20/2054(a) | | | 935 | | | | 1,030,725 | |
JPMorgan Chase & Co.
1.04%, 02/04/2027 | | | 1,516 | | | | 1,445,324 | |
1.578%, 04/22/2027 | | | 1,511 | | | | 1,441,902 | |
2.956%, 05/13/2031 | | | 848 | | | | 760,707 | |
2.963%, 01/25/2033 | | | 808 | | | | 705,853 | |
4.505%, 10/22/2028 | | | 32 | | | | 31,786 | |
4.979%, 07/22/2028 | | | 329 | | | | 330,579 | |
5.04%, 01/23/2028 | | | 890 | | | | 894,655 | |
5.766%, 04/22/2035 | | | 410 | | | | 426,761 | |
KBC Group NV
4.932%, 10/16/2030(a) | | | 797 | | | | 788,950 | |
Lloyds Banking Group PLC
7.50%, 09/27/2025(b) | | | 287 | | | | 288,449 | |
M&T Bank Corp.
7.413%, 10/30/2029 | | | 833 | | | | 896,591 | |
Morgan Stanley
5.652%, 04/13/2028 | | | 1,077 | | | | 1,098,206 | |
Morgan Stanley Bank NA
4.447%, 10/15/2027 | | | 1,100 | | | | 1,094,346 | |
Series B
5.504%, 05/26/2028 | | | 1,094 | | | | 1,112,762 | |
Nationwide Building Society
2.972%, 02/16/2028(a) | | | 404 | | | | 385,767 | |
NatWest Group PLC
8.125%, 11/10/2033(b) | | | 256 | | | | 273,692 | |
Nordea Bank Abp
6.625%, 03/26/2026(a)(b) | | | 335 | | | | 336,775 | |
Royal Bank of Canada
Series G
4.522%, 10/18/2028 | | | 764 | | | | 759,859 | |
Santander Holdings USA, Inc.
5.353%, 09/06/2030 | | | 488 | | | | 483,057 | |
Societe Generale SA
5.519%, 01/19/2028(a) | | | 884 | | | | 887,023 | |
7.367%, 01/10/2053(a) | | | 1,103 | | | | 1,123,913 | |
Standard Chartered PLC
5.005%, 10/15/2030(a) | | | 525 | | | | 518,516 | |
| | |
| |
| abfunds.com | | AB CORPORATE INCOME SHARES | 9 |
PORTFOLIO OF INVESTMENTS (continued)
| | | | | | | | |
| | | Principal
Amount
(000) | | | U.S. $ Value | |
| |
Sumitomo Mitsui Trust Bank Ltd.
4.45%, 09/10/2027(a) | | $ | 233 | | | $ | 231,229 | |
Svenska Handelsbanken AB
4.375%, 03/01/2027(a)(b) | | | 400 | | | | 382,552 | |
Synchrony Financial
5.935%, 08/02/2030 | | | 268 | | | | 271,814 | |
Toronto-Dominion Bank (The)
5.146%, 09/10/2034 | | | 381 | | | | 374,439 | |
Truist Financial Corp.
1.267%, 03/02/2027 | | | 1,331 | | | | 1,269,042 | |
UBS Group AG
1.364%, 01/30/2027(a) | | | 528 | | | | 504,515 | |
9.25%, 11/13/2028(a)(b) | | | 273 | | | | 297,174 | |
US Bank NA/Cincinnati OH
4.507%, 10/22/2027 | | | 441 | | | | 439,474 | |
Wells Fargo & Co.
5.707%, 04/22/2028 | | | 569 | | | | 580,016 | |
| | | | | | | | |
| | | | | | | 47,261,035 | |
| | | | | | | | |
Brokerage – 0.2% | |
Charles Schwab Corp. (The)
Series I
4.00%, 06/01/2026(b) | | | 595 | | | | 570,891 | |
| | | | | | | | |
|
Insurance – 2.7% | |
Allstate Corp. (The)
Series B
8.318% (CME Term SOFR 3 Month + 3.20%), 08/15/2053(c) | | | 712 | | | | 712,306 | |
Athene Global Funding
1.985%, 08/19/2028(a) | | | 292 | | | | 260,552 | |
2.55%, 11/19/2030(a) | | | 73 | | | | 62,741 | |
2.717%, 01/07/2029(a) | | | 118 | | | | 107,079 | |
4.721%, 10/08/2029(a) | | | 708 | | | | 695,086 | |
5.526%, 07/11/2031(a) | | | 199 | | | | 201,555 | |
5.583%, 01/09/2029(a) | | | 46 | | | | 46,666 | |
5.684%, 02/23/2026(a) | | | 925 | | | | 932,252 | |
Cigna Group (The)
7.875%, 05/15/2027 | | | 53 | | | | 56,499 | |
Hartford Financial Services Group, Inc. (The)
Series ICON
7.505% (CME Term SOFR 3 Month + 2.39%), 02/12/2047(a)(c) | | | 535 | | | | 494,779 | |
MetLife, Inc.
Series D
5.875%, 03/15/2028(b) | | | 170 | | | | 171,727 | |
Principal Life Global Funding II
4.60%, 08/19/2027(a) | | | 412 | | | | 411,959 | |
| | |
| |
10 | AB CORPORATE INCOME SHARES | | abfunds.com |
PORTFOLIO OF INVESTMENTS (continued)
| | | | | | | | |
| | | Principal
Amount
(000) | | | U.S. $ Value | |
| |
Prudential Financial, Inc.
5.375%, 05/15/2045 | | $ | 260 | | | $ | 258,601 | |
6.50%, 03/15/2054 | | | 1,359 | | | | 1,417,818 | |
| | | | | | | | |
| | | | | | | 5,829,620 | |
| | | | | | | | |
REITs – 2.7% | |
American Tower Corp.
1.60%, 04/15/2026 | | | 567 | | | | 541,406 | |
2.75%, 01/15/2027 | | | 1,487 | | | | 1,424,888 | |
Essential Properties LP
2.95%, 07/15/2031 | | | 454 | | | | 386,113 | |
GLP Capital LP/GLP Financing II, Inc.
3.25%, 01/15/2032 | | | 139 | | | | 120,008 | |
4.00%, 01/15/2030 | | | 435 | | | | 405,142 | |
5.375%, 04/15/2026 | | | 1,414 | | | | 1,414,552 | |
Host Hotels & Resorts LP
5.50%, 04/15/2035 | | | 659 | | | | 646,156 | |
Simon Property Group LP
4.75%, 09/26/2034 | | | 480 | | | | 460,286 | |
Trust Fibra Uno
7.375%, 02/13/2034(a) | | | 358 | | | | 354,384 | |
| | | | | | | | |
| | | | | | | 5,752,935 | |
| | | | | | | | |
| | | | | | | 59,414,481 | |
| | | | | | | | |
Utility – 9.8% | |
Electric – 9.7% | |
AEP Texas, Inc.
5.25%, 05/15/2052 | | | 1,193 | | | | 1,114,083 | |
AES Panama Generation Holdings SRL
4.375%, 05/31/2030(a) | | | 193 | | | | 170,539 | |
Alexander Funding Trust II
7.467%, 07/31/2028(a) | | | 640 | | | | 677,210 | |
Alfa Desarrollo SpA
4.55%, 09/27/2051(a) | | | 218 | | | | 163,870 | |
American Electric Power Co., Inc.
6.95%, 12/15/2054 | | | 270 | | | | 282,023 | |
Berkshire Hathaway Energy Co.
5.95%, 05/15/2037 | | | 1,245 | | | | 1,313,550 | |
6.125%, 04/01/2036 | | | 1,298 | | | | 1,385,226 | |
CenterPoint Energy Houston Electric LLC
5.05%, 03/01/2035 | | | 562 | | | | 560,314 | |
Commonwealth Edison Co.
5.65%, 06/01/2054 | | | 762 | | | | 781,728 | |
DTE Energy Co.
4.95%, 07/01/2027 | | | 655 | | | | 658,589 | |
Empresas Publicas de Medellin ESP
4.25%, 07/18/2029(a) | | | 200 | | | | 175,104 | |
Enel Chile SA
4.875%, 06/12/2028 | | | 62 | | | | 61,388 | |
| | |
| |
| abfunds.com | | AB CORPORATE INCOME SHARES | 11 |
PORTFOLIO OF INVESTMENTS (continued)
| | | | | | | | |
| | | Principal
Amount
(000) | | | U.S. $ Value | |
| |
Engie Energia Chile SA
6.375%, 04/17/2034(a) | | $ | 663 | | | $ | 675,696 | |
Entergy Louisiana LLC
5.70%, 03/15/2054 | | | 778 | | | | 796,283 | |
Entergy Texas, Inc.
5.55%, 09/15/2054 | | | 258 | | | | 256,648 | |
Fells Point Funding Trust
3.046%, 01/31/2027(a) | | | 261 | | | | 250,307 | |
FirstEnergy Transmission LLC
2.866%, 09/15/2028(a) | | | 1,520 | | | | 1,411,214 | |
Florida Power & Light Co.
4.40%, 05/15/2028 | | | 1,127 | | | | 1,120,689 | |
5.05%, 04/01/2028 | | | 1,364 | | | | 1,382,687 | |
NextEra Energy Capital Holdings, Inc.
6.70%, 09/01/2054 | | | 74 | | | | 75,939 | |
Niagara Energy SAC
5.746%, 10/03/2034(a) | | | 333 | | | | 326,340 | |
Niagara Mohawk Power Corp.
2.759%, 01/10/2032(a) | | | 556 | | | | 473,061 | |
4.278%, 12/15/2028(a) | | | 361 | | | | 349,979 | |
5.29%, 01/17/2034(a) | | | 1,392 | | | | 1,382,075 | |
Pacific Gas and Electric Co.
5.55%, 05/15/2029 | | | 182 | | | | 185,343 | |
PECO Energy Co.
5.25%, 09/15/2054 | | | 372 | | | | 364,742 | |
PPL Capital Funding, Inc.
5.25%, 09/01/2034 | | | 86 | | | | 85,373 | |
Public Service Electric and Gas Co.
5.30%, 08/01/2054 | | | 656 | | | | 655,357 | |
5.45%, 03/01/2054 | | | 483 | | | | 489,004 | |
Public Service Enterprise Group, Inc.
8.625%, 04/15/2031 | | | 248 | | | | 288,771 | |
Virginia Electric and Power Co.
5.55%, 08/15/2054 | | | 884 | | | | 890,197 | |
Vistra Operations Co. LLC
4.30%, 07/15/2029(a) | | | 706 | | | | 676,327 | |
Vistra Operations Co., LLC
6.95%, 10/15/2033(a) | | | 1,297 | | | | 1,412,109 | |
| | | | | | | | |
| | | | | | | 20,891,765 | |
| | | | | | | | |
Natural Gas – 0.1% | |
GNL Quintero SA
4.634%, 07/31/2029(a) | | | 118 | | | | 116,144 | |
| | | | | | | | |
| | | | | | | 21,007,909 | |
| | | | | | | | |
Total Corporates - Investment Grade
(cost $207,569,287) | | | | | | | 208,640,582 | |
| | | | | |
| | |
| |
12 | AB CORPORATE INCOME SHARES | | abfunds.com |
PORTFOLIO OF INVESTMENTS (continued)
| | | | | | | | |
| | | Principal
Amount
(000) | | | U.S. $ Value | |
| |
QUASI-SOVEREIGNS – 1.0% | |
Quasi-Sovereign Bonds – 1.0% | |
Chile – 0.3% | |
Empresa de Transporte de Pasajeros Metro SA
3.65%, 05/07/2030(a) | | $ | 350 | | | $ | 324,898 | |
4.70%, 05/07/2050(a) | | | 295 | | | | 247,357 | |
| | | | | | | | |
| | | | | | | 572,255 | |
| | | | | | | | |
Mexico – 0.3% | |
Comision Federal de Electricidad
3.348%, 02/09/2031(a) | | | 321 | | | | 270,523 | |
Petroleos Mexicanos
6.50%, 01/23/2029 | | | 135 | | | | 126,710 | |
6.75%, 09/21/2047 | | | 112 | | | | 79,906 | |
6.95%, 01/28/2060 | | | 169 | | | | 120,412 | |
7.69%, 01/23/2050 | | | 80 | | | | 62,152 | |
| | | | | | | | |
| | | | | | | 659,703 | |
| | | | | | | | |
Peru – 0.3% | |
Corp. Financiera de Desarrollo SA
2.40%, 09/28/2027(a) | | | 250 | | | | 230,000 | |
5.95%, 04/30/2029(a) | | | 432 | | | | 436,968 | |
| | | | | | | | |
| | | | | | | 666,968 | |
| | | | | | | | |
Qatar – 0.1% | |
QatarEnergy
3.125%, 07/12/2041(a) | | | 277 | | | | 209,828 | |
| | | | | | | | |
| | |
Total Quasi-Sovereigns
(cost $2,435,820) | | | | | | | 2,108,754 | |
| | | | | |
| | | | | | | | |
GOVERNMENTS - SOVEREIGN BONDS – 0.5% | | | | | | | | |
Colombia – 0.3% | |
Colombia Government International Bond
3.125%, 04/15/2031 | | | 562 | | | | 447,352 | |
5.20%, 05/15/2049 | | | 200 | | | | 136,700 | |
| | | | | | | | |
| | | | | | | 584,052 | |
| | | | | | | | |
Mexico – 0.1% | |
Mexico Government International Bond
4.60%, 01/23/2046 | | | 200 | | | | 152,000 | |
4.75%, 03/08/2044 | | | 120 | | | | 95,280 | |
| | | | | | | | |
| | | | | | | 247,280 | |
| | | | | | | | |
Qatar – 0.1% | |
Qatar Government International Bond
4.817%, 03/14/2049(a) | | | 228 | | | | 215,175 | |
| | | | | | | | |
| | |
| |
| abfunds.com | | AB CORPORATE INCOME SHARES | 13 |
PORTFOLIO OF INVESTMENTS (continued)
| | | | | | | | |
| | | Principal
Amount
(000) | | | U.S. $ Value | |
| |
Uruguay – 0.0% | |
Uruguay Government International Bond
4.375%, 01/23/2031 | | $ | 54 | | | $ | 53,037 | |
| | | | | | | | |
| | |
Total Governments - Sovereign Bonds
(cost $1,349,588) | | | | | | | 1,099,544 | |
| | | | | |
| | | | | | | | |
EMERGING MARKETS - CORPORATE BONDS – 0.0% | | | | | | | | |
Industrial – 0.0% | |
Energy – 0.0% | |
Ecopetrol SA
5.875%, 05/28/2045
(cost $22,025) | | | 25 | | | | 17,563 | |
| | | | | | | | |
| | |
Total Investments – 98.2%
(cost $211,376,720) | | | | | | | 211,866,443 | |
Other assets less liabilities – 1.8% | | | | | | | 3,929,019 | |
| | | | | |
| | |
Net Assets – 100.0% | | | | | | $ | 215,795,462 | |
| | | | | | | | |
FUTURES (see Note C)
| | | | | | | | | | | | | | | | |
| Description | | Number of
Contracts | | | Expiration
Month | | | Current
Notional | | | Value and
Unrealized
Appreciation
(Depreciation) | |
Purchased Contracts | |
U.S. T-Note 5 Yr (CBT) Futures | | | 5 | | | | December 2024 | | | $ | 536,172 | | | $ | (163 | ) |
U.S. T-Note 10 Yr (CBT) Futures | | | 29 | | | | December 2024 | | | | 3,203,594 | | | | (107,635 | ) |
U.S. Ultra Bond (CBT) Futures | | | 189 | | | | December 2024 | | | | 23,743,125 | | | | (1,423,504 | ) |
| | | | |
Sold Contracts | | | | | | | | | | | | | | | | |
U.S. 10 Yr Ultra Futures | | | 58 | | | | December 2024 | | | | 6,597,500 | | | | 244,917 | |
U.S. T-Note 2 Yr (CBT) Futures | | | 112 | | | | December 2024 | | | | 23,065,875 | | | | 210,730 | |
| | | | | | | | | | | | | | | | |
| | | $ | (1,075,655 | ) |
| | | | | |
| (a) | Security is exempt from registration under Rule 144A or Regulation S of the Securities Act of 1933. These securities are considered restricted, but liquid and may be resold in transactions exempt from registration. At October 31, 2024, the aggregate market value of these securities amounted to $45,813,557 or 21.2% of net assets. |
| (b) | Securities are perpetual and, thus, do not have a predetermined maturity date. The date shown, if applicable, reflects the next call date. |
| (c) | Floating Rate Security. Stated interest/floor/ceiling rate was in effect at October 31, 2024. |
Glossary:
CBT – Chicago Board of Trade
CME – Chicago Mercantile Exchange
REIT – Real Estate Investment Trust
SOFR – Secured Overnight Financing Rate
See notes to financial statements.
| | |
| |
14 | AB CORPORATE INCOME SHARES | | abfunds.com |
STATEMENT OF ASSETS & LIABILITIES
October 31, 2024 (unaudited)
| | | | |
| Assets | |
Investments in securities, at value (cost $211,376,720) | | $ | 211,866,443 | |
Cash | | | 2,144,660 | |
Cash collateral due from broker | | | 1,015,401 | |
Interest receivable | | | 2,239,894 | |
Receivable for investment securities sold | | | 2,145,582 | |
Receivable for shares of beneficial interest sold | | | 140,258 | |
Receivable for variation margin on futures | | | 48,263 | |
| | | | |
Total assets | | | 219,600,501 | |
| | | | |
| Liabilities | |
Payable for investment securities purchased | | | 2,760,281 | |
Dividends payable | | | 959,249 | |
Payable for shares of beneficial interest redeemed | | | 80,514 | |
Foreign capital gains tax payable | | | 4,995 | |
| | | | |
Total liabilities | | | 3,805,039 | |
| | | | |
Net Assets | | $ | 215,795,462 | |
| | | | |
| Composition of Net Assets | |
Shares of beneficial interest, at par | | $ | 219 | |
Additional paid-in capital | | | 253,508,389 | |
Accumulated loss | | | (37,713,146 | ) |
| | | | |
Net Assets | | $ | 215,795,462 | |
| | | | |
Net Asset Value Per Share—unlimited shares of beneficial interest authorized, $.00001 par value (based on 21,859,392 common shares outstanding) | | $ | 9.87 | |
| | | | |
See notes to financial statements.
| | |
| |
| abfunds.com | | AB CORPORATE INCOME SHARES | 15 |
STATEMENT OF OPERATIONS
Six Months Ended October 31, 2024 (unaudited)
| | | | | | | | |
| Investment Income | |
Interest | | $ | 5,827,003 | | | | | |
| | | | | | | | |
Total investment income | | | | | | $ | 5,827,003 | |
| | | | | | | | |
| Realized and Unrealized Gain on Investment Transactions | | | | | | | | |
Net realized gain on: | | | | | | | | |
Investment transactions | | | | | | | 923,765 | |
Futures | | | | | | | 684,363 | |
Swaps | | | | | | | 13,253 | |
Net change in unrealized appreciation (depreciation) of: | | | | | | | | |
Investments | | | | | | | 5,908,490 | |
Futures | | | | | | | 63,576 | |
Swaps | | | | | | | (5,586 | ) |
| | | | | | | | |
Net gain on investment transactions | | | | | | | 7,587,861 | |
| | | | | | | | |
Net Increase in Net Assets from Operations | | | | | | $ | 13,414,864 | |
| | | | | | | | |
See notes to financial statements.
| | |
| |
16 | AB CORPORATE INCOME SHARES | | abfunds.com |
STATEMENT OF CHANGES IN NET ASSETS
| | | | | | | | |
| | | Six Months Ended
October 31, 2024
(unaudited) | | | Year Ended
April 30,
2024 | |
| Increase (Decrease) in Net Assets from Operations | | | | | | | | |
Net investment income | | $ | 5,827,003 | | | $ | 11,116,964 | |
Net realized gain (loss) on investment transactions | | | 1,621,381 | | | | (12,312,370 | ) |
Net change in unrealized appreciation of investments | | | 5,966,480 | | | | 6,120,000 | |
| | | | | | | | |
Net increase in net assets from operations | | | 13,414,864 | | | | 4,924,594 | |
Distribution to Shareholders | | | (5,842,402 | ) | | | (11,191,914 | ) |
| Transactions in Shares of Beneficial Interest | | | | | | | | |
Net increase (decrease) | | | (7,353,810 | ) | | | 38,607,981 | |
| | | | | | | | |
Total increase | | | 218,652 | | | | 32,340,661 | |
| Net Assets | | | | | | | | |
Beginning of period | | | 215,576,810 | | | | 183,236,149 | |
| | | | | | | | |
End of period | | $ | 215,795,462 | | | $ | 215,576,810 | |
| | | | | | | | |
See notes to financial statements.
| | |
| |
| abfunds.com | | AB CORPORATE INCOME SHARES | 17 |
NOTES TO FINANCIAL STATEMENTS
October 31, 2024 (unaudited)
NOTE A
Significant Accounting Policies
AB Corporate Shares (the “Trust”) is registered under the Investment Company Act of 1940 (the “1940 Act”), as an open-end, diversified management investment company. The Trust, which is a Massachusetts Business Trust, operates as a “series” company currently offering four separate portfolios: AB Corporate Income Shares, AB Municipal Income Shares, AB Taxable Multi-Sector Income Shares and AB Impact Municipal Income Shares. Each portfolio is considered to be a separate entity for financial reporting and tax purposes. This report relates only to AB Corporate Income Shares (the “Fund”).
Shares of the Fund are offered exclusively to holders of accounts established under wrap-fee programs sponsored and maintained by certain registered investment advisers approved by AllianceBernstein L.P. (the “Adviser”). The Fund’s shares may be purchased at the relevant net asset value without a sales charge or other fee. The financial statements have been prepared in conformity with U.S. generally accepted accounting principles (“U.S. GAAP”), which require management to make certain estimates and assumptions that affect the reported amounts of assets and liabilities in the financial statements and amounts of income and expenses during the reporting period. Actual results could differ from those estimates. The Fund is an investment company under U.S. GAAP and follows the accounting and reporting guidance applicable to investment companies. The following is a summary of significant accounting policies followed by the Fund.
1. Security Valuation
Portfolio securities are valued at market value determined on the basis of market quotations or, if market quotations are not readily available or are unreliable, at “fair value” as determined in accordance with procedures approved by and under the oversight of the Trust’s Board of Trustees (the “Board”). Pursuant to these procedures, the the Adviser serves as the Fund’s valuation designee pursuant to Rule 2a-5 of the 1940 Act. In this capacity, the Adviser is responsible, among other things, for making all fair value determinations relating to the Fund’s portfolio investments, subject to the Board’s oversight.
In general, the market values of securities which are readily available and deemed reliable are determined as follows: securities listed on a national securities exchange (other than securities listed on the NASDAQ Stock Market, Inc. (“NASDAQ”)) or on a foreign securities exchange are valued at the last sale price at the close of the exchange or foreign securities exchange. If there has been no sale on such day, the securities are valued at the last traded price from the previous day. Securities listed on more
| | |
| |
18 | AB CORPORATE INCOME SHARES | | abfunds.com |
NOTES TO FINANCIAL STATEMENTS (continued)
than one exchange are valued by reference to the principal exchange on which the securities are traded; securities listed only on NASDAQ are valued in accordance with the NASDAQ Official Closing Price; listed or over the counter (“OTC”) market put or call options are valued at the mid level between the current bid and ask prices. If either a current bid or current ask price is unavailable, the Adviser will have discretion to determine the best valuation (e.g., last trade price in the case of listed options); open futures are valued using the closing settlement price or, in the absence of such a price, the most recent quoted bid price. If there are no quotations available for the day of valuation, the last available closing settlement price is used; U.S. Government securities and any other debt instruments having 60 days or less remaining until maturity are generally valued at market by an independent pricing vendor, if a market price is available. If a market price is not available, the securities are valued at amortized cost. This methodology is commonly used for short term securities that have an original maturity of 60 days or less, as well as short term securities that had an original term to maturity that exceeded 60 days. In instances when amortized cost is utilized, the Valuation Committee (the “Committee”) must reasonably conclude that the utilization of amortized cost is approximately the same as the fair value of the security. Factors the Committee will consider include, but are not limited to, an impairment of the creditworthiness of the issuer or material changes in interest rates. Fixed-income securities, including mortgage-backed and asset-backed securities, may be valued on the basis of prices provided by a pricing service or at a price obtained from one or more of the major broker-dealers. In cases where broker-dealer quotes are obtained, the Adviser may establish procedures whereby changes in market yields or spreads are used to adjust, on a daily basis, a recently obtained quoted price on a security. Swaps and other derivatives are valued daily, primarily using independent pricing services, independent pricing models using market inputs, as well as third party broker-dealers or counterparties. Open-end mutual funds are valued at the closing net asset value per share, while exchange traded funds are valued at the closing market price per share.
Securities for which market quotations are not readily available (including restricted securities) or are deemed unreliable are valued at fair value as deemed appropriate by the Adviser. Factors considered in making this determination may include, but are not limited to, information obtained by contacting the issuer, analysts, analysis of the issuer’s financial statements or other available documents. In addition, the Fund may use fair value pricing for securities primarily traded in non-U.S. markets because most foreign markets close well before the Fund values its securities at 4:00 p.m., Eastern Time. The earlier close of these foreign markets gives rise to the possibility that significant events, including broad market moves, may have occurred in the interim and may materially affect the value of those
| | |
| |
| abfunds.com | | AB CORPORATE INCOME SHARES | 19 |
NOTES TO FINANCIAL STATEMENTS (continued)
securities. To account for this, the Fund generally values many of its foreign equity securities using fair value prices based on third party vendor modeling tools to the extent available.
2. Fair Value Measurements
In accordance with U.S. GAAP regarding fair value measurements, fair value is defined as the price that the Fund would receive to sell an asset or pay to transfer a liability in an orderly transaction between market participants at the measurement date. U.S. GAAP establishes a framework for measuring fair value, and a three-level hierarchy for fair value measurements based upon the transparency of inputs to the valuation of an asset or liability (including those valued based on their market values as described in Note A.1 above). Inputs may be observable or unobservable and refer broadly to the assumptions that market participants would use in pricing the asset or liability. Observable inputs reflect the assumptions market participants would use in pricing the asset or liability based on market data obtained from sources independent of the Fund. Unobservable inputs reflect the Fund’s own assumptions about the assumptions that market participants would use in pricing the asset or liability based on the best information available in the circumstances. Each investment is assigned a level based upon the observability of the inputs which are significant to the overall valuation. The three-tier hierarchy of inputs is summarized below.
| | • | | Level 1—quoted prices in active markets for identical investments |
| | • | | Level 2—other significant observable inputs (including quoted prices for similar investments, interest rates, prepayment speeds, credit risk, etc.) |
| | • | | Level 3—significant unobservable inputs (including the Fund’s own assumptions in determining the fair value of investments) |
The fair value of debt instruments, such as bonds, and over-the-counter derivatives is generally based on market price quotations, recently executed market transactions (where observable) or industry recognized modeling techniques and are generally classified as Level 2. Pricing vendor inputs to Level 2 valuations may include quoted prices for similar investments in active markets, interest rate curves, coupon rates, currency rates, yield curves, option adjusted spreads, default rates, credit spreads and other unique security features in order to estimate the relevant cash flows which are then discounted to calculate fair values. If these inputs are unobservable and significant to the fair value, these investments will be classified as Level 3.
Other fixed income investments, including non-U.S. government and corporate debt, are generally valued using quoted market prices, if available, which are typically impacted by current interest rates, maturity dates and
| | |
| |
20 | AB CORPORATE INCOME SHARES | | abfunds.com |
NOTES TO FINANCIAL STATEMENTS (continued)
any perceived credit risk of the issuer. Additionally, in the absence of quoted market prices, these inputs are used by pricing vendors to derive a valuation based upon industry or proprietary models which incorporate issuer specific data with relevant yield/spread comparisons with more widely quoted bonds with similar key characteristics. Those investments for which there are observable inputs are classified as Level 2. Where the inputs are not observable, the investments are classified as Level 3.
The following table summarizes the valuation of the Fund’s investments by the above fair value hierarchy levels as of October 31, 2024:
| | | | | | | | | | | | | | | | |
Investments in
Securities: | | Level 1 | | | Level 2 | | | Level 3 | | | Total | |
Assets: | | | | | | | | | | | | | | | | |
Corporates – Investment Grade | | $ | – 0 | – | | $ | 208,640,582 | | | $ | – 0 | – | | $ | 208,640,582 | |
Quasi-Sovereigns | | | – 0 | – | | | 2,108,754 | | | | – 0 | – | | | 2,108,754 | |
Governments – Sovereign Bonds | | | – 0 | – | | | 1,099,544 | | | | – 0 | – | | | 1,099,544 | |
Emerging Markets – Corporate Bonds | | | – 0 | – | | | 17,563 | | | | – 0 | – | | | 17,563 | |
| | | | | | | | | | | | | | | | |
Total Investments in Securities | | | – 0 | – | | | 211,866,443 | | | | – 0 | – | | | 211,866,443 | |
Other Financial Instruments(a): | | | | | | | | | | | | | | | | |
Assets: | | | | | | | | | | | | | | | | |
Futures | | | 455,647 | | | | – 0 | – | | | – 0 | – | | | 455,647 | (b) |
Liabilities: | | | | | | | | | | | | | | | | |
Futures | | | (1,531,302 | ) | | | – 0 | – | | | – 0 | – | | | (1,531,302 | )(b) |
| | | | | | | | | | | | | | | | |
Total | | $ | (1,075,655 | ) | | $ | 211,866,443 | | | $ | – 0 | – | | $ | 210,790,788 | |
| | | | | | | | | | | | | | | | |
| (a) | Other financial instruments include derivative instruments, such as futures, forwards and swaps. Derivative instruments are valued at the unrealized appreciation (depreciation) on the instrument. Other financial instruments may also include swaps with upfront premiums, written options and written swaptions which are valued at market value. |
| (b) | Only variation margin receivable (payable) at period end is reported within the statement of assets and liabilities. This amount reflects cumulative unrealized appreciation (depreciation) on futures and centrally cleared swaps as reported in the portfolio of investments. Where applicable, centrally cleared swaps with upfront premiums are presented here at market value. |
3. Taxes
It is the Fund’s policy to meet the requirements of the Internal Revenue Code applicable to regulated investment companies and to distribute all of its investment company taxable income and net realized gains, if any, to shareholders. Therefore, no provisions for federal income or excise taxes are required.
In accordance with U.S. GAAP requirements regarding accounting for uncertainties in income taxes, management has analyzed the Fund’s tax positions taken or expected to be taken on federal and state income tax returns for all open tax years (the current and the prior three tax years) and has concluded that no provision for income tax is required in the Fund’s financial statements.
| | |
| |
| abfunds.com | | AB CORPORATE INCOME SHARES | 21 |
NOTES TO FINANCIAL STATEMENTS (continued)
4. Investment Income and Investment Transactions
Dividend income is recorded on the ex-dividend date or as soon as the Fund is informed of the dividend. Interest income is accrued daily. Investment transactions are accounted for on the date the securities are purchased or sold. Investment gains or losses are determined on the identified cost basis. Non-cash dividends, if any, are recorded on the ex-dividend date at the fair value of the securities received. The Fund amortizes premiums and accretes discounts as adjustments to interest income. The Fund accounts for distributions received from real estate investment trust (“REIT”) investments or from regulated investment companies as dividend income, realized gain, or return of capital based on information provided by the REIT or the investment company.
5. Dividends and Distributions
Dividends and distributions to shareholders, if any, are recorded on the ex-dividend date. Income dividends and capital gains distributions are determined in accordance with federal tax regulations and may differ from those determined in accordance with U.S. GAAP. To the extent these differences are permanent, such amounts are reclassified within the capital accounts based on their federal tax basis treatment; temporary differences do not require such reclassification.
6. Cash and Short-Term Investments
Cash and short-term investments include cash on hand and short-term investments with maturities of less than one year when purchased.
NOTE B
Advisory Fee and Other Transactions with Affiliates
Under the terms of the Advisory Agreement, the Fund pays no advisory fee to the Adviser and the Adviser reimburses or pays for the Fund’s operating expenses. The Fund is an integral part of separately managed accounts in wrap-fee programs and other investment programs. Typically, participants in these programs pay a fee to their investment adviser for all costs and expenses of the separately managed account, including costs and expenses associated with the Fund, and a fee is paid by their investment adviser to the Adviser. In certain cases, participants may have a direct relationship with the Adviser without the involvement of a third party investment adviser, in which case the participant would pay a fee directly to the Adviser. The Adviser serves as investment manager and adviser of the Fund and continuously furnishes an investment program for the Fund and manages, supervises and conducts the affairs of the Fund, subject to the supervisions of the Fund’s Board. The Advisory Agreement provides that the Adviser or an affiliate will furnish, or pay the expenses of the Fund for, office space, facilities and equipment, services of executive and other personnel of the Fund and certain administrative services.
| | |
| |
22 | AB CORPORATE INCOME SHARES | | abfunds.com |
NOTES TO FINANCIAL STATEMENTS (continued)
The Fund has entered into a distribution agreement with AllianceBernstein Investments, Inc., the Fund’s principal underwriter (the “Underwriter”), to permit the Underwriter to distribute the Fund’s shares, which are sold at their net asset value without any sales charge. The Fund does not pay a fee for this service. The Underwriter is a wholly owned subsidiary of the Adviser.
AllianceBernstein Investor Services, Inc. (“ABIS”), a wholly-owned subsidiary of the Adviser, acts as the Fund’s registrar, transfer agent and dividend-disbursing agent. ABIS registers the transfer, issuance and redemption of Fund shares and disburses dividends and other distributions to Fund shareholders. The Fund does not pay a fee for this service.
NOTE C
Investment Transactions
Purchases and sales of investment securities (excluding short-term investments) for the six months ended October 31, 2024 were as follows:
| | | | | | | | |
| | | Purchases | | | Sales | |
Investment securities (excluding
U.S. government securities) | | $ | 132,290,523 | | | $ | 138,908,018 | |
U.S. government securities | | | – 0 | – | | | – 0 | – |
The cost of investments for federal income tax purposes was substantially the same as the cost for financial reporting purposes. Accordingly, gross unrealized appreciation and unrealized depreciation are as follows:
| | | | |
Gross unrealized appreciation | | $ | 3,406,750 | |
Gross unrealized depreciation | | | (3,992,682 | ) |
| | | | |
Net unrealized depreciation | | $ | (585,932 | ) |
| | | | |
1. Derivative Financial Instruments
The Fund may use derivatives in an effort to earn income and enhance returns, to replace more traditional direct investments, to obtain exposure to otherwise inaccessible markets (collectively, “investment purposes”), or to hedge or adjust the risk profile of its portfolio.
The principal types of derivatives utilized by the Fund, as well as the methods in which they may be used are:
The Fund may buy or sell futures for investment purposes or for the purpose of hedging its portfolio against adverse effects of potential movements in the market. The Fund bears the market risk that arises from changes in the value of these instruments and the imperfect correlation between movements in the price of the futures and movements in the price of the assets, reference rates or indices which they are designed to track. Among other things, the Fund may
| | |
| |
| abfunds.com | | AB CORPORATE INCOME SHARES | 23 |
NOTES TO FINANCIAL STATEMENTS (continued)
purchase or sell futures for foreign currencies or options thereon for non-hedging purposes as a means of making direct investment in foreign currencies.
At the time the Fund enters into futures, the Fund deposits with the broker or segregates at its custodian cash or securities as collateral to satisfy initial margin requirements set by the exchange on which the transaction is effected. Pursuant to the contract, with respect to cash collateral, the Fund agrees to receive from or pay to the broker an amount of cash equal to the daily fluctuation in the value of the contract; in the case of securities collateral, the Fund agrees to adjust the securities position held in the segregated account accordingly. Such receipts, payments or adjustments are known as variation margin and are recorded by the Fund as unrealized gains or losses. Risks may arise from the potential inability of a counterparty to meet the terms of the contract. The credit/counterparty risk for exchange-traded futures is generally less than privately negotiated futures, since the clearinghouse, which is the issuer or counterparty to each exchange-traded future, has robust risk mitigation standards, including the requirement to provide initial and variation margin. When the contract is closed, the Fund records a realized gain or loss equal to the difference between the value of the contract at the time it was opened and the time it was closed.
Use of long futures subjects the Fund to risk of loss in excess of the amounts shown on the statement of assets and liabilities, up to the notional value of the futures. Use of short futures subjects the Fund to unlimited risk of loss. Under some circumstances, futures exchanges may establish daily limits on the amount that the price of futures can vary from the previous day’s settlement price, which could effectively prevent liquidation of unfavorable positions.
During the six months ended October 31, 2024, the Fund held futures for hedging purposes.
The Fund may enter into swaps for investment purposes or to hedge its exposure to interest rates, credit risk or inflation. A swap is an agreement that obligates two parties to exchange a series of cash flows at specified intervals based upon or calculated by reference to changes in specified prices, rates or indexes for a specified amount of an underlying asset or inflation. The payment flows are usually netted against each other, with the difference being paid by one party to the other. In addition, collateral may be pledged or received by the Fund in accordance with the terms of the respective swaps to provide value and recourse to the Fund or its counterparties in the event of default, bankruptcy or insolvency by one of the parties to the swap.
| | |
| |
24 | AB CORPORATE INCOME SHARES | | abfunds.com |
NOTES TO FINANCIAL STATEMENTS (continued)
Risks may arise as a result of the failure of the counterparty to the swap to comply with the terms of the swap. The loss incurred by the failure of a counterparty is generally limited to the net interim payment to be received by the Fund, and/or the termination value at the end of the contract. Therefore, the Fund considers the creditworthiness of each counterparty to a swap in evaluating potential counterparty risk. This risk is mitigated by having a netting arrangement between the Fund and the counterparty and by the posting of collateral by the counterparty to the Fund to cover the Fund’s exposure to the counterparty. Additionally, risks may arise from unanticipated movements in interest rates, inflation or in the value of the underlying securities. The Fund accrues for the interim payments on swaps on a daily basis, with the net amount recorded within unrealized appreciation (depreciation) of swaps on the statement of assets and liabilities, where applicable. Once the interim payments are settled in cash, the net amount is recorded as realized gain/(loss) on swaps on the statement of operations, in addition to any realized gain/(loss) recorded upon the termination of swaps. Upfront premiums paid or received for swaps are recognized as cost or proceeds on the statement of assets and liabilities and are amortized on a straight line basis over the life of the contract. Amortized upfront premiums are included in net realized gain/(loss) from swaps on the statement of operations. Fluctuations in the value of swaps are recorded as a component of net change in unrealized appreciation (depreciation) of swaps on the statement of operations.
Certain standardized swaps, including certain interest rate swaps and credit default swaps, are subject to mandatory central clearing. Cleared swaps are transacted through futures commission merchants (“FCMs”) that are members of central clearinghouses, with the clearinghouse serving as central counterparty, similar to transactions in futures contracts. Centralized clearing will be required for additional categories of swaps on a phased-in basis based on requirements published by the Securities and Exchange Commission and Commodity Futures Trading Commission.
At the time the Fund enters into a centrally cleared swap, the Fund deposits with the broker or segregates at its custodian cash or securities as collateral to satisfy initial margin requirements set by the clearinghouse on which the transaction is effected. Pursuant to the contract, with respect to cash collateral, the Fund agrees to receive from or pay to the broker an amount of cash equal to the daily fluctuation in the value of the contract; in the case of securities collateral, the Fund agrees to adjust the securities position held in the segregated account accordingly. Such receipts, payments or adjustments are known as variation margin and are recorded by the
| | |
| |
| abfunds.com | | AB CORPORATE INCOME SHARES | 25 |
NOTES TO FINANCIAL STATEMENTS (continued)
Fund as unrealized gains or losses. Risks may arise from the potential inability of a counterparty to meet the terms of the contract. The credit/counterparty risk for centrally cleared swaps is generally less than non-centrally cleared swaps, since the clearinghouse, which is the issuer or counterparty to each centrally cleared swap, has robust risk mitigation standards, including the requirement to provide initial and variation margin. When the contract is closed, the Fund records a realized gain or loss equal to the difference between the value of the contract at the time it was opened and the time it was closed.
Credit Default Swaps:
The Fund may enter into credit default swaps, including to manage its exposure to the market or certain sectors of the market, to reduce its risk exposure to defaults by corporate and sovereign issuers held by the Fund, or to create exposure to corporate or sovereign issuers to which it is not otherwise exposed. The Fund may purchase credit protection (“Buy Contract”) or provide credit protection (“Sale Contract”) on the referenced obligation of the credit default swap. During the term of the swap, the Fund receives/(pays) fixed payments from/(to) the respective counterparty, calculated at the agreed upon rate applied to the notional amount. If the Fund is a buyer/(seller) of protection and a credit event occurs, as defined under the terms of the swap, the Fund will either (i) receive from the seller/(pay to the buyer) of protection an amount equal to the notional amount of the swap (the “Maximum Payout Amount”) and deliver/(take delivery of) the referenced obligation or (ii) receive/(pay) a net settlement amount in the form of cash or securities equal to the notional amount of the swap less the recovery value of the referenced obligation. In certain circumstances Maximum Payout Amounts may be partially offset by recovery values of the respective referenced obligations, upfront premium received upon entering into the agreement, or net amounts received from settlement of buy protection credit default swaps entered into by the Fund for the same referenced obligations with the same counterparty.
Credit default swaps may involve greater risks than if the Fund had invested in the referenced obligation directly. Credit default swaps are subject to general market risk, liquidity risk, counterparty risk and credit risk. If the Fund is a buyer of protection and no credit event occurs, it will lose the payments it made to its counterparty. If the Fund is a seller of protection and a credit event occurs, the value of the referenced obligation received by the Fund coupled with the periodic payments previously received, may be less than the Maximum Payout Amount it pays to the buyer, resulting in a net loss to the Fund.
| | |
| |
26 | AB CORPORATE INCOME SHARES | | abfunds.com |
NOTES TO FINANCIAL STATEMENTS (continued)
Implied credit spreads over U.S. Treasuries of comparable maturity utilized in determining the market value of credit default swaps on issuers as of period end are disclosed in the portfolio of investments. The implied spreads serve as an indicator of the current status of the payment/performance risk and typically reflect the likelihood of default by the issuer of the referenced obligation. The implied credit spread of a particular reference obligation also reflects the cost of buying/selling protection and may reflect upfront payments required to be made to enter into the agreement. Widening credit spreads typically represent a deterioration of the referenced obligation’s credit soundness and greater likelihood of default or other credit event occurring as defined under the terms of the agreement. A credit spread identified as “Defaulted” indicates a credit event has occurred for the referenced obligation.
During the six months ended October 31, 2024, the Fund held credit default swaps for hedging purposes.
The Fund typically enters into International Swaps and Derivatives Association, Inc. Master Agreements (“ISDA Master Agreement”) with its OTC derivative contract counterparties in order to, among other things, reduce its credit risk to OTC counterparties. ISDA Master Agreements include provisions for general obligations, representations, collateral and events of default or termination. Under an ISDA Master Agreement, the Fund typically may offset with the OTC counterparty certain derivative financial instruments’ payables and/or receivables with collateral held and/or posted and create one single net payment (close-out netting) in the event of default or termination. In the event of a default by an OTC counterparty, the return of collateral with market value in excess of the Fund’s net liability, held by the defaulting party, may be delayed or denied.
The Fund’s ISDA Master Agreements may contain provisions for early termination of OTC derivative transactions in the event the net assets of the Fund decline below specific levels (“net asset contingent features”). If these levels are triggered, the Fund’s OTC counterparty has the right to terminate such transaction and require the Fund to pay or receive a settlement amount in connection with the terminated transaction. If OTC derivatives were held at period end, please refer to netting arrangements by the OTC counterparty table below for additional details.
| | |
| |
| abfunds.com | | AB CORPORATE INCOME SHARES | 27 |
NOTES TO FINANCIAL STATEMENTS (continued)
During the six months ended October 31, 2024, the Fund had entered into the following derivatives:
| | | | | | | | | | | | |
| | | Asset Derivatives | | | Liability Derivatives | |
Derivative Type | | Statement of
Assets and
Liabilities
Location | | Fair Value | | | Statement of
Assets and
Liabilities
Location | | Fair Value | |
Interest rate contracts | | Receivable for variation margin on futures | | $ | 455,647 | * | | Payable for variation margin on futures | | $ | 1,531,302 | * |
| | | | | | | | | | | | |
Total | | | | $ | 455,647 | | | | | $ | 1,531,302 | |
| | | | | | | | | | | | |
| * | Only variation margin receivable/payable at period end is reported within the statement of assets and liabilities. This amount reflects cumulative unrealized appreciation (depreciation) on futures and centrally cleared swaps as reported in the portfolio of investments. |
| | | | | | | | | | |
Derivative Type | | Location of Gain or
(Loss) on Derivatives
Within Statement of
Operations | | Realized Gain
or (Loss) on
Derivatives | | | Change in
Unrealized
Appreciation or
(Depreciation) | |
Interest rate contracts | | Net realized gain (loss) on futures; Net change in unrealized appreciation (depreciation) of futures | | $ | 684,363 | | | $ | 63,576 | |
| | | |
Credit contracts | | Net realized gain (loss) on swaps; Net change in unrealized appreciation (depreciation) of swaps | | | 13,253 | | | | (5,586 | ) |
| | | | | | | | | | |
Total | | | | $ | 697,616 | | | $ | 57,990 | |
| | | | | | | | | | |
The following table represents the average monthly volume of the Fund’s derivative transactions during the six months ended October 31, 2024:
| | | | |
Futures: | | | | |
Average notional amount of buy contracts | | $ | 29,365,373 | |
Average notional amount of sale contracts | | $ | 29,351,960 | |
Centrally Cleared Credit Default Swaps: | | | | |
Average notional amount of sale contracts | | $ | 9,800,000 | (a) |
| (a) | Positions were open for one month during the period. |
| | |
| |
28 | AB CORPORATE INCOME SHARES | | abfunds.com |
NOTES TO FINANCIAL STATEMENTS (continued)
NOTE D
Shares of Beneficial Interest
Transactions in shares of beneficial interest were as follows:
| | | | | | | | | | | | | | | | | | | | | | | | |
| | | | | | | | | | | | | | | | | | | | | | | | |
| | | Shares | | | | | | Amount | | | | |
| | | Six Months Ended
October 31, 2024
(unaudited) | | | Year Ended
April 30,
2024 | | | | | | Six Months Ended
October 31, 2024
(unaudited) | | | Year Ended
April 30,
2024 | | | | |
| | | | | | | | |
Shares sold | | | 1,617,296 | | | | 9,268,895 | | | | | | | $ | 15,989,385 | | | $ | 89,251,896 | | | | | |
| | | | | |
Shares redeemed | | | (2,366,502 | ) | | | (5,302,811 | ) | | | | | | | (23,343,195 | ) | | | (50,643,915 | ) | | | | |
| | | | | |
Net increase (decrease) | | | (749,206 | ) | | | 3,966,084 | | | | | | | $ | (7,353,810 | ) | | $ | 38,607,981 | | | | | |
| | | | | |
NOTE E
Risks Involved in Investing in the Fund
Market Risk—The value of the Fund’s assets will fluctuate as the market or markets in which the Fund invests fluctuate. The value of the Fund’s investments may decline, sometimes rapidly and unpredictably, simply because of economic changes or other events, including public health crises (including the occurrence of a contagious disease or illness) and regional and global conflicts, that affect large portions of the market.
Credit Risk—An issuer or guarantor of a fixed-income security, or the counterparty to a derivatives or other contract, may be unable or unwilling to make timely payments of interest or principal, or to otherwise honor its obligations. The issuer or guarantor may default, causing a loss of the full principal amount of a security and any accrued interest. The degree of risk for a particular security may be reflected in its credit rating. There is the possibility that the credit rating of a fixed-income security may be downgraded after purchase, which may adversely affect the value of the security. Investments in fixed-income securities with lower ratings tend to have a higher probability that an issuer will default or fail to meet its payment obligations.
Interest-Rate Risk—Changes in interest rates will affect the value of investments in fixed-income securities. When interest rates rise, the value of existing investments in fixed-income securities tends to fall and this decrease in value may not be offset by higher income from new investments. Interest-rate risk is generally greater for fixed-income securities with longer maturities or durations. The Fund may be subject to a greater risk of rising interest rates than would normally be the case due to the recent end of a period of historically low rates and the effects of potential central bank monetary policy, and government fiscal policy, initiatives and market reactions to those initiatives.
| | |
| |
| abfunds.com | | AB CORPORATE INCOME SHARES | 29 |
NOTES TO FINANCIAL STATEMENTS (continued)
Duration Risk—Duration is a measure that relates the expected price volatility of a fixed-income security to changes in interest rates. The duration of a fixed-income security may be shorter than or equal to the full maturity of a fixed-income security. Fixed-income securities with longer durations have more risk and will decrease in price as interest rates rise.
Inflation Risk—This is the risk that the value of assets or income from investments will be less in the future as inflation decreases the value of money. As inflation increases, the value of the Fund’s assets can decline as can the value of the Fund’s distributions. This risk is significantly greater for fixed-income securities with longer maturities.
Foreign (Non-U.S.) Risk—Investments in securities of non-U.S. issuers may involve more risk than those of U.S. issuers. These securities may fluctuate more widely in price and may be more difficult to trade due to adverse market, economic, political, regulatory or other factors.
Derivatives Risk—Derivatives may be difficult to price or unwind and leveraged so that small changes may produce disproportionate losses for the Fund. A short position in a derivative instrument involves the risk of a theoretically unlimited increase in the value of the underlying asset, reference rate or index, which could cause the Fund to suffer a potentially unlimited loss. Derivatives, especially over-the-counter derivatives, are also subject to counterparty risk, which is the risk that the counterparty (the party on the other side of the transaction) on a derivative transaction will be unable or unwilling to honor its contractual obligations to the Fund.
Indemnification Risk—In the ordinary course of business, the Fund enters into contracts that contain a variety of indemnifications. The Fund’s maximum exposure under these arrangements is unknown. However, the Fund has not had prior claims or losses pursuant to these indemnification provisions and expects the risk of loss thereunder to be remote. Therefore, the Fund has not accrued any liability in connection with these indemnification provisions.
Management Risk—The Fund is subject to management risk because it is an actively-managed investment fund. The Adviser will apply its investment techniques and risk analyses in making investment decisions, but there is no guarantee that its techniques will produce the intended results. Some of these techniques may incorporate, or rely upon, quantitative models, but there is no guarantee that these models will generate accurate forecasts, reduce risk or otherwise perform as expected.
| | |
| |
30 | AB CORPORATE INCOME SHARES | | abfunds.com |
NOTES TO FINANCIAL STATEMENTS (continued)
NOTE F
Joint Credit Facility
A number of open-end mutual funds managed by the Adviser, including the Fund, participate in a $325 million revolving credit facility (the “Facility”) intended to provide short-term financing related to redemptions and other short term liquidity requirements, subject to certain restrictions. Commitment fees related to the Facility are paid by the participating funds and are included in miscellaneous expenses in the statement of operations. The Fund did not utilize the Facility during the six months ended October 31, 2024.
NOTE G
Distributions to Shareholders
The tax character of distributions to be paid for the year ending April 30, 2025 will be determined at the end of the current fiscal year.
The tax character of distributions paid during the fiscal years ended April 30, 2024 and April 30, 2023 were as follows:
| | | | | | | | |
| | | 2024 | | | 2023 | |
Distributions paid from: | | | | | | | | |
Ordinary income | | $ | 11,191,914 | | | $ | 6,423,355 | |
| | | | | | | | |
Total distributions paid | | $ | 11,191,914 | | | $ | 6,423,355 | |
| | | | | | | | |
As of April 30, 2024, the components of accumulated earnings (deficit) on a tax basis were as follows:
| | | | |
Undistributed ordinary income | | $ | 1,109,917 | |
Accumulated capital and other losses | | | (39,909,401 | )(a) |
Unrealized appreciation (depreciation) | | | (5,509,381 | )(b) |
| | | | |
Total accumulated earnings (deficit) | | $ | (44,308,865 | )(c) |
| | | | |
| (a) | As of April 30, 2024, the Fund had a net capital loss carryforward of $39,909,401. |
| (b) | The differences between book-basis and tax-basis unrealized appreciation (depreciation) are attributable primarily to the recognition for tax purposes of unrealized gains/losses on certain derivative instruments, the tax treatment of callable bonds, the tax treatment of swaps, and the tax deferral of losses on wash sales. |
| (c) | The differences between book-basis and tax-basis components of accumulated earnings (deficit) are attributable primarily to the accrual of foreign capital gains tax and dividends payable |
For tax purposes, net realized capital losses may be carried over to offset future capital gains, if any. Funds are permitted to carry forward capital losses for an indefinite period, and such losses will retain their character as either short-term or long-term capital losses. As of April 30, 2024, the Fund had a net short-term capital loss carryforward of $12,164,577 and a net long-term capital loss carryforward of $27,744,824, which may be carried forward for an indefinite period.
| | |
| |
| abfunds.com | | AB CORPORATE INCOME SHARES | 31 |
NOTES TO FINANCIAL STATEMENTS (continued)
NOTE H
Recent Accounting Pronouncements
In December 2022, the Financial Accounting Standards Board issued an Accounting Standards Update, ASU 2022-06, “Reference Rate Reform (Topic 848) – Deferral of the Sunset Date of Topic 848”. ASU 2022-06 is an amendment to ASU 2020-04, which provided optional guidance to ease the potential accounting burden due to the discontinuation of the LIBOR and other interbank-offered based reference rates and which was effective as of March 12, 2020 through December 31, 2022. ASU 2022-06 extends the effective period through December 31, 2024. Management is currently evaluating the impact, if any, of applying ASU 2022-06.
In November 2023, the Financial Accounting Standards Board issued Accounting Standards Update, ASU 2023-07, “Segment Reporting (Topic 280)”. ASU 2023-07 requires public entities to provide disclosure of significant segment expenses that are regularly provided to the chief operating decision maker (“CODM”). ASU 2023-07, among other things, (i) requires a single segment public entity to provide all necessary disclosures required by Topic 280 it, (ii) requires a public entity to disclose the title and position of the CODM and an explanation of how the CODM uses the reported measure(s) of segment profit and loss in assessing segment performance and deciding how to allocate resources and (iii) provides the ability for a public entity to elect more than one performance measure. ASU 2023-07 is effective for fiscal years beginning after December 15, 2023, and interim periods within fiscal years beginning after December 15, 2024. Early adoption of ASU 2023-07 is permitted. Management is currently evaluating the impact, if any, of applying ASU 2023-07.
NOTE I
Subsequent Events
Management has evaluated subsequent events for possible recognition or disclosure in the financial statements through the date the financial statements are issued. Management has determined that there are no material events that would require disclosure in the Fund’s financial statements through this date.
| | |
| |
32 | AB CORPORATE INCOME SHARES | | abfunds.com |
FINANCIAL HIGHLIGHTS
Selected Data For A Share Of Beneficial Interest Outstanding Throughout Each Period
| | | | | | | | | | | | | | | | | | | | | | | | |
| | | Six Months
Ended
October 31,
2024 (unaudited) | | | Year Ended April 30, | |
| | | 2024 | | | 2023 | | | 2022 | | | 2021 | | | 2020 | |
| | | | |
| | | | | | | | | | | | | | | | | | | | | | | | |
Net asset value, beginning of period | | | $ 9.54 | | | | $ 9.83 | | | | $ 10.22 | | | | $ 11.82 | | | | $ 11.56 | | | | $ 11.11 | |
| | | | |
Income From Investment Operations | | | | | | | | | | | | | | | | | | | | | | | | |
| | | | | | |
Net investment income(a) | | | .26 | | | | .51 | | | | .39 | | | | .33 | | | | .37 | | | | .44 | |
| | | | | | |
Net realized and unrealized gain (loss) on investment transactions | | | .33 | | | | (.29 | ) | | | (.39 | ) | | | (1.47 | ) | | | .55 | | | | .51 | |
| | | | |
| | | | | | |
Net increase (decrease) in net asset value from operations | | | .59 | | | | .22 | | | | – 0 | – | | | (1.14 | ) | | | .92 | | | | .95 | |
| | | | |
Less: Dividends and Distributions | | | | | | | | | | | | | | | | | | | | | | | | |
| | | | | | |
Dividends from net investment income | | | (.26 | ) | | | (.51 | ) | | | (.39 | ) | | | (.34 | ) | | | (.38 | ) | | | (.45 | ) |
| | | | | | |
Distributions from net realized gain on investment transactions | | | – 0 | – | | | – 0 | – | | | – 0 | – | | | (.12 | ) | | | (.28 | ) | | | (.05 | ) |
| | | | |
Total dividends and distributions | | | (.26 | ) | | | (.51 | ) | | | (.39 | ) | | | (.46 | ) | | | (.66 | ) | | | (.50 | ) |
| | | | |
Net asset value, end of period | | | $ 9.87 | | | | $ 9.54 | | | | $ 9.83 | | | | $ 10.22 | | | | $ 11.82 | | | | $ 11.56 | |
| | | | |
| | | | | | |
Total Return | | | | | | | | | | | | | | | | | | | | | | | | |
| | | | | | |
Total investment return based on net asset value(b) | | | 6.26 | % | | | 2.35 | % | | | .16 | % | | | (10.08 | )% | | | 7.90 | % | | | 8.65 | % |
| | | | | | |
Ratios/Supplemental Data | | | | | | | | | | | | | | | | | | | | | | | | |
| | | | | | |
Net assets, end of period (000’s omitted) | | | $215,795 | | | | $215,577 | | | | $183,236 | | | | $222,550 | | | | $208,745 | | | | $114,455 | |
| | | | | | |
Ratio to average net assets of: | | | | | | | | | | | | | | | | | | | | | | | | |
| | | | | | |
Net investment income | | | 5.28 | %^ | | | 5.31 | % | | | 3.94 | % | | | 2.84 | % | | | 3.02 | % | | | 3.83 | % |
| | | | | | |
Portfolio turnover rate | | | 62 | % | | | 140 | % | | | 85 | % | | | 49 | % | | | 43 | % | | | 87 | % |
| (a) | Based on average shares outstanding. |
| (b) | Total investment return is calculated assuming an initial investment made at the net asset value at the beginning of the period, reinvestment of all dividends and distributions at net asset value during the period, and redemption on the last day of the period. Total return does not reflect the deduction of taxes that a shareholder would pay on fund distributions or the redemption of fund shares. Total investment return calculated for a period of less than one year is not annualized. |
See notes to financial statements.
| | |
| |
| abfunds.com | | AB CORPORATE INCOME SHARES | 33 |
Information Regarding the Review and Approval of the Fund’s Advisory Agreement
The disinterested trustees (the “directors”) of AB Corporate Shares (the “Company”) unanimously approved the continuance of the Company’s Advisory Agreement with the Adviser in respect of AB Corporate Income Shares (the “Fund”) at a meeting held in-person on July 30-31, 2024 (the “Meeting”).
Prior to approval of the continuance of the Advisory Agreement, the directors had requested from the Adviser, and received and evaluated, extensive materials. They reviewed the proposed continuance of the Advisory Agreement with the Adviser and with experienced counsel who are independent of the Adviser, who advised on the relevant legal standards. The directors also reviewed additional materials, including comparative analytical data prepared by the Senior Vice President of the Fund. The directors also discussed the proposed continuance in private sessions with counsel.
The directors noted that the Fund is designed as a vehicle for the wrap fee account market (where investors pay fees to a wrap fee sponsor which pays investment fees and expenses from such fee). The directors also noted that no advisory fee is payable by the Fund, that the Advisory Agreement does not include the reimbursement provision for certain administrative expenses included in the advisory agreements of most of the open-end AB Funds, and that the Adviser is responsible for payment of the Fund’s ordinary expenses. The directors noted that the Company acknowledges in the Advisory Agreement that the Adviser and its affiliates expect to receive compensation from third parties in connection with services provided under the Advisory Agreement. The directors further noted that the Adviser receives payments from the wrap fee program sponsors (the “Sponsors”) that use the Fund as an investment vehicle for their clients.
The directors considered their knowledge of the nature and quality of the services provided by the Adviser to the Fund gained from their experience as directors or trustees of most of the registered investment companies advised by the Adviser, their overall confidence in the Adviser’s integrity and competence they have gained from that experience, the Adviser’s initiative in identifying and raising potential issues with the directors and its responsiveness, frankness and attention to concerns raised by the directors in the past, including the Adviser’s willingness to consider and implement organizational and operational changes designed to improve investment results and the services provided to the AB Funds. The directors noted that they have four regular meetings each year, at each of which they review extensive materials and information from the Adviser, including information on the investment performance of the Fund.
| | |
| |
34 | AB CORPORATE INCOME SHARES | | abfunds.com |
The directors also considered all factors they believed relevant, including the specific matters discussed below. During the course of their deliberations, the directors evaluated, among other things, the reasonableness of the advisory fee. The directors did not identify any particular information that was all-important or controlling, and different directors may have attributed different weights to the various factors. The directors determined that the selection of the Adviser to manage the Fund and the overall arrangements between the Fund and the Adviser, as provided in the Advisory Agreement, including the advisory fee, were fair and reasonable in light of the services performed, expenses incurred and such other matters as the directors considered relevant in the exercise of their business judgment. The material factors and conclusions that formed the basis for the directors’ determinations included the following:
Nature, Extent and Quality of Services Provided
The directors considered the scope and quality of services provided by the Adviser under the Advisory Agreement, including the quality of the investment research capabilities of the Adviser and the other resources it has dedicated to performing services for the Fund. The directors noted that the Adviser from time to time reviews the Fund’s investment strategies and from time to time proposes changes intended to improve the Fund’s relative or absolute performance for the directors’ consideration. They also noted the professional experience and qualifications of the Fund’s portfolio management team and other senior personnel of the Adviser. The quality of administrative and other services, including the Adviser’s role in coordinating the activities of the Fund’s other service providers, also was considered. The directors concluded that, overall, they were satisfied with the nature, extent and quality of services provided to the Fund under the Advisory Agreement.
Costs of Services Provided and Profitability
The directors reviewed a schedule of the revenues and expenses and related notes indicating the profitability of the Fund to the Adviser for calendar years 2022 and 2023 that had been prepared with an expense allocation methodology arrived at in consultation with an independent consultant at the request of the directors. The directors noted the assumptions and methods of allocation used by the Adviser in preparing fund-specific profitability data and understood that there are a number of potentially acceptable allocation methodologies for information of this type. The directors noted that the profitability information reflected all revenues and expenses of the Adviser’s relationship with the Fund. The directors recognized that it is difficult to make comparisons of the profitability of the Advisory Agreement with the profitability of fund advisory contracts for unaffiliated funds because comparative information is not generally publicly available and is affected by numerous factors. The directors focused on the profitability of the Adviser’s relationship with the Fund before taxes and distribution expenses. The directors concluded that the Adviser’s level of profitability from its relationship with the Fund was not unreasonable.
| | |
| |
| abfunds.com | | AB CORPORATE INCOME SHARES | 35 |
Fall-Out Benefits
The directors considered the other benefits to the Adviser and its affiliates from their relationships with the Fund. The directors noted that the Adviser is compensated by the Sponsors. The directors understood that the Adviser also might derive reputational and other benefits from its association with the Fund.
Investment Results
In addition to the information reviewed by the directors in connection with the Meeting, the directors receive detailed performance information for the Fund at each regular Board meeting during the year.
At the Meeting, the directors reviewed performance information prepared by an independent service provider (the “15(c) service provider”), showing the performance of the Fund against a group of similar funds (“peer group”) and a larger group of similar funds (“peer universe”), each selected by the 15(c) service provider, and information prepared by the Adviser showing the Fund’s performance against a broad-based securities market index, in each case for the 1-, 3-, 5- and 10-year periods ended May 31, 2024 and (in the case of comparisons with the broad-based securities market index) for the period from inception. The directors were cognizant that the Fund was neither designed nor offered as a standalone investment and was intended to serve solely as a component of certain separately managed accounts (“SMAs”). The Adviser had explained that this attribute made it difficult to select an appropriate benchmark for the Fund. At the directors’ request, the Adviser provided information showing the weighting of the Fund in a current SMA and the overall performance of the SMA versus its stated benchmark. Based on their review, the directors concluded that the Fund’s investment performance was acceptable.
Advisory Fees
The directors considered the advisory fee rate payable by the Fund to the Adviser (zero) and information provided by the 15(c) service provider concerning advisory fee rates payable by other funds in the same category as the Fund. The directors recognized that it is difficult to make comparisons of advisory fees because there are variations in the services that are included in the fees payable by other funds.
The directors noted the unusual arrangements in the Advisory Agreement providing for no advisory fee but were cognizant that the Adviser is indirectly compensated by the Sponsors for its services to the Fund. The directors reviewed the fee arrangements between the Adviser and each of the current Sponsors and noted that such fees were negotiated on an arm’s length basis and were within the range of fees paid by wrap fee sponsors to other advisers of similar funds. While the Adviser’s fee arrangements with the Sponsors vary, the directors acknowledged the Adviser’s view that a portion of such fees (less the expenses of the Fund
| | |
| |
36 | AB CORPORATE INCOME SHARES | | abfunds.com |
paid by the Adviser) may reasonably be viewed as compensating the Adviser for advisory services it provides to the Fund (the “implied fee”) and that the Adviser believes that while the Sponsors pay the Adviser different fee rates, the rate of fee attributable to Fund management at the Fund level is the same for all Sponsors. The directors also considered the fee rate schedules used by other registered investment companies that invest in fixed income securities that are advised by the Adviser.
The directors also considered the Adviser’s fee schedule for other clients utilizing investment strategies similar to those of the Fund. For this purpose, they reviewed the relevant advisory fee information from the Adviser’s Form ADV and in a report from the Fund’s Senior Vice President and noted the differences between the Fund’s fee schedule, on the one hand, and the Adviser’s institutional fee schedule, on the other. The directors recognized that such information was of limited utility in light of the Fund’s unusual fee arrangement. The directors noted that the Adviser may, in some cases, agree to fee rates with large institutional clients that are lower than those reviewed by the directors and that they had previously discussed with the Adviser its policies in respect of such arrangements.
The Adviser reviewed with the directors the significantly greater scope of the services it provides to the Fund relative to institutional clients. In this regard, the Adviser noted, among other things, that, compared to institutional accounts, the Fund (i) demands considerably more portfolio management, research and trading resources due to significantly higher daily cash flows; (ii) has more tax and regulatory restrictions and compliance obligations; (iii) must prepare and file or distribute regulatory and other communications about fund operations; and (iv) must provide shareholder servicing to retail investors. The Adviser also reviewed the greater legal risks presented by the large and changing population of Fund shareholders who may assert claims against the Adviser in individual or class actions, and the greater entrepreneurial risk in offering new fund products, which require substantial investment to launch, may not succeed, and generally must be priced to compete with larger, more established funds resulting in lack of profitability to the Adviser until a new fund achieves scale. In light of the substantial differences in services rendered by the Adviser to institutional clients as compared to the Fund, and the different risk profile, the directors considered these fee comparisons inapt and did not place significant weight on them in their deliberations.
The directors did not consider comparative expense information for the Fund because the Fund does not bear ordinary expenses.
Economies of Scale
The directors did not consider the extent to which fee levels in the Advisory Agreement for the Fund reflect economies of scale because the Advisory Agreement does not provide for any compensation to be paid to the
| | |
| |
| abfunds.com | | AB CORPORATE INCOME SHARES | 37 |
Adviser by the Fund and the Fund’s expense ratio is zero. They did note, however, that the fee payable to the Adviser by the current Sponsors declines at a breakpoint based on either individual account sizes or on total assets managed by the Adviser for the Sponsor.
| | |
| |
38 | AB CORPORATE INCOME SHARES | | abfunds.com |
NOTES
| | |
| |
| abfunds.com | | AB CORPORATE INCOME SHARES | 39 |
NOTES
| | |
| |
40 | AB CORPORATE INCOME SHARES | | abfunds.com |
AB CORPORATE INCOME SHARES
66 Hudson Boulevard East
New York, NY 10001
800 221 5672
CIS-0152-1024 
OCT 10.31.24

SEMI-ANNUAL FINANCIAL STATEMENTS AND ADDITIONAL INFORMATION
AB IMPACT MUNICIPAL INCOME SHARES

| | |
| |
| Investment Products Offered | | • Are Not FDIC Insured • May Lose Value • Are Not Bank Guaranteed |
Investors should consider the investment objectives, risks, charges and expenses of the Fund carefully before investing. For copies of our prospectus or summary prospectus, which contain this and other information, visit us online at www.abfunds.com or contact your AB representative. Please read the prospectus and/or summary prospectus carefully before investing.
This shareholder report must be preceded or accompanied by the Fund’s prospectus for individuals who are not current shareholders of the Fund.
You may obtain a description of the Fund’s proxy voting policies and procedures, and information regarding how the Fund voted proxies relating to portfolio securities during the most recent 12-month period ended June 30, without charge. Simply visit AB’s website at www.abfunds.com, or go to the Securities and Exchange Commission’s (the “Commission”) website at www.sec.gov, or call AB at (800) 227 4618.
The Fund files its complete schedule of portfolio holdings with the Commission for the first and third quarters of each fiscal year as an exhibit to its reports on Form N-PORT. The Fund’s Form N-PORT reports are available on the Commission’s website at www.sec.gov. AB publishes full portfolio holdings for the Fund monthly at www.abfunds.com.
AllianceBernstein Investments, Inc. (ABI) is the distributor of the AB family of mutual funds. ABI is a member of FINRA and is an affiliate of AllianceBernstein L.P., the Adviser of the funds.
The [A/B] logo and AllianceBernstein® are registered trademarks used by permission of the owner, AllianceBernstein L.P.
PORTFOLIO OF INVESTMENTS
October 31, 2024 (unaudited)
| | | | | | | | |
| | | Principal
Amount
(000) | | | U.S. $ Value | |
| |
MUNICIPAL OBLIGATIONS – 98.1% | |
Long-Term Municipal Bonds – 98.1% | |
Alabama – 0.9% | |
Alabama Community College System ACCS Enhancements Fee Revenue
AGM Series 2021
4.00%, 09/01/2051 | | $ | 5,500 | | | $ | 5,194,712 | |
| | | | | | | | |
|
Arizona – 4.1% | |
Arizona Industrial Development Authority
Series 2021-A
4.00%, 07/01/2051 | | | 3,195 | | | | 2,811,709 | |
Arizona Industrial Development Authority
(KIPP NYC Public Charter Schools)
Series 2021-A
4.00%, 07/01/2061 | | | 3,980 | | | | 3,398,077 | |
Series 2021-B
4.00%, 07/01/2051 | | | 1,250 | | | | 1,100,042 | |
Arizona Industrial Development Authority
(Phoenix Children’s Hospital Obligated Group)
Series 2020
4.00%, 02/01/2050 | | | 4,500 | | | | 4,245,768 | |
Series 2021
4.00%, 02/01/2038 | | | 1,400 | | | | 1,411,632 | |
Industrial Development Authority of the County of Pima (The)
(TMC HealthCare Obligated Group)
Series 2021
4.00%, 04/01/2046 | | | 3,500 | | | | 3,249,172 | |
Maricopa County Industrial Development Authority
(Arizona Autism Charter Schools Obligated Group)
Series 2020
5.00%, 07/01/2040(a) | | | 500 | | | | 504,308 | |
5.00%, 07/01/2050(a) | | | 1,175 | | | | 1,153,255 | |
5.00%, 07/01/2054(a) | | | 640 | | | | 618,829 | |
Series 2021
4.00%, 07/01/2051(a) | | | 1,625 | | | | 1,333,133 | |
4.00%, 07/01/2061(a) | | | 5,210 | | | | 4,105,530 | |
| | | | | | | | |
| | | | | | | 23,931,455 | |
| | | | | | | | |
California – 14.9% | |
California Educational Facilities Authority
(Mount St Mary’s University/CA)
Series 2018-A
5.00%, 10/01/2036 | | | 405 | | | | 427,183 | |
5.00%, 10/01/2046 | | | 2,750 | | | | 2,852,353 | |
| | |
| |
| abfunds.com | | AB IMPACT MUNICIPAL INCOME SHARES | 1 |
PORTFOLIO OF INVESTMENTS (continued)
| | | | | | | | |
| | | Principal
Amount
(000) | | | U.S. $ Value | |
| |
California Health Facilities Financing Authority
(Children’s Hospital Los Angeles)
Series 2017-A
5.00%, 08/15/2047 | | $ | 3,750 | | | $ | 3,797,031 | |
California Health Facilities Financing Authority
(On Lok Senior Health Services Obligated Group)
Series 2020
5.00%, 08/01/2050 | | | 1,000 | | | | 1,021,692 | |
5.00%, 08/01/2055 | | | 1,200 | | | | 1,219,765 | |
California Health Facilities Financing Authority
(State of California Personal Income Tax Revenue)
Series 2022
4.19%, 06/01/2037 | | | 3,390 | | | | 3,150,753 | |
California Infrastructure & Economic Development Bank
(California Academy of Sciences)
Series 2024
3.25%, 08/01/2029 | | | 5,000 | | | | 5,015,701 | |
California Infrastructure & Economic Development Bank
(California Science Center Foundation)
Series 2021
4.00%, 05/01/2046 | | | 5,000 | | | | 4,943,864 | |
4.00%, 05/01/2051 | | | 5,000 | | | | 4,825,832 | |
4.00%, 05/01/2055 | | | 5,000 | | | | 4,767,764 | |
California Infrastructure & Economic Development Bank
(Roseville Sustainable Energy Partner LLC)
Series 2024
5.00%, 07/01/2044 | | | 2,000 | | | | 2,121,161 | |
California Municipal Finance Authority
(Community Health Centers of The Central Coast, Inc.)
Series 2021-A
5.00%, 12/01/2036(a) | | | 710 | | | | 733,371 | |
5.00%, 12/01/2046(a) | | | 7,985 | | | | 8,037,071 | |
5.00%, 12/01/2054(a) | | | 1,990 | | | | 1,972,953 | |
California Municipal Finance Authority
(Healthright 360)
Series 2019-A
5.00%, 11/01/2039(a) | | | 1,775 | | | | 1,726,258 | |
5.00%, 11/01/2049(a) | | | 6,075 | | | | 5,500,399 | |
California Municipal Finance Authority
(La Maestra Family Clinic, Inc.)
Series 2021
4.00%, 09/01/2046 | | | 2,960 | | | | 2,908,756 | |
4.00%, 09/01/2051 | | | 2,745 | | | | 2,649,611 | |
| | |
| |
2 | AB IMPACT MUNICIPAL INCOME SHARES | | abfunds.com |
PORTFOLIO OF INVESTMENTS (continued)
| | | | | | | | |
| | | Principal
Amount
(000) | | | U.S. $ Value | |
| |
California Municipal Finance Authority
(Valley Health Team, Inc.)
Series 2021
4.00%, 07/01/2037 | | $ | 1,200 | | | $ | 1,222,106 | |
4.00%, 07/01/2046 | | | 2,090 | | | | 2,052,769 | |
4.00%, 07/01/2051 | | | 1,945 | | | | 1,893,238 | |
California School Finance Authority
(Bright Star Schools Obligated Group)
Series 2017
5.00%, 06/01/2037(a) | | | 600 | | | | 602,248 | |
5.00%, 06/01/2054(a) | | | 250 | | | | 239,208 | |
California School Finance Authority
(Downtown College Prep Obligated Group)
Series 2016
4.75%, 06/01/2036(a) | | | 1,365 | | | | 1,169,361 | |
5.00%, 06/01/2051(a) | | | 2,500 | | | | 1,857,172 | |
California School Finance Authority
(Ednovate Obligated Group)
Series 2018
5.00%, 06/01/2037(a) | | | 1,000 | | | | 1,001,102 | |
5.00%, 06/01/2048(a) | | | 1,085 | | | | 1,028,839 | |
5.00%, 06/01/2056(a) | | | 1,000 | | | | 931,075 | |
California School Finance Authority
(Equitas Academy Obligated Group)
Series 2018-A
5.00%, 06/01/2048(a) | | | 3,750 | | | | 3,623,866 | |
California School Finance Authority
(Girls Athletic Leadership Schools Los Angeles)
Series 2021
4.00%, 06/01/2041(a) | | | 955 | | | | 804,100 | |
4.00%, 06/01/2051(a) | | | 1,000 | | | | 768,659 | |
California School Finance Authority
(Green DOT Public Schools Obligated Group)
Series 2018
5.00%, 08/01/2038(a) | | | 3,000 | | | | 3,067,449 | |
Series 2022
5.375%, 08/01/2042(a) | | | 1,500 | | | | 1,585,853 | |
City of Oakland CA
Series 2023-A
5.50%, 07/15/2053 | | | 2,500 | | | | 2,835,624 | |
Series 2023-D
5.50%, 07/15/2053 | | | 2,500 | | | | 2,835,624 | |
Port of Los Angeles
Series 2024-2
5.00%, 08/01/2037 | | | 2,000 | | | | 2,186,976 | |
| | | | | | | | |
| | | | | | | 87,376,787 | |
| | | | | | | | |
| | |
| |
| abfunds.com | | AB IMPACT MUNICIPAL INCOME SHARES | 3 |
PORTFOLIO OF INVESTMENTS (continued)
| | | | | | | | |
| | | Principal
Amount
(000) | | | U.S. $ Value | |
| |
Colorado – 0.5% | |
Denver Health & Hospital Authority
Series 2019-A
4.00%, 12/01/2038 | | $ | 1,020 | | | $ | 965,312 | |
4.00%, 12/01/2039 | | | 1,000 | | | | 943,853 | |
4.00%, 12/01/2040 | | | 750 | | | | 703,988 | |
| | | | | | | | |
| | | | | | | 2,613,153 | |
| | | | | | | | |
Connecticut – 0.9% | |
City of Bridgeport CT
Series 2021-A
4.00%, 08/01/2037 | | | 775 | | | | 781,900 | |
4.00%, 08/01/2039 | | | 1,000 | | | | 1,002,598 | |
4.00%, 08/01/2040 | | | 325 | | | | 324,210 | |
BAM Series 2018-C
5.00%, 07/15/2036 | | | 1,000 | | | | 1,050,192 | |
5.00%, 07/15/2038 | | | 620 | | | | 648,605 | |
BAM Series 2019-A
5.00%, 02/01/2035 | | | 1,500 | | | | 1,591,373 | |
| | | | | | | | |
| | | | | | | 5,398,878 | |
| | | | | | | | |
District of Columbia – 4.7% | |
District of Columbia
(Gallaudet University)
Series 2021
5.00%, 04/01/2046 | | | 1,715 | | | | 1,791,143 | |
5.00%, 04/01/2051 | | | 2,635 | | | | 2,727,446 | |
District of Columbia
(KIPP DC Obligated Group)
Series 2017-A
5.00%, 07/01/2042 | | | 1,785 | | | | 1,812,476 | |
Series 2017-B
5.00%, 07/01/2037 | | | 2,425 | | | | 2,483,921 | |
5.00%, 07/01/2042 | | | 2,000 | | | | 2,030,785 | |
District of Columbia
(KIPP DC Public Charter Schools)
Series 2019
4.00%, 07/01/2039 | | | 4,275 | | | | 4,097,187 | |
District of Columbia
(Plenary Infrastructure DC LLC State Lease)
Series 2022
5.00%, 08/31/2027 | | | 620 | | | | 644,068 | |
5.50%, 02/28/2035 | | | 4,025 | | | | 4,537,210 | |
5.50%, 02/29/2036 | | | 1,625 | | | | 1,839,954 | |
5.50%, 08/31/2036 | | | 1,800 | | | | 2,040,388 | |
5.50%, 02/28/2037 | | | 3,100 | | | | 3,523,388 | |
| | | | | | | | |
| | | | | | | 27,527,966 | |
| | | | | | | | |
| | |
| |
4 | AB IMPACT MUNICIPAL INCOME SHARES | | abfunds.com |
PORTFOLIO OF INVESTMENTS (continued)
| | | | | | | | |
| | | Principal
Amount
(000) | | | U.S. $ Value | |
| |
Florida – 1.2% | |
Florida Development Finance Corp.
(United Cerebral Palsy of Central Florida, Inc.)
Series 2020
5.00%, 06/01/2040 | | $ | 825 | | | $ | 791,311 | |
5.00%, 06/01/2050 | | | 3,735 | | | | 3,408,430 | |
Miami-Dade County Housing Finance Authority
(Wynwood Works LLC)
Series 2023-A
5.70%, 06/01/2052(a) | | | 2,000 | | | | 2,026,056 | |
Series 2023-B
5.78%, 06/01/2027(a) | | | 1,000 | | | | 1,006,399 | |
| | | | | | | | |
| | | | | | | 7,232,196 | |
| | | | | | | | |
Illinois – 8.0% | |
Chicago Housing Authority
Series 2018-A
5.00%, 01/01/2035 | | | 3,545 | | | | 3,678,207 | |
Chicago Transit Authority
(Chicago Transit Authority Sales Tax)
Series 2017
5.00%, 12/01/2051 | | | 5,085 | | | | 5,146,184 | |
Chicago Transit Authority Sales Tax Receipts Fund
Series 2014
5.25%, 12/01/2049 | | | 5,000 | | | | 5,012,129 | |
Series 2020-A
5.00%, 12/01/2045 | | | 7,315 | | | | 7,569,095 | |
Series 2022-A
4.00%, 12/01/2049 | | | 4,190 | | | | 3,929,608 | |
5.00%, 12/01/2057 | | | 3,770 | | | | 3,896,477 | |
Cook County Community College District No. 508
BAM Series 2017
5.00%, 12/01/2047 | | | 620 | | | | 630,048 | |
Illinois Finance Authority
(Lawndale Educational & Regional Network Charter School Obligated Group)
Series 2021
4.00%, 11/01/2041 | | | 2,600 | | | | 2,369,703 | |
4.00%, 11/01/2051 | | | 3,680 | | | | 3,151,542 | |
4.00%, 11/01/2056 | | | 3,850 | | | | 3,229,126 | |
Illinois Finance Authority
(University of Illinois)
Series 2020
4.00%, 10/01/2040 | | | 615 | | | | 574,885 | |
4.00%, 10/01/2050 | | | 6,505 | | | | 5,842,630 | |
| | |
| |
| abfunds.com | | AB IMPACT MUNICIPAL INCOME SHARES | 5 |
PORTFOLIO OF INVESTMENTS (continued)
| | | | | | | | |
| | | Principal
Amount
(000) | | | U.S. $ Value | |
| |
4.00%, 10/01/2055 | | $ | 2,000 | | | $ | 1,753,592 | |
| | | | | | | | |
| | | | | | | 46,783,226 | |
| | | | | | | | |
Indiana – 0.5% | |
Muncie Sanitary District
AGM Series 2021-A
5.00%, 01/01/2029 | | | 685 | | | | 729,465 | |
5.00%, 07/01/2029 | | | 600 | | | | 642,967 | |
5.00%, 01/01/2030 | | | 1,000 | | | | 1,075,998 | |
5.00%, 07/01/2030 | | | 420 | | | | 453,640 | |
| | | | | | | | |
| | | | | | | 2,902,070 | |
| | | | | | | | |
Louisiana – 0.5% | |
Tangipahoa Parish Hospital Service District No. 1
Series 2021
4.00%, 02/01/2041 | | | 1,500 | | | | 1,379,839 | |
4.00%, 02/01/2042 | | | 1,500 | | | | 1,365,894 | |
| | | | | | | | |
| | | | | | | 2,745,733 | |
| | | | | | | | |
Maryland – 4.1% | |
Maryland Economic Development Corp.
Series 2020
5.00%, 07/01/2056 | | | 1,225 | | | | 1,241,253 | |
Maryland Economic Development Corp.
(Bowie State University)
Series 2020
4.00%, 07/01/2050 | | | 1,200 | | | | 1,034,378 | |
Maryland Economic Development Corp.
(Maryland Econ Dev Corp.-Morgan View & Thurgood Marshall Student Hsg)
Series 2020
5.00%, 07/01/2050 | | | 2,500 | | | | 2,549,755 | |
Series 2022
5.00%, 07/01/2033 | | | 1,895 | | | | 2,040,674 | |
5.00%, 07/01/2034 | | | 1,840 | | | | 1,970,633 | |
Maryland Economic Development Corp.
(Maryland Economic Development Corp. Morgan View & Thurgood Marshall Student Hsg)
Series 2022
6.00%, 07/01/2058 | | | 1,250 | | | | 1,375,538 | |
Maryland Economic Development Corp.
(Purple Line Transit Partners LLC)
Series 2022
5.25%, 06/30/2052 | | | 8,000 | | | | 8,320,762 | |
5.25%, 06/30/2055 | | | 5,000 | | | | 5,198,084 | |
| | | | | | | | |
| | | | | | | 23,731,077 | |
| | | | | | | | |
| | |
| |
6 | AB IMPACT MUNICIPAL INCOME SHARES | | abfunds.com |
PORTFOLIO OF INVESTMENTS (continued)
| | | | | | | | |
| | | Principal
Amount
(000) | | | U.S. $ Value | |
| |
Massachusetts – 4.6% | |
Massachusetts Bay Transportation Authority Sales Tax Revenue
Series 2024-B
5.25%, 07/01/2054 | | $ | 2,000 | | | $ | 2,195,116 | |
Massachusetts Development Finance Agency
Series 2023
4.375%, 07/01/2052 | | | 5,500 | | | | 5,292,021 | |
Massachusetts Development Finance Agency
(Boston Medical Center Corp. Obligated Group)
Series 2015-D
5.00%, 07/01/2044 | | | 8,265 | | | | 8,277,825 | |
Series 2016-E
5.00%, 07/01/2037 | | | 765 | | | | 774,652 | |
Series 2017-F
5.00%, 07/01/2030 | | | 1,475 | | | | 1,535,325 | |
Series 2023
5.25%, 07/01/2048 | | | 2,720 | | | | 2,916,463 | |
Massachusetts Development Finance Agency
(Tufts Medicine Obligated Group)
Series 2019-A
5.00%, 07/01/2036 | | | 1,765 | | | | 1,790,810 | |
5.00%, 07/01/2039 | | | 2,250 | | | | 2,269,232 | |
AGM Series 2020-C
4.00%, 10/01/2045 | | | 1,090 | | | | 1,041,230 | |
Massachusetts Development Finance Agency
(WGBH Educational Foundation)
Series 2017-A
4.00%, 01/01/2032 | | | 825 | | | | 836,733 | |
| | | | | | | | |
| | | | | | | 26,929,407 | |
| | | | | | | | |
Michigan – 8.4% | |
Center Line Public Schools
Series 2018
5.00%, 05/01/2038 | | | 895 | | | | 937,248 | |
City of Detroit MI
Series 2018
5.00%, 04/01/2027 | | | 500 | | | | 519,384 | |
5.00%, 04/01/2032 | | | 770 | | | | 800,534 | |
5.00%, 04/01/2034 | | | 1,255 | | | | 1,300,521 | |
5.00%, 04/01/2035 | | | 1,500 | | | | 1,551,843 | |
5.00%, 04/01/2036 | | | 1,200 | | | | 1,239,571 | |
5.00%, 04/01/2037 | | | 1,100 | | | | 1,134,698 | |
Series 2021-A
4.00%, 04/01/2042 | | | 1,050 | | | | 980,797 | |
5.00%, 04/01/2050 | | | 3,650 | | | | 3,749,291 | |
| | |
| |
| abfunds.com | | AB IMPACT MUNICIPAL INCOME SHARES | 7 |
PORTFOLIO OF INVESTMENTS (continued)
| | | | | | | | |
| | | Principal
Amount
(000) | | | U.S. $ Value | |
| |
Series 2023-A
5.25%, 05/01/2028 | | $ | 300 | | | $ | 319,166 | |
5.25%, 05/01/2030 | | | 700 | | | | 764,975 | |
5.25%, 05/01/2031 | | | 600 | | | | 660,431 | |
5.25%, 05/01/2032 | | | 600 | | | | 665,599 | |
5.25%, 05/01/2033 | | | 800 | | | | 893,769 | |
6.00%, 05/01/2039 | | | 2,500 | | | | 2,857,859 | |
Detroit City School District
Series 2020-A
5.00%, 05/01/2036 | | | 1,145 | | | | 1,224,491 | |
5.00%, 05/01/2037 | | | 1,150 | | | | 1,223,631 | |
5.00%, 05/01/2039 | | | 1,645 | | | | 1,735,504 | |
5.00%, 05/01/2040 | | | 1,000 | | | | 1,050,481 | |
Downriver Utility Wastewater Authority
AGM Series 2018
5.00%, 04/01/2043 | | | 1,515 | | | | 1,563,564 | |
Ferris State University
Series 2019-A
5.00%, 10/01/2025 | | | 2,000 | | | | 2,031,231 | |
5.00%, 10/01/2026 | | | 2,185 | | | | 2,256,386 | |
Flint Hospital Building Authority
Series 2013
4.75%, 07/01/2028 | | | 110 | | | | 109,141 | |
Series 2013-A
5.25%, 07/01/2039 | | | 1,250 | | | | 1,247,475 | |
Flint Hospital Building Authority
(Hurley Medical Center)
Series 2020
4.00%, 07/01/2035 | | | 1,000 | | | | 937,007 | |
4.00%, 07/01/2038 | | | 1,575 | | | | 1,450,012 | |
4.00%, 07/01/2041 | | | 3,500 | | | | 3,109,318 | |
5.00%, 07/01/2031 | | | 2,405 | | | | 2,470,294 | |
Flint Public Library
AGM Series
2020 3.00%, 05/01/2029 | | | 1,085 | | | | 1,056,057 | |
3.00%, 05/01/2030 | | | 1,175 | | | | 1,138,228 | |
Great Lakes Water Authority Water Supply System Revenue
Series 2016-B
5.00%, 07/01/2046 | | | 1,225 | | | | 1,242,194 | |
Series 2020-B
5.00%, 07/01/2045 | | | 1,350 | | | | 1,424,579 | |
5.00%, 07/01/2049 | | | 1,300 | | | | 1,356,993 | |
Series 2022-A
5.00%, 07/01/2038 | | | 1,215 | | | | 1,342,715 | |
5.25%, 07/01/2039 | | | 1,925 | | | | 2,150,152 | |
5.25%, 07/01/2040 | | | 735 | | | | 818,593 | |
| | | | | | | | |
| | | | | | | 49,313,732 | |
| | | | | | | | |
| | |
| |
8 | AB IMPACT MUNICIPAL INCOME SHARES | | abfunds.com |
PORTFOLIO OF INVESTMENTS (continued)
| | | | | | | | |
| | | Principal
Amount
(000) | | | U.S. $ Value | |
| |
Minnesota – 0.6% | |
City of Minneapolis MN
Series 2021-A
4.00%, 07/01/2051 | | $ | 3,585 | | | $ | 2,599,208 | |
Housing & Redevelopment Authority of The City of St. Paul Minnesota
(Metro Deaf School)
Series 2018-A
5.00%, 06/15/2048(a) | | | 1,000 | | | | 970,272 | |
| | | | | | | | |
| | | | | | | 3,569,480 | |
| | | | | | | | |
Missouri – 0.0% | |
St. Louis Community College District
Series 2017
4.00%, 04/01/2035 | | | 200 | | | | 201,143 | |
| | | | | | | | |
|
New Jersey – 4.7% | |
Essex County Improvement Authority
(North Star Academy Charter School of Newark, Inc.)
Series 2020
4.00%, 07/15/2040(a) | | | 3,200 | | | | 3,037,120 | |
4.00%, 07/15/2050(a) | | | 3,260 | | | | 2,906,055 | |
New Jersey Economic Development Authority
(Foundation Academy Charter School A NJ Nonprofit Corp.)
Series 2018-A
5.00%, 07/01/2050 | | | 1,000 | | | | 1,002,418 | |
New Jersey Economic Development Authority
(New Jersey Economic Development Authority State Lease)
Series 2023 | | | | | | | | |
5.185%, 03/01/2030 | | | 1,500 | | | | 1,533,653 | |
5.198%, 03/01/2031 | | | 1,500 | | | | 1,534,200 | |
New Jersey Economic Development Authority
(New Jersey Transit Corp. State Lease)
Series 2020
5.00%, 11/01/2044 | | | 10,925 | | | | 11,343,354 | |
New Jersey Economic Development Authority
(North Star Academy Charter School of Newark, Inc.)
Series 2017
5.00%, 07/15/2047 | | | 1,175 | | | | 1,186,205 | |
New Jersey Economic Development Authority
(Seeing Eye, Inc. (The))
Series 2015
5.00%, 03/01/2025 | | | 3,205 | | | | 3,219,751 | |
| | |
| |
| abfunds.com | | AB IMPACT MUNICIPAL INCOME SHARES | 9 |
PORTFOLIO OF INVESTMENTS (continued)
| | | | | | | | |
| | | Principal
Amount
(000) | | | U.S. $ Value | |
| |
New Jersey Economic Development Authority
(State of New Jersey Division of Property Management & Construction Lease)
Series 2018-C
5.00%, 06/15/2027 | | $ | 645 | | | $ | 675,121 | |
5.00%, 06/15/2042 | | | 1,000 | | | | 1,025,038 | |
| | | | | | | | |
| | | | | | | 27,462,915 | |
| | | | | | | | |
New York – 17.0% | |
Buffalo Sewer Authority
Series 2021
1.75%, 06/15/2049(b) | | | 2,380 | | | | 1,720,772 | |
Build NYC Resource Corp.
Series 2017
5.00%, 06/01/2037(a) | | | 500 | | | | 505,258 | |
Build NYC Resource Corp.
(Academic Leadership Charter School)
Series 2021
4.00%, 06/15/2031 | | | 200 | | | | 198,979 | |
4.00%, 06/15/2036 | | | 990 | | | | 967,952 | |
Build NYC Resource Corp.
(Children’s Aid Society (The))
Series 2019
4.00%, 07/01/2044 | | | 1,890 | | | | 1,814,739 | |
4.00%, 07/01/2049 | | | 600 | | | | 564,430 | |
Build NYC Resource Corp.
(Classical Charter School, Inc.)
Series 2023
4.75%, 06/15/2058 | | | 760 | | | | 735,483 | |
Build NYC Resource Corp.
(East Harlem Scholars Academy Charter School Obligated Group)
Series 2022
5.75%, 06/01/2052(a) | | | 2,250 | | | | 2,364,694 | |
5.75%, 06/01/2062(a) | | | 7,000 | | | | 7,342,906 | |
Build NYC Resource Corp.
(Global Community Charter School)
Series 2022
4.00%, 06/15/2032 | | | 900 | | | | 904,505 | |
5.00%, 06/15/2042 | | | 2,800 | | | | 2,865,718 | |
5.00%, 06/15/2052 | | | 1,520 | | | | 1,530,448 | |
5.00%, 06/15/2057 | | | 1,300 | | | | 1,304,831 | |
Build NYC Resource Corp.
(Inwood Academy for Leadership Charter
School)
Series 2018-A
5.50%, 05/01/2048(a) | | | 500 | | | | 507,456 | |
| | |
| |
10 | AB IMPACT MUNICIPAL INCOME SHARES | | abfunds.com |
PORTFOLIO OF INVESTMENTS (continued)
| | | | | | | | |
| | | Principal
Amount
(000) | | | U.S. $ Value | |
| |
Build NYC Resource Corp.
(KIPP NYC Public Charter Schools)
Series 2023
5.25%, 07/01/2057 | | $ | 1,625 | | | $ | 1,678,961 | |
5.25%, 07/01/2062 | | | 2,000 | | | | 2,059,930 | |
Build NYC Resource Corp.
(Metropolitan Lighthouse Charter School)
Series 2017
5.00%, 06/01/2052(a) | | | 3,260 | | | | 3,221,225 | |
Series 2017-A
5.00%, 06/01/2047(a) | | | 1,725 | | | | 1,726,486 | |
Metropolitan Transportation Authority
Series 2014-D
5.00%, 11/15/2039 | | | 4,000 | | | | 4,002,194 | |
Series 2020-A
4.00%, 11/15/2043 | | | 1,480 | | | | 1,430,255 | |
Series 2020-C
4.75%, 11/15/2045 | | | 6,015 | | | | 6,180,978 | |
5.25%, 11/15/2055 | | | 17,020 | | | | 17,818,427 | |
Series 2020-D
4.00%, 11/15/2050 | | | 5,000 | | | | 4,731,970 | |
Series 2020-E
4.00%, 11/15/2045 | | | 3,000 | | | | 2,881,678 | |
5.00%, 11/15/2032 | | | 3,250 | | | | 3,535,263 | |
Series 2021-A
4.00%, 11/15/2041 | | | 7,500 | | | | 7,422,393 | |
Series 2024-B
5.00%, 11/15/2043 | | | 2,000 | | | | 2,151,873 | |
BAM Series 2024-A
4.00%, 11/15/2048 | | | 4,500 | | | | 4,298,172 | |
Monroe County Industrial Development Corp./NY
(True North Rochester Prep Charter School) Series 2020
5.00%, 06/01/2040(a) | | | 1,895 | | | | 1,933,282 | |
New York City Health and Hospitals Corp.
(New York City Health and Hospital Corp. Lease)
Series 2021-A
4.00%, 02/15/2045 | | | 1,110 | | | | 1,081,594 | |
New York Power Authority
(New York Power Authority SFP Transmission Project)
AGM Series 2023
5.00%, 11/15/2053 | | | 4,000 | | | | 4,293,480 | |
| | |
| |
| abfunds.com | | AB IMPACT MUNICIPAL INCOME SHARES | 11 |
PORTFOLIO OF INVESTMENTS (continued)
| | | | | | | | |
| | | Principal
Amount
(000) | | | U.S. $ Value | |
| |
New York State Dormitory Authority
(Montefiore Obligated Group)
Series 2018
5.00%, 08/01/2032 | | $ | 375 | | | $ | 388,513 | |
5.00%, 08/01/2034 | | | 750 | | | | 774,167 | |
AGM Series 2020
3.00%, 09/01/2050 | | | 2,000 | | | | 1,511,103 | |
New York Transportation Development Corp.
(Elevated Accessibility Enhancements Holding Co., LLC)
Series 2023
6.971%, 06/30/2051 | | | 2,000 | | | | 2,026,397 | |
Onondaga Civic Development Corp.
(Crouse Health Hospital Inc Obligated Group)
Series 2024
5.125%, 08/01/2044 | | | 1,250 | | | | 1,263,038 | |
| | | | | | | | |
| | | | | | | 99,739,550 | |
| | | | | | | | |
North Carolina – 0.8% | |
North Carolina Central University
Series 2019
4.00%, 04/01/2049 | | | 2,270 | | | | 2,076,998 | |
5.00%, 04/01/2044 | | | 2,500 | | | | 2,551,709 | |
| | | | | | | | |
| | | | | | | 4,628,707 | |
| | | | | | | | |
Ohio – 3.2% | |
American Municipal Power, Inc.
(American Municipal Power Solar Electricity Prepayment Revenue)
Series 2019
5.00%, 02/15/2044 | | | 2,150 | | | | 2,224,715 | |
Cleveland-Cuyahoga County Port Authority
(Cleveland Museum of Natural History (The))
Series 2021
4.00%, 07/01/2051 | | | 1,370 | | | | 1,238,730 | |
County of Cuyahoga OH
(MetroHealth System (The))
Series 2017
5.00%, 02/15/2042 | | | 7,865 | | | | 7,956,672 | |
5.25%, 02/15/2047 | | | 1,500 | | | | 1,523,656 | |
County of Darke OH
(Wayne Hospital Co. Obligated Group)
Series 2019-A
5.00%, 09/01/2049 | | | 2,690 | | | | 2,616,915 | |
| | |
| |
12 | AB IMPACT MUNICIPAL INCOME SHARES | | abfunds.com |
PORTFOLIO OF INVESTMENTS (continued)
| | | | | | | | |
| | | Principal
Amount
(000) | | | U.S. $ Value | |
| |
Ohio Higher Educational Facility Commission
(Ashtabula County Medical Center Obligated Group)
Series 2022
5.25%, 01/01/2041 | | $ | 2,000 | | | $ | 2,116,163 | |
5.25%, 01/01/2052 | | | 1,000 | | | | 1,034,683 | |
| | | | | | | | |
| | | | | | | 18,711,534 | |
| | | | | | | | |
Oklahoma – 1.8% | |
Oklahoma Development Finance Authority
(OU Medicine Obligated Group)
Series 2018-B
5.00%, 08/15/2033 | | | 2,100 | | | | 2,157,448 | |
5.50%, 08/15/2057 | | | 3,365 | | | | 3,432,312 | |
Series 2022-A
5.50%, 08/15/2041 | | | 5,000 | | | | 5,146,668 | |
| | | | | | | | |
| | | | | | | 10,736,428 | |
| | | | | | | | |
Pennsylvania – 8.6% | |
City of Philadelphia PA Water & Wastewater Revenue
Series 2018-A
5.00%, 10/01/2048 | | | 3,050 | | | | 3,157,896 | |
Series 2019-B
5.00%, 11/01/2049 | | | 3,095 | | | | 3,214,958 | |
Series 2022-C
5.50%, 06/01/2047 | | | 5,780 | | | | 6,364,053 | |
Delaware County Authority
(Elwyn Obligated Group)
Series 2017
5.00%, 06/01/2037 | | | 2,585 | | | | 2,542,046 | |
Hospitals & Higher Education Facilities Authority of Philadelphia (The)
(Temple University Health System Obligated Group)
Series 2017
5.00%, 07/01/2032 | | | 885 | | | | 905,066 | |
5.00%, 07/01/2034 | | | 2,130 | | | | 2,169,814 | |
AGM Series 2022
4.00%, 07/01/2040 | | | 4,475 | | | | 4,400,311 | |
Philadelphia Authority for Industrial Development
(City of Philadelphia PA)
Series 2018
5.00%, 05/01/2036 | | | 1,620 | | | | 1,697,247 | |
5.00%, 05/01/2037 | | | 1,390 | | | | 1,453,707 | |
5.00%, 05/01/2038 | | | 1,000 | | | | 1,045,126 | |
AGM Series 2017
5.00%, 12/01/2035 | | | 200 | | | | 208,368 | |
| | |
| |
| abfunds.com | | AB IMPACT MUNICIPAL INCOME SHARES | 13 |
PORTFOLIO OF INVESTMENTS (continued)
| | | | | | | | |
| | | Principal
Amount
(000) | | | U.S. $ Value | |
| |
Philadelphia Authority for Industrial Development
(Russell Byers Charter School)
Series 2020
5.00%, 05/01/2040 | | $ | 2,100 | | | $ | 2,101,292 | |
Philadelphia Energy Authority (The)
(City of Philadelphia PA Lease)
Series 2023
5.00%, 11/01/2036 | | | 1,500 | | | | 1,669,032 | |
5.00%, 11/01/2039 | | | 1,850 | | | | 2,033,678 | |
5.00%, 11/01/2040 | | | 700 | | | | 766,323 | |
5.00%, 11/01/2041 | | | 1,265 | | | | 1,377,530 | |
5.00%, 11/01/2042 | | | 1,050 | | | | 1,139,656 | |
5.00%, 11/01/2043 | | | 750 | | | | 810,318 | |
Pittsburgh Water & Sewer Authority
AGM Series 2019-A
5.00%, 09/01/2044 | | | 2,000 | | | | 2,099,260 | |
AGM Series 2020-B
4.00%, 09/01/2045 | | | 2,250 | | | | 2,198,624 | |
4.00%, 09/01/2050 | | | 2,500 | | | | 2,395,029 | |
AGM Series 2023-A
4.25%, 09/01/2053 | | | 2,500 | | | | 2,457,440 | |
School District of the City of Erie (The)
AGM Series 2019-A
5.00%, 04/01/2031 | | | 930 | | | | 992,882 | |
AGM Series 2019-C
5.00%, 04/01/2028 | | | 1,850 | | | | 1,959,974 | |
5.00%, 04/01/2029 | | | 1,000 | | | | 1,074,553 | |
| | | | | | | | |
| | | | | | | 50,234,183 | |
| | | | | | | | |
Rhode Island – 1.2% | |
Rhode Island Health and Educational Building Corp.
(City of Providence RI) | | | | | | | | |
BAM Series 2021-D
4.00%, 05/15/2038 | | | 2,930 | | | | 2,966,489 | |
4.00%, 05/15/2040 | | | 1,375 | | | | 1,380,646 | |
4.00%, 05/15/2041 | | | 2,485 | | | | 2,488,824 | |
| | | | | | | | |
| | | | | | | 6,835,959 | |
| | | | | | | | |
Texas – 1.4% | |
City of Mission TX
BAM Series 2021
5.00%, 02/15/2028 | | | 1,000 | | | | 1,055,252 | |
5.00%, 02/15/2029 | | | 1,000 | | | | 1,065,693 | |
El Paso County Hospital District
Series 2024
4.125%, 02/15/2049(c) | | | 1,000 | | | | 958,989 | |
| | |
| |
14 | AB IMPACT MUNICIPAL INCOME SHARES | | abfunds.com |
PORTFOLIO OF INVESTMENTS (continued)
| | | | | | | | |
| | | Principal
Amount
(000) | | | U.S. $ Value | |
| |
4.25%, 02/15/2054(c) | | $ | 600 | | | $ | 576,519 | |
5.00%, 08/15/2042 | | | 3,400 | | | | 3,649,524 | |
5.00%, 08/15/2043 | | | 1,000 | | | | 1,068,983 | |
| | | | | | | | |
| | | | | | | 8,374,960 | |
| | | | | | | | |
Washington – 0.6% | |
Pend Oreille County Public Utility District No. 1 Box Canyon
Series 2018
5.00%, 01/01/2044 | | | 3,600 | | | | 3,673,811 | |
| | | | | | | | |
|
West Virginia – 0.8% | |
Morgantown Utility Board, Inc.
Series 2018-B
5.00%, 12/01/2043 | | | 2,555 | | | | 2,640,825 | |
West Virginia Hospital Finance Authority
(West Virginia United Health System Obligated Group)
Series 2017-A
5.00%, 06/01/2047 | | | 1,775 | | | | 1,794,498 | |
| | | | | | | | |
| | | | | | | 4,435,323 | |
| | | | | | | | |
Wisconsin – 4.1% | |
Wisconsin Health & Educational Facilities Authority
(Hmong American Peace Academy Ltd.)
Series 2020
5.00%, 03/15/2050 | | | 3,520 | | | | 3,524,015 | |
Wisconsin Public Finance Authority
(Bancroft Neurohealth Obligated Group)
Series 2016
5.125%, 06/01/2048(a) | | | 4,430 | | | | 4,367,202 | |
Wisconsin Public Finance Authority
(Crossroads Health Project)
Series 2023
8.125%, 07/01/2058(a) | | | 1,000 | | | | 1,039,291 | |
Wisconsin Public Finance Authority
(NC A&T Real Estate Foundation LLC)
Series 2019
5.00%, 06/01/2034 | | | 1,000 | | | | 1,028,658 | |
5.00%, 06/01/2044 | | | 6,315 | | | | 6,354,301 | |
Wisconsin Public Finance Authority
(Scotland Health Care System Obligated Group)
Series 2021-A
4.00%, 10/01/2047 | | | 8,255 | | | | 7,405,816 | |
| | | | | | | | |
| | | | | | | 23,719,283 | |
| | | | | | | | |
Total Municipal Obligations
(cost $593,455,305) | | | | | | | 574,003,668 | |
| | | | | | | | |
| | |
| |
| abfunds.com | | AB IMPACT MUNICIPAL INCOME SHARES | 15 |
PORTFOLIO OF INVESTMENTS (continued)
| | | | | | | | |
| | |
Shares | | | U.S. $ Value | |
| |
SHORT-TERM INVESTMENTS – 0.6% | |
Investment Companies – 0.6% | |
AB Fixed Income Shares, Inc. – Government Money Market Portfolio – Class AB,
4.72%(d)(e)(f)
(cost $3,759,404) | | | 3,759,404 | | | $ | 3,759,404 | |
| | | | | | | | |
| | |
Total Investments – 98.7%
(cost $597,214,709) | | | | | | | 577,763,072 | |
Other assets less liabilities – 1.3% | | | | | | | 7,597,505 | |
| | | | | |
| | |
Net Assets – 100.0% | | | | | | $ | 585,360,577 | |
| | | | | |
CENTRALLY CLEARED INFLATION (CPI) SWAPS (see Note C)
| | | | | | | | | | | | | | | | | | | | | | | | | | |
| | | | | | | | | Rate Type | | | | | | | | | | | |
Notional
Amount
(000) | | | Termination
Date | | | Payments
made
by the
Fund | | Payments
received
by the
Fund | | Payment
Frequency
Paid/
Received | | Market
Value | | | Upfront
Premiums
Paid
(Received) | | | Unrealized
Appreciation
(Depreciation) | |
| USD | | | 29,852 | | | | 10/15/2029 | | | 2.516% | | CPI# | | Maturity | | $ | (22,997 | ) | | $ | – 0 | – | | $ | (22,997 | ) |
| USD | | | 29,824 | | | | 10/15/2029 | | | 2.451% | | CPI# | | Maturity | | | 65,404 | | | | – 0 | – | | | 65,404 | |
| USD | | | 29,824 | | | | 10/15/2029 | | | 2.499% | | CPI# | | Maturity | | | 250 | | | | – 0 | – | | | 250 | |
| | | | | | | | | | | | | | | | | | | | | | | | | | |
| | | | | | | | | | | | | | | | $ | 42,657 | | | $ | – 0 | – | | $ | 42,657 | |
| | | | | | | | | | | | | | | | | | | | | | | | | | |
| # | Variable interest rate based on the rate of inflation as determined by the Consumer Price Index (CPI). |
CENTRALLY CLEARED INTEREST RATE SWAPS (see Note C)
| | | | | | | | | | | | | | | | | | | | | | | | | | |
| | | | | | | | | Rate Type | | | | | | | | | | | |
Notional
Amount
(000) | | | Termination
Date | | | Payments
made
by the
Fund | | Payments
received
by the
Fund | | Payment
Frequency
Paid/
Received | | Market
Value | | | Upfront
Premiums
Paid
(Received) | | | Unrealized
Appreciation
(Depreciation) | |
| USD | | | 15,600 | | | | 07/31/2029 | | | 1 Day
SOFR | | 3.986% | | Annual | | $ | 79,995 | | | $ | – 0 | – | | $ | 79,995 | |
| USD | | | 12,400 | | | | 07/31/2029 | | | 1 Day
SOFR | | 4.461% | | Annual | | | 332,839 | | | | – 0 | – | | | 332,839 | |
| USD | | | 11,000 | | | | 07/31/2029 | | | 1 Day
SOFR | | 3.975% | | Annual | | | 50,876 | | | | – 0 | – | | | 50,876 | |
| USD | | | 10,000 | | | | 07/31/2029 | | | 1 Day
SOFR | | 3.938% | | Annual | | | 29,337 | | | | – 0 | – | | | 29,337 | |
| USD | | | 12,180 | | | | 10/15/2029 | | | 1 Day
SOFR | | 3.814% | | Annual | | | 14,580 | | | | – 0 | – | | | 14,580 | |
| USD | | | 12,160 | | | | 10/15/2029 | | | 1 Day
SOFR | | 3.740% | | Annual | | | (26,821 | ) | | | – 0 | – | | | (26,821 | ) |
| USD | | | 12,160 | | | | 10/15/2029 | | | 1 Day
SOFR | | 3.761% | | Annual | | | (15,848 | ) | | | – 0 | – | | | (15,848 | ) |
| | |
| |
16 | AB IMPACT MUNICIPAL INCOME SHARES | | abfunds.com |
PORTFOLIO OF INVESTMENTS (continued)
| | | | | | | | | | | | | | | | | | | | | | | | | | |
| | | | | | | | | Rate Type | | | | | | | | | | | |
Notional
Amount
(000) | | | Termination
Date | | | Payments
made
by the
Fund | | Payments
received
by the
Fund | | Payment
Frequency
Paid/
Received | | Market
Value | | | Upfront
Premiums
Paid
(Received) | | | Unrealized
Appreciation
(Depreciation) | |
| USD | | | 24,100 | | | | 07/31/2030 | | | 1 Day
SOFR | | 4.016% | | Annual | | $ | 215,065 | | | $ | – 0 | – | | $ | 215,065 | |
| USD | | | 28,600 | | | | 11/01/2030 | | | 1 Day
SOFR | | 4.518% | | Annual | | | 905,546 | | | | – 0 | – | | | 905,546 | |
| USD | | | 16,000 | | | | 07/31/2031 | | | 1 Day
SOFR | | 4.181% | | Annual | | | 340,757 | | | | – 0 | – | | | 340,757 | |
| USD | | | 15,400 | | | | 09/15/2031 | | | 1 Day
SOFR | | 3.533% | | Annual | | | (237,077 | ) | | | – 0 | – | | | (237,077 | ) |
| USD | | | 4,900 | | | | 09/15/2031 | | | 1 Day
SOFR | | 3.768% | | Annual | | | – 0 | – | | | – 0 | – | | | – 0 | – |
| USD | | | 4,500 | | | | 09/15/2031 | | | 1 Day
SOFR | | 3.411% | | Annual | | | (107,952 | ) | | | – 0 | – | | | (107,952 | ) |
| USD | | | 3,800 | | | | 09/15/2031 | | | 1 Day
SOFR | | 3.517% | | Annual | | | (66,028 | ) | | | – 0 | – | | | (66,028 | ) |
| USD | | | 33,400 | | | | 12/19/2033 | | | 3.571% | | 1 Day
SOFR | | Annual | | | 1,038,465 | | | | – 0 | – | | | 1,038,465 | |
| USD | | | 19,200 | | | | 06/15/2034 | | | 3.543% | | 1 Day
SOFR | | Annual | | | 439,762 | | | | 2,370 | | | | 437,392 | |
| USD | | | 13,410 | | | | 08/15/2034 | | | 3.314% | | 1 Day
SOFR | | Annual | | | 525,530 | | | | – 0 | – | | | 525,530 | |
| USD | | | 10,500 | | | | 08/15/2034 | | | 3.304% | | 1 Day
SOFR | | Annual | | | 448,882 | | | | – 0 | – | | | 448,882 | |
| | | | | | | | | | | | | | | | | | | | | | | | | | |
| | | | | | | | | | | | | | | | $ | 3,967,908 | | | $ | 2,370 | | | $ | 3,965,538 | |
| | | | | | | | | | | | | | | | | | | | | | | | | | |
| (a) | Security is exempt from registration under Rule 144A or Regulation S of the Securities Act of 1933. These securities are considered restricted, but liquid and may be resold in transactions exempt from registration. At October 31, 2024, the aggregate market value of these securities amounted to $75,317,741 or 12.9% of net assets. |
| (b) | Coupon rate adjusts periodically based upon a predetermined schedule. Stated interest rate in effect at October 31, 2024. |
| (c) | When-Issued or delayed delivery security. |
| (d) | Affiliated investments. |
| (e) | The rate shown represents the 7-day yield as of period end. |
| (f) | To obtain a copy of the fund’s shareholder report, please go to the Securities and Exchange Commission’s website at www.sec.gov, or call AB at (800) 227-4618. |
As of October 31, 2024, the Fund’s percentages of investments in municipal bonds that are insured and in insured municipal bonds that have been pre-refunded or escrowed to maturity are 9.3% and 0.0%, respectively.
Glossary:
AGM – Assured Guaranty Municipal
BAM – Build American Mutual
DOT – Department of Transportation
SOFR – Secured Overnight Financing Rate
See notes to financial statements.
| | |
| |
| abfunds.com | | AB IMPACT MUNICIPAL INCOME SHARES | 17 |
STATEMENT OF ASSETS & LIABILITIES
October 31, 2024 (unaudited)
| | | | |
| Assets | | | | |
Investments in securities, at value | | | | |
Unaffiliated issuers (cost $593,455,305) | | $ | 574,003,668 | |
Affiliated issuers (cost $3,759,404) | | | 3,759,404 | |
Cash collateral due from broker | | | 2,375,219 | |
Interest receivable | | | 9,031,924 | |
Receivable due from Adviser | | | 149,132 | |
Receivable for shares of beneficial interest sold | | | 40,144 | |
Affiliated dividends receivable | | | 10,931 | |
| | | | |
Total assets | | | 589,370,422 | |
| | | | |
| Liabilities | | | | |
Due to custodian | | | 479,655 | |
Dividends payable | | | 1,878,513 | |
Payable for investment securities purchased | | | 1,549,712 | |
Payable for variation margin on centrally cleared swaps | | | 89,739 | |
Payable for shares of beneficial interest redeemed | | | 12,226 | |
| | | | |
Total liabilities | | | 4,009,845 | |
| | | | |
Net Assets | | $ | 585,360,577 | |
| | | | |
| Composition of Net Assets | | | | |
Shares of beneficial interest, at par | | $ | 596 | |
Additional paid-in capital | | | 614,950,505 | |
Accumulated loss | | | (29,590,524 | ) |
| | | | |
Net Assets | | $ | 585,360,577 | |
| | | | |
Net Asset Value Per Share—unlimited shares of beneficial interest authorized, $.00001 par value (based on 59,610,129 common shares outstanding) | | $ | 9.82 | |
| | | | |
See notes to financial statements.
| | |
| |
18 | AB IMPACT MUNICIPAL INCOME SHARES | | abfunds.com |
STATEMENT OF OPERATIONS
Six Months Ended October 31, 2024 (unaudited)
| | | | | | | | |
| Investment Income | |
Interest | | $ | 11,001,878 | | | | | |
Dividends—Affiliated issuers | | | 91,097 | | | | | |
Other income(a) | | | 3,324 | | | | | |
| | | | | | | | |
Total investment income | | | | | | $ | 11,096,299 | |
| | | | | |
| Realized and Unrealized Gain (Loss) on Investment Transactions | | | | | | | | |
Net realized loss on: | | | | | | | | |
Investment transactions | | | | | | | (4,136,623 | ) |
Swaps | | | | | | | (474,381 | ) |
Net change in unrealized appreciation of: | | | | | | | | |
Investments | | | | | | | 16,758,823 | |
Swaps | | | | | | | 4,132,639 | |
| | | | | | | | |
Net gain on investment transactions | | | | | | | 16,280,458 | |
| | | | | | | | |
Net Increase in Net Assets from Operations | | | | | | $ | 27,376,757 | |
| | | | | |
| (a) | Other income includes a reimbursement for investment in affiliated issuer (see Note B). |
See notes to financial statements.
| | |
| |
| abfunds.com | | AB IMPACT MUNICIPAL INCOME SHARES | 19 |
STATEMENT OF CHANGES IN NET ASSETS
| | | | | | | | |
| | | Six Months Ended
October 31, 2024
(unaudited) | | | Year Ended
April 30,
2024 | |
| Increase (Decrease) in Net Assets from Operations | | | | | | | | |
Net investment income | | $ | 11,096,299 | | | $ | 20,719,875 | |
Net realized loss on investment transactions | | | (4,611,004 | ) | | | (5,978,197 | ) |
Net change in unrealized appreciation of investments | | | 20,891,462 | | | | 5,763,930 | |
| | | | | | | | |
Net increase in net assets from operations | | | 27,376,757 | | | | 20,505,608 | |
Distribution to Shareholders | | | (10,732,235 | ) | | | (20,167,561 | ) |
| Transactions in Shares of Beneficial Interest | | | | | | | | |
Net increase (decrease) | | | (2,688,060 | ) | | | 29,036,450 | |
| | | | | | | | |
Total increase | | | 13,956,462 | | | | 29,374,497 | |
| Net Assets | | | | | | | | |
Beginning of period | | | 571,404,115 | | | | 542,029,618 | |
| | | | | | | | |
End of period | | $ | 585,360,577 | | | $ | 571,404,115 | |
| | | | | | | | |
See notes to financial statements.
| | |
| |
20 | AB IMPACT MUNICIPAL INCOME SHARES | | abfunds.com |
NOTES TO FINANCIAL STATEMENTS
October 31, 2024 (unaudited)
NOTE A
Significant Accounting Policies
AB Corporate Shares (the “Trust”) is registered under the Investment Company Act of 1940 (the “1940 Act”), as an open-end, diversified management investment company. The Trust, which is a Massachusetts Business Trust, operates as a “series” company currently offering four separate portfolios: AB Corporate Income Shares, AB Municipal Income Shares, AB Taxable Multi-Sector Income Shares and AB Impact Municipal Income Shares. Each portfolio is considered to be a separate entity for financial reporting and tax purposes. This report relates only to AB Impact Municipal Income Shares (the “Fund”).
Shares of the Fund are offered exclusively to holders of accounts established under wrap fee programs sponsored and maintained by certain registered investment advisers approved by AllianceBernstein L.P. (the “Adviser”). The Fund’s shares may be purchased at the relevant net asset value without a sales charge or other fee. The financial statements have been prepared in conformity with U.S. generally accepted accounting principles (“U.S. GAAP”), which require management to make certain estimates and assumptions that affect the reported amounts of assets and liabilities in the financial statements and amounts of income and expenses during the reporting period. Actual results could differ from those estimates. The Fund is an investment company under U.S. GAAP and follows the accounting and reporting guidance applicable to investment companies. The following is a summary of significant accounting policies followed by the Fund.
1. Security Valuation
Portfolio securities are valued at market value determined on the basis of market quotations or, if market quotations are not readily available or are unreliable, at “fair value” as determined in accordance with procedures approved by and under the oversight of the Trust’s Board of Trustees (the “Board”). Pursuant to these procedures, the the Adviser serves as the Fund’s valuation designee pursuant to Rule 2a-5 of the 1940 Act. In this capacity, the Adviser is responsible, among other things, for making all fair value determinations relating to the Fund’s portfolio investments, subject to the Board’s oversight.
In general, the market values of securities which are readily available and deemed reliable are determined as follows: securities listed on a national securities exchange (other than securities listed on the NASDAQ Stock Market, Inc. (“NASDAQ”)) or on a foreign securities exchange are valued at the last sale price at the close of the exchange or foreign securities exchange. If there has been no sale on such day, the securities are valued at the last traded price from the previous day. Securities listed on more
| | |
| |
| abfunds.com | | AB IMPACT MUNICIPAL INCOME SHARES | 21 |
NOTES TO FINANCIAL STATEMENTS (continued)
than one exchange are valued by reference to the principal exchange on which the securities are traded; securities listed only on NASDAQ are valued in accordance with the NASDAQ Official Closing Price; listed or over the counter (“OTC”) market put or call options are valued at the mid level between the current bid and ask prices. If either a current bid or current ask price is unavailable, the Adviser will have discretion to determine the best valuation (e.g., last trade price in the case of listed options); open futures are valued using the closing settlement price or, in the absence of such a price, the most recent quoted bid price. If there are no quotations available for the day of valuation, the last available closing settlement price is used; U.S. Government securities and any other debt instruments having 60 days or less remaining until maturity are generally valued at market by an independent pricing vendor, if a market price is available. If a market price is not available, the securities are valued at amortized cost. This methodology is commonly used for short term securities that have an original maturity of 60 days or less, as well as short term securities that had an original term to maturity that exceeded 60 days. In instances when amortized cost is utilized, the Valuation Committee (the “Committee”) must reasonably conclude that the utilization of amortized cost is approximately the same as the fair value of the security. Factors the Committee will consider include, but are not limited to, an impairment of the creditworthiness of the issuer or material changes in interest rates. Fixed-income securities, including mortgage-backed and asset-backed securities, may be valued on the basis of prices provided by a pricing service or at a price obtained from one or more of the major broker-dealers. In cases where broker-dealer quotes are obtained, the Adviser may establish procedures whereby changes in market yields or spreads are used to adjust, on a daily basis, a recently obtained quoted price on a security. Swaps and other derivatives are valued daily, primarily using independent pricing services, independent pricing models using market inputs, as well as third party broker-dealers or counterparties. Open-end mutual funds are valued at the closing net asset value per share, while exchange traded funds are valued at the closing market price per share.
Securities for which market quotations are not readily available (including restricted securities) or are deemed unreliable are valued at fair value as deemed appropriate by the Adviser. Factors considered in making this determination may include, but are not limited to, information obtained by contacting the issuer, analysts, analysis of the issuer’s financial statements or other available documents. In addition, the Fund may use fair value pricing for securities primarily traded in non-U.S. markets because most foreign markets close well before the Fund values its securities at 4:00 p.m., Eastern Time. The earlier close of these foreign markets gives rise to the possibility that significant events, including broad market moves, may have occurred in the interim and may materially affect the value of those securities. To account for
| | |
| |
22 | AB IMPACT MUNICIPAL INCOME SHARES | | abfunds.com |
NOTES TO FINANCIAL STATEMENTS (continued)
this, the Fund generally values many of its foreign equity securities using fair value prices based on third party vendor modeling tools to the extent available.
2. Fair Value Measurements
In accordance with U.S. GAAP regarding fair value measurements, fair value is defined as the price that the Fund would receive to sell an asset or pay to transfer a liability in an orderly transaction between market participants at the measurement date. U.S. GAAP establishes a framework for measuring fair value, and a three-level hierarchy for fair value measurements based upon the transparency of inputs to the valuation of an asset or liability (including those valued based on their market values as described in Note A.1 above). Inputs may be observable or unobservable and refer broadly to the assumptions that market participants would use in pricing the asset or liability. Observable inputs reflect the assumptions market participants would use in pricing the asset or liability based on market data obtained from sources independent of the Fund. Unobservable inputs reflect the Fund’s own assumptions about the assumptions that market participants would use in pricing the asset or liability based on the best information available in the circumstances. Each investment is assigned a level based upon the observability of the inputs which are significant to the overall valuation. The three-tier hierarchy of inputs is summarized below.
| | • | | Level 1—quoted prices in active markets for identical investments |
| | • | | Level 2—other significant observable inputs (including quoted prices for similar investments, interest rates, prepayment speeds, credit risk, etc.) |
| | • | | Level 3—significant unobservable inputs (including the Fund’s own assumptions in determining the fair value of investments) |
The fair value of debt instruments, such as bonds, and over-the-counter derivatives is generally based on market price quotations, recently executed market transactions (where observable) or industry recognized modeling techniques and are generally classified as Level 2. Pricing vendor inputs to Level 2 valuations may include quoted prices for similar investments in active markets, interest rate curves, coupon rates, currency rates, yield curves, option adjusted spreads, default rates, credit spreads and other unique security features in order to estimate the relevant cash flows which are then discounted to calculate fair values. If these inputs are unobservable and significant to the fair value, these investments will be classified as Level 3.
Other fixed income investments, including non-U.S. government and corporate debt, are generally valued using quoted market prices, if available,
| | |
| |
| abfunds.com | | AB IMPACT MUNICIPAL INCOME SHARES | 23 |
NOTES TO FINANCIAL STATEMENTS (continued)
which are typically impacted by current interest rates, maturity dates and any perceived credit risk of the issuer. Additionally, in the absence of quoted market prices, these inputs are used by pricing vendors to derive a valuation based upon industry or proprietary models which incorporate issuer specific data with relevant yield/spread comparisons with more widely quoted bonds with similar key characteristics. Those investments for which there are observable inputs are classified as Level 2. Where the inputs are not observable, the investments are classified as Level 3.
The following table summarizes the valuation of the Fund’s investments by the above fair value hierarchy levels as of October 31, 2024:
| | | | | | | | | | | | | | | | |
Investments in
Securities: | | Level 1 | | | Level 2 | | | Level 3 | | | Total | |
Assets: | | | | | | | | | | | | | | | | |
Long-Term Municipal Bonds | | $ | – 0 | – | | $ | 574,003,668 | | | $ | – 0 | – | | $ | 574,003,668 | |
Short-Term Investments | | | 3,759,404 | | | | – 0 | – | | | – 0 | – | | | 3,759,404 | |
| | | | | | | | | | | | | | | | |
Total Investments in Securities | | | 3,759,404 | | | | 574,003,668 | | | | – 0 | – | | | 577,763,072 | |
Other Financial Instruments(a): | | | | | | | | | | | | | | | | |
Assets: | | | | | | | | | | | | | | | | |
Centrally Cleared Inflation (CPI) Swaps | | | – 0 | – | | | 65,654 | | | | – 0 | – | | | 65,654 | (b) |
Centrally Cleared Interest Rate Swaps | | | – 0 | – | | | 4,421,634 | | | | – 0 | – | | | 4,421,634 | (b) |
Liabilities: | | | | | | | | | | | | | | | | |
Centrally Cleared Inflation (CPI) Swaps | | | – 0 | – | | | (22,997 | ) | | | – 0 | – | | | (22,997 | )(b) |
Centrally Cleared Interest Rate Swaps | | | – 0 | – | | | (453,726 | ) | | | – 0 | – | | | (453,726 | )(b) |
| | | | | | | | | | | | | | | | |
Total | | $ | 3,759,404 | | | $ | 578,014,233 | | | $ | – 0 | – | | $ | 581,773,637 | |
| | | | | | | | | | | | | | | | |
| (a) | Other financial instruments include derivative instruments, such as futures, forwards and swaps. Derivative instruments are valued at the unrealized appreciation (depreciation) on the instrument. Other financial instruments may also include swaps with upfront premiums, written options and written swaptions which are valued at market value. |
| (b) | Only variation margin receivable (payable) at period end is reported within the statement of assets and liabilities. This amount reflects cumulative unrealized appreciation (depreciation) on futures and centrally cleared swaps as reported in the portfolio of investments. Where applicable, centrally cleared swaps with upfront premiums are presented here at market value. |
3. Taxes
It is the Fund’s policy to meet the requirements of the Internal Revenue Code applicable to regulated investment companies and to distribute all of its investment company taxable income and net realized gains, if any, to shareholders. Therefore, no provisions for federal income or excise taxes are required.
| | |
| |
24 | AB IMPACT MUNICIPAL INCOME SHARES | | abfunds.com |
NOTES TO FINANCIAL STATEMENTS (continued)
In accordance with U.S. GAAP requirements regarding accounting for uncertainties in income taxes, management has analyzed the Fund’s tax positions taken or expected to be taken on federal and state income tax returns for all open tax years (the current and the prior three tax years) and has concluded that no provision for income tax is required in the Fund’s financial statements.
4. Investment Income and Investment Transactions
Dividend income is recorded on the ex-dividend date or as soon as the Fund is informed of the dividend. Interest income is accrued daily. Investment transactions are accounted for on the date the securities are purchased or sold. Investment gains or losses are determined on the identified cost basis. Non-cash dividends, if any, are recorded on the ex-dividend date at the fair value of the securities received. The Fund amortizes premiums and accretes discounts as adjustments to interest income. The Fund accounts for distributions received from real estate investment trust (“REIT”) investments or from regulated investment companies as dividend income, realized gain, or return of capital based on information provided by the REIT or the investment company.
5. Dividends and Distributions
Dividends and distributions to shareholders, if any, are recorded on the ex-dividend date. Income dividends and capital gains distributions are determined in accordance with federal tax regulations and may differ from those determined in accordance with U.S. GAAP. To the extent these differences are permanent, such amounts are reclassified within the capital accounts based on their federal tax basis treatment; temporary differences do not require such reclassification.
6. Cash and Short-Term Investments
Cash and short-term investments include cash on hand and short-term investments with maturities of less than one year when purchased.
NOTE B
Advisory Fee and Other Transactions with Affiliates
Under the terms of the advisory agreement, the Fund pays no advisory fee to the Adviser and the Adviser reimburses or pays for the Fund’s operating expenses. The Fund is an integral part of separately managed accounts in wrap-fee programs and other investment programs. Typically, participants in these programs pay a fee to their investment adviser for all costs and expenses of the separately managed account, including costs and expenses associated with the Fund, and a fee is paid by their investment adviser to the Adviser. In certain cases, participants may have a direct relationship with the Adviser without the involvement of a third party investment adviser, in which case the participant would pay a fee directly
| | |
| |
| abfunds.com | | AB IMPACT MUNICIPAL INCOME SHARES | 25 |
NOTES TO FINANCIAL STATEMENTS (continued)
to the Adviser. The Adviser serves as investment manager and adviser of the Fund and continuously furnishes an investment program for the Fund and manages, supervises and conducts the affairs of the Fund, subject to the supervisions of the Fund’s Board. The advisory agreement provides that the Adviser or an affiliate will furnish, or pay the expenses of the Fund for, office space, facilities and equipment, services of executive and other personnel of the Fund and certain administrative services.
The Fund has entered into a distribution agreement with AllianceBernstein Investments, Inc., the Fund’s principal underwriter (the “Underwriter”), to permit the Underwriter to distribute the Fund’s shares, which are sold at their net asset value without any sales charge. The Fund does not pay a fee for this service. The Underwriter is a wholly owned subsidiary of the Adviser.
AllianceBernstein Investor Services, Inc. (“ABIS”), a wholly-owned subsidiary of the Adviser, acts as the Fund’s registrar, transfer agent and dividend-disbursing agent. ABIS registers the transfer, issuance and redemption of Fund shares and disburses dividends and other distributions to Fund shareholders. The Fund does not pay a fee for this service.
The Fund may invest in AB Government Money Market Portfolio (the “Government Money Market Portfolio”) which has a contractual annual advisory fee rate of .20% of the portfolio’s average daily net assets and bears its own expenses. The Adviser had contractually agreed to waive .10% of the advisory fee of Government Money Market Portfolio (resulting in a net advisory fee of .10%) until August 31, 2023. Effective September 1, 2023, the Adviser has contractually agreed to waive .05% of the advisory fee of Government Money Market Portfolio (resulting in a net advisory fee of .15%) until August 31, 2024. In connection with the investment by the Fund in Government Money Market Portfolio, the Adviser has contractually agreed to reimburse the Fund in an amount equal to the Fund’s pro rata share of the effective advisory fee of Government Money Market Portfolio, as borne indirectly by the Fund as an acquired fund fee and expense. For the six months ended October 31, 2024, such reimbursement amounted to $3,324.
A summary of the Fund’s transactions in AB mutual funds for the six months ended October 31, 2024 is as follows:
| | | | | | | | | | | | | | | | | | | | |
Fund | | Market Value
4/30/24
(000) | | | Purchases
at Cost
(000) | | | Sales
Proceeds
(000) | | | Market Value
10/31/24
(000) | | | Dividend
Income
(000) | |
Government Money Market Portfolio | | $ | 2,016 | | | $ | 59,143 | | | $ | 57,400 | | | $ | 3,759 | | | $ | 91 | |
| | |
| |
26 | AB IMPACT MUNICIPAL INCOME SHARES | | abfunds.com |
NOTES TO FINANCIAL STATEMENTS (continued)
NOTE C
Investment Transactions
Purchases and sales of investment securities (excluding short-term investments) for the six months ended October 31, 2024 were as follows:
| | | | | | | | |
| | | Purchases | | | Sales | |
Investment securities (excluding
U.S. government securities) | | $ | 64,072,682 | | | $ | 59,318,621 | |
U.S. government securities | | | 4,523,630 | | | | 5,530,270 | |
The cost of investments for federal income tax purposes was substantially the same as the cost for financial reporting purposes. Accordingly, gross unrealized appreciation and unrealized depreciation are as follows:
| | | | |
Gross unrealized appreciation | | $ | 10,295,333 | |
Gross unrealized depreciation | | | (25,738,775 | ) |
| | | | |
Net unrealized depreciation | | $ | (15,443,442 | ) |
| | | | |
1. Derivative Financial Instruments
The Fund may use derivatives in an effort to earn income and enhance returns, to replace more traditional direct investments, to obtain exposure to otherwise inaccessible markets (collectively, “investment purposes”), or to hedge or adjust the risk profile of its portfolio.
The principal types of derivatives utilized by the Fund, as well as the methods in which they may be used are:
The Fund may enter into swaps for investment purposes or to hedge its exposure to interest rates, credit risk, equity markets or currencies. A swap is an agreement that obligates two parties to exchange a series of cash flows at specified intervals based upon or calculated by reference to changes in specified prices, rates or indexes for a specified amount of an underlying asset or inflation. The payment flows are usually netted against each other, with the difference being paid by one party to the other. In addition, collateral may be pledged or received by the Fund in accordance with the terms of the respective swaps to provide value and recourse to the Fund or its counterparties in the event of default, bankruptcy or insolvency by one of the parties to the swap.
Risks may arise as a result of the failure of the counterparty to the swap to comply with the terms of the swap. The loss incurred by the failure of a counterparty is generally limited to the net interim payment to be received by the Fund, and/or the termination value at the end of the contract. Therefore, the Fund considers the creditworthiness of
| | |
| |
| abfunds.com | | AB IMPACT MUNICIPAL INCOME SHARES | 27 |
NOTES TO FINANCIAL STATEMENTS (continued)
each counterparty to a swap in evaluating potential counterparty risk. This risk is mitigated by having a netting arrangement between the Fund and the counterparty and by the posting of collateral by the counterparty to the Fund to cover the Fund’s exposure to the counterparty. Additionally, risks may arise from unanticipated movements in interest rates, inflation or in the value of the underlying securities. The Fund accrues for the interim payments on swaps on a daily basis, with the net amount recorded within unrealized appreciation (depreciation) of swaps on the statement of assets and liabilities, where applicable. Once the interim payments are settled in cash, the net amount is recorded as realized gain/(loss) on swaps on the statement of operations, in addition to any realized gain/(loss) recorded upon the termination of swaps. Upfront premiums paid or received for swaps are recognized as cost or proceeds on the statement of assets and liabilities and are amortized on a straight line basis over the life of the contract. Amortized upfront premiums are included in net realized gain/(loss) from swaps on the statement of operations. Fluctuations in the value of swaps are recorded as a component of net change in unrealized appreciation (depreciation) of swaps on the statement of operations.
Certain standardized swaps, including certain interest rate swaps and credit default swaps, are subject to mandatory central clearing. Cleared swaps are transacted through futures commission merchants (“FCMs”) that are members of central clearinghouses, with the clearinghouse serving as central counterparty, similar to transactions in futures contracts. Centralized clearing will be required for additional categories of swaps on a phased-in basis based on requirements published by the Securities and Exchange Commission and Commodity Futures Trading Commission.
At the time the Fund enters into a centrally cleared swap, the Fund deposits with the broker or segregates at its custodian cash or securities as collateral to satisfy initial margin requirements set by the clearinghouse on which the transaction is effected. Pursuant to the contract, with respect to cash collateral, the Fund agrees to receive from or pay to the broker an amount of cash equal to the daily fluctuation in the value of the contract; in the case of securities collateral, the Fund agrees to adjust the securities position held in the segregated account accordingly. Such receipts, payments or adjustments are known as variation margin and are recorded by the Fund as unrealized gains or losses. Risks may arise from the potential inability of a counterparty to meet the terms of the contract. The credit/counterparty risk for centrally cleared swaps is generally less than non-centrally cleared swaps, since the clearinghouse, which is the issuer or counterparty to each centrally cleared swap, has robust
| | |
| |
28 | AB IMPACT MUNICIPAL INCOME SHARES | | abfunds.com |
NOTES TO FINANCIAL STATEMENTS (continued)
risk mitigation standards, including the requirement to provide initial and variation margin. When the contract is closed, the Fund records a realized gain or loss equal to the difference between the value of the contract at the time it was opened and the time it was closed.
Interest Rate Swaps:
The Fund is subject to interest rate risk exposure in the normal course of pursuing its investment objectives. Because the Fund holds fixed rate bonds, the value of these bonds may decrease if interest rates rise. To help hedge against this risk and to maintain its ability to generate income at prevailing market rates, the Fund may enter into interest rate swaps. Interest rate swaps are agreements between two parties to exchange cash flows based on a notional amount. The Fund may elect to pay a fixed rate and receive a floating rate, or, receive a fixed rate and pay a floating rate on a notional amount.
In addition, the Fund may also enter into interest rate swap transactions to preserve a return or spread on a particular investment or portion of its portfolio, or protecting against an increase in the price of securities the Fund anticipates purchasing at a later date. Interest rate swaps involve the exchange by the Fund with another party of their respective commitments to pay or receive interest (e.g., an exchange of floating rate payments for fixed rate payments) computed based on a contractually-based principal (or “notional”) amount. Interest rate swaps are entered into on a net basis (i.e., the two payment streams are netted out, with the Fund receiving or paying, as the case may be, only the net amount of the two payments).
During the six months ended October 31, 2024, the Fund held interest rate swaps for hedging purposes.
Inflation (CPI) Swaps:
Inflation swap agreements are contracts in which one party agrees to pay the cumulative percentage increase in a price index (the Consumer Price Index with respect to CPI swaps) over the term of the swap (with some lag on the inflation index), and the other pays a compounded fixed rate. Inflation swaps may be used to protect the net asset value, or NAV, of a Fund against an unexpected change in the rate of inflation measured by an inflation index since the value of these agreements is expected to increase if there are unexpected inflation increases.
During the six months ended October 31, 2024, the Fund held inflation (CPI) swaps for hedging purposes.
The Fund typically enters into International Swaps and Derivatives Association, Inc. Master Agreements (“ISDA Master Agreement”) with its OTC
| | |
| |
| abfunds.com | | AB IMPACT MUNICIPAL INCOME SHARES | 29 |
NOTES TO FINANCIAL STATEMENTS (continued)
derivative contract counterparties in order to, among other things, reduce its credit risk to OTC counterparties. ISDA Master Agreements include provisions for general obligations, representations, collateral and events of default or termination. Under an ISDA Master Agreement, the Fund typically may offset with the OTC counterparty certain derivative financial instruments’ payables and/or receivables with collateral held and/or posted and create one single net payment (close-out netting) in the event of default or termination. In the event of a default by an OTC counterparty, the return of collateral with market value in excess of the Fund’s net liability, held by the defaulting party, may be delayed or denied.
The Fund’s ISDA Master Agreements may contain provisions for early termination of OTC derivative transactions in the event the net assets of the Fund decline below specific levels (“net asset contingent features”). If these levels are triggered, the Fund’s OTC counterparty has the right to terminate such transaction and require the Fund to pay or receive a settlement amount in connection with the terminated transaction. If OTC derivatives were held at period end, please refer to netting arrangements by the OTC counterparty table below for additional details.
During the six months ended October 31, 2024, the Fund had entered into the following derivatives:
| | | | | | | | | | | | |
| | | Asset Derivatives | | | Liability Derivatives | |
Derivative Type | | Statement of
Assets and
Liabilities
Location | | Fair Value | | | Statement of
Assets and
Liabilities
Location | | Fair Value | |
Interest rate contracts | |
Receivable for variation margin on centrally cleared swaps | |
$ |
4,484,918 |
* | |
Payable for variation margin on centrally cleared swaps | |
$ |
476,723 |
* |
| | | | | | | | | | | | |
Total | | | | $ | 4,484,918 | | | | | $ | 476,723 | |
| | | | | | | | | | | | |
| * | Only variation margin receivable/payable at period end is reported within the statement of assets and liabilities. This amount reflects cumulative unrealized appreciation (depreciation) on futures and centrally cleared swaps as reported in the portfolio of investments. |
| | | | | | | | | | |
Derivative Type | | Location of Gain
or (Loss) on
Derivatives
Within Statement of
Operations | | Realized Gain
or (Loss) on
Derivatives | | | Change in
Unrealized
Appreciation or
(Depreciation) | |
Interest rate contracts | | Net realized gain (loss) on swaps; Net change in unrealized appreciation (depreciation) of swaps | | $ | (474,381 | ) | | $ | 4,132,639 | |
| | | | | | | | | | |
Total | | | | $ | (474,381) | | | $ | 4,132,639 | |
| | | | | | | | | | |
| | |
| |
30 | AB IMPACT MUNICIPAL INCOME SHARES | | abfunds.com |
NOTES TO FINANCIAL STATEMENTS (continued)
The following table represents the average monthly volume of the Fund’s derivative transactions during the six months ended October 31, 2024:
| | | | |
Centrally Cleared Interest Rate Swaps: | | | | |
Average notional amount | | $ | 186,774,286 | |
Centrally Cleared Inflation Swaps: | | | | |
Average notional amount | | $ | 89,500,000 | (a) |
| (a) | Positions were open for one month during the period. |
NOTE D
Shares of Beneficial Interest
Transactions in shares of beneficial interest were as follows:
| | | | | | | | | | | | | | | | | | | | | | | | |
| | | | | | | | | | | | | | | | | | | | | | | | |
| | | Shares | | | | | | Amount | | | | |
| | | Six Months Ended
October 31, 2024
(unaudited) | | | Year Ended
April 30,
2024 | | | | | | Six Months Ended
October 31, 2024
(unaudited) | | | Year Ended
April 30,
2024 | | | | |
| | | | | | | | |
Shares sold | | | 3,980,739 | | | | 9,731,162 | | | | | | | $ | 39,044,488 | | | $ | 92,033,389 | | | | | |
| | | | | |
Shares redeemed | | | (4,250,078 | ) | | | (6,642,394 | ) | | | | | | | (41,732,548 | ) | | | (62,996,939 | ) | | | | |
| | | | | |
Net increase (decrease) | | | (269,339 | ) | | | 3,088,768 | | | | | | | $ | (2,688,060 | ) | | $ | 29,036,450 | | | | | |
| | | | | |
NOTE E
Risks Involved in Investing in the Fund
Market Risk—The value of the Fund’s assets will fluctuate as the market or markets in which the Fund invests fluctuates. The value of the Fund’s investments may decline, sometimes rapidly and unpredictably, simply because of economic changes or other events, including public health crises (including the occurrence of a contagious disease or illness) and regional and global conflicts, that affect large portions of the market.
ESG Risk—Applying ESG and sustainability criteria to the investment process may exclude securities of certain issuers for non-investment reasons and, therefore, the Fund may forgo some market opportunities available to funds that do not use ESG or sustainability criteria. Securities selected based on ESG factors may shift into and out of favor depending on market and economic conditions, and the Fund’s performance may at times be better or worse than the performance of funds that do not use ESG or sustainability criteria. Furthermore, ESG and sustainability criteria are not uniformly defined, and the Fund’s ESG and sustainability criteria may differ from those used by other funds. In addition, in evaluating an investment, the Adviser is dependent upon information and data that may be incomplete, inaccurate or unavailable, which could adversely affect the analysis of the ESG and sustainability factors relevant to a particular investment.
| | |
| |
| abfunds.com | | AB IMPACT MUNICIPAL INCOME SHARES | 31 |
NOTES TO FINANCIAL STATEMENTS (continued)
Credit Risk—An issuer or guarantor of a fixed-income security, or the counterparty to a derivatives or other contract, may be unable or unwilling to make timely payments of interest or principal, or to otherwise honor its obligations. The issuer or guarantor may default, causing a loss of the full principal amount of a security and any accrued interest. The degree of risk for a particular security may be reflected in its credit rating. There is the possibility that the credit rating of a fixed-income security may be downgraded after purchase, which may adversely affect the value of the security. Investments in fixed-income securities with lower ratings tend to have a higher probability that an issuer will default or fail to meet its payment obligations.
Municipal Market Risk—This is the risk that special factors may adversely affect the value of municipal securities and have a significant effect on the yield or value of the Fund’s investments in municipal securities. These factors include economic conditions, political or legislative changes, public health crises, uncertainties related to the tax status of municipal securities, and the rights of investors in these securities. To the extent that the Fund invests more of its assets in a particular state’s municipal securities, the Fund may be vulnerable to events adversely affecting that state, including economic, political and regulatory occurrences, court decisions, terrorism, public health crises (including the occurrence of a contagious disease or illness) and catastrophic natural disasters, such as hurricanes, fires or earthquakes. The Fund’s investments in certain municipal securities with principal and interest payments that are made from the revenues of a specific project or facility, and not general tax revenues, may have increased risks. Factors affecting the project or facility, such as local business or economic conditions, could have a significant effect on the project’s ability to make payments of principal and interest on these securities.
In addition, changes in tax rates or the treatment of income from certain types of municipal securities, among other things, could negatively affect the municipal securities markets.
Tax Risk—There is no guarantee that all of the Fund’s income will remain exempt from U.S. federal or state income taxes. From time to time, the U.S. Government and the U.S. Congress consider changes in U.S. federal income tax law that could limit or eliminate the federal tax exemption for municipal bond income, which would in effect reduce the income received by shareholders from the Fund by increasing taxes on that income. In such event, the Fund’s net asset value, or NAV, could also decline as yields on municipal bonds, which are typically lower than those on taxable bonds, would be expected to increase to approximately the yield of comparable taxable bonds. Actions or anticipated actions affecting the tax exempt
| | |
| |
32 | AB IMPACT MUNICIPAL INCOME SHARES | | abfunds.com |
NOTES TO FINANCIAL STATEMENTS (continued)
status of municipal bonds could also result in significant shareholder redemptions of Fund shares as investors anticipate adverse effects on the Fund or seek higher yields to offset the potential loss of the tax deduction. As a result, the Fund would be required to maintain higher levels of cash to meet the redemptions, which would negatively affect the Fund’s yield. The U.S. federal income tax treatment of payments in respect of certain derivative contracts is unclear.
Below Investment-Grade Securities Risk—Investments in fixed-income securities with lower ratings (commonly known as “junk bonds”) tend to have a higher probability that an issuer will default or fail to meet its payment obligations. These securities may be subject to greater price volatility due to such factors as specific corporate developments, interest rate sensitivity, negative perceptions of the junk bond market generally and may be more difficult to trade than other types of securities.
Interest-Rate Risk—Changes in interest rates will affect the value of investments in fixed-income securities. When interest rates rise, the value of existing investments in fixed-income securities tends to fall and this decrease in value may not be offset by higher income from new investments. Interest rate risk is generally greater for fixed-income securities with longer maturities or durations. The Fund may be subject to a greater risk of rising interest rates than would normally be the case due to the recent end of a period of historically low rates and the effects of potential central bank monetary policy, and government fiscal policy, initiatives and market reactions to those initiatives.
Duration Risk—Duration is a measure that relates the expected price volatility of a fixed-income security to changes in interest rates. The duration of a fixed-income security may be shorter than or equal to full maturity of a fixed-income security. Fixed-income securities with longer durations have more risk and will decrease in price as interest rates rise.
Inflation Risk—This is the risk that the value of assets or income from investments will be less in the future as inflation decreases the value of money. As inflation increases, the value of the Fund’s assets can decline as can the value of the Fund’s distributions. This risk is significantly greater for fixed-income securities with longer maturities.
Leverage Risk—When the Fund borrows money or otherwise leverages its investments, its performance may be volatile because leverage tends to exaggerate the effect of any increase or decrease in the value of the Fund’s investments. The Fund may create leverage through the use of reverse repurchase arrangements, forward currency exchange contracts, forward commitments, dollar rolls or futures or by borrowing money. The
| | |
| |
| abfunds.com | | AB IMPACT MUNICIPAL INCOME SHARES | 33 |
NOTES TO FINANCIAL STATEMENTS (continued)
use of other types of derivative instruments by the Fund, such as options and swaps, may also result in a form of leverage. Leverage may result in higher returns to the Fund than if the Fund were not leveraged, but may also adversely affect returns, particularly if the market is declining.
Illiquid Investments Risk—Illiquid investments risk exists when particular investments, such as lower-rated securities, are or become difficult to purchase or sell, possibly preventing the Fund from selling such investments at an advantageous price. The Fund is subject to illiquid investments risk because the market for municipal securities is generally smaller than many other markets. Derivatives and securities involving substantial market and credit risk tend to involve greater illiquid investments risk than most other types of investments.
Derivatives Risk—Derivatives may be difficult to price or unwind and leveraged so that small changes may produce disproportionate losses for the Fund. A short position in a derivative instrument involves the risk of a theoretically unlimited increase in the value of the underlying asset, reference rate or index, which could cause the Fund to suffer a potentially unlimited loss. Derivatives, especially over-the-counter derivatives, are also subject to counterparty risk, which is the risk that the counterparty (the party on the other side of the transaction) on a derivative transaction will be unable or unwilling to honor its contractual obligations to the Fund.
Indemnification Risk—In the ordinary course of business, the Fund enters into contracts that contain a variety of indemnifications. The Fund’s maximum exposure under these arrangements is unknown. However, the Fund has not had prior claims or losses pursuant to these indemnification provisions and expects the risk of loss thereunder to be remote. Therefore, the Fund has not accrued any liability in connection with these indemnification provisions.
Management Risk—The Fund is subject to management risk because it is an actively-managed investment fund. The Adviser will apply its investment techniques and risk analyses in making investment decisions, but there is no guarantee that its techniques will produce the intended results. Some of these techniques may incorporate, or rely upon, quantitative models, but there is no guarantee that these models will generate accurate forecasts, reduce risk or otherwise perform as expected.
NOTE F
Joint Credit Facility
A number of open-end mutual funds managed by the Adviser, including the Fund, participate in a $325 million revolving credit facility (the “Facility”) intended to provide short-term financing, if necessary, subject to certain
| | |
| |
34 | AB IMPACT MUNICIPAL INCOME SHARES | | abfunds.com |
NOTES TO FINANCIAL STATEMENTS (continued)
restrictions in connection with abnormal redemption activity. Commitment fees related to the Facility are paid by the Adviser. The Fund did not utilize the Facility during the six months ended October 31, 2024.
NOTE G
Distributions to Shareholders
The tax character of distributions to be paid for the year ending April 30, 2025 will be determined at the end of the current fiscal year. The tax character of distributions paid during the fiscal years ended April 30, 2024 and April 30, 2023 were as follows:
| | | | | | | | |
| | | 2024 | | | 2023 | |
Distributions paid from: | | | | | | | | |
Ordinary income | | $ | 1,357,374 | | | $ | 1,651,825 | |
| | | | | | | | |
Total taxable distributions paid | | | 1,357,374 | | | | 1,651,825 | |
Tax-exempt income | | | 18,810,187 | | | | 16,451,270 | |
| | | | | | | | |
Total distributions paid | | $ | 20,167,561 | | | $ | 18,103,095 | |
| | | | | | | | |
As of April 30, 2024, the components of accumulated earnings (deficit) on a tax basis were as follows:
| | | | |
Undistributed tax-exempt income | | $ | 1,708,828 | |
Accumulated capital and other losses | | $ | (10,276,152 | )(a) |
Unrealized appreciation (depreciation) | | | (35,954,581 | )(b) |
| | | | |
Total accumulated earnings (deficit) | | $ | (44,521,905 | )(c) |
| | | | |
| (a) | As of April 30, 2024, the Fund had a net capital loss carryforward of $10,276,152. |
| (b) | The difference between book-basis and tax-basis unrealized appreciation (depreciation) is attributable primarily to the tax treatment of swaps. |
| (c) | The difference between book-basis and tax-basis components of accumulated earnings (deficit) is attributable primarily to dividends payable. |
For tax purposes, net realized capital losses may be carried over to offset future capital gains, if any. Funds are permitted to carry forward capital losses for an indefinite period, and such losses will retain their character as either short-term or long-term capital losses. As of April 30, 2024, the Fund had a net short-term capital loss carryforward of $8,124,654 and a net long-term capital loss carryforward of $2,151,498, which may be carried forward for an indefinite period.
NOTE H
Recent Accounting Pronouncements
In December 2022, the Financial Accounting Standards Board issued an Accounting Standards Update, ASU 2022-06, “Reference Rate Reform (Topic 848) – Deferral of the Sunset Date of Topic 848”. ASU 2022-06 is an amendment to ASU 2020-04, which provided optional guidance to ease the potential accounting burden due to the discontinuation of the
| | |
| |
| abfunds.com | | AB IMPACT MUNICIPAL INCOME SHARES | 35 |
NOTES TO FINANCIAL STATEMENTS (continued)
LIBOR and other interbank-offered based reference rates and which was effective as of March 12, 2020 through December 31, 2022. ASU 2022-06 extends the effective period through December 31, 2024. Management is currently evaluating the impact, if any, of applying ASU 2022-06.
In November 2023, the Financial Accounting Standards Board issued Accounting Standards Update, ASU 2023-07, “Segment Reporting (Topic 280)”. ASU 2023-07 requires public entities to provide disclosure of significant segment expenses that are regularly provided to the chief operating decision maker (“CODM”). ASU 2023-07, among other things, (i) requires a single segment public entity to provide all necessary disclosures required by Topic 280 it, (ii) requires a public entity to disclose the title and position of the CODM and an explanation of how the CODM uses the reported measure(s) of segment profit and loss in assessing segment performance and deciding how to allocate resources and (iii) provides the ability for a public entity to elect more than one performance measure. ASU 2023-07 is effective for fiscal years beginning after December 15, 2023, and interim periods within fiscal years beginning after December 15, 2024. Early adoption of ASU 2023-07 is permitted. Management is currently evaluating the impact, if any, of applying ASU 2023-07.
NOTE I
Subsequent Events
Management has evaluated subsequent events for possible recognition or disclosure in the financial statements through the date the financial statements are issued. Management has determined that there are no material events that would require disclosure in the Fund’s financial statements through this date.
| | |
| |
36 | AB IMPACT MUNICIPAL INCOME SHARES | | abfunds.com |
FINANCIAL HIGHLIGHTS
Selected Data For A Share Of Beneficial Interest Outstanding Throughout Each Period
| | | | | | | | | | | | | | | | | | | | | | | | |
| | | Six Months
Ended
October 31,
2024 (unaudited) | | | Year Ended April 30, | |
| | | 2024 | | | 2023 | | | 2022 | | | 2021 | | | 2020 | |
| | | | | | | | | | | | | | | | | | | | | | | | |
| | | | |
Net asset value, beginning of period | | | $ 9.54 | | | | $ 9.54 | | | | $ 9.76 | | | | $ 10.91 | | | | $ 9.91 | | | | $ 10.19 | |
| | | | |
Income From Investment Operations | | | | | | | | | | | | | | | | | | | | | | | | |
| | | | | | |
Net investment income(a) | | | .19 | | | | .35 | | | | .31 | | | | .28 | | | | .31 | | | | .33 | |
| | | | | | |
Net realized and unrealized gain (loss) on investment transactions | | | .27 | | | | (.01 | ) | | | (.20 | ) | | | (1.16 | ) | | | 1.00 | | | | (.27 | ) |
| | | | | | |
Contributions from Affiliates | | | – 0 | – | | | – 0 | – | | | – 0 | – | | | – 0 | – | | | .00 | (b) | | | – 0 | – |
| | | | |
Net increase (decrease) in net asset value from operations | | | .46 | | | | .34 | | | | .11 | | | | (.88 | ) | | | 1.31 | | | | .06 | |
| | | | |
Less: Dividends | | | | | | | | | | | | | | | | | | | | | | | | |
| | | | | | |
Dividends from net investment income | | | (.18 | ) | | | (.34 | ) | | | (.33 | ) | | | (.27 | ) | | | (.31 | ) | | | (.34 | ) |
| | | | |
Net asset value, end of period | | | $ 9.82 | | | | $ 9.54 | | | | $ 9.54 | | | | $ 9.76 | | | | $ 10.91 | | | | $ 9.91 | |
| | | | |
| | | | | | |
Total Return | | | | | | | | | | | | | | | | | | | | | | | | |
| | | | | | |
Total investment return based on net asset value(c) | | | 4.84 | % | | | 3.70 | % | | | 1.20 | % | | | (8.23 | )% | | | 13.32 | % | | | .40 | % |
| | | | | | |
Ratios/Supplemental Data | | | | | | | | | | | | | | | | | | | | | | | | |
| | | | | | |
Net assets, end of period (000’s omitted) | | | $585,361 | | | | $571,404 | | | | $542,030 | | | | $516,931 | | | | $458,181 | | | | $245,297 | |
| | | | | | |
Ratio to average net assets of: | | | | | | | | | | | | | | | | | | | | | | | | |
| | | | | | |
Net investment income | | | 3.76 | %^ | | | 3.73 | % | | | 3.32 | % | | | 2.59 | % | | | 2.88 | % | | | 3.18 | % |
| | | | | | |
Portfolio turnover rate | | | 11 | % | | | 15 | % | | | 8 | % | | | 13 | % | | | 14 | % | | | 2 | % |
| (a) | Based on average shares outstanding. |
| (b) | Amount is less than $.005. |
| (c) | Total investment return is calculated assuming an initial investment made at the net asset value at the beginning of the period, reinvestment of all dividends and distributions at net asset value during the period, and redemption on the last day of the period. Total return does not reflect the deduction of taxes that a shareholder would pay on fund distributions or the redemption of fund shares. Total investment return calculated for a period of less than one year is not annualized. |
See notes to financial statements.
| | |
| |
| abfunds.com | | AB IMPACT MUNICIPAL INCOME SHARES | 37 |
Information Regarding the Review and Approval of the Fund’s Advisory Agreement
The disinterested trustees (the “directors”) of AB Corporate Shares (the “Company”) unanimously approved the continuance of the Company’s Advisory Agreement with the Adviser in respect of AB Impact Municipal Income Shares (the “Fund”) at a meeting held in-person on July 30-31, 2024 (the “Meeting”).
Prior to approval of the continuance of the Advisory Agreement, the directors had requested from the Adviser, and received and evaluated, extensive materials. They reviewed the proposed continuance of the Advisory Agreement with the Adviser and with experienced counsel who are independent of the Adviser, who advised on the relevant legal standards. The directors also reviewed additional materials, including comparative analytical data prepared by the Senior Vice President of the Fund. The directors also discussed the proposed continuance in private sessions with counsel.
The directors noted that the Fund is designed as a vehicle for the wrap fee account market (where investors pay fees to a wrap fee sponsor which pays investment fees and expenses from such fee). The directors also noted that no advisory fee is payable by the Fund, that the Advisory Agreement does not include the reimbursement provision for certain administrative expenses included in the advisory agreements of most of the open-end AB Funds, and that the Adviser is responsible for payment of the Fund’s ordinary expenses. The directors noted that the Company acknowledges in the Advisory Agreement that the Adviser and its affiliates expect to receive compensation from third parties in connection with services provided under the Advisory Agreement. The directors further noted that the Adviser receives payments from the wrap fee program sponsors (the “Sponsors”) that use the Fund as an investment vehicle for their clients.
The directors considered their knowledge of the nature and quality of the services provided by the Adviser to the Fund gained from their experience as directors or trustees of most of the registered investment companies advised by the Adviser, their overall confidence in the Adviser’s integrity and competence they have gained from that experience, the Adviser’s initiative in identifying and raising potential issues with the directors and its responsiveness, frankness and attention to concerns raised by the directors in the past, including the Adviser’s willingness to consider and implement organizational and operational changes designed to improve investment results and the services provided to the AB Funds. The directors noted that they have four regular meetings each year, at each of which they review extensive materials and information from the Adviser, including information on the investment performance of the Fund and the money market fund advised by the Adviser in which the Fund invests a portion of its assets.
| | |
| |
38 | AB IMPACT MUNICIPAL INCOME SHARES | | abfunds.com |
The directors also considered all factors they believed relevant, including the specific matters discussed below. During the course of their deliberations, the directors evaluated, among other things, the reasonableness of the advisory fee. The directors did not identify any particular information that was all-important or controlling, and different directors may have attributed different weights to the various factors. The directors determined that the selection of the Adviser to manage the Fund and the overall arrangements between the Fund and the Adviser, as provided in the Advisory Agreement, including the advisory fee, were fair and reasonable in light of the services performed, expenses incurred and such other matters as the directors considered relevant in the exercise of their business judgment. The material factors and conclusions that formed the basis for the directors’ determinations included the following:
Nature, Extent and Quality of Services Provided
The directors considered the scope and quality of services provided by the Adviser under the Advisory Agreement, including the quality of the investment research capabilities of the Adviser and the other resources it has dedicated to performing services for the Fund. The directors noted that the Adviser from time to time reviews the Fund’s investment strategies and from time to time proposes changes intended to improve the Fund’s relative or absolute performance for the directors’ consideration. They also noted the professional experience and qualifications of the Fund’s portfolio management team and other senior personnel of the Adviser. The quality of administrative and other services, including the Adviser’s role in coordinating the activities of the Fund’s other service providers, also was considered. The directors concluded that, overall, they were satisfied with the nature, extent and quality of services provided to the Fund under the Advisory Agreement.
Costs of Services Provided and Profitability
The directors reviewed a schedule of the revenues and expenses and related notes indicating the profitability of the Fund to the Adviser for calendar years 2022 and 2023 that had been prepared with an expense allocation methodology arrived at in consultation with an independent consultant at the request of the directors. The directors noted the assumptions and methods of allocation used by the Adviser in preparing fund-specific profitability data and understood that there are a number of potentially acceptable allocation methodologies for information of this type. The directors noted that the profitability information reflected all revenues and expenses of the Adviser’s relationship with the Fund. The directors recognized that it is difficult to make comparisons of the profitability of the Advisory Agreement with the profitability of fund advisory contracts for unaffiliated funds because comparative information is not generally publicly available and is affected by numerous factors. The directors focused on the profitability of the Adviser’s relationship with the Fund before taxes and
| | |
| |
| abfunds.com | | AB IMPACT MUNICIPAL INCOME SHARES | 39 |
distribution expenses. The directors concluded that the Adviser’s level of profitability from its relationship with the Fund was not unreasonable.
Fall-Out Benefits
The directors considered the other benefits to the Adviser and its affiliates from their relationships with the Fund and the money market fund advised by the Adviser in which the Fund invests. The directors noted that the Adviser is compensated by the Sponsors. The directors understood that the Adviser also might derive reputational and other benefits from its association with the Fund.
Investment Results
In addition to the information reviewed by the directors in connection with the Meeting, the directors receive detailed performance information for the Fund at each regular Board meeting during the year.
At the Meeting, the directors reviewed performance information prepared by an independent service provider (the “15(c) service provider”), showing the performance of the Fund against a group of similar funds (“peer group”) and a larger group of similar funds (“peer universe”), each selected by the 15(c) service provider, and information prepared by the Adviser showing the Fund’s performance against a broad-based securities market index, in each case for the 1-, 3- and 5-year periods ended May 31, 2024 and (in the case of comparisons with the broad-based securities market index) for the period from inception. The directors were cognizant that the Fund was neither designed nor offered as a standalone investment and was intended to serve solely as a component of certain separately managed accounts (“SMAs”). The Adviser had explained that this attribute made it difficult to select an appropriate benchmark for the Fund. At the directors’ request, the Adviser provided information showing the weighting of the Fund in a current SMA and the overall performance of the SMA versus its stated benchmark. Based on their review, the directors concluded that the Fund’s investment performance was acceptable.
Advisory Fees
The directors considered the advisory fee rate payable by the Fund to the Adviser (zero) and information provided by the 15(c) service provider concerning advisory fee rates payable by other funds in the same category as the Fund. The directors recognized that it is difficult to make comparisons of advisory fees because there are variations in the services that are included in the fees payable by other funds.
The directors noted the unusual arrangements in the Advisory Agreement providing for no advisory fee but were cognizant that the Adviser is indirectly compensated by the Sponsors for its services to the Fund. The directors reviewed the fee arrangements between the Adviser and each of the current Sponsors and noted that such fees were negotiated on an
| | |
| |
40 | AB IMPACT MUNICIPAL INCOME SHARES | | abfunds.com |
arm’s length basis and were within the range of fees paid by wrap fee sponsors to other advisers of similar funds. While the Adviser’s fee arrangements with the Sponsors vary, the directors acknowledged the Adviser’s view that a portion of such fees (less the expenses of the Fund paid by the Adviser) may reasonably be viewed as compensating the Adviser for advisory services it provides to the Fund (the “implied fee”) and that the Adviser believes that while the Sponsors pay the Adviser different fee rates, the rate of fee attributable to Fund management at the Fund level is the same for all Sponsors. The directors also considered the fee rate schedules used by other registered investment companies that invest in fixed income securities that are advised by the Adviser.
The Adviser informed the directors that there were no institutional products managed by the Adviser that utilize investment strategies similar to those of the Fund.
The directors did not consider comparative expense information for the Fund because the Fund does not bear ordinary expenses.
Economies of Scale
The directors did not consider the extent to which fee levels in the Advisory Agreement for the Fund reflect economies of scale because the Advisory Agreement does not provide for any compensation to be paid to the Adviser by the Fund and the Fund’s expense ratio is zero. They did note, however, that the fee payable to the Adviser by the current Sponsors declines at a breakpoint based on either individual account sizes or on total assets managed by the Adviser for the Sponsor.
| | |
| |
| abfunds.com | | AB IMPACT MUNICIPAL INCOME SHARES | 41 |
NOTES
| | |
| |
42 | AB IMPACT MUNICIPAL INCOME SHARES | | abfunds.com |
NOTES
| | |
| |
| abfunds.com | | AB IMPACT MUNICIPAL INCOME SHARES | 43 |
NOTES
| | |
| |
44 | AB IMPACT MUNICIPAL INCOME SHARES | | abfunds.com |
AB IMPACT MUNICIPAL INCOME SHARES
66 Hudson Boulevard East
New York, NY 10001
800 221 5672
IMISH-0152-1024 
OCT 10.31.24

SEMI-ANNUAL FINANCIAL STATEMENTS AND ADDITIONAL INFORMATION
AB MUNICIPAL INCOME SHARES

| | |
| |
| Investment Products Offered | | • Are Not FDIC Insured • May Lose Value • Are Not Bank Guaranteed |
Investors should consider the investment objectives, risks, charges and expenses of the Fund carefully before investing. For copies of our prospectus or summary prospectus, which contain this and other information, visit us online at www.abfunds.com or contact your AB representative. Please read the prospectus and/or summary prospectus carefully before investing.
This shareholder report must be preceded or accompanied by the Fund’s prospectus for individuals who are not current shareholders of the Fund.
You may obtain a description of the Fund’s proxy voting policies and procedures, and information regarding how the Fund voted proxies relating to portfolio securities during the most recent 12-month period ended June 30, without charge. Simply visit AB’s website at www.abfunds.com, or go to the Securities and Exchange Commission’s (the “Commission”) website at www.sec.gov, or call AB at (800) 227 4618.
The Fund files its complete schedule of portfolio holdings with the Commission for the first and third quarters of each fiscal year as an exhibit to its reports on Form N-PORT. The Fund’s Form N-PORT reports are available on the Commission’s website at www.sec.gov. AB publishes full portfolio holdings for the Fund monthly at www.abfunds.com.
AllianceBernstein Investments, Inc. (ABI) is the distributor of the AB family of mutual funds. ABI is a member of FINRA and is an affiliate of AllianceBernstein L.P., the Adviser of the funds.
The [A/B] logo and AllianceBernstein® are registered trademarks used by permission of the owner, AllianceBernstein L.P.
PORTFOLIO OF INVESTMENTS
October 31, 2024 (unaudited)
| | | | | | | | |
| | | Principal
Amount
(000) | | | U.S. $ Value | |
| |
MUNICIPAL OBLIGATIONS – 103.6% | | | | | | | | |
Long-Term Municipal Bonds – 103.5% | | | | | | | | |
Alabama – 4.4% | | | | | | | | |
Black Belt Energy Gas District
Series 2024-B
5.00%, 10/01/2055 | | $ | 40,965 | | | $ | 43,497,850 | |
Black Belt Energy Gas District
(Apollo Global Management, Inc.)
Series 2024-A
5.25%, 05/01/2055 | | | 8,000 | | | | 8,666,788 | |
Black Belt Energy Gas District
(Goldman Sachs Group, Inc. (The))
Series 2022-F
5.50%, 11/01/2053 | | | 15,500 | | | | 16,470,773 | |
Series 2023-A
5.25%, 01/01/2054(a)(b) | | | 46,865 | | | | 50,442,866 | |
Series 2023-C
5.50%, 10/01/2054 | | | 16,055 | | | | 17,650,894 | |
Series 2023-D
5.079% (SOFR + 1.85%), 06/01/2049(c) | | | 20,500 | | | | 21,074,843 | |
Black Belt Energy Gas District
(Morgan Stanley)
5.728% (SOFR + 2.15%), 02/01/2053(a)(b)(c) | | | 10,000 | | | | 10,393,849 | |
Black Belt Energy Gas District
(Nomura Holdings, Inc.)
Series 2022-A
4.00%, 12/01/2052 | | | 17,325 | | | | 17,267,661 | |
Black Belt Energy Gas District
(Pacific Mutual Holding Co.)
Series 2024-C
5.00%, 05/01/2055 | | | 31,900 | | | | 34,053,142 | |
Black Belt Energy Gas District
(Royal Bank of Canada)
Series 2023-B
5.25%, 12/01/2053(a)(b) | | | 22,380 | | | | 24,180,424 | |
County of Jefferson AL Sewer Revenue
Series 2024
5.25%, 10/01/2041 | | | 2,250 | | | | 2,450,491 | |
5.25%, 10/01/2044 | | | 2,665 | | | | 2,879,978 | |
5.50%, 10/01/2053 | | | 9,610 | | | | 10,402,947 | |
Energy Southeast A Cooperative District
(Morgan Stanley)
Series 2023-A
5.279% (SOFR + 2.05%), 11/01/2053(c) | | | 16,000 | | | | 16,209,954 | |
5.50%, 11/01/2053(b) | | | 17,645 | | | | 19,291,407 | |
| | |
| |
| abfunds.com | | AB MUNICIPAL INCOME SHARES | 1 |
PORTFOLIO OF INVESTMENTS (continued)
| | | | | | | | |
| | | Principal
Amount
(000) | | | U.S. $ Value | |
| |
Series 2023-B
5.429% (SOFR + 2.20%), 04/01/2054(c) | | $ | 10,000 | | | $ | 10,225,350 | |
Series 2024-B
5.25%, 07/01/2054 | | | 41,865 | | | | 45,055,565 | |
Homewood Educational Building Authority
(CHF – Horizons II LLC)
Series 2024
5.00%, 10/01/2056 | | | 1,200 | | | | 1,201,956 | |
5.50%, 10/01/2049 | | | 4,500 | | | | 4,758,012 | |
5.50%, 10/01/2054 | | | 1,400 | | | | 1,470,505 | |
Infirmary Health System Special Care Facilities Financing Authority of Mobile
(Infirmary Health System Obligated Group)
Series 2016
5.00%, 02/01/2036 | | | 5,000 | | | | 5,059,562 | |
5.00%, 02/01/2041 | | | 5,000 | | | | 5,047,064 | |
Series 2021
4.00%, 02/01/2041 | | | 3,370 | | | | 3,163,648 | |
4.00%, 02/01/2046 | | | 9,640 | | | | 8,638,907 | |
Jefferson County Board of Education/AL
Series 2018
5.00%, 02/01/2039(a)(b) | | | 5,000 | | | | 5,188,799 | |
5.00%, 02/01/2046(a)(b) | | | 23,280 | | | | 23,827,120 | |
Lower Alabama Gas District (The)
(Goldman Sachs Group, Inc. (The))
Series 2016-A
5.00%, 09/01/2031 | | | 2,235 | | | | 2,386,508 | |
Mobile County Industrial Development Authority
(ArcelorMittal SA)
Series 2024
5.00%, 06/01/2054 | | | 28,330 | | | | 28,921,902 | |
Southeast Alabama Gas Supply District (The)
(Morgan Stanley)
Series 2024
5.00%, 06/01/2049 | | | 38,405 | | | | 41,072,753 | |
Southeast Alabama Gas Supply District (The)
(Pacific Mutual Holding Co.)
Series 2024-A
5.00%, 08/01/2054 | | | 35,220 | | | | 37,702,390 | |
Southeast Energy Authority A Cooperative District
Series 2024-C
5.00%, 11/01/2055 | | | 10,000 | | | | 10,750,145 | |
| | |
| |
2 | AB MUNICIPAL INCOME SHARES | | abfunds.com |
PORTFOLIO OF INVESTMENTS (continued)
| | | | | | | | |
| | | Principal
Amount
(000) | | | U.S. $ Value | |
| |
Southeast Energy Authority A Cooperative District
(Goldman Sachs Group, Inc. (The))
Series 2022-B
5.00%, 05/01/2053 | | $ | 4,085 | | | $ | 4,261,729 | |
Southeast Energy Authority A Cooperative District
(Morgan Stanley)
Series 2021-B
4.00%, 12/01/2051 | | | 15,000 | | | | 15,005,061 | |
Series 2022-A
5.50%, 01/01/2053 | | | 7,620 | | | | 8,210,211 | |
5.998% (SOFR + 2.42%), 01/01/2053(a)(b)(c) | | | 10,000 | | | | 10,521,817 | |
Southeast Energy Authority A Cooperative District
(Royal Bank of Canada)
Series 2023-B
5.00%, 01/01/2054 | | | 28,425 | | | | 30,160,594 | |
Southeast Energy Authority A Cooperative District
(Sumitomo Mitsui Financial Group, Inc.)
Series 2023-A
5.25%, 01/01/2054 | | | 10,000 | | | | 10,583,095 | |
| | | | | | | | |
| | | | | | | 608,146,560 | |
| | | | | | | | |
Alaska – 0.1% | | | | | | | | |
Municipality of Anchorage AK Solid Waste Services Revenue
Series 2022-A
5.25%, 11/01/2062 | | | 3,000 | | | | 3,167,706 | |
State of Alaska International Airports System
Series 2016-B
5.00%, 10/01/2033 | | | 6,500 | | | | 6,575,403 | |
5.00%, 10/01/2034 | | | 2,500 | | | | 2,527,741 | |
| | | | | | | | |
| | | | | | | 12,270,850 | |
| | | | | | | | |
American Samoa – 0.1% | | | | | | | | |
American Samoa Economic Development Authority
(Territory of American Samoa)
Series 2015-A
6.625%, 09/01/2035 | | | 3,235 | | | | 3,292,570 | |
Series 2018
7.125%, 09/01/2038(a) | | | 8,315 | | | | 8,915,042 | |
| | | | | | | | |
| | | | | | | 12,207,612 | |
| | | | | | | | |
| | |
| |
| abfunds.com | | AB MUNICIPAL INCOME SHARES | 3 |
PORTFOLIO OF INVESTMENTS (continued)
| | | | | | | | |
| | | Principal
Amount
(000) | | | U.S. $ Value | |
| |
Arizona – 2.8% | | | | | | | | |
Arizona Industrial Development Authority
Series 2024
5.00%, 11/01/2054 | | $ | 8,205 | | | $ | 8,642,364 | |
Arizona Industrial Development Authority
(AZIDA 2019-2)
Series 2019-2, Class A
3.625%, 05/20/2033 | | | 14,330 | | | | 13,606,409 | |
Arizona Industrial Development Authority
(Benjamin Franklin Charter School Obligated Group)
Series 2023
4.43%, 07/01/2033(a) | | | 520 | | | | 523,248 | |
5.25%, 07/01/2053(a) | | | 1,000 | | | | 1,002,567 | |
5.50%, 07/01/2058(a) | | | 1,000 | | | | 1,009,156 | |
Arizona Industrial Development Authority
(Equitable School Revolving Fund LLC Obligated Group)
Series 2021
4.00%, 11/01/2051(a) | | | 11,325 | | | | 9,989,818 | |
Arizona Industrial Development Authority
(Heritage Academy Laveen & Gateway Obligated Group)
Series 2021
5.00%, 07/01/2051(a) | | | 10,000 | | | | 9,225,382 | |
Arizona Industrial Development Authority
(KIPP Nashville Obligated Group)
Series 2022-A
5.00%, 07/01/2047 | | | 750 | | | | 758,493 | |
5.00%, 07/01/2057 | | | 1,500 | | | | 1,505,952 | |
5.00%, 07/01/2062 | | | 1,460 | | | | 1,462,217 | |
Arizona Industrial Development Authority
(KIPP NYC Public Charter Schools)
Series 2021-B
4.00%, 07/01/2051 | | | 1,000 | | | | 880,034 | |
4.00%, 07/01/2061 | | | 4,600 | | | | 3,927,426 | |
Arizona Industrial Development Authority
(Legacy Cares, Inc.)
Series 2020
6.75%, 07/01/2030(d)(e)(f) | | | 1,500 | | | | 60,000 | |
7.75%, 07/01/2050(d)(e)(f) | | | 33,950 | | | | 1,358,000 | |
Series 2021-A
6.00%, 07/01/2051(d)(e)(f) | | | 1,425 | | | | 57,000 | |
Arizona Industrial Development Authority
(North Carolina Central University Project)
BAM Series 2019
5.00%, 06/01/2049 | | | 785 | | | | 797,041 | |
| | |
| |
4 | AB MUNICIPAL INCOME SHARES | | abfunds.com |
PORTFOLIO OF INVESTMENTS (continued)
| | | | | | | | |
| | | Principal
Amount
(000) | | | U.S. $ Value | |
| |
Arizona Industrial Development Authority
(Pinecrest Academy of Nevada)
Series 2018
5.75%, 07/15/2048(a) | | $ | 1,000 | | | $ | 1,012,683 | |
Series 2020-A
4.00%, 07/15/2030(a) | | | 1,395 | | | | 1,385,580 | |
4.00%, 07/15/2040(a) | | | 4,180 | | | | 3,800,820 | |
4.00%, 07/15/2050(a) | | | 1,000 | | | | 841,461 | |
Arizona Industrial Development Authority
(Provident Group – EMU Properties LLC)
Series 2018
5.00%, 05/01/2051(d)(f) | | | 1,100 | | | | 605,000 | |
Chandler Industrial Development Authority
(Intel Corp.)
Series 2022
5.00%, 09/01/2042 | | | 3,900 | | | | 3,993,337 | |
5.00%, 09/01/2052 | | | 1,500 | | | | 1,536,063 | |
Series 2023
4.10%, 12/01/2037 | | | 6,000 | | | | 6,025,611 | |
Series 2024
4.00%, 06/01/2049 | | | 40,000 | | | | 40,008,900 | |
City of Glendale AZ
(City of Glendale AZ COP)
Series 2021
2.442%, 07/01/2032 | | | 5,000 | | | | 4,275,952 | |
2.542%, 07/01/2033 | | | 5,000 | | | | 4,211,062 | |
2.642%, 07/01/2034 | | | 6,795 | | | | 5,640,567 | |
2.742%, 07/01/2035 | | | 10,000 | | | | 8,197,757 | |
2.842%, 07/01/2036 | | | 13,000 | | | | 10,538,417 | |
City of Phoenix Civic Improvement Corp.
(City of Phoenix AZ Water System Revenue)
Series 2014-B
5.00%, 07/01/2026 | | | 11,000 | | | | 11,016,808 | |
City of Tempe AZ
(City of Tempe AZ COP)
Series 2021
2.321%, 07/01/2034 | | | 10,500 | | | | 8,388,187 | |
2.421%, 07/01/2035 | | | 10,325 | | | | 8,118,113 | |
Glendale Industrial Development Authority
(Beatitudes Campus Obligated Group (The))
Series 2017
5.00%, 11/15/2036 | | | 1,000 | | | | 937,784 | |
Glendale Industrial Development Authority
(Royal Oaks Life Care Community)
Series 2016
5.00%, 05/15/2039 | | | 2,700 | | | | 2,703,937 | |
| | |
| |
| abfunds.com | | AB MUNICIPAL INCOME SHARES | 5 |
PORTFOLIO OF INVESTMENTS (continued)
| | | | | | | | |
| | | Principal
Amount
(000) | | | U.S. $ Value | |
| |
Industrial Development Authority of the City of Phoenix Arizona (The)
(AZ GFF Tiyan LLC Lease)
Series 2014
5.00%, 02/01/2029 | | $ | 18,125 | | | $ | 17,764,137 | |
Industrial Development Authority of the City of Phoenix Arizona (The)
(BASIS Schools, Inc. Obligated Group)
Series 2015
5.00%, 07/01/2035(a) | | | 2,000 | | | | 2,008,446 | |
Industrial Development Authority of the City of Phoenix Arizona (The)
(GreatHearts Arizona Obligated Group)
Series 2014
5.00%, 07/01/2044 | | | 3,875 | | | | 3,874,943 | |
Industrial Development Authority of the County of Pima (The)
(Edkey, Inc. Obligated Group)
Series 2020
5.00%, 07/01/2049(a) | | | 6,890 | | | | 6,487,769 | |
5.00%, 07/01/2055(a) | | | 3,700 | | | | 3,436,513 | |
Industrial Development Authority of the County of Pima (The)
(La Posada at Park Centre, Inc. Obligated Group)
Series 2022
5.625%, 11/15/2030(a) | | | 9,500 | | | | 9,646,392 | |
6.875%, 11/15/2052(a) | | | 6,500 | | | | 7,058,194 | |
7.00%, 11/15/2057(a) | | | 2,915 | | | | 3,173,088 | |
La Paz County Industrial Development Authority
(Harmony Public Schools)
Series 2016
5.00%, 02/15/2046(a) | | | 3,500 | | | | 3,477,047 | |
Maricopa County Industrial Development Authority
(Arizona Autism Charter Schools Obligated Group)
Series 2021
4.00%, 07/01/2061(a) | | | 2,875 | | | | 2,265,528 | |
Maricopa County Industrial Development Authority
(Benjamin Franklin Charter School Ltd.)
Series 2018-A
6.00%, 07/01/2052(a) | | | 20,370 | | | | 20,933,292 | |
| | |
| |
6 | AB MUNICIPAL INCOME SHARES | | abfunds.com |
PORTFOLIO OF INVESTMENTS (continued)
| | | | | | | | |
| | | Principal
Amount
(000) | | | U.S. $ Value | |
| |
Maricopa County Industrial Development Authority
(Commercial Metals Co.)
Series 2022
4.00%, 10/15/2047(a) | | $ | 24,115 | | | $ | 21,391,647 | |
Maricopa County Industrial Development Authority
(HonorHealth Obligated Group)
Series 2024-D
5.00%, 12/01/2039 | | | 2,725 | | | | 3,016,233 | |
5.00%, 12/01/2040 | | | 5,750 | | | | 6,322,411 | |
5.00%, 12/01/2041 | | | 1,525 | | | | 1,668,844 | |
Maricopa County Industrial Development Authority
(Legacy Traditional School Obligated Group)
Series 2019
5.00%, 07/01/2049(a) | | | 2,000 | | | | 1,994,919 | |
5.00%, 07/01/2054(a) | | | 2,300 | | | | 2,262,261 | |
Maricopa County Industrial Development Authority
(Morrison Education Group Obligated Group)
Series 2024-A
6.50%, 07/01/2054(a) | | | 8,500 | | | | 8,833,765 | |
6.625%, 07/01/2059(a) | | | 5,000 | | | | 5,216,467 | |
6.75%, 07/01/2063(a) | | | 5,880 | | | | 6,158,166 | |
Maricopa County Industrial Development Authority
(Valley Christian Schools)
Series 2023
6.25%, 07/01/2053(a) | | | 1,650 | | | | 1,688,042 | |
6.375%, 07/01/2058(a) | | | 3,670 | | | | 3,765,834 | |
Salt Verde Financial Corp.
(Citigroup, Inc.)
Series 2007
5.00%, 12/01/2032 | | | 10,945 | | | | 11,765,431 | |
5.00%, 12/01/2037 | | | 2,915 | | | | 3,159,859 | |
5.25%, 12/01/2027 | | | 16,425 | | | | 17,244,954 | |
Sierra Vista Industrial Development Authority
Series 2024
5.00%, 06/15/2044(a) | | | 1,300 | | | | 1,307,512 | |
5.00%, 06/15/2054(a) | | | 2,500 | | | | 2,476,958 | |
5.00%, 06/15/2064(a) | | | 2,500 | | | | 2,430,166 | |
Sierra Vista Industrial Development Authority
(American Leadership Academy, Inc.)
Series 2023
5.75%, 06/15/2058(a) | | | 10,000 | | | | 10,382,845 | |
| | |
| |
| abfunds.com | | AB MUNICIPAL INCOME SHARES | 7 |
PORTFOLIO OF INVESTMENTS (continued)
| | | | | | | | |
| | | Principal
Amount
(000) | | | U.S. $ Value | |
| |
Tempe Industrial Development Authority
(Friendship Village of Tempe)
Series 2019
5.00%, 12/01/2054 | | $ | 1,185 | | | $ | 1,147,523 | |
Tempe Industrial Development Authority
(Mirabella at ASU, Inc.)
Series 2017-A
6.125%, 10/01/2047(a) | | | 1,065 | | | | 667,011 | |
Yuma Industrial Development Authority
Series 2024
4.00%, 08/01/2054 | | | 2,500 | | | | 2,403,061 | |
5.25%, 08/01/2054 | | | 10,235 | | | | 10,995,681 | |
| | | | | | | | |
| | | | | | | 384,468,085 | |
| | | | | | | | |
Arkansas – 0.5% | | | | | | | | |
Arkansas Development Finance Authority
(Baptist Memorial Health Care Obligated Group)
Series 2020
5.00%, 09/01/2044 | | | 21,000 | | | | 21,479,818 | |
Arkansas Development Finance Authority
(Hybar LLC)
Series 2023
6.875%, 07/01/2048(a) | | | 7,185 | | | | 7,912,736 | |
Series 2024
7.375%, 07/01/2048(a) | | | 34,700 | | | | 38,663,309 | |
Arkansas Development Finance Authority
(United States Steel Corp.)
Series 2022
5.45%, 09/01/2052 | | | 5,000 | | | | 5,184,299 | |
| | | | | | | | |
| | | | | | | 73,240,162 | |
| | | | | | | | |
California – 13.0% | | | | | | | | |
Alameda Corridor Transportation Authority
Series 2022-A
5.35%, 10/01/2048(g) | | | 17,000 | | | | 9,776,595 | |
5.38%, 10/01/2049(g) | | | 10,435 | | | | 5,985,722 | |
5.40%, 10/01/2050(g) | | | 7,345 | | | | 4,192,724 | |
AGM Series 2024
Zero Coupon, 10/01/2049 | | | 7,250 | | | | 2,221,480 | |
Zero Coupon, 10/01/2053 | | | 15,000 | | | | 3,657,186 | |
Align Affordable Housing Bond Fund LP
(Park Landing LP)
Series 2022-2
5.66%, 08/01/2052 | | | 17,900 | | | | 17,867,510 | |
Align Affordable Housing Bond Fund LP
(SHI – Lake Worth LLC)
Series 2021
3.25%, 12/01/2051(a) | | | 26,000 | | | | 23,432,508 | |
| | |
| |
8 | AB MUNICIPAL INCOME SHARES | | abfunds.com |
PORTFOLIO OF INVESTMENTS (continued)
| | | | | | | | |
| | | Principal
Amount
(000) | | | U.S. $ Value | |
| |
ARC70 II TRUST
Series 2021
4.00%, 12/01/2059 | | $ | 7,860 | | | $ | 6,888,357 | |
Series 2023
4.84%, 04/01/2065(e)(h) | | | 60,680 | | | | 56,877,064 | |
California Community Choice Financing Authority
Series 2024
5.00%, 02/01/2055(i) | | | 36,510 | | | | 39,247,845 | |
5.00%, 08/01/2055 | | | 26,635 | | | | 28,539,352 | |
California Community Choice Financing Authority
(American International Group, Inc.)
Series 2023-D
5.50%, 05/01/2054 | | | 61,410 | | | | 65,639,902 | |
California Community Choice Financing Authority
(Apollo Global Management, Inc.)
Series 2024
5.00%, 01/01/2055 | | | 14,745 | | | | 15,835,123 | |
California Community Choice Financing Authority
(Deutsche Bank AG)
Series 2023
5.25%, 01/01/2054 | | | 115,505 | | | | 124,013,491 | |
California Community Choice Financing Authority
(Goldman Sachs Group, Inc. (The))
Series 2021
4.00%, 10/01/2052 | | | 1,000 | | | | 1,015,286 | |
Series 2023
5.25%, 11/01/2054 | | | 3,800 | | | | 4,102,721 | |
California Community Choice Financing Authority
(Morgan Stanley)
Series 2023
4.679% (SOFR + 1.63%), 07/01/2053(a)(b)(c) | | | 16,800 | | | | 16,789,883 | |
4.899% (SOFR + 1.67%), 02/01/2054(c) | | | 10,000 | | | | 10,092,419 | |
5.00%, 02/01/2054 | | | 48,650 | | | | 52,182,987 | |
Series 2024
5.00%, 05/01/2054 | | | 27,820 | | | | 30,013,315 | |
California Community College Financing Authority
(NCCD-Orange Coast Properties LLC)
Series 2018
5.25%, 05/01/2043 | | | 4,485 | | | | 4,637,518 | |
| | |
| |
| abfunds.com | | AB MUNICIPAL INCOME SHARES | 9 |
PORTFOLIO OF INVESTMENTS (continued)
| | | | | | | | |
| | | Principal
Amount
(000) | | | U.S. $ Value | |
| |
5.25%, 05/01/2048 | | $ | 6,750 | | | $ | 6,955,764 | |
5.25%, 05/01/2053 | | | 6,300 | | | | 6,471,872 | |
California Community Housing Agency
(California Community Housing Agency Aster Apartments)
Series 2021-A
4.00%, 02/01/2056(a) | | | 23,800 | | | | 20,957,618 | |
California Community Housing Agency
(California Community Housing Agency Brio Apartments & Next on Lex Apartments)
Series 2021
4.00%, 02/01/2056(a) | | | 39,200 | | | | 33,356,248 | |
California Community Housing Agency
(California Community Housing Agency Fountains at Emerald Park)
Series 2021
3.00%, 08/01/2056(a) | | | 17,000 | | | | 12,519,274 | |
4.00%, 08/01/2046(a) | | | 7,585 | | | | 6,501,012 | |
California Community Housing Agency
(California Community Housing Agency Summit at Sausalito Apartments)
Series 2021
3.00%, 02/01/2057(a) | | | 19,715 | | | | 14,013,310 | |
California Community Housing Agency
(California Community Housing Agency Twin Creek Apartments)
Series 2022
Zero Coupon, 08/01/2065(a) | | | 121,230 | | | | 4,978,455 | |
5.50%, 02/01/2040(a) | | | 4,875 | | | | 4,409,846 | |
Series 2022-A
4.50%, 08/01/2052(a) | | | 21,280 | | | | 17,323,927 | |
California Educational Facilities Authority
(Chapman University)
Series 2015
5.00%, 04/01/2033 | | | 4,005 | | | | 4,028,285 | |
5.00%, 04/01/2034 | | | 4,205 | | | | 4,228,479 | |
California Educational Facilities Authority
(Loma Linda University)
Series 2017-A
5.00%, 04/01/2031 | | | 1,000 | | | | 1,036,656 | |
5.00%, 04/01/2042 | | | 1,000 | | | | 1,018,371 | |
California Enterprise Development Authority
(Heights Christian Schools)
Series 2023
6.25%, 06/01/2053(a) | | | 2,000 | | | | 2,021,843 | |
| | |
| |
10 | AB MUNICIPAL INCOME SHARES | | abfunds.com |
PORTFOLIO OF INVESTMENTS (continued)
| | | | | | | | |
| | | Principal
Amount
(000) | | | U.S. $ Value | |
| |
California Enterprise Development Authority
(Rocketship Education Obligated Group)
Series 2022
4.00%, 06/01/2042(a) | | $ | 5,000 | | | $ | 4,339,846 | |
California Health Facilities Financing Authority
(Children’s Hospital Los Angeles)
Series 2017-A
5.00%, 08/15/2037 | | | 1,700 | | | | 1,743,908 | |
California Housing Finance Agency
Series 2019-2, Class A
4.00%, 03/20/2033 | | | 14,120 | | | | 14,237,393 | |
Series 2021-1, Class A
3.50%, 11/20/2035 | | | 8,996 | | | | 8,625,204 | |
Series 2021-2, Class A
3.75%, 03/25/2035 | | | 42,617 | | | | 41,942,591 | |
Series 2021-2, Class X
0.82%, 03/25/2035(j) | | | 22,053 | | | | 969,692 | |
Series 2021-3, Class A
3.25%, 08/20/2036 | | | 6,823 | | | | 6,334,866 | |
Series 2021-3, Class X
0.77%, 08/20/2036(j) | | | 19,850 | | | | 964,972 | |
Series 2023-1, Class A
4.375%, 09/20/2036 | | | 21,275 | | | | 21,884,994 | |
California Infrastructure & Economic Development Bank
(DesertXpress Enterprises LLC)
Series 2024
8.00%, 01/01/2050(a) | | | 12,400 | | | | 12,778,186 | |
California Infrastructure & Economic Development Bank
(Equitable School Revolving Fund LLC Obligated Group)
Series 2020-B
4.00%, 11/01/2045 | | | 850 | | | | 826,741 | |
4.00%, 11/01/2050 | | | 860 | | | | 815,315 | |
California Infrastructure & Economic Development Bank
(Roseville Sustainable Energy Partner LLC)
Series 2024
5.25%, 07/01/2054 | | | 8,000 | | | | 8,457,750 | |
California Infrastructure & Economic Development Bank
(WFCS Holdings II LLC)
Series 2021
Zero Coupon, 01/01/2061(a) | | | 2,960 | | | | 231,804 | |
Series 2021-A1
5.00%, 01/01/2056(a) | | | 3,000 | | | | 2,995,086 | |
| | |
| |
| abfunds.com | | AB MUNICIPAL INCOME SHARES | 11 |
PORTFOLIO OF INVESTMENTS (continued)
| | | | | | | | |
| | | Principal
Amount
(000) | | | U.S. $ Value | |
| |
California Municipal Finance Authority
(Azusa Pacific University)
Series 2015-B
5.00%, 04/01/2041 | | $ | 4,900 | | | $ | 4,684,995 | |
California Municipal Finance Authority
(BOLD Program)
Series 2023-B
5.75%, 09/01/2053 | | | 2,850 | | | | 3,084,024 | |
California Municipal Finance Authority
(California Baptist University)
Series 2016-A
5.00%, 11/01/2046(a) | | | 2,000 | | | | 2,005,079 | |
California Municipal Finance Authority
(CHF-Riverside II LLC)
Series 2019
5.00%, 05/15/2039 | | | 2,030 | | | | 2,124,693 | |
5.00%, 05/15/2040 | | | 1,000 | | | | 1,043,605 | |
California Municipal Finance Authority
(Community Health Centers of The Central Coast, Inc.)
Series 2021-A
5.00%, 12/01/2046(a) | | | 1,490 | | | | 1,499,716 | |
California Municipal Finance Authority
(Goodwill Industries of Sacramento Valley & Northern Nevada, Inc.)
Series 2012-A
6.625%, 01/01/2032(a) | | | 760 | | | | 756,924 | |
Series 2014
5.00%, 01/01/2035 | | | 1,085 | | | | 950,555 | |
California Municipal Finance Authority
(LAX Integrated Express Solutions LLC)
Series 2018
4.00%, 12/31/2047 | | | 7,040 | | | | 6,467,115 | |
5.00%, 12/31/2043 | | | 37,050 | | | | 37,432,197 | |
California Municipal Finance Authority
(Samuel Merritt University)
Series 2022
5.25%, 06/01/2053 | | | 5,000 | | | | 5,380,423 | |
California Pollution Control Financing Authority
(Poseidon Resources Channelside LP)
Series 2012
5.00%, 11/21/2045(a) | | | 9,725 | | | | 9,725,321 | |
Series 2023
5.00%, 07/01/2027(a) | | | 2,000 | | | | 2,081,521 | |
5.00%, 07/01/2028(a) | | | 2,350 | | | | 2,478,799 | |
5.00%, 07/01/2029(a) | | | 2,300 | | | | 2,454,825 | |
| | |
| |
12 | AB MUNICIPAL INCOME SHARES | | abfunds.com |
PORTFOLIO OF INVESTMENTS (continued)
| | | | | | | | |
| | | Principal
Amount
(000) | | | U.S. $ Value | |
| |
5.00%, 07/01/2030(a) | | $ | 2,600 | | | $ | 2,792,537 | |
5.00%, 07/01/2031(a) | | | 3,000 | | | | 3,244,083 | |
5.00%, 07/01/2032(a) | | | 5,470 | | | | 5,950,305 | |
5.00%, 07/01/2033(a) | | | 5,865 | | | | 6,419,082 | |
5.00%, 07/01/2034(a) | | | 3,000 | | | | 3,271,859 | |
5.00%, 07/01/2036(a) | | | 2,650 | | | | 2,865,746 | |
5.00%, 07/01/2037(a) | | | 2,250 | | | | 2,428,103 | |
5.00%, 07/01/2038(a) | | | 3,500 | | | | 3,766,448 | |
5.00%, 11/21/2045(a) | | | 1,100 | | | | 1,151,232 | |
California Pollution Control Financing Authority
(Rialto Bioenergy Facility LLC)
Series 2019
7.50%, 12/01/2040(d)(e)(f)(k) | | | 785 | | | | 79 | |
California Pollution Control Financing Authority
(San Diego County Water Authority Desalination Project Pipeline)
Series 2019
5.00%, 11/21/2045(a) | | | 4,890 | | | | 5,000,597 | |
California Public Finance Authority
(Enso Village)
Series 2021
2.375%, 11/15/2028(a) | | | 1,360 | | | | 1,334,251 | |
California Public Finance Authority
(Kendal at Ventura)
Series 2023
10.00%, 05/15/2028(a) | | | 800 | | | | 945,513 | |
California School Finance Authority
(Aspire Public Schools Obligated Group)
Series 2020-A
5.00%, 08/01/2059(a) | | | 3,120 | | | | 3,135,900 | |
California School Finance Authority
(Classical Academy Obligated Group)
Series 2021
4.00%, 10/01/2046(a) | | | 2,800 | | | | 2,456,761 | |
Series 2022
5.00%, 10/01/2042(a) | | | 1,000 | | | | 1,019,524 | |
5.00%, 10/01/2052(a) | | | 1,000 | | | | 1,001,887 | |
5.00%, 10/01/2061(a) | | | 1,500 | | | | 1,498,043 | |
California School Finance Authority
(Downtown College Prep Obligated Group)
Series 2016
5.00%, 06/01/2046(a) | | | 3,630 | | | | 2,817,516 | |
| | |
| |
| abfunds.com | | AB MUNICIPAL INCOME SHARES | 13 |
PORTFOLIO OF INVESTMENTS (continued)
| | | | | | | | |
| | | Principal
Amount
(000) | | | U.S. $ Value | |
| |
California School Finance Authority
(Equitas Academy Obligated Group)
Series 2018-A
5.00%, 06/01/2056(a) | | $ | 8,850 | | | $ | 8,379,884 | |
California School Finance Authority
(Hawking STEAM Charter Schools, Inc.)
Series 2022
5.25%, 07/01/2052(a) | | | 2,250 | | | | 2,294,555 | |
5.50%, 07/01/2062(a) | | | 2,775 | | | | 2,846,994 | |
California School Finance Authority
(KIPP SoCal Public Schools Obligated Group)
Series 2019-A
5.00%, 07/01/2039(a) | | | 2,325 | | | | 2,404,235 | |
5.00%, 07/01/2049(a) | | | 700 | | | | 709,905 | |
California School Finance Authority
(KIPP SoCal Public Schools)
Series 2014-A
5.00%, 07/01/2034(a) | | | 1,075 | | | | 1,075,704 | |
California School Finance Authority
(Lighthouse Community Public Schools Obligated Group)
Series 2022
6.375%, 06/01/2052(a) | | | 1,225 | | | | 1,291,633 | |
California School Finance Authority
(Rocketship Education Obligated Group)
Series 2017-G
5.00%, 06/01/2047(a) | | | 2,330 | | | | 2,274,442 | |
California State University
2.719%, 11/01/2052(a)(b) | | | 5,000 | | | | 3,430,783 | |
2.975%, 11/01/2051(a)(b) | | | 5,000 | | | | 3,525,256 | |
Series 2021-B
2.374%, 11/01/2035(a)(b) | | | 10,000 | | | | 7,881,193 | |
California Statewide Communities Development Authority
(California Baptist University)
Series 2017-A
5.00%, 11/01/2041(a) | | | 2,875 | | | | 2,901,582 | |
California Statewide Communities Development Authority
(CHF-Irvine LLC)
BAM Series 2021
3.00%, 05/15/2051 | | | 13,000 | | | | 9,993,119 | |
California Statewide Communities Development Authority
(Enloe Medical Center Obligated Group)
AGM Series 2022-A
5.25%, 08/15/2052 | | | 3,000 | | | | 3,202,338 | |
| | |
| |
14 | AB MUNICIPAL INCOME SHARES | | abfunds.com |
PORTFOLIO OF INVESTMENTS (continued)
| | | | | | | | |
| | | Principal
Amount
(000) | | | U.S. $ Value | |
| |
5.375%, 08/15/2057 | | $ | 3,720 | | | $ | 3,991,960 | |
California Statewide Communities Development Authority
(Lancer Educational Housing LLC)
Series 2016
5.00%, 06/01/2036(a) | | | 5,250 | | | | 5,318,083 | |
5.00%, 06/01/2046(a) | | | 7,000 | | | | 7,019,756 | |
California Statewide Communities Development Authority
(Loma Linda University Medical Center)
Series 2016-A
5.00%, 12/01/2041(a) | | | 15,285 | | | | 15,434,633 | |
5.25%, 12/01/2056(a) | | | 14,795 | | | | 14,945,619 | |
Series 2018
5.25%, 12/01/2038(a) | | | 3,000 | | | | 3,121,779 | |
5.25%, 12/01/2048(a) | | | 6,440 | | | | 6,588,097 | |
Series 2018-A
5.00%, 12/01/2033(a) | | | 1,350 | | | | 1,400,279 | |
5.50%, 12/01/2058(a) | | | 19,145 | | | | 19,731,316 | |
California Statewide Communities Development Authority
(NCCD-Hooper Street LLC)
Series 2019
5.25%, 07/01/2049(a) | | | 1,125 | | | | 1,137,896 | |
5.25%, 07/01/2052(a) | | | 1,500 | | | | 1,514,061 | |
City of Los Angeles CA
Series 2024
5.00%, 06/26/2025 | | | 62,000 | | | | 62,770,319 | |
City of Los Angeles Department of Airports
Series 2019
5.00%, 05/15/2044 | | | 15,415 | | | | 15,861,916 | |
Series 2020-C
5.00%, 05/15/2036(a)(b) | | | 10,000 | | | | 10,545,958 | |
City of Roseville CA
(HP Campus Oaks Community Facilities District No. 1)
Series 2016
5.50%, 09/01/2046 | | | 850 | | | | 863,634 | |
City of Vernon CA Electric System Revenue
Series 2022-2
5.00%, 08/01/2039 | | | 425 | | | | 457,484 | |
5.00%, 08/01/2040 | | | 375 | | | | 402,169 | |
5.00%, 08/01/2041 | | | 420 | | | | 448,614 | |
CMFA Special Finance Agency
(CMFA Special Finance Agency Enclave)
Series 2022-A
4.00%, 08/01/2058(a) | | | 15,100 | | | | 12,040,939 | |
| | |
| |
| abfunds.com | | AB MUNICIPAL INCOME SHARES | 15 |
PORTFOLIO OF INVESTMENTS (continued)
| | | | | | | | |
| | | Principal
Amount
(000) | | | U.S. $ Value | |
| |
CMFA Special Finance Agency
(CMFA Special Finance Agency Latitude33)
Series 2021-A
3.00%, 12/01/2056(a) | | $ | 18,760 | | | $ | 13,250,831 | |
CMFA Special Finance Agency
(CMFA Special Finance Agency Solana at Grand)
Series 2021-A
4.00%, 08/01/2056(a) | | | 12,525 | | | | 11,134,704 | |
CMFA Special Finance Agency VII
(CMFA Special Finance Agency VII The Breakwater Apartments)
Series 2021
3.00%, 08/01/2056(a) | | | 8,415 | | | | 5,930,364 | |
CMFA Special Finance Agency VIII Elan Huntington Beach
Series 2021
3.00%, 08/01/2056(a) | | | 15,450 | | | | 10,932,738 | |
4.00%, 08/01/2047(a) | | | 3,540 | | | | 3,087,371 | |
County of Los Angeles CA
Series 2024
5.00%, 06/30/2025 | | | 4,605 | | | | 4,662,593 | |
CSCDA Community Improvement Authority
(CSCDA Community Improvement Authority 777 Place-Pomona)
Series 2021
3.25%, 05/01/2057(a) | | | 23,500 | | | | 16,365,999 | |
4.00%, 05/01/2057(a) | | | 15,550 | | | | 11,135,868 | |
CSCDA Community Improvement Authority
(CSCDA Community Improvement Authority 1818 Platinum Triangle-Anaheim)
Series 2021
3.25%, 04/01/2057(a) | | | 13,940 | | | | 10,179,684 | |
CSCDA Community Improvement Authority
(CSCDA Community Improvement Authority Acacia on Santa Rosa Creek)
Series 2021
4.00%, 10/01/2056(a) | | | 13,215 | | | | 11,606,150 | |
CSCDA Community Improvement Authority
(CSCDA Community Improvement Authority Altana Apartments)
Series 2021
4.00%, 10/01/2056(a) | | | 15,200 | | | | 12,365,148 | |
| | |
| |
16 | AB MUNICIPAL INCOME SHARES | | abfunds.com |
PORTFOLIO OF INVESTMENTS (continued)
| | | | | | | | |
| | | Principal
Amount
(000) | | | U.S. $ Value | |
| |
CSCDA Community Improvement Authority
(CSCDA Community Improvement Authority Jefferson Platinum Triangle Apartments)
Series 2021-A2
3.125%, 08/01/2056(a) | | $ | 10,025 | | | $ | 7,611,157 | |
CSCDA Community Improvement Authority
(CSCDA Community Improvement Authority Millennium South Bay-Hawthorne)
Series 2021
3.25%, 07/01/2056(a) | | | 22,165 | | | | 15,556,769 | |
4.00%, 07/01/2058(a) | | | 6,000 | | | | 4,224,149 | |
CSCDA Community Improvement Authority
(CSCDA Community Improvement Authority Oceanaire Apartments)
Series 2021
3.20%, 09/01/2046(a) | | | 2,500 | | | | 1,902,199 | |
4.00%, 09/01/2056(a) | | | 24,830 | | | | 19,229,909 | |
CSCDA Community Improvement Authority
(CSCDA Community Improvement Authority Park Crossing Apartments)
Series 2021
3.25%, 12/01/2058(a) | | | 12,700 | | | | 8,993,615 | |
CSCDA Community Improvement Authority
(CSCDA Community Improvement Authority Pasadena Portfolio)
Series 2021
3.00%, 12/01/2056(a) | | | 22,570 | | | | 15,686,333 | |
4.00%, 12/01/2056(a) | | | 3,400 | | | | 2,555,332 | |
CSCDA Community Improvement Authority
(CSCDA Community Improvement Authority The Crescent)
Series 2022
4.30%, 07/01/2059(a) | | | 11,500 | | | | 9,936,838 | |
CSCDA Community Improvement Authority
(CSCDA Community Improvement Authority Theo Apartments)
Series 2021
4.00%, 05/01/2057(a) | | | 5,400 | | | | 3,915,269 | |
CSCDA Community Improvement Authority
(CSCDA Community Improvement Authority Union South Bay)
Series 2021-A2
4.00%, 07/01/2056(a) | | | 27,100 | | | | 22,129,611 | |
| | |
| |
| abfunds.com | | AB MUNICIPAL INCOME SHARES | 17 |
PORTFOLIO OF INVESTMENTS (continued)
| | | | | | | | |
| | | Principal
Amount
(000) | | | U.S. $ Value | |
| |
CSCDA Community Improvement Authority
(CSCDA Community Improvement Authority Vineyard Gardens Apartments)
Series 2021
3.25%, 10/01/2058(a) | | $ | 8,930 | | | $ | 6,296,658 | |
4.00%, 10/01/2048(a) | | | 2,000 | | | | 1,494,558 | |
CSCDA Community Improvement Authority
(CSCDA Community Improvement Authority Waterscape Apartments)
Series 2021-A
3.00%, 09/01/2056(a) | | | 15,405 | | | | 10,935,165 | |
Golden State Tobacco Securitization Corp.
3.293%, 06/01/2042(a)(b) | | | 6,850 | | | | 5,354,982 | |
Series 2021
3.85%, 06/01/2050 | | | 16,310 | | | | 14,983,606 | |
Series 2021-A
4.214%, 06/01/2050 | | | 2,900 | | | | 2,161,754 | |
Series 2021-B
Zero Coupon, 06/01/2066 | | | 225,990 | | | | 24,453,994 | |
Golden State Tobacco Securitization Corp.
(Golden State Tobacco Securitization Corp. Lease)
Series 2021
2.746%, 06/01/2034(a)(b) | | | 14,780 | | | | 12,622,361 | |
3.115%, 06/01/2038(a)(b) | | | 29,325 | | | | 24,167,222 | |
Hastings Campus Housing Finance Authority
Series 2020-A
5.00%, 07/01/2061(a) | | | 14,340 | | | | 12,994,967 | |
Los Angeles Unified School District/CA
Series 2024-A
5.00%, 07/01/2031 | | | 17,500 | | | | 20,120,550 | |
M-S-R Energy Authority
(Citigroup, Inc.)
Series 2009-A
6.50%, 11/01/2039 | | | 3,390 | | | | 4,317,723 | |
Series 2009-B
6.50%, 11/01/2039 | | | 3,865 | | | | 4,922,713 | |
Series 2009-C
7.00%, 11/01/2034 | | | 5,000 | | | | 6,219,231 | |
Milpitas Unified School District/CA
Series 2014-B
4.00%, 08/01/2037 | | | 8,195 | | | | 8,164,115 | |
Northern California Energy Authority
(Pacific Mutual Holding Co.)
Series 2024
5.00%, 12/01/2054 | | | 14,855 | | | | 15,751,743 | |
| | |
| |
18 | AB MUNICIPAL INCOME SHARES | | abfunds.com |
PORTFOLIO OF INVESTMENTS (continued)
| | | | | | | | |
| | | Principal
Amount
(000) | | | U.S. $ Value | |
| |
River Islands Public Financing Authority
(River Islands Public Financing Authority Community Facilities District No. 2003-1)
Series 2022
5.75%, 09/01/2052 | | $ | 1,600 | | | $ | 1,648,212 | |
Sacramento County Water Financing Authority
(Sacramento County Water Agency)
NATL Series 2007-B
4.106% (CME Term SOFR 3 Month + 0.57%), 06/01/2039(c) | | | 33,680 | | | | 30,536,181 | |
San Diego County Regional Airport Authority
Series 2023
5.00%, 07/01/2048 | | | 7,270 | | | | 7,615,446 | |
5.25%, 07/01/2058 | | | 3,275 | | | | 3,456,164 | |
San Francisco City & County Airport Comm
3.053%, 05/01/2034(a)(b) | | | 3,500 | | | | 3,008,226 | |
3.183%, 05/01/2035(a)(b) | | | 5,500 | | | | 4,693,732 | |
3.333%, 05/01/2037(a)(b) | | | 2,250 | | | | 1,880,451 | |
San Francisco Intl Airport
Series 2018
5.00%, 05/01/2043 | | | 11,000 | | | | 11,248,323 | |
Series 2019-A
5.00%, 05/01/2044(a)(b) | | | 14,000 | | | | 14,403,001 | |
Series 2019-E
5.00%, 05/01/2050 | | | 7,000 | | | | 7,175,844 | |
Series 2020-E
5.00%, 05/01/2037 | | | 8,525 | | | | 8,947,467 | |
5.00%, 05/01/2038 | | | 11,000 | | | | 11,547,276 | |
Series 2023-E
5.50%, 05/01/2040 | | | 10,000 | | | | 11,165,144 | |
5.75%, 05/01/2048 | | | 10,000 | | | | 11,071,598 | |
Series 2024
5.25%, 05/01/2041 | | | 10,000 | | | | 10,996,107 | |
5.25%, 05/01/2042 | | | 10,000 | | | | 10,909,301 | |
5.25%, 05/01/2043 | | | 7,100 | | | | 7,685,782 | |
San Joaquin Hills Transportation Corridor Agency
Series 2014-B
5.25%, 01/15/2044 | | | 1,000 | | | | 1,002,161 | |
Series 2021-A
4.00%, 01/15/2044 | | | 1,429 | | | | 1,438,199 | |
San Jose Evergreen Community College District
Series 2012
5.833% (CME Term SOFR 3 Month + 1.00%), 07/01/2043(c) | | | 3,970 | | | | 3,929,572 | |
| | |
| |
| abfunds.com | | AB MUNICIPAL INCOME SHARES | 19 |
PORTFOLIO OF INVESTMENTS (continued)
| | | | | | | | |
| | | Principal
Amount
(000) | | | U.S. $ Value | |
| |
Southern California Logistics Airport Authority
AGC Series 2006
5.00%, 12/01/2036 | | $ | 100 | | | $ | 100,996 | |
5.00%, 12/01/2043 | | | 1,585 | | | | 1,600,782 | |
Southern California Public Power Authority
(American International Group, Inc.)
Series 2024-A
5.00%, 04/01/2055 | | | 40,490 | | | | 43,035,606 | |
State of California
Series 2023
6.00%, 03/01/2033 | | | 10,000 | | | | 10,878,995 | |
Series 2024
4.00%, 08/01/2049 | | | 11,300 | | | | 11,334,550 | |
4.00%, 08/01/2054 | | | 3,600 | | | | 3,586,629 | |
5.00%, 09/01/2025 | | | 8,800 | | | | 8,946,413 | |
Tobacco Securitization Authority of Northern California
(Sacramento County Tobacco Securitization Corp.)
Series 2021
Zero Coupon, 06/01/2060 | | | 19,650 | | | | 3,195,552 | |
Tobacco Securitization Authority of Southern California
Series 2019
Zero Coupon, 06/01/2054 | | | 10,480 | | | | 2,083,132 | |
5.00%, 06/01/2039 | | | 1,555 | | | | 1,646,696 | |
| | | | | | | | |
| | | | | | | 1,807,175,200 | |
| | | | | | | | |
Colorado – 2.9% | | | | | | | | |
Aurora Highlands Community Authority Board
Series 2021-A
5.75%, 12/01/2051 | | | 15,000 | | | | 14,190,320 | |
Centerra Metropolitan District No. 1
Series 2017
5.00%, 12/01/2037(a) | | | 5,000 | | | | 4,933,592 | |
Series 2022
6.50%, 12/01/2053 | | | 4,350 | | | | 4,474,662 | |
City & County of Denver CO Airport System Revenue
Series 2022-A
5.00%, 11/15/2033 | | | 9,000 | | | | 9,700,167 | |
5.50%, 11/15/2053 | | | 10,475 | | | | 11,289,392 | |
City & County of Denver CO Airport System Revenue
(United Airlines, Inc.)
Series 2017
5.00%, 10/01/2032 | | | 645 | | | | 645,101 | |
| | |
| |
20 | AB MUNICIPAL INCOME SHARES | | abfunds.com |
PORTFOLIO OF INVESTMENTS (continued)
| | | | | | | | |
| | | Principal
Amount
(000) | | | U.S. $ Value | |
| |
Colorado Educational & Cultural Facilities Authority
(Ascent Classical Academy Charter Schools, Inc.)
Series 2024
5.75%, 04/01/2059(a) | | $ | 2,250 | | | $ | 2,320,424 | |
5.80%, 04/01/2054(a) | | | 3,725 | | | | 3,866,926 | |
Colorado Educational & Cultural Facilities Authority
(James Irwin Educational Foundation Obligated Group)
Series 2022
5.00%, 09/01/2052 | | | 850 | | | | 852,662 | |
5.00%, 09/01/2057 | | | 2,100 | | | | 2,104,237 | |
5.00%, 09/01/2062 | | | 2,000 | | | | 1,993,946 | |
Colorado Educational & Cultural Facilities Authority
(STEAD School (The))
Series 2023-A
7.00%, 07/01/2034(a) | | | 18,215 | | | | 18,720,913 | |
Series 2023-B
8.125%, 07/01/2028(a) | | | 465 | | | | 466,694 | |
Colorado Educational & Cultural Facilities Authority
(Vega Collegiate Academy)
Series 2021
5.00%, 02/01/2051(a) | | | 3,500 | | | | 3,309,153 | |
5.00%, 02/01/2061(a) | | | 2,870 | | | | 2,649,563 | |
Colorado Health Facilities Authority
5.00%, 11/01/2040(a)(b) | | | 4,650 | | | | 5,042,521 | |
5.00%, 11/01/2041(a)(b) | | | 5,075 | | | | 5,484,236 | |
5.00%, 11/01/2042(a)(b) | | | 3,800 | | | | 4,086,082 | |
5.25%, 11/01/2052(a)(b) | | | 10,000 | | | | 10,696,789 | |
Colorado Health Facilities Authority
(Aberdeen Ridge, Inc. Obligated Group)
Series 2021-A
5.00%, 05/15/2049 | | | 1,300 | | | | 884,718 | |
5.00%, 05/15/2058 | | | 3,000 | | | | 1,927,286 | |
Series 2021-B
2.125%, 05/15/2028 | | | 1,500 | | | | 1,444,751 | |
Colorado Health Facilities Authority
(CommonSpirit Health)
Series 2019-A
4.00%, 08/01/2038 | | | 6,600 | | | | 6,480,866 | |
5.00%, 08/01/2039 | | | 1,000 | | | | 1,043,452 | |
5.00%, 08/01/2044 | | | 93,310 | | | | 96,014,245 | |
Series 2022
5.50%, 11/01/2047 | | | 2,500 | | | | 2,748,663 | |
| | |
| |
| abfunds.com | | AB MUNICIPAL INCOME SHARES | 21 |
PORTFOLIO OF INVESTMENTS (continued)
| | | | | | | | |
| | | Principal
Amount
(000) | | | U.S. $ Value | |
| |
Colorado Health Facilities Authority
(Frasier Meadows Manor, Inc. Obligated Group)
Series 2023-2
4.00%, 05/15/2048 | | $ | 2,100 | | | $ | 1,824,685 | |
Colorado Health Facilities Authority
(Intermountain Healthcare Obligated Group)
Series 2024-A
5.00%, 05/15/2054 | | | 10,000 | | | | 10,523,582 | |
Colorado Health Facilities Authority
(Sanford Obligated Group)
Series 2019-A
5.00%, 11/01/2044 | | | 7,050 | | | | 7,347,200 | |
Series 2019-B
3.696%, 11/01/2039 | | | 1,525 | | | | 1,295,754 | |
Colorado State Education Loan Program
Series 2024-A
5.00%, 06/30/2025 | | | 60,000 | | | | 60,700,236 | |
Douglas County Housing Partnership
(Bridgewater Castle Rock ALF LLC)
Series 2021
5.375%, 01/01/2041(d)(e)(f) | | | 19,590 | | | | 14,692,500 | |
Johnstown Plaza Metropolitan District
Series 2022
4.25%, 12/01/2046 | | | 13,433 | | | | 12,039,215 | |
Longs Peak Metropolitan District
Series 2021
5.25%, 12/01/2051(a) | | | 5,000 | | | | 4,954,222 | |
Meridian Ranch Metropolitan District 2018 Subdistrict
Series 2022
6.25%, 12/01/2037 | | | 1,435 | | | | 1,453,680 | |
6.50%, 12/01/2042 | | | 1,105 | | | | 1,122,362 | |
6.75%, 12/01/2052 | | | 1,925 | | | | 1,952,388 | |
Platte River Metropolitan District
Series 2023-A
6.50%, 08/01/2053(a) | | | 3,355 | | | | 3,466,921 | |
Plaza Metropolitan District No. 1
Series 2013
5.00%, 12/01/2040(a) | | | 1,500 | | | | 1,490,443 | |
Public Authority for Colorado Energy
(Bank of America Corp.)
Series 2008
6.50%, 11/15/2038 | | | 16,535 | | | | 19,896,752 | |
Pueblo Urban Renewal Authority
Series 2021
4.75%, 12/01/2045(e) | | | 8,010 | | | | 5,463,283 | |
| | |
| |
22 | AB MUNICIPAL INCOME SHARES | | abfunds.com |
PORTFOLIO OF INVESTMENTS (continued)
| | | | | | | | |
| | | Principal
Amount
(000) | | | U.S. $ Value | |
| |
Regional Transportation District
(Denver Transit Partners LLC)
Series 2020
5.00%, 01/15/2032 | | $ | 2,300 | | | $ | 2,470,759 | |
Riverwalk Metropolitan District No. 2
Series 2022-A
5.00%, 12/01/2042 | | | 4,000 | | | | 3,675,868 | |
5.00%, 12/01/2052 | | | 1,500 | | | | 1,326,652 | |
Sagebrush Farm Metropolitan District No. 1
Series 2022-A
6.75%, 12/01/2052 | | | 3,500 | | | | 3,681,525 | |
Spring Hill Metropolitan District No. 3
Series 2022-A
6.75%, 12/01/2052(a) | | | 667 | | | | 683,550 | |
St. Vrain Lakes Metropolitan District No. 4
Series 2024-A
6.75%, 09/20/2054(a)(g) | | | 1,500 | | | | 1,076,650 | |
STC Metropolitan District No. 2
Series 2019-A
5.00%, 12/01/2038 | | | 940 | | | | 920,525 | |
5.00%, 12/01/2049 | | | 1,000 | | | | 946,772 | |
Sterling Ranch Community Authority Board
(Sterling Ranch Colorado Metropolitan District No. 2)
Series 2020-A
4.25%, 12/01/2050 | | | 2,250 | | | | 2,040,214 | |
Sterling Ranch Community Authority Board
(Sterling Ranch Metropolitan District No. 3)
Series 2022
6.50%, 12/01/2042 | | | 2,215 | | | | 2,354,965 | |
6.75%, 12/01/2053 | | | 11,000 | | | | 11,676,311 | |
Series 2023
8.375%, 12/15/2054 | | | 2,500 | | | | 2,533,952 | |
Vauxmont Metropolitan District
AGM Series 2019
3.25%, 12/15/2050 | | | 646 | | | | 530,857 | |
AGM Series 2020
5.00%, 12/01/2033 | | | 370 | | | | 396,701 | |
5.00%, 12/01/2050 | | | 435 | | | | 449,531 | |
Verve Metropolitan District No. 1
Series 2023
6.50%, 12/01/2043 | | | 3,365 | | | | 3,294,032 | |
6.75%, 12/01/2052 | | | 4,000 | | | | 3,919,869 | |
| | | | | | | | |
| | | | | | | 407,573,317 | |
| | | | | | | | |
| | |
| |
| abfunds.com | | AB MUNICIPAL INCOME SHARES | 23 |
PORTFOLIO OF INVESTMENTS (continued)
| | | | | | | | |
| | | Principal
Amount
(000) | | | U.S. $ Value | |
| |
Connecticut – 0.6% | | | | | | | | |
City of New Haven CT
AGM Series 2019-A
5.00%, 08/01/2039 | | $ | 1,650 | | | $ | 1,725,185 | |
Connecticut State Health & Educational Facilities Authority
(Hartford HealthCare Obligated Group)
Series 2020-A
4.00%, 07/01/2036 | | | 1,000 | | | | 1,012,998 | |
Connecticut State Health & Educational Facilities Authority
(Quinnipiac University)
Series 2015-L
5.00%, 07/01/2045 | | | 5,750 | | | | 5,777,792 | |
Connecticut State Health & Educational Facilities Authority
(Sacred Heart University, Inc.)
Series 2017-I1
5.00%, 07/01/2035 | | | 1,000 | | | | 1,029,349 | |
5.00%, 07/01/2037 | | | 1,095 | | | | 1,123,722 | |
Connecticut State Health & Educational Facilities Authority
(Seabury Retirement Community)
Series 2016-A
5.00%, 09/01/2046(a) | | | 1,000 | | | | 979,245 | |
5.00%, 09/01/2053(a) | | | 1,475 | | | | 1,401,736 | |
Connecticut State Health & Educational Facilities Authority
(University of Hartford (The))
Series 2019
4.00%, 07/01/2044 | | | 10,710 | | | | 8,534,679 | |
4.00%, 07/01/2049 | | | 3,325 | | | | 2,575,469 | |
5.00%, 07/01/2033 | | | 470 | | | | 468,982 | |
5.00%, 07/01/2034 | | | 295 | | | | 292,751 | |
Connecticut State Health & Educational Facilities Authority
(University of New Haven, Inc.)
Series 2018
5.00%, 07/01/2034 | | | 1,000 | | | | 1,012,765 | |
Series 2018-K1
5.00%, 07/01/2028 | | | 765 | | | | 787,867 | |
5.00%, 07/01/2035 | | | 1,055 | | | | 1,066,248 | |
5.00%, 07/01/2036 | | | 2,205 | | | | 2,224,222 | |
5.00%, 07/01/2037 | | | 1,085 | | | | 1,093,196 | |
5.00%, 07/01/2038 | | | 1,980 | | | | 1,988,557 | |
State of Connecticut
Series 2016-E
5.00%, 10/15/2034 | | | 4,595 | | | | 4,709,414 | |
| | |
| |
24 | AB MUNICIPAL INCOME SHARES | | abfunds.com |
PORTFOLIO OF INVESTMENTS (continued)
| | | | | | | | |
| | | Principal
Amount
(000) | | | U.S. $ Value | |
| |
Series 2016-F
5.00%, 10/15/2031 | | $ | 10,205 | | | $ | 10,537,922 | |
Series 2017-A
5.00%, 04/15/2032 | | | 6,700 | | | | 6,960,658 | |
5.00%, 04/15/2033 | | | 10,985 | | | | 11,381,275 | |
5.00%, 04/15/2034 | | | 4,855 | | | | 5,023,695 | |
Series 2019-B
5.00%, 02/15/2025 | | | 11,830 | | | | 11,882,962 | |
Town of Hamden CT
(Whitney Center, Inc. Obligated Group)
Series 2022-A
7.00%, 01/01/2053 | | | 3,900 | | | | 4,240,810 | |
| | | | | | | | |
| | | | | | | 87,831,499 | |
| | | | | | | | |
Delaware – 0.0% | | | | | | | | |
Delaware River & Bay Authority
Series 2021
4.00%, 01/01/2042 | | | 550 | | | | 552,993 | |
Delaware State Economic Development Authority
(Newark Charter School, Inc.)
Series 2020
5.00%, 09/01/2050 | | | 1,125 | | | | 1,142,875 | |
| | | | | | | | |
| | | | | | | 1,695,868 | |
| | | | | | | | |
District of Columbia – 0.5% | | | | | | | | |
District of Columbia
(District of Columbia International School Obligated Group)
Series 2019
5.00%, 07/01/2039 | | | 1,000 | | | | 1,029,379 | |
5.00%, 07/01/2049 | | | 2,075 | | | | 2,095,695 | |
5.00%, 07/01/2054 | | | 3,565 | | | | 3,587,222 | |
District of Columbia
(District of Columbia Union Market TIF Area)
Series 2024
6.25%, 06/01/2041(a)(g) | | | 1,500 | | | | 891,039 | |
6.60%, 06/01/2049(a)(g) | | | 2,400 | | | | 1,395,762 | |
Series 2024-A
5.125%, 06/01/2034(a) | | | 6,580 | | | | 6,563,208 | |
District of Columbia
(KIPP DC Obligated Group)
Series 2017-A
5.00%, 07/01/2042 | | | 3,230 | | | | 3,279,718 | |
5.00%, 07/01/2048 | | | 5,350 | | | | 5,396,214 | |
Series 2017-B
5.00%, 07/01/2037 | | | 1,465 | | | | 1,500,595 | |
5.00%, 07/01/2042 | | | 2,000 | | | | 2,030,785 | |
| | |
| |
| abfunds.com | | AB MUNICIPAL INCOME SHARES | 25 |
PORTFOLIO OF INVESTMENTS (continued)
| | | | | | | | |
| | | Principal
Amount
(000) | | | U.S. $ Value | |
| |
District of Columbia
(Rocketship DC Obligated Group)
Series 2019
5.00%, 06/01/2056(a) | | $ | 3,255 | | | $ | 3,125,175 | |
Series 2021
5.00%, 06/01/2041(a) | | | 1,190 | | | | 1,198,656 | |
5.00%, 06/01/2051(a) | | | 4,345 | | | | 4,226,482 | |
Series 2024
5.625%, 06/01/2044 | | | 1,000 | | | | 1,042,044 | |
5.75%, 06/01/2054 | | | 1,000 | | | | 1,032,530 | |
6.00%, 06/01/2058 | | | 1,000 | | | | 1,046,333 | |
District of Columbia Tobacco Settlement Financing Corp.
Series 2006
Zero Coupon, 06/15/2055 | | | 182,000 | | | | 18,435,303 | |
Metropolitan Washington Airports Authority Aviation Revenue
Series 2020-A
5.00%, 10/01/2025 | | | 5,000 | | | | 5,062,231 | |
Series 2021-A
5.00%, 10/01/2046 | | | 7,400 | | | | 7,655,500 | |
Metropolitan Washington Airports Authority Dulles Toll Road Revenue
Series 2009
Zero Coupon, 10/01/2037 | | | 10,000 | | | | 5,867,333 | |
| | | | | | | | |
| | | | | | | 76,461,204 | |
| | | | | | | | |
Florida – 5.7% | | | | | | | | |
Bexley Community Development District
Series 2016
4.875%, 05/01/2047 | | | 985 | | | | 951,778 | |
Cape Coral Health Facilities Authority
(Gulf Care, Inc. Obligated Group)
Series 2015
5.875%, 07/01/2040(a) | | | 1,400 | | | | 1,041,859 | |
6.00%, 07/01/2045(a) | | | 1,215 | | | | 901,799 | |
6.00%, 07/01/2050(a) | | | 2,895 | | | | 2,139,157 | |
Capital Projects Finance Authority/FL
Series 2024
5.00%, 06/15/2054(a) | | | 1,200 | | | | 1,179,893 | |
5.00%, 06/15/2064(a) | | | 1,890 | | | | 1,823,940 | |
Capital Projects Finance Authority/FL
(CAPFA Capital Corp. 2000F)
Series 2020-A
5.00%, 10/01/2026 | | | 2,000 | | | | 2,039,062 | |
5.00%, 10/01/2029 | | | 1,650 | | | | 1,724,053 | |
5.00%, 10/01/2032 | | | 1,000 | | | | 1,037,669 | |
5.00%, 10/01/2033 | | | 1,050 | | | | 1,084,878 | |
| | |
| |
26 | AB MUNICIPAL INCOME SHARES | | abfunds.com |
PORTFOLIO OF INVESTMENTS (continued)
| | | | | | | | |
| | | Principal
Amount
(000) | | | U.S. $ Value | |
| |
Capital Projects Finance Authority/FL
(IDEA Lakeland)
Series 2023
7.00%, 06/15/2030(a) | | $ | 12,790 | | | $ | 13,325,833 | |
Capital Trust Agency, Inc.
(Aviva Senior Life)
Series 2017
5.00%, 07/01/2046(a) | | | 1,300 | | | | 995,570 | |
Capital Trust Agency, Inc.
(Educational Growth Fund LLC)
Series 2021
Zero Coupon, 07/01/2061(a) | | | 83,000 | | | | 5,801,028 | |
3.375%, 07/01/2031(a) | | | 1,210 | | | | 1,170,010 | |
5.00%, 07/01/2056(a) | | | 45,885 | | | | 44,596,035 | |
Capital Trust Agency, Inc.
(Southeastern University Obligated Group)
Series 2023
6.00%, 05/01/2043(a) | | | 2,000 | | | | 2,027,061 | |
6.25%, 05/01/2048(a) | | | 2,500 | | | | 2,540,280 | |
6.375%, 05/01/2053(a) | | | 4,500 | | | | 4,576,607 | |
Capital Trust Agency, Inc.
(Team Success A School of Excellence, Inc.)
Series 2020
5.00%, 06/01/2045(a) | | | 1,615 | | | | 1,527,574 | |
5.00%, 06/01/2055(a) | | | 3,250 | | | | 2,979,232 | |
Series 2022
5.50%, 06/01/2057(a) | | | 3,000 | | | | 2,959,554 | |
Capital Trust Authority
Series 2024
5.00%, 06/01/2064(a) | | | 4,250 | | | | 4,192,073 | |
Capital Trust Authority
(IDEA Florida, Inc.)
Series 2023-A
6.25%, 06/15/2053(a) | | | 6,250 | | | | 6,525,719 | |
6.375%, 06/15/2058(a) | | | 4,000 | | | | 4,190,589 | |
City of Jacksonville FL
(Genesis Health, Inc. Obligated Group)
Series 2020
4.00%, 11/01/2039 | | | 1,650 | | | | 1,577,870 | |
4.00%, 11/01/2040 | | | 2,175 | | | | 2,076,316 | |
4.00%, 11/01/2045 | | | 2,500 | | | | 2,290,058 | |
5.00%, 11/01/2050 | | | 8,625 | | | | 8,793,395 | |
City of Lakeland FL
(Pre-refunded – US Treasuries)
Series 2015
5.00%, 11/15/2040 | | | 5,610 | | | | 5,613,055 | |
| | |
| |
| abfunds.com | | AB MUNICIPAL INCOME SHARES | 27 |
PORTFOLIO OF INVESTMENTS (continued)
| | | | | | | | |
| | | Principal
Amount
(000) | | | U.S. $ Value | |
| |
City of Palmetto FL
(Renaissance Arts and Education, Inc.)
Series 2022
5.25%, 06/01/2052 | | $ | 2,955 | | | $ | 3,006,270 | |
5.375%, 06/01/2057 | | | 1,000 | | | | 1,021,566 | |
5.625%, 06/01/2062 | | | 7,965 | | | | 8,229,002 | |
City of South Miami Health Facilities Authority, Inc.
(Baptist Health South Florida Obligated Group)
Series 2017
5.00%, 08/15/2037 | | | 8,405 | | | | 8,675,233 | |
5.00%, 08/15/2047 | | | 6,125 | | | | 6,245,041 | |
City of Tallahassee FL
(Tallahassee Memorial HealthCare, Inc.)
Series 2016
5.00%, 12/01/2055 | | | 3,535 | | | | 3,477,077 | |
City of Tampa FL
(State of Florida Cigarette Tax Revenue)
Series 2020-A
Zero Coupon, 09/01/2036 | | | 700 | | | | 425,433 | |
Zero Coupon, 09/01/2037 | | | 700 | | | | 405,637 | |
Zero Coupon, 09/01/2040 | | | 980 | | | | 486,406 | |
Zero Coupon, 09/01/2041 | | | 1,000 | | | | 469,979 | |
Zero Coupon, 09/01/2045 | | | 1,850 | | | | 699,110 | |
Zero Coupon, 09/01/2049 | | | 1,350 | | | | 410,812 | |
Collier County Industrial Development Authority
(NCH Healthcare System, Inc. Obligated Group)
Series 2024
5.00%, 10/01/2054 | | | 6,500 | | | | 6,974,902 | |
County of Lake FL
(Waterman Communities, Inc.)
Series 2020
5.75%, 08/15/2050 | | | 5,000 | | | | 5,029,053 | |
5.75%, 08/15/2055 | | | 3,905 | | | | 3,912,414 | |
County of Lee FL Airport Revenue
Series 2024
5.25%, 10/01/2042 | | | 5,500 | | | | 5,989,657 | |
5.25%, 10/01/2044 | | | 4,550 | | | | 4,918,818 | |
County of Miami-Dade FL Aviation Revenue
Series 2015-A
5.00%, 10/01/2031 | | | 1,100 | | | | 1,110,172 | |
County of Miami-Dade Seaport Department
Series 2023-A
5.25%, 10/01/2052 | | | 7,900 | | | | 8,326,187 | |
| | |
| |
28 | AB MUNICIPAL INCOME SHARES | | abfunds.com |
PORTFOLIO OF INVESTMENTS (continued)
| | | | | | | | |
| | | Principal
Amount
(000) | | | U.S. $ Value | |
| |
County of Osceola FL Transportation Revenue
Series 2020-A
Zero Coupon, 10/01/2035 | | $ | 1,000 | | | $ | 628,947 | |
Zero Coupon, 10/01/2036 | | | 860 | | | | 509,096 | |
Zero Coupon, 10/01/2037 | | | 1,390 | | | | 781,105 | |
Zero Coupon, 10/01/2038 | | | 1,185 | | | | 628,458 | |
Zero Coupon, 10/01/2039 | | | 1,610 | | | | 805,307 | |
County of Palm Beach FL
(Provident Group – LU Properties II LLC)
Series 2024
8.50%, 06/01/2033 | | | 650 | | | | 653,756 | |
County of Palm Beach FL
(Provident Group – LU Properties LLC)
Series 2024
6.00%, 06/01/2044 | | | 4,000 | | | | 4,037,461 | |
6.125%, 06/01/2054 | | | 5,000 | | | | 5,026,654 | |
6.25%, 06/01/2059 | | | 4,000 | | | | 4,042,509 | |
County of Palm Beach FL
(Provident Group-PBAU Properties LLC)
Series 2019
5.00%, 04/01/2039(a) | | | 1,435 | | | | 1,410,357 | |
5.00%, 04/01/2051(a) | | | 11,645 | | | | 11,024,290 | |
County of Pasco FL
(H Lee Moffitt Cancer Center & Research Institute Obligated Group)
Series 2023
5.00%, 07/01/2030(a)(b) | | | 52,000 | | | | 56,468,828 | |
Florida Development Finance Corp.
Series 2024
4.375%, 10/01/2054(a) | | | 18,800 | | | | 18,797,932 | |
Florida Development Finance Corp.
(Assistance Unlimited, Inc.)
Series 2022
5.00%, 08/15/2032(a) | | | 460 | | | | 459,882 | |
5.25%, 08/15/2037(a) | | | 700 | | | | 695,293 | |
5.625%, 08/15/2042(a) | | | 1,520 | | | | 1,515,592 | |
5.875%, 08/15/2052(a) | | | 5,000 | | | | 4,975,737 | |
6.00%, 08/15/2057(a) | | | 1,000 | | | | 1,002,356 | |
Florida Development Finance Corp.
(Brightline Trains Florida LLC)
AGM Series 2024
5.00%, 07/01/2044 | | | 10,000 | | | | 10,375,781 | |
5.25%, 07/01/2053 | | | 12,900 | | | | 13,426,907 | |
Florida Development Finance Corp.
(Cornerstone Charter Academy, Inc. Obligated Group)
Series 2022
5.00%, 10/01/2032(a) | | | 925 | | | | 952,444 | |
| | |
| |
| abfunds.com | | AB MUNICIPAL INCOME SHARES | 29 |
PORTFOLIO OF INVESTMENTS (continued)
| | | | | | | | |
| | | Principal
Amount
(000) | | | U.S. $ Value | |
| |
5.00%, 10/01/2042(a) | | $ | 4,815 | | | $ | 4,831,398 | |
5.125%, 10/01/2052(a) | | | 4,120 | | | | 4,068,587 | |
5.25%, 10/01/2056(a) | | | 4,825 | | | | 4,817,349 | |
Florida Development Finance Corp.
(Drs Kiran & Pallavi Patel 2017 Foundation for Global Understanding, Inc.)
Series 2021
4.00%, 07/01/2051(a) | | | 1,000 | | | | 860,125 | |
Florida Development Finance Corp.
(Mater Academy, Inc.)
Series 2020-A
5.00%, 06/15/2040 | | | 3,150 | | | | 3,178,617 | |
5.00%, 06/15/2050 | | | 13,310 | | | | 13,317,862 | |
Series 2022-A
4.00%, 06/15/2042 | | | 1,000 | | | | 906,305 | |
5.00%, 06/15/2047 | | | 2,470 | | | | 2,475,960 | |
Florida Development Finance Corp.
(Mayflower Retirement Center, Inc. Obligated Group)
Series 2020
5.25%, 06/01/2050(a) | | | 5,000 | | | | 4,890,298 | |
5.25%, 06/01/2055(a) | | | 5,500 | | | | 5,290,215 | |
Series 2021
4.00%, 06/01/2041(a) | | | 830 | | | | 715,280 | |
Florida Development Finance Corp.
(Parrish Charter Academy)
Series 2023
6.25%, 04/23/2058(a) | | | 7,635 | | | | 7,665,366 | |
Florida Development Finance Corp.
(Renaissance Charter School, Inc. Series 2020A/B Obligated Group)
Series 2021
5.375%, 06/15/2040 | | | 1,000 | | | | 1,004,621 | |
Florida Development Finance Corp.
(Renaissance Charter School, Inc.)
Series 2023
6.75%, 06/15/2053(a) | | | 5,750 | | | | 6,317,390 | |
Florida Development Finance Corp.
(River City Education Obligated Group)
Series 2021
4.00%, 07/01/2035 | | | 925 | | | | 898,463 | |
Series 2022
5.00%, 07/01/2042 | | | 2,225 | | | | 2,278,754 | |
5.00%, 07/01/2051 | | | 1,045 | | | | 1,052,064 | |
5.00%, 02/01/2057 | | | 1,725 | | | | 1,728,417 | |
5.00%, 07/01/2057 | | | 740 | | | | 741,466 | |
| | |
| |
30 | AB MUNICIPAL INCOME SHARES | | abfunds.com |
PORTFOLIO OF INVESTMENTS (continued)
| | | | | | | | |
| | | Principal
Amount
(000) | | | U.S. $ Value | |
| |
Florida Development Finance Corp.
(Seaside School Consortium, Inc.)
Series 2022
6.00%, 06/15/2057 | | $ | 7,000 | | | $ | 7,380,850 | |
Florida Development Finance Corp.
(SFP – Tampa I LLC)
Series 2024
5.00%, 06/01/2044(a) | | | 3,275 | | | | 3,329,745 | |
5.25%, 06/01/2054(a) | | | 5,550 | | | | 5,650,147 | |
5.25%, 06/01/2059(a) | | | 7,900 | | | | 8,012,518 | |
6.50%, 06/01/2059(a) | | | 3,800 | | | | 3,864,722 | |
Florida Development Finance Corp.
(United Cerebral Palsy of Central Florida, Inc.)
Series 2020
5.00%, 06/01/2050 | | | 1,950 | | | | 1,779,501 | |
Florida Higher Educational Facilities Financial Authority
(Florida Institute of Technology, Inc.)
Series 2019
4.00%, 10/01/2037 | | | 1,000 | | | | 928,911 | |
5.00%, 10/01/2031 | | | 1,235 | | | | 1,279,803 | |
Florida Higher Educational Facilities Financial Authority
(Ringling College of Art and Design, Inc.)
Series 2017
5.00%, 03/01/2032 | | | 265 | | | | 270,568 | |
5.00%, 03/01/2034 | | | 2,395 | | | | 2,433,989 | |
5.00%, 03/01/2042 | | | 2,785 | | | | 2,802,398 | |
5.00%, 03/01/2047 | | | 1,950 | | | | 1,953,342 | |
Series 2019
5.00%, 03/01/2044 | | | 1,065 | | | | 1,070,879 | |
5.00%, 03/01/2049 | | | 10,425 | | | | 10,433,299 | |
Florida Municipal Power Agency
(Florida Municipal Power Agency All-Requirements Power Supply Project Revenue)
Series 2021
1.425%, 10/01/2026 | | | 2,700 | | | | 2,551,323 | |
Greater Orlando Aviation Authority
Series 2017-A
5.00%, 10/01/2031(a)(b) | | | 4,350 | | | | 4,491,596 | |
5.00%, 10/01/2032(a)(b) | | | 1,500 | | | | 1,546,951 | |
5.00%, 10/01/2034(a)(b) | | | 2,150 | | | | 2,210,734 | |
5.00%, 10/01/2035(a)(b) | | | 3,500 | | | | 3,589,041 | |
5.00%, 10/01/2036(a)(b) | | | 4,000 | | | | 4,096,574 | |
| | |
| |
| abfunds.com | | AB MUNICIPAL INCOME SHARES | 31 |
PORTFOLIO OF INVESTMENTS (continued)
| | | | | | | | |
| | | Principal
Amount
(000) | | | U.S. $ Value | |
| |
Series 2019-A
5.00%, 10/01/2034 | | $ | 2,000 | | | $ | 2,091,706 | |
5.00%, 10/01/2036 | | | 5,000 | | | | 5,206,995 | |
5.00%, 10/01/2044 | | | 13,000 | | | | 13,323,814 | |
5.00%, 10/01/2049 | | | 4,500 | | | | 4,585,726 | |
5.00%, 10/01/2054 | | | 4,000 | | | | 4,060,370 | |
Halifax Hospital Medical Center
Series 2024
4.25%, 06/01/2054 | | | 2,250 | | | | 2,160,413 | |
Hillsborough County Aviation Authority
Series 2024
5.25%, 10/01/2042 | | | 4,500 | | | | 4,927,460 | |
5.25%, 10/01/2044 | | | 11,475 | | | | 12,472,968 | |
5.50%, 10/01/2054 | | | 27,170 | | | | 29,659,152 | |
Hillsborough County Industrial Development Authority
Series 2024
5.50%, 11/15/2054 | | | 13,500 | | | | 15,098,798 | |
Hillsborough County Industrial Development Authority
(BayCare Obligated Group)
Series 2024-C
4.125%, 11/15/2051 | | | 14,000 | | | | 13,486,536 | |
Jacksonville Transportation Authority
Series 2025
5.00%, 08/01/2026(i) | | | 1,785 | | | | 1,823,306 | |
5.00%, 08/01/2028(i) | | | 2,750 | | | | 2,903,645 | |
5.00%, 08/01/2029(i) | | | 1,000 | | | | 1,070,225 | |
5.00%, 08/01/2034(i) | | | 1,190 | | | | 1,319,501 | |
5.00%, 08/01/2036(i) | | | 1,500 | | | | 1,667,162 | |
Lakewood Ranch Stewardship District
(Lakewood Ranch Stewardship District Series 2019 Assessment)
Series 2018
5.30%, 05/01/2039 | | | 1,000 | | | | 1,028,831 | |
5.45%, 05/01/2048 | | | 1,525 | | | | 1,557,953 | |
Lakewood Ranch Stewardship District
(Lakewood Ranch Stewardship District Series 2023 Assessment)
Series 2023
6.125%, 05/01/2043 | | | 2,220 | | | | 2,358,295 | |
6.30%, 05/01/2054 | | | 4,160 | | | | 4,385,783 | |
Lee County Industrial Development Authority/FL
Series 2024-C
5.00%, 11/15/2054 | | | 5,000 | | | | 5,151,555 | |
| | |
| |
32 | AB MUNICIPAL INCOME SHARES | | abfunds.com |
PORTFOLIO OF INVESTMENTS (continued)
| | | | | | | | |
| | | Principal
Amount
(000) | | | U.S. $ Value | |
| |
Lee County Industrial Development Authority/FL
(Cypress Cove at Healthpark Florida Obligated Group)
Series 2022
5.25%, 10/01/2052 | | $ | 1,350 | | | $ | 1,251,543 | |
5.25%, 10/01/2057 | | | 3,650 | | | | 3,341,954 | |
Lee County Industrial Development Authority/FL
(Shell Point Obligated Group)
Series 2024
5.25%, 11/15/2044 | | | 2,525 | | | | 2,713,283 | |
5.25%, 11/15/2054 | | | 1,000 | | | | 1,052,160 | |
Marshall Creek Community Development District
(Marshall Creek Community Development District 2015A)
Series 2015-A
5.00%, 05/01/2032 | | | 1,130 | | | | 1,133,581 | |
Miami Beach Health Facilities Authority
(Mount Sinai Medical Center of Florida Obligated Group)
Series 2014
5.00%, 11/15/2039 | | | 2,000 | | | | 2,000,537 | |
Miami-Dade County Educational Facilities Authority
Series 2024-A
5.25%, 04/01/2048(i) | | | 10,000 | | | | 10,897,185 | |
Miami-Dade County Expressway Authority
Series 2014-A
5.00%, 07/01/2034 | | | 4,000 | | | | 4,002,994 | |
Miami-Dade County Housing Finance Authority
(Wynwood Works LLC)
Series 2023-A
5.70%, 06/01/2052(a) | | | 6,875 | | | | 6,964,568 | |
Series 2023-B
5.78%, 06/01/2027(a) | | | 3,640 | | | | 3,663,293 | |
Miami-Dade County Industrial Development Authority
(AcadeMir Charter School Middle & Preparatory Academy Obligated Group)
Series 2022
5.00%, 07/01/2037(a) | | | 525 | | | | 535,270 | |
5.25%, 07/01/2042(a) | | | 770 | | | | 784,525 | |
5.25%, 07/01/2052(a) | | | 2,435 | | | | 2,443,963 | |
5.50%, 07/01/2061(a) | | | 4,375 | | | | 4,431,943 | |
| | |
| |
| abfunds.com | | AB MUNICIPAL INCOME SHARES | 33 |
PORTFOLIO OF INVESTMENTS (continued)
| | | | | | | | |
| | | Principal
Amount
(000) | | | U.S. $ Value | |
| |
Mid-Bay Bridge Authority
Series 2015-A
5.00%, 10/01/2028 | | $ | 1,600 | | | $ | 1,619,513 | |
5.00%, 10/01/2040 | | | 2,000 | | | | 2,010,151 | |
Series 2015-C
5.00%, 10/01/2035 | | | 1,750 | | | | 1,763,598 | |
5.00%, 10/01/2040 | | | 1,000 | | | | 1,005,522 | |
Middleton Community Development District A
(Middleton Community Development District A Series 2022 Phase I Special Assmnt)
Series 2022
6.20%, 05/01/2053 | | | 3,470 | | | | 3,681,207 | |
North Broward Hospital District
Series 2017-B
5.00%, 01/01/2037 | | | 4,070 | | | | 4,191,932 | |
5.00%, 01/01/2042 | | | 10,510 | | | | 10,739,024 | |
5.00%, 01/01/2048 | | | 10,000 | | | | 10,146,594 | |
Orange County Health Facilities Authority
(Presbyterian Retirement Communities, Inc. Obligated Group)
Series 2023
4.00%, 08/01/2042 | | | 6,020 | | | | 5,669,150 | |
Palm Beach County Educational Facilities Authority
(Palm Beach Atlantic University Obligated Group)
Series 2021
4.00%, 10/01/2041 | | | 1,030 | | | | 931,230 | |
4.00%, 10/01/2051 | | | 4,330 | | | | 3,641,089 | |
Series 2024
5.00%, 10/01/2043 | | | 2,260 | | | | 2,303,425 | |
5.25%, 10/01/2053 | | | 2,850 | | | | 2,898,809 | |
Palm Beach County Health Facilities Authority
(Federation CCRC Operations Corp. Obligated Group)
Series 2020
5.00%, 06/01/2055 | | | 2,880 | | | | 2,814,136 | |
Series 2022
4.25%, 06/01/2056 | | | 5,825 | | | | 4,963,727 | |
Palm Beach County Health Facilities Authority
(Green Cay Life Plan Village, Inc.)
Series 2022
11.50%, 07/01/2027(a) | | | 1,800 | | | | 2,283,727 | |
| | |
| |
34 | AB MUNICIPAL INCOME SHARES | | abfunds.com |
PORTFOLIO OF INVESTMENTS (continued)
| | | | | | | | |
| | | Principal
Amount
(000) | | | U.S. $ Value | |
| |
Palm Beach County Health Facilities Authority
(Jupiter Medical Center Obligated Group)
Series 2022
5.00%, 11/01/2038 | | $ | 400 | | | $ | 421,964 | |
5.00%, 11/01/2039 | | | 685 | | | | 720,077 | |
5.00%, 11/01/2040 | | | 650 | | | | 680,255 | |
5.00%, 11/01/2041 | | | 2,330 | | | | 2,428,417 | |
5.00%, 11/01/2042 | | | 500 | | | | 519,238 | |
5.00%, 11/01/2047 | | | 13,835 | | | | 14,172,290 | |
5.00%, 11/01/2052 | | | 19,480 | | | | 19,874,043 | |
Pinellas County Industrial Development Authority
Series 2019
5.00%, 07/01/2039 | | | 6,620 | | | | 6,688,116 | |
Pinellas County Industrial Development Authority
(Drs Kiran & Pallavi Patel 2017 Foundation for Global Understanding, Inc.)
Series 2019
5.00%, 07/01/2029 | | | 1,055 | | | | 1,075,621 | |
Polk County Industrial Development Authority/FL
(Mineral Development LLC)
Series 2020
5.875%, 01/01/2033(a) | | | 3,805 | | | | 3,393,674 | |
St. Johns County Industrial Development Authority
(Presbyterian Retirement Communities, Inc. Obligated Group)
Series 2020
4.00%, 08/01/2055 | | | 5,300 | | | | 4,569,240 | |
Village Community Development District No. 13
(Village Community Development District No. 13 Phase I Series 2019 Special Assmnts)
Series 2019
3.00%, 05/01/2029 | | | 950 | | | | 920,018 | |
3.375%, 05/01/2034 | | | 1,425 | | | | 1,358,825 | |
3.55%, 05/01/2039 | | | 2,480 | | | | 2,293,368 | |
3.70%, 05/01/2050 | | | 9,475 | | | | 8,095,015 | |
| | |
| |
| abfunds.com | | AB MUNICIPAL INCOME SHARES | 35 |
PORTFOLIO OF INVESTMENTS (continued)
| | | | | | | | |
| | | Principal
Amount
(000) | | | U.S. $ Value | |
| |
Village Community Development District No. 13
(Village Community Development Dist No. 13 Phase II Series 2020 Special Assmnts)
Series 2020
3.50%, 05/01/2051(a) | | $ | 4,820 | | | $ | 3,940,297 | |
Village Community Development District No. 14
(Village Community Development District No. 14 Series 2022 Phase I Special Asmnts)
Series 2022
5.50%, 05/01/2053 | | | 2,160 | | | | 2,244,656 | |
Village Community Development District No. 15
(Village Community Development District No. 15 Series 2023 Phase I Special Asmnts)
Series 2023
5.00%, 05/01/2043(a) | | | 1,250 | | | | 1,289,523 | |
5.25%, 05/01/2054(a) | | | 2,140 | | | | 2,209,212 | |
Village Community Development District No. 15
(Village Community Development District No 15 Series 2024 Special Assessment)
Series 2024
4.80%, 05/01/2055(a) | | | 1,000 | | | | 997,948 | |
| | | | | | | | |
| | | | | | | 790,540,460 | |
| | | | | | | | |
Georgia – 4.5% | | | | | | | | |
Atlanta Development Authority (The)
Series 2024-A
5.00%, 04/01/2034(a) | | | 3,250 | | | | 3,267,375 | |
Atlanta Development Authority (The)
(City of Atlanta GA Westside Tax Allocation District Gulch Area)
Series 2024
6.50%, 12/15/2048(a)(g) | | | 39,450 | | | | 32,943,665 | |
Series 2024-A
5.50%, 04/01/2039(a) | | | 10,500 | | | | 10,642,666 | |
Augusta Development Authority
(WellStar Health System Obligated Group)
Series 2018
5.00%, 07/01/2027 | | | 1,635 | | | | 1,706,252 | |
City of Atlanta GA Department of Aviation
Series 2019-B
5.00%, 07/01/2044 | | | 9,000 | | | | 9,221,311 | |
Series 2022-B
5.00%, 07/01/2047 | | | 10,000 | | | | 10,351,474 | |
| | |
| |
36 | AB MUNICIPAL INCOME SHARES | | abfunds.com |
PORTFOLIO OF INVESTMENTS (continued)
| | | | | | | | |
| | | Principal
Amount
(000) | | | U.S. $ Value | |
| |
5.00%, 07/01/2052 | | $ | 10,000 | | | $ | 10,291,274 | |
City of Atlanta GA Water & Wastewater Revenue
(Pre-refunded – US Treasuries)
Series 2015
5.00%, 11/01/2043 | | | 16,000 | | | | 16,140,424 | |
Clarke County Hospital Authority
(Piedmont Healthcare, Inc. Obligated Group)
Series 2016
5.00%, 07/01/2031 | | | 2,500 | | | | 2,565,080 | |
DeKalb County Housing Authority
(HADC Avenues LLC)
Series 2023
6.17%, 06/01/2053(a) | | | 29,150 | | | | 28,114,496 | |
7.00%, 06/01/2041(a) | | | 6,740 | | | | 6,384,152 | |
Development Authority for Fulton County
(Piedmont Healthcare, Inc. Obligated Group)
Series 2016-A
5.00%, 07/01/2032 | | | 2,000 | | | | 2,048,076 | |
Development Authority of Gwinnett County
(Board of Regents of the University System of Georgia Lease)
Series 2017-A
5.00%, 07/01/2032 | | | 1,205 | | | | 1,247,713 | |
5.00%, 07/01/2033 | | | 2,370 | | | | 2,450,875 | |
5.00%, 07/01/2035 | | | 4,945 | | | | 5,093,646 | |
5.00%, 07/01/2037 | | | 2,335 | | | | 2,399,089 | |
Development Authority of Monroe County (The)
(Georgia Power Co.)
Series 2023
3.875%, 10/01/2048 | | | 5,000 | | | | 5,037,985 | |
Fayette County Development Authority
Series 2024
5.00%, 10/01/2032 | | | 750 | | | | 817,267 | |
5.00%, 10/01/2034 | | | 750 | | | | 824,206 | |
5.00%, 10/01/2035 | | | 825 | | | | 902,952 | |
5.00%, 10/01/2036 | | | 900 | | | | 981,423 | |
5.25%, 10/01/2049 | | | 9,360 | | | | 10,024,644 | |
Fayette County Development Authority
(United States Soccer Federation, Inc.)
Series 2024
5.00%, 10/01/2044 | | | 1,000 | | | | 1,056,267 | |
5.25%, 10/01/2054 | | | 13,250 | | | | 14,092,118 | |
| | |
| |
| abfunds.com | | AB MUNICIPAL INCOME SHARES | 37 |
PORTFOLIO OF INVESTMENTS (continued)
| | | | | | | | |
| | | Principal
Amount
(000) | | | U.S. $ Value | |
| |
Fayette County Hospital Authority/GA
(Piedmont Healthcare, Inc. Obligated Group)
Series 2016
5.00%, 07/01/2034 | | $ | 1,620 | | | $ | 1,655,246 | |
5.00%, 07/01/2035 | | | 6,355 | | | | 6,489,897 | |
5.00%, 07/01/2036 | | | 2,735 | | | | 2,791,366 | |
George L Smith II Congress Center Authority
Series 2021
4.00%, 01/01/2054 | | | 1,485 | | | | 1,320,805 | |
Glynn-Brunswick Memorial Hospital Authority
(Southeast Georgia Health System Obligated Group)
Series 2017
5.00%, 08/01/2043 | | | 10,880 | | | | 10,890,646 | |
5.00%, 08/01/2047 | | | 1,800 | | | | 1,774,317 | |
Main Street Natural Gas, Inc.
Series 2024-D
5.00%, 04/01/2054 | | | 26,300 | | | | 28,237,092 | |
Main Street Natural Gas, Inc.
(Citadel LP)
Series 2022-C
4.00%, 08/01/2052(a) | | | 37,500 | | | | 37,372,005 | |
Main Street Natural Gas, Inc.
(Citigroup, Inc.)
Series 2022-A
4.00%, 09/01/2052 | | | 2,185 | | | | 2,208,789 | |
Series 2022-B
5.00%, 12/01/2052 | | | 12,195 | | | | 12,917,368 | |
Series 2023-A
5.00%, 06/01/2053 | | | 6,750 | | | | 7,171,429 | |
Series 2023-D
5.00%, 05/01/2054 | | | 55,235 | | | | 58,879,604 | |
Series 2024-C
5.00%, 12/01/2054 | | | 23,805 | | | | 25,366,163 | |
Main Street Natural Gas, Inc.
(Macquarie Group Ltd.)
Series 2019-A
5.00%, 05/15/2033 | | | 5,000 | | | | 5,164,937 | |
5.00%, 05/15/2043 | | | 15,500 | | | | 15,965,003 | |
Main Street Natural Gas, Inc.
(Royal Bank of Canada)
Series 2023
4.929% (SOFR + 1.70%), 12/01/2053(c) | | | 25,000 | | | | 25,725,197 | |
Series 2023-B
5.00%, 07/01/2053 | | | 11,720 | | | | 12,421,135 | |
| | |
| |
38 | AB MUNICIPAL INCOME SHARES | | abfunds.com |
PORTFOLIO OF INVESTMENTS (continued)
| | | | | | | | |
| | | Principal
Amount
(000) | | | U.S. $ Value | |
| |
Series 2023-C
5.00%, 09/01/2053 | | $ | 24,815 | | | $ | 26,393,740 | |
Series 2024-A
5.00%, 05/01/2054 | | | 35,000 | | | | 37,319,436 | |
Series 2024-B
5.00%, 12/01/2054 | | | 44,070 | | | | 47,181,148 | |
Municipal Electric Authority of Georgia
Series 2019
5.00%, 01/01/2038 | | | 675 | | | | 702,056 | |
5.00%, 01/01/2039 | | | 1,215 | | | | 1,252,591 | |
5.00%, 01/01/2048 | | | 2,460 | | | | 2,489,944 | |
5.00%, 01/01/2049 | | | 5,000 | | | | 5,101,984 | |
5.00%, 01/01/2056 | | | 4,655 | | | | 4,734,182 | |
5.00%, 01/01/2059 | | | 6,270 | | | | 6,307,140 | |
Series 2022
4.50%, 07/01/2063 | | | 15,000 | | | | 14,729,694 | |
5.00%, 07/01/2052 | | | 12,000 | | | | 12,453,629 | |
Series 2023
5.00%, 07/01/2039 | | | 1,000 | | | | 1,087,177 | |
5.50%, 07/01/2064 | | | 10,200 | | | | 10,882,922 | |
Series 2024
5.25%, 01/01/2049 | | | 5,645 | | | | 6,100,764 | |
AGM Series 2023
5.00%, 07/01/2048 | | | 1,570 | | | | 1,658,955 | |
5.00%, 07/01/2055 | | | 3,200 | | | | 3,341,538 | |
5.00%, 07/01/2064 | | | 6,055 | | | | 6,301,694 | |
| | | | | | | | |
| | | | | | | 622,994,023 | |
| | | | | | | | |
Guam – 0.4% | | | | | | | | |
Guam Education Financing Foundation
(Guam Education Financing Foundation COP)
Series 2016-B
5.00%, 10/01/2026(a) | | | 6,595 | | | | 6,561,414 | |
Guam Government Waterworks Authority
Series 2020-A
5.00%, 01/01/2050 | | | 3,790 | | | | 3,884,010 | |
Guam Power Authority
Series 2022-A
5.00%, 10/01/2043 | | | 3,300 | | | | 3,472,173 | |
Territory of Guam
Series 2019
5.00%, 11/15/2031 | | | 1,510 | | | | 1,533,550 | |
Territory of Guam
(Guam Section 30 Income Tax)
Series 2016-A
5.00%, 12/01/2029 | | | 1,310 | | | | 1,343,663 | |
5.00%, 12/01/2030 | | | 4,160 | | | | 4,258,219 | |
| | |
| |
| abfunds.com | | AB MUNICIPAL INCOME SHARES | 39 |
PORTFOLIO OF INVESTMENTS (continued)
| | | | | | | | |
| | | Principal
Amount
(000) | | | U.S. $ Value | |
| |
5.00%, 12/01/2032 | | $ | 3,545 | | | $ | 3,620,683 | |
Territory of Guam
(Territory of Guam Business Privilege Tax)
Series 2015
5.00%, 11/15/2029 | | | 13,375 | | | | 13,548,858 | |
Series 2015-D
5.00%, 11/15/2033 | | | 3,570 | | | | 3,600,710 | |
5.00%, 11/15/2035 | | | 8,945 | | | | 9,008,684 | |
Series 2021-F
4.00%, 01/01/2036 | | | 4,050 | | | | 3,972,568 | |
| | | | | | | | |
| | | | | | | 54,804,532 | |
| | | | | | | | |
Hawaii – 0.2% | | | | | | | | |
City & County Honolulu HI Wastewater System Revenue
Series 2025
5.00%, 07/01/2032(i) | | | 3,950 | | | | 4,399,097 | |
5.00%, 07/01/2033(i) | | | 6,750 | | | | 7,562,600 | |
5.00%, 07/01/2034(i) | | | 4,875 | | | | 5,510,472 | |
5.00%, 07/01/2036(i) | | | 3,375 | | | | 3,830,939 | |
| | | | | | | | |
| | | | | | | 21,303,108 | |
| | | | | | | | |
Idaho – 0.1% | | | | | | | | |
Idaho Health Facilities Authority
(North Canyon Medical Center, Inc.)
Series 2023
7.00%, 11/01/2048 | | | 4,500 | | | | 4,879,333 | |
7.125%, 11/01/2057 | | | 7,495 | | | | 8,147,178 | |
Idaho Housing & Finance Association
(Battelle Energy Alliance LLC)
Series 2010-A
7.00%, 02/01/2036 | | | 200 | | | | 200,371 | |
| | | | | | | | |
| | | | | | | 13,226,882 | |
| | | | | | | | |
Illinois – 6.5% | | | | | | | | |
Bellwood Municipal Housing Corp.
(Village of Bellwood IL)
Series 2024
6.375%, 12/01/2059(a) | | | 6,450 | | | | 6,388,830 | |
Chicago Board of Education
Series 2012-A
5.00%, 12/01/2042 | | | 6,635 | | | | 6,511,184 | |
Series 2015-C
5.25%, 12/01/2035 | | | 2,790 | | | | 2,790,779 | |
5.25%, 12/01/2039 | | | 8,080 | | | | 8,080,339 | |
Series 2015-E
5.125%, 12/01/2032 | | | 1,000 | | | | 1,000,321 | |
Series 2016-A
7.00%, 12/01/2044 | | | 1,400 | | | | 1,430,396 | |
| | |
| |
40 | AB MUNICIPAL INCOME SHARES | | abfunds.com |
PORTFOLIO OF INVESTMENTS (continued)
| | | | | | | | |
| | | Principal
Amount
(000) | | | U.S. $ Value | |
| |
Series 2016-B
6.50%, 12/01/2046 | | $ | 1,900 | | | $ | 1,960,580 | |
Series 2017-G
5.00%, 12/01/2034 | | | 4,150 | | | | 4,201,807 | |
Series 2017-H
5.00%, 12/01/2036 | | | 900 | | | | 907,280 | |
Series 2018-A
5.00%, 12/01/2026 | | | 5,430 | | | | 5,539,248 | |
5.00%, 12/01/2027 | | | 6,300 | | | | 6,488,831 | |
Series 2019-A
5.00%, 12/01/2029 | | | 2,950 | | | | 3,076,723 | |
5.00%, 12/01/2030 | | | 5,120 | | | | 5,303,828 | |
Series 2019-B
5.00%, 12/01/2030 | | | 935 | | | | 968,570 | |
5.00%, 12/01/2031 | | | 1,030 | | | | 1,064,117 | |
5.00%, 12/01/2032 | | | 635 | | | | 653,433 | |
5.00%, 12/01/2033 | | | 500 | | | | 513,257 | |
Series 2021-A
5.00%, 12/01/2032 | | | 2,400 | | | | 2,488,171 | |
5.00%, 12/01/2033 | | | 4,510 | | | | 4,663,579 | |
5.00%, 12/01/2036 | | | 1,210 | | | | 1,237,134 | |
5.00%, 12/01/2038 | | | 7,730 | | | | 7,861,324 | |
5.00%, 12/01/2039 | | | 2,000 | | | | 2,028,983 | |
5.00%, 12/01/2040 | | | 1,750 | | | | 1,768,223 | |
5.00%, 12/01/2041 | | | 7,765 | | | | 7,820,444 | |
Series 2021-B
5.00%, 12/01/2036 | | | 1,000 | | | | 1,022,425 | |
Series 2022-B
4.00%, 12/01/2041 | | | 5,765 | | | | 5,064,162 | |
Series 2023
5.00%, 04/01/2045 | | | 1,500 | | | | 1,559,930 | |
5.25%, 04/01/2033 | | | 1,250 | | | | 1,388,449 | |
5.25%, 04/01/2034 | | | 1,000 | | | | 1,105,800 | |
5.50%, 04/01/2042 | | | 5,000 | | | | 5,422,692 | |
Series 2023-A
5.875%, 12/01/2047 | | | 19,500 | | | | 20,990,280 | |
6.00%, 12/01/2049 | | | 33,500 | | | | 36,237,962 | |
Chicago O’Hare International Airport
Series 2016-B
5.00%, 01/01/2034 | | | 5,000 | | | | 5,054,935 | |
Series 2016-C
5.00%, 01/01/2035 | | | 1,625 | | | | 1,642,759 | |
5.00%, 01/01/2038 | | | 7,625 | | | | 7,700,445 | |
Series 2017-B
5.00%, 01/01/2036 | | | 12,000 | | | | 12,312,044 | |
5.00%, 01/01/2037 | | | 14,800 | | | | 15,170,551 | |
Series 2022
4.50%, 01/01/2048 | | | 10,750 | | | | 10,694,868 | |
| | |
| |
| abfunds.com | | AB MUNICIPAL INCOME SHARES | 41 |
PORTFOLIO OF INVESTMENTS (continued)
| | | | | | | | |
| | | Principal
Amount
(000) | | | U.S. $ Value | |
| |
4.625%, 01/01/2053 | | $ | 10,000 | | | $ | 9,908,336 | |
5.00%, 01/01/2055 | | | 4,400 | | | | 4,497,481 | |
5.50%, 01/01/2055(a)(b) | | | 19,000 | | | | 20,208,938 | |
Series 2024-A
5.25%, 01/01/2041 | | | 2,150 | | | | 2,338,853 | |
5.25%, 01/01/2042 | | | 2,450 | | | | 2,654,484 | |
5.25%, 01/01/2043 | | | 2,625 | | | | 2,833,097 | |
5.50%, 01/01/2044 | | | 2,625 | | | | 2,905,465 | |
5.50%, 01/01/2059 | | | 19,500 | | | | 20,962,157 | |
Series 2024-C
5.00%, 01/01/2033 | | | 11,000 | | | | 11,802,004 | |
5.25%, 01/01/2045 | | | 1,000 | | | | 1,079,267 | |
Chicago O’Hare International Airport
(Pre-refunded – US Treasuries)
Series 2015-C
5.00%, 01/01/2034 | | | 1,665 | | | | 1,668,070 | |
Chicago O’Hare International Airport
(TrIPs Obligated Group)
Series 2018
5.00%, 07/01/2033 | | | 1,395 | | | | 1,427,924 | |
5.00%, 07/01/2038 | | | 1,500 | | | | 1,522,831 | |
5.00%, 07/01/2048 | | | 5,000 | | | | 5,015,444 | |
Chicago Transit Authority Sales Tax Receipts Fund
Series 2020-A
5.00%, 12/01/2045 | | | 5,000 | | | | 5,173,681 | |
5.00%, 12/01/2055 | | | 6,000 | | | | 6,125,954 | |
City of Chicago IL
(Goldblatts Supportive Living Project)
Series 2013
6.375%, 12/01/2052(d)(f) | | | 1,050 | | | | 624,578 | |
Eastern Illinois Economic Development Authority
(City of Mattoon IL Sales & Hotel Tax)
Series 2023
5.00%, 11/01/2033 | | | 1,000 | | | | 1,008,849 | |
6.00%, 05/01/2046 | | | 3,580 | | | | 3,629,585 | |
Illinois Finance Authority
(Acero Charter Schools, Inc. Obligated Group)
Series 2021
4.00%, 10/01/2035(a) | | | 1,280 | | | | 1,231,538 | |
4.00%, 10/01/2042(a) | | | 4,150 | | | | 3,715,912 | |
Illinois Finance Authority
(Ascension Health Credit Group)
Series 2016-C
5.00%, 02/15/2025 | | | 6,000 | | | | 6,024,888 | |
| | |
| |
42 | AB MUNICIPAL INCOME SHARES | | abfunds.com |
PORTFOLIO OF INVESTMENTS (continued)
| | | | | | | | |
| | | Principal
Amount
(000) | | | U.S. $ Value | |
| |
5.00%, 02/15/2041 | | $ | 2,835 | | | $ | 2,892,738 | |
Illinois Finance Authority
(Bradley University)
Series 2021-A
4.00%, 08/01/2046 | | | 2,000 | | | | 1,748,545 | |
Illinois Finance Authority
(DePaul College Prep)
Series 2023
4.30%, 08/01/2028(a) | | | 1,220 | | | | 1,234,300 | |
4.50%, 08/01/2033(a) | | | 1,275 | | | | 1,325,122 | |
5.25%, 08/01/2038(a) | | | 3,895 | | | | 4,233,485 | |
5.50%, 08/01/2043(a) | | | 4,485 | | | | 4,841,070 | |
5.625%, 08/01/2053(a) | | | 7,250 | | | | 7,726,969 | |
Illinois Finance Authority
(Illinois Institute of Technology)
Series 2019
4.00%, 09/01/2035 | | | 1,000 | | | | 897,647 | |
4.00%, 09/01/2037 | | | 1,130 | | | | 973,533 | |
4.00%, 09/01/2039 | | | 2,000 | | | | 1,669,792 | |
4.00%, 09/01/2041 | | | 6,625 | | | | 5,374,748 | |
5.00%, 09/01/2036 | | | 2,095 | | | | 2,040,162 | |
5.00%, 09/01/2038 | | | 5,930 | | | | 5,650,938 | |
5.00%, 09/01/2040 | | | 2,285 | | | | 2,138,433 | |
Illinois Finance Authority
(Lake Forest College)
Series 2022-A
5.25%, 10/01/2052 | | | 1,500 | | | | 1,515,389 | |
5.50%, 10/01/2042 | | | 1,045 | | | | 1,089,783 | |
5.50%, 10/01/2047 | | | 1,000 | | | | 1,033,748 | |
Illinois Finance Authority
(LRS Holdings LLC)
Series 2023
7.375%, 09/01/2042(a) | | | 23,500 | | | | 27,360,549 | |
Illinois Finance Authority
(Park Place of Elmhurst Obligated Group)
Series 2021
5.125%, 05/15/2060 | | | 3,489 | | | | 1,884,155 | |
Illinois Finance Authority
(Plymouth Place Obligated Group)
Series 2022
6.50%, 05/15/2042 | | | 2,000 | | | | 2,173,375 | |
6.50%, 05/15/2047 | | | 2,000 | | | | 2,151,053 | |
6.625%, 05/15/2052 | | | 1,910 | | | | 2,054,099 | |
6.75%, 05/15/2058 | | | 1,765 | | | | 1,901,262 | |
Illinois Finance Authority
(Pre-refunded – US Treasuries)
Series 2015
5.25%, 05/15/2050 | | | 2,000 | | | | 2,019,385 | |
| | |
| |
| abfunds.com | | AB MUNICIPAL INCOME SHARES | 43 |
PORTFOLIO OF INVESTMENTS (continued)
| | | | | | | | |
| | | Principal
Amount
(000) | | | U.S. $ Value | |
| |
Illinois Finance Authority
(Rosalind Franklin University of Medicine and Science)
Series 2017-A
5.00%, 08/01/2042 | | $ | 1,000 | | | $ | 1,009,864 | |
5.00%, 08/01/2047 | | | 2,475 | | | | 2,486,272 | |
Series 2017-C
5.00%, 08/01/2046 | | | 2,900 | | | | 2,916,043 | |
Illinois Finance Authority
(Silver Cross Hospital Obligated Group)
Series 2015-C
5.00%, 08/15/2035 | | | 4,750 | | | | 4,785,193 | |
Illinois Finance Authority
(University of Illinois)
Series 2020
4.00%, 10/01/2050 | | | 3,615 | | | | 3,246,904 | |
Illinois Finance Authority
(Washington and Jane Smith Community – Orland Park)
Series 2022
4.00%, 10/15/2044 | | | 10,890 | | | | 9,007,588 | |
Illinois Housing Development Authority
(Drexel Court & Lake Park East)
Series 2022
7.17%, 11/01/2038 | | | 1,675 | | | | 1,736,734 | |
Series 2024
5.67%, 11/01/2038(e) | | | 16,210 | | | | 16,172,344 | |
Illinois State Toll Highway Authority
Series 2015-A
5.00%, 01/01/2031 | | | 1,500 | | | | 1,519,015 | |
5.00%, 01/01/2032 | | | 1,625 | | | | 1,644,470 | |
Series 2015-B
5.00%, 01/01/2036 | | | 2,850 | | | | 2,900,385 | |
Series 2016-B
5.00%, 01/01/2041 | | | 3,450 | | | | 3,513,922 | |
Series 2019-A
5.00%, 01/01/2025 | | | 7,900 | | | | 7,919,634 | |
5.00%, 01/01/2026 | | | 12,735 | | | | 13,016,934 | |
Metropolitan Pier & Exposition Authority
Series 2015-B
5.00%, 12/15/2045 | | | 13,300 | | | | 13,376,222 | |
Series 2017
4.85%, 12/15/2042(g) | | | 1,400 | | | | 1,016,665 | |
Series 2017-A
5.00%, 06/15/2057 | | | 4,000 | | | | 4,047,152 | |
Series 2017-B
Zero Coupon, 12/15/2054 | | | 9,850 | | | | 2,445,856 | |
| | |
| |
44 | AB MUNICIPAL INCOME SHARES | | abfunds.com |
PORTFOLIO OF INVESTMENTS (continued)
| | | | | | | | |
| | | Principal
Amount
(000) | | | U.S. $ Value | |
| |
Series 2020
5.00%, 06/15/2050 | | $ | 44,345 | | | $ | 45,376,797 | |
Metropolitan Pier & Exposition Authority
(Metropolitan Pier & Exposition Authority Lease)
Series 2020
5.00%, 06/15/2042 | | | 2,675 | | | | 2,793,542 | |
Metropolitan Pier & Exposition Authority
(State of Illinois McCormick Place Expansion Project Fund)
Series 2012
Zero Coupon, 12/15/2041 | | | 9,400 | | | | 4,524,638 | |
Zero Coupon, 12/15/2051 | | | 11,385 | | | | 3,269,687 | |
State of Illinois
Series 2010
7.35%, 07/01/2035 | | | 10,108 | | | | 10,970,806 | |
Series 2016
5.00%, 02/01/2027 | | | 19,125 | | | | 19,851,354 | |
5.00%, 02/01/2029 | | | 5,945 | | | | 6,163,205 | |
5.00%, 11/01/2032 | | | 5,245 | | | | 5,373,267 | |
5.00%, 11/01/2035 | | | 8,000 | | | | 8,155,974 | |
Series 2017-A
5.00%, 12/01/2028 | | | 2,700 | | | | 2,837,273 | |
5.00%, 12/01/2034 | | | 2,585 | | | | 2,674,476 | |
Series 2017-C
5.00%, 11/01/2029 | | | 4,335 | | | | 4,533,911 | |
Series 2017-D
5.00%, 11/01/2026 | | | 16,070 | | | | 16,610,199 | |
5.00%, 11/01/2028 | | | 8,450 | | | | 8,873,643 | |
Series 2018-A
5.00%, 10/01/2028 | | | 1,710 | | | | 1,821,743 | |
5.00%, 10/01/2029 | | | 1,030 | | | | 1,087,250 | |
5.00%, 05/01/2030 | | | 2,185 | | | | 2,288,783 | |
Series 2019-B
4.00%, 11/01/2033 | | | 9,500 | | | | 9,579,121 | |
4.00%, 11/01/2036 | | | 16,375 | | | | 16,277,123 | |
4.00%, 11/01/2037 | | | 16,920 | | | | 16,747,458 | |
5.00%, 11/01/2030 | | | 8,225 | | | | 8,817,054 | |
Series 2020
5.50%, 05/01/2030 | | | 2,750 | | | | 2,941,352 | |
5.75%, 05/01/2045 | | | 2,500 | | | | 2,713,120 | |
Series 2020-B
5.00%, 10/01/2030 | | | 2,000 | | | | 2,168,606 | |
Series 2021-A
5.00%, 12/01/2030 | | | 9,955 | | | | 10,808,299 | |
5.00%, 03/01/2046 | | | 4,000 | | | | 4,167,232 | |
Series 2022-A
5.25%, 03/01/2037 | | | 2,500 | | | | 2,736,212 | |
| | |
| |
| abfunds.com | | AB MUNICIPAL INCOME SHARES | 45 |
PORTFOLIO OF INVESTMENTS (continued)
| | | | | | | | |
| | | Principal
Amount
(000) | | | U.S. $ Value | |
| |
5.50%, 03/01/2042 | | $ | 12,610 | | | $ | 13,779,477 | |
5.50%, 03/01/2047 | | | 4,500 | | | | 4,855,277 | |
Series 2022-B
5.25%, 10/01/2037 | | | 13,000 | | | | 14,280,682 | |
Series 2022-C
5.50%, 10/01/2045 | | | 19,000 | | | | 20,655,945 | |
Series 2023-B
5.00%, 05/01/2036 | | | 5,000 | | | | 5,415,615 | |
5.25%, 05/01/2041 | | | 2,750 | | | | 2,965,989 | |
5.25%, 05/01/2042 | | | 5,000 | | | | 5,372,998 | |
5.25%, 05/01/2043 | | | 2,500 | | | | 2,677,496 | |
5.50%, 05/01/2047 | | | 5,000 | | | | 5,397,306 | |
Series 2023-C
5.00%, 05/01/2033 | | | 15,000 | | | | 16,413,313 | |
Series 2023-D
5.00%, 07/01/2036 | | | 5,000 | | | | 5,420,611 | |
Series 2024
5.00%, 02/01/2037 | | | 16,130 | | | | 17,756,344 | |
Series 2024-A
5.257%, 05/01/2030 | | | 10,000 | | | | 10,158,143 | |
5.277%, 05/01/2031 | | | 2,000 | | | | 2,030,755 | |
Series 2024-B
4.25%, 05/01/2046 | | | 4,750 | | | | 4,565,198 | |
5.00%, 05/01/2039 | | | 3,000 | | | | 3,259,641 | |
5.00%, 05/01/2040 | | | 5,000 | | | | 5,405,934 | |
5.25%, 05/01/2043 | | | 3,085 | | | | 3,351,934 | |
5.25%, 05/01/2044 | | | 6,000 | | | | 6,495,969 | |
State of Illinois
(Pre-refunded – US Treasuries)
Series 2014
5.00%, 05/01/2031 | | | 7,615 | | | | 7,637,625 | |
State of Illinois Sales Tax Revenue
Series 2024-C
5.00%, 06/15/2040 | | | 1,525 | | | | 1,650,457 | |
Village of Antioch IL Special Service Areas No. 1 & 2
Series 2016-A
4.50%, 03/01/2033 | | | 2,922 | | | | 2,767,901 | |
Series 2016-B
7.00%, 03/01/2033 | | | 1,374 | | | | 1,349,266 | |
Village of Pingree Grove IL Special Service Area No. 7
Series 2015
4.50%, 03/01/2025 | | | 173 | | | | 172,822 | |
5.00%, 03/01/2036 | | | 2,957 | | | | 2,875,857 | |
Series 2015-B
6.00%, 03/01/2036 | | | 786 | | | | 786,509 | |
| | | | | | | | |
| | | | | | | 896,826,685 | |
| | | | | | | | |
| | |
| |
46 | AB MUNICIPAL INCOME SHARES | | abfunds.com |
PORTFOLIO OF INVESTMENTS (continued)
| | | | | | | | |
| | | Principal
Amount
(000) | | | U.S. $ Value | |
| |
Indiana – 1.7% | | | | | | | | |
City of Valparaiso IN
(Pratt Paper IN LLC)
Series 2024
4.50%, 01/01/2034(a) | | $ | 1,830 | | | $ | 1,860,791 | |
4.875%, 01/01/2044(a) | | | 1,550 | | | | 1,581,680 | |
5.00%, 01/01/2054(a) | | | 8,000 | | | | 8,117,957 | |
City of Whiting IN
(BP PLC)
Series 2023
4.40%, 11/01/2045 | | | 10,000 | | | | 10,295,266 | |
Indiana Finance Authority
Series 2024
5.00%, 07/01/2054 | | | 1,400 | | | | 1,421,467 | |
5.25%, 07/01/2064 | | | 1,250 | | | | 1,276,612 | |
Indiana Finance Authority
(Baptist Healthcare System Obligated Group)
Series 2017
5.00%, 08/15/2051 | | | 3,905 | | | | 3,954,855 | |
Indiana Finance Authority
(Brightmark Plastics Renewal Indiana LLC)
Series 2019
7.00%, 03/01/2039(e) | | | 30,305 | | | | 14,206,339 | |
Indiana Finance Authority
(CWA Authority, Inc.)
Series 2024
5.00%, 10/01/2036 | | | 1,440 | | | | 1,627,250 | |
5.00%, 10/01/2038 | | | 1,220 | | | | 1,368,609 | |
5.00%, 10/01/2040 | | | 1,000 | | | | 1,109,090 | |
5.00%, 10/01/2041 | | | 1,500 | | | | 1,655,412 | |
5.00%, 10/01/2042 | | | 1,435 | | | | 1,575,566 | |
5.00%, 10/01/2043 | | | 1,550 | | | | 1,693,405 | |
5.00%, 10/01/2044 | | | 1,600 | | | | 1,740,962 | |
Indiana Finance Authority
(Good Samaritan Hospital Obligated Group)
Series 2022
4.00%, 04/01/2037 | | | 2,620 | | | | 2,486,694 | |
4.00%, 04/01/2039 | | | 1,630 | | | | 1,524,910 | |
4.00%, 04/01/2041 | | | 2,305 | | | | 2,110,838 | |
4.00%, 04/01/2042 | | | 2,400 | | | | 2,175,259 | |
Indiana Finance Authority
(Greencroft Goshen Obligated Group)
Series 2021
4.00%, 11/15/2043 | | | 6,700 | | | | 5,990,274 | |
| | |
| |
| abfunds.com | | AB MUNICIPAL INCOME SHARES | 47 |
PORTFOLIO OF INVESTMENTS (continued)
| | | | | | | | |
| | | Principal
Amount
(000) | | | U.S. $ Value | |
| |
Series 2023-2
4.00%, 11/15/2024 | | $ | 905 | | | $ | 904,674 | |
4.00%, 11/15/2025 | | | 985 | | | | 977,801 | |
4.00%, 11/15/2028 | | | 1,000 | | | | 988,798 | |
4.00%, 11/15/2029 | | | 1,000 | | | | 989,478 | |
4.00%, 11/15/2037 | | | 1,800 | | | | 1,728,953 | |
Indiana Finance Authority
(Marquette Manor)
Series 2015-A
5.00%, 03/01/2030 | | | 1,000 | | | | 1,002,306 | |
Indiana Finance Authority
(Ohio Valley Electric Corp.)
Series 2020
3.00%, 11/01/2030 | | | 11,725 | | | | 11,204,859 | |
Series 2020-A
3.00%, 11/01/2030 | | | 7,290 | | | | 6,962,830 | |
Series 2021-B
2.50%, 11/01/2030 | | | 5,065 | | | | 4,639,143 | |
Series 2022-A
4.25%, 11/01/2030 | | | 3,000 | | | | 3,075,919 | |
Indiana Finance Authority
(Parkview Health System Obligated Group)
Series 2024-A
5.00%, 11/01/2054(a) | | | 10,000 | | | | 10,579,512 | |
Series 2024-B
4.084% (SOFR + 0.71%), 11/01/2046(a)(c)(e) | | | 32,030 | | | | 31,985,805 | |
Indiana Finance Authority
(SFP-PUFW I LLC)
Series 2024
5.00%, 07/01/2049 | | | 3,000 | | | | 3,045,989 | |
5.00%, 07/01/2059 | | | 1,000 | | | | 1,006,103 | |
Indiana Finance Authority
(University of Evansville)
Series 2022
5.00%, 09/01/2029 | | | 1,755 | | | | 1,821,916 | |
5.00%, 09/01/2030 | | | 1,845 | | | | 1,917,156 | |
5.00%, 09/01/2031 | | | 1,935 | | | | 2,010,818 | |
5.00%, 09/01/2032 | | | 2,035 | | | | 2,112,783 | |
5.25%, 09/01/2037 | | | 3,415 | | | | 3,543,851 | |
5.25%, 09/01/2044 | | | 10,000 | | | | 10,123,820 | |
5.25%, 09/01/2057 | | | 5,995 | | | | 6,006,936 | |
Indiana Housing & Community Development Authority
(Vita of Marion LLC)
Series 2021-A
5.25%, 04/01/2041(a) | | | 1,000 | | | | 839,329 | |
| | |
| |
48 | AB MUNICIPAL INCOME SHARES | | abfunds.com |
PORTFOLIO OF INVESTMENTS (continued)
| | | | | | | | |
| | | Principal
Amount
(000) | | | U.S. $ Value | |
| |
Indianapolis Local Public Improvement Bond Bank
(Pan Am Plaza Hotel)
Series 2023
5.75%, 03/01/2043 | | $ | 6,670 | | | $ | 7,255,140 | |
6.00%, 03/01/2053 | | | 9,200 | | | | 9,994,960 | |
6.125%, 03/01/2057 | | | 10,810 | | | | 11,767,450 | |
Series 2023-F
7.75%, 03/01/2067 | | | 10,750 | | | | 12,163,600 | |
BAM Series 2023
5.25%, 03/01/2067 | | | 16,800 | | | | 17,772,705 | |
| | | | | | | | |
| | | | | | | 234,195,870 | |
| | | | | | | | |
Iowa – 0.5% | | | | | | | | |
Iowa Finance Authority
(Pre-refunded – US Treasuries)
Series 2022
5.00%, 12/01/2050 | | | 35,950 | | | | 41,036,555 | |
Iowa Finance Authority
(Wesley Retirement Services, Inc. Obligated Group)
Series 2021
4.00%, 12/01/2031 | | | 4,115 | | | | 3,911,360 | |
4.00%, 12/01/2041 | | | 7,810 | | | | 6,616,033 | |
4.00%, 12/01/2046 | | | 5,225 | | | | 4,213,158 | |
4.00%, 12/01/2051 | | | 9,340 | | | | 7,291,774 | |
Iowa Higher Education Loan Authority
(Des Moines University Osteopathic Medical Center)
Series 2022
5.375%, 10/01/2052 | | | 1,600 | | | | 1,655,972 | |
Iowa Higher Education Loan Authority
(Simpson College)
Series 2020
5.50%, 11/01/2051 | | | 7,160 | | | | 6,706,733 | |
Iowa Tobacco Settlement Authority
Series 2021-A
4.00%, 06/01/2049 | | | 4,000 | | | | 3,735,996 | |
| | | | | | | | |
| | | | | | | 75,167,581 | |
| | | | | | | | |
Kansas – 0.5% | | | | | | | | |
City of Colby KS
(Citizens Medical Center, Inc.)
Series 2024
5.50%, 07/01/2026 | | | 18,800 | | | | 18,856,118 | |
City of Overland Park KS Sales Tax Revenue
Series 2022
6.00%, 11/15/2034(a) | | | 1,775 | | | | 1,814,687 | |
| | |
| |
| abfunds.com | | AB MUNICIPAL INCOME SHARES | 49 |
PORTFOLIO OF INVESTMENTS (continued)
| | | | | | | | |
| | | Principal
Amount
(000) | | | U.S. $ Value | |
| |
6.50%, 11/15/2042(a) | | $ | 13,650 | | | $ | 13,933,920 | |
City of Topeka KS
(Congregational Home Obligated Group (The))
Series 2022-A
5.75%, 12/01/2033 | | | 3,465 | | | | 3,569,123 | |
6.25%, 12/01/2042 | | | 2,920 | | | | 3,047,849 | |
6.50%, 12/01/2052 | | | 6,000 | | | | 6,217,119 | |
Kansas Development Finance Authority
(State of Kansas Department of Administration Lease)
Series 2021-K
2.39%, 05/01/2036 | | | 8,000 | | | | 6,136,726 | |
Overland Park Development Corp.
(City of Overland Park KS)
Series 2019
5.00%, 03/01/2035 | | | 2,085 | | | | 2,090,178 | |
5.00%, 03/01/2037 | | | 2,070 | | | | 2,072,383 | |
5.00%, 03/01/2039 | | | 2,325 | | | | 2,318,225 | |
5.00%, 03/01/2044 | | | 1,000 | | | | 985,610 | |
5.00%, 03/01/2049 | | | 5,875 | | | | 5,704,983 | |
Wyandotte County-Kansas City Unified Government
(Wyandotte County-Kansas City Unified Government Sales Tax)
Series 2018
4.50%, 06/01/2040 | | | 1,225 | | | | 1,200,137 | |
| | | | | | | | |
| | | | | | | 67,947,058 | |
| | | | | | | | |
Kentucky – 2.2% | | | | | | | | |
City of Ashland KY
(Royal Blue Health LLC Obligated Group)
Series 2019
4.00%, 02/01/2035 | | | 930 | | | | 894,245 | |
City of Henderson KY
(Pratt Paper KY LLC)
Series 2022
4.45%, 01/01/2042(a) | | | 9,000 | | | | 8,788,697 | |
County of Trimble KY
(Louisville Gas and Electric Co.)
Series 2017
3.75%, 06/01/2033 | | | 6,955 | | | | 6,991,551 | |
Series 2020
1.30%, 09/01/2044 | | | 8,500 | | | | 7,750,660 | |
Kenton County Airport Board
Series 2024-A
5.25%, 01/01/2049 | | | 4,500 | | | | 4,781,454 | |
5.25%, 01/01/2054 | | | 13,750 | | | | 14,503,930 | |
| | |
| |
50 | AB MUNICIPAL INCOME SHARES | | abfunds.com |
PORTFOLIO OF INVESTMENTS (continued)
| | | | | | | | |
| | | Principal
Amount
(000) | | | U.S. $ Value | |
| |
Kentucky Economic Development Finance Authority
(Baptist Healthcare System Obligated Group)
Series 2017-B
5.00%, 08/15/2034 | | $ | 1,500 | | | $ | 1,556,117 | |
5.00%, 08/15/2035 | | | 3,085 | | | | 3,195,443 | |
5.00%, 08/15/2037 | | | 1,550 | | | | 1,600,006 | |
5.00%, 08/15/2041 | | | 6,905 | | | | 7,054,825 | |
5.00%, 08/15/2046 | | | 2,740 | | | | 2,781,277 | |
Kentucky Economic Development Finance Authority
(Carmel Manor, Inc.)
Series 2022
4.50%, 10/01/2027 | | | 4,000 | | | | 4,000,466 | |
Kentucky Economic Development Finance Authority
(CommonSpirit Health)
Series 2019-A
5.00%, 08/01/2044 | | | 9,040 | | | | 9,301,991 | |
5.00%, 08/01/2049 | | | 7,660 | | | | 7,813,227 | |
Kentucky Economic Development Finance Authority
(Masonic Homes of Kentucky, Inc. Obligated Group)
Series 2012
5.375%, 11/15/2042 | | | 1,685 | | | | 1,423,765 | |
5.50%, 11/15/2045 | | | 710 | | | | 593,678 | |
Series 2016
5.00%, 05/15/2031 | | | 2,000 | | | | 1,931,517 | |
Series 2016-A
5.00%, 05/15/2046 | | | 1,100 | | | | 913,569 | |
5.00%, 05/15/2051 | | | 2,000 | | | | 1,601,839 | |
Kentucky Economic Development Finance Authority
(Owensboro Health, Inc. Obligated Group)
Series 2015
5.25%, 06/01/2050 | | | 24,090 | | | | 24,117,549 | |
Series 2017-A
5.00%, 06/01/2031 | | | 2,000 | | | | 2,046,192 | |
5.00%, 06/01/2032 | | | 3,500 | | | | 3,576,525 | |
5.00%, 06/01/2037 | | | 4,325 | | | | 4,392,780 | |
5.00%, 06/01/2041 | | | 3,300 | | | | 3,331,631 | |
5.25%, 06/01/2041 | | | 7,625 | | | | 7,744,007 | |
Series 2017-B
5.00%, 06/01/2040 | | | 5,000 | | | | 5,055,530 | |
| | |
| |
| abfunds.com | | AB MUNICIPAL INCOME SHARES | 51 |
PORTFOLIO OF INVESTMENTS (continued)
| | | | | | | | |
| | | Principal
Amount
(000) | | | U.S. $ Value | |
| |
Kentucky Economic Development Finance Authority
(Rosedale Green)
Series 2015
5.50%, 11/15/2035 | | $ | 2,265 | | | $ | 2,209,565 | |
5.75%, 11/15/2045 | | | 3,350 | | | | 3,092,793 | |
Kentucky Housing Corp.
(Churchill Park LLLP)
Series 2022-A
4.65%, 05/01/2025(a) | | | 2,665 | | | | 2,666,448 | |
5.75%, 11/01/2040(a) | | | 12,370 | | | | 12,681,625 | |
Series 2022-B
6.75%, 11/01/2040(a) | | | 2,050 | | | | 2,099,502 | |
Kentucky Public Energy Authority
(BP PLC)
Series 2024-B
5.00%, 01/01/2055 | | | 61,785 | | | | 66,227,107 | |
Kentucky Public Energy Authority
(Goldman Sachs Group, Inc. (The))
Series 2024-A
5.00%, 05/01/2055 | | | 14,815 | | | | 15,713,838 | |
Kentucky Public Energy Authority
(Morgan Stanley)
Series 2019-C
4.00%, 02/01/2050 | | | 3,170 | | | | 3,195,225 | |
Series 2022-A
4.00%, 08/01/2052 | | | 11,290 | | | | 11,415,527 | |
Series 2023-A
5.209% (SOFR + 1.98%), 04/01/2054(c) | | | 25,000 | | | | 25,000,000 | |
5.25%, 04/01/2054 | | | 10,000 | | | | 10,859,528 | |
Louisville/Jefferson County Metropolitan Government
(Norton Healthcare Obligated Group)
Series 2016
5.00%, 10/01/2033 | | | 8,205 | | | | 8,351,979 | |
Series 2020
5.00%, 10/01/2047 | | | 1,965 | | | | 2,105,333 | |
Series 2020-A
5.00%, 10/01/2038 | | | 965 | | | | 1,004,424 | |
| | | | | | | | |
| | | | | | | 304,365,365 | |
| | | | | | | | |
Louisiana – 1.7% | | | | | | | | |
Jefferson Sales Tax District
AGM Series 2017-B
5.00%, 12/01/2034 | | | 1,000 | | | | 1,043,085 | |
5.00%, 12/01/2036 | | | 2,400 | | | | 2,493,781 | |
| | |
| |
52 | AB MUNICIPAL INCOME SHARES | | abfunds.com |
PORTFOLIO OF INVESTMENTS (continued)
| | | | | | | | |
| | | Principal
Amount
(000) | | | U.S. $ Value | |
| |
Louisiana Local Government Environmental Facilities & Community Development Auth
(Louisiana Utilities Restoration Corp. ELL System Restoration Revenue)
Series 2022
4.475%, 08/01/2039 | | $ | 10,000 | | | $ | 9,563,224 | |
Series 2023
5.048%, 12/01/2034 | | | 10,000 | | | | 10,103,855 | |
Louisiana Local Government Environmental Facilities & Community Development Auth
(St. James Place of Baton Rouge)
Series 2015-A
6.00%, 11/15/2035 | | | 2,100 | | | | 2,106,376 | |
Louisiana Local Government Environmental Facilities & Community Development Auth
(Woman’s Hospital Foundation)
Series 2017
5.00%, 10/01/2034(a)(b) | | | 8,985 | | | | 9,253,794 | |
5.00%, 10/01/2036(a)(b) | | | 8,460 | | | | 8,711,346 | |
5.00%, 10/01/2037(a)(b) | | | 5,000 | | | | 5,142,422 | |
5.00%, 10/01/2044(a)(b) | | | 5,155 | | | | 5,233,584 | |
Louisiana Public Facilities Authority
(Calcasieu Bridge Partners LLC)
Series 2024
5.00%, 09/01/2066 | | | 57,000 | | | | 58,150,425 | |
5.50%, 09/01/2054 | | | 16,250 | | | | 17,528,721 | |
5.75%, 09/01/2064 | | | 48,500 | | | | 52,469,701 | |
Louisiana Public Facilities Authority
(Geo Prep Mid-City of Greater Baton Rouge)
Series 2022
5.625%, 06/01/2037(a) | | | 415 | | | | 429,326 | |
6.25%, 06/01/2062(a) | | | 1,425 | | | | 1,474,542 | |
Louisiana Public Facilities Authority
(Louisiana Pellets, Inc.)
Series 2013-B
10.50%, 07/01/2039(d)(f) | | | 2,750 | | | | 27 | |
Series 2014-A
7.50%, 07/01/2023(f)(l) | | | 1,250 | | | | 12 | |
Louisiana Public Facilities Authority
(Louisiana State University & Agricultural & Mechanical College Auxiliary Revenue)
Series 2019
5.00%, 07/01/2059 | | | 10,270 | | | | 10,380,027 | |
| | |
| |
| abfunds.com | | AB MUNICIPAL INCOME SHARES | 53 |
PORTFOLIO OF INVESTMENTS (continued)
| | | | | | | | |
| | | Principal
Amount
(000) | | | U.S. $ Value | |
| |
Louisiana Public Facilities Authority
(Louisiana State University & Agricultural & Mechanical College Lease)
Series 2017
5.00%, 07/01/2042 | | $ | 1,500 | | | $ | 1,526,739 | |
5.00%, 07/01/2047 | | | 6,515 | | | | 6,597,140 | |
5.00%, 07/01/2052 | | | 7,300 | | | | 7,371,578 | |
5.00%, 07/01/2057 | | | 2,250 | | | | 2,264,357 | |
Louisiana Public Facilities Authority
(Pre-refunded – US Govt Agencies)
Series 2016
5.00%, 05/15/2047 | | | 10 | | | | 10,276 | |
New Orleans Aviation Board
Series 2017-B
5.00%, 01/01/2043 | | | 1,000 | | | | 1,005,058 | |
Series 2024
5.00%, 01/01/2034(i) | | | 1,940 | | | | 2,077,624 | |
5.00%, 01/01/2035(i) | | | 6,120 | | | | 6,508,497 | |
5.25%, 01/01/2040(i) | | | 8,500 | | | | 9,092,195 | |
5.25%, 01/01/2041(i) | | | 3,460 | | | | 3,692,270 | |
Parish of St. James LA
(NuStar Logistics LP)
Series 2020-2
6.35%, 07/01/2040(a) | | | 3,690 | | | | 4,058,512 | |
Parish of St. John the Baptist LA
(Marathon Oil Corp.)
Series 2019
2.20%, 06/01/2037 | | | 3,700 | | | | 3,615,476 | |
St. Tammany Parish Finance Authority
(Christwood)
Series 2015
5.25%, 11/15/2037 | | | 1,050 | | | | 1,033,352 | |
| | | | | | | | |
| | | | | | | 242,937,322 | |
| | | | | | | | |
Maine – 0.1% | | | | | | | | |
Finance Authority of Maine
(Casella Waste Systems, Inc.)
Series 2017
5.25%, 01/01/2025(a) | | | 4,630 | | | | 4,639,483 | |
Series 2018-R2
4.375%, 08/01/2035(a) | | | 3,125 | | | | 3,134,756 | |
Maine Health & Higher Educational Facilities Authority
(Maine Medical Center)
Series 2018-A
5.00%, 07/01/2048 | | | 6,250 | | | | 6,339,085 | |
| | | | | | | | |
| | | | | | | 14,113,324 | |
| | | | | | | | |
| | |
| |
54 | AB MUNICIPAL INCOME SHARES | | abfunds.com |
PORTFOLIO OF INVESTMENTS (continued)
| | | | | | | | |
| | | Principal
Amount
(000) | | | U.S. $ Value | |
| |
Maryland – 1.3% | | | | | | | | |
City of Baltimore MD
(City of Baltimore MD Harbor Point Special Taxing District)
Series 2019
3.625%, 06/01/2046(a) | | $ | 1,750 | | | $ | 1,439,803 | |
Series 2019-B
3.875%, 06/01/2046(a) | | | 300 | | | | 252,276 | |
County of Frederick MD
(County of Frederick MD Urbana Community Development Authority)
Series 2020-C
4.00%, 07/01/2050(a) | | | 2,570 | | | | 2,300,141 | |
Maryland Economic Development Corp.
(Maryland Econ Dev Corp.-Morgan View & Thurgood Marshall Student Hsg)
Series 2020
4.25%, 07/01/2050 | | | 1,130 | | | | 1,039,440 | |
Maryland Economic Development Corp.
(Maryland Economic Development Corp. Morgan View & Thurgood Marshall Student Hsg)
Series 2022
5.75%, 07/01/2053 | | | 2,860 | | | | 3,110,614 | |
6.00%, 07/01/2058 | | | 10,000 | | | | 11,004,302 | |
Maryland Economic Development Corp.
(Purple Line Transit Partners LLC)
Series 2022
5.00%, 12/31/2036 | | | 3,200 | | | | 3,391,615 | |
5.00%, 06/30/2037 | | | 2,400 | | | | 2,540,200 | |
5.00%, 12/31/2037 | | | 2,605 | | | | 2,753,193 | |
5.00%, 06/30/2038 | | | 2,920 | | | | 3,081,394 | |
5.00%, 12/31/2038 | | | 1,015 | | | | 1,069,396 | |
5.25%, 06/30/2047 | | | 3,125 | | | | 3,269,170 | |
5.25%, 06/30/2052 | | | 50,415 | | | | 52,436,405 | |
5.25%, 06/30/2055 | | | 14,980 | | | | 15,573,461 | |
Maryland Health & Higher Educational Facilities Authority
(Meritus Medical Center Obligated Group)
Series 2015
5.00%, 07/01/2031 | | | 3,245 | | | | 3,273,767 | |
Maryland Health & Higher Educational Facilities Authority
(TidalHealth Obligated Group)
Series 2020
4.00%, 07/01/2036 | | | 2,520 | | | | 2,496,639 | |
4.00%, 07/01/2037 | | | 2,575 | | | | 2,530,067 | |
| | |
| |
| abfunds.com | | AB MUNICIPAL INCOME SHARES | 55 |
PORTFOLIO OF INVESTMENTS (continued)
| | | | | | | | |
| | | Principal
Amount
(000) | | | U.S. $ Value | |
| |
4.00%, 07/01/2038 | | $ | 1,555 | | | $ | 1,515,177 | |
4.00%, 07/01/2040 | | | 1,645 | | | | 1,585,062 | |
5.00%, 07/01/2046 | | | 22,040 | | | | 22,725,642 | |
Maryland Stadium Authority
Series 2024
5.00%, 06/01/2045 | | | 2,000 | | | | 2,169,534 | |
5.00%, 06/01/2054 | | | 11,750 | | | | 12,521,090 | |
Maryland Stadium Authority
(Baltimore City Public School Construction Financing Fund)
Series 2020
5.00%, 05/01/2050(a)(b) | | | 29,840 | | | | 33,061,529 | |
| | | | | | | | |
| | | | | | | 185,139,917 | |
| | | | | | | | |
Massachusetts – 0.9% | | | | | | | | |
City of Newton MA
Series 2024
5.00%, 03/28/2025 | | | 20,000 | | | | 20,147,614 | |
City of Quincy MA
Series 2024
5.00%, 07/25/2025 | | | 12,000 | | | | 12,174,241 | |
Massachusetts Bay Transportation Authority Sales Tax Revenue
Series 2024-A
5.00%, 07/01/2042 | | | 5,000 | | | | 5,586,653 | |
5.00%, 07/01/2043 | | | 3,000 | | | | 3,330,497 | |
5.25%, 07/01/2052 | | | 5,500 | | | | 6,053,842 | |
Massachusetts Development Finance Agency
(Emerson College)
Series 2016-A
5.00%, 01/01/2047 | | | 8,170 | | | | 8,221,369 | |
Series 2017-A
5.00%, 01/01/2040 | | | 670 | | | | 681,653 | |
Massachusetts Development Finance Agency
(Emmanuel College/MA)
Series 2016-A
5.00%, 10/01/2043 | | | 3,405 | | | | 3,403,168 | |
Massachusetts Development Finance Agency
(Lasell University)
Series 2021
4.00%, 07/01/2027 | | | 250 | | | | 244,718 | |
Massachusetts Development Finance Agency
(Merrimack College)
Series 2017
5.00%, 07/01/2047 | | | 3,665 | | | | 3,689,368 | |
| | |
| |
56 | AB MUNICIPAL INCOME SHARES | | abfunds.com |
PORTFOLIO OF INVESTMENTS (continued)
| | | | | | | | |
| | | Principal
Amount
(000) | | | U.S. $ Value | |
| |
Series 2022
5.00%, 07/01/2052 | | $ | 1,150 | | | $ | 1,165,281 | |
Massachusetts Development Finance Agency
(Salem Community Corp. Obligated Group)
Series 2022
5.25%, 01/01/2050 | | | 2,680 | | | | 2,554,353 | |
Massachusetts Development Finance Agency
(Simmons University)
Series 2018-L
5.00%, 10/01/2034 | | | 1,360 | | | | 1,375,857 | |
5.00%, 10/01/2035 | | | 1,000 | | | | 1,009,119 | |
Series 2023
5.00%, 10/01/2043 | | | 1,100 | | | | 1,073,137 | |
5.25%, 10/01/2036 | | | 415 | | | | 427,857 | |
5.25%, 10/01/2037 | | | 500 | | | | 513,881 | |
5.25%, 10/01/2038 | | | 515 | | | | 527,501 | |
5.25%, 10/01/2039 | | | 520 | | | | 530,472 | |
Massachusetts Development Finance Agency
(South Shore Hospital, Inc. Obligated Group)
Series 2016-I
5.00%, 07/01/2031 | | | 1,350 | | | | 1,364,459 | |
5.00%, 07/01/2041 | | | 2,500 | | | | 2,507,713 | |
Massachusetts Development Finance Agency
(Springfield College)
Series 2021
4.00%, 06/01/2056 | | | 4,000 | | | | 3,208,029 | |
5.00%, 06/01/2026 | | | 420 | | | | 425,938 | |
5.00%, 06/01/2027 | | | 445 | | | | 453,721 | |
5.00%, 06/01/2028 | | | 1,850 | | | | 1,898,117 | |
Series 2021-B
4.00%, 06/01/2050 | | | 1,700 | | | | 1,408,039 | |
Massachusetts Development Finance Agency
(Tufts Medicine Obligated Group)
Series 2013-G
5.00%, 07/01/2037 | | | 2,550 | | | | 2,550,422 | |
Series 2019-A
5.00%, 07/01/2036 | | | 1,000 | | | | 1,014,623 | |
Series 2024
8.50%, 10/01/2026 | | | 16,305 | | | | 16,548,230 | |
| | |
| |
| abfunds.com | | AB MUNICIPAL INCOME SHARES | 57 |
PORTFOLIO OF INVESTMENTS (continued)
| | | | | | | | |
| | | Principal
Amount
(000) | | | U.S. $ Value | |
| |
Massachusetts Development Finance Agency
(UMass Memorial Health Care Obligated Group)
Series 2016
5.00%, 07/01/2041 | | $ | 1,480 | | | $ | 1,495,194 | |
5.00%, 07/01/2046 | | | 2,500 | | | | 2,514,678 | |
Massachusetts Port Authority
Series 2021-E
5.00%, 07/01/2051 | | | 2,260 | | | | 2,327,495 | |
Massachusetts School Building Authority
(Massachusetts School Building Authority Sales Tax)
Series 2009
5.715%, 08/15/2039 | | | 10,255 | | | | 10,683,889 | |
| | | | | | | | |
| | | | | | | 121,111,128 | |
| | | | | | | | |
Michigan – 0.9% | | | | | | | | |
City of Detroit MI
Series 2014-B
4.00%, 04/01/2044(g) | | | 10,000 | | | | 7,891,724 | |
Series 2018
5.00%, 04/01/2033 | | | 1,000 | | | | 1,038,077 | |
5.00%, 04/01/2034 | | | 2,250 | | | | 2,331,612 | |
5.00%, 04/01/2035 | | | 1,000 | | | | 1,034,562 | |
5.00%, 04/01/2036 | | | 700 | | | | 723,083 | |
5.00%, 04/01/2038 | | | 2,135 | | | | 2,199,200 | |
Series 2020
5.50%, 04/01/2045 | | | 1,690 | | | | 1,778,081 | |
5.50%, 04/01/2050 | | | 2,170 | | | | 2,267,219 | |
Series 2021-A
5.00%, 04/01/2038 | | | 1,100 | | | | 1,165,016 | |
5.00%, 04/01/2046 | | | 2,030 | | | | 2,098,276 | |
5.00%, 04/01/2050 | | | 1,000 | | | | 1,027,203 | |
Series 2023-A
5.25%, 05/01/2025 | | | 1,750 | | | | 1,761,606 | |
5.25%, 05/01/2027 | | | 300 | | | | 313,775 | |
5.25%, 05/01/2029 | | | 700 | | | | 755,825 | |
Series 2023-B
6.844%, 05/01/2028 | | | 935 | | | | 953,544 | |
Series 2023-C
6.00%, 05/01/2043 | | | 1,500 | | | | 1,687,329 | |
Detroit Downtown Development Authority
(Detroit Downtown Development Authority Catalyst Development Area)
Series 2024
5.00%, 07/01/2048 | | | 1,395 | | | | 1,450,334 | |
| | |
| |
58 | AB MUNICIPAL INCOME SHARES | | abfunds.com |
PORTFOLIO OF INVESTMENTS (continued)
| | | | | | | | |
| | | Principal
Amount
(000) | | | U.S. $ Value | |
| |
Grand Rapids Economic Development Corp.
(Beacon Hill at Eastgate)
Series 2017-A
5.00%, 11/01/2032 | | $ | 1,055 | | | $ | 1,068,386 | |
5.00%, 11/01/2037 | | | 600 | | | | 604,634 | |
Great Lakes Water Authority Water Supply System Revenue
Series 2016-A
5.00%, 07/01/2046(a)(b) | | | 1,025 | | | | 1,042,367 | |
Series 2016-D
5.00%, 07/01/2036(a)(b) | | | 25,210 | | | | 25,826,768 | |
Kalamazoo Economic Development Corp.
(Heritage Community of Kalamazoo Obligated Group)
Series 2019
5.00%, 05/15/2037 | | | 1,100 | | | | 1,101,705 | |
Series 2020
5.00%, 05/15/2055 | | | 6,860 | | | | 6,187,949 | |
Kalamazoo Hospital Finance Authority
(Pre-refunded – US Treasuries)
Series 2016
4.00%, 05/15/2031 | | | 10 | | | | 10,135 | |
4.00%, 05/15/2032 | | | 20 | | | | 20,269 | |
4.00%, 05/15/2033 | | | 30 | | | | 30,404 | |
4.00%, 05/15/2036 | | | 65 | | | | 65,874 | |
Michigan Finance Authority
(Albion College)
Series 2022
4.00%, 12/01/2046 | | | 1,895 | | | | 1,290,610 | |
4.00%, 12/01/2051 | | | 1,935 | | | | 1,295,394 | |
Michigan Finance Authority
(Great Lakes Water Authority Water Supply System Revenue)
Series 2015-D1
5.00%, 07/01/2034 | | | 2,000 | | | | 2,015,106 | |
Series 2015-D2
5.00%, 07/01/2034 | | | 3,400 | | | | 3,423,892 | |
Michigan Finance Authority
(Henry Ford Health System Obligated Group)
Series 2016
5.00%, 11/15/2032 | | | 3,850 | | | | 3,963,411 | |
Michigan Finance Authority
(Michigan Finance Authority Tobacco Settlement Revenue)
Series 2020-A
3.267%, 06/01/2039 | | | 5,000 | | | | 4,668,332 | |
| | |
| |
| abfunds.com | | AB MUNICIPAL INCOME SHARES | 59 |
PORTFOLIO OF INVESTMENTS (continued)
| | | | | | | | |
| | | Principal
Amount
(000) | | | U.S. $ Value | |
| |
4.00%, 06/01/2049 | | $ | 5,000 | | | $ | 4,489,602 | |
Michigan Finance Authority
(Public Lighting Authority)
Series 2014-B
5.00%, 07/01/2031 | | | 1,450 | | | | 1,451,776 | |
5.00%, 07/01/2032 | | | 3,000 | | | | 3,003,525 | |
5.00%, 07/01/2033 | | | 3,500 | | | | 3,503,929 | |
Michigan Strategic Fund
(Michigan Strategic Fund – I 75 Improvement Project)
Series 2018
5.00%, 12/31/2033 | | | 2,000 | | | | 2,063,529 | |
5.00%, 12/31/2043 | | | 5,000 | | | | 5,075,650 | |
5.00%, 06/30/2048 | | | 8,600 | | | | 8,714,718 | |
AGM Series 2018
4.25%, 12/31/2038 | | | 3,630 | | | | 3,586,124 | |
Michigan Tobacco Settlement Finance Authority
(Tobacco Settlement Financing Corp./MI)
Series 2008-C
Zero Coupon, 06/01/2058 | | | 241,050 | | | | 7,180,807 | |
Wayne State University
Series 2018-A
5.00%, 11/15/2043 | | | 4,000 | | | | 4,110,571 | |
| | | | | | | | |
| | | | | | | 126,271,933 | |
| | | | | | | | |
Minnesota – 1.2% | | | | | | | | |
City of Bloomington MN
Series 2024-A
6.18%, 07/01/2041(a) | | | 10,670 | | | | 10,697,450 | |
City of Brooklyn Park MN
(Brooklyn Park AH I LLLP)
Series 2023
6.205%, 01/01/2042(a)(g) | | | 23,500 | | | | 24,408,174 | |
City of Brooklyn Park MN
(Brooklyn Park AH II LLLP)
Series 2024
6.26%, 07/01/2041(a) | | | 25,045 | | | | 25,217,683 | |
City of Columbus MN
(Adalyn Avenue LLLP)
Series 2023
5.98%, 12/01/2041(a) | | | 19,500 | | | | 19,960,937 | |
City of Fridley MN
(Roers Fridley Apartments Owner II LLC)
Series 2023-A
5.75%, 06/01/2041(a) | | | 6,635 | | | | 6,713,895 | |
| | |
| |
60 | AB MUNICIPAL INCOME SHARES | | abfunds.com |
PORTFOLIO OF INVESTMENTS (continued)
| | | | | | | | |
| | | Principal
Amount
(000) | | | U.S. $ Value | |
| |
City of Ramsey MN
(Pact Charter School)
Series 2022-A
5.00%, 06/01/2032 | | $ | 11,800 | | | $ | 11,947,446 | |
City of St. Cloud MN
Series 2024
5.00%, 05/01/2041 | | | 1,000 | | | | 1,092,499 | |
5.00%, 05/01/2054 | | | 5,240 | | | | 5,530,765 | |
City of St. Cloud MN
(CentraCare Health System Obligated Group)
Series 2024
5.00%, 05/01/2042 | | | 1,000 | | | | 1,088,442 | |
Dakota County Community Development Agency
(Rosemont AH I LLLP)
Series 2023
5.30%, 07/01/2028(a) | | | 7,165 | | | | 7,159,506 | |
5.66%, 07/01/2041(a) | | | 19,240 | | | | 19,211,571 | |
Housing & Redevelopment Authority of The City of St. Paul Minnesota
(Hmong College Prep Academy)
Series 2020
5.00%, 09/01/2040 | | | 1,390 | | | | 1,404,598 | |
Housing & Redevelopment Authority of The City of St. Paul Minnesota
(Minnesota Math & Science Academy)
Series 2021
3.00%, 06/01/2031(e) | | | 800 | | | | 701,977 | |
4.00%, 06/01/2041(e) | | | 1,120 | | | | 892,710 | |
4.00%, 06/01/2051(e) | | | 1,250 | | | | 893,901 | |
4.00%, 06/01/2056(e) | | | 2,180 | | | | 1,506,561 | |
Minneapolis-St. Paul Metropolitan Airports Commission
Series 2024
5.25%, 01/01/2044 | | | 12,500 | | | | 13,401,064 | |
5.25%, 01/01/2049 | | | 1,000 | | | | 1,058,678 | |
Minnesota Higher Education Facilities Authority
(College of St. Scholastica, Inc.)
Series 2019
4.00%, 12/01/2040 | | | 5,700 | | | | 5,055,561 | |
Minnesota Higher Education Facilities Authority
(St. Catherine University)
Series 2018-A
5.00%, 10/01/2045 | | | 1,900 | | | | 1,900,927 | |
| | |
| |
| abfunds.com | | AB MUNICIPAL INCOME SHARES | 61 |
PORTFOLIO OF INVESTMENTS (continued)
| | | | | | | | |
| | | Principal
Amount
(000) | | | U.S. $ Value | |
| |
State of Minnesota
(State of Minnesota Lease)
Series 2022-A
5.00%, 03/01/2025 | | $ | 11,290 | | | $ | 11,352,268 | |
Western Minnesota Municipal Power Agency
Series 2019-A
3.156%, 01/01/2039 | | | 2,000 | | | | 1,672,666 | |
| | | | | | | | |
| | | | | | | 172,869,279 | |
| | | | | | | | |
Mississippi – 0.4% | | | | | | | | |
Mississippi Business Finance Corp.
(Alden Group Renewable Energy Mississippi LLC)
Series 2022
8.00%, 12/01/2029(e) | | | 14,500 | | | | 14,735,350 | |
Mississippi Development Bank
(Magnolia Regional Health Center)
Series 2021
4.00%, 10/01/2041(a) | | | 2,500 | | | | 2,055,695 | |
5.00%, 10/01/2026(a) | | | 1,700 | | | | 1,718,064 | |
5.00%, 10/01/2027(a) | | | 900 | | | | 912,878 | |
5.00%, 10/01/2028(a) | | | 1,900 | | | | 1,934,316 | |
5.00%, 10/01/2033(a) | | | 2,270 | | | | 2,294,333 | |
Mississippi Hospital Equipment & Facilities Authority
(Baptist Memorial Health Care Obligated Group)
Series 2016-A
5.00%, 09/01/2036 | | | 1,645 | | | | 1,661,596 | |
5.00%, 09/01/2041 | | | 16,350 | | | | 16,433,864 | |
Mississippi Hospital Equipment & Facilities Authority
(Forrest County General Hospital)
Series 2019
4.00%, 01/01/2037 | | | 720 | | | | 701,907 | |
5.00%, 01/01/2035 | | | 1,230 | | | | 1,295,729 | |
State of Mississippi
(Pre-refunded – US Treasuries)
Series 2015-A
4.00%, 10/01/2030 | | | 9,085 | | | | 9,162,188 | |
Series 2015-F
4.00%, 11/01/2033 | | | 6,325 | | | | 6,385,497 | |
| | | | | | | | |
| | | | | | | 59,291,417 | |
| | | | | | | | |
| | |
| |
62 | AB MUNICIPAL INCOME SHARES | | abfunds.com |
PORTFOLIO OF INVESTMENTS (continued)
| | | | | | | | |
| | | Principal
Amount
(000) | | | U.S. $ Value | |
| |
Missouri – 0.7% | | | | | | | | |
Cape Girardeau County Industrial Development Authority
(Mercy Health/MO)
Series 2017-A
5.00%, 03/01/2036 | | $ | 2,810 | | | $ | 2,885,439 | |
Health & Educational Facilities Authority of the State of Missouri
(Lutheran Senior Services Obligated Group)
Series 2016-A
5.00%, 02/01/2046 | | | 1,000 | | | | 1,004,867 | |
Series 2019
4.00%, 02/01/2042 | | | 18,770 | | | | 17,718,139 | |
4.00%, 02/01/2048 | | | 21,850 | | | | 19,673,731 | |
5.00%, 02/01/2042 | | | 620 | | | | 639,444 | |
5.00%, 02/01/2048 | | | 2,600 | | | | 2,647,411 | |
Kansas City Industrial Development Authority
(Kingswood Senior Living Community)
Series 2021
2.00%, 11/15/2046(d)(f) | | | 2,319 | | | | 108,689 | |
5.00%, 11/15/2046(d)(f) | | | 5,196 | | | | 3,616,651 | |
Series 2021-A
10.00%, 11/15/2037(d)(f) | | | 1,601 | | | | 1,369,945 | |
Series 2021-C
7.50%, 11/15/2046(d)(f) | | | 1,279 | | | | 1,010,436 | |
Kansas City Industrial Development Authority
(Platte Purchase Project)
Series 2019
5.00%, 07/01/2040(a) | | | 2,680 | | | | 2,450,676 | |
Lee’s Summit Industrial Development Authority
(John Knox Village Obligated Group)
Series 2016-A
5.00%, 08/15/2036 | | | 1,300 | | | | 1,306,927 | |
5.00%, 08/15/2046 | | | 1,760 | | | | 1,642,774 | |
5.00%, 08/15/2051 | | | 1,000 | | | | 899,428 | |
Series 2018
5.00%, 08/15/2042 | | | 6,940 | | | | 6,756,860 | |
Series 2021-A
5.00%, 08/15/2056 | | | 10,000 | | | | 9,239,429 | |
Missouri Joint Municipal Electric Utility Commission
(Pre-refunded – US Treasuries)
Series 2014-A
5.00%, 01/01/2031 | | | 3,240 | | | | 3,247,341 | |
| | |
| |
| abfunds.com | | AB MUNICIPAL INCOME SHARES | 63 |
PORTFOLIO OF INVESTMENTS (continued)
| | | | | | | | |
| | | Principal
Amount
(000) | | | U.S. $ Value | |
| |
St. Louis County Industrial Development Authority
(Friendship Village St. Louis Obligated Group)
Series 2018
5.25%, 09/01/2053 | | $ | 7,560 | | | $ | 7,598,743 | |
St. Louis County Industrial Development Authority
(St. Andrews Resources for Seniors Obligated Group)
Series 2015-A
5.00%, 12/01/2035 | | | 2,000 | | | | 2,000,084 | |
5.125%, 12/01/2045 | | | 4,500 | | | | 4,275,096 | |
Taney County Industrial Development Authority
(Taney County Industrial Development Authority Lease)
Series 2023
5.00%, 10/01/2033(a) | | | 1,000 | | | | 986,968 | |
6.00%, 10/01/2049(a) | | | 2,475 | | | | 2,475,391 | |
| | | | | | | | |
| | | | | | | 93,554,469 | |
| | | | | | | | |
Montana – 0.0% | | | | | | | | |
Montana Facility Finance Authority
(Benefis Health System Obligated Group)
Series 2016
5.00%, 02/15/2034 | | | 1,085 | | | | 1,112,773 | |
| | | | | | | | |
| | |
Nebraska – 0.3% | | | | | | | | |
Central Plains Energy Project
(Bank of Montreal)
Series 2023-A
5.00%, 05/01/2054 | | | 11,255 | | | | 11,873,561 | |
Central Plains Energy Project
(Goldman Sachs Group, Inc. (The))
Series 2017-A
5.00%, 09/01/2031 | | | 2,050 | | | | 2,165,006 | |
5.00%, 09/01/2034 | | | 1,510 | | | | 1,616,978 | |
5.00%, 09/01/2036 | | | 5,000 | | | | 5,381,852 | |
5.00%, 09/01/2037 | | | 8,715 | | | | 9,401,431 | |
Series 2022-1
5.00%, 05/01/2053 | | | 5,000 | | | | 5,274,067 | |
| | | | | | | | |
| | | | | | | 35,712,895 | |
| | | | | | | | |
Nevada – 0.6% | | | | | | | | |
Carson City NV
(Carson Tahoe Regional Healthcare)
Series 2017
5.00%, 09/01/2037 | | | 1,160 | | | | 1,185,730 | |
| | |
| |
64 | AB MUNICIPAL INCOME SHARES | | abfunds.com |
PORTFOLIO OF INVESTMENTS (continued)
| | | | | | | | |
| | | Principal
Amount
(000) | | | U.S. $ Value | |
| |
5.00%, 09/01/2047 | | $ | 2,775 | | | $ | 2,799,783 | |
City of Reno NV
(County of Washoe NV Sales Tax Revenue)
Series 2018-C
Zero Coupon, 07/01/2058(a) | | | 19,500 | | | | 2,728,818 | |
City of Sparks NV
(City of Sparks NV Sales Tax)
Series 2019-A
2.75%, 06/15/2028(a) | | | 2,150 | | | | 2,093,601 | |
Clark County School District
Series 2017-C
5.00%, 06/15/2033 | | | 5,775 | | | | 6,096,449 | |
5.00%, 06/15/2034 | | | 5,000 | | | | 5,260,034 | |
5.00%, 06/15/2035 | | | 2,635 | | | | 2,761,649 | |
5.00%, 06/15/2036 | | | 3,700 | | | | 3,703,400 | |
AGM Series 2019-B
3.00%, 06/15/2037 | | | 5,185 | | | | 4,681,554 | |
Las Vegas Redevelopment Agency
(Las Vegas Redevelopment Agency Redevelopment Area 1)
Series 2016
5.00%, 06/15/2040 | | | 1,800 | | | | 1,813,517 | |
Reno-Tahoe Airport Authority
Series 2024
5.25%, 07/01/2040 | | | 2,415 | | | | 2,619,056 | |
5.25%, 07/01/2043 | | | 1,500 | | | | 1,605,719 | |
5.25%, 07/01/2044 | | | 1,155 | | | | 1,232,513 | |
5.25%, 07/01/2049 | | | 4,200 | | | | 4,443,716 | |
5.25%, 07/01/2054 | | | 1,600 | | | | 1,690,280 | |
State of Nevada Department of Business & Industry
Series 2018
6.95%, 02/15/2038(d)(e)(f) | | | 1,703 | | | | 6,981 | |
State of Nevada Department of Business & Industry
(DesertXpress Enterprises LLC)
Series 2024
8.125%, 01/01/2050 | | | 22,700 | | | | 23,392,282 | |
Tahoe-Douglas Visitors Authority
Series 2020
5.00%, 07/01/2040 | | | 4,200 | | | | 4,311,032 | |
5.00%, 07/01/2045 | | | 2,800 | | | | 2,838,680 | |
5.00%, 07/01/2051 | | | 9,000 | | | | 9,063,274 | |
| | | | | | | | |
| | | | | | | 84,328,068 | |
| | | | | | | | |
| | |
| |
| abfunds.com | | AB MUNICIPAL INCOME SHARES | 65 |
PORTFOLIO OF INVESTMENTS (continued)
| | | | | | | | |
| | | Principal
Amount
(000) | | | U.S. $ Value | |
| |
New Hampshire – 1.6% | | | | | | | | |
National Finance Authority
Series 2022-2, Class X
0.675%, 10/01/2036(j) | | $ | 24,321 | | | $ | 1,102,306 | |
New Hampshire Business Finance Authority
Series 2020-1, Class A
4.125%, 01/20/2034 | | | 20,264 | | | | 20,244,321 | |
Series 2022-1, Class A
4.375%, 09/20/2036 | | | 40,249 | | | | 40,155,424 | |
Series 2022-1, Class X
0.334%, 09/20/2036(j) | | | 24,246 | | | | 505,382 | |
Series 2022-2, Class A
4.00%, 10/20/2036 | | | 26,267 | | | | 25,411,848 | |
Series 2023-2, Class A
3.875%, 01/20/2038 | | | 1,972 | | | | 1,873,000 | |
Series 2024
4.15%, 10/20/2040 | | | 12,600 | | | | 12,558,012 | |
5.00%, 12/01/2028(a)(i) | | | 6,000 | | | | 5,996,930 | |
5.125%, 12/15/2030 | | | 5,000 | | | | 4,941,391 | |
5.30%, 12/01/2032(a) | | | 5,500 | | | | 5,505,685 | |
Series 2024-1, Class A
4.25%, 07/20/2041 | | | 13,619 | | | | 13,323,114 | |
New Hampshire Business Finance Authority
(Brazoria-Fort Bend County Municipal Utility District No. 3)
Series 2024
4.875%, 12/01/2033(a) | | | 5,000 | | | | 4,959,959 | |
New Hampshire Business Finance Authority
(Bridgeland Water & Utility Districts 490, 491 & 158)
Series 2024
5.375%, 12/15/2035(a) | | | 20,500 | | | | 20,528,239 | |
New Hampshire Business Finance Authority
(Covanta Holding Corp.)
Series 2018
4.875%, 11/01/2042(a) | | | 12,520 | | | | 12,404,487 | |
New Hampshire Business Finance Authority
(Presbyterian Homes Obligated Group/PA)
Series 2023
5.25%, 07/01/2048 | | | 2,000 | | | | 2,112,288 | |
New Hampshire Business Finance Authority
(Reworld Holding Corp.)
Series 2018
4.625%, 11/01/2042(a) | | | 10,000 | | | | 9,527,507 | |
Series 2020-A
3.625%, 07/01/2043(a) | | | 4,800 | | | | 4,015,916 | |
| | |
| |
66 | AB MUNICIPAL INCOME SHARES | | abfunds.com |
PORTFOLIO OF INVESTMENTS (continued)
| | | | | | | | |
| | | Principal
Amount
(000) | | | U.S. $ Value | |
| |
Series 2020-B
3.75%, 07/01/2045(a) | | $ | 4,785 | | | $ | 4,044,615 | |
New Hampshire Business Finance Authority
(Tamarron Project)
Series 2024
5.25%, 12/01/2035(a) | | | 9,550 | | | | 9,361,899 | |
New Hampshire Health and Education Facilities Authority Act
(Dartmouth-Hitchcock Obligated Group)
Series 2020-A
5.00%, 08/01/2059 | | | 20,000 | | | | 21,554,540 | |
| | | | | | | | |
| | | | | | | 220,126,863 | |
| | | | | | | | |
New Jersey – 5.2% | | | | | | | | |
Camden County Improvement Authority (The)
(KIPP Cooper Norcross Obligated Group)
Series 2022
6.00%, 06/15/2047 | | | 1,030 | | | | 1,106,786 | |
6.00%, 06/15/2062 | | | 5,360 | | | | 5,698,092 | |
City of Hoboken NJ
Series 2024-A
4.00%, 03/12/2025 | | | 10,335 | | | | 10,368,718 | |
Essex County Improvement Authority
(North Star Academy Charter School of Newark, Inc.)
Series 2020
4.00%, 07/15/2050(a) | | | 1,260 | | | | 1,123,199 | |
New Jersey Economic Development Authority
(Lutheran Social Ministries at Crane’s Mill, Inc.)
Series 2018
5.00%, 01/01/2034 | | | 1,500 | | | | 1,526,245 | |
5.00%, 01/01/2039 | | | 2,500 | | | | 2,513,922 | |
5.00%, 01/01/2049 | | | 3,000 | | | | 2,862,572 | |
New Jersey Economic Development Authority
(New Jersey Economic Development Authority State Lease)
Series 2018-A
5.00%, 06/15/2042 | | | 4,385 | | | | 4,494,791 | |
5.00%, 06/15/2047 | | | 1,500 | | | | 1,531,363 | |
Series 2021-G
5.25%, 09/01/2025(a) | | | 10,000 | | | | 10,145,065 | |
| | |
| |
| abfunds.com | | AB MUNICIPAL INCOME SHARES | 67 |
PORTFOLIO OF INVESTMENTS (continued)
| | | | | | | | |
| | | Principal
Amount
(000) | | | U.S. $ Value | |
| |
New Jersey Economic Development Authority
(North Star Academy Charter School of Newark, Inc.)
Series 2017
5.00%, 07/15/2047 | | $ | 1,000 | | | $ | 1,009,536 | |
New Jersey Economic Development Authority
(NYNJ Link Borrower LLC)
Series 2013
5.125%, 01/01/2034 | | | 6,045 | | | | 6,050,859 | |
New Jersey Economic Development Authority
(Port Newark Container Terminal LLC)
Series 2017
5.00%, 10/01/2037 | | | 8,895 | | | | 9,107,399 | |
5.00%, 10/01/2047 | | | 8,790 | | | | 8,873,428 | |
New Jersey Economic Development Authority
(State of New Jersey Department of the Treasury Lease)
Series 2019
5.00%, 06/15/2035 | | | 2,750 | | | | 2,925,725 | |
New Jersey Economic Development Authority
(State of New Jersey Division of Property Management & Construction Lease)
Series 2018-C
5.00%, 06/15/2042 | | | 7,085 | | | | 7,262,393 | |
New Jersey Economic Development Authority
(State of New Jersey Motor Vehicle Surcharge Revenue Lease)
Series 2017-A
5.00%, 07/01/2033 | | | 1,640 | | | | 1,655,665 | |
New Jersey Economic Development Authority
(State of New Jersey)
Series 2024-S
5.00%, 06/15/2035 | | | 1,500 | | | | 1,677,070 | |
5.25%, 06/15/2036 | | | 3,000 | | | | 3,407,657 | |
5.25%, 06/15/2037 | | | 3,065 | | | | 3,464,696 | |
5.25%, 06/15/2039 | | | 3,000 | | | | 3,364,375 | |
New Jersey Economic Development Authority
(UMM Energy Partners LLC)
Series 2012-A
5.125%, 06/15/2043 | | | 735 | | | | 734,957 | |
| | |
| |
68 | AB MUNICIPAL INCOME SHARES | | abfunds.com |
PORTFOLIO OF INVESTMENTS (continued)
| | | | | | | | |
| | | Principal
Amount
(000) | | | U.S. $ Value | |
| |
New Jersey Economic Development Authority
(United Airlines, Inc.)
Series 2012
5.25%, 09/15/2029 | | $ | 7,090 | | | $ | 7,097,240 | |
Series 2014-B
5.625%, 11/15/2030 | | | 1,475 | | | | 1,482,064 | |
New Jersey Educational Facilities Authority
(Stevens Institute of Technology International, Inc.)
Series 2020-A
4.00%, 07/01/2050 | | | 1,805 | | | | 1,636,603 | |
5.00%, 07/01/2045 | | | 4,460 | | | | 4,573,562 | |
New Jersey Health Care Facilities Financing Authority
(Hackensack Meridian Health Obligated Group)
Series 2017-A
5.00%, 07/01/2035 | | | 1,300 | | | | 1,347,868 | |
New Jersey Health Care Facilities Financing Authority
(Inspira Health Obligated Group)
Series 2017-A
5.00%, 07/01/2036 | | | 1,000 | | | | 1,031,470 | |
5.00%, 07/01/2042 | | | 7,645 | | | | 7,813,354 | |
New Jersey Health Care Facilities Financing Authority
(New Jersey Health Care Facilities Financing Authority State Lease)
Series 2017
5.00%, 10/01/2035 | | | 1,070 | | | | 1,112,782 | |
New Jersey Transportation Trust Fund Authority
Series 2024-A
4.00%, 06/15/2042 | | | 10,200 | | | | 10,015,575 | |
5.00%, 06/15/2037 | | | 11,170 | | | | 12,423,032 | |
5.00%, 06/15/2042 | | | 11,070 | | | | 12,045,584 | |
New Jersey Transportation Trust Fund Authority
(New Jersey Transportation Fed Hwy Grant)
Series 2016
5.00%, 06/15/2027 | | | 1,000 | | | | 1,027,086 | |
5.00%, 06/15/2028 | | | 21,660 | | | | 22,238,058 | |
5.00%, 06/15/2029 | | | 13,435 | | | | 13,769,952 | |
5.00%, 06/15/2030 | | | 6,000 | | | | 6,143,123 | |
Series 2018-A
5.00%, 06/15/2029 | | | 1,910 | | | | 1,958,532 | |
| | |
| |
| abfunds.com | | AB MUNICIPAL INCOME SHARES | 69 |
PORTFOLIO OF INVESTMENTS (continued)
| | | | | | | | |
| | | Principal
Amount
(000) | | | U.S. $ Value | |
| |
5.00%, 06/15/2030 | | $ | 24,975 | | | $ | 25,570,751 | |
5.00%, 06/15/2031 | | | 12,000 | | | | 12,269,743 | |
New Jersey Transportation Trust Fund Authority
(New Jersey Transportation Trust Fund Authority State Lease)
Series 2018-A
5.00%, 12/15/2033 | | | 22,085 | | | | 23,280,474 | |
Series 2019
5.00%, 06/15/2046 | | | 2,325 | | | | 2,398,986 | |
Series 2023-A
5.00%, 06/15/2039 | | | 5,085 | | | | 5,543,448 | |
5.00%, 06/15/2040 | | | 4,000 | | | | 4,342,368 | |
Series 2023-B
5.00%, 06/15/2042 | | | 9,040 | | | | 9,771,310 | |
AGM Series 2006-C
Zero Coupon, 12/15/2033 | | | 5,170 | | | | 3,715,624 | |
New Jersey Transportation Trust Fund Authority
(Pre-refunded – Others)
Series 2014-A
5.00%, 06/15/2038 | | | 1,000 | | | | 1,003,012 | |
New Jersey Transportation Trust Fund Authority
(Pre-refunded – US Treasuries)
Series 2019
5.00%, 12/15/2024 | | | 4,290 | | | | 4,297,405 | |
New Jersey Transportation Trust Fund Authority
(State of New Jersey Lease)
Series 2023-B
5.25%, 06/15/2050 | | | 20,000 | | | | 21,739,248 | |
New Jersey Turnpike Authority
Series 2019-A
5.00%, 01/01/2048 | | | 11,320 | | | | 11,803,916 | |
Series 2024-A
4.00%, 01/01/2035 | | | 8,000 | | | | 8,488,746 | |
5.00%, 01/01/2027 | | | 18,000 | | | | 18,829,460 | |
5.00%, 01/01/2032 | | | 28,655 | | | | 32,182,935 | |
5.00%, 01/01/2033 | | | 64,000 | | | | 72,577,114 | |
5.00%, 01/01/2034 | | | 38,775 | | | | 44,238,514 | |
Series 2024-C
5.00%, 01/01/2043 | | | 49,500 | | | | 54,423,864 | |
5.00%, 01/01/2044 | | | 15,000 | | | | 16,441,509 | |
Passaic County Improvement Authority (The)
(Paterson Arts & Science Charter School)
Series 2023
4.25%, 07/01/2033 | | | 575 | | | | 582,408 | |
| | |
| |
70 | AB MUNICIPAL INCOME SHARES | | abfunds.com |
PORTFOLIO OF INVESTMENTS (continued)
| | | | | | | | |
| | | Principal
Amount
(000) | | | U.S. $ Value | |
| |
5.25%, 07/01/2043 | | $ | 1,020 | | | $ | 1,062,736 | |
South Jersey Transportation Authority
Series 2022
4.625%, 11/01/2047 | | | 5,000 | | | | 5,045,024 | |
Tobacco Settlement Financing Corp./NJ
Series 2018-A
5.00%, 06/01/2031 | | | 1,425 | | | | 1,493,695 | |
5.00%, 06/01/2046 | | | 2,200 | | | | 2,240,989 | |
Series 2018-B
5.00%, 06/01/2046 | | | 125,210 | | | | 125,560,300 | |
Township of Woodbridge NJ
Series 2024
4.00%, 03/14/2025 | | | 10,855 | | | | 10,891,070 | |
| | | | | | | | |
| | | | | | | 716,415,047 | |
| | | | | | | | |
New Mexico – 0.1% | | | | | | | | |
City of Santa Fe NM
(El Castillo Retirement Residences Obligated Group)
Series 2019
5.00%, 05/15/2039 | | | 480 | | | | 490,753 | |
5.00%, 05/15/2044 | | | 500 | | | | 504,045 | |
5.00%, 05/15/2049 | | | 1,200 | | | | 1,195,098 | |
New Mexico Hospital Equipment Loan Council
(Haverland Carter Lifestyle Obligated Group)
Series 2019
5.00%, 07/01/2049 | | | 13,180 | | | | 12,605,115 | |
| | | | | | | | |
| | | | | | | 14,795,011 | |
| | | | | | | | |
New York – 9.0% | | | | | | | | |
Brookhaven Local Development Corp.
(Jefferson’s Ferry)
Series 2020
4.00%, 11/01/2045 | | | 2,250 | | | | 2,130,714 | |
Build NYC Resource Corp.
(Albert Einstein College of Medicine, Inc.)
Series 2016
5.50%, 09/01/2045(a) | | | 44,790 | | | | 44,878,344 | |
Build NYC Resource Corp.
(East Harlem Scholars Academy Charter School Obligated Group)
Series 2022
5.75%, 06/01/2062(a) | | | 1,500 | | | | 1,573,480 | |
Build NYC Resource Corp.
(Global Community Charter School)
Series 2022
5.00%, 06/15/2057 | | | 1,050 | | | | 1,053,902 | |
| | |
| |
| abfunds.com | | AB MUNICIPAL INCOME SHARES | 71 |
PORTFOLIO OF INVESTMENTS (continued)
| | | | | | | | |
| | | Principal
Amount
(000) | | | U.S. $ Value | |
| |
Build NYC Resource Corp.
(Integration Charter Schools)
Series 2021
4.00%, 06/01/2025(a) | | $ | 115 | | | $ | 113,239 | |
Build NYC Resource Corp.
(KIPP NYC Public Charter Schools)
Series 2023
5.25%, 07/01/2052 | | | 2,000 | | | | 2,071,267 | |
5.25%, 07/01/2062 | | | 4,500 | | | | 4,634,842 | |
Build NYC Resource Corp.
(Metropolitan College of New York)
Series 2014
5.00%, 11/01/2039 | | | 1,560 | | | | 951,600 | |
5.25%, 11/01/2034 | | | 2,240 | | | | 1,366,400 | |
Build NYC Resource Corp.
(Metropolitan Lighthouse Charter School)
Series 2017
5.00%, 06/01/2052(a) | | | 1,250 | | | | 1,235,132 | |
Build NYC Resource Corp.
(South Bronx Charter School For International Cultures & The Arts)
Series 2023
7.00%, 04/15/2053(a) | | | 4,360 | | | | 4,929,503 | |
7.00%, 04/15/2058(a) | | | 11,305 | | | | 12,742,740 | |
City of New York NY
Series 2018-E
5.00%, 03/01/2037(a)(b) | | | 7,500 | | | | 7,867,977 | |
5.00%, 03/01/2038(a)(b) | | | 10,000 | | | | 10,469,632 | |
Series 2024-C
4.00%, 03/01/2046 | | | 27,000 | | | | 26,343,795 | |
5.00%, 03/01/2043 | | | 2,605 | | | | 2,840,770 | |
City of Rochester NY
Series 2024-I
5.00%, 07/31/2025 | | | 16,000 | | | | 16,206,048 | |
Dutchess County Local Development Corp.
(Bard College)
Series 2020-A
5.00%, 07/01/2045 | | | 9,600 | | | | 9,796,283 | |
5.00%, 07/01/2051 | | | 17,400 | | | | 17,602,315 | |
Hempstead Town Local Development Corp.
(Evergreen Charter School, Inc.)
Series 2022-A
5.25%, 06/15/2052 | | | 17,470 | | | | 17,798,385 | |
5.50%, 06/15/2057 | | | 7,350 | | | | 7,580,100 | |
Long Island Power Authority
Series 2024-A
5.00%, 09/01/2044 | | | 6,480 | | | | 7,072,691 | |
| | |
| |
72 | AB MUNICIPAL INCOME SHARES | | abfunds.com |
PORTFOLIO OF INVESTMENTS (continued)
| | | | | | | | |
| | | Principal
Amount
(000) | | | U.S. $ Value | |
| |
5.25%, 09/01/2054 | | $ | 10,000 | | | $ | 10,881,710 | |
Metropolitan Transportation Authority
Series 2015-B
5.00%, 11/15/2032 | | | 3,715 | | | | 3,738,125 | |
Series 2015-C
5.00%, 11/15/2027 | | | 1,110 | | | | 1,127,716 | |
5.25%, 11/15/2030 | | | 4,000 | | | | 4,068,243 | |
Series 2015-D
5.00%, 11/15/2031 | | | 1,350 | | | | 1,369,068 | |
5.00%, 11/15/2032 | | | 5,135 | | | | 5,205,957 | |
5.00%, 11/15/2034 | | | 5,430 | | | | 5,501,736 | |
Series 2016-A
5.00%, 11/15/2032 | | | 4,740 | | | | 4,812,934 | |
Series 2016-D
5.00%, 11/15/2027 | | | 5,695 | | | | 5,869,227 | |
5.00%, 11/15/2029 | | | 1,750 | | | | 1,795,914 | |
Series 2017-C
5.00%, 11/15/2028 | | | 12,930 | | | | 13,727,786 | |
5.00%, 11/15/2029 | | | 16,435 | | | | 17,356,180 | |
5.00%, 11/15/2034 | | | 6,810 | | | | 7,112,236 | |
Series 2019-C
5.00%, 11/15/2038 | | | 380 | | | | 400,572 | |
Series 2020-A
4.00%, 11/15/2043 | | | 2,020 | | | | 1,952,105 | |
5.00%, 11/15/2045 | | | 4,740 | | | | 5,097,726 | |
Series 2020-C
4.75%, 11/15/2045 | | | 23,880 | | | | 24,538,945 | |
5.00%, 11/15/2050 | | | 8,750 | | | | 9,063,026 | |
5.25%, 11/15/2055 | | | 15,885 | | | | 16,630,183 | |
Series 2020-D
4.00%, 11/15/2048 | | | 7,150 | | | | 6,797,810 | |
4.00%, 11/15/2049 | | | 6,425 | | | | 6,094,561 | |
5.00%, 11/15/2043 | | | 5,000 | | | | 5,246,464 | |
Series 2021-A
4.00%, 11/15/2041 | | | 2,000 | | | | 1,979,305 | |
Metropolitan Transportation Authority
(Pre-refunded – US Treasuries)
Series 2019
5.00%, 11/15/2048 | | | 3,075 | | | | 3,076,687 | |
Monroe County Industrial Development Corp./NY
(Academy of Health Sciences Charter School)
Series 2022
5.875%, 07/01/2052(a) | | | 4,675 | | | | 4,791,868 | |
6.00%, 07/01/2057(a) | | | 1,615 | | | | 1,662,782 | |
| | |
| |
| abfunds.com | | AB MUNICIPAL INCOME SHARES | 73 |
PORTFOLIO OF INVESTMENTS (continued)
| | | | | | | | |
| | | Principal
Amount
(000) | | | U.S. $ Value | |
| |
Monroe County Industrial Development Corp./NY
(St Ann’s of Greater Rochester Obligated Group)
Series 2019
5.00%, 01/01/2050 | | $ | 6,520 | | | $ | 5,834,268 | |
Monroe County Industrial Development Corp./NY
(True North Rochester Prep Charter School)
Series 2020
5.00%, 06/01/2059(a) | | | 1,620 | | | | 1,629,026 | |
Nassau County Industrial Development Agency
(Amsterdam House Continuing Care Retirement Community, Inc.)
Series 2021
5.00%, 01/01/2058(d)(f)(g) | | | 525 | | | | 79,279 | |
9.00%, 01/01/2041(d)(e)(f) | | | 270 | | | | 270,000 | |
New York City Housing Development Corp.
Series 2020
2.55%, 08/01/2040 | | | 3,645 | | | | 2,879,574 | |
New York City Transitional Finance Authority
(New York City Transitional Finance Authority Future Tax Secured Revenue)
Series 2024-F
4.25%, 02/01/2054 | | | 6,500 | | | | 6,407,957 | |
New York City Transitional Finance Authority Future Tax Secured Revenue
Series 2022-F
3.75%, 02/01/2033 | | | 13,000 | | | | 12,067,884 | |
3.85%, 02/01/2034 | | | 3,955 | | | | 3,643,141 | |
New York Counties Tobacco Trust V
Series 2005
Zero Coupon, 06/01/2050 | | | 30,000 | | | | 4,723,206 | |
New York Liberty Development Corp.
(3 World Trade Center LLC)
Series 2014
5.00%, 11/15/2044(a) | | | 13,560 | | | | 13,559,727 | |
5.375%, 11/15/2040(a) | | | 3,395 | | | | 3,395,793 | |
7.25%, 11/15/2044(a) | | | 9,665 | | | | 9,670,727 | |
New York Power Authority
(New York Power Authority SFP Transmission Project)
AGM Series 2023
5.00%, 11/15/2048 | | | 5,250 | | | | 5,671,378 | |
5.00%, 11/15/2053 | | | 7,000 | | | | 7,513,590 | |
| | |
| |
74 | AB MUNICIPAL INCOME SHARES | | abfunds.com |
PORTFOLIO OF INVESTMENTS (continued)
| | | | | | | | |
| | | Principal
Amount
(000) | | | U.S. $ Value | |
| |
New York State Dormitory Authority
Series 2024
4.00%, 05/01/2054 | | $ | 24,795 | | | $ | 23,153,955 | |
5.25%, 10/01/2049 | | | 4,500 | | | | 4,774,548 | |
5.50%, 11/01/2047 | | | 1,000 | | | | 1,098,288 | |
Series 2025
5.00%, 05/01/2030(i) | | | 5,405 | | | | 5,893,515 | |
5.00%, 05/01/2031(i) | | | 1,820 | | | | 2,004,538 | |
5.00%, 05/01/2032(i) | | | 7,925 | | | | 8,815,421 | |
5.00%, 05/01/2033(i) | | | 7,000 | | | | 7,855,120 | |
5.00%, 05/01/2034(i) | | | 6,000 | | | | 6,780,814 | |
5.00%, 05/01/2035(i) | | | 7,000 | | | | 7,855,684 | |
5.00%, 05/01/2036(i) | | | 14,000 | | | | 15,642,369 | |
5.00%, 05/01/2037(i) | | | 4,185 | | | | 4,656,655 | |
5.00%, 05/01/2042(i) | | | 5,000 | | | | 5,435,946 | |
5.00%, 05/01/2043(i) | | | 4,000 | | | | 4,334,540 | |
New York State Dormitory Authority
(Cornell University)
Series 2024-A
5.50%, 07/01/2054 | | | 16,000 | | | | 18,003,968 | |
New York State Dormitory Authority
(Garnet Health Medical Center Obligated Group)
Series 2017
5.00%, 12/01/2030(a) | | | 1,200 | | | | 1,195,788 | |
5.00%, 12/01/2031(a) | | | 1,000 | | | | 989,717 | |
5.00%, 12/01/2034(a) | | | 2,000 | | | | 1,945,988 | |
New York State Dormitory Authority
(Montefiore Obligated Group)
Series 2018
5.00%, 08/01/2035 | | | 2,085 | | | | 2,148,369 | |
AGM Series 2020
3.00%, 09/01/2050 | | | 14,890 | | | | 11,250,159 | |
New York State Dormitory Authority
(State of New York Pers Income Tax)
Series 2021
2.202%, 03/15/2034(a)(b) | | | 13,000 | | | | 10,466,136 | |
2.252%, 03/15/2032 | | | 13,000 | | | | 10,990,006 | |
New York State Dormitory Authority
(Wagner College)
Series 2022
5.00%, 07/01/2057 | | | 14,965 | | | | 13,968,445 | |
New York State Thruway Authority
(New York State Thruway Authority Gen Toll Road)
Series 2016-A
5.00%, 01/01/2041 | | | 3,800 | | | | 3,848,415 | |
| | |
| |
| abfunds.com | | AB MUNICIPAL INCOME SHARES | 75 |
PORTFOLIO OF INVESTMENTS (continued)
| | | | | | | | |
| | | Principal
Amount
(000) | | | U.S. $ Value | |
| |
New York Transportation Development Corp.
Series 2024
5.50%, 12/31/2054(i) | | $ | 30,500 | | | $ | 32,501,688 | |
5.50%, 12/31/2060(i) | | | 4,435 | | | | 4,689,305 | |
New York Transportation Development Corp.
(Delta Air Lines, Inc.)
Series 2018
5.00%, 01/01/2028 | | | 15,300 | | | | 15,860,835 | |
5.00%, 01/01/2029 | | | 18,660 | | | | 19,317,862 | |
Series 2020
4.00%, 10/01/2030 | | | 13,980 | | | | 13,997,139 | |
4.375%, 10/01/2045 | | | 40,110 | | | | 38,324,419 | |
Series 2023
5.625%, 04/01/2040 | | | 11,250 | | | | 12,077,930 | |
6.00%, 04/01/2035 | | | 13,875 | | | | 15,490,010 | |
New York Transportation Development Corp.
(Empire State Thruway Partners LLC)
Series 2021
4.00%, 04/30/2053 | | | 13,315 | | | | 11,338,951 | |
New York Transportation Development Corp.
(JFK International Air Terminal LLC)
Series 2020
5.00%, 12/01/2030 | | | 1,000 | | | | 1,063,522 | |
5.00%, 12/01/2035 | | | 1,100 | | | | 1,148,409 | |
Series 2022
5.00%, 12/01/2039 | | | 1,510 | | | | 1,575,178 | |
5.00%, 12/01/2040 | | | 2,500 | | | | 2,596,625 | |
5.00%, 12/01/2041 | | | 11,500 | | | | 11,910,739 | |
New York Transportation Development Corp.
(JFK NTO LLC)
Series 2023
5.375%, 06/30/2060 | | | 35,900 | | | | 37,187,507 | |
6.00%, 06/30/2054 | | | 30,580 | | | | 33,011,312 | |
Series 2024
5.00%, 06/30/2060 | | | 70,760 | | | | 72,051,129 | |
5.25%, 06/30/2049 | | | 2,250 | | | | 2,351,775 | |
5.50%, 06/30/2054 | | | 44,430 | | | | 46,965,651 | |
AGM Series 2023
5.00%, 06/30/2049 | | | 5,000 | | | | 5,139,398 | |
5.125%, 06/30/2060 | | | 13,000 | | | | 13,334,685 | |
| | |
| |
76 | AB MUNICIPAL INCOME SHARES | | abfunds.com |
PORTFOLIO OF INVESTMENTS (continued)
| | | | | | | | |
| | | Principal
Amount
(000) | | | U.S. $ Value | |
| |
New York Transportation Development Corp.
(Laguardia Gateway Partners LLC)
Series 2016-A
5.00%, 07/01/2041 | | $ | 15,840 | | | $ | 15,753,681 | |
5.00%, 07/01/2046 | | | 6,895 | | | | 6,847,322 | |
5.25%, 01/01/2050 | | | 29,285 | | | | 29,283,732 | |
Niagara Area Development Corp.
(Reworld Holding Corp.)
Series 2018-A
4.75%, 11/01/2042(a) | | | 13,765 | | | | 13,159,752 | |
Port Authority of New York & New Jersey
Series 2018-2
5.00%, 09/15/2026 | | | 4,000 | | | | 4,110,781 | |
Series 2021
3.175%, 07/15/2060 | | | 10,000 | | | | 6,716,453 | |
Series 2023-2
5.00%, 12/01/2034 | | | 6,960 | | | | 7,513,297 | |
Suffolk Regional Off-Track Betting Co.
Series 2024
5.00%, 12/01/2034 | | | 5,500 | | | | 5,681,112 | |
6.00%, 12/01/2053 | | | 12,400 | | | | 12,910,952 | |
Town of Oyster Bay NY
Series 2024
4.00%, 03/07/2025 | | | 31,750 | | | | 31,834,093 | |
Triborough Bridge & Tunnel Authority
5.25%, 05/15/2057(a)(b) | | | 10,000 | | | | 10,752,953 | |
Series 2020-A
5.00%, 11/15/2049 | | | 2,060 | | | | 2,161,684 | |
Triborough Bridge & Tunnel Authority
(Metropolitan Transportation Authority Payroll Mobility Tax Revenue)
Series 2021-A
2.591%, 05/15/2036 | | | 4,000 | | | | 3,186,294 | |
2.917%, 05/15/2040 | | | 10,000 | | | | 7,631,255 | |
Series 2022-C
5.00%, 05/15/2047(a)(b) | | | 10,000 | | | | 10,636,641 | |
5.25%, 05/15/2052(a)(b) | | | 10,000 | | | | 10,780,539 | |
Series 2024
5.00%, 11/15/2033 | | | 1,690 | | | | 1,955,606 | |
5.00%, 11/15/2035 | | | 13,000 | | | | 14,937,562 | |
Triborough Bridge & Tunnel Authority Sales Tax Revenue
Series 2024-A
5.25%, 05/15/2064 | | | 16,000 | | | | 17,401,518 | |
TSASC, Inc./NY
Series 2016
5.00%, 06/01/2045 | | | 10,200 | | | | 9,098,279 | |
| | |
| |
| abfunds.com | | AB MUNICIPAL INCOME SHARES | 77 |
PORTFOLIO OF INVESTMENTS (continued)
| | | | | | | | |
| | | Principal
Amount
(000) | | | U.S. $ Value | |
| |
5.00%, 06/01/2048 | | $ | 8,370 | | | $ | 7,384,087 | |
Series 2017-A
5.00%, 06/01/2041 | | | 1,560 | | | | 1,584,033 | |
Ulster County Capital Resource Corp.
(Woodland Pond at New Paltz)
Series 2017
5.00%, 09/15/2037 | | | 860 | | | | 780,635 | |
5.25%, 09/15/2042 | | | 365 | | | | 321,401 | |
5.25%, 09/15/2047 | | | 625 | | | | 524,832 | |
5.25%, 09/15/2053 | | | 1,340 | | | | 1,084,617 | |
Western Regional Off-Track Betting Corp.
Series 2021
3.00%, 12/01/2026(a) | | | 540 | | | | 526,930 | |
| | | | | | | | |
| | | | | | | 1,248,106,069 | |
| | | | | | | | |
North Carolina – 0.3% | | | | | | | | |
Fayetteville State University
Series 2023
5.00%, 04/01/2027(a) | | | 415 | | | | 429,827 | |
5.00%, 04/01/2028(a) | | | 455 | | | | 477,241 | |
5.00%, 04/01/2029(a) | | | 500 | | | | 530,520 | |
5.00%, 04/01/2030(a) | | | 545 | | | | 582,252 | |
5.00%, 04/01/2031(a) | | | 600 | | | | 644,883 | |
5.00%, 04/01/2034(a) | | | 770 | | | | 839,791 | |
5.00%, 04/01/2036(a) | | | 900 | | | | 976,539 | |
5.00%, 04/01/2037(a) | | | 970 | | | | 1,048,492 | |
5.00%, 04/01/2040(a) | | | 1,205 | | | | 1,286,171 | |
5.00%, 04/01/2042(a) | | | 1,380 | | | | 1,464,374 | |
Greater Asheville Regional Airport Authority
AGM Series 2022-A
5.50%, 07/01/2047 | | | 2,880 | | | | 3,093,217 | |
5.50%, 07/01/2052 | | | 5,000 | | | | 5,332,589 | |
North Carolina Medical Care Commission
(Aldersgate United Methodist Retirement Community, Inc. Obligated Group)
Series 2017
5.00%, 07/01/2047 | | | 2,950 | | | | 2,303,819 | |
North Carolina Medical Care Commission
(Aldersgate United Methodist Retirement Community, Inc.)
Series 2015
4.875%, 07/01/2040 | | | 5,000 | | | | 4,178,571 | |
5.00%, 07/01/2045 | | | 4,650 | | | | 3,710,697 | |
North Carolina Medical Care Commission
(Pennybyrn at Maryfield)
Series 2015
5.00%, 10/01/2030 | | | 2,250 | | | | 2,251,383 | |
| | |
| |
78 | AB MUNICIPAL INCOME SHARES | | abfunds.com |
PORTFOLIO OF INVESTMENTS (continued)
| | | | | | | | |
| | | Principal
Amount
(000) | | | U.S. $ Value | |
| |
North Carolina Medical Care Commission
(Sharon Towers)
Series 2019-A
5.00%, 07/01/2044 | | $ | 1,000 | | | $ | 1,005,758 | |
North Carolina Medical Care Commission
(United Methodist Retirement Homes Inc Obligated Group (The))
Series 2024
5.00%, 10/01/2049 | | | 510 | | | | 524,719 | |
5.125%, 10/01/2054 | | | 2,000 | | | | 2,060,450 | |
North Carolina Turnpike Authority
Series 2018
5.00%, 01/01/2040 | | | 5,000 | | | | 5,192,873 | |
AGM Series 2024
Zero Coupon, 01/01/2050 | | | 11,750 | | | | 3,534,292 | |
Zero Coupon, 01/01/2051 | | | 7,490 | | | | 2,132,806 | |
Zero Coupon, 01/01/2052 | | | 6,435 | | | | 1,733,644 | |
Zero Coupon, 01/01/2053 | | | 1,750 | | | | 446,599 | |
| | | | | | | | |
| | | | | | | 45,781,507 | |
| | | | | | | | |
North Dakota – 0.4% | | | | | | | | |
City of Grand Forks ND
(Altru Health System Obligated Group)
Series 2021
4.00%, 12/01/2035 | | | 4,000 | | | | 3,833,532 | |
4.00%, 12/01/2036 | | | 3,625 | | | | 3,448,892 | |
4.00%, 12/01/2037 | | | 1,190 | | | | 1,123,729 | |
4.00%, 12/01/2040 | | | 1,875 | | | | 1,721,716 | |
4.00%, 12/01/2041 | | | 1,865 | | | | 1,693,541 | |
5.00%, 12/01/2034 | | | 7,545 | | | | 7,873,639 | |
Series 2023-A
5.42%, 12/01/2053 | | | 5,270 | | | | 5,471,749 | |
AGM Series 2021
3.00%, 12/01/2051 | | | 4,000 | | | | 2,939,471 | |
County of Grand Forks ND
(Red River Biorefinery LLC)
Series 2021
6.625%, 12/15/2031(d)(e)(f)(k)(m) | | | 5,195 | | | | – 0 | – |
7.00%, 12/15/2043(d)(e)(f)(k)(m) | | | 5,390 | | | | – 0 | – |
County of Ward ND
(Trinity Health Obligated Group)
Series 2017-C
5.00%, 06/01/2038 | | | 2,000 | | | | 2,023,008 | |
5.00%, 06/01/2043 | | | 2,000 | | | | 2,004,588 | |
5.00%, 06/01/2048 | | | 13,500 | | | | 13,281,031 | |
5.00%, 06/01/2053 | | | 5,230 | | | | 5,062,257 | |
| | | | | | | | |
| | | | | | | 50,477,153 | |
| | | | | | | | |
| | |
| |
| abfunds.com | | AB MUNICIPAL INCOME SHARES | 79 |
PORTFOLIO OF INVESTMENTS (continued)
| | | | | | | | |
| | | Principal
Amount
(000) | | | U.S. $ Value | |
| |
Ohio – 3.5% | | | | | | | | |
Akron Bath Copley Joint Township Hospital District
(Summa Health System Obligated Group)
Series 2020
3.00%, 11/15/2040 | | $ | 4,500 | | | $ | 3,644,281 | |
4.00%, 11/15/2036 | | | 1,000 | | | | 958,912 | |
4.00%, 11/15/2037 | | | 800 | | | | 761,776 | |
4.00%, 11/15/2038 | | | 750 | | | | 708,563 | |
American Municipal Power, Inc.
(American Municipal Power Combined Hydroelectric Revenue)
Series 2016-A
5.00%, 02/15/2041 | | | 6,000 | | | | 6,076,542 | |
5.00%, 02/15/2046 | | | 4,000 | | | | 4,039,486 | |
Buckeye Tobacco Settlement Financing Authority
Series 2020-A
4.00%, 06/01/2048 | | | 10,000 | | | | 8,959,864 | |
Series 2020-B Zero Coupon, 06/01/2057 | | | 113,000 | | | | 10,466,003 | |
5.00%, 06/01/2055 | | | 141,270 | | | | 127,559,012 | |
City of Chillicothe OH
(Adena Health System Obligated Group)
Series 2017
5.00%, 12/01/2037 | | | 3,765 | | | | 3,860,586 | |
5.00%, 12/01/2047 | | | 3,735 | | | | 3,760,641 | |
County of Cuyahoga OH
(MetroHealth System (The))
Series 2017
5.00%, 02/15/2042 | | | 12,600 | | | | 12,746,862 | |
5.00%, 02/15/2052 | | | 5,680 | | | | 5,706,910 | |
5.25%, 02/15/2047 | | | 12,860 | | | | 13,062,810 | |
5.50%, 02/15/2057 | | | 9,370 | | | | 9,537,687 | |
County of Franklin OH
(First Community Village Obligated Group)
Series 2019
5.00%, 07/01/2049 | | | 3,670 | | | | 3,235,051 | |
County of Hamilton OH
(Christ Hospital Obligated Group)
Series 2023
5.00%, 06/01/2034(b) | | | 8,075 | | | | 8,699,663 | |
5.00%, 06/01/2038(b) | | | 7,440 | | | | 7,957,926 | |
County of Hamilton OH
(UC Health Obligated Group)
Series 2020
5.00%, 09/15/2050 | | | 23,425 | | | | 23,447,359 | |
| | |
| |
80 | AB MUNICIPAL INCOME SHARES | | abfunds.com |
PORTFOLIO OF INVESTMENTS (continued)
| | | | | | | | |
| | | Principal
Amount
(000) | | | U.S. $ Value | |
| |
County of Hardin OH
(Ohio Northern University)
Series 2020
5.25%, 05/01/2040 | | $ | 500 | | | $ | 479,221 | |
5.50%, 05/01/2050 | | | 1,000 | | | | 941,932 | |
County of Marion OH
(United Church Homes, Inc. Obligated Group)
Series 2019
5.125%, 12/01/2049 | | | 2,210 | | | | 1,810,768 | |
County of Ross OH
(Adena Health System Obligated Group)
Series 2019
5.00%, 12/01/2049 | | | 6,000 | | | | 6,068,752 | |
County of Washington OH
(Marietta Area Health Care, Inc. Obligated Group)
Series 2022
6.375%, 12/01/2037 | | | 1,000 | | | | 1,077,991 | |
6.625%, 12/01/2042 | | | 16,000 | | | | 17,539,395 | |
6.75%, 12/01/2052 | | | 29,885 | | | | 32,715,166 | |
Jefferson County Port Authority/OH
(JSW Steel USA Ohio, Inc.)
Series 2021
3.50%, 12/01/2051(a) | | | 8,950 | | | | 6,960,216 | |
Series 2023
5.00%, 12/01/2053(a) | | | 16,000 | | | | 16,307,149 | |
Lancaster Port Authority
Series 2024-A
5.00%, 02/01/2055(i) | | | 10,900 | | | | 11,597,666 | |
Ohio Air Quality Development Authority
(American Electric Power Co., Inc.)
Series 2019
2.40%, 12/01/2038 | | | 1,030 | | | | 954,773 | |
Ohio Air Quality Development Authority
(Duke Energy Corp.)
Series 2022
4.25%, 11/01/2039 | | | 17,100 | | | | 17,332,873 | |
Ohio Air Quality Development Authority
(Ohio Valley Electric Corp.)
Series 2019
3.25%, 09/01/2029 | | | 1,780 | | | | 1,742,102 | |
Ohio Higher Educational Facility Commission
Series 2024
5.00%, 05/01/2039 | | | 880 | | | | 946,744 | |
5.00%, 05/01/2040 | | | 785 | | | | 840,365 | |
5.00%, 05/01/2041 | | | 815 | | | | 868,341 | |
| | |
| |
| abfunds.com | | AB MUNICIPAL INCOME SHARES | 81 |
PORTFOLIO OF INVESTMENTS (continued)
| | | | | | | | |
| | | Principal
Amount
(000) | | | U.S. $ Value | |
| |
5.00%, 05/01/2042 | | $ | 435 | | | $ | 461,541 | |
5.25%, 05/01/2049 | | | 5,630 | | | | 5,975,556 | |
5.25%, 05/01/2054 | | | 6,825 | | | | 7,211,424 | |
Ohio Higher Educational Facility Commission
(John Carroll University)
Series 2022
4.00%, 10/01/2047 | | | 1,750 | | | | 1,541,482 | |
4.00%, 10/01/2052 | | | 11,900 | | | | 10,230,805 | |
Port of Greater Cincinnati Development Authority
(Duke Energy Convention Center Project)
Series 2024
5.00%, 12/01/2053 | | | 1,275 | | | | 1,333,450 | |
5.00%, 12/01/2063 | | | 11,105 | | | | 11,519,973 | |
Port of Greater Cincinnati Development Authority
(IDEA Greater Cincinnati, Inc.)
Series 2021
4.375%, 06/15/2056 | | | 3,480 | | | | 3,436,224 | |
State of Ohio
Series 2017-U
5.00%, 05/01/2025 | | | 3,410 | | | | 3,440,774 | |
Series 2019
3.276%, 01/01/2042 | | | 1,635 | | | | 1,354,244 | |
Toledo-Lucas County Port Authority
(ParkUToledo, Inc.)
Series 2021 | | | | | | | | |
4.00%, 01/01/2041 | | | 3,000 | | | | 2,916,961 | |
4.00%, 01/01/2043 | | | 2,000 | | | | 1,915,569 | |
4.00%, 01/01/2046 | | | 2,000 | | | | 1,872,941 | |
4.00%, 01/01/2051 | | | 8,500 | | | | 7,768,279 | |
4.00%, 01/01/2057 | | | 7,500 | | | | 6,728,428 | |
University of Toledo
Series 2023-B
4.631% (SOFR + 0.90%), 06/01/2036(a)(b)(c) | | | 50,590 | | | | 49,471,167 | |
| | | | | | | | |
| | | | | | | 490,552,206 | |
| | | | | | | | |
Oklahoma – 0.6% | | | | | | | | |
Oklahoma Development Finance Authority
(Oklahoma City University Obligated Group)
Series 2019
5.00%, 08/01/2044 | | | 7,650 | | | | 7,606,227 | |
5.00%, 08/01/2049 | | | 12,780 | | | | 12,394,982 | |
| | |
| |
82 | AB MUNICIPAL INCOME SHARES | | abfunds.com |
PORTFOLIO OF INVESTMENTS (continued)
| | | | | | | | |
| | | Principal
Amount
(000) | | | U.S. $ Value | |
| |
Oklahoma Development Finance Authority
(OU Medicine Obligated Group)
Series 2018-B
5.00%, 08/15/2038 | | $ | 1,000 | | | $ | 1,018,687 | |
5.25%, 08/15/2043 | | | 11,545 | | | | 11,779,023 | |
5.50%, 08/15/2052 | | | 5,615 | | | | 5,734,578 | |
5.50%, 08/15/2057 | | | 21,080 | | | | 21,501,674 | |
Series 2022-A
5.50%, 08/15/2037 | | | 10,000 | | | | 10,411,614 | |
5.50%, 08/15/2041 | | | 11,995 | | | | 12,346,858 | |
| | | | | | | | |
| | | | | | | 82,793,643 | |
| | | | | | | | |
Oregon – 0.5% | | | | | | | | |
Astoria Hospital Facilities Authority
(Columbia Lutheran Charities Obligated Group)
Series 2024
5.00%, 08/01/2034 | | | 13,250 | | | | 14,575,953 | |
5.00%, 08/01/2035 | | | 1,660 | | | | 1,819,016 | |
5.25%, 08/01/2037 | | | 1,960 | | | | 2,170,842 | |
5.25%, 08/01/2038 | | | 2,185 | | | | 2,411,597 | |
5.25%, 08/01/2039 | | | 1,205 | | | | 1,323,543 | |
5.25%, 08/01/2040 | | | 1,000 | | | | 1,089,685 | |
5.25%, 08/01/2041 | | | 1,725 | | | | 1,869,653 | |
5.25%, 08/01/2049 | | | 5,500 | | | | 5,800,085 | |
5.25%, 08/01/2054 | | | 7,750 | | | | 8,119,125 | |
Clackamas County Hospital Facility Authority
(Rose Villa, Inc. Obligated Group)
Series 2020-A
5.125%, 11/15/2040 | | | 750 | | | | 757,454 | |
5.375%, 11/15/2055 | | | 2,940 | | | | 2,945,305 | |
Medford Hospital Facilities Authority
(Asante Health System Obligated Group)
Series 2020-A
5.00%, 08/15/2045(a)(b) | | | 4,500 | | | | 4,678,549 | |
5.00%, 08/15/2050(a)(b) | | | 5,500 | | | | 5,658,884 | |
Multnomah County School District No. 40
Series 2023-A
Zero Coupon, 06/15/2043 | | | 6,430 | | | | 2,673,150 | |
Oregon State Facilities Authority
(Legacy Health Obligated Group)
Series 2022
5.00%, 06/01/2030 | | | 1,630 | | | | 1,747,452 | |
Oregon State Facilities Authority
(Samaritan Health Services, Inc. Obligated Group)
Series 2020
5.00%, 10/01/2040 | | | 1,750 | | | | 1,805,357 | |
| | |
| |
| abfunds.com | | AB MUNICIPAL INCOME SHARES | 83 |
PORTFOLIO OF INVESTMENTS (continued)
| | | | | | | | |
| | | Principal
Amount
(000) | | | U.S. $ Value | |
| |
Umatilla County School District No. 6R Umatilla
Series 2023-B
Zero Coupon, 06/15/2043 | | $ | 2,350 | | | $ | 978,142 | |
Zero Coupon, 06/15/2053 | | | 10,500 | | | | 2,517,059 | |
| | | | | | | | |
| | | | | | | 62,940,851 | |
| | | | | | | | |
Other – 0.2% | | | | | | | | |
Affordable Housing Tax-Exempt Bond Pass-Thru Trust
Series 2023-2
6.00%, 10/05/2040(a) | | | 17,556 | | | | 18,380,358 | |
Federal Home Loan Mortgage Corp. Multifamily VRD Certificates
Series 2022-ML13, Class AUS
3.125%, 09/25/2036 | | | 3,870 | | | | 3,455,318 | |
Series 2022-ML13, Class XCA
0.96%, 07/25/2036(j) | | | 17,041 | | | | 905,129 | |
Series 2022-ML13, Class XUS
0.98%, 09/25/2036(j) | | | 30,185 | | | | 1,996,235 | |
| | | | | | | | |
| | | | | | | 24,737,040 | |
| | | | | | | | |
Pennsylvania – 4.3% | | | | | | | | |
Allegheny County Hospital Development Authority
(Allegheny Health Network Obligated Group)
Series 2018-A
5.00%, 04/01/2034 | | | 10,135 | | | | 10,486,220 | |
5.00%, 04/01/2035 | | | 12,500 | | | | 12,905,693 | |
5.00%, 04/01/2036 | | | 10,900 | | | | 11,218,972 | |
Allentown Neighborhood Improvement Zone Development Authority
(Allentown Neighborhood Improvement Zone Center City Investment Corp. Revenue)
Series 2018
5.00%, 05/01/2033(a) | | | 2,000 | | | | 2,028,668 | |
5.375%, 05/01/2042(a) | | | 2,500 | | | | 2,505,691 | |
Series 2022
5.25%, 05/01/2042(a) | | | 11,065 | | | | 10,986,351 | |
Berks County Industrial Development Authority
(Pre-refunded – US Treasuries)
Series 2018
5.00%, 05/15/2048 | | | 1,000 | | | | 1,027,735 | |
Berks County Municipal Authority (The)
Series 2024
5.00%, 06/30/2039 | | | 20,822 | | | | 20,573,725 | |
| | |
| |
84 | AB MUNICIPAL INCOME SHARES | | abfunds.com |
PORTFOLIO OF INVESTMENTS (continued)
| | | | | | | | |
| | | Principal
Amount
(000) | | | U.S. $ Value | |
| |
6.00%, 06/30/2044(g) | | $ | 9,823 | | | $ | 6,999,427 | |
8.00%, 06/30/2034 | | | 3,135 | | | | 3,216,259 | |
Series 2024-A
6.00%, 06/30/2034 | | | 1,483 | | | | 1,602,874 | |
Bucks County Industrial Development Authority
(Grand View Hospital/Sellersville PA Obligated Group)
Series 2021
4.00%, 07/01/2046 | | | 11,850 | | | | 9,854,432 | |
4.00%, 07/01/2051 | | | 13,300 | | | | 10,764,159 | |
5.00%, 07/01/2030 | | | 1,275 | | | | 1,307,787 | |
5.00%, 07/01/2031 | | | 2,300 | | | | 2,358,642 | |
5.00%, 07/01/2032 | | | 500 | | | | 511,342 | |
5.00%, 07/01/2033 | | | 1,170 | | | | 1,193,076 | |
5.00%, 07/01/2034 | | | 1,300 | | | | 1,321,484 | |
5.00%, 07/01/2035 | | | 1,555 | | | | 1,576,028 | |
5.00%, 07/01/2036 | | | 1,225 | | | | 1,238,219 | |
5.00%, 07/01/2038 | | | 1,000 | | | | 1,005,600 | |
5.00%, 07/01/2040 | | | 2,500 | | | | 2,491,384 | |
5.00%, 07/01/2041 | | | 4,630 | | | | 4,581,145 | |
5.00%, 07/01/2054 | | | 15,100 | | | | 14,305,666 | |
Chambersburg Area Municipal Authority
(Wilson College)
Series 2018
5.75%, 10/01/2043 | | | 1,350 | | | | 1,329,117 | |
6.00%, 10/01/2048 | | | 9,000 | | | | 8,998,994 | |
Chester County Industrial Development Authority
(Collegium Charter School)
Series 2017-A
5.125%, 10/15/2037 | | | 1,500 | | | | 1,509,319 | |
5.25%, 10/15/2047 | | | 3,830 | | | | 3,829,895 | |
Series 2022
6.00%, 10/15/2052(a) | | | 1,075 | | | | 1,125,429 | |
Chester County Industrial Development Authority
(Woodlands at Greystone Neighborhood Improvement District)
Series 2018
5.125%, 03/01/2048(a) | | | 791 | | | | 752,276 | |
City of Philadelphia PA
Series 2017
5.00%, 08/01/2029 | | | 6,000 | | | | 6,300,507 | |
5.00%, 08/01/2031 | | | 6,110 | | | | 6,386,135 | |
Series 2017-A
5.00%, 08/01/2033 | | | 3,000 | | | | 3,121,802 | |
| | |
| |
| abfunds.com | | AB MUNICIPAL INCOME SHARES | 85 |
PORTFOLIO OF INVESTMENTS (continued)
| | | | | | | | |
| | | Principal
Amount
(000) | | | U.S. $ Value | |
| |
5.00%, 08/01/2034 | | $ | 10,000 | | | $ | 10,379,820 | |
City of Philadelphia PA Water & Wastewater Revenue
2.189%, 07/01/2032(a)(b) | | | 3,725 | | | | 3,233,158 | |
2.289%, 07/01/2033(a)(b) | | | 3,060 | | | | 2,486,149 | |
Series 2017-A
5.00%, 10/01/2035 | | | 3,805 | | | | 3,963,325 | |
5.00%, 10/01/2036 | | | 1,300 | | | | 1,352,374 | |
Series 2021-B
2.926%, 07/01/2045 | | | 5,000 | | | | 3,659,291 | |
Commonwealth of Pennsylvania
Series 2015
5.00%, 03/15/2025 | | | 6,420 | | | | 6,459,102 | |
Series 2022
5.00%, 10/01/2040 | | | 10,000 | | | | 10,990,284 | |
County of Lehigh PA
(Lehigh Valley Health Network Obligated Group)
Series 2016-A
4.00%, 07/01/2035 | | | 10,000 | | | | 10,008,259 | |
Series 2019
5.00%, 07/01/2044 | | | 6,885 | | | | 7,112,062 | |
Crawford County Hospital Authority
(Meadville Medical Center Obligated Group)
Series 2016-A
6.00%, 06/01/2046 | | | 1,175 | | | | 1,185,924 | |
6.00%, 06/01/2051 | | | 2,200 | | | | 2,208,147 | |
Cumberland County Municipal Authority
(Asbury Pennsylvania Obligated Group)
Series 2019
5.00%, 01/01/2045 | | | 1,815 | | | | 1,692,753 | |
Delaware County Authority
(Elwyn Obligated Group)
Series 2017
5.00%, 06/01/2032 | | | 1,750 | | | | 1,750,646 | |
Lancaster County Hospital Authority/PA
(St. Anne’s Retirement Community Obligated Group)
Series 2020
5.00%, 03/01/2040 | | | 2,000 | | | | 1,840,882 | |
5.00%, 03/01/2050 | | | 500 | | | | 427,241 | |
Series 2022
5.00%, 03/01/2029 | | | 2,170 | | | | 2,143,796 | |
Lancaster Municipal Authority
Series 2024
5.00%, 05/01/2049 | | | 1,000 | | | | 1,038,386 | |
| | |
| |
86 | AB MUNICIPAL INCOME SHARES | | abfunds.com |
PORTFOLIO OF INVESTMENTS (continued)
| | | | | | | | |
| | | Principal
Amount
(000) | | | U.S. $ Value | |
| |
5.00%, 05/01/2054 | | $ | 800 | | | $ | 822,587 | |
Lancaster Municipal Authority
(Garden Spot Village Obligated Group)
Series 2024
5.00%, 05/01/2059 | | | 1,590 | | | | 1,627,524 | |
Montgomery County Higher Education and Health Authority
(HumanGood Pennsylvania Obligated Group)
Series 2017
5.00%, 12/01/2047 | | | 5,500 | | | | 5,512,370 | |
Montgomery County Higher Education and Health Authority
(Thomas Jefferson University Obligated Group)
Series 2018
5.00%, 09/01/2035 | | | 3,600 | | | | 3,744,873 | |
Series 2019
5.00%, 09/01/2051 | | | 2,300 | | | | 2,330,821 | |
Series 2022
4.00%, 05/01/2052 | | | 5,900 | | | | 5,454,081 | |
Montgomery County Industrial Development Authority/PA
(Whitemarsh Continuing Care Retirement Community)
Series 2015
5.25%, 01/01/2040 | | | 4,740 | | | | 4,676,778 | |
Moon Industrial Development Authority
(Baptist Homes Society Obligated Group)
Series 2015
6.125%, 07/01/2050 | | | 2,500 | | | | 1,707,669 | |
Moon Industrial Development Authority
(Baptist Homes Society)
Series 2015
5.75%, 07/01/2035 | | | 5,135 | | | | 4,103,710 | |
6.00%, 07/01/2045 | | | 2,600 | | | | 1,816,366 | |
Northeastern Pennsylvania Hospital and Education Authority
(Wilkes University)
Series 2016-A
5.00%, 03/01/2037 | | | 2,675 | | | | 2,661,097 | |
Series 2016-B
5.25%, 03/01/2031 | | | 1,640 | | | | 1,656,968 | |
5.25%, 03/01/2037 | | | 1,170 | | | | 1,173,834 | |
| | |
| |
| abfunds.com | | AB MUNICIPAL INCOME SHARES | 87 |
PORTFOLIO OF INVESTMENTS (continued)
| | | | | | | | |
| | | Principal
Amount
(000) | | | U.S. $ Value | |
| |
Pennsylvania Economic Development Financing Authority
(Commonwealth of Pennsylvania Department of Transportation)
Series 2022
5.75%, 06/30/2048 | | $ | 11,000 | | | $ | 11,843,920 | |
6.00%, 06/30/2061 | | | 22,100 | | | | 24,169,289 | |
AGM Series 2022
5.75%, 12/31/2062 | | | 12,850 | | | | 14,083,866 | |
Pennsylvania Economic Development Financing Authority
(Iron Cumberland LLC)
Series 2022
7.00%, 12/01/2029 | | | 28,430 | | | | 28,364,870 | |
Pennsylvania Economic Development Financing Authority
(Pennsylvania Economic Development Finance Authority Sewage)
Series 2020
4.00%, 01/01/2027 | | | 1,530 | | | | 1,540,696 | |
4.00%, 01/01/2029 | | | 450 | | | | 454,321 | |
4.00%, 01/01/2030 | | | 1,575 | | | | 1,589,389 | |
4.00%, 01/01/2032 | | | 800 | | | | 802,491 | |
Pennsylvania Economic Development Financing Authority
(Presbyterian Homes Obligated Group/PA)
Series 2023
5.25%, 07/01/2046 | | | 2,500 | | | | 2,653,735 | |
5.25%, 07/01/2049 | | | 1,215 | | | | 1,281,596 | |
Pennsylvania Economic Development Financing Authority
(Reworld Holding Corp.)
Series 2019
3.25%, 08/01/2039(a) | | | 2,330 | | | | 1,901,609 | |
Pennsylvania Higher Educational Facilities Authority
Series 2024
4.00%, 11/01/2042(i) | | | 2,000 | | | | 1,909,560 | |
4.375%, 11/01/2054(i) | | | 15,750 | | | | 15,196,230 | |
5.25%, 11/01/2044(i) | | | 1,500 | | | | 1,629,735 | |
5.50%, 11/01/2054(i) | | | 1,700 | | | | 1,851,385 | |
Pennsylvania Higher Educational Facilities Authority
(Drexel University)
Series 2016
5.00%, 05/01/2032 | | | 1,000 | | | | 1,013,808 | |
| | |
| |
88 | AB MUNICIPAL INCOME SHARES | | abfunds.com |
PORTFOLIO OF INVESTMENTS (continued)
| | | | | | | | |
| | | Principal
Amount
(000) | | | U.S. $ Value | |
| |
Pennsylvania Turnpike Commission
5.00%, 12/01/2046(a)(b) | | $ | 26,610 | | | $ | 28,389,054 | |
Series 2016
5.00%, 06/01/2037 | | | 4,000 | | | | 4,060,066 | |
Series 2016-A
5.00%, 06/01/2025 | | | 11,000 | | | | 11,107,448 | |
Series 2018-A
5.00%, 12/01/2043 | | | 10,000 | | | | 10,447,799 | |
Series 2024
5.00%, 12/01/2038 | | | 11,290 | | | | 12,734,051 | |
Philadelphia Authority for Industrial Development
(MaST Community Charter School III)
Series 2021
5.00%, 08/01/2050 | | | 5,000 | | | | 4,828,099 | |
5.00%, 08/01/2054 | | | 3,560 | | | | 3,401,970 | |
Philadelphia Authority for Industrial Development
(Philadelphia Electrical & Technology Charter High School)
Series 2021
4.00%, 06/01/2056 | | | 2,550 | | | | 2,075,889 | |
Philadelphia Authority for Industrial Development
(Philadelphia Performing Arts Charter School)
Series 2020
5.00%, 06/15/2040(a) | | | 3,285 | | | | 3,313,565 | |
5.00%, 06/15/2050(a) | | | 6,285 | | | | 6,226,262 | |
Philadelphia Authority for Industrial Development
(St Joseph’s University)
Series 2022
5.50%, 11/01/2060 | | | 10,000 | | | | 10,790,581 | |
Philadelphia Authority for Industrial Development
(Tacony Academy Charter School)
Series 2023
5.00%, 06/15/2033(a) | | | 965 | | | | 991,305 | |
5.375%, 06/15/2038(a) | | | 1,270 | | | | 1,309,941 | |
Philadelphia Gas Works Co.
Series 2017
5.00%, 08/01/2042 | | | 5,000 | | | | 5,141,314 | |
Pittsburgh Water & Sewer Authority
AGM Series 2023-C
4.531% (SOFR + 0.80%), 09/01/2040(a)(b)(c) | | | 46,555 | | | | 45,442,843 | |
| | |
| |
| abfunds.com | | AB MUNICIPAL INCOME SHARES | 89 |
PORTFOLIO OF INVESTMENTS (continued)
| | | | | | | | |
| | | Principal
Amount
(000) | | | U.S. $ Value | |
| |
School District of Philadelphia (The)
Series 2015-A
5.00%, 09/01/2034 | | $ | 1,615 | | | $ | 1,633,404 | |
5.00%, 09/01/2035 | | | 1,000 | | | | 1,009,097 | |
Series 2016-F
5.00%, 09/01/2033 | | | 3,000 | | | | 3,062,542 | |
5.00%, 09/01/2036 | | | 1,000 | | | | 1,017,827 | |
Series 2018-A
5.00%, 09/01/2034 | | | 1,000 | | | | 1,045,251 | |
5.00%, 09/01/2036 | | | 1,000 | | | | 1,042,804 | |
5.00%, 09/01/2037 | | | 1,000 | | | | 1,042,648 | |
5.00%, 09/01/2038 | | | 1,000 | | | | 1,041,951 | |
Series 2018-B
5.00%, 09/01/2043 | | | 3,000 | | | | 3,099,193 | |
Series 2019-A
5.00%, 09/01/2044 | | | 17,900 | | | | 18,652,079 | |
Scranton-Lackawanna Health and Welfare Authority
(Scranton Parking System Concession Project)
Series 2016-A
5.00%, 01/01/2051(a) | | | 6,765 | | | | 4,030,720 | |
5.00%, 01/01/2057(a) | | | 5,345 | | | | 3,058,780 | |
Series 2016-B
6.08%, 01/01/2026(a) | | | 335 | | | | 327,279 | |
Series 2016-C
Zero Coupon, 01/01/2036(a) | | | 2,945 | | | | 1,047,010 | |
Series 2016-D
Zero Coupon, 01/01/2057(e) | | | 58,055 | | | | 3,229,681 | |
State Public School Building Authority
(Harrisburg School District)
AGM Series 2016
5.00%, 12/01/2029 | | | 1,365 | | | | 1,413,981 | |
5.00%, 12/01/2030 | | | 7,160 | | | | 7,397,914 | |
State Public School Building Authority
(Pre-refunded – US Treasuries)
AGM Series 2016
5.00%, 12/01/2029 | | | 220 | | | | 229,414 | |
Union County Hospital Authority
(Evangelical Community Hospital Obligated Group)
Series 2018
5.00%, 08/01/2038 | | | 2,685 | | | | 2,758,325 | |
5.00%, 08/01/2043 | | | 5,750 | | | | 5,864,635 | |
| | | | | | | | |
| | | | | | | 601,185,552 | |
| | | | | | | | |
| | |
| |
90 | AB MUNICIPAL INCOME SHARES | | abfunds.com |
PORTFOLIO OF INVESTMENTS (continued)
| | | | | | | | |
| | | Principal
Amount
(000) | | | U.S. $ Value | |
| |
Puerto Rico – 2.9% | | | | | | | | |
Commonwealth of Puerto Rico
Series 2021-A
Zero Coupon, 07/01/2033 | | $ | 6,410 | | | $ | 4,374,674 | |
4.00%, 07/01/2033 | | | 12,000 | | | | 11,822,056 | |
4.00%, 07/01/2035 | | | 4,200 | | | | 4,118,618 | |
4.00%, 07/01/2037 | | | 1,631 | | | | 1,581,710 | |
4.00%, 07/01/2041 | | | 2,217 | | | | 2,091,122 | |
4.00%, 07/01/2046 | | | 2,306 | | | | 2,149,777 | |
5.375%, 07/01/2025 | | | 3,138 | | | | 3,171,832 | |
5.625%, 07/01/2029 | | | 2,542 | | | | 2,734,557 | |
5.75%, 07/01/2031 | | | 3,784 | | | | 4,171,213 | |
Series 2022-A
Zero Coupon, 11/01/2051 | | | 12,831 | | | | 7,008,827 | |
5.069%, 11/01/2051 | | | 43,485 | | | | 28,428,064 | |
Series 2022-C
Zero Coupon, 11/01/2043 | | | 90,649 | | | | 58,355,612 | |
GDB Debt Recovery Authority of Puerto Rico
Series 2018
7.50%, 08/20/2040 | | | 4,773 | | | | 4,641,265 | |
Puerto Rico Commonwealth Aqueduct & Sewer Authority
Series 2020-A
5.00%, 07/01/2030(a) | | | 5,500 | | | | 5,803,254 | |
5.00%, 07/01/2035(a) | | | 9,455 | | | | 9,862,640 | |
Series 2021-A
4.00%, 07/01/2042(a) | | | 2,500 | | | | 2,385,335 | |
Series 2021-B
4.00%, 07/01/2042(a) | | | 4,000 | | | | 3,849,927 | |
Puerto Rico Electric Power Authority
Series 2007-T
5.00%, 07/01/2032(d)(f) | | | 7,315 | | | | 3,767,225 | |
5.00%, 07/01/2037(d)(f) | | | 15,260 | | | | 7,858,900 | |
Series 2008-W
5.25%, 07/01/2033(d)(f) | | | 1,000 | | | | 515,000 | |
5.50%, 07/01/2038(d)(f) | | | 10,490 | | | | 5,402,350 | |
Series 2010-A
5.25%, 07/01/2029(d)(f) | | | 2,950 | | | | 1,519,250 | |
5.25%, 07/01/2030(d)(f) | | | 1,040 | | | | 535,600 | |
Series 2010-C
5.00%, 07/01/2024(f)(l) | | | 1,735 | | | | 902,200 | |
5.25%, 07/01/2027(d)(f) | | | 3,360 | | | | 1,730,400 | |
5.25%, 07/01/2028(d)(f) | | | 500 | | | | 257,500 | |
Series 2010-DDD
5.00%, 07/01/2021(f)(l) | | | 1,050 | | | | 546,000 | |
5.00%, 07/01/2022(f)(l) | | | 950 | | | | 494,000 | |
| | |
| |
| abfunds.com | | AB MUNICIPAL INCOME SHARES | 91 |
PORTFOLIO OF INVESTMENTS (continued)
| | | | | | | | |
| | | Principal
Amount
(000) | | | U.S. $ Value | |
| |
Series 2010-X
5.25%, 07/01/2040(d)(f) | | $ | 20,585 | | | $ | 10,601,275 | |
5.75%, 07/01/2036(d)(f) | | | 7,375 | | | | 3,798,125 | |
Series 2010-ZZ
5.25%, 07/01/2018(f)(l) | | | 3,500 | | | | 1,820,000 | |
5.25%, 07/01/2024(f)(l) | | | 2,565 | | | | 1,333,800 | |
5.25%, 07/01/2025(d)(f) | | | 620 | | | | 319,300 | |
Series 2012-A
5.00%, 07/01/2029(d)(f) | | | 2,510 | | | | 1,292,650 | |
5.00%, 07/01/2042(d)(f) | | | 2,125 | | | | 1,094,375 | |
5.05%, 07/01/2042(d)(f) | | | 2,585 | | | | 1,331,275 | |
Series 2013-A
7.00%, 07/01/2033(d)(f) | | | 1,700 | | | | 875,500 | |
7.00%, 07/01/2040(d)(f) | | | 750 | | | | 386,250 | |
AGM Series 2007-V
5.25%, 07/01/2031 | | | 25,380 | | | | 25,351,663 | |
NATL Series 2007-V
5.25%, 07/01/2029 | | | 5,965 | | | | 5,868,050 | |
5.25%, 07/01/2033 | | | 9,250 | | | | 9,148,648 | |
Puerto Rico Industrial Tourist Educational Medical & Environmental Control Facilities Financing Auth
Series 2023-A
6.625%, 01/01/2027 | | | 1,937 | | | | 1,916,046 | |
6.625%, 01/01/2028 | | | 14,770 | | | | 14,593,434 | |
Puerto Rico Industrial Tourist Educational Medical & Environmental Control Facilities Financing Auth
(AES Puerto Rico LP)
12.50%, 12/15/2025(k)(m) | | | 3,431 | | | | 3,328,433 | |
Puerto Rico Industrial Tourist Educational Medical & Environmental Control Facilities Financing Auth
(San Juan Cruise Port LLC)
Series 2024
6.50%, 01/01/2042 | | | 3,250 | | | | 3,839,628 | |
6.75%, 01/01/2045 | | | 3,500 | | | | 4,164,989 | |
Puerto Rico Sales Tax Financing Corp. Sales Tax Revenue
Series 2018-A
Zero Coupon, 07/01/2027 | | | 537 | | | | 483,744 | |
Zero Coupon, 07/01/2029 | | | 523 | | | | 435,708 | |
Zero Coupon, 07/01/2046 | | | 123,224 | | | | 40,240,991 | |
Zero Coupon, 07/01/2051 | | | 58,864 | | | | 14,205,879 | |
Series 2019-A
4.329%, 07/01/2040 | | | 15,975 | | | | 15,808,183 | |
4.55%, 07/01/2040 | | | 1,198 | | | | 1,203,464 | |
| | |
| |
92 | AB MUNICIPAL INCOME SHARES | | abfunds.com |
PORTFOLIO OF INVESTMENTS (continued)
| | | | | | | | |
| | | Principal
Amount
(000) | | | U.S. $ Value | |
| |
5.00%, 07/01/2058 | | $ | 52,251 | | | $ | 52,352,069 | |
| | | | | | | | |
| | | | | | | 395,872,387 | |
| | | | | | | | |
Rhode Island – 0.0% | | | | | | | | |
Rhode Island Health and Educational Building Corp.
(City of Woonsocket RI Lease)
AGM Series 2017-A
5.00%, 05/15/2029 | | | 1,000 | | | | 1,046,909 | |
| | | | | | | | |
| | |
South Carolina – 2.9% | | | | | | | | |
Columbia Housing Authority/SC
(Garden Lakes Apartments)
Series 2022
4.80%, 11/01/2024 | | | 5,010 | | | | 5,010,000 | |
5.26%, 11/01/2032 | | | 710 | | | | 703,811 | |
5.41%, 11/01/2039 | | | 12,570 | | | | 12,363,545 | |
6.28%, 11/01/2039 | | | 540 | | | | 531,616 | |
Greenville Housing Authority/SC
(Victor Verdae Apartments)
Series 2023
6.16%, 05/01/2063(a) | | | 16,500 | | | | 15,838,338 | |
Orangeburg County School District
Series 2024
5.00%, 08/13/2025 | | | 21,000 | | | | 21,268,479 | |
Patriots Energy Group Financing Agency
(Sumitomo Mitsui Financial Group, Inc.)
Series 2023-A
5.25%, 10/01/2054(a)(b) | | | 30,000 | | | | 32,429,604 | |
South Carolina Jobs-Economic Development Authority
Series 2024
5.00%, 11/15/2035 | | | 1,225 | | | | 1,269,205 | |
5.25%, 11/15/2039 | | | 1,000 | | | | 1,051,925 | |
5.50%, 11/15/2044 | | | 1,000 | | | | 1,058,692 | |
South Carolina Jobs-Economic Development Authority
(Bon Secours Mercy Health, Inc.)
Series 2020
5.00%, 12/01/2046 | | | 10,595 | | | | 11,018,578 | |
South Carolina Jobs-Economic Development Authority
(FAH Pelham LLC)
Series 2023
10.00%, 08/01/2039(a) | | | 580 | | | | 545,039 | |
Series 2023-A
6.50%, 02/01/2056(a) | | | 16,895 | | | | 17,769,421 | |
| | |
| |
| abfunds.com | | AB MUNICIPAL INCOME SHARES | 93 |
PORTFOLIO OF INVESTMENTS (continued)
| | | | | | | | |
| | | Principal
Amount
(000) | | | U.S. $ Value | |
| |
Series 2023-B
7.50%, 08/01/2047(a) | | $ | 7,000 | | | $ | 7,126,478 | |
South Carolina Jobs-Economic Development Authority
(International Paper Co.)
Series 2023
4.00%, 04/01/2033 | | | 6,000 | | | | 6,047,224 | |
South Carolina Jobs-Economic Development Authority
(Last Step Recycling LLC)
Series 2021
6.00%, 06/01/2031(d)(e)(f) | | | 2,470 | | | | 370,500 | |
6.25%, 06/01/2040(d)(e)(f) | | | 6,100 | | | | 915,000 | |
6.50%, 06/01/2051(d)(e)(f) | | | 9,070 | | | | 1,360,500 | |
South Carolina Jobs-Economic Development Authority
(Novant Health Obligated Group)
Series 2024
4.50%, 11/01/2054 | | | 25,000 | | | | 24,868,962 | |
5.00%, 11/01/2038 | | | 6,590 | | | | 7,294,388 | |
5.25%, 11/01/2041 | | | 4,000 | | | | 4,472,270 | |
5.25%, 11/01/2044 | | | 3,000 | | | | 3,316,506 | |
5.50%, 11/01/2050 | | | 7,100 | | | | 7,846,870 | |
5.50%, 11/01/2054 | | | 48,175 | | | | 52,991,455 | |
South Carolina Jobs-Economic Development Authority
(PSG Patriot’s Place Apartments LLC)
Series 2022
5.75%, 06/01/2052(g) | | | 15,800 | | | | 11,770,169 | |
South Carolina Public Service Authority
Series 2015-A
5.00%, 12/01/2050 | | | 33,180 | | | | 33,268,143 | |
Series 2016-A
5.00%, 12/01/2034 | | | 3,815 | | | | 3,898,022 | |
5.00%, 12/01/2036 | | | 1,000 | | | | 1,020,265 | |
Series 2016-B
5.00%, 12/01/2037 | | | 2,000 | | | | 2,051,094 | |
5.00%, 12/01/2041 | | | 10,500 | | | | 10,699,509 | |
5.00%, 12/01/2056 | | | 7,350 | | | | 7,414,776 | |
Series 2021-A
4.00%, 12/01/2035 | | | 1,000 | | | | 1,012,123 | |
Series 2022
4.00%, 12/01/2038 | | | 550 | | | | 551,007 | |
4.00%, 12/01/2049 | | | 5,166 | | | | 4,906,663 | |
5.00%, 12/01/2036 | | | 447 | | | | 485,759 | |
5.00%, 12/01/2038 | | | 1,742 | | | | 1,883,158 | |
| | |
| |
94 | AB MUNICIPAL INCOME SHARES | | abfunds.com |
PORTFOLIO OF INVESTMENTS (continued)
| | | | | | | | |
| | | Principal
Amount
(000) | | | U.S. $ Value | |
| |
Series 2022-A
4.00%, 12/01/2052 | | $ | 14,000 | | | $ | 12,694,325 | |
5.00%, 12/01/2055 | | | 10,000 | | | | 10,356,970 | |
Series 2024-A
5.00%, 12/01/2039 | | | 1,310 | | | | 1,438,304 | |
5.00%, 12/01/2040 | | | 2,000 | | | | 2,184,437 | |
5.00%, 12/01/2041 | | | 3,000 | | | | 3,260,298 | |
5.00%, 12/01/2042 | | | 3,135 | | | | 3,392,090 | |
5.50%, 12/01/2054 | | | 15,250 | | | | 16,734,165 | |
Series 2024-B
5.00%, 12/01/2041 | | | 2,800 | | | | 3,042,945 | |
5.00%, 12/01/2043 | | | 12,000 | | | | 12,888,310 | |
5.25%, 12/01/2054 | | | 12,500 | | | | 13,410,130 | |
| | | | | | | | |
| | | | | | | 395,831,068 | |
| | | | | | | | |
South Dakota – 0.2% | | | | | | | | |
County of Lincoln SD
(Augustana College Association/SD)
Series 2021
4.00%, 08/01/2051 | | | 2,410 | | | | 2,006,078 | |
4.00%, 08/01/2056 | | | 2,415 | | | | 1,961,124 | |
4.00%, 08/01/2061 | | | 4,020 | | | | 3,195,537 | |
South Dakota Health & Educational Facilities Authority
(Monument Health Obligated Group)
Series 2017
5.00%, 09/01/2033 | | | 3,260 | | | | 3,375,379 | |
5.00%, 09/01/2040 | | | 15,035 | | | | 15,418,257 | |
South Dakota Housing Development Authority
(Schuett Spearfish LP)
Series 2023
6.15%, 09/01/2039 | | | 5,360 | | | | 5,572,952 | |
| | | | | | | | |
| | | | | | | 31,529,327 | |
| | | | | | | | |
Tennessee – 1.7% | | | | | | | | |
Bristol Industrial Development Board
(Bristol Industrial Development Board Sales Tax)
Series 2016-A
5.00%, 12/01/2035(a) | | | 9,080 | | | | 8,868,318 | |
5.125%, 12/01/2042(a) | | | 31,490 | | | | 30,567,425 | |
Series 2016-B
Zero Coupon, 12/01/2031(a) | | | 3,800 | | | | 2,614,574 | |
Knox County Industrial Development Board
(Tompaul Knoxville LLC)
Series 2022
8.75%, 11/01/2032(a) | | | 2,000 | | | | 2,044,601 | |
| | |
| |
| abfunds.com | | AB MUNICIPAL INCOME SHARES | 95 |
PORTFOLIO OF INVESTMENTS (continued)
| | | | | | | | |
| | | Principal
Amount
(000) | | | U.S. $ Value | |
| |
9.25%, 11/01/2042(a) | | $ | 5,450 | | | $ | 5,570,793 | |
9.50%, 11/01/2052(a) | | | 15,100 | | | | 15,432,618 | |
Metropolitan Government Nashville & Davidson County Health & Educational Facilities Board
(Trevecca Nazarene University)
Series 2021
4.00%, 10/01/2051 | | | 2,000 | | | | 1,692,158 | |
Metropolitan Government Nashville & Davidson County Health & Educational Facilities Board
(Vanderbilt University Medical Center Obligated Group)
Series 2016
5.00%, 07/01/2040 | | | 2,435 | | | | 2,477,341 | |
Series 2017-A
5.00%, 07/01/2048 | | | 2,335 | | | | 2,366,143 | |
Metropolitan Government Nashville & Davidson County Industrial Development Board
(Nashville & Davidson County TN South Nashville Central Business Improvement Dist)
Series 2021
Zero Coupon, 06/01/2043(a) | | | 7,250 | | | | 2,931,596 | |
Metropolitan Nashville Airport Authority (The)
Series 2022-B
5.25%, 07/01/2047 | | | 12,500 | | | | 13,240,313 | |
5.50%, 07/01/2052 | | | 9,000 | | | | 9,659,057 | |
Tennergy Corp./TN
(Nomura Holdings, Inc.)
Series 2022-A
5.50%, 10/01/2053 | | | 27,000 | | | | 29,204,374 | |
Tennergy Corp./TN
(Royal Bank of Canada)
Series 2024
5.00%, 10/01/2054 | | | 41,975 | | | | 44,618,959 | |
Tennessee Energy Acquisition Corp.
(Goldman Sachs Group, Inc. (The))
Series 2021
5.00%, 05/01/2052 | | | 17,820 | | | | 19,075,934 | |
Series 2023-A
5.00%, 05/01/2053 | | | 26,300 | | | | 27,346,661 | |
Wilson County Health & Educational Facilities Board
(Limestone Trail Apartments)
Series 2021
4.00%, 12/01/2039 | | | 10,000 | | | | 8,509,437 | |
| | |
| |
96 | AB MUNICIPAL INCOME SHARES | | abfunds.com |
PORTFOLIO OF INVESTMENTS (continued)
| | | | | | | | |
| | | Principal
Amount
(000) | | | U.S. $ Value | |
| |
4.25%, 12/01/2024 | | $ | 6,000 | | | $ | 5,979,923 | |
| | | | | | | | |
| | | | | | | 232,200,225 | |
| | | | | | | | |
Texas – 5.5% | | | | | | | | |
Abilene Convention Center Hotel Development Corp.
(City of Abilene TX Abilene Convention Center Revenue)
Series 2021-A
4.00%, 10/01/2050 | | | 4,070 | | | | 3,257,009 | |
Series 2021-B
5.00%, 10/01/2050(a) | | | 11,140 | | | | 9,544,334 | |
Arlington Higher Education Finance Corp.
(BASIS Texas Charter Schools, Inc.)
Series 2021
4.50%, 06/15/2056(a) | | | 1,000 | | | | 1,000,105 | |
Series 2023
4.875%, 06/15/2056(a) | | | 1,500 | | | | 1,513,469 | |
Series 2024
4.25%, 06/15/2039(a) | | | 1,095 | | | | 1,070,215 | |
4.50%, 06/15/2044(a) | | | 830 | | | | 796,497 | |
4.75%, 06/15/2049(a) | | | 1,830 | | | | 1,788,332 | |
4.875%, 06/15/2059(a) | | | 1,000 | | | | 977,856 | |
5.00%, 06/15/2064(a) | | | 1,500 | | | | 1,484,583 | |
Arlington Higher Education Finance Corp.
(Cypress Christian School, Inc.)
Series 2024-2
6.00%, 06/01/2053(a) | | | 5,080 | | | | 5,211,325 | |
6.25%, 06/01/2063(a) | | | 9,155 | | | | 9,465,557 | |
Arlington Higher Education Finance Corp.
(Magellan School (The))
Series 2022
6.25%, 06/01/2052(a) | | | 6,015 | | | | 6,270,431 | |
6.375%, 06/01/2062(a) | | | 9,785 | | | | 10,213,894 | |
Arlington Higher Education Finance Corp.
(Wayside Schools)
Series 2021-A
4.00%, 08/15/2036 | | | 500 | | | | 469,325 | |
4.00%, 08/15/2046 | | | 695 | | | | 591,015 | |
Baytown Municipal Development District
(Baytown Municipal Development District Baytown Convention Center Hotel Revenue)
Series 2021
4.00%, 10/01/2045 | | | 8,545 | | | | 7,486,387 | |
4.00%, 10/01/2050 | | | 3,815 | | | | 3,227,971 | |
| | |
| |
| abfunds.com | | AB MUNICIPAL INCOME SHARES | 97 |
PORTFOLIO OF INVESTMENTS (continued)
| | | | | | | | |
| | | Principal
Amount
(000) | | | U.S. $ Value | |
| |
Board of Regents of the University of Texas System
Series 2019-B
5.00%, 08/15/2049 | | $ | 11,000 | | | $ | 12,607,511 | |
Brazoria County Industrial Development Corp.
(Aleon Renewable Metals LLC)
Series 2022
10.00%, 06/01/2042(a) | | | 10,000 | | | | 9,000,000 | |
Series 2023
12.00%, 06/01/2043(a) | | | 2,500 | | | | 2,488,909 | |
Central Texas Regional Mobility Authority
Series 2020-A
5.00%, 01/01/2044 | | | 2,230 | | | | 2,323,957 | |
5.00%, 01/01/2049 | | | 3,940 | | | | 4,068,347 | |
Series 2021-B
5.00%, 01/01/2046 | | | 4,600 | | | | 4,794,915 | |
Central Texas Turnpike System
Series 2024-A
5.00%, 08/15/2038 | | | 8,100 | | | | 8,945,971 | |
Series 2024-C
5.00%, 08/15/2038 | | | 14,700 | | | | 16,197,221 | |
5.00%, 08/15/2041 | | | 3,500 | | | | 3,781,135 | |
5.00%, 08/15/2042 | | | 1,850 | | | | 1,990,056 | |
City of Abilene TX
(Pre-refunded – US Treasuries)
Series 2015
5.00%, 02/15/2032 | | | 1,330 | | | | 1,336,022 | |
City of Dallas Housing Finance Corp.
(DHFC The Briscoe Apartments LLC)
Series 2022
Zero Coupon, 12/01/2062(a) | | | 183,265 | | | | 12,562,779 | |
6.00%, 12/01/2062 | | | 20,940 | | | | 20,499,887 | |
City of Dallas Housing Finance Corp.
(DHFC The Dylan Apartments LLC)
Series 2022
6.00%, 12/01/2062(a) | | | 10,025 | | | | 9,643,583 | |
6.25%, 12/01/2054(a) | | | 4,070 | | | | 3,706,103 | |
City of Dallas TX
Series 2020-A
5.00%, 02/15/2025 | | | 7,125 | | | | 7,155,837 | |
Series 2021
5.00%, 02/15/2025 | | | 5,000 | | | | 5,021,930 | |
City of Fort Worth TX
Series 2020
5.00%, 03/01/2025 | | | 7,630 | | | | 7,670,774 | |
| | |
| |
98 | AB MUNICIPAL INCOME SHARES | | abfunds.com |
PORTFOLIO OF INVESTMENTS (continued)
| | | | | | | | |
| | | Principal
Amount
(000) | | | U.S. $ Value | |
| |
City of Houston TX
Series 2021-B
2.047%, 03/01/2033 | | $ | 2,495 | | | $ | 2,048,928 | |
2.147%, 03/01/2034 | | | 7,405 | | | | 5,970,884 | |
City of Houston TX
(City of Houston TX Hotel Occupancy Tax)
Series 2015
5.00%, 09/01/2030 | | | 1,965 | | | | 1,967,313 | |
City of Houston TX Airport System Revenue
AGM Series 2023
5.25%, 07/01/2042 | | | 5,000 | | | | 5,409,708 | |
5.25%, 07/01/2043 | | | 5,000 | | | | 5,389,713 | |
5.25%, 07/01/2048 | | | 5,000 | | | | 5,330,800 | |
City of Houston TX Airport System Revenue
(United Airlines, Inc.)
Series 2014
5.00%, 07/01/2029 | | | 16,960 | | | | 16,965,236 | |
Series 2015-B
5.00%, 07/15/2030 | | | 1,960 | | | | 1,969,751 | |
5.00%, 07/15/2035 | | | 1,000 | | | | 1,002,725 | |
Series 2018
5.00%, 07/15/2028 | | | 22,875 | | | | 23,557,469 | |
Series 2020
5.00%, 07/01/2027 | | | 1,750 | | | | 1,788,030 | |
5.00%, 07/15/2027 | | | 2,500 | | | | 2,555,225 | |
City of San Antonio TX Electric & Gas Systems Revenue
Series 2021-A
5.00%, 02/01/2046 | | | 5,000 | | | | 5,226,651 | |
Series 2024-A
5.25%, 02/01/2049 | | | 10,000 | | | | 10,956,996 | |
Clifton Higher Education Finance Corp.
(Valor Texas Education Foundation)
Series 2023-A
5.50%, 06/15/2033(a) | | | 1,000 | | | | 1,025,412 | |
6.00%, 06/15/2043(a) | | | 3,365 | | | | 3,427,162 | |
6.00%, 06/15/2048(a) | | | 4,125 | | | | 4,153,744 | |
6.25%, 06/15/2053(a) | | | 5,000 | | | | 5,075,237 | |
Conroe Local Government Corp.
(Conroe Local Government Corp. Conroe Convention Center Hotel)
Series 2021
4.00%, 10/01/2050 | | | 1,525 | | | | 1,361,928 | |
County of Denton TX
Series 2024
4.00%, 07/15/2044 | | | 1,000 | | | | 980,190 | |
| | |
| |
| abfunds.com | | AB MUNICIPAL INCOME SHARES | 99 |
PORTFOLIO OF INVESTMENTS (continued)
| | | | | | | | |
| | | Principal
Amount
(000) | | | U.S. $ Value | |
| |
County of Harris TX Toll Road Revenue
Series 2024-A
4.00%, 08/15/2054 | | $ | 5,500 | | | $ | 5,196,462 | |
County of Williamson TX
(Pre-refunded – US Treasuries)
Series 2015
5.00%, 02/15/2038 | | | 2,400 | | | | 2,410,170 | |
Dallas County Flood Control District No. 1
Series 2015
5.00%, 04/01/2028(a) | | | 1,650 | | | | 1,650,081 | |
Dallas Fort Worth International Airport
Series 2022-A
4.507%, 11/01/2051 | | | 2,000 | | | | 1,800,091 | |
Harris County Industrial Development Corp.
(Energy Transfer LP)
Series 2023
4.05%, 11/01/2050 | | | 24,195 | | | | 24,337,317 | |
Hidalgo County Regional Mobility Authority
Series 2022-A
Zero Coupon, 12/01/2042 | | | 2,000 | | | | 824,610 | |
Zero Coupon, 12/01/2051 | | | 11,540 | | | | 2,858,234 | |
Zero Coupon, 12/01/2054 | | | 3,340 | | | | 700,499 | |
Zero Coupon, 12/01/2056 | | | 17,105 | | | | 3,213,451 | |
Series 2022-B
Zero Coupon, 12/01/2042 | | | 1,395 | | | | 548,422 | |
Zero Coupon, 12/01/2043 | | | 2,000 | | | | 743,870 | |
Zero Coupon, 12/01/2044 | | | 5,640 | | | | 1,976,698 | |
Zero Coupon, 12/01/2055 | | | 2,895 | | | | 515,392 | |
Zero Coupon, 12/01/2056 | | | 5,000 | | | | 839,442 | |
Irving Hospital Authority
(Baylor Medical Center at Irving)
Series 2017-A
5.00%, 10/15/2044 | | | 8,505 | | | | 8,547,906 | |
Mansfield Independent School District
(Pre-refunded – US Govt Agencies)
Series 2015
5.00%, 02/15/2045 | | | 13,000 | | | | 13,060,371 | |
McKinney Independent School District
Series 2024
5.00%, 02/15/2025 | | | 10,000 | | | | 10,048,217 | |
Mission Economic Development Corp.
(Natgasoline LLC)
Series 2018
4.625%, 10/01/2031(a) | | | 25,610 | | | | 25,615,291 | |
| | |
| |
100 | AB MUNICIPAL INCOME SHARES | | abfunds.com |
PORTFOLIO OF INVESTMENTS (continued)
| | | | | | | | |
| | | Principal
Amount
(000) | | | U.S. $ Value | |
| |
New Hope Cultural Education Facilities Finance Corp.
(Army Retirement Residence Obligated Group)
Series 2022
5.75%, 07/15/2052 | | $ | 4,490 | | | $ | 4,577,123 | |
6.00%, 07/15/2057 | | | 10,300 | | | | 10,614,807 | |
New Hope Cultural Education Facilities Finance Corp.
(BSPV – Plano LLC)
Series 2023
0.00%, 12/31/2030 | | | 1,388 | | | | 872,422 | |
7.25%, 12/31/2030 | | | 7,820 | | | | 7,779,571 | |
New Hope Cultural Education Facilities Finance Corp.
(Buckingham Senior Living Community, Inc. Obligated Group)
Series 2021
2.00%, 11/15/2061(d)(f)(g) | | | 210 | | | | 76,388 | |
7.50%, 11/15/2036(d)(f) | | | 50 | | | | 42,454 | |
7.50%, 11/15/2037(d)(f) | | | 10 | | | | 8,210 | |
New Hope Cultural Education Facilities Finance Corp.
(Dwyer Workforce Development)
Series 2023
8.50%, 09/01/2027(e) | | | 22,190 | | | | 22,261,598 | |
New Hope Cultural Education Facilities Finance Corp.
(Legacy at Midtown Park, Inc. Obligated Group)
Series 2018-A
5.50%, 07/01/2054 | | | 10,200 | | | | 7,661,142 | |
New Hope Cultural Education Facilities Finance Corp.
(Morningside Ministries Obligated Group)
Series 2020
5.00%, 01/01/2040 | | | 790 | | | | 711,326 | |
5.00%, 01/01/2055 | | | 3,010 | | | | 2,426,364 | |
Series 2022
4.00%, 01/01/2047 | | | 4,575 | | | | 3,296,919 | |
4.25%, 01/01/2057 | | | 1,380 | | | | 957,795 | |
5.00%, 01/01/2057 | | | 2,950 | | | | 2,359,598 | |
New Hope Cultural Education Facilities Finance Corp.
(Outlook at Windhaven Forefront Living Obligated Group)
Series 2022
6.875%, 10/01/2057 | | | 500 | | | | 496,477 | |
| | |
| |
| abfunds.com | | AB MUNICIPAL INCOME SHARES | 101 |
PORTFOLIO OF INVESTMENTS (continued)
| | | | | | | | |
| | | Principal
Amount
(000) | | | U.S. $ Value | |
| |
Newark Higher Education Finance Corp.
(Abilene Christian University)
Series 2022
4.00%, 04/01/2057 | | $ | 10,000 | | | $ | 8,743,477 | |
North East Texas Regional Mobility Authority
Series 2016
5.00%, 01/01/2046 | | | 4,940 | | | | 4,978,002 | |
North Texas Tollway Authority
(North Texas Tollway System)
Series 2017-B
5.00%, 01/01/2033 | | | 1,400 | | | | 1,447,970 | |
5.00%, 01/01/2043 | | | 6,000 | | | | 6,117,371 | |
Port of Beaumont Navigation District
(Jefferson 2020 Bond Lessee & Borrower LLC Obligated Group)
Series 2024
5.00%, 01/01/2039(a) | | | 3,470 | | | | 3,569,768 | |
5.125%, 01/01/2044(a) | | | 4,175 | | | | 4,287,860 | |
5.25%, 01/01/2054(a) | | | 2,900 | | | | 2,983,353 | |
10.00%, 07/01/2026(a) | | | 4,000 | | | | 4,092,047 | |
Port of Beaumont Navigation District
(Jefferson Railport Terminal II LLC)
Series 2021
2.125%, 01/01/2028(a) | | | 540 | | | | 506,872 | |
2.25%, 01/01/2029(a) | | | 800 | | | | 737,633 | |
2.50%, 01/01/2030(a) | | | 905 | | | | 825,768 | |
2.625%, 01/01/2031(a) | | | 500 | | | | 450,924 | |
Red River Health Facilities Development Corp.
(Pre-refunded – US Treasuries)
Series 2014-A
7.75%, 11/15/2044 | | | 1,315 | | | | 1,316,939 | |
Tarrant County Cultural Education Facilities Finance Corp.
5.00%, 11/15/2045(d)(f)(k)(m) | | | 2,896 | | | | – 0 | – |
5.25%, 11/15/2047(d)(f)(k)(m) | | | 894 | | | | – 0 | – |
Tarrant County Cultural Education Facilities Finance Corp.
(Cumberland Rest, Inc./The Obligated Group)
Series 2024
5.00%, 10/01/2044 | | | 1,175 | | | | 1,257,550 | |
Tarrant County Cultural Education Facilities Finance Corp.
(Edgemere Retirement Senior Quality Lifestyles Corp.)
5.00%, 11/15/2030(d)(f)(k)(m) | | | 3,273 | | | | – 0 | – |
| | |
| |
102 | AB MUNICIPAL INCOME SHARES | | abfunds.com |
PORTFOLIO OF INVESTMENTS (continued)
| | | | | | | | |
| | | Principal
Amount
(000) | | | U.S. $ Value | |
| |
Tarrant County Cultural Education Facilities Finance Corp.
(Stayton at Museum Way)
Series 2020-A
5.75%, 12/01/2054(d)(f) | | $ | 6,485 | | | $ | 4,085,585 | |
Texas Municipal Gas Acquisition & Supply Corp. III
(Macquarie Group Ltd.)
Series 2021
5.00%, 12/15/2029 | | | 4,710 | | | | 4,969,033 | |
5.00%, 12/15/2031 | | | 4,775 | | | | 5,081,528 | |
Texas Municipal Gas Acquisition & Supply Corp. IV
(BP PLC)
Series 2023-A
5.50%, 01/01/2054 | | | 1,660 | | | | 1,787,679 | |
Series 2023-B
5.50%, 01/01/2054 | | | 46,605 | | | | 52,152,687 | |
Texas Municipal Gas Acquisition and Supply Corp. I
(Bank of America Corp.)
Series 2008-D
6.25%, 12/15/2026 | | | 4,955 | | | | 5,091,743 | |
Texas Private Activity Bond Surface Transportation Corp.
(NTE Mobility Partners LLC)
Series 2019
4.00%, 12/31/2037 | | | 4,000 | | | | 3,945,110 | |
5.00%, 12/31/2031 | | | 5,000 | | | | 5,329,655 | |
Series 2023
5.50%, 12/31/2058 | | | 42,420 | | | | 45,512,079 | |
Texas Private Activity Bond Surface Transportation Corp.
(NTE Mobility Partners Segments 3 LLC)
Series 2019
5.00%, 06/30/2058 | | | 56,150 | | | | 56,914,982 | |
Texas State University System
Series 2017-A
5.00%, 03/15/2025 | | | 3,910 | | | | 3,934,931 | |
Texas Transportation Commission State Highway 249 System
Series 2019
5.00%, 08/01/2057 | | | 56,130 | | | | 57,094,302 | |
| | |
| |
| abfunds.com | | AB MUNICIPAL INCOME SHARES | 103 |
PORTFOLIO OF INVESTMENTS (continued)
| | | | | | | | |
| | | Principal
Amount
(000) | | | U.S. $ Value | |
| |
Uptown Development Authority
(City of Houston TX Reinvestment Zone No. 16)
Series 2017-A
5.00%, 09/01/2035 | | $ | 1,015 | | | $ | 1,022,391 | |
| | | | | | | | |
| | | | | | | 761,592,301 | |
| | | | | | | | |
Utah – 0.5% | | | | | | | | |
Black Desert Public Infrastructure District
(Black Desert Public Infrastructure District Black Desert Assessment Area No. 1)
Series 2024
5.625%, 12/01/2053(a) | | | 10,200 | | | | 10,448,642 | |
Grapevine Wash Local District
Series 2024-A
6.00%, 03/01/2055(a) | | | 13,000 | | | | 12,510,462 | |
Grapevine Wash Local District
(Grapevine Wash Local District Assessment Area No. 1)
Series 2024-A
5.25%, 12/01/2044(a) | | | 12,300 | | | | 11,916,702 | |
MIDA Mountain Veterans Program Public Infrastructure District
Series 2024
5.00%, 06/01/2044(a) | | | 1,000 | | | | 994,105 | |
5.20%, 06/01/2054(a) | | | 3,625 | | | | 3,631,598 | |
Military Installation Development Authority
(Military Installation Development Authority Military Recreation Assessment Area)
Series 2021-A
4.00%, 06/01/2052 | | | 5,000 | | | | 4,172,360 | |
Utah Infrastructure Agency
Series 2022
5.00%, 10/15/2032 | | | 1,000 | | | | 1,056,105 | |
5.00%, 10/15/2037 | | | 1,410 | | | | 1,467,317 | |
5.00%, 10/15/2046 | | | 3,250 | | | | 3,292,936 | |
Series 2023
5.625%, 10/15/2038 | | | 1,000 | | | | 1,102,684 | |
6.00%, 10/15/2047 | | | 2,765 | | | | 3,037,433 | |
Series 2024
5.00%, 10/15/2028 | | | 490 | | | | 511,855 | |
5.00%, 10/15/2029 | | | 515 | | | | 542,245 | |
5.00%, 10/15/2030 | | | 540 | | | | 570,682 | |
5.00%, 10/15/2031 | | | 570 | | | | 604,611 | |
5.00%, 10/15/2032 | | | 595 | | | | 633,293 | |
5.00%, 10/15/2033 | | | 625 | | | | 666,777 | |
5.00%, 10/15/2034 | | | 660 | | | | 704,452 | |
| | |
| |
104 | AB MUNICIPAL INCOME SHARES | | abfunds.com |
PORTFOLIO OF INVESTMENTS (continued)
| | | | | | | | |
| | | Principal
Amount
(000) | | | U.S. $ Value | |
| |
5.25%, 10/15/2036 | | $ | 535 | | | $ | 579,700 | |
5.25%, 10/15/2039 | | | 500 | | | | 535,657 | |
5.50%, 10/15/2044 | | | 1,050 | | | | 1,125,775 | |
5.50%, 10/15/2048 | | | 1,280 | | | | 1,353,849 | |
Wohali Public Infrastructure District No. 1
(Wohali Public Infrastructure District No. 1 Assessment Area No. 1)
Series 2023
7.00%, 12/01/2042(a) | | | 6,443 | | | | 6,472,807 | |
| | | | | | | | |
| | | | | | | 67,932,047 | |
| | | | | | | | |
Vermont – 0.1% | | | | | | | | |
Vermont Economic Development Authority
(Casella Waste Systems, Inc.)
Series 2018
4.625%, 04/01/2036(a) | | | 1,100 | | | | 1,127,386 | |
Series 2022
5.00%, 06/01/2052(a) | | | 3,750 | | | | 3,847,413 | |
Vermont Educational & Health Buildings Financing Agency
(St Michael’s College, Inc.)
Series 2023
5.25%, 10/01/2052(a) | | | 3,000 | | | | 2,588,253 | |
5.50%, 10/01/2043(a) | | | 2,500 | | | | 2,350,451 | |
| | | | | | | | |
| | | | | | | 9,913,503 | |
| | | | | | | | |
Virginia – 2.4% | | | | | | | | |
Atlantic Park Community Development Authority
(Atlantic Park Community Development Authority District)
Series 2023
6.25%, 08/01/2045(a) | | | 19,060 | | | | 18,113,730 | |
Cherry Hill Community Development Authority
(Potomac Shores Project)
Series 2015
5.15%, 03/01/2035(a) | | | 1,000 | | | | 1,002,355 | |
Fairfax County Industrial Development Authority
(Inova Health System Obligated Group)
Series 2022
4.00%, 05/15/2042 | | | 10,065 | | | | 10,008,454 | |
Henrico County Economic Development Authority
(Westminster-Canterbury Corp. Obligated Group)
Series 2022
5.00%, 10/01/2047 | | | 2,000 | | | | 2,101,332 | |
| | |
| |
| abfunds.com | | AB MUNICIPAL INCOME SHARES | 105 |
PORTFOLIO OF INVESTMENTS (continued)
| | | | | | | | |
| | | Principal
Amount
(000) | | | U.S. $ Value | |
| |
5.00%, 10/01/2052 | | $ | 4,500 | | | $ | 4,690,503 | |
James City County Economic Development Authority
(Williamsburg Landing, Inc. Obligated Group)
Series 2024
5.25%, 12/01/2027 | | | 1,900 | | | | 1,902,181 | |
Series 2024-A
6.875%, 12/01/2058 | | | 2,100 | | | | 2,319,385 | |
Tobacco Settlement Financing Corp./VA
Series 2007-B1
5.00%, 06/01/2047 | | | 7,490 | | | | 7,081,970 | |
US Bank Trust Co. NA
(Park Landing LP)
Series 2022-B
5.90%, 08/01/2052 | | | 16,002 | | | | 14,620,731 | |
Virginia Beach Development Authority
(Westminster-Canterbury on Chesapeake Bay Obligated Group)
Series 2023
5.375%, 09/01/2029 | | | 3,000 | | | | 3,108,430 | |
7.00%, 09/01/2053 | | | 3,665 | | | | 4,190,710 | |
7.00%, 09/01/2059 | | | 7,050 | | | | 8,010,551 | |
Virginia College Building Authority
(Commonwealth of Virginia State Lease)
Series 2022
5.00%, 02/01/2025 | | | 11,000 | | | | 11,041,501 | |
Virginia College Building Authority
(Marymount University)
Series 2015
5.00%, 07/01/2045(a) | | | 1,500 | | | | 1,312,283 | |
5.25%, 07/01/2035(a) | | | 1,200 | | | | 1,170,272 | |
Series 2015-A
5.00%, 07/01/2035(a) | | | 1,500 | | | | 1,432,976 | |
5.00%, 07/01/2045(a) | | | 1,610 | | | | 1,408,517 | |
Virginia College Building Authority
(Regent University)
Series 2021
4.00%, 06/01/2036 | | | 1,700 | | | | 1,633,915 | |
Virginia College Building Authority
(Virginia College Building Authority State Lease)
Series 2019-A
5.00%, 02/01/2025 | | | 16,695 | | | | 16,757,987 | |
Virginia Small Business Financing Authority
Series 2024-A
4.50%, 12/01/2044(i) | | | 3,450 | | | | 3,387,709 | |
| | |
| |
106 | AB MUNICIPAL INCOME SHARES | | abfunds.com |
PORTFOLIO OF INVESTMENTS (continued)
| | | | | | | | |
| | | Principal
Amount
(000) | | | U.S. $ Value | |
| |
5.00%, 12/01/2034(i) | | $ | 5,000 | | | $ | 5,361,711 | |
5.00%, 12/01/2039(i) | | | 3,000 | | | | 3,158,744 | |
Virginia Small Business Financing Authority
(95 Express Lanes LLC)
Series 2022
5.00%, 07/01/2038 | | | 4,250 | | | | 4,450,318 | |
4.00%, 01/01/2040 | | | 3,000 | | | | 2,866,594 | |
4.00%, 07/01/2040 | | | 500 | | | | 477,255 | |
Virginia Small Business Financing Authority
(Bon Secours Mercy Health, Inc.)
Series 2022
5.00%, 10/01/2040 | | | 10,000 | | | | 10,854,505 | |
Virginia Small Business Financing Authority
(Capital Beltway Express LLC)
Series 2022
5.00%, 12/31/2047 | | | 28,825 | | | | 29,959,402 | |
Virginia Small Business Financing Authority
(Elizabeth River Crossings OpCo LLC)
Series 2022
4.00%, 01/01/2030 | | | 3,070 | | | | 3,090,851 | |
4.00%, 01/01/2031 | | | 2,650 | | | | 2,658,082 | |
4.00%, 01/01/2033 | | | 7,500 | | | | 7,481,659 | |
4.00%, 01/01/2034 | | | 3,500 | | | | 3,475,924 | |
4.00%, 01/01/2037 | | | 10,000 | | | | 9,781,494 | |
Virginia Small Business Financing Authority
(I-66 Express Mobility Partners LLC)
Series 2017
5.00%, 12/31/2056 | | | 55,235 | | | | 55,820,955 | |
Virginia Small Business Financing Authority
(National Senior Campuses, Inc. Obligated Group)
Series 2020
4.00%, 01/01/2051 | | | 18,500 | | | | 16,149,181 | |
Virginia Small Business Financing Authority
(P3 VB Holdings LLC)
Series 2023
8.50%, 12/01/2052(a) | | | 13,290 | | | | 13,264,661 | |
Virginia Small Business Financing Authority
(Total Fiber Recovery @ Chesapeake LLC)
Series 2022
8.50%, 06/01/2042(e) | | | 24,285 | | | | 22,654,709 | |
9.245% (SOFR + 5.50%), 06/01/2029(c)(e) | | | 20,870 | | | | 19,663,612 | |
| | | | | | | | |
| | | | | | | 326,465,149 | |
| | | | | | | | |
| | |
| |
| abfunds.com | | AB MUNICIPAL INCOME SHARES | 107 |
PORTFOLIO OF INVESTMENTS (continued)
| | | | | | | | |
| | | Principal
Amount
(000) | | | U.S. $ Value | |
| |
Washington – 1.7% | | | | | | | | |
Central Puget Sound Regional Transit Authority
(Central Puget Sound Regional Transit Auth Sales Motor Vehicle & Rental Car Tax)
Series 2016-S
5.00%, 11/01/2046 | | $ | 11,000 | | | $ | 12,801,965 | |
Grays Harbor County Public Hospital District No. 1
Series 2023
6.875%, 12/01/2049 | | | 3,000 | | | | 3,355,128 | |
6.875%, 12/01/2053 | | | 1,155 | | | | 1,285,418 | |
King County Public Hospital District No. 4
Series 2015-A
5.00%, 12/01/2030 | | | 2,235 | | | | 2,244,976 | |
Pend Oreille County Public Utility District No. 1 Box Canyon
Series 2018
5.00%, 01/01/2048 | | | 9,000 | | | | 9,158,767 | |
Port of Seattle WA
Series 2015-C
5.00%, 04/01/2033 | | | 5,035 | | | | 5,037,273 | |
Series 2021
5.00%, 08/01/2046 | | | 12,550 | | | | 12,950,430 | |
State of Washington
Series 2024-R
5.00%, 07/01/2025 | | | 19,000 | | | | 19,225,977 | |
Washington Health Care Facilities Authority
(CommonSpirit Health)
Series 2019-A
5.00%, 08/01/2037 | | | 2,000 | | | | 2,098,314 | |
5.00%, 08/01/2039 | | | 5,970 | | | | 6,229,411 | |
Washington Health Care Facilities Authority
(Fred Hutchinson Cancer Center Obligated Group)
Series 2020
4.00%, 09/01/2045 | | | 2,045 | | | | 1,900,739 | |
5.00%, 09/01/2039 | | | 1,655 | | | | 1,759,669 | |
5.00%, 09/01/2045 | | | 2,070 | | | | 2,154,639 | |
5.00%, 09/01/2050 | | | 2,000 | | | | 2,066,456 | |
Washington Health Care Facilities Authority
(Overlake Hospital Medical Center Obligated Group)
Series 2017
4.00%, 07/01/2042 | | | 3,500 | | | | 3,208,323 | |
| | |
| |
108 | AB MUNICIPAL INCOME SHARES | | abfunds.com |
PORTFOLIO OF INVESTMENTS (continued)
| | | | | | | | |
| | | Principal
Amount
(000) | | | U.S. $ Value | |
| |
Series 2017-A
5.00%, 07/01/2035 | | $ | 2,350 | | | $ | 2,397,313 | |
5.00%, 07/01/2036 | | | 2,965 | | | | 3,020,475 | |
Series 2017-B
5.00%, 07/01/2034 | | | 1,855 | | | | 1,895,243 | |
Washington Health Care Facilities Authority
(Virginia Mason Medical Center Obligated Group)
Series 2017
5.00%, 08/15/2033 | | | 6,710 | | | | 6,885,031 | |
5.00%, 08/15/2035 | | | 5,750 | | | | 5,875,939 | |
5.00%, 08/15/2037 | | | 3,565 | | | | 3,634,434 | |
Washington State Convention Center Public Facilities District
Series 2021
4.00%, 07/01/2043 | | | 8,070 | | | | 7,655,499 | |
Washington State Convention Center Public Facilities District
(Washington State Convention Center Public Facilities Dist Lodging Tax Revenue)
Series 2021
4.00%, 07/01/2031 | | | 11,045 | | | | 11,145,715 | |
Washington State Housing Finance Commission
Series 2021-1, Class A
3.50%, 12/20/2035 | | | 18,622 | | | | 17,520,360 | |
Series 2021-1, Class X
0.726%, 12/20/2035(j) | | | 14,230 | | | | 598,884 | |
Series 2023-1, Class A
3.375%, 04/20/2037 | | | 22,322 | | | | 20,134,442 | |
Series 2023-1, Class X
1.449%, 04/20/2037(j) | | | 68,826 | | | | 7,159,303 | |
Washington State Housing Finance Commission
(Presbyterian Retirement Communities Northwest Obligated Group)
Series 2013
5.00%, 01/01/2028(a) | | | 845 | | | | 831,255 | |
5.25%, 01/01/2043(a) | | | 2,870 | | | | 2,613,169 | |
Series 2015
6.00%, 01/01/2045(a) | | | 2,920 | | | | 2,843,509 | |
Series 2016
4.00%, 01/01/2026(a) | | | 1,855 | | | | 1,842,473 | |
5.00%, 01/01/2031(a) | | | 5,305 | | | | 5,338,949 | |
5.00%, 01/01/2036(a) | | | 1,075 | | | | 1,075,759 | |
5.00%, 01/01/2046(a) | | | 1,140 | | | | 1,069,279 | |
| | |
| |
| abfunds.com | | AB MUNICIPAL INCOME SHARES | 109 |
PORTFOLIO OF INVESTMENTS (continued)
| | | | | | | | |
| | | Principal
Amount
(000) | | | U.S. $ Value | |
| |
Series 2019-A
5.00%, 01/01/2044(a) | | $ | 1,330 | | | $ | 1,263,969 | |
5.00%, 01/01/2049(a) | | | 3,305 | | | | 3,048,367 | |
5.00%, 01/01/2055(a) | | | 11,670 | | | | 10,515,939 | |
Washington State Housing Finance Commission
(Seattle Academy of Arts & Sciences)
Series 2023
5.625%, 07/01/2038(a) | | | 1,215 | | | | 1,325,192 | |
6.125%, 07/01/2053(a) | | | 5,805 | | | | 6,324,748 | |
6.25%, 07/01/2059(a) | | | 9,845 | | | | 10,751,526 | |
6.375%, 07/01/2063(a) | | | 4,250 | | | | 4,647,356 | |
Washington State Housing Finance Commission
(Spokane United Methodist Homes Obligated Group)
Series 2020
5.00%, 01/01/2051(a) | | | 2,000 | | | | 1,891,390 | |
5.00%, 01/01/2056(a) | | | 2,500 | | | | 2,325,315 | |
| | | | | | | | |
| | | | | | | 231,108,318 | |
| | | | | | | | |
West Virginia – 0.4% | | | | | | | | |
City of South Charleston WV
(City of South Charleston WV South Charleston Park Place Excise Tax District)
Series 2022
4.50%, 06/01/2050(a) | | | 1,000 | | | | 780,331 | |
Monongalia County Commission Excise Tax District
Series 2023
7.00%, 06/01/2043(a) | | | 2,475 | | | | 2,625,773 | |
8.00%, 06/01/2053(a)(g) | | | 13,590 | | | | 2,980,396 | |
Tobacco Settlement Finance Authority/WV
Series 2020
4.875%, 06/01/2049 | | | 6,980 | | | | 6,710,656 | |
West Virginia Economic Development Authority
(Appalachian Power Co.)
Series 2024
3.375%, 03/01/2040 | | | 6,250 | | | | 6,199,973 | |
West Virginia Economic Development Authority
(Arch Resources, Inc.)
Series 2021
4.125%, 07/01/2045 | | | 3,835 | | | | 3,836,678 | |
| | |
| |
110 | AB MUNICIPAL INCOME SHARES | | abfunds.com |
PORTFOLIO OF INVESTMENTS (continued)
| | | | | | | | |
| | | Principal
Amount
(000) | | | U.S. $ Value | |
| |
West Virginia Economic Development Authority
(Wyoming County Coal LLC)
Series 2023
9.00%, 06/01/2038(a) | | $ | 31,250 | | | $ | 32,241,556 | |
| | | | | | | | |
| | | | | | | 55,375,363 | |
| | | | | | | | |
Wisconsin – 4.2% | | | | | | | | |
St. Croix Chippewa Indians of Wisconsin
Series 2021
5.00%, 09/30/2041(a) | | | 8,850 | | | | 8,133,100 | |
State of Wisconsin
Series 2025-1
5.00%, 05/01/2034(i) | | | 2,625 | | | | 2,992,391 | |
5.00%, 05/01/2035(i) | | | 1,875 | | | | 2,152,020 | |
5.00%, 05/01/2036(i) | | | 1,230 | | | | 1,406,120 | |
Series 2025-2
5.00%, 05/01/2026(i) | | | 2,615 | | | | 2,675,024 | |
5.00%, 05/01/2027(i) | | | 5,000 | | | | 5,231,744 | |
5.00%, 05/01/2028(i) | | | 3,000 | | | | 3,200,100 | |
5.00%, 05/01/2029(i) | | | 5,000 | | | | 5,425,044 | |
5.00%, 05/01/2038(i) | | | 1,700 | | | | 1,928,995 | |
Wisconsin Center District
(Wisconsin Center District Ded Tax)
Series 2022
5.25%, 12/15/2061(a) | | | 6,995 | | | | 7,049,512 | |
Wisconsin Health & Educational Facilities Authority
(Forensic Science & Protective Medicine Collaboration, Inc.)
Series 2024
5.00%, 08/01/2027(a) | | | 10,200 | | | | 10,415,045 | |
Wisconsin Health & Educational Facilities Authority
(Marshfield Clinic Health System Obligated Group)
Series 2024
5.50%, 02/15/2054 | | | 10,000 | | | | 10,798,416 | |
AGM Series 2020
3.00%, 02/15/2038 | | | 1,035 | | | | 899,945 | |
5.00%, 02/15/2031 | | | 2,000 | | | | 2,138,082 | |
BAM Series 2024
4.50%, 02/15/2054 | | | 2,000 | | | | 1,925,685 | |
Wisconsin Health & Educational Facilities Authority
(Oakwood Lutheran Senior Ministries Obligated Group)
Series 2021
4.00%, 01/01/2037 | | | 1,550 | | | | 1,486,219 | |
| | |
| |
| abfunds.com | | AB MUNICIPAL INCOME SHARES | 111 |
PORTFOLIO OF INVESTMENTS (continued)
| | | | | | | | |
| | | Principal
Amount
(000) | | | U.S. $ Value | |
| |
4.00%, 01/01/2057 | | $ | 9,815 | | | $ | 8,011,447 | |
Wisconsin Health & Educational Facilities Authority
(St. Camillus Health System Obligated Group)
Series 2019
5.00%, 11/01/2039 | | | 950 | | | | 954,210 | |
5.00%, 11/01/2046 | | | 870 | | | | 837,537 | |
5.00%, 11/01/2054 | | | 3,295 | | | | 3,068,428 | |
Wisconsin Housing & Economic Development Authority
(Roers Sun Prairie Apartments Owner LLC)
Series 2022
4.625%, 03/15/2040(a) | | | 2,510 | | | | 2,254,723 | |
Series 2022-A
3.875%, 12/01/2039(a) | | | 11,525 | | | | 10,300,391 | |
Wisconsin Public Finance Authority
Series 2024 Zero Coupon, 12/15/2034(a) | | | 9,962 | | | | 5,451,063 | |
5.50%, 12/15/2038(a) | | | 14,700 | | | | 14,714,481 | |
5.50%, 07/01/2044 | | | 2,600 | | | | 2,759,716 | |
5.75%, 07/01/2049 | | | 4,000 | | | | 4,271,393 | |
5.75%, 07/01/2054 | | | 2,000 | | | | 2,129,345 | |
Wisconsin Public Finance Authority
(21st Century Public Academy)
Series 2020
5.00%, 06/01/2049(a) | | | 1,340 | | | | 1,178,170 | |
Wisconsin Public Finance Authority
(Bancroft Neurohealth Obligated Group)
Series 2016
5.125%, 06/01/2048(a) | | | 3,335 | | | | 3,287,725 | |
Wisconsin Public Finance Authority
(Blue Ridge Healthcare Obligated Group)
Series 2020
4.00%, 01/01/2045 | | | 1,500 | | | | 1,414,024 | |
5.00%, 01/01/2038 | | | 550 | | | | 574,953 | |
5.00%, 01/01/2039 | | | 700 | | | | 728,420 | |
5.00%, 01/01/2040 | | | 500 | | | | 518,570 | |
Wisconsin Public Finance Authority
(Carmelite System, Inc. Obligated Group (The))
Series 2020
5.00%, 01/01/2045 | | | 2,030 | | | | 2,071,608 | |
Wisconsin Public Finance Authority
(Catholic Bishop of Chicago (The))
Series 2021
5.75%, 07/25/2041(e) | | | 57,000 | | | | 51,564,543 | |
| | |
| |
112 | AB MUNICIPAL INCOME SHARES | | abfunds.com |
PORTFOLIO OF INVESTMENTS (continued)
| | | | | | | | |
| | | Principal
Amount
(000) | | | U.S. $ Value | |
| |
Wisconsin Public Finance Authority
(Celanese US Holdings LLC)
Series 2016-B
5.00%, 12/01/2025 | | $ | 1,000 | | | $ | 1,011,550 | |
Series 2016-C
4.30%, 11/01/2030 | | | 2,060 | | | | 2,064,595 | |
Wisconsin Public Finance Authority
(CFC-SA LLC)
Series 2022
5.00%, 02/01/2052 | | | 17,600 | | | | 17,851,569 | |
5.00%, 02/01/2062 | | | 14,890 | | | | 15,023,474 | |
5.50%, 02/01/2042(a) | | | 5,950 | | | | 6,178,676 | |
5.75%, 02/01/2052(a) | | | 16,500 | | | | 17,148,527 | |
6.00%, 02/01/2062(a) | | | 20,960 | | | | 22,153,611 | |
Wisconsin Public Finance Authority
(Crossroads Health Project)
Series 2023
8.00%, 07/01/2053(a) | | | 14,895 | | | | 15,478,240 | |
8.125%, 07/01/2058(a) | | | 14,900 | | | | 15,485,439 | |
Wisconsin Public Finance Authority
(FAH Tree House LLC)
Series 2023
6.50%, 08/01/2053(a) | | | 18,100 | | | | 18,067,239 | |
6.625%, 02/01/2046(a) | | | 12,500 | | | | 11,477,232 | |
Wisconsin Public Finance Authority
(Gannon University)
Series 2017
5.00%, 05/01/2042 | | | 1,500 | | | | 1,496,328 | |
5.00%, 05/01/2047 | | | 2,750 | | | | 2,671,066 | |
Wisconsin Public Finance Authority
(KDC Agribusiness LLC)
12.00%, 09/14/2023(f)(k)(l)(m) | | | 9,807 | | | | – 0 | – |
Series 2022
15.00%, 04/30/2023(e)(f)(k)(l)(m) | | | 21,900 | | | | – 0 | – |
Series 2023
15.00%, 04/30/2023(e)(f)(k)(l)(m) | | | 4,895 | | | | 49 | |
Wisconsin Public Finance Authority
(Lackland Project)
Series 2024
Zero Coupon, 02/01/2031 | | | 12,280 | | | | 7,878,492 | |
Wisconsin Public Finance Authority
(Lehigh Valley Health Network, Inc.)
Series 2023
6.625%, 12/01/2032(a) | | | 1,040 | | | | 1,045,476 | |
7.25%, 12/01/2042(a) | | | 7,775 | | | | 7,896,129 | |
7.50%, 12/01/2052(a) | | | 5,400 | | | | 5,532,975 | |
| | |
| |
| abfunds.com | | AB MUNICIPAL INCOME SHARES | 113 |
PORTFOLIO OF INVESTMENTS (continued)
| | | | | | | | |
| | | Principal
Amount
(000) | | | U.S. $ Value | |
| |
Wisconsin Public Finance Authority
(McLemore Resort Manager LLC)
Series 2021
4.50%, 06/01/2056(a) | | $ | 13,735 | | | $ | 10,977,126 | |
Wisconsin Public Finance Authority
(Moses H Cone Memorial Hospital Obligated Group)
Series 2022-A
5.00%, 10/01/2052(a)(b) | | | 10,000 | | | | 10,475,963 | |
Wisconsin Public Finance Authority
(National Senior Communities, Inc. Obligated Group)
Series 2022
4.00%, 01/01/2047 | | | 1,400 | | | | 1,248,239 | |
4.00%, 01/01/2052 | | | 2,350 | | | | 2,027,363 | |
Wisconsin Public Finance Authority
(North San Gabriel Municipal Utility District No. 1)
Series 2023
Zero Coupon, 09/01/2029(a) | | | 8,000 | | | | 5,686,089 | |
Wisconsin Public Finance Authority
(Pine Lake Preparatory, Inc.)
Series 2015
5.25%, 03/01/2035(a) | | | 1,550 | | | | 1,554,692 | |
5.50%, 03/01/2045(a) | | | 3,510 | | | | 3,517,730 | |
Wisconsin Public Finance Authority
(Pre-refunded – US Treasuries)
Series 2014-A
5.75%, 11/15/2044(a) | | | 1,000 | | | | 1,000,652 | |
Series 2020
5.00%, 04/01/2030(a) | | | 25 | | | | 26,650 | |
5.00%, 04/01/2040(a) | | | 80 | | | | 87,939 | |
5.00%, 04/01/2050(a) | | | 335 | | | | 368,246 | |
Series 2022
4.00%, 04/01/2032(a) | | | 15 | | | | 15,553 | |
4.00%, 04/01/2052(a) | | | 40 | | | | 42,548 | |
Wisconsin Public Finance Authority
(QCF Behavioral Hospitals I Obligated Group)
Series 2024
7.50%, 07/01/2059(a) | | | 15,500 | | | | 17,232,185 | |
Wisconsin Public Finance Authority
(Queens University of Charlotte)
Series 2022
5.25%, 03/01/2042 | | | 12,000 | | | | 12,313,879 | |
5.25%, 03/01/2047 | | | 5,100 | | | | 5,168,276 | |
| | |
| |
114 | AB MUNICIPAL INCOME SHARES | | abfunds.com |
PORTFOLIO OF INVESTMENTS (continued)
| | | | | | | | |
| | | Principal
Amount
(000) | | | U.S. $ Value | |
| |
Wisconsin Public Finance Authority
(RBS Evolution LLC)
Series 2023
10.00%, 11/01/2038(a) | | $ | 19,400 | | | $ | 21,952,138 | |
Wisconsin Public Finance Authority
(Roseman University of Health Sciences)
Series 2020
5.00%, 04/01/2030(a) | | | 475 | | | | 491,358 | |
5.00%, 04/01/2040(a) | | | 1,320 | | | | 1,359,925 | |
5.00%, 04/01/2050(a) | | | 6,150 | | | | 6,209,209 | |
Series 2022
4.00%, 04/01/2052(a) | | | 2,615 | | | | 2,288,705 | |
Wisconsin Public Finance Authority
(Samaritan Housing Foundation Obligated Group)
Series 2021
4.00%, 06/01/2056(a) | | | 29,090 | | | | 23,476,398 | |
Series 2022
4.00%, 06/01/2049(a) | | | 3,880 | | | | 3,266,934 | |
Wisconsin Public Finance Authority
(Seabury Retirement Community)
Series 2015-A
5.00%, 09/01/2030(a) | | | 545 | | | | 545,252 | |
Wisconsin Public Finance Authority
(Signorelli Projects)
Series 2024
5.375%, 12/15/2032(a) | | | 8,000 | | | | 8,003,858 | |
Wisconsin Public Finance Authority
(Southeast Overtown Park West Community Redevelopment Agency)
Series 2024
5.00%, 06/01/2041(a) | | | 12,500 | | | | 12,812,409 | |
Wisconsin Public Finance Authority
(Southeastern Regional Medical Center Obligated Group)
Series 2021
4.00%, 02/01/2046 | | | 8,000 | | | | 6,405,318 | |
4.00%, 02/01/2051 | | | 11,500 | | | | 8,853,740 | |
Wisconsin Public Finance Authority
(Triad Math & Science Academy Co.)
Series 2021
4.00%, 06/15/2051 | | | 6,415 | | | | 5,628,612 | |
4.00%, 06/15/2061 | | | 1,035 | | | | 869,834 | |
Series 2022
5.00%, 06/15/2042 | | | 1,140 | | | | 1,168,850 | |
5.25%, 06/15/2052 | | | 1,610 | | | | 1,653,083 | |
5.375%, 06/15/2057 | | | 2,320 | | | | 2,390,213 | |
| | |
| |
| abfunds.com | | AB MUNICIPAL INCOME SHARES | 115 |
PORTFOLIO OF INVESTMENTS (continued)
| | | | | | | | |
| | | Principal
Amount
(000) | | | U.S. $ Value | |
| |
5.50%, 06/15/2050 | | $ | 650 | | | $ | 677,199 | |
5.50%, 06/15/2062 | | | 4,025 | | | | 4,162,445 | |
Wisconsin Public Finance Authority
(UMA Education, Inc.)
Series 2019
5.00%, 10/01/2034(a) | | | 15,970 | | | | 16,388,955 | |
5.00%, 10/01/2039(a) | | | 5,035 | | | | 5,102,851 | |
Wisconsin Public Finance Authority
(UNC Health Appalachian Obligated Group)
Series 2021
4.00%, 07/01/2046 | | | 1,100 | | | | 902,455 | |
Wisconsin Public Finance Authority
(Uwharrie Charter Academy)
Series 2022
5.00%, 06/15/2052(a) | | | 4,315 | | | | 4,238,642 | |
5.00%, 06/15/2057(a) | | | 6,105 | | | | 5,941,868 | |
5.00%, 06/15/2062(a) | | | 8,090 | | | | 7,797,621 | |
Wisconsin Public Finance Authority
(Washoe Barton Medical Clinic)
Series 2021
4.00%, 12/01/2031(a) | | | 2,450 | | | | 2,362,703 | |
4.00%, 12/01/2041(a) | | | 2,405 | | | | 2,173,454 | |
4.00%, 12/01/2051(a) | | | 4,210 | | | | 3,577,779 | |
Wisconsin Public Finance Authority
(WFCS Holdings II LLC)
Series 2021-A1
5.00%, 01/01/2056(a) | | | 4,915 | | | | 4,793,396 | |
| | | | | | | | |
| | | | | | | 589,647,190 | |
| | | | | | | | |
Total Long-Term Municipal Bonds
(cost $14,638,299,730) | | | | | | | 14,345,309,175 | |
| | | | | | | | |
| | | | | | | | |
Short-Term Municipal Notes – 0.1% | | | | | | | | |
Florida – 0.1% | | | | | | | | |
Escambia County Housing Finance Authority
(4900 S. Rio Grande Avenue LP)
Series 2023-A
6.88%, 11/01/2053(a) | | | 2,780 | | | | 3,055,549 | |
Series 2023-B
6.45%, 05/01/2027(a) | | | 7,665 | | | | 7,864,149 | |
| | | | | | | | |
| | |
Total Short-Term Municipal Notes
(cost $10,445,000) | | | | | | | 10,919,698 | |
| | | | | | | | |
| | |
Total Municipal Obligations
(cost $14,648,744,730) | | | | | | | 14,356,228,873 | |
| | | | | | | | |
| | | | | | | | |
| | |
| |
116 | AB MUNICIPAL INCOME SHARES | | abfunds.com |
PORTFOLIO OF INVESTMENTS (continued)
| | | | | | | | |
| | | Principal
Amount
(000) | | | U.S. $ Value | |
| |
COMMERCIAL MORTGAGE-BACKED SECURITIES – 0.3% | | | | | | | | |
Non-Agency Fixed Rate CMBS – 0.2% | | | | | | | | |
City of Fort Wayne IN
10.75%, 12/01/2029(d)(f) | | $ | 1,243 | | | $ | 124 | |
New Hampshire Business Finance Authority
Series 2024-2, Class A
3.625%, 08/20/2039 | | | 7,880 | | | | 7,363,436 | |
Series 2024-3
4.03%, 10/20/2041 | | | 19,159 | | | | 18,395,369 | |
| | | | | | | | |
| | | | | | | 25,758,929 | |
| | | | | | | | |
Non-Agency Floating Rate CMBS – 0.1% | | | | | | | | |
New Hampshire Business Finance Authority
Series 2024-1, Class X
0.49%, 07/01/2051(j) | | | 17,635 | | | | 679,434 | |
Series 2024-2, Class X
0.51%, 08/20/2039(j) | | | 39,900 | | | | 1,653,907 | |
Washington State Housing Finance Commission
Series 2024-2
4.084%, 03/20/2040 | | | 11,095 | | | | 10,686,815 | |
| | | | | | | | |
| | | | | | | 13,020,156 | |
| | | | | | | | |
Total Commercial Mortgage-Backed Securities
(cost $40,144,654) | | | | | | | 38,779,085 | |
| | | | | | | | |
| | | | | | | | |
ASSET-BACKED SECURITIES – 0.1% | | | | | | | | |
Other ABS - Fixed Rate – 0.1% | | | | | | | | |
Commonwealth of Puerto Rico
Series 2022-A
0.00%, 11/01/2051 | | | 36,000 | | | | 9,581,875 | |
County of Montgomery OH
Series 2018
6.00%, 04/01/2038(d)(e)(f) | | | 1,607 | | | | 112,468 | |
Series 2018-A
6.25%, 04/01/2049(d)(e)(f) | | | 8,118 | | | | 568,244 | |
Highlands County Health Facilities Authority
Series 2018
6.00%, 04/01/2038(d)(f) | | | 1,229 | | | | 86,038 | |
6.25%, 04/01/2049(d)(f) | | | 1,462 | | | | 102,346 | |
HTA HRRB Custodial Trust
5.25%, 07/01/2036 | | | 346 | | | | 349,441 | |
HTA TRRB Custodial Trust
Series 2022
5.25%, 07/01/2036 | | | 678 | | | | 680,676 | |
5.25%, 07/01/2041 | | | 7,065 | | | | 6,825,441 | |
| | |
| |
| abfunds.com | | AB MUNICIPAL INCOME SHARES | 117 |
PORTFOLIO OF INVESTMENTS (continued)
| | | | | | | | |
| | | Principal
Amount
(000) | | | U.S. $ Value | |
| |
Metropolitan Government Nashville & Davidson County Health & Educational Facilities Board
Series 2018-A
6.25%, 04/01/2049(d)(e)(f) | | $ | 4,049 | | | $ | 283,419 | |
| | | | | | | | |
| | |
Total Asset-Backed Securities
(cost $27,495,335) | | | | | | | 18,589,948 | |
| | | | | | | | |
| | | | | | | | |
CORPORATES - NON-INVESTMENT GRADE – 0.0% | | | | | | | | |
Financial Institutions – 0.0% | | | | | | | | |
REITs – 0.0% | | | | | | | | |
Bridgewater Castle Rock ALF LLC
9.50%, 06/30/2025(m)
(cost $4,990,000) | | | 4,990 | | | | 4,990,000 | |
| | | | | | | | |
| | |
| | | Shares | | | | |
PREFERRED STOCKS – 0.0% | |
Utility – 0.0% | | | | | | | | |
Electric – 0.0% | | | | | | | | |
AES Puerto Rico LP
0.00%(f)(k)(m)
(cost $5,885,280) | | | 324,846 | | | | 945,302 | |
| | | | | | | | |
| | | | | | | | |
SHORT-TERM INVESTMENTS – 0.0% | | | | | | | | |
Investment Companies – 0.0% | | | | | | | | |
AB Fixed Income Shares, Inc. – Government Money Market Portfolio – Class AB, 4.72%(n)(o)(p)
(cost $3,246,238) | | | 3,246,238 | | | | 3,246,238 | |
| | | | | | | | |
| | |
Total Investments – 104.0%
(cost $14,730,506,237) | | | | | | | 14,422,779,446 | |
Other assets less liabilities – (4.0)% | | | | | | | (557,070,340 | ) |
| | | | | |
| | |
Net Assets – 100.0% | | | | | | $ | 13,865,709,106 | |
| | | | | |
| | |
| |
118 | AB MUNICIPAL INCOME SHARES | | abfunds.com |
PORTFOLIO OF INVESTMENTS (continued)
CENTRALLY CLEARED INFLATION (CPI) SWAPS (see Note C)
| | | | | | | | | | | | | | | | | | | | | | | | | | |
| | | | | | | | | Rate Type | | | | | | | | | | | |
Notional
Amount
(000) | | | Termination
Date | | | Payments
made
by the
Fund | | Payments
received
by the
Fund | | Payment
Frequency
Paid/
Received | | Market
Value | | | Upfront
Premiums
Paid
(Received) | | | Unrealized
Appreciation
(Depreciation) | |
| USD | | | 219,860 | | | | 01/15/2028 | | | 1.230% | | CPI# | | Maturity | | $ | 42,265,754 | | | $ | – 0 | – | | $ | 42,265,754 | |
| USD | | | 53,630 | | | | 01/15/2028 | | | 0.735% | | CPI# | | Maturity | | | 12,321,260 | | | | – 0 | – | | | 12,321,260 | |
| USD | | | 265,880 | | | | 01/15/2029 | | | CPI# | | 3.390% | | Maturity | | | (7,309,259 | ) | | | – 0 | – | | | (7,309,259 | ) |
| USD | | | 190,780 | | | | 01/15/2029 | | | CPI# | | 3.735% | | Maturity | | | 492,487 | | | | – 0 | – | | | 492,487 | |
| USD | | | 79,070 | | | | 01/15/2029 | | | CPI# | | 3.331% | | Maturity | | | (2,574,813 | ) | | | – 0 | – | | | (2,574,813 | ) |
| USD | | | 742,122 | | | | 10/15/2029 | | | 2.516% | | CPI# | | Maturity | | | (571,701 | ) | | | – 0 | – | | | (571,701 | ) |
| USD | | | 741,440 | | | | 10/15/2029 | | | 2.451% | | CPI# | | Maturity | | | 1,625,978 | | | | – 0 | – | | | 1,625,978 | |
| USD | | | 741,438 | | | | 10/15/2029 | | | 2.499% | | CPI# | | Maturity | | | 6,221 | | | | – 0 | – | | | 6,221 | |
| USD | | | 67,450 | | | | 01/15/2030 | | | 1.572% | | CPI# | | Maturity | | | 12,169,351 | | | | – 0 | – | | | 12,169,351 | |
| USD | | | 67,450 | | | | 01/15/2030 | | | 1.587% | | CPI# | | Maturity | | | 12,073,582 | | | | – 0 | – | | | 12,073,582 | |
| USD | | | 93,000 | | | | 01/15/2031 | | | 2.782% | | CPI# | | Maturity | | | 6,682,981 | | | | – 0 | – | | | 6,682,981 | |
| USD | | | 85,000 | | | | 01/15/2031 | | | 2.680% | | CPI# | | Maturity | | | 6,983,271 | | | | – 0 | – | | | 6,983,271 | |
| USD | | | 76,750 | | | | 01/15/2031 | | | 2.989% | | CPI# | | Maturity | | | 3,893,669 | | | | – 0 | – | | | 3,893,669 | |
| USD | | | 75,410 | | | | 01/15/2032 | | | CPI# | | 3.064% | | Maturity | | | (2,749,024 | ) | | | – 0 | – | | | (2,749,024 | ) |
| USD | | | 52,000 | | | | 04/15/2032 | | | CPI# | | 2.909% | | Maturity | | | (2,587,968 | ) | | | – 0 | – | | | (2,587,968 | ) |
| | | | | | | | | | | | | | | | | | | | | | | | | | |
| | $ | 82,721,789 | | | $ | – 0 | – | | $ | 82,721,789 | |
| | | | | | | | | | | | |
| # | Variable interest rate based on the rate of inflation as determined by the Consumer Price Index (CPI). |
CENTRALLY CLEARED INTEREST RATE SWAPS (see Note C)
| | | | | | | | | | | | | | | | | | | | | | | | | | |
| | | | | | | | | Rate Type | | | | | | | | | | | |
Notional
Amount
(000) | | | Termination
Date | | | Payments
made
by the
Fund | | Payments
received
by the
Fund | | Payment
Frequency
Paid/
Received | | Market
Value | | | Upfront
Premiums
Paid
(Received) | | | Unrealized
Appreciation
(Depreciation) | |
| USD | | | 275,000 | | | | 01/15/2027 | | | 1 Day SOFR | | 3.947% | | Annual | | $ | (2,761,471 | ) | | $ | – 0 | – | | $ | (2,761,471 | ) |
| USD | | | 290,400 | | | | 07/31/2029 | | | 1 Day SOFR | | 4.461% | | Annual | | | 7,794,722 | | | | – 0 | – | | | 7,794,722 | |
| USD | | | 258,455 | | | | 10/15/2029 | | | 1 Day SOFR | | 3.814% | | Annual | | | 309,384 | | | | – 0 | – | | | 309,384 | |
| USD | | | 258,023 | | | | 10/15/2029 | | | 1 Day SOFR | | 3.761% | | Annual | | | (336,270 | ) | | | – 0 | – | | | (336,270 | ) |
| USD | | | 258,022 | | | | 10/15/2029 | | | 1 Day SOFR | | 3.740% | | Annual | | | (569,109 | ) | | | – 0 | – | | | (569,109 | ) |
| USD | | | 126,000 | | | | 07/31/2031 | | | 1 Day SOFR | | 3.877% | | Annual | | | 322,042 | | | | – 0 | – | | | 322,042 | |
| USD | | | 578,060 | | | | 09/15/2031 | | | 1 Day SOFR | | 3.786% | | Annual | | | 391,484 | | | | – 0 | – | | | 391,484 | |
| USD | | | 115,700 | | | | 09/15/2031 | | | 1 Day SOFR | | 3.768% | | Annual | | | – 0 | – | | | – 0 | – | | | – 0 | – |
| USD | | | 90,000 | | | | 09/15/2031 | | | 1 Day SOFR | | 3.262% | | Annual | | | (2,906,439 | ) | | | – 0 | – | | | (2,906,439 | ) |
| USD | | | 250,000 | | | | 08/15/2033 | | | 1 Day SOFR | | 3.477% | | Annual | | | (5,822,718 | ) | | | – 0 | – | | | (5,822,718 | ) |
| USD | | | 500,000 | | | | 11/15/2033 | | | 1 Day SOFR | | 4.180% | | Annual | | | 13,132,184 | | | | – 0 | – | | | 13,132,184 | |
| USD | | | 450,000 | | | | 11/15/2033 | | | 1 Day SOFR | | 4.114% | | Annual | | | 9,432,027 | | | | – 0 | – | | | 9,432,027 | |
| USD | | | 345,100 | | | | 08/15/2034 | | | 3.304% | | 1 Day SOFR | | Annual | | | 14,753,457 | | | | – 0 | – | | | 14,753,457 | |
| USD | | | 300,000 | | | | 08/15/2034 | | | 3.187% | | 1 Day SOFR | | Annual | | | 15,121,840 | | | | – 0 | – | | | 15,121,840 | |
| USD | | | 250,000 | | | | 08/15/2034 | | | 3.264% | | 1 Day SOFR | | Annual | | | 11,142,410 | | | | 7,444 | | | | 11,134,966 | |
| USD | | | 130,000 | | | | 08/15/2034 | | | 3.231% | | 1 Day SOFR | | Annual | | | 6,141,594 | | | | – 0 | – | | | 6,141,594 | |
| | | | | | | | | | | | | | | | | | | | | | | | | | |
| | $ | 66,145,137 | | | $ | 7,444 | | | $ | 66,137,693 | |
| | | | | | | | | | | | |
| | |
| |
| abfunds.com | | AB MUNICIPAL INCOME SHARES | 119 |
PORTFOLIO OF INVESTMENTS (continued)
INTEREST RATE SWAPS (see Note C)
| | | | | | | | | | | | | | | | | | | | | | | | | | | | | | |
| | | | Rate Type | | | |
| Swap Counterparty | | Notional
Amount
(000) | | | Termination
Date | | | Payments
made
by the
Fund | | Payments
received
by the
Fund | | Payment
Frequency
Paid/
Received | | Market
Value | | | Upfront
Premiums
Paid
(Received) | | | Unrealized
Appreciation
(Depreciation) | |
Citibank, NA | | | USD | | | | 52,610 | | | | 10/09/2029 | | | 1.125% | | SIFMA* | | Quarterly | | $ | 4,208,384 | | | $ | – 0 | – | | $ | 4,208,384 | |
JPMorgan Chase Bank, NA | | | USD | | | | 10,000 | | | | 10/23/2025 | | | MMD 30 Year^ | | 4.100% | | Maturity | | | (73,746 | ) | | | – 0 | – | | | (73,746 | ) |
JPMorgan Chase Bank, NA | | | USD | | | | 10,000 | | | | 10/24/2025 | | | MMD 30 Year^ | | 4.230% | | Maturity | | | 301,569 | | | | – 0 | – | | | 301,569 | |
Morgan Stanley Capital Services LLC | | | USD | | | | 10,000 | | | | 08/29/2025 | | | MMD 30 Year^ | | 3.840% | | Maturity | | | (724,291 | ) | | | – 0 | – | | | (724,291 | ) |
| | | | | | | | | | | | | | | | | | | | | | | | | | | | | | |
| | | | | | | | | | | | | | | | | | | | $ | 3,711,916 | | | $ | – 0 | – | | $ | 3,711,916 | |
| | | | | | | | | | | | | | | | | | | | | | | | | | | | | | |
| * | Variable interest rate based on the Securities Industry & Financial Markets Association (SIFMA) Municipal Swap Index. |
| ^ | Variable interest rate based on the Municipal Market Data AAA General Obligation Scale. |
| (a) | Security is exempt from registration under Rule 144A or Regulation S of the Securities Act of 1933. These securities are considered restricted, but liquid and may be resold in transactions exempt from registration. At October 31, 2024, the aggregate market value of these securities amounted to $3,353,705,076 or 24.2% of net assets. |
| (b) | Security represents the underlying municipal obligation of an inverse floating rate obligation held by the Fund (see Note H). |
| (c) | Floating Rate Security. Stated interest/floor/ceiling rate was in effect at October 31, 2024. |
| (e) | Security is exempt from registration under Rule 144A or Regulation S of the Securities Act of 1933. These securities, which represent 2.04% of net assets as of October 31, 2024, are considered illiquid and restricted. Additional information regarding such securities follows: |
| | | | | | | | | | | | | | | | |
144A/Restricted &
Illiquid Securities | | Acquisition
Date | | | Cost | | | Market
Value | | | Percentage of
Net Assets | |
ARC70 II TRUST
Series 2023 4.84%, 04/01/2065 | |
| 07/18/2023 -
07/30/2024 |
| | $ | 60,628,151 | | | $ | 56,877,064 | | | | 0.41 | % |
Arizona Industrial Development Authority
(Legacy Cares, Inc.)
Series 2020
6.75%, 07/01/2030 | | | 05/16/2022 | | | | 1,555,637 | | | | 60,000 | | | | 0.00 | % |
Arizona Industrial Development Authority
(Legacy Cares, Inc.)
Series 2020
7.75%, 07/01/2050 | |
| 08/12/2020 -
07/20/2022 |
| | | 35,639,422 | | | | 1,358,000 | | | | 0.01 | % |
Arizona Industrial Development Authority
(Legacy Cares, Inc.)
Series 2021-A
6.00%, 07/01/2051 | | | 07/21/2022 | | | | 1,324,222 | | | | 57,000 | | | | 0.00 | % |
| | |
| |
120 | AB MUNICIPAL INCOME SHARES | | abfunds.com |
PORTFOLIO OF INVESTMENTS (continued)
| | | | | | | | | | | | | | | | |
144A/Restricted &
Illiquid Securities | | Acquisition
Date | | | Cost | | | Market
Value | | | Percentage of
Net Assets | |
California Pollution Control Financing Authority (Rialto Bioenergy Facility LLC)
Series 2019
7.50%, 12/01/2040 | | | 05/16/2019 | | | $ | 790,267 | | | $ | 79 | | | | 0.00 | % |
County of Grand Forks ND (Red River Biorefinery LLC)
Series 2021
6.625%, 12/15/2031 | | | 05/21/2021 | | | | 5,195,000 | | | | – 0 | – | | | 0.00 | % |
County of Grand Forks ND (Red River Biorefinery LLC)
Series 2021
7.00%, 12/15/2043 | | | 05/21/2021 | | | | 5,390,000 | | | | – 0 | – | | | 0.00 | % |
County of Montgomery OH
Series 2018
6.00%, 04/01/2038 | | | 09/15/2020 | | | | 819,409 | | | | 112,468 | | | | 0.00 | % |
County of Montgomery OH
Series 2018-A
6.25%, 04/01/2049 | |
| 08/29/2018 -
10/05/2020 |
| | | 4,912,943 | | | | 568,244 | | | | 0.00 | % |
Douglas County Housing Partnership
(Bridgewater Castle Rock ALF LLC)
Series 2021
5.375%, 01/01/2041 | | | 01/14/2021 | | | | 19,316,163 | | | | 14,692,500 | | | | 0.11 | % |
Housing & Redevelopment Authority of The City of St. Paul Minnesota
(Minnesota Math & Science Academy)
Series 2021
3.00%, 06/01/2056 | | | 04/27/2023 | | | | 696,866 | | | | 701,977 | | | | 0.03 | % |
Housing & Redevelopment Authority of The City of St. Paul Minnesota
(Minnesota Math & Science Academy)
Series 2021
4.00%, 06/01/2041 | | | 11/14/2023 | | | | 810,964 | | | | 892,710 | | | | 0.03 | % |
Housing & Redevelopment Authority of The City of St. Paul Minnesota
(Minnesota Math & Science Academy)
Series 2021
4.00%, 06/01/2051 | | | 05/09/2023 | | | | 882,672 | | | | 893,901 | | | | 0.03 | % |
Housing & Redevelopment Authority of The City of St. Paul Minnesota
(Minnesota Math & Science Academy)
Series 2021
4.00%, 06/01/2056 | |
| 04/17/2023 -
11/14/2023 |
| | | 1,433,213 | | | | 1,506,561 | | | | 0.03 | % |
| | |
| |
| abfunds.com | | AB MUNICIPAL INCOME SHARES | 121 |
PORTFOLIO OF INVESTMENTS (continued)
| | | | | | | | | | | | | | | | |
144A/Restricted &
Illiquid Securities | | Acquisition
Date | | | Cost | | | Market
Value | | | Percentage of
Net Assets | |
Illinois Housing Development Authority
(Drexel Court & Lake Park East)
Series 2024 5.67%, 11/01/2038 | | | 10/19/2022 | | | $ | 16,210,000 | | | $ | 16,172,344 | | | | 0.12 | % |
Indiana Finance Authority (Brightmark Plastics Renewal Indiana LLC) Series 2019
7.00%, 03/01/2039 | |
| 03/28/2019 -
06/09/2022 |
| | | 29,050,003 | | | | 14,206,339 | | | | 0.10 | % |
Indiana Finance Authority (Parkview Health System Obligated Group)
Series 2024-B
4.084%, 11/01/2046 | | | 06/24/2024 | | | | 32,030,000 | | | | 31,985,805 | | | | 0.23 | % |
Metropolitan Government Nashville & Davidson County Health & Educational Facilities Board Series 2018-A
6.25%, 04/01/2049 | | | 08/29/2018 | | | | 4,021,391 | | | | 283,419 | | | | 0.00 | % |
Mississippi Business Finance Corp.
(Alden Group Renewable Energy Mississippi LLC)
Series 2022
8.00%, 12/01/2029 | | | 12/13/2022 | | | | 14,329,740 | | | | 14,735,350 | | | | 0.11 | % |
Nassau County Industrial Development Agency (Amsterdam House Continuing Care Retirement Community, Inc.)
Series 2021
9.00%, 01/01/2041 | | | 09/03/2021 | | | | 270,000 | | | | 270,000 | | | | 0.00 | % |
New Hope Cultural Education Facilities Finance Corp. (Dwyer Workforce Development)
Series 2023
8.50%, 09/01/2027 | |
| 02/03/2023 -
07/30/2024 |
| | | 22,189,635 | | | | 22,261,598 | | | | 0.16 | % |
Pueblo Urban Renewal Authority
Series 2021
4.75%, 12/01/2045 | |
| 03/24/2021 -
03/30/2021 |
| | | 8,175,194 | | | | 5,463,283 | | | | 0.04 | % |
Scranton-Lackawanna Health and Welfare Authority (Scranton Parking System Concession Project)
Series 2016-D Zero Coupon, 01/01/2057 | | | 08/24/2016 | | | | 7,420,255 | | | | 3,229,681 | | | | 0.02 | % |
| | |
| |
122 | AB MUNICIPAL INCOME SHARES | | abfunds.com |
PORTFOLIO OF INVESTMENTS (continued)
| | | | | | | | | | | | | | | | |
144A/Restricted &
Illiquid Securities | | Acquisition
Date | | | Cost | | | Market
Value | | | Percentage of
Net Assets | |
South Carolina Jobs-Economic Development Authority
(Last Step Recycling LLC)
Series 2021
6.00%, 06/01/2031 | |
| 10/04/2022 -
04/17/2023 |
| | $ | 2,079,453 | | | $ | 370,500 | | | | 0.00 | % |
South Carolina Jobs-Economic Development Authority
(Last Step Recycling LLC)
Series 2021
6.25%, 06/01/2040 | |
| 06/16/2021 -
07/20/2022 |
| | | 5,930,103 | | | | 915,000 | | | | 0.01 | % |
South Carolina Jobs-Economic Development Authority
(Last Step Recycling LLC)
Series 2021
6.50%, 06/01/2051 | |
| 06/16/2021 -
10/20/2022 |
| | | 7,844,598 | | | | 1,360,500 | | | | 0.01 | % |
State of Nevada Department of Business & Industry
Series 2018
6.95%, 02/15/2038 | | | 08/24/2018 | | | | 1,702,635 | | | | 6,981 | | | | 0.00 | % |
Virginia Small Business Financing Authority
(Total Fiber Recovery @ Chesapeake LLC)
Series 2022
8.50%, 06/01/2042 | |
| 06/08/2022 -
07/29/2024 |
| | | 24,194,301 | | | | 22,654,709 | | | | 0.16 | % |
Virginia Small Business Financing Authority
(Total Fiber Recovery @ Chesapeake LLC)
Series 2022
9.245%, 06/01/2029 | |
| 06/08/2022 -
07/29/2024 |
| | | 20,794,551 | | | | 19,663,612 | | | | 0.14 | % |
Wisconsin Public Finance Authority
(Catholic Bishop of Chicago (The))
Series 2021
5.75%, 07/25/2041 | | | 08/03/2021 | | | | 57,000,000 | | | | 51,564,543 | | | | 0.37 | % |
Wisconsin Public Finance Authority
(KDC Agribusiness LLC)
Series 2022
15.00%, 04/30/2023 | | | 11/10/2022 | | | | 21,900,000 | | | | – 0 | – | | | 0.00 | % |
Wisconsin Public Finance Authority
(KDC Agribusiness LLC)
Series 2023
15.00%, 04/30/2023 | | | 03/16/2023 | | | | 4,895,000 | | | | 49 | | | | 0.00 | % |
| (f) | Non-income producing security. |
| (g) | Coupon rate adjusts periodically based upon a predetermined schedule. Stated interest rate in effect at October 31, 2024. |
| (h) | Inverse floater security. |
| (i) | When-Issued or delayed delivery security. |
| | |
| |
| abfunds.com | | AB MUNICIPAL INCOME SHARES | 123 |
PORTFOLIO OF INVESTMENTS (continued)
| (k) | Fair valued by the Adviser. |
| (l) | Defaulted matured security. |
| (m) | Security in which significant unobservable inputs (Level 3) were used in determining fair value. |
| (n) | Affiliated investments. |
| (o) | The rate shown represents the 7-day yield as of period end. |
| (p) | To obtain a copy of the fund’s shareholder report, please go to the Securities and Exchange Commission’s website at www.sec.gov, or call AB at (800) 227-4618. |
As of October 31, 2024, the Fund’s percentages of investments in municipal bonds that are insured and in insured municipal bonds that have been pre-refunded or escrowed to maturity are 2.2% and 0.0%, respectively.
Glossary:
ABS – Asset-Backed Securities
AGC – Assured Guaranty Corporation
AGM – Assured Guaranty Municipal
BAM – Build American Mutual
CCRC – Congregate Care Retirement Center
CHF – Collegiate Housing Foundation
CMBS – Commercial Mortgage-Backed Securities
CME – Chicago Mercantile Exchange
COP – Certificate of Participation
MMD – Municipal Market Data
NATL – National Interstate Corporation
SD – School District
SOFR – Secured Overnight Financing Rate
See notes to financial statements.
| | |
| |
124 | AB MUNICIPAL INCOME SHARES | | abfunds.com |
STATEMENT OF ASSETS & LIABILITIES
October 31, 2024 (unaudited)
| | | | |
| Assets | | | | |
Investments in securities, at value | | | | |
Unaffiliated issuers (cost $14,727,259,999) | | $ | 14,419,533,208 | |
Affiliated issuers (cost $3,246,238) | | | 3,246,238 | |
Cash collateral due from broker | | | 66,956,955 | |
Interest receivable | | | 202,790,542 | |
Receivable for shares of beneficial interest sold | | | 8,425,468 | |
Unrealized appreciation on interest rate swaps | | | 4,509,953 | |
Receivable for investment securities sold | | | 3,938,513 | |
Affiliated dividends receivable | | | 660,876 | |
Receivable due from Adviser | | | 28,294 | |
| | | | |
Total assets | | | 14,710,090,047 | |
| | | | |
| Liabilities | | | | |
Due to custodian | | | 812,817 | |
Payable for floating rate notes issued* | | | 490,290,000 | |
Payable for investment securities purchased | | | 287,234,796 | |
Dividends payable | | | 52,333,494 | |
Payable for shares of beneficial interest redeemed | | | 5,589,161 | |
Cash collateral due to broker | | | 3,950,000 | |
Payable for variation margin on centrally cleared swaps | | | 1,311,573 | |
Unrealized depreciation on interest rate swaps | | | 798,037 | |
Accrued expenses and other liabilities | | | 2,061,063 | |
| | | | |
Total liabilities | | | 844,380,941 | |
| | | | |
Net Assets | | $ | 13,865,709,106 | |
| | | | |
| Composition of Net Assets | | | | |
Shares of beneficial interest, at par | | $ | 12,316 | |
Additional paid-in capital | | | 14,083,895,691 | |
Accumulated loss | | | (218,198,901 | ) |
| | | | |
Net Assets | | $ | 13,865,709,106 | |
| | | | |
Net Asset Value Per Share—unlimited shares of beneficial interest authorized, $.00001 par value (based on 1,231,624,631 common shares outstanding) | | $ | 11.26 | |
| | | | |
| * | Represents short-term floating rate certificates issued by tender option bond trusts (see Note H). |
See notes to financial statements.
| | |
| |
| abfunds.com | | AB MUNICIPAL INCOME SHARES | 125 |
STATEMENT OF OPERATIONS
Six Months Ended October 31, 2024 (unaudited)
| | | | | | | | |
| Investment Income | | | | | | | | |
Interest | | $ | 310,778,941 | | | | | |
Dividends—Affiliated issuers | | | 3,327,516 | | | | | |
Other income(a) | | | 102,615 | | | $ | 314,209,072 | |
| | | | | | | | |
| Expenses | | | | | | | | |
Interest and investment expense | | | 10,602,717 | | | | | |
| | | | | | | | |
Total expenses | | | | | | | 10,602,717 | |
| | | | | | | | |
Net investment income | | | | | | | 303,606,355 | |
| | | | | | | | |
| Realized and Unrealized Gain (Loss) on Investment Transactions | | | | | | | | |
Net realized loss on: | | | | | | | | |
Investment transactions | | | | | | | (7,725,958 | ) |
Swaps | | | | | | | (28,107,501 | ) |
Net change in unrealized appreciation (depreciation) of: | | | | | | | | |
Investments | | | | | | | 262,071,123 | |
Swaps | | | | | | | 171,276,924 | |
| | | | | | | | |
Net gain on investment transactions | | | | | | | 397,514,588 | |
| | | | | | | | |
Net Increase in Net Assets from Operations | | | | | | $ | 701,120,943 | |
| | | | | | | | |
| (a) | Other income includes a reimbursement for investment in affiliated issuer (see Note B). |
See notes to financial statements.
| | |
| |
126 | AB MUNICIPAL INCOME SHARES | | abfunds.com |
STATEMENT OF CHANGES IN NET ASSETS
| | | | | | | | |
| | | Six Months Ended
October 31, 2024
(unaudited) | | | Year Ended
April 30,
2024 | |
| Increase (Decrease) in Net Assets from Operations | | | | | | | | |
Net investment income | | $ | 303,606,355 | | | $ | 488,694,256 | |
Net realized loss on investment transactions | | | (35,833,459 | ) | | | (27,640,584 | ) |
Net change in unrealized appreciation (depreciation) of investments | | | 433,348,047 | | | | (146,682,869 | ) |
| | | | | | | | |
Net increase in net assets from operations | | | 701,120,943 | | | | 314,370,803 | |
Distribution to Shareholders | | | (286,720,257 | ) | | | (462,980,749 | ) |
| Transactions in Shares of Beneficial Interest | | | | | | | | |
Net increase | | | 1,314,179,452 | | | | 2,916,953,165 | |
| | | | | | | | |
Total increase | | | 1,728,580,138 | | | | 2,768,343,219 | |
| Net Assets | | | | | | | | |
Beginning of period | | | 12,137,128,968 | | | | 9,368,785,749 | |
| | | | | | | | |
End of period | | $ | 13,865,709,106 | | | $ | 12,137,128,968 | |
| | | | | | | | |
See notes to financial statements.
| | |
| |
| abfunds.com | | AB MUNICIPAL INCOME SHARES | 127 |
NOTES TO FINANCIAL STATEMENTS
October 31, 2024 (unaudited)
NOTE A
Significant Accounting Policies
AB Corporate Shares (the “Trust”) is registered under the Investment Company Act of 1940 (the “1940 Act”), as an open-end, diversified management investment company. The Trust, which is a Massachusetts Business Trust, operates as a “series” company currently offering four separate portfolios: AB Corporate Income Shares, AB Municipal Income Shares, AB Taxable Multi-Sector Income Shares and AB Impact Municipal Income Shares. Each portfolio is considered to be a separate entity for financial reporting and tax purposes. This report relates only to AB Municipal Income Shares (the “Fund”).
Shares of the Fund are offered exclusively to holders of accounts established under wrap fee programs sponsored and maintained by certain registered investment advisers approved by AllianceBernstein L.P. (the “Adviser”). The Fund’s shares may be purchased at the relevant net asset value without a sales charge or other fee. The financial statements have been prepared in conformity with U.S. generally accepted accounting principles (“U.S. GAAP”), which require management to make certain estimates and assumptions that affect the reported amounts of assets and liabilities in the financial statements and amounts of income and expenses during the reporting period. Actual results could differ from those estimates. The Fund is an investment company under U.S. GAAP and follows the accounting and reporting guidance applicable to investment companies. The following is a summary of significant accounting policies followed by the Fund.
1. Security Valuation
Portfolio securities are valued at market value determined on the basis of market quotations or, if market quotations are not readily available or are unreliable, at “fair value” as determined in accordance with procedures approved by and under the oversight of the Trust’s Board of Trustees (the “Board”). Pursuant to these procedures, the Adviser serves as the Fund’s valuation designee pursuant to Rule 2a-5 of the 1940 Act. In this capacity, the Adviser is responsible, among other things, for making all fair value determinations relating to the Fund’s portfolio investments, subject to the Board’s oversight.
In general, the market values of securities which are readily available and deemed reliable are determined as follows: securities listed on a national securities exchange (other than securities listed on the NASDAQ Stock Market, Inc. (“NASDAQ”)) or on a foreign securities exchange are valued at the last sale price at the close of the exchange or foreign securities exchange. If there has been no sale on such day, the securities are valued at the last traded price from the previous day. Securities listed on more
| | |
| |
128 | AB MUNICIPAL INCOME SHARES | | abfunds.com |
NOTES TO FINANCIAL STATEMENTS (continued)
than one exchange are valued by reference to the principal exchange on which the securities are traded; securities listed only on NASDAQ are valued in accordance with the NASDAQ Official Closing Price; listed or over the counter (“OTC”) market put or call options are valued at the mid level between the current bid and ask prices. If either a current bid or current ask price is unavailable, the Adviser will have discretion to determine the best valuation (e.g., last trade price in the case of listed options); open futures are valued using the closing settlement price or, in the absence of such a price, the most recent quoted bid price. If there are no quotations available for the day of valuation, the last available closing settlement price is used; U.S. Government securities and any other debt instruments having 60 days or less remaining until maturity are generally valued at market by an independent pricing vendor, if a market price is available. If a market price is not available, the securities are valued at amortized cost. This methodology is commonly used for short term securities that have an original maturity of 60 days or less, as well as short term securities that had an original term to maturity that exceeded 60 days. In instances when amortized cost is utilized, the Valuation Committee (the “Committee”) must reasonably conclude that the utilization of amortized cost is approximately the same as the fair value of the security. Factors the Committee will consider include, but are not limited to, an impairment of the creditworthiness of the issuer or material changes in interest rates. Fixed-income securities, including mortgage-backed and asset-backed securities, may be valued on the basis of prices provided by a pricing service or at a price obtained from one or more of the major broker-dealers. In cases where broker-dealer quotes are obtained, the Adviser may establish procedures whereby changes in market yields or spreads are used to adjust, on a daily basis, a recently obtained quoted price on a security. Swaps and other derivatives are valued daily, primarily using independent pricing services, independent pricing models using market inputs, as well as third party broker-dealers or counterparties. Open-end mutual funds are valued at the closing net asset value per share, while exchange traded funds are valued at the closing market price per share.
Securities for which market quotations are not readily available (including restricted securities) or are deemed unreliable are valued at fair value as deemed appropriate by the Adviser. Factors considered in making this determination may include, but are not limited to, information obtained by contacting the issuer, analysts, analysis of the issuer’s financial statements or other available documents. In addition, the Fund may use fair value pricing for securities primarily traded in non-U.S. markets because most foreign markets close well before the Fund values its securities at 4:00 p.m., Eastern Time. The earlier close of these foreign markets gives rise to the possibility that significant events, including broad market moves, may have occurred in the interim and may materially affect the value of those
| | |
| |
| abfunds.com | | AB MUNICIPAL INCOME SHARES | 129 |
NOTES TO FINANCIAL STATEMENTS (continued)
securities. To account for this, the Fund generally values many of its foreign equity securities using fair value prices based on third party vendor modeling tools to the extent available.
2. Fair Value Measurements
In accordance with U.S. GAAP regarding fair value measurements, fair value is defined as the price that the Fund would receive to sell an asset or pay to transfer a liability in an orderly transaction between market participants at the measurement date. U.S. GAAP establishes a framework for measuring fair value, and a three-level hierarchy for fair value measurements based upon the transparency of inputs to the valuation of an asset or liability (including those valued based on their market values as described in Note A.1 above). Inputs may be observable or unobservable and refer broadly to the assumptions that market participants would use in pricing the asset or liability. Observable inputs reflect the assumptions market participants would use in pricing the asset or liability based on market data obtained from sources independent of the Fund. Unobservable inputs reflect the Fund’s own assumptions about the assumptions that market participants would use in pricing the asset or liability based on the best information available in the circumstances. Each investment is assigned a level based upon the observability of the inputs which are significant to the overall valuation. The three-tier hierarchy of inputs is summarized below.
| | • | | Level 1—quoted prices in active markets for identical investments |
| | • | | Level 2—other significant observable inputs (including quoted prices for similar investments, interest rates, prepayment speeds, credit risk, etc.) |
| | • | | Level 3—significant unobservable inputs (including the Fund’s own assumptions in determining the fair value of investments) |
The fair value of debt instruments, such as bonds, and over-the-counter derivatives is generally based on market price quotations, recently executed market transactions (where observable) or industry recognized modeling techniques and are generally classified as Level 2. Pricing vendor inputs to Level 2 valuations may include quoted prices for similar investments in active markets, interest rate curves, coupon rates, currency rates, yield curves, option adjusted spreads, default rates, credit spreads and other unique security features in order to estimate the relevant cash flows which are then discounted to calculate fair values. If these inputs are unobservable and significant to the fair value, these investments will be classified as Level 3.
Valuations of mortgage-backed or other asset-backed securities, by pricing vendors, are based on both proprietary and industry recognized models and discounted cash flow techniques. Significant inputs to the valuation
| | |
| |
130 | AB MUNICIPAL INCOME SHARES | | abfunds.com |
NOTES TO FINANCIAL STATEMENTS (continued)
of these instruments are value of the collateral, the rates and timing of delinquencies, the rates and timing of prepayments, and default and loss expectations, which are driven in part by housing prices for residential mortgages. Significant inputs are determined based on relative value analyses, which incorporate comparisons to instruments with similar collateral and risk profiles, including relevant indices. Mortgage and asset-backed securities for which management has collected current observable data through pricing services are generally categorized within Level 2. Those investments for which current observable data has not been provided are classified as Level 3.
Other fixed income investments, including non-U.S. government and corporate debt, are generally valued using quoted market prices, if available, which are typically impacted by current interest rates, maturity dates and any perceived credit risk of the issuer. Additionally, in the absence of quoted market prices, these inputs are used by pricing vendors to derive a valuation based upon industry or proprietary models which incorporate issuer specific data with relevant yield/spread comparisons with more widely quoted bonds with similar key characteristics. Those investments for which there are observable inputs are classified as Level 2. Where the inputs are not observable, the investments are classified as Level 3.
The following table summarizes the valuation of the Fund’s investments by the above fair value hierarchy levels as of October 31, 2024:
| | | | | | | | | | | | | | | | |
Investments in
Securities: | | Level 1 | | | Level 2 | | | Level 3 | | | Total | |
Assets: | | | | | | | | | | | | | | | | |
Long-Term Municipal Bonds | | $ | – 0 | – | | $ | 14,341,980,693 | | | $ | 3,328,482 | (a) | | $ | 14,345,309,175 | |
Short-Term Municipal Notes | | | – 0 | – | | | 10,919,698 | | | | – 0 | – | | | 10,919,698 | |
Commercial Mortgage-Backed Securities | | | – 0 | – | | | 38,779,085 | | | | – 0 | – | | | 38,779,085 | |
Asset-Backed Securities | | | – 0 | – | | | 18,589,948 | | | | – 0 | – | | | 18,589,948 | |
Corporates – Non-Investment Grade | | | – 0 | – | | | – 0 | – | | | 4,990,000 | | | | 4,990,000 | |
Preferred Stocks | | | – 0 | – | | | – 0 | – | | | 945,302 | | | | 945,302 | |
Short-Term Investments | | | 3,246,238 | | | | – 0 | – | | | – 0 | – | | | 3,246,238 | |
| | | | | | | | | | | | | | | | |
Total Investments in Securities | | | 3,246,238 | | | | 14,410,269,424 | | | | 9,263,784 | (a) | | | 14,422,779,446 | |
| | |
| |
| abfunds.com | | AB MUNICIPAL INCOME SHARES | 131 |
NOTES TO FINANCIAL STATEMENTS (continued)
| | | | | | | | | | | | | | | | |
Investments in
Securities: | | Level 1 | | | Level 2 | | | Level 3 | | | Total | |
Other Financial Instruments(b): | | | | | | | | | | | | | | | | |
Assets: | | | | | | | | | | | | | | | | |
Centrally Cleared Inflation (CPI) Swaps | | $ | – 0 | – | | $ | 98,514,554 | | | $ | – 0 | – | | $ | 98,514,554 | (c) |
Centrally Cleared Interest Rate Swaps | | | – 0 | – | | | 78,541,144 | | | | – 0 | – | | | 78,541,144 | (c) |
Interest Rate Swaps | | | – 0 | – | | | 4,509,953 | | | | – 0 | – | | | 4,509,953 | |
Liabilities: | | | | | | | | | | | | | | | | |
Centrally Cleared Inflation (CPI) Swaps | | | – 0 | – | | | (15,792,765 | ) | | | – 0 | – | | | (15,792,765 | )(c) |
Centrally Cleared Interest Rate Swaps | | | – 0 | – | | | (12,396,007 | ) | | | – 0 | – | | | (12,396,007 | )(c) |
Interest Rate Swaps | | | – 0 | – | | | (798,037 | ) | | | – 0 | – | | | (798,037 | ) |
| | | | | | | | | | | | | | | | |
Total | | $ | 3,246,238 | | | $ | 14,562,848,266 | | | $ | 9,263,784 | (a) | | $ | 14,575,358,288 | |
| | | | | | | | | | | | | | | | |
The Fund holds liabilities for floating rate note obligations which are not reflected in the table above. The fair value of the Fund’s liabilities for floating rate note obligations approximates their liquidation values. Floating rate note obligations are generally classified as level 2.
| (a) | The Fund held securities with zero market value at period end. |
| (b) | Other financial instruments include derivative instruments, such as futures, forwards and swaps. Derivative instruments are valued at the unrealized appreciation (depreciation) on the instrument. Other financial instruments may also include swaps with upfront premiums, written options and written swaptions which are valued at market value. |
| (c) | Only variation margin receivable (payable) at period end is reported within the statement of assets and liabilities. This amount reflects cumulative unrealized appreciation (depreciation) on futures and centrally cleared swaps as reported in the portfolio of investments. Where applicable, centrally cleared swaps with upfront premiums are presented here at market value. |
3. Taxes
It is the Fund’s policy to meet the requirements of the Internal Revenue Code applicable to regulated investment companies and to distribute all of its investment company taxable income and net realized gains, if any, to shareholders. Therefore, no provisions for federal income or excise taxes are required.
In accordance with U.S. GAAP requirements regarding accounting for uncertainties in income taxes, management has analyzed the Fund’s tax positions taken or expected to be taken on federal and state income tax returns for all open tax years (the current and the prior three tax years) and has concluded that no provision for income tax is required in the Fund’s financial statements.
| | |
| |
132 | AB MUNICIPAL INCOME SHARES | | abfunds.com |
NOTES TO FINANCIAL STATEMENTS (continued)
4. Investment Income and Investment Transactions
Dividend income is recorded on the ex-dividend date or as soon as the Fund is informed of the dividend. Interest income is accrued daily. Investment transactions are accounted for on the date the securities are purchased or sold. Investment gains or losses are determined on the identified cost basis. Non-cash dividends, if any, are recorded on the ex-dividend date at the fair value of the securities received. The Fund amortizes premiums and accretes discounts as adjustments to interest income. The Fund accounts for distributions received from real estate investment trust (“REIT”) investments or from regulated investment companies as dividend income, realized gain, or return of capital based on information provided by the REIT or the investment company.
5. Dividends and Distributions
Dividends and distributions to shareholders, if any, are recorded on the ex-dividend date. Income dividends and capital gains distributions are determined in accordance with federal tax regulations and may differ from those determined in accordance with U.S. GAAP. To the extent these differences are permanent, such amounts are reclassified within the capital accounts based on their federal tax basis treatment; temporary differences do not require such reclassification.
6. Cash and Short-Term Investments
Cash and short-term investments include cash on hand and short-term investments with maturities of less than one year when purchased.
NOTE B
Advisory Fee and Other Transactions with Affiliates
Under the terms of the advisory agreement, the Fund pays no advisory fee to the Adviser and the Adviser reimburses or pays for the Fund’s operating expenses. The Fund is an integral part of separately managed accounts in wrap fee programs and other investment programs. Typically, participants in these programs pay a fee to their investment adviser for all costs and expenses of the separately managed account, including costs and expenses associated with the Fund, and a fee is paid by their investment adviser to the Adviser. In certain cases, participants may have a direct relationship with the Adviser without the involvement of a third party investment adviser, in which case the participant would pay a fee directly to the Adviser. The Adviser serves as investment manager and adviser of the Fund and continuously furnishes an investment program for the Fund and manages, supervises and conducts the affairs of the Fund, subject to the supervisions of the Fund’s Board. The advisory agreement provides that the Adviser or an affiliate will furnish, or pay the expenses of the Fund for, office space, facilities and equipment, services of executive and other personnel of the Fund and certain administrative services.
| | |
| |
| abfunds.com | | AB MUNICIPAL INCOME SHARES | 133 |
NOTES TO FINANCIAL STATEMENTS (continued)
The Fund has entered into a distribution agreement with AllianceBernstein Investments, Inc., the Fund’s principal underwriter (the “Underwriter”), to permit the Underwriter to distribute the Fund’s shares, which are sold at their net asset value without any sales charge. The Fund does not pay a fee for this service. The Underwriter is a wholly owned subsidiary of the Adviser.
AllianceBernstein Investor Services, Inc. (“ABIS”), a wholly-owned subsidiary of the Adviser, acts as the Fund’s registrar, transfer agent and dividend-disbursing agent. ABIS registers the transfer, issuance and redemption of Fund shares and disburses dividends and other distributions to Fund shareholders. The Fund does not pay a fee for this service.
The Fund may invest in AB Government Money Market Portfolio (the “Government Money Market Portfolio”) which has a contractual annual advisory fee rate of .20% of the portfolio’s average daily net assets and bears its own expenses. The Adviser had contractually agreed to waive .10% of the advisory fee of Government Money Market Portfolio (resulting in a net advisory fee of .10%) until August 31, 2023. Effective September 1, 2023, the Adviser has contractually agreed to waive .05% of the advisory fee of Government Money Market Portfolio (resulting in a net advisory fee of .15%) until August 31, 2024. In connection with the investment by the Fund in Government Money Market Portfolio, the Adviser has contractually agreed to reimburse the Fund in an amount equal to the Fund’s pro rata share of the effective advisory fee of Government Money Market Portfolio, as borne indirectly by the Fund as an acquired fund fee and expense. For the six months ended October 31, 2024, such reimbursement amounted to $102,615.
A summary of the Fund’s transactions in AB mutual funds for the six months ended October 31, 2024 is as follows:
| | | | | | | | | | | | | | | | | | | | |
Fund | | Market Value
4/30/24
(000) | | | Purchases
at Cost
(000) | | | Sales
Proceeds
(000) | | | Market Value
10/31/24
(000) | | | Dividend
Income
(000) | |
Government Money Market Portfolio | | $ | 47,424 | | | $ | 1,760,763 | | | $ | 1,804,941 | | | $ | 3,246 | | | $ | 3,328 | |
| | |
| |
134 | AB MUNICIPAL INCOME SHARES | | abfunds.com |
NOTES TO FINANCIAL STATEMENTS (continued)
NOTE C
Investment Transactions
Purchases and sales of investment securities (excluding short-term investments) for the six months ended October 31, 2024 were as follows:
| | | | | | | | |
| | | Purchases | | | Sales | |
Investment securities (excluding U.S. government securities) | | $ | 2,760,955,302 | | | $ | 717,568,047 | |
U.S. government securities | | | – 0 | – | | | – 0 | – |
The cost of investments for federal income tax purposes was substantially the same as the cost for financial reporting purposes. Accordingly, gross unrealized appreciation and unrealized depreciation are as follows:
| | | | |
Gross unrealized appreciation | | $ | 472,522,398 | |
Gross unrealized depreciation | | | (627,677,791 | ) |
| | | | |
Net unrealized depreciation | | $ | (155,155,393 | ) |
| | | | |
1. Derivative Financial Instruments
The Fund may use derivatives in an effort to earn income and enhance returns, to replace more traditional direct investments, to obtain exposure to otherwise inaccessible markets (collectively, “investment purposes”), or to hedge or adjust the risk profile of its portfolio.
The principal types of derivatives utilized by the Fund, as well as the methods in which they may be used are:
The Fund may enter into swaps for investment purposes or to hedge its exposure to interest rates or credit risk. A swap is an agreement that obligates two parties to exchange a series of cash flows at specified intervals based upon or calculated by reference to changes in specified prices, rates or indexes for a specified amount of an underlying asset or inflation. The payment flows are usually netted against each other, with the difference being paid by one party to the other. In addition, collateral may be pledged or received by the Fund in accordance with the terms of the respective swaps to provide value and recourse to the Fund or its counterparties in the event of default, bankruptcy or insolvency by one of the parties to the swap.
Risks may arise as a result of the failure of the counterparty to the swap to comply with the terms of the swap. The loss incurred by the failure of a counterparty is generally limited to the net interim payment to be received by the Fund, and/or the termination value at the end of the contract. Therefore, the Fund considers the creditworthiness of each counterparty to a swap in evaluating potential counterparty risk.
| | |
| |
| abfunds.com | | AB MUNICIPAL INCOME SHARES | 135 |
NOTES TO FINANCIAL STATEMENTS (continued)
This risk is mitigated by having a netting arrangement between the Fund and the counterparty and by the posting of collateral by the counterparty to the Fund to cover the Fund’s exposure to the counterparty. Additionally, risks may arise from unanticipated movements in interest rates, inflation or in the value of the underlying securities. The Fund accrues for the interim payments on swaps on a daily basis, with the net amount recorded within unrealized appreciation/depreciation of swaps on the statement of assets and liabilities, where applicable. Once the interim payments are settled in cash, the net amount is recorded as realized gain/(loss) on swaps on the statement of operations, in addition to any realized gain/(loss) recorded upon the termination of swaps. Upfront premiums paid or received for swaps are recognized as cost or proceeds on the statement of assets and liabilities and are amortized on a straight line basis over the life of the contract. Amortized upfront premiums are included in net realized gain/(loss) from swaps on the statement of operations. Fluctuations in the value of swaps are recorded as a component of net change in unrealized appreciation/depreciation of swaps on the statement of operations.
Certain standardized swaps, including certain interest rate swaps and credit default swaps, are subject to mandatory central clearing. Cleared swaps are transacted through futures commission merchants (“FCMs”) that are members of central clearinghouses, with the clearinghouse serving as central counterparty, similar to transactions in futures contracts. Centralized clearing will be required for additional categories of swaps on a phased-in basis based on requirements published by the Securities and Exchange Commission and Commodity Futures Trading Commission.
At the time the Fund enters into a centrally cleared swap, the Fund deposits with the broker or segregates at its custodian cash or securities as collateral to satisfy initial margin requirements set by the clearinghouse on which the transaction is effected. Pursuant to the contract, with respect to cash collateral, the Fund agrees to receive from or pay to the broker an amount of cash equal to the daily fluctuation in the value of the contract; in the case of securities collateral, the Fund agrees to adjust the securities position held in the segregated account accordingly. Such receipts, payments or adjustments are known as variation margin and are recorded by the Fund as unrealized gains or losses. Risks may arise from the potential inability of a counterparty to meet the terms of the contract. The credit/counterparty risk for centrally cleared swaps is generally less than non-centrally cleared swaps, since the clearinghouse, which is the issuer or counterparty to each centrally cleared swap, has robust risk mitigation standards, including the requirement to provide initial
| | |
| |
136 | AB MUNICIPAL INCOME SHARES | | abfunds.com |
NOTES TO FINANCIAL STATEMENTS (continued)
and variation margin. When the contract is closed, the Fund records a realized gain or loss equal to the difference between the value of the contract at the time it was opened and the time it was closed.
Interest Rate Swaps:
The Fund is subject to interest rate risk exposure in the normal course of pursuing its investment objectives. Because the Fund holds fixed rate bonds, the value of these bonds may decrease if interest rates rise. To help hedge against this risk and to maintain its ability to generate income at prevailing market rates, the Fund may enter into interest rate swaps. Interest rate swaps are agreements between two parties to exchange cash flows based on a notional amount. The Fund may elect to pay a fixed rate and receive a floating rate, or, receive a fixed rate and pay a floating rate on a notional amount.
In addition, the Fund may also enter into interest rate swap transactions to preserve a return or spread on a particular investment or portion of its portfolio, or protecting against an increase in the price of securities the Fund anticipates purchasing at a later date. Interest rate swaps involve the exchange by the Fund with another party of their respective commitments to pay or receive interest (e.g., an exchange of floating rate payments for fixed rate payments) computed based on a contractually-based principal (or “notional”) amount. Interest rate swaps are entered into on a net basis (i.e., the two payment streams are netted out, with the Fund receiving or paying, as the case may be, only the net amount of the two payments).
During the six months ended October 31, 2024, the Fund held interest rate swaps for hedging purposes.
Inflation (CPI) Swaps:
Inflation swap agreements are contracts in which one party agrees to pay the cumulative percentage increase in a price index (the Consumer Price Index with respect to CPI swaps) over the term of the swap (with some lag on the inflation index), and the other pays a compounded fixed rate. Inflation swaps may be used to protect the net asset value, or NAV, of a Fund against an unexpected change in the rate of inflation measured by an inflation index since the value of these agreements is expected to increase if there are unexpected inflation increases.
During the six months ended October 31, 2024, the Fund held inflation (CPI) swaps for hedging purposes.
The Fund typically enters into International Swaps and Derivatives Association, Inc. Master Agreements (“ISDA Master Agreement”) with its OTC derivative contract counterparties in order to, among other things, reduce
| | |
| |
| abfunds.com | | AB MUNICIPAL INCOME SHARES | 137 |
NOTES TO FINANCIAL STATEMENTS (continued)
its credit risk to OTC counterparties. ISDA Master Agreements include provisions for general obligations, representations, collateral and events of default or termination. Under an ISDA Master Agreement, the Fund typically may offset with the OTC counterparty certain derivative financial instruments’ payables and/or receivables with collateral held and/or posted and create one single net payment (close-out netting) in the event of default or termination. In the event of a default by an OTC counterparty, the return of collateral with market value in excess of the Fund’s net liability, held by the defaulting party, may be delayed or denied.
The Fund’s ISDA Master Agreements may contain provisions for early termination of OTC derivative transactions in the event the net assets of the Fund decline below specific levels (“net asset contingent features”). If these levels are triggered, the Fund’s OTC counterparty has the right to terminate such transaction and require the Fund to pay or receive a settlement amount in connection with the terminated transaction. If OTC derivatives were held at period end, please refer to netting arrangements by the OTC counterparty table below for additional details.
During the six months ended October 31, 2024, the Fund had entered into the following derivatives:
| | | | | | | | | | | | |
| | | Asset Derivatives | | | Liability Derivatives | |
Derivative
Type | | Statement of
Assets and
Liabilities
Location | | Fair Value | | | Statement of
Assets and
Liabilities
Location | | Fair Value | |
Interest rate contracts | | Receivable for variation margin on centrally cleared swaps | | $ | 177,048,254 | * | | Payable for variation margin on centrally cleared swaps | | $ | 28,188,772 | * |
| | | | |
Interest rate contracts | | Unrealized appreciation on interest rate swaps | | | 4,509,953 | | | Unrealized depreciation on interest rate swaps | | | 798,037 | |
| | | | | | | | | | | | |
Total | | | | $ | 181,558,207 | | | | | $ | 28,986,809 | |
| | | | | | | | | | | | |
| * | Only variation margin receivable/payable at period end is reported within the statement of assets and liabilities. |
| | |
| |
138 | AB MUNICIPAL INCOME SHARES | | abfunds.com |
NOTES TO FINANCIAL STATEMENTS (continued)
This amount reflects cumulative unrealized appreciation (depreciation) on futures and centrally cleared swaps as reported in the portfolio of investments.
| | | | | | | | | | |
Derivative Type | | Location of
Gain or (Loss)
on Derivatives
Within Statement
of Operations | | Realized Gain
or (Loss) on
Derivatives | | | Change in
Unrealized
Appreciation or
(Depreciation) | |
Interest rate contracts | | Net realized gain (loss) on swaps; Net change in unrealized appreciation (depreciation) of swaps | | $ | (28,107,501 | ) | | $ | 171,276,924 | |
| | | | | | | | | | |
Total | | | | $ | (28,107,501 | ) | | $ | 171,276,924 | |
| | | | | | | | | | |
The following table represents the average monthly volume of the Fund’s derivative transactions during the six months ended October 31, 2024:
| | | | |
Interest Rate Swaps: | | | | |
Average notional amount | | $ | 59,752,857 | |
Centrally Cleared Interest Rate Swaps: | | | | |
Average notional amount | | $ | 3,195,322,857 | |
Centrally Cleared Inflation Swaps: | | | | |
Average notional amount | | $ | 1,644,137,143 | |
For financial reporting purposes, the Fund does not offset derivative assets and derivative liabilities that are subject to netting arrangements in the statement of assets and liabilities.
All OTC derivatives held at period end were subject to netting arrangements. The following table presents the Fund’s derivative assets and liabilities by OTC counterparty net of amounts available for offset under ISDA Master Agreements (“MA”) and net of the related collateral received/pledged by the Fund as of October 31, 2024. Exchange-traded derivatives and centrally cleared swaps are not subject to netting arrangements and as such are excluded from the table.
| | | | | | | | | | | | | | | | | | | | |
Counterparty | | Derivative
Assets
Subject to a
MA | | | Derivatives
Available
for Offset | | | Cash
Collateral
Received* | | | Security
Collateral
Received* | | | Net Amount
of Derivative
Assets | |
Citibank, NA | | $ | 4,208,384 | | | $ | – 0 | – | | $ | (3,950,000 | ) | | $ | – 0 | – | | $ | 258,384 | |
JPMorgan Chase Bank, NA | | | 301,569 | | | | (73,746 | ) | | | – 0 | – | | | – 0 | – | | | 227,823 | |
| | | | | | | | | | | | | | | | | | | | |
Total | | $ | 4,509,953 | | | $ | (73,746 | ) | | $ | (3,950,000 | ) | | $ | – 0 | – | | $ | 486,207 | ^ |
| | | | | | | | | | | | | | | | | | | | |
| | |
| |
| abfunds.com | | AB MUNICIPAL INCOME SHARES | 139 |
NOTES TO FINANCIAL STATEMENTS (continued)
| | | | | | | | | | | | | | | | | | | | |
Counterparty | | Derivative
Liabilities
Subject to a
MA | | | Derivatives
Available
for Offset | | | Cash
Collateral
Pledged* | | | Security
Collateral
Pledged* | | | Net Amount
of Derivative
Liabilities | |
JPMorgan Chase Bank, NA | | $ | 73,746 | | | $ | (73,746 | ) | | $ | – 0 | – | | $ | – 0 | – | | $ | – 0 | – |
Morgan Stanley Capital Services LLC | | | 724,291 | | | | – 0 | – | | | (640,000 | ) | | | – 0 | – | | | 84,291 | |
| | | | | | | | | | | | | | | | | | | | |
Total | | $ | 798,037 | | | $ | (73,746 | ) | | $ | (640,000 | ) | | $ | – 0 | – | | $ | 84,291 | ^ |
| | | | | | | | | | | | | | | | | | | | |
| * | The actual collateral received/pledged may be more than the amount reported due to over-collateralization. |
| ^ | Net amount represents the net receivable/payable that would be due from/to the counterparty in the event of default or termination. The net amount from OTC financial derivative instruments can only be netted across transactions governed under the same master agreement with the same counterparty. |
NOTE D
Shares of Beneficial Interest
Transactions in shares of beneficial interest were as follows:
| | | | | | | | | | | | | | | | | | | | | | | | |
| | | | | | | | | | | | | | | | | | | | | | | | |
| | | Shares | | | | | | Amount | | | | |
| | | Six Months Ended
October 31, 2024
(unaudited) | | | Year Ended
April 30,
2024 | | | | | | Six Months Ended
October 31, 2024
(unaudited) | | | Year Ended
April 30,
2024 | | | | |
| | | | | | | | |
Shares sold | | | 192,233,665 | | | | 506,082,273 | | | | | | | $ | 2,166,418,619 | | | $ | 5,480,423,265 | | | | | |
| | | | | |
Shares redeemed | | | (75,835,552 | ) | | | (239,169,160 | ) | | | | | | | (852,239,167) | | | | (2,563,470,100 | ) | | | | |
| | | | | |
Net increase | | | 116,398,113 | | | | 266,913,113 | | | | | | | $ | 1,314,179,452 | | | $ | 2,916,953,165 | | | | | |
| | | | | |
NOTE E
Risks Involved in Investing in the Fund
Market Risk—The value of the Fund’s assets will fluctuate as the market or markets in which the Fund invests fluctuate. The value of the Fund’s investments may decline, sometimes rapidly and unpredictably, simply because of economic changes or other events, including public health crises (including the occurrence of a contagious disease or illness) and regional and global conflicts, that affect large portions of the market.
Credit Risk—An issuer or guarantor of a fixed-income security, or the counterparty to a derivatives or other contract, may be unable or unwilling to make timely payments of interest or principal, or to otherwise honor its obligations. The issuer or guarantor may default, causing a loss of the full principal amount of a security and any accrued interest. The degree of risk for a particular security may be reflected in its credit rating. There is the possibility that the credit rating of a fixed-income security may be downgraded after purchase, which may adversely affect the value of the security. Investments in fixed-income securities with lower ratings tend to have a higher probability that an issuer will default or fail to meet its payment obligations.
| | |
| |
140 | AB MUNICIPAL INCOME SHARES | | abfunds.com |
NOTES TO FINANCIAL STATEMENTS (continued)
Municipal Market Risk—This is the risk that special factors may adversely affect the value of municipal securities and have a significant effect on the yield or value of the Fund’s investments in municipal securities. These factors include economic conditions, political or legislative changes, public health crises, uncertainties related to the tax status of municipal securities, and the rights of investors in these securities. To the extent that the Fund invests more of its assets in a particular state’s municipal securities, the Fund may be vulnerable to events adversely affecting that state, including economic, political and regulatory occurrences, court decisions, terrorism, public health crises (including the occurrence of a contagious disease or illness) and catastrophic natural disasters, such as hurricanes, fires or earthquakes. The Fund’s investments in certain municipal securities with principal and interest payments that are made from the revenues of a specific project or facility, and not general tax revenues, may have increased risks. Factors affecting the project or facility, such as local business or economic conditions, could have a significant effect on the project’s ability to make payments of principal and interest on these securities.
In addition, changes in tax rates or the treatment of income from certain types of municipal securities, among other things, could negatively affect the municipal securities markets.
Tax Risk—There is no guarantee that all of the Fund’s income will remain exempt from U.S. federal or state income taxes. From time to time, the U.S. Government and the U.S. Congress consider changes in U.S. federal income tax law that could limit or eliminate the federal tax exemption for municipal bond income, which would in effect reduce the income received by shareholders from the Fund by increasing taxes on that income. In such event, the Fund’s net asset value, or NAV, could also decline as yields on municipal bonds, which are typically lower than those on taxable bonds, would be expected to increase to approximately the yield of comparable taxable bonds. Actions or anticipated actions affecting the tax exempt status of municipal bonds could also result in significant shareholder redemptions of Fund shares as investors anticipate adverse effects on the Fund or seek higher yields to offset the potential loss of the tax deduction. As a result, the Fund would be required to maintain higher levels of cash to meet the redemptions, which would negatively affect the Fund’s yield. The U.S. federal income tax treatment of payments in respect of certain derivative contracts is unclear.
Below Investment-Grade Securities Risk—Investments in fixed-income securities with lower ratings (commonly known as “junk bonds”) tend to have a higher probability that an issuer will default or fail to meet its payment obligations. These securities may be subject to greater price volatility
| | |
| |
| abfunds.com | | AB MUNICIPAL INCOME SHARES | 141 |
NOTES TO FINANCIAL STATEMENTS (continued)
due to such factors as specific corporate developments, interest rate sensitivity and negative perceptions of the junk bond market generally and may be more difficult to trade than other types of securities.
Interest-Rate Risk—Changes in interest rates will affect the value of investments in fixed-income securities. When interest rates rise, the value of existing investments in fixed-income securities tends to fall and this decrease in value may not be offset by higher income from new investments. Interest-rate risk is generally greater for fixed-income securities with longer maturities or durations. The Fund may be subject to a greater risk of rising interest rates than would normally be the case due to the recent end of a period of historically low rates and the effects of potential central bank monetary policy, and government fiscal policy, initiatives and market reactions to those initiatives.
Duration Risk—Duration is a measure that relates the expected price volatility of a fixed-income security to changes in interest rates. The duration of a fixed-income security may be shorter than or equal to full maturity of a fixed-income security. Fixed-income securities with longer durations have more risk and will decrease in price as interest rates rise.
Inflation Risk—This is the risk that the value of assets or income from investments will be less in the future as inflation decreases the value of money. As inflation increases, the value of the Fund’s assets can decline as can the value of the Fund’s distributions. This risk is significantly greater for fixed-income securities with longer maturities.
Leverage Risk—When the Fund borrows money or otherwise leverages its investments, its performance may be volatile because leverage tends to exaggerate the effect of any increase or decrease in the value of the Fund’s investments. The Fund may create leverage through the use of reverse repurchase arrangements, forward currency exchange contracts, forward commitments, dollar rolls or futures or by borrowing money. The use of other types of derivative instruments by the Fund, such as options and swaps, may also result in a form of leverage. Leverage may result in higher returns to the Fund than if the Fund were not leveraged, but may also adversely affect returns, particularly if the market is declining.
Illiquid Investments Risk—Illiquid investments risk exists when particular investments, such as lower-rated securities, are or become difficult to purchase or sell, possibly preventing the Fund from selling such investments at an advantageous price. The Fund is subject to illiquid investments risk because the market for municipal securities is generally smaller than many other markets. Derivatives and securities involving substantial market and credit risk tend to involve greater illiquid investments risk than most other types of investments.
| | |
| |
142 | AB MUNICIPAL INCOME SHARES | | abfunds.com |
NOTES TO FINANCIAL STATEMENTS (continued)
Derivatives Risk—Derivatives may be difficult to price or unwind and leveraged so that small changes may produce disproportionate losses for the Fund. A short position in a derivative instrument involves the risk of a theoretically unlimited increase in the value of the underlying asset, reference rate or index, which could cause the Fund to suffer a potentially unlimited loss. Derivatives, especially over-the-counter derivatives, are also subject to counterparty risk, which is the risk that the counterparty (the party on the other side of the transaction) on a derivative transaction will be unable or unwilling to honor its contractual obligations to the Fund.
Indemnification Risk—In the ordinary course of business, the Fund enters into contracts that contain a variety of indemnifications. The Fund’s maximum exposure under these arrangements is unknown. However, the Fund has not had prior claims or losses pursuant to these indemnification provisions and expects the risk of loss thereunder to be remote. Therefore, the Fund has not accrued any liability in connection with these indemnification provisions.
Management Risk—The Fund is subject to management risk because it is an actively-managed investment fund. The Adviser will apply its investment techniques and risk analyses in making investment decisions, but there is no guarantee that its techniques will produce the intended results. Some of these techniques may incorporate, or rely upon, quantitative models, but there is no guarantee that these models will generate accurate forecasts, reduce risk or otherwise perform as expected.
NOTE F
Joint Credit Facility
A number of open-end mutual funds managed by the Adviser, including the Fund, participate in a $325 million revolving credit facility (the “Facility”) intended to provide short-term financing related to redemptions and other short term liquidity requirements, subject to certain restrictions. Commitment fees related to the Facility are paid by the participating funds and are included in miscellaneous expenses in the statement of operations. The Fund did not utilize the Facility during the six months ended October 31, 2024.
NOTE G
Distributions to Shareholders
The tax character of distributions to be paid for the year ending April 30, 2025 will be determined at the end of the current fiscal year.
| | |
| |
| abfunds.com | | AB MUNICIPAL INCOME SHARES | 143 |
NOTES TO FINANCIAL STATEMENTS (continued)
The tax character of distributions paid during the fiscal years ended April 30, 2024 and April 30, 2023 were as follows:
| | | | | | | | |
| | | 2024 | | | 2023 | |
Distributions paid from: | | | | | | | | |
Ordinary income | | $ | 31,837,803 | | | $ | 26,840,993 | |
| | | | | | | | |
Total taxable distributions | | | 31,837,803 | | | | 26,840,993 | |
Tax-exempt income | | | 431,142,946 | | | | 321,585,581 | |
| | | | | | | | |
Total distributions paid | | $ | 462,980,749 | | | $ | 348,426,574 | |
| | | | | | | | |
As of April 30, 2024, the components of accumulated earnings (deficit) on a tax basis were as follows:
| | | | |
Undistributed ordinary income | | $ | 46,904,575 | |
Accumulated capital and other losses | | $ | (48,972,896 | )(a) |
Unrealized appreciation (depreciation) | | | (587,885,949 | )(b) |
| | | | |
Total accumulated earnings (deficit) | | $ | (589,954,270 | )(c) |
| | | | |
| (a) | As of April 30, 2024, the Fund had a net capital loss carryforward of $48,972,896. |
| (b) | The differences between book-basis and tax-basis unrealized appreciation (depreciation) are attributable primarily to the tax treatment of tender option bonds, the tax treatment of swaps, the tax deferral of losses on wash sales, and the tax treatment of bond restructuring. |
| (c) | The differences between book-basis and tax-basis components of accumulated earnings (deficit) are attributable primarily to the tax treatment of defaulted securities and dividends payable. |
For tax purposes, net realized capital losses may be carried over to offset future capital gains, if any. Funds are permitted to carry forward capital losses for an indefinite period, and such losses will retain their character as either short-term or long-term capital losses. As of April 30, 2024, the Fund had a net short-term capital loss carryforward of $24,945,460 which may be carried forward for an indefinite period.
NOTE H
Floating Rate Notes Issued in Connection with Securities Held
The Fund may engage in tender option bond (“TOB”) transactions in which the Fund transfers a fixed rate bond (“Fixed Rate Bond”) into a Special Purpose Vehicle (the “SPV”, which is generally organized as a trust). The Fund buys a residual interest in the assets and cash flows of the SPV, often referred to as an inverse floating rate obligation (“Inverse Floater”). The SPV also issues floating rate notes (“Floating Rate Notes”) which are sold to third parties. The Floating Rate Notes pay interest at rates that generally reset weekly and their holders have the option to tender their notes to a liquidity provider for redemption at par. The Inverse Floater held by the Fund gives the Fund the right (1) to cause the holders of the Floating Rate Notes to tender their notes at par, and (2) to have the trustee transfer the Fixed Rate Bond held by the SPV to the Fund, thereby collapsing the SPV. The SPV may also be collapsed in certain other circumstances. In accordance with
| | |
| |
144 | AB MUNICIPAL INCOME SHARES | | abfunds.com |
NOTES TO FINANCIAL STATEMENTS (continued)
U.S. GAAP requirements regarding accounting for transfers and servicing of financial assets and extinguishments of liabilities, the Fund accounts for the transaction described above as a secured borrowing by including the Fixed Rate Bond in its portfolio of investments and the Floating Rate Notes as a liability under the caption “Payable for floating rate notes issued” in its statement of assets and liabilities. Interest expense related to the Fund’s liability with respect to Floating Rate Notes is recorded as incurred. The interest expense is also included in the Fund’s expense ratio. At October 31, 2024, the amount of the Fund’s Floating Rate Notes outstanding was $490,290,000 and the related interest rate was 3.06% to 5.03%. For the six months ended October 31, 2024, the average amount of Floating Rate Notes outstanding and the daily weighted average interest rate were $487,044,158 and 4.26%, respectively.
The Fund may also purchase Inverse Floaters in the secondary market without first owning the underlying bond. Such an Inverse Floater is included in the Fund’s portfolio of investments but is not required to be treated as a secured borrowing and reflected in the Fund’s financial statements as a secured borrowing.
NOTE I
Recent Accounting Pronouncements
In December 2022, the Financial Accounting Standards Board issued an Accounting Standards Update, ASU 2022-06, “Reference Rate Reform (Topic 848) – Deferral of the Sunset Date of Topic 848”. ASU 2022-06 is an amendment to ASU 2020-04, which provided optional guidance to ease the potential accounting burden due to the discontinuation of the LIBOR and other interbank-offered based reference rates and which was effective as of March 12, 2020 through December 31, 2022. ASU 2022-06 extends the effective period through December 31, 2024. Management is currently evaluating the impact, if any, of applying ASU 2022-06.
In November 2023, the Financial Accounting Standards Board issued Accounting Standards Update, ASU 2023-07, “Segment Reporting (Topic 280)”. ASU 2023-07 requires public entities to provide disclosure of significant segment expenses that are regularly provided to the chief operating decision maker (“CODM”). ASU 2023-07, among other things, (i) requires a single segment public entity to provide all necessary disclosures required by Topic 280 it, (ii) requires a public entity to disclose the title and position of the CODM and an explanation of how the CODM uses the reported measure(s) of segment profit and loss in assessing segment performance and deciding how to allocate resources and (iii) provides the ability for a public entity to elect more than one performance measure. ASU 2023-07 is effective for fiscal years beginning after December 15, 2023, and interim periods within fiscal years beginning after December 15, 2024.
| | |
| |
| abfunds.com | | AB MUNICIPAL INCOME SHARES | 145 |
NOTES TO FINANCIAL STATEMENTS (continued)
Early adoption of ASU 2023-07 is permitted. Management is currently evaluating the impact, if any, of applying ASU 2023-07.
NOTE J
Subsequent Events
Management has evaluated subsequent events for possible recognition or disclosure in the financial statements through the date the financial statements are issued. Management has determined that there are no material events that would require disclosure in the Fund’s financial statements through this date.
| | |
| |
146 | AB MUNICIPAL INCOME SHARES | | abfunds.com |
FINANCIAL HIGHLIGHTS
Selected Data For A Share Of Beneficial Interest Outstanding Throughout Each Period
| | | | | | | | | | | | | | | | | | | | | | | | |
| | | Six Months
Ended
October 31,
2024 (unaudited) | | | Year Ended April 30, | |
| | | 2024 | | | 2023 | | | 2022 | | | 2021 | | | 2020 | |
| | | | |
| | | | | | | | | | | | | | | | | | | | | | | | |
Net asset value, beginning of period | | | $ 10.88 | | | | $ 11.04 | | | | $ 11.36 | | | | $ 12.70 | | | | $ 10.80 | | | | $ 11.70 | |
| | | | |
Income From Investment Operations | | | | | | | | | | | | | | | | | | | | | | | | |
| | | | | | |
Net investment income(a) | | | .26 | | | | .50 | | | | .45 | | | | .43 | | | | .44 | | | | .44 | |
| | | | | | |
Net realized and unrealized gain (loss) on investment transactions | | | .37 | | | | (.18 | ) | | | (.30 | ) | | | (1.35 | ) | | | 1.91 | | | | (.90 | ) |
| | | | |
| | | | | | |
Net increase (decrease) in net asset value from operations | | | .63 | | | | .32 | | | | .15 | | | | (.92 | ) | | | 2.35 | | | | (.46 | ) |
| | | | |
Less: Dividends | | | | | | | | | | | | | | | | | | | | | | | | |
| | | | | | |
Dividends from net investment income | | | (.25 | ) | | | (.48 | ) | | | (.47 | ) | | | (.42 | ) | | | (.45 | ) | | | (.44 | ) |
| | | | |
Net asset value, end of period | | | $ 11.26 | | | | $ 10.88 | | | | $ 11.04 | | | | $ 11.36 | | | | $ 12.70 | | | | $ 10.80 | |
| | | | |
Total Return | | | | | | | | | | | | | | | | | | | | | | | | |
| | | | | | |
Total investment return based on net asset value(b) | | | 5.78 | % | | | 2.99 | %+ | | | 1.44 | %+ | | | (7.52 | )% | | | 22.01 | % | | | (4.23 | )% |
| | | | | | |
Ratios/Supplemental Data | | | | | | | | | | | | | | | | | | | | | | | | |
| | | | | | |
Net assets, end of period (000’s omitted) | | | $13,865,709 | | | | $12,137,129 | | | | $9,368,786 | | | | $7,305,688 | | | | $6,349,716 | | | | $4,685,911 | |
| | | | | | |
Ratio to average net assets of: | | | | | | | | | | | | | | | | | | | | | | | | |
| | | | | | |
Expenses(c) | | | .16 | %^ | | | .22 | % | | | .21 | % | | | .07 | % | | | .07 | % | | | .01 | % |
| | | | | | |
Net investment income | | | 4.59 | %^ | | | 4.65 | % | | | 4.10 | % | | | 3.38 | % | | | 3.62 | % | | | 3.67 | % |
| | | | | | |
Portfolio turnover rate | | | 5 | % | | | 17 | % | | | 18 | % | | | 6 | % | | | 10 | % | | | 12 | % |
| (a) | Based on average shares outstanding. |
| (b) | Total investment return is calculated assuming an initial investment made at the net asset value at the beginning of the period, reinvestment of all dividends and distributions at net asset value during the period, and redemption on the last day of the period. Total return does not reflect the deduction of taxes that a shareholder would pay on fund distributions or the redemption of fund shares. Total investment return calculated for a period of less than one year is not annualized. |
| (c) | The expense ratios, excluding interest expense are .00%, .00%, .00%, .00%, .00% and .00%, respectively. |
| + | The net asset value and total return include adjustments in accordance with accounting principles generally accepted in the United States of America for financial reporting purposes. As such, the net asset value and total return for shareholder transactions may differ from financial statements. |
See notes to financial statements.
| | |
| |
| abfunds.com | | AB MUNICIPAL INCOME SHARES | 147 |
Information Regarding the Review and Approval of the Fund’s Advisory Agreement
The disinterested trustees (the “directors”) of AB Corporate Shares (the “Company”) unanimously approved the continuance of the Company’s Advisory Agreement with the Adviser in respect of AB Municipal Income Shares (the “Fund”) at a meeting held in-person on July 30-31, 2024 (the “Meeting”).
Prior to approval of the continuance of the Advisory Agreement, the directors had requested from the Adviser, and received and evaluated, extensive materials. They reviewed the proposed continuance of the Advisory Agreement with the Adviser and with experienced counsel who are independent of the Adviser, who advised on the relevant legal standards. The directors also reviewed additional materials, including comparative analytical data prepared by the Senior Vice President of the Fund. The directors also discussed the proposed continuance in private sessions with counsel.
The directors noted that the Fund is designed as a vehicle for the wrap fee account market (where investors pay fees to a wrap fee sponsor which pays investment fees and expenses from such fee). The directors also noted that no advisory fee is payable by the Fund, that the Advisory Agreement does not include the reimbursement provision for certain administrative expenses included in the advisory agreements of most of the open-end AB Funds, and that the Adviser is responsible for payment of the Fund’s ordinary expenses. The directors noted that the Company acknowledges in the Advisory Agreement that the Adviser and its affiliates expect to receive compensation from third parties in connection with services provided under the Advisory Agreement. The directors further noted that the Adviser receives payments from the wrap fee program sponsors (the “Sponsors”) that use the Fund as an investment vehicle for their clients.
The directors considered their knowledge of the nature and quality of the services provided by the Adviser to the Fund gained from their experience as directors or trustees of most of the registered investment companies advised by the Adviser, their overall confidence in the Adviser’s integrity and competence they have gained from that experience, the Adviser’s initiative in identifying and raising potential issues with the directors and its responsiveness, frankness and attention to concerns raised by the directors in the past, including the Adviser’s willingness to consider and implement organizational and operational changes designed to improve investment results and the services provided to the AB Funds. The directors noted that they have four regular meetings each year, at each of which they review extensive materials and information from the Adviser, including information on the investment performance of the Fund and the money market fund advised by the Adviser in which the Fund invests a portion of its assets.
| | |
| |
148 | AB MUNICIPAL INCOME SHARES | | abfunds.com |
The directors also considered all factors they believed relevant, including the specific matters discussed below. During the course of their deliberations, the directors evaluated, among other things, the reasonableness of the advisory fee. The directors did not identify any particular information that was all-important or controlling, and different directors may have attributed different weights to the various factors. The directors determined that the selection of the Adviser to manage the Fund and the overall arrangements between the Fund and the Adviser, as provided in the Advisory Agreement, including the advisory fee, were fair and reasonable in light of the services performed, expenses incurred and such other matters as the directors considered relevant in the exercise of their business judgment. The material factors and conclusions that formed the basis for the directors’ determinations included the following:
Nature, Extent and Quality of Services Provided
The directors considered the scope and quality of services provided by the Adviser under the Advisory Agreement, including the quality of the investment research capabilities of the Adviser and the other resources it has dedicated to performing services for the Fund. The directors noted that the Adviser from time to time reviews the Fund’s investment strategies and from time to time proposes changes intended to improve the Fund’s relative or absolute performance for the directors’ consideration. They also noted the professional experience and qualifications of the Fund’s portfolio management team and other senior personnel of the Adviser. The quality of administrative and other services, including the Adviser’s role in coordinating the activities of the Fund’s other service providers, also was considered. The directors concluded that, overall, they were satisfied with the nature, extent and quality of services provided to the Fund under the Advisory Agreement.
Costs of Services Provided and Profitability
The directors reviewed a schedule of the revenues and expenses and related notes indicating the profitability of the Fund to the Adviser for calendar years 2022 and 2023 that had been prepared with an expense allocation methodology arrived at in consultation with an independent consultant at the request of the directors. The directors noted the assumptions and methods of allocation used by the Adviser in preparing fund-specific profitability data and understood that there are a number of potentially acceptable allocation methodologies for information of this type. The directors noted that the profitability information reflected all revenues and expenses of the Adviser’s relationship with the Fund. The directors recognized that it is difficult to make comparisons of the profitability of the Advisory Agreement with the profitability of fund advisory contracts for unaffiliated funds because comparative information is not generally publicly available and is affected by numerous factors. The directors focused on the profitability of the Adviser’s relationship with the Fund before taxes and distribution expenses. The directors concluded that the Adviser’s level of profitability from its relationship with the Fund was not unreasonable.
| | |
| |
| abfunds.com | | AB MUNICIPAL INCOME SHARES | 149 |
Fall-Out Benefits
The directors considered the other benefits to the Adviser and its affiliates from their relationships with the Fund and the underlying fund advised by the Adviser in which the Fund invests. The directors noted that the Adviser is compensated by the Sponsors. The directors understood that the Adviser also might derive reputational and other benefits from its association with the Fund.
Investment Results
In addition to the information reviewed by the directors in connection with the Meeting, the directors receive detailed performance information for the Fund at each regular Board meeting during the year.
At the Meeting, the directors reviewed performance information prepared by an independent service provider (the “15(c) service provider”), showing the performance of the Fund against a group of similar funds (“peer group”) and a larger group of similar funds (“peer universe”), each selected by the 15(c) service provider, and information prepared by the Adviser showing the Fund’s performance against a broad-based securities market index, in each case for the 1-, 3-, 5- and 10-year periods ended May 31, 2024 and (in the case of comparisons with the broad-based securities market index) for the period from inception. The directors were cognizant that the Fund was neither designed nor offered as a standalone investment and was intended to serve solely as a component of certain separately managed accounts (“SMAs”). The Adviser had explained that this attribute made it difficult to select an appropriate benchmark for the Fund. At the directors’ request, the Adviser provided information showing the weighting of the Fund in a current SMA and the overall performance of the SMA versus its stated benchmark. Based on their review and their discussion with the Adviser of the reasons for the Fund’s underperformance in the most recent period, the directors concluded that the Fund’s investment performance was acceptable.
Advisory Fees
The directors considered the advisory fee rate payable by the Fund to the Adviser (zero) and information provided by the 15(c) service provider concerning advisory fee rates payable by other funds in the same category as the Fund. The directors recognized that it is difficult to make comparisons of advisory fees because there are variations in the services that are included in the fees payable by other funds.
The directors noted the unusual arrangements in the Advisory Agreement providing for no advisory fee but were cognizant that the Adviser is indirectly compensated by the Sponsors for its services to the Fund. The directors reviewed the fee arrangements between the Adviser and each of the current Sponsors and noted that such fees were negotiated on an arm’s length basis and were within the range of fees paid by wrap fee
| | |
| |
150 | AB MUNICIPAL INCOME SHARES | | abfunds.com |
sponsors to other advisers of similar funds. While the Adviser’s fee arrangements with the Sponsors vary, the directors acknowledged the Adviser’s view that a portion of such fees (less the expenses of the Fund paid by the Adviser) may reasonably be viewed as compensating the Adviser for advisory services it provides to the Fund (the “implied fee”) and that the Adviser believes that while the Sponsors pay the Adviser different fee rates, the rate of fee attributable to Fund management at the Fund level is the same for all Sponsors. The directors also considered the fee rate schedules used by other registered investment companies that invest in fixed income securities that are advised by the Adviser.
The Adviser informed the directors that there were no institutional products managed by the Adviser that utilize investment strategies similar to those of the Fund.
The directors did not consider comparative expense information for the Fund because the Fund does not bear ordinary expenses.
Economies of Scale
The directors did not consider the extent to which fee levels in the Advisory Agreement for the Fund reflect economies of scale because the Advisory Agreement does not provide for any compensation to be paid to the Adviser by the Fund and the Fund’s expense ratio is zero. They did note, however, that the fee payable to the Adviser by the current Sponsors declines at a breakpoint based on either individual account sizes or on total assets managed by the Adviser for the Sponsor.
| | |
| |
| abfunds.com | | AB MUNICIPAL INCOME SHARES | 151 |
NOTES
| | |
| |
152 | AB MUNICIPAL INCOME SHARES | | abfunds.com |
AB MUNICIPAL INCOME SHARES
66 Hudson Boulevard East
New York, NY 10001
MIS-0152-1024 
OCT 10.31.2024

SEMI-ANNUAL FINANCIAL STATEMENTS AND ADDITIONAL INFORMATION
AB TAXABLE MULTI-SECTOR INCOME SHARES

| | |
| |
| Investment Products Offered | | • Are Not FDIC Insured • May Lose Value • Are Not Bank Guaranteed |
Investors should consider the investment objectives, risks, charges and expenses of the Fund carefully before investing. For copies of our prospectus or summary prospectus, which contain this and other information, visit us online at www.abfunds.com or contact your AB representative. Please read the prospectus and/or summary prospectus carefully before investing.
This shareholder report must be preceded or accompanied by the Fund’s prospectus for individuals who are not current shareholders of the Fund.
You may obtain a description of the Fund’s proxy voting policies and procedures, and information regarding how the Fund voted proxies relating to portfolio securities during the most recent 12-month period ended June 30, without charge. Simply visit AB’s website at www.abfunds.com, or go to the Securities and Exchange Commission’s (the “Commission”) website at www.sec.gov, or call AB at (800) 227 4618.
The Fund files its complete schedule of portfolio holdings with the Commission for the first and third quarters of each fiscal year as an exhibit to its reports on Form N-PORT. The Fund’s Form N-PORT reports are available on the Commission’s website at www.sec.gov. AB publishes full portfolio holdings for the Fund monthly at www.abfunds.com.
AllianceBernstein Investments, Inc. (ABI) is the distributor of the AB family of mutual funds. ABI is a member of FINRA and is an affiliate of AllianceBernstein L.P., the Adviser of the funds.
The [A/B] logo and AllianceBernstein® are registered trademarks used by permission of the owner, AllianceBernstein L.P.
PORTFOLIO OF INVESTMENTS
October 31, 2024 (unaudited)
| | | | | | | | |
| | | Principal
Amount
(000) | | | U.S. $ Value | |
| |
CORPORATES - INVESTMENT GRADE – 63.2% | | | | | | | | |
Industrial – 39.0% | | | | | | | | |
Basic – 4.6% | | | | | | | | |
AngloGold Ashanti Holdings PLC
3.375%, 11/01/2028 | | $ | 1,000 | | | $ | 922,490 | |
Eastman Chemical Co.
3.80%, 03/15/2025 | | | 2,000 | | | | 1,988,800 | |
Ecolab, Inc.
3.25%, 12/01/2027 | | | 3,000 | | | | 2,889,870 | |
EIDP, Inc.
1.70%, 07/15/2025 | | | 1,265 | | | | 1,238,207 | |
Freeport-McMoRan, Inc.
4.125%, 03/01/2028 | | | 2,000 | | | | 1,946,320 | |
Newmont Corp.
2.80%, 10/01/2029 | | | 1,000 | | | | 915,420 | |
PPG Industries, Inc.
1.20%, 03/15/2026 | | | 2,000 | | | | 1,904,920 | |
Rohm & Haas Co.
7.85%, 07/15/2029 | | | 1,000 | | | | 1,110,270 | |
Sherwin-Williams Co. (The)
3.45%, 06/01/2027 | | | 1,000 | | | | 970,600 | |
Southern Copper Corp.
3.875%, 04/23/2025 | | | 1,000 | | | | 987,500 | |
Westlake Corp.
3.60%, 08/15/2026 | | | 3,000 | | | | 2,936,460 | |
WRKCo, Inc.
3.90%, 06/01/2028 | | | 1,000 | | | | 964,680 | |
4.00%, 03/15/2028 | | | 2,000 | | | | 1,944,320 | |
| | | | | | | | |
| | | | | | | 20,719,857 | |
| | | | | | | | |
Capital Goods – 4.4% | |
3M Co.
2.65%, 04/15/2025 | | | 2,000 | | | | 1,979,300 | |
Boeing Co. (The)
2.196%, 02/04/2026 | | | 2,000 | | | | 1,926,440 | |
3.25%, 03/01/2028 | | | 1,000 | | | | 930,760 | |
Caterpillar Financial Services Corp.
4.375%, 08/16/2029 | | | 1,000 | | | | 990,720 | |
Emerson Electric Co.
1.80%, 10/15/2027 | | | 2,000 | | | | 1,852,660 | |
Northrop Grumman Corp.
2.93%, 01/15/2025 | | | 2,000 | | | | 1,990,740 | |
Parker-Hannifin Corp.
4.25%, 09/15/2027 | | | 2,000 | | | | 1,982,840 | |
RTX Corp.
3.125%, 05/04/2027 | | | 2,000 | | | | 1,927,920 | |
| | |
| |
| abfunds.com | | AB TAXABLE MULTI-SECTOR INCOME SHARES | 1 |
PORTFOLIO OF INVESTMENTS (continued)
| | | | | | | | |
| | | Principal
Amount
(000) | | | U.S. $ Value | |
| |
Trane Technologies Financing Ltd.
3.55%, 11/01/2024 | | $ | 2,000 | | | $ | 2,000,000 | |
Waste Management, Inc.
3.15%, 11/15/2027 | | | 3,000 | | | | 2,884,680 | |
Westinghouse Air Brake Technologies Corp.
3.45%, 11/15/2026 | | | 1,000 | | | | 975,050 | |
| | | | | | | | |
| | | | | | | 19,441,110 | |
| | | | | | | | |
Communications - Media – 1.5% | | | | | | | | |
Charter Communications Operating LLC/Charter Communications Operating Capital
2.25%, 01/15/2029 | | | 1,000 | | | | 877,750 | |
Discovery Communications LLC
3.95%, 03/20/2028 | | | 2,000 | | | | 1,887,240 | |
4.125%, 05/15/2029 | | | 1,000 | | | | 930,480 | |
Omnicom Group, Inc./Omnicom Capital, Inc.
3.65%, 11/01/2024 | | | 2,000 | | | | 2,000,000 | |
Warnermedia Holdings, Inc.
3.755%, 03/15/2027 | | | 1,000 | | | | 962,810 | |
| | | | | | | | |
| | | | | | | 6,658,280 | |
| | | | | | | | |
Communications - Telecommunications – 1.6% | | | | | | | | |
AT&T, Inc.
1.65%, 02/01/2028 | | | 1,000 | | | | 908,630 | |
T-Mobile USA, Inc.
2.625%, 04/15/2026 | | | 3,402 | | | | 3,298,341 | |
Verizon Communications, Inc.
4.125%, 03/16/2027 | | | 3,000 | | | | 2,964,150 | |
| | | | | | | | |
| | | | | | | 7,171,121 | |
| | | | | | | | |
Consumer Cyclical - Automotive – 1.6% | | | | | | | | |
Ford Motor Credit Co., LLC
2.90%, 02/10/2029 | | | 1,000 | | | | 892,410 | |
4.95%, 05/28/2027 | | | 779 | | | | 770,096 | |
General Motors Financial Co., Inc.
4.30%, 04/06/2029 | | | 1,000 | | | | 966,200 | |
5.40%, 05/08/2027 | | | 1,000 | | | | 1,011,800 | |
6.145% (SOFR + 1.30%), 04/07/2025(a) | | | 1,500 | | | | 1,504,035 | |
Toyota Motor Credit Corp.
3.65%, 01/08/2029 | | | 2,000 | | | | 1,934,940 | |
| | | | | | | | |
| | | | | | | 7,079,481 | |
| | | | | | | | |
Consumer Cyclical - Entertainment – 0.4% | | | | | | | | |
YMCA of Greater New York
2.303%, 08/01/2026 | | | 1,765 | | | | 1,667,219 | |
| | | | | | | | |
| | |
Consumer Cyclical - Other – 1.3% | | | | | | | | |
Las Vegas Sands Corp.
3.50%, 08/18/2026 | | | 1,000 | | | | 971,780 | |
| | |
| |
2 | AB TAXABLE MULTI-SECTOR INCOME SHARES | | abfunds.com |
PORTFOLIO OF INVESTMENTS (continued)
| | | | | | | | |
| | | Principal
Amount
(000) | | | U.S. $ Value | |
| |
Marriott International, Inc./MD
3.75%, 03/15/2025 | | $ | 1,075 | | | $ | 1,068,787 | |
4.875%, 05/15/2029 | | | 2,000 | | | | 2,001,780 | |
Series R
3.125%, 06/15/2026 | | | 2,000 | | | | 1,953,200 | |
| | | | | | | | |
| | | | | | | 5,995,547 | |
| | | | | | | | |
Consumer Cyclical - Restaurants – 0.2% | | | | | | | | |
McDonald’s Corp.
3.375%, 05/26/2025 | | | 1,000 | | | | 992,140 | |
| | | | | | | | |
| | |
Consumer Cyclical - Retailers – 2.0% | | | | | | | | |
AutoZone, Inc.
3.25%, 04/15/2025 | | | 2,000 | | | | 1,983,820 | |
Dollar Tree, Inc.
4.00%, 05/15/2025 | | | 2,000 | | | | 1,986,720 | |
NIKE, Inc.
2.40%, 03/27/2025 | | | 2,250 | | | | 2,228,962 | |
Ross Stores, Inc.
0.875%, 04/15/2026 | | | 1,000 | | | | 946,890 | |
VF Corp.
2.40%, 04/23/2025 | | | 1,670 | | | | 1,648,574 | |
| | | | | | | | |
| | | | | | | 8,794,966 | |
| | | | | | | | |
Consumer Non-Cyclical – 5.8% | | | | | | | | |
Altria Group, Inc.
4.80%, 02/14/2029 | | | 1,000 | | | | 994,040 | |
Amgen, Inc.
2.20%, 02/21/2027 | | | 3,000 | | | | 2,848,110 | |
Archer-Daniels-Midland Co.
2.50%, 08/11/2026 | | | 3,000 | | | | 2,893,230 | |
Baylor Scott & White Holdings
Series 2021
0.827%, 11/15/2025 | | | 2,275 | | | | 2,182,794 | |
Cencora, Inc.
3.25%, 03/01/2025 | | | 1,350 | | | | 1,341,549 | |
CVS Health Corp.
1.30%, 08/21/2027 | | | 2,000 | | | | 1,811,340 | |
General Mills, Inc.
3.20%, 02/10/2027 | | | 2,000 | | | | 1,936,500 | |
Gilead Sciences, Inc.
3.65%, 03/01/2026 | | | 1,000 | | | | 987,290 | |
Hershey Co. (The)
0.90%, 06/01/2025 | | | 1,300 | | | | 1,271,608 | |
Kraft Heinz Foods Co.
3.00%, 06/01/2026 | | | 1,000 | | | | 973,480 | |
Philip Morris International, Inc.
3.375%, 08/11/2025 | | | 2,000 | | | | 1,982,520 | |
| | |
| |
| abfunds.com | | AB TAXABLE MULTI-SECTOR INCOME SHARES | 3 |
PORTFOLIO OF INVESTMENTS (continued)
| | | | | | | | |
| | | Principal
Amount
(000) | | | U.S. $ Value | |
| |
Shire Acquisitions Investments Ireland DAC
3.20%, 09/23/2026 | | $ | 46 | | | $ | 44,923 | |
Sysco Corp.
3.75%, 10/01/2025 | | | 2,500 | | | | 2,480,075 | |
Tyson Foods, Inc.
3.55%, 06/02/2027 | | | 1,000 | | | | 970,460 | |
4.35%, 03/01/2029 | | | 1,000 | | | | 974,830 | |
UPMC
Series D-1
3.60%, 04/03/2025 | | | 2,250 | | | | 2,234,363 | |
| | | | | | | | |
| | | | | | | 25,927,112 | |
| | | | | | | | |
Energy – 5.7% | | | | | | | | |
Baker Hughes Holdings LLC/Baker Hughes Co-Obligor, Inc.
2.061%, 12/15/2026 | | | 3,000 | | | | 2,853,870 | |
Canadian Natural Resources Ltd.
3.85%, 06/01/2027 | | | 2,000 | | | | 1,955,940 | |
ConocoPhillips Co.
6.95%, 04/15/2029 | | | 2,000 | | | | 2,190,720 | |
Continental Resources, Inc./OK
4.375%, 01/15/2028 | | | 1,000 | | | | 970,040 | |
Diamondback Energy, Inc.
3.25%, 12/01/2026 | | | 2,000 | | | | 1,941,640 | |
5.20%, 04/18/2027 | | | 2,000 | | | | 2,020,460 | |
Energy Transfer LP
3.90%, 07/15/2026 | | | 2,000 | | | | 1,971,180 | |
Enterprise Products Operating LLC
3.125%, 07/31/2029 | | | 2,000 | | | | 1,867,660 | |
Exxon Mobil Corp.
2.992%, 03/19/2025 | | | 2,000 | | | | 1,985,420 | |
Marathon Oil Corp.
5.30%, 04/01/2029 | | | 1,000 | | | | 1,016,910 | |
MPLX LP
1.75%, 03/01/2026 | | | 2,000 | | | | 1,920,440 | |
ONEOK, Inc.
4.35%, 03/15/2029 | | | 2,000 | | | | 1,948,360 | |
Tennessee Gas Pipeline Co., LLC
2.90%, 03/01/2030(b) | | | 2,000 | | | | 1,788,820 | |
Williams Cos., Inc. (The)
5.40%, 03/02/2026 | | | 1,000 | | | | 1,006,610 | |
| | | | | | | | |
| | | | | | | 25,438,070 | |
| | | | | | | | |
Services – 3.8% | | | | | | | | |
Alibaba Group Holding Ltd.
3.60%, 11/28/2024 | | | 1,500 | | | | 1,498,065 | |
Amazon.com, Inc.
1.65%, 05/12/2028 | | | 3,000 | | | | 2,731,260 | |
| | |
| |
4 | AB TAXABLE MULTI-SECTOR INCOME SHARES | | abfunds.com |
PORTFOLIO OF INVESTMENTS (continued)
| | | | | | | | |
| | | Principal
Amount
(000) | | | U.S. $ Value | |
| |
Booking Holdings, Inc.
3.65%, 03/15/2025 | | $ | 1,000 | | | $ | 995,620 | |
eBay, Inc.
1.90%, 03/11/2025 | | | 2,000 | | | | 1,977,820 | |
Expedia Group, Inc.
3.80%, 02/15/2028 | | | 3,000 | | | | 2,904,480 | |
Global Payments, Inc.
1.20%, 03/01/2026 | | | 2,000 | | | | 1,907,860 | |
Mastercard, Inc.
2.00%, 03/03/2025 | | | 2,250 | | | | 2,229,705 | |
Verisk Analytics, Inc.
4.00%, 06/15/2025 | | | 2,500 | | | | 2,484,550 | |
| | | | | | | | |
| | | | | | | 16,729,360 | |
| | | | | | | | |
Technology – 5.1% | |
Fidelity National Information Services, Inc.
1.15%, 03/01/2026 | | | 3,000 | | | | 2,860,290 | |
Intel Corp.
2.60%, 05/19/2026 | | | 2,000 | | | | 1,931,980 | |
International Business Machines Corp.
1.70%, 05/15/2027 | | | 1,000 | | | | 932,090 | |
3.30%, 05/15/2026 | | | 2,000 | | | | 1,962,120 | |
3.50%, 05/15/2029 | | | 1,000 | | | | 950,290 | |
Jabil, Inc.
3.95%, 01/12/2028 | | | 2,000 | | | | 1,938,020 | |
Kyndryl Holdings, Inc.
2.70%, 10/15/2028 | | | 2,000 | | | | 1,819,700 | |
Microchip Technology, Inc.
4.25%, 09/01/2025 | | | 1,000 | | | | 994,670 | |
Oracle Corp.
2.50%, 04/01/2025 | | | 3,100 | | | | 3,068,938 | |
2.65%, 07/15/2026 | | | 1,000 | | | | 967,240 | |
QUALCOMM, Inc.
1.30%, 05/20/2028 | | | 3,000 | | | | 2,685,450 | |
VMware LLC
1.40%, 08/15/2026 | | | 3,000 | | | | 2,828,100 | |
| | | | | | | | |
| | | | | | | 22,938,888 | |
| | | | | | | | |
Transportation - Airlines – 0.4% | |
Southwest Airlines Co.
3.00%, 11/15/2026 | | | 2,000 | | | | 1,927,420 | |
| | | | | | | | |
| | |
Transportation - Services – 0.6% | | | | | | | | |
Ryder System, Inc.
1.75%, 09/01/2026 | | | 3,000 | | | | 2,839,560 | |
| | | | | | | | |
| | | | | | | 174,320,131 | |
| | | | | | | | |
| | |
| |
| abfunds.com | | AB TAXABLE MULTI-SECTOR INCOME SHARES | 5 |
PORTFOLIO OF INVESTMENTS (continued)
| | | | | | | | |
| | | Principal
Amount
(000) | | | U.S. $ Value | |
| |
Financial Institutions – 19.9% | | | | | | | | |
Banking – 15.5% | |
Ally Financial, Inc.
6.992%, 06/13/2029 | | $ | 2,000 | | | $ | 2,086,920 | |
Banco Santander SA
3.80%, 02/23/2028 | | | 2,000 | | | | 1,926,680 | |
Bank of America Corp.
1.197%, 10/24/2026 | | | 1,000 | | | | 964,650 | |
1.319%, 06/19/2026 | | | 1,000 | | | | 976,670 | |
3.559%, 04/23/2027 | | | 1,000 | | | | 981,940 | |
3.97%, 03/05/2029 | | | 1,000 | | | | 971,350 | |
Series N
1.658%, 03/11/2027 | | | 2,000 | | | | 1,914,920 | |
Barclays PLC
4.972%, 05/16/2029 | | | 4,000 | | | | 3,982,320 | |
Capital One Financial Corp.
3.75%, 03/09/2027 | | | 2,000 | | | | 1,954,180 | |
3.80%, 01/31/2028 | | | 1,000 | | | | 966,680 | |
Citigroup, Inc.
1.122%, 01/28/2027 | | | 1,000 | | | | 954,770 | |
3.668%, 07/24/2028 | | | 2,000 | | | | 1,937,980 | |
3.98%, 03/20/2030 | | | 1,000 | | | | 959,050 | |
4.075%, 04/23/2029 | | | 1,000 | | | | 972,760 | |
Citizens Financial Group, Inc.
5.841%, 01/23/2030 | | | 1,000 | | | | 1,021,670 | |
Deutsche Bank AG/New York NY
2.311%, 11/16/2027 | | | 2,000 | | | | 1,891,300 | |
Discover Bank
Series B
3.45%, 07/27/2026 | | | 3,385 | | | | 3,299,021 | |
Goldman Sachs Group, Inc. (The)
1.431%, 03/09/2027 | | | 2,000 | | | | 1,909,580 | |
4.387%, 06/15/2027 | | | 1,000 | | | | 994,270 | |
HSBC Holdings PLC
1.645%, 04/18/2026 | | | 2,210 | | | | 2,174,728 | |
4.041%, 03/13/2028 | | | 1,000 | | | | 979,650 | |
ING Groep NV
5.862% (SOFR + 1.01%), 04/01/2027(a) | | | 1,350 | | | | 1,355,603 | |
JPMorgan Chase & Co.
1.578%, 04/22/2027 | | | 1,000 | | | | 954,270 | |
2.182%, 06/01/2028 | | | 4,500 | | | | 4,214,430 | |
3.54%, 05/01/2028 | | | 1,000 | | | | 970,010 | |
4.005%, 04/23/2029 | | | 1,000 | | | | 972,320 | |
4.203%, 07/23/2029 | | | 2,500 | | | | 2,441,825 | |
KeyCorp
2.25%, 04/06/2027 | | | 2,000 | | | | 1,877,660 | |
| | |
| |
6 | AB TAXABLE MULTI-SECTOR INCOME SHARES | | abfunds.com |
PORTFOLIO OF INVESTMENTS (continued)
| | | | | | | | |
| | | Principal
Amount
(000) | | | U.S. $ Value | |
| |
M&T Bank Corp.
7.413%, 10/30/2029 | | $ | 2,000 | | | $ | 2,152,680 | |
Mitsubishi UFJ Financial Group, Inc.
1.412%, 07/17/2025 | | | 2,300 | | | | 2,246,203 | |
Mizuho Financial Group, Inc.
1.554%, 07/09/2027 | | | 4,200 | | | | 3,978,786 | |
Morgan Stanley
0.985%, 12/10/2026 | | | 1,000 | | | | 958,040 | |
Series G
1.512%, 07/20/2027 | | | 6,000 | | | | 5,677,500 | |
Santander Holdings USA, Inc.
6.565%, 06/12/2029 | | | 1,000 | | | | 1,037,380 | |
Sumitomo Mitsui Financial Group, Inc.
3.04%, 07/16/2029 | | | 1,000 | | | | 922,890 | |
Synchrony Financial
5.15%, 03/19/2029 | | | 2,000 | | | | 1,968,720 | |
Wells Fargo & Co.
2.188%, 04/30/2026 | | | 2,850 | | | | 2,809,216 | |
3.196%, 06/17/2027 | | | 1,000 | | | | 975,110 | |
| | | | | | | | |
| | | | | | | 69,333,732 | |
| | | | | | | | |
Finance – 0.2% | | | | | | | | |
Air Lease Corp.
2.30%, 02/01/2025 | | | 1,000 | | | | 992,250 | |
| | | | | | | | |
| | |
Insurance – 0.7% | | | | | | | | |
Cigna Group (The)
3.40%, 03/01/2027 | | | 3,000 | | | | 2,913,240 | |
| | | | | | | | |
| | |
REITs – 3.5% | | | | | | | | |
American Homes 4 Rent LP
4.90%, 02/15/2029 | | | 1,000 | | | | 995,250 | |
American Tower Corp.
1.50%, 01/31/2028 | | | 1,000 | | | | 901,630 | |
3.80%, 08/15/2029 | | | 1,000 | | | | 951,620 | |
Boston Properties LP
3.65%, 02/01/2026 | | | 1,000 | | | | 981,230 | |
Crown Castle, Inc.
1.05%, 07/15/2026 | | | 2,000 | | | | 1,877,620 | |
2.90%, 03/15/2027 | | | 2,000 | | | | 1,914,060 | |
EPR Properties
4.50%, 06/01/2027 | | | 1,000 | | | | 980,310 | |
Equinix, Inc.
1.80%, 07/15/2027 | | | 3,000 | | | | 2,781,510 | |
GLP Capital LP/GLP Financing II, Inc.
5.375%, 04/15/2026 | | | 3,000 | | | | 3,001,170 | |
| | |
| |
| abfunds.com | | AB TAXABLE MULTI-SECTOR INCOME SHARES | 7 |
PORTFOLIO OF INVESTMENTS (continued)
| | | | | | | | |
| | | Principal
Amount
(000) | | | U.S. $ Value | |
| |
Kite Realty Group Trust
4.00%, 03/15/2025 | | $ | 1,000 | | | $ | 994,490 | |
| | | | | | | | |
| | | | | | | 15,378,890 | |
| | | | | | | | |
| | | | | | | 88,618,112 | |
| | | | | | | | |
Utility – 4.3% | | | | | | | | |
Electric – 4.0% | | | | | | | | |
American Electric Power Co., Inc.
3.20%, 11/13/2027 | | | 2,000 | | | | 1,915,560 | |
Duke Energy Corp.
2.65%, 09/01/2026 | | | 3,000 | | | | 2,895,270 | |
Entergy Corp.
2.95%, 09/01/2026 | | | 1,000 | | | | 968,640 | |
Entergy Mississippi LLC
2.85%, 06/01/2028 | | | 2,000 | | | | 1,878,200 | |
National Rural Utilities Cooperative Finance Corp.
3.40%, 02/07/2028 | | | 2,000 | | | | 1,925,940 | |
NextEra Energy Capital Holdings, Inc.
1.875%, 01/15/2027 | | | 1,000 | | | | 940,630 | |
Pacific Gas and Electric Co.
5.55%, 05/15/2029 | | | 1,000 | | | | 1,018,370 | |
PacifiCorp
5.10%, 02/15/2029 | | | 2,000 | | | | 2,022,860 | |
Pinnacle West Capital Corp.
1.30%, 06/15/2025 | | | 2,700 | | | | 2,636,712 | |
Public Service Electric and Gas Co.
3.20%, 05/15/2029 | | | 2,000 | | | | 1,883,940 | |
| | | | | | | | |
| | | | | | | 18,086,122 | |
| | | | | | | | |
Other Utility – 0.3% | |
American Water Capital Corp.
3.40%, 03/01/2025 | | | 1,135 | | | | 1,128,644 | |
| | | | | | | | |
| | | | | | | 19,214,766 | |
| | | | | | | | |
Total Corporates – Investment Grade
(cost $282,317,531) | | | | | | | 282,153,009 | |
| | | | | |
| | | | | | | | |
LOCAL GOVERNMENTS - US MUNICIPAL BONDS – 15.5% | | | | | | | | |
United States – 15.5% | | | | | | | | |
Antonio B Won Pat International Airport Authority
Series 2021-A
2.499%, 10/01/2025 | | | 740 | | | | 723,663 | |
California Earthquake Authority
Series 2022-A
5.603%, 07/01/2027 | | | 2,000 | | | | 2,011,428 | |
| | |
| |
8 | AB TAXABLE MULTI-SECTOR INCOME SHARES | | abfunds.com |
PORTFOLIO OF INVESTMENTS (continued)
| | | | | | | | |
| | | Principal
Amount
(000) | | | U.S. $ Value | |
| |
Series 2024-A
5.75%, 11/01/2024 | | $ | 1,000 | | | $ | 1,000,000 | |
California State Public Works Board
(State of California Department of General Services Lease)
Series 2024
4.917%, 04/01/2027 | | | 3,900 | | | | 3,939,276 | |
City & County of Denver CO Airport System Revenue
Series 2020-C
1.115%, 11/15/2024 | | | 750 | | | | 748,948 | |
City of Detroit MI
Series 2023-B
6.844%, 05/01/2028 | | | 1,245 | | | | 1,269,692 | |
City of New York NY
Series 2021
0.982%, 08/01/2025 | | | 380 | | | | 370,074 | |
Series 2024-D
4.38%, 10/01/2029 | | | 2,350 | | | | 2,335,264 | |
City of San Antonio TX
Series 2023
5.635%, 02/01/2026 | | | 3,000 | | | | 3,005,707 | |
Commonwealth of Massachusetts
(Commonwealth of Massachusetts COVID-19 Recovery Assessment Revenue)
Series 2022-B
4.11%, 07/15/2031 | | | 792 | | | | 776,213 | |
County of Broward FL Airport System Revenue
Series 2019-C
2.384%, 10/01/2026 | | | 1,000 | | | | 962,005 | |
Dallas Fort Worth International Airport
Series 2023
4.738%, 11/01/2026 | | | 1,125 | | | | 1,132,438 | |
Empire State Development Corp.
(Pre-refunded – US Treasuries)
Series 2020-F
0.87%, 03/15/2025 | | | 1,400 | | | | 1,380,202 | |
Florida Municipal Power Agency
(Florida Municipal Power Agency All-Requirements Power Supply Project Revenue)
Series 2021
1.425%, 10/01/2026 | | | 1,000 | | | | 944,935 | |
Golden State Tobacco Securitization Corp.
Series 2021
3.85%, 06/01/2050 | | | 4,645 | | | | 4,267,250 | |
| | |
| |
| abfunds.com | | AB TAXABLE MULTI-SECTOR INCOME SHARES | 9 |
PORTFOLIO OF INVESTMENTS (continued)
| | | | | | | | |
| | | Principal
Amount
(000) | | | U.S. $ Value | |
| |
Guam Government Waterworks Authority
Series 2020-B
2.75%, 07/01/2030 | | $ | 1,200 | | | $ | 1,070,885 | |
Inland Empire Tobacco Securitization Corp.
Series 2019
3.678%, 06/01/2038 | | | 580 | | | | 540,481 | |
Louisiana Local Government Environmental Facilities & Community Development Authority
Series 2023-ELL, Class A1
5.081%, 06/01/2031 | | | 2,578 | | | | 2,603,660 | |
Massachusetts Port Authority
Series 2011-B
6.202%, 07/01/2031 | | | 3,345 | | | | 3,480,466 | |
Metropolitan Transportation Authority Payroll Mobility Tax Revenue
Series 2024-A
5.37%, 12/19/2024 | | | 3,000 | | | | 3,000,713 | |
Municipal Electric Authority of Georgia
Series 2021
1.897%, 01/01/2027 | | | 385 | | | | 363,454 | |
New Jersey Economic Development Authority
(New Jersey Economic Development Authority State Lease)
NATL Series 1997-A
7.425%, 02/15/2029 | | | 3,000 | | | | 3,193,111 | |
Series 2023
4.927%, 03/01/2026 | | | 1,050 | | | | 1,054,005 | |
New Jersey Turnpike Authority
Series 2021-B
0.897%, 01/01/2025 | | | 2,000 | | | | 1,987,198 | |
New York State Dormitory Authority
(State of New York Pers Income Tax)
Series 2024-B
5.113%, 03/15/2025 | | | 1,000 | | | | 999,843 | |
Pennsylvania Turnpike Commission
Series 2019
2.556%, 12/01/2025 | | | 760 | | | | 744,037 | |
San Francisco City & County Public Utilities Commission Wastewater Revenue
Series 2024
4.655%, 10/01/2027 | | | 3,000 | | | | 3,018,284 | |
San Jose Evergreen Community College District
Series 2012
5.887% (CME Term SOFR 3 Month + 1.00%), 07/01/2043(a) | | | 990 | | | | 979,918 | |
| | |
| |
10 | AB TAXABLE MULTI-SECTOR INCOME SHARES | | abfunds.com |
PORTFOLIO OF INVESTMENTS (continued)
| | | | | | | | |
| | | Principal
Amount
(000) | | | U.S. $ Value | |
| |
State Board of Administration Finance Corp.
(Florida Hurricane Catastrophe Fund)
Series 2020-A
1.258%, 07/01/2025 | | $ | 1,010 | | | $ | 985,531 | |
State of California
Series 2023
5.10%, 03/01/2029 | | | 2,000 | | | | 2,050,423 | |
State of Connecticut
Series 2022-A
3.292%, 06/15/2025 | | | 1,000 | | | | 992,249 | |
State of Hawaii
Series 2023-G
4.588%, 10/01/2026 | | | 2,000 | | | | 2,008,018 | |
State of Hawaii Airports System Revenue
Series 2020-E
1.392%, 07/01/2025 | | | 1,000 | | | | 979,934 | |
State of Illinois
Series 2023-A
5.254%, 05/01/2025 | | | 1,000 | | | | 1,001,990 | |
Series 2024-A
5.256%, 05/01/2026 | | | 5,000 | | | | 5,030,636 | |
Taxable Municipal Funding Trust
Series 2024-B
5.15%, 06/30/2028(b)(c) | | | 3,000 | | | | 3,000,000 | |
Tennessee Energy Acquisition Corp.
(Goldman Sachs Group, Inc. (The))
Series 2023-A
5.75%, 05/01/2028 | | | 2,000 | | | | 2,033,736 | |
Tobacco Settlement Finance Authority/WV
Series 2020
4.875%, 06/01/2049 | | | 3,455 | | | | 3,321,678 | |
| | | | | | | | |
| | |
Total Local Governments – US Municipal Bonds
(cost $69,384,490) | | | | | | | 69,307,345 | |
| | | | | | | | |
| | | | | | | | |
GOVERNMENTS - TREASURIES – 8.3% | | | | | | | | |
United States – 8.3% | |
U.S. Treasury Notes
4.00%, 01/15/2027 | | | 15,000 | | | | 14,953,125 | |
4.125%, 02/15/2027 | | | 22,000 | | | | 21,986,250 | |
| | | | | | | | |
| | |
Total Governments – Treasuries
(cost $36,806,592) | | | | | | | 36,939,375 | |
| | | | | | | | |
| | | | | | | | |
| | |
| |
| abfunds.com | | AB TAXABLE MULTI-SECTOR INCOME SHARES | 11 |
PORTFOLIO OF INVESTMENTS (continued)
| | | | | | | | |
| | | Principal
Amount
(000) | | | U.S. $ Value | |
| |
ASSET-BACKED SECURITIES – 4.1% | | | | | | | | |
Autos - Fixed Rate – 2.1% | |
Americredit Automobile Receivables Trust
Series 2023-1, Class A2A
5.84%, 10/19/2026 | | $ | 475 | | | $ | 475,894 | |
Avis Budget Rental Car Funding AESOP LLC
Series 2023-3A, Class A
5.44%, 02/22/2028(b) | | | 3,000 | | | | 3,023,709 | |
Carmax Auto Owner Trust
Series 2021-1, Class C
0.94%, 12/15/2026 | | | 500 | | | | 491,804 | |
Carvana Auto Receivables Trust
Series 2021-N1, Class C
1.30%, 01/10/2028 | | | 206 | | | | 198,556 | |
Series 2023-N1, Class A
6.36%, 04/12/2027(b) | | | 315 | | | | 315,942 | |
Series 2023-P3, Class A2
6.09%, 11/10/2026(b) | | | 241 | | | | 241,866 | |
Flagship Credit Auto Trust
Series 2023-1, Class A2
5.38%, 12/15/2026(b) | | | 480 | | | | 480,217 | |
Foursight Capital Automobile Receivables Trust
Series 2023-1, Class A2
5.43%, 10/15/2026(b) | | | 63 | | | | 62,785 | |
LAD Auto Receivables Trust
Series 2023-1A, Class A2
5.68%, 10/15/2026(b) | | | 454 | | | | 454,330 | |
Lendbuzz Securitization Trust
Series 2023-1A, Class A2
6.92%, 08/15/2028(b) | | | 1,891 | | | | 1,919,833 | |
Santander Bank Auto Credit-Linked Notes
Series 2023-A, Class B
6.493%, 06/15/2033(b) | | | 228 | | | | 229,156 | |
Tricolor Auto Securitization Trust
Series 2023-1A, Class A
6.48%, 08/17/2026(b) | | | 2 | | | | 2,196 | |
US Bank NA
Series 2023-1, Class B
6.789%, 08/25/2032(b) | | | 599 | | | | 606,464 | |
Westlake Automobile Receivables Trust
Series 2023-2A, Class A2A
5.87%, 07/15/2026(b) | | | 235 | | | | 235,192 | |
World Omni Select Auto Trust
Series 2023-A, Class A2A
5.92%, 03/15/2027 | | | 708 | | | | 709,505 | |
| | | | | | | | |
| | | | | | | 9,447,449 | |
| | | | | | | | |
| | |
| |
12 | AB TAXABLE MULTI-SECTOR INCOME SHARES | | abfunds.com |
PORTFOLIO OF INVESTMENTS (continued)
| | | | | | | | |
| | | Principal
Amount
(000) | | | U.S. $ Value | |
| |
Other ABS - Fixed Rate – 2.0% | |
Affirm Asset Securitization Trust
Series 2024-X1, Class A
6.27%, 05/15/2029(b) | | $ | 689 | | | $ | 691,756 | |
Dext ABS LLC
Series 2023-1, Class A2
5.99%, 03/15/2032(b) | | | 1,531 | | | | 1,542,593 | |
Domino’s Pizza Master Issuer LLC
Series 2021-1A, Class A2I
2.662%, 04/25/2051(b) | | | 778 | | | | 703,433 | |
Marlette Funding Trust
Series 2024-1A, Class A
5.95%, 07/17/2034(b) | | | 645 | | | | 647,913 | |
Oklahoma Development Finance Authority
Series 2022-ONG, Class A1
3.877%, 05/01/2037 | | | 1,474 | | | | 1,424,759 | |
Pagaya AI Debt Trust
Series 2023-3, Class A
7.60%, 12/16/2030(b) | | | 770 | | | | 773,715 | |
Series 2024-1, Class A
6.66%, 07/15/2031(b) | | | 139 | | | | 141,116 | |
Texas Natural Gas Securitization Finance Corp.
Series 2023-1, Class A1
5.102%, 04/01/2035 | | | 1,854 | | | | 1,881,595 | |
Theorem Funding Trust
Series 2023-1A, Class A
7.58%, 04/15/2029(b) | | | 220 | | | | 222,417 | |
Upstart Securitization Trust
Series 2023-2, Class A
6.77%, 06/20/2033(b) | | | 938 | | | | 941,435 | |
| | | | | | | | |
| | | | | | | 8,970,732 | |
| | | | | | | | |
Total Asset-Backed Securities
(cost $18,434,837) | | | | | | | 18,418,181 | |
| | | | | | | | |
| | | | | | | | |
COLLATERALIZED MORTGAGE OBLIGATIONS – 3.8% | | | | | | | | |
Risk Share Floating Rate – 3.8% | | | | | | | | |
Connecticut Avenue Securities Trust
Series 2023-R03, Class 2M1
7.357% (CME Term SOFR + 2.50%), 04/25/2043(a)(b) | | | 765 | | | | 778,079 | |
Series 2023-R04, Class 1M1
7.157% (CME Term SOFR + 2.30%), 05/25/2043(a)(b) | | | 1,510 | | | | 1,543,100 | |
Series 2023-R05, Class 1M1
6.757% (CME Term SOFR + 1.90%), 06/25/2043(a)(b) | | | 1,913 | | | | 1,933,354 | |
| | |
| |
| abfunds.com | | AB TAXABLE MULTI-SECTOR INCOME SHARES | 13 |
PORTFOLIO OF INVESTMENTS (continued)
| | | | | | | | |
| | | Principal
Amount
(000) | | | U.S. $ Value | |
| |
Series 2023-R06, Class 1M1
6.557% (CME Term SOFR + 1.70%), 07/25/2043(a)(b) | | $ | 649 | | | $ | 651,203 | |
Series 2023-R07, Class 2M1
6.807% (CME Term SOFR + 1.95%), 09/25/2043(a)(b) | | | 888 | | | | 890,912 | |
Series 2024-R03, Class 2M1
6.007% (CME Term SOFR + 1.15%), 03/25/2044(a)(b) | | | 1,774 | | | | 1,775,431 | |
Series 2024-R04, Class 1M1
5.957% (CME Term SOFR + 1.10%), 05/25/2044(a)(b) | | | 1,796 | | | | 1,795,740 | |
Federal Home Loan Mortgage Corp. Structured Agency Credit Risk Debt Notes
Series 2015-DNA1, Class M3
8.271% (CME Term SOFR + 3.41%), 10/25/2027(a) | | | 3 | | | | 2,953 | |
Series 2023-DNA1, Class M1A
6.957% (CME Term SOFR + 2.10%), 03/25/2043(a)(b) | | | 299 | | | | 302,309 | |
Series 2023-DNA2, Class M1A
6.957% (CME Term SOFR + 2.10%), 04/25/2043(a)(b) | | | 1,212 | | | | 1,233,136 | |
Series 2023-HQA1, Class M1A
6.857% (CME Term SOFR + 2.00%), 05/25/2043(a)(b) | | | 1,799 | | | | 1,815,606 | |
Series 2023-HQA2, Class M1A
6.857% (CME Term SOFR + 2.00%), 06/25/2043(a)(b) | | | 1,163 | | | | 1,168,842 | |
Series 2024-HQA2, Class M1
6.057% (CME Term SOFR + 1.20%), 08/25/2044(a)(b) | | | 2,843 | | | | 2,845,605 | |
Federal National Mortgage Association Connecticut Avenue Securities
Series 2016-C01, Class 1M2
11.721% (CME Term SOFR + 6.86%), 08/25/2028(a) | | | 98 | | | | 101,960 | |
Series 2016-C02, Class 1M2
10.971% (CME Term SOFR + 6.11%), 09/25/2028(a) | | | 70 | | | | 71,615 | |
| | | | | | | | |
| | | | | | | 16,909,845 | |
| | | | | | | | |
Agency Fixed Rate – 0.0% | |
Federal Home Loan Mortgage Corp. REMICs
Series 4029, Class LD
1.75%, 01/15/2027 | | | 3 | | | | 2,560 | |
| | |
| |
14 | AB TAXABLE MULTI-SECTOR INCOME SHARES | | abfunds.com |
PORTFOLIO OF INVESTMENTS (continued)
| | | | | | | | |
| | | Principal
Amount
(000) | | | U.S. $ Value | |
| |
Series 4459, Class CA
5.00%, 12/15/2034 | | $ | 9 | | | $ | 8,799 | |
| | | | | | | | |
| | | | | | | 11,359 | |
| | | | | | | | |
Total Collateralized Mortgage Obligations
(cost $16,805,486) | | | | | | | 16,921,204 | |
| | | | | | | | |
| | | | | | | | |
AGENCIES – 2.2% | | | | | | | | |
Agency Debentures – 2.2% | | | | | | | | |
Federal Home Loan Banks
4.75%, 04/09/2027
(cost $9,459,638) | | | 9,480 | | | | 9,622,011 | |
| | | | | | | | |
| | | | | | | | |
COMMERCIAL MORTGAGE-BACKED SECURITIES – 0.3% | | | | | | | | |
Non-Agency Floating Rate CMBS – 0.3% | | | | | | | | |
BAMLL Commercial Mortgage Securities Trust
Series 2017-SCH, Class AF
5.851% (CME Term SOFR 1 Month + 1.05%), 11/15/2033(a)(b) | | | 1,000 | | | | 999,568 | |
Invitation Homes Trust
Series 2018-SFR4, Class A
6.019% (CME Term SOFR 1 Month + 1.21%), 01/17/2038(a)(b) | | | 291 | | | | 291,297 | |
| | | | | | | | |
| | | | | | | 1,290,865 | |
| | | | | | | | |
Non-Agency Fixed Rate CMBS – 0.0% | |
LSTAR Commercial Mortgage Trust
Series 2016-4, Class A2
2.579%, 03/10/2049(b) | | | 16 | | | | 15,473 | |
| | | | | | | | |
| | |
Total Commercial Mortgage-Backed Securities
(cost $1,306,882) | | | | | | | 1,306,338 | |
| | | | | | | | |
| | | | | | | | |
CORPORATES - NON-INVESTMENT GRADE – 0.1% | | | | | | | | |
Industrial – 0.1% | | | | | | | | |
Consumer Non-Cyclical – 0.1% | | | | | | | | |
Newell Brands, Inc.
4.875%, 06/01/2025 | | | 183 | | | | 183,000 | |
5.70%, 04/01/2026(d) | | | 459 | | | | 460,097 | |
| | | | | | | | |
| | |
Total Corporates – Non-Investment Grade
(cost $656,219) | | | | | | | 643,097 | |
| | | | | | | | |
| | |
| |
| abfunds.com | | AB TAXABLE MULTI-SECTOR INCOME SHARES | 15 |
PORTFOLIO OF INVESTMENTS (continued)
| | | | | | | | |
| | |
Shares | | | U.S. $ Value | |
| |
SHORT-TERM INVESTMENTS – 2.0% | | | | | | | | |
Investment Companies – 2.0% | | | | | | | | |
AB Fixed Income Shares, Inc. – Government Money Market Portfolio – Class AB,
4.72%(e)(f)(g)
(cost $9,013,798) | | | 9,013,798 | | | $ | 9,013,798 | |
| | | | | | | | |
| | |
Total Investments – 99.5%
(cost $444,185,473) | | | | | | | 444,324,358 | |
Other assets less liabilities – 0.5% | | | | | | | 2,232,547 | |
| | | | | |
| | |
Net Assets – 100.0% | | | | | | $ | 446,556,905 | |
| | | | | |
| (a) | Floating Rate Security. Stated interest/floor/ceiling rate was in effect at October 31, 2024. |
| (b) | Security is exempt from registration under Rule 144A or Regulation S of the Securities Act of 1933. These securities are considered restricted, but liquid and may be resold in transactions exempt from registration. At October 31, 2024, the aggregate market value of these securities amounted to $36,064,543 or 8.1% of net assets. |
| (c) | Inverse floater security. |
| (d) | Coupon rate adjusts periodically based upon a predetermined schedule. Stated interest rate in effect at October 31, 2024. |
| (e) | Affiliated investments. |
| (f) | To obtain a copy of the fund’s shareholder report, please go to the Securities and Exchange Commission’s website at www.sec.gov, or call AB at (800) 227-4618. |
| (g) | The rate shown represents the 7-day yield as of period end. |
Glossary:
ABS – Asset-Backed Securities
CMBS – Commercial Mortgage-Backed Securities
CME – Chicago Mercantile Exchange
NATL – National Interstate Corporation
REIT – Real Estate Investment Trust
REMICs – Real Estate Mortgage Investment Conduits
SOFR – Secured Overnight Financing Rate
UPMC – University of Pittsburgh Medical Center
See notes to financial statements.
| | |
| |
16 | AB TAXABLE MULTI-SECTOR INCOME SHARES | | abfunds.com |
STATEMENT OF ASSETS & LIABILITIES
October 31, 2024 (unaudited)
| | | | |
| Assets | |
Investments in securities, at value | | | | |
Unaffiliated issuers (cost $435,171,675) | | $ | 435,310,560 | |
Affiliated issuers (cost $9,013,798) | | | 9,013,798 | |
Cash | | | 5,038 | |
Unaffiliated interest and dividends receivable | | | 3,732,347 | |
Receivable for shares of beneficial interest sold | | | 179,955 | |
Receivable for investment securities sold | | | 155,390 | |
Affiliated dividends receivable | | | 40,111 | |
Receivable due from Adviser | | | 1,695 | |
| | | | |
Total assets | | | 448,438,894 | |
| | | | |
| Liabilities | |
Dividends payable | | | 1,680,577 | |
Payable for shares of beneficial interest redeemed | | | 201,412 | |
| | | | |
Total liabilities | | | 1,881,989 | |
| | | | |
Net Assets | | $ | 446,556,905 | |
| | | | |
| Composition of Net Assets | |
Shares of beneficial interest, at par | | $ | 456 | |
Additional paid-in capital | | | 449,596,315 | |
Accumulated loss | | | (3,039,866 | ) |
| | | | |
Net Assets | | $ | 446,556,905 | |
| | | | |
Net Asset Value Per Share—unlimited shares of beneficial interest authorized, $.00001 par value (based on 45,636,136 common shares outstanding) | | $ | 9.79 | |
| | | | |
See notes to financial statements.
| | |
| |
| abfunds.com | | AB TAXABLE MULTI-SECTOR INCOME SHARES | 17 |
STATEMENT OF OPERATIONS
Six Months Ended October 31, 2024 (unaudited)
| | | | | | | | |
| Investment Income | | | | | | | | |
Interest | | $ | 9,242,694 | | | | | |
Dividends—Affiliated issuers | | | 286,889 | | | | | |
Other income(a) | | | 8,070 | | | | | |
| | | | | | | | |
Total investment income | | | | | | $ | 9,537,653 | |
| | | | | | | | |
| Realized and Unrealized Gain on Investment Transactions | | | | | | | | |
Net realized gain on: | | | | | | | | |
Investment transactions | | | | | | | 521,619 | |
Swaps | | | | | | | 403,964 | |
Net change in unrealized appreciation of: | | | | | | | | |
Investments | | | | | | | 5,262,224 | |
Swaps | | | | | | | 191,736 | |
| | | | | | | | |
Net gain on investment transactions | | | | | | | 6,379,543 | |
| | | | | | | | |
Net Increase in Net Assets from Operations | | | | | | $ | 15,917,196 | |
| | | | | | | | |
| (a) | Other income includes a reimbursement for investment in affiliated issuer (see Note B). |
See notes to financial statements.
| | |
| |
18 | AB TAXABLE MULTI-SECTOR INCOME SHARES | | abfunds.com |
STATEMENT OF CHANGES IN NET ASSETS
| | | | | | | | |
| | | Six Months Ended
October 31, 2024
(unaudited) | | | Year Ended
April 30,
2024 | |
| Increase (Decrease) in Net Assets from Operations | | | | | | | | |
Net investment income | | $ | 9,537,653 | | | $ | 15,552,576 | |
Net realized gain (loss) on investment transactions | | | 925,583 | | | | (3,129,107 | ) |
Net change in unrealized appreciation of investments | | | 5,453,960 | | | | 3,856,189 | |
| | | | | | | | |
Net increase in net assets from operations | | | 15,917,196 | | | | 16,279,658 | |
Distribution to Shareholders | | | (9,444,184 | ) | | | (14,094,957 | ) |
| Transactions in Shares of Beneficial Interest | | | | | | | | |
Net increase | | | 38,739,416 | | | | 27,296,366 | |
| | | | | | | | |
Total increase | | | 45,212,428 | | | | 29,481,067 | |
| Net Assets | | | | | | | | |
Beginning of period | | | 401,344,477 | | | | 371,863,410 | |
| | | | | | | | |
End of period | | $ | 446,556,905 | | | $ | 401,344,477 | |
| | | | | | | | |
See notes to financial statements.
| | |
| |
| abfunds.com | | AB TAXABLE MULTI-SECTOR INCOME SHARES | 19 |
NOTES TO FINANCIAL STATEMENTS
October 31, 2024 (unaudited)
NOTE A
Significant Accounting Policies
AB Corporate Shares (the “Trust”) is registered under the Investment Company Act of 1940 (the “1940 Act”), as an open-end, diversified management investment company. The Trust, which is a Massachusetts Business Trust, operates as a “series” company currently offering four separate portfolios: AB Corporate Income Shares, AB Municipal Income Shares, AB Taxable Multi-Sector Income Shares and AB Impact Municipal Income Shares. Each portfolio is considered to be a separate entity for financial reporting and tax purposes. This report relates only to AB Taxable Multi-Sector Income Shares (the “Fund”).
Shares of the Fund are offered exclusively to holders of accounts established under wrap fee programs sponsored and maintained by certain registered investment advisers approved by AllianceBernstein L.P. (the “Adviser”). The Fund’s shares may be purchased at the relevant net asset value without a sales charge or other fee. The financial statements have been prepared in conformity with U.S. generally accepted accounting principles (“U.S. GAAP”), which require management to make certain estimates and assumptions that affect the reported amounts of assets and liabilities in the financial statements and amounts of income and expenses during the reporting period. Actual results could differ from those estimates. The Fund is an investment company under U.S. GAAP and follows the accounting and reporting guidance applicable to investment companies. The following is a summary of significant accounting policies followed by the Fund.
1. Security Valuation
Portfolio securities are valued at market value determined on the basis of market quotations or, if market quotations are not readily available or are unreliable, at “fair value” as determined in accordance with procedures approved by and under the oversight of the Trust’s Board of Trustees (the “Board”). Pursuant to these procedures, the Adviser serves as the Fund’s valuation designee pursuant to Rule 2a-5 of the 1940 Act. In this capacity, the Adviser is responsible, among other things, for making all fair value determinations relating to the Fund’s portfolio investments, subject to the Board’s oversight.
In general, the market values of securities which are readily available and deemed reliable are determined as follows: securities listed on a national securities exchange (other than securities listed on the NASDAQ Stock Market, Inc. (“NASDAQ”)) or on a foreign securities exchange are valued at the last sale price at the close of the exchange or foreign securities exchange. If there has been no sale on such day, the securities are valued at the last traded price from the previous day. Securities listed on more
| | |
| |
20 | AB TAXABLE MULTI-SECTOR INCOME SHARES | | abfunds.com |
NOTES TO FINANCIAL STATEMENTS (continued)
than one exchange are valued by reference to the principal exchange on which the securities are traded; securities listed only on NASDAQ are valued in accordance with the NASDAQ Official Closing Price; listed or over the counter (“OTC”) market put or call options are valued at the mid level between the current bid and ask prices. If either a current bid or current ask price is unavailable, the Adviser will have discretion to determine the best valuation (e.g., last trade price in the case of listed options); open futures are valued using the closing settlement price or, in the absence of such a price, the most recent quoted bid price. If there are no quotations available for the day of valuation, the last available closing settlement price is used; U.S. Government securities and any other debt instruments having 60 days or less remaining until maturity are generally valued at market by an independent pricing vendor, if a market price is available. If a market price is not available, the securities are valued at amortized cost. This methodology is commonly used for short term securities that have an original maturity of 60 days or less, as well as short term securities that had an original term to maturity that exceeded 60 days. In instances when amortized cost is utilized, the Valuation Committee (the “Committee”) must reasonably conclude that the utilization of amortized cost is approximately the same as the fair value of the security. Factors the Committee will consider include, but are not limited to, an impairment of the creditworthiness of the issuer or material changes in interest rates. Fixed-income securities, including mortgage-backed and asset-backed securities, may be valued on the basis of prices provided by a pricing service or at a price obtained from one or more of the major broker-dealers. In cases where broker-dealer quotes are obtained, the Adviser may establish procedures whereby changes in market yields or spreads are used to adjust, on a daily basis, a recently obtained quoted price on a security. Swaps and other derivatives are valued daily, primarily using independent pricing services, independent pricing models using market inputs, as well as third party broker-dealers or counterparties. Open-end mutual funds are valued at the closing net asset value per share, while exchange traded funds are valued at the closing market price per share.
Securities for which market quotations are not readily available (including restricted securities) or are deemed unreliable are valued at fair value as deemed appropriate by the Adviser. Factors considered in making this determination may include, but are not limited to, information obtained by contacting the issuer, analysts, analysis of the issuer’s financial statements or other available documents. In addition, the Fund may use fair value pricing for securities primarily traded in non-U.S. markets because most foreign markets close well before the Fund values its securities at 4:00 p.m., Eastern Time. The earlier close of these foreign markets gives rise to the possibility that significant events, including broad market moves, may have occurred in the interim and may materially affect the value of those securities. To
| | |
| |
| abfunds.com | | AB TAXABLE MULTI-SECTOR INCOME SHARES | 21 |
NOTES TO FINANCIAL STATEMENTS (continued)
account for this, the Fund generally values many of its foreign equity securities using fair value prices based on third party vendor modeling tools to the extent available.
2. Fair Value Measurements
In accordance with U.S. GAAP regarding fair value measurements, fair value is defined as the price that the Fund would receive to sell an asset or pay to transfer a liability in an orderly transaction between market participants at the measurement date. U.S. GAAP establishes a framework for measuring fair value, and a three-level hierarchy for fair value measurements based upon the transparency of inputs to the valuation of an asset or liability (including those valued based on their market values as described in Note A.1 above). Inputs may be observable or unobservable and refer broadly to the assumptions that market participants would use in pricing the asset or liability. Observable inputs reflect the assumptions market participants would use in pricing the asset or liability based on market data obtained from sources independent of the Fund. Unobservable inputs reflect the Fund’s own assumptions about the assumptions that market participants would use in pricing the asset or liability based on the best information available in the circumstances. Each investment is assigned a level based upon the observability of the inputs which are significant to the overall valuation. The three-tier hierarchy of inputs is summarized below.
| | • | | Level 1—quoted prices in active markets for identical investments |
| | • | | Level 2—other significant observable inputs (including quoted prices for similar investments, interest rates, prepayment speeds, credit risk, etc.) |
| | • | | Level 3—significant unobservable inputs (including the Fund’s own assumptions in determining the fair value of investments) |
The fair value of debt instruments, such as bonds, and over-the-counter derivatives is generally based on market price quotations, recently executed market transactions (where observable) or industry recognized modeling techniques and are generally classified as Level 2. Pricing vendor inputs to Level 2 valuations may include quoted prices for similar investments in active markets, interest rate curves, coupon rates, currency rates, yield curves, option adjusted spreads, default rates, credit spreads and other unique security features in order to estimate the relevant cash flows which are then discounted to calculate fair values. If these inputs are unobservable and significant to the fair value, these investments will be classified as Level 3.
Valuations of mortgage-backed or other asset-backed securities, by pricing vendors, are based on both proprietary and industry recognized models and discounted cash flow techniques. Significant inputs to the valuation
| | |
| |
22 | AB TAXABLE MULTI-SECTOR INCOME SHARES | | abfunds.com |
NOTES TO FINANCIAL STATEMENTS (continued)
of these instruments are value of the collateral, the rates and timing of delinquencies, the rates and timing of prepayments, and default and loss expectations, which are driven in part by housing prices for residential mortgages. Significant inputs are determined based on relative value analyses, which incorporate comparisons to instruments with similar collateral and risk profiles, including relevant indices. Mortgage and asset-backed securities for which management has collected current observable data through pricing services are generally categorized within Level 2. Those investments for which current observable data has not been provided are classified as Level 3.
Other fixed income investments, including non-U.S. government and corporate debt, are generally valued using quoted market prices, if available, which are typically impacted by current interest rates, maturity dates and any perceived credit risk of the issuer. Additionally, in the absence of quoted market prices, these inputs are used by pricing vendors to derive a valuation based upon industry or proprietary models which incorporate issuer specific data with relevant yield/spread comparisons with more widely quoted bonds with similar key characteristics. Those investments for which there are observable inputs are classified as Level 2. Where the inputs are not observable, the investments are classified as Level 3.
The following table summarizes the valuation of the Fund’s investments by the above fair value hierarchy levels as of October 31, 2024:
| | | | | | | | | | | | | | | | |
Investments in
Securities: | | Level 1 | | | Level 2 | | | Level 3 | | | Total | |
Assets: | | | | | | | | | | | | | | | | |
Corporates—Investment Grade | | $ | – 0 | – | | $ | 282,153,009 | | | $ | – 0 | – | | $ | 282,153,009 | |
Local Governments—US Municipal Bonds | | | – 0 | – | | | 69,307,345 | | | | – 0 | – | | | 69,307,345 | |
Governments—Treasuries | | | – 0 | – | | | 36,939,375 | | | | – 0 | – | | | 36,939,375 | |
Asset-Backed Securities | | | – 0 | – | | | 18,418,181 | | | | – 0 | – | | | 18,418,181 | |
Collateralized Mortgage Obligations | | | – 0 | – | | | 16,921,204 | | | | – 0 | – | | | 16,921,204 | |
Agencies | | | – 0 | – | | | 9,622,011 | | | | – 0 | – | | | 9,622,011 | |
Commercial Mortgage-Backed Securities | | | – 0 | – | | | 1,306,338 | | | | – 0 | – | | | 1,306,338 | |
Corporates—Non-Investment Grade | | | – 0 | – | | | 643,097 | | | | – 0 | – | | | 643,097 | |
Short-Term Investments | | | 9,013,798 | | | | – 0 | – | | | – 0 | – | | | 9,013,798 | |
| | | | | | | | | | | | | | | | |
Total Investments in Securities | | | 9,013,798 | | | | 435,310,560 | | | | – 0 | – | | | 444,324,358 | |
Other Financial Instruments(a) | | | – 0 | – | | | – 0 | – | | | – 0 | – | | | – 0 | – |
| | | | | | | | | | | | | | | | |
Total | | $ | 9,013,798 | | | $ | 435,310,560 | | | $ | – 0 | – | | $ | 444,324,358 | |
| | | | | | | | | | | | | | | | |
| (a) | Other financial instruments include derivative instruments, such as futures, forwards and swaps. Derivative instruments are valued at the unrealized appreciation (depreciation) on the instrument. Other |
| | |
| |
| abfunds.com | | AB TAXABLE MULTI-SECTOR INCOME SHARES | 23 |
NOTES TO FINANCIAL STATEMENTS (continued)
| | financial instruments may also include swaps with upfront premiums, written options and written swaptions which are valued at market value. |
3. Taxes
It is the Fund’s policy to meet the requirements of the Internal Revenue Code applicable to regulated investment companies and to distribute all of its investment company taxable income and net realized gains, if any, to shareholders. Therefore, no provisions for federal income or excise taxes are required.
In accordance with U.S. GAAP requirements regarding accounting for uncertainties in income taxes, management has analyzed the Fund’s tax positions taken or expected to be taken on federal and state income tax returns for all open tax years (the current and the prior three tax years) and has concluded that no provision for income tax is required in the Fund’s financial statements.
4. Investment Income and Investment Transactions
Dividend income is recorded on the ex-dividend date or as soon as the Fund is informed of the dividend. Interest income is accrued daily. Investment transactions are accounted for on the date the securities are purchased or sold. Investment gains or losses are determined on the identified cost basis. Non-cash dividends, if any, are recorded on the ex-dividend date at the fair value of the securities received. The Fund amortizes premiums and accretes discounts as adjustments to interest income. The Fund accounts for distributions received from real estate investment trust (“REIT”) investments or from regulated investment companies as dividend income, realized gain, or return of capital based on information provided by the REIT or the investment company.
5. Dividends and Distributions
Dividends and distributions to shareholders, if any, are recorded on the ex-dividend date. Income dividends and capital gains distributions are determined in accordance with federal tax regulations and may differ from those determined in accordance with U.S. GAAP. To the extent these differences are permanent, such amounts are reclassified within the capital accounts based on their federal tax basis treatment; temporary differences do not require such reclassification.
6. Cash and Short-Term Investments
Cash and short-term investments include cash on hand and short-term investments with maturities of less than one year when purchased.
| | |
| |
24 | AB TAXABLE MULTI-SECTOR INCOME SHARES | | abfunds.com |
NOTES TO FINANCIAL STATEMENTS (continued)
NOTE B
Advisory Fee and Other Transactions with Affiliates
Under the terms of the Advisory Agreement, the Fund pays no advisory fee to the Adviser and the Adviser reimburses or pays for the Fund’s operating expenses. The Fund is an integral part of separately managed accounts in wrap fee programs and other investment programs. Typically, participants in these programs pay a fee to their investment adviser for all costs and expenses of the separately managed account, including costs and expenses associated with the Fund, and a fee is paid by their investment adviser to the Adviser. In certain cases, participants may have a direct relationship with the Adviser without the involvement of a third party investment adviser, in which case the participant would pay a fee directly to the Adviser. The Adviser serves as investment manager and adviser of the Fund and continuously furnishes an investment program for the Fund and manages, supervises and conducts the affairs of the Fund, subject to the supervisions of the Fund’s Board. The Advisory Agreement provides that the Adviser or an affiliate will furnish, or pay the expenses of the Fund for, office space, facilities and equipment, services of executive and other personnel of the Fund and certain administrative services.
The Fund has entered into a distribution agreement with AllianceBernstein Investments, Inc., the Fund’s principal underwriter (the “Underwriter”), to permit the Underwriter to distribute the Fund’s shares, which are sold at their net asset value without any sales charge. The Fund does not pay a fee for this service. The Underwriter is a wholly owned subsidiary of the Adviser.
AllianceBernstein Investor Services, Inc. (“ABIS”), a wholly-owned subsidiary of the Adviser, acts as the Fund’s registrar, transfer agent and dividend-disbursing agent. ABIS registers the transfer, issuance and redemption of Fund shares and disburses dividends and other distributions to Fund shareholders. The Fund does not pay a fee for this service.
The Fund may invest in AB Government Money Market Portfolio (the “Government Money Market Portfolio”) which has a contractual annual advisory fee rate of .20% of the portfolio’s average daily net assets and bears its own expenses. The Adviser had contractually agreed to waive .10% of the advisory fee of Government Money Market Portfolio (resulting in a net advisory fee of .10%) until August 31, 2023. Effective September 1, 2023, the Adviser has contractually agreed to waive .05% of the advisory fee of Government Money Market Portfolio (resulting in a net advisory fee of .15%) until August 31, 2024. In connection with the investment by the Fund in Government Money Market Portfolio, the Adviser has contractually agreed to reimburse its advisory fee from the Fund in an amount equal to the Fund’s pro rata share of the effective advisory fee of Government
| | |
| |
| abfunds.com | | AB TAXABLE MULTI-SECTOR INCOME SHARES | 25 |
NOTES TO FINANCIAL STATEMENTS (continued)
Money Market Portfolio, as borne indirectly by the Fund as an acquired fund fee and expense. For the six months ended October 31, 2024, such reimbursement amounted to $8,070.
A summary of the Fund’s transactions in AB mutual funds for the six months ended October 31, 2024 is as follows:
| | | | | | | | | | | | | | | | | | | | |
Fund | | Market Value
4/30/24
(000) | | | Purchases
at Cost
(000) | | | Sales
Proceeds
(000) | | | Market Value
10/31/24
(000) | | | Dividend
Income
(000) | |
Government Money Market Portfolio | | $ | 4,378 | | | $ | 119,210 | | | $ | 114,574 | | | $ | 9,014 | | | $ | 287 | |
NOTE C
Investment Transactions
Purchases and sales of investment securities (excluding short-term investments) for the six months ended October 31, 2024 were as follows:
| | | | | | | | |
| | | Purchases | | | Sales | |
Investment securities (excluding U.S. government securities) | | $ | 153,468,279 | | | $ | 85,607,302 | |
U.S. government securities | | | 5,080,353 | | | | 27,431,032 | |
The cost of investments for federal income tax purposes was substantially the same as the cost for financial reporting purposes. Accordingly, gross unrealized appreciation and unrealized depreciation are as follows:
| | | | |
Gross unrealized appreciation | | $ | 2,286,407 | |
Gross unrealized depreciation | | | (2,147,522 | ) |
| | | | |
Net unrealized appreciation | | $ | 138,885 | |
| | | | |
1. Derivative Financial Instruments
The Fund may use derivatives in an effort to earn income and enhance returns, to replace more traditional direct investments, to obtain exposure to otherwise inaccessible markets (collectively, “investment purposes”), or to hedge or adjust the risk profile of its portfolio.
The principal types of derivatives utilized by the Fund, as well as the methods in which they may be used are:
The Fund may enter into swaps for investment purposes or to hedge its exposure to interest rates, credit risk or currencies. The Fund may also enter into swaps for non-hedging purposes as a means of gaining market exposures, making direct investments in foreign currencies, as
| | |
| |
26 | AB TAXABLE MULTI-SECTOR INCOME SHARES | | abfunds.com |
NOTES TO FINANCIAL STATEMENTS (continued)
described below under “Currency Transactions.” A swap is an agreement that obligates two parties to exchange a series of cash flows at specified intervals based upon or calculated by reference to changes in specified prices, rates or indexes for a specified amount of an underlying asset or inflation. The payment flows are usually netted against each other, with the difference being paid by one party to the other. In addition, collateral may be pledged or received by the Fund in accordance with the terms of the respective swaps to provide value and recourse to the Fund or its counterparties in the event of default, bankruptcy or insolvency by one of the parties to the swap.
Risks may arise as a result of the failure of the counterparty to the swap to comply with the terms of the swap. The loss incurred by the failure of a counterparty is generally limited to the net interim payment to be received by the Fund, and/or the termination value at the end of the contract. Therefore, the Fund considers the creditworthiness of each counterparty to a swap in evaluating potential counterparty risk. This risk is mitigated by having a netting arrangement between the Fund and the counterparty and by the posting of collateral by the counterparty to the Fund to cover the Fund’s exposure to the counterparty. Additionally, risks may arise from unanticipated movements in interest rates, inflation or in the value of the underlying securities. The Fund accrues for the interim payments on swaps on a daily basis, with the net amount recorded within unrealized appreciation (depreciation) of swaps on the statement of assets and liabilities, where applicable. Once the interim payments are settled in cash, the net amount is recorded as realized gain/(loss) on swaps on the statement of operations, in addition to any realized gain/(loss) recorded upon the termination of swaps. Upfront premiums paid or received for swaps are recognized as cost or proceeds on the statement of assets and liabilities and are amortized on a straight line basis over the life of the contract. Amortized upfront premiums are included in net realized gain/(loss) from swaps on the statement of operations. Fluctuations in the value of swaps are recorded as a component of net change in unrealized appreciation (depreciation) of swaps on the statement of operations.
Certain standardized swaps, including certain interest rate swaps and credit default swaps, are subject to mandatory central clearing. Cleared swaps are transacted through futures commission merchants (“FCMs”) that are members of central clearinghouses, with the clearinghouse serving as central counterparty, similar to transactions in futures contracts. Centralized clearing will be required for additional categories of swaps on a phased-in basis based on requirements published by the Securities and Exchange Commission and Commodity Futures Trading Commission.
| | |
| |
| abfunds.com | | AB TAXABLE MULTI-SECTOR INCOME SHARES | 27 |
NOTES TO FINANCIAL STATEMENTS (continued)
At the time the Fund enters into a centrally cleared swap, the Fund deposits with the broker or segregates at its custodian cash or securities as collateral to satisfy initial margin requirements set by the clearinghouse on which the transaction is effected. Pursuant to the contract, with respect to cash collateral, the Fund agrees to receive from or pay to the broker an amount of cash equal to the daily fluctuation in the value of the contract; in the case of securities collateral, the Fund agrees to adjust the securities position held in the segregated account accordingly. Such receipts, payments or adjustments are known as variation margin and are recorded by the Fund as unrealized gains or losses. Risks may arise from the potential inability of a counterparty to meet the terms of the contract. The credit/counterparty risk for centrally cleared swaps is generally less than non-centrally cleared swaps, since the clearinghouse, which is the issuer or counterparty to each centrally cleared swap, has robust risk mitigation standards, including the requirement to provide initial and variation margin. When the contract is closed, the Fund records a realized gain or loss equal to the difference between the value of the contract at the time it was opened and the time it was closed.
Interest Rate Swaps:
The Fund is subject to interest rate risk exposure in the normal course of pursuing its investment objectives. Because the Fund holds fixed rate bonds, the value of these bonds may decrease if interest rates rise. To help hedge against this risk and to maintain its ability to generate income at prevailing market rates, the Fund may enter into interest rate swaps. Interest rate swaps are agreements between two parties to exchange cash flows based on a notional amount. The Fund may elect to pay a fixed rate and receive a floating rate, or, receive a fixed rate and pay a floating rate on a notional amount.
In addition, the Fund may also enter into interest rate swap transactions to preserve a return or spread on a particular investment or portion of its portfolio, or protecting against an increase in the price of securities the Fund anticipates purchasing at a later date. Interest rate swaps involve the exchange by the Fund with another party of their respective commitments to pay or receive interest (e.g., an exchange of floating rate payments for fixed rate payments) computed based on a contractually-based principal (or “notional”) amount. Interest rate swaps are entered into on a net basis (i.e., the two payment streams are netted out, with the Fund receiving or paying, as the case may be, only the net amount of the two payments).
During the six months ended October 31, 2024, the Fund held interest rate swaps for non-hedging purposes.
| | |
| |
28 | AB TAXABLE MULTI-SECTOR INCOME SHARES | | abfunds.com |
NOTES TO FINANCIAL STATEMENTS (continued)
Credit Default Swaps:
The Fund may enter into credit default swaps, including to manage its exposure to the market or certain sectors of the market, to reduce its risk exposure to defaults by corporate and sovereign issuers held by the Fund, or to create exposure to corporate or sovereign issuers to which it is not otherwise exposed. The Fund may purchase credit protection (“Buy Contract”) or provide credit protection (“Sale Contract”) on the referenced obligation of the credit default swap. During the term of the swap, the Fund receives/(pays) fixed payments from/(to) the respective counterparty, calculated at the agreed upon rate applied to the notional amount. If the Fund is a buyer/(seller) of protection and a credit event occurs, as defined under the terms of the swap, the Fund will either (i) receive from the seller/(pay to the buyer) of protection an amount equal to the notional amount of the swap (the “Maximum Payout Amount”) and deliver/(take delivery of) the referenced obligation or (ii) receive/(pay) a net settlement amount in the form of cash or securities equal to the notional amount of the swap less the recovery value of the referenced obligation. In certain circumstances Maximum Payout Amounts may be partially offset by recovery values of the respective referenced obligations, upfront premium received upon entering into the agreement, or net amounts received from settlement of buy protection credit default swaps entered into by the Fund for the same referenced obligations with the same counterparty.
Credit default swaps may involve greater risks than if the Fund had invested in the referenced obligation directly. Credit default swaps are subject to general market risk, liquidity risk, counterparty risk and credit risk. If the Fund is a buyer of protection and no credit event occurs, it will lose the payments it made to its counterparty. If the Fund is a seller of protection and a credit event occurs, the value of the referenced obligation received by the Fund coupled with the periodic payments previously received, may be less than the Maximum Payout Amount it pays to the buyer, resulting in a net loss to the Fund.
Implied credit spreads over U.S. Treasuries of comparable maturity utilized in determining the market value of credit default swaps on issuers as of period end are disclosed in the portfolio of investments. The implied spreads serve as an indicator of the current status of the payment/performance risk and typically reflect the likelihood of default by the issuer of the referenced obligation. The implied credit spread of a particular reference obligation also reflects the cost of buying/selling protection and may reflect upfront payments required to be made to enter into the agreement. Widening credit spreads typically represent a deterioration of the referenced obligation’s credit soundness and
| | |
| |
| abfunds.com | | AB TAXABLE MULTI-SECTOR INCOME SHARES | 29 |
NOTES TO FINANCIAL STATEMENTS (continued)
greater likelihood of default or other credit event occurring as defined under the terms of the agreement. A credit spread identified as “Defaulted” indicates a credit event has occurred for the referenced obligation.
During the six months ended October 31, 2024, the Fund held credit default swaps for non-hedging purposes.
The Fund typically enters into International Swaps and Derivatives Association, Inc. Master Agreements (“ISDA Master Agreement”) with its OTC derivative contract counterparties in order to, among other things, reduce its credit risk to OTC counterparties. ISDA Master Agreements include provisions for general obligations, representations, collateral and events of default or termination. Under an ISDA Master Agreement, the Fund typically may offset with the OTC counterparty certain derivative financial instruments’ payables and/or receivables with collateral held and/or posted and create one single net payment (close-out netting) in the event of default or termination. In the event of a default by an OTC counterparty, the return of collateral with market value in excess of the Fund’s net liability, held by the defaulting party, may be delayed or denied.
The Fund’s ISDA Master Agreements may contain provisions for early termination of OTC derivative transactions in the event the net assets of the Fund decline below specific levels (“net asset contingent features”). If these levels are triggered, the Fund’s OTC counterparty has the right to terminate such transaction and require the Fund to pay or receive a settlement amount in connection with the terminated transaction. If OTC derivatives were held at period end, please refer to netting arrangements by the OTC counterparty table below for additional details.
During the six months ended October 31, 2024, the Fund had entered into the following derivatives:
| | | | | | | | | | |
Derivative Type | | Location of Gain
or (Loss) on
Derivatives Within
Statement of
Operations | | Realized Gain
or (Loss) on
Derivatives | | | Change in
Unrealized
Appreciation or
(Depreciation) | |
Interest rate contracts | | Net realized gain (loss) on swaps; Net change in unrealized appreciation (depreciation) of swaps | | $ | 299,279 | | | $ | 184,892 | |
| | | |
Credit contracts | | Net realized gain (loss) on swaps; Net change in unrealized appreciation (depreciation) of swaps | | | 104,685 | | | | 6,844 | |
| | | | | | | | | | |
Total | | | | $ | 403,964 | | | $ | 191,736 | |
| | | | | | | | | | |
| | |
| |
30 | AB TAXABLE MULTI-SECTOR INCOME SHARES | | abfunds.com |
NOTES TO FINANCIAL STATEMENTS (continued)
The following table represents the average monthly volume of the Fund’s derivative transactions during the six months ended October 31, 2024:
| | | | |
Centrally Cleared Interest Rate Swaps: | | | | |
Average notional amount | | $ | 55,500,000 | (a) |
Credit Default Swaps: | | | | |
Average notional amount of sale contracts | | $ | 657,745 | (b) |
Centrally Cleared Credit Default Swaps: | | | | |
Average notional amount of sale contracts | | $ | 18,070,000 | (c) |
| (a) | Positions were open for four months during the period. |
| (b) | Positions were open for three months during the period. |
| (c) | Positions were open for five months during the period. |
2. Currency Transactions
The Fund may invest in non-U.S. Dollar-denominated securities on a currency hedged or unhedged basis. The Fund may seek investment opportunities by taking long or short positions in currencies through the use of currency-related derivatives, including forward currency exchange contracts, futures and options on futures, swaps, and other options. The Fund may enter into transactions for investment opportunities when it anticipates that a foreign currency will appreciate or depreciate in value but securities denominated in that currency are not held by the Fund and do not present attractive investment opportunities. Such transactions may also be used when the Adviser believes that it may be more efficient than a direct investment in a foreign currency-denominated security. The Fund may also conduct currency exchange contracts on a spot basis (i.e., for cash at the spot rate prevailing in the currency exchange market for buying or selling currencies).
NOTE D
Shares of Beneficial Interest
Transactions in shares of beneficial interest were as follows:
| | | | | | | | | | | | | | | | | | | | | | | | |
| | | | | | | | | | | | | | | | | | | | | | | | |
| | | Shares | | | | | | Amount | | | | |
| | | Six Months Ended
October 31, 2024
(unaudited) | | | Year Ended
April 30,
2024 | | | | | | Six Months Ended
October 31, 2024
(unaudited) | | | Year Ended
April 30,
2024 | | | | |
| | | | | | | | |
Shares sold | | | 7,410,532 | | | | 13,234,899 | | | | | | | $ | 72,373,363 | | | $ | 127,071,284 | | | | | |
| | | | | |
Shares redeemed | | | (3,448,901 | ) | | | (10,404,638 | ) | | | | | | | (33,633,947 | ) | | | (99,774,918 | ) | | | | |
| | | | | |
Net increase | | | 3,961,631 | | | | 2,830,261 | | | | | | | $ | 38,739,416 | | | $ | 27,296,366 | | | | | |
| | | | | |
NOTE E
Risks Involved in Investing in the Fund
Market Risk—The value of the Fund’s assets will fluctuate as the market or markets in which the Fund invests fluctuate. The value of the Fund’s investments may decline, sometimes rapidly and unpredictably, simply
| | |
| |
| abfunds.com | | AB TAXABLE MULTI-SECTOR INCOME SHARES | 31 |
NOTES TO FINANCIAL STATEMENTS (continued)
because of economic changes or other events, including public health crises (including the occurrence of a contagious disease or illness) and regional and global conflicts, that affect large portions of the market.
Credit Risk—An issuer or guarantor of a fixed-income security, or the counterparty to a derivatives or other contract, may be unable or unwilling to make timely payments of interest or principal, or to otherwise honor its obligations. The issuer or guarantor may default, causing a loss of the full principal amount of a security and any accrued interest. The degree of risk for a particular security may be reflected in its credit rating. There is the possibility that the credit rating of a fixed-income security may be downgraded after purchase, which may adversely affect the value of the security.
Interest-Rate Risk—Changes in interest rates will affect the value of investments in fixed-income securities. When interest rates rise, the value of existing investments in fixed-income securities tends to fall and this decrease in value may not be offset by higher income from new investments. Interest-rate risk is generally greater for fixed-income securities with longer maturities or durations. The Fund may be subject to a greater risk of rising interest rates than would normally be the case due to the recent end of a period of historically low rates and the effects of potential central bank monetary policy, and government fiscal policy, initiatives and market reactions to those initiatives.
Duration Risk—Duration is a measure that relates the expected price volatility of a fixed-income security to changes in interest rates. The duration of a fixed-income security may be shorter than or equal to the full maturity of a fixed-income security. Fixed-income securities with longer durations have more risk and will decrease in price as interest rates rise.
Below Investment-Grade Securities Risk—Investments in fixed-income securities with lower ratings (commonly known as “junk bonds”) tend to have a higher probability that an issuer will default or fail to meet its payment obligations. These securities may be subject to greater price volatility due to such factors as specific corporate developments, interest rate sensitivity and negative perceptions of the junk bond market generally and may be more difficult to trade than other types of securities.
Inflation Risk—This is the risk that the value of assets or income from investments will be less in the future as inflation decreases the value of money. As inflation increases, the value of the Fund’s assets can decline as can the value of the Fund’s distributions. This risk is significantly greater for fixed-income securities with longer maturities.
Foreign (Non-U.S.) Risk—Investments in securities of non-U.S. issuers may involve more risk than those of U.S. issuers. These securities may
| | |
| |
32 | AB TAXABLE MULTI-SECTOR INCOME SHARES | | abfunds.com |
NOTES TO FINANCIAL STATEMENTS (continued)
fluctuate more widely in price and may be more difficult to trade due to adverse market, economic, political, regulatory or other factors.
Emerging-Market Risk—Investments in emerging-market countries may have more risk because the markets are less developed and less liquid as well as being subject to increased economic, political, regulatory or other uncertainties.
Currency Risk—Fluctuations in currency exchange rates may negatively affect the value of the Fund’s investments or reduce its returns.
Mortgage-Related and/or Other Asset-Backed Securities Risk—Investments in mortgage-related and other asset-backed securities are subject to certain additional risks. The value of these securities may be particularly sensitive to changes in interest rates. These risks include “extension risk”, which is the risk that, in periods of rising interest rates, issuers may delay the payment of principal, and “prepayment risk”, which is the risk that in periods of falling interest rates, issuers may pay principal sooner than expected, exposing the Fund to a lower rate of return upon reinvestment of principal. Mortgage-backed securities offered by non-governmental issuers and other asset-backed securities may be subject to other risks, such as higher rates of default in the mortgages or assets backing the securities or risks associated with the nature and servicing of mortgages or assets backing the securities.
Municipal Market Risk—This is the risk that special factors may adversely affect the value of municipal securities and have a significant effect on the yield or value of the Fund’s investments in municipal securities. These factors include economic conditions, political or legislative changes, public health crises, uncertainties related to the tax status of municipal securities, and the rights of investors in these securities. To the extent that the Fund invests more of its assets in a particular state’s municipal securities, the Fund may be vulnerable to events adversely affecting that state, including economic, political and regulatory occurrences, court decisions, terrorism, public health crises (including the occurrence of a contagious disease or illness) and catastrophic natural disasters, such as hurricanes, fires or earthquakes. The Fund’s investments in certain municipal securities with principal and interest payments that are made from the revenues of a specific project or facility, and not general tax revenues, may have increased risks. Factors affecting the project or facility, such as local business or economic conditions, could have a significant effect on the project’s ability to make payments of principal and interest on these securities.
In addition, changes in tax rates or the treatment of income from certain types of municipal securities, among other things, could negatively affect the municipal securities markets.
| | |
| |
| abfunds.com | | AB TAXABLE MULTI-SECTOR INCOME SHARES | 33 |
NOTES TO FINANCIAL STATEMENTS (continued)
Sector Risk—The Fund may have more risk because it may invest to a significant extent in one or more particular market sectors. To the extent it does so, market or economic factors affecting the relevant sector(s) could have a major effect on the value of the Fund’s investments.
Derivatives Risk—Derivatives may be difficult to price or unwind and leveraged so that small changes may produce disproportionate losses for the Fund. A short position in a derivative instrument involves the risk of a theoretically unlimited increase in the value of the underlying asset, reference rate or index, which could cause the Fund to suffer a potentially unlimited loss. Derivatives, especially over-the-counter derivatives, are also subject to counterparty risk, which is the risk that the counterparty (the party on the other side of the transaction) on a derivative transaction will be unable or unwilling to honor its contractual obligations to the Fund.
Leverage Risk—When the Fund borrows money or otherwise leverages its investments, its performance may be volatile because leverage tends to exaggerate the effect of any increase or decrease in the value of the Fund’s investments. The Fund may create leverage through the use of reverse repurchase arrangements, forward currency exchange contracts, forward commitments, dollar rolls or futures or by borrowing money. The use of other types of derivative instruments by the Fund, such as options and swaps, may also result in a form of leverage. Leverage may result in higher returns to the Fund than if the Fund were not leveraged, but may also adversely affect returns, particularly if the market is declining.
Indemnification Risk—In the ordinary course of business, the Fund enters into contracts that contain a variety of indemnifications. The Fund’s maximum exposure under these arrangements is unknown. However, the Fund has not had prior claims or losses pursuant to these indemnification provisions and expects the risk of loss thereunder to be remote. Therefore, the Fund has not accrued any liability in connection with these indemnification provisions.
Management Risk—The Fund is subject to management risk because it is an actively-managed investment fund. The Adviser will apply its investment techniques and risk analyses in making investment decisions, but there is no guarantee that its techniques will produce the intended results. Some of these techniques may incorporate, or rely upon, quantitative models, but there is no guarantee that these models will generate accurate forecasts, reduce risk or otherwise perform as expected.
NOTE F
Joint Credit Facility
A number of open-end mutual funds managed by the Adviser, including the Fund, participate in a $325 million revolving credit facility (the “Facility”)
| | |
| |
34 | AB TAXABLE MULTI-SECTOR INCOME SHARES | | abfunds.com |
NOTES TO FINANCIAL STATEMENTS (continued)
intended to provide short-term financing related to redemptions and other short term liquidity requirements, subject to certain restrictions. Commitment fees related to the Facility are paid by the participating funds and are included in miscellaneous expenses in the statement of operations. The Fund did not utilize the Facility during the six months ended October 31, 2024.
NOTE G
Distributions to Shareholders
The tax character of distributions to be paid for the year ending April 30, 2025 will be determined at the end of the current fiscal year.
The tax character of distributions paid during the fiscal years ended April 30, 2024 and April 30, 2023 were as follows:
| | | | | | | | |
| | | 2024 | | | 2023 | |
Distributions paid from: | | | | | | | | |
Ordinary income | | $ | 14,094,957 | | | $ | 7,510,630 | |
Net long-term capital gains | | | – 0 | – | | | 487,295 | |
| | | | | | | | |
Total taxable distributions paid | | $ | 14,094,957 | | | $ | 7,997,925 | |
| | | | | | | | |
As of April 30, 2024, the components of accumulated earnings (deficit) on a tax basis were as follows:
| | | | |
Undistributed ordinary income | | $ | 1,457,139 | |
Accumulated capital and other losses | | | (4,218,470 | )(a) |
Unrealized appreciation (depreciation) | | | (5,313,019 | )(b) |
| | | | |
Total accumulated earnings (deficit) | | $ | (8,074,350 | )(c) |
| | | | |
| (a) | As of April 30, 2024, the Fund had a net capital loss carryforward of $4,218,470. |
| (b) | The differences between book-basis and tax-basis unrealized appreciation (depreciation) are attributable primarily to the tax treatment of callable bonds and the tax treatment of swaps. |
| (c) | The difference between book-basis and tax-basis components of accumulated earnings (deficit) is attributable primarily to dividends payable. |
For tax purposes, net realized capital losses may be carried over to offset future capital gains, if any. Funds are permitted to carry forward capital losses for an indefinite period, and such losses will retain their character as either short-term or long-term capital losses. As of April 30, 2024, the Fund had a net short-term capital loss carryforward of $3,479,902 and a net long-term capital loss carryforward of $738,568, which may be carried forward for an indefinite period.
NOTE H
Recent Accounting Pronouncements
In December 2022, the Financial Accounting Standards Board issued an Accounting Standards Update, ASU 2022-06, “Reference Rate Reform (Topic 848) – Deferral of the Sunset Date of Topic 848”. ASU 2022-06 is
| | |
| |
| abfunds.com | | AB TAXABLE MULTI-SECTOR INCOME SHARES | 35 |
NOTES TO FINANCIAL STATEMENTS (continued)
an amendment to ASU 2020-04, which provided optional guidance to ease the potential accounting burden due to the discontinuation of the LIBOR and other interbank-offered based reference rates and which was effective as of March 12, 2020 through December 31, 2022. ASU 2022-06 extends the effective period through December 31, 2024. Management is currently evaluating the impact, if any, of applying ASU 2022-06.
In November 2023, the Financial Accounting Standards Board issued Accounting Standards Update, ASU 2023-07, “Segment Reporting (Topic 280)”. ASU 2023-07 requires public entities to provide disclosure of significant segment expenses that are regularly provided to the chief operating decision maker (“CODM”). ASU 2023-07, among other things, (i) requires a single segment public entity to provide all necessary disclosures required by Topic 280 it, (ii) requires a public entity to disclose the title and position of the CODM and an explanation of how the CODM uses the reported measure(s) of segment profit and loss in assessing segment performance and deciding how to allocate resources and (iii) provides the ability for a public entity to elect more than one performance measure. ASU 2023-07 is effective for fiscal years beginning after December 15, 2023, and interim periods within fiscal years beginning after December 15, 2024. Early adoption of ASU 2023-07 is permitted. Management is currently evaluating the impact, if any, of applying ASU 2023-07.
NOTE I
Subsequent Events
Management has evaluated subsequent events for possible recognition or disclosure in the financial statements through the date the financial statements are issued. Management has determined that there are no material events that would require disclosure in the Fund’s financial statements through this date.
| | |
| |
36 | AB TAXABLE MULTI-SECTOR INCOME SHARES | | abfunds.com |
FINANCIAL HIGHLIGHTS
Selected Data For A Share Of Beneficial Interest Outstanding Throughout Each Period
| | | | | | | | | | | | | | | | | | | | | | | | |
| | | Six Months
Ended
October 31,
2024 (unaudited) | | | Year Ended April 30, | |
| | | 2024 | | | 2023 | | | 2022 | | | 2021 | | | 2020 | |
| | | | |
| | | | | | | | | | | | | | | | | | | | | | | | |
Net asset value, beginning of period | | | $ 9.63 | | | | $ 9.57 | | | | $ 9.59 | | | | $ 10.04 | | | | $ 9.89 | | | | $ 9.82 | |
| | | | |
Income From Investment Operations | | | | | | | | | | | | | | | | | | | | | | | | |
| | | | | | |
Net investment income(a) | | | .22 | | | | .39 | | | | .23 | | | | .10 | | | | .14 | | | | .24 | |
| | | | | | |
Net realized and unrealized gain (loss) on investment transactions | | | .16 | | | | .03 | | | | (.02 | ) | | | (.39 | ) | | | .16 | | | | .09 | |
| | | | |
Net increase (decrease) in net asset value from operations | | | .38 | | | | .42 | | | | .21 | | | | (.29 | ) | | | .30 | | | | .33 | |
| | | | |
Less: Dividends and Distributions | | | | | | | | | | | | | | | | | | | | | | | | |
| | | | | | |
Dividends from net investment income | | | (.22 | ) | | | (.36 | ) | | | (.22 | ) | | | (.12 | ) | | | (.15 | ) | | | (.26 | ) |
| | | | | | |
Distributions from net realized gain on investment transactions | | | – 0 | – | | | – 0 | – | | | (.01 | ) | | | (.04 | ) | | | – 0 | – | | | – 0 | – |
| | | | |
Total dividends and distributions | | | (.22 | ) | | | (.36 | ) | | | (.23 | ) | | | (.16 | ) | | | (.15 | ) | | | (.26 | ) |
| | | | |
Net asset value, end of period | | | $ 9.79 | | | | $ 9.63 | | | | $ 9.57 | | | | $ 9.59 | | | | $ 10.04 | | | | $ 9.89 | |
| | | | |
| | | | | | |
Total Return | | | | | | | | | | | | | | | | | | | | | | | | |
| | | | | | |
Total investment return based on net asset value(b) | | | 3.95 | % | | | 4.41 | % | | | 2.21 | % | | | (2.98 | )% | | | 3.02 | % | | | 3.43 | % |
| | | | | | |
Ratios/Supplemental Data | | | | | | | | | | | | | | | | | | | | | | | | |
| | | | | | |
Net assets, end of period (000’s omitted) | | | $446,557 | | | | $401,344 | | | | $371,863 | | | | $297,166 | | | | $305,872 | | | | $178,508 | |
| | | | | | |
Ratio to average net assets of: | | | | | | | | | | | | | | | | | | | | | | | | |
| | | | | | |
Expenses | | | .00 | %^ | | | .00 | % | | | .00 | % | | | .00 | % | | | .00 | % | | | .01 | %(c) |
| | | | | | |
Net investment income | | | 4.47 | %^ | | | 4.09 | % | | | 2.44 | % | | | 1.03 | % | | | 1.36 | % | | | 2.47 | % |
| | | | | | |
Portfolio turnover rate | | | 28 | % | | | 40 | % | | | 56 | % | | | 45 | % | | | 74 | % | | | 124 | % |
| (a) | Based on average shares outstanding. |
| (b) | Total investment return is calculated assuming an initial investment made at the net asset value at the beginning of the period, reinvestment of all dividends and distributions at net asset value during the period, and redemption on the last day of the period. Total return does not reflect the deduction of taxes that a shareholder would pay on fund distributions or the redemption of fund shares. Total investment return calculated for a period of less than one year is not annualized. |
| (c) | The expense ratio, excluding bank overdraft expense, is .00%. |
See notes to financial statements
| | |
| |
| abfunds.com | | AB TAXABLE MULTI-SECTOR INCOME SHARES | 37 |
Information Regarding the Review and Approval of the Fund’s Advisory Agreement
The disinterested trustees (the “directors”) of AB Corporate Shares (the “Company”) unanimously approved the continuance of the Company’s Advisory Agreement with the Adviser in respect of AB Taxable Multi-Sector Income Shares (the “Fund”) at a meeting held in-person on July 30-31, 2024 (the “Meeting”).
Prior to approval of the continuance of the Advisory Agreement, the directors had requested from the Adviser, and received and evaluated, extensive materials. They reviewed the proposed continuance of the Advisory Agreement with the Adviser and with experienced counsel who are independent of the Adviser, who advised on the relevant legal standards. The directors also reviewed additional materials, including comparative analytical data prepared by the Senior Vice President of the Fund. The directors also discussed the proposed continuance in private sessions with counsel.
The directors noted that the Fund is designed as a vehicle for the wrap fee account market (where investors pay fees to a wrap fee sponsor which pays investment fees and expenses from such fee). The directors also noted that no advisory fee is payable by the Fund, that the Advisory Agreement does not include the reimbursement provision for certain administrative expenses included in the advisory agreements of most of the open-end AB Funds, and that the Adviser is responsible for payment of the Fund’s ordinary expenses. The directors noted that the Company acknowledges in the Advisory Agreement that the Adviser and its affiliates expect to receive compensation from third parties in connection with services provided under the Advisory Agreement. The directors further noted that the Adviser receives payments from the wrap fee program sponsors (the “Sponsors”) that use the Fund as an investment vehicle for their clients.
The directors considered their knowledge of the nature and quality of the services provided by the Adviser to the Fund gained from their experience as directors or trustees of most of the registered investment companies advised by the Adviser, their overall confidence in the Adviser’s integrity and competence they have gained from that experience, the Adviser’s initiative in identifying and raising potential issues with the directors and its responsiveness, frankness and attention to concerns raised by the directors in the past, including the Adviser’s willingness to consider and implement organizational and operational changes designed to improve investment results and the services provided to the AB Funds. The directors noted that they have four regular meetings each year, at each of which they review extensive materials and information from the Adviser, including information on the investment performance of the Fund and the money market fund advised by the Adviser in which the Fund invests a portion of its assets.
| | |
| |
38 | AB TAXABLE MULTI-SECTOR INCOME SHARES | | abfunds.com |
The directors also considered all factors they believed relevant, including the specific matters discussed below. During the course of their deliberations, the directors evaluated, among other things, the reasonableness of the advisory fee. The directors did not identify any particular information that was all-important or controlling, and different directors may have attributed different weights to the various factors. The directors determined that the selection of the Adviser to manage the Fund and the overall arrangements between the Fund and the Adviser, as provided in the Advisory Agreement, including the advisory fee, were fair and reasonable in light of the services performed, expenses incurred and such other matters as the directors considered relevant in the exercise of their business judgment. The material factors and conclusions that formed the basis for the directors’ determinations included the following:
Nature, Extent and Quality of Services Provided
The directors considered the scope and quality of services provided by the Adviser under the Advisory Agreement, including the quality of the investment research capabilities of the Adviser and the other resources it has dedicated to performing services for the Fund. The directors noted that the Adviser from time to time reviews the Fund’s investment strategies and from time to time proposes changes intended to improve the Fund’s relative or absolute performance for the directors’ consideration. They also noted the professional experience and qualifications of the Fund’s portfolio management team and other senior personnel of the Adviser. The quality of administrative and other services, including the Adviser’s role in coordinating the activities of the Fund’s other service providers, also was considered. The directors concluded that, overall, they were satisfied with the nature, extent and quality of services provided to the Fund under the Advisory Agreement.
Costs of Services Provided and Profitability
The directors reviewed a schedule of the revenues and expenses and related notes indicating the profitability of the Fund to the Adviser for calendar years 2022 and 2023 that had been prepared with an expense allocation methodology arrived at in consultation with an independent consultant at the request of the directors. The directors noted the assumptions and methods of allocation used by the Adviser in preparing fund-specific profitability data and understood that there are a number of potentially acceptable allocation methodologies for information of this type. The directors noted that the profitability information reflected all revenues and expenses of the Adviser’s relationship with the Fund. The directors recognized that it is difficult to make comparisons of the profitability of the Advisory Agreement with the profitability of fund advisory contracts for unaffiliated funds because comparative information is not generally publicly available and is affected by numerous factors. The directors focused on the profitability of the Adviser’s relationship with the Fund before taxes and
| | |
| |
| abfunds.com | | AB TAXABLE MULTI-SECTOR INCOME SHARES | 39 |
distribution expenses. The directors concluded that the Adviser’s level of profitability from its relationship with the Fund was not unreasonable.
Fall-Out Benefits
The directors considered the other benefits to the Adviser and its affiliates from their relationships with the Fund and the money market fund advised by the Adviser in which the Fund invests. The directors noted that the Adviser is compensated by the Sponsors. The directors understood that the Adviser also might derive reputational and other benefits from its association with the Fund.
Investment Results
In addition to the information reviewed by the directors in connection with the Meeting, the directors receive detailed performance information for the Fund at each regular Board meeting during the year.
At the Meeting, the directors reviewed performance information prepared by an independent service provider (the “15(c) service provider”), showing the performance of the Fund against a group of similar funds (“peer group”) and a larger group of similar funds (“peer universe”), each selected by the 15(c) service provider, and information prepared by the Adviser showing the Fund’s performance against a broad-based securities market index, in each case for the 1-, 3-, 5- and 10-year periods ended May 31, 2024 and (in the case of comparisons with the broad-based securities market index) for the period from inception. The directors were cognizant that the Fund was neither designed nor offered as a standalone investment and was intended to serve solely as a component of certain separately managed accounts (“SMAs”). The Adviser had explained that this attribute made it difficult to select an appropriate benchmark for the Fund. At the directors’ request, the Adviser provided information showing the weighting of the Fund in a current SMA and the overall performance of the SMA versus its stated benchmark. Based on their review, the directors concluded that the Fund’s investment performance was acceptable.
Advisory Fees
The directors considered the advisory fee rate payable by the Fund to the Adviser (zero) and information provided by the 15(c) service provider concerning advisory fee rates payable by other funds in the same category as the Fund. The directors recognized that it is difficult to make comparisons of advisory fees because there are variations in the services that are included in the fees payable by other funds.
The directors noted the unusual arrangements in the Advisory Agreement providing for no advisory fee but were cognizant that the Adviser is indirectly compensated by the Sponsors for its services to the Fund. The directors reviewed the fee arrangements between the Adviser and each of the current Sponsors and noted that such fees were negotiated on an
| | |
| |
40 | AB TAXABLE MULTI-SECTOR INCOME SHARES | | abfunds.com |
arm’s length basis and were within the range of fees paid by wrap fee sponsors to other advisers of similar funds. While the Adviser’s fee arrangements with the Sponsors vary, the directors acknowledged the Adviser’s view that a portion of such fees (less the expenses of the Fund paid by the Adviser) may reasonably be viewed as compensating the Adviser for advisory services it provides to the Fund (the “implied fee”) and that the Adviser believes that while the Sponsors pay the Adviser different fee rates, the rate of fee attributable to Fund management at the Fund level is the same for all Sponsors. The directors also considered the fee rate schedules used by other registered investment companies that invest in fixed income securities that are advised by the Adviser.
The directors also considered the Adviser’s fee schedule for other clients utilizing investment strategies similar to those of the Fund. For this purpose, they reviewed the relevant advisory fee information from the Adviser’s Form ADV and in a report from the Fund’s Senior Vice President and noted the differences between the Fund’s fee schedule, on the one hand, and the Adviser’s institutional fee schedule and the schedule of fees charged by the Adviser to any offshore funds and for services to any sub-advised funds utilizing investment strategies similar to those of the Fund, on the other. The directors recognized that such information was of limited utility in light of the Fund’s unusual fee arrangement. The directors noted that the Adviser may, in some cases, agree to fee rates with large institutional clients that are lower than those reviewed by the directors and that they had previously discussed with the Adviser its policies in respect of such arrangements. The directors also compared the advisory fee rate for the Fund with that for another fund advised by the Adviser utilizing similar investment strategies.
The Adviser reviewed with the directors the significantly greater scope of the services it provides to the Fund relative to institutional, offshore fund and sub-advised fund clients. In this regard, the Adviser noted, among other things, that, compared to institutional and offshore or sub-advisory accounts, the Fund (i) demands considerably more portfolio management, research and trading resources due to significantly higher daily cash flows; (ii) has more tax and regulatory restrictions and compliance obligations; (iii) must prepare and file or distribute regulatory and other communications about fund operations; and (iv) must provide shareholder servicing to retail investors. The Adviser also reviewed the greater legal risks presented by the large and changing population of Fund shareholders who may assert claims against the Adviser in individual or class actions, and the greater entrepreneurial risk in offering new fund products, which require substantial investment to launch, may not succeed, and generally must be priced to compete with larger, more established funds resulting in lack of profitability to the Adviser until a new fund achieves scale. In light of the substantial differences in services rendered by the Adviser to institutional, offshore fund and sub-advised fund clients as compared to the Fund, and
| | |
| |
| abfunds.com | | AB TAXABLE MULTI-SECTOR INCOME SHARES | 41 |
the different risk profile, the directors considered these fee comparisons inapt and did not place significant weight on them in their deliberations.
The directors did not consider comparative expense information for the Fund because the Fund does not bear ordinary expenses.
Economies of Scale
The directors did not consider the extent to which fee levels in the Advisory Agreement for the Fund reflect economies of scale because the Advisory Agreement does not provide for any compensation to be paid to the Adviser by the Fund and the Fund’s expense ratio is zero. They did note, however, that the fee payable to the Adviser by the current Sponsors declines at a breakpoint based on either individual account sizes or on total assets managed by the Adviser for the Sponsor.
| | |
| |
42 | AB TAXABLE MULTI-SECTOR INCOME SHARES | | abfunds.com |
NOTES
| | |
| |
| abfunds.com | | AB TAXABLE MULTI-SECTOR INCOME SHARES | 43 |
NOTES
| | |
| |
44 | AB TAXABLE MULTI-SECTOR INCOME SHARES | | abfunds.com |
AB TAXABLE MULTI-SECTOR INCOME SHARES
66 Hudson Boulevard East
New York, NY 10001
800 221 5672
TMSIS-0152-1024 
ITEM 8. CHANGES IN AND DISAGREEMENTS WITH ACCOUNTANTS FOR OPEN-END MANAGEMENT INVESTMENT COMPANIES.
There were no disagreements with accountants during the reporting period.
ITEM 9. PROXY DISCLOSURES FOR OPEN-END MANAGEMENT INVESTMENT COMPANIES
ACS
At a Special Meeting held on July 18, 2024, shareholders of AB Corporate Income Shares (the “Fund”), a series of AB Corporate Shares, elected Trustees in connection with the establishment of a single, unitary board (“Unitary Board”) responsible for overseeing mutual funds, exchange-traded funds and certain closed-end investment companies sponsored and advised by the Adviser. In connection with the establishment of the Unitary Board, Ms. Jacklin and Messrs. Downey and Turner will retire as Trustees effective December 31, 2024, and Mr. Erzan will resign as a Trustee effective December 31, 2024, but will continue to serve as President and Chief Executive Officer of the AB Funds. Shareholders of the Fund elected four individuals to serve as Trustees effective January 1, 2025 (the “Trustees-Elect”), who will serve on the Unitary Board with current Trustees Mses. Loeb and McMullen and Messrs. Bermudez and Moody. The number of votes cast for and withheld, as well as the number of abstentions and broker non-votes with respect to the election of each nominee for office is included below.
| | | | | | | | | | | | |
Trustee: | | Voted For | | | Withheld
Authority | | | Abstained | | Broker
Non-Votes |
Jorge A. Bermudez | | | 948,359,802.494 | | | | 903,646.000 | | | N/A | | N/A |
Alexander Chaloff | | | 948,331,040.494 | | | | 932,408.000 | | | N/A | | N/A |
R. Jay Gerken | | | 948,311,538.494 | | | | 951,910.000 | | | N/A | | N/A |
Jeffrey R. Holland | | | 948,480,330.494 | | | | 783,118.000 | | | N/A | | N/A |
Jeanette W. Loeb | | | 939,825,292.494 | | | | 9,438,156.000 | | | N/A | | N/A |
Carol C. McMullen | | | 948,453,701.494 | | | | 809,747.000 | | | N/A | | N/A |
Garry L. Moody | | | 948,094,604.494 | | | | 1,168,844.000 | | | N/A | | N/A |
Emilie D. Wrapp | | | 948,492,149.494 | | | | 771,299.000 | | | N/A | | N/A |
ACS
At a Special Meeting held on July 18, 2024, shareholders of AB Impact Municipal Income Shares (the “Fund”), a series of AB Corporate Shares, elected Trustees in connection with the establishment of a single, unitary board (“Unitary Board”) responsible for overseeing mutual funds, exchange-traded funds and certain closed-end investment companies sponsored and advised by the Adviser. In connection with the establishment of the Unitary Board, Ms. Jacklin and Messrs. Downey and Turner will retire as Trustees effective December 31, 2024, and Mr. Erzan will resign as a Trustee effective December 31, 2024, but will continue to serve as President and Chief Executive Officer of the AB Funds. Shareholders of the Fund elected four individuals to serve as Trustees effective January 1, 2025 (the “Trustees-Elect”), who will serve on the Unitary Board with current Trustees Mses. Loeb and McMullen and Messrs. Bermudez and Moody. The number of votes cast for and withheld, as well as the number of abstentions and broker non-votes with respect to the election of each nominee for office is included below.
| | | | | | | | | | | | |
Trustee: | | Voted For | | | Withheld
Authority | | | Abstained | | Broker
Non-Votes |
Jorge A. Bermudez | | | 948,359,802.494 | | | | 903,646.000 | | | N/A | | N/A |
Alexander Chaloff | | | 948,331,040.494 | | | | 932,408.000 | | | N/A | | N/A |
R. Jay Gerken | | | 948,311,538.494 | | | | 951,910.000 | | | N/A | | N/A |
Jeffrey R. Holland | | | 948,480,330.494 | | | | 783,118.000 | | | N/A | | N/A |
Jeanette W. Loeb | | | 939,825,292.494 | | | | 9,438,156.000 | | | N/A | | N/A |
Carol C. McMullen | | | 948,453,701.494 | | | | 809,747.000 | | | N/A | | N/A |
Garry L. Moody | | | 948,094,604.494 | | | | 1,168,844.000 | | | N/A | | N/A |
Emilie D. Wrapp | | | 948,492,149.494 | | | | 771,299.000 | | | N/A | | N/A |
ACS
At a Special Meeting held on July 18, 2024, shareholders of AB Municipal Income Shares (the “Fund”), a series of AB Corporate Shares, elected Trustees in connection with the establishment of a single, unitary board (“Unitary Board”) responsible for overseeing mutual funds, exchange-traded funds and certain closed-end investment companies sponsored and advised by the Adviser. In connection with the establishment of the Unitary Board, Ms. Jacklin and Messrs. Downey and Turner will retire as Trustees effective December 31, 2024, and Mr. Erzan will resign as a Trustee effective December 31, 2024, but will continue to serve as President and Chief Executive Officer of the AB Funds. Shareholders of the Fund elected four individuals to serve as Trustees effective January 1, 2025 (the “Trustees-Elect”), who will serve on the Unitary Board with current Trustees Mses. Loeb and McMullen and Messrs. Bermudez and Moody. The number of votes cast for and withheld, as well as the number of abstentions and broker non-votes with respect to the election of each nominee for office is included below.
| | | | | | | | | | | | |
Trustee: | | Voted For | | | Withheld
Authority | | | Abstained | | Broker
Non-Votes |
Jorge A. Bermudez | | | 948,359,802.494 | | | | 903,646.000 | | | N/A | | N/A |
Alexander Chaloff | | | 948,331,040.494 | | | | 932,408.000 | | | N/A | | N/A |
R. Jay Gerken | | | 948,311,538.494 | | | | 951,910.000 | | | N/A | | N/A |
Jeffrey R. Holland | | | 948,480,330.494 | | | | 783,118.000 | | | N/A | | N/A |
Jeanette W. Loeb | | | 939,825,292.494 | | | | 9,438,156.000 | | | N/A | | N/A |
Carol C. McMullen | | | 948,453,701.494 | | | | 809,747.000 | | | N/A | | N/A |
Garry L. Moody | | | 948,094,604.494 | | | | 1,168,844.000 | | | N/A | | N/A |
Emilie D. Wrapp | | | 948,492,149.494 | | | | 771,299.000 | | | N/A | | N/A |
ACS
At a Special Meeting held on July 18, 2024, shareholders of AB Taxable Multi-Sector Income Shares (the “Fund”), a series of AB Corporate Shares, elected Trustees in connection with the establishment of a single, unitary board (“Unitary Board”) responsible for overseeing mutual funds, exchange-traded funds and certain closed-end investment companies sponsored and advised by the Adviser. In connection with the establishment of the Unitary Board, Ms. Jacklin and Messrs. Downey and Turner will retire as Trustees effective December 31, 2024, and Mr. Erzan will resign as a Trustee effective December 31, 2024, but will continue to serve as President and Chief Executive Officer of the AB Funds. Shareholders of the Fund elected four individuals to serve as Trustees effective January 1, 2025 (the “Trustees-Elect”), who will serve on the Unitary Board with current Trustees Mses. Loeb and McMullen and Messrs. Bermudez and Moody. The number of votes cast for and withheld, as well as the number of abstentions and broker non-votes with respect to the election of each nominee for office is included below.
| | | | | | | | | | | | |
Trustee: | | Voted For | | | Withheld
Authority | | | Abstained | | Broker
Non-Votes |
Jorge A. Bermudez | | | 948,359,802.494 | | | | 903,646.000 | | | N/A | | N/A |
Alexander Chaloff | | | 948,331,040.494 | | | | 932,408.000 | | | N/A | | N/A |
R. Jay Gerken | | | 948,311,538.494 | | | | 951,910.000 | | | N/A | | N/A |
Jeffrey R. Holland | | | 948,480,330.494 | | | | 783,118.000 | | | N/A | | N/A |
Jeanette W. Loeb | | | 939,825,292.494 | | | | 9,438,156.000 | | | N/A | | N/A |
Carol C. McMullen | | | 948,453,701.494 | | | | 809,747.000 | | | N/A | | N/A |
Garry L. Moody | | | 948,094,604.494 | | | | 1,168,844.000 | | | N/A | | N/A |
Emilie D. Wrapp | | | 948,492,149.494 | | | | 771,299.000 | | | N/A | | N/A |
ITEM 10. REMUNERATION PAID TO DIRECTORS, OFFICERS, AND OTHERS OF OPEN-END MANAGEMENT INVESTMENT COMPANIES.
Aggregate remuneration paid to all Directors and advisory board members are included within the Financial Statements under Item 7 of this Form N-CSR.
ITEM 11. STATEMENT REGARDING BASIS FOR APPROVAL OF INVESTMENT ADVISORY CONTRACT.
Statement regarding basis for Approval of Investment Advisory Contract included within the Financial Statements under Item 7 of this Form N-CSR.
ITEM 12. DISCLOSURE OF PROXY VOTING POLICIES AND PROCEDURES FOR CLOSED-END MANAGEMENT INVESTMENT COMPANIES.
Not applicable to the registrant.
ITEM 13. PORTFOLIO MANAGERS OF CLOSED-END MANAGEMENT INVESTMENT COMPANIES
Not applicable to the registrant.
ITEM 14. PURCHASES OF EQUITY SECURITIES BY CLOSED-END MANAGEMENT INVESTMENT COMPANY AND AFFILIATED PURCHASERS.
Not applicable to the registrant
ITEM 15. SUBMISSION OF MATTERS TO A VOTE OF SECURITY HOLDERS.
There have been no material changes to the procedures by which shareholders may recommend nominees to the Fund’s Board of Directors since the Fund last provided disclosure in response to this item.
ITEM 16. CONTROLS AND PROCEDURES.
(a) The registrant’s principal executive officer and principal financial officer have concluded that the registrant’s disclosure controls and procedures (as defined in Rule 30a-2(c) under the Investment Company Act of 1940, as amended) are effective at the reasonable assurance level based on their evaluation of these controls and procedures as of a date within 90 days of the filing date of this document.
(b) There were no changes in the registrant’s internal controls over financial reporting that occurred during the period covered by this report that has materially affected, or is reasonably likely to materially affect, the registrant’s internal control over financial reporting.
ITEM 17. DISCLOSURE OF SECURITIES LENDING ACTIVITIES FOR CLOSED-END MANAGEMENT INVESTMENT COMPANIES.
Not applicable to the registrant
ITEM 18. RECOVERY OF ERRONEOUSLY AWARDED COMPENSATION.
Not applicable to the registrant
ITEM 19. EXHIBITS.
The following exhibits are attached to this Form N-CSR:
SIGNATURES
Pursuant to the requirements of the Securities Exchange Act of 1934 and the Investment Company Act of 1940, the registrant has duly caused this report to be signed on its behalf by the undersigned, thereunto duly authorized.
| | |
| (Registrant): AB Corporate Shares |
| |
| By: | | /s/ Onur Erzan |
| | Onur Erzan |
| | President |
| |
| Date: | | December 27, 2024 |
Pursuant to the requirements of the Securities Exchange Act of 1934 and the Investment Company Act of 1940, this report has been signed below by the following persons on behalf of the registrant and in the capacities and on the dates indicated.
| | |
| By: | | /s/ Onur Erzan |
| | Onur Erzan |
| | President |
| |
| Date: | | December 27, 2024 |
| |
| By: | | /s/ Stephen M. Woetzel |
| | Stephen M. Woetzel |
| | Treasurer and Chief Financial Officer |
| |
| Date: | | December 27, 2024 |