UNITED STATES
SECURITIES AND EXCHANGE COMMISSION
WASHINGTON, D.C. 20549
FORM N-CSR
CERTIFIED SHAREHOLDER REPORT OF REGISTERED
MANAGEMENT INVESTMENT COMPANIES
Investment Company Act file number: 811-21497
AB CORPORATE SHARES
(Exact name of registrant as specified in charter)
1345 Avenue of the Americas, New York, New York 10105
(Address of principal executive offices) (Zip code)
Joseph J. Mantineo
AllianceBernstein L.P.
1345 Avenue of the Americas
New York, New York 10105
(Name and address of agent for service)
Registrant’s telephone number, including area code: (800) 221-5672
Date of fiscal year end: April 30, 2023
Date of reporting period: October 31, 2022
| ITEM 1. | REPORTS TO STOCKHOLDERS. |
OCT 10.31.22

SEMI-ANNUAL REPORT
AB CORPORATE INCOME SHARES

| | |
| |
| Investment Products Offered | | • Are Not FDIC Insured • May Lose Value • Are Not Bank Guaranteed |
Investors should consider the investment objectives, risks, charges and expenses of the Fund carefully before investing. For copies of our prospectus or summary prospectus, which contain this and other information, visit us online at www.abfunds.com or contact your AB representative. Please read the prospectus and/or summary prospectus carefully before investing.
This shareholder report must be preceded or accompanied by the Fund’s prospectus for individuals who are not current shareholders of the Fund.
You may obtain a description of the Fund’s proxy voting policies and procedures, and information regarding how the Fund voted proxies relating to portfolio securities during the most recent 12-month period ended June 30, without charge. Simply visit AB’s website at www.abfunds.com, or go to the Securities and Exchange Commission’s (the “Commission”) website at www.sec.gov, or call AB at (800) 227 4618.
The Fund files its complete schedule of portfolio holdings with the Commission for the first and third quarters of each fiscal year as an exhibit to its reports on Form N-PORT. The Fund’s Form N-PORT reports are available on the Commission’s website at www.sec.gov. AB publishes full portfolio holdings for the Fund monthly at www.abfunds.com.
AllianceBernstein Investments, Inc. (ABI) is the distributor of the AB family of mutual funds. ABI is a member of FINRA and is an affiliate of AllianceBernstein L.P., the Adviser of the funds.
The [A/B] logo is a registered service mark of AllianceBernstein and AllianceBernstein® is a registered service mark used by permission of the owner, AllianceBernstein L.P.
| | |
| FROM THE PRESIDENT | |  |
Dear Shareholder,
We’re pleased to provide this report for AB Corporate Income Shares (the “Fund”). Please review the discussion of Fund performance, the market conditions during the reporting period and the Fund’s investment strategy.
At AB, we’re striving to help our clients achieve better outcomes by:
| + | | Fostering diverse perspectives that give us a distinctive approach to navigating global capital markets |
| + | | Applying differentiated investment insights through a connected global research network |
| + | | Embracing innovation to design better ways to invest and leading-edge mutual-fund solutions |
Whether you’re an individual investor or a multibillion-dollar institution, we’re putting our knowledge and experience to work for you every day.
For more information about AB’s comprehensive range of products and shareholder resources, please log on to www.abfunds.com.
Thank you for your investment in AB mutual funds—and for placing your trust in our firm.
Sincerely,

Onur Erzan
President and Chief Executive Officer, AB Mutual Funds
| | |
| |
| abfunds.com | | AB CORPORATE INCOME SHARES | 1 |
SEMI-ANNUAL REPORT
December 13, 2022
This report provides management’s discussion of fund performance for AB Corporate Income Shares for the semi-annual reporting period ended October 31, 2022. Please note, shares of this Fund are available only to separately managed accounts or participants in “wrap fee” programs or other investment programs approved by the Adviser.
The Fund’s investment objective is to earn high current income.
NAV RETURNS AS OF OCTOBER 31, 2022 (unaudited)
| | | | |
| | |
| | | 6 Months | | 12 Months |
| | |
| AB CORPORATE INCOME SHARES | | -8.44% | | -20.00% |
| | |
| Bloomberg US Credit Bond Index | | -7.57% | | -18.91% |
INVESTMENT RESULTS
The table above shows the Fund’s performance compared to its benchmark, the Bloomberg US Credit Bond Index, for the six- and 12-month periods ended October 31, 2022.
During both periods, the Fund underperformed the benchmark. Over the six-month period, security selection was the largest detractor, relative to the benchmark, as losses within technology, real estate investment trusts (“REITs”), banking, electric and finance were partially offset by a gain within consumer cyclical–other. Yield-curve positioning also detracted, mostly due to positioning on the three- to six-year parts of the curve and maturities 10 years and longer, while gains in maturities three years and under, and on the six- to 10-year parts of the curve, partially offset losses. Industry allocation hampered returns, from overweights to consumer cyclical–other and REITs, which were offset by gains from overweights to technology and energy, and an underweight to US municipal bonds.
During the 12-month period, security selection detracted the most. Losses within banking, technology, energy, finance and REITs were partially offset by gains from selection within insurance and consumer cyclical–other. Industry allocation also detracted, mostly from an underweight to supranationals and an overweight to media. Yield-curve positioning on the four- to seven-year parts of the curve detracted, offset by gains on the one- to three-year parts of the curve.
The Fund utilized derivatives in the form of futures and interest rate swaps for hedging purposes, and credit default swaps for investment purposes, which had no material impact on absolute returns for either period.
| | |
| |
2 | AB CORPORATE INCOME SHARES | | abfunds.com |
MARKET REVIEW AND INVESTMENT STRATEGY
Fixed-income government bond market yields rose, and bond prices fell sharply in most markets except Japan during the six-month period ended October 31, 2022. Major central banks escalated the process of raising interest rates and ending bond purchases. Relative developed-market government bond returns were led by Japan and trailed significantly in the UK. Securitized assets generally outperformed corporate bonds. Global investment-grade corporate bonds—which typically have longer maturities and are more sensitive to changes in yields than high-yield corporates—trailed US Treasuries in the US and outperformed eurozone treasuries. High-yield corporate bonds outperformed government bonds in the US and eurozone. Emerging-market hard-currency sovereign and corporate bonds underperformed developed-market treasuries and corporates. Emerging-market local-currency bonds underperformed as the US dollar advanced against all major developed-market currencies and the vast majority of emerging-market currencies. Brent crude oil prices fell as global growth and demand began to slow.
The Fund’s Senior Investment Management Team (the “Team”) continues to seek attractively priced securities through top-down and bottom-up research, while mitigating overall risk. The Team invests primarily in single-sector, investment-grade issues of global corporates, but has leeway to invest in below investment-grade bonds as well.
INVESTMENT POLICIES
The Fund invests, under normal circumstances, at least 80% of its net assets in US corporate bonds. The Fund may also invest in US government securities (other than US government securities that are mortgage-backed or asset-backed securities), repurchase agreements and forward contracts relating to US government securities. The Fund normally invests all of its assets in securities that are rated, at the time of purchase, at least BBB- or the equivalent by any nationally recognized statistical rating organization. The Fund will not invest in unrated corporate debt securities. The Fund has the flexibility to invest in long- and short-term fixed-income securities. In making decisions about whether to buy or sell securities, the Adviser will consider, among other things, the strength of certain sectors of the fixed-income market relative to others, interest rates and other general market conditions and the credit quality of individual issuers.
(continued on next page)
| | |
| |
| abfunds.com | | AB CORPORATE INCOME SHARES | 3 |
The Fund also may: invest in convertible debt securities; invest up to 10% of its assets in inflation-indexed securities; invest up to 5% of its net assets in preferred stock; purchase and sell interest rate futures contracts and options; enter into swap transactions; invest in zero-coupon securities and “payment-in-kind” debentures; make secured loans of portfolio securities; and invest in US dollar-denominated fixed-income securities issued by non-US companies.
| | |
| |
4 | AB CORPORATE INCOME SHARES | | abfunds.com |
DISCLOSURES AND RISKS
Benchmark Disclosure
The Bloomberg US Credit Bond Index is unmanaged and does not reflect fees and expenses associated with the active management of a fund. The Bloomberg US Credit Bond Index represents the performance of the US credit securities within the US fixed-income market. An investor cannot invest directly in an index, and its results are not indicative of the performance for any specific investment, including the Fund.
A Word About Risk
Market Risk: The value of the Fund’s assets will fluctuate as the stock or bond market fluctuates. The value of the Fund’s investments may decline, sometimes rapidly and unpredictably, simply because of economic changes or other events, including public health crises (including the occurrence of a contagious disease or illness) and regional and global conflicts, that affect large portions of the market.
Credit Risk: An issuer or guarantor of a fixed-income security, or the counterparty to a derivatives or other contract, may be unable or unwilling to make timely payments of interest or principal, or to otherwise honor its obligations. The issuer or guarantor may default, causing a loss of the full principal amount of a security and any accrued interest. The degree of risk for a particular security may be reflected in its credit rating. There is the possibility that the credit rating of a fixed-income security may be downgraded after purchase, which may adversely affect the value of the security. Investments in fixed-income securities with lower ratings tend to have a higher probability that an issuer will default or fail to meet its payment obligations.
Interest-Rate Risk: Changes in interest rates will affect the value of investments in fixed-income securities. When interest rates rise, the value of existing investments in fixed-income securities tends to fall and this decrease in value may not be offset by higher income from new investments. Interest-rate risk is generally greater for fixed-income securities with longer maturities or durations. The Fund may be subject to greater risk of rising interest rates than would normally be the case due to the end of a recent period of historically low rates and the effect of potential government fiscal policy initiatives and resulting market reaction to those initiatives.
Inflation Risk: This is the risk that the value of assets or income from investments will be less in the future as inflation decreases the value of money. As inflation increases, the value of the Fund’s assets can decline as can the value of the Fund’s distributions. This risk is significantly greater for fixed-income securities with longer maturities.
| | |
| |
| abfunds.com | | AB CORPORATE INCOME SHARES | 5 |
DISCLOSURES AND RISKS (continued)
Foreign (Non-US) Risk: Investments in securities of non-US issuers may involve more risk than those of US issuers. These securities may fluctuate more widely in price and may be more difficult to trade due to adverse market, economic, political, regulatory or other factors.
Derivatives Risk: Derivatives may be difficult to price or unwind and leveraged so that small changes may produce disproportionate losses for the Fund. Derivatives, especially over-the-counter derivatives, are also subject to counterparty risk, which is the risk that the counterparty (the party on the other side of the transaction) on a derivative transaction will be unable or unwilling to honor its contractual obligations to the Fund.
Management Risk: The Fund is subject to management risk because it is an actively managed investment fund. The Adviser will apply its investment techniques and risk analyses in making investment decisions, but there is no guarantee that its techniques will produce the intended results. Some of these techniques may incorporate, or rely upon, quantitative models, but there is no guarantee that these models will generate accurate forecasts, reduce risk or otherwise perform as expected.
These risks are fully discussed in the Fund’s prospectus. As with all investments, you may lose money by investing in the Fund.
An Important Note About Historical Performance
The performance shown in this report represents past performance and does not guarantee future results. Current performance may be lower or higher than the performance information shown. You may obtain performance information current to the most recent month-end by calling (800) 227 4618. The investment return and principal value of an investment in the Fund will fluctuate, so that your shares, when redeemed, may be worth more or less than their original cost. Performance assumes reinvestment of distributions and does not account for taxes.
Investors should consider the investment objectives, risks, charges and expenses of the Fund carefully before investing. For copies of our prospectus and/or summary prospectus, which contain this and other information, visit us online at www.abfunds.com or contact your AllianceBernstein Investments representative. Please read the prospectus and/or summary prospectus carefully before investing.
| | |
| |
6 | AB CORPORATE INCOME SHARES | | abfunds.com |
HISTORICAL PERFORMANCE
AVERAGE ANNUAL RETURNS AS OF OCTOBER 31, 2022 (unaudited)
| | | | |
| |
| | | NAV Returns | |
| |
| 1 Year | | | -20.00% | |
| |
| 5 Years | | | 0.14% | |
| |
| 10 Years | | | 1.83% | |
AVERAGE ANNUAL RETURNS
AS OF THE MOST RECENT CALENDAR QUARTER-END
SEPTEMBER 30, 2022 (unaudited)
| | | | |
| |
| | | NAV Returns | |
| |
| 1 Year | | | -18.78% | |
| |
| 5 Years | | | 0.47% | |
| |
| 10 Years | | | 2.09% | |
The prospectus fee table shows the fees and the total operating expenses of the Fund as 0.00% because the Adviser does not charge any fees or expenses and reimburses Fund operating expenses, except certain extraordinary expenses, taxes, brokerage costs and the interest on borrowings or certain leveraged transactions. Participants in a wrap fee program or other investment program eligible to invest in the Fund pay fees to the program sponsor and should review the program brochure or other literature provided by the sponsor for a discussion of fees and expenses charged.
| | |
| |
| abfunds.com | | AB CORPORATE INCOME SHARES | 7 |
EXPENSE EXAMPLE
(unaudited)
As a shareholder of the Fund, you may incur various ongoing non-operating and extraordinary costs. This example is intended to help you understand your ongoing costs (in dollars) of investing in the Fund and to compare these costs with the ongoing costs of investing in other mutual funds.
The Example is based on an investment of $1,000 invested at the beginning of the period and held for the entire period as indicated below.
Actual Expenses
The table below provides information about actual account values and actual expenses. You may use the information in this line, together with the amount you invested, to estimate the expenses that you paid over the period. Simply divide your account value by $1,000 (for example, an $8,600 account value divided by $1,000 = 8.6), then multiply the result by the number in the first line under the heading entitled “Expenses Paid During Period” to estimate the expenses you paid on your account during this period.
Hypothetical Example for Comparison Purposes
The table below provides information about hypothetical account values and hypothetical expenses based on the Fund’s actual expense ratio and an assumed annual rate of return of 5% before expenses, which is not the Fund’s actual return. The hypothetical account values and expenses may not be used to estimate the actual ending account balance or expenses you paid for the period. You may use this information to compare the ongoing costs of investing in the Fund and other funds by comparing this 5% hypothetical example with the 5% hypothetical examples that appear in the shareholder reports of other funds.
Please note that the expenses shown in the table are meant to highlight your ongoing costs only and do not reflect any transactional costs, such as sales charges (loads), or contingent deferred sales charges on redemptions. Therefore, the hypothetical example is useful in comparing ongoing costs only, and will not help you determine the relative total costs of owning different funds. In addition, if these transactional costs were included, your costs would have been higher.
| | | | | | | | | | | | | | | | |
| | | Beginning
Account Value
May 1, 2022 | | | Ending
Account Value
October 31, 2022 | | | Expenses Paid
During Period* | | | Annualized
Expense Ratio* | |
Actual | | $ | 1,000 | | | $ | 915.60 | | | $ | – 0 | – | | | 0.00 | % |
Hypothetical** | | $ | 1,000 | | | $ | 1,025.21 | | | $ | – 0 | – | | | 0.00 | % |
| * | Expenses are equal to the Fund’s annualized expense ratio, multiplied by the average account value over the period, multiplied by 184/365 (to reflect the one-half year period). The Fund’s operating expenses are borne by the Adviser or its affiliates. |
| ** | Assumes 5% annual return before expenses. |
| | |
| |
8 | AB CORPORATE INCOME SHARES | | abfunds.com |
PORTFOLIO SUMMARY
October 31, 2022 (unaudited)
PORTFOLIO STATISTICS
Net Assets ($mil): $147.3
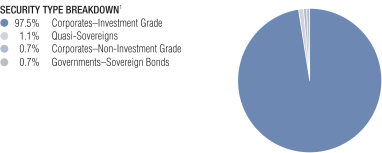
| 1 | The Fund’s security type breakdown is expressed as a percentage of total investments and may vary over time. The Fund also enters into derivative transactions, which may be used for hedging or investment purposes (see “Portfolio of Investments” section of the report for additional details). |
| | |
| |
| abfunds.com | | AB CORPORATE INCOME SHARES | 9 |
PORTFOLIO OF INVESTMENTS
October 31, 2022 (unaudited)
| | | | | | | | |
| | | Principal
Amount
(000) | | | U.S. $ Value | |
| |
CORPORATES - INVESTMENT GRADE – 95.6% | | | | | | | | |
Industrial – 55.8% | | | | | | | | |
Basic – 4.4% | | | | | | | | |
Anglo American Capital PLC 3.875%, 03/16/2029(a) | | $ | 221 | | | $ | 187,339 | |
5.625%, 04/01/2030(a) | | | 435 | | | | 410,433 | |
Celanese US Holdings LLC
5.90%, 07/05/2024 | | | 165 | | | | 162,149 | |
6.05%, 03/15/2025 | | | 165 | | | | 160,499 | |
Celulosa Arauco y Constitucion SA
4.25%, 04/30/2029(a) | | | 246 | | | | 210,299 | |
4.50%, 08/01/2024 | | | 200 | | | | 194,663 | |
EI du Pont de Nemours and Co.
1.70%, 07/15/2025 | | | 433 | | | | 396,624 | |
Equate Petrochemical BV
2.625%, 04/28/2028(a) | | | 317 | | | | 261,890 | |
Freeport Indonesia PT
4.763%, 04/14/2027(a) | | | 240 | | | | 215,100 | |
5.315%, 04/14/2032(a) | | | 240 | | | | 200,100 | |
Georgia-Pacific LLC
3.734%, 07/15/2023(a) | | | 828 | | | | 819,703 | |
Glencore Funding LLC
1.625%, 09/01/2025(a) | | | 521 | | | | 463,508 | |
4.625%, 04/29/2024(a) | | | 175 | | | | 172,225 | |
Inversiones CMPC SA
3.85%, 01/13/2030(a) | | | 210 | | | | 174,864 | |
LyondellBasell Industries NV
4.625%, 02/26/2055 | | | 792 | | | | 567,230 | |
Mosaic Co. (The)
5.625%, 11/15/2043 | | | 170 | | | | 148,726 | |
Nucor Corp.
4.30%, 05/23/2027 | | | 246 | | | | 234,487 | |
Reliance Steel & Aluminum Co.
4.50%, 04/15/2023 | | | 838 | | | | 834,078 | |
Sealed Air Corp.
1.573%, 10/15/2026(a) | | | 545 | | | | 456,764 | |
Westlake Corp.
3.375%, 08/15/2061 | | | 430 | | | | 237,700 | |
| | | | | | | | |
| | | | | | | 6,508,381 | |
| | | | | | | | |
Capital Goods – 2.7% | | | | | | | | |
Caterpillar Financial Services Corp.
0.65%, 07/07/2023 | | | 860 | | | | 835,464 | |
CNH Industrial Capital LLC
1.95%, 07/02/2023 | | | 310 | | | | 302,765 | |
3.95%, 05/23/2025 | | | 177 | | | | 169,605 | |
5.45%, 10/14/2025 | | | 303 | | | | 299,818 | |
| | |
| |
10 | AB CORPORATE INCOME SHARES | | abfunds.com |
PORTFOLIO OF INVESTMENTS (continued)
| | | | | | | | |
| | | Principal
Amount
(000) | | | U.S. $ Value | |
| |
Eaton Corp.
4.70%, 08/23/2052 | | $ | 335 | | | $ | 285,011 | |
John Deere Capital Corp.
4.85%, 10/11/2029 | | | 223 | | | | 219,227 | |
Northrop Grumman Corp.
3.25%, 08/01/2023 | | | 840 | | | | 828,484 | |
Waste Management, Inc.
4.15%, 04/15/2032 | | | 450 | | | | 414,162 | |
Westinghouse Air Brake Technologies Corp.
4.40%, 03/15/2024 | | | 602 | | | | 590,369 | |
| | | | | | | | |
| | | | | | | 3,944,905 | |
| | | | | | | | |
Communications - Media – 5.7% | |
Charter Communications Operating LLC/Charter Communications Operating Capital
3.50%, 06/01/2041 | | | 495 | | | | 312,142 | |
3.70%, 04/01/2051 | | | 225 | | | | 134,998 | |
5.125%, 07/01/2049 | | | 299 | | | | 220,725 | |
5.25%, 04/01/2053 | | | 300 | | | | 226,131 | |
5.375%, 05/01/2047 | | | 519 | | | | 400,123 | |
Comcast Corp.
2.937%, 11/01/2056 | | | 522 | | | | 302,368 | |
3.25%, 11/01/2039 | | | 558 | | | | 404,829 | |
4.65%, 07/15/2042 | | | 278 | | | | 232,010 | |
Discovery Communications LLC
4.65%, 05/15/2050 | | | 59 | | | | 38,650 | |
5.20%, 09/20/2047 | | | 468 | | | | 332,664 | |
5.30%, 05/15/2049 | | | 82 | | | | 59,119 | |
FactSet Research Systems, Inc.
2.90%, 03/01/2027 | | | 515 | | | | 460,307 | |
Fox Corp.
3.05%, 04/07/2025 | | | 23 | | | | 21,732 | |
5.576%, 01/25/2049 | | | 346 | | | | 288,858 | |
Interpublic Group of Cos., Inc. (The)
3.375%, 03/01/2041 | | | 340 | | | | 219,569 | |
Meta Platforms, Inc.
4.65%, 08/15/2062(a) | | | 515 | | | | 381,048 | |
Netflix, Inc.
4.875%, 04/15/2028 | | | 705 | | | | 670,124 | |
Omnicom Group, Inc./Omnicom Capital, Inc.
3.65%, 11/01/2024 | | | 767 | | | | 740,048 | |
Paramount Global
4.20%, 05/19/2032 | | | 225 | | | | 180,164 | |
Prosus NV
3.257%, 01/19/2027(a) | | | 237 | | | | 195,525 | |
3.68%, 01/21/2030(a) | | | 210 | | | | 153,799 | |
Tencent Holdings Ltd.
2.39%, 06/03/2030(a) | | | 397 | | | | 288,768 | |
| | |
| |
| abfunds.com | | AB CORPORATE INCOME SHARES | 11 |
PORTFOLIO OF INVESTMENTS (continued)
| | | | | | | | |
| | | Principal
Amount
(000) | | | U.S. $ Value | |
| |
Thomson Reuters Corp.
5.65%, 11/23/2043 | | $ | 220 | | | $ | 195,479 | |
Time Warner Cable Enterprises LLC
8.375%, 03/15/2023 | | | 967 | | | | 978,768 | |
Walt Disney Co. (The)
4.00%, 10/01/2023 | | | 40 | | | | 39,720 | |
6.40%, 12/15/2035 | | | 161 | | | | 170,420 | |
8.875%, 04/26/2023 | | | 105 | | | | 106,833 | |
Warnermedia Holdings, Inc.
5.05%, 03/15/2042(a) | | | 305 | | | | 223,001 | |
Weibo Corp.
3.50%, 07/05/2024 | | | 373 | | | | 350,923 | |
| | | | | | | | |
| | | | | | | 8,328,845 | |
| | | | | | | | |
Communications - Telecommunications – 0.6% | |
AT&T, Inc.
3.50%, 09/15/2053 | | | 179 | | | | 115,054 | |
6.55%, 01/15/2028 | | | 100 | | | | 101,147 | |
Corning, Inc.
4.75%, 03/15/2042 | | | 455 | | | | 377,618 | |
Rogers Communications, Inc.
4.50%, 03/15/2043 | | | 4 | | | | 3,057 | |
Verizon Communications, Inc.
1.75%, 01/20/2031 | | | 400 | | | | 297,400 | |
| | | | | | | | |
| | | | | | | 894,276 | |
| | | | | | | | |
Consumer Cyclical - Automotive – 0.9% | |
General Motors Co.
5.95%, 04/01/2049 | | | 115 | | | | 97,151 | |
General Motors Financial Co., Inc.
4.15%, 06/19/2023 | | | 116 | | | | 115,013 | |
6.05%, 10/10/2025 | | | 303 | | | | 300,658 | |
Harley-Davidson Financial Services, Inc.
3.05%, 02/14/2027(a) | | | 831 | | | | 709,117 | |
Hyundai Capital America
5.875%, 04/07/2025(a) | | | 160 | | | | 158,841 | |
| | | | | | | | |
| | | | | | | 1,380,780 | |
| | | | | | | | |
Consumer Cyclical - Entertainment – 0.2% | |
Hasbro, Inc.
5.10%, 05/15/2044 | | | 355 | | | | 277,351 | |
| | | | | | | | |
|
Consumer Cyclical - Other – 1.2% | |
Las Vegas Sands Corp.
2.90%, 06/25/2025 | | | 685 | | | | 619,418 | |
3.90%, 08/08/2029 | | | 390 | | | | 314,633 | |
Lennar Corp.
4.50%, 04/30/2024 | | | 395 | | | | 388,644 | |
| | |
| |
12 | AB CORPORATE INCOME SHARES | | abfunds.com |
PORTFOLIO OF INVESTMENTS (continued)
| | | | | | | | |
| | | Principal
Amount
(000) | | | U.S. $ Value | |
| |
Marriott International, Inc./MD
Series EE
5.75%, 05/01/2025 | | $ | 366 | | | $ | 369,591 | |
MDC Holdings, Inc.
6.00%, 01/15/2043 | | | 140 | | | | 106,551 | |
| | | | | | | | |
| | | | | | | 1,798,837 | |
| | | | | | | | |
Consumer Cyclical - Restaurants – 0.5% | |
McDonald’s Corp.
3.625%, 09/01/2049 | | | 215 | | | | 152,181 | |
4.45%, 09/01/2048 | | | 185 | | | | 150,620 | |
4.60%, 05/26/2045 | | | 280 | | | | 231,271 | |
4.70%, 12/09/2035 | | | 220 | | | | 200,493 | |
| | | | | | | | |
| | | | | | | 734,565 | |
| | | | | | | | |
Consumer Cyclical - Retailers – 1.6% | |
AutoNation, Inc.
3.85%, 03/01/2032 | | | 515 | | | | 401,731 | |
AutoZone, Inc.
3.125%, 04/21/2026 | | | 795 | | | | 740,622 | |
Lowe’s Cos., Inc.
5.80%, 09/15/2062 | | | 565 | | | | 505,828 | |
Ross Stores, Inc.
4.70%, 04/15/2027 | | | 160 | | | | 153,120 | |
4.80%, 04/15/2030 | | | 115 | | | | 106,110 | |
5.45%, 04/15/2050 | | | 175 | | | | 150,318 | |
Walmart, Inc.
3.95%, 06/28/2038 | | | 320 | | | | 279,354 | |
| | | | | | | | |
| | | | | | | 2,337,083 | |
| | | | | | | | |
Consumer Non-Cyclical – 13.0% | |
AbbVie, Inc.
4.05%, 11/21/2039 | | | 80 | | | | 64,439 | |
4.40%, 11/06/2042 | | | 350 | | | | 286,587 | |
Altria Group, Inc.
3.40%, 05/06/2030 | | | 180 | | | | 146,250 | |
4.00%, 02/04/2061 | | | 300 | | | | 178,857 | |
5.95%, 02/14/2049 | | | 180 | | | | 146,043 | |
AmerisourceBergen Corp.
0.737%, 03/15/2023 | | | 277 | | | | 272,524 | |
4.25%, 03/01/2045 | | | 165 | | | | 126,847 | |
4.30%, 12/15/2047 | | | 295 | | | | 227,722 | |
Amgen, Inc.
4.40%, 02/22/2062 | | | 570 | | | | 433,542 | |
4.875%, 03/01/2053 | | | 335 | | | | 284,130 | |
Anheuser-Busch InBev Worldwide, Inc.
4.95%, 01/15/2042 | | | 310 | | | | 274,437 | |
| | |
| |
| abfunds.com | | AB CORPORATE INCOME SHARES | 13 |
PORTFOLIO OF INVESTMENTS (continued)
| | | | | | | | |
| | | Principal
Amount
(000) | | | U.S. $ Value | |
| |
BAT Capital Corp.
2.259%, 03/25/2028 | | $ | 307 | | | $ | 242,941 | |
4.39%, 08/15/2037 | | | 323 | | | | 234,191 | |
4.906%, 04/02/2030 | | | 394 | | | | 344,407 | |
5.65%, 03/16/2052 | | | 195 | | | | 147,543 | |
7.75%, 10/19/2032 | | | 112 | | | | 114,480 | |
BAT International Finance PLC
4.448%, 03/16/2028 | | | 395 | | | | 350,523 | |
Baxalta, Inc.
4.00%, 06/23/2025 | | | 765 | | | | 741,591 | |
Baxter International, Inc.
0.868%, 12/01/2023 | | | 545 | | | | 520,361 | |
Bristol-Myers Squibb Co.
3.625%, 05/15/2024 | | | 833 | | | | 817,306 | |
3.70%, 03/15/2052 | | | 480 | | | | 356,342 | |
3.90%, 03/15/2062 | | | 485 | | | | 354,700 | |
Cardinal Health, Inc.
4.50%, 11/15/2044 | | | 305 | | | | 229,043 | |
4.90%, 09/15/2045 | | | 305 | | | | 245,513 | |
Cargill, Inc.
3.625%, 04/22/2027(a) | | | 560 | | | | 527,615 | |
4.375%, 04/22/2052(a) | | | 350 | | | | 284,519 | |
5.125%, 10/11/2032(a) | | | 166 | | | | 161,988 | |
Cigna Corp.
3.00%, 07/15/2023 | | | 71 | | | | 70,032 | |
4.80%, 08/15/2038 | | | 530 | | | | 467,009 | |
7.875%, 05/15/2027 | | | 53 | | | | 57,441 | |
CommonSpirit Health
4.35%, 11/01/2042 | | | 44 | | | | 34,196 | |
Constellation Brands, Inc.
4.35%, 05/09/2027 | | | 355 | | | | 339,256 | |
CVS Health Corp.
3.875%, 07/20/2025 | | | 308 | | | | 297,356 | |
4.78%, 03/25/2038 | | | 621 | | | | 538,463 | |
5.125%, 07/20/2045 | | | 315 | | | | 270,242 | |
Gilead Sciences, Inc.
0.75%, 09/29/2023 | | | 203 | | | | 195,357 | |
2.80%, 10/01/2050 | | | 175 | | | | 106,769 | |
3.65%, 03/01/2026 | | | 781 | | | | 740,224 | |
Hershey Co. (The)
0.90%, 06/01/2025 | | | 898 | | | | 810,741 | |
3.125%, 11/15/2049 | | | 245 | | | | 165,755 | |
Johnson & Johnson
5.85%, 07/15/2038 | | | 240 | | | | 251,630 | |
McKesson Corp.
1.30%, 08/15/2026 | | | 926 | | | | 796,166 | |
| | |
| |
14 | AB CORPORATE INCOME SHARES | | abfunds.com |
PORTFOLIO OF INVESTMENTS (continued)
| | | | | | | | |
| | | Principal
Amount
(000) | | | U.S. $ Value | |
| |
Merck & Co., Inc.
2.90%, 12/10/2061 | | $ | 205 | | | $ | 124,673 | |
Molson Coors Brewing Co.
4.20%, 07/15/2046 | | | 210 | | | | 154,711 | |
Mylan, Inc.
4.20%, 11/29/2023 | | | 682 | | | | 669,144 | |
Newell Brands, Inc.
6.375%, 09/15/2027 | | | 320 | | | | 313,338 | |
Ochsner LSU Health System of North Louisiana
Series 2021
2.51%, 05/15/2031 | | | 264 | | | | 197,448 | |
PepsiCo, Inc.
0.40%, 10/07/2023 | | | 787 | | | | 754,662 | |
3.90%, 07/18/2032 | | | 330 | | | | 305,692 | |
Pilgrim’s Pride Corp.
3.50%, 03/01/2032(a) | | | 400 | | | | 307,020 | |
Sysco Corp.
2.45%, 12/14/2031 | | | 425 | | | | 331,657 | |
3.15%, 12/14/2051 | | | 460 | | | | 286,856 | |
6.60%, 04/01/2050 | | | 227 | | | | 232,675 | |
Thermo Fisher Scientific, Inc.
0.797%, 10/18/2023 | | | 1,258 | | | | 1,207,479 | |
Wyeth LLC
5.95%, 04/01/2037 | | | 240 | | | | 250,231 | |
Zimmer Biomet Holdings, Inc.
1.45%, 11/22/2024 | | | 803 | | | | 740,719 | |
| | | | | | | | |
| | | | | | | 19,131,383 | |
| | | | | | | | |
Energy – 8.1% | |
BP Capital Markets America, Inc.
2.939%, 06/04/2051 | | | 485 | | | | 299,531 | |
3.00%, 02/24/2050 | | | 660 | | | | 417,153 | |
Conocophillips Co.
3.80%, 03/15/2052 | | | 405 | | | | 303,207 | |
Continental Resources, Inc./OK
2.875%, 04/01/2032(a) | | | 304 | | | | 222,306 | |
4.90%, 06/01/2044 | | | 495 | | | | 352,613 | |
5.75%, 01/15/2031(a) | | | 221 | | | | 201,086 | |
Devon Energy Corp.
5.60%, 07/15/2041 | | | 355 | | | | 324,239 | |
Diamondback Energy, Inc.
6.25%, 03/15/2033 | | | 318 | | | | 319,425 | |
Ecopetrol SA
5.875%, 09/18/2023 | | | 64 | | | | 62,816 | |
5.875%, 05/28/2045 | | | 25 | | | | 15,221 | |
Enable Midstream Partners LP
5.00%, 05/15/2044 | | | 41 | | | | 31,169 | |
| | |
| |
| abfunds.com | | AB CORPORATE INCOME SHARES | 15 |
PORTFOLIO OF INVESTMENTS (continued)
| | | | | | | | |
| | | Principal
Amount
(000) | | | U.S. $ Value | |
| |
Enbridge Energy Partners LP
7.375%, 10/15/2045 | | $ | 286 | | | $ | 302,579 | |
Energy Transfer LP
3.90%, 07/15/2026 | | | 440 | | | | 406,314 | |
5.35%, 05/15/2045 | | | 135 | | | | 107,135 | |
6.25%, 04/15/2049 | | | 473 | | | | 412,868 | |
Eni SpA
5.70%, 10/01/2040(a) | | | 420 | | | | 366,295 | |
Enterprise Products Operating LLC
3.70%, 01/31/2051 | | | 130 | | | | 87,955 | |
4.20%, 01/31/2050 | | | 437 | | | | 321,510 | |
4.45%, 02/15/2043 | | | 195 | | | | 154,261 | |
4.80%, 02/01/2049 | | | 85 | | | | 68,652 | |
4.90%, 05/15/2046 | | | 45 | | | | 36,898 | |
EOG Resources, Inc.
4.375%, 04/15/2030 | | | 74 | | | | 70,228 | |
EQT Corp.
5.70%, 04/01/2028 | | | 131 | | | | 127,494 | |
Exxon Mobil Corp.
4.114%, 03/01/2046 | | | 514 | | | | 412,428 | |
4.327%, 03/19/2050 | | | 220 | | | | 182,728 | |
Flex Intermediate Holdco LLC
3.363%, 06/30/2031(a) | | | 215 | | | | 163,282 | |
4.317%, 12/30/2039(a) | | | 215 | | | | 147,103 | |
Kinder Morgan, Inc.
5.55%, 06/01/2045 | | | 485 | | | | 419,229 | |
Marathon Oil Corp.
6.60%, 10/01/2037 | | | 305 | | | | 300,886 | |
Marathon Petroleum Corp.
5.125%, 12/15/2026 | | | 1,038 | | | | 1,020,437 | |
6.50%, 03/01/2041 | | | 165 | | | | 160,938 | |
MPLX LP
4.95%, 09/01/2032 | | | 335 | | | | 303,440 | |
4.95%, 03/14/2052 | | | 300 | | | | 232,428 | |
5.20%, 03/01/2047 | | | 231 | | | | 184,624 | |
5.20%, 12/01/2047 | | | 144 | | | | 115,201 | |
ONEOK Partners LP
6.125%, 02/01/2041 | | | 430 | | | | 379,978 | |
Pioneer Natural Resources Co.
2.15%, 01/15/2031 | | | 560 | | | | 433,966 | |
Sabine Pass Liquefaction LLC
5.625%, 04/15/2023 | | | 217 | | | | 217,004 | |
Suncor Energy, Inc.
6.50%, 06/15/2038 | | | 305 | | | | 299,971 | |
6.85%, 06/01/2039 | | | 215 | | | | 216,552 | |
Targa Resources Corp.
6.25%, 07/01/2052 | | | 495 | | | | 442,728 | |
| | |
| |
16 | AB CORPORATE INCOME SHARES | | abfunds.com |
PORTFOLIO OF INVESTMENTS (continued)
| | | | | | | | |
| | | Principal
Amount
(000) | | | U.S. $ Value | |
| |
Tengizchevroil Finance Co. International Ltd.
3.25%, 08/15/2030(a) | | $ | 265 | | | $ | 169,467 | |
TransCanada PipeLines Ltd.
6.20%, 10/15/2037 | | | 67 | | | | 65,377 | |
7.625%, 01/15/2039 | | | 88 | | | | 96,145 | |
Valero Energy Corp.
7.50%, 04/15/2032 | | | 308 | | | | 334,901 | |
Western Midstream Operating LP
4.65%, 07/01/2026 | | | 81 | | | | 76,575 | |
5.45%, 04/01/2044 | | | 149 | | | | 120,624 | |
Williams Cos., Inc. (The)
3.50%, 10/15/2051 | | | 540 | | | | 346,232 | |
6.30%, 04/15/2040 | | | 130 | | | | 125,529 | |
| | | | | | | | |
| | | | | | | 11,978,728 | |
| | | | | | | | |
Services – 2.7% | |
Alibaba Group Holding Ltd.
2.125%, 02/09/2031 | | | 400 | | | | 286,092 | |
2.70%, 02/09/2041 | | | 300 | | | | 156,489 | |
Amazon.com, Inc.
4.10%, 04/13/2062 | | | 280 | | | | 214,679 | |
4.25%, 08/22/2057 | | | 170 | | | | 136,774 | |
Block Financial LLC
2.50%, 07/15/2028 | | | 430 | | | | 353,163 | |
Booking Holdings, Inc.
4.625%, 04/13/2030 | | | 800 | | | | 754,440 | |
Expedia Group, Inc.
6.25%, 05/01/2025(a) | | | 33 | | | | 32,981 | |
Global Payments, Inc.
2.90%, 11/15/2031 | | | 545 | | | | 416,767 | |
5.40%, 08/15/2032 | | | 551 | | | | 509,289 | |
Mastercard, Inc.
2.00%, 03/03/2025 | | | 804 | | | | 755,607 | |
Moody’s Corp.
5.25%, 07/15/2044 | | | 135 | | | | 120,488 | |
S&P Global, Inc.
2.90%, 03/01/2032(a) | | | 226 | | | | 186,045 | |
4.25%, 05/01/2029(a) | | | 90 | | | | 83,987 | |
4.75%, 08/01/2028(a) | | | 20 | | | | 19,389 | |
| | | | | | | | |
| | | | | | | 4,026,190 | |
| | | | | | | | |
Technology – 13.2% | |
Analog Devices, Inc.
2.95%, 04/01/2025 | | | 36 | | | | 34,442 | |
Apple, Inc.
2.45%, 08/04/2026 | | | 782 | | | | 719,784 | |
2.65%, 05/11/2050 | | | 170 | | | | 106,860 | |
3.25%, 02/23/2026 | | | 840 | | | | 800,738 | |
| | |
| |
| abfunds.com | | AB CORPORATE INCOME SHARES | 17 |
PORTFOLIO OF INVESTMENTS (continued)
| | | | | | | | |
| | | Principal
Amount
(000) | | | U.S. $ Value | |
| |
4.10%, 08/08/2062 | | $ | 345 | | | $ | 268,344 | |
4.45%, 05/06/2044 | | | 871 | | | | 778,552 | |
Baidu, Inc.
1.625%, 02/23/2027 | | | 435 | | | | 357,348 | |
3.075%, 04/07/2025 | | | 265 | | | | 246,959 | |
Broadcom, Inc.
3.137%, 11/15/2035(a) | | | 466 | | | | 323,222 | |
3.187%, 11/15/2036(a) | | | 573 | | | | 390,964 | |
3.419%, 04/15/2033(a) | | | 140 | | | | 106,770 | |
4.926%, 05/15/2037(a) | | | 452 | | | | 372,538 | |
CDW LLC/CDW Finance Corp.
2.67%, 12/01/2026 | | | 445 | | | | 384,022 | |
Cisco Systems, Inc.
2.20%, 09/20/2023 | | | 773 | | | | 755,716 | |
Dell International LLC/EMC Corp.
6.02%, 06/15/2026 | | | 774 | | | | 772,816 | |
8.35%, 07/15/2046 | | | 42 | | | | 44,595 | |
Entegris Escrow Corp.
4.75%, 04/15/2029(a) | | | 395 | | | | 352,715 | |
Fidelity National Information Services, Inc.
0.375%, 03/01/2023 | | | 1,295 | | | | 1,275,562 | |
4.50%, 07/15/2025 | | | 73 | | | | 71,044 | |
HP, Inc.
4.20%, 04/15/2032 | | | 390 | | | | 319,320 | |
5.50%, 01/15/2033 | | | 695 | | | | 618,745 | |
Infor, Inc.
1.75%, 07/15/2025(a) | | | 95 | | | | 85,181 | |
Intel Corp.
4.75%, 03/25/2050 | | | 454 | | | | 368,789 | |
5.05%, 08/05/2062 | | | 675 | | | | 550,139 | |
International Business Machines Corp.
4.25%, 05/15/2049 | | | 570 | | | | 442,132 | |
4.90%, 07/27/2052 | | | 660 | | | | 556,578 | |
KLA Corp.
4.95%, 07/15/2052 | | | 500 | | | | 436,205 | |
Kyndryl Holdings, Inc.
2.05%, 10/15/2026 | | | 1,080 | | | | 846,806 | |
Lam Research Corp.
3.75%, 03/15/2026 | | | 142 | | | | 136,256 | |
Micron Technology, Inc.
6.75%, 11/01/2029 | | | 359 | | | | 359,169 | |
Microsoft Corp.
2.00%, 08/08/2023 | | | 848 | | | | 832,244 | |
2.40%, 08/08/2026 | | | 864 | | | | 799,433 | |
3.95%, 08/08/2056 | | | 225 | | | | 179,060 | |
NXP BV/NXP Funding LLC
5.55%, 12/01/2028 | | | 1,176 | | | | 1,127,760 | |
| | |
| |
18 | AB CORPORATE INCOME SHARES | | abfunds.com |
PORTFOLIO OF INVESTMENTS (continued)
| | | | | | | | |
| | | Principal
Amount
(000) | | | U.S. $ Value | |
| |
NXP BV/NXP Funding LLC/NXP USA, Inc.
2.70%, 05/01/2025 | | $ | 24 | | | $ | 22,187 | |
Oracle Corp.
2.50%, 04/01/2025 | | | 619 | | | | 578,647 | |
3.60%, 04/01/2040 | | | 436 | | | | 294,719 | |
3.65%, 03/25/2041 | | | 233 | | | | 157,981 | |
3.85%, 04/01/2060 | | | 94 | | | | 56,722 | |
4.00%, 11/15/2047 | | | 537 | | | | 354,909 | |
5.375%, 07/15/2040 | | | 143 | | | | 119,396 | |
6.125%, 07/08/2039 | | | 254 | | | | 232,382 | |
QUALCOMM, Inc.
1.65%, 05/20/2032 | | | 295 | | | | 221,808 | |
SK Hynix, Inc.
2.375%, 01/19/2031(a) | | | 390 | | | | 274,536 | |
Skyworks Solutions, Inc.
3.00%, 06/01/2031 | | | 259 | | | | 192,543 | |
Take-Two Interactive Software, Inc.
3.30%, 03/28/2024 | | | 263 | | | | 255,341 | |
Texas Instruments, Inc.
4.10%, 08/16/2052 | | | 239 | | | | 196,434 | |
TSMC Arizona Corp.
4.50%, 04/22/2052 | | | 345 | | | | 283,217 | |
Western Digital Corp.
3.10%, 02/01/2032 | | | 430 | | | | 298,218 | |
| | | | | | | | |
| | | | | | | 19,359,848 | |
| | | | | | | | |
Transportation - Airlines – 0.1% | |
Delta Air Lines, Inc./SkyMiles IP Ltd.
4.50%, 10/20/2025(a) | | | 131 | | | | 127,608 | |
| | | | | | | | |
|
Transportation - Services – 0.9% | |
ENA Master Trust
4.00%, 05/19/2048(a) | | | 370 | | | | 250,906 | |
ERAC USA Finance LLC
3.85%, 11/15/2024(a) | | | 711 | | | | 685,276 | |
Penske Truck Leasing Co. Lp/PTL Finance Corp. 3.90%, 02/01/2024(a) | | | 300 | | | | 292,704 | |
4.20%, 04/01/2027(a) | | | 117 | | | | 108,437 | |
| | | | | | | | |
| | | | | | | 1,337,323 | |
| | | | | | | | |
| | | | | | | 82,166,103 | |
| | | | | | | | |
Financial Institutions – 32.1% | |
Banking – 19.5% | |
AIB Group PLC
7.583%, 10/14/2026(a) | | | 455 | | | | 452,393 | |
Banco de Credito del Peru S.A.
3.125%, 07/01/2030(a) | | | 274 | | | | 240,243 | |
| | |
| |
| abfunds.com | | AB CORPORATE INCOME SHARES | 19 |
PORTFOLIO OF INVESTMENTS (continued)
| | | | | | | | |
| | | Principal
Amount
(000) | | | U.S. $ Value | |
| |
Banco Santander SA
1.722%, 09/14/2027 | | $ | 600 | | | $ | 489,606 | |
Bank of America Corp.
2.592%, 04/29/2031 | | | 575 | | | | 454,532 | |
2.884%, 10/22/2030 | | | 450 | | | | 366,912 | |
3.384%, 04/02/2026 | | | 390 | | | | 366,245 | |
3.846%, 03/08/2037 | | | 510 | | | | 409,331 | |
3.97%, 03/05/2029 | | | 520 | | | | 467,184 | |
3.974%, 02/07/2030 | | | 390 | | | | 345,095 | |
4.271%, 07/23/2029 | | | 727 | | | | 660,472 | |
4.827%, 07/22/2026 | | | 495 | | | | 481,239 | |
Bank of Ireland Group PLC
6.253%, 09/16/2026(a) | | | 320 | | | | 309,245 | |
Barclays PLC
7.385%, 11/02/2028 | | | 499 | | | | 496,535 | |
BBVA Bancomer SA/Texas
5.875%, 09/13/2034(a) | | | 330 | | | | 274,634 | |
BNP Paribas SA
2.591%, 01/20/2028(a) | | | 450 | | | | 379,728 | |
4.625%, 02/25/2031(a) | | | 223 | | | | 154,396 | |
Canadian Imperial Bank of Commerce
3.30%, 04/07/2025 | | | 395 | | | | 375,459 | |
Capital One Financial Corp.
4.985%, 07/24/2026 | | | 335 | | | | 322,689 | |
Citigroup, Inc.
3.875%, 02/18/2026(b) | | | 344 | | | | 282,245 | |
4.14%, 05/24/2025 | | | 345 | | | | 335,126 | |
Series W
4.00%, 12/10/2025(b) | | | 368 | | | | 310,228 | |
Series Y
4.15%, 11/15/2026(b) | | | 569 | | | | 446,085 | |
Credit Suisse Group AG
4.55%, 04/17/2026 | | | 790 | | | | 691,969 | |
6.373%, 07/15/2026(a) | | | 250 | | | | 233,183 | |
Danske Bank A/S
4.298%, 04/01/2028(a) | | | 250 | | | | 220,568 | |
Deutsche Bank AG/New York NY
2.311%, 11/16/2027 | | | 910 | | | | 725,425 | |
6.119%, 07/14/2026 | | | 173 | | | | 165,381 | |
Discover Bank
4.682%, 08/09/2028 | | | 385 | | | | 369,581 | |
Federation des Caisses Desjardins du Quebec
4.40%, 08/23/2025(a) | | | 335 | | | | 321,660 | |
Goldman Sachs Group, Inc. (The)
1.948%, 10/21/2027 | | | 340 | | | | 288,922 | |
4.223%, 05/01/2029 | | | 392 | | | | 354,721 | |
| | |
| |
20 | AB CORPORATE INCOME SHARES | | abfunds.com |
PORTFOLIO OF INVESTMENTS (continued)
| | | | | | | | |
| | | Principal
Amount
(000) | | | U.S. $ Value | |
| |
Series V
4.125%, 11/10/2026(b) | | $ | 248 | | | $ | 193,182 | |
HSBC Holdings PLC
2.013%, 09/22/2028 | | | 285 | | | | 224,036 | |
2.206%, 08/17/2029 | | | 335 | | | | 253,910 | |
2.251%, 11/22/2027 | | | 355 | | | | 292,091 | |
3.973%, 05/22/2030 | | | 342 | | | | 282,389 | |
4.583%, 06/19/2029 | | | 970 | | | | 844,424 | |
4.60%, 12/17/2030(b) | | | 267 | | | | 176,303 | |
4.755%, 06/09/2028 | | | 420 | | | | 378,218 | |
4.762%, 03/29/2033 | | | 242 | | | | 192,366 | |
JPMorgan Chase & Co.
2.947%, 02/24/2028 | | | 405 | | | | 356,599 | |
4.323%, 04/26/2028 | | | 560 | | | | 521,287 | |
4.565%, 06/14/2030 | | | 494 | | | | 453,255 | |
4.912%, 07/25/2033 | | | 500 | | | | 457,650 | |
5.717%, 09/14/2033 | | | 320 | | | | 297,286 | |
8.00%, 04/29/2027 | | | 520 | | | | 570,622 | |
Series Q
5.15%, 05/01/2023(b) | | | 205 | | | | 199,588 | |
Lloyds Banking Group PLC
4.716%, 08/11/2026 | | | 335 | | | | 316,672 | |
M&T Bank Corp.
3.50%, 09/01/2026(b) | | | 264 | | | | 197,129 | |
Mitsubishi UFJ Financial Group, Inc.
1.64%, 10/13/2027 | | | 828 | | | | 697,507 | |
4.788%, 07/18/2025 | | | 495 | | | | 485,689 | |
Mizuho Financial Group, Inc.
5.414%, 09/13/2028 | | | 560 | | | | 540,870 | |
Morgan Stanley
3.62%, 04/17/2025 | | | 555 | | | | 536,113 | |
3.622%, 04/01/2031 | | | 125 | | | | 106,580 | |
4.431%, 01/23/2030 | | | 440 | | | | 401,205 | |
4.889%, 07/20/2033 | | | 500 | | | | 456,410 | |
6.296%, 10/18/2028 | | | 595 | | | | 600,385 | |
National Australia Bank Ltd.
3.347%, 01/12/2037(a) | | | 665 | | | | 494,321 | |
Nationwide Building Society
2.972%, 02/16/2028(a) | | | 404 | | | | 342,228 | |
PNC Financial Services Group, Inc. (The)
Series O
6.46% (LIBOR 3 Month + 3.68%),
02/01/2023(b)(c) | | | 358 | | | | 357,434 | |
Santander Holdings USA, Inc.
2.49%, 01/06/2028 | | | 126 | | | | 104,097 | |
4.40%, 07/13/2027 | | | 393 | | | | 355,433 | |
Societe Generale SA
2.797%, 01/19/2028(a) | | | 795 | | | | 658,578 | |
| | |
| |
| abfunds.com | | AB CORPORATE INCOME SHARES | 21 |
PORTFOLIO OF INVESTMENTS (continued)
| | | | | | | | |
| | | Principal
Amount
(000) | | | U.S. $ Value | |
| |
Standard Chartered PLC
1.456%, 01/14/2027(a) | | $ | 345 | | | $ | 285,977 | |
3.971%, 03/30/2026(a) | | | 245 | | | | 225,322 | |
Synchrony Bank
5.625%, 08/23/2027 | | | 250 | | | | 235,683 | |
Truist Financial Corp.
Series Q
5.10%, 03/01/2030(b) | | | 382 | | | | 335,858 | |
UBS Group AG
4.488%, 05/12/2026(a) | | | 222 | | | | 210,583 | |
4.703%, 08/05/2027(a) | | | 335 | | | | 311,188 | |
Wells Fargo & Co.
3.908%, 04/25/2026 | | | 553 | | | | 526,180 | |
4.808%, 07/25/2028 | | | 330 | | | | 312,952 | |
Series BB
3.90%, 03/15/2026(b) | | | 805 | | | | 683,348 | |
Western Union Co. (The)
2.75%, 03/15/2031 | | | 490 | | | | 358,959 | |
Westpac Banking Corp.
3.02%, 11/18/2036 | | | 630 | | | | 445,190 | |
4.11%, 07/24/2034 | | | 475 | | | | 393,922 | |
5.405%, 08/10/2033 | | | 335 | | | | 292,334 | |
| | | | | | | | |
| | | | | | | 28,752,385 | |
| | | | | | | | |
Brokerage – 1.1% | |
Charles Schwab Corp. (The)
Series G
5.375%, 06/01/2025(b) | | | 158 | | | | 154,318 | |
Series I
4.00%, 06/01/2026(b) | | | 595 | | | | 485,306 | |
Jefferies Financial Group, Inc.
5.50%, 10/18/2023 | | | 444 | | | | 442,988 | |
Nomura Holdings, Inc.
5.099%, 07/03/2025 | | | 495 | | | | 484,912 | |
| | | | | | | | |
| | | | | | | 1,567,524 | |
| | | | | | | | |
Finance – 1.8% | |
Air Lease Corp.
2.875%, 01/15/2026 | | | 100 | | | | 88,921 | |
Aircastle Ltd.
2.85%, 01/26/2028(a) | | | 664 | | | | 499,162 | |
4.25%, 06/15/2026 | | | 21 | | | | 18,523 | |
5.25%, 08/11/2025(a) | | | 210 | | | | 196,501 | |
Aviation Capital Group LLC
1.95%, 01/30/2026(a) | | | 274 | | | | 228,058 | |
1.95%, 09/20/2026(a) | | | 391 | | | | 314,579 | |
3.50%, 11/01/2027(a) | | | 116 | | | | 94,505 | |
4.375%, 01/30/2024(a) | | | 220 | | | | 212,144 | |
| | |
| |
22 | AB CORPORATE INCOME SHARES | | abfunds.com |
PORTFOLIO OF INVESTMENTS (continued)
| | | | | | | | |
| | | Principal
Amount
(000) | | | U.S. $ Value | |
| |
Synchrony Financial
2.875%, 10/28/2031 | | $ | 368 | | | $ | 260,191 | |
3.95%, 12/01/2027 | | | 276 | | | | 237,562 | |
4.875%, 06/13/2025 | | | 267 | | | | 256,518 | |
5.15%, 03/19/2029 | | | 319 | | | | 285,875 | |
| | | | | | | | |
| | | | | | | 2,692,539 | |
| | | | | | | | |
Insurance – 5.5% | |
ACE Capital Trust II
9.70%, 04/01/2030 | | | 345 | | | | 430,039 | |
Allstate Corp. (The)
Series B
5.75%, 08/15/2053 | | | 712 | | | | 651,088 | |
Berkshire Hathaway, Inc.
2.75%, 03/15/2023 | | | 395 | | | | 392,014 | |
Centene Corp.
2.45%, 07/15/2028 | | | 294 | | | | 241,824 | |
Guardian Life Insurance Co. of America (The)
3.70%, 01/22/2070(a) | | | 210 | | | | 128,440 | |
Hartford Financial Services Group, Inc. (The)
Series ICON
5.03% (LIBOR 3 Month + 2.12%),
02/12/2047(a)(c) | | | 535 | | | | 440,647 | |
Massachusetts Mutual Life Insurance Co.
5.077%, 02/15/2069(a) | | | 170 | | | | 138,191 | |
MassMutual Global Funding II
0.60%, 04/12/2024(a) | | | 420 | | | | 392,591 | |
0.85%, 06/09/2023(a) | | | 270 | | | | 263,469 | |
Met Tower Global Funding
0.70%, 04/05/2024(a) | | | 705 | | | | 660,345 | |
MetLife Capital Trust IV
7.875%, 12/15/2037(a) | | | 150 | | | | 156,174 | |
MetLife, Inc.
Series D
5.875%, 03/15/2028(b) | | | 170 | | | | 153,697 | |
Nationwide Mutual Insurance Co.
9.375%, 08/15/2039(a) | | | 120 | | | | 148,728 | |
New York Life Insurance Co.
4.45%, 05/15/2069(a) | | | 180 | | | | 135,713 | |
Nippon Life Insurance Co.
2.75%, 01/21/2051(a) | | | 490 | | | | 364,702 | |
Peachtree Corners Funding Trust
3.976%, 02/15/2025(a) | | | 110 | | | | 105,509 | |
Prudential Financial, Inc.
5.20%, 03/15/2044 | | | 547 | | | | 510,433 | |
5.375%, 05/15/2045 | | | 260 | | | | 243,532 | |
5.625%, 06/15/2043 | | | 689 | | | | 680,801 | |
Reinsurance Group of America, Inc.
3.15%, 06/15/2030 | | | 383 | | | | 315,182 | |
| | |
| |
| abfunds.com | | AB CORPORATE INCOME SHARES | 23 |
PORTFOLIO OF INVESTMENTS (continued)
| | | | | | | | |
| | | Principal
Amount
(000) | | | U.S. $ Value | |
| |
Swiss Re Finance Luxembourg SA
5.00%, 04/02/2049(a) | | $ | 400 | | | $ | 348,604 | |
UnitedHealth Group, Inc.
4.95%, 05/15/2062 | | | 345 | | | | 304,156 | |
6.05%, 02/15/2063 | | | 290 | | | | 298,381 | |
Voya Financial, Inc.
5.65%, 05/15/2053 | | | 690 | | | | 667,037 | |
| | | | | | | | |
| | | | | | | 8,171,297 | |
| | | | | | | | |
REITs – 4.2% | |
American Homes 4 Rent LP
4.25%, 02/15/2028 | | | 5 | | | | 4,562 | |
American Tower Corp.
5.00%, 02/15/2024 | | | 515 | | | | 512,363 | |
Essential Properties LP
2.95%, 07/15/2031 | | | 454 | | | | 322,508 | |
GLP Capital LP/GLP Financing II, Inc.
5.25%, 06/01/2025 | | | 313 | | | | 303,069 | |
5.375%, 04/15/2026 | | | 114 | | | | 108,792 | |
Kilroy Realty LP
3.45%, 12/15/2024 | | | 40 | | | | 37,799 | |
Kimco Realty Corp.
2.80%, 10/01/2026 | | | 95 | | | | 84,128 | |
Office Properties Income Trust
2.65%, 06/15/2026 | | | 246 | | | | 179,846 | |
3.45%, 10/15/2031 | | | 660 | | | | 403,940 | |
4.50%, 02/01/2025 | | | 350 | | | | 292,159 | |
Public Storage
3.494% (SOFR + 0.47%), 04/23/2024(c) | | | 335 | | | | 332,374 | |
Realty Income Corp.
2.85%, 12/15/2032 | | | 357 | | | | 279,292 | |
4.60%, 02/06/2024 | | | 1,016 | | | | 1,008,786 | |
Regency Centers LP
3.75%, 06/15/2024 | | | 33 | | | | 31,893 | |
SITE Centers Corp.
3.625%, 02/01/2025 | | | 804 | | | | 748,130 | |
4.25%, 02/01/2026 | | | 178 | | | | 166,051 | |
4.70%, 06/01/2027 | | | 295 | | | | 272,078 | |
Spirit Realty LP
3.20%, 02/15/2031 | | | 385 | | | | 294,806 | |
4.00%, 07/15/2029 | | | 132 | | | | 111,519 | |
Ventas Realty LP
4.125%, 01/15/2026 | | | 23 | | | | 21,813 | |
Vornado Realty LP
2.15%, 06/01/2026 | | | 425 | | | | 351,322 | |
3.40%, 06/01/2031 | | | 358 | | | | 264,354 | |
| | | | | | | | |
| | | | | | | 6,131,584 | |
| | | | | | | | |
| | | | | | | 47,315,329 | |
| | | | | | | | |
| | |
| |
24 | AB CORPORATE INCOME SHARES | | abfunds.com |
PORTFOLIO OF INVESTMENTS (continued)
| | | | | | | | |
| | | Principal
Amount
(000) | | | U.S. $ Value | |
| |
Utility – 7.7% | |
Electric – 6.8% | |
Abu Dhabi National Energy Co. PJSC
4.375%, 04/23/2025(a) | | $ | 215 | | | $ | 209,531 | |
AEP Texas, Inc.
4.70%, 05/15/2032 | | | 404 | | | | 367,971 | |
AES Panama Generation Holdings SRL
4.375%, 05/31/2030(a) | | | 200 | | | | 157,225 | |
Alfa Desarrollo SpA
4.55%, 09/27/2051(a) | | | 219 | | | | 140,287 | |
American Transmission Systems
2.65%, 01/15/2032(a) | | | 455 | | | | 355,378 | |
Berkshire Hathaway Energy Co.
6.125%, 04/01/2036 | | | 210 | | | | 213,202 | |
CenterPoint Energy, Inc.
3.278% (SOFR + 0.65%), 05/13/2024(c) | | | 310 | | | | 303,865 | |
Commonwealth Edison Co.
Series 133
3.85%, 03/15/2052 | | | 185 | | | | 137,697 | |
Consolidated Edison Co. of New York, Inc.
3.60%, 06/15/2061 | | | 220 | | | | 145,917 | |
4.50%, 05/15/2058 | | | 290 | | | | 220,638 | |
Series A
4.125%, 05/15/2049 | | | 280 | | | | 210,048 | |
Duke Energy Carolinas LLC
3.45%, 04/15/2051 | | | 400 | | | | 272,984 | |
Duke Energy Corp.
4.20%, 06/15/2049 | | | 218 | | | | 159,011 | |
Duke Energy Progress LLC
4.00%, 04/01/2052 | | | 134 | | | | 101,559 | |
Empresas Publicas de Medellin ESP
4.25%, 07/18/2029(a) | | | 200 | | | | 142,662 | |
Enel Americas SA
4.00%, 10/25/2026 | | | 53 | | | | 48,820 | |
Enel Chile SA
4.875%, 06/12/2028 | | | 62 | | | | 55,989 | |
Enel Finance International NV
7.50%, 10/14/2032(a) | | | 500 | | | | 502,165 | |
Engie Energia Chile SA
3.40%, 01/28/2030(a) | | | 425 | | | | 310,250 | |
Fells Point Funding Trust
3.046%, 01/31/2027(a) | | | 261 | | | | 232,110 | |
Florida Power & Light Co.
2.866% (SOFR + 0.25%), 05/10/2023(c) | | | 140 | | | | 139,565 | |
3.95%, 03/01/2048 | | | 632 | | | | 490,641 | |
| | |
| |
| abfunds.com | | AB CORPORATE INCOME SHARES | 25 |
PORTFOLIO OF INVESTMENTS (continued)
| | | | | | | | |
| | | Principal
Amount
(000) | | | U.S. $ Value | |
| |
Georgia Power Co.
4.30%, 03/15/2042 | | $ | 340 | | | $ | 274,526 | |
4.70%, 05/15/2032 | | | 165 | | | | 154,971 | |
Kentucky Utilities Co.
3.30%, 06/01/2050 | | | 52 | | | | 34,260 | |
National Rural Utilities Cooperative Finance Corp.
0.35%, 02/08/2024 | | | 590 | | | | 555,886 | |
3.40%, 11/15/2023 | | | 265 | | | | 260,339 | |
3.45%, 06/15/2025 | | | 365 | | | | 349,823 | |
NextEra Energy Capital Holdings, Inc.
3.254% (LIBOR 3 Month + 0.27%),
02/22/2023(c) | | | 495 | | | | 493,896 | |
5.00%, 07/15/2032 | | | 255 | | | | 242,505 | |
5.65%, 05/01/2079 | | | 404 | | | | 343,275 | |
Niagara Mohawk Power Corp.
5.783%, 09/16/2052(a) | | | 320 | | | | 290,067 | |
Public Service Electric and Gas Co.
3.80%, 03/01/2046 | | | 385 | | | | 287,218 | |
Public Service Enterprise Group, Inc.
8.625%, 04/15/2031 | | | 248 | | | | 281,703 | |
San Diego Gas & Electric Co.
Series WWW
2.95%, 08/15/2051 | | | 215 | | | | 135,375 | |
Southern California Edison Co.
0.70%, 04/03/2023 | | | 400 | | | | 392,684 | |
Southern Co. (The)
2.95%, 07/01/2023 | | | 412 | | | | 405,227 | |
Southern Power Co.
Series F
4.95%, 12/15/2046 | | | 77 | | | | 61,972 | |
Virginia Electric & Power Co.
8.875%, 11/15/2038 | | | 233 | | | | 290,845 | |
Wisconsin Electric Power Co.
4.75%, 09/30/2032 | | | 320 | | | | 304,858 | |
| | | | | | | | |
| | | | | | | 10,076,945 | |
| | | | | | | | |
Natural Gas – 0.9% | |
Atmos Energy Corp.
3.375%, 09/15/2049 | | | 325 | | | | 219,339 | |
5.45%, 10/15/2032 | | | 113 | | | | 113,590 | |
GNL Quintero SA
4.634%, 07/31/2029(a) | | | 165 | | | | 151,954 | |
NiSource, Inc.
5.65%, 02/01/2045 | | | 60 | | | | 54,434 | |
ONE Gas, Inc.
0.85%, 03/11/2023 | | | 296 | | | | 291,788 | |
4.25%, 09/01/2032 | | | 81 | | | | 73,929 | |
| | |
| |
26 | AB CORPORATE INCOME SHARES | | abfunds.com |
PORTFOLIO OF INVESTMENTS (continued)
| | | | | | | | |
| | | Principal
Amount
(000) | | | U.S. $ Value | |
| |
Piedmont Natural Gas Co., Inc.
5.05%, 05/15/2052 | | $ | 435 | | | $ | 367,240 | |
| | | | | | | | |
| | | | | | | 1,272,274 | |
| | | | | | | | |
| | | | | | | 11,349,219 | |
| | | | | | | | |
Total Corporates - Investment Grade
(cost $165,527,671) | | | | | | | 140,830,651 | |
| | | | | | | | |
|
QUASI-SOVEREIGNS – 1.0% | |
Quasi-Sovereign Bonds – 1.0% | |
Chile – 0.4% | |
Empresa de Transporte de Pasajeros Metro SA
3.65%, 05/07/2030(a) | | | 350 | | | | 301,722 | |
4.70%, 05/07/2050(a) | | | 295 | | | | 218,448 | |
| | | | | | | | |
| | | | | | | 520,170 | |
| | | | | | | | |
Mexico – 0.4% | |
Comision Federal de Electricidad
3.348%, 02/09/2031(a) | | | 321 | | | | 236,096 | |
Petroleos Mexicanos
6.50%, 01/23/2029 | | | 135 | | | | 108,810 | |
6.75%, 09/21/2047 | | | 112 | | | | 67,368 | |
6.95%, 01/28/2060 | | | 169 | | | | 100,766 | |
7.69%, 01/23/2050 | | | 80 | | | | 51,575 | |
| | | | | | | | |
| | | | | | | 564,615 | |
| | | | | | | | |
Peru – 0.1% | |
Corp. Financiera de Desarrollo SA
2.40%, 09/28/2027(a) | | | 250 | | | | 200,750 | |
| | | | | | | | |
|
Qatar – 0.1% | |
Qatar Energy
3.125%, 07/12/2041(a) | | | 277 | | | | 195,077 | |
| | | | | | | | |
| | |
Total Quasi-Sovereigns
(cost $2,008,771) | | | | | | | 1,480,612 | |
| | | | | | | | |
|
CORPORATES - NON-INVESTMENT GRADE – 0.7% | |
Industrial – 0.5% | |
Consumer Cyclical - Automotive – 0.2% | |
Ford Motor Credit Co. LLC
3.81%, 01/09/2024 | | | 395 | | | | 381,941 | |
| | | | | | | | |
|
Consumer Non-Cyclical – 0.3% | |
Perrigo Finance Unlimited Co.
4.375%, 03/15/2026 | | | 420 | | | | 393,670 | |
| | | | | | | | |
| | | | | | | 775,611 | |
| | | | | | | | |
| | |
| |
| abfunds.com | | AB CORPORATE INCOME SHARES | 27 |
PORTFOLIO OF INVESTMENTS (continued)
| | | | | | | | |
| | | Principal
Amount
(000) | | | U.S. $ Value | |
| |
Financial Institutions – 0.2% | |
REITs – 0.2% | |
Diversified Healthcare Trust
4.75%, 02/15/2028 | | $ | 407 | | | $ | 277,505 | |
| | | | | | | | |
| | |
Total Corporates - Non-Investment Grade
(cost $1,172,710) | | | | | | | 1,053,116 | |
| | | | | | | | |
| | |
GOVERNMENTS - SOVEREIGN
BONDS – 0.7% | | | | | | | | |
Colombia – 0.4% | |
Colombia Government International Bond
3.125%, 04/15/2031 | | | 562 | | | | 385,427 | |
5.20%, 05/15/2049 | | | 200 | | | | 121,475 | |
| | | | | | | | |
| | | | | | | 506,902 | |
| | | | | | | | |
Mexico – 0.2% | |
Mexico Government International Bond
4.60%, 01/23/2046 | | | 200 | | | | 145,975 | |
4.75%, 03/08/2044 | | | 120 | | | | 91,072 | |
| | | | | | | | |
| | | | | | | 237,047 | |
| | | | | | | | |
Peru – 0.0% | |
Peruvian Government International Bond
2.392%, 01/23/2026 | | | 53 | | | | 47,677 | |
| | | | | | | | |
|
Qatar – 0.1% | |
Qatar Government International Bond
4.817%, 03/14/2049(a) | | | 228 | | | | 202,968 | |
| | | | | | | | |
|
Uruguay – 0.0% | |
Uruguay Government International Bond
4.375%, 01/23/2031 | | | 54 | | | | 51,295 | |
| | | | | | | | |
| | |
Total Governments - Sovereign Bonds
(cost $1,404,574) | | | | | | | 1,045,889 | |
| | | | | | | | |
| | |
Total Investments – 98.0%
(cost $170,113,726) | | | | | | | 144,410,268 | |
Other assets less liabilities – 2.0% | | | | | | | 2,926,257 | |
| | | | | | | | |
| | |
Net Assets – 100.0% | | | | | | $ | 147,336,525 | |
| | | | | | | | |
| | |
| |
28 | AB CORPORATE INCOME SHARES | | abfunds.com |
PORTFOLIO OF INVESTMENTS (continued)
FUTURES (see Note C)
| | | | | | | | | | | | | | | | |
| Description | | Number of
Contracts | | | Expiration
Month | | | Current
Notional | | | Value and
Unrealized
Appreciation
(Depreciation) | |
Purchased Contracts | |
U.S. 10 Yr Ultra Futures | | | 15 | | | | December 2022 | | | $ | 1,739,766 | | | $ | (12,162 | ) |
U.S. T-Note 5 Yr (CBT) Futures | | | 153 | | | | December 2022 | | | | 16,308,844 | | | | (522,736 | ) |
U.S. Ultra Bond (CBT) Futures | | | 46 | | | | December 2022 | | | | 5,872,187 | | | | (930,967 | ) |
|
Sold Contracts | |
U.S. T-Note 2 Yr (CBT) Futures | | | 39 | | | | December 2022 | | | | 7,970,930 | | | | 167,225 | |
U.S. T-Note 10 Yr (CBT) Futures | | | 10 | | | | December 2022 | | | | 1,105,938 | | | | 70,205 | |
U.S. Ultra Bond (CBT) Futures | | | 1 | | | | December 2022 | | | | 127,656 | | | | 21,967 | |
| | | | | | | | | | | | | | | | |
| | | $ | (1,206,468 | ) |
| | | | | | | | | | | | | | | | |
CENTRALLY CLEARED CREDIT DEFAULT SWAPS (see Note C)
| | | | | | | | | | | | | | | | | | | | | | | | | | | | | | | | |
Description | | Fixed
Rate
(Pay)
Receive | | | Payment
Frequency | | | Implied
Credit
Spread at
October 31,
2022 | | | Notional
Amount
(000) | | | Market
Value | | | Upfront
Premiums Paid/ (Received) | | | Unrealized
Appreciation
(Depreciation) | |
Sale Contracts | | | | | | | | | | | | | | | | | | | | | | | | | | | | | | | | |
CDX-NAIG
Series 39,
5 Year Index, 12/20/2027* | | | 1.00 | % | | | Quarterly | | | | 0.90 | % | | | USD | | | | 3,280 | | | $ | 18,281 | | | $ | 3,280 | | | $ | 15,001 | |
CENTRALLY CLEARED INTEREST RATE SWAPS (see Note C)
| | | | | | | | | | | | | | | | | | | | | | | | | | | | | | |
| | | | | | | | | Rate Type | | | | | | | | | | | | |
Notional Amount (000) | | | Termination
Date | | | Payments
made
by the
Fund | | | Payments
received
by the
Fund | | | Payment
Frequency
Paid/
Received | | Market
Value | | | Upfront
Premiums
Paid/
(Received) | | | Unrealized
Appreciation
(Depreciation) | |
| USD | | | 60 | | | | 11/04/2044 | | |
| 3 Month
LIBOR |
| | | 3.049% | | | Quarterly/ Semi-Annual | | $ | (7,809 | ) | | $ | – 0 | – | | $ | (7,809 | ) |
| USD | | | 60 | | | | 05/05/2045 | | |
| 3 Month
LIBOR |
| | | 2.562% | | | Quarterly/Semi-Annual | | | (12,334 | ) | | | – 0 | – | | | (12,334 | ) |
| USD | | | 60 | | | | 06/02/2046 | | |
| 3 Month
LIBOR |
| | | 2.186% | | | Quarterly/Semi-Annual | | | (16,010 | ) | | | – 0 | – | | | (16,010 | ) |
| USD | | | 690 | | | | 07/15/2046 | | |
| 3 Month
LIBOR |
| | | 1.783% | | | Quarterly/Semi-Annual | | | (227,929 | ) | | | – 0 | – | | | (227,929 | ) |
| USD | | | 270 | | | | 09/02/2046 | | |
| 3 Month
LIBOR |
| | | 1.736% | | | Quarterly/Semi-Annual | | | (92,857 | ) | | | – 0 | – | | | (92,857 | ) |
| USD | | | 50 | | | | 11/02/2046 | | |
| 3 Month
LIBOR |
| | | 2.086% | | | Quarterly/Semi-Annual | | | (14,242 | ) | | | – 0 | – | | | (14,242 | ) |
| | | | | | | | | | | | | | | | | | | | | | | | | | | | | | |
| | | | | | | | | | | | | | | | | | | | $ | (371,181 | ) | | $ | – 0 | – | | $ | (371,181 | ) |
| | | | | | | | | | | | | | | | | | | | | | | | | | | | | | |
| (a) | Security is exempt from registration under Rule 144A or Regulation S of the Securities Act of 1933. These securities are considered restricted, but liquid and may be resold in transactions exempt from registration. At October 31, 2022, the aggregate market value of these securities amounted to $25,715,263 or 17.5% of net assets. |
| | |
| |
| abfunds.com | | AB CORPORATE INCOME SHARES | 29 |
PORTFOLIO OF INVESTMENTS (continued)
| (b) | Securities are perpetual and, thus, do not have a predetermined maturity date. The date shown, if applicable, reflects the next call date. |
| (c) | Floating Rate Security. Stated interest/floor/ceiling rate was in effect at October 31, 2022. |
Glossary:
CBT – Chicago Board of Trade
CDX-NAIG – North American Investment Grade Credit Default Swap Index
LIBOR – London Interbank Offered Rate
PJSC – Public Joint Stock Company
REIT – Real Estate Investment Trust
SOFR – Secured Overnight Financing Rate
See notes to financial statements.
| | |
| |
30 | AB CORPORATE INCOME SHARES | | abfunds.com |
STATEMENT OF ASSETS & LIABILITIES
October 31, 2022 (unaudited)
| | | | |
| Assets | |
Investments in securities, at value (cost $170,113,726) | | $ | 144,410,268 | |
Cash | | | 3,752,598 | |
Cash collateral due from broker | | | 731,796 | |
Receivable for investment securities sold | | | 1,717,717 | |
Interest and dividends receivable | | | 1,537,595 | |
Receivable for shares of beneficial interest sold | | | 132,493 | |
Other assets | | | 4,623 | |
| | | | |
Total assets | | | 152,287,090 | |
| | | | |
| Liabilities | |
Payable for investment securities purchased | | | 4,226,492 | |
Dividends payable | | | 497,579 | |
Payable for variation margin on futures | | | 151,413 | |
Payable for shares of beneficial interest redeemed | | | 51,332 | |
Payable for variation margin on centrally cleared swaps | | | 18,132 | |
Foreign capital gains tax payable | | | 5,617 | |
| | | | |
Total liabilities | | | 4,950,565 | |
| | | | |
Net Assets | | $ | 147,336,525 | |
| | | | |
| Composition of Net Assets | |
Shares of beneficial interest, at par | | $ | 160 | |
Additional paid-in capital | | | 196,755,061 | |
Accumulated loss | | | (49,418,696 | ) |
| | | | |
Net Assets | | $ | 147,336,525 | |
| | | | |
Net Asset Value Per Share—unlimited shares of beneficial interest authorized, $.00001 par value (based on 16,046,535 common shares outstanding) | | $ | 9.18 | |
| | | | |
See notes to financial statements.
| | |
| |
| abfunds.com | | AB CORPORATE INCOME SHARES | 31 |
STATEMENT OF OPERATIONS
Six Months Ended October 31, 2022 (unaudited)
| | | | | | | | |
| Investment Income | |
Interest | | $ | 3,059,030 | | | | | |
Other income | | | 400 | | | | | |
| | | | | | | | |
Total investment income | | | | | | $ | 3,059,430 | |
| | | | | | | | |
| Realized and Unrealized Gain (Loss) on Investment Transactions | | | | | | | | |
Net realized loss on: | | | | | | | | |
Investment transactions | | | | | | | (15,288,200 | ) |
Futures | | | | | | | (2,410,038 | ) |
Swaps | | | | | | | (11,907 | ) |
Net change in unrealized appreciation (depreciation) of: | | | | | | | | |
Investments(a) | | | | | | | 94,900 | |
Futures | | | | | | | 400,203 | |
Swaps | | | | | | | (143,411 | ) |
| | | | | | | | |
Net loss on investment transactions | | | | | | | (17,358,453 | ) |
| | | | | | | | |
Net Decrease in Net Assets from Operations | | | | | | $ | (14,299,023 | ) |
| | | | | | | | |
| (a) | Net of decrease in accrued foreign capital gains taxes on unrealized gains of $71. |
See notes to financial statements.
| | |
| |
32 | AB CORPORATE INCOME SHARES | | abfunds.com |
STATEMENT OF CHANGES IN NET ASSETS
| | | | | | | | |
| | | Six Months Ended
October 31, 2022
(unaudited) | | | Year Ended
April 30,
2022 | |
| Increase (Decrease) in Net Assets from Operations | | | | | | | | |
Net investment income | | $ | 3,059,430 | | | $ | 6,619,146 | |
Net realized loss on investment transactions | | | (17,710,145 | ) | | | (2,059,176 | ) |
Net change in unrealized appreciation (depreciation) of investments | | | 351,692 | | | | (31,460,792 | ) |
| | | | | | | | |
Net decrease in net assets from operations | | | (14,299,023 | ) | | | (26,900,822 | ) |
Distribution to Shareholders | | | (3,144,434 | ) | | | (9,462,001 | ) |
| Transactions in Shares of Beneficial Interest | | | | | | | | |
Net increase (decrease) | | | (57,769,790 | ) | | | 50,167,122 | |
| | | | | | | | |
Total increase (decrease) | | | (75,213,247 | ) | | | 13,804,299 | |
| Net Assets | |
Beginning of period | | | 222,549,772 | | | | 208,745,473 | |
| | | | | | | | |
End of period | | $ | 147,336,525 | | | $ | 222,549,772 | |
| | | | | | | | |
See notes to financial statements.
| | |
| |
| abfunds.com | | AB CORPORATE INCOME SHARES | 33 |
NOTES TO FINANCIAL STATEMENTS
October 31, 2022 (unaudited)
NOTE A
Significant Accounting Policies
AB Corporate Shares (the “Trust”) is registered under the Investment Company Act of 1940, as an open-end, diversified management investment company. The Trust, which is a Massachusetts Business Trust, operates as a “series” company currently offering five separate portfolios: AB Corporate Income Shares, AB Municipal Income Shares, AB Taxable Multi-Sector Income Shares, AB Impact Municipal Income Shares and AB Tax-Aware Real Return Income Shares. Each portfolio is considered to be a separate entity for financial reporting and tax purposes. This report relates only to AB Corporate Income Shares (the “Fund”).
Shares of the Fund are offered exclusively to holders of accounts established under wrap-fee programs sponsored and maintained by certain registered investment advisers approved by AllianceBernstein L.P. (the “Adviser”). The Fund’s shares may be purchased at the relevant net asset value without a sales charge or other fee. The financial statements have been prepared in conformity with U.S. generally accepted accounting principles (“U.S. GAAP”), which require management to make certain estimates and assumptions that affect the reported amounts of assets and liabilities in the financial statements and amounts of income and expenses during the reporting period. Actual results could differ from those estimates. The Fund is an investment company under U.S. GAAP and follows the accounting and reporting guidance applicable to investment companies. The following is a summary of significant accounting policies followed by the Fund.
1. Security Valuation
Portfolio securities are valued at market value determined on the basis of market quotations or, if market quotations are not readily available or are unreliable, at “fair value” as determined in accordance with procedures approved by and under the oversight of the Trust’s Board of Trustees (the “Board”). Pursuant to these procedures, the Adviser serves as the Fund’s valuation designee pursuant to Rule 2a-5 of the 1940 Act. In this capacity, the Adviser is responsible, among other things, for making all fair value determinations relating to the Fund’s portfolio investments, subject to the Board’s oversight.
In general, the market values of securities which are readily available and deemed reliable are determined as follows: securities listed on a national securities exchange (other than securities listed on the NASDAQ Stock Market, Inc. (“NASDAQ”)) or on a foreign securities exchange are valued at the last sale price at the close of the exchange or foreign securities exchange. If there has been no sale on such day, the securities are valued
| | |
| |
34 | AB CORPORATE INCOME SHARES | | abfunds.com |
NOTES TO FINANCIAL STATEMENTS (continued)
at the last traded price from the previous day. Securities listed on more than one exchange are valued by reference to the principal exchange on which the securities are traded; securities listed only on NASDAQ are valued in accordance with the NASDAQ Official Closing Price; listed or over the counter (“OTC”) market put or call options are valued at the mid level between the current bid and ask prices. If either a current bid or current ask price is unavailable, the Adviser will have discretion to determine the best valuation (e.g., last trade price in the case of listed options); open futures are valued using the closing settlement price or, in the absence of such a price, the most recent quoted bid price. If there are no quotations available for the day of valuation, the last available closing settlement price is used; U.S. Government securities and any other debt instruments having 60 days or less remaining until maturity are generally valued at market by an independent pricing vendor, if a market price is available. If a market price is not available, the securities are valued at amortized cost. This methodology is commonly used for short term securities that have an original maturity of 60 days or less, as well as short term securities that had an original term to maturity that exceeded 60 days. In instances when amortized cost is utilized, the Valuation Committee (the “Committee”) must reasonably conclude that the utilization of amortized cost is approximately the same as the fair value of the security. Factors the Committee will consider include, but are not limited to, an impairment of the creditworthiness of the issuer or material changes in interest rates. Fixed-income securities, including mortgage-backed and asset-backed securities, may be valued on the basis of prices provided by a pricing service or at a price obtained from one or more of the major broker-dealers. In cases where broker-dealer quotes are obtained, the Adviser may establish procedures whereby changes in market yields or spreads are used to adjust, on a daily basis, a recently obtained quoted price on a security. Swaps and other derivatives are valued daily, primarily using independent pricing services, independent pricing models using market inputs, as well as third party broker-dealers or counterparties. Open-end mutual funds are valued at the closing net asset value per share, while exchange traded funds are valued at the closing market price per share.
Securities for which market quotations are not readily available (including restricted securities) or are deemed unreliable are valued at fair value as deemed appropriate by the Adviser. Factors considered in making this determination may include, but are not limited to, information obtained by contacting the issuer, analysts, analysis of the issuer’s financial statements or other available documents. In addition, the Fund may use fair value pricing for securities primarily traded in non-U.S. markets because most foreign markets close well before the Fund values its securities at 4:00 p.m., Eastern Time. The earlier close of these foreign markets gives rise to the
| | |
| |
| abfunds.com | | AB CORPORATE INCOME SHARES | 35 |
NOTES TO FINANCIAL STATEMENTS (continued)
possibility that significant events, including broad market moves, may have occurred in the interim and may materially affect the value of those securities. To account for this, the Fund generally values many of its foreign equity securities using fair value prices based on third party vendor modeling tools to the extent available.
2. Fair Value Measurements
In accordance with U.S. GAAP regarding fair value measurements, fair value is defined as the price that the Fund would receive to sell an asset or pay to transfer a liability in an orderly transaction between market participants at the measurement date. U.S. GAAP establishes a framework for measuring fair value, and a three-level hierarchy for fair value measurements based upon the transparency of inputs to the valuation of an asset or liability (including those valued based on their market values as described in Note A.1 above). Inputs may be observable or unobservable and refer broadly to the assumptions that market participants would use in pricing the asset or liability. Observable inputs reflect the assumptions market participants would use in pricing the asset or liability based on market data obtained from sources independent of the Fund. Unobservable inputs reflect the Fund’s own assumptions about the assumptions that market participants would use in pricing the asset or liability based on the best information available in the circumstances. Each investment is assigned a level based upon the observability of the inputs which are significant to the overall valuation. The three-tier hierarchy of inputs is summarized below.
| | • | | Level 1—quoted prices in active markets for identical investments |
| | • | | Level 2—other significant observable inputs (including quoted prices for similar investments, interest rates, prepayment speeds, credit risk, etc.) |
| | • | | Level 3—significant unobservable inputs (including the Fund’s own assumptions in determining the fair value of investments) |
The fair value of debt instruments, such as bonds, and over-the-counter derivatives is generally based on market price quotations, recently executed market transactions (where observable) or industry recognized modeling techniques and are generally classified as Level 2. Pricing vendor inputs to Level 2 valuations may include quoted prices for similar investments in active markets, interest rate curves, coupon rates, currency rates, yield curves, option adjusted spreads, default rates, credit spreads and other unique security features in order to estimate the relevant cash flows which are then discounted to calculate fair values. If these inputs are unobservable and significant to the fair value, these investments will be classified as Level 3.
| | |
| |
36 | AB CORPORATE INCOME SHARES | | abfunds.com |
NOTES TO FINANCIAL STATEMENTS (continued)
Other fixed income investments, including non-U.S. government and corporate debt, are generally valued using quoted market prices, if available, which are typically impacted by current interest rates, maturity dates and any perceived credit risk of the issuer. Additionally, in the absence of quoted market prices, these inputs are used by pricing vendors to derive a valuation based upon industry or proprietary models which incorporate issuer specific data with relevant yield/spread comparisons with more widely quoted bonds with similar key characteristics. Those investments for which there are observable inputs are classified as Level 2. Where the inputs are not observable, the investments are classified as Level 3.
The following table summarizes the valuation of the Fund’s investments by the above fair value hierarchy levels as of October 31, 2022:
| | | | | | | | | | | | | | | | |
Investments in
Securities: | | Level 1 | | | Level 2 | | | Level 3 | | | Total | |
Assets: | | | | | | | | | | | | | | | | |
Corporates – Investment Grade | | $ | – 0 | – | | $ | 140,830,651 | | | $ | – 0 | – | | $ | 140,830,651 | |
Quasi-Sovereigns | | | – 0 | – | | | 1,480,612 | | | | – 0 | – | | | 1,480,612 | |
Corporates – Non-Investment Grade | | | – 0 | – | | | 1,053,116 | | | | – 0 | – | | | 1,053,116 | |
Governments – Sovereign Bonds | | | – 0 | – | | | 1,045,889 | | | | – 0 | – | | | 1,045,889 | |
| | | | | | | | | | | | | | | | |
Total Investments in Securities | | | – 0 | – | | | 144,410,268 | | | | – 0 | – | | | 144,410,268 | |
Other Financial Instruments(a): | | | | | | | | | | | | | | | | |
Assets: | | | | | | | | | | | | | | | | |
Futures | | | 259,397 | | | | – 0 | – | | | – 0 | – | | | 259,397 | (b) |
Centrally Cleared Credit Default Swaps | | | – 0 | – | | | 18,281 | | | | – 0 | – | | | 18,281 | (b) |
Liabilities: | | | | | | | | | | | | | | | | |
Futures | | | (1,465,865 | ) | | | – 0 | – | | | – 0 | – | | | (1,465,865 | )(b) |
Centrally Cleared Interest Rate Swaps | | | – 0 | – | | | (371,181 | ) | | | – 0 | – | | | (371,181 | )(b) |
| | | | | | | | | | | | | | | | |
Total | | $ | (1,206,468 | ) | | $ | 144,057,368 | | | $ | – 0 | – | | $ | 142,850,900 | |
| | | | | | | | | | | | | | | | |
| (a) | Other financial instruments are derivative instruments, such as futures, forwards and swaps, which are valued at the unrealized appreciation (depreciation) on the instrument. Other financial instruments may also include swaps with upfront premiums, written options and written swaptions which are valued at market value. |
| (b) | Only variation margin receivable/(payable) at period end is reported within the statement of assets and liabilities. This amount reflects cumulative unrealized appreciation (depreciation) on futures and centrally cleared swaps as reported in the portfolio of investments. Where applicable, centrally cleared swaps with upfront premiums are presented here at market value. |
3. Taxes
It is the Fund’s policy to meet the requirements of the Internal Revenue Code applicable to regulated investment companies and to distribute all of its investment company taxable income and net realized gains, if any, to shareholders. Therefore, no provisions for federal income or excise taxes are required.
| | |
| |
| abfunds.com | | AB CORPORATE INCOME SHARES | 37 |
NOTES TO FINANCIAL STATEMENTS (continued)
In accordance with U.S. GAAP requirements regarding accounting for uncertainties in income taxes, management has analyzed the Fund’s tax positions taken or expected to be taken on federal and state income tax returns for all open tax years (the current and the prior three tax years) and has concluded that no provision for income tax is required in the Fund’s financial statements.
4. Investment Income and Investment Transactions
Dividend income is recorded on the ex-dividend date or as soon as the Fund is informed of the dividend. Interest income is accrued daily. Investment transactions are accounted for on the date the securities are purchased or sold. Investment gains or losses are determined on the identified cost basis. Non-cash dividends, if any, are recorded on the ex-dividend date at the fair value of the securities received. The Fund amortizes premiums and accretes discounts as adjustments to interest income. The Fund accounts for distributions received from REIT investments or from regulated investment companies as dividend income, realized gain, or return of capital based on information provided by the REIT or the investment company.
5. Dividends and Distributions
Dividends and distributions to shareholders, if any, are recorded on the ex-dividend date. Income dividends and capital gains distributions are determined in accordance with federal tax regulations and may differ from those determined in accordance with U.S. GAAP. To the extent these differences are permanent, such amounts are reclassified within the capital accounts based on their federal tax basis treatment; temporary differences do not require such reclassification.
NOTE B
Advisory Fee and Other Transactions with Affiliates
Under the terms of the Advisory Agreement, the Fund pays no advisory fee to the Adviser and the Adviser reimburses or pays for the Fund’s operating expenses. The Fund is an integral part of separately managed accounts in wrap-fee programs and other investment programs. Typically, participants in these programs pay a fee to their investment adviser for all costs and expenses of the separately managed account, including costs and expenses associated with the Fund, and a fee is paid by their investment adviser to the Adviser. In certain cases, participants may have a direct relationship with the Adviser without the involvement of a third party investment adviser, in which case the participant would pay a fee directly to the Adviser. The Adviser serves as investment manager and adviser of the Fund and continuously furnishes an investment program for the Fund and manages, supervises and conducts the affairs of the Fund, subject to the supervisions of the Fund’s Board. The Advisory Agreement provides
| | |
| |
38 | AB CORPORATE INCOME SHARES | | abfunds.com |
NOTES TO FINANCIAL STATEMENTS (continued)
that the Adviser or an affiliate will furnish, or pay the expenses of the Fund for, office space, facilities and equipment, services of executive and other personnel of the Fund and certain administrative services.
The Fund has entered into a distribution agreement with AllianceBernstein Investments, Inc., the Fund’s principal underwriter (the “Underwriter”), to permit the Underwriter to distribute the Fund’s shares, which are sold at their net asset value without any sales charge. The Fund does not pay a fee for this service. The Underwriter is a wholly owned subsidiary of the Adviser.
AllianceBernstein Investor Services, Inc. (“ABIS”), a wholly-owned subsidiary of the Adviser, acts as the Fund’s registrar, transfer agent and dividend-disbursing agent. ABIS registers the transfer, issuance and redemption of Fund shares and disburses dividends and other distributions to Fund shareholders. The Fund does not pay a fee for this service.
NOTE C
Investment Transactions
Purchases and sales of investment securities (excluding short-term investments) for the six months ended October 31, 2022 were as follows:
| | | | | | | | |
| | | Purchases | | | Sales | |
Investment securities (excluding | | | | | | | | |
U.S. government securities) | | $ | 52,895,749 | | | $ | 113,386,931 | |
U.S. government securities | | | 2,193,139 | | | | 2,203,633 | |
The cost of investments for federal income tax purposes was substantially the same as the cost for financial reporting purposes. Accordingly, gross unrealized appreciation and unrealized depreciation are as follows:
| | | | |
Gross unrealized appreciation | | $ | 1,067,437 | |
Gross unrealized depreciation | | | (28,333,543 | ) |
| | | | |
Net unrealized depreciation | | $ | (27,266,106 | ) |
| | | | |
1. Derivative Financial Instruments
The Fund may use derivatives in an effort to earn income and enhance returns, to replace more traditional direct investments, to obtain exposure to otherwise inaccessible markets (collectively, “investment purposes”), or to hedge or adjust the risk profile of its portfolio.
The principal types of derivatives utilized by the Fund, as well as the methods in which they may be used are:
The Fund may buy or sell futures for investment purposes or for the purpose of hedging its portfolio against adverse effects of potential
| | |
| |
| abfunds.com | | AB CORPORATE INCOME SHARES | 39 |
NOTES TO FINANCIAL STATEMENTS (continued)
movements in the market. The Fund bears the market risk that arises from changes in the value of these instruments and the imperfect correlation between movements in the price of the futures and movements in the price of the assets, reference rates or indices which they are designed to track. Among other things, the Fund may purchase or sell futures for foreign currencies or options thereon for non-hedging purposes as a means of making direct investment in foreign currencies.
At the time the Fund enters into futures, the Fund deposits and maintains as collateral an initial margin with the broker, as required by the exchange on which the transaction is effected. Such amount is shown as cash collateral due from broker on the statement of assets and liabilities. Pursuant to the contract, the Fund agrees to receive from or pay to the broker an amount of cash equal to the daily fluctuation in the value of the contract. Such receipts or payments are known as variation margin and are recorded by the Fund as unrealized gains or losses. Risks may arise from the potential inability of a counterparty to meet the terms of the contract. The credit/counterparty risk for exchange-traded futures is generally less than privately negotiated futures, since the clearinghouse, which is the issuer or counterparty to each exchange-traded future, has robust risk mitigation standards, including the requirement to provide initial and variation margin. When the contract is closed, the Fund records a realized gain or loss equal to the difference between the value of the contract at the time it was opened and the time it was closed.
Use of long futures subjects the Fund to risk of loss in excess of the amounts shown on the statement of assets and liabilities, up to the notional value of the futures. Use of short futures subjects the Fund to unlimited risk of loss. Under some circumstances, futures exchanges may establish daily limits on the amount that the price of futures can vary from the previous day’s settlement price, which could effectively prevent liquidation of unfavorable positions.
During the six months ended October 31, 2022, the Fund held futures for hedging purposes.
The Fund may enter into swaps to hedge its exposure to interest rates or credit risk. A swap is an agreement that obligates two parties to exchange a series of cash flows at specified intervals based upon or calculated by reference to changes in specified prices or rates for a specified amount of an underlying asset. The payment flows are usually netted against each other, with the difference being paid by one party to the other. In addition, collateral may be pledged or
| | |
| |
40 | AB CORPORATE INCOME SHARES | | abfunds.com |
NOTES TO FINANCIAL STATEMENTS (continued)
received by the Fund in accordance with the terms of the respective swaps to provide value and recourse to the Fund or its counterparties in the event of default, bankruptcy or insolvency by one of the parties to the swap.
Risks may arise as a result of the failure of the counterparty to the swap to comply with the terms of the swap. The loss incurred by the failure of a counterparty is generally limited to the net interim payment to be received by the Fund, and/or the termination value at the end of the contract. Therefore, the Fund considers the creditworthiness of each counterparty to a swap in evaluating potential counterparty risk. This risk is mitigated by having a netting arrangement between the Fund and the counterparty and by the posting of collateral by the counterparty to the Fund to cover the Fund’s exposure to the counterparty. Additionally, risks may arise from unanticipated movements in interest rates or in the value of the underlying securities. The Fund accrues for the interim payments on swaps on a daily basis, with the net amount recorded within unrealized appreciation (depreciation) of swaps on the statement of assets and liabilities, where applicable. Once the interim payments are settled in cash, the net amount is recorded as realized gain/(loss) on swaps on the statement of operations, in addition to any realized gain/(loss) recorded upon the termination of swaps. Upfront premiums paid or received for swaps are recognized as cost or proceeds on the statement of assets and liabilities and are amortized on a straight line basis over the life of the contract. Amortized upfront premiums are included in net realized gain/(loss) from swaps on the statement of operations. Fluctuations in the value of swaps are recorded as a component of net change in unrealized appreciation (depreciation) of swaps on the statement of operations.
Certain standardized swaps, including certain interest rate swaps and credit default swaps, are (or soon will be) subject to mandatory central clearing. Cleared swaps are transacted through futures commission merchants (“FCMs”) that are members of central clearinghouses, with the clearinghouse serving as central counterparty, similar to transactions in futures contracts. Centralized clearing will be required for additional categories of swaps on a phased-in basis based on requirements published by the Securities and Exchange Commission and Commodity Futures Trading Commission.
At the time the Fund enters into a centrally cleared swap, the Fund deposits and maintains as collateral an initial margin with the broker, as required by the clearinghouse on which the transaction is effected. Such amount is shown as cash collateral due from broker on the statement of assets and liabilities. Pursuant to the contract, the Fund
| | |
| |
| abfunds.com | | AB CORPORATE INCOME SHARES | 41 |
NOTES TO FINANCIAL STATEMENTS (continued)
agrees to receive from or pay to the broker an amount of cash equal to the daily fluctuation in the value of the contract. Such receipts or payments are known as variation margin and are recorded by the Fund as unrealized gains or losses. Risks may arise from the potential inability of a counterparty to meet the terms of the contract. The credit/counterparty risk for centrally cleared swaps is generally less than non-centrally cleared swaps, since the clearinghouse, which is the issuer or counterparty to each centrally cleared swap, has robust risk mitigation standards, including the requirement to provide initial and variation margin. When the contract is closed, the Fund records a realized gain or loss equal to the difference between the value of the contract at the time it was opened and the time it was closed.
Interest Rate Swaps:
The Fund is subject to interest rate risk exposure in the normal course of pursuing its investment objectives. Because the Fund holds fixed rate bonds, the value of these bonds may decrease if interest rates rise. To help hedge against this risk and to maintain its ability to generate income at prevailing market rates, the Fund may enter into interest rate swaps. Interest rate swaps are agreements between two parties to exchange cash flows based on a notional amount. The Fund may elect to pay a fixed rate and receive a floating rate, or, receive a fixed rate and pay a floating rate on a notional amount.
In addition, the Fund may also enter into interest rate swap transactions to preserve a return or spread on a particular investment or portion of its portfolio, or protecting against an increase in the price of securities the Fund anticipates purchasing at a later date. Interest rate swaps involve the exchange by a Fund with another party of their respective commitments to pay or receive interest (e.g., an exchange of floating rate payments for fixed rate payments) computed based on a contractually-based principal (or “notional”) amount. Interest rate swaps are entered into on a net basis (i.e., the two payment streams are netted out, with the Fund receiving or paying, as the case may be, only the net amount of the two payments).
During the six months ended October 31, 2022, the Fund held interest rate swaps for hedging purposes.
Credit Default Swaps:
The Fund may enter into credit default swaps, including to manage its exposure to the market or certain sectors of the market, to reduce its risk exposure to defaults by corporate and sovereign issuers held by the Fund, or to create exposure to corporate or sovereign issuers to which it is not otherwise exposed. The Fund may purchase credit protection (“Buy Contract”) or provide credit protection (“Sale Contract”) on the
| | |
| |
42 | AB CORPORATE INCOME SHARES | | abfunds.com |
NOTES TO FINANCIAL STATEMENTS (continued)
referenced obligation of the credit default swap. During the term of the swap, the Fund receives/(pays) fixed payments from/(to) the respective counterparty, calculated at the agreed upon rate applied to the notional amount. If the Fund is a buyer/(seller) of protection and a credit event occurs, as defined under the terms of the swap, the Fund will either (i) receive from the seller/(pay to the buyer) of protection an amount equal to the notional amount of the swap (the “Maximum Payout Amount”) and deliver/(take delivery of) the referenced obligation or (ii) receive/(pay) a net settlement amount in the form of cash or securities equal to the notional amount of the swap less the recovery value of the referenced obligation. In certain circumstances Maximum Payout Amounts may be partially offset by recovery values of the respective referenced obligations, upfront premium received upon entering into the agreement, or net amounts received from settlement of buy protection credit default swaps entered into by the Fund for the same referenced obligations with the same counterparty.
Credit default swaps may involve greater risks than if a Fund had invested in the referenced obligation directly. Credit default swaps are subject to general market risk, liquidity risk, counterparty risk and credit risk. If the Fund is a buyer of protection and no credit event occurs, it will lose the payments it made to its counterparty. If the Fund is a seller of protection and a credit event occurs, the value of the referenced obligation received by the Fund coupled with the periodic payments previously received, may be less than the Maximum Payout Amount it pays to the buyer, resulting in a net loss to the Fund.
Implied credit spreads over U.S. Treasuries of comparable maturity utilized in determining the market value of credit default swaps on issuers as of period end are disclosed in the portfolio of investments. The implied spreads serve as an indicator of the current status of the payment/performance risk and typically reflect of the likelihood of default by the issuer of the referenced obligation. The implied credit spread of a particular reference obligation also reflects the cost of buying/selling protection and may reflect upfront payments required to be made to enter into the agreement. Widening credit spreads typically represent a deterioration of the referenced obligation’s credit soundness and greater likelihood of default or other credit event occurring as defined under the terms of the agreement. A credit spread identified as “Defaulted” indicates a credit event has occurred for the referenced obligation.
During the six months ended October 31, 2022, the Fund held credit default swaps for non-hedging purposes.
| | |
| |
| abfunds.com | | AB CORPORATE INCOME SHARES | 43 |
NOTES TO FINANCIAL STATEMENTS (continued)
The Fund typically enters into International Swaps and Derivatives Association, Inc. Master Agreements (“ISDA Master Agreement”) with its OTC derivative contract counterparties in order to, among other things, reduce its credit risk to OTC counterparties. ISDA Master Agreements include provisions for general obligations, representations, collateral and events of default or termination. Under an ISDA Master Agreement, the Fund typically may offset with the OTC counterparty certain derivative financial instruments’ payables and/or receivables with collateral held and/or posted and create one single net payment (close-out netting) in the event of default or termination. In the event of a default by an OTC counterparty, the return of collateral with market value in excess of the Fund’s net liability, held by the defaulting party, may be delayed or denied.
The Fund’s ISDA Master Agreements may contain provisions for early termination of OTC derivative transactions in the event the net assets of the Fund decline below specific levels (“net asset contingent features”). If these levels are triggered, the Fund’s OTC counterparty has the right to terminate such transaction and require the Fund to pay or receive a settlement amount in connection with the terminated transaction. If OTC derivatives were held at period end, please refer to netting arrangements by the OTC counterparty table below for additional details.
During the six months ended October 31, 2022, the Fund had entered into the following derivatives:
| | | | | | | | | | | | |
| | | Asset Derivatives | | | Liability Derivatives | |
Derivative Type | | Statement of
Assets and
Liabilities
Location | | Fair Value | | | Statement of
Assets and
Liabilities
Location | | Fair Value | |
Interest rate contracts | |
Receivable /Payable for variation margin on futures | |
$ |
259,397 |
* | |
Receivable/Payable for variation margin on futures | |
$ |
1,465,865 |
* |
| | | | |
Credit contracts | | Receivable/Payable for variation margin on centrally cleared swaps | | | 15,001 | * | | | | | | |
| | | | |
Interest rate contracts | | | | | | | |
Receivable/Payable for variation margin on centrally cleared swaps | |
|
371,181 |
* |
| | | | | | | | | | | | |
Total | | | | $ | 274,398 | | | | | $ | 1,837,046 | |
| | | | | | | | | | | | |
| * | Only variation margin receivable/payable at period end is reported within the statement of assets and liabilities. This amount reflects cumulative unrealized appreciation (depreciation) on futures and centrally cleared swaps as reported in the portfolio of investments. |
| | |
| |
44 | AB CORPORATE INCOME SHARES | | abfunds.com |
NOTES TO FINANCIAL STATEMENTS (continued)
| | | | | | | | | | |
Derivative Type | | Location of Gain or
(Loss) on Derivatives
Within Statement of
Operations | | Realized Gain
or (Loss) on
Derivatives | | | Change in
Unrealized
Appreciation or
(Depreciation) | |
Interest rate contracts | | Net realized gain (loss) on futures; Net change in unrealized appreciation (depreciation) of futures | | $ | (2,410,038 | ) | | $ | 400,203 | |
| | | |
Interest rate contracts | | Net realized gain (loss) on swaps; Net change in unrealized appreciation (depreciation) of swaps | | | 1,972 | | | | (175,158 | ) |
| | | |
Credit contracts | | Net realized gain (loss) on swaps; Net change in unrealized appreciation (depreciation) of swaps | | | (13,879 | ) | | | 31,747 | |
| | | | | | | | | | |
Total | | | | $ | (2,421,945 | ) | | $ | 256,792 | |
| | | | | | | | | | |
The following table represents the average monthly volume of the Fund’s derivative transactions during the six months ended October 31, 2022:
| | | | |
Futures: | | | | |
Average notional amount of buy contracts | | $ | 20,966,541 | |
Average notional amount of sale contracts | | $ | 10,359,549 | |
Centrally Cleared Interest Rate Swaps: | | | | |
Average notional amount | | $ | 1,190,000 | |
Centrally Cleared Credit Default Swaps: | | | | |
Average notional amount of sale contracts | | $ | 3,280,000 | |
NOTE D
Shares of Beneficial Interest
Transactions in shares of beneficial interest were as follows:
| | | | | | | | | | | | | | | | | | | | | | | | |
| | | | | | | | | | | | | | | | | | | | | | | | |
| | | Shares | | | | | | Amount | | | | |
| | | Six Months Ended
October 31, 2022
(unaudited) | | | Year Ended
April 30, 2022 | | | | | | Six Months Ended
October 31, 2022
(unaudited) | | | Year Ended
April 30, 2022 | | | | |
| | | | | |
Shares sold | | | 1,138,317 | | | | 9,419,121 | | | | | | | $ | 11,292,533 | | | $ | 111,031,586 | | | | | |
| | | | | |
Shares redeemed | | | (6,860,977 | ) | | | (5,307,601 | ) | | | | | | | (69,062,323 | ) | | | (60,864,464 | ) | | | | |
| | | | | |
Net increase (decrease) | | | (5,722,660 | ) | | | 4,111,520 | | | | | | | $ | (57,769,790 | ) | | $ | 50,167,122 | | | | | |
| | | | | |
NOTE E
Risks Involved in Investing in the Fund
Market Risk—The value of the Fund’s assets will fluctuate as the stock or bond market fluctuates. The value of the Fund’s investments may decline, sometimes rapidly and unpredictably, simply because of economic changes or other events, including public health crises (including the
| | |
| |
| abfunds.com | | AB CORPORATE INCOME SHARES | 45 |
NOTES TO FINANCIAL STATEMENTS (continued)
occurrence of a contagious disease or illness) and regional and global conflicts, that affect large portions of the market.
Credit Risk—An issuer or guarantor of a fixed-income security, or the counterparty to a derivatives or other contract, may be unable or unwilling to make timely payments of interest or principal, or to otherwise honor its obligations. The issuer or guarantor may default, causing a loss of the full principal amount of a security and any accrued interest. The degree of risk for a particular security may be reflected in its credit rating. There is the possibility that the credit rating of a fixed-income security may be downgraded after purchase, which may adversely affect the value of the security. Investments in fixed-income securities with lower ratings tend to have a higher probability that an issuer will default or fail to meet its payment obligations.
Interest-Rate Risk—Changes in interest rates will affect the value of investments in fixed-income securities. When interest rates rise, the value of existing investments in fixed-income securities tends to fall and this decrease in value may not be offset by higher income from new investments. Interest rate risk is generally greater for fixed-income securities with longer maturities or durations. The Fund may be subject to a greater risk of rising interest rates than would normally be the case due to the end of a recent period of historically low rates and the effect of potential government fiscal policy initiatives and resulting market reaction to those initiatives.
Inflation Risk—This is the risk that the value of assets or income from investments will be less in the future as inflation decreases the value of money. As inflation increases, the value of the Fund’s assets can decline as can the value of the Fund’s distributions. This risk is significantly greater for fixed-income securities with longer maturities.
Foreign (Non-U.S.) Risk—Investments in securities of non-U.S. issuers may involve more risk than those of U.S. issuers. These securities may fluctuate more widely in price and may be more difficult to trade due to adverse market, economic, political, regulatory or other factors.
Derivatives Risk—Derivatives may be difficult to price or unwind and leveraged so that small changes may produce disproportionate losses for the Fund. A short position in a derivative instrument involves the risk of a theoretically unlimited increase in the value of the underlying instrument, which could cause the Fund to suffer a (potentially unlimited) loss. Derivatives, especially over-the-counter derivatives, are also subject to counterparty risk, which is the risk that the counterparty (the party on the
| | |
| |
46 | AB CORPORATE INCOME SHARES | | abfunds.com |
NOTES TO FINANCIAL STATEMENTS (continued)
other side of the transaction) on a derivative transaction will be unable or unwilling to honor its contractual obligations to the Fund.
LIBOR Transition and Associated Risk—A Fund may be exposed to debt securities, derivatives or other financial instruments that utilize the London Interbank Offered Rate, or “LIBOR,” as a “benchmark” or “reference rate” for various interest rate calculations. In 2017, the United Kingdom Financial Conduct Authority (“FCA”), which regulates LIBOR, announced a desire to phase out the use of LIBOR by the end of 2021. The FCA and LIBOR’s administrator, ICE Benchmark Administration, have since announced that most LIBOR settings (which reflect LIBOR rates quoted in different currencies over various time periods) will no longer be published after the end of 2021 but that the most widely used U.S. Dollar LIBOR settings will continue to be published until June 30, 2023. However, banks were strongly encouraged to cease entering into agreements with counterparties referencing LIBOR by the end of 2021. It is possible that a subset of LIBOR settings will be published after these dates on a “synthetic” basis, but any such publications would be considered non-representative of the underlying market. Since 2018 the Federal Reserve Bank of New York has published the secured overnight funding rate (referred to as SOFR), which is intended to replace U.S. Dollar LIBOR. SOFR is a broad measure of the cost of borrowing cash overnight collateralized by U.S. Treasury securities in the repurchase agreement (repo) market and has been used increasingly on a voluntary basis in new instruments and transactions. In addition, on March 15, 2022, the Adjustable Interest Rate Act was signed into law. This law provides a statutory fallback mechanism to replace LIBOR with a benchmark rate that is selected by the Federal Reserve Board and based on SOFR for certain contracts that reference LIBOR without adequate fallback provisions.
The elimination of LIBOR or changes to other reference rates or any other changes or reforms to the determination or supervision of reference rates could have an adverse impact on the market for, or value of, any securities or payments linked to those reference rates, which may adversely affect a Fund’s performance and/or net asset value. Uncertainty and risk also remain regarding the willingness and ability of issuers and lenders to include revised provisions in new and existing contracts or instruments. Consequently, the transition from LIBOR to other reference rates may lead to increased volatility and illiquidity in markets that are tied to LIBOR, fluctuations in values of LIBOR-related investments or investments in issuers that utilize LIBOR, increased difficulty in borrowing or refinancing and diminished effectiveness of hedging strategies, potentially adversely affecting a Fund’s performance. Furthermore, the risks associated with the expected discontinuation of LIBOR and transition may be exacerbated if
| | |
| |
| abfunds.com | | AB CORPORATE INCOME SHARES | 47 |
NOTES TO FINANCIAL STATEMENTS (continued)
the work necessary to effect an orderly transition to an alternative reference rate is not completed in a timely manner. Neither the effect of the LIBOR transition process nor its ultimate success can yet be known.
Indemnification Risk—In the ordinary course of business, the Fund enters into contracts that contain a variety of indemnifications. The Fund’s maximum exposure under these arrangements is unknown. However, the Fund has not had prior claims or losses pursuant to these indemnification provisions and expects the risk of loss thereunder to be remote. Therefore, the Fund has not accrued any liability in connection with these indemnification provisions.
Management Risk—The Fund is subject to management risk because it is an actively-managed investment fund. The Adviser will apply its investment techniques and risk analyses in making investment decisions, but there is no guarantee that its techniques will produce the intended results. Some of these techniques may incorporate, or rely upon, quantitative models, but there is no guarantee that these models will generate accurate forecasts, reduce risk or otherwise perform as expected.
NOTE F
Joint Credit Facility
A number of open-end mutual funds managed by the Adviser, including the Fund, participate in a $325 million revolving credit facility (the “Facility”) intended to provide short-term financing related to redemptions and other short term liquidity requirements, subject to certain restrictions. Commitment fees related to the Facility are paid by the participating funds and are included in miscellaneous expenses in the statement of operations. The Fund did not utilize the Facility during the six months ended October 31, 2022.
NOTE G
Distributions to Shareholders
The tax character of distributions to be paid for the year ending April 30, 2023 will be determined at the end of the current fiscal year. The tax character of distributions paid during the fiscal years ended April 30, 2022 and April 30, 2021 were as follows:
| | | | | | | | |
| | | 2022 | | | 2021 | |
Distributions paid from: | | | | | | | | |
Ordinary income | | $ | 7,221,076 | | | $ | 7,513,033 | |
Net long-term capital gains | | | 2,240,925 | | | | 1,902,658 | |
| | | | | | | | |
Total distributions paid | | $ | 9,462,001 | | | $ | 9,415,691 | |
| | | | | | | | |
| | |
| |
48 | AB CORPORATE INCOME SHARES | | abfunds.com |
NOTES TO FINANCIAL STATEMENTS (continued)
As of April 30, 2022, the components of accumulated earnings/(deficit) on a tax basis were as follows:
| | | | |
Undistributed ordinary income | | $ | 754,454 | |
Accumulated capital and other losses | | | (5,831,169 | )(a) |
Unrealized appreciation (depreciation) | | | (26,273,070 | )(b) |
| | | | |
Total accumulated earnings/(deficit) | | $ | (31,349,785 | )(c) |
| | | | |
| (a) | As of April 30, 2022, the Fund had a post-October short term capital loss deferral of $3,668,555 and a post-October long term capital loss deferral of $2,162,614. |
| (b) | The differences between book-basis and tax-basis unrealized appreciation (depreciation) are attributable primarily to the recognition for tax purposes of unrealized gains/losses on certain derivative instruments, the tax treatment of callable bonds, the tax treatment of swaps, and the tax deferral of losses on wash sales. |
| (c) | The differences between book-basis and tax-basis components of accumulated earnings/(deficit) are attributable primarily to the accrual of foreign capital gains tax and dividends payable. |
For tax purposes, net realized capital losses may be carried over to offset future capital gains, if any. Funds are permitted to carry forward capital losses for an indefinite period, and such losses will retain their character as either short-term or long-term capital losses. As of April 30, 2022, the Fund did not have any capital loss carryforwards.
NOTE H
Recent Accounting Pronouncements
In March 2020, the Financial Accounting Standards Board issued an Accounting Standards Update, ASU 2020-04, “Reference Rate Reform (Topic 848)—Facilitation of the Effects of Reference Rate Reform on Financial Reporting.” ASU 2020-04 provides optional guidance to ease the potential accounting burden due to the discontinuation of the LIBOR and other interbank-offered based reference rates. ASU 2020-04 is effective as of March 12, 2020 through December 31, 2022. Management is currently evaluating the impact, if any, of applying ASU 2020-04.
NOTE I
Subsequent Events
Management has evaluated subsequent events for possible recognition or disclosure in the financial statements through the date the financial statements are issued. Management has determined that there are no material events that would require disclosure in the Fund’s financial statements through this date.
| | |
| |
| abfunds.com | | AB CORPORATE INCOME SHARES | 49 |
FINANCIAL HIGHLIGHTS
Selected Data For A Share Of Beneficial Interest Outstanding Throughout Each Period
| | | | | | | | | | | | | | | | | | | | | | | | |
| | | Six Months
Ended
October 31,
2022 (unaudited) | | |
Year Ended April 30, | |
| | | 2022 | | | 2021 | | | 2020 | | | 2019 | | | 2018 | |
| | | | | | | | | | | | | | | | | | | | | | | | |
| | | | |
| | | | | | | | | | | | | | | | | | | | | | | | |
Net asset value, beginning of period | | | $ 10.22 | | | | $ 11.82 | | | | $ 11.56 | | | | $ 11.11 | | | | $ 10.81 | | | | $ 11.14 | |
| | | | |
Income From Investment Operations | | | | | | | | | | | | | | | | | | | | | | | | |
| | | | | | |
Net investment income(a) | | | .18 | | | | .33 | | | | .37 | | | | .44 | | | | .44 | | | | .39 | |
| | | | | | |
Net realized and unrealized gain (loss) on investment transactions | | | (1.03 | ) | | | (1.47 | ) | | | .55 | | | | .51 | | | | .30 | | | | (.33 | ) |
| | | | |
Net increase (decrease) in net asset value from operations | | | (.85 | ) | | | (1.14 | ) | | | .92 | | | | .95 | | | | .74 | | | | .06 | |
| | | | |
Less: Dividends and Distributions | | | | | | | | | | | | | | | | | | | | | | | | |
| | | | | | |
Dividends from net investment income | | | (.19 | ) | | | (.34 | ) | | | (.38 | ) | | | (.45 | ) | | | (.44 | ) | | | (.39 | ) |
| | | | | | |
Distributions from net realized gain on investment transactions | | | – 0 | – | | | (.12 | ) | | | (.28 | ) | | | (.05 | ) | | | – 0 | – | | | – 0 | – |
| | | | |
Total dividends and distributions | | | (.19 | ) | | | (.46 | ) | | | (.66 | ) | | | (.50 | ) | | | (.44 | ) | | | (.39 | ) |
| | | | |
Net asset value, end of period | | | $ 9.18 | | | | $ 10.22 | | | | $ 11.82 | | | | $ 11.56 | | | | $ 11.11 | | | | $ 10.81 | |
| | | | |
| | | | | | |
Total Return | | | | | | | | | | | | | | | | | | | | | | | | |
| | | | | | |
Total investment return based on net asset value(b) | | | (8.44 | )% | | | (10.08 | )% | | | 7.90 | % | | | 8.65 | % | | | 7.03 | % | | | .50 | % |
| | | | | | |
Ratios/Supplemental Data | | | | | | | | | | | | | | | | | | | | | | | | |
| | | | | | |
Net assets, end of period (000’s omitted) | | | $147,337 | | | | $222,550 | | | | $208,745 | | | | $114,455 | | | | $98,680 | | | | $84,740 | |
| | | | | | |
Ratio to average net assets of: | | | | | | | | | | | | | | | | | | | | | | | | |
| | | | | | |
Net investment income | | | 3.64 | %^ | | | 2.84 | % | | | 3.02 | % | | | 3.83 | % | | | 4.06 | % | | | 3.47 | % |
| | | | | | |
Portfolio turnover rate | | | 33 | % | | | 49 | % | | | 43 | % | | | 87 | % | | | 140 | % | | | 73 | % |
| (a) | Based on average shares outstanding. |
| (b) | Total investment return is calculated assuming an initial investment made at the net asset value at the beginning of the period, reinvestment of all dividends and distributions at net asset value during the period, and redemption on the last day of the period. Total return does not reflect the deduction of taxes that a shareholder would pay on fund distributions or the redemption of fund shares. Total investment return calculated for a period of less than one year is not annualized. |
See notes to financial statements.
| | |
| |
50 | AB CORPORATE INCOME SHARES | | abfunds.com |
BOARD OF TRUSTEES
| | |
Marshall C. Turner, Jr.(1), Chairman Jorge A. Bermudez(1) Michael J. Downey(1) Onur Erzan, President and Chief Executive Officer | | Nancy P. Jacklin(1) Jeanette W. Loeb(1) Carol C. McMullen(1) Garry L. Moody(1) |
OFFICERS
| | |
Russell Wald(2), Vice President Tiffanie Wong(2), Vice President Emilie D. Wrapp, Secretary Michael B. Reyes, Senior Vice President | | Joseph J. Mantineo, Treasurer and Chief Financial Officer Phyllis J. Clarke, Controller Vincent S. Noto, Chief Compliance Officer |
| | |
Custodian and Accounting Agent State Street Bank and Trust Company
State Street Corporation CCB/5
1 Iron Street
Boston, MA 02210 Principal Underwriter AllianceBernstein Investments, Inc.
501 Commerce Street
Nashville, TN 37203 | | Legal Counsel Seward & Kissel LLP
One Battery Park Plaza
New York, NY 10004 Independent Registered Public Accounting Firm Ernst & Young LLP One Manhattan West New York, NY 10001 |
Transfer Agent AllianceBernstein Investor Services, Inc.
P.O. Box 786003
San Antonio, TX 78278
Toll-Free (800) 221-5672 |
| 1 | Member of the Audit Committee, the Governance and Nominating Committee, and the Independent Directors Committee. |
| 2 | The day-to-day management of, and investment decisions for, the Fund’s Portfolio are made by the Adviser’s Corporate Income Shares Investment Team. Mr. Wald and Ms. Wong are the investment professionals primarily responsible for the day-to-day management of the Fund’s Portfolio. |
| | |
| |
| abfunds.com | | AB CORPORATE INCOME SHARES | 51 |
Operation and Effectiveness of the Fund’s Liquidity Risk Management Program:
In October 2016, the Securities and Exchange Commission (“SEC”) adopted the open-end fund liquidity rule (the “Liquidity Rule”). In June 2018 the SEC adopted a requirement that funds disclose information about the operation and effectiveness of their Liquidity Risk Management Program (“LRMP”) in their reports to shareholders.
One of the requirements of the Liquidity Rule is for the Fund to designate an Administrator of the Fund’s Liquidity Risk Management Program. The Administrator of the Fund’s LRMP is AllianceBernstein L.P., the Fund’s investment adviser (the “Adviser”). The Adviser has delegated the responsibility to its Liquidity Risk Management Committee (the “Committee”).
Another requirement of the Liquidity Rule is for the Fund’s Board of Trustees (the “Fund Board”) to receive an annual written report from the Administrator of the LRMP, which addresses the operation of the Fund’s LRMP and assesses its adequacy and effectiveness. The Adviser provided the Fund Board with such annual report during the first quarter of 2022, which covered the period January 1, 2021 through December 31, 2021 (the “Program Reporting Period”).
The LRMP’s principal objectives include supporting the Fund’s compliance with limits on investments in illiquid assets and mitigating the risk that the Fund will be unable to meet its redemption obligations in a timely manner.
Pursuant to the LRMP, the Fund classifies the liquidity of its portfolio investments into one of the four categories defined by the SEC: Highly Liquid, Moderately Liquid, Less Liquid, and Illiquid. These classifications are reported to the SEC on Form N-PORT.
During the Program Reporting Period, the Committee reviewed whether the Fund’s strategy is appropriate for an open-end structure, incorporating any holdings of less liquid and illiquid assets. If the Fund participated in derivative transactions, the exposure from such transactions were considered in the LRMP.
The Committee also performed an analysis to determine whether the Fund is required to maintain a Highly Liquid Investment Minimum (“HLIM”). The Committee also incorporated the following information when determining the Fund’s reasonably anticipated trading size for purposes of liquidity monitoring: historical net redemption activity, a Fund’s concentration in an issuer, shareholder concentration, investment performance, total net assets, and distribution channels.
The Adviser informed the Fund Board that the Committee believes the Fund’s LRMP is adequately designed, has been implemented as intended,
| | |
| |
52 | AB CORPORATE INCOME SHARES | | abfunds.com |
and has operated effectively since its inception. No material exceptions have been noted since the implementation of the LRMP. During the Program Reporting Period, liquidity in all markets was significantly recovered and improved compared to the prior reporting period which included extreme levels of price volatility and relative illiquidity beginning in March 2020 with COVID-19 impacts. As such, the program operated in a relatively robust and benign liquidity environment experienced in markets during the Program Reporting Period. There were no liquidity events that impacted the Fund or its ability to timely meet redemptions during the Program Reporting Period.
| | |
| |
| abfunds.com | | AB CORPORATE INCOME SHARES | 53 |
Information Regarding the Review and Approval of the Fund’s Advisory Agreement
The disinterested trustees (the “directors”) of AB Corporate Shares (the “Company”) unanimously approved the continuance of the Company’s Advisory Agreement with the Adviser in respect of AB Corporate Income Shares (the “Fund”) at a meeting held by video conference on November 2-4, 2021 (the “Meeting”).
Prior to approval of the continuance of the Advisory Agreement, the directors had requested from the Adviser, and received and evaluated, extensive materials. They reviewed the proposed continuance of the Advisory Agreement with the Adviser and with experienced counsel who are independent of the Adviser, who advised on the relevant legal standards. The directors also reviewed additional materials, including comparative analytical data prepared by the Senior Analyst for the Fund. The directors also discussed the proposed continuance in private sessions with counsel.
The directors noted that the Fund is designed as a vehicle for the wrap fee account market (where investors pay fees to a wrap fee sponsor which pays investment fees and expenses from such fee). The directors also noted that no advisory fee is payable by the Fund, that the Advisory Agreement does not include the reimbursement provision for certain administrative expenses included in the advisory agreements of most of the open-end AB Funds, and that the Adviser is responsible for payment of the Fund’s ordinary expenses. The directors noted that the Company acknowledges in the Advisory Agreement that the Adviser and its affiliates expect to receive compensation from third parties in connection with services provided under the Advisory Agreement. The directors further noted that the Adviser receives payments from the wrap fee program sponsors (the “Sponsors”) that use the Fund as an investment vehicle for their clients.
The directors considered their knowledge of the nature and quality of the services provided by the Adviser to the Fund gained from their experience as directors or trustees of most of the registered investment companies advised by the Adviser, their overall confidence in the Adviser’s integrity and competence they have gained from that experience, the Adviser’s initiative in identifying and raising potential issues with the directors and its responsiveness, frankness and attention to concerns raised by the directors in the past, including the Adviser’s willingness to consider and implement organizational and operational changes designed to improve investment results and the services provided to the AB Funds. The directors noted that they have four regular meetings each year, at each of which they review extensive materials and information from the Adviser, including information on the investment performance of the Fund.
The directors also considered all factors they believed relevant, including the specific matters discussed below. During the course of their deliberations, the directors evaluated, among other things, the reasonableness of
| | |
| |
54 | AB CORPORATE INCOME SHARES | | abfunds.com |
the advisory fee. The directors did not identify any particular information that was all-important or controlling, and different directors may have attributed different weights to the various factors. The directors determined that the selection of the Adviser to manage the Fund and the overall arrangements between the Fund and the Adviser, as provided in the Advisory Agreement, including the advisory fee, were fair and reasonable in light of the services performed, expenses incurred and such other matters as the directors considered relevant in the exercise of their business judgment. The material factors and conclusions that formed the basis for the directors’ determinations included the following:
Nature, Extent and Quality of Services Provided
The directors considered the scope and quality of services provided by the Adviser under the Advisory Agreement, including the quality of the investment research capabilities of the Adviser and the other resources it has dedicated to performing services for the Fund. The directors noted that the Adviser from time to time reviews the Fund’s investment strategies and from time to time proposes changes intended to improve the Fund’s relative or absolute performance for the directors’ consideration. They also noted the professional experience and qualifications of the Fund’s portfolio management team and other senior personnel of the Adviser. The quality of administrative and other services, including the Adviser’s role in coordinating the activities of the Fund’s other service providers, also was considered. The directors concluded that, overall, they were satisfied with the nature, extent and quality of services provided to the Fund under the Advisory Agreement.
Costs of Services Provided and Profitability
The directors reviewed a schedule of the revenues and expenses and related notes indicating the profitability of the Fund to the Adviser for calendar years 2019 and 2020 that had been prepared with an expense allocation methodology arrived at in consultation with an independent consultant at the request of the directors. The directors noted the assumptions and methods of allocation used by the Adviser in preparing fund-specific profitability data and understood that there are a number of potentially acceptable allocation methodologies for information of this type. The directors noted that the profitability information reflected all revenues and expenses of the Adviser’s relationship with the Fund. The directors recognized that it is difficult to make comparisons of the profitability of the Advisory Agreement with the profitability of fund advisory contracts for unaffiliated funds because comparative information is not generally publicly available and is affected by numerous factors. The directors focused on the profitability of the Adviser’s relationship with the Fund before taxes and distribution expenses. The directors concluded that the Adviser’s level of profitability from its relationship with the Fund was not unreasonable.
Fall-Out Benefits
The directors considered the other benefits to the Adviser and its affiliates from their relationships with the Fund. The directors noted that the Adviser
| | |
| |
| abfunds.com | | AB CORPORATE INCOME SHARES | 55 |
is compensated by the Sponsors. The directors understood that the Adviser also might derive reputational and other benefits from its association with the Fund.
Investment Results
In addition to the information reviewed by the directors in connection with the Meeting, the directors receive detailed performance information for the Fund at each regular Board meeting during the year.
At the Meeting, the directors reviewed performance information prepared by an independent service provider (the “15(c) service provider”), showing the performance of the Fund against a group of similar funds (“peer group”) and a larger group of similar funds (“peer universe”), each selected by the 15(c) service provider, and information prepared by the Adviser showing the Fund’s performance against a broad-based securities market index, in each case for the 1-, 3-, 5- and 10-year periods ended July 31, 2021 and (in the case of comparisons with the broad-based securities market index) for the period from inception. The directors were cognizant that the Fund was neither designed nor offered as a standalone investment and was intended to serve solely as a component of certain separately managed accounts (“SMAs”). The Adviser had explained that this attribute made it difficult to select an appropriate benchmark for the Fund. At the directors’ request, the Adviser provided information showing the weighting of the Fund in a current SMA and the overall performance of the SMA versus its stated benchmark. Based on their review, the directors concluded that the Fund’s investment performance was acceptable.
Advisory Fees
The directors considered the advisory fee rate payable by the Fund to the Adviser (zero) and information provided by the 15(c) service provider concerning advisory fee rates payable by other funds in the same category as the Fund. The directors recognized that it is difficult to make comparisons of advisory fees because there are variations in the services that are included in the fees payable by other funds.
The directors noted the unusual arrangements in the Advisory Agreement providing for no advisory fee but were cognizant that the Adviser is indirectly compensated by the Sponsors for its services to the Fund. The directors reviewed the fee arrangements between the Adviser and each of the current Sponsors and noted that such fees were negotiated on an arm’s length basis and were within the range of fees paid by wrap fee sponsors to other advisers of similar funds. While the Adviser’s fee arrangements with the Sponsors vary, the directors acknowledged the Adviser’s view that a portion of such fees (less the expenses of the Fund paid by the Adviser) may reasonably be viewed as compensating the Adviser for advisory services it provides to the Fund (the “implied fee”) and that the Adviser believes that while the Sponsors pay the Adviser different
| | |
| |
56 | AB CORPORATE INCOME SHARES | | abfunds.com |
fee rates, the rate of fee attributable to Fund management at the Fund level is the same for all Sponsors. The directors also considered the fee rate schedules used by other registered investment companies that invest in fixed income securities that are advised by the Adviser.
The directors also considered the Adviser’s fee schedule for other clients utilizing investment strategies similar to those of the Fund. For this purpose, they reviewed the relevant advisory fee information from the Adviser’s Form ADV and in a report from the Fund’s Senior Analyst and noted the differences between the Fund’s fee schedule, on the one hand, and the Adviser’s institutional fee schedule, on the other. The directors recognized that such information was of limited utility in light of the Fund’s unusual fee arrangement. The directors noted that the Adviser may, in some cases, agree to fee rates with large institutional clients that are lower than those reviewed by the directors and that they had previously discussed with the Adviser its policies in respect of such arrangements.
The Adviser reviewed with the directors the significantly greater scope of the services it provides to the Fund relative to institutional clients. In this regard, the Adviser noted, among other things, that, compared to institutional accounts, the Fund (i) demands considerably more portfolio management, research and trading resources due to significantly higher daily cash flows; (ii) has more tax and regulatory restrictions and compliance obligations; (iii) must prepare and file or distribute regulatory and other communications about fund operations; and (iv) must provide shareholder servicing to retail investors. The Adviser also reviewed the greater legal risks presented by the large and changing population of Fund shareholders who may assert claims against the Adviser in individual or class actions, and the greater entrepreneurial risk in offering new fund products, which require substantial investment to launch, may not succeed, and generally must be priced to compete with larger, more established funds resulting in lack of profitability to the Adviser until a new fund achieves scale. In light of the substantial differences in services rendered by the Adviser to institutional clients as compared to the Fund, and the different risk profile, the directors considered these fee comparisons inapt and did not place significant weight on them in their deliberations.
The directors did not consider comparative expense information for the Fund because the Fund does not bear ordinary expenses.
Economies of Scale
The directors did not consider the extent to which fee levels in the Advisory Agreement for the Fund reflect economies of scale because the Advisory Agreement does not provide for any compensation to be paid to the Adviser by the Fund and the Fund’s expense ratio is zero. They did note, however, that the fee payable to the Adviser by the current Sponsors declines at a breakpoint based on either individual account sizes or on total assets managed by the Adviser for the Sponsor.
| | |
| |
| abfunds.com | | AB CORPORATE INCOME SHARES | 57 |
This page is not part of the Shareholder Report or the Financial Statements.
AB FAMILY OF FUNDS
US EQUITY
CORE
Core Opportunities Fund
Select US Equity Portfolio
Sustainable US Thematic Portfolio
GROWTH
Concentrated Growth Fund
Discovery Growth Fund
Growth Fund
Large Cap Growth Fund
Small Cap Growth Portfolio
VALUE
Discovery Value Fund
Equity Income Fund
Relative Value Fund
Small Cap Value Portfolio
Value Fund
INTERNATIONAL/ GLOBAL EQUITY
CORE
Global Core Equity Portfolio
International Strategic Core Portfolio
Sustainable Global Thematic Fund
Sustainable International Thematic Fund
Tax-Managed Wealth Appreciation Strategy
Wealth Appreciation Strategy
GROWTH
Concentrated International Growth Portfolio
VALUE
All China Equity Portfolio
International Value Fund
FIXED INCOME
MUNICIPAL
High Income Municipal Portfolio
Intermediate California Municipal Portfolio
Intermediate Diversified Municipal Portfolio
Intermediate New York Municipal Portfolio
Municipal Bond Inflation Strategy
Tax-Aware Fixed Income Opportunities Portfolio
National Portfolio
Arizona Portfolio
California Portfolio
Massachusetts Portfolio
Minnesota Portfolio
New Jersey Portfolio
New York Portfolio
Ohio Portfolio
Pennsylvania Portfolio
Virginia Portfolio
TAXABLE
Bond Inflation Strategy
Global Bond Fund
High Income Fund
High Yield Portfolio
Income Fund
Intermediate Duration Portfolio
Limited Duration High Income Portfolio
Short Duration Income Portfolio
Short Duration Portfolio
Sustainable Thematic Credit Portfolio
Total Return Bond Portfolio
ALTERNATIVES
All Market Real Return Portfolio
Global Real Estate Investment Fund
Select US Long/Short Portfolio
MULTI-ASSET
All Market Income Portfolio
All Market Total Return Portfolio
Emerging Markets Multi-Asset Portfolio
Global Risk Allocation Fund
Sustainable Thematic Balanced Portfolio
Tax-Managed All Market Income Portfolio
CLOSED-END FUNDS
AllianceBernstein Global High Income Fund
AllianceBernstein National Municipal Income Fund
EXCHANGE-TRADED FUNDS
Tax-Aware Short Duration Municipal ETF
Ultra Short Income ETF
We also offer Government Money Market Portfolio, which serves as the money market fund exchange vehicle for the AB mutual funds. You could lose money by investing in the Fund. Although the Fund seeks to preserve the value of your investment at $1.00 per share, it cannot guarantee it will do so. The Fund may impose a fee upon sale of your shares or may temporarily suspend your ability to sell shares if the Fund’s liquidity falls below required minimums because of market conditions or other factors. An investment in the Fund is not insured or guaranteed by the Federal Deposit Insurance Corporation or any other government agency. The Fund’s sponsor has no legal obligation to provide financial support to the Fund, and you should not expect that the sponsor will provide financial support to the Fund at any time.
Investors should consider the investment objectives, risks, charges and expenses of the Fund carefully before investing. For copies of our prospectus or summary prospectus, which contain this and other information, visit us online at www.abfunds.com or contact your AB representative. Please read the prospectus and/or summary prospectus carefully before investing.
| | |
| |
58 | AB CORPORATE INCOME SHARES | | abfunds.com |
NOTES
| | |
| |
| abfunds.com | | AB CORPORATE INCOME SHARES | 59 |
NOTES
| | |
| |
60 | AB CORPORATE INCOME SHARES | | abfunds.com |
AB CORPORATE INCOME SHARES
1345 Avenue of the Americas
New York, NY 10105
800 221 5672
CIS-0152-1022 
OCT 10.31.22

SEMI-ANNUAL REPORT
AB IMPACT MUNICIPAL INCOME SHARES

| | |
| |
| Investment Products Offered | | • Are Not FDIC Insured • May Lose Value • Are Not Bank Guaranteed |
Investors should consider the investment objectives, risks, charges and expenses of the Fund carefully before investing. For copies of our prospectus or summary prospectus, which contain this and other information, visit us online at www.abfunds.com or contact your AB representative. Please read the prospectus and/or summary prospectus carefully before investing.
This shareholder report must be preceded or accompanied by the Fund’s prospectus for individuals who are not current shareholders of the Fund.
You may obtain a description of the Fund’s proxy voting policies and procedures, and information regarding how the Fund voted proxies relating to portfolio securities during the most recent 12-month period ended June 30, without charge. Simply visit AB’s website at www.abfunds.com, or go to the Securities and Exchange Commission’s (the “Commission”) website at www.sec.gov, or call AB at (800) 227 4618.
The Fund files its complete schedule of portfolio holdings with the Commission for the first and third quarters of each fiscal year as an exhibit to its reports on Form N-PORT. The Fund’s Form N-PORT reports are available on the Commission’s website at www.sec.gov. AB publishes full portfolio holdings for the Fund monthly at www.abfunds.com.
AllianceBernstein Investments, Inc. (ABI) is the distributor of the AB family of mutual funds. ABI is a member of FINRA and is an affiliate of AllianceBernstein L.P., the Adviser of the funds.
The [A/B] logo is a registered service mark of AllianceBernstein and AllianceBernstein® is a registered service mark used by permission of the owner, AllianceBernstein L.P.
| | |
| FROM THE PRESIDENT | |  |
Dear Shareholder,
We’re pleased to provide this report for AB Impact Municipal Income Shares (the “Fund”). Please review the discussion of Fund performance, the market conditions during the reporting period and the Fund’s investment strategy.
At AB, we’re striving to help our clients achieve better outcomes by:
| + | | Fostering diverse perspectives that give us a distinctive approach to navigating global capital markets |
| + | | Applying differentiated investment insights through a connected global research network |
| + | | Embracing innovation to design better ways to invest and leading-edge mutual-fund solutions |
Whether you’re an individual investor or a multibillion-dollar institution, we’re putting our knowledge and experience to work for you every day.
For more information about AB’s comprehensive range of products and shareholder resources, please log on to www.abfunds.com.
Thank you for your investment in AB mutual funds—and for placing your trust in our firm.
Sincerely,

Onur Erzan
President and Chief Executive Officer, AB Mutual Funds
| | |
| |
| abfunds.com | | AB IMPACT MUNICIPAL INCOME SHARES | 1 |
SEMI-ANNUAL REPORT
December 12, 2022
This report provides management’s discussion of fund performance for AB Impact Municipal Income Shares for the semi-annual reporting period ended October 31, 2022. Please note, shares of this Fund are available only to separately managed accounts or participants in “wrap fee” programs or other investment programs approved by the Adviser.
The investment objective of the Fund is to earn the highest level of current income, exempt from federal taxation, that is available consistent with what the Adviser considers to be an appropriate level of risk.
NAV RETURNS AS OF OCTOBER 31, 2022 (unaudited)
| | | | | | | | |
| | |
| | | 6 Months | | | 12 Months | |
| | |
| AB IMPACT MUNICIPAL INCOME SHARES | | | -7.49% | | | | -15.97% | |
| | |
| Bloomberg Municipal Bond Index | | | -4.43% | | | | -11.98% | |
INVESTMENT RESULTS
The table above shows the Fund’s performance compared to its benchmark, the Bloomberg Municipal Bond Index, for the six- and 12-month periods ended October 31, 2022.
During both periods, the Fund underperformed its benchmark. The Fund’s overweight to municipal credit detracted, relative to the benchmark. Security selection within the not-for-profit health-care sector detracted, while selection in tax-supported local lease contributed. An overweight to public primary/secondary education detracted, while an overweight to interest-rate swaps contributed.
The Fund utilized derivatives for hedging purposes in the form of interest rate swaps, which detracted from absolute performance for both periods, and Consumer Price Index swaps, which had no material impact on absolute performance for either period.
MARKET REVIEW AND INVESTMENT STRATEGY
Yields continued their ascent higher toward the end of the reporting period ended October 31, 2022. During the 12-month period, the yield on a 10-Year AAA municipal bond rose to 3.39% from 1.22% and the yield on the 10-Year US Treasury rose to 4.06% from 1.58%. Demand for municipals continued to weaken during the six-month period, as investors have pulled approximately $104.8 billion year to date from municipal bond mutual funds and exchange-traded funds as of October 26, 2022. In addition to broader fixed-income market volatility, these municipal market
| | |
| |
2 | AB IMPACT MUNICIPAL INCOME SHARES | | abfunds.com |
outflows contributed to municipal underperformance versus US Treasuries, with 10-Year AAA Muni/Treasury after-tax spreads widening 73 basis points (“b.p.”) during the 12-month period and 1 b.p. during the six-month period. Average BBB credit spreads widened during the 12-month and six-month periods by approximately 60 b.p. and 26 b.p., respectively.
The underlying goals of the Fund are to make environmentally, socially and financially productive investments in historically marginalized and underserved communities to reduce gaps that exist in such areas as academic achievement, economic development or the provision of health care. Essentially, the Fund’s Senior Investment Management Team is looking to create a better tomorrow. Inherent in these goals is to make investments toward improving the quality of life for all by enhancing and promoting civic engagement, an informed citizenry, culture, and the physical and natural sciences.
The Fund may purchase municipal securities that are insured under policies issued by certain insurance companies. Historically, insured municipal securities typically received a higher credit rating, which meant that the issuer of the securities paid a lower interest rate. As a result of declines in the credit quality and associated downgrades of most bond insurers, insurance has less value than it did in the past. The market now values insured municipal securities primarily based on the credit quality of the issuer of the security, with little value given to the insurance feature. In purchasing such insured securities, the Adviser evaluates the risk and return of municipal securities through its own research. If an insurance company’s rating is downgraded or the company becomes insolvent, the prices of municipal securities insured by the insurance company may decline. As of October 31, 2022, the Fund’s percentages of investments in municipal bonds that are insured and in insured municipal bonds that have been pre-refunded or escrowed to maturity were 15.39% and 0.00%, respectively.
INVESTMENT POLICIES
The Fund pursues its objective by investing principally in high-yielding municipal securities of any credit quality that (i) score highly on the Adviser’s environmental, social and corporate governance (“ESG”) criteria and (ii) are deemed by the Adviser to have an environmental or social impact in underserved or low socio-economic communities. As a matter of fundamental policy, the Fund invests, under normal circumstances, at least 80% of its net assets in municipal securities that pay interest that is exempt from federal income tax. These securities may pay interest that is subject to the federal alternative minimum tax for certain taxpayers.
The Adviser evaluates each security in which the Fund invests using
(continued on next page)
| | |
| |
| abfunds.com | | AB IMPACT MUNICIPAL INCOME SHARES | 3 |
both a traditional municipal bond credit analysis and a consideration of the security’s overall ESG score under the Adviser’s ESG evaluation criteria. Under this ESG evaluation, to arrive at an overall ESG score, each security is scored on environmental, social and governance factors, and the scores are weighted based on the Adviser’s assessment of the relevance of each factor within a given sector (e.g., education, health care, renewable energy and mass transit). For example, social factors are weighted more heavily in the overall ESG score for a security of an issuer in the education sector than they are for a security of an issuer in the mass transit sector, where environmental factors predominate. The Adviser regularly reviews the overall ESG scores assigned to securities under consideration for purposes of determining the securities in which to invest for the Fund.
The Adviser’s ESG evaluation is conducted on an industry sector basis and includes the use of key performance indicators that vary in materiality by sector. The Adviser’s environmental evaluation covers issues such as clean and renewable energy, climate change and water conservation. The Adviser’s social evaluation covers issues such as economic impact, high quality safety-net health care and overall community health needs, and the reduction of achievement gaps between wealthy and poor school districts. The Adviser’s governance evaluation covers issues such as stewardship of debt and capital, board governance and transparency.
The Adviser also assesses a security’s risk and return characteristics as well as a security’s impact on the overall risk and return characteristics of the Fund. In making this assessment, the Adviser takes into account various factors including the credit quality, maturity, sensitivity to interest rates and the expected after-tax returns of the security under consideration and of the Fund’s other holdings.
The Fund may invest without limit in lower-rated securities (“junk bonds”), which may include securities having the lowest rating, and in unrated securities that, in the Adviser’s judgment, would be lower-rated securities if rated. The Fund may invest in fixed-income securities with any maturity or duration. The Fund will seek to increase income for shareholders by investing in longer-maturity bonds. Consistent with its objective of seeking a higher level of income, the Fund may experience greater volatility and a higher risk of loss of principal than other municipal funds.
The Fund may also invest in tender option bond transactions (“TOBs”); forward commitments; zero-coupon municipal securities and variable-, floating- and inverse-floating-rate municipal securities; certain types of
(continued on next page)
| | |
| |
4 | AB IMPACT MUNICIPAL INCOME SHARES | | abfunds.com |
mortgage-related securities; and derivatives, such as options, futures contracts, forwards and swaps.
The Fund may make short sales of securities or maintain a short position, and may use other investment techniques. The Fund may use leverage for investment purposes to increase income through the use of TOBs and derivative instruments, such as interest rate swaps.
| | |
| |
| abfunds.com | | AB IMPACT MUNICIPAL INCOME SHARES | 5 |
DISCLOSURES AND RISKS
Benchmark Disclosure
The Bloomberg Municipal Bond Index is unmanaged and does not reflect fees and expenses associated with the active management of a fund. The Bloomberg Municipal Bond Index represents the performance of the long-term tax-exempt bond market consisting of investment-grade bonds. An investor cannot invest directly in an index, and its results are not indicative of the performance for any specific investment, including the Fund.
A Word About Risk
Market Risk: The value of the Fund’s assets will fluctuate as the stock or bond market fluctuates. The value of the Fund’s investments may decline, sometimes rapidly and unpredictably, simply because of economic changes or other events, including public health crises (including the occurrence of a contagious disease or illness) and regional and global conflicts, that affect large portions of the market.
ESG Risk: Applying ESG and sustainability criteria to the investment process may exclude securities of certain issuers for non-investment reasons and, therefore, the Fund may forgo some market opportunities available to funds that do not use ESG or sustainability criteria. Securities selected based on ESG factors may shift into and out of favor depending on market and economic conditions, and the Fund’s performance may at times be better or worse than the performance of funds that do not use ESG or sustainability criteria. Furthermore, “sustainability” is not a uniformly defined characteristic, and the Fund’s sustainability criteria may differ from those used by other funds. In addition, in evaluating an investment, the investment adviser is dependent upon information and data that may be incomplete, inaccurate or unavailable, which could adversely affect the analysis of the ESG and sustainability factors relevant to a particular investment.
Credit Risk: An issuer or guarantor of a fixed-income security, or the counterparty to a derivatives or other contract, may be unable or unwilling to make timely payments of interest or principal, or to otherwise honor its obligations. The issuer or guarantor may default, causing a loss of the full principal amount of a security and any accrued interest. The degree of risk for a particular security may be reflected in its credit rating. There is the possibility that the credit rating of a fixed-income security may be downgraded after purchase, which may adversely affect the value of the security. Investments in fixed-income securities with lower ratings tend to have a higher probability that an issuer will default or fail to meet its payment obligations.
Municipal Market Risk: This is the risk that special factors may adversely affect the value of municipal securities and have a significant effect on the
| | |
| |
6 | AB IMPACT MUNICIPAL INCOME SHARES | | abfunds.com |
DISCLOSURES AND RISKS (continued)
yield or value of the Fund’s investments in municipal securities. These factors include economic conditions, political or legislative changes, public health crises, uncertainties related to the tax status of municipal securities, and the rights of investors in these securities. To the extent that the Fund invests more of its assets in a particular state’s municipal securities, the Fund may be vulnerable to events adversely affecting that state, including economic, political and regulatory occurrences, court decisions, terrorism, public health crises (including the occurrence of a contagious disease or illness) and catastrophic natural disasters, such as hurricanes, fires or earthquakes. For example, the novel coronavirus (COVID-19) pandemic has significantly stressed the financial resources of many issuers of municipal securities, which could impair any such issuer’s ability to meet its financial obligations when due and adversely impact the value of its securities held by the Fund. As the full effects of the COVID-19 pandemic on state and local economies and on issuers of municipal securities are still uncertain, the financial difficulties of issuers of municipal securities may continue or worsen, adversely affecting the performance of the Fund. The Fund’s investments in certain municipal securities with principal and interest payments that are made from the revenues of a specific project or facility, and not general tax revenues, may have increased risks. Factors affecting the project or facility, such as local business or economic conditions, could have a significant effect on the project’s ability to make payments of principal and interest on these securities.
Congress has previously considered making changes to the municipal securities provisions of the Internal Revenue Code that could change the US federal income tax treatment of certain types of municipal securities.
Tax Risk: There is no guarantee that all of the Fund’s income will remain exempt from federal or state income taxes. From time to time, the US government and the US Congress consider changes in federal tax law that could limit or eliminate the federal tax exemption for municipal bond income, which would in effect reduce the income received by shareholders from the Fund by increasing taxes on that income. In such event, the Fund’s net asset value (“NAV”) could also decline as yields on municipal bonds, which are typically lower than those on taxable bonds, would be expected to increase to approximately the yield of comparable taxable bonds. Actions or anticipated actions affecting the tax-exempt status of municipal bonds could also result in significant shareholder redemptions of Fund shares as investors anticipate adverse effects on the Fund or seek higher yields to offset the potential loss of the tax deduction. As a result, the Fund would be required to maintain higher levels of cash to meet the redemptions, which would negatively affect the Fund’s yield. The federal income tax treatment of payments in respect of certain derivative contracts is unclear.
| | |
| |
| abfunds.com | | AB IMPACT MUNICIPAL INCOME SHARES | 7 |
DISCLOSURES AND RISKS (continued)
Below Investment-Grade Securities Risk: Investments in fixed-income securities with lower ratings (commonly known as “junk bonds”) tend to have a higher probability that an issuer will default or fail to meet its payment obligations. These securities may be subject to greater price volatility due to such factors as specific corporate developments, interest-rate sensitivity, negative perceptions of the junk bond market generally and may be more difficult to trade than other types of securities.
Interest-Rate Risk: Changes in interest rates will affect the value of investments in fixed-income securities. When interest rates rise, the value of existing investments in fixed-income securities tends to fall and this decrease in value may not be offset by higher income from new investments. Interest-rate risk is generally greater for fixed-income securities with longer maturities or durations. The Fund may be subject to greater risk of rising interest rates than would normally be the case due to the end of a recent period of historically low rates and the effect of potential government fiscal policy initiatives and resulting market reaction to those initiatives.
Inflation Risk: This is the risk that the value of assets or income from investments will be less in the future as inflation decreases the value of money. As inflation increases, the value of the Fund’s assets can decline as can the value of the Fund’s distributions. This risk is significantly greater for fixed-income securities with longer maturities.
Leverage Risk: To the extent the Fund uses leveraging techniques, its NAV may be more volatile because leverage tends to exaggerate the effect of changes in interest rates and any increase or decrease in the value of the Fund’s investments.
Illiquid Investments Risk: Illiquid investments risk exists when particular investments, such as lower-rated securities, are or become difficult to purchase or sell, possibly preventing the Fund from selling such investments at an advantageous price. The Fund is subject to illiquid investments risk because the market for municipal securities is generally smaller than many other markets. Derivatives and securities involving substantial market and credit risk tend to involve greater illiquid investments risk than most other types of investments.
Derivatives Risk: Derivatives may be difficult to price or unwind and leveraged so that small changes may produce disproportionate losses for the Fund. Derivatives, especially over-the-counter derivatives, are also subject to counterparty risk, which is the risk that the counterparty (the party on the other side of the transaction) on a derivative transaction will be unable or unwilling to honor its contractual obligations to the Fund.
| | |
| |
8 | AB IMPACT MUNICIPAL INCOME SHARES | | abfunds.com |
DISCLOSURES AND RISKS (continued)
Management Risk: The Fund is subject to management risk because it is an actively managed investment fund. The Adviser will apply its investment techniques and risk analyses in making investment decisions, but there is no guarantee that its techniques will produce the intended results. Some of these techniques may incorporate, or rely upon, quantitative models, but there is no guarantee that these models will generate accurate forecasts, reduce risk or otherwise perform as expected.
These risks are fully discussed in the Fund’s prospectus. As with all investments, you may lose money by investing in the Fund.
An Important Note About Historical Performance
The performance shown in this report represents past performance and does not guarantee future results. Current performance may be lower or higher than the performance information shown. You may obtain performance information current to the most recent month-end by calling (800) 227 4618. The investment return and principal value of an investment in the Fund will fluctuate, so that your shares, when redeemed, may be worth more or less than their original cost. Performance assumes reinvestment of distributions and does not account for taxes.
Investors should consider the investment objectives, risks, charges and expenses of the Fund carefully before investing. For copies of our prospectus and/or summary prospectus, which contain this and other information, visit us online at www.abfunds.com or contact your AllianceBernstein Investments representative. Please read the prospectus and/or summary prospectus carefully before investing.
| | |
| |
| abfunds.com | | AB IMPACT MUNICIPAL INCOME SHARES | 9 |
HISTORICAL PERFORMANCE
AVERAGE ANNUAL RETURNS AS OF OCTOBER 31, 2022 (unaudited)
| | | | |
| |
| | | NAV Returns | |
| |
| 1 Year | | | -15.97% | |
| |
| 5 Years | | | 0.71% | |
| |
| Since Inception1 | | | 0.66% | |
AVERAGE ANNUAL RETURNS
AS OF THE MOST RECENT CALENDAR QUARTER-END
SEPTEMBER 30, 2022 (unaudited)
| | | | |
| |
| | | NAV Returns | |
| |
| 1 Year | | | -14.62% | |
| |
| 5 Years | | | 1.07% | |
| |
| Since Inception1 | | | 0.97% | |
The prospectus fee table shows the fees and the total annual operating expenses of the Fund as 0.00% because the Adviser does not charge any fees or expenses and reimburses Fund operating expenses except certain extraordinary expenses, taxes, brokerage costs and the interest on borrowings or certain leveraged transactions. Participants in a wrap fee program or other investment program eligible to invest in the Fund pay fees to the program sponsor and should review the program brochure or other literature provided by the sponsor for a discussion of fees and expenses charged.
| 1 | Inception date: 9/12/2017. |
| | |
| |
10 | AB IMPACT MUNICIPAL INCOME SHARES | | abfunds.com |
EXPENSE EXAMPLE
(unaudited)
As a shareholder of the Fund, you may incur various ongoing non-operating and extraordinary costs. This example is intended to help you understand your ongoing costs (in dollars) of investing in the Fund and to compare these costs with the ongoing costs of investing in other mutual funds.
The Example is based on an investment of $1,000 invested at the beginning of the period and held for the entire period as indicated below.
Actual Expenses
The table below provides information about actual account values and actual expenses. You may use the information, together with the amount you invested, to estimate the expenses that you paid over the period. Simply divide your account value by $1,000 (for example, an $8,600 account value divided by $1,000 = 8.6), then multiply the result by the number under the heading entitled “Expenses Paid During Period” to estimate the expenses you paid on your account during this period.
Hypothetical Example for Comparison Purposes
The table below also provides information about hypothetical account values and hypothetical expenses based on the Fund’s actual expense ratio and an assumed annual rate of return of 5% before expenses, which is not the Fund’s actual return. The hypothetical account values and expenses may not be used to estimate the actual ending account balance or expenses you paid for the period. You may use this information to compare the ongoing costs of investing in the Fund and other funds by comparing this 5% hypothetical example with the 5% hypothetical examples that appear in the shareholder reports of other funds.
Please note that the expenses shown in the table are meant to highlight your ongoing costs only and do not reflect any transactional costs, such as sales charges (loads), or contingent deferred sales charges on redemptions. Therefore, the hypothetical example is useful in comparing ongoing costs only, and will not help you determine the relative total costs of owning different funds. In addition, if these transactional costs were included, your costs would have been higher.
| | | | | | | | | | | | | | | | |
| | | Beginning
Account Value
May 1, 2022 | | | Ending
Account Value
October 31, 2022 | | | Expenses Paid
During Period* | | | Annualized
Expense Ratio* | |
Actual | | $ | 1,000 | | | $ | 925.10 | | | $ | – 0 – | | | | 0.00 | % |
Hypothetical** | | $ | 1,000 | | | $ | 1,025.21 | | | $ | – 0 – | | | | 0.00 | % |
| * | Expenses are equal to the Fund’s annualized expense ratio, multiplied by the average account value over the period, multiplied by 184/365 (to reflect the one-half year period). The Fund’s operating expenses are borne by the Adviser or its affiliates. |
| ** | Assumes 5% annual return before expenses. |
| | |
| |
| abfunds.com | | AB IMPACT MUNICIPAL INCOME SHARES | 11 |
PORTFOLIO SUMMARY
October 31, 2022 (unaudited)
PORTFOLIO STATISTICS
Net Assets ($mil): $491.6
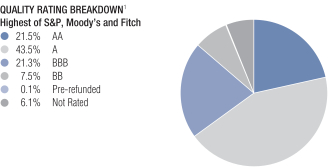
| 1 | The Fund’s quality rating breakdown is expressed as a percentage of the Fund’s total investments in municipal securities and may vary over time. The Fund also enters into derivative transactions, which may be used for hedging or investment purposes (see “Portfolio of Investments” section of the report for additional details). The quality ratings are determined by using the S&P Global Ratings (“S&P”), Moody’s Investors Services, Inc.(“Moody’s”) and Fitch Ratings, Ltd.(“Fitch”). The Fund considers the credit ratings issued by S&P, Moody’s and Fitch and uses the highest rating issued by the agencies. These ratings are a measure of the quality and safety of a bond or portfolio, based on the issuer’s financial condition. AAA is the highest (best) and D is the lowest (worst). If applicable, the pre-refunded category includes bonds which are secured by U.S. Government securities and therefore are deemed high-quality investment-grade by the Adviser. If applicable, Not Applicable (N/A) includes non-creditworthy investments such as equities, currency contracts, futures and options. If applicable, the Not Rated category includes bonds that are not rated by a nationally recognized statistical rating organization. The Adviser evaluates the creditworthiness of non-rated securities based on a number of factors including, but not limited to, cash flows, enterprise value and economic environment. |
| | |
| |
12 | AB IMPACT MUNICIPAL INCOME SHARES | | abfunds.com |
PORTFOLIO OF INVESTMENTS
October 31, 2022 (unaudited)
| | | | | | | | |
| | | Principal
Amount
(000) | | | U.S. $ Value | |
| |
MUNICIPAL OBLIGATIONS – 93.1% | | | | | | | | |
Long-Term Municipal Bonds – 93.1% | | | | | | | | |
Alabama – 1.6% | | | | | | | | |
Alabama Community College System ACCS Enhancements Fee Revenue
AGM Series 2021
4.00%, 09/01/2046 | | $ | 3,900 | | | $ | 3,345,970 | |
4.00%, 09/01/2051 | | | 5,500 | | | | 4,650,671 | |
| | | | | | | | |
| | | | | | | 7,996,641 | |
| | | | | | | | |
American Samoa – 0.1% | | | | | | | | |
American Samoa Economic Development Authority
(Territory of American Samoa)
Series 2018
6.00%, 09/01/2023(a) | | | 430 | | | | 431,121 | |
| | | | | | | | |
| | |
Arizona – 4.1% | | | | | | | | |
Arizona Industrial Development Authority
Series 2021-A
4.00%, 07/01/2051 | | | 5,840 | | | | 4,160,915 | |
Arizona Industrial Development Authority
(Phoenix Children’s Hospital Obligated Group)
Series 2020
4.00%, 02/01/2050 | | | 4,500 | | | | 3,569,533 | |
5.00%, 02/01/2034 | | | 1,300 | | | | 1,347,587 | |
5.00%, 02/01/2035 | | | 1,100 | | | | 1,130,836 | |
Series 2021
4.00%, 02/01/2038 | | | 1,400 | | | | 1,262,346 | |
Industrial Development Authority of the County of Pima(The)
(TMC HealthCare Obligated Group)
Series 2021
4.00%, 04/01/2046 | | | 3,500 | | | | 2,806,552 | |
Maricopa County Industrial Development Authority
(Arizona Autism Charter Schools Obligated Group)
Series 2020
5.00%, 07/01/2040(a) | | | 500 | | | | 447,460 | |
5.00%, 07/01/2050(a) | | | 1,175 | | | | 993,572 | |
5.00%, 07/01/2054(a) | | | 640 | | | | 527,160 | |
Series 2021
4.00%, 07/01/2041(a) | | | 365 | | | | 277,232 | |
4.00%, 07/01/2051(a) | | | 1,080 | | | | 742,555 | |
4.00%, 07/01/2061(a) | | | 4,210 | | | | 2,731,167 | |
| | | | | | | | |
| | | | | | | 19,996,915 | |
| | | | | | | | |
| | |
| |
| abfunds.com | | AB IMPACT MUNICIPAL INCOME SHARES | 13 |
PORTFOLIO OF INVESTMENTS (continued)
| | | | | | | | |
| | | Principal
Amount
(000) | | | U.S. $ Value | |
| |
California – 12.1% | | | | | | | | |
California Educational Facilities Authority
(Mount St.Mary’s University, Inc.)
Series 2018-A
5.00%, 10/01/2036 | | $ | 405 | | | $ | 419,492 | |
5.00%, 10/01/2046 | | | 2,750 | | | | 2,784,804 | |
California Health Facilities Financing Authority
(Children’s Hospital Los Angeles)
Series 2017-A
5.00%, 08/15/2047 | | | 3,750 | | | | 3,557,343 | |
California Health Facilities Financing Authority
(On Lok Senior Health Services Obligated Group)
Series 2020
5.00%, 08/01/2050 | | | 1,000 | | | | 964,175 | |
5.00%, 08/01/2055 | | | 1,200 | | | | 1,147,078 | |
California Health Facilities Financing Authority
(State of California Personal Income Tax Revenue)
Series 2022
4.19%, 06/01/2037 | | | 1,000 | | | | 842,931 | |
California Infrastructure & Economic Development Bank
(California Academy of Sciences)
Series 2021
2.59% (MUNIPSA + 0.35%), 08/01/2047(b) | | | 8,000 | | | | 7,892,061 | |
California Infrastructure & Economic Development Bank
(California Science Center Foundation)
Series 2021
4.00%, 05/01/2046 | | | 5,000 | | | | 4,262,543 | |
4.00%, 05/01/2051 | | | 5,000 | | | | 4,195,287 | |
4.00%, 05/01/2055 | | | 5,000 | | | | 4,152,256 | |
California Municipal Finance Authority
(Community Health Centers of The Central Coast, Inc.)
Series 2021-A
5.00%, 12/01/2036(a) | | | 350 | | | | 328,078 | |
5.00%, 12/01/2046(a) | | | 3,725 | | | | 3,219,059 | |
5.00%, 12/01/2054(a) | | | 1,240 | | | | 1,047,531 | |
California Municipal Finance Authority
(Healthright 360)
Series 2019-A
5.00%, 11/01/2039(a) | | | 1,775 | | | | 1,618,415 | |
5.00%, 11/01/2049(a) | | | 3,500 | | | | 3,019,377 | |
| | |
| |
14 | AB IMPACT MUNICIPAL INCOME SHARES | | abfunds.com |
PORTFOLIO OF INVESTMENTS (continued)
| | | | | | | | |
| | | Principal
Amount
(000) | | | U.S. $ Value | |
| |
California Municipal Finance Authority
(La Maestra Family Clinic, Inc.)
Series 2021
4.00%, 09/01/2046 | | $ | 2,960 | | | $ | 2,547,765 | |
4.00%, 09/01/2051 | | | 2,745 | | | | 2,337,277 | |
California Municipal Finance Authority
(Valley Health Team, Inc.)
Series 2021
4.00%, 07/01/2037 | | | 1,200 | | | | 1,119,932 | |
4.00%, 07/01/2046 | | | 2,090 | | | | 1,800,872 | |
4.00%, 07/01/2051 | | | 1,945 | | | | 1,657,075 | |
California School Finance Authority
(Bright Star Schools Obligated Group)
Series 2017
5.00%, 06/01/2037(a) | | | 600 | | | | 562,146 | |
5.00%, 06/01/2054(a) | | | 250 | | | | 215,390 | |
California School Finance Authority
(Downtown College Prep Obligated Group)
Series 2016
5.00%, 06/01/2051(a) | | | 500 | | | | 412,048 | |
California School Finance Authority
(Ednovate Obligated Group) | | | | | | | | |
Series 2018
5.00%, 06/01/2048(a) | | | 1,085 | | | | 928,863 | |
5.00%, 06/01/2056(a) | | | 1,000 | | | | 828,884 | |
California School Finance Authority
(Equitas Academy Obligated Group)
Series 2018-A
5.00%, 06/01/2048(a) | | | 3,750 | | | | 3,258,171 | |
California School Finance Authority
(Girls Athletic Leadership Schools Los Angeles)
Series 2021
4.00%, 06/01/2041(a) | | | 955 | | | | 707,926 | |
4.00%, 06/01/2051(a) | | | 1,000 | | | | 661,962 | |
California School Finance Authority
(Green DOT Public Schools Obligated Group)
Series 2018
5.00%, 08/01/2038(a) | | | 1,000 | | | | 986,094 | |
Series 2022
5.375%, 08/01/2042(c) | | | 1,500 | | | | 1,498,104 | |
Coalinga-Huron Joint Unified School District
BAM Series 2018-B
5.00%, 08/01/2048 | | | 500 | | | | 510,579 | |
| | | | | | | | |
| | | | | | | 59,483,518 | |
| | | | | | | | |
| | |
| |
| abfunds.com | | AB IMPACT MUNICIPAL INCOME SHARES | 15 |
PORTFOLIO OF INVESTMENTS (continued)
| | | | | | | | |
| | | Principal
Amount
(000) | | | U.S. $ Value | |
| |
Colorado – 0.5% | | | | | | | | |
Denver Health & Hospital Authority
Series 2019-A
4.00%, 12/01/2038 | | $ | 1,020 | | | $ | 838,172 | |
4.00%, 12/01/2039 | | | 1,000 | | | | 809,417 | |
4.00%, 12/01/2040 | | | 750 | | | | 598,707 | |
| | | | | | | | |
| | | | | | | 2,246,296 | |
| | | | | | | | |
Connecticut – 1.2% | | | | | | | | |
City of Bridgeport CT
Series 2017-A
5.00%, 11/01/2025 | | | 525 | | | | 546,728 | |
Series 2021-A
4.00%, 08/01/2037 | | | 775 | | | | 702,303 | |
4.00%, 08/01/2039 | | | 1,000 | | | | 877,913 | |
4.00%, 08/01/2040 | | | 325 | | | | 281,825 | |
BAM Series 2018-C
5.00%, 07/15/2036 | | | 1,000 | | | | 1,042,621 | |
5.00%, 07/15/2038 | | | 620 | | | | 643,640 | |
BAM Series 2019-A
5.00%, 02/01/2035 | | | 1,500 | | | | 1,572,755 | |
| | | | | | | | |
| | | | | | | 5,667,785 | |
| | | | | | | | |
District of Columbia – 3.8% | | | | | | | | |
District of Columbia
(Gallaudet University)
Series 2021
5.00%, 04/01/2046 | | | 1,715 | | | | 1,677,604 | |
5.00%, 04/01/2051 | | | 2,635 | | | | 2,551,527 | |
District of Columbia
(KIPP DC Obligated Group)
Series 2017-A
5.00%, 07/01/2042 | | | 1,785 | | | | 1,768,395 | |
Series 2017-B
5.00%, 07/01/2037 | | | 625 | | | | 628,167 | |
District of Columbia
(KIPP DC Public Charter Schools)
Series 2019
4.00%, 07/01/2039 | | | 2,275 | | | | 1,962,841 | |
District of Columbia
(Plenary Infrastructure DC LLC State Lease) Series 2022
5.50%, 02/28/2035 | | | 4,025 | | | | 4,088,442 | |
5.50%, 02/29/2036 | | | 1,625 | | | | 1,639,921 | |
5.50%, 08/31/2036 | | | 1,800 | | | | 1,814,583 | |
5.50%, 02/28/2037 | | | 1,850 | | | | 1,841,450 | |
| | |
| |
16 | AB IMPACT MUNICIPAL INCOME SHARES | | abfunds.com |
PORTFOLIO OF INVESTMENTS (continued)
| | | | | | | | |
| | | Principal
Amount
(000) | | | U.S. $ Value | |
| |
District of Columbia Water & Sewer Authority
Series 2016-A
5.00%, 10/01/2035 | | $ | 820 | | | $ | 848,284 | |
| | | | | | | | |
| | | | | | | 18,821,214 | |
| | | | | | | | |
Florida – 0.8% | | | | | | | | |
Florida Development Finance Corp.
(United Cerebral Palsy of Central Florida, Inc.)
Series 2020
5.00%, 06/01/2040 | | | 825 | | | | 707,223 | |
5.00%, 06/01/2050 | | | 1,785 | | | | 1,431,987 | |
Pinellas County School Board
(Pinellas County School Board COP)
Series 2021-A
5.00%, 07/01/2027 | | | 900 | | | | 955,547 | |
5.00%, 07/01/2030 | | | 1,000 | | | | 1,081,557 | |
| | | | | | | | |
| | | | | | | 4,176,314 | |
| | | | | | | | |
Illinois – 7.5% | | | | | | | | |
Chicago Transit Authority
(Chicago Transit Authority Sales Tax)
Series 2017
5.00%, 12/01/2051 | | | 5,085 | | | | 4,763,582 | |
Chicago Transit Authority Sales Tax Receipts Fund
Series 2014
5.25%, 12/01/2049 | | | 5,000 | | | | 5,024,463 | |
Series 2020-A
5.00%, 12/01/2045 | | | 6,010 | | | | 5,742,319 | |
5.00%, 12/01/2055 | | | 6,500 | | | | 6,040,418 | |
Series 2022-A
4.00%, 12/01/2049 | | | 4,190 | | | | 3,254,829 | |
Cook County Community College District No. 508
Series 2013
5.25%, 12/01/2043 | | | 605 | | | | 577,287 | |
BAM Series 2017
5.00%, 12/01/2047 | | | 620 | | | | 622,816 | |
Illinois Finance Authority
(Lawndale Educational & Regional Network Charter School Obligated Group)
Series 2021
4.00%, 11/01/2041 | | | 750 | | | | 615,141 | |
4.00%, 11/01/2051 | | | 2,000 | | | | 1,510,142 | |
4.00%, 11/01/2056 | | | 2,250 | | | | 1,642,782 | |
| | |
| |
| abfunds.com | | AB IMPACT MUNICIPAL INCOME SHARES | 17 |
PORTFOLIO OF INVESTMENTS (continued)
| | | | | | | | |
| | | Principal
Amount
(000) | | | U.S. $ Value | |
| |
Illinois Finance Authority
(University of Illinois)
Series 2020
4.00%, 10/01/2040 | | $ | 1,865 | | | $ | 1,553,379 | |
4.00%, 10/01/2050 | | | 5,000 | | | | 3,831,678 | |
4.00%, 10/01/2055 | | | 2,000 | | | | 1,481,666 | |
| | | | | | | | |
| | | | | | | 36,660,502 | |
| | | | | | | | |
Indiana – 0.6% | | | | | | | | |
Muncie Sanitary District
AGM Series 2021-A
5.00%, 01/01/2029 | | | 685 | | | | 730,938 | |
5.00%, 07/01/2029 | | | 600 | | | | 642,787 | |
5.00%, 01/01/2030 | | | 1,000 | | | | 1,074,457 | |
5.00%, 07/01/2030 | | | 420 | | | | 452,515 | |
| | | | | | | | |
| | | | | | | 2,900,697 | |
| | | | | | | | |
Kansas – 0.1% | | | | | | | | |
Seward County Unified School District No. 480 Liberal
Series 2017-B
5.00%, 09/01/2028 (Pre-refunded/ETM) | | | 555 | | | | 580,122 | |
| | | | | | | | |
| | |
Louisiana – 0.5% | | | | | | | | |
Tangipahoa Parish Hospital Service District No. 1
Series 2021
4.00%, 02/01/2041 | | | 1,500 | | | | 1,231,218 | |
4.00%, 02/01/2042 | | | 1,500 | | | | 1,217,490 | |
| | | | | | | | |
| | | | | | | 2,448,708 | |
| | | | | | | | |
Maryland – 3.4% | | | | | | | | |
Maryland Economic Development Corp.
(Bowie State University)
Series 2020
4.00%, 07/01/2050 | | | 1,200 | | | | 893,466 | |
Maryland Economic Development Corp.
(Maryland Economic Development Corp. Morgan View & Thurgood Marshall Student Hsg)
Series 2022
5.00%, 07/01/2033 | | | 1,895 | | | | 1,907,872 | |
5.00%, 07/01/2034 | | | 1,840 | | | | 1,838,264 | |
Maryland Economic Development Corp.
(Morgan State University)
Series 2020
5.00%, 07/01/2050 | | | 2,500 | | | | 2,264,073 | |
| | |
| |
18 | AB IMPACT MUNICIPAL INCOME SHARES | | abfunds.com |
PORTFOLIO OF INVESTMENTS (continued)
| | | | | | | | |
| | | Principal
Amount
(000) | | | U.S. $ Value | |
| |
Maryland Economic Development Corp.
(Purple Line Transit Partners LLC)
Series 2022
5.25%, 06/30/2055 | | $ | 10,000 | | | $ | 9,645,285 | |
| | | | | | | | |
| | | | | | | 16,548,960 | |
| | | | | | | | |
Massachusetts – 3.3% | | | | | | | | |
Massachusetts Development Finance Agency
(Boston Medical Center Corp. Obligated Group)
Series 2015-D
5.00%, 07/01/2044 | | | 7,415 | | | | 7,063,818 | |
Series 2016-E
5.00%, 07/01/2037 | | | 765 | | | | 760,524 | |
Series 2017-F
5.00%, 07/01/2030 | | | 1,475 | | | | 1,505,362 | |
Massachusetts Development Finance Agency
(Wellforce Obligated Group)
Series 2019-A
5.00%, 07/01/2036 | | | 1,765 | | | | 1,707,084 | |
5.00%, 07/01/2039 | | | 2,250 | | | | 2,136,447 | |
5.00%, 07/01/2044 | | | 1,645 | | | | 1,517,629 | |
AGM Series 2020-C
4.00%, 10/01/2045 | | | 1,090 | | | | 889,869 | |
Massachusetts Development Finance Agency
(WGBH Educational Foundation)
Series 2017-A
4.00%, 01/01/2032 | | | 825 | | | | 823,046 | |
| | | | | | | | |
| | | | | | | 16,403,779 | |
| | | | | | | | |
Michigan – 10.5% | | | | | | | | |
Center Line Public Schools
Series 2018
5.00%, 05/01/2038 | | | 895 | | | | 937,469 | |
City of Detroit MI
Series 2018
5.00%, 04/01/2026 | | | 585 | | | | 596,367 | |
5.00%, 04/01/2027 | | | 500 | | | | 510,550 | |
5.00%, 04/01/2032 | | | 770 | | | | 775,244 | |
5.00%, 04/01/2033 | | | 180 | | | | 180,279 | |
5.00%, 04/01/2034 | | | 1,255 | | | | 1,249,420 | |
5.00%, 04/01/2035 | | | 1,000 | | | | 988,537 | |
5.00%, 04/01/2036 | | | 700 | | | | 689,632 | |
5.00%, 04/01/2037 | | | 1,100 | | | | 1,077,140 | |
Series 2021-A
4.00%, 04/01/2040 | | | 1,050 | | | | 846,560 | |
5.00%, 04/01/2033 | | | 1,125 | | | | 1,121,691 | |
5.00%, 04/01/2036 | | | 1,200 | | | | 1,168,631 | |
| | |
| |
| abfunds.com | | AB IMPACT MUNICIPAL INCOME SHARES | 19 |
PORTFOLIO OF INVESTMENTS (continued)
| | | | | | | | |
| | | Principal
Amount
(000) | | | U.S. $ Value | |
| |
5.00%, 04/01/2039 | | $ | 1,175 | | | $ | 1,115,490 | |
5.00%, 04/01/2050 | | | 3,650 | | | | 3,302,200 | |
Detroit City School District
Series 2020-A
5.00%, 05/01/2036 | | | 1,145 | | | | 1,188,017 | |
5.00%, 05/01/2037 | | | 1,150 | | | | 1,189,478 | |
5.00%, 05/01/2039 | | | 1,645 | | | | 1,696,367 | |
5.00%, 05/01/2040 | | | 1,000 | | | | 1,029,547 | |
AGM Series 2005-A
5.25%, 05/01/2030 | | | 4,260 | | | | 4,707,406 | |
Downriver Utility Wastewater Authority
AGM Series 2018
5.00%, 04/01/2043 | | | 1,515 | | | | 1,564,838 | |
Ferris State University
Series 2019-A
5.00%, 10/01/2024 | | | 2,000 | | | | 2,060,157 | |
5.00%, 10/01/2025 | | | 2,000 | | | | 2,086,241 | |
5.00%, 10/01/2026 | | | 2,185 | | | | 2,303,971 | |
Flint Hospital Building Authority
(Hurley Medical Center)
Series 2020
4.00%, 07/01/2041 | | | 3,500 | | | | 2,752,698 | |
5.00%, 07/01/2031 | | | 2,405 | | | | 2,462,137 | |
Flint Public Library
AGM Series 2020
3.00%, 05/01/2029 | | | 1,085 | | | | 1,032,333 | |
3.00%, 05/01/2030 | | | 1,175 | | | | 1,099,538 | |
Grand Rapids Public Schools
AGM Series 2017
5.00%, 05/01/2027 | | | 200 | | | | 213,341 | |
AGM Series 2019
5.00%, 11/01/2040 | | | 1,800 | | | | 1,866,557 | |
Great Lakes Water Authority Water Supply System Revenue
Series 2016-B
5.00%, 07/01/2046 | | | 1,225 | | | | 1,244,113 | |
Series 2016-C
5.00%, 07/01/2026 | | | 695 | | | | 730,668 | |
Series 2020-B
5.00%, 07/01/2045 | | | 1,350 | | | | 1,386,430 | |
5.00%, 07/01/2049 | | | 1,300 | | | | 1,292,852 | |
Series 2022-A
5.00%, 07/01/2037 | | | 1,000 | | | | 1,046,254 | |
5.00%, 07/01/2038 | | | 1,215 | | | | 1,267,044 | |
5.25%, 07/01/2039 | | | 1,925 | | | | 2,037,858 | |
5.25%, 07/01/2040 | | | 735 | | | | 773,604 | |
| | | | | | | | |
| | | | | | | 51,590,659 | |
| | | | | | | | |
| | |
| |
20 | AB IMPACT MUNICIPAL INCOME SHARES | | abfunds.com |
PORTFOLIO OF INVESTMENTS (continued)
| | | | | | | | |
| | | Principal
Amount
(000) | | | U.S. $ Value | |
| |
Minnesota – 0.6% | | | | | | | | |
City of Minneapolis MN
(Hennepin Schools)
Series 2021-A
4.00%, 07/01/2056 | | $ | 3,000 | | | $ | 2,003,704 | |
Housing & Redevelopment Authority of The City of St.Paul Minnesota
(Metro Deaf School)
Series 2018-A
5.00%, 06/15/2048(a) | | | 1,000 | | | | 849,143 | |
| | | | | | | | |
| | | | | | | 2,852,847 | |
| | | | | | | | |
Missouri – 0.0% | | | | | | | | |
St. Louis Community College District
Series 2017
4.00%, 04/01/2035 | | | 200 | | | | 197,602 | |
| | | | | | | | |
| | |
New Jersey – 4.5% | | | | | | | | |
Essex County Improvement Authority
(North Star Academy Charter School of Newark, Inc.)
Series 2020
4.00%, 07/15/2040(a) | | | 1,600 | | | | 1,317,739 | |
4.00%, 07/15/2050(a) | | | 3,260 | | | | 2,457,094 | |
New Jersey Economic Development Authority
(Foundation Academy Charter School A NJ Nonprofit Corp.)
Series 2018-A
5.00%, 07/01/2050 | | | 1,000 | | | | 899,731 | |
New Jersey Economic Development Authority
(New Jersey Transit Corp. State Lease)
Series 2020
4.00%, 11/01/2044 | | | 5,500 | | | | 4,537,757 | |
5.00%, 11/01/2044 | | | 6,925 | | | | 6,655,293 | |
New Jersey Economic Development Authority
(North Star Academy Charter School of Newark, Inc.)
Series 2017
5.00%, 07/15/2047 | | | 1,170 | | | | 1,084,388 | |
New Jersey Economic Development Authority
(Seeing Eye, Inc. (The))
Series 2015
5.00%, 03/01/2025 | | | 3,205 | | | | 3,288,278 | |
New Jersey Economic Development Authority
(State of New Jersey Division of Property Management & Construction Lease)
Series 2018-C
5.00%, 06/15/2027 | | | 645 | | | | 669,161 | |
| | |
| |
| abfunds.com | | AB IMPACT MUNICIPAL INCOME SHARES | 21 |
PORTFOLIO OF INVESTMENTS (continued)
| | | | | | | | |
| | | Principal
Amount
(000) | | | U.S. $ Value | |
| |
5.00%, 06/15/2042 | | $ | 1,000 | | | $ | 970,173 | |
| | | | | | | | |
| | | | | | | 21,879,614 | |
| | | | | | | | |
New York – 14.4% | | | | | | | | |
Buffalo Sewer Authority
Series 2021
1.75%, 06/15/2049 | | | 2,000 | | | | 1,249,255 | |
Build NYC Resource Corp.
(Academic Leadership Charter School)
Series 2021
4.00%, 06/15/2031 | | | 200 | | | | 184,481 | |
4.00%, 06/15/2036 | | | 385 | | | | 330,813 | |
Build NYC Resource Corp.
(Children’s Aid Society (The))
Series 2019
4.00%, 07/01/2044 | | | 550 | | | | 457,726 | |
4.00%, 07/01/2049 | | | 600 | | | | 487,941 | |
Build NYC Resource Corp.
(Global Community Charter School)
Series 2022
4.00%, 06/15/2032 | | | 500 | | | | 456,430 | |
5.00%, 06/15/2042 | | | 850 | | | | 768,123 | |
5.00%, 06/15/2052 | | | 1,520 | | | | 1,316,174 | |
5.00%, 06/15/2057 | | | 1,300 | | | | 1,099,664 | |
Build NYC Resource Corp.
(Inwood Academy for Leadership Charter School)
Series 2018-A
5.50%, 05/01/2048(a) | | | 500 | | | | 462,052 | |
Build NYC Resource Corp.
(Metropolitan Lighthouse Charter School)
Series 2017
5.00%, 06/01/2052(a) | | | 2,260 | | | | 1,907,713 | |
Series 2017-A
5.00%, 06/01/2047(a) | | | 725 | | | | 624,076 | |
City of Buffalo NY
Series 2021-B
5.00%, 04/01/2026 | | | 2,025 | | | | 2,125,889 | |
Metropolitan Transportation Authority
Series 2014-D
5.00%, 11/15/2039 | | | 4,000 | | | | 3,829,102 | |
Series 2017-C
5.00%, 11/15/2026 | | | 5,710 | | | | 5,847,632 | |
5.00%, 11/15/2029 | | | 1,165 | | | | 1,187,462 | |
5.00%, 11/15/2033 | | | 1,000 | | | | 995,279 | |
Series 2018-B
5.00%, 11/15/2026 | | | 2,160 | | | | 2,212,064 | |
| | |
| |
22 | AB IMPACT MUNICIPAL INCOME SHARES | | abfunds.com |
PORTFOLIO OF INVESTMENTS (continued)
| | | | | | | | |
| | | Principal
Amount
(000) | | | U.S. $ Value | |
| |
Series 2020-C
4.75%, 11/15/2045 | | $ | 19,035 | | | $ | 16,864,934 | |
Series 2020-E
4.00%, 11/15/2045 | | | 4,250 | | | | 3,345,533 | |
5.00%, 11/15/2030 | | | 5,000 | | | | 5,039,535 | |
5.00%, 11/15/2032 | | | 4,500 | | | | 4,470,669 | |
Series 2021-A
4.00%, 11/15/2042 | | | 7,500 | | | | 6,086,625 | |
Series 2021-D
2.374% (SOFR + 0.33%), 11/01/2035(b) | | | 1,795 | | | | 1,742,212 | |
Monroe County Industrial Development Corp./NY
(Rochester Regional Health Obligated Group)
Series 2020
4.00%, 12/01/2046 | | | 6,945 | | | | 5,327,937 | |
Monroe County Industrial Development Corp./NY
(True North Rochester Prep Charter School)
Series 2020
5.00%, 06/01/2040(a) | | | 1,265 | | | | 1,190,070 | |
New York State Dormitory Authority
(Montefiore Obligated Group)
Series 2018
5.00%, 08/01/2032 | | | 375 | | | | 356,604 | |
5.00%, 08/01/2034 | | | 750 | | | | 695,205 | |
Series 2020
4.00%, 09/01/2045 | | | 500 | | | | 356,573 | |
| | | | | | | | |
| | | | | | | 71,017,773 | |
| | | | | | | | |
North Carolina – 0.9% | | | | | | | | |
North Carolina Central University
Series 2019
4.00%, 04/01/2049 | | | 2,270 | | | | 1,819,715 | |
5.00%, 04/01/2044 | | | 2,500 | | | | 2,463,696 | |
| | | | | | | | |
| | | | | | | 4,283,411 | |
| | | | | | | | |
Ohio – 2.5% | | | | | | | | |
American Municipal Power, Inc.
Series 2019
5.00%, 02/15/2044 | | | 2,150 | | | | 2,163,432 | |
Cleveland-Cuyahoga County Port Authority
(Cleveland Museum of Natural History (The))
Series 2021
4.00%, 07/01/2051 | | | 1,100 | | | | 868,003 | |
| | |
| |
| abfunds.com | | AB IMPACT MUNICIPAL INCOME SHARES | 23 |
PORTFOLIO OF INVESTMENTS (continued)
| | | | | | | | |
| | | Principal
Amount
(000) | | | U.S. $ Value | |
| |
County of Cuyahoga OH
(MetroHealth System (The))
Series 2017
5.00%, 02/15/2042 | | $ | 4,365 | | | $ | 4,184,890 | |
5.25%, 02/15/2047 | | | 1,500 | | | | 1,442,753 | |
County of Darke OH
(Wayne Hospital Co. Obligated Group)
Series 2019-A
5.00%, 09/01/2049 | | | 690 | | | | 567,056 | |
Ohio Higher Educational Facility Commission
(Ashtabula County Medical Center Obligated Group)
Series 2022
5.25%, 01/01/2041 | | | 2,000 | | | | 1,999,239 | |
5.25%, 01/01/2052 | | | 1,000 | | | | 968,874 | |
| | | | | | | | |
| | | | | | | 12,194,247 | |
| | | | | | | | |
Oklahoma – 1.8% | | | | | | | | |
Oklahoma Development Finance Authority
(OU Medicine Obligated Group)
Series 2018-B
5.00%, 08/15/2033 | | | 2,000 | | | | 1,775,158 | |
5.50%, 08/15/2057 | | | 3,365 | | | | 2,697,451 | |
Series 2022-A
5.50%, 08/15/2041 | | | 5,000 | | | | 4,420,698 | |
| | | | | | | | |
| | | | | | | 8,893,307 | |
| | | | | | | | |
Oregon – 0.2% | | | | | | | | |
Tri-County Metropolitan Transportation District of Oregon
Series 2017-A
5.00%, 10/01/2026 | | | 865 | | | | 910,481 | |
Series 2018-A
5.00%, 10/01/2029 | | | 250 | | | | 265,136 | |
| | | | | | | | |
| | | | | | | 1,175,617 | |
| | | | | | | | |
Pennsylvania – 7.2% | | | | | | | | |
Capital Region Water Water Revenue
Series 2018
5.00%, 07/15/2025 | | | 1,000 | | | | 1,037,061 | |
5.00%, 07/15/2026 | | | 510 | | | | 535,153 | |
City of Philadelphia PA Water & Wastewater Revenue
Series 2018-A
5.00%, 10/01/2048 | | | 3,050 | | | | 3,082,770 | |
Series 2019-B
5.00%, 11/01/2049 | | | 3,095 | | | | 3,120,943 | |
Series 2020-A
5.00%, 11/01/2045 | | | 5,000 | | | | 5,106,525 | |
| | |
| |
24 | AB IMPACT MUNICIPAL INCOME SHARES | | abfunds.com |
PORTFOLIO OF INVESTMENTS (continued)
| | | | | | | | |
| | | Principal
Amount
(000) | | | U.S. $ Value | |
| |
Delaware County Authority
(Elwyn Obligated Group)
Series 2017
5.00%, 06/01/2037 | | $ | 825 | | | $ | 727,220 | |
Hospitals & Higher Education Facilities Authority of Philadelphia (The)
(Temple University Health System Obligated Group)
Series 2017
5.00%, 07/01/2032 | | | 885 | | | | 898,224 | |
5.00%, 07/01/2034 | | | 230 | | | | 231,811 | |
AGM Series 2022
4.00%, 07/01/2040 | | | 4,475 | | | | 3,864,920 | |
Philadelphia Authority for Industrial Development
(City of Philadelphia PA)
Series 2018
5.00%, 05/01/2036 | | | 1,620 | | | | 1,675,306 | |
5.00%, 05/01/2037 | | | 1,390 | | | | 1,434,007 | |
5.00%, 05/01/2038 | | | 1,000 | | | | 1,029,554 | |
AGM Series 2017
5.00%, 12/01/2035 | | | 200 | | | | 210,557 | |
Philadelphia Authority for Industrial Development
(Russell Byers Charter School)
Series 2020
5.00%, 05/01/2040 | | | 1,050 | | | | 994,788 | |
Pittsburgh Water & Sewer Authority
AGM Series 2019-A
5.00%, 09/01/2044 | | | 2,000 | | | | 2,060,257 | |
AGM Series 2020-B
4.00%, 09/01/2045 | | | 2,250 | | | | 1,954,432 | |
4.00%, 09/01/2050 | | | 2,500 | | | | 2,117,981 | |
School District of the City of Erie (The)
AGM Series 2019-A
5.00%, 04/01/2031 | | | 405 | | | | 437,223 | |
AGM Series 2019-C
5.00%, 04/01/2028 | | | 1,850 | | | | 1,964,615 | |
5.00%, 04/01/2029 | | | 1,000 | | | | 1,070,990 | |
Wilkes-Barre Area School District/PA
BAM Series 2019
5.00%, 04/15/2059 | | | 1,620 | | | | 1,605,429 | |
| | | | | | | | |
| | | | | | | 35,159,766 | |
| | | | | | | | |
| | |
| |
| abfunds.com | | AB IMPACT MUNICIPAL INCOME SHARES | 25 |
PORTFOLIO OF INVESTMENTS (continued)
| | | | | | | | |
| | | Principal
Amount
(000) | | | U.S. $ Value | |
| |
Rhode Island – 3.0% | | | | | | | | |
Providence Public Building Authority
(City of Providence RI Lease)
AGM Series 2020-A
5.00%, 09/15/2030 | | $ | 2,890 | | | $ | 3,129,883 | |
5.00%, 09/15/2031 | | | 5,110 | | | | 5,508,751 | |
Rhode Island Health and Educational Building Corp.
(City of Providence RI)
BAM Series 2021-D
4.00%, 05/15/2038 | | | 2,930 | | | | 2,714,854 | |
4.00%, 05/15/2040 | | | 1,375 | | | | 1,253,706 | |
4.00%, 05/15/2041 | | | 2,485 | | | | 2,248,251 | |
| | | | | | | | |
| | | | | | | 14,855,445 | |
| | | | | | | | |
Texas – 0.7% | | | | | | | | |
Brownsville Independent School District
Series 2017
5.00%, 08/15/2023 | | | 750 | | | | 760,676 | |
City of Mission TX
BAM Series 2021
5.00%, 02/15/2028 | | | 1,000 | | | | 1,064,182 | |
5.00%, 02/15/2029 | | | 1,000 | | | | 1,070,994 | |
El Paso County Hospital District
Series 2017
5.00%, 08/15/2037 | | | 370 | | | | 365,545 | |
| | | | | | | | |
| | | | | | | 3,261,397 | |
| | | | | | | | |
Utah – 0.7% | | | | | | | | |
Ogden City School District Municipal Building Authority
(Ogden City School District)
Series 2018
5.00%, 01/15/2038 | | | 3,490 | | | | 3,579,833 | |
| | | | | | | | |
| | |
Washington – 0.7% | | | | | | | | |
Pend Oreille County Public Utility District No. 1 Box Canyon
Series 2018
5.00%, 01/01/2044 | | | 3,600 | | | | 3,458,005 | |
| | | | | | | | |
| | |
West Virginia – 1.4% | | | | | | | | |
Morgantown Utility Board, Inc.
Series 2018-B
5.00%, 12/01/2043 | | | 2,555 | | | | 2,652,901 | |
| | |
| |
26 | AB IMPACT MUNICIPAL INCOME SHARES | | abfunds.com |
PORTFOLIO OF INVESTMENTS (continued)
| | | | | | | | |
| | | Principal
Amount
(000) | | | U.S. $ Value | |
| |
West Virginia Hospital Finance Authority
(West Virginia United Health System Obligated Group)
Series 2016-A
4.00%, 06/01/2031 | | $ | 2,800 | | | $ | 2,685,558 | |
Series 2017-A
5.00%, 06/01/2047 | | | 1,775 | | | | 1,677,307 | |
| | | | | | | | |
| | | | | | | 7,015,766 | |
| | | | | | | | |
Wisconsin – 4.4% | | | | | | | | |
City of Milwaukee WI Sewerage System Revenue
Series 2021-S
5.00%, 06/01/2030 | | | 1,000 | | | | 1,068,814 | |
5.00%, 06/01/2031 | | | 1,000 | | | | 1,071,900 | |
Milwaukee Redevelopment Authority
(Milwaukee Public Schools Lease)
Series 2017
5.00%, 11/15/2025 | | | 200 | | | | 208,959 | |
Wisconsin Health & Educational Facilities Authority
(Hmong American Peace Academy Ltd.)
Series 2020
5.00%, 03/15/2050 | | | 3,520 | | | | 3,146,389 | |
Wisconsin Public Finance Authority
(Bancroft Neurohealth Obligated Group)
Series 2016
5.125%, 06/01/2048(a) | | | 4,430 | | | | 3,832,914 | |
Wisconsin Public Finance Authority
(NC A&T Real Estate Foundation LLC)
Series 2019
5.00%, 06/01/2044 | | | 6,315 | | | | 5,500,933 | |
Wisconsin Public Finance Authority
(Scotland Health Care System Obligated Group)
Series 2021-A
4.00%, 10/01/2047 | | | 8,255 | | | | 6,757,288 | |
| | | | | | | | |
| | | | | | | 21,587,197 | |
| | | | | | | | |
Total Municipal Obligations
(cost $542,970,842) | | | | | | | 457,365,058 | |
| | | | | | | | |
| | | | | | | | |
| | |
| |
| abfunds.com | | AB IMPACT MUNICIPAL INCOME SHARES | 27 |
PORTFOLIO OF INVESTMENTS (continued)
| | | | | | | | |
| | | Principal
Amount
(000) | | | U.S. $ Value | |
| |
CORPORATES - INVESTMENT
GRADE – 2.3% | | | | | | | | |
Industrial – 1.2% | | | | | | | | |
Consumer Cyclical - Other – 0.6% | | | | | | | | |
Conservation Fund A Nonprofit Corp. (The)
Series 2019
3.474%, 12/15/2029 | | $ | 3,267 | | | $ | 2,762,869 | |
| | | | | | | | |
| | |
Other Industrial – 0.5% | | | | | | | | |
Howard University
Series 2020
1.991%, 10/01/2025 | | | 1,000 | | | | 885,800 | |
2.291%, 10/01/2026 | | | 1,000 | | | | 871,140 | |
2.516%, 10/01/2025 | | | 1,000 | | | | 902,090 | |
| | | | | | | | |
| | | | | | | 2,659,030 | |
| | | | | | | | |
Services – 0.1% | | | | | | | | |
Bush Foundation
2.754%, 10/01/2050 | | | 1,000 | | | | 624,530 | |
| | | | | | | | |
| | | | | | | 6,046,429 | |
| | | | | | | | |
Financial Institutions – 1.1% | | | | | | | | |
Finance – 1.1% | | | | | | | | |
BlueHub Loan Fund, Inc.
Series 2020
3.099%, 01/01/2030 | | | 1,000 | | | | 853,613 | |
Low Income Investment Fund
Series 2019
3.711%, 07/01/2029 | | | 5,000 | | | | 4,540,239 | |
| | | | | | | | |
| | | | | | | 5,393,852 | |
| | | | | | | | |
Total Corporates - Investment Grade
(cost $13,267,000) | | | | | | | 11,440,281 | |
| | | | | | | | |
| | |
| | | Shares | | | | |
SHORT-TERM INVESTMENTS – 2.9% | | | | | | | | |
Investment Companies – 2.9% | | | | | | | | |
AB Fixed Income Shares, Inc. – Government Money Market Portfolio – Class AB, 2.67%(d)(e)(f)
(cost $14,329,903) | | | 14,329,903 | | | | 14,329,903 | |
| | | | | | | | |
| | |
Total Investments – 98.3%
(cost $570,567,745) | | | | | | | 483,135,242 | |
Other assets less liabilities – 1.7% | | | | | | | 8,500,655 | |
| | | | | | | | |
| | |
Net Assets – 100.0% | | | | | | $ | 491,635,897 | |
| | | | | | | | |
| | |
| |
28 | AB IMPACT MUNICIPAL INCOME SHARES | | abfunds.com |
PORTFOLIO OF INVESTMENTS (continued)
CENTRALLY CLEARED INFLATION (CPI) SWAPS (see Note C)
| | | | | | | | | | | | | | | | | | | | | | | | | | |
| | | | | | | | | Rate Type | | | | | | | | | | | |
Notional
Amount
(000) | | | Termination
Date | | | Payments
made
by the
Fund | | Payments
received
by the
Fund | | Payment
Frequency
Paid/
Received | | Market
Value | | | Upfront
Premiums
Paid/
(Received) | | | Unrealized
Appreciation
(Depreciation) | |
| USD | | | 3,750 | | | | 01/15/2025 | | | 4.028% | | CPI# | | Maturity | | $ | 142,638 | | | $ | – 0 | – | | $ | 142,638 | |
| USD | | | 2,800 | | | | 01/15/2027 | | | CPI# | | 3.466% | | Maturity | | | (126,264 | ) | | | (6,428 | ) | | | (119,836 | ) |
| USD | | | 19,100 | | | | 01/15/2029 | | | CPI# | | 3.735% | | Maturity | | | (131,138 | ) | | | – 0 | – | | | (131,138 | ) |
| USD | | | 17,000 | | | | 01/15/2030 | | | 2.650% | | CPI# | | Maturity | | | 1,542,781 | | | | – 0 | – | | | 1,542,781 | |
| USD | | | 7,500 | | | | 01/15/2031 | | | 2.782% | | CPI# | | Maturity | | | 581,725 | | | | – 0 | – | | | 581,725 | |
| USD | | | 4,400 | | | | 01/15/2031 | | | 2.989% | | CPI# | | Maturity | | | 255,589 | | | | – 0 | – | | | 255,589 | |
| USD | | | 5,570 | | | | 01/15/2032 | | | CPI# | | 3.064% | | Maturity | | | (258,141 | ) | | | – 0 | – | | | (258,141 | ) |
| USD | | | 5,180 | | | | 04/15/2032 | | | CPI# | | 2.971% | | Maturity | | | (272,150 | ) | | | – 0 | – | | | (272,150 | ) |
| | | | | | | | | | | | | | | | | | | | | | | | | | |
| | | | | | | | | | | | | | | | $ | 1,735,040 | | | $ | (6,428 | ) | | $ | 1,741,468 | |
| | | | | | | | | | | | | | | | | | | | | | | | | | |
| # | Variable interest rate based on the rate of inflation as determined by the Consumer Price Index (CPI). |
CENTRALLY CLEARED INTEREST RATE SWAPS (see Note C)
| | | | | | | | | | | | | | | | | | | | | | | | | | |
| | | | | | | | | Rate Type | | | | | | | | | | | |
Notional
Amount
(000) | | | Termination
Date | | | Payments
made
by the
Fund | | Payments
received
by the
Fund | | Payment
Frequency Paid/
Received | | Market
Value | | | Upfront
Premiums
Paid/
(Received) | | | Unrealized
Appreciation
(Depreciation) | |
| USD | | | 34,000 | | | | 04/15/2032 | | | 3.069% | | 1 Day
SOFR | | Annual | | $ | 2,075,947 | | | $ | – 0 | – | | $ | 2,075,947 | |
| USD | | | 6,000 | | | | 04/15/2032 | | | 3.065% | | 1 Day
SOFR | | Annual | | | 351,359 | | | | – 0 | – | | | 351,359 | |
| USD | | | 6,200 | | | | 02/15/2041 | | | 1.630% | | 3 Month
LIBOR | | Semi-Annual/ Quarterly | | | 1,980,737 | | | | – 0 | – | | | 1,980,737 | |
| USD | | | 5,000 | | | | 02/15/2041 | | | 1.760% | | 3 Month
LIBOR | | Semi-Annual/ Quarterly | | | 1,511,747 | | | | – 0 | – | | | 1,511,747 | |
| | | | | | | | | | | | | | | | | | | | | | | | | | |
| | | | | | | | | | | | | | | | $ | 5,919,790 | | | $ | – 0 | – | | $ | 5,919,790 | |
| | | | | | | | | | | | | | | | | | | | | | | | | | |
| (a) | Security is exempt from registration under Rule 144A or Regulation S of the Securities Act of 1933. These securities are considered restricted, but liquid and may be resold in transactions exempt from registration. At October 31, 2022, the aggregate market value of these securities amounted to $36,585,012 or 7.44% of net assets. |
| (b) | Floating Rate Security. Stated interest/floor/ceiling rate was in effect at October 31, 2022. |
| (c) | When-Issued or delayed delivery security. |
| (d) | Affiliated investments. |
| (e) | The rate shown represents the 7-day yield as of period end. |
| (f) | To obtain a copy of the fund’s shareholder report, please go to the Securities and Exchange Commission’s website at www.sec.gov, or call AB at (800) 227-4618. |
| | |
| |
| abfunds.com | | AB IMPACT MUNICIPAL INCOME SHARES | 29 |
PORTFOLIO OF INVESTMENTS (continued)
As of October 31, 2022, the Fund’s percentages of investments in municipal bonds that are insured and in insured municipal bonds that have been pre-refunded or escrowed to maturity are 15.4% and 0.0%, respectively.
Glossary:
AGM – Assured Guaranty Municipal
BAM – Build American Mutual
COP – Certificate of Participation
CPI – Consumer Price Index
DOT – Department of Transportation
ETM – Escrowed to Maturity
LIBOR – London Interbank Offered Rate
MUNIPSA – SIFMA Municipal Swap Index
SOFR – Secured Overnight Financing Rate
See notes to financial statements.
| | |
| |
30 | AB IMPACT MUNICIPAL INCOME SHARES | | abfunds.com |
STATEMENT OF ASSETS & LIABILITIES
October 31, 2022 (unaudited)
| | | | |
| Assets | |
Investments in securities, at value | |
Unaffiliated issuers (cost $556,237,842) | | $ | 468,805,339 | |
Affiliated issuers (cost $14,329,903) | | | 14,329,903 | |
Cash collateral due from broker | | | 2,571,113 | |
Interest receivable | | | 7,484,139 | |
Receivable for shares of beneficial interest sold | | | 879,344 | |
Receivable for variation margin on centrally cleared swaps | | | 364,591 | |
Receivable for investment securities sold | | | 105,000 | |
Receivable due from Adviser | | | 1,365 | |
Other assets | | | 10,841 | |
| | | | |
Total assets | | | 494,551,635 | |
| | | | |
| Liabilities | |
Payable for investment securities purchased | | | 1,495,350 | |
Dividends payable | | | 1,381,556 | |
Payable for shares of beneficial interest redeemed | | | 38,832 | |
| | | | |
Total liabilities | | | 2,915,738 | |
| | | | |
Net Assets | | $ | 491,635,897 | |
| | | | |
| Composition of Net Assets | |
Shares of beneficial interest, at par | | $ | 554 | |
Additional paid-in capital | | | 575,075,732 | |
Accumulated loss | | | (83,440,389 | ) |
| | | | |
Net Assets | | $ | 491,635,897 | |
| | | | |
Net Asset Value Per Share—unlimited shares of beneficial interest authorized, $.00001 par value (based on 55,376,915 common shares outstanding) | | $ | 8.88 | |
| | | | |
See notes to financial statements.
| | |
| |
| abfunds.com | | AB IMPACT MUNICIPAL INCOME SHARES | 31 |
STATEMENT OF OPERATIONS
Six Months Ended October 31, 2022 (unaudited)
| | | | | | | | |
| Investment Income | |
Interest | | $ | 8,151,834 | | | | | |
Dividends—Affiliated issuers | | | 112,823 | | | | | |
Other income(a) | | | 7,984 | | | | | |
| | | | | | | | |
Total investment income | | | | | | $ | 8,272,641 | |
| | | | | |
| Realized and Unrealized Gain (Loss) on Investment Transactions | | | | | | | | |
Net realized gain (loss) on: | | | | | | | | |
Investment transactions | | | | | | | (1,500,348 | ) |
Swaps | | | | | | | 6,812,145 | |
Net change in unrealized appreciation (depreciation) of: | | | | | | | | |
Investments | | | | | | | (50,422,038 | ) |
Swaps | | | | | | | (2,749,859 | ) |
| | | | | | | | |
Net loss on investment transactions | | | | | | | (47,860,100 | ) |
| | | | | | | | |
Net Decrease in Net Assets from Operations | | | | | | $ | (39,587,459 | ) |
| | | | | |
| (a) | Other income includes a reimbursement for investment in affiliated issuer (see Note B). |
See notes to financial statements.
| | |
| |
32 | AB IMPACT MUNICIPAL INCOME SHARES | | abfunds.com |
STATEMENT OF CHANGES IN NET ASSETS
| | | | | | | | |
| | | Six Months Ended
October 31, 2022
(unaudited) | | | Year Ended
April 30,
2022 | |
| Increase (Decrease) in Net Assets from Operations | | | | | | | | |
Net investment income | | $ | 8,272,641 | | | $ | 13,124,584 | |
Net realized gain (loss) on investment transactions | | | 5,311,797 | | | | (7,699,767 | ) |
Net change in unrealized appreciation (depreciation) of investments | | | (53,171,897 | ) | | | (51,368,884 | ) |
| | | | | | | | |
Net decrease in net assets from operations | | | (39,587,459 | ) | | | (45,944,067 | ) |
Distribution to Shareholders | | | (8,600,223 | ) | | | (12,908,351 | ) |
| Transactions in Shares of Beneficial Interest | | | | | | | | |
Net increase | | | 22,892,137 | | | | 117,602,750 | |
| | | | | | | | |
Total increase (decrease) | | | (25,295,545 | ) | | | 58,750,332 | |
| Net Assets | |
Beginning of period | | | 516,931,442 | | | | 458,181,110 | |
| | | | | | | | |
End of period | | $ | 491,635,897 | | | $ | 516,931,442 | |
| | | | | | | | |
See notes to financial statements.
| | |
| |
| abfunds.com | | AB IMPACT MUNICIPAL INCOME SHARES | 33 |
NOTES TO FINANCIAL STATEMENTS
October 31, 2022 (unaudited)
NOTE A
Significant Accounting Policies
AB Corporate Shares (the “Trust”) is registered under the Investment Company Act of 1940, as an open-end, diversified management investment company. The Trust, which is a Massachusetts Business Trust, operates as a “series” company currently offering five separate portfolios: AB Corporate Income Shares, AB Municipal Income Shares, AB Taxable Multi-Sector Income Shares, AB Impact Municipal Income Shares and AB Tax-Aware Real Return Income Shares. Each portfolio is considered to be a separate entity for financial reporting and tax purposes. This report relates only to AB Impact Municipal Income Shares (the “Fund”).
Shares of the Fund are offered exclusively to holders of accounts established under wrap fee programs sponsored and maintained by certain registered investment advisers approved by AllianceBernstein L.P. (the “Adviser”). The Fund’s shares may be purchased at the relevant net asset value without a sales charge or other fee. The financial statements have been prepared in conformity with U.S. generally accepted accounting principles (“U.S. GAAP”), which require management to make certain estimates and assumptions that affect the reported amounts of assets and liabilities in the financial statements and amounts of income and expenses during the reporting period. Actual results could differ from those estimates. The Fund is an investment company under U.S. GAAP and follows the accounting and reporting guidance applicable to investment companies. The following is a summary of significant accounting policies followed by the Fund.
1. Security Valuation
Portfolio securities are valued at market value determined on the basis of market quotations or, if market quotations are not readily available or are unreliable, at “fair value” as determined in accordance with procedures approved by and under the oversight of the Trust’s Board of Trustees (the “Board”). Pursuant to these procedures, the Adviser serves as the Fund’s valuation designee pursuant to Rule 2a-5 of the 1940 Act. In this capacity, the Adviser is responsible, among other things, for making all fair value determinations relating to the Fund’s portfolio investments, subject to the Board’s oversight.
In general, the market values of securities which are readily available and deemed reliable are determined as follows: securities listed on a national securities exchange (other than securities listed on the NASDAQ Stock Market, Inc. (“NASDAQ”)) or on a foreign securities exchange are valued at the last sale price at the close of the exchange or foreign securities exchange. If there has been no sale on such day, the securities are valued at the last traded price from the previous day. Securities listed on more
| | |
| |
34 | AB IMPACT MUNICIPAL INCOME SHARES | | abfunds.com |
NOTES TO FINANCIAL STATEMENTS (continued)
than one exchange are valued by reference to the principal exchange on which the securities are traded; securities listed only on NASDAQ are valued in accordance with the NASDAQ Official Closing Price; listed or over the counter (“OTC”) market put or call options are valued at the mid level between the current bid and ask prices. If either a current bid or current ask price is unavailable, the Adviser will have discretion to determine the best valuation (e.g., last trade price in the case of listed options); open futures are valued using the closing settlement price or, in the absence of such a price, the most recent quoted bid price. If there are no quotations available for the day of valuation, the last available closing settlement price is used; U.S. Government securities and any other debt instruments having 60 days or less remaining until maturity are generally valued at market by an independent pricing vendor, if a market price is available. If a market price is not available, the securities are valued at amortized cost. This methodology is commonly used for short term securities that have an original maturity of 60 days or less, as well as short term securities that had an original term to maturity that exceeded 60 days. In instances when amortized cost is utilized, the Valuation Committee (the “Committee”) must reasonably conclude that the utilization of amortized cost is approximately the same as the fair value of the security. Factors the Committee will consider include, but are not limited to, an impairment of the creditworthiness of the issuer or material changes in interest rates. Fixed-income securities, including mortgage-backed and asset-backed securities, may be valued on the basis of prices provided by a pricing service or at a price obtained from one or more of the major broker-dealers. In cases where broker-dealer quotes are obtained, the Adviser may establish procedures whereby changes in market yields or spreads are used to adjust, on a daily basis, a recently obtained quoted price on a security. Swaps and other derivatives are valued daily, primarily using independent pricing services, independent pricing models using market inputs, as well as third party broker-dealers or counterparties. Open-end mutual funds are valued at the closing net asset value per share, while exchange traded funds are valued at the closing market price per share.
Securities for which market quotations are not readily available (including restricted securities) or are deemed unreliable are valued at fair value as deemed appropriate by the Adviser. Factors considered in making this determination may include, but are not limited to, information obtained by contacting the issuer, analysts, analysis of the issuer’s financial statements or other available documents. In addition, the Fund may use fair value pricing for securities primarily traded in non-U.S. markets because most foreign markets close well before the Fund values its securities at 4:00 p.m., Eastern Time. The earlier close of these foreign markets gives rise to the possibility that significant events, including broad market moves, may have occurred in the interim and may materially affect the value of those
| | |
| |
| abfunds.com | | AB IMPACT MUNICIPAL INCOME SHARES | 35 |
NOTES TO FINANCIAL STATEMENTS (continued)
securities. To account for this, the Fund generally values many of its foreign equity securities using fair value prices based on third party vendor modeling tools to the extent available.
2. Fair Value Measurements
In accordance with U.S. GAAP regarding fair value measurements, fair value is defined as the price that the Fund would receive to sell an asset or pay to transfer a liability in an orderly transaction between market participants at the measurement date. U.S. GAAP establishes a framework for measuring fair value, and a three-level hierarchy for fair value measurements based upon the transparency of inputs to the valuation of an asset or liability (including those valued based on their market values as described in Note A.1 above). Inputs may be observable or unobservable and refer broadly to the assumptions that market participants would use in pricing the asset or liability. Observable inputs reflect the assumptions market participants would use in pricing the asset or liability based on market data obtained from sources independent of the Fund. Unobservable inputs reflect the Fund’s own assumptions about the assumptions that market participants would use in pricing the asset or liability based on the best information available in the circumstances. Each investment is assigned a level based upon the observability of the inputs which are significant to the overall valuation. The three-tier hierarchy of inputs is summarized below.
| | • | | Level 1—quoted prices in active markets for identical investments |
| | • | | Level 2—other significant observable inputs (including quoted prices for similar investments, interest rates, prepayment speeds, credit risk, etc.) |
| | • | | Level 3—significant unobservable inputs (including the Fund’s own assumptions in determining the fair value of investments) |
The fair value of debt instruments, such as bonds, and over-the-counter derivatives is generally based on market price quotations, recently executed market transactions (where observable) or industry recognized modeling techniques and are generally classified as Level 2. Pricing vendor inputs to Level 2 valuations may include quoted prices for similar investments in active markets, interest rate curves, coupon rates, currency rates, yield curves, option adjusted spreads, default rates, credit spreads and other unique security features in order to estimate the relevant cash flows which are then discounted to calculate fair values. If these inputs are unobservable and significant to the fair value, these investments will be classified as Level 3.
Other fixed income investments, including non-U.S. government and corporate debt, are generally valued using quoted market prices, if available, which are typically impacted by current interest rates, maturity dates and
| | |
| |
36 | AB IMPACT MUNICIPAL INCOME SHARES | | abfunds.com |
NOTES TO FINANCIAL STATEMENTS (continued)
any perceived credit risk of the issuer. Additionally, in the absence of quoted market prices, these inputs are used by pricing vendors to derive a valuation based upon industry or proprietary models which incorporate issuer specific data with relevant yield/spread comparisons with more widely quoted bonds with similar key characteristics. Those investments for which there are observable inputs are classified as Level 2. Where the inputs are not observable, the investments are classified as Level 3.
The following table summarizes the valuation of the Fund’s investments by the above fair value hierarchy levels as of October 31, 2022:
| | | | | | | | | | | | | | | | |
Investments in Securities: | | Level 1 | | | Level 2 | | | Level 3 | | | Total | |
Assets: | |
Long-Term Municipal Bonds | | $ | – 0 | – | | $ | 457,365,058 | | | $ | – 0 | – | | $ | 457,365,058 | |
Corporates – Investment Grade | | | – 0 | – | | | 11,440,281 | | | | – 0 | – | | | 11,440,281 | |
Short-Term Investments | | | 14,329,903 | | | | – 0 | – | | | – 0 | – | | | 14,329,903 | |
| | | | | | | | | | | | | | | | |
Total Investments in Securities | | | 14,329,903 | | | | 468,805,339 | | | | – 0 | – | | | 483,135,242 | |
Other Financial Instruments(a): | | | | | | | | | | | | | | | | |
Assets: | |
Centrally Cleared Inflation (CPI) Swaps | | | – 0 | – | | | 2,522,733 | | | | – 0 | – | | | 2,522,733 | (b) |
Centrally Cleared Interest Rate Swaps | | | – 0 | – | | | 5,919,790 | | | | – 0 | – | | | 5,919,790 | (b) |
Liabilities: | |
Centrally Cleared Inflation (CPI) Swaps | | | – 0 | – | | | (787,693 | ) | | | – 0 | – | | | (787,693 | )(b) |
| | | | | | | | | | | | | | | | |
Total | | $ | 14,329,903 | | | $ | 476,460,169 | | | $ | – 0 | – | | $ | 490,790,072 | |
| | | | | | | | | | | | | | | | |
| (a) | Other financial instruments are derivative instruments, such as futures, forwards and swaps, which are valued at the unrealized appreciation (depreciation) on the instrument. Other financial instruments may also include swaps with upfront premiums, written options and written swaptions which are valued at market value. |
| (b) | Only variation margin receivable/(payable) at period end is reported within the statement of assets and liabilities. This amount reflects cumulative unrealized appreciation (depreciation) on futures and centrally cleared swaps as reported in the portfolio of investments. Where applicable, centrally cleared swaps with upfront premiums are presented here at market value. |
3. Taxes
It is the Fund’s policy to meet the requirements of the Internal Revenue Code applicable to regulated investment companies and to distribute all of its investment company taxable income and net realized gains, if any, to shareholders. Therefore, no provisions for federal income or excise taxes are required.
In accordance with U.S. GAAP requirements regarding accounting for uncertainties in income taxes, management has analyzed the Fund’s tax positions taken or expected to be taken on federal and state income tax
| | |
| |
| abfunds.com | | AB IMPACT MUNICIPAL INCOME SHARES | 37 |
NOTES TO FINANCIAL STATEMENTS (continued)
returns for all open tax years (the current and the prior tax year) and has concluded that no provision for income tax is required in the Fund’s financial statements.
4. Investment Income and Investment Transactions
Dividend income is recorded on the ex-dividend date or as soon as the Fund is informed of the dividend. Interest income is accrued daily. Investment transactions are accounted for on the date the securities are purchased or sold. Investment gains or losses are determined on the identified cost basis. Non-cash dividends, if any, are recorded on the ex-dividend date at the fair value of the securities received. The Fund amortizes premiums and accretes discounts as adjustments to interest income. The Fund accounts for distributions received from REIT investments or from regulated investment companies as dividend income, realized gain, or return of capital based on information provided by the REIT or the investment company.
5. Dividends and Distributions
Dividends and distributions to shareholders, if any, are recorded on the ex-dividend date. Income dividends and capital gains distributions are determined in accordance with federal tax regulations and may differ from those determined in accordance with U.S. GAAP. To the extent these differences are permanent, such amounts are reclassified within the capital accounts based on their federal tax basis treatment; temporary differences do not require such reclassification.
NOTE B
Advisory Fee and Other Transactions with Affiliates
Under the terms of the advisory agreement, the Fund pays no advisory fee to the Adviser and the Adviser reimburses or pays for the Fund’s operating expenses. The Fund is an integral part of separately managed accounts in wrap fee programs and other investment programs. Typically, participants in these programs pay a fee to their investment adviser for all costs and expenses of the separately managed account, including costs and expenses associated with the Fund, and a fee is paid by their investment adviser to the Adviser. In certain cases, participants may have a direct relationship with the Adviser without the involvement of a third party investment adviser, in which case the participant would pay a fee directly to the Adviser. The Adviser serves as investment manager and adviser of the Fund and continuously furnishes an investment program for the Fund and manages, supervises and conducts the affairs of the Fund, subject to the supervisions of the Fund’s Board. The advisory agreement provides that the Adviser or an affiliate will furnish, or pay the expenses of the Fund for, office space, facilities and equipment, services of executive and other personnel of the Fund and certain administrative services.
| | |
| |
38 | AB IMPACT MUNICIPAL INCOME SHARES | | abfunds.com |
NOTES TO FINANCIAL STATEMENTS (continued)
The Fund has entered into a distribution agreement with AllianceBernstein Investments, Inc., the Fund’s principal underwriter (the “Underwriter”), to permit the Underwriter to distribute the Fund’s shares, which are sold at their net asset value without any sales charge. The Fund does not pay a fee for this service. The Underwriter is a wholly owned subsidiary of the Adviser.
AllianceBernstein Investor Services, Inc. (“ABIS”), a wholly-owned subsidiary of the Adviser, acts as the Fund’s registrar, transfer agent and dividend-disbursing agent. ABIS registers the transfer, issuance and redemption of Fund shares and disburses dividends and other distributions to Fund shareholders. The Fund does not pay a fee for this service.
The Fund may invest in AB Government Money Market Portfolio (the “Government Money Market Portfolio”) which has a contractual annual advisory fee rate of .20% of the portfolio’s average daily net assets and bears its own expenses. The Adviser has contractually agreed to waive .10% of the advisory fee of Government Money Market Portfolio (resulting in a net advisory fee of .10%) until August 31, 2023. In connection with the investment by the Fund in Government Money Market Portfolio, the Adviser has contractually agreed to reimburse the Fund in an amount equal to the Fund’s pro rata share of the effective advisory fee of Government Money Market Portfolio, as borne indirectly by the Fund as an acquired fund fee and expense. For the six months ended October 31, 2022, such reimbursement amounted to $7,984.
A summary of the Fund’s transactions in AB mutual funds for the six months ended October 31, 2022 is as follows:
| | | | | | | | | | | | | | | | | | | | |
Fund | | Market Value
4/30/22
(000) | | | Purchases
at Cost
(000) | | | Sales
Proceeds
(000) | | | Market Value
10/31/22
(000) | | | Dividend
Income
(000) | |
Government Money Market Portfolio | | $ | 20,057 | | | $ | 69,590 | | | $ | 75,317 | | | $ | 14,330 | | | $ | 113 | |
NOTE C
Investment Transactions
Purchases and sales of investment securities (excluding short-term investments) for the six months ended October 31, 2022 were as follows:
| | | | | | | | |
| | | Purchases | | | Sales | |
Investment securities (excluding U.S. government securities) | | $ | 41,179,877 | | | $ | 14,876,234 | |
U.S. government securities | | | – 0 | – | | | – 0 | – |
| | |
| |
| abfunds.com | | AB IMPACT MUNICIPAL INCOME SHARES | 39 |
NOTES TO FINANCIAL STATEMENTS (continued)
The cost of investments for federal income tax purposes was substantially the same as the cost for financial reporting purposes. Accordingly, gross unrealized appreciation and unrealized depreciation are as follows:
| | | | |
Gross unrealized appreciation | | $ | 8,446,398 | |
Gross unrealized depreciation | | | (88,217,643 | ) |
| | | | |
Net unrealized depreciation | | $ | (79,771,245 | ) |
| | | | |
1. Derivative Financial Instruments
The Fund may use derivatives in an effort to earn income and enhance returns, to replace more traditional direct investments, to obtain exposure to otherwise inaccessible markets (collectively, “investment purposes”), or to hedge or adjust the risk profile of its portfolio.
The principal types of derivatives utilized by the Fund, as well as the methods in which they may be used are:
The Fund may enter into swaps to hedge its exposure to interest rates, credit risk, equity markets or currencies. A swap is an agreement that obligates two parties to exchange a series of cash flows at specified intervals based upon or calculated by reference to changes in specified prices or rates for a specified amount of an underlying asset. The payment flows are usually netted against each other, with the difference being paid by one party to the other. In addition, collateral may be pledged or received by the Fund in accordance with the terms of the respective swaps to provide value and recourse to the Fund or its counterparties in the event of default, bankruptcy or insolvency by one of the parties to the swap.
Risks may arise as a result of the failure of the counterparty to the swap to comply with the terms of the swap. The loss incurred by the failure of a counterparty is generally limited to the net interim payment to be received by the Fund, and/or the termination value at the end of the contract. Therefore, the Fund considers the creditworthiness of each counterparty to a swap in evaluating potential counterparty risk. This risk is mitigated by having a netting arrangement between the Fund and the counterparty and by the posting of collateral by the counterparty to the Fund to cover the Fund’s exposure to the counterparty. Additionally, risks may arise from unanticipated movements in interest rates or in the value of the underlying securities. The Fund accrues for the interim payments on swaps on a daily basis, with the net amount recorded within unrealized appreciation (depreciation) of swaps on the statement of assets and liabilities, where applicable. Once the interim payments are settled in cash, the net amount is recorded as realized gain/(loss) on swaps on the
| | |
| |
40 | AB IMPACT MUNICIPAL INCOME SHARES | | abfunds.com |
NOTES TO FINANCIAL STATEMENTS (continued)
statement of operations, in addition to any realized gain/(loss) recorded upon the termination of swaps. Upfront premiums paid or received for swaps are recognized as cost or proceeds on the statement of assets and liabilities and are amortized on a straight line basis over the life of the contract. Amortized upfront premiums are included in net realized gain/(loss) from swaps on the statement of operations. Fluctuations in the value of swaps are recorded as a component of net change in unrealized appreciation (depreciation) of swaps on the statement of operations.
Certain standardized swaps, including certain interest rate swaps and credit default swaps, are (or soon will be) subject to mandatory central clearing. Cleared swaps are transacted through futures commission merchants (“FCMs”) that are members of central clearinghouses, with the clearinghouse serving as central counterparty, similar to transactions in futures contracts. Centralized clearing will be required for additional categories of swaps on a phased-in basis based on requirements published by the Securities and Exchange Commission and Commodity Futures Trading Commission.
At the time the Fund enters into a centrally cleared swap, the Fund deposits and maintains as collateral an initial margin with the broker, as required by the clearinghouse on which the transaction is effected. Such amount is shown as cash collateral due from broker on the statement of assets and liabilities. Pursuant to the contract, the Fund agrees to receive from or pay to the broker an amount of cash equal to the daily fluctuation in the value of the contract. Such receipts or payments are known as variation margin and are recorded by the Fund as unrealized gains or losses. Risks may arise from the potential inability of a counterparty to meet the terms of the contract. The credit/counterparty risk for centrally cleared swaps is generally less than non-centrally cleared swaps, since the clearinghouse, which is the issuer or counterparty to each centrally cleared swap, has robust risk mitigation standards, including the requirement to provide initial and variation margin. When the contract is closed, the Fund records a realized gain or loss equal to the difference between the value of the contract at the time it was opened and the time it was closed.
Interest Rate Swaps:
The Fund is subject to interest rate risk exposure in the normal course of pursuing its investment objectives. Because the Fund holds fixed rate bonds, the value of these bonds may decrease if interest rates rise. To help hedge against this risk and to maintain its ability to generate income at prevailing market rates, the Fund may enter into interest rate swaps. Interest rate swaps are agreements between two parties to exchange cash flows based on a notional amount. The
| | |
| |
| abfunds.com | | AB IMPACT MUNICIPAL INCOME SHARES | 41 |
NOTES TO FINANCIAL STATEMENTS (continued)
Fund may elect to pay a fixed rate and receive a floating rate, or, receive a fixed rate and pay a floating rate on a notional amount.
In addition, the Fund may also enter into interest rate swap transactions to preserve a return or spread on a particular investment or portion of its portfolio, or protecting against an increase in the price of securities the Fund anticipates purchasing at a later date. Interest rate swaps involve the exchange by a Fund with another party of their respective commitments to pay or receive interest (e.g., an exchange of floating rate payments for fixed rate payments) computed based on a contractually-based principal (or “notional”) amount. Interest rate swaps are entered into on a net basis (i.e., the two payment streams are netted out, with the Fund receiving or paying, as the case may be, only the net amount of the two payments).
During the six months ended October 31, 2022, the Fund held interest rate swaps for hedging purposes.
Inflation (CPI) Swaps:
Inflation swap agreements are contracts in which one party agrees to pay the cumulative percentage increase in a price index (the Consumer Price Index with respect to CPI swaps) over the term of the swap (with some lag on the inflation index), and the other pays a compounded fixed rate. Inflation swaps may be used to protect the net asset value, or NAV, of a Fund against an unexpected change in the rate of inflation measured by an inflation index since the value of these agreements is expected to increase if there are unexpected inflation increases.
During the six months ended October 31, 2022, the Fund held inflation (CPI) swaps for hedging purposes.
The Fund typically enters into International Swaps and Derivatives Association, Inc. Master Agreements (“ISDA Master Agreement”) with its OTC derivative contract counterparties in order to, among other things, reduce its credit risk to OTC counterparties. ISDA Master Agreements include provisions for general obligations, representations, collateral and events of default or termination. Under an ISDA Master Agreement, the Fund typically may offset with the OTC counterparty certain derivative financial instruments’ payables and/or receivables with collateral held and/or posted and create one single net payment (close-out netting) in the event of default or termination. In the event of a default by an OTC counterparty, the return of collateral with market value in excess of the Fund’s net liability, held by the defaulting party, may be delayed or denied.
The Fund’s ISDA Master Agreements may contain provisions for early termination of OTC derivative transactions in the event the net assets of
| | |
| |
42 | AB IMPACT MUNICIPAL INCOME SHARES | | abfunds.com |
NOTES TO FINANCIAL STATEMENTS (continued)
the Fund decline below specific levels (“net asset contingent features”). If these levels are triggered, the Fund’s OTC counterparty has the right to terminate such transaction and require the Fund to pay or receive a settlement amount in connection with the terminated transaction. If OTC derivatives were held at period end, please refer to netting arrangements by the OTC counterparty table below for additional details.
During the six months ended October 31, 2022, the Fund had entered into the following derivatives:
| | | | | | | | | | | | |
| | | Asset Derivatives | | | Liability Derivatives | |
Derivative Type | | Statement of
Assets and
Liabilities
Location | | Fair Value | | | Statement of
Assets and
Liabilities
Location | | Fair Value | |
Interest rate contracts | | Receivable/Payable for variation margin on centrally cleared swaps | | $ | 8,442,523 | * | | Receivable/Payable for variation margin on centrally cleared swaps | | $ | 781,265 | * |
| | | | | | | | | | | | |
Total | | | | $ | 8,442,523 | | | | | $ | 781,265 | |
| | | | | | | | | | | | |
| * | Only variation margin receivable/payable at period end is reported within the statement of assets and liabilities. This amount reflects cumulative unrealized appreciation (depreciation) on futures and centrally cleared swaps as reported in the portfolio of investments. |
| | | | | | | | | | |
Derivative Type | | Location of Gain
or (Loss) on
Derivatives
Within Statement of
Operations | | Realized Gain
or (Loss) on
Derivatives | | | Change in
Unrealized
Appreciation or
(Depreciation) | |
Interest rate contracts | | Net realized gain (loss) on swaps; Net change in unrealized appreciation (depreciation) of swaps | | $ | 6,812,145 | | | $ | (2,749,859 | ) |
| | | | | | | | | | |
Total | | | | $ | 6,812,145 | | | $ | (2,749,859 | ) |
| | | | | | | | | | |
The following table represents the average monthly volume of the Fund’s derivative transactions during the six months ended October 31, 2022:
| | | | |
Centrally Cleared Interest Rate Swaps: | | | | |
Average notional amount | | $ | 119,200,000 | |
Centrally Cleared Inflation Swaps: | | | | |
Average notional amount | | $ | 65,300,000 | |
| | |
| |
| abfunds.com | | AB IMPACT MUNICIPAL INCOME SHARES | 43 |
NOTES TO FINANCIAL STATEMENTS (continued)
NOTE D
Shares of Beneficial Interest
Transactions in shares of beneficial interest were as follows:
| | | | | | | | | | | | | | | | | | | | | | | | |
| | | | | | | | | | | | | | | | | | | | | | | | |
| | | Shares | | | | | | Amount | | | | |
| | | Six Months Ended
October 31, 2022
(unaudited) | | | Year Ended
April 30,
2022 | | | | | | Six Months Ended
October 31, 2022
(unaudited) | | | Year Ended
April 30,
2022 | | | | |
| | | | | | | | |
Shares sold | | | 6,778,246 | | | | 17,035,551 | | | | | | | $ | 64,474,030 | | | $ | 182,792,266 | | | | | |
| | | | | |
Shares redeemed | | | (4,374,516 | ) | | | (6,075,323 | ) | | | | | | | (41,581,893 | ) | | | (65,189,516 | ) | | | | |
| | | | | |
Net increase | | | 2,403,730 | | | | 10,960,228 | | | | | | | $ | 22,892,137 | | | $ | 117,602,750 | | | | | |
| | | | | |
NOTE E
Risks Involved in Investing in the Fund
Market Risk—The value of the Fund’s assets will fluctuate as the stock or bond market fluctuates. The value of the Fund’s investments may decline, sometimes rapidly and unpredictably, simply because of economic changes or other events, including public health crises (including the occurrence of a contagious disease or illness) and regional and global conflicts, that affect large portions of the market.
ESG Risk—Applying environmental, social and corporate governance (“ESG”) and sustainability criteria to the investment process may exclude securities of certain issuers for non-investment reasons and, therefore, the Fund may forgo some market opportunities available to funds that do not use ESG or sustainability criteria. Securities selected based on ESG factors may shift into and out of favor depending on market and economic conditions, and the Fund’s performance may at times be better or worse than the performance of funds that do not use ESG or sustainability criteria. Furthermore, “sustainability” is not a uniformly defined characteristic, and the Fund’s sustainability criteria may differ from those used by other funds. In addition, in evaluating an investment, the investment adviser is dependent upon information and data that may be incomplete, inaccurate or unavailable, which could adversely affect the analysis of the ESG and sustainability factors relevant to a particular investment.
Credit Risk—An issuer or guarantor of a fixed-income security, or the counterparty to a derivatives or other contract, may be unable or unwilling to make timely payments of interest or principal, or to otherwise honor its obligations. The issuer or guarantor may default, causing a loss of the full principal amount of a security and any accrued interest. The degree of risk for a particular security may be reflected in its credit rating. There is the possibility that the credit rating of a fixed-income security may be downgraded after purchase, which may adversely affect the value of the
| | |
| |
44 | AB IMPACT MUNICIPAL INCOME SHARES | | abfunds.com |
NOTES TO FINANCIAL STATEMENTS (continued)
security. Investments in fixed-income securities with lower ratings tend to have a higher probability that an issuer will default or fail to meet its payment obligations.
Municipal Market Risk—This is the risk that special factors may adversely affect the value of municipal securities and have a significant effect on the yield or value of the Fund’s investments in municipal securities. These factors include economic conditions, political or legislative changes, public health crises, uncertainties related to the tax status of municipal securities, and the rights of investors in these securities. To the extent that the Fund invests more of its assets in a particular state’s municipal securities, the Fund may be vulnerable to events adversely affecting that state, including economic, political and regulatory occurrences, court decisions, terrorism, public health crises (including the occurrence of a contagious disease or illness) and catastrophic natural disasters, such as hurricanes, fires or earthquakes. For example, the novel coronavirus (COVID-19) pandemic has significantly stressed the financial resources of many issuers of municipal securities, which could impair any such issuer’s ability to meet its financial obligations when due and adversely impact the value of its securities held by the Fund. As the full effects of the COVID-19 pandemic on state and local economies and on issuers of municipal securities are still uncertain, the financial difficulties of issuers of municipal securities may continue or worsen, adversely affecting the performance of the Fund. The Fund’s investments in certain municipal securities with principal and interest payments that are made from the revenues of a specific project or facility, and not general tax revenues, may have increased risks. Factors affecting the project or facility, such as local business or economic conditions, could have a significant effect on the project’s ability to make payments of principal and interest on these securities.
Congress has previously considered making changes to the municipal securities provisions of the Internal Revenue Code that could change the U.S. federal income tax treatment of certain types of municipal securities.
Tax Risk—There is no guarantee that all of the Fund’s income will remain exempt from federal or state income taxes. From time to time, the U.S. Government and the U.S. Congress consider changes in federal tax law that could limit or eliminate the federal tax exemption for municipal bond income, which would in effect reduce the income received by shareholders from the Fund by increasing taxes on that income. In such event, the Fund’s net asset value, or NAV, could also decline as yields on municipal bonds, which are typically lower than those on taxable bonds, would be expected to increase to approximately the yield of comparable taxable bonds. Actions or anticipated actions affecting the tax exempt status of municipal bonds could also result in significant shareholder redemptions of
| | |
| |
| abfunds.com | | AB IMPACT MUNICIPAL INCOME SHARES | 45 |
NOTES TO FINANCIAL STATEMENTS (continued)
Fund shares as investors anticipate adverse effects on the Fund or seek higher yields to offset the potential loss of the tax deduction. As a result, the Fund would be required to maintain higher levels of cash to meet the redemptions, which would negatively affect the Fund’s yield. The federal income tax treatment of payments in respect of certain derivative contracts is unclear.
Below Investment-Grade Securities Risk—Investments in fixed-income securities with lower ratings (commonly known as “junk bonds”) tend to have a higher probability that an issuer will default or fail to meet its payment obligations. These securities may be subject to greater price volatility due to such factors as specific corporate developments, interest rate sensitivity, negative perceptions of the junk bond market generally and may be more difficult to trade than other types of securities.
Interest-Rate Risk—Changes in interest rates will affect the value of investments in fixed-income securities. When interest rates rise, the value of existing investments in fixed-income securities tends to fall and this decrease in value may not be offset by higher income from new investments. Interest rate risk is generally greater for fixed-income securities with longer maturities or durations. The Fund may be subject to a greater risk of rising interest rates than would normally be the case due to the end of a recent period of historically low rates and the effect of potential government fiscal policy initiatives and resulting market reaction to those initiatives.
Inflation Risk—This is the risk that the value of assets or income from investments will be less in the future as inflation decreases the value of money. As inflation increases, the value of the Fund’s assets can decline as can the value of the Fund’s distributions. This risk is significantly greater for fixed-income securities with longer maturities.
Leverage Risk—When the Fund borrows money or otherwise leverages its investments, its performance may be volatile because leverage tends to exaggerate the effect of any increase or decrease in the value of the Fund’s investments. The Fund may create leverage through the use of reverse repurchase arrangements, forward currency exchange contracts, forward commitments, dollar rolls or futures or by borrowing money. The use of other types of derivative instruments by the Fund, such as options and swaps, may also result in a form of leverage. Leverage may result in higher returns to the Fund than if the Fund were not leveraged, but may also adversely affect returns, particularly if the market is declining.
Illiquid Investments Risk—Illiquid investments risk exists when particular investments, such as lower-rated securities, are or become difficult to
| | |
| |
46 | AB IMPACT MUNICIPAL INCOME SHARES | | abfunds.com |
NOTES TO FINANCIAL STATEMENTS (continued)
purchase or sell, possibly preventing the Fund from selling such investments at an advantageous price. The Fund is subject to illiquid investments risk because the market for municipal securities is generally smaller than many other markets. Derivatives and securities involving substantial market and credit risk tend to involve greater illiquid investments risk than most other types of investments.
Derivatives Risk—Derivatives may be difficult to price or unwind and leveraged so that small changes may produce disproportionate losses for the Fund. A short position in a derivative instrument involves the risk of a theoretically unlimited increase in the value of the underlying instrument, which could cause the Fund to suffer a (potentially unlimited) loss. Derivatives, especially over-the-counter derivatives, are also subject to counterparty risk, which is the risk that the counterparty (the party on the other side of the transaction) on a derivative transaction will be unable or unwilling to honor its contractual obligations to the Fund.
LIBOR Transition and Associated Risk—A Fund may be exposed to debt securities, derivatives or other financial instruments that utilize the London Interbank Offered Rate, or “LIBOR,” as a “benchmark” or “reference rate” for various interest rate calculations. In 2017, the United Kingdom Financial Conduct Authority (“FCA”), which regulates LIBOR, announced a desire to phase out the use of LIBOR by the end of 2021. The FCA and LIBOR’s administrator, ICE Benchmark Administration, have since announced that most LIBOR settings (which reflect LIBOR rates quoted in different currencies over various time periods) will no longer be published after the end of 2021 but that the most widely used U.S. Dollar LIBOR settings will continue to be published until June 30, 2023. However, banks were strongly encouraged to cease entering into agreements with counterparties referencing LIBOR by the end of 2021. It is possible that a subset of LIBOR settings will be published after these dates on a “synthetic” basis, but any such publications would be considered non-representative of the underlying market. Since 2018 the Federal Reserve Bank of New York has published the secured overnight funding rate (referred to as SOFR), which is intended to replace U.S. Dollar LIBOR. SOFR is a broad measure of the cost of borrowing cash overnight collateralized by U.S. Treasury securities in the repurchase agreement (repo) market and has been used increasingly on a voluntary basis in new instruments and transactions. In addition, on March 15, 2022, the Adjustable Interest Rate Act was signed into law. This law provides a statutory fallback mechanism to replace LIBOR with a benchmark rate that is selected by the Federal Reserve Board and based on SOFR for certain contracts that reference LIBOR without adequate fallback provisions.
The elimination of LIBOR or changes to other reference rates or any other changes or reforms to the determination or supervision of reference rates
| | |
| |
| abfunds.com | | AB IMPACT MUNICIPAL INCOME SHARES | 47 |
NOTES TO FINANCIAL STATEMENTS (continued)
could have an adverse impact on the market for, or value of, any securities or payments linked to those reference rates, which may adversely affect a Fund’s performance and/or net asset value. Uncertainty and risk also remain regarding the willingness and ability of issuers and lenders to include revised provisions in new and existing contracts or instruments. Consequently, the transition from LIBOR to other reference rates may lead to increased volatility and illiquidity in markets that are tied to LIBOR, fluctuations in values of LIBOR-related investments or investments in issuers that utilize LIBOR, increased difficulty in borrowing or refinancing and diminished effectiveness of hedging strategies, potentially adversely affecting a Fund’s performance. Furthermore, the risks associated with the expected discontinuation of LIBOR and transition may be exacerbated if the work necessary to effect an orderly transition to an alternative reference rate is not completed in a timely manner. Neither the effect of the LIBOR transition process nor its ultimate success can yet be known.
Indemnification Risk—In the ordinary course of business, the Fund enters into contracts that contain a variety of indemnifications. The Fund’s maximum exposure under these arrangements is unknown. However, the Fund has not had prior claims or losses pursuant to these indemnification provisions and expects the risk of loss thereunder to be remote. Therefore, the Fund has not accrued any liability in connection with these indemnification provisions.
Management Risk—The Fund is subject to management risk because it is an actively-managed investment fund. The Adviser will apply its investment techniques and risk analyses in making investment decisions, but there is no guarantee that its techniques will produce the intended results. Some of these techniques may incorporate, or rely upon, quantitative models, but there is no guarantee that these models will generate accurate forecasts, reduce risk or otherwise perform as expected.
NOTE F
Joint Credit Facility
A number of open-end mutual funds managed by the Adviser, including the Fund, participate in a $325 million revolving credit facility (the “Facility”) intended to provide short-term financing, if necessary, subject to certain restrictions in connection with abnormal redemption activity. Commitment fees related to the Facility are paid by the Adviser. The Fund did not utilize the Facility during the six months ended October 31, 2022.
| | |
| |
48 | AB IMPACT MUNICIPAL INCOME SHARES | | abfunds.com |
NOTES TO FINANCIAL STATEMENTS (continued)
NOTE G
Distributions to Shareholders
The tax character of distributions to be paid for the year ending April 30, 2023 will be determined at the end of the current fiscal year. The tax character of distributions paid during the fiscal years ended April 30, 2022 and April 30, 2021 were as follows:
| | | | | | | | |
| | | 2022 | | | 2021 | |
Distributions paid from: | | | | | | | | |
Ordinary income | | $ | 846,774 | | | $ | 485,107 | |
| | | | | | | | |
Total taxable distributions | | | 846,774 | | | | 485,107 | |
Tax exempt distributions | | | 12,061,577 | | | | 9,791,105 | |
| | | | | | | | |
Total distributions paid | | $ | 12,908,351 | | | $ | 10,276,212 | |
| | | | | | | | |
As of April 30, 2022, the components of accumulated earnings/(deficit) on a tax basis were as follows:
| | | | |
Undistributed tax-exempt income | | $ | 1,275,445 | |
Accumulated capital and other losses | | | (8,816,806 | )(a) |
Unrealized appreciation (depreciation) | | | (26,434,569 | )(b) |
| | | | |
Total accumulated earnings/(deficit) | | $ | (33,975,930 | )(c) |
| | | | |
| (a) | As of April 30, 2022, the Fund had a net capital loss carryforward of $8,816,806. |
| (b) | The differences between book-basis and tax-basis unrealized appreciation (depreciation) are attributable primarily to the tax treatment of swaps. |
| (c) | The difference between book-basis and tax-basis components of accumulated earnings/(deficit) are attributable primarily to dividends payable. |
For tax purposes, net realized capital losses may be carried over to offset future capital gains, if any. Funds are permitted to carry forward capital losses for an indefinite period, and such losses will retain their character as either short-term or long-term capital losses. As of April 30, 2022, the Fund had a net short-term capital loss carryforward of $8,715,816 and a net long-term capital loss carryforward of $100,990, which may be carried forward for an indefinite period.
NOTE H
Recent Accounting Pronouncements
In March 2020, the Financial Accounting Standards Board issued an Accounting Standards Update, ASU 2020-04, “Reference Rate Reform (Topic 848) – Facilitation of the Effects of Reference Rate Reform on Financial Reporting.” ASU 2020-04 provides optional guidance to ease the potential accounting burden due to the discontinuation of the LIBOR and other interbank-offered based reference rates. ASU 2020-04 is effective as of March 12, 2020 through December 31, 2022. Management is currently evaluating the impact, if any, of applying ASU 2020-04.
| | |
| |
| abfunds.com | | AB IMPACT MUNICIPAL INCOME SHARES | 49 |
NOTES TO FINANCIAL STATEMENTS (continued)
NOTE I
Subsequent Events
Management has evaluated subsequent events for possible recognition or disclosure in the financial statements through the date the financial statements are issued. Management has determined that there are no material events that would require disclosure in the Fund’s financial statements through this date.
| | |
| |
50 | AB IMPACT MUNICIPAL INCOME SHARES | | abfunds.com |
FINANCIAL HIGHLIGHTS
Selected Data For A Share Of Beneficial Interest Outstanding Throughout Each Period
| | | | | | | | | | | | | | | | | | | | | | | | |
| | | Six Months
Ended
October 31,
2022
(unaudited) | | | Year Ended April 30, | | | September 12, 2017(a) to April 30,
2018 | |
| | | 2022 | | | 2021 | | | 2020 | | | 2019 | |
| | | | | | | | | | | | | | | | | | | | | | | | |
| | | | |
Net asset value, beginning of period | | | $ 9.76 | | | | $ 10.91 | | | | $ 9.91 | | | | $ 10.19 | | | | $ 9.79 | | | | $ 10.00 | |
| | | | |
Income From Investment Operations | | | | | | | | | | | | | | | | | | | | | | | | |
| | | | | | |
Net investment income(b) | | | .15 | | | | .28 | | | | .31 | | | | .33 | | | | .33 | | | | .18 | |
| | | | | | |
Net realized and unrealized gain (loss) on investment transactions | | | (.87 | ) | | | (1.16 | ) | | | 1.00 | | | | (.27 | ) | | | .40 | | | | (.22 | ) |
| | | | | | |
Contributions from Affiliates | | | – 0 | – | | | – 0 | – | | | .00 | (c) | | | – 0 | – | | | – 0 | – | | | – 0 | – |
| | | | |
Net increase (decrease) in net asset value from operations | | | (.72 | ) | | | (.88 | ) | | | 1.31 | | | | .06 | | | | .73 | | | | (.04 | ) |
| | | | |
Less: Dividends | |
| | | | | | |
Dividends from net investment income | | | (.16 | ) | | | (.27 | ) | | | (.31 | ) | | | (.34 | ) | | | (.33 | ) | | | (.17 | ) |
| | | | |
Net asset value, end of period | | | $ 8.88 | | | | $ 9.76 | | | | $ 10.91 | | | | $ 9.91 | | | | $ 10.19 | | | | $ 9.79 | |
| | | | |
|
Total Return | |
| | | | | | |
Total investment return based on net asset value(d) | | | (7.49 | )% | | | (8.23 | )% | | | 13.32 | % | | | .40 | % | | | 7.56 | % | | | (.44 | )% |
| | | | | | |
Ratios/Supplemental Data | | | | | | | | | | | | | | | | | | | | | | | | |
| | | | | | |
Net assets, end of period (000’s omitted) | | | $491,636 | | | | $516,931 | | | | $458,181 | | | | $245,297 | | | | $132,964 | | | | $37,341 | |
| | | | | | |
Ratio to average net assets of: | | | | | | | | | | | | | | | | | | | | | | | | |
| | | | | | |
Net investment income | | | 3.16 | %^ | | | 2.59 | % | | | 2.88 | % | | | 3.18 | % | | | 3.35 | % | | | 2.89 | %^ |
| | | | | | |
Portfolio turnover rate | | | 3 | % | | | 13 | % | | | 14 | % | | | 2 | % | | | 23 | % | | | 8 | % |
| (a) | Commencement of operations. |
| (b) | Based on average shares outstanding. |
| (c) | Amount is less than $.005. |
| (d) | Total investment return is calculated assuming an initial investment made at the net asset value at the beginning of the period, reinvestment of all dividends and distributions at net asset value during the period, and redemption on the last day of the period. Total return does not reflect the deduction of taxes that a shareholder would pay on fund distributions or the redemption of fund shares. Total investment return calculated for a period of less than one year is not annualized. |
See notes to financial statements.
| | |
| |
| abfunds.com | | AB IMPACT MUNICIPAL INCOME SHARES | 51 |
BOARD OF TRUSTEES
| | |
Marshall C. Turner, Jr.(1),
Chairman Jorge A. Bermudez(1) Michael J. Downey(1) Onur Erzan, President and Chief Executive Officer | | Nancy P. Jacklin(1) Jeanette W. Loeb(1) Carol C. McMullen(1) Garry L. Moody(1) |
OFFICERS
| | |
Marc Uy(2), Vice President Matthew J. Norton(2), Vice President Emilie D. Wrapp, Secretary Michael B. Reyes, Senior Vice President | | Joseph J. Mantineo, Treasurer and Chief Financial Officer Phyllis J. Clarke, Controller Vincent S. Noto, Chief Compliance Officer |
| | |
Custodian and Accounting Agent State Street Bank and Trust Company
State Street Corporation CCB/5
1 Iron Street
Boston, MA 02210 Principal Underwriter AllianceBernstein Investments, Inc.
501 Commerce Street Nashville, TN 37203 | | Legal Counsel Seward & Kissel LLP
One Battery Park Plaza
New York, NY 10004 Independent Registered Public Accounting Firm Ernst & Young LLP One Manhattan West
New York, NY 10001 |
Transfer Agent AllianceBernstein Investor Services, Inc. P.O. Box 786003
San Antonio, TX 78278
Toll-Free (800) 221-5672 | | |
| 1 | Member of the Audit Committee, the Governance and Nominating Committee, and the Independent Directors Committee. |
| 2 | The day-to-day management of, and investment decisions for, the Fund’s Portfolio are made by the Adviser’s Municipal Impact Investment Team. Messrs. Norton and Uy are the investment professionals primarily responsible for the day-to-day management of the Fund’s Portfolio. |
| | |
| |
52 | AB IMPACT MUNICIPAL INCOME SHARES | | abfunds.com |
Operation and Effectiveness of the Fund’s Liquidity Risk Management Program:
In October 2016, the Securities and Exchange Commission (“SEC”) adopted the open-end fund liquidity rule (the “Liquidity Rule”). In June 2018 the SEC adopted a requirement that funds disclose information about the operation and effectiveness of their Liquidity Risk Management Program (“LRMP”) in their reports to shareholders.
One of the requirements of the Liquidity Rule is for the Fund to designate an Administrator of the Fund’s Liquidity Risk Management Program. The Administrator of the Fund’s LRMP is AllianceBernstein L.P., the Fund’s investment adviser (the “Adviser”). The Adviser has delegated the responsibility to its Liquidity Risk Management Committee (the “Committee”).
Another requirement of the Liquidity Rule is for the Fund’s Board of Trustees (the “Fund Board”) to receive an annual written report from the Administrator of the LRMP, which addresses the operation of the Fund’s LRMP and assesses its adequacy and effectiveness. The Adviser provided the Fund Board with such annual report during the first quarter of 2022, which covered the period January 1, 2021 through December 31, 2021 (the “Program Reporting Period”).
The LRMP’s principal objectives include supporting the Fund’s compliance with limits on investments in illiquid assets and mitigating the risk that the Fund will be unable to meet its redemption obligations in a timely manner.
Pursuant to the LRMP, the Fund classifies the liquidity of its portfolio investments into one of the four categories defined by the SEC: Highly Liquid, Moderately Liquid, Less Liquid, and Illiquid. These classifications are reported to the SEC on Form N-PORT.
During the Program Reporting Period, the Committee reviewed whether the Fund’s strategy is appropriate for an open-end structure, incorporating any holdings of less liquid and illiquid assets. If the Fund participated in derivative transactions, the exposure from such transactions were considered in the LRMP.
The Committee also performed an analysis to determine whether the Fund is required to maintain a Highly Liquid Investment Minimum (“HLIM”). The Committee also incorporated the following information when determining the Fund’s reasonably anticipated trading size for purposes of liquidity monitoring: historical net redemption activity, a Fund’s concentration in an issuer, shareholder concentration, investment performance, total net assets, and distribution channels.
The Adviser informed the Fund Board that the Committee believes the Fund’s LRMP is adequately designed, has been implemented as intended,
| | |
| |
| abfunds.com | | AB IMPACT MUNICIPAL INCOME SHARES | 53 |
and has operated effectively since its inception. No material exceptions have been noted since the implementation of the LRMP. During the Program Reporting Period, liquidity in all markets was significantly recovered and improved compared to the prior reporting period which included extreme levels of price volatility and relative illiquidity beginning in March 2020 with COVID-19 impacts. As such, the program operated in a relatively robust and benign liquidity environment experienced in markets during the Program Reporting Period. There were no liquidity events that impacted the Fund or its ability to timely meet redemptions during the Program Reporting Period.
| | |
| |
54 | AB IMPACT MUNICIPAL INCOME SHARES | | abfunds.com |
Information Regarding the Review and Approval of the Fund’s Advisory Agreement
The disinterested trustees (the “directors”) of AB Corporate Shares (the “Company”) unanimously approved the continuance of the Company’s Advisory Agreement with the Adviser in respect of AB Impact Municipal Income Shares (the “Fund”) at a meeting held by video conference on November 2-4, 2021 (the “Meeting”).
Prior to approval of the continuance of the Advisory Agreement, the directors had requested from the Adviser, and received and evaluated, extensive materials. They reviewed the proposed continuance of the Advisory Agreement with the Adviser and with experienced counsel who are independent of the Adviser, who advised on the relevant legal standards. The directors also reviewed additional materials, including comparative analytical data prepared by the Senior Analyst for the Fund. The directors also discussed the proposed continuance in private sessions with counsel.
The directors noted that the Fund is designed as a vehicle for the wrap fee account market (where investors pay fees to a wrap fee sponsor which pays investment fees and expenses from such fee). The directors also noted that no advisory fee is payable by the Fund, that the Advisory Agreement does not include the reimbursement provision for certain administrative expenses included in the advisory agreements of most of the open-end AB Funds, and that the Adviser is responsible for payment of the Fund’s ordinary expenses. The directors noted that the Company acknowledges in the Advisory Agreement that the Adviser and its affiliates expect to receive compensation from third parties in connection with services provided under the Advisory Agreement. The directors further noted that the Adviser receives payments from the wrap fee program sponsors (the “Sponsors”) that use the Fund as an investment vehicle for their clients.
The directors considered their knowledge of the nature and quality of the services provided by the Adviser to the Fund gained from their experience as directors or trustees of most of the registered investment companies advised by the Adviser, their overall confidence in the Adviser’s integrity and competence they have gained from that experience, the Adviser’s initiative in identifying and raising potential issues with the directors and its responsiveness, frankness and attention to concerns raised by the directors in the past, including the Adviser’s willingness to consider and implement organizational and operational changes designed to improve investment results and the services provided to the AB Funds. The directors noted that they have four regular meetings each year, at each of which they review extensive materials and information from the Adviser, including information on the investment performance of the Fund and the money market fund advised by the Adviser in which the Fund invests a portion of its assets.
| | |
| |
| abfunds.com | | AB IMPACT MUNICIPAL INCOME SHARES | 55 |
The directors also considered all factors they believed relevant, including the specific matters discussed below. During the course of their deliberations, the directors evaluated, among other things, the reasonableness of the advisory fee. The directors did not identify any particular information that was all-important or controlling, and different directors may have attributed different weights to the various factors. The directors determined that the selection of the Adviser to manage the Fund and the overall arrangements between the Fund and the Adviser, as provided in the Advisory Agreement, including the advisory fee, were fair and reasonable in light of the services performed, expenses incurred and such other matters as the directors considered relevant in the exercise of their business judgment. The material factors and conclusions that formed the basis for the directors’ determinations included the following:
Nature, Extent and Quality of Services Provided
The directors considered the scope and quality of services provided by the Adviser under the Advisory Agreement, including the quality of the investment research capabilities of the Adviser and the other resources it has dedicated to performing services for the Fund. The directors noted that the Adviser from time to time reviews the Fund’s investment strategies and from time to time proposes changes intended to improve the Fund’s relative or absolute performance for the directors’ consideration. They also noted the professional experience and qualifications of the Fund’s portfolio management team and other senior personnel of the Adviser. The quality of administrative and other services, including the Adviser’s role in coordinating the activities of the Fund’s other service providers, also was considered. The directors concluded that, overall, they were satisfied with the nature, extent and quality of services provided to the Fund under the Advisory Agreement.
Costs of Services Provided and Profitability
The directors reviewed a schedule of the revenues and expenses and related notes indicating the profitability of the Fund to the Adviser for calendar years 2019 and 2020 that had been prepared with an expense allocation methodology arrived at in consultation with an independent consultant at the request of the directors. The directors noted the assumptions and methods of allocation used by the Adviser in preparing fund-specific profitability data and understood that there are a number of potentially acceptable allocation methodologies for information of this type. The directors noted that the profitability information reflected all revenues and expenses of the Adviser’s relationship with the Fund. The directors recognized that it is difficult to make comparisons of the profitability of the Advisory Agreement with the profitability of fund advisory contracts for unaffiliated funds because comparative information is not generally publicly available and is affected by numerous factors. The directors focused on the profitability of the Adviser’s relationship with the Fund before taxes and distribution expenses. The directors concluded that the Adviser’s level of profitability from its relationship with the Fund was not unreasonable.
| | |
| |
56 | AB IMPACT MUNICIPAL INCOME SHARES | | abfunds.com |
Fall-Out Benefits
The directors considered the other benefits to the Adviser and its affiliates from their relationships with the Fund and the money market fund advised by the Adviser in which the Fund invests. The directors noted that the Adviser is compensated by the Sponsors. The directors understood that the Adviser also might derive reputational and other benefits from its association with the Fund.
Investment Results
In addition to the information reviewed by the directors in connection with the Meeting, the directors receive detailed performance information for the Fund at each regular Board meeting during the year.
At the Meeting, the directors reviewed performance information prepared by an independent service provider (the “15(c) service provider”), showing the performance of the Fund against a group of similar funds (“peer group”) and a larger group of similar funds (“peer universe”), each selected by the 15(c) service provider, and information prepared by the Adviser showing the Fund’s performance against a broad-based securities market index, in each case for the 1- and 3-year periods ended July 31, 2021 and (in the case of comparisons with the broad-based securities market index) for the period from inception. The directors were cognizant that the Fund was neither designed nor offered as a standalone investment and was intended to serve solely as a component of certain separately managed accounts (“SMAs”). The Adviser had explained that this attribute made it difficult to select an appropriate benchmark for the Fund. At the directors’ request, the Adviser provided information showing the weighting of the Fund in a current SMA and the overall performance of the SMA versus its stated benchmark. Based on their review, the directors concluded that the Fund’s investment performance was acceptable.
Advisory Fees
The directors considered the advisory fee rate payable by the Fund to the Adviser (zero) and information provided by the 15(c) service provider concerning advisory fee rates payable by other funds in the same category as the Fund. The directors recognized that it is difficult to make comparisons of advisory fees because there are variations in the services that are included in the fees payable by other funds.
The directors noted the unusual arrangements in the Advisory Agreement providing for no advisory fee but were cognizant that the Adviser is indirectly compensated by the Sponsors for its services to the Fund. The directors reviewed the fee arrangements between the Adviser and each of the current Sponsors and noted that such fees were negotiated on an arm’s length basis and were within the range of fees paid by wrap fee sponsors to other advisers of similar funds. While the Adviser’s fee arrangements with the Sponsors vary, the directors acknowledged the
| | |
| |
| abfunds.com | | AB IMPACT MUNICIPAL INCOME SHARES | 57 |
Adviser’s view that a portion of such fees (less the expenses of the Fund paid by the Adviser) may reasonably be viewed as compensating the Adviser for advisory services it provides to the Fund (the “implied fee”) and that the Adviser believes that while the Sponsors pay the Adviser different fee rates, the rate of fee attributable to Fund management at the Fund level is the same for all Sponsors. The directors also considered the fee rate schedules used by other registered investment companies that invest in fixed income securities that are advised by the Adviser.
The Adviser informed the directors that there were no institutional products managed by the Adviser that utilize investment strategies similar to those of the Fund.
The directors did not consider comparative expense information for the Fund because the Fund does not bear ordinary expenses.
Economies of Scale
The directors did not consider the extent to which fee levels in the Advisory Agreement for the Fund reflect economies of scale because the Advisory Agreement does not provide for any compensation to be paid to the Adviser by the Fund and the Fund’s expense ratio is zero. They did note, however, that the fee payable to the Adviser by the current Sponsors declines at a breakpoint based on either individual account sizes or on total assets managed by the Adviser for the Sponsor.
| | |
| |
58 | AB IMPACT MUNICIPAL INCOME SHARES | | abfunds.com |
This page is not part of the Shareholder Report or the Financial Statements.
AB FAMILY OF FUNDS
US EQUITY
CORE
Core Opportunities Fund
Select US Equity Portfolio
Sustainable US Thematic Portfolio
GROWTH
Concentrated Growth Fund
Discovery Growth Fund
Growth Fund
Large Cap Growth Fund
Small Cap Growth Portfolio
VALUE
Discovery Value Fund
Equity Income Fund
Relative Value Fund
Small Cap Value Portfolio
Value Fund
INTERNATIONAL/ GLOBAL EQUITY
CORE
Global Core Equity Portfolio
International Strategic Core Portfolio
Sustainable Global Thematic Fund
Sustainable International Thematic Fund
Tax-Managed Wealth Appreciation Strategy
Wealth Appreciation Strategy
GROWTH
Concentrated International Growth Portfolio
VALUE
All China Equity Portfolio
International Value Fund
FIXED INCOME
MUNICIPAL
High Income Municipal Portfolio
Intermediate California Municipal Portfolio
Intermediate Diversified Municipal Portfolio
Intermediate New York Municipal Portfolio
Municipal Bond Inflation Strategy
Tax-Aware Fixed Income Opportunities Portfolio
National Portfolio
Arizona Portfolio
California Portfolio
Massachusetts Portfolio
Minnesota Portfolio
New Jersey Portfolio
New York Portfolio
Ohio Portfolio
Pennsylvania Portfolio
Virginia Portfolio
TAXABLE
Bond Inflation Strategy
Global Bond Fund
High Income Fund
High Yield Portfolio
Income Fund
Intermediate Duration Portfolio
Limited Duration High Income Portfolio
Short Duration Income Portfolio
Short Duration Portfolio
Sustainable Thematic Credit Portfolio
Total Return Bond Portfolio
ALTERNATIVES
All Market Real Return Portfolio
Global Real Estate Investment Fund
Select US Long/Short Portfolio
MULTI-ASSET
All Market Income Portfolio
All Market Total Return Portfolio
Emerging Markets Multi-Asset Portfolio
Global Risk Allocation Fund
Sustainable Thematic Balanced Portfolio
Tax-Managed All Market Income Portfolio
CLOSED-END FUNDS
AllianceBernstein Global High Income Fund
AllianceBernstein National Municipal Income Fund
EXCHANGE-TRADED FUNDS
Tax-Aware Short Duration Municipal ETF
Ultra Short Income ETF
We also offer Government Money Market Portfolio, which serves as the money market fund exchange vehicle for the AB mutual funds. You could lose money by investing in the Fund. Although the Fund seeks to preserve the value of your investment at $1.00 per share, it cannot guarantee it will do so. The Fund may impose a fee upon sale of your shares or may temporarily suspend your ability to sell shares if the Fund’s liquidity falls below required minimums because of market conditions or other factors. An investment in the Fund is not insured or guaranteed by the Federal Deposit Insurance Corporation or any other government agency. The Fund’s sponsor has no legal obligation to provide financial support to the Fund, and you should not expect that the sponsor will provide financial support to the Fund at any time.
Investors should consider the investment objectives, risks, charges and expenses of the Fund carefully before investing. For copies of our prospectus or summary prospectus, which contain this and other information, visit us online at www.abfunds.com or contact your AB representative. Please read the prospectus and/or summary prospectus carefully before investing.
| | |
| |
| abfunds.com | | AB IMPACT MUNICIPAL INCOME SHARES | 59 |
NOTES
| | |
| |
60 | AB IMPACT MUNICIPAL INCOME SHARES | | abfunds.com |
AB IMPACT MUNICIPAL INCOME SHARES
1345 Avenue of the Americas
New York, NY 10105
800 221 5672
IMISH-0152-1022 
OCT 10.31.22

SEMI-ANNUAL REPORT
AB MUNICIPAL INCOME SHARES

| | |
| |
| Investment Products Offered | | • Are Not FDIC Insured • May Lose Value • Are Not Bank Guaranteed |
Investors should consider the investment objectives, risks, charges and expenses of the Fund carefully before investing. For copies of our prospectus or summary prospectus, which contain this and other information, visit us online at www.abfunds.com or contact your AB representative. Please read the prospectus and/or summary prospectus carefully before investing.
This shareholder report must be preceded or accompanied by the Fund’s prospectus for individuals who are not current shareholders of the Fund.
You may obtain a description of the Fund’s proxy voting policies and procedures, and information regarding how the Fund voted proxies relating to portfolio securities during the most recent 12-month period ended June 30, without charge. Simply visit AB’s website at www.abfunds.com, or go to the Securities and Exchange Commission’s (the “Commission”) website at www.sec.gov, or call AB at (800) 227 4618.
The Fund files its complete schedule of portfolio holdings with the Commission for the first and third quarters of each fiscal year as an exhibit to its reports on Form N-PORT. The Fund’s Form N-PORT reports are available on the Commission’s website at www.sec.gov. AB publishes full portfolio holdings for the Fund monthly at www.abfunds.com.
AllianceBernstein Investments, Inc. (ABI) is the distributor of the AB family of mutual funds. ABI is a member of FINRA and is an affiliate of AllianceBernstein L.P., the Adviser of the funds.
The [A/B] logo is a registered service mark of AllianceBernstein and AllianceBernstein® is a registered service mark used by permission of the owner, AllianceBernstein L.P.
| | |
| FROM THE PRESIDENT | |  |
Dear Shareholder,
We’re pleased to provide this report for AB Municipal Income Shares (the “Fund”). Please review the discussion of Fund performance, the market conditions during the reporting period and the Fund’s investment strategy.
At AB, we’re striving to help our clients achieve better outcomes by:
| + | | Fostering diverse perspectives that give us a distinctive approach to navigating global capital markets |
| + | | Applying differentiated investment insights through a connected global research network |
| + | | Embracing innovation to design better ways to invest and leading-edge mutual-fund solutions |
Whether you’re an individual investor or a multibillion-dollar institution, we’re putting our knowledge and experience to work for you every day.
For more information about AB’s comprehensive range of products and shareholder resources, please log on to www.abfunds.com.
Thank you for your investment in AB mutual funds—and for placing your trust in our firm.
Sincerely,

Onur Erzan
President and Chief Executive Officer, AB Mutual Funds
| | |
| |
| abfunds.com | | AB MUNICIPAL INCOME SHARES | 1 |
SEMI-ANNUAL REPORT
December 14, 2022
This report provides management’s discussion of fund performance for AB Municipal Income Shares for the semi-annual reporting period ended October 31, 2022. Please note, shares of this Fund are available only to separately managed accounts or participants in “wrap fee” programs or other investment programs approved by the Adviser.
The investment objective of the Fund is to earn the highest level of current income, exempt from federal taxation, that is available consistent with what the Adviser considers to be an appropriate level of risk.
NAV RETURNS AS OF OCTOBER 31, 2022 (unaudited)
| | | | | | | | |
| | |
| | | 6 Months | | | 12 Months | |
| | |
| AB MUNICIPAL INCOME SHARES | | | -7.09% | | | | -15.69% | |
| | |
| Bloomberg Municipal Bond Index | | | -4.43% | | | | -11.98% | |
INVESTMENT RESULTS
The table above shows the Fund’s performance compared to its benchmark, the Bloomberg Municipal Bond Index, for the six- and 12-month periods ended October 31, 2022.
During both periods, the Fund underperformed the benchmark. The Fund is generally used to provide exposure to lower-rated municipal bonds and longer-duration bonds within separately managed account strategies. The Fund was overweight lower-rated (noninvestment-grade) bonds, relative to the benchmark, which is fully composed of investment-grade bonds. This overweight detracted from performance for both periods.
During the six-month period, security selection within the industrial revenue bond/airline sector added and detracted within the special tax sector. Over the 12-month period, security selection within public primary/secondary education added and detracted within the multi-family housing sector. During both periods, yield-curve positioning detracted overall, though underweights to the intermediate part of the curve contributed.
The Fund utilized derivatives for hedging purposes in the form of interest rate swaps, which detracted from absolute performance for both periods, as well as Consumer Price Index swaps, which had no material impact for either period, and credit default swaps, which had no material impact for the 12-month period.
| | |
| |
2 | AB MUNICIPAL INCOME SHARES | | abfunds.com |
MARKET REVIEW AND INVESTMENT STRATEGY
Yields continued their ascent higher toward the end of the reporting period ended October 31, 2022. During the 12-month period, the yield on a 10-Year AAA municipal bond rose to 3.39% from 1.22% and the yield on the 10-Year US Treasury rose to 4.06% from 1.58%. Demand for municipals continued to weaken during the six-month period, as investors have pulled approximately $104.8 billion year to date from municipal bond mutual funds and exchange-traded funds as of October 26, 2022. In addition to broader fixed-income market volatility, these municipal market outflows contributed to municipal underperformance versus US Treasuries, with 10-Year AAA Muni/Treasury after-tax spreads widening 73 basis points (“b.p.”) during the 12-month period and 1 b.p. during the six-month period. Average BBB credit spreads widened during the 12-month and six-month periods by approximately 60 b.p. and 26 b.p., respectively.
The Fund’s Senior Investment Management Team relies on an investment process that combines quantitative and fundamental research to build effective municipal bond portfolios.
The Fund may purchase municipal securities that are insured under policies issued by certain insurance companies. Historically, insured municipal securities typically received a higher credit rating, which meant that the issuer of the securities paid a lower interest rate. As a result of declines in the credit quality and associated downgrades of most bond insurers, insurance has less value than it did in the past. The market now values insured municipal securities primarily based on the credit quality of the issuer of the security, with little value given to the insurance feature. In purchasing such insured securities, the Adviser evaluates the risk and return of municipal securities through its own research. If an insurance company’s rating is downgraded or the company becomes insolvent, the prices of municipal securities insured by the insurance company may decline. As of October 31, 2022, the Fund’s percentages of investments in municipal bonds that are insured and in insured municipal bonds that have been pre-refunded or escrowed to maturity were 1.85% and 0.00%, respectively.
INVESTMENT POLICIES
The Fund pursues its objective by investing principally in high-yielding municipal securities that may be noninvestment grade or investment-grade. As a matter of fundamental policy, the Fund invests, under normal circumstances, at least 80% of its net assets in municipal securities that pay interest that is exempt from federal income tax. These securities may pay interest that is subject to the federal alternative minimum tax for certain taxpayers.
(continued on next page)
| | |
| |
| abfunds.com | | AB MUNICIPAL INCOME SHARES | 3 |
The Adviser selects securities for purchase or sale based on its assessment of the securities’ risk and return characteristics as well as the securities’ impact on the overall risk and return characteristics of the Fund. In making this assessment, the Adviser takes into account various factors, including the credit quality and sensitivity to interest rates of the securities under consideration and of the Fund’s other holdings.
The Fund may invest without limit in lower-rated securities (“junk bonds”), which may include securities having the lowest rating, and in unrated securities that, in the Adviser’s judgment, would be lower-rated securities if rated. The Fund may invest in fixed-income securities with any maturity or duration. The Fund will seek to increase income for shareholders by investing in longer maturity bonds. Consistent with its objective of seeking a higher level of income, the Fund may experience greater volatility and a higher risk of loss of principal than other municipal funds.
The Fund may also invest in tender option bond transactions (“TOBs”); forward commitments; zero-coupon municipal securities and variable-, floating- and inverse-floating-rate municipal securities; certain types of mortgage-related securities; and derivatives, such as options, futures contracts, forwards and swaps.
The Fund may make short sales of securities or maintain a short position, and may use other investment techniques. The Fund may use leverage for investment purposes to increase income through the use of TOBs and derivative instruments, such as interest rate swaps.
| | |
| |
4 | AB MUNICIPAL INCOME SHARES | | abfunds.com |
DISCLOSURES AND RISKS
Benchmark Disclosure
The Bloomberg Municipal Bond Index is unmanaged and does not reflect fees and expenses associated with the active management of a fund. The Bloomberg Municipal Bond Index represents the performance of the long-term tax-exempt bond market consisting of investment-grade bonds. An investor cannot invest directly in an index, and its results are not indicative of the performance for any specific investment, including the Fund.
A Word About Risk
Market Risk: The value of the Fund’s assets will fluctuate as the stock or bond market fluctuates. The value of the Fund’s investments may decline, sometimes rapidly and unpredictably, simply because of economic changes or other events, including public health crises (including the occurrence of a contagious disease or illness) and regional and global conflicts, that affect large portions of the market.
Credit Risk: An issuer or guarantor of a fixed-income security, or the counterparty to a derivatives or other contract, may be unable or unwilling to make timely payments of interest or principal, or to otherwise honor its obligations. The issuer or guarantor may default, causing a loss of the full principal amount of a security and any accrued interest. The degree of risk for a particular security may be reflected in its credit rating. There is the possibility that the credit rating of a fixed-income security may be downgraded after purchase, which may adversely affect the value of the security. Investments in fixed-income securities with lower ratings tend to have a higher probability that an issuer will default or fail to meet its payment obligations.
Municipal Market Risk: This is the risk that special factors may adversely affect the value of municipal securities and have a significant effect on the yield or value of the Fund’s investments in municipal securities. These factors include economic conditions, political or legislative changes, public health crises, uncertainties related to the tax status of municipal securities, and the rights of investors in these securities. To the extent that the Fund invests more of its assets in a particular state’s municipal securities, the Fund may be vulnerable to events adversely affecting that state, including economic, political and regulatory occurrences, court decisions, terrorism, public health crises (including the occurrence of a contagious disease or illness) and catastrophic natural disasters, such as hurricanes, fires or earthquakes. For example, the novel coronavirus (COVID-19) pandemic has significantly stressed the financial resources of many issuers of municipal securities, which could impair any such issuer’s ability to meet its financial obligations when due and adversely impact the value of its securities held by the Fund. As the full effects of the COVID-19 pandemic on
| | |
| |
| abfunds.com | | AB MUNICIPAL INCOME SHARES | 5 |
DISCLOSURES AND RISKS (continued)
state and local economies and on issuers of municipal securities are still uncertain, the financial difficulties of issuers of municipal securities may continue or worsen, adversely affecting the performance of the Fund. The Fund’s investments in certain municipal securities with principal and interest payments that are made from the revenues of a specific project or facility, and not general tax revenues, may have increased risks. Factors affecting the project or facility, such as local business or economic conditions, could have a significant effect on the project’s ability to make payments of principal and interest on these securities.
Congress has previously considered making changes to the municipal securities provisions of the Internal Revenue Code that could change the US federal income tax treatment of certain types of municipal securities.
Tax Risk: There is no guarantee that all of the Fund’s income will remain exempt from federal or state income taxes. From time to time, the US government and the US Congress consider changes in federal tax law that could limit or eliminate the federal tax exemption for municipal bond income, which would in effect reduce the income received by shareholders from the Fund by increasing taxes on that income. In such event, the Fund’s net asset value (“NAV”) could also decline as yields on municipal bonds, which are typically lower than those on taxable bonds, would be expected to increase to approximately the yield of comparable taxable bonds. Actions or anticipated actions affecting the tax-exempt status of municipal bonds could also result in significant shareholder redemptions of Fund shares as investors anticipate adverse effects on the Fund or seek higher yields to offset the potential loss of the tax deduction. As a result, the Fund would be required to maintain higher levels of cash to meet the redemptions, which would negatively affect the Fund’s yield. The federal income tax treatment of payments in respect of certain derivative contracts is unclear.
Below Investment-Grade Securities Risk: Investments in fixed-income securities with lower ratings (commonly known as “junk bonds”) tend to have a higher probability that an issuer will default or fail to meet its payment obligations. These securities may be subject to greater price volatility due to such factors as specific corporate developments, interest-rate sensitivity and negative perceptions of the junk bond market generally and may be more difficult to trade than other types of securities.
Interest-Rate Risk: Changes in interest rates will affect the value of investments in fixed-income securities. When interest rates rise, the value of existing investments in fixed-income securities tends to fall and this decrease in value may not be offset by higher income from new investments. Interest-rate risk is generally greater for fixed-income securities with longer maturities or durations. The Fund may be subject to greater risk of
| | |
| |
6 | AB MUNICIPAL INCOME SHARES | | abfunds.com |
DISCLOSURES AND RISKS (continued)
rising interest rates than would normally be the case due to the end of a recent period of historically low rates and the effect of potential government fiscal policy initiatives and resulting market reaction to those initiatives.
Inflation Risk: This is the risk that the value of assets or income from investments will be less in the future as inflation decreases the value of money. As inflation increases, the value of the Fund’s assets can decline as can the value of the Fund’s distributions. This risk is significantly greater for fixed-income securities with longer maturities.
Leverage Risk: To the extent the Fund uses leveraging techniques, its NAV may be more volatile because leverage tends to exaggerate the effect of changes in interest rates and any increase or decrease in the value of the Fund’s investments.
Illiquid Investments Risk: Illiquid investments risk exists when particular investments, such as lower-rated securities, are or become difficult to purchase or sell, possibly preventing the Fund from selling such investments at an advantageous price. The Fund is subject to illiquid investments risk because the market for municipal securities is generally smaller than many other markets. Derivatives and securities involving substantial market and credit risk tend to involve greater illiquid investments risk than most other types of investments.
Derivatives Risk: Derivatives may be difficult to price or unwind and leveraged so that small changes may produce disproportionate losses for the Fund. Derivatives, especially over-the-counter derivatives, are also subject to counterparty risk, which is the risk that the counterparty (the party on the other side of the transaction) on a derivative transaction will be unable or unwilling to honor its contractual obligations to the Fund.
Management Risk: The Fund is subject to management risk because it is an actively managed investment fund. The Adviser will apply its investment techniques and risk analyses in making investment decisions, but there is no guarantee that its techniques will produce the intended results. Some of these techniques may incorporate, or rely upon, quantitative models, but there is no guarantee that these models will generate accurate forecasts, reduce risk or otherwise perform as expected.
These risks are fully discussed in the Fund’s prospectus. As with all investments, you may lose money by investing in the Fund.
An Important Note About Historical Performance
The performance shown in this report represents past performance and does not guarantee future results. Current performance may be lower or higher than the performance information shown. You may
| | |
| |
| abfunds.com | | AB MUNICIPAL INCOME SHARES | 7 |
DISCLOSURES AND RISKS (continued)
obtain performance information current to the most recent month-end by calling (800) 227 4618. The investment return and principal value of an investment in the Fund will fluctuate, so that your shares, when redeemed, may be worth more or less than their original cost. Performance assumes reinvestment of distributions and does not account for taxes.
Investors should consider the investment objectives, risks, charges and expenses of the Fund carefully before investing. For copies of our prospectus and/or summary prospectus, which contain this and other information, visit us online at www.abfunds.com or contact your AllianceBernstein Investments representative. Please read the prospectus and/or summary prospectus carefully before investing.
| | |
| |
8 | AB MUNICIPAL INCOME SHARES | | abfunds.com |
HISTORICAL PERFORMANCE
AVERAGE ANNUAL RETURNS AS OF OCTOBER 31, 2022 (unaudited)
| | | | |
| |
| | | NAV Returns | |
| |
| 1 Year | | | -15.69% | |
| |
| 5 Years | | | 1.54% | |
| |
| 10 Years | | | 3.43% | |
AVERAGE ANNUAL RETURNS
AS OF THE MOST RECENT CALENDAR QUARTER-END
SEPTEMBER 30, 2022 (unaudited)
| | | | |
| |
| | | NAV Returns | |
| |
| 1 Year | | | -14.43% | |
| |
| 5 Years | | | 1.91% | |
| |
| 10 Years | | | 3.74% | |
The prospectus fee table shows the fees and the total annual operating expenses of the Fund as 0.07% because the Adviser does not charge any fees or expenses and reimburses Fund operating expenses except certain extraordinary expenses, taxes, brokerage costs and the interest on borrowings or certain leveraged transactions. Participants in a wrap fee program or other investment program eligible to invest in the Fund pay fees to the program sponsor and should review the program brochure or other literature provided by the sponsor for a discussion of fees and expenses charged.
| | |
| |
| abfunds.com | | AB MUNICIPAL INCOME SHARES | 9 |
EXPENSE EXAMPLE
(unaudited)
As a shareholder of the Fund, you may incur various ongoing non-operating and extraordinary costs. This example is intended to help you understand your ongoing costs (in dollars) of investing in the Fund and to compare these costs with the ongoing costs of investing in other mutual funds.
The Example is based on an investment of $1,000 invested at the beginning of the period and held for the entire period as indicated below.
Actual Expenses
The table below provides information about actual account values and actual expenses. You may use the information in this line, together with the amount you invested, to estimate the expenses that you paid over the period. Simply divide your account value by $1,000 (for example, an $8,600 account value divided by $1,000 = 8.6), then multiply the result by the number in the first line under the heading entitled “Expenses Paid During Period” to estimate the expenses you paid on your account during this period.
Hypothetical Example for Comparison Purposes
The table below provides information about hypothetical account values and hypothetical expenses based on the Fund’s actual expense ratio and an assumed annual rate of return of 5% before expenses, which is not the Fund’s actual return. The hypothetical account values and expenses may not be used to estimate the actual ending account balance or expenses you paid for the period. You may use this information to compare the ongoing costs of investing in the Fund and other funds by comparing this 5% hypothetical example with the 5% hypothetical examples that appear in the shareholder reports of other funds.
Please note that the expenses shown in the table are meant to highlight your ongoing costs only and do not reflect any transactional costs, such as sales charges (loads), or contingent deferred sales charges on redemptions. Therefore, the hypothetical example is useful in comparing ongoing costs only, and will not help you determine the relative total costs of owning different funds. In addition, if these transactional costs were included, your costs would have been higher.
| | | | | | | | | | | | | | | | |
| | | Beginning
Account Value
May 1, 2022 | | | Ending
Account Value
October 31, 2022 | | | Expenses Paid
During Period* | | | Annualized
Expense Ratio* | |
Actual | | $ | 1,000 | | | $ | 929.10 | | | $ | 0.63 | | | | 0.13 | % |
Hypothetical** | | $ | 1,000 | | | $ | 1,024.55 | | | $ | 0.66 | | | | 0.13 | % |
| * | Expenses are equal to the Fund’s annualized expense ratio (interest expense incurred) multiplied by the average account value over the period, multiplied by 184/365 (to reflect the one-half year period). The Fund’s operating expenses are borne by the Adviser or its affiliates. |
| ** | Assumes 5% annual return before expenses. |
| | |
| |
10 | AB MUNICIPAL INCOME SHARES | | abfunds.com |
PORTFOLIO SUMMARY
October 31, 2022 (unaudited)
PORTFOLIO STATISTICS
Net Assets ($mil): $7,580.9
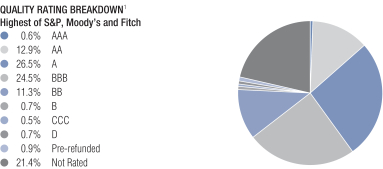
| 1 | The Fund’s quality rating breakdown is expressed as a percentage of the Fund’s total investments in municipal securities and may vary over time. The Fund also enters into derivative transactions, which may be used for hedging or investment purposes (see “Portfolio of Investments” section of the report for additional details). The quality ratings are determined by using the S&P Global Ratings (“S&P”), Moody’s Investors Services, Inc. (“Moody’s”) and Fitch Ratings, Ltd.(“Fitch”). The Fund considers the credit ratings issued by S&P, Moody’s and Fitch and uses the highest rating issued by the agencies. These ratings are a measure of the quality and safety of a bond or portfolio, based on the issuer’s financial condition. AAA is the highest (best) and D is the lowest (worst). If applicable, the pre-refunded category includes bonds which are secured by U.S. Government securities and therefore are deemed high-quality investment-grade by the Adviser. If applicable, Not Applicable (N/A) includes non-creditworthy investments such as equities, currency contracts, futures and options. If applicable, the Not Rated category includes bonds that are not rated by a nationally recognized statistical rating organization. The Adviser evaluates the creditworthiness of non-rated securities based on a number of factors including, but not limited to, cash flows, enterprise value and economic environment. |
| | |
| |
| abfunds.com | | AB MUNICIPAL INCOME SHARES | 11 |
PORTFOLIO OF INVESTMENTS
October 31, 2022 (unaudited)
| | | | | | | | |
| | | Principal
Amount
(000) | | | U.S. $ Value | |
| |
MUNICIPAL OBLIGATIONS – 102.1% | |
Long-Term Municipal Bonds – 102.1% | |
Alabama – 2.4% | |
Black Belt Energy Gas District
(Goldman Sachs Group, Inc. (The))
Series 2021
4.00%, 10/01/2052 | | $ | 22,000 | | | $ | 21,177,288 | |
Series 2022-F
5.50%, 11/01/2053 | | | 15,500 | | | | 15,655,319 | |
County of Jefferson AL Sewer Revenue
Series 2013-D
6.00%, 10/01/2042 | | | 11,645 | | | | 12,418,016 | |
Infirmary Health System Special Care Facilities Financing Authority of Mobile (Infirmary Health System Obligated Group)
Series 2016
5.00%, 02/01/2036 | | | 5,000 | | | | 5,016,057 | |
5.00%, 02/01/2041 | | | 5,000 | | | | 4,863,921 | |
Series 2021
4.00%, 02/01/2041 | | | 3,370 | | | | 2,898,475 | |
4.00%, 02/01/2046 | | | 9,640 | | | | 7,954,540 | |
Jefferson County Board of Education/AL
Series 2018
5.00%, 02/01/2039 | | | 5,000 | | | | 5,156,701 | |
5.00%, 02/01/2046 | | | 23,280 | | | | 23,566,088 | |
Southeast Alabama Gas Supply District (The)
(Goldman Sachs Group, Inc. (The))
Series 2018-A
4.00%, 04/01/2049 | | | 13,350 | | | | 13,166,381 | |
Southeast Energy Authority A Cooperative District
Series 2022-A
4.95% (SOFR + 2.42%), 01/01/2053(a)(b) | | | 10,000 | | | | 9,941,268 | |
Southeast Energy Authority A Cooperative District
(Morgan Stanley)
Series 2021-B
4.00%, 12/01/2051 | | | 15,000 | | | | 13,503,029 | |
Series 2022
5.50%, 01/01/2053(a) | | | 7,620 | | | | 7,702,319 | |
Sumter County Industrial Development Authority/AL
(Enviva, Inc.)
Series 2022
6.00%, 07/15/2052 | | | 47,065 | | | | 42,493,699 | |
| | | | | | | | |
| | | | | | | 185,513,101 | |
| | | | | | | | |
| | |
| |
12 | AB MUNICIPAL INCOME SHARES | | abfunds.com |
PORTFOLIO OF INVESTMENTS (continued)
| | | | | | | | |
| | | Principal
Amount
(000) | | | U.S. $ Value | |
| |
Alaska – 0.1% | | | | | | | | |
State of Alaska International Airports System
Series 2016-B
5.00%, 10/01/2033 | | $ | 6,500 | | | $ | 6,630,114 | |
5.00%, 10/01/2034 | | | 2,500 | | | | 2,544,985 | |
| | | | | | | | |
| | | | | | | 9,175,099 | |
| | | | | | | | |
American Samoa – 0.2% | | | | | | | | |
American Samoa Economic Development Authority
(Territory of American Samoa)
Series 2015-A
6.625%, 09/01/2035 | | | 3,235 | | | | 3,392,330 | |
Series 2018
7.125%, 09/01/2038(c) | | | 8,315 | | | | 9,212,047 | |
| | | | | | | | |
| | | | 12,604,377 | |
| | | | | | | | |
Arizona – 2.2% | | | | | | | | |
Arizona Industrial Development Authority (Arizona Industrial Development Authority)
Series 2019-2, Class A
3.625%, 05/20/2033 | | | 14,996 | | | | 13,533,128 | |
Arizona Industrial Development Authority (Equitable School Revolving Fund LLC Obligated Group)
Series 2021
4.00%, 11/01/2051(c) | | | 11,325 | | | | 8,564,142 | |
Arizona Industrial Development Authority (KIPP Nashville Obligated Group)
Series 2022-A
5.00%, 07/01/2047 | | | 750 | | | | 685,771 | |
Arizona Industrial Development Authority (Kipp New York, Inc. Jerome Facility)
Series 2021-B
4.00%, 07/01/2051 | | | 1,000 | | | | 712,485 | |
Arizona Industrial Development Authority (Legacy Cares, Inc.)
Series 2020
6.75%, 07/01/2030(c) | | | 1,500 | | | | 1,272,831 | |
7.75%, 07/01/2050(c) | | | 33,950 | | | | 29,782,885 | |
Series 2021-A
6.00%, 07/01/2051(c) | | | 1,425 | | | | 994,240 | |
Arizona Industrial Development Authority (North Carolina Central University Project)
BAM Series 2019
5.00%, 06/01/2049 | | | 785 | | | | 799,625 | |
5.00%, 06/01/2054 | | | 3,000 | | | | 3,047,927 | |
| | |
| |
| abfunds.com | | AB MUNICIPAL INCOME SHARES | 13 |
PORTFOLIO OF INVESTMENTS (continued)
| | | | | | | | |
| | | Principal
Amount
(000) | | | U.S. $ Value | |
| |
Arizona Industrial Development Authority (Pinecrest Academy of Nevada)
Series 2020-A
4.00%, 07/15/2030(c) | | $ | 1,195 | | | $ | 1,089,007 | |
Arizona Industrial Development Authority (Provident Group – EMU Properties LLC)
Series 2018
5.00%, 05/01/2051 | | | 1,100 | | | | 696,902 | |
City of Glendale AZ
(City of Glendale AZ COP)
Series 2021
2.442%, 07/01/2032(d) | | | 5,000 | | | | 3,838,448 | |
2.542%, 07/01/2033(d) | | | 5,000 | | | | 3,759,311 | |
2.642%, 07/01/2034(d) | | | 6,795 | | | | 5,024,818 | |
2.742%, 07/01/2035(d) | | | 10,000 | | | | 7,237,340 | |
2.842%, 07/01/2036(d) | | | 13,000 | | | | 9,205,382 | |
City of Tempe AZ
2.321%, 07/01/2034(d) | | | 10,500 | | | | 7,724,386 | |
2.421%, 07/01/2035(d) | | | 10,325 | | | | 7,427,077 | |
Glendale Industrial Development Authority (Beatitudes Campus Obligated Group (The))
Series 2017
5.00%, 11/15/2036 | | | 1,000 | | | | 874,097 | |
Glendale Industrial Development Authority (Royal Oaks Life Care Community)
Series 2016
5.00%, 05/15/2039 | | | 2,700 | | | | 2,461,490 | |
Industrial Development Authority of the City of Phoenix (The)
(GreatHearts Arizona Obligated Group)
Series 2014
5.00%, 07/01/2044 | | | 3,875 | | | | 3,658,329 | |
Industrial Development Authority of the County of Pima (The)
(La Posada at Park Centre, Inc. Obligated Group)
Series 2022
5.625%, 11/15/2030 | | | 9,500 | | | | 9,322,561 | |
6.875%, 11/15/2052(c) | | | 6,500 | | | | 6,422,464 | |
7.00%, 11/15/2057(c) | | | 2,915 | | | | 2,877,387 | |
Industrial Development Authority of the County of Pima (The)
(Edkey, Inc. Obligated Group)
Series 2020
5.00%, 07/01/2049(c) | | | 6,890 | | | | 5,749,994 | |
5.00%, 07/01/2055(c) | | | 3,700 | | | | 3,008,448 | |
| | |
| |
14 | AB MUNICIPAL INCOME SHARES | | abfunds.com |
PORTFOLIO OF INVESTMENTS (continued)
| | | | | | | | |
| | | Principal
Amount
(000) | | | U.S. $ Value | |
| |
Maricopa County Industrial Development Authority
(Benjamin Franklin Charter School Ltd.)
Series 2018-A
6.00%, 07/01/2052(c) | | $ | 19,500 | | | $ | 19,572,267 | |
Maricopa County Industrial Development Authority
(Commercial Metals Co.)
Series 2022
4.00%, 10/15/2047(c) | | | 1,500 | | | | 1,101,933 | |
Salt Verde Financial Corp.
(Citigroup, Inc.)
Series 2007
5.00%, 12/01/2032 | | | 1,510 | | | | 1,515,526 | |
Tempe Industrial Development Authority (Friendship Village of Tempe)
Series 2019
5.00%, 12/01/2054 | | | 1,185 | | | | 949,275 | |
Tempe Industrial Development Authority (Mirabella at ASU, Inc.)
Series 2017-A
6.125%, 10/01/2047(c) | | | 1,065 | | | | 898,754 | |
| | | | | | | | |
| | | | 163,808,230 | |
| | | | | | | | |
Arkansas – 0.2% | | | | | | | | |
Arkansas Development Finance Authority (Baptist Memorial Health Care Obligated Group)
Series 2020
5.00%, 09/01/2044 | | | 16,250 | | | | 14,778,770 | |
Arkansas Development Finance Authority (United States Steel Corp.)
Series 2022
5.45%, 09/01/2052(c) | | | 5,000 | | | | 4,505,037 | |
| | | | | | | | |
| | | | | | | 19,283,807 | |
| | | | | | | | |
California – 9.4% | | | | | | | | |
Alameda Corridor Transportation Authority
Series 2022-A
Zero Coupon, 10/01/2048 | | | 17,000 | | | | 7,630,504 | |
Zero Coupon, 10/01/2049 | | | 10,435 | | | | 4,638,287 | |
Zero Coupon, 10/01/2050 | | | 7,345 | | | | 3,232,363 | |
Anaheim Public Financing Authority
Series 2014-A
5.00%, 05/01/2031 (Pre-refunded/ETM) | | | 1,460 | | | | 1,499,339 | |
ARC70 II TRUST
Series 2021
4.00%, 12/01/2059 | | | 7,860 | | | | 6,230,374 | |
| | |
| |
| abfunds.com | | AB MUNICIPAL INCOME SHARES | 15 |
PORTFOLIO OF INVESTMENTS (continued)
| | | | | | | | |
| | | Principal
Amount
(000) | | | U.S. $ Value | |
| |
Bay Area Toll Authority
Series 2013-S
5.00%, 04/01/2027 (Pre-refunded/ETM) | | $ | 1,000 | | | $ | 1,008,162 | |
California Community College Financing Authority
(NCCD-Orange Coast Properties LLC)
Series 2018
5.25%, 05/01/2043 | | | 2,000 | | | | 1,866,775 | |
California Community Housing Agency (California Community Housing Agency Aster Apartments)
Series 2021-A
4.00%, 02/01/2056(c) | | | 23,800 | | | | 17,767,347 | |
California Community Housing Agency (California Community Housing Agency Brio Apartments & Next on Lex Apartments)
Series 2021
4.00%, 02/01/2056(c) | | | 35,100 | | | | 26,211,855 | |
California Community Housing Agency (California Community Housing Agency Fountains at Emerald Park)
Series 2021
3.00%, 08/01/2056(c) | | | 16,000 | | | | 9,571,891 | |
4.00%, 08/01/2046(c) | | | 7,675 | | | | 5,311,851 | |
California Community Housing Agency (California Community Housing Agency Summit at Sausalito Apartments)
Series 2021
3.00%, 02/01/2057(c) | | | 12,380 | | | | 7,477,108 | |
California Community Housing Agency (California Community Housing Agency Twin Creek Apartments)
Series 2022
Zero Coupon, 08/01/2065(c) | | | 119,980 | | | | 5,305,696 | |
5.50%, 02/01/2040(c) | | | 4,875 | | | | 4,058,989 | |
Series 2022-A
4.50%, 08/01/2052(c) | | | 21,280 | | | | 16,439,521 | |
California Educational Facilities Authority (Chapman University)
Series 2015
5.00%, 04/01/2033 | | | 4,005 | | | | 4,095,584 | |
5.00%, 04/01/2034 | | | 4,205 | | | | 4,296,694 | |
California Educational Facilities Authority (Loma Linda University)
Series 2017-A
5.00%, 04/01/2031 | | | 1,000 | | | | 1,048,342 | |
5.00%, 04/01/2042 | | | 1,000 | | | | 1,024,812 | |
| | |
| |
16 | AB MUNICIPAL INCOME SHARES | | abfunds.com |
PORTFOLIO OF INVESTMENTS (continued)
| | | | | | | | |
| | | Principal
Amount
(000) | | | U.S. $ Value | |
| |
California Enterprise Development Authority (Rocketship Education Obligated Group)
Series 2022
4.00%, 06/01/2042(c) | | $ | 5,000 | | | $ | 3,739,208 | |
California Health Facilities Financing Authority
(Children’s Hospital Los Angeles)
Series 2017-A
5.00%, 08/15/2037 | | | 1,700 | | | | 1,662,293 | |
California Health Facilities Financing Authority
(CommonSpirit Health)
Series 2020-A
4.00%, 04/01/2044 | | | 12,500 | | | | 10,100,307 | |
California Housing Finance Agency
Series 2019-2, Class A
4.00%, 03/20/2033 | | | 14,667 | | | | 13,871,917 | |
Series 2021-1, Class A
3.50%, 11/20/2035 | | | 9,295 | | | | 7,947,252 | |
Series 2021-2, Class X
0.823%, 03/25/2035(e) | | | 23,000 | | | | 1,279,145 | |
Series 2021-3, Class A
3.25%, 08/20/2036 | | | 7,041 | | | | 5,763,559 | |
California Infrastructure & Economic Development Bank
(Equitable School Revolving Fund LLC Obligated Group)
Series 2020-B
4.00%, 11/01/2045 | | | 850 | | | | 713,322 | |
4.00%, 11/01/2050 | | | 860 | | | | 700,411 | |
California Municipal Finance Authority (CHF-Riverside II LLC)
Series 2019
5.00%, 05/15/2039 | | | 2,030 | | | | 1,944,027 | |
5.00%, 05/15/2040 | | | 1,000 | | | | 951,737 | |
California Municipal Finance Authority (Community Health Centers of The Central Coast, Inc.)
Series 2021-A
5.00%, 12/01/2046(c) | | | 1,490 | | | | 1,287,624 | |
California Municipal Finance Authority (Goodwill Industries of Sacramento Valley & Northern Nevada, Inc.)
Series 2012-A
6.625%, 01/01/2032(c) | | | 960 | | | | 939,888 | |
Series 2014
5.00%, 01/01/2035 | | | 1,085 | | | | 906,014 | |
| | |
| |
| abfunds.com | | AB MUNICIPAL INCOME SHARES | 17 |
PORTFOLIO OF INVESTMENTS (continued)
| | | | | | | | |
| | | Principal
Amount
(000) | | | U.S. $ Value | |
| |
California Municipal Finance Authority
(LAX Integrated Express Solutions LLC)
Series 2018
4.00%, 12/31/2047 | | $ | 2,040 | | | $ | 1,571,015 | |
5.00%, 12/31/2043 | | | 10,720 | | | | 10,141,636 | |
AGM Series 2018
4.00%, 12/31/2047 | | | 3,000 | | | | 2,347,059 | |
California Municipal Finance Authority (Partnerships to Uplift Communities Lakeview Terrace and Los Angeles Project)
Series 2012-A
5.30%, 08/01/2047 | | | 1,025 | | | | 882,379 | |
California Pollution Control Financing Authority
(Poseidon Resources Channelside LP)
Series 2012
5.00%, 11/21/2045(c) | | | 4,675 | | | | 4,169,935 | |
California Pollution Control Financing Authority
(Rialto Bioenergy Facility LLC)
Series 2019
7.50%, 12/01/2040(c) | | | 785 | | | | 499,693 | |
California Public Finance Authority
(Enso Village)
Series 2021
2.125%, 11/15/2027(c) | | | 2,500 | | | | 2,278,433 | |
2.375%, 11/15/2028(c) | | | 3,000 | | | | 2,701,763 | |
California School Finance Authority
Series 2014-A
6.40%, 08/01/2034 (Pre-refunded/ETM)(c) | | | 3,000 | | | | 3,102,753 | |
California School Finance Authority (Classical Academy Obligated Group)
Series 2022
5.00%, 10/01/2052(c) | | | 1,000 | | | | 898,146 | |
5.00%, 10/01/2061(c) | | | 1,500 | | | | 1,312,472 | |
California School Finance Authority
(Equitas Academy Obligated Group)
Series 2018-A
5.00%, 06/01/2056(c) | | | 8,850 | | | | 7,454,829 | |
California School Finance Authority (Lighthouse Community Public Schools Obligated Group)
Series 2022
6.375%, 06/01/2052(a)(c) | | | 1,225 | | | | 1,212,870 | |
| | |
| |
18 | AB MUNICIPAL INCOME SHARES | | abfunds.com |
PORTFOLIO OF INVESTMENTS (continued)
| | | | | | | | |
| | | Principal
Amount
(000) | | | U.S. $ Value | |
| |
California State University 2.719%, 11/01/2052(d) | | $ | 5,000 | | | $ | 2,890,122 | |
2.975%, 11/01/2051 | | | 5,000 | | | | 3,211,550 | |
Series 2021-B
2.374%, 11/01/2035(d) | | | 10,000 | | | | 6,986,758 | |
California Statewide Communities Development Authority
(CHF-Irvine LLC)
BAM Series 2021
3.00%, 05/15/2051 | | | 13,000 | | | | 8,691,411 | |
California Statewide Communities Development Authority
(Enloe Medical Center Obligated Group)
AGM Series 2022-A
5.25%, 08/15/2052(a) | | | 3,000 | | | | 2,966,729 | |
5.375%, 08/15/2057(a) | | | 3,720 | | | | 3,691,235 | |
California Statewide Communities Development Authority
(Loma Linda University Medical Center)
Series 2016-A
5.00%, 12/01/2041(c) | | | 15,285 | | | | 13,990,871 | |
5.25%, 12/01/2056(c) | | | 31,105 | | | | 28,246,824 | |
Series 2018
5.25%, 12/01/2038(c) | | | 1,000 | | | | 966,346 | |
5.25%, 12/01/2048(c) | | | 6,440 | | | | 5,884,629 | |
Series 2018-A
5.00%, 12/01/2033(c) | | | 1,350 | | | | 1,290,101 | |
5.50%, 12/01/2058(c) | | | 19,145 | | | | 17,886,417 | |
California Statewide Communities Development Authority
(Moldaw Residences)
Series 2014-A
5.25%, 11/01/2044(c) | | | 1,200 | | | | 967,184 | |
5.375%, 11/01/2049(c) | | | 1,000 | | | | 800,019 | |
California Statewide Communities Development Authority
(NCCD-Hooper Street LLC)
Series 2019
5.25%, 07/01/2049(c) | | | 1,125 | | | | 912,747 | |
City of Los Angeles Department of Airports
5.00%, 05/15/2044(d) | | | 15,415 | | | | 15,151,302 | |
Series 2020-C
5.00%, 05/15/2036 | | | 10,000 | | | | 10,063,934 | |
City of Roseville CA
(HP Campus Oaks Community Facilities District No. 1)
Series 2016
5.50%, 09/01/2046 | | | 850 | | | | 860,417 | |
| | |
| |
| abfunds.com | | AB MUNICIPAL INCOME SHARES | 19 |
PORTFOLIO OF INVESTMENTS (continued)
| | | | | | | | |
| | | Principal
Amount
(000) | | | U.S. $ Value | |
| |
City of Vernon CA Electric System Revenue
Series 2022-2
5.00%, 08/01/2039 | | $ | 425 | | | $ | 417,190 | |
5.00%, 08/01/2040 | | | 375 | | | | 366,315 | |
5.00%, 08/01/2041 | | | 420 | | | | 407,895 | |
CMFA Special Finance Agency
Series 2022-A
4.00%, 08/01/2058(c) | | | 15,000 | | | | 10,755,579 | |
CMFA Special Finance Agency
(CMFA Special Finance Agency Latitude33)
Series 2021-A
3.00%, 12/01/2056(c) | | | 5,900 | | | | 3,432,796 | |
CMFA Special Finance Agency
(CMFA Special Finance Agency Solana at Grand)
Series 2021-A
4.00%, 08/01/2056(c) | | | 8,650 | | | | 6,446,398 | |
CMFA Special Finance Agency VIII Elan Huntington Beach
Series 2021
3.00%, 08/01/2056(c) | | | 4,450 | | | | 2,658,191 | |
4.00%, 08/01/2047(c) | | | 4,000 | | | | 2,853,607 | |
CSCDA Community Improvement Authority (CSCDA Community Improvement Authority 1818 Platinum Triangle-Anaheim)
Series 2021
3.25%, 04/01/2057(c) | | | 3,890 | | | | 2,422,729 | |
CSCDA Community Improvement Authority (CSCDA Community Improvement Authority 777 Place-Pomona)
Series 2021
3.25%, 05/01/2057(c) | | | 11,150 | | | | 7,035,101 | |
4.00%, 05/01/2057(c) | | | 15,550 | | | | 9,784,623 | |
CSCDA Community Improvement Authority (CSCDA Community Improvement Authority Acacia on Santa Rosa Creek)
Series 2021
4.00%, 10/01/2056(c) | | | 10,130 | | | | 7,545,435 | |
CSCDA Community Improvement Authority (CSCDA Community Improvement Authority Altana Apartments)
Series 2021
4.00%, 10/01/2056(c) | | | 15,200 | | | | 10,437,880 | |
CSCDA Community Improvement Authority (CSCDA Community Improvement Authority Crescent)
Series 2022
4.30%, 07/01/2059(c) | | | 11,400 | | | | 8,552,316 | |
| | |
| |
20 | AB MUNICIPAL INCOME SHARES | | abfunds.com |
PORTFOLIO OF INVESTMENTS (continued)
| | | | | | | | |
| | | Principal
Amount
(000) | | | U.S. $ Value | |
| |
CSCDA Community Improvement Authority (CSCDA Community Improvement Authority Jefferson Platinum Triangle Apartments)
Series 2021-A2
3.125%, 08/01/2056(c) | | $ | 7,025 | | | $ | 4,325,820 | |
CSCDA Community Improvement Authority (CSCDA Community Improvement Authority Millennium South Bay-Hawthorne)
Series 2021
3.25%, 07/01/2056(c) | | | 17,380 | | | | 10,363,164 | |
4.00%, 07/01/2058(c) | | | 6,000 | | | | 3,712,963 | |
CSCDA Community Improvement Authority (CSCDA Community Improvement Authority Oceanaire Apartments)
Series 2021
4.00%, 09/01/2056(c) | | | 5,000 | | | | 3,553,470 | |
CSCDA Community Improvement Authority (CSCDA Community Improvement Authority Park Crossing Apartments)
Series 2021
3.25%, 12/01/2058(c) | | | 12,700 | | | | 7,682,465 | |
CSCDA Community Improvement Authority (CSCDA Community Improvement Authority Pasadena Portfolio)
Series 2021
3.00%, 12/01/2056(c) | | | 15,430 | | | | 9,165,559 | |
4.00%, 12/01/2056(c) | | | 2,400 | | | | 1,541,851 | |
CSCDA Community Improvement Authority (CSCDA Community Improvement Authority Theo Apartments)
Series 2021
4.00%, 05/01/2057(c) | | | 5,400 | | | | 3,412,763 | |
CSCDA Community Improvement Authority (CSCDA Community Improvement Authority Union South Bay)
Series 2021-A2
4.00%, 07/01/2056(c) | | | 27,100 | | | | 18,886,155 | |
CSCDA Community Improvement Authority (CSCDA Community Improvement Authority Vineyard Gardens Apartments)
Series 2021
3.25%, 10/01/2058(c) | | | 5,000 | | | | 3,030,300 | |
4.00%, 10/01/2048(c) | | | 2,000 | | | | 1,318,388 | |
| | |
| |
| abfunds.com | | AB MUNICIPAL INCOME SHARES | 21 |
PORTFOLIO OF INVESTMENTS (continued)
| | | | | | | | |
| | | Principal
Amount
(000) | | | U.S. $ Value | |
| |
CSCDA Community Improvement Authority
(CSCDA Community Improvement Authority Waterscape Apartments)
Series 2021-A
3.00%, 09/01/2056(c) | | $ | 7,905 | | | $ | 4,656,084 | |
Golden State Tobacco Securitization Corp.
2.746%, 06/01/2034(d) | | | 14,780 | | | | 11,336,946 | |
3.293%, 06/01/2042(d) | | | 6,850 | | | | 4,766,370 | |
Series 2021
3.115%, 06/01/2038(d) | | | 29,325 | | | | 21,638,577 | |
3.85%, 06/01/2050 | | | 22,000 | | | | 18,759,147 | |
Hastings Campus Housing Finance Authority
Series 2020-A
5.00%, 07/01/2045(c) | | | 2,530 | | | | 2,075,165 | |
5.00%, 07/01/2061(c) | | | 40,600 | | | | 30,967,134 | |
M-S-R Energy Authority
(Citigroup, Inc.)
Series 2009-B
6.50%, 11/01/2039 | | | 17,685 | | | | 20,140,801 | |
Oakland Unified School District/Alameda County
Series 2015-A
5.00%, 08/01/2030 | | | 1,275 | | | | 1,321,632 | |
5.00%, 08/01/2034 (Pre-refunded/ETM) | | | 1,440 | | | | 1,506,479 | |
5.00%, 08/01/2040 (Pre-refunded/ETM) | | | 3,500 | | | | 3,661,580 | |
Palomar Health
(Palomar Health Obligated Group)
Series 2016
5.00%, 11/01/2039 | | | 3,740 | | | | 3,625,668 | |
Series 2017
5.00%, 11/01/2042 | | | 3,125 | | | | 3,019,682 | |
River Islands Public Financing Authority (River Islands Public Financing Authority Community Facilities District No 2003-1)
Series 2022
5.75%, 09/01/2052 | | | 1,600 | | | | 1,413,286 | |
Riverside County Transportation Commission
Series 2021
4.00%, 06/01/2040 | | | 3,875 | | | | 3,408,259 | |
Sacramento County Water Financing Authority (Sacramento County Water Agency)
NATL Series 2007-B
2.635% (LIBOR 3 Month + 0.57%), 06/01/2039(b) | | | 33,680 | | | | 28,956,582 | |
| | |
| |
22 | AB MUNICIPAL INCOME SHARES | | abfunds.com |
PORTFOLIO OF INVESTMENTS (continued)
| | | | | | | | |
| | | Principal
Amount
(000) | | | U.S. $ Value | |
| |
San Diego County Regional Airport Authority
Series 2021-B
4.00%, 07/01/2046 | | $ | 5,000 | | | $ | 4,052,858 | |
4.00%, 07/01/2051 | | | 10,000 | | | | 7,902,812 | |
San Diego Unified School District/CA
Series 2021-N
4.00%, 07/01/2046 | | | 5,000 | | | | 4,422,372 | |
San Francisco City & County Airport Comm
3.053%, 05/01/2034(d) | | | 3,500 | | | | 2,735,866 | |
3.333%, 05/01/2037(d) | | | 2,250 | | | | 1,704,795 | |
San Francisco City & County Airport Comm
3.183%, 05/01/2035(d) | | | 5,500 | | | | 4,259,034 | |
Series 2020-E
5.00%, 05/01/2038(d) | | | 11,000 | | | | 10,907,477 | |
San Francisco City & County Redevelopment Agency Successor Agency
(Mission Bay South Public Imp)
Series 2013-A
5.00%, 08/01/2031 | | | 1,000 | | | | 1,000,389 | |
San Francisco Intl Airport
Series 2020-E
5.00%, 05/01/2037(d) | | | 8,525 | | | | 8,484,737 | |
Series 2022-A
5.00%, 05/01/2052 | | | 14,000 | | | | 13,368,681 | |
San Joaquin Hills Transportation Corridor Agency
Series 2014-B
5.25%, 01/15/2044 | | | 1,000 | | | | 1,001,523 | |
Series 2021-A
4.00%, 01/15/2044 | | | 1,429 | | | | 1,221,350 | |
Southern California Logistics Airport Authority
AGC Series 2006
5.00%, 12/01/2036 | | | 100 | | | | 101,247 | |
5.00%, 12/01/2043 | | | 1,585 | | | | 1,604,773 | |
Tobacco Securitization Authority of Northern California
(Sacramento County Tobacco Securitization Corp.)
Series 2021
Zero Coupon, 06/01/2060 | | | 5,050 | | | | 622,212 | |
Tobacco Securitization Authority of Southern California
Series 2019
Zero Coupon, 06/01/2054 | | | 10,480 | | | | 1,760,047 | |
5.00%, 06/01/2039 | | | 1,555 | | | | 1,553,197 | |
| | | | | | | | |
| | | | | | | 712,619,492 | |
| | | | | | | | |
| | |
| |
| abfunds.com | | AB MUNICIPAL INCOME SHARES | 23 |
PORTFOLIO OF INVESTMENTS (continued)
| | | | | | | | |
| | | Principal
Amount
(000) | | | U.S. $ Value | |
| |
Colorado – 3.3% | | | | | | | | |
Aurora Highlands Community Authority Board
Series 2021-A
5.75%, 12/01/2051 | | $ | 15,000 | | | $ | 12,549,567 | |
Centerra Metropolitan District No. 1
Series 2017
5.00%, 12/01/2037(c) | | | 5,000 | | | | 4,534,608 | |
City & County of Denver CO
(United Airlines, Inc.)
Series 2017
5.00%, 10/01/2032 | | | 645 | | | | 620,330 | |
City & County of Denver CO. Airport System Revenue
Series 2022-A
4.125%, 11/15/2047 | | | 14,750 | | | | 12,296,082 | |
4.125%, 11/15/2053 | | | 9,000 | | | | 7,416,842 | |
City & County of Denver CO. Airport System Revenue
(Denver Intl Airport)
Series 2018-A
5.00%, 12/01/2031 | | | 7,180 | | | | 7,324,475 | |
Colorado Educational & Cultural Facilities Authority
(James Irwin Educational Foundation Obligated Group)
Series 2022
5.00%, 09/01/2052 | | | 850 | | | | 780,525 | |
5.00%, 09/01/2057 | | | 2,100 | | | | 1,874,276 | |
5.00%, 09/01/2062 | | | 2,000 | | | | 1,748,363 | |
Colorado Educational & Cultural Facilities Authority
(Vega Collegiate Academy)
Series 2021
5.00%, 02/01/2051(c) | | | 1,700 | | | | 1,333,745 | |
5.00%, 02/01/2061(c) | | | 1,435 | | | | 1,082,894 | |
Colorado Health Facilities Authority
5.00%, 11/01/2040(d) | | | 4,650 | | | | 4,639,026 | |
5.00%, 11/01/2041(d) | | | 5,075 | | | | 5,044,144 | |
5.00%, 11/01/2042(d) | | | 3,800 | | | | 3,771,462 | |
5.25%, 11/01/2052(d) | | | 10,000 | | | | 9,954,900 | |
Colorado Health Facilities Authority
(Aberdeen Ridge, Inc. Obligated Group)
Series 2021-A
5.00%, 05/15/2049 | | | 1,300 | | | | 992,179 | |
5.00%, 05/15/2058 | | | 3,000 | | | | 2,172,124 | |
Series 2021-B
2.125%, 05/15/2028 | | | 1,500 | | | | 1,343,523 | |
| | |
| |
24 | AB MUNICIPAL INCOME SHARES | | abfunds.com |
PORTFOLIO OF INVESTMENTS (continued)
| | | | | | | | |
| | | Principal
Amount
(000) | | | U.S. $ Value | |
| |
Colorado Health Facilities Authority
(CommonSpirit Health)
Series 2019-A
4.00%, 08/01/2037 | | $ | 1,695 | | | $ | 1,473,517 | |
4.00%, 08/01/2038 | | | 6,600 | | | | 5,641,009 | |
5.00%, 08/01/2044(d) | | | 60,345 | | | | 70,907,696 | |
Series 2022
5.50%, 11/01/2047 | | | 2,500 | | | | 2,538,993 | |
Colorado Health Facilities Authority
(Frasier Meadows Manor, Inc. Obligated Group)
Series 2023-2
4.00%, 05/15/2048(a) | | | 2,100 | | | | 1,462,738 | |
Colorado Health Facilities Authority
(Intermountain Healthcare Obligated Group)
Series 2022
5.00%, 05/15/2047 | | | 20,000 | | | | 20,492,034 | |
Colorado Health Facilities Authority
(Parkview Medical Center, Inc. Obligated Group)
Series 2015-B
5.00%, 09/01/2030 | | | 1,150 | | | | 1,166,222 | |
Colorado Health Facilities Authority
(Sanford Obligated Group)
Series 2019-A
5.00%, 11/01/2049 | | | 7,050 | | | | 6,517,406 | |
Copper Ridge Metropolitan District
Series 2019
5.00%, 12/01/2039 | | | 2,345 | | | | 2,038,513 | |
5.00%, 12/01/2043 | | | 1,315 | | | | 1,098,179 | |
Douglas County Housing Partnership
(Bridgewater Castle Rock ALF LLC)
Series 2021
5.375%, 01/01/2041(c) | | | 19,590 | | | | 14,058,350 | |
Four Corners Business Improvement District
Series 2022
6.00%, 12/01/2052 | | | 1,500 | | | | 1,262,873 | |
Johnstown Plaza Metropolitan District
Series 2022
4.25%, 12/01/2046 | | | 10,000 | | | | 7,568,144 | |
Longs Peak Metropolitan District
Series 2021
5.25%, 12/01/2051(c) | | | 5,000 | | | | 3,882,244 | |
Plaza Metropolitan District No. 1
Series 2013
5.00%, 12/01/2040(c) | | | 1,500 | | | | 1,342,017 | |
| | |
| |
| abfunds.com | | AB MUNICIPAL INCOME SHARES | 25 |
PORTFOLIO OF INVESTMENTS (continued)
| | | | | | | | |
| | | Principal
Amount
(000) | | | U.S. $ Value | |
| |
Pueblo Urban Renewal Authority
Series 2021
4.75%, 12/01/2045(c) | | $ | 8,010 | | | $ | 6,164,365 | |
Regional Transportation District
(Denver Transit Partners LLC)
Series 2020
4.00%, 07/15/2034 | | | 1,000 | | | | 907,001 | |
4.00%, 07/15/2035 | | | 1,180 | | | | 1,057,209 | |
5.00%, 01/15/2032 | | | 2,300 | | | | 2,331,838 | |
Riverwalk Metropolitan District No. 2
Series 2022-A
5.00%, 12/01/2042 | | | 4,000 | | | | 3,344,202 | |
5.00%, 12/01/2052 | | | 1,500 | | | | 1,184,600 | |
Sagebrush Farm Metropolitan District No 1
Series 2022-A
6.75%, 12/01/2052 | | | 3,500 | | | | 3,213,903 | |
Spring Hill Metropolitan District No 3
Series 2022-A
6.75%, 12/01/2052(c) | | | 4,000 | | | | 3,821,910 | |
STC Metropolitan District No. 2
Series 2019-A
5.00%, 12/01/2038 | | | 940 | | | | 837,288 | |
5.00%, 12/01/2049 | | | 1,000 | | | | 846,899 | |
Sterling Ranch Community Authority Board
(Sterling Ranch Colorado Metropolitan District No. 2)
Series 2020-A
4.25%, 12/01/2050 | | | 2,250 | | | | 1,672,039 | |
Sterling Ranch Community Authority Board
(Sterling Ranch Metropolitan District No. 3)
Series 2017-A
5.00%, 12/01/2047 | | | 1,000 | | | | 1,021,366 | |
Vauxmont Metropolitan District AGM
Series 2019
3.25%, 12/15/2050 | | | 772 | | | | 566,830 | |
AGM Series 2020
5.00%, 12/01/2033 | | | 370 | | | | 393,649 | |
5.00%, 12/01/2050 | | | 435 | | | | 436,887 | |
| | | | | | | | |
| | | | | | | 248,728,986 | |
| | | | | | | | |
Connecticut – 2.1% | | | | | | | | |
City of New Haven CT
AGM Series 2019-A
5.00%, 08/01/2039 | | | 1,650 | | | | 1,721,378 | |
| | |
| |
26 | AB MUNICIPAL INCOME SHARES | | abfunds.com |
PORTFOLIO OF INVESTMENTS (continued)
| | | | | | | | |
| | | Principal
Amount
(000) | | | U.S. $ Value | |
| |
Connecticut State Health & Educational Facilities Authority
(Hartford HealthCare Obligated Group)
Series 2020-A
4.00%, 07/01/2036 | | $ | 1,000 | | | $ | 908,215 | |
4.00%, 07/01/2037 | | | 1,200 | | | | 1,079,011 | |
Connecticut State Health & Educational Facilities Authority
(Quinnipiac University)
Series 2015-L
5.00%, 07/01/2045 | | | 5,750 | | | | 5,743,745 | |
Connecticut State Health & Educational Facilities Authority
(Sacred Heart University, Inc.)
Series 2017-I1
5.00%, 07/01/2035 | | | 1,000 | | | | 1,021,913 | |
5.00%, 07/01/2037 | | | 1,095 | | | | 1,113,299 | |
Connecticut State Health & Educational Facilities Authority
(Seabury Retirement Community)
Series 2016-A
5.00%, 09/01/2046(c) | | | 1,000 | | | | 859,301 | |
5.00%, 09/01/2053(c) | | | 1,475 | | | | 1,231,090 | |
Connecticut State Health & Educational Facilities Authority
(University of Hartford (The))
Series 2019
4.00%, 07/01/2044 | | | 10,710 | | | | 7,939,925 | |
4.00%, 07/01/2049 | | | 7,325 | | | | 5,185,847 | |
5.00%, 07/01/2033 | | | 470 | | | | 449,971 | |
5.00%, 07/01/2034 | | | 295 | | | | 279,292 | �� |
Connecticut State Health & Educational Facilities Authority
(University of New Haven, Inc.)
Series 2018
5.00%, 07/01/2034 | | | 1,000 | | | | 943,484 | |
Series 2018-K1
5.00%, 07/01/2028 | | | 765 | | | | 754,575 | |
5.00%, 07/01/2035 | | | 1,055 | | | | 986,886 | |
5.00%, 07/01/2036 | | | 2,205 | | | | 2,047,678 | |
5.00%, 07/01/2037 | | | 1,085 | | | | 997,323 | |
5.00%, 07/01/2038 | | | 1,980 | | | | 1,805,134 | |
State of Connecticut
Series 2013-E
5.00%, 08/15/2031(d) | | | 1,000 | | | | 1,010,886 | |
Series 2015-F
5.00%, 11/15/2032 | | | 2,875 | | | | 2,983,034 | |
| | |
| |
| abfunds.com | | AB MUNICIPAL INCOME SHARES | 27 |
PORTFOLIO OF INVESTMENTS (continued)
| | | | | | | | |
| | | Principal
Amount
(000) | | | U.S. $ Value | |
| |
Series 2016-A
5.00%, 03/15/2032 | | $ | 8,165 | | | $ | 8,473,836 | |
Series 2016-E
5.00%, 10/15/2028(d) | | | 5,000 | | | | 5,282,909 | |
5.00%, 10/15/2029(d) | | | 3,250 | | | | 3,426,747 | |
5.00%, 10/15/2034(d) | | | 4,595 | | | | 4,754,779 | |
Series 2016-F
5.00%, 10/15/2031(d) | | | 10,205 | | | | 10,677,722 | |
Series 2017-A
5.00%, 04/15/2029(d) | | | 5,285 | | | | 5,608,064 | |
5.00%, 04/15/2032(d) | | | 6,700 | | | | 7,027,257 | |
5.00%, 04/15/2033(d) | | | 10,985 | | | | 11,470,239 | |
5.00%, 04/15/2034(d) | | | 4,855 | | | | 5,054,015 | |
Series 2018-A
5.00%, 04/15/2034 | | | 5,430 | | | | 5,697,443 | |
5.00%, 04/15/2037 | | | 2,500 | | | | 2,594,502 | |
Series 2018-C
5.00%, 06/15/2031 | | | 1,325 | | | | 1,411,325 | |
5.00%, 06/15/2032 | | | 1,775 | | | | 1,881,225 | |
5.00%, 06/15/2033 | | | 1,250 | | | | 1,317,407 | |
5.00%, 06/15/2034 | | | 1,100 | | | | 1,154,627 | |
5.00%, 06/15/2035 | | | 1,040 | | | | 1,088,551 | |
5.00%, 06/15/2038 | | | 1,000 | | | | 1,036,637 | |
Series 2018-E
5.00%, 09/15/2037 | | | 1,035 | | | | 1,076,736 | |
Series 2020-A
5.00%, 01/15/2040 | | | 8,300 | | | | 8,582,935 | |
Series 2020-C
4.00%, 06/01/2035 | | | 1,525 | | | | 1,458,072 | |
4.00%, 06/01/2037 | | | 1,000 | | | | 940,035 | |
4.00%, 06/01/2038 | | | 1,250 | | | | 1,164,012 | |
Series 2022-A
3.875%, 06/15/2028 | | | 5,150 | | | | 4,799,116 | |
3.975%, 06/15/2029 | | | 5,000 | | | | 4,608,509 | |
4.06%, 06/15/2030 | | | 5,000 | | | | 4,566,888 | |
4.11%, 06/15/2031 | | | 5,000 | | | | 4,519,322 | |
State of Connecticut Special Tax Revenue
Series 2012-A
5.00%, 01/01/2031 | | | 5,000 | | | | 5,014,288 | |
Series 2020
5.00%, 05/01/2038 | | | 2,780 | | | | 2,931,089 | |
Town of Hamden CT
(Whitney Center, Inc. Obligated Group)
Series 2022-A
7.00%, 01/01/2053 | | | 3,900 | | | | 3,822,759 | |
| | | | | | | | |
| | | | | | | 160,503,033 | |
| | | | | | | | |
| | |
| |
28 | AB MUNICIPAL INCOME SHARES | | abfunds.com |
PORTFOLIO OF INVESTMENTS (continued)
| | | | | | | | |
| | | Principal
Amount
(000) | | | U.S. $ Value | |
| |
Delaware – 0.1% | | | | | | | | |
Delaware River & Bay Authority
Series 2021
4.00%, 01/01/2042 | | $ | 550 | | | $ | 492,078 | |
Delaware State Economic Development Authority
Series 2014
5.00%, 09/01/2044 (Pre-refunded/ETM) | | | 1,125 | | | | 1,155,851 | |
5.00%, 09/01/2049 (Pre-refunded/ETM) | | | 1,315 | | | | 1,351,062 | |
Delaware State Economic Development Authority
(Newark Charter School, Inc.)
Series 2020
5.00%, 09/01/2050 | | | 1,125 | | | | 1,075,148 | |
| | | | | | | | |
| | | | | | | 4,074,139 | |
| | | | | | | | |
District of Columbia – 0.5% | | | | | | | | |
District of Columbia
(District of Columbia International School Obligated Group)
Series 2019
5.00%, 07/01/2049 | | | 1,075 | | | | 960,628 | |
District of Columbia
(Friendship Public Charter School, Inc.)
Series 2016-A
5.00%, 06/01/2041 | | | 735 | | | | 700,534 | |
5.00%, 06/01/2046 | | | 1,165 | | | | 1,086,871 | |
District of Columbia
(KIPP DC Obligated Group)
Series 2017-A
5.00%, 07/01/2042 | | | 3,230 | | | | 3,199,952 | |
5.00%, 07/01/2048 | | | 5,350 | | | | 5,178,048 | |
Series 2017-B
5.00%, 07/01/2037 | | | 1,465 | | | | 1,472,424 | |
District of Columbia
(Rocketship DC Obligated Group)
Series 2021
5.00%, 06/01/2051(c) | | | 1,000 | | | | 857,991 | |
5.00%, 06/01/2061(c) | | | 1,000 | | | | 831,024 | |
District of Columbia Tobacco Settlement Financing Corp.
Series 2006
Zero Coupon, 06/15/2055 | | | 182,000 | | | | 12,677,158 | |
Metropolitan Washington Airports Authority Aviation Revenue
Series 2018-A
5.00%, 10/01/2048 | | | 7,400 | | | | 7,161,245 | |
| | |
| |
| abfunds.com | | AB MUNICIPAL INCOME SHARES | 29 |
PORTFOLIO OF INVESTMENTS (continued)
| | | | | | | | |
| | | Principal
Amount
(000) | | | U.S. $ Value | |
| |
Series 2020-A
4.00%, 10/01/2035 | | $ | 1,750 | | | $ | 1,611,572 | |
4.00%, 10/01/2039 | | | 2,000 | | | | 1,764,109 | |
| | | | | | | | |
| | | | | | | 37,501,556 | |
| | | | | | | | |
Florida – 6.3% | | | | | | | | |
Alachua County Health Facilities Authority
(Shands Teaching Hospital & Clinics Obligated Group)
Series 2014-A
5.00%, 12/01/2044 | | | 1,000 | | | | 952,187 | |
Align Affordable Housing Bond Fund LP
(SHI – Lake Worth LLC)
Series 2021
3.25%, 12/01/2051(c) | | | 26,000 | | | | 21,641,992 | |
Bexley Community Development District
Series 2016
4.875%, 05/01/2047 | | | 985 | | | | 878,746 | |
Cape Coral Health Facilities Authority
(Gulf Care, Inc. Obligated Group)
Series 2015
5.875%, 07/01/2040(c) | | | 1,400 | | | | 1,244,175 | |
6.00%, 07/01/2045(c) | | | 1,215 | | | | 1,065,345 | |
6.00%, 07/01/2050(c) | | | 2,895 | | | | 2,495,717 | |
Capital Projects Finance Authority/FL
(CAPFA Capital Corp. 2000F)
Series 2020-A
5.00%, 10/01/2026 | | | 2,000 | | | | 2,005,547 | |
5.00%, 10/01/2029 | | | 1,650 | | | | 1,633,792 | |
5.00%, 10/01/2032 | | | 1,000 | | | | 968,065 | |
5.00%, 10/01/2033 | | | 1,050 | | | | 1,011,463 | |
Capital Trust Agency, Inc.
(Aviva Senior Life)
Series 2017
5.00%, 07/01/2046(c) | | | 1,300 | | | | 977,140 | |
Capital Trust Agency, Inc.
(Educational Growth Fund LLC)
Series 2021
3.375%, 07/01/2031(c) | | | 1,270 | | | | 1,078,551 | |
5.00%, 07/01/2056(c) | | | 26,650 | | | | 22,182,519 | |
Capital Trust Agency, Inc.
(Team Success A School of Excellence, Inc.)
Series 2020
5.00%, 06/01/2045(c) | | | 1,615 | | | | 1,299,257 | |
5.00%, 06/01/2055(c) | | | 2,250 | | | | 1,724,074 | |
Series 2022
5.50%, 06/01/2057(c) | | | 3,000 | | | | 2,393,888 | |
| | |
| |
30 | AB MUNICIPAL INCOME SHARES | | abfunds.com |
PORTFOLIO OF INVESTMENTS (continued)
| | | | | | | | |
| | | Principal
Amount
(000) | | | U.S. $ Value | |
| |
City of Jacksonville FL
(Genesis Health, Inc. Obligated Group)
Series 2020
4.00%, 11/01/2039 | | $ | 1,650 | | | $ | 1,438,499 | |
4.00%, 11/01/2040 | | | 2,175 | | | | 1,878,646 | |
4.00%, 11/01/2045 | | | 7,500 | | | | 6,217,577 | |
5.00%, 11/01/2050 | | | 8,230 | | | | 7,934,629 | |
City of Lakeland FL
(Lakeland Regional Health Systems Obligated Group)
Series 2015
5.00%, 11/15/2040 | | | 5,610 | | | | 5,530,746 | |
City of Palmetto FL
(Renaissance Arts and Education, Inc.)
Series 2022
5.25%, 06/01/2052 | | | 2,955 | | | | 2,651,951 | |
5.375%, 06/01/2057 | | | 1,000 | | | | 896,749 | |
5.625%, 06/01/2062 | | | 3,465 | | | | 3,174,911 | |
City of South Miami Health Facilities Authority, Inc.
(Baptist Health South Florida Obligated Group)
Series 2017
5.00%, 08/15/2037(d) | | | 8,405 | | | | 8,519,875 | |
5.00%, 08/15/2047(d) | | | 6,125 | | | | 5,916,041 | |
City of Tallahassee FL
(Tallahassee Memorial HealthCare, Inc.)
Series 2015-A
5.00%, 12/01/2044 | | | 1,200 | | | | 1,138,168 | |
Series 2016
5.00%, 12/01/2055 | | | 3,535 | | | | 3,259,771 | |
City of Tampa FL
(State of Florida Cigarette Tax Revenue)
Series 2020-A
Zero Coupon, 09/01/2036 | | | 700 | | | | 337,030 | |
Zero Coupon, 09/01/2037 | | | 700 | | | | 317,788 | |
Zero Coupon, 09/01/2040 | | | 980 | | | | 371,761 | |
Zero Coupon, 09/01/2041 | | | 1,000 | | | | 357,838 | |
Zero Coupon, 09/01/2045 | | | 1,850 | | | | 514,171 | |
Zero Coupon, 09/01/2049 | | | 1,350 | | | | 292,117 | |
County of Broward FL Airport System Revenue
Series 2019-A
4.00%, 10/01/2044 | | | 12,170 | | | | 10,075,184 | |
5.00%, 10/01/2038 | | | 3,095 | | | | 3,048,466 | |
5.00%, 10/01/2044 | | | 3,000 | | | | 2,875,761 | |
| | |
| |
| abfunds.com | | AB MUNICIPAL INCOME SHARES | 31 |
PORTFOLIO OF INVESTMENTS (continued)
| | | | | | | | |
| | | Principal
Amount
(000) | | | U.S. $ Value | |
| |
County of Broward FL Airport System Revenue
(Fort Lauderdale Hollywood Intl Airport)
Series 2017
5.00%, 10/01/2042 | | $ | 5,000 | | | $ | 4,849,650 | |
5.00%, 10/01/2047 | | | 2,880 | | | | 2,743,155 | |
County of Lake FL
(Waterman Communities, Inc.)
Series 2020
5.75%, 08/15/2050 | | | 5,000 | | | | 4,148,993 | |
5.75%, 08/15/2055 | | | 3,905 | | | | 3,166,607 | |
County of Miami-Dade FL Aviation Revenue
Series 2014-A
5.00%, 10/01/2033(d) | | | 10,000 | | | | 9,957,299 | |
Series 2015-A
5.00%, 10/01/2031 | | | 1,100 | | | | 1,104,229 | |
Series 2017-B
5.00%, 10/01/2040 | | | 9,025 | | | | 8,622,668 | |
County of Miami-Dade Seaport Department
Series 2021-B
4.00%, 10/01/2046 | | | 5,000 | | | | 4,131,928 | |
4.00%, 10/01/2050 | | | 15,000 | | | | 12,158,225 | |
County of Osceola FL Transportation Revenue
Series 2020-A
Zero Coupon, 10/01/2035 | | | 1,000 | | | | 471,547 | |
Zero Coupon, 10/01/2036 | | | 860 | | | | 379,924 | |
Zero Coupon, 10/01/2037 | | | 1,390 | | | | 574,912 | |
Zero Coupon, 10/01/2038 | | | 1,185 | | | | 458,883 | |
Zero Coupon, 10/01/2039 | | | 1,610 | | | | 582,153 | |
County of Palm Beach FL
(Provident Group-PBAU Properties LLC)
Series 2019
5.00%, 04/01/2039(c) | | | 1,000 | | | | 869,993 | |
5.00%, 04/01/2051(c) | | | 3,030 | | | | 2,434,254 | |
Florida Development Finance Corp.
(Assistance Unlimited, Inc,)
Series 2022
5.00%, 08/15/2032(c) | | | 460 | | | | 413,961 | |
5.25%, 08/15/2037(c) | | | 700 | | | | 603,836 | |
5.625%, 08/15/2042(c) | | | 1,520 | | | | 1,312,335 | |
5.875%, 08/15/2052(c) | | | 5,000 | | | | 4,250,087 | |
6.00%, 08/15/2057(c) | | | 1,000 | | | | 848,542 | |
Florida Development Finance Corp.
(Brightline Trains Florida LLC)
Series 2020
7.375%, 01/01/2049(c) | | | 5,500 | | | | 4,642,926 | |
| | |
| |
32 | AB MUNICIPAL INCOME SHARES | | abfunds.com |
PORTFOLIO OF INVESTMENTS (continued)
| | | | | | | | |
| | | Principal
Amount
(000) | | | U.S. $ Value | |
| |
Florida Development Finance Corp.
(Cornerstone Charter Academy, Inc.)
Series 2022
5.00%, 10/01/2032(c) | | $ | 925 | | | $ | 903,074 | |
5.00%, 10/01/2042(c) | | | 1,105 | | | | 971,687 | |
5.125%, 10/01/2052(c) | | | 3,120 | | | | 2,645,478 | |
5.25%, 10/01/2056(c) | | | 1,900 | | | | 1,603,363 | |
Florida Development Finance Corp.
(IDEA Florida, Inc.)
Series 2022
5.25%, 06/15/2029(c) | | | 1,030 | | | | 975,848 | |
Florida Development Finance Corp.
(Mater Academy, Inc.)
Series 2020-A
5.00%,��06/15/2040 | | | 1,650 | | | | 1,548,577 | |
5.00%, 06/15/2050 | | | 4,815 | | | | 4,308,117 | |
5.00%, 06/15/2055 | | | 4,600 | | | | 4,054,925 | |
Series 2022-A
5.00%, 06/15/2047 | | | 2,310 | | | | 2,086,822 | |
Florida Development Finance Corp.
(Mayflower Retirement Center, Inc. Obligated Group)
Series 2020
5.25%, 06/01/2050(c) | | | 5,000 | | | | 4,299,585 | |
5.25%, 06/01/2055(c) | | | 5,500 | | | | 4,651,441 | |
Series 2021
4.00%, 06/01/2041(c) | | | 830 | | | | 609,439 | |
Florida Development Finance Corp.
(River City Education Obligated Group)
Series 2022
5.00%, 07/01/2042 | | | 435 | | | | 399,970 | |
5.00%, 07/01/2042(a) | | | 460 | | | | 412,931 | |
5.00%, 07/01/2051 | | | 395 | | | | 350,330 | |
5.00%, 07/01/2051(a) | | | 650 | | | | 560,371 | |
5.00%, 02/01/2057 | | | 575 | | | | 498,150 | |
5.00%, 07/01/2057(a) | | | 680 | | | | 571,413 | |
Florida Development Finance Corp.
(Seaside School Consortium, Inc.)
Series 2022
6.00%, 06/15/2057 | | | 7,000 | | | | 6,924,796 | |
Florida Higher Educational Facilities Financial Authority
(Florida Institute of Technology, Inc.)
Series 2019
4.00%, 10/01/2037 | | | 1,000 | | | | 845,362 | |
| | |
| |
| abfunds.com | | AB MUNICIPAL INCOME SHARES | 33 |
PORTFOLIO OF INVESTMENTS (continued)
| | | | | | | | |
| | | Principal
Amount
(000) | | | U.S. $ Value | |
| |
Florida Higher Educational Facilities Financial Authority
(Ringling College of Art and Design, Inc.)
Series 2017
5.00%, 03/01/2032 | | $ | 265 | | | $ | 263,423 | |
5.00%, 03/01/2034 | | | 2,395 | | | | 2,347,716 | |
Series 2019
5.00%, 03/01/2044 | | | 1,065 | | | | 985,690 | |
5.00%, 03/01/2049 | | | 8,425 | | | | 7,638,820 | |
Florida Municipal Power Agency
(Florida Municipal Power Agency All-Requirements Power Supply Project Revenue)
Series 2021
1.425%, 10/01/2026 | | | 2,700 | | | | 2,337,429 | |
Greater Orlando Aviation Authority
5.00%, 10/01/2034(d) | | | 2,000 | | | | – 0 | – |
5.00%, 10/01/2044(d) | | | 13,000 | | | | 12,758,405 | |
Series 2017-A
5.00%, 10/01/2031 | | | 4,350 | | | | 4,422,645 | |
5.00%, 10/01/2032 | | | 1,500 | | | | 1,521,290 | |
5.00%, 10/01/2034 | | | 2,150 | | | | 2,155,048 | |
5.00%, 10/01/2035 | | | 3,500 | | | | 3,470,270 | |
5.00%, 10/01/2036 | | | 4,000 | | | | 3,961,318 | |
Series 2019-A
5.00%, 10/01/2036(d) | | | 5,000 | | | | 4,961,481 | |
5.00%, 10/01/2049(d) | | | 4,500 | | | | 4,296,704 | |
5.00%, 10/01/2054(d) | | | 4,000 | | | | 3,801,842 | |
Series 2022-A
4.00%, 10/01/2052 | | | 7,500 | | | | 6,060,068 | |
Highlands County Health Facilities Authority
(Trousdale Foundation Obligated Group)
Series 2018
6.00%, 04/01/2038(f)(g) | | | 1,530 | | | | 575,280 | |
6.25%, 04/01/2049(f)(g) | | | 1,820 | | | | 684,320 | |
Lakewood Ranch Stewardship District
(Lakewood Ranch Stewardship District Northeast Sector Project)
Series 2018
5.30%, 05/01/2039 | | | 1,000 | | | | 965,878 | |
5.45%, 05/01/2048 | | | 1,525 | | | | 1,429,528 | |
Lee County Industrial Development Authority/FL
(Cypress Cove at Healthpark Florida Obligated Group)
Series 2022
5.25%, 10/01/2052 | | | 1,350 | | | | 1,127,075 | |
5.25%, 10/01/2057 | | | 3,650 | | | | 2,976,343 | |
| | |
| |
34 | AB MUNICIPAL INCOME SHARES | | abfunds.com |
PORTFOLIO OF INVESTMENTS (continued)
| | | | | | | | |
| | | Principal
Amount
(000) | | | U.S. $ Value | |
| |
Manatee County School District
(Manatee County School District Sales Tax)
AGM Series 2017
5.00%, 10/01/2030 | | $ | 2,700 | | | $ | 2,830,955 | |
Marshall Creek Community Development District
(Marshall Creek Community Development District 2015A)
Series 2015-A
5.00%, 05/01/2032 | | | 1,395 | | | | 1,357,473 | |
Martin County Health Facilities Authority
(Cleveland Clinic Health System Obligated Group)
Series 2019
4.00%, 01/01/2046 | | | 4,000 | | | | 3,474,024 | |
Miami Beach Health Facilities Authority
(Mount Sinai Medical Center of Florida, Inc.)
Series 2014
5.00%, 11/15/2039 | | | 2,000 | | | | 1,956,317 | |
Miami-Dade County Expressway Authority
Series 2014-A
5.00%, 07/01/2034 | | | 4,000 | | | | 4,054,467 | |
Miami-Dade County Industrial Development Authority
(AcadeMir Charter School Middle & Preparatory Academy Obligated Group)
Series 2022
5.00%, 07/01/2037(c) | | | 525 | | | | 462,080 | |
5.25%, 07/01/2042(c) | | | 770 | | | | 663,181 | |
5.25%, 07/01/2052(c) | | | 1,715 | | | | 1,410,385 | |
5.50%, 07/01/2061(c) | | | 1,185 | | | | 968,613 | |
Mid-Bay Bridge Authority
Series 2015-A
5.00%, 10/01/2028 | | | 1,600 | | | | 1,619,598 | |
5.00%, 10/01/2040 | | | 2,000 | | | | 1,955,763 | |
Series 2015-C
5.00%, 10/01/2035 | | | 1,750 | | | | 1,735,135 | |
5.00%, 10/01/2040 | | | 1,000 | | | | 965,443 | |
Middleton Community Development District A
Series 2022
6.20%, 05/01/2053 | | | 3,500 | | | | 3,411,205 | |
North Broward Hospital District
Series 2017-B
5.00%, 01/01/2037 | | | 4,070 | | | | 3,966,421 | |
| | |
| |
| abfunds.com | | AB MUNICIPAL INCOME SHARES | 35 |
PORTFOLIO OF INVESTMENTS (continued)
| | | | | | | | |
| | | Principal
Amount
(000) | | | U.S. $ Value | |
| |
5.00%, 01/01/2048 | | $ | 17,520 | | | $ | 15,908,791 | |
Orange County Health Facilities Authority
(Presbyterian Retirement Communities, Inc. Obligated Group)
Series 2023
4.00%, 08/01/2042(a) | | | 5,750 | | | | 4,494,433 | |
Palm Beach County Educational Facilities Authority
(Palm Beach Atlantic University Obligated Group)
Series 2021
4.00%, 10/01/2041 | | | 1,030 | | | | 861,192 | |
4.00%, 10/01/2051 | | | 4,330 | | | | 3,356,208 | |
Palm Beach County Health Facilities Authority
(ACTS Retirement-Life Communities, Inc. Obligated Group)
Series 2020-B
5.00%, 11/15/2042 | | | 1,000 | | | | 931,681 | |
Palm Beach County Health Facilities Authority
(Federation CCRC Operations Corp. Obligated Group)
Series 2020
5.00%, 06/01/2055 | | | 2,880 | | | | 2,477,094 | |
Series 2022
4.25%, 06/01/2056 | | | 4,825 | | | | 3,424,667 | |
Palm Beach County Health Facilities Authority
(Green Cay Life Plan Village, Inc.)
Series 2022
11.50%, 07/01/2027(c) | | | 1,800 | | | | 1,724,815 | |
Palm Beach County Health Facilities Authority
(Jupiter Medical Center Obligated Group)
Series 2022
5.00%, 11/01/2038 | | | 400 | | | | 386,367 | |
5.00%, 11/01/2039 | | | 685 | | | | 658,116 | |
5.00%, 11/01/2040 | | | 650 | | | | 620,972 | |
5.00%, 11/01/2041 | | | 2,330 | | | | 2,216,768 | |
5.00%, 11/01/2042 | | | 500 | | | | 473,106 | |
5.00%, 11/01/2047 | | | 11,835 | | | | 10,827,801 | |
5.00%, 11/01/2052 | | | 15,630 | | | | 14,203,114 | |
Pinellas County Industrial Development Authority
Series 2019
5.00%, 07/01/2039 | | | 1,955 | | | | 1,793,104 | |
| | |
| |
36 | AB MUNICIPAL INCOME SHARES | | abfunds.com |
PORTFOLIO OF INVESTMENTS (continued)
| | | | | | | | |
| | | Principal
Amount
(000) | | | U.S. $ Value | |
| |
Polk County Industrial Development Authority
(Mineral Development LLC)
Series 2020
5.875%, 01/01/2033(c) | | $ | 4,000 | | | $ | 3,885,074 | |
St. Johns County Industrial Development Authority
(Presbyterian Retirement Communities, Inc. Obligated Group)
Series 2020
4.00%, 08/01/2055 | | | 5,300 | | | | 4,189,974 | |
Tampa Florida Hospitals
5.00%, 07/01/2050(d) | | | 18,325 | | | | 17,387,955 | |
Town of Davie FL
Series 2013-A
5.625%, 04/01/2043
(Pre-refunded/ETM) | | | 3,765 | | | | 3,802,516 | |
Town of Davie FL
(Nova Southeastern University, Inc.)
Series 2018
5.00%, 04/01/2048 | | | 24,650 | | | | 24,813,358 | |
Village Community Development District No. 13
Series 2019
3.00%, 05/01/2029 | | | 965 | | | | 823,745 | |
3.375%, 05/01/2034 | | | 1,450 | | | | 1,151,629 | |
3.55%, 05/01/2039 | | | 2,520 | | | | 1,876,852 | |
3.70%, 05/01/2050 | | | 9,620 | | | | 6,497,143 | |
Series 2020
3.50%, 05/01/2051(c) | | | 4,885 | | | | 3,050,505 | |
Village Community Development District No. 14
Series 2022
5.50%, 05/01/2053 | | | 4,000 | | | | 3,930,337 | |
Volusia County School Board
(Volusia County School Board COP)
Series 2014-B
5.00%, 08/01/2031 | | | 1,625 | | | | 1,656,055 | |
| | | | | | | | |
| | | | 475,242,928 | |
| | | | | | | | |
Georgia – 2.2% | | | | | | | | |
Augusta Development Authority
(AU Health System Obligated Group)
Series 2018
5.00%, 07/01/2027 | | | 1,635 | | | | 1,556,768 | |
City of Atlanta GA Department of Aviation
Series 2014-A
5.00%, 01/01/2033 | | | 1,820 | | | | 1,838,564 | |
| | |
| |
| abfunds.com | | AB MUNICIPAL INCOME SHARES | 37 |
PORTFOLIO OF INVESTMENTS (continued)
| | | | | | | | |
| | | Principal
Amount
(000) | | | U.S. $ Value | |
| |
Series 2021-C
4.00%, 07/01/2040 | | $ | 2,305 | | | $ | 2,006,911 | |
Series 2022-B
5.00%, 07/01/2047 | | | 12,430 | | | | 12,040,482 | |
5.00%, 07/01/2052 | | | 20,000 | | | | 19,065,888 | |
Clarke County Hospital Authority
(Piedmont Healthcare, Inc. Obligated Group)
Series 2016
5.00%, 07/01/2031 | | | 2,500 | | | | 2,581,936 | |
Development Authority for Fulton County
(Piedmont Healthcare, Inc. Obligated Group)
Series 2016-A
5.00%, 07/01/2032 | | | 2,000 | | | | 2,054,486 | |
Development Authority of Gwinnett County
(Board of Regents of the University System of Georgia Lease)
Series 2017-A
5.00%, 07/01/2032(d) | | | 1,205 | | | | 1,257,906 | |
5.00%, 07/01/2033(d) | | | 2,370 | | | | 2,462,290 | |
5.00%, 07/01/2035(d) | | | 4,945 | | | | 5,105,887 | |
5.00%, 07/01/2037(d) | | | 2,335 | | | | 2,398,675 | |
Fayette County Hospital Authority/GA
(Piedmont Healthcare, Inc. Obligated Group)
Series 2016
5.00%, 07/01/2034 | | | 1,620 | | | | 1,649,835 | |
5.00%, 07/01/2035 | | | 6,355 | | | | 6,449,529 | |
5.00%, 07/01/2036 | | | 2,735 | | | | 2,777,724 | |
Fulton County Residential Care Facilities for the Elderly Authority
(All Saints-St Luke’s Episcopal Home for the Retired Obligated Group)
Series 2019
5.00%, 04/01/2047(c) | | | 6,500 | | | | 5,115,283 | |
5.00%, 04/01/2054(c) | | | 2,000 | | | | 1,514,536 | |
George L Smith II Congress Center Authority
(Signia Hotel Management LLC)
Series 2021
4.00%, 01/01/2054 | | | 1,485 | | | | 1,114,671 | |
Glynn-Brunswick Memorial Hospital Authority
(Southeast Georgia Health System Obligated Group)
Series 2017
5.00%, 08/01/2043 | | | 2,680 | | | | 2,490,457 | |
| | |
| |
38 | AB MUNICIPAL INCOME SHARES | | abfunds.com |
PORTFOLIO OF INVESTMENTS (continued)
| | | | | | | | |
| | | Principal
Amount
(000) | | | U.S. $ Value | |
| |
5.00%, 08/01/2047 | | $ | 10,000 | | | $ | 9,114,223 | |
Main Street Natural Gas, Inc.
(Citadel LP)
Series 2022-C
4.00%, 08/01/2052(c) | | | 18,500 | | | | 17,085,135 | |
Main Street Natural Gas, Inc.
(Royal Bank of Canada)
Series 2018-A
4.00%, 04/01/2048 | | | 12,175 | | | | 12,149,017 | |
Series 2018-C
4.00%, 08/01/2048 | | | 12,245 | | | | 12,211,577 | |
Municipal Electric Authority of Georgia
Series 2019
5.00%, 01/01/2038 | | | 1,235 | | | | 1,211,921 | |
5.00%, 01/01/2039 | | | 1,215 | | | | 1,185,588 | |
5.00%, 01/01/2048 | | | 2,460 | | | | 2,247,156 | |
5.00%, 01/01/2049 | | | 5,000 | | | | 4,696,350 | |
5.00%, 01/01/2056 | | | 4,655 | | | | 4,338,880 | |
5.00%, 01/01/2059 | | | 2,395 | | | | 2,146,544 | |
Series 2022
4.50%, 07/01/2063 | | | 15,000 | | | | 12,907,257 | |
5.00%, 07/01/2052 | | | 12,000 | | | | 11,219,181 | |
Private Colleges & Universities Authority
(Corp. of Mercer University (The))
Series 2021
4.00%, 10/01/2050 | | | 2,700 | | | | 2,166,017 | |
| | | | | | | | |
| | | | 166,160,674 | |
| | | | | | | | |
Guam – 0.6% | | | | | | | | |
Guam Government Waterworks Authority
Series 2020-A
5.00%, 01/01/2050 | | | 3,790 | | | | 3,582,232 | |
Guam Power Authority
Series 2022-A
5.00%, 10/01/2043 | | | 3,300 | | | | 3,232,197 | |
Territory of Guam
Series 2019
5.00%, 11/15/2031 | | | 1,855 | | | | 1,801,983 | |
Territory of Guam
(Guam Section 30 Income Tax)
Series 2016-A
5.00%, 12/01/2029 | | | 1,310 | | | | 1,305,441 | |
5.00%, 12/01/2030 | | | 4,160 | | | | 4,128,443 | |
5.00%, 12/01/2032 | | | 3,545 | | | | 3,469,939 | |
Territory of Guam
(Territory of Guam Business Privilege Tax)
Series 2015-D
5.00%, 11/15/2032 | | | 13,000 | | | | 12,728,821 | |
| | |
| |
| abfunds.com | | AB MUNICIPAL INCOME SHARES | 39 |
PORTFOLIO OF INVESTMENTS (continued)
| | | | | | | | |
| | | Principal
Amount
(000) | | | U.S. $ Value | |
| |
5.00%, 11/15/2033 | | $ | 3,570 | | | $ | 3,466,442 | |
5.00%, 11/15/2035 | | | 8,935 | | | | 8,520,041 | |
Series 2021-F
4.00%, 01/01/2036 | | | 4,050 | | | | 3,415,892 | |
| | | | | | | | |
| | | | 45,651,431 | |
| | | | | | | | |
Idaho – 0.0% | | | | | | | | |
Idaho Housing & Finance Association
(Battelle Energy Alliance LLC)
Series 2010-A
7.00%, 02/01/2036 | | | 200 | | | | 200,253 | |
| | | | | | | | |
| | |
Illinois – 9.8% | | | | | | | | |
Chicago Board of Education
Series 2012-A
5.00%, 12/01/2042 | | | 6,635 | | | | 5,872,090 | |
Series 2015-C
5.25%, 12/01/2035 | | | 2,790 | | | | 2,668,278 | |
5.25%, 12/01/2039 | | | 7,525 | | | | 6,960,794 | |
Series 2015-E
5.125%, 12/01/2032 | | | 1,000 | | | | 972,420 | |
Series 2016-A
7.00%, 12/01/2044 | | | 1,400 | | | | 1,461,781 | |
Series 2016-B
6.50%, 12/01/2046 | | | 1,900 | | | | 1,961,539 | |
Series 2017-G
5.00%, 12/01/2034 | | | 4,150 | | | | 3,931,002 | |
Series 2017-H
5.00%, 12/01/2036 | | | 900 | | | | 842,647 | |
5.00%, 12/01/2046 | | | 6,095 | | | | 5,302,587 | |
Series 2018-A
5.00%, 12/01/2026 | | | 5,430 | | | | 5,388,433 | |
5.00%, 12/01/2027 | | | 6,300 | | | | 6,225,137 | |
5.00%, 12/01/2028 | | | 5,975 | | | | 5,886,098 | |
Series 2019-A
5.00%, 12/01/2029 | | | 2,950 | | | | 2,893,206 | |
5.00%, 12/01/2030 | | | 4,120 | | | | 4,022,177 | |
Series 2019-B
5.00%, 12/01/2030 | | | 935 | | | | 912,800 | |
5.00%, 12/01/2031 | | | 1,030 | | | | 997,466 | |
5.00%, 12/01/2032 | | | 635 | | | | 610,487 | |
5.00%, 12/01/2033 | | | 500 | | | | 476,564 | |
Series 2021-A
5.00%, 12/01/2033 | | | 4,510 | | | | 4,309,376 | |
5.00%, 12/01/2036 | | | 1,010 | | | | 931,093 | |
5.00%, 12/01/2038 | | | 2,730 | | | | 2,486,165 | |
5.00%, 12/01/2039 | | | 2,000 | | | | 1,812,429 | |
5.00%, 12/01/2040 | | | 1,750 | | | | 1,575,591 | |
| | |
| |
40 | AB MUNICIPAL INCOME SHARES | | abfunds.com |
PORTFOLIO OF INVESTMENTS (continued)
| | | | | | | | |
| | | Principal
Amount
(000) | | | U.S. $ Value | |
| |
5.00%, 12/01/2041 | | $ | 5,300 | | | $ | 4,746,670 | |
Series 2021-B
5.00%, 12/01/2036 | | | 1,000 | | | | 920,230 | |
Series 2022-B
4.00%, 12/01/2041 | | | 42,765 | | | | 33,609,001 | |
Chicago O’Hare International Airport
5.25%, 01/01/2053(d) | | | 20,000 | | | | 20,584,400 | |
5.50%, 01/01/2055(d) | | | 19,000 | | | | 19,996,170 | |
Series 2015-C
5.00%, 01/01/2034 | | | 1,665 | | | | 1,651,609 | |
Series 2016-B
5.00%, 01/01/2034 | | | 5,000 | | | | 5,089,697 | |
Series 2016-C
5.00%, 01/01/2035 | | | 1,625 | | | | 1,644,878 | |
5.00%, 01/01/2038 | | | 7,625 | | | | 7,682,337 | |
Series 2017-B
5.00%, 01/01/2035 | | | 6,645 | | | | 6,749,768 | |
5.00%, 01/01/2036 | | | 12,000 | | | | 12,176,071 | |
5.00%, 01/01/2037 | | | 14,800 | | | | 14,989,592 | |
Series 2022
4.50%, 01/01/2048 | | | 10,000 | | | | 8,745,815 | |
4.625%, 01/01/2053 | | | 10,000 | | | | 8,686,275 | |
Chicago O’Hare International Airport
(TrIPs Obligated Group)
Series 2018
5.00%, 07/01/2033 | | | 645 | | | | 636,392 | |
5.00%, 07/01/2038 | | | 1,500 | | | | 1,432,571 | |
5.00%, 07/01/2048 | | | 5,000 | | | | 4,531,705 | |
Chicago Transit Authority
(Chicago Transit Authority Sales Tax)
Series 2020-A
4.00%, 12/01/2050(d) | | | 12,340 | | | | 9,541,379 | |
Chicago Transit Authority Sales Tax Receipts Fund
Series 2020-A
5.00%, 12/01/2045(d) | | | 5,000 | | | | 4,777,304 | |
5.00%, 12/01/2055(d) | | | 6,000 | | | | 5,575,771 | |
City of Chicago IL
(Goldblatts Supportive Living Project)
Series 2013
6.375%, 12/01/2052 | | | 1,050 | | | | 638,551 | |
Illinois Finance Authority
Series 2015
5.25%, 05/15/2050
(Pre-refunded/ETM) | | | 2,000 | | | | 2,088,932 | |
| | |
| |
| abfunds.com | | AB MUNICIPAL INCOME SHARES | 41 |
PORTFOLIO OF INVESTMENTS (continued)
| | | | | | | | |
| | | Principal
Amount
(000) | | | U.S. $ Value | |
| |
Illinois Finance Authority
(Acero Charter Schools, Inc. Obligated Group)
Series 2021
4.00%, 10/01/2042(c) | | $ | 3,400 | | | $ | 2,554,543 | |
Illinois Finance Authority
(Ascension Health Credit Group)
Series 2016-C
5.00%, 02/15/2041 | | | 2,835 | | | | 2,845,345 | |
Illinois Finance Authority
(Clark-Lindsey Village Obligated Group)
Series 2022-A
4.60%, 06/01/2027 | | | 400 | | | | 385,423 | |
5.125%, 06/01/2032 | | | 350 | | | | 326,942 | |
5.25%, 06/01/2037 | | | 340 | | | | 309,577 | |
5.375%, 06/01/2042 | | | 985 | | | | 884,272 | |
5.50%, 06/01/2057 | | | 5,280 | | | | 4,530,753 | |
Illinois Finance Authority
(Illinois Institute of Technology)
Series 2019
4.00%, 09/01/2035 | | | 1,000 | | | | 840,414 | |
4.00%, 09/01/2037 | | | 1,130 | | | | 924,891 | |
4.00%, 09/01/2039 | | | 1,150 | | | | 916,188 | |
4.00%, 09/01/2041 | | | 1,000 | | | | 777,747 | |
5.00%, 09/01/2036 | | | 1,095 | | | | 1,031,730 | |
5.00%, 09/01/2038 | | | 1,365 | | | | 1,267,592 | |
5.00%, 09/01/2040 | | | 1,035 | | | | 947,889 | |
Illinois Finance Authority
(Lake Forest College)
Series 2022-A
5.25%, 10/01/2052 | | | 1,500 | | | | 1,279,394 | |
5.50%, 10/01/2042 | | | 1,045 | | | | 967,012 | |
5.50%, 10/01/2047 | | | 1,000 | | | | 901,536 | |
Illinois Finance Authority
(Park Place of Elmhurst Obligated Group)
Series 2021
5.125%, 05/15/2060 | | | 3,515 | | | | 2,408,023 | |
Illinois Finance Authority
(Plymouth Place Obligated Group)
Series 2022
4.75%, 11/15/2027(a) | | | 1,500 | | | | 1,497,339 | |
5.25%, 11/15/2027(a) | | | 1,525 | | | | 1,522,326 | |
6.50%, 05/15/2042(a) | | | 2,000 | | | | 2,021,953 | |
6.50%, 05/15/2047(a) | | | 2,000 | | | | 1,990,259 | |
6.625%, 05/15/2052(a) | | | 1,910 | | | | 1,901,380 | |
6.75%, 05/15/2058(a) | | | 1,765 | | | | 1,755,541 | |
| | |
| |
42 | AB MUNICIPAL INCOME SHARES | | abfunds.com |
PORTFOLIO OF INVESTMENTS (continued)
| | | | | | | | |
| | | Principal
Amount
(000) | | | U.S. $ Value | |
| |
Illinois Finance Authority
(Rosalind Franklin University of Medicine and Science)
Series 2017-A
5.00%, 08/01/2042 | | $ | 1,000 | | | $ | 970,039 | |
5.00%, 08/01/2047 | | | 2,000 | | | | 1,894,707 | |
Series 2017-C
5.00%, 08/01/2046 | | | 1,000 | | | | 950,438 | |
Illinois Finance Authority
(Silver Cross Hospital Obligated Group)
Series 2015-C
5.00%, 08/15/2035 | | | 4,750 | | | | 4,752,528 | |
Illinois Finance Authority
(Washington and Jane Smith Home (The))
Series 2022
4.00%, 10/15/2044 | | | 10,890 | | | | 8,068,585 | |
Illinois Housing Development Authority
Series 2022
5.67%, 12/01/2025(c) | | | 17,000 | | | | 16,931,340 | |
7.17%, 11/01/2038 | | | 1,675 | | | | 1,645,294 | |
Illinois State Toll Highway Authority
Series 2015-A
5.00%, 01/01/2031 | | | 1,500 | | | | 1,552,000 | |
5.00%, 01/01/2032 | | | 1,625 | | | | 1,679,269 | |
Series 2015-B
5.00%, 01/01/2036 | | | 2,850 | | | | 2,932,303 | |
Series 2016-A
5.00%, 12/01/2032 | | | 7,000 | | | | 7,259,911 | |
Series 2016-B
5.00%, 01/01/2041 | | | 3,450 | | | | 3,482,785 | |
Metropolitan Pier & Exposition Authority
Series 2012
Zero Coupon, 12/15/2041 | | | 9,400 | | | | 3,045,419 | |
Zero Coupon, 12/15/2051 | | | 11,385 | | | | 1,932,160 | |
Series 2015-B
5.00%, 12/15/2045 | | | 13,300 | | | | 12,307,970 | |
Series 2017-B
Zero Coupon, 12/15/2054 | | | 9,850 | | | | 1,379,772 | |
Series 2020
4.00%, 06/15/2050 | | | 2,525 | | | | 1,902,793 | |
5.00%, 06/15/2050 | | | 47,895 | | | | 43,776,547 | |
State of Illinois
Series 2010
7.35%, 07/01/2035 | | | 11,946 | | | | 12,232,525 | |
Series 2014
5.00%, 05/01/2023 | | | 7,185 | | | | 7,221,066 | |
| | |
| |
| abfunds.com | | AB MUNICIPAL INCOME SHARES | 43 |
PORTFOLIO OF INVESTMENTS (continued)
| | | | | | | | |
| | | Principal
Amount
(000) | | | U.S. $ Value | |
| |
5.00%, 05/01/2031 | | $ | 7,615 | | | $ | 7,620,363 | |
Series 2016
5.00%, 02/01/2024 | | | 2,525 | | | | 2,546,265 | |
5.00%, 02/01/2027 | | | 19,125 | | | | 19,247,081 | |
5.00%, 02/01/2029 | | | 5,945 | | | | 5,949,946 | |
5.00%, 11/01/2032 | | | 5,245 | | | | 5,192,434 | |
5.00%, 11/01/2035 | | | 8,000 | | | | 7,761,885 | |
Series 2017-A
5.00%, 12/01/2025 | | | 3,510 | | | | 3,536,734 | |
5.00%, 12/01/2026 | | | 6,000 | | | | 6,040,439 | |
5.00%, 12/01/2028 | | | 2,700 | | | | 2,703,245 | |
5.00%, 12/01/2034 | | | 2,585 | | | | 2,516,267 | |
Series 2017-C
5.00%, 11/01/2029 | | | 29,335 | | | | 29,347,655 | |
Series 2017-D
5.00%, 11/01/2024 | | | 7,395 | | | | 7,459,245 | |
5.00%, 11/01/2025 | | | 31,725 | | | | 31,970,440 | |
5.00%, 11/01/2026 | | | 16,685 | | | | 16,798,954 | |
5.00%, 11/01/2027 | | | 9,285 | | | | 9,317,459 | |
5.00%, 11/01/2028 | | | 8,450 | | | | 8,461,082 | |
Series 2018-A
5.00%, 10/01/2027 | | | 14,590 | | | | 14,646,088 | |
5.00%, 10/01/2028 | | | 1,710 | | | | 1,712,960 | |
5.00%, 05/01/2029 | | | 5,235 | | | | 5,239,474 | |
5.00%, 10/01/2029 | | | 1,030 | | | | 1,030,529 | |
5.00%, 05/01/2030 | | | 2,185 | | | | 2,184,726 | |
Series 2018-B
5.00%, 10/01/2026 | | | 5,000 | | | | 5,035,088 | |
Series 2019-B
4.00%, 11/01/2033 | | | 9,500 | | | | 8,414,865 | |
4.00%, 11/01/2036 | | | 16,375 | | | | 13,957,908 | |
4.00%, 11/01/2037 | | | 16,920 | | | | 14,248,077 | |
5.00%, 11/01/2030 | | | 8,225 | | | | 8,217,476 | |
Series 2020
5.50%, 05/01/2030 | | | 2,750 | | | | 2,834,744 | |
5.75%, 05/01/2045 | | | 2,500 | | | | 2,506,292 | |
Series 2020-B
5.00%, 10/01/2030 | | | 2,000 | | | | 1,998,360 | |
5.00%, 10/01/2031 | | | 2,100 | | | | 2,089,906 | |
Series 2021-A
5.00%, 03/01/2035 | | | 2,700 | | | | 2,625,140 | |
5.00%, 03/01/2036 | | | 3,250 | | | | 3,148,478 | |
5.00%, 03/01/2037 | | | 3,750 | | | | 3,613,441 | |
5.00%, 03/01/2046 | | | 9,000 | | | | 8,193,253 | |
Series 2022-A
5.25%, 03/01/2037 | | | 2,500 | | | | 2,470,889 | |
5.50%, 03/01/2042 | | | 12,610 | | | | 12,470,250 | |
| | |
| |
44 | AB MUNICIPAL INCOME SHARES | | abfunds.com |
PORTFOLIO OF INVESTMENTS (continued)
| | | | | | | | |
| | | Principal
Amount
(000) | | | U.S. $ Value | |
| |
5.50%, 03/01/2047 | | $ | 4,500 | | | $ | 4,351,132 | |
Series 2022-B
5.25%, 10/01/2037 | | | 13,000 | | | | 12,844,962 | |
Series 2022-C
5.50%, 10/01/2045 | | | 19,000 | | | | 18,496,711 | |
Village of Antioch IL Special Service Areas No. 1 & 2
Series 2016-A
4.50%, 03/01/2033 | | | 3,376 | | | | 2,956,499 | |
Series 2016-B
7.00%, 03/01/2033 | | | 1,554 | | | | 1,416,422 | |
Village of Pingree Grove IL Special Service Area No. 7
Series 2015
4.50%, 03/01/2025 | | | 482 | | | | 473,928 | |
5.00%, 03/01/2036 | | | 2,957 | | | | 2,680,448 | |
Series 2015-B
6.00%, 03/01/2036 | | | 857 | | | | 826,475 | |
| | | | | | | | |
| | | | 742,854,813 | |
| | | | | | | | |
Indiana – 1.3% | | | | | | | | |
Indiana Finance Authority
Series 2013-A
5.00%, 07/01/2040
(Pre-refunded/ETM) | | | 2,400 | | | | 2,413,073 | |
5.00%, 07/01/2044
(Pre-refunded/ETM) | | | 6,070 | | | | 6,103,065 | |
5.00%, 07/01/2048
(Pre-refunded/ETM) | | | 2,500 | | | | 2,513,618 | |
Indiana Finance Authority
(Baptist Healthcare System Obligated Group)
Series 2017
5.00%, 08/15/2051 | | | 3,905 | | | | 3,780,460 | |
Indiana Finance Authority
(Brightmark Plastics Renewal Indiana LLC)
Series 2019
7.00%, 03/01/2039(c) | | | 32,495 | | | | 23,653,601 | |
Indiana Finance Authority
(Good Samaritan Hospital Obligated Group)
Series 2022
4.00%, 04/01/2037 | | | 2,620 | | | | 2,107,382 | |
4.00%, 04/01/2039 | | | 1,630 | | | | 1,270,941 | |
4.00%, 04/01/2041 | | | 2,305 | | | | 1,752,543 | |
4.00%, 04/01/2042 | | | 2,400 | | | | 1,804,319 | |
| | |
| |
| abfunds.com | | AB MUNICIPAL INCOME SHARES | 45 |
PORTFOLIO OF INVESTMENTS (continued)
| | | | | | | | |
| | | Principal
Amount
(000) | | | U.S. $ Value | |
| |
Indiana Finance Authority
(Greencroft Goshen Obligated Group)
Series 2021
4.00%, 11/15/2043 | | $ | 6,700 | | | $ | 5,006,161 | |
Series 2023-2
4.00%, 11/15/2023(a) | | | 795 | | | | 791,881 | |
4.00%, 11/15/2024(a) | | | 905 | | | | 887,021 | |
4.00%, 11/15/2025(a) | | | 985 | | | | 948,714 | |
4.00%, 11/15/2028(a) | | | 1,000 | | | | 901,863 | |
4.00%, 11/15/2029(a) | | | 1,000 | | | | 882,683 | |
4.00%, 11/15/2037(a) | | | 1,800 | | | | 1,374,727 | |
Indiana Finance Authority
(Marquette Manor)
Series 2015-A
5.00%, 03/01/2030 | | | 1,000 | | | | 1,000,752 | |
Indiana Finance Authority
(Ohio Valley Electric Corp.)
Series 2020
3.00%, 11/01/2030 | | | 11,725 | | | | 9,938,054 | |
Series 2020-A
3.00%, 11/01/2030 | | | 7,290 | | | | 6,178,970 | |
Series 2021-B
2.50%, 11/01/2030 | | | 5,065 | | | | 4,141,763 | |
Indiana Finance Authority
(University of Evansville)
Series 2022
5.00%, 09/01/2029 | | | 1,755 | | | | 1,729,801 | |
5.00%, 09/01/2030 | | | 1,845 | | | | 1,807,263 | |
5.00%, 09/01/2031 | | | 1,935 | | | | 1,878,507 | |
5.00%, 09/01/2032 | | | 2,035 | | | | 1,955,714 | |
5.25%, 09/01/2044 | | | 10,000 | | | | 8,934,512 | |
5.25%, 09/01/2057 | | | 2,010 | | | | 1,697,638 | |
| | | | | | | | |
| | | | 95,455,026 | |
| | | | | | | | |
Iowa – 1.3% | | | | | | | | |
Iowa Finance Authority
(Iowa Fertilizer Co. LLC)
Series 2022
5.00%, 12/01/2050 | | | 59,970 | | | | 53,277,642 | |
Iowa Finance Authority
(Lifespace Communities, Inc. Obligated Group)
Series 2018-A
5.00%, 05/15/2043 | | | 8,405 | | | | 7,198,767 | |
5.00%, 05/15/2048 | | | 6,000 | | | | 4,999,622 | |
| | |
| |
46 | AB MUNICIPAL INCOME SHARES | | abfunds.com |
PORTFOLIO OF INVESTMENTS (continued)
| | | | | | | | |
| | | Principal
Amount
(000) | | | U.S. $ Value | |
| |
Iowa Finance Authority
(Wesley Retirement Services, Inc. Obligated Group)
Series 2021
4.00%, 12/01/2031 | | $ | 5,560 | | | $ | 4,893,347 | |
4.00%, 12/01/2041 | | | 7,810 | | | | 6,049,004 | |
4.00%, 12/01/2046 | | | 5,225 | | | | 3,822,946 | |
4.00%, 12/01/2051 | | | 9,340 | | | | 6,586,777 | |
Iowa Higher Education Loan Authority
(Simpson College)
Series 2020
5.50%, 11/01/2051 | | | 7,160 | | | | 6,306,441 | |
Iowa Tobacco Settlement Authority
Series 2021-A
4.00%, 06/01/2049 | | | 4,000 | | | | 3,111,081 | |
| | | | | | | | |
| | | | 96,245,627 | |
| | | | | | | | |
Kansas – 0.2% | | | | | | | | |
Kansas Development Finance Authority
(State of Kansas Department of Administration Lease)
Series 2021-K
2.39%, 05/01/2036 | | | 8,000 | | | | 5,442,918 | |
Overland Park Development Corp.
(City of Overland Park KS)
Series 2019
5.00%, 03/01/2035 | | | 1,765 | | | | 1,615,043 | |
5.00%, 03/01/2037 | | | 2,070 | | | | 1,869,690 | |
5.00%, 03/01/2039 | | | 2,325 | | | | 2,063,895 | |
5.00%, 03/01/2044 | | | 1,000 | | | | 856,668 | |
5.00%, 03/01/2049 | | | 5,875 | | | | 4,933,749 | |
Wyandotte County-Kansas City Unified Government
(Wyandotte County-Kansas City Unified Government Sales Tax)
Series 2018
4.50%, 06/01/2040 | | | 1,520 | | | | 1,291,243 | |
| | | | | | | | |
| | | | 18,073,206 | |
| | | | | | | | |
Kentucky – 1.8% | | | | | | | | |
City of Ashland KY
(Ashland Hospital Corp. Obligated Group)
Series 2019
4.00%, 02/01/2035 | | | 930 | | | | 810,606 | |
City of Henderson KY
(Pratt Paper LLC)
Series 2022
4.45%, 01/01/2042(c) | | | 9,000 | | | | 7,558,891 | |
| | |
| |
| abfunds.com | | AB MUNICIPAL INCOME SHARES | 47 |
PORTFOLIO OF INVESTMENTS (continued)
| | | | | | | | |
| | | Principal
Amount
(000) | | | U.S. $ Value | |
| |
County of Trimble KY
(Louisville Gas and Electric Co.)
Series 2020
1.30%, 09/01/2044 | | $ | 8,500 | | | $ | 6,780,884 | |
Kentucky Economic Development Finance Authority
(Baptist Healthcare System Obligated Group)
Series 2017-B
5.00%, 08/15/2034(d) | | | 1,500 | | | | 1,523,407 | |
5.00%, 08/15/2035(d) | | | 3,085 | | | | 3,127,155 | |
5.00%, 08/15/2037(d) | | | 1,550 | | | | 1,566,549 | |
5.00%, 08/15/2041(d) | | | 6,905 | | | | 6,909,532 | |
5.00%, 08/15/2046(d) | | | 2,740 | | | | 2,683,352 | |
Kentucky Economic Development Finance Authority
(Carmel Manor, Inc.)
Series 2022
4.50%, 10/01/2027 | | | 4,000 | | | | 3,934,142 | |
Kentucky Economic Development Finance Authority
(CommonSpirit Health)
Series 2019-A
4.00%, 08/01/2038 | | | 1,000 | | | | 859,484 | |
4.00%, 08/01/2039 | | | 1,135 | | | | 959,597 | |
5.00%, 08/01/2044(d) | | | 6,105 | | | | 5,822,738 | |
5.00%, 08/01/2049(d) | | | 7,660 | | | | 7,108,720 | |
Kentucky Economic Development Finance Authority
(Masonic Homes of Kentucky, Inc. Obligated Group)
Series 2012
5.375%, 11/15/2042 | | | 1,685 | | | | 1,369,017 | |
5.50%, 11/15/2045 | | | 1,000 | | | | 806,333 | |
Series 2016-A
5.00%, 05/15/2046 | | | 1,100 | | | | 861,623 | |
5.00%, 05/15/2051 | | | 2,000 | | | | 1,524,669 | |
Kentucky Economic Development Finance Authority
(Owensboro Health, Inc. Obligated Group)
Series 2015
5.25%, 06/01/2050 | | | 24,090 | | | | 22,571,607 | |
Series 2017-A
5.00%, 06/01/2031 | | | 2,000 | | | | 2,030,874 | |
5.00%, 06/01/2032 | | | 3,500 | | | | 3,530,652 | |
5.00%, 06/01/2037 | | | 4,325 | | | | 4,269,193 | |
| | |
| |
48 | AB MUNICIPAL INCOME SHARES | | abfunds.com |
PORTFOLIO OF INVESTMENTS (continued)
| | | | | | | | |
| | | Principal
Amount
(000) | | | U.S. $ Value | |
| |
5.00%, 06/01/2041 | | $ | 4,300 | | | $ | 3,992,929 | |
5.00%, 06/01/2045 | | | 8,750 | | | | 7,862,816 | |
5.25%, 06/01/2041 | | | 6,750 | | | | 6,598,861 | |
Series 2017-B
5.00%, 06/01/2040 | | | 5,000 | | | | 4,683,197 | |
Kentucky Economic Development Finance Authority
(Rosedale Green)
Series 2015
5.50%, 11/15/2035 | | | 2,265 | | | | 1,984,547 | |
5.75%, 11/15/2045 | | | 3,350 | | | | 2,791,154 | |
Kentucky Public Energy Authority
(Morgan Stanley)
Series 2022-A
4.00%, 08/01/2052(d) | | | 10,000 | | | | 9,155,751 | |
Louisville/Jefferson County Metropolitan Government
(Norton Healthcare Obligated Group)
Series 2016
5.00%, 10/01/2033 | | | 8,205 | | | | 8,323,693 | |
Series 2020
5.00%, 10/01/2047 | | | 1,965 | | | | 2,046,072 | |
Series 2020-A
5.00%, 10/01/2038 | | | 965 | | | | 962,959 | |
| | | | | | | | |
| | | | 135,011,004 | |
| | | | | | | | |
Louisiana – 1.2% | | | | | | | | |
Jefferson Sales Tax District AGM
Series 2017-B
5.00%, 12/01/2034 | | | 1,000 | | | | 1,045,733 | |
5.00%, 12/01/2036 | | | 2,400 | | | | 2,505,601 | |
Louisiana Local Government Environmental Facilities & Community Development Auth
(Louisiana Utilities Restoration Corp.)
Series 2022
4.475%, 08/01/2039 | | | 10,000 | | | | 8,860,659 | |
Louisiana Local Government Environmental Facilities & Community Development Auth
(St. James Place of Baton Rouge)
Series 2015-A
6.00%, 11/15/2035 | | | 2,100 | | | | 1,978,668 | |
Louisiana Local Government Environmental Facilities & Community Development Auth
(Woman’s Hospital Foundation)
Series 2017
5.00%, 10/01/2034(d) | | | 8,985 | | | | 9,127,446 | |
| | |
| |
| abfunds.com | | AB MUNICIPAL INCOME SHARES | 49 |
PORTFOLIO OF INVESTMENTS (continued)
| | | | | | | | |
| | | Principal
Amount
(000) | | | U.S. $ Value | |
| |
5.00%, 10/01/2036(d) | | $ | 8,460 | | | $ | 8,548,630 | |
5.00%, 10/01/2037(d) | | | 5,000 | | | | 5,048,265 | |
5.00%, 10/01/2044(d) | | | 5,155 | | | | 4,928,674 | |
Louisiana Public Facilities Authority
Series 2016
5.00%, 05/15/2047
(Pre-refunded/ETM) | | | 10 | | | | 10,488 | |
Louisiana Public Facilities Authority
(Geo Prep Mid-City of Greater Baton Rouge)
Series 2022
5.625%, 06/01/2037(c) | | | 415 | | | | 388,885 | |
6.25%, 06/01/2062(c) | | | 1,425 | | | | 1,285,724 | |
Louisiana Public Facilities Authority
(Louisiana Pellets, Inc.)
Series 2013-B
10.50%, 07/01/2039(f)(g)(h) | | | 2,750 | | | | 28 | |
Series 2014-A
7.50%, 07/01/2023(f)(g)(h) | | | 1,250 | | | | 13 | |
Louisiana Public Facilities Authority
(Louisiana State University & Agricultural & Mechanical College Auxiliary Revenue)
Series 2019
5.00%, 07/01/2059 | | | 10,270 | | | | 9,766,837 | |
Louisiana Public Facilities Authority
(Louisiana State University & Agricultural & Mechanical College Lease)
Series 2017
5.00%, 07/01/2042 | | | 1,500 | | | | 1,478,705 | |
5.00%, 07/01/2047 | | | 6,515 | | | | 6,293,325 | |
5.00%, 07/01/2052 | | | 7,300 | | | | 7,032,857 | |
5.00%, 07/01/2057 | | | 2,250 | | | | 2,141,853 | |
New Orleans Aviation Board
Series 2017-B
5.00%, 01/01/2043 | | | 1,000 | | | | 958,089 | |
Parish of St. James LA
(NuStar Logistics LP)
Series 2020-2
6.35%, 07/01/2040(c) | | | 3,990 | | | | 4,192,662 | |
6.35%, 10/01/2040(c) | | | 3,385 | | | | 3,556,932 | |
Parish of St. John the Baptist LA
(Marathon Oil Corp.)
Series 2019
2.00%, 06/01/2037 | | | 4,855 | | | | 4,808,662 | |
2.10%, 06/01/2037 | | | 2,465 | | | | 2,373,398 | |
2.20%, 06/01/2037 | | | 3,700 | | | | 3,352,314 | |
| | |
| |
50 | AB MUNICIPAL INCOME SHARES | | abfunds.com |
PORTFOLIO OF INVESTMENTS (continued)
| | | | | | | | |
| | | Principal
Amount
(000) | | | U.S. $ Value | |
| |
Port New Orleans Board of Commissioners
Series 2013-B
5.00%, 04/01/2029
(Pre-refunded/ETM) | | $ | 540 | | | $ | 543,671 | |
5.00%, 04/01/2031
(Pre-refunded/ETM) | | | 1,000 | | | | 1,006,798 | |
St Tammany Parish Finance Authority
(Christwood)
Series 2015
5.25%, 11/15/2037 | | | 1,050 | | | | 971,701 | |
| | | | | | | | |
| | | | 92,206,618 | |
| | | | | | | | |
Maine – 0.2% | | | | | | | | |
Finance Authority of Maine
(Casella Waste Systems, Inc.)
Series 2017
5.25%, 01/01/2025(c) | | | 4,630 | | | | 4,610,046 | |
Series 2018-R2
4.375%, 08/01/2035(c) | | | 1,700 | | | | 1,653,405 | |
Maine Health & Higher Educational Facilities Authority
(Maine Medical Center)
Series 2018-A
5.00%, 07/01/2043 | | | 3,370 | | | | 3,317,970 | |
5.00%, 07/01/2048 | | | 6,250 | | | | 6,006,466 | |
| | | | | | | | |
| | | | 15,587,887 | |
| | | | | | | | |
Maryland – 2.4% | | | | | | | | |
City of Baltimore MD
(East Baltimore Research Park Project)
Series 2017-A
5.00%, 09/01/2038 | | | 1,000 | | | | 953,593 | |
City of Baltimore MD
(Harbor Point Special Taxing District)
Series 2019
3.625%, 06/01/2046(c) | | | 1,750 | | | | 1,249,934 | |
Series 2019-B
3.875%, 06/01/2046(c) | | | 300 | | | | 219,978 | |
County of Frederick MD
(County of Frederick MD Urbana Community Development Authority)
Series 2020-C
4.00%, 07/01/2050(c) | | | 2,615 | | | | 2,045,117 | |
Maryland Economic Development Corp.
(City of Baltimore MD Port Covington Development District)
Series 2020
4.00%, 09/01/2040 | | | 2,250 | | | | 1,837,113 | |
4.00%, 09/01/2050 | | | 2,500 | | | | 1,855,096 | |
| | |
| |
| abfunds.com | | AB MUNICIPAL INCOME SHARES | 51 |
PORTFOLIO OF INVESTMENTS (continued)
| | | | | | | | |
| | | Principal
Amount
(000) | | | U.S. $ Value | |
| |
Maryland Economic Development Corp.
(Maryland Economic Development Corp. Morgan View & Thurgood Marshall Student Hsg)
Series 2022
5.75%, 07/01/2053(a) | | $ | 2,860 | | | $ | 2,861,856 | |
6.00%, 07/01/2058(a) | | | 10,000 | | | | 10,115,830 | |
Maryland Economic Development Corp.
(Purple Line Transit Partners LLC)
Series 2022
5.00%, 12/31/2036 | | | 3,200 | | | | 3,185,062 | |
5.00%, 06/30/2037 | | | 2,400 | | | | 2,378,611 | |
5.00%, 12/31/2037 | | | 2,605 | | | | 2,581,254 | |
5.00%, 06/30/2038 | | | 2,920 | | | | 2,873,397 | |
5.00%, 12/31/2038 | | | 1,015 | | | | 998,466 | |
5.25%, 06/30/2047 | | | 26,800 | | | | 26,192,816 | |
5.25%, 06/30/2052 | | | 10,000 | | | | 9,700,870 | |
5.25%, 06/30/2055 | | | 21,720 | | | | 20,949,559 | |
Maryland Health & Higher Educational Facilities Authority
(Meritus Medical Center Obligated Group)
Series 2015
5.00%, 07/01/2031 | | | 3,245 | | | | 3,273,165 | |
Maryland Health & Higher Educational Facilities Authority
(TidalHealth Obligated Group)
Series 2020
4.00%, 07/01/2036 | | | 2,520 | | | | 2,280,660 | |
4.00%, 07/01/2037 | | | 2,575 | | | | 2,306,875 | |
4.00%, 07/01/2038 | | | 1,555 | | | | 1,379,326 | |
4.00%, 07/01/2039 | | | 1,585 | | | | 1,393,294 | |
4.00%, 07/01/2040 | | | 1,645 | | | | 1,432,855 | |
5.00%, 07/01/2046 | | | 22,040 | | | | 21,293,342 | |
Maryland Health & Higher Educational Facilities Authority
(UPMC Obligated Group)
Series 2020-B
4.00%, 04/15/2036(d) | | | 3,140 | | | | 2,850,063 | |
4.00%, 04/15/2037(d) | | | 3,270 | | | | 2,906,079 | |
4.00%, 04/15/2038(d) | | | 3,405 | | | | 2,975,455 | |
4.00%, 04/15/2039(d) | | | 3,535 | | | | 3,038,994 | |
4.00%, 04/15/2040(d) | | | 3,180 | | | | 2,707,115 | |
Maryland Stadium Authority
(Baltimore City Public School Construction Financing Fund)
Series 2020
5.00%, 05/01/2050 | | | 29,840 | | | | 29,549,519 | |
| | |
| |
52 | AB MUNICIPAL INCOME SHARES | | abfunds.com |
PORTFOLIO OF INVESTMENTS (continued)
| | | | | | | | |
| | | Principal
Amount
(000) | | | U.S. $ Value | |
| |
State of Maryland Department of Transportation
Series 2022-2
5.00%, 12/01/2024(a) | | $ | 2,500 | | | $ | 2,586,256 | |
5.00%, 12/01/2026(a) | | | 3,500 | | | | 3,722,257 | |
5.00%, 12/01/2027(a) | | | 2,500 | | | | 2,692,466 | |
5.00%, 12/01/2029(a) | | | 2,375 | | | | 2,610,883 | |
| | | | | | | | |
| | | | 178,997,156 | |
| | | | | | | | |
Massachusetts – 0.5% | | | | | | | | |
Massachusetts Development Finance Agency
(Emerson College)
Series 2016-A
5.00%, 01/01/2047 | | | 2,220 | | | | 2,084,536 | |
Series 2017-A
5.00%, 01/01/2040 | | | 670 | | | | 645,963 | |
Massachusetts Development Finance Agency
(Emmanuel College/MA)
Series 2016-A
5.00%, 10/01/2043 | | | 1,760 | | | | 1,628,418 | |
Massachusetts Development Finance Agency
(Lasell University)
Series 2021
4.00%, 07/01/2027 | | | 250 | | | | 236,315 | |
4.00%, 07/01/2028 | | | 325 | | | | 303,181 | |
4.00%, 07/01/2029 | | | 340 | | | | 312,738 | |
4.00%, 07/01/2040 | | | 3,005 | | | | 2,309,249 | |
4.00%, 07/01/2045 | | | 1,600 | | | | 1,154,391 | |
Massachusetts Development Finance Agency
(Salem Community Corp. Obligated Group)
Series 2022
5.25%, 01/01/2050 | | | 2,680 | | | | 2,261,026 | |
Massachusetts Development Finance Agency
(Simmons University)
Series 2018-L
5.00%, 10/01/2034 | | | 1,360 | | | | 1,364,456 | |
5.00%, 10/01/2035 | | | 1,000 | | | | 1,001,474 | |
Massachusetts Development Finance Agency
(South Shore Hospital, Inc. Obligated Group)
Series 2016-I
5.00%, 07/01/2031 | | | 1,350 | | | | 1,372,609 | |
| | |
| |
| abfunds.com | | AB MUNICIPAL INCOME SHARES | 53 |
PORTFOLIO OF INVESTMENTS (continued)
| | | | | | | | |
| | | Principal
Amount
(000) | | | U.S. $ Value | |
| |
5.00%, 07/01/2041 | | $ | 2,500 | | | $ | 2,413,734 | |
Massachusetts Development Finance Agency
(Springfield College)
Series 2021
4.00%, 06/01/2056 | | | 4,000 | | | | 2,999,968 | |
5.00%, 06/01/2026 | | | 420 | | | | 427,237 | |
5.00%, 06/01/2027 | | | 445 | | | | 453,551 | |
5.00%, 06/01/2028 | | | 1,850 | | | | 1,889,787 | |
Series 2021-B
4.00%, 06/01/2035 | | | 2,300 | | | | 2,053,220 | |
4.00%, 06/01/2050 | | | 1,700 | | | | 1,324,874 | |
Massachusetts Development Finance Agency
(UMass Memorial Health Care Obligated Group)
Series 2016
5.00%, 07/01/2041 | | | 1,480 | | | | 1,444,355 | |
5.00%, 07/01/2046 | | | 2,500 | | | | 2,366,731 | |
Massachusetts Development Finance Agency
(Wellforce Obligated Group)
Series 2013-G
5.00%, 07/01/2037 | | | 2,550 | | | | 2,550,217 | |
Series 2019-A
5.00%, 07/01/2036 | | | 1,000 | | | | 967,186 | |
Massachusetts Port Authority
Series 2021-E
5.00%, 07/01/2051 | | | 2,260 | | | | 2,194,619 | |
| | | | | | | | |
| | | | | | | 35,759,835 | |
| | | | | | | | |
Michigan – 1.7% | |
City of Detroit MI
Series 2014-B
4.00%, 04/01/2044 | | | 10,000 | | | | 6,895,448 | |
Series 2018
5.00%, 04/01/2033 | | | 1,000 | | | | 1,001,549 | |
5.00%, 04/01/2034 | | | 1,250 | | | | 1,244,442 | |
5.00%, 04/01/2038 | | | 2,135 | | | | 2,072,596 | |
Series 2020
5.50%, 04/01/2045 | | | 1,690 | | | | 1,675,388 | |
5.50%, 04/01/2050 | | | 2,170 | | | | 2,171,719 | |
Series 2021-A
5.00%, 04/01/2038 | | | 1,100 | | | | 1,057,751 | |
5.00%, 04/01/2046 | | | 2,030 | | | | 1,858,458 | |
| | |
| |
54 | AB MUNICIPAL INCOME SHARES | | abfunds.com |
PORTFOLIO OF INVESTMENTS (continued)
| | | | | | | | |
| | | Principal
Amount
(000) | | | U.S. $ Value | |
| |
Grand Rapids Economic Development Corp.
(Beacon Hill at Eastgate)
Series 2017-A
5.00%, 11/01/2032 | | $ | 1,055 | | | $ | 947,875 | |
5.00%, 11/01/2037 | | | 600 | | | | 512,023 | |
Great Lakes Water Authority Water Supply System Revenue
Series 2016-A
5.00%, 07/01/2046 | | | 1,025 | | | | 1,043,069 | |
Series 2016-D
5.00%, 07/01/2036 | | | 25,210 | | | | 25,886,329 | |
Kalamazoo Economic Development Corp.
(Heritage Community of Kalamazoo Obligated Group)
Series 2019
5.00%, 05/15/2037 | | | 1,100 | | | | 955,649 | |
Series 2020
5.00%, 05/15/2055 | | | 6,860 | | | | 5,271,831 | |
Kalamazoo Hospital Finance Authority
4.00%, 05/15/2031(d) | | | 1,500 | | | | 1,473,935 | |
4.00%, 05/15/2032(d) | | | 3,350 | | | | 3,213,646 | |
4.00%, 05/15/2033(d) | | | 4,750 | | | | 4,454,819 | |
4.00%, 05/15/2036(d) | | | 10,500 | | | | 9,579,065 | |
Michigan Finance Authority
Series 2014
5.00%, 06/01/2034 (Pre-refunded/ETM) | | | 2,000 | | | | 2,054,152 | |
Michigan Finance Authority
(Albion College)
Series 2022
4.00%, 12/01/2046 | | | 2,120 | | | | 1,697,997 | |
4.00%, 12/01/2051 | | | 2,165 | | | | 1,679,546 | |
Michigan Finance Authority
(Great Lakes Water Authority Water Supply System Revenue)
Series 2014-D4
5.00%, 07/01/2029 | | | 1,100 | | | | 1,118,168 | |
5.00%, 07/01/2034 | | | 1,000 | | | | 1,011,369 | |
Series 2015-D1
5.00%, 07/01/2034 | | | 2,000 | | | | 2,035,416 | |
Series 2015-D2
5.00%, 07/01/2034 | | | 3,400 | | | | 3,452,505 | |
Michigan Finance Authority
(Henry Ford Health System Obligated Group)
Series 2016
5.00%, 11/15/2032 | | | 3,850 | | | | 3,915,991 | |
| | |
| |
| abfunds.com | | AB MUNICIPAL INCOME SHARES | 55 |
PORTFOLIO OF INVESTMENTS (continued)
| | | | | | | | |
| | | Principal
Amount
(000) | | | U.S. $ Value | |
| |
Series 2019-A
5.00%, 11/15/2048 | | $ | 6,635 | | | $ | 6,375,031 | |
Michigan Finance Authority
(Michigan Finance Authority Tobacco Settlement Revenue)
Series 2020-A
4.00%, 06/01/2049 | | | 5,000 | | | | 3,820,891 | |
Michigan Finance Authority
(Public Lighting Authority)
Series 2014-B
5.00%, 07/01/2031 | | | 1,450 | | | | 1,451,109 | |
5.00%, 07/01/2032 | | | 3,000 | | | | 2,997,862 | |
5.00%, 07/01/2033 | | | 3,500 | | | | 3,478,782 | |
Michigan Strategic Fund
(Michigan Strategic Fund – I 75 Improvement Project)
Series 2018
5.00%, 06/30/2048 | | | 8,600 | | | | 7,482,001 | |
Michigan Tobacco Settlement Finance Authority
(Tobacco Settlement Financing Corp./MI)
Series 2008-C
Zero Coupon, 06/01/2058 | | | 241,050 | | | | 9,507,976 | |
Wayne State University
Series 2018-A
5.00%, 11/15/2043 | | | 4,000 | | | | 4,083,124 | |
| | | | | | | | |
| | | | | | | 127,477,512 | |
| | | | | | | | |
Minnesota – 0.2% | |
City of Ramsey MN
(Pact Charter School)
Series 2022-A
5.00%, 06/01/2032 | | | 11,800 | | | | 11,212,810 | |
City of Wayzata MN
(Wayzata Bay Senior Housing, Inc.)
Series 2019
5.00%, 08/01/2054 | | | 1,000 | | | | 877,906 | |
Duluth Economic Development Authority
(Essentia Health Obligated Group)
Series 2018-A
5.00%, 02/15/2043 | | | 2,500 | | | | 2,446,352 | |
5.00%, 02/15/2048 | | | 425 | | | | 407,409 | |
Housing & Redevelopment Authority of The City of St. Paul Minnesota
(Hmong College Prep Academy)
Series 2020
5.00%, 09/01/2040 | | | 1,390 | | | | 1,241,755 | |
| | |
| |
56 | AB MUNICIPAL INCOME SHARES | | abfunds.com |
PORTFOLIO OF INVESTMENTS (continued)
| | | | | | | | |
| | | Principal
Amount
(000) | | | U.S. $ Value | |
| |
Minnesota Higher Education Facilities Authority
(St. Catherine University)
Series 2018-A
5.00%, 10/01/2045 | | $ | 1,900 | | | $ | 1,904,971 | |
| | | | | | | | |
| | | | | | | 18,091,203 | |
| | | | | | | | |
Mississippi – 0.4% | |
Mississippi Development Bank
(Magnolia Regional Health Center)
Series 2021
4.00%, 10/01/2041(c) | | | 2,500 | | | | 1,881,346 | |
5.00%, 10/01/2024(c) | | | 880 | | | | 887,426 | |
5.00%, 10/01/2026(c) | | | 1,700 | | | | 1,719,275 | |
5.00%, 10/01/2027(c) | | | 900 | | | | 911,866 | |
5.00%, 10/01/2028(c) | | | 1,900 | | | | 1,927,590 | |
5.00%, 10/01/2033(c) | | | 2,270 | | | | 2,237,860 | |
Mississippi Hospital Equipment & Facilities Authority
(Baptist Memorial Health Care Obligated Group)
Series 2016-A
5.00%, 09/01/2036 | | | 1,645 | | | | 1,607,145 | |
5.00%, 09/01/2041 | | | 12,130 | | | | 11,228,093 | |
5.00%, 09/01/2046 | | | 6,135 | | | | 5,522,074 | |
Mississippi Hospital Equipment & Facilities Authority
(Forrest General Hospital, Inc.)
Series 2019
4.00%, 01/01/2037 | | | 720 | | | | 650,579 | |
5.00%, 01/01/2035 | | | 1,230 | | | | 1,253,035 | |
| | | | | | | | |
| | | | | | | 29,826,289 | |
| | | | | | | | |
Missouri – 1.1% | |
Cape Girardeau County Industrial Development Authority
(SoutheastHEALTH Obligated Group)
Series 2017-A
5.00%, 03/01/2036 | | | 2,810 | | | | 2,771,755 | |
Series 2021
4.00%, 03/01/2041 | | | 1,170 | | | | 924,634 | |
Health & Educational Facilities Authority of the State of Missouri
(Lutheran Senior Services Obligated Group)
Series 2016-A
5.00%, 02/01/2046 | | | 1,000 | | | | 891,476 | |
Series 2019
4.00%, 02/01/2042 | | | 18,770 | | | | 14,445,807 | |
| | |
| |
| abfunds.com | | AB MUNICIPAL INCOME SHARES | 57 |
PORTFOLIO OF INVESTMENTS (continued)
| | | | | | | | |
| | | Principal
Amount
(000) | | | U.S. $ Value | |
| |
4.00%, 02/01/2048 | | $ | 21,850 | | | $ | 15,776,626 | |
5.00%, 02/01/2042 | | | 620 | | | | 566,909 | |
5.00%, 02/01/2048 | | | 2,600 | | | | 2,266,880 | |
Kansas City Industrial Development Authority
Series 2019
5.00%, 07/01/2040(c) | | | 3,065 | | | | 2,480,792 | |
Kansas City Industrial Development Authority
(Kansas City United Methodist Retirement Home Obligated Group)
Series 2021-A
10.00%, 11/15/2037 | | | 1,601 | | | | 1,354,954 | |
Series 2021-C
7.50%, 11/15/2046 | | | 1,279 | | | | 952,575 | |
Kansas City Industrial Development Authority
(Kingswood Senior Living Community)
Series 2021
2.00%, 11/15/2046 | | | 2,319 | | | | 109,217 | |
5.00%, 11/15/2046 | | | 5,196 | | | | 3,786,080 | |
Lee’s Summit Industrial Development Authority
(John Knox Village Obligated Group)
Series 2014-A
5.25%, 08/15/2039 | | | 2,330 | | | | 2,078,527 | |
Series 2016-A
5.00%, 08/15/2036 | | | 1,300 | | | | 1,154,487 | |
5.00%, 08/15/2046 | | | 1,760 | | | | 1,440,540 | |
5.00%, 08/15/2051 | | | 1,000 | | | | 799,188 | |
Series 2018
5.00%, 08/15/2042 | | | 6,940 | | | | 5,864,573 | |
Series 2021-A
5.00%, 08/15/2056 | | | 10,000 | | | | 7,833,956 | |
Missouri Joint Municipal Electric Utility Commission
Series 2014
5.00%, 01/01/2031 | | | 3,240 | | | | 3,296,996 | |
St. Louis County Industrial Development Authority
(Friendship Village St. Louis Obligated Group)
Series 2018
5.25%, 09/01/2053 | | | 7,560 | | | | 6,154,326 | |
| | |
| |
58 | AB MUNICIPAL INCOME SHARES | | abfunds.com |
PORTFOLIO OF INVESTMENTS (continued)
| | | | | | | | |
| | | Principal
Amount
(000) | | | U.S. $ Value | |
| |
St. Louis County Industrial Development Authority
(St. Andrews Resources for Seniors Obligated Group)
Series 2015-A
5.00%, 12/01/2035 | | $ | 2,000 | | | $ | 1,879,070 | |
5.125%, 12/01/2045 | | | 4,500 | | | | 4,031,859 | |
| | | | | | | | |
| | | | | | | 80,861,227 | |
| | | | | | | | |
Montana – 0.0% | |
Montana Facility Finance Authority
(Benefis Health System Obligated Group)
Series 2016
5.00%, 02/15/2034 | | | 1,085 | | | | 1,091,644 | |
| | | | | | | | |
| | |
Nebraska – 0.3% | | | | | | | | |
Central Plains Energy Project
(Goldman Sachs Group, Inc. (The))
Series 2017-A
5.00%, 09/01/2034 | | | 1,510 | | | | 1,506,466 | |
5.00%, 09/01/2036 | | | 13,035 | | | | 12,886,548 | |
5.00%, 09/01/2037 | | | 5,410 | | | | 5,317,194 | |
| | | | | | | | |
| | | | | | | 19,710,208 | |
| | | | | | | | |
Nevada – 0.5% | |
Carson City NV
(Carson Tahoe Regional Healthcare)
Series 2017
5.00%, 09/01/2037 | | | 1,160 | | | | 1,136,572 | |
5.00%, 09/01/2047 | | | 2,775 | | | | 2,650,621 | |
City of Reno NV
(County of Washoe NV Sales Tax Revenue)
Series 2018-C
Zero Coupon, 07/01/2058(c) | | | 25,500 | | | | 2,595,931 | |
City of Sparks NV
(City of Sparks NV Sales Tax)
Series 2019-A
2.75%, 06/15/2028(c) | | | 3,540 | | | | 3,062,136 | |
Clark County School District
Series 2017-C
5.00%, 06/15/2033(d) | | | 11,550 | | | | 6,061,698 | |
5.00%, 06/15/2034(d) | | | 10,000 | | | | 5,215,222 | |
5.00%, 06/15/2035(d) | | | 5,270 | | | | 2,741,008 | |
5.00%, 06/15/2036 | | | 3,700 | | | | 3,706,010 | |
AGM Series 2019-B
3.00%, 06/15/2037 | | | 5,185 | | | | 4,012,085 | |
| | |
| |
| abfunds.com | | AB MUNICIPAL INCOME SHARES | 59 |
PORTFOLIO OF INVESTMENTS (continued)
| | | | | | | | |
| | | Principal
Amount
(000) | | | U.S. $ Value | |
| |
Las Vegas Redevelopment Agency
Series 2016
5.00%, 06/15/2040 | | $ | 1,800 | | | $ | 1,802,805 | |
State of Nevada Department of Business & Industry
(Fulcrum Sierra Biofuels LLC)
Series 2018
6.95%, 02/15/2038(c) | | | 1,890 | | | | 1,627,150 | |
Tahoe-Douglas Visitors Authority Series 2020
5.00%, 07/01/2040 | | | 2,250 | | | | 2,113,870 | |
5.00%, 07/01/2045 | | | 2,800 | | | | 2,559,577 | |
5.00%, 07/01/2051 | | | 3,000 | | | | 2,687,575 | |
| | | | | | | | |
| | | | | | | 41,972,260 | |
| | | | | | | | |
New Hampshire – 1.3% | |
National Finance Authority
(New Hampshire Business Finance Authority)
Series 2022-2, Class X
0.674%, 10/01/2036(e) | | | 25,000 | | | | 1,292,597 | |
New Hampshire Business Finance Authority
Series 2020-1, Class A
4.125%, 01/20/2034 | | | 20,998 | | | | 19,370,064 | |
Series 2022-1, Class A
4.375%, 09/20/2036 | | | 41,329 | | | | 37,303,175 | |
Series 2022-2
0.334%, 09/20/2036 | | | 25,000 | | | | 585,715 | |
Series 2022-2, Class A
4.00%, 10/20/2036 | | | 26,973 | | | | 23,351,373 | |
New Hampshire Business Finance Authority
(Covanta Holding Corp.)
Series 2020-A
3.625%, 07/01/2043(c) | | | 1,960 | | | | 1,441,446 | |
Series 2020-B
3.75%, 07/01/2045(c) | | | 3,525 | | | | 2,639,670 | |
New Hampshire Health and Education Facilities Authority Act
(Dartmouth-Hitchcock Obligated Group)
Series 2020-A
5.00%, 08/01/2059 | | | 18,120 | | | | 16,872,808 | |
| | | | | | | | |
| | | | | | | 102,856,848 | |
| | | | | | | | |
| | |
| |
60 | AB MUNICIPAL INCOME SHARES | | abfunds.com |
PORTFOLIO OF INVESTMENTS (continued)
| | | | | | | | |
| | | Principal
Amount
(000) | | | U.S. $ Value | |
| |
New Jersey – 6.2% | |
New Jersey Economic Development Authority
Series 2013
5.00%, 03/01/2030 (Pre-refunded/ETM) | | $ | 3,455 | | | $ | 3,475,446 | |
Series 2014-P
5.00%, 06/15/2029 (Pre-refunded/ETM) | | | 3,730 | | | | 3,833,381 | |
New Jersey Economic Development Authority
(New Jersey Economic Development Authority State Lease)
Series 2017-D
5.00%, 06/15/2033 | | | 2,870 | | | | 2,908,729 | |
5.00%, 06/15/2042 | | | 4,650 | | | | 4,511,303 | |
Series 2018-A
5.00%, 06/15/2042 | | | 4,385 | | | | 4,254,207 | |
5.00%, 06/15/2047 | | | 1,500 | | | | 1,435,048 | |
Series 2021-Q
4.00%, 06/15/2038 | | | 1,050 | | | | 922,894 | |
4.00%, 06/15/2039 | | | 1,000 | | | | 867,217 | |
4.00%, 06/15/2040 | | | 1,000 | | | | 858,990 | |
4.00%, 06/15/2041 | | | 1,750 | | | | 1,487,766 | |
4.00%, 06/15/2046 | | | 1,500 | | | | 1,222,637 | |
New Jersey Economic Development Authority
(New Jersey Transit Corp. State Lease)
Series 2020
4.00%, 11/01/2044 | | | 3,450 | | | | 2,846,411 | |
5.00%, 11/01/2033 | | | 3,770 | | | | 3,837,510 | |
New Jersey Economic Development Authority
(NYNJ Link Borrower LLC)
Series 2013
5.125%, 01/01/2034 | | | 6,045 | | | | 5,882,695 | |
New Jersey Economic Development Authority
(Port Newark Container Terminal LLC)
Series 2017
5.00%, 10/01/2037 | | | 3,450 | | | | 3,354,453 | |
5.00%, 10/01/2047 | �� | | 7,210 | | | | 6,659,545 | |
New Jersey Economic Development Authority
(State of New Jersey Department of the Treasury Lease)
Series 2019
5.00%, 06/15/2030 | | | 2,990 | | | | 3,099,896 | |
| | |
| |
| abfunds.com | | AB MUNICIPAL INCOME SHARES | 61 |
PORTFOLIO OF INVESTMENTS (continued)
| | | | | | | | |
| | | Principal
Amount
(000) | | | U.S. $ Value | |
| |
5.00%, 06/15/2035 | | $ | 2,750 | | | $ | 2,764,314 | |
5.00%, 06/15/2037 | | | 2,000 | | | | 1,990,390 | |
New Jersey Economic Development Authority
(State of New Jersey Division of Property Management & Construction Lease)
Series 2018-C
5.00%, 06/15/2042 | | | 7,085 | | | | 6,873,673 | |
New Jersey Economic Development Authority
(State of New Jersey Motor Vehicle Surcharge Revenue Lease)
Series 2017-A
5.00%, 07/01/2033 | | | 1,640 | | | | 1,655,947 | |
New Jersey Economic Development Authority
(UMM Energy Partners LLC)
Series 2012-A
5.125%, 06/15/2043 | | | 735 | | | | 691,594 | |
New Jersey Economic Development Authority
(United Airlines, Inc.)
Series 2012
5.25%, 09/15/2029 | | | 8,270 | | | | 8,125,457 | |
Series 2014-B
5.625%, 11/15/2030 | | | 1,475 | | | | 1,453,035 | |
New Jersey Educational Facilities Authority
(Stevens Institute of Technology International, Inc.)
Series 2020-A
4.00%, 07/01/2050 | | | 1,805 | | | | 1,416,783 | |
5.00%, 07/01/2045 | | | 4,460 | | | | 4,280,067 | |
New Jersey Health Care Facilities Financing Authority
(Hackensack Meridian Health Obligated Group)
Series 2017-A
5.00%, 07/01/2035 | | | 1,300 | | | | 1,346,192 | |
New Jersey Health Care Facilities Financing Authority
(Inspira Health Obligated Group)
Series 2017-A
5.00%, 07/01/2036 | | | 1,000 | | | | 1,008,178 | |
5.00%, 07/01/2042 | | | 7,645 | | | | 7,490,050 | |
| | |
| |
62 | AB MUNICIPAL INCOME SHARES | | abfunds.com |
PORTFOLIO OF INVESTMENTS (continued)
| | | | | | | | |
| | | Principal
Amount
(000) | | | U.S. $ Value | |
| |
New Jersey Health Care Facilities Financing Authority
(New Jersey Health Care Facilities Financing Authority State Lease)
Series 2017
5.00%, 10/01/2035 | | $ | 1,070 | | | $ | 1,073,975 | |
New Jersey Health Care Facilities Financing Authority
(RWJ Barnabas Health Obligated Group)
Series 2014
5.00%, 07/01/2044 | | | 2,040 | | | | 2,007,510 | |
New Jersey Transportation Trust Fund Authority
(New Jersey Transportation Fed Hwy Grant)
Series 2016
5.00%, 06/15/2024 | | | 3,130 | | | | 3,193,300 | |
5.00%, 06/15/2027 | | | 1,000 | | | | 1,033,665 | |
5.00%, 06/15/2028 | | | 21,660 | | | | 22,323,842 | |
5.00%, 06/15/2029 | | | 13,435 | | | | 13,820,042 | |
5.00%, 06/15/2030 | | | 6,000 | | | | 6,160,882 | |
Series 2018-A
5.00%, 06/15/2029 | | | 1,910 | | | | 1,964,740 | |
5.00%, 06/15/2030 | | | 24,975 | | | | 25,644,672 | |
5.00%, 06/15/2031 | | | 12,000 | | | | 12,288,614 | |
New Jersey Transportation Trust Fund Authority
(New Jersey Transportation Trust Fund Authority State Lease)
Series 2014-A
5.00%, 06/15/2038 | | | 1,000 | | | | 985,134 | |
Series 2015-A
5.00%, 06/15/2045 | | | 8,450 | | | | 8,109,549 | |
Series 2018-A
5.00%, 12/15/2030 | | | 2,000 | | | | 2,061,716 | |
5.00%, 12/15/2032 | | | 1,000 | | | | 1,019,165 | |
5.00%, 12/15/2033 | | | 29,040 | | | | 29,481,806 | |
5.00%, 12/15/2034 | | | 7,135 | | | | 7,188,109 | |
5.00%, 12/15/2035 | | | 5,230 | | | | 5,233,564 | |
5.00%, 12/15/2036 | | | 10,000 | | | | 9,985,129 | |
Series 2019
5.00%, 06/15/2034 | | | 1,000 | | | | 1,009,733 | |
5.00%, 06/15/2038 | | | 2,670 | | | | 2,630,307 | |
5.00%, 12/15/2039 | | | 2,500 | | | | 2,456,259 | |
5.00%, 06/15/2046 | | | 2,325 | | | | 2,228,131 | |
Series 2019-B
4.00%, 06/15/2037 | | | 770 | | | | 685,516 | |
| | |
| |
| abfunds.com | | AB MUNICIPAL INCOME SHARES | 63 |
PORTFOLIO OF INVESTMENTS (continued)
| | | | | | | | |
| | | Principal
Amount
(000) | | | U.S. $ Value | |
| |
5.00%, 06/15/2032 | | $ | 3,480 | | | $ | 3,552,187 | |
Series 2022-A
5.00%, 06/15/2030 | | | 7,500 | | | | 7,792,021 | |
5.00%, 06/15/2032 | | | 7,500 | | | | 7,727,075 | |
5.00%, 06/15/2033 | | | 10,250 | | | | 10,508,725 | |
New Jersey Turnpike Authority
Series 2015-E
5.00%, 01/01/2033 | | | 8,400 | | | | 8,598,518 | |
5.00%, 01/01/2045 | | | 7,000 | | | | 7,077,079 | |
Series 2016-A
5.00%, 01/01/2033 | | | 6,500 | | | | 6,720,585 | |
Series 2017-A
5.00%, 01/01/2033 | | | 5,000 | | | | 5,219,269 | |
5.00%, 01/01/2034 | | | 10,000 | | | | 10,428,439 | |
Series 2017-B
5.00%, 01/01/2032 | | | 8,540 | | | | 9,003,447 | |
5.00%, 01/01/2033 | | | 5,000 | | | | 5,252,660 | |
Series 2019-A
5.00%, 01/01/2048(d) | | | 11,320 | | | | 11,524,405 | |
South Jersey Transportation Authority
Series 2022
4.625%, 11/01/2047 | | | 5,000 | | | | 4,505,367 | |
Tobacco Settlement Financing Corp./NJ
Series 2018-A
5.00%, 06/01/2031 | | | 1,425 | | | | 1,459,538 | |
Series 2018-B
5.00%, 06/01/2046 | | | 131,000 | | | | 120,289,951 | |
| | | | | | | | |
| | | | | | | 472,798,434 | |
| | | | | | | | |
New Mexico – 0.2% | |
City of Santa Fe NM
(El Castillo Retirement Residences Obligated Group)
Series 2019
5.00%, 05/15/2039 | | | 480 | | | | 408,547 | |
5.00%, 05/15/2044 | | | 500 | | | | 407,232 | |
5.00%, 05/15/2049 | | | 1,200 | | | | 944,754 | |
New Mexico Hospital Equipment Loan Council
(Haverland Carter Lifestyle Obligated Group)
Series 2019
5.00%, 07/01/2039 | | | 1,875 | | | | 1,567,663 | |
5.00%, 07/01/2049 | | | 17,260 | | | | 13,301,569 | |
Winrock Town Center Tax Increment Development District No. 1
Series 2022
4.25%, 05/01/2040(c) | | | 2,750 | | | | 2,159,151 | |
| | | | | | | | |
| | | | | | | 18,788,916 | |
| | | | | | | | |
| | |
| |
64 | AB MUNICIPAL INCOME SHARES | | abfunds.com |
PORTFOLIO OF INVESTMENTS (continued)
| | | | | | | | |
| | | Principal
Amount
(000) | | | U.S. $ Value | |
| |
New York – 8.4% | |
Build NYC Resource Corp.
(Albert Einstein College of Medicine, Inc.)
Series 2016
5.50%, 09/01/2045(c) | | $ | 33,290 | | | $ | 32,857,373 | |
Build NYC Resource Corp.
(Integration Charter Schools)
Series 2021
4.00%, 06/01/2025(c) | | | 355 | | | | 333,370 | |
Build NYC Resource Corp.
(Metropolitan College of New York)
Series 2014
5.25%, 11/01/2034 | | | 2,240 | | | | 2,105,055 | |
City of New York NY
Series 2018-E
5.00%, 03/01/2037 | | | 7,500 | | | | 7,701,869 | |
5.00%, 03/01/2038 | | | 10,000 | | | | 10,239,236 | |
Series 2020-A
5.00%, 08/01/2032 | | | 2,875 | | | | 3,117,916 | |
5.00%, 08/01/2033 | | | 1,500 | | | | 1,609,400 | |
Dutchess County Local Development Corp.
(Bard College)
Series 2020-A
5.00%, 07/01/2045(c) | | | 7,500 | | | | 6,551,588 | |
5.00%, 07/01/2051(c) | | | 13,000 | | | | 11,057,949 | |
Dutchess County Local Development Corp.
(Health QuestSystems Obligated Group)
Series 2016-B
5.00%, 07/01/2046 | | | 13,520 | | | | 12,243,527 | |
Metropolitan Transportation Authority
Series 2012-F
5.00%, 11/15/2030 | | | 2,540 | | | | 2,541,516 | |
Series 2013-D
5.00%, 11/15/2043 | | | 2,000 | | | | 1,874,937 | |
Series 2013-E
5.00%, 11/15/2032 | | | 4,425 | | | | 4,442,285 | |
Series 2015-B
5.00%, 11/15/2032 | | | 3,715 | | | | 3,715,844 | |
Series 2015-C
5.00%, 11/15/2027 | | | 1,110 | | | | 1,124,184 | |
5.25%, 11/15/2030 | | | 4,000 | | | | 4,064,436 | |
Series 2015-D
5.00%, 11/15/2031 | | | 1,350 | | | | 1,352,548 | |
5.00%, 11/15/2032 | | | 5,135 | | | | 5,136,400 | |
5.00%, 11/15/2034 | | | 5,430 | | | | 5,346,810 | |
Series 2016-A
5.00%, 11/15/2026 | | | 2,150 | | | | 2,201,184 | |
| | |
| |
| abfunds.com | | AB MUNICIPAL INCOME SHARES | 65 |
PORTFOLIO OF INVESTMENTS (continued)
| | | | | | | | |
| | | Principal
Amount
(000) | | | U.S. $ Value | |
| |
5.00%, 11/15/2032 | | $ | 3,440 | | | $ | 3,445,115 | |
Series 2016-C
4.00%, 11/15/2026 | | | 1,705 | | | | 1,683,598 | |
Series 2016-D
5.00%, 11/15/2027 | | | 5,695 | | | | 5,772,326 | |
5.00%, 11/15/2029 | | | 1,750 | | | | 1,762,663 | |
Series 2017-A
5.00%, 11/15/2026 | | | 1,525 | | | | 1,561,758 | |
Series 2017-B
5.00%, 11/15/2027 | | | 1,185 | | | | 1,211,332 | |
Series 2017-C
5.00%, 11/15/2025 | | | 1,450 | | | | 1,485,326 | |
5.00%, 11/15/2026 | | | 2,340 | | | | 2,396,402 | |
5.00%, 11/15/2028 | | | 12,930 | | | | 13,211,570 | |
5.00%, 11/15/2029 | | | 16,435 | | | | 16,751,875 | |
5.00%, 11/15/2033 | | | 2,020 | | | | 2,010,464 | |
5.00%, 11/15/2034 | | | 6,810 | | | | 6,705,667 | |
Series 2017-D
4.00%, 11/15/2042 | | | 1,000 | | | | 811,550 | |
Series 2018-B
5.00%, 11/15/2028 | | | 1,340 | | | | 1,364,412 | |
Series 2019-A
5.00%, 11/15/2048 | | | 3,075 | | | | 3,110,321 | |
Series 2019-C
5.00%, 11/15/2038 | | | 380 | | | | 366,319 | |
Series 2020-A
4.00%, 11/15/2051 | | | 1,625 | | | | 1,226,876 | |
5.00%, 11/15/2045 | | | 4,740 | | | | 4,853,459 | |
5.00%, 11/15/2047 | | | 2,630 | | | | 2,395,461 | |
5.00%, 11/15/2049 | | | 2,000 | | | | 1,808,687 | |
Series 2020-C
4.75%, 11/15/2045 | | | 26,880 | | | | 23,815,572 | |
5.00%, 11/15/2050 | | | 8,750 | | | | 7,897,516 | |
5.25%, 11/15/2055 | | | 2,000 | | | | 1,877,966 | |
Series 2020-D
4.00%, 11/15/2047 | | | 9,495 | | | | 7,348,375 | |
4.00%, 11/15/2049 | | | 6,425 | | | | 4,906,473 | |
5.00%, 11/15/2043 | | | 5,000 | | | | 4,687,342 | |
Series 2020-E
4.00%, 11/15/2045 | | | 3,000 | | | | 2,361,553 | |
5.00%, 11/15/2029 | | | 1,800 | | | | 1,830,486 | |
5.00%, 11/15/2030 | | | 2,345 | | | | 2,363,542 | |
5.00%, 11/15/2032 | | | 1,250 | | | | 1,241,852 | |
5.00%, 11/15/2033 | | | 1,500 | | | | 1,492,919 | |
Series 2021-A
4.00%, 11/15/2042 | | | 2,000 | | | | 1,623,100 | |
4.00%, 11/15/2043 | | | 2,000 | | | | 1,605,368 | |
| | |
| |
66 | AB MUNICIPAL INCOME SHARES | | abfunds.com |
PORTFOLIO OF INVESTMENTS (continued)
| | | | | | | | |
| | | Principal
Amount
(000) | | | U.S. $ Value | |
| |
4.00%, 11/15/2044 | | $ | 2,500 | | | $ | 1,986,407 | |
4.00%, 11/15/2046 | | | 3,840 | | | | 2,994,984 | |
4.00%, 11/15/2047 | | | 10,000 | | | | 7,739,205 | |
4.00%, 11/15/2048 | | | 1,285 | | | | 987,102 | |
4.00%, 11/15/2050 | | | 8,000 | | | | 6,076,445 | |
Monroe County Industrial Development Corp./NY
(St Ann’s of Greater Rochester Obligated Group)
Series 2019
5.00%, 01/01/2050 | | | 6,520 | | | | 4,905,872 | |
Monroe County Industrial Development Corp./NY
(True North Rochester Prep Charter School)
Series 2020
5.00%, 06/01/2059(c) | | | 1,080 | | | | 942,923 | |
Monroe County Industrial Development Corp/NY
(Academy of Health Sciences Charter School)
Series 2022
5.875%, 07/01/2052(c) | | | 2,000 | | | | 1,810,905 | |
6.00%, 07/01/2057(c) | | | 1,615 | | | | 1,457,305 | |
Nassau County Industrial Development Agency
(Amsterdam House Continuing Care Retirement Community, Inc.)
Series 2021
5.00%, 01/01/2058 | | | 525 | | | | 267,164 | |
9.00%, 01/01/2041(c) | | | 270 | | | | 223,852 | |
New York City Housing Development Corp.
Series 2020
2.55%, 08/01/2040 | | | 3,645 | | | | 2,530,625 | |
New York City Transitional Finance Authority Future Tax Secured Revenue
Series 2022-F
3.75%, 02/01/2033 | | | 13,000 | | | | 11,294,067 | |
3.85%, 02/01/2034 | | | 3,955 | | | | 3,428,153 | |
New York Counties Tobacco Trust V
Series 2005
Zero Coupon, 06/01/2050 | | | 30,000 | | | | 3,376,914 | |
New York Liberty Development Corp.
(Goldman Sachs Headquarters LLC)
Series 2005
5.25%, 10/01/2035 | | | 5,765 | | | | 5,961,689 | |
| | |
| |
| abfunds.com | | AB MUNICIPAL INCOME SHARES | 67 |
PORTFOLIO OF INVESTMENTS (continued)
| | | | | | | | |
| | | Principal
Amount
(000) | | | U.S. $ Value | |
| |
New York Liberty Development Corp.
(One Bryant Park LLC)
Series 2019
2.80%, 09/15/2069 | | $ | 2,620 | | | $ | 2,127,715 | |
New York State Dormitory Authority
(Garnet Health Medical Center Obligated Group)
Series 2017
5.00%, 12/01/2030(c) | | | 1,200 | | | | 1,183,877 | |
5.00%, 12/01/2031(c) | | | 1,000 | | | | 983,076 | |
5.00%, 12/01/2034(c) | | | 2,000 | | | | 1,923,379 | |
New York State Dormitory Authority
(Montefiore Obligated Group)
Series 2018
5.00%, 08/01/2035 | | | 2,085 | | | | 1,915,469 | |
New York State Dormitory Authority
(State of New York Pers Income Tax)
Series 2021
2.202%, 03/15/2034(d) | | | 13,000 | | | | 9,516,022 | |
2.252%, 03/15/2032(d) | | | 13,000 | | | | 9,898,368 | |
New York State Dormitory Authority
(Wagner College)
Series 2022
5.00%, 07/01/2057 | | | 14,965 | | | | 13,095,807 | |
New York State Thruway Authority
(New York State Thruway Authority Gen Toll Road)
Series 2016-A
5.00%, 01/01/2041 | | | 3,800 | | | | 3,807,950 | |
New York State Thruway Authority
(State of New York Pers Income Tax)
Series 2022
4.125%, 03/15/2056 | | | 10,000 | | | | 8,326,816 | |
5.00%, 03/15/2055 | | | 20,000 | | | | 20,382,726 | |
New York Transportation Development Corp.
(Delta Air Lines, Inc.)
Series 2018
5.00%, 01/01/2027 | | | 17,365 | | | | 17,312,247 | |
5.00%, 01/01/2028 | | | 15,300 | | | | 15,243,955 | |
5.00%, 01/01/2029 | | | 18,660 | | | | 18,522,168 | |
Series 2020
4.00%, 10/01/2030 | | | 19,325 | | | | 18,086,005 | |
4.375%, 10/01/2045 | | | 50,345 | | | | 41,699,913 | |
New York Transportation Development Corp.
(Empire State Thruway Partners LLC)
Series 2021
4.00%, 04/30/2053 | | | 2,670 | | | | 1,957,919 | |
| | |
| |
68 | AB MUNICIPAL INCOME SHARES | | abfunds.com |
PORTFOLIO OF INVESTMENTS (continued)
| | | | | | | | |
| | | Principal
Amount
(000) | | | U.S. $ Value | |
| |
New York Transportation Development Corp.
(JFK International Air Terminal LLC)
Series 2022
5.00%, 12/01/2038 | | $ | 10,000 | | | $ | 9,329,683 | |
5.00%, 12/01/2039 | | | 2,500 | | | | 2,311,820 | |
5.00%, 12/01/2041 | | | 1,500 | | | | 1,360,497 | |
New York Transportation Development Corp.
(Laguardia Gateway Partners LLC)
Series 2016-A
5.00%, 07/01/2041 | | | 15,840 | | | | 14,794,633 | |
5.00%, 07/01/2046 | | | 17,215 | | | | 15,718,701 | |
5.25%, 01/01/2050 | | | 13,885 | | | | 13,033,158 | |
Niagara Area Development Corp.
(Covanta Holding Corp.)
Series 2018-A
4.75%, 11/01/2042(c) | | | 6,045 | | | | 5,090,978 | |
Orange County Funding Corp.
(The Hamlet at Wallkill)
Series 2013
6.50%, 01/01/2046 | | | 1,035 | | | | 799,465 | |
Port Authority of New York & New Jersey
Series 2013-178
5.00%, 12/01/2033 | | | 5,000 | | | | 5,045,100 | |
Series 2021
3.175%, 07/15/2060 | | | 10,000 | | | | 6,037,407 | |
Triborough Bridge & Tunnel Authority
5.25%, 05/15/2057(d) | | | 10,000 | | | | 10,353,217 | |
Series 2020-A
5.00%, 11/15/2054 | | | 3,000 | | | | 3,036,746 | |
Triborough Bridge & Tunnel Authority
(Metropolitan Transportation Authority Payroll Mobility Tax Revenue)
Series 2021-A
2.591%, 05/15/2036(d) | | | 4,000 | | | | 2,881,687 | |
2.917%, 05/15/2040(d) | | | 10,000 | | | | 6,875,020 | |
Series 2022-C
5.00%, 05/15/2047(d) | | | 10,000 | | | | 10,238,285 | |
5.25%, 05/15/2052(d) | | | 10,000 | | | | 10,415,419 | |
TSASC, Inc./NY
Series 2017-A
5.00%, 06/01/2041 | | | 1,560 | | | | 1,554,049 | |
Ulster County Capital Resource Corp.
(Woodland Pond at New Paltz)
Series 2017
5.00%, 09/15/2037 | | | 860 | | | | 674,373 | |
| | |
| |
| abfunds.com | | AB MUNICIPAL INCOME SHARES | 69 |
PORTFOLIO OF INVESTMENTS (continued)
| | | | | | | | |
| | | Principal
Amount
(000) | | | U.S. $ Value | |
| |
5.25%, 09/15/2042 | | $ | 365 | | | $ | 278,660 | |
5.25%, 09/15/2047 | | | 625 | | | | 455,910 | |
5.25%, 09/15/2053 | | | 1,340 | | | | 940,737 | |
Westchester County Local Development Corp.
(Kendal on Hudson)
Series 2013
5.00%, 01/01/2034 | | | 3,840 | | | | 3,850,974 | |
Westchester County Local Development Corp.
(Purchase Senior Learning Community Obligated Group)
Series 2021
3.125%, 07/01/2025(c) | | | 6,790 | | | | 6,522,243 | |
Westchester County Local Development Corp.
(Westchester County Health Care Corp. Obligated Group)
Series 2016
5.00%, 11/01/2046 | | | 7,055 | | | | 6,376,949 | |
Western Regional Off-Track Betting Corp.
Series 2021
3.00%, 12/01/2026(c) | | | 1,070 | | | | 956,011 | |
| | | | | | | | |
| | | | | | | 637,503,418 | |
| | | | | | | | |
North Carolina – 0.4% | |
Fayetteville State University
Series 2023
5.00%, 04/01/2027(a)(c) | | | 415 | | | | 423,868 | |
5.00%, 04/01/2028(a)(c) | | | 455 | | | | 465,334 | |
5.00%, 04/01/2029(a)(c) | | | 500 | | | | 511,647 | |
5.00%, 04/01/2030(a)(c) | | | 545 | | | | 557,443 | |
5.00%, 04/01/2031(a)(c) | | | 600 | | | | 610,913 | |
5.00%, 04/01/2034(a)(c) | | | 770 | | | | 773,539 | |
5.00%, 04/01/2036(a)(c) | | | 900 | | | | 896,159 | |
5.00%, 04/01/2037(a)(c) | | | 970 | | | | 961,525 | |
5.00%, 04/01/2040(a)(c) | | | 1,205 | | | | 1,178,951 | |
5.00%, 04/01/2042(a)(c) | | | 1,380 | | | | 1,340,928 | |
Greater Asheville Regional Airport Authority AGM Series 2022-A
5.50%, 07/01/2047 | | | 2,880 | | | | 2,923,547 | |
5.50%, 07/01/2052 | | | 5,000 | | | | 5,046,571 | |
North Carolina Medical Care Commission
Series 2015-A
5.00%, 09/01/2037
(Pre-refunded/ETM) | | | 1,735 | | | | 1,784,135 | |
Series 2017
5.00%, 09/01/2046 (Pre-refunded/ETM) | | | 1,000 | | | | 1,043,622 | |
| | |
| |
70 | AB MUNICIPAL INCOME SHARES | | abfunds.com |
PORTFOLIO OF INVESTMENTS (continued)
| | | | | | | | |
| | | Principal
Amount
(000) | | | U.S. $ Value | |
| |
North Carolina Medical Care Commission
(Aldersgate United Methodist Retirement Community, Inc.)
Series 2015
4.875%, 07/01/2040 | | $ | 5,000 | | | $ | 4,280,059 | |
5.00%, 07/01/2045 | | | 1,000 | | | | 835,719 | |
North Carolina Medical Care Commission
(Pennybyrn at Maryfield)
Series 2015
5.00%, 10/01/2030 | | | 2,250 | | | | 2,195,376 | |
North Carolina Medical Care Commission
(Sharon Towers)
Series 2019-A
5.00%, 07/01/2044 | | | 1,000 | | | | 891,782 | |
North Carolina Turnpike Authority
Series 2018
5.00%, 01/01/2040 | | | 5,000 | | | | 4,798,878 | |
| | | | | | | | |
| | | | | | | 31,519,996 | |
| | | | | | | | |
North Dakota – 0.2% | |
City of Grand Forks ND
(Altru Health System Obligated Group)
Series 2021
4.00%, 12/01/2040 | | | 1,875 | | | | 1,536,590 | |
4.00%, 12/01/2041 | | | 1,865 | | | | 1,504,857 | |
5.00%, 12/01/2034 | | | 2,045 | | | | 2,057,420 | |
County of Grand Forks ND
(Red River Biorefinery LLC)
Series 2021
6.625%, 12/15/2031(c) | | | 5,195 | | | | 3,052,937 | |
7.00%, 12/15/2043(c) | | | 5,390 | | | | 2,979,926 | |
County of Ward ND
(Trinity Health Obligated Group)
Series 2017-C
5.00%, 06/01/2048 | | | 5,000 | | | | 3,998,260 | |
5.00%, 06/01/2053 | | | 5,230 | | | | 4,113,616 | |
| | | | | | | | |
| | | | | | | 19,243,606 | |
| | | | | | | | |
Ohio – 4.1% | |
Akron Bath Copley Joint Township Hospital District
(Summa Health System Obligated Group)
Series 2020
3.00%, 11/15/2040 | | | 4,500 | | | | 3,014,548 | |
4.00%, 11/15/2036 | | | 1,000 | | | | 837,393 | |
4.00%, 11/15/2037 | | | 800 | | | | 662,273 | |
4.00%, 11/15/2038 | | | 750 | | | | 614,086 | |
| | |
| |
| abfunds.com | | AB MUNICIPAL INCOME SHARES | 71 |
PORTFOLIO OF INVESTMENTS (continued)
| | | | | | | | |
| | | Principal
Amount
(000) | | | U.S. $ Value | |
| |
American Municipal Power, Inc.
Series 2016-A
5.00%, 02/15/2041 | | $ | 6,000 | | | $ | 6,048,764 | |
5.00%, 02/15/2046 | | | 4,000 | | | | 4,026,461 | |
Buckeye Tobacco Settlement Financing Authority
Series 2020-A
4.00%, 06/01/2048 | | | 10,000 | | | | 7,917,853 | |
Series 2020-B
5.00%, 06/01/2055 | | | 176,110 | | | | 148,220,234 | |
City of Chillicothe OH
(Adena Health System Obligated Group)
Series 2017
5.00%, 12/01/2037 | | | 3,765 | | | | 3,783,900 | |
5.00%, 12/01/2047 | | | 3,735 | | | | 3,561,924 | |
County of Allen/OH Hospital Facilities Revenue
(Bon Secours Mercy Health, Inc.)
Series 2020
4.00%, 12/01/2040 | | | 10,390 | | | | 9,166,362 | |
County of Cuyahoga OH
(MetroHealth System (The))
Series 2017
5.00%, 02/15/2042 | | | 6,490 | | | | 6,222,208 | |
5.00%, 02/15/2052 | | | 5,680 | | | | 5,158,319 | |
5.25%, 02/15/2047 | | | 12,860 | | | | 12,369,202 | |
County of Franklin OH
(First Community Village Obligated Group)
Series 2019
5.00%, 07/01/2049 | | | 3,855 | | | | 3,089,630 | |
County of Hamilton OH
(UC Health Obligated Group)
Series 2020
5.00%, 09/15/2050 | | | 18,425 | | | | 17,582,452 | |
County of Hardin OH
(Ohio Northern University)
Series 2020
5.25%, 05/01/2040 | | | 500 | | | | 425,032 | |
5.50%, 05/01/2050 | | | 1,000 | | | | 825,347 | |
County of Marion OH
(United Church Homes, Inc. Obligated Group)
Series 2019
5.125%, 12/01/2049 | | | 2,210 | | | | 1,842,207 | |
County of Montgomery OH
(Trousdale Foundation Obligated Group)
Series 2018
6.00%, 04/01/2038(c)(f)(g) | | | 2,000 | | | | 752,000 | |
| | |
| |
72 | AB MUNICIPAL INCOME SHARES | | abfunds.com |
PORTFOLIO OF INVESTMENTS (continued)
| | | | | | | | |
| | | Principal
Amount
(000) | | | U.S. $ Value | |
| |
Series 2018-A
6.25%, 04/01/2049(c)(f)(g) | | $ | 10,105 | | | $ | 3,799,480 | |
County of Ross OH
(Adena Health System Obligated Group)
Series 2019
5.00%, 12/01/2049 | | | 6,000 | | | | 5,695,221 | |
County of Washington OH
(Marietta Area Health Care, Inc. Obligated Group)
Series 2022
6.625%, 12/01/2042 | | | 10,000 | | | | 9,019,020 | |
6.75%, 12/01/2052 | | | 24,200 | | | | 21,551,506 | |
Ohio Air Quality Development Authority
(Ohio Valley Electric Corp.)
Series 2019
3.25%, 09/01/2029 | | | 1,780 | | | | 1,583,285 | |
Ohio Higher Educational Facility Commission
(John Carroll University)
Series 2022
4.00%, 10/01/2052 | | | 6,000 | | | | 4,540,525 | |
Ohio Higher Educational Facility Commission
(Kenyon College)
Series 2020
5.00%, 07/01/2038 | | | 2,520 | | | | 2,566,553 | |
5.00%, 07/01/2039 | | | 2,635 | | | | 2,677,657 | |
5.00%, 07/01/2042 | | | 4,535 | | | | 4,582,218 | |
Port of Greater Cincinnati Development Authority
Series 2021
4.375%, 06/15/2056 | | | 3,480 | | | | 3,150,252 | |
Toledo-Lucas County Port Authority
(ParkUToledo Inc)
Series 2021
4.00%, 01/01/2057 | | | 6,500 | | | | 4,519,538 | |
Toledo-Lucas County Port Authority
(ParkUToledo, Inc.)
Series 2021
4.00%, 01/01/2041 | | | 3,000 | | | | 2,389,703 | |
4.00%, 01/01/2043 | | | 2,000 | | | | 1,557,189 | |
4.00%, 01/01/2046 | | | 2,000 | | | | 1,506,795 | |
4.00%, 01/01/2051 | | | 8,500 | | | | 6,085,932 | |
| | | | | | | | |
| | | | | | | 311,345,069 | |
| | | | | | | | |
| | |
| |
| abfunds.com | | AB MUNICIPAL INCOME SHARES | 73 |
PORTFOLIO OF INVESTMENTS (continued)
| | | | | | | | |
| | | Principal
Amount
(000) | | | U.S. $ Value | |
| |
Oklahoma – 1.0% | |
Oklahoma Development Finance Authority
(Oklahoma City University Obligated Group)
Series 2019
5.00%, 08/01/2044 | | $ | 7,650 | | | $ | 6,835,955 | |
5.00%, 08/01/2049 | | | 12,780 | | | | 11,152,458 | |
Oklahoma Development Finance Authority
(OU Medicine Obligated Group)
Series 2018-B
5.25%, 08/15/2043 | | | 19,045 | | | | 15,970,191 | |
5.50%, 08/15/2052 | | | 5,615 | | | | 4,594,404 | |
5.50%, 08/15/2057 | | | 21,080 | | | | 16,898,150 | |
Series 2022-A
5.50%, 08/15/2037 | | | 10,000 | | | | 8,793,020 | |
5.50%, 08/15/2041 | | | 11,995 | | | | 10,605,253 | |
| | | | | | | | |
| | | | | | | 74,849,431 | |
| | | | | | | | |
Oregon – 0.2% | |
Clackamas County Hospital Facility Authority
(Rose Villa, Inc. Obligated Group)
Series 2020-A
5.125%, 11/15/2040 | | | 750 | | | | 658,734 | |
5.375%, 11/15/2055 | | | 2,940 | | | | 2,478,686 | |
Medford Hospital Facilities Authority
(Asante Health System Obligated Group)
Series 2020-A
5.00%, 08/15/2045 | | | 4,500 | | | | 4,428,954 | |
5.00%, 08/15/2050 | | | 5,500 | | | | 5,271,825 | |
Oregon State Facilities Authority
(Samaritan Health Services, Inc. Obligated Group)
Series 2020
5.00%, 10/01/2040 | | | 1,750 | | | | 1,677,805 | |
Yamhill County Hospital Authority
(Friendsview Manor Obligated Group)
Series 2021-B
1.75%, 11/15/2026 | | | 950 | | | | 861,105 | |
| | | | | | | | |
| | | | | | | 15,377,109 | |
| | | | | | | | |
Pennsylvania – 5.8% | |
Allegheny County Hospital Development Authority
(Allegheny Health Network Obligated Group)
Series 2018-A
5.00%, 04/01/2034 | | | 10,135 | | | | 10,306,912 | |
| | |
| |
74 | AB MUNICIPAL INCOME SHARES | | abfunds.com |
PORTFOLIO OF INVESTMENTS (continued)
| | | | | | | | |
| | | Principal
Amount
(000) | | | U.S. $ Value | |
| |
5.00%, 04/01/2035 | | $ | 12,500 | | | $ | 12,667,694 | |
5.00%, 04/01/2036 | | | 10,900 | | | | 11,031,493 | |
Allentown Neighborhood Improvement Zone Development Authority
Series 2017
5.00%, 05/01/2042(c) | | | 2,270 | | | | 1,940,185 | |
Series 2018
5.00%, 05/01/2033(c) | | | 1,750 | | | | 1,622,525 | |
5.375%, 05/01/2042(c) | | | 2,500 | | | | 2,206,956 | |
Series 2022
5.25%, 05/01/2042(c) | | | 11,545 | | | | 10,055,858 | |
Bensalem Township School District
Series 2013
5.00%, 06/01/2029 (Pre-refunded/ETM) | | | 8,570 | | | | 8,732,832 | |
Berks County Industrial Development Authority
(Highlands at Wyomissing (The))
Series 2018
5.00%, 05/15/2048 | | | 1,000 | | | | 894,077 | |
Berks County Industrial Development Authority
(Tower Health Obligated Group)
Series 2017
5.00%, 11/01/2047 | | | 8,925 | | | | 6,063,425 | |
5.00%, 11/01/2050 | | | 9,270 | | | | 6,158,026 | |
Berks County Municipal Authority (The)
(Tower Health Obligated Group)
Series 2012-A
4.50%, 11/01/2041 | | | 4,050 | | | | 2,651,313 | |
Series 2020-B
5.00%, 02/01/2040 | | | 7,000 | | | | 6,557,253 | |
Bucks County Industrial Development Authority
(Grand View Hospital/Sellersville PA Obligated Group)
Series 2021
4.00%, 07/01/2051 | | | 7,550 | | | | 4,991,784 | |
5.00%, 07/01/2031 | | | 1,150 | | | | 1,139,784 | |
5.00%, 07/01/2054 | | | 5,000 | | | | 4,011,058 | |
Chambersburg Area Municipal Authority
(Wilson College)
Series 2018
5.75%, 10/01/2043 | | | 1,350 | | | | 1,220,759 | |
6.00%, 10/01/2048 | | | 9,000 | | | | 8,219,247 | |
| | |
| |
| abfunds.com | | AB MUNICIPAL INCOME SHARES | 75 |
PORTFOLIO OF INVESTMENTS (continued)
| | | | | | | | |
| | | Principal
Amount
(000) | | | U.S. $ Value | |
| |
Chester County Industrial Development Authority
(Collegium Charter School)
Series 2022
6.00%, 10/15/2052(c) | | $ | 1,075 | | | $ | 987,286 | |
Chester County Industrial Development Authority
(Woodlands at Greystone Neighborhood Improvement District)
Series 2018
5.125%, 03/01/2048(c) | | | 916 | | | | 810,053 | |
City of Philadelphia PA
Series 2017
5.00%, 08/01/2029 | | | 6,000 | | | | 6,309,683 | |
5.00%, 08/01/2031 | | | 6,110 | | | | 6,397,456 | |
Series 2017-A
5.00%, 08/01/2033 | | | 3,000 | | | | 3,115,312 | |
5.00%, 08/01/2034 | | | 10,000 | | | | 10,372,339 | |
Series 2019-B
5.00%, 02/01/2036 | | | 3,300 | | | | 3,414,423 | |
5.00%, 02/01/2037 | | | 2,900 | | | | 2,987,405 | |
5.00%, 02/01/2038 | | | 2,700 | | | | 2,774,612 | |
City of Philadelphia PA Water & Wastewater Revenue
2.189%, 07/01/2032(d) | | | 3,725 | | | | 2,837,048 | |
2.289%, 07/01/2033(d) | | | 3,060 | | | | 2,280,225 | |
Series 2017-A
5.00%, 10/01/2035 | | | 3,805 | | | | 3,973,081 | |
5.00%, 10/01/2036 | | | 1,300 | | | | 1,355,814 | |
Commonwealth of Pennsylvania
(Commonwealth of Pennsylvania COP)
Series 2018-A
5.00%, 07/01/2038 | | | 1,120 | | | | 1,170,341 | |
County of Lehigh PA
(Lehigh Valley Health Network Obligated Group)
Series 2016-A
4.00%, 07/01/2035 | | | 10,000 | | | | 9,209,492 | |
Series 2019
5.00%, 07/01/2044 | | | 6,885 | | | | 6,661,600 | |
Crawford County Hospital Authority
(Meadville Medical Center Obligated Group)
Series 2016-A
6.00%, 06/01/2046 | | | 1,175 | | | | 1,158,719 | |
6.00%, 06/01/2051 | | | 2,200 | | | | 2,114,391 | |
| | |
| |
76 | AB MUNICIPAL INCOME SHARES | | abfunds.com |
PORTFOLIO OF INVESTMENTS (continued)
| | | | | | | | |
| | | Principal
Amount
(000) | | | U.S. $ Value | |
| |
Cumberland County Municipal Authority
(Asbury Pennsylvania Obligated Group)
Series 2019
5.00%, 01/01/2045 | | $ | 1,815 | | | $ | 1,568,034 | |
Geisinger Authority
(Geisinger Health System Obligated Group)
Series 2017
4.00%, 02/15/2047 | | | 20,385 | | | | 17,266,454 | |
Series 2020
4.00%, 04/01/2050 | | | 9,060 | | | | 7,575,413 | |
Geisinger Pennsylvania Authority Health System
5.00%, 04/01/2050(d) | | | 10,000 | | | | 9,729,049 | |
Lancaster County Hospital Authority/PA
(St Anne’s Retirement Community Obligated Group)
Series 2020
5.00%, 03/01/2040 | | | 2,000 | | | | 1,683,260 | |
5.00%, 03/01/2050 | | | 500 | | | | 390,418 | |
Series 2022
5.00%, 03/01/2029 | | | 2,170 | | | | 2,049,269 | |
Montgomery County Higher Education and Health Authority
(HumanGood Pennsylvania Obligated Group)
Series 2017
5.00%, 12/01/2047 | | | 1,500 | | | | 1,364,426 | |
Montgomery County Higher Education and Health Authority
(Thomas Jefferson University Obligated Group)
Series 2018
5.00%, 09/01/2035 | | | 3,600 | | | | 3,689,773 | |
Series 2019
4.00%, 09/01/2049 | | | 5,900 | | | | 4,865,462 | |
5.00%, 09/01/2051 | | | 2,300 | | | | 2,171,031 | |
Series 2022
5.00%, 05/01/2057(d) | | | 16,395 | | | | 15,267,237 | |
Montgomery County Industrial Development Authority/PA
(ACTS Retirement-Life Communities, Inc. Obligated Group)
Series 2020
4.00%, 11/15/2043 | | | 500 | | | | 396,585 | |
5.00%, 11/15/2045 | | | 1,560 | | | | 1,428,343 | |
| | |
| |
| abfunds.com | | AB MUNICIPAL INCOME SHARES | 77 |
PORTFOLIO OF INVESTMENTS (continued)
| | | | | | | | |
| | | Principal
Amount
(000) | | | U.S. $ Value | |
| |
Montgomery County Industrial Development Authority/PA
(Whitemarsh Continuing Care Retirement Community)
Series 2015
5.00%, 01/01/2030 | | $ | 1,040 | | | $ | 1,005,890 | |
5.25%, 01/01/2040 | | | 4,740 | | | | 4,405,055 | |
Moon Industrial Development Authority
(Baptist Homes Society Obligated Group)
Series 2015
6.125%, 07/01/2050 | | | 2,500 | | | | 2,037,048 | |
Moon Industrial Development Authority
(Baptist Homes Society)
Series 2015
5.75%, 07/01/2035 | | | 5,135 | | | | 4,468,523 | |
6.00%, 07/01/2045 | | | 2,600 | | | | 2,146,004 | |
Northeastern Pennsylvania Hospital and Education Authority
(Wilkes University)
Series 2016-A
5.00%, 03/01/2037 | | | 2,675 | | | | 2,635,476 | |
Series 2016-B
5.25%, 03/01/2031 | | | 1,140 | | | | 1,157,550 | |
5.25%, 03/01/2037 | | | 1,170 | | | | 1,174,082 | |
Pennsylvania Economic Development Financing Authority
(Covanta Holding Corp.)
Series 2019
3.25%, 08/01/2039(c) | | | 2,330 | | | | 1,641,147 | |
Pennsylvania Economic Development Financing Authority
(Iron Cumberland LLC)
Series 2022
7.00%, 12/01/2029 | | | 31,570 | | | | 29,983,077 | |
Pennsylvania Economic Development Financing Authority
(National Railroad Passenger Corp.)
Series 2012-A
5.00%, 11/01/2041 | | | 1,620 | | | | 1,619,887 | |
Pennsylvania Economic Development Financing Authority
(PA Bridges Finco LP)
Series 2015
5.00%, 12/31/2034 | | | 2,830 | | | | 2,742,516 | |
| | |
| |
78 | AB MUNICIPAL INCOME SHARES | | abfunds.com |
PORTFOLIO OF INVESTMENTS (continued)
| | | | | | | | |
| | | Principal
Amount
(000) | | | U.S. $ Value | |
| |
Pennsylvania Economic Development Financing Authority
(Pennsylvania Economic Development Finance Authority Sewage)
Series 2020
3.00%, 01/01/2023 | | $ | 750 | | | $ | 749,255 | |
4.00%, 01/01/2027 | | | 1,530 | | | | 1,501,585 | |
4.00%, 01/01/2029 | | | 450 | | | | 435,403 | |
4.00%, 01/01/2030 | | | 400 | | | | 383,771 | |
4.00%, 01/01/2032 | | | 800 | | | | 749,529 | |
Pennsylvania Economic Development Financing Authority
(UPMC Obligated Group)
Series 2020-A
4.00%, 04/15/2036(d) | | | 2,755 | | | | 2,485,176 | |
4.00%, 04/15/2037(d) | | | 3,400 | | | | 3,021,611 | |
4.00%, 04/15/2038(d) | | | 5,000 | | | | 4,369,243 | |
4.00%, 04/15/2039(d) | | | 5,000 | | | | 4,298,435 | |
Series 2020-A1
4.00%, 04/15/2040(d) | | | 8,375 | | | | 7,129,588 | |
Pennsylvania Higher Educational Facilities Authority
(Drexel University)
Series 2016
5.00%, 05/01/2032 | | | 1,000 | | | | 1,018,305 | |
Pennsylvania Turnpike Commission
Series 2016
5.00%, 06/01/2037 | | | 4,000 | | | | 4,036,592 | |
Series 2017-B
5.00%, 06/01/2035 | | | 7,850 | | | | 7,955,310 | |
5.00%, 06/01/2036 | | | 5,000 | | | | 5,040,817 | |
Series 2018-A
5.00%, 12/01/2043 | | | 10,000 | | | | 10,019,626 | |
Series 2019-A
5.00%, 12/01/2038 | | | 5,435 | | | | 5,499,694 | |
5.00%, 12/01/2044 | | | 3,745 | | | | 3,636,631 | |
Philadelphia Authority for Industrial Development
(City of Philadelphia PA)
Series 2018
5.00%, 05/01/2035 | | | 1,000 | | | | 1,035,536 | |
Philadelphia Authority for Industrial Development
(MaST Community Charter School II)
Series 2020
5.00%, 08/01/2040 | | | 600 | | | | 563,591 | |
5.00%, 08/01/2050 | | | 1,425 | | | | 1,278,289 | |
| | |
| |
| abfunds.com | | AB MUNICIPAL INCOME SHARES | 79 |
PORTFOLIO OF INVESTMENTS (continued)
| | | | | | | | |
| | | Principal
Amount
(000) | | | U.S. $ Value | |
| |
Philadelphia Authority for Industrial Development
(MaST Community Charter School III)
Series 2021
5.00%, 08/01/2050 | | $ | 5,000 | | | $ | 4,485,223 | |
5.00%, 08/01/2054 | | | 3,560 | | | | 3,137,357 | |
Philadelphia Authority for Industrial Development
(Philadelphia Performing Arts Charter School)
Series 2020
5.00%, 06/15/2050(c) | | | 1,700 | | | | 1,418,124 | |
Philadelphia Gas Works Co.
Series 2017
5.00%, 08/01/2042 | | | 5,000 | | | | 5,044,851 | |
School District of Philadelphia (The)
Series 2015-A
5.00%, 09/01/2034 | | | 1,615 | | | | 1,675,698 | |
5.00%, 09/01/2035 | | | 1,000 | | | | 1,036,493 | |
Series 2016-F
5.00%, 09/01/2033 | | | 3,000 | | | | 3,094,969 | |
5.00%, 09/01/2036 | | | 1,000 | | | | 1,022,400 | |
Series 2018-A
5.00%, 09/01/2034 | | | 1,000 | | | | 1,027,618 | |
5.00%, 09/01/2036 | | | 1,000 | | | | 1,024,549 | |
5.00%, 09/01/2037 | | | 1,000 | | | | 1,021,919 | |
5.00%, 09/01/2038 | | | 1,000 | | | | 1,018,192 | |
Series 2018-B
5.00%, 09/01/2043 | | | 3,000 | | | | 3,008,605 | |
Series 2019-A
4.00%, 09/01/2037 | | | 2,230 | | | | 2,014,116 | |
4.00%, 09/01/2038 | | | 1,700 | | | | 1,519,789 | |
4.00%, 09/01/2039 | | | 1,600 | | | | 1,420,528 | |
5.00%, 09/01/2044(d) | | | 17,900 | | | | 17,917,222 | |
Scranton-Lackawanna Health and Welfare Authority
(Scranton Parking System Concession Project)
Series 2016-A
5.00%, 01/01/2051(c) | | | 6,765 | | | | 4,077,301 | |
5.00%, 01/01/2057(c) | | | 5,345 | | | | 3,109,472 | |
Series 2016-B
6.08%, 01/01/2026(c) | | | 610 | | | | 577,980 | |
Series 2016-C
Zero Coupon, 01/01/2036(c) | | | 2,945 | | | | 893,376 | |
Series 2016-D
Zero Coupon, 01/01/2057(i) | | | 58,055 | | | | 3,483,300 | |
| | |
| |
80 | AB MUNICIPAL INCOME SHARES | | abfunds.com |
PORTFOLIO OF INVESTMENTS (continued)
| | | | | | | | |
| | | Principal
Amount
(000) | | | U.S. $ Value | |
| |
State Public School Building Authority
AGM Series 2016
5.00%, 12/01/2029 | | $ | 1,365 | | | $ | 1,404,414 | |
5.00%, 12/01/2029 (Pre-refunded/ETM) | | | 220 | | | | 233,461 | |
5.00%, 12/01/2030 | | | 7,160 | | | | 7,353,238 | |
Union County Hospital Authority
(Evangelical Community Hospital Obligated Group)
Series 2018
5.00%, 08/01/2038 | | | 2,685 | | | | 2,746,450 | |
5.00%, 08/01/2043 | | | 5,750 | | | | 5,704,514 | |
| | | | | | | | |
| | | | | | | 438,540,616 | |
| | | | | | | | |
Puerto Rico – 4.2% | | | | | | | | |
Children’s Trust Fund
Series 2005-A
Zero Coupon, 05/15/2050 | | | 8,370 | | | | 1,442,441 | |
Series 2008-A
Zero Coupon, 05/15/2057 | | | 261,400 | | | | 14,301,272 | |
Commonwealth of Puerto Rico
Series 2021-A
Zero Coupon, 07/01/2024 | | | 707 | | | | 642,758 | |
Zero Coupon, 07/01/2033 | | | 6,410 | | | | 3,257,246 | |
4.00%, 07/01/2033 | | | 16,025 | | | | 13,560,220 | |
4.00%, 07/01/2035 | | | 4,200 | | | | 3,432,435 | |
4.00%, 07/01/2037 | | | 1,631 | | | | 1,296,905 | |
4.00%, 07/01/2041 | | | 2,217 | | | | 1,685,627 | |
4.00%, 07/01/2046 | | | 2,306 | | | | 1,672,671 | |
5.25%, 07/01/2023 | | | 1,180 | | | | 1,181,957 | |
5.375%, 07/01/2025 | | | 7,870 | | | | 7,865,367 | |
5.625%, 07/01/2027 | | | 8,953 | | | | 9,015,575 | |
5.625%, 07/01/2029 | | | 3,905 | | | | 3,927,296 | |
5.75%, 07/01/2031 | | | 3,784 | | | | 3,806,575 | |
Series 2022-A
5.06%, 11/01/2051 | | | 42,340 | | | | 18,047,425 | |
Series 2022-C
0.01%, 11/01/2043 | | | 81,500 | | | | 37,184,289 | |
GDB Debt Recovery Authority of Puerto Rico
Series 2018
7.50%, 08/20/2040 | | | 6,900 | | | | 5,942,590 | |
PR Custodial Trust
Series 2022
5.50%, 07/01/2029 | | | 411 | | | | 413,371 | |
Puerto Rico Commonwealth Aqueduct & Sewer Authority
Series 2008-A
6.125%, 07/01/2024 | | | 3,590 | | | | 3,636,502 | |
| | |
| |
| abfunds.com | | AB MUNICIPAL INCOME SHARES | 81 |
PORTFOLIO OF INVESTMENTS (continued)
| | | | | | | | |
| | | Principal
Amount
(000) | | | U.S. $ Value | |
| |
Puerto Rico Electric Power Authority
Series 2007-T
5.00%, 07/01/2032(f)(g) | | $ | 7,315 | | | $ | 5,486,250 | |
5.00%, 07/01/2037(f)(g) | | | 14,970 | | | | 11,227,500 | |
Series 2008-W
5.25%, 07/01/2033(f)(g) | | | 1,000 | | | | 750,000 | |
5.50%, 07/01/2038(f)(g) | | | 10,490 | | | | 7,906,838 | |
Series 2010-A
5.25%, 07/01/2029(f)(g) | | | 2,950 | | | | 2,212,500 | |
5.25%, 07/01/2030(f)(g) | | | 1,040 | | | | 780,000 | |
Series 2010-C
5.00%, 07/01/2024(f)(g) | | | 1,735 | | | | 1,301,250 | |
Series 2010-DDD
5.00%, 07/01/2021(f)(j) | | | 1,050 | | | | 784,875 | |
5.00%, 07/01/2022(f)(j) | | | 950 | | | | 710,125 | |
Series 2010-X
5.25%, 07/01/2040(f)(g) | | | 12,605 | | | | 9,453,750 | |
5.75%, 07/01/2036(f)(g) | | | 7,375 | | | | 5,586,563 | |
Series 2010-ZZ
5.25%, 07/01/2024(f)(g) | | | 2,565 | | | | 1,923,750 | |
5.25%, 07/01/2025(f)(g) | | | 620 | | | | 465,000 | |
Series 2012-A
5.00%, 07/01/2029(f)(g) | | | 2,510 | | | | 1,882,500 | |
5.00%, 07/01/2042(f)(g) | | | 1,740 | | | | 1,305,000 | |
AGM Series 2007-U
5.00%, 07/01/2023 | | | 1,050 | | | | 1,065,343 | |
AGM Series 2007-V
5.25%, 07/01/2031 | | | 25,380 | | | | 24,967,722 | |
NATL Series 2007-V
5.25%, 07/01/2029 | | | 5,965 | | | | 5,904,819 | |
Puerto Rico Highway & Transportation Authority
AGC Series 2005-L
5.25%, 07/01/2041 | | | 8,600 | | | | 8,264,812 | |
AGC Series 2007-C
5.50%, 07/01/2031 | | | 1,235 | | | | 1,236,031 | |
AGC Series 2007-N
5.25%, 07/01/2036 | | | 825 | | | | 798,156 | |
AGM Series 2007-C
5.25%, 07/01/2036 | | | 1,800 | | | | 1,741,430 | |
NATL Series 2007
5.50%, 07/01/2028 | | | 1,000 | | | | 1,003,824 | |
Puerto Rico Industrial Tourist Educational Medical & Environmental Control Facilities Financing Auth
(AES Puerto Rico LP)
Series 2000
6.625%, 06/01/2026 | | | 21,370 | | | | 22,131,016 | |
| | |
| |
82 | AB MUNICIPAL INCOME SHARES | | abfunds.com |
PORTFOLIO OF INVESTMENTS (continued)
| | | | | | | | |
| | | Principal
Amount
(000) | | | U.S. $ Value | |
| |
Puerto Rico Sales Tax Financing Corp. Sales Tax Revenue
Series 2018-A
Zero Coupon, 07/01/2024 | | $ | 195 | | | $ | 179,037 | |
Zero Coupon, 07/01/2027 | | | 537 | | | | 418,171 | |
Zero Coupon, 07/01/2029 | | | 523 | | | | 362,763 | |
Zero Coupon, 07/01/2046 | | | 15,224 | | | | 3,296,827 | |
Series 2019-A
4.329%, 07/01/2040 | | | 15,975 | | | | 13,398,285 | |
4.55%, 07/01/2040 | | | 1,198 | | | | 1,033,177 | |
5.00%, 07/01/2058 | | | 54,251 | | | | 46,519,587 | |
| | | | | | | | |
| | | | | | | 316,409,423 | |
| | | | | | | | |
Rhode Island – 0.0% | | | | | | | | |
Rhode Island Health and Educational Building Corp.
(City of Woonsocket RI Lease)
AGM Series 2017-A
5.00%, 05/15/2028 | | | 1,000 | | | | 1,071,607 | |
5.00%, 05/15/2029 | | | 1,000 | | | | 1,054,399 | |
| | | | | | | | |
| | | | | | | 2,126,006 | |
| | | | | | | | |
South Carolina – 2.0% | | | | | | | | |
Columbia Housing Authority/SC
Series 2022
4.80%, 11/01/2024 | | | 5,010 | | | | 4,846,839 | |
5.26%, 11/01/2032 | | | 800 | | | | 749,113 | |
5.41%, 11/01/2039 | | | 12,570 | | | | 11,340,159 | |
6.28%, 11/01/2039 | | | 545 | | | | 489,099 | |
South Carolina Jobs-Economic Development Authority
(Bon Secours Mercy Health, Inc.)
Series 2020
5.00%, 12/01/2046 | | | 9,595 | | | | 9,617,891 | |
South Carolina Jobs-Economic Development Authority
(Last Step Recycling LLC)
Series 2021
6.00%, 06/01/2031(c) | | | 1,470 | | | | 1,158,616 | |
6.25%, 06/01/2040(c) | | | 6,100 | | | | 4,416,656 | |
6.50%, 06/01/2051(c) | | | 9,070 | | | | 6,238,382 | |
South Carolina Jobs-Economic Development Authority
(Lutheran Homes of South Carolina Obligated Group)
Series 2013
5.00%, 05/01/2043 | | | 1,000 | | | | 801,573 | |
5.125%, 05/01/2048 | | | 1,000 | | | | 785,388 | |
| | |
| |
| abfunds.com | | AB MUNICIPAL INCOME SHARES | 83 |
PORTFOLIO OF INVESTMENTS (continued)
| | | | | | | | |
| | | Principal
Amount
(000) | | | U.S. $ Value | |
| |
South Carolina Jobs-Economic Development Authority
(PSG Patriot’s Place Apartments LLC)
Series 2022
Zero Coupon, 06/01/2052 | | $ | 15,630 | | | $ | 9,540,972 | |
South Carolina Public Service Authority
Series 2016-A
5.00%, 12/01/2034 | | | 3,815 | | | | 3,832,738 | |
5.00%, 12/01/2036 | | | 1,000 | | | | 998,678 | |
Series 2016-B
5.00%, 12/01/2037 | | | 3,430 | | | | 3,395,381 | |
5.00%, 12/01/2041 | | | 10,500 | | | | 10,268,922 | |
5.00%, 12/01/2046 | | | 17,500 | | | | 16,879,216 | |
5.00%, 12/01/2056 | | | 7,350 | | | | 6,987,963 | |
Series 2022
4.00%, 12/01/2038 | | | 550 | | | | 483,731 | |
4.00%, 12/01/2046 | | | 3,031 | | | | 2,494,106 | |
4.00%, 12/01/2049 | | | 11,781 | | | | 9,549,580 | |
4.00%, 12/01/2050 | | | 5,155 | | | | 4,161,012 | |
5.00%, 12/01/2036 | | | 447 | | | | 451,635 | |
5.00%, 12/01/2038 | | | 1,742 | | | | 1,734,492 | |
Series 2022-A
4.00%, 12/01/2047 | | | 25,000 | | | | 20,453,473 | |
4.00%, 12/01/2052 | | | 20,000 | | | | 16,012,206 | |
University of South Carolina
Series 2021-A
5.00%, 05/01/2039 | | | 5,695 | | | | 5,982,637 | |
| | | | | | | | |
| | | | | | | 153,670,458 | |
| | | | | | | | |
South Dakota – 0.3% | | | | | | | | |
County of Lincoln SD
(Augustana College Association (The))
Series 2021
4.00%, 08/01/2051 | | | 1,410 | | | | 1,008,588 | |
4.00%, 08/01/2056 | | | 2,415 | | | | 1,663,451 | |
4.00%, 08/01/2061 | | | 2,960 | | | | 1,972,500 | |
South Dakota Health & Educational Facilities Authority
(Regional Health System Obligated Group/SD)
Series 2017
5.00%, 09/01/2033 | | | 3,260 | | | | 3,327,727 | |
South Dakota Health & Educational Facilities Authority
(South Dakota Health & Educational Facilities Authority)
Series 2017
5.00%, 09/01/2040 | | | 15,035 | | | | 14,910,089 | |
| | | | | | | | |
| | | | | | | 22,882,355 | |
| | | | | | | | |
| | |
| |
84 | AB MUNICIPAL INCOME SHARES | | abfunds.com |
PORTFOLIO OF INVESTMENTS (continued)
| | | | | | | | |
| | | Principal
Amount
(000) | | | U.S. $ Value | |
| |
Tennessee – 1.0% | | | | | | | | |
Bristol Industrial Development Board
(Bristol Industrial Development Board Sales Tax)
Series 2016-A
5.00%, 12/01/2035(c) | | $ | 9,080 | | | $ | 8,321,504 | |
5.125%, 12/01/2042(c) | | | 28,990 | | | | 25,902,426 | |
Series 2016-B
Zero Coupon, 12/01/2031(c) | | | 2,000 | | | | 1,182,838 | |
Chattanooga Health Educational & Housing Facility Board
(CommonSpirit Health)
Series 2019-A
4.00%, 08/01/2038 | | | 1,000 | | | | 854,698 | |
5.00%, 08/01/2044 | | | 6,140 | | | | 5,856,120 | |
5.00%, 08/01/2049 | | | 5,120 | | | | 4,751,520 | |
Metropolitan Government Nashville & Davidson County Health & Educational Facilities Board
(Trousdale Foundation Obligated Group)
Series 2018-A
6.25%, 04/01/2049(c)(f)(g) | | | 5,040 | | | | 1,895,040 | |
Metropolitan Government Nashville & Davidson County Health & Educational Facilities Board
(Vanderbilt University Medical Center Obligated Group)
Series 2016
5.00%, 07/01/2040 | | | 2,435 | | | | 2,378,790 | |
Series 2017-A
5.00%, 07/01/2048 | | | 2,335 | | | | 2,160,884 | |
Metropolitan Government Nashville & Davidson County Industrial Development Board
(South Nashville Central Business Improvement District)
Series 2021
Zero Coupon, 06/01/2043(c) | | | 7,250 | | | | 2,014,636 | |
Tennessee Energy Acquisition Corp.
(Goldman Sachs Group, Inc. (The))
Series 2021
5.00%, 05/01/2052 | | | 7,925 | | | | 7,721,168 | |
Wilson County Health & Educational Facilities Board
Series 2021
4.00%, 12/01/2039 | | | 10,000 | | | | 7,139,809 | |
4.25%, 12/01/2024 | | | 6,000 | | | | 5,592,213 | |
| | | | | | | | |
| | | | | | | 75,771,646 | |
| | | | | | | | |
| | |
| |
| abfunds.com | | AB MUNICIPAL INCOME SHARES | 85 |
PORTFOLIO OF INVESTMENTS (continued)
| | | | | | | | |
| | | Principal
Amount
(000) | | | U.S. $ Value | |
| |
Texas – 5.9% | | | | | | | | |
Abilene Convention Center Hotel Development Corp.
(City of Abilene TX Abilene Convention Center Revenue)
Series 2021-B
5.00%, 10/01/2050(c) | | $ | 5,300 | | | $ | 4,154,215 | |
Arlington Higher Education Finance Corp.
(BASIS Texas Charter Schools, Inc.)
Series 2021
4.50%, 06/15/2056(c) | | | 1,000 | | | | 943,407 | |
Arlington Higher Education Finance Corp.
(Wayside Schools)
Series 2021-A
4.00%, 08/15/2036 | | | 500 | | | | 409,119 | |
4.00%, 08/15/2046 | | | 695 | | | | 503,310 | |
Baytown Municipal Development District
(Baytown Municipal Development District Baytown Convention Center Hotel Revenue)
Series 2021
4.00%, 10/01/2045 | | | 8,545 | | | | 7,343,844 | |
4.00%, 10/01/2050 | | | 3,815 | | | | 3,214,590 | |
Brazoria County Industrial Development Corp.
(Aleon Renewable Metals LLC)
Series 2022
10.00%, 06/01/2042(c) | | | 10,000 | | | | 9,803,090 | |
Central Texas Regional Mobility Authority
Series 2013
5.00%, 01/01/2042 (Pre-refunded/ETM) | | | 3,500 | | | | 3,509,711 | |
Series 2015-A
5.00%, 01/01/2045 (Pre-refunded/ETM) | | | 4,905 | | | | 5,114,855 | |
Series 2020-A
5.00%, 01/01/2044 | | | 2,230 | | | | 2,155,792 | |
5.00%, 01/01/2049 | | | 3,940 | | | | 3,732,267 | |
Series 2021-B
5.00%, 01/01/2046 | | | 4,600 | | | | 4,392,486 | |
Series 2021-C
5.00%, 01/01/2027 | | | 7,000 | | | | 7,180,025 | |
Central Texas Turnpike System
Series 2015-C
5.00%, 08/15/2037 | | | 6,800 | | | | 6,843,770 | |
City of Austin TX Airport System Revenue
Series 2019-B
5.00%, 11/15/2039 | | | 1,000 | | | | 981,482 | |
| | |
| |
86 | AB MUNICIPAL INCOME SHARES | | abfunds.com |
PORTFOLIO OF INVESTMENTS (continued)
| | | | | | | | |
| | | Principal
Amount
(000) | | | U.S. $ Value | |
| |
City of Houston TX
Series 2021-B
2.047%, 03/01/2033 | | $ | 2,495 | | | $ | 1,812,418 | |
2.147%, 03/01/2034 | | | 7,405 | | | | 5,257,490 | |
City of Houston TX
(City of Houston TX Hotel Occupancy Tax)
Series 2015
5.00%, 09/01/2030 | | | 1,965 | | | | 1,988,894 | |
City of Houston TX Airport System Revenue
(United Airlines, Inc.)
Series 2014
5.00%, 07/01/2029 | | | 16,960 | | | | 16,713,592 | |
Series 2015-B
5.00%, 07/15/2030 | | | 1,960 | | | | 1,929,128 | |
5.00%, 07/15/2035 | | | 1,000 | | | | 940,681 | |
Series 2018
5.00%, 07/15/2028 | | | 22,875 | | | | 22,617,299 | |
Series 2020
5.00%, 07/01/2027 | | | 1,750 | | | | 1,738,401 | |
5.00%, 07/15/2027 | | | 2,500 | | | | 2,483,293 | |
City of San Antonio TX Electric & Gas Systems Revenue
Series 2021-A
5.00%, 02/01/2046 | | | 5,000 | | | | 5,073,477 | |
Clifton Higher Education Finance Corp.
(IDEA Public Schools)
Series 2012
5.00%, 08/15/2042 | | | 530 | | | | 530,097 | |
Series 2013
6.00%, 08/15/2043 | | | 1,000 | | | | 1,011,521 | |
Conroe Local Government Corp.
(Conroe Local Government Corp. Conroe Convention Center Hotel)
Series 2021
4.00%, 10/01/2050 | | | 2,525 | | | | 2,001,442 | |
Dallas County Flood Control District No. 1
Series 2015
5.00%, 04/01/2028(c) | | | 1,650 | | | | 1,617,394 | |
Dallas Fort Worth International Airport
Series 2022-A
4.507%, 11/01/2051 | | | 2,000 | | | | 1,665,263 | |
Decatur Hospital Authority
Series 2014-A
5.25%, 09/01/2044 | | | 3,150 | | | | 3,034,096 | |
Series 2021
4.00%, 09/01/2034 | | | 1,679 | | | | 1,412,386 | |
| | |
| |
| abfunds.com | | AB MUNICIPAL INCOME SHARES | 87 |
PORTFOLIO OF INVESTMENTS (continued)
| | | | | | | | |
| | | Principal
Amount
(000) | | | U.S. $ Value | |
| |
4.00%, 09/01/2044 | | $ | 3,876 | | | $ | 2,909,181 | |
Grand Parkway Transportation Corp.
Series 2018
5.00%, 02/01/2023 | | | 5,340 | | | | 5,358,302 | |
Harris County Cultural Education Facilities Finance Corp.
(Memorial Hermann Health System Obligated Group)
Series 2022
5.00%, 07/01/2052(d) | | | 10,000 | | | | 9,590,525 | |
Hidalgo County Regional Mobility Authority
Series 2022-A
Zero Coupon, 12/01/2042 | | | 2,000 | | | | 635,305 | |
Zero Coupon, 12/01/2051 | | | 8,040 | | | | 1,428,731 | |
Series 2022-B
Zero Coupon, 12/01/2042 | | | 1,395 | | | | 421,487 | |
Zero Coupon, 12/01/2043 | | | 2,000 | | | | 562,372 | |
Zero Coupon, 12/01/2044 | | | 5,640 | | | | 1,467,885 | |
Zero Coupon, 12/01/2055 | | | 2,895 | | | | 358,042 | |
Zero Coupon, 12/01/2056 | | | 5,000 | | | | 580,519 | |
Irving Hospital Authority
(Baylor Medical Center at Irving)
Series 2017-A
5.00%, 10/15/2044 | | | 8,505 | | | | 8,216,689 | |
Katy Independent School District
Series 2022
4.00%, 02/15/2047 | | | 6,450 | | | | 5,720,715 | |
Lower Colorado River Authority
(LCRA Transmission Services Corp.)
Series 2022
5.00%, 05/15/2034 | | | 3,015 | | | | 3,185,501 | |
5.00%, 05/15/2035 | | | 4,100 | | | | 4,297,485 | |
5.00%, 05/15/2042 | | | 18,710 | | | | 19,081,120 | |
Mission Economic Development Corp.
(Natgasoline LLC)
Series 2018
4.625%, 10/01/2031(c) | | | 25,410 | | | | 23,909,951 | |
New Hope Cultural Education Facilities Finance Corp.
Series 2017-A
5.00%, 04/01/2037 (Pre-refunded/ETM) | | | 2,050 | | | | 2,166,360 | |
New Hope Cultural Education Facilities Finance Corp.
(Army Retirement Residence Obligated Group)
Series 2022
5.75%, 07/15/2052 | | | 4,490 | | | | 4,005,914 | |
| | |
| |
88 | AB MUNICIPAL INCOME SHARES | | abfunds.com |
PORTFOLIO OF INVESTMENTS (continued)
| | | | | | | | |
| | | Principal
Amount
(000) | | | U.S. $ Value | |
| |
6.00%, 07/15/2057 | | $ | 10,300 | | | $ | 9,421,827 | |
New Hope Cultural Education Facilities Finance Corp.
(BSPV – Plano LLC)
Series 2019
7.25%, 12/01/2053(f)(g) | | | 7,820 | | | | 7,038,000 | |
New Hope Cultural Education Facilities Finance Corp.
(Buckingham Senior Living Community, Inc. Obligated Group)
Series 2021
2.00%, 11/15/2061 | | | 202 | | | | 89,092 | |
7.50%, 11/15/2036 | | | 50 | | | | 41,955 | |
7.50%, 11/15/2037 | | | 10 | | | | 7,957 | |
New Hope Cultural Education Facilities Finance Corp.
(Legacy at Midtown Park, Inc. Obligated Group)
Series 2018-A
5.50%, 07/01/2054 | | | 4,500 | | | | 3,373,255 | |
New Hope Cultural Education Facilities Finance Corp.
(Morningside Ministries Obligated Group)
Series 2020
5.00%, 01/01/2040 | | | 790 | | | | 675,730 | |
5.00%, 01/01/2055 | | | 3,010 | | | | 2,344,183 | |
Series 2022
4.00%, 01/01/2047 | | | 4,575 | | | | 3,093,719 | |
4.25%, 01/01/2057 | | | 1,380 | | | | 888,168 | |
5.00%, 01/01/2057 | | | 2,950 | | | | 2,229,716 | |
New Hope Cultural Education Facilities Finance Corp.
(Outlook at Windhaven Forefront Living Obligated Group)
Series 2022
6.875%, 10/01/2057 | | | 500 | | | | 450,213 | |
Newark Higher Education Finance Corp.
(Abilene Christian University)
Series 2022
4.00%, 04/01/2057 | | | 10,000 | | | | 7,570,148 | |
North East Texas Regional Mobility Authority
Series 2016
5.00%, 01/01/2046 | | | 4,940 | | | | 4,467,881 | |
North Texas Tollway Authority
(North Texas Tollway System)
Series 2014-B
5.00%, 01/01/2031 | | | 8,975 | | | | 9,093,863 | |
| | |
| |
| abfunds.com | | AB MUNICIPAL INCOME SHARES | 89 |
PORTFOLIO OF INVESTMENTS (continued)
| | | | | | | | |
| | | Principal
Amount
(000) | | | U.S. $ Value | |
| |
Series 2015-A
5.00%, 01/01/2035 | | $ | 7,000 | | | $ | 7,101,526 | |
Series 2017-B
5.00%, 01/01/2033 | | | 1,400 | | | | 1,445,610 | |
5.00%, 01/01/2043 | | | 6,000 | | | | 6,012,680 | |
Series 2020
3.079%, 01/01/2042 | | | 4,990 | | | | 3,499,819 | |
Series 2021
3.011%, 01/01/2043(d) | | | 7,500 | | | | 5,157,399 | |
Port Beaumont Navigation District
(Jefferson Railport Terminal II LLC)
Series 2020
4.00%, 01/01/2050(c) | | | 3,315 | | | | 2,260,926 | |
Series 2021
2.125%, 01/01/2028(c) | | | 540 | | | | 446,322 | |
2.25%, 01/01/2029(c) | | | 800 | | | | 639,401 | |
2.50%, 01/01/2030(c) | | | 905 | | | | 708,673 | |
2.625%, 01/01/2031(c) | | | 500 | | | | 382,739 | |
Red River Health Facilities Development Corp.
Series 2014-A
7.75%, 11/15/2044 (Pre-refunded/ETM) | | | 1,315 | | | | 1,423,988 | |
Sanger Industrial Development Corp.
(Texas Pellets, Inc.)
Series 2012-B 8.00%, 07/01/2038(f)(g)(h) | | | 2,180 | | | | 545,000 | |
Tarrant County Cultural Education Facilities
Finance Corp.
(Edgemere Retirement Senior Quality Lifestyles Corp.)
Series 2015-A
5.00%, 11/15/2045(f)(g) | | | 3,540 | | | | 1,416,000 | |
Series 2015-B
5.00%, 11/15/2030(f)(g) | | | 4,000 | | | | 1,600,000 | |
Series 2017
5.25%, 11/15/2047(f)(g) | | | 1,115 | | | | 446,000 | |
Tarrant County Cultural Education Facilities
Finance Corp.
(Stayton at Museum Way)
Series 2020-A
5.75%, 12/01/2054 | | | 6,475 | | | | 4,631,659 | |
Tarrant County Cultural Education Facilities
Finance Corp.
(Trinity Terrace Project)
Series 2014-A1
5.00%, 10/01/2044 | | | 1,065 | | | | 984,603 | |
| | |
| |
90 | AB MUNICIPAL INCOME SHARES | | abfunds.com |
PORTFOLIO OF INVESTMENTS (continued)
| | | | | | | | |
| | | Principal
Amount
(000) | | | U.S. $ Value | |
| |
5.00%, 10/01/2049 | | $ | 4,285 | | | $ | 3,876,007 | |
Texas Municipal Gas Acquisition & Supply Corp. I
(Bank of America Corp.)
Series 2008-D
6.25%, 12/15/2026 | | | 7,595 | | | | 7,866,994 | |
Texas Private Activity Bond Surface Transportation Corp.
(Blueridge Transportation Group LLC)
Series 2016
5.00%, 12/31/2040 | | | 1,255 | | | | 1,231,315 | |
5.00%, 12/31/2045 | | | 4,250 | | | | 4,049,387 | |
5.00%, 12/31/2050 | | | 16,075 | | | | 14,981,683 | |
Texas Private Activity Bond Surface Transportation Corp.
(NTE Mobility Partners LLC)
Series 2019
4.00%, 12/31/2037 | | | 4,000 | | | | 3,437,566 | |
4.00%, 12/31/2038 | | | 2,600 | | | | 2,205,882 | |
4.00%, 12/31/2039 | | | 2,500 | | | | 2,097,887 | |
5.00%, 12/31/2031 | | | 5,000 | | | | 5,050,452 | |
Texas Private Activity Bond Surface Transportation Corp.
(NTE Mobility Partners Segments 3 LLC)
Series 2013
6.75%, 06/30/2043 | | | 3,600 | | | | 3,663,242 | |
Series 2019
5.00%, 06/30/2058 | | | 85,330 | | | | 75,902,221 | |
Texas Transportation Commission State Highway 249 System
Series 2019
5.00%, 08/01/2057 | | | 7,500 | | | | 6,841,251 | |
Uptown Development Authority
Series 2017-A
5.00%, 09/01/2035 | | | 1,015 | | | | 994,452 | |
| | | | | | | | |
| | | | | | | 447,691,310 | |
| | | | | | | | |
Utah – 0.2% | |
City of Salt Lake City UT Airport Revenue
Series 2018-A
5.00%, 07/01/2048(d) | | | 7,245 | | | | 6,894,306 | |
Military Installation Development Authority
Series 2021-A
4.00%, 06/01/2052 | | | 5,000 | | | | 3,418,302 | |
Utah Infrastructure Agy Teleco
Series 2022
5.00%, 10/15/2032 | | | 1,000 | | | | 971,378 | |
| | |
| |
| abfunds.com | | AB MUNICIPAL INCOME SHARES | 91 |
PORTFOLIO OF INVESTMENTS (continued)
| | | | | | | | |
| | | Principal
Amount
(000) | | | U.S. $ Value | |
| |
5.00%, 10/15/2037 | | $ | 1,410 | | | $ | 1,333,734 | |
| | | | | | | | |
| | | | | | | 12,617,720 | |
| | | | | | | | |
Vermont – 0.1% | |
Vermont Economic Development Authority
(Casella Waste Systems, Inc.)
Series 2018
4.625%, 04/01/2036(c) | | | 1,100 | | | | 1,035,210 | |
Series 2022
5.00%, 06/01/2052(c) | | | 3,750 | | | | 3,614,606 | |
| | | | | | | | |
| | | | | | | 4,649,816 | |
| | | | | | | | |
Virginia – 2.3% | |
Align Affordable Housing Bond Fund LP
(Park Landing LP)
Series 2022-2
5.66%, 08/01/2052 | | | 7,910 | | | | 6,751,314 | |
Arlington County Industrial Development Authority
(Virginia Hospital Center Arlington Health System/VA)
Series 2020
4.00%, 07/01/2038 | | | 1,435 | | | | 1,281,462 | |
4.00%, 07/01/2040 | | | 2,125 | | | | 1,864,154 | |
5.00%, 07/01/2036 | | | 850 | | | | 877,761 | |
Cherry Hill Community Development Authority
(Potomac Shores Project)
Series 2015
5.15%, 03/01/2035(c) | | | 1,000 | | | | 951,680 | |
Chesapeake Bay Bridge & Tunnel District
Series 2016
5.00%, 07/01/2046 | | | 1,000 | | | | 1,006,208 | |
Fairfax County Economic Development Authority
Series 2013-A
5.00%, 12/01/2047 (Pre-refunded/ETM) | | | 1,955 | | | | 1,990,056 | |
Henrico County Economic Development Authority
(Westminster-Canterbury Corp. Obligated Group)
Series 2022
5.00%, 10/01/2047 | | | 2,000 | | | | 1,964,401 | |
5.00%, 10/01/2052 | | | 4,500 | | | | 4,354,642 | |
Tobacco Settlement Financing Corp./VA
Series 2007-B1
5.00%, 06/01/2047 | | | 7,490 | | | | 6,524,535 | |
| | |
| |
92 | AB MUNICIPAL INCOME SHARES | | abfunds.com |
PORTFOLIO OF INVESTMENTS (continued)
| | | | | | | | |
| | | Principal
Amount
(000) | | | U.S. $ Value | |
| |
Virginia College Building Authority
(Marymount University)
Series 2015
5.00%, 07/01/2045(c) | | $ | 1,500 | | | $ | 1,335,068 | |
5.25%, 07/01/2035(c) | | | 1,000 | | | | 971,121 | |
Series 2015-A
5.00%, 07/01/2045(c) | | | 1,110 | | | | 987,950 | |
Virginia Small Business Financing Authority
(95 Express Lanes LLC)
Series 2022
4.00%, 01/01/2040 | | | 3,000 | | | | 2,489,173 | |
4.00%, 07/01/2040 | | | 500 | | | | 413,388 | |
4.00%, 01/01/2048 | | | 20,770 | | | | 15,743,176 | |
Virginia Small Business Financing Authority
(Capital Beltway Express LLC)
Series 2022
5.00%, 12/31/2047 | | | 17,000 | | | | 16,301,324 | |
5.00%, 12/31/2052 | | | 17,790 | | | | 16,902,158 | |
5.00%, 12/31/2057 | | | 10,500 | | | | 9,865,826 | |
Virginia Small Business Financing Authority
(Elizabeth River Crossings OpCo LLC)
Series 2022
4.00%, 01/01/2030 | | | 3,070 | | | | 2,920,272 | |
4.00%, 01/01/2031 | | | 2,650 | | | | 2,490,762 | |
4.00%, 01/01/2033 | | | 7,500 | | | | 6,869,017 | |
4.00%, 01/01/2034 | | | 3,500 | | | | 3,160,019 | |
4.00%, 01/01/2037 | | | 10,000 | | | | 8,673,944 | |
Virginia Small Business Financing Authority
(I-66 Express Mobility Partners LLC)
Series 2017
5.00%, 12/31/2052 | | | 2,250 | | | | 2,045,222 | |
Virginia Small Business Financing Authority
(National Senior Campuses, Inc. Obligated Group)
Series 2020
4.00%, 01/01/2051 | | | 18,500 | | | | 14,626,618 | |
Virginia Small Business Financing Authority
(Total Fiber Recovery @ Chesapeake LLC)
Series 2022
6.50%, 06/01/2029(c) | | | 20,215 | | | | 18,969,212 | |
8.50%, 06/01/2042(c) | | | 23,525 | | | | 21,048,173 | |
| | | | | | | | |
| | | | | | | 173,378,636 | |
| | | | | | | | |
Washington – 1.7% | |
Kalispel Tribe of Indians
Series 2018-A
5.25%, 01/01/2038(c) | | | 750 | | | | 774,799 | |
| | |
| |
| abfunds.com | | AB MUNICIPAL INCOME SHARES | 93 |
PORTFOLIO OF INVESTMENTS (continued)
| | | | | | | | |
| | | Principal
Amount
(000) | | | U.S. $ Value | |
| |
King County Public Hospital District No. 4
Series 2015-A
5.00%, 12/01/2030 | | $ | 2,235 | | | $ | 2,173,398 | |
Pend Oreille County Public Utility District No. 1 Box Canyon
Series 2018
5.00%, 01/01/2048 | | | 9,000 | | | | 8,520,810 | |
Port of Seattle WA
Series 2015-C
5.00%, 04/01/2033 | | | 5,035 | | | | 5,101,444 | |
Series 2019
5.00%, 04/01/2044 | | | 3,380 | | | | 3,245,917 | |
Washington Health Care Facilities Authority
(CommonSpirit Health)
Series 2019-A
5.00%, 08/01/2037 | | | 2,000 | | | | 2,005,944 | |
5.00%, 08/01/2039 | | | 4,970 | | | | 4,939,220 | |
5.00%, 08/01/2044 | | | 12,915 | | | | 12,317,881 | |
Washington Health Care Facilities Authority
(Overlake Hospital Medical Center Obligated Group)
Series 2017-A
5.00%, 07/01/2035 | | | 2,350 | | | | 2,386,928 | |
Series 2017-B
5.00%, 07/01/2034 | | | 1,855 | | | | 1,892,242 | |
Washington Health Care Facilities Authority
(Seattle Cancer Care Alliance Obligated Group)
Series 2020
4.00%, 09/01/2045 | | | 2,045 | | | | 1,698,171 | |
5.00%, 09/01/2039 | | | 1,655 | | | | 1,644,732 | |
5.00%, 09/01/2045 | | | 2,070 | | | | 2,004,797 | |
5.00%, 09/01/2050 | | | 2,000 | | | | 1,897,458 | |
Washington Health Care Facilities Authority
(Virginia Mason Medical Center Obligated Group)
Series 2017
5.00%, 08/15/2033 | | | 6,250 | | | | 6,299,231 | |
5.00%, 08/15/2035 | | | 5,750 | | | | 5,750,442 | |
5.00%, 08/15/2037 | | | 3,755 | | | | 3,705,961 | |
Washington State Convention Center Public Facilities District
(Washington State Convention Center Public Facilities District Hotel Occupancy Tax)
Series 2021
4.00%, 07/01/2031 | | | 19,340 | | | | 16,687,018 | |
| | |
| |
94 | AB MUNICIPAL INCOME SHARES | | abfunds.com |
PORTFOLIO OF INVESTMENTS (continued)
| | | | | | | | |
| | | Principal
Amount
(000) | | | U.S. $ Value | |
| |
Washington State Housing Finance Commission
Series 2021-1, Class A
3.50%, 12/20/2035 | | $ | 19,231 | | | $ | 16,249,587 | |
Washington State Housing Finance Commission
Series 2021-1, Class X
0.725%, 12/20/2035(e) | | | 14,713 | | | | 740,394 | |
Washington State Housing Finance Commission
(Presbyterian Retirement Communities Northwest Obligated Group)
Series 2013
5.00%, 01/01/2028(c) | | | 1,030 | | | | 976,873 | |
5.25%, 01/01/2043(c) | | | 2,870 | | | | 2,415,860 | |
Series 2015
6.00%, 01/01/2045(c) | | | 2,920 | | | | 2,620,447 | |
Series 2016
5.00%, 01/01/2031(c) | | | 2,650 | | | | 2,408,826 | |
5.00%, 01/01/2046(c) | | | 1,140 | | | | 893,393 | |
Series 2019-A
5.00%, 01/01/2044(c) | | | 1,330 | | | | 1,054,528 | |
5.00%, 01/01/2049(c) | | | 3,305 | | | | 2,526,125 | |
5.00%, 01/01/2055(c) | | | 11,670 | | | | 8,664,190 | |
Washington State Housing Finance Commission
(Rockwood Retirement Communities)
Series 2014-A
7.375%, 01/01/2044(c) | | | 5,115 | | | | 5,122,500 | |
Washington State Housing Finance Commission
(Spokane United Methodist Homes Obligated Group)
Series 2020
5.00%, 01/01/2051(c) | | | 2,000 | | | | 1,436,767 | |
5.00%, 01/01/2056(c) | | | 3,000 | | | | 2,103,086 | |
| | | | | | | | |
| | | | | | | 130,258,969 | |
| | | | | | | | |
West Virginia – 0.1% | |
City of South Charleston WV
(City of South Charleston WV South Charleston Park Place Excise Tax District)
Series 2022
4.50%, 06/01/2050(c) | | | 1,000 | | | | 711,340 | |
Tobacco Settlement Finance Authority/WV
Series 2020
4.875%, 06/01/2049 | | | 3,000 | | | | 2,550,640 | |
| | |
| |
| abfunds.com | | AB MUNICIPAL INCOME SHARES | 95 |
PORTFOLIO OF INVESTMENTS (continued)
| | | | | | | | |
| | | Principal
Amount
(000) | | | U.S. $ Value | |
| |
West Virginia Economic Development Authority
(Arch Resources, Inc.)
Series 2021
4.125%, 07/01/2045 | | $ | 4,035 | | | $ | 3,893,199 | |
West Virginia Hospital Finance Authority
Series 2013-A
5.50%, 06/01/2044 (Pre-refunded/ETM) | | | 2,100 | | | | 2,126,414 | |
| | | | | | | | |
| | | | | | | 9,281,593 | |
| | | | | | | | |
Wisconsin – 4.0% | |
St. Croix Chippewa Indians of Wisconsin
Series 2021
5.00%, 09/30/2041(c) | | | 8,850 | | | | 6,496,689 | |
UMA Education, Inc.
Series 2019
5.00%, 10/01/2034(c) | | | 15,970 | | | | 14,687,400 | |
5.00%, 10/01/2039(c) | | | 5,035 | | | | 4,445,689 | |
Wisconsin Center District
(Wisconsin Center District Ded Tax)
Series 2022
5.25%, 12/15/2061(c) | | | 6,995 | | | | 6,269,968 | |
Wisconsin Health & Educational Facilities Authority
(Aspirus, Inc. Obligated Group)
Series 2017
5.00%, 08/15/2052(d) | | | 20,345 | | | | 19,658,499 | |
Wisconsin Health & Educational Facilities Authority
(Marshfield Clinic Health System Obligated Group)
AGM Series 2020
3.00%, 02/15/2038 | | | 1,035 | | | | 786,275 | |
4.00%, 02/15/2036 | | | 1,600 | | | | 1,454,048 | |
4.00%, 02/15/2037 | | | 1,050 | | | | 943,421 | |
5.00%, 02/15/2031 | | | 2,000 | | | | 2,125,159 | |
Wisconsin Health & Educational Facilities Authority
(Oakwood Lutheran Senior Ministries Obligated Group)
Series 2021
4.00%, 01/01/2057 | | | 9,815 | | | | 6,561,471 | |
Wisconsin Health & Educational Facilities Authority
(Rogers Memorial Hospital, Inc. Obligated Group)
Series 2019
5.00%, 07/01/2044 | | | 1,000 | | | | 955,102 | |
| | |
| |
96 | AB MUNICIPAL INCOME SHARES | | abfunds.com |
PORTFOLIO OF INVESTMENTS (continued)
| | | | | | | | |
| | | Principal
Amount
(000) | | | U.S. $ Value | |
| |
Wisconsin Health & Educational Facilities Authority
(St. Camillus Health System Obligated Group)
Series 2019
5.00%, 11/01/2039 | | $ | 950 | | | $ | 808,157 | |
5.00%, 11/01/2046 | | | 870 | | | | 697,286 | |
5.00%, 11/01/2054 | | | 3,295 | | | | 2,542,845 | |
Wisconsin Health & Educational Facilities Authority
(Thedacare, Inc. Obligated Group)
Series 2019
4.00%, 12/15/2035 | | | 1,795 | | | | 1,641,423 | |
4.00%, 12/15/2036 | | | 1,865 | | | | 1,703,280 | |
4.00%, 12/15/2037 | | | 1,830 | | | | 1,647,144 | |
4.00%, 12/15/2038 | | | 1,915 | | | | 1,707,040 | |
Wisconsin Housing & Economic Development Authority
(Roers Sun Prairie Apartments Owner LLC)
Series 2022
4.625%, 03/15/2040(c) | | | 2,510 | | | | 2,044,384 | |
Series 2022-A
3.875%, 12/01/2039(c) | | | 11,525 | | | | 9,285,474 | |
Wisconsin Public Finance Authority
Series 2014-A
5.75%, 11/15/2044
(Pre-refunded/ETM)(c) | | | 1,000 | | | | 1,043,908 | |
Wisconsin Public Finance Authority
Series 2022
6.00%, 02/01/2062(c) | | | 20,960 | | | | 18,007,004 | |
Wisconsin Public Finance Authority
(21st Century Public Academy)
Series 2020
5.00%, 06/01/2049(c) | | | 1,340 | | | | 1,038,431 | |
Wisconsin Public Finance Authority
(ACTS Retirement-Life Communities, Inc. Obligated Group)
Series 2020
4.00%, 11/15/2037 | | | 600 | | | | 510,925 | |
5.00%, 11/15/2041 | | | 1,500 | | | | 1,407,098 | |
Wisconsin Public Finance Authority
(Appalachian Regional Healthcare System Obligated Group)
Series 2021
4.00%, 07/01/2046 | | | 1,100 | | | | 844,307 | |
4.00%, 07/01/2051 | | | 1,675 | | | | 1,223,698 | |
| | |
| |
| abfunds.com | | AB MUNICIPAL INCOME SHARES | 97 |
PORTFOLIO OF INVESTMENTS (continued)
| | | | | | | | |
| | | Principal
Amount
(000) | | | U.S. $ Value | |
| |
Wisconsin Public Finance Authority
(Bancroft Neurohealth Obligated Group)
Series 2016
5.125%, 06/01/2048(c) | | $ | 3,335 | | | $ | 2,885,501 | |
Wisconsin Public Finance Authority
(Blue Ridge Healthcare Obligated Group)
Series 2020
4.00%, 01/01/2045 | | | 1,500 | | | | 1,256,797 | |
5.00%, 01/01/2038 | | | 550 | | | | 545,977 | |
5.00%, 01/01/2039 | | | 700 | | | | 691,961 | |
5.00%, 01/01/2040 | | | 500 | | | | 492,004 | |
Wisconsin Public Finance Authority
(Carmelite System, Inc. Obligated Group (The))
Series 2020
5.00%, 01/01/2045 | | | 2,030 | | | | 1,881,149 | |
Wisconsin Public Finance Authority
(Catholic Bishop of Chicago (The))
Series 2021
5.75%, 07/25/2041(c) | | | 57,000 | | | | 48,725,994 | |
Wisconsin Public Finance Authority
(Celanese US Holdings LLC)
Series 2016-C
4.30%, 11/01/2030 | | | 2,060 | | | | 1,984,306 | |
Series 2016-D
4.05%, 11/01/2030 | | | 720 | | | | 681,733 | |
Wisconsin Public Finance Authority
(CFC-SA LLC)
Series 2022
5.00%, 02/01/2052 | | | 11,500 | | | | 9,681,383 | |
5.00%, 02/01/2062 | | | 11,250 | | | | 9,194,232 | |
5.75%, 02/01/2052(c) | | | 15,500 | | | | 13,043,140 | |
Wisconsin Public Finance Authority
(Gannon University)
Series 2017
5.00%, 05/01/2042 | | | 1,000 | | | | 918,819 | |
5.00%, 05/01/2047 | | | 1,650 | | | | 1,473,159 | |
Wisconsin Public Finance Authority
(Mary’s Woods at Marylhurst, Inc.)
Series 2017-A
5.25%, 05/15/2037(c) | | | 1,000 | | | | 898,317 | |
5.25%, 05/15/2042(c) | | | 1,000 | | | | 864,765 | |
5.25%, 05/15/2047(c) | | | 1,225 | | | | 1,024,033 | |
Wisconsin Public Finance Authority
(McLemore Resort Manager LLC)
Series 2021
4.50%, 06/01/2056(c) | | | 11,235 | | | | 7,521,467 | |
| | |
| |
98 | AB MUNICIPAL INCOME SHARES | | abfunds.com |
PORTFOLIO OF INVESTMENTS (continued)
| | | | | | | | |
| | | Principal
Amount
(000) | | | U.S. $ Value | |
| |
Wisconsin Public Finance Authority
(Moses H Cone Memorial Hospital Obligated Group)
Series 2022-A
5.00%, 10/01/2052 | | $ | 10,000 | | | $ | 9,825,708 | |
Wisconsin Public Finance Authority
(National Senior Communities, Inc. Obligated Group)
Series 2022
4.00%, 01/01/2047 | | | 1,400 | | | | 1,094,815 | |
4.00%, 01/01/2052 | | | 2,350 | | | | 1,767,763 | |
Wisconsin Public Finance Authority
(Pine Lake Preparatory, Inc.)
Series 2015
5.25%, 03/01/2035(c) | | | 1,550 | | | | 1,523,259 | |
Wisconsin Public Finance Authority
(Queens University of Charlotte)
Series 2022
5.25%, 03/01/2042 | | | 12,000 | | | | 11,231,564 | |
5.25%, 03/01/2047 | | | 5,100 | | | | 4,669,921 | |
Wisconsin Public Finance Authority
(Renown Regional Medical Center)
Series 2020
4.00%, 06/01/2045 | | | 8,840 | | | | 7,396,274 | |
Wisconsin Public Finance Authority
(Roseman University of Health Sciences)
Series 2020
5.00%, 04/01/2030(c) | | | 500 | | | | 488,784 | |
5.00%, 04/01/2040(c) | | | 1,400 | | | | 1,256,920 | |
5.00%, 04/01/2050(c) | | | 3,250 | | | | 2,709,007 | |
Wisconsin Public Finance Authority
(Samaritan Housing Foundation Obligated Group)
Series 2021
4.00%, 06/01/2056(c) | | | 29,090 | | | | 17,386,217 | |
Series 2022
4.00%, 06/01/2049(c) | | | 3,900 | | | | 2,473,458 | |
Wisconsin Public Finance Authority
(Seabury Retirement Community)
Series 2015-A
5.00%, 09/01/2030(c) | | | 545 | | | | 509,679 | |
Wisconsin Public Finance Authority
(Sky Harbour Capital LLC Obligated Group)
Series 2021
4.25%, 07/01/2054 | | | 3,500 | | | | 2,282,245 | |
| | |
| |
| abfunds.com | | AB MUNICIPAL INCOME SHARES | 99 |
PORTFOLIO OF INVESTMENTS (continued)
| | | | | | | | |
| | | Principal
Amount
(000) | | | U.S. $ Value | |
| |
Wisconsin Public Finance Authority
(Southeastern Regional Medical Center Obligated Group)
Series 2021
4.00%, 02/01/2046 | | $ | 6,500 | | | $ | 5,073,452 | |
4.00%, 02/01/2051 | | | 10,000 | | | | 7,582,718 | |
Wisconsin Public Finance Authority
(Uwharrie Charter Academy)
Series 2022
5.00%, 06/15/2052(c) | | | 3,315 | | | | 2,705,570 | |
5.00%, 06/15/2057(c) | | | 4,105 | | | | 3,289,096 | |
5.00%, 06/15/2062(c) | | | 1,295 | | | | 1,021,267 | |
Wisconsin Public Finance Authority
(Washoe Barton Medical Clinic)
Series 2021
4.00%, 12/01/2051 | | | 3,300 | | | | 2,394,196 | |
| | | | | | | | |
| | | | | | | 300,982,775 | |
| | | | | | | | |
Total Municipal Obligations
(cost $8,987,187,526) | | | | | | | 7,742,832,771 | |
| | | | | |
| | | | | | | | |
COMMERCIAL MORTGAGE-BACKED SECURITIES – 0.5% | | | | | | | | |
Agency CMBS – 0.5% | |
California Housing Finance Agency
Series 2021-2, Class A
3.75%, 03/25/2035 | | | 34,985 | | | | 32,427,200 | |
Series 2021-3, Class X
0.764%, 08/20/2036(e) | | | 20,513 | | | | 1,224,069 | |
| | | | | | | | |
| | |
Total Commercial Mortgage-Backed Securities
(cost $42,683,973) | | | | | | | 33,651,269 | |
| | | | | | | | |
| | | | | | | | |
CORPORATES - NON-INVESTMENT GRADE – 0.0% | | | | | | | | |
Industrial – 0.0% | |
Banks – 0.0% | |
UMB Financial Corp.
10.00%, 01/01/2049(k)(l)
(cost $1,137,682) | | | 1,138 | | | | 1,132,623 | |
| | | | | | | | |
| | |
| |
100 | AB MUNICIPAL INCOME SHARES | | abfunds.com |
PORTFOLIO OF INVESTMENTS (continued)
| | | | | | | | |
| | | Shares | | | U.S. $ Value | |
| |
SHORT-TERM INVESTMENTS – 2.1% | |
Investment Companies – 2.1% | |
AB Fixed Income Shares, Inc. – Government Money Market Portfolio – Class AB, 2.67%(m)(n)(o)
(cost $160,387,715) | | | 160,387,715 | | | $ | 160,387,715 | |
| | | | | | | | |
| | |
Total Investments – 104.7%
(cost $9,191,396,896) | | | | | | | 7,938,004,378 | |
Other assets less liabilities – (4.7)% | | | | | | | (357,089,580 | ) |
| | | | | |
| | |
Net Assets – 100.0% | | | | | | $ | 7,580,914,798 | |
| | | | | |
CENTRALLY CLEARED INFLATION (CPI) SWAPS (see Note C)
| | | | | | | | | | | | | | | | | | | | | | | | | | |
| | | | | | | | | Rate Type | | | | | | | | | | | |
Notional
Amount
(000) | | | Termination
Date | | | Payments
made
by the
Fund | | Payments
received
by the
Fund | | Payment
Frequency
Paid/
Received | | Market
Value | | | Upfront
Premiums
Paid/
(Received) | | | Unrealized
Appreciation
(Depreciation) | |
| USD | | | 90,795 | | | | 01/15/2025 | | | 2.565% | | CPI# | | Maturity | | $ | 8,759,396 | | | $ | – 0 | – | | $ | 8,759,396 | |
| USD | | | 45,398 | | | | 01/15/2025 | | | 2.613% | | CPI# | | Maturity | | | 4,295,344 | | | | – 0 | – | | | 4,295,344 | |
| USD | | | 45,397 | | | | 01/15/2025 | | | 2.585% | | CPI# | | Maturity | | | 4,344,127 | | | | – 0 | – | | | 4,344,127 | |
| USD | | | 34,210 | | | | 01/15/2025 | | | 4.028% | | CPI# | | Maturity | | | 1,301,237 | | | | – 0 | – | | | 1,301,237 | |
| USD | | | 83,920 | | | | 01/15/2026 | | | CPI# | | 3.765% | | Maturity | | | (3,211,999 | ) | | | – 0 | – | | | (3,211,999 | ) |
| USD | | | 158,000 | | | | 01/15/2027 | | | CPI# | | 3.320% | | Maturity | | | (8,502,757 | ) | | | – 0 | – | | | (8,502,757 | ) |
| USD | | | 156,000 | | | | 01/15/2027 | | | CPI# | | 3.466% | | Maturity | | | (7,034,722 | ) | | | (178,689 | ) | | | (6,856,033 | ) |
| USD | | | 127,850 | | | | 01/15/2027 | | | CPI# | | 3.323% | | Maturity | | | (6,857,407 | ) | | | – 0 | – | | | (6,857,407 | ) |
| USD | | | 371,020 | | | | 01/15/2028 | | | 0.735% | | CPI# | | Maturity | | | 81,356,190 | | | | – 0 | – | | | 81,356,190 | |
| USD | | | 219,860 | | | | 01/15/2028 | | | 1.230% | | CPI# | | Maturity | | | 40,632,230 | | | | – 0 | – | | | 40,632,230 | |
| USD | | | 273,300 | | | | 01/15/2029 | | | CPI# | | 3.390% | | Maturity | | | (9,437,003 | ) | | | – 0 | – | | | (9,437,003 | ) |
| USD | | | 190,780 | | | | 01/15/2029 | | | CPI# | | 3.735% | | Maturity | | | (1,309,867 | ) | | | – 0 | – | | | (1,309,867 | ) |
| USD | | | 79,070 | | | | 01/15/2029 | | | CPI# | | 3.331% | | Maturity | | | (3,099,265 | ) | | | – 0 | – | | | (3,099,265 | ) |
| USD | | | 67,450 | | | | 01/15/2030 | | | 1.572% | | CPI# | | Maturity | | | 11,888,031 | | | | – 0 | – | | | 11,888,031 | |
| USD | | | 67,450 | | | | 01/15/2030 | | | 1.587% | | CPI# | | Maturity | | | 11,799,835 | | | | – 0 | – | | | 11,799,835 | |
| USD | | | 93,000 | | | | 01/15/2031 | | | 2.782% | | CPI# | | Maturity | | | 7,213,387 | | | | – 0 | – | | | 7,213,387 | |
| USD | | | 85,000 | | | | 01/15/2031 | | | 2.680% | | CPI# | | Maturity | | | 7,399,563 | | | | – 0 | – | | | 7,399,563 | |
| USD | | | 76,750 | | | | 01/15/2031 | | | 2.989% | | CPI# | | Maturity | | | 4,458,296 | | | | – 0 | – | | | 4,458,296 | |
| USD | | | 75,410 | | | | 01/15/2032 | | | CPI# | | 3.064% | | Maturity | | | (3,494,869 | ) | | | – 0 | – | | | (3,494,869 | ) |
| USD | | | 52,000 | | | | 04/15/2032 | | | CPI# | | 2.909% | | Maturity | | | (3,059,949 | ) | | | – 0 | – | | | (3,059,949 | ) |
| | | | | | | | | | | | | | | | | | | | | | | | | | |
| | $ | 137,439,798 | | | $ | (178,689 | ) | | $ | 137,618,487 | |
| | | | | | | | | | | | |
| # | Variable interest rate based on the rate of inflation as determined by the Consumer Price Index (CPI). |
| | |
| |
| abfunds.com | | AB MUNICIPAL INCOME SHARES | 101 |
PORTFOLIO OF INVESTMENTS (continued)
CENTRALLY CLEARED INTEREST RATE SWAPS (see Note C)
| | | | | | | | | | | | | | | | | | | | | | | | | | |
| | | | | | | | | Rate Type | | | | | | | | | | | |
Notional
Amount
(000) | | | Termination
Date | | | Payments
made
by the
Fund | | Payments
received
by the
Fund | | Payment
Frequency
Paid/
Received | | Market
Value | | | Upfront
Premiums
Paid/
(Received) | | | Unrealized
Appreciation
(Depreciation) | |
| USD | | | 275,000 | | | | 01/15/2027 | | | 1 Day
SOFR | | 3.947% | | Annual | | $ | (1,621,223 | ) | | $ | – 0 | – | | $ | (1,621,223 | ) |
| USD | | | 120,000 | | | | 01/15/2027 | | | 1 Day
SOFR | | 3.231% | | Annual | | | (3,968,960 | ) | | | – 0 | – | | | (3,968,960 | ) |
| USD | | | 85,000 | | | | 01/15/2027 | | | 1 Day
SOFR | | 3.245% | | Annual | | | (2,765,644 | ) | | | – 0 | – | | | (2,765,644 | ) |
| USD | | | 80,000 | | | | 01/15/2027 | | | 1 Day
SOFR | | 2.748% | | Annual | | | (3,778,396 | ) | | | – 0 | – | | | (3,778,396 | ) |
| USD | | | 240,000 | | | | 01/15/2029 | | | 1.363% | | 3 Month
LIBOR | | Semi-Annual/ Quarterly | | | 36,901,014 | | | | (160,366 | ) | | | 37,061,380 | |
| USD | | | 150,000 | | | | 01/15/2031 | | | 1.439% | | 3 Month
LIBOR | | Semi-Annual/
Quarterly | | | 27,767,805 | | | | – 0 | – | | | 27,767,805 | |
| USD | | | 280,900 | | | | 04/15/2032 | | | 1.280% | | 1 Day
SOFR | | Annual | | | 57,378,674 | | | | – 0 | – | | | 57,378,674 | |
| USD | | | 230,000 | | | | 04/15/2032 | | | 2.621% | | 1 Day
SOFR | | Annual | | | 22,252,374 | | | | – 0 | – | | | 22,252,374 | |
| USD | | | 200,000 | | | | 04/15/2032 | | | 1.305% | | 1 Day
SOFR | | Annual | | | 40,433,835 | | | | – 0 | – | | | 40,433,835 | |
| USD | | | 174,000 | | | | 04/15/2032 | | | 2.177% | | 1 Day
SOFR | | Annual | | | 22,451,216 | | | | – 0 | – | | | 22,451,216 | |
| USD | | | 155,000 | | | | 04/15/2032 | | | 2.574% | | 1 Day
SOFR | | Annual | | | 14,944,684 | | | | – 0 | – | | | 14,944,684 | |
| USD | | | 100,000 | | | | 04/15/2032 | | | 2.444% | | 1 Day
SOFR | | Annual | | | 11,091,200 | | | | – 0 | – | | | 11,091,200 | |
| USD | | | 50,000 | | | | 02/15/2051 | | | 1.469% | | 1 Day
SOFR | | Annual | | | 17,827,236 | | | | – 0 | – | | | 17,827,236 | |
| | | | | | | | | | | | | | | | | | | | | | | | | | |
| | $ | 238,913,815 | | | $ | (160,366 | ) | | $ | 239,074,181 | |
| | | | | | | | | | | | |
INTEREST RATE SWAPS (see Note C)
| | | | | | | | | | | | | | | | | | | | | | | | | | | | | | | | |
| | | | | | | | | Rate Type | | | | | | | | | | | | | |
Swap
Counterparty | | Notional
Amount
(000) | | | Termination
Date | | | Payments
made
by the
Fund | | | Payments
received
by the
Fund | | | Payment
Frequency
Paid/
Received | | | Market
Value | | | Upfront
Premiums
Paid/
(Received) | | | Unrealized
Appreciation
(Depreciation) | |
Citibank, NA | | | USD 52,610 | | | | 10/09/2029 | | | | 1.125 | % | | | SIFMA | * | | | Quarterly | | | $ | 6,993,202 | | | $ | – 0 | – | | $ | 6,993,202 | |
| * | Variable interest rate based on the Securities Industry & Financial Markets Association (SIFMA) Municipal Swap Index. |
| (a) | When-Issued or delayed delivery security. |
| (b) | Floating Rate Security. Stated interest/floor/ceiling rate was in effect at October 31, 2022. |
| (c) | Security is exempt from registration under Rule 144A or Regulation S of the Securities Act of 1933. These securities are considered restricted, but liquid and may be resold in transactions exempt from registration. At October 31, 2022, the aggregate market value of these securities amounted to $1,191,647,865 or 15.7% of net assets. |
| (d) | Security represents the underlying municipal obligation of an inverse floating rate obligation held by the Fund (see Note H). |
| | |
| |
102 | AB MUNICIPAL INCOME SHARES | | abfunds.com |
PORTFOLIO OF INVESTMENTS (continued)
| (f) | Non-income producing security. |
| (h) | Restricted and illiquid security. |
| | | | | | | | | | | | | | | | |
Restricted & Illiquid
Securities | | Acquisition
Date | | | Cost | | | Market
Value | | | Percentage of
Net Assets | |
Louisiana Public Facilities Authority
(Louisiana Pellets, Inc.)
Series 2013-B
10.50%, 07/01/2039 | | | 11/22/2013 | | | $ | 1,973,785 | | | $ | 28 | | | | 0.00 | % |
Louisiana Public Facilities Authority
(Louisiana Pellets, Inc.)
Series 2014-A
7.50%, 07/01/2023 | | | 07/31/2014 | | | | 868,863 | | | | 13 | | | | 0.00 | % |
Sanger Industrial Development Corp.
(Texas Pellets, Inc.)
Series 2012-B
8.00%, 07/01/2038 | | | 08/31/2012 | | | | 2,180,000 | | | | 545,000 | | | | 0.01 | % |
| (i) | Security is exempt from registration under Rule 144A or Regulation S of the Securities Act of 1933. These securities, which represent 0.05% of net assets as of October 31, 2022, are considered illiquid and restricted. Additional information regarding such securities follows: |
| | | | | | | | | | | | | | | | |
144A/Restricted & Illiquid
Securities | | Acquisition
Date | | | Cost | | | Market
Value | | | Percentage of
Net Assets | |
Scranton-Lackawanna Health and Welfare Authority
(Scranton Parking System Concession Project)
Series 2016-D
Zero Coupon, 01/01/2057 | | | 11/29/2017 | | | $ | 6,529,334 | | | $ | 3,483,300 | | | | 0.05 | % |
| (j) | Defaulted matured security. |
| (k) | Security in which significant unobservable inputs (Level 3) were used in determining fair value. |
| (l) | Fair valued by the Adviser. |
| (m) | Affiliated investments. |
| (n) | The rate shown represents the 7-day yield as of period end. |
| (o) | To obtain a copy of the fund’s shareholder report, please go to the Securities and Exchange Commission’s website at www.sec.gov, or call AB at (800) 227-4618. |
As of October 31, 2022, the Fund’s percentages of investments in municipal bonds that are insured and in insured municipal bonds that have been pre-refunded or escrowed to maturity are 1.9% and 0.0%, respectively.
Glossary:
AGC – Assured Guaranty Corporation
AGM – Assured Guaranty Municipal
BAM – Build American Mutual
CCRC – Congregate Care Retirement Center
CMBS – Commercial Mortgage-Backed Securities
COP – Certificate of Participation
CPI – Consumer Price Index
ETM – Escrowed to Maturity
LIBOR – London Interbank Offered Rate
| | |
| |
| abfunds.com | | AB MUNICIPAL INCOME SHARES | 103 |
PORTFOLIO OF INVESTMENTS (continued)
NATL – National Interstate Corporation
SD – School District
SOFR – Secured Overnight Financing Rate
UPMC – University of Pittsburgh Medical Center
See notes to financial statements.
| | |
| |
104 | AB MUNICIPAL INCOME SHARES | | abfunds.com |
STATEMENT OF ASSETS & LIABILITIES
October 31, 2022 (unaudited)
| | | | |
| Assets | |
Investments in securities, at value | | | | |
Unaffiliated issuers (cost $9,031,009,181) | | $ | 7,777,616,663 | |
Affiliated issuers (cost $160,387,715) | | | 160,387,715 | |
Cash | | | 3,056,740 | |
Cash collateral due from broker | | | 56,484,102 | |
Interest receivable | | | 119,154,957 | |
Receivable for shares of beneficial interest sold | | | 28,033,255 | |
Receivable for variation margin on centrally cleared swaps | | | 7,438,652 | |
Unrealized appreciation on interest rate swaps | | | 6,993,202 | |
Receivable for investment securities sold | | | 6,098,003 | |
Affiliated dividends receivable | | | 254,378 | |
Receivable due from Adviser | | | 42,521 | |
| | | | |
Total assets | | | 8,165,560,188 | |
| | | | |
| Liabilities | |
Payable for floating rate notes issued* | | | 420,565,000 | |
Payable for investment securities purchased | | | 101,587,295 | |
Dividends payable | | | 27,173,243 | |
Payable for shares of beneficial interest redeemed | | | 13,715,797 | |
Cash collateral due to broker | | | 6,760,000 | |
Other liabilities | | | 14,844,055 | |
| | | | |
Total liabilities | | | 584,645,390 | |
| | | | |
Net Assets | | $ | 7,580,914,798 | |
| | | | |
| Composition of Net Assets | |
Shares of beneficial interest, at par | | $ | 7,328 | |
Additional paid-in capital | | | 8,572,642,540 | |
Accumulated loss | | | (991,735,070 | ) |
| | | | |
Net Assets | | $ | 7,580,914,798 | |
| | | | |
Net Asset Value Per Share—unlimited shares of beneficial interest authorized, $.00001 par value (based on 732,813,020 common shares outstanding) | | $ | 10.34 | |
| | | | |
| * | Represents short-term floating rate certificates issued by tender option bond trusts (see Note H). |
See notes to financial statements.
| | |
| |
| abfunds.com | | AB MUNICIPAL INCOME SHARES | 105 |
STATEMENT OF OPERATIONS
Six Months Ended October 31, 2022 (unaudited)
| | | | | | | | |
| Investment Income | | | | | | | | |
Interest | | $ | 156,179,462 | | | | | |
Dividends—Affiliated issuers | | | 1,647,280 | | | | | |
Other income(a) | | | 86,538 | | | $ | 157,913,280 | |
| | | | | | | | |
| Expenses | | | | | | | | |
Interest expense | | | 4,961,958 | | | | | |
| | | | | | | | |
Total expenses | | | | | | | 4,961,958 | |
| | | | | | | | |
Net investment income | | | | | | | 152,951,322 | |
| | | | | | | | |
| Realized and Unrealized Gain (Loss) on Investment Transactions | | | | | | | | |
Net realized gain (loss) on: | | | | | | | | |
Investment transactions | | | | | | | (87,647,748 | ) |
Swaps | | | | | | | 39,808,305 | |
Net change in unrealized appreciation (depreciation) of: | | | | | | | | |
Investments | | | | | | | (740,666,686 | ) |
Swaps | | | | | | | 69,563,881 | |
| | | | | | | | |
Net loss on investment transactions | | | | | | | (718,942,248 | ) |
| | | | | | | | |
Net Decrease in Net Assets from Operations | | | | | | $ | (565,990,926 | ) |
| | | | | | | | |
| (a) | Other income includes a reimbursement for investment in affiliated issuer (see Note B). |
See notes to financial statements.
| | |
| |
106 | AB MUNICIPAL INCOME SHARES | | abfunds.com |
STATEMENT OF CHANGES IN NET ASSETS
| | | | | | | | |
| | | Six Months Ended
October 31, 2022
(unaudited) | | | Year Ended
April 30,
2022 | |
| Increase (Decrease) in Net Assets from Operations | | | | | | | | |
Net investment income | | $ | 152,951,322 | | | $ | 238,882,546 | |
Net realized loss on investment transactions | | | (47,839,443 | ) | | | (33,655,078 | ) |
Net change in unrealized appreciation (depreciation) of investments | | | (671,102,805 | ) | | | (809,932,346 | ) |
| | | | | | | | |
Net decrease in net assets from operations | | | (565,990,926 | ) | | | (604,704,878 | ) |
Distribution to Shareholders | | | (157,122,562 | ) | | | (234,498,949 | ) |
| Transactions in Shares of Beneficial Interest | | | | | | | | |
Net increase | | | 998,340,221 | | | | 1,795,176,001 | |
| | | | | | | | |
Total increase | | | 275,226,733 | | | | 955,972,174 | |
| Net Assets | | | | | | | | |
Beginning of period | | | 7,305,688,065 | | | | 6,349,715,891 | |
| | | | | | | | |
End of period | | $ | 7,580,914,798 | | | $ | 7,305,688,065 | |
| | | | | | | | |
See notes to financial statements.
| | |
| |
| abfunds.com | | AB MUNICIPAL INCOME SHARES | 107 |
NOTES TO FINANCIAL STATEMENTS
October 31, 2022 (unaudited)
NOTE A
Significant Accounting Policies
AB Corporate Shares (the “Trust”) is registered under the Investment Company Act of 1940, as an open-end, diversified management investment company. The Trust, which is a Massachusetts Business Trust, operates as a “series” company currently offering five separate portfolios: AB Corporate Income Shares, AB Municipal Income Shares, AB Taxable Multi-Sector Income Shares, AB Impact Municipal Income Shares and AB Tax-Aware Real Return Income Shares. Each portfolio is considered to be a separate entity for financial reporting and tax purposes. This report relates only to AB Municipal Income Shares (the “Fund”).
Shares of the Fund are offered exclusively to holders of accounts established under wrap fee programs sponsored and maintained by certain registered investment advisers approved by AllianceBernstein L.P. (the “Adviser”). The Fund’s shares may be purchased at the relevant net asset value without a sales charge or other fee. The financial statements have been prepared in conformity with U.S. generally accepted accounting principles (“U.S. GAAP”), which require management to make certain estimates and assumptions that affect the reported amounts of assets and liabilities in the financial statements and amounts of income and expenses during the reporting period. Actual results could differ from those estimates. The Fund is an investment company under U.S. GAAP and follows the accounting and reporting guidance applicable to investment companies. The following is a summary of significant accounting policies followed by the Fund.
1. Security Valuation
Portfolio securities are valued at market value determined on the basis of market quotations or, if market quotations are not readily available or are unreliable, at “fair value” as determined in accordance with procedures approved by and under the oversight of the Trust’s Board of Trustees (the “Board”). Pursuant to these procedures, the Adviser serves as the Fund’s valuation designee pursuant to Rule 2a-5 of the 1940 Act. In this capacity, the Adviser is responsible, among other things, for making all fair value determinations relating to the Fund’s portfolio investments, subject to the Board’s oversight.
In general, the market values of securities which are readily available and deemed reliable are determined as follows: securities listed on a national securities exchange (other than securities listed on the NASDAQ Stock Market, Inc. (“NASDAQ”)) or on a foreign securities exchange are valued at the last sale price at the close of the exchange or foreign securities exchange. If there has been no sale on such day, the securities are valued at the last traded price from the previous day. Securities listed on more
| | |
| |
108 | AB MUNICIPAL INCOME SHARES | | abfunds.com |
NOTES TO FINANCIAL STATEMENTS (continued)
than one exchange are valued by reference to the principal exchange on which the securities are traded; securities listed only on NASDAQ are valued in accordance with the NASDAQ Official Closing Price; listed or over the counter (“OTC”) market put or call options are valued at the mid level between the current bid and ask prices. If either a current bid or current ask price is unavailable, the Adviser will have discretion to determine the best valuation (e.g., last trade price in the case of listed options); open futures are valued using the closing settlement price or, in the absence of such a price, the most recent quoted bid price. If there are no quotations available for the day of valuation, the last available closing settlement price is used; U.S. Government securities and any other debt instruments having 60 days or less remaining until maturity are generally valued at market by an independent pricing vendor, if a market price is available. If a market price is not available, the securities are valued at amortized cost. This methodology is commonly used for short term securities that have an original maturity of 60 days or less, as well as short term securities that had an original term to maturity that exceeded 60 days. In instances when amortized cost is utilized, the Valuation Committee (the “Committee”) must reasonably conclude that the utilization of amortized cost is approximately the same as the fair value of the security. Factors the Committee will consider include, but are not limited to, an impairment of the creditworthiness of the issuer or material changes in interest rates. Fixed-income securities, including mortgage-backed and asset-backed securities, may be valued on the basis of prices provided by a pricing service or at a price obtained from one or more of the major broker-dealers. In cases where broker-dealer quotes are obtained, the Adviser may establish procedures whereby changes in market yields or spreads are used to adjust, on a daily basis, a recently obtained quoted price on a security. Swaps and other derivatives are valued daily, primarily using independent pricing services, independent pricing models using market inputs, as well as third party broker-dealers or counterparties. Open-end mutual funds are valued at the closing net asset value per share, while exchange traded funds are valued at the closing market price per share.
Securities for which market quotations are not readily available (including restricted securities) or are deemed unreliable are valued at fair value as deemed appropriate by the Adviser. Factors considered in making this determination may include, but are not limited to, information obtained by contacting the issuer, analysts, analysis of the issuer’s financial statements or other available documents. In addition, the Fund may use fair value pricing for securities primarily traded in non-U.S. markets because most foreign markets close well before the Fund values its securities at 4:00 p.m., Eastern Time. The earlier close of these foreign markets gives rise to the possibility that significant events, including broad market moves, may have occurred in the interim and may materially affect the value of those
| | |
| |
| abfunds.com | | AB MUNICIPAL INCOME SHARES | 109 |
NOTES TO FINANCIAL STATEMENTS (continued)
securities. To account for this, the Fund generally values many of its foreign equity securities using fair value prices based on third party vendor modeling tools to the extent available.
2. Fair Value Measurements
In accordance with U.S. GAAP regarding fair value measurements, fair value is defined as the price that the Fund would receive to sell an asset or pay to transfer a liability in an orderly transaction between market participants at the measurement date. U.S. GAAP establishes a framework for measuring fair value, and a three-level hierarchy for fair value measurements based upon the transparency of inputs to the valuation of an asset or liability (including those valued based on their market values as described in Note A.1 above). Inputs may be observable or unobservable and refer broadly to the assumptions that market participants would use in pricing the asset or liability. Observable inputs reflect the assumptions market participants would use in pricing the asset or liability based on market data obtained from sources independent of the Fund. Unobservable inputs reflect the Fund’s own assumptions about the assumptions that market participants would use in pricing the asset or liability based on the best information available in the circumstances. Each investment is assigned a level based upon the observability of the inputs which are significant to the overall valuation. The three-tier hierarchy of inputs is summarized below.
| | • | | Level 1—quoted prices in active markets for identical investments |
| | • | | Level 2—other significant observable inputs (including quoted prices for similar investments, interest rates, prepayment speeds, credit risk, etc.) |
| | • | | Level 3—significant unobservable inputs (including the Fund’s own assumptions in determining the fair value of investments) |
The fair value of debt instruments, such as bonds, and over-the-counter derivatives is generally based on market price quotations, recently executed market transactions (where observable) or industry recognized modeling techniques and are generally classified as Level 2. Pricing vendor inputs to Level 2 valuations may include quoted prices for similar investments in active markets, interest rate curves, coupon rates, currency rates, yield curves, option adjusted spreads, default rates, credit spreads and other unique security features in order to estimate the relevant cash flows which are then discounted to calculate fair values. If these inputs are unobservable and significant to the fair value, these investments will be classified as Level 3.
Other fixed income investments, including non-U.S. government and corporate debt, are generally valued using quoted market prices, if available, which are typically impacted by current interest rates, maturity dates and
| | |
| |
110 | AB MUNICIPAL INCOME SHARES | | abfunds.com |
NOTES TO FINANCIAL STATEMENTS (continued)
any perceived credit risk of the issuer. Additionally, in the absence of quoted market prices, these inputs are used by pricing vendors to derive a valuation based upon industry or proprietary models which incorporate issuer specific data with relevant yield/spread comparisons with more widely quoted bonds with similar key characteristics. Those investments for which there are observable inputs are classified as Level 2. Where the inputs are not observable, the investments are classified as Level 3.
The following table summarizes the valuation of the Fund’s investments by the above fair value hierarchy levels as of October 31, 2022:
| | | | | | | | | | | | | | | | |
| | | Level 1 | | | Level 2 | | | Level 3 | | | Total | |
Assets: | | | | | | | | | | | | | | | | |
Long-Term Municipal Bonds | | $ | – 0 | – | | $ | 7,742,832,771 | | | $ | – 0 | – | | $ | 7,742,832,771 | |
Commercial Mortgage-Backed Securities | | | – 0 | – | | | 33,651,269 | | | | – 0 | – | | | 33,651,269 | |
Corporates—Non-Investment Grade | | | – 0 | – | | | – 0 | – | | | 1,132,623 | | | | 1,132,623 | |
Short-Term Investments | | | 160,387,715 | | | | – 0 | – | | | – 0 | – | | | 160,387,715 | |
Liabilities: | | | | | | | | | | | | | | | | |
Floating Rate Notes(a) | | | (420,565,000 | ) | | | – 0 | – | | | – 0 | – | | | (420,565,000 | ) |
| | | | | | | | | | | | | | | | |
Total Investments in Securities | | | (260,177,285 | ) | | | 7,776,484,040 | | | | 1,132,623 | | | | 7,517,439,378 | |
Other Financial Instruments(b): | | | | | | | | | | | | | | | | |
Assets: | | | | | | | | | | | | | | | | |
Centrally Cleared Inflation (CPI) Swaps | | | – 0 | – | | | 183,447,636 | | | | – 0 | – | | | 183,447,636 | (c) |
Centrally Cleared Interest Rate Swaps | | | – 0 | – | | | 251,048,038 | | | | – 0 | – | | | 251,048,038 | (c) |
Interest Rate Swaps | | | – 0 | – | | | 6,993,202 | | | | – 0 | – | | | 6,993,202 | |
Liabilities: | | | | | | | | | | | | | | | | |
Centrally Cleared Inflation (CPI) Swaps | | | – 0 | – | | | (46,007,838 | ) | | | – 0 | – | | | (46,007,838 | )(c) |
Centrally Cleared Interest Rate Swaps | | | – 0 | – | | | (12,134,223 | ) | | | – 0 | – | | | (12,134,223 | )(c) |
| | | | | | | | | | | | | | | | |
Total | | $ | (260,177,285 | ) | | $ | 8,159,830,855 | | | $ | 1,132,623 | | | $ | 7,900,786,193 | |
| | | | | | | | | | | | | | | | |
| (a) | The Fund may hold liabilities in which the fair value approximates the carrying amount for financial statement purposes. |
| (b) | Other financial instruments are derivative instruments, such as futures, forwards and swaps, which are valued at the unrealized appreciation (depreciation) on the instrument. Other financial instruments may also include swaps with upfront premiums, written options and written swaptions which are valued at market value. |
| (c) | Only variation margin receivable/(payable) at period end is reported within the statement of assets and liabilities. This amount reflects cumulative unrealized appreciation (depreciation) on futures and centrally cleared swaps as reported in the portfolio of investments. Where applicable, centrally cleared swaps with upfront premiums are presented here at market value. |
| | |
| |
| abfunds.com | | AB MUNICIPAL INCOME SHARES | 111 |
NOTES TO FINANCIAL STATEMENTS (continued)
3. Taxes
It is the Fund’s policy to meet the requirements of the Internal Revenue Code applicable to regulated investment companies and to distribute all of its investment company taxable income and net realized gains, if any, to shareholders. Therefore, no provisions for federal income or excise taxes are required.
In accordance with U.S. GAAP requirements regarding accounting for uncertainties in income taxes, management has analyzed the Fund’s tax positions taken or expected to be taken on federal and state income tax returns for all open tax years (the current and the prior three tax years) and has concluded that no provision for income tax is required in the Fund’s financial statements.
4. Investment Income and Investment Transactions
Dividend income is recorded on the ex-dividend date or as soon as the Fund is informed of the dividend. Interest income is accrued daily. Investment transactions are accounted for on the date the securities are purchased or sold. Investment gains or losses are determined on the identified cost basis. Non-cash dividends, if any, are recorded on the ex-dividend date at the fair value of the securities received. The Fund amortizes premiums and accretes discounts as adjustments to interest income. The Fund accounts for distributions received from REIT investments or from regulated investment companies as dividend income, realized gain, or return of capital based on information provided by the REIT or the investment company.
5. Dividends and Distributions
Dividends and distributions to shareholders, if any, are recorded on the ex-dividend date. Income dividends and capital gains distributions are determined in accordance with federal tax regulations and may differ from those determined in accordance with U.S. GAAP. To the extent these differences are permanent, such amounts are reclassified within the capital accounts based on their federal tax basis treatment; temporary differences do not require such reclassification.
NOTE B
Advisory Fee and Other Transactions with Affiliates
Under the terms of the advisory agreement, the Fund pays no advisory fee to the Adviser and the Adviser reimburses or pays for the Fund’s operating expenses. The Fund is an integral part of separately managed accounts in wrap fee programs and other investment programs. Typically, participants in these programs pay a fee to their investment adviser for all costs and expenses of the separately managed account, including costs and expenses associated with the Fund, and a fee is paid by their investment
| | |
| |
112 | AB MUNICIPAL INCOME SHARES | | abfunds.com |
NOTES TO FINANCIAL STATEMENTS (continued)
adviser to the Adviser. In certain cases, participants may have a direct relationship with the Adviser without the involvement of a third party investment adviser, in which case the participant would pay a fee directly to the Adviser. The Adviser serves as investment manager and adviser of the Fund and continuously furnishes an investment program for the Fund and manages, supervises and conducts the affairs of the Fund, subject to the supervisions of the Fund’s Board. The advisory agreement provides that the Adviser or an affiliate will furnish, or pay the expenses of the Fund for, office space, facilities and equipment, services of executive and other personnel of the Fund and certain administrative services.
The Fund has entered into a distribution agreement with AllianceBernstein Investments, Inc., the Fund’s principal underwriter (the “Underwriter”), to permit the Underwriter to distribute the Fund’s shares, which are sold at their net asset value without any sales charge. The Fund does not pay a fee for this service. The Underwriter is a wholly owned subsidiary of the Adviser.
AllianceBernstein Investor Services, Inc. (“ABIS”), a wholly-owned subsidiary of the Adviser, acts as the Fund’s registrar, transfer agent and dividend-disbursing agent. ABIS registers the transfer, issuance and redemption of Fund shares and disburses dividends and other distributions to Fund shareholders. The Fund does not pay a fee for this service.
The Fund may invest in AB Government Money Market Portfolio (the “Government Money Market Portfolio”) which has a contractual annual advisory fee rate of ..20% of the portfolio’s average daily net assets and bears its own expenses. The Adviser has contractually agreed to waive .10% of the advisory fee of Government Money Market Portfolio (resulting in a net advisory fee of .10%) until August 31, 2023. In connection with the investment by the Fund in Government Money Market Portfolio, the Adviser has contractually agreed to reimburse the Fund in an amount equal to the Fund’s pro rata share of the effective advisory fee of Government Money Market Portfolio, as borne indirectly by the Fund as an acquired fund fee and expense. For the six months ended October 31, 2022, such reimbursement amounted to $86,538.
A summary of the Fund’s transactions in AB mutual funds for the six months ended October 31, 2022 is as follows:
| | | | | | | | | | | | | | | | | | | | |
Fund | | Market Value
4/30/22
(000) | | | Purchases
at Cost
(000) | | | Sales
Proceeds
(000) | | | Market Value
10/31/22
(000) | | | Dividend
Income
(000) | |
Government Money Market Portfolio | | $ | 122,400 | | | $ | 1,339,390 | | | $ | 1,301,402 | | | $ | 160,388 | | | $ | 1,647 | |
| | |
| |
| abfunds.com | | AB MUNICIPAL INCOME SHARES | 113 |
NOTES TO FINANCIAL STATEMENTS (continued)
NOTE C
Investment Transactions
Purchases and sales of investment securities (excluding short-term investments) for the six months ended October 31, 2022 were as follows:
| | | | | | | | |
| | | Purchases | | | Sales | |
Investment securities (excluding U.S. government securities) | | $ | 1,825,171,950 | | | $ | 927,292,536 | |
U.S. government securities | | | – 0 | – | | | – 0 | – |
The cost of investments for federal income tax purposes was substantially the same as the cost for financial reporting purposes. Accordingly, gross unrealized appreciation and unrealized depreciation are as follows:
| | | | |
Gross unrealized appreciation | | $ | 452,034,896 | |
Gross unrealized depreciation | | | (1,321,741,544 | ) |
| | | | |
Net unrealized depreciation | | $ | (869,706,648 | ) |
| | | | |
1. Derivative Financial Instruments
The Fund may use derivatives in an effort to earn income and enhance returns, to replace more traditional direct investments, to obtain exposure to otherwise inaccessible markets (collectively, “investment purposes”), or to hedge or adjust the risk profile of its portfolio.
The principal types of derivatives utilized by the Fund, as well as the methods in which they may be used are:
The Fund may enter into swaps to hedge its exposure to interest rates or credit risk. A swap is an agreement that obligates two parties to exchange a series of cash flows at specified intervals based upon or calculated by reference to changes in specified prices or rates for a specified amount of an underlying asset. The payment flows are usually netted against each other, with the difference being paid by one party to the other. In addition, collateral may be pledged or received by the Fund in accordance with the terms of the respective swaps to provide value and recourse to the Fund or its counterparties in the event of default, bankruptcy or insolvency by one of the parties to the swap.
Risks may arise as a result of the failure of the counterparty to the swap to comply with the terms of the swap. The loss incurred by the failure of a counterparty is generally limited to the net interim payment to be received by the Fund, and/or the termination value at the end of the contract. Therefore, the Fund considers the creditworthiness of each counterparty to a swap in evaluating potential counterparty risk. This risk is mitigated by having a netting arrangement between the
| | |
| |
114 | AB MUNICIPAL INCOME SHARES | | abfunds.com |
NOTES TO FINANCIAL STATEMENTS (continued)
Fund and the counterparty and by the posting of collateral by the counterparty to the Fund to cover the Fund’s exposure to the counterparty. Additionally, risks may arise from unanticipated movements in interest rates or in the value of the underlying securities. The Fund accrues for the interim payments on swaps on a daily basis, with the net amount recorded within unrealized appreciation (depreciation) of swaps on the statement of assets and liabilities, where applicable. Once the interim payments are settled in cash, the net amount is recorded as realized gain/(loss) on swaps on the statement of operations, in addition to any realized gain/(loss) recorded upon the termination of swaps. Upfront premiums paid or received for swaps are recognized as cost or proceeds on the statement of assets and liabilities and are amortized on a straight line basis over the life of the contract. Amortized upfront premiums are included in net realized gain/(loss) from swaps on the statement of operations. Fluctuations in the value of swaps are recorded as a component of net change in unrealized appreciation (depreciation) of swaps on the statement of operations.
Certain standardized swaps, including certain interest rate swaps and credit default swaps, are (or soon will be) subject to mandatory central clearing. Cleared swaps are transacted through futures commission merchants (“FCMs”) that are members of central clearinghouses, with the clearinghouse serving as central counterparty, similar to transactions in futures contracts. Centralized clearing will be required for additional categories of swaps on a phased-in basis based on requirements published by the Securities and Exchange Commission and Commodity Futures Trading Commission.
At the time the Fund enters into a centrally cleared swap, the Fund deposits and maintains as collateral an initial margin with the broker, as required by the clearinghouse on which the transaction is effected. Such amount is shown as cash collateral due from broker on the statement of assets and liabilities. Pursuant to the contract, the Fund agrees to receive from or pay to the broker an amount of cash equal to the daily fluctuation in the value of the contract. Such receipts or payments are known as variation margin and are recorded by the Fund as unrealized gains or losses. Risks may arise from the potential inability of a counterparty to meet the terms of the contract. The credit/counterparty risk for centrally cleared swaps is generally less than non-centrally cleared swaps, since the clearinghouse, which is the issuer or counterparty to each centrally cleared swap, has robust risk mitigation standards, including the requirement to provide initial and variation margin. When the contract is closed, the Fund records a realized gain or loss equal to the difference between the value of the contract at the time it was opened and the time it was closed.
| | |
| |
| abfunds.com | | AB MUNICIPAL INCOME SHARES | 115 |
NOTES TO FINANCIAL STATEMENTS (continued)
Interest Rate Swaps:
The Fund is subject to interest rate risk exposure in the normal course of pursuing its investment objectives. Because the Fund holds fixed rate bonds, the value of these bonds may decrease if interest rates rise. To help hedge against this risk and to maintain its ability to generate income at prevailing market rates, the Fund may enter into interest rate swaps. Interest rate swaps are agreements between two parties to exchange cash flows based on a notional amount. The Fund may elect to pay a fixed rate and receive a floating rate, or, receive a fixed rate and pay a floating rate on a notional amount.
In addition, the Fund may also enter into interest rate swap transactions to preserve a return or spread on a particular investment or portion of its portfolio, or protecting against an increase in the price of securities the Fund anticipates purchasing at a later date. Interest rate swaps involve the exchange by a Fund with another party of their respective commitments to pay or receive interest (e.g., an exchange of floating rate payments for fixed rate payments) computed based on a contractually-based principal (or “notional”) amount. Interest rate swaps are entered into on a net basis (i.e., the two payment streams are netted out, with the Fund receiving or paying, as the case may be, only the net amount of the two payments).
During the six months ended October 31, 2022, the Fund held interest rate swaps for hedging purposes.
Inflation (CPI) Swaps:
Inflation swap agreements are contracts in which one party agrees to pay the cumulative percentage increase in a price index (the Consumer Price Index with respect to CPI swaps) over the term of the swap (with some lag on the inflation index), and the other pays a compounded fixed rate. Inflation swaps may be used to protect the net asset value, or NAV, of a Fund against an unexpected change in the rate of inflation measured by an inflation index since the value of these agreements is expected to increase if there are unexpected inflation increases.
During the six months ended October 31, 2022, the Fund held inflation (CPI) swaps for hedging purposes.
The Fund typically enters into International Swaps and Derivatives Association, Inc. Master Agreements (“ISDA Master Agreement”) with its OTC derivative contract counterparties in order to, among other things, reduce its credit risk to OTC counterparties. ISDA Master Agreements include provisions for general obligations, representations, collateral and events of default or termination. Under an ISDA Master Agreement, the Fund typically may offset with the OTC counterparty certain derivative financial
| | |
| |
116 | AB MUNICIPAL INCOME SHARES | | abfunds.com |
NOTES TO FINANCIAL STATEMENTS (continued)
instruments’ payables and/or receivables with collateral held and/or posted and create one single net payment (close-out netting) in the event of default or termination. In the event of a default by an OTC counterparty, the return of collateral with market value in excess of the Fund’s net liability, held by the defaulting party, may be delayed or denied.
The Fund’s ISDA Master Agreements may contain provisions for early termination of OTC derivative transactions in the event the net assets of the Fund decline below specific levels (“net asset contingent features”). If these levels are triggered, the Fund’s OTC counterparty has the right to terminate such transaction and require the Fund to pay or receive a settlement amount in connection with the terminated transaction. If OTC derivatives were held at period end, please refer to netting arrangements by the OTC counterparty table below for additional details.
During the six months ended October 31, 2022, the Fund had entered into the following derivatives:
| | | | | | | | | | | | |
| | | Asset Derivatives | | | Liability Derivatives | |
Derivative
Type | | Statement of
Assets and
Liabilities
Location | | Fair Value | | | Statement of
Assets and
Liabilities
Location | | Fair Value | |
Interest rate contracts | | Receivable/Payable for variation margin on centrally cleared swaps | | $ | 434,656,040 | * | | Receivable/Payable for variation margin on centrally cleared swaps | | $ | 57,963,372 | * |
| | | | |
Interest rate contracts | | Unrealized appreciation on interest rate swaps | | | 6,993,202 | | | | | | | |
| | | | | | | | | | | | |
Total | | | | $ | 441,649,242 | | | | | $ | 57,963,372 | |
| | | | | | | | | | | | |
| * | Only variation margin receivable/payable at period end is reported within the statement of assets and liabilities. |
This amount reflects cumulative unrealized appreciation (depreciation) on futures and centrally cleared swaps as reported in the portfolio of investments.
| | | | | | | | | | |
Derivative Type | | Location of Gain
or (Loss) on
Derivatives Within
Statement of
Operations | | Realized
Gain or
(Loss) on
Derivatives | | | Change in
Unrealized
Appreciation or
(Depreciation) | |
Interest rate contracts | | Net realized gain (loss) on swaps; Net change in unrealized appreciation (depreciation) of swaps | | $ | 39,808,305 | | | $ | 69,563,881 | |
| | | | | | | | | | |
Total | | | | $ | 39,808,305 | | | $ | 69,563,881 | |
| | | | | | | | | | |
| | |
| |
| abfunds.com | | AB MUNICIPAL INCOME SHARES | 117 |
NOTES TO FINANCIAL STATEMENTS (continued)
The following table represents the average monthly volume of the Fund’s derivative transactions during the six months ended October 31, 2022:
| | | | |
Interest Rate Swaps: | | | | |
Average notional amount | | $ | 52,610,000 | |
Centrally Cleared Interest Rate Swaps: | | | | |
Average notional amount | | $ | 2,211,988,571 | |
Centrally Cleared Inflation Swaps: | | | | |
Average notional amount | | $ | 2,392,660,000 | |
For financial reporting purposes, the Fund does not offset derivative assets and derivative liabilities that are subject to netting arrangements in the statement of assets and liabilities.
All OTC derivatives held at period end were subject to netting arrangements. The following table presents the Fund’s derivative assets and liabilities by OTC counterparty net of amounts available for offset under ISDA Master Agreements (“MA”) and net of the related collateral received/pledged by the Fund as of October 31, 2022. Exchange-traded derivatives and centrally cleared swaps are not subject to netting arrangements and as such are excluded from the table.
| | | | | | | | | | | | | | | | | | | | |
Counterparty | | Derivative
Assets
Subject to a
MA | | | Derivatives
Available
for Offset | | | Cash
Collateral
Received* | | | Security
Collateral
Received* | | | Net Amount
of Derivative
Assets | |
Citibank, N.A. | | $ | 6,993,202 | | | $ | – 0 | – | | $ | (6,760,000 | ) | | $ | – 0 | – | | $ | 233,202 | |
| | | | | | | | | | | | | | | | | | | | |
Total | | $ | 6,993,202 | | | $ | – 0 | – | | $ | (6,760,000 | ) | | $ | – 0 | – | | $ | 233,202 | ^ |
| | | | | | | | | | | | | | | | | | | | |
| * | The actual collateral received/pledged may be more than the amount reported due to over-collateralization. |
| ^ | Net amount represents the net receivable/payable that would be due from/to the counterparty in the event of default or termination. The net amount from OTC financial derivative instruments can only be netted across transactions governed under the same master agreement with the same counterparty. |
NOTE D
Shares of Beneficial Interest
Transactions in shares of beneficial interest were as follows:
| | | | | | | | | | | | | | | | | | | | | | | | |
| | | | | | | | | | | | | | | | | | | | | | | | |
| | | Shares | | | | | | Amount | | | | |
| | | Six Months Ended
October 31, 2022
(unaudited) | | | Year Ended
April 30,
2022 | | | | | | Six Months Ended
October 31, 2022
(unaudited) | | | Year Ended
April 30,
2022 | | | | |
| | | | | | | | |
Shares sold | | | 209,135,777 | | | | 226,863,887 | | | | | | | $ | 2,304,706,812 | | | $ | 2,840,231,872 | | | | | |
| | | | | |
Shares redeemed | | | (119,580,410 | ) | | | (83,479,736 | ) | | | | | | | (1,306,366,591 | ) | | | (1,045,055,871 | ) | | | | |
| | | | | |
Net increase | | | 89,555,367 | | | | 143,384,151 | | | | | | | $ | 998,340,221 | | | $ | 1,795,176,001 | | | | | |
| | | | | |
| | |
| |
118 | AB MUNICIPAL INCOME SHARES | | abfunds.com |
NOTES TO FINANCIAL STATEMENTS (continued)
NOTE E
Risks Involved in Investing in the Fund
Market Risk—The value of the Fund’s assets will fluctuate as the stock or bond market fluctuates. The value of the Fund’s investments may decline, sometimes rapidly and unpredictably, simply because of economic changes or other events, including public health crises (including the occurrence of a contagious disease or illness) and regional and global conflicts, that affect large portions of the market.
Credit Risk—An issuer or guarantor of a fixed-income security, or the counterparty to a derivatives or other contract, may be unable or unwilling to make timely payments of interest or principal, or to otherwise honor its obligations. The issuer or guarantor may default, causing a loss of the full principal amount of a security and any accrued interest. The degree of risk for a particular security may be reflected in its credit rating. There is the possibility that the credit rating of a fixed-income security may be downgraded after purchase, which may adversely affect the value of the security. Investments in fixed-income securities with lower ratings tend to have a higher probability that an issuer will default or fail to meet its payment obligations.
Municipal Market Risk—This is the risk that special factors may adversely affect the value of municipal securities and have a significant effect on the yield or value of the Fund’s investments in municipal securities. These factors include economic conditions, political or legislative changes, public health crises, uncertainties related to the tax status of municipal securities, and the rights of investors in these securities. To the extent that the Fund invests more of its assets in a particular state’s municipal securities, the Fund may be vulnerable to events adversely affecting that state, including economic, political and regulatory occurrences, court decisions, terrorism, public health crises (including the occurrence of a contagious disease or illness) and catastrophic natural disasters, such as hurricanes, fires or earthquakes. For example, the novel coronavirus (COVID-19) pandemic has significantly stressed the financial resources of many issuers of municipal securities, which could impair any such issuer’s ability to meet its financial obligations when due and adversely impact the value of its securities held by the Fund. As the full effects of the COVID-19 pandemic on state and local economies and on issuers of municipal securities are still uncertain, the financial difficulties of issuers of municipal securities may continue or worsen, adversely affecting the performance of the Fund. The Fund’s investments in certain municipal securities with principal and interest payments that are made from the revenues of a specific project or facility, and not general tax revenues, may have increased risks. Factors affecting the project or facility, such as local business or economic conditions, could
| | |
| |
| abfunds.com | | AB MUNICIPAL INCOME SHARES | 119 |
NOTES TO FINANCIAL STATEMENTS (continued)
have a significant effect on the project’s ability to make payments of principal and interest on these securities.
Congress has previously considered making changes to the municipal securities provisions of the Internal Revenue Code that could change the U.S. federal income tax treatment of certain types of municipal securities.
Tax Risk—There is no guarantee that all of the Fund’s income will remain exempt from federal or state income taxes. From time to time, the U.S. Government and the U.S. Congress consider changes in federal tax law that could limit or eliminate the federal tax exemption for municipal bond income, which would in effect reduce the income received by shareholders from the Fund by increasing taxes on that income. In such event, the Fund’s net asset value, or NAV, could also decline as yields on municipal bonds, which are typically lower than those on taxable bonds, would be expected to increase to approximately the yield of comparable taxable bonds. Actions or anticipated actions affecting the tax exempt status of municipal bonds could also result in significant shareholder redemptions of Fund shares as investors anticipate adverse effects on the Fund or seek higher yields to offset the potential loss of the tax deduction. As a result, the Fund would be required to maintain higher levels of cash to meet the redemptions, which would negatively affect the Fund’s yield. The federal income tax treatment of payments in respect of certain derivative contracts is unclear.
Below Investment-Grade Securities Risk—Investments in fixed-income securities with lower ratings (commonly known as “junk bonds”) tend to have a higher probability that an issuer will default or fail to meet its payment obligations. These securities may be subject to greater price volatility due to such factors as specific corporate developments, interest rate sensitivity and negative perceptions of the junk bond market generally and may be more difficult to trade than other types of securities.
Interest-Rate Risk—Changes in interest rates will affect the value of investments in fixed-income securities. When interest rates rise, the value of existing investments in fixed-income securities tends to fall and this decrease in value may not be offset by higher income from new investments. Interest rate risk is generally greater for fixed-income securities with longer maturities or durations. The Fund may be subject to a greater risk of rising interest rates than would normally be the case due to the end of a recent period of historically low rates and the effect of potential government fiscal policy initiatives and resulting market reaction to those initiatives.
| | |
| |
120 | AB MUNICIPAL INCOME SHARES | | abfunds.com |
NOTES TO FINANCIAL STATEMENTS (continued)
Inflation Risk—This is the risk that the value of assets or income from investments will be less in the future as inflation decreases the value of money. As inflation increases, the value of the Fund’s assets can decline as can the value of the Fund’s distributions. This risk is significantly greater for fixed-income securities with longer maturities.
Leverage Risk—When the Fund borrows money or otherwise leverages its investments, its performance may be volatile because leverage tends to exaggerate the effect of any increase or decrease in the value of the Fund’s investments. The Fund may create leverage through the use of reverse repurchase arrangements, forward currency exchange contracts, forward commitments, dollar rolls or futures or by borrowing money. The use of other types of derivative instruments by the Fund, such as options and swaps, may also result in a form of leverage. Leverage may result in higher returns to the Fund than if the Fund were not leveraged, but may also adversely affect returns, particularly if the market is declining.
Illiquid Investments Risk—Illiquid investments risk exists when particular investments, such as lower-rated securities, are or become difficult to purchase or sell, possibly preventing the Fund from selling such investments at an advantageous price. The Fund is subject to illiquid investments risk because the market for municipal securities is generally smaller than many other markets. Derivatives and securities involving substantial market and credit risk tend to involve greater illiquid investments risk than most other types of investments.
Derivatives Risk—Derivatives may be difficult to price or unwind and leveraged so that small changes may produce disproportionate losses for the Fund. A short position in a derivative instrument involves the risk of a theoretically unlimited increase in the value of the underlying instrument, which could cause the Fund to suffer a (potentially unlimited) loss. Derivatives, especially over-the-counter derivatives, are also subject to counterparty risk, which is the risk that the counterparty (the party on the other side of the transaction) on a derivative transaction will be unable or unwilling to honor its contractual obligations to the Fund.
LIBOR Transition and Associated Risk—A Fund may be exposed to debt securities, derivatives or other financial instruments that utilize the London Interbank Offered Rate, or “LIBOR,” as a “benchmark” or “reference rate” for various interest rate calculations. In 2017, the United Kingdom Financial Conduct Authority (“FCA”), which regulates LIBOR, announced a desire to phase out the use of LIBOR by the end of 2021. The FCA and LIBOR’s administrator, ICE Benchmark Administration, have since announced that most LIBOR settings (which reflect LIBOR rates quoted in different currencies over various time periods) will no longer be
| | |
| |
| abfunds.com | | AB MUNICIPAL INCOME SHARES | 121 |
NOTES TO FINANCIAL STATEMENTS (continued)
published after the end of 2021 but that the most widely used U.S. Dollar LIBOR settings will continue to be published until June 30, 2023. However, banks were strongly encouraged to cease entering into agreements with counterparties referencing LIBOR by the end of 2021. It is possible that a subset of LIBOR settings will be published after these dates on a “synthetic” basis, but any such publications would be considered non-representative of the underlying market. Since 2018 the Federal Reserve Bank of New York has published the secured overnight funding rate (referred to as SOFR), which is intended to replace U.S. Dollar LIBOR. SOFR is a broad measure of the cost of borrowing cash overnight collateralized by U.S. Treasury securities in the repurchase agreement (repo) market and has been used increasingly on a voluntary basis in new instruments and transactions. In addition, on March 15, 2022, the Adjustable Interest Rate Act was signed into law. This law provides a statutory fallback mechanism to replace LIBOR with a benchmark rate that is selected by the Federal Reserve Board and based on SOFR for certain contracts that reference LIBOR without adequate fallback provisions.
The elimination of LIBOR or changes to other reference rates or any other changes or reforms to the determination or supervision of reference rates could have an adverse impact on the market for, or value of, any securities or payments linked to those reference rates, which may adversely affect a Fund’s performance and/or net asset value. Uncertainty and risk also remain regarding the willingness and ability of issuers and lenders to include revised provisions in new and existing contracts or instruments. Consequently, the transition from LIBOR to other reference rates may lead to increased volatility and illiquidity in markets that are tied to LIBOR, fluctuations in values of LIBOR-related investments or investments in issuers that utilize LIBOR, increased difficulty in borrowing or refinancing and diminished effectiveness of hedging strategies, potentially adversely affecting a Fund’s performance. Furthermore, the risks associated with the expected discontinuation of LIBOR and transition may be exacerbated if the work necessary to effect an orderly transition to an alternative reference rate is not completed in a timely manner. Neither the effect of the LIBOR transition process nor its ultimate success can yet be known.
Indemnification Risk—In the ordinary course of business, the Fund enters into contracts that contain a variety of indemnifications. The Fund’s maximum exposure under these arrangements is unknown. However, the Fund has not had prior claims or losses pursuant to these indemnification provisions and expects the risk of loss thereunder to be remote. Therefore, the Fund has not accrued any liability in connection with these indemnification provisions.
| | |
| |
122 | AB MUNICIPAL INCOME SHARES | | abfunds.com |
NOTES TO FINANCIAL STATEMENTS (continued)
Management Risk—The Fund is subject to management risk because it is an actively-managed investment fund. The Adviser will apply its investment techniques and risk analyses in making investment decisions, but there is no guarantee that its techniques will produce the intended results. Some of these techniques may incorporate, or rely upon, quantitative models, but there is no guarantee that these models will generate accurate forecasts, reduce risk or otherwise perform as expected.
NOTE F
Joint Credit Facility
A number of open-end mutual funds managed by the Adviser, including the Fund, participate in a $325 million revolving credit facility (the “Facility”) intended to provide short-term financing related to redemptions and other short term liquidity requirements, subject to certain restrictions. Commitment fees related to the Facility are paid by the participating funds and are included in miscellaneous expenses in the statement of operations. The Fund did not utilize the Facility during the six months ended October 31, 2022.
NOTE G
Distributions to Shareholders
The tax character of distributions to be paid for the year ending April 30, 2023 will be determined at the end of the current fiscal year. The tax character of distributions paid during the fiscal years ended April 30, 2022 and April 30, 2021 were as follows:
| | | | | | | | |
| | | 2022 | | | 2021 | |
Distributions paid from: | | | | | | | | |
Ordinary income | | $ | 11,930,509 | | | $ | 9,503,344 | |
| | | | | | | | |
Total taxable distributions | | | 11,930,509 | | | | 9,503,344 | |
Tax-exempt distributions | | | 222,568,440 | | | | 195,517,763 | |
| | | | | | | | |
Total distributions paid | | $ | 234,498,949 | | | $ | 205,021,107 | |
| | | | | | | | |
As of April 30, 2022, the components of accumulated earnings/(deficit) on a tax basis were as follows:
| | | | |
Undistributed tax-exempt income | | $ | 21,527,237 | |
Accumulated capital and other losses | | | (48,700,265 | )(a) |
Unrealized appreciation (depreciation) | | | (219,850,009 | )(b) |
| | | | |
Total accumulated earnings/(deficit) | | $ | (247,023,037 | )(c) |
| | | | |
| (a) | As of April 30, 2022, the Fund had a net capital loss carryforward of $48,700,265. |
| (b) | The differences between book-basis and tax-basis unrealized appreciation (depreciation) are attributable primarily to the tax treatment of tender option bonds, the tax treatment of swaps, and the tax deferral of losses on wash sales. |
| (c) | The differences between book-basis and tax-basis components of accumulated earnings/(deficit) are attributable primarily to the tax treatment of defaulted securities and dividends payable. |
| | |
| |
| abfunds.com | | AB MUNICIPAL INCOME SHARES | 123 |
NOTES TO FINANCIAL STATEMENTS (continued)
For tax purposes, net realized capital losses may be carried over to offset future capital gains, if any. Funds are permitted to carry forward capital losses for an indefinite period, and such losses will retain their character as either short-term or long-term capital losses. As of April 30, 2022, the Fund had a net short-term capital loss carryforward of $48,700,265, which may be carried forward for an indefinite period.
NOTE H
Floating Rate Notes Issued in Connection with Securities Held
The Fund may engage in tender option bond (“TOB”) transactions in which the Fund transfers a fixed rate bond (“Fixed Rate Bond”) into a Special Purpose Vehicle (the “SPV”, which is generally organized as a trust). The Fund buys a residual interest in the assets and cash flows of the SPV, often referred to as an inverse floating rate obligation (“Inverse Floater”). The SPV also issues floating rate notes (“Floating Rate Notes”) which are sold to third parties. The Floating Rate Notes pay interest at rates that generally reset weekly and their holders have the option to tender their notes to a liquidity provider for redemption at par. The Inverse Floater held by the Fund gives the Fund the right (1) to cause the holders of the Floating Rate Notes to tender their notes at par, and (2) to have the trustee transfer the Fixed Rate Bond held by the SPV to the Fund, thereby collapsing the SPV. The SPV may also be collapsed in certain other circumstances. In accordance with U.S. GAAP requirements regarding accounting for transfers and servicing of financial assets and extinguishments of liabilities, the Fund accounts for the transaction described above as a secured borrowing by including the Fixed Rate Bond in its portfolio of investments and the Floating Rate Notes as a liability under the caption “Payable for floating rate notes issued” in its statement of assets and liabilities. Interest expense related to the Fund’s liability with respect to Floating Rate Notes is recorded as incurred. The interest expense is also included in the Fund’s expense ratio. At October 31, 2022, the amount of the Fund’s Floating Rate Notes outstanding was $420,565,000 and the related interest rate was 2.27% to 3.27%. For the six months ended October 31, 2022, the average amount of Floating Rate Notes outstanding and the daily weighted average interest rate were $453,224,565 and 2.14%, respectively.
The Fund may also purchase Inverse Floaters in the secondary market without first owning the underlying bond. Such an Inverse Floater is included in the Fund’s portfolio of investments but is not required to be treated as a secured borrowing and reflected in the Fund’s financial statements as a secured borrowing.
| | |
| |
124 | AB MUNICIPAL INCOME SHARES | | abfunds.com |
NOTES TO FINANCIAL STATEMENTS (continued)
NOTE I
Recent Accounting Pronouncements
In March 2020, the Financial Accounting Standards Board issued an Accounting Standards Update, ASU 2020-04, “Reference Rate Reform (Topic 848) – Facilitation of the Effects of Reference Rate Reform on Financial Reporting.” ASU 2020-04 provides optional guidance to ease the potential accounting burden due to the discontinuation of the LIBOR and other interbank-offered based reference rates. ASU 2020-04 is effective as of March 12, 2020 through December 31, 2022. Management is currently evaluating the impact, if any, of applying ASU 2020-04.
NOTE J
Subsequent Events
Management has evaluated subsequent events for possible recognition or disclosure in the financial statements through the date the financial statements are issued. Management has determined that there are no material events that would require disclosure in the Fund’s financial statements through this date.
| | |
| |
| abfunds.com | | AB MUNICIPAL INCOME SHARES | 125 |
FINANCIAL HIGHLIGHTS
Selected Data For A Share Of Beneficial Interest Outstanding Throughout Each Period
| | | | | | | | | | | | | | | | | | | | | | | | |
| | | Six Months
Ended
October 31,
2022 (unaudited) | | | Year Ended April 30, | |
| | | 2022 | | | 2021 | | | 2020 | | | 2019 | | | 2018 | |
| | | | |
| | | | | | | | | | | | | | | | | | | | | | | | |
Net asset value, beginning of period | | | $ 11.36 | | | | $ 12.70 | | | | $ 10.80 | | | | $ 11.70 | | | | $ 11.32 | | | | $ 11.25 | |
| | | | |
Income From Investment Operations | | | | | | | | | | | | | | | | | | | | | | | | |
| | | | | | |
Net investment income(a) | | | .22 | | | | .43 | | | | .44 | | | | .44 | | | | .45 | | | | .44 | |
| | | | | | |
Net realized and unrealized gain (loss) on investment transactions | | | (1.02 | ) | | | (1.35 | ) | | | 1.91 | | | | (.90 | ) | | | .38 | | | | .07 | |
| | | | |
Net increase (decrease) in net asset value from operations | | | (.80 | ) | | | (.92 | ) | | | 2.35 | | | | (.46 | ) | | | .83 | | | | .51 | |
| | | | |
Less: Dividends | | | | | | | | | | | | | | | | | | | | | | | | |
| | | | | | |
Dividends from net investment income | | | (.22 | ) | | | (.42 | ) | | | (.45 | ) | | | (.44 | ) | | | (.45 | ) | | | (.44 | ) |
| | | | |
Net asset value, end of period | | | $ 10.34 | | | | $ 11.36 | | | | $ 12.70 | | | | $ 10.80 | | | | $ 11.70 | | | | $ 11.32 | |
| | | | |
Total Return | | | | | | | | | | | | | | | | | | | | | | | | |
| | | | | | |
Total investment return based on net asset value(b) | | | (7.09 | )% | | | (7.52 | )% | | | 22.01 | % | | | (4.23 | )% | | | 7.53 | % | | | 4.55 | % |
| | | | | | |
Ratios/Supplemental Data | | | | | | | | | | | | | | | | | | | | | | | | |
| | | | | | |
Net assets, end of period (000’s omitted) | | | $7,580,915 | | | | $7,305,688 | | | | $6,349,716 | | | | $4,685,911 | | | | $3,509,575 | | | | $2,760,892 | |
| | | | | | |
Ratio to average net assets of: | | | | | | | | | | | | | | | | | | | | | | | | |
| | | | | | |
Expenses(c) | | | .13 | %^ | | | .07 | % | | | .07 | % | | | .01 | % | | | .01 | % | | | .01 | % |
| | | | | | |
Net investment income | | | 3.95 | %^ | | | 3.38 | % | | | 3.62 | % | | | 3.67 | % | | | 3.91 | % | | | 3.82 | % |
| | | | | | |
Portfolio turnover rate | | | 12 | % | | | 6 | % | | | 10 | % | | | 12 | % | | | 14 | % | | | 19 | % |
| (a) | Based on average shares outstanding. |
| (b) | Total investment return is calculated assuming an initial investment made at the net asset value at the beginning of the period, reinvestment of all dividends and distributions at net asset value during the period, and redemption on the last day of the period. Total return does not reflect the deduction of taxes that a shareholder would pay on fund distributions or the redemption of fund shares. Total investment return calculated for a period of less than one year is not annualized. |
| (c) | The expense ratios, excluding interest expense are .00%, .00%, .00%, .00%, .00% and .00%, respectively. |
See notes to financial statements.
| | |
| |
126 | AB MUNICIPAL INCOME SHARES | | abfunds.com |
BOARD OF TRUSTEES
| | |
Marshall C. Turner, Jr.(1),
Chairman Jorge A. Bermudez(1) Michael J. Downey(1) Onur Erzan, President and Chief Executive Officer | | Nancy P. Jacklin(1) Jeanette W. Loeb(1) Carol C. McMullen(1) Garry L. Moody(1) |
|
|
|
|
OFFICERS
| | |
Terrance T. Hults(2), Vice President Matthew J. Norton(2), Vice President Andrew Potter(2), Vice President Daryl Clements(2), Vice President Emilie D. Wrapp, Secretary | | Michael B. Reyes, Senior Vice President Joseph J. Mantineo, Treasurer and Chief Financial Officer Phyllis J. Clarke, Controller Vincent S. Noto, Chief Compliance Officer |
| | |
Custodian and Accounting Agent State Street Bank and Trust Company
State Street Corporation CCB/5
1 Iron Street
Boston, MA 02210 Principal Underwriter AllianceBernstein Investments, Inc.
501 Commerce Street
Nashville, TN 37203 Transfer Agent AllianceBernstein
Investor Services, Inc.
P.O. Box 786003
San Antonio, TX 78278-6003
Toll-Free (800) 221-5672 | | Legal Counsel Seward & Kissel LLP
One Battery Park Plaza
New York, NY 10004 Independent Registered Public Accounting Firm Ernst & Young LLP
One Manhattan West
New York, NY 10001 |
| 1 | Member of the Audit Committee, the Governance and Nominating Committee, and the Independent Directors Committee. |
| 2 | The day-to-day management of, and investment decisions for, the Fund’s Portfolio are made by the Adviser’s Municipal Bond Investment Team. Messrs. Hults, Norton, Clements and Potter are the investment professionals primarily responsible for the day-to-day management of the Fund’s Portfolio. |
| | |
| |
| abfunds.com | | AB MUNICIPAL INCOME SHARES | 127 |
Operation and Effectiveness of the Fund’s Liquidity Risk Management Program:
In October 2016, the Securities and Exchange Commission (“SEC”) adopted the open-end fund liquidity rule (the “Liquidity Rule”). In June 2018 the SEC adopted a requirement that funds disclose information about the operation and effectiveness of their Liquidity Risk Management Program (“LRMP”) in their reports to shareholders.
One of the requirements of the Liquidity Rule is for the Fund to designate an Administrator of the Fund’s Liquidity Risk Management Program. The Administrator of the Fund’s LRMP is AllianceBernstein L.P., the Fund’s investment adviser (the “Adviser”). The Adviser has delegated the responsibility to its Liquidity Risk Management Committee (the “Committee”).
Another requirement of the Liquidity Rule is for the Fund’s Board of Trustees (the “Fund Board”) to receive an annual written report from the Administrator of the LRMP, which addresses the operation of the Fund’s LRMP and assesses its adequacy and effectiveness. The Adviser provided the Fund Board with such annual report during the first quarter of 2022, which covered the period January 1, 2021 through December 31, 2021 (the “Program Reporting Period”).
The LRMP’s principal objectives include supporting the Fund’s compliance with limits on investments in illiquid assets and mitigating the risk that the Fund will be unable to meet its redemption obligations in a timely manner.
Pursuant to the LRMP, the Fund classifies the liquidity of its portfolio investments into one of the four categories defined by the SEC: Highly Liquid, Moderately Liquid, Less Liquid, and Illiquid. These classifications are reported to the SEC on Form N-PORT.
During the Program Reporting Period, the Committee reviewed whether the Fund’s strategy is appropriate for an open-end structure, incorporating any holdings of less liquid and illiquid assets. If the Fund participated in derivative transactions, the exposure from such transactions were considered in the LRMP.
The Committee also performed an analysis to determine whether the Fund is required to maintain a Highly Liquid Investment Minimum (“HLIM”). The Committee also incorporated the following information when determining the Fund’s reasonably anticipated trading size for purposes of liquidity monitoring: historical net redemption activity, a Fund’s concentration in an issuer, shareholder concentration, investment performance, total net assets, and distribution channels.
The Adviser informed the Fund Board that the Committee believes the Fund’s LRMP is adequately designed, has been implemented as intended,
| | |
| |
128 | AB MUNICIPAL INCOME SHARES | | abfunds.com |
and has operated effectively since its inception. No material exceptions have been noted since the implementation of the LRMP. During the Program Reporting Period, liquidity in all markets was significantly recovered and improved compared to the prior reporting period which included extreme levels of price volatility and relative illiquidity beginning in March 2020 with COVID-19 impacts. As such, the program operated in a relatively robust and benign liquidity environment experienced in markets during the Program Reporting Period. There were no liquidity events that impacted the Fund or its ability to timely meet redemptions during the Program Reporting Period.
| | |
| |
| abfunds.com | | AB MUNICIPAL INCOME SHARES | 129 |
Information Regarding the Review and Approval of the Fund’s Advisory Agreement
The disinterested trustees (the “directors”) of AB Corporate Shares (the “Company”) unanimously approved the continuance of the Company’s Advisory Agreement with the Adviser in respect of AB Municipal Income Shares (the “Fund”) at a meeting held by video conference on November 2-4, 2021 (the “Meeting”).
Prior to approval of the continuance of the Advisory Agreement, the directors had requested from the Adviser, and received and evaluated, extensive materials. They reviewed the proposed continuance of the Advisory Agreement with the Adviser and with experienced counsel who are independent of the Adviser, who advised on the relevant legal standards. The directors also reviewed additional materials, including comparative analytical data prepared by the Senior Analyst for the Fund. The directors also discussed the proposed continuance in private sessions with counsel.
The directors noted that the Fund is designed as a vehicle for the wrap fee account market (where investors pay fees to a wrap fee sponsor which pays investment fees and expenses from such fee). The directors also noted that no advisory fee is payable by the Fund, that the Advisory Agreement does not include the reimbursement provision for certain administrative expenses included in the advisory agreements of most of the open-end AB Funds, and that the Adviser is responsible for payment of the Fund’s ordinary expenses. The directors noted that the Company acknowledges in the Advisory Agreement that the Adviser and its affiliates expect to receive compensation from third parties in connection with services provided under the Advisory Agreement. The directors further noted that the Adviser receives payments from the wrap fee program sponsors (the “Sponsors”) that use the Fund as an investment vehicle for their clients.
The directors considered their knowledge of the nature and quality of the services provided by the Adviser to the Fund gained from their experience as directors or trustees of most of the registered investment companies advised by the Adviser, their overall confidence in the Adviser’s integrity and competence they have gained from that experience, the Adviser’s initiative in identifying and raising potential issues with the directors and its responsiveness, frankness and attention to concerns raised by the directors in the past, including the Adviser’s willingness to consider and implement organizational and operational changes designed to improve investment results and the services provided to the AB Funds. The directors noted that they have four regular meetings each year, at each of which they review extensive materials and information from the Adviser, including information on the investment performance of the Fund and the money market fund advised by the Adviser in which the Fund invests a portion of its assets.
| | |
| |
130 | AB MUNICIPAL INCOME SHARES | | abfunds.com |
The directors also considered all factors they believed relevant, including the specific matters discussed below. During the course of their deliberations, the directors evaluated, among other things, the reasonableness of the advisory fee. The directors did not identify any particular information that was all-important or controlling, and different directors may have attributed different weights to the various factors. The directors determined that the selection of the Adviser to manage the Fund and the overall arrangements between the Fund and the Adviser, as provided in the Advisory Agreement, including the advisory fee, were fair and reasonable in light of the services performed, expenses incurred and such other matters as the directors considered relevant in the exercise of their business judgment. The material factors and conclusions that formed the basis for the directors’ determinations included the following:
Nature, Extent and Quality of Services Provided
The directors considered the scope and quality of services provided by the Adviser under the Advisory Agreement, including the quality of the investment research capabilities of the Adviser and the other resources it has dedicated to performing services for the Fund. The directors noted that the Adviser from time to time reviews the Fund’s investment strategies and from time to time proposes changes intended to improve the Fund’s relative or absolute performance for the directors’ consideration. They also noted the professional experience and qualifications of the Fund’s portfolio management team and other senior personnel of the Adviser. The quality of administrative and other services, including the Adviser’s role in coordinating the activities of the Fund’s other service providers, also was considered. The directors concluded that, overall, they were satisfied with the nature, extent and quality of services provided to the Fund under the Advisory Agreement.
Costs of Services Provided and Profitability
The directors reviewed a schedule of the revenues and expenses and related notes indicating the profitability of the Fund to the Adviser for calendar years 2019 and 2020 that had been prepared with an expense allocation methodology arrived at in consultation with an independent consultant at the request of the directors. The directors noted the assumptions and methods of allocation used by the Adviser in preparing fund-specific profitability data and understood that there are a number of potentially acceptable allocation methodologies for information of this type. The directors noted that the profitability information reflected all revenues and expenses of the Adviser’s relationship with the Fund. The directors recognized that it is difficult to make comparisons of the profitability of the Advisory Agreement with the profitability of fund advisory contracts for unaffiliated funds because comparative information is not generally publicly available and is affected by numerous factors. The directors focused on the profitability of the Adviser’s relationship with the Fund before taxes and
| | |
| |
| abfunds.com | | AB MUNICIPAL INCOME SHARES | 131 |
distribution expenses. The directors concluded that the Adviser’s level of profitability from its relationship with the Fund was not unreasonable.
Fall-Out Benefits
The directors considered the other benefits to the Adviser and its affiliates from their relationships with the Fund and the underlying fund advised by the Adviser in which the Fund invests. The directors noted that the Adviser is compensated by the Sponsors. The directors understood that the Adviser also might derive reputational and other benefits from its association with the Fund.
Investment Results
In addition to the information reviewed by the directors in connection with the Meeting, the directors receive detailed performance information for the Fund at each regular Board meeting during the year.
At the Meeting, the directors reviewed performance information prepared by an independent service provider (the “15(c) service provider”), showing the performance of the Fund against a group of similar funds (“peer group”) and a larger group of similar funds (“peer universe”), each selected by the 15(c) service provider, and information prepared by the Adviser showing the Fund’s performance against a broad-based securities market index, in each case for the 1-, 3-, 5- and 10-year periods ended July 31, 2021 and (in the case of comparisons with the broad-based securities market index) for the period from inception. The directors were cognizant that the Fund was neither designed nor offered as a standalone investment and was intended to serve solely as a component of certain separately managed accounts (“SMAs”). The Adviser had explained that this attribute made it difficult to select an appropriate benchmark for the Fund. At the directors’ request, the Adviser provided information showing the weighting of the Fund in a current SMA and the overall performance of the SMA versus its stated benchmark. Based on their review, the directors concluded that the Fund’s investment performance was acceptable.
Advisory Fees
The directors considered the advisory fee rate payable by the Fund to the Adviser (zero) and information provided by the 15(c) service provider concerning advisory fee rates payable by other funds in the same category as the Fund. The directors recognized that it is difficult to make comparisons of advisory fees because there are variations in the services that are included in the fees payable by other funds.
The directors noted the unusual arrangements in the Advisory Agreement providing for no advisory fee but were cognizant that the Adviser is indirectly compensated by the Sponsors for its services to the Fund. The directors reviewed the fee arrangements between the Adviser and each of the current Sponsors and noted that such fees were negotiated on an
| | |
| |
132 | AB MUNICIPAL INCOME SHARES | | abfunds.com |
arm’s length basis and were within the range of fees paid by wrap fee sponsors to other advisers of similar funds. While the Adviser’s fee arrangements with the Sponsors vary, the directors acknowledged the Adviser’s view that a portion of such fees (less the expenses of the Fund paid by the Adviser) may reasonably be viewed as compensating the Adviser for advisory services it provides to the Fund (the “implied fee”) and that the Adviser believes that while the Sponsors pay the Adviser different fee rates, the rate of fee attributable to Fund management at the Fund level is the same for all Sponsors. The directors also considered the fee rate schedules used by other registered investment companies that invest in fixed income securities that are advised by the Adviser.
The Adviser informed the directors that there were no institutional products managed by the Adviser that utilize investment strategies similar to those of the Fund.
The directors did not consider comparative expense information for the Fund because the Fund does not bear ordinary expenses.
Economies of Scale
The directors did not consider the extent to which fee levels in the Advisory Agreement for the Fund reflect economies of scale because the Advisory Agreement does not provide for any compensation to be paid to the Adviser by the Fund and the Fund’s expense ratio is zero. They did note, however, that the fee payable to the Adviser by the current Sponsors declines at a breakpoint based on either individual account sizes or on total assets managed by the Adviser for the Sponsor.
| | |
| |
| abfunds.com | | AB MUNICIPAL INCOME SHARES | 133 |
This page is not part of the Shareholder Report or the Financial Statements.
AB FAMILY OF FUNDS
US EQUITY
CORE
Core Opportunities Fund
Select US Equity Portfolio
Sustainable US Thematic Portfolio
GROWTH
Concentrated Growth Fund
Discovery Growth Fund
Growth Fund
Large Cap Growth Fund
Small Cap Growth Portfolio
VALUE
Discovery Value Fund
Equity Income Fund
Relative Value Fund
Small Cap Value Portfolio
Value Fund
INTERNATIONAL/ GLOBAL EQUITY
CORE
Global Core Equity Portfolio
International Strategic Core Portfolio
Sustainable Global Thematic Fund
Sustainable International Thematic Fund
Tax-Managed Wealth Appreciation Strategy
Wealth Appreciation Strategy
GROWTH
Concentrated International Growth Portfolio
VALUE
All China Equity Portfolio
International Value Fund
FIXED INCOME
MUNICIPAL
High Income Municipal Portfolio
Intermediate California Municipal Portfolio
Intermediate Diversified Municipal Portfolio
Intermediate New York Municipal Portfolio
Municipal Bond Inflation Strategy
Tax-Aware Fixed Income Opportunities Portfolio
National Portfolio
Arizona Portfolio
California Portfolio
Massachusetts Portfolio
Minnesota Portfolio
New Jersey Portfolio
New York Portfolio
Ohio Portfolio
Pennsylvania Portfolio
Virginia Portfolio
TAXABLE
Bond Inflation Strategy
Global Bond Fund
High Income Fund
High Yield Portfolio
Income Fund
Intermediate Duration Portfolio
Limited Duration High Income Portfolio
Short Duration Income Portfolio
Short Duration Portfolio
Sustainable Thematic Credit Portfolio
Total Return Bond Portfolio
ALTERNATIVES
All Market Real Return Portfolio
Global Real Estate Investment Fund
Select US Long/Short Portfolio
MULTI-ASSET
All Market Income Portfolio
All Market Total Return Portfolio
Emerging Markets Multi-Asset Portfolio
Global Risk Allocation Fund
Sustainable Thematic Balanced Portfolio
Tax-Managed All Market Income Portfolio
CLOSED-END FUNDS
AllianceBernstein Global High Income Fund
AllianceBernstein National Municipal Income Fund
EXCHANGE-TRADED FUNDS
Tax-Aware Short Duration Municipal ETF
Ultra Short Income ETF
We also offer Government Money Market Portfolio, which serves as the money market fund exchange vehicle for the AB mutual funds. You could lose money by investing in the Fund. Although the Fund seeks to preserve the value of your investment at $1.00 per share, it cannot guarantee it will do so. The Fund may impose a fee upon sale of your shares or may temporarily suspend your ability to sell shares if the Fund’s liquidity falls below required minimums because of market conditions or other factors. An investment in the Fund is not insured or guaranteed by the Federal Deposit Insurance Corporation or any other government agency. The Fund’s sponsor has no legal obligation to provide financial support to the Fund, and you should not expect that the sponsor will provide financial support to the Fund at any time.
Investors should consider the investment objectives, risks, charges and expenses of the Fund carefully before investing. For copies of our prospectus or summary prospectus, which contain this and other information, visit us online at www.abfunds.com or contact your AB representative. Please read the prospectus and/or summary prospectus carefully before investing.
| | |
| |
134 | AB MUNICIPAL INCOME SHARES | | abfunds.com |
NOTES
| | |
| |
| abfunds.com | | AB MUNICIPAL INCOME SHARES | 135 |
NOTES
| | |
| |
136 | AB MUNICIPAL INCOME SHARES | | abfunds.com |
AB MUNICIPAL INCOME SHARES
1345 Avenue of the Americas
New York, NY 10105
800 221 5672
MIS-0152-1022 
OCT 10.31.22

SEMI-ANNUAL REPORT
AB TAXABLE MULTI-SECTOR INCOME SHARES

| | |
| |
| Investment Products Offered | | • Are Not FDIC Insured • May Lose Value • Are Not Bank Guaranteed |
Investors should consider the investment objectives, risks, charges and expenses of the Fund carefully before investing. For copies of our prospectus or summary prospectus, which contain this and other information, visit us online at www.abfunds.com or contact your AB representative. Please read the prospectus and/or summary prospectus carefully before investing.
This shareholder report must be preceded or accompanied by the Fund’s prospectus for individuals who are not current shareholders of the Fund.
You may obtain a description of the Fund’s proxy voting policies and procedures, and information regarding how the Fund voted proxies relating to portfolio securities during the most recent 12-month period ended June 30, without charge. Simply visit AB’s website at www.abfunds.com, or go to the Securities and Exchange Commission’s (the “Commission”) website at www.sec.gov, or call AB at (800) 227 4618.
The Fund files its complete schedule of portfolio holdings with the Commission for the first and third quarters of each fiscal year as an exhibit to its reports on Form N-PORT. The Fund’s Form N-PORT reports are available on the Commission’s website at www.sec.gov. AB publishes full portfolio holdings for the Fund monthly at www.abfunds.com.
AllianceBernstein Investments, Inc. (ABI) is the distributor of the AB family of mutual funds. ABI is a member of FINRA and is an affiliate of AllianceBernstein L.P., the Adviser of the funds.
The [A/B] logo is a registered service mark of AllianceBernstein and AllianceBernstein® is a registered service mark used by permission of the owner, AllianceBernstein L.P.
| | |
| FROM THE PRESIDENT | |  |
Dear Shareholder,
We’re pleased to provide this report for AB Taxable Multi-Sector Income Shares (the “Fund”). Please review the discussion of Fund performance, the market conditions during the reporting period and the Fund’s investment strategy.
At AB, we’re striving to help our clients achieve better outcomes by:
| + | | Fostering diverse perspectives that give us a distinctive approach to navigating global capital markets |
| + | | Applying differentiated investment insights through a connected global research network |
| + | | Embracing innovation to design better ways to invest and leading-edge mutual-fund solutions |
Whether you’re an individual investor or a multibillion-dollar institution, we’re putting our knowledge and experience to work for you every day.
For more information about AB’s comprehensive range of products and shareholder resources, please log on to www.abfunds.com.
Thank you for your investment in AB mutual funds—and for placing your trust in our firm.
Sincerely,

Onur Erzan
President and Chief Executive Officer, AB Mutual Funds
| | |
| |
| abfunds.com | | AB TAXABLE MULTI-SECTOR INCOME SHARES | 1 |
SEMI-ANNUAL REPORT
December 12, 2022
This report provides management’s discussion of fund performance for AB Taxable Multi-Sector Income Shares for the semi-annual reporting period ended October 31, 2022. Please note, shares of this Fund are available only to separately managed accounts or participants in “wrap fee” programs or other investment programs approved by the Adviser.
The Fund’s investment objective is to generate income and price appreciation.
NAV RETURNS AS OF OCTOBER 31, 2022 (unaudited)
| | | | | | | | |
| | |
| | | 6 Months | | | 12 Months | |
| | |
| AB TAXABLE MULTI-SECTOR INCOME SHARES | | | -1.33% | | | | -4.25% | |
| | |
| Bloomberg US Aggregate ex Government Bond Index | | | -7.30% | | | | -16.88% | |
INVESTMENT RESULTS
The table above shows the Fund’s performance compared to its benchmark, the Bloomberg US Aggregate ex Government Bond Index, for the six- and 12-month periods ended October 31, 2022.
During both periods, the Fund outperformed the benchmark. During the six-month period, positioning on the five- to 30-year parts of the yield curve contributed the most, relative to the benchmark, exceeding a loss from positioning on the two-year part of the curve. Industry allocation also contributed, from an underweight to 30-year conventional mortgage-backed securities, off-benchmark exposure to US municipal bonds and overweights to energy and consumer noncyclical that exceeded losses from an overweight to consumer cyclical—other and exposure to collateralized mortgage obligations. Security selection within the US municipal bonds, banking, consumer cyclical—other and basic sectors added to performance, offset by a loss from selection within consumer noncyclical.
Over the 12-month period, yield-curve positioning was the largest contributor, as positioning on the five- to 30-year parts of the curve added more than a loss from positioning on the two-year part of the curve. Security selection also contributed, mostly from selection within US municipal bonds, banking, consumer noncyclical, retail, consumer cyclical—other, basic and services. Industry allocation added to returns, as off-benchmark exposure to US Treasuries, an underweight to 30-year conventional mortgages and an overweight to car loan asset-backed securities contributed more than losses from overweights to US municipal bonds and consumer cyclical—other, as well as off-benchmark exposure to collateralized mortgage obligations.
| | |
| |
2 | AB TAXABLE MULTI-SECTOR INCOME SHARES | | abfunds.com |
During both periods, the Fund utilized derivatives in the form of interest rate swaps for hedging purposes, which had an immaterial impact on absolute returns, as well as credit default swaps for hedging and investment purposes, which added to returns.
MARKET REVIEW AND INVESTMENT STRATEGY
Fixed-income government bond market yields rose, and bond prices fell sharply in most markets except Japan during the six-month period ended October 31, 2022. Major central banks escalated the process of raising interest rates and ending bond purchases. Relative developed-market government bond returns were led by Japan and trailed significantly in the UK. Securitized assets generally outperformed corporate bonds. Global investment-grade corporate bonds—which typically have longer maturities and are more sensitive to changes in yields than high-yield corporates—trailed US Treasuries in the US and outperformed eurozone treasuries. High-yield corporate bonds outperformed government bonds in the US and eurozone. Emerging-market hard-currency sovereign and corporate bonds underperformed developed-market treasuries and corporates. Emerging-market local-currency bonds underperformed as the US dollar advanced against all major developed-market currencies and the vast majority of emerging-market currencies. Brent crude oil prices fell as global growth and demand began to slow.
The Fund’s Senior Investment Management Team (the “Team”) continues to seek attractively priced securities through top-down and bottom-up research, while mitigating overall risk. The Team invests primarily in single-sector, investment-grade issues of global corporates but has leeway to invest in below investment-grade bonds as well.
INVESTMENT POLICIES
The Fund invests, under normal circumstances, at least 80% of its net assets in fixed-income securities. The Fund may invest in a broad range of securities in both developed and emerging markets. The Fund may invest across all fixed-income sectors, including corporate and US and non-US government securities. The Fund may invest up to 50% of its assets in below investment-grade bonds (“junk bonds”). The Fund expects to invest in readily marketable fixed-income securities with a range of maturities from short- to long-term.
The Fund may invest without limit in US dollar-denominated foreign fixed-income securities and may invest up to 50% of its assets in non-US dollar-denominated foreign fixed-income securities. These investments may include, in each case, developed- and emerging-market debt securities.
(continued on next page)
| | |
| |
| abfunds.com | | AB TAXABLE MULTI-SECTOR INCOME SHARES | 3 |
The Adviser selects securities for purchase or sale based on its assessment of the securities’ risk and return characteristics as well as the securities’ impact on the overall risk and return characteristics of the Fund. In making this assessment, the Adviser takes into account various factors, including the credit quality and sensitivity to interest rates of the securities under consideration and of the Fund’s other holdings.
The Fund may also invest in mortgage-related and other asset-backed securities; loan participations; inflation-indexed securities; structured securities; variable-, floating- and inverse-floating-rate instruments; and preferred stock, and may use other investment techniques. The Fund may use leverage for investment purposes. The Fund intends, among other things, to enter into transactions such as reverse repurchase agreements, forward contracts and dollar rolls. The Fund may invest, without limit, in derivatives, such as options, futures contracts, forwards or swap agreements.
Currencies can have a dramatic effect on returns of non-US dollar-denominated fixed-income securities, significantly adding to returns in some years and greatly diminishing them in others. The Adviser evaluates currency and fixed-income positions separately and may seek to hedge the currency exposure resulting from the Fund’s fixed-income securities positions when it finds the currency exposure unattractive. To hedge a portion of its currency risk, the Fund may from time to time invest in currency-related derivatives, including forward currency exchange contracts, futures contracts, options on futures contracts, swaps and options. The Adviser may also seek investment opportunities by taking long or short positions in currencies through the use of currency-related derivatives.
| | |
| |
4 | AB TAXABLE MULTI-SECTOR INCOME SHARES | | abfunds.com |
DISCLOSURES AND RISKS
Benchmark Disclosure
The Bloomberg US Aggregate ex Government Bond Index is unmanaged and does not reflect fees and expenses associated with the active management of a fund. The Bloomberg US Aggregate ex Government Bond Index represents the performance of securities within the US investment-grade fixed-rate bond market, with index components for corporate securities, mortgage pass-through securities, asset-backed securities and commercial mortgage-backed securities. An investor cannot invest directly in an index, and its results are not indicative of the performance for any specific investment, including the Fund.
A Word About Risk
Market Risk: The value of the Fund’s assets will fluctuate as the stock or bond market fluctuates. The value of the Fund’s investments may decline, sometimes rapidly and unpredictably, simply because of economic changes or other events, including public health crises (including the occurrence of a contagious disease or illness) and regional and global conflicts, that affect large portions of the market.
Credit Risk: An issuer or guarantor of a fixed-income security, or the counterparty to a derivatives or other contract, may be unable or unwilling to make timely payments of interest or principal, or to otherwise honor its obligations. The issuer or guarantor may default, causing a loss of the full principal amount of a security and any accrued interest. The degree of risk for a particular security may be reflected in its credit rating. There is the possibility that the credit rating of a fixed-income security may be downgraded after purchase, which may adversely affect the value of the security.
Interest-Rate Risk: Changes in interest rates will affect the value of investments in fixed-income securities. When interest rates rise, the value of existing investments in fixed-income securities tends to fall and this decrease in value may not be offset by higher income from new investments. Interest-rate risk is generally greater for fixed-income securities with longer maturities or durations. The Fund may be subject to greater risk of rising interest rates than would normally be the case due to the end of a recent period of historically low rates and the effect of potential government fiscal policy initiatives and resulting market reaction to those initiatives.
Below Investment-Grade Securities Risk: Investments in fixed-income securities with lower ratings (commonly known as “junk bonds”) tend to have a higher probability that an issuer will default or fail to meet its payment obligations. These securities may be subject to greater price volatility due to such factors as specific corporate developments, interest-rate
| | |
| |
| abfunds.com | | AB TAXABLE MULTI-SECTOR INCOME SHARES | 5 |
DISCLOSURES AND RISKS (continued)
sensitivity, negative perceptions of the junk bond market generally and may be more difficult to trade than other types of securities.
Inflation Risk: This is the risk that the value of assets or income from investments will be less in the future as inflation decreases the value of money. As inflation increases, the value of the Fund’s assets can decline as can the value of the Fund’s distributions. This risk is significantly greater for fixed-income securities with longer maturities.
Foreign (Non-US) Risk: Investments in securities of non-US issuers may involve more risk than those of US issuers. These securities may fluctuate more widely in price and may be more difficult to trade due to adverse market, economic, political, regulatory or other factors.
Emerging-Market Risk: Investments in emerging-market countries may have more risk because the markets are less developed and less liquid as well as being subject to increased economic, political, regulatory or other uncertainties.
Currency Risk: Fluctuations in currency exchange rates may negatively affect the value of the Fund’s investments or reduce its returns.
Mortgage-Related and/or Other Asset-Backed Securities Risk: Investments in mortgage-related and other asset-backed securities are subject to certain additional risks. The value of these securities may be particularly sensitive to changes in interest rates. These risks include “extension risk”, which is the risk that, in periods of rising interest rates, issuers may delay the payment of principal, and “prepayment risk”, which is the risk that in periods of falling interest rates, issuers may pay principal sooner than expected, exposing the Fund to a lower rate of return upon reinvestment of principal. Mortgage-backed securities offered by nongovernmental issuers and other asset-backed securities may be subject to other risks, such as higher rates of default in the mortgages or assets backing the securities or risks associated with the nature and servicing of mortgages or assets backing the securities.
Municipal Market Risk: This is the risk that special factors may adversely affect the value of municipal securities and have a significant effect on the yield or value of the Fund’s investments in municipal securities. These factors include economic conditions, political or legislative changes, public health crises, uncertainties related to the tax status of municipal securities, and the rights of investors in these securities. To the extent that the Fund invests more of its assets in a particular state’s municipal securities, the Fund may be vulnerable to events adversely affecting that state, including economic, political and regulatory occurrences, court decisions, terrorism, public health crises (including the occurrence of a contagious disease or
| | |
| |
6 | AB TAXABLE MULTI-SECTOR INCOME SHARES | | abfunds.com |
DISCLOSURES AND RISKS (continued)
illness) and catastrophic natural disasters, such as hurricanes, fires or earthquakes. For example, the novel coronavirus (COVID-19) pandemic has significantly stressed the financial resources of many issuers of municipal securities, which could impair any such issuer’s ability to meet its financial obligations when due and adversely impact the value of its securities held by the Fund. As the full effects of the COVID-19 pandemic on state and local economies and on issuers of municipal securities are still uncertain, the financial difficulties of issuers of municipal securities may continue or worsen, adversely affecting the performance of the Fund. The Fund’s investments in certain municipal securities with principal and interest payments that are made from the revenues of a specific project or facility, and not general tax revenues, may have increased risks. Factors affecting the project or facility, such as local business or economic conditions, could have a significant effect on the project’s ability to make payments of principal and interest on these securities.
Congress has previously considered making changes to the municipal securities provisions of the Internal Revenue Code that could change the US federal income tax treatment of certain types of municipal securities.
Sector Risk: The Fund may have more risk because it may invest to a significant extent in one or more particular market sectors. To the extent it does so, market or economic factors affecting the relevant sector(s) could have a major effect on the value of the Fund’s investments.
Derivatives Risk: Derivatives may be difficult to price or unwind and leveraged so that small changes may produce disproportionate losses for the Fund. Derivatives, especially over-the-counter derivatives, are also subject to counterparty risk, which is the risk that the counterparty (the party on the other side of the transaction) on a derivative transaction will be unable or unwilling to honor its contractual obligations to the Fund.
Leverage Risk: To the extent the Fund uses leveraging techniques, its net asset value (“NAV”) may be more volatile because leverage tends to exaggerate the effect of changes in interest rates and any increase or decrease in the value of the Fund’s investments.
Management Risk: The Fund is subject to management risk because it is an actively managed investment fund. The Adviser will apply its investment techniques and risk analyses in making investment decisions, but there is no guarantee that its techniques will produce the intended results. Some of these techniques may incorporate, or rely upon, quantitative models, but there is no guarantee that these models will generate accurate forecasts, reduce risk or otherwise perform as expected.
| | |
| |
| abfunds.com | | AB TAXABLE MULTI-SECTOR INCOME SHARES | 7 |
DISCLOSURES AND RISKS (continued)
These risks are fully discussed in the Fund’s prospectus. As with all investments, you may lose money by investing in the Fund.
An Important Note About Historical Performance
The performance shown in this report represents past performance and does not guarantee future results. Current performance may be lower or higher than the performance information shown. You may obtain performance information current to the most recent month-end by calling (800) 227 4618. The investment return and principal value of an investment in the Fund will fluctuate, so that your shares, when redeemed, may be worth more or less than their original cost. Performance assumes reinvestment of distributions and does not account for taxes.
Investors should consider the investment objectives, risks, charges and expenses of the Fund carefully before investing. For copies of our prospectus and/or summary prospectus, which contain this and other information, visit us online at www.abfunds.com or contact your AllianceBernstein Investments representative. Please read the prospectus and/or summary prospectus carefully before investing.
| | |
| |
8 | AB TAXABLE MULTI-SECTOR INCOME SHARES | | abfunds.com |
HISTORICAL PERFORMANCE
AVERAGE ANNUAL RETURNS AS OF OCTOBER 31, 2022 (unaudited)
| | | | |
| |
| | | NAV Returns | |
| |
| 1 Year | | | -4.25% | |
| |
| 5 Years | | | 1.14% | |
| |
| 10 Years | | | 1.21% | |
AVERAGE ANNUAL RETURNS
AS OF THE MOST RECENT CALENDAR QUARTER-END
SEPTEMBER 30, 2022 (unaudited)
| | | | |
| |
| | | NAV Returns | |
| |
| 1 Year | | | -4.41% | |
| |
| 5 Years | | | 1.16% | |
| |
| 10 Years | | | 1.23% | |
The prospectus fee table shows the fees and the total annual operating expenses of the Fund as 0.00% because the Adviser does not charge any fees or expenses and reimburses Fund operating expenses, except certain extraordinary expenses, taxes, brokerage costs and the interest on borrowings or certain leveraged transactions. Participants in a wrap fee program or other investment program eligible to invest in the Fund pay fees to the program sponsor and should review the program brochure or other literature provided by the sponsor for a discussion of fees and expenses charged.
| | |
| |
| abfunds.com | | AB TAXABLE MULTI-SECTOR INCOME SHARES | 9 |
EXPENSE EXAMPLE
(unaudited)
As a shareholder of the Fund, you may incur various ongoing non-operating and extraordinary costs. This example is intended to help you understand your ongoing costs (in dollars) of investing in the Fund and to compare these costs with the ongoing costs of investing in other mutual funds.
The Example is based on an investment of $1,000 invested at the beginning of the period and held for the entire period as indicated below.
Actual Expenses
The table below provides information about actual account values and actual expenses. You may use the information in this line, together with the amount you invested, to estimate the expenses that you paid over the period. Simply divide your account value by $1,000 (for example, an $8,600 account value divided by $1,000 = 8.6), then multiply the result by the number in the first line under the heading entitled “Expenses Paid During Period” to estimate the expenses you paid on your account during this period.
Hypothetical Example for Comparison Purposes
The table below provides information about hypothetical account values and hypothetical expenses based on the Fund’s actual expense ratio and an assumed annual rate of return of 5% before expenses, which is not the Fund’s actual return. The hypothetical account values and expenses may not be used to estimate the actual ending account balance or expenses you paid for the period. You may use this information to compare the ongoing costs of investing in the Fund and other funds by comparing this 5% hypothetical example with the 5% hypothetical examples that appear in the shareholder reports of other funds.
Please note that the expenses shown in the table are meant to highlight your ongoing costs only and do not reflect any transactional costs, such as sales charges (loads), or contingent deferred sales charges on redemptions. Therefore, the hypothetical example is useful in comparing ongoing costs only, and will not help you determine the relative total costs of owning different funds. In addition, if these transactional costs were included, your costs would have been higher.
| | | | | | | | | | | | | | | | |
| | | Beginning
Account Value
May 1, 2022 | | | Ending
Account Value
October 31, 2022 | | | Expenses Paid
During Period* | | | Annualized
Expense Ratio* | |
Actual | | $ | 1,000 | | | $ | 986.70 | | | $ | – 0 | – | | | 0.00 | % |
Hypothetical** | | $ | 1,000 | | | $ | 1,025.21 | | | $ | – 0 | – | | | 0.00 | % |
| * | Expenses are equal to the Fund’s annualized expense ratio, multiplied by the average account value over the period, multiplied by 184/365 (to reflect the one-half year period). The Fund’s operating expenses are borne by the Adviser or its affiliates. |
| ** | Assumes 5% annual return before expenses. |
| | |
| |
10 | AB TAXABLE MULTI-SECTOR INCOME SHARES | | abfunds.com |
PORTFOLIO SUMMARY
October 31, 2022 (unaudited)
PORTFOLIO STATISTICS
Net Assets ($mil): $319.5
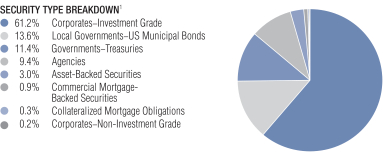
| 1 | The Fund’s security type breakdown is expressed as a percentage of total investments and may vary over time. The Fund also enters into derivative transactions, which may be used for hedging or investment purposes (see “Portfolio of Investments” section of the report for additional details). |
| | |
| |
| abfunds.com | | AB TAXABLE MULTI-SECTOR INCOME SHARES | 11 |
PORTFOLIO OF INVESTMENTS
October 31, 2022 (unaudited)
| | | | | | | | |
| | | Principal
Amount
(000) | | | U.S. $ Value | |
| |
CORPORATES - INVESTMENT
GRADE – 60.8% | | | | | | | | |
Industrial – 40.7% | |
Basic – 2.6% | |
Air Products and Chemicals, Inc.
1.50%, 10/15/2025 | | $ | 1,600 | | | $ | 1,451,040 | |
Eastman Chemical Co.
3.80%, 03/15/2025 | | | 2,000 | | | | 1,917,340 | |
EI du Pont de Nemours and Co.
1.70%, 07/15/2025 | | | 1,265 | | | | 1,158,727 | |
Georgia-Pacific LLC
0.625%, 05/15/2024(a) | | | 1,750 | | | | 1,630,440 | |
LyondellBasell Industries NV
5.75%, 04/15/2024 | | | 1,140 | | | | 1,142,953 | |
Southern Copper Corp.
3.875%, 04/23/2025 | | | 1,000 | | | | 954,375 | |
| | | | | | | | |
| | | | | | | 8,254,875 | |
| | | | | | | | |
Capital Goods – 4.6% | |
3M Co.
3.00%, 08/07/2025 | | | 2,500 | | | | 2,371,625 | |
Caterpillar Financial Services Corp.
3.096% (SOFR + 0.27%), 09/13/2024(b) | | | 1,000 | | | | 988,500 | |
CNH Industrial Capital LLC
1.95%, 07/02/2023 | | | 2,000 | | | | 1,953,320 | |
General Dynamics Corp.
3.25%, 04/01/2025 | | | 1,665 | | | | 1,600,814 | |
Illinois Tool Works, Inc.
3.50%, 03/01/2024 | | | 1,550 | | | | 1,523,495 | |
John Deere Capital Corp.
3.159% (SOFR + 0.12%), 07/10/2023(b) | | | 1,000 | | | | 995,050 | |
Parker-Hannifin Corp.
2.70%, 06/14/2024 | | | 1,000 | | | | 958,200 | |
Republic Services, Inc.
2.50%, 08/15/2024 | | | 1,000 | | | | 952,410 | |
Trane Technologies Luxembourg Finance SA
3.55%, 11/01/2024 | | | 2,000 | | | | 1,930,420 | |
Waste Management, Inc.
2.40%, 05/15/2023 | | | 1,630 | | | | 1,607,539 | |
| | | | | | | | |
| | | | | | | 14,881,373 | |
| | | | | | | | |
Communications - Media – 0.7% | |
Omnicom Group, Inc./Omnicom Capital, Inc.
3.65%, 11/01/2024 | | | 2,000 | | | | 1,929,720 | |
TWDC Enterprises 18 Corp.
2.35%, 12/01/2022 | | | 250 | | | | 249,612 | |
| | | | | | | | |
| | | | | | | 2,179,332 | |
| | | | | | | | |
| | |
| |
12 | AB TAXABLE MULTI-SECTOR INCOME SHARES | | abfunds.com |
PORTFOLIO OF INVESTMENTS (continued)
| | | | | | | | |
| | | Principal
Amount
(000) | | | U.S. $ Value | |
| |
Communications -
Telecommunications – 1.5% | | | | | | | | |
Rogers Communications, Inc.
3.00%, 03/15/2023 | | $ | 2,000 | | | $ | 1,983,700 | |
T-Mobile USA, Inc.
2.625%, 04/15/2026 | | | 1,402 | | | | 1,265,936 | |
Verizon Communications, Inc.
2.355%, 03/15/2032 | | | 2,169 | | | | 1,642,345 | |
| | | | | | | | |
| | | | | | | 4,891,981 | |
| | | | | | | | |
Consumer Cyclical - Automotive – 0.9% | | | | | | | | |
General Motors Financial Co., Inc.
4.34% (SOFR + 1.30%), 04/07/2025(b) | | | 1,500 | | | | 1,462,740 | |
General Motors Financial Co., Inc.
5.10%, 01/17/2024 | | | 1,500 | | | | 1,486,680 | |
| | | | | | | | |
| | | | | | | 2,949,420 | |
| | | | | | | | |
Consumer Cyclical - Entertainment – 0.5% | | | | | | | | |
YMCA of Greater New York
2.303%, 08/01/2026 | | | 1,765 | | | | 1,553,606 | |
| | | | | | | | |
|
Consumer Cyclical - Other – 3.3% | |
DR Horton, Inc.
2.50%, 10/15/2024 | | | 2,875 | | | | 2,710,378 | |
Las Vegas Sands Corp.
3.20%, 08/08/2024 | | | 2,885 | | | | 2,743,577 | |
Lennar Corp.
4.50%, 04/30/2024 | | | 3,025 | | | | 2,976,328 | |
Marriott International, Inc./MD
3.75%, 03/15/2025 | | | 1,075 | | | | 1,030,839 | |
PulteGroup, Inc.
5.50%, 03/01/2026 | | | 1,000 | | | | 979,520 | |
| | | | | | | | |
| | | | | | | 10,440,642 | |
| | | | | | | | |
Consumer Cyclical - Restaurants – 0.3% | | | | | | | | |
McDonald’s Corp.
3.375%, 05/26/2025 | | | 1,000 | | | | 960,600 | |
| | | | | | | | |
|
Consumer Cyclical - Retailers – 2.8% | |
AutoZone, Inc.
3.25%, 04/15/2025 | | | 2,000 | | | | 1,900,120 | |
Costco Wholesale Corp.
2.75%, 05/18/2024 | | | 1,000 | | | | 971,330 | |
Dollar Tree, Inc.
4.00%, 05/15/2025 | | | 2,000 | | | | 1,939,700 | |
NIKE, Inc.
2.40%, 03/27/2025 | | | 2,250 | | | | 2,126,925 | |
VF Corp.
2.40%, 04/23/2025 | | | 1,670 | | | | 1,547,088 | |
| | |
| |
| abfunds.com | | AB TAXABLE MULTI-SECTOR INCOME SHARES | 13 |
PORTFOLIO OF INVESTMENTS (continued)
| | | | | | | | |
| | | Principal
Amount
(000) | | | U.S. $ Value | |
| |
Walmart, Inc.
3.30%, 04/22/2024 | | $ | 500 | | | $ | 489,880 | |
| | | | | | | | |
| | | | | | | 8,975,043 | |
| | | | | | | | |
Consumer Non-Cyclical – 7.9% | | | | | | | | |
AmerisourceBergen Corp.
0.737%, 03/15/2023 | | | 701 | | | | 689,672 | |
3.25%, 03/01/2025 | | | 1,350 | | | | 1,292,126 | |
Baxter International, Inc.
0.868%, 12/01/2023 | | | 2,300 | | | | 2,196,017 | |
Baylor Scott & White Holdings
Series 2021
0.827%, 11/15/2025 | | | 2,275 | | | | 2,007,187 | |
Cardinal Health, Inc.
3.079%, 06/15/2024 | | | 1,000 | | | | 962,550 | |
3.20%, 03/15/2023 | | | 1,000 | | | | 992,480 | |
Cigna Corp.
4.125%, 11/15/2025 | | | 1,000 | | | | 965,750 | |
CommonSpirit Health
2.76%, 10/01/2024 | | | 1,000 | | | | 950,080 | |
Gilead Sciences, Inc.
3.65%, 03/01/2026 | | | 1,000 | | | | 947,790 | |
3.70%, 04/01/2024 | | | 1,300 | | | | 1,276,587 | |
Hershey Co. (The)
0.90%, 06/01/2025 | | | 1,300 | | | | 1,173,679 | |
Newell Brands, Inc.
4.45%, 04/01/2026 | | | 613 | | | | 570,121 | |
4.875%, 06/01/2025 | | | 183 | | | | 176,560 | |
Philip Morris International, Inc.
3.375%, 08/11/2025 | | | 2,000 | | | | 1,898,460 | |
Shire Acquisitions Investments Ireland DAC
2.875%, 09/23/2023 | | | 640 | | | | 626,003 | |
Sysco Corp.
3.75%, 10/01/2025 | | | 2,500 | | | | 2,390,325 | |
Tyson Foods, Inc.
3.95%, 08/15/2024 | | | 3,000 | | | | 2,928,360 | |
UPMC
Series D-1
3.60%, 04/03/2025 | | | 2,250 | | | | 2,161,957 | |
Zoetis, Inc.
3.25%, 02/01/2023 | | | 1,000 | | | | 995,390 | |
| | | | | | | | |
| | | | | | | 25,201,094 | |
| | | | | | | | |
Energy – 5.8% | | | | | | | | |
Canadian Natural Resources Ltd.
3.80%, 04/15/2024 | | | 3,000 | | | | 2,928,660 | |
Chevron Corp.
1.141%, 05/11/2023 | | | 1,665 | | | | 1,633,715 | |
| | |
| |
14 | AB TAXABLE MULTI-SECTOR INCOME SHARES | | abfunds.com |
PORTFOLIO OF INVESTMENTS (continued)
| | | | | | | | |
| | | Principal
Amount
(000) | | | U.S. $ Value | |
| |
Continental Resources, Inc./OK
3.80%, 06/01/2024 | | $ | 3,000 | | | $ | 2,896,230 | |
EOG Resources, Inc.
4.15%, 01/15/2026 | | | 2,000 | | | | 1,941,140 | |
EQT Corp.
6.125%, 02/01/2025 | | | 1,500 | | | | 1,501,320 | |
Exxon Mobil Corp.
1.571%, 04/15/2023 | | | 1,655 | | | | 1,631,565 | |
2.992%, 03/19/2025 | | | 2,000 | | | | 1,915,800 | |
Ovintiv Exploration Inc.
5.375%, 01/01/2026 | | | 2,200 | | | | 2,152,546 | |
Phillips 66
0.90%, 02/15/2024 | | | 1,900 | | | | 1,798,996 | |
| | | | | | | | |
| | | | | | | 18,399,972 | |
| | | | | | | | |
Services – 3.7% | | | | | | | | |
Alibaba Group Holding Ltd.
3.60%, 11/28/2024 | | | 1,500 | | | | 1,424,790 | |
Amazon.com, Inc.
2.40%, 02/22/2023 | | | 875 | | | | 869,549 | |
Booking Holdings, Inc.
3.65%, 03/15/2025 | | | 1,000 | | | | 963,380 | |
eBay, Inc.
2.75%, 01/30/2023 | | | 1,500 | | | | 1,491,450 | |
Enterprise Community Loan Fund, Inc.
Series 2018
3.685%, 11/01/2023 | | | 1,180 | | | | 1,161,793 | |
Global Payments, Inc.
2.65%, 02/15/2025 | | | 1,000 | | | | 928,550 | |
Mastercard, Inc.
2.00%, 03/03/2025 | | | 2,250 | | | | 2,114,572 | |
Moody’s Corp.
4.875%, 02/15/2024 | | | 500 | | | | 497,650 | |
Verisk Analytics, Inc.
4.00%, 06/15/2025 | | | 2,500 | | | | 2,410,800 | |
| | | | | | | | |
| | | | | | | 11,862,534 | |
| | | | | | | | |
Technology – 6.1% | | | | | | | | |
Apple, Inc.
2.40%, 05/03/2023 | | | 1,250 | | | | 1,236,050 | |
2.85%, 05/11/2024 | | | 250 | | | | 243,195 | |
3.00%, 02/09/2024 | | | 1,400 | | | | 1,371,510 | |
Autodesk, Inc.
4.375%, 06/15/2025 | | | 800 | | | | 783,944 | |
Fidelity National Information Services, Inc.
0.375%, 03/01/2023 | | | 2,250 | | | | 2,216,227 | |
Fiserv, Inc.
2.75%, 07/01/2024 | | | 2,250 | | | | 2,152,125 | |
| | |
| |
| abfunds.com | | AB TAXABLE MULTI-SECTOR INCOME SHARES | 15 |
PORTFOLIO OF INVESTMENTS (continued)
| | | | | | | | |
| | | Principal
Amount
(000) | | | U.S. $ Value | |
| |
Hewlett Packard Enterprise Co.
1.45%, 04/01/2024 | | $ | 1,715 | | | $ | 1,623,368 | |
2.25%, 04/01/2023 | | | 500 | | | | 494,200 | |
International Business Machines Corp.
3.30%, 05/15/2026 | | | 2,000 | | | | 1,876,540 | |
Kyndryl Holdings, Inc.
2.05%, 10/15/2026 | | | 1,751 | | | | 1,372,924 | |
Microchip Technology, Inc.
4.25%, 09/01/2025 | | | 1,000 | | | | 953,560 | |
Oracle Corp.
2.50%, 04/01/2025 | | | 3,100 | | | | 2,897,911 | |
QUALCOMM, Inc.
3.45%, 05/20/2025 | | | 1,800 | | | | 1,736,352 | |
Salesforce, Inc.
3.25%, 04/11/2023 | | | 625 | | | | 621,019 | |
| | | | | | | | |
| | | | | | | 19,578,925 | |
| | | | | | | | |
| | | | | | | 130,129,397 | |
| | | | | | | | |
Financial Institutions – 17.1% | |
Banking – 12.1% | |
American Express Co.
3.40%, 02/27/2023 | | | 1,300 | | | | 1,293,838 | |
Bank of America Corp.
3.004%, 12/20/2023 | | | 615 | | | | 612,761 | |
3.093%, 10/01/2025 | | | 1,250 | | | | 1,183,338 | |
3.342% (BSBY 3 Month + 0.43%), 05/28/2024(b) | | | 1,000 | | | | 989,000 | |
3.458%, 03/15/2025 | | | 500 | | | | 482,035 | |
Barclays PLC
1.007%, 12/10/2024 | | | 1,500 | | | | 1,405,485 | |
3.932%, 05/07/2025 | | | 1,000 | | | | 951,740 | |
Capital One Financial Corp.
2.636%, 03/03/2026 | | | 1,000 | | | | 917,220 | |
3.90%, 01/29/2024 | | | 500 | | | | 490,175 | |
Citigroup, Inc.
1.678%, 05/15/2024 | | | 1,000 | | | | 978,040 | |
4.14%, 05/24/2025 | | | 2,000 | | | | 1,942,760 | |
Danske Bank A/S
4.296% (LIBOR 3 Month + 1.06%), 09/12/2023(a)(b) | | | 2,250 | | | | 2,247,727 | |
HSBC Holdings PLC
1.645%, 04/18/2026 | | | 2,210 | | | | 1,931,054 | |
ING Groep NV
4.035% (SOFR + 1.01%), 04/01/2027(b) | | | 1,350 | | | | 1,285,591 | |
JPMorgan Chase & Co.
1.514%, 06/01/2024 | | | 1,800 | | | | 1,757,520 | |
3.271% (SOFR + 0.54%), 06/01/2025(b) | | | 1,300 | | | | 1,269,710 | |
3.797%, 07/23/2024 | | | 725 | | | | 714,509 | |
| | |
| |
16 | AB TAXABLE MULTI-SECTOR INCOME SHARES | | abfunds.com |
PORTFOLIO OF INVESTMENTS (continued)
| | | | | | | | |
| | | Principal
Amount
(000) | | | U.S. $ Value | |
| |
KeyBank NA/Cleveland OH
0.423%, 01/03/2024 | | $ | 2,000 | | | $ | 1,982,340 | |
Mitsubishi UFJ Financial Group, Inc.
1.412%, 07/17/2025 | | | 2,300 | | | | 2,053,187 | |
Mizuho Financial Group, Inc.
1.241%, 07/10/2024 | | | 2,000 | | | | 1,934,440 | |
Morgan Stanley
2.72%, 07/22/2025 | | | 1,000 | | | | 943,720 | |
3.737%, 04/24/2024 | | | 2,000 | | | | 1,980,020 | |
Nationwide Building Society
4.363%, 08/01/2024(a) | | | 200 | | | | 196,280 | |
Natwest Group PLC
4.269%, 03/22/2025 | | | 2,000 | | | | 1,928,300 | |
Sumitomo Mitsui Financial Group, Inc.
1.474%, 07/08/2025 | | | 2,600 | | | | 2,321,488 | |
Toronto-Dominion Bank (The)
3.165% (SOFR + 0.35%), 09/10/2024(b) | | | 2,000 | | | | 1,969,000 | |
Wells Fargo & Co.
2.188%, 04/30/2026 | | | 1,850 | | | | 1,683,500 | |
2.406%, 10/30/2025 | | | 1,150 | | | | 1,070,823 | |
| | | | | | | | |
| | | | | | | 38,515,601 | |
| | | | | | | | |
Brokerage – 0.9% | |
Charles Schwab Corp. (The)
3.402% (SOFR + 0.50%), 03/18/2024(b) | | | 3,000 | | | | 2,978,550 | |
| | | | | | | | |
|
Finance – 1.7% | |
AerCap Ireland Capital DAC/AerCap Global Aviation Trust
1.65%, 10/29/2024 | | | 1,000 | | | | 908,980 | |
2.45%, 10/29/2026 | | | 1,000 | | | | 845,620 | |
Air Lease Corp.
2.30%, 02/01/2025 | | | 1,000 | | | | 915,760 | |
3.875%, 07/03/2023 | | | 300 | | | | 296,370 | |
Aircastle Ltd.
4.125%, 05/01/2024 | | | 2,500 | | | | 2,383,550 | |
| | | | | | | | |
| | | | | | | 5,350,280 | |
| | | | | | | | |
REITs – 2.4% | |
American Tower Corp.
3.375%, 05/15/2024 | | | 2,100 | | | | 2,035,131 | |
GLP Capital LP/GLP Financing II, Inc.
5.375%, 04/15/2026 | | | 3,000 | | | | 2,862,960 | |
Host Hotels & Resorts LP
Series E
4.00%, 06/15/2025 | | | 1,002 | | | | 943,714 | |
Kite Realty Group Trust
4.00%, 03/15/2025 | | | 1,000 | | | | 943,660 | |
| | |
| |
| abfunds.com | | AB TAXABLE MULTI-SECTOR INCOME SHARES | 17 |
PORTFOLIO OF INVESTMENTS (continued)
| | | | | | | | |
| | | Principal
Amount
(000) | | | U.S. $ Value | |
| |
Simon Property Group LP
3.50%, 09/01/2025 | | $ | 1,000 | | | $ | 949,730 | |
| | | | | | | | |
| | | | | | | 7,735,195 | |
| | | | | | | | |
| | | | | | | 54,579,626 | |
| | | | | | | | |
Utility – 3.0% | |
Electric – 1.5% | |
Pinnacle West Capital Corp.
1.30%, 06/15/2025 | | | 2,700 | | | | 2,406,915 | |
WEC Energy Group, Inc.
0.80%, 03/15/2024 | | | 2,400 | | | | 2,256,384 | |
| | | | | | | | |
| | | | | | | 4,663,299 | |
| | | | | | | | |
Natural Gas – 0.7% | |
Southern Co. Gas Capital Corp.
2.45%, 10/01/2023 | | | 2,200 | | | | 2,142,294 | |
| | | | | | | | |
|
Other Utility – 0.8% | |
American Water Capital Corp.
3.40%, 03/01/2025 | | | 1,135 | | | | 1,090,031 | |
3.85%, 03/01/2024 | | | 1,650 | | | | 1,618,683 | |
| | | | | | | | |
| | | | | | | 2,708,714 | |
| | | | | | | | |
| | | | | | | 9,514,307 | |
| | | | | | | | |
Total Corporates - Investment Grade
(cost $206,173,385) | | | | | | | 194,223,330 | |
| | | | | | | | |
| | | | | | | | |
LOCAL GOVERNMENTS - US MUNICIPAL BONDS – 13.5% | | | | | | | | |
United States – 13.5% | |
Antonio B Won Pat International Airport Authority
Series 2021-A
2.499%, 10/01/2025 | | | 740 | | | | 675,991 | |
California Earthquake Authority
Series 2022-A
5.603%, 07/01/2027 | | | 2,000 | | | | 1,985,983 | |
Chicago O’Hare International Airport
Series 2020-D
1.168%, 01/01/2024 | | | 2,000 | | | | 1,915,116 | |
City & County of Denver CO. Airport System Revenue
Series 2020-C
1.115%, 11/15/2024 | | | 750 | | | | 691,741 | |
City of Glendale AZ
(City of Glendale AZ COP)
Series 2021
0.897%, 07/01/2024 | | | 3,000 | | | | 2,799,629 | |
| | |
| |
18 | AB TAXABLE MULTI-SECTOR INCOME SHARES | | abfunds.com |
PORTFOLIO OF INVESTMENTS (continued)
| | | | | | | | |
| | | Principal
Amount
(000) | | | U.S. $ Value | |
| |
City of Houston TX Airport System Revenue
Series 2020-C
1.272%, 07/01/2024 | | $ | 1,000 | | | $ | 939,536 | |
City of Jacksonville FL
(City of Jacksonville FL Lease)
Series 2020-C
0.594%, 10/01/2023 | | | 1,500 | | | | 1,438,762 | |
City of New York NY
Series 2021
0.982%, 08/01/2025 | | | 380 | | | | 342,036 | |
Series 2021-D
0.59%, 08/01/2023 | | | 1,625 | | | | 1,575,235 | |
Colorado Health Facilities Authority
(Sanford Obligated Group)
Series 2019-B
2.237%, 11/01/2022 | | | 100 | | | | 100,000 | |
2.396%, 11/01/2023 | | | 1,050 | | | | 1,022,498 | |
Commonwealth of Massachusetts
(Commonwealth of Massachusetts COVID-19 Recovery Assessment Revenue)
Series 2022-B
4.11%, 07/15/2031 | | | 2,000 | | | | 1,908,081 | |
County of Broward FL Airport System Revenue
Series 2019-C
2.384%, 10/01/2026 | | | 1,000 | | | | 904,835 | |
County of Riverside CA
Series 2020
2.363%, 02/15/2023 | | | 200 | | | | 198,568 | |
Florida Development Finance Corp.
(Brightline Trains Florida LLC)
Series 2022
2.90%, 12/01/2056 | | | 1,000 | | | | 992,043 | |
Florida Municipal Power Agency
(Florida Municipal Power Agency All-Requirements Power Supply Project Revenue)
Series 2021
1.425%, 10/01/2026 | | | 1,000 | | | | 865,714 | |
Golden State Tobacco Securitization Corp.
Series 2021
1.85%, 06/01/2031 | | | 360 | | | | 352,530 | |
Inland Empire Tobacco Securitization Corp.
Series 2019
3.678%, 06/01/2038 | | | 775 | | | | 714,014 | |
Kansas Development Finance Authority
(State of Kansas Department of Administration Lease)
Series 2021-K
0.407%, 05/01/2023 | | | 1,415 | | | | 1,383,088 | |
| | |
| |
| abfunds.com | | AB TAXABLE MULTI-SECTOR INCOME SHARES | 19 |
PORTFOLIO OF INVESTMENTS (continued)
| | | | | | | | |
| | | Principal
Amount
(000) | | | U.S. $ Value | |
| |
Massachusetts Development Finance Agency
(Berklee College of Music, Inc.)
Series 2020
1.494%, 10/01/2023 | | $ | 385 | | | $ | 371,934 | |
Metropolitan Pier & Exposition Authority
Series 2022
3.00%, 06/15/2024 | | | 1,000 | | | | 977,135 | |
Metropolitan Transportation Authority
Series 2019-A
5.00%, 11/15/2048 | | | 2,000 | | | | 2,022,973 | |
Michigan Finance Authority
(Michigan Finance Authority School Loan Revolving Fund)
Series 2019
2.366%, 09/01/2049 | | | 1,000 | | | | 977,796 | |
Municipal Electric Authority of Georgia
Series 2021
1.897%, 01/01/2027 | | | 385 | | | | 337,294 | |
New Jersey Economic Development Authority
(New Jersey Economic Development Authority State Lease)
Series 2021-G
5.25%, 09/01/2023(a) | | | 1,440 | | | | 1,458,103 | |
New Jersey Turnpike Authority
Series 2021-B
0.638%, 01/01/2024 | | | 1,000 | | | | 950,565 | |
0.897%, 01/01/2025 | | | 2,000 | | | | 1,829,922 | |
New York State Urban Development Corp.
Series 2020-F
0.87%, 03/15/2025 | | | 1,400 | | | | 1,277,608 | |
Ohio Turnpike & Infrastructure Commission
Series 2020
1.746%, 02/15/2023 | | | 700 | | | | 694,312 | |
Oklahoma Development Finance Authority
Series 2022
3.877%, 05/01/2037 | | | 1,760 | | | | 1,636,936 | |
Pennsylvania Turnpike Commission
Series 2019
2.556%, 12/01/2025 | | | 760 | | | | 705,196 | |
Port of Portland OR Airport Revenue
Series 2020-T
1.00%, 07/01/2023 | | | 1,200 | | | | 1,169,305 | |
Reedy Creek Improvement District
Series 2020-A
1.549%, 06/01/2023 | | | 700 | | | | 685,806 | |
State Board of Administration Finance Corp.
Series 2020-A
1.258%, 07/01/2025 | | | 1,010 | | | | 908,932 | |
| | |
| |
20 | AB TAXABLE MULTI-SECTOR INCOME SHARES | | abfunds.com |
PORTFOLIO OF INVESTMENTS (continued)
| | | | | | | | |
| | | Principal
Amount
(000) | | | U.S. $ Value | |
| |
State of Connecticut
Series 2021-A
0.309%, 06/01/2023 | | $ | 150 | | | $ | 146,199 | |
0.508%, 06/01/2024 | | | 1,000 | | | | 933,897 | |
Series 2022-A
3.292%, 06/15/2025 | | | 1,000 | | | | 959,259 | |
State of Hawaii Airports System Revenue
Series 2020-E
1.392%, 07/01/2025 | | | 1,000 | | | | 912,969 | |
Tobacco Settlement Finance Authority/WV
Series 2020
3.00%, 06/01/2035 | | | 887 | | | | 816,411 | |
University of California
Series 2022-S
5.00%, 05/15/2024 | | | 2,500 | | | | 2,568,969 | |
| | | | | | | | |
| | |
Total Local Governments - US Municipal Bonds
(cost $45,809,230) | | | | | | | 43,146,921 | |
| | | | | | | | |
| | | | | | | | |
GOVERNMENTS - TREASURIES – 11.4% | |
United States – 11.4% | |
U.S. Treasury Notes
3.125%, 08/15/2025
(cost $37,116,399) | | | 37,500 | | | | 36,199,219 | |
| | | | | | | | |
| | | | | | | | |
AGENCIES – 9.4% | |
Agency Debentures – 9.4% | |
Federal Home Loan Banks
4.50%, 10/03/2024
(cost $29,967,480) | | | 30,000 | | | | 29,943,660 | |
| | | | | | | | |
| | | | | | | | |
ASSET-BACKED SECURITIES – 2.9% | |
Autos - Fixed Rate – 2.6% | |
Carmax Auto Owner Trust
Series 2021-1, Class C
0.94%, 12/15/2026 | | | 500 | | | | 450,104 | |
Carvana Auto Receivables Trust
Series 2021-N1, Class C
1.30%, 01/10/2028 | | | 521 | | | | 490,500 | |
CPS Auto Receivables Trust
Series 2021-A, Class C
0.83%, 09/15/2026(a) | | | 486 | | | | 478,368 | |
Series 2021-B, Class C
1.23%, 03/15/2027(a) | | | 1,000 | | | | 963,358 | |
DT Auto Owner Trust
Series 2021-1A, Class C
0.84%, 10/15/2026(a) | | | 500 | | | | 477,264 | |
| | |
| |
| abfunds.com | | AB TAXABLE MULTI-SECTOR INCOME SHARES | 21 |
PORTFOLIO OF INVESTMENTS (continued)
| | | | | | | | |
| | | Principal
Amount
(000) | | | U.S. $ Value | |
| |
Exeter Automobile Receivables Trust
Series 2021-1A, Class C
0.74%, 01/15/2026 | | $ | 1,959 | | | $ | 1,914,567 | |
Foursight Capital Automobile Receivables Trust
Series 2021-1, Class C
1.02%, 09/15/2026(a) | | | 850 | | | | 810,554 | |
JPMorgan Chase Bank NA – CACLN
Series 2021-1, Class B
0.875%, 09/25/2028(a) | | | 820 | | | | 790,316 | |
Westlake Automobile Receivables Trust
Series 2021-1A, Class C
0.95%, 03/16/2026(a) | | | 2,000 | | | | 1,914,728 | |
| | | | | | | | |
| | | | | | | 8,289,759 | |
| | | | | | | | |
Other ABS - Fixed Rate – 0.3% | |
Affirm Asset Securitization Trust
Series 2021-Z1, Class A
1.07%, 08/15/2025(a) | | | 363 | | | | 352,122 | |
Domino’s Pizza Master Issuer LLC
Series 2021-1A, Class A2I
2.662%, 04/25/2051(a) | | | 788 | | | | 631,957 | |
Upstart Securitization Trust
Series 2021-1, Class A
0.87%, 03/20/2031(a) | | | 59 | | | | 58,215 | |
| | | | | | | | |
| | | | | | | 1,042,294 | |
| | | | | | | | |
Total Asset-Backed Securities
(cost $9,845,101) | | | | | | | 9,332,053 | |
| | | | | | | | |
| | | | | | | | |
COMMERCIAL MORTGAGE-BACKED SECURITIES – 0.9% | | | | | | | | |
Non-Agency Floating Rate CMBS – 0.7% | |
BAMLL Commercial Mortgage Securities Trust
Series 2017-SCH, Class AF
4.413% (LIBOR 1 Month + 1.00%), 11/15/2033(a)(b) | | | 1,000 | | | | 910,407 | |
DBWF Mortgage Trust
Series 2018-GLKS, Class A
4.51% (LIBOR 1 Month + 1.03%), 12/19/2030(a)(b) | | | 1,000 | | | | 959,929 | |
Invitation Homes Trust
Series 2018-SFR4, Class A
4.512% (LIBOR 1 Month + 1.10%), 01/17/2038(a)(b) | | | 315 | | | | 309,855 | |
| | | | | | | | |
| | | | | | | 2,180,191 | |
| | | | | | | | |
Non-Agency Fixed Rate CMBS – 0.2% | |
JPMorgan Chase Commercial Mortgage Securities Trust
Series 2012-LC9, Class AS
3.353%, 12/15/2047(a) | | | 750 | | | | 748,168 | |
| | |
| |
22 | AB TAXABLE MULTI-SECTOR INCOME SHARES | | abfunds.com |
PORTFOLIO OF INVESTMENTS (continued)
| | | | | | | | |
| | | Principal
Amount
(000) | | | U.S. $ Value | |
| |
LSTAR Commercial Mortgage Trust
Series 2016-4, Class A2
2.579%, 03/10/2049(a) | | $ | 29 | | | $ | 28,643 | |
| | | | | | | | |
| | | | | | | 776,811 | |
| | | | | | | | |
Total Commercial Mortgage-Backed Securities
(cost $3,077,079) | | | | | | | 2,957,002 | |
| | | | | | | | |
| | | | | | | | |
COLLATERALIZED MORTGAGE OBLIGATIONS – 0.3% | | | | | | | | |
Risk Share Floating Rate – 0.3% | |
Bellemeade Re Ltd.
Series 2019-3A, Class M1B
5.186% (LIBOR 1 Month + 1.60%), 07/25/2029(a)(b) | | | 80 | | | | 79,723 | |
Federal Home Loan Mortgage Corp. Structured Agency Credit Risk Debt Notes
Series 2014-DN3, Class M3
7.586% (LIBOR 1 Month + 4.00%), 08/25/2024(b) | | | 35 | | | | 35,054 | |
Series 2015-DNA1, Class M3
6.886% (LIBOR 1 Month + 3.30%), 10/25/2027(b) | | | 46 | | | | 46,085 | |
Federal National Mortgage Association Connecticut Avenue Securities
Series 2014-C01, Class M2
7.986% (LIBOR 1 Month + 4.40%), 01/25/2024(b) | | | 126 | | | | 127,797 | |
Series 2014-C03, Class 2M2
6.486% (LIBOR 1 Month + 2.90%), 07/25/2024(b) | | | 52 | | | | 52,239 | |
Series 2016-C01, Class 1M2
10.336% (LIBOR 1 Month + 6.75%), 08/25/2028(b) | | | 205 | | | | 213,450 | |
Series 2016-C02, Class 1M2
9.586% (LIBOR 1 Month + 6.00%), 09/25/2028(b) | | | 189 | | | | 195,314 | |
Series 2016-C03, Class 1M2
8.886% (LIBOR 1 Month + 5.30%), 10/25/2028(b) | | | 110 | | | | 113,708 | |
| | | | | | | | |
| | | | | | | 863,370 | |
| | | | | | | | |
Agency Fixed Rate – 0.0% | |
Federal Home Loan Mortgage Corp. REMICs
Series 4029, Class LD
1.75%, 01/15/2027 | | | 64 | | | | 61,238 | |
| | |
| |
| abfunds.com | | AB TAXABLE MULTI-SECTOR INCOME SHARES | 23 |
PORTFOLIO OF INVESTMENTS (continued)
| | | | | | | | |
| | | Principal
Amount
(000) | | | U.S. $ Value | |
| |
Series 4459, Class CA
5.00%, 12/15/2034 | | $ | 19 | | | $ | 19,201 | |
| | | | | | | | |
| | | | | | | 80,439 | |
| | | | | | | | |
Total Collateralized Mortgage Obligations
(cost $967,134) | | | | | | | 943,809 | |
| | | | | | | | |
| | | | | | | | |
CORPORATES - NON-INVESTMENT
GRADE – 0.2% | | | | | | | | |
Industrial – 0.2% | |
Consumer Cyclical - Automotive – 0.2% | |
Ford Motor Credit Co. LLC
4.95%, 05/28/2027
(cost $779,092) | | | 779 | | | | 713,673 | |
| | | | | | | | |
| | |
Total Investments – 99.4%
(cost $333,734,900) | | | | | | | 317,459,667 | |
Other assets less liabilities – 0.6% | | | | | | | 2,030,977 | |
| | | | | | | | |
| | |
Net Assets – 100.0% | | | | | | $ | 319,490,644 | |
| | | | | | | | |
CENTRALLY CLEARED INTEREST RATE SWAPS (see Note C)
| | | | | | | | | | | | | | | | | | | | | | | | | | |
| | | | | | | | | Rate Type | | | | | | | | | | | |
Notional
Amount
(000) | | | Termination
Date | | | Payments
made
by the
Fund | | Payments
received
by the
Fund | | Payment
Frequency
Paid/
Received | | Market
Value | | | Upfront
Premiums
Paid/
(Received) | | | Unrealized
Appreciation
(Depreciation) | |
| USD | | | 44,000 | | | | 01/31/2024 | | | 1 Day
SOFR | | 1.031% | | Annual | | $ | (2,043,401 | ) | | $ | – 0 | – | | $ | (2,043,401 | ) |
| USD | | | 16,000 | | | | 03/31/2025 | | | 1 Day
SOFR | | 4.121 | | Annual | | | (97,647 | ) | | | – 0 | – | | | (97,647 | ) |
| USD | | | 20,000 | | | | 03/31/2027 | | | 1.478% | | 1 Day SOFR | | Annual | | | 2,107,014 | | | | – 0 | – | | | 2,107,014 | |
| | | | | | | | | | | | | | | | | | | | | | | | | | |
| | | | $ | (34,034 | ) | | $ | – 0 | – | | $ | (34,034 | ) |
| | | | | | | | | | | | | | | | | | | | | | | | | | |
CREDIT DEFAULT SWAPS (see Note C)
| | | | | | | | | | | | | | | | | | | | | | | | | | | | | | | | |
Swap Counterparty &
Referenced Obligation | | Fixed
Rate
(Pay)
Receive | | | Payment
Frequency | | | Implied
Credit
Spread at
October 31,
2022 | | | Notional
Amount
(000) | | | Market
Value | | | Upfront
Premiums
Paid/
(Received) | | | Unrealized
Appreciation
(Depreciation) | |
Sale Contracts | |
Citigroup Global Markets, Inc. | | | | | | | | | | | | | | | | | | | | | | | | | | | | | |
CDX-CMBX.NA.A
Series 6, 05/11/2063* | | | 2.00 | % | | | Monthly | | | | 7.50 | % | | | USD | | | | 1,453 | | | $ | (156,676 | ) | | $ | 12,917 | | | $ | (169,593 | ) |
CDX-CMBX.NA.BBB-
Series 6, 05/11/2063* | | | 3.00 | | | | Monthly | | | | 7.50 | | | | USD | | | | 22 | | | | (5,014 | ) | | | (2,088 | ) | | | (2,926 | ) |
| | |
| |
24 | AB TAXABLE MULTI-SECTOR INCOME SHARES | | abfunds.com |
PORTFOLIO OF INVESTMENTS (continued)
| | | | | | | | | | | | | | | | | | | | | | | | | | | | | | | | |
Swap Counterparty &
Referenced Obligation | | Fixed
Rate
(Pay)
Receive | | | Payment
Frequency | | | Implied
Credit
Spread at
October 31,
2022 | | | Notional
Amount
(000) | | | Market
Value | | | Upfront
Premiums
Paid/
(Received) | | | Unrealized
Appreciation
(Depreciation) | |
CDX-CMBX.NA.BBB-
Series 6, 05/11/2063* | | | 3.00 | % | | | Monthly | | | | 7.50 | % | | | USD | | | | 41 | | | $ | (9,245 | ) | | $ | (5,286 | ) | | $ | (3,959 | ) |
CDX-CMBX.NA.BBB-
Series 6, 05/11/2063* | | | 3.00 | | | | Monthly | | | | 7.50 | | | | USD | | | | 126 | | | | (28,206 | ) | | | (11,566 | ) | | | (16,640 | ) |
Credit Suisse International | | | | | | | | | | | | | | | | | | | | | | | | | | | | | |
CDX-CMBX.NA.BBB-
Series 6, 05/11/2063* | | | 3.00 | | | | Monthly | | | | 7.50 | | | | USD | | | | 13 | | | | (2,820 | ) | | | (1,185 | ) | | | (1,635 | ) |
CDX-CMBX.NA.BBB-
Series 6, 05/11/2063* | | | 3.00 | | | | Monthly | | | | 7.50 | | | | USD | | | | 157 | | | | (35,100 | ) | | | (14,769 | ) | | | (20,331 | ) |
CDX-CMBX.NA.BBB-
Series 6, 05/11/2063* | | | 3.00 | | | | Monthly | | | | 7.50 | | | | USD | | | | 235 | | | | (52,495 | ) | | | (21,521 | ) | | | (30,974 | ) |
Goldman Sachs International | | | | | | | | | | | | | | | | | | | | | | | | | | | | | |
CDX-CMBX.NA.BBB-
Series 6, 05/11/2063* | | | 3.00 | | | | Monthly | | | | 7.50 | | | | USD | | | | 204 | | | | (45,600 | ) | | | (18,145 | ) | | | (27,455 | ) |
JPMorgan Securities, LLC | | | | | | | | | | | | | | | | | | | | | | | | | | | | | |
CDX-CMBX.NA.BBB-
Series 6, 05/11/2063* | | | 3.00 | | | | Monthly | | | | 7.50 | | | | USD | | | | 746 | | | | (167,042 | ) | | | (106,052 | ) | | | (60,990 | ) |
| | | | | | | | | | | | | | | | | | | | | | | | | | | | | | | | |
| | | | | | | | | | | | | | | | | | | | | | $ | (502,198 | ) | | $ | (167,695 | ) | | $ | (334,503 | ) |
| | | | | | | | | | | | | | | | | | | | | | | | | | | | | | | | |
| (a) | Security is exempt from registration under Rule 144A or Regulation S of the Securities Act of 1933. These securities are considered restricted, but liquid and may be resold in transactions exempt from registration. At October 31, 2022, the aggregate market value of these securities amounted to $15,046,157 or 4.7% of net assets. |
| (b) | Floating Rate Security. Stated interest/floor/ceiling rate was in effect at October 31, 2022. |
Glossary:
ABS – Asset-Backed Securities
BSBY – Bloomberg Short-Term Bank Yield Index
CDX-CMBX.NA – North American Commercial Mortgage-Backed Index
CMBS – Commercial Mortgage-Backed Securities
COP – Certificate of Participation
LIBOR – London Interbank Offered Rate
REIT – Real Estate Investment Trust
REMICs – Real Estate Mortgage Investment Conduits
SOFR – Secured Overnight Financing Rate
See notes to financial statements.
| | |
| |
| abfunds.com | | AB TAXABLE MULTI-SECTOR INCOME SHARES | 25 |
STATEMENT OF ASSETS & LIABILITIES
October 31, 2022 (unaudited)
| | | | |
| Assets | |
Investments in securities, at value (cost $333,734,900) | | $ | 317,459,667 | |
Cash collateral due from broker | | | 1,193,533 | |
Interest receivable | | | 1,914,391 | |
Receivable for shares of beneficial interest sold | | | 779,408 | |
Receivable for variation margin on centrally cleared swaps | | | 19,893 | |
Affiliated dividends receivable | | | 1,905 | |
Receivable due from Adviser | | | 1,136 | |
Other assets | | | 517 | |
| | | | |
Total assets | | | 321,370,450 | |
| | | | |
| Liabilities | |
Due to custodian | | | 569,649 | |
Dividends payable | | | 561,782 | |
Market value on credit default swaps (net premiums received $167,695) | | | 502,198 | |
Payable for shares of beneficial interest redeemed | | | 246,177 | |
| | | | |
Total liabilities | | | 1,879,806 | |
| | | | |
Net Assets | | $ | 319,490,644 | |
| | | | |
| Composition of Net Assets | |
Shares of beneficial interest, at par | | $ | 341 | |
Additional paid-in capital | | | 338,201,407 | |
Accumulated loss | | | (18,711,104 | ) |
| | | | |
Net Assets | | $ | 319,490,644 | |
| | | | |
Net Asset Value Per Share—unlimited shares of beneficial interest authorized, $.00001 par value (based on 34,067,791 common shares outstanding) | | $ | 9.38 | |
| | | | |
See notes to financial statements.
| | |
| |
26 | AB TAXABLE MULTI-SECTOR INCOME SHARES | | abfunds.com |
STATEMENT OF OPERATIONS
Six Months Ended October 31, 2022 (unaudited)
| | | | | | | | |
| Investment Income | | | | | | | | |
Interest | | $ | 2,625,995 | | | | | |
Dividends—Affiliated issuers | | | 72,475 | | | | | |
Other income(a) | | | 4,813 | | | | | |
| | | | | | | | |
Total investment income | | | | | | $ | 2,703,283 | |
| | | | | | | | |
| Realized and Unrealized Gain (Loss) on Investment Transactions | | | | | | | | |
Net realized gain (loss) on: | | | | | | | | |
Investment transactions | | | | | | | (2,449,168 | ) |
Swaps | | | | | | | 44,249 | |
Net change in unrealized appreciation (depreciation) of: | | | | | | | | |
Investments | | | | | | | (4,769,766 | ) |
Swaps | | | | | | | 108,961 | |
| | | | | | | | |
Net loss on investment transactions | | | | | | | (7,065,724 | ) |
| | | | | | | | |
Net Decrease in Net Assets from Operations | | | | | | $ | (4,362,441 | ) |
| | | | | | | | |
| (a) | Other income includes a reimbursement for investment in affiliated issuer (see Note B). |
See notes to financial statements.
| | |
| |
| abfunds.com | | AB TAXABLE MULTI-SECTOR INCOME SHARES | 27 |
STATEMENT OF CHANGES IN NET ASSETS
| | | | | | | | |
| | | Six Months Ended
October 31, 2022
(unaudited) | | | Year Ended
April 30,
2022 | |
Increase (Decrease) in Net Assets
from Operations | |
Net investment income | | $ | 2,703,283 | | | $ | 3,163,524 | |
Net realized gain (loss) on investment transactions | | | (2,404,919 | ) | | | 1,000,597 | |
Net change in unrealized appreciation (depreciation) of investments | | | (4,660,805 | ) | | | (13,666,403 | ) |
| | | | | | | | |
Net decrease in net assets from operations | | | (4,362,441 | ) | | | (9,502,282 | ) |
Distribution to Shareholders | | | (2,693,245 | ) | | | (4,804,206 | ) |
| Transactions in Shares of Beneficial Interest | | | | | | | | |
Net increase | | | 29,380,150 | | | | 5,600,368 | |
| | | | | | | | |
Total increase (decrease) | | | 22,324,464 | | | | (8,706,120 | ) |
| Net Assets | | | | | | | | |
Beginning of period | | | 297,166,180 | | | | 305,872,300 | |
| | | | | | | | |
End of period | | $ | 319,490,644 | | | $ | 297,166,180 | |
| | | | | | | | |
See notes to financial statements.
| | |
| |
28 | AB TAXABLE MULTI-SECTOR INCOME SHARES | | abfunds.com |
NOTES TO FINANCIAL STATEMENTS
October 31, 2022 (unaudited)
NOTE A
Significant Accounting Policies
AB Corporate Shares (the “Trust”) is registered under the Investment Company Act of 1940, as an open-end, diversified management investment company. The Trust, which is a Massachusetts Business Trust, operates as a “series” company currently offering five separate portfolios: AB Corporate Income Shares, AB Municipal Income Shares, AB Taxable Multi-Sector Income Shares, AB Impact Municipal Income Shares and AB Tax-Aware Real Return Income Shares. Each portfolio is considered to be a separate entity for financial reporting and tax purposes. This report relates only to AB Taxable Multi-Sector Income Shares (the “Fund”).
Shares of the Fund are offered exclusively to holders of accounts established under wrap fee programs sponsored and maintained by certain registered investment advisers approved by AllianceBernstein L.P. (the “Adviser”). The Fund’s shares may be purchased at the relevant net asset value without a sales charge or other fee. The financial statements have been prepared in conformity with U.S. generally accepted accounting principles (“U.S. GAAP”), which require management to make certain estimates and assumptions that affect the reported amounts of assets and liabilities in the financial statements and amounts of income and expenses during the reporting period. Actual results could differ from those estimates. The Fund is an investment company under U.S. GAAP and follows the accounting and reporting guidance applicable to investment companies. The following is a summary of significant accounting policies followed by the Fund.
1. Security Valuation
Portfolio securities are valued at market value determined on the basis of market quotations or, if market quotations are not readily available or are unreliable, at “fair value” as determined in accordance with procedures approved by and under the oversight of the Trust’s Board of Trustees (the “Board”). Pursuant to these procedures, the Adviser serves as the Fund’s valuation designee pursuant to Rule 2a-5 of the 1940 Act. In this capacity, the Adviser is responsible, among other things, for making all fair value determinations relating to the Fund’s portfolio investments, subject to the Board’s oversight.
In general, the market values of securities which are readily available and deemed reliable are determined as follows: securities listed on a national securities exchange (other than securities listed on the NASDAQ Stock Market, Inc. (“NASDAQ”)) or on a foreign securities exchange are valued at the last sale price at the close of the exchange or foreign securities exchange. If there has been no sale on such day, the securities are valued at the last traded price from the previous day. Securities listed on more
| | |
| |
| abfunds.com | | AB TAXABLE MULTI-SECTOR INCOME SHARES | 29 |
NOTES TO FINANCIAL STATEMENTS (continued)
than one exchange are valued by reference to the principal exchange on which the securities are traded; securities listed only on NASDAQ are valued in accordance with the NASDAQ Official Closing Price; listed or over the counter (“OTC”) market put or call options are valued at the mid level between the current bid and ask prices. If either a current bid or current ask price is unavailable, the Adviser will have discretion to determine the best valuation (e.g., last trade price in the case of listed options); open futures are valued using the closing settlement price or, in the absence of such a price, the most recent quoted bid price. If there are no quotations available for the day of valuation, the last available closing settlement price is used; U.S. Government securities and any other debt instruments having 60 days or less remaining until maturity are generally valued at market by an independent pricing vendor, if a market price is available. If a market price is not available, the securities are valued at amortized cost. This methodology is commonly used for short term securities that have an original maturity of 60 days or less, as well as short term securities that had an original term to maturity that exceeded 60 days. In instances when amortized cost is utilized, the Valuation Committee (the “Committee”) must reasonably conclude that the utilization of amortized cost is approximately the same as the fair value of the security. Factors the Committee will consider include, but are not limited to, an impairment of the creditworthiness of the issuer or material changes in interest rates. Fixed-income securities, including mortgage-backed and asset-backed securities, may be valued on the basis of prices provided by a pricing service or at a price obtained from one or more of the major broker-dealers. In cases where broker-dealer quotes are obtained, the Adviser may establish procedures whereby changes in market yields or spreads are used to adjust, on a daily basis, a recently obtained quoted price on a security. Swaps and other derivatives are valued daily, primarily using independent pricing services, independent pricing models using market inputs, as well as third party broker-dealers or counterparties. Open-end mutual funds are valued at the closing net asset value per share, while exchange traded funds are valued at the closing market price per share.
Securities for which market quotations are not readily available (including restricted securities) or are deemed unreliable are valued at fair value as deemed appropriate by the Adviser. Factors considered in making this determination may include, but are not limited to, information obtained by contacting the issuer, analysts, analysis of the issuer’s financial statements or other available documents. In addition, the Fund may use fair value pricing for securities primarily traded in non-U.S. markets because most foreign markets close well before the Fund values its securities at 4:00 p.m., Eastern Time. The earlier close of these foreign markets gives rise to the possibility that significant events, including broad market moves, may have occurred in the interim and may materially affect the value of those
| | |
| |
30 | AB TAXABLE MULTI-SECTOR INCOME SHARES | | abfunds.com |
NOTES TO FINANCIAL STATEMENTS (continued)
securities. To account for this, the Fund generally values many of its foreign equity securities using fair value prices based on third party vendor modeling tools to the extent available.
2. Fair Value Measurements
In accordance with U.S. GAAP regarding fair value measurements, fair value is defined as the price that the Fund would receive to sell an asset or pay to transfer a liability in an orderly transaction between market participants at the measurement date. U.S. GAAP establishes a framework for measuring fair value, and a three-level hierarchy for fair value measurements based upon the transparency of inputs to the valuation of an asset or liability (including those valued based on their market values as described in Note A.1 above). Inputs may be observable or unobservable and refer broadly to the assumptions that market participants would use in pricing the asset or liability. Observable inputs reflect the assumptions market participants would use in pricing the asset or liability based on market data obtained from sources independent of the Fund. Unobservable inputs reflect the Fund’s own assumptions about the assumptions that market participants would use in pricing the asset or liability based on the best information available in the circumstances. Each investment is assigned a level based upon the observability of the inputs which are significant to the overall valuation. The three-tier hierarchy of inputs is summarized below.
| | • | | Level 1—quoted prices in active markets for identical investments |
| | • | | Level 2—other significant observable inputs (including quoted prices for similar investments, interest rates, prepayment speeds, credit risk, etc.) |
| | • | | Level 3—significant unobservable inputs (including the Fund’s own assumptions in determining the fair value of investments) |
The fair value of debt instruments, such as bonds, and over-the-counter derivatives is generally based on market price quotations, recently executed market transactions (where observable) or industry recognized modeling techniques and are generally classified as Level 2. Pricing vendor inputs to Level 2 valuations may include quoted prices for similar investments in active markets, interest rate curves, coupon rates, currency rates, yield curves, option adjusted spreads, default rates, credit spreads and other unique security features in order to estimate the relevant cash flows which are then discounted to calculate fair values. If these inputs are unobservable and significant to the fair value, these investments will be classified as Level 3.
Valuations of mortgage-backed or other asset-backed securities, by pricing vendors, are based on both proprietary and industry recognized models and discounted cash flow techniques. Significant inputs to the valuation
| | |
| |
| abfunds.com | | AB TAXABLE MULTI-SECTOR INCOME SHARES | 31 |
NOTES TO FINANCIAL STATEMENTS (continued)
of these instruments are value of the collateral, the rates and timing of delinquencies, the rates and timing of prepayments, and default and loss expectations, which are driven in part by housing prices for residential mortgages. Significant inputs are determined based on relative value analyses, which incorporate comparisons to instruments with similar collateral and risk profiles, including relevant indices. Mortgage and asset-backed securities for which management has collected current observable data through pricing services are generally categorized within Level 2. Those investments for which current observable data has not been provided are classified as Level 3.
Other fixed income investments, including non-U.S. government and corporate debt, are generally valued using quoted market prices, if available, which are typically impacted by current interest rates, maturity dates and any perceived credit risk of the issuer. Additionally, in the absence of quoted market prices, these inputs are used by pricing vendors to derive a valuation based upon industry or proprietary models which incorporate issuer specific data with relevant yield/spread comparisons with more widely quoted bonds with similar key characteristics. Those investments for which there are observable inputs are classified as Level 2. Where the inputs are not observable, the investments are classified as Level 3.
The following table summarizes the valuation of the Fund’s investments by the above fair value hierarchy levels as of October 31, 2022:
| | | | | | | | | | | | | | | | |
Investments in
Securities: | | Level 1 | | | Level 2 | | | Level 3 | | | Total | |
Assets: | | | | | | | | | | | | | | | | |
Corporates—Investment Grade | | $ | – 0 | – | | $ | 194,223,330 | | | $ | – 0 | – | | $ | 194,223,330 | |
Local Governments—US Municipal Bonds | | | – 0 | – | | | 43,146,921 | | | | – 0 | – | | | 43,146,921 | |
Governments—Treasuries | | | – 0 | – | | | 36,199,219 | | | | – 0 | – | | | 36,199,219 | |
Agencies | | | – 0 | – | | | 29,943,660 | | | | – 0 | – | | | 29,943,660 | |
Asset-Backed Securities | | | – 0 | – | | | 9,332,053 | | | | – 0 | – | | | 9,332,053 | |
Commercial Mortgage-Backed Securities | | | – 0 | – | | | 2,957,002 | | | | – 0 | – | | | 2,957,002 | |
Collateralized Mortgage Obligations | | | – 0 | – | | | 943,809 | | | | – 0 | – | | | 943,809 | |
Corporates—Non-Investment Grade | | | – 0 | – | | | 713,673 | | | | – 0 | – | | | 713,673 | |
| | | | | | | | | | | | | | | | |
Total Investments in Securities | | | – 0 | – | | | 317,459,667 | | | | – 0 | – | | | 317,459,667 | |
Other Financial Instruments(a): | | | | | | | | | | | | | | | | |
Assets: | | | | | | | | | | | | | | | | |
Centrally Cleared Interest Rate Swaps | | | – 0 | – | | | 2,107,014 | | | | – 0 | – | | | 2,107,014 | (b) |
Liabilities: | | | | | | | | | | | | | | | | |
Centrally Cleared Interest Rate Swaps | | | – 0 | – | | | (2,141,048 | ) | | | – 0 | – | | | (2,141,048 | )(b) |
Credit Default Swaps | | | – 0 | – | | | (502,198 | ) | | | – 0 | – | | | (502,198 | ) |
| | | | | | | | | | | | | | | | |
Total | | $ | – 0 | – | | $ | 316,923,435 | | | $ | – 0 | – | | $ | 316,923,435 | |
| | | | | | | | | | | | | | | | |
| (a) | Other financial instruments are derivative instruments, such as futures, forwards and swaps, which are valued at the unrealized appreciation (depreciation) on the instrument. Other financial instruments may also include swaps with upfront premiums, written options and written swaptions which are valued at market value. |
| | |
| |
32 | AB TAXABLE MULTI-SECTOR INCOME SHARES | | abfunds.com |
NOTES TO FINANCIAL STATEMENTS (continued)
| (b) | Only variation margin receivable/(payable) at period end is reported within the statement of assets and liabilities. This amount reflects cumulative unrealized appreciation (depreciation) on futures and centrally cleared swaps as reported in the portfolio of investments. Where applicable, centrally cleared swaps with upfront premiums are presented here at market value. |
3. Taxes
It is the Fund’s policy to meet the requirements of the Internal Revenue Code applicable to regulated investment companies and to distribute all of its investment company taxable income and net realized gains, if any, to shareholders. Therefore, no provisions for federal income or excise taxes are required.
In accordance with U.S. GAAP requirements regarding accounting for uncertainties in income taxes, management has analyzed the Fund’s tax positions taken or expected to be taken on federal and state income tax returns for all open tax years (the current and the prior three tax years) and has concluded that no provision for income tax is required in the Fund’s financial statements.
4. Investment Income and Investment Transactions
Dividend income is recorded on the ex-dividend date or as soon as the Fund is informed of the dividend. Interest income is accrued daily. Investment transactions are accounted for on the date the securities are purchased or sold. Investment gains or losses are determined on the identified cost basis. Non-cash dividends, if any, are recorded on the ex-dividend date at the fair value of the securities received. The Fund amortizes premiums and accretes discounts as adjustments to interest income. The Fund accounts for distributions received from REIT investments or from regulated investment companies as dividend income, realized gain, or return of capital based on information provided by the REIT or the investment company.
5. Dividends and Distributions
Dividends and distributions to shareholders, if any, are recorded on the ex-dividend date. Income dividends and capital gains distributions are determined in accordance with federal tax regulations and may differ from those determined in accordance with U.S. GAAP. To the extent these differences are permanent, such amounts are reclassified within the capital accounts based on their federal tax basis treatment; temporary differences do not require such reclassification.
NOTE B
Advisory Fee and Other Transactions with Affiliates
Under the terms of the Advisory Agreement, the Fund pays no advisory fee to the Adviser and the Adviser reimburses or pays for the Fund’s operating expenses. The Fund is an integral part of separately managed accounts in
| | |
| |
| abfunds.com | | AB TAXABLE MULTI-SECTOR INCOME SHARES | 33 |
NOTES TO FINANCIAL STATEMENTS (continued)
wrap fee programs and other investment programs. Typically, participants in these programs pay a fee to their investment adviser for all costs and expenses of the separately managed account, including costs and expenses associated with the Fund, and a fee is paid by their investment adviser to the Adviser. In certain cases, participants may have a direct relationship with the Adviser without the involvement of a third party investment adviser, in which case the participant would pay a fee directly to the Adviser. The Adviser serves as investment manager and adviser of the Fund and continuously furnishes an investment program for the Fund and manages, supervises and conducts the affairs of the Fund, subject to the supervisions of the Fund’s Board. The Advisory Agreement provides that the Adviser or an affiliate will furnish, or pay the expenses of the Fund for, office space, facilities and equipment, services of executive and other personnel of the Fund and certain administrative services.
The Fund has entered into a distribution agreement with AllianceBernstein Investments, Inc., the Fund’s principal underwriter (the “Underwriter”), to permit the Underwriter to distribute the Fund’s shares, which are sold at their net asset value without any sales charge. The Fund does not pay a fee for this service. The Underwriter is a wholly owned subsidiary of the Adviser.
AllianceBernstein Investor Services, Inc. (“ABIS”), a wholly-owned subsidiary of the Adviser, acts as the Fund’s registrar, transfer agent and dividend-disbursing agent. ABIS registers the transfer, issuance and redemption of Fund shares and disburses dividends and other distributions to Fund shareholders. The Fund does not pay a fee for this service.
The Fund may invest in AB Government Money Market Portfolio (the “Government Money Market Portfolio”) which has a contractual annual advisory fee rate of ..20% of the portfolio’s average daily net assets and bears its own expenses. The Adviser has contractually agreed to waive .10% of the advisory fee of Government Money Market Portfolio (resulting in a net advisory fee of .10%) until August 31, 2023. In connection with the investment by the Fund in Government Money Market Portfolio, the Adviser has contractually agreed to reimburse its advisory fee from the Fund in an amount equal to the Fund’s pro rata share of the effective advisory fee of Government Money Market Portfolio, as borne indirectly by the Fund as an acquired fund fee and expense. For the six months ended October 31, 2022, such reimbursement amounted to $4,813.
| | |
| |
34 | AB TAXABLE MULTI-SECTOR INCOME SHARES | | abfunds.com |
NOTES TO FINANCIAL STATEMENTS (continued)
A summary of the Fund’s transactions in AB mutual funds for the six months ended October 31, 2022 is as follows:
| | | | | | | | | | | | | | | | | | | | |
Fund | | Market Value
4/30/22
(000) | | | Purchases
at Cost
(000) | | | Sales
Proceeds
(000) | | | Market Value
10/31/22
(000) | | | Dividend
Income
(000) | |
Government Money Market Portfolio | | $ | 5,198 | | | $ | 86,336 | | | $ | 91,534 | | | $ | – 0 | – | | $ | 72 | |
NOTE C
Investment Transactions
Purchases and sales of investment securities (excluding short-term investments) for the six months ended October 31, 2022 were as follows:
| | | | | | | | |
| | | Purchases | | | Sales | |
Investment securities (excluding U.S. government securities) | | $ | 47,455,640 | | | $ | 46,954,361 | |
U.S. government securities | | | 76,039,995 | | | | 34,417,976 | |
The cost of investments for federal income tax purposes was substantially the same as the cost for financial reporting purposes. Accordingly, gross unrealized appreciation and unrealized depreciation are as follows:
| | | | |
Gross unrealized appreciation | | $ | 2,121,324 | |
Gross unrealized depreciation | | | (18,765,094 | ) |
| | | | |
Net unrealized depreciation | | $ | (16,643,770 | ) |
| | | | |
1. Derivative Financial Instruments
The Fund may use derivatives in an effort to earn income and enhance returns, to replace more traditional direct investments, to obtain exposure to otherwise inaccessible markets (collectively, “investment purposes”), or to hedge or adjust the risk profile of its portfolio.
The principal types of derivatives utilized by the Fund, as well as the methods in which they may be used are:
The Fund may enter into swaps to hedge its exposure to interest rates, credit risk or currencies. The Fund may also enter into swaps for non-hedging purposes as a means of gaining market exposures, making direct investments in foreign currencies, as described below under “Currency Transactions.” A swap is an agreement that obligates two parties to exchange a series of cash flows at specified intervals based upon or calculated by reference to changes in specified prices or rates for a specified amount of an underlying asset. The payment flows are usually netted against each other, with the
| | |
| |
| abfunds.com | | AB TAXABLE MULTI-SECTOR INCOME SHARES | 35 |
NOTES TO FINANCIAL STATEMENTS (continued)
difference being paid by one party to the other. In addition, collateral may be pledged or received by the Fund in accordance with the terms of the respective swaps to provide value and recourse to the Fund or its counterparties in the event of default, bankruptcy or insolvency by one of the parties to the swap.
Risks may arise as a result of the failure of the counterparty to the swap to comply with the terms of the swap. The loss incurred by the failure of a counterparty is generally limited to the net interim payment to be received by the Fund, and/or the termination value at the end of the contract. Therefore, the Fund considers the creditworthiness of each counterparty to a swap in evaluating potential counterparty risk. This risk is mitigated by having a netting arrangement between the Fund and the counterparty and by the posting of collateral by the counterparty to the Fund to cover the Fund’s exposure to the counterparty. Additionally, risks may arise from unanticipated movements in interest rates or in the value of the underlying securities. The Fund accrues for the interim payments on swaps on a daily basis, with the net amount recorded within unrealized appreciation (depreciation) of swaps on the statement of assets and liabilities, where applicable. Once the interim payments are settled in cash, the net amount is recorded as realized gain/(loss) on swaps on the statement of operations, in addition to any realized gain/(loss) recorded upon the termination of swaps. Upfront premiums paid or received for swaps are recognized as cost or proceeds on the statement of assets and liabilities and are amortized on a straight line basis over the life of the contract. Amortized upfront premiums are included in net realized gain/(loss) from swaps on the statement of operations. Fluctuations in the value of swaps are recorded as a component of net change in unrealized appreciation (depreciation) of swaps on the statement of operations.
Certain standardized swaps, including certain interest rate swaps and credit default swaps, are (or soon will be) subject to mandatory central clearing. Cleared swaps are transacted through futures commission merchants (“FCMs”) that are members of central clearinghouses, with the clearinghouse serving as central counterparty, similar to transactions in futures contracts. Centralized clearing will be required for additional categories of swaps on a phased-in basis based on requirements published by the Securities and Exchange Commission and Commodity Futures Trading Commission.
At the time the Fund enters into a centrally cleared swap, the Fund deposits and maintains as collateral an initial margin with the broker, as required by the clearinghouse on which the transaction is effected.
| | |
| |
36 | AB TAXABLE MULTI-SECTOR INCOME SHARES | | abfunds.com |
NOTES TO FINANCIAL STATEMENTS (continued)
Such amount is shown as cash collateral due from broker on the statement of assets and liabilities. Pursuant to the contract, the Fund agrees to receive from or pay to the broker an amount of cash equal to the daily fluctuation in the value of the contract. Such receipts or payments are known as variation margin and are recorded by the Fund as unrealized gains or losses. Risks may arise from the potential inability of a counterparty to meet the terms of the contract. The credit/counterparty risk for centrally cleared swaps is generally less than non-centrally cleared swaps, since the clearinghouse, which is the issuer or counterparty to each centrally cleared swap, has robust risk mitigation standards, including the requirement to provide initial and variation margin. When the contract is closed, the Fund records a realized gain or loss equal to the difference between the value of the contract at the time it was opened and the time it was closed.
Interest Rate Swaps:
The Fund is subject to interest rate risk exposure in the normal course of pursuing its investment objectives. Because the Fund holds fixed rate bonds, the value of these bonds may decrease if interest rates rise. To help hedge against this risk and to maintain its ability to generate income at prevailing market rates, the Fund may enter into interest rate swaps. Interest rate swaps are agreements between two parties to exchange cash flows based on a notional amount. The Fund may elect to pay a fixed rate and receive a floating rate, or, receive a fixed rate and pay a floating rate on a notional amount.
In addition, the Fund may also enter into interest rate swap transactions to preserve a return or spread on a particular investment or portion of its portfolio, or protecting against an increase in the price of securities the Fund anticipates purchasing at a later date. Interest rate swaps involve the exchange by a Fund with another party of their respective commitments to pay or receive interest (e.g., an exchange of floating rate payments for fixed rate payments) computed based on a contractually-based principal (or “notional”) amount. Interest rate swaps are entered into on a net basis (i.e., the two payment streams are netted out, with the Fund receiving or paying, as the case may be, only the net amount of the two payments).
During the six months ended October 31, 2022, the Fund held interest rate swaps for hedging purposes.
Credit Default Swaps:
The Fund may enter into credit default swaps, including to manage its exposure to the market or certain sectors of the market, to reduce its risk exposure to defaults by corporate and sovereign issuers held by the Fund, or to create exposure to corporate or sovereign issuers to
| | |
| |
| abfunds.com | | AB TAXABLE MULTI-SECTOR INCOME SHARES | 37 |
NOTES TO FINANCIAL STATEMENTS (continued)
which it is not otherwise exposed. The Fund may purchase credit protection (“Buy Contract”) or provide credit protection (“Sale Contract”) on the referenced obligation of the credit default swap. During the term of the swap, the Fund receives/(pays) fixed payments from/(to) the respective counterparty, calculated at the agreed upon rate applied to the notional amount. If the Fund is a buyer/(seller) of protection and a credit event occurs, as defined under the terms of the swap, the Fund will either (i) receive from the seller/(pay to the buyer) of protection an amount equal to the notional amount of the swap (the “Maximum Payout Amount”) and deliver/(take delivery of) the referenced obligation or (ii) receive/(pay) a net settlement amount in the form of cash or securities equal to the notional amount of the swap less the recovery value of the referenced obligation. In certain circumstances Maximum Payout Amounts may be partially offset by recovery values of the respective referenced obligations, upfront premium received upon entering into the agreement, or net amounts received from settlement of buy protection credit default swaps entered into by the Fund for the same referenced obligations with the same counterparty.
Credit default swaps may involve greater risks than if a Fund had invested in the referenced obligation directly. Credit default swaps are subject to general market risk, liquidity risk, counterparty risk and credit risk. If the Fund is a buyer of protection and no credit event occurs, it will lose the payments it made to its counterparty. If the Fund is a seller of protection and a credit event occurs, the value of the referenced obligation received by the Fund coupled with the periodic payments previously received, may be less than the Maximum Payout Amount it pays to the buyer, resulting in a net loss to the Fund.
Implied credit spreads over U.S. Treasuries of comparable maturity utilized in determining the market value of credit default swaps on issuers as of period end are disclosed in the portfolio of investments. The implied spreads serve as an indicator of the current status of the payment/performance risk and typically reflect the likelihood of default by the issuer of the referenced obligation. The implied credit spread of a particular reference obligation also reflects the cost of buying/selling protection and may reflect upfront payments required to be made to enter into the agreement. Widening credit spreads typically represent a deterioration of the referenced obligation’s credit soundness and greater likelihood of default or other credit event occurring as defined under the terms of the agreement. A credit spread identified as “Defaulted” indicates a credit event has occurred for the referenced obligation.
| | |
| |
38 | AB TAXABLE MULTI-SECTOR INCOME SHARES | | abfunds.com |
NOTES TO FINANCIAL STATEMENTS (continued)
During the six months ended October 31, 2022, the Fund held credit default swaps for hedging and non-hedging purposes.
The Fund typically enters into International Swaps and Derivatives Association, Inc. Master Agreements (“ISDA Master Agreement”) with its OTC derivative contract counterparties in order to, among other things, reduce its credit risk to OTC counterparties. ISDA Master Agreements include provisions for general obligations, representations, collateral and events of default or termination. Under an ISDA Master Agreement, the Fund typically may offset with the OTC counterparty certain derivative financial instruments’ payables and/or receivables with collateral held and/or posted and create one single net payment (close-out netting) in the event of default or termination. In the event of a default by an OTC counterparty, the return of collateral with market value in excess of the Fund’s net liability, held by the defaulting party, may be delayed or denied.
The Fund’s ISDA Master Agreements may contain provisions for early termination of OTC derivative transactions in the event the net assets of the Fund decline below specific levels (“net asset contingent features”). If these levels are triggered, the Fund’s OTC counterparty has the right to terminate such transaction and require the Fund to pay or receive a settlement amount in connection with the terminated transaction. If OTC derivatives were held at period end, please refer to netting arrangements by the OTC counterparty table below for additional details.
During the six months ended October 31, 2022, the Fund had entered into the following derivatives:
| | | | | | | | | | | | |
| | | Asset Derivatives | | | Liability Derivatives | |
Derivative Type | | Statement of
Assets and
Liabilities
Location | | Fair Value | | | Statement of
Assets and
Liabilities
Location | | Fair Value | |
Interest rate contracts | | Receivable/Payable for variation margin on centrally cleared swaps | | $ | 2,107,014 | * | | Receivable/Payable for variation margin on centrally cleared swaps | | $ | 2,141,048 | * |
| | | | |
Credit contracts | | | | | | | | Market value on credit default swaps | | | 502,198 | |
| | | | | | | | | | | | |
Total | | | | $ | 2,107,014 | | | | | $ | 2,643,246 | |
| | | | | | | | | | | | |
| * | Only variation margin receivable/payable at period end is reported within the statement of assets and liabilities. This amount reflects cumulative unrealized appreciation (depreciation) on futures and centrally cleared swaps as reported in the portfolio of investments. |
| | |
| |
| abfunds.com | | AB TAXABLE MULTI-SECTOR INCOME SHARES | 39 |
NOTES TO FINANCIAL STATEMENTS (continued)
| | | | | | | | | | |
Derivative Type | | Location of Gain
or (Loss) on
Derivatives Within
Statement of
Operations | | Realized Gain
or (Loss) on
Derivatives | | | Change in
Unrealized
Appreciation or
(Depreciation) | |
Interest rate contracts | | Net realized gain (loss) on swaps; Net change in unrealized appreciation (depreciation) of swaps | | $ | – 0 | – | | $ | (29,833 | ) |
| | | |
Credit contracts | | Net realized gain (loss) on swaps; Net change in unrealized appreciation (depreciation) of swaps | | | 44,249 | | | | 138,794 | |
| | | | | | | | | | |
Total | | | | $ | 44,249 | | | $ | 108,961 | |
| | | | | | | | | | |
The following table represents the average monthly volume of the Fund’s derivative transactions during the six months ended October 31, 2022:
| | | | |
Centrally Cleared Interest Rate Swaps: | | | | |
Average notional amount | | $ | 68,571,429 | |
Credit Default Swaps: | | | | |
Average notional amount of sale contracts | | $ | 3,604,320 | |
For financial reporting purposes, the Fund does not offset derivative assets and derivative liabilities that are subject to netting arrangements in the statement of assets and liabilities.
All OTC derivatives held at period end were subject to netting arrangements. The following table presents the Fund’s derivative assets and liabilities by OTC counterparty net of amounts available for offset under ISDA Master Agreements (“MA”) and net of the related collateral received/pledged by the Fund as of October 31, 2022. Exchange-traded derivatives and centrally cleared swaps are not subject to netting arrangements and as such are excluded from the table.
| | | | | | | | | | | | | | | | | | | | |
Counterparty | | Derivative
Liabilities
Subject to a
MA | | | Derivatives
Available
for Offset | | | Cash
Collateral
Received* | | | Security
Collateral
Received* | | | Net Amount
of Derivative
Liabilities | |
Citigroup Global Markets, Inc. | | $ | 199,141 | | | $ | – 0 | – | | $ | (199,141 | ) | | $ | – 0 | – | | $ | – 0 | – |
Credit Suisse International | | | 90,415 | | | | – 0 | – | | | – 0 | – | | | – 0 | – | | | 90,415 | |
Goldman Sachs International | | | 45,600 | | | | – 0 | – | | | – 0 | – | | | – 0 | – | | | 45,600 | |
JPMorgan Securities, LLC | | | 167,042 | | | | – 0 | – | | | (167,042 | ) | | | – 0 | – | | | – 0 | – |
| | | | | | | | | | | | | | | | | | | | |
Total | | $ | 502,198 | | | $ | – 0 | – | | $ | (366,183 | ) | | $ | – 0 | – | | $ | 136,015 | ^ |
| | | | | | | | | | | | | | | | | | | | |
| * | The actual collateral received/pledged may be more than the amount reported due to over-collateralization. |
| ^ | Net amount represents the net receivable/payable that would be due from/to the counterparty in the event of default or termination. The net amount from OTC financial derivative instruments can only be netted across transactions governed under the same master agreement with the same counterparty. |
| | |
| |
40 | AB TAXABLE MULTI-SECTOR INCOME SHARES | | abfunds.com |
NOTES TO FINANCIAL STATEMENTS (continued)
2. Currency Transactions
The Fund may invest in non-U.S. Dollar-denominated securities on a currency hedged or unhedged basis. The Fund may seek investment opportunities by taking long or short positions in currencies through the use of currency-related derivatives, including forward currency exchange contracts, futures and options on futures, swaps, and other options. The Fund may enter into transactions for investment opportunities when it anticipates that a foreign currency will appreciate or depreciate in value but securities denominated in that currency are not held by the Fund and do not present attractive investment opportunities. Such transactions may also be used when the Adviser believes that it may be more efficient than a direct investment in a foreign currency-denominated security. The Fund may also conduct currency exchange contracts on a spot basis (i.e., for cash at the spot rate prevailing in the currency exchange market for buying or selling currencies).
NOTE D
Shares of Beneficial Interest
Transactions in shares of beneficial interest were as follows:
| | | | | | | | | | | | | | | | | | | | | | | | |
| | | | | | | | | | | | | | | | | | | | | | | | |
| | | Shares | | | | | | Amount | | | | |
| | | Six Months Ended
October 31, 2022
(unaudited) | | | Year Ended
April 30,
2022 | | | | | | Six Months Ended
October 31, 2022
(unaudited) | | | Year Ended
April 30,
2022 | | | | |
| | | | | | | | |
Shares sold | | | 8,712,625 | | | | 11,055,833 | | | | | | | $ | 83,050,625 | | | $ | 109,716,305 | | | | | |
| | | | | |
Shares issued in reinvestment of dividends and distributions | | | – 0 | – | | | 1 | | | | | | | | – 0 | – | | | 10 | | | | | |
| | | | | |
Shares redeemed | | | (5,632,772 | ) | | | (10,538,231 | ) | | | | | | | (53,670,475 | ) | | | (104,115,947 | ) | | | | |
| | | | | |
Net increase | | | 3,079,853 | | | | 517,603 | | | | | | | $ | 29,380,150 | | | $ | 5,600,368 | | | | | |
| | | | | |
NOTE E
Risks Involved in Investing in the Fund
Market Risk—The value of the Fund’s assets will fluctuate as the stock or bond market fluctuates. The value of the Fund’s investments may decline, sometimes rapidly and unpredictably, simply because of economic changes or other events, including public health crises (including the occurrence of a contagious disease or illness) and regional and global conflicts, that affect large portions of the market.
Credit Risk—An issuer or guarantor of a fixed-income security, or the counterparty to a derivatives or other contract, may be unable or unwilling to make timely payments of interest or principal, or to otherwise honor its obligations. The issuer or guarantor may default, causing a loss of the full principal amount of a security and any accrued interest. The degree of risk
| | |
| |
| abfunds.com | | AB TAXABLE MULTI-SECTOR INCOME SHARES | 41 |
NOTES TO FINANCIAL STATEMENTS (continued)
for a particular security may be reflected in its credit rating. There is the possibility that the credit rating of a fixed-income security may be downgraded after purchase, which may adversely affect the value of the security.
Interest-Rate Risk—Changes in interest rates will affect the value of investments in fixed-income securities. When interest rates rise, the value of existing investments in fixed-income securities tends to fall and this decrease in value may not be offset by higher income from new investments. Interest rate risk is generally greater for fixed-income securities with longer maturities or durations. The Fund may be subject to a greater risk of rising interest rates than would normally be the case due to the end of a recent period of historically low rates and the effect of potential government fiscal policy initiatives and resulting market reaction to those initiatives.
Below Investment-Grade Securities Risk—Investments in fixed-income securities with lower ratings (commonly known as “junk bonds”) tend to have a higher probability that an issuer will default or fail to meet its payment obligations. These securities may be subject to greater price volatility due to such factors as specific corporate developments, interest rate sensitivity, negative perceptions of the junk bond market generally and may be more difficult to trade than other types of securities.
Inflation Risk—This is the risk that the value of assets or income from investments will be less in the future as inflation decreases the value of money. As inflation increases, the value of the Fund’s assets can decline as can the value of the Fund’s distributions. This risk is significantly greater for fixed-income securities with longer maturities.
Foreign (Non-U.S.) Risk—Investments in securities of non-U.S. issuers may involve more risk than those of U.S. issuers. These securities may fluctuate more widely in price and may be more difficult to trade due to adverse market, economic, political, regulatory or other factors.
Emerging Market Risk—Investments in emerging market countries may have more risk because the markets are less developed and less liquid as well as being subject to increased economic, political, regulatory or other uncertainties.
Currency Risk—Fluctuations in currency exchange rates may negatively affect the value of the Fund’s investments or reduce its returns.
Mortgage-Related and/or Other Asset-Backed Securities Risk—Investments in mortgage-related and other asset-backed securities are subject to certain additional risks. The value of these securities may be particularly sensitive to changes in interest rates. These risks include “extension risk”, which is the risk that, in periods of rising interest rates,
| | |
| |
42 | AB TAXABLE MULTI-SECTOR INCOME SHARES | | abfunds.com |
NOTES TO FINANCIAL STATEMENTS (continued)
issuers may delay the payment of principal, and “prepayment risk”, which is the risk that in periods of falling interest rates, issuers may pay principal sooner than expected, exposing the Fund to a lower rate of return upon reinvestment of principal. Mortgage-backed securities offered by non-governmental issuers and other asset-backed securities may be subject to other risks, such as higher rates of default in the mortgages or assets backing the securities or risks associated with the nature and servicing of mortgages or assets backing the securities.
Municipal Market Risk—This is the risk that special factors may adversely affect the value of municipal securities and have a significant effect on the yield or value of the Fund’s investments in municipal securities. These factors include economic conditions, political or legislative changes, public health crises, uncertainties related to the tax status of municipal securities, and the rights of investors in these securities. To the extent that the Fund invests more of its assets in a particular state’s municipal securities, the Fund may be vulnerable to events adversely affecting that state, including economic, political and regulatory occurrences, court decisions, terrorism, public health crises (including the occurrence of a contagious disease or illness) and catastrophic natural disasters, such as hurricanes, fires or earthquakes. For example, the novel coronavirus (COVID-19) pandemic has significantly stressed the financial resources of many issuers of municipal securities, which could impair any such issuer’s ability to meet its financial obligations when due and adversely impact the value of its securities held by the Fund. As the full effects of the COVID-19 pandemic on state and local economies and on issuers of municipal securities are still uncertain, the financial difficulties of issuers of municipal securities may continue or worsen, adversely affecting the performance of the Fund. The Fund’s investments in certain municipal securities with principal and interest payments that are made from the revenues of a specific project or facility, and not general tax revenues, may have increased risks. Factors affecting the project or facility, such as local business or economic conditions, could have a significant effect on the project’s ability to make payments of principal and interest on these securities.
Congress has previously considered making changes to the municipal securities provisions of the Internal Revenue Code that could change the U.S. federal income tax treatment of certain types of municipal securities.
Sector Risk—The Fund may have more risk because it may invest to a significant extent in one or more particular market sectors. To the extent it does so, market or economic factors affecting the relevant sector(s) could have a major effect on the value of the Fund’s investments.
| | |
| |
| abfunds.com | | AB TAXABLE MULTI-SECTOR INCOME SHARES | 43 |
NOTES TO FINANCIAL STATEMENTS (continued)
Derivatives Risk—Derivatives may be difficult to price or unwind and leveraged so that small changes may produce disproportionate losses for the Fund. A short position in a derivative instrument involves the risk of a theoretically unlimited increase in the value of the underlying instrument, which could cause the Fund to suffer a (potentially unlimited) loss. Derivatives, especially over-the-counter derivatives, are also subject to counterparty risk, which is the risk that the counterparty (the party on the other side of the transaction) on a derivative transaction will be unable or unwilling to honor its contractual obligations to the Fund.
Leverage Risk—When the Fund borrows money or otherwise leverages its investments, its performance may be volatile because leverage tends to exaggerate the effect of any increase or decrease in the value of the Fund’s investments. The Fund may create leverage through the use of reverse repurchase arrangements, forward currency exchange contracts, forward commitments, dollar rolls or futures or by borrowing money. The use of other types of derivative instruments by the Fund, such as options and swaps, may also result in a form of leverage. Leverage may result in higher returns to the Fund than if the Fund were not leveraged, but may also adversely affect returns, particularly if the market is declining.
LIBOR Transition and Associated Risk—A Fund may be exposed to debt securities, derivatives or other financial instruments that utilize the London Interbank Offered Rate, or “LIBOR,” as a “benchmark” or “reference rate” for various interest rate calculations. In 2017, the United Kingdom Financial Conduct Authority (“FCA”), which regulates LIBOR, announced a desire to phase out the use of LIBOR by the end of 2021. The FCA and LIBOR’s administrator, ICE Benchmark Administration, have since announced that most LIBOR settings (which reflect LIBOR rates quoted in different currencies over various time periods) will no longer be published after the end of 2021 but that the most widely used U.S. Dollar LIBOR settings will continue to be published until June 30, 2023. However, banks were strongly encouraged to cease entering into agreements with counterparties referencing LIBOR by the end of 2021. It is possible that a subset of LIBOR settings will be published after these dates on a “synthetic” basis, but any such publications would be considered non-representative of the underlying market. Since 2018 the Federal Reserve Bank of New York has published the secured overnight funding rate (referred to as SOFR), which is intended to replace U.S. Dollar LIBOR. SOFR is a broad measure of the cost of borrowing cash overnight collateralized by U.S. Treasury securities in the repurchase agreement (repo) market and has been used increasingly on a voluntary basis in new instruments and transactions. In addition, on March 15, 2022, the Adjustable Interest Rate Act was signed into law. This law provides a statutory fallback mechanism to replace LIBOR with a benchmark rate that is
| | |
| |
44 | AB TAXABLE MULTI-SECTOR INCOME SHARES | | abfunds.com |
NOTES TO FINANCIAL STATEMENTS (continued)
selected by the Federal Reserve Board and based on SOFR for certain contracts that reference LIBOR without adequate fallback provisions.
The elimination of LIBOR or changes to other reference rates or any other changes or reforms to the determination or supervision of reference rates could have an adverse impact on the market for, or value of, any securities or payments linked to those reference rates, which may adversely affect a Fund’s performance and/or net asset value. Uncertainty and risk also remain regarding the willingness and ability of issuers and lenders to include revised provisions in new and existing contracts or instruments. Consequently, the transition from LIBOR to other reference rates may lead to increased volatility and illiquidity in markets that are tied to LIBOR, fluctuations in values of LIBOR-related investments or investments in issuers that utilize LIBOR, increased difficulty in borrowing or refinancing and diminished effectiveness of hedging strategies, potentially adversely affecting a Fund’s performance. Furthermore, the risks associated with the expected discontinuation of LIBOR and transition may be exacerbated if the work necessary to effect an orderly transition to an alternative reference rate is not completed in a timely manner. Neither the effect of the LIBOR transition process nor its ultimate success can yet be known.
Indemnification Risk—In the ordinary course of business, the Fund enters into contracts that contain a variety of indemnifications. The Fund’s maximum exposure under these arrangements is unknown. However, the Fund has not had prior claims or losses pursuant to these indemnification provisions and expects the risk of loss thereunder to be remote. Therefore, the Fund has not accrued any liability in connection with these indemnification provisions.
Management Risk—The Fund is subject to management risk because it is an actively-managed investment fund. The Adviser will apply its investment techniques and risk analyses in making investment decisions, but there is no guarantee that its techniques will produce the intended results. Some of these techniques may incorporate, or rely upon, quantitative models, but there is no guarantee that these models will generate accurate forecasts, reduce risk or otherwise perform as expected.
NOTE F
Joint Credit Facility
A number of open-end mutual funds managed by the Adviser, including the Fund, participate in a $325 million revolving credit facility (the “Facility”) intended to provide short-term financing related to redemptions and other short term liquidity requirements, subject to certain restrictions. Commitment fees related to the Facility are paid by the participating funds and are included in miscellaneous expenses in the statement of operations. The Fund did not utilize the Facility during the six months ended October 31, 2022.
| | |
| |
| abfunds.com | | AB TAXABLE MULTI-SECTOR INCOME SHARES | 45 |
NOTES TO FINANCIAL STATEMENTS (continued)
NOTE G
Distributions to Shareholders
The tax character of distributions to be paid for the year ending April 30, 2023 will be determined at the end of the current fiscal year. The tax character of distributions paid during the fiscal years ended April 30, 2022 and April 30, 2021 were as follows:
| | | | | | | | |
| | | 2022 | | | 2021 | |
Distributions paid from: | | | | |
Ordinary income | | $ | 3,392,140 | | | $ | 3,756,471 | |
Net long-term capital gains | | | 1,412,066 | | | | 47,516 | |
| | | | | | | | |
Total taxable distributions paid | | $ | 4,804,206 | | | $ | 3,803,987 | |
| | | | | | | | |
As of April 30, 2022, the components of accumulated earnings/(deficit) on a tax basis were as follows:
| | | | |
Undistributed capital gains | | $ | 485,962 | |
Unrealized appreciation (depreciation) | | | (11,806,809 | )(a) |
| | | | |
Total accumulated earnings/(deficit) | | $ | (11,320,847 | )(b) |
| | | | |
| (a) | The differences between book-basis and tax-basis unrealized appreciation (depreciation) are attributable primarily to the tax treatment of callable bonds, the tax treatment of swaps, and the tax deferral of losses on wash sales. |
| (b) | The difference between book-basis and tax-basis components of accumulated earnings/(deficit) are attributable primarily to dividends payable. |
For tax purposes, net realized capital losses may be carried over to offset future capital gains, if any. Funds are permitted to carry forward capital losses for an indefinite period, and such losses will retain their character as either short-term or long-term capital losses. As of April 30, 2022, the Fund did not have any capital loss carryforwards.
NOTE H
Recent Accounting Pronouncements
In March 2020, the Financial Accounting Standards Board issued an Accounting Standards Update, ASU 2020-04, “Reference Rate Reform (Topic 848) – Facilitation of the Effects of Reference Rate Reform on Financial Reporting.” ASU 2020-04 provides optional guidance to ease the potential accounting burden due to the discontinuation of the LIBOR and other interbank-offered based reference rates. ASU 2020-04 is effective as of March 12, 2020 through December 31, 2022. Management is currently evaluating the impact, if any, of applying ASU 2020-04.
| | |
| |
46 | AB TAXABLE MULTI-SECTOR INCOME SHARES | | abfunds.com |
NOTES TO FINANCIAL STATEMENTS (continued)
NOTE I
Subsequent Events
Management has evaluated subsequent events for possible recognition or disclosure in the financial statements through the date the financial statements are issued. Management has determined that there are no material events that would require disclosure in the Fund’s financial statements through this date.
| | |
| |
| abfunds.com | | AB TAXABLE MULTI-SECTOR INCOME SHARES | 47 |
FINANCIAL HIGHLIGHTS
Selected Data For A Share Of Beneficial Interest Outstanding Throughout Each Period
| | | | | | | | | | | | | | | | | | | | | | | | |
| | | Six Months
Ended
October 31,
2022
(unaudited) | | | Year Ended April 30, | |
| | | 2022 | | | 2021 | | | 2020 | | | 2019 | | | 2018 | |
| | | | |
| | | | | | | | | | | | | | | | | | | | | | | | |
Net asset value, beginning of period | | | $ 9.59 | | | | $ 10.04 | | | | $ 9.89 | | | | $ 9.82 | | | | $ 9.70 | | | | $ 9.84 | |
| | | | |
Income From Investment Operations | | | | | | | | | | | | | | | | | | | | | | | | |
| | | | | | |
Net investment income(a) | | | .08 | | | | .10 | | | | .14 | | | | .24 | | | | .25 | | | | .20 | |
| | | | | | |
Net realized and unrealized gain (loss) on investment transactions | | | (.21 | ) | | | (.39 | ) | | | .16 | | | | .09 | | | | .13 | | | | (.14 | ) |
| | | | |
| | | | | | |
Net increase (decrease) in net asset value from operations | | | (.13 | ) | | | (.29 | ) | | | .30 | | | | .33 | | | | .38 | | | | .06 | |
| | | | |
Less: Dividends | | | | | | | | | | | | | | | | | | | | | | | | |
| | | | | | |
Dividends from net investment income | | | (.08 | ) | | | (.12 | ) | | | (.15 | ) | | | (.26 | ) | | | (.26 | ) | | | (.20 | ) |
| | | | | | |
Distributions from net realized gain on investment transactions | | | – 0 | – | | | (.04 | ) | | | – 0 | – | | | – 0 | – | | | – 0 | – | | | – 0 | – |
| | | | |
Net asset value, end of period | | | $ 9.38 | | | | $ 9.59 | | | | $ 10.04 | | | | $ 9.89 | | | | $ 9.82 | | | | $ 9.70 | |
| | | | |
Total Return | | | | | | | | | | | | | | | | | | | | | | | | |
| | | | | | |
Total investment return based on net asset value(b) | | | (1.33 | )% | | | (2.98 | )% | | | 3.02 | % | | | 3.43 | % | | | 4.00 | % | | | .65 | % |
| | | | | | |
Ratios/Supplemental Data | | | | | | | | | | | | | | | | | | | | | | | | |
| | | | | | |
Net assets, end of period (000’s omitted) | | | $319,491 | | | | $297,166 | | | | $305,872 | | | | $178,508 | | | | $154,300 | | | | $129,628 | |
| | | | | | |
Ratio to average net assets of: | | | | | | | | | | | | | | | | | | | | | | | | |
| | | | | | |
Expenses | | | .00 | % | | | .00 | % | | | .00 | % | | | .01 | %(c) | | | .00 | % | | | .00 | % |
| | | | | | |
Net investment income | | | 1.76 | %^ | | | 1.03 | % | | | 1.36 | % | | | 2.47 | % | | | 2.62 | % | | | 2.05 | % |
| | | | | | |
Portfolio turnover rate | | | 27 | % | | | 45 | % | | | 74 | % | | | 124 | % | | | 45 | % | | | 81 | % |
| (a) | Based on average shares outstanding. |
| (b) | Total investment return is calculated assuming an initial investment made at the net asset value at the beginning of the period, reinvestment of all dividends and distributions at net asset value during the period, and redemption on the last day of the period. Total return does not reflect the deduction of taxes that a shareholder would pay on fund distributions or the redemption of fund shares. Total investment return calculated for a period of less than one year is not annualized. |
| (c) | The expense ratio, excluding bank overdraft expense, is .00%. |
See notes to financial statements.
| | |
| |
48 | AB TAXABLE MULTI-SECTOR INCOME SHARES | | abfunds.com |
BOARD OF TRUSTEES
| | |
Marshall C. Turner, Jr.(1),
Chairman Jorge A. Bermudez(1) Michael J. Downey(1) Onur Erzan, President and Chief Executive Officer | | Nancy P. Jacklin(1) Jeanette W. Loeb(1) Carol C. McMullen(1) Garry L. Moody(1) |
OFFICERS
| | |
Scott A. DiMaggio(2), Vice President Janaki Rao(2), Vice President Emilie D. Wrapp, Secretary Michael B. Reyes, Senior Vice President | | Joseph J. Mantineo, Treasurer and Chief Financial Officer Phyllis J. Clarke, Controller Vincent S. Noto, Chief Compliance Officer |
| | |
Custodian and Accounting Agent State Street Bank and Trust Company
State Street Corporation CCB/5
1 Iron Street
Boston, MA 02210 Principal Underwriter AllianceBernstein Investments, Inc.
501 Commerce Street Nashville, TN 37203 Transfer Agent AllianceBernstein Investor Services, Inc.
P.O. Box 786003
San Antonio, TX 78278
Toll-Free (800) 221-5672 | | Legal Counsel Seward & Kissel LLP
One Battery Park Plaza
New York, NY 10004 Independent Registered Public Accounting Firm Ernst & Young LLP One Manhattan West New York, NY 10001 |
| 1 | Member of the Audit Committee, the Governance and Nominating Committee and the Independent Directors Committee. |
| 2 | The day-to-day management of, and investment decisions for, the Fund’s portfolio are made by the Adviser’s Core Fixed-Income Team. Messrs. DiMaggio and Rao are the investment professionals primarily responsible for the day-to-day management of the Fund’s portfolio. |
| | |
| |
| abfunds.com | | AB TAXABLE MULTI-SECTOR INCOME SHARES | 49 |
Operation and Effectiveness of the Fund’s Liquidity Risk Management Program:
In October 2016, the Securities and Exchange Commission (“SEC”) adopted the open-end fund liquidity rule (the “Liquidity Rule”). In June 2018 the SEC adopted a requirement that funds disclose information about the operation and effectiveness of their Liquidity Risk Management Program (“LRMP”) in their reports to shareholders.
One of the requirements of the Liquidity Rule is for the Fund to designate an Administrator of the Fund’s Liquidity Risk Management Program. The Administrator of the Fund’s LRMP is AllianceBernstein L.P., the Fund’s investment adviser (the “Adviser”). The Adviser has delegated the responsibility to its Liquidity Risk Management Committee (the “Committee”).
Another requirement of the Liquidity Rule is for the Fund’s Board of Trustees (the “Fund Board”) to receive an annual written report from the Administrator of the LRMP, which addresses the operation of the Fund’s LRMP and assesses its adequacy and effectiveness. The Adviser provided the Fund Board with such annual report during the first quarter of 2022, which covered the period January 1, 2021 through December 31, 2021 (the “Program Reporting Period”).
The LRMP’s principal objectives include supporting the Fund’s compliance with limits on investments in illiquid assets and mitigating the risk that the Fund will be unable to meet its redemption obligations in a timely manner.
Pursuant to the LRMP, the Fund classifies the liquidity of its portfolio investments into one of the four categories defined by the SEC: Highly Liquid, Moderately Liquid, Less Liquid, and Illiquid. These classifications are reported to the SEC on Form N-PORT.
During the Program Reporting Period, the Committee reviewed whether the Fund’s strategy is appropriate for an open-end structure, incorporating any holdings of less liquid and illiquid assets. If the Fund participated in derivative transactions, the exposure from such transactions were considered in the LRMP.
The Committee also performed an analysis to determine whether the Fund is required to maintain a Highly Liquid Investment Minimum (“HLIM”). The Committee also incorporated the following information when determining the Fund’s reasonably anticipated trading size for purposes of liquidity monitoring: historical net redemption activity, a Fund’s concentration in an issuer, shareholder concentration, investment performance, total net assets, and distribution channels.
The Adviser informed the Fund Board that the Committee believes the Fund’s LRMP is adequately designed, has been implemented as intended,
| | |
| |
50 | AB TAXABLE MULTI-SECTOR INCOME SHARES | | abfunds.com |
and has operated effectively since its inception. No material exceptions have been noted since the implementation of the LRMP. During the Program Reporting Period, liquidity in all markets was significantly recovered and improved compared to the prior reporting period which included extreme levels of price volatility and relative illiquidity beginning in March 2020 with COVID-19 impacts. As such, the program operated in a relatively robust and benign liquidity environment experienced in markets during the Program Reporting Period. There were no liquidity events that impacted the Fund or its ability to timely meet redemptions during the Program Reporting Period.
| | |
| |
| abfunds.com | | AB TAXABLE MULTI-SECTOR INCOME SHARES | 51 |
Information Regarding the Review and Approval of the Fund’s Advisory Agreement
The disinterested trustees (the “directors”) of AB Corporate Shares (the “Company”) unanimously approved the continuance of the Company’s Advisory Agreement with the Adviser in respect of AB Taxable Multi-Sector Income Shares (the “Fund”) at a meeting held by video conference on November 2-4, 2021 (the “Meeting”).
Prior to approval of the continuance of the Advisory Agreement, the directors had requested from the Adviser, and received and evaluated, extensive materials. They reviewed the proposed continuance of the Advisory Agreement with the Adviser and with experienced counsel who are independent of the Adviser, who advised on the relevant legal standards. The directors also reviewed additional materials, including comparative analytical data prepared by the Senior Analyst for the Fund. The directors also discussed the proposed continuance in private sessions with counsel.
The directors noted that the Fund is designed as a vehicle for the wrap fee account market (where investors pay fees to a wrap fee sponsor which pays investment fees and expenses from such fee). The directors also noted that no advisory fee is payable by the Fund, that the Advisory Agreement does not include the reimbursement provision for certain administrative expenses included in the advisory agreements of most of the open-end AB Funds, and that the Adviser is responsible for payment of the Fund’s ordinary expenses. The directors noted that the Company acknowledges in the Advisory Agreement that the Adviser and its affiliates expect to receive compensation from third parties in connection with services provided under the Advisory Agreement. The directors further noted that the Adviser receives payments from the wrap fee program sponsors (the “Sponsors”) that use the Fund as an investment vehicle for their clients.
The directors considered their knowledge of the nature and quality of the services provided by the Adviser to the Fund gained from their experience as directors or trustees of most of the registered investment companies advised by the Adviser, their overall confidence in the Adviser’s integrity and competence they have gained from that experience, the Adviser’s initiative in identifying and raising potential issues with the directors and its responsiveness, frankness and attention to concerns raised by the directors in the past, including the Adviser’s willingness to consider and implement organizational and operational changes designed to improve investment results and the services provided to the AB Funds. The directors noted that they have four regular meetings each year, at each of which they review extensive materials and information from the Adviser, including information on the investment performance of the Fund and the money market fund advised by the Adviser in which the Fund invests a portion of its assets.
| | |
| |
52 | AB TAXABLE MULTI-SECTOR INCOME SHARES | | abfunds.com |
The directors also considered all factors they believed relevant, including the specific matters discussed below. During the course of their deliberations, the directors evaluated, among other things, the reasonableness of the advisory fee. The directors did not identify any particular information that was all-important or controlling, and different directors may have attributed different weights to the various factors. The directors determined that the selection of the Adviser to manage the Fund and the overall arrangements between the Fund and the Adviser, as provided in the Advisory Agreement, including the advisory fee, were fair and reasonable in light of the services performed, expenses incurred and such other matters as the directors considered relevant in the exercise of their business judgment. The material factors and conclusions that formed the basis for the directors’ determinations included the following:
Nature, Extent and Quality of Services Provided
The directors considered the scope and quality of services provided by the Adviser under the Advisory Agreement, including the quality of the investment research capabilities of the Adviser and the other resources it has dedicated to performing services for the Fund. The directors noted that the Adviser from time to time reviews the Fund’s investment strategies and from time to time proposes changes intended to improve the Fund’s relative or absolute performance for the directors’ consideration. They also noted the professional experience and qualifications of the Fund’s portfolio management team and other senior personnel of the Adviser. The quality of administrative and other services, including the Adviser’s role in coordinating the activities of the Fund’s other service providers, also was considered. The directors concluded that, overall, they were satisfied with the nature, extent and quality of services provided to the Fund under the Advisory Agreement.
Costs of Services Provided and Profitability
The directors reviewed a schedule of the revenues and expenses and related notes indicating the profitability of the Fund to the Adviser for calendar years 2019 and 2020 that had been prepared with an expense allocation methodology arrived at in consultation with an independent consultant at the request of the directors. The directors noted the assumptions and methods of allocation used by the Adviser in preparing fund-specific profitability data and understood that there are a number of potentially acceptable allocation methodologies for information of this type. The directors noted that the profitability information reflected all revenues and expenses of the Adviser’s relationship with the Fund. The directors recognized that it is difficult to make comparisons of the profitability of the Advisory Agreement with the profitability of fund advisory contracts for unaffiliated funds because comparative information is not generally publicly available and is affected by numerous factors. The directors focused on the profitability of the Adviser’s relationship with the Fund before taxes and distribution expenses. The directors noted that the Fund was not profitable
| | |
| |
| abfunds.com | | AB TAXABLE MULTI-SECTOR INCOME SHARES | 53 |
to the Adviser in 2019. The directors concluded that the Adviser’s level of profitability from its relationship with the Fund in 2020 was not unreasonable.
Fall-Out Benefits
The directors considered the other benefits to the Adviser and its affiliates from their relationships with the Fund and the money market fund advised by the Adviser in which the Fund invests. The directors noted that the Adviser is compensated by the Sponsors. The directors understood that the Adviser also might derive reputational and other benefits from its association with the Fund.
Investment Results
In addition to the information reviewed by the directors in connection with the Meeting, the directors receive detailed performance information for the Fund at each regular Board meeting during the year.
At the Meeting, the directors reviewed performance information prepared by an independent service provider (the “15(c) service provider”), showing the performance of the Fund against a group of similar funds (“peer group”) and a larger group of similar funds (“peer universe”), each selected by the 15(c) service provider, and information prepared by the Adviser showing the Fund’s performance against a broad-based securities market index, in each case for the 1-, 3-, 5- and 10-year periods ended July 31, 2021 and (in the case of comparisons with the broad-based securities market index) for the period from inception. The directors were cognizant that the Fund was neither designed nor offered as a standalone investment and was intended to serve solely as a component of certain separately managed accounts (“SMAs”). The Adviser had explained that this attribute made it difficult to select an appropriate benchmark for the Fund. At the directors’ request, the Adviser provided information showing the weighting of the Fund in a current SMA and the overall performance of the SMA versus its stated benchmark. Based on their review, the directors concluded that the Fund’s investment performance was acceptable.
Advisory Fees
The directors considered the advisory fee rate payable by the Fund to the Adviser (zero) and information provided by the 15(c) service provider concerning advisory fee rates payable by other funds in the same category as the Fund. The directors recognized that it is difficult to make comparisons of advisory fees because there are variations in the services that are included in the fees payable by other funds.
The directors noted the unusual arrangements in the Advisory Agreement providing for no advisory fee but were cognizant that the Adviser is indirectly compensated by the Sponsors for its services to the Fund. The directors reviewed the fee arrangements between the Adviser and each of the current Sponsors and noted that such fees were negotiated on an
| | |
| |
54 | AB TAXABLE MULTI-SECTOR INCOME SHARES | | abfunds.com |
arm’s length basis and were within the range of fees paid by wrap fee sponsors to other advisers of similar funds. While the Adviser’s fee arrangements with the Sponsors vary, the directors acknowledged the Adviser’s view that a portion of such fees (less the expenses of the Fund paid by the Adviser) may reasonably be viewed as compensating the Adviser for advisory services it provides to the Fund (the “implied fee”) and that the Adviser believes that while the Sponsors pay the Adviser different fee rates, the rate of fee attributable to Fund management at the Fund level is the same for all Sponsors. The directors also considered the fee rate schedules used by other registered investment companies that invest in fixed income securities that are advised by the Adviser.
The directors also considered the Adviser’s fee schedule for other clients utilizing investment strategies similar to those of the Fund. For this purpose, they reviewed the relevant advisory fee information from the Adviser’s Form ADV and in a report from the Fund’s Senior Analyst and noted the differences between the Fund’s fee schedule, on the one hand, and the Adviser’s institutional fee schedule and the schedule of fees charged by the Adviser to any offshore funds and for services to any sub-advised funds utilizing investment strategies similar to those of the Fund, on the other. The directors recognized that such information was of limited utility in light of the Fund’s unusual fee arrangement. The directors noted that the Adviser may, in some cases, agree to fee rates with large institutional clients that are lower than those reviewed by the directors and that they had previously discussed with the Adviser its policies in respect of such arrangements. The directors also compared the advisory fee rate for the Fund with that for another fund advised by the Adviser utilizing similar investment strategies.
The Adviser reviewed with the directors the significantly greater scope of the services it provides to the Fund relative to institutional, offshore fund and sub-advised fund clients. In this regard, the Adviser noted, among other things, that, compared to institutional and offshore or sub-advisory accounts, the Fund (i) demands considerably more portfolio management, research and trading resources due to significantly higher daily cash flows; (ii) has more tax and regulatory restrictions and compliance obligations; (iii) must prepare and file or distribute regulatory and other communications about fund operations; and (iv) must provide shareholder servicing to retail investors. The Adviser also reviewed the greater legal risks presented by the large and changing population of Fund shareholders who may assert claims against the Adviser in individual or class actions, and the greater entrepreneurial risk in offering new fund products, which require substantial investment to launch, may not succeed, and generally must be priced to compete with larger, more established funds resulting in lack of profitability to the Adviser until a new fund achieves scale. In light of the substantial differences in services rendered by the Adviser to institutional, offshore fund and sub-advised fund clients as compared to the Fund, and
| | |
| |
| abfunds.com | | AB TAXABLE MULTI-SECTOR INCOME SHARES | 55 |
the different risk profile, the directors considered these fee comparisons inapt and did not place significant weight on them in their deliberations.
The directors did not consider comparative expense information for the Fund because the Fund does not bear ordinary expenses.
Economies of Scale
The directors did not consider the extent to which fee levels in the Advisory Agreement for the Fund reflect economies of scale because the Advisory Agreement does not provide for any compensation to be paid to the Adviser by the Fund and the Fund’s expense ratio is zero. They did note, however, that the fee payable to the Adviser by the current Sponsors declines at a breakpoint based on either individual account sizes or on total assets managed by the Adviser for the Sponsor.
| | |
| |
56 | AB TAXABLE MULTI-SECTOR INCOME SHARES | | abfunds.com |
This page is not part of the Shareholder Report or the Financial Statements.
AB FAMILY OF FUNDS
US EQUITY
CORE
Core Opportunities Fund
Select US Equity Portfolio
Sustainable US Thematic Portfolio
GROWTH
Concentrated Growth Fund
Discovery Growth Fund
Growth Fund
Large Cap Growth Fund
Small Cap Growth Portfolio
VALUE
Discovery Value Fund
Equity Income Fund
Relative Value Fund
Small Cap Value Portfolio
Value Fund
INTERNATIONAL/ GLOBAL EQUITY
CORE
Global Core Equity Portfolio
International Strategic Core Portfolio
Sustainable Global Thematic Fund
Sustainable International Thematic Fund
Tax-Managed Wealth Appreciation Strategy
Wealth Appreciation Strategy
GROWTH
Concentrated International Growth Portfolio
VALUE
All China Equity Portfolio
International Value Fund
FIXED INCOME
MUNICIPAL
High Income Municipal Portfolio
Intermediate California Municipal Portfolio
Intermediate Diversified Municipal Portfolio
Intermediate New York Municipal Portfolio
Municipal Bond Inflation Strategy
Tax-Aware Fixed Income Opportunities Portfolio
National Portfolio
Arizona Portfolio
California Portfolio
Massachusetts Portfolio
Minnesota Portfolio
New Jersey Portfolio
New York Portfolio
Ohio Portfolio
Pennsylvania Portfolio
Virginia Portfolio
TAXABLE
Bond Inflation Strategy
Global Bond Fund
High Income Fund
High Yield Portfolio
Income Fund
Intermediate Duration Portfolio
Limited Duration High Income Portfolio
Short Duration Income Portfolio
Short Duration Portfolio
Sustainable Thematic Credit Portfolio
Total Return Bond Portfolio
ALTERNATIVES
All Market Real Return Portfolio
Global Real Estate Investment Fund
Select US Long/Short Portfolio
MULTI-ASSET
All Market Income Portfolio
All Market Total Return Portfolio
Emerging Markets Multi-Asset Portfolio
Global Risk Allocation Fund
Sustainable Thematic Balanced Portfolio
Tax-Managed All Market Income Portfolio
CLOSED-END FUNDS
AllianceBernstein Global High Income Fund
AllianceBernstein National Municipal Income Fund
EXCHANGE-TRADED FUNDS
Tax-Aware Short Duration Municipal ETF
Ultra Short Income ETF
We also offer Government Money Market Portfolio, which serves as the money market fund exchange vehicle for the AB mutual funds. You could lose money by investing in the Fund. Although the Fund seeks to preserve the value of your investment at $1.00 per share, it cannot guarantee it will do so. The Fund may impose a fee upon sale of your shares or may temporarily suspend your ability to sell shares if the Fund’s liquidity falls below required minimums because of market conditions or other factors. An investment in the Fund is not insured or guaranteed by the Federal Deposit Insurance Corporation or any other government agency. The Fund’s sponsor has no legal obligation to provide financial support to the Fund, and you should not expect that the sponsor will provide financial support to the Fund at any time.
Investors should consider the investment objectives, risks, charges and expenses of the Fund carefully before investing. For copies of our prospectus or summary prospectus, which contain this and other information, visit us online at www.abfunds.com or contact your AB representative. Please read the prospectus and/or summary prospectus carefully before investing.
| | |
| |
| abfunds.com | | AB TAXABLE MULTI-SECTOR INCOME SHARES | 57 |
NOTES
| | |
| |
58 | AB TAXABLE MULTI-SECTOR INCOME SHARES | | abfunds.com |
NOTES
| | |
| |
| abfunds.com | | AB TAXABLE MULTI-SECTOR INCOME SHARES | 59 |
NOTES
| | |
| |
60 | AB TAXABLE MULTI-SECTOR INCOME SHARES | | abfunds.com |
AB TAXABLE MULTI-SECTOR INCOME SHARES
1345 Avenue of the Americas
New York, NY 10105
800 221 5672
TMSIS-0152-1022 
OCT 10.31.22

SEMI-ANNUAL REPORT
AB TAX-AWARE REAL RETURN INCOME SHARES

| | |
| |
| Investment Products Offered | | • Are Not FDIC Insured • May Lose Value • Are Not Bank Guaranteed |
Investors should consider the investment objectives, risks, charges and expenses of the Fund carefully before investing. For copies of our prospectus or summary prospectus, which contain this and other information, visit us online at www.abfunds.com or contact your AB representative. Please read the prospectus and/or summary prospectus carefully before investing.
This shareholder report must be preceded or accompanied by the Fund’s prospectus for individuals who are not current shareholders of the Fund.
You may obtain a description of the Fund’s proxy voting policies and procedures, and information regarding how the Fund voted proxies relating to portfolio securities during the most recent 12-month period ended June 30, without charge. Simply visit AB’s website at www.abfunds.com, or go to the Securities and Exchange Commission’s (the “Commission”) website at www.sec.gov, or call AB at (800) 227 4618.
The Fund files its complete schedule of portfolio holdings with the Commission for the first and third quarters of each fiscal year as an exhibit to its reports on Form N-PORT. The Fund’s Form N-PORT reports are available on the Commission’s website at www.sec.gov. AB publishes full portfolio holdings for the Fund monthly at www.abfunds.com.
AllianceBernstein Investments, Inc. (ABI) is the distributor of the AB family of mutual funds. ABI is a member of FINRA and is an affiliate of AllianceBernstein L.P., the Adviser of the funds.
The [A/B] logo is a registered service mark of AllianceBernstein and AllianceBernstein® is a registered service mark used by permission of the owner, AllianceBernstein L.P.
| | |
| FROM THE PRESIDENT | |  |
Dear Shareholder,
We’re pleased to provide this report for AB Tax-Aware Real Return Income Shares (the “Fund”). Please review the discussion of Fund performance, the market conditions during the reporting period and the Fund’s investment strategy.
At AB, we’re striving to help our clients achieve better outcomes by:
| + | | Fostering diverse perspectives that give us a distinctive approach to navigating global capital markets |
| + | | Applying differentiated investment insights through a connected global research network |
| + | | Embracing innovation to design better ways to invest and leading-edge mutual-fund solutions |
Whether you’re an individual investor or a multibillion-dollar institution, we’re putting our knowledge and experience to work for you every day.
For more information about AB’s comprehensive range of products and shareholder resources, please log on to www.abfunds.com.
Thank you for your investment in AB mutual funds—and for placing your trust in our firm.
Sincerely,

Onur Erzan
President and Chief Executive Officer, AB Mutual Funds
| | |
| |
| abfunds.com | | AB TAX-AWARE REAL RETURN INCOME SHARES | 1 |
SEMI-ANNUAL REPORT
December 14, 2022
This report provides management’s discussion of fund performance for AB Tax-Aware Real Return Income Shares for the semi-annual reporting period ended October 31, 2022. Please note, shares of this Fund are available only to separately managed accounts or participants in “wrap fee” programs or other investment programs approved by the Adviser.
The investment objective of the Fund is to maximize real after-tax return for investors subject to federal income taxation.
NAV RETURNS AS OF OCTOBER 31, 2022 (unaudited)
| | | | | | | | |
| | |
| | | 6 Months | | | 12 Months | |
| | |
| AB TAX-AWARE REAL RETURN INCOME SHARES | | | -7.83% | | | | -3.59% | |
| | |
| Bloomberg 1-10 Year TIPS Index | | | -5.32% | | | | -7.18% | |
INVESTMENT RESULTS
The table above shows the Fund’s performance compared to its benchmark, the Bloomberg 1-10 Year Treasury Inflation Protected Securities (“TIPS”) Index, for the six- and 12-month periods ended October 31, 2022.
The Fund underperformed the benchmark for the six-month period, but outperformed for the 12-month period. The Fund is generally used to provide inflation protection within separately managed account strategies and as such maintains a higher level of protection than would relate to the bonds in the Fund itself. The Fund’s overweight to inflation protection through the usage of Consumer Price Index (“CPI”) swaps, total return swaps based on the Bloomberg 1-10 Year TIPS Index and interest rate swaps detracted from performance, relative to the benchmark, for the six-month period, but contributed for the 12-month period.
During the six-month period, the Fund’s overweight to municipals contributed, relative to the benchmark. The Fund’s overweight to municipal credit detracted.
For the 12-month period, the Fund’s overweight to municipals, including municipal credit, detracted. Yield-curve positioning contributed overall due to its relative overweight in longer maturity bonds.
The Fund utilized derivatives for hedging purposes in the form of CPI swaps, interest rate swaps and total return swaps, which detracted from absolute performance over the six-month period and added over the 12-month period.
| | |
| |
2 | AB TAX-AWARE REAL RETURN INCOME SHARES | | abfunds.com |
MARKET REVIEW AND INVESTMENT STRATEGY
Yields continued their ascent higher toward the end of the reporting period ended October 31, 2022. During the 12-month period, the yield on a 10-Year AAA municipal bond rose to 3.39% from 1.22% and the yield on the 10-Year US Treasury rose to 4.06% from 1.58%. Demand for municipals continued to weaken during the six-month period, as investors have pulled approximately $104.8 billion year to date from municipal bond mutual funds and exchange-traded funds as of October 26, 2022. In addition to broader fixed-income market volatility, these municipal market outflows contributed to municipal underperformance versus US Treasuries, with 10-Year AAA Muni/Treasury after-tax spreads widening 73 basis points (“b.p.”) during the 12-month period and 1 b.p. during the six-month period. Average BBB credit spreads widened during the 12-month and six-month periods by approximately 60 b.p. and 26 b.p., respectively.
The Fund’s Senior Investment Management Team (the “Team”) continues to focus on real after-tax return by investing in municipal bonds that generate income exempt from federal income taxes. In seeking to manage volatility and interest-rate risk, the Team focuses on intermediate-term bonds and seeks to provide inflation protection by entering inflation swap agreements or investing in other inflation-protected instruments.
INVESTMENT POLICIES
The Fund seeks real after-tax return for investors who are subject to federal income taxes. Real return is the rate of return after adjusting for inflation. The Fund pursues its objective by investing primarily in municipal securities that pay interest exempt from federal taxation and by using inflation protection derivatives instruments. Municipal securities may pay interest that is subject to the federal alternative minimum tax for certain taxpayers.
The Fund may invest in fixed-income securities with any maturity or duration. The Fund may also invest without limit in fixed-income securities that are rated below investment grade (commonly known as “junk bonds”).
The Adviser selects securities for purchase or sale based on its assessment of the securities’ risk and return characteristics as well as the securities’ impact on the overall risk and return characteristics of the Fund. In making this assessment, the Adviser takes into account various factors, including the credit quality and sensitivity to interest rates of the securities under consideration and of the Fund’s other holdings.
The Fund may make significant use of derivatives, including swaps, futures, options and forwards. To provide inflation protection, the
(continued on next page)
| | |
| |
| abfunds.com | | AB TAX-AWARE REAL RETURN INCOME SHARES | 3 |
Fund will enter into various kinds of inflation swap agreements. The Fund may use other inflation-protected instruments. Payments to the Fund pursuant to swaps will result in taxable income, either ordinary income or capital gains, rather than income exempt from federal taxation. The Fund may at times seek a substantial amount of inflation protection and, consequently, may generate substantial taxable income. It is expected that the Fund’s primary use of derivatives will be for the purposes of inflation protection.
The Fund may also invest in forward commitments; zero-coupon municipal securities and variable-, floating- and inverse-floating-rate municipal securities; and certain types of mortgage-related securities.
The Fund may utilize leverage for investment purposes through the use of tender option bond transactions (“TOBs”). The Adviser will consider the impact of TOBs, swaps and other derivatives in making its assessments of the Fund’s risks. The resulting exposures to markets, sectors, issuers or specific securities will be continuously monitored by the Adviser.
| | |
| |
4 | AB TAX-AWARE REAL RETURN INCOME SHARES | | abfunds.com |
DISCLOSURES AND RISKS
Benchmark Disclosure
The Bloomberg 1-10 Year TIPS Index is unmanaged and does not reflect fees and expenses associated with the active management of a fund. The Bloomberg 1-10 Year TIPS Index represents the performance of US Treasury inflation-indexed securities with maturities between one and ten years. An investor cannot invest directly in an index, and its results are not indicative of the performance for any specific investment, including the Fund.
A Word About Risk
Market Risk: The value of the Fund’s assets will fluctuate as the stock or bond market fluctuates. The value of the Fund’s investments may decline, sometimes rapidly and unpredictably, simply because of economic changes or other events, including public health crises (including the occurrence of a contagious disease or illness) and regional and global conflicts, that affect large portions of the market.
Credit Risk: An issuer or guarantor of a fixed-income security, or the counterparty to a derivatives or other contract, may be unable or unwilling to make timely payments of interest or principal, or to otherwise honor its obligations. The issuer or guarantor may default, causing a loss of the full principal amount of a security and any accrued interest. The degree of risk for a particular security may be reflected in its credit rating. There is the possibility that the credit rating of a fixed-income security may be downgraded after purchase, which may adversely affect the value of the security. Investments in fixed-income securities with lower ratings tend to have a higher probability that an issuer will default or fail to meet its payment obligations.
Interest-Rate Risk: Changes in interest rates will affect the value of investments in fixed-income securities. When interest rates rise, the value of existing investments in fixed-income securities tends to fall and this decrease in value may not be offset by higher income from new investments. Interest-rate risk is generally greater for fixed-income securities with longer maturities or durations. The Fund may be subject to greater risk of rising interest rates than would normally be the case due to the end of a recent period of historically low rates and the effect of potential government fiscal policy initiatives and resulting market reaction to those initiatives.
Below Investment-Grade Securities Risk: Investments in fixed-income securities with lower ratings (commonly known as “junk bonds”) tend to have a higher probability that an issuer will default or fail to meet its payment obligations. These securities may be subject to greater price volatility due to such factors as specific corporate developments and negative perceptions of the junk bond market generally and may be more difficult to trade than other types of securities.
| | |
| |
| abfunds.com | | AB TAX-AWARE REAL RETURN INCOME SHARES | 5 |
DISCLOSURES AND RISKS (continued)
Duration Risk: Duration is a measure that relates the expected price volatility of a fixed-income security to changes in interest rates. The duration of a fixed-income security may be shorter than or equal to full maturity of a fixed-income security. Fixed-income securities with longer durations have more risk and will decrease in price as interest rates rise.
Municipal Market Risk: This is the risk that special factors may adversely affect the value of municipal securities and have a significant effect on the yield or value of the Fund’s investments in municipal securities. These factors include economic conditions, political or legislative changes, public health crises, uncertainties related to the tax status of municipal securities, and the rights of investors in these securities. To the extent that the Fund invests more of its assets in a particular state’s municipal securities, the Fund may be vulnerable to events adversely affecting that state, including economic, political and regulatory occurrences, court decisions, terrorism, public health crises (including the occurrence of a contagious disease or illness) and catastrophic natural disasters, such as hurricanes, fires or earthquakes. For example, the novel coronavirus (COVID-19) pandemic has significantly stressed the financial resources of many issuers of municipal securities, which could impair any such issuer’s ability to meet its financial obligations when due and adversely impact the value of its securities held by the Fund. As the full effects of the COVID-19 pandemic on state and local economies and on issuers of municipal securities are still uncertain, the financial difficulties of issuers of municipal securities may continue or worsen, adversely affecting the performance of the Fund. The Fund’s investments in certain municipal securities with principal and interest payments that are made from the revenues of a specific project or facility, and not general tax revenues, may have increased risks. Factors affecting the project or facility, such as local business or economic conditions, could have a significant effect on the project’s ability to make payments of principal and interest on these securities.
Congress has previously considered making changes to the municipal securities provisions of the Internal Revenue Code that could change the US federal income tax treatment of certain types of municipal securities.
Inflation Risk: This is the risk that the value of assets or income from investments will be less in the future as inflation decreases the value of money. As inflation increases, the value of the Fund’s assets can decline as can the value of the Fund’s distributions. This risk is significantly greater for fixed-income securities with longer maturities.
Derivatives Risk: Derivatives may be difficult to price or unwind and leveraged so that small changes may produce disproportionate losses for the Fund. Derivatives, especially over-the-counter derivatives, are also subject to counterparty risk, which is the risk that the counterparty (the
| | |
| |
6 | AB TAX-AWARE REAL RETURN INCOME SHARES | | abfunds.com |
DISCLOSURES AND RISKS (continued)
party on the other side of the transaction) on a derivative transaction will be unable or unwilling to honor its contractual obligations to the Fund.
Leverage Risk: To the extent the Fund uses leveraging techniques, such as TOBs, its net asset value (“NAV”) may be more volatile because leverage tends to exaggerate the effect of changes in interest rates and any increase or decrease in the value of the Fund’s investments.
Illiquid Investments Risk: Illiquid investments risk exists when particular investments, such as lower-rated securities, are or become difficult to purchase or sell, possibly preventing the Fund from selling such investments at an advantageous price. The Fund is subject to illiquid investments risk because the market for municipal securities is generally smaller than many other markets. Derivatives and securities involving substantial market and credit risk tend to involve greater illiquid investments risk than most other types of investments.
Management Risk: The Fund is subject to management risk because it is an actively managed investment fund. The Adviser will apply its investment techniques and risk analyses in making investment decisions, but there is no guarantee that its techniques will produce the intended results. Some of these techniques may incorporate, or rely upon, quantitative models, but there is no guarantee that these models will generate accurate forecasts, reduce risk or otherwise perform as expected.
These risks are fully discussed in the Fund’s prospectus. As with all investments, you may lose money by investing in the Fund.
An Important Note About Historical Performance
The performance shown in this report represents past performance and does not guarantee future results. Current performance may be lower or higher than the performance information shown. You may obtain performance information current to the most recent month-end by calling (800) 227 4618. The investment return and principal value of an investment in the Fund will fluctuate, so that your shares, when redeemed, may be worth more or less than their original cost. Performance assumes reinvestment of distributions and does not account for taxes. The Fund commenced investment operations on May 2, 2011, and continued operations through March 20, 2014, the date on which all shares of the Fund were redeemed. Between March 20, 2014, and November 12, 2019, the Fund did not conduct investment operations. The Fund resumed investment operations on November 13, 2019. The performance information shown is only for the current activation period. Because the Fund has had periods in which it was not conducting investment operations, its performance is not comparable to the performance of other mutual funds.
| | |
| |
| abfunds.com | | AB TAX-AWARE REAL RETURN INCOME SHARES | 7 |
DISCLOSURES AND RISKS (continued)
Investors should consider the investment objectives, risks, charges and expenses of the Fund carefully before investing. For copies of our prospectus and/or summary prospectus, which contain this and other information, visit us online at www.abfunds.com or contact your AllianceBernstein Investments representative. Please read the prospectus and/or summary prospectus carefully before investing.
| | |
| |
8 | AB TAX-AWARE REAL RETURN INCOME SHARES | | abfunds.com |
HISTORICAL PERFORMANCE
AVERAGE ANNUAL RETURNS AS OF OCTOBER 31, 2022 (unaudited)
| | | | |
| |
| | | NAV Returns | |
| |
| 1 Year | | | -3.59% | |
| |
| Since Inception1 | | | 7.01% | |
AVERAGE ANNUAL RETURNS
AS OF THE MOST RECENT CALENDAR QUARTER-END
SEPTEMBER 30, 2022 (unaudited)
| | | | |
| |
| | | NAV Returns | |
| |
| 1 Year | | | -4.88% | |
| |
| Since Inception1 | | | 5.71% | |
The prospectus fee table shows the fees and the total annual operating expenses of the Fund as 0.00% because the Adviser does not charge any fees or expenses and reimburses Fund operating expenses except certain extraordinary expenses, taxes, brokerage costs and the interest on borrowings or certain leveraged transactions. Participants in a wrap fee program or other investment program eligible to invest in the Fund pay fees to the program sponsor and should review the program brochure or other literature provided by the sponsor for a discussion of fees and expenses charged.
| 1 | Current activation date: 11/12/2019. |
| | |
| |
| abfunds.com | | AB TAX-AWARE REAL RETURN INCOME SHARES | 9 |
EXPENSE EXAMPLE
(unaudited)
As a shareholder of the Fund, you may incur various ongoing non-operating and extraordinary costs. This example is intended to help you understand your ongoing costs (in dollars) of investing in the Fund and to compare these costs with the ongoing costs of investing in other mutual funds.
The Example is based on an investment of $1,000 invested at the beginning of the period and held for the entire period as indicated below.
Actual Expenses
The table below provides information about actual account values and actual expenses. You may use the information, together with the amount you invested, to estimate the expenses that you paid over the period. Simply divide your account value by $1,000 (for example, an $8,600 account value divided by $1,000 = 8.6), then multiply the result by the number under the heading entitled “Expenses Paid During Period” to estimate the expenses you paid on your account during this period.
Hypothetical Example for Comparison Purposes
The table below also provides information about hypothetical account values and hypothetical expenses based on the Fund’s actual expense ratio and an assumed annual rate of return of 5% before expenses, which is not the Fund’s actual return. The hypothetical account values and expenses may not be used to estimate the actual ending account balance or expenses you paid for the period. You may use this information to compare the ongoing costs of investing in the Fund and other funds by comparing this 5% hypothetical example with the 5% hypothetical examples that appear in the shareholder reports of other funds.
Please note that the expenses shown in the table are meant to highlight your ongoing costs only and do not reflect any transactional costs, such as sales charges (loads), or contingent deferred sales charges on redemptions. Therefore, the hypothetical example is useful in comparing ongoing costs only, and will not help you determine the relative total costs of owning different funds. In addition, if these transactional costs were included, your costs would have been higher.
| | | | | | | | | | | | | | | | |
| | | Beginning
Account Value
May 1, 2022 | | | Ending
Account Value
October 31, 2022 | | | Expenses Paid
During Period* | | | Annualized
Expense Ratio* | |
Actual | | $ | 1,000 | | | $ | 921.70 | | | $ | – 0 – | | | | 0.00 | % |
Hypothetical** | | $ | 1,000 | | | $ | 1,025.21 | | | $ | – 0 – | | | | 0.00 | % |
| * | Expenses are equal to the Fund’s annualized expense ratio, multiplied by the average account value over the period, multiplied by 184/365 (to reflect the one-half year period). The Fund’s operating expenses are borne by the Adviser or its affiliates. |
| ** | Assumes 5% annual return before expenses. |
| | |
| |
10 | AB TAX-AWARE REAL RETURN INCOME SHARES | | abfunds.com |
PORTFOLIO SUMMARY
October 31, 2022 (unaudited)
PORTFOLIO STATISTICS
Net Assets ($mil): $8.7
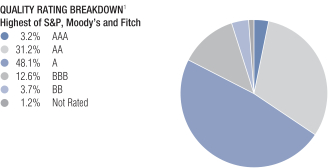
| 1 | The Fund’s quality rating breakdown is expressed as a percentage of the Fund’s total investments in municipal securities and may vary over time. The Fund also enters into derivative transactions, which may be used for hedging or investment purposes (see “Portfolio of Investments” section of the report for additional details). The quality ratings are determined by using the S&P Global Ratings (“S&P”), Moody’s Investors Services, Inc. (“Moody’s”) and Fitch Ratings, Ltd. (“Fitch”). The Fund considers the credit ratings issued by S&P, Moody’s and Fitch and uses the highest rating issued by the agencies. These ratings are a measure of the quality and safety of a bond or portfolio, based on the issuer’s financial condition. AAA is the highest (best) and D is the lowest (worst). If applicable, the pre-refunded category includes bonds which are secured by U.S. Government securities and therefore are deemed high-quality investment-grade by the Adviser. If applicable, Not Applicable (N/A) includes non-creditworthy investments, such as equities, currency contracts, futures and options. If applicable, the Not Rated category includes bonds that are not rated by a nationally recognized statistical rating organization. The Adviser evaluates the creditworthiness of non-rated securities based on a number of factors including, but not limited to, cash flows, enterprise value and economic environment. |
| | |
| |
| abfunds.com | | AB TAX-AWARE REAL RETURN INCOME SHARES | 11 |
PORTFOLIO OF INVESTMENTS
October 31, 2022 (unaudited)
| | | | | | | | |
| | | Principal
Amount
(000) | | | U.S. $ Value | |
| |
MUNICIPAL OBLIGATIONS – 75.6% | |
Long-Term Municipal Bonds – 75.6% | |
Alaska – 4.8% | |
Alaska Industrial Development & Export Authority
(Greater Fairbanks Community Hospital Foundation Obligated Group)
Series 2019
4.00%, 04/01/2033 | | $ | 445 | | | $ | 416,363 | |
| | | | | | | | |
|
Arizona – 3.2% | |
City of Phoenix Civic Improvement Corp.
(Phoenix Sky Harbor International Airport)
Series 2019-B
5.00%, 07/01/2033 | | | 275 | | | | 278,033 | |
| | | | | | | | |
|
Colorado – 4.0% | |
Weld County School District No. RE-2 Eaton
Series 2019
5.00%, 12/01/2027 | | | 325 | | | | 349,561 | |
| | | | | | | | |
|
Connecticut – 9.5% | |
City of New Haven CT
Series 2017-A
5.25%, 08/01/2026 | | | 70 | | | | 73,521 | |
Connecticut State Health & Educational Facilities Authority
(Hartford HealthCare Obligated Group)
Series 2020-A
5.00%, 07/01/2034 | | | 515 | | | | 527,486 | |
State of Connecticut
Series 2020-A
5.00%, 01/15/2031 | | | 215 | | | | 232,886 | |
| | | | | | | | |
| | | | | | | 833,893 | |
| | | | | | | | |
District of Columbia – 3.6% | |
District of Columbia
(District of Columbia Fed Hwy Grant)
Series 2020
5.00%, 12/01/2031 | | | 290 | | | | 312,988 | |
| | | | | | | | |
|
Florida – 3.9% | |
Capital Projects Finance Authority/FL
(CAPFA Capital Corp. 2000F)
Series 2020-A
5.00%, 10/01/2033 | | | 250 | | | | 240,825 | |
Greater Orlando Aviation Authority
Series 2019-A
5.00%, 10/01/2027 | | | 95 | | | | 98,273 | |
| | | | | | | | |
| | | | | | | 339,098 | |
| | | | | | | | |
| | |
| |
12 | AB TAX-AWARE REAL RETURN INCOME SHARES | | abfunds.com |
PORTFOLIO OF INVESTMENTS (continued)
| | | | | | | | |
| | | Principal
Amount
(000) | | | U.S. $ Value | |
| |
Illinois – 7.7% | |
Illinois Finance Authority
(Illinois Institute of Technology)
Series 2019
5.00%, 09/01/2032 | | $ | 100 | | | $ | 97,063 | |
Sales Tax Securitization Corp.
Series 2020-A
5.00%, 01/01/2026 | | | 270 | | | | 278,620 | |
State of Illinois
Series 2018-A
5.00%, 10/01/2025 | | | 295 | | | | 297,292 | |
| | | | | | | | |
| | | | | | | 672,975 | |
| | | | | | | | |
Kentucky – 10.5% | |
City of Ashland KY
(Ashland Hospital Corp. Obligated Group)
Series 2019
5.00%, 02/01/2027 | | | 100 | | | | 102,707 | |
Kentucky Public Energy Authority
(Morgan Stanley)
Series 2019-C
4.00%, 02/01/2050 | | | 570 | | | | 538,753 | |
Louisville/Jefferson County Metropolitan Government
(Norton Healthcare Obligated Group)
Series 2020-A
4.00%, 10/01/2040 | | | 320 | | | | 278,460 | |
| | | | | | | | |
| | | | | | | 919,920 | |
| | | | | | | | |
Louisiana – 1.2% | |
Parish of St. James LA
(NuStar Logistics LP)
Series 2020
5.85%, 08/01/2041(a) | | | 100 | | | | 101,932 | |
| | | | | | | | |
|
Michigan – 2.0% | |
Michigan State University
Series 2019-C
5.00%, 08/15/2032 | | | 160 | | | | 171,229 | |
| | | | | | | | |
|
New Jersey – 3.9% | |
New Jersey Transportation Trust Fund Authority
(New Jersey Transportation Trust Fund Authority State Lease)
Series 2019
5.00%, 12/15/2031 | | | 330 | | | | 339,369 | |
| | | | | | | | |
| | |
| |
| abfunds.com | | AB TAX-AWARE REAL RETURN INCOME SHARES | 13 |
PORTFOLIO OF INVESTMENTS (continued)
| | | | | | | | |
| | | Principal
Amount
(000) | | | U.S. $ Value | |
| |
New York – 6.8% | |
Metropolitan Transportation Authority
Series 2012-C
5.00%, 11/15/2030 | | $ | 260 | | | $ | 260,165 | |
New York City Transitional Finance Authority
Future Tax Secured Revenue
Series 2019-B
5.00%, 11/01/2035 | | | 200 | | | | 211,071 | |
New York Transportation Development Corp.
(Delta Air Lines, Inc.)
Series 2020
4.375%, 10/01/2045 | | | 150 | | | | 124,242 | |
| | | | | | | | |
| | | | | | | 595,478 | |
| | | | | | | | |
Ohio – 1.7% | |
Buckeye Tobacco Settlement Financing Authority
Series 2020-A
5.00%, 06/01/2035 | | | 150 | | | | 153,122 | |
| | | | | | | | |
|
Other – 0.9% | |
Federal Home Loan Mortgage Corp. Multifamily VRD Certificates
2.65%, 06/15/2036(a) | | | 100 | | | | 80,433 | |
| | | | | | | | |
|
Pennsylvania – 3.3% | |
City of Philadelphia PA
Series 2019-B
5.00%, 02/01/2030 | | | 155 | | | | 163,835 | |
Commonwealth Financing Authority
(Commonwealth Financing Authority State Lease)
Series 2018
5.00%, 06/01/2025 | | | 120 | | | | 122,983 | |
| | | | | | | | |
| | | | | | | 286,818 | |
| | | | | | | | |
Texas – 2.0% | |
City of Houston TX Airport System Revenue
(United Airlines, Inc.)
Series 2014
5.00%, 07/01/2029 | | | 100 | | | | 98,547 | |
Port Beaumont Navigation District
(Jefferson Railport Terminal II LLC)
Series 2020
3.625%, 01/01/2035(a) | | | 100 | | | | 77,070 | |
| | | | | | | | |
| | | | | | | 175,617 | |
| | | | | | | | |
Virginia – 2.3% | |
Virginia College Building Authority
(Virginia College Building Authority State Lease)
Series 2019
5.00%, 02/01/2026 | | | 190 | | | | 199,579 | |
| | | | | | | | |
| | |
| |
14 | AB TAX-AWARE REAL RETURN INCOME SHARES | | abfunds.com |
PORTFOLIO OF INVESTMENTS (continued)
| | | | | | | | |
| | | Principal
Amount
(000) | | | U.S. $ Value | |
| |
West Virginia – 3.8% | |
State of West Virginia
Series 2019
5.00%, 06/01/2027 | | $ | 315 | | | $ | 336,619 | |
| | | | | | | | |
|
Wisconsin – 0.5% | |
UMA Education, Inc.
Series 2019
5.00%, 10/01/2034(a) | | | 50 | | | | 45,984 | |
| | | | | | | | |
| | |
Total Municipal Obligations
(cost $7,478,394) | | | | | | | 6,609,011 | |
| | | | | |
| | |
| | | Shares | | | | |
SHORT-TERM INVESTMENTS – 15.8% | |
Investment Companies – 15.8% | |
AB Fixed Income Shares, Inc. – Government Money Market Portfolio – Class AB,
2.67%(b)(c)(d)
(cost $1,385,021) | | | 1,385,021 | | | | 1,385,021 | |
| | | | | | | | |
| | |
Total Investments – 91.4%
(cost $8,863,415) | | | | | | | 7,994,032 | |
Other assets less liabilities – 8.6% | | | | | | | 754,062 | |
| | | | | | | | |
| | |
Net Assets – 100.0% | | | | | | $ | 8,748,094 | |
| | | | | | | | |
CENTRALLY CLEARED INFLATION (CPI) SWAPS (see Note C)
| | | | | | | | | | | | | | | | | | | | | | | | | | | | | | | | |
| | | | | | | | | Rate Type | | | | | | | | | | | | | |
Notional
Amount
(000) | | | Termination
Date | | | Payments
made
by the
Fund | | | Payments
received
by the
Fund | | | Payment
Frequency Paid/
Received | | | Market
Value | | | Upfront
Premiums
Paid/
(Received) | | | Unrealized
Appreciation
(Depreciation) | |
USD | | | 3,000 | | | | 02/10/2023 | | | | 1.558% | | | | CPI# | | | | Maturity | | | $ | 333,094 | | | $ | – 0 | – | | $ | 333,094 | |
USD | | | 900 | | | | 12/24/2024 | | | | 1.846% | | | | CPI# | | | | Maturity | | | | 107,935 | | | | – 0 | – | | | 107,935 | |
USD | | | 2,000 | | | | 02/10/2027 | | | | 1.755% | | | | CPI# | | | | Maturity | | | | 278,830 | | | | – 0 | – | | | 278,830 | |
USD | | | 2,350 | | | | 12/24/2029 | | | | 1.978% | | | | CPI# | | | | Maturity | | | | 331,503 | | | | – 0 | – | | | 331,503 | |
| | | | | | | | | | | | | | | | | | | | | | | | | | | | | | | | |
| | | | | | | | | | | | | | | | | | | | | | $ | 1,051,362 | | | $ | – 0 | – | | $ | 1,051,362 | |
| | | | | | | | | | | | | | | | | | | | | | | | | | | | | | | | |
| # | Variable interest rate based on the rate of inflation as determined by the Consumer Price Index (CPI). |
| | |
| |
| abfunds.com | | AB TAX-AWARE REAL RETURN INCOME SHARES | 15 |
PORTFOLIO OF INVESTMENTS (continued)
CENTRALLY CLEARED INTEREST RATE SWAPS (see Note C)
| | | | | | | | | | | | | | | | | | | | | | | | | | | | | | | | |
| | | | | | | | | Rate Type | | | | | | | | | | | | | |
Notional
Amount
(000) | | | Termination
Date | | | Payments
made
by the
Fund | | | Payments
received
by the
Fund | | | Payment
Frequency Paid/
Received | | | Market
Value | | | Upfront
Premiums
Paid/
(Received) | | | Unrealized
Appreciation
(Depreciation) | |
USD | | | 5,910 | | | | 02/01/2024 | | | | 1.143% | | | | 1 Day SOFR | | | | Annual | | | $ | 262,181 | | | $ | – 0 | – | | $ | 262,181 | |
USD | | | 6,590 | | | | 02/01/2027 | | | | 1.465% | | | | 1 Day SOFR | | | | Annual | | | | 665,081 | | | | – 0 | – | | | 665,081 | |
USD | | | 2,270 | | | | 02/01/2032 | | | | 1.600% | | | | 1 Day SOFR | | | | Annual | | | | 389,526 | | | | – 0 | – | | | 389,526 | |
| | | | | | | | | | | | | | | | | | | | | | | | | | | | | | | | |
| | | | | | | | | | | | | | | | | | | | | | $ | 1,316,788 | | | $ | – 0 | – | | $ | 1,316,788 | |
| | | | | | | | | | | | | | | | | | | | | | | | | | | | | | | | |
INFLATION (CPI) SWAPS (see Note C)
| | | | | | | | | | | | | | | | | | | | | | | | | | | | | | | | | | | | |
| | | | | | | | | | | | Rate Type | | | | | | | | | | | | | |
Swap
Counterparty | | Notional
Amount
(000) | | | Termination
Date | | | Payments
made
by the
Fund | | | Payments
received
by the
Fund | | | Payment
Frequency
Paid/
Received | | | Market
Value | | | Upfront
Premiums
Paid/
(Received) | | | Unrealized
Appreciation
(Depreciation) | |
JPMorgan Chase Bank, NA | | | USD | | | | 1,000 | | | | 04/29/2036 | | | | 2.498 | % | | | CPI | # | | | Maturity | | | $ | 95,978 | | | $ | – 0 | – | | $ | 95,978 | |
| # | Variable interest rate based on the rate of inflation as determined by the Consumer Price Index (CPI). |
TOTAL RETURN SWAPS (see Note C)
| | | | | | | | | | | | | | | | | | | | | | |
Counterparty &
Referenced Obligation | | Rate Paid/
Received | | Payment
Frequency | | | Current
Notional
(000) | | | Maturity
Date | | | Unrealized
Appreciation
(Depreciation) | |
Receive Total Return on Reference Obligation | | | | | | | | | |
Barclays Bank PLC | | | | | | | | | | | | | | | | | | | | | | |
Barclays Capital US Inflation Linked Bonds 1 to 10 Year | | 1 Day SOFR Plus 0.25% | | | Maturity | | | | USD | | | | 5,432 | | | | 03/01/2023 | | | $ | (435,688 | ) |
Barclays Capital US Inflation Linked Bonds 1 to 10 Year | | 1 Day SOFR Plus 0.25% | | | Maturity | | | | USD | | | | 7,993 | | | | 03/23/2023 | | | $ | (603,556 | ) |
| | | | | | | | | | | | | | | | | | | | | | |
| | | | | | | | | | | | | | | | | | | | $ | (1,039,244 | ) |
| | | | | | | | | | | | | | | | | | | | | | |
| (a) | Security is exempt from registration under Rule 144A or Regulation S of the Securities Act of 1933. These securities are considered restricted, but liquid and may be resold in transactions exempt from registration. At October 31, 2022, the aggregate market value of these securities amounted to $305,419 or 3.5% of net assets. |
| (b) | Affiliated investments. |
| (c) | The rate shown represents the 7-day yield as of period end. |
| (d) | To obtain a copy of the fund’s shareholder report, please go to the Securities and Exchange Commission’s website at www.sec.gov, or call AB at (800) 227-4618. |
Glossary:
CPI – Consumer Price Index
SOFR – Secured Overnight Financing Rate
See notes to financial statements.
| | |
| |
16 | AB TAX-AWARE REAL RETURN INCOME SHARES | | abfunds.com |
STATEMENT OF ASSETS & LIABILITIES
October 31, 2022 (unaudited)
| | | | |
| Assets | | | | |
Investments in securities, at value | | | | |
Unaffiliated issuers (cost $7,478,394) | | $ | 6,609,011 | |
Affiliated issuers (cost $1,385,021) | | | 1,385,021 | |
Cash collateral due from broker | | | 1,569,510 | |
Unrealized appreciation on inflation swaps | | | 95,978 | |
Interest receivable | | | 89,624 | |
Receivable for variation margin on centrally cleared swaps | | | 35,869 | |
Affiliated dividends receivable | | | 2,267 | |
Receivable due from Adviser | | | 255 | |
Other assets | | | 447 | |
| | | | |
Total assets | | | 9,787,982 | |
| | | | |
| Liabilities | | | | |
Unrealized depreciation on total return swaps | | | 1,039,244 | |
Dividends payable | | | 644 | |
| | | | |
Total liabilities | | | 1,039,888 | |
| | | | |
Net Assets | | $ | 8,748,094 | |
| | | | |
| Composition of Net Assets | | | | |
Shares of beneficial interest, at par | | $ | 8 | |
Additional paid-in capital | | | 7,387,822 | |
Distributable earnings | | | 1,360,264 | |
| | | | |
Net Assets | | $ | 8,748,094 | |
| | | | |
Net Asset Value Per Share—unlimited shares of beneficial interest authorized, $.00001 par value (based on 795,656 common shares outstanding) | | $ | 10.99 | |
| | | | |
See notes to financial statements.
| | |
| |
| abfunds.com | | AB TAX-AWARE REAL RETURN INCOME SHARES | 17 |
STATEMENT OF OPERATIONS
Six Months Ended October 31, 2022 (unaudited)
| | | | | | | | |
| Investment Income | | | | | | | | |
Interest | | $ | 70,346 | | | | | |
Dividends—Affiliated issuers | | | 13,497 | | | | | |
Other income(a) | | | 885 | | | | | |
| | | | | | | | |
Total investment income | | | | | | $ | 84,728 | |
| | | | | | | | |
| Expenses | | | | | | | | |
Bank overdraft expense | | | 447 | | | | | |
| | | | | | | | |
Total expenses | | | | | | | 447 | |
| | | | | | | | |
Net investment income | | | | | | | 84,281 | |
| | | | | | | | |
| Realized and Unrealized Loss on Investment Transactions | | | | | | | | |
Net realized loss on: | | | | | | | | |
Swaps | | | | | | | (377 | ) |
Net change in unrealized appreciation (depreciation) of: | | | | | | | | |
Investments | | | | | | | (369,259 | ) |
Swaps | | | | | | | (473,016 | ) |
| | | | | | | | |
Net loss on investment transactions | | | | | | | (842,652 | ) |
| | | | | | | | |
Net Decrease in Net Assets from Operations | | | | | | $ | (758,371 | ) |
| | | | | | | | |
| (a) | Other income includes a reimbursement for investment in affiliated issuer (see Note B). |
See notes to financial statements.
| | |
| |
18 | AB TAX-AWARE REAL RETURN INCOME SHARES | | abfunds.com |
STATEMENT OF CHANGES IN NET ASSETS
| | | | | | | | |
| | | Six Months Ended
October 31, 2022
(unaudited) | | | Year Ended
April 30,
2022 | |
| Increase (Decrease) in Net Assets from Operations | | | | | | | | |
Net investment income | | $ | 84,281 | | | $ | 270,765 | |
Net realized gain (loss) on investment transactions | | | (377 | ) | | | 885,622 | |
Net change in unrealized appreciation (depreciation) of investments | | | (842,275 | ) | | | 1,076,017 | |
| | | | | | | | |
Net increase (decrease) in net assets from operations | | | (758,371 | ) | | | 2,232,404 | |
Distribution to Shareholders | | | (3,956 | ) | | | (2,009,794 | ) |
| Transactions in Shares of Beneficial Interest | | | | | | | | |
Net decrease | | | (389,481 | ) | | | (10,955,389 | ) |
| | | | | | | | |
Total decrease | | | (1,151,808 | ) | | | (10,732,779 | ) |
| Net Assets | | | | | | | | |
Beginning of period | | | 9,899,902 | | | | 20,632,681 | |
| | | | | | | | |
End of period | | $ | 8,748,094 | | | $ | 9,899,902 | |
| | | | | | | | |
See notes to financial statements.
| | |
| |
| abfunds.com | | AB TAX-AWARE REAL RETURN INCOME SHARES | 19 |
NOTES TO FINANCIAL STATEMENTS
October 31, 2022 (unaudited)
NOTE A
Significant Accounting Policies
AB Corporate Shares (the “Trust”) is registered under the Investment Company Act of 1940, as an open-end, diversified management investment company. The Trust, which is a Massachusetts Business Trust, operates as a “series” company currently offering five separate portfolios: AB Corporate Income Shares, AB Municipal Income Shares, AB Taxable Multi-Sector Income Shares, AB Impact Municipal Income Shares and AB Tax-Aware Real Return Income Shares. Each portfolio is considered to be a separate entity for financial reporting and tax purposes. This report relates only to AB Tax-Aware Real Return Income Shares (the “Fund”).
Shares of the Fund are offered exclusively to holders of accounts established under wrap-fee programs sponsored and maintained by certain registered investment advisers approved by AllianceBernstein L.P. (the “Adviser”). The Fund’s shares may be purchased at the relevant net asset value without a sales charge or other fee. The financial statements have been prepared in conformity with U.S. generally accepted accounting principles (“U.S. GAAP”), which require management to make certain estimates and assumptions that affect the reported amounts of assets and liabilities in the financial statements and amounts of income and expenses during the reporting period. Actual results could differ from those estimates. The Fund is an investment company under U.S. GAAP and follows the accounting and reporting guidance applicable to investment companies. The following is a summary of significant accounting policies followed by the Fund.
1. Security Valuation
Portfolio securities are valued at market value determined on the basis of market quotations or, if market quotations are not readily available or are unreliable, at “fair value” as determined in accordance with procedures approved by and under the oversight of the Trust’s Board of Trustees (the “Board”). Pursuant to these procedures, the Adviser serves as the Fund’s valuation designee pursuant to Rule 2a-5 of the 1940 Act. In this capacity, the Adviser is responsible, among other things, for making all fair value determinations relating to the Fund’s portfolio investments, subject to the Board’s oversight.
In general, the market values of securities which are readily available and deemed reliable are determined as follows: securities listed on a national securities exchange (other than securities listed on the NASDAQ Stock Market, Inc. (“NASDAQ”)) or on a foreign securities exchange are valued at the last sale price at the close of the exchange or foreign securities exchange. If there has been no sale on such day, the securities are valued at the last traded price from the previous day. Securities listed on more
| | |
| |
20 | AB TAX-AWARE REAL RETURN INCOME SHARES | | abfunds.com |
NOTES TO FINANCIAL STATEMENTS (continued)
than one exchange are valued by reference to the principal exchange on which the securities are traded; securities listed only on NASDAQ are valued in accordance with the NASDAQ Official Closing Price; listed or over the counter (“OTC”) market put or call options are valued at the mid level between the current bid and ask prices. If either a current bid or current ask price is unavailable, the Adviser will have discretion to determine the best valuation (e.g., last trade price in the case of listed options); open futures are valued using the closing settlement price or, in the absence of such a price, the most recent quoted bid price. If there are no quotations available for the day of valuation, the last available closing settlement price is used; U.S. Government securities and any other debt instruments having 60 days or less remaining until maturity are generally valued at market by an independent pricing vendor, if a market price is available. If a market price is not available, the securities are valued at amortized cost. This methodology is commonly used for short term securities that have an original maturity of 60 days or less, as well as short term securities that had an original term to maturity that exceeded 60 days. In instances when amortized cost is utilized, the Valuation Committee (the “Committee”) must reasonably conclude that the utilization of amortized cost is approximately the same as the fair value of the security. Factors the Committee will consider include, but are not limited to, an impairment of the creditworthiness of the issuer or material changes in interest rates. Fixed-income securities, including mortgage-backed and asset-backed securities, may be valued on the basis of prices provided by a pricing service or at a price obtained from one or more of the major broker-dealers. In cases where broker-dealer quotes are obtained, the Adviser may establish procedures whereby changes in market yields or spreads are used to adjust, on a daily basis, a recently obtained quoted price on a security. Swaps and other derivatives are valued daily, primarily using independent pricing services, independent pricing models using market inputs, as well as third party broker-dealers or counterparties. Open-end mutual funds are valued at the closing net asset value per share, while exchange traded funds are valued at the closing market price per share.
Securities for which market quotations are not readily available (including restricted securities) or are deemed unreliable are valued at fair value as deemed appropriate by the Adviser. Factors considered in making this determination may include, but are not limited to, information obtained by contacting the issuer, analysts, analysis of the issuer’s financial statements or other available documents. In addition, the Fund may use fair value pricing for securities primarily traded in non-U.S. markets because most foreign markets close well before the Fund values its securities at 4:00 p.m., Eastern Time. The earlier close of these foreign markets gives rise to the possibility that significant events, including broad market moves, may have occurred in the interim and may materially affect the value of those securities. To account for
| | |
| |
| abfunds.com | | AB TAX-AWARE REAL RETURN INCOME SHARES | 21 |
NOTES TO FINANCIAL STATEMENTS (continued)
this, the Fund generally values many of its foreign equity securities using fair value prices based on third party vendor modeling tools to the extent available.
2. Fair Value Measurements
In accordance with U.S. GAAP regarding fair value measurements, fair value is defined as the price that the Fund would receive to sell an asset or pay to transfer a liability in an orderly transaction between market participants at the measurement date. U.S. GAAP establishes a framework for measuring fair value, and a three-level hierarchy for fair value measurements based upon the transparency of inputs to the valuation of an asset or liability (including those valued based on their market values as described in Note A.1 above). Inputs may be observable or unobservable and refer broadly to the assumptions that market participants would use in pricing the asset or liability. Observable inputs reflect the assumptions market participants would use in pricing the asset or liability based on market data obtained from sources independent of the Fund. Unobservable inputs reflect the Fund’s own assumptions about the assumptions that market participants would use in pricing the asset or liability based on the best information available in the circumstances. Each investment is assigned a level based upon the observability of the inputs which are significant to the overall valuation. The three-tier hierarchy of inputs is summarized below.
| | • | | Level 1—quoted prices in active markets for identical investments |
| | • | | Level 2—other significant observable inputs (including quoted prices for similar investments, interest rates, prepayment speeds, credit risk, etc.) |
| | • | | Level 3—significant unobservable inputs (including the Fund’s own assumptions in determining the fair value of investments) |
The fair value of debt instruments, such as bonds, and over-the-counter derivatives is generally based on market price quotations, recently executed market transactions (where observable) or industry recognized modeling techniques and are generally classified as Level 2. Pricing vendor inputs to Level 2 valuations may include quoted prices for similar investments in active markets, interest rate curves, coupon rates, currency rates, yield curves, option adjusted spreads, default rates, credit spreads and other unique security features in order to estimate the relevant cash flows which are then discounted to calculate fair values. If these inputs are unobservable and significant to the fair value, these investments will be classified as Level 3.
Other fixed income investments, including non-U.S. government and corporate debt, are generally valued using quoted market prices, if available, which are typically impacted by current interest rates, maturity dates and
| | |
| |
22 | AB TAX-AWARE REAL RETURN INCOME SHARES | | abfunds.com |
NOTES TO FINANCIAL STATEMENTS (continued)
any perceived credit risk of the issuer. Additionally, in the absence of quoted market prices, these inputs are used by pricing vendors to derive a valuation based upon industry or proprietary models which incorporate issuer specific data with relevant yield/spread comparisons with more widely quoted bonds with similar key characteristics. Those investments for which there are observable inputs are classified as Level 2. Where the inputs are not observable, the investments are classified as Level 3.
The following table summarizes the valuation of the Fund’s investments by the above fair value hierarchy levels as of October 31, 2022:
| | | | | | | | | | | | | | | | |
Investments in
Securities: | | Level 1 | | | Level 2 | | | Level 3 | | | Total | |
Assets: | |
Long-Term Municipal Bonds | | $ | – 0 | – | | $ | 6,609,011 | | | $ | – 0 | – | | $ | 6,609,011 | |
Short-Term Investments | | | 1,385,021 | | | | – 0 | – | | | – 0 | – | | | 1,385,021 | |
| | | | | | | | | | | | | | | | |
Total Investments in Securities | | | 1,385,021 | | | | 6,609,011 | | | | – 0 | – | | | 7,994,032 | |
Other Financial Instruments(a): | | | | | | | | | | | | |
Assets: | | | | | | | | | | | | | | | | |
Centrally Cleared Inflation (CPI) Swaps | | | – 0 | – | | | 1,051,362 | | | | – 0 | – | | | 1,051,362 | (b) |
Centrally Cleared Interest Rate Swaps | | | – 0 | – | | | 1,316,788 | | | | – 0 | – | | | 1,316,788 | (b) |
Inflation (CPI) Swaps | | | – 0 | – | | | 95,978 | | | | – 0 | – | | | 95,978 | |
Liabilities: | | | | | | | | | | | | | | | | |
Total Return Swaps | | | – 0 | – | | | (1,039,244 | ) | | | – 0 | – | | | (1,039,244 | ) |
| | | | | | | | | | | | | | | | |
Total | | $ | 1,385,021 | | | $ | 8,033,895 | | | $ | – 0 | – | | $ | 9,418,916 | |
| | | | | | | | | | | | | | | | |
| (a) | Other financial instruments are derivative instruments, such as futures, forwards and swaps, which are valued at the unrealized appreciation (depreciation) on the instrument. Other financial instruments may also include swaps with upfront premiums, written options and written swaptions which are valued at market value. |
| (b) | Only variation margin receivable/(payable) at period end is reported within the statement of assets and liabilities. This amount reflects cumulative unrealized appreciation (depreciation) on futures and centrally cleared swaps as reported in the portfolio of investments. Where applicable, centrally cleared swaps with upfront premiums are presented here at market value. |
3. Taxes
It is the Fund’s policy to meet the requirements of the Internal Revenue Code applicable to regulated investment companies and to distribute all of its investment company taxable income and net realized gains, if any, to shareholders. Therefore, no provisions for federal income or excise taxes are required.
In accordance with U.S. GAAP requirements regarding accounting for uncertainties in income taxes, management has analyzed the Fund’s tax positions taken or expected to be taken on federal and state income tax returns for all open tax years (the current tax year) and has concluded that no provision for income tax is required in the Fund’s financial statements.
| | |
| |
| abfunds.com | | AB TAX-AWARE REAL RETURN INCOME SHARES | 23 |
NOTES TO FINANCIAL STATEMENTS (continued)
4. Investment Income and Investment Transactions
Dividend income is recorded on the ex-dividend date or as soon as the Fund is informed of the dividend. Interest income is accrued daily. Investment transactions are accounted for on the date the securities are purchased or sold. Investment gains or losses are determined on the identified cost basis. Non-cash dividends, if any, are recorded on the ex-dividend date at the fair value of the securities received. The Fund amortizes premiums and accretes discounts as adjustments to interest income. The Fund accounts for distributions received from REIT investments or from regulated investment companies as dividend income, realized gain, or return of capital based on information provided by the REIT or the investment company.
5. Dividends and Distributions
Dividends and distributions to shareholders, if any, are recorded on the ex-dividend date. Income dividends and capital gains distributions are determined in accordance with federal tax regulations and may differ from those determined in accordance with U.S. GAAP. To the extent these differences are permanent, such amounts are reclassified within the capital accounts based on their federal tax basis treatment; temporary differences do not require such reclassification.
NOTE B
Advisory Fee and Other Transactions with Affiliates
Under the terms of the Advisory Agreement, the Fund pays no advisory fee to the Adviser and the Adviser reimburses or pays for the Fund’s operating expenses. The Fund is an integral part of separately managed accounts in wrap-fee programs and other investment programs. Typically, participants in these programs pay a fee to their investment adviser for all costs and expenses of the separately managed account, including costs and expenses associated with the Fund, and a fee is paid by their investment adviser to the Adviser. In certain cases, participants may have a direct relationship with the Adviser without the involvement of a third party investment adviser, in which case the participant would pay a fee directly to the Adviser. The Adviser serves as investment manager and adviser of the Fund and continuously furnishes an investment program for the Fund and manages, supervises and conducts the affairs of the Fund, subject to the supervisions of the Fund’s Board. The Advisory Agreement provides that the Adviser or an affiliate will furnish, or pay the expenses of the Fund for, office space, facilities and equipment, services of executive and other personnel of the Fund and certain administrative services.
The Fund has entered into a distribution agreement with AllianceBernstein Investments, Inc., the Fund’s principal underwriter (the “Underwriter”), to permit the Underwriter to distribute the Fund’s shares, which are sold at
| | |
| |
24 | AB TAX-AWARE REAL RETURN INCOME SHARES | | abfunds.com |
NOTES TO FINANCIAL STATEMENTS (continued)
their net asset value without any sales charge. The Fund does not pay a fee for this service. The Underwriter is a wholly owned subsidiary of the Adviser.
AllianceBernstein Investor Services, Inc. (“ABIS”), a wholly-owned subsidiary of the Adviser, acts as the Fund’s registrar, transfer agent and dividend-disbursing agent. ABIS registers the transfer, issuance and redemption of Fund shares and disburses dividends and other distributions to Fund shareholders. The Fund does not pay a fee for this service.
The Fund may invest in AB Government Money Market Portfolio (the “Government Money Market Portfolio”) which has a contractual annual advisory fee rate of .20% of the portfolio’s average daily net assets and bears its own expenses. The Adviser has contractually agreed to waive .10% of the advisory fee of Government Money Market Portfolio (resulting in a net advisory fee of .10%) until August 31, 2023. In connection with the investment by the Fund in Government Money Market Portfolio, the Adviser has contractually agreed to reimburse its advisory fee from the Fund in an amount equal to the Fund’s pro rata share of the effective advisory fee of Government Money Market Portfolio, as borne indirectly by the Fund as an acquired fund fee and expense. For the six months ended October 31, 2022, such reimbursement amounted to $885.
A summary of the Fund’s transactions in AB mutual funds for the six months ended October 31, 2022 is as follows:
| | | | | | | | | | | | | | | | | | | | |
Fund | | Market Value
4/30/22
(000) | | | Purchases
at Cost
(000) | | | Sales
Proceeds
(000) | | | Market Value
10/31/22
(000) | | | Dividend
Income
(000) | |
Government Money Market Portfolio | | $ | 2,209 | | | $ | 3,507 | | | $ | 4,331 | | | $ | 1,385 | | | $ | 13 | |
NOTE C
Investment Transactions
Purchases and sales of investment securities (excluding short-term investments) for the six months ended October 31, 2022 were as follows:
| | | | | | | | |
| | | Purchases | | | Sales | |
Investment securities (excluding U.S. government securities) | | $ | – 0 | – | | $ | – 0 | – |
U.S. government securities | | | – 0 | – | | | – 0 | – |
| | |
| |
| abfunds.com | | AB TAX-AWARE REAL RETURN INCOME SHARES | 25 |
NOTES TO FINANCIAL STATEMENTS (continued)
The cost of investments for federal income tax purposes was substantially the same as the cost for financial reporting purposes. Accordingly, gross unrealized appreciation and unrealized depreciation are as follows:
| | | | |
Gross unrealized appreciation | | $ | 2,466,747 | |
Gross unrealized depreciation | | | (1,911,246 | ) |
| | | | |
Net unrealized appreciation | | $ | 555,501 | |
| | | | |
1. Derivative Financial Instruments
The Fund may use derivatives in an effort to earn income and enhance returns, to replace more traditional direct investments, to obtain exposure to otherwise inaccessible markets (collectively, “investment purposes”), or to hedge or adjust the risk profile of its portfolio.
The principal types of derivatives utilized by the Fund, as well as the methods in which they may be used are:
The Fund may enter into swaps to hedge its exposure to interest rates, credit risk, equity markets or currencies. A swap is an agreement that obligates two parties to exchange a series of cash flows at specified intervals based upon or calculated by reference to changes in specified prices or rates for a specified amount of an underlying asset. The payment flows are usually netted against each other, with the difference being paid by one party to the other. In addition, collateral may be pledged or received by the Fund in accordance with the terms of the respective swaps to provide value and recourse to the Fund or its counterparties in the event of default, bankruptcy or insolvency by one of the parties to the swap.
Risks may arise as a result of the failure of the counterparty to the swap to comply with the terms of the swap. The loss incurred by the failure of a counterparty is generally limited to the net interim payment to be received by the Fund, and/or the termination value at the end of the contract. Therefore, the Fund considers the creditworthiness of each counterparty to a swap in evaluating potential counterparty risk. This risk is mitigated by having a netting arrangement between the Fund and the counterparty and by the posting of collateral by the counterparty to the Fund to cover the Fund’s exposure to the counterparty. Additionally, risks may arise from unanticipated movements in interest rates or in the value of the underlying securities. The Fund accrues for the interim payments on swaps on a daily basis, with the net amount recorded within unrealized appreciation (depreciation) of swaps on the statement of assets and liabilities, where applicable. Once the interim payments are settled in cash, the net amount is recorded as realized gain/(loss) on swaps on the
| | |
| |
26 | AB TAX-AWARE REAL RETURN INCOME SHARES | | abfunds.com |
NOTES TO FINANCIAL STATEMENTS (continued)
statement of operations, in addition to any realized gain/(loss) recorded upon the termination of swaps. Upfront premiums paid or received for swaps are recognized as cost or proceeds on the statement of assets and liabilities and are amortized on a straight line basis over the life of the contract. Amortized upfront premiums are included in net realized gain/(loss) from swaps on the statement of operations. Fluctuations in the value of swaps are recorded as a component of net change in unrealized appreciation (depreciation) of swaps on the statement of operations.
Certain standardized swaps, including certain interest rate swaps and credit default swaps, are (or soon will be) subject to mandatory central clearing. Cleared swaps are transacted through futures commission merchants (“FCMs”) that are members of central clearinghouses, with the clearinghouse serving as central counterparty, similar to transactions in futures contracts. Centralized clearing will be required for additional categories of swaps on a phased-in basis based on requirements published by the Securities and Exchange Commission and Commodity Futures Trading Commission.
At the time the Fund enters into a centrally cleared swap, the Fund deposits and maintains as collateral an initial margin with the broker, as required by the clearinghouse on which the transaction is effected. Such amount is shown as cash collateral due from broker on the statement of assets and liabilities. Pursuant to the contract, the Fund agrees to receive from or pay to the broker an amount of cash equal to the daily fluctuation in the value of the contract. Such receipts or payments are known as variation margin and are recorded by the Fund as unrealized gains or losses. Risks may arise from the potential inability of a counterparty to meet the terms of the contract. The credit/counterparty risk for centrally cleared swaps is generally less than non-centrally cleared swaps, since the clearinghouse, which is the issuer or counterparty to each centrally cleared swap, has robust risk mitigation standards, including the requirement to provide initial and variation margin. When the contract is closed, the Fund records a realized gain or loss equal to the difference between the value of the contract at the time it was opened and the time it was closed.
Interest Rate Swaps:
The Fund is subject to interest rate risk exposure in the normal course of pursuing its investment objectives. Because the Fund holds fixed rate bonds, the value of these bonds may decrease if interest rates rise. To help hedge against this risk and to maintain its ability to generate income at prevailing market rates, the Fund may enter into interest rate swaps. Interest rate swaps are agreements between two parties to exchange cash flows based on a notional amount. The
| | |
| |
| abfunds.com | | AB TAX-AWARE REAL RETURN INCOME SHARES | 27 |
NOTES TO FINANCIAL STATEMENTS (continued)
Fund may elect to pay a fixed rate and receive a floating rate, or, receive a fixed rate and pay a floating rate on a notional amount.
In addition, the Fund may also enter into interest rate swap transactions to preserve a return or spread on a particular investment or portion of its portfolio, or protecting against an increase in the price of securities the Fund anticipates purchasing at a later date. Interest rate swaps involve the exchange by a Fund with another party of their respective commitments to pay or receive interest (e.g., an exchange of floating rate payments for fixed rate payments) computed based on a contractually-based principal (or “notional”) amount. Interest rate swaps are entered into on a net basis (i.e., the two payment streams are netted out, with the Fund receiving or paying, as the case may be, only the net amount of the two payments).
During the six months ended October 31, 2022, the Fund held interest rate swaps for hedging purposes.
Inflation (CPI) Swaps:
Inflation swap agreements are contracts in which one party agrees to pay the cumulative percentage increase in a price index (the Consumer Price Index with respect to CPI swaps) over the term of the swap (with some lag on the inflation index), and the other pays a compounded fixed rate. Inflation swaps may be used to protect the net asset value, or NAV, of a Fund against an unexpected change in the rate of inflation measured by an inflation index since the value of these agreements is expected to increase if there are unexpected inflation increases.
During the six months ended October 31, 2022, the Fund held inflation (CPI) swaps for hedging purposes.
Total Return Swaps:
The Fund may enter into total return swaps in order to take a “long” or “short” position with respect to an underlying referenced asset. The Fund is subject to market price volatility of the underlying referenced asset. A total return swap involves commitments to pay interest in exchange for a market linked return based on a notional amount. To the extent that the total return of the security, group of securities or index underlying the transaction exceeds or falls short of the offsetting interest obligation, the Fund will receive a payment from or make a payment to the counterparty.
During the six months ended October 31, 2022, the Fund held total return swaps for hedging purposes.
The Fund typically enters into International Swaps and Derivatives Association, Inc. Master Agreements (“ISDA Master Agreement”) with its OTC
| | |
| |
28 | AB TAX-AWARE REAL RETURN INCOME SHARES | | abfunds.com |
NOTES TO FINANCIAL STATEMENTS (continued)
derivative contract counterparties in order to, among other things, reduce its credit risk to OTC counterparties. ISDA Master Agreements include provisions for general obligations, representations, collateral and events of default or termination. Under an ISDA Master Agreement, the Fund typically may offset with the OTC counterparty certain derivative financial instruments’ payables and/or receivables with collateral held and/or posted and create one single net payment (close-out netting) in the event of default or termination. In the event of a default by an OTC counterparty, the return of collateral with market value in excess of the Fund’s net liability, held by the defaulting party, may be delayed or denied.
The Fund’s ISDA Master Agreements may contain provisions for early termination of OTC derivative transactions in the event the net assets of the Fund decline below specific levels (“net asset contingent features”). If these levels are triggered, the Fund’s OTC counterparty has the right to terminate such transaction and require the Fund to pay or receive a settlement amount in connection with the terminated transaction. If OTC derivatives were held at period end, please refer to netting arrangements by the OTC counterparty table below for additional details.
During the six months ended October 31, 2022, the Fund had entered into the following derivatives:
| | | | | | | | | | | | |
| | | Asset Derivatives | | | Liability Derivatives | |
Derivative Type | | Statement of
Assets and
Liabilities
Location | | Fair Value | | | Statement of
Assets and
Liabilities
Location | | Fair Value | |
Interest rate contracts | |
Receivable/Payable for variation margin on centrally cleared swaps | |
$ |
2,368,150 |
* | | | | | | |
| | | | |
Interest rate contracts | | Unrealized appreciation on inflation swaps | | | 95,978 | | | | | | | |
| | | | |
Interest rate contracts | | | | | | | | Unrealized depreciation on total return swaps | | $ | 1,039,244 | |
| | | | | | | | | | | | |
Total | | | | $ | 2,464,128 | | | | | $ | 1,039,244 | |
| | | | | | | | | | | | |
| * | Only variation margin receivable/payable at period end is reported within the statement of assets and liabilities. This amount reflects cumulative unrealized appreciation (depreciation) on futures and centrally cleared swaps as reported in the portfolio of investments. |
| | |
| |
| abfunds.com | | AB TAX-AWARE REAL RETURN INCOME SHARES | 29 |
NOTES TO FINANCIAL STATEMENTS (continued)
| | | | | | | | | | | | |
Derivative Type | | Location of Gain
or (Loss) on
Derivatives Within
Statement of
Operations | | Realized Gain
or (Loss) on
Derivatives | | | Change in
Unrealized
Appreciation or
(Depreciation) | |
Interest rate contracts | | Net realized gain (loss) on swaps; Net change in unrealized appreciation (depreciation) of swaps | | $ | (377 | ) | | $ | (473,016 | ) |
| | | | | | | | | | |
Total | | | | $ | (377 | ) | | $ | (473,016 | ) |
| | | | | | | | | | |
The following table represents the average monthly volume of the Fund’s derivative transactions during the six months ended October 31, 2022:
| | | | |
Inflation Swaps: | | | | |
Average notional amount | | $ | 1,000,000 | |
Centrally Cleared Interest Rate Swaps: | | | | |
Average notional amount | | $ | 14,770,000 | |
Centrally Cleared Inflation Swaps: | | | | |
Average notional amount | | $ | 8,250,000 | |
Total Return Swaps: | | | | |
Average notional amount | | $ | 14,300,000 | |
For financial reporting purposes, the Fund does not offset derivative assets and derivative liabilities that are subject to netting arrangements in the statement of assets and liabilities.
All OTC derivatives held at period end were subject to netting arrangements. The following table presents the Fund’s derivative assets and liabilities by OTC counterparty net of amounts available for offset under ISDA Master Agreements (“MA”) and net of the related collateral received/pledged by the Fund as of October 31, 2022. Exchange-traded derivatives and centrally cleared swaps are not subject to netting arrangements and as such are excluded from the table.
| | | | | | | | | | | | | | | | | | | | |
Counterparty | | Derivative
Assets
Subject to a
MA | | | Derivatives
Available
for Offset | | | Cash
Collateral
Received* | | | Security
Collateral
Received* | | | Net Amount
of Derivative
Assets | |
JPMorgan Chase Bank, NA | | $ | 95,978 | | | $ | – 0 | – | | $ | – 0 | – | | $ | – 0 | – | | $ | 95,978 | |
| | | | | | | | | | | | | | | | | | | | |
Total | | $ | 95,978 | | | $ | – 0 | – | | $ | – 0 | – | | $ | – 0 | – | | $ | 95,978 | ^ |
| | | | | | | | | | | | | | | | | | | | |
| | | | | |
Counterparty | | Derivative
Liabilities
Subject to a
MA | | | Derivatives
Available
for Offset | | | Cash
Collateral
Pledged* | | | Security
Collateral
Pledged* | | | Net Amount
of Derivative
Liabilities | |
Barclays Bank PLC | | $ | 1,039,244 | | | $ | – 0 | – | | $ | (1,039,244 | ) | | $ | – 0 | – | | $ | – 0 | – |
| | | | | | | | | | | | | | | | | | | | |
Total | | $ | 1,039,244 | | | $ | – 0 | – | | $ | (1,039,244 | ) | | $ | – 0 | – | | $ | 0 | ^ |
| | | | | | | | | | | | | | | | | | | | |
| * | The actual collateral received/pledged may be more than the amount reported due to over-collateralization. |
| ^ | Net amount represents the net receivable/payable that would be due from/to the counterparty in the event of default or termination. The net amount from OTC financial derivative instruments can only be netted across transactions governed under the same master agreement with the same counterparty. |
| | |
| |
30 | AB TAX-AWARE REAL RETURN INCOME SHARES | | abfunds.com |
NOTES TO FINANCIAL STATEMENTS (continued)
NOTE D
Shares of Beneficial Interest
Transactions in shares of beneficial interest were as follows:
| | | | | | | | | | | | | | | | | | | | | | | | |
| | | | | | | | | | | | | | | | | | | | | | | | |
| | | Shares | | | | | | Amount | | | | |
| | | Six Months Ended
October 31, 2022
(unaudited) | | | Year Ended
April 30, 2022 | | | | | | Six Months Ended
October 31, 2022
(unaudited) | | | Year Ended
April 30, 2022 | | | | |
| | | | | | | | |
Shares sold | | | 13,911 | | | | 217,371 | | | | | | | $ | 158,600 | | | $ | 2,537,515 | | | | | |
| | | | | |
Shares redeemed | | | (47,436 | ) | | | (1,170,884 | ) | | | | | | | (548,081 | ) | | | (13,492,904 | ) | | | | |
| | | | | |
Net decrease | | | (33,525 | ) | | | (953,513 | ) | | | | | | $ | (389,481 | ) | | $ | (10,955,389 | ) | | | | |
| | | | | |
NOTE E
Risks Involved in Investing in the Fund
Market Risk—The value of the Fund’s assets will fluctuate as the stock or bond market fluctuates. The value of the Fund’s investments may decline, sometimes rapidly and unpredictably, simply because of economic changes or other events, including public health crises (including the occurrence of a contagious disease or illness) and regional and global conflicts, that affect large portions of the market.
Credit Risk—An issuer or guarantor of a fixed-income security, or the counterparty to a derivatives or other contract, may be unable or unwilling to make timely payments of interest or principal, or to otherwise honor its obligations. The issuer or guarantor may default, causing a loss of the full principal amount of a security and any accrued interest. The degree of risk for a particular security may be reflected in its credit rating. There is the possibility that the credit rating of a fixed-income security may be downgraded after purchase, which may adversely affect the value of the security. Investments in fixed-income securities with lower ratings tend to have a higher probability that an issuer will default or fail to meet its payment obligations.
Interest-Rate Risk—Changes in interest rates will affect the value of investments in fixed-income securities. When interest rates rise, the value of existing investments in fixed-income securities tends to fall and this decrease in value may not be offset by higher income from new investments. Interest rate risk is generally greater for fixed-income securities with longer maturities or durations. The Fund may be subject to a greater risk of rising interest rates than would normally be the case due to the end of a recent period of historically low rates and the effect of potential government fiscal policy initiatives and resulting market reaction to those initiatives.
Below Investment-Grade Securities Risk—Investments in fixed-income securities with lower ratings (commonly known as “junk bonds”) are subject
| | |
| |
| abfunds.com | | AB TAX-AWARE REAL RETURN INCOME SHARES | 31 |
NOTES TO FINANCIAL STATEMENTS (continued)
to a higher probability that an issuer will default or fail to meet its payment obligations. These securities may be subject to greater price volatility due to such factors as specific corporate developments and negative perceptions of the junk bond market generally and may be more difficult to trade than other types of securities.
Duration Risk—Duration is a measure that relates the expected price volatility of a fixed-income security to changes in interest rates. The duration of a fixed-income security may be shorter than or equal to full maturity of a fixed-income security. Fixed-income securities with longer durations have more risk and will decrease in price as interest rates rise.
Municipal Market Risk—This is the risk that special factors may adversely affect the value of municipal securities and have a significant effect on the yield or value of the Fund’s investments in municipal securities. These factors include economic conditions, political or legislative changes, public health crises, uncertainties related to the tax status of municipal securities, and the rights of investors in these securities. To the extent that the Fund invests more of its assets in a particular state’s municipal securities, the Fund may be vulnerable to events adversely affecting that state, including economic, political and regulatory occurrences, court decisions, terrorism, public health crises (including the occurrence of a contagious disease or illness) and catastrophic natural disasters, such as hurricanes, fires or earthquakes. For example, the novel coronavirus (COVID-19) pandemic has significantly stressed the financial resources of many issuers of municipal securities, which could impair any such issuer’s ability to meet its financial obligations when due and adversely impact the value of its securities held by the Fund. As the full effects of the COVID-19 pandemic on state and local economies and on issuers of municipal securities are still uncertain, the financial difficulties of issuers of municipal securities may continue or worsen, adversely affecting the performance of the Fund. The Fund’s investments in certain municipal securities with principal and interest payments that are made from the revenues of a specific project or facility, and not general tax revenues, may have increased risks. Factors affecting the project or facility, such as local business or economic conditions, could have a significant effect on the project’s ability to make payments of principal and interest on these securities.
Congress has previously considered making changes to the municipal securities provisions of the Internal Revenue Code that could change the U.S. federal income tax treatment of certain types of municipal securities.
Inflation Risk—This is the risk that the value of assets or income from investments will be less in the future as inflation decreases the value of money. As inflation increases, the value of the Fund’s assets can decline
| | |
| |
32 | AB TAX-AWARE REAL RETURN INCOME SHARES | | abfunds.com |
NOTES TO FINANCIAL STATEMENTS (continued)
as can the value of the Fund’s distributions. This risk is significantly greater for fixed-income securities with longer maturities.
Derivatives Risk—Derivatives may be difficult to price or unwind and leveraged so that small changes may produce disproportionate losses for the Fund. A short position in a derivative instrument involves the risk of a theoretically unlimited increase in the value of the underlying instrument, which could cause the Fund to suffer a (potentially unlimited) loss. Derivatives, especially over-the-counter derivatives, are also subject to counterparty risk, which is the risk that the counterparty (the party on the other side of the transaction) on a derivative transaction will be unable or unwilling to honor its contractual obligations to the Fund.
Leverage Risk—When the Fund borrows money or otherwise leverages its investments, its performance may be volatile because leverage tends to exaggerate the effect of any increase or decrease in the value of the Fund’s investments. The Fund may create leverage through the use of reverse repurchase arrangements, forward currency exchange contracts, forward commitments, dollar rolls or futures or by borrowing money. The use of other types of derivative instruments by the Fund, such as options and swaps, may also result in a form of leverage. Leverage may result in higher returns to the Fund than if the Fund were not leveraged, but may also adversely affect returns, particularly if the market is declining.
Illiquid Investments Risk—Illiquid investments risk exists when particular investments, such as lower-rated securities, are or become difficult to purchase or sell, possibly preventing the Fund from selling such investments at an advantageous price. The Fund is subject to illiquid investments risk because the market for municipal securities is generally smaller than many other markets. Derivatives and securities involving substantial market and credit risk tend to involve greater illiquid investments risk than most other types of investments.
LIBOR Transition and Associated Risk—A Fund may be exposed to debt securities, derivatives or other financial instruments that utilize the London Interbank Offered Rate, or “LIBOR,” as a “benchmark” or “reference rate” for various interest rate calculations. In 2017, the United Kingdom Financial Conduct Authority (“FCA”), which regulates LIBOR, announced a desire to phase out the use of LIBOR by the end of 2021. The FCA and LIBOR’s administrator, ICE Benchmark Administration, have since announced that most LIBOR settings (which reflect LIBOR rates quoted in different currencies over various time periods) will no longer be published after the end of 2021 but that the most widely used U.S. Dollar LIBOR settings will continue to be published until June 30, 2023. However, banks were strongly encouraged to cease entering into agreements with
| | |
| |
| abfunds.com | | AB TAX-AWARE REAL RETURN INCOME SHARES | 33 |
NOTES TO FINANCIAL STATEMENTS (continued)
counterparties referencing LIBOR by the end of 2021. It is possible that a subset of LIBOR settings will be published after these dates on a “synthetic” basis, but any such publications would be considered non-representative of the underlying market. Since 2018 the Federal Reserve Bank of New York has published the secured overnight funding rate (referred to as SOFR), which is intended to replace U.S. Dollar LIBOR. SOFR is a broad measure of the cost of borrowing cash overnight collateralized by U.S. Treasury securities in the repurchase agreement (repo) market and has been used increasingly on a voluntary basis in new instruments and transactions. In addition, on March 15, 2022, the Adjustable Interest Rate Act was signed into law. This law provides a statutory fallback mechanism to replace LIBOR with a benchmark rate that is selected by the Federal Reserve Board and based on SOFR for certain contracts that reference LIBOR without adequate fallback provisions.
The elimination of LIBOR or changes to other reference rates or any other changes or reforms to the determination or supervision of reference rates could have an adverse impact on the market for, or value of, any securities or payments linked to those reference rates, which may adversely affect a Fund’s performance and/or net asset value. Uncertainty and risk also remain regarding the willingness and ability of issuers and lenders to include revised provisions in new and existing contracts or instruments. Consequently, the transition from LIBOR to other reference rates may lead to increased volatility and illiquidity in markets that are tied to LIBOR, fluctuations in values of LIBOR-related investments or investments in issuers that utilize LIBOR, increased difficulty in borrowing or refinancing and diminished effectiveness of hedging strategies, potentially adversely affecting a Fund’s performance. Furthermore, the risks associated with the expected discontinuation of LIBOR and transition may be exacerbated if the work necessary to effect an orderly transition to an alternative reference rate is not completed in a timely manner. Neither the effect of the LIBOR transition process nor its ultimate success can yet be known.
Indemnification Risk—In the ordinary course of business, the Fund enters into contracts that contain a variety of indemnifications. The Fund’s maximum exposure under these arrangements is unknown. However, the Fund has not had prior claims or losses pursuant to these indemnification provisions and expects the risk of loss thereunder to be remote. Therefore, the Fund has not accrued any liability in connection with these indemnification provisions.
Management Risk—The Fund is subject to management risk because it is an actively-managed investment fund. The Adviser will apply its investment techniques and risk analyses in making investment decisions, but there is no guarantee that its techniques will produce the intended results.
| | |
| |
34 | AB TAX-AWARE REAL RETURN INCOME SHARES | | abfunds.com |
NOTES TO FINANCIAL STATEMENTS (continued)
Some of these techniques may incorporate, or rely upon, quantitative models, but there is no guarantee that these models will generate accurate forecasts, reduce risk or otherwise perform as expected.
NOTE F
Joint Credit Facility
A number of open-end mutual funds managed by the Adviser, including the Fund, participate in a $325 million revolving credit facility (the “Facility”) intended to provide short-term financing related to redemptions and other short term liquidity requirements, subject to certain restrictions. Commitment fees related to the Facility are paid by the participating funds and are included in miscellaneous expenses in the statement of operations. The Fund did not utilize the Facility during the six months ended October 31, 2022.
NOTE G
Distributions to Shareholders
The tax character of distributions to be paid for the year ending April 30, 2023 will be determined at the end of the current fiscal year. The tax character of distributions paid during the fiscal years ended April 30, 2022 and April 30, 2021 were as follows:
| | | | | | | | |
| | | 2022 | | | 2021 | |
Distributions paid from: | | | | | | | | |
Ordinary income | | $ | 533 | | | $ | 74,184 | |
Net long-term capital gains | | | 2,009,261 | | | | 2,884 | |
| | | | | | | | |
Total taxable distributions paid | | | 2,009,794 | | | | 77,068 | |
Tax-exempt income | | | – 0 | – | | | 91,730 | |
| | | | | | | | |
Total distributions paid | | $ | 2,009,794 | | | $ | 168,798 | |
| | | | | | | | |
As of April 30, 2022, the components of accumulated earnings/(deficit) on a tax basis were as follows:
| | | | |
Undistributed capital gains | | $ | 681,048 | |
Unrealized appreciation (depreciation) | | | 1,441,543 | (a) |
| | | | |
Total accumulated earnings/(deficit) | | $ | 2,122,591 | |
| | | | |
| (a) | The differences between book-basis and tax-basis unrealized appreciation (depreciation) are attributable primarily to the tax treatment of swaps. |
For tax purposes, net realized capital losses may be carried over to offset future capital gains, if any. Funds are permitted to carry forward capital losses for an indefinite period, and such losses will retain their character as either short-term or long-term capital losses. As of April 30, 2022, the Fund did not have any capital loss carryforwards.
| | |
| |
| abfunds.com | | AB TAX-AWARE REAL RETURN INCOME SHARES | 35 |
NOTES TO FINANCIAL STATEMENTS (continued)
NOTE H
Recent Accounting Pronouncements
In March 2020, the Financial Accounting Standards Board issued an Accounting Standards Update, ASU 2020-04, “Reference Rate Reform (Topic 848) – Facilitation of the Effects of Reference Rate Reform on Financial Reporting.” ASU 2020-04 provides optional guidance to ease the potential accounting burden due to the discontinuation of the LIBOR and other interbank-offered based reference rates. ASU 2020-04 is effective as of March 12, 2020 through December 31, 2022. Management is currently evaluating the impact, if any, of applying ASU 2020-04.
NOTE I
Subsequent Events
Management has evaluated subsequent events for possible recognition or disclosure in the financial statements through the date the financial statements are issued. Management has determined that there are no material events that would require disclosure in the Fund’s financial statements through this date.
| | |
| |
36 | AB TAX-AWARE REAL RETURN INCOME SHARES | | abfunds.com |
FINANCIAL HIGHLIGHTS
Selected Data For A Share Of Beneficial Interest Outstanding Throughout Each Period
| | | | | | | | | | | | | | | | |
| | | Six Months
Ended
October 31,
2022 (unaudited) | | | Year Ended April 30, | | | November 12, 2019(a) to April 30, 2020 | |
| | | 2022 | | | 2021 | |
| | | | |
Net asset value, beginning of period | | | $ 11.94 | | | | $ 11.57 | | | | $ 8.95 | | | | $ 10.00 | |
| | | | |
Income From Investment Operations | | | | | | | | | | | | | | | | |
| | | | |
Net investment income(b) | | | .10 | | | | .17 | | | | .16 | | | | .07 | |
| | | | |
Net realized and unrealized gain (loss) on investment transactions | | | (1.05 | ) | | | 1.36 | | | | 2.55 | | | | (1.11 | ) |
| | | | |
Net increase (decrease) in net asset value from operations | | | (.95 | ) | | | 1.53 | | | | 2.71 | | | | (1.04 | ) |
| | | | |
Less: Dividends | | | | | | | | | | | | | | | | |
| | | | |
Dividends from net investment income | | | (.00 | )(c) | | | (.02 | ) | | | (.09 | ) | | | (.01 | ) |
| | | | |
Distributions from net realized gain on investment transactions | | | – 0 | – | | | (1.14 | ) | | | – 0 | – | | | – 0 | – |
| | | | |
Net asset value, end of period | | | $ 10.99 | | | | $ 11.94 | | | | $ 11.57 | | | | $ 8.95 | |
| | | | | | | | |
| | | | |
Total Return | | | | | | | | | | | | | | | | |
| | | | |
Total investment return based on net asset value(d) | | | (7.83 | )% | | | 13.65 | % | | | 30.32 | % | | | (10.43 | )% |
| | | | |
Ratios/Supplemental Data | | | | | | | | | | | | | | | | |
| | | | |
Net assets, end of period (000’s omitted) | | | $8,748 | | | | $9,900 | | | | $20,633 | | | | $18,760 | |
| | | | |
Ratio to average net assets of: | | | | | | | | | | | | | | | | |
| | | | |
Expenses | | | .01 | %(e)^ | | | .00 | % | | | .00 | % | | | .01 | %(e)^ |
| | | | |
Net investment income | | | 1.79 | %^ | | | 1.40 | % | | | 1.53 | % | | | 1.55 | %^ |
| | | | |
Portfolio turnover rate | | | 0 | % | | | 13 | % | | | 5 | % | | | 10 | % |
| (a) | Commencement of operations. |
| (b) | Based on average shares outstanding. |
| (c) | Amount is less than $.005. |
| (d) | Total investment return is calculated assuming an initial investment made at the net asset value at the beginning of the period, reinvestment of all dividends and distributions at net asset value during the period, and redemption on the last day of the period. Total return does not reflect the deduction of taxes that a shareholder would pay on fund distributions or the redemption of fund shares. Total investment return calculated for a period of less than one year is not annualized. |
| (e) | The expense ratio, excluding bank overdraft expense, is .00%. |
See notes to financial statements.
| | |
| |
| abfunds.com | | AB TAX-AWARE REAL RETURN INCOME SHARES | 37 |
BOARD OF TRUSTEES
| | |
Marshall C. Turner, Jr.(1), Chairman Jorge A. Bermudez(1) Michael J. Downey(1) Onur Erzan, President
and Chief Executive Officer | | Nancy P. Jacklin(1) Jeanette W. Loeb(1) Carol C. McMullen(1) Garry L. Moody(1) |
|
|
|
|
|
OFFICERS
| | |
Terrance T. Hults(2), Vice President Matthew J. Norton(2), Vice President Andrew D. Potter(2), Vice President Daryl Clements(2), Vice President Emilie D. Wrapp, Secretary | | Michael B. Reyes, Senior Vice President Joseph J. Mantineo, Treasurer and Chief Financial Officer Phyllis J. Clarke, Controller Vincent S. Noto, Chief Compliance Officer |
| | |
Custodian and Accounting Agent State Street Bank and Trust Company
State Street Corporation CCB/5
1 Iron Street
Boston, MA 02210 Principal Underwriter AllianceBernstein Investments, Inc.
501 Commerce Street
Nashville, TN 37203 Transfer Agent AllianceBernstein Investor Services, Inc.
P.O. Box 786003
San Antonio, TX 78278
Toll-Free (800) 221-5672 | | Legal Counsel Seward & Kissel LLP
One Battery Park Plaza
New York, NY 10004 Independent Registered Public Accounting Firm Ernst & Young LLP
One Manhattan West
New York, NY 10001 |
| 1 | Member of the Audit Committee, the Governance and Nominating Committee, and the Independent Directors Committee. |
| 2 | The day-to-day management of, and investment decisions for, the Fund’s portfolio are made by the Adviser’s Municipal Bond Investment Team. Messrs. Hults, Norton, Clements and Potter are the investment professionals primarily responsible for the day-to-day management of the Fund’s portfolio. |
| | |
| |
38 | AB TAX-AWARE REAL RETURN INCOME SHARES | | abfunds.com |
Operation and Effectiveness of the Fund’s Liquidity Risk Management Program:
In October 2016, the Securities and Exchange Commission (“SEC”) adopted the open-end fund liquidity rule (the “Liquidity Rule”). In June 2018 the SEC adopted a requirement that funds disclose information about the operation and effectiveness of their Liquidity Risk Management Program (“LRMP”) in their reports to shareholders.
One of the requirements of the Liquidity Rule is for the Fund to designate an Administrator of the Fund’s Liquidity Risk Management Program. The Administrator of the Fund’s LRMP is AllianceBernstein L.P., the Fund’s investment adviser (the “Adviser”). The Adviser has delegated the responsibility to its Liquidity Risk Management Committee (the “Committee”).
Another requirement of the Liquidity Rule is for the Fund’s Board of Trustees (the “Fund Board”) to receive an annual written report from the Administrator of the LRMP, which addresses the operation of the Fund’s LRMP and assesses its adequacy and effectiveness. The Adviser provided the Fund Board with such annual report during the first quarter of 2022, which covered the period January 1, 2021 through December 31, 2021 (the “Program Reporting Period”).
The LRMP’s principal objectives include supporting the Fund’s compliance with limits on investments in illiquid assets and mitigating the risk that the Fund will be unable to meet its redemption obligations in a timely manner.
Pursuant to the LRMP, the Fund classifies the liquidity of its portfolio investments into one of the four categories defined by the SEC: Highly Liquid, Moderately Liquid, Less Liquid, and Illiquid. These classifications are reported to the SEC on Form N-PORT.
During the Program Reporting Period, the Committee reviewed whether the Fund’s strategy is appropriate for an open-end structure, incorporating any holdings of less liquid and illiquid assets. If the Fund participated in derivative transactions, the exposure from such transactions were considered in the LRMP.
The Committee also performed an analysis to determine whether the Fund is required to maintain a Highly Liquid Investment Minimum (“HLIM”). The Committee also incorporated the following information when determining the Fund’s reasonably anticipated trading size for purposes of liquidity monitoring: historical net redemption activity, a Fund’s concentration in an issuer, shareholder concentration, investment performance, total net assets, and distribution channels.
The Adviser informed the Fund Board that the Committee believes the Fund’s LRMP is adequately designed, has been implemented as intended, and has operated effectively since its inception. No material exceptions
| | |
| |
| abfunds.com | | AB TAX-AWARE REAL RETURN INCOME SHARES | 39 |
have been noted since the implementation of the LRMP. During the Program Reporting Period, liquidity in all markets was significantly recovered and improved compared to the prior reporting period which included extreme levels of price volatility and relative illiquidity beginning in March 2020 with COVID-19 impacts. As such, the program operated in a relatively robust and benign liquidity environment experienced in markets during the Program Reporting Period. There were no liquidity events that impacted the Fund or its ability to timely meet redemptions during the Program Reporting Period.
| | |
| |
40 | AB TAX-AWARE REAL RETURN INCOME SHARES | | abfunds.com |
Information Regarding the Review and Approval of the Fund’s Advisory Agreement
The disinterested trustees (the “directors”) of AB Corporate Shares (the “Company”) unanimously approved the continuance of the Company’s Advisory Agreement with the Adviser in respect of AB Tax-Aware Real Return Income Shares (the “Fund”) at a meeting held by video conference on November 2-4, 2021 (the “Meeting”).
Prior to approval of the continuance of the Advisory Agreement, the directors had requested from the Adviser, and received and evaluated, extensive materials. They reviewed the proposed continuance of the Advisory Agreement with the Adviser and with experienced counsel who are independent of the Adviser, who advised on the relevant legal standards. The directors also reviewed additional materials, including comparative analytical data prepared by the Senior Analyst for the Fund. The directors also discussed the proposed continuance in private sessions with counsel.
The directors noted that the Fund is designed as a vehicle for the wrap fee account market (where investors pay fees to a wrap fee sponsor which pays investment fees and expenses from such fee). The directors also noted that no advisory fee is payable by the Fund to the Adviser, that the Advisory Agreement does not include the reimbursement provision for certain administrative expenses included in the advisory agreements of most of the open-end AB Funds, and that the Adviser is responsible for payment of the Fund’s ordinary expenses. The directors noted that the Company acknowledges in the Advisory Agreement that the Adviser and its affiliates expect to receive compensation from third parties in connection with services provided to the Fund under the Advisory Agreement. The directors further noted that the Adviser receives payments from the wrap fee program sponsors (the “Sponsors”) that use the Fund as an investment vehicle for their clients.
The directors considered their knowledge of the nature and quality of the services provided by the Adviser to the Fund gained from their experience as directors or trustees of most of the registered investment companies advised by the Adviser, their overall confidence in the Adviser’s integrity and competence they have gained from that experience, the Adviser’s initiative in identifying and raising potential issues with the directors and its responsiveness, frankness and attention to concerns raised by the directors in the past, including the Adviser’s willingness to consider and implement organizational and operational changes designed to improve investment results and the services provided to the AB Funds. The directors noted that they have four regular meetings each year, at each of which they review extensive materials and information from the Adviser, including information on the investment performance of the Fund and the money market fund advised by the Adviser in which the Fund invests a portion of its assets.
| | |
| |
| abfunds.com | | AB TAX-AWARE REAL RETURN INCOME SHARES | 41 |
The directors also considered all factors they believed relevant, including the specific matters discussed below. During the course of their deliberations, the directors evaluated, among other things, the reasonableness of the advisory fee. The directors did not identify any particular information that was all-important or controlling, and different directors may have attributed different weights to the various factors. The directors determined that the selection of the Adviser to manage the Fund and the overall arrangements between the Fund and the Adviser, as provided in the Advisory Agreement, including the advisory fee, were fair and reasonable in light of the services performed, expenses incurred and such other matters as the directors considered relevant in the exercise of their business judgment. The material factors and conclusions that formed the basis for the directors’ determinations included the following:
Nature, Extent and Quality of Services Provided
The directors considered the scope and quality of services provided by the Adviser under the Advisory Agreement, including the quality of the investment research capabilities of the Adviser and the other resources it has dedicated to performing services for the AB Funds. They also noted the professional experience and qualifications of the Fund’s portfolio management team and other senior personnel of the Adviser. The quality of administrative and other services, including the Adviser’s role in coordinating the activities of the Fund’s other service providers, also was considered. The directors concluded that, overall, they were satisfied with the nature, extent and quality of services provided to the Fund under the Advisory Agreement.
Costs of Services Provided and Profitability
The directors reviewed a schedule of the revenues and expenses and related notes indicating the profitability of the Fund to the Adviser for calendar year 2020 that had been prepared with an expense allocation methodology arrived at in consultation with an independent consultant at the request of the directors. The directors noted the assumptions and methods of allocation used by the Adviser in preparing fund-specific profitability data and understood that there are a number of potentially acceptable allocation methodologies for information of this type. The directors noted that the profitability information reflected all revenues and expenses of the Adviser’s relationship with the Fund. The directors recognized that it is difficult to make comparisons of the profitability of the Advisory Agreement with the profitability of fund advisory contracts for unaffiliated funds because comparative information is not generally publicly available and is affected by numerous factors. The directors focused on the profitability of the Adviser’s relationship with the Fund before taxes and distribution expenses. The directors noted that the Fund was not profitable to the Adviser in the period reviewed.
| | |
| |
42 | AB TAX-AWARE REAL RETURN INCOME SHARES | | abfunds.com |
Fall-Out Benefits
The directors considered the other benefits to the Adviser and its affiliates from their relationships with the Fund and the money market fund advised by the Adviser in which the Fund invests. The directors noted that the Adviser is compensated by the Sponsors. The directors understood that the Adviser also might derive reputational and other benefits from its association with the Fund.
Investment Results
In addition to the information reviewed by the directors in connection with the Meeting, the directors receive detailed performance information for the Fund at each regular Board meeting during the year.
At the Meeting, the directors reviewed performance information prepared by an independent service provider (the “15(c) service provider”), showing the performance of the Fund against a group of similar funds (“peer group”) and a larger group of similar funds (“peer universe”), each selected by the 15(c) service provider, and information prepared by the Adviser showing the Fund’s performance against a broad-based securities market index, in each case for the 1-year period ended July 31, 2021 and (in the case of comparisons with the broad-based securities market index) for the period from inception. The directors were cognizant that the Fund was neither designed nor offered as a standalone investment and was intended to serve solely as a component of certain separately managed accounts (“SMAs”). The Adviser had explained that this attribute made it difficult to select an appropriate benchmark for the Fund. At the directors’ request, the Adviser provided information showing the weighting of the Fund in a current SMA and the overall performance of the SMA versus its stated benchmark. Based on their review, the directors concluded that the Fund’s investment performance was acceptable.
Advisory Fees
The directors considered the advisory fee rate payable by the Fund to the Adviser (zero) and information provided by the 15(c) provider concerning advisory fee rates payable by other funds in the same category as the Fund. The directors recognized that it is difficult to make comparisons of advisory fees because there are variations in the services that are included in the fees payable by other funds.
The directors noted the unusual arrangements in the Advisory Agreement providing for no advisory fee but were cognizant that the Adviser would be indirectly compensated by the Sponsors for its services to the Fund. The directors reviewed the fee arrangements between the Adviser and each of the current Sponsors and noted that such fees were negotiated on an arm’s length basis and were within the range of fees paid by wrap fee sponsors to other advisers of similar funds. While the Adviser’s fee arrangements with the Sponsors vary, the directors acknowledged the
| | |
| |
| abfunds.com | | AB TAX-AWARE REAL RETURN INCOME SHARES | 43 |
Adviser’s view that a portion of such fees (less the expenses of the Fund paid by the Adviser) may reasonably be viewed as compensating the Adviser for advisory services it provides to the Fund (the “implied fee”) and that the Adviser believes that while the Sponsors pay the Adviser different fee rates, the rate of fee attributable to Fund management at the Fund level is the same for all Sponsors. The directors also considered the fee rate schedules used by other registered investment companies that invest in fixed income securities that are advised by the Adviser.
The Adviser informed the directors that there were no institutional products managed by it that utilize investment strategies similar to those of the Fund.
The directors did not consider comparative expense information for the Fund because the Fund does not bear ordinary expenses.
Economies of Scale
The directors did not consider the extent to which fee levels in the Advisory Agreement for the Fund reflect economies of scale because the Advisory Agreement does not provide for any compensation to be paid to the Adviser by the Fund and the Fund’s expense ratio is zero. They did note, however, that the fee payable to the Adviser by the current Sponsors declines at a breakpoint based on either individual account sizes or on total assets managed by the Adviser for the Sponsor.
| | |
| |
44 | AB TAX-AWARE REAL RETURN INCOME SHARES | | abfunds.com |
This page is not part of the Shareholder Report or the Financial Statements.
AB FAMILY OF FUNDS
US EQUITY
CORE
Core Opportunities Fund
Select US Equity Portfolio
Sustainable US Thematic Portfolio
GROWTH
Concentrated Growth Fund
Discovery Growth Fund
Growth Fund
Large Cap Growth Fund
Small Cap Growth Portfolio
VALUE
Discovery Value Fund
Equity Income Fund
Relative Value Fund
Small Cap Value Portfolio
Value Fund
INTERNATIONAL/ GLOBAL EQUITY
CORE
Global Core Equity Portfolio
International Strategic Core Portfolio
Sustainable Global Thematic Fund
Sustainable International Thematic Fund
Tax-Managed Wealth Appreciation Strategy
Wealth Appreciation Strategy
GROWTH
Concentrated International Growth Portfolio
VALUE
All China Equity Portfolio
International Value Fund
FIXED INCOME
MUNICIPAL
High Income Municipal Portfolio
Intermediate California Municipal Portfolio
Intermediate Diversified Municipal Portfolio
Intermediate New York Municipal Portfolio
Municipal Bond Inflation Strategy
Tax-Aware Fixed Income Opportunities Portfolio
National Portfolio
Arizona Portfolio
California Portfolio
Massachusetts Portfolio
Minnesota Portfolio
New Jersey Portfolio
New York Portfolio
Ohio Portfolio
Pennsylvania Portfolio
Virginia Portfolio
TAXABLE
Bond Inflation Strategy
Global Bond Fund
High Income Fund
High Yield Portfolio
Income Fund
Intermediate Duration Portfolio
Limited Duration High Income Portfolio
Short Duration Income Portfolio
Short Duration Portfolio
Sustainable Thematic Credit Portfolio
Total Return Bond Portfolio
ALTERNATIVES
All Market Real Return Portfolio
Global Real Estate Investment Fund
Select US Long/Short Portfolio
MULTI-ASSET
All Market Income Portfolio
All Market Total Return Portfolio
Emerging Markets Multi-Asset Portfolio
Global Risk Allocation Fund
Sustainable Thematic Balanced Portfolio
Tax-Managed All Market Income Portfolio
CLOSED-END FUNDS
AllianceBernstein Global High Income Fund
AllianceBernstein National Municipal Income Fund
EXCHANGE-TRADED FUNDS
Tax-Aware Short Duration Municipal ETF
Ultra Short Income ETF
We also offer Government Money Market Portfolio, which serves as the money market fund exchange vehicle for the AB mutual funds. You could lose money by investing in the Fund. Although the Fund seeks to preserve the value of your investment at $1.00 per share, it cannot guarantee it will do so. The Fund may impose a fee upon sale of your shares or may temporarily suspend your ability to sell shares if the Fund’s liquidity falls below required minimums because of market conditions or other factors. An investment in the Fund is not insured or guaranteed by the Federal Deposit Insurance Corporation or any other government agency. The Fund’s sponsor has no legal obligation to provide financial support to the Fund, and you should not expect that the sponsor will provide financial support to the Fund at any time.
Investors should consider the investment objectives, risks, charges and expenses of the Fund carefully before investing. For copies of our prospectus or summary prospectus, which contain this and other information, visit us online at www.abfunds.com or contact your AB representative. Please read the prospectus and/or summary prospectus carefully before investing.
| | |
| |
| abfunds.com | | AB TAX-AWARE REAL RETURN INCOME SHARES | 45 |
NOTES
| | |
| |
46 | AB TAX-AWARE REAL RETURN INCOME SHARES | | abfunds.com |
NOTES
| | |
| |
| abfunds.com | | AB TAX-AWARE REAL RETURN INCOME SHARES | 47 |
NOTES
| | |
| |
48 | AB TAX-AWARE REAL RETURN INCOME SHARES | | abfunds.com |
AB TAX-AWARE REAL RETURN INCOME SHARES
1345 Avenue of the Americas
New York, NY 10105
800 221 5672
TARRIS-0152-1022 
Not applicable when filing a semi-annual report to shareholders.
| ITEM 3. | AUDIT COMMITTEE FINANCIAL EXPERT. |
Not applicable when filing a semi-annual report to shareholders.
| ITEM 4. | PRINCIPAL ACCOUNTANT FEES AND SERVICES. |
Not applicable when filing a semi-annual report to shareholders.
| ITEM 5. | AUDIT COMMITTEE OF LISTED REGISTRANTS. |
Not applicable to the registrant.
Please see Schedule of Investments contained in the Report to Shareholders included under Item 1 of this Form N-CSR.
| ITEM 7. | DISCLOSURE OF PROXY VOTING POLICIES AND PROCEDURES FOR CLOSED-END MANAGEMENT INVESTMENT COMPANIES. |
Not applicable to the registrant.
| ITEM 8. | PORTFOLIO MANAGERS OF CLOSED-END MANAGEMENT INVESTMENT COMPANIES. |
Not applicable to the registrant.
| ITEM 9. | PURCHASES OF EQUITY SECURITIES BY CLOSED-END MANAGEMENT INVESTMENT COMPANY AND AFFILIATED PURCHASERS. |
Not applicable to the registrant.
| ITEM 10. | SUBMISSION OF MATTERS TO A VOTE OF SECURITY HOLDERS. |
There have been no material changes to the procedures by which shareholders may recommend nominees to the Fund’s Board of Directors since the Fund last provided disclosure in response to this item.
| ITEM 11. | CONTROLS AND PROCEDURES. |
(a) The registrant’s principal executive officer and principal financial officer have concluded that the registrant’s disclosure controls and procedures (as defined in Rule 30a-2(c) under the Investment Company Act of 1940, as amended) are effective at the reasonable assurance level based on their evaluation of these controls and procedures as of a date within 90 days of the filing date of this document.
(b) There were no changes in the registrant’s internal controls over financial reporting that occurred during the period that has materially affected, or is reasonably likely to materially affect, the registrant’s internal control over financial reporting.
| ITEM 12. | DISCLOSURE OF SECURITIES LENDING ACTIVITIES FOR CLOSED-END MANAGEMENT INVESTMENT COMPANIES. |
Not applicable to the registrant.
The following exhibits are attached to this Form N-CSR:
SIGNATURES
Pursuant to the requirements of the Securities Exchange Act of 1934 and the Investment Company Act of 1940, the registrant has duly caused this report to be signed on its behalf by the undersigned, thereunto duly authorized.
| | |
| (Registrant): AB Corporate Shares |
| |
| By: | | /s/ Onur Erzan |
| | Onur Erzan |
| | President |
| |
| Date: | | December 27, 2022 |
Pursuant to the requirements of the Securities Exchange Act of 1934 and the Investment Company Act of 1940, this report has been signed below by the following persons on behalf of the registrant and in the capacities and on the dates indicated.
| | |
| By: | | /s/ Onur Erzan |
| | Onur Erzan |
| | President |
| |
| Date: | | December 27, 2022 |
| |
| By: | | /s/ Joseph J. Mantineo |
| | Joseph J. Mantineo |
| | Treasurer and Chief Financial Officer |
| |
| Date: | | December 27, 2022 |