UNITED STATES
SECURITIES AND EXCHANGE COMMISSION
Washington, D.C. 20549
SCHEDULE 14A
Proxy Statement Pursuant to Section 14(a)
of the Securities Exchange Act of 1934
(Amendment No. )
| Filed by the Registrant ☒ | | | |
Filed by a Party other than the Registrant ☐ | | |
Check the appropriate box:
☐ | | | Preliminary Proxy Statement |
☐ | | | Confidential, for Use of the Commission Only (as permitted by Rule 14a-6(e)(2)) |
| ☒ | | | Definitive Proxy Statement |
☐ | | | Definitive Additional Materials |
☐ | | | Soliciting Material Pursuant to §240.14a-12 |
ULTRA CLEAN HOLDINGS, INC.
(Name of Registrant as Specified In Its Charter)
(Name of Person(s) Filing Proxy Statement, if other than the Registrant)
Payment of Filing Fee (Check the appropriate box):
| ☒ | | | No fee required. | |||
☐ | | | Fee paid previously with preliminary materials. | |||
☐ | | | Fee computed on table in exhibit required by Item 25(b) per Exchange Act Rules 14a-6(i)(1) and 0-11. | |||

ULTRA CLEAN HOLDINGS, INC.
26462 Corporate Avenue
Hayward, CA 94545
NOTICE OF 2024 ANNUAL MEETING
OF STOCKHOLDERS
OF ULTRA CLEAN HOLDINGS, INC.
Purposes: |
| • Elect our directors |
| • Ratify the appointment of PricewaterhouseCoopers LLP as our independent registered public accounting firm for fiscal 2024 |
| • Hold an advisory vote on executive compensation |
| • Conduct other business that may properly come before the annual meeting or any adjournment or postponement thereof |
Adjournments or Postponements |
| In the event of an adjournment, postponement or emergency that may change the annual meeting’s time, date or location, we will make an announcement, issue a press release or post information at www.uct.com/investors to notify stockholders, as appropriate. Information on or accessible through our website is not incorporated by reference in this Proxy Statement. |
| Important Notice Regarding The Availability Of Proxy Materials For The Stockholder Meeting To Be Held On May 22, 2024: This Proxy Statement, along with our 2023 Annual Report to Stockholders, is available on the following website: http://materials.proxyvote.com. |
| Sincerely, |
/s/ James P. Scholhamer James P. Scholhamer Chief Executive Officer April 25, 2024 |
 | | | Date: May 22, 2024 Time: 12:30 p.m. Pacific Time |
| Virtual Meeting: | |||
| www.virtualshareholdermeeting.com/UCTT2024 | |||
| The Annual Meeting will be held in a virtual meeting format only. You will not be able to attend the Annual Meeting physically. To be admitted to the Annual Meeting at www.virtualshareholdermeeting.com/UCTT2024, you must enter the control number found on your proxy card, voting instruction form or notice. | |||
| Who Can Vote: | |||
| March 28, 2024 is the record date for voting. Only stockholders of record at the close of business on that date may vote at the annual meeting or any adjournment thereof. | |||
| All stockholders are cordially invited to attend the meeting. At the meeting, you will hear a report on our business and have a chance to meet some of our directors and executive officers. | |||
 | | | VOTE ONLINE |
 | | | VOTE BY PHONE |
 | | | VOTE BY MAIL Sign, date and return your proxy card in the postage-paid envelope. |
 | | | VOTE DURING THE MEETING Whether you expect to attend the meeting or not, please vote electronically via the Internet or by telephone or by completing, signing and promptly returning the enclosed proxy card in the enclosed postage-prepaid envelope. You may change your vote and revoke your proxy at any time before the polls close at the meeting by following the procedures described in the accompanying proxy statement. |
ULTRA CLEAN HOLDINGS, INC.
26462 Corporate Avenue
Hayward, CA 94545
PROXY STATEMENT FOR 2024 ANNUAL MEETING OF STOCKHOLDERS
May 22, 2024
Your vote is very important. For this reason, our Board of Directors is requesting that you permit your shares of common stock to be represented at our 2024 Annual Meeting of Stockholders by the proxies named on the enclosed proxy card. This proxy statement contains important information for you to consider in deciding how to vote on the matters brought before the meeting. The date of this proxy statement is April 26, 2024. The proxy statement and form of proxy are first being mailed to our stockholders on or about April 26, 2024.
Important Notice Regarding The Availability Of Proxy Materials For The Stockholder Meeting To Be Held On May 22, 2024: This Proxy Statement, along with our 2023 Annual Report to Stockholders, is available on the following website: http://materials.proxyvote.com.
General Information
Ultra Clean Holdings, Inc., referred to in this proxy statement as “Ultra Clean,” “UCT,” the “Company” or “we,” is soliciting the enclosed proxy for use at our Annual Meeting of Stockholders to be held on May 22, 2024 at 12:30 p.m., Pacific Time or at any adjournment thereof for the purposes set forth in this proxy statement. Our annual meeting will be a virtual meeting of stockholders, which will be conducted via a live audio webcast. You will be able to attend the Annual Meeting, submit your questions and vote online during the meeting by visiting www.virtualshareholdermeeting.com/UCTT2024.
In the event of an adjournment, postponement or emergency that may change the Annual Meeting’s time, date or location, we will make an announcement, issue a press release or post information at www.uct.com/investors to notify stockholders, as appropriate. Information on or accessible through our website is not incorporated by reference in this Proxy Statement.
Who May Attend and Vote at Our Annual Meeting
All holders of our common stock, as reflected in our records at the close of business on March 28, 2024, the record date for voting, may attend and vote at the meeting. To be admitted to the Annual Meeting at www.virtualshareholdermeeting.com/UCTT2024, you must enter the control number found on your proxy card, voting instruction form or notice you previously received.
Each share of common stock that you owned on the record date entitles you to one vote on each matter properly brought before the meeting. As of the record date, there were issued and outstanding 44,659,468 shares of our common stock, $0.001 par value.
Holding Shares as a “Beneficial Owner” (or in “Street Name”)
Most stockholders are considered the “beneficial owners” of their shares, that is, they hold their shares through a broker, bank or nominee rather than directly in their own names. As summarized below, there are some distinctions between shares held of record and those owned beneficially or in “street name.”
Stockholder of Record. If your shares are registered directly in your name with our transfer agent, you are considered the stockholder of record with respect to those shares. If you are a stockholder of record, we are sending paper copies of the proxy materials directly to you. As our stockholder of record, you have the right to grant your voting proxy directly to us by signing and mailing the enclosed proxy card or by voting on the Internet or telephone or at the annual meeting.
Beneficial Owner. If your shares are held in a stock brokerage account or by a bank or nominee, you are considered the beneficial owner of shares held in street name, and the proxy statement is being forwarded to you by or on behalf of your broker, bank or nominee (who is considered the stockholder of record with respect to those shares). As the beneficial
| 1 |
owner, you have the right to direct your broker, bank, or nominee how to vote by following the instructions you receive from your broker, bank or nominee. You are also invited to attend the annual meeting. However, since you are not the stockholder of record, you may not vote these shares at the annual meeting unless you request, complete and deliver a proxy from your broker, bank or nominee.
How to Vote
You may vote in person at the virtual meeting or by proxy.
Voting by Proxy. If you are a stockholder of record, you may vote by proxy over the Internet, by telephone or by mail if you complete and return the enclosed proxy card by following the instructions on the proxy card. If your shares are held in street name, you have the right to direct your broker, bank or nominee how to vote by following the instructions you receive from your broker, bank or nominee. The shares voted electronically, telephonically or represented by the proxy cards received, properly marked, dated, signed and not revoked, will be voted at the annual meeting. We recommend that you vote by proxy even if you plan to attend the meeting. You may change your vote at the meeting even if you have previously submitted a proxy.
Voting at the Annual Meeting. The method or timing of your vote will not limit your right to vote at the annual meeting. However, if your shares are held in the name of a bank, broker or other nominee, you must obtain a legal proxy, executed in your favor, from the holder of record to be able to vote at the annual meeting. You should allow yourself enough time prior to the annual meeting to obtain this proxy from the holder of record.
How Proxies Work
This proxy statement is furnished in connection with the solicitation of proxies by us for use at the annual meeting and at any adjournment of that meeting. If you give us your proxy, you authorize us to vote your shares at the meeting in the manner you direct. You may vote for all, some or none of our director candidates. You may also vote for or against the other proposals, or you may abstain from voting.
If you give us your proxy but do not specify how your shares shall be voted on a particular matter, your shares will be voted:
| • | FOR the election of each of the named nominees for director; |
| • | FOR the ratification of the appointment of PricewaterhouseCoopers LLP as our independent registered public accounting firm; |
| • | FOR the approval of the compensation of our named executive officers; and |
| • | with respect to any other matter that may come before the annual meeting, as recommended by our Board of Directors or otherwise in the proxies’ discretion. |
Changing or Revoking Your Vote
You have the right to revoke your previously submitted proxy at any time before your proxy is exercised at the annual meeting.
If you are the stockholder of record, you may revoke your proxy by resubmitting your vote on a later date on the Internet or by telephone (only your latest Internet or telephone proxy submitted prior to the annual meeting will be counted), by signing and returning a new proxy card with a later date, by attending and voting at the annual meeting or by giving written notice to our Secretary that you wish to revoke your previously submitted proxy.
If you hold shares beneficially in street name, you may revoke your proxy by submitting new voting instructions to your broker, bank or nominee by following the instructions they provide you or, if you have obtained a legal proxy from your broker, bank or nominee giving you the right to vote your shares, by attending and voting at the annual meeting.
Note that for both stockholders of record and beneficial owners, attendance at the annual meeting will not cause your previously granted proxy to be revoked unless you specifically so request or vote in person at the annual meeting.
| 2 |
Important Notice Regarding Delivery of Stockholder Documents
Only one proxy statement, annual report and set of accompanying materials, if applicable, are being delivered by us to multiple stockholders sharing an address, who have consented to receiving one set of such materials, until we receive contrary instructions from any such stockholders. We will deliver, promptly upon written or oral request, a separate copy of such materials to a stockholder at a shared address to which a single copy of such materials was delivered. A stockholder who wishes to receive a separate copy of the proxy statement and accompanying materials now or in the future, or stockholders sharing an address who are receiving multiple copies of the proxy statement and accompanying materials and wish to receive a single copy of such materials, should submit a request to Broadridge, c/o Householding Department, 51 Mercedes Way, Edgewood, NY 11717 or call 800-542-1061.
Votes Needed to Hold the Meeting and Approve Proposals
In order to carry on the business of the annual meeting, the holders of a majority of the outstanding capital stock of the Company entitled to vote at a meeting of stockholders must be represented at the meeting, either in person or by proxy. Abstentions and broker non-votes are counted for the purpose of determining the presence of a quorum. Broker non-votes occur when shares held by a broker on behalf of a beneficial owner are not voted with respect to a particular proposal, which generally occurs when the broker has not received voting instructions from the beneficial owner and lacks the discretionary authority to vote the shares itself.
Election of Directors. Our Amended and Restated Bylaws provide that a director nominee must receive a majority of the votes cast with respect to such nominee in uncontested director elections (i.e., the number of shares voted “for” a director nominee must exceed the number of shares voted “against” such nominee). Accordingly, abstentions and broker non-votes will have no effect on the outcome of this proposal. If an incumbent director nominee fails to receive a majority of the votes cast in an uncontested election, the director shall immediately tender his or her resignation to the Board. The Nominating, Environmental, Social and Corporate Governance Committee of the Board, or such other committee designated by the Board, shall make a recommendation to the Board as to whether to accept or reject the resignation of such incumbent director, or whether other action should be taken. The Board shall act on the resignation, taking into account the committee’s recommendation, and publicly disclose its decision regarding the resignation within 90 days following certification of the election results. If the Board accepts a director’s resignation, or if a nominee for director is not elected and the nominee is not an incumbent director, the remaining members of the Board may fill the resulting vacancy or may decrease the size of the Board.
Brokers do not have discretionary authority to vote shares without instructions from beneficial owners in the election of directors. Therefore, beneficial owners who are not stockholders of record and who want their votes to be counted in the election of directors must give voting instructions to their bank, broker or nominee before the date of the annual meeting.
Ratification of the appointment of our independent registered public accounting firm. The affirmative vote of the holders of a majority of the shares of common stock present in person or represented by proxy and entitled to vote on the proposal will be required to ratify the appointment of our independent registered public accounting firm for the current fiscal year. We believe that the ratification of our independent registered public accounting firm is a routine proposal for which brokers may vote shares held on behalf of beneficial owners who have not given voting instructions with respect to that proposal. Accordingly, we do not anticipate any broker non-votes for this proposal, and abstentions will have the same effect as negative votes for this proposal.
Advisory vote on the compensation of our named executive officers. The affirmative vote of the holders of a majority of the shares of common stock present in person or represented by proxy and entitled to vote on the proposal will be sufficient to approve, by an advisory, non-binding vote, the compensation of our named executive officers for fiscal 2023. The advisory vote on the compensation of our named executive officers, while held annually, is not considered a routine proposal; therefore, brokers lack the discretionary authority to vote shares without instructions from beneficial owners for this proposal. Abstentions will have the same effect as negative votes for this proposal, and broker non-votes will have no effect on the outcome of this proposal.
Approval of any other matter properly submitted to the stockholders at the annual meeting generally will require the affirmative vote of the holders of a majority of the shares of common stock present in person or represented by proxy and entitled to vote on that matter.
| 3 |
Security Ownership of Certain Beneficial Owners and Management
The table below sets forth information as of March 1, 2024 regarding the beneficial ownership (as defined by Rule 13d-3(d)(1) under the Securities Exchange Act of 1934, as amended (the “Exchange Act”)) of our common stock by:
| • | each person or group known by us to own beneficially more than five percent of our common stock; |
| • | each of our directors, director nominees and named executive officers individually; and |
| • | all directors and executive officers as a group. |
In accordance with applicable rules of the Securities and Exchange Commission (the “SEC”), beneficial ownership includes voting or investment power with respect to securities and includes the shares issuable pursuant to stock options that are exercisable, and shares subject to restricted stock units that vest and are delivered, within 60 days of March 1, 2024. Shares issuable pursuant to the exercise of stock options, and restricted stock units that vest, in the 60 days following March 1, 2024, are deemed outstanding for the purpose of computing the ownership percentage of the person holding such options, or shares subject to restricted stock units, but are not deemed outstanding for computing the ownership percentage of any other person. The percentage of beneficial ownership for the following table is based on 44,659,468 shares of common stock outstanding as of March 1, 2024.
The address of each of the named individuals in the table below is c/o Ultra Clean Holdings, Inc., 26462 Corporate Avenue, Hayward, CA 94545 unless otherwise indicated below. To our knowledge, except as indicated in the footnotes to this table and pursuant to applicable community property laws, the persons named in the table have sole voting and investment power with respect to all shares of common stock.
| | | SHARES OF COMMON STOCK BENEFICIALLY OWNED | ||||
| NAME AND ADDRESS OF BENEFICIAL OWNER | | | NUMBER | | | PERCENT |
| Greater than 5% Stockholders | | | | | ||
BlackRock, Inc.(1) | | | 7,201,258 | | | 16.1% |
55 East 52nd Street | | | | | ||
| New York, NY 10055 | | | | | ||
The Vanguard Group(2) | | | 4,360,555 | | | 9.8% |
| 100 Vanguard Boulevard | | | | | ||
| Malvern, PA 19355 | | | | | ||
Dimensional Fund Advisors L.P.(3) | | | 2,750,042 | | | 6.2% |
| 6300 Bee Cave Road | | | | | ||
| Austin, TX 78746 | | | | | ||
Frontier Capital Management(4) | | | 2,559,943 | | | 5.7% |
| 99 Summer Street | | | | | ||
| Boston, MA 02110 | | | | | ||
Swedbank Robur Fonder AB(5) | | | 2,434,224 | | | 5.5% |
| SE 105 34 | | | | | ||
| Stockholm, Sweden | | | | | ||
| Named Executive Officers, Directors and Director Nominees | | | | | ||
James P. Scholhamer(6) | | | 359,192 | | | * |
Sheri L. Savage(7) | | | 61,506 | | | * |
Vijayan S. Chinnasami(8) | | | 140,000 | | | * |
Christopher S. Cook(9) | | | 13,347 | | | * |
Jeffrey L. McKibben(10) | | | 8,228 | | | * |
Clarence L. Granger(11) | | | 97,134 | | | * |
Thomas T. Edman(11) | | | 34,196 | | | * |
David T. ibnAle(11) | | | 56,896 | | | * |
Emily M. Liggett(11) | | | 37,226 | | | * |
Ernest E. Maddock(11) | | | 34,396 | | | * |
Barbara V. Scherer(11) | | | 49,896 | | | * |
Jacqueline A. Seto(11) | | | 17,105 | | | * |
All Executive Officers and Directors as a Group (16 persons)(12) | | | 976,972 | | | 2.2% |
| * | Less than 1%. |
| (1) | Based on a Schedule 13G filed on January 22, 2024 with the SEC for the period ended December 29, 2023. |
| (2) | Based on a Schedule 13G filed with the SEC on February 13, 2024 for the period ended December 29, 2023. |
| (3) | Based on a Schedule 13G filed with the SEC on February 9, 2024 for the period ended December 29, 2023. |
| 4 |
| (4) | Based on a Schedule 13G filed with the SEC on February 14, 2024 for the period ended December 29, 2023. |
| (5) | Based on a Schedule 13G filed with the SEC on January 25, 2024 for the period ended December 29, 2023. |
| (6) | Includes (i) 8,001 performance restricted stock units that were scheduled to vest on March 15, 2024; (ii) 12,115 restricted stock units that were scheduled to vest on April 29, 2024; and (iii) 25,936 restricted stock units that were scheduled to vest on April 30, 2024. |
| (7) | Includes (i) 2,618 performance restricted stock units that were scheduled to vest on March 15, 2024; (ii) 2,053 restricted stock units that were scheduled to vest on March 25, 2024; (iii) 5,543 restricted stock units that were scheduled to vest on April 29, 2024; and (iv) 10,167 restricted stock units that were scheduled to vest on April 30, 2024. |
| (8) | No restricted stock units are scheduled to vest. |
| (9) | Includes (i) 7,127 restricted stock units that were scheduled to vest on April 29, 2024; and (ii) 6,220 restricted stock units that were scheduled to vest on April 30, 2024. |
| (10) | Includes (i) 2,771 restricted stock units that were scheduled to vest on April 29, 2024; and (ii) 3,628 restricted stock units that were scheduled to vest on April 30, 2024. |
| (11) | Includes 5,296 restricted stock awards that vest on May 17, 2024. |
| (12) | Consists of shares beneficially owned by our current executive officers and directors as of March 1, 2024, which include (i) 11,534 performance restricted stock units that were scheduled to vest on March 15, 2024; (ii) 2,908 restricted stock units that were scheduled to vest on March 25, 2024; (iii) 34,860 restricted stock units that were scheduled to vest on April 29, 2024; (iv) 64,945 restricted stock units that were scheduled to vest on April 30, 2024; and (v) 37,072 restricted stock awards that were scheduled to vest on May 17, 2024. |
At the close of business on March 28, 2024, the record date, we had 44,659,468 shares of common stock outstanding. Each share of our common stock is entitled to one vote on all matters properly submitted for a stockholder vote.
Delinquent Section 16(a) Reports
Section 16(a) requires our directors, executive officers and beneficial holders of 10% or more of a registered class of our equity securities to file certain reports with the SEC regarding ownership of, and transactions in, our equity securities. Based solely on a review of Forms 3, 4 and 5 and amendments thereto furnished to us and written representations we received from our directors and officers required to file the reports, we believe that all of our directors, executive officers and beneficial holders of 10% or more of a registered class of our equity securities, filed, on a timely basis, all reports required by Section 16(a) of the Exchange Act for the year ended December 29, 2023, except that one Form 4 was filed late with respect to one transaction each for Jeffrey McKibben and Christopher Cook, in each case due to an administrative error.
Cost of Proxy Solicitation
We will pay the cost of this proxy solicitation. Some of our employees may also solicit proxies, without any additional compensation. We may also reimburse banks, brokerage firms and nominees for their expenses in forwarding proxy materials to their customers who are beneficial owners of our common stock and obtaining their voting instructions.
Deadline for Receipt of Stockholder Proposals
If you wish to submit a proposal for inclusion in the proxy statement for our 2025 Annual Meeting of Stockholders, you must follow the procedures outlined in Rule 14a-8 of the Exchange Act, and we must receive your proposal at the address below no later than December 26, 2024. Stockholders intending to present a proposal at the next annual meeting without the inclusion of such proposal in the Company’s proxy materials, including for the election of director nominees, must comply with the requirements set forth in our Amended and Restated Bylaws. The Amended and Restated Bylaws require, among other things, that a stockholder must submit a written notice of intent to present such a proposal at the address below not less than 90 days nor more than 120 days prior to the first anniversary of the preceding year’s annual meeting of stockholders (as long as the date of the annual meeting is not advanced more than 30 days prior to such anniversary date or delayed more than 70 days after such anniversary date, in which case notice must be received no earlier than 120 days prior to such meeting and no later than the later of 70 days prior to such meeting or the 10th day following the public announcement of the date of such meeting). Therefore, we must receive notice of such proposal for the 2025 Annual Meeting of Stockholders no earlier than January 22, 2025, and no later than February 21, 2025, otherwise such notice will be considered untimely and we will not be required to present it at the 2025 Annual Meeting of Stockholders. The Company reserves the right to reject, rule out of order or take other appropriate action with respect to any proposal that does not comply with these and other applicable requirements. In addition to the requirements contained in our Amended and Restated Bylaws, to comply with the SEC’s universal proxy rules, a stockholder who intends to solicit proxies in support of director nominees other than our nominees must comply with the additional requirements of Rule 14a-19 of the Exchange Act.
| 5 |
Contacting Ultra Clean
If you have questions or would like more information about the annual meeting, you can contact us in either of the following ways:
•By telephone: | | | 510-576-4400 |
•By fax: | | | 510-576-4401 |
•In writing at our principal executive offices: | | | Ultra Clean Holdings, Inc. Attn: Secretary 26462 Corporate Avenue Hayward, CA 94545 |
| 6 |
We are a leading developer and supplier of critical subsystems, components, parts, and ultra-high purity cleaning and analytical services primarily for the semiconductor industry. We offer our customers an integrated outsourced solution for major subassemblies, improved design-to-delivery cycle times, design for manufacturability, prototyping and part and component manufacturing, as well as tool chamber parts cleaning and coating, and micro-contamination analytical services. Our Products division primarily designs, engineers and manufactures production tools, components, parts, and modules and subsystems for the semiconductor and display capital equipment markets. Products include chemical delivery modules, frame assemblies, gas delivery systems, fluid delivery systems, precision robotics and process modules as well as other high-level assemblies. Our Services division provides ultra-high purity parts cleaning, process tool part recoating, surface encapsulation and high sensitivity micro contamination analysis primarily for the semiconductor device makers and wafer fabrication equipment (“WFE”) markets.
Fiscal 2023 Year in Review
Performance Highlights:
In 2023, our revenue and earnings largely reflected the overall decline seen across the broader semiconductor market amid geopolitical events and macroeconomic forces, including inflationary pressures and rising interest rates, leading to weak consumer spending. Elevated inventory throughout the semiconductor supply chain also continued to impact industry performance, as customers work off excess inventory following two years of strong revenue growth.
To manage through this downturn, we took decisive actions to make cost structure improvements and optimize profits in the short term without compromising our ability to react quickly to seize opportunities when industry growth resumes. Enhancing operations and increasing capacity to support the next industry expansion were top priorities in 2023.
While the semiconductor equipment inventory adjustment cycle currently remains fluid, we believe the semiconductor market we serve will continue to grow over the long term due to multi-year industry demand from a broad range of drivers, such as new central processing unit (“CPU”) and graphics processing unit (“GPU”) architectures that enable higher performance servers necessary for cloud, artificial intelligence (“AI”) and machine learning applications. We also believe that semiconductor original equipment manufacturers (“OEM”) are increasingly relying on partners like UCT to fulfill their expanding capacity requirements. Additionally, we believe that we are strategically positioned to continue to benefit from device manufacturers’ reliance on precision cleaning and coating to manufacture ever more complex devices.
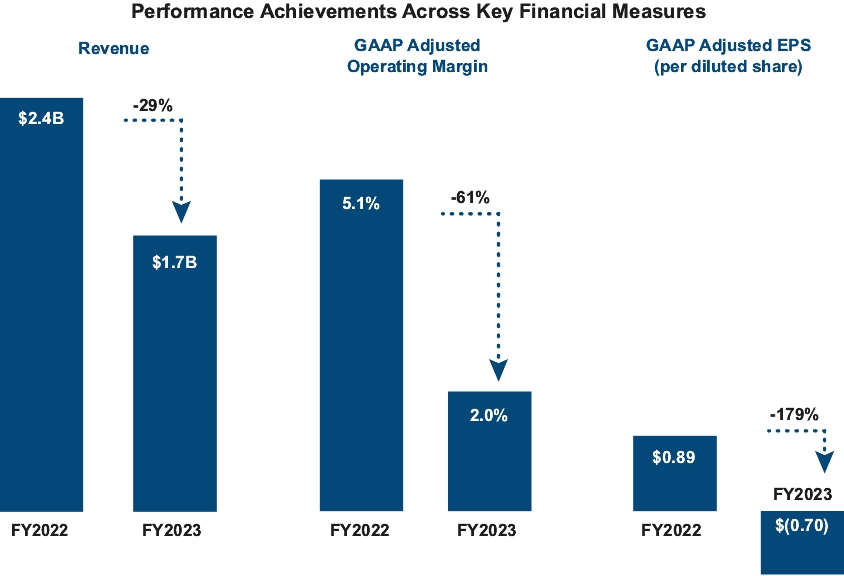
| • | Achieved revenue of $1.7 billion in 2023, compared to $2.4 billion in 2022. |
| • | GAAP operating margin was 2.0% in 2023, compared to 5.1% in prior year. Non-GAAP* operating margin was 4.9% in 2023, compared to 11.0% in 2022. Differences in annual results were mainly due to decreased efficiencies in lower volume of sales in 2023 compared to 2022. |
| • | GAAP earnings (loss) per share (“EPS”) was $(0.70) in 2023 and $0.89 in 2022. Non-GAAP EPS was $0.56 in 2023, compared to $3.98 in 2022. |
| 7 |
| • | Paid down $39 million in debt and repurchased $29 million of shares outstanding. During 2022 and 2023, UCT has paid down a total of $79 million in debt and repurchased $41 million of shares outstanding. |
| • | Completed the acquisition of HIS Innovations Group (“HIS”), a privately held company based in Hillsboro, Oregon. HIS is a leading supplier to the semiconductor sub-fab segment including the design, manufacturing, and integration of components, process solutions, and fully integrated sub-systems. The acquisition strengthens our leadership in developing and supplying critical products to the semiconductor industry and extends our reach into the sub-fab area. |
| • | Advanced global capacity while consolidating and modernizing operations into state-of-the-art, scalable facilities in strategic locations around the world. |
* Non-GAAP is adjusted for amortization of intangible assets, stock-based compensation, restructuring charges, acquisition activity costs, fair value adjustments, legal-related costs, VAT settlement, net loss on divestitures, Covid-19 related costs and the tax effects of the foregoing adjustments. See Appendix A for a reconciliation of GAAP to non-GAAP measures and for additional information about the non-GAAP measures we use in this proxy statement.
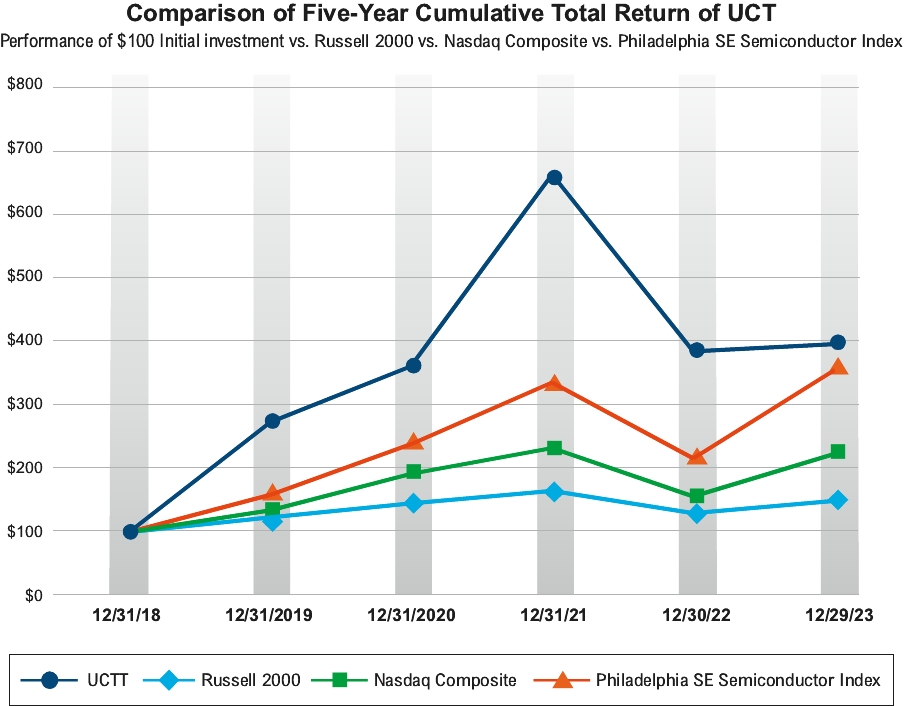
Stock Price Performance:
In 2023, our total shareholder return increased a modest 3% year-over-year amid the continued global softening in end-market demand for semiconductors. This downturn, beginning in the fourth quarter of 2022, is driven by inflationary pressures and rising interest rates, both of which have impacted consumer spending.
However, as shown below, for the five-year period beginning December 31, 2018, UCT has outperformed major indices including the Russell 2000 and the Nasdaq Composite. This demonstrates our capacity to satisfy rising demand for our products and services during the three successive years (2019-2021) of record industry growth, during which we outperformed the Philadelphia SE Semiconductor Index. We will continue to synchronize our worldwide operations with our customers’ forecasts to ensure we have the flexibility and capacity to meet future demand. These efforts are creating long-lasting value to our customers and will increase UCT’s leading position within the industry over the long term.
| 8 |
The following is a summary of key highlights of the Company’s financial performance for fiscal year 2023:
| | | YEARS ENDED | | | | | ||||||
| | | 12/29/2023 | | | 12/31/2022 | | | INCREASE (DECREASE) | | | % INCREASE (DECREASE) | |
| | | (DOLLARS ARE IN MILLIONS) | ||||||||||
| Revenues | | | $1,734.5 | | | $2,374.3 | | | $(639.8) | | | (26.9)% |
| Gross margin | | | 16.0% | | | 19.6% | | | (3.6)% | | | (18.4)% |
| Non-GAAP gross margin* | | | 16.6% | | | 20.2% | | | (3.6)% | | | (17.8)% |
| Income from operations | | | $35.2 | | | $120.4 | | | $(85.2) | | | (70.8)% |
| Non-GAAP income from operations* | | | $85.3 | | | $260.2 | | | $(174.9) | | | (67.2)% |
| Operating cash flow | | | $135.9 | | | $47.2 | | | $88.7 | | | 187.9% |
| Market capitalization at fiscal year end | | | $1,524.2 | | | $1,497.1 | | | $27.1 | | | 1.8% |
| * | Non-GAAP is adjusted for amortization of intangible assets, stock-based compensation, restructuring charges, acquisition activity costs, fair value adjustments, legal-related costs, VAT settlement, net loss on divestitures, Covid-19 related costs and the tax effects of the foregoing adjustments. See Appendix A for a reconciliation of income from operations to non-GAAP income from operations and gross margin to non- GAAP gross margin and for additional information about the non-GAAP measures we use in this proxy statement. |
| 9 |
Our Amended and Restated Bylaws provide that our Board of Directors shall be elected at the annual meeting of our stockholders, and each director so elected shall hold office until such director’s successor is elected and qualified or until such director’s earlier death, resignation or removal. Our Board of Directors, at the recommendation of the Nominating, Environmental, Social and Corporate Governance Committee, has recommended for nomination the nominees for director named below. All of these nominees currently serve as our directors. Each nominee has consented to serve as a nominee, to serve as a director if elected, and to being named a nominee in this proxy statement. If a director nominee becomes unavailable before the election, your proxy authorizes the people named as proxies to vote for a replacement nominee if our Board of Directors names one.
Our Amended and Restated Bylaws provide that a director nominee must receive a majority of the votes cast with respect to such nominee in uncontested director elections (i.e., the number of shares voted “for” a director nominee must exceed the number of shares voted “against” such nominee). Accordingly, abstentions and broker non-votes will have no effect on the outcome of this proposal. If an incumbent director nominee fails to receive a majority of the votes cast in an uncontested election, the director shall immediately tender his or her resignation to the Board. The Nominating, Environmental, Social and Corporate Governance Committee of the Board, or such other committee designated by the Board, shall make a recommendation to the Board as to whether to accept or reject the resignation of such incumbent director, or whether other action should be taken. The Board shall act on the resignation, taking into account the committee’s recommendation, and publicly disclose its decision regarding the resignation within 90 days following certification of the election results. If the Board accepts a director’s resignation, or if a nominee for director is not elected and the nominee is not an incumbent director, the remaining members of the Board may fill the resulting vacancy or may decrease the size of the Board.
| NAME | | | POSITION/OFFICE HELD WITH THE COMPANY | | | AGE | | | DIRECTOR SINCE |
| Clarence L. Granger | | | Chairman of the Board and Nominee for Director | | | 75 | | | 2002 |
| James P. Scholhamer | | | Chief Executive Officer, Director and Nominee for Director | | | 57 | | | 2015 |
| David T. ibnAle | | | Director and Nominee for Director | | | 52 | | | 2002 |
| Emily M. Liggett | | | Director and Nominee for Director | | | 68 | | | 2014 |
| Thomas T. Edman | | | Director and Nominee for Director | | | 61 | | | 2015 |
| Barbara V. Scherer | | | Director and Nominee for Director | | | 68 | | | 2015 |
| Ernest E. Maddock | | | Director and Nominee for Director | | | 66 | | | 2018 |
| Jacqueline A. Seto | | | Director and Nominee for Director | | | 58 | | | 2020 |
Members of our Board self-identify as set forth in the table below:
| Total Number of Directors | | | 8 |
| | | FEMALE | | | MALE | | | NON-BINARY | | | DID NOT DISCLOSE GENDER | |
| Part I: Gender Identity | | | | | | | | | ||||
| Directors | | | 3 | | | 5 | | | | | ||
| Part II: Demographic Background* | | | | | | | | | ||||
| African American or Black | | | | | 1 | | | | | |||
| Alaskan Native or Native American | | | | | | | | | ||||
| Asian | | | 1 | | | | | | | |||
| Hispanic or Latinx | | | | | | | | | ||||
| Native Hawaiian or Pacific Islander | | | | | | | | | ||||
| White | | | 1 | | | 3 | | | | | ||
| Two or More Races or Ethnicities | | | 1 | | | | | | | |||
| LGBTQ+ | | | | | 1 | | | | | |||
| Did Not Disclose Demographic Background | | | | | | | | |
| 10 |
Set forth below is information about each of our nominees for director:
 | | | Clarence L. Granger — Chairman and Independent Director Director since 2002 Age: 75 Key qualifications and expertise considered by the Board in nominating this director: • Extensive knowledge of UCT’s business, strategy, people, operations, finances and competitive position in the semiconductor capital equipment industry as our former CEO • Executive leadership and vision • Global network of customer, industry and government relationships |
| Clarence L. Granger has served as our Chairman since October 2006. From 1996 to 2015, Mr. Granger served in multiple roles with UCT including Chief Operating Officer and Executive Vice President of Operations, culminating with 12 years as our Chief Executive Officer. Before joining UCT, Mr. Granger held executive management roles at Seagate Technology, HMT Technology and Xidex, including the position of Chief Executive Officer for HMT Technology. Mr. Granger has a B.S. in Industrial Engineering from the University of California at Berkeley and an M.S. in Industrial Engineering from Stanford University. | |||
 | | | James P. Scholhamer — Chief Executive Officer and Director Director since 2015 Age: 57 Key qualifications and expertise considered by the Board in nominating this director: • Strong engineering and operations experience • Provides the Board of Directors with a unique perspective as Chief Executive Officer and leader of our strategic planning process |
| Before joining UCT as Chief Executive Officer in 2015, James P. Scholhamer served as Corporate Vice President and General Manager of Applied Materials, Inc., leading the Equipment Products Group and Display Services Group of its Global Service Division. Earlier at Applied Materials, Mr. Scholhamer served as Vice President of Operations-Energy for the Environmental and Display Products Division and Corporate Vice President and General Manager of the Display Business Group. Prior to joining Applied Materials, Mr. Scholhamer worked for Applied Films Corporation as Vice President of Operations, Engineering and Research Development and as Vice President of Thin Film Coating Division and Thin Film Equipment Division. Mr. Scholhamer holds a B.S. in Materials and Metallurgical Engineering from the University of Michigan. | |||
| 11 |
 | | | David T. ibnAle — Independent Director Director since 2002 Age: 52 Key qualifications and expertise considered by the Board in nominating this director: • Expertise in corporate finance, accounting and strategy • Brings a thorough understanding of business management, including investment, corporate strategy and mergers and acquisitions to UCT’s growth initiatives • Qualifies as a financial expert and provides important support as a member of our Audit Committee |
| David T. ibnAle is a Founding and Managing Partner of Advance Venture Partners LLC. He has 26 years of experience as an investor in high-growth technology companies. Before co-founding AVP, Mr. ibnAle was a Managing Director of TPG Growth, the growth equity and middle-market investment platform of TPG. Prior to joining TPG Growth, he was an investment professional and Partner at Francisco Partners and an investment professional at Summit Partners. Mr. ibnAle has served on the Boards of Directors of several public and private technology companies, and currently serves on the Boards of Affinity, Alto Solutions, AutoLeap, Morning Consult, Nativo and UrbanSitter. Mr. ibnAle also serves as Vice Chair of the Board of Trustees and as Chair of the Investment Committee of the San Francisco Foundation and on the Board of Directors and Investment Committee of the Black Economic Alliance Venture Fund. Mr. ibnAle holds a B.A. in Public Policy and an M.A. in International Development Policy from Stanford University, and an M.B.A. from the Stanford University Graduate School of Business. | |||
 | | | Emily Liggett — Independent Director Director since 2014 Age: 68 Key qualifications and expertise considered by the Board in nominating this director: • CEO and management experience in a variety of technical industrial companies • International perspective; has managed worldwide businesses, partnerships, and international joint ventures • Expertise in strategy, operations, new product development, sales, marketing, and business development for highly technical businesses |
| Emily Liggett is the Founder and Chief Executive Officer of Liggett Advisors, a strategy/implementation consulting business, since 2017. Previously, Ms. Liggett was CEO of NovaTorque, Inc., CEO of Apexon, CEO of Capstone Turbine and CEO of Elo TouchSystems. Before these roles, she held assignments in sales, marketing, operations and general management at Raychem Corporation, including GM of the Raychem Telecommunications Division. Ms. Liggett is presently a director of Materion Corporation. She was previously a director of Kaiser Aluminum, MTS Systems Corporation and of Immersion Corporation, and serves on the Purdue Research Foundation Board of Directors. As a board member, Ms. Liggett has developed expertise in oversight of corporate sustainability matters including environmental, social and governance best practices and implementation. Ms. Liggett has a B.S. in Chemical Engineering from Purdue University, an M.S. degree in Manufacturing Systems and an M.B.A. from Stanford University. | |||
 | | | Thomas T. Edman — Independent Director Director since 2015 Age: 61 Key qualifications and expertise considered by the Board in nominating this director: • Business acumen and experience in the technology industry with sizeable companies, including as CEO of a public company • Extensive experience in Asia and with compensation matters |
| Thomas T. Edman is currently Chief Executive Officer of TTM Technologies Inc. since 2014 and has been a member of its Board of Directors since 2004. Mr. Edman held multiple management roles at Applied Materials Inc., including Group Vice President and General Manager of the AKT Display Business Group and Corporate Vice President of Corporate Business Development. Before that he served as President and CEO of Applied Films Corporation and also as General Manager of the High Performance Materials Division of Marubeni Specialty Chemicals Inc. Mr. Edman is currently the Chairman of the IPC, a trade association for the electronics manufacturing industry. Mr. Edman holds a B.A. in East Asian Studies (Japan) from Yale University and an M.B.A. from The Wharton School at the University of Pennsylvania. | |||
| 12 |
 | | | Barbara V. Scherer — Independent Director Director since 2015 Age: 68 Key qualifications and expertise considered by the Board in nominating this director: • Extensive experience in the technology industry, including significant operational expertise • Practical and strategic insight into complex financial reporting and management issues |
| Barbara V. Scherer’s career spans more than 30 years, including 25 years in senior financial leadership roles in the technology industry. Previously, she was Senior Vice President, Finance and Administration and Chief Financial Officer of Plantronics Inc. from 1998 to 2012. Before Plantronics, she held executive management positions spanning 11 years in the disk drive industry, was an associate with The Boston Consulting Group and was a member of the corporate finance team at ARCO. Ms. Scherer is a member of the Board of Directors of NETGEAR Inc. a former chair of the audit committee and current chair of the compensation committee. She previously served as a director of Ansys Inc., chairing the audit committee from 2018-2022. She also served as a director of Keithley Instruments Inc., chaired audit committee from 2008-2010, and has experience serving on the boards of nonprofit organizations. Ms. Scherer received a B.A. from the University of California at Santa Barbara and an M.B.A. from the School of Management at Yale University. | |||
 | | | Ernest E. Maddock — Independent Director Director since 2018 Age: 66 Key qualifications and expertise considered by the Board in nominating this director: • Practical and strategic insight into complex financial reporting and management issues • Significant operational expertise • Knowledge of critical drivers across the semiconductor ecosystem |
| Ernest E. Maddock has held leadership positions at multiple global companies during his career. Mr. Maddock served as Senior Vice President and Chief Financial Officer at Micron Technology from 2015 until his retirement in 2018. Prior to joining Micron, Mr. Maddock served as Executive Vice President and Chief Financial Officer of Riverbed Technology. Before joining Riverbed, he spent 15 years at Lam Research Corporation (“Lam”), rising to Executive Vice President and Chief Financial Officer. His previous roles at Lam included Vice President, Customer Support Business Group; and Group Vice President and Senior Vice President of Global Operations. Currently, Mr. Maddock serves on the Board of Directors of Avnet, Inc., Ouster Inc., Teradyne, Inc., and previously served as a member of the Board of Directors for Intersil Corporation. Mr. Maddock holds a B.S. in Industrial Management from the Georgia Institute of Technology and an M.B.A. from Georgia State University. | |||
 | | | Jacqueline A. Seto — Independent Director Director since 2020 Age: 58 Key qualifications and expertise considered by the Board in nominating this director: • Deep understanding of the semiconductor industry • Proven strategic insight • Extensive experience in product strategy and marketing |
| Jacqueline A. Seto is currently Principal of Side People Consulting, partnering with emerging companies and with non-profit organizations advising on strategic and business planning, change management and other executive service consulting. Previously, Ms. Seto spent 22 years at Lam Research, where she advanced to the position of Group Vice President and General Manager of the Clean Business Unit. Her previous roles at Lam included Corporate Vice President and General Manager in the Reliant Business Unit, Vice President of Product and Strategic Marketing and Managing Director of Emerging Businesses. Ms. Seto currently serves as a member of the Board of Trustees for The Oregon Museum of Science and Industry, and as a member of the Board of Directors for the International Women’s Forum Oregon. She previously served as a member of the Board of Directors for TriAegis Residential Services, for Mastersranking.com and as the Board Secretary of Prevent Child Abuse Oregon. As a board member, Ms. Seto has developed expertise in oversight of corporate sustainability matters including environmental, social and governance best practices and implementation. Ms. Seto holds a Bachelor of Engineering in Chemical Engineering from McGill University. | |||
| 13 |
There are no family relationships among any of our directors and executive officers. There are no arrangements or understandings between any of our directors and us pursuant to which such director was or is to be selected as a director or nominee. Information related to the compensation of our Board of Directors can be found under “Director Compensation” below.
 | | | Our Board of Directors recommends that you vote “FOR” each of the nominees to the Board of Directors set forth in this Proposal 1. |
Director Independence. We are required to comply with the director independence rules of the Nasdaq Stock Market (“Nasdaq”) and the SEC. These rules require that the board of directors of a listed company be composed of a majority of independent directors and that the audit committee, compensation and people committee and nominating, environmental, social and corporate governance committee be composed solely of independent directors.
Our Board of Directors has determined that each of our directors and director nominees is independent in accordance with applicable Nasdaq and SEC rules other than Mr. Scholhamer. Accordingly, a majority of our current Board of Directors is independent as required by Nasdaq rules and, upon election of each of our director nominees at the 2024 Annual Meeting of Stockholders, a majority of our Board of Directors will be independent as required by Nasdaq rules.
Director Responsibilities. We are governed by our Board of Directors and its various committees that meet throughout the year. Our Board of Directors currently consists of eight directors. During 2023, there were five meetings of our Board of Directors. We expect directors to attend and prepare for all meetings of the Board of Directors and the meetings of the committees on which they serve. Each of our directors attended 100% of the aggregate number of meetings of the Board of Directors and the committees on which he or she served during 2023.
Board Leadership Structure. Our corporate governance guidelines allow for the flexibility to combine or separate the offices of Chairman and the Chief Executive Officer to best serve the interests of the Company and its stockholders. Mr. Scholhamer serves as the Chief Executive Officer of the Company and Mr. Granger serves as the Chairman of our Board of Directors. Our Board of Directors believes our current board leadership structure to be an efficient and successful leadership model for the Company, promoting clear accountability and effective decision-making. The roles of our Chairman and Chief Executive Officer are separated to allow Mr. Scholhamer to develop and execute on our corporate strategy and focus on day-to-day operations and company performance. Our Board of Directors believes that our stockholders benefit from Mr. Granger’s service as Chairman due to his deep background and experience in our industry and his knowledge of our operations as our former Chief Executive Officer. Our Board of Directors recognizes that a different leadership model may be warranted under different circumstances. Accordingly, our Board of Directors periodically reviews its leadership structure.
The Board also continually reviews the need for effective independent oversight. Each member of each of our Board of Director’s standing committees is an independent director, and each independent director is actively involved in independent oversight. Our independent directors meet in executive session during each regularly scheduled quarterly meeting of our Board of Directors and periodically evaluate both our Chairman and our Chief Executive Officer as well as Board and committee performance. All directors have unrestricted access to management at all times and frequently communicate with the Chairman, the Chief Executive Officer and other members of management on a variety of topics. Given the above factors, our Board of Directors has determined that our leadership structure is appropriate.
Corporate Governance. Our Board of Directors has adopted corporate governance guidelines. These guidelines address items such as the qualifications and responsibilities of our directors and director candidates and the corporate governance policies and standards applicable to us in general. In addition, we have adopted a code of business conduct and ethics that applies to all officers, directors and employees. Our corporate governance guidelines and our code of business conduct and ethics as well as the charters of the Nominating, Environmental, Social and Corporate Governance Committee, Audit Committee and Compensation and People Committee are available on our website at http://uct.com/investors/corporate-governance/. Information on or accessible through our website is not incorporated by reference in this Proxy Statement.
Communicating with our Board of Directors. Any stockholder wishing to communicate with our Board of Directors may send a letter to our Secretary at 26462 Corporate Avenue, Hayward, CA 94545. Communications intended specifically for non-employee directors should be sent to the attention of the chair of the Nominating, Environmental, Social and Corporate Governance Committee.
| 14 |
Annual Meeting Attendance. Our Board of Directors has adopted a policy that all members should attend each annual meeting of stockholders when practical. All incumbent directors attended the 2023 Annual Meeting of Stockholders.
Our Board of Directors plays an active role, as a whole and also at the committee level, in overseeing the management of our risks. Our Board of Directors regularly reviews reports from the management team on areas of material risk to the Company, including operational, financial, legal, cyber, environmental, social and governance (“ESG”) and strategic risks. Each of the committees of our Board of Directors also oversees the management of company risks that fall within the committee’s areas of responsibility. The Audit Committee periodically reviews risks associated with financial reporting and internal controls, as well as risks associated with liquidity, customer credit, inventory reserves and cybersecurity. The Nominating, Environmental, Social and Corporate Governance Committee assists the Board in overseeing risks associated with board organization, membership, structure and ESG. The Compensation and People Committee assists the Board in reviewing whether any material risks arise from our compensation programs and in overseeing risks associated with succession planning for our executives. The Board also reviews our director and officer insurance annually.
Our ESG vision is to successfully align our strategy and operations with our values as a responsible global company in a thoughtful and authentic manner. Incorporating ESG goals into our operating framework reflects our longstanding commitment to our customers, partners, shareholders, employees and the communities in which we operate.
Environmental Stewardship
 | | | UCT is committed to sustainable solutions that minimize our environmental impact and support our long-term success. As a growing, global company, UCT is continuously improving and expanding the scope of our environmental efforts. Our policy sets environmental protection as a priority and is approved and supported by the executive leadership team. The foundation of the policy is the concept of reducing, reusing and recycling to minimize our environmental footprint. We focus on continuous improvement by regularly assessing new requirements and stakeholder input. In addition, we have established an Environmental Management System that includes procedures to maintain compliance with regulatory requirements and industry best practices. We have a goal of zero environmental impact incidents. Our performance against this policy is monitored via reviews and audits. |
| | | OUR EFFORTS TO ADVANCE INDUSTRY-WIDE SOLUTIONS UCT is committed to “SuCCESS2030” (Supply Chain Certification for Environmental and Social Sustainability) spearheaded by Applied Materials. This initiative supports sustainability efforts throughout the semiconductor equipment supply chain. The goal is to build a responsible and sustainable end-to-end supply chain for the future of semiconductors. Consistent with SuCCESS2030 goals, we are an active member of the Responsible Business Alliance (“RBA”) and adhere to the RBA Code of Conduct, which is a set of social, environmental and ethical industry standards. As a participant in SuCCESS2030, we engage with Applied Materials’ external auditors and analyze operational enhancements, including auditing our suppliers to ensure adherence to RBA guidelines. We also subscribe to the RBA’s Responsible Mineral Initiative, which establishes standards for environmentally responsible and ethical business practices in the electronics industry and its supply chain. In 2022, we successfully submitted the Conflict Minerals Reporting Template and Extended Minerals Reporting Template as part of our commitment to SuCCESS2030. In 2022, UCT became a Founding Member of the Semiconductor Climate Consortium (“SCC”), the first global alliance of semiconductor ecosystem companies focused on reducing greenhouse gas emissions across the value chain. The SCC’s members are committed to the following objectives: • Collaboration – Align on common approaches, technology innovations and communications channels to continuously reduce greenhouse gas emissions. |
| 15 |
| | | • Transparency – Publicly report progress and Scope 1, 2 and 3 emissions annually. • Ambition – Set near- and long-term decarbonization targets with the aim of reaching net zero emissions by 2050. | |
| | | SCC founding members are committed to driving climate progress within the semiconductor industry and support the Paris Agreement and related accords aimed at accelerating and intensifying the actions and investments required for a sustainable low-carbon future. | |
| | | Additionally, we are actively engaged with various industry efforts offered by our key customers, such as the Catalyze program that aims at furthering the adoption of renewable electricity throughout the global semiconductor value chain. | |
| | | To support our ambition, UCT is committed to lowering our greenhouse gas (“GHG”) emissions and sharing our progress on a timeline as required by various regulatory authorities. To achieve our objectives, since 2022 and continuing through 2023, we have been working with outside experts to develop internal processes and automated systems that will enable us to collect, analyze and report our GHG footprint across global operational sites. Our reporting will be aligned with the framework developed by the Task Force on Climate-related Financial Disclosures (“TCFD”), which has emerged as the most prominent global standard for reporting in accordance with the regulatory requirements. Once we have baseline data this year, our next step will be to develop an initiatives roadmap aligned with our business and operations strategy, for long term emissions reduction consistent with SCC and Science Based Target Initiative. Our key customers are supportive of our plan and required data sharing roadmap with them, some of which is expected to start later this year. Other highlights: | |
| | | ENERGY EFFICIENT OPERATIONS Increased efficiency can lower GHG emissions and other pollutants to help protect the environment. • UCT incorporates energy efficiency considerations into our capacity expansions. For example, our newest facilities in Ireland and Malaysia include infrastructure to support planned solar installations that will reduce our energy consumption over time. In addition, the site design of our recently opened state-of-the-art facility in Chandler, Arizona follows Leadership in Energy and Environmental Design (“LEED”) certification guidelines. We incorporate LED lighting and motion sensors in new facilities to reduce energy consumption. • Our global sites incorporate lean manufacturing methods where possible to increase energy efficiency and reduce waste. | |
| | | RESPONSIBLE USE OF RESOURCES UCT recognizes that the responsible use of natural resources is essential to sustainably growing our business and protecting the environment. • UCT follows RBA’s Responsible Minerals Assurance Process for tantalum. Tantalum is a rare metal commonly used in the electronics industry where high reliability in extreme environments is required. Tantalum is covered by regulations related to “conflict minerals” in the United States and the European Union. • Our Environmentally Clean Process (“ECP”) for tantalum-deposited parts recover up to 95% of the metal, enabling it to re-enter the commodity market and reduce the demand for mined material. • ECP also increases part lifetime and reduces wastewater generation while eliminating the use of chemicals at some of our high-volume cleaning facilities. • UCT acknowledges our duty to protect water sources in the communities in which we operate and strives to conserve water use across our global operations by sharing best practices among sites. • In 2023, we launched a survey with our suppliers on their awareness and level of adoption of ESG principles. Additionally, we are working with our suppliers on perfluoroalkyl and polyfluoroalkyl substances (“PFAS”) risk and possible alternate solutions. |
| 16 |
| | | REDUCING CHEMICAL USE UCT’s parts cleaning business uses chemical-free processes where possible. This lowers our environmental impact by reducing the amount of waste requiring treatment and enabling the safe return of water to the environment. | |
| | | MINIMIZING WASTE UCT is committed to reducing waste across our locations to limit our environmental footprint. We have implemented reuse programs for packaging materials with our customers and suppliers, adhering to the semiconductor industry’s stringent protective packaging requirements. | |
| | | REDUCING TRANSPORTATION To reduce our overall emissions, UCT seeks to minimize transportation emissions wherever possible among our operations, and with our suppliers and employees. Many of UCT’s sites are strategically positioned close to our customers, which reduces the distance products must travel. Where possible, we develop regional supply chains that reduce overall shipping requirements. |
Social Responsibility
 | | | We aim to build a responsible and sustainable end-to-end supply chain, ensure employee health and safety in the workplace, foster an atmosphere of acceptance, inclusion, belonging, trust and mutual respect in the workplace, promote employee engagement inside and outside the company and give back to communities. UCT strives to positively impact society by ensuring the people we work with are safe and treated with dignity and respect. We strive to be a good neighbor in the communities in which we operate. |
| | | HEALTH, WELLNESS AND SAFETY • The safety of our personnel is our top priority. We have an established Safety policy to outline expectations, including our goal of zero accidents and injuries. Safety incident levels across our Products and Services Divisions are consistently below industry benchmarks. • We consistently train, educate and qualify personnel to enable a safety-focused work environment. | |
| | | • We subscribe to the Responsible Business Alliance (“RBA”) Responsible Labor Initiative, which establishes standards to ensure that working conditions in the electronics industry and its supply chains are safe and that workers are treated with respect and dignity. | |
| | | • We require written certification from strategic direct product suppliers that the materials incorporated into their products comply with applicable laws and regulations, including laws regarding slavery and human trafficking of the country or countries in which they are doing business. | |
| | | DIVERSITY, INCLUSION AND ENGAGEMENT Central to UCT’s values is the belief that employees are our most important assets. Our goal is to foster an atmosphere of acceptance, inclusion, belonging, trust and respect for all. We embrace diversity and multiculturalism. We respect regional differences while fostering a culture that maximizes both organizational and individual potential. Our culture emphasizes leadership, open and honest communication, training and mentoring, and a positive reward system. • Diversity initiatives are overseen by our executive management team, including efforts to recruit from a broad talent base and initiatives to support a more inclusive workforce. • UCT recently established an Employee Experience and Well-being committee focused on cultivating an environment that prioritizes respect, mental well-being and active engagement. In 2023, this committee introduced programs for our global employees to engage in new ways with leadership as well as improve their physical and mental health. • Our employees take mandatory training to establish behavioral expectations, improve |
| 17 |
| | | diversity and inclusion sentiment, and ensure that every employee is treated with dignity and respect. • In 2022, UCT completed a diversity survey of our employees holding the title vice president or higher; with 100% participation, 61% of these senior leaders self-identified as female and/or minorities. We are currently developing a framework to broaden our efforts to monitor diversity across all levels of the company. • UCT launched a company-wide learning management system (LMS) in 2022 that provides all employees with opportunities to advance their skills, knowledge and careers. Course offerings include leadership and professional skills, diversity and inclusion training, project management certification, environmental, health and safety courses and more. In 2023, more than 5,200 UCT employees engaged in LMS training for a total of more than 19,800 training hours. • We are committed to the success of our employees. In 2023, 99% of our global workforce participated in performance reviews to measure achievements and opportunities against personal and corporate goals. All of our full-time, permanent employees participate financially in the success of the company via formal profit sharing or performance bonus plans. • In 2023, UCT introduced specialized training for high-potential employees to enhance individual leadership capabilities and foster a culture of continuous improvement and innovation. • We actively solicit the input of our employees as part of our efforts to make UCT an attractive place to work and to enhance recruiting and retention. In 2022, the results of a company-wide survey revealed that 76% of our employees would recommend UCT as a good place to work. | |
| | | We are committed to contributing to the communities in which we operate and support our employees who participate in local events through the investment of time and resources. In 2023, UCT organized and conducted 31 events designed to give back and support local organizations and individuals. |
Corporate Governance
 | | | Sound governance and strong leadership are key to delivering sustained value to our stakeholders. To succeed, we must safeguard and retain the trust of employees, partners, customers, investors and the communities in which we work and live. As stewards of the company, our Board of Directors provides guidance and oversight and ensures that we maintain our high ethical standards. Effective corporate governance requires achieving the right mix of experience, background and diversity in perspectives; this is particularly important in a complex and highly technical business like ours. For more information on board diversity, please see page 10. We benefit from a highly engaged and informed Board of Directors. Our board composition complies with Nasdaq and Securities and Exchange Commission rules regarding director independence and includes women and those from under-represented groups. Given the importance of ESG considerations, two of UCT’s three board committees share oversight responsibility for ESG: • The Nominating, Environmental, Social and Corporate Governance Committee (formerly the Nominating and Corporate Governance Committee) provides oversight and guidance for ESG matters focusing on environmental and governance areas. • The Compensation and People Committee (formerly the Compensation Committee) provides oversight and guidance for the social component of ESG, including talent and career development, employee retention, promotion of diversity, equity and inclusion and other people-related matters. |
| 18 |
| | | These committees meet regularly and provide input and guidance for consideration of environmental, social and governance matters to the broader board on a regular basis | |
| | | CYBERSECURITY Managing cyber-risk is increasingly critical to governance in today’s interconnected world. Our Board of Directors has the overall oversight responsibility for our risk management, and delegates the cybersecurity and other risks relating to our information controls and security to our Audit Committee. Both the Audit Committee and the full Board regularly receive updates from our management on cybersecurity matters and our ongoing risk management efforts, and actively participate in ongoing discussions. In addition, the Board and the Compensation and People Committee review and approve the key performance indicators applicable to all management personnel responsible for effectively managing cybersecurity risk management programs at UCT and engage in regular review of the Company’s performance against those indicators. UCT has a Chief Information Officer and a Chief Information Security Officer (“CISO”), who report to the Board formally once per year, and, in the interim, on specific issues as appropriate. UCT’s cybersecurity management program ensures that technology, data management and privacy risks are identified, analyzed and managed and, together with our broader business continuity plans, aim to not only address immediate response to cybersecurity incidents but also ensure swift restoration of critical systems and the maintenance of core business functions in the face of digital threats. Our senior management and information technology security teams devote considerable time and resources to conducting regular evaluations of our systems and implementing necessary enhancements to our security infrastructure to better guard against evolving cybersecurity threats. Our employees, contractors and directors receive regular information security training and participate in ongoing, mandatory cybersecurity awareness programs. UCT has a security risk insurance policy, and we continue to enhance our security posture consistent with the risk program established by our CISO. This includes expanding our global information security program, adding broad technical expertise, and advancing our enterprise security capabilities portfolio. We have adopted measures to combat potential cyberattacks and information espionage, including implementation of certain security tools to detect nefarious activities within our system. UCT’s information security is externally audited using the National Institute of Standards and Technology (“NIST”) Cybersecurity Framework, and our information security is also tested as part of the annual financial audit. UCT also participates in a number of customer cybersecurity audits each year, and our externally visible cybersecurity health is monitored by third-party service providers. |
| 19 |
Our Board of Directors has three principal committees. The following describes each committee’s current membership, the number of meetings held during 2023 and its mission:
| AUDIT COMMITTEE |
| Among other matters, the Audit Committee is responsible for: |
| • providing oversight of our accounting and financial reporting processes and audits of our financial statements; |
| • assisting the Board in its oversight of the integrity of our financial statements and the adequacy and effectiveness of our internal controls over financial reporting; |
| • periodically reviews risks related to data protection and cybersecurity; |
| • the qualifications, independence and performance of our independent auditors (including hiring and replacing our independent auditors as appropriate, reviewing and pre-approving any audit and non-audit services provided by our independent auditors and approving fees related to such services); |
| • the performance of our internal audit function; |
| • the review, approval and oversight of our Cash and Investment Policy and Financial Risk Management Policy, including oversight over our hedging strategy and the use of swaps and other derivative instruments for hedging risks; |
| • compliance with legal and regulatory requirements; |
| • compliance with our code of business conduct and ethics (and requests for waivers therefrom); and |
| • preparing the Audit Committee report that SEC rules require to be included in our proxy statement. |
A copy of the Audit Committee’s charter is available on our website at http://uct.com/investors/governance/. Information on or accessible through our website is not incorporated by reference in this proxy statement.
The current members of the Audit Committee are Ernest E. Maddock (chair), Barbara V. Scherer, Thomas T. Edman and David T. ibnAle. Our Board of Directors has determined that each member of the committee satisfies both the SEC’s additional independence requirement for members of audit committees and the other requirements of Nasdaq for members of audit committees. The Board of Directors has also concluded that each member of the Audit Committee qualifies as an audit committee financial expert as defined by SEC rules and has the financial sophistication required by Nasdaq. The Audit Committee met five times in 2023.
| COMPENSATION AND PEOPLE COMMITTEE |
| Among other matters, our Compensation and People Committee: |
| • oversees our compensation and benefits programs and policies generally, including the issuance of equity-based compensation; |
| • evaluates the performance of our executive officers and other senior executives; |
| • reviews our management succession plan; |
| • oversees and sets compensation for our executive officers, Board members and other senior executives; |
| • reviews and recommends inclusion of the Compensation Discussion and Analysis required to be included in our proxy statement by SEC rules; |
| • oversees the social component of ESG matters; and |
| • oversees the administration of, and, as appropriate, the enforcement of the Company’s Compensation Recoupment Policy and any recoupment-related activity. |
A copy of the Compensation and People Committee’s charter is available on our website at http://uct.com/investors/corporate-governance/. The Compensation and People Committee’s process for deliberations on executive compensation is described below under “Compensation Discussion and Analysis.” Information on or accessible through our website is not incorporated by reference in this Proxy Statement.
As part of our oversight of our executive compensation program and in conjunction with the Compensation and People Committee, we consider the impact of our executive compensation program and the incentives created by different elements of the executive compensation program on our risk profile. In addition, we review all of our compensation policies and procedures, including the incentives that they create and factors that affect the likelihood of excessive risk-taking, to determine whether they present a significant risk to the Company. Based on this review, we have concluded that our compensation policies and procedures are not reasonably likely to have a material adverse effect on the Company.
| 20 |
Our executive succession planning process is a thoughtfully designed, long-term approach overseen by the Compensation and People Committee and the Board. At least annually, the Compensation and People Committee, the Board and the management team of the Company, devote a significant amount of time reviewing talent management activities, including succession plans and internal talent pool development. This includes long-term planning for executive development to ensure leadership sustainability, diversity, continuity and positive outcomes for the Company.
The current members of the Compensation and People Committee are Thomas T. Edman (chair), David T. ibnAle, Emily M. Liggett and Jacqueline A. Seto. Our Board of Directors has determined each member of the committee is independent as defined under Nasdaq and SEC rules. The Compensation and People Committee met seven times in 2023.
| NOMINATING, ENVIRONMENTAL, SOCIAL AND CORPORATE GOVERNANCE COMMITTEE |
| Among other matters, our Nominating, Environmental, Social and Corporate Governance Committee: |
| • reviews and evaluates the size, composition, function and duties of the Board consistent with its needs; |
| • establishes criteria for the selection of candidates to the Board and its committees, and identifies individuals qualified to become Board members consistent with such criteria, including the consideration of nominees submitted by shareholders; |
| • recommends to the Board director nominees for election at our annual or special meetings of stockholders at which directors are to be elected or to fill any vacancies or newly created directorships that may occur between such meetings; |
| • recommends directors for appointment to committees of the Board; |
| • makes recommendations to the Board as to determinations of director independence; |
| • leads the process and assists the Board in evaluating its performance and the performance of its committees; |
| • periodically reviews our corporate governance guidelines and code of business conduct and ethics, and oversees compliance with our corporate governance guidelines; and |
| • oversees ESG matters focused on the environmental and governance components. |
A copy of the Nominating, Environmental, Social and Corporate Governance Committee’s charter is available on our website at http://uct.com/investors/corporate-governance/. Information on or accessible through our website is not incorporated by reference in this Proxy Statement.
The current members of the Nominating, Environmental, Social and Corporate Governance Committee are Jacqueline Seto (chair), Emily M. Liggett, Barbara V. Scherer, and Ernest E. Maddock. Our Board of Directors has determined that each member of the Nominating, Environmental, Social and Corporate Governance Committee is independent as defined under Nasdaq. The Nominating, Environmental, Social and Corporate Governance Committee met four times in 2023.
Director Qualifications. The Nominating, Environmental, Social and Corporate Governance Committee of the Board operates pursuant to a written charter and establishes membership criteria for the Board and each committee of the Board and recommends to the Board individuals for membership on the Board and its committees. There is no fixed set of qualifications that must be satisfied before a candidate will be considered. Rather, candidates for director nominees are reviewed in the context of the current composition of our Board of Directors, our operating requirements and the interests of our stockholders. In conducting its assessment, the committee considers issues of judgment, diversity, age, skills, background, experience and such other factors as it deems appropriate given the needs of the Company and our Board of Directors. Although we do not have a formal policy with regard to the consideration of diversity, when identifying and selecting director nominees, the Nominating, Environmental, Social and Corporate Governance Committee also considers the impact a nominee would have in terms of increasing the diversity of our Board of Directors with respect to professional experience, skills, backgrounds, viewpoints and areas of expertise. The Nominating, Environmental, Social and Corporate Governance Committee also considers the independence, financial literacy and financial expertise standards required by our committee charters and applicable laws, rules and regulations, and the ability of the candidate to devote the time and attention necessary to serve as a director and a committee member.
Identifying and Evaluating Nominees for Director. In the event that vacancies are anticipated or otherwise arise, the Nominating, Environmental, Social and Corporate Governance Committee considers various potential candidates for director. Candidates may come to the attention of the Nominating, Environmental, Social and Corporate Governance Committee through current directors, professional search firms, stockholders or other persons. Candidates are evaluated at regular or special meetings of the Nominating, Environmental, Social and Corporate Governance Committee (or our independent directors) and may be considered at any point during the year.
| 21 |
Stockholder Nominees. Candidates for director recommended by stockholders will be considered by the Nominating, Environmental, Social and Corporate Governance Committee. Such recommendations should include the candidate’s name, home and business contact information, detailed biographical data, relevant qualifications for membership on our Board of Directors, information regarding any relationships between the candidate and our Company within the last three years and a written indication by the recommended candidate of the candidate’s willingness to serve on our Board of Directors. Stockholder recommendations, with such accompanying information, should be sent to the attention of the Chair of the Nominating, Environmental, Social and Corporate Governance Committee at the address listed under “Information Concerning Solicitation and Voting — Contacting Ultra Clean.”
Stockholders also may nominate directors for election at our annual meeting of stockholders by following the provisions set forth in our Amended and Restated Bylaws. The deadline and procedures for stockholder nominations are disclosed elsewhere in this proxy statement under the caption “Information Concerning Solicitation and Voting— Deadline for Receipt of Stockholder Proposals.”
The Compensation and People Committee reviews and determines the compensation for our non-employee directors with the assistance from our independent compensation consultant, Semler Brossy Consulting Group, LLC (“Semler Brossy”). Since the election of our directors at the 2023 Annual Meeting of Stockholders, our non-employee directors earn the following twelve-months retainers for service on our Board of Directors and its standing committees:
| • | a $60,000 twelve-months cash retainer for service as a member of our Board of Directors |
| • | an additional $70,000 twelve-months cash fee for serving as independent chair of our Board of Directors |
| • | the following additional twelve-months cash retainers for service on the standing committees of our Board of Directors: |
| • | Audit Committee – $12,500 (or $25,000 for the chair) |
| • | Compensation and People Committee – $10,000 (or $20,000 for the chair) |
| • | Nominating, Environmental, Social and Corporate Governance Committee – 10,000 (or $20,000 for the chair). |
No fee is paid for attendance at any Board of Directors or committee meeting. Cash retainers for Board and committee service are paid quarterly.
Annual Stock Awards. On an annual basis, each non-employee director is eligible to receive an annual award of restricted stock. On the date of our 2023 annual meeting of stockholders, each of our non-employee directors at such time was granted a restricted stock award with a value of approximately $160,000 (equating to 5,296 shares of our common stock based on the 60 trading days average price of our common stock preceding the grant date) that fully vests on the earlier of (i) the day before the 2024 Annual Meeting of Stockholders and (ii) May 17, 2024.
Initial Stock Awards. Upon joining the Board (other than at an annual meeting), each non-employee director is eligible to receive an initial award of restricted stock, in an amount equal to the value of the annual non-employee director award for such year, pro-rated based on the length of services provided from appointment to the Board until the following annual stockholder meeting. The restricted stock will become fully vested on the date of the annual stockholder meeting following such award.
| 22 |
The following table sets forth compensation for our non-employee directors for fiscal 2023. Our only employee director during fiscal 2023, Mr. Scholhamer, does not receive separate compensation for service as a director. Information on Mr. Scholhamer’s compensation for fiscal 2023 is disclosed in the Summary Compensation Table below.
| NAME | | | FEES EARNED OR PAID IN CASH(3) ($) | | | STOCK AWARDS(1)(2) ($) | | | TOTAL ($) |
| Thomas T. Edman | | | 91,993 | | | 150,195 | | | 242,188 |
| Clarence L. Granger | | | 118,955 | | | 150,195 | | | 269,150 |
| David T. ibnAle | | | 82,048 | | | 150,195 | | | 232,243 |
| Emily M. Liggett | | | 83,699 | | | 150,195 | | | 233,894 |
| Ernest E. Maddock | | | 94,479 | | | 150,195 | | | 244,674 |
| Jacqueline A. Seto | | | 85,370 | | | 150,195 | | | 235,565 |
| Barbara V. Scherer | | | 82,048 | | | 150,195 | | | 232,243 |
| (1) | The amounts shown are the grant date fair values for restricted stock awards granted in fiscal year 2023 computed in accordance with FASB ASC Topic 718 based on the closing price of our common stock on the day preceding the grant date. Pursuant to SEC rules, the amounts shown exclude the impact of estimated forfeitures related to service-based vesting conditions. |
| (2) | Messrs. Edman, Granger, ibnAle and Maddock and Mses. Liggett, Scherer and Seto each held an outstanding restricted stock award with respect to 5,296 shares of our common stock as of December 29, 2023. |
Related Person Transaction Policy. Our written Related Person Transaction Policy requires our Board of Directors or the Nominating, Environmental, Social and Corporate Governance Committee to review and approve all related person transactions. Our directors and officers are required to promptly notify our Chief Compliance Officer (currently our General Counsel) of any transaction which potentially involves a related person. Our Board of Directors or the Nominating, Environmental, Social and Corporate Governance Committee then considers all relevant facts and circumstances, including without limitation the commercial reasonableness of the terms of the transaction, the benefit and perceived benefit, or lack thereof, to the Company, opportunity costs of alternate transactions, the materiality and character of the related person’s direct or indirect interest, and the actual or apparent conflict of interest of the related person. Our Board of Directors or the Nominating, Environmental, Social and Corporate Governance Committee will not approve or ratify a related person transaction unless it has determined that, upon consideration of all relevant information, the transaction is in, or not inconsistent with, the best interests of the Company and its stockholders.
In fiscal 2023, we have not entered into any transactions, nor are there any currently proposed transactions, between us and a related party where the amount involved exceeds, or would exceed, $120,000, and in which any related person had or will have a direct or indirect material interest.
| 23 |
The Audit Committee has appointed PricewaterhouseCoopers LLP (“PwC”) to serve as our independent registered public accounting firm for fiscal 2024. We are asking you to ratify this appointment. Ratification of the appointment of PwC as our independent registered public accounting firm for fiscal 2024 requires the affirmative vote of the holders of a majority of our common stock present in person or represented by proxy at the annual meeting and entitled to vote thereon. Abstentions will have the same effect as negative votes for this proposal. Although ratification is not required for us to retain PwC, in the event of a majority vote against ratification, the Audit Committee may reconsider its selection. Even if the appointment is ratified, the Audit Committee may, in its discretion, direct the appointment of a different independent registered public accounting firm at any time during the year if the Audit Committee determines that such a change would be in the Company’s and its stockholders’ best interests.
Change in Registrant’s Certifying Accountant
During fiscal 2023, Moss Adams LLP (“Moss Adams”) served as our independent auditors. In the third fiscal quarter of 2023, the Audit Committee decided to engage in a competitive process to select the Company’s independent registered public accounting firm for the fiscal year ending December 27, 2024. The competitive selection process conducted by the Audit Committee involved multiple registered public accounting firms and Moss Adams, the Company’s then current independent registered public accounting firm. Moss Adams submitted a written proposal and participated in oral presentations to members of the Company’s management and Audit Committee during the fourth fiscal quarter of 2023. On March 6, 2024, Moss Adams informed the Audit Committee that it was resigning as our independent registered public accounting firm, and the Audit Committee approved the appointment of PwC to serve as the Company’s independent registered public accounting firm for the fiscal year ending December 27, 2024.
Moss Adams’ reports on our consolidated financial statements for each of the fiscal years ended December 29, 2023 and December 30, 2022 did not contain any adverse opinion or disclaimer of opinion, nor were they qualified or modified as to uncertainty, audit scope, or accounting principles.
During each of the fiscal years ended December 29, 2023 and December 30, 2022, and subsequent interim period through March 6, 2024, the effective date of Moss Adams’ resignation, (i) there were no disagreements (as that term is defined in Item 304(a)(1)(iv) of Regulation S-K and the related instructions) between the Company and Moss Adams of any matter of accounting principles or practices, financial statement disclosure, or auditing scope or procedures, which disagreements, if not resolved to the satisfaction of Moss Adams, would have caused Moss Adams to make reference to the subject matter of the disagreement in its reports on the Company’s financial statements for such years, and (ii) there were no “reportable events” (as that term is defined in Item 304(a)(1)(v) of Regulation S-K), except that the Company identified material weaknesses in its internal control over financial reporting during each such period.
The material weaknesses for the fiscal year ended December 30, 2022, related to information technology general controls (“ITGCs”) within the Company’s primary enterprise resource planning (“ERP”) system, its primary revenue system for the Services segment, and related ERP access controls affecting the independent review of manual journal entry postings. Business process controls dependent on the affected information systems, or that were dependent on data or financial reports generated from the affected information systems to be accurate and complete, could have been adversely affected. As disclosed in the Company’s Annual Report on Form 10-K for the fiscal year ended December 29, 2023, the Company completed the actions and measures designed to remediate the control deficiencies that had led to these material weaknesses and determined that, as of December 29, 2023, these control activities have been appropriately designed and implemented, and have operated effectively for a sufficient period of time to conclude that these previously identified material weaknesses had been remediated.
The material weaknesses for the fiscal year ended December 29, 2023, related to deficiencies in the control environment, risk assessment, control activities, and monitoring activities components of the Internal Control – Integrated Framework (2013) issued by the Committee of Sponsoring Organizations of the Treadway Commission concerning: (i) sufficiency of processes related to identifying and analyzing risks to the achievement of objectives across the entity, (ii) sufficiency of competent personnel to analyze risk and develop internal control activities to support the achievement of the Company’s internal control objectives; and (iii) performing control activities in accordance with established policies in a timely manner. These material weaknesses contributed to the following additional material weaknesses: (a) The Company did not design and maintain effective ITGCs for certain information systems that are relevant to the preparation of its consolidated financial statements related to certain Fluid Solutions operating subsidiaries in its Products segment which have not been migrated to its primary ERP systems; (b) The Company did not design and maintain effective application controls over certain information technology systems or business process
| 24 |
controls that are relevant to the preparation of its consolidated financial statements for certain of its international operating subsidiaries in the Products segment which have not been migrated to its primary ERP system. The business process controls were deemed ineffective because they could have allowed for certain personnel to have incompatible duties allowing for the creation, review, and processing of certain transactions without independent review and authorization which affects substantially all financial statement account balances and disclosures within such subsidiaries; (c) The Company did not design and maintain effective controls to determine the valuation of inventories, including the write down of inventory to its estimated market value less costs to sell and the validation and approval of inventory costing; (d) The Company did not design effective controls necessary to validate the accuracy of certain data used within the operation of controls which affects substantially all financial statement account balances and disclosures; and (e) The Company did not design and maintain effective controls related to the review of cash flow forecasts used in the valuation of certain assets and liabilities acquired in a business combination. These material weaknesses were identified and initially reported in the Company’s Annual report on Form 10-K for the fiscal year ended December 29, 2023, and have not been remediated as of the date of this proxy statement.
The Audit Committee discussed the reportable events described above with Moss Adams and the Company has authorized Moss Adams to respond fully to the inquiries of PwC, the Company’s successor independent registered public accounting firm, concerning these reportable events.
We previously provided Moss Adams with a copy of the disclosures regarding this change in independent registered public accounting firm reproduced in this proxy statement and we received a letter from Moss Adams addressed to the SEC stating that they agree with the above statements. A copy of this letter was filed as an exhibit to our Current Report on Form 8-K filed with the SEC on March 8, 2024.
No representative of Moss Adams is expected to be present at the annual meeting of stockholders.
Appointment of Independent Registered Public Accounting Firm PwC
On March 6, 2024, we appointed PwC as the company’s independent registered public accounting firm to perform independent audit services beginning with fiscal year 2024. Through March 6, 2024, neither the company, nor anyone on its behalf, consulted PwC regarding either (i) the application of accounting principles to a specified transaction, either completed or proposed, or the type of audit opinion that might be rendered with respect to our consolidated financial statements, in any case where a written report or oral advice was provided to the company by PwC that PwC concluded was an important factor considered by the company in reaching a decision as to any accounting, auditing or financial reporting issue; or (ii) any matter that was the subject of a disagreement (as that term is defined in Item 304(a)(1)(iv) of Regulation S-K and the related instructions) or a “reportable event” (as that term is defined in Item 304(a)(1)(v) of Regulation S-K).
A representative of PwC is expected to be present at the annual meeting of stockholders, will have the opportunity to make a statement if he/she desires to do so and is expected to be available to respond to appropriate questions.
| 25 |
Set forth below are the aggregate audit fees incurred for the professional services provided by Moss Adams and its affiliates in fiscal 2023 and fiscal 2022.
| | | FISCAL YEAR ENDED | ||||
| | | DECEMBER 29, 2023 | | | DECEMBER 30, 2022 | |
| Audit fees | | | $4,375,950 | | | $4,885,008 |
| Audit related fees | | | $188,000 | | | $96,500 |
| Total | | | $4,563,950 | | | $4,981,508 |
Audit fees consist of fees billed, or to be billed, for services rendered to us and our subsidiaries for the audit of our annual financial statements and internal control over financial reporting, reviews of our quarterly financial statements included in our quarterly reports on Form 10-Q and audit services provided in connection with other statutory and regulatory filings. Audit related fees for 2023 and 2022 consisted of fees billed for services rendered to us for employee benefit plans and certain due diligence projects.
The Audit Committee’s policy requires that the committee preapprove audit and non-audit services to be provided by our independent auditors before the auditors are engaged to render services. The Audit Committee may delegate its authority to pre-approve services to one or more Audit Committee members; provided that such designees present any such approvals to the full Audit Committee at the next Audit Committee meeting.
All services described above were pre-approved in accordance with the Audit Committee’s pre-approval policies.
| | | Our Board of Directors recommends that you vote “FOR” ratification of the appointment of PricewaterhouseCoopers LLP as our independent registered public accounting firm for fiscal 2024. |
| 26 |
Notwithstanding any statement to the contrary in any of our previous or future filings with the Securities and Exchange Commission, this report of the Audit Committee of our Board of Directors shall not be deemed “filed” with the Securities and Exchange Commission or “soliciting material” under the Securities Exchange Act of 1934, as amended, and shall not be incorporated by reference into any such filings.
The Audit Committee represents and assists the Board in fulfilling its responsibilities relating to the integrity of the Company’s financial statements. Areas of responsibility include evaluating audit performance and managing relations with our independent registered public accounting firm. The committee also monitors the activities and performance of the Company’s internal audit function, including scope of reviews, staffing levels, and reporting and follow-up procedures. As they pertain to the integrity of the Company’s financial statements, the Audit Committee also oversees policies and results with respect to risk assessment and risk management, including risks related to data protection and cybersecurity. In addition, the Audit Committee oversees the Company’s internal ethics and compliance program and receives quarterly reports from the Ethics and Compliance Officer. The key responsibilities of our Audit Committee are set forth in our Audit Committee’s charter, which is available on our website at http://uct.com/investors/corporate-governance/. This report relates to the activities undertaken by the Audit Committee in fulfilling such responsibilities.
The Audit Committee members are not professional auditors, and their functions are not intended to duplicate or to certify the activities of management and the independent registered public accounting firm. The Audit Committee oversees our financial reporting process on behalf of our Board of Directors. Our management has the primary responsibility for the financial statements and reporting process, including our systems of internal controls over financial reporting. In fulfilling its oversight responsibilities, the Audit Committee reviewed and discussed with management the audited financial statements included in the Annual Report on Form 10-K for the year ended December 29, 2023. This review included a discussion of the quality and the acceptability of our financial reporting and internal control over financial reporting, including the clarity of disclosures in the financial statements.
During the fiscal year ended December 29, 2023, the Audit Committee closely monitored the remediation plans for the two material weaknesses that were identified by management at the conclusion of the fiscal year ended December 30, 2022. At the conclusion of fiscal year ended December 29, 2023, these material weaknesses were remediated.
Over the course of fiscal year ended December 29, 2023, management concluded that additional material weaknesses were present. These material weaknesses are distinct from those identified at the conclusion of the fiscal year ended December 30, 2022 and remediated during the fiscal year ended December 29, 2023. To address these new material weaknesses identified at the conclusion of fiscal year ended December 29, 2023, management has developed a comprehensive plan, which includes the retention of a nationally recognized firm with deep expertise in these matters. The Audit Committee is closely monitoring and reviewing the progress against this plan.
The Audit Committee has discussed with the independent auditors the matters required to be discussed by the applicable requirements of the Public Company Accounting Oversight Board (“PCAOB”) and the Commission. The Audit Committee has received the written disclosures and the letter from the independent registered public accounting firm required by applicable requirements of the PCAOB regarding the independent accountant’s communications with the Audit Committee concerning independence. The Audit Committee discussed with the independent registered public accounting firm such auditors’ independence from management and Ultra Clean, including the matters in such written disclosures required by applicable requirements of the PCAOB regarding the independent accountant’s communications with the Audit Committee concerning independence.
The Audit Committee further discussed with our independent registered public accounting firm the overall scope and plans for their audits. The Audit Committee meets periodically with the independent registered public accounting firm, with and without management present, to discuss any significant matters regarding internal control over financial reporting that have come to their attention during the audit, and to discuss the overall quality of our financial reporting.
| 27 |
In reliance on the reviews and discussions referred to above, the Audit Committee recommended to our Board of Directors and our Board of Directors approved that the audited financial statements and disclosures under “Management’s Discussion and Analysis of Financial Condition and Results of Operations” be included in the Annual Report on Form 10-K for the year ended December 29, 2023, as filed with the Securities and Exchange Commission on March 6, 2024.
Members of the Audit Committee
Ernest E. Maddock, Chair
Barbara V. Scherer
Thomas T. Edman
David T. ibnAle
| 28 |
This proposal provides you with an opportunity to cast a non-binding, advisory vote approving the fiscal 2023 compensation of our named executive officers as disclosed pursuant to the compensation disclosure rules of the SEC in this proxy statement, including the “Compensation Discussion and Analysis,” the compensation tables and other narrative executive compensation disclosures. We expect to hold a non-binding advisory vote on executive compensation annually until our next non-binding advisory vote on the frequency of stockholder advisory votes on executive compensation, which is required no later than our 2029 Annual Meeting of Stockholders. Abstentions will have the same effect as negative votes for this proposal, and broker non-votes will have no effect on the outcome of this proposal.
As described in detail under the heading “Compensation Discussion and Analysis,” our executive compensation programs are designed to attract, motivate and retain our named executive officers, who are critical to our success. Under these programs, our named executive officers are rewarded for the achievement of specific short-term and long-term goals. We believe our 2023 executive compensation is appropriate. Please see the “Compensation Discussion and Analysis” beginning on page 30 for additional details about our executive compensation philosophy and programs, including information about the fiscal 2023 compensation of our named executive officers. This advisory vote is not intended to address any specific item of compensation, but rather the overall compensation principles and practices and the fiscal 2023 compensation of our named executive officers.
As an advisory vote, this proposal is not binding on us or our Board of Directors. The Compensation and People Committee and our Board of Directors value the opinions of the stockholders and will consider the outcome of the vote when making future compensation decisions.
| | | Our Board of Directors recommends that you vote “FOR” the approval of the non-binding advisory vote on compensation of our named executive officers for fiscal 2023 as disclosed pursuant to the compensation disclosure rules of the SEC, which disclosure includes the “Compensation Discussion and Analysis,” the compensation tables and other narrative executive compensation disclosures in this proxy statement. |
| 29 |
The Compensation Discussion and Analysis, or CD&A, describes and analyzes our executive compensation philosophy and program in the context of the paid during 2023, the last fiscal year, to our Chief Executive Officer, Chief Financial Officer, and each of our three next highest paid executive officers (collectively referred to as our named executive officers). Our named executive officers (“NEOs”) for fiscal 2023 were:
| NAME | | | AGE | | | POSITION |
| James P. Scholhamer | | | 57 | | | Chief Executive Officer & Director |
| Sheri L. Savage | | | 53 | | | Chief Financial Officer and Senior Vice President of Finance |
Vijayan S. Chinnasami(1) | | | 58 | | | Chief Operating Officer |
| Christopher S. Cook | | | 55 | | | President, Products Division |
| Jeffrey L. McKibben | | | 61 | | | Chief Information Officer |
| (1) | The Board approved termination of Mr. Chinnasami’s employment without cause, effective as of December 31, 2023. |
Fiscal 2023 Performance and Compensation Highlights
Despite the operational challenges associated with supply chain disruptions induced by excess inventory accumulated by our customers, we delivered strong financial and market performance and maintained the design of our incentive programs.
Performance Highlights:
| • | Achieved revenue of $1.7 billion in 2023, a decrease of 26.9% year-over-year. |
| • | Non-GAAP operating margin was 4.9% in 2023, compared to 11% in 2022. |
| • | Non-GAAP EPS was $0.56 in 2023, compared to $3.98 in 2022. As of December 29, 2023, UCT had $307 million in cash and cash equivalents. |
Compensation Highlights:
| • | Our annual cash incentive outcomes for FY2023 were paid based on revenue, operating results and execution against strategic objectives. On average, the NEOs received annual cash incentive outcomes of 99% of target. |
| • | We made increases to target cash compensation, primarily through base salary increases, for our non-CEO NEOs ranging from 2.2% to 10% to more closely align their incentive with market levels. To bring him closer to competitive market levels, we increased target cash compensation to 6.9% for our CEO through a base salary increase, while his target incentive remained flat at 110% of base salary. |
| • | Target total pay opportunities (defined as base salary plus target annual incentive plus target equity grant) for all non-CEO NEOs increased by a range of 1% to 4%(1), and increased for our CEO by 14.3%, to similarly account for being below the market midrange and seeking to achieve parity with internal and external peers. |
| • | We continued to rely on performance-based equity as part of our long-term incentive program with a 55% mix for our CEO, 50% mix for Chief Financial Officer, Chief Operating Officer and Chief Information Officer and 25% for other NEOs. Based on the pre-determined calculation criteria set forth in our long-term incentive program, our performance-based equity payout for the equity granted in 2021 vested at 30%. |
| (1) | Pay opportunities for Christopher S. Cook is not included here as fiscal 2023 was his first annual equity grant cycle. |
| 30 |
Governance and Executive Pay Policies and Practices
The Company is committed to responsible executive compensation and governance practices that support our business and talent strategies to compete in the semiconductor industry while also aligning with prevailing governance practices. The following list contains items that we believe are in the shareholder’s best interest and practices that we avoid due to the potential for a misalignment between pay and performance:
| WHAT WE DO | | | WHAT WE DO NOT DO |
✔ Conduct an annual compensation review | | | ✗ No excessive perquisites or benefits |
✔ Conduct an annual Say-on-Pay advisory vote | | | ✗ No excise tax gross-ups |
✔ Conduct an annual compensation risk assessment | | | ✗ No hedging or pledging of equity holdings |
✔ Utilize an independent compensation consultant | | | ✗ No stock option repricing |
✔ Balance performance metrics in incentive plans | | | ✗ No single-trigger change in control benefits |
✔ Deliver more than 50% of CEO equity in PSUs | | | |
✔ Utilize relative performance in PSUs | | | |
✔ Provide market competitive severance benefits | | | |
✔ Maintain stock ownership guidelines | | | |
✔ Ability to clawback incentive payments | | | |
✔ Incorporate an average of 75% of “at risk” compensation for executive officers | | |
Overview of Compensation Program and Philosophy
As a general principle, the Company seeks to tie executive compensation closely with the Company’s performance. When assessing our compensation programs, our Compensation and People Committee relies on three guiding principles:
| 1. | Attract, reward, and retain executive officers and other key employees to help drive our business forward. More specifically, we compete for key talent with other companies in the semiconductor sector, and the competition is high. Further, we are in regular talent competition with other technology companies outside of the semiconductor sector, which puts upward pressure on pay opportunities – particularly long-term, equity incentive values. |
| 2. | Motivate key employees to achieve goals using individual performance goals combined with a balanced scorecard approach at the corporate, business unit and operational levels that enhance stockholder value. These corporate goals track with our longer-term objective of profitable growth and market share gains. Our corporate goals also addressed the integration of newly acquired businesses, including the integration of key talent. |
| 3. | Promote pay for performance, internal compensation equity and external competitiveness. |
To meet these objectives, we have historically adopted the following long-term compensation policies:
| • | Pay compensation that is competitive with the practices of similarly situated electronics manufacturing services (EMS) companies and the practices of similar companies noted in industry surveys; and |
| • | Pay for performance by: |
| • | offering short-term cash incentive opportunities upon achievement of performance goals we consider challenging but achievable; and |
| • | providing significant, long-term equity incentive opportunities in order to retain those individuals with the leadership abilities necessary for increasing long-term stockholder value while aligning the interests of our executive officers with those of our stockholders. |
Our Compensation and People Committee considers these policies in determining the appropriate allocation of base salaries, annual cash incentive compensation, long-term equity-based compensation, and other benefits. Other considerations include our business objectives and environmental, fiduciary and corporate responsibilities (including internal compensation equity considerations and affordability), competitive practices and trends, regulatory requirements, and the mitigation of risks associated with these policies. Like most companies, we use a combination of fixed and variable compensation programs to reward and incentivize strong performance, as well as to align the interests
| 31 |
of our executive officers with those of our stockholders. In determining the particular elements of compensation that will be used to implement our overall compensation policies, the Compensation and People Committee takes into consideration a number of factors related to corporate and individual performance, as further described below, as well as competitive practices among our peer group.
Our Board of Directors and Compensation and People Committee have a long-standing practice of generally targeting compensation at or around the midrange of comparable companies for each element of our compensation program. The Compensation and People Committee believes that targeting overall, and each element of, compensation at or around the midrange of peer compensation will enable us to remain competitive in attracting and retaining qualified executive officers while avoiding paying amounts in excess of what we believe is necessary to attract and retain such executive officers. Our Compensation and People Committee also retains the discretion to target compensation for specific individuals based on a variety of additional factors, including Company and individual performance.
Process for Determining Executive Compensation
Each year, our Compensation and People Committee, together with our senior management team, establishes performance targets for short-term and long-term incentive plans that require the achievement of significant financial results. Each year, our Compensation and People Committee determines compensation by assessing prior year performance against these established financial targets, as well as other factors such as the compensation paid by comparable companies (which may include comparisons to companies in broad-based compensation surveys or, for fiscal 2023, our peer group), achievement of strategic objectives, improvements in market share and the professional development and potential of individual officers. Ultimately, the amount of compensation awarded to our executive officers is determined based on performance and what our Compensation and People Committee believes is in the best interests of our stockholders.
The Compensation and People Committee meets with our Chief Executive Officer and other executives, including our Chief Human Resources Officer, as necessary, to obtain recommendations with respect to Company compensation programs, practices, and packages. The Chief Executive Officer, in consultation with our Chief Human Resources Officer, makes recommendations to the Compensation and People Committee on executive performance, base salary, annual bonus targets and equity compensation for the executive team and other employees, other than himself. Our Chief Human Resources Officer also meets directly with the Compensation and People Committee (including outside the presence of our Chief Executive Officer) to assist the Compensation and People Committee in its decision-making process, including its analysis of broad-based data from third-party industry surveys and other data on executive compensation. Although the Compensation and People Committee considers management’s recommendations with respect to executive compensation, the Compensation and People Committee makes all final decisions on executive compensation matters.
Our Chief Executive Officer and Chief Human Resources Officer attend most of the Compensation and People Committee’s meetings, but the Compensation and People Committee also holds executive sessions not attended by any members of management or non-independent directors. The Compensation and People Committee deliberates and makes decisions with respect to performance and compensation without the Chief Executive Officer and the Company’s other executives present. The Compensation and People Committee has the ultimate authority to make decisions with respect to the compensation of our executive officers, but may, if it chooses, delegate some of its responsibilities to subcommittees. The Compensation and People Committee has not in the past delegated authority with respect to the compensation of executive officers.
The Compensation and People Committee initially engaged Semler Brossy as its outside compensation consultant in 2019 to provide an independent review of the Company’s executive compensation program, including an analysis of both the competitive market and the design of our compensation programs. Semler Brossy continued to provide advice and recommended a course of action for fiscal year 2023. More specifically, Semler Brossy advised the Compensation and People Committee on the designation of peer group companies, evaluated the final list of peer companies approved by the Compensation and People Committee and provided competitive compensation data and analysis relating to the compensation of our Chief Executive Officer and our other executive officers. Semler Brossy also furnished the Compensation and People Committee with reports on peer company practices relating to the following matters: short-term and long-term compensation program design; equity compensation; retention value of current equity holdings; target incentive opportunities; and compensation trends. In addition, Semler Brossy assisted the Compensation and People Committee with its CEO pay ratio analysis and provided our Compensation and People Committee assistance in developing our Compensation Discussion and Analysis in this proxy statement. Semler Brossy attended meetings of the Compensation and People Committee regarding executive compensation and communicated with the chair of the Compensation and People Committee outside of meetings. The consultant reported to the
| 32 |
Committee rather than to management, although the consultant met with management from time to time for purposes of gathering information on proposals that management made or may make to the Compensation and People Committee. The Compensation and People Committee has the authority to replace the compensation consultant or hire additional consultants at any time.
Semler Brossy provides analyses and recommendations that inform the Compensation and People Committee’s decisions, but it does not decide or approve any compensation decisions. Except for the Company’s subscription to certain broad-based compensation survey data, Semler Brossy has not provided any services to the Company other than to the Compensation and People Committee and receives compensation from the Company only for services provided to the Compensation and People Committee. Our Compensation and People Committee assessed the independence of Semler Brossy pursuant to SEC and Nasdaq rules and concluded that Semler Brossy is independent and that Semler Brossy’s work has not raised any conflict of interest.
Compensation Structure
The following are the primary elements of our executive compensation program:
| (i) | base salary; |
| (ii) | cash incentive opportunities; |
| (iii) | annual long-term equity incentive awards (both time-based and performance-based); and |
| (iv) | retirement and welfare benefit plans, including a deferred compensation plan, a 401(k) plan, limited executive perquisites and other benefit programs generally available to all employees. |
Pay Mix. We have selected the foregoing compensation elements because each is considered useful and/or necessary to meet one or more of the principal objectives of our compensation policy. For example, base salary and cash incentive target percentages are set with the goal of attracting employees and adequately compensating and rewarding them for their individual performance, level of responsibility, experience, and the Company’s annual financial results, while our equity compensation programs are geared toward providing long-term incentives and rewards for the achievement of long-term business objectives and retaining key talent. We believe that these elements of compensation, when combined, are effective, and will continue to be effective, in achieving the objectives of our compensation program. The charts below depict the allocation of fixed versus “at-risk” pay for the total target compensation for our NEOs in 2023:
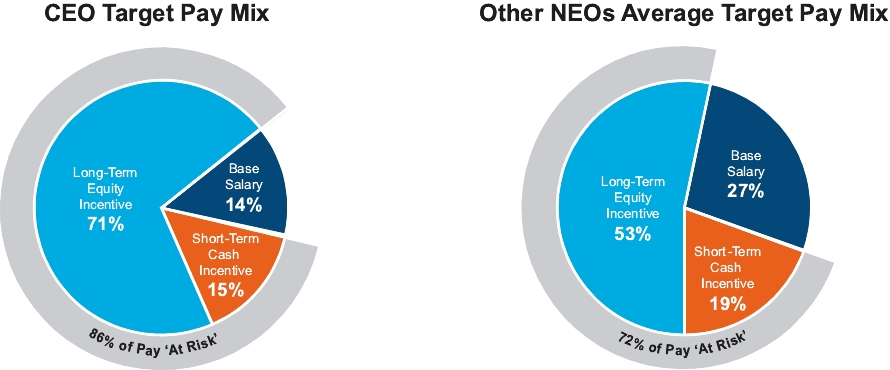
The Compensation and People Committee reviews base salary, cash incentive programs and long-term incentive programs on at least an annual basis. Other programs are reviewed from time to time to ensure that benefit levels remain competitive but are not included in the annual determination of an executive’s compensation package. In setting compensation levels for a particular executive, the Compensation and People Committee takes into consideration the proposed compensation package as a whole and each element individually, as well as the executive’s past and expected future contributions to our business.
Our Compensation and People Committee believes that the particular elements of compensation identified above produce a well-balanced mix of both fixed and at-risk compensation that collectively promote retention value and provide each executive officer with both short-term and long-term performance incentives. Base pay provides the executive officer with a measure of security as to the minimum level of compensation he or she will receive while the annual and long-term incentive components motivate the executive officer to focus on the business metrics that will maximize company performance over the long term. Our Compensation and People Committee believes that this approach will yield increases in stockholder value, provide an appropriate reward for our executive officers, and reduce the risk of loss of executive officers to competitors.
| 33 |
While each element of our compensation program is intended to motivate and encourage employees at all levels to drive performance and achieve superior results for our stockholders, each element is weighted differently for each of our NEOs based on the employee’s position and ability to impact our financial results. In general, the percentage of at-risk pay – or pay based on the performance of the executive against corporate or individual goals, or that is based on the performance of our trading price – increases with job responsibility. This balance is intended to offer an opportunity for gain in the event of successful performance, matched with the prospect of less compensation when performance falls short of established financial and/or stockholder return targets.
Compensation Levels and Market Competitiveness. Overall compensation targets for executive officers are determined based on one or more of the following factors: the individual’s duties and responsibilities within our global Company; the individual’s experience and expertise; the compensation levels for the individual’s peers within our Company; compensation levels for similar positions in our industry or in the technology industry more generally; performance of the individual and our Company as a whole; and the levels of compensation necessary to recruit new executive officers. For fiscal 2023, our Compensation and People Committee reviewed the compensation of our executive officers and compared it with both that of our 2023 peer group and broader, composite global market survey data from the Radford Global Technology Survey.
For purposes of fiscal 2023 compensation decisions, Semler Brossy advised the Compensation and People Committee in October 2022 (based on publicly available data at such time) on the designation of peer group companies, using the following criteria: companies in the semiconductor and semiconductor equipment sectors and electronic manufacturing services and electronic equipment and instruments industries, companies with comparable revenues for the trailing 12 months and market capitalization to ours, and other companies selected by shareholder advisory services, as well as other qualitative factors. For the 2023 peer group, the median revenue and market capitalization as of October 2022 was $1,465 million and $1,956 million, respectively, versus $2,342 million and $1,368 million, respectively, for the Company. To develop a competitive market composite for our NEOs, Semler Brossy weighted composite market survey data, derived from both peer survey and general technology industry survey data, equally with named peer proxy data.
This resulted in a peer group that included companies which, along with the broader survey data discussed above, were used for assessing our competitive market positioning in 2023 (collectively, the “Compensation Peer Group”) as set forth below:
• Advanced Energy Industries (AEIS) • Alpha & Omega Semiconductor (AOSL) • Benchmark Electronics (BHE) • Cohu (COHU) • Diodes (DIOD) • Fabrinet (FN) • FormFactor (FORM) • Ichor (ICHR) • Kimball Electronics (KE) • Kulicke and Soffa Industries (KLIC) | | | • Methode Electronics (MEI) • MKS Instruments (MKSI) • Onto Innovation (ONTO) • OSI Systems (OSIS) • Photronics (PLAB) • Plexus (PLXS) • Semtech (SMTC) • SMART Global Holdings (SGH) • Synaptics (SYNA) • TTM Technologies (TTMI) |
| - | Three companies were removed because they were acquired, downsized or outsized (CMC Materials, Azenta, Entegris) |
This Compensation Peer Group is not used for purposes of analyzing the Company’s stock price performance as compared to the Nasdaq Composite Index and the RDG Semiconductor Composite Index. For further information regarding the Company’s cumulative total and relative stockholder return, see our graph included in our Annual Report on Form 10-K for the year ended December 29, 2023.
As discussed above, our Compensation and People Committee has a long-term practice of targeting the compensation levels of our executive officers at or around the median of the compensation of comparable officers at comparable companies, as derived from peer group data and broader composite survey data. Our Compensation and People Committee may vary from this target range for various elements of compensation depending on the executive officer’s job performance, skill set, level of responsibility, prior compensation, and business conditions, or for other reasons. Any significant variations of our fiscal 2023 pay decisions as compared to long-term targeted levels are further discussed below.
2023 Say-on-Pay Results
At our 2023 Annual Meeting of Stockholders, the stockholders approved, with approximately 90% of the votes cast, our non-binding, advisory vote on our fiscal 2022 executive compensation program (“say-on-pay”). Executive compensation decisions for fiscal 2023 and other details are discussed below in this compensation discussion and analysis.
| 34 |
Based on the results of a separate non-binding advisory shareholder vote on the frequency of future shareholder advisory votes regarding the compensation program for our named executive officers held at our 2023 Annual Meeting of Stockholders, our Board determined that we will continue to hold our say-on-pay vote on an annual basis.
Cash Compensation
Base salaries and cash incentives are a significant portion of our executive compensation package. We believe this cash compensation helps us remain competitive in attracting and retaining executive talent. Cash incentives are also paid in order to motivate officers to achieve our business goals.
Base Salaries. Base salaries, and any increases or decreases to those levels for each executive officer, are reviewed and approved each year by our Compensation and People Committee. Such adjustments may be based on factors such as the overall performance of our Company, new roles and responsibilities assumed by the executive officer, the performance of the executive officer’s area of responsibility, the executive officer’s impact on strategic goals, the length of service with our Company, or revisions to or alignment with our long-term compensation philosophy. The Compensation and People Committee also takes into account the cyclical nature of our business (which results from the industries we serve (in particular the semiconductor industry) being highly cyclical, with recurring periods of over-supply of products), the state of our industry and the economy in general. However, there is no specific weighting applied to any one factor in setting the level of base salary, and the process ultimately relies on the subjective exercise of our Compensation and People Committee’s judgment. Although salaries were targeted at or around the midrange of our Compensation Peer Group for fiscal 2023, our Compensation and People Committee also took into account historical compensation, internal parity with other executives, potential as a key contributor, and special recruiting and retention situations. The 2023 base salaries for our NEOs shown in the table below were generally within targeted levels.
In February of 2023, our Compensation and People Committee approved base salary increases for our NEOs as set forth in the table below:
| | | BASE SALARY | |||||||
| NAME | | | 2023 | | | 2022 | | | Y/Y CHANGE |
| James P. Scholhamer | | | $775,000 | | | $725,000 | | | 6.9% |
| Sheri L. Savage | | | 550,000 | | | 500,000 | | | 10% |
Vijayan S. Chinnasami(1) | | | 600,000 | | | 580,000 | | | 3.4% |
| Christopher S. Cook | | | 500,000 | | | 480,000 | | | 4.2% |
| Jeffrey L. McKibben | | | 440,000 | | | 420,000 | | | 4.8% |
| (1) | The Board approved termination of Mr. Chinnasami’s employment without cause, effective 12/31/2023. |
In fiscal 2023, the Compensation and People Committee determined to increase the base salary of our Chief Executive Officer by 6.9% to $775,000, as part of the Compensation and People Committee’s long-term goal of more closely aligning our Chief Executive Officer’s base salary with the market and to recognize Mr. Scholhamer’s strong performance in the role of Chief Executive Officer and his significant contributions to our organization.
The Compensation and People Committee also determined to increase the base salaries of Ms. Savage by 10% to more closely align her base salary with market levels, consistent with the Compensation and People Committee’s long-term compensation philosophy.
Our base salary levels were also set after considering the significance of the roles of these executives in our overall management for fiscal 2023 and the Compensation and People Committee’s determination of the correlation of their responsibilities with our overall corporate operating performance. Overall, the Compensation and People Committee determined that the base salary levels/increases were consistent with the Company’s overall compensation objectives and were appropriate to retain our executives at a point in time at which the Company had achieved strong results in fiscal 2023.
Fiscal 2023 Cash Incentive Bonuses. On March 23, 2023, the Compensation and People Committee approved target incentive cash compensation for our executive officers for 2023 under our Management Bonus Plan (the “Management Bonus Plan”). The Company’s executive officers were eligible to participate in the Management Bonus Plan, which provided for the opportunity to earn quarterly and annual bonuses based on corporate and individual performance during the fiscal year. Bonuses under the Management Bonus Plan are based on each executive officer’s annual target cash incentive opportunity (established as a percentage of each executive officer’s base salary, referred to as the “Target Bonus”).
| 35 |
For each executive officer, 85% of the cash bonus opportunity under the Management Bonus Plan was evaluated based on multiples (ranging from 0 to 2) of the Target Bonus based on performance of the Company against corporate goals and objectives as approved by the Compensation and People Committee for the applicable measurement period, 55% of which was based on quarterly financial and operating performance and paid out quarterly, and 45% of which was based on annual corporate goals and objectives and paid out annually. In addition, for each executive officer, an additional 15% of their cash bonus opportunity under the Management Bonus Plan was evaluated based on a multiple (ranging from 0 to 1) of the Target Bonus related to their individual performance against annual individual goals and objectives as approved by the Compensation and People Committee and paid out annually. Under this Management Bonus Plan, bonuses based on corporate goals and objectives were limited to no more than twice the amount of 85% of the applicable executive officer’s Target Bonus, and bonuses based on individual goals and objectives were limited to no more than 15% of the applicable executive officer’s Target Bonus. The Compensation and People Committee may increase or decrease bonuses calculated under the Management Bonus Plan at its discretion based on corporate or individual performance.

Corporate goals and objectives under the Management Bonus Plan may include goals and objectives relating to operational performance (e.g., quality and delivery performance), growth, implementation of strategic programs, financial results as compared to the Company’s operating plan or other benchmarks, and human resource initiatives. Individual goals and objectives were tailored to each executive officer’s position and are designed to award performance based on the individual’s contribution to the Company’s growth, financial performance, structural organization and achievement of strategic initiatives.
Target Bonus opportunities under the Management Bonus Plan are reviewed and approved on an annual basis for each named executive officer and established based on each named executive officer’s role and level of responsibility within the organization. As discussed earlier, the Compensation and People Committee maintained the target incentive bonus opportunities for all NEOs. For fiscal 2023, the target bonus percentages as a percentage of base salary were consistent for each of our NEOs with fiscal 2022, as follows:
| | | TARGET BONUS AS A PERCENTAGE OF BASE SALARY | ||||
| Named Executive Officer | | | 2023 | | | 2022 |
| James P. Scholhamer | | | 110% | | | 110% |
| Sheri L. Savage | | | 85% | | | 85% |
Vijayan S. Chinnasami(1) | | | 85% | | | 85% |
Christopher S. Cook(1) | | | 60% | | | 60% |
| Jeffrey L. McKibben | | | 60% | | | 60% |
| (1) | The Board approved termination of Mr. Chinnasami’s employment without cause, effective December 31, 2023. |
Under the Management Bonus Plan, an executive’s total cash incentive compensation cannot exceed 200% of the applicable executive’s annual target cash incentive compensation over the applicable bonus period, without the approval of the Compensation and People Committee.
At the beginning of each year, the Compensation and People Committee reviews and establishes (a) quantitative corporate goals for the first half of the year and the full year and (b) a combination of quantitative and qualitative individual performance goals for the full year. Then, in July of each year, the Compensation and People Committee reviews and establishes quantitative corporate goals for the second half of the year for the relevant portion of the cash incentive compensation. The original first half and annual corporate goals remain unchanged. The Compensation and People Committee utilize this approach to find a reasonable balance between having an annual program but allowing for some flexibility to determine second half goals, in order to account for the current state of the business and the Company’s industry, including the changes in business outlook of the Company’s major customers.
| 36 |
The Compensation and People Committee believe that the goals are rigorous yet attainable to drive overall Company performance and remain appropriate throughout the year when the sector is experiencing heightened levels of volatility. At the end of each performance period, the Compensation and People Committee reviews the performance against the pre-determined threshold, target, and maximum goals.
For fiscal 2023, bonuses earned by our named executive officers under the Management Bonus Plan were as follows:
NAMED EXECUTIVE OFFICER(1) | | | 2023 CASH INCENTIVE BONUS | | | 2023 | | | 2023 | | | 2022 | |||||||||||||||
| | Q1 | | | Q2 | | | Q3 | | | Q4 | | | ANNUAL | | | TOTAL | | | TARGET(2) | | | ACHIEVEMENT | | | TOTAL | ||
| James P. Scholhamer | | | $70,538 | | | $50,841 | | | $99,478 | | | $110,508 | | | $456,720 | | | $788,084 | | | $825,000 | | | 96% | | | $925,479 |
| Sheri L. Savage | | | 37,591 | | | 27,094 | | | 53,139 | | | 60,601 | | | 245,390 | | | 423,814 | | | 446,250 | | | 95% | | | 485,484 |
Vijayan S Chinnasami(3) | | | 44,042 | | | 31,929 | | | 60,288 | | | 60,794 | | | 363,477 | | | 560,530 | | | 507,652 | | | 110% | | | 562,707 |
| Christopher S. Cook | | | 25,473 | | | 18,360 | | | 35,849 | | | 38,888 | | | 163,055 | | | 281,626 | | | 294,000 | | | 96% | | | 275,742 |
| Jeffrey L. McKibben | | | 22,289 | | | 16,065 | | | 31,382 | | | 34,222 | | | 139,675 | | | 243,633 | | | 258,000 | | | 94% | | | 288,893 |
| (1) | The Management Bonus Plan for 2023 included quarterly bonus opportunities based on Company financial and operational metrics, and a separate annual bonus opportunity based on additional annual Company financial and operational metrics and individual goals. |
| (2) | Target incentive cash compensation was calculated based on the Target Bonus as a Percentage of Base Salary table above and the executive officer’s base salary for 2023 as set forth in the Base Salary table above. |
| (3) | Vijayan S. Chinnasami’s termination was effective December 31, 2023. |
Quarterly achievement of corporate goals and objectives for our NEOs for 2023 was determined based on a corporate scorecard approved by the Compensation and People Committee at the time of the adoption of the Management Bonus Plan. These quarterly corporate goals and objectives were set based on key performance indicators for (i) quality and delivery performance as measured by customer scorecards, various internal quantitative quality and delivery metrics and qualitative assessments of customer satisfaction and (ii) financial performance, as measured by the Company’s actual revenue and free cash flow against the Company’s annual operating plan for 2023, which is updated for the second half of the year. Each of these goals was considered challenging but achievable at the time they were established.
Annual achievement of corporate goals and objectives for our NEOs for 2023 was also determined based on a corporate scorecard approved by the Compensation and People Committee at the time of the adoption of the Management Bonus Plan. These annual corporate goals and objectives were based on key performance indicators for (i) the achievement of operational performance goals, including continuous improvement in quality, delivery, safety and customer perception of UCT’s operational performance, (ii) growth, measured by the Product division’s revenue growth as compared to the overall market for wafer fab equipment growth, and Services division’s revenue growth from integrated device manufacturers as compared to the overall market for wafer start growth, (iii) the achievement of key strategic programs for the Company in 2023, including to grow strategic engagement and design win with customers’ technology, product and operational roadmap, (iv) the achievement of key human capital strategic goals, including employee engagement to improve productivity, engagement and retention, (v) compliance and audit, work cross functionally to structure a robust IT General Controls/Segregation of Duty structure that will be used in 2024 Financial/Controls Audit, and (vi) financial performance, measured by revenue, operating margin and free cash flow against the Company’s annual operating plan for 2023, capital expense control and payment terms management.
Annual achievement of individual goals and objectives for our NEOs for 2023 was determined based on an individual scorecard for each NEO approved by the Compensation and People Committee at the time of the adoption of the Management Bonus Plan. Each of these goals was considered challenging but achievable at the time they were established.
The Compensation and People Committee determined that the above goals and objectives for the 2023 Management Bonus Plan were appropriate to drive successful execution of specific, near-term strategic objectives for the Company, enhance accountability, and continue to emphasize the Company’s financial performance during the fiscal year in the achievement of annual cash incentive bonuses, while at the same time balancing near-term financial performance with strategic and operational objectives that would support the Company’s long-term growth and long- term strategies.
After each quarter of fiscal 2023, the Compensation and People Committee reviewed actual corporate performance against the quarterly corporate scorecards, and in February 2024, the Compensation and People Committee reviewed actual corporate performance for fiscal 2023 against the annual corporate scorecards. The Compensation and People Committee approved payouts under the Management Bonus Plan for each quarter in fiscal 2023 and for the annual 2023 period consistent with the Company’s scorecard achievement.
In February 2024, the Compensation and People Committee also reviewed each of our NEOs’ actual individual performance against the annual individual scorecards. Following this review, the Compensation and People Committee
| 37 |
determined to award our Chief Executive Officer an annual individual bonus equal to 15% (out of 15%) of his Target Bonus based on his achievement of goals. The Compensation and People Committee determined to award our Chief Financial Officer an additional annual individual bonus equal to 15% (out of 15%) of her Target Bonus based on her achievement of goals. The Compensation and People Committee also determined to award our other NEOs additional annual individual bonuses ranging from 13.5% to 15% (out of 15%) based on their achievement of individual goals.
Our Compensation and People Committee invests significant time determining the financial and non-financial targets for the Company’s Management Bonus Program. In general, management makes the initial recommendation for the financial and non-financial targets based upon the Company’s annual Board-approved operating plan and other strategic goals and objectives, as well as the bonus opportunity for each officer, and these recommendations are reviewed and discussed by the Compensation and People Committee and its advisors. The major factors used in setting one or more targets for a particular year are the results for the most recently completed year and the annual operating plan for the current year. Other factors considered may include general economic and market conditions. Overall, the Compensation and People Committee seeks to tie a significant proportion of cash compensation to performance, while factoring in the Company’s current and expected financial results given current and expected business conditions and the cyclical nature of the semiconductor equipment industry. The Compensation and People Committee also recognizes that the Management Bonus Plan provides increased cash payments to our executives if we achieve results above targets, providing our executives an opportunity to achieve higher cash compensation for performance above expectations. We intend for the performance goals to be challenging but achievable and to reflect strong corporate performance.
Quarterly bonuses under the Management Bonus Plan are calculated and paid on a quarterly basis, subject to the employee’s continued service with the Company through the applicable payment date, which the Company believes to have a positive effect on employee morale.
| 38 |
Equity Compensation
Our equity compensation program is intended to align the interests of our executive officers with those of our stockholders by creating a long-term incentive for our executive officers to maximize stockholder value. The equity compensation program also is designed to encourage our executive officers to remain employed with us in a very competitive labor market. The Compensation and People Committee regularly monitors the changes in the business environment in which we operate and periodically reviews changes to our equity compensation program to help us meet our goals, which include the achievement of long-term stockholder value.
Types of Equity Awards. In fiscal 2023, consistent with recent years, we granted our NEOs a combination of time- based and performance-based restricted stock units, or RSUs and PSUs.
Mix of Performance versus Time-based “Refresh” Grants. The mix of time-based and performance-based awards for grants made in April 2023 were generally consistent with 2022. In allocating equity awards between time-based and performance-based awards, the Compensation and People Committee considers each NEO’s level of responsibility, and the relationship between that NEO’s performance and our common share price. The Compensation and People Committee determined that 55% of the annual “refresh” equity awards that were granted to our Chief Executive Officer and 50% to our Chief Financial Officer, Chief Operating Officer and Chief Information Officer would consist of performance-based awards because their roles focus more on overall corporate performance than our other NEOs.
Performance-Based Equity Design. The annual PSU award program was designed to consider multiple performance metrics over a three-year performance period. The vesting criterion for the PSU awards at the end of the three-year period is the Company’s total GAAP revenue growth as compared to its peers, subject to modifications based on the Company’s relative TSR performance as compared to its peers and the Company’s operating EBITDA margin as compared to its operating plan. The overall program has a cap of 200% of target.
The Compensation and People Committee identified relative GAAP revenue growth as the primary metric for the new PSU design to focus attention on growing the business and driving behaviors to identify new avenues of growth, both organically and through strategic investments. Operating EBITDA margin remains a key priority for the business during a period of growth and relative TSR provides direct alignment with shareholders. The Compensation and People Committee selected the use of relative performance measurement for both revenue growth and TSR to ensure that Ultra Clean is gaining market share and outperforming peers and selected the use of absolute operating margin to provide better line of sight for the participating officers. The combination of the three metrics allows for a holistic review of overall company performance and focuses on overall top-line revenue growth while ensuring appropriate attention to operating margins and overall shareholder value.
For the relative revenue growth and relative TSR performance metrics, the Compensation and People Committee identified a separate group of performance peers that includes a wider range of companies, including non-US companies, exposed to similar dynamics within the semiconductor industry and also identified by several shareholders as key competitors. Semler Brossy conducted extensive back-testing to understand any correlation and directional alignment across these metrics when calibrating the peer group. The Compensation and People Committee removed one peer, CMC Materials, following their acquisition by Entegris in 2022, and did not make any additional adjustments. This resulted in a peer group that included the following companies (collectively, the “Performance Peer Group”) with companies also included in the Compensation Peer Group identified with an (*):
• Advanced Energy Industries (*) (AEIS) • Amkor (AMKR) • Applied Materials (AMAT) • ASM International (ASM) • ASML Holdings (ASML) • Axcelis Technologies (ACLS) • Azenta (AZTA) • Entegris (ENTG) • FormFactor (*) (FORM) • Ichor (*) (ICHR) | | | • KLA (KLAC) • Kulicke and Soffa Industries (*) (KLIC) • Lam Research (LRCX) • MKS Instruments (*) ((MKSI) • Nova Measuring Instruments (NVMI) • Onto Innovation (*) (ONTO) • PDF Solutions (PDFS) • Photronics (*) (PLAB) • Teradyne (TER) • Veeco Instruments (VECO) |
| 39 |
The relative revenue growth metric pays linearly out between 0% to 200% based on the Company’s relative performance compared to the Performance Peer Group from the three-year period starting January 1, 2023 through December 31, 2025 based on the following schedule:
| FY2023-FY2025 RELATIVE REVENUE POSITIONING | | | PAYOUT |
Below 30th %ile | | | 0% |
30th %ile | | | 50% |
50th %ile | | | 100% |
80th %ile or above | | | 200% |
The absolute operating margin modifier can be applied at -25%, 0%, or +25% based on the Company’s actual operating EBITDA margin performance compared to each annual operating plan within the three-year period. The performance for each year in the three-year period will be averaged to determine the final result based on the following schedule (results are not linearly interpolated):
FY2023-FY2025 AVERAGE OPERATING EBITDA MARGIN(1) | | | PAYOUT |
| More than +200 basis points improvement | | | +25% |
| Within -200 and 200 basis points improvement | | | 0% |
| More than -200 basis point improvement | | | -25% |
| (1) | See Appendix A for a reconciliation of GAAP to non-GAAP measures and for additional information about the non-GAAP measures we use in this proxy statement. |
The relative TSR modifier can be applied at -25%, 0%, or +25% based on the Company’s relative performance compared to the Performance Peer Group from the three-year period starting January 1, 2023 through December 31, 2025 based on the following schedule (results are not linearly interpolated):
FY2023-FY2025 RELATIVE TSR(1) RANK (INCLUDING ULTRA CLEAN) | | | PAYOUT |
| Top Third (e.g., Rank 1 through 7) | | | +25% |
| Middle Third (e.g., Rank 8 through 15) | | | 0% |
| Bottom Third (e.g., Rank 16 through 22) | | | -25% |
In April 2023, the Compensation and People Committee granted the following long-term equity awards to our named executive officers:
| NAME | | | TIME- BASED (# SHARES) | | | PERFORMANCE- BASED (# SHARES) | | | TOTAL (# SHARES) | | | VALUE OF TARGET ANNUAL EQUITY GRANT ($)(1) |
| James P. Scholhamer | | | 55,985 | | | 68,426 | | | 124,411 | | | $4,000,000 |
| Sheri L. Savage | | | 21,772 | | | 21,772 | | | 43,544 | | | 1,400,000 |
Vijayan S. Chinnasami(2) | | | 21,772 | | | 21,772 | | | 43,544 | | | 1,400,000 |
| Christopher S. Cook | | | 18,661 | | | 6,220 | | | 24,881 | | | 800,000 |
| Jeffrey L. McKibben | | | 10,886 | | | 10,886 | | | 21,772 | | | 700,000 |
| (1) | The number of RSUs awarded to each of our executive officers was determined using a target dollar value, with the number of RSUs and PSUs granted to achieve such target dollar value based on the average closing price of the Company’s common stock during the 60 business days prior to the grant date. The grant date for these awards was April 28, 2023, and the average closing price was $32.15. |
| (2) | Vijayan S. Chinnasami termination effective December 31, 2023. His performance-based equity granted in 2023 was cancelled. |
Size of FY2023 “Refresh.” The number of equity awards the Compensation and People Committee granted to each executive officer in 2023 was determined based on a variety of factors, including each individual executive’s job performance and his or her level of job responsibility. The Compensation and People Committee also considered the use of long-term equity awards as a means to retain and incentivize executives. The size of each equity award granted to a NEO in 2023 was determined based on target equity value rather than a target number of units. Accordingly, the number of equity awards granted was influenced by our stock price at the time the awards were granted.
The number and target value of the long-term equity granted to Mr. Scholhamer in fiscal 2023 was set at a target annual equity grant value of approximately $4 million. The $4 million annual grant represented an 18% increase for
| 40 |
Mr. Scholhamer compared to his $3.4 million fiscal 2022 equity grant, as part of the Compensation and People Committee’s long-term goal of more closely aligning our Chief Executive Officer’s equity awards with market levels, and also to recognize Mr. Scholhamer’s sustained strong performance and significant contributions to our organization. The Compensation and People Committee also considered its long-term goal of setting grants at a level consistent with the midrange provided to comparable officers by members of our peer group in determining grants for our non-CEO NEOs for fiscal 2023 (and in the case of new hires, at levels competitive for such executives in the employment market), while at the same time considering the relative positions of each NEO within our global organization and past grant practices. The 2023 equity awards granted in April 2023 for our NEOs shown in the table above were all generally within targeted levels, as adjusted to maintain internal equity for NEOs with similar levels of responsibility within our Company.
The equity awards granted during fiscal 2023 to our NEOs are set forth in detail under “Grants of Plan-Based Awards” below.
Promotion and New Hire Grants. The Compensation and People Committee’s policy has been to make promotion grants on solely a time-based vesting schedule to enhance retention.
Grant Practices. We have implemented procedures to regularize our equity award grant process, by making new hire grants and annual executive grants on the same day each month. The Compensation and People Committee has not granted, nor does it intend in the future to grant, equity compensation awards to executives in anticipation of the release of material nonpublic information that is likely to result in changes to the price of our common stock, such as a significant positive or negative earnings announcement. Because our equity awards typically vest over multiple years, we believe recipients are motivated to see our stock price rise in the long-term rather than benefit from an immediate but short-term increase in the price of our stock following a grant.
2021 PSU Grants. On April 30th, 2021, the Compensation and People Committee granted a mix of RSUs and PSUs to the executive officers. The PSUs granted in 2021 vested in 2023 and resulted in the issuance of shares to executive officers. Based on the relative revenue performance detailed above, these PSUs were achieved at 55%. The Committee then applied the -25% modifier based on relative TSR company performance and did not have any modifier applied due to the performance on Operating Margin vs. plan. The combination of those calculations resulted in a 30% achievement. For purposes of the payout calculation, companies that were either acquired, taken private, or have gone bankrupt were positioned at the bottom of the group on both relative revenue and relative TSR performance.
Other Benefit Plans
Deferred Compensation. We maintain a non-qualified deferred compensation plan, which allows eligible employees, including executive officers and directors, to voluntarily defer receipt of a portion of his/her salary and all or a portion of a bonus payment until the date or dates elected by the participant, thereby allowing the participating employee to defer taxation on such amounts. This plan gives highly compensated employees the opportunity to defer more compensation than they would otherwise be permitted to defer under a tax-qualified retirement plan, such as our 401(k) plan. We believe that deferred compensation is a competitive practice to enable us to attract and retain top talent. We do not make matching or other employer contributions to the deferred compensation plan because we believe the deferral opportunity is enough of a benefit on its own.
Executive Perquisites. We offer limited perquisites to our executive officers. In addition to health care coverage that is generally available to our other employees, our executive officers are eligible for annual physical examinations more extensive than under the Company’s standard plans.
Other Benefits. We also offer a number of other benefits to the executive officers pursuant to benefit programs that provide for broad-based employee participation. For example, our retirement plan is a tax-qualified 401(k) plan, which is a broad-based employee plan. Under the 401(k) plan, all participating employees (including executive officers) are eligible to receive limited matching contributions that are subject to vesting over time.
The main objectives of our benefits programs are to give our employees access to quality healthcare, financial protection from unforeseen events, assistance in achieving retirement financial goals, enhanced health and productivity and to provide support for global workforce mobility, in full compliance with applicable legal requirements. These generally available benefits typically do not specifically factor into decisions regarding an individual executive’s total compensation or equity award package.
Post-Termination Arrangements
Our post-termination arrangements with our NEOs are described in this proxy statement below. We believe the severance benefits under these agreements or policies are reasonable in amount and provide protection to key executive officers who would be likely to receive similar benefits from our competitors. The Compensation and People Committee reviews the potential costs and triggering events of employment and severance agreements and policies before approving them and will continue to consider appropriate and reasonable measures to encourage retention.
| 41 |
Compensation Recovery, or “Clawback” Policy
Our executive officers covered by Section 16 of the Exchange Act are subject to the Company’s Compensation Recoupment Policy. The Compensation Recoupment Policy was adopted by the Board in compliance with Section 10D of the Exchange Act and Section 5608 of the Nasdaq Listing Rules and took effect on October 19, 2023. It enables us, in the event that a material restatement of financial results is required, to recover excess amount of incentive-based compensation issued to covered individuals during any of the 3 fiscal years immediately preceding the date of such restatement. A copy of the Compensation Recoupment Policy is attached as Exhibit 97.1 to our Annual Report on Form 10-K for the year ended December 29, 2023.
The Board of Directors has adopted stock ownership guidelines for our directors to more closely align the interests of our directors with those of our stockholders. The guidelines provide that each director should hold at least 3X annual cash compensation shares of our common stock, and that each director be allowed three years from the date such director joined our Board of Directors to accumulate such number of shares of our common stock. All of our Directors are currently in compliance with our stock ownership guidelines.
The Board of Directors has also adopted stock ownership guidelines for our Chief Executive Officer. The policy was amended in February 2020 to provide that our Chief Executive Officer should hold common stock with a value at least 3X his or her base salary, and that he or she be allowed three years from the date such person becomes our Chief Executive Officer to accumulate such number of shares of our common stock. The amendment to the policy was intended to bring it in line with more contemporary governance and peer practices. Our Chief Executive Officer is currently in compliance with our stock ownership guidelines.
In October 2023, the Board also adopted stock ownership guidelines for the rest of our Section 16 officers, providing that the remaining Section 16 officers should hold common stock with a value at least equal to his or her base salary, and that he or she be allowed three years from the date such person becomes a Section 16 officer to accumulate such number of shares of our common stock. Our Section 16 officers are currently in compliance with our stock ownership guidelines.
The Company’s Insider Trading Policy, which can be found on our website, provides that our securities shall not be made subject to hedge transactions or puts and calls. The Insider Trading Policy further prohibits any pledges of our securities by our directors and executive officers.
The Compensation and People Committee determined to engage Semler Brossy with respect to fiscal 2023 executive officer and non-employee director compensation matters. Semler Brossy was retained by our Compensation and People Committee to provide an independent review of the Company’s executive compensation programs, including an analysis of both the competitive market and the design of the programs for 2023. In addition, during 2023, Semler Brossy assisted the Compensation and People Committee with its CEO pay ratio analysis and provided our Compensation and People Committee assistance in developing our Compensation Discussion and Analysis in this proxy statement. Semler Brossy also furnished the Compensation and People Committee with reports on peer company practices relating to the following matters: short-term and long-term compensation program design; equity compensation; retention value of current equity holdings; target incentive opportunities; and compensation trends.
Accounting and Tax Considerations
In designing our executive compensation programs, the Compensation and People Committee generally considers the accounting and tax effects as well as direct costs. We recognize a charge to earnings for accounting purposes when equity awards are granted. The Compensation and People Committee considers the impact to dilution and overhang when making decisions pertaining to equity instruments.
We do not require executive compensation to be tax deductible for the Company, but instead balance the cost and benefits of tax deductibility to comply with our executive compensation goals. This includes consideration of Section 162(m) of the Internal Revenue Code, which generally limits our ability to deduct compensation paid to each “covered employee” (as defined in the Internal Revenue Code) to the extent such individual’s compensation exceeds $1 million in any one year.
| 42 |
The Compensation and People Committee of the Board of Directors of Ultra Clean Holdings, Inc. has reviewed and discussed the Compensation Discussion and Analysis, which appears in this proxy statement, with the management of Ultra Clean Holdings, Inc. Based on this review and discussion, the Compensation and People Committee recommended to the Board of Directors that the Compensation Discussion and Analysis be included in Ultra Clean Holdings, Inc.’s proxy statement.
Members of the Compensation and People Committee
Thomas T. Edman, Chair
David T. ibnAle
Emily M. Liggett
Jacqueline A. Seto
| 43 |
The following table shows compensation information for the three most recently completed fiscal years for our principal executive officer, our principal financial officer and our other three most highly compensated NEOs as of December 29, 2023:
| NAME AND POSITION | | | YEAR | | | SALARY ($) | | | BONUS ($) | | | STOCK AWARDS ($)(1) | | | NON-EQUITY INCENTIVE PLAN COMPENSATION ($)(2) | | | ALL OTHER COMPENSATION ($) | | | TOTAL ($) |
James P. Scholhamer Chief Executive Officer | | | 2023 | | | 736,538 | | | | | 3,507,146 | | | 788,084 | | | 11,996(3) | | | 5,043,765 | |
| | 2022 | | | 704,808 | | | | | 2,598,339 | | | 925,479 | | | 11,598 | | | 4,240,224 | |||
| | 2021 | | | 636,538 | | | | | 3,682,347 | | | 871,530 | | | 11,351 | | | 5,201,766 | |||
Sheri L. Savage Chief Financial Officer and Senior Vice President of Finance | | | 2023 | | | 511,539 | | | | | 1,227,505 | | | 423,814 | | | 10,366(4) | | | 2,173,224 | |
| | 2022 | | | 489,231 | | | | | 1,342,217 | | | 485,484 | | | 8,967 | | | 2,325,899 | |||
| | 2021 | | | 451,923 | | | | | 1,288,774 | | | 459,045 | | | 8,072 | | | 2,207,814 | |||
Vijayan S. Chinnasami(8) Chief Operating Officer | | | 2023 | | | 593,173 | | | | | 1,227,505(9) | | | 560,530 | | | 45,877(5) | | | 2,427,085 | |
| | 2022 | | | 573,511 | | | | | 1,342,217 | | | 562,707 | | | 44,563 | | | 2,522,998 | |||
| | 2021 | | | 532,404 | | | | | 1,288,774 | | | 549,333 | | | 44,444 | | | 2,414,955 | |||
Christopher S. Cook President, Products Division | | | 2023 | | | 484,615 | | | | | 701,395 | | | 281,626 | | | 2,075(6) | | | 1,469,712 | |
| | 2022 | | | 343,385 | | | 100,000 | | | 687,795 | | | 275,742 | | | 1,058 | | | 1,407,980 | ||
Jeffrey L. McKibben Chief Information Officer | | | 2023 | | | 424,615 | | | | | 613,753 | | | 243,633 | | | 8,363(7) | | | 1,290,364 | |
| | 2022 | | | 414,615 | | | | | 534,923 | | | 288,893 | | | 6,744 | | | 1,245,175 | |||
| | 2021 | | | 138,462 | | | | | 803,736 | | | 90,099 | | | 572 | | | 1,032,869 |
| (1) | Amounts shown do not reflect compensation received by the named executive officers. The amounts shown are the grant date fair value for stock awards granted in the applicable fiscal year, based on the 60 trading days average price of our common stock preceding the grant date. The other valuation assumptions and the methodology used to determine such amounts are set forth in Note 1 of the Notes to our Consolidated Financial Statements included in our Form 10-K for the year ended December 29, 2023. |
The value the NEOs will ultimately receive from their 2023 PSUs will depend on the performance requirements and the market price of Common Stock at the end of the three-year performance cycle. In fiscal year 2023, PSUs were granted to all NEOs except for Mr. Cook, who was appointed to his role subsequent to the annual equity grant process. The amounts reported were calculated in accordance with ASC 718 and reflect the grant date fair value at target (100%). The minimum number of PSUs that can be earned at the end of the three-year performance cycle is 0% and the maximum is 200%. The grant date fair value for the PSUs awarded to Mr. Scholhamer, Ms. Savage, Mr. Chinnasami, Mr. Cook and Mr. McKibben at the maximum payout of 200% is $3,857,858, $1,227,505, $1,227,505, $350,684, and $613,753, respectively.
The value the NEOs may receive from their RSUs will depend on whether the time-based vesting requirement is met and the market price of Common Stock on the vesting date. See Grants of Plan-Based Awards in Fiscal Year 2023 table for the number of RSUs granted in fiscal year 2023.
| (2) | Amounts consist of incentive bonuses earned in 2023. |
| (3) | This amount consists of (a) matching contribution of $9,900 under the 401(k) Plan and (b) $2,096 in disability, accident, and life insurance premiums. |
| (4) | This amount consists of (a) matching contribution of $8,269 under the 401(k) Plan and (b) $2,096 in disability, accident, and life insurance premiums. |
| (5) | This amount consists of auto allowance. |
| (6) | This amount consists of $2,075 in disability, accident, and life insurance premiums. |
| (7) | This amount consists of (a) matching contribution of $6,369 under the 401(k) Plan and (b) $1,993 in disability, accident, and life insurance premiums. |
| (8) | Vijayan S. Chinnasami was terminated without cause effective December 31, 2023; consistent with our severance policy, the performance-based equity granted in 2022 will vest at the end of its applicable performance period in accordance with our long-term incentive plan. |
| 44 |
The following table shows all plan-based awards granted to the named executive officers during fiscal 2023:
| NAME | | | GRANT DATE | | | COMPENSATION COMMITTEE COMPENSATION ACTION DATE | | | ESTIMATED FUTURE PAYOUTS UNDER NON-EQUITY INCENTIVE PLAN AWARDS(1) | | | ESTIMATED FUTURE PAYOUTS UNDER EQUITY INCENTIVE PLANS(2) | | | ALL OTHER STOCK AWARDS NUMBER OF STOCK OR UNITS (#)(3) | | | GRANT DATE FAIR VALUE OF STOCK AWARDS ($)(4) | |||||||||
| | TARGET ($) | | | MAXIMUM ($) | | | THRESHOLD (#) | | | TARGET (#) | | | MAXIMUM (#) | | |||||||||||||
James P. Scholhamer | | | | | | | 852,500 | | | 1,705,000 | | | — | | | — | | | — | | | — | | | — | ||
| | 4/28/2023 | | | 3/22/2023 | | | — | | | — | | | 17,107 | | | 68,426 | | | 136,852 | | | — | | | 1,928,929 | ||
| | 4/28/2023 | | | 3/22/2023 | | | — | | | — | | | — | | | — | | | — | | | 55,985 | | | 1,578,217 | ||
Sheri L Savage | | | | | | | 467,500 | | | 935,000 | | | — | | | — | | | — | | | — | | | — | ||
| | 4/28/2023 | | | 3/22/2023 | | | — | | | — | | | 5,443 | | | 21,772 | | | 43,544 | | | — | | | 613,753 | ||
| | 4/28/2023 | | | 3/22/2023 | | | — | | | — | | | — | | | — | | | — | | | 21,772 | | | 613,753 | ||
Vijayan S. Chinnasami(5) | | | | | | | 510,000 | | | 1,020,000 | | | — | | | — | | | — | | | — | | | — | ||
| | 4/28/2023 | | | 3/22/2023 | | | — | | | — | | | 5,443 | | | 21,772 | | | 43,544 | | | — | | | 613,753 | ||
| | 4/28/2023 | | | 3/22/2023 | | | — | | | — | | | — | | | — | | | — | | | 21,772 | | | 613,753 | ||
| Christopher S. Cook | | | | | | | 300,000 | | | 600,000 | | | — | | | — | | | — | | | — | | | — | ||
| | | 4/28/2023 | | | 3/22/2023 | | | — | | | — | | | 1,555 | | | 6,220 | | | 12,440 | | | — | | | 175,342 | |
| | | 4/28/2023 | | | 3/22/2023 | | | — | | | — | | | — | | | — | | | — | | | 18,661 | | | 526,054 | |
Jeffrey L. McKibben | | | | | | | 264,000 | | | 528,000 | | | — | | | — | | | — | | | — | | | — | ||
| | 4/28/2023 | | | 3/22/2023 | | | — | | | — | | | 2,722 | | | 10,886 | | | 21,772 | | | — | | | 306,876 | ||
| | 4/28/2023 | | | 3/22/2023 | | | — | | | — | | | — | | | — | | | — | | | 10,886 | | | 306,876 | ||
| (1) | Reflects target at 100% and maximum cash award amounts pursuant to the Management Bonus Plan for fiscal 2023. |
| (2) | Reflects performance-based restricted stock units. The amounts shown in the “Threshold”, “Target”, and “Maximum” columns reflect the payout opportunity associated with established levels of performance or achievement. |
| (3) | Represents time-based stock units issued under our stock incentive plan. |
| (4) | Under the terms of our stock incentive plan, fair market value is defined as the closing price on the day preceding the grant date. Our practice is for grants to be effective on the last Friday of the month in which the grant is approved. |
| (5) | Vijayan S. Chinnasami’s termination was effective December 31, 2023. |
| 45 |
The following table shows all outstanding equity awards held by the named executive officers as of December 29, 2023:
| | | STOCK AWARDS | | | EQUITY INCENTIVE PLAN AWARDS | |||||||
| NAME | | | RSU SHARES OR UNITS THAT HAVE NOT VESTED (#) | | | MARKET VALUE OF SHARES OR UNITS THAT HAVE NOT VESTED ($)(1) | | | NUMBER OF UNEARNED SHARES, UNITS OR OTHER RIGHTS THAT HAVE NOT VESTED (#) | | | MARKET VALUE OF UNEARNED SHARES, UNITS OR OTHER RIGHTS THAT HAVE NOT VESTED ($)(1) |
| James P. Scholhamer | | | 7,275(2) | | | 248,369 | | | 8,001(3) | | | 273,154 |
| | 24,231(4) | | | 827,246 | | | 22,212(5) | | | 758,301 | ||
| | 55,985(8) | | | 1,911,328 | | | 34,213(9) | | | 1,168,032 | ||
| Sheri L. Savage | | | 2,910(2) | | | 99,347 | | | 2,618(3) | | | 89,379 |
| | 4,106(6) | | | 140,179 | | | 8,315(5) | | | 283,857 | ||
| | 11,086(4) | | | 378,476 | | | 10,886(9) | | | 371,648 | ||
| | 21,772(8) | | | 743,296 | | | — | | | — | ||
Vijayan S. Chinnasami(10) | | | — | | | — | | | 2,618(3) | | | 89,379 |
| | — | | | — | | | 8,315(5) | | | 283,857 | ||
| Christopher S. Cook | | | 14,254(7) | | | 486,632 | | | 3,110(9) | | | 106,175 |
| | 18,661(8) | | | 637,087 | | | — | | | — | ||
| Jeffrey L. McKibben | | | 5,320(7) | | | 181,625 | | | 4,157(5) | | | 141,920 |
| | 707(7) | | | 24,137 | | | 5,443(9) | | | 185,824 | ||
| | 5,543(4) | | | 189,238 | | | — | | | — | ||
| | 10,886(8) | | | 371,648 | | | — | | | — | ||
| (1) | Based on the closing price of our common stock as of December 29, 2023 (our fiscal 2023 year-end), which was $34.14. |
| (2) | Remaining units vest on April 30, 2024. |
| (3) | Represents performance-based awards granted in fiscal 2021, vested at the end of the 3-year performance cycle at 30% on 3/29/2024. |
| (4) | 1/2 vest on April 29, 2024, and April 29, 2025, respectively. |
| (5) | Represents performance-based awards granted in fiscal 2022, assuming achievement of the threshold target performance criteria at the end of the 3-year performance cycle. |
| (6) | Represents one-time transitional RSU. 1/2 vest on April 29, 2024, and April 29, 2025, respectively. |
| (7) | New hire grants, 1/3 vest on vesting anniversary date. |
| (8) | 1/3 vest on April 30, 2024, April 30, 2025, and April 30, 2026, respectively. |
| (9) | Represents performance-based awards granted in fiscal 2023, assuming achievement of the threshold target performance criteria at the end of the 3-year performance cycle. |
| (10) | Vijayan S. Chinnasami’s termination was effective December 31, 2023. Consistent with our severance policy, the performance-based equity granted in 2022 will vest at the end of its applicable performance period in accordance with our long-term incentive plan. |
| 46 |
The following table shows all stock awards vested and value realized upon vesting, by the named executive officers during fiscal 2023, which ended on December 29, 2023:
| | | STOCK AWARDS | ||||
| NAME | | | NUMBER OF SHARES ACQUIRED ON VESTING (#) | | | VALUE REALIZED ON VESTING ($)(1) |
| James P. Scholhamer | | | 73,717 | | | 2,103,883 |
| Sheri L. Savage | | | 35,827 | | | 1,031,983 |
Vijayan S. Chinnasami(2) | | | 35,826 | | | 1,031,954 |
| Christopher S. Cook | | | 7,126 | | | 203,376 |
| Jeffrey L. McKibben | | | 8,797 | | | 290,237 |
| (1) | The value realized equals the fair market value of the Company’s common stock on the date of vesting multiplied by the number of stock awards vesting. |
| (2) | Vijayan S. Chinnasami termination was effective December 31, 2023. |
We maintain a nonqualified deferred compensation plan, the Ultra Clean Holdings, Inc. 2004 Executive Deferred Compensation Plan (the “EDCP”), which allows eligible employees, including executive officers, and directors to voluntarily defer receipt of a portion of his/her salary and all or a portion of a bonus payment until the date or dates elected by the participant, thereby allowing the participating employee to defer taxation on such amounts. Amounts credited to the EDCP consist only of cash compensation that has been earned and payment of which has been deferred by the participant. The amounts deferred under the EDCP are credited with realized gains on investments and interest at market rates on cash balances. We do not make matching or other employer contributions to the EDCP.
None of our named executive officers participated in the EDCP for fiscal 2023 and one of the named executive officers currently has an outstanding balance under the EDCP.
Change in Control Severance Agreement with James P. Scholhamer. We maintain a Change in Control Severance Agreement with James P. Scholhamer. If upon, or within 3 months prior to or 12 months following a change in control, Mr. Scholhamer is terminated without cause or he resigns for good reason, he is entitled to receive a lump sum payment equal to 200% of his then-current salary, plus 200% of average annual cash bonus as determined by us over the prior three years, payment or reimbursement of health benefit continuation coverage under COBRA for 24 months (or, if earlier, until he becomes eligible for group health coverage with another employer) and accelerated vesting of 100% of his unvested outstanding equity awards, in each case subject to his timely execution and non-revocation of a release of claims in favor of the Company.
Change in Control Severance Agreement with Sheri L. Savage. We maintain a Change in Control Severance Agreement with Sheri L. Savage. Such agreement provides that, if upon, or within 12 months following, a change in control, Ms. Savage is terminated without cause or she resigns for good reason, she is entitled to receive a lump sum payment equal to 150% of her then- current salary, plus 150% of average annual cash bonus as determined by us over the prior three years, payment or reimbursement of health benefit continuation coverage under COBRA for 24 months (or, if earlier, until she becomes eligible for group health coverage with another employer) and accelerated vesting of 100% of her unvested outstanding equity awards, in each case subject to her timely execution and non-revocation of a release of claims in favor of the Company.
Change in Control Severance Agreement with Other Named Executive Officers. The Compensation and People Committee’s practice is to enter a change in control severance agreement with each of its named executive officers. The Company’s change in control severance agreement provides that, with the exception of Chief Operating Officer, if upon, or within three months prior to or 12 months following, a change in control, such executive officer is terminated without cause or he or she resigns for good reason, he or she is entitled to receive a lump sum payment equal to 75% of his or her then-current salary, plus 75% of average annual cash bonus as determined by us over the prior three years, payment or reimbursement of health benefit continuation coverage under COBRA for 9 months (or, if earlier, until he or she becomes eligible for group health coverage with another employer) and accelerated vesting of 100% of his or her unvested outstanding equity awards, in each case subject to the applicable named executive officer’s timely execution and non-revocation of a release of claims in favor of the Company. For the Chief Operating Officer, the Company’s
| 47 |
change in control severance agreement provides that, if upon, or within 12 months following, a change in control, the Chief Operating Officer is terminated without cause or he resigns for good reason, he is entitled to receive 150% of his then-current salary, plus 150% of average annual cash bonus as determined by us over the prior three years, payment or reimbursement of health benefit continuation coverage under COBRA for 24 months (or, if earlier, until he becomes eligible for group health coverage with another employer) and accelerated vesting of 100% of his unvested outstanding equity awards, in each case subject to the Chief Operating Officer’s timely execution and non-revocation of a release of claims in favor of the Company.
“Good reason” is defined as (i) a reduction in the executive’s then existing annual salary by more than 10% other than in connection with an action affecting a majority of the executive officers of the Company, (ii) relocation of the principal place of the executive’s employment to a location more than 50 miles from the principal place of executive’s employment prior to the change in control or (iii) a material reduction in the executive’s authority, duties or responsibilities after the change in control. “Cause” exists if the executive officer: (A) is convicted of, or pleads guilty or no contest to, a criminal offense; (B) engages in any act of fraud or dishonesty; (C) breaches any agreement with the Company; (D) commits any material violation of a Company policy; or (E) fails, refuses or neglects to perform the services required of the executive in his or her position at the Company (subject in certain cases to a cure period).
The following table shows amounts that would have been paid if such named executive officers had been terminated on December 29, 2023 in connection with a change of control:
| NAME | | | SALARY ($) | | | CASH INCENTIVE ($) | | | HEALTH BENEFITS ($)(1) | | | VALUE OF ACCELERATED VESTING ($)(2) |
| James P. Scholhamer | | | $1,550,000 | | | $1,723,396 | | | $40,006 | | | $7,750,224 |
| Sheri L. Savage | | | 825,000 | | | 684,172 | | | 4,684 | | | 2,970,317 |
Vijayan S. Chinnasami(3) | | | — | | | — | | | — | | | — |
| Christopher S. Cook | | | 375,000 | | | 209,013 | | | 23,645 | | | 1,336,069 |
| Jeffrey L. McKibben | | | 330,000 | | | 199,697 | | | 35,005 | | | 1,422,136 |
| (1) | Estimated assuming that each executive enrolls in continued group health benefits. |
| (2) | Amounts based on our stock price as of December 29, 2023, less the option exercise price, in the case of options. |
| (3) | Vijayan S. Chinnasami termination effective December 31, 2023. Mr. Chinnasami was paid a severance amount consistent with our severance policy. |
Severance Policy for Executive Officers. Under our severance policy for executive officers of the Company, in the event that any of our named executive officers is terminated without “Cause” (as defined above), subject to the applicable executive’s timely execution and non-revocation of a release of claims in favor of the Company, the executive would be entitled to receive the following payments and benefits:
Chief Executive Officer. The CEO would receive 150% of the CEO’s then-current salary, plus 150% of the CEO’s average annual cash bonus and cash incentive compensation as determined by us over the prior three years, payment of health benefit continuation coverage under COBRA for 18 months (or, if earlier, until he becomes eligible for group health coverage with another employer) and immediate vesting of unvested outstanding equity awards that would vest within 18 months.
Chief Financial Officer and Chief Operating Officer. The CFO or COO would receive 100% of the executive’s then-current salary, 100% of the executive’s average annual cash bonus and cash incentive compensation as determined by us over the prior three years, payment of health benefit continuation coverage under COBRA for 12 months (or, if earlier, until he or she becomes eligible for group health coverage with another employer) and immediate vesting of unvested outstanding equity awards that would vest within 12 months.
Other NEOs. In the event that an executive officer other than those described in the foregoing, is terminated without cause and signs a release of claims, the executive would receive 75% of the executive’s then-current salary, 50% of the executive’s average annual cash bonus and cash incentive compensation as determined by us over the prior three years and payment of health benefit continuation coverage under COBRA for 9 months (or, if earlier, until he or she becomes eligible for group health coverage with another employer).
We may revise or terminate this policy at any time, except that following a change in control, the policy may not be terminated or amended to adversely affect a participant for 12 months following the change in control.
| 48 |
The following table shows amounts that would have been paid if the named executive officers had been terminated without cause on December 29, 2023:
| NAME | | | SALARY ($) | | | CASH INCENTIVE ($) | | | HEALTH BENEFITS ($)(1) | | | VALUE OF ACCELERATED VESTING ($)(2) |
| James P. Scholhamer | | | $1,162,500 | | | $1,292,547 | | | $30,004 | | | $4,777,040 |
| Sheri L. Savage | | | 550,000 | | | 456,114 | | | 2,342 | | | 904,437 |
Vijayan S. Chinnasami(3) | | | — | | | — | | | — | | | — |
| Christopher S. Cook | | | 375,000 | | | 139,342 | | | 23,645 | | | 455,667 |
| Jeffrey L. McKibben | | | 330,000 | | | 133,132 | | | 35,005 | | | 424,224 |
| (1) | Estimated assuming that each executive enrolls in continued group health benefits. |
| (2) | Amounts based on our stock price as of December 29, 2023, less the option exercise price, in the case of options. |
| (3) | Vijayan S. Chinnasami termination effective December 31, 2023. Mr. Chinnasami was paid a severance amount consistent with our severance policy. |
CEO Pay Ratio
As required by Section 953(b) of the Dodd-Frank Wall Street Reform and Consumer Protection Act and Item 402(u) of Regulation S-K, we are required to disclose the ratio of our median employee’s annual total compensation to the annual total compensation of our principal executive officer.
During fiscal 2023, the principal executive officer of Ultra Clean was our Chief Executive Officer, James P. Scholhamer. For fiscal 2023, the combined annual total compensation for Mr. Scholhamer was $5,043,765, and for our median employee was $40,731, resulting in an estimated pay ratio of approximately 124:1.
In accordance with the flexibility provided by Item 402(u) of Regulation S-K, we identified the median employee by calculating the aggregate amount of each employee’s 2023 base annual compensation (including overtime), bonus earned for 2023, and the value of commission or profit-sharing value received in 2023. We then ranked the compensation of our employees from lowest to highest and identified the median employee.
This calculation was performed for all employees of the Company as of December 29, 2023 (excluding our CEO), whether employed on a full-time or part-time basis. For ease of administration, we did not include the accounting value of equity awards granted.
Once we identified our median employee, we then calculated such employee’s annual total compensation for 2023 using the same methodology as that utilized for determining the annual total compensation of our NEOs in 2023 (as set forth in the 2023 Summary Compensation Table on page 44). Our CEO’s annual total compensation for 2023 for purposes of the Pay Ratio Rule is equal to the amount reported in the “Total” column in the 2023 Summary Compensation Table.
The pay ratio reported above is a reasonable estimate calculated in a manner consistent with SEC rules based on our internal records and the methodology described above. Because the SEC rules for identifying the median compensated employee and calculating the pay ratio based on that employee’s annual total compensation allow companies to adopt a variety of methodologies, to apply certain exclusions, and to make reasonable estimates and assumptions that reflect their employee populations and compensation practices, the pay ratio reported by other companies may not be comparable to the pay ratio reported above, as other companies have different employee populations and compensation practices and may utilize different methodologies, exclusions, estimates and assumptions in calculating their own pay ratios.
| 49 |
Pay Versus Performance
The following table sets forth additional compensation information of our Principal Executive Officer (PEO) and our other (non-PEO) NEOs along with total shareholder return, net income, and GAAP revenue growth performance results for our fiscal years 2020, 2021, 2022 and 2023.
Year(1) | | | Summary Comp Table Total for PEO(2) | | | Compensation Actually Paid to PEO(3)(4) | | | Average Summary Comp Table Total for non-PEO NEOs(2) | | | Average Compensation Actually Paid to non-PEO NEOs(3)(5) | | | Company’s Total Shareholder Return(6) | | | Peer Group Total Shareholder Return(6) | | | GAAP Net Income | | | GAAP Revenue Growth(7) |
| (a) | | | (b) | | | (c) | | | (d) | | | (e) | | | (f) | | | (g) | | | (h) | | | (i) |
| 2023 | | | $5,043,765 | | | $4,314,644 | | | $1,840,096 | | | $1,751,380 | | | $146 | | | $277 | | | ($31,300,000) | | | -27% |
| 2022 | | | $4,240,224 | | | ($505,754) | | | $1,875,513 | | | $597,671 | | | $142 | | | $123 | | | $40,400,000 | | | 13% |
| 2021 | | | $5,201,766 | | | $11,184,818 | | | $1,754,208 | | | $4,029,427 | | | $245 | | | $219 | | | $119,500,000 | | | 50% |
| 2020 | | | $3,417,579 | | | $5,684,347 | | | $1,571,782 | | | $2,441,747 | | | $135 | | | $145 | | | $77,600,000 | | | 31% |
| (1) | NEOs included in the above compensation columns reflect the following: |
| Year | | | PEO #1 | | | NON-PEO NEOs |
| 2023 | | | Mr. Scholhamer | | | Messrs. Chinnasami, Cook, and McKibben and Ms. Savage |
| 2022 | | | Mr. Scholhamer | | | Messrs. Chinnasami, Cook, and McKibben and Ms. Savage |
| 2021 | | | Mr. Scholhamer | | | Messrs. Chinnasami, Williams, and Bentick and Ms. Savage |
| 2020 | | | Mr. Scholhamer | | | Messrs. Chinnasami, Williams, and Bentick and Ms. Savage |
| (2) | Amounts reported in this column represent (i) the total compensation as reported in the Summary Compensation Table for the applicable year in the case of our PEO and (ii) the average of the total compensation as reported in the Summary Compensation Table for the Company’s other NEOs for the applicable year. |
| (3) | SEC rules require certain adjustments be made to the Summary Compensation Table totals to determine “compensation actually paid” as reported in the Pay versus Performance Table. “Compensation actually paid” does not necessarily represent cash and/or equity value transferred to the applicable NEO without restriction, but rather is a value calculated under applicable SEC rules. In general, “compensation actually paid” is calculated as Summary Compensation Table total compensation adjusted to include the fair market value of equity awards as of last day of the applicable fiscal year or, if earlier, the vesting date (rather than the grant date). |
| (4) | Compensation Actually Paid to our PEO reflects the following adjustments from total compensation reported in the Summary Compensation Table: |
| | | 2023 | |
| Total Reported in Summary Compensation Table (SCT) | | | $5,043,765 |
| Less, value of Stock Awards reported in SCT | | | ($3,507,146) |
| Plus, Year-End value of Awards Granted in Fiscal Year that are Unvested and Outstanding | | | $3,959,355 |
| Plus, Change in Fair Value of Prior Year awards that are Outstanding and Unvested | | | ($3,327,125) |
| Plus, FMV of Awards Granted this Year and that Vested this Year | | | $0 |
| Plus, Change in Fair Value (from prior year-end) of Prior Year awards that Vested this year | | | $2,145,795 |
| Less Prior Year Fair Value of Prior Year awards that Failed to vest this Year | | | $0 |
| Total Adjustments | | | ($729,121) |
| Actual Compensation Paid | | | $4,314,644 |
| 50 |
| (5) | The average Compensation Actually Paid to the non-PEO NEOs reflects the following adjustments from Total compensation reported in the Summary Compensation Table: |
| | | 2023 | |
| Total Reported in Summary Compensation Table (SCT) | | | $1,840,096 |
| Less, value of Stock Awards reported in SCT | | | ($942,540) |
| Plus, Year-End value of Awards Granted in Fiscal Year that are Unvested and Outstanding | | | $1,077,483 |
| Plus, Change in Fair Value of Prior Year awards that are Outstanding and Unvested | | | ($861,772) |
| Plus, FMV of Awards Granted this Year and that Vested this Year | | | $0 |
| Plus, Change in Fair Value (from prior year-end) of Prior Year awards that Vested this year | | | $638,113 |
| Less Prior Year Fair Value of Prior Year awards that Failed to vest this Year | | | $0 |
| Total Adjustments | | | ($88,716) |
| Actual Compensation Paid | | | $1,751,380 |
| (6) | Peer group TSR reflects the RDG Semiconductor Composite Index performance as reflected in our Annual Report on Form 10-K for the fiscal year ended December 29, 2023 pursuant to Item 201(e) of Regulation S-K. For the Company and peer group TSR, each year reflects what the cumulative value of $100 would be, including reinvestment of dividends, if such amount were invested on December 28, 2019. |
| (7) | GAAP Revenue Growth is used as the Company selected metric and it is part of our annual incentive program and the primary component of our PSUs which measures relative revenue growth against a select group of performance peers. |
As highlighted in our CD&A, one of our primary principles of our compensation program is to ensure that there is a substantial portion of compensation of executive officer pay that is at-risk and is highly dependent on the Company’s short-term and long-term financial, operation, and stock price performance.
For our executives, over 40% of their opportunity is tied to long-term equity incentives which will depend on our revenue growth and share price performance while roughly 20% of our executive pay is tied to annual financial and operational performance. We expect a stronger correlation to stock price performance and revenue growth through the combination of (a) having a significant portion of our pay tied to long-term incentives and (b) using PSUs linked to revenue growth and relative TSR as part of our annual long-term incentive mix. This relationship is highlighted in more detail in the next section.
Relationship Between the Company’s Pay and Performance:
Below are graphs showing the relationship of “compensation actually paid” (CAP) to our Chief Executive Officer and other named executive officers in 2020, 2021, 2022, and 2023 to (1) TSR of both the Company and the RDG Semiconductor Composite Index, (2) the Company’s net income and (3) the Company’s GAAP revenue growth.
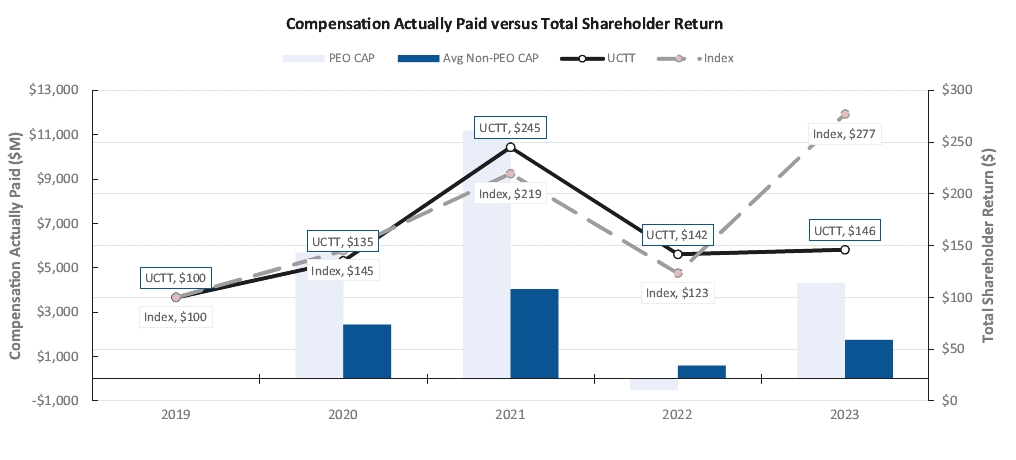
| 51 |
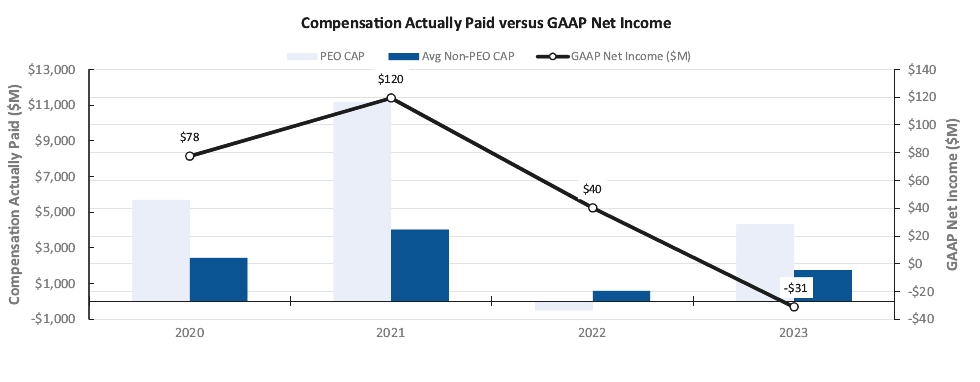
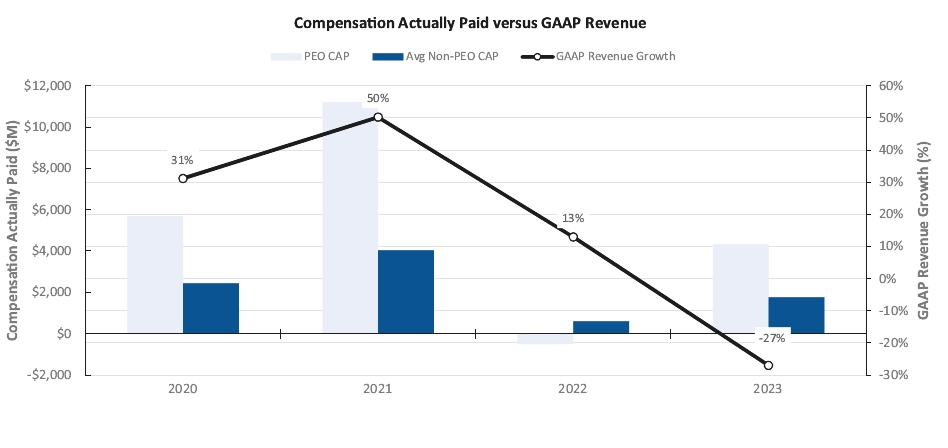
The following is a list of financial performance and non-financial performance measures, which in the Company’s assessment, represent the most important measures used by the Company to link compensation actually paid to the NEOs for 2023:
| (i) | GAAP Revenue Growth |
| (ii) | Non-GAAP Adjusted Operating Margin |
| (iii) | Relative Total Shareholder Return |
| (iv) | Free Cash Flow |
| (v) | Strategic Programs (ERP implementation, expense reduction, site optimization and product transition goals) |
| (vi) | Human Capital Goals |
For additional details regarding these performance measures, please see the sections titled “Fiscal 2023 Cash Incentive Bonuses” and “Equity Compensation” in our Compensation Discussion and Analysis elsewhere in this Proxy Statement.
| 52 |
We know of no other matters to be submitted to the meeting. If any other matters properly come before the meeting, it is the intention of the persons named in the enclosed form of proxy to vote the shares they represent as the Company or the Company’s management may recommend.
| | | BY ORDER OF THE BOARD OF DIRECTORS | ||||
| | | | | |||
| | | By: | | | /s/ James P. Scholhamer | |
| | | | | Name: James P. Scholhamer | ||
| | | | | Title: Chief Executive Officer | ||
Dated: April 26, 2024
| 53 |
Appendix A: Reconciliation of GAAP to Non-GAAP Measures
UNAUDITED RECONCILIATION OF GAAP TO NON-GAAP ADJUSTED RESULTS
| | | TWELVE MONTHS ENDED | ||||
| | | DECEMBER 29, 2023 | | | DECEMBER 30, 2022 | |
| Reconciliation of GAAP Net Income to Non-GAAP Net Income (in millions) | | | | | ||
| Reported net income attributable to UCT on a GAAP basis | | | $(31.1) | | | $40.4 |
Amortization of intangible assets(1) | | | 24.1 | | | 30.1 |
Stock-based compensation expense(2) | | | 12.5 | | | 19.3 |
Restructuring charges(3) | | | 9.2 | | | 3.3 |
Acquisition related costs(4) | | | 4.3 | | | 0.6 |
Fair value related adjustments(5) | | | 4.0 | | | — |
Legal-related costs(6) | | | (0.4) | | | 2.2 |
VAT settlement(7) | | | — | | | 2.9 |
Net loss on divestitures(8) | | | — | | | 77.4 |
Covid-19 related costs(9) | | | — | | | 2.9 |
Income tax effect of non-GAAP adjustments(11) | | | (10.2) | | | (22.2) |
Income tax effect of valuation allowance(12) | | | 12.8 | | | 23.9 |
| Non-GAAP net income attributable to UCT | | | $25.2 | | | $181.9 |
| | | | | |||
| Reconciliation of GAAP Income from operations to Non-GAAP Income from operations (in millions) | | | | | ||
| Reported income from operations on a GAAP basis | | | $35.2 | | | $120.4 |
Amortization of intangible assets(1) | | | 24.1 | | | 30.1 |
Stock-based compensation expense(2) | | | 12.5 | | | 19.3 |
Restructuring charges(3) | | | 9.2 | | | 3.3 |
Acquisition related costs(4) | | | 4.3 | | | 0.6 |
Fair value related adjustments(5) | | | 0.4 | | | — |
Legal-related costs(6) | | | (0.4) | | | 2.2 |
VAT settlement(7) | | | — | | | 4.0 |
Net loss on divestitures(8) | | | — | | | 77.4 |
Covid-19 related costs(9) | | | — | | | 2.2 |
| Non-GAAP income from operations | | | $85.3 | | | $260.2 |
| | | | | |||
| Reconciliation of GAAP Operating margin to Non-GAAP Operating margin | | | | | ||
| Reported operating margin on a GAAP basis | | | 2.0% | | | 5.1% |
Amortization of intangible assets(1) | | | 1.4% | | | 1.3% |
Stock-based compensation expense(2) | | | 0.7% | | | 0.8% |
Restructuring charges(3) | | | 0.5% | | | 0.1% |
Acquisition related costs(4) | | | 0.3% | | | 0.0% |
Fair value related adjustments(5) | | | 0.0% | | | — |
Legal-related costs(6) | | | 0.0% | | | 0.1% |
VAT settlement(7) | | | — | | | 0.2% |
Net loss on divestitures(8) | | | — | | | 3.3% |
Covid-19 related costs(9) | | | — | | | 0.1% |
| Non-GAAP operating margin | | | 4.9% | | | 11.0% |
| | | | | |||
| Reconciliation of GAAP Gross profit to Non-GAAP Gross profit (in millions) | | | | | ||
| Reported gross profit on a GAAP basis | | | $277.3 | | | $465.0 |
Amortization of intangible assets(1) | | | 6.5 | | | 6.3 |
Stock-based compensation expense(2) | | | 1.5 | | | 1.5 |
Restructuring charges(3) | | | 1.6 | | | 1.0 |
Fair value related adjustments(5) | | | 0.4 | | | — |
VAT settlement(7) | | | — | | | 4.0 |
Covid-19 related costs(9) | | | — | | | 2.9 |
| Non-GAAP gross profit | | | $287.3 | | | $480.7 |
| | | | | |||
| Reconciliation of GAAP Gross margin to Non-GAAP Gross margin | | | | | ||
| Reported gross margin on a GAAP basis | | | 16.0% | | | 19.6% |
Amortization of intangible assets(1) | | | 0.4% | | | 0.3% |
Stock-based compensation expense(2) | | | 0.1% | | | 0.1% |
Restructuring charges(3) | | | 0.1% | | | 0.0% |
Fair value related adjustments(5) | | | 0.0% | | | — |
VAT settlement(7) | | | —% | | | 0.2% |
Covid-19 related costs(9) | | | — | | | 0.1% |
| Non-GAAP gross margin | | | 16.6% | | | 20.2% |
| A-1 |
| | | TWELVE MONTHS ENDED | ||||
| | | DECEMBER 29, 2023 | | | DECEMBER 30, 2022 | |
| Reconciliation of GAAP Interest and other income (expense) to Non-GAAP Interest and other income (expense) (in millions) | | | | | ||
| Reported interest and other income (expense) on a GAAP basis | | | $(46.5) | | | $(32.1) |
Fair value related adjustments(8) | | | 4.9 | | | — |
| Non-GAAP interest and other income (expense) | | | $(41.6) | | | $(32.1) |
| | | | | |||
| | | | | |||
| Reconciliation of GAAP Earnings Per Diluted Share to Non-GAAP Earnings Per Diluted Share | | | | | ||
| Reported net income on a GAAP basis | | | $(0.70) | | | $0.88 |
Amortization of intangible assets(1) | | | 0.54 | | | 0.66 |
Stock-based compensation expense(2) | | | 0.28 | | | 0.42 |
Restructuring charges(3) | | | 0.20 | | | 0.07 |
Acquisition related costs(4) | | | 0.10 | | | 0.09 |
Fair value related adjustments(5) | | | 0.09 | | | — |
Legal-related costs(6) | | | (0.01) | | | 0.05 |
VAT settlement(7) | | | 0.06 | | | 0.09 |
Net loss on divestitures(8) | | | — | | | 1.69 |
Covid-19 related costs(9) | | | — | | | 0.06 |
Income tax effect of non-GAAP adjustments(10) | | | (0.23) | | | (0.49) |
Income tax effect of valuation allowance(11) | | | 0.29 | | | 0.52 |
| Non-GAAP net income | | | $0.56 | | | $3.98 |
| Weighted average number of diluted shares (in millions) on a non-GAAP basis | | | 45.1 | | | 45.7 |
ULTRA CLEAN HOLDINGS, INC.
UNAUDITED RECONCILIATION OF GAAP TO NON-GAAP EFFECTIVE INCOME TAX RATE
| | | TWELVE MONTHS ENDED | ||||
| | | DECEMBER 29, 2023 | | | DECEMBER 30, 2022 | |
| (in millions, except percentages) | | | | | ||
| Provision for income taxes on a GAAP basis | | | $10.9 | | | $37.9 |
Income tax effect of non-GAAP adjustments(10) | | | 10.2 | | | 22.2 |
Income tax effect of valuation allowance(11) | | | (12.8) | | | (23.9) |
| Non-GAAP provision for income taxes | | | $8.3 | | | $36.3 |
| | | | | |||
| Income before income taxes on a GAAP basis | | | $(11.3) | | | $88.3 |
Amortization of intangible assets(1) | | | 24.1 | | | 30.1 |
Stock-based compensation expense(2) | | | 12.5 | | | 19.3 |
Restructuring charges(3) | | | 9.2 | | | 3.3 |
Acquisition related costs(4) | | | 4.3 | | | 0.6 |
Fair value related adjustments(5) | | | 5.4 | | | — |
Legal-related costs(6) | | | (0.4) | | | 2.2 |
VAT settlement(7) | | | — | | | 4.0 |
Net loss on divestitures(8) | | | — | | | 77.4 |
Covid-19 related costs(9) | | | — | | | — |
| Non-GAAP income before income taxes | | | $438 | | | $228.1 |
| Effective income tax rate on a GAAP basis | | | (96.5)% | | | 42.9% |
| Non-GAAP effective income tax rate | | | 18.9% | | | 15.9% |
| 1 | Amortization of intangible assets related to the Company’s business acquisitions |
| 2 | Represents compensation expense for stock granted to employees and directors |
| 3 | Represents severance, retention and costs related to facility closures |
| 4 | Represents acquisition activity costs |
| 5 | Fair value adjustments related to contingent consideration, HIS’ sold inventories, intercompany loan related to an acquisition, net of $1.3 million loss attributable to noncontrolling |
| 6 | Represents estimated costs related to legal proceedings |
| 7 | Represents impact of value added tax ruling |
| A-2 |
| 8 | Represents the net loss on the divestiture of certain non-core subsidiary entities |
| 9 | Covid-19 related costs incurred during the period |
| 10 | Tax effect of items (1) through (9) above based on the non-GAAP tax rate |
| 11 | The Company’s GAAP tax expense is generally higher than the Company’s non-GAAP tax expense, primarily due to losses in the U.S. with full federal and state valuation allowances. The Company’s non-GAAP tax rate and resulting non-GAAP tax expense considers the tax implications as if there was no federal or state valuation allowance position in effect. |
| A-3 |
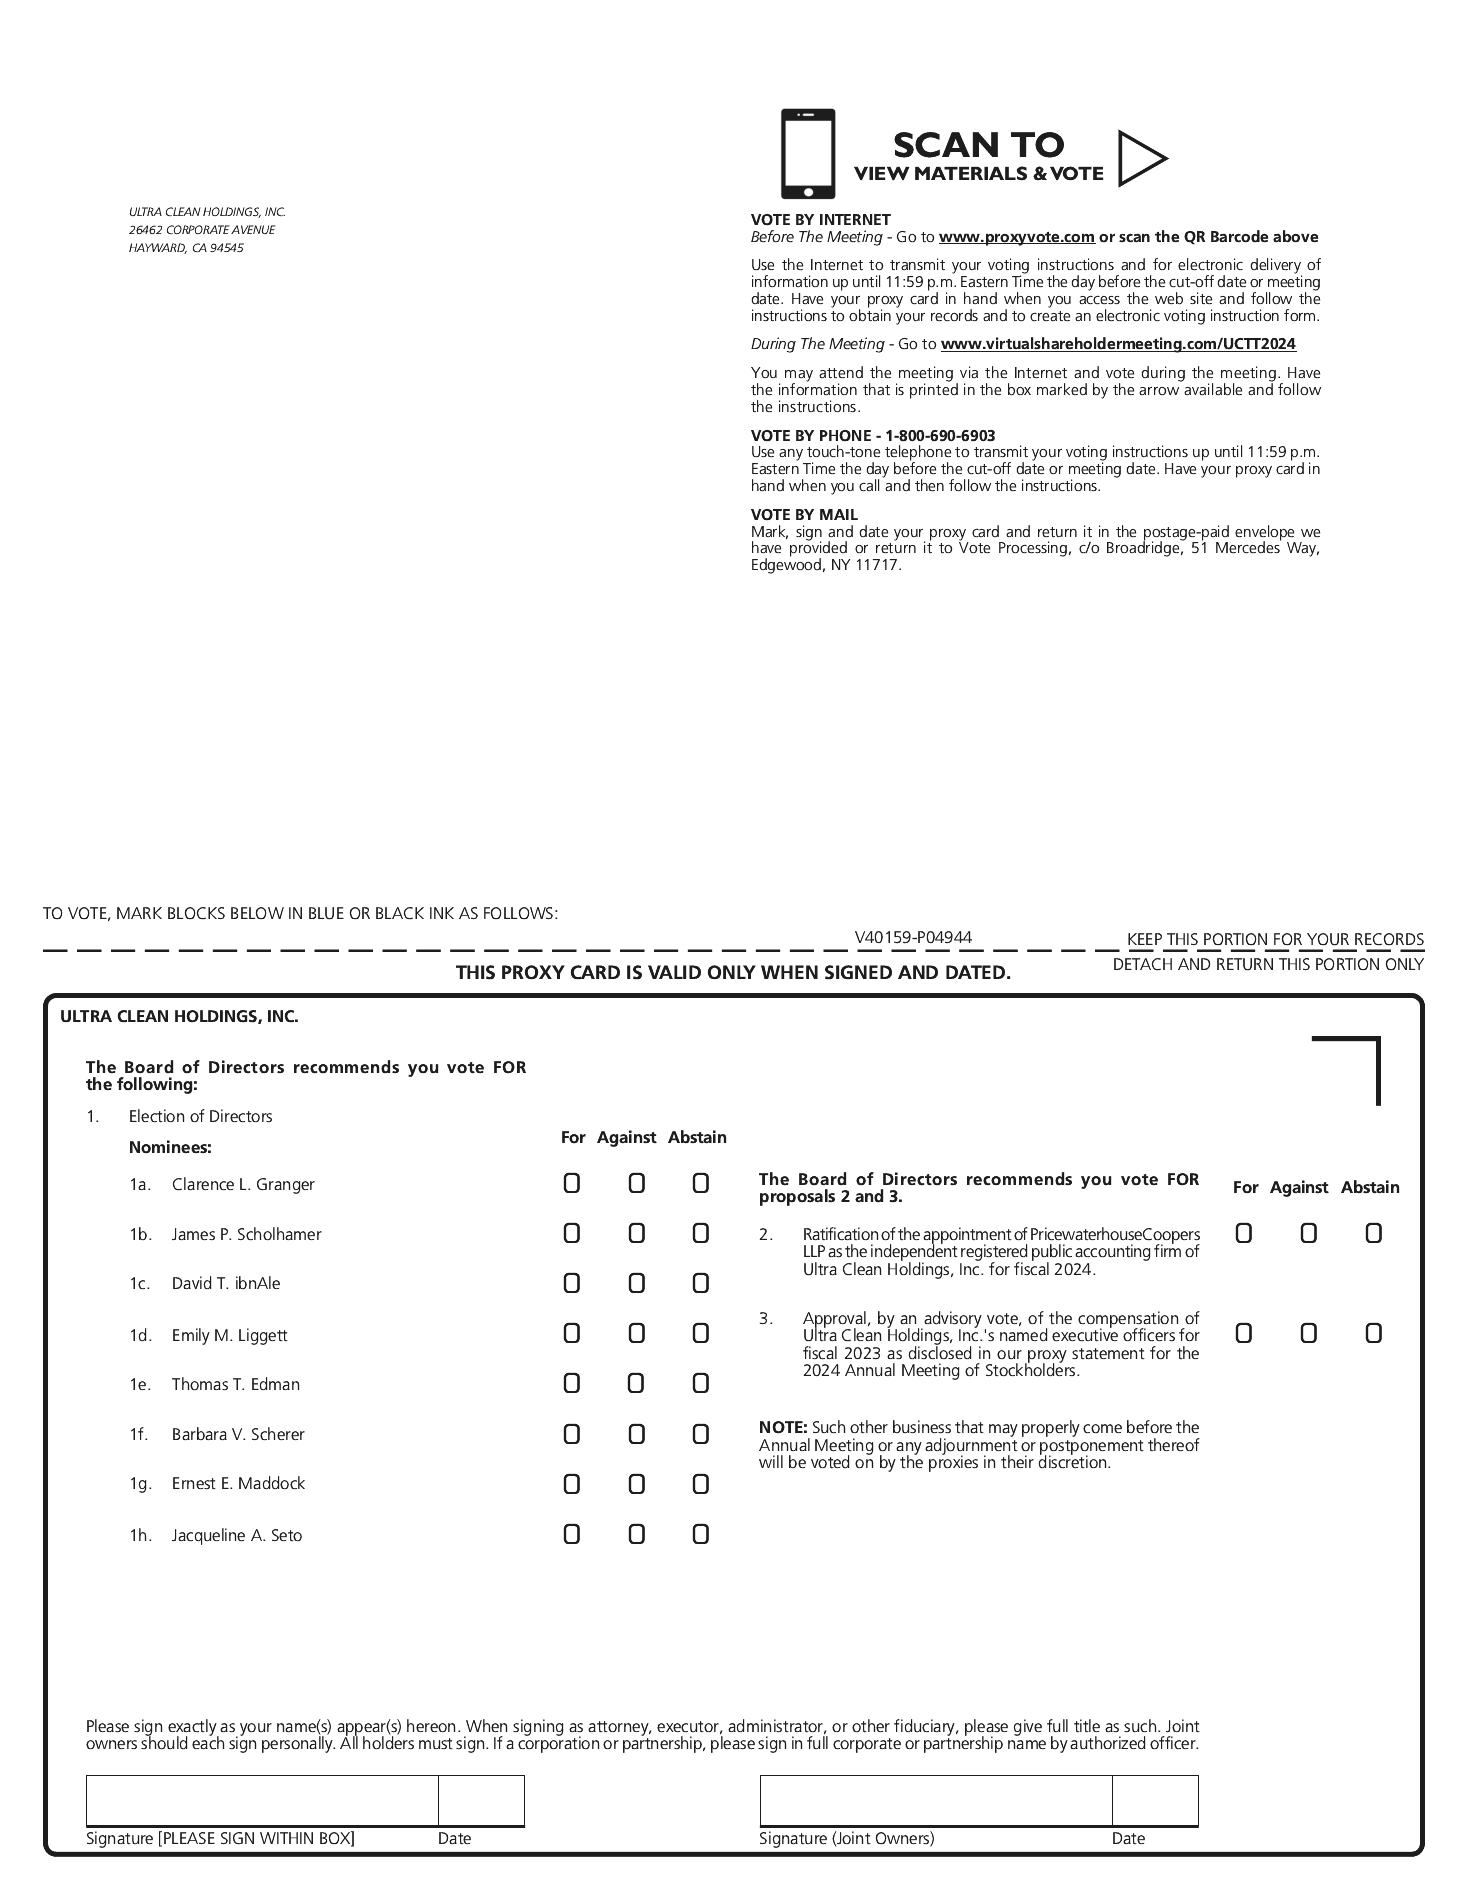
0001275014 6 2022-12-31 2023-12-29