UNITED STATES
SECURITIES AND EXCHANGE COMMISSION
Washington, D.C. 20549
FORM N-CSR
CERTIFIED SHAREHOLDER REPORT OF REGISTERED MANAGEMENT INVESTMENT COMPANIES
Investment Company Act file number 811-21494
NUVEEN FLOATING RATE INCOME FUND
(Exact name of registrant as specified in charter)
Nuveen Investments
333 West Wacker Drive
Chicago, IL 60606
(Address of principal executive offices) (Zip code)
Kevin J. McCarthy
Nuveen Investments
333 West Wacker Drive
Chicago, IL 60606
(Name and address of agent for service)
Registrant’s telephone number, including area code: (312) 917-7700
Date of fiscal year end: July 31
Date of reporting period: July 31, 2010
Form N-CSR is to be used by management investment companies to file reports with the Commission not later than 10 days after the transmission to stockholders of any report that is required to be transmitted to stockholders under Rule 30e-1 under the Investment Company Act of 1940 (17 CFR 270.30e-1). The Commission may use the information provided on Form N-CSR in its regulatory, disclosure review, inspection, and policymaking roles.
A registrant is required to disclose the information specified by Form N-CSR, and the Commission will make this information public. A registrant is not required to respond to the collection of information contained in Form N-CSR unless the Form displays a currently valid Office of Management and Budget (“OMB”) control number. Please direct comments concerning the accuracy of the information collection burden estimate and any suggestions for reducing the burden to Secretary, Securities and Exchange Commission, 450 Fifth Street, NW, Washington, DC 20549-0609. The OMB has reviewed this collection of information under the clearance requirements of 44 U.S.C. ss. 3507.
ITEM 1. REPORTS TO SHAREHOLDERS
Closed-End Funds
| | | |
| |
Nuveen Investments
Closed-End Funds
High current income from portfolios of senior corporate loans. | | |
| | | |
Annual Report
July 31, 2010 | | |
| |
| |
| | | | | | | |
| | | | | | |
Nuveen Senior
Income Fund
NSL | | Nuveen Floating
Rate Income Fund
JFR | | Nuveen Floating
Rate Income
Opportunity Fund
JRO | | |
NUVEEN INVESTMENTS ANNOUNCES STRATEGIC COMBINATION WITH FAF ADVISORS
On July 29, 2010, Nuveen Investments, Inc. announced that U.S. Bancorp will receive a 9.5% stake in Nuveen Investments and cash consideration in exchange for the long-term asset business of U.S. Bancorp’s FAF Advisors (FAF). Nuveen Investments is the parent of Nuveen Asset Management (NAM), the investment adviser for the Funds included in this report.
FAF Advisors, which currently manages about $25 billion of long-term assets and serves as the advisor of the First American Funds, will be combined with NAM, which currently manages about $75 billion in municipal fixed income assets. Upon completion of the transaction, Nuveen Investments, which currently manages about $150 billion of assets across several high-quality affiliates, will manage a combined total of about $175 billion in institutional and retail assets.
This combination will not affect the investment objectives, strategies or policies of the Funds in this report. Over time, Nuveen Investments expects that the combination will provide even more ways to meet the needs of investors who work with financial advisors and consultants by enhancing the multi-boutique model of Nuveen Investments, which also includes highly respected investment teams at NWQ Investment Management, Santa Barbara Asset Management, Symphony Asset Management, Tradewinds Global Investors, Winslow Capital and Nuveen HydePark.
The transaction is expected to close late in 2010, subject to customary conditions.
Chairman’s
Letter to Shareholders
Dear Shareholder,
Recent months have revealed the fragility and disparity of the global economic recovery. In the U.S., the rate of economic growth has slowed as various stimulus programs have started to wind down, exposing weakness in the underlying economy. In contrast, many emerging market countries are experiencing a return to comparatively high rates of growth. Confidence in global financial markets has been undermined by concerns about high sovereign debt levels in Europe and the U.S. Until these countries can begin credible programs to reduce their budgetary deficits, market unease and hesitation will remain. On a more positive note, even though the countries now enjoying the strongest recovery depend on exports to countries with trade deficits, these importing countries have resisted the temptation to damage world trade by erecting trade barriers.
The U.S. economy is subject to unusually high levels of uncertainty as it struggles to recover from a devastating financial crisis. Unemployment remains stubbornly high, due to what appears to be both cyclical and structural forces. Federal Reserve policy makers are considering novel approaches to provide support to the economy, and administration policy makers are debating additional stimulus measures. However, the high levels of debt owed both by U.S. consumers and the U.S. government limit their ability to engineer a stronger economic recovery.
The U.S. financial markets reflect the crosscurrents now impacting the U.S. economy. Today’s historically low interest rates reflect the Fed’s easy monetary policy and the demand for U.S. government debt by U.S. and overseas investors looking for a safe haven for investment. Despite a continued corporate earnings recovery, equity markets continue to reflect concern about the possibility of a “double dip” recession. Encouragingly, financial institutions are rebuilding their balance sheets and the financial reform legislation enacted this summer has the potential to address many of the most significant contributors to the financial crisis, although many details still have to be worked out.
In this difficult environment, your Nuveen investment team continues to seek sustainable investment opportunities and, at the same time, remains alert for potential risks that may result from a recovery still facing many headwinds. As your representative, the Nuveen Fund Board monitors the activities of each investment team to assure that all maintain their investment disciplines. As always, I encourage you to contact your financial consultant if you have any questions about your investment in a Nuveen Fund.
On behalf of the other members of your Fund Board, we look forward to continuing to earn your trust in the months and years ahead.
Sincerely,
Robert P. Bremner
Chairman of the Board
September 22, 2010
Portfolio Manager’s Comments
Nuveen Senior Income Fund (NSL)
Nuveen Floating Rate Income Fund (JFR)
Nuveen Floating Rate Income Opportunity Fund (JRO)
The Funds’ investment portfolios have been managed since 2001 by Gunther Stein of Symphony Asset Management, LLC, an affiliate of Nuveen Investments. Gunther, who is Symphony’s chief investment officer, has more than 20 years of investment management experience, much of it in evaluating and purchasing senior corporate loans and other high-yield debt.
Here Gunther talks about general economic and market conditions, his management strategies and the performance of the Funds for the twelve-month period ended July 31, 2010.
What were the general market conditions for the twelve-month period?
During this period, there continued to be considerable stress on the economy and both the Federal Reserve (Fed) and the federal government took actions intended to improve the overall economic environment. For its part, the Fed continued to hold the benchmark fed funds rate in a target range of zero to 0.25%. At its June 2010 meeting, the central bank renewed its pledge to keep the fed funds rate “exceptionally low” for an “extended period.” The federal government focused on implementing a $787 billion economic stimulus package intended to provide job creation, tax relief, fiscal assistance to state and local governments and expansion of unemployment benefits.
Certain statements in this report are forward-looking statements. Discussions of specific investments are for illustration only and are not intended as recommendations of individual investments. The forward-looking statements and other views expressed herein are those of the portfolio manager as of the date of this report. Actual future results or occurrences may differ significantly from those anticipated in any forward-looking statements, and the views expressed herein are subject to change at any time, due to numerous market and other factors. The Funds disclaim any obligation to update publicly or revise any forward-looking statements or views expressed herein.
These and other measures taken by the Fed and the government to ease the economic recession helped to produce some signs of improvement. Over the four calendar quarters comprising most of this period, the U.S. economy, as measured by the U.S. gross domestic product (GDP), grew at annualized rates of 1.6%, 5.0%, 3.7% and 1.6%, respectively. This marked the first time since 2007 that the economy managed to string together four consecutive positive quarters. Housing also provided something of a bright spot, as the S&P/Case-Shiller Home Price Index of average residential prices gained 3.6% for the twelve months ended June 2010 (the most recent data available at the time this report was produced). This moved average home prices across the United States to levels similar to where they were in the autumn of 2003.
Inflation continued to be relatively tame, as the Consumer Price Index (CPI) rose 1.2% year-over-year as of July 2010. The labor markets remained weak, with the national unemployment rate at 9.5% as of July 2010. This compares with the 26-year high of 10.1% in October 2009 and a rate of 9.4% in July 2009.
In the senior loan market, the second half of 2009 saw a continuation of the positive momentum from earlier in the year. This could be attributed to three primary drivers: lack
of new issuance, incremental demand for the asset class, and relative strength in fundamentals.
Market technical factors remained firm as a result of limited new supply as well as new money being put into loans. New issue activity was virtually nonexistent during the period, although some smaller deals came to market. While the fourth quarter of 2009 saw the highest level of institutional new issuance for the year, the levels paled in comparison with recent years. Many of the deals were driven by refinancings, which continued throughout 2010. Refinancings provide opportunities on a select basis to purchase higher quality new issues with attractive spreads and LIBOR floors. Meanwhile, mutual fund inflows in the second half of 2009 and the first quarter of 2010 remained consistent, given the attractive return profile of senior loan assets and the floating rate coupon which historically has outperformed in rising-rate environments. Institutional investors also showed interest in the asset class off and on throughout the year, with buyers appearing despite spread contraction.
The period also saw an improving fundamental environment for senior loans, with relatively low default rates and better recoveries forecasts from market participants and rating agencies. While fundamentals still were not particularly strong, most companies issuing leveraged loans consistently reported better-than-expected operating and net earnings results throughout 2009 and into 2010. This helped to drive positive price action. The Credit Suisse Leverage Loan Index rose +13.98% during the second half of the 2009.
What key strategies were used to manage the Fund during the twelve-month period ended July 31, 2010?
The investment objective of each Fund is to achieve a high level of current income by investing primarily in adjustable rate secured and unsecured senior loans and other debt instruments. Other investments may include U.S. dollar denominated senior loans of non-U.S. borrowers and equity securities and warrants acquired in connection with the Fund’s investment in senior loans.
Toward the end of 2009 and early in 2010, we shifted our investments toward higher quality names as we believed the pace of the rally in riskier assets would normalize as the market leveled off. We also continued to utilize new issues, as well as a variety of older positions where we felt that risk-adjusted returns remained attractive. In addition, we continued to hold select positions in lower quality companies that were purchased at deep discounts to par, such as Infor Global and Citadel. However, the vast majority of the assets in the portfolio traded above 85% of par as fewer broad-based market opportunities were present.
How did the Fund perform over this twelve-month period?
The performance of the Funds, as well as the performance of certain market indexes, is presented in the accompanying table.
Average Annual Total Returns on Common Share Net Asset Value
For periods ended 7/31/10
| | | | | | | |
| | | 1-Year | | 5-Year | | 10-Year |
| NSL | | 28.15% | | 3.94% | | 5.08% |
| JFR | | 23.85% | | 3.43% | | 3.66% |
| JRO | | 26.66% | | 3.99% | | 4.02% |
CSFB Leveraged Loan Index1 | | 14.62% | | 3.88% | | 4.46% |
Barclays Capital U.S. Aggregate Bond Index2 | | 8.91% | | 5.96% | | 6.49% |
| | | | | | | |
For the twelve months ended July 31, 2010, all three Funds outperformed the comparative indexes. During the period, higher risk assets generally outperformed higher quality assets. The risk-driven rally was most evident in some of the low dollar-priced names we hold in the Funds, such as Tribune Company and Swift Transportation. However, some newer higher-quality assets such as Reynolds Brands also performed well.
The more-levered companies generally outperformed during the period, however these names largely underperformed during the previous year and during the financial crisis. There were several special situations that dragged on performance, such as MGM, which is a distressed issuer that had experienced some difficulty with the auction of some of its assets. Other distressed issuers, such as Intelsat also contributed negatively to performance.
Past performance is not predictive of future results. Current performance may be higher or lower than the data shown. Returns do not reflect the deduction of taxes that shareholders may have to pay on Fund distributions or upon the sale of Fund shares.
For additional information, see the individual Performance Overview for your Fund in this report.
| |
| 1 | The CSFB Leveraged Loan Index is a representative, unmanaged index of tradeable, senior, U.S. dollar-denominated leveraged loans. Index returns do not include the effects of any sales charges or management fees. It is not possible to invest directly in an index. |
| |
| 2 | The Barclays Capital U.S. Aggregate Bond Index is an unmanaged index that includes all investment-grade, publicly issued, fixed-rate, dollar denominated, nonconvertible debt issues and commercial mortgage backed securities with maturities of at least one year and outstanding par values of $150 million or more. Index returns do not include the effects of any sales charges or management fees. It is not possible to invest directly in an index. |
IMPACT OF THE FUNDS’ LEVERAGE STRATEGIES ON PERFORMANCE
One important factor impacting the returns of these Funds relative to the comparative indexes was the Funds’ use of financial leverage, primarily through bank borrowings. The Funds use leverage because their managers believe that, over time, leveraging provides opportunities for additional income and total returns for common shareholders. However, use of leverage also can expose common shareholders to additional volatility. For example, as the prices of securities held by a Fund decline, the negative impact of these valuation changes on common share net asset value and common shareholder total return is magnified by the use of leverage. Conversely, leverage may enhance common share returns during periods when the prices of Fund holdings generally are rising.
The use of leverage made a significant positive contribution to the return of each Fund over this period.
RECENT DEVELOPMENTS REGARDING THE FUNDS’ LEVERAGED CAPITAL STRUCTURES
Shortly after their inceptions, each Fund issued auction rate preferred shares (ARPS) to create financial leverage. As noted in past shareholder reports, the weekly auctions for those ARPS shares began in February 2008 to consistently fail, causing the Funds to pay the so-called “maximum rate” to ARPS shareholders under the terms of the ARPS in the Funds’ charter documents. With the goal of lowering the relative cost of leverage over time for common shareholders and providing liquidity at par for preferred shareholders, the Funds sought to refinance all of their outstanding ARPS beginning shortly thereafter. The Funds completed this refinancing process during 2009 and since then have relied upon bank borrowings to create financial leverage.
In April and May 2010, 30 Nuveen leveraged closed-end funds, including JRO, received a demand letter from a law firm on behalf of purported holders of common shares of each such fund, alleging that Nuveen and the funds’ officers and Board of Directors/Trustees breached their fiduciary duties related to the redemption at par of the funds’ ARPS. In response, the Board established an ad hoc Demand Committee consisting of certain of its disinterested and independent Board members to investigate the claims. The Demand Committee retained independent counsel to assist it in conducting an extensive investigation. Based upon its investigation, the Demand Committee found that it was not in the best interests of each fund or its shareholders to take the actions suggested in the demand letters, and recommended that the full Board reject the demands made in the demand letters. After reviewing the findings and recommendation of the Demand Committee, the full Board of each fund unanimously adopted the Demand Committee’s recommendation.
Subsequently, twenty of the funds that received demand letters (not including JRO) were named as nominal defendants in a putative shareholder derivative action complaint captioned Safier and Smith v. Nuveen Asset Management, et al. that was filed in the Circuit Court of Cook County, Illinois, Chancery Division (the “Cook County Chancery Court”) on July 27, 2010. Three additional funds (not including JRO) were named as nominal defendants in a similar complaint captioned Curbow v. Nuveen Asset Management, et al. filed in the Cook County Chancery Court on August 12, 2010, and three additional funds (not including JRO) were named as nominal defendants in a similar complaint captioned Beidler v. Nuveen Asset Management, et al. filed in the Cook County Chancery Court on September 21, 2010 (collectively, the “Complaints”). The Complaints, filed on behalf of purported holders of each fund’s common shares, also name Nuveen Asset Management as a defendant, together with current and former Officers and Trustees of each of the funds (together with the nominal defendants, collectively, the “Defendants”). The Complaints contain the same basic allegations contained in the demand letters. The suits seek a declaration that the Defendants have breached their fiduciary duties, an order directing the Defendants not to redeem any ARPS at their liquidation value using fund assets, indeterminate monetary damages in favor of the funds and an award of plaintiffs’ costs and disbursements in pursuing the action. Nuveen Asset Management believes that the Complaints are without merit, and intends to defend vigorously against these charges.
For up-to-date information, please visit the Nuveen CEF Auction Rate Preferred Resource Center at: http://www.nuveen.com/arps.
Common Share Distribution
and Share Price Information
As noted earlier, these Funds use financial leverage to potentially enhance opportunities for additional income for common shareholders. The Funds’ use of this leverage strategy continued to provide incremental income, although the extent of this benefit was reduced to some degree by short-term interest rates that remained relatively high during the early part of the period. This, in turn, kept the Funds’ borrowing costs high. All three fund’s distributions increased twice over the twelve-month period.
During certain periods, each Fund may pay dividends at a rate that may be more or less than the amount of net investment income actually earned by the Fund during the period. If a Fund has cumulatively earned more than it has paid in dividends, it holds the excess in reserve as undistributed net investment income (UNII) as part of the Fund’s common share NAV. Conversely, if a Fund has cumulatively paid dividends in excess of its earnings, the excess constitutes negative UNII that is likewise reflected in the Fund’s common share NAV. As of July 31, 2010, NSL had a positive UNII balance for tax purposes while JFR & JRO had negative UNII balances for tax purposes. For financial statement purposes, JRO had a positive UNII balance while NSL and JFR had negative UNII balances.
Common Share Repurchases and Share Price Information
As of July 31, 2010, and since the inception of the Funds’ repurchase program, JFR and JRO have cumulatively repurchased common shares as shown in the accompanying table. Since the inception of the Fund’s repurchase program, NSL has not repurchased any of its outstanding common shares.
| | | | | |
| | | Common Shares
| | % of Outstanding
|
| Fund | | Repurchased | | Common Shares |
| JFR | | 147,593 | | 0.3% |
| JRO | | 19,400 | | 0.1% |
| | | | | |
During the twelve-month reporting period, the JFR and JRO repurchased common shares at a weighted average price and a weighted average discount per common share as shown in the accompanying table.
| | | | | | | |
| | | | | Weighted Average
| | Weighted Average
|
| | | Common Shares
| | Price Per Share
| | Discount Per Share
|
| Fund | | Repurchased | | Repurchased | | Repurchased |
| JFR | | 137,893 | | $9.15 | | 12.86% |
| JRO | | 9,700 | | $8.95 | | 13.25% |
| | | | | | | |
As of July 31, 2010, the Funds were trading at (+) premiums/ (-) discounts to their common share NAVs as shown in the accompanying table.
| | | | | |
| | | | | Twelve-Month
|
| | | 7/31/10
| | Average
|
| | | (+) Premium/
| | (+) Premium/
|
| Fund | | (-) Discount | | (-) Discount |
| NSL | | (+)2.06% | | (+)1.56% |
| JFR | | (-)2.35% | | (-)6.13% |
| JRO | | (+)2.65% | | (-)2.86% |
| | | | | |
| | | | |
| | | | |
NSL
Performance
OVERVIEW | | | Nuveen Senior
Income Fund |
| | | | as of July 31, 2010 |
| | | |
| Fund Snapshot |
| Common Share Price | | $6.95 |
| | | |
| Common Share Net Asset Value | | $6.81 |
| | | |
| Premium/(Discount) to NAV | | 2.06% |
| | | |
| Latest Dividend | | $0.0400 |
| | | |
| Market Yield | | 6.91% |
| | | |
Net Assets Applicable to
Common Shares ($000) | | $203,261 |
| | | |
| | | | | |
Average Annual Total Return
|
| (Inception 10/26/99) |
| | | On Share Price | | On NAV |
| 1-Year | | 44.83% | | 28.15% |
| | | | | |
| 5-Year | | 3.61% | | 3.94% |
| | | | | |
| 10-Year | | 5.11% | | 5.08% |
| | | | | |
| | | |
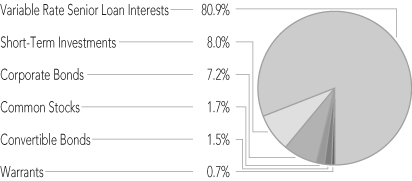
Portfolio Composition
|
| (as a % of total investments) |
| Media | | 10.6% |
| | | |
| Hotels, Restaurants & Leisure | | 9.3% |
| | | |
| Health Care Providers & Services | | 8.7% |
| | | |
| Specialty Retail | | 4.4% |
| | | |
| Building Products | | 4.1% |
| | | |
| IT Services | | 3.4% |
| | | |
| Oil, Gas & Consumable Fuels | | 2.8% |
| | | |
| Automobiles | | 2.8% |
| | | |
| Paper & Forest Products | | 2.4% |
| | | |
| Chemicals | | 2.4% |
| | | |
| Road & Rail | | 2.3% |
| | | |
| Diversified Telecommunication Services | | 2.3% |
| | | |
| Airlines | | 2.3% |
| | | |
| Communications Equipment | | 2.2% |
| | | |
| Real Estate Management & Development | | 2.2% |
| | | |
| Software | | 2.2% |
| | | |
| Food & Staples Retailing | | 2.0% |
| | | |
| Leisure Equipment & Products | | 1.8% |
| | | |
| Pharmaceuticals | | 1.7% |
| | | |
| Internet Software & Services | | 1.6% |
| | | |
| Auto Components | | 1.5% |
| | | |
| Food Products | | 1.2% |
| | | |
| Aerospace & Defense | | 1.2% |
| | | |
| Household Products | | 1.2% |
| | | |
| Warrants | | 0.7% |
| | | |
| Short-Term Investments | | 8.0% |
| | | |
| Other | | 14.7% |
| | | |
| | | |
Top Five Issuers
|
| (as a % of total long-term investments) |
| Infor Global Solutions Intermediate Holdings, Ltd. | | 2.4% |
| | | |
| Charter Communications Operating Holdings LLC | | 2.1% |
| | | |
| Swift Transportation Company, Inc. | | 2.0% |
| | | |
| Michaels Stores, Inc. | | 2.0% |
| | | |
| Venetian Casino Resort LLC | | 2.0% |
| | | |
Portfolio Allocation (as a % of total investments)
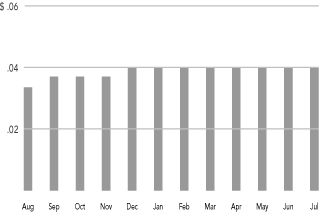
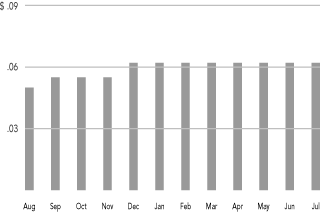
2009-2010 Monthly Dividends Per Common Share
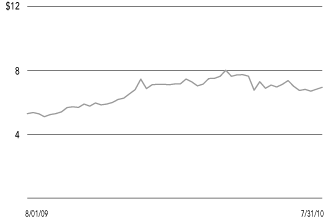
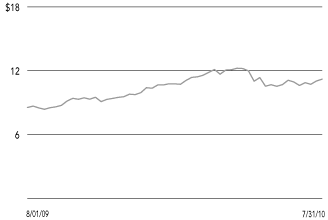
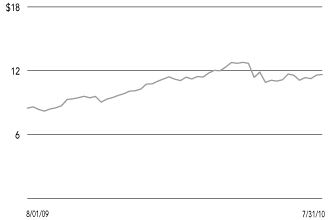
Share Price Performance — Weekly Closing Price
Refer to the Glossary of Terms Used in this Report for further definition of the terms used within this Fund’s Performance Overview page.
| | | | |
| | | | |
JFR
Performance
OVERVIEW | | | Nuveen Floating
Rate Income
Fund |
| | | | as of July 31, 2010 |
| | | |
| Fund Snapshot |
| Common Share Price | | $11.20 |
| | | |
| Common Share Net Asset Value | | $11.47 |
| | | |
| Premium/(Discount) to NAV | | -2.35% |
| | | |
| Latest Dividend | | $0.0510 |
| | | |
| Market Yield | | 5.46% |
| | | |
Net Assets Applicable to
Common Shares ($000) | | $542,456 |
| | | |
| | | | | |
Average Annual Total Return
|
| (Inception 3/25/04) |
| | | On Share Price | | On NAV |
| 1-Year | | 41.48% | | 23.85% |
| | | | | |
| 5-Year | | 4.17% | | 3.43% |
| | | | | |
| Since Inception | | 3.01% | | 3.66% |
| | | | | |
| | | |
Portfolio Composition
|
| (as a % of total investments) |
| Media | | 12.2% |
| | | |
| Hotels, Restaurants & Leisure | | 10.1% |
| | | |
| Health Care Providers & Services | | 6.5% |
| | | |
| Specialty Retail | | 4.8% |
| | | |
| IT Services | | 4.2% |
| | | |
| Road & Rail | | 3.8% |
| | | |
| Diversified Telecommunication Services | | 3.3% |
| | | |
| Building Products | | 3.2% |
| | | |
| Wireless Telecommunication Services | | 2.9% |
| | | |
| Chemicals | | 2.7% |
| | | |
| Oil, Gas & Consumable Fuels | | 2.7% |
| | | |
| Software | | 2.6% |
| | | |
| Airlines | | 2.4% |
| | | |
| Real Estate Management & Development | | 2.4% |
| | | |
| Communications Equipment | | 2.1% |
| | | |
| Automobiles | | 1.9% |
| | | |
| Auto Components | | 1.9% |
| | | |
| Pharmaceuticals | | 1.8% |
| | | |
| Insurance | | 1.8% |
| | | |
| Internet Software & Services | | 1.6% |
| | | |
| Leisure Equipment & Products | | 1.6% |
| | | |
| Food Products | | 1.5% |
| | | |
| Investment Companies | | 1.6% |
| | | |
| Warrants | | 0.4% |
| | | |
| Short-Term Investments | | 6.0% |
| | | |
| Other | | 14.0% |
| | | |
| | | |
Top Five Issuers
|
| (as a % of total long-term investments) |
| Swift Transportation Company, Inc. | | 3.3% |
| | | |
| Univision Communications, Inc. | | 2.8% |
| | | |
| Venetian Casino Resort LLC | | 2.5% |
| | | |
| Avaya, Inc. | | 2.0% |
| | | |
| Federal-Mogul Corporation | | 2.0% |
| | | |
Portfolio Allocation (as a % of total investments)
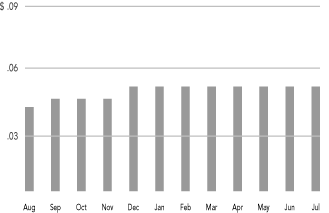
2009-2010 Monthly Dividends Per Common Share
Share Price Performance — Weekly Closing Price
Refer to the Glossary of Terms Used in this Report for further definition of the terms used within this Fund’s Performance Overview page.
| | | | |
| | | | |
JRO
Performance
OVERVIEW | | | Nuveen Floating
Rate Income
Opportunity Fund |
| | | | as of July 31, 2010 |
| | | |
| Fund Snapshot |
| Common Share Price | | $11.64 |
| | | |
| Common Share Net Asset Value | | $11.34 |
| | | |
| Premium/(Discount) to NAV | | 2.65% |
| | | |
| Latest Dividend | | $0.0620 |
| | | |
| Market Yield | | 6.39% |
| | | |
Net Assets Applicable to
Common Shares ($000) | | $322,136 |
| | | |
| | | | | |
Average Annual Total Return
|
| (Inception 7/27/04) |
| | | On Share Price | | On NAV |
| 1-Year | | 49.00% | | 26.66% |
| | | | | |
| 5-Year | | 6.20% | | 3.99% |
| | | | | |
| Since Inception | | 4.22% | | 4.02% |
| | | | | |
| | | |
Portfolio Composition
|
| (as a % of total investments) |
| Media | | 13.5% |
| | | |
| Hotels, Restaurants & Leisure | | 10.3% |
| | | |
| Health Care Providers & Services | | 5.8% |
| | | |
| Specialty Retail | | 4.1% |
| | | |
| Road & Rail | | 4.0% |
| | | |
| IT Services | | 3.8% |
| | | |
| Oil, Gas & Consumable Fuels | | 3.4% |
| | | |
| Wireless Telecommunication Services | | 2.9% |
| | | |
| Diversified Telecommunication Services | | 2.9% |
| | | |
| Real Estate Management & Development | | 2.8% |
| | | |
| Communications Equipment | | 2.7% |
| | | |
| Software | | 2.6% |
| | | |
| Building Products | | 2.6% |
| | | |
| Auto Components | | 2.6% |
| | | |
| Airlines | | 2.5% |
| | | |
| Automobiles | | 2.5% |
| | | |
| Internet Software & Services | | 2.0% |
| | | |
| Chemicals | | 1.9% |
| | | |
| Pharmaceuticals | | 1.9% |
| | | |
| Food & Staples Retailing | | 1.7% |
| | | |
| Diversified Consumer Services | | 1.7% |
| | | |
| Health Care Equipment & Supplies | | 1.6% |
| | | |
| Warrants | | 0.5% |
| | | |
| Short-Term Investments | | 5.0% |
| | | |
| Other | | 14.7% |
| | | |
| | | |
Top Five Issuers
|
| (as a % of total long-term investments) |
| Swift Transportation Company, Inc. | | 3.2% |
| | | |
| Clear Channel Communications, Inc. | | 2.7% |
| | | |
| Federal-Mogul Corporation | | 2.6% |
| | | |
| Avaya, Inc. | | 2.5% |
| | | |
| Venetian Casino Resort LLC | | 2.5% |
| | | |
Portfolio Allocation (as a % of total investments)
2009-2010 Monthly Dividends Per Common Share
Share Price Performance — Weekly Closing Price
Refer to the Glossary of Terms Used in this Report for further definition of the terms used within this Fund’s Performance Overview page.
Report of Independent
Registered Public Accounting Firm
The Board of Trustees and Shareholders
Nuveen Senior Income Fund
Nuveen Floating Rate Income Fund
Nuveen Floating Rate Income Opportunity Fund
We have audited the accompanying statements of assets and liabilities, including the portfolios of investments, of Nuveen Senior Income Fund, Nuveen Floating Rate Income Fund and Nuveen Floating Rate Income Opportunity Fund (the “Funds”), as of July 31, 2010, and the related statements of operations and cash flows for the year then ended, the statements of changes in net assets for each of the two years in the period then ended, and the financial highlights for each of the five years in the period then ended. These financial statements and financial highlights are the responsibility of the Funds’ management. Our responsibility is to express an opinion on these financial statements and financial highlights based on our audits.
We conducted our audits in accordance with the standards of the Public Company Accounting Oversight Board (United States). Those standards require that we plan and perform the audit to obtain reasonable assurance about whether the financial statements and financial highlights are free of material misstatement. We were not engaged to perform an audit of the Funds’ internal control over financial reporting. Our audits included consideration of internal control over financial reporting as a basis for designing audit procedures that are appropriate in the circumstances, but not for the purpose of expressing an opinion on the effectiveness of the Funds’ internal control over financial reporting. Accordingly, we express no such opinion. An audit also includes examining, on a test basis, evidence supporting the amounts and disclosures in the financial statements and financial highlights, assessing the accounting principles used and significant estimates made by management and evaluating the overall financial statement presentation. Our procedures included confirmation of securities owned as of July 31, 2010, by correspondence with the broker, custodian, counterparty and selling or agent banks or by other appropriate auditing procedures where replies from selling or agent banks were not received. We believe that our audits provide a reasonable basis for our opinion.
In our opinion, the financial statements and financial highlights referred to above present fairly, in all material respects, the financial positions of Nuveen Senior Income Fund, Nuveen Floating Rate Income Fund and Nuveen Floating Rate Income Opportunity Fund at July 31, 2010, the results of their operations and cash flows for the year then ended, the changes in their net assets for each of the two years in the period then ended, and the financial highlights for each of the five years in the period then ended in conformity with U.S. generally accepted accounting principles.
Chicago, Illinois
September 27, 2010
| | | | | | |
| | | | | | |
NSL | | | Nuveen Senior Income Fund
Portfolio of Investments |
| | | | | | July 31, 2010 |
| | | | | | | | | | | | | | | | | | | | | |
| | | | | Weighted
| | | | | | | | | | |
Principal
| | | | | Average
| | | | | | | | | | |
| Amount (000) | | | Description (1) | | Coupon | | | Maturity (2) | | | Ratings (3) | | | Value | |
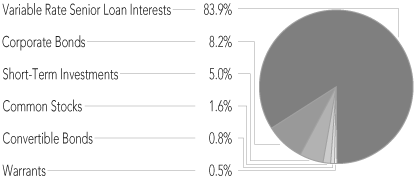
| | | | | Variable Rate Senior Loan Interests – 117.7% (80.9% of Total Investments) (4) |
| | | | | |
| | | | | Aerospace & Defense – 1.8% (1.2% of Total Investments) |
| | | | | | | | | | | | | | | | | | | | | |
| $ | 574 | | | DAE Aviation Holdings, Inc., Term Loan B1 | | | 4.230% | | | | 7/31/14 | | | | B | | | $ | 521,330 | |
| | 558 | | | DAE Aviation Holdings, Inc., Term Loan B2 | | | 4.230% | | | | 7/31/14 | | | | B | | | | 506,118 | |
| | 112 | | | Hawker Beechcraft, LLC, LC Facility | | | 2.533% | | | | 3/26/14 | | | | CCC+ | | | | 90,580 | |
| | 1,874 | | | Hawker Beechcraft, LLC, Term Loan | | | 2.374% | | | | 3/26/14 | | | | CCC+ | | | | 1,519,032 | |
| | 1,000 | | | McKechnie Aerospace Holdings, Inc., Term Loan | | | 5.320% | | | | 5/11/15 | | | | N/R | | | | 927,323 | |
| | | | | | | | | | | | | | | | | | | | | |
| | 4,118 | | | Total Aerospace & Defense | | | | | | | | | | | | | | | 3,564,383 | |
| | | | | | | | | | | | | | | | | | | | | |
| | | | | Airlines – 3.3% (2.3% of Total Investments) |
| | | | | | | | | | | | | | | | | | | | | |
| | 1,940 | | | Delta Air Lines, Inc., Credit Linked Deposit | | | 2.258% | | | | 4/30/12 | | | | Ba2 | | | | 1,853,104 | |
| | 1,940 | | | Delta Air Lines, Inc., Term Loan | | | 3.591% | | | | 4/30/14 | | | | B | | | | 1,762,166 | |
| | 3,546 | | | United Air Lines, Inc., Term Loan B | | | 2.375% | | | | 2/01/14 | | | | BB– | | | | 3,154,636 | |
| | | | | | | | | | | | | | | | | | | | | |
| | 7,426 | | | Total Airlines | | | | | | | | | | | | | | | 6,769,906 | |
| | | | | | | | | | | | | | | | | | | | | |
| | | | | Auto Components – 2.0% (1.4% of Total Investments) |
| | | | | | | | | | | | | | | | | | | | | |
| | 3,056 | | | Federal-Mogul Corporation, Tranche B, Term Loan | | | 2.286% | | | | 12/29/14 | | | | Ba3 | | | | 2,735,669 | |
| | 1,560 | | | Federal-Mogul Corporation, Tranche C, Term Loan | | | 2.279% | | | | 12/28/15 | | | | Ba3 | | | | 1,396,127 | |
| | | | | | | | | | | | | | | | | | | | | |
| | 4,616 | | | Total Auto Components | | | | | | | | | | | | | | | 4,131,796 | |
| | | | | | | | | | | | | | | | | | | | | |
| | | | | Automobiles – 2.4% (1.6% of Total Investments) |
| | | | | | | | | | | | | | | | | | | | | |
| | 4,931 | | | Ford Motor Company, Term Loan | | | 3.350% | | | | 12/15/13 | | | | Ba1 | | | | 4,800,633 | |
| | | | | | | | | | | | | | | | | | | | | |
| | | | | Building Products – 4.1% (2.8% of Total Investments) |
| | | | | | | | | | | | | | | | | | | | | |
| | 1,327 | | | Building Materials Corporation of America, Term Loan | | | 3.125% | | | | 2/22/14 | | | | BBB– | | | | 1,285,533 | |
| | 1,331 | | | Euramax Holdings, Inc., PIK Term Loan | | | 3.000% | | | | 6/29/13 | | | | B– | | | | 1,255,124 | |
| | 1,288 | | | Euramax Holdings, Inc., Term Loan | | | 10.000% | | | | 6/29/13 | | | | B– | | | | 1,214,692 | |
| | 4,568 | | | TFS Acquisition, Term Loan | | | 10.000% | | | | 8/11/13 | | | | B– | | | | 4,545,101 | |
| | | | | | | | | | | | | | | | | | | | | |
| | 8,514 | | | Total Building Products | | | | | | | | | | | | | | | 8,300,450 | |
| | | | | | | | | | | | | | | | | | | | | |
| | | | | Chemicals – 3.1% (2.1% of Total Investments) |
| | | | | | | | | | | | | | | | | | | | | |
| | 400 | | | Celanese US Holdings LLC, Credit Linked Deposit | | | 2.098% | | | | 4/02/14 | | | | BB+ | | | | 384,000 | |
| | 541 | | | Hercules Offshore, Inc., Term Loan | | | 6.000% | | | | 7/11/13 | | | | B2 | | | | 482,418 | |
| | 119 | | | Hexion Specialty Chemicals, Inc., Term Loan C1 | | | 2.813% | | | | 5/05/13 | | | | Ba3 | | | | 112,178 | |
| | 53 | | | Hexion Specialty Chemicals, Inc., Term Loan C2 | | | 2.813% | | | | 5/05/13 | | | | Ba3 | | | | 49,811 | |
| | 1,412 | | | Hexion Specialty Chemicals, Inc., Term Loan C4 | | | 2.625% | | | | 5/05/13 | | | | Ba3 | | | | 1,327,573 | |
| | 897 | | | Ineos US Finance LLC, Tranche B2 | | | 7.500% | | | | 12/16/13 | | | | B | | | | 884,189 | |
| | 897 | | | Ineos US Finance LLC, Tranche C2 | | | 8.000% | | | | 12/16/14 | | | | B | | | | 884,212 | |
| | 710 | | | Styron Corporation, Term Loan | | | 7.500% | | | | 6/17/16 | | | | B+ | | | | 716,213 | |
| | 1,508 | | | Univar, Inc., Term Loan | | | 3.316% | | | | 10/10/14 | | | | B+ | | | | 1,450,624 | |
| | | | | | | | | | | | | | | | | | | | | |
| | 6,537 | | | Total Chemicals | | | | | | | | | | | | | | | 6,291,218 | |
| | | | | | | | | | | | | | | | | | | | | |
| | | | | Commercial Services & Supplies – 1.5% (1.0% of Total Investments) |
| | | | | | | | | | | | | | | | | | | | | |
| | 134 | | | ServiceMaster Company, Delayed Term Loan | | | 2.820% | | | | 7/24/14 | | | | B+ | | | | 123,748 | |
| | 1,347 | | | ServiceMaster Company, Term Loan | | | 2.879% | | | | 7/24/14 | | | | B+ | | | | 1,242,639 | |
| | 995 | | | Universal City Development Partners, Ltd., Term Loan | | | 5.500% | | | | 11/06/14 | | | | Ba2 | | | | 998,002 | |
| | 727 | | | West Corporation, Term Loan B4 | | | 4.249% | | | | 7/15/16 | | | | BB– | | | | 706,498 | |
| | | | | | | | | | | | | | | | | | | | | |
| | 3,203 | | | Total Commercial Services & Supplies | | | | | | | | | | | | | | | 3,070,887 | |
| | | | | | | | | | | | | | | | | | | | | |
| | | | | Communications Equipment – 2.9% (2.0% of Total Investments) |
| | | | | | | | | | | | | | | | | | | | | |
| | 5,449 | | | Avaya, Inc., Term Loan | | | 3.260% | | | | 10/24/14 | | | | B1 | | | | 4,848,252 | |
| | 998 | | | Telcordia Technologies, Inc., Term Loan | | | 6.750% | | | | 4/30/16 | | | | B+ | | | | 993,759 | |
| | | | | | | | | | | | | | | | | | | | | |
| | 6,447 | | | Total Communications Equipment | | | | | | | | | | | | | | | 5,842,011 | |
| | | | | | | | | | | | | | | | | | | | | |
| | | | | Containers & Packaging – 0.0% (0.0% of Total Investments) |
| | | | | | | | | | | | | | | | | | | | | |
| | 34 | | | Graham Packaging Company LP, Term Loan B | | | 2.636% | | | | 10/07/11 | | | | B+ | | | | 34,410 | |
| | | | | | | | | | | | | | | | | | | | | |
| | | | | Diversified Consumer Services – 1.3% (0.9% of Total Investments) |
| | | | | | | | | | | | | | | | | | | | | |
| | 2,935 | | | Cengage Learning Acquisitions, Inc., Term Loan | | | 3.030% | | | | 7/03/14 | | | | B+ | | | | 2,604,123 | |
| | | | | | | | | | | | | | | | | | | | | |
| | | | | Diversified Financial Services – 1.7% (1.1% of Total Investments) |
| | | | | | | | | | | | | | | | | | | | | |
| | 550 | | | CIT Group, Inc., Tranche A1, Term Loan | | | 13.000% | | | | 1/18/12 | | | | BB | | | | 568,385 | |
| | 1,100 | | | CIT Group, Inc., Tranche B1, Term Loan | | | 13.000% | | | | 1/18/12 | | | | BB | | | | 1,135,009 | |
| | 1,736 | | | Fox Acquisition Sub LLC, Term Loan B | | | 7.500% | | | | 7/14/15 | | | | B | | | | 1,670,852 | |
| | | | | | | | | | | | | | | | | | | | | |
| | 3,386 | | | Total Diversified Financial Services | | | | | | | | | | | | | | | 3,374,246 | |
| | | | | | | | | | | | | | | | | | | | | |
| | | | | | | | | | | | | | | | | | | | | |
| | | | | Weighted
| | | | | | | | | | |
Principal
| | | | | Average
| | | | | | | | | | |
| Amount (000) | | | Description (1) | | Coupon | | | Maturity (2) | | | Ratings (3) | | | Value | |
| | | | | Diversified Telecommunication Services – 3.3% (2.3% of Total Investments) |
| | | | | | | | | | | | | | | | | | | | | |
| $ | 1,995 | | | Cincinnati Bell Inc., Tranche B, Term Loan | | | 6.500% | | | | 11/18/14 | | | | BB | | | $ | 1,962,938 | |
| | 323 | | | Intelsat, Tranche B2, Term Loan A | | | 3.033% | | | | 1/03/14 | | | | BB– | | | | 305,794 | |
| | 323 | | | Intelsat, Tranche B2, Term Loan B | | | 3.033% | | | | 1/03/14 | | | | BB– | | | | 305,700 | |
| | 323 | | | Intelsat, Tranche B2, Term Loan C | | | 3.033% | | | | 1/03/14 | | | | BB– | | | | 305,700 | |
| | 2,000 | | | Intelsat, Unsecured Term Loan | | | 3.026% | | | | 2/01/14 | | | | B+ | | | | 1,800,000 | |
| | 2,267 | | | Level 3 Financing, Inc., Term Loan | | | 2.724% | | | | 3/13/14 | | | | B+ | | | | 2,038,112 | |
| | | | | | | | | | | | | | | | | | | | | |
| | 7,231 | | | Total Diversified Telecommunication Services | | | | | | | | | | | | | | | 6,718,244 | |
| | | | | | | | | | | | | | | | | | | | | |
| | | | | Electric Utilities – 0.7% (0.5% of Total Investments) |
| | | | | | | | | | | | | | | | | | | | | |
| | 451 | | | Calpine Corporation, DIP Term Loan | | | 3.415% | | | | 3/29/14 | | | | B+ | | | | 428,752 | |
| | 556 | | | Calpine Corporation, Delayed Draw, Term Loan, (5), (6) | | | 0.500% | | | | 3/29/14 | | | | B+ | | | | (70,139 | ) |
| | 445 | | | TXU Corporation, Term Loan B2 | | | 3.975% | | | | 10/10/14 | | | | B+ | | | | 346,686 | |
| | 950 | | | TXU Corporation, Term Loan B3 | | | 3.846% | | | | 10/10/14 | | | | B+ | | | | 736,933 | |
| | | | | | | | | | | | | | | | | | | | | |
| | 2,402 | | | Total Electric Utilities | | | | | | | | | | | | | | | 1,442,232 | |
| | | | | | | | | | | | | | | | | | | | | |
| | | | | Electrical Equipment – 1.7% (1.2% of Total Investments) |
| | | | | | | | | | | | | | | | | | | | | |
| | 3,790 | | | Allison Transmission Holdings, Inc., Term Loan | | | 3.100% | | | | 8/07/14 | | | | B | | | | 3,548,331 | |
| | | | | | | | | | | | | | | | | | | | | |
| | | | | Food & Staples Retailing – 1.9% (1.3% of Total Investments) |
| | | | | | | | | | | | | | | | | | | | | |
| | 4,457 | | | U.S. Foodservice, Inc., Term Loan | | | 2.828% | | | | 7/03/14 | | | | B2 | | | | 3,879,521 | |
| | | | | | | | | | | | | | | | | | | | | |
| | | | | Food Products – 1.8% (1.2% of Total Investments) |
| | | | | | | | | | | | | | | | | | | | | |
| | 1,949 | | | BLB Management Services, Inc., Term Loan, WI/DD | | | TBD | | | | TBD | | | | N/R | | | | 1,409,729 | |
| | 1,700 | | | Michael Foods Group, Inc., Term Loan B | | | 6.250% | | | | 6/29/16 | | | | BB– | | | | 1,706,588 | |
| | 492 | | | Pinnacle Foods Finance LLC, Tranche C, Term Loan | | | 7.500% | | | | 4/02/14 | | | | B | | | | 493,967 | |
| | | | | | | | | | | | | | | | | | | | | |
| | 4,141 | | | Total Food Products | | | | | | | | | | | | | | | 3,610,284 | |
| | | | | | | | | | | | | | | | | | | | | |
| | | | | Health Care Equipment & Supplies – 1.2% (0.8% of Total Investments) |
| | | | | | | | | | | | | | | | | | | | | |
| | 239 | | | Fenwal, Inc., Delayed Term Loan | | | 2.788% | | | | 2/28/14 | | | | B | | | | 207,069 | |
| | 759 | | | Fenwal, Inc., Term Loan | | | 2.788% | | | | 2/28/14 | | | | B | | | | 657,379 | |
| | 899 | | | Symbion, Inc., Term Loan A | | | 3.566% | | | | 8/23/13 | | | | B1 | | | | 814,266 | |
| | 929 | | | Symbion, Inc., Term Loan B | | | 3.566% | | | | 8/25/14 | | | | B1 | | | | 841,453 | |
| | | | | | | | | | | | | | | | | | | | | |
| | 2,826 | | | Total Health Care Equipment & Supplies | | | | | | | | | | | | | | | 2,520,167 | |
| | | | | | | | | | | | | | | | | | | | | |
| | | | | Health Care Providers & Services – 12.1% (8.3% of Total Investments) |
| | | | | | | | | | | | | | | | | | | | | |
| | 1,496 | | | Ardent Medical Services, Inc., Term Loan | | | 6.500% | | | | 9/15/15 | | | | B1 | | | | 1,459,779 | |
| | 170 | | | Community Health Systems, Inc., Delayed Term Loan | | | 2.788% | | | | 7/25/14 | | | | BB | | | | 160,963 | |
| | 3,306 | | | Community Health Systems, Inc., Term Loan | | | 2.788% | | | | 7/25/14 | | | | BB | | | | 3,137,327 | |
| | 936 | | | HCA, Inc., Tranche B2, Term Loan | | | 3.783% | | | | 3/31/17 | | | | BB | | | | 912,517 | |
| | 215 | | | IASIS Healthcare LLC, Delayed Term Loan | | | 2.316% | | | | 3/14/14 | | | | Ba2 | | | | 203,239 | |
| | 58 | | | IASIS Healthcare LLC, Letter of Credit | | | 2.280% | | | | 3/14/14 | | | | Ba2 | | | | 55,303 | |
| | 2,111 | | | IASIS Healthcare LLC, PIK Term Loan | | | 4.250% | | | | 6/16/14 | | | | CCC+ | | | | 1,986,592 | |
| | 621 | | | IASIS Healthcare LLC, Term Loan | | | 2.316% | | | | 3/14/14 | | | | Ba2 | | | | 587,226 | |
| | 3,810 | | | LifeCare, Term Loan B | | | 4.730% | | | | 8/10/12 | | | | B2 | | | | 3,524,250 | |
| | 1,901 | | | Rehabcare Group, Inc., Term Loan B | | | 6.000% | | | | 11/24/15 | | | | BB | | | | 1,889,467 | |
| | 1,712 | | | Select Medical Corporation, Term Loan, WI/DD | | | TBD | | | | TBD | | | | Ba2 | | | | 1,668,254 | |
| | 396 | | | Skilled Healthcare Group, Inc., Delayed Term Loan | | | 5.250% | | | | 4/09/16 | | | | B1 | | | | 364,833 | |
| | 4,346 | | | Skilled Healthcare Group, Inc., Term Loan, DD1 | | | 5.250% | | | | 4/09/16 | | | | B1 | | | | 4,002,218 | |
| | 3,000 | | | Universal Health Services Term Loan, WI/DD | | | TBD | | | | TBD | | | | BB+ | | | | 2,982,499 | |
| | 1,574 | | | Vanguard Health Holding Company II LLC, Initial Term Loan | | | 5.000% | | | | 1/29/16 | | | | Ba2 | | | | 1,561,055 | |
| | | | | | | | | | | | | | | | | | | | | |
| | 25,652 | | | Total Health Care Providers & Services | | | | | | | | | | | | | | | 24,495,522 | |
| | | | | | | | | | | | | | | | | | | | | |
| | | | | Hotels, Restaurants & Leisure – 13.1% (9.0% of Total Investments) |
| | | | | | | | | | | | | | | | | | | | | |
| | 2,000 | | | 24 Hour Fitness Worldwide, Inc., Term Loan | | | 6.750% | | | | 4/22/16 | | | | Ba2 | | | | 1,866,500 | |
| | 3,368 | | | CCM Merger, Inc., Term Loan B | | | 8.500% | | | | 7/13/12 | | | | BB– | | | | 3,327,946 | |
| | 1,470 | | | Cedar Fair LP, Term Loan, WI/DD | | | TBD | | | | TBD | | | | Ba2 | | | | 1,476,234 | |
| | 1,000 | | | Harrah’s Operating Company, Inc., Term Loan B1 | | | 3.498% | | | | 1/28/15 | | | | B | | | | 858,264 | |
| | 2,000 | | | Harrah’s Operating Company, Inc., Term Loan B2 | | | 3.498% | | | | 1/28/15 | | | | B | | | | 1,722,126 | |
| | 997 | | | Harrah’s Operating Company, Inc., Term Loan B3 | | | 3.498% | | | | 1/28/15 | | | | B | | | | 852,256 | |
| | 390 | | | Isle of Capri Casinos, Inc., Delayed Term Loan A | | | 5.000% | | | | 11/25/13 | | | | B+ | | | | 369,247 | |
| | 506 | | | Isle of Capri Casinos, Inc., Delayed Term Loan B | | | 5.000% | | | | 11/25/13 | | | | B+ | | | | 479,114 | |
| | 1,264 | | | Isle of Capri Casinos, Inc., Delayed Term Loan | | | 5.000% | | | | 11/25/13 | | | | B+ | | | | 1,197,785 | |
| | 2,361 | | | Orbitz Worldwide, Inc., Term Loan | | | 3.417% | | | | 7/25/14 | | | | B+ | | | | 2,219,713 | |
| | 188 | | | OSI Restaurant Partners LLC, Revolver | | | 1.432% | | | | 6/14/13 | | | | B+ | | | | 163,405 | |
| | 1,673 | | | OSI Restaurant Partners LLC, Term Loan | | | 2.875% | | | | 6/14/14 | | | | B+ | | | | 1,456,606 | |
| | 1,000 | | | QCE LLC, Term Loan | | | 6.066% | | | | 11/05/13 | | | | N/R | | | | 677,500 | |
| | 994 | | | Reynolds Group Holdings, Inc., US Term Loan | | | 6.250% | | | | 11/05/15 | | | | BB– | | | | 993,005 | |
| | 993 | | | SW Acquisitions Co., Inc., Term Loan | | | 5.750% | | | | 6/01/16 | | | | BB+ | | | | 994,833 | |
| | | | |
| | | | |
NSL | | | Nuveen Senior Income Fund (continued)
Portfolio of Investments July 31, 2010 |
| | | | | | | | | | | | | | | | | | | | | |
| | | | | Weighted
| | | | | | | | | | |
Principal
| | | | | Average
| | | | | | | | | | |
| Amount (000) | | | Description (1) | | Coupon | | | Maturity (2) | | | Ratings (3) | | | Value | |
| | | | | Hotels, Restaurants & Leisure (continued) |
| | | | | | | | | | | | | | | | | | | | | |
| $ | 970 | | | Travelport LLC, Delayed Term Loan | | | 2.816% | | | | 8/23/13 | | | | Ba3 | | | $ | 914,495 | |
| | 268 | | | Travelport LLC, Letter of Credit | | | 3.033% | | | | 8/23/13 | | | | Ba3 | | | | 253,028 | |
| | 1,334 | | | Travelport LLC, Term Loan | | | 2.816% | | | | 8/23/13 | | | | Ba3 | | | | 1,261,038 | |
| | 1,119 | | | Venetian Casino Resort LLC, Delayed Term Loan, DD1 | | | 2.070% | | | | 5/23/14 | | | | B– | | | | 1,041,281 | |
| | 4,761 | | | Venetian Casino Resort LLC, Term Loan, DD1 | | | 2.070% | | | | 5/23/14 | | | | B– | | | | 4,431,111 | |
| | | | | | | | | | | | | | | | | | | | | |
| | 28,656 | | | Total Hotels, Restaurants & Leisure | | | | | | | | | | | | | | | 26,555,487 | |
| | | | | | | | | | | | | | | | | | | | | |
| | | | | Household Products – 1.8% (1.2% of Total Investments) |
| | | | | | | | | | | | | | | | | | | | | |
| | 3,509 | | | Spectrum Brands, Inc., Term Loan | | | 8.000% | | | | 6/16/16 | | | | B | | | | 3,551,057 | |
| | | | | | | | | | | | | | | | | | | | | |
| | | | | Insurance – 1.3% (0.9% of Total Investments) |
| | | | | | | | | | | | | | | | | | | | | |
| | 1,165 | | | Conseco, Inc., Term Loan | | | 7.500% | | | | 10/10/13 | | | | B2 | | | | 1,141,731 | |
| | 1,563 | | | Fidelity National Information Services, Inc., Term Loan B | | | 5.250% | | | | 7/18/16 | | | | Ba2 | | | | 1,573,405 | |
| | | | | | | | | | | | | | | | | | | | | |
| | 2,728 | | | Total Insurance | | | | | | | | | | | | | | | 2,715,136 | |
| | | | | | | | | | | | | | | | | | | | | |
| | | | | Internet Software & Services – 1.6% (1.1% of Total Investments) |
| | | | | | | | | | | | | | | | | | | | | |
| | 1,459 | | | Open Solutions, Inc., Term Loan B | | | 2.625% | | | | 1/23/14 | | | | BB– | | | | 1,262,557 | |
| | 2,000 | | | SkillSoft PLC Term Loan | | | 6.500% | | | | 5/30/17 | | | | BB | | | | 2,007,500 | |
| | | | | | | | | | | | | | | | | | | | | |
| | 3,459 | | | Total Internet Software & Services | | | | | | | | | | | | | | | 3,270,057 | |
| | | | | | | | | | | | | | | | | | | | | |
| | | | | IT Services – 4.6% (3.2% of Total Investments) |
| | | | | | | | | | | | | | | | | | | | | |
| | 953 | | | First Data Corporation, Term Loan B1 | | | 3.078% | | | | 9/24/14 | | | | B+ | | | | 831,563 | |
| | 2,473 | | | First Data Corporation, Term Loan B2 | | | 3.078% | | | | 9/24/14 | | | | B+ | | | | 2,155,624 | |
| | 127 | | | Infor Global Solutions Intermediate Holdings, Ltd., Delayed Term Loan, First Lien | | | 6.030% | | | | 7/28/15 | | | | B+ | | | | 118,556 | |
| | 2,090 | | | Infor Global Solutions Intermediate Holdings, Ltd., Delayed Term Loan, Second Lien, DD1 | | | 6.566% | | | | 3/02/14 | | | | CCC+ | | | | 1,546,600 | |
| | 545 | | | Infor Global Solutions Intermediate Holdings, Ltd., Extended Delayed Term Loan | | | 6.070% | | | | 7/28/15 | | | | B+ | | | | 508,380 | |
| | 1,008 | | | Infor Global Solutions Intermediate Holdings, Ltd., Holdco PIK Term Loan, WI/DD | | | TBD | | | | TBD | | | | N/R | | | | 414,822 | |
| | 270 | | | Infor Global Solutions Intermediate Holdings, Ltd., Term Loan, First Lien | | | 4.070% | | | | 7/28/12 | | | | B+ | | | | 251,521 | |
| | 3,610 | | | Infor Global Solutions Intermediate Holdings, Ltd., Term Loan, Second Lien, DD1 | | | 6.566% | | | | 3/02/14 | | | | CCC+ | | | | 2,647,332 | |
| | 1,038 | | | Infor Global Solutions Intermediate Holdings, Ltd., Term Loan | | | 6.070% | | | | 7/28/15 | | | | B+ | | | | 962,672 | |
| | | | | | | | | | | | | | | | | | | | | |
| | 12,114 | | | Total IT Services | | | | | | | | | | | | | | | 9,437,070 | |
| | | | | | | | | | | | | | | | | | | | | |
| | | | | Leisure Equipment & Products – 2.6% (1.8% of Total Investments) |
| | | | | | | | | | | | | | | | | | | | | |
| | 3,244 | | | Bombardier Recreational Products, Inc., Term Loan | | | 3.193% | | | | 6/28/13 | | | | Caa1 | | | | 2,813,754 | |
| | 1,260 | | | Herbst Gaming, Inc., Delayed Term Loan, (7), (8) | | | 10.500% | | | | 12/02/11 | | | | N/R | | | | 775,061 | |
| | 2,613 | | | Herbst Gaming, Inc., Term Loan, (7), (8) | | | 10.500% | | | | 12/02/11 | | | | N/R | | | | 1,607,050 | |
| | | | | | | | | | | | | | | | | | | | | |
| | 7,117 | | | Total Leisure Equipment & Products | | | | | | | | | | | | | | | 5,195,865 | |
| | | | | | | | | | | | | | | | | | | | | |
| | | | | Media – 13.6% (9.4% of Total Investments) |
| | | | | | | | | | | | | | | | | | | | | |
| | 64 | | | American Media Operations, Inc., Term Loan | | | 5.500% | | | | 1/30/13 | | | | B3 | | | | 61,185 | |
| | 1,656 | | | Carmike Cinemas, Inc., Term Loan | | | 5.500% | | | | 1/27/16 | | | | B1 | | | | 1,655,840 | |
| | 1,000 | | | Charter Communications Operating Holdings LLC, Holdco Term Loan | | | 3.038% | | | | 3/06/14 | | | | BB+ | | | | 917,750 | |
| | 4,380 | | | Charter Communications Operating Holdings LLC, Term Loan C | | | 3.790% | | | | 9/06/16 | | | | BB+ | | | | 4,186,832 | |
| | 540 | | | Charter Communications Operating Holdings LLC, Term Loan | | | 2.320% | | | | 3/06/14 | | | | BB+ | | | | 513,140 | |
| | 1,465 | | | Citadel Broadcasting Corporation, Term Loan, (9) | | | 11.000% | | | | 6/03/15 | | | | BB+ | | | | 1,538,046 | |
| | 1,539 | | | Gray Television, Inc., Term Loan B | | | 3.850% | | | | 12/31/14 | | | | B | | | | 1,449,297 | |
| | 2,400 | | | Interactive Data Corporation, Term Loan, WI/DD | | | TBD | | | | TBD | | | | Ba3 | | | | 2,398,999 | |
| | 3,860 | | | Metro-Goldwyn-Mayer Studios, Inc., Term Loan B, (7), (8), (9) | | | 18.250% | | | | 4/09/12 | | | | N/R | | | | 1,692,564 | |
| | 1,210 | | | Nielsen Finance LLC, Term Loan B | | | 4.095% | | | | 5/02/16 | | | | Ba3 | | | | 1,172,801 | |
| | 1,000 | | | Emmis Operating Company, Tranche B, Term Loan, WI/DD | | | TBD | | | | TBD | | | | Caa2 | | | | 847,500 | |
| | 1,888 | | | Philadelphia Newspapers, Term Loan, (7), (8) | | | 6.500% | | | | 6/29/13 | | | | N/R | | | | 580,623 | |
| | 2,974 | | | Spanish Broadcasting System, Inc., Term Loan B | | | 2.290% | | | | 6/11/12 | | | | B– | | | | 2,681,428 | |
| | 1,082 | | | SuperMedia, Term Loan | | | 8.000% | | | | 12/31/15 | | | | B– | | | | 915,428 | |
| | 2,410 | | | Tribune Company, Term Loan B, (7), (8), DD1 | | | 3.000% | | | | 6/04/14 | | | | Ca | | | | 1,548,409 | |
| | 4,968 | | | Univision Communications, Inc., Term Loan | | | 2.566% | | | | 9/29/14 | | | | B2 | | | | 4,350,847 | |
| | 2,000 | | | Yell Group PLC, Term Loan | | | 4.066% | | | | 7/31/14 | | | | N/R | | | | 1,210,000 | |
| | | | | | | | | | | | | | | | | | | | | |
| | 34,436 | | | Total Media | | | | | | | | | | �� | | | | | 27,720,689 | |
| | | | | | | | | | | | | | | | | | | | | |
| | | | | Metals & Mining – 1.0% (0.7% of Total Investments) |
| | | | | | | | | | | | | | | | | | | | | |
| | 2,135 | | | John Maneely Company, Term Loan | | | 3.775% | | | | 12/09/13 | | | | B | | | | 2,031,112 | |
| | | | | | | | | | | | | | | | | | | | | |
| | | | | Multiline Retail – 1.6% (1.1% of Total Investments) |
| | | | | | | | | | | | | | | | | | | | | |
| | 3,508 | | | Neiman Marcus Group, Inc., Term Loan, DD1 | | | 2.473% | | | | 4/06/13 | | | | BB– | | | | 3,315,654 | |
| | | | | | | | | | | | | | | | | | | | | |
| | | | | Oil, Gas & Consumable Fuels – 3.6% (2.5% of Total Investments) |
| | | | | | | | | | | | | | | | | | | | | |
| | 167 | | | Alon USA Energy, Inc., Edgington Facility | | | 2.566% | | | | 8/05/13 | | | | BB– | | | | 131,227 | |
| | 1,337 | | | Alon USA Energy, Inc., Paramount Facility | | | 2.669% | | | | 8/05/13 | | | | BB– | | | | 1,049,738 | |
| | 1,000 | | | Big West Oil LLC, New Term Loan | | | 12.000% | | | | 7/23/15 | | | | B+ | | | | 1,008,333 | |
| | | | | | | | | | | | | | | | | | | | | |
| | | | | Weighted
| | | | | | | | | | |
Principal
| | | | | Average
| | | | | | | | | | |
| Amount (000) | | | Description (1) | | Coupon | | | Maturity (2) | | | Ratings (3) | | | Value | |
| | | | | Oil, Gas & Consumable Fuels (continued) |
| | | | | | | | | | | | | | | | | | | | | |
| $ | 295 | | | Calumet Lubricants Company LP, Credit Linked Deposit | | | 4.383% | | | | 1/03/15 | | | | B1 | | | $ | 273,235 | |
| | 2,176 | | | Calumet Lubricants Company LP, Term Loan | | | 4.436% | | | | 1/03/15 | | | | B1 | | | | 2,018,166 | |
| | 750 | | | DynCorp International, Inc., Term Loan | | | 6.250% | | | | 7/07/16 | | | | Ba1 | | | | 754,125 | |
| | 2,369 | | | Venoco, Inc., Term Loan | | | 4.375% | | | | 5/07/14 | | | | BB– | | | | 2,147,240 | |
| | | | | | | | | | | | | | | | | | | | | |
| | 8,094 | | | Total Oil, Gas & Consumable Fuels | | | | | | | | | | | | | | | 7,382,064 | |
| | | | | | | | | | | | | | | | | | | | | |
| | | | | Paper & Forest Products – 3.0% (2.1% of Total Investments) |
| | | | | | | | | | | | | | | | | | | | | |
| | 3,000 | | | Newark Group, Inc., DIP Term Loan, WI/DD | | | TBD | | | | TBD | | | | N/R | | | | 3,030,000 | |
| | 3,830 | | | Wilton Products, Term Loan | | | 3.760% | | | | 8/01/14 | | | | B+ | | | | 3,121,648 | |
| | | | | | | | | | | | | | | | | | | | | |
| | 6,830 | | | Total Paper & Forest Products | | | | | | | | | | | | | | | 6,151,648 | |
| | | | | | | | | | | | | | | | | | | | | |
| | | | | Personal Products – 1.0% (0.7% of Total Investments) |
| | | | | | | | | | | | | | | | | | | | | |
| | 1,995 | | | Revlon Consumer Products Corporation, Term Loan | | | 6.000% | | | | 3/11/15 | | | | Ba3 | | | | 1,961,334 | |
| | | | | | | | | | | | | | | | | | | | | |
| | | | | Pharmaceuticals – 2.1% (1.5% of Total Investments) |
| | | | | | | | | | | | | | | | | | | | | |
| | 2,000 | | | Graceway Pharmaceuticals LLC, Second Lien Term Loan, (11) | | | 6.816% | | | | 5/03/13 | | | | CCC | | | | 796,666 | |
| | 2,182 | | | Graceway Pharmaceuticals LLC, Term Loan | | | 3.066% | | | | 5/03/12 | | | | B– | | | | 1,831,711 | |
| | 236 | | | Warner Chilcott Corporation, Add on Term Loan | | | 5.750% | | | | 4/30/15 | | | | BB+ | | | | 236,412 | |
| | 644 | | | Warner Chilcott Corporation, Term Loan A | | | 5.500% | | | | 10/30/14 | | | | BB+ | | | | 644,309 | |
| | 303 | | | Warner Chilcott Corporation, Term Loan B1 | | | 5.750% | | | | 4/30/15 | | | | BB+ | | | | 303,718 | |
| | 505 | | | Warner Chilcott Corporation, Term Loan B2 | | | 5.750% | | | | 4/30/15 | | | | BB+ | | | | 505,745 | |
| | | | | | | | | | | | | | | | | | | | | |
| | 5,870 | | | Total Pharmaceuticals | | | | | | | | | | | | | | | 4,318,561 | |
| | | | | | | | | | | | | | | | | | | | | |
| | | | | Professional Services – 1.3% (0.9% of Total Investments) |
| | | | | | | | | | | | | | | | | | | | | |
| | 1,833 | | | US Invsetigations Services Inc., Term Loan B, WI/DD | | | TBD | | | | TBD | | | | B+ | | | | 1,833,333 | |
| | 978 | | | Vertrue Inc., Term Loan | | | 3.540% | | | | 8/16/14 | | | | Ba3 | | | | 849,953 | |
| | | | | | | | | | | | | | | | | | | | | |
| | 2,811 | | | Total Professional Services | | | | | | | | | | | | | | | 2,683,286 | |
| | | | | | | | | | | | | | | | | | | | | |
| | | | | Real Estate Management & Development – 3.3% (2.2% of Total Investments) |
| | | | | | | | | | | | | | | | | | | | | |
| | 3,502 | | | Capital Automotive LP, Tranche C | | | 2.850% | | | | 12/14/12 | | | | Ba3 | | | | 3,269,688 | |
| | 1,729 | | | LNR Property Corporation, Term Loan B | | | 7.750% | | | | 7/12/11 | | | | CCC | | | | 1,652,720 | |
| | 1,916 | | | Realogy Corporation, Delayed Term Loan | | | 3.380% | | | | 10/10/13 | | | | Caa1 | | | | 1,683,359 | |
| | | | | | | | | | | | | | | | | | | | | |
| | 7,147 | | | Total Real Estate Management & Development | | | | | | | | | | | | | | | 6,605,767 | |
| | | | | | | | | | | | | | | | | | | | | |
| | | | | Road & Rail – 2.9% (2.0% of Total Investments) |
| | | | | | | | | | | | | | | | | | | | | |
| | 392 | | | Avis Budget Car Rental LLC, Term Loan | | | 5.750% | | | | 4/19/14 | | | | Ba2 | | | | 390,000 | |
| | 5,716 | | | Swift Transportation Company, Inc., Term Loan | | | 8.250% | | | | 5/12/14 | | | | B– | | | | 5,578,436 | |
| | | | | | | | | | | | | | | | | | | | | |
| | 6,108 | | | Total Road & Rail | | | | | | | | | | | | | | | 5,968,436 | |
| | | | | | | | | | | | | | | | | | | | | |
| | | | | Semiconductors & Equipment – 1.5% (1.0% of Total Investments) |
| | | | | | | | | | | | | | | | | | | | | |
| | 1,200 | | | Freescale Semiconductor, Inc., Term Loan | | | 4.596% | | | | 12/01/16 | | | | B2 | | | | 1,105,934 | |
| | 1,995 | | | Spansion LLC, Term Loan | | | 5.500% | | | | 2/09/15 | | | | BB– | | | | 1,984,403 | |
| | | | | | | | | | | | | | | | | | | | | |
| | 3,195 | | | Total Semiconductors & Equipment | | | | | | | | | | | | | | | 3,090,337 | |
| | | | | | | | | | | | | | | | | | | | | |
| | | | | Software – 3.2% (2.2% of Total Investments) |
| | | | | | | | | | | | | | | | | | | | | |
| | 2,768 | | | Dealer Computer Services, Inc., New Term Loan | | | 5.250% | | | | 4/21/17 | | | | BB– | | | | 2,744,622 | |
| | 2,000 | | | IPC Systems, Inc., Term Loan, Second Lien | | | 5.783% | | | | 6/01/15 | | | | CCC | | | | 1,650,000 | |
| | 914 | | | IPC Systems, Inc., Term Loan | | | 2.697% | | | | 6/02/14 | | | | B1 | | | | 817,089 | |
| | 500 | | | Reynolds Group Holdings, Inc., Incremental US Term Loan | | | 5.750% | | | | 5/05/16 | | | | BB– | | | | 498,438 | |
| | 800 | | | Vertafore Inc., Term Loan, WI/DD | | | TBD | | | | TBD | | | | N/R | | | | 797,750 | |
| | | | | | | | | | | | | | | | | | | | | |
| | 6,982 | | | Total Software | | | | | | | | | | | | | | | 6,507,899 | |
| | | | | | | | | | | | | | | | | | | | | |
| | | | | Specialty Retail – 6.1% (4.2% of Total Investments) |
| | | | | | | | | | | | | | | | | | | | | |
| | 5,066 | | | Burlington Coat Factory Warehouse Corporation, Term Loan | | | 2.710% | | | | 5/28/13 | | | | B– | | | | 4,802,594 | |
| | 4,483 | | | Michaels Stores, Inc., Term Loan B1, DD1 | | | 2.762% | | | | 10/31/13 | | | | B | | | | 4,204,759 | |
| | 1,396 | | | Michaels Stores, Inc., Term Loan B2 | | | 5.012% | | | | 7/31/16 | | | | B | | | | 1,337,199 | |
| | 2,000 | | | Toys “R” Us–Delaware, Inc., Term Loan B | | | 4.575% | | | | 7/19/12 | | | | BB– | | | | 1,982,500 | |
| | | | | | | | | | | | | | | | | | | | | |
| | 12,945 | | | Total Specialty Retail | | | | | | | | | | | | | | | 12,327,052 | |
| | | | | | | | | | | | | | | | | | | | | |
| | | | | Wireless Telecommunication Services – 1.7% (1.2% of Total Investments) |
| | | | | | | | | | | | | | | | | | | | | |
| | 1,985 | | | Asurion Corporation, Term Loan | | | 3.356% | | | | 7/03/14 | | | | N/R | | | | 1,905,048 | |
| | 2,000 | | | Clear Channel Communications, Inc., Tranche B, Term Loan | | | 3.966% | | | | 11/13/15 | | | | Caa1 | | | | 1,599,286 | |
| | | | | | | | | | | | | | | | | | | | | |
| | 3,985 | | | Total Wireless Telecommunication Services | | | | | | | | | | | | | | | 3,504,334 | |
| | | | | | | | | | | | | | | | | | | | | |
| $ | 266,270 | | | Total Variable Rate Senior Loan Interests (cost $249,909,289) | | | | | | | | | | | | | | | 239,291,209 | |
| | | | | | | | | | | | | | | | | | | | | |
| | | | |
| | | | |
NSL | | | Nuveen Senior Income Fund (continued)
Portfolio of Investments July 31, 2010 |
| | | | | | | | | | | | | | | | | | | | | |
| | | | | | | | | | | | | | | |
| | | | | | | | | | | | | | | |
| Shares | | | Description (1) | | | | | | | | | | | Value | |
| | | | | Common Stocks – 2.5% (1.7% of Total Investments) |
| | | | | |
| | | | | Building Products – 1.9% (1.3% of Total Investments) |
| | | | | | | | | | | | | | | | | | | | | |
| | 88,501 | | | Masonite Worldwide Holdings, (10), (12) | | | | | | | | | | | | | | $ | 3,777,886 | |
| | | | | | | | | | | | | | | | | | | | | |
| | | | | Chemicals – 0.3% (0.2% of Total Investments) |
| | | | | | | | | | | | | | | | | | | | | |
| | 20,014 | | | LyondellBasell Industries NV, (10) | | | | | | | | | | | | | | | 360,252 | |
| | 18,343 | | | LyondellBasell Industries NV, (10) | | | | | | | | | | | | | | | 330,174 | |
| | | | | | | | | | | | | | | | | | | | | |
| | | | | Total Chemicals | | | | | | | | | | | | | | | 690,426 | |
| | | | | | | | | | | | | | | | | | | | | |
| | | | | Media – 0.3% (0.2% of Total Investments) |
| | | | | | | | | | | | | | | | | | | | | |
| | 33,484 | | | Readers Digest Association Inc., (10), (12) | | | | | | | | | | | | | | | 661,309 | |
| | | | | | | | | | | | | | | | | | | | | |
| | | | | Total Common Stocks (cost $5,477,758) | | | 5,129,621 | |
| | | | | | | | | | | | | | | | | | | | | |
| | | | | | | | | | | | | | | |
Principal
| | | | | | | | | | | | | | | |
| Amount (000) | | | Description (1) | | Coupon | | | Maturity | | | Ratings (3) | | | Value | |
| | | | | Convertible Bonds – 2.2% (1.5% of Total Investments) |
| | | | | |
| | | | | Communications Equipment – 0.4% (0.3% of Total Investments) |
| | | | | | | | | | | | | | | | | | | | | |
| $ | 1,000 | | | Nortel Networks Corporation, (7), (8), (14) | | | 1.750% | | | | 4/15/12 | | | | D | | | $ | 785,000 | |
| | | | | | | | | | | | | | | | | | | | | |
| | | | | Computers & Peripherals – 0.7% (0.5% of Total Investments) |
| | | | | | | | | | | | | | | | | | | | | |
| | 2,000 | | | Hutchinson Technology Inc. | | | 3.250% | | | | 1/15/26 | | | | B– | | | | 1,520,000 | |
| | | | | | | | | | | | | | | | | | | | | |
| | | | | Food & Staples Retailing – 1.1% (0.7% of Total Investments) |
| | | | | | | | | | | | | | | | | | | | | |
| | 2,700 | | | Great Atlantic & Pacific Tea Company Inc. | | | 5.125% | | | | 6/15/11 | | | | Caa3 | | | | 2,136,375 | |
| | | | | | | | | | | | | | | | | | | | | |
| $ | 5,700 | | | Total Convertible Bonds (cost $4,382,418) | | | | | | | | | | | | | | | 4,441,375 | |
| | | | | | | | | | | | | | | | | | | | | |
| | | | | | | | | | | | | | | |
Principal
| | | | | | | | | | | | | | | |
| Amount (000) | | | Description (1) | | Coupon | | | Maturity | | | Ratings (3) | | | Value | |
| | | | | Corporate Bonds – 10.5% (7.2% of Total Investments) |
| | | | | |
| | | | | Auto Components – 0.2% (0.1% of Total Investments) |
| | | | | | | | | | | | | | | | | | | | | |
| $ | 400 | | | Exide Technologies | | | 10.500% | | | | 3/15/13 | | | | B– | | | $ | 408,000 | |
| | | | | | | | | | | | | | | | | | | | | |
| | | | | Automobiles – 1.7% (1.1% of Total Investments) |
| | | | | | | | | | | | | | | | | | | | | |
| | 6,000 | | | General Motors Corporation, (8) | | | 8.250% | | | | 7/15/23 | | | | N/R | | | | 2,070,000 | |
| | 4,000 | | | General Motors Corporation, (8) | | | 6.750% | | | | 5/01/28 | | | | N/R | | | | 1,310,000 | |
| | | | | | | | | | | | | | | | | | | | | |
| | 10,000 | | | Total Automobiles | | | | | | | | | | | | | | | 3,380,000 | |
| | | | | | | | | | | | | | | | | | | | | |
| | | | | Biotechnology – 0.8% (0.5% of Total Investments) |
| | | | | | | | | | | | | | | | | | | | | |
| | 2,000 | | | Angiotech Pharmaceuticals, Inc., Floating Rate Note, 3.750% plus three-month LIBOR, DD1 | | | 4.204% | | | | 12/01/13 | | | | CC | | | | 1,527,500 | |
| | | | | | | | | | | | | | | | | | | | | |
| | | | | Construction Materials – 1.0% (0.7% of Total Investments) |
| | | | | | | | | | | | | | | | | | | | | |
| | 2,000 | | | Headwaters Inc., 144A | | | 11.375% | | | | 11/01/14 | | | | B+ | | | | 2,040,000 | |
| | | | | | | | | | | | | | | | | | | | | |
| | | | | Health Care Providers & Services – 0.7% (0.5% of Total Investments) |
| | | | | | | | | | | | | | | | | | | | | |
| | 1,000 | | | Select Medical Corporation, Floating Rate Note, 5.750% plus six-month LIBOR | | | 6.418% | | | | 9/15/15 | | | | CCC+ | | | | 876,250 | |
| | 500 | | | Select Medical Corporation | | | 7.625% | | | | 2/01/15 | | | | B– | | | | 481,250 | |
| | | | | | | | | | | | | | | | | | | | | |
| | 1,500 | | | Total Health Care Providers & Services – 0.7% (0.5% of Total Investments) | | | | | | | | | | | | | | | 1,357,500 | |
| | | | | | | | | | | | | | | | | | | | | |
| | | | | Health Care Technology – 0.5% (0.4% of Total Investments) |
| | | | | | | | | | | | | | | | | | | | | |
| | 1,000 | | | Merge Healthcare Inc., 144A | | | 11.750% | | | | 5/01/15 | | | | B+ | | | | 1,010,000 | |
| | | | | | | | | | | | | | | | | | | | | |
| | | | | Hotels, Restaurants & Leisure – 0.5% (0.4% of Total Investments) |
| | | | | | | | | | | | | | | | | | | | | |
| | 1,000 | | | CKE Restaurant Inc., 144A | | | 11.375% | | | | 7/15/18 | | | | B | | | | 1,022,500 | |
| | | | | | | | | | | | | | | | | | | | | |
| | | | | Household Durables – 0.3% (0.2% of Total Investments) |
| | | | | | | | | | | | | | | | | | | | | |
| | 700 | | | William Lyon Homes Inc., Unsecured Senior Note | | | 10.750% | | | | 4/01/13 | | | | Caa3 | | | | 584,500 | |
| | | | | | | | | | | | | | | | | | | | | |
| | | | | Internet Software & Services – 0.8% (0.5% of Total Investments) |
| | | | | | | | | | | | | | | | | | | | | |
| | 2,000 | | | Open Solutions Inc., 144A | | | 9.750% | | | | 2/01/15 | | | | CCC+ | | | | 1,555,000 | |
| | | | | | | | | | | | | | | | | | | | | |
| | | | | IT Services – 0.3% (0.2% of Total Investments) |
| | | | | | | | | | | | | | | | | | | | | |
| | 1,000 | | | First Data Corporation | | | 11.250% | | | | 3/31/16 | | | | CCC+ | | | | 645,000 | |
| | | | | | | | | | | | | | | | | | | | | |
| | | | | | | | | | | | | | | | | | | | | |
| | | | | | | | | | | | | | | |
Principal
| | | | | | | | | | | | | | | |
| Amount (000) | | | Description (1) | | Coupon | | | Maturity | | | Ratings (3) | | | Value | |
| | | | | Media – 1.5% (1.0% of Total Investments) |
| | | | | | | | | | | | | | | | | | | | | |
| $ | 1,250 | | | Clear Channel Communications, Inc. | | | 5.000% | | | | 3/15/12 | | | | CCC– | | | $ | 1,143,750 | |
| | 500 | | | Clear Channel Communications, Inc. | | | 5.500% | | | | 9/15/14 | | | | CCC– | | | | 297,500 | |
| | 2,000 | | | Clear Channel Communications, Inc. | | | 10.750% | | | | 8/01/16 | | | | CCC– | | | | 1,537,500 | |
| | | | | | | | | | | | | | | | | | | | | |
| | 3,750 | | | Total Media | | | | | | | | | | | | | | | 2,978,750 | |
| | | | | | | | | | | | | | | | | | | | | |
| | | | | Multi-Utilities – 0.2% (0.2% of Total Investments) |
| | | | | | | | | | | | | | | | | | | | | |
| | 500 | | | Bon-Ton Department Stores Inc. | | | 10.250% | | | | 3/15/14 | | | | CCC+ | | | | 491,875 | |
| | | | | | | | | | | | | | | | | | | | | |
| | | | | Oil, Gas & Consumable Fuels – 0.5% (0.3% of Total Investments) |
| | | | | | | | | | | | | | | | | | | | | |
| | 1,100 | | | Western Refining Inc., Floating Rate Note, 7.500% plus three-month LIBOR, 144A | | | 7.954% | | | | 6/15/14 | | | | B3 | | | | 1,006,500 | |
| | | | | | | | | | | | | | | | | | | | | |
| | | | | Paper & Forest Products – 0.4% (0.3% of Total Investments) |
| | | | | | | | | | | | | | | | | | | | | |
| | 1,000 | | | Verso Paper Holdings LLC., Floating Rate Note, 3.750% plus three-month LIBOR | | | 4.204% | | | | 8/01/14 | | | | B | | | | 866,250 | |
| | | | | | | | | | | | | | | | | | | | | |
| | | | | Pharmaceuticals – 0.4% (0.3% of Total Investments) |
| | | | | | | | | | | | | | | | | | | | | |
| | 1,500 | | | Angiotech Pharmaceuticals Inc., DD1 | | | 7.750% | | | | 4/01/14 | | | | C | | | | 855,000 | |
| | | | | | | | | | | | | | | | | | | | | |
| | | | | Road & Rail – 0.4% (0.3% of Total Investments) |
| | | | | | | | | | | | | | | | | | | | | |
| | 1,000 | | | Avis Budget Car Rental, Floating Rate Note, 2.500% plus three-month LIBOR | | | 2.954% | | | | 5/15/14 | | | | B | | | | 890,000 | |
| | | | | | | | | | | | | | | | | | | | | |
| | | | | Specialty Retail – 0.3% (0.2% of Total Investments) |
| | | | | | | | | | | | | | | | | | | | | |
| | 1,000 | | | Local Insight Regatta Holdings | | | 11.000% | | | | 12/01/17 | | | | Caa3 | | | | 607,500 | |
| | | | | | | | | | | | | | | | | | | | | |
| $ | 31,450 | | | Total Corporate Bonds (cost $19,981,024) | | | | | | | | | | | | | | | 21,225,875 | |
| | | | | | | | | | | | | | | | | | | | | |
| | | | | | | | | | | | | | | |
| | | | | | | | | | | | | | | |
| Shares | | | Description (1) | | | | | | | | | | | Value | |
| | | | | Warrants – 1.0% (0.7% of Total Investments) |
| | | | | | | | | | | | | | | | | | | | | |
| | 85,405 | | | Citadel Broadcasting Corporation | | | | | | | | | | | | | | $ | 2,049,720 | |
| | | | | | | | | | | | | | | | | | | | | |
| | | | | Total Warrants (cost $2,602,717) | | | 2,049,720 | |
| | | | | | | | | | | | | | | | | | | | | |
| | | | | | | | | | | | | | | |
Principal
| | | | | | | | | | | | | | | |
| Amount (000) | | | Description (1) | | Coupon | | | Maturity | | | | | | Value | |
| | | | | Short-Term Investments – 11.7% (8.0% of Total Investments) |
| | | | | | | | | | | | | | | | | | | | | |
| $ | 23,818 | | | Repurchase Agreement with Fixed Income Clearing Corporation, dated 7/30/10, repurchase price $23,817,947, collateralized by $24,145,000 U.S. Treasury Notes, 0.875%, due 3/31/11, value $24,295,906 | | | 0.020% | | | | 8/02/10 | | | | | | | $ | 23,817,907 | |
| | | | | | | | | | | | | | | | | | | | | |
| | | | | Total Short-Term Investments (cost $23,817,907) | | | | | | | | | | | | | | | 23,817,907 | |
| | | | | | | | | | | | | | | | | | | | | |
| | | | | Total Investments (cost $306,171,113) – 145.6% | | | 295,955,707 | |
| | | | | | | | | | | | | | | | | | | | | |
| | | | | Borrowings – (36.4)% (13), (15) | | | (73,950,000 | ) |
| | | | | | | | | | | | | | | | | | | | | |
| | | | | Other Assets Less Liabilities – (9.2)% | | | (18,745,149 | ) |
| | | | | | | | | | | | | | | | | | | | | |
| | | | | Net Assets Applicable to Common Shares – 100% | | $ | 203,260,558 | |
| | | | | | | | | | | | | | | | | | | | | |
| | | | |
| | | | |
NSL | | | Nuveen Senior Income Fund (continued)
Portfolio of Investments July 31, 2010 |
| | | | | | | |
| | | | | | | For Fund portfolio compliance purposes, the Fund’s industry classifications refer to any one or more of the industry sub-classifications used by one or more widely recognized market indexes or ratings group indexes, and/or as defined by Fund management. This definition may not apply for purposes of this report, which may combine industry sub-classifications into sectors for reporting ease. |
| | | | | (1) | | All percentages shown in the Portfolio of Investments are based on net assets applicable to Common shares unless otherwise noted. |
| | | | | (2) | | Senior Loans generally are subject to mandatory and/or optional prepayment. Because of these mandatory prepayment conditions and because there may be significant economic incentives for a Borrower to prepay, prepayments of Senior Loans may occur. As a result, the actual remaining maturity of Senior Loans held may be substantially less than the stated maturities shown. |
| | | | | (3) | | Ratings: Using the highest of Standard & Poor’s Group (“Standard & Poor’s”), Moody’s Investor Service, Inc. (“Moody’s”) or Fitch, Inc. (“Fitch”) rating. Ratings below BBB by Standard & Poor’s, Baa by Moody’s or BBB by Fitch are considered to be below investment grade. |
| | | | | (4) | | Senior Loans generally pay interest at rates which are periodically adjusted by reference to a base short-term, floating lending rate plus an assigned fixed rate. These floating lending rates are generally (i) the lending rate referenced by the London Inter-Bank Offered Rate (“LIBOR”), or (ii) the prime rate offered by one or more major United States banks. |
| | | | | | | Senior Loans may be considered restricted in that the Fund ordinarily is contractually obligated to receive approval from the Agent Bank and/or Borrower prior to the disposition of a Senior Loan. |
| | | | | (5) | | Investment, or portion of investment, represents an unfunded Senior Loan commitment outstanding at July 31, 2010. |
| | | | | (6) | | Negative value represents unrealized depreciation on unfunded Senior Loan commitment outstanding at July 31, 2010. |
| | | | | (7) | | At or subsequent to July 31, 2010, this issue was under the protection of the Federal Bankruptcy Court or has filed for bankruptcy. |
| | | | | (8) | | Non-income producing; denotes that the issuer has defaulted on the payment of principal or interest. |
| | | | | (9) | | The Fund’s Adviser concluded this issue is not likely to meet its future interest payment obligations and directed the Fund’s custodian to cease accruing additional income and “write-off” any remaining recorded balances on the Fund’s records. |
| | | | | (10) | | Non-income producing; issuer has not declared a dividend within the past twelve months. |
| | | | | (11) | | Subsequent to the reporting period, the Adviser has concluded this issue is not likely to meet its future interest payment obligations and has directed the Fund’s custodian to cease accruing additional income and “write-off” any remaining recorded balances on the Fund’s records. |
| | | | | (12) | | For fair value measurement disclosure purposes, Common Stock categorized as Level 2. See Notes to Financial Statements, Footnote 1 – General Information and Significant Accounting Policies, Investment Valuation for more information. |
| | | | | (13) | | Borrowings as a percentage of Total Investments is 25.0%. |
| | | | | (14) | | The Fund’s Adviser has concluded this issue is not likely to meet its future interest payment obligations and has directed the Fund’s custodian to cease accruing additional income on the Fund’s records. |
| | | | | (15) | | The Fund may pledge up to 100% of its eligible investments in the Portfolio of Investments as collateral for Borrowings. |
| | | | | N/R | | Not rated. |
| | | | | DD1 | | Investment, or portion of investment, purchased on a delayed delivery basis. |
| | | | | WI/DD | | Purchased on a when-issued or delayed delivery basis. |
| | | | | 144A | | Investment is exempt from registration under Rule 144A of the Securities Act of 1933, as amended. These investments may only be resold in transactions exempt from registration which are normally those transactions with qualified institutional buyers. |
| | | | | TBD | | Senior Loan purchased on a when-issued or delayed-delivery basis. Certain details associated with this purchase are not known prior to the settlement date of the transaction. In addition, Senior Loans typically trade without accrued interest and therefore a weighted average coupon rate is not available prior to settlement. At settlement, if still unknown, the Borrower or counterparty will provide the Fund with the final weighted average coupon rate and maturity date. |
See accompanying notes to financial statements.
| | | | | | |
| | | | | | |
JFR | | | Nuveen Floating Rate Income Fund
Portfolio of Investments |
| | | | | | July 31, 2010 |
| | | | | | | | | | | | | | | | | | | | | |
| | | | | Weighted
| | | | | | | | | | |
Principal
| | | | | Average
| | | | | | | | | | |
| Amount (000) | | | Description (1) | | Coupon | | | Maturity (2) | | | Ratings (3) | | | Value | |
| | | | | Variable Rate Senior Loan Interests – 118.7% (83.8% of Total Investments) (4) |
| | | | | |
| | | | | Aerospace & Defense – 1.1% (0.8% of Total Investments) |
| | | | | | | | | | | | | | | | | | | | | |
| $ | 415 | | | Aveos Fleet Performance, Inc., ABL Term Loan | | | 11.250% | | | | 3/12/13 | | | | B | | | $ | 414,579 | |
| | 429 | | | Aveos Fleet Performance, Inc., Term Loan | | | 8.500% | | | | 3/12/15 | | | | B | | | | 410,656 | |
| | 168 | | | Hawker Beechcraft, LLC, LC Facility | | | 2.533% | | | | 3/26/14 | | | | CCC+ | | | | 135,870 | |
| | 496 | | | Hawker Beechcraft, LLC, Term Loan B | | | 10.500% | | | | 3/26/14 | | | | CCC+ | | | | 494,544 | |
| | 2,811 | | | Hawker Beechcraft, LLC, Term Loan | | | 2.374% | | | | 3/26/14 | | | | CCC+ | | | | 2,278,548 | |
| | 2,300 | | | Transdigm, Inc., Term Loan B | | | 2.538% | | | | 6/23/13 | | | | Ba2 | | | | 2,239,214 | |
| | | | | | | | | | | | | | | | | | | | | |
| | 6,619 | | | Total Aerospace & Defense | | | | | | | | | | | | | | | 5,973,411 | |
| | | | | | | | | | | | | | | | | | | | | |
| | | | | Airlines – 3.2% (2.2% of Total Investments) |
| | | | | | | | | | | | | | | | | | | | | |
| | 3,177 | | | Delta Air Lines, Inc., Credit Linked Deposit | | | 2.258% | | | | 4/30/12 | | | | Ba2 | | | | 3,034,930 | |
| | 5,292 | | | Delta Air Lines, Inc., Term Loan | | | 3.591% | | | | 4/30/14 | | | | B | | | | 4,807,032 | |
| | 10,515 | | | United Air Lines, Inc., Term Loan B, DD1 | | | 2.375% | | | | 2/01/14 | | | | BB– | | | | 9,355,167 | |
| | | | | | | | | | | | | | | | | | | | | |
| | 18,984 | | | Total Airlines | | | | | | | | | | | | | | | 17,197,129 | |
| | | | | | | | | | | | | | | | | | | | | |
| | | | | Auto Components – 2.7% (1.9% of Total Investments) |
| | | | | | | | | | | | | | | | | | | | | |
| | 10,401 | | | Federal-Mogul Corporation, Tranche B, Term Loan | | | 2.286% | | | | 12/29/14 | | | | Ba3 | | | | 9,310,555 | |
| | 5,744 | | | Federal-Mogul Corporation, Tranche C, Term Loan | | | 2.279% | | | | 12/28/15 | | | | Ba3 | | | | 5,141,620 | |
| | | | | | | | | | | | | | | | | | | | | |
| | 16,145 | | | Total Auto Components | | | | | | | | | | | | | | | 14,452,175 | |
| | | | | | | | | | | | | | | | | | | | | |
| | | | | Automobiles – 2.0% (1.4% of Total Investments) |
| | | | | | | | | | | | | | | | | | | | | |
| | 11,347 | | | Ford Motor Company, Term Loan | | | 3.350% | | | | 12/15/13 | | | | Ba1 | | | | 11,046,621 | |
| | | | | | | | | | | | | | | | | | | | | |
| | | | | Building Products – 2.2% (1.6% of Total Investments) |
| | | | | | | | | | | | | | | | | | | | | |
| | 7,707 | | | Building Materials Corporation of America, Term Loan | | | 3.125% | | | | 2/22/14 | | | | BBB– | | | | 7,463,828 | |
| | 4,539 | | | TFS Acquisition, Term Loan | | | 10.000% | | | | 8/11/13 | | | | B– | | | | 4,516,007 | |
| | | | | | | | | | | | | | | | | | | | | |
| | 12,246 | | | Total Building Products | | | | | | | | | | | | | | | 11,979,835 | |
| | | | | | | | | | | | | | | | | | | | | |
| | | | | Chemicals – 3.5% (2.5% of Total Investments) |
| | | | | | | | | | | | | | | | | | | | | |
| | 1,400 | | | Celanese US Holdings LLC, Credit Linked Deposit | | | 2.098% | | | | 4/02/14 | | | | BB+ | | | | 1,344,000 | |
| | 541 | | | Hercules Offshore, Inc., Term Loan | | | 6.000% | | | | 7/11/13 | | | | B2 | | | | 482,418 | |
| | 2,910 | | | Hexion Specialty Chemicals, Inc., Term Loan C1 | | | 2.813% | | | | 5/05/13 | | | | Ba3 | | | | 2,742,280 | |
| | 1,292 | | | Hexion Specialty Chemicals, Inc., Term Loan C2 | | | 2.813% | | | | 5/05/13 | | | | Ba3 | | | | 1,217,676 | |
| | 3,690 | | | Ineos US Finance LLC, Tranche B2 | | | 7.500% | | | | 12/16/13 | | | | B | | | | 3,637,360 | |
| | 3,690 | | | Ineos US Finance LLC, Tranche C2 | | | 8.000% | | | | 12/16/14 | | | | B | | | | 3,637,360 | |
| | 2,880 | | | Styron Corporation, Term Loan | | | 7.500% | | | | 6/17/16 | | | | B+ | | | | 2,905,200 | |
| | 3,371 | | | Univar, Inc., Term Loan | | | 3.316% | | | | 10/10/14 | | | | B+ | | | | 3,243,968 | |
| | | | | | | | | | | | | | | | | | | | | |
| | 19,774 | | | Total Chemicals | | | | | | | | | | | | | | | 19,210,262 | |
| | | | | | | | | | | | | | | | | | | | | |
| | | | | Commercial Services & Supplies – 1.7% (1.2% of Total Investments) |
| | | | | | | | | | | | | | | | | | | | | |
| | 3,117 | | | Rental Services Corporation, Term Loan | | | 4.040% | | | | 11/30/13 | | | | B– | | | | 2,960,470 | |
| | 178 | | | ServiceMaster Company, Delayed Term Loan | | | 2.820% | | | | 7/24/14 | | | | B+ | | | | 164,147 | |
| | 1,786 | | | ServiceMaster Company, Term Loan | | | 2.879% | | | | 7/24/14 | | | | B+ | | | | 1,648,312 | |
| | 1,990 | | | Universal City Development Partners, Ltd., Term Loan | | | 5.500% | | | | 11/06/14 | | | | Ba2 | | | | 1,996,004 | |
| | 2,296 | | | West Corporation, Term Loan B4 | | | 4.249% | | | | 7/15/16 | | | | BB– | | | | 2,231,144 | |
| | | | | | | | | | | | | | | | | | | | | |
| | 9,367 | | | Total Commercial Services & Supplies | | | | | | | | | | | | | | | 9,000,077 | |
| | | | | | | | | | | | | | | | | | | | | |
| | | | | Communications Equipment – 2.9% (2.0% of Total Investments) |
| | | | | | | | | | | | | | | | | | | | | |
| | 16,589 | | | Avaya, Inc., Term Loan | | | 3.260% | | | | 10/24/14 | | | | B1 | | | | 14,760,342 | |
| | 1,006 | | | Telcordia Technologies, Inc., Term Loan | | | 6.750% | | | | 4/30/16 | | | | B+ | | | | 1,002,110 | |
| | | | | | | | | | | | | | | | | | | | | |
| | 17,595 | | | Total Communications Equipment | | | | | | | | | | | | | | | 15,762,452 | |
| | | | | | | | | | | | | | | | | | | | | |
| | | | | Consumer Finance – 0.2% (0.1% of Total Investments) |
| | | | | | | | | | | | | | | | | | | | | |
| | 1,027 | | | Peach Holdings, Inc., Term Loan | | | 6.250% | | | | 11/21/13 | | | | CCC– | | | | 779,768 | |
| | | | | | | | | | | | | | | | | | | | | |
| | | | | Containers & Packaging – 0.7% (0.5% of Total Investments) |
| | | | | | | | | | | | | | | | | | | | | |
| | 455 | | | Amscan Holdings, Inc., Term Loan | | | 2.788% | | | | 5/27/13 | | | | B1 | | | | 430,887 | |
| | 303 | | | Graham Packaging Company LP, Term Loan B | | | 2.636% | | | | 10/07/11 | | | | B+ | | | | 302,867 | |
| | 2,865 | | | Graham Packaging Company LP, Term Loan C | | | 6.750% | | | | 4/05/14 | | | | B+ | | | | 2,893,414 | |
| | | | | | | | | | | | | | | | | | | | | |
| | 3,623 | | | Total Containers & Packaging | | | | | | | | | | | | | | | 3,627,168 | |
| | | | | | | | | | | | | | | | | | | | | |
| | | | |
| | | | |
JFR | | | Nuveen Floating Rate Income Fund (continued)
Portfolio of Investments July 31, 2010 |
| | | | | | | | | | | | | | | | | | | | | |
| | | | | Weighted
| | | | | | | | | | |
Principal
| | | | | Average
| | | | | | | | | | |
| Amount (000) | | | Description (1) | | Coupon | | | Maturity (2) | | | Ratings (3) | | | Value | |
| | | | | Diversified Consumer Services – 1.7% (1.2% of Total Investments) |
| | | | | | | | | | | | | | | | | | | | | |
| $ | 6,704 | | | Cengage Learning Acquisitions, Inc., Term Loan | | | 3.030% | | | | 7/03/14 | | | | B+ | | | $ | 5,947,753 | |
| | 3,500 | | | Quad Graphics, Inc., Term Loan | | | 5.500% | | | | 8/23/16 | | | | BB+ | | | | 3,331,563 | |
| | | | | | | | | | | | | | | | | | | | | |
| | 10,204 | | | Total Diversified Consumer Services | | | | | | | | | | | | | | | 9,279,316 | |
| | | | | | | | | | | | | | | | | | | | | |
| | | | | Diversified Financial Services – 0.8% (0.6% of Total Investments) |
| | | | | | | | | | | | | | | | | | | | | |
| | 1,100 | | | CIT Group, Inc., Tranche A1, Term Loan | | | 13.000% | | | | 1/18/12 | | | | BB | | | | 1,136,770 | |
| | 1,650 | | | CIT Group, Inc., Tranche B1, Term Loan | | | 13.000% | | | | 1/18/12 | | | | BB | | | | 1,702,514 | |
| | 1,736 | | | Fox Acquisition Sub LLC, Term Loan B | | | 7.500% | | | | 7/14/15 | | | | B | | | | 1,670,852 | |
| | | | | | | | | | | | | | | | | | | | | |
| | 4,486 | | | Total Diversified Financial Services | | | | | | | | | | | | | | | 4,510,136 | |
| | | | | | | | | | | | | | | | | | | | | |
| | | | | Diversified Telecommunication Services – 4.4% (3.1% of Total Investments) |
| | | | | | | | | | | | | | | | | | | | | |
| | 4,988 | | | Cincinnati Bell Inc., Tranche B, Term Loan | | | 6.500% | | | | 11/18/14 | | | | BB | | | | 4,907,346 | |
| | 3,802 | | | Intelsat, Tranche B2, Term Loan | | | 3.033% | | | | 1/03/14 | | | | BB– | | | | 3,617,326 | |
| | 3,155 | | | Intelsat, Tranche B2, Term Loan A | | | 3.033% | | | | 1/03/14 | | | | BB– | | | | 2,983,845 | |
| | 3,154 | | | Intelsat, Tranche B2, Term Loan B | | | 3.033% | | | | 1/03/14 | | | | BB– | | | | 2,982,927 | |
| | 3,154 | | | Intelsat, Tranche B2, Term Loan C | | | 3.033% | | | | 1/03/14 | | | | BB– | | | | 2,982,927 | |
| | 6,800 | | | Level 3 Financing, Inc., Term Loan | | | 2.724% | | | | 3/13/14 | | | | B+ | | | | 6,114,336 | |
| | 296 | | | MetroPCS Wireless, Inc., Tranche B1, Term Loan | | | 2.625% | | | | 11/03/13 | | | | Ba1 | | | | 288,731 | |
| | | | | | | | | | | | | | | | | | | | | |
| | 25,349 | | | Total Diversified Telecommunication Services | | | | | | | | | | | | | | | 23,877,438 | |
| | | | | | | | | | | | | | | | | | | | | |
| | | | | Electric Utilities – 1.2% (0.8% of Total Investments) |
| | | | | | | | | | | | | | | | | | | | | |
| | 2,518 | | | Calpine Corporation, DIP Term Loan | | | 3.415% | | | | 3/29/14 | | | | B+ | | | | 2,394,813 | |
| | 2,222 | | | Calpine Corporation, Delayed Draw, Term Loan, (5), (6) | | | 0.500% | | | | 3/29/14 | | | | B+ | | | | (280,556 | ) |
| | 2,607 | | | TXU Corporation, Term Loan B2 | | | 3.975% | | | | 10/10/14 | | | | B+ | | | | 2,029,021 | |
| | 2,895 | | | TXU Corporation, Term Loan B3 | | | 3.846% | | | | 10/10/14 | | | | B+ | | | | 2,245,524 | |
| | | | | | | | | | | | | | | | | | | | | |
| | 10,242 | | | Total Electric Utilities | | | | | | | | | | | | | | | 6,388,802 | |
| | | | | | | | | | | | | | | | | | | | | |
| | | | | Electrical Equipment – 1.4% (1.0% of Total Investments) |
| | | | | | | | | | | | | | | | | | | | | |
| | 7,864 | | | Allison Transmission Holdings, Inc., Term Loan | | | 3.100% | | | | 8/07/14 | | | | B | | | | 7,363,143 | |
| | | | | | | | | | | | | | | | | | | | | |
| | | | | Food & Staples Retailing – 1.4% (1.0% of Total Investments) |
| | | | | | | | | | | | | | | | | | | | | |
| | 8,704 | | | U.S. Foodservice, Inc., Term Loan | | | 2.828% | | | | 7/03/14 | | | | B2 | | | | 7,576,752 | |
| | | | | | | | | | | | | | | | | | | | | |
| | | | | Food Products – 2.1% (1.5% of Total Investments) |
| | | | | | | | | | | | | | | | | | | | | |
| | 2,000 | | | BLB Management Services, Inc., Term Loan, WI/DD | | | TBD | | | | TBD | | | | N/R | | | | 1,446,666 | |
| | 376 | | | Dole Food Company, Inc., Deposit-Funded Commitment | | | 7.941% | | | | 4/12/13 | | | | Ba2 | | | | 376,675 | |
| | 4,700 | | | Michael Foods Group, Inc., Term Loan B | | | 6.250% | | | | 6/29/16 | | | | BB– | | | | 4,718,213 | |
| | 4,918 | | | Pinnacle Foods Finance LLC, Tranche C, Term Loan | | | 7.500% | | | | 4/02/14 | | | | B | | | | 4,939,669 | |
| | | | | | | | | | | | | | | | | | | | | |
| | 11,994 | | | Total Food Products | | | | | | | | | | | | | | | 11,481,223 | |
| | | | | | | | | | | | | | | | | | | | | |
| | | | | Health Care Equipment & Supplies – 0.3% (0.2% of Total Investments) |
| | | | | | | | | | | | | | | | | | | | | |
| | 195 | | | Bausch & Lomb, Inc., Delayed Term Loan | | | 3.566% | | | | 4/24/15 | | | | BB– | | | | 187,166 | |
| | 805 | | | Bausch & Lomb, Inc., Term Loan | | | 3.628% | | | | 4/24/15 | | | | BB– | | | | 772,773 | |
| | 145 | | | Fenwal, Inc., Delayed Term Loan | | | 2.788% | | | | 2/28/14 | | | | B | | | | 125,613 | |
| | 846 | | | Fenwal, Inc., Term Loan | | | 2.788% | | | | 2/28/14 | | | | B | | | | 732,848 | |
| | | | | | | | | | | | | | | | | | | | | |
| | 1,991 | | | Total Health Care Equipment & Supplies | | | | | | | | | | | | | | | 1,818,400 | |
| | | | | | | | | | | | | | | | | | | | | |
| | | | | Health Care Providers & Services – 8.5% (6.0% of Total Investments) |
| | | | | | | | | | | | | | | | | | | | | |
| | 1,496 | | | Ardent Medical Services, Inc., Term Loan | | | 6.500% | | | | 9/15/15 | | | | B1 | | | | 1,459,779 | |
| | 600 | | | Community Health Systems, Inc., Delayed Term Loan | | | 2.788% | | | | 7/25/14 | | | | BB | | | | 569,272 | |
| | 11,690 | | | Community Health Systems, Inc., Term Loan | | | 2.788% | | | | 7/25/14 | | | | BB | | | | 11,092,805 | |
| | 1,112 | | | HCA, Inc., Tranche B2, Term Loan | | | 3.783% | | | | 3/31/17 | | | | BB | | | | 1,084,478 | |
| | 4,112 | | | Health Management Associates, Inc., Term Loan | | | 2.283% | | | | 2/28/14 | | | | BB– | | | | 3,876,206 | |
| | 800 | | | HealthSouth Corporation, Tranche 1, Term Loan | | | 2.790% | | | | 3/10/13 | | | | BB– | | | | 778,068 | |
| | 658 | | | HealthSouth Corporation, Tranche 2, Term Loan | | | 4.290% | | | | 9/10/15 | | | | BB– | | | | 651,789 | |
| | 778 | | | IASIS Healthcare LLC, Delayed Term Loan | | | 2.316% | | | | 3/14/14 | | | | Ba2 | | | | 735,654 | |
| | 212 | | | IASIS Healthcare LLC, Letter of Credit | | | 2.280% | | | | 3/14/14 | | | | Ba2 | | | | 200,177 | |
| | 1,130 | | | IASIS Healthcare LLC, PIK Term Loan | | | 4.250% | | | | 6/16/14 | | | | CCC+ | | | | 1,063,667 | |
| | 2,247 | | | IASIS Healthcare LLC, Term Loan | | | 2.316% | | | | 3/14/14 | | | | Ba2 | | | | 2,125,552 | |
| | 3,810 | | | LifeCare, Term Loan B | | | 4.730% | | | | 8/10/12 | | | | B2 | | | | 3,524,250 | |
| | 1,901 | | | Rehabcare Group, Inc., Term Loan B | | | 6.000% | | | | 11/24/15 | | | | BB | | | | 1,889,467 | |
| | 1,323 | | | Select Medical Corporation, Term Loan, WI/DD | | | TBD | | | | TBD | | | | Ba2 | | | | 1,288,968 | |
| | 9,000 | | | Universal Health Services Term Loan, WI/DD | | | TBD | | | | TBD | | | | BB+ | | | | 8,947,498 | |
| | 6,965 | | | Vanguard Health Holding Company II LLC, Initial Term Loan | | | 5.000% | | | | 1/29/16 | | | | Ba2 | | | | 6,907,772 | |
| | | | | | | | | | | | | | | | | | | | | |
| | 47,834 | | | Total Health Care Providers & Services | | | | | | | | | | | | | | | 46,195,402 | |
| | | | | | | | | | | | | | | | | | | | | |
| | | | | | | | | | | | | | | | | | | | | |
| | | | | Weighted
| | | | | | | | | | |
Principal
| | | | | Average
| | | | | | | | | | |
| Amount (000) | | | Description (1) | | Coupon | | | Maturity (2) | | | Ratings (3) | | | Value | |
| | | | | Hotels, Restaurants & Leisure – 12.7% (9.0% of Total Investments) |
| | | | | | | | | | | | | | | | | | | | | |
| $ | 5,000 | | | 24 Hour Fitness Worldwide, Inc., Term Loan | | | 6.750% | | | | 4/22/16 | | | | Ba2 | | | $ | 4,666,250 | |
| | 69 | | | Buffets, Inc., 1st Lien PF/LC Loan | | | 7.669% | | | | 4/22/15 | | | | N/R | | | | 62,180 | |
| | 937 | | | CCM Merger, Inc., Term Loan B | | | 8.500% | | | | 7/13/12 | | | | BB– | | | | 925,812 | |
| | 4,243 | | | Cedar Fair LP, Term Loan, WI/DD | | | TBD | | | | TBD | | | | Ba2 | | | | 4,260,057 | |
| | 2,113 | | | Fontainebleau Las Vegas LLC, Term Loan, (7), (8) | | | 4.000% | | | | 6/06/14 | | | | N/R | | | | 457,712 | |
| | 1,500 | | | Harrah’s Operating Company, Inc., Term Loan B1 | | | 3.498% | | | | 1/28/15 | | | | B | | | | 1,287,396 | |
| | 5,000 | | | Harrah’s Operating Company, Inc., Term Loan B2 | | | 3.498% | | | | 1/28/15 | | | | B | | | | 4,305,315 | |
| | 1,994 | | | Harrah’s Operating Company, Inc., Term Loan B3 | | | 3.498% | | | | 1/28/15 | | | | B | | | | 1,704,513 | |
| | 925 | | | Isle of Capri Casinos, Inc., Delayed Term Loan A, DD1 | | | 5.000% | | | | 11/25/13 | | | | B+ | | | | 877,031 | |
| | 1,006 | | | Isle of Capri Casinos, Inc., Delayed Term Loan B | | | 5.000% | | | | 11/25/13 | | | | B+ | | | | 953,476 | |
| | 2,475 | | | Isle of Capri Casinos, Inc., Delayed Term Loan, DD1 | | | 5.000% | | | | 11/25/13 | | | | B+ | | | | 2,345,260 | |
| | 6,610 | | | Orbitz Worldwide, Inc., Term Loan | | | 3.417% | | | | 7/25/14 | | | | B+ | | | | 6,215,729 | |
| | 498 | | | OSI Restaurant Partners LLC, Revolver | | | 1.432% | | | | 6/14/13 | | | | B+ | | | | 433,581 | |
| | 4,698 | | | OSI Restaurant Partners LLC, Term Loan | | | 2.875% | | | | 6/14/14 | | | | B+ | | | | 4,091,369 | |
| | 2,981 | | | Reynolds Group Holdings, Inc., US Term Loan | | | 6.250% | | | | 11/05/15 | | | | BB– | | | | 2,979,014 | |
| | 7,958 | | | SW Acquisitions Co., Inc., Term Loan | | | 5.750% | | | | 6/01/16 | | | | BB+ | | | | 7,976,159 | |
| | 1,940 | | | Travelport LLC, Delayed Term Loan | | | 2.816% | | | | 8/23/13 | | | | Ba3 | | | | 1,828,989 | |
| | 981 | | | Travelport LLC, Letter of Credit | | | 3.033% | | | | 8/23/13 | | | | Ba3 | | | | 927,770 | |
| | 4,891 | | | Travelport LLC, Term Loan | | | 2.816% | | | | 8/23/13 | | | | Ba3 | | | | 4,623,807 | |
| | 3,771 | | | Venetian Casino Resort LLC, Delayed Term Loan, DD1 | | | 2.070% | | | | 5/23/14 | | | | B– | | | | 3,509,616 | |
| | 15,754 | | | Venetian Casino Resort LLC, Term Loan, DD1 | | | 2.070% | | | | 5/23/14 | | | | B– | | | | 14,660,900 | |
| | | | | | | | | | | | | | | | | | | | | |
| | 75,344 | | | Total Hotels, Restaurants & Leisure | | | | | | | | | | | | | | | 69,091,936 | |
| | | | | | | | | | | | | | | | | | | | | |
| | | | | Household Products – 1.8% (1.2% of Total Investments) |
| | | | | | | | | | | | | | | | | | | | | |
| | 9,359 | | | Spectrum Brands, Inc., Term Loan | | | 8.000% | | | | 6/16/16 | | | | B | | | | 9,470,476 | |
| | | | | | | | | | | | | | | | | | | | | |
| | | | | Industrial Conglomerates – 0.5% (0.3% of Total Investments) |
| | | | | | | | | | | | | | | | | | | | | |
| | 2,490 | | | CF Industries, Inc., Term Loan | | | 4.500% | | | | 4/05/15 | | | | BBB | | | | 2,504,742 | |
| | | | | | | | | | | | | | | | | | | | | |
| | | | | Insurance – 2.5% (1.8% of Total Investments) |
| | | | | | | | | | | | | | | | | | | | | |
| | 10,217 | | | Conseco, Inc., Term Loan | | | 7.500% | | | | 10/10/13 | | | | B2 | | | | 10,012,874 | |
| | 3,750 | | | Fidelity National Information Services, Inc., Term Loan B | | | 5.250% | | | | 7/18/16 | | | | Ba2 | | | | 3,776,171 | |
| | | | | | | | | | | | | | | | | | | | | |
| | 13,967 | | | Total Insurance | | | | | | | | | | | | | | | 13,789,045 | |
| | | | | | | | | | | | | | | | | | | | | |
| | | | | Internet Software & Services – 1.9% (1.3% of Total Investments) |
| | | | | | | | | | | | | | | | | | | | | |
| | 762 | | | Open Solutions, Inc., Term Loan B | | | 2.625% | | | | 1/23/14 | | | | BB– | | | | 659,842 | |
| | 2,973 | | | Sabre, Inc., Term Loan | | | 2.373% | | | | 9/30/14 | | | | B1 | | | | 2,687,376 | |
| | 3,000 | | | Savvis Inc., Term Loan B, WI/DD | | | TBD | | | | TBD | | | | B1 | | | | 2,910,000 | |
| | 4,000 | | | SkillSoft PLC Term Loan | | | 6.500% | | | | 5/30/17 | | | | BB | | | | 4,015,000 | |
| | | | | | | | | | | | | | | | | | | | | |
| | 10,735 | | | Total Internet Software & Services | | | | | | | | | | | | | | | 10,272,218 | |
| | | | | | | | | | | | | | | | | | | | | |
| | | | | IT Services – 5.5% (3.9% of Total Investments) |
| | | | | | | | | | | | | | | | | | | | | |
| | 7,557 | | | First Data Corporation, Term Loan B2 | | | 3.078% | | | | 9/24/14 | | | | B+ | | | | 6,586,013 | |
| | 5,912 | | | First Data Corporation, Term Loan B3 | | | 3.078% | | | | 9/24/14 | | | | B+ | | | | 5,156,718 | |
| | 127 | | | Infor Global Solutions Intermediate Holdings, Ltd., Delayed Term Loan, First Lien | | | 6.030% | | | | 7/28/15 | | | | B+ | | | | 118,556 | |
| | 2,475 | | | Infor Global Solutions Intermediate Holdings, Ltd., Delayed Term Loan, Second Lien, DD1 | | | 6.566% | | | | 3/02/14 | | | | CCC+ | | | | 1,831,500 | |
| | 1,865 | | | Infor Global Solutions Intermediate Holdings, Ltd., Extended Delayed Term Loan | | | 6.070% | | | | 7/28/15 | | | | B+ | | | | 1,739,280 | |
| | 4,516 | | | Infor Global Solutions Intermediate Holdings, Ltd., Holdco PIK Term Loan, DD1 | | | 8.000% | | | | 9/02/14 | | | | N/R | | | | 1,859,095 | |
| | 270 | | | Infor Global Solutions Intermediate Holdings, Ltd., Term Loan, First Lien | | | 4.070% | | | | 7/28/12 | | | | B+ | | | | 251,521 | |
| | 4,275 | | | Infor Global Solutions Intermediate Holdings, Ltd., Term Loan, Second Lien, DD1 | | | 6.566% | | | | 3/02/14 | | | | CCC+ | | | | 3,134,999 | |
| | 3,568 | | | Infor Global Solutions Intermediate Holdings, Ltd., Term Loan | | | 6.070% | | | | 7/28/15 | | | | B+ | | | | 3,309,247 | |
| | 6,171 | | | SunGard Data Systems, Inc., Term Loan B | | | 2.095% | | | | 2/28/14 | | | | BB | | | | 5,856,973 | |
| | | | | | | | | | | | | | | | | | | | | |
| | 36,736 | | | Total IT Services | | | | | | | | | | | | | | | 29,843,902 | |
| | | | | | | | | | | | | | | | | | | | | |
| | | | | Leisure Equipment & Products – 2.2% (1.6% of Total Investments) |
| | | | | | | | | | | | | | | | | | | | | |
| | 13,840 | | | Bombardier Recreational Products, Inc., Term Loan | | | 3.193% | | | | 6/28/13 | | | | Caa1 | | | | 12,006,430 | |
| | | | | | | | | | | | | | | | | | | | | |
| | | | | Media – 15.8% (11.2% of Total Investments) |
| | | | | | | | | | | | | | | | | | | | | |
| | 28 | | | American Media Operations, Inc., Term Loan | | | 5.500% | | | | 1/30/13 | | | | B3 | | | | 27,193 | |
| | 3,000 | | | Charter Communications Operating Holdings LLC, Holdco Term Loan | | | 3.038% | | | | 3/06/14 | | | | BB+ | | | | 2,753,250 | |
| | 8,579 | | | Charter Communications Operating Holdings LLC, Term Loan C | | | 3.790% | | | | 9/06/16 | | | | BB+ | | | | 8,200,863 | |
| | 1,057 | | | Charter Communications Operating Holdings LLC, Term Loan | | | 2.320% | | | | 3/06/14 | | | | BB+ | | | | 1,005,101 | |
| | 2,777 | | | Citadel Broadcasting Corporation, Term Loan, (9), DD1 | | | 11.000% | | | | 6/03/15 | | | | BB+ | | | | 2,916,152 | |
| | 1,675 | | | Gray Television, Inc., Term Loan B | | | 3.850% | | | | 12/31/14 | | | | B | | | | 1,576,880 | |
| | 6,400 | | | Interactive Data Corporation, Term Loan, WI/DD | | | TBD | | | | TBD | | | | Ba3 | | | | 6,397,331 | |
| | 3,081 | | | Live Nation Entertainment Inc., Term Loan B | | | 4.500% | | | | 11/07/16 | | | | B– | | | | 3,040,785 | |
| | | | |
| | | | |
JFR | | | Nuveen Floating Rate Income Fund (continued)
Portfolio of Investments July 31, 2010 |
| | | | | | | | | | | | | | | | | | | | | |
| | | | | Weighted
| | | | | | | | | | |
Principal
| | | | | Average
| | | | | | | | | | |
| Amount (000) | | | Description (1) | | Coupon | | | Maturity (2) | | | Ratings (3) | | | Value | |
| | | | | Media (continued) |
| | | | | | | | | | | | | | | | | | | | | |
| $ | 3,226 | | | Mediacom Broadband LLC, Tranche D, Term Loan | | | 5.500% | | | | 3/31/17 | | | | BB– | | | $ | 3,149,016 | |
| | 15,885 | | | Metro-Goldwyn-Mayer Studios, Inc., Term Loan B, (7), (8), (9) | | | 18.250% | | | | 4/09/12 | | | | N/R | | | | 6,965,763 | |
| | 1,170 | | | Nielsen Finance LLC, Term Loan A | | | 2.345% | | | | 8/09/13 | | | | Ba3 | | | | 1,113,822 | |
| | 7,485 | | | Nielsen Finance LLC, Term Loan B | | | 4.095% | | | | 5/02/16 | | | | Ba3 | | | | 7,253,887 | |
| | 4,721 | | | Philadelphia Newspapers, Term Loan, (7), (8) | | | 6.500% | | | | 6/29/13 | | | | N/R | | | | 1,451,557 | |
| | 5,393 | | | Spanish Broadcasting System, Inc., Term Loan B | | | 2.290% | | | | 6/11/12 | | | | B– | | | | 4,862,682 | |
| | 2,885 | | | SuperMedia, Term Loan | | | 8.000% | | | | 12/31/15 | | | | B– | | | | 2,441,141 | |
| | 10,432 | | | Tribune Company, Term Loan B, (7), (8), DD1 | | | 3.000% | | | | 6/04/14 | | | | Ca | | | | 6,702,849 | |
| | 22,855 | | | Univision Communications, Inc., Term Loan | | | 2.566% | | | | 9/29/14 | | | | B2 | | | | 20,013,898 | |
| | 3,000 | | | UPC Broadband Holding BV, Term Loan N | | | 4.251% | | | | 12/31/17 | | | | Ba3 | | | | 2,825,625 | |
| | 5,092 | | | Yell Group PLC, Term Loan | | | 4.066% | | | | 7/31/14 | | | | N/R | | | | 3,080,667 | |
| | | | | | | | | | | | | | | | | | | | | |
| | 108,741 | | | Total Media | | | | | | | | | | | | | | | 85,778,462 | |
| | | | | | | | | | | | | | | | | | | | | |
| | | | | Metals & Mining – 0.6% (0.5% of Total Investments) |
| | | | | | | | | | | | | | | | | | | | | |
| | 3,661 | | | John Maneely Company, Term Loan | | | 3.775% | | | | 12/09/13 | | | | B | | | | 3,483,400 | |
| | | | | | | | | | | | | | | | | | | | | |
| | | | | Multiline Retail – 1.2% (0.8% of Total Investments) |
| | | | | | | | | | | | | | | | | | | | | |
| | 6,814 | | | Neiman Marcus Group, Inc., Term Loan | | | 2.473% | | | | 4/06/13 | | | | BB– | | | | 6,440,559 | |
| | | | | | | | | | | | | | | | | | | | | |
| | | | | Oil, Gas & Consumable Fuels – 3.4% (2.4% of Total Investments) |
| | | | | | | | | | | | | | | | | | | | | |
| | 259 | | | Alon USA Energy, Inc., Edgington Facility | | | 2.566% | | | | 8/05/13 | | | | BB– | | | | 203,079 | |
| | 2,069 | | | Alon USA Energy, Inc., Paramount Facility | | | 2.669% | | | | 8/05/13 | | | | BB– | | | | 1,624,519 | |
| | 3,000 | | | Big West Oil LLC, New Term Loan | | | 12.000% | | | | 7/23/15 | | | | B+ | | | | 3,024,999 | |
| | 1,834 | | | Brand Energy & Infrastructure Services, Inc., Term Loan B | | | 2.813% | | | | 2/07/14 | | | | B1 | | | | 1,636,917 | |
| | 412 | | | Calumet Lubricants Company LP, Credit Linked Deposit | | | 4.383% | | | | 1/03/15 | | | | B1 | | | | 382,330 | |
| | 3,045 | | | Calumet Lubricants Company LP, Term Loan | | | 4.436% | | | | 1/03/15 | | | | B1 | | | | 2,823,970 | |
| | 2,932 | | | CCS Income Trust, Term Loan | | | 3.316% | | | | 11/14/14 | | | | B | | | | 2,474,154 | |
| | 3,000 | | | DynCorp International, Inc., Term Loan | | | 6.250% | | | | 7/07/16 | | | | Ba1 | | | | 3,016,500 | |
| | 3,346 | | | Venoco, Inc., Term Loan | | | 4.375% | | | | 5/07/14 | | | | BB– | | | | 3,032,896 | |
| | | | | | | | | | | | | | | | | | | | | |
| | 19,897 | | | Total Oil, Gas & Consumable Fuels | | | | | | | | | | | | | | | 18,219,364 | |
| | | | | | | | | | | | | | | | | | | | | |
| | | | | Paper & Forest Products – 1.2% (0.9% of Total Investments) |
| | | | | | | | | | | | | | | | | | | | | |
| | 5,000 | | | Newark Group, Inc., DIP Term Loan, WI/DD | | | TBD | | | | TBD | | | | N/R | | | | 5,050,000 | |
| | 1,915 | | | Wilton Products, Term Loan | | | 3.760% | | | | 8/01/14 | | | | B+ | | | | 1,560,824 | |
| | | | | | | | | | | | | | | | | | | | | |
| | 6,915 | | | Total Paper & Forest Products | | | | | | | | | | | | | | | 6,610,824 | |
| | | | | | | | | | | | | | | | | | | | | |
| | | | | Personal Products – 0.7% (0.5% of Total Investments) |
| | | | | | | | | | | | | | | | | | | | | |
| | 3,990 | | | Revlon Consumer Products Corporation, Term Loan | | | 6.000% | | | | 3/11/15 | | | | Ba3 | | | | 3,922,669 | |
| | | | | | | | | | | | | | | | | | | | | |
| | | | | Pharmaceuticals – 2.6% (1.8% of Total Investments) |
| | | | | | | | | | | | | | | | | | | | | |
| | 5,125 | | | Graceway Pharmaceuticals LLC, Second Lien Term Loan, (11), DD1 | | | 6.816% | | | | 5/03/13 | | | | CCC | | | | 2,041,457 | |
| | 1,781 | | | Graceway Pharmaceuticals LLC, Term Loan | | | 3.066% | | | | 5/03/12 | | | | B– | | | | 1,495,185 | |
| | 1,539 | | | Warner Chilcott Corporation, Add on Term Loan | | | 5.750% | | | | 4/30/15 | | | | BB+ | | | | 1,540,705 | |
| | 4,176 | | | Warner Chilcott Corporation, Term Loan A | | | 5.500% | | | | 10/30/14 | | | | BB+ | | | | 4,177,668 | |
| | 1,840 | | | Warner Chilcott Corporation, Term Loan B1 | | | 5.750% | | | | 4/30/15 | | | | BB+ | | | | 1,840,969 | |
| | 3,063 | | | Warner Chilcott Corporation, Term Loan B2 | | | 5.750% | | | | 4/30/15 | | | | BB+ | | | | 3,065,547 | |
| | | | | | | | | | | | | | | | | | | | | |
| | 17,524 | | | Total Pharmaceuticals | | | | | | | | | | | | | | | 14,161,531 | |
| | | | | | | | | | | | | | | | | | | | | |
| | | | | Professional Services – 0.2% (0.1% of Total Investments) |
| | | | | | | | | | | | | | | | | | | | | |
| | 978 | | | Vertrue Inc., Term Loan | | | 3.540% | | | | 8/16/14 | | | | Ba3 | | | | 849,953 | |
| | | | | | | | | | | | | | | | | | | | | |
| | | | | Real Estate Management & Development – 3.4% (2.4% of Total Investments) |
| | | | | | | | | | | | | | | | | | | | | |
| | 7,813 | | | Capital Automotive LP, Tranche C | | | 2.850% | | | | 12/14/12 | | | | Ba3 | | | | 7,295,521 | |
| | 6,057 | | | LNR Property Corporation, Term Loan B | | | 7.750% | | | | 7/12/11 | | | | CCC | | | | 5,788,633 | |
| | 5,820 | | | Realogy Corporation, Delayed Term Loan | | | 3.380% | | | | 10/10/13 | | | | Caa1 | | | | 5,114,687 | |
| | | | | | | | | | | | | | | | | | | | | |
| | 19,690 | | | Total Real Estate Management & Development | | | | | | | | | | | | | | | 18,198,841 | |
| | | | | | | | | | | | | | | | | | | | | |
| | | | | Road & Rail – 5.1% (3.6% of Total Investments) |
| | | | | | | | | | | | | | | | | | | | | |
| | 653 | | | Avis Budget Car Rental LLC, Term Loan | | | 5.750% | | | | 4/19/14 | | | | Ba2 | | | | 650,000 | |
| | 511 | | | Hertz Corporation, Letter of Credit | | | 2.087% | | | | 12/21/12 | | | | Ba1 | | | | 495,199 | |
| | 2,764 | | | Hertz Corporation, Term Loan | | | 2.093% | | | | 12/21/12 | | | | Ba1 | | | | 2,677,617 | �� |
| | 24,257 | | | Swift Transportation Company, Inc., Term Loan | | | 8.250% | | | | 5/12/14 | | | | B– | | | | 23,673,415 | |
| | | | | | | | | | | | | | | | | | | | | |
| | 28,185 | | | Total Road & Rail | | | | | | | | | | | | | | | 27,496,231 | |
| | | | | | | | | | | | | | | | | | | | | |
| | | | | | | | | | | | | | | | | | | | | |
| | | | | Weighted
| | | | | | | | | | |
Principal
| | | | | Average
| | | | | | | | | | |
| Amount (000) | | | Description (1) | | Coupon | | | Maturity (2) | | | Ratings (3) | | | Value | |
| | | | | Semiconductors & Equipment – 0.9% (0.7% of Total Investments) |
| | | | | | | | | | | | | | | | | | | | | |
| $ | 2,322 | | | Freescale Semiconductor, Inc., Term Loan | | | 4.596% | | | | 12/01/16 | | | | B2 | | | $ | 2,139,109 | |
| | 2,993 | | | Spansion LLC, Term Loan | | | 5.500% | | | | 2/09/15 | | | | BB– | | | | 2,976,604 | |
| | | | | | | | | | | | | | | | | | | | | |
| | 5,315 | | | Total Semiconductors & Equipment | | | | | | | | | | | | | | | 5,115,713 | |
| | | | | | | | | | | | | | | | | | | | | |
| | | | | Software – 3.7% (2.6% of Total Investments) |
| | | | | | | | | | | | | | | | | | | | | |
| | 10,785 | | | Dealer Computer Services, Inc., New Term Loan | | | 5.250% | | | | 4/21/17 | | | | BB– | | | | 10,693,699 | |
| | 7,000 | | | IPC Systems, Inc., Term Loan, Second Lien | | | 5.783% | | | | 6/01/15 | | | | CCC | | | | 5,775,000 | |
| | 1,818 | | | IPC Systems, Inc., Term Loan | | | 2.697% | | | | 6/02/14 | | | | B1 | | | | 1,626,007 | |
| | 2,000 | | | Reynolds Group Holdings, Inc., Incremental US Term Loan | | | 5.750% | | | | 5/05/16 | | | | BB– | | | | 1,993,750 | |
| | | | | | | | | | | | | | | | | | | | | |
| | 21,603 | | | Total Software | | | | | | | | | | | | | | | 20,088,456 | |
| | | | | | | | | | | | | | | | | | | | | |
| | | | | Specialty Retail – 6.8% (4.8% of Total Investments) |
| | 12,231 | | | Burlington Coat Factory Warehouse Corporation, Term Loan | | | 2.710% | | | | 5/28/13 | | | | B– | | | | 11,595,787 | |
| | 7,490 | | | Michaels Stores, Inc., Term Loan B1, DD1 | | | 2.762% | | | | 10/31/13 | | | | B | | | | 7,025,122 | |
| | 5,107 | | | Michaels Stores, Inc., Term Loan B2 | | | 5.012% | | | | 7/31/16 | | | | B | | | | 4,890,465 | |
| | 1,725 | | | Pilot Travel Centers LLC, Term Loan | | | 3.250% | | | | 6/30/16 | | | | BBB– | | | | 1,730,207 | |
| | 11,985 | | | Toys “R” Us–Delaware, Inc., Term Loan B | | | 4.575% | | | | 7/19/12 | | | | BB– | | | | 11,880,205 | |
| | | | | | | | | | | | | | | | | | | | | |
| | 38,538 | | | Total Specialty Retail | | | | | | | | | | | | | | | 37,121,786 | |
| | | | | | | | | | | | | | | | | | | | | |
| | | | | Trading Companies & Distributors – 0.3% (0.2% of Total Investments) |
| | | | | | | | | | | | | | | | | | | | | |
| | 232 | | | Brenntag Holdings GmbH & Co. KG, Acquisition Facility | | | 4.101% | | | | 1/20/14 | | | | BBB– | | | | 232,568 | |
| | 1,332 | | | Brenntag Holdings GmbH & Co. KG, Facility B2 | | | 4.085% | | | | 1/20/14 | | | | BBB– | | | | 1,336,546 | |
| | | | | | | | | | | | | | | | | | | | | |
| | 1,564 | | | Total Trading Companies & Distributors | | | | | | | | | | | | | | | 1,569,114 | |
| | | | | | | | | | | | | | | | | | | | | |
| | | | | Wireless Telecommunication Services – 3.7% (2.6% of Total Investments) |
| | | | | | | | | | | | | | | | | | | | | |
| | 10,918 | | | Asurion Corporation, Term Loan | | | 3.356% | | | | 7/03/14 | | | | N/R | | | | 10,477,765 | |
| | 8,000 | | | Clear Channel Communications, Inc., Tranche B, Term Loan, DD1 | | | 3.966% | | | | 11/13/15 | | | | Caa1 | | | | 6,397,144 | |
| | 3,229 | | | MetroPCS Wireless, Inc., Term Loan | | | 3.500% | | | | 11/03/16 | | | | N/R | | | | 3,189,087 | |
| | | | | | | | | | | | | | | | | | | | | |
| | 22,147 | | | Total Wireless Telecommunication Services | | | | | | | | | | | | | | | 20,063,996 | |
| | | | | | | | | | | | | | | | | | | | | |
| $ | 713,428 | | | Total Variable Rate Senior Loan Interests (cost $655,987,699) | | | | | | | | | | | | | | | 643,619,158 | |
| | | | | | | | | | | | | | | | | | | | | |
| | | | | | | | | | | | | | | |
| | | | | | | | | | | | | | | |
| Shares | | | Description (1) | | | | | | | | | | | Value | |
| | | | | Common Stocks – 3.1% (2.2% of Total Investments) |
| | | | | |
| | | | | Aerospace & Defense – 0.1% (0.1% of Total Investments) |
| | | | | | | | | | | | | | | | | | | | | |
| | 44,943 | | | Aveos Fleet Performance Inc., (10), (12) | | | | | | | | | | | | | | $ | 797,738 | |
| | | | | | | | | | | | | | | | | | | | | |
| | | | | Building Products – 2.4% (1.7% of Total Investments) |
| | | | | | | | | | | | | | | | | | | | | |
| | 301,905 | | | Masonite Worldwide Holdings, (10), (12) | | | | | | | | | | | | | | | 12,887,570 | |
| | | | | | | | | | | | | | | | | | | | | |
| | | | | Chemicals – 0.2% (0.2% of Total Investments) |
| | | | | | | | | | | | | | | | | | | | | |
| | 40,027 | | | LyondellBasell Industries NV, (10) | | | | | | | | | | | | | | | 720,486 | |
| | 36,686 | | | LyondellBasell Industries NV, (10) | | | | | | | | | | | | | | | 660,348 | |
| | | | | | | | | | | | | | | | | | | | | |
| | | | | Total Chemicals | | | | | | | | | | | | | | | 1,380,834 | |
| | | | | | | | | | | | | | | | | | | | | |
| | | | | Media – 0.4% (0.2% of Total Investments) |
| | | | | | | | | | | | | | | | | | | | | |
| | 33,622 | | | Citadel Broadcasting Corp Class B Shares, (10), (12) | | | | | | | | | | | | | | | 806,928 | |
| | 7,341 | | | Citadel Broadcasting Corporation, (10), (12) | | | | | | | | | | | | | | | 176,184 | |
| | 49,989 | | | Readers Digest Association Inc., (10), (12) | | | | | | | | | | | | | | | 987,283 | |
| | | | | | | | | | | | | | | | | | | | | |
| | | | | Total Media | | | | | | | | | | | | | | | 1,970,395 | |
| | | | | | | | | | | | | | | | | | | | | |
| | | | | Total Common Stocks (cost $19,562,675) | | | 17,036,537 | |
| | | | | | | | | | | | | | | | | | | | | |
| | | | | | | | | | | | | | | |
Principal
| | | | | | | | | | | | | | | |
| Amount (000) | | | Description (1) | | Coupon | | | Maturity | | | Ratings (3) | | | Value | |
| | | | | Convertible Bonds – 0.3% (0.2% of Total Investments) |
| | | | | |
| | | | | Airlines – 0.2% (0.1% of Total Investments) |
| | | | | | | | | | | | | | | | | | | | | |
| $ | 1,000 | | | UAL Corporation | | | 4.500% | | | | 6/30/21 | | | | CCC | | | $ | 1,015,000 | |
| | | | | | | | | | | | | | | | | | | | | |
| | | | | |
| | | | | Communications Equipment – 0.1% (0.1% of Total Investments) |
| | | | | | | | | | | | | | | | | | | | | |
| | 500 | | | Nortel Networks Corporation, (7), (8), (14) | | | 1.750% | | | | 4/15/12 | | | | D | | | | 392,500 | |
| | | | | | | | | | | | | | | | | | | | | |
| $ | 1,500 | | | Total Convertible Bonds (cost $1,362,657) | | | | | | | | | | | | | | | 1,407,500 | |
| | | | | | | | | | | | | | | | | | | | | |
| | | | |
| | | | |
JFR | | | Nuveen Floating Rate Income Fund (continued)
Portfolio of Investments July 31, 2010 |
| | | | | | | | | | | | | | | | | | | | | |
| | | | | | | | | | | | | | | |
Principal
| | | | | | | | | | | | | | | |
| Amount (000) | | | Description (1) | | Coupon | | | Maturity | | | Ratings (3) | | | Value | |
| | | | | Corporate Bonds – 8.3% (5.8% of Total Investments) |
| | | | | |
| | | | | Automobiles – 0.6% (0.5% of Total Investments) |
| | | | | | | | | | | | | | | | | | | | | |
| $ | 10,000 | | | General Motors Corporation, (8) | | | 8.250% | | | | 7/15/23 | | | | N/R | | | $ | 3,450,000 | |
| | | | | | | | | | | | | | | | | | | | | |
| | | | | Biotechnology – 0.2% (0.1% of Total Investments) |
| | | | | | | | | | | | | | | | | | | | | |
| | 1,023 | | | Angiotech Pharmaceuticals, Inc., Floating Rate Note, 3.750% plus three-month LIBOR | | | 4.204% | | | | 12/01/13 | | | | C | | | | 781,316 | |
| | | | | | | | | | | | | | | | | | | | | |
| | | | | Construction Materials – 0.2% (0.1% of Total Investments) |
| | | | | | | | | | | | | | | | | | | | | |
| | 1,000 | | | Headwaters Inc., 144A | | | 11.375% | | | | 11/01/14 | | | | B+ | | | | 1,020,000 | |
| | | | | | | | | | | | | | | | | | | | | |
| | | | | Diversified Telecommunication Services – 0.3% (0.2% of Total Investments) |
| | | | | | | | | | | | | | | | | | | | | |
| | 2,000 | | | Nortel Networks Limited, (7), (8), (14) | | | 0.000% | | | | 7/15/11 | | | | N/R | | | | 1,580,000 | |
| | | | | | | | | | | | | | | | | | | | | |
| | | | | Energy Equipment & Services – 0.9% (0.7% of Total Investments) |
| | | | | | | | | | | | | | | | | | | | | |
| | 5,000 | | | Williams Companies Inc., Floating Rate Note, 2.000% plus three-month LIBOR, 144A | | | 2.454% | | | | 10/01/10 | | | | Baa3 | | | | 4,998,115 | |
| | | | | | | | | | | | | | | | | | | | | |
| | | | | Health Care Providers & Services – 0.6% (0.4% of Total Investments) |
| | | | | | | | | | | | | | | | | | | | | |
| | 2,000 | | | HCA Inc., 144A | | | 8.500% | | | | 4/15/19 | | | | BB | | | | 2,220,000 | |
| | 500 | | | Select Medical Corporation, Floating Rate Note, 5.750% plus six-month LIBOR | | | 6.418% | | | | 9/15/15 | | | | CCC+ | | | | 438,125 | |
| | 750 | | | Select Medical Corporation | | | 7.625% | | | | 2/01/15 | | | | B– | | | | 721,875 | |
| | | | | | | | | | | | | | | | | | | | | |
| | 3,250 | | | Total Health Care Providers & Services | | | | | | | | | | | | | | | 3,380,000 | |
| | | | | | | | | | | | | | | | | | | | | |
| | | | | Health Care Technology – 0.5% (0.3% of Total Investments) |
| | | | | | | | | | | | | | | | | | | | | |
| | 2,500 | | | Merge Healthcare Inc., 144A | | | 11.750% | | | | 5/01/15 | | | | B+ | | | | 2,525,000 | |
| | | | | | | | | | | | | | | | | | | | | |
| | | | | Hotels, Restaurants & Leisure – 1.6% (1.1% of Total Investments) |
| | | | | | | | | | | | | | | | | | | | | |
| | 1,875 | | | CKE Restaurant Inc., 144A | | | 11.375% | | | | 7/15/18 | | | | B | | | | 1,917,188 | |
| | 7,900 | | | Mohegan Tribal Gaming Authority | | | 8.000% | | | | 4/01/12 | | | | CCC+ | | | | 6,794,000 | |
| | | | | | | | | | | | | | | | | | | | | |
| | 9,775 | | | Total Hotels, Restaurants & Leisure | | | | | | | | | | | | | | | 8,711,188 | |
| | | | | | | | | | | | | | | | | | | | | |
| | | | | Internet Software & Services – 0.4% (0.3% of Total Investments) |
| | | | | | | | | | | | | | | | | | | | | |
| | 2,750 | | | Open Solutions Inc., 144A | | | 9.750% | | | | 2/01/15 | | | | CCC+ | | | | 2,138,125 | |
| | | | | | | | | | | | | | | | | | | | | |
| | | | | IT Services – 0.5% (0.3% of Total Investments) |
| | | | | | | | | | | | | | | | | | | | | |
| | 1,053 | | | First Data Corporation | | | 10.550% | | | | 9/24/15 | | | | B– | | | | 813,249 | |
| | 2,500 | | | First Data Corporation | | | 11.250% | | | | 3/31/16 | | | | CCC+ | | | | 1,612,500 | |
| | | | | | | | | | | | | | | | | | | | | |
| | 3,553 | | | Total IT Services | | | | | | | | | | | | | | | 2,425,749 | |
| | | | | | | | | | | | | | | | | | | | | |
| | | | | Media – 1.1% (0.8% of Total Investments) |
| | | | | | | | | | | | | | | | | | | | | |
| | 3,000 | | | Clear Channel Communications, Inc. | | | 5.000% | | | | 3/15/12 | | | | CCC– | | | | 2,745,000 | |
| | 1,250 | | | Clear Channel Communications, Inc. | | | 5.500% | | | | 9/15/14 | | | | CCC– | | | | 743,750 | |
| | 3,250 | | | Clear Channel Communications, Inc. | | | 10.750% | | | | 8/01/16 | | | | CCC– | | | | 2,498,438 | |
| | | | | | | | | | | | | | | | | | | | | |
| | 7,500 | | | Total Media | | | | | | | | | | | | | | | 5,987,188 | |
| | | | | | | | | | | | | | | | | | | | | |
| | | | | Oil, Gas & Consumable Fuels – 0.4% (0.3% of Total Investments) |
| | | | | | | | | | | | | | | | | | | | | |
| | 2,500 | | | Western Refining Inc., Floating Rate Note, 7.500% plus three-month LIBOR, 144A | | | 7.954% | | | | 6/15/14 | | | | B3 | | | | 2,287,500 | |
| | | | | | | | | | | | | | | | | | | | | |
| | | | | Paper & Forest Products – 0.3% (0.2% of Total Investments) |
| | | | | | | | | | | | | | | | | | | | | |
| | 2,000 | | | Verso Paper Holdings LLC., Floating Rate Note, 3.750% plus three-month LIBOR | | | 4.204% | | | | 8/01/14 | | | | B | | | | 1,732,500 | |
| | | | | | | | | | | | | | | | | | | | | |
| | | | | Road & Rail – 0.3% (0.2% of Total Investments) |
| | | | | | | | | | | | | | | | | | | | | |
| | 2,000 | | | Avis Budget Car Rental, Floating Rate Note, 2.500% plus three-month LIBOR | | | 2.954% | | | | 5/15/14 | | | | B | | | | 1,780,000 | |
| | | | | | | | | | | | | | | | | | | | | |
| | | | | Wireless Telecommunication Services – 0.4% (0.3% of Total Investments) |
| | | | | | | | | | | | | | | | | | | | | |
| | 2,000 | | | Sprint Nextel Corporation | | | 8.375% | | | | 8/15/17 | | | | BB– | | | | 2,100,000 | |
| | | | | | | | | | | | | | | | | | | | | |
| $ | 56,851 | | | Total Corporate Bonds (cost $44,735,167) | | | | | | | | | | | | | | | 44,896,681 | |
| | | | | | | | | | | | | | | | | | | | | |
| | | | | | | | | | | | | | | |
| | | | | | | | | | | | | | | |
| Shares | | | Description (1) | | | | | | | | | | | Value | |
| | | | | Investment Companies – 2.3% (1.6% of Total Investments) |
| | | | | | | | | | | | | | | | | | | | | |
| | 353,668 | | | Eaton Vance Floating-Rate Income Trust Fund | | | | | | | | | | | | | | $ | 5,527,831 | |
| | 963,820 | | | Eaton Vance Senior Income Trust | | | | | | | | | | | | | | | 6,756,378 | |
| | | | | | | | | | | | | | | | | | | | | |
| | | | | Total Investment Companies (cost $11,947,776) | | | 12,284,209 | |
| | | | | | | | | | | | | | | | | | | | | |
| | | | | | | | | | | | | | | | | | | | | |
| | | | | | | | | | | | | | | |
| | | | | | | | | | | | | | | |
| Shares | | | Description (1) | | | | | | | | | | | Value | |
| | | | | Warrants – 0.5% (0.4% of Total Investments) |
| | | | | | | | | | | | | | | | | | | | | |
| | 120,965 | | | Citadel Broadcasting Corporation | | | | | | | | | | | | | | $ | 2,903,160 | |
| | | | | | | | | | | | | | | | | | | | | |
| | | | | Total Warrants (cost $3,686,408) | | | 2,903,160 | |
| | | | | | | | | | | | | | | | | | | | | |
| | | | | | | | | | | | | | | |
Principal
| | | | | | | | | | | | | | | |
| Amount (000) | | | Description (1) | | Coupon | | | Maturity | | | | | | Value | |
| | | | | Short-Term Investments – 8.4% (6.0% of Total Investments) |
| | | | | | | | | | | | | | | | | | | | | |
| $ | 45,774 | | | Repurchase Agreement with Fixed Income Clearing Corporation, dated 7/30/10, repurchase price $45,774,102, collateralized by $6,890,000 U.S. Treasury Notes,
4.500%, due 2/28/11, value $7,186,959 and $39,260,000 U.S. Treasury Notes,
0.875%, due 3/31/11, value $39,505,375 | | | 0.020% | | | | 8/02/10 | | | | | | | $ | 45,774,026 | |
| | | | | | | | | | | | | | | | | | | | | |
| | | | | Total Short-Term Investments (cost $45,774,026) | | | | | | | | | | | | | | | 45,774,026 | |
| | | | | | | | | | | | | | | | | | | | | |
| | | | | Total Investments (cost $783,056,408) – 141.6% | | | 767,921,271 | |
| | | | | | | | | | | | | | | | | | | | | |
| | | | | Borrowings – (36.5)% (13), (15) | | | (197,740,000 | ) |
| | | | | | | | | | | | | | | | | | | | | |
| | | | | Other Assets Less Liabilities – (5.1)% | | | (27,724,877 | ) |
| | | | | | | | | | | | | | | | | | | | | |
| | | | | Net Assets Applicable to Common Shares – 100% | | $ | 542,456,394 | |
| | | | | | | | | | | | | | | | | | | | | |
| | | | | | | |
| | | | | | | For Fund portfolio compliance purposes, the Fund’s industry classifications refer to any one or more of the industry sub-classifications used by one or more widely recognized market indexes or ratings group indexes, and/or as defined by Fund management. This definition may not apply for purposes of this report, which may combine industry sub-classifications into sectors for reporting ease. |
| | | | | (1) | | All percentages shown in the Portfolio of Investments are based on net assets applicable to Common shares unless otherwise noted. |
| | | | | (2) | | Senior Loans generally are subject to mandatory and/or optional prepayment. Because of these mandatory prepayment conditions and because there may be significant economic incentives for a Borrower to prepay, prepayments of Senior Loans may occur. As a result, the actual remaining maturity of Senior Loans held may be substantially less than the stated maturities shown. |
| | | | | (3) | | Ratings: Using the highest of Standard & Poor’s Group (“Standard & Poor’s”), Moody’s Investor Service, Inc. (“Moody’s”) or Fitch, Inc. (“Fitch”) rating. Ratings below BBB by Standard & Poor’s, Baa by Moody’s or BBB by Fitch are considered to be below investment grade. |
| | | | | (4) | | Senior Loans generally pay interest at rates which are periodically adjusted by reference to a base short-term, floating lending rate plus an assigned fixed rate. These floating lending rates are generally (i) the lending rate referenced by the London Inter-Bank Offered Rate (“LIBOR”), or (ii) the prime rate offered by one or more major United States banks. |
| | | | | | | Senior Loans may be considered restricted in that the Fund ordinarily is contractually obligated to receive approval from the Agent Bank and/or Borrower prior to the disposition of a Senior Loan. |
| | | | | (5) | | Investment, or portion of investment, represents an unfunded Senior Loan commitment outstanding at July 31, 2010. |
| | | | | (6) | | Negative value represents unrealized depreciation on unfunded Senior Loan commitment outstanding at July 31, 2010. |
| | | | | (7) | | At or subsequent to July 31, 2010, this issue was under the protection of the Federal Bankruptcy Court or has filed for bankruptcy. |
| | | | | (8) | | Non-income producing; denotes that the issuer has defaulted on the payment of principal or interest. |
| | | | | (9) | | The Fund’s Adviser concluded this issue is not likely to meet its future interest payment obligations and directed the Fund’s custodian to cease accruing additional income and “write-off” any remaining recorded balances on the Fund’s records. |
| | | | | (10) | | Non-income producing; issuer has not declared a dividend within the past twelve months. |
| | | | | (11) | | Subsequent to the reporting period, the Adviser has concluded this issue is not likely to meet its future interest payment obligations and has directed the Fund’s custodian to cease accruing additional income and “write-off” any remaining recorded balances on the Fund’s records. |
| | | | | (12) | | For fair value measurement disclosure purposes, Common Stock categorized as Level 2. See Notes to Financial Statements, Footnote 1 – General Information and Significant Accounting Policies, Investment Valuation for more information. |
| | | | | (13) | | Borrowings as a percentage of Total Investments is 25.8%. |
| | | | | (14) | | The Fund’s Adviser has concluded this issue is not likely to meet its future interest payment obligations and has directed the Fund’s custodian to cease accruing additional income on the Fund’s records. |
| | | | | (15) | | The Fund may pledge up to 100% of its eligible investments in the portfolio of Investments as collateral for Borrowings. |
| | | | | N/R | | Not rated. |
| | | | | DD1 | | Investment, or portion of investment, purchased on a delayed delivery basis. |
| | | | | WI/DD | | Purchased on a when-issued or delayed delivery basis. |
| | | | | 144A | | Investment is exempt from registration under Rule 144A of the Securities Act of 1933, as amended. These investments may only be resold in transactions exempt from registration which are normally those transactions with qualified institutional buyers. |
| | | | | TBD | | Senior Loan purchased on a when-issued or delayed-delivery basis. Certain details associated with this purchase are not known prior to the settlement date of the transaction. In addition, Senior Loans typically trade without accrued interest and therefore a weighted average coupon rate is not available prior to settlement. At settlement, if still unknown, the Borrower or counterparty will provide the Fund with the final weighted average coupon rate and maturity date. |
See accompanying notes to financial statements.
| | | | | | |
| | | | | | |
JRO | | | Nuveen Floating Rate Income Opportunity Fund
Portfolio of Investments |
| | | | | | July 31, 2010 |
| | | | | | | | | | | | | | | | | | | | | |
| | | | | | | | | | | | | | | |
| | | | | Weighted
| | | | | | | | | | |
Principal
| | | | | Average
| | | | | | | | | | |
| Amount (000) | | | Description (1) | | Coupon | | | Maturity (2) | | | Ratings (3) | | | Value | |
| | | | | Variable Rate Senior Loan Interests – 120.3% (83.9% of Total Investments) (4) |
| | | | | |
| | | | | Aerospace & Defense – 1.3% (0.9% of Total Investments) |
| | | | | | | | | | | | | | | | | | | | | |
| $ | 574 | | | DAE Aviation Holdings, Inc., Term Loan B1 | | | 4.230% | | | | 7/31/14 | | | | B | | | $ | 521,330 | |
| | 558 | | | DAE Aviation Holdings, Inc., Term Loan B2 | | | 4.230% | | | | 7/31/14 | | | | B | | | | 506,118 | |
| | 112 | | | Hawker Beechcraft, LLC, LC Facility | | | 2.533% | | | | 3/26/14 | | | | CCC+ | | | | 90,580 | |
| | 496 | | | Hawker Beechcraft, LLC, Term Loan B | | | 10.500% | | | | 3/26/14 | | | | CCC+ | | | | 494,544 | |
| | 1,874 | | | Hawker Beechcraft, LLC, Term Loan | | | 2.374% | | | | 3/26/14 | | | | CCC+ | | | | 1,519,032 | |
| | 1,150 | | | Transdigm, Inc., Term Loan B | | | 2.538% | | | | 6/23/13 | | | | Ba2 | | | | 1,119,607 | |
| | | | | | | | | | | | | | | | | | | | | |
| | 4,764 | | | Total Aerospace & Defense | | | | | | | | | | | | | | | 4,251,211 | |
| | | | | | | | | | | | | | | | | | | | | |
| | | | | Airlines – 3.3% (2.3% of Total Investments) |
| | | | | | | | | | | | | | | | | | | | | |
| | 2,227 | | | Delta Air Lines, Inc., Credit Linked Deposit | | | 2.258% | | | | 4/30/12 | | | | Ba2 | | | | 2,127,287 | |
| | 3,339 | | | Delta Air Lines, Inc., Term Loan | | | 3.591% | | | | 4/30/14 | | | | B | | | | 3,033,123 | |
| | 6,249 | | | United Air Lines, Inc., Term Loan B | | | 2.375% | | | | 2/01/14 | | | | BB– | | | | 5,560,056 | |
| | | | | | | | | | | | | | | | | | | | | |
| | 11,815 | | | Total Airlines | | | | | | | | | | | | | | | 10,720,466 | |
| | | | | | | | | | | | | | | | | | | | | |
| | | | | Auto Components – 3.5% (2.5% of Total Investments) |
| | | | | | | | | | | | | | | | | | | | | |
| | 8,421 | | | Federal-Mogul Corporation, Tranche B, Term Loan | | | 2.286% | | | | 12/29/14 | | | | Ba3 | | | | 7,538,408 | |
| | 4,297 | | | Federal-Mogul Corporation, Tranche C, Term Loan | | | 2.279% | | | | 12/28/15 | | | | Ba3 | | | | 3,846,882 | |
| | | | | | | | | | | | | | | | | | | | | |
| | 12,718 | | | Total Auto Components | | | | | | | | | | | | | | | 11,385,290 | |
| | | | | | | | | | | | | | | | | | | | | |
| | | | | Automobiles – 2.5% (1.8% of Total Investments) |
| | | | | | | | | | | | | | | | | | | | | |
| | 8,366 | | | Ford Motor Company, Term Loan | | | 3.350% | | | | 12/15/13 | | | | Ba1 | | | | 8,144,748 | |
| | | | | | | | | | | | | | | | | | | | | |
| | | | | Building Products – 2.1% (1.4% of Total Investments) |
| | | | | | | | | | | | | | | | | | | | | |
| | 3,296 | | | Building Materials Corporation of America, Term Loan | | | 3.125% | | | | 2/22/14 | | | | BBB– | | | | 3,191,515 | |
| | 3,531 | | | TFS Acquisition, Term Loan | | | 10.000% | | | | 8/11/13 | | | | B– | | | | 3,513,265 | |
| | | | | | | | | | | | | | | | | | | | | |
| | 6,827 | | | Total Building Products | | | | | | | | | | | | | | | 6,704,780 | |
| | | | | | | | | | | | | | | | | | | | | |
| | | | | Chemicals – 2.6% (1.8% of Total Investments) |
| | | | | | | | | | | | | | | | | | | | | |
| | 800 | | | Celanese US Holdings LLC, Credit Linked Deposit | | | 2.098% | | | | 4/02/14 | | | | BB+ | | | | 768,000 | |
| | 517 | | | Hercules Offshore, Inc., Term Loan | | | 6.000% | | | | 7/11/13 | | | | B2 | | | | 460,801 | |
| | 1,460 | | | Hexion Specialty Chemicals, Inc., Tranche C, Term Loan B1 | | | 4.313% | | | | 5/05/15 | | | | Ba3 | | | | 1,373,358 | |
| | 613 | | | Hexion Specialty Chemicals, Inc., Tranche C, Term Loan B2 | | | 4.313% | | | | 5/05/15 | | | | Ba3 | | | | 576,401 | |
| | 1,469 | | | Ineos US Finance LLC, Tranche B2 | | | 7.500% | | | | 12/16/13 | | | | B | | | | 1,448,571 | |
| | 1,469 | | | Ineos US Finance LLC, Tranche C2 | | | 8.000% | | | | 12/16/14 | | | | B | | | | 1,448,571 | |
| | 2,150 | | | Styron Corporation, Term Loan | | | 7.500% | | | | 6/17/16 | | | | B+ | | | | 2,168,813 | |
| | | | | | | | | | | | | | | | | | | | | |
| | 8,478 | | | Total Chemicals | | | | | | | | | | | | | | | 8,244,515 | |
| | | | | | | | | | | | | | | | | | | | | |
| | | | | Commercial Services & Supplies – 1.5% (1.1% of Total Investments) |
| | | | | | | | | | | | | | | | | | | | | |
| | 1,562 | | | Rental Services Corporation, Term Loan | | | 4.040% | | | | 11/30/13 | | | | B– | | | | 1,483,082 | |
| | 89 | | | ServiceMaster Company, Delayed Term Loan | | | 2.820% | | | | 7/24/14 | | | | B+ | | | | 82,074 | |
| | 893 | | | ServiceMaster Company, Term Loan | | | 2.879% | | | | 7/24/14 | | | | B+ | | | | 824,156 | |
| | 1,990 | | | Universal City Development Partners, Ltd., Term Loan | | | 5.500% | | | | 11/06/14 | | | | Ba2 | | | | 1,996,004 | |
| | 512 | | | West Corporation, Term Loan B4 | | | 4.249% | | | | 7/15/16 | | | | BB– | | | | 497,318 | |
| | | | | | | | | | | | | | | | | | | | | |
| | 5,046 | | | Total Commercial Services & Supplies | | | | | | | | | | | | | | | 4,882,634 | |
| | | | | | | | | | | | | | | | | | | | | |
| | | | | Communications Equipment – 3.7% (2.6% of Total Investments) |
| | | | | | | | | | | | | | | | | | | | | |
| | 12,382 | | | Avaya, Inc., Term Loan | | | 3.260% | | | | 10/24/14 | | | | B1 | | | | 11,017,609 | |
| | 1,006 | | | Telcordia Technologies, Inc., Term Loan | | | 6.750% | | | | 4/30/16 | | | | B+ | | | | 1,002,110 | |
| | | | | | | | | | | | | | | | | | | | | |
| | 13,388 | | | Total Communications Equipment | | | | | | | | | | | | | | | 12,019,719 | |
| | | | | | | | | | | | | | | | | | | | | |
| | | | | Containers & Packaging – 0.1% (0.1% of Total Investments) |
| | | | | | | | | | | | | | | | | | | | | |
| | 455 | | | Amscan Holdings, Inc., Term Loan | | | 2.788% | | | | 5/27/13 | | | | B1 | | | | 430,887 | |
| | | | | | | | | | | | | | | | | | | | | |
| | | | | Diversified Consumer Services – 2.5% (1.7% of Total Investments) |
| | | | | | | | | | | | | | | | | | | | | |
| | 3,148 | | | Cengage Learning Acquisitions, Inc., Term Loan | | | 3.030% | | | | 7/03/14 | | | | B+ | | | | 2,792,547 | |
| | 254 | | | Laureate Education, Inc., Delayed Term Loan | | | 3.743% | | | | 8/15/14 | | | | B1 | | | | 231,013 | |
| | 1,694 | | | Laureate Education, Inc., Term Loan B | | | 3.743% | | | | 8/15/14 | | | | B1 | | | | 1,543,263 | |
| | 3,500 | | | Quad Graphics, Inc., Term Loan | | | 5.500% | | | | 8/23/16 | | | | BB+ | | | | 3,331,563 | |
| | | | | | | | | | | | | | | | | | | | | |
| | 8,596 | | | Total Diversified Consumer Services | | | | | | | | | | | | | | | 7,898,386 | |
| | | | | | | | | | | | | | | | | | | | | |
| | | | | | | | | | | | | | | | | | | | | |
| | | | | | | | | | | | | | | |
| | | | | Weighted
| | | | | | | | | | |
Principal
| | | | | Average
| | | | | | | | | | |
| Amount (000) | | | Description (1) | | Coupon | | | Maturity (2) | | | Ratings (3) | | | Value | |
| | | | | Diversified Financial Services – 1.0% (0.7% of Total Investments) |
| | | | | | | | | | | | | | | | | | | | | |
| $ | 550 | | | CIT Group, Inc., Tranche A1, Term Loan | | | 13.000% | | | | 1/18/12 | | | | BB | | | $ | 568,385 | |
| | 1,100 | | | CIT Group, Inc., Tranche B1, Term Loan | | | 13.000% | | | | 1/18/12 | | | | BB | | | | 1,135,009 | |
| | 1,736 | | | Fox Acquisition Sub LLC, Term Loan B | | | 7.500% | | | | 7/14/15 | | | | B | | | | 1,670,852 | |
| | | | | | | | | | | | | | | | | | | | | |
| | 3,386 | | | Total Diversified Financial Services | | | | | | | | | | | | | | | 3,374,246 | |
| | | | | | | | | | | | | | | | | | | | | |
| | | | | Diversified Telecommunication Services – 3.9% (2.7% of Total Investments) |
| | | | | | | | | | | | | | | | | | | | | |
| | 2,993 | | | Cincinnati Bell Inc., Tranche B, Term Loan | | | 6.500% | | | | 11/18/14 | | | | BB | | | | 2,944,408 | |
| | 1,901 | | | Intelsat, Tranche B2, Term Loan | | | 3.033% | | | | 1/03/14 | | | | BB– | | | | 1,808,663 | |
| | 575 | | | Intelsat, Tranche B2, Term Loan A | | | 3.033% | | | | 1/03/14 | | | | BB– | | | | 543,455 | |
| | 574 | | | Intelsat, Tranche B2, Term Loan B | | | 3.033% | | | | 1/03/14 | | | | BB– | | | | 543,288 | |
| | 574 | | | Intelsat, Tranche B2, Term Loan C | | | 3.033% | | | | 1/03/14 | | | | BB– | | | | 543,288 | |
| | 2,000 | | | Intelsat, Unsecured Term Loan | | | 3.026% | | | | 2/01/14 | | | | B+ | | | | 1,800,000 | |
| | 4,533 | | | Level 3 Financing, Inc., Term Loan | | | 2.724% | | | | 3/13/14 | | | | B+ | | | | 4,076,224 | |
| | 159 | | | MetroPCS Wireless, Inc., Term Loan | | | 2.625% | | | | 11/03/13 | | | | Ba1 | | | | 154,459 | |
| | | | | | | | | | | | | | | | | | | | | |
| | 13,309 | | | Total Diversified Telecommunication Services | | | | | | | | | | | | | | | 12,413,785 | |
| | | | | | | | | | | | | | | | | | | | | |
| | | | | Electric Utilities – 0.9% (0.6% of Total Investments) |
| | | | | | | | | | | | | | | | | | | | | |
| | 918 | | | Calpine Corporation, DIP Term Loan | | | 3.415% | | | | 3/29/14 | | | | B+ | | | | 872,928 | |
| | 1,111 | | | Calpine Corporation, Delayed Draw, Term Loan, (5), (6) | | | 0.500% | | | | 3/29/14 | | | | B+ | | | | (140,278 | ) |
| | 1,667 | | | TXU Corporation, Term Loan B2 | | | 3.975% | | | | 10/10/14 | | | | B+ | | | | 1,297,291 | |
| | 950 | | | TXU Corporation, Term Loan B3 | | | 3.846% | | | | 10/10/14 | | | | B+ | | | | 736,933 | |
| | | | | | | | | | | | | | | | | | | | | |
| | 4,646 | | | Total Electric Utilities | | | | | | | | | | | | | | | 2,766,874 | |
| | | | | | | | | | | | | | | | | | | | | |
| | | | | Electrical Equipment – 1.3% (0.9% of Total Investments) |
| | | | | | | | | | | | | | | | | | | | | |
| | 4,311 | | | Allison Transmission Holdings, Inc., Term Loan | | | 3.100% | | | | 8/07/14 | | | | B | | | | 4,036,217 | |
| | | | | | | | | | | | | | | | | | | | | |
| | | | | Food & Staples Retailing – 1.8% (1.3% of Total Investments) |
| | | | | | | | | | | | | | | | | | | | | |
| | 500 | | | Roundy’s Supermarkets, Inc., Term Loan, Second Lien | | | 10.000% | | | | 4/16/16 | | | | CCC+ | | | | 508,125 | |
| | 6,213 | | | U.S. Foodservice, Inc., Term Loan | | | 2.828% | | | | 7/03/14 | | | | B2 | | | | 5,408,317 | |
| | | | | | | | | | | | | | | | | | | | | |
| | 6,713 | | | Total Food & Staples Retailing | | | | | | | | | | | | | | | 5,916,442 | |
| | | | | | | | | | | | | | | | | | | | | |
| | | | | Food Products – 2.2% (1.5% of Total Investments) |
| | | | | | | | | | | | | | | | | | | | | |
| | 2,000 | | | BLB Management Services, Inc., Term Loan, WI/DD | | | TBD | | | | TBD | | | | N/R | | | | 1,446,666 | |
| | 168 | | | Dole Food Company, Inc., Deposit-Funded Commitment | | | 7.941% | | | | 4/12/13 | | | | Ba2 | | | | 168,888 | |
| | 2,600 | | | Michael Foods Group, Inc., Term Loan B | | | 6.250% | | | | 6/29/16 | | | | BB– | | | | 2,610,075 | |
| | 2,951 | | | Pinnacle Foods Finance LLC, Tranche C, Term Loan | | | 7.500% | | | | 4/02/14 | | | | B | | | | 2,963,801 | |
| | | | | | | | | | | | | | | | | | | | | |
| | 7,719 | | | Total Food Products | | | | | | | | | | | | | | | 7,189,430 | |
| | | | | | | | | | | | | | | | | | | | | |
| | | | | Health Care Equipment & Supplies – 1.8% (1.2% of Total Investments) |
| | | | | | | | | | | | | | | | | | | | | |
| | 195 | | | Bausch & Lomb, Inc., Delayed Term Loan | | | 3.566% | | | | 4/24/15 | | | | BB– | | | | 187,166 | |
| | 805 | | | Bausch & Lomb, Inc., Term Loan | | | 3.628% | | | | 4/24/15 | | | | BB– | | | | 772,773 | |
| | 239 | | | Fenwal, Inc., Delayed Term Loan | | | 2.788% | | | | 2/28/14 | | | | B | | | | 207,069 | |
| | 759 | | | Fenwal, Inc., Term Loan | | | 2.788% | | | | 2/28/14 | | | | B | | | | 657,379 | |
| | 1,424 | | | Select Medical Corporation, Term Loan, WI/DD | | | TBD | | | | TBD | | | | Ba2 | | | | 1,387,760 | |
| | 1,348 | | | Symbion, Inc., Term Loan A | | | 3.566% | | | | 8/23/13 | | | | B1 | | | | 1,221,398 | |
| | 1,393 | | | Symbion, Inc., Term Loan B | | | 3.566% | | | | 8/25/14 | | | | B1 | | | | 1,262,180 | |
| | | | | | | | | | | | | | | | | | | | | |
| | 6,163 | | | Total Health Care Equipment & Supplies | | | | | | | | | | | | | | | 5,695,725 | |
| | | | | | | | | | | | | | | | | | | | | |
| | | | | Health Care Providers & Services – 6.7% (4.7% of Total Investments) |
| | | | | | | | | | | | | | | | | | | | | |
| | 304 | | | Community Health Systems, Inc., Delayed Term Loan | | | 2.788% | | | | 7/25/14 | | | | BB | | | | 288,128 | |
| | 5,918 | | | Community Health Systems, Inc., Term Loan | | | 2.788% | | | | 7/25/14 | | | | BB | | | | 5,615,883 | |
| | 1,118 | | | HCA, Inc., Term Loan | | | 2.783% | | | | 11/18/13 | | | | BB | | | | 1,081,811 | |
| | 291 | | | IASIS Healthcare LLC, Delayed Term Loan | | | 2.316% | | | | 3/14/14 | | | | Ba2 | | | | 275,421 | |
| | 79 | | | IASIS Healthcare LLC, Letter of Credit | | | 2.280% | | | | 3/14/14 | | | | Ba2 | | | | 74,944 | |
| | 2,185 | | | IASIS Healthcare LLC, PIK Term Loan | | | 4.250% | | | | 6/16/14 | | | | CCC+ | | | | 2,056,419 | |
| | 841 | | | IASIS Healthcare LLC, Term Loan | | | 2.316% | | | | 3/14/14 | | | | Ba2 | | | | 795,783 | |
| | 7,000 | | | Universal Health Services Term Loan, WI/DD | | | TBD | | | | TBD | | | | BB+ | | | | 6,959,165 | |
| | 4,417 | | | Vanguard Health Holding Company II LLC, Initial Term Loan | | | 5.000% | | | | 1/29/16 | | | | Ba2 | | | | 4,380,845 | |
| | | | | | | | | | | | | | | | | | | | | |
| | 22,153 | | | Total Health Care Providers & Services | | | | | | | | | | | | | | | 21,528,399 | |
| | | | | | | | | | | | | | | | | | | | | |
| | | | | Hotels, Restaurants & Leisure – 14.2% (9.9% of Total Investments) |
| | | | | | | | | | | | | | | | | | | | | |
| | 3,000 | | | 24 Hour Fitness Worldwide, Inc., Term Loan | | | 6.750% | | | | 4/22/16 | | | | Ba2 | | | | 2,799,750 | |
| | 97 | | | CBRL Group, Inc., Term Loan B2 | | | 1.850% | | | | 4/26/13 | | | | BB– | | | | 95,261 | |
| | 1,507 | | | CCM Merger, Inc., Term Loan B | | | 8.500% | | | | 7/13/12 | | | | BB– | | | | 1,488,944 | |
| | 2,205 | | | Cedar Fair LP, Term Loan, WI/DD | | | TBD | | | | TBD | | | | Ba2 | | | | 2,214,351 | |
| | 282 | | | Fontainebleau Las Vegas LLC, Delayed Term Loan, (7), (8) | | | 4.000% | | | | 6/06/14 | | | | N/R | | | | 61,028 | |
| | | | |
| | | | |
JRO | | | Nuveen Floating Rate Income Opportunity Fund (continued)
Portfolio of Investments July 31, 2010 |
| | | | | | | | | | | | | | | | | | | | | |
| | | | | | | | | | | | | | | |
| | | | | Weighted
| | | | | | | | | | |
Principal
| | | | | Average
| | | | | | | | | | |
| Amount (000) | | | Description (1) | | Coupon | | | Maturity (2) | | | Ratings (3) | | | Value | |
| | | | | Hotels, Restaurants & Leisure (continued) |
| | | | | | | | | | | | | | | | | | | | | |
| $ | 1,408 | | | Fontainebleau Las Vegas LLC, Term Loan, (7), (8) | | | 4.000% | | | | 6/06/14 | | | | N/R | | | $ | 305,141 | |
| | 1,500 | | | Harrah’s Operating Company, Inc., Term Loan B1 | | | 3.498% | | | | 1/28/15 | | | | B | | | | 1,287,396 | |
| | 3,000 | | | Harrah’s Operating Company, Inc., Term Loan B2 | | | 3.498% | | | | 1/28/15 | | | | B | | | | 2,583,189 | |
| | 1,994 | | | Harrah’s Operating Company, Inc., Term Loan B3 | | | 3.498% | | | | 1/28/15 | | | | B | | | | 1,704,513 | |
| | 757 | | | Isle of Capri Casinos, Inc., Delayed Term Loan A, DD1 | | | 5.000% | | | | 11/25/13 | | | | B+ | | | | 716,983 | |
| | 814 | | | Isle of Capri Casinos, Inc., Delayed Term Loan B | | | 5.000% | | | | 11/25/13 | | | | B+ | | | | 771,513 | |
| | 1,995 | | | Isle of Capri Casinos, Inc., Delayed Term Loan, DD1 | | | 5.000% | | | | 11/25/13 | | | | B+ | | | | 1,890,352 | |
| | 4,721 | | | Orbitz Worldwide, Inc., Term Loan | | | 3.417% | | | | 7/25/14 | | | | B+ | | | | 4,439,507 | |
| | 308 | | | OSI Restaurant Partners LLC, Revolver | | | 1.432% | | | | 6/14/13 | | | | B+ | | | | 268,053 | |
| | 2,999 | | | OSI Restaurant Partners LLC, Term Loan | | | 2.875% | | | | 6/14/14 | | | | B+ | | | | 2,611,342 | |
| | 994 | | | Reynolds Group Holdings, Inc., US Term Loan | | | 6.250% | | | | 11/05/15 | | | | BB– | | | | 993,005 | |
| | 3,489 | | | Shingle Springs Tribal Gaming Authority, Term Loan | | | 10.500% | | | | 12/17/13 | | | | N/R | | | | 3,297,379 | |
| | 3,219 | | | SW Acquisitions Co., Inc., Term Loan | | | 5.750% | | | | 6/01/16 | | | | BB+ | | | | 3,226,332 | |
| | 1,940 | | | Travelport LLC, Delayed Term Loan | | | 2.816% | | | | 8/23/13 | | | | Ba3 | | | | 1,828,989 | |
| | 406 | | | Travelport LLC, Letter of Credit | | | 3.033% | | | | 8/23/13 | | | | Ba3 | | | | 384,196 | |
| | 1,865 | | | Travelport LLC, Term Loan | | | 2.816% | | | | 8/23/13 | | | | Ba3 | | | | 1,762,688 | |
| | 2,296 | | | Venetian Casino Resort LLC, Delayed Term Loan, DD1 | | | 2.070% | | | | 5/23/14 | | | | B– | | | | 2,136,295 | |
| | 9,421 | | | Venetian Casino Resort LLC, Term Loan, DD1 | | | 2.070% | | | | 5/23/14 | | | | B– | | | | 8,767,065 | |
| | | | | | | | | | | | | | | | | | | | | |
| | 50,217 | | | Total Hotels, Restaurants & Leisure | | | | | | | | | | | | | | | 45,633,272 | |
| | | | | | | | | | | | | | | | | | | | | |
| | | | | Household Products – 2.0% (1.4% of Total Investments) |
| | | | | | | | | | | | | | | | | | | | | |
| | 6,439 | | | Spectrum Brands, Inc., Term Loan | | | 8.000% | | | | 6/16/16 | | | | B | | | | 6,515,282 | |
| | | | | | | | | | | | | | | | | | | | | |
| | | | | Insurance – 1.8% (1.2% of Total Investments) |
| | | | | | | | | | | | | | | | | | | | | |
| | 3,288 | | | Conseco, Inc., Term Loan | | | 7.500% | | | | 10/10/13 | | | | B2 | | | | 3,222,432 | |
| | 2,500 | | | Fidelity National Information Services, Inc., Term Loan B | | | 5.250% | | | | 7/18/16 | | | | Ba2 | | | | 2,517,448 | |
| | | | | | | | | | | | | | | | | | | | | |
| | 5,788 | | | Total Insurance | | | | | | | | | | | | | | | 5,739,880 | |
| | | | | | | | | | | | | | | | | | | | | |
| | | | | Internet Software & Services – 2.2% (1.5% of Total Investments) |
| | | | | | | | | | | | | | | | | | | | | |
| | 762 | | | Open Solutions, Inc., Term Loan B | | | 2.625% | | | | 1/23/14 | | | | BB– | | | | 659,842 | |
| | 3,852 | | | Sabre, Inc., Term Loan | | | 2.373% | | | | 9/30/14 | | | | B1 | | | | 3,482,150 | |
| | 3,000 | | | SkillSoft PLC Term Loan | | | 6.500% | | | | 5/30/17 | | | | BB | | | | 3,011,250 | |
| | | | | | | | | | | | | | | | | | | | | |
| | 7,614 | | | Total Internet Software & Services | | | | | | | | | | | | | | | 7,153,242 | |
| | | | | | | | | | | | | | | | | | | | | |
| | | | | IT Services – 4.7% (3.3% of Total Investments) |
| | | | | | | | | | | | | | | | | | | | | |
| | 826 | | | Attachmate Corporation, Term Loan | | | 3.566% | | | | 4/13/13 | | | | BB– | | | | 771,005 | |
| | 3,148 | | | First Data Corporation, Term Loan B2 | | | 3.078% | | | | 9/24/14 | | | | B+ | | | | 2,743,979 | |
| | 990 | | | First Data Corporation, Term Loan B3 | | | 3.078% | | | | 9/24/14 | | | | B+ | | | | 863,414 | |
| | 127 | | | Infor Global Solutions Intermediate Holdings, Ltd., Delayed Term Loan, First Lien | | | 6.030% | | | | 7/28/15 | | | | B+ | | | | 118,556 | |
| | 2,292 | | | Infor Global Solutions Intermediate Holdings, Ltd., Delayed Term Loan, Second Lien, DD1 | | | 6.566% | | | | 3/02/14 | | | | CCC+ | | | | 1,695,833 | |
| | 538 | | | Infor Global Solutions Intermediate Holdings, Ltd., Extended Delayed Term Loan | | | 6.070% | | | | 7/28/15 | | | | B+ | | | | 501,297 | |
| | 5,581 | | | Infor Global Solutions Intermediate Holdings, Ltd., Holdco PIK Term Loan, DD1 | | | 8.000% | | | | 9/02/14 | | | | N/R | | | | 2,297,316 | |
| | 270 | | | Infor Global Solutions Intermediate Holdings, Ltd., Term Loan, First Lien | | | 4.070% | | | | 7/28/12 | | | | B+ | | | | 251,521 | |
| | 3,958 | | | Infor Global Solutions Intermediate Holdings, Ltd., Term Loan, Second Lien, DD1 | | | 6.566% | | | | 3/02/14 | | | | CCC+ | | | | 2,902,776 | |
| | 1,023 | | | Infor Global Solutions Intermediate Holdings, Ltd., Term Loan | | | 6.070% | | | | 7/28/15 | | | | B+ | | | | 949,168 | |
| | 2,066 | | | SunGard Data Systems, Inc., Term Loan B | | | 2.095% | | | | 2/28/14 | | | | BB | | | | 1,960,819 | |
| | | | | | | | | | | | | | | | | | | | | |
| | 20,819 | | | Total IT Services | | | | | | | | | | | | | | | 15,055,684 | |
| | | | | | | | | | | | | | | | | | | | | |
| | | | | Leisure Equipment & Products – 2.0% (1.4% of Total Investments) |
| | | | | | | | | | | | | | | | | | | | | |
| | 7,612 | | | Bombardier Recreational Products, Inc., Term Loan | | | 3.193% | | | | 6/28/13 | | | | Caa1 | | | | 6,603,718 | |
| | | | | | | | | | | | | | | | | | | | | |
| | | | | Media – 16.7% (11.6% of Total Investments) |
| | | | | | | | | | | | | | | | | | | | | |
| | 3,000 | | | Charter Communications Operating Holdings LLC, Holdco Term Loan | | | 3.038% | | | | 3/06/14 | | | | BB+ | | | | 2,753,250 | |
| | 6,426 | | | Charter Communications Operating Holdings LLC, Term Loan C, DD1 | | | 3.790% | | | | 9/06/16 | | | | BB+ | | | | 6,142,342 | |
| | 669 | | | Charter Communications Operating Holdings LLC, Term Loan | | | 2.320% | | | | 3/06/14 | | | | BB+ | | | | 635,947 | |
| | 2,421 | | | Citadel Broadcasting Corporation, Term Loan, (9), DD1 | | | 11.000% | | | | 6/03/15 | | | | BB+ | | | | 2,542,739 | |
| | 811 | | | Cumulus Media, Inc., Term Loan | | | 4.079% | | | | 6/11/14 | | | | B– | | | | 733,780 | |
| | 1,232 | | | Gray Television, Inc., Term Loan B | | | 3.850% | | | | 12/31/14 | | | | B | | | | 1,160,324 | |
| | 2,913 | | | HIT Entertainment, Inc., Term Loan B | | | 5.597% | | | | 6/01/12 | | | | B1 | | | | 2,733,703 | |
| | 2,000 | | | HIT Entertainment, Inc., Term Loan | | | 5.850% | | | | 2/26/13 | | | | Caa2 | | | | 1,325,000 | |
| | 4,000 | | | Interactive Data Corporation, Term Loan, WI/DD | | | TBD | | | | TBD | | | | Ba3 | | | | 3,998,332 | |
| | 3,087 | | | Live Nation Entertainment Inc., Term Loan B, | | | 4.500% | | | | 11/07/16 | | | | B– | | | | 3,046,911 | |
| | 6,804 | | | Metro-Goldwyn-Mayer Studios, Inc., Term Loan B, (7), (8), (9) | | | 18.250% | | | | 4/09/12 | | | | N/R | | | | 2,983,752 | |
| | 5,857 | | | Metro-Goldwyn-Mayer Studios, Inc., Term Loan, (7), (8) | | | 18.250% | | | | 4/09/12 | | | | N/R | | | | 2,568,316 | |
| | 1,430 | | | Nielsen Finance LLC, Term Loan A | | | 2.345% | | | | 8/09/13 | | | | Ba3 | | | | 1,361,232 | |
| | 3,042 | | | Nielsen Finance LLC, Term Loan B | | | 4.095% | | | | 5/02/16 | | | | Ba3 | | | | 2,947,921 | |
| | | | | | | | | | | | | | | | | | | | | |
| | | | | | | | | | | | | | | |
| | | | | Weighted
| | | | | | | | | | |
Principal
| | | | | Average
| | | | | | | | | | |
| Amount (000) | | | Description (1) | | Coupon | | | Maturity (2) | | | Ratings (3) | | | Value | |
| | | | | Media (continued) |
| | | | | | | | | | | | | | | | | | | | | |
| $ | 3,667 | | | Philadelphia Newspapers, Term Loan A, (7), (8) | | | 0.000% | | | | 6/29/12 | | | | N/R | | | $ | 4,034 | |
| | 2,971 | | | Spanish Broadcasting System, Inc., Term Loan B | | | 2.290% | | | | 6/11/12 | | | | B– | | | | 2,679,098 | |
| | 1,803 | | | SuperMedia, Term Loan | | | 8.000% | | | | 12/31/15 | | | | B– | | | | 1,525,713 | |
| | 4,557 | | | Tribune Company, Term Loan B, (7), (8), DD1 | | | 3.000% | | | | 6/04/14 | | | | Ca | | | | 2,928,161 | |
| | 10,931 | | | Univision Communications, Inc., Term Loan | | | 2.566% | | | | 9/29/14 | | | | B2 | | | | 9,571,863 | |
| | 3,402 | | | Yell Group PLC, Term Loan | | | 4.066% | | | | 7/31/14 | | | | N/R | | | | 2,058,039 | |
| | | | | | | | | | | | | | | | | | | | | |
| | 71,023 | | | Total Media | | | | | | | | | | | | | | | 53,700,457 | |
| | | | | | | | | | | | | | | | | | | | | |
| | | | | Metals & Mining – 0.2% (0.2% of Total Investments) |
| | | | | | | | | | | | | | | | | | | | | |
| | 763 | | | John Maneely Company, Term Loan | | | 3.775% | | | | 12/09/13 | | | | B | | | | 726,144 | |
| | | | | | | | | | | | | | | | | | | | | |
| | | | | Multiline Retail – 1.4% (1.0% of Total Investments) |
| | | | | | | | | | | | | | | | | | | | | |
| | 4,719 | | | Neiman Marcus Group, Inc., Term Loan, DD1 | | | 2.473% | | | | 4/06/13 | | | | BB– | | | | 4,459,962 | |
| | | | | | | | | | | | | | | | | | | | | |
| | | | | Oil, Gas & Consumable Fuels – 4.5% (3.2% of Total Investments) |
| | | | | | | | | | | | | | | | | | | | | |
| | 223 | | | Alon USA Energy, Inc., Edgington Facility | | | 2.566% | | | | 8/05/13 | | | | BB– | | | | 175,091 | |
| | 1,784 | | | Alon USA Energy, Inc., Paramount Facility | | | 2.669% | | | | 8/05/13 | | | | BB– | | | | 1,400,616 | |
| | 2,000 | | | Big West Oil LLC, New Term Loan | | | 12.000% | | | | 7/23/15 | | | | B+ | | | | 2,016,666 | |
| | 575 | | | Calumet Lubricants Company LP, Credit Linked Deposit | | | 4.383% | | | | 1/03/15 | | | | B1 | | | | 533,046 | |
| | 4,245 | | | Calumet Lubricants Company LP, Term Loan | | | 4.436% | | | | 1/03/15 | | | | B1 | | | | 3,937,186 | |
| | 2,940 | | | CCS Income Trust, Term Loan | | | 3.316% | | | | 11/14/14 | | | | B | | | | 2,480,371 | |
| | 1,500 | | | DynCorp International, Inc., Term Loan | | | 6.250% | | | | 7/07/16 | | | | Ba1 | | | | 1,508,250 | |
| | 2,868 | | | Venoco, Inc., Term Loan | | | 4.375% | | | | 5/07/14 | | | | BB– | | | | 2,599,625 | |
| | | | | | | | | | | | | | | | | | | | | |
| | 16,135 | | | Total Oil, Gas & Consumable Fuels | | | | | | | | | | | | | | | 14,650,851 | |
| | | | | | | | | | | | | | | | | | | | | |
| | | | | Paper & Forest Products – 2.2% (1.5% of Total Investments) |
| | | | | | | | | | | | | | | | | | | | | |
| | 4,000 | | | Newark Group, Inc., DIP Term Loan, WI/DD | | | TBD | | | | TBD | | | | N/R | | | | 4,040,000 | |
| | 3,830 | | | Wilton Products, Term Loan | | | 3.760% | | | | 8/01/14 | | | | B+ | | | | 3,121,648 | |
| | | | | | | | | | | | | | | | | | | | | |
| | 7,830 | | | Total Paper & Forest Products | | | | | | | | | | | | | | | 7,161,648 | |
| | | | | | | | | | | | | | | | | | | | | |
| | | | | Pharmaceuticals – 2.5% (1.7% of Total Investments) |
| | | | | | | | | | | | | | | | | | | | | |
| | 2,625 | | | Graceway Pharmaceuticals LLC, Second Lien Term Loan, (11), DD1 | | | 6.816% | | | | 5/03/13 | | | | CCC | | | | 1,045,624 | |
| | 2,182 | | | Graceway Pharmaceuticals LLC, Term Loan | | | 3.066% | | | | 5/03/12 | | | | B– | | | | 1,831,711 | |
| | 708 | | | Warner Chilcott Corporation, Add on Term Loan | | | 5.750% | | | | 4/30/15 | | | | BB+ | | | | 709,235 | |
| | 1,932 | | | Warner Chilcott Corporation, Term Loan A | | | 5.500% | | | | 10/30/14 | | | | BB+ | | | | 1,932,928 | |
| | 910 | | | Warner Chilcott Corporation, Term Loan B1 | | | 5.750% | | | | 4/30/15 | | | | BB+ | | | | 911,154 | |
| | 1,516 | | | Warner Chilcott Corporation, Term Loan B2 | | | 5.750% | | | | 4/30/15 | | | | BB+ | | | | 1,517,236 | |
| | | | | | | | | | | | | | | | | | | | | |
| | 9,873 | | | Total Pharmaceuticals | | | | | | | | | | | | | | | 7,947,888 | |
| | | | | | | | | | | | | | | | | | | | | |
| | | | | Real Estate Management & Development – 4.0% (2.8% of Total Investments) |
| | | | | | | | | | | | | | | | | | | | | |
| | 5,235 | | | Capital Automotive LP, Tranche C | | | 2.850% | | | | 12/14/12 | | | | Ba3 | | | | 4,888,104 | |
| | 3,786 | | | LNR Property Corporation, Term Loan B | | | 7.750% | | | | 7/12/11 | | | | CCC | | | | 3,617,896 | |
| | 4,850 | | | Realogy Corporation, Delayed Term Loan | | | 3.380% | | | | 10/10/13 | | | | Caa1 | | | | 4,262,240 | |
| | | | | | | | | | | | | | | | | | | | | |
| | 13,871 | | | Total Real Estate Management & Development | | | | | | | | | | | | | | | 12,768,240 | |
| | | | | | | | | | | | | | | | | | | | | |
| | | | | Road & Rail – 5.1% (3.6% of Total Investments) |
| | | | | | | | | | | | | | | | | | | | | |
| | 522 | | | Avis Budget Car Rental LLC, Term Loan | | | 5.750% | | | | 4/19/14 | | | | Ba2 | | | | 520,000 | |
| | 290 | | | Hertz Corporation, Letter of Credit | | | 2.087% | | | | 12/21/12 | | | | Ba1 | | | | 280,589 | |
| | 1,566 | | | Hertz Corporation, Term Loan | | | 2.093% | | | | 12/21/12 | | | | Ba1 | | | | 1,517,190 | |
| | 14,622 | | | Swift Transportation Company, Inc., Term Loan | | | 8.250% | | | | 5/12/14 | | | | B– | | | | 14,270,244 | |
| | | | | | | | | | | | | | | | | | | | | |
| | 17,000 | | | Total Road & Rail | | | | | | | | | | | | | | | 16,588,023 | |
| | | | | | | | | | | | | | | | | | | | | |
| | | | | Semiconductors & Equipment – 1.0% (0.7% of Total Investments) |
| | | | | | | | | | | | | | | | | | | | | |
| | 1,200 | | | Freescale Semiconductor, Inc., Term Loan | | | 4.596% | | | | 12/01/16 | | | | B2 | | | | 1,105,934 | |
| | 1,995 | | | Spansion LLC, Term Loan | | | 5.500% | | | | 2/09/15 | | | | BB– | | | | 1,984,403 | |
| | | | | | | | | | | | | | | | | | | | | |
| | 3,195 | | | Total Semiconductors & Equipment | | | | | | | | | | | | | | | 3,090,337 | |
| | | | | | | | | | | | | | | | | | | | | |
| | | | | Software – 3.7% (2.6% of Total Investments) |
| | | | | | | | | | | | | | | | | | | | | |
| | 7,294 | | | Dealer Computer Services, Inc., New Term Loan | | | 5.250% | | | | 4/21/17 | | | | BB– | | | | 7,232,714 | |
| | 1,000 | | | IPC Systems, Inc., Term Loan, Second Lien | | | 5.783% | | | | 6/01/15 | | | | CCC | | | | 825,000 | |
| | 3,370 | | | IPC Systems, Inc., Term Loan | | | 2.697% | | | | 6/02/14 | | | | B1 | | | | 3,014,430 | |
| | 1,000 | | | Reynolds Group Holdings, Inc., Incremental US Term Loan | | | 5.750% | | | | 5/05/16 | | | | BB– | | | | 996,875 | |
| | | | | | | | | | | | | | | | | | | | | |
| | 12,664 | | | Total Software | | | | | | | | | | | | | | | 12,069,019 | |
| | | | | | | | | | | | | | | | | | | | | |
| | | | | Specialty Retail – 5.9% (4.1% of Total Investments) |
| | 7,610 | | | Burlington Coat Factory Warehouse Corporation, Term Loan | | | 2.710% | | | | 5/28/13 | | | | B– | | | | 7,214,883 | |
| | | | |
| | | | |
JRO | | | Nuveen Floating Rate Income Opportunity Fund (continued)
Portfolio of Investments July 31, 2010 |
| | | | | | | | | | | | | | | | | | | | | |
| | | | | | | | | | | | | | | |
| | | | | Weighted
| | | | | | | | | | |
Principal
| | | | | Average
| | | | | | | | | | |
| Amount (000) | | | Description (1) | | Coupon | | | Maturity (2) | | | Ratings (3) | | | Value | |
| | | | | Specialty Retail (continued) |
| | | | | | | | | | | | | | | | | | | | | |
| $ | 5,428 | | | Michaels Stores, Inc., Term Loan B1, DD1 | | | 2.762% | | | | 10/31/13 | | | | B | | | $ | 5,090,797 | |
| | 1,732 | | | Michaels Stores, Inc., Term Loan B2 | | | 5.012% | | | | 7/31/16 | | | | B | | | | 1,658,307 | |
| | 4,985 | | | Toys “R” Us–Delaware, Inc., Term Loan B | | | 4.575% | | | | 7/19/12 | | | | BB– | | | | 4,941,455 | |
| | | | | | | | | | | | | | | | | | | | | |
| | 19,755 | | | Total Specialty Retail | | | | | | | | | | | | | | | 18,905,442 | |
| | | | | | | | | | | | | | | | | | | | | |
| | | | | Wireless Telecommunication Services – 3.5% (2.4% of Total Investments) |
| | | | | | | | | | | | | | | | | | | | | |
| | 4,963 | | | Asurion Corporation, Term Loan | | | 3.356% | | | | 7/03/14 | | | | N/R | | | | 4,762,620 | |
| | 6,070 | | | Clear Channel Communications, Inc., Tranche B, Term Loan, DD1 | | | 3.966% | | | | 11/13/15 | | | | Caa1 | | | | 4,853,780 | |
| | 1,727 | | | MetroPCS Wireless, Inc., Term Loan | | | 3.500% | | | | 11/03/16 | | | | N/R | | | | 1,706,021 | |
| | | | | | | | | | | | | | | | | | | | | |
| | 12,760 | | | Total Wireless Telecommunication Services | | | | | | | | | | | | | | | 11,322,421 | |
| | | | | | | | | | | | | | | | | | | | | |
| $ | 436,930 | | | Total Variable Rate Senior Loan Interests (cost $397,299,821) | | | | | | | | | | | | | | | 387,695,264 | |
| | | | | | | | | | | | | | | | | | | | | |
| | | | | | | | | | | | | | | |
| Shares | | | Description (1) | | | | | | | | | | | Value | |
| | | | | Common Stocks – 2.3% (1.6% of Total Investments) |
| | | | | |
| | | | | Building Products – 1.6% (1.2% of Total Investments) |
| | | | | | | | | | | | | | | | | | | | | |
| | 124,402 | | | Masonite Worldwide Holdings, (10), (12) | | | | | | | | | | | | | | $ | 5,310,410 | |
| | | | | | | | | | | | | | | | | | | | | |
| | | | | Chemicals – 0.2% (0.1% of Total Investments) |
| | | | | | | | | | | | | | | | | | | | | |
| | 20,014 | | | LyondellBasell Industries NV, (10) | | | | | | | | | | | | | | | 360,252 | |
| | 18,343 | | | LyondellBasell Industries NV, (10) | | | | | | | | | | | | | | | 330,174 | |
| | | | | | | | | | | | | | | | | | | | | |
| | | | | Total Chemicals | | | | | | | | | | | | | | | 690,426 | |
| | | | | | | | | | | | | | | | | | | | | |
| | | | | Media – 0.5% (0.3% of Total Investments) |
| | | | | | | | | | | | | | | | | | | | | |
| | 30,851 | | | Citadel Broadcasting Corp Class B Shares, (10), (12), DD1 | | | | | | | | | | | | | | | 740,424 | |
| | 6,606 | | | Citadel Broadcasting Corporation, (10), (12) | | | | | | | | | | | | | | | 158,544 | |
| | 33,776 | | | Readers Digest Association Inc., (10), (12), DD1 | | | | | | | | | | | | | | | 667,076 | |
| | | | | | | | | | | | | | | | | | | | | |
| | | | | Total Media | | | | | | | | | | | | | | | 1,566,044 | |
| | | | | | | | | | | | | | | | | | | | | |
| | | | | Total Common Stocks (cost $8,583,532) | | | 7,566,880 | |
| | | | | | | | | | | | | | | | | | | | | |
| | | | | | | | | | | | | | | |
Principal
| | | | | | | | | | | | | | | |
| Amount (000) | | | Description (1) | | Coupon | | | Maturity | | | Ratings (3) | | | Value | |
| | | | | Convertible Bonds – 1.1% (0.8% of Total Investments) |
| | | | | |
| | | | | Airlines – 0.3% (0.2% of Total Investments) |
| | | | | | | | | | | | | | | | | | | | | |
| $ | 1,000 | | | UAL Corporation | | | 4.500% | | | | 6/30/21 | | | | CCC | | | $ | 1,015,000 | |
| | | | | | | | | | | | | | | | | | | | | |
| | | | | |
| | | | | Communications Equipment – 0.1% (0.1% of Total Investments) |
| | | | | | | | | | | | | | | | | | | | | |
| | 500 | | | Nortel Networks Corporation, (7), (8), (14) | | | 1.750% | | | | 4/15/12 | | | | D | | | | 392,500 | |
| | | | | | | | | | | | | | | | | | | | | |
| | | | | Food & Staples Retailing – 0.7% (0.5% of Total Investments) |
| | | | | | | | | | | | | | | | | | | | | |
| | 2,547 | | | Great Atlantic & Pacific Tea Company Inc. | | | 5.125% | | | | 6/15/11 | | | | Caa3 | | | | 2,015,314 | |
| | | | | | | | | | | | | | | | | | | | | |
| $ | 4,047 | | | Total Convertible Bonds (cost $3,332,713) | | | | | | | | | | | | | | | 3,422,814 | |
| | | | | | | | | | | | | | | | | | | | | |
| | | | | | | | | | | | | | | |
Principal
| | | | | | | | | | | | | | | |
| Amount (000) | | | Description (1) | | Coupon | | | Maturity | | | Ratings (3) | | | Value | |
| | | | | Corporate Bonds – 11.8% (8.2% of Total Investments) |
| | | | | |
| | | | | Auto Components – 0.2% (0.1% of Total Investments) |
| | | | | | | | | | | | | | | | | | | | | |
| $ | 600 | | | Exide Technologies | | | 10.500% | | | | 3/15/13 | | | | B– | | | $ | 612,000 | |
| | | | | | | | | | | | | | | | | | | | | |
| | | | | Automobiles – 1.1% (0.8% of Total Investments) |
| | | | | | | | | | | | | | | | | | | | | |
| | 10,000 | | | General Motors Corporation, (8) | | | 8.250% | | | | 7/15/23 | | | | N/R | | | | 3,450,000 | |
| | | | | | | | | | | | | | | | | | | | | |
| | | | | Construction Materials – 0.6% (0.4% of Total Investments) |
| | | | | | | | | | | | | | | | | | | | | |
| | 2,000 | | | Headwaters Inc., 144A | | | 11.375% | | | | 11/01/14 | | | | B+ | | | | 2,040,000 | |
| | | | | | | | | | | | | | | | | | | | | |
| | | | | Diversified Telecommunication Services – 0.2% (0.2% of Total Investments) |
| | | | | | | | | | | | | | | | | | | | | |
| | 1,000 | | | Nortel Networks Limited, (7), (8), (14) | | | 0.000% | | | | 7/15/11 | | | | N/R | | | | 790,000 | |
| | | | | | | | | | | | | | | | | | | | | |
| | | | | Health Care Equipment & Supplies – 0.5% (0.3% of Total Investments) |
| | | | | | | | | | | | | | | | | | | | | |
| | 1,500 | | | Reable Therapeutics Financing Corporation | | | 11.750% | | | | 11/15/14 | | | | CCC+ | | | | 1,582,500 | |
| | | | | | | | | | | | | | | | | | | | | |
| | | | | | | | | | | | | | | | | | | | | |
| | | | | | | | | | | | | | | |
Principal
| | | | | | | | | | | | | | | |
| Amount (000) | | | Description (1) | | Coupon | | | Maturity | | | Ratings (3) | | | Value | |
| | | | | Health Care Providers & Services – 1.6% (1.1% of Total Investments) |
| | | | | | | | | | | | | | | | | | | | | |
| $ | 1,000 | | | LifeCare Holdings Inc. | | | 9.250% | | | | 8/15/13 | | | | CCC– | | | $ | 755,000 | |
| | 2,500 | | | Select Medical Corporation, Floating Rate Note, 5.750% plus six-month LIBOR | | | 6.418% | | | | 9/15/15 | | | | CCC+ | | | | 2,190,625 | |
| | 1,250 | | | Select Medical Corporation | | | 7.625% | | | | 2/01/15 | | | | B– | | | | 1,203,125 | |
| | 1,031 | | | US Oncology Holdings Inc., Floating Rate Note, 5.500% plus six-month LIBOR | | | 6.168% | | | | 3/15/12 | | | | CCC+ | | | | 982,028 | |
| | | | | | | | | | | | | | | | | | | | | |
| | 5,781 | | | Total Health Care Providers & Services | | | | | | | | | | | | | | | 5,130,778 | |
| | | | | | | | | | | | | | | | | | | | | |
| | | | | Health Care Technology – 0.8% (0.5% of Total Investments) |
| | | | | | | | | | | | | | | | | | | | | |
| | 2,500 | | | Merge Healthcare Inc., 144A | | | 11.750% | | | | 5/01/15 | | | | B+ | | | | 2,525,000 | |
| | | | | | | | | | | | | | | | | | | | | |
| | | | | Hotels, Restaurants & Leisure – 0.6% (0.4% of Total Investments) |
| | | | | | | | | | | | | | | | | | | | | |
| | 1,875 | | | CKE Restaurant Inc., 144A | | | 11.375% | | | | 7/15/18 | | | | B | | | | 1,917,188 | |
| | | | | | | | | | | | | | | | | | | | | |
| | | | | Household Durables – 0.2% (0.1% of Total Investments) |
| | | | | | | | | | | | | | | | | | | | | |
| | 700 | | | William Lyon Homes Inc., Unsecured Senior Note | | | 10.750% | | | | 4/01/13 | | | | Caa3 | | | | 584,500 | |
| | | | | | | | | | | | | | | | | | | | | |
| | | | | Internet Software & Services – 0.7% (0.5% of Total Investments) |
| | | | | | | | | | | | | | | | | | | | | |
| | 2,750 | | | Open Solutions Inc., 144A | | | 9.750% | | | | 2/01/15 | | | | CCC+ | | | | 2,138,125 | |
| | | | | | | | | | | | | | | | | | | | | |
| | | | | IT Services – 0.8% (0.5% of Total Investments) |
| | | | | | | | | | | | | | | | | | | | | |
| | 1,053 | | | First Data Corporation | | | 10.550% | | | | 9/24/15 | | | | B– | | | | 813,249 | |
| | 2,500 | | | First Data Corporation | | | 11.250% | | | | 3/31/16 | | | | CCC+ | | | | 1,612,500 | |
| | | | | | | | | | | | | | | | | | | | | |
| | 3,553 | | | Total IT Services | | | | | | | | | | | | | | | 2,425,749 | |
| | | | | | | | | | | | | | | | | | | | | |
| | | | | Media – 2.1% (1.5% of Total Investments) |
| | | | | | | | | | | | | | | | | | | | | |
| | 2,750 | | | Clear Channel Communications, Inc. | | | 5.000% | | | | 3/15/12 | | | | CCC– | | | | 2,516,250 | |
| | 1,250 | | | Clear Channel Communications, Inc. | | | 5.500% | | | | 9/15/14 | | | | CCC– | | | | 743,750 | |
| | 4,750 | | | Clear Channel Communications, Inc. | | | 10.750% | | | | 8/01/16 | | | | CCC– | | | | 3,651,563 | |
| | | | | | | | | | | | | | | | | | | | | |
| | 8,750 | | | Total Media | | | | | | | | | | | | | | | 6,911,563 | |
| | | | | | | | | | | | | | | | | | | | | |
| | | | | Multi-Utilities – 0.2% (0.1% of Total Investments) |
| | | | | | | | | | | | | | | | | | | | | |
| | 500 | | | Bon-Ton Department Stores Inc. | | | 10.250% | | | | 3/15/14 | | | | CCC+ | | | | 491,875 | |
| | | | | | | | | | | | | | | | | | | | | |
| | | | | Oil, Gas & Consumable Fuels – 0.4% (0.3% of Total Investments) |
| | | | | | | | | | | | | | | | | | | | | |
| | 1,400 | | | Western Refining Inc., Floating Rate Note, 7.500% plus three-month LIBOR 144A | | | 7.954% | | | | 6/15/14 | | | | B3 | | | | 1,281,000 | |
| | | | | | | | | | | | | | | | | | | | | |
| | | | | Pharmaceuticals – 0.3% (0.2% of Total Investments) |
| | | | | | | | | | | | | | | | | | | | | |
| | 1,500 | | | Angiotech Pharmaceuticals Inc., Floating Rate Note, 3.750% plus three-month LIBOR, WI/DD | | | 4.204% | | | | 4/01/14 | | | | CC | | | | 855,000 | |
| | | | | | | | | | | | | | | | | | | | | |
| | | | | Road & Rail – 0.5% (0.4% of Total Investments) |
| | | | | | | | | | | | | | | | | | | | | |
| | 2,000 | | | Avis Budget Car Rental, Floating Rate Note, 2.500% plus three-month LIBOR | | | 2.954% | | | | 5/15/14 | | | | B | | | | 1,780,000 | |
| | | | | | | | | | | | | | | | | | | | | |
| | | | | Trading Companies & Distributors – 0.4% (0.3% of Total Investments) |
| | | | | | | | | | | | | | | | | | | | | |
| | 2,000 | | | Penhall International Corporation, 144A, (8), (11) | | | 12.000% | | | | 8/01/14 | | | | Caa3 | | | | 1,292,500 | |
| | | | | | | | | | | | | | | | | | | | | |
| | | | | Wireless Telecommunication Services – 0.6% (0.5% of Total Investments) |
| | | | | | | | | | | | | | | | | | | | | |
| | 2,000 | | | Sprint Nextel Corporation | | | 8.375% | | | | 8/15/17 | | | | BB– | | | | 2,100,000 | |
| | | | | | | | | | | | | | | | | | | | | |
| $ | 50,409 | | | Total Corporate Bonds (cost $36,090,618) | | | | | | | | | | | | | | | 37,907,778 | |
| | | | | | | | | | | | | | | | | | | | | |
| | | | | | | | | | | | | | | |
| Shares | | | Description (1) | | | | | | | | | | | Value | |
| | | | | Warrants – 0.8% (0.5% of Total Investments) |
| | | | | | | | | | | | | | | | | | | | | |
| | 103,736 | | | Citadel Broadcasting Corporation | | | | | | | | | | | | | | $ | 2,489,664 | |
| | | | | | | | | | | | | | | | | | | | | |
| | | | | Total Warrants (cost $3,161,355) | | | 2,489,664 | |
| | | | | | | | | | | | | | | | | | | | | |
| | | | | | | | | | | | | | | |
Principal
| | | | | | | | | | | | | | | |
| Amount (000) | | | Description (1) | | Coupon | | | Maturity | | | | | | Value | |
| | | | | Short-Term Investments – 7.1% (5.0% of Total Investments) |
| | | | | | | | | | | | | | | | | | | | | |
| $ | 22,898 | | | Repurchase Agreement with Fixed Income Clearing Corporation, dated 7/30/10, repurchase price $22,898,282, collateralized by $23,270,000 U.S. Treasury Notes, 0.875%, due 12/31/10, value $23,357,263 | | | 0.020% | | | | 8/02/10 | | | | | | | $ | 22,898,244 | |
| | | | | | | | | | | | | | | | | | | | | |
| | | | | Total Short-Term Investments (cost $22,898,244) | | | | | | | 22,898,244 | |
| | | | | | | | | | | | | | | | | | | | | |
| | | | | Total Investments (cost $471,366,283) – 143.4% | | | 461,980,644 | |
| | | | | | | | | | | | | | | | | | | | | |
| | | | | Borrowings – (36.4)% (13), (15) | | | (117,270,000 | ) |
| | | | | | | | | | | | | | | | | | | | | |
| | | | | Other Assets Less Liabilities – (7.0)% | | | (22,574,925 | ) |
| | | | | | | | | | | | | | | | | | | | | |
| | | | | Net Assets Applicable to Common Shares – 100% | | $ | 322,135,719 | |
| | | | | | | | | | | | | | | | | | | | | |
| | | | |
| | | | |
JRO | | | Nuveen Floating Rate Income Opportunity Fund (continued)
Portfolio of Investments July 31, 2010 |
| | | | | | | |
| | | | | | | For Fund portfolio compliance purposes, the Fund’s industry classifications refer to any one or more of the industry sub-classifications used by one or more widely recognized market indexes or ratings group indexes, and/or as defined by Fund management. This definition may not apply for purposes of this report, which may combine industry sub-classifications into sectors for reporting ease. |
| | | | | (1) | | All percentages shown in the Portfolio of Investments are based on net assets applicable to Common shares unless otherwise noted. |
| | | | | (2) | | Senior Loans generally are subject to mandatory and/or optional prepayment. Because of these mandatory prepayment conditions and because there may be significant economic incentives for a Borrower to prepay, prepayments of Senior Loans may occur. As a result, the actual remaining maturity of Senior Loans held may be substantially less than the stated maturities shown. |
| | | | | (3) | | Ratings: Using the highest of Standard & Poor’s Group (“Standard & Poor’s”), Moody’s Investor Service, Inc. (“Moody’s”) or Fitch, Inc. (“Fitch”) rating. Ratings below BBB by Standard & Poor’s, Baa by Moody’s or BBB by Fitch are considered to be below investment grade. |
| | | | | (4) | | Senior Loans generally pay interest at rates which are periodically adjusted by reference to a base short-term, floating lending rate plus an assigned fixed rate. These floating lending rates are generally (i) the lending rate referenced by the London Inter-Bank Offered Rate (“LIBOR”), or (ii) the prime rate offered by one or more major United States banks. |
| | | | | | | Senior Loans may be considered restricted in that the Fund ordinarily is contractually obligated to receive approval from the Agent Bank and/or Borrower prior to the disposition of a Senior Loan. |
| | | | | (5) | | Investment, or portion of investment, represents an unfunded Senior Loan commitment outstanding at July 31, 2010. |
| | | | | (6) | | Negative value represents unrealized depreciation on unfunded Senior Loan commitment outstanding at July 31, 2010. |
| | | | | (7) | | At or subsequent to July 31, 2010, this issue was under the protection of the Federal Bankruptcy Court or has filed for bankruptcy. |
| | | | | (8) | | Non-income producing; denotes that the issuer has defaulted on the payment of principal or interest. |
| | | | | (9) | | The Fund’s Adviser concluded this issue is not likely to meet its future interest payment obligations and directed the Fund’s custodian to cease accruing additional income and “write-off” any remaining recorded balances on the Fund’s records. |
| | | | | (10) | | Non-income producing; issuer has not declared a dividend within the past twelve months. |
| | | | | (11) | | Subsequent to the reporting period, the Adviser has concluded this issue is not likely to meet its future interest payment obligations and has directed the Fund’s custodian to cease accruing additional income and “write-off” any remaining recorded balances on the Fund’s records. |
| | | | | (12) | | For fair value measurement disclosure purposes, Common Stock categorized as Level 2. See Notes to Financial Statements, Footnote 1 – General Information and Significant Accounting Policies, Investment Valuation for more information. |
| | | | | (13) | | Borrowings as a percentage of Total Investments is 25.4%. |
| | | | | (14) | | The Fund’s Adviser has concluded this issue is not likely to meet its future interest payment obligations and has directed the Fund’s custodian to cease accruing additional income on the Fund’s records. |
| | | | | (15) | | The Fund may pledge up to 100% of its eligible instruments in the Portfolio of Investments as collateral for Borrowings. |
| | | | | N/R | | Not rated. |
| | | | | DD1 | | Investment, or portion of investment, purchased on a delayed delivery basis. |
| | | | | WI/DD | | Purchased on a when-issued or delayed delivery basis. |
| | | | | 144A | | Investment is exempt from registration under Rule 144A of the Securities Act of 1933, as amended. These investments may only be resold in transactions exempt from registration which are normally those transactions with qualified institutional buyers. |
| | | | | TBD | | Senior Loan purchased on a when-issued or delayed-delivery basis. Certain details associated with this purchase are not known prior to the settlement date of the transaction. In addition, Senior Loans typically trade without accrued interest and therefore a weighted average coupon rate is not available prior to settlement. At settlement, if still unknown, the Borrower or counterparty will provide the Fund with the final weighted average coupon rate and maturity date. |
See accompanying notes to financial statements.
| | | | | | |
| | | | | | |
| | | Statement of
Assets & Liabilities |
| | | | | | July 31, 2010 |
| | | | | | | | | | | | | |
| | | | | | | | | Floating
| |
| | | | | | Floating
| | | Rate
| |
| | | Senior
| | | Rate
| | | Income
| |
| | | Income
| | | Income
| | | Opportunity
| |
| | | (NSL) | | | (JFR) | | | (JRO) | |
Assets | | | | | | | | | | | | |
| Investments, at value (cost $282,353,206, $737,282,382 and $448,468,039, respectively) | | $ | 272,137,800 | | | $ | 722,147,245 | | | $ | 439,082,400 | |
| Short-term investments (at cost, which approximates value) | | | 23,817,907 | | | | 45,774,026 | | | | 22,898,244 | |
| Cash | | | – | | | | 2,625 | | | | – | |
| Receivables: | | | | | | | | | | | | |
| Interest | | | 1,640,221 | | | | 3,679,101 | | | | 2,965,268 | |
| Investments sold | | | 4,910,771 | | | | 17,939,418 | | | | 13,165,953 | |
| Matured senior loans | | | 488,598 | | | | 1,278,294 | | | | 852,196 | |
| Other assets | | | 169,838 | | | | 332,625 | | | | 194,322 | |
| | | | | | | | | | | | | |
| Total assets | | | 303,165,135 | | | | 791,153,334 | | | | 479,158,383 | |
| | | | | | | | | | | | | |
Liabilities | | | | | | | | | | | | |
| Borrowings | | | 73,950,000 | | | | 197,740,000 | | | | 117,270,000 | |
| Payables: | | | | | | | | | | | | |
| Investments purchased | | | 24,290,070 | | | | 47,606,449 | | | | 37,410,500 | |
| Common share dividends | | | 1,174,282 | | | | 2,327,544 | | | | 1,742,945 | |
| Accrued expenses: | | | | | | | | | | | | |
| Interest on borrowings | | | 30,365 | | | | 71,397 | | | | 48,153 | |
| Management fees | | | 195,046 | | | | 414,539 | | | | 227,061 | |
| Other | | | 264,814 | | | | 537,011 | | | | 324,005 | |
| | | | | | | | | | | | | |
| Total liabilities | | | 99,904,577 | | | | 248,696,940 | | | | 157,022,664 | |
| | | | | | | | | | | | | |
| Net assets applicable to Common shares | | $ | 203,260,558 | | | $ | 542,456,394 | | | $ | 322,135,719 | |
| | | | | | | | | | | | | |
| Common shares outstanding | | | 29,846,884 | | | | 47,297,036 | | | | 28,411,034 | |
| | | | | | | | | | | | | |
| Net asset value per Common share outstanding (net assets applicable to Common shares, divided by Common shares outstanding) | | $ | 6.81 | | | $ | 11.47 | | | $ | 11.34 | |
| | | | | | | | | | | | | |
| | | | | | | | | | | | | |
Net assets applicable to Common shares consist of: | | | | | | | | | | | | |
| | | | | | | | | | | | | |
| Common shares, $.01 par value per share | | $ | 298,469 | | | $ | 472,970 | | | $ | 284,110 | |
| Paid-in surplus | | | 268,859,772 | | | | 667,769,861 | | | | 400,705,676 | |
| Undistributed (Over-distribution of) net investment income | | | (305,950 | ) | | | (582,484 | ) | | | 1,153,709 | |
| Accumulated net realized gain (loss) from investments | | | (55,376,327 | ) | | | (110,068,816 | ) | | | (70,622,137 | ) |
| Net unrealized appreciation (depreciation) of investments | | | (10,215,406 | ) | | | (15,135,137 | ) | | | (9,385,639 | ) |
| | | | | | | | | | | | | |
| Net assets applicable to Common shares | | $ | 203,260,558 | | | $ | 542,456,394 | | | $ | 322,135,719 | |
| | | | | | | | | | | | | |
See accompanying notes to financial statements.
| | | | | | |
| | | | | | |
| | | Statement of
Operations |
| | | | | | Year Ended July 31, 2010 |
| | | | | | | | | | | | | |
| | | | | | | | | Floating Rate
| |
| | | Senior
| | | Floating Rate
| | | Income
| |
| | | Income
| | | Income
| | | Opportunity
| |
| | | (NSL) | | | (JFR) | | | (JRO) | |
Investment Income | | | | | | | | | | | | |
| Interest | | $ | 14,889,920 | | | $ | 44,925,405 | | | $ | 32,785,944 | |
| Dividends | | | – | | | | 695,560 | | | | – | |
| Fees | | | 187,703 | | | | 1,792,754 | | | | 1,302,235 | |
| Other | | | 166,773 | | | | 440,320 | | | | 293,547 | |
| | | | | | | | | | | | | |
| Total investment income | | | 15,244,396 | | | | 47,854,039 | | | | 34,381,726 | |
| | | | | | | | | | | | | |
Expenses | | | | | | | | | | | | |
| Management fees | | | 2,226,026 | | | | 5,901,440 | | | | 3,539,246 | |
| Preferred shares – auction fees | | | 197 | | | | 15,420 | | | | 6,432 | |
| Preferred shares – dividend disbursing agent fees | | | 4,488 | | | | 19,573 | | | | 3,760 | |
| Shareholders’ servicing agent fees and expenses | | | 3,650 | | | | 1,196 | | | | 678 | |
| Interest expense on borrowings and amortization of borrowing costs | | | 256,397 | | | | 179,203 | | | | 403,671 | |
| Fees on borrowings | | | 1,425,393 | | | | 3,867,726 | | | | 2,257,014 | |
| Custodian’s fees and expenses | | | 121,159 | | | | 262,066 | | | | 170,773 | |
| Trustees’ fees and expenses | | | 8,234 | | | | 22,025 | | | | 13,098 | |
| Professional fees | | | 96,121 | | | | 152,726 | | | | 109,087 | |
| Shareholders’ reports – printing and mailing expenses | | | 74,105 | | | | 125,962 | | | | 78,552 | |
| Stock exchange listing fees | | | 10,152 | | | | 16,099 | | | | 9,662 | |
| Investor relations expense | | | 32,065 | | | | 25,275 | | | | 15,211 | |
| Other expenses | | | 15,472 | | | | 23,461 | | | | 18,091 | |
| | | | | | | | | | | | | |
| Total expenses before custodian fee credit and expense reimbursement | | | 4,273,459 | | | | 10,612,172 | | | | 6,625,275 | |
| Custodian fee credit | | | (45 | ) | | | (53 | ) | | | (133 | ) |
| Expense reimbursement | | | (30,102 | ) | | | (1,506,051 | ) | | | (928,804 | ) |
| | | | | | | | | | | | | |
| Net expenses | | | 4,243,312 | | | | 9,106,068 | | | | 5,696,338 | |
| | | | | | | | | | | | | |
| Net investment income | | | 11,001,084 | | | | 38,747,971 | | | | 28,685,388 | |
| | | | | | | | | | | | | |
Realized and Unrealized Gain (Loss) | | | | | | | | | | | | |
| Net realized gain (loss) from investments | | | 843,334 | | | | (15,811,388 | ) | | | (5,845,955 | ) |
| Change in net unrealized appreciation (depreciation) of investments | | | 35,288,873 | | | | 85,441,084 | | | | 48,450,761 | |
| | | | | | | | | | | | | |
| Net realized and unrealized gain (loss) | | | 36,132,207 | | | | 69,629,696 | | | | 42,604,806 | |
| | | | | | | | | | | | | |
Distributions to Preferred Shareholders | | | | | | | | | | | | |
| From net investment income | | | (15,266 | ) | | | (219,515 | ) | | | (123,985 | ) |
| | | | | | | | | | | | | |
| Net increase (decrease) in net assets applicable to Common shares from operations | | $ | 47,118,025 | | | $ | 108,158,152 | | | $ | 71,166,209 | |
| | | | | | | | | | | | | |
See accompanying notes to financial statements.
| | | | | | |
| | | | | | |
| | | Statement of
Changes in Net Assets |
| | | | | | |
| | | | | | | | | | | | | | | | | | | | | | | | | |
| | | | | | | | | Floating Rate
| |
| | | Senior Income (NSL) | | | Floating Rate Income (JFR) | | | Income Opportunity (JRO) | |
| | | Year Ended
| | | Year Ended
| | | Year Ended
| | | Year Ended
| | | Year Ended
| | | Year Ended
| |
| | | 7/31/10 | | | 7/31/09 | | | 7/31/10 | | | 7/31/09 | | | 7/31/10 | | | 7/31/09 | |
Operations | | | | | | | | | | | | | | | | | | | | | | | | |
| Net investment income | | $ | 11,001,084 | | | $ | 13,489,915 | | | $ | 38,747,971 | | | $ | 33,730,105 | | | $ | 28,685,388 | | | $ | 20,678,590 | |
| Net realized gain (loss) from investments | | | 843,334 | | | | (41,868,681 | ) | | | (15,811,388 | ) | | | (88,776,440 | ) | | | (5,845,955 | ) | | | (59,909,344 | ) |
| Change in net unrealized appreciation (depreciation) of investments | | | 35,288,873 | | | | (2,031,671 | ) | | | 85,441,084 | | | | (8,811,769 | ) | | | 48,450,761 | | | | (1,018,926 | ) |
| Distributions to Preferred Shareholders from net investment income | | | (15,266 | ) | | | (558,631 | ) | | | (219,515 | ) | | | (3,411,778 | ) | | | (123,985 | ) | | | (2,033,297 | ) |
| | | | | | | | | | | | | | | | | | | | | | | | | |
| Net increase (decrease) in net assets applicable to Common shares from operations | | | 47,118,025 | | | | (30,969,068 | ) | | | 108,158,152 | | | | (67,269,882 | ) | | | 71,166,209 | | | | (42,282,977 | ) |
| | | | | | | | | | | | | | | | | | | | | | | | | |
Distributions to Common Shareholders | | | | | | | | | | | | | | | | | | | | | | | | |
| From net investment income | | | (13,860,296 | ) | | | (13,425,459 | ) | | | (27,633,733 | ) | | | (30,319,224 | ) | | | (20,196,415 | ) | | | (20,560,895 | ) |
| | | | | | | | | | | | | | | | | | | | | | | | | |
| Decrease in net assets applicable to Common shares from distributions to Common shareholders | | | (13,860,296 | ) | | | (13,425,459 | ) | | | (27,633,733 | ) | | | (30,319,224 | ) | | | (20,196,415 | ) | | | (20,560,895 | ) |
| | | | | | | | | | | | | | | | | | | | | | | | | |
Capital Share Transactions | | | | | | | | | | | | | | | | | | | | | | | | |
| Common shares: | | | | | | | | | | | | | | | | | | | | | | | | |
| Net proceeds from shares issued to shareholders due to reinvestment of distributions | | | 86,152 | | | | – | | | | 169,959 | | | | 216,446 | | | | 128,250 | | | | – | |
| Repurchased and retired | | | – | | | | – | | | | (1,264,374 | ) | | | (74,280 | ) | | | (87,047 | ) | | | (71,303 | ) |
| | | | | | | | | | | | | | | | | | | | | | | | | |
| Net increase (decrease) in net assets applicable to Common shares from capital share transactions | | | 86,152 | | | | – | | | | (1,094,415 | ) | | | 142,166 | | | | 41,203 | | | | (71,303 | ) |
| | | | | | | | | | | | | | | | | | | | | | | | | |
| Net increase (decrease) in net assets applicable to Common shares | | | 33,343,881 | | | | (44,394,527 | ) | | | 79,430,004 | | | | (97,446,940 | ) | | | 51,010,997 | | | | (62,915,175 | ) |
| Net assets applicable to Common shares at the beginning of year | | | 169,916,677 | | | | 214,311,204 | | | | 463,026,390 | | | | 560,473,330 | | | | 271,124,722 | | | | 334,039,897 | |
| | | | | | | | | | | | | | | | | | | | | | | | | |
| Net assets applicable to Common shares at the end of year | | $ | 203,260,558 | | | $ | 169,916,677 | | | $ | 542,456,394 | | | $ | 463,026,390 | | | $ | 322,135,719 | | | $ | 271,124,722 | |
| | | | | | | | | | | | | | | | | | | | | | | | | |
| Undistributed (Over-distribution of) net investment income at the end of year | | $ | (305,950 | ) | | $ | 152,935 | | | $ | (582,484 | ) | | $ | (3,729,664 | ) | | $ | 1,153,709 | | | $ | (794,250 | ) |
| | | | | | | | | | | | | | | | | | | | | | | | | |
See accompanying notes to financial statements.
| | | | | | |
| | | | | | |
| | | Statement of
Cash Flows |
| | | | Year Ended July 31, 2010 |
| | | | | | | | | | | | | |
| | | | | | | | | Floating Rate
| |
| | | Senior
| | | Floating Rate
| | | Income
| |
| | | Income
| | | Income
| | | Opportunity
| |
| | | (NSL) | | | (JFR) | | | (JRO) | |
Cash Flows from Operating Activities: | | | | | | | | | | | | |
Net Increase (Decrease) in Net Assets Applicable to Common Shares from Operations | | | 47,118,025 | | | | 108,158,152 | | | | 71,166,209 | |
| Adjustments to reconcile the net increase (decrease) in net assets applicable to Common shares from operations to net cash provided by (used in) operating activities: | | | | | | | | | | | | |
| Purchases of investments | | | (179,018,664 | ) | | | (368,205,820 | ) | | | (256,736,383 | ) |
| Proceeds from sales and maturities of investments | | | 173,182,914 | | | | 350,984,439 | | | | 238,742,739 | |
| Proceeds from (Purchases of) short-term investments, net | | | (12,200,142 | ) | | | (25,865,080 | ) | | | (13,912,540 | ) |
| Amortization (Accretion) of premiums and discounts, net | | | (4,843,856 | ) | | | (7,356,446 | ) | | | (6,190,460 | ) |
| (Increase) Decrease in receivable for interest | | | 188,076 | | | | (581,037 | ) | | | 41,623 | |
| (Increase) Decrease in receivable for investments sold | | | 7,045,747 | | | | (219,362 | ) | | | 2,634,593 | |
| (Increase) Decrease in receivable for matured senior loans | | | (488,598 | ) | | | (1,278,294 | ) | | | (852,196 | ) |
| (Increase) Decrease in other assets | | | (99,086 | ) | | | (250,030 | ) | | | (151,354 | ) |
| Increase (Decrease) in payable for investments purchased | | | 1,422,735 | | | | (3,364,477 | ) | | | 14,258,133 | |
| Increase (Decrease) in payable for Preferred share dividends | | | (3,704 | ) | | | – | | | | (8,695 | ) |
| Increase (Decrease) in accrued interest on borrowings | | | 8,858 | | | | (198,798 | ) | | | 23,737 | |
| Increase (Decrease) in accrued management fees | | | 46,496 | | | | 116,589 | | | | 63,168 | |
| Increase (Decrease) in accrued other liabilities | | | (19,084 | ) | | | (311,197 | ) | | | (53,474 | ) |
| Net realized (gain) loss from investments | | | (843,334 | ) | | | 15,811,388 | | | | 5,845,955 | |
| Net realized (gain) loss from paydowns | | | 2,415,593 | | | | (7,942,309 | ) | | | (6,455,924 | ) |
| Change in net unrealized (appreciation) depreciation of investments | | | (35,288,873 | ) | | | (85,441,084 | ) | | | (48,450,761 | ) |
| Taxes paid on undistributed capital gains | | | (60,354 | ) | | | (28,157 | ) | | | (71,260 | ) |
| | | | | | | | | | | | | |
| Net cash provided by (used in) operating activities | | | (1,437,251 | ) | | | (25,971,523 | ) | | | (106,890 | ) |
| | | | | | | | | | | | | |
Cash Flows from Financing Activities: | | | | | | | | | | | | |
| Increase (Decrease) in cash overdraft balance | | | (31,564 | ) | | | – | | | | – | |
| Increase (Decrease) in borrowings | | | 41,050,000 | | | | 159,240,000 | | | | 79,920,000 | |
| Cash distributions paid to Common shareholders | | | (13,581,185 | ) | | | (27,001,478 | ) | | | (19,726,063 | ) |
| Cost of Common shares repurchased and retired | | | – | | | | (1,264,374 | ) | | | (87,047 | ) |
| Increase (Decrease) in Preferred shares | | | (26,000,000 | ) | | | (105,000,000 | ) | | | (60,000,000 | ) |
| | | | | | | | | | | | | |
| Net cash provided by (used in) financing activities | | | 1,437,251 | | | | 25,974,148 | | | | 106,890 | |
| | | | | | | | | | | | | |
Net Increase (Decrease) in Cash | | | – | | | | 2,625 | | | | – | |
| Cash at the beginning of period | | | – | | | | – | | | | – | |
| | | | | | | | | | | | | |
Cash at the End of Period | | | – | | | | 2,625 | | | | – | |
| | | | | | | | | | | | | |
Supplemental Disclosure of Cash Flow Information
Cash paid by Senior Income (NSL), Floating Rate Income (JFR) and Floating Rate Income Opportunity (JRO) for interest on borrowings (excluding amortization of borrowing costs) during the fiscal year ended July 31, 2010, was $222,408, $811,833 and $339,989, respectively.
Non-cash financing activities not included herein consist of reinvestments of Common share distributions of $86,152, $169,959 and $128,250 for Senior Income (NSL), Floating Rate Income (JFR) and Floating Rate Income Opportunity (JRO), respectively.
See accompanying notes to financial statements.
| | | | | | |
| | | | | | |
| | | Notes to
Financial Statements |
| | | | | | |
| |
| 1. | General Information and Significant Accounting Policies |
The funds covered in this report and their corresponding Common share New York Stock Exchange (“NYSE”) symbols are Nuveen Senior Income Fund (NSL), Nuveen Floating Rate Income Fund (JFR) and Nuveen Floating Rate Income Opportunity Fund (JRO) (collectively, the “Funds”). The Funds are registered under the Investment Company Act of 1940, as amended, as closed-end management investment companies.
Senior Income’s (NSL) investment objective is to achieve a high level of current income, consistent with capital preservation. The Fund invests 80% of its total assets in adjustable rate senior secured loans. The Fund may invest up to 20% of its total assets in U.S. dollar- denominated senior loans of non-U.S. borrowers, senior loans that are not secured, other debt securities, and equity securities and warrants acquired in connection with the Fund’s investment in senior loans.
Floating Rate Income’s (JFR) investment objective is to achieve a high level of current income. The Fund invests at least 65% of its managed assets in adjustable rate senior loans that are secured by specific collateral. The Fund may invest a substantial portion of its managed assets in senior loans and other debt instruments that are, at the time of investment, rated below investment grade or are unrated but judged to be of comparable quality by the Fund’s sub-adviser Symphony Asset Management LLC (“Symphony”), a subsidiary of Nuveen Investments, Inc. (“Nuveen”).
Floating Rate Income Opportunity’s (JRO) investment objective is to achieve a high level of current income. The Fund invests at least 80% of its managed assets in adjustable rate loans, primarily secured senior loans. As part of the 80% requirement, the Fund also may invest in unsecured senior loans and secured and unsecured subordinated loans. The Fund invests at least 65% of its managed assets in adjustable rate senior loans that are secured by specific collateral.
In June 2009, the Financial Accounting Standards Board (“FASB”) established the FASB Accounting Standards Codificationtm (the “Codification”) as the single source of authoritative accounting principles recognized by the FASB in the preparation of financial statements in conformity with generally accepted accounting principles (“GAAP”). The Codification supersedes existing non-grandfathered, non-SEC accounting and reporting standards. The Codification did not change GAAP but rather organized it into a hierarchy where all guidance within the Codification carries an equal level of authority. The Codification became effective for financial statements issued for interim and annual periods ending after September 15, 2009. The Codification did not have a material effect on the Funds’ financial statements.
The following is a summary of significant accounting policies followed by the Funds in the preparation of their financial statements in accordance with accounting principles generally accepted in the United States (“U.S. GAAP”).
Investment Valuation
Common stocks and other equity-type securities are valued at the last sales price on the securities exchange on which such securities are primarily traded and are generally classified as Level 1. Securities primarily traded on the NASDAQ National Market (“NASDAQ”) are valued, except as indicated below, at the NASDAQ Official Closing Price and are generally classified as Level 1. However, securities traded on a securities exchange or NASDAQ for which there were no transactions on a given day or securities not listed on a securities exchange or NASDAQ are valued at the mean between the quoted bid and ask prices.
Prices of fixed-income securities, senior loans and derivative instruments are provided by a pricing service approved by the Funds’ Board of Trustees. Floating Rate Income Opportunity (JRO) currently expects that the independent pricing services will be unable to provide a market based price for certain of the privately negotiated subordinated loans issued by middle market companies. The pricing services, with input from Symphony and Nuveen Asset Management (the “Adviser”), a wholly-owned subsidiary of Nuveen, will estimate the fair value for such subordinated loans, subject to the supervision of Symphony and the Adviser. Floating Rate Income Opportunity (JRO) may engage an independent appraiser to periodically provide an independent determination of the value, or an opinion with respect to the pricing services’ value, of such loans. These securities are generally classified as Level 2. Fixed-income securities are valued by a pricing service that values portfolio securities at the mean between the quoted bid and ask prices or the yield equivalent when quotations are readily available. These securities are generally classified as Level 2. Securities for which quotations are not readily available are valued at fair value as determined by the pricing service using methods that may include consideration of the following: yields or prices of investments of comparable quality, type of issue, coupon, maturity and rating, market quotes or indications of value from security dealers, evaluations of anticipated cash flows or collateral, general market conditions and other information and analysis, including the obligor’s credit characteristics considered relevant. The pricing service may employ electronic data processing techniques and/or a matrix system to
| | | | |
| | | | |
| | | Notes to
Financial Statements (continued) |
determine valuations. These securities are generally classified as Level 2. Highly rated zero coupon fixed-income securities, like U.S. Treasury Bills, issued with maturities of one year or less, are valued using the amortized cost method when 60 days or less remain until maturity. With amortized cost, any discount or premium is amortized each day, regardless of the impact of fluctuating rates on the market value of the security. These securities will generally be classified as Level 1 or Level 2.
Like most fixed income instruments, the senior loans in which the Funds invest are not listed on an organized exchange. The secondary market of senior loans may be less liquid relative to markets for other fixed-income securities. Consequently, the value of senior loans, determined as described above, may differ significantly from the value that would have been determined had there been an active market for that senior loan. These securities are generally classified as Level 2.
Temporary investments in securities that have variable rate and demand features qualifying them as short-term investments are valued at amortized cost, which approximates market value. These securities are generally classified as Level 1.
Certain securities may not be able to be priced by the pre-established pricing methods as described above. Such securities may be valued by the Funds’ Board of Trustees or its designee at fair value. These securities generally include, but are not limited to, restricted securities (securities which may not be publicly sold without registration under the Securities Act) for which a pricing service is unable to provide a market price; securities whose trading has been formally suspended; fixed-income securities that have gone into default and for which there is no current market quotation; a security whose market price is not available from a pre-established pricing source; a security with respect to which an event has occurred that is likely to materially affect the value of the security after the market has closed but before the calculation of a Fund’s net asset value (as may be the case in non-U.S. markets on which the security is primarily traded) or make it difficult or impossible to obtain a reliable market quotation; and a security whose price, as provided by the pricing service, is not deemed to reflect the security’s fair value. As a general principle, the fair value of an issue of securities would appear to be the amount that the owner might reasonably expect to receive for them in a current sale. A variety of factors may be considered in determining the fair value of these securities, which may include consideration of the following: yields or prices of investments of comparable quality, type of issue, coupon, maturity and rating, market quotes or indications of value from security dealers, evaluations of anticipated cash flows or collateral, general market conditions and other information and analysis, including the obligor’s credit characteristics considered relevant. These securities are classified generally as Level 2 or Level 3 depending on the priority of the significant inputs. Regardless of the method employed to value a particular security, all valuations are subject to review by the Funds’ Board of Trustees or its designee.
Refer to Footnote 2 – Fair Value Measurements for further details on the leveling of securities held by the Funds as of the end of the reporting period.
Investment Transactions
Investment transactions are recorded on a trade date basis. Trade date for senior and subordinated loans purchased in the “primary market” is considered the date on which the loan allocations are determined. Trade date for senior and subordinated loans purchased in the “secondary market” is the date on which the transaction is entered into. Realized gains and losses from investment transactions are determined on the specific identification method. Investments purchased on a when-issued/delayed delivery basis may have extended settlement periods. Any investments so purchased are subject to market fluctuation during this period. The Funds have instructed the custodian to segregate assets with a current value at least equal to the amount of the when-issued/delayed delivery purchase commitments. At July 31, 2010, Senior Income (NSL), Floating Rate Income (JFR) and Floating Rate Income Opportunity (JRO) had outstanding when-issued/delayed delivery purchase commitments of $24,286,327, $46,688,326 and $36,863,387, respectively.
Investment Income
Dividend income is recorded on the ex-dividend date. Interest income, which includes the amortization of premiums and accretion of discounts for financial reporting purposes, is recorded on an accrual basis. Interest income also includes paydown gains and losses, if any. Fee income, consists primarily of amendment fees. Amendment fees are earned as compensation for evaluating and accepting changes to an original senior loan agreement and are recognized when received. Other income includes the increase of the net realizable value of the receivable of matured senior loans during the current fiscal period.
Income Taxes
Each Fund is a separate taxpayer for federal income tax purposes. Each Fund intends to distribute substantially all of its net investment income and net capital gains to shareholders and to otherwise comply with the requirements of Subchapter M of the Internal Revenue Code applicable to regulated investment companies. Therefore, no federal income tax provision is required.
For all open tax years and all major taxing jurisdictions, management of the Funds has concluded that there are no significant uncertain tax positions that would require recognition in the financial statements. Open tax years are those that are open for examination by taxing authorities (i.e., generally the last four tax year ends and the interim tax period since then). Furthermore, management of the Funds is also not aware of any tax positions for which it is reasonably possible that the total amounts of unrecognized tax benefits will significantly change in the next twelve months.
Dividends and Distributions to Common Shareholders
Dividends to Common shareholders are declared monthly. Net realized capital gains from investment transactions, if any, are distributed to shareholders at least annually. Furthermore, capital gains are distributed only to the extent they exceed available capital loss carryforwards.
Distributions to Common shareholders are recorded on the ex-dividend date. The amount and timing of distributions are determined in accordance with federal corporate income tax regulations, which may differ from U.S. GAAP.
Preferred Shares
During the fiscal year ended July 31, 2010, Senior Income Fund (NSL) had outstanding Taxable Auction Preferred (“Preferred”) shares. The dividend rates paid by the Fund was determined every twenty-eight days, pursuant to a dutch auction process overseen by the auction agent, and was payable at the end of each rate period.
During the fiscal year ended July 31, 2010, Floating Rate Income (JFR) and Floating Rate Income Opportunity (JRO) had outstanding FundPreferred shares (“FundPreferred”) shares. The dividend rates paid by the Funds were determined every seven days, pursuant to a dutch auction process overseen by the auction agent, and were payable at the end of each rate period.
Beginning in February 2008, more shares for sale were submitted in the regularly scheduled auctions for the Preferred shares issued by the Funds than there were offers to buy. This meant that these auctions “failed to clear,” and that many Preferred shareholders who wanted to sell their shares in these auctions were unable to do so. Preferred shareholders unable to sell their shares received distributions at the “maximum rate” applicable to failed auctions as calculated in accordance with the pre-established terms of the Preferred shares.
These developments have generally not affected the portfolio management or investment policies of the Funds. However, one continuing implication of these auction failures for Common shareholders is that the Funds’ cost of leverage likely had been incrementally higher at times than it otherwise would had been had the auctions continued to be successful. As a result, the Funds’ Common share earnings likely had been lower than they otherwise might have been.
As of July 31, 2010, Senior Income (NSL), Floating Rate Income (JFR) and Floating Rate Income Opportunity (JRO) redeemed all of their outstanding Preferred shares, at liquidation values of $46,000,000, $400,000,000 and $240,000,000, respectively.
Derivative Financial Instruments
Each Fund is authorized to invest in derivative financial instruments, including forwards, futures, options and swap transactions. Although each Fund is authorized to invest in such financial instruments, and may do so in the future, they did not make any such investments during the fiscal year ended July 31, 2010.
Repurchase Agreements
In connection with transactions in repurchase agreements, it is each Fund’s policy that its custodian take possession of the underlying collateral securities, the fair value of which exceeds the principal amount of the repurchase transaction, including accrued interest, at all times. If the seller defaults, and the fair value of the collateral declines, realization of the collateral may be delayed or limited.
Custodian Fee Credit
Each Fund has an arrangement with the custodian bank whereby certain custodian fees and expenses are reduced by net credits earned on each Fund’s cash on deposit with the bank. Such deposit arrangements are an alternative to overnight investments. Credits for cash balances may be offset by charges for any days on which a Fund overdraws its account at the custodian bank.
Borrowing Costs
Costs incurred by each Fund in connection with structuring its refinancing during the fiscal year ended July 31, 2010, were recorded as a deferred charge which were amortized through May 14, 2010, and included as a component of “Interest expense on borrowings and amortization of borrowing costs” on the Statement of Operations.
Indemnifications
Under the Funds’ organizational documents, their officers and trustees are indemnified against certain liabilities arising out of the performance of their duties to the Funds. In addition, in the normal course of business, the Funds enter into contracts that provide general indemnifications to other parties. The Funds’ maximum exposure under these arrangements is unknown as this would involve future claims that may be made against the Funds that have not yet occurred. However, the Funds have not had prior claims or losses pursuant to these contracts and expect the risk of loss to be remote.
| | | | |
| | | | |
| | | | Notes to
Financial Statements (continued) |
Use of Estimates
The preparation of financial statements in conformity with U.S. GAAP requires management to make estimates and assumptions that affect the reported amounts of assets and liabilities at the date of the financial statements and the reported amounts of increases and decreases in net assets applicable to Common shares from operations during the reporting period. Actual results may differ from those estimates.
| |
| 2. | Fair Value Measurements |
In determining the value of each Fund’s investments, various inputs are used. These inputs are summarized in the three broad levels listed below:
| | | | | |
| Level 1 | | – | | Quoted prices in active markets for identical securities. |
| Level 2 | | – | | Other significant observable inputs (including quoted prices for similar securities, interest rates, prepayment speeds, credit risk, etc.). |
| Level 3 | | – | | Significant unobservable inputs (including management’s assumptions in determining the fair value of investments). |
The inputs or methodologies used for valuing securities are not an indication of the risk associated with investing in those securities. The following is a summary of each Fund’s fair value measurements as of July 31, 2010:
| | | | | | | | | | | | | | | | | |
| Senior Income (NSL) | | Level 1 | | | Level 2 | | | Level 3 | | | Total | |
| Investments: | | | | | | | | | | | | | | | | |
| Variable Rate Senior Loan Interests | | $ | – | | | $ | 239,291,209 | | | | $ – | | | $ | 239,291,209 | |
| Common Stocks* | | | 690,426 | | | | 4,439,195 | | | | – | | | | 5,129,621 | |
| Convertible Bonds | | | – | | | | 4,441,375 | | | | – | | | | 4,441,375 | |
| Corporate Bonds | | | – | | | | 21,225,875 | | | | – | | | | 21,225,875 | |
| Warrants | | | – | | | | 2,049,720 | | | | – | | | | 2,049,720 | |
| Short-Term Investments | | | 23,817,907 | | | | – | | | | – | | | | 23,817,907 | |
| | | | | | | | | | | | | | | | | |
| Total | | $ | 24,508,333 | | | $ | 271,447,374 | | | $ | – | | | $ | 295,955,707 | |
| | | | | | | | | | | | | | | | | |
| | | | | | | | | | | | | | | | | |
| Floating Rate Income (JFR) | | Level 1 | | | Level 2 | | | Level 3 | | | Total | |
| Investments: | | | | | | | | | | | | | | | | |
| Variable Rate Senior Loan Interests | | $ | – | | | $ | 643,619,158 | | | $ | – | | | $ | 643,619,158 | |
| Common Stocks* | | | 1,380,834 | | | | 15,655,703 | | | | – | | | | 17,036,537 | |
| Convertible Bonds | | | – | | | | 1,407,500 | | | | – | | | | 1,407,500 | |
| Corporate Bonds | | | – | | | | 44,896,681 | | | | – | | | | 44,896,681 | |
| Investment Companies | | | 12,284,209 | | | | – | | | | – | | | | 12,284,209 | |
| Warrants | | | – | | | | 2,903,160 | | | | – | | | | 2,903,160 | |
| Short-Term Investments | | | 45,774,026 | | | | – | | | | – | | | | 45,774,026 | |
| | | | | | | | | | | | | | | | | |
| Total | | $ | 59,439,069 | | | $ | 708,482,202 | | | $ | – | | | $ | 767,921,271 | |
| | | | | | | | | | | | | | | | | |
| | | | | | | | | | | | | | | | | |
| | | | | | | | | | | | | | | | | |
| Floating Rate Income Opportunity (JRO) | | Level 1 | | | Level 2 | | | Level 3 | | | Total | |
| Investments: | | | | | | | | | | | | | | | | |
| Variable Rate Senior Loan Interests | | $ | – | | | $ | 387,695,264 | | | $ | – | | | $ | 387,695,264 | |
| Common Stocks* | | | 690,426 | | | | 6,876,454 | | | | – | | | | 7,566,880 | |
| Convertible Bonds | | | – | | | | 3,422,814 | | | | – | | | | 3,422,814 | |
| Corporate Bonds | | | – | | | | 37,907,778 | | | | – | | | | 37,907,778 | |
| Warrants | | | – | | | | 2,489,664 | | | | – | | | | 2,489,664 | |
| Short-Term Investments | | | 22,898,244 | | | | – | | | | – | | | | 22,898,244 | |
| | | | | | | | | | | | | | | | | |
| Total | | $ | 23,588,670 | | | $ | 438,391,974 | | | $ | – | | | $ | 461,980,644 | |
| | | | | | | | | | | | | | | | | |
| |
| * | Refer to the Fund’s Portfolio of Investments for industry breakdown of Common Stocks classified as Level 2. |
The following is a reconciliation of Senior Income’s (NSL) Level 3 investments held at the beginning and end of the measurement period:
| | | | | |
| | | Senior Income (NSL)
| |
| | | Level 3
| |
| | | Variable Rate
| |
| | | Senior Loan Interests | |
| Balance at the beginning of year | | $ | 89,569 | |
| Gains (losses): | | | | |
| Net realized gains (losses) | | | (7,138,672 | ) |
| Net change in unrealized appreciation (depreciation) | | | 8,355,543 | |
| Net purchases at cost (sales at proceeds) | | | (1,306,440 | ) |
| Net discounts (premiums) | | | – | |
| Net transfers in to (out of) at end of period fair value | | | – | |
| | | | | |
| Balance at the end of year | | $ | – | |
| | | | | |
| |
| 3. | Derivative Instruments and Hedging Activities |
The Funds record derivative instruments at fair value, with changes in fair value recognized on the Statement of Operations, when applicable. Even though the Funds’ investments in derivatives may represent economic hedges, they are not considered to be hedge transactions for financial reporting purposes. The Funds did not invest in derivative instruments during the fiscal year ended July 31, 2010.
Common Shares
Transactions in Common shares were as follows:
| | | | | | | | | | | | | | | | | | | | | | | | | |
| | | | | | | | | Floating Rate
| |
| | | Senior Income (NSL) | | | Floating Rate Income (JFR) | | | Income Opportunity (JRO) | |
| | | Year
| | | Year
| | | Year
| | | Year
| | | Year
| | | Year
| |
| | | Ended
| | | Ended
| | | Ended
| | | Ended
| | | Ended
| | | Ended
| |
| | | 7/31/10 | | | 7/31/09 | | | 7/31/10 | | | 7/31/09 | | | 7/31/10 | | | 7/31/09 | |
| Common shares: | | | | | | | | | | | | | | | | | | | | | | | | |
| Issued to shareholders due to reinvestment of distributions | | | 12,531 | | | | – | | | | 14,604 | | | | 34,819 | | | | 11,112 | | | | – | |
| Repurchased and retired | | | – | | | | – | | | | (137,893 | ) | | | (9,700 | ) | | | (9,700 | ) | | | (9,700 | ) |
| | | | | | | | | | | | | | | | | | | | | | | | | |
| Total | | | 12,531 | | | | – | | | | (123,289 | ) | | | 25,119 | | | | 1,412 | | | | (9,700 | ) |
| | | | | | | | | | | | | | | | | | | | | | | | | |
| Weighted average Common share: | | | | | | | | | | | | | | | | | | | | | | | | |
| Price per share repurchased and retired | | | $ – | | | | $ – | | | | $ 9.15 | | | | $ 7.64 | | | | $ 8.95 | | | | $ 7.33 | |
| Discount per share repurchased and retired | | | – | | | | – | | | | 12.86 | % | | | 16.08 | % | | | 13.25 | % | | | 16.02 | % |
Preferred Shares
Transactions in Preferred shares were as follows:
| | | | | | | | | | | | | | | | | | | | | | | | | | | | | | | | | | | | | | | | | | | | | | | | | |
| | | | | | | | | Floating Rate
| |
| | | Senior Income (NSL) | | | Floating Rate Income (JFR) | | | Income Opportunity (JRO) | |
| | | Year Ended
| | | Year Ended
| | | Year Ended
| | | Year Ended
| | | Year Ended
| | | Year Ended
| |
| | | 7/31/10 | | | 7/31/09 | | | 7/31/10 | | | 7/31/09 | | | 7/31/10 | | | 7/31/09 | |
| | | Shares | | | Amount | | | Shares | | | Amount | | | Shares | | | Amount | | | Shares | | | Amount | | | Shares | | | Amount | | | Shares | | | Amount | |
| Preferred shares redeemed: |
| Series M | | | – | | | $ | – | | | | – | | | $ | – | | | | 1,050 | | | $ | 26,250,000 | | | | 600 | | | $ | 15,000,000 | | | | 800 | | | $ | 20,000,000 | | | | 534 | | | $ | 13,350,000 | |
| Series T | | | – | | | | – | | | | – | | | | – | | | | 1,050 | | | | 26,250,000 | | | | 600 | | | | 15,000,000 | | | | — | | | | — | | | | — | | | | — | |
| Series W | | | – | | | | – | | | | – | | | | – | | | | 1,050 | | | | 26,250,000 | | | | 600 | | | | 15,000,000 | | | | — | | | | — | | | | — | | | | — | |
| Series TH | | | 1,040 | | | | 26,000,000 | | | | 800 | | | | 20,000,000 | | | | — | | | | — | | | | — | | | | — | | | | 800 | | | | 20,000,000 | | | | 534 | | | | 13,350,000 | |
| Series F | | | – | | | | – | | | | – | | | | – | | | | 1,050 | | | | 26,250,000 | | | | 600 | | | | 15,000,000 | | | | 800 | | | | 20,000,000 | | | | 532 | | | | 13,300,000 | |
| | | | | | | | | | | | | | | | | | | | | | | | | | | | | | | | | | | | | | | | | | | | | | | | | |
| Total | | | 1,040 | | | $ | 26,000,000 | | | | 800 | | | $ | 20,000,000 | | | | 4,200 | | | $ | 105,000,000 | | | | 2,400 | | | $ | 60,000,000 | | | | 2,400 | | | $ | 60,000,000 | | | | 1,600 | | | $ | 40,000,000 | |
| | | | | | | | | | | | | | | | | | | | | | | | | | | | | | | | | | | | | | | | | | | | | | | | | |
| | | | |
| | | | |
| | | | Notes to
Financial Statements (continued) |
| |
| 5. | Investment Transactions |
Purchases and sales (including maturities but excluding short-term investments) during the fiscal year ended July 31, 2010, were as follows:
| | | | | | | | | | | | | |
| | | | | | | | | Floating
| |
| | | | | | Floating
| | | Rate
| |
| | | Senior
| | | Rate
| | | Income
| |
| | | Income
| | | Income
| | | Opportunity
| |
| | | (NSL) | | | (JFR) | | | (JRO) | |
| Purchases | | $ | 179,018,664 | | | $ | 368,205,820 | | | $ | 256,736,383 | |
| Sales and maturities | | | 173,182,914 | | | | 350,984,439 | | | | 238,742,739 | |
| | | | | | | | | | | | | |
| |
| 6. | Income Tax Information |
The following information is presented on an income tax basis. Differences between amounts for financial statement and federal income tax purposes are primarily due to the treatment of paydown gains and losses, timing differences in recognizing certain gains and losses on investment transactions and, for Floating Rate Income (JFR) and Floating Rate Income Opportunity (JRO), recognition of premium amortization. To the extent that differences arise that are permanent in nature, such amounts are reclassified within the capital accounts as detailed below. Temporary differences do not require reclassification. Temporary and permanent differences do not impact the net asset values of the Funds.
At July 31, 2010, the cost and unrealized appreciation (depreciation) of investments as determined on a federal income tax basis, were as follows:
| | | | | | | | | | | | | |
| | | | | | | | | Floating
| |
| | | | | | Floating
| | | Rate
| |
| | | Senior
| | | Rate
| | | Income
| |
| | | Income
| | | Income
| | | Opportunity
| |
| | | (NSL) | | | (JFR) | | | (JRO) | |
| Cost of investments | | $ | 306,193,613 | | | $ | 784,531,193 | | | $ | 471,919,488 | |
| | | | | | | | | | | | | |
| Gross unrealized: | | | | | | | | | | | | |
| Appreciation | | $ | 10,420,896 | | | $ | 23,638,909 | | | $ | 18,010,746 | |
| Depreciation | | | (20,658,802 | ) | | | (40,248,831 | ) | | | (27,949,590 | ) |
| | | | | | | | | | | | | |
| Net unrealized appreciation (depreciation) of investments | | $ | (10,237,906 | ) | | $ | (16,609,922 | ) | | $ | (9,938,844 | ) |
| | | | | | | | | | | | | |
Permanent differences, primarily due to federal taxes paid, paydowns, expiration of capital loss carryforwards and bond premium adjustments resulted in reclassifications among the Funds’ components of net assets at July 31, 2010, the Funds’ tax year-end, as follows:
| | | | | | | | | | | | | |
| | | | | | | | | Floating
| |
| | | | | | Floating
| | | Rate
| |
| | | Senior
| | | Rate
| | | Income
| |
| | | Income
| | | Income
| | | Opportunity
| |
| | | (NSL) | | | (JFR) | | | (JRO) | |
| Paid-in-surplus | | $ | (14,268,135 | ) | | $ | (28,157 | ) | | $ | (71,260 | ) |
| Undistributed (Over-distribution of) net investment income | | | 2,415,593 | | | | (7,747,543 | ) | | | (6,417,029 | ) |
| Accumulated net realized gain (loss) | | | 11,852,542 | | | | 7,775,700 | | | | 6,488,289 | |
| | | | | | | | | | | | | |
The tax components of undistributed net ordinary income and net long-term capital gains at July 31, 2010, the Funds’ tax year end, were as follows:
| | | | | | | | | | | | | |
| | | | | | | | | Floating
| |
| | | | | | Floating
| | | Rate
| |
| | | Senior
| | | Rate
| | | Income
| |
| | | Income
| | | Income
| | | Opportunity
| |
| | | (NSL) | | | (JFR) | | | (JRO) | |
| Undistributed net ordinary income * | | $ | 1,389,952 | | | $ | 3,605,436 | | | $ | 3,717,652 | |
| Undistributed net long-term capital gains | | | – | | | | – | | | | – | |
| | | | | | | | | | | | | |
| |
| * | Net ordinary income consists of net taxable income derived from dividends, interest, and net short-term capital gains, if any. Undistributed net ordinary income (on a tax basis) has not been reduced for the dividend declared on July 1, 2010, paid on August 2, 2010. |
The tax character of distributions paid during the Funds’ tax years ended July 31, 2010 and July 31, 2009, was designated for purposes of the dividends paid deduction as follows:
| | | | | | | | | | | | | |
| | | | | | | | | Floating
| |
| | | | | | Floating
| | | Rate
| |
| | | Senior
| | | Rate
| | | Income
| |
| | | Income
| | | Income
| | | Opportunity
| |
| 2010 | | (NSL) | | | (JFR) | | | (JRO) | |
| Distributions from net ordinary income * | | $ | 13,684,842 | | | $ | 27,379,807 | | | $ | 19,988,093 | |
| Distributions from net long-term capital gains | | | – | | | | – | | | | – | |
| | | | | | | | | | | | | |
| | | | | | | | | | | | | |
| | | | | | | | | Floating
| |
| | | | | | Floating
| | | Rate
| |
| | | Senior
| | | Rate
| | | Income
| |
| | | Income
| | | Income
| | | Opportunity
| |
| 2009 | | (NSL) | | | (JFR) | | | (JRO) | |
| Distributions from net ordinary income * | | $ | 14,308,050 | | | $ | 35,343,923 | | | $ | 23,471,413 | |
| Distributions from net long-term capital gains | | | – | | | | – | | | | – | |
| | | | | | | | | | | | | |
| |
| * | Net ordinary income consists of net taxable income derived from dividends, interest, and net short-term capital gains, if any. |
At July 31, 2010, the Funds’ tax year end, the Funds had unused capital loss carryforwards available for federal income tax purposes to be applied against future capital gains, if any. If not applied, the carryforwards will expire as follows:
| | | | | | | | | | | | | |
| | | | | | | | | Floating
| |
| | | | | | Floating
| | | Rate
| |
| | | Senior
| | | Rate
| | | Income
| |
| | | Income
| | | Income
| | | Opportunity
| |
| | | (NSL) | | | (JFR) | | | (JRO) | |
| Expiration: | | | | | | | | | | | | |
| July 31, 2011 | | $ | 10,704,255 | | | $ | — | | | $ | — | |
| July 31, 2013 | | | — | | | | 819,145 | | | | 30,377 | |
| July 31, 2014 | | | — | | | | 2,934,270 | | | | 2,151,577 | |
| July 31, 2015 | | | 1,002,070 | | | | 9,492,118 | | | | 5,017,841 | |
| July 31, 2016 | | | — | | | | 183,234 | | | | 1,294,188 | |
| July 31, 2017 | | | 8,900,332 | | | | 21,620,554 | | | | 13,760,353 | |
| July 31, 2018 | | | 29,264,459 | | | | 67,020,214 | | | | 46,332,843 | |
| | | | | | | | | | | | | |
| Total | | $ | 49,871,116 | | | $ | 102,069,535 | | | $ | 68,587,179 | |
| | | | | | | | | | | | | |
At July 31, 2010, $14,207,781 of Senior Income’s (NSL) capital loss carryforward expired.
The Funds have elected to defer net realized losses from investments incurred from November 1, 2009 through July 31, 2010, the Funds’ tax year end, (“post-October losses”) in accordance with federal income tax regulations. Post-October losses are treated as having arisen on the first day of the following fiscal year:
| | | | | | | | | | | | | |
| | | | | | | | | Floating
| |
| | | | | | Floating
| | | Rate
| |
| | | Senior
| | | Rate
| | | Income
| |
| | | Income
| | | Income
| | | Opportunity
| |
| | | (NSL) | | | (JFR) | | | (JRO) | |
| Post-October capital losses | | $ | 5,482,712 | | | $ | 6,989,418 | | | $ | 1,503,280 | |
| | | | | | | | | | | | | |
| |
| 7. | Management Fees and Other Transactions with Affiliates |
Each Fund’s management fee is separated into two components – a fund–level fee, based only on the amount of assets within each individual Fund, and a complex-level fee, based on the aggregate amount of all fund assets managed by the Adviser. This pricing structure enables each Fund’s shareholders to benefit from growth in the assets within their respective Fund as well as from growth in the amount of complex-wide assets managed by the Adviser.
The annual fund-level fee for each Fund, payable monthly, is calculated according to the following schedule:
| | | | | |
| | | Senior Income (NSL)
|
| Average Daily Managed Assets* | | Fund-Level Fee Rate |
| For the first $1 billion | | | .6500 | % |
| For the next $1 billion | | | .6375 | |
| For the next $3 billion | | | .6250 | |
| For the next $5 billion | | | .6000 | |
| For Managed Assets over $10 billion | | | .5750 | |
| | | | | |
| | | | |
| | | | |
| | | | Notes to
Financial Statements (continued) |
| | | | | |
| | | Floating Rate Income (JFR)
|
| | | Floating Rate Income Opportunity (JRO)
|
| Average Daily Managed Assets* | | Fund-Level Fee Rate |
| For the first $500 million | | | .6500 | % |
| For the next $500 million | | | .6250 | |
| For the next $500 million | | | .6000 | |
| For the next $500 million | | | .5750 | |
| For Managed Assets over $2 billion | | | .5500 | |
| | | | | |
The annual complex-level fee for each Fund, payable monthly, is calculated according to the following schedule:
| | | | | |
| Complex-Level Managed Asset Breakpoint Level* | | Effective Rate at Breakpoint Level |
| $55 billion | | | .2000 | % |
| $56 billion | | | .1996 | |
| $57 billion | | | .1989 | |
| $60 billion | | | .1961 | |
| $63 billion | | | .1931 | |
| $66 billion | | | .1900 | |
| $71 billion | | | .1851 | |
| $76 billion | | | .1806 | |
| $80 billion | | | .1773 | |
| $91 billion | | | .1691 | |
| $125 billion | | | .1599 | |
| $200 billion | | | .1505 | |
| $250 billion | | | .1469 | |
| $300 billion | | | .1445 | |
| | | | | |
| |
| * | The complex-level fee is calculated based upon the aggregate daily managed assets of all Nuveen funds, with such daily managed assets defined separately for each fund in its management agreement, but excluding assets attributable to investments in other Nuveen funds. For the complex-level and fund-level fees, daily managed assets include closed-end fund assets managed by the Adviser that are attributable to financial leverage. For these purposes, financial leverage includes the funds’ use of preferred stock and borrowings and certain investments in the residual interest certificates (also called inverse floating rate securities) in tender option bond (TOB) trusts, including the portion of assets held by a TOB trust that has been effectively financed by the trust’s issuance of floating rate securities, subject to an agreement by the Adviser to limit the amount of such assets for determining managed assets in certain circumstances. As of July 31, 2010, the complex-level fee rate was .1844%. |
The management fee compensates the Adviser for overall investment advisory and administrative services and general office facilities. The Adviser has entered into Sub-Advisory Agreements with Symphony under which Symphony manages the investment portfolios of the Funds. Symphony is compensated for its services to the Funds from the management fees paid to the Adviser.
The Funds pay no compensation directly to those of its trustees who are affiliated with the Adviser or to its officers, all of whom receive remuneration for their services to the Funds from the Adviser or its affiliates. The Board of Trustees has adopted a deferred compensation plan for independent trustees that enables trustees to elect to defer receipt of all or a portion of the annual compensation they are entitled to receive from certain Nuveen advised funds. Under the plan, deferred amounts are treated as though equal dollar amounts had been invested in shares of select Nuveen advised funds.
For the first ten years of Senior Income’s (NSL) operations, the Adviser has agreed to reimburse the Fund, as a percentage of average daily managed assets, for fees and expenses in the amounts and for the time periods set forth below:
| | | | | | | | | | | |
Year Ending
| | | | Year Ending
| | |
| October 31, | | | | October 31, | | |
| 1999 * | | | .45 | % | | 2005 | | | .35 | % |
| 2000 | | | .45 | | | 2006 | | | .25 | |
| 2001 | | | .45 | | | 2007 | | | .15 | |
| 2002 | | | .45 | | | 2008 | | | .10 | |
| 2003 | | | .45 | | | 2009 | | | .05 | |
| 2004 | | | .45 | | | | | | | |
| | | | | | | | | | | |
| |
| * | From the commencement of operations. |
The Adviser has not agreed to reimburse Senior Income (NSL) for any portion of its fees and expenses beyond October 31, 2009.
For the first eight years of Floating Rate Income’s (JFR) operations, the Adviser has agreed to reimburse the Fund, as a percentage of average daily managed assets, for fees and expenses in the amounts and for the time periods set forth below:
| | | | | | | | | | | |
Year Ending
| | | | Year Ending
| | |
| March 31, | | | | March 31, | | |
| 2004 * | | | .32 | % | | 2009 | | | .32 | % |
| 2005 | | | .32 | | | 2010 | | | .24 | |
| 2006 | | | .32 | | | 2011 | | | .16 | |
| 2007 | | | .32 | | | 2012 | | | .08 | |
| 2008 | | | .32 | | | | | | | |
| | | | | | | | | | | |
| |
| * | From the commencement of operations. |
The Adviser has not agreed to reimburse Floating Rate Income (JFR) for any portion of its fees and expenses beyond March 31, 2012.
For the first eight years of Floating Rate Income Opportunity’s (JRO) operations, the Adviser has agreed to reimburse the Fund, as a percentage of average daily managed assets, for fees and expenses in the amounts and for the time periods set forth below:
| | | | | | | | | | | |
Year Ending
| | | | Year Ending
| | |
| July 31, | | | | July 31, | | |
| 2004 * | | | .30 | % | | 2009 | | | .30 | % |
| 2005 | | | .30 | | | 2010 | | | .22 | |
| 2006 | | | .30 | | | 2011 | | | .14 | |
| 2007 | | | .30 | | | 2012 | | | .08 | |
| 2008 | | | .30 | | | | | | | |
| | | | | | | | | | | |
| |
| * | From the commencement of operations. |
The Adviser has not agreed to reimburse Floating Rate Income Opportunity (JRO) for any portion of its fees and expenses beyond July 31, 2012.
| |
| 8. | Senior Loan Commitments |
Unfunded Commitments
Pursuant to the terms of certain of the variable rate senior loan agreements, the Funds may have unfunded senior loan commitments. Each Fund will maintain with the custodian, cash, liquid securities and/or liquid senior loans having an aggregate value at least equal to the amount of unfunded senior loan commitments. At July 31, 2010, Senior Income (NSL), Floating Rate Income (JFR) and Floating Rate Income Opportunity (JRO) had unfunded senior loan commitments of $555,556, $2,222,222 and $1,111,111, respectively.
Participation Commitments
With respect to the senior loans held in each Fund’s portfolio, the Funds may: 1) invest in assignments; 2) act as a participant in primary lending syndicates; or 3) invest in participations. If a Fund purchases a participation of a senior loan interest, the Fund would typically enter into a contractual agreement with the lender or other third party selling the participation, rather than directly with the Borrower. As such, the Fund not only assumes the credit risk of the Borrower, but also that of the Selling Participant or other persons interpositioned between the Fund and the Borrower. At July 31, 2010, there were no such outstanding participation commitments in any of the Funds.
| |
| 9. | Borrowing Arrangements |
Senior Income (NSL) has entered into a $75,500,000 million Revolving Credit and Security Agreement with an affiliate of Citibank N.A. (“Citibank”). As of July 31, 2010, the Fund’s outstanding balance on these borrowings was $73,950,000. For the fiscal year ended July 31, 2010, the average daily balance outstanding and average interest rate on these borrowings were $67,937,123 and .34%, respectively.
Floating Rate Income (JFR) has entered into a $209,500,000 million Revolving Credit and Security Agreement with an affiliate of Citibank. As of July 31, 2010, the Fund’s outstanding balance on these borrowings was $197,740,000. For the fiscal year ended July 31, 2010, the average daily balance outstanding and average interest rate on these borrowings were $180,143,945 and .34%, respectively.
Floating Rate Income Opportunity (JRO) has entered into a $120,000,000 million Revolving Credit and Security Agreement with an affiliate of Citibank. As of July 31, 2010, the Fund’s outstanding balance on these borrowings was $117,270,000. For the fiscal year ended July 31, 2010, the average daily balance outstanding and average interest rate on these borrowings were $107,208,411 and .34%, respectively.
The aforementioned agreements renewed on May 14, 2010.
In order to maintain these borrowing arrangements, the Funds must meet certain collateral, asset coverage and other requirements. Borrowings outstanding are fully secured by securities held in the Funds’ Portfolios of Investments.
| | | | |
| | | | |
| | | | Notes to
Financial Statements (continued) |
Interest expense incurred on these borrowings, which is based on a commercial paper rate, is recognized as “Interest expense on borrowings” on the Statement of Operations. In addition to the interest expense, each Fund pays a .65% per annum program fee, based on the average daily outstanding balance and a .35% per annum liquidity fee, based on the total commitment amount of the borrowings through the renewal date, both of which are recognized as “Fees on borrowings” on the Statement of Operations.
| |
| 10. | New Accounting Standards |
Fair Value Measurements
On January 21, 2010, FASB issued changes to the authoritative guidance under U.S. GAAP for fair value measurements. The objective of which is to provide guidance on how investment assets and liabilities are to be valued and disclosed. Specifically, the amendment requires reporting entities disclose Level 3 activity for purchase, sales, issuances and settlements in the Level 3 roll-forward on a gross basis rather than as one net number. The effective date of the amendment is for interim and annual periods beginning after December 15, 2010. At this time, management is evaluating the implications of this guidance and the impact it will have to the financial statement amounts and footnote disclosures, if any.
| | | | | | |
| | | | | | |
| | | | Financial
Highlights |
| | | | Selected data for a Common share outstanding throughout each period: |
| | | | | | | | | | | | | | | | | | | | | | | | | | | | | | | | | | | | | | | | | | | | | | | | | | | | | |
| | | | | | Investment Operations | | | Less Distributions | | | | | | | | | | | | | |
| | | | | | | | | | | | Distributions
| | | | | | | | | | | | | | | | | | | | | | | | | | | | |
| | | | | | | | | | | | from Net
| | | Distributions
| | | | | | Net
| | | | | | | | | Offering Costs
| | | | | | | | | | |
| | | Beginning
| | | | | | | | | Investment
| | | from Capital
| | | | | | Investment
| | | Capital
| | | | | | and
| | | Discount
| | | Ending
| | | | |
| | | Common
| | | | | | Net
| | | Income to
| | | Gains to
| | | | | | Income to
| | | Gains to
| | | | | | Preferred
| | | from
| | | Common
| | | | |
| | | Share
| | | Net
| | | Realized/
| | | Preferred
| | | Preferred
| | | | | | Common
| | | Common
| | | | | | Share
| | | Shares
| | | Share
| | | Ending
| |
| | | Net Asset
| | | Investment
| | | Unrealized
| | | Share-
| | | Share-
| | | | | | Share-
| | | Share-
| | | | | | Underwriting
| | | Repurchased
| | | Net Asset
| | | Market
| |
| | | Value | | | Income(a) | | | Gain (Loss) | | | holders(b) | | | holders(b) | | | Total | | | holders | | | holders | | | Total | | | Discounts | | | and Retired | | | Value | | | Value | |
| Senior Income (NSL) |
| | | | | | | | | | | | | | | | | | | | | | | | | | | | | | | | | | | | | | | | | | | | | | | | | | | | | |
| Year Ended 7/31: |
| 2010 | | $ | 5.70 | | | $ | .37 | | | $ | 1.20 | | | $ | – | * | | $ | – | | | | 1.57 | | | $ | (.46 | ) | | $ | – | | | $ | (.46 | ) | | $ | – | | | $ | – | | | $ | 6.81 | | | $ | 6.95 | |
| 2009 | | | 7.18 | | | | .45 | | | | (1.46 | ) | | | (.02 | ) | | | – | | | | (1.03 | ) | | | (.45 | ) | | | – | | | | (.45 | ) | | | – | | | | – | | | | 5.70 | | | | 5.15 | |
| 2008 | | | 8.00 | | | | .72 | | | | (.83 | ) | | | (.07 | ) | | | – | | | | (.18 | ) | | | (.64 | ) | | | – | | | | (.64 | ) | | | – | | | | – | | | | 7.18 | | | | 6.18 | |
| 2007 | | | 8.33 | | | | .79 | | | | (.33 | ) | | | (.08 | ) | | | – | | | | .38 | | | | (.71 | ) | | | – | | | | (.71 | ) | | | – | | | | – | | | | 8.00 | | | | 8.08 | |
| 2006 | | | 8.48 | | | | .69 | | | | (.15 | ) | | | (.07 | ) | | | – | | | | .47 | | | | (.62 | ) | | | – | | | | (.62 | ) | | | – | | | | – | | | | 8.33 | | | | 8.15 | |
| |
| Floating Rate Income (JFR) |
| | | | | | | | | | | | | | | | | | | | | | | | | | | | | | | | | | | | | | | | | | | | | | | | | | | | | |
| Year Ended 7/31: |
| 2010 | | | 9.76 | | | | .82 | | | | 1.47 | | | | – | * | | | – | | | | 2.29 | | | | (.58 | ) | | | – | | | | (.58 | ) | | | – | | | | – | * | | | 11.47 | | | $ | 11.20 | |
| 2009 | | | 11.83 | | | | .71 | | | | (2.07 | ) | | | (.07 | ) | | | – | | | | (1.43 | ) | | | (.64 | ) | | | – | | | | (.64 | ) | | | – | | | | – | * | | | 9.76 | | | | 8.37 | |
| 2008 | | | 13.08 | | | | 1.40 | | | | (1.20 | ) | | | (.37 | ) | | | – | | | | (.17 | ) | | | (1.08 | ) | | | – | | | | (1.08 | ) | | | – | | | | – | | | | 11.83 | | | | 10.19 | |
| 2007 | | | 13.90 | | | | 1.56 | | | | (.78 | ) | | | (.43 | ) | | | – | | | | .35 | | | | (1.17 | ) | | | – | | | | (1.17 | ) | | | – | | | | – | | | | 13.08 | | | | 12.88 | |
| 2006 | | | 14.11 | | | | 1.31 | | | | (.18 | ) | | | (.35 | ) | | | – | | | | .78 | | | | (.99 | ) | | | – | | | | (.99 | ) | | | – | | | | – | | | | 13.90 | | | | 13.15 | |
| |
| Floating Rate Income Opportunity (JRO) |
| | | | | | | | | | | | | | | | | | | | | | | | | | | | | | | | | | | | | | | | | | | | | | | | | | | | | |
| Year Ended 7/31: |
| 2010 | | | 9.54 | | | | 1.01 | | | | 1.50 | | | | – | * | | | – | | | | 2.51 | | | | (.71 | ) | | | – | | | | (.71 | ) | | | – | | | | – | * | | | 11.34 | | | $ | 11.64 | |
| 2009 | | | 11.75 | | | | .73 | | | | (2.15 | ) | | | (.07 | ) | | | – | | | | (1.49 | ) | | | (.72 | ) | | | – | | | | (.72 | ) | | | – | | | | – | * | | | 9.54 | | | | 8.35 | |
| 2008 | | | 13.14 | | | | 1.41 | | | | (1.29 | ) | | | (.37 | ) | | | – | | | | (.25 | ) | | | (1.14 | ) | | | – | | | | (1.14 | ) | | | – | | | | – | | | | 11.75 | | | | 10.06 | |
| 2007 | | | 13.95 | | | | 1.62 | | | | (.78 | ) | | | (.43 | ) | | | – | | | | .41 | | | | (1.22 | ) | | | – | | | | (1.22 | ) | | | – | | | | – | | | | 13.14 | | | | 13.05 | |
| 2006 | | | 14.08 | | | | 1.38 | | | | (.13 | ) | | | (.35 | ) | | | – | | | | .90 | | | | (1.03 | ) | | | – | | | | (1.03 | ) | | | – | | | | – | | | | 13.95 | | | | 13.30 | |
| | | | | | | | | | | | | | | | | | | | | | | | | | | | | | | | | | | | | | | | | | | | | | | | | | | | | |
| | |
| (a) | | Per share Net Investment Income is calculated using the average daily shares method. |
| (b) | | The amounts shown are based on Common share equivalents. |
| (c) | | Total Return Based on Market Value is the combination of changes in the market price per share and the effect of reinvested dividend income and reinvested capital gains distributions, if any, at the average price paid per share at the time of reinvestment. The last dividend declared in the period, which is typically paid on the first business day of the following month, is assumed to be reinvested at the ending market price. The actual reinvestment for the last dividend declared in the period may take place over several days, and in some instances may not be based on the market price, so the actual reinvestment price may be different from the price used in the calculation. Total returns are not annualized. |
| |
| | Total Return Based on Common Share Net Asset Value is the combination of changes in Common share net asset value, reinvested dividend income at net asset value and reinvested capital gains distributions at net asset value, if any. The last dividend declared in the period, which is typically paid on the first business day of the following month, is assumed to be reinvested at the ending net asset value. The actual reinvest price for the last dividend declared in the period may often be based on the Fund’s market price (and not its net asset value), and therefore may be different from the price used in the calculation. Total returns are not annualized. |
| | | | | | | | | | | | | | | | | | | | | | | | | | | | | | | | | | | | | | | | | | | | | | | | | | | | | |
| | | | | | | | | Ratios/Supplemental Data | | | | | | | | | | | | | | | | |
| | | | | | | | | Ratios to Average Net
| | | Ratios to Average Net
| | | | | | | | | | |
| | | | | | | | | Assets Applicable to
| | | Assets Applicable to
| | | | | | | | | | |
| | | | | | | | | Common Shares Before
| | | Common Shares After
| | | | | | | | | Borrowings at
| |
| | | Total Returns | | | | | | Reimbursement(d) | | | Reimbursement(d)(e) | | | | | | Preferred Shares at End of Period | | | End of Period | |
| | | | | | Based
| | | | | | | | | | | | | | | | | | | | | | | | | | | | | | | | | | |
| | | | | | on
| | | Ending
| | | | | | | | | | | | | | | | | | | | | | | | | | | | | | | |
| | | | | | Common
| | | Net
| | | | | | | | | | | | | | | | | | | | | | | | | | | | | | | |
| | | Based
| | | Share
| | | Assets
| | | | | | | | | | | | | | | | | | Aggregate
| | | Liquidation
| | | | | | Aggregate
| | | Asset
| |
| | | on
| | | Net
| | | Applicable to
| | | | | | Net
| | | | | | Net
| | | Portfolio
| | | Amount
| | | and Market
| | | Asset
| | | Amount
| | | Coverage
| |
| | | Market
| | | Asset
| | | Common
| | | | | | Investment
| | | | | | Investment
| | | Turnover
| | | Outstanding
| | | Value Per
| | | Coverage
| | | Outstanding
| | | Per
| |
| | | Value(c) | | | Value(c) | | | Shares (000) | | | Expenses | | | Income(f) | | | Expenses | | | Income(f) | | | Rate | | | (000) | | | Share | | | Per Share | | | (000) | | | $1,000 | |
| | | | | | | | | | | | | | | | | | | | | | | | | | | | | | | | | | | | | | | | | | | | | | | | | | | | | |
| | | | 44.83 | % | | | 28.15 | % | | | $203,261 | | | | 2.18 | % | | | 5.61 | % | | | 2.17 | % | | | 5.62 | % | | | 68 | % | | $ | – | | | $ | – | | | $ | – | | | $ | 73,950 | | | $ | 3,749 | |
| | | | (6.83 | ) | | | (12.25 | ) | | | 169,917 | | | | 3.50 | | | | 9.39 | | | | 3.39 | | | | 9.50 | | | | 48 | | | | 26,000 | | | | 25,000 | | | | 188,381 | | | | 32,900 | | | | 6,955 | |
| | | | (16.31 | ) | | | (2.32 | ) | | | 214,311 | | | | 3.88 | | | | 9.38 | | | | 3.69 | | | | 9.57 | | | | 50 | | | | 46,000 | | | | 25,000 | | | | 141,473 | | | | 90,000 | | | | 3,892 | |
| | | | 7.79 | | | | 4.39 | | | | 238,779 | | | | 3.88 | | | | 8.99 | | | | 3.59 | | | | 9.27 | | | | 80 | | | | 46,000 | | | | 25,000 | | | | 154,771 | | | | 103,000 | | | | 3,765 | |
| | | | (1.87 | ) | | | 5.78 | | | | 248,271 | | | | 3.52 | | | | 7.74 | | | | 3.08 | | | | 8.18 | | | | 55 | | | | 46,000 | | | | 25,000 | | | | 159,930 | | | | 103,000 | | | | 3,857 | |
| |
| |
| | | | | | | | | | | | | | | | | | | | | | | | | | | | | | | | | | | | | | | | | | | | | | | | | | | | | |
| | | | | | | | | | | | | | | | | | | | | | | | | | | | | | | | | | | | | | | | | | | | | | | | | | | | | |
| | | | 41.48 | % | | | 23.85 | % | | | 542,456 | | | | 2.03 | | | | 7.14 | | | | 1.74 | | | | 7.42 | | | | 51 | | | | – | | | | – | | | | – | | | | 197,740 | | | | 3,743 | |
| | | | (9.82 | ) | | | (10.37 | ) | | | 463,026 | | | | 3.25 | | | | 8.27 | | | | 2.79 | | | | 8.74 | | | | 38 | | | | 105,000 | | | | 25,000 | | | | 135,244 | | | | 38,500 | | | | 15,754 | |
| | | | (13.07 | ) | | | (1.43 | ) | | | 560,473 | | | | 2.04 | | | | 10.71 | | | | 1.50 | | | | 11.25 | | | | 30 | | | | 165,000 | | | | 25,000 | | | | 109,920 | | | | 235,000 | | | | 4,087 | |
| | | | 6.69 | | | | 2.33 | | | | 619,843 | | | | 1.59 | | | | 10.63 | | | | 1.08 | | | | 11.14 | | | | 81 | | | | 400,000 | | | | 25,000 | | | | 63,740 | | | | – | | | | – | |
| | | | 3.70 | | | | 5.72 | | | | 657,517 | | | | 1.61 | | | | 8.83 | | | | 1.10 | | | | 9.34 | | | | 50 | | | | 400,000 | | | | 25,000 | | | | 66,095 | | | | – | | | | – | |
| |
| |
| | | | | | | | | | | | | | | | | | | | | | | | | | | | | | | | | | | | | | | | | | | | | | | | | | | | | |
| | | | | | | | | | | | | | | | | | | | | | | | | | | | | | | | | | | | | | | | | | | | | | | | | | | | | |
| | | | 49.00 | % | | | 26.66 | % | | | 322,136 | | | | 2.14 | | | | 8.95 | | | | 1.84 | | | | 9.25 | | | | 58 | | | | – | | | | – | | | | – | | | | 117,270 | | | | 3,747 | |
| | | | (7.35 | ) | | | (10.57 | ) | | | 271,125 | | | | 3.35 | | | | 8.74 | | | | 2.86 | | | | 9.23 | | | | 41 | | | | 60,000 | | | | 25,000 | | | | 137,969 | | | | 37,350 | | | | 9,865 | |
| | | | (14.88 | ) | | | (1.99 | ) | | | 334,040 | | | | 2.06 | | | | 10.88 | | | | 1.55 | | | | 11.38 | | | | 33 | | | | 100,000 | | | | 25,000 | | | | 108,510 | | | | 140,000 | | | | 4,100 | |
| | | | 7.13 | | | | 2.73 | | | | 373,366 | | | | 1.61 | | | | 11.06 | | | | 1.13 | | | | 11.54 | | | | 81 | | | | 240,000 | | | | 25,000 | | | | 63,892 | | | | – | | | | – | |
| | | | 7.32 | | | | 6.60 | | | | 396,195 | | | | 1.63 | | | | 9.36 | | | | 1.15 | | | | 9.84 | | | | 50 | | | | 240,000 | | | | 25,000 | | | | 66,270 | | | | – | | | | – | |
| | | | | | | | | | | | | | | | | | | | | | | | | | | | | | | | | | | | | | | | | | | | | | | | | | | | | |
| | |
| (d) | | • Ratios do not reflect the effect of dividend payments to Preferred shareholders. |
| | • Net Investment Income ratios reflect income earned and expenses incurred on assets attributable to Preferred shares and/or borrowings, where applicable. |
| | • Each ratio includes the effect of the interest expense paid on borrowings as follows: |
| | | | | |
Ratios of Borrowings Interest Expense to
| |
| Average Net Assets Applicable to Common Shares(g) | |
| Senior Income (NSL) |
| Year Ended 7/31: |
| 2010 | | | .13 | % |
| 2009 | | | 1.28 | |
| 2008 | | | 2.05 | |
| 2007 | | | 2.22 | |
| 2006 | | | 1.85 | |
| | | | | |
| Floating Rate Income (JFR) |
| Year Ended 7/31: |
| 2010 | | | .13 | % |
| 2009 | | | 1.04 | |
| 2008 | | | .28 | |
| 2007 | | | – | |
| 2006 | | | – | |
| | | | | |
| Floating Rate Income Opportunity (JRO) |
| Year Ended 7/31: |
| 2010 | | | .13 | % |
| 2009 | | | 1.14 | |
| 2008 | | | .28 | |
| 2007 | | | – | |
| 2006 | | | – | |
| | | | | |
| | |
| (e) | | After expense reimbursement from the Adviser, where applicable. Ratios do not reflect the effect of custodian fee credits earned on the Fund’s net cash deposit with the custodian bank and/or legal fee refunds, where applicable. As of October 31, 2009, the Adviser is no longer reimbursing Senior Income (NSL) for any fees or expenses. |
| (f) | | For the fiscal year ended July 31, 2010, each ratio of Net Investment Income includes the effect of the increase of the net realizable value of the receivable of matured senior loans as described in Footnote 1 — General Information and Significant Accounting Policies, Investment Income. For the fiscal year ended July 31, 2010, the increase (decrease) to the Ratios of Net Investment Income to Average Net Assets Applicable to Common Shares is .09%, .08% and .09% for Senior Income (NSL), Floating Rate Income (JFR) and Floating Rate Income Opportunity (JRO), respectively. |
| (g) | | Borrowings Interest Expense includes amortization of borrowing costs, where applicable. Borrowing costs were fully amortized and expensed as of July 31, 2009. |
| * | | Rounds to less than $.01 per share. |
See accompanying notes to financial statements.
Board Members & Officers (Unaudited)
The management of the Fund, including general supervision of the duties performed for the Fund by the Adviser, is the responsibility of the Board Members of the Fund. The number of board members of the Fund is currently set at nine. None of the board members who are not “interested” persons of the Fund (referred to herein as “independent board members”) has ever been a director or employee of, or consultant to, Nuveen or its affiliates. The names and business addresses of the board members and officers of the Fund, their principal occupations and other affiliations during the past five years, the number of portfolios each oversees and other directorships they hold are set forth below.
| | | | | | | | | | |
| |
Name, Birthdate
| | | Position(s) Held with
| | Year First
| | Principal Occupation(s)
| | Number of Portfolios
|
and Address
| | | the Fund
| | Elected or
| | Including other Directorships
| | in Fund Complex
|
| | |
| | Appointed
| | During Past 5 Years
| | Overseen by
|
| | | | | | and Term(1) | | | | Board Member |
| |
| |
| INDEPENDENT BOARD MEMBERS: |
| |
| n ROBERT P. BREMNER(2) |
8/22/40
333 W. Wacker Drive
Chicago, IL 60606 | | | Chairman of
the Board
and Board Member | | 1996
Class III | | Private Investor and Management Consultant; Treasurer and Director, Humanities Council of Washington, D.C. | | 200 |
| |
| n JACK B. EVANS |
10/22/48
333 W. Wacker Drive
Chicago, IL 60606 | | | Board Member | | 1999
Class III | | President, The Hall-Perrine Foundation, a private philanthropic corporation (since 1996); Director and Chairman, United Fire Group, a publicly held company; President Pro Tem of the Board of Regents for the State of Iowa University System; Director, Gazette Companies; Life Trustee of Coe College and the Iowa College Foundation; formerly, Director, Alliant Energy; formerly, Director, Federal Reserve Bank of Chicago; formerly, President and Chief Operating Officer, SCI Financial Group, Inc., a regional financial services firm. | | 200 |
| |
| n WILLIAM C. HUNTER |
3/6/48
333 W. Wacker Drive
Chicago, IL 60606 | | | Board Member | | 2004
Class I | | Dean, Tippie College of Business, University of Iowa (since 2006); Director (since 2004) of Xerox Corporation; Director (since 2005), Beta Gamma Sigma International Honor Society; formerly, Dean and Distinguished Professor of Finance, School of Business at the University of Connecticut (2003-2006); previously, Senior Vice President and Director of Research at the Federal Reserve Bank of Chicago (1995-2003); Director, SS&C Technologies, Inc. (May 2005-October 2005); formerly, Director (1997-2007), Credit Research Center at Georgetown University. | | 200 |
| | | | | | | | | | |
| |
Name, Birthdate
| | | Position(s) Held with
| | Year First
| | Principal Occupation(s)
| | Number of Portfolios
|
and Address
| | | the Fund
| | Elected or
| | Including other Directorships
| | in Fund Complex
|
| | |
| | Appointed
| | During Past 5 Years
| | Overseen by
|
| | | | | | and Term(1) | | | | Board Member |
| |
| INDEPENDENT BOARD MEMBERS (continued): |
| | | | | | | | | | |
| |
| n DAVID J. KUNDERT(2) |
10/28/42
333 W. Wacker Drive
Chicago, IL 60606 | | | Board Member | | 2005
Class II | | Director, Northwestern Mutual Wealth Management Company; retired (since 2004) as Chairman, JPMorgan Fleming Asset Management, President and CEO, Banc One Investment Advisors Corporation, and President, One Group Mutual Funds; prior thereto, Executive Vice President, Banc One Corporation and Chairman and CEO, Banc One Investment Management Group; Member, Board of Regents, Luther College; member of the Wisconsin Bar Association; member of Board of Directors, Friends of Boerner Botanical Gardens; member of Board of Directors and Chair of Investment Committee, Greater Milwaukee Foundation. | | 200 |
| |
| n WILLIAM J. SCHNEIDER(2) |
9/24/44
333 W. Wacker Drive
Chicago, IL 60606 | | | Board Member | | 1997
Class III | | Chairman of Miller-Valentine Partners Ltd., a real estate investment company; formerly, Senior Partner and Chief Operating Officer (retired, 2004) of Miller-Valentine Group; member, University of Dayton Business School Advisory Council; member, Mid-America Health System Board; formerly member and Chair, Dayton Philharmonic Orchestra Association; formerly, member, Business Advisory Council, Cleveland Federal Reserve Bank. | | 200 |
| |
| n JUDITH M. STOCKDALE |
12/29/47
333 W. Wacker Drive
Chicago, IL 60606 | | | Board Member | | 1997
Class I | | Executive Director, Gaylord and Dorothy Donnelley Foundation (since 1994); prior thereto, Executive Director, Great Lakes Protection Fund (1990-1994). | | 200 |
| |
| n CAROLE E. STONE(2) |
6/28/47
333 W. Wacker Drive
Chicago, IL 60606 | | | Board Member | | 2007
Class I | | Director, Chicago Board Options Exchange (since 2006); Director, C2 Options Exchange, Incorporated (since 2009); Commissioner, New York State Commission on Public Authority Reform (since 2005); formerly, Chair, New York Racing Association Oversight Board (2005-2007). | | 200 |
| |
| n TERENCE J. TOTH(2) |
9/29/59
333 W. Wacker Drive
Chicago, IL 60606 | | | Board Member | | 2008
Class II | | Director, Legal & General Investment Management America, Inc. (since 2008); Managing Partner, Promus Capital (since 2008); formerly CEO and President, Northern Trust Global Investments (2004-2007); Executive Vice President, Quantitative Management & Securities Lending (2000-2004); prior thereto, various positions with Northern Trust Company (since 1994); member: Goodman Theatre Board (since 2004); Chicago Fellowship Boards (since 2005), University of Illinois Leadership Council Board (since 2007) and Catalyst Schools of Chicago Board (since 2008); formerly member: Northern Trust Mutual Funds Board (2005-2007), Northern Trust Global Investments Board (2004-2007), Northern Trust Japan Board (2004-2007), Northern Trust Securities Inc. Board (2003-2007) and Northern Trust Hong Kong Board (1997-2004). | | 200 |
| | | | | | | | | | |
| |
Name, Birthdate
| | | Position(s) Held with
| | Year First
| | Principal Occupation(s)
| | Number of Portfolios
|
and Address
| | | the Fund
| | Elected or
| | Including other Directorships
| | in Fund Complex
|
| | |
| | Appointed
| | During Past 5 Years
| | Overseen by
|
| | | | | | and Term(1) | | | | Board Member |
| |
| INTERESTED BOARD MEMBER: |
| |
| n JOHN P. AMBOIAN(3) |
6/14/61
333 W. Wacker Drive
Chicago, IL 60606 | | | Board Member | | 2008
Class II | | Chief Executive Officer (since July 2007), Director (since 1999) and Chairman (since 2007) of Nuveen Investments, Inc.; Chief Executive Officer (since 2007) of Nuveen Asset Management, Nuveen Investments Advisors, Inc.; President (since 2005) of Nuveen Commodities Asset Management, LLC. | | 200 |
| |
Name, Birthdate
| | | Position(s) Held with
| | Year First
| | Principal Occupation(s)
| | Number of Portfolios
|
and Address
| | | the Fund
| | Elected or
| | During Past 5 Years
| | in Fund Complex
|
| | |
| | Appointed(4)
| |
| | Overseen by
|
| | | | | | | | | | Officer |
| |
| |
| OFFICERS of the FUND: |
| |
| n GIFFORD R. ZIMMERMAN |
9/9/56
333 W. Wacker Drive
Chicago, IL 60606 | | | Chief
Administrative
Officer | | 1988 | | Managing Director (since 2002), Assistant Secretary and Associate General Counsel of Nuveen Investments, LLC; Managing Director, Associate General Counsel and Assistant Secretary, of Nuveen Asset Management (since 2002) and of Symphony Asset Management LLC, (since 2003); Vice President and Assistant Secretary of NWQ Investment Management Company, LLC. (since 2002), Nuveen Investments Advisers Inc. (since 2002), Tradewinds Global Investors, LLC, and Santa Barbara Asset Management, LLC (since 2006), Nuveen HydePark Group LLC and Nuveen Investment Solutions, Inc. (since 2007); Managing Director (since 2004) and Assistant Secretary (since 1994) of Nuveen Investments, Inc.; Managing Director (since 2005) of Nuveen Commodities Asset Management, LLC; Chartered Financial Analyst. | | 200 |
| |
| n WILLIAM ADAMS IV |
6/9/55
333 W. Wacker Drive
Chicago, IL 60606 | | | Vice President | | 2007 | | Executive Vice President of Nuveen Investments, Inc.; Executive Vice President, U.S. Structured Products of Nuveen Investments, LLC, (since 1999); Executive Vice President (since 2005) of Nuveen Commodities Asset Management, LLC. | | 125 |
| |
| n CEDRIC H. ANTOSIEWICZ |
1/11/62
333 W. Wacker Drive
Chicago, IL 60606 | | | Vice President | | 2007 | | Managing Director, (since 2004), previously, Vice President (1993-2004) of Nuveen Investments, LLC. | | 125 |
| |
| n NIZIDA ARRIAGA |
6/1/68
333 W. Wacker Drive
Chicago, IL 60606 | | | Vice President | | 2009 | | Senior Vice President of Nuveen Investments, LLC (since 2010); formerly, Vice President (2007-2010); Portfolio Manager, Allstate Investments, LLC (1996-2006); Chartered Financial Analyst. | | 200 |
| | | | | | | | | | |
| |
Name, Birthdate
| | | Position(s) Held with
| | Year First
| | Principal Occupation(s)
| | Number of Portfolios
|
and Address
| | | the Fund
| | Elected or
| | During Past 5 Years
| | in Fund Complex
|
| | |
| | Appointed(4)
| |
| | Overseen by
|
| | | | | | | | | | Officer |
| |
| OFFICERS of the FUND (continued): |
| | | | | | | | | | |
| |
| n MICHAEL T. ATKINSON |
2/3/66
333 W. Wacker Drive
Chicago, IL 60606 | | | Vice President and Assistant Secretary | | 2000 | | Vice President (since 2002) of Nuveen Investments, LLC; Vice President of Nuveen Asset Management (since 2005). | | 200 |
| |
| n MARGO L. COOK |
4/11/64
333 W. Wacker Drive
Chicago, IL 60606 | | | Vice President | | 2009 | | Executive Vice President (since Oct 2008) of Nuveen Investments, Inc.; previously, Head of Institutional Asset Management (2007-2008) of Bear Stearns Asset Management; Head of Institutional Asset Mgt (1986-2007) of Bank of NY Mellon; Chartered Financial Analyst. | | 200 |
| |
| n LORNA C. FERGUSON |
10/24/45
333 W. Wacker Drive
Chicago, IL 60606 | | | Vice President | | 1998 | | Managing Director (since 2004) of Nuveen Investments, LLC and Managing Director (since 2005) of Nuveen Asset Management. | | 200 |
| |
| n STEPHEN D. FOY |
5/31/54
333 W. Wacker Drive
Chicago, IL 60606 | | | Vice President
and Controller | | 1998 | | Senior Vice President (since 2010), formerly, Vice President (1993-2010) and Funds Controller (since 1998) of Nuveen Investments, LLC; Senior Vice President (since 2010), formerly, Vice President (2005-2010) of Nuveen Asset Management; Certified Public Accountant. | | 200 |
| |
| n SCOTT S. GRACE |
8/20/70
333 W. Wacker Drive
Chicago, IL 60606 | | | Vice President
and Treasurer | | 2009 | | Managing Director, Corporate Finance & Development, Treasurer (since 2009) of Nuveen Investments, LLC, Managing Director and Treasurer of Nuveen Asset Management (since 2009); formerly, Treasurer (2006-2009), Senior Vice President (2008-2009), previously, Vice President (2006-2008) of Janus Capital Group, Inc,; formerly, Senior Associate in Morgan Stanley’s Global Financial Services Group (2000-2003); Chartered Accountant Designation. | | 200 |
| |
| n WILLIAM T. HUFFMAN |
5/7/69
333 W. Wacker Drive
Chicago, IL 60606 | | | Vice President | | 2009 | | Chief Operating Officer, Municipal Fixed Income (since 2008) of Nuveen Asset Management; previously, Chairman, President and Chief Executive Officer (2002-2007) of Northern Trust Global Advisors, Inc. and Chief Executive Officer (2007) of Northern Trust Global Investments Limited; Certified Public Accountant. | | 136 |
| |
| n WALTER M. KELLY |
2/24/70
333 W. Wacker Drive
Chicago, IL 60606 | | | Chief Compliance
Officer and
Vice President | | 2003 | | Senior Vice President (since 2008), Vice President (2006-2008) formerly, Assistant Vice President and Assistant General Counsel (2003-2006) of Nuveen Investments, LLC; Senior Vice President (since 2008), formerly, Vice President (2006-2008) and Assistant Secretary (since 2008) of Nuveen Asset Management. | | 200 |
| | | | | | | | | | |
| |
Name, Birthdate
| | | Position(s) Held with
| | Year First
| | Principal Occupation(s)
| | Number of Portfolios
|
and Address
| | | the Fund
| | Elected or
| | During Past 5 Years
| | in Fund Complex
|
| | |
| | Appointed(4)
| |
| | Overseen by
|
| | | | | | | | | | Officer |
| |
| OFFICERS of the FUND (continued): |
| | | | | | | | | | |
| |
| n DAVID J. LAMB |
3/22/63
333 W. Wacker Drive
Chicago, IL 60606 | | | Vice President | | 2000 | | Senior Vice President (since 2009), formerly, Vice President (2000-2009) of Nuveen Investments, LLC; Senior Vice President (since 2010), formerly, Vice President (2005-2010) of Nuveen Asset Management; Certified Public Accountant. | | 200 |
| |
| n TINA M. LAZAR |
8/27/61
333 W. Wacker Drive
Chicago, IL 60606 | | | Vice President | | 2002 | | Senior Vice President (since 2009), formerly, Vice President of Nuveen Investments, LLC (1999-2009); Senior Vice President (since 2010), formerly, Vice President (2005-2010) of Nuveen Asset Management. | | 200 |
| |
| n LARRY W. MARTIN |
7/27/51
333 W. Wacker Drive
Chicago, IL 60606 | | | Vice President
and Assistant Secretary | | 1988 | | Senior Vice President (since 2010), formerly, Vice President (1993-2010), Assistant Secretary and Assistant General Counsel of Nuveen Investments, LLC; Vice President (since 2005) and Assistant Secretary of Nuveen Investments, Inc.; Vice President (since 2005) and Assistant Secretary (since 1997) of Nuveen Asset Management; Vice President and Assistant Secretary of Nuveen Investments Advisers Inc. (since 2002); NWQ Investment Management Company, LLC (since 2002), Symphony Asset Management LLC (since 2003), Tradewinds Global Investors, LLC, Santa Barbara Asset Management LLC (since 2006) and of Nuveen HydePark Group, LLC and Nuveen Investment Solutions, Inc. (since 2007). | | 200 |
| |
| n KEVIN J. MCCARTHY |
3/26/66
333 W. Wacker Drive
Chicago, IL 60606 | | | Vice President
and Secretary | | 2007 | | Managing Director (since 2008), formerly, Vice President (2007-2008), Nuveen Investments, LLC; Managing Director (since 2008), formerly, Vice President, and Assistant Secretary, Nuveen Asset Management, and Nuveen Investment Holdings, Inc.; Vice President (since 2007) and Assistant Secretary, Nuveen Investment Advisers Inc., NWQ Investment Management Company, LLC, Tradewinds Global Investors LLC, NWQ Holdings, LLC, Symphony Asset Management LLC, Santa Barbara Asset Management LLC, Nuveen HydePark Group, LLC and Nuveen Investment Solutions, Inc. (since 2007); prior thereto, Partner, Bell, Boyd & Lloyd LLP (1997-2007). | | 200 |
| |
| n MICHELLE A. MCCARTHY |
7/6/65
333 W. Wacker Drive
Chicago, IL 60606 | | | Vice President | | 2010 | | Managing Director, Director of Risk Management (since May, 2010), Nuveen Investments, LLC; formerly, Chief Risk Officer (2009-2010) of Russell Investment Group; formerly, SVP (2003-2009), Chief Market & Operational Risk Officer (2006-2009), Washington Mutual Bank. | | 200 |
| |
| n JOHN V. MILLER |
4/10/67
333 W. Wacker Drive
Chicago, IL 60606 | | | Vice President | | 2007 | | Chief Investment Officer and Managing Director (since 2007), formerly, Vice President (2002-2007) of Nuveen Asset Management and Managing Director (since 2007), formerly, Vice President (2002-2007) of Nuveen Investments, LLC; Chartered Financial Analyst. | | 136 |
| | | | | | | | | | |
| |
Name, Birthdate
| | | Position(s) Held with
| | Year First
| | Principal Occupation(s)
| | Number of Portfolios
|
and Address
| | | the Fund
| | Elected or
| | During Past 5 Years
| | in Fund Complex
|
| | |
| | Appointed(4)
| |
| | Overseen by
|
| | | | | | | | | | Officer |
| |
| OFFICERS of the FUND (continued): |
| | | | | | | | | | |
| |
| n GREGORY T. MINO |
1/4/71
333 W. Wacker Drive
Chicago, IL 60606 | | | Vice President | | 2009 | | Senior Vice President (since 2010) of Nuveen Investments, LLC, formerly, Director (2004-2007) and Executive Director (2007-2008) of UBS Global Asset Management; previously, Vice President (2000-2003) and Director (2003-2004) of Merrill Lynch Investment Managers; Chartered Financial Analyst. | | 200 |
| |
| n CHRISTOPHER M. ROHRBACHER |
8/1/71
333 W. Wacker Drive
Chicago, IL 60606 | | | Vice President
and Assistant
Secretary | | 2008 | | Vice President, Nuveen Investments, LLC (since 2008); Vice President and Assistant Secretary, Nuveen Asset Management (since 2008); prior thereto, Associate, Skadden, Arps, Slate, Meagher & Flom LLP (2002-2008). | | 200 |
| |
| n JAMES F. RUANE |
7/3/62
333 W. Wacker Drive
Chicago, IL 60606 | | | Vice President
and Assistant
Secretary | | 2007 | | Vice President, Nuveen Investments, LLC (since 2007); prior thereto, Partner, Deloitte & Touche USA LLP (2005-2007), formerly, senior tax manager (2002-2005); Certified Public Accountant. | | 200 |
| |
| n MARK L. WINGET |
12/21/68
333 W. Wacker Drive
Chicago, IL 60606 | | | Vice President
and Assistant
Secretary | | 2008 | | Vice President, Nuveen Investments, LLC (since 2008); Vice President and Assistant Secretary, Nuveen Asset Management (since 2008); prior thereto, Counsel, Vedder Price P.C. (1997-2007). | | 200 |
| |
| (1) | Board Members serve three year terms. The Board of Trustees is divided into three classes, Class I, Class II, and Class III, with each being elected to serve until the third succeeding annual shareholders’ meeting subsequent to its election or thereafter in each case when its respective successors are duly elected or appointed. The first year elected or appointed represents the year in which the Board Member was first elected or appointed to any fund in the Nuveen Complex. |
| |
| (2) | Also serves as a trustee of the Nuveen Diversified Commodity Fund, a Nuveen-sponsored commodity pool that has filed a registration statement on Form S-1 with the SEC for a proposed initial public offering. The S-1 has not been declared effective, and the commodity pool has not commenced operations. |
| |
| (3) | Mr. Amboian is an interested trustee because of his position with Nuveen Investments, Inc. and certain of its subsidiaries, which are affiliates of the Nuveen Funds. |
| |
| (4) | Officers serve one year terms through August of each year. The year first elected or appointed represents the year in which the Officer was first elected or appointed to any fund in the Nuveen Complex. |
Annual Investment Management
Agreement Approval Process (Unaudited)
The Investment Company Act of 1940, as amended (the “1940 Act”), provides, in substance, that each investment advisory agreement between a fund and its investment adviser (including sub-advisers) will continue in effect from year to year only if its continuance is approved at least annually by the fund’s board members, including by a vote of a majority of the board members who are not parties to the advisory agreement or “interested persons” of any parties (the “Independent Board Members”), cast in person at a meeting called for the purpose of considering such approval. In connection with such approvals, the fund’s board members must request and evaluate, and the investment adviser is required to furnish, such information as may be reasonably necessary to evaluate the terms of the advisory agreement. Accordingly, at a meeting held on May 25-26, 2010 (the “May Meeting”), the Boards of Trustees (each, a “Board,” and each Trustee, a “Board Member”) of the Funds, including a majority of the Independent Board Members, considered and approved the continuation of the advisory and sub-advisory agreements for the Funds for an additional one-year period. These agreements include the investment advisory agreements between Nuveen Asset Management (“NAM”) and each Fund and the sub-advisory agreements between NAM and Symphony Asset Management LLC (the “Sub-Adviser”). In preparation for their considerations at the May Meeting, the Board also held a separate meeting on April 21-22, 2010 (the “April Meeting”). Accordingly, the factors considered and determinations made regarding the renewals by the Independent Board Members include those made at the April Meeting.
In addition, in evaluating the applicable advisory agreements (each, an “Investment Management Agreement”) and sub-advisory agreements (each, a “Sub-advisory Agreement,” and each Investment Management Agreement and Sub-advisory Agreement, an “Advisory Agreement”), the Independent Board Members reviewed a broad range of information relating to the Funds, NAM and the Sub-Adviser (NAM and the Sub-Adviser are each a “Fund Adviser”), including absolute and comparative performance, fee and expense information for the Funds (as described in more detail below), the profitability of Nuveen for its advisory activities (which includes its wholly owned subsidiaries), and other information regarding the organization, personnel, and services provided by the respective Fund Adviser. The Independent Board Members also met quarterly as well as at other times as the need arose during the year and took into account the information provided at such meetings and the knowledge gained therefrom. Prior to approving the renewal of the Advisory Agreements, the Independent Board Members reviewed the foregoing information with their independent legal counsel and with management, reviewed materials from independent legal counsel describing applicable law and their duties in reviewing advisory contracts, and met with independent legal counsel in private sessions without management present. The Independent Board Members considered the legal advice provided by independent legal counsel and relied upon their knowledge of the Fund Adviser, its services and the Funds resulting from their meetings and other interactions throughout the year and their own business judgment in determining the factors to be considered in evaluating the Advisory Agreements. Each Board Member may have accorded different weight to the various factors in reaching his or her conclusions with respect to a Fund’s Advisory Agreements. The Independent Board Members did not identify any single factor as all-important or controlling. The Independent Board Members’ considerations were instead based on a comprehensive consideration of all the information presented. The principal factors considered by the Board and its conclusions are described below.
| |
| A. | Nature, Extent and Quality of Services |
In considering renewal of the Advisory Agreements, the Independent Board Members considered the nature, extent and quality of the Fund Adviser’s services, including advisory services and administrative services. The Independent Board Members reviewed materials outlining, among other things, the Fund Adviser’s organization and business; the types of services that the Fund Adviser or its affiliates provide and are expected to provide to the Funds; the performance record of the applicable Fund (as described in further detail below); and any initiatives Nuveen had taken for the applicable fund product line, including continued activities to refinance
auction rate preferred securities, manage leverage during periods of market turbulence and implement an enhanced leverage management process, modify investment mandates in light of market conditions and seek shareholder approval as necessary, maintain the fund share repurchase program and maintain shareholder communications to keep shareholders apprised of Nuveen’s efforts in refinancing preferred shares. In addition to the foregoing, the Independent Board Members also noted the additional services that NAM or its affiliates provide to closed-end funds, including, in particular, Nuveen’s continued commitment to supporting the secondary market for the common shares of its closed-end funds through a variety of programs designed to raise investor and analyst awareness and understanding of closed-end funds. These efforts include maintaining an investor relations program to provide timely information and education to financial advisers and investors; providing marketing for the closed-end funds; maintaining and enhancing a closed-end fund website; participating in conferences and having direct communications with analysts and financial advisors.
As part of their review, the Independent Board Members also evaluated the background, experience and track record of the Fund Adviser’s investment personnel. In this regard, the Independent Board Members considered any changes in the personnel, and the impact on the level of services provided to the Funds, if any. The Independent Board Members also reviewed information regarding portfolio manager compensation arrangements to evaluate the Fund Adviser’s ability to attract and retain high quality investment personnel, preserve stability, and reward performance but not provide an incentive for taking undue risks.
In addition to advisory services, the Independent Board Members considered the quality of administrative services provided by NAM and its affiliates including product management, fund administration, oversight of service providers, shareholder services, administration of Board relations, regulatory and portfolio compliance and legal support. Given the importance of compliance, the Independent Board Members also considered NAM’s compliance program, including the report of the chief compliance officer regarding the Funds’ compliance policies and procedures.
The Independent Board Members also considered NAM’s oversight of the performance, business activities and compliance of the Sub-Adviser. In that regard, the Independent Board Members reviewed an evaluation of the Sub-Adviser from NAM. The evaluation also included information relating to the Sub-Adviser’s organization, operations, personnel, assets under management, investment philosophy, strategies and techniques in managing the Funds, developments affecting the Sub-Adviser, and an analysis of the Sub-Adviser. As described in further detail below, the Board also considered the performance of the Funds. In addition, the Board recognized that the Sub-advisory Agreements were essentially agreements for portfolio management services only and the Sub-Adviser was not expected to supply other significant administrative services to the Funds. As part of their oversight, the Independent Board Members also continued their program of seeking to visit each sub-adviser to the Nuveen funds at least once over a multiple year rotation, meeting with key investment and business personnel. In this regard, the Independent Board Members met with the Sub-Adviser in 2010. The Independent Board Members noted that NAM recommended the renewal of the Sub-advisory Agreements and considered the basis for such recommendations.
Based on their review, the Independent Board Members found that, overall, the nature, extent and quality of services provided (and expected to be provided) to the Funds under the respective Investment Management Agreement or Sub-advisory Agreement, as applicable, were satisfactory.
| |
| B. | The Investment Performance of the Funds and Fund Advisers |
The Board considered the performance results of each Fund over various time periods. The Board reviewed, among other things, each Fund’s historic investment performance as well as information comparing the Fund’s performance information with that of other funds (the “Performance Peer Group”) based on data provided by an independent provider of mutual fund data and with recognized and/or customized benchmarks. In this regard, the performance information the Board reviewed included the Fund’s total return information compared to the returns of its Performance Peer Group and recognized and/or customized benchmarks for the quarter, one-, three- and five-year periods ending December 31, 2009 and for the same periods ending March 31, 2010. Moreover, the Board reviewed the peer ranking of the Nuveen funds sub-advised by the Sub-Adviser in the aggregate. The Independent Board Members also reviewed historic premium and discount levels, including a summary of actions taken to date for the Nuveen Floating Rate Income Fund and the Nuveen Floating Rate Income Opportunity Fund. This information supplemented the Fund performance information provided to the
Annual Investment Management
Agreement Approval Process (Unaudited) (continued)
Board at each of its quarterly meetings. In reviewing peer comparison information, the Independent Board Members recognized that the Performance Peer Group of certain funds may not adequately represent the objectives and strategies of the funds, thereby limiting the usefulness of comparing a fund’s performance with that of its Performance Peer Group.
Based on their review, the Independent Board Members determined that each Fund’s investment performance over time had been satisfactory. In this regard, the Board noted that each Fund generally demonstrated favorable performance in comparison to its respective peers, performing in the top two quartiles.
| |
| C. | Fees, Expenses and Profitability |
1. Fees and Expenses
The Board evaluated the management fees and expenses of each Fund reviewing, among other things, such Fund’s gross management fees, net management fees and net expense ratios in absolute terms as well as compared to the fee and expenses of a comparable universe of funds based on data provided by an independent fund data provider (the “Peer Universe”) and in certain cases, to a more focused subset of funds in the Peer Universe (the “Peer Group”) and any expense limitations.
The Independent Board Members further reviewed the methodology regarding the construction of the applicable Peer Universe and/or Peer Group. In reviewing the comparisons of fee and expense information, the Independent Board Members took into account that in certain instances various factors such as: the asset level of a fund relative to peers; the limited size and particular composition of the Peer Universe or Peer Group; the investment objectives of the peers; expense anomalies; changes in the funds comprising the Peer Universe or Peer Group from year to year; levels of reimbursement; the timing of information used; and the differences in the type and use of leverage may impact the comparative data, thereby limiting the ability to make a meaningful comparison with peers.
In reviewing the fee schedule for a Fund, the Independent Board Members also considered the fund-level and complex-wide breakpoint schedules (described in further detail below) and any fee waivers and reimbursements provided by Nuveen (applicable, in particular, for certain closed-end funds launched since 1999). The Independent Board Members noted that the Nuveen Floating Rate Income Fund and the Nuveen Floating Rate Income Opportunity Fund had net management fees and/or net expense ratios below, at or near (within 5 basis points or less) the peer averages of their Peer Group or Peer Universe. They noted that the Nuveen Senior Income Fund had a net expense ratio above the peer average, but a net advisory fee below the peer average.
Based on their review of the fee and expense information provided, the Independent Board Members determined that each Fund’s management fees were reasonable in light of the nature, extent and quality of services provided to the Fund.
2. Comparisons with the Fees of Other Clients
The Independent Board Members further reviewed information regarding the nature of services and fee rates offered by NAM to other clients. Such clients include separately managed accounts (both retail and institutional accounts), foreign investment funds offered by Nuveen and funds that are not offered by Nuveen but are sub-advised by one of Nuveen’s investment management teams. In evaluating the comparisons of fees, the Independent Board Members noted that the fee rates charged to the Funds and other clients vary, among other things, because of the different services involved and the additional regulatory and compliance requirements associated with registered investment companies, such as the Funds. Accordingly, the Independent Board Members considered the differences in the product types, including, but not limited to, the services provided, the structure and operations, product distribution and costs thereof, portfolio investment policies, investor profiles, account sizes and regulatory requirements. The Independent Board Members noted, in particular, that the range of services provided to the Funds (as discussed above) is much more extensive than that provided to separately managed accounts. Given the inherent differences in the products, particularly the extensive services provided to the Funds, the Independent Board Members believe such facts justify the different levels of fees.
In considering the fees of the Sub-Adviser, the Independent Board Members also considered the pricing schedule or fees that the Sub-Adviser charges for similar investment management services for other fund
sponsors or clients (such as retail and/or institutional managed accounts) as applicable. The Independent Board Members also reviewed the fees the Sub-Adviser assesses for equity and taxable fixed-income hedge funds it manages, which include a performance fee.
3. Profitability of Fund Advisers
In conjunction with its review of fees, the Independent Board Members also considered the profitability of Nuveen for its advisory activities (which incorporated Nuveen’s wholly-owned affiliated sub-advisers) and its financial condition. The Independent Board Members reviewed the revenues and expenses of Nuveen’s advisory activities for the last two years, the allocation methodology used in preparing the profitability data and an analysis of the key drivers behind the changes in revenues and expenses that impacted profitability in 2009. The Independent Board Members noted this information supplemented the profitability information requested and received during the year to help keep them apprised of developments affecting profitability (such as changes in fee waivers and expense reimbursement commitments). In this regard, the Independent Board Members noted that they had also appointed an Independent Board Member as a point person to review and keep them apprised of changes to the profitability analysis and/or methodologies during the year. The Independent Board Members also considered Nuveen’s revenues for advisory activities, expenses, and profit margin compared to that of various unaffiliated management firms with similar amounts of assets under management and relatively comparable asset composition prepared by Nuveen.
In reviewing profitability, the Independent Board Members recognized the subjective nature of determining profitability which may be affected by numerous factors including the allocation of expenses. Further, the Independent Board Members recognized the difficulties in making comparisons as the profitability of other advisers generally is not publicly available and the profitability information that is available for certain advisers or management firms may not be representative of the industry and may be affected by, among other things, the adviser’s particular business mix, capital costs, types of funds managed and expense allocations. Notwithstanding the foregoing, the Independent Board Members reviewed Nuveen’s methodology and assumptions for allocating expenses across product lines to determine profitability. In reviewing profitability, the Independent Board Members recognized Nuveen’s investment in its fund business. Based on their review, the Independent Board Members concluded that Nuveen’s level of profitability for its advisory activities was reasonable in light of the services provided.
In evaluating the reasonableness of the compensation, the Independent Board Members also considered other amounts paid to a Fund Adviser by the Funds as well as any indirect benefits (such as soft dollar arrangements, if any) the Fund Adviser and its affiliates receive, or are expected to receive, that are directly attributable to the management of the Funds, if any. See Section E below for additional information on indirect benefits a Fund Adviser may receive as a result of its relationship with the Funds. Based on their review of the overall fee arrangements of each Fund, the Independent Board Members determined that the advisory fees and expenses of the respective Fund were reasonable.
| |
| D. | Economies of Scale and Whether Fee Levels Reflect These Economies of Scale |
With respect to economies of scale, the Independent Board Members have recognized the potential benefits resulting from the costs of a fund being spread over a larger asset base, although economies of scale are difficult to measure and predict with precision, particularly on a fund-by-fund basis. One method to help ensure the shareholders share in these benefits is to include breakpoints in the advisory fee schedule. Generally, management fees for funds in the Nuveen complex are comprised of a fund-level component and a complex-level component, subject to certain exceptions. Accordingly, the Independent Board Members reviewed and considered the applicable fund-level breakpoints in the advisory fee schedules that reduce advisory fees as asset levels increase. Further, the Independent Board Members noted that although closed-end funds may from time to time make additional share offerings, the growth of their assets will occur primarily through the appreciation of such funds’ investment portfolio.
In addition to fund-level advisory fee breakpoints, the Board also considered the Funds’ complex-wide fee arrangement. Pursuant to the complex-wide fee arrangement, the fees of the funds in the Nuveen complex are generally reduced as the assets in the fund complex reach certain levels. The complex-wide fee arrangement seeks to provide the benefits of economies of scale to fund shareholders when total fund complex assets increase, even if assets of a particular fund are unchanged or have decreased. The approach reflects the notion
Annual Investment Management
Agreement Approval Process (Unaudited) (continued)
that some of Nuveen’s costs are attributable to services provided to all its funds in the complex and therefore all funds benefit if these costs are spread over a larger asset base.
Based on their review, the Independent Board Members concluded that the breakpoint schedules and complex-wide fee arrangement were acceptable and reflect economies of scale to be shared with shareholders when assets under management increase.
In evaluating fees, the Independent Board Members received and considered information regarding potential “fall out” or ancillary benefits the respective Fund Adviser or its affiliates may receive as a result of its relationship with each Fund. In this regard, the Independent Board Members considered any revenues received by affiliates of NAM for serving as agent at Nuveen’s trading desk and as co-manager in initial public offerings of new closed-end funds.
In addition to the above, the Independent Board Members considered whether each Fund Adviser received any benefits from soft dollar arrangements whereby a portion of the commissions paid by a Fund for brokerage may be used to acquire research that may be useful to the Fund Adviser in managing the assets of the Funds and other clients. With respect to NAM, the Independent Board Members noted that NAM does not currently have any soft dollar arrangements; however, to the extent certain bona fide agency transactions that occur on markets that traditionally trade on a principal basis and riskless principal transactions are considered as generating “commissions,” NAM intends to comply with the applicable safe harbor provisions. With respect to the Sub-Adviser, the Board considered that the Sub-Adviser currently does not enter into soft dollar arrangements; however, it has adopted a soft dollar policy in the event it does so in the future.
Based on their review, the Independent Board Members concluded that any indirect benefits received by a Fund Adviser as a result of its relationship with a Fund were reasonable and within acceptable parameters.
The Independent Board Members did not identify any single factor discussed previously as all-important or controlling. The Board Members, including the Independent Board Members, unanimously concluded that the terms of the Investment Management Agreements and Sub-advisory Agreements are fair and reasonable, that the respective Fund Adviser’s fees are reasonable in light of the services provided to each Fund and that the Investment Management Agreements and the Sub-advisory Agreements be renewed.
Reinvest Automatically
Easily and Conveniently
Nuveen makes reinvesting easy. A phone call is all it takes to set up your reinvestment account.
Nuveen Closed-End Funds Dividend Reinvestment Plan
Your Nuveen Closed-End Fund allows you to conveniently reinvest dividends and/or capital gains distributions in additional Fund shares.
By choosing to reinvest, you’ll be able to invest money regularly and automatically, and watch your investment grow through the power of tax-free compounding. Just like dividends or distributions in cash, there may be times when income or capital gains taxes may be payable on dividends or distributions that are reinvested.
It is important to note that an automatic reinvestment plan does not ensure a profit, nor does it protect you against loss in a declining market.
Easy and convenient
To make recordkeeping easy and convenient, each month you’ll receive a statement showing your total dividends and distributions, the date of investment, the shares acquired and the price per share, and the total number of shares you own.
How shares are purchased
The shares you acquire by reinvesting will either be purchased on the open market or newly issued by the Fund. If the shares are trading at or above net asset value at the time of valuation, the Fund will issue new shares at the greater of the net asset value or 95% of the then-current market price. If the shares are trading at less than net asset value, shares for your account will be purchased on the open market. If the Plan Agent begins purchasing Fund shares on the open market while shares are trading below net asset value, but the Fund’s shares subsequently trade at or above their net asset value before the Plan Agent is able to complete its purchases, the Plan Agent may cease open-market purchases and may invest the uninvested portion of the distribution in newly-issued Fund shares at a price equal to the greater of the shares’ net asset value or 95% of the shares’ market value on the last business day immediately prior to the purchase date. Dividends and distributions received to purchase shares in the open market will normally be invested shortly after the dividend payment date. No interest will be paid on dividends and distributions awaiting reinvestment. Because the market price of the shares may increase before purchases are completed, the average purchase price per share may exceed the market price at the time of valuation, resulting in the acquisition of fewer shares than if the dividend or distribution had been paid in shares issued by the Fund. A pro rata portion of any applicable brokerage commissions on open market purchases will be paid by Plan participants. These commissions usually will be lower than those charged on individual transactions.
Flexible
You may change your distribution option or withdraw from the Plan at any time, should your needs or situation change.
You can reinvest whether your shares are registered in your name, or in the name of a brokerage firm, bank, or other nominee. Ask your investment advisor if his or her firm will participate on your behalf. Participants whose shares are registered in the name of one firm may not be able to transfer the shares to another firm and continue to participate in the Plan.
The Fund reserves the right to amend or terminate the Plan at any time. Although the Fund reserves the right to amend the Plan to include a service charge payable by the participants, there is no direct service charge to participants in the Plan at this time.
Call today to start reinvesting dividends and/or distributions
For more information on the Nuveen Automatic Reinvestment Plan or to enroll in or withdraw from the Plan, speak with your financial advisor or call us at (800) 257-8787.
Glossary of Terms
Used in this Report
| |
| n | Average Annual Total Return: This is a commonly used method to express an investment’s performance over a particular, usually multi-year time period. It expresses the return that would have been necessary each year to equal the investment’s actual cumulative performance (including change in common share NAV or market price and reinvested dividends and capital gains distributions, if any) over the time period being considered. |
| |
| n | Collateralized Debt Obligations (CDOs): Collateralized debt obligations are a type of asset-backed security constructed from a portfolio of fixed-income assets. CDOs usually are divided into different tranches having different ratings and paying different interest rates. Losses, if any, are applied in reverse order of seniority and so junior tranches generally offer higher coupons to compensate for added default risk. |
| |
| n | Market Yield (also known as Dividend Yield or Current Yield): Market yield is based on the Fund’s current annualized monthly distribution divided by the Fund’s current market price. The Fund’s monthly distributions to its shareholders may be comprised of ordinary income, net realized capital gains and, if at the end of the calendar year the Fund’s cumulative net ordinary income and net realized gains are less than the amount of the Fund’s distributions, a tax return of capital. |
| |
| n | Net Asset Value (NAV): A Fund’s NAV per common share is calculated by subtracting the liabilities of the Fund (including any Preferred shares issued in order to leverage the Fund) from its total assets and then dividing the remainder by the number of common shares outstanding. Fund NAVs are calculated at the end of each business day. |
Board of Trustees
John P. Amboian
Robert P. Bremner
Jack B. Evans
William C. Hunter
David J. Kundert
William J. Schneider
Judith M. Stockdale
Carole E. Stone
Terence J. Toth
Fund Manager
Nuveen Asset Management
333 West Wacker Drive
Chicago, IL 60606
Custodian
State Street Bank & Trust Company
Boston, MA
Transfer Agent and
Shareholder Services
State Street Bank & Trust Company
Nuveen Funds
P.O. Box 43071
Providence, RI
02940-3071
(800) 257-8787
Legal Counsel
Chapman and Cutler LLP
Chicago, IL
Independent Registered
Public Accounting Firm
Ernst & Young LLP
Chicago, IL
Quarterly Portfolio of Investments and Proxy Voting Information
You may obtain (i) each Fund’s quarterly portfolio of investments, (ii) information regarding how the Funds voted proxies relating to portfolio securities held during the most recent twelve-month period ended June 30, and (iii) a description of the policies and procedures that the Funds used to determine how to vote proxies relating to portfolio securities without charge, upon request, by calling Nuveen Investments toll-free at (800) 257-8787 or on Nuveen’s website at www.nuveen.com.
You may also obtain this and other Fund information directly from the Securities and Exchange Commission (“SEC”). The SEC may charge a copying fee for this information. Visit the SEC on-line at http://www.sec.gov or in person at the SEC’s Public Reference Room in Washington, D.C. Call the SEC at (202) 942-8090 for room hours and operation. You may also request Fund information by sending an e-mail request to publicinfo@sec.gov or by writing to the SEC’s Public Reference Section at 100 F Street NE, Washington, D.C. 20549.
CEO Certification Disclosure
Each Fund’s Chief Executive Officer has submitted to the New York Stock Exchange (“NYSE”) the annual CEO certification as required by Section 303A.12(a) of the NYSE Listed Company Manual.
Each Fund has filed with the SEC the certification of its Chief Executive Officer and Chief Financial Officer required by Section 302 of the Sarbanes-Oxley Act.
Distribution Information
The following federal income tax information is provided with respect to the Funds’ distributions paid during the taxable year ended July 31, 2010. Senior Income (NSL), Floating Rate Income (JFR) and Floating Rate Income Opportunity (JRO) hereby designate 98.93%, 93.72% and 95.25%, respectively, (or the maximum amount eligible) of ordinary income distributions as Interest-Related Dividends as defined in Internal Revenue Code Section 871(k) for the taxable year ended July 31, 2010.
Common Share Information
Each Fund intends to repurchase shares of its own common in the future at such times and in such amounts as is deemed advisable. During the period covered by this report, the Funds repurchased shares of their common stock as shown in the accompanying table.
| | | |
| | | Common Shares
|
| Fund | | Repurchased |
| NSL | | – |
| JFR | | 137,893 |
| JRO | | 9,700 |
| | | |
Any future repurchases will be reported to shareholders in the next annual or semi-annual report.
Nuveen Investments:
Serving Investors for Generations
Since 1898, financial advisors and their clients have relied on Nuveen Investments to provide dependable investment solutions through continued adherence to proven, longterm investing principles. Today, we offer a range of high quality equity and fixed-income solutions designed to be integral components of a well-diversified core portfolio.
Focused on meeting investor needs.
Nuveen Investments is a global investment management firm that seeks to help secure the long-term goals of institutions and high net worth investors as well as the consultants and financial advisors who serve them. We market our growing range of specialized investment solutions under the high-quality brands of HydePark, NWQ, Nuveen, Santa Barbara, Symphony, Tradewinds and Winslow Capital. In total, Nuveen Investments managed approximately $150 billion of assets on June 30, 2010.
Find out how we can help you.
To learn more about the products and services of Nuveen Investments may be able to help you meet your financial goals, talk to your financial advisor, or call us at (800) 257-8787. Please read the information provided carefully before you invest. Investors should consider the investment objective and policies, risk considerations, charges and expenses of any investment carefully. Where applicable, be sure to obtain a prospectus, which contains this and other relevant information. To obtain a prospectus, please contact your securities representative or Nuveen Investments, 333 W. Wacker Dr., Chicago, IL 60606. Please read the prospectus carefully before you invest or send money.
Learn more about Nuveen Funds at: www.nuveen.com/cef
Nuveen makes things e-simple.
It only takes a minute to sign up for e-Reports. Once enrolled, you’ll receive an e-mail as soon as your Nuveen Fund information is ready—no more waiting for delivery by regular mail. Just click on the link within the e-mail to see the report and save it on your computer if you wish.
Free e-Reports right to your e-mail!
www.investordelivery.com
If you receive your Nuveen Fund distributions and statements from your financial advisor or brokerage account.
OR
www.nuveen.com/accountaccess
If you receive your Nuveen Fund distributions and statements directly from Nuveen.
| | | | | |
Distributed by
Nuveen Investments, LLC
333 West Wacker Drive
Chicago, IL 60606
www.nuveen.com | | | | |
EAN-B-0710D
ITEM 2. CODE OF ETHICS.
As of the end of the period covered by this report, the registrant has adopted a code of ethics that applies to the registrant’s principal executive officer, principal financial officer, principal accounting officer or controller, or persons performing similar functions. There were no amendments to or waivers from the Code during the period covered by this report. The registrant has posted the code of ethics on its website at www.nuveen.com/CEF/Info/Shareholder/. (To view the code, click on Fund Governance and then click on Code of Conduct.)
ITEM 3. AUDIT COMMITTEE FINANCIAL EXPERT.
The registrant’s Board of Directors or Trustees (“Board”) determined that the registrant has at least one “audit committee financial expert” (as defined in Item 3 of Form N-CSR) serving on its Audit Committee. The registrant’s audit committee financial expert is Jack B. Evans, who is “independent” for purposes of Item 3 of Form N-CSR.
Mr. Evans was formerly President and Chief Operating Officer of SCI Financial Group, Inc., a full service registered broker-dealer and registered investment adviser (“SCI”). As part of his role as President and Chief Operating Officer, Mr. Evans actively supervised the Chief Financial Officer (the “CFO”) and actively supervised the CFO’s preparation of financial statements and other filings with various regulatory authorities. In such capacity, Mr. Evans was actively involved in the preparation of SCI’s financial statements and the resolution of issues raised in connection therewith. Mr. Evans has also served on the audit committee of various reporting companies. At such companies, Mr. Evans was involved in the oversight of audits, audit plans, and the preparation of financial statements. Mr. Evans also formerly chaired the audit committee of the Federal Reserve Bank of Chicago.
ITEM 4. PRINCIPAL ACCOUNTANT FEES AND SERVICES.
NUVEEN FLOATING RATE INCOME FUND
The following tables show the amount of fees that Ernst & Young LLP, the Fund’s auditor, billed to the Fund during the Fund’s last two full fiscal years. For engagements with Ernst & Young LLP the Audit Committee approved in advance all audit services and non-audit services that Ernst & Young LLP provided to the Fund, except for those non-audit services that were subject to the pre-approval exception under Rule 2-01 of Regulation S-X (the “pre-approval exception”). The pre-approval exception for services provided directly to the Fund waives the pre-approval requirement for services other than audit, review or attest services if: (A) the aggregate amount of all such services provided constitutes no more than 5% of the total amount of revenues paid by the Fund to its accountant during the fiscal year in which the services are provided; (B) the Fund did not recognize the services as non-audit services at the time of the engagement; and (C) the services are promptly brought to the Audit Committee’s attention, and the Committee (or its delegate) approves the services before the audit is completed.
The Audit Committee has delegated certain pre-approval responsibilities to its Chairman (or, in his absence, any other member of the Audit Committee).
SERVICES THAT THE FUND’S AUDITOR BILLED TO THE FUND
| | | | | | | | | | | | | | | | | |
| | | Audit Fees Billed | | Audit-Related Fees | | Tax Fees | | All Other Fees |
| Fiscal Year Ended | | to Fund 1 | | Billed to Fund 2 | | Billed to Fund 3 | | Billed to Fund 4 |
| |
| July 31, 2010 | | $ | 67,144 | | | $ | 0 | | | $ | 0 | | | $ | 10,000 | |
| |
| | | | | | | | | | | | | | | | | |
| Percentage approved pursuant to pre-approval exception | | | 0 | % | | | 0 | % | | | 0 | % | | | 0 | % |
| |
| | | | | | | | | | | | | | | | | |
| July 31, 2009 | | $ | 68,028 | | | $ | 0 | | | $ | 0 | | | $ | 10,000 | |
| |
| | | | | | | | | | | | | | | | | |
| Percentage approved pursuant to pre-approval exception | | | 0 | % | | | 0 | % | | | 0 | % | | | 0 | % |
| |
| 1 | | “Audit Fees” are the aggregate fees billed for professional services for the audit of the Fund’s annual financial statements and services provided in connection with statutory and regulatory filings or engagements. |
| |
| 2 | | “Audit Related Fees” are the aggregate fees billed for assurance and related services reasonably related to the performance of the audit or review of financial statements and are not reported under “Audit Fees”. |
| |
| 3 | | “Tax Fees” are the aggregate fees billed for professional services for tax advice, tax compliance, and tax planning. |
| |
| 4 | | “All Other Fees” are the aggregate fees billed for products and services for agreed upon procedures engagements performed for leveraged funds. |
SERVICES THAT THE FUND’S AUDITOR BILLED TO THE
ADVISER AND AFFILIATED FUND SERVICE PROVIDERS
The following tables show the amount of fees billed by Ernst & Young LLP to Nuveen Asset Management (“NAM” or the “Adviser”), and any entity controlling, controlled by or under common control with NAM that provides ongoing services to the Fund (“Affiliated Fund Service Provider”), for engagements directly related to the Fund’s operations and financial reporting, during the Fund’s last two full fiscal years.
The tables also show the percentage of fees subject to the pre-approval exception. The pre-approval exception for services provided to the Adviser and any Affiliated Fund Service Provider (other than audit, review or attest services) waives the pre-approval requirement if: (A) the aggregate amount of all such services provided constitutes no more than 5% of the total amount of revenues paid to Ernst & Young LLP by the Fund, the Adviser and Affiliated Fund Service Providers during the fiscal year in which the services are provided that would have to be pre-approved by the Audit Committee; (B) the Fund did not recognize the services as non-audit services at the time of the engagement; and (C) the services are promptly brought to the Audit Committee’s attention, and the Committee (or its delegate) approves the services before the Fund’s audit is completed.
| | | | | | | | | | | | | |
| | | Audit-Related Fees | | Tax Fees Billed to | | All Other Fees |
| | | Billed to Adviser and | | Adviser and | | Billed to Adviser |
| | | Affiliated Fund | | Affiliated Fund | | and Affiliated Fund |
| Fiscal Year Ended | | Service Providers | | Service Providers | | Service Providers |
| |
| July 31, 2010 | | $ | 0 | | | $ | 0 | | | $ | 0 | |
| |
| | | | | | | | | | | | | |
| Percentage approved pursuant to pre-approval exception | | | 0 | % | | | 0 | % | | | 0 | % |
| |
| | | | | | | | | | | | | |
| July 31, 2009 | | $ | 0 | | | $ | 0 | | | $ | 0 | |
| |
| | | | | | | | | | | | | |
| Percentage approved pursuant to pre-approval exception | | | 0 | % | | | 0 | % | | | 0 | % |
| |
NON-AUDIT SERVICES
The following table shows the amount of fees that Ernst & Young LLP billed during the Fund’s last two full fiscal years for non-audit services. The Audit Committee is required to pre-approve non-audit services that Ernst & Young LLP provides to the Adviser and any Affiliated Fund Services Provider, if the engagement related directly to the Fund’s operations and financial reporting (except for those subject to the pre-approval exception described above). The Audit Committee requested and received information from Ernst & Young LLP about any non-audit services that Ernst & Young LLP rendered during the Fund’s last fiscal year to the Adviser and any Affiliated Fund Service Provider. The Committee considered this information in evaluating Ernst & Young LLP’s independence.
| | | | | | | | | | | | | | | | | |
| | | | | | | Total Non-Audit Fees | | | | |
| | | | | | | billed to Adviser and | | | | |
| | | | | | | Affiliated Fund Service | | Total Non-Audit Fees | | |
| | | | | | | Providers (engagements | | billed to Adviser and | | |
| | | | | | | related directly to the | | Affiliated Fund Service | | |
| | | Total Non-Audit Fees | | operations and financial | | Providers (all other | | |
| Fiscal Year Ended | | Billed to Fund | | reporting of the Fund) | | engagements) | | Total |
| |
| July 31, 2010 | | $ | 10,000 | | | $ | 0 | | | $ | 0 | | | $ | 10,000 | |
| July 31, 2009 | | $ | 10,000 | | | $ | 0 | | | $ | 0 | | | $ | 10,000 | |
“Non-Audit Fees billed to Fund” for both fiscal year ends represent “Tax Fees” and “All Other Fees” billed to Fund in their respective amounts from the previous table.
Audit Committee Pre-Approval Policies and Procedures. Generally, the Audit Committee must approve (i) all non-audit services to be performed for the Fund by the Fund’s independent accountants and (ii) all audit and non-audit services to be performed by the Fund’s independent accountants for the Affiliated Fund Service Providers with respect to operations and financial reporting of the Fund. Regarding tax and research projects conducted by the independent accountants for the Fund and Affiliated Fund Service Providers (with respect to operations and financial reports of the Fund) such engagements will be (i) pre-approved by the Audit Committee if they are expected to be for amounts greater than $10,000; (ii) reported to the Audit Committee chairman for his verbal approval prior to engagement if they are expected to be for amounts under $10,000 but greater than $5,000; and (iii) reported to the Audit Committee at the next Audit Committee meeting if they are expected to be for an amount under $5,000.
ITEM 5. AUDIT COMMITTEE OF LISTED REGISTRANTS.
The registrant’s Board has a separately designated Audit Committee established in accordance with Section 3(a)(58)(A) of the Securities Exchange Act of 1934, as amended (15 U.S.C. 78c(a)(58)(A)). The members of the audit committee are Robert P. Bremner, Jack B. Evans, David J. Kundert, William J. Schneider and Terence J. Toth.
ITEM 6. SCHEDULE OF INVESTMENTS.
| | (a) | | See Portfolio of Investments in Item 1. |
| |
| | (b) | | Not applicable. |
ITEM 7. DISCLOSURE OF PROXY VOTING POLICIES AND PROCEDURES FOR CLOSED-END MANAGEMENT INVESTMENT COMPANIES.
SYMPHONY
Symphony Asset Management votes proxies with the objective of maximizing shareholder value for its clients and in accordance with the firm’s Policies and Procedures for Proxy Voting. Symphony’s Proxy Voting Committee is responsible for establishing proxy voting guidelines; review and oversight of the firm’s Policies and Procedures for Proxy Voting; oversight of day-to-day proxy voting related activities; and, for overseeing the activities of proxy service providers utilized by the firm.
Symphony has established guidelines for proxy voting based on the recommendations of an independent third-party proxy service provider. Symphony utilizes one or more independent third-party service providers to vote proxy in accordance with Symphony’s guidelines. Service providers also provide proxy voting related research material as required.
In its Policies and Procedures for Proxy Voting, Symphony specifies a process for identifying and managing conflicts of interest in the proxy voting process so that votes are cast in the best interests of clients. Conflicts of interest may arise from relationships Symphony has with its clients, vendors and lenders. Symphony portfolio managers may change a proxy vote recommended by the firm’s guidelines to resolve a conflict of interest or for other reasons in the best economic interests of clients. Symphony’s Proxy Voting Committee reviews vote changes.
ITEM 8. PORTFOLIO MANAGERS OF CLOSED-END MANAGEMENT INVESTMENT COMPANIES.
The Adviser has engaged Symphony Asset Management also referred to as “Sub-Adviser”) as Sub-Adviser to provide discretionary investment advisory services. The following section provides information on the portfolio managers of the Sub-Adviser.
SYMPHONY ASSET MANAGEMENT
A. PORTFOLIO MANAGER BIOGRAPHIES
Gunther Stein, Director of Fixed Income Strategies, Portfolio Manager
Gunther Stein is the lead portfolio manager for both high yield and convertible bond strategies at Symphony Asset Management as well as the lead portfolio manager of Nuveen’s senior loan asset management team. Prior to joining Symphony in 1999, Stein was a high yield portfolio manager at Wells Fargo Bank, where he was responsible for investing in public high yield bonds and bank loans and also managed a team of credit analysts. Stein joined Wells Fargo in 1993 as an Associate in its Loan Syndications/Leveraged Finance Group. Previously, Stein worked for four years as a euro-currency deposit trader with First Interstate Bank. He has also worked for Standard Chartered Bank, Mexico City and Citibank Investment Bank, London. He completed Wells Fargo’s Credit Management Training program and holds an M.B.A. from the University of Texas, Austin. He graduated from the University of California at Berkeley with a B.A. in Economics.
B. OTHER ACCOUNTS
OTHER ACCOUNTS MANAGED BY Gunther Stein as of 7/31/10
| | | | | |
| | | Gunther Stein |
| (a) RICs | | | | |
| Number of accts | | | 6 | |
| Assets | | $ | 1.48 | billion |
| | | | | |
| (b) Other pooled accts | | | | �� |
| Non-performance fee accts | | | | |
| Number of accts | | | 2 | |
| Assets | | $ | 18.08 | million |
| Performance fee accts | | | | |
| Number of accts | | | 13 | |
| Assets | | $ | 3.98 | billion |
| | | | | |
| (c) Other | | | | |
| Non-performance fee accts | | | | |
| Number of accts | | | 4 | |
| Assets | | $ | 5.21 | million |
| Performance fee accts | | | | |
| Number of accts | | | 3 | |
| Assets | | $ | 750.44 | million |
C. POTENTIAL MATERIAL CONFLICTS OF INTEREST
As described above, the portfolio managers may manage other accounts with investment strategies similar to the Fund, including other investment companies and separately managed accounts. Fees earned by the Sub-adviser may vary among these accounts and the portfolio managers may personally invest in some but not all of these accounts. These factors could create conflicts of interest because a portfolio manager may have incentives to favor certain accounts over others, resulting in other accounts outperforming the Fund. A conflict may also exist if a portfolio manager identified a limited investment opportunity that may be appropriate for more than one account, but the Fund is not able to take full advantage of that opportunity due to the need to allocate that opportunity among multiple accounts. In addition, the portfolio managers may execute transactions for another account that may adversely impact the value of securities held by the Fund. However, the Sub-adviser believes that these risks are mitigated by the fact that accounts with like investment strategies managed by a particular portfolio manager are generally managed in a similar fashion, subject to exceptions to account for particular investment restrictions or policies applicable only to certain accounts, differences in cash flows and account sizes, and other factors. In addition, the Sub-adviser has adopted trade allocation procedures that require equitable allocation of trade orders for a particular security among participating accounts.
D. FUND MANAGER COMPENSATION
Symphony investment professionals receive compensation based on three elements: fixed-base salary, participation in a bonus pool and certain long-term incentives.
The fixed-base salary is set at a level determined by Symphony and is reviewed periodically to ensure that it is competitive with base salaries paid by similar financial services companies for persons playing similar roles.
The portfolio manager is also eligible to receive an annual bonus from a pool based on Symphony’s aggregate asset-based and performance fees after all operating expenses. The level of this bonus to each individual portfolio manager is determined by senior management’s assessment of the team’s performance, and the individual’s contribution to and performance on that team. Factors considered in that assessment include the total return and risk-adjusted total return performance of the accounts for which the individual serves as portfolio manager relative to any benchmarks established for those accounts; the individual’s effectiveness in communicating investment performance to investors and/or their advisors; and the individual’s contribution to the firm’s overall investment process and to the execution of investment strategies. The portfolio manager also receives long-term incentives tied to the performance and growth of Symphony and Nuveen.
E. OWNERSHIP OF JFR SECURITIES AS OF JULY 31, 2010.
ITEM 9. PURCHASES OF EQUITY SECURITIES BY CLOSED-END MANAGEMENT INVESTMENT COMPANY AND AFFILIATED PURCHASERS.
| | | | | | | | | | | | | | | | | |
| | | | | | | (b) | | | (c) | | | (d)* | |
| | | (a) | | | AVERAGE | | | TOTAL NUMBER OF SHARES | | | MAXIMUM NUMBER (OR | |
| | | TOTAL NUMBER OF | | | PRICE | | | (OR UNITS) PURCHASED AS | | | APPROXIMATE DOLLAR VALUE) OF | |
| | | SHARES (OR | | | PAID PER | | | PART OF PUBLICLY | | | SHARES (OR UNITS) THAT MAY YET | |
| | | UNITS) | | | SHARE (OR | | | ANNOUNCED PLANS OR | | | BE PURCHASED UNDER THE PLANS OR | |
| Period* | | PURCHASED | | | UNIT) | | | PROGRAMS | | | PROGRAMS | |
| AUGUST 1-31, 2009 | | | 20,593 | | | $ | 8.27 | | | | 20,593 | | | | 4,719,407 | |
| SEPTEMBER 1-30, 2009 | | | 0 | | | | | | | | 0 | | | | 4,719,407 | |
| OCTOBER 1-31, 2009 | | | 67,200 | | | $ | 9.29 | | | | 67,200 | | | | 4,672,800 | |
| NOVEMBER 1-30, 2009 | | | 50,100 | | | $ | 9.33 | | | | 50,100 | | | | 4,622,700 | |
| DECEMBER 1-31, 2009 | | | 0 | | | | | | | | 0 | | | | 4,622,700 | |
| JANUARY 1-31, 2010 | | | 0 | | | | | | | | 0 | | | | 4,622,700 | |
| FEBRUARY 1-28, 2010 | | | 0 | | | | | | | | 0 | | | | 4,622,700 | |
| MARCH 1-31, 2010 | | | 0 | | | | | | | | 0 | | | | 4,622,700 | |
| APRIL 1-30, 2010 | | | 0 | | | | | | | | 0 | | | | 4,622,700 | |
| MAY 1-31, 2010 | | | 0 | | | | | | | | 0 | | | | 4,622,700 | |
| JUNE 1-30, 2010 | | | 0 | | | | | | | | 0 | | | | 4,622,700 | |
| JULY 1-31, 2010 | | | 0 | | | | | | | | 0 | | | | 4,622,700 | |
| TOTAL | | | 137,893 | | | | | | | | | | | | | |
| | |
| * | | The registrant’s repurchase program, which authorized the repurchase of 4,740,000 shares, was announced August 7, 2008. On October 3, 2009, the program was reauthorized for a maximum repurchase amount of 4,740,000 shares. Any repurchases made by the registrant pursuant to the program were made through open-market transactions. |
ITEM 10. SUBMISSION OF MATTERS TO A VOTE OF SECURITY HOLDERS.
There have been no material changes to the procedures by which shareholders may recommend nominees to the registrant’s Board implemented after the registrant last provided disclosure in response to this Item.
ITEM 11. CONTROLS AND PROCEDURES.
| | (a) | | The registrant’s principal executive and principal financial officers, or persons performing similar functions, have concluded that the registrant’s disclosure controls and procedures (as defined in Rule 30a-3(c) under the Investment Company Act of 1940, as amended (the “1940 Act”) (17 CFR 270.30a-3(c))) are effective, as of a date within 90 days of the filing date of this report that includes the disclosure required by this paragraph, based on their evaluation of the controls and procedures required by Rule 30a-3(b) under the 1940 Act (17 CFR 270.30a-3(b)) and Rules 13a-15(b) or 15d-15(b) under the Securities Exchange Act of 1934, as amended (the “Exchange Act”) (17 CFR 240.13a-15(b) or 240.15d-15(b)). |
| |
| | (b) | | There were no changes in the registrant’s internal control over financial reporting (as defined in Rule 30a-3(d) under the 1940 Act (17 CFR 270.30a-3(d)) that occurred during the second fiscal quarter of the period covered by this report that has materially affected, or is reasonably likely to materially affect, the registrant’s internal control over financial reporting. |
ITEM 12. EXHIBITS.
File the exhibits listed below as part of this Form. Letter or number the exhibits in the sequence indicated.
(a)(1) Any code of ethics, or amendment thereto, that is the subject of the disclosure required by Item 2, to the extent that the registrant intends to satisfy the Item 2 requirements through filing of an exhibit: Not applicable because the code is posted on registrant’s website at www.nuveen.com/CEF/Info/Shareholder/ and there were no amendments during the period covered by this report. (To view the code, click on Fund Governance and then Code of Conduct.)
(a)(2) A separate certification for each principal executive officer and principal financial officer of the registrant as required by Rule 30a-2(a) under the 1940 Act (17 CFR 270.30a-2(a)) in the exact form set forth below: Ex-99.CERT Attached hereto.
(a)(3) Any written solicitation to purchase securities under Rule 23c-1 under the 1940 Act (17 CFR 270.23c-1) sent or given during the period covered by the report by or on behalf of the registrant to 10 or more persons. Not applicable.
(b) If the report is filed under Section 13(a) or 15(d) of the Exchange Act, provide the certifications required by Rule 30a-2(b) under the 1940 Act (17 CFR 270.30a-2(b)); Rule 13a-14(b) or Rule 15d-14(b) under the Exchange Act (17 CFR 240.13a-14(b) or 240.15d-14(b)), and Section 1350 of Chapter 63 of Title 18 of the United States Code (18 U.S.C. 1350) as an exhibit. A certification furnished pursuant to this paragraph will not be deemed “filed” for purposes of Section 18 of the Exchange Act (15 U.S.C. 78r), or otherwise subject to the liability of that section. Such certification will not be deemed to be incorporated by reference into any filing under the Securities Act of 1933 or the Exchange Act, except to the extent that the registrant specifically incorporates it by reference. Ex-99.906 CERT attached hereto.
SIGNATURES
Pursuant to the requirements of the Securities Exchange Act of 1934 and the Investment Company Act of 1940, the registrant has duly caused this report to be signed on its behalf by the undersigned, thereunto duly authorized.
(Registrant) NUVEEN FLOATING RATE INCOME FUND
| | | | | |
| | | |
| By (Signature and Title) | /s/ Kevin J. McCarthy | | |
| | Kevin J. McCarthy | | |
| | Vice President and Secretary | | |
Date: October 7, 2010
Pursuant to the requirements of the Securities Exchange Act of 1934 and the Investment Company Act of 1940, this report has been signed below by the following persons on behalf of the registrant and in the capacities and on the dates indicated.
| | | | | |
| | | |
| By (Signature and Title) | /s/ Gifford R. Zimmerman | | |
| | Gifford R. Zimmerman | | |
| | Chief Administrative Officer
(principal executive officer) | | |
Date: October 7, 2010
| | | | | |
| | | |
| By (Signature and Title) | /s/ Stephen D. Foy | | |
| | Stephen D. Foy | | |
| | Vice President and Controller
(principal financial officer) | | |
Date: October 7, 2010