REPORT OF INDEPENDENT REGISTERED ANNUAL REPORT FOR THE FISCAL YEAR ENDING DECEMBER 31, 2010
As filed with the Securities and Exchange Commission on April 14, 2011
UNITED STATES
SECURITIES AND EXCHANGE COMMISSION
WASHINGTON, D.C. 20549
FORM 20-F
(Mark One)
| [ ] | REGISTRATION STATEMENT PURSUANT TO SECTION 12(b) OR (g) OF THE SECURITIES EXCHANGE ACT OF 1934 |
| OR | |
| [x] | ANNUAL REPORT PURSUANT TO SECTION 13 OR 15(d) OF THE SECURITIES EXCHANGE ACT OF 1934 For the fiscal year ended December 31, 2010 |
| OR | |
| [ ] | TRANSITION REPORT PURSUANT TO SECTION 13 OR 15(d) OF THE SECURITIES EXCHANGE ACT OF 1934 |
| OR | |
| [ ] | SHELL COMPANY REPORT PURSUANT TO SECTION 13 OR 15(d) OF THE SECURITIES EXCHANGE ACT OF 1934 |
Date of event requiring this shell company report . . . . . . . . . . . . . . . . . . .
For the transition period from to
Commission file number 001-32305
| CORPBANCA |
| (Exact name of Registrant as specified in its charter) |
| (Translation of Registrant’s name into English) |
| Republic of Chile |
| (Jurisdiction of incorporation or organization) |
Rosario Norte 660 Las Condes Santiago, Chile |
| (Address of principal executive offices) |
| John Paul Fischer, Telephone: +(562) 660 2141, Facsimile: +(562) 660 2476, Address: Rosario Norte 660, Las Condes, Santiago, Chile |
| (Name, Telephone, E-mail and/or Facsimile number and Address of Company Contact Person) |
Securities registered or to be registered pursuant to Section 12(b) of the Act.
| Title of each class | Name of each exchange on which registered | |
American Depositary Shares representing common shares | New York Stock Exchange | |
| Common shares, no par value* | New York Stock Exchange* |
| * | Not for trading purposes, but only in connection with the registration of American Depositary Shares pursuant to the requirements of the Securities and Exchange Commission. |
Securities registered or to be registered pursuant to Section 12(g) of the Act.
| None |
| (Title of Class) |
Securities for which there is a reporting obligation pursuant to Section 15(d) of the Act.
| None |
| (Title of Class) |
Indicate the number of outstanding shares of each of the issuer’s classes of capital or common stock as of the close of the period covered by the annual report.
| 226,909,290,577 | |
Indicate by check mark if the registrant is a well-known seasoned issuer, as defined in Rule 405 of the Securities Act.
[x] Yes [ ] No
If this report is an annual or transition report, indicate by check mark if the registrant is not required to file reports pursuant to Section 13 or 15(d) of the Securities Exchange Act of 1934.
[ ] Yes [x] No
Note — Checking the box above will not relieve any registrant required to file reports pursuant to Section 13 or 15(d) of the Securities Exchange Act of 1934 from their obligations under those Sections.
Indicate by check mark whether the registrant (1) has filed all reports required to be filed by Section 13 or 15(d) of the Securities Exchange Act of 1934 during the preceding 12 months (or for such shorter period that the registrant was required to file such reports), and (2) has been subject to such filing requirements for the past 90 days.
[x] Yes [ ] No
Indicate by check mark whether the registrant has submitted electronically and posted on its corporate Web site, if any, every Interactive Data File required to be submitted and posted pursuant to Rule 405 of Regulation S-T (§232.405 of this chapter) during the preceding 12 months (or for such shorter period that the registrant was required to submit and post such files).
[ ] Yes [x] No
Indicate by check mark whether the registrant is a large accelerated filer, an accelerated filer, or a non-accelerated filer. See definition of “accelerated filer and large accelerated filer” in Rule 12b-2 of the Exchange Act. (Check one):
| Large accelerated filer [x] | Accelerated filer [ ] | Non-accelerated filer [ ] |
Indicate by check mark which basis of accounting the registrant has used to prepare the financial statements included in this filing:
| U.S. GAAP [ ] | International Financial Reporting Standards as issued by the International Accounting Standards Board [x] | Other [ ] |
If “Other” has been checked in response to the previous question, indicate by check mark which financial statement item the registrant has elected to follow.
[ ] Item 17 [ ] Item 18
If this is an annual report, indicate by check mark whether the registrant is a shell company (as defined in Rule 12b-2 of the Exchange Act).
[ ] Yes [x] No
(APPLICABLE ONLY TO ISSUERS INVOLVED IN BANKRUPTCY PROCEEDINGS DURING THE PAST FIVE YEARS)
Indicate by check mark whether the registrant has filed all documents and reports required to be filed by Sections 12, 13 or 15(d) of the Securities Exchange Act of 1934 subsequent to the distribution of securities under a plan confirmed by a court.
[ ] Yes [ ] No
CAUTIONARY LANGUAGE REGARDING FORWARD-LOOKING STATEMENTS
This Annual Report on Form 20-F contains statements that constitute forward-looking statements within the meaning of the safe harbor provisions of the Private Securities Litigation Reform Act of 1995. Forward-looking statements include statements preceded by, followed by or that include “believes,” “expects,” “intends,” “plans,” “projects,” “estimates” or “anticipates” and similar expressions. These statements appear throughout this Annual Report, including, without limitation, under “Item 3. Key Information—Risk Factors”, “Item 4. Information on the Company” and “Item 5. Operating and Financial Review and Prospects”, are not based on historical facts but instead represent only our belief regarding future events, many of which, by their nature, are inherently uncertain and outside our control and include statements regarding our current intent, belief or expectations with respect to (1) our asset growth and financing plans, (2) trends affecting our financial condition or results of operations, (3) the impact of competition and regulations, (4) projected capital expenditures, and (5) liquidity. Such forward-looking statements are not guarantees of future performance and involve risks and uncertainties, and actual results may differ materially from those described in such forward-looking statements included in this Annual Report as a result of various factors (including, without limitation, the actions of competitors, future global economic conditions, market conditions, currency exchange rates and operating and financial risks), many of which are beyond our control. The occurrence of any such factors, not currently expected by us, would significantly alter the results set forth in these statements.
Factors that could cause actual results to differ materially and adversely include, but are not limited to:
| · | trends affecting our financial condition or results of operations, |
| · | our dividend policy, |
| · | changes in the participation of our shareholders or any other factor that may result in a change of control, |
| · | the amount of our indebtedness, |
| · | natural disasters, |
| · | changes in general economic, business, regulatory, political or other conditions in Chile or changes in general economic or business conditions in Latin America, |
| · | changes in capital markets in general that may affect policies or attitudes towards lending to Chile or Chilean companies or securities issued by Chilean companies, |
| · | the monetary and interest rate policies of the Central Bank, |
| · | inflation or deflation, |
| · | unemployment, |
| · | unanticipated increases in financing and other costs or the inability to obtain additional debt or equity financing on attractive terms, |
| · | unanticipated turbulence in interest rates, |
| · | movements in currency exchange rates, |
| · | movements in equity prices or other rates or prices, |
| · | changes in Chilean and foreign laws and regulations, |
| · | changes in taxes, |
| · | competition, changes in competition and pricing environments, |
| · | our inability to hedge certain risks economically, |
| · | the adequacy of our loss allowances, provisions or reserves, |
| · | technological changes, |
| · | changes in consumer spending and saving habits, |
| · | successful implementation of new technologies, |
2
| · | loss of market share, |
| · | changes in, or failure to comply with applicable banking, insurance, securities or other regulations, and |
| · | the other factors discussed under “Item 3. Key Information—Risk Factors” in this Annual Report. |
You should not place undue reliance on such statements, which speak only as of the date that they were made. These cautionary statements should be considered in connection with any written or oral forward-looking statements that we may make in the future. We do not undertake any obligation to release publicly any revisions to such forward-looking statements after the date of this Annual Report to reflect later events or circumstances or to reflect the occurrence of unanticipated events.
3
ENFORCEABILITY OF CIVIL LIABILITIES
We are a sociedad anónima (corporation) organized under the laws of the Republic of Chile. Nearly all of our directors and executive officers are not residents of the United States and a substantial portion of our assets and the assets of these persons are located outside the United States. As a result, it may not be possible for you to effect service of process within the United States upon us or such persons or to enforce against them or us in the United States or other foreign courts, judgment obtained in the United States predicated upon the civil liability provisions of the federal securities laws of the United States.
No treaty exists between the United States and Chile for the reciprocal enforcement of judgments. Chilean courts, however, have enforced final judgments rendered in the United States by virtue of the legal principles of reciprocity and comity, subject to the review in Chile of the United States judgment in order to ascertain whether certain basic principles of due process and public policy have been respected without reviewing the merits of the subject matter of the case. If a U.S. court grants a final judgment in an action based on the civil liability provisions of the federal securities laws of the United States, enforceability of this judgment in Chile will be subject to the obtaining of the relevant “exequatur” (i.e., recognition and enforcement of the foreign judgment) according to Chilean civil procedure law in force at that time, and satisfying certain factors. Currently, the most important of these factors are the existence of reciprocity, absent which the foreign judgment may not be enforced in Chile; the absence of any conflict between the foreign judgment and Chilean laws (excluding for this purpose the laws of civil procedure) and public policies; the absence of a conflicting judgment by a Chilean court relating to the same parties and arising from the same facts and circumstances; the observance of all applicable laws to serve process on the defendant and protect the defendant’s right to defense; the absence of any further means for appeal or review of the judgment in the jurisdiction where judgment was rendered; the Chilean courts’ determination that the U.S. courts had jurisdiction; that service of process was appropriately made on the defendant and that the defendant was afforded a real opportunity to appear before the court and defend its case; and that enforcement would not violate Chilean public policy.
If an action is started before Chilean courts, there is doubt as to the enforceability of liabilities predicated solely on the U.S. federal securities laws and as to the enforceability in Chilean courts of judgments of United States courts obtained in actions predicated solely upon the civil liability provisions of the federal securities laws of the United States.
4
TABLE OF CONTENTS
| ................................................................................................................................................................................................................................................. | 6 | |
| ITEM 1. IDENTITY OF DIRECTORS, SENIOR MANAGEMENT AND ADVISERS................................................................................................ | 6 | |
| ITEM 2. OFFER STATISTICS AND EXPECTED TIMETABLE................................................................................................................................... | 6 | |
ITEM 3. KEY INFORMATION.......................................................................................................................................................................................... ITEM 4. INFORMATION ON THE COMPANY............................................................................................................................................................. ITEM 4A. UNRESOLVED STAFF COMMENTS............................................................................................................................................................. ITEM 5. OPERATING AND FINANCIAL REVIEW AND PROSPECTS...................................................................................................................... ITEM 6. DIRECTORS, SENIOR MANAGEMENT AND EMPLOYEES....................................................................................................................... ITEM 7. MAJOR SHAREHOLDERS AND RELATED PARTY TRANSACTIONS................................................................................................... ITEM 8. FINANCIAL INFORMATION............................................................................................................................................................................ ITEM 9. OFFER AND LISTING DETAILS....................................................................................................................................................................... ITEM 10. ADDITIONAL INFORMATION....................................................................................................................................................................... ITEM 11. QUANTITATIVE AND QUALITATIVE DISCLOSURES ABOUT MARKET RISK............................................................................... ITEM 12. DESCRIPTION OF SECURITIES OTHER THAN EQUITY SECURITIES.................................................................................................. | 6 21 81 81 105 110 113 114 115 132 144 | |
| ................................................................................................................................................................................................................................................. | 144 | |
ITEM 13. DEFAULTS, DIVIDEND ARREARAGES AND DELINQUENCIES............................................................................................................ | 144 | |
ITEM 14. MATERIAL MODIFICATIONS TO THE RIGHTS OF SECURITY HOLDERS AND USE OF PROCEEDS......................................... ITEM 15. CONTROLS AND PROCEDURES................................................................................................................................................................... ITEM 16. [RESERVED]...................................................................................................................................................................................................... ITEM 16A. AUDIT COMMITTEE FINANCIAL EXPERT........................................................................................................................................... ITEM 16B. CODE OF ETHICS........................................................................................................................................................................................... ITEM 16C. PRINCIPAL ACCOUNTANT FEES AND SERVICES................................................................................................................................ ITEM 16D. EXEMPTIONS FROM THE LISTING STANDARDS FOR AUDIT COMMITTEES............................................................................ ITEM 16E. PURCHASES OF EQUITY SECURITIES BY THE ISSUER AND AFFILIATED PURCHASERS........................................................ ITEM 16F. CHANGE IN REGISTRANT’S CERTIFYING ACCOUNTANT................................................................................................................ ITEM 16G. CORPORATE GOVERNANCE...................................................................................................................................................................... | 144 145 146 146 147 147 147 147 148 148 | |
| ................................................................................................................................................................................................................................................. | 150 | |
ITEM 17. FINANCIAL STATEMENTS........................................................................................................................................................................... ITEM 18. FINANCIAL STATEMENTS........................................................................................................................................................................... ITEM 19. EXHIBITS........................................................................................................................................................................................................... | 150 150 150 | |
5
Not applicable.
Not applicable.
PRESENTATION OF FINANCIAL AND OTHER INFORMATION
Prior to December 31, 2008 and including our consolidated financial statements as of and for the year ended December 31, 2008, we prepared our consolidated financial statements in accordance with generally accepted accounting principles in Chile and regulations of the Chilean Superintendencia de Bancos e Instituciones Financieras, also referred to as the Chilean Superintendency of Banks or the SBIF, collectively referred to as “Chilean GAAP,” which differed in certain respects from generally accepted accounting principles in the United States, or U.S. GAAP.
The Chilean Superintendencia de Valores y Seguros, or the Chilean Superintendency of Securities and Insurance or the SVS, announced in 2004 that all public companies are required to present complete financial statements in compliance with International Financial Reporting Standards, or IFRS, beginning in 2009. The transition from Chilean GAAP to IFRS is scheduled to follow a gradual implementation plan taking place over at least a three-year period from 2009 to 2011, beginning with financial institutions in 2009. Full convergence is the intended goal of the transition to IFRS. However, due to the gradual approach to the adoption of IFRS and because not all regulators require full IFRS, different accounting frameworks will coexist in Chile for a period of time.
Chilean banks are subject to the regulatory supervision of the Chilean Superintendency of Banks under the provisions of the Decreto de Fuerza de Ley No.3 of 1997, or the General Banking Law. The General Banking Law establishes that, in accordance with Chilean legal regulations, Chilean banks must abide by the accounting standards stipulated by the Chilean Superintendency of Banks.
The Chilean Superintendency of Banks, by means of Circular No. 3,410 (2007) and Circular No. 3,443 (2008) issued its “Compendium of Accounting Standards” as its framework strategic plan, which contains the new accounting standards and reporting formats for the financial industry required to be adopted by banking institutions effective January 1, 2009.
In order to comply with requirements of the Securities and Exchange Commission, or the SEC, we have prepared our audited consolidated financial statements under IFRS as issued by the IASB. Unless otherwise indicated herein, as used hereafter IFRS refers to the standards issued by the IASB.
The selected consolidated financial information included herein as of and for the year ended December 31, 2010, together with the selected consolidated financial information as of and for the years ended December 31, 2008 and 2009, is derived from, and presented on the same basis as, our consolidated financial statements and should be read together with the consolidated financial statements. Since our consolidated financial statements, including the selected consolidated information included herein, have been prepared using IFRS, they are not comparable with the audited consolidated financial statements included in the annual reports filed on Form 20-F for the years ended December 31, 2008 and prior thereto. See “Item 5. Operating and Financial Review and Prospects—Operating Results—Critical Accounting Policies and Estimates”. The selected consolidated financial information for the years ended December 31, 2006 and 2007 was not prepared using IFRS and a conversion would cause a considerable amount of effort and expense. As a result, the selected consolidated financial information for the years ended December 31, 2006 and 2007 has been omitted from this Annual Report.
Our audited consolidated financial statements as of December 31, 2008, 2009 and 2010 and for each of the three years in the period ended December 31, 2010 are referred to herein as our financial statements. Unless otherwise indicated, financial data for all full-year periods through December 31, 2010 included in our audited consolidated financial statements and in the other financial information contained elsewhere in this Annual Report have been expressed in Chilean pesos as of December 31, 2010.
In this Annual Report, references to “$,” “US$,” “U.S. dollars” and “dollars” are to United States dollars, references to “pesos” or “Ch$” are to Chilean pesos (and “MCh$” to millions of Chilean pesos), and references to “UF” are to Unidades de Fomento. The UF is an inflation-indexed, peso-denominated unit that is linked to and adjusted daily to reflect changes in the previous month’s Chilean consumer price index. As of December 31, 2010 one UF equaled US$45.87 and Ch$21,455.55, and as of April 12, 2011, one UF equaled US$46.19 and Ch$21,608.00. See “Item 5. Operating and Financial Review and Prospects”.
This Annual Report contains translations of certain peso amounts into U.S. dollars at specified rates solely for the convenience of the reader. These translations should not be construed as representations that the peso amounts actually represent such U.S. dollar amounts, were converted from U.S. dollars at the rate indicated in preparing our financial statements or could be converted into U.S. dollars at the rate indicated. Unless otherwise indicated, such U.S. dollar amounts have been translated from pesos based on our exchange rate of Ch$467.78 as of December 31, 2010. See “—Exchange Rate Information” below.
6
Unless otherwise specified, all references in this Annual Report (except in our financial statements) to loans are to loans and financial leases before deduction for allowances for loan losses, and, except as otherwise specified, all market share data presented herein are based on information published periodically by the Chilean Superintendency of Banks. Past due loans include, with respect to any loan, the amount of principal and interest that is 90 days or more overdue and include the installments of such loans that are not yet overdue.
Certain figures included in this Annual Report and in our financial statements have been rounded for ease of presentation. Percentage figures included in this Annual Report have not in all cases been calculated on the basis of such rounded figures but on the basis of such amounts prior to rounding. For this reason, percentage amounts in this Annual Report may vary from those obtained by performing the same calculations using the figures in our financial statements. Certain other amounts that appear in this Annual Report may not sum due to rounding.
In this Annual Report, all macro-economic data related to the Chilean economy is based on information published by the Central Bank. All market share and other data related to the Chilean financial system is based on information published by the Chilean Superintendency of Banks as well as other publicly available information. Prior to January 1, 2008, the Chilean Superintendency of Banks published the unconsolidated risk index of the Chilean financial system on a monthly basis and, as a result, information regarding the consolidated risk index of the Chilean financial system as a whole is not available for periods prior to January 1, 2008. As of January 1, 2009, the Chilean Superintendency of Banks publishes the consolidated risk index of the Chilean financial system on a monthly basis.
EXCHANGE RATE INFORMATION
Chile has two currency markets, the Mercado Cambiario Formal, or the Formal Exchange Market, and the Mercado Cambiario Informal, or the Informal Exchange Market. The Central Bank is empowered to determine that certain purchases and sales of foreign currencies must be carried out on the Formal Exchange Market. Pursuant to Central Bank regulations which are currently in effect, all payments, remittances or transfers of foreign currency abroad which are required to be effected through the Formal Exchange Market may be effected with foreign currency obtained outside the Formal Exchange Market. The Formal Exchange Market is comprised of the banks and other entities so authorized by the Central Bank. Current regulations require that the Central Bank be informed of certain transactions and that these transactions be effected through the Formal Exchange Market.
The reference exchange rate for the Formal Exchange Market is reset daily by the Central Bank, taking into account internal and external inflation, and is adjusted daily to reflect variations in parities between the peso and each of the U.S. dollar, the Euro and the Japanese yen. The observed exchange rate for a given date is the average exchange rate of the transactions conducted in the Formal Exchange Market on the immediately preceding banking day, as certified by the Central Bank.
Purchases and sales of foreign currencies which may be effected outside the Formal Exchange Market can be carried out in the Informal Exchange Market. The Informal Exchange Market reflects transactions carried out at informal exchange rates by entities not expressly authorized to operate in the Formal Exchange Market, such as certain foreign exchange houses and travel agencies. There are no limits imposed on the extent to which the rate of exchange in the Informal Exchange Market can fluctuate above or below the observed exchange rate. On December 31, 2010, the average exchange rate in the Informal Exchange Market was approximately the same as the published observed exchange rate for such date of Ch$467.78 per US$1.00. The average exchange rate in the Informal Exchange Market is widely used by the public in Chile. The method used to estimate the daily exchange rate is as follows:
a. Daily spot rates are obtained from the Datatec system, which contains all daily market foreign currency trading activities. |
b. We only consider those transactions which occurred during the time frame of 12:45 pm and 1:00 pm. |
c. The exchange rate is calculated using the simple average of transactions selected. |
d. Alternatively, we can substitute the Datatec system with market information obtained from the Santiago Stock Exchange’s OTC trade system. |
As of December 31, 2010 the U.S. dollar exchange rate used by us was Ch$467.78 per US$1.00.
The following table sets forth the annual low, high, average and period-end observed exchange rate for U.S. dollars for the periods set forth below, as reported by the Central Bank.
7
| Daily Observed Exchange Rate Ch$ per US$(1) | |||||||
| Low(2) | High(2) | Average(3) | Period End | ||||
| 2006 | 511.44 | 549.63 | 530.26 | 534.43 | |||
| 2007 | 493.14 | 548.67 | 522.69 | 495.82 | |||
| 2008 | 431.22 | 676.75 | 521.79 | 629.11 | |||
| 2009 | 491.09 | 643.87 | 559.67 | 506.43 | |||
| 2010 | 468.37 | 549.17 | 510.38 | 468.37 | |||
| October 2010 | 475.93 | 494.44 | 484.04 | 491.76 | |||
| November 2010 | 477.05 | 488.72 | 482.32 | 486.39 | |||
| December 2010 | 468.37 | 487.87 | 474.78 | 468.37 | |||
| January 2011 | 466.05 | 499.03 | 489.44 | 483.32 | |||
| February 2011 | 468.94 | 484.14 | 475.69 | 475.63 | |||
| March 2011 | 472.74 | 485.37 | 479.65 | 482.08 | |||
| April 2011(4) | 470.19 | 479.16 | 474.16 | 471.00 | |||
______________________
| (1) | Nominal figures. |
| (2) | Exchange rates are the actual low and high, on a day-by-day basis for each period. |
| (3) | The average of the exchange rates on the last day of each month during the period. |
| (4) | Through April 12, 2011. |
The following table sets forth the annual low, high, average and period-end exchange rate for U.S. dollars for the periods under our policy to calculate our own exchange rate:
| Bank’s Exchange Rate Ch$ per US$(1) | |||||||
| Low(2) | High(2) | Average(3) | Period End | ||||
2006 | 514.21 | 547.31 | 529.10 | 532.07 | |||
2007 | 493.07 | 548.09 | 522.57 | 497.87 | |||
2008 | 431.40 | 680.15 | 522.50 | 637.44 | |||
2009 | 490.77 | 640.60 | 559.16 | 507.52 | |||
2010 | 467.78 | 547.94 | 510.18 | 467.78 | |||
October 2010 | 476.77 | 495.01 | 484.44 | 489.99 | |||
November 2010 | 476.98 | 488.21 | 482.06 | 487.56 | |||
December 2010 | 468.30 | 485.32 | 473.76 | 467.78 | |||
January 2011 | 466.62 | 498.13 | 490.30 | 483.42 | |||
February 2011 | 468.49 | 480.05 | 474.86 | 476.36 | |||
March 2011 | 473.23 | 487.66 | 479.85 | 477.18 | |||
April 2011(4) | 470.54 | 476.33 | 473.44 | 473.88 | |||
______________________
| (1) | Nominal figures. |
| (2) | Exchange rates are the actual low and high, on a day-by-day basis for each period. |
| (3) | The average of the exchange rates on the last day of each month during the period. |
| (4) | Through April 12, 2011. |
We make no representation that the Chilean peso or the U.S. dollar amounts referred to herein actually represent, could have been or could be converted in U.S. dollars or Chilean pesos, as the case may be, at the rates indicated, at any particular rate or at all.
A. SELECTED FINANCIAL DATA
The following tables present our selected financial data as of the dates and for the periods indicated. You should read the following information together with our audited consolidated financial statements, including the notes thereto, included in this Annual Report and the information set forth in “Item 5. Operating and Financial Review and Prospects”.
8
The selected consolidated balance sheet data as of December 31, 2009 and 2010 and the selected consolidated income statement data for each of the three years in the period ended December 31, 2010 appearing herein have been derived from the audited consolidated financial statements for the year ended December 31, 2010 appearing elsewhere in this Annual Report, which have been audited by Deloitte & Touche Sociedad de Auditores y Consultores Ltda., or Deloitte.
We have prepared our consolidated annual financial statements as of and for the year ended December 31, 2010 in accordance with IFRS as issued by the IASB. The selected consolidated financial information included herein as of and for the year ended December 31, 2010, together with the selected consolidated financial information for the years ended December 31, 2008 and 2009, is derived from, and presented on the same basis as, our consolidated financial statements and should be read together with the consolidated financial statements. Since our consolidated financial statements, including the selected consolidated information included herein, have been prepared using IFRS as issued by the IASB, they are not comparable with the audited consolidated financial statements included in the annual reports filed on Form 20-F for the years ended December 31, 2008 and prior thereto. Readers should exercise caution in determining trends based on prior annual reports. See “Item 5. Operating and Financial Review and Prospects—Operating Results—Critical Accounting Policies and Estimates”.
| As of and for fiscal years ended December | |||||||||||
| 2008 | 2009 | 2010 | 2010(1) | ||||||||
(in millions of Ch$, in millions of US$, as of December 31, 2010) | |||||||||||
| Ch$ | Ch$ | Ch$ | US$ | ||||||||
| CONSOLIDATED INCOME STATEMENT DATA | |||||||||||
| Interest income | 560,893 | 314,115 | 387,639 | 828.7 | |||||||
| Interest expense | (346,717) | (120,727) | (163,229) | (348.9) | |||||||
| Net interest income | 214,176 | 193,388 | 224,410 | 479.8 | |||||||
| Provisions for loan losses | (54,983) | (71,271) | (52,351) | (111.9) | |||||||
| Net service fee income | 42,052 | 43,261 | 58,221 | 124.5 | |||||||
| Trading and investment foreign exchange gains and other operating income | 19,930 | 59,285 | 44,033 | 94.1 | |||||||
| Income attributable to investments in other companies | 262 | 445 | 296 | 0.6 | |||||||
| Total operating expenses | (123,451) | (122,667) | (132,683) | (283.6) | |||||||
| Income before income taxes | 97,986 | 102,441 | 141,926 | 303.5 | |||||||
| Income tax expense | (9,304) | (16,249) | (20,353) | (43.5) | |||||||
| Net income for the year(2) | 88,682 | 86,192 | 121,573 | 259.9 | |||||||
| Net income per common share(3) | 0.392 | 0.390 | 0.540 | 0.0011 | |||||||
| Dividends per common share(4) | 0.392 | 0.390 | 0.540 | 0.0011 | |||||||
| Dividend per ADS(4) (5) | 2,060 | 2,060 | 2,679 | 5.7 | |||||||
| Common shares outstanding (in thousands) | 221,236,558.3 | 221,854,744.5 | 226,909,290.6 | ||||||||
| CONSOLIDATED BALANCE SHEET DATA | |||||||||||
| Cash and deposits in banks | 81,326 | 110,331 | 202,339 | 432.6 | |||||||
| Items in course of collection | 117,703 | 95,796 | 79,680 | 170.3 | |||||||
| Trading portfolio financial assets | 85,105 | 76,156 | 197,580 | 422.4 | |||||||
| Investments under agreements to resell | 50,514 | 51,970 | 75,676 | 161.8 | |||||||
| Derivative financial instruments | 209,482 | 126,140 | 204,067 | 436.2 | |||||||
| Loans and receivables from banks, net | 37,671 | 86,220 | 63,998 | 136.8 | |||||||
| Loans and receivables from customers, net | 4,881,013 | 4,912,392 | 5,364,980 | 11,469.0 | |||||||
| Financial investments available-for-sale | 576,478 | 737,162 | 746,248 | 1,595.3 | |||||||
| Investments in other companies | 3,699 | 3,583 | 3,583 | 7.7 | |||||||
| Intangible assets | 12,252 | 13,630 | 13,096 | 28.0 | |||||||
| Property, plant and equipment, net | 51,231 | 55,212 | 53,430 | 114.2 | |||||||
| Current income tax provision | 6,488 | — | — | — | |||||||
| Deferred income taxes | 12,795 | 19,060 | 21,956 | 46.9 | |||||||
| Other assets | 80,176 | 92,307 | 104,207 | 222.8 | |||||||
| TOTAL ASSETS | 6,205,933 | 6,379,959 | 7,130,840 | 15,244.0 | |||||||
9
| As of and for fiscal years ended December | |||||||
| 2008 | 2009 | 2010 | 2010(1) | ||||
| (in millions of Ch$, in millions of US$, as of December 31, 2010) | |||||||
| Current accounts and demand deposits | 357,902 | 496,270 | 612,064 | 1,308.4 | |||
| Items in course of collection | 86,176 | 64,854 | 41,525 | 88.8 | |||
| Investments under agreements to repurchase | 351,471 | 465,513 | 189,350 | 404.8 | |||
| Time deposits and saving accounts | 3,350,742 | 3,316,045 | 3,700,454 | 7,910.7 | |||
| Derivative financial instruments | 195,608 | 114,703 | 175,261 | 374.7 | |||
| Borrowings from financial institutions | 492,606 | 362,403 | 503,692 | 1,076.7 | |||
| Debt issued | 765,172 | 935,219 | 1,215,435 | 2,598.3 | |||
| Other financial obligations | 47,394 | 26,853 | 23,660 | 50.6 | |||
| Current income tax provision | — | 7,831 | 7,168 | 15.3 | |||
| Deferred income taxes | 10,606 | 15,644 | 21,244 | 45.4 | |||
| Provisions | 32,427 | 49,804 | 67,732 | 144.8 | |||
| Other liabilities | 18,552 | 17,471 | 20,998 | 44.9 | |||
| TOTAL LIABILITIES | 5,708,656 | 5,872,610 | 6,578,583 | 14,063.4 | |||
| Shareholders´ equity | 497,277 | 507,349 | 552,257 | 1,180.6 | |||
| TOTAL LIABILITIES AND SHAREHOLDERS’ EQUITY | 6,205,933 | 6,379,959 | 7,130,840 | 15,244.0 | |||
As of and for fiscal years ended December | ||||||
2008 | 2009 | 2010 | ||||
| CONSOLIDATED RATIOS | ||||||
| Profitability and performance | ||||||
| Net interest margin(6) | 4.6% | 3.6% | 3.6% | |||
| Return on average total assets(7) | 1.6% | 1.4% | 1.8% | |||
| Return on average shareholders’ equity(8) | 19.0% | 18.4% | 23.9% | |||
| Efficiency ratio (consolidated)(9) | 44.7% | 41.5% | 41.0% | |||
| Dividend payout ratio(10) | 100.0% | 100.0% | 100.0% | |||
| Capital | ||||||
| Average shareholders’ equity as a percentage of average total assets | 8.6% | 7.7% | 7.5% | |||
| Total liabilities as a percentage of shareholders’ equity | 8.7% | 8.6% | 8.4% | |||
| Asset quality | ||||||
| Allowances for loan losses as a percentage of overdue loans(11) | 163.3% | 598.0% | 165.8% | |||
| Overdue loans as a percentage of total loans(11) | 0.9% | 0.3% | 1.2% | |||
| Allowances for loan losses as a percentage of total loans | 1.5% | 1.9% | 1.9% | |||
| Past due loans as a percentage of total loans(12) | 0.8% | 0.8% | 0.9% | |||
| OTHER DATA | ||||||
| Foreign exchange rate (Ch$/US$) | 28% | (19.5)% | (7.8)% | |||
| Number of employees | 3,022 | 3,127 | 3,422 | |||
| Number of branches and offices | 109 | 112 | 113 | |||
10
| (1) | Amounts stated in U.S. dollars as of and for the year ended December 31, 2010 have been translated from pesos at our exchange rate of Ch$467.78 per US$1.00 as of December 31, 2010. |
| (2) | This item includes non-controlling interest in the amount of Ch$0, Ch$0 and Ch$(977) for the years ended December 31, 2008, 2009 and 2010 respectively. |
| (3) | Net income per common share has been calculated on the basis of the weighted average number of shares outstanding for the period. As of December 31, 2008, 2009 and 2010, one ADS equaled 5,000 common shares. |
| (4) | Represents dividends paid in respect of net income earned in the prior fiscal year. |
| (5) | As of December 31, 2008, 2009 and 2010, each ADS represented 5,000 common shares. |
| (6) | Net interest margin is defined as net interest income divided by average interest-earning assets. |
| (7) | Return on average total assets is defined as net income divided by average total assets. |
| (8) | Return on average shareholders’ equity is defined as net income divided by average shareholders’ equity. |
| (9) | Operating expenses as a percentage of operating income. Operating income is the aggregate of net interest income, fees and income from service (net) and other operating income (net). |
| (10) | Represents dividends divided by net income. |
| (11) | Overdue loans consist of all non-current loans. |
| (12) | Past due loans include, with respect to any loan, the amount of principal or interest that is 90 days or more overdue, and include the installments of such loan that are not yet overdue. |
B. CAPITALIZATION AND INDEBTEDNESS
Not applicable.
C. REASONS FOR THE OFFER AND USE OF PROCEEDS
Not applicable.
D. RISK FACTORS
RISKS ASSOCIATED WITH OUR BUSINESS
The growth and make-up of our loan portfolio may expose us to increased loan losses.
From January 1, 2008 to December 31, 2010, the compounded annual growth rate of our aggregate gross loan portfolio was 11.4%. Our business strategy is to grow profitably while increasing the size of our loan portfolio. The growth of our loan portfolio (particularly in the lower-middle to middle income consumer and small and medium-sized corporate business segments) may expose us to a higher level of loan losses and require us to establish proportionately higher levels of provisions for loan losses, which offset the increased income that we can expect to receive as our loan portfolio grows.
Our loan portfolio may not continue to grow at the same rate.
There can be no assurance that in the future our loan portfolio will continue to grow at the same or similar rates as the growth rate that we historically experienced. A reversal of the rate of growth of the Chilean economy, a slowdown in the growth of customer demand, an increase in market competition or changes in governmental regulations, could adversely affect the rate of growth of our loan portfolio and our risk index and, accordingly, increase our required allowances for loan losses. Economic turmoil could also materially and adversely affect the liquidity, businesses and financial condition of our customers as well as lead to a general decline in consumer spending and a rise in unemployment, which in turn could lead to decreased demand for borrowings in general.
We are vulnerable to the current disruptions and volatility in the global financial markets.
Global economic conditions deteriorated significantly in the second half of 2008, and many countries, including the United States, are currently in or are recovering from the impact of the global recession. Many major financial institutions, including some of the world’s largest global commercial banks, investment banks, mortgage lenders, mortgage guarantors and insurance companies, have experienced significant difficulties. Around the world, there have also been runs on deposits at several financial institutions, numerous institutions have sought additional capital and many lenders and institutional investors have reduced or ceased providing funding to borrowers (including to other financial institutions).
Continued or worsening disruption and volatility in the global financial markets could have a material adverse effect on our ability to access capital and liquidity on financial terms acceptable to us, if at all. If capital markets financing ceases to become available, or becomes excessively expensive, we may be forced to raise the rates we pay on deposits to attract more customers. Any such increase in capital markets funding costs or deposit rates could have a material adverse effect on our interest margins.
11
In Chile, the economic recession caused a rise in unemployment, a fall in consumer spending, a fall in real estate prices and a general decline in economic activity. Although these factors have been slowed during 2010, it is possible for us to experience these problems again in the future.
Increased competition and industry consolidation may adversely affect the results of our operations.
The Chilean market for financial services is highly competitive. We compete with other Chilean private sector domestic and foreign banks, with BancoEstado (a state-owned bank) and with large department stores that offer consumer loans to a large segment of the Chilean population. The lower-middle to middle income segments of the Chilean population and the small and medium-sized corporate segments have become the target markets of several banks, and competition in these segments is likely to increase. As a result, net interest margins in these segments have declined. Although we believe that demand for financial products and services from the lower-middle to middle income consumer market segments and for small and medium-sized companies will continue to grow during the remainder of the decade, our net interest margins may not be maintained at their current levels.
We also face competition from non-bank and non-finance competitors with respect to some of our credit products, such as credit cards and consumer loans. Non-bank competition from large department stores has become increasingly significant in the consumer lending sector. Since 2001, three new private sector banks affiliated with Chile’s largest department stores have initiated operations mainly as consumer and medium-sized corporate niche banks. In addition, we face competition from non-bank finance competitors, such as leasing, factoring and automobile finance companies, with respect to loans and credit products, and from mutual funds, pension funds and insurance companies, with respect to savings products and mortgage loans. Banks continue to be the main suppliers of leasing, factoring and mutual funds in Chile, and the insurance sales business has seen rapid growth. Nevertheless, non-banking competition, especially department stores, may be able to engage in some types of advertising and promotion in which, by virtue of Chilean banking rules and regulations, we are prohibited from engaging.
The increase in competition within the Chilean banking industry has led to, among other things, consolidation in the industry. In 2007, Scotiabank SudAmericano acquired 100.0% of Banco Desarrollo and in 2008, Banco de Chile and Citibank Chile merged operations. In 2010, Scotiabank acquired Royal Bank of Scotland’s Chilean banking operations. Consolidation, which can result in the creation of larger and stronger competitors, may adversely affect our financial condition and results of operations by decreasing the net interest margins we are able to generate and increasing our costs of operation.
Our allowances for loan losses may not be adequate to cover the future actual losses to our loan portfolio.
As of December 31, 2010, our allowance for loan losses was Ch$104,215.0 million (excluding allowances and impairment for foreign bank loans), and the ratio of our allowance for loan losses to total loans was 1.9%. The amount of allowances is based on our current assessment of and expectations concerning various factors affecting the quality of our loan portfolio. These factors include, among other things, our borrowers’ financial condition, repayment abilities and repayment intentions, the realizable value of any collateral, the prospects for support from any guarantor, Chile’s economy, government macroeconomic policies, interest rates and the legal and regulatory environment. As the recent global financial crisis has demonstrated, many of these factors are beyond our control. In addition, as these factors evolve, the models we use to determine the appropriate level of allowance for loan losses require recalibration, which can lead to increased provision expense. We believe our allowance for loan losses is adequate as of the date hereof for all known losses. If our assessment of and expectations concerning the above mentioned factors differ from actual developments, or if the quality of our loan portfolio deteriorates or the future actual losses exceed our estimates, our allowance for loan losses may not be adequate to cover actual losses and we may need to make additional allowances for loan losses, which may materially and adversely affect our results of operations and financial condition.
Our exposure to individuals and small and medium-sized businesses could lead to higher levels of past due loans and subsequent loan losses.
A substantial number of our customers consist of individuals and small and medium-sized companies (those with annual sales between Ch$600.0 million and Ch$5,999.0 million). As part of our business strategy, we seek to increase lending and other services to small and medium-sized companies and lower-income individuals. Our business results relating to our lower-income individual and small and medium-sized company customers are, however, more likely to be adversely affected by downturns in the Chilean economy, including increases in unemployment, than our business from large corporations and high-income individuals. For example, unemployment directly affects the capacity of individuals to obtain and repay consumer loans. Consequently, in the future we may experience higher levels of past due loans, which could result in higher allowances for loan losses.
If we are unable to maintain the quality of our loan portfolio, our financial condition and results of operations may be materially and adversely affected.
As of December 31, 2010, our past due loans were Ch$62,873.0 million, which resulted in a past due loans to total loans ratio of 1.1%. We seek to continue to improve our credit risk management policies and procedures. However, we cannot assure you that our credit risk management policies, procedures and systems are free from any deficiency. Failure of credit risk management policies may result in an increase in the level of non-performing loans and adversely affect the quality of our loan portfolio. In addition, the quality of our loan portfolio may also deteriorate due to various other reasons, including factors beyond our control, such as the macroeconomic factors affecting Chile’s economy. If such deterioration were to occur, it could materially adversely affect our financial conditions and results of operations.
12
The value of the collateral securing our loans may not be sufficient, and we may be unable to realize the full value of the collateral securing our loan portfolio.
The value of the collateral securing our loan portfolio may significantly fluctuate or decline due to factors beyond our control, including macroeconomic factors affecting Chile’s economy. The real estate market is particularly vulnerable to a negative economic climate and this may affect us as real estate represents a significant portion of the collateral securing our residential mortgages loan portfolio. We may also not have sufficiently recent information on the value of collateral, which may result in an inaccurate assessment for impairment losses of our loans secured by such collateral. If this were to occur, we may need to make additional allowances to cover actual impairment losses of our loans, which may materially and adversely affect our results of operations and financial condition.
The effectiveness of our credit risk management is affected by the quality and scope of information available in Chile.
In assessing customers’ creditworthiness, we rely largely on the credit information available from our own internal databases, the Chilean Superintendency of Banks, Dicom (a Chilean nationwide credit data base) and other sources. Due to limitations in the availability of information and the developing information infrastructure in Chile, our assessment of the credit risks associated with a particular customer may not be based on complete, accurate or reliable information. In addition, although we have been improving our credit scoring systems to better assess borrowers’ credit risk profiles, we cannot assure you that our credit scoring systems collect complete or accurate information reflecting the actual behavior of customers or that their credit risk can be assessed correctly. Without complete, accurate and reliable information, we have to rely on other publicly available resources and our internal resources, which may not be effective. As a result, our ability to effectively manage our credit risk may be materially adversely affected.
Our results of operations are affected by interest rate volatility.
Our results of operations depend to a great extent on our net interest income. In 2008, 2009 and 2010, our ratio of net interest income to total operating income was 77.6%, 65.5% and 68.7%, respectively. Changes in market interest rates could affect the interest rates earned on our interest-earning assets differently from the interest rates paid on our interest-bearing liabilities leading to a reduction in our net interest income. Interest rates are highly sensitive to many factors beyond our control, including the reserve policies of the Central Bank, deregulation of the financial sector in Chile, domestic and international economic and political conditions and other factors. Yields on the Chilean government’s 90-day benchmark rate began to rise in the latter part of 2005 and through 2006, 2007, 2008, 2009 and 2010, reaching a high of 5.2% and a low of 4.4% in 2006, a high of 6.2% and a low of 4.6% in 2007, a high of 8.4% and a low of 6.5% in 2008, a high of 7.1% and a low of 0.1% in 2009 and a high of 3.5% and a low of 0.1% in 2010. During 2008, we began to increase our investments in available-for-sale instruments as our current strategy is to build a profitable medium-term portfolio. As of December 31, 2008, 2009 and 2010, we had Ch$576,478.0 million, Ch$737,162.0 million and Ch$746,248.0 million, respectively, in financial investments available-for-sale. Any volatility in interest rates could adversely affect our business, our future financial performance and the market value of our securities.
Since our principal sources of funds are short-term deposits, a sudden shortage of funds could cause an increase in costs of funding and an adverse effect on our revenues.
Deposits and other term deposits are our primary sources of funding, which represent 56.3% of our liabilities. If a substantial number of our depositors withdraw their demand deposits or do not roll over their time deposits upon maturity, our liquidity position, results of operations and financial condition may be materially and adversely affected. We cannot assure you that in the event of a sudden or unexpected shortage of funds, any money markets in which we operate will be able to maintain levels of funding without incurring higher funding costs or the liquidation of certain assets. If this were to happen, our results of operations and financial condition may be materially and adversely affected.
The legal restrictions on the exposure of Chilean pension funds may adversely affect our access to funding.
Chilean regulations impose restrictions on the share of assets that a Chilean pension fund management company (Administradora de Fondos de Pensiones, an “AFP”) may allocate to a single issuer, which is currently 7.0% per fund managed by an AFP (including any securities issued by the issuer and any bank deposits with the issuer). If the exposure of an AFP to a single issuer exceeds the 7.0% limit, the AFP is required to reduce its exposure below the limit within three years. As of December 31, 2010, the aggregate exposure of AFPs to us was approximately Ch$463,747.0 million (US$991.0 million) or 0.7% of their total assets. If the exposure of any AFP to us exceeds the regulatory limit, we would need to seek alternative sources of funding, which could be more expensive and, as a consequence, may have a material adverse effect on our financial condition and results of operations.
13
Pension funds must also comply with other investment limits. Approved legislation in Chile (Reformas al Mercado de Capitales II (also known as MK2)) relaxed the limits on making investments abroad in order to permit pension funds to further diversify their investment portfolios. As of December 31, 2010, the limit on making investments abroad was 60.0% and will gradually increase to 80.0% during 2011. As a result, pension funds may change the composition of their portfolios, including reducing their deposits with local banks. As of December 31, 2010, 10.4% of our time deposits were from AFPs. Although the legislation referred to above is intended to promote a gradual relaxation of the investment limits, and we may be able to substitute the reduced institutional funds with retail deposits, there can be no assurance that this occurrence will not have a materially adverse impact on our business, financial condition and results of operations.
We may be unable to meet requirements relating to capital adequacy.
Chilean banks are required by the General Banking Law to maintain regulatory capital of at least 8.0% of risk-weighted assets, net of required loan loss allowance and deductions, and paid-in capital and reserves (“basic capital”) of at least 3.0% of total assets, net of required loan loss allowances. In order to maintain a high solvency classification from the SBIF, we need to have regulatory capital over 10.0% of risk-weighted assets, and our intention is to have the highest classification from the SBIF. As of December 31, 2010, the ratio of our regulatory capital to risk-weighted assets, net of loan loss allowance and deductions, was 13.4%. Certain developments could affect our ability to continue to satisfy the current capital adequacy requirements applicable to us, including:
| · | the increase of risk-weighted assets as a result of the expansion of our business, |
| · | the failure to increase our capital correspondingly, |
| · | losses resulting from a deterioration in our asset quality, |
| · | declines in the value of our investment instrument portfolio, |
| · | changes in accounting rules, and |
| · | changes in the guidelines regarding the calculation of the capital adequacy ratios of banks in Chile. |
As provided in Article 68 of the General Banking Law, if we fail to comply with the legal requirements relating to the maintenance of regulatory capital (which is comprised of effective net worth and basic capital, as both concepts are defined in such provision), we must comply with such legal requirements within a period of sixty days. For each day we fail to comply with such legal requirements, we may be subject to a daily penalty equal to one thousandth of the deficit of the effective net worth or basic capital, as the case may be.
Our business is highly dependent on proper functioning and improvement of information technology systems.
Our business is highly dependant on the ability of our information technology systems to accurately process a large number of transactions across numerous and diverse markets and products in a timely manner. The proper functioning of our financial control, risk management, accounting, customer service and other data processing systems is critical to our business and our ability to compete effectively. We have backup data for our key data processing systems that could be used in the event of a catastrophe or a failure of our primary systems, and have established alternative communication networks where available. However, we do not operate all of our backup systems on a real time basis and cannot assure you that our business activities would not be materially disrupted if there were a partial or complete failure of any of these primary information technology systems or communication networks. Such failures could be caused by, among other things, software bugs, computer virus attacks or conversion errors due to system upgrading. In addition, any security breach caused by unauthorized access to information or systems, intentional malfunctions or loss or corruption of data, software, hardware or other computer equipment, could have a material adverse effect on our business, results of operations and financial condition.
Our ability to remain competitive and achieve further growth will depend in part on our ability to upgrade our information technology systems and increase our capacity on a timely and cost effective basis. Any substantial failure to improve or upgrade information technology systems effectively or on a timely basis could materially and adversely affect our competitiveness, results of operations and financial condition.
We may experience operational problems or errors.
We, like all large financial institutions, are exposed to many types of operational risks, including the risk of fraud by employees and outsiders, failure to obtain proper authorizations, failure to properly document transactions, equipment failures and errors by employees. Although we maintain a system of operational controls, there can be no assurances that operational problems or errors will not occur and that their occurrence will not have a material adverse impact on our business, financial condition and results of operations.
14
Our anti-money laundering and anti-terrorist financing measures may not prevent third parties from using us as a conduit for those activities, which could have a material adverse effect on our business, financial condition and results of operations.
We believe that we are in compliance with applicable anti-money laundering and anti-terrorist financing laws and regulations and we have adopted various policies and procedures, including internal controls and “know-your customer” procedures, aimed at preventing money laundering and terrorist financing. In addition, because we also rely on our correspondent banks having their own appropriate anti-money laundering and anti-terrorist financing procedures, we use what we believe are commercially reasonable procedures for monitoring our correspondent banks. However, these measures, procedures and compliance may not be entirely effective in preventing third parties from using us (and our correspondent banks) as a conduit for money laundering (including illegal cash operations) or terrorist financing without our (and our correspondent banks’) knowledge or consent. If we were to be associated with money laundering (including illegal cash operations) or terrorist financing, our reputation could be harmed and we could become subject to fines, sanctions or legal enforcement (including being added to any “blacklists” that would prohibit certain parties from engaging in transactions with us), which could have a material adverse effect on our business, financial condition and results of operation.
Banking regulations may restrict our operations and thereby adversely affect our financial condition and results of operations.
We are subject to regulation by the Chilean Superintendency of Banks. In addition, we are subject to regulation by the Central Bank with regard to certain matters, including reserve requirements, interest rates, foreign exchange mismatches and market risks. During the Chilean financial crisis of 1982 and 1983, the Central Bank and the Chilean Superintendency of Banks strictly controlled the funding, lending and general business matters of the banking industry in Chile.
Pursuant to the General Banking Law, all Chilean banks may, subject to the approval of the Chilean Superintendency of Banks, engage in certain businesses other than commercial banking depending on the risk associated with such business and the financial strength of the bank. Such additional businesses include securities brokerage, asset management, securitization, insurance brokerage, leasing, factoring, financial advisory, custody and transportation of securities, loan collection and financial services. The General Banking Law also applies to the Chilean banking system as a modified version of the capital adequacy guidelines issued by the Basel Committee on Banking Regulation and Supervisory Practices and limits the discretion of the Chilean Superintendency of Banks to deny new banking licenses.
As a result of the recent global financial crisis, there has been an increase in government regulation of the financial services industry in many countries. Such regulation may also be increased in Chile, including the imposition of higher capital requirements, heightened disclosure standards and restrictions on certain types of transaction structures. In addition, numerous novel regulatory proposals have been discussed or proposed. If enacted, new regulations could require us to inject further capital into our business, restrict the type or volume of transactions we enter into, or set limits on or require the modification of rates or fees that we charge on certain loans or other products, any of which could lower the return on our investments, assets and equity. We may also face increased compliance costs and limitations on our ability to pursue certain business opportunities.
There can be no assurance that regulators will not in the future impose more restrictive limitations on the activities of banks, including us. Any such change could have a material adverse effect on our financial condition or results of operations.
Historically, Chilean banks have not paid interest on amounts deposited in checking accounts. However, since June 1, 2002, the Central Bank has allowed banks to pay interest on checking accounts. Currently, there are no applicable restrictions on the interest that may be paid on checking accounts. We have paid interest on some checking accounts under certain conditions. If competition or other factors lead us to pay interest on checking accounts, to relax the conditions under which we pay interest or to increase the number of checking accounts on which we pay interest, any such change could have a material adverse effect on our financial condition or results of operations.
We are subject to regulatory inspections and examinations.
We are also subject to various inspections, examinations, inquiries, audits and other regulatory requirements by Chilean regulatory authorities. We cannot assure you that we will be able to meet all of the applicable regulatory requirements and guidelines, or that we will not be subject to sanctions, fines, restrictions on our business or other penalties in the future as a result of noncompliance. If sanctions, fines, restrictions on our business or other penalties are imposed on us for failure to comply with applicable requirements, guidelines or regulations, our business, financial condition, results of operations and our reputation and ability to engage in business may be materially and adversely affected.
15
RISKS RELATING TO CHILE
The occurrence of natural disasters in the regions where we operate could impair our ability to conduct business effectively and could impact our results of operations.
We are exposed to the risk of natural disasters such as the earthquake in 2010 as well as tsunamis and volcanic eruptions in the regions where we operate. In the event of a natural disaster, unanticipated problems with our disaster recovery systems could have a material adverse impact on our ability to conduct business in the affected region, particularly if those problems affect our computer-based data processing, transmission, storage and retrieval systems and destroy valuable data. In addition, if a significant number of our local employees and managers were unavailable in the event of a disaster, our ability to effectively conduct business could be severely compromised. A natural disaster, such as the earthquake in 2010, could damage some of our branches and ATMs, forcing us to close damaged facilities or locations, increased recovery costs as well as cause economic harm to our clients. A natural disaster or multiple catastrophic events could have a material adverse effect on local businesses in the affected region and could result in substantial volatility or adverse harm in our business, financial condition and results of operations for any fiscal quarter or year.
Our growth and profitability depend on the level of economic activity in Chile and other emerging markets.
A substantial amount of our loans are to borrowers doing business in Chile. Accordingly, the recoverability of these loans in particular, our ability to increase the amount of loans outstanding and our results of operations and financial condition in general, are dependent to a significant extent on the level of economic activity in Chile. The Chilean economy has been influenced, to varying degrees, by economic conditions in other emerging market countries. Changes in Chilean economic growth in the future or future developments in or affecting the Chilean economy, including consequences of economic difficulties in Brazil, and other emerging markets or a deceleration in the economic growth of Asian or other developed nations to which Chile exports a majority of its goods, could materially and adversely affect our business, financial condition or results of operations.
According to data published by the Central Bank, the Chilean economy grew at a rate of 3.2%, fell by 1.9% and grew by 5.2% (estimated) in 2008, 2009 and 2010, respectively. Historically, lower economic growth has adversely affected the overall asset quality of the Chilean banking system and our loan portfolio. Below is a detail of the of the risk index of the banks comprising the Chilean financial system according to information published by the Chilean Superintendency of Banks:
| Year ended December 31, | Risk Index |
| 2008(1) | 1.7% |
| 2009(1) | 2.4% |
| 2010(1) | 2.5% |
| (1) | As of January 1, 2008, the Chilean Superintendency of Banks publishes monthly consolidated financial information. Prior to 2008, the Chilean Superintendency of Banks published unconsolidated information. Index includes contingent loans and allowances. |
See “Item 4. Information on the Company—Business Overview—Selected Statistical Information—Risk Index of Our Loan Portfolio” for a definition of “risk index.” Our results of operations and financial condition could also be affected by changes in economic or other policies of the Chilean government, which has exercised and continues to exercise a substantial influence over many aspects of the private sector, or other political or economic developments in Chile.
��
Although economic conditions are different in each country, investors’ reactions to developments in one country may affect the securities of issuers in other countries, including Chile. Starting in September 2008, the economic and financial crisis in the United States and Europe sparked a series of financial institution failures throughout the globe. This resulted in a liquidity crisis and a reduction in growth of the global economy as financial institutions tightened risk policies and reduced lending to banks, corporations and individuals. Consequently, Chile was affected by a strong decrease in growth during the fourth quarter of 2008 and in 2009 as its trading partners entered into recession affecting local corporate sales, employment levels, plans for investment and the price of exports. In 2010, the Chilean economy recovered with high levels of growth, low unemployment, low inflation and low interest rates, that contributed to the positive trends of the banking industry during 2010. Nonetheless, a global financial crisis could affect the Chilean economy and have a material adverse effect on our financial condition, results of operations and the market value of our securities.
16
In addition, our financial condition and results of operations could also be affected by regulatory changes in administrative practices, changes in economic or other policies of the Chilean government or other political or economic developments in or affecting Chile, over which we have no control.
Economic and political problems encountered by other countries may adversely affect the Chilean economy, our results of operations and the market value of our securities.
The market value of securities issued by Chilean companies, including banks, are to varying degrees influenced by economic and market considerations in other countries. We cannot assure you that future developments in or affecting the Chilean economy, including consequences of economic difficulties in other markets, will not materially and adversely affect our business, financial condition or results of operations.
We are directly exposed to risks related to the weakness and volatility of the economic and political situation in Latin America, especially in Argentina and Brazil. If Argentina’s economic environment significantly deteriorates or does not improve, the economy in Chile, as both a neighboring country and a trading partner, could also be affected and could experience slower growth than in recent years. If there are cuts in gas exports from Argentina to Chile, as there has been in prior years, it could adversely affect economic growth in Chile. This could result in the need for us to increase our allowances for loan losses, thereby adversely affecting our financial results, our results of operations and the market value of our securities. Crises and political uncertainties in other Latin American countries could also have a material adverse effect on Chile, the market value of our securities or our business.
Current economic conditions may make it more difficult for us to continue funding our business on favorable terms.
Historically, one of our principal sources of funds has been time deposits. Time deposits represented 58.7%, 56.4% and 56.3% of our total liabilities as of December 31, 2008, 2009 and 2010, respectively. Large-denominations in time deposits from institutional investors may, under some circumstances, be a less stable source of funding than savings and bonds, such as during periods of significant changes in market interest rates for these types of deposit products and any resulting increased competition for such funds. Recent limitations on liquidity triggered by the world economic crisis starting in 2008 has impacted global markets and affected sources of funding, including time deposits. As of December 31, 2010, our investment portfolio did not contain instruments (i) backed by, or otherwise related to, U.S. subprime mortgages, or (ii) with exposure to monoline financial guarantors. Although our results of operations and financial position have not suffered a significant impact as a consequence of the recent credit market instability in the U.S. and the liquidity available in the Chilean market has permitted us to fund our operations and maintain our regular business activities, we cannot assure you that we will be able to continue funding our business or, if so, maintain our current levels of funding without incurring higher funding costs or having to liquidate certain assets. See “Item 5. Operating and Financial Review and Prospects—Operating Results—Recent Developments in the Banking Industry”.
Deceleration of economic growth in Asia, the United States and other developed nations may have an adverse effect on the Chilean economy, on our business, financial condition and results of operations and the market value of our ADSs and common shares.
We are directly exposed to risks related to the weakness and volatility of the economic and political situation in Asia, the United States and other developed nations, including the global economic world crisis that still affects part of the world, especially Europe. If these nations’ economic environments deteriorate, the economy in Chile could also be affected and could experience slower growth than in recent years thereby adversely affecting our business, financial condition and results of operations as well as the market value of our securities.
Currency fluctuations could adversely affect our financial condition and results of operations and the value of our ADSs and common shares.
The Chilean government’s economic policies and any future changes in the value of the peso against the U.S. dollar could affect the dollar value of our securities. The peso has been subject to significant devaluations in the past and could be subject to similar fluctuations in the future. As of December 31, 2008, the peso depreciated against the U.S. dollar by 28.0% as compared to 2007. In 2009, the peso appreciated against the U.S. dollar by 20.4% as compared to 2008. As of December 31, 2010, the peso appreciated against the U.S. dollar by 7.4% as compared to 2009.
Our results of operations may be affected by fluctuations in exchange rates between the peso and the dollar despite our policy and Chilean regulations relating to the general avoidance of material exchange rate gaps. Entering into forward exchange transactions enables us to reduce the negative impact of material gaps between the balances of our foreign currency-denominated assets and liabilities. As of December 31, 2008, 2009 and 2010, the gap between foreign currency denominated assets and foreign currency denominated liabilities, excluding derivatives, was Ch$(158,770.0) million, Ch$(279,942.0) million and Ch$(444,175.0) million, respectively.
17
We may decide to change our policy regarding exchange rate gaps. Regulations that limit such gaps may also be amended or eliminated. Greater exchange rate gaps will increase our exposure to the devaluation of the peso, and any such devaluation may impair our capacity to service our foreign-currency obligations and may, therefore, materially and adversely affect our financial condition and results of operations. Notwithstanding the existence of general policies and regulations that limit material exchange rate gaps, the economic policies of the Chilean government and any future fluctuations of the peso against the dollar could affect our financial condition and results of operations.
Trading transactions in Chile of the common shares underlying our ADSs are denominated in pesos. Cash distributions with respect to our common shares are received in pesos by the depositary, which then converts such amounts to U.S. dollars at the then-prevailing exchange rate for the purpose of making payments in respect of our ADSs. If the value of the peso falls relative to the U.S. dollar, the dollar value of our ADSs and any distributions to be received from the depositary will be reduced. In addition, the depositary will incur customary currency conversion costs (to be borne by the holders of our ADSs) in connection with the conversion and subsequent distribution of dividends or other payments.
Chile’s banking regulatory and capital markets environment is continually evolving and may change.
Changes in banking regulations may materially and adversely affect our business, financial condition and results of operations. Chilean laws, regulations, policies and interpretations of laws relating to the banking sector and financial institutions are continually evolving and changing. In 2007, new regulations governing the Chilean capital markets were approved (Reformas al Mercado de Capitales II (also known as MK2)). These regulations, among other things, modified certain provisions set forth in the General Banking Law. Under new legislation, the limit on the amount that a bank is allowed to grant as an unsecured loan to a single individual or entity was increased to 10.0% of regulatory capital (and up to 30.0% of regulatory capital if any loans granted in excess of the 10.0% is secured by collateral). Previously, these limits were set at 5.0% and 25.0%, respectively. Although any such increase may increase our lending activity, it may also increase the risks associated with the growth of our loan portfolio and increase competition as the number of banks that can compete in the corporate segment increases.
In June 2010, additional regulations governing the Chilean capital markets, called Reforma al Mercado de Capitales III (also known as MK3), were approved. MK3, among other things, allows non-Chilean banks with representative offices in Chile to directly promote the credit products and services of their parent companies. Previously, these representative offices could only act as intermediaries between their parent companies and local companies. This change may further increase competition by increasing the number of banks that can compete directly in Chile.
Inflation could adversely affect our financial condition and results of operations.
Inflation in Chile gained momentum in 2008, reaching 7.1%. However, economic activity slowed significantly in 2009, resulting in 1.4% deflation. Economic growth increased in 2010, ending the year with 3.0% inflation, in part supported by additional government and private sector spending to finance the reconstruction work required to restore Chile’s productive capacity and financial aid to the areas affected by the 2010 earthquake and tsunami. The Central Bank increased the interbank rate to 1.5% in July 2010, and further to 2.0% in August 2010 in response to an increase in inflation expectations driven by increased economic activity. In 2010, the Central Bank continued increasing the interbank rate in September, October, November and December to 2.50%, 2.75%, 3.00% and 3.25%, respectively. High levels of inflation or deflation in Chile could adversely affect the Chilean economy and have an adverse effect on our business, financial condition and results of operations.
Increased regulation of the financial services industry in Chile could increase our costs and result in lower profits.
As a result of the recent financial crisis, there has been an increase in government regulation of the financial services industry in many countries. Such regulation may also be increased in Chile, including the imposition of higher capital requirements, heightened disclosure standards and restrictions on certain types of transaction structures. In addition, novel regulatory proposals are abound in the current environment. If enacted, new regulations could require us to inject further capital into our business as well as in businesses we acquire, restrict the type or volume of transactions we enter into, or set limits on or require the modification of rates or fees that we charge on certain loans or other products, any of which could lower the return on our investments, assets and equity. Although we currently comply with the minimum regulatory capital ratio required under the Chilean banking regulation, no assurance can be given that in the future we will need to inject additional capital to our business if such regulation is amended. We may also face increased compliance costs and limitations on our ability to pursue certain business opportunities.
A worsening of labor relations in Chile could impact our business.
As of December 31, 2010, on a consolidated basis we had 3,422 employees, of which 45.6% were unionized. We generally apply the terms of our collective bargaining agreement to unionized and non-unionized employees. We have traditionally enjoyed good relations with our employees and their unions, but we cannot assure you that in the future a strengthening of cross-industry labor movements will not result in increased employee or labor costs that could materially and adversely affect our business, financial condition or results of operations.
18
Any downgrading of Chile’s debt credit rating for domestic and international debt by international credit rating agencies may also affect our ratings, our business, our future financial performance, stockholders’ equity and the value of our securities.
Any adverse revisions to Chile’s credit ratings for domestic and international debt by international rating agencies may adversely affect our ratings, and, as a result, our cost of funding, including interest rates paid on our deposits and securities. If this were to happen, it could have a material adverse effect on our business, future financial performance, stockholders’ equity and the value of our securities.
Chile has different corporate disclosure and accounting standards than those you may be familiar with in the United States.
As a regulated financial institution, we are required to submit to the Chilean Superintendency of Banks unaudited consolidated and unconsolidated balance sheets and income statements, excluding any related footnote disclosure on a monthly basis. As of January 2008, the statements have to be prepared in accordance with Circular No. 3,410 “Compendium of Accounting Standards” and the rules of the Chilean Superintendency of Banks. The Chilean Superintendency of Banks also makes summary financial information available within four weeks of receipt. Although Chilean banks are required to apply IFRS as issued by the IASB as of January 1, 2009, certain exceptions introduced by the SBIF prevent banks from achieving full convergence. In those situations which are not addressed by the guidance issued by the Chilean Superintendency of Banks, institutions must follow the generally accepted accounting principles issued by the Association of Chilean Accountants, which coincide with IFRS as issued by the IASB. However, in order to comply with the requirements of the SEC, our consolidated annual financial statements as of and for the three years ended December 31, 2008, 2009 and 2010 have been prepared under IFRS as issued by the IASB in order to comply with the SEC requirements.
The securities laws of Chile, which govern open, or publicly listed, companies such as ours, have as a principal objective promoting disclosure of all material corporate information to the public. Chilean disclosure requirements, however, differ from those in the United States in some important respects. In addition, although Chilean law imposes restrictions on insider trading and price manipulation, applicable Chilean laws are different from those in the United States and in certain respects the Chilean securities markets are not as highly regulated and supervised as the U.S. securities markets.
Our status as a controlled company and a foreign private issuer exempts us from certain of the corporate governance standards of the NYSE, limiting the protections afforded to investors.
We are a “controlled company” and a “foreign private issuer” within the meaning of the NYSE corporate governance standards. Under the NYSE rules, a controlled company is exempt from certain NYSE corporate governance requirements. In addition, a foreign private issuer may elect to comply with the practice of its home country and not to comply with certain NYSE corporate governance requirements, including the requirements that (1) a majority of the Board of Directors consist of independent directors, (2) a nominating and corporate governance committee be established that is composed entirely of independent directors and has a written charter addressing the committee’s purpose and responsibilities, (3) a compensation committee be established that is composed entirely of independent directors and has a written charter addressing the committee’s purpose and responsibilities, and (4) an annual performance evaluation of the nominating and corporate governance and compensation committees be undertaken. We currently use these exemptions and intend to continue using these exemptions. Accordingly, you will not have the same protections afforded to investors in companies that are subject to all NYSE corporate governance requirements. See “Item 16G. Corporate Governance” for a comparison of the corporate governance standards of the New York Stock Exchange and Chilean practice.
We cannot assure you of the accuracy or comparability of facts, forecasts and statistics contained in this report with respect to Chile, its economy and banking industry.
Facts, forecasts and statistics in this document relating to Chile, Chile’s economy and the Chilean banking industry, including market share information, are derived from various official and other publicly available sources that we generally believe to be reliable. However, we cannot guarantee the quality and reliability of such official and other sources of materials. In addition, these facts, forecasts and statistics have not been independently verified by us and, therefore, we make no representation as to the accuracy of such facts, forecasts and statistics, which may not be consistent with other information compiled within or outside of Chile and may not be complete or up to date. We have taken reasonable care in reproducing or extracting the information from such sources. However, because of possibly flawed or ineffective methodologies underlying the published information or discrepancies between the published information and market practice and other problems, these facts, forecasts or statistics may be inaccurate and may not be comparable from period to period or to facts, forecasts or statistics produced for other economies, and you should not unduly rely upon them.
19
Chile imposes controls on foreign investment and repatriation of investments that may affect your investment in, and earnings from, our ADSs.
Equity investments in Chile by persons who are not Chilean residents have generally been subject to various exchange control regulations which restrict the repatriation of the investments and earnings therefrom. In April 2001, the Central Bank eliminated the regulations that affected foreign investors except that investors are still required to provide the Central Bank with information related to equity investments and conduct such operations within the Formal Exchange Market. See “Item 10. Additional Information—Exchange Controls” for a discussion of the types of information required to be provided.
Owners of ADSs are entitled to receive dividends on the underlying shares to the same extent as the holders of shares. Dividends received by holders of ADSs will be converted into U.S. dollars and distributed net of foreign currency exchange fees and fees of the depositary and will be subject to Chilean withholding tax, currently imposed at a rate of 35.0% (subject to credits in certain cases). If for any reason, including changes in Chilean laws or regulations, the depositary were unable to convert pesos to U.S. dollars, investors may receive dividends and other distributions, if any, in pesos.
Additional Chilean restrictions applicable to holders of our ADSs, the disposition of the shares underlying them or the repatriation of the proceeds from such disposition or the payment of dividends could be imposed in the future and we cannot advise you as to the duration or impact of such restrictions if imposed.
Increase in income tax rate.
Like all Chilean companies, we are subject to income tax at a rate of 17.0% of our taxable income. Since the earthquake of 2010, the Chilean government has found it necessary to raise funds in order to finance the reconstruction of the affected areas. As a result, the income tax rate is scheduled to temporarily increase to 20.0% in 2011 and will be reduced to 18.5% in 2012, returning to 17.0% in 2013.
RISKS RELATING TO OUR ADSs
There may be a lack of liquidity and market for our ADSs and common shares.
A lack of liquidity in the markets may develop for our ADSs, which would negatively affect the ability of the holders to sell our ADSs or the price at which holders of our ADSs will be able to sell them. Future trading prices of our ADSs will depend on many factors including, among other things, prevailing interest rates, our operating results and the market for similar securities.
Our common shares underlying the ADSs is listed and traded on the Santiago Stock Exchange and the Chilean Electronic Exchange, although the trading market for the common shares is small by international standards. As of December 31, 2010, we had 226,909,290,577 common shares. The Chilean securities markets are substantially smaller, less liquid and more volatile than major securities markets in the United States. In addition, according to Article 14 of the Ley de Mercado de Valores, Ley No. 18,045, or the Chilean Securities Market Law, the Superintendencia de Valores y Seguros, or the Chilean Superintendency of Securities and Insurance, may suspend the offer, quotation or trading of shares of any company listed on the Chilean stock exchanges for up to 30 days if, in its opinion, such suspension is necessary to protect investors or is justified for reasons of public interest. Such suspension may be extended for up to 120 days. If, at the expiration of the extension, the circumstances giving rise to the original suspension have not changed, the Chilean Superintendency of Securities and Insurance will then cancel the relevant listing in the registry of securities. Furthermore, the Santiago Stock Exchange may inquire as to any movement in the price of any securities in excess of 10.0% and suspend trading in such securities for a day if it is deemed necessary. These and other factors may substantially limit your ability to sell the common shares underlying your ADSs at a price and time at which you wish to do so.
Certain actions by our principal shareholder may have an adverse effect on the future market value of our ADSs and common shares and may have interests that differ from those of our other shareholders.
The controlling shareholder of Corp Group Banking S.A. is Mr. Alvaro Saieh Bendeck. As of December 31, 2010, together with members his family, Mr. Saieh Bendeck maintains in an indirect ownership of 75.6% of Corp Group Banking S.A. and approximately 49.6% of Corpbanca’s outstanding common shares. In addition, Mr. Saieh Bendeck with his family are holders of 100.0% of the ownership rights of Compañía Inmobiliaria y de Inversiones Saga S.A. and SG Inversiones Bancarias Limitada. The sale or disposition by Mr. Saieh Bendeck of our ADSs or common shares that he indirectly owns, or the perception in the marketplace that such a sale or disposition may occur, may adversely affect the trading price of our shares on the Santiago Stock Exchange and, consequently, the market value of the ADSs. In addition, Mr. Saieh Bendeck holds shares with sufficient voting power under Chilean law to approve substantially all of the forms of corporate action subject to decision by shareholders’ meetings, including the distribution of dividends, to elect a majority of the nine members of our board of directors, direct our management and control substantially all matters that are to be decided by a vote of shareholders, including fundamental corporate transactions.
20
You may be unable to exercise preemptive rights.
The Ley Sobre Sociedades Anónimas, Ley No. 18,046 and the Reglamento de Sociedades Anónimas, which we refer to collectively as the Chilean Corporations Law, and applicable regulations require that whenever we issue new common shares for cash, we are obligated by law to grant preemptive rights to all of our shareholders (including the depositary on behalf of the holders of ADSs), giving them the right to purchase a sufficient number of shares to maintain their existing ownership percentage. However, we may not be able to offer shares to United States holders of ADSs pursuant to preemptive rights granted to our shareholders in connection with any future issuance of common shares unless a registration statement under the U.S. Securities Act of 1933, as amended, or the Act, is effective with respect to such rights and common shares, or an exemption from the registration requirements of the Act is available.
You may have fewer and less well defined shareholders’ rights than with shares of a company in the United States.
Our corporate affairs are governed by our estatutos, or by-laws, and the laws of Chile. Under such laws, our shareholders may have fewer or less well-defined rights than they might have as shareholders of a corporation incorporated in a U.S. jurisdiction. For example, under legislation applicable to Chilean banks, our shareholders would not be entitled to appraisal rights in the event of a merger or other business combination undertaken by us.
Holders of ADSs are not entitled to attend shareholders’ meetings, and they may only vote through the depositary.
Under Chilean law, a shareholder is required to be registered in our shareholders’ registry at least five business days before a shareholders’ meeting in order to vote at such meeting. A holder of ADSs will not be able to meet this requirement and accordingly is not entitled to vote at shareholders’ meetings because the shares underlying the ADSs will be registered in the name of the depositary. While a holder of ADSs is entitled to instruct the depositary as to how to vote the shares represented by ADSs in accordance with the procedures provided for in the deposit agreement, a holder of ADSs will not be able to vote its shares directly at a shareholders’ meeting or to appoint a proxy to do so. In certain instances, a discretionary proxy may vote our shares underlying the ADSs if a holder of ADSs does not instruct the depositary with respect to voting.
It may be difficult to enforce civil liabilities against us or our directors, officers and controlling persons.
We are organized under the laws of Chile, and nearly all of our directors, officers and controlling persons reside outside the United States. In addition, all or a substantial portion of our assets are located in Chile. As a result, it may not be possible for investors to effect service of process within the United States on such persons or to enforce judgments against them, including in any action based on civil liabilities under the U.S. federal securities laws. There is doubt as to the enforceability against such persons in Chile, whether in original actions or in actions to enforce judgments of U.S. courts, of liabilities based solely on the U.S. federal securities laws.
In order for ADS holders to enforce, in Chilean courts, judgments obtained in the U.S. courts against us or our directors and executive officers based on the civil liability provisions of the U.S. federal securities laws, an exequatur (i.e., recognition and enforcement of the foreign judgment) must be obtained; provided, however, that a U.S. court granted a final judgment in the action based on the civil liability provisions of U.S. federal securities laws. Such exequatur shall be obtained in accordance with Chilean civil procedure law currently in force, and consequently, subject to the satisfaction of certain factors. The most important of these factors are the existence of reciprocity treaties between the countries, the absence of a conflicting judgment by a Chilean court relating to the same parties and arising from the same facts and circumstances and the Chilean courts’ determination that the U.S. courts had jurisdiction, that process was appropriately served on the defendant, that the enforcement is in full force in the foreign country and that enforcement would not violate Chilean public policy. Failure to satisfy any of such requirements may result in non-enforcement of your rights.
A. HISTORY AND DEVELOPMENT OF THE COMPANY
We are a sociedad anónima (corporation) organized under the laws of the Republic of Chile and licensed by the Chilean Superintendency of Banks to operate as a commercial bank. Our principal executive offices are located at Rosario Norte 660, Las Condes, Santiago, Chile. Our telephone number is 56-2-660-8000 and our website is www.corpbanca.cl. Our agent in the United States is Fernando Burgos Concha, located at 845 Third Avenue, 5th Floor, New York, NY 10022-6601. Information set forth on our website does not constitute a part of this Annual Report. Corpbanca and all our subsidiaries are organized under the laws of Chile. The terms “Corpbanca,” “the bank,” “we,” “us” and “our” in this Annual Report refer to Corpbanca together with its subsidiaries unless otherwise specified.
21
History
Corpbanca is Chile’s oldest currently operating private bank. We were founded as Banco de Concepción in 1871 by a group of residents of the City of Concepción, Chile, led by Aníbal Pinto, who would later become President of Chile. In 1971, Banco de Concepción was transferred to a government agency, Corporación de Fomento de la Producción (the Chilean Corporation for the Development of Production, or CORFO). Also in 1971, Banco de Concepción acquired Banco Francés e Italiano in Chile, which provided for the expansion of Banco de Concepción into Santiago. In 1972 and 1975, the bank acquired Banco de Chillán and Banco de Valdivia, respectively. In November 1975, CORFO sold its shares of the bank to private business persons, who took control of the bank in 1976. In 1980, the name of the bank was changed to Banco Concepción. In 1983, control of Banco Concepción was assumed by the Chilean Superintendency of Banks. The bank remained under the control of the Chilean Superintendency of Banks through 1986, when it was acquired by Sociedad Nacional de Minería (the Chilean National Mining Society, or SONAMI). Under SONAMI’s control, Banco Concepción focused on providing financing to small- and medium-sized mining interests, increased its capital and sold a portion of its high-risk portfolio to the Central Bank. Investors led by Mr. Alvaro Saieh Bendeck purchased a majority interest of Banco Concepción from SONAMI in 1996. For over 20 years, Mr. Saieh Bendeck has directed the acquisition, creation and operation of a number of commercial banks, mutual fund companies, insurance companies and other financial entities in Chile and other parts of Latin America.
Following our acquisition in 1996, we began to take significant steps to improve our credit risk policies, increase operating efficiency and expand our operations. These steps included applying stricter provisioning and charge-off standards to our loan portfolio, cost cutting measures and technological improvements. We also changed our name to Corpbanca and hired a management team with substantial experience in the Chilean financial services industry. Several of our senior officers, prior to joining Corpbanca, were employed by Banco Osorno y La Union prior to its merger with Banco Santander-Chile in 1996. In addition, we significantly expanded our operations in 1998 through the acquisition of the consumer loan division of Corfinsa (which was formerly a consumer loan division of Banco Sudamericano, currently Scotiabank Sudamericano) and the finance company Financiera Condell S.A. In November 2002, we completed the largest equity capital-raising transaction in Chile in that year, providing us with Ch$111,732.0 million (approximately US$238.9 million using the exchange rate that was in effect as of December 31, 2002) in capital to help implement our growth strategies. During this time, we consolidated our information technology systems into a single, integrated platform, Integrated Banking System, or IBS, a central information system that replaced a number of systems, providing us with a single, central electronic database that gives us up-to-date customer information in each of our business lines and calculates net earnings and profitability of each product and client segment.
As a result of the steps we have taken since the 1996 acquisition, we have developed a number of significant competitive strengths that we believe will continue to contribute to our growth potential. These include operating efficiencies, improved asset quality, an experienced management team, and a strong technological infrastructure. In addition, our asset quality, as reflected by our risk index and our risk classification by the Chilean Superintendency of Banks, is comparable to that of our principal competitors, and our adequate capitalization places us in a strong position among Chilean banks in terms of ability to fund growth, especially with the placement of subordinated bonds. In recent years, our cost of funding has decreased as a result of improvements in our ratings. We believe that these strengths position us well for continued growth in the Chilean financial services industry.
As of December 31, 2010, our gross loan portfolio amounted to Ch$5,469,195.0 million, as compared to Ch$4,956,500.0 million (nominal) and Ch$5,011,656.0 million (nominal) in 2008 and 2009, respectively, representing a compounded annual growth rate of 11.4% in nominal terms. For that period, we had total loans of Ch$5,469,195.0 million (approximately US$11,691.8 million), deposits of Ch$3,700,454.0 million (approximately US$7,910.7 million) and allowances for loan losses of Ch$104,215.0 million (excluding allowances and impairment for foreign bank loans) (approximately US$222.8 million). During the last years, our consolidated efficiency ratio (operating expenses as a percentage of operating income which is the aggregate of net interest income, net fees and income from services and net other operating income) was 44.7%, 41.5% and 40.6% in 2008, 2009 and 2010, respectively.
As of December 31, 2010, we had total assets of Ch$7,130,840.0 million (approximately US$15.0 billion), shareholders’ equity (excluding net income for the year to date) of Ch$426,764.0 million (approximately US$918.6 million) and our return on average shareholders’ equity was 25.1%. In 2010, we had net interest income of Ch$224,410.0 million (approximately US$480.0 million), net income of Ch$121,573.0 million (approximately US$260.0 million) and provisions for loan losses of Ch$52,351.0 million (approximately US$111.9 million).
Capital Expenditures
The following table reflects our capital expenditures in the years ended December 31, 2008, 2009 and 2010:
22
| For the Year Ended December 31, | ||||||
| 2008 | 2009 | 2010 | ||||
| (in millions of Ch$ as of December 31, 2010) | ||||||
| Land and buildings | Ch$ 5,039 | Ch$ 2,895 | Ch$ 770 | |||
| Machinery and equipment | 1,133 | 3,506 | 1,580 | |||
| Furniture and fixtures | ___ | ___ | ___ | |||
| Vehicle | ___ | ___ | ___ | |||
| Other | 3,298 | 4,655 | 3,590 | |||
| Total | Ch$ 9,470 | Ch$ 11,056 | Ch$ 5,940 | |||
Capital divestitures resulted in a gain in sale of property, plant and equipment amounting to Ch$557.0 million as of December 31, 2010 as compared to Ch$5.0 million in 2009. See note 32 of our audited consolidated financial statements included herein.
As of December 31, 2010, capital expenditures totaled Ch$5,940.0 million which was mainly due to the purchase of computer equipment and information technology projects. Capital expenditures are financed through our own funds.
Strategy
Our primary business objectives include enhancing our market position in the Chilean financial services industry in terms of profitability, market share, service coverage and by providing high quality financial products and services through efficient distribution channels to our customer base. We intend to achieve these objectives through the following strategies:
Continue to grow our operations profitably
We seek to achieve organic growth by offering competitive products and services in all of our lines of business. We believe that our strong franchise in the retail banking segment offers us the potential for significant growth in our loan portfolio. We are also focusing our marketing efforts on potential clients among small and medium-sized companies, large corporate clients and private banking customers. As part of our growth strategy, we plan to increase our retail banking operations in lower income segments. We also intend to leverage our investment in SMU Corp by issuing Corpbanca credit cards to be used at Unimarc stores operated by our SMU Corp joint venture partner, installing our ATM machines and distributing our banking products in Unimarc stores throughout Chile, depending on the SBIF’s authorization. In addition, we may seek to expand through strategic acquisitions and joint ventures.
Capitalize on customer loyalty through cross-selling
We intend to increase our market share and profitability by continuing to cross-sell services and products to our existing clients. We have instituted processes that facilitate our ability to offer additional financial services to our clients, which we believe will increase our revenues obtained from fees for services. In addition, we cross-sell loan products to our checking and savings account customers that are tailored to their individual needs and financial situation.
Actively manage risk exposure
We have a dedicated risk management team that focuses on monitoring risks across all areas of our business. Our Retail Risk and Companies Risk divisions participate actively in the establishment of credit policies, approvals, monitoring, collections, and operational risk associated with our business. Our Risk Committee meets periodically review and consider proposed loans. We intend to continue to maintain what we believe to be conservative credit approval standards and reserve policies, enabling us to minimize the risk of ultimate loss. As of December 31, 2010, we had allowances for loan losses of Ch$104,215.0 million (excluding allowances and impairment for foreign bank loans), representing 1.9% of total loans, and charge-offs for 2010 of Ch$61,926.0 million, representing 1.2% of average loans for the period.
Increase operating efficiency through technological advances
We seek to increase operating efficiency by continuing to reduce costs, broadening our array of distribution channels and enhancing our distribution network through the adoption of cost-saving technologies. We continue to update our branch operations to allow for an increased level of customer “self-help.” We are also working to increase use of internet banking by our customers. Currently, our customers are able to obtain account information, make bill payments, transfer funds and perform other transactions through our internet site. Our internet clients increased 12.4% in 2010 from 2009. We have also implemented a central information system that provides us with a single, central electronic database that gives us up-to-date customer information in each of our business lines and calculates net earnings and profitability of each transaction, product and client segment. This system has resulted in additional cost savings. Furthermore, we have implemented a management information system (MIS). Through which we are able to assess the profitability of our customer relationships by analyzing and monitoring our customers, products, branches and divisions individually or as a whole. We believe that these tools along with other technological advances will continue to improve our cost structure by minimizing the number of transactions that are initiated through our traditional branch network while at the same time responding to our customers’ evolving needs.
23
Focus on building customer satisfaction
The quality of service that we provide our customers is key to our growth strategy. We not only focus on gaining new customers, but on strengthening and establishing long-term relationships. This requires us to identify and understand the needs of our clients and in turn measure their satisfaction. We continue to develop new processes and technological solutions to provide our clients with excellent customer service. In order to achieve our goal, we recently established a new division that is exclusively focused on customer satisfaction.
Ownership Structure
The following diagram shows our ownership structure as of December 31, 2010:

Share Repurchase Program
On April 15, 2008, at an extraordinary shareholders’ meeting, our shareholders approved a program for Corpbanca to purchase shares issued by us, or the Share Repurchase Program, to be purchased in the local Chilean market through one or more tender offers in accordance with article 198 subsection 5 of the Securities Market Law. The purpose of the Share Repurchase Program is to invest and trade our own shares depending on share price fluctuations experienced throughout the duration of the Program. The main terms and conditions of the Share Repurchase Program are set forth as follows:
| · | The maximum percentage of shares to be repurchased will be equivalent to 5.0% of the shares issued and paid and outstanding, or up to 11,345,464,528 shares. Shares may only be repurchased for up to the amount of retained earnings. |
| · | The minimum repurchase price to be paid for the shares will be Ch$2.90 per share and the maximum repurchase price will be Ch$3.05 per share. |
· | The Share Repurchase Program will have a term of three years beginning on April 15, 2008. |
· | Shares repurchased must be sold within 24 months of acquisition. Any shares not resold during this time frame will be cancelled, resulting in a reduction of paid-in capital. |
· | If shares are resold, shareholders have a preemptive right to acquire the repurchased shares. |
· | Repurchased shares, although registered in our name, do not have voting or dividend rights. |
On April 22, 2008, our Board of Directors, acting as authorized by our shareholders at the extraordinary shareholders’ meeting held on April 15, 2008, agreed to the following:
· | To set the repurchase price of the shares at Ch$3.03 per share. |
24
· | That the number of shares to be offered in the Share Repurchase Program will be 5,672,732,264 shares, which represent 2.5% of our total issued and outstanding shares. |
· | The share acquisition process will be carried out in accordance with the terms and conditions approved by the Shareholders at the extraordinary shareholders’ meeting through one or more tender offers (Ofertas Públicas de Adquisición de Acciones) in accordance with article 198 subsection 5 of the Securities Market Law, and Circular No. 1,514 of the Superintendency of Securities and Insurance and applicable law in the Securities Exchange of the Santiago Stock Exchange. |
· | The offer commenced on April 30, 2008, for a period of 30 days. |
· | The tender offer expired on May 29, 2008, and 6,849,927,252 shares were tendered. |
· | As acceptance orders were received for more shares than the number of shares offered to be purchased, in accordance with the conditions of the offer, a pro rata factor of 0.828144892 was applied. |
· | The total number of shares repurchased and held as treasury stock was 5,672,732,264, reducing our total shares outstanding to 221,236,558,313. |
Preferred Offering of Shares
On October 15, 2009, at an extraordinary shareholders’ meeting, our shareholders authorized the sale of up to 5,672,732,264 shares, equivalent to 2.5% of our share capital, which would be offered to those shareholders registered in the respective shareholders’ registry 5 business days prior to the sale prorated based on their share participation. On November 24, 2009, our Board of Directors, acting as authorized by our shareholders at the extraordinary shareholders’ meeting held on October 15, 2009 (i) set the price of each share to be issued at an amount to be equal to Ch$3.50, (ii) set December 6, 2009 as the commencement date of the first preferred offering period and January 4, 2010 as the expiration date, (iii) set January 5, 2010 as the commencement date of the second preferred offering period and February 18, 2010 as the expiration date, and (iv) the rest of the shares were auctioned on April 21, 2010. A total of 5,672,732,264 shares were issued under this offering increasing our total shares outstanding to 226,909,290,500.
During 2010, Corpbanca finished the process of selling its 5,672,732,264 own issued shares (see note 23 to our consolidated financial statements), which it had repurchased in May 2008. During 2010, Corpbanca sold 5,054,546,026 of its own issued shares which meant an increase in equity totaling Ch$17,693.0 million.
The process in which the shares were sold is represented in the following chart.
| Date | Number of Shares | Price of the Shares | |||||
| Period 1 | December 6, 2009 – January 4, 2010 | 618,186,238 | 3.50 | ||||
| Period 2 | January 5, 2010 – February 18, 2010 | 5,052,027,491 | 3.50 | ||||
| Period 3 | April 4, 2010 | 2,518,535 | 4.50 | ||||
B. BUSINESS OVERVIEW
Principal Business Activities
We provide a broad range of commercial and retail banking services to our customers. In addition, we provide financial advisory services, mutual fund management, insurance brokerage and securities brokerage services through our subsidiaries. The following chart sets forth our principal lines of business:
25
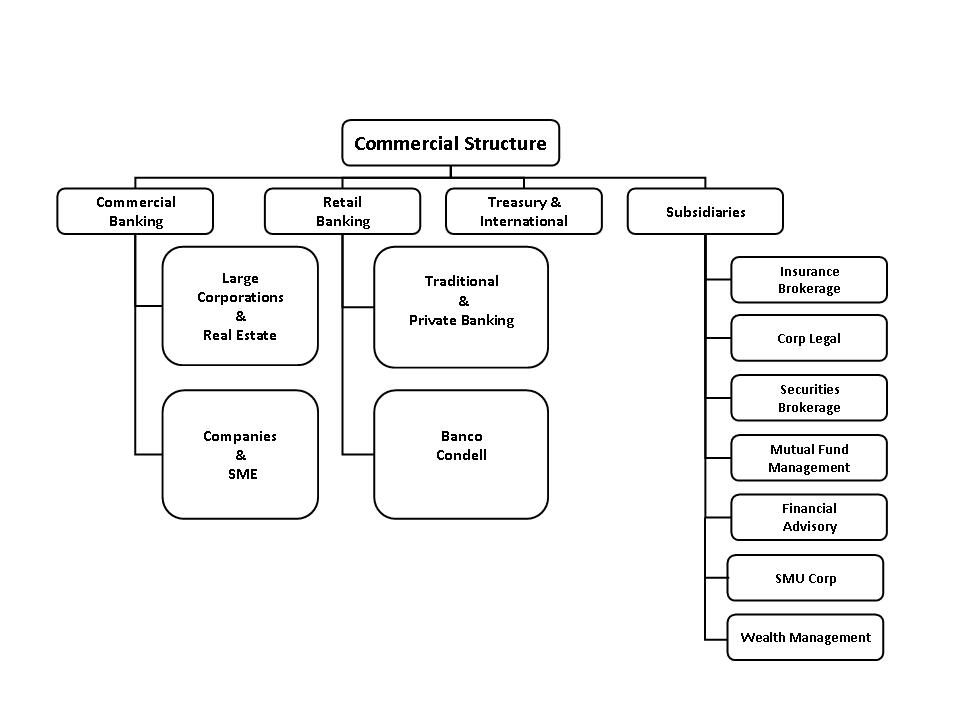
| (1) | Also see “Item 5. Operating and Financial Review and Prospects—Operating Results” for a financial summary of our lines of business as of December 31, 2008, 2009 and 2010. |
The following table provides information on the composition of our loan portfolio and other revenue-producing assets as of December 31, 2008 and 2009:
| As of December 31, | ||||||||
| 2008 | 2009 | Variation | Variation (%) | |||||
| (in millions of Ch$ as of December 31, 2010) | ||||||||
| Commercial loans: | ||||||||
| Commercial loans | 2,803,566 | 3,103,403 | 299,837 | 10.7% | ||||
| Foreign trade loans | 457,526 | 218,082 | (239,444) | (52.3) | ||||
| Current account debtors | 83,224 | 47,471 | (35,753) | (43.0) | ||||
| Factoring operations | 54,120 | 53,262 | (858) | (1.6) | ||||
| Leasing transactions | 322,644 | 293,709 | (28,935) | (9.0) | ||||
| Other loans and receivables | 2,222 | 1,415 | (737) | (36.3) | ||||
| Subtotals | 3,723,302 | 3,717,342 | (4,416) | (0.2) | ||||
| Mortgage loans: | ||||||||
| Letters of credit loans | 168,235 | 143,206 | (25,029) | (14.9) | ||||
| Endorsable mutual mortgage loans | 269,138 | 210,236 | (58,902) | (21.9) | ||||
| Other mutual mortgage loans | 234,197 | 391,665 | 157,468 | 67.2 | ||||
| Leasing transactions | 365 | 160 | (205) | (56.2) | ||||
| Other loans and receivables | 15,697 | 55,429 | 39,732 | 253.1 | ||||
| Subtotal | 687,632 | 800,696 | 113,064 | 16.4 | ||||
| Consumer loans: | ||||||||
| Consumer loans | 321,475 | 272,607 | (48,868) | (15.2) | ||||
| Current account debtors | 29,808 | 26,078 | (3,730) | (12.5) | ||||
| Credit card debtors | 65,482 | 51,797 | (13,685) | (20.9) | ||||
| Consumer leasing transactions | 271 | 517 | 246 | 90.8 | ||||
| Other loans and receivables | 53,043 | 43,355 | 9,688 | (18.3) | ||||
| Subtotal | 470,079 | 394,354 | (75,725) | (16.1) | ||||
| Total | 4,881,013 | 4,912,392 | 32,923 | 0.6% | ||||
26
The following table provides information on the composition of our loan portfolio and other revenue-producing assets as of December 31, 2009 and 2010:
| As of December 31, | ||||||||||
| 2009 | 2010 | Variation | Variation (%) | |||||||
| (in millions of Ch$ as of December 31, 2010) | ||||||||||
| Commercial loans: | ||||||||||
| Commercial loans | 3,103,403 | 3,319,366 | 215,963 | 6.9% | ||||||
| Foreign trade loans | 218,082 | 246,709 | 28,627 | 13.1 | ||||||
| Current account debtors | 47,471 | 51,705 | 4,234 | 8.9 | ||||||
| Factoring operations | 53,262 | 65,121 | 11,859 | 22.3 | ||||||
| Leasing transactions | 293,709 | 277,387 | (16,322) | (5.6) | ||||||
| Other loans and receivables | 1,415 | 1,247 | (168) | (11.9) | ||||||
| Subtotals | 3,717,342 | 3,961,535 | 244,193 | 6.5 | ||||||
| Mortgage loans: | ||||||||||
| Letters of credit loans | 143,206 | 121,391 | (21,815) | (15.2) | ||||||
| Endorsable mutual mortgage loans | 210,236 | 269,132 | 58,896 | 28.0 | ||||||
| Other mutual mortgage loans | 391,665 | 582,378 | 190,712 | 48.7 | ||||||
| Leasing transactions | 160 | 146 | (14) | (8.8) | ||||||
| Other loans and receivables | 55,429 | 50,655 | (4,774) | (8.6) | ||||||
| Subtotal | 800,696 | 1,023,702 | 223,005 | 27.9 | ||||||
| Consumer loans: | ||||||||||
| Consumer loans | 272,607 | 257,695 | (14,912) | (5.5) | ||||||
| Current account debtors | 26,078 | 24,563 | (1,515) | (5.8) | ||||||
| Credit card debtors | 51,797 | 51,302 | (495) | (1.0) | ||||||
| Consumer leasing transactions | 517 | 702 | 185 | 35.8 | ||||||
| Other loans and receivables | 43,355 | 45,481 | 2,126 | 4.9 | ||||||
| Subtotal | 394,354 | 379,743 | (14,611) | (3.7) | ||||||
| Total | 4,912,392 | 5,364,980 | 452,577 | 9.2% | ||||||
| (1) | All of the above categories except mortgage loans are combined into “Loans” as described in “Item 4. Information on the Company—Business Overview—Selected Statistical Information—Average Balance Sheets, Income Earned from Interest Earning Assets and Interest Paid on Interest Bearing Liabilities”. |
Commercial Banking
We offer a range of products and services to our business clients depending on their size, ownership structure and/or investments under management. Our commercial banking segments are served by two separate business divisions: Large Companies and Corporate Division (wholesale banking), and Companies Division. For the years ended 2008, 2009 and 2010, our total average corporate loans outstanding for our Large Companies and Corporate Division and Companies Division amounted to Ch$3,013,612.0 million or 68.5% of total average loans, Ch$3,362,523.0 million or 70.7% of total average loans and Ch$3,632,785.0 million or 70.3% of total average loans, respectively.
Large Companies and Corporate Division (wholesale banking). This division serves large economic groups, state-owned companies, mining companies, utilities, energy, seaports, airports, public hospitals or any business with annual sales in excess of US$30.0 million. Our Large Companies and Corporate Division focuses on offering clients a broad range of services tailored to fit their specific needs. These services include deposit-taking and lending in both pesos and foreign currencies, trade financing, general commercial loans, working capital loans, letters of credit, interest rate, foreign exchange derivatives (including foreign exchange options) and cash flow management. This division also serves our real estate and project finance customers. As of December 31, 2010, we had over 922 Large Companies and Corporate banking customers. We also offer our wholesale banking customers securities brokerage and financial advisory services through our subsidiaries as well as those products and services available through our New York branch. For the years ended 2008, 2009 and 2010, our total average corporate loans outstanding for our Large Companies and Corporate Division amounted to Ch$1,867,023.0 or 42.4% of total average loans, Ch$2,293,991.0 million or 48.2% of total average loans and Ch$2,493,947.0 million or 48.3% of total average loans, respectively.
27
Companies Division. Our Companies Division provides services to businesses with annual sales of less than US$30.0 million in Santiago and no set limit throughout the rest of Chile, except for large economic groups and state-owned mining companies, utilities and energy companies, ports, airports and public hospitals. This division also serves small and medium-sized businesses and provides support to our factoring and leasing clients. Greater detail of each of these business areas are provided in the paragraphs found below.
This division offers our customers a broad range of financial products, including general commercial loans, working capital loans, trade finance, on-lending of financing originated by CORFO (Corporación de Fomento a la Produccion), overdraft credit lines, letters of credit, mortgage loans, term deposits, factoring and leasing. As of December 31, 2010, we had over 14,520 customers in our Companies Division.
Within our Companies Division, we have a special unit focused on small and medium size companies, with annual sales between US$200,000.0 and US$2.0 million. We are able to offer an array of products through our small and medium-sized business unit, including products (such as lines of credit) backed by governmental warranties created to develop small and medium-sized businesses.
Retail Banking
We offer a range of products and services to our individual clients depending on their monthly income and/or net worth. Our retail banking divisions serve retail customers across all income levels, from low-income to high income individuals organized in two divisions: Traditional and Private Banking and Banco Condell.
Traditional and Private Banking
Traditional Banking. Our Traditional Banking Division is mainly oriented toward individuals with medium-high income levels (focused on clients with over Ch$1.2 million monthly income). Our traditional banking services are marketed and operated under the Corpbanca brand name. We offer our traditional and private banking clients products such as checking and deposit accounts, credit lines, credit and debit cards, personal installment loans, mortgage loans, insurance banking and time deposits, among others. In addition, we provide time deposits, mutual funds and savings accounts in pesos, Euros, UF and U.S. dollars, with a minimum term of 7 days and no minimum amount for foreign-currency accounts.
Private Banking. Within our Private Banking Division, we provide private banking services to our high income and high net worth customers. We consider high income individuals to be customers with a monthly income in excess of US$10,000.0 or a net worth in excess of US$600,000.0. Each client under our private banking or “Private Banking” program is provided with a liaison officer who oversees the client’s entire relationship with us across all product lines. In addition to the products and services we provide to private banking customers, we offer tailored lending products designed to help keep their businesses growing. As of December 31, 2010, we had 5,008 Private Banking clients, an increase of 9.0% as compared to December 31, 2009.
For the year ended 2010, our Traditional and Private Banking Division had loans with an annual average balance of Ch$1,297,209.0 million or 25.1% of total average loans (a year-on-year increase of 11.0%).
We offer the following products and services, among others, to our traditional and private banking customers:
Checking and Deposit Accounts. Our main checking account product is our “Integral” checking account, through which customers are provided with a package of services including ATM cards, a credit line, Master Card and American Express credit cards with credit levels established pursuant to the creditworthiness of the individual, fraud insurance and access to internet and telephone banking. As of December 31, 2010, we had approximately 80,612 retail checking accounts, an increase of 9.0% as compared to December 31, 2009. Additionally, this growth in retail checking accounts has not reduced the average balance per account which increased from Ch$1.13 million in 2009 to Ch$1.35 million in 2010.
Credit and Debit Cards. We issue MasterCard and American Express credit cards to our individual clients. In addition to traditional cards, we offer cards issued under certain specialized customer loyalty programs and tailor our marketing of credit card services to different groups based on personal income. Annual fees are charged to those customers who do not hold “Integral” accounts with us in order to promote cross-selling and provide full service to customers. As of December 31, 2010, we had approximately 164,557 credit cards issued under the brand name Corpbanca, a decrease of 15.0% as compared to December 31, 2009. We believe this decrease does not have a significant impact on the results of our retail banking, since most of these credit cards were unused. Our promotions such as discounts on gasoline purchases have allowed us to excel in sales as well as usage-rates of this product. During the fourth quarter of 2010, the usage-rate for our cards was greater than the market average at 46.9% while the industry’s average was 32.7%.
28
We also offer debit cards, which can be used for banking transactions at ATMs operating on the Redbanc network, as well as at retailers associated with the Redcompra program. Under this agreement, we have access to over 8,200 ATMs (including BancoEstado ATMs) in Chile.
Mortgage Loans. We offer two types of mortgages: residential mortgages for the purchase of new and existing homes (including refinancing of existing residential mortgages) and other mortgages, which are loans for other purposes secured by real property owned by the customer. Our UF-denominated mortgage loans generally have maturities between five and 30 years. In order to reduce our exposure to interest rate fluctuations and inflation with respect to our residential mortgage UF-denominated portfolio, a portion of these mortgages are funded through the issuance of mortgage finance bonds in the Chilean financial market, which bear a real market rate of interest plus a fixed spread over the rate of variation of the UF. Chilean banking regulations limit the amount of a residential mortgage loan that may be financed with a mortgage finance bond to 90.0% of the lesser of (a) the purchase price of the property securing the loan and (b) the appraised value of such property. However, we also offer our customers Mutuos Hipotecarios, a mortgage-lending product differing from the traditional financing of mortgage loans with mortgage finance bonds. Mutuos Hipotecarios are financed with our general funds, particularly through the issuance of long-term subordinated bonds. In addition, we generally require that the monthly payments on residential mortgage loans do not exceed 25.0% of the borrower’s household after-tax monthly income.
We continue to increase our marketing efforts relating to our mortgage services. Our market penetration for mortgage products has historically been lower than our overall Chilean market share for all banking products, which as of December 31, 2010 was 5.3% (on a consolidated basis). As a result of competitive pricing, product innovation, timely customer service, product knowledge as well as our overall focus on mortgage services, we have been able to achieve our recent results and increase our market share. Accordingly, our market share for mortgage products has grown from 4.2%, 4.6% and 5.3% as of December 31, 2008, 2009 and 2010, respectively. We intend to continue to grow in this market.
Consumer Loans. We offer personal consumer loans for a variety of purposes, including personal loans (with automatic payments deducted from a checking or credit card account and with life, home and/or unemployment insurance); university and post-graduate education loans (including life insurance). Our consumer loans are generally installment loans denominated in pesos or UF, bear interest at fixed or variable rates and typically have maturities up to 5 years with the exception of university and post-graduate education loans, which have maturities up to 10 years.
Lower Income Retail Banking (Banco Condell). Our Lower Income Retail Banking Division operates under the trade name Banco Condell and is focused on clients with an annual income lower than Ch$7.2 million (US$20,000.0). Banco Condell has 53 standalone branches and its own brand identity.
Under the Banco Condell brand, we offer consumer lending, credit card services, mortgage loans, insurance and time deposits to the traditionally underserved low-to-middle income segments of the Chilean population. For the year ended 2010, our Banco Condell division managed loans with an annual average balance of Ch$147,617.0 million or 2.7% of total loans. Improved economic conditions in Chile over the past decade have resulted in an increased demand for consumer credit by low- to middle-income individuals, whom we classify as persons with annual income between Ch$2.4 million and Ch$7.2 million. Many of these individuals have not had prior exposure to banking products or services. Through Banco Condell, we focus on developing and marketing products specifically oriented to individuals in this segment of the population while introducing them to the banking sector. We offer, among others, the following products and services to our lower income retail banking-Banco Condell customers:
Consumer Loans. We offer personal loans under the Banco Condell brand, including personal debt consolidation loans. These loans are generally denominated in pesos, repayable through equal monthly installments and typically have maturities up to 5 years. Life and unemployment insurance are mandatory in connection with these loans.
Credit Cards. Under the Banco Condell brand, we provide MasterCard credit cards, which require the payment of an annual fee. However, this fee is waived if the card has transactions such as cash advances or purchases on a monthly basis. As of December 31, 2010, we had approximately 11,167 credit cards issued under the brand name Banco Condell.
Mortgage Loans. Under the Banco Condell brand, we offer mortgage loans for the purchase of new and existing homes denominated in UF. In addition, we generally require that the monthly payments on a residential mortgage loan not exceed 25.0% of the borrower’s household after-tax monthly income.
Treasury and International Division
Our Treasury and International Division specializes in financial management and is largely responsible for our funding and liquidity as well as management of any gap on our balance sheet. In addition, through our Treasury and International Division we manage proprietary trading functions, market making and distribution and sales of flow and non flow instruments for our corporate clients. This division is responsible for obtaining foreign currency-denominated credit lines from financial institutions outside of Chile.
29
As of December 31, 2010, the outstanding loans from foreign banks were US$1,175.0 million with approximately 30 institutions in U.S., Canada, Germany, France, Holland, England, Italy, Switzerland, Japan, Singapore and other countries including Latin America. The international global risk assets outstanding as of December 31, 2010 were US$806.0 million.
Non-Banking Financial Services Offered through Subsidiaries
We have made several strategic long-term investments in non-banking financial services companies (each of which are regulated and supervised by the SBIF), which are engaged in activities complementary to our core banking activities. Through these companies, each of which is our wholly-owned subsidiary, we intend to continue to develop a comprehensive financial services group able to meet the diverse financial needs of our current and potential clients. These businesses combined represent 1.7% of our assets and 1.5% of our net income as of and for the year ended December 31, 2010.
The following table sets forth certain financial information with respect to our financial services subsidiaries as of December 31, 2008, 2009 and 2010, in millions of pesos. Amounts relating to inter-company transactions have not been removed for purposes of this table.
As of and for the year ended December 31, 2008 | As of and for the year ended December 31, 2009 | As of and for the year ended December 31, 2010 | |||||||||||||||
Assets | Shareholder’s Equity | Net Income | Assets | Shareholder’s Equity | Net Income | Assets | Shareholder’s Equity | Net Income | |||||||||
| (in millions of Ch$ as of December 31, 2010) | |||||||||||||||||
| Corpbanca Corredores de Bolsa S.A. | Ch$ 131,900 | Ch$ 25,889 | Ch$ 1,845 | Ch$ 164,038 | Ch$ 29,196 | Ch$ 3,380 | Ch$ 248,011 | Ch$ 86,619 | Ch$ 5,545 | ||||||||
| Corpbanca Administradora General de Fondos S.A. | 3,824 | 3,226 | 1,323 | 5,608 | 4,329 | 2,454 | 8,639 | 6,873 | 5,063 | ||||||||
| Corpbanca Corredores de Seguros S.A | 4,820 | 4,544 | 4,338 | 5,642 | 5.032 | 4,832 | 6,238 | 5,729 | 5,616 | ||||||||
| Corpbanca Asesorías Financieras S.A. | 962 | 811 | 625 | 1,810 | 1,429 | 1,245 | 4,848 | 4,225 | 4,056 | ||||||||
| Corp Legal S.A. | 583 | 431 | 201 | 777 | 649 | 212 | 1,160 | 872 | 422 | ||||||||
| Corpbanca Agencia de Valores S.A. | — | — | — | 630 | 630 | (1) | 3,291 | 977 | (258) | ||||||||
| Corpbanca New York Branch | — | — | — | 22,289 | 13,897 | (1,019) | 138,312 | 11,358 | (415) | ||||||||
| SMU Corp. | 6,804 | 6,007 | (1,993) | ||||||||||||||
Securities Brokerage Services. Our subsidiary Corpbanca Corredores de Bolsa S.A., or CCB, is a member of the Santiago Stock Exchange and is registered with the Chilean Superintendency of Securities and Insurance as a security broker. CCB’s primary activities are providing brokerage services in equities, fixed income, and foreign currency exchange. CCB’s net income was Ch$1,845.0 million, Ch$3,380.0 million and Ch$5,545.0 million for 2008, 2009 and 2010, respectively. CCB had assets under custody of Ch$234,936.0 million, Ch$282,233.0 million and Ch$295,706.0 as of December 31, 2008, 2009 and 2010. In 2010, CCB’s operating income increased by Ch$3,373.0 million, or 46.0%, as compared to the prior year. This was mainly the result of an increase in income from its financial operations and customer-driven fees and revenues.
Corpbanca Agencia de Valores S.A. Corpbanca Agencia de Valores S.A., or CAV, is registered with the Chilean Superintendency of Securities and Insurance as a securities broker, but because it is not a member of the Santiago Stock Exchange nor of any other Stock Exchange in Chile it provides brokerage services outside of the Stock Exchanges. Its primary activities are to provide financial solutions to high net worth individuals and family offices in Chile.
Mutual Fund Management. We incorporated Corpbanca Administradora General de Fondos S.A., or CAGF, to complement banking services offered to individual and corporate clients. CAGF’s current function is to manage mutual fund assets for its clients in fixed and variable income instruments in both the local and foreign markets. For the years ended December 31, 2008, 2009 and 2010, CAGF had net income of Ch$1,323.0 million, Ch$2,454.0 million and Ch$5,063.0, respectively. CAGF had total assets of Ch$3,824.0 million, Ch$5,608.0 million and Ch$8,639.0 million as of December 31, 2008, 2009 and 2010, respectively. As of December 31, 2010, CAGF managed 26 mutual funds including fixed income funds, which is an increase of two mutual funds when compared to 2009, and total assets under management amounting to Ch$494,981.0 million, a decrease of Ch$10.0 million when compared to December 31, 2009. The increase in the net income is due to clients reallocating their capital from money market funds to other types of funds that have higher fees. In order to grow our CAGF business, we intend to continue to offer new types of mutual funds tailored to our clients’ needs.
Financial Advisory Services. Corpbanca Asesorías Financieras S.A., or CAF, provides a broad range of financial advisory services to a variety of corporations and government agencies, including those services related to debt restructurings, syndicated loans, structured loans, structured investment funds, bilateral grants, mergers and acquisitions, privatizations and company valuations . For the years ended December 31, 2008, 2009 and 2010, CAF had net income of Ch$625.0 million, Ch$1,245.0 million and Ch$4,056.0 million, respectively. CAF had total assets of Ch$962.0 million, Ch$1,810.0 million and Ch$4,848.0 million as of December 31, 2008, 2009 and 2010, respectively.
30
Insurance Brokerage. In accordance with our strategy of expanding the breadth of financial services that we offer, our subsidiary Corpbanca Corredores de Seguros S.A., or CCS, offers a full line of insurance products. Many of these products complement the various banking and loan services that we provide, such as unemployment and life insurance in connection with personal loans and insurance in connection with mortgage lending. Through CCS we also provide non credit-related insurance to existing clients and the general public. For the years ended December 31, 2008, 2009 and 2010, CCS had net income of Ch$4,338.0 million, Ch$4,832.0 million and Ch$5,616.0 million, respectively. CCS had total assets of Ch$4,820.0 million, Ch$5,642.0 million and Ch$6,238.0 million as of December 31, 2008, 2009 and 2010, respectively.
Legal Advisory Services. The Chilean Superintendency of Banks granted us authorization for the creation of our subsidiary Corp Legal S.A., or Corp Legal, on January 26, 2007. Corp Legal offers standard procedures of legal services to the bank and its clients.
SMU Corp S.A. In 2009, we created SMU Corp S.A. (“SMU Corp”), a joint venture with SMU S.A. (“SMU”), a retail business holding company owned by our principal shareholder, which indirectly owns Unimarc. As of December 31, 2010, Unimarc was the third largest Chilean supermarket chain in terms of total sales and the largest in terms of food sales. We have a 51.0% ownership interest in the joint venture. We believe that SMU Corp has the potential to increase our participation in the retail banking sector through the issuance of a Corpbanca credit card for Unimarc clients. We believe our expertise in credit risk management will be supplemented by SMU’s knowledge of Chile’s retail business, providing us with access to over 250 Unimarc stores and supermarkets and over 5 million Unimarc customers. We believe that through SMU Corp we will have a better understanding of our clients by detecting their preferences, consumer habits, frequency of purchases and determining average amounts spent by our customers.
New York Branch
On October 22 and 24, 2008, the U.S. Federal Reserve Board and the U.S. Office of the Comptroller of the Currency (OCC) respectively granted us authorization to establish a Federal Branch in the city of New York in the United States. The branch began operations in May 2009. The following is a brief description of our target markets, lines of business, competition and structure for the branch office in the city of New York.
Operations and Services Market. We offer a wide range of credit operations and services to retail customers and large and medium-sized companies. Operating with an offshore foreign bank or foreign branch of a Chilean bank is especially attractive to clients abroad as it provides a sense of proximity and it allows us to accompany our customers as they operate abroad, responding to their needs and improving our services. Our target market consists of retail customers with sophisticated financial needs, medium and large Chilean companies active in foreign trade, Latin American companies, and Chilean and Latin American banks without offshore branch offices (correspondent banks), among others.
Lines of Business. Our branch supports the commercial needs of Chilean companies doing business abroad. Another important service is the provision of syndicated project financing, together with other international institutions, to finance a variety of investment projects. From a financial investment perspective, our New York branch makes it possible to trade instruments from different issuers with a wide range of risks and returns. The branch also has a private banking unit to provide current accounts and other associated services.
Competition. Our branch complements our domestic structure, by providing additional international services to our customers. This allows us to compete with other banks in Chile that presently have branches or related companies abroad. We also plan to generate business with other major international banks which do not have branches in Chile.
Structure. The New York branch is managed by a general manager and organized into six different divisions. Each division is run by a Vice President. These divisions are: Compliance, Financial Controller, Operations and Technology, Commercial, Risk and Treasury. Each of these divisions, especially Compliance, has strong ties to their counterparts in Chile, closely coordinating their activities. We periodically analyze and issue reports on the branch’s performance. We examine aspects such as internal controls; IT systems with respect to business management and decision-making, risk follow-up, private classification of risks and contingency scenarios based on credit risk and overall credit process management; financial risk management and treasury operations; operational and technological risk management; and strategic planning processes. Supervision and control over these matters led by our upper management through our Board of Directors. The New York branch also has an internal auditor that reports directly to the Comptroller in Chile.
Distribution Channels, Electronic Banking and Technology
Our distribution network provides integrated financial services and products to our customers through several diverse channels, including ATMs, branches, internet banking, and telephone banking. As of December 31, 2010, we operated 113 branch offices in Chile, which includes 53 branches operating as Corpbanca, 56 branches operating as Banco Condell, our consumer finance division. In addition, as of December 31, 2010, we owned and operated 382 ATMs in Chile, and our customers have access to over 8,200 ATMs (including BancoEstado ATMs) in Chile through our agreement with Redbanc S.A., or Redbanc. We utilize a number of different sales channels including account executives, telemarketing and the internet to attract new clients. Our branch system serves as the main distribution network for our full range of products and services.
31
We offer internet banking to our customers 24 hours a day through our password-protected internet site, www.corpbanca.cl. Our internet site offers a broad range of services, including up-to-date information on balances in deposit, checking, loan, credit card and other accounts and transactional capabilities such as transfers and payments. As of December 31, 2010, we had over 72,100 customers with activated internet passwords, allowing them to access our internet banking services. We are a member of the Sociedad Interbancaria de Transferencias Electrónicas S.A., an organization that facilitates electronic banking transactions on behalf of our customers as well as other Chilean banks. We also provide our customers with access to a 24-hour phone-banking call center that grants them access to account information and allows them to effect certain payments by telephone.
We have developed a specialized internet-based service designed to facilitate and optimize the financial management of our commercial customers. This service, which we market under the name “Cash Management,” includes services such as payroll support and payments to suppliers.
We have entered into several service and lease agreements with IBM de Chile S.A.C., which provides us with the computer hardware and network build-out that we use in our headquarters and branch offices. We have entered into a software consulting and development agreement with Datapro, Inc., which provides consulting and development for the IBS.
Competition
Overview
The Chilean financial services market consists of a variety of largely distinct sectors. The most significant sector, commercial banking, includes a number of privately-owned banks and one state-owned bank, BancoEstado (which operates within the same legal and regulatory framework as the private sector banks). The private sector banks include those that are Chilean-owned, i.e., controlled by a Chilean entity, as well as a number of foreign-owned banks which are operated in Chile but controlled by a foreign entity. The Chilean banking system is comprised of 24 private sector banks and one public sector bank. Four private sector banks along with the state-owned bank together accounted for 75.0% of all outstanding loans by Chilean financial institutions as of December 31, 2010: Banco Santander (20.9%), Banco de Chile (19.2%), BCI (12.7%), Corpbanca (7.3%) and BancoEstado (15.2%). All market share statistics in this paragraph are presented according to the Chilean Superintendency of Banks on a consolidated basis.
The Chilean banking system has experienced a consolidation process in recent years with mergers and acquisitions of banking entities in line with a global trend. Currently, the largest Chilean bank in terms of loans outstanding is Banco Santander. In April 1996, Banco Santander acquired control of Banco Osorno y La Union, merging their operations. In January 1997, Banco Santiago and Banco O’Higgins merged into one entity. Also in 1997, Banco Santander absorbed the operations of Financiera Fusa. In 1999, following the international merger of Banco Santander de España and Banco Central Hispano, Banco Santander Central Hispano acquired control of Santander-Chile and Banco Santiago. During April 2002, the Chilean Superintendency of Banks authorized Banco Santander Central Hispano to increase its participation in Banco Santiago by way of acquisition of 35.5% of the shares of the latter owned by Banco Central de Chile. In May 2002, the Chilean Superintendency of Banks authorized Santander-Chile and Banco Santiago to merge. This merger enabled these banks to become the largest financial institution in Chile in terms of loans outstanding.
In September 1998, Banco Bilbao Vizcaya (BBV) de España, subscribed a capital increase of Bank Bhif, thus controlling 55.0% of the bank. In 1998, we acquired the assets of Corfinsa, which pertained to the consumer loan division of Banco SudAmericano, and then acquired the Financiera Condell S.A., a finance company. In 1999, Citibank acquired Atlas financial company. In July 1999, Bank of Nova Scotia acquired control of Banco Sudamericano, by increasing its interest from 28.0% to 60.6%, and in late 2001 changed its name to Scotiabank SudAmericano. In early 2001, the Luksic group (which controlled Banco Edwards since 1999) acquired control of Banco de Chile, merging both banks in January 2002. In January 2004, Banco de Crédito e Inversiones acquired 99.9% of Banco Conosur. In early 2007, Itaú Holding Financiera S.A. acquired 100.0% of BankBoston Chile and the SBIF authorized the sale of Banco Internacional to Inversiones del Rosario S.A. Also in 2007, Rabobank was authorized to purchase HNS Banco and Scotiabank Sudamericano was authorized to acquire 100.0% of Banco Desarrollo. In January 2008, Banco de Chile and Citibank Chile were authorized to merge operations and in April 2008, Royal Bank of Scotland was granted authorization to acquire 100.0% of ABN AMRO Bank Chile.
32
In recent years, several applications for banking licenses have been filed with the Chilean Superintendency of Banks. In 2000, Deutsche Bank initiated operations in Chile. During 2001, the Chilean Superintendency of Banks authorized the formation of Banco HNS, which is oriented to small and medium sized businesses through leasing and factoring financing. In the same year, the Chilean Superintendency of Banks authorized the creation of Banco Monex, which is also oriented to small and medium sized businesses through trade finance, exchange transactions and financial derivatives. In 2001, Falabella, a Chilean department store, received authorization to commence its banking operations, which are primarily linked to its consumer credit business. In May 2002, Banco Ripley initiated operations of consumer loans to mid to low-income individuals. In September 2002, Financiera Conosur filed an application with the Chilean Superintendency of Banks to request its corporate conversion into a bank, which took place in 2003. In July 2003, Banco Paris, linked to the Almacenes Paris department store, was authorized to initiate operations. In 2004, Grupo Penta, linked to former shareholders of Banco de Chile, received a banking license for a new bank named “Banco Penta,” which has been operating ever since. It is expected that the trend to create niche banks will continue. In addition, the Chilean Superintendency of Banks authorized HSBC Bank Chile to convert its branch into a subsidiary bank. In May 2008, DnB NOR Bank from Norway requested authorization from the Chilean Superintendency of Banks to open a banking branch and in January 2009 was granted permission. In November 2009, the Chilean Superintendency of Banks authorized Consorcio to acquire Banco Monex.
We believe that our principal competitors are BCI, Banco de Chile and Banco Santander. As compared to other Chilean banks, we believe our position in the Chilean banking industry has enabled us to compete with international banks seeking to provide loans to companies operating in Chile, especially since we are able to offer alternative sources of financing. We also believe that the close relationships we have developed with our small and medium-sized business customers over the years provide us with a competitive advantage.
Commercial banks, such as us, face increasing competition from other financial intermediaries who can provide larger companies with access to the capital markets as an alternative to bank loans. The enactment of the Reforma al Mercado de Capitales (Capital Markets Reform Bill) in 2001 has made it more tax-advantageous and easier for companies to issue commercial paper in Chile, adding an additional financing alternative. To the extent permitted by the General Banking Law, we seek to maintain a competitive position in this respect through the investment banking activities of our subsidiary CAF.
We face competition in our mortgage and consumer loans businesses from insurance companies, which have been permitted to grant mortgage loans. We believe that, in addition to the other banks that operate in Chile, our main competitors in the credit card business are department stores and other non-banking businesses involved in the issuance of private-label credit cards. We intend to remain competitive in the mortgage loan services and credit card markets through product innovation.
We also experience competition from banks that provide international private banking services. We believe our main competitive advantage in our Private Banking segment has been our ability to provide our customers with tailored lending products and responses to their needs as soon as possible. Our lower income retail banking segment, Banco Condell, competes with consumer divisions of other banks such as Banefe, CrediChile, among others, as well as certain consumer credit providers, including department stores. We believe the main competitive advantage of our Banco Condell brand is our ability to provide responses as soon as possible, know our customers’ needs and provide a fair price structure.
Loans
As of December 31, 2009 and 2010, our gross loan portfolio was Ch$5,034,282.0 million (approximately US$10,762.1 million) and Ch$5,533,372.0 million (approximately US$11,803.8 million) including interbank loans, respectively. This placed us as the fourth largest financial institution among private Chilean banks and fifth place among all banks operating in Chile. Our gross loan portfolio represented 7.3% of the market for loans in the Chilean financial system (comprising all commercial banks) as of such date. During the period 2008 to 2010, the compounded annual growth rate of our loan portfolio excluding interbank loans in nominal terms was 5.0% as compared to an increase of 3.3% in the average market loan portfolio.
The following table sets forth the aggregate outstanding loans for us and the four other private sector banks with the largest market shares in Chile as of December 31 in each of the last three years:
| Bank Loans | ||||||
As of December 31, | ||||||
2008 | 2009 | 2010 | ||||
| Banco Santander (1) | 14,604,840 | 13,727,864 | 15,657,556 | |||
| Banco de Chile (1) (2) | 13,649,005 | 13,184,553 | 14,365,829 | |||
| Banco de Crédito e Inversiones (BCI) (1) | 9,340,574 | 8,797,325 | 9,531,565 | |||
| CORPBANCA (3) | 4,961,160 | 5,034,282 | 5,533,372 | |||
| BBVA (1) | 5,262,417 | 4,818,896 | 5,442,705 | |||
| Scotiabank Sudamericano (1) | 4,629,241 | 4,096,541 | 3,922,448 | |||
| Others (1) | 17,820,879 | 19,301,210 | 20,564,693 | |||
| Total | 70,268,116 | 68,960,671 | 75,018,168 | |||
33
| Source: Chilean Superintendency of Banks. |
| (1) | The information is presented under standards issued by Chilean Superintendency of Banks. |
| (2) | Includes Citibank Chile. Banco de Chile and Citibank Chile merged operations in January 2008. |
| (3) | The amounts under IFRS for the years ended December 31, 2008, 2009 and 2010, are Ch$4,956,500.0 million, Ch$5,011,656.0 and Ch$5,469,195.0 million, respectively. |
Deposits
We had consolidated deposits of Ch$3,700,454.0 million (approximately US$7,910.7 million) as of December 31, 2010, which consisted of our current accounts, bankers’ drafts, savings accounts, time deposits and other commitments. Our market share of 8.1% for deposits and other obligations as of such date ranks us in fifth place among private sector banks in Chile.
The following table sets forth the aggregate deposits for us and the five other private sector banks with the largest market share as of December 31 in each of the last three years:
Bank Deposits and Other Obligations(1) | ||||||
As of December 31, | ||||||
2008 | 2009 | 2010 | ||||
| Banco Santander (1) | 12,706,023 | 10,708,791 | 7,258,757 | |||
| Banco de Chile (1)(2) | 11,479,851 | 11,145,557 | 7,697,968 | |||
| Banco de Crédito e Inversiones (BCI) (1) | 8,094,809 | 7,892,111 | 5,467,545 | |||
| BBVA (1) | 4,500,082 | 3,837,236 | 3,290,852 | |||
CORPBANCA (3) | 3,350,742 | 3,316,045 | 3,700,454 | |||
| Scotiabank Sudamericano (1) | 2,875,837 | 2,195,789 | 1,733,640 | |||
| Others (1) | 17,739,146 | 18,978,161 | 16,337,561 | |||
| Total | 60,746,490 | 58,073,690 | 45,486,777 | |||
| Source: Chilean Superintendency of Banks. |
(1) The information is presented under standards issued by Chilean Superintendency of Banks.
(2) Includes Citibank Chile. Banco de Chile and Citibank Chile merged operations in January 2008.
(3) The amounts under IFRS for the years ended December 31, 2008, 2009 and 2010, are Ch$3,350,742.0 million, Ch$3,316,045.0 and Ch$3,700,454.0 million, respectively.
Shareholders’ Equity
With Ch$475,839.0 million (approximately US$1,017.2 million) in shareholders’ equity (excluding net income and accrual for mandatory dividends), we were the 6th largest commercial bank in Chile by this measure as of December 31, 2010.
The following table sets forth the level of shareholders’ equity for us and the six largest private sector banks in Chile (measured by shareholders’ equity) as of December 31 in each of the last three years:
Shareholders´ Equity (excluding net income) | ||||||
As of December 31, | ||||||
2008 | 2009 | 2010 | ||||
| Banco Santander (1) | 1,676,488 | 1,787,692 | 2,006,754 | |||
| Banco de Chile (1)(2) | 1,488,433 | 1,573,264 | 1,646,630 | |||
| Scotiabank Sudamericano (1) | 751,319 | 477,168 | 539,578 | |||
| Banco de Crédito e Inversiones (BCI) (1) | 836,064 | 944,382 | 1,105,789 | |||
| BBVA (1) | 462,802 | 500,356 | 513,044 | |||
CORPBANCA (3) | 436,191 | 460,980 | 475,839 | |||
| Others (1) | 2,183,730 | 2,711,292 | 2,783,897 | |||
| Total | 7,835,027 | 8,455,134 | 9,071,531 | |||
| Source: Chilean Superintendency of Banks. |
| (1) | The information is presented under standards issued by Chilean Superintendency of Banks. |
34
| (2) | Includes Citibank Chile. Banco de Chile and Citibank Chile merged operations in January 2008. |
| (3) | The amounts under IFRS, excluding net income and accrual for mandatory dividends, for the years ended December 31, 2008, 2009 and 2010, are Ch$436,750.0 million, Ch$463,711.0 million and Ch$486,286.0 million, respectively. |
Regulation and Supervision
General
In Chile, only banks may maintain checking accounts for their customers, conduct foreign trade operations, and together with financial companies, accept time deposits. The principal authorities that regulate financial institutions in Chile are the Chilean Superintendency of Banks and the Central Bank. Chilean banks are primarily subject to the General Banking Law and secondarily, to the extent not inconsistent with such statute, the provisions of the Chilean Corporations Law governing public corporations, except for certain provisions which are expressly excluded.
The modern Chilean banking system dates from 1925 and has been characterized by periods of substantial regulation and state intervention, as well as periods of deregulation. The most recent period of deregulation commenced in 1975 and culminated in the adoption of a series of amendments to the General Banking Law. That law, amended most recently in 2002, granted additional powers to banks, including general underwriting powers for new issues of certain debt and equity securities and the power to create subsidiaries to engage in activities related to banking, such as brokerage, investment advisory, mutual fund services, administration of investment funds, factoring, securitization products and financial leasing services. Following the Chilean banking crisis of 1982 and 1983, the Chilean Superintendency of Banks assumed control of 21 financial institutions representing approximately 51.0% of the total loans in the banking system. As part of the solution to this crisis, the Central Bank permitted financial institutions to sell to it a certain portion of their problem loan portfolios, at the book value of such loan portfolios. Each institution then repurchased such loans at their economic value (which, in most cases, was much lower than the book value at which the Central Bank had acquired the loans) and the difference was to be repaid to the Central Bank out of future income. Pursuant to Law No. 18,818, which was passed in 1989, this difference was converted into a subordinated obligation with no fixed term, known as deuda subordinada or subordinated debt, which in the event of liquidation of the institution, would be paid after the institution’s other debts had been paid in full.
Central Bank
The Central Bank is an autonomous legal entity created by the Chilean Constitution. It is subject to the Chilean Constitution and its own ley orgánica constitucional, or constitutional law. To the extent not inconsistent with the Chilean Constitution or the Central Bank’s constitutional law, the Central Bank is also subject to private sector laws (but in no event is it subject to the laws applicable to the public sector). It is directed and administered by a board of directors composed of five members designated by the President of Chile, subject to the approval of the Senate.
The legal purpose of the Central Bank is to maintain the stability of the peso and the orderly functioning of Chile’s internal and external payment system. The Central Bank’s powers include setting reserve requirements, regulating the amount of money and credit in circulation, establishing regulations and guidelines regarding finance companies, foreign exchange (including the Formal Exchange Market) and banks’ deposit-taking activities.
Chilean Superintendency of Banks
Banks in Chile are supervised and controlled by the Chilean Superintendency of Banks, an independent Chilean governmental agency. The Chilean Superintendency of Banks authorizes the creation of new banks and has broad powers to interpret and enforce legal and regulatory requirements applicable to banks and financial companies. Furthermore, in case of noncompliance with such legal and regulatory requirements, the Chilean Superintendency of Banks has the ability to impose sanctions. In extreme cases, it can appoint, with the prior approval of the board of directors of the Central Bank, a provisional administrator to manage a bank. It must also approve any amendment to a bank’s bylaws or any increase in its capital.
The Chilean Superintendency of Banks examines all banks from time to time, generally at least once a year. Banks are also required to submit monthly financial statements to the Chilean Superintendency of Banks, and a bank’s financial statements are published at least four times a year in a newspaper with countrywide coverage. In addition, banks are required to provide extensive information regarding their operations at various periodic intervals to the Chilean Superintendency of Banks. A bank’s annual financial statements and the opinion of its independent auditors must also be submitted to the Chilean Superintendency of Banks.
Any person wishing to acquire, directly or indirectly, 10.0% or more of the share capital of a bank must obtain the prior approval of the Chilean Superintendency of Banks. The absence of such approval will cause the holder of such shares so acquired to lose the voting rights of such shares. The Chilean Superintendency of Banks may only refuse to grant its approval based on specific grounds set forth in the General Banking Law.
35
According to Article 35 bis of the General Banking Law, the prior authorization of the Chilean Superintendency of Banks is required for:
· | the merger of two or more banks, |
· | the acquisition of all or a substantial portion of a bank’s assets and liabilities, |
· | the control by the same person, or controlling group, of two or more banks, or |
· | a substantial increase in the share ownership of a bank by a controlling shareholder of that bank. |
Such prior authorization is required solely when the acquiring bank or the resulting group of banks would own a significant market share in loans, defined by the Chilean Superintendency of Banks to be more than 15.0% of all loans in the Chilean banking system. The intended purchase, merger or expansion may be denied by the Chilean Superintendency of Banks. Alternatively, a purchase, merger or expansion, when the acquiring bank or resulting group would own a market share in loans defined by the Chilean Superintendency of Banks to be more than 20.0% of all loans in the Chilean banking system, may be conditioned on one or more of the following:
· | that the bank or banks maintain an effective equity (as defined under “Capital Adequacy Requirements” below) higher than 8.0% and up to 14.0% of their risk weighted assets, |
· | that the technical reserve established in Article 65 of the General Banking Law be applicable when deposits exceed one and a half times the resulting bank’s paid-in capital and reserves, or |
· | that the margin for interbank loans be diminished to 20.0% of the resulting bank’s effective equity. |
If the acquiring bank or resulting group would own a market share in loans defined by the Chilean Superintendency of Banks to be more than 15.0% but less than 20.0%, the authorization will be conditioned on the bank or banks maintaining an effective equity not lower than 10.0% of their risk-weighted assets for the time set forth by the Chilean Superintendency of Banks, which may not be less than one year.
Pursuant to the regulations of the Chilean Superintendency of Banks, the following ownership disclosures are required:
· | banks are required to inform the Chilean Superintendency of Banks of the identity of any person owning, directly or indirectly, 5.0% or more of such banks’ shares, |
· | holders of ADSs must disclose to the depositary the identity of beneficial owners of ADSs registered under such holders’ names, and |
| · | the depositary is required to notify the bank as to the identity of beneficial owners of ADSs which such depositary has registered and the bank, in turn, is required to notify the Chilean Superintendency of Banks as to the identity of the beneficial owners of the ADSs representing 5.0% or more of such bank’s shares. |
Reporting of delinquent accounts. On March 25 and April 8, 2010, the Superintendency of Banks or SBIF issued temporary regulations (applicable during March and April 2010) with the purpose of protecting the credit history of borrowers affected by the earthquake. Pursuant to these regulations, banks may report accounts in arrears as current to the extent such accounts were current as of February 27, 2010, the date of the earthquake and tsunami, and the bank determines that the borrower missed payments due to the recent earthquake and tsunami. Additionally, the bank must either (i) be in the process of modifying the terms of the borrower’s loan, or (ii) have been unable to contact the borrower. In connection with mortgage loans in arrears, if the bank determines that a total loss is expected, the regulations allow the reporting of these mortgage loans to remain current until insurance proceeds are received. In connection with a partial loss on such loans, the bank must consider financing the borrower’s insurance deductible payments on the same terms as the mortgage loan’s principal. In connection with restructurings of loans to borrowers from affected areas in March and April, the regulations allow banks not to report the modified loans as restructured for purposes of classification, allowances and interest accrual, provided that the loans were current as of February 27, 2010, the date of the earthquake and tsunami. Following the termination of these temporary regulations on April 30, 2010, the bank was directed to reclassify all accounts and loans affected by these regulations according to normal reporting regulations.
Limitations on Types of Activities
Chilean banks can only conduct those activities allowed by the General Banking Law: making loans, accepting deposits and, subject to limitations, making investments and performing financial services. Investments are restricted to real estate for the bank’s own use, gold, foreign exchange and debt securities. Through subsidiaries, banks may also engage in other specific financial service activities such as securities brokerage services, mutual fund management, investment fund management, financial advisory and leasing activities. Subject to specific limitations and the prior approval of the Chilean Superintendency of Banks and the Central Bank, Chilean banks may own majority or minority interests in foreign banks.
36
On March 2, 2002, the Central Bank authorized banks to pay interest on checking accounts. On March 20, 2002, the Chilean Superintendency of Banks published guidelines establishing that beginning on June 1, 2002, banks could offer a new checking account product that pays interest. The Chilean Superintendency of Banks also stated that these accounts may be subject to minimum balance limits and different interest rates depending on average balances held in the account. This product is optional and banks may charge fees for the use of this new product. For banks with a solvency score of less than A, the Central Bank imposed additional caps on the interest rate that can be charged.
Deposit Insurance
In Chile, the government guarantees up to 90.0% of the principal amount of certain time and demand deposits held by natural persons in the Chilean banking system. The government guarantee covers those obligations with a maximum value of UF120.0 per person (Ch$2.6 million or US$5,504.0 as of December 31, 2010) per calendar year.
Reserve Requirements
Deposits are subject to a reserve requirement of 9.0% for demand deposits and 3.6% for time deposits. Banks are authorized to deduct daily from their foreign currency denominated liabilities subject to the reserve requirement, the balance in foreign currency of certain loans and financial investments held outside of Chile. The deductions should be done as follows:
· | first, term liabilities denominated in foreign currency and subject to reserve requirements, |
· | second, if there is any positive difference, demand liabilities denominated in foreign currency and subject to reserve requirements, and |
· | finally, foreign loans subject to reserve requirements. The total amount deductible cannot exceed 70.0% of a bank’s effective equity. |
The Central Bank has statutory authority to increase these percentages to up to 40.0% for demand deposits and to up to 20.0% for time deposits, to implement monetary policy. In addition, we are subject to a reserve requirement applicable to Chilean banks pursuant to which we must hold a certain amount of assets in cash or in highly liquid instruments.
Chilean regulations also require that gaps between assets and liabilities maturing within less than 30 days not exceed a bank’s Net Capital Base (as defined below) and that gaps among assets and liabilities maturing within less than 90 days not exceed twice a bank’s equity.
Minimum Capital
Under the General Banking Law, a bank must have a minimum paid-in capital and reserves of UF800,000.0 (Ch$17,164.0 million or US$36.7 million as of December 31, 2010). However, a bank may begin its operations with 50.0% of such amount, provided that it has a total capital ratio (defined as effective equity as a percentage of risk weighted assets) of not less than 12.0%. When such a bank’s paid-in capital reaches UF600,000.0 (Ch$12,873.0 million or US$27.5 million as of December 31, 2010) the total capital ratio required is reduced to 10.0%.
Capital Adequacy Requirements
According to the General Banking Law, each bank should have an effective equity of at least 8.0% of its risk weighted assets, net of required allowances. Effective equity is defined as the aggregate of:
· | a bank’s paid-in capital and reserves, excluding capital attributable to subsidiaries and foreign branches, known as capital básico, or Net Capital Base, |
· | its subordinated bonds, considered at the issuing price (but decreasing 20.0% for each year during the period commencing six years prior to maturity), but not exceeding 50.0% of its Net Capital Base, and |
· | certain allowances for loan losses, up to 1.25% of risk weighted assets to the extent these allowances exceed those required by law or regulation. |
Banks must also have a Net Capital Base of at least 3.0% of its total assets, net of required allowances. An amendment enacted on November 7, 2001 to the General Banking Law eliminated the exclusion of the investment in subsidiaries and foreign branches from the calculation of Net Capital Base.
37
The calculation of risk-weighted assets is based on a five category risk classification system to be applied to a bank asset that is based on the Basel Committee recommendations.
Lending Limits
Under the General Banking Law, Chilean banks are subject to certain lending limits, including the following material limits:
· | a bank cannot extend to any entity or individual (or any one group of related entities), directly or indirectly, unsecured credit in an amount that exceeds 10.0% of the bank’s effective equity, or in an amount that exceeds 30.0% (previously 25.0%) of its effective equity if the excess over 10.0% (previously 5.0%) is secured by certain assets with a value equal to or higher than such excess. In the case of foreign export trade financing, the ceiling for unsecured credits is also 10.0% (previously 5.0%) and the ceiling for secured credits is also established at 30.0%. In the case of financing infrastructure projects built through the concession mechanism, the 10.0% (previously 5.0%) ceiling for unsecured credits is 15.0% if secured by a pledge over the concession, or if granted by two or more banks or finance companies which have executed a credit agreement with the builder or holder of the concession, while the ceiling for secured credits remains at 30.0% (previously 25.0%), |
· | a bank cannot extend loans to another financial institution subject to the General Banking Law in an aggregate amount exceeding 30.0% of its effective equity, |
· | a bank cannot directly or indirectly grant a loan whose purpose is to allow an individual or entity to acquire shares of the lender bank, |
· | a bank cannot lend, directly or indirectly, to a director or any other person who has the power to act on behalf of the bank, and |
· | a bank cannot grant loans to related parties (including holders of more than 1.0% of its shares, except in the case of companies which are actively traded on the Santiago Stock Exchange, like Corpbanca, in which case the limit is 5.0%) on more favorable terms than those generally offered to non-related parties. Loans granted to related parties are subject to the limitations described in the first bullet point above. In addition, the aggregate amount of loans to related parties cannot exceed 5.0% of the bank’s effective equity, or 25.0% if the excess thereof is secured. |
In addition, the General Banking Law limits the aggregate amount of loans that a bank may grant to its employees to 1.5% of its effective equity, and provides that no individual employee may receive loans in excess of 10.0% of this 1.5% limit. Notwithstanding these limitations, a bank may grant to each of its employees a single residential mortgage loan for personal use once during such employee’s term of employment.
Current Regulations Relating to Classification of Banks and Loans; Allowances for Loan Losses
Classification of Loans. For purposes of the current classifications, loans are divided into: (i) consumer loans (including loans granted to individuals for the purpose of financing the acquisition of consumer goods or payment of services), (ii) residential mortgage loans (including loans granted to individuals for the acquisition, construction or repair of residential real estate, in which the value of the property covers at least 100.0% of the amount of the loan), (iii) leasing operations (including consumer leasing, commercial leasing and residential leasing), (iv) factoring operations, and (v) commercial loans (includes all loans other than consumer loans and residential mortgage loans).
In accordance with the regulations in force until December 31, 2010, the models and methods used to classify our loan portfolio must conform to the guiding principles summarized below.
Models Based on the Analysis of Commercial Borrowers Analyzed on an Individual Basis. Current regulations require that all commercial loans of Ch$200.0 million or more, as well as commercial loans to other clients that because of their size, complexity or exposure need to be analyzed with more detail, should be assigned to a risk category level, determined by considering the following risk factors: the borrower’s (i) industry or sector, (ii) owners or managers, (iii) access to credit, (iv) payment capacity, (v) payment behavior, and (vi) net worth. Based upon the analysis of such risk factors, the loan will be assigned to one of the risk categories. If the borrower has no apparent credit risk, the loan will be classified as either A1, A2 or A3. The loan will be classified as B if the borrower has some credit risk but no apparent deterioration of payment capacity. Finally, if the borrower has diminished or impaired capacity to repay its loans, it will be classified as either C1, C2, C3, C4, D1 or D2.
For loans classified as A1, A2, A3 and B, the board of directors of a bank is authorized to determine the levels of required allowances. For loans classified in Categories C1, C2, C3, C4, D1 and D2, the bank must have the following levels of allowances:
38
| Classification | Estimated range of loss | Allowance | |||
| C1 | Up to and including 3% | 2% | |||
| C2 | More than 3% up to 19% | 10% | |||
| C3 | More than 19% up to 29% | 25% | |||
| C4 | More than 29% up to 49% | 40% | |||
| D1 | More than 49% up to 79% | 65% | |||
| D2 | More than 79% | 90% |
For further information relating to the classification system applicable to commercial loans of Ch$200.0 million or more, see “Item 4. Information on the Company—Business Overview—Selected Statistical Information—Classification of Loan Portfolio Based on the Borrower’s Payment Performance”.
Models Based on Group Analysis. Under current regulations, the levels of required allowances for commercial loans that do not need to be analyzed on an individual basis and all consumer loans and mortgage loans are to be determined by the bank. This determination is made according to the estimated loss that may result from the loans, by classifying the loan portfolio using one or both of the following models: (i) a model based on the characteristics of the borrower and its outstanding loans, and/or (ii) a model based on the behavior of a group of loans. For the first model, the borrowers and their loans with similar characteristics will be placed into groups and each group will be assigned a risk level. For the second model, loans with analogous past payment histories and similar characteristics will be placed into groups and each group will be assigned a risk level.
Additional Provisions and Allowances. Historically, a bank could also voluntarily maintain additional allowances for loan losses in excess of the minimum amounts required as global and individual allowances. However, current regulations in effect as of January 1, 2004 no longer permit these additional allowances, which are not based on specific identified risks. Banks are now able to create provisions and allowances above the previously described limits only to cover specific risks that have been authorized by their board of directors.
We began provisioning in accordance with current regulations as of January 1, 2004. For further information, see “Item 4. Information on the Company—Business Overview—Selected Statistical Information—Current Regulations Relating To Classification of Banks and Loans; Allowances for Loan Losses”.
Obligations Denominated in Chilean Pesos and Foreign Currencies. Chilean peso and foreign currency denominated obligations of Chilean banks are subject to three requirements:
· | a reserve requirement of 9.0% for demand deposits and 3.6% for time deposits, |
· | exposures to market risk, including foreign currency risk, are incorporate into Basle Capital Requirements, and |
· | under Central Bank regulations applicable since August 31, 1999, (1) the aggregate amount of a bank’s net foreign currency liabilities having an original maturity of less than 30 days cannot exceed the bank’s Net Capital Base, and (2) the aggregate amount of a bank’s net foreign currency liabilities having an original maturity of less than 90 days cannot exceed twice the bank’s Net Capital Base. |
Capital Markets
Under the General Banking Law, banks in Chile may purchase, sell, place, underwrite and act as paying agents with respect to certain debt securities. Likewise, banks in Chile may place and underwrite certain equity securities. Bank subsidiaries may also engage in debt placement and dealing, equity issuance advice and securities brokerage, as well as in financial leasing, mutual fund and investment fund administration, investment advisory services and merger and acquisition services. These subsidiaries are regulated by the Chilean Superintendency of Banks and, in some cases, also by the Chilean Superintendency of Securities and Insurance, the regulator of the Chilean securities market and of open-stock (public) corporations.
Legal Provisions Regarding Banking Institutions with Economic Difficulties
The General Banking Law provides that if specified adverse circumstances exist at any bank, its board of directors must correct the situation within 30 days from the date of receipt of the relevant financial statements. If the board of directors is unable to do so, it must call a special shareholders’ meeting to increase the capital of the bank by the amount necessary to return the bank to financial stability. If the shareholders reject the capital increase, or if it is not effected within the term and in the manner agreed to at the meeting, or if the Chilean Superintendency of Banks does not approve the board of directors proposal, the bank will be barred from increasing its loan portfolio beyond that stated in the financial statements presented to the board of directors and from making any further investments in any instrument other than in instruments issued by the Central Bank. In such a case, or in the event that a bank is unable to make timely payment in respect of its obligations or if a bank is under provisional administration of the Chilean Superintendency of Banks, the General Banking Law provides that the bank may receive a two-year term loan from another bank. The terms and conditions of such a loan must be approved by the directors of both banks, as well as by the Chilean Superintendency of Banks, but need not be submitted to the borrowing bank’s shareholders for their approval. In any event, a creditor bank cannot grant interbank loans to an insolvent bank in an amount exceeding 25.0% of the creditor bank’s effective equity. The board of directors of a bank that is unable to make timely payment of its obligations must present a reorganization plan to its creditors in order to capitalize the credits, extend their respective terms, forgive debts or take other measures for the payment of the debts. If the board of directors of a bank submits a reorganization plan to its creditors and such arrangement is approved, all subordinated debt issued by the bank, whether or not matured, will be converted by operation of law into common shares in the amount required for the ratio of effective equity to risk-weighted assets not to be lower than 12.0%. If a bank fails to pay an obligation, it must notify the Chilean Superintendency of Banks, which shall determine if the bank is solvent.
39
Dissolution and Liquidation of Banks
The Chilean Superintendency of Banks may establish that a bank must be liquidated for the benefit of its depositors or other creditors when such bank does not have the necessary solvency to continue its operations. In such case, the Chilean Superintendency of Banks must revoke a bank’s authorization to exist and order its mandatory liquidation, subject to agreement by the Central Bank. The Chilean Superintendency of Banks must also revoke a bank’s authorization if the reorganization plan of such bank has been rejected twice. The resolution by the Chilean Superintendency of Banks must state the reason for ordering the liquidation and must name a liquidator, unless the Superintendent of Banks assumes this responsibility. When a liquidation is declared, all checking accounts, other demand deposits received in the ordinary course of business, other deposits unconditionally payable immediately are required to be paid by using existing funds of the bank, its deposits with the Central Bank or its investments in instruments that represent its reserves.
If these funds are insufficient to pay these obligations, the liquidator may seize the rest of the bank’s assets, as needed. If necessary and in specified circumstances, the Central Bank will lend the bank the funds necessary to pay these obligations. Any such loans are preferential to any claims of other creditors of the liquidated bank.
Investments in Foreign Securities
Under current Chilean banking regulations, banks in Chile may grant loans to foreign individuals and entities and invest in certain foreign currency securities. Chilean banks may only invest in equity securities of foreign banks and certain other foreign companies which may be affiliates of the bank or which would support the bank’s business if such companies were incorporated in Chile. Banks in Chile may also invest in debt securities traded in formal secondary markets. Such debt securities shall qualify as (1) securities issued or guaranteed by foreign sovereign states or their central banks or other foreign or international financial entities, and (2) bonds issued by foreign companies. Such foreign currency securities must have a minimum rating as follows:
| Rating Agency | Short Term | Long Term | |||
| Moody’s | P2 | Baa3 | |||
| Standard and Poor’s | A3 | BBB- | |||
| Fitch IBCA | F2 | BBB- |
A Chilean bank may invest in securities having a minimum rating as follows, provided that in case the total amount of these investments exceeds 20.0%, (or 30.0% in certain cases), of the effective equity of the bank, a provision of 100.0% of the excess shall be established by the bank:
| Rating Agency | Short Term | Long Term | |||
| Moody’s | P2 | Ba3 | |||
| Standard and Poor’s | A3 | BB- | |||
| Fitch IBCA | F2 | BB- |
If investments in these securities and certain loans referred to below exceed 70.0% of the effective equity of the bank, a provision for 100.0% of the excess shall be established, unless the excess, up to 70.0% of the bank’s effective equity, is invested in securities having a minimum rating as follows:
| Rating Agency | Short Term | Long Term | |||
| Moody’s | P2 | Aa3 | |||
| Standard and Poor’s | a-1+ | AA- | |||
| Fitch IBCA | F1+ | AA- |
40
Subject to specific conditions, a bank may grant loans in dollars to subsidiaries or branches of Chilean companies located abroad, to companies listed on foreign stock exchanges authorized by the Central Bank and, in general, to individuals and entities domiciled abroad, as long as the Central Bank is kept informed of such activities.
In the event that the sum of the investments of a bank in foreign currency and of the commercial and foreign trade loans granted to foreign individuals and entities exceeds 70.0% of the effective equity of such bank, the excess is subject to a mandatory reserve of 100.0%.
Selected Statistical Information
The following information is included for analytical purposes and should be read in conjunction with our financial statements as well as “Item 5. Operating and Financial Review and Prospects”. Unless otherwise indicated, financial data in the following tables as of December 31, 2008, 2009 and 2010 has been expressed in pesos as of December 31, 2010. The UF is linked to, and is adjusted daily to reflect changes in, the previous month’s CPI.
Our consolidated annual financial statements as of and for the year ended December 31, 2010 have been prepared in accordance with IFRS as issued by the IASB. The selected consolidated financial information included herein as of and for the year ended December 31, 2010, together with the selected consolidated financial information for the year ended December 31, 2008 and 2009, is derived from, and presented on the same basis as, our consolidated financial statements and should be read together with the consolidated financial statements.
Since our consolidated financial statements, including the selected consolidated information included herein, have been prepared using IFRS, they are not comparable with the audited consolidated financial statements included in the annual reports filed on Form 20-F for the years ended December 31, 2008 and prior thereto. Readers should exercise caution in determining trends based on prior annual reports. See “Item 5. Operating and Financial Review and Prospects—Operating Results—Critical Accounting Policies and Estimates”.
Average Balance Sheets, Income Earned From Interest-Earning Assets and Interest Paid on Interest Bearing Liabilities
The average balances for interest-earning assets and interest bearing liabilities, including interest and readjustments received and paid, have been calculated on the basis of daily balances on an unconsolidated basis. Unless otherwise set forth herein, such average balances as they apply to the operations of our subsidiaries were calculated on the basis of month-end balances. Such average balances are presented in pesos, in UFs and in foreign currencies (principally US$).
The nominal interest rate has been calculated by dividing the amount of interest and principal readjustment due to changes in the UF index (gain or loss) during the period by the related average balance, both amounts expressed in pesos. The nominal rates calculated for each period have been converted into real rates using the following formulas:
| Rp = | 1 + Np | – 1 | Rd = | (1 + Nd)(1 + D) | – 1 |
| 1 + I | 1 + I |
Where:
Rp= real average rate for peso-denominated assets and liabilities (in Ch$ and UF) for the period,
Rd= real average rate for foreign currency denominated assets and liabilities for the period,
Np= average nominal rate for peso-denominated assets and liabilities for the period,
Nd= average nominal rate for foreign currency denominated assets and liabilities for the period,
D= devaluation rate of the peso to the U.S. dollar for the period, and
I= inflation rate in Chile for the period (based on the variation of the Chilean consumer price index).
The real interest rate can be negative for a portfolio of peso-denominated loans when the inflation rate for the period is higher than the average nominal rate of the loan portfolio for the same period. A similar effect could occur for a portfolio of foreign currency denominated loans when the inflation rate for the period is higher than the sum of the devaluation rate for the period and the corresponding average nominal rate of the portfolio. The formula for the average real rate for foreign currency denominated assets and liabilities (Rd) reflects a gain or loss in purchasing power caused by the difference between the devaluation rate of the peso and the inflation rate in Chile during the period.
41
The following example illustrates the calculation of the real interest rate for a dollar-denominated asset bearing a nominal annual interest rate of 10.0% (Nd = 0.10), assuming a 5.0% annual devaluation rate (D = 0.05) and a 12.0% annual inflation rate (I = 0.12):
| Rd = | (1 + 0.10)(1 + 0.05) | – 1 = 3.125% per year |
| 1 + 0.12 |
In the example, since the inflation rate was higher than the devaluation rate, the real rate is lower than the nominal rate in dollars. If, for example, the annual devaluation rate were 15.0%, using the same numbers, the real rate in pesos would be 12.9%, which is higher than the nominal rate in U.S. dollars. Using the initial example, if the annual inflation rate were greater than 15.5%, the real rate would be negative.
Interest and average balances have been calculated by taking into consideration the following:
· | Foreign exchange gains or losses on foreign currency denominated assets and liabilities have not been included in interest income or expense. |
| · | Interest on financial investments does not include trading gains or losses on these investments. |
· | Past due loans only include the payments that are 90 or more days overdue, and do not include the portion of such loan that is not overdue (principal amount) or those payments which are less than 90 days overdue, unless legal proceedings have been commenced for the entire outstanding balance according to the terms of the loan. This practice differs from that normally followed in the United States where the amount classified as past due would include the total principal, payments and interest on all loans which have any portion overdue. |
| · | Penalty interest is not recognized on past due payments (loans with more than one payment) or past due loans (one payment). |
| · | The interest earned from past due loans is only the proportion of interest earned on each of these payments. We do not accrue penalty interest on these payments. |
| · | Loans that are not yet 90 days or more overdue have been included in each of the various categories of loans, and affect the various averages. |
· | Non-performing commercial loans (those loans which do not accrue interest) consist of loans included in Categories C4, D1 and D2 and loans (or portions thereof) that are overdue. |
· | Included in loans and receivables to banks are interbank deposits maintained in the Central Bank and foreign banks. Such assets have a distorting effect on the average interest rate earned on total interest-earning assets because currently balances maintained in peso amounts do not earn interest, and the only balances held in a foreign currency that earn interest are those maintained in U.S. dollars, but those only earn interest on the amounts that are legally required to be held for liquidity purposes. Additionally, this account includes interest earned by overnight investments. Consequently, the average interest earned on such assets is comparatively low. We maintain these deposits in these accounts to comply with statutory requirements and to facilitate international business, rather than to earn income. |
· | The monetary gain or loss on interest-earning assets and interest bearing liabilities is not included as a component of interest income or interest expense because inflation effects are taken into account in the calculation of real interest rates. |
42
The following tables show, by currency of denomination, average balances and, where applicable, interest amounts, nominal rates and rates for our assets and liabilities for the years ended December 31, 2008, 2009 and 2010:
| Year ended December 31, | |||||||||||||||||||||||||||||||||||||||||
| 2008 | 2009 | 2010 | |||||||||||||||||||||||||||||||||||||||
| Average Balance | Interest Earned | Average Nominal Rate | Average Real Rate | Average Balance | Interest Earned | Average Nominal Rate | Average Real Rate | Average Balance | Interest Earned | Average Nominal Rate | Average Real Rate | ||||||||||||||||||||||||||||||
| (in millions of Ch$ as of December 31, 2010 except for percentages) | |||||||||||||||||||||||||||||||||||||||||
| ASSETS | |||||||||||||||||||||||||||||||||||||||||
| INTEREST EARNING ASSETS | |||||||||||||||||||||||||||||||||||||||||
| Deposits in Central Bank | |||||||||||||||||||||||||||||||||||||||||
| Ch$ | Ch$ | 51,245 | Ch$ | 2,805 | 5.5 | % | (3.1) | % | Ch$ | 46,869 | Ch$ | 607 | 1.3 | % | 3.7 | % | Ch$ | 55,676 | Ch$ | 1,165 | 2.1 | % | (0.4) | % | |||||||||||||||||
| UF | — | — | — | — | — | — | — | — | ---— | -— | — | — | |||||||||||||||||||||||||||||
| Foreign currency | 10,548 | 79 | 0.7 | % | 18.4 | % | 19,433 | 1 | — | 22.8 | % | 23,826 | — | — | 5.4 | % | |||||||||||||||||||||||||
| Total | 61,793 | 2,884 | 6.2 | % | 0.5 | % | 66,302 | 608 | 1.3 | % | 9.3 | % | 79,502 | 1,165 | 2.1 | % | 1.3 | ||||||||||||||||||||||||
| Financial investments | |||||||||||||||||||||||||||||||||||||||||
| Ch$ | 51,060 | 3,834 | 7.5 | % | (1.3) | % | 303,421 | 12,651 | 4.2 | % | 6.6 | % | 294,380 | 13,337 | 4.5 | % | 2.0 | % | |||||||||||||||||||||||
| UF | 138,784 | 18,440 | 13.3 | % | 4.0 | % | 211,645 | (158) | (0.1) | % | 2.3 | % | 476,548 | 22,354 | 4.7 | % | 2.1 | % | |||||||||||||||||||||||
| Foreign currency | — | — | — | — | 764 | 41 | 5.4 | % | 29.4 | % | 12,430 | 665 | 5.3 | % | 11.0 | % | |||||||||||||||||||||||||
| Total | 189,844 | 22,274 | 11.7 | % | 2.6 | % | 515,830 | 12,534 | 2.4 | % | 4.9 | % | 783,358 | 36,356 | 4.6 | % | 2.2 | % | |||||||||||||||||||||||
| Total Loans | |||||||||||||||||||||||||||||||||||||||||
| Ch$ | 1,993,805 | 231,283 | 11.6 | % | 2.5 | % | 2,293,329 | 226,195 | 9.9 | % | 12.5 | % | 2,561,426 | 190,973 | 7.5 | % | 4.8 | % | |||||||||||||||||||||||
| UF | 1.852,089 | 224,577 | 12.1 | % | 3.0 | % | 1,872,318 | 48,773 | 2.6 | % | 5.0 | % | 1,950,937 | 134,843 | 6.9 | % | 4.3 | % | |||||||||||||||||||||||
| Foreign currency | 554,635 | 65,599 | 11.8 | % | 31.4 | % | 589,725 | 23,782 | 4.0 | % | 27.8 | % | 654,252 | 18,731 | 2.9 | % | 8.4 | % | |||||||||||||||||||||||
| Total | 4,400,529 | 521,459 | 11.8 | % | 6.3 | % | 4,755,372 | 298,750 | 6.3 | % | 11.4 | % | 5,166,615 | 344,547 | 6.7 | % | 5.1 | % | |||||||||||||||||||||||
| Interbank loans | |||||||||||||||||||||||||||||||||||||||||
| Ch$ | 18,096 | 713 | 3.9 | % | (4.6) | % | 7,660 | 29 | 0.4 | % | 2.7 | % | 50,303 | 51 | 0.1 | % | (2.3) | % | |||||||||||||||||||||||
| UF | — | — | — | — | — | — | — | — | — | — | — | — | |||||||||||||||||||||||||||||
| Foreign currency | 15,156 | 610 | 4.0 | % | 22.3 | % | 17,062 | 379 | 2.2 | % | 25.6 | % | 31,426 | 678 | 2.2 | % | 7.6 | % | |||||||||||||||||||||||
| Total | 33,252 | 1,323 | 4.0 | % | 7.7 | % | 24,722 | 408 | 1.7 | % | 18.5 | % | 81,729 | 729 | 0.9 | % | 1.5 | % | |||||||||||||||||||||||
| Investment under resale agreements | |||||||||||||||||||||||||||||||||||||||||
| Ch$ | 90,225 | 12,455 | 13.8 | % | 4.5 | % | 43,779 | 1,734 | 4.0 | % | 6.4 | % | 52,479 | 2,861 | 5.5 | % | 2.9 | % | |||||||||||||||||||||||
| UF | — | — | — | — | — | — | — | — | 16,852 | 746 | — | 1.9 | % | ||||||||||||||||||||||||||||
| Foreign currency | — | — | — | — | — | — | — | — | 1,909 | 15 | — | — | |||||||||||||||||||||||||||||
| Total | 90,225 | 12,455 | 13.8 | % | 4.5 | % | 43,779 | 1,734 | 4.0 | % | 6.4 | % | 71,240 | 3,622 | 5.1 | % | 1.7 | % | |||||||||||||||||||||||
| Other interest earning assets | |||||||||||||||||||||||||||||||||||||||||
| Ch$ | — | — | — | — | — | — | — | — | — | — | — | — | |||||||||||||||||||||||||||||
| UF | — | — | — | — | — | — | — | — | — | — | — | — | |||||||||||||||||||||||||||||
| Foreign currency | 24,191 | 498 | 2.1 | % | 20.0 | % | 37,286 | 81 | 0.2 | % | 23.1 | % | 20,406 | 1,220 | 6.0 | % | 11.7 | % | |||||||||||||||||||||||
| Total | 24,191 | 498 | 2.1 | % | 20.0 | % | 37,286 | 81 | 0.2 | % | 23.1 | % | 20,406 | 1,220 | 6.0 | % | 11.7 | % | |||||||||||||||||||||||
| Total interest earning assets | |||||||||||||||||||||||||||||||||||||||||
| Ch$ | 2,204,431 | 251,090 | 11.4 | % | 2.3 | % | 2,695,058 | 241,217 | 9.0 | % | 11.5 | % | 3,014,264 | 208,387 | 6.9 | % | 4.3 | % | |||||||||||||||||||||||
| UF | 1,990,873 | 243,017 | 12.2 | % | 3.0 | % | 2,083,963 | 48,615 | 2.3 | % | 4.7 | % | 2,444,337 | 157,943 | 6.5 | % | 3.9 | % | |||||||||||||||||||||||
| Foreign currency | 604,530 | 66,786 | 11.0 | % | 30.5 | % | 664,270 | 24,283 | 3.7 | % | 27.3 | % | 744,249 | 21,309 | 2.9 | % | 8.4 | % | |||||||||||||||||||||||
| Total | Ch$ | 4,799,834 | Ch$ | 560,893 | 11.7 | % | 6.2 | % | Ch$ | 5,443,291 | Ch$ | 314,115 | 5.8 | % | 10.9 | % | Ch$ | 6,202,850 | Ch$ | 387,639 | 6.2 | % | 4.6 | % | |||||||||||||||||
43
| Year ended December 31, | ||||||||||||||||||||||||||||||||||||||||
2008 | 2009 | 2010 | ||||||||||||||||||||||||||||||||||||||
| Average | Average | Average | Average | Average | Average | |||||||||||||||||||||||||||||||||||
| Average | Interest | Nominal | Real | Average | Interest | Nominal | Real | Average | Interest | Nominal | Real | |||||||||||||||||||||||||||||
Balance | Earned | Rate | Rate | Balance | Earned | Rate | Rate | Balance | Earned | Rate | Rate | |||||||||||||||||||||||||||||
| (in millions of Ch$ as of December 31, 2010 except for percentages) | ||||||||||||||||||||||||||||||||||||||||
| NON-INTEREST EARNING ASSETS | ||||||||||||||||||||||||||||||||||||||||
| Cash | ||||||||||||||||||||||||||||||||||||||||
| Ch$ | Ch$ | 117,879 | Ch$ | 151,745 | Ch$ | 188,210 | ||||||||||||||||||||||||||||||||||
| UF | — | — | — | |||||||||||||||||||||||||||||||||||||
| Foreign currency | 58,433 | 49,267 | 57,044 | |||||||||||||||||||||||||||||||||||||
| Total | 176,312 | 201,012 | 245,254 | |||||||||||||||||||||||||||||||||||||
| Allowance for loan losses | ||||||||||||||||||||||||||||||||||||||||
| Ch$ | 59,019 | 85,807 | 98,434 | |||||||||||||||||||||||||||||||||||||
| UF | — | — | — | |||||||||||||||||||||||||||||||||||||
| Foreign currency | — | 14 | 146 | |||||||||||||||||||||||||||||||||||||
| Total | 59,019 | 85,821 | 98,580 | |||||||||||||||||||||||||||||||||||||
| Property, plant and equipment | ||||||||||||||||||||||||||||||||||||||||
| Ch$ | 33,048 | 52,567 | 55,310 | |||||||||||||||||||||||||||||||||||||
| UF | — | — | — | |||||||||||||||||||||||||||||||||||||
| Foreign currency | — | 62 | 96 | |||||||||||||||||||||||||||||||||||||
| Total | 33,048 | 52,629 | 55,406 | |||||||||||||||||||||||||||||||||||||
| Derivates | ||||||||||||||||||||||||||||||||||||||||
| Ch$ | 142,174 | 127,946 | 152,774 | |||||||||||||||||||||||||||||||||||||
| UF | — | — | — | |||||||||||||||||||||||||||||||||||||
| Foreign currency | 2 | — | 17 | |||||||||||||||||||||||||||||||||||||
| Total | 142,176 | 127,946 | 152,791 | |||||||||||||||||||||||||||||||||||||
| Other assets | ||||||||||||||||||||||||||||||||||||||||
| Ch$ | 125,205 | 331,505 | 386,693 | |||||||||||||||||||||||||||||||||||||
| UF | 37,526 | 52,243 | 61,272 | |||||||||||||||||||||||||||||||||||||
| Foreign currency | 33,811 | (186,134 | ) | (201,388) | ||||||||||||||||||||||||||||||||||||
| Total | 196,542 | 197,614 | 246,577 | |||||||||||||||||||||||||||||||||||||
| Total non-interest earning assets | ||||||||||||||||||||||||||||||||||||||||
| Ch$ | 477,325 | 749,570 | 684,553 | |||||||||||||||||||||||||||||||||||||
| UF | 37,526 | 52,243 | 61,272 | |||||||||||||||||||||||||||||||||||||
| Foreign currency | 92,246 | (136,791 | ) | (144,377) | ||||||||||||||||||||||||||||||||||||
| Total | 607,097 | 665,022 | 601,448 | |||||||||||||||||||||||||||||||||||||
| Total assets (1) | ||||||||||||||||||||||||||||||||||||||||
| Ch$ | 2,681,756 | 251,090 | 3,444,628 | 241,217 | 3,698,817 | 208,387 | ||||||||||||||||||||||||||||||||||
| UF | 2,028,399 | 243,017 | 2,136,206 | 48,615 | 2,505,609 | 157,943 | ||||||||||||||||||||||||||||||||||
| Foreign currency | 696,776 | 66,786 | 527,479 | 24,283 | 599,872 | 21,309 | ||||||||||||||||||||||||||||||||||
| Total Ch$ | Ch$ | 5,406,931 | Ch$ | 560,893 | Ch$ | 6,108,313 | Ch$ | 314,115 | Ch$ | 6,804,298 | Ch$ | 387,639 | ||||||||||||||||||||||||||||
(1) Represents total of interest earning and non-interest earning assets.
44
Year ended December 31, | ||||||||||||||||||||||||||||||||||
2008 | 2009 | 2010 | ||||||||||||||||||||||||||||||||
| Average | Average | Average | Average | Average | Average | |||||||||||||||||||||||||||||
| Average | Interest | Nominal | Real | Average | Interest | Nominal | Real | Average | Interest | Nominal | Real | |||||||||||||||||||||||
Balance | Paid | Rate | Rate | Balance | Paid | Rate | Rate | Balance | Paid | Rate | Rate | |||||||||||||||||||||||
| (in millions of Ch$ as of December 31, 2010 except for percentages) | ||||||||||||||||||||||||||||||||||
| LIABILITIES | ||||||||||||||||||||||||||||||||||
| INTEREST-BEARING LIABILITIES | ||||||||||||||||||||||||||||||||||
| Time deposits | ||||||||||||||||||||||||||||||||||
| Ch$ | Ch$ | 2,103,660 | Ch$ | 152,286 | 7.2% | (1.5) | Ch$2,346,380 | Ch$ | 82,425 | 3.5% | 6.0% | Ch$ | 2,676,020 | Ch$ | 63,195 | 2.4% | (0.1)% | |||||||||||||||||
| UF | 398,711 | 47,351 | 11.9% | 2.7 | 386,127 | (1,848) | (0.5)% | 1.9% | 348,666 | 15,257 | 4.4% | 1.8% | ||||||||||||||||||||||
| Foreign currency | 380,658 | 16,429 | 4.3% | 22.6 | 473,394 | 10,145 | 2.1% | 25.5% | 523,158 | 7,523 | 1.4% | 6.9% | ||||||||||||||||||||||
| Total | 2,883,029 | 216,066 | 7.5% | 2.3 | 3,205,901 | 90,722 | 2.8% | 8.3% | 3,547,844 | 85,975 | 2.4% | 1.1% | ||||||||||||||||||||||
| Central Bank borrowings | ||||||||||||||||||||||||||||||||||
| Ch$ | — | — | — | — | 8,386 | 205 | 2.4% | 4.9% | 1,274 | 115 | 9.0% | 6.3% | ||||||||||||||||||||||
| UF | — | — | — | — | — | — | — | — | — | — | — | — | ||||||||||||||||||||||
| Foreign currency | — | — | — | — | — | — | — | — | — | — | — | — | ||||||||||||||||||||||
| Total | — | — | — | — | 8,386 | 205 | 2.4% | 4.9% | 1,274 | 115 | 9.0% | 6.3% | ||||||||||||||||||||||
| Repurchase agreements | ||||||||||||||||||||||||||||||||||
| Ch$ | 164,921 | 14,094 | 8.5% | (0.3)% | 267,061 | 4,275 | 1.6% | 4.0% | 422,140 | 4,847 | 1.1% | (1.3)% | ||||||||||||||||||||||
| UF | — | — | — | — | — | — | — | — | 2,157 | 54 | 2.5% | — | ||||||||||||||||||||||
| Foreign currency | — | — | — | — | — | — | — | — | — | — | — | — | ||||||||||||||||||||||
| Total | 164,921 | 14,094 | 8.5% | (0.3)% | 267,061 | 4,275 | 1.6% | 4.0% | 424,297 | 4,901 | 1.2% | (1.3)% | ||||||||||||||||||||||
| Mortgage finance bonds | ||||||||||||||||||||||||||||||||||
| Ch$ | 241 | 6 | 2.5% | (5.9)% | 226 | 5 | 2.2% | 4.6% | 208 | 4 | 1.9% | (0.6)% | ||||||||||||||||||||||
| UF | 339,309 | 44,654 | 13.2% | 3.9 | 296,952 | 5,304 | 1.8% | 4.2% | 246,470 | 16,424 | 6.7% | 4.1% | ||||||||||||||||||||||
| Foreign currency | — | — | — | — | — | — | — | — | — | — | — | |||||||||||||||||||||||
| Total | 339,550 | 44,660 | 13.2% | 3.9% | 297,178 | 5,309 | 1.8% | 4.2% | 246,678 | 16,428 | 6.7% | 4.1% | ||||||||||||||||||||||
| Bonds | ||||||||||||||||||||||||||||||||||
| Ch$ | — | — | — | — | — | — | — | — | — | — | — | — | ||||||||||||||||||||||
| UF | 386,927 | 49,726 | 12.9% | 3.6% | 472,516 | 7,830 | 1.7% | 4.1% | 712,624 | 46,225 | 6.5% | 3.9% | ||||||||||||||||||||||
| Foreign currency | — | — | — | — | — | — | — | 32,943 | 109 | 0.3% | 5.7% | |||||||||||||||||||||||
| Total | 386,927 | 49,726 | 12.9% | 3.6% | 472,516 | 7,830 | 1.7% | 4.1% | 745,567 | 46,334 | 6.2% | 4.0% | ||||||||||||||||||||||
| Other interest-bearing liabilities | ||||||||||||||||||||||||||||||||||
| Ch$ | 26,213 | 1,794 | 6.8% | (1.9)% | 101,834 | 3,217 | 3.2% | 5.6% | 360,261 | 1,469 | 0.4% | (2.0)% | ||||||||||||||||||||||
| UF | 30,401 | 7,508 | 24.7% | 14.5% | 28,623 | 135 | 0.5% | 2.8% | 26,529 | 1,924 | 7.3% | 4.6% | ||||||||||||||||||||||
| Foreign currency | 347,791 | 12,869 | 3.7% | 21.9% | 363,218 | 9,034 | 2.5% | 25.6% | 413,472 | 6,083 | 1.5% | 6.9% | ||||||||||||||||||||||
| Total | 404,405 | 22,171 | 5.5% | 19.8% | 493,675 | 12,386 | 2.5% | 20.4% | 800,262 | 9,476 | 1.2% | 2.8% | ||||||||||||||||||||||
| Total interest-bearing liabilities | ||||||||||||||||||||||||||||||||||
| Ch$ | 2,295,035 | 168,180 | 7.3% | (1.4)% | 2,723,887 | 90,127 | 3.3% | 5.7% | 3,445,962 | 69,630 | 2.3% | (0.2)% | ||||||||||||||||||||||
| UF | 1,155,348 | 149,239 | 12.9% | 3.7% | 1,184,218 | 11,421 | 1.0% | 3.3% | 1,336,446 | 79,884 | 5.3% | 2.8% | ||||||||||||||||||||||
| Foreign currency | 728,449 | 29,298 | 4.0% | 22.3% | 836,612 | 19,179 | 2.3% | 25.6% | 983,515 | 13,715 | 1.4% | 6.8% | ||||||||||||||||||||||
| Total | Ch$ | 4,178,832 | Ch$ | 346,717 | 8.3% | 4.1% | Ch$4,744,717 | Ch$120,727 | 2.5% | 8.7% | Ch$ | 5,765,922 | Ch$ | 163,229 | 2.8% | 1.7% | ||||||||||||||||||
45
Year ended December 31, | ||||||||||||||||||||||||||||||||||||||||
2008 | 2009 | 2010 | ||||||||||||||||||||||||||||||||||||||
| Average | Average | Average | Average | Average | Average | |||||||||||||||||||||||||||||||||||
| Average | Interest | Nominal | Real | Average | Interest | Nominal | Real | Average | Interest | Nominal | Real | |||||||||||||||||||||||||||||
Balance | Paid | Rate | Rate | Balance | Paid | Rate | Rate | Balance | Paid | Rate | Rate | |||||||||||||||||||||||||||||
| (in millions of Ch$ as of December 31, 2010 except for percentages) | ||||||||||||||||||||||||||||||||||||||||
| NON-INTEREST BEARING LIABILITIES | ||||||||||||||||||||||||||||||||||||||||
| Non-interest-bearing demand deposits | ||||||||||||||||||||||||||||||||||||||||
| Ch$ | Ch$ | 189,021 | Ch$ | 192,530 | Ch$ | 243,704 | ||||||||||||||||||||||||||||||||||
| UF | 1,260 | 1,030 | 1,738 | |||||||||||||||||||||||||||||||||||||
| Foreign currency | 56,351 | 47,960 | 64,432 | |||||||||||||||||||||||||||||||||||||
| Total | 246,632 | 241,520 | 309,874 | |||||||||||||||||||||||||||||||||||||
| Derivates | ||||||||||||||||||||||||||||||||||||||||
| Ch$ | 135,130 | 120,064 | 125,363 | |||||||||||||||||||||||||||||||||||||
| UF | — | — | — | |||||||||||||||||||||||||||||||||||||
| Foreign currency | — | — | 4 | |||||||||||||||||||||||||||||||||||||
| Total | 135,130 | 120,064 | 125,367 | |||||||||||||||||||||||||||||||||||||
| Other non-interest-bearing | ||||||||||||||||||||||||||||||||||||||||
| Ch$ | 362,011 | 504,364 | 94,048 | |||||||||||||||||||||||||||||||||||||
| UF | — | — | — | |||||||||||||||||||||||||||||||||||||
| Foreign currency | 17,312 | 29,713 | 798 | |||||||||||||||||||||||||||||||||||||
| Total | 379,323 | 534,077 | 94,846 | |||||||||||||||||||||||||||||||||||||
| Shareholders’ equity (1) | ||||||||||||||||||||||||||||||||||||||||
| Ch$ | 467,014 | 467,935 | 508,289 | |||||||||||||||||||||||||||||||||||||
| UF | — | — | — | |||||||||||||||||||||||||||||||||||||
| Foreign currency | — | — | — | |||||||||||||||||||||||||||||||||||||
| Total | 467,014 | 467,935 | 508,289 | |||||||||||||||||||||||||||||||||||||
| Total non-interest-bearing liabilities and shareholders’ equity | ||||||||||||||||||||||||||||||||||||||||
| Ch$ | 1,153,176 | 1,284,893 | 971,404 | |||||||||||||||||||||||||||||||||||||
| UF | 1,260 | 1,030 | 1,738 | |||||||||||||||||||||||||||||||||||||
| Foreign currency | 73,663 | 77,673 | 65,234 | |||||||||||||||||||||||||||||||||||||
| Total | 1,228,099 | 1,363,596 | 1,038,376 | |||||||||||||||||||||||||||||||||||||
| Total liabilities and shareholders’ equity (1) | ||||||||||||||||||||||||||||||||||||||||
| Ch$ | 3,448,211 | 168,180 | 4,008,780 | 90,127 | 4,417,365 | 69,630 | ||||||||||||||||||||||||||||||||||
| UF | 1,156,608 | 149,239 | 1,185,248 | 11,421 | 1,338,183 | 79,884 | ||||||||||||||||||||||||||||||||||
| Foreign currency | 802,112 | 29,298 | 914,285 | 19,179 | 1,048,749 | 13,715 | ||||||||||||||||||||||||||||||||||
| Total | Ch$ | 5,406,931 | Ch$ | 346,717 | Ch$ | 6,108,313 | Ch$120,727 | Ch$ | 6,804,298 | Ch$ | 163,229 | |||||||||||||||||||||||||||||
| (1) | Represents total of interest-bearing and non-interest bearing liabilities and shareholders’ equity. |
46
Interest-earning Assets—Net Interest Margin
The following tables analyze, by currency of denomination, our levels of average interest-earning assets and net interest, and illustrate the comparative margins obtained, for each of the periods indicated:
Year ended December 31, | ||||||||||
2008 | 2009 | 2010 | ||||||||
(in millions of Ch$ as of December 31, 2010, except for percentages) | ||||||||||
| Total average interest earning assets | ||||||||||
| Ch$ | Ch$ | 2,204,431 | Ch$ | 2,695,058 | Ch$ | 3,014,264 | ||||
| UF | 1,990,873 | 2,083,963 | 2,444,337 | |||||||
| Foreign currency | 604,530 | 664,270 | 744,249 | |||||||
| Total | Ch$ | 4,799,834 | Ch$ | 5,443,291 | Ch$ | 6,202,850 | ||||
| Net interest earned (1) | ||||||||||
| Ch$ | Ch$ | 82,910 | Ch$ | 151,090 | Ch$ | 138,757 | ||||
| UF | 93,778 | 37,194 | 78,059 | |||||||
| Foreign currency | 37,488 | 5,104 | 7,594 | |||||||
| Total | Ch$ | 214,176 | Ch$ | 193,388 | Ch$ | 224,410 | ||||
| Net interest margin, nominal basis (2) | ||||||||||
| Ch$ | 3.8% | 5.6% | 4.6% | |||||||
| UF | 4.7% | 1.8% | 3.2% | |||||||
| Foreign currency | 6.2% | 0.8% | 1.0% | |||||||
| Total | 4.5% | 3.6% | 3.6% | |||||||
| (1) | Net interest earned is defined as interest income earned less interest expense incurred. |
| (2) | Net interest margin is defined as net interest income divided by average interest-earning assets. |
Changes in Net Interest Income and Interest Expense—Volume and Rate Analysis
The following tables allocate, by currency of denomination, changes in our net interest income between changes in the average volume of interest-earning assets and interest bearing liabilities and changes in their respective nominal interest rates from 2008 to 2009 and 2009 to 2010. Volume and rate variances have been calculated based on movements in average balances over the year and changes in nominal interest rates, average interest-earning assets and average interest bearing liabilities. The net change attributable to changes in both volume and rate has been allocated proportionately to the change due to volume and the change due to rate.
| Increase (Decrease) | ||||||||||||||
| from 2008 to 2009 | ||||||||||||||
| due to changes in | Net change | |||||||||||||
| Rate and | from 2008 | |||||||||||||
| Volume | Rate | Volume | to 2009 | |||||||||||
| (in millions of Ch$ as of December 31, 2009) | ||||||||||||||
| INTEREST EARNING ASSETS | ||||||||||||||
| Deposits in central Bank | ||||||||||||||
| Ch$ | Ch$ | (240) | Ch$ | (21) | Ch$ | (1,936) | Ch$ | (2,197) | ||||||
| UF | — | — | — | — | ||||||||||
| Foreign currency | 67 | (1) | (145) | (79) | ||||||||||
| Total | (173) | (22) | (2,081 | ) | (2,276) | |||||||||
| Financial investments | ||||||||||||||
| Ch$ | 18,949 | (17) | (10,115) | 8,817 | ||||||||||
| UF | 9,681 | (185) | (28,094) | (18,598) | ||||||||||
| Foreign currency | — | — | 41 | ) | 41 | |||||||||
| Total | 28,630 | (202) | (38,168) | (9,740) | ||||||||||
| Loans | ||||||||||||||
| Ch$ | 34,745 | (346) | (39,487) | (5,088) | ||||||||||
| UF | 2,453 | (1,763) | (176,494) | (175,804) | ||||||||||
| Foreign currency | 4,150 | (432) | (45,535) | (41,817) | ||||||||||
| Total | 41,348 | (2,541) | (261,516) | 222,709 | ||||||||||
| Interbank loans | ||||||||||||||
| Ch$ | (411) | (6) | (267) | (684) | ||||||||||
| UF | — | — | — | — | ||||||||||
| Foreign currency | 77 | (3) | (305 | ) | (231) | |||||||||
| Total | (334) | (9) | (572) | (915) | ||||||||||
| Investment under resale agreements | ||||||||||||||
| Ch$ | (4,187) | (36) | (6,498) | (10,721) | ||||||||||
| UF | — | — | — | — | ||||||||||
| Foreign currency | — | — | — | — | ||||||||||
| Total | (4,187) | (36) | (6,498) | (10,721) | ||||||||||
| Total interest earning assets | ||||||||||||||
| Ch$ | — | — | — | — | ||||||||||
| UF | — | — | — | — | ||||||||||
| Foreign currency | 270 | (4) | (683) | (417) | ||||||||||
| Total | 270 | (4) | (683) | (417) | ||||||||||
| Total Interest earning assets | ||||||||||||||
| Ch$ | 48,856 | (426) | (58,303) | (9,873) | ||||||||||
| UF | 12,134 | (1,948) | (204,588) | (194,402) | ||||||||||
| Foreign currency | 4,564 | (440) | (46,627) | (42,503) | ||||||||||
| Total | Ch$ | 65,554 | Ch$ | 2,814 | Ch$ | (309,518) | Ch$ | (246,778) | ||||||
47
| Increase (Decrease) | |||||||||||||
| from 2008 to 2009 | |||||||||||||
| due to changes in | Net change | ||||||||||||
| Rate and | from 2008 | ||||||||||||
| Volume | Rate | Volume | to 2009 | ||||||||||
| (in millions of Ch$ as of December 31, 2009) | |||||||||||||
| INTEREST BEARING LIABILITIES | |||||||||||||
| Time deposits | |||||||||||||
| Ch$ | Ch$ | 17,571 | Ch$ | (784) | Ch$ | (86,648) | Ch$ | (69,861) | |||||
| UF | (1,494) | (493) | (47,212) | (49,199) | |||||||||
| Foreign currency | 4,002 | (83) | (10,203) | (6,284) | |||||||||
| Total | 20,079 | (1,360) | (144,063) | (125,344) | |||||||||
| Central Bank borrowings | |||||||||||||
| Ch$ | — | — | 205 | 205 | |||||||||
| UF | — | — | — | — | |||||||||
| Foreign currency | — | — | — | — | |||||||||
| Total | — | — | 205 | 205 | |||||||||
| Repurchase agreements | |||||||||||||
| Ch$ | 8,729 | (11,454) | (7,094) | (9,819) | |||||||||
| UF | — | — | — | ||||||||||
| Foreign currency | — | — | — | — | |||||||||
| Total | 8,729 | (11,454) | (7,094) | (9,819) | |||||||||
| Mortgage finance bonds | 4 | ||||||||||||
| Ch$ | — | — | (1) | (1) | |||||||||
| UF | (5,574) | (386) | (33,390) | (39,350) | |||||||||
| Foreign currency | — | — | — | — | |||||||||
| Total | (5,574) | (386) | (33,391) | (39,351) | |||||||||
| Bonds | |||||||||||||
| Ch$ | — | — | — | — | |||||||||
| UF | 10,999 | (433) | (52,462) | (41,896) | |||||||||
| Foreign currency | — | — | — | — | |||||||||
| Total | 10,999 | (433) | (52,462) | (41,896) | |||||||||
| Other interest bearing liabilities | |||||||||||||
| Ch$ | 5,175 | (10) | (3,742) | 1,423 | |||||||||
| UF | (439) | (74) | (6,860) | (7,373) | |||||||||
| Foreign currency | 571 | (42) | (4,364) | (3,835) | |||||||||
| Total | 5,307 | (126) | (14,966) | (9,785) | |||||||||
| Total interest bearing liabilities | |||||||||||||
| Ch$ | 31,475 | (12,248) | (97,280) | (78,053) | |||||||||
| UF | 3,492 | (1,386) | (139,924) | (137,818) | |||||||||
| Foreign currency | 4,573 | (125) | (14,567) | (10,119) | |||||||||
| Total | Ch$ | 39,540 | Ch$ | (13,759) | Ch$ | (251,771) | Ch$ | (225,990) | |||||
48
| Increase (Decrease) | ||||||||||||||
| from 2009 to 2010 | ||||||||||||||
| due to changes in | Net change | |||||||||||||
| Rate and | from 2009 | |||||||||||||
| Volume | Rate | Volume | to 2010 | |||||||||||
| (in millions of Ch$ as of December 31, 2010) | ||||||||||||||
| INTEREST EARNING ASSETS | ||||||||||||||
| Deposits in Central Bank | ||||||||||||||
| Ch$ | Ch$ | 114 | Ch$ | 4 | Ch$ | 440 | Ch$ | 558 | ||||||
| UF | — | — | — | — | ||||||||||
| Foreign currency | — | — | (1) | (1) | ||||||||||
| Total | 114 | 4 | 439 | 557 | ||||||||||
| Financial investments | ||||||||||||||
| Ch$ | (377) | 11 | 1,052 | 686 | ||||||||||
| UF | (198) | 101 | 22,608 | 22,511 | ||||||||||
| Foreign currency | 630 | — | (6) | ) | 624 | |||||||||
| Total | 55 | 112 | 23,654 | 23,821 | ||||||||||
| Loans | ||||||||||||||
| Ch$ | 26,443 | (552) | (61,113) | (35,222) | ||||||||||
| UF | 2,048 | 806 | 83,216 | 86,070 | ||||||||||
| Foreign currency | 2,602 | (69) | (7,584) | (5,051) | ||||||||||
| Total | 31,093 | 185 | 14,519 | 45,797 | ||||||||||
| Interbank loans | ||||||||||||||
| Ch$ | 161 | — | (140) | 21 | ||||||||||
| UF | — | — | — | — | ||||||||||
| Foreign currency | 319 | — | (20) | 299 | ||||||||||
| Total | 480 | — | (160) | 320 | ||||||||||
| Investment under resale agreements | ||||||||||||||
| Ch$ | 345 | 7 | 776 | 1,128 | ||||||||||
| UF | — | — | 746 | 746 | ||||||||||
| Foreign currency | — | — | 15 | 15 | ||||||||||
| Total | 345 | 7 | 1,537 | 1,889 | ||||||||||
| Total interest earning assets | ||||||||||||||
| Ch$ | — | — | — | — | ||||||||||
| UF | — | — | — | — | ||||||||||
| Foreign currency | (37) | 21 | 1,153 | 1,137 | ||||||||||
| Total | (37) | 21 | 1,153 | 1,137 | ||||||||||
| Total Interest earning assets | ||||||||||||||
| Ch$ | 26,686 | (530) | (58,985) | (32,829) | ||||||||||
| UF | 1,850 | 907 | 106,570 | 109,327 | ||||||||||
| Foreign currency | 3,514 | (48) | (6,443) | (2,977) | ||||||||||
| Total | Ch$ | 32,050 | Ch$ | 329 | Ch$ | 41,142 | Ch$ | 73,521 | ||||||
49
| Increase (Decrease) | |||||||||||||
| from 2009 to 2010 | |||||||||||||
| due to changes in | Net change | ||||||||||||
| Rate and | from 2009 | ||||||||||||
| Volume | Rate | Volume | to 2010 | ||||||||||
| (in millions of Ch$ as of December 31, 2010) | |||||||||||||
| INTEREST BEARING LIABILITIES | |||||||||||||
| Time deposits | |||||||||||||
| Ch$ | Ch$ | 11,580 | Ch$ | (270) | Ch$ | (30,539) | Ch$ | (19,229) | |||||
| UF | 179 | 187 | 16,738 | 17,104 | |||||||||
| Foreign currency | 1,066 | (33) | (3,655) | (2,622) | |||||||||
| Total | 12,825 | (116) | (17,456) | (4,747) | |||||||||
| Central Bank borrowings | |||||||||||||
| Ch$ | (174) | 6 | 78 | (90) | |||||||||
| UF | — | — | — | — | |||||||||
| Foreign currency | — | — | — | — | |||||||||
| Total | (174) | 6 | 78 | (90) | |||||||||
| Repurchase agreements | |||||||||||||
| Ch$ | 2,481 | (12) | (1,897) | 572 | |||||||||
| UF | 54 | 54 | |||||||||||
| Foreign currency | — | — | — | — | |||||||||
| Total | 2,481 | (12) | (1,843) | 626 | |||||||||
| Mortgage finance bonds | |||||||||||||
| Ch$ | — | — | (1) | (1) | |||||||||
| UF | (902) | 145 | 11,877 | 11,120 | |||||||||
| Foreign currency | — | — | — | — | |||||||||
| Total | (902) | 145 | 11,876 | 11,119 | |||||||||
| Bonds | |||||||||||||
| Ch$ | — | — | — | — | |||||||||
| UF | 3,979 | 228 | 34,188 | 38,395 | |||||||||
| Foreign currency | — | — | 109 | 109 | |||||||||
| Total | 3,979 | 228 | 34,297 | 38,504 | |||||||||
| Other interest bearing liabilities | |||||||||||||
| Ch$ | 8,164 | (28) | (9,884) | (1,748) | |||||||||
| UF | (10) | 19 | 1,779 | 1,788 | |||||||||
| Foreign currency | 1,250 | (37) | (4,164) | (2,951) | |||||||||
| Total | 9,404 | (46) | (12,269) | (2,911) | |||||||||
| Total interest bearing liabilities | |||||||||||||
| Ch$ | 22,051 | (304) | (42,243) | (20,496) | |||||||||
| UF | 3,246 | 579 | 64,636 | 68,461 | |||||||||
| Foreign currency | 2,316 | (70) | (7,710) | (5,464) | |||||||||
| Total | Ch$ | 27,613 | Ch$ | 205 | Ch$ | 14,683 | Ch$ | 42,501 | |||||
50
Return on Equity and Assets
The following tables set forth our return on average shareholders’ equity and average total assets and related information for each of the periods indicated.
| Years ended | |||||||
| December 31, 2008, 2009 and 2010 | |||||||
| (in millions of Ch$, except for percentages) | |||||||
| 2008 | 2009 | 2010 | |||||
| Net income for the year | 88,682 | 86,192 | 121,573 | ||||
| Equity holder of the bank | 88,682 | 86,192 | 122,550 | 119 | |||
| Average total assets | 5,406,931 | 6,108,313 | 6,804,298 | ||||
| Average equity | 467,014 | 467,935 | 508,289 | ||||
| Net income as a percentage of: | |||||||
| Average total assets | 1.72% | 1.42% | 1.79% | ||||
| Average equity | 19.93% | 18.53% | 23.92% | ||||
| Average equity as a percentage of: | |||||||
| Average total assets | 8.64% | 7.66% | 7.47% | ||||
| Net income for the year | 88,682 | 86,192 | 121,573 | ||||
| Dividend payout ratio, based on net income attributable to shareholders | 100% | 100% | 100% | ||||
Investment Portfolio
Financial investments are classified at the time of the purchase, based on management’s intentions, as either trading or investment instruments, the latter of which are categorized as available-for-sale or held-to-maturity. As of December 31, 2008, 2009 and 2010, we have not classified any securities as held-to-maturity.
51
Financial investments as of December 31, 2008, 2009 and 2010 are as follows:
| As of December 31, | |||||||
| 2008 | 2009 | 2010 | |||||
| MCh$ | MCh$ | MCh$ | |||||
| Held- for- trading: | |||||||
| Chilean Central Bank and government securities: | |||||||
| Chilean Central Bank securities | 54,179 | 260 | 88,077 | ||||
| Chilean Central Bank notes | 3,599 | 589 | — | ||||
| Other government securities | 7,930 | 8,332 | 8 | ||||
| Other national institution securities: | |||||||
| Bonds | — | — | 2,998 | ||||
| Notes | — | — | — | ||||
| Other securities | 13,599 | 54,788 | 71,379 | ||||
| Foreign institution securities: | |||||||
| Bonds | — | — | 1,922 | ||||
| Notes | — | — | — | ||||
| Other foreign securities | — | 2,495 | 550 | ||||
| Mutual fund investments: | |||||||
| Funds managed by related organizations | 5,798 | 9,692 | 32,646 | ||||
| Funds managed by third parties | — | — | — | ||||
| Total | 85,105 | 76,156 | 197,580 | ||||
| Available- for- sale: | |||||||
| Chilean Central Bank and government securities | |||||||
| Chilean Central Bank securities | 284,498 | 548,073 | 543,901 | ||||
| Chilean treasury bonds | 22,326 | 26,748 | — | ||||
| Other government securities | 11,934 | 1,474 | 40,140 | ||||
| Other financial instruments | |||||||
| Promissory notes related to deposits in local banks | 206,604 | 146,934 | 123,226 | ||||
| Chilean mortgage finance bonds | 2,951 | 1,827 | 1,553 | ||||
| Chilean financial institution bonds | 48,165 | — | — | ||||
| Other local investments | — | 4,100 | — | ||||
| Financial instruments issued abroad | |||||||
| Foreign government and Central Bank instruments | — | — | — | ||||
| Other foreign investments | — | 1,563 | 17,955 | ||||
| Impairment provision | — | — | — | ||||
| Unquoted securities in active markets | |||||||
| Chilean corporate bonds | — | 6,443 | 19,473 | ||||
| Other investments | — | — | — | ||||
| Impairment provision | — | — | — | ||||
| Total | 576,478 | 737,162 | 746,248 | ||||
52
In addition to the securities issued by the Central Bank and the Chilean government disclosed above, we also have a concentration of investments in time deposits and mortgage securities (Ch$18,481.0 million) issued by Banco del Estado de Chile, representing approximately 3.6% of our shareholders’ equity, as of December 31, 2010. We do not hold securities of any issuer other than the Central Bank, which the aggregate book value of the investment exceeds 10.0% of our shareholders’ equity as of the end of the latest reported period.
The following table sets forth an analysis of our investments, by time remaining to maturity and the weighted average nominal rates of such investments, as of December 31, 2010:
Within one year | Weighted average Nominal Rate | After one year but within five years | Weighted average Nominal Rate | After five years but within ten years | Weighted average Nominal Rate | After ten years | Weighted average Nominal Rate | Total | |||||||||||
| (in millions of Ch$ as of December 31, 2010, except for percentages) | |||||||||||||||||||
| Ch$ | % | Ch$ | % | Ch$ | % | Ch$ | % | Ch$ | |||||||||||
| Held- for- trading: | |||||||||||||||||||
Chilean Central Bank and government securities: | |||||||||||||||||||
| Chilean Central Bank securities | 2,924 | 4.4 | 85,153 | 4.4 | — | — | — | — | 88,077 | ||||||||||
| Chilean Central Bank notes | — | — | — | — | — | — | — | — | — | ||||||||||
| Other government securities | — | — | 8 | 4.6 | — | — | — | — | 8 | ||||||||||
| Other national institution securities: | |||||||||||||||||||
| Bonds | — | — | — | — | 429 | 3.7 | 2,569 | 4.4 | 2,998 | ||||||||||
| Notes | — | — | — | — | — | — | — | — | — | ||||||||||
| Other securities | 68,046 | 1.8 | 3,146 | 3.1 | 136 | 3.7 | 51 | 3.6 | 71,379 | ||||||||||
| Foreign institution securities: | |||||||||||||||||||
| Bonds | 1,922 | 0.1 | — | — | — | — | — | — | 1,922 | ||||||||||
| Notes | — | — | — | — | — | — | — | — | — | ||||||||||
| Other foreign securities | 550 | 0.1 | — | — | — | — | — | — | 550 | ||||||||||
| Mutual fund investments: | |||||||||||||||||||
| Funds managed by related organizations | 32,646 | 0.3 | — | — | — | — | — | — | 32,646 | ||||||||||
| Funds managed by third parties | — | — | — | — | — | — | — | — | — | ||||||||||
| Total | 106,088 | 1.4 | 88,307 | 4.4 | 565 | 3.7 | 2,620 | 4.4 | 197,580 | ||||||||||
53
Within one year | Weighted average Nominal Rate | After one year but within five years | Weighted average Nominal Rate | After five years but within ten years | Weighted average Nominal Rate | After ten years | Weighted average Nominal Rate | Total | |||||||||||
| Ch$ | % | Ch$ | % | Ch$ | % | Ch$ | % | Ch$ | |||||||||||
| Available-for-sale: | |||||||||||||||||||
| Chilean Central Bank and government securities: | |||||||||||||||||||
| Chilean Central Bank securities | 27,279 | 5.5 | 451,770 | 5.6 | 64,853 | 3.0 | — | — | 543,901 | ||||||||||
| Chilean treasury bonds | — | — | — | — | — | — | — | — | — | ||||||||||
| Other government securities | 2,309 | 2.3 | 37,831 | 3.2 | — | — | — | — | 40,140 | ||||||||||
| Other financial instruments | |||||||||||||||||||
| Promissory notes related to deposits in local banks | 38,005 | 2.4 | 85,221 | 2.6 | — | — | — | — | 123,226 | ||||||||||
| Chilean mortgage finance bonds | 255 | 5.2 | 802 | 5.1 | 309 | 4.4 | 187 | 4.4 | 1,553 | ||||||||||
| Chilean financial institution bonds | — | — | — | — | — | — | — | — | — | ||||||||||
| Other local investments | — | — | — | — | — | — | — | — | — | ||||||||||
| Financial instruments issued abroad | |||||||||||||||||||
| Foreign government and Central Bank instruments | — | — | — | — | — | — | — | — | — | ||||||||||
| Other foreign investments | — | — | — | — | 3,417 | 6.1 | 14,537 | 6.4 | 17,955 | ||||||||||
| Impairment provision | — | — | — | — | — | — | — | — | — | ||||||||||
| Unquoted securities in active markets | |||||||||||||||||||
| Chilean corporate bonds | 477 | 3.5 | 18,747 | 3.5 | 249 | 3.5 | — | — | 19,473 | ||||||||||
| Other investments | — | — | — | — | — | — | — | — | — | ||||||||||
| Impairment provision | — | — | — | — | — | — | — | — | — | ||||||||||
| Total | 68,325 | 3.7 | 594,371 | 5.0 | 68,828 | 3.2 | 14,724 | 6.4 | 746,248 |
Loan portfolio
The following table analyzes our loans by type of loan. Except where otherwise specified, all loan amounts stated below are before deduction for the allowance for loan losses. Total loans reflect our loan portfolio, including past due principal amounts.
As of December 31, | |||||||
2008 | 2009 | 2010 | |||||
(in millions of Ch$ as of December 31, 2010) | |||||||
| Commercial loans: | |||||||
| Commercial loans | 2,829,220 | 3,144,217 | 3,367,491 | ||||
| Foreign trade loans | 463,113 | 233,478 | 260,976 | ||||
| Current account debtors | 84,006 | 48,320 | 52,362 | ||||
| Factoring operations | 54,333 | 53,548 | 66,616 | ||||
| Leasing transactions | 325,172 | 295,857 | 280,535 | ||||
| Other loans and receivables | 2,307 | 1,450 | 1,261 | ||||
| Subtotals | 3,758,151 | 3,776,870 | 4,029,241 | ||||
| Mortgage loans: | |||||||
| Letters of credit loans | 170,073 | 144,707 | 122,933 | Cdd | |||
| Endorsable mutual mortgage loans | 270,475 | 212,468 | 272,829 | Few | |||
| Other mutual mortgage loans | 235,430 | 393,290 | 585,104 | ||||
| Leasing transactions | 366 | 160 | 146 | ||||
| Other loans and receivables | 15,890 | 56,110 | 51,627 | ||||
| Subtotals | 692,234 | 806,735 | 1,032,639 | ||||
| Consumer loans: | |||||||
| Consumer loans | 341,229 | 294,396 | 276,296 | De | |||
| Current account debtors | 30,226 | 26,437 | 24,901 | 2 | |||
| Credit card debtors | 70,937 | 55,359 | 54,386 | ||||
| Consumer leasing transactions | 274 | 523 | 708 | ||||
| Other loans and receivables | 63,449 | 51,336 | 51,024 | ||||
| Subtotals | 506,115 | 428,051 | 407,315 | ||||
| Loans | 4,956,500 | 5,011,656 | 5,469,195 | ||||
| Loans and receivables from banks | 37,696 | 86,226 | 64,187 | ||||
| Total (1) | 4,994,196 | 5,097,882 | 5,533,382 | ||||
54
(1) | All of the above categories except mortgage loans, past due loans and loans and receivables to banks are combined into “Loans” as reported in the tables set forth under “Item 4. Information on the Company—Business Overview—Selected Statistical Information—Average Balance Sheets, Income Earned from Interest Earning Assets and Interest Paid on Interest Bearing Liabilities”. |
The loan categories are as follows:
Commercial loans are comprised of the following:
General commercial loans. General commercial loans are long-term and short-term loans granted to Chilean corporations and individuals in pesos, UF or US$ on an adjustable or fixed rate basis, primarily to finance working capital or investments. Commercial loans represent the largest portion of our loan portfolio. Interest accrues daily on a 30-day or 360-day basis. Loan payments are scheduled monthly, biannually or yearly, depending on the terms of the loan. Although we determine the interest rate, it cannot exceed the maximum rate for commercial loans.
Foreign trade loans. Foreign trade loans are fixed rate, short-term loans made in foreign currencies (principally US$) to finance imports and exports.
Lines of credit and overdrafts. Lines of credit and overdrafts are short-term operating loans where our customers receive a certain pre-approved credit limit to draw upon when capital is needed.
Leasing contracts. Leasing contracts are contracts which include a clause granting a lessee a purchase option on leased assets at the end of the contract.
Factored receivables. Factored receivables are derived from our factoring operations, which consist of purchasing outstanding debt portfolios, such as bills, invoices, notes, or contracts, advancing a payment representing the future cash flows from such assets, and then performing the related collection function. The receivables are sold with recourse in the event accounts prove uncollectible.
55
Other outstanding loans. Other outstanding loans include other commercial loans not classified in the above categories, which are financed by our general borrowings.
Mortgage loans are either inflation-indexed (denominated in UF) or denominated in pesos at fixed rates. These loans are long-term with monthly payments of principal and interest secured by a real property mortgage. Mortgage loans represent the largest portion of our portfolio of loans to individuals. As required by the Superintendency of Banks and Financial Institutions (SBIF), mortgage loans include the loans granted to individuals in order to acquire, expand, repair or construct their houses. Mortgage loans include letter of credit loans, endorsable mutual mortgage loans or other mutual mortgage loans. In relation to the letters of credit loans, Chapter 9-1 of the Updated Compendium of Rules (RAN) issued by the SBIF states that the banks may use these products only in the granting of loans for acquisition, construction or extension of houses, as long as the loans are granted to the final users of such properties. In the other loans that are granted, such as those to construction companies for the construction of one or more houses, we are required to use letters of credit for general purposes. Regarding endorsable mortgage loans, Chapter 8-4 of the Updated Compendium of Rules (RAN) of the SBIF, states that the banks are allowed to grant endorsable loans with mortgage guarantees, subject to the provisions stipulated in No. 7 of Article 69 of the General Law on Banks and in the previously mentioned Chapter. Other mortgage loans includes the complementary credits to the loans granted for these same purposes and the linkage credits granted before the granting of the mortgage loans. It considers also the leasing operations for housing and other accounts receivable. Any credit granted to pay or restructure all or part of the previously mentioned credits, shall also be included in this item. Mortgage loans denominated in UF are financed in two ways: traditional mortgage loans are financed by mortgage finance bonds that we issue and sell in the Chilean financial market, and new and flexible mortgages are financed by our own funds. Mortgage loans denominated in pesos are financed by our own funds and through liabilities denominated in pesos with durations of 2 to 5 years. We no longer offer mortgage loans denominated in pesos as there was low demand for that product. At the time of approval, the amount of a mortgage loan cannot be more than 75.0% of the lower of the purchase price or the appraised value of the mortgaged property. Interest accrues daily based on a 360-day year. Although we have allowances for mortgage loan losses, mortgage loans are ultimately secured by the mortgaged property.
Consumer loans are loans to individuals, granted in pesos, generally on a fixed rate basis, to finance the purchase of consumer goods or to pay for services. They also include credit card balances subject to interest charges. Interest accrues daily on a 30- or 360-day basis. Loan payments are scheduled monthly. Although we determine the interest rate, it cannot exceed the maximum rate for consumer loans established by the Chilean Superintendency of Banks.
Past due loans include, with respect to any loan, the amount of principal or interest that is 90 days or more overdue, and do not include the installments of such loan that are not overdue or that are less than 90 days overdue, unless legal proceedings have been commenced for the entire outstanding balance according to the terms of the loan.
Loans and receivables to banks includes interbank loans to local and foreign banks and deposits in the Chilean Central Bank.
Contingent loans consist of guarantees granted by us in Ch$, UF and foreign currencies (principally US$), as well as open and unused letters of credit. Under IFRS, contingent liabilities are required to be held off balance sheet. See note 1 “Summary of significant accounting policies” and note 22 “Contingencies, commitments and responsibilities” to our audited consolidated financial statements included herein for a better understanding and analysis of the figures held off the balance.
Any collateral provided generally consists of a mortgage on real estate, a pledge of marketable securities, a letter of credit or cash. The existence and amount of collateral generally varies from loan to loan.
We use several types of concessions, frequently used in the market, to renegotiate our loans such as payment extensions, new operations or external refinancing to reduce the probability of losing the amount of the loan that the client has with us and improve collections.
The following table sets forth our commercial renegotiation portfolio for the periods indicated:
| Renegotiation portfolio | Recovery | Write-offs | |
| 2008 | 95,315,044 | 19,164,452 | 5,256,820 |
| 2009 | 94,564,754 | 11,991,688 | 6,605,865 |
| 2010 | 114,307,242 | 22,015,936 | 9,571,773 |
56
Risk Index of Our Loan Portfolio
As of January 1, 2004, additional and voluntary allowances have been included in the calculation of our risk index resulting in a higher index. The risk index is calculated as total loans over allowances for loan losses. Beginning in January 2008, in relation to the reclassifications of the balance sheet to conform to IFRS, our risk index for commercial loans is calculated by including commercial lines of credit and overdrafts, foreign trade loans, commercial leases, factoring and other commercial loans. Mortgage loans include mortgage leasing arrangements and consumer mortgage loans, which include consumer leasing.
Commercial loans. Our risk index as of December 31, 2008, 2009 and 2010 was 0.9%, 1.5% and 2.2%, respectively, this last increase is mainly due to the overall condition of the domestic economy and, accordingly, of our customers. The quality of our commercial loans depends on Chilean GDP growth, interest rates, changes in regulations, the general level of indebtedness and other economic conditions. Commercial loans include foreign trade loans, leasing contracts and factored receivables.
Mortgage loans. The risk index of our residential mortgage loans has remained relatively stable and reached 1.3% as of December 31, 2010 (0.75% and 0.6% as of December 31, 2008 and 2009, respectively). This was mainly due to adequate economic conditions in Chile and that collateral associated with mortgage loans has not suffered from high price volatility.
Consumer loans. The risk index of our consumer loans was 6.5% as of December 31, 2010 compared to 6.9% and 7.9% as of December 31, 2008 and 2009, respectively. This increase is principally due to the high inflation rates experienced during the prior two years, which in turn decreased the purchasing power of consumers and particularly affected, on an industry-wide basis, consumer finance loans.
In order to reduce the risks of the loan portfolio, our credit committee meets weekly to review and approve or decline new loan proposals. See “—Regulation and Supervision—Lending Limits” above and “—Credit Review Process” below.
Maturity and Interest Rate Sensitivity of Loans
The following table sets forth an analysis of our loans by type and time remaining to maturity as of December 31, 2010:
Balance as of December 31, 2010 | Due within 1 month | Due after 1 month but within 6 month | Due after 6 month but within 12 month | Due after 1 year but within 3 years | Due after 3 year but within 5 years | Due after 5 years | |||||||||
| (in millions of Ch$ as of December 31, 2010) | |||||||||||||||
| Commercial loans | 3,367,491 | 524,300 | 341,315 | 518,099 | 792,175 | 757,563 | 434,039 | ||||||||
| Foreign trade loans | 260,976 | 79,492 | 81,239 | 85,925 | 10,019 | 4,301 | — | ||||||||
| Current account debtors | 52,362 | 7,371 | 4,956 | 39,121 | 914 | — | — | ||||||||
| Factoring operations | 66,616 | 38,283 | 11,044 | 13,755 | 3,534 | — | — | ||||||||
| Leasing transactions | 280,535 | 12,871 | 13,395 | 55,032 | 88,557 | 41,577 | 69,103 | ||||||||
| Other loans and receivables | 1,261 | 1,207 | 31 | 23 | — | — | — | ||||||||
| Subtotals | 4,029,241 | 663,524 | 451,980 | 711,955 | 895,199 | 803,441 | 503,142 | ||||||||
| Letters of credit loans | 122, 933 | 4,579 | 1,576 | 7,201 | 19,552 | 28,296 | 61,729 | ||||||||
| Endorsable mutual mortgage loans | 272,829 | 4,613 | 1,600 | 7,351 | 20,813 | 34,726 | 203,726 | ||||||||
| Other mutual mortgage loans | 585,104 | 7,774 | 3,727 | 17,098 | 47,836 | 77,151 | 431,518 | ||||||||
| Leasing transactions | 146 | 3 | 2 | 10 | 28 | 48 | 55 | ||||||||
| Other loans and receivables | 51,627 | 917 | 288 | 1,326 | 3,767 | 6,281 | 39,048 | ||||||||
| Subtotals | 1,032,639 | 17,886 | 7,193 | 32,986 | 91,996 | 146,502 | 736,076 | ||||||||
| Consumer loans | 276,296 | 19,960 | 14,839 | 65,512 | 125,503 | 48,322 | 2,160 | ||||||||
| Current account debtors | 24,901 | 1,684 | 3,463 | 18,683 | 1,071 | — | — | ||||||||
| Credit card debtors | 54,386 | 42,503 | 3,655 | 6,789 | 1,417 | 22 | — | ||||||||
| Consumer leasing transactions | 708 | 45 | 49 | 205 | 405 | 4 | — | ||||||||
| Other loans and receivables | 51,024 | 4,222 | 2,403 | 10,614 | 25,072 | 8,713 | — | ||||||||
| Subtotals | �� | 407,315 | 68,414 | 24,409 | 101,803 | 153,468 | 57,061 | 2,160 | |||||||
| Subtotals loans | 5,469,195 | 749,824 | 483,582 | 846,744 | 1,140,663 | 1,007,004 | 1,241,378 | ||||||||
| Loans and receivables to banks | 64,187 | ||||||||||||||
| Total loans | 5,533,382 | ||||||||||||||
57
Due in 1 year or less | Due after 1 year through 5 years | Due after 5 years | Balance as of December 31, 2010 | ||||||
| (in millions of constant Ch$ as of December 31, 2010) | |||||||||
| Commercial loans | 1,383,714 | 1,549,738 | 434,039 | 3,367,491 | |||||
| Foreign trade loans | 246,656 | 14,320 | — | 260,976 | |||||
| Current account debtors | 51,448 | 914 | — | 52,362 | |||||
| Factoring operations | 63,082 | 3,534 | — | 66,616 | |||||
| Leasing transactions | 81,298 | 130,134 | 69,103 | 280,535 | |||||
| Other loans and receivables | 1,261 | — | — | 1,261 | |||||
| Subtotals | 1,827,459 | 1,698,640 | 503,142 | 4,029,241 | |||||
| Letters of credit loans | 13,356 | 47,848 | 61,729 | 122, 933 | |||||
| Endorsable mutual mortgage loans | 13,564 | 55,539 | 203,726 | 272,829 | |||||
| Other mutual mortgage loans | 28,599 | 124,987 | 431,518 | 585,104 | |||||
| Leasing transactions | 15 | 76 | 55 | 146 | |||||
| Other loans and receivables | 2,531 | 10,048 | 39,048 | 51,627 | |||||
| Subtotals | 58,065 | 238,498 | 736,076 | 1,032,639 | |||||
| Consumer loans | 100,311 | 173,825 | 2,160 | 276,296 | |||||
| Current account debtors | 23,830 | 1,071 | — | 24,901 | |||||
| Credit card debtors | 52,947 | 1,439 | — | 54,386 | |||||
| Consumer leasing transactions | 299 | 409 | — | 708 | |||||
| Other loans and receivables | 17,239 | 33,785 | — | 51,024 | |||||
| Subtotals | 194,626 | 210,529 | 2,160 | 407,315 | |||||
| Subtotals loans | |||||||||
| Loans and receivables to banks | 64,187 | ||||||||
| Total loans | 5,533,382 | ||||||||
58
The following table presents the interest rate sensitivity of our outstanding loans due after one year as of December 31, 2010.
As of December 31, 2010 | ||||
| Variable rate: | ||||
| Ch$ | Ch$ | 504,948 | ||
| UF | 1,526,570 | |||
| Ch$ indexed to US$ | 3,142 | |||
| Foreign currency | 5,787 | |||
| Subtotal | 2,040,447 | |||
| Fixed rate: | ||||
| Ch$ | 739,998 | |||
| UF | 303,746 | |||
| Ch$ indexed to US$ | 3,808 | |||
| Foreign currency | 301,046 | |||
| Subtotal | 1,348,598 | |||
| Total | Ch$ | 3,389,045 | ||
The following table sets forth an analysis of our foreign loans by type and time remaining to maturity as of December 31, 2010:
Due in 1 year or less | Due after 1 year through 5 years | Due after 5 year | Total | ||||||||||
| Commercial loans | Ch$ | 24,670 | Ch$ | 24,667 | Ch$ | 42,294 | Ch$ | 91,631 | |||||
| Foreign trade loans | 15,488 | 9,107 | — | 24,595 | |||||||||
| Total | Ch$ | 40,158 | Ch$ | 33,774 | Ch$ | 42,294 | Ch$ | 116,226 | |||||
Loans by Economic Activity
The following table sets forth as of the dates indicated, an analysis of our loan portfolio before provisions based on the borrower’s principal business activity:
As of December 31, | ||||||||||||||||||||
2008 | 2009 | 2010 | ||||||||||||||||||
| Loan | % of Loan | Loan | % of Loan | Loan | % of Loan | |||||||||||||||
Portfolio | Portfolio | Portfolio | Portfolio | Portfolio | Portfolio | |||||||||||||||
| (in millions of Ch$ as of December 31, 2010, except for percentages) | 5 | |||||||||||||||||||
| Agriculture, livestock, agribusiness, fishing | ||||||||||||||||||||
| Agriculture and livestock | Ch$ | 170,194 | 3.4% | Ch$ | 151,272 | 3.0% | Ch$ | 156,951 | 2.9% | |||||||||||
| Fruit | — | — | — | — | — | — | ||||||||||||||
| Forestry and wood extraction | 21,501 | 0.4% | 14,006 | 0.3% | 41,585 | 0.7% | . | |||||||||||||
| Fishing | 86,195 | 1.7% | 68,281 | 1.4% | 58,347 | 1.1% | 1 | |||||||||||||
| Subtotal | 277,440 | 5.6% | 233,559 | 4.7% | 256,883 | 4.7% | ||||||||||||||
| Mining and petroleum | 80,685 | 83,855 | 96,298 | - | ||||||||||||||||
| Subtotal | 80,685 | 1.6% | 83,855 | 1.8% | 96,298 | 1.8% | ||||||||||||||
| Manufacturing | 314,644 | 234,217 | 443,477 | - | ||||||||||||||||
| Subtotal | 314,644 | 6.4% | 234,217 | 4.7% | 443,477 | 8.1% | ||||||||||||||
| Electricity, gas and water | 257,066 | 239,087 | 247,523 | - | ||||||||||||||||
| Subtotal | 257,066 | 5.2% | 239,087 | 4.8% | 247,523 | 4.5% | ||||||||||||||
| Construction | 388,817 | 510,805 | 457,376 | - | ||||||||||||||||
| Subtotal | 388,817 | 7.9% | 510,805 | 10.2% | 457,376 | 8.3% | ||||||||||||||
| Commerce | 402,332 | 514,520 | 352,848 | — | ||||||||||||||||
| Subtotal | 402,332 | 8.1% | 514,520 | 10.3% | 352,848 | 6.5% | ||||||||||||||
| Transport, storage and communications | ||||||||||||||||||||
| Transport and storage | 113,843 | 2.3% | 184,558 | 3.7% | 163,237 | 2.9% | ||||||||||||||
| Communications | 28,635 | 0.6% | 48,739 | 1.0% | 43,350 | 0.8% | ||||||||||||||
| Subtotal | 142,478 | 2.9% | 233,297 | 4.7% | 206,587 | 3.7% | ||||||||||||||
| Services | 1,513,938 | 1,621,658 | 1,936,260 | — | ||||||||||||||||
| Subtotal | 1,513,938 | 30.4% | 1,621,658 | 32.4% | 1,936,260 | 35.4% | ||||||||||||||
| Others | 380,301 | 7.7% | 105,872 | 2.1% | 31,989 | 0.6% | ||||||||||||||
| Community, social and personal services | — | — | — | — | — | |||||||||||||||
Consumer credit(1) | 506,115 | 10.2% | 428,051 | 8.5% | 407,315 | 7.5% | ||||||||||||||
Residential mortgage loans(1) | 692,234 | 14.0% | 806,735 | 16.1% | 1,032,639 | 18.9% | ||||||||||||||
Lease contracts(1) | — | — | — | — | — | — | ||||||||||||||
Factoring(1) | — | — | — | — | — | — | ||||||||||||||
| Subtotal | 1,198,349 | 24.2% | 1,234,786 | 24.6% | 1,439,954 | 26.4% | ||||||||||||||
| Total | Ch$ | 4,956,500 | 100.0% | Ch$ | 5,011,656 | 100.0% | Ch$ | 5,469,195 | 100.0% | |||||||||||
59
| (1) | Figures prepared according to IFRS. We have classified our loan portfolio taking into account the debtor that receives the loan. |
Foreign Country Outstanding Loans
Our cross-border outstanding loans are principally trade-related. These loans include loans granted mainly to foreign financial institutions. The table below lists our total amounts outstanding to borrowers in foreign countries as of December 31 of each of the last three years. This table does not include foreign trade-related loans to Chilean borrowers.
As of December 31, | |||||||
2008 | 2009 | 2010 | |||||
| (in millions of Ch$ of December 31, 2010) | |||||||
| Argentina | Ch$ 21,726 | Ch$ — | Ch$ 117 | ||||
| Belgium | — | 89 | 10 | ||||
| Bolivia | 51 | 13 | 25 | ||||
| Brazil | 19,111 | 4,304 | 176 | ||||
| Canada | 5,280 | 280 | — | ||||
| Cayman Islands | — | — | — | ||||
| Chinese | — | 18,197 | 32,360 | ||||
| Colombia | 35 | — | 386 | ||||
| Korea | — | 5,672 | 6,111 | ||||
| Ecuador | 161 | 723 | 211 | ||||
| England | 28 | 149 | 195 | ||||
| France | — | — | 2,467 | ||||
| Germany | — | 1,452 | 1,316 | ||||
| Japan | — | — | — | ||||
| India | — | 6,197 | 9,019 | ||||
| Italy | — | 1,321 | — | ||||
| Malaysia | 71 | 17 | — | ||||
| Mexico | 458 | — | — | ||||
| New Zealand | 64 | — | — | ||||
| Panama | — | — | — | ||||
| Peru | 7,301 | 387 | 2,352 | ||||
| Singapore | — | — | 124 | ||||
| Spain | 5 | 18,968 | 17,807 | ||||
| Switzerland | 191 | 125 | 94 | ||||
| Taiwan | — | 207 | 84 | ||||
| United States | 3,531 | 2,620 | 1,749 | ||||
| Uruguay | — | 247 | — | ||||
| Venezuela | 2,178 | — | — | ||||
| Total (1) | Ch$ 60,191 | Ch$ 60,968 | Ch$ 74,603 | ||||
| (1) | Foreign loans are mainly interbank or commercial loans. |
60
We also maintain deposits abroad (primarily demand deposits) in foreign banks, as needed to conduct our foreign trade transactions. The table below lists the amounts of foreign deposits by country as of December 31, 2008, 2009 and 2010.
As of December 31, | |||||||
2008 | 2009 | 2010 | |||||
| (in millions of constant Ch$ as of December 31, 2010) | |||||||
| Australia | 31 | 54 | 40 | ||||
| Belgium | 536 | — | 203 | ||||
| Canada | 550 | 185 | 258 | ||||
| Denmark | 3 | 3 | 6 | ||||
| Germany | 1,405 | 419 | 7,061 | ||||
| Italy | 467 | 295 | 80 | ||||
| Japan | 64 | 12 | 90 | ||||
| Norway | 5 | 2 | 202 | ||||
| Spain | 456 | 102 | 89 | ||||
| Sweden | 15 | 7 | 4 | ||||
| Switzerland | 15 | 13 | 107 | ||||
| United Kingdom | 325 | 57 | 40 | ||||
| United States | 18,924 | 18,662 | 67,136 | ||||
| Total | Ch$ 22,796 | Ch$ 19,811 | Ch$ 75,316 | ||||
Companies Credit Risk Division
The objective of the Companies Credit Risk Division is to maintain an adequate ratio of risk to return for the corporate loan portfolio, provide a balance between commercial business goals, and to maintain sound acceptance criteria. These objectives are all in accordance with our strategic objectives.
To accomplish this goal, this division combines the following elements: (i) personnel with significant experience from various divisions, (ii) a sound, risk-conscious culture aligned with the bank’s strategy, (iii) a well defined corporate credit process, in terms of approval, monitoring and collection procedures, (iv) a regulatory and preventive outlook on risk; (v) active participation in the loan approval process, complete with a market-segmented structure, (vi) supervision of the loan approval process via Monitoring, Default and Ex-post Review Committees, (vii) dissemination of a risk-conscious culture throughout the bank, (viii) continuous training for executives in the commercial and risk areas, and (ix) direct participation through the Risk Division in managing and collecting on deteriorated loans.
In addition, we have a number of credit committees with the ability to approve loans within certain amounts and terms depending on the credit risk rating of the potential borrower. Various risk managers of different levels of seniority participate in the credit approval process when certain predefined credit levels are surpassed.
61
Retail Risk
We are in the process of reorganizing our loan portfolio by increasing our share of the retail and small and medium-sized commercial market segments. As a result, managing risks in these segments is a key factor in our strategic development.
We continue to modernize and improve our risk management practices through a series of investments in technology. These investments have been made in order to improve loan evaluation, monitoring, and collecting processes as well as intelligence, modeling decision-making, forecasts, and reengineering of all associated processes.
The model used to manage commercial credit risk is based on a comprehensive analysis of risk and return, aimed at complying with projected indices and figures.
The specific objectives of the Retail Risk Division are to: (i) plan, manage, forecast and control risks within each line of business, (ii) design and implement action plans to adjust relevant projections or deviations to the desired risk level for each line of business, (iii) provide us with clear, simple, safe and systematic processes for credit flows and collections, (iv) develop the decision-making, segmentation, valuation and forecasting models as well as information systems necessary for methodical risk management, (v) maintain the Board of Directors informed as to the development of risk conditions affecting our diverse areas of business, and (vi) ensure compliance with numerous risk management standards and regulations.
The following methodologies are used by the Retail Risk Division:
1. | Admission and Initial Approval: Our main strategy for this stage is to develop and apply automated decision-making models that consider a prospective client’s demographics, credit history, net worth and ability to pay over other variables such as collateral, co-signers, etc. These same concepts are applied by the various committees in completing non-automated evaluations. |
We have numerous local committees at branch offices, in regions outside Santiago and within central commercial areas, all of which have been delegated decision-making authority based on pre-defined profiles and amounts. In addition, we have specialized central risk units that analyze and resolve special cases.
Portfolio Management: Portfolio management is based on a comprehensive look at various factors, including, among others, a borrower’s credit behavior, ability to pay and net worth. This is carried out via continuous valuation with automated decision-making and forecast models.
Collection Management: We perform collection activities during the various phases of default, via companies with significant experience in these matters that are well integrated in the local market. Internally, we analyze, develop and monitor different collection strategies and tactics to implement any necessary changes and improvements to these processes in a timely manner. The collection strategy is based mainly on a thorough assessment of the borrower, with emphasis on early defaults so as to address problems in a timely manner.
2. | Provision Models: We use a methodology for provisioning for consumer and mortgage loans. This methodology consists of statistical models based on the borrower’s credit behavior, including any noncompliance with other financial and commercial institutions, the length of default and the demographics of the client and its segment. |
Credit Review Process
We perform a credit analysis of our entire commercial and retail (consumer) borrowers. Credit risk presented by our current or potential borrowers is evaluated in accordance to policies and standards which have been approved by our Board of Directors.
A potential commercial borrower’s evaluation focuses primarily on the credit history and reputation of its owners and management, its market position and the demand for its products or services, its production processes and facilities, its current and projected cash flows, its solvency and when it applies, the guarantees offered in connection with the loan. We also use tools such as sector reports, standard risk models for major industries, and reports relating to the potential commercial borrower’s sales patterns.
In the case of individual retail borrowers, the credit approval process is based primarily on an evaluation of the borrower’s credit behavior which combines the applicant’s commercial behavioral variables such as current debt levels, ability to pay and socio-economic level, among others, along with centralized evaluation and decision-making systems in cases where the applicant does not fit the standard model. The information presented by a prospective borrower is evaluated by considering the individual’s income, expenses, personal assets, credit history and our previous experience (if any) with the individual.
Prior to extending credit to a commercial borrower, we assign a credit risk rating to such potential borrower based on our analysis that helps identify each applicant’s risk profile. These ratings are based on a scale of 1 to 10, with a rating of 1 being excellent and rating of 10 corresponding to certain loss. In general, we consider ratings 1 through 6 to be acceptable ratings, and ratings 7 through 10 to be indicative of probable losses. Loan approvals are made at various levels and with varying degrees of involvement by different categories of executives (A through I) depending on the credit risk rating we have assigned to the potential borrower, the size of the loan under consideration and the collateral offered, if any. Collateral granted for loans generally consists of mortgages on real estate. In all cases, the approval of at least three officers is required in order to approve a loan.
62
Our evaluation of a potential transaction with a borrower is based on the concept of total customer risk. Total customer risk takes into account (i) the direct risk (actual and potential), (ii) the indirect risk, and (iii) the risks related to the client, such as having common partners, being part of an economic group or common guarantees.
The following table shows the category of executives that were required to approve secured and unsecured commercial borrowing transactions, according to the credit risk rating of the potential borrower and the Chilean Pesos amount of the total customer risk based on exchange rates in effect prior to November 2010:
| Category of Executives That | Maximum Amount of Total Customer Credit Risk in Chilean Pesos | |||||||||||||||||||
| May Approve Transaction | Rating 1 and 2 | Rating 3 | Rating 4 and 5 | Rating 5D | Rating 6 and above | |||||||||||||||
| Executive | From | MCh$ | 10,000 | MCh$ | 6,000 | MCh$ | 4,000 | MCh$ | 3,000 | MCh$ | 800 | |||||||||
| Superior Committee | Up to | 10,000 | 6,000 | 4,000 | 3,000 | 800 | ||||||||||||||
| Division Manager Committee | Up to | 3,500 | 2,200 | 1,800 | 1,000 | 400 | ||||||||||||||
| Manager Committee | Up to | 1,500 | 1,250 | 1,000 | 750 | 250 | ||||||||||||||
| A Executives | Up to | 750 | 750 | 500 | 350 | 150 | ||||||||||||||
| Risk Committee | Up to | 850 | 700 | 500 | 350 | 150 | ||||||||||||||
| B Executives | Up to | 250 | 250 | 200 | 200 | 80 | ||||||||||||||
The following table details the maximum limits of customer credit risk in Chilean Pesos that executives of each category were permitted to approve prior to November 1, 2010. This table applies to all potential borrowers with credit risk ratings of 1 to 5 and varies according to whether the customer credit risk is comprised of secured or unsecured obligations.
| Maximum Amount of | |||||||
| Total Customer Credit | |||||||
| Risk in Chilean Pesos | |||||||
| Category of Executives That May Approve Transaction | Unsecured | Secured | |||||
| C Executives | MCh$ | 60 | MCh$ | 120 | |||
| D Executives | 40 | 100 | |||||
| E Executives | 30 | 80 | |||||
| F Executives | 15 | 60 | |||||
| G Executives | 10 | 40 | |||||
| H Executives | 5 | 20 | |||||
| I Executives | 3 | 5 | |||||
| J Executives | 1 | — | |||||
| K Executives | 1 | — | |||||
Beginning January 2009, we adjusted the loan approval limits that were required to approve secured and unsecured commercial borrowing transactions. The new limits have been established in the local currency as the majority of our loans are denominated in Chilean pesos. The following table summarizes the limits of each category of executives that are permitted to approve secured and unsecured commercial borrowing transactions, according to the credit risk rating of the potential borrower and the Chilean peso amounts of the total customer risk at the time that the application for credit is made:
| Category of Executives That | Maximum Amount of Total Customer Credit Risk in Chilean Pesos | |||||||||||||||||||
| May Approve Transaction | Rating 1 and 2 | Rating 3 | Rating 4 and 5 | Rating 5D | Rating 6 and above | |||||||||||||||
| Executive | From | MCh$ | 7,000 | MCh$ | 5,000 | MCh$ | 2,500 | MCh$ | 2,000 | MCh$ | 1,000 | |||||||||
| Division Manager Committee | Up to | 7,000 | 5,000 | 2,500 | 2,000 | 1,000 | ||||||||||||||
| Manager Committee | Up to | 1,500 | 1,250 | 1,000 | 750 | 250 | ||||||||||||||
| A Executives | Up to | 750 | 750 | 500 | 350 | 150 | ||||||||||||||
| Risk Committee | Up to | 850 | 700 | 500 | 350 | 150 | ||||||||||||||
| B Executives | Up to | 250 | 250 | 200 | 200 | 80 | ||||||||||||||
63
All transactions at the Risk Committee level or higher are reviewed by our credit risk managers. All transactions resulting in total customer credit risk in excess of the amounts that can be reviewed by the Superior Committee as shown in the above table must be authorized by the Directors Committee of our Board of Directors, the Chief Executive Officer and three other members of the Board of Directors.
The following table details the maximum limits of customer credit risk in Chilean Pesos that executives of each category are permitted to approve beginning November 1, 2010. This table applies to all potential borrowers with credit risk ratings of 1 to 5 and varies according to whether the customer credit risk is comprised of secured or unsecured obligations.
| Maximum Amount of | |||||||
| Total Customer Credit | |||||||
| Risk in Chilean Pesos | |||||||
| Category of Executives That May Approve Transaction | Unsecured | Secured | |||||
| C Executives | MCh$ | 60 | MCh$ | 120 | |||
| D Executives | 40 | 100 | |||||
| E Executives | 30 | 80 | |||||
| F Executives | 15 | 60 | |||||
| G Executives | 10 | 40 | |||||
| H Executives | 5 | 20 | |||||
| I Executives | 3 | 5 | |||||
| J Executives | 1 | — | |||||
| K Executives | 1 | — | |||||
Our Credit Risk Divisions also monitor compliance with the terms of loans we have granted, such as payment dates, conditions and covenants. The monitoring process includes verification of the use of proceeds and contractual conditions, continuing financial analysis of the borrower and any guarantors, on-site visits to the borrower’s place of business, confirmation of credit information and analysis of the economic environment as it affects the borrower or its sector, among other tools. Generally, the Credit Risk Department performs this monitoring on a yearly basis. If a debtor exhibits an elevated level of risk based on the results of our yearly monitoring, we may place such debtor on a special watch list. We monitor debtors on the watch list on a monthly basis. The Credit Risk Department regularly meets to decide whether to take any action (such as reducing outstanding loan amounts or requesting collateral) in respect of debtors on the watch list. In addition, our Credit Risk Department has a unit dedicated to administering the loan accounts of debtors with respect to which losses are expected or have occurred. This unit supervises the process of collections and legal proceedings.
We also monitor the quality of the loan portfolio on a continuous basis. The purpose of this special supervision is to maintain constant scrutiny of the portions of the portfolio that represent the greatest risk and to anticipate any deterioration. Based on this ongoing review of the loan portfolio, we believe we are able to detect problem loans and make a decision on a client’s status. This includes measures such as reducing or extinguishing a loan, or requiring better collateral from the client. The control systems require that loans be reviewed at least three times per year for those clients in the lowest category of credit watch.
Current Regulations Relating to Classification of Banks and Loans; Allowances for Loan Losses
According to current regulation effective January 1, 2004, banks are classified in Categories 1, 2, 3 or 4 depending on the models and methods used by banks to classify their loan portfolio and determine allowances for loan losses. Category 1 banks are those banks whose methods and models are satisfactory to the Chilean Superintendency of Banks. Category 1 banks are entitled to continue using the same methods and models they currently have in place. Banks classified as Category 2 banks must maintain the minimum levels of reserves established by the Chilean Superintendency of Banks. Once the board of directors of a Category 2 bank is made aware of any problems detected by the Chilean Superintendency of Banks it must take steps to correct the problems. Finally, banks classified in Categories 3 or 4 must maintain the minimum levels of reserves established by the Chilean Superintendency of Banks until they are authorized by the Chilean Superintendency of Banks to do otherwise. We have been classified in Category 1 since January 1, 2004.
Classification of Loans. For purposes of these current classifications, loans are divided into: (i) consumer loans (including loans granted to individuals for the purpose of financing the acquisition of consumer goods or payment of services), (ii) residential mortgage loans (including loans granted to individuals for the acquisition, construction or repair of residential real estate, in which the value of the property covers at least 100.0% of the amount of the loan), (iii) leasing operations (including consumer leasing, commercial leasing and residential leasing), (iv) factoring operations, and (v) commercial loans (includes all loans other than consumer loans and residential mortgage loans).
64
In accordance with current regulations, the models and methods used to classify our loan portfolio must conform to the guiding principles summarized below, which have been established by the Chilean Superintendency of Banks.
Models Based on the Analysis of Commercial Borrowers of Ch$200.0 million or More
The current SBIF model requires that all commercial loans of Ch$200.0 million or more be assigned to a risk category level, determined by considering the borrower’s following risk factors (i) industry or sector, (ii) owners or managers, (iii) financial situation, (iv) payment capacity, and (v) payment behavior. Based on the aforementioned risk factors, the loans will be assigned to a risk category. If the borrower has no apparent credit risk, the loan will be classified as A1, A2 or A3. The loan will be classified as B if the borrower has low credit risk but no apparent deterioration of payment capacity. Finally, if the borrower’s loan repayment capacity has diminished, it will be classified as C1, C2, C3, C4, D1 or D2.
Risk Category A
Risk category A1 includes commercial borrowers with well-known and highly qualified senior management, strong market reputation, high asset quality, strong payment capability, and low debt levels with excellent debt service coverage capability. In particular, this category is reserved solely for corporate borrowers with domestic debt ratings equal to or exceeding AA-; provided that if several debt ratings exist with respect to the same borrower, the lowest rating will be considered for risk categorization purposes.
Categories A2 and A3 include commercial borrowers with qualified senior management and fair market reputation, high asset quality and liquidity, robust capacity to make required payments and to service debt, as well as steady net profit margins. The only difference between Category A2 and A3 is that Category A3 borrowers have a minimum probability of financial deterioration.
Risk Category B
This category includes borrowers with an acceptable credit capacity, average risk levels and acceptable quality and liquidity portfolio assets. Their payment capacity is subject to business and financial cycles, and their debt levels may be higher than average for their respective industry or sector. These borrowers maintain open access to the financial system, but in certain cases may need to provide third party guarantees in order to obtain financing.
Risk Category C
Our default portfolio includes debtors who show an impaired capacity. Their classification is related to collateral coverage, therefore the commercial pricing of which is adjusted by a percentage that differs depending on the type of collateral.
Provisions allocated for this type of portfolio are defined by the bank, and include the following risk categories:
| Category | % Provision | % Collateral |
| C1 | 2% | 97% or more |
| C2 | 10% | 81% to 96% |
| C3 | 25% | 71% to 80% |
| C4 | 40% | 51% to 70% |
| D1 | 65% | 21% to 50% |
| D2 | 90% | 0% to 20% |
The allowances for loan losses for “Our default portfolio” reflected in our IFRS financial statements are not based on the SBIF criteria described above, but rather on the criteria described under “Item 5. Operating and Financial Review and Prospects–Operating Results–Critical Accounting Policies and Estimates–Allowance for Loan Losses”.
According to our IFRS model, the amount of impairment losses incurred on these loans is measured as the difference between their carrying amount and the present value of their expected future cash flows. Our allowances for loan losses do not differ significantly in the reported periods from those allowances required by the SBIF rules in 2008 and 2009.
Additional Provisions and Allowances
Historically, a bank could voluntarily maintain additional allowances for loan losses in excess of the minimum amounts required by global and individual allowances. However, current regulations in effect as of January 1, 2004 no longer permit these additional allowances, which are not based on specific identified risks. Banks are now able to set provisions and allowances above the previously described limits only to cover specific risks that have been authorized by their board of directors.
65
Categories
Our current classification system includes 11 categories (1, 2, 3, 4, 5, 5D, 6, 7, 8, 9 and 10, which correspond to the ten categories set forth by the Chilean Superintendency of Banks’ for loans A1, A2, A3, B, C1, C2, C3, C4, D1 and D2), as more fully described below.
| Category 1: | “Excellent” | This category includes commercial borrowers with excellent management, social character, asset quality, payment capability, and low debt levels with excellent debt service coverage capability. This typically includes companies that are leaders in their respective industries with ample access to domestic and international capital markets and stable margins that are in line with those prevalent in their industry. In particular, this category is reserved solely for corporate borrowers with domestic debt ratings equal to or exceeding AA-, provided that if several debt ratings exist with respect to the borrower, the lowest will be considered for purposes of classification. Category 1 corresponds to category A1 of the Chilean Superintendency of Banks. | ||
| Category 2: | “Strong” | This category includes commercial borrowers with good management and without problems relating to social character. These borrowers have high asset quality and liquidity, a solid capacity to make required payments and service their debt, and stable net margins. These borrowers also have a strong position in the domestic market in their respective industries with good access to domestic capital markets. Category 2 corresponds to Category A2 of the Chilean Superintendency of Banks. | ||
| Category 3: | “Good” | This category includes borrowers with good liquidity levels and asset quality, good payment capacity and debt service coverage ability. These borrowers also have good management capabilities and margins with a normal degree of stability. These companies have a minimal probability of financial deterioration. Borrowers in this category are normally solid regional companies, leaders in local markets with good access to the financial system, or medium-size companies within their industry or sector. Category 3 corresponds to Category A3 of the Chilean Superintendency of Banks. | ||
| Category 4: | “Acceptable” | This category includes borrowers with an acceptable credit capacity and an average risk level and acceptable asset portfolios and liquidity. Their capacity to pay is subject to business and financial cycles, and debt levels may be higher than average for their industry or sector. These borrowers maintain good access to the financial system, but in some cases may need to provide third party guarantees in order to obtain financing. Loans to these borrowers require some level of monitoring because they are not financially solid enough to handle strong economic downturns or market activity. Guarantees or other contractual protections are recommended with respect to loans made to borrowers in this category. Category 4 also corresponds to Category A3 of the Chilean Superintendency of Banks. | ||
| Category 5: | “Marginal” | This category includes borrowers with a higher than average risk level. These borrowers have low levels of liquidity and limited debt capacity. They are typically smaller companies than average for their sector or industry and have limited access to financing. Loans to these borrowers require a higher level of monitoring as they are probably unable to survive strong financial or economic crises. Adequate protections, such as of guarantees on real property, are required. Typical borrowers in this category include companies with high debt loads, start-ups, and all others that do not merit a higher classification. Category 5 corresponds to Category B of the Chilean Superintendency of Banks. | ||
| Category 5D: | “Weak” | This category includes debtors with poor payment history and weak financial condition, but that provide guarantees that result in an estimated loan recovery percentage of at least 97% of amounts due. Category 5D corresponds to Category C1 of the Chilean Superintendency of Banks. |
66
| Category 6: | “Vigilance” | This category includes debtors under special vigilance. These borrowers have displayed serious deterioration and require constant monitoring. Loans to borrowers in this category require special strategies to either guarantee the amounts due, reduce the bank’s exposure, or terminate the credit relationship. This category includes borrowers with poor payment behavior but that provide guarantees that result in an estimated loan recovery of 81% to 96% of amounts due. Category 6 corresponds to Category C2 of the Chilean Superintendency of Banks. | ||
| Category 7: | “Vulnerable” | This category includes debtors with serious weaknesses in their business but that provide guarantees that result in an estimated loan recovery of 71.0% to 80.0% of amounts due. Category 7 corresponds to Category C3 of the Chilean Superintendency of Banks. | ||
| Category 8: | “Sub-Standard” | This category includes debtors with serious difficulty in paying the amounts due and for whom the debt is inadequately protected by the capital of the borrower, and the guarantees provided result in an estimated loan recovery of 51.0% to 70.0% of amounts due. Category 8 corresponds to Category C4 of the Chilean Superintendency of Banks. | ||
| Category 9: | “Doubtful” | This category includes debtors for whom serious doubts exist with respect to repayment in the normal course and for which guarantees provided result in an estimated loan recovery of 21.0% to 50.0% of amounts due. Category 9 corresponds to Category D1 of the Chilean Superintendency of Banks. | ||
| Category 10: | “Loss” | This category includes loans to debtors where total loan loss is expected and any guarantees result in an estimated loan recovery of up to 20.0% of amounts due. Category 10 corresponds to Category D2 of the Chilean Superintendency of Banks. |
Models Based on Group Analysis of Commercial Borrowers of Less than Ch$200.0 million
The levels of required allowances for commercial loans less than Ch$200.0 million and all consumer loans and mortgage loans are to be determined by the bank. This determination is made according to the loss that may result from the loans by classifying the loan portfolio using one or both of the following models: (i) a model based on the characteristics of the borrower and its outstanding loans, and/or (ii) a model based on the behavior of a group of loans. For the first model, the borrowers and their loans with similar characteristics are placed into groups and each group is assigned a risk level. For the second model, loans with similar past payment histories and similar characteristics are placed into groups and each group is assigned a risk level.
Total Loans – models based on group analysis
As of December 31, 2008 | ||||||||||||
Total Loans MCh$ | Allowances for loan losses MCh$ | Risk Index (%) | ||||||||||
| Commercial | 312,502 | 10,670 | 3.4 | % | ||||||||
| Leasing commercial | 38,979 | 1,162 | 3.0 | % | ||||||||
| Factoring commercial | 54,333 | 213 | 0.4 | % | ||||||||
| Consumer | 505,841 | 36,033 | 7.1 | % | ||||||||
| Leasing consumer | 274 | 3 | 1.2 | % | ||||||||
| Mortgage | 691,868 | 4,601 | 0.7 | % | ||||||||
| Leasing mortgage | 366 | 1 | 0.0 | % | ||||||||
67
As of December 31, 2009 | ||||||||||||
Total Loans MCh$ | Allowances for loan losses MCh$ | Risk Index (%) | ||||||||||
| Commercial | 340,628 | 15,560 | 4.6 | % | ||||||||
| Leasing commercial | 37,065 | 885 | 2.4 | % | ||||||||
| Factoring commercial | 53,548 | 286 | 0.5 | % | ||||||||
| Consumer | 427,528 | 33,691 | 7.9 | % | ||||||||
| Leasing consumer | 523 | 6 | 1.2 | % | ||||||||
| Mortgage | 806,575 | 6,039 | 0.8 | % | ||||||||
| Leasing mortgage | 160 | — | 0.0 | % | ||||||||
As of December 31, 2010 | ||||||||||||
Total Loans MCh$ | Allowances for loan losses MCh$ | Risk Index (%) | ||||||||||
| Commercial | 318,689 | 11,590 | 3.6 | % | ||||||||
| Leasing commercial | 30,863 | 524 | 1.7 | % | ||||||||
| Factoring commercial | 6,153 | 340 | 5.5 | % | ||||||||
| Consumer | 406,607 | 27,566 | 6.8 | % | ||||||||
| Leasing consumer | 708 | 6 | 0.9 | % | ||||||||
| Mortgage | 1,032,493 | 8,937 | 0.9 | % | ||||||||
| Leasing Mortgage | 146 | — | 0 | % | ||||||||
Consumer Loans - models based on group analysis
Consumer Loans – As of December 31, 2008 | ||||||||||||
Total Loans MCh$ | Allowances for loan losses MCh$ | Risk Index (%) | ||||||||||
| Credit cards | 70,911 | 4,767 | 6.7 | % | ||||||||
| Lines of credit | 32,205 | 1,064 | 3.3 | % | ||||||||
| Others revolving | 143 | 10 | 7.0 | % | ||||||||
| Consumer loans | 192,386 | 15,244 | 7.9 | % | ||||||||
| Student loans | 31,129 | 655 | 2.1 | % | ||||||||
| Salary discount loan | 143,301 | 5,968 | 4.2 | % | ||||||||
| Renegotiation | 25,163 | 6,286 | 25.0 | % | ||||||||
| Others | 10,603 | 2,039 | 19.2 | % | ||||||||
68
Consumer Loans – As of December 31, 2009 | ||||||||||||
Total Loans MCh$ | Allowances for loan losses MCh$ | Risk Index (%) | ||||||||||
| Credit cards | 55,356 | 3,562 | 6.4 | % | ||||||||
| Lines of credit | 26,437 | 359 | 1.4 | % | ||||||||
| Others revolving | 91 | 5 | 5.5 | % | ||||||||
| Consumer loans | 177,090 | 13,033 | 7.4 | % | ||||||||
| Student loans | 26,340 | 546 | 2.1 | % | ||||||||
| Salary discount loan | 90,202 | 2,722 | 3.0 | % | ||||||||
| Renegotiation | 51,910 | 13,403 | 25.8 | % | ||||||||
| Others | 101 | 61 | 60.4 | % | ||||||||
Consumer loans – As of December 31, 2010 | |||||
Total Loans MCh$ | Allowances for loan losses MCh$ | Risk Index (%) | |||
| Credit cards | 54,188 | 3,059 | 5.6% | ||
| Lines of credit | 24,893 | 338 | 1.4% | ||
| Others revolving | 60 | 4 | 6.7% | ||
| Consumer loans | 198,335 | 9,931 | 5.0% | ||
| Car loans | — | — | 0.0% | ||
| Student loans | 22,520 | 360 | 1.6% | ||
| Salary discount loan | 58,286 | 1,804 | 3.1% | ||
| Renegotiation | 48,018 | 11,978 | 24.9% | ||
| Others | 307 | 92 | 30.0% | ||
Corpbanca computes provisions through a model based on group analysis for both commercial and retail banking loan portfolios. For our commercial loan portfolios all customers with loan exposure lower than Ch$200.0 million of Corporate Banking, small and medium-sized business banking (SME) and Real Estate Banking, compute their loan loss provisions by applying a risk matrix, which classify debtors into eight risk ratings. The Bank calculates monthly allowances for credit losses and by considering the following inputs: Payment behavior of the debtor to Corpbanca, debtor's payment behavior in the financial system and guarantee coverage (loan to value).
Based on a historical analysis, we have modeled both the probability of default and the incurred losses by using as inputs the status of each customer in terms of internal payment behavior, external payment behavior and loan-to-value ratio. Different combinations of these three parameters allow us to allocate each borrower in a final-combined-rating for which the required provision has been calculated.
We have two different methodologies for our models based on group analysis for consumer loans and mortgage loans (Retail Banking). For our loans, we determine clients’ risk profile, to the portfolio based on attributes of the debtors and their debts. The configuration of distinguishing groups is executed by using demographic variables, debt (internal and external), default and maturity for the consumer loans. In the case of model provisions for the mortgage loans portfolio, it is performed by using variables such as the amount of debt, payment behavior and the loan-to-value ratio. Each credit operation, based on the characteristics that allow us to identify it, is associated with a specific risk matrix.
Models based on group analysis for consumer loans and mortgage loans (Retail Banking)
Provisioning models used for consumer portfolios (including mortgage loans for housing) determine a client’s risk profile to the portfolio based on attributes of the debtors and their debts. The configuration of discriminating groups were executed using demographic variables, debt (internal and external), default and maturity. In the case of model provisions for the mortgage loans portfolio, it is performed using variables such as the amount of debt, payment behavior and the loan-to value ratio.
Retail Credit Risk Division:
| Our Retail Credit Risk Division is responsible for the whole credit cycle management of three business units: Banco Condell (Low income segment (C3-D)), which is primarily consumer loans, credit cards and a few mortgage loans, SMU Corp S.A. (Private Level Credit Card, mainly for our low income segment C3-D) and Retail Banking for higher income segments (our medium-high income segments (ABC1-C2)), which is primarily unsecured lending, consumer loans, revolving lines of credit, credit cards and mortgage loans. |
69
| Our credit risk management segment works to provide our branches with the best and simplest available information and tools to maximize the value of their profits and losses. The credit risk management process is composed of the following: | ||
Credit Initiation. We strive to have in place a high quality underwriting process. An excellence in our credit decision-making process means healthy portfolios with very low early delinquency incident rates and profitable asset portfolios. Our credit initiation process consists of: | ||
| -Credit Initiation Tools: credit scoring, credit bureau information (60 months of positive and negative information), check lists to support our credit analysis (a 5 step process), credit policies and daily training. | ||
| -Accountability and Responsibility (tied to incentive plans): branch managers know their customers and they are responsible for credit decisions but they must first seek approval with an underwriter (Risk Division). Credit authorization will be delegated based on the results of an internal credit initiation report. | ||
| -Analytical Driven Sales Process: We know the customers we want and we seek them out. On a monthly basis, our credit division selects names to offer credit cards and revolving credit lines for all segments, current customers or prospective customers. | ||
| -Control Environment: A 4 or 5 month review of accounting records is required to understand sales quality, to assess early delinquency rates and a sales scoring mix is reviewed on a daily basis. Also, branch managers are trained to understand their loan authorization ability (approving credit worthy customers and declining non-credit worthy customers). | ||
Maintenance. We strive to have high market share in the most profitable segments (low-medium risk and medium-high usage) and low market share in the lowest profitable segments (high risk or low usage). The result of which means a higher revenue share. The maintenance process is composed of: | ||
| -Renewals / Non-Renewals (Revolving Products): Renewals and non-renewals are based on customer payment behavior and profitability. | ||
| -Campaigns: Top-up and cross-selling offers are implemented. On a monthly basis, the Risk Division selects our best customers to offer refinancing options on their current loans. Our goal is to have 100% of a customers Share of Wallet in our most profitable segments, which provides us with a healthy balance of investments among the products and services we offer. | ||
Collection. We strive to have in place a high quality collection process, consisting of the right strategy, vendors and products and policies. | ||
70
| -Collection Strategy: Our collection strategy is currently based on geographic coverage and delinquency buckets. It includes reporting delinquent customers to the credit bureau (15 days past due). The next steps include customer risk segmentation to define our end to end collection strategy (intensity of calls, letters, mms (multimedia messaging), scripts, skip tracing and remedial offers). Our collection strategy is also included in the branch manager’s responsibilities. | |
| -Vendors: Our vendors provide cover, benchmarks and sometimes testing (champion/challenger). Also, the continuity of our business plan requires the use of vendors in cases of emergency and union instability, among others. | |
| -Policies and Products: Rewrites, remedial offers and settlements are made as needed. We must maximize capital recovery. | |
| -Technology: Our systems, Predictive Dialer and Collection System, are in place. The Collection System is in a migration process (Debt Manager, Fair Isaac Solution). | |
| -Control Environment: Customers surveys and strong Management Information Systems enable us to have a controlled process. | |
Write Off Policy, Recovery and Planning. The write off policy, recovery and planning process consists of: | |
| -Write Off Policy: Our write off policy is triggered for an unsecured portfolio at 180 days past due and 4 years for mortgages. | |
| -Loss Loan Reserve: History of write offs and recoveries are used to calculate the reserves of each portfolio. On a monthly basis a Back Testing Analysis is reviewed in order to ensure the right coverage, as well as model performance. | |
Management Information Systems (MIS) and Portfolio Management. We strive to develop strong MIS to understand our portfolio performance in real time. The MIS and Portfolio Management processes consist of: | |
| -MIS: Reports are prepared to understand the credit portfolio behavior by main segmentations (sales quality, by sales channel, scoring, type of customer, location (branch), products and loan to value (for mortgages), etc.). Also, the Risk Credit Division has the capability to deepen any analysis if necessary. | |
| -Sales Indicators: Sales indicators include total applications, approvals and denials, scoring mix, approval rates, through the door analysis and vintage coincidence, among others (30+, 60+, 90+, write off and recovery). | |
| -Portfolio Review Indicators: Portfolio review indicators include delinquencies by bucket, net flows (roll forward, roll back, stay), is-was analysis, gross write off, recoveries, net credit losses, charge off, vintage analysis, rewrite of sales, payments, pre-payments and refinance rate, etc. | |
71
| -Portfolio Management: Periodic review against budgets and forecasts in order to adjust and make decisions, if necessary. | |
Provisioning models used for consumer portfolios are expected loss models, with segmentation of the portfolio based on attributes of the debtors and their debts. The configuration of loan authorization groups was determined using demographic variables, debt (internal and external), default and maturity. | |
| In the case of model provisions for our mortgage portfolio, segmentation is performed using the variables of debt and overdue payments, which have as mitigating the level of coverage of the mortgage. | |
The required provisions relating to each loan category vary depending on whether the commercial loan is secured by real property, as shown in the table below:
| Required Provisions | |||||||
| Corpbanca’s Categories | Commercial Loans | Mortgage Backed Commercial Loans | Estimated Loan Recovery | ||||
| 1 — Excellent | 0% | 0% | 100% | ||||
| 2 — Strong | 0% | 0% | 100% | ||||
| 3 — Good | 0% | 0.03% | 100% | ||||
| 4 — Acceptable | 0.15% | 0.38% | 100% | ||||
| 5 — Marginal | 0.69% | 0.94% | 100% | ||||
| 5D — Weak | 2% | 2% | 97% | ||||
| 6 — Vigilance | 10% | 10% | 81% to 96% | ||||
| 7 — Vulnerable | 25% | 25% | 71% to 80% | ||||
| 8 — Sub-Standard | 40% | 40% | 51% to 70% | ||||
| 9 — Doubtful | 65% | 65% | 21% to 50% | ||||
| 10 — Loss | 90% | 90% | 0% to 20% | ||||
The provisions relating to loan categories 1 through 5 have been estimated by us following regulations established by the Chilean Superintendency of Banks, while the provisions relating to loan categories 5D through 10 have been set in the amounts required by the Chilean Superintendency of Banks. The categories estimated by us consider the client’s economic sector, market, product, demand, administration quality, access to credit, payment behavior, profitability, cash flow, equity and liabilities. Since January 2011, the new regulations establish that all categories will be set by the Chilean Superintendency of Banks. We believe our allowance for loan losses is adequate as of the date hereof for all known losses.
As of December 31, 2010, our allowances for credit losses under IFRS are less than the allowances required by the SBIF. The following table shows the allowances for credit losses acquired by the SBIF and the allowances we established under IFRS.
SBIF Required Allowances | IFRS Allowances Established | |
2010 | 2010 | |
| (in millions of Ch$ as of December 31) | ||
| 55,230 | 52,351 | |
During 2010, the SBIF stated that the banks should establish additional allowances for the normal portion of the portfolio to be applied in the results of 2010. Such provisions were not considered in the IFRS model of Corpbanca, which explains the main difference between the local provisions under SBIF and IFRS.
For the years ended 2008 and 2009, our allowances for loan losses do not differ significantly in the reported periods from those allowances required by the SBIF Rules.
72
Analysis of our Loan Classification
The following tables provide statistical data regarding the classification of our loans as of the end of each of the last three years, applying the classification explained in prior pages:
2008
| Individual Portfolio | Group Portfolio | ||||||||||||||||||||||||||
| A1 | A2 | A3 | B1 | B2 | B3 | C | Impaired | Total | Normal | Impaired | Total | General Total | |||||||||||||||
| MCH$ | MCH$ | MCH$ | MCH$ | MCH$ | MCH$ | MCH$ | MCH$ | MCH$ | MCH$ | MCH$ | MCH$ | MCH$ | |||||||||||||||
| Loans and receivable to banks | 20,005 | — | — | 17,691 | — | — | — | — | 37,696 | — | — | — | 37,696 | ||||||||||||||
| Loans and receivable to customers | |||||||||||||||||||||||||||
| Commercial loans | |||||||||||||||||||||||||||
| General commercial loans | — | 36,230 | 1,142,273 | 844,734 | 423,950 | — | — | 115,919 | 2,563,106 | 228,848 | 37,266 | 266,114 | 2,829,220 | ||||||||||||||
| Foreign trade loans | — | — | 162,114 | 111,366 | 116,613 | — | — | 58,058 | 448,151 | 13,898 | 1,063 | 14,961 | 463,112 | ||||||||||||||
| Lines of credit and overdrafts | — | 5 | 31,350 | 9,155 | 12,271 | — | — | 1,570 | 54,351 | 27,887 | 1,769 | 29,656 | 84,007 | ||||||||||||||
| Factored receivables | — | — | — | — | — | — | — | — | — | 49,668 | 4,665 | 54,333 | 54,333 | ||||||||||||||
| Leasing contracts | — | 23,579 | 29,962 | 95,434 | 120,684 | — | — | 16,535 | 286,194 | 29,230 | 9,749 | 38,979 | 325,173 | ||||||||||||||
| Other outstanding loan | — | — | — | 26 | 273 | — | — | 236 | 535 | 1,508 | 263 | 1,771 | 2,306 | ||||||||||||||
| Subtotal commercial loans | — | 59,814 | 1,365,699 | 1,060,715 | 673,791 | — | — | 192,318 | 3,352,337 | 351,039 | 54,775 | 405,814 | 3,758,151 | ||||||||||||||
| Consumer loans | — | — | — | — | — | — | — | — | — | 472,993 | 33,122 | 506,115 | 506,115 | ||||||||||||||
| Mortgage loans | — | — | — | — | — | — | — | — | — | 667,506 | 24,728 | 692,234 | 692,234 | ||||||||||||||
| Total loans and receivable to customers | — | 59,814 | 1,365,699 | 1,060,715 | 673,791 | — | — | 192,318 | 3,352,337 | 1,491,538 | 112,625 | 1,604,163 | 4,956,500 | ||||||||||||||
| Financial investments | — | — | — | — | — | — | — | — | — | — | — | — | — | ||||||||||||||
2009
| Individual Portfolio | Group Portfolio | ||||||||||||||||||||||||||
| A1 | A2 | A3 | B1 | B2 | B3 | C | Impaired | Total | Normal | Impaired | Total | General Total | |||||||||||||||
| MCH$ | MCH$ | MCH$ | MCH$ | MCH$ | MCH$ | MCH$ | MCH$ | MCH$ | MCH$ | MCH$ | MCH$ | MCH$ | |||||||||||||||
| Loans and receivable to banks | 72,636 | 9,524 | 4,066 | — | — | — | — | — | 86,226 | — | — | — | 86,226 | ||||||||||||||
| Loans and receivable to customers | |||||||||||||||||||||||||||
| Commercial loans | |||||||||||||||||||||||||||
| General commercial loans | 9,005 | 24,269 | 1,301,811 | 891,532 | 503,887 | — | — | 115,519 | 2,846,023 | 248,326 | 49,867 | 298,193 | 3,144,216 | ||||||||||||||
| Foreign trade loans | — | — | 57,910 | 47,411 | 45,758 | — | — | 68,736 | 219,815 | 12,603 | 1,059 | 13,662 | 233,477 | ||||||||||||||
| Lines of credit and overdrafts | — | — | 1,724 | 5,879 | 11,431 | — | — | 1,466 | 20,500 | 25,831 | 1,990 | 27,821 | 48,321 | ||||||||||||||
| Factored receivables | — | — | — | — | — | — | — | — | — | 50,034 | 3,514 | 53,548 | 53,548 | ||||||||||||||
| Leasing contracts | — | 22,435 | 27,013 | 82,705 | 103,085 | — | — | 23,554 | 258,792 | 29,733 | 7,332 | 37,065 | 295,857 | ||||||||||||||
| Other outstanding loan | — | — | 157 | 114 | 210 | — | — | 18 | 499 | 853 | 99 | 952 | 1,451 | ||||||||||||||
| Subtotal commercial loans | 9,005 | 46,704 | 1,388,615 | 1,027,641 | 664,371 | — | — | 209,293 | 3,345,629 | 367,380 | 63,861 | 431,241 | 3,776,870 | ||||||||||||||
| Consumer Loans | — | — | — | — | — | — | — | — | — | 399,344 | 28,707 | 428, 051 | 428,051 | ||||||||||||||
| Mortgage loans | — | — | — | — | — | — | — | — | — | 778,143 | 28,592 | 806,735 | 806,735 | ||||||||||||||
| Total loans and receivable to customers | 9,005 | 46,704 | 1,388,615 | 1,027,641 | 664,371 | — | — | 209,293 | 3,345,629 | 1,544,867 | 121,160 | 1,666,027 | 5,011,656 | ||||||||||||||
| Financial investments | — | — | — | — | — | — | — | — | — | — | — | — | — | ||||||||||||||
73
2010
| Individual Portfolio | Group Portfolio | ||||||||||||||||||||||||||
| A1 | A2 | A3 | B1 | B2 | B3 | C | Impaired | Total | Normal | Impaired | Total | General Total | |||||||||||||||
| MCH$ | MCH$ | MCH$ | MCH$ | MCH$ | MCH$ | MCH$ | MCH$ | MCH$ | MCH$ | MCH$ | MCH$ | MCH$ | |||||||||||||||
| Loans and receivable to banks | 8,604 | — | 41,920 | 12,857 | 777 | — | — | 29 | 64,187 | — | — | — | 64,187 | ||||||||||||||
| Loans and receivable to customers | |||||||||||||||||||||||||||
| Commercial loans | |||||||||||||||||||||||||||
| General Commercial loans | 76,742 | 38,027 | 1,239,111 | 897,967 | 727,483 | — | — | 115,575 | 3,094,905 | 205,482 | 67,104 | 272,586 | 3,367,491 | ||||||||||||||
| Foreign trade loans | — | — | 48,093 | 72,944 | 69,549 | — | — | 51,998 | 242,584 | 17,063 | 1,329 | 18,392 | 260,976 | ||||||||||||||
| Lines of credit and overdrafts | — | — | 1,044 | 5,691 | 17,652 | — | — | 1,133 | 25,520 | 21,069 | 5,773 | 26,842 | 52,362 | ||||||||||||||
| Factored receivables | 461 | — | 16,871 | 9,360 | 32,156 | — | — | 1,615 | 60,463 | 4,354 | 1,799 | 6,153 | 66,616 | ||||||||||||||
| Leasing contracts | — | 22,349 | 18,569 | 61,219 | 117,040 | — | — | 30,495 | 249,672 | 20,174 | 10,689 | 30,863 | 280,535 | ||||||||||||||
| Other outstanding loan | — | — | 73 | 40 | 267 | — | — | 12 | 392 | 833 | 36 | 869 | 1,261 | ||||||||||||||
| Subtotal commercial loans | 77,203 | 60,376 | 1,323,761 | 1,047,221 | 964,147 | — | — | 200,828 | 3,673,536 | 268,975 | 86,730 | 355,705 | 4,029,241 | ||||||||||||||
| Consumer loans | — | — | — | — | — | — | — | — | — | 381,235 | 26,080 | 407,315 | 407,315 | ||||||||||||||
| Mortgage loans | — | — | — | — | — | — | — | — | — | 999,636 | 33,003 | 1,032,639 | 1,032,639 | ||||||||||||||
| Total loans and receivable to customers | — | — | |||||||||||||||||||||||||
| Financial investments | 77,203 | 60,376 | 1,323,761 | 1,047,221 | 964,147 | — | — | 200,828 | 3,673,536 | 1,649,846 | 145,813 | 1,795,659 | 5,469,195 | ||||||||||||||
The following table sets forth our allowances for loan losses:
As of December 31, | ||||||||||
2008 | 2009 | 2010 | ||||||||
(in millions of Ch$ as of December 31, 2010, except for percentages) | ||||||||||
| Allowances for loan losses | Ch$ 75,487 | Ch$ 99,264 | Ch$ 104,215 | |||||||
| Loan allowances as a percentage of total loans | 1.5% | 2.0% | 1.9% | |||||||
Classification of Loan Portfolio Based on the Borrower’s Payment Performance
Accrued interest and UF-indexation adjustments from overdue loans are recognized only when, and to the extent, received. Non-performing loans that are not yet 90 days or more overdue have been included in each of the various categories of loans, and therefore affect the various averages.
Non-performing loans consist of commercial loans included in Category C4 for more than one year, all commercial loans included in Category D1 and D2 and loans (or portions thereof) that are overdue. According to the definition adopted by management, non-performing loans consist of commercial loans included in categories eight, nine and ten (or portions thereof) that are overdue. We cease to accrue interest on loans as soon as they become overdue. Past due loans include, with respect to any loan, the portion of principal or interest that is 90 or more days overdue, and do not include the portion of such loan that is not overdue or that is less than 90 days overdue, unless legal proceedings have been commenced for the entire outstanding balance according to the terms of the loan. This practice differs from that normally followed in the United States where the amount classified as past due would include the total principal and interest on all loans which have any portion overdue.
We are required to charge off commercial loans not later than 24 months after being classified as past due, if unsecured, and if secured, not later than 36 months after being classified as past due. When an installment of a past due commercial loan (either secured or unsecured) is written off, we must charge off all installments which are overdue, notwithstanding our right, if any, to charge off the entire amount of the loan. Once any amount of a loan is written off, each subsequent installment must be written off as it becomes overdue, notwithstanding our right, if any, to charge off the entire amount of the loan. In the case of past due consumer loans, a similar practice applies, except that after the first installment becomes six months past due, we must charge off the entire remaining part of the loan. We may charge off any loan (commercial or consumer) before the first installment becomes overdue we must charge off an overdue loan (commercial or consumer) before the terms set forth above in certain circumstances. Loans are written off against the allowance for loan losses to the extent of any required reserves for such loans; the remainder of such loans is written off against income.
In general, legal collection proceedings are commenced with respect to consumer loans once they are 90 days past due and with respect to mortgage loans once they are 150 days past due. Legal collection proceedings are always commenced within one year of such loans becoming past due, unless the bank determines that the size of the past due amount does not warrant such proceedings. In addition, the majority of our commercial loans are short-term, with single payments at maturity.
74
The following tables set forth as of December 31 of each of the last three years the current and overdue principal and interest amounts, by domestic and foreign loans:
Domestic Loans
As of December 31, | ||||||||||
2008 | 2009 | 2010 | ||||||||
| (in millions of Ch$ as of December 31, 2010) | ||||||||||
| Current | Ch$ | 4,811,415 | Ch$ | 4,892,417 | Ch$ | 5,290,096 | ||||
| Overdue 1-29 days | 11,705 | 7,087 | 7,832 | |||||||
| Overdue 30-89 days | 34,543 | 9,512 | 8,190 | |||||||
| Overdue 90 days or more (“past due”) | 38,646 | 41,672 | 46,851 | 46,85 | ||||||
| Total loans | Ch$ | 4,896,309 | Ch$ | 4,950,688 | Ch$ | 5,352,959 | ||||
Foreign Loans
As of December 31, | ||||||||||
2008 | 2009 | 2010 | ||||||||
| (in millions of Ch$ as of December 31, 2010) | ||||||||||
| Current | Ch$ | 60,191 | Ch$ | 60,968 | Ch$ | 116,226 | ||||
| Overdue 1-29 days | — | — | — | |||||||
| Overdue 30-89 days | — | — | — | |||||||
| Overdue 90 days or more (“past due”) | — | — | — | |||||||
| Total loans | Ch$ | 60,191 | Ch$ | 60,968 | Ch$ | 116,226 | ||||
Total Loans
As of December 31, | ||||||||||
2008 | 2009 | 2010 | ||||||||
| (in millions of Ch$ as of December 31, 2010) | ||||||||||
| Current | Ch$ | 4,871,606 | Ch$ | 4,953,385 | Ch$ | 5,406,322 | ||||
| Overdue 1-29 days | 11,705 | 7,087 | 7,832 | 77 | ||||||
| Overdue 30-89 days | 34,543 | 9,512 | 8,190 | |||||||
| Overdue 90 days or more (“past due”) | 38,646 | 41,672 | 46,851 | 46 | ||||||
| Total loans | Ch$ | 4,956,500 | Ch$ | 5,011,656 | Ch$ | 5,469,195 | ||||
| Overdue loans expressed as a percentage of total loans | 0.7% | 0.2% | 0.1% | |||||||
| Past due loans as a percentage of total loans | 0.8% | 0.8% | 0.9% | |||||||
Analysis of Impaired Loans and Amounts Past Due
The following table analyzes our impaired loans and past due loans and the allowances for loan losses existing as of the dates indicated. Impaired loans are all loans included in categories 6, 7, 8, 9 and 10. The information provided is related to domestic loans, because we did not have any significant non-accrual or past due foreign loans in the periods presented. All of our restructured loans are included in the following table:
75
As of December 31, | ||||||||||||
2008 | 2009 | 2010 | ||||||||||
(in millions of Ch$ as of December 31, 2010 except for percentages) | ||||||||||||
| Total loans | Ch$ | 4,956,500 | Ch$ | 5,011,656 | Ch$ | 5,469,195 | ||||||
| Impaired loans | 304,943 | 330,453 | 346,641 | |||||||||
| Allowance for loan losses | 75,487 | 99,264 | 104,215 | |||||||||
| Impaired loans as a percentage of total loans | 6.2 | % | 6.6 | % | 6.3 | % | ||||||
| Amounts past due (1) | 38,646 | 41,672 | 46,851 | |||||||||
| To the extent secured (2) | 20,642 | 25,934 | 22,773 | |||||||||
| To the extent unsecured | 18,004 | 15,738 | 24,078 | |||||||||
| Amounts past due as a percentage of: | ||||||||||||
| Total loans | 0.8 | % | 0.8 | % | 0.9 | % | ||||||
| To the extent secured (2) | 0.4 | % | 0.5 | % | 0.4 | % | ||||||
| To the extent unsecured | 0.4 | % | 0.3 | % | 0.4 | % | ||||||
| Total loans for which at least one payment is past due (1) | 131,117 | 93,751 | 111,421 | |||||||||
| Loans for which at least one payment is past due as a percentage of total loans | 2.6 | % | 1.9 | % | 2.0 | % | ||||||
| Allowance for loans losses as a percentage of: | ||||||||||||
| Total loans | 1.5 | % | 2.0 | % | 1.9 | % | ||||||
| Total impaired loans | 24.8% | % | 30.0 | % | 30.1 | % | ||||||
| Total amounts past due | 195.3 | % | 238.2 | % | 222.4 | % | ||||||
| Total amounts past due-unsecured | 419.3 | % | 630.7 | % | 432.8 | % | ||||||
| (1) | Past due loans that are 90 days or more overdue as to any payments of principal or interest. We continue to accrue interest and indexation on the principal payments not yet overdue for those loans that have installments overdue unless we believe those amounts are uncollectible. Accrued interest and indexation adjustments are included in our recorded investment in the purpose of determining the required allowance for loan losses. |
| (2) | Security generally consists of mortgages on real estate, pledges of marketable securities, letters of credit or cash. |
Analysis of Allowances for Loan Losses
The following table analyzes our provisions for loan losses charged to income and changes in the allowances attributable to write-offs, allowances released, recoveries, allowances on loans acquired:
As of December 31, | ||||||||||||
2008 | 2009 | 2010 | ||||||||||
| (in millions of Ch$ as of December 31, 2010) | ||||||||||||
| Allowances for loan losses at beginning of period | Ch$ | 54,944 | Ch$ | 75,487 | Ch$ | 99,264 | ||||||
| Allowances on acquired loans | ||||||||||||
| Write-offs | (45,939 | ) | (60,772 | ) | (61,926 | ) | ||||||
| Provisions established | 75,030 | 104,318 | 93,145 | |||||||||
| Provisions released (1) | (8,548 | ) | (19,769 | ) | (26,268 | ) | ||||||
| Allowances for loan losses at end of period | Ch$ | 75,487 | Ch$ | 99,264 | Ch$ | 104,215 | ||||||
| Ratio of write-offs to average loans | 1.0 | % | 1.3 | % | 1.2 | % | ||||||
| Allowances for loan losses at end of period as a percentage of total loans | 1.5 | % | 2.0 | % | 1.9 | % | ||||||
| (1) | Represents the aggregate amount of allowances for loan losses released during the year as a result of recoveries or a determination by management that the level of risk existing in the loan portfolio has been reduced. |
76
Our policy with respect to write-offs follows the standards under IFRS. We are required to write off commercial loans, if unsecured, no later than 24 months after being classified as past due and, if secured, no later than 36 months after being classified as past due. When an installment of a past due commercial loan (either secured or unsecured) is written off, we must write off the entire amount of the loan. In the case of past due consumer loans, a similar practice applies, except that after first installment has been classified as past due for six months, we must write off the entire remaining part of the loan.
We believe that our application of write-off policies does not result in significant differences in our financial results as compared to our competitors, has enabled us to generally decrease write-offs since 1999, and maintain them at an adequate level. The effects of these efforts can be seen in the following table, which shows the write-offs breakdown by loan category:
As of December 31, | ||||||||||
2008 | 2009 | 2010 | ||||||||
| (in millions of Ch$ as of December 31, 2010) | ||||||||||
| Consumer loans | Ch$ | 39,296 | Ch$ | 51,412 | Ch$ | 45,645 | ||||
| Residential mortgage loans | 493 | 524 | 537 | |||||||
| Commercial loans | 6,150 | 8,836 | 15,744 | |||||||
| Total | Ch$ | 45,939 | Ch$ | 60,772 | Ch$ | 61,926 | ||||
The following table shows loan loss recoveries by loan category for the periods indicated:
As of December 31, | ||||||||||
2008 | 2009 | 2010 | ||||||||
| (in millions of Ch$ as of December 31, 2010) | ||||||||||
| Consumer loans | Ch$ | 9,143 | Ch$ | 11,329 | Ch$ | 11,893 | ||||
| Residential mortgage loans | 285 | 111 | 90 | |||||||
| Commercial loans | 1,607 | 1,776 | 2,726 | |||||||
| Total | Ch$ | 11,035 | Ch$ | 13,216 | Ch$ | 14,709 | ||||
Net provisions—i.e., new provisions adjusted by provisions reversed—have been determined so that provisions for loan losses as a percentage of total loans follow the overall loan quality and consequently the movement in the risk index. Total loan allowances consist of allowances for commercial loans, consumer loans and residential mortgage loans.
Based on information available regarding our debtors, we believe that our allowances for loan losses are sufficient to cover known probable losses and losses inherent in a loan portfolio of the size and nature of our loan portfolio.
Allocation of Allowances for Loan Losses
The following tables set forth, as of December 31 for each of the last three years, the proportions of our required minimum allowances for loan losses that were attributable to our commercial, consumer and residential mortgage loans as of each such date.
| As of December 31, 2010 | ||||||||||||
Allowance amount(1) | Allowance Amount as a percentage of loans in category | Allowance Amount as a percentage of total loans (2) | Loans in category as percentage of total | |||||||||
| Commercial loans | Ch$ | 67,706 | 1.7 | % | 1.2 | % | 72.7 | % | ||||
| Consumer loans | 27,572 | 6.8 | % | 0.5 | % | 7.4 | % | |||||
| Residential mortgage loans | 8,937 | 0.9 | % | 0.2 | % | 18.7 | % | |||||
| Loans and receivables to banks | 189 | 0.3 | % | 0.0 | % | 1.2 | % | |||||
| Total | Ch$ | 104,404 | 1.9 | % | 1.9 | % | 100.0 | % | ||||
77
| As of December 31, 2009 | ||||||||||||
Allowance amount(1) | Allowance Amount as a percentage of loans in category | Allowance Amount as a percentage of total loans (2) | Loans in category as percentage of total | |||||||||
| Commercial loans | Ch$ | 59,528 | 1.6 | % | 1.2 | % | 74.1 | % | ||||
| Consumer loans | 33,697 | 7.9 | % | 0.7 | % | 8.4 | % | |||||
| Residential mortgage loans | 6,039 | 0.7 | % | 0.1 | % | 15.8 | % | |||||
| Loans and receivables to banks | 6 | 0.0 | % | 0.0 | % | 1.7 | % | |||||
| Total | Ch$ | 99,270 | 1.9 | % | 1.9 | % | 100.0 | % | ||||
| As of December 31, 2008 | ||||||||||||
Allowance amount(1) | Allowance Amount as a percentage of loans in category | Allowance Amount as a percentage of total loans (2) | Loans in category as percentage of total | |||||||||
| Commercial loans | Ch$ | 34,849 | 0.9 | % | 0.7 | % | 75.3 | % | ||||
| Consumer loans | 36,036 | 7.1 | % | 0.7 | % | 10.1 | % | |||||
| Residential mortgage loans | 4,602 | 0.7 | % | 0.1 | % | 13.8 | % | |||||
| Loans and receivables to banks | 25 | 0.1 | % | 0.0 | % | 0.8 | % | |||||
| Total | Ch$ | 75,512 | 1.5 | % | 1.5 | % | 100.0 | % | ||||
| (1) | In millions of Ch$ as of December 31, 2010, except for percentages. |
| (2) | Based on our loan classification, for the purpose of determining the loan loss allowance. |
Composition of Deposits and Other Commitments
The following table sets forth the composition of our deposits and similar commitments as of December 31, 2008, 2009 and 2010.
As of December 31, | ||||||||||
2008 | 2009 | 2010 | ||||||||
| (in millions of Ch$ as of December 31, 2010) | ||||||||||
| Checking accounts | Ch$ | 258,664 | Ch$ | 328,078 | Ch$ | 405,301 | ||||
| Other demand liabilities | 93,495 | 159,687 | 206,763 | |||||||
| Savings accounts | 10,078 | 9,011 | ssssss | 8,666 | 8 | |||||
| Time deposits | 3,340,664 | 3,307,034 | 3,691,788 | |||||||
| Other commitments | 5,743 | 8,505 | 5,994 | |||||||
| Total | Ch$ | 3,708,644 | Ch$ | 3,812,315 | Ch$ | 4,318,512 | ||||
Maturity of Deposits
The following table sets forth information regarding the currency and maturity of our deposits as of December 31, 2010, expressed in percentages. UF-denominated deposits are similar to peso-denominated deposits in all respects, except that the principal is readjusted periodically based on variations in the CPI.
| As of December 31, 2010 | |||||||||
| Foreign | |||||||||
| Ch$ | UF | Currency | Total | ||||||
| Demand deposits | 16.14 | % | 0.65 | % | 11.58 | % | 14.20 | % | |
| Savings accounts | — | 2.52 | — | 0.20 | |||||
| Time deposits: | |||||||||
| Maturing within 3 months | 67.88 | 31.10 | 85.30 | 67.64 | |||||
| Maturing after 3 but within 6 months | 9.55 | 15.06 | 2.92 | 8.97 | |||||
| Maturing after 6 but within 12 months | 4.31 | 23.48 | 0.07 | 5.18 | |||||
| Maturing after 12 months | 2.12 | 27.19 | 0.13 | 3.81 | |||||
| Total time deposits | 83.86 | 96.83 | 88.42 | 85.60 | |||||
| Total deposits | 100.00 | % | 100.00 | % | 100.00 | % | 100.00 | % | |
78
The following table sets forth information regarding the maturity of the outstanding time deposits in excess of US$100,000.0 (or its equivalent) issued by us as of December 31, 2010.
| As of December 31, 2010 | |||||||||||||
| Foreign | |||||||||||||
| Ch$ | UF | Currency | Total | ||||||||||
| (in millions of Ch$ as of December 31, 2010) | |||||||||||||
| Maturing within 3 months | Ch$ | 683,306 | Ch$ | 5,862 | Ch$ | 131,524 | Ch$ | 820,692 | |||||
| Maturing after 3 but within 6 months | 125,241 | — | 298 | 125,539 | |||||||||
| Maturing after 6 but within 12 months | 46,890 | 47,921 | — | 94,811 | |||||||||
| Maturing after 12 months | 5,121 | 21,383 | 21 | — | - | 26,504 | 26, | ||||||
| Total time deposits | Ch$ | 860,558 | Ch$ | 75,166 | Ch$ | 131,822 | Ch$ | 1,067,546 | |||||
Minimum Capital Requirements
As of December 31, 2008, 2009 and 2010 the table sets forth our minimum capital requirements set as follows:
| As of December 31, | ||||||||
| 2008 | 2009 | 2010 | ||||||
(in millions of Ch$ as of December 31, 2010, except for percentages) | ||||||||
| Net capital base | 497,277 | 507,349 | 549,314 | |||||
| 3% total assets net of provisions | (196,944 | ) | (202,826 | ) | (229,026 | ) | ||
| Excess over minimum required equity | 300,333 | 304,523 | 320,288 | |||||
| Net capital base as a percentage of the total assets, net of provisions | 7.57 | % | 7.50 | % | 7.19 | % | ||
| Effective equity | 587,360 | 739,463 | 801,412 | |||||
| 8% of the risk-weighted assets | (422,907 | ) | (455,633 | ) | (477,861 | ) | ||
| Excess over minimum required equity | 164,453 | 283,830 | 323,550 | |||||
| Effective equity as a percentage of the risk-weighted assets | 11.11 | % | 12.98 | % | 13.42 | % | ||
Short-term Borrowings
Our short-term borrowings (other than deposits and other obligations) totaled Ch$415,665.0 million, Ch$572,063.0 million and Ch$357,687.0 million as of December 31, 2008, 2009 and 2010, respectively, in accordance with IFRS.
The principal categories of our short-term borrowings are amounts borrowed under foreign trade lines of credit, domestic interbank loans and repurchase agreements. The table below presents the amounts outstanding at the end of each period indicated and the weighted average nominal interest rate for each such period by type of short-term borrowing.
As of and for the Year Ended December 31, | |||||||||||||||||||
2008 | 2009 | 2010 | |||||||||||||||||
Year End Balance | Weighted Average Nominal Interest Rate | Year End Balance | Weighted Average Nominal Interest Rate | Year End Balance | Weighted Average Nominal Interest Rate | ||||||||||||||
(in millions of Ch$ as of December 31, 2010, except for rate date) | |||||||||||||||||||
| Investments under repurchase agreements | Ch$ | 106,734 | 7.6 | Ch$ | 41,135 | 1.0 | Ch$ | 189,350 | 1.2 | ||||||||||
| Central Bank borrowings | 244,737 | 8.3 | 424,378 | 0.5 | — | ||||||||||||||
| Domestic interbank loans | 59,205 | 8.2 | 1,300 | 1.2 | 43,141 | 0.8 | 0.8 | ||||||||||||
| Borrowings under foreign trade credit lines | 4,989 | 4.7 | 105,250 | 1.4 | 125,196 | 1.0 | |||||||||||||
| Other obligations | — | — | — | — | |||||||||||||||
| Total short-term borrowings | Ch$ | 415,665 | 7.3 | Ch$ | 572,063 | 1.0 | Ch$ | 357,687 | 1.1 | ||||||||||
79
The following table shows the average balance and the weighted average nominal rate for each short-term borrowing category during the periods indicated:
| 2008 | 2009 | 2010 | |||||||||||
| Weighted | Weighted | Weighted | |||||||||||
| Average | Average | Average | |||||||||||
| Nominal | Nominal | Nominal | |||||||||||
| Average | Interest | Average | Interest | Average | Interest | ||||||||
| Balance | Rate | Balance | Rate | Balance | Rate | ||||||||
| Investments under repurchase agreements | 164,921 | 8.5 | % | 267,061 | 4.0 | % | 424,297 | 1.2 | % | ||||
| Central Bank borrowing | — | — | 8,386 | 4.9 | 1,274 | 0.2 | |||||||
| Domestic interbank loans | 28,480 | 7.3 | 99,762 | 2.4 | 39,364 | 2.5 | |||||||
| Subtotal | 193,401 | 8.3 | 375,209 | 3.6 | 464,935 | 1.4 | 1.3 | ||||||
| Borrowings under foreign trade credit lines | 6,447 | 1.0 | 35,510 | 1.3 | 82,809 | 2.2 | |||||||
| Total short-term borrowings | 199,848 | 8.1 | % | 410,719 | 3.4 | % | 547,744 | 1.4 | % | ||||
The following table presents the maximum month-end balances of our principal sources of short-term borrowings during the periods indicated:
Maximum 2008 Month-End Balance | Maximum 2009 Month-End Balance | Maximum 2010 Month-End Balance | |||||
| (in millions of Ch$ as of December 31, 2010) | |||||||
| Investments under repurchase agreements | 244,737 | 424,378 | 650,853 | ||||
| Central Bank borrowings | 117,300 | 46,865 | 113,941 | ||||
| Domestic interbank loans | 65,618 | 140,617 | 114,096 | ||||
| Borrowings under foreign trade credit lines | 470,867 | 403,476 | 518,660 | ||||
| Other obligations | 47,395 | 46,415 | 28,563 | ||||
80
C. ORGANIZATIONAL STRUCTURE
The following diagram presents our current corporate structure and includes each of our subsidiaries and the proportion of their respective ownership interests held by us:
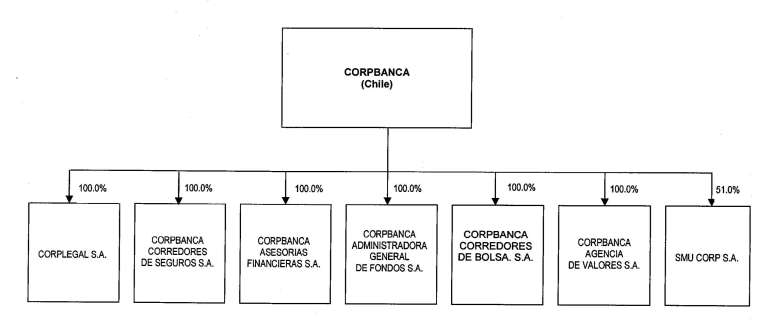
All of our subsidiaries have their jurisdiction of incorporation in the Republic of Chile. For more information about the services they provide see “Item 4. Information on the Company – Business Overview – Non-Banking Financial Services Offered through Subsidiaries”.
On October 22 and 24, 2008, the U.S. Federal Reserve Board and the U.S. Office of the Comptroller of the Currency (OCC) respectively granted us authorization to establish a federal branch in the city of New York in the United States. The branch began operating in May 2009.
D. PROPERTY
Our principal executive offices are located at Rosario Norte 660, Las Condes, Santiago, Chile since 2007. As of December 31, 2010, we owned 29 of the 113 properties where our branches were located. The remaining 84 branch locations were leased. Total branch space as of December 31, 2010 aggregates to approximately 63,309 square meters (681,452 square feet). Our branches are located throughout Chile, including the Santiago metropolitan region.
Not applicable.
A. OPERATING RESULTS
The following discussion should be read in conjunction with our financial statements, together with the notes thereto, included elsewhere in this Annual Report. Our financial statements have been prepared in accordance with IFRS as issued by IASB.
Our consolidated annual financial statements as of and for the year ended December 31, 2010 have been prepared in accordance with IFRS issued by IASB. The selected consolidated financial information included herein as of and for the year ended December 31, 2010, together with the selected consolidated financial information for the years ended December 31, 2008 and 2009, is derived from, and presented on the same basis as, our consolidated financial statements and should be read together with the consolidated financial statements. Since our consolidated financial statements, including the selected consolidated information included herein, have been prepared using IFRS, they are not comparable with the audited consolidated financial statements included in the annual reports filed on Form 20-F for the years ended December 31, 2008 and prior thereto. Readers should exercise caution in determining trends based on prior annual reports.
81
General Conditions
We are a “sociedad anónima” organized under the laws of Chile and our stock is quoted on the Santiago Stock Exchange and the Chilean Electronic Exchange. We are regulated by the Chilean Superintendency of Banks. We offer general commercial and consumer banking services and provide other services, including factoring, collection, leasing, securities and insurance brokerage, asset management and investment banking.
We have prepared this operating and financial review in a manner consistent with the way our management views our business as a whole (see “Item 4. Information on the Company—Business Overview” and note 1 to our audited consolidated financial statements included herein). As a result we present the following key sections to the operating and financial review:
The following classification of revenues and expenses is based on our consolidated financial statements.
Revenues. We have three main sources of revenues, which include both cash and non-cash items:
| · | Interest income. We earn interest income from our interest-earning assets, which are mainly represented by loans to customers. |
| · | Fees and income from services. We earn service fee and commission revenues related to checking accounts, loans, mutual funds, credit cards and other financial services. |
| · | Other income. We earn income relating to changes in the fair value of our securities portfolio, other trading activities and foreign exchange transactions. |
Expenses. Our main expenses, which include both cash and non-cash items, are:
| · | Interest expense. We incur interest expense on our interest bearing liabilities, such as deposits, short-term borrowings and long-term debt. |
| · | Provisions for loan losses. We establish provisions for loan losses in accordance with SBIF regulations based on the size of our loan portfolio and our expectations regarding the ability of our customers to repay their loans. |
| · | Other expenses. We incur expenses relating to salaries and benefits, administrative expenses and other non-interest expenses. |
The Chilean Economy
All of our investments are located in Chile. Accordingly, our financial condition and results of operations are substantially dependent upon economic conditions prevailing in Chile. Chile experienced profound economic reforms during the 1970s and 1980s. The Chilean economy grew at rates averaging more than 7.0% per annum from 1985 until the onset of the Asian economic crisis in 1997. Since then, the average rate of growth from 1998 to 2006 stagnated to only 3.6% and showed a period of higher growth in 2007 with a rate of 5.1%. In 2008 this rate slowed to 3.5% as a worldwide recession hit many developed nations throughout the world. During 2008, the world economy witnessed the impact of the international financial crisis, which originated in the U.S. subprime real estate sector. During the first half of 2008, various banks throughout the world accumulated significant losses on financial investments in the U.S. real estate market and the U.S. economy began to show the first signs of a recession during this period. Towards the second half of the year, the crisis began to spread to the banking systems of most major industrialized nations. The international markets took an even more negative turn in mid-September 2008 after the investment bank Lehman Brothers went bankrupt. The ensuing liquidity crisis and fear of further bank failures unleashed an accelerated reduction in indebtedness within the global financial system, with massive liquidations of assets and costly attempts to recapitalize banks, both in the United States and Europe.
Financial authorities from the world’s largest economies began to strengthen liquidity provisions through a wide range of instruments, together with coordinated decision making by various central banks on monetary policy matters. The abrupt contraction of credit supply from numerous banks throughout the developed world continued, generating strong deceleration of the principal components of domestic spending, consumption and investment, further aggravating the recession in larger economies such as the United States, Japan, the United Kingdom and the Eurozone in general. In that context, emerging countries were not exempt from the impacts of this crisis. Emerging Asian economies’ strong dependency on external demand from industrialized economies gave way, towards the end of the year, to a recession in its industrial sector—the principal driving force in these economies. For Latin America, in turn, the significant drop in raw materials prices deteriorated its regional economic outlook, as national income in the region is quite exposed to the value of export commodities.
Chile began to experience the impact of these negative global conditions towards the end of 2008, principally in the form of write-downs of local assets, a deceleration in the margin of some activity indicators and a moderation in the strong inflationary pressure felt during the first three quarters of 2008. First, the global fall in demand for riskier financial assets was reflected internally in a decrease in the value of local assets (more than 20.0% if measured in local currency) and the depreciation of the Chilean peso with respect to the U.S. dollar (also approximately 20.0%). During the second half of 2008, the local economy performed worse overall than in the first half of the year, driven by deceleration of non-tradable goods sectors (construction, commerce and services), which was not offset by positive performances in the energy sector, explained by greater availability of water for generating electricity, and the telecommunications sector, because of increases in broadband access. According to the Chilean Central Bank, copper prices increased from US$1.4 to US$3.3 as of December 31, 2008 and 2009, respectively. The high copper prices in prior years and the ability of the government to save these revenues produced significant solvency in external accounts, playing an important role for the funding of future fiscal stimulus packages.
82
As for inflation, the first three quarters of 2008 were characterized by significant absorption of external inflation, which caused domestic prices to rise. This resulted in high local inflation figures that, as of October 2008, showed a nearly 10.0% variation over the prior twelve months, far exceeding the goal of 3.0% established by local monetary authorities (as of December 2008, inflation reached 7.1%). In this highly inflationary environment, the Central Bank decided to act by successively increasing the monetary policy rate during the year. Thus, the monetary rate that began the year at 6.0% reached approximately 8.3% by September 2008 and closed the year at the same level. Nevertheless, at year end the international value of some energy-related commodities dropped, which lowered inflation for the last quarter, with 2008 accumulated inflation of approximately 7.1% is significantly lower than previously forecasted figures.
During 2009, the Chilean economy suffered its worst contraction in the last 30 years, which was the result of the impact of the global crisis that originated in developed countries and spread to emerging economies. As a result, the local economy significantly contracted, which was influenced by the deterioration of the industrial, mining and commercial sectors. The global crisis put severe stress on financial markets around the world with the ability to obtain credit being adversely affected, thereby stifling the productive capacity of many countries around the world. In particular, the leading commercial regions (US, the European Union and Japan) suffered the worst economic downturn in decades.
The impact of the global economic crisis that erupted in October 2008 had significant effects on the Chilean economy during the first quarter of 2009 with the low levels of a number of economic indicators, which measure the economic vitality of the local Chilean economy. Nevertheless, there was evidence of a point of inflection in global inflation near the end of the first quarter and into the second quarter of 2009. At that point, several international economic indicators began to stabilize and/or rise and some regions in the world started to show signs of recovery.
During the third quarter of 2009, the global economy began on a path towards recovery, particularly in developed economies with large industrial sectors. Asian countries, such as China, and some South American countries began to exhibit fast growth rates in manufacturing production. This growth in manufacturing production reversed the course of a decrease in the volume of commercial goods produced around the world. It is important to note that the growth in the third quarter of 2009 was in large part the result of specific stimulus packages initiated by governments around the world, whereby the governments heavily increased their spending to compensate for the shrinking demand in the private sector. Nevertheless, the more developed economies experienced a seemingly stable recovery due to the lingering influence of uncertainty in the financial markets. As a result, the labor markets in several countries suffered and many consumption based economies began some form of debt reduction processes.
During 2009, according to published estimates of the International Monetary Fund, the economies around the world contracted at an annual rate of (1.1%) and developed economies plummeted by 3.4%. From the perspective of the local Chilean economy, the impact of the global economic crisis was similar to that experienced in other emerging economies. During the global economic crisis, the Chilean GDP decreased by 1.8%, which is the worst decrease in GDP since the 1980’s. In Chile, the labor market was the sector that was impacted the most with the unemployment rate reported to have reached a peak of 10.8% in the third quarter of 2009.
As a result of a fall in the price of goods and the appreciation of the US dollar, Chile experienced deflation for the first time in 74 years. Specifically, Chile had a deflation rate of (1.4%). As a result, the Central Bank of Chile’s monetary rate reached a historic low of 0.5%, which remained as such throughout 2009. In addition, the Central Bank of Chile adopted non-traditional monetary policies such as establishing a liquidity fund for banks to utilize to finance plant maintenance programs. Towards the end of 2009, the weakening of the US dollar and the stable rise in the price of copper has helped appreciate the Chilean peso.
2010 was a positive year for worldwide economies generally and in particular Chile. After a decrease of 1.5% of GDP in 2009, the Chilean economy grew over 5.0% in 2010. The unemployment rate returned to pre-crisis levels, the inflation rate decreased to 3.0% at year end and the Chilean economy started recovering after a negative 2009. The Chilean peso appreciated 8.0% as a result of the improvement of the Chilean economy and the rise in the copper price.
83
Recent Developments in the Banking Industry
During the last ten years, the Chilean banking industry has experienced significant concentration and had many new players enter the market. In 1998, 32 financial institutions operated in Chile and the five largest banks had a combined market share of approximately 40.0%. That year, Corpbanca acquired Financiera Condell and then the assets of Corfinsa, and Citibank Chile acquired Corporación Financiera Atlas. The market experienced two mergers in 2002: Banco de Chile with Banco Edwards and Banco Santander with Banco Santiago. During that same year, Banco Ripley began operating. In 2003, Banco del Desarrollo merged with Sudameris and in 2004 Banco Penta and Banco Paris commenced operations. Then, in 2005, Banco de Crédito e Inversiones acquired Financiera Conosur and in 2008 Banco de Chile merged with Citibank, and Scotiabank acquired Banco del Desarrollo. Thus, by the end of 2010, only 25 financial institutions were operating, of which one is operated by the State of Chile and four are branches of foreign banks. As of December 31, 2010, the five largest banks boast a market share of approximately 75.0%, leaving the industry more concentrated, but with increased competition as recent large mergers have increased competition, reducing spreads significantly. In light of these lower spreads, banks have been forced to improve operating efficiency to compensate for deteriorating margins.
In 1997, GDP grew 6.6%, which was reduced to 3.3% in 1998 as a result of the Asian financial crisis. Growth reached its lowest point in 1999 of (0.7%). Because of the crisis, the Chilean banking industry, which recorded 13.2% growth in 1997, saw growth abruptly fall to 4.8% in 1998, reaching its weakest point in December 2002 with barely 1.6% annual growth.
Between 2004 and 2009, the Chilean banking sector has grown at annual rates over 14.0%. In 2010, loans (not including contingent credits and interbank loans) showed an 8.7% increase over a twelve-month period, which can be further divided into an increase of 6.9% in corporate loans and an increase of 11.7% in retail loans.
Since the last quarter of 2007, loan approval conditions have become more restrictive for both large corporations and real estate companies as well as small and medium enterprises. In fact, surveys conducted by the Central Bank, reported quarterly in a publication called “Bank Loan Survey Results,” also noted that restrictions on loan approvals increased during 2008. In 2009, 16 of the 25 foreign and local banks ended the year with less loans than in 2008. This is mainly explained by commercial loans, which decreased by 5.7% during the year. However, consumer loans increased 5.2% during the year, mainly because mortgage loans increased by 7.2%. This was explained by low interest rates during 2009. 19 of the 20 local banks had an increase in their mortgage loan portfolio, although only 8 had an increase in their consumer loan portfolio.
In 2010, total loans grew 8.7% in nominal terms. This is explained by a growth of 6.9% in commercial loans, 11.9% in consumer loans and 11.6% in mortgage loans. In recent years, consumer and mortgage loans have grown more rapidly than commercial loans. In 2010, 61.0% of total loans for the banking industry corresponded to commercial loans, followed by 26.0% for mortgage loans and 13.0% for consumer loans. In 2010, commercial loans decreased 1.05%, while mortgage and consumer loans have increased 0.68% and 0.37%, respectively. This is explained by excess liquidity accumulated by companies during the financial crisis, leading them to postpone their credit needs. The strong increase in consumer and mortgage loans is attributable to favorable economic conditions and strong sector competition to expand these portfolios. The retail segment is more concentrated in larger banks than the companies segment. This segment has grown in both consumer and mortgage loans. Consumer loan growth in the amount of 11.9% is slightly greater than mortgage loan growth. The two largest banks in Chile hold 50.0% market share in this segment. Mortgage loan growth in 2010 was 11.6%. A favorable economic cycle and low interest rates explain a large part of this growth. Unlike consumer loans, mortgage loans are less concentrated in a few banks.
The risk index at the end of 2010 increased by 9 basis points, reflecting a similar credit quality compared to 2009.
Net Income in the banking industry increased 29.0% during 2010 and experienced an average return-on-equity of 20.0% during such period, high by 410 basis points when compared to 2009.
UF-denominated Assets and Liabilities. The UF is revalued by the Chilean National Institute of Statistics in monthly cycles. Every day in the period beginning the tenth day of the current month through the ninth day of the succeeding month, the nominal peso value of the UF is indexed up (or down in the event of deflation) in order to reflect each day a proportional amount of the prior calendar month’s change in the CPI. One UF was equal to Ch$21,452.6, Ch$20,942.9 and Ch$21,455.6 as of December 31, 2008, 2009 and 2010, respectively. The effect of any changes in the nominal peso value of our UF-denominated assets and liabilities is reflected in our results of operations as an increase (or decrease, in the event of deflation) in interest income and expense, respectively. Our net interest income is positively affected by increases in inflation to the extent that our average UF-denominated assets exceed our average UF-denominated liabilities. Conversely, our net interest income will be negatively affected by inflation in any period in which our average UF-denominated liabilities exceed our average UF-denominated assets. Our average UF-denominated assets exceeded our average UF-denominated liabilities by Ch$940,589.0 million, Ch$1,246,590.0 million and Ch$1,268,516.0 million during the years ended December 31, 2008, 2009 and 2010, respectively. See “Item 4. Information on the Company—Business Overview—Selected Statistical Information—Average Balance Sheets, Income Earned from Interest Earning Assets and Interest Paid on Interest Bearing Liabilities”.
84
Peso-denominated Assets and Liabilities. Rates of interest prevailing in Chile during any period reflect in significant part the rate of inflation during the period and expectations of future inflation. The responsiveness to such prevailing rates of our peso-denominated interest-earning assets and interest bearing liabilities varies. See “Interest Rates” below, “Results of Operations” below and “Item 11. Quantitative and Qualitative Disclosures About Market Risk”. We maintain a substantial amount of non-interest bearing peso-denominated demand deposits. The ratio of the average balance of such demand deposits to average interest-earning assets was 1.3%, 1.8% and 3.9% during the years ended December 31, 2008, 2009 and 2010, respectively. Because such deposits are not sensitive to inflation or changes in the market interest rate environment, any decline in market rates of interest or the rate of inflation adversely affects our net interest margin on assets funded with such deposits and any increase in the rate of inflation increases the net interest margin on such assets. From 2008 to 2010, we decreased our percentage of U.S. dollar based loans in our total loan portfolio from 14.0% to 11.0%.
Interest Rates
Interest rates earned and paid on our assets and liabilities, respectively, reflect, to a certain degree, inflation, expectations regarding inflation, shifts in short-term interest rates set by the Central Bank and movements in long-term real rates. The Central Bank manages short-term interest rates based on its objectives of balancing low inflation and economic growth. Because our liabilities generally reprice to reflect interest rate changes more frequently than our interest-earning assets, changes in the rate of inflation or short-term rates in the economy are reflected in the rates of interest paid by us on our liabilities before such changes are reflected in the rates of interest earned by us on our assets. Therefore, when short-term interest rates fall, our net interest margin is positively impacted, but when short-term rates increase, our interest margin is negatively affected. At the same time, our net interest margin tends to be adversely affected in the short term by a decrease in inflation because generally our UF-denominated assets exceed our UF-denominated liabilities. See “Item 5. Operating and Financial Overview and Prospects—Operating Results—The Chilean Economy” and “—UF-denominated Assets and Liabilities” above. An increase in long-term rates also has a positive effect on our net interest margin, because our interest-earning assets generally have a longer duration than our interest bearing liabilities.
In addition, because our peso-denominated liabilities have relatively short repricing periods, they are generally more responsive to changes in inflation or short-term rates than our UF-denominated liabilities. As a result, during periods when current inflation or expected inflation exceeds the previous month’s inflation, customers often switch funds from peso-denominated deposits to more expensive UF-denominated deposits, thereby adversely affecting our net interest margin. See “Item 5. Operating and Financial Review and Prospects—Liquidity and Capital Resources—Sources of Liquidity—Financial Investments”.
Currency Exchange Rates
A material portion of our assets and liabilities is denominated in foreign currencies, principally the U.S. dollar, and we historically have maintained and in the future may continue to maintain material gaps in the balances of such assets and liabilities. Currently, we do not maintain material gaps between the balances of these assets and liabilities. Our reported income is affected by changes in the value of the peso with respect to foreign currencies (principally the U.S. dollar) because such assets and liabilities, as well as interest earned or paid on such assets and liabilities, and gains (losses) realized upon the sale of such assets, are translated to pesos in preparing our financial statements. The Chilean government’s economic policies and any future changes in the value of the peso against the U.S. dollar could adversely affect our financial condition and results of operations. In the past, the peso has been subject to significant volatility when compared to the U.S. dollar. In 2008, the peso depreciated against the U.S. dollar by 28.0% as compared to 2007. In 2009, the peso appreciated against the U.S. dollar by 24.0% as compared to 2008. In 2010, the peso appreciated against the U.S. dollar by 7.5% as compared to 2009. Our exchange rate as of December 31, 2008, 2009 and 2010 was Ch$629.10, Ch$507.50 and Ch$467.78 per US$1.00, respectively. The peso may be subject to significant fluctuations in the future. As previously described, we began calculating our foreign exchange rates in accordance with Circular No. 3,345 issued by the Chilean Superintendency of Banks and its related amendments. See “Item 3. Key Information—Exchange Rate Information”.
Entering into forward exchange transactions enables us to reduce the negative impact of material gaps between the balances of our foreign currency-denominated assets and liabilities. As of December 31, 2008, 2009 and 2010, the gap between foreign currency denominated assets and foreign currency denominated liabilities, including forward contracts, was Ch$(159,817.0) million, Ch$(281,209.0) million and Ch$(450,355.0) million, respectively.
Critical Accounting Policies and Estimates
As a Chilean bank, we prepare our consolidated financial statements in conformity with IFRS.
In preparing our consolidated financial statements, we use estimates and assumptions to account for certain assets, liabilities, revenues, expenses and other transactions. The consolidated financial statements include various estimates and assumptions, including but not limited to the adequacy of the allowance for loan losses, estimates of the fair value of certain financial instruments, the selection of useful lives of certain assets and the valuation and recoverability of goodwill and deferred tax assets. We evaluate these estimates and judgments on an ongoing basis. Management bases its estimates and judgments on historical experience and on various other factors that are believed to be reasonable under the circumstances. Actual results in future periods could differ from those estimates and assumptions, and if these differences were significant enough, our reported results of operations would be affected materially.
85
Note 1 to our financial statements contains a summary of our significant accounting policies. We believe that the following are the more critical judgment areas or involve a higher degree of complexity in the application of the accounting policies that currently affect our financial condition and results of operations:
Allowance for Loan Losses
We have established allowances to cover probable loan losses in accordance with IFRS.
Although the level of detail in the statutory loan category schedules limits management’s discretion regarding the category to which a given loan should correspond, our management is required to make estimates and judgments about inherently subjective matters in determining the classification of individual loans and such classification affects the determination of the allowance for loan losses. The allowance for loan losses requires us to make estimates and, consequently, we regularly evaluate our allowance for loan losses by taking into consideration factors such as changes in the nature and volume of our loan portfolio, trends in forecasted portfolio credit quality and economic conditions that may affect our borrowers’ ability to pay. Increases in our allowance for loan losses are reflected as provisions for loan losses in our income statement. Loans are charged off when management determines that the loan or a portion thereof is uncollectible. Write-offs are recorded as a reduction of the allowance for loan losses. See “Item 4. Information on the Company—Business Overview—Selected Statistical Information—Current Regulations Relating to Classification of Banks and Loans; Allowances for Loan Losses”.
For a further description of regulations relating to loan classification and provisioning, see “Item 4. Information on the Company—Business Overview—Selected Statistical Information—Current Regulations Relating to Classification of Banks and Loans; Allowances for Loan Losses”.
We consider the accounting estimates related to allowance for loan losses to be “critical accounting estimates” because: (i) they are highly susceptible to change from period to period because our assumptions about the risk of loss used to classify our loans are updated for recent performance experience which may increase or decrease our risk index that is used to determine our global allowance, (ii) our specific allowances are also updated to reflect recent performance which may result in an increase or decrease in our specific allowances, (iii) it requires management to make estimates and assumptions about loan classification and the related estimated probable loss, if any, and (iv) any significant difference between our estimated losses (as reflected in the specific and general provisions) as of the balance sheet date and our actual losses will require us to adjust our allowance for loan losses that may result in additional provisions for loan losses in future periods which could have a significant impact on our future net income and/or financial condition. As of December 31, 2010, our allowance for loan losses was Ch$104,215.0 million (excluding allowances and impairment for foreign bank loans).
Derivative Financial Instruments
The derivative financial instruments are recorded at fair value. Fair values are based on quoted market prices or, if not available, on internally developed pricing models based on independently obtained market information. If market information is limited or in some instances, not available, management applies its professional judgment. Other factors that may also affect estimates are incorrect model assumptions, market dislocations and unexpected correlations. Notwithstanding the level of subjectivity in determining fair value, we believe our estimates of fair value are adequate. The use of different models or assumptions could lead to changes in our reported results.
In addition, we make loans and accept deposits in amounts denominated in foreign currencies, principally the U.S. dollar. Such assets and liabilities are translated at the applicable exchange rate at the balance sheet date.
Financial Investments
Financial investments are summarized as follows:
Trading Instruments - Instruments for trading are securities acquired for which we have the intent to generate earnings from short-term price fluctuations or through brokerage margins, or that are included in a portfolio created for such purposes. Instruments for trading are valued at their fair value according to market prices on the closing date of the balance sheet.
Investment Instruments - Investment instruments are classified into two categories: held-to-maturity investments and instruments available-for-sale. Held-to-maturity investments only include those instruments for which we have the intent and ability to hold-to-maturity. Investment instruments not classified as held-to-maturity or trading are considered to be available-for-sale. Investment instruments are recorded initially at cost. Instruments available-for-sale are valued at each subsequent period-end at their fair value. Mark-to-market adjustments are reported in a separate component of shareholders’ equity. All purchases and sales of investment instruments, to be delivered within the deadline stipulated by market regulation and conventions, are recognized on the commitment date, which is the date on which the commitment is made to purchase or sell the asset. Other purchases or sales are treated as forwards until they are liquidated.
86
We enter into security repurchase agreements as a form of borrowing. The liability for the repurchase of the investment is classified as “investments under agreements to repurchase” and is carried at cost plus accrued interest.
We also enter into resale agreements as a form of investment. Under these agreements we purchase securities, which are included as assets under the caption “investments purchased under agreements to resell” and are carried at cost plus accrued interest.
The following tables set forth the aging of our past due loans:
| December 31, 2010 | ||||||||||||||||||||||||
Less than 30 days MCh$ | Between 30-89 days MCh$ | Between 90-180 days MCh$ | Between 181-240 days MCh$ | Between 241-360 days MCh$ | More than 360 days MCh$ | Total MCh$ | ||||||||||||||||||
| Loans and receivables to banks | ||||||||||||||||||||||||
| Loans and receivables to customers: | ||||||||||||||||||||||||
| Commercial loans | 5,846 | 5,277 | 6,147 | 1,930 | 11,703 | 17,852 | 48,756 | |||||||||||||||||
| Mortgage loans | 622 | 590 | 1,446 | 321 | 456 | 4,488 | 7,923 | |||||||||||||||||
| Consumer loans | 1,364 | 2,323 | 2,507 | — | — | — | 6,194 | |||||||||||||||||
| Financial investments | — | — | — | — | — | — | — | |||||||||||||||||
| Total | 7,832 | 8,190 | 10,100 | 2,251 | 12,159 | 22,340 | 62,873 | |||||||||||||||||
| December 31, 2009 | ||||||||||||||||||||||||
Less than 30 days MCh$ | Between 30-89 days MCh$ | Between 90-180 days MCh$ | Between 181-240 days MCh$ | Between 241-360 days MCh$ | More than 360 days MCh$ | Total MCh$ | ||||||||||||||||||
| Loans and receivables to banks | ||||||||||||||||||||||||
| Loans and receivables to customers: | ||||||||||||||||||||||||
| Commercial loans | 5,491 | 6,671 | 6,090 | 3,895 | 6,834 | 14,566 | 43,547 | |||||||||||||||||
| Mortgage loans | 487 | 293 | 1,560 | 243 | 688 | 4,545 | 7,816 | |||||||||||||||||
| Consumer loans | 1,109 | 2,548 | 3,251 | — | — | — | 6,908 | |||||||||||||||||
| Financial investments | — | — | — | — | — | — | — | |||||||||||||||||
| Total | 7,087 | 9,512 | 10,901 | 4,138 | 7,522 | 19,111 | 58,271 | |||||||||||||||||
| December 31, 2008 | ||||||||||||||||||||||||
Less than 30 days MCh$ | Between 30-89 days MCh$ | Between 90-180 days MCh$ | Between 181-240 days MCh$ | Between 241-360 days MCh$ | More than 360 days MCh$ | Total MCh$ | ||||||||||||||||||
| Loans and receivables to banks | ||||||||||||||||||||||||
| Loans and receivables to customers: | ||||||||||||||||||||||||
| Commercial loans | 9,810 | 31,680 | 923 | 10,293 | 4,245 | 12,146 | 69,097 | |||||||||||||||||
| Mortgage loans | 353 | 174 | 1,041 | 507 | 973 | 3,456 | 6,504 | |||||||||||||||||
| Consumer loans | 1,487 | 2,662 | 5,143 | — | — | — | 9,292 | |||||||||||||||||
| Financial investments | — | — | — | — | — | — | — | |||||||||||||||||
| Total | 11,650 | 34,516 | 7,107 | 10,800 | 5,218 | 15,602 | 84,893 | |||||||||||||||||
Recently Adopted and New Accounting Pronouncements
See note 1 our consolidated financial statements for a detailed description of recently adopted and new accounting pronouncements in IFRS.
87
Results of Operations
The selected consolidated financial information included herein as of and for the year ended December 31, 2010, together with the selected consolidated financial information for the year ended December 31, 2008 and 2009, is derived from, and presented on the same basis as, our consolidated financial statements and should be read together with the consolidated financial statements. Since our consolidated financial statements, including the selected consolidated information included herein, have been prepared using IFRS, they are not comparable with the audited consolidated financial statements included in the annual reports filed on Form 20-F for the years ended December 31, 2008 and prior thereto. Readers should exercise caution in determining trends based on prior annual reports.
Results of Operations for the Years Ended December 31, 2009 and 2010
The following table sets forth the principal components of our net income for the years ended December 31, 2009 and 2010:
For the Year Ended December 31, | % Change from | ||||||||
| 2009 | 2010 | Prior Year | |||||||
(in millions of Ch$ as of December 31, 2010, except for percentages) | |||||||||
| Components of net income: | |||||||||
| Net interests income | Ch$ | 193,388 | Ch$ | 224,410 | 16.0 | % | |||
| Provisions for loan losses | (71,271) | (52,351) | (26.5) | % | |||||
| Fees and income from services, net | 43,261 | 58,221 | 34.6 | % | |||||
Trading and investment, foreign exchange gains and other operating income | 59,285 | 44,033 | (25.7) | % | |||||
| Income attributable to investments in other companies | 445 | 296 | (33.5) | % | |||||
| Total operating expenses | (122,667) | (132,683) | 8.2 | % | |||||
| Income before income taxes | 102,441 | 141,926 | 38.5 | % | |||||
| Income taxes | (16,249) | (20,353) | 25.3 | % | |||||
| Net income for the year | Ch$ | 86,192 | Ch$ | 121,573 | 41.0 | % | |||
The following table presents summary information related to our lines of business for the years ended December 31, 2009 and 2010:
| As of December 31, 2009 | |||||||||||||||
| Commercial Banking | Retail Banking | ||||||||||||||
Large Companies and Corporate | Companies | Traditional and Private Banking | Banco Condell Consumer Division | Treasury and International (1) | Non- Banking Financial Services | Total | |||||||||
| MCh$ | MCh$ | MCh$ | MCh$ | MCh$ | MCh$ | MCh$ | |||||||||
| Net interest income | 37,932 | 49,816 | 56,237 | 22,443 | 11,106 | 15,854 | 193,388 | ||||||||
| Fees and income from services, net | 8,284 | 10,061 | 16,228 | 3,846 | (430 | ) | 5,272 | 43,261 | |||||||
| Trading and investment income, net | — | (3,500 | ) | — | — | 6,204 | 1,859 | 4,563 | |||||||
| Foreign exchange gains (losses), net | 8,603 | 887 | — | — | 36,969 | 3,176 | 49,635 | ||||||||
| Other operating income | — | 2,490 | — | — | 227 | 2,370 | 5,087 | ||||||||
| Provision for loan losses | (16,116 | ) | (12,370 | ) | (20,672 | ) | (21,891 | ) | — | (222 | ) | (71,271 | ) | ||
| Gross operational margin | 38,703 | 47,384 | 51,793 | 4,398 | 54,076 | 28,309 | 224,663 | ||||||||
| Other income and expenses | — | — | — | — | — | — | 445 | ||||||||
| Operating expenses | — | — | — | — | — | — | (122,667 | ) | |||||||
| Profit before tax | — | — | — | — | — | — | 102,441 | ||||||||
| Average loans | 2,293,991 | 1,068,532 | 1,168,395 | 193,068 | 31,386 | — | 4,755,372 | ||||||||
| Average investments | — | — | — | — | 515,830 | — | 515,830 | ||||||||
| (1) | Includes other non-segment items. |
88
| As of December 31, 2010 | |||||||||||||||
| Commercial Banking | Retail Banking | ||||||||||||||
Large Companies and Corporate | Companies | Traditional and Private Banking | Banco Condell Consumer Division | Treasury and International (1) | Non- Banking Financial Services | Total | |||||||||
| MCh$ | MCh$ | MCh$ | MCh$ | MCh$ | MCh$ | MCh$ | |||||||||
| Net interest income | 36,363 | 48,132 | 54,457 | 20,667 | 62,717 | 2,074 | 224,410 | ||||||||
| Fees and income from services, net | 13,060 | 12,523 | 22,525 | 3,318 | (357) | 7,152 | 58,221 | ||||||||
| Trading and investment income, net | 758 | (2,564) | — | — | (11,324) | 3,720 | (9,410) | ||||||||
| Foreign exchange gains (losses), net | 9,024 | 4,063 | 72 | — | 28,646 | 2,806 | 44,611 | ||||||||
| Other operating income | — | 3,657 | — | — | 186 | 4,990 | 8,832 | ||||||||
| Provision for loan losses | (1,873) | (26,051) | (21,132) | (12,429) | 1,360 | 7,774 | (52,351) | ||||||||
| Gross operational margin | 57,332 | 39,760 | 55,922 | 11,556 | 81,228 | 28,516 | 274,313 | ||||||||
| Other income and expenses | — | 10 | 22 | — | — | 264 | 296 | ||||||||
| Operating expenses | (9,152) | (16,715) | (54,170) | (19,784) | (12,173) | (20,689) | (132,683) | ||||||||
| Profit before tax | 48,180 | 23,055 | 1,774 | (8,228) | 69,055 | 8,091 | 141,926 | ||||||||
| Average loans | 2,493,947 | 1,138,838 | 1,297,209 | 147,617 | 89,003 | — | 5,166,616 | ||||||||
| Average investments | — | — | — | — | 783,358 | — | 783,358 | ||||||||
| (1) | Includes other non-segment items. |
Net Interest Income
The following table sets forth the elements of our net interest income for the years ended December 31, 2009 and 2010:
| For the Year Ended December 31, | % Change from | ||||||||
| 2009 | 2010 | Prior Year | |||||||
(in millions of Ch$ as of December 31, 2010, except for percentages) | |||||||||
| Interest income | Ch$ | 314,115 | Ch$ | 387,639 | 23.4 | ||||
| Interest expense | (120,727) | (163,229) | 35.2 | ||||||
| Net interest income | Ch$ | 193,388 | Ch$ | 224,410 | 16.0% | ||||
Our net interest income increased by 16.0% in 2010 as compared to 2009. The increase in net interest income was the result of (i) our balance sheet structure, which is short in pesos and foreign currency (mainly US dollars) and long in UF, and (ii) our gapping strategy. The UF increased in 2010 by 2.4%, reflecting the period of inflation that the Chilean economy was experiencing. On the other hand, following our gapping strategy, the interest rate increased from 0.5% to 3.3% during the year, increasing our funding cost. The increase in total loans in addition to a positive inflation environment explains the increase in our net interest income. It is important to mention that under IFRS, our exposure to inflation risk is greater, since we no longer realize gains and losses on our non-monetary assets and liabilities which are mainly fixed assets and shareholders’ equity.
89
The following table sets forth information as to key elements of our interest income for the years ended December 31, 2009 and 2010:
| For the year ended December 31, | % Change from prior | ||||||||
| 2009 | 2010 | Year | |||||||
(in millions of Ch$ as of December 31, 2010 except for percentages) | |||||||||
| Interest income | Ch$ | 314,115 | Ch$ | 387,639 | 23.4 | % | |||
| Average interest-earning assets: | |||||||||
| Loans | 4,755,372 | 5,166,615 | 8.6 | % | |||||
| Financial investments | 515,830 | 783,358 | 51.9 | % | |||||
| Interbank deposits | 24,722 | Ch$ | 1,721 | 230.6 | % | ||||
| Total average interest-earning assets | Ch$ | 5,295,924 | 6,031,694 | 13.9 | % | ||||
Our interest-income assets were Ch$387,639.0 million in 2010 as compared to Ch$314,115.0 million in 2009, representing an increase of 23.4%. The increase is mainly explained by the change in the UF. In 2009, the UF decreased 2.4%, while in 2010 it increased 2.4%. In 2009, our results of operations and financial position have not suffered any direct impact as a consequence of the credit market instability in the U.S. resulting from concerns with increased defaults of subprime and certain other mortgage products and loss of liquidity in markets for mortgage related securities. As of December 31, 2010, our investment portfolio did not contain instruments (i) backed by, or otherwise related to, U.S. subprime mortgages, or (ii) with exposure to monoline financial guarantors. Moreover, we have not been materially affected by the high cost of funding in the global market, mainly because the liquidity available from the Chilean market enabled us to fund our operations and maintain our regular business activities.
The following table sets forth the key elements of our interest expense for the years ended December 31, 2009 and 2010:
| For the year ended December 31, | % Change from | ||||||||
| 2009 | 2010 | prior year | |||||||
| (in millions of Ch$ as of December 31, 2010 except for percentages) | |||||||||
| Interest expense | Ch$ | 120,727 | Ch$ | 163,229 | 35.2 | % | |||
| Average interest-bearing liabilities: | |||||||||
| Bonds | 472,516 | 745,567 | 57.8 | % | |||||
| Time deposits | 3,205,901 | 3,547,844 | 10.7 | % | |||||
| Central Bank borrowings | 8,386 | 1,274 | (84.8) | % | |||||
| Repurchase agreements | 267,061 | 424,297 | 58.9 | % | |||||
| Mortgage finance bonds | 297,178 | 246,678 | (17.0) | % | |||||
| Other interest-bearing liabilities | 493,675 | 800,262 | 62 | 62.1 | % | ||||
| Total average interest-bearing liabilities | Ch$ | 4,744,717 | Ch$ | 5,765,922 | 21.5 | % | |||
Our interest expense was Ch$163,229.0 million in 2010 compared to Ch$120,727.0 million in 2009, representing an increase of 35.2%. The increase in interest expense is mainly related to our increased financing needs to fund our growth in interest-earning assets, higher inflation rate experienced in 2010, and increases in the monetary rate.
Our funding strategy was mainly driven by diversifying our liability structure, searching for new opportunities in the market and increasing the duration of our funding. In 2010, we entered into a Senior Unsecured Term Loan Facility that amounted USD$167.0 million. This loan has an maturity date of two years and it was coordinated by BNP Paribas. Citibank, Commerzbank, Standard Chartered and Wells Fargo, among others, participated as well. The bank also issued Reg S notes in the international market in the amount of US$178.1 million, in addition to local bonds in the Chilean market in the amount of UF18.8 million (Ch$403,364.0 million).
Net interest margin (net interest income divided by average interest-earning assets) remained relatively flat year-on-year at approximately 3.6%.
Provisions for Loan Losses
Provisions and recoveries for loan losses were Ch$52,351.0 million in 2010 as compared to Ch$71,271.0 million in 2009, a decrease of 27.0% mainly due to better conditions in the Chilean economy. Write-offs increased by 1.9% in 2010 amounting to Ch$61,926.0 million. Allowances for loan losses as a percentage of total loans was 1.9% as of December 31, 2010, which decreased slightly when compared to our risk index of 2.0% as of December 31, 2009.
The following table sets forth certain information relating to our allowances for loan losses as of December 31, 2009 and 2010:
| As of December 31, | % Change from prior year | |||||||||||
| 2009 | 2010 | |||||||||||
| (in millions of Ch$ as of December 31, 2010 except for percentages) | ||||||||||||
| Total loans | Ch$ | 5,011,656 | Ch$ | 5,469,195 | 9.1 | % | ||||||
| Impaired loans | 330,453 | 346,641 | 4.9 | % | ||||||||
| Allowances for loan losses | 99,264 | 104,215 | 5.0 | % | ||||||||
| Allowances for loan losses as a percentage of total loans | 2.0 | % | 1.9 | % | (5.0) | % | ||||||
| Allowances for loan losses as a percentage of past due loans | 238.2 | % | 222.4 | % | (6.6) | % | ||||||
| Allowances for loan losses as a percentage of impaired loans | 30.0 | % | 30.1 | % | 0.3 | % | ||||||
90
Net Fees and Income from Services
Fees and income from services for the year ended December 31, 2010 were Ch$58,221.0 million, an increase of Ch$14,960.0 million, or 35.0% when compared to last year. Throughout 2010, we maintained our growth in retail banking (especially through mortgage loans) which allowed us to end the year with over 190,000 retail customers. Furthermore, we continued our effort to expand cross-selling and product usage and raised fees in line with what we believe to be the market standard. As of December 31, 2010, we had approximately 80,600 retail checking accounts and 164,500 credit cards, an increase over the prior year of 9.0% in retail checking accounts and a 15.0% decrease in credit cards. However, this growth in retail checking accounts was accompanied by an increase in the average balance per account from Ch$1.1 million in 2009 to Ch$1.4 million in 2010. Our promotions such as discounts on gasoline purchases have improved sales and usage rates of this product. During 2010, the usage rate for our cards continued above the market standard at 46.9% while the industry’s average was 32.7%.
Other Net Operating Income
The following table sets forth certain components of our other net operating income for the years ended December 31, 2009 and 2010:
| For the year ended December 31, | % Change from prior | ||||||||
| 2009 | 2010 | year | |||||||
| (in millions of Ch$ as of December 31, 2010 except for percentages) | |||||||||
| Trading activities, net | Ch$ | 4,563 | Ch$ | (9,410) | (306.2) | % | |||
| Foreign exchange transactions, net | 49,635 | 44,611 | (10.1) | % | |||||
| Other operating income and expenses, net | 5,087 | 8,832 | 73.6 | % | |||||
| Total other operating income (loss), net | Ch$ | 59,285 | Ch$ | 44,033 | (25.7) | % | |||
In 2010, we recorded a total other operating income of Ch$44,033.0 million as compared to Ch$59,285.0 million in 2009. Net revenues from treasury activities (net trading and investment income and foreign exchange gains and losses) decreased by Ch$18,997.0 million as compared to the prior year. We maintain positions which are reported as trading or foreign exchange transactions, even though they may provide an effective economic hedge for managing risk.
Operating Expenses
The following table sets forth the principal components of our operating expenses for the years ended December 31, 2009 and 2010:
| For the year ended December 31, | % Change from prior | ||||||||
| 2009 | 2010 | year | |||||||
| (in millions of Ch$ as of December 31, 2010 except for percentages) | |||||||||
| Personnel salaries expenses | Ch$ | 65,733 | Ch$ | 71,034 | 8.1 | % | |||
| Administration expenses | 44,592 | 46,793 | 4.9 | % | |||||
| Depreciation and amortization | 6,310 | 7,117 | 12.8 | % | |||||
| Other operating expenses | 6,032 | 7,739 | 28.3 | % | |||||
| Total operating expenses | Ch$ | 122,667 | Ch$ | 132,683 | 12 | 8.2 | % | ||
Operating expenses increased by Ch$10,016.0 million, or 8.2% in 2010 as compared to 2009. This increase is mainly due to the increase of other expenses by 110.6%, although personnel salary and administrative expenses also increased by 4.9% and 12.8%, respectively. As of December 31, 2010, our roster was 3,422 employees, a 3.4% increase compared to 2009. Additionally, administrative and other expenses include payments for a service agreement to our affiliate Corp Group Interhold S.A. Under this agreement, we pay fees of approximately UF6,250.0 per month. This agreement was signed on July 6, 2001 and had an initial five year term which is automatically renewable for one-year periods thereafter. The goodwill that was recorded in 1998 for the purchase of the Corfinsa portfolio and Financiera Condell was fully amortized.
According to the SBIF, our efficiency ratio (operating expenses as a percentage of operating income, which is the aggregate of net interest income, net fees and income from services and net other operating income) decreased to 38.1% in 2010 from 39.0% in 2009, which is a result of our core strategy.
Income Taxes
Our net tax liability remained relatively flat year-on-year and ended 2010 at Ch$20,353.0 million.
91
Results of Operations for the Years Ended December 31, 2008 and 2009
The following table sets forth the principal components of our net income for the years ended December 31, 2008 and 2009:
For the Year Ended December 31, | % Change from Prior Year | ||||||||
| 2008 | 2009 | ||||||||
(in millions of Ch$ as of December 31, 2009, except for percentages) | |||||||||
| Components of net income: | |||||||||
| Net interests income | Ch$ | 214,176 | Ch$ | 193,388 | (9.7) | % | |||
| Provisions for loan losses | (54,983 | ) | (71,271 | ) | 29.6 | % | |||
| Net service fee income | 42,052 | 43,261 | 2.9 | % | |||||
| Trading and investment, foreign exchange gains and other spending income | 19,930 | 59,285 | 197.5 | % | |||||
| Income attributable to investments in other companies | 262 | 445 | 69.8 | % | |||||
| Operating expenses | (123,451 | ) | (122,667 | ) | (0.6) | % | |||
| Income before income taxes | 97,986 | 102,441 | 4.6 | % | |||||
| Income taxes | (9,304 | ) | (16,249 | ) | 74.6 | % | |||
| Net income for the year | Ch$ | 88,682 | Ch$ | 86,192 | (2.8) | % | |||
The following table presents summary information related to our lines of business for the years ended December 31, 2008 and 2009:
| As of December 31, 2008 | |||||||||||||||
| Commercial Banking | Retail Banking | ||||||||||||||
Large Companies and Corporate | Companies | Traditional and Private Banking | Banco Condell Consumer Division | Treasury and International (1) | Non- Banking Financial Services | Total | |||||||||
| MCh$ | MCh$ | MCh$ | MCh$ | MCh$ | MCh$ | MCh$ | |||||||||
| Net interest income | 21,525 | 39,104 | 51,612 | 29,820 | 61,775 | 10,340 | 214,176 | ||||||||
| Fees and income from services, net | 4,492 | 8,356 | 15,117 | 5,411 | 270 | 8,406 | 42,052 | ||||||||
| Trading and investment income, net | — | (5,059 | ) | — | — | 60,056 | — | 54,997 | |||||||
| Foreign exchange gains (losses), net | 2,810 | 4,656 | 62 | — | (50,415 | ) | — | (42,887 | ) | ||||||
| Other operating income | — | 459 | 700 | — | 194 | 6,467 | 7,820 | ||||||||
| Provision for loan losses | (3,353 | ) | (7,082 | ) | (21,507 | ) | (23,640 | ) | — | 599 | (54,983 | ) | |||
| Gross operational margin | 25,474 | 40,434 | 45,984 | 11,591 | 71,880 | 25,812 | 221,175 | ||||||||
| Other income and expenses | — | — | — | — | — | — | 262 | ||||||||
| Operating expenses | — | — | — | — | — | — | (123,451 | ) | |||||||
| Profit before tax | — | — | — | — | — | — | 97,986 | ||||||||
| Average loans | 1,867,023 | 1,146,589 | 1,104,849 | 272,065 | 10,003 | — | 4,400,529 | ||||||||
| Average investments | — | — | — | — | 189,844 | — | 189,844 | ||||||||
| As of December 31, 2009 | |||||||||||||||
| Commercial Banking | Retail Banking | ||||||||||||||
Large Companies and Corporate | Companies | Traditional and Private Banking | Banco Condell Consumer Division | Treasury and International (1) | Non- Banking Financial Services | Total | |||||||||
| MCh$ | MCh$ | MCh$ | MCh$ | MCh$ | MCh$ | MCh$ | |||||||||
| Net interest income | 37,932 | 49,816 | 56,237 | 22,443 | 11,106 | 15,854 | 193,388 | ||||||||
| Fees and income from services, net | 8,284 | 10,061 | 16,228 | 3,846 | (430 | ) | 5,272 | 43,261 | |||||||
| Trading and investment income, net | — | (3,500 | ) | — | — | 6,204 | 1,859 | 4,563 | |||||||
| Foreign exchange gains (losses), net | 8,603 | 887 | — | — | 36,969 | 3,176 | 49,635 | ||||||||
| Other operating income | — | 2,490 | — | — | 227 | 2,370 | 5,087 | ||||||||
| Provision for loan losses | (16,116 | ) | (12,370 | ) | (20,672 | ) | (21,891 | ) | — | (222 | ) | (71,271 | ) | ||
| Gross operational margin | 38,703 | 47,384 | 51,793 | 4,398 | 54,076 | 28,309 | 224,663 | ||||||||
| Other income and expenses | — | — | — | — | — | — | 445 | ||||||||
| Operating expenses | — | — | — | — | — | — | (122,667 | ) | |||||||
| Profit before tax | — | — | — | — | — | — | 102,441 | ||||||||
| Average loans | 2,293,991 | 1,068,532 | 1,168,395 | 193,068 | 31,386 | — | 4,755,372 | ||||||||
| Average investments | — | — | — | — | 515,830 | — | 515,830 | ||||||||
92
Net Interest Income
The following table sets forth the elements of our net interest income for the years ended December 31, 2008 and 2009:
| For the Year Ended December 31, | % Change from | ||||||||
| 2008 | 2009 | Prior Year | |||||||
(in millions of Ch$ as of December 31, 2009, except for percentages) | |||||||||
| Interest income | Ch$ | 560,893 | Ch$ | 314,115 | (44.0) | % | |||
| Interest expense | (346,717) | (120,727) | (65.2) | % | |||||
| Net interest income | Ch$ | 214,176 | Ch$ | 193,388 | (9.7) | % | |||
Our interest income decreased by 9.7% in 2009 as compared to 2008. The decrease in net interest income was the result of (i) our balance sheet structure, which is short in pesos and foreign currency (mainly US dollars) and long in UF, and (ii) our gapping strategy. The UF effect during 2009 was -2.4%, reflecting the period of deflation the Chilean economy was experiencing. On the other hand, following our gapping strategy, the interest rate decreased from 8.3% to 0.5% during the year. We were able to capitalize on this decrease because our time deposits are based more in pesos than in UF. As a result, our peso denominated time deposits rebounded quicker than our asset structure and allowed us to capitalize on the value generated from the decreased interest rate. It is important to mention that under IFRS, our exposure to inflation risk is greater, since we no longer realize gains and losses on our non-monetary assets and liabilities which are mainly fixed assets and shareholders’ equity.
The following table sets forth information as to key elements of our interest income for the years ended December 31, 2008 and 2009:
| For the year ended December 31, | % Change from | |||||||||
| 2008 | 2009 | Prior Year | ||||||||
(in millions of Ch$ as of December 31, 2009 except for percentages) | ||||||||||
| Interest income | Ch$ | 560,893 | Ch$ | 314,115 | (44.0) | % | ||||
| Average interest-earning assets: | ||||||||||
| Loans | 4,400,529 | 4,755,372 | 8.1 | % | ||||||
| Financial investments | 189,844 | 515,830 | 171.7 | % | ||||||
| Interbank deposits | 33,252 | 24,722 | (25.7) | % | ||||||
| Total average interest-earning assets | Ch$ | 4,623,625 | Ch$ | 5,295,924 | 14.5 | % | ||||
Our interest income assets were Ch$314,115.0 million in 2009 as compared to Ch$560,893.0 million in 2008, representing a decrease of 44.0%. The decrease is mainly explained by the change in the UF. In 2008 the UF increased 9.3%, while in 2009 it decreased 2.4%. Our results of operations and financial position have not suffered any direct impact as a consequence of the recent credit market instability in the U.S. resulting from concerns with increased defaults of subprime and certain other mortgage products and loss of liquidity in markets for mortgage related securities. As of December 31, 2009, our investment portfolio did not contain instruments (i) backed by, or otherwise related to, U.S. subprime mortgages, or (ii) with exposure to monoline financial guarantors. Moreover, we have not been materially affected by the high cost of funding in the global market, mainly because the liquidity available from the Chilean market enabled us to fund its operations and maintain its regular business activities.
The following table sets forth the key elements of our interest expense for the years ended December 31, 2008 and 2009:
93
| For the year ended December 31, | % Change from | ||||||||
| 2008 | 2009 | prior year | |||||||
| (in millions of Ch$ as of December 31, 2009 except for percentages) | |||||||||
| Interest expense | Ch$ | 346,717 | Ch$ | 120,727 | (65.2) | % | |||
| Average interest-bearing liabilities: | |||||||||
| Bonds | 386,927 | 472,516 | 22.1 | % | |||||
| Time deposits | 2,883,029 | 3,205,901 | 11.2 | % | |||||
| Central Bank borrowings | — | 8,386 | 100.0 | % | |||||
| Repurchase agreements | 164,921 | 267,061 | 61.9 | % | |||||
| Mortgage finance bonds | 339,550 | 297,178 | (12.5) | % | |||||
| Other interest-bearing liabilities | 404,405 | 493,675 | 22.1 | % | |||||
| Total average interest-bearing liabilities | Ch$ | 4,178,832 | Ch$ | 4,744,717 | 13.5 | % | |||
Our interest expense was Ch$120,727.0 million in 2009 compared to Ch$346,717.0 million in 2008, representing a decrease of 65.2%. The decrease in interest expense is mainly related our decreased financing needs to fund our growth in interest-earning assets, lower inflation rate experienced in 2009, decreases in the monetary rate and a decrease in the risk premium.
Our funding strategy was mainly driven by growth in time deposits and the issuance of subordinated bonds. In 2009, we placed UF7,000,000.0 million in subordinated bonds in the local market, representing approximately Ch$146,600.0 million as of December 31, 2009. Our time deposits represent 64.8% of our total interest-bearing liabilities, respectively.
Net interest margin (net interest income divided by average interest-earning assets) remained relatively flat year-on-year at approximately 3.6%.
Provisions for Loan Losses
Provisions and recoveries for loan losses were Ch$71,271.0 million in 2009 as compared to Ch$54,983.0 million in 2008, an increase of 29.6% mainly due to our growth in loans and because of a change in risk classification of certain corporate customers related to the Chilean salmon industry crisis. Write-offs increased by 32.3% in 2009 amounting to Ch$60,772.0 million. Allowances for loan losses as a percentage of total loans was 2.0% as of December 31, 2009 which increased slightly when compared to our risk index of 1.5% as of December 31, 2008. The increase is principally due to weaker economic conditions in Chile in some sectors for our loan portfolio.
The following table sets forth certain information relating to our allowances for loan losses as of December 31, 2008 and 2009:
| As of December 31, | % Change from prior year | ||||||||
| 2008 | 2009 | ||||||||
| (in millions of Ch$ as of December 31, 2009 except for percentages) | |||||||||
| Total loans | Ch$ | 4,956,500 | Ch$ | 5,011,656 | 1.1 | % | |||
| Impaired loans | 304,943 | 330,453 | 8.4 | % | |||||
| Allowances for loan losses | 75,487 | 99,264 | 31.5 | % | |||||
| Allowances for loan losses as a percentage of total loans | 1.5 | % | 2.0 | % | 33.3 | % | |||
| Allowances for loan losses as a percentage of past due loans | 193.5 | % | 238.2 | % | 21.9 | % | |||
| Allowances for loan losses as a percentage of impaired loans | 24.8 | % | 30.0 | % | 21.0 | % | |||
Net Fees and Income from Services
Fees and income from services for the year ended December 31, 2009 were Ch$43,261.0 million, an increase of Ch$1,209.0 million, or 2.9% when compared to last year. Throughout 2009, we maintained our growth in retail banking (especially through mortgage loans) which allowed us to end the year with over 200,000 retail customers. Furthermore, we continued our effort to expand cross-selling and product usage and raised fees in line with what we believe to be the market standard. As of December 31, 2009, we had approximately 72,444 retail checking accounts and 194,000 credit cards, an increase over the prior year of 6.1% of retail checking accounts and a decrease 20.0% of credit cards. However, this growth in retail checking accounts has not resulted in a reduction of the average balance per account which remains flat at Ch$1.0 million and in line with industry standards. Our promotions such as discounts on gasoline purchases have improved sales and usage rates of this product. During the fourth quarter of 2008, the usage rate for our cards was above the market standard at 45.8% while the industry’s average was 36.6%. During 2009, the usage rate for our cards continued above the market standard at 45.7% while the industry’s average was 35.2%
94
Other Net Operating Income
The following table sets forth certain components of our other net operating income for the years ended December 31, 2008 and 2009:
| For the year ended December 31, | % Change from prior | ||||||||
| 2008 | 2009 | year | |||||||
| (in millions of Ch$ as of December 31, 2009 except for percentages) | |||||||||
| Trading activities, net | Ch$ | 54,997 | Ch$ | 4,563 | (91.7 | )% | |||
| Foreign exchange transactions, net | (42,887 | ) | 49,635 | 215.7 | % )% | ||||
| Other operating income and expenses, net | 7,820 | 5,087 | (34.9 | )% | |||||
| Total other operating income (loss), net | Ch$ | 19,930 | Ch$ | 59,285 | 197.5 | % | |||
In 2009, we recorded a total other operating income of Ch$59,285.0 million as compared to Ch$19,930.0 million in 2008. Net revenues from treasury activities (net trading and investment income and foreign exchange gains and losses) increased by Ch$42,088.0 million as compared to the prior year. We maintain positions which are reported as trading or foreign exchange transactions, even though they may provide an effective economic hedge for managing risk.
Operating Expenses
The following table sets forth the principal components of our operating expenses for the years ended December 31, 2008 and 2009:
| For the year ended December 31, | % Change from prior | ||||||||
| 2008 | 2009 | year | |||||||
| (in millions of Ch$ as of December 31, 2009 except for percentages) | |||||||||
| Personnel salaries expenses | Ch$ | 57,716 | Ch$ | 65,733 | 13.9 | % | |||
| Administration expenses | 54,651 | 44,592 | (18.4 | )% | |||||
| Depreciation and amortization | 6,832 | 6,310 | (7.6 | )% | |||||
| Other operating expenses | 4,252 | 6,032 | 41.9 | % | |||||
| Total operating expenses | Ch$ | 123,451 | Ch$ | 122,667 | (0.6 | )% | |||
Operating expenses experienced a slight change, decreasing by Ch$784.0 million, or 0.6% in 2009 as compared to 2008. This increase is mainly due to personnel salary expenses, up by 13.9%, although administrative and other expenses decreased by 18.4%. ��This is a result of our strategy to become a leading bank in terms of our efficiency ratio. During 2009, our average number of employees increased to 3,278, an increase of 0.4% over last year. As of December 31, 2009, our roster remained relatively flat at approximately 3,311 employees. Additionally, administrative and other expenses include payments for a service agreement to our affiliate Corp Group Interhold S.A. Under this agreement, we pay fees of approximately UF6,250.0 per month. This agreement was signed on July 6, 2001 and had an initial five year term which is automatically renewable for one-year periods thereafter. The goodwill that was recorded in 1998 for the purchase of the Corfinsa portfolio and Financiera Condell fully amortized.
Our efficiency ratio (operating expenses as a percentage of operating income, which is the aggregate of net interest income, net fees and income from services and net other operating income) decreased to 50.7% in 2009 from 45.9% in 2008, which is a result of our core strategy.
Income Taxes
Our net tax liability increased from Ch$16,249.0 million in 2009 to Ch$20,353.0 million in 2010.
B. LIQUIDITY AND CAPITAL RESOURCES
We maintain adequate liquidity to ensure our ability to honor withdrawals of deposits, make repayments of other liabilities at maturity, extend loans and meet our own working capital requirements.
95
Sources of Liquidity
Our liquidity depends upon our (i) capital, (ii) reserves, and (iii) financial investments, including investments in government securities and other financial institutions. To cover any liquidity shortfalls and to enhance our liquidity position, we have established lines of credit with foreign and domestic banks and also have access to Central Bank borrowings.
While we are continuing to use all available sources of funding as we believe appropriate, we are continuing to place special emphasis on increasing deposits from retail customers. These deposits consist primarily of checking accounts that do not bear interest and accordingly represent an inexpensive source of funding for us. In addition, to the extent that these types of deposits represent a larger percentage of our funding base, the percentage represented by time deposits is expected to decrease and, accordingly, we believe that the materiality to our business of uncertainties relating to rolling over deposits will be diminished. In April 2005, we issued UF8,000,000.0 (approximately US$315.0 million) of bonds in the Chilean market with the goal of using the proceeds to reduce our UF gap between assets and liabilities, improve our liquidity and reduce funding costs. In 2008, we placed UF3,000,000.0 in 25 year subordinated bonds to be used to finance our normal business activities and improve our balance sheet structure. In 2009, we placed UF7,000,000.0 in 25 year subordinated bonds with the same purpose, taking advantage of favorable market conditions.
On July 29, 2010, we entered into a US$167.5 million senior unsecured syndicated term loan facility with BNP Paribas, as Administrative Agent, and BNP Paribas Securities Corp., Citigroup Global Markets Inc., Commerzbank Aktiengesellschaft, Standard Chartered Bank and Wells Fargo Securities, LLC, as Lead Arrangers and Book-Runners. The proceeds of the loan were used mainly to fund our lending activities and for general corporate purposes. On August 1, 2010, we implemented a local bond program for a maximum amount of UF150.0 million at any time outstanding. Under the local bond program, we are capable of issuing two type of securities: (i) senior bonds, for a total amount of UF100.0 million, divided in 28 series (from AB to AZ and from BA to BC), with a maturity ranging between 3 to 30 years and an interest rate of 3.0%, and (ii) subordinated bonds, for a total amount of UF50.0 million, divided in 16 series (from BD to BS), with a maturity ranging between 20 to 35 years and an interest rate of 4.0%. For all the series of bonds that could be issued under the local bond program, the amortization of capital will be made in full at maturity. The objective of the local bond program is to structure the future issuances of debt of Corpbanca in a way that provides for diverse alternatives of placements in order to manage efficiently its outstanding indebtedness. On November 3, 2010, we issued US$178.1 million in Reg S notes in the international market. We also issued local bonds in the Chilean market during 2010 in the amount of UF18.8 million (Ch$403,364.0). See note 19 to our audited consolidated financial statements included herein.
Capital
As of December 31, 2010, we had shareholders’ equity in excess of that required by Chilean regulatory requirements. According to the General Banking Law, a bank should have an effective equity of at least 8.0% of its risk-weighted assets, net of required reserves, and paid-in capital and reserves (capital básico, or Net Capital Base) of at least 3.0% of its total assets, net of required reserves. For these purposes, the effective equity of a bank is the sum of (a) a bank’s Net Capital Base, (b) subordinated bonds issued by a bank valued at their placement price up to 50.0% of its Net Capital Base; provided that the value of the bonds shall decrease 20.0% for each year that lapses during the period commencing six years prior to their maturity, and (c) loan loss allowances in an amount up to 1.3% of a bank’s risk-weighted assets. The calculation of the effective equity does not include the capital contributions made to subsidiaries of a bank. Amendments to the capital markets law, which became effective as of June 30, 2002, resulted in changes in the calculation of each bank’s regulatory capital. The amendments require the calculation of capital contributions to be made on a consolidated basis rather than on an unconsolidated basis. For purposes of weighing the risk of a bank’s assets, the General Banking Law categorizes assets based on the nature of the issuer, availability of funds, nature of the assets and existence of collateral securing such assets.
Reserves
Under the General Banking Law, a bank must have a minimum paid-in capital and reserves of UF800,000.0 (Ch$17,164.0 million or US$36.7 million as of December 31, 2010). However, a bank may begin its operations with 50.0% of such amount, provided that it has a total capital ratio (defined as effective equity as a percentage of risk weighted assets) of not less than 12.0%. When such bank’s paid-in capital reaches UF600,000.0 (Ch$12,873.0 million or US$27.5 million as of December 31, 2010) the total capital ratio required is reduced to 10.0%.
The following table sets forth our minimum capital requirements of the dates indicated. See note 35 to our consolidated financial statements included herein for a description of the minimum capital requirements.
As of December 31 | ||||||||||
2008 | 2009 | 2010 | ||||||||
(in millions of Ch$ as of December 31, 2010, except percentages) | ||||||||||
| Net capital base | Ch$ | 497,277 | 507,349 | 549,314 | ||||||
| 3% total assets net of provisions | (196,944) | (202,826) | (229,026) | |||||||
| Excess over minimum required equity | 300,333 | 304,523 | 320,288 | |||||||
| Net capital base as a percentage of the total assets, net of provisions | 7.57 | % | 7.50 | % | 7.20 | % | ||||
| Effective equity | Ch$ | 587,360 | 739,463 | 801,402 | ||||||
| 8% of the risk-weighted assets | (422,907) | (455,633) | (477,861) | |||||||
| Excess over minimum required equity | 164,453 | 283,830 | 323,550 | |||||||
| Effective equity as a percentage of the risk weighted assets | 11.11 | % | 12.98 | % | 13.40 | % | ||||
96
Financial Investments
The following table sets forth our investment in Chilean government and corporate securities and certain other financial investments as of December 31, 2008, 2009 and 2010. Financial investments are classified at the time of the purchase, based on management’s intentions, as either trading or investment instruments, the latter of which are categorized as available-for-sale or held-to-maturity. As of December 31, 2008, 2009 and 2010, we have not classified any securities as held-to-maturity.
As of December 31, | |||||||
2008 | 2009 | 2010 | |||||
| MCh$ | MCh$ | MCh$ | |||||
| Held-for-Trading: | |||||||
| Chilean Central Bank and government securities: | |||||||
| Chilean Central Bank securities | 54,179 | 260 | 88,077 | ||||
| Chilean treasury bonds | 3,599 | 589 | — | ||||
| Other government securities | 7,930 | 8,332 | 8 | ||||
| Other national institution securities: | |||||||
| Bonds | — | — | 2,998 | ||||
| Notes | — | — | — | ||||
| Other securities | 13,599 | 54,788 | 71,379 | ||||
| Foreign institution securities: | |||||||
| Bonds | — | — | 1,922 | ||||
| Notes | — | — | — | ||||
| Other foreign securities | — | 2,495 | 550 | ||||
| Mutual funds investments: | |||||||
| Funds managed by related organizations | 5,798 | 9,692 | 32,646 | ||||
| Funds managed by third parties | — | — | — | ||||
| Total | 85,105 | 76,156 | 197,580 | ||||
| Available- for- sale: | |||||||
| Chilean Central Bank and government securities | |||||||
| Chilean Central Bank securities | 284,498 | 548,073 | 543,902 | ||||
| Chilean treasury bonds | 22,326 | 26,748 | — | ||||
| Other government securities | 11,934 | 1,474 | 40,140 | ||||
| Other financial instruments | |||||||
| Promissory notes related to deposits in local banks | 206,604 | 146,934 | 123,226 | ||||
| Chilean mortgage finance bonds | 2,951 | 1,827 | 1,553 | ||||
| Chilean financial institution bonds | 48,165 | — | — | ||||
| Other local investments | — | 4,100 | — | ||||
| Financial instruments issued abroad | |||||||
| Foreign government and central bank instruments | — | — | — | ||||
| Other foreign investments | — | 1,563 | 17,954 | ||||
| Impairment provision | — | — | — | ||||
| Unquoted securities in active markets | |||||||
| Chilean corporate bonds | — | 6,443 | 19,473 | ||||
| Other investments | — | — | — | ||||
| Impairment provision | — | — | — | ||||
| Total | 576,478 | 737,162 | 746,248 | ||||
97
In addition to the securities issued by the Central Bank and the Chilean government disclosed above, we also have a concentration of investments in time deposits and mortgage securities Ch$18,481.0 million issued by Banco del Estado de Chile, representing approximately 3.6% of our shareholders’ equity, as of December 31, 2010. We do not hold securities of any issuer other than the Central Bank, which the aggregate book value of the investment exceeds 10.0% of our shareholders’ equity as of the end of the latest reported period.
The following table shows interest rates per annum applicable to certain Central Bank bonds as of the dates indicated:
Peso- denominated | Peso-denominated | UF-denominated | UF-denominated | ||||||||
| As of the end of | five-year bond | 10-year bond | five-year bond | 10-year bond | |||||||
| 2008 | January | 6.42 | — | 2.86 | 2.92 | ||||||
| February | 6.36 | — | 2.69 | 2.84 | |||||||
| March | — | — | 2.25 | 2.66 | |||||||
| April | 6.42 | — | 2.21 | 2.67 | |||||||
| May | 6.88 | 7.05 | 2.71 | 3.15 | |||||||
| June | 7.61 | 7.65 | 2.84 | 3.38 | |||||||
| July | 7.74 | 7.76 | 2.90 | 3.38 | |||||||
| August | 7.59 | 7.79 | 2.93 | 3.33 | |||||||
| September | — | — | 3.16 | 3.36 | |||||||
| October | — | — | 3.24 | 3.22 | |||||||
| November | 6.26 | — | 3.39 | 3.19 | |||||||
| December | 6.02 | — | 3.35 | 3.29 | |||||||
| 2009 | January | 5.31 | — | 3.12 | 2.71 | ||||||
| February | 4.53 | — | 1.99 | 2.19 | |||||||
| March | 4.01 | — | 1.78 | — | |||||||
| April | 4.52 | — | 1.87 | 2.56 | |||||||
| May | 4.64 | — | 2.86 | 3.30 | |||||||
| June | 4.91 | — | — | — | |||||||
| July | — | — | — | — | |||||||
| August | — | — | — | — | |||||||
| September | — | — | — | — | |||||||
| October | — | — | — | — | |||||||
| November | — | — | — | — | |||||||
| December | — | — | — | — | |||||||
| 2010 | January | 5.27 | — | — | — | ||||||
| February | 5.38 | — | — | — | |||||||
| March | 5.41 | — | — | — | |||||||
| April | 5.56 | — | — | — | |||||||
| May | 5.53 | — | — | — | |||||||
| June | 5.57 | — | — | — | |||||||
| July | 5.59 | — | — | — | |||||||
| August | 5.59 | — | — | — | |||||||
| September | 5.58 | — | — | — | |||||||
| October | 5.67 | — | — | — | |||||||
| November | 5.72 | — | — | — | |||||||
| December | 5.66 | .75.75 | — | — | — |
98
| (*) | Through December 31, 2010 |
Our total financial instruments as a percentage of total assets increased to 13.0% as of December 31, 2010. Prior to 2008, our balance of financial instruments was significantly smaller than it had been historically, however during 2008, we began increasing the amount of available-for-sale investments as our current strategy is to build a profitable mid-term investment portfolio.
We have implemented certain structural changes that we believe will improve our ability to manage our exposure to market risks. For example, our Assets & Liabilities Committee, or our A&L Committee, updated certain exposure limits applicable to our investment portfolio, including limits relating to potential losses. In addition, while we previously determined our potential loss and position limits on the basis of our free effective equity, which allowed us to establish relatively high limits due to our high level of capitalization, our A&L Committee has determined that such limits should be analyzed and determined on the basis of our net income. As a result of these adjustments, we have enhanced our ability to effectively manage market risks. A description of the currently applicable limits, as well as information relating to other tools that we employ to manage market risk, is included herein under “Item 11. Quantitative and Qualitative Disclosures about Market Risk.”
The following table sets forth an analysis of our investments, by time remaining to maturity and the weighted average nominal rates of such investments as of December 31, 2010:
| Within one year | Weighted average Nominal Rate | After one year but within five years | Weighted average Nominal Rate | After five years but within ten years | Weighted average Nominal Rate | After ten years | Weighted average Nominal Rate | Total | |||||||||||
| (in millions of Ch$ as of December 31, 2010, except for percentages) | |||||||||||||||||||
| Ch$ | % | Ch$ | % | Ch$ | % | Ch$ | % | Ch$ | |||||||||||
| Held- for- trading: | |||||||||||||||||||
| Chilean Central Bank and Government securities: | |||||||||||||||||||
| Chilean Central Bank securities | 2,924 | 4.4 | 85,153 | 4.4 | — | — | — | — | 88,077 | ||||||||||
| Chilean Central Bank notes | — | — | — | — | — | — | — | — | — | ||||||||||
| Other government securities | — | — | 8 | 4.6 | — | — | — | — | 8 | ||||||||||
| Other national institution securities: | |||||||||||||||||||
| Bonds | — | — | — | — | 429 | 3.7 | 2,569 | 4.4 | 2,998 | ||||||||||
| Notes | — | — | — | — | — | — | — | — | — | ||||||||||
| Other securities | 68,046 | 1.8 | 3,146 | 3.1 | 136 | 3.7 | 51 | 3.6 | 71,379 | ||||||||||
| Foreign institution securities: | |||||||||||||||||||
| Bonds | 1,922 | 0.1 | — | — | — | — | — | — | 1,922 | ||||||||||
| Notes | — | — | — | — | — | — | — | — | — | ||||||||||
| Other foreign securities | 550 | 0.1 | — | — | — | — | — | — | 550 | ||||||||||
| Mutual funds investments: | |||||||||||||||||||
| Funds managed by related organizations | 32,646 | 0.3 | — | — | — | — | — | — | 32,646 | ||||||||||
| Funds managed by third parties | — | — | — | — | — | — | — | — | — | ||||||||||
| Total | 106,088 | 1.4 | 88,307 | 4.4 | 565 | 3.7 | 2,620 | 4.4 | 197,580 | ||||||||||
| Available-for-sale: | |||||||||||||||||||
| Chilean Central Bank and government securities | |||||||||||||||||||
| Chilean Central Bank securities | 27,279 | 5.5 | 451,770 | 5.6 | 64,853 | 3.0 | — | — | 543,902 | ||||||||||
| Chilean treasury bonds | — | — | — | — | — | — | — | — | — | ||||||||||
| Other government securities | 2,309 | 2.3 | 37,831 | 3.2 | — | — | — | — | 40,140 | ||||||||||
| Other financial instruments | |||||||||||||||||||
| Promissory notes related to deposits in local banks | 38,005 | 2.4 | 85,221 | 2.6 | — | — | — | — | 123,226 | ||||||||||
| Chilean mortgage finance bonds | 255 | 5.2 | 802 | 5.1 | 309 | 4.4 | 187 | 4.4 | 1,553 | ||||||||||
| Chilean financial institution bonds | — | — | — | — | — | — | — | — | — | ||||||||||
| Other local investments | — | — | — | — | — | — | — | — | — | ||||||||||
| Financial instruments issued abroad | |||||||||||||||||||
| Foreign government and central bank instruments | — | — | — | — | — | — | — | — | — | ||||||||||
| Other foreign investments | — | — | 3,417 | 6.1 | 14,537 | 6.4 | 17,954 | ||||||||||||
| Impairment provision | — | — | — | — | — | — | — | — | — | ||||||||||
| Unquoted securities in active markets | |||||||||||||||||||
| Chilean corporate bonds | 477 | 3.5 | 18,747 | 3.5 | 249 | 3.5 | — | — | 19,473 | ||||||||||
| Other investments | — | — | — | — | — | — | — | — | — | ||||||||||
| Impairment provision | — | — | — | — | — | — | — | — | — | ||||||||||
| Total | 68,325 | 3.7 | 594,371 | 5.0 | 68,828 | 3.2 | 14,724 | 6.4 | 746,248 | ||||||||||
99
Unused Sources of Liquidity
As part of our liquidity policy, we maintain at all times a diversified portfolio of highly liquid assets that can be quickly mobilized, including cash, financial investments and Central Bank and government securities.
Working Capital
The majority of our funding is derived from deposits and other borrowings from the public. In our opinion, our working capital is sufficient for our present needs.
Liquidity Management
We seek to ensure that, even under adverse conditions, we have access to the funds necessary to cover client needs, maturing liabilities and capital requirements. Liquidity risk arises in the general funding for our financing, trading and investment activities. It includes the risk of unexpected increases in the cost of funding the portfolio of assets at appropriate maturities and rates, the risk of being unable to liquidate a position in a timely manner at a reasonable price and the risk that we will be required to repay liabilities earlier than anticipated. See “Item 11. Quantitative and Qualitative Disclosures about Market Risk” for information relating to the methods we employ in managing our liquidity.
Cash Flow
The tables below set forth information about our main sources and uses of cash. Our subsidiaries do not provide a significant percentage of our consolidated cash flow. No legal or economic restrictions exist on the ability of our subsidiaries to transfer funds to us in the form of loans or cash dividends as long as these subsidiaries abide by the regulations in the Chilean Corporations Law regarding loans to related parties and minimum dividend payments.
Net Cash Provided by Operating Activities
Year Ended December 31, | |||||||||||||||||||
2008 | 2009 | 2010 | |||||||||||||||||
| (in millions of Ch$ of December 31, 2010) | |||||||||||||||||||
| Net cash provided by operating activities | Ch$ | 34,624 | Ch$ | (76,271 | ) | Ch$ | (118,035) | ||||||||||||
100
In 2010, our net cash provided by operating activities experienced a decrease from a Ch$76,271.0 million loss in 2009 to a Ch$118,035.0 million loss in 2010.
The main changes during the period were mainly due to time deposits and savings accounts in the amount of Ch$462,280.0 million, foreign borrowings in the amount of Ch$572,500.0 million and provision for loan losses in the amount of Ch$67,060.0 million.
Net Cash Used in Investing Activities
Year Ended December 31, | ||||||||||
2008 | 2009 | 2010 | ||||||||
| (in millions of Ch$ of December 31, 2010) | ||||||||||
| Net cash used in investing activities | Ch$ | (8,610) | Ch$ | (8,081) | Ch$ | (4,018) | ||||
Our net cash used in investing activities decreased from a Ch$8,081.0 million loss in 2009 to a Ch$4,018.0 million loss in 2010. This decrease in net cash used in investing activities was mainly due to a decrease of over 50.0% in equipment investments and a decrease of over 70.0% in building investments.
Net Cash Provided by Financing Activities
Year Ended December 31, | ||||||||||
2008 | 2009 | 2010 | ||||||||
| (in millions of Ch$ of December 31, 2010) | ||||||||||
| Net cash provided by financing activities | Ch$ | (65,646) | Ch$ | 144,220 | Ch$ | 274,210 | ||||
Our net cash provided by financing activities increased from a Ch$144,220.0 million gain in 2009 to a Ch$274,210.0 million gain in 2010. This increase in net cash provided by financing activities was mainly due to an increase in funding issuing bonds.
Deposits and Other Borrowings
The following table sets forth our average month-end balance of our liabilities for the years ended December 31, 2008, 2009 and 2010, in each case together with the related average nominal interest rates paid thereon.
101
Year ended December 31, | ||||||||||||||||||||||||||||||
2008 | 2009 | 2010 | ||||||||||||||||||||||||||||
| Average | Average | Average | ||||||||||||||||||||||||||||
| Average | Interest | Nominal | Average | Interest | Nominal | Average | Interest | Nominal | ||||||||||||||||||||||
Balance | Paid | Rate | Balance | Paid | Rate | Balance | Paid | Rate | ||||||||||||||||||||||
| (in millions of Ch$ as of December 31, 2010, except for percentages) | ||||||||||||||||||||||||||||||
| Time deposits | Ch$ 2,883,029 | Ch$ 216,066 | 7.5% | Ch$ 3,205,901 | Ch$ 90,722 | 2.8% | Ch$ 3,547,844 | Ch$ 85,975 | 2.4% | |||||||||||||||||||||
| Central Bank borrowings | — | — | — | 8,386 | 205 | 2.4 | 1,274 | 115 | 9.0 | |||||||||||||||||||||
| Repurchase agreements | 64,921 | 14,094 | 8.5 | 267,061 | 4,275 | 1.6 | 424,297 | 4,901 | 1.2 | |||||||||||||||||||||
| Mortgage finance bonds | 339,550 | 44,660 | 13.2 | 297,178 | 5,309 | 1.8 | 246,678 | 16,428 | 6.7 | |||||||||||||||||||||
| Bonds | 386,927 | 49,726 | 12.9 | 472,516 | 7,830 | 1.7 | 745,567 | 46,334 | 6.2 | |||||||||||||||||||||
| Other interest bearing-liabilities | 404,405 | 22,171 | 5.5 | 493,675 | 12,386 | 2.5 | 800,262 | 9,476 | 1.2 | |||||||||||||||||||||
| Subtotal interest-bearing liabilities | 4,178,832 | 346,717 | 8.3% | 4,744,717 | 120,727 | 2.5% | 5,765,922 | 163,229 | 2.8% | |||||||||||||||||||||
| Non-interest bearing liabilities: | ||||||||||||||||||||||||||||||
| Non-interest bearing deposits | 246,632 | 241,520 | 309,874 | |||||||||||||||||||||||||||
| Derivates | 135,130 | 120,064 | 125,367 | |||||||||||||||||||||||||||
| Other non-interest bearing liabilities | 379,323 | 534,077 | 94,846 | |||||||||||||||||||||||||||
| Shareholders’ equity | 467,014 | 467,935 | 508,289 | |||||||||||||||||||||||||||
| Subtotal non-interest bearing liabilities | 1,228,099 | — | 1,363,596 | — | 1,038,376 | |||||||||||||||||||||||||
| Total | Ch$ 5,406,931 | Ch$ 346,717 | — | Ch$ 6,108,313 | Ch$ | 120,727 | — | Ch$ 6,804,298 | Ch$ | 163,229 | — | |||||||||||||||||||
Our current funding strategy is to continue to utilize all sources of funding in accordance with their cost, their availability and our general asset and liability management strategy. Our most important source of funding is our time deposits. Time deposits represented 56.3% of our average interest bearing liabilities for the year ended December 31, 2010. We are continuing to place special emphasis on increasing deposits from retail customers, which consist primarily of checking accounts that do not bear interest and accordingly represent an inexpensive source of funding for us. Our total checking accounts increased 23.0% compared to 2009. To the extent that these types of deposits represent a larger percentage of our funding base, the percentage represented by time deposits is expected to decrease and, accordingly, we believe that the materiality to our business of uncertainties relating to rolling over deposits will be diminished. We also intend to continue to broaden our customer deposit base, to emphasize core deposit funding and to fund our mortgage loans with the matched funding available through the issuance of mortgage finance bonds in Chile’s domestic capital markets. Management believes that broadening our deposit base by increasing the number of account holders has created a more stable funding source.
C. RESEARCH AND DEVELOPMENT, PATENTS AND LICENSES
We do not currently conduct any significant research and development activities.
D. TREND INFORMATION
Our net interest income in 2010 increased when compared to 2009. The increase in total loans in addition to a positive inflation environment explains the increase in our net interest income. Core inflation calculated from December to December of each year increased 3.0% in 2010.
Our net interest income is positively affected by an inflationary environment to the extent that our average UF-denominated assets exceed our average UF-denominated liabilities, while our net interest income is negatively affected by inflation in any period in which our average UF-denominated liabilities exceed our average UF-denominated assets. Currently, we have more UF-denominated assets than liabilities.
Our operating incomes depend significantly on our net interest income. In 2008, 2009 and 2010, net interest income over total operating incomes represented 77.9%, 65.4% and 68.7%, respectively. Changes in market interest rates may affect the interest rates earned on our interest-earning assets and the interest rates paid on our interest bearing liabilities which may result in a further reduction in our net interest income.
Consolidation, which can result in the creation of larger and stronger competitors, may adversely affect our financial condition and results of operations by decreasing the net interest margins we are able to generate and increasing our costs of operation. In addition, we expect to continue to face competition from non-banking financial entities such as department stores, leasing, factoring and automobile finance companies, mutual funds, pension funds and insurance companies.
The following are the most important trends, uncertainties and events that are reasonably likely to affect us or that would cause the financial information disclosed herein not to be indicative of our future operating results or financial condition:
102
· Uncertainties relating to economic growth expectations and interest rate cycles, especially in the United States, where the high current account deficit of the U.S. economy may translate into an upward adjustment of risk premium and higher global interest rates. |
· Adverse impacts as a result of earthquakes, tsunamis and aftershocks. |
· The downturn in the Chilean economy could be worse than expected. Higher than expected unemployment rates and lower economic growth could increase provision expenses and decrease our rate of loan growth in the future. |
Also see “Item 5. Operating and Financial Review and Prospects—Operating Results”.
E. OFF-BALANCE SHEET ARRANGEMENTS
We are party to transactions with off-balance-sheet risk in the normal course of our business. These transactions expose us to credit risk in addition to amounts recognized in the consolidated financial statements and include commitments to extend credit. These commitments include such items as guarantees, open and unused letters of credit, overdrafts and credit card lines of credit.
Such commitments are agreements to lend to a customer at a future date, subject to the customer’s compliance with contractual terms. Since a substantial portion of these commitments are expected to expire without being drawn upon, the total commitment amounts do not necessarily represent our actual future cash requirements. The amounts of these commitments is Ch$1,052,282.0 million as of December 31, 2010.
Contingent loans consist of guarantees granted by us in Ch$, UF and foreign currencies (principally US$), as well as open and unused letters of credit. The total amount of contingent loans held off balance sheet as of December 31, 2008, 2009 and 2010 was Ch$980,742.0 million, Ch$906,956.0 million and Ch$1,052,282.0 million, respectively. Contingent loans are considered in the calculation of risk weighted assets and capital requirements as well as for credit risk reserve requirements (see note 35 to our consolidated financial statements included herein).
We use the same credit policies in making commitments to extend credit as we do for granting loans. In the opinion of our management, our outstanding commitments do not represent an unusual credit risk.
Traditional financial instruments which meet the definition of a “derivative” such as forwards in foreign currency, UF, interest rate futures currency and interest rate swaps, currency and interest rate options and others, are initially recognized on the balance sheet at their fair value. The fair value is obtained from market quotes, discounted cash flow models and option valuation models, as applicable. For further details of fair value, see note 34 of the consolidated financial statements included herein.
In terms of outstanding exposure to credit risk, the true measure of risk from derivative transactions is the marked-to-market value of the contracts at a point in time (i.e., the cost to replace the contract at the current market rates should the counterparty default prior to the settlement). For most derivative transactions, the notional principal amount does not change hands; it is simply an amount that is used as a reference upon which to calculate payments. As of December 31, 2010, the net unrealized gain or loss on our derivative portfolio, determined based on the marked-to-market value, was a loss of Ch$14,327.0 million.
F. TABULAR DISCLOSURE OF CONTRACTUAL OBLIGATIONS
In addition to the scheduled maturities of our contractual obligations which are included under “—Liquidity and Capital Resources—Sources of Liquidity” above, as of December 31, 2010, we also had other commercial commitments which mainly consist of open and unused letters of credit together with guarantees granted by us in Ch$, UF and foreign currencies (principally U.S. dollars). We expect most of these commitments to expire unused.
The following table sets forth our contractual obligations and other commercial commitments by time remaining to maturity, as of December 31, 2010, including accrued interest:
103
| Payments due by period | |||||||||||||||
| Less than | 1-3 | 3-5 | More than 5 | ||||||||||||
| Total | 1 year | years | years | years | |||||||||||
| (in millions of Ch$ as of December 31, 2010, except for percentages) | |||||||||||||||
| Time deposits and saving accounts | |||||||||||||||
| Time deposits | Ch$ | 3,691,596 | Ch$ | 3,527,186 | Ch$ | 149,827 | Ch$ | — | Ch$ | 14,583 | |||||
| Term savings accounts | 8,666 | 8,666 | — | — | — | ||||||||||
| Other term creditor balances | 192 | 118 | 34 | 38 | 2 | ||||||||||
| Subtotals | 3,700,454 | 3,535,970 | 149,861 | 38 | 14,585 | ||||||||||
| Bank obligations | |||||||||||||||
| Loans obtained from financial institutions and the Chilean Central Bank | — | — | — | — | — | ||||||||||
| Loans obtained from national financial institutions | 39,964 | 39,964 | — | — | — | ||||||||||
| Loans obtained from foreign financial institutions | 463,728 | 386,311 | 77,417 | — | — | ||||||||||
| Subtotals | 503,692 | 426,275 | 77,417 | — | — | ||||||||||
| Debt issued | |||||||||||||||
| Letters of credit | 226,451 | 28,538 | 44,212 | 41,745 | 111,956 | ||||||||||
| Bonds | 700,570 | 98,439 | 167,348 | 140,851 | 293,932 | ||||||||||
| Subordinated bonds | 288,414 | 7,388 | 7,301 | 4,563 | 269,162 | ||||||||||
| Subtotals | 1,215,435 | 134,365 | 218,861 | 187,159 | 675,050 | ||||||||||
| Other financial liabilities | |||||||||||||||
| Public sector liabilities | 19,313 | 5,159 | 7,260 | 3,758 | 3,136 | ||||||||||
| Borrowings from domestic financial institutions | 4,347 | 4,347 | — | — | — | ||||||||||
| Foreign borrowings | — | — | — | — | — | ||||||||||
| Subtotals | 23,660 | 9,506 | 7,260 | 3,758 | 3,136 | ||||||||||
| Total contractual obligations | 5,443,241 | 4,106,116 | 453,399 | 190,955 | 692,771 | ||||||||||
104
A. DIRECTORS AND SENIOR MANAGEMENT
We are managed by our General Manager (Gerente General) under the direction of our Board of Directors (Directorio), which, in accordance with the Company’s by laws (estatutos sociales), consists of 9 directors and 2 alternates who are elected at our annual shareholders’ meetings. Members of the Board of Directors are elected for three-year terms. Most of our current members of the Board of Directors were elected on October 15, 2009. Cumulative voting is permitted for the election of directors. The Board of Directors may appoint replacements to fill any vacancies that occur during periods between elections. Our principal executive officers are appointed by the Board of Directors and the Chief Executive Officer of Corpbanca and hold office at its discretion. Scheduled meetings of the Board of Directors are held monthly. Extraordinary meetings can be held when called in one of three ways: by the Chairman of the Board of Directors, by one or more directors with the prior approval of the Chairman of the Board of Directors, or by five directors. None of the members of our Board of Directors has a contract or agreement which entitles any director to any benefits upon termination of employment with Corpbanca.
Our current directors are as follows:
| Directors | Position | Age | ||
| Alvaro Saieh Bendeck | Chairman and Director | 61 | ||
| Jorge Andrés Saieh Guzmán | First Vice Chairman and Director | 40 | ||
| Fernando Massú Tare | Second Vice Chairman and Director | 54 | ||
| Jorge Selume Zaror | Director | 59 | ||
| Fernando Aguad Dagach | Director | 51 | ||
| Hernán Somerville Senn | Director | 70 | ||
| Julio Barriga Silva | Director | 73 | ||
| Brian D. O’Neill | Director | 54 | ||
| Gustavo Arriagada Morales | Director | 56 | ||
| Hector Valdés Ruiz | Alternate Director | 63 | ||
| Juan Rafael Gutiérrez Avila | Alternate Director | 70 |
Alvaro Saieh Bendeck became Chairman of our Board of Directors on October 15, 2009. Prior to this Mr. Saieh Bendeck was a Director and First Vice Chairman of our Board of Directors since June 18, 1996. Prior to this Mr. Saieh Bendeck served as the Chief Executive Officer and later the First Vice Chairman of Banco Osorno y La Union. Mr. Saieh Bendeck is currently the Chairman of Corp Group Interhold S.A. and a director of the Santiago Stock Exchange. Mr. Saieh Bendeck also serves similar positions on a variety of different boards. Mr. Saieh Bendeck received a B.A. in Business and Administration and graduated from the Universidad de Chile. Mr. Saieh Bendeck holds a Ph.D. in Economics from the University of Chicago. Jorge Andrés Saieh Guzmán, referred to below, is the son of Mr. Saieh Bendeck.
Jorge Andrés Saieh Guzmán became a Director and First Vice Chairman of our Board of Directors on August 25, 1998. Mr. Saieh Guzmán also serves as the Chairman of the board of directors for Consorcio Periodístico de Chile S.A., Vice Chairman of both Corp Group Interhold S.A. and the Chilean National Press Association. In addition, Mr. Saieh Guzmán is a member of the board of Corp Group Inmobiliaria S.A and the Vidadeporte foundation. Mr. Saieh Guzmán has also served as the Vice Chairman of the board of AFP Protección, as a member of the board of AFP Provida and as a member of the board of our former affiliate Corpbanca Venezuela. Mr. Saieh Guzmán also serves similar positions on a variety of different boards. Mr. Saieh Guzmán received a B.A. in Business and Administration and graduated from the Universidad Gabriela Mistral. Mr. Saieh Guzmán holds a Masters in Economics and a Masters in Business and Administration from the University of Chicago. Alvaro Saieh Bendeck, referred to above, is the father of Mr. Saieh Guzmán.
Fernando Massú Tare became a Director and Second Vice Chairman of our Board of Directors on October 15, 2009. Prior to this Mr. Massú served as Group Corporate Director of Corp Group (2008). Previously he held the post of Global Wholesale Banking Director with Banco Santander Chile from 1995-2007. Financial Director postings within the Santander Group in Portugal and Canada: 1992-1995 and General Manager Citicorp Chile 1982-1992. Mr. Massú received a B.A. in Business and Administration from Universidad Adolfo Ibañez and attended the Professional Management Course at Harvard University.
Jorge Selume Zaror became a Director on May 23, 2001. Mr. Selume also serves as director of the board, among others, for Vidacorp S.A., Indisa Clinic, and the Universidad Las Americas. Prior to this Mr. Selume was a director on the board of directors of Banco Osorno y La Union, a director of the government budget office of Chile, Chairman of our former affiliate Corpbanca Venezuela and the Chief Executive Officer of Corpbanca between 1996 and 2001. Mr. Selume received a B.A. in Business and Administration and graduated from the Universidad de Chile. Mr. Selume holds a Masters in Economics from the University of Chicago.
105
Fernando Aguad Dagach became a Director on June 18, 1996. Mr. Aguad has previously held similar positions in a variety of institutions including Interbank Perú, Banco Osorno y La Union and Canal de Televisión La Red. Mr. Aguad is an investor in financial institutions.
Hernán Somerville Senn became a Director on April 29, 1997. Prior to this, from June 1983 through December 1988, Mr. Somerville was the Coordinating Director of Foreign Debt of the Central Bank. Mr. Somerville is currently a director of Enersis and Inacap. Mr. Somerville is also the Chairman, among others, of the Association of Banks and Financial Institutions, Transbank. S.A., and the Chilean-Indian Chamber of Commerce. Mr. Somerville is a lawyer and received his law degree from the Universidad de Chile. Mr. Somerville is currently a member of the Chilean, Interamerican, and the City of New York Bar Associations.
Julio Barriga Silva became a Director on April 29, 1997. Previously, Mr. Barriga was the Chairman of Banco Santiago and the Chief Executive Officer of BancoEstado. Mr. Barriga is an agricultural engineer and an agricultural economist from the Universidad de Chile.
Brian D. O’Neill became a Director on October 15, 2009. Prior to this he was Deputy Assistant Secretary of State, Western Hemisphere, US Department of Treasury (2007-2009), and Acting US Director on the Interamerican-Development Bank (IDB) (2008). Between 1977 and 2007 he served on various positions within JP Morgan Chase, lately Member of the Americas Management Committee; Vice Chairman Investment Banking Coverage and Chairman, Investment Banking, Canada & Latin America. He is also on the Supervisory Board of Directors of Die Erste Bank Austria; Director Americas Society; Director Council of the Americas among others. Mr. O’Neill received a B.A. from the University of San Diego, CA, and an MBA from the Thunderbird School.
Gustavo Arriagada Morales became a Director on September 28, 2010. Mr. Arriagada was the Superintendent of Banks and Financial Institutions. He received a B.A. in Business and Administration from the Universidad de Chile.
Hector Valdés Ruiz became an Alternate Director on October 15, 2009. Prior to this he was Advisor to the CEO Corpbanca (2003-2009); CEO of Banco Santiago, Chile (1986-1998); Finance Manager Compañía Chilena de Tabacos, Chile (1985-1986) He is also a Director of Transbank. Mr. Valdés received a B.A. in Business and Economics from the Universidad Catolica de Chile.
Juan Rafael Gutiérrez Avila became an Alternate Director on April 29, 1997. Mr. Gutiérrez is a Public Accountant (Contador Público y Auditor) and was a director of Banco Osorno y La Union and AFP Provida from April 1998 through July 1999. Currently his work relates to real estate and financial activities.
Our current Executive Officers are as follows:
| Executive Officer | Position | Age | ||
| Mario Chamorro Carrizo | Chief Executive Officer | 53 | ||
| Oscar Cerda Urrutia | Division Manager — Companies | 55 | ||
| Pedro Silva Yrarrázaval | Division Manager — International and Treasury | 50 | ||
| Cristián Canales Palacios | Division Manager — Legal Services | 46 | ||
| Gerardo Schlotfeldt Leighton | Division Manager — Retail Banking and Banco Condell | 50 | ||
| Fernando Valdivieso Larraín | Division Manager — Companies Credit Risk | 58 | ||
| Jorge Garrao Fortes | Division Manager — Commercial Credit Risk | 39 | ||
| Jose Francisco Sanchez Figueroa | Division Manager — Large Companies and Corporate | 57 | ||
| Armando Ariño Joiro | Division Manager — Operations and Technology | 45 | ||
| Verónica Villarroel Molina | Division Manager — Manager of Human Resources | 41 | ||
| Maria Gabriela Salvador Broussaingaray | Division Manager — Manager of Client Service | 41 | ||
| Eugenio Gigogne Miqueles | Chief Financial Officer | 46 | ||
| Fernando Burgos Concha | General Manager — New York Branch | 57 | ||
| José Manuel Mena Valencia | Comptroller Manager — Reports to Audit Committee | 55 |
Mario Chamorro Carrizo has served as our Chief Executive Officer since May 30, 2006. From 2003 to 2006, Mr. Chamorro served as Chief Executive Officer of our former affiliate, Corpbanca Venezuela, and later served as Chairman of the Board of Directors of Corpbanca Venezuela. From 2001 to 2003 Mr. Chamorro served as Chief Executive Officer of Corpbanca in Chile and from 1999 to 2001 served as its Chief Operating Officer. From 1996 to 1999 Mr. Chamorro served as Chief Financial Officer of Corp Group and previously Mr. Chamorro held a similar position at Banco Osorno y La Union. Mr. Chamorro received a B.A. in Business and Administration from the Universidad de Chile. Mr. Chamorro also received a Masters in Business and Administration from the University of California, Los Angeles (UCLA).
106
Jose Francisco Sanchez Figueroa has served as the Division Manager of Corpbanca since October 2009. Previously Mr. Sanchez was Deputy Head Large Companies and Corporate at Corpbanca, as well as other postings within the area (1996-2009). Mr. Sanchez received a B.A. in Business and Economics from the Universidad Católica de Chile.
Oscar Cerda Urrutia has served as the Division Manager of Companies since June 2008. Mr. Cerda was previously the Chief Executive Officer of Banco Ripley. Mr. Cerda received a B.A. in Business and Administration from the Universidad de Concepcion.
Pedro Silva Yrarrázaval has served as the Division Manager of Treasury and International since October 2006. Mr. Silva was previously the Chief Executive Officer of our subsidiary Corpbanca Administradora General de Fondos S.A. (Asset Management). Mr. Silva received a B.A. in Business and Administration from the Universidad de Chile. Mr. Silva also received a Masters in Business and Administration from the University of Chicago.
Gerardo Schlotfeldt Leigthon has served as the Division Manager of Banco Condell since June 2010 and as Division Manager of Retail Banking since January 2011. Previously, he was the CEO of Banco Paris. Mr. Schlotfeldt received an undergraduate degree in Industrial Civil Engineering from the Universidad Católica de Chile.
Cristián Canales Palacios has served as the Division Manager of Legal Services since April 2003. Mr. Canales served as our Legal Services Manager from 2002 to February 2003 and as Senior Attorney from 1996 to 2001. From 1989 to 1996 Mr. Canales served as the Attorney of Banco Osorno y La Union. Mr. Canales received a law degree from the Universidad de Chile.
Fernando Valdivieso Larraín has served as our Companies Credit Risk Division Manager since 2005. From 2002 to 2005 Mr. Valdivieso was the Risk Manager of Vida Corp. From 1999 to 2001 he served as a risk manager in Banco de A. Edwards. From 1990 — 1999 he held similar positions in Banco de Santiago. Mr. Valdivieso received a B.A. in Business and Administration from the Universidad Católica de Chile.
Jorge Garrao Fortes has served as our Commercial Credit Risk Division Manager since September 10, 2010. He has over 14 years of experience in the financial market. Mr. Garrao received an undergraduate degree in Industrial Civil Engineering from the Universidad de Chile.
Armando Ariño Joiro has served as the Division Manager of Operations and Technology since 2008. In 2008, the Operations Division merged with Information Technology creating the new Division Operations and Technology. From November 2000 to 2008 he served as Division Manager of Information Technology. From 1995 to 2000 Mr. Ariño served as the Information Technology Senior Consultant of Coinfin (Colombia) and from 1993 to 1995 he served as the Information Technology Manager of Finasol (Colombia). Mr. Ariño received an undergraduate degree in Information Technology Civil Engineering with a specialization in Banking from the Universidad INCCA in Colombia.
Verónica Villarroel Molina has served as the Division Manager of Human Resources since July 2009. Previously, she has served as Senior Generalist Senior Consumer Bank by Citibank (2005-2009). She holds a degree in psychology from the Universidad Católica de Chile, and a degree in philosophy from the Universidad de Playa Ancha Valparaíso.
Maria Gabriela Salvador Broussaingaray has served as the Division Manager of Client Service of Corpbanca since April 2010 . Previously Ms. Salvador had the same responsibility in Banco de Chile. Ms. Salvador received a B.A. in Business and Economics from the Universidad de Chile and has more than 18 years of experience in the financial sector.
Eugenio Gigogne Miqueles has served as CFO of Corpbanca since April 2010. Previously, he had served as head of the market risk department. Before arriving at Corpbanca in 2009, Mr. Gigogne was the CFO of Scotiabank — Chile. Mr. Gigogne received a B.A. in Business and Economics from the Universidad de Chile and an MBA from Tulane University, USA.
Fernando Burgos Concha has served as General Manager of Corpbanca´s New York Branch effective June 2010. Previously, Mr. Burgos served as Manager of the International Area of Corpbanca for a period of seven years. Prior to that, since 1995, he held several positions within Corpbanca and its parent, Corp Group Banking S.A. Mr. Burgos received a Bachelor of Science in Management from the US Air Force Academy, Colorado Springs USA.
José Manuel Mena Valencia has served as our Comptroller Manager since March 2008. From 1995 to 2008 Mr. Mena served as the Chief Executive Officer of BancoEstado. Previously, he was the Chief Financial Officer of Banco Osorno y La Union. Mr. Mena received an undergraduate degree in Industrial Civil Engineering. Mr. Mena also received a Masters in Economics from the Universidad de Chile.
B. COMPENSATION
Consistent with Chilean law, we do not disclose to our shareholders, or otherwise make public, information regarding the individual compensation of our directors or officers. For the year ended December 31, 2010, we did not pay fees to our directors and no amounts were set aside or accrued by us to provide pension, retirement or similar benefits for our directors and executive officers. In the ordinary shareholders’ meeting held in February 2010, the Board of Directors agreed to pay each director UF100.0 per month, each vice-president UF400.0 per month and the president UF600.0 per month. We engaged in transactions with companies controlled by certain of our directors under the applicable requirements of the Chilean Companies Law. In 2010, we paid our senior management and committee members an aggregate of Ch$15,765.0 million. Chilean law does not require us to have a compensation committee.
107
C. BOARD PRACTICES
The Directors Committee
The Directors Committee is comprised of the following three members of the Board of Directors: Messrs. Fernando Massú, Jorge Andrés Saieh and Gustavo Arriagada, who chairs it. The Directors Committee’s responsibilities are, among others:
· reviewing the reports of the internal and external auditors, the balance sheet and any other financial statements presented by the administration to the shareholders, and to pronounce about it previous to its presentation to the shareholders for approval, |
| · | recommending external auditors and rating agencies to the Board of Directors, |
| · | reviewing operations with related parties and reporting to the Board of Directors, |
| · | reviewing the compensation plans of executive officers and principal officers, |
| · | examining the systems of remuneration and compensation plans for managers, senior executives and employees of the Company, |
| · | preparing an annual report about its activities, including its main recommendations to shareholders, and |
| · | other duties required by our by-laws, a shareholders meeting and our Board of Directors. |
Members of the Director’s Committee receive a monthly remuneration.
The Audit Committee
In May 2003, the Chilean Superintendency of Banks adopted a resolution requiring that, from January 2004, all Chilean banks establish an Audit Committee composed of two or more members, two of whom must be directors appointed by the Board of Directors. Our Audit Committee is comprised of Messrs. Hernán Somerville, Brian O’Neill, René Cortazar and Alejandro Ferreiro. The main duties of the Audit Committee are to review the efficiency of internal control systems, to ensure compliance with laws and regulations and to have a clear understanding of the risks involved in our business. The Chilean Superintendency of Banks recommends that at least one of the members of the Audit Committee, who must also be a member of the Board of Directors, be experienced with respect to the accounting procedures and financial aspects of banking operations. The members of the Audit Committee appointed by the Board of Directors must be independent according to the criteria set by the Board of Directors. In furtherance of the independence of the Audit Committee, our Board of Directors has determined that Audit Committee members should not, for the last three years, have held positions as our principal executive officers, have performed professional services for us, have commercial commitments with us or with any of our affiliates or related persons, or have relations with other entities related to us from which they have received material payments. Moreover, they may not accept any payment or other compensatory fee from us, other than in their capacity as members of the Audit Committee or of other committees. All the members of the Audit Committee receive a monthly remuneration.
According to its charter, the duties of the Audit Committee are, among others:
| · | proposing external auditors to the Board of Directors or the Directors Committee, |
| · | proposing rating agencies to the Board of Directors or the Directors Committee, |
| · | analyzing and supervising the activities, organizational structure and qualifications of our internal auditing staff, whom report directly to the Audit Committee, |
| · | approving the audit plan for us and our affiliates, |
| · | reviewing audits and internal reports, |
| · | coordinating with internal and external auditors, |
108
| · | reviewing annual and interim financial statements and informing the Board of Directors of the results of such reviews, |
| · | reviewing the reports, procedures and extent of the work of external auditors, |
| · | reviewing the procedures and content of reports from external risk evaluators, |
| · | discussing the effectiveness and reliability of internal control procedures, |
| · | reviewing the performance of information systems, their sufficiency, reliability and use in decision making, |
| · | discussing the observance of internal regulations related to compliance with laws and regulations, |
| · | reviewing and deliberating on issues related to conflicts of interests, |
| · | investigating suspected fraudulent activities, |
| · | reviewing the inspection reports, instructions and presentations from the Chilean Superintendency of Banks, |
| · | reviewing compliance with the annual program of internal auditing, and |
| · | informing the Board of Directors of any change in accounting principles and its effects. |
Other duties of the Audit Committee include, as needed:
| · | reviewing procedures to detect money-laundering, |
| · | asking internal auditors to perform specific tasks, |
| · | making recommendations on specific tasks to external auditors, and |
| · | intervening in any other situation where intervention is warranted in the committee’s discretion. |
The Audit Committee has a charter that establishes its composition, organization, objectives, duties, responsibilities and extension of its activities. The Chilean Superintendency of Banks requires the Audit Committee to meet at least every four months and to provide an annual written report to the Board of Directors informing it of its activities. The report must also be presented to the annual shareholders’ meeting. According to its charter, the Audit Committee meets twice per month.
Other Committees
Anti-Money Laundering and Anti-Terrorism Finance Prevention Committee:
This Committee is in charge of preventing money laundering and terrorism financing. Its main purposes include planning and coordinating activities to comply with related policies and procedures, maintaining itself informed of work carried out by the Compliance Officer and making decisions on any improvements to control measures proposed by the Compliance Officer. This Committee is comprised of one director, the Chief Executive Officer, the Legal Services Division Manager, one Area Manager and the Compliance Officer. This Committee has the authority to request attendance from any executives or associates that it deems necessary. The Committee has regular monthly meetings and holds extraordinary sessions when considered appropriate by any of its members.
Compliance Committee:
The purpose of this Committee is to monitor compliance with the Codes of Conduct and other complementary rules; establish and develop procedures necessary for compliance with these codes; interpret, administer and supervise compliance with these rules; and resolve any conflicts that may arise. This Committee is comprised of one director; the Chief Executive Officer; the Legal Services Division Manager; the Organizational Development Division Manager and the Compliance Officer.
D. EMPLOYEES
As of December 31, 2010, on a consolidated basis we had 3,422 employees, 3,247 of whom were bank employees and 175 of whom were employees of our subsidiaries. Approximately 45.6% of our employees were unionized as of that date. All management positions are held by non-unionized employees. We believe that we have good relationships with our employees and the unions to which some of our employees belong.
109
As of December of each of the years ended 2008, 2009 and 2010, we had 3,072, 3,311 and 3,422 employees, respectively, on a consolidated basis.
E. SHARE OWNERSHIP
Mr. Alvaro Saieh Bendeck, our chairman and a member of our Board of Directors, together with his family maintains an indirect ownership of 75.6% of Corp Group Banking S.A. In addition, Mr. Alvaro Saieh Bendeck with his family are indirect holders of 100.0% of the ownership rights of Compañía Inmobiliaria y de Inversiones Saga Ltda. and also of SG Inversiones Bancarias Ltda. These holding companies, controlled by Mr. Saieh Bendeck, beneficially own approximately 49.6%, 8.7% and 3.7% of our outstanding shares, respectively. Mr. Fernando Aguad Dagach and his family indirectly beneficially own approximately 2.5% of our outstanding shares. In addition, Mr. Jorge Selume Zaror and his family indirectly own approximately 1.5% of our outstanding shares. Other than as stated above, no director or officer owns more than 1.0% of our outstanding common shares.
Our directors and senior managers do not have different or preferential voting rights with respect to those shares they own.
We do not have any arrangements for issuing capital to our employees, including any arrangements that involve the issue or grant of options of our shares or securities.
A. MAJOR SHAREHOLDERS
Our only outstanding voting securities are our common shares. As of December 31, 2010, we had 226,909,290,577 common shares.
On April 15, 2008, at an Extraordinary shareholders’ meeting, our shareholders approved the Share Repurchase Program to repurchase our shares in the local Chilean market through one or more tender offers in accordance with Article 198 subsection 5 of the Chilean Securities Market Law. The purpose of the Share Repurchase Program is to invest and trade our own shares in accordance to share price fluctuations experienced throughout the duration of the program. The maximum percentage of shares to be repurchased under this Program is equivalent to 5.0% of the shares issued and paid, or up to 11,345,464,528 shares. On April 22, 2008, our Board of Directors, acting as authorized by our shareholders at the extraordinary shareholders’ meeting held on April 15, 2008, repurchased 5,672,732,264 shares, which represent 2.5% of our issued and paid shares. This repurchase reduced our total shares outstanding to 221,236,558,313.
On October 15, 2009, at an extraordinary shareholders’ meeting, our shareholders authorized the sale of up to 5,672,732,264 shares, equivalent to 2.5% of our share capital, which would be offered to those shareholders registered in the respective shareholders’ registry 5 business days prior to the sale, prorated based on their share participation. On November 24, 2009, our Board of Directors, acting as authorized by our shareholders at the extraordinary shareholders’ meeting held on October 15, 2009 (i) set the price of each share to be issued in an amount to be equal to Ch$3.5, (ii) set December 6, 2009 as the commencement date of the first preferred offering period and January 4, 2010 as the expiration date, (iii) set January 5, 2010 as the commencement date of the second preferred offering period, and (iv) February 18, 2010 as the expiration date.
The process in which the shares were sold is represented in the following chart:
| Date | Number of Shares | Price of the Shares | |||||
| Period 1 | December 6, 2009 — January 4, 2010 | 618,186,238 | 3.50 | ||||
| Period 2 | January 5, 2010 — February 18, 2010 | 5,052,027,491 | 3.50 | ||||
| Period 3 | April 4, 2010 | 2,518,535 | 4.50 |
The following table sets forth information with respect to the record and beneficial ownership of our capital stock as of December 31, 2010 with respect to each shareholder known to us to own more than 5.0% of the outstanding common shares and all directors and executive officers as a group, except treasury shares which have been included in the table below:
| Stockholder | Number of shares | Percentage of total share capital | Number of Votes | Percentage of Voting and Dividend rights | |||||
| Corp Group Banking S.A.(1)(3) | 112,530,207,591 | 49.59% | 112,530,207,591 | 49.59% | |||||
| Compañía Inmobiliaria y de Inversiones Saga Ltda.(2)(3) | 19,764,285,412 | 8.71% | 19,764,285,412 | 8.71% | 5% | ||||
| Other shareholders(4) | 94,614,797,574 | 41.70% | 94,614,797,574 | 41.70% |
110
| (1) | As of December 31, 2010, Corp Group Financial Chile B.V., or CGFC, indirectly owned 100.0% of the outstanding capital stock of Corp Group Banking S.A., or CGB. CGFC is controlled by Mr. Alvaro Saieh Bendeck who, together with his family, indirectly owns a majority of its voting stock. Accordingly, beneficial ownership of CGB’s shares are attributed to Mr. Saieh Bendeck and his family, and Mr. Saieh Bendeck and family thereby also indirectly controls Corpbanca. As set forth in footnote (2) below, Mr. Saieh Bendeck and his spouse also indirectly beneficially owns an additional 8.7% of the shares of Corpbanca through Saga (as defined below). |
| (2) | Compañía Inmobiliaria y de Inversiones Saga Ltda., or Saga, is indirectly controlled by Mr. Alvaro Saieh Bendeck and his spouse. Accordingly, beneficial ownership of Saga’s shares is attributed to Mr. Saieh Bendeck and his spouse. |
| (3) | Mr. Alvaro Saieh Bendeck and his family are deemed to have beneficial ownership of these shares. |
| (4) | Other shareholders include public shareholders and related parties. The related parties include Cía de Seguros Corpvida S.A., Inversiones Heracles Ltda. and SG Inversiones Bancarias Ltda. |
On November 21, 2003, Corp Group Banking S.A., or CGB, completed the offering and sale of 5,287,726 ADSs, representing an aggregate of 26,438,630,000 common shares, or 5,000 common shares per ADS, in a transaction exempt from the registration requirements of the Securities Act pursuant to Rule 144A and Regulation S thereunder. Concurrently with the ADSs offering, CGB completed a public offering and sale of 26,438,637,013 common shares in Chile. In October 2004, we conducted a public offering of ADSs in exchange for ADSs that had been issued pursuant to Rule 144A. Also, on November 1, 2004, our new ADSs were listed on the New York Stock Exchange.
As of December 31, 2010, ADR holders (through the Depositary) held approximately 1.0% of our total shares, represented by one registered shareholder. The remaining 99.0% of our total shares were held locally, in Chile, represented by 3,537 local and foreign shareholders (excluding those shares held by us). All of our shareholders have identical voting rights.
B. RELATED PARTY TRANSACTIONS
General
In the ordinary course of our business, we engage in a variety of transactions with certain of our affiliates and related parties. The Chilean Corporations Law requires that our transactions with related parties be in our interest and also on a market basis or on similar terms to those customarily prevailing in the market. We are required to compare the terms of any such transaction to those prevailing in the market at the date the transaction is to be entered into. In the event that the transaction is not within the ordinary course of business, prior to its effectiveness, the Directors Committee must prepare a report describing the conditions of the operation and present it to the Board of Directors for its express approval. Directors of companies that violate this provision are liable for losses resulting from such violations. Under the General Banking Law, transactions between a bank and its affiliates are subject to certain additional restrictions.
In addition, under the Chilean Corporations Law, a company may not enter into a transaction in which one or more of its directors has a direct or indirect interest unless (i) such transaction has received the prior approval of the company’s board of directors, and (ii) the terms of such transaction are consistent with the terms of transactions of a similar type prevailing in the market. If it is not possible to reach such a judgment, the board may appoint two independent evaluators. The evaluators’ final conclusions must be made available to shareholders and directors for a period of 20 business days, during which shareholders representing 5.0% or more of the issued voting shares may request the board to call a shareholders’ meeting to resolve the matter, with the agreement of two-thirds of the issued voting shares required for approval. For purposes of this regulation, the law considers that the amount of a proposed transaction is material if (1) it exceeds 1.0% of the company’s net worth (provided that it also exceeds UF2,000.0), or (2) it exceeds UF20,000.0.
All resolutions approving such transactions must be reported to the company’s shareholders at the next annual shareholders’ meeting. Violations of this provision may result in administrative, criminal or civil liability to the corporation, the shareholders and/or third parties who suffer losses as a result of such violation. We believe that we have complied with the applicable requirements of the Chilean Corporations Law in all transactions with related parties and affirm that we will continue to comply with such requirements.
As of December 31, 2008, 2009 and 2010, loans to related parties totaled Ch$52,904.0 million, Ch$205,253.0 million and Ch$125,620.0 million, respectively, and related party receivables, other than loans, totaled Ch$24,640.0 million, Ch$23,311.0 million and Ch$22,739.0, respectively. See note 33 to our financial statements for a more detailed accounting of transactions with related parties.
111
Loans to related parties
As of December 31, 2008, 2009 and 2010, loans to related parties were as follows:
| 2008 | ||||||||||
| Operating Companies | Investment Companies | Individuals(1) | ||||||||
| (in millions of Ch$ as of December 31, 2010) | ||||||||||
| Loans and receivables to customers | ||||||||||
| Commercial loans | Ch$ | 48,408 | Ch$ | 2,477 | Ch$ | 1,039 | ||||
| Mortgage loans | — | — | 854 | |||||||
| Consumer loans | 156 | — | 143 | |||||||
| Loans and receivables to customers - gross | 48,564 | 2,477 | 2,036 | |||||||
| Provision for loan losses | (144 | ) | (9 | ) | (20 | ) | ||||
| Loans and receivables to customers, net | Ch$ | 48,420 | Ch$ | 2,468 | Ch$ | 2,016 | ||||
| Other | Ch$ | 1,047 | ||||||||
| 2009 | ||||||||||
| Operating Companies | Investment Companies | Individuals(1) | ||||||||
| (in millions of Ch$ as of December 31, 2010) | ||||||||||
| Loans and receivables to customers: | ||||||||||
| Commercial loans | Ch$ | 197,804 | Ch$ | 3,732 | Ch$ | 844 | ||||
| Mortgage loans | — | — | 1,886 | |||||||
| Consumer loans | 1,234 | — | 112 | |||||||
| Loans and receivables to customers - gross | 199,038 | 3,732 | 2,842 | |||||||
| Provision for loan losses | (335 | ) | (13 | ) | (11 | ) | ||||
| Loans and receivables to customers, net | Ch$ | 198,703 | Ch$ | 3,719 | Ch$ | 2,831 | ||||
| Other | Ch$ | 545 | ||||||||
| 2010 | ||||||||||
| Operating Companies | Investment Companies | Individuals(1) | ||||||||
| (in millions of Ch$ as of December 31, 2010) | ||||||||||
| Loans and receivables to customers: | ||||||||||
| Commercial loans | Ch$ | 117,043 | Ch$ | 2,466 | Ch$ | 306 | ||||
| Mortgage loans | — | — | 4,184 | |||||||
| Consumer loans | 1 | — | 1,931 | |||||||
| Loans and receivables to customers - gross | 117,044 | 2,466 | 6,421 | |||||||
| Provision for loan losses | (291 | ) | (4 | ) | (16 | ) | ||||
| Loans and receivables to customers, net | Ch$ | 116,753 | Ch$ | 2,462 | Ch$ | 6,405 | ||||
| Other | Ch$ | 1,240 | ||||||||
| (1) | Includes debt obligations that are equal to or greater than UF3,000.0 indexed-liked units of account, equivalent to Ch$64.0 million as of December 31, 2010. |
All loans were made in the ordinary course of business, were made on substantially the same terms, including interest rates and collateral, as those prevailing at the time for comparable transactions with other persons, and did not involve more than the normal risk of collectability or present other unfavorable features. During 2008, 2009 and 2010 and in accordance with IFRS, the largest amounts of related party loans outstanding amounted to Ch$75,513.0 million, Ch$207,558.0 million and Ch$128,297.0, respectively.
112
Other Transactions with Related Parties
During 2008, 2009 and 2010, we had the following income (expenses) from services provided to (by) related parties:
Year ended December 31, | ||||||||||||
2008 | 2009 | 2010 | ||||||||||
Company | Income (expenses) | Income (expenses) | Income (expenses) | |||||||||
(in millions of Ch$ as of December 31, 2010) | ||||||||||||
| Corp Group Interhold S.A. | (1,783 | ) | (2,078 | ) | (1,931 | ) | ||||||
| Nexus S.A. | (1,733 | ) | (1,153 | ) | (922 | ) | ||||||
| Transbank S.A. | (2,957 | ) | (2,294 | ) | (2,110 | ) | ||||||
| Recaudaciones y Cobranzas S.A. | (366 | ) | (695 | ) | (792 | ) | ||||||
| Redbanc S.A. | (472 | ) | (892 | ) | (800 | ) | ||||||
| Fundación Corpgroup Centro Cultural | (68 | ) | (90 | ) | (133 | ) | ||||||
| Inmobiliaria e Inversiones San Francisco Ltda. | (167 | ) | (134 | ) | (174 | ) | ||||||
| Asesorías Santa Josefina Ltda. | (160 | ) | (139 | ) | (146 | ) | ||||||
| Inmobiliaria e Inversiones Boquiñeni Ltda. | (55 | ) | (51 | ) | (66 | ) | ||||||
| Promoservice S.A. | (56 | ) | — | (372 | ) | |||||||
| Compañía de Seguros Vida Corp. S.A. | (101 | ) | (79 | ) | (226 | ) | ||||||
| Inmobiliaria Edificio Corp Group S.A. | (2,529 | ) | (2,389 | ) | (2,445 | ) | ||||||
| Empresa Periodistica La Tercera S.A. | (263 | ) | (363 | ) | (36 | ) | ||||||
| SMU S.A. Rendic Hnos S.A. | — | (38 | ) | (15 | ) | |||||||
These transactions were carried out on terms normally prevailing in the market at the date of the transaction.
C. INTERESTS OF EXPERTS AND COUNSEL
Not applicable.
A. CONSOLIDATED STATEMENTS AND OTHER FINANCIAL INFORMATION
See “Item 17. Financial Statements”.
Legal Proceedings
We are not involved in any legal or arbitration proceedings that we believe are reasonably likely to have a material adverse effect on us or our operations. We are not involved in any material legal or arbitration proceedings in which any of our directors, any member of our senior management or any of our affiliates is either a party adverse to us or our subsidiaries or has a material interest adverse to us or our subsidiaries. We are involved in collections proceedings initiated by us in the normal course of business and certain proceedings against us in the ordinary course of banking business.
Dividend Policy
Under the Chilean Corporations Law, as defined herein, Chilean open stock companies, such as ours, are generally required to distribute at least 30.0% of their net income each year, unless otherwise agreed by the unanimous consent of our shareholders. Provided that the statutory minimum is observed, Chilean law allows a majority of the shareholders to change and approve our dividend policy for any given period. In the event of any loss of capital or of the legal reserve, no dividends can be distributed so long as such loss is not recovered from earnings or otherwise. No dividends above the legal minimum can be distributed if doing so would result in the bank exceeding its indebtedness ratio or its lending limits.
The balance of our distributable net income is generally retained for use in our business (including for the maintenance of any required legal reserves). Although our Board of Directors currently intends to pay regular annual dividends, the amount of dividend payments will depend upon, among other factors, our then current level of earnings, capital and legal reserve requirements, as well as market conditions, and there can be no assurance as to the amount or timing of future dividends. Our actual dividend policy is to distribute at least 50.0% of each fiscal year net income, calculated as total net income for the period less an amount which maintains capital constant in real terms. Dividend distributions in 2008, 2009 and 2010 each amounted to 100.0% of net income for the previous fiscal year.
113
In the event that dividends are paid, holders of ADSs will be entitled to receive dividends to the same extent as the owners of common shares. Dividends received by holders of ADSs will, absent changes in Chilean exchange controls or other laws, be converted into U.S. dollars and distributed net of currency exchange expenses and fees of the depositary and will be subject to Chilean withholding tax, currently imposed at the rate of 35.0% (which may be subject to credits in certain cases).
B. SIGNIFICANT CHANGES
At the ordinary shareholder meeting on February 24, 2011, our shareholders approved a proposal by the board of directors to establish that the dividends paid for subsequent years cannot exceed 75.0% of net income.
A. OFFER AND LISTING DETAILS
Price History
The table below shows, for the periods indicated, high and low closing prices (in nominal pesos) of the common shares on the Santiago Stock Exchange and of our ADSs on the New York Stock Exchange.
| Santiago Stock Exchange | New York Stock Exchange | ||||||||
| Common Shares | ADSs | ||||||||
| High | Low | High | Low | ||||||
| (Ch$ per share (1)) | (US$ per ADS(2)) | ||||||||
| Annual Price History | |||||||||
| 2006 | 3.03 | 2.28 | 28.73 | 21.69 | |||||
| 2007 | 3.82 | 2.76 | 39.06 | 23.74 | |||||
| 2008 | 3.38 | 2.31 | 35.15 | 16.90 | |||||
| 2009 | 4.10 | 2.40 | 42.40 | 19.26 | |||||
| 2010 | 8.90 | 4.10 | 94.00 | 39.00 | |||||
| Quarterly Price History | |||||||||
2009 1st Quarter | 2.90 | 2.40 | 26.05 | 19.26 | |||||
2009 2nd Quarter | 3.18 | 2.49 | 30.10 | 20.75 | |||||
2009 3rd Quarter | 3.61 | 3.05 | 32.02 | 27.25 | |||||
2009 4th Quarter | 4.10 | 3.48 | 42.40 | 32.02 | |||||
2010 1st Quarter | 4.65 | 4.06 | 44.25 | 39.00 | |||||
2010 2nd Quarter | 5.30 | 4.38 | 50.27 | 40.71 | |||||
2010 3rd Quarter | 7.64 | 5.24 | 79.00 | 48.35 | |||||
2010 4th Quarter | 8.91 | 7.05 | 94.04 | 71.80 | |||||
| Monthly Price History | |||||||||
| September 2010 | 7.64 | 5.99 | 79.00 | 60.70 | |||||
| October 2010 | 7.85 | 7.05 | 78.85 | 71.88 | |||||
| November 2010 | 8.47 | 7.49 | 88.75 | 78.00 | |||||
| December 2010 | 8.91 | 8.17 | 94.04 | 84.65 | |||||
| January 2011 | 8.78 | 7.93 | 93.76 | 79.77 | |||||
| February 2011(3) | 7.92 | 7.03 | 81.82 | 21.29 | |||||
| March 2011 | 7.27 | 6.85 | 23.10 | 21.10 | |||||
| April 2011(4) | 7.36 | 7.10 | 23.18 | 22.50 | |||||
| Sources: | Santiago Stock Exchange Official Quotation Bulletin; NYSE. |
| (1) | Pesos per share reflect nominal price at trade date. |
| (2) | Price per ADS in US$: one ADS represents 5,000 common shares |
| (3) | On February 23, 2011, Corpbanca changed the ratio of its ADSs from 5,000 common shares to 1 ADS to 1,500 common shares to 1 ADS. |
| (4) | Through April 12, 2011. |
114
No trading suspensions relating to our common shares have occurred.
The table below shows, for the periods indicated, the average daily trading volume for our common shares on the Santiago Stock Exchange and of our ADSs on the New York Stock Exchange.
| Santiago Stock Exchange | New York Stock Exchange | |||||||
Common Shares Volume (Ch$)(1) | ADSs Volume (US$) | |||||||
| Annual Average Daily Trading Volume | ||||||||
| 2009 | 403,119,867 | 85,921 | ||||||
| 2010 | 1,265,196,079 | 432,448 | ||||||
| Quarterly Average Daily Trading Volume | ||||||||
| 2009 1st Quarter | 583,664,482 | 123,500 | ||||||
| 2009 2nd Quarter | 409,971,070 | 60,684 | ||||||
| 2009 3rd Quarter | 398,953,539 | 101,027 | ||||||
| 2009 4th Quarter | 217,243,591 | 59,229 | ||||||
| 2010 1st Quarter | 681,092,374 | 198,517 | ||||||
| 2010 2nd Quarter | 499,115,324 | 221,924 | ||||||
| 2010 3rd Quarter | 1,092,831,775 | 492,427 | ||||||
| 2010 4th Quarter | 2,858,151,259 | 795,726 | ||||||
| Monthly Average Daily Trading Volume | ||||||||
| September 2010 | 1,642,486,884 | 782,671 | ||||||
| October 2010 | 44,988,496,082 | 15,606,295 | ||||||
| November 2010 | 78,334,411,159 | 21,847,639 | ||||||
| December | 2,565,831,943 | 612,388 | ||||||
| January 2011 | 1,043,921,425 | 811,001 | ||||||
| February 2011 | 1,355,485,499 | 807,418 | ||||||
| March 2011 | 703,273,588 | 692,042 | ||||||
| April 2011(2) | 844,183,830 | 712,599 | ||||||
| Sources: | Santiago Stock Exchange Official Quotation Bulletin; NYSE. |
| (1) | Pesos per share reflect nominal price at trade date. |
| (2) | Through April 12, 2011. |
B. PLAN OF DISTRIBUTION
Not applicable.
C. MARKETS
Our common shares are traded on the Santiago Stock Exchange under the symbol “Corpbanca”. Our ADSs have been listed since November 1, 2004 on the New York Stock Exchange under the symbol “BCA”.
D. SELLING SHAREHOLDER
Not applicable.
E. DILUTION
Not applicable.
F. EXPENSES OF THE ISSUE
Not applicable.
A. SHARE CAPITAL
Not applicable.
115
B. MEMORANDUM AND ARTICLES OF INCORPORATION
Set forth below is material information concerning our share capital and a brief summary of the significant provisions of our estatutos, as defined below, and Chilean law. This description contains material information concerning the shares, but does not purport to be complete and is qualified in its entirety by reference to our estatutos, the General Banking Law, the Chilean Corporations Law and the Ley de Mercado de Valores, or the Chilean Securities Market Law, each referred to below.
General
Shareholder rights in a Chilean bank that is also an open-stock (public) corporation are governed by the corporation’s estatutos, which effectively serve the purpose of both the articles or certificate of incorporation and the bylaws of a company incorporated in the United States, by the General Banking Law and secondarily, to the extent not inconsistent with the latter, by the provisions of Chilean Corporations Law applicable to publicly traded corporations except for certain provisions which are expressly excluded. Article 137 of the Chilean Corporations Law provides that all provisions of the Chilean Corporations Law take precedence over any contrary provision in a corporation’s estatutos. Both the Chilean Corporations Law and our estatutos provide that legal actions by shareholders against us (or our officers or directors) to enforce their rights as shareholders or by one shareholder against another in their capacity as such are to be brought in Chile in arbitration proceedings, notwithstanding the plaintiff’s right to submit the action to the ordinary courts of Chile.
The Chilean securities markets are principally regulated by the Chilean Superintendency of Securities and Insurance under the Chilean Securities Market Law and the Chilean Corporations Law. In the case of banks, compliance with these laws is supervised by the Chilean Superintendency of Banks. These two laws provide for disclosure requirements, restrictions on insider trading and price manipulation and protection of minority investors. The Chilean Securities Market Law sets forth requirements relating to public offerings, stock exchanges and brokers, and outlines disclosure requirements for companies that issue publicly offered securities. The Chilean Corporations Law sets forth the rules and requirements for establishing open stock corporations while eliminating government supervision of closed (closely-held) corporations. Open stock (public) corporations are those that voluntarily or are legally required to register their shares in the Securities Registry.
Board of Directors
The Board of Directors has 9 regular members and 2 alternate members, elected by shareholder vote at General Shareholders’ Meetings. The directors may be either shareholders or non-shareholders of the Company. There is no age limit for directors.
A director remains in office for three years and may be re-elected indefinitely. If for any reason, the General Shareholders’ Meeting where the new appointments of directors are to be made is not held, the duties of those serving as such shall be extended until their replacements are designated, in which case, the Board of Directors shall convene a meeting at the earliest possible time in order to effect the appointments.
The directors are entitled to compensation for the performance of their duties. The amount of their compensation is determined annually at the General Shareholders’ Meeting. In addition, payments in the form of wages, fees, travel accounts, expense accounts, dues as representatives of the Board of Directors and other cash payments, payments in kind or royalties of any sort whatsoever, may be paid to certain directors for the performance of specific duties or tasks in addition to their functions as directors imposed upon them specifically by the General Shareholders’ Meeting. Any special compensation is timely notified at the General Shareholders’ Meeting, and for that purpose, a detailed and separate entry shall be made in Corpbanca’s Annual Report to investors, which shall expressly indicate the complete name of each of the directors receiving special compensation.
Without prejudice to any other incapacity or incompatibility established by law, the following may not be directors: (a) those persons who have been sentenced or are being tried, either as principals or accessories, for crimes punishable with a penalty of temporary or permanent suspension from or incapacity to hold public office, (b) those persons who have been declared bankrupt and have not been rehabilitated, (c) members of the House of Representatives and the Senate, (d) directors or employees of any other financial institution; employees appointed by the President of the Republic and employees or officers of (i) the State, (ii) any public service, public institution, semi-public institution, autonomous entity or state-controlled company (any such entity a “Public Entity”), or (iii) any enterprise, corporation or public or private entity in which the State or a Public Entity has a majority interest, has made capital contributions, or is represented or participating, provided that persons holding positions in teaching activities in any of the above entities may be directors, and (f) the bank’s employees, which shall not prevent a director from holding on a temporary basis and for a term not to exceed ninety days the position of General Manager. Chief Executive Officers may not be elected as directors.
For purposes of the appointment of directors, each shareholder shall have the right to one vote per share for purposes of appointing a single person, or to distribute his votes in between candidates as he may deem convenient, and the persons obtaining the largest number of votes in the same and single process shall be awarded positions, until all positions have been filled. The election of the regular and alternate board members shall be carried out separately. For purposes of the casting of the vote, the Chairman and the Secretary, together with any other persons that may have been previously designated by at the meeting to sign the minutes thereof, shall issue a certificate giving evidence of the oral votes of shareholders attending, following the order of the list of attendance being taken.
116
Each shareholder shall be entitled, however, to cast his vote by means of a ballot signed by him, stating whether he signs for his own account or as a representative. This entitlement notwithstanding, in order to expedite the voting process, the Chairman of the bank or the Superintendency, as the case may be, is entitled to order that the vote be taken alternatively or by oral vote or by means of ballots. At the time of polling, the Chairman may instruct that the votes be read aloud, in order for those in attendance to count for themselves the number of votes issued and verify the outcome of the voting process.
Every appointment of directors, or any changes in the appointment of directors, shall be transcribed into a public deed before a notary public, published in a newspaper of Santiago and notified to the Superintendency of Banks and Financial Institutions, by means of the filing of a copy of the respective public deed. Likewise, the appointments of General Manager, Manager and Deputy Managers shall be communicated and transcribed into a public deed.
If a director ceases to be able to perform his or her duties, whether by reason of conflict of interest, limitation, legal incapacity, impossibility, resignation or any other legal cause, the vacancy shall be filled as follows: (a) the positions of regular directors shall be filled by an alternate director, and (b) the positions of alternate directors vacated upon the application of (a) above, and the positions of regular directors if a regular director’s position can not be filled pursuant to clause (a) because both alternate members have already become regular members, shall be filled by the Board of Directors on its first meeting after the vacancy occurs. Board members appointed pursuant to clause (b) will remain in the position until the next General Shareholders’ Meeting, where the appointment may be ratified, in which case, the replacement director will remain in his or her position until the expiration of the term of the director he or she replaced and shall act as full director.
The alternate directors may temporarily replace regular directors in case of their absence or temporary inability to attend a board meeting. The alternate board members are always entitled to attend and speak at board meetings. They will be entitled to vote at such meetings only when a regular member is absent and such alternate member acts as the absent member’s replacement.
During the first meeting following the General Shareholders’ Meeting, the Board of Directors shall elect, by an absolute majority and in separate and secret votes, from among its members, a Chairman, a First Vice Chairman and a Second Vice Chairman. If no one were to obtain such majority, the election will be repeated among those who obtained the three greatest majorities, adding the blank votes to the person who obtained the greatest number of votes. In case of a tie the vote shall be repeated and if a tie were to occur again, there shall be a drawing. The Chairman, the First Vice President and the Second Vice President may be reelected indefinitely.
The Board of Directors meets in ordinary sessions at least once a month, held on pre-set dates and times determined by the Board. Extraordinary meetings are held whenever called by the Chairman, whether at his own will or upon the request of one or more directors, so long as the Chairman determines in advance that the meeting is justified, except if the request is made by the absolute majority of the directors in office, in which case the meeting shall be held without such prior determination. The extraordinary meetings may only address those matters specifically included in the agenda for the extraordinary meeting, except that, if the meeting is attended by all the directors in office, they may agree otherwise by a unanimous vote. Notifications of meetings of the Board of Directors shall be made by certified letter sent to the addressed of each director registered with the bank, at least 5 days in advance of the date on which the ordinary or extraordinary session should be held. The 5-day period shall be calculated from the date on which the letter is placed in the mail.
The quorum for the Board of Directors’ Meeting is five of its members. Resolutions shall be adopted by the affirmative vote of the absolute majority of the attending directors. In the event of a tie, the person acting as the Chairman of the meeting shall cast a deciding vote.
Directors having a vested interest in a negotiation, act, contract or transaction that is not related to the bank business, either as principal or as representative of another person, shall communicate such fact to the other directors. If the respective resolutions are approved by the Board, it shall be in accordance with the prevailing company’s interest and fair market conditions and director’s interest must be disclosed at the next General Shareholders’ Meeting by the Chairman of such Board meeting.
The discussions and resolutions of the Board of Directors shall be recorded in a special book of minutes maintained by the Secretary. The relevant minutes shall be signed by the directors attending the meeting and by the Board of Directors, or his alternate. If a director determines that the minutes for a meeting are inaccurate or incomplete, he is entitled to record an objection before actually signing the minutes. The resolutions adopted may be carried out prior to the approval of the minutes at a subsequent meeting. In the event of death, refusal or incapacity for any reason of any of the directors attending to sign the minutes, such circumstance shall be recorded at the end of the minutes stating the reason for the impediment.
117
The directors are personally liable for all of the acts they effect in the performance of their duties. Any director who wishes to disclaim responsibility for any act or resolution of the Board of Directors must to record his opposition in the minutes, and the Chairman must report the opposition at the following General Shareholders’ Meeting.
The Board will represent the bank in and out of court and, for the performance of the bank’s business, a circumstance that will not be necessary to prove before third parties, it will be empowered with all the authorities and powers of administration that the law or the by-laws do not set as exclusive to the General Shareholders’ Meeting, without being necessary to grant any special power of attorney, even for those acts that the law requires to do so. This provision is notwithstanding the judicial representation of the bank that is part of the General Manager’s authorities. The Board may delegate part of its authority to the General Manager, to the Managers, Deputy Managers or Attorneys of the bank, a Director, a Commission of Directors, and for specifically determined purposes, in other persons.
Capitalization
Under Chilean law, the shareholders of a company, acting at an extraordinary shareholders’ meeting, have the power to authorize an increase in such company’s capital. When an investor subscribes for issued shares, the shares are registered in such investor’s name, even if not paid for, and the investor is treated as a shareholder for all purposes except with regard to receipt of dividends and the return of capital; provided that the shareholders may, by amending the by-laws, also grant the right to receive dividends or distributions of capital. The investor becomes eligible to receive dividends and returns of capital once it has paid for the shares (if it has paid for only a portion of such shares, it is entitled to receive a corresponding pro-rata portion of the dividends declared and/or returns of capital with respect to such shares unless the Company’s by-laws provide otherwise). If an investor does not pay for shares for which it has subscribed on or prior to the date agreed upon for payment, the board of directors of the company is obligated to initiate legal action to recover outstanding amounts unless holders of two thirds of the issued shares in an extraordinary shareholders meeting authorizes the board of directors to refrain from pursuing the collection, in which case the company’s capital will be reduced to the amount actually paid. In the case of banks, authorized shares and issued shares which have not been paid for within the period fixed for their payment by the Chilean Superintendency of Banks are cancelled and are no longer available for issuance by the company.
Article 22 of Chilean Corporations Law states that the purchaser of shares of a company implicitly accepts its bylaws and any agreements adopted at shareholders’ meetings.
Ownership Restrictions
Under Article 12 of the Chilean Securities Market Law and the regulations of the Chilean Superintendency of Banks, shareholders of open stock corporations are required to report the following to the Chilean Superintendency of Securities and Insurance and the Chilean stock exchanges:
· | any direct or indirect acquisition or sale of shares that results in the holder’s acquiring or ceasing to own, directly or indirectly, 10.0% or more of an open stock corporation’s share capital, and |
· | any direct or indirect acquisition or sale of shares or options to buy or sell shares, in any amount, if made by a holder of 10.0% or more of an open stock corporation’s capital or if made by a director, liquidator, main officer, general manager or manager of such corporation. |
In addition, majority shareholders must state in their report whether their purpose is to acquire control of the company or if they are making a financial investment. A beneficial owner of ADSs representing 10.0% or more of our share capital will be subject to these reporting requirements under Chilean law.
Under Article 54 of the Chilean Securities Market Law and the regulations of the Chilean Superintendency of Securities and Insurance, persons or entities intending to acquire control, directly or indirectly, of a publicly traded company, regardless of the acquisition vehicle or procedure, and including acquisitions made through direct subscriptions or private transactions, are also required to inform the public of such acquisition at least 10 business days before the date on which the transaction is to be completed, but in any case, as soon as negotiations regarding the change of control begin (i.e., when information and documents concerning the target are delivered to the potential acquiror) through a filing with the Chilean Superintendency of Securities and Insurance, the stock exchanges and the companies controlled by and that control the target and through a notice published in two Chilean newspapers, which notice must disclose, among other information, the person or entity purchasing or selling and the price and conditions of any negotiations.
Prior to such publication, a written communication to such effect must be sent to the target corporation, the controlling corporation, the corporations controlled by the target corporation, the Chilean Superintendency of Securities and Insurance, and to the Chilean stock exchanges on which the securities are listed.
118
In addition to the foregoing, Article 54A of the Chilean Securities Market Law requires that within two business days of the completion of the transactions pursuant to which a person has acquired control of a publicly traded company, a notice shall be published in the same newspapers in which the notice referred to above was published and notices shall be sent to the same persons mentioned in the preceding paragraphs.
A beneficial owner of ADSs intending to acquire control of us will be subject to the foregoing reporting requirements.
The provisions of the aforementioned articles do not apply whenever the acquisition is being made through a tender or exchange offer.
Title XXV of the Chilean Securities Market Law on tender offers and the regulations of the Chilean Superintendency of Securities and Insurance provides that the following transactions shall be carried out through a tender offer:
· | an offer which allows a person to take control of a publicly traded company (sociedad anónima abierta), unless the shares are being sold by a controlling shareholder of such company at a price in cash which is not substantially higher than the market price and the shares of such company are actively traded on a stock exchange, |
· | an offer for all the outstanding shares of a publicly traded company (sociedad anónima abierta) upon acquiring two thirds or more of its voting shares (this offer must be made at a price not lower than the price at which appraisal rights may be exercised, that is, book value if the shares of the company are not actively traded or, if the shares of the company are actively traded, the weighted average price at which the stock has been traded during the two months immediately preceding the acquisition), and |
· | an offer for a controlling percentage of the shares of a listed operating company if such person intends to take control of the company (whether listed or not) controlling such operating company, to the extent that the operating company represents 75.0% or more of the consolidated net worth of the holding company. |
Article 200 of the Chilean Securities Market Law prohibits any shareholder that has taken control of a publicly traded company to acquire, for a period of 12 months from the date of the transaction that granted it control of the publicly traded company, a number of shares equal to or higher than 3.0% of the outstanding issued shares of the target without making a tender offer at a price per share not lower than the price paid at the time of taking control. Should the acquisition from the other shareholders of the company be made on the floor of a stock exchange and on a pro rata basis, the controlling shareholder may purchase a higher percentage of shares, if so permitted by the regulations of the stock exchange.
Title XV of the Chilean Securities Market Law sets forth the basis to determine what constitutes a controlling power, a direct holding and a related party. The Chilean Securities Market Law defines control as the power of a person, or group of persons acting pursuant to a joint action agreement, to direct the majority of the votes in the shareholders meetings of the corporation, or to elect the majority of members of its board of directors, or to influence the management of the corporation significantly. Significant influence is deemed to exist in respect of the person or group holding, directly or indirectly, at least 25.0% of the voting share capital, unless:
· | another person or group of persons acting pursuant to joint action agreement, directly or indirectly, control a stake equal to or higher than the percentage controlled by such person, |
· | the person or group does not control, directly or indirectly, more than 40.0% of the voting share capital and the number of shares controlled is lower than the sum of the shares held by other shareholders holding more than 5.0% of the share capital, and |
· | in cases where the Chilean Superintendency of Securities and Insurance has ruled otherwise, based on the distribution or atomization of the overall shareholding. |
According to the Chilean Securities Market Law a joint action agreement is an agreement among two or more parties which, directly or indirectly, own shares in a corporation at the same time and whereby they agree to participate with the same interest in the management of the corporation or in taking control of the same. The law presumes that such an agreement exists between:
· | a principal and its agents, |
· | spouses and relatives up to certain level of kindred, |
· | entities within the same business group, and |
· | an entity and its controller or any of its members. |
119
Likewise, the Chilean Superintendency of Securities and Insurance may determine that a joint action agreement exists between two or more entities considering, among others, the number of companies in which they participate, the frequency with which they vote identically in the election of directors, appointment of managers and other resolutions passed at shareholders’ meetings.
According to Article 96 of the Chilean Securities Market Law a business group is a group of entities with such ties in their ownership, management or credit liabilities that it may be assumed that the economic and financial action of such members is directed by, or subordinated to, the joint interests of the group, or that there are common credit risks in the credits granted to, or securities issued by, them. According to the Chilean Securities Market Law the following entities are part of the same business group:
| · | a company and its controller, |
| · | all the companies with a common controller and the latter, and |
| · | all the entities that the Chilean Superintendency of Securities and Insurance declare to be part of the business group due to one or more of the following reasons: |
| · | a substantial part of the assets of the company is involved in the business group, whether as investments in securities, equity rights, loans or guaranties, |
| · | the company has a significant level of indebtedness and that the business group has a material participation as a lender or guarantor, |
· | when the controller is a group of entities, that the company is a member of a controller of the entities mentioned in the first two bullets above and there are grounds to include it in the business group, and |
· | when the controller is a group of entities, that the company is controlled by a member of the controlling group and there are grounds to include it in the business group. |
Article 36 of the General Banking Law states that as a matter of public policy, no person or company may acquire, directly or indirectly, more than 10.0% of the shares of a bank without the prior authorization of the Chilean Superintendency of Banks, which may not be unreasonably withheld. The prohibition would also apply to beneficial owners of ADSs. In the absence of such authorization, any person or group of persons acting in concert would not be permitted to exercise voting rights with respect to the shares or ADSs acquired. In determining whether or not to issue such an authorization, the Chilean Superintendency of Banks considers a number of factors enumerated in the General Banking Law, including the financial stability of the purchasing party.
Article 35 bis of the General Banking Law requires the prior authorization of the Chilean Superintendency of Banks for:
| · | the merger of two or more banks, |
| · | the acquisition of all or a substantial portion (more than one third) of a banks’ assets and liabilities by another bank, |
| · | the control by the same person, or controlling group, of two or more banks, or |
| · | a substantial increase in the share ownership by a controlling shareholder of a bank (understood as either acquiring a majority or two thirds of the bank’s shares). |
Such prior authorization is required solely when the acquiring bank or the resulting group of banks would own a significant market share in loans, defined by the Chilean Superintendency of Banks to be more than 15.0% of all loans in the Chilean banking system. The intended purchase, merger or expansion may be denied by the Chilean Superintendency of Banks pursuant to a report from the Chilean Central Bank’s Counsel. Alternatively, a purchase, merger or expansion, when the acquiring bank or resulting group would have a market share in loans defined by the Chilean Superintendency of Banks to be more than 20.0% of all loans in the Chilean banking system, may be conditioned on one or more of the following:
| · | that the bank or banks maintain an effective equity higher than 8.0% and up to 14.0% of their risk weighted assets, |
· | that the technical reserve established in Article 65 of the General Banking Law be applicable when deposits exceed one and a half times the resulting bank’s paid-in capital and reserves, or |
| · | that the margin for interbank loans be diminished to 20.0% of resulting bank’s effective equity. |
If the acquiring bank or resulting group would have a market share in loans defined by the Chilean Superintendency of Banks to be more than 15.0% but less than 20.0%, the authorization will be conditioned on the bank or banks maintaining an effective equity not lower than 10.0% of their risk-weighted assets for the time set forth by the Chilean Superintendency of Banks, which may not be less than one year.
120
According to the General Banking Law a bank may not grant loans to related parties on more favorable terms than those generally offered to non-related parties. Article 84 No. 2 of the General Banking Law and the regulations issued by the Chilean Superintendency of Banks create the presumption that natural persons who are holders of shares and who beneficially own more than 1.0% of the shares are related to the bank and imposes certain restrictions on the amounts and terms of loans made by banks to related parties. This presumption would also apply to beneficial owners of ADSs representing more than 1.0% of the shares, and accordingly the limitations of Article 84 No. 2 would be applicable to such beneficial owners. Finally, according to the regulations of the Chilean Superintendency of Banks, Chilean banks that issue ADSs are required to inform the Chilean Superintendency of Banks if any person, directly or indirectly, acquires ADSs representing 5.0% or more of the total amount of shares of capital stock issued by such bank.
Article 16 bis of the General Banking Law provides that the individuals or legal entities which, individually or with other people, directly control a bank and who individually own more than 10.0% of its shares shall send to the Chilean Superintendency of Banks reliable information on their financial situation in the form and within the time set forth in Resolution No. 3,156 of the Chilean Superintendency of Banks.
Preemptive Rights and Increases of Share Capital
The Chilean Corporations Law provides that whenever a Chilean company issues new shares for cash, it must offer to its existing shareholders the right to purchase a sufficient number of shares to maintain their existing ownership percentages in the company. Pursuant to this requirement, preemptive rights in connection with any future issue of shares will be offered by us to the depositary as the registered owner of the shares underlying the ADSs. However, the depositary will not be able to make such preemptive rights available to holders of ADSs unless a registration statement under the Securities Act is effective with respect to the underlying shares or an exemption from the registration requirements thereunder is available.
We intend to evaluate, at the time of any preemptive rights offering, the practicality under Chilean law and Central Bank regulations in effect at the time of making such rights available to our ADS holders, as well as the costs and potential liabilities associated with registration of such rights and the related common shares under the Securities Act, and the indirect benefits to us of thereby enabling the exercise by all or certain holders of ADSs of their preemptive rights and any other factors we consider appropriate at the time, and then to make a decision as to whether to file such registration statement. We cannot assure you that any registration statement would be filed. If we do not file a registration statement and no exemption from the registration requirements under the Securities Act is available, the depositary will attempt to sell such holders’ preemptive rights and distribute the proceeds thereof, after deduction of its expenses and fees, if a premium can be recognized over the cost of such sale. In the event that the depositary is not able, or determines that it is not feasible, to sell such rights at a premium over the cost of any such sale, all or certain holders of ADSs may receive no value for such rights. The inability of all or certain holders of ADSs to exercise preemptive rights in respect of common shares underlying such ADSs could result in such holders not maintaining their percentage ownership of the common shares following such preemptive rights offering unless such holder made additional market purchases of ADSs or common shares.
Under Chilean law, preemptive rights are exercisable or freely transferable by shareholders during a period that cannot be less than 30 days following the grant of such rights. During such period, and for an additional 30-day period thereafter, a Chilean company is not permitted to offer any unsubscribed shares for sale to third parties on terms which are more favorable than those offered to its shareholders. At the end of such additional 30-day period, a Chilean open stock corporation is authorized to sell unsubscribed shares to third parties on any terms, provided they are sold on a Chilean stock exchange. Unsubscribed shares that are not sold on a Chilean stock exchange can be sold to third parties only on terms no more favorable for the purchaser than those offered to shareholders.
On December 30, 2010, our Board of Directors agreed to hold an Extraordinary Shareholders Meeting on January 27, 2011, in order to submit to the shareholders for approval a proposal to increase the capital of the bank through the issuance of 40,042,815,984 new common shares. The new common shares would have no par value and represent 15.0% of the new total capital stock of Corpbanca. On the same day, we informed the Chilean local authorities of the potential capital increase by filing an Hecho Esencial with the SVS.
A majority of the shareholders of the bank approved the proposed capital increase at the Extraordinary Shareholders Meeting held on January 27, 2011, and the Board of Directors was expressly authorized to determine the offering price for the new common shares and whether to offer them in Chile or abroad; in particular, the securities market in the United States through the issuance and listing of ADRs on the NYSE.
121
Shareholders’ Meetings and Voting Rights
An ordinary annual meeting of shareholders is held within the first four months of each year, generally in February. The ordinary annual meeting of shareholders is the corporate body that approves the annual financial statements, approves all dividends in accordance with the dividend policy, approved by general shareholders’ meeting elects the members of our Board of Directors and approves any other matter which does not require an extraordinary shareholders’ meeting. The last ordinary annual meeting of our shareholders was held on February 24, 2011.
Extraordinary meetings may be called by our Board of Directors when deemed appropriate, and ordinary or extraordinary meetings must be called by our Board of Directors when requested by shareholders representing at least 10.0% of the issued voting shares or by the Chilean Superintendency of Banks. Notice to convene the ordinary annual meeting or an extraordinary meeting is given by means of three notices which must be published in a newspaper of our corporate domicile (currently Santiago) or in the Official Gazette in a prescribed manner, and the first notice must be published not less than 15 days nor more than 20 days in advance of the scheduled meeting. Notice must also be mailed 15 days in advance to each shareholder and given to the Chilean Superintendency of Banks and the Santiago, Valparaiso and Electronic Stock Exchanges. Currently, we publish our official notices in the Diario La Tercera.
The quorum for a shareholders’ meeting is established by the presence, in person or by proxy, of shareholders representing at least an absolute majority of the issued shares; if a quorum is not present at the first meeting, the meeting can be reconvened (in accordance with the procedures described in the previous paragraph) and, upon the meeting being reconvened, shareholders present at the reconvened meeting are deemed to constitute a quorum regardless of the percentage of the shares represented. The shareholders’ meetings pass resolutions by the affirmative vote of an absolute majority of those voting shares present or represented at the meeting. The vote required at any shareholders’ meeting to approve any of the following actions, however, is a two-thirds majority of the issued shares:
| · | a change in corporate form, merger or spin-off, |
| · | an amendment to our term of existence or early dissolution, |
| · | a change in corporate domicile, |
| · | a decrease of corporate capital, |
| · | the approval of capital contributions in kind and a valuation of the assets contributed, |
| · | a modification of the powers exercisable through the shareholders’ meetings or limitations on the powers of our Board of Directors, |
| · | a reduction in the number of members of our Board of Directors, |
· | the transfer of 50.0% or more of the corporate assets, regardless of whether it includes liabilities, or the formation or amendment of any business plan that contemplates the transfer of 50.0% or more of the corporate assets, |
| · | any non-cash distribution in respect of the shares, |
| · | the creation of security interests to secure third-party obligations in excess of 50.0% of the corporate assets, unless granted to a subsidiary, |
| · | the repurchase of shares, |
| · | the approval of material related-party transactions when requested by shareholders representing at least 5.0% of the issued and outstanding shares with right to vote, or |
| · | the decision to distribute less than 30.0% of the net profits of any given year as dividends. |
Shareholders may accumulate their votes for the election of directors and cast the same in favor of one person.
In general, Chilean law does not require a Chilean open stock corporation to provide the level and type of information that U.S. securities laws require a reporting company to provide to its shareholders in connection with a solicitation of proxies. However, shareholders are entitled to examine the books of the company within the 15-day period before the ordinary annual meeting. Under Chilean law, a notice of a shareholders’ meeting listing matters to be addressed at the meeting must be mailed not fewer than 15 days prior to the date of such meeting, and, in cases of an ordinary annual meeting, shareholders must have available an annual report of the company’s activities which includes audited financial statements. In addition to these requirements, we regularly provide, and management currently intends to continue to provide, together with the notice of shareholders’ meeting, a proposal for the final annual dividend.
122
The Chilean Corporations Law provides that whenever shareholders representing 10.0% or more of the issued voting shares so request, a Chilean company’s annual report must include, in addition to the materials provided by the board of directors to shareholders, such shareholders’ comments and proposals in relation to the company’s affairs. Similarly, the Chilean Corporations Law provides that whenever the board of directors of an open stock corporation convenes an ordinary meeting of the shareholders and solicits proxies for that meeting, or distributes information supporting its decisions, or other similar material, it is obligated to include as an annex to its annual report any pertinent comments and proposals that may have been made by shareholders owning 10.0% or more of the company’s voting shares who have requested that such comments and proposals be so included.
Only shareholders registered as such with us on the fifth business day prior to the date of a meeting are entitled to attend and vote their shares. A shareholder may appoint another individual (who need not be a shareholder) as his proxy to attend and vote on his behalf. Every shareholder entitled to attend and vote at a shareholders’ meeting has one vote for every share subscribed.
Dividend, Liquidation and Appraisal Rights
Under the Chilean Corporations Law, Chilean companies are generally required to distribute at least 30.0% of their earnings as dividends. In the event of any loss of capital or of the legal reserve, no dividends can be distributed so long as such loss is not recovered. Also, no dividends of a bank above the legal minimum can be distributed if doing so would result in the bank exceeding its indebtedness ratio or its lending limits.
Dividends that are declared but not paid by the date set for payment at the time of declaration are adjusted from the date set for payment to the date such dividends are actually paid. The right to receive a dividend lapses if it is not claimed within five years from the date the dividend is payable.
We may declare a dividend in cash or in shares. When a share dividend is declared above the legal minimum (which minimum must be paid in cash), our shareholders must be given the option to elect to receive cash. Our ADS holders may, in the absence of an effective registration statement under the Securities Act or an available exemption from the registration requirement thereunder, effectively be required to receive a dividend in cash.
In the event of our liquidation, the holders of fully paid shares would participate equally and ratably, in proportion to the number of paid-in shares held by them, in the assets available after payment of all creditors.
In accordance with the General Banking Law, our shareholders would have no appraisal rights in the event of a business combination or otherwise.
Approval of Financial Statements
Our Board of Directors is required to submit our audited financial statements to the shareholders annually for their approval. The approval or rejection of such financial statements is entirely within our shareholders’ discretion. If our shareholders reject our financial statements, our Board of Directors must submit new financial statements not later than 60 days from the date of such rejection. If our shareholders reject our new financial statements, our entire Board of Directors is deemed removed from office and a new Board of Directors is elected at the same meeting. Directors who individually approved such rejected financial statements are disqualified for re-election for the ensuing period.
Registrations and Transfers
Our shares are registered by an administration agent named DCV Registros S.A. This entity is responsible for our shareholders’ registry. In the case of jointly owned shares, an attorney-in-fact must be appointed to represent the joint owners in dealings with us.
C. MATERIAL CONTRACTS
The following is a brief summary of our material contracts currently in force. A copy of each of these contracts has been included as an exhibit hereto. See “Item 19. Exhibits”.
Sublease Automatic Teller Machine Contract. On November 26, 2008, we entered into a contract with SMU S.A., Rendic Hermanos S.A., Supermercados Bryc S.A. and Distribuidora Super Diez S.A., each a related party, to sublease Corpbanca space in order to install automatic teller machines in the supermarket chains administrated by the previously mentioned corporations. The contract covers a term from November 26, 2008 to June 30, 2019. Corpbanca prepaid the lessors UF1,152,213.0 for the total amount and term of the spaces subleased. For further information, see note 33 to the consolidated financial statements included herein.
123
Systems Operations Services Agreement. We have entered into a Systems Operations Services Agreement with IBM, initially dated March 30, 2001, and covering a term from April 1, 2001 through April 15, 2006 which can be renegotiated periodically. The contract now covers a term from April 16, 2008 to April 30, 2018. Under this agreement, IBM provides outsourcing Computer System Operations services to us and we are obligated to pay fees amounting to UF2,821.7 per month.
Service Contract. We have entered into a Service Contract with our affiliate Corp Group Interhold S.A. This agreement is dated July 6, 2001 and covered a five-year term which is automatically renewed for one-year periods thereafter. Under this agreement, Corp Group Interhold shall provide us with professional and technical consulting including preparation of financial statements, implementing financial and administrative procedures; preparing, analyzing, and providing legal advisory services; and analyzing economic, financial sectors and feasibility of investment plans. Under this agreement, we pay fees of approximately UF6,250.0 per month.
Software Consulting and Development Agreement. We have entered into a Software Consulting and Development Agreement, for the Integrated Banking System (IBS), dated as of October 4, 2001, with Datapro, Inc. The contract covers a five-year term for system maintenance and adjustments, which is automatically renewable at the end of the term. The contract includes an initial charge for development and user license of US$380,000.0 and a schedule of additional fees for services provided as well as a monthly maintenance fee.
Redbanc Agreement. We have entered into an agreement to participate in the automated teller machine network operated by Redbanc S.A., dated as of April 1, 2001. The contract covers a three-year term which is automatically and successively renewed for equal three-year periods. The purpose of this agreement is to provide services to facilitate the performance of banking objectives. This includes the installation, operation, maintenance, and development of equipment, devices, systems, and services used for the management and operation of automated and non-automated cash and point-of-sale machines and the related services. Redbanc shall invoice and charge us a different monthly fee for each of the services connected to the automated teller machine network.
D. EXCHANGE CONTROLS
The Central Bank is responsible for, among other things, monetary policies and exchange controls in Chile. Foreign investments can be registered with the Foreign Investment Committee under Decree Law No. 600 of 1974, as amended, or can be registered with the Central Bank under the Central Bank Act and the Compendio de Normas de Cambios Internacionales, or the Central Bank Foreign Exchange Regulations or the Compendium. The Central Bank Act is a constitutional law requiring a “special majority” vote of the Chilean Congress to be modified.
The Central Bank Foreign Exchange Regulations were amended on April 19, 2001. The main objective of these amendments was to facilitate capital movements from and into Chile and encourage foreign investment. According to the new Central Bank Foreign Exchange Regulations, investors are allowed to freely enter into any kind of foreign exchange transaction, the only restriction being that investors must inform the Central Bank about certain operations which they have conducted and must conduct certain operations through the Formal Exchange Market. The types of information related to equity investment that must be reported to the Central Bank by non-Chilean residents include the occurrence of, among other things, any assignment, substitution, changes in organizational status, change in the form of the investment, or material changes to the terms of the agreement governing the foreign currency transaction. Transactions that are required to be conducted through the Formal Exchange Market include transactions involving foreign commercial bank loans or Chilean company issued bonds, deposits made in Chilean financial institutions by foreign depositors, and equity investments and contributions of capital by foreign investors. The Formal Exchange Market entities through which transactions are conducted will report such transactions to the Central Bank.
Pursuant to the provisions of Chapter XIV of the Compendium, it is not necessary to seek the Central Bank’s prior approval in order to establish an ADR facility. The Central Bank only requires that (i) any foreign investor acquiring shares to be converted into ADSs who has actually brought funds into Chile for that purpose shall bring those funds through the Formal Exchange Market, (ii) any foreign investor acquiring shares to be converted into ADSs informs the Central Bank of the investment in the terms and conditions described below, (iii) all remittances of funds from Chile to the foreign investor upon the sale of the shares underlying the ADSs or from dividends or other distributions made in connection therewith, shall be made through the Formal Exchange Market, and (iv) all remittances of funds to the foreign investor, whether or not from Chile, shall be informed to the Central Bank in the terms and conditions described below.
When the shares to be converted into ADSs have been acquired by the foreign investor with funds brought into Chile through the Formal Exchange Market, a registration form shall be filed with the Department of International Financial Operations of the Central Bank by the foreign investor acting through an entity of the Formal Exchange Market on or before the date on which the foreign currency is brought into Chile. However, if the funds were brought into Chile with a different purpose and subsequently were used to acquire shares to be converted into ADSs, the Department of International Financial Operations of the Central Bank then shall be informed of such investment by the Custodian within ten days following the end of each fifteen-day period on which the Custodian has to deliver periodic reports to the Central Bank. If the funds were not brought into Chile, a registration form shall be filed with the Department of International Financial Operations of the Central Bank by the foreign investor itself or through an entity of the Formal Exchange Market within first 10 days of the month following the date on which the proceeds were used. Any foreign investor (other than the Depositary) who has acquired shares and wishes to convert the same into ADSs shall assign to the Depositary, prior to any such conversion, any foreign investment rights it may have pursuant to Chapter XIV of the Compendium. Any such assignment shall be filed with the Central Bank within the first 10 days of the month following its execution.
124
All payments in U.S. dollars in connection with the ADS facility made from Chile shall be made through the Formal Exchange Market. Pursuant to Chapter XIV of the Compendium no previous authorization from the Central Bank is required for the remittance of U.S. dollars obtained in the sale of the shares underlying ADSs or from dividends or other distributions made in connection therewith. The entity of the Formal Exchange Market participating in the transfer shall provide certain information to the Central Bank on the next banking business day. In the event there are payments made outside Chile, the foreign investor shall provide the relevant information to the Central Bank directly or through an entity of the Formal Exchange Market within the first 10 days of the month following the date on which the payment was made.
Under Chapter XIV of the Compendium payments and remittances of funds from Chile are governed by the rules in effect at the time the payment or remittance is made. Therefore, any change made to Chilean laws and regulations after the date hereof will affect foreign investors who have acquired ADSs or shares to be converted into ADSs. There can be no assurance that further Central Bank regulations or legislative changes to the current foreign exchange control regime in Chile will not restrict or prevent foreign investors to purchase and remit abroad U.S. dollars, nor can there be any assessment to the duration or impact of such restrictions, if imposed.
This situation is different from the one governing ADSs issued by Chilean companies prior to April 19, 2001. Prior to such date, ADSs representing shares of stock of Chilean corporations were subject to Chapter XXVI of the Compendium, which addressed the issuance of ADSs by Chilean companies and foreign investment contracts entered into among the issuer of the shares, the Central Bank and the depository pursuant to Article 47 of the Central Bank Act. Chapter XXVI of the Compendium and the corresponding foreign investment contracts granted foreign investors the vested right to acquire dollars with the proceeds obtained in the sale of the underlying shares of stock, or from dividends or other distributions made in connection therewith and remit them abroad. On April 19, 2001, the Central Bank eliminated Chapter XXVI of the Compendium and made the establishment of new ADR facilities subject to the provisions of Chapter XIV of the Compendium. All foreign investment contracts executed under the provisions of Chapter XXVI of the Compendium remain in full force and effect and are governed by the provisions in effect at the time of their execution.
The foregoing is a summary of the Central Bank’s regulations with respect to the issuance of ADSs representing common shares as in force and effect as of the date hereof. This summary does not purport to be complete and is qualified in its entirety by reference to the provisions of Chapter XIV of the Compendium, a copy of which is available from Corpbanca upon request.
There can be no assurance that further Central Bank regulations or legislative changes to the current foreign exchange control regime in Chile will not restrict or prevent foreign investors from purchasing or remitting U.S. dollars, or that further restrictions applicable to foreign investors which affect their ability to remit the capital, dividends or other benefits in connection with the shares of stock will not be imposed by the Central Bank in the future, nor can there be any assessment to the duration or impact of such restrictions, if imposed.
E. TAXATION
Chilean Tax Considerations
The following discussion is based on material Chilean income tax laws presently in force, including Ruling No. 324 of January 29, 1990 of the Chilean Internal Revenue Service and other applicable regulations and rulings. The discussion summarizes the material Chilean income tax consequences of an investment in the ADSs or common shares received in exchange for ADSs by an individual who is not domiciled in or a resident of Chile or a legal entity that is not organized under the laws of Chile and does not have a permanent establishment located in Chile, which we refer to as a foreign holder. For purposes of Chilean law, an individual holder is a resident of Chile if he or she has resided in Chile for more than six consecutive months in one calendar year or for a total of more than six months, whether consecutive or not, in two consecutive tax years. An individual holder is domiciled in Chile if he or she resides in Chile with the purpose of staying in Chile (such purpose to be evidenced by circumstances such as the acceptance of employment within Chile or the relocation of his or her family to Chile). This discussion is not intended as tax advice to any particular investor, which can be rendered only in light of that investor’s particular tax situation.
Under Chilean law, provisions contained in statutes such as tax rates applicable to foreign holders, the computation of taxable income for Chilean purposes and the manner in which Chilean taxes are imposed and collected may be amended only by another statute. In addition, the Chilean tax authorities issue rulings and regulations of either general or specific application interpreting the provisions of Chilean tax law. Absent a retroactive law, Chilean taxes may not be assessed retroactively against taxpayers who act in good faith relying on such rulings and regulations, but Chilean tax authorities may change said rulings and regulations prospectively. There is no general income tax treaty in force between Chile and the United States (although a treaty has been signed it has not yet been ratified by each country and therefore is not yet effective).
125
Cash Dividends and Other Distributions
Cash dividends paid by us with respect to the ADSs or common shares held by a Foreign Holder will be subject to a 35.0% Chilean withholding tax, which is withheld and paid over by us. We refer to this as the Chilean withholding tax. A credit against the Chilean withholding tax is available based on the level of corporate income tax, or first category tax, actually paid by us on the taxable income to which the dividend is imputed; however, this credit does not reduce the Chilean withholding tax on a one-for-one basis because it also increases the base on which the Chilean withholding tax is imposed. In addition, distribution of book income in excess of retained taxable income is subject to the Chilean withholding tax, but such distribution is not eligible for the credit. In case such withholding is determined to be excessive at the end of the year, foreign holders will have rights to file for the reimbursement of the excess withholding. Under Chilean income tax law, for purposes of determining the level of the first category tax that has been paid by us, dividends generally are assumed to have been paid out of our oldest retained taxable profits. The first category tax rate is 17.0%. According to the transitory change by law 24.455, dated November 31, 2010, the tax rate for the 2011 year is 20.0%, 2012 is 18.5% and 17.0% for subsequent years. The foregoing tax consequences apply to cash dividends paid by us. Dividend distributions made in property (other than common shares) will be subject to the same Chilean tax rules as cash dividends.
Capital Gains
Gains realized on the sale, exchange or other disposition by a foreign holder of ADSs (or ADRs evidencing ADSs) will not be subject to Chilean taxation, provided that such disposition occurs outside Chile. The deposit and withdrawal of common shares in exchange for ADRs will not be subject to any Chilean taxes.
Gains recognized on a sale or exchange of common shares received in exchange for ADSs (as distinguished from sales or exchanges of ADSs representing such common shares) by a foreign holder will be subject to both the first category tax and the Chilean withholding tax (the former being creditable against the latter) if (1) the foreign holder has held such common shares for less than one year since exchanging ADSs for the common shares, (2) the foreign holder acquired and disposed of the common shares in the ordinary course of its business or as a regular trader of stock, or (3) the sale is made to a company in which the foreign holder holds an interest (10.0% or more of the shares in the case of open stock corporations). A provisional 20% withholding tax is imposed on the amount of the sale or exchange of common shares received in exchange for ADSs. In all other cases, gain on the disposition of common shares will be subject only to the first category tax levied as a sole tax. However, in these latter cases, if it is impossible to determine the taxable capital gain, a 5.0% withholding will be imposed on the total amount to be remitted abroad without any deductions as a provisional payment of the total tax due.
The tax basis of common shares received in exchange for ADSs will be the acquisition value of such shares. The valuation procedure set forth in the deposit agreement, which values common shares that are being exchanged at the highest price at which they trade on the Santiago Stock Exchange on the date of the exchange, generally will determine the acquisition value for this purpose. Consequently, the conversion of ADSs into common shares and sale of such common shares for the value established under the deposit agreement will not generate a capital gain subject to taxation in Chile to the extent that the sale price is equal to the acquisition value at the time of redemption as discussed above. In the event the sale price exceeds the acquisition value of such shares determined as explained above, such capital gain will be subject to first category tax and the Chilean withholding tax as discussed above.
The distribution and exercise of preemptive rights relating to the common shares will not be subject to Chilean taxation. Amounts received in exchange for the shares or assignment of preemptive rights relating to the shares will be subject to both the first category tax and the Chilean withholding tax (the former being creditable against the latter to the extent described above).
The Chilean Internal Revenue Service has not enacted any rule nor issued any ruling about the applicability of the following norms to the foreign holders of ADRs.
Pursuant to an amendment to the Chilean Income Tax Law published on November 7, 2001 (Law No. 19,768, amended by Law 20,448, dated August 13, 2010), the sale and disposition of shares of Chilean public corporations which are actively traded on stock exchanges is exempted from Chilean taxes on capital gains if the sale or disposition was made on a local stock exchange so long as the shares were purchased on a public stock exchange. However, Law N°20,448 limited this benefit to shares acquired and sold on a local stock exchange, with which it is unlikely that it will apply to the sale of shares resulting from an exchange of ADSs. Investors who request delivery of ADSs in the form of common shares should consult with their tax advisor to determine whether such shares will be eligible for the foregoing exemption.
126
Other Chilean Taxes
No Chilean inheritance, gift or succession taxes apply to the transfer or disposition of the ADSs by a foreign holder but such taxes generally will apply to the transfer at death or by a gift of common shares by a foreign holder. No Chilean stamp, issue, registration or similar taxes or duties apply to foreign holders of ADSs or common shares.
Withholding Tax Certificates
Upon request, we will provide to foreign holders appropriate documentation evidencing the payment of the Chilean withholding tax.
U.S. federal income tax considerations
This section is a summary of certain U.S. federal income tax consequences applicable to the acquisition, ownership and disposition by a U.S. holder (as defined below) of ADSs or common shares. This summary applies to you only if you are a U.S. holder and you hold your ADSs or common shares as capital assets (generally, property held for investment) for U.S. federal income tax purposes. This summary is not a comprehensive description of all of the tax consequences that may be relevant to a decision to hold or dispose of our ADSs or common shares.
This section does not apply to you if you are a U.S. holder subject to special rules, including for example:
| · | a dealer in securities, |
| · | a trader in securities that elects to use a mark-to-market method of accounting for securities holdings, |
| · | a regulated investment company, |
| · | a real estate investment trust, |
| · | a tax-exempt organization, |
| · | a bank or other financial institution, |
| · | a life insurance company, |
| · | a partnership (or other entity treated as a partnership for U.S. federal income tax purposes), |
| · | a person liable for alternative minimum tax, |
| · | a person that actually or constructively owns 10.0% or more of the bank’s shares, |
| · | a person that holds ADSs or common shares as part of a straddle, a hedging, conversion or constructive sale transaction, or |
| · | a person whose functional currency is not the U.S. dollar. |
This section is based on the Internal Revenue Code of 1986, as amended, its legislative history, existing and proposed regulations, published rulings, and court decisions, all as of the date of this Annual Report. These laws are subject to change, possibly on a retroactive basis. This summary does not address any U.S. state or local or non-U.S. tax considerations or any U.S. federal estate, gift or alternative minimum tax considerations. On February 4, 2010, a comprehensive income tax treaty between the United States and Chile was signed, however such treaty has not yet been ratified by each country and therefore is not yet effective. It is unclear at this time when such treaty will be ratified by both countries. You should consult your tax advisor regarding the ongoing status of this treaty, and if ratified the impact such treaty would have on the consequences described in this Annual Report.
As used herein, the term “U.S. holder” means a beneficial owner of ADSs or common shares who is:
| · | an individual who is a citizen or resident of the United States, |
| · | a corporation (or other entity taxable as a corporation for U.S. federal income tax purposes), created or organized in or under the laws of the United States, any state thereof, or the District of Columbia, |
| · | an estate whose income is subject to U.S. federal income tax regardless of its source, or |
| · | a trust if such trust validly elects to be treated as a U.S. person for U.S. federal income tax purposes or if (1) a court within the United States is able to exercise primary supervision over its administration, and (2) one or more U.S. persons have the authority to control all of the substantial decisions of such trust. |
If a partnership (or other entity treated as such for U.S. federal income tax purposes) holds the ADSs or common shares, the U.S. federal income tax treatment of a partner will generally depend on the status of the partner and the tax treatment of the partnership. A partner in a partnership holding the ADSs or common shares should consult its tax advisor with regard to the U.S. federal income tax treatment of its investment in the ADSs or common shares.
127
Prospective investors should consult their tax advisors as to the particular tax considerations applicable to them relating to the acquisition, ownership and disposition of our ADSs or common shares, including the applicability of U.S. federal, state and local tax laws and non-U.S. tax laws.
Ownership of ADSs
In general
The discussion below assumes that the representations contained in the deposit agreement are true and that the obligations in the deposit agreement and any related agreement will be performed in accordance with the terms. For U.S. federal income tax purposes, if you are a holder of ADSs, you generally will be treated as the owner of our common shares represented by such ADSs. Accordingly, deposits or withdrawals of common shares for ADSs will not be subject to U.S. federal income tax. The U.S. Treasury Department has expressed concern that depositaries for ADRs, or other intermediaries between the holders of shares of an issuer and the issuer, may be taking actions that are inconsistent with the claiming of U.S. foreign tax credits by U.S. holders of such receipts or shares. These actions would also be inconsistent with claiming the reduced rate for “qualified dividend income” described below. Accordingly, the analysis regarding the availability of a U.S. foreign tax credit for Chilean withholding taxes and sourcing rules described below and availability of the reduced rate for qualified dividend income could be affected by future actions that may be taken by the U.S. Treasury Department.
Taxation of distributions
Subject to the passive foreign investment company, or PFIC, rules discussed below, if you are a U.S. holder, the gross amount of any distribution of cash or property (including the net amount of Chilean taxes withheld, if any, on the distribution, after taking into account the credit for first category tax, as discussed above under “—Chilean Tax Considerations—Cash Dividends and Other Distributions”), paid by the bank out of its current or accumulated earnings and profits (as determined for U.S. federal income tax purposes) will be includable in gross income as ordinary dividend income. You must include any Chilean tax withheld from such distribution in gross income even though you do not in fact receive it. The dividend is taxable to you when you, in the case of common shares, or the depositary, in the case of ADSs, receive the dividend, actually or constructively. Distributions in excess of current and accumulated earnings and profits, as determined for U.S. federal income tax purposes, will be treated as a non-taxable return of capital to the extent of your basis in the ADSs or common shares and thereafter as either long-term or short-term capital gain, depending on whether you have held our ADSs or common shares for more than one year at the time of the distribution. The bank does not currently maintain, and does not intend to maintain, calculations of our earnings and profits in accordance with U.S. federal income tax principles. Consequently, a U.S. investor should treat the entire amount of any distribution received as a dividend. As used below, the term “dividend” means a distribution that constitutes a dividend for U.S. federal income tax purposes.
If you are a noncorporate U.S. holder, dividends paid to you in taxable years beginning before January 1, 2013 may constitute qualified dividend income and be taxable to you at a maximum tax rate of 15.0% provided that (1) certain holding period requirements are met, (2) the ADSs or common shares are readily tradable on an established securities market in the United States, and (3) the bank is not a PFIC. Under U.S. Internal Revenue Service authority, ADSs are considered for purposes of clause (2) above to be readily tradable on an established securities market in the United States because they are listed on the New York Stock Exchange. Based on existing guidance, it is not entirely clear whether dividends received with respect to the common shares will be treated as qualified dividend income because the common shares are not themselves listed on a U.S. exchange. Moreover, as discussed below, under “—Passive Foreign Investment Company rules”, we believe that we will not be treated as a PFIC for U.S. federal income tax purposes with respect to our 2010 and current taxable year, and based on our current expectations regarding the value and nature of our assets, the sources and nature of our income, relevant market and shareholder data and our current business plans, we do not anticipate becoming a PFIC in the future. However, there can be no assurance in this regard because the PFIC determination is made annually and is based on the portion of our assets (including goodwill) and income that is characterized as passive under the PFIC rules and our continued qualification for an exception to the PFIC rules for certain foreign banks. You should consult your tax advisor regarding the availability of the lower rate for dividends paid with respect to our ADSs or common shares. Dividends paid by us generally will not be eligible for the dividends-received deduction available to certain U.S. corporations.
The amount of the dividend distribution that you must include in your income as a U.S. holder will be the U.S. dollar value of the peso payments made, determined at the spot peso/U.S. dollar rate on the date the dividend distribution is actually or constructively received by you or the depositary, regardless of whether the payment is in fact converted into U.S. dollars at that time. If the dividend is converted to U.S. dollars on the date of receipt, a U.S. holder generally will not recognize a foreign currency gain or loss. However, if the U.S. holder converts the pesos into U.S. dollars on a later date, the U.S. holder must include in income any gain or loss resulting from any exchange rate fluctuations. The gain or loss will be equal to the difference between (i) the U.S. dollar value of the amount included in income when the dividend was received, and (ii) the amount received on the conversion of the pesos into U.S. dollars. Generally, any gain or loss resulting from currency exchange fluctuations during the period from the date you include the dividend payment in income to the date you convert the payment into U.S. dollars will be treated as ordinary income or loss and will not be eligible for the special tax rate applicable to qualified dividend income. The gain or loss generally will be income or loss from sources within the United States for foreign tax credit limitation purposes. U.S. holders should consult their own tax advisors regarding the tax consequences to them if the bank pays dividends in pesos or any other non-U.S. currency. The amount of any distribution of property other than cash will be the fair market value of such property on the date of distribution.
128
Subject to certain limitations (including minimum holding period requirements), Chilean income tax withheld (after taking into account the credit for first category tax, when available) and paid over to Chile will generally be creditable or deductible against your U.S. federal income tax liability. If the amount of Chilean withholding tax initially withheld from a dividend is determined under applicable Chilean law to be excessive, however (as described above under “—Chilean Tax Considerations—Cash Dividends and Other Distributions”), the excess tax may not be creditable. Special rules apply in determining the foreign tax credit limitation with respect to dividends received by individuals that are subject to a reduced 15.0% tax rate for qualified dividends. Dividends will be income from sources outside the United States and generally be categorized as “passive category income” for most U.S. holders for U.S. foreign tax credit purposes. A U.S. holder that does not elect to claim a credit for any foreign income taxes paid during the taxable year may instead claim a deduction in respect of such foreign income taxes, provided that the U.S. holder elects to deduct (rather than credit) all foreign income taxes paid or accrued for the taxable year. This discussion does not address special rules that apply to U.S. holders who, for purposes of determining the amount of the foreign tax credit, take foreign income taxes into account when accrued. The rules governing foreign tax credits are complex and a U.S. holder should consult its own tax advisor regarding the availability of foreign tax credits under its particular circumstances.
Taxation of dispositions
Subject to the PFIC rules discussed below, if you are a U.S. holder and you sell or otherwise dispose of your ADSs or common shares in a taxable disposition, you will recognize capital gain or loss for U.S. federal income tax purposes equal to the difference between the U.S. dollar value of the amount that you realize and your tax basis, determined in U.S. dollars, in your ADSs or common shares. Any such gain or loss will be long-term capital gain or loss if your ADSs or common shares have been held for more than one year. Certain non-corporate U.S. holders (including individuals) may be eligible for preferential rates of U.S. federal income tax in respect of long-term capital gains. The deductibility of capital losses is subject to limitations.
If you are a U.S. holder of our ADSs or common shares, the initial tax basis of your ADSs or common shares will be the U.S. dollar purchase price or, if purchased in pesos, the U.S. dollar value of the peso-denominated purchase price determined on the date of purchase. If the common shares are treated as being traded on an “established securities market,” a cash basis U.S. holder, or, if it elects, an accrual basis U.S. holder, will determine the U.S. dollar value of the cost of such common shares by translating the amount paid at the spot rate of exchange on the settlement date of the purchase. If you convert U.S. dollars to pesos and immediately use the currency to purchase common shares, such conversion generally will not result in taxable gain or loss to you.
The amount realized generally will be equal to the amount of cash or the fair market value of any other property received. With respect to the sale or exchange of our common shares, if the payment received is in pesos, the amount realized generally will be the U.S. dollar value of the payment received determined on (1) the date of receipt of payment in the case of a cash basis U.S. holder, and (2) the date of disposition in the case of an accrual basis U.S. holder. If our common shares are treated as being traded on an “established securities market,” a cash basis U.S. holder, or, if it elects, an accrual basis U.S. holder, will determine the U.S. dollar value of the amount realized by translating the amount received at the spot rate of exchange on the settlement date of the sale.
If a Chilean income tax is withheld on the sale, exchange or other taxable disposition of our ADSs or common shares, the amount realized by a U.S. holder will include the gross amount of the proceeds of that sale, exchange or other taxable disposition before deduction of the Chilean income tax. Capital gain or loss, if any realized by a U.S. holder on the sale, exchange or other taxable disposition of ADSs or common shares generally will be treated as U.S. source gain or loss for U.S. foreign tax credit purposes. Consequently, in the case of a gain from the disposition of a common share that is subject to Chilean income tax, the U.S. holder may not be able to benefit from the foreign tax credit for that Chilean income tax (i.e., because the gain from the disposition would be U.S. source), unless the U.S. holder can apply the credit against U.S. federal income tax payable on other income from foreign sources. Alternatively, the U.S. holder may take a deduction for the Chilean income tax, provided that the U.S. holder elects to deduct all foreign taxes paid or accrued for the taxable year. The rules governing foreign tax credits are complex and a U.S. holder should consult its own tax advisor regarding the availability of foreign tax credits under its particular circumstances.
Passive Foreign Investment Company rules
Based upon our current estimates, expectations and projections of the value and classification of our assets, the sources and nature of our income and our use of the net proceeds of this offering, we believe that the bank’s ADSs and common shares should not be treated as stock of a PFIC for U.S. federal income tax purposes for the current year or in the foreseeable future, but this conclusion is a factual determination that is made annually and there can be no assurance that we will not be considered a PFIC for the current year or any subsequent year. Our actual PFIC status for our current taxable year ending December 31, 2011 will not be determinable until after the close of our current taxable year ending December 31, 2011 and accordingly, there is no guarantee that we will not be a PFIC for 2011 or any future taxable year.
129
In general, if you are a U.S. holder, the bank will be a PFIC with respect to you if for any taxable year in which you held the bank’s ADSs or common shares:
| · | at least 75.0% of the bank’s gross income for the taxable year is “passive income”, or |
| · | at least 50.0% of the value, determined on the basis of a quarterly average, of the bank’s assets is attributable to assets that produce or are held for the production of passive income. |
Passive income for this purpose generally includes dividends, interest, royalties, rents, annuities and gains from assets that produce passive income. We will be treated as owning our proportionate share of the assets and earnings and our proportionate share of the income of any other corporation in which we own, directly or indirectly, at least 25.0% by value of the stock of another corporation. If we are a PFIC for any year during which you hold our ADSs or common shares, you will generally be required to treat our ADSs or common shares as stock in a PFIC for all succeeding years which you hold our ADSs or common shares, even if the bank does not otherwise meet the PFIC tests for such year.
We are unable to determine with certainty that we are not a PFIC because the application of the PFIC rules to banks is unclear under present U.S. federal income tax law. Banks generally derive a substantial part of their income from assets that are interest bearing or that otherwise could be considered passive under the PFIC rules. The U.S. Internal Revenue Service has issued a notice and has proposed regulations that exclude from passive income any income derived in the active conduct of a banking business by a qualifying foreign bank (the “active bank exception”). The U.S. Internal Revenue Service notice and proposed regulations have different requirements for qualifying as a foreign bank, and for determining the banking income that may be excluded from passive income under the active bank exception. Moreover, the proposed regulations have been outstanding since 1994 and will not be effective unless finalized.
We believe that we should qualify as an active bank under both the notice and the proposed regulations, assuming that the proposed regulations are finalized in their current form. Accordingly, based on our present regulatory status under Chilean law, the present nature of our activities including the planned offering of ADSs, and the present composition of our assets and sources of income, we do not believe we were a PFIC for the taxable year ending December 31, 2010 (the latest period for which the determination can be made) and we do not expect to be a PFIC for the current year or for any future years.
However, because a PFIC determination is a factual determination that must be made following the close of each taxable year and is based on, among other things, the market value of our assets and shares, and because the proposed regulations (although retroactive in application) are not currently in force, our PFIC status may change and there can be no assurance that we will not be considered a PFIC for the current year or any subsequent year. If the bank is treated as a PFIC for any year in which you hold ADSs or common shares, and you are a U.S. holder that did not make a mark-to-market election, as described below, you will be subject to special rules with respect to:
| · | any gain you realize on the sale or other disposition (including certain pledges) of your ADSs or common shares, and |
| · | any excess distribution that the bank makes to you (generally, any distributions to you during a single taxable year that are greater than 125.0% of the average annual distributions received by you in respect of the ADSs or common shares during the three preceding taxable years or, if shorter, your holding period for the ADSs or common shares). |
Under these rules:
| · | the gain or excess distribution will be allocated ratably over your holding period for the ADSs or common shares, |
| · | the amount allocated to the taxable year in which you realized the gain or excess distribution will be taxed as ordinary income, |
| · | the amount allocated to each prior year, with certain exceptions, will be taxed at the highest tax rate in effect for that year, and |
| · | the interest charge generally applicable to underpayments of tax will be imposed in respect of the tax attributable to each such year. |
The tax liability for amounts allocated to years prior to the year of disposition or “excess distribution” cannot be offset by any net operating losses for such years, and gains (but not losses) realized on the sale of the ADSs or common shares cannot be treated as capital, even if you hold the ADSs or ordinary shares as capital assets. If we were a PFIC, certain subsidiaries and other entities in which we have a direct or indirect interest may also be PFICs (“Lower-tier PFICs”). Under attribution rules, U.S. holders would be deemed to own their proportionate shares of Lower-tier PFICs and would be subject to U.S. federal income tax according to the rules described above on (i) certain distributions by a Lower-tier PFIC, and (ii) certain dispositions of shares of a Lower-tier PFIC, in each case as if the U.S. holder held such shares directly, even though such U.S. holder had not received the proceeds of those distributions or dispositions.
130
Alternatively, a U.S. holder of “marketable stock” (as defined below) may make a mark-to-market election. If you make this election, you will not be subject to the PFIC rules described above. Instead, in general, you will include as ordinary income each year the excess, if any, of the fair market value of your ADSs or common shares at the end of the taxable year over your adjusted basis in your ADSs or common shares. These amounts of ordinary income will not be eligible for the favorable tax rates applicable to qualified dividend income or long-term capital gains. You will also be allowed to take an ordinary loss in respect of both (1) the excess, if any, of the adjusted basis of your ADSs or common shares over their fair market value at the end of the taxable year, and (2) any loss realized on the actual sale or disposition of the ADSs or common shares, but in each case only to the extent of the net amount of previously included income as a result of the mark-to-market election. Any loss on an actual sale of your ADSs or common shares would be a capital loss to the extent it exceeds any previously included mark-to-market income not offset by previous ordinary deductions. Your basis in the ADSs or common shares will be adjusted to reflect any such income or loss amounts.
The mark-to-market election is available only for “marketable stock,” which is stock that is regularly traded in other than de minimis quantities on at least 15 days during each calendar quarter on a qualified exchange, including the NYSE, or other market, as defined in applicable regulations. The ADSs are listed on the NYSE, and we expect, although no assurance can be given, that they will be regularly traded on the NYSE. It is unclear whether the common shares will be treated as “marketable stock” for purpose of the mark-to-market rules. In addition, the mark-to-market election generally would not be effective for any Lower-tier PFICs. You are urged to consult your own tax advisors regarding the U.S. federal income tax consequences that would arise if we are treated as a PFIC while you hold ADSs or common shares.
In addition, notwithstanding any election you make with regard to the ADSs or common shares, dividends that you receive from us will not constitute qualified dividend income to you if the bank is a PFIC either in the taxable year of the distribution or any preceding taxable year during which you held our ADSs or common shares. Instead, you must include the gross amount of any such dividend paid by us out of the bank’s accumulated earnings and profits (as determined for U.S. federal income tax purposes) in your gross income, and it will be subject to tax at rates applicable to ordinary income.
If you hold ADSs or common shares that are treated as PFIC shares with respect to you, you will be required to file U.S. Internal Revenue Service Form 8621 in any year in which you have in effect a mark-to-market election, receive a direct or indirect distribution, or recognize gain on any direct or indirect disposition with respect to our ADSs or common shares. Additionally, under recently enacted legislation, if you hold ADSs or common shares in any year in which we are a PFIC, the U.S. Treasury Department may require you to file an annual report containing such information as the U.S. Treasury Department may require.
In addition, if we are a PFIC, we do not intend to prepare or provide you with the information necessary to make a “qualified electing fund” election, which, like the mark-to-market election, is a means by which U.S. taxpayers may elect out of the tax treatment that generally applies to PFICs.
You are urged to consult your tax advisor regarding the application of the PFIC rules to your investment in ADSs or common shares, including the availability and advisability of making an election to avoid the adverse tax consequences of the PFIC rules should we be considered a PFIC for any taxable year and the application of the recently enacted legislation to your particular situation.
Recently enacted legislation — Medicare tax
Recently enacted legislation will impose a 3.8% tax with respect to certain individuals, trusts and estates on the lesser of (i) modified adjusted gross income in excess of US$200,000 (US$250,000 for joint-filers), and (ii) net investment income, in either case for taxable years beginning after December 31, 2012. For these purposes, net investment income will generally include any dividends paid to you with respect to the ADSs or common shares and any gain realized on the sale, exchange or other taxable disposition of an ADS or common share.
Backup withholding tax and information reporting requirements
U.S. backup withholding tax and information reporting requirements generally apply to certain payments to certain non-exempt holders of ADSs or common shares. Information reporting generally will apply to payments of dividends on, and to proceeds from the sale or redemption of, ADSs or common shares made within the United States, or by a U.S. payor or U.S. middleman, to a holder of ADSs or common shares, other than an exempt recipient. A payor will be required to withhold backup withholding tax from any payments of dividends on, or the proceeds from the sale or redemption of, ADSs or common shares within the United States, or by a U.S. payor or U.S. middleman, to a holder, other than an exempt recipient, if such holder fails to furnish its correct taxpayer identification number or otherwise fails to comply with, or establish an exemption from, such backup withholding tax requirements. The backup withholding tax rate is currently 28.0%.
131
Backup withholding is not an additional tax. Any backup withholding tax generally will be allowed as a credit against the holder’s U.S. federal income tax liability or, to the extent the withheld amount exceeds such liability, refunded upon the timely filing of a U.S. federal income tax return.
Recently enacted legislation imposes new reporting requirements on certain U.S. investors in connection with the holding of certain foreign financial assets, including ADSs or common shares, either directly or though certain foreign financial institutions, if the aggregate value of all of such assets exceeds US$50,000. This new legislation also imposes penalties if such investor is required to submit such information to the U.S. Internal Revenue Service and fails to do so. You should consult your tax advisor regarding the application of these new reporting requirements to your particular situation.
The above description is not intended to constitute a complete analysis of all tax consequences relating to the ownership of the ADSs or common shares. Investors deciding on whether or not to invest in ADSs or common shares should consult their own tax advisors concerning the tax consequences of their particular situations.
F. DIVIDENDS AND PAYING AGENTS
Not applicable.
G. STATEMENT BY EXPERTS
Not applicable.
H. DOCUMENTS ON DISPLAY
The documents concerning Corpbanca which are referred to in this Annual Report may be inspected at our offices at Rosario Norte 660, Las Condes, Santiago, Chile.
I SUBSIDIARY INFORMATION
Not applicable.
General
This section describes the financial risks, liquidity risk and market risks to which we are exposed in our business activities. Additionally, an explanation is included of the internal tools and regulatory methods used to control these risks, portfolios over which these market risks approach are applied and quantitative disclosures that demonstrate the level of exposure to financial risk we assumed.
The principal types of inherent risk in our business are market, liquidity, operational and credit risk. The effectiveness with which we are able to manage the balance between risk and reward is a significant factor in our ability to generate long-term stable earnings growth. Our senior management places great emphasis on risk administration.
The composition of our assets, liabilities and shareholders’ equity as of December 31, 2010 by currency and term is as follows:
| As of December 31, 2010 | ||||||||||||||||||
| Ch$ indexed | Foreign | |||||||||||||||||
| Ch$ | UF | to US$ | Currency | Total | Percentage | |||||||||||||
| (in millions of Ch$ as of December 31, 2010, except for percentages) | ||||||||||||||||||
| Assets | ||||||||||||||||||
| Cash and due from banks | Ch$ | 180,360 | Ch$ | — | Ch$ | — | Ch$ | 101,659 | Ch$ | 282,019 | 4.0 | % | ||||||
| Other assets: | ||||||||||||||||||
| Less than 1 year | 1,752,893 | 499,418 | 2,702 | 438,920 | 2,693,933 | 37.8 | % | |||||||||||
| From 1 to 3 years | 851,443 | 739,372 | 4,377 | 119,431 | 1,714,623 | 24.0 | % | |||||||||||
| More than 3 years | 759,872 | 1,554,921 | 2,798 | 173,459 | 2,491,050 | 34.9 | % | |||||||||||
| Bank premises and equipment (2) | 53,332 | — | — | 98 | 53,430 | 0.7 | % | |||||||||||
| Allowances for loan losses | (104,215 | ) | — | — | — | (104,215 | ) | (1.5) | % | |||||||||
| Total | Ch$ | 3,493,685 | Ch$ | 2,793,711 | Ch$ | 9,877 | Ch$ | 833,567 | Ch$ | 7,130,840 | 100.0 | % | ||||||
| Percentage of total assets | 49.0 | % | 39.2 | % | 0.1 | % | 11.7 | % | 100.0 | % | ||||||||
| Liabilities and Shareholders Equity | ||||||||||||||||||
| Non-interest-bearing deposits (1) | Ch$ | 560,479 | Ch$ | 2,109 | Ch$ | — | Ch$ | 91,001 | Ch$ | 653,589 | 9.2 | % | ||||||
| Other liabilities: | ||||||||||||||||||
| Less than 1 year | 3,098,622 | 332,526 | 6,754 | 1,103,754 | 4,541,656 | 63.7 | % | |||||||||||
| From 1 to 3 years | 101,522 | 303,070 | 1,979 | 78,300 | 484,871 | 6.8 | % | |||||||||||
| More than 3 years | 15,368 | 882,545 | 554 | - | 898,467 | 12.6 | % | |||||||||||
| Shareholders’ equity (2) | 455,999 | 92,625 | - | 3,633 | 552,257 | 7.7 | % | |||||||||||
| Total | Ch$ | 4,231,990 | Ch$ | 1,612,875 | Ch$ | 9,287 | Ch$ | 1,276,688 | Ch$ | 7,130,840 | 100.0 | % | ||||||
| Percentage of total liabilities and shareholders’ equity | 59.4 | % | 22.6 | % | 0.1 | % | 17.9 | % | 100 | % | — | |||||||
132
| (1) | Includes checking accounts, banker’s drafts and transactions payable. | |
| (2) | Our shareholders’ equity, which includes undistributed net income, and bank premises and equipment are denominated in pesos, but the amounts at which they are carried on the balance sheet are adjusted to reflect the effects of inflation. |
Policies
Our policy with respect to asset and liability management is to maximize our net interest income and return on assets and equity while managing interest rate, liquidity and foreign exchange risks while remaining within the limits provided by Chilean banking regulations and internal risk policies and limits.
Our asset and liability management policies are developed by our Asset & Liability Committee, or our A&L Committee, following guidelines established by our Board of Directors. The A&L Committee is composed of eleven members, including a director, the Chief Executive Officer, the Division Manager—Treasury and International, the Financial Risk Manager, our Chief Financial Officer, and the Division Managers of Management Control and Planning, Retail Banking, Non-Banking Financial Services and Commercial Banking, represented by the Managers of the Corporate and Business Banking Divisions. The role of the Financial Risk Manager and the A&L Committee is to ensure that our treasury and international division’s operations are consistently in compliance with our internal risk policies and limits, as well as applicable regulations. The A&L Committee typically meets once per month. Senior members of our treasury and international division meet regularly with the A&L Committee and outside consultants to discuss our asset and liability position. The members of our financial risk management department are not employed in our banking operations or treasury and international division.
Our treasury and international division manages trading activities following the guidelines set by the A&L Committee and Corpbanca’s credit risk and market risk and control departments. The market risk and control department’s activities consist of (i) applying VaR techniques (as discussed below), (ii) marking to market our fixed income portfolio, derivatives portfolio and measuring daily profit and loss from trading activities, (iii) comparing VaR and other exposures against the established limits, and (iv) providing information about trading activities to the A&L Committee, other members of senior management and the treasury and international division.
Our market risk analysis focuses on managing risk exposure relating to (i) the interest rate risk relating to fixed income portfolio (comprised of a “trading” portfolio and “an available-for-sale” portfolio), which contains mainly Chilean government bonds, corporate bonds, mortgage finance bonds issued by third parties and interest rate derivatives, (ii) the interest rate risk relating to asset and liability positions, (iii) liquidity risk, and (iv) our net foreign currency position, which includes all of our assets and liabilities in foreign currencies (mainly U.S. dollars), including derivatives that hedge certain foreign currency mismatches that arise between investments and the funding thereof.
Market Risk
Market risk is the risk of losses due to unexpected changes in interest rates, foreign exchange rates, inflation rates and other rates or prices. We are exposed to market risk mainly as a result of the following activities:
| · | Trading in financial instruments, which exposes us to interest rate and foreign exchange rate risk, |
| · | Engaging in banking activities, which subjects us to interest rate risk, since a change in interest rates affected gross interest income, gross interest expense and customer behavior, |
133
| · | Engaging in banking activities, which exposes us to inflation rate risk, since a variation in CPI or expected inflation affects gross interest income, gross interest expense and customer behavior, |
| · | Trading in the local equity market, which subjects us to potential losses caused by fluctuations of the stock market, and |
| · | Investing in assets or funding with liabilities whose returns or accounts are denominated in currencies other than the peso, which subjects us to foreign exchange risk between the peso and such other currencies. |
Interest Rate Sensitivity
A key component of our asset and liability policy is the management of interest rate sensitivity. Interest rate sensitivity is the relationship between market interest rates and net interest income due to the maturity or repricing characteristics of interest-earning assets and interest bearing liabilities. For any given period, the pricing structure is matched when an equal amount of such assets and liabilities mature or reprice in that period. Any mismatch of interest-earning assets and interest bearing liabilities is known as a gap position. A positive gap denotes asset sensitivity and means that an increase in interest rates would have a positive effect on net interest income while a decrease in interest rates would have a negative effect on net interest income. Accordingly, a negative gap denotes asset sensitivity and means that a decrease in interest rates would have a negative effect on net interest income while an increase in interest rates would have a positive effect on net interest income.
Our interest rate sensitivity strategy takes into account not only the rates of return and the underlying degree of risk, but also liquidity requirements, including minimum regulatory cash reserves, mandatory liquidity ratios, withdrawal and maturity of deposits, capital costs and additional demand for funds. Our maturity mismatches and positions are monitored by our A&L Committee and are managed within established limits.
Exchange Rate Sensitivity
In recent years, our operating income has benefited from fluctuations in the exchange rate between the peso and the U.S. dollar due to our policy. However, devaluation or appreciation of the peso against the U.S. dollar or other currencies in which we hold non-hedged positions could be expected to have the following principal effects:
| · | If we maintain a net asset position (or positive gap) in U.S. dollars and a devaluation of the peso against the dollar occurs, we would record a related gain, and if an appreciation of the peso occurs, we would record a related loss, |
| · | If we maintain a net liability position (or negative gap) in U.S. dollars and a devaluation of the peso against the dollar occurs, we would record a related loss, and if an appreciation of the peso occurs, we would record a related gain, |
| · | If the inflation rate, reflected on a UF-value variation, for a period exceeded the devaluation of the peso against the U.S. dollar during the same period, we would record a related gain if it had a net asset position (or positive gap) in UFs which exceeded a net liability position (or negative gap) in U.S. dollars, and we would record a related loss if we had a net liability position (or negative gap) in U.S. dollars which exceeded a net asset position (or positive gap) in UFs. The same effect would occur if there were an appreciation of the peso against the U.S. dollar, and |
| · | If the inflation rate, reflected on a UF-value variation, for a period were lower than the rate of devaluation of the peso against the U.S. dollar during the same period, we would record a related gain if we maintained a net asset position (or positive gap) in U.S. dollars and a net liability position (or negative gap) in UFs and, accordingly, we would record a related loss if we had a net liability position (or negative gap) in U.S. dollars and a net asset position (or positive gap) in UFs. |
Regulatory method to control market risk
On an unconsolidated basis, we must separate our balance sheet in two distinct categories; trading portfolio (Libro de Negociación) and unconsolidated non-trading, or structural, portfolio (Libro de Banca). The trading portfolio as defined by the Chilean Superintendency of Banks includes all instruments valued at market prices, free of any restrictions for their immediate sale and that are frequently bought and sold by the bank and are maintained with the intention of selling them in the short-term in order to profit from short-term price variations. The non-trading portfolio is defined as all instruments in the balance sheet not considered in the trading portfolio.
We must also report the following absolute risk levels:
134
Trading Portfolio:
Exposure to interest rate risk: Interest rate risk of the trading portfolio is basically a sensitivity analysis that calculates potential losses assuming an increase in nominal rate yields curves, real rates and foreign currency rates by 75 to 350 basis point.
| · | Exposure to foreign currency risk: The foreign currency risk is calculated using sensitivity factors linked to the credit risk rating of the issuing country. |
| · | Market risk exposure of options: options risk is calculated using sensitivity factors called delta, gamma and vega that basically measure the sensitivity of the value of the options to changes in the price of the underlying security and its volatility. |
Non-trading Portfolio:
| · | Exposure to short-term interest rate risk; sensitivity analysis that is calculated for assets and liabilities with maturities of less than 1 year, assuming a 200 basis point parallel shift of the nominal yield curve, 400 for real rates and 200 for foreign interest rates. |
· | Exposure to inflation risk; sensitivity analysis that is calculated for our net position in assets and liabilities, comprised of UF-denominated instruments, assuming a 200 basis point adverse impact on the related yield curve. |
| · | Exposure to long-term interest rate risk; sensitivity analysis that is calculated for assets and liabilities with maturities from 1 to over 20 years, assuming a 200 basis point parallel shift of the nominal yield curve, 400 for real rates and 200 for foreign interest rates. |
The Chilean Superintendency of Banks has defined various limits for these risks.
| 1) | EMR limit. A bank’s regulatory capital must be greater or equal to the sum of the exposure to market risk multiplied by the minimum capital adequacy ratio defined in the General Banking Law. In other words: |
RC – ((k * RWA) + EMR) > 0
Where:
RC: | Regulatory capital as defined by the General Banking Law. |
k: | Minimum capital adequacy ratio, in the case Corpbanca is required to have a capital adequacy ratio above 8%. |
RWA: | Consolidated risk weighted assets as defined by the General Banking Law. |
EMR: | Exposure to market risk, Corpbanca’s EMR is equal to its interest rate exposure for its trading portfolio plus currency risk for the bank’s position. |
| 2) | Limit on exposure to short term interest rate and inflation risk of our non-trading portfolio. Corpbanca’s exposure to short term interest rate and inflation risk of the non-trading portfolio cannot exceed 25.0% of its unconsolidated net interest income plus fees sensitive to interest rate volatility. |
| 3) | Limit on exposure to long-term interest rate risk of a banks non-trading portfolio. Corpbanca’s exposure to long-term interest rate risk of the unconsolidated non-trading portfolio cannot exceed 27.0% of its regulatory capital. |
The following is a description of the models adopted by local regulators for measuring market risks.
Interest Rate Risk of Trading Portfolio: Regulatory Method
The interest rate risk of the trading portfolio as defined by the Central Bank is equal to the sum of:
| 1) | The sensitivity analysis of the trading portfolio |
| 2) | Vertical adjustment factor |
| 3) | Horizontal adjustment factor |
The sensitivity factor of the trading portfolio is calculated using the following formula:

135
Where:
| Amt | : | Trading Assets (pesos, inflation linked and foreign currency) |
| Pmt | : | Liabilities funding trading positions (pesos, inflation linked and foreign currency) |
amt | : | Sensitivity factor to rise interest rate |
| m | : | Currency (pesos, inflation linked and foreign currency) |
| t | : | Time period |
| å | : | Summation |
| | | | : | Absolute value |
The vertical adjustment factor is calculated in the following manner
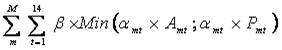
Where:
| b | : | Vertical adjustment factor, equal to 10% |
| Min( ) | : | Compensated net position |
A horizontal adjustment must be made following the vertical adjustment. To determine the horizontal adjustment one must multiply the horizontal adjustment factor by the compensated net position for Zone 1, Zone 2, Zone 3, Zones 1 and 2, Zones 2 and 3 and Zones 1 through 3.
Horizontal adjustment= *Adjusted net position
| Compensated net position Zone 1,2 or 3 | Min (Adjusted net asset position; absolute value of adjusted net liability position in Zone 1,2 or 3) | |
| Compensated net position Zones 1 and 2 | Min (adjusted net asset position in Zones 1 and 2, absolute value of | |
| adjusted net liability position in Zones 1 and 2) | ||
| Compensated net position Zones 2 and 3 | Min (adjusted net asset position in Zone 3 and Zone 2 (deducting adjusted net asset position that have been compensated for with net liability positions in Zone 1), absolute value of adjusted net liability position in Zone 3 and Zone 2 (deducting adjusted net liability positions that have been compensated for with net liability positions in Zone 1) | |
| Compensated net position Zones 1- 3 | Min (Adjusted net asset position in Zone 3 and Zone 1 (deducting adjusted net asset position that have been compensated for with net liability positions in Zone 2), absolute value of adjusted net liability position in Zone 3 and Zone 1 (deducting adjusted net liability positions that have been compensated for with net liability positions in Zone 2) |
The following table illustrates the value of the different factors used for calculating the interest rate risk of the trading portfolio:
| Horizontal adjustment factor | |||||||||||||||||||||||||
| Change in interest | Vertical | Between | Between | ||||||||||||||||||||||
| rate (bp) | Sensitivity factor | adjustment | Within the | adjacent | zones 1 | ||||||||||||||||||||
| Zone | Period | Ch$ | UF | FX | a Ch$ | a UF | a FX | factor | zones | zones | and 3 | ||||||||||||||
| Zone 1 | 1 | Up to 30 days | 125 | 350 | 125 | 0.0005 | 0.0014 | 0.0005 | b = 10% | l1 = 40% | l12 = 40% | l13 = 100% | |||||||||||||
| 2 | 31 days to 3 mths | 125 | 300 | 125 | 0.0019 | 0.0047 | 0.0020 | b = 10% | l1 = 40% | l12 = 40% | l13 = 100% | ||||||||||||||
| 3 | 3 - 6 mths | 125 | 250 | 125 | 0.0042 | 0.0088 | 0.0044 | b = 10% | l1 = 40% | l12 = 40% | l13 = 100% | ||||||||||||||
| 4 | 6 - 9 mths | 125 | 200 | 125 | 0.0069 | 0.0116 | 0.0072 | b = 10% | l1 = 40% | l12 = 40% | l13 = 100% | ||||||||||||||
| 5 | 9 mths - 1 year | 125 | 175 | 125 | 0.0095 | 0.0140 | 0.0100 | b = 10% | l1 = 40% | l12 = 40% | l13 = 100% | ||||||||||||||
| Zone 2 | 6 | 1 - 2 years | 100 | 125 | 100 | 0.0124 | 0.0166 | 0.0133 | b = 10% | l2 = 30% | l12 = 40% | l13 = 100% | |||||||||||||
| 7 | 2 - 3 years | 100 | 100 | 100 | 0.0191 | 0.0211 | 0.0211 | b = 10% | l2 = 30% | l12 = 40% | l13 = 100% | ||||||||||||||
| 8 | 3 - years | 100 | 100 | 100 | 0.0248 | 0.0281 | 0.0281 | b = 10% | l2 = 30% | l23 = 40% | l13 = 100% | ||||||||||||||
136
| Zone 3 | 9 | 4 - 5 years | 75 | 75 | 75 | 0.0221 | 0.0258 | 0.0258 | b = 10% | l3 = 30% | l23 = 40% | l13 = 100% | |||||||||||||
| 10 | 5 - 7 years | 75 | 75 | 75 | 0.0263 | 0.0320 | 0.0320 | b = 10% | l3 = 30% | l23 = 40% | l13 = 100% | ||||||||||||||
| 11 | 7 - 10 years | 75 | 75 | 75 | 0.0307 | 0.0401 | 0.0401 | b = 10% | l3 = 30% | l23 = 40% | l13 = 100% | ||||||||||||||
| 12 | 10 - 15 years | 75 | 75 | 75 | 0.0332 | 0.0486 | 0.0486 | b = 10% | l3 = 30% | l23 = 40% | l13 = 100% | ||||||||||||||
| 13 | 15 - 20 years | 75 | 75 | 75 | 0.0317 | 0.0534 | 0.0534 | b = 10% | l3 = 30% | l23 = 40% | l13 = 100% | ||||||||||||||
| 14 | > 20 years | 75 | 75 | 75 | 0.0278 | 0.0539 | 0.0539 | b = 10% | l3 = 30% | l23 = 40% | l13 = 100% |
Foreign Currency Risk: Regulatory Method
The foreign currency risk as defined by the Central Bank is equal to:

| Where: | ||
| PNA | : | Net asset position |
| PNP | : | Net liabilities position |
| PNoro | : | Net gold position |
si | : | Sensitivity factor for each currency |
| j | : | Foreign currency |
| S | : | Summation |
| | | | : | Absolute value |
| Max | : | Maximum value |
Interest Rate and Inflation Risk of Non-trading Portfolio: Regulatory Method
The short-term interest rate risk and inflation risk of non-trading portfolio as defined by Central bank is equal to:
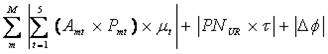
The long-term interest rate risk of the non-trading portfolio is calculated according to the following formula:
Where:
| Amt | : | Non-trading Assets (pesos, inflation linked and foreign currency) |
| Pmt | : | Non-trading Liabilities (pesos, inflation linked and foreign currency) |
mt | : | Sensitivity factor associated with interest rate movement |
| NPur | : | Net position in inflation linked instruments, including those subject to price level restatement |
| t | : | Factor that measures the sensitive to movements in the inflation index. This factor is equal a 2% |
| DF | : | Effect on fess from shifts in interest rate and assumes a 200 basis point movement |
| r | : | Sensitive factor to increase in interest rates |
| T | : | Time period |
| M | : | Currency (pesos, inflation linked and foreign currency) |
| S | : | Summation |
| | | | : | Absolute value |
137
Change in interest rate (bp) | Sensitivity factor short-term | Sensitivity factor long-term (rmt) | |||||||||||||||
| Period | Ch$ | UF | FX | (mt) | Ch$ | UF | FX | ||||||||||
| 1 | Up to 30 days | 200 | 400 | 200 | 0.0192 | 0.0008 | 0.0016 | 0.0008 | |||||||||
| 2 | 31 days to 3 mths | 200 | 400 | 200 | 0.0167 | 0.0030 | 0.0063 | 0.0031 | |||||||||
| 3 | 3 - 6 mths | 200 | 400 | 200 | 0.0125 | 0.0067 | 0.0140 | 0.0070 | |||||||||
| 4 | 6 - 9 mths | 200 | 400 | 200 | 0.0075 | 0.0110 | 0.0231 | 0.0116 | |||||||||
| 5 | 9 mths - 1 year | 200 | 400 | 200 | 0.0025 | 0.0152 | 0.0320 | 0.0160 | |||||||||
| 6 | 1 - 2 years | 200 | 300 | 200 | — | 0.0248 | 0.0399 | 0.0266 | |||||||||
| 7 | 2 - 3 years | 200 | 200 | 200 | — | 0.0382 | 0.0422 | 0.0422 | |||||||||
| 8 | 3 - years | 200 | 200 | 200 | — | 0.0496 | 0.0563 | 0.0563 | |||||||||
| 9 | 4 - 5 years | 200 | 200 | 200 | — | 0.0591 | 0.0690 | 0.0690 | |||||||||
| 10 | 5 - 7 years | 200 | 200 | 200 | — | 0.0702 | 0.0856 | 0.0856 | |||||||||
| 11 | 7 - 10 years | 200 | 200 | 200 | — | 0.0823 | 0.1076 | 0.1076 | |||||||||
| 12 | 10 - 15 years | 200 | 200 | 200 | — | 0.0894 | 0.1309 | 0.1309 | |||||||||
| 13 | 15 - 20 years | 200 | 200 | 200 | — | 0.0860 | 0.1450 | 0.1450 | |||||||||
| 14 | > 20 years | 200 | 200 | 200 | — | 0.0762 | 0.1480 | 0.1480 | |||||||||
As of December 31, 2010, our interest rate risk gap (less than one year), measured according to the above methodology, was 22.1% of our gross margin. As of the same date, our interest rate risk gap for long-term assets and liabilities was 15.9% of our regulatory capital. In each case, the interest rate risk gaps were in compliance with current Chilean regulations. Assets and liabilities included in this calculation belong to the above-mentioned Libro de Banca.
Assumptions and Limitations of Scenario Simulations/sensitivity Analysis (Regulatory Method)
Our scenario simulation methodology should be interpreted in light of the limitations of our models, which include:
| · | The scenario simulation assumes that the volumes remain on balance sheet and that they are always renewed at maturity, omitting the fact that credit risk considerations and pre-payments may affect the maturity of certain positions. |
| · | This model assumes set shifts in interest rates and sensitivity factors for different time periods and does not take into consideration any other scenario for each time period or other sensitivity factors. |
| · | The model does not take into consideration the sensitivity of volumes to these shifts in interest rates. |
| · | The model does not take into consideration our subsidiaries which are subject to market risks. |
Quantitative Disclosures about Market Risk: Regulatory Method
The following table illustrates our market risk exposure according to the Chilean regulatory method as of December 31, 2008, 2009 and 2010:
As of December 31, | ||||||
| 2008 | 2009 | 2010 | ||||
(in millions of Ch$ as of December 31, 2010) | ||||||
| Market risk of trading portfolio | 7,874 | 9,262 | 24,300 | |||
| 8% x risk weighted assets | 420,985 | 400,913 | 473,244 | |||
| Subtotal | 428,859 | 410,175 | 497,544 | |||
| Limit = regulatory capital | 570,114 | 727,436 | 794,647 | |||
| Available margin | 141,255 | 317,261 | 297,103 | |||
| Market risk of short-term non-trading portfolio | 36,218 | 56,476 | 56,683 | |||
| Limit = 35% of (net interest income + net fee income sensitive to interest rates) | 58,335 | 68,600 | 91,687 | |||
| Available margin | 22,117 | 12,124 | 35,004 | |||
| Market risk of long-term non-trading portfolio | 143,703 | 122,432 | 128,618 | |||
| Limit = 27% of regulatory capital (25% in 2007) | 153,931 | 198,625 | 214,554 | |||
| Available margin | 10,228 | 76,193 | 85,936 | |||
138
Internal Methods to Control Market Risk
Below is a quantitative and qualitative description of our markets risks tools according to our internal guidelines. Our policies establish a set of tools for monitoring market risks both, statistical and sensitive approaches, being main tools Value at Risk methodology.
VaR Methodology
General
We use Value-at-Risk, or VaR, methodology as a statistical tool to measure and control both the interest rate risk trading portfolio and the currency risk relating to our net foreign currency position, which includes all assets and liabilities in foreign currency (principally U.S. dollars) including forward and swap contracts used to hedge positions.
As calculated by Corpbanca, VaR is an estimate of the expected loss in the market value of a given portfolio over a one-day horizon at a one-tailed 95.0% confidence interval. In other words, it is the one-day loss, expressed in Chilean pesos that Corpbanca would expect to suffer on a given portfolio 95.0% of the time, subject to certain assumptions and limitations discussed below. Conversely, it is the loss figure that Corpbanca would expect to exceed only 5.0% of the time. VaR provides a single estimate of market risk that is comparable from one market risk to the other. Volatility is calculated utilizing approximately 100 historical observations used as input for an exponentially weighted moving average mode, where the calculation of the volatility includes a decay factor that gives more importance to the newer values. A one-day holding period is utilized (carry one day loss). We use VaR estimates to alert senior management whenever the statistically expected losses in our fixed income portfolio and net foreign currency position exceed certain pre-set levels which we believe to be prudent.
Limits
This daily VaR limit has been set to Ch$450.0 million for the trading portfolio by the A&L Committee and is subject to revaluation and revision every year or at the determination of the A&L Committee.
Assumptions and Limitations of VaR Model
Our VaR model assumes that changes in market risk factors have a normal distribution and that the parameters, the standard deviation of risk factor changes and the correlation between them have been estimated accurately. The model assumes that the correlation and changes in market rates/prices included in our historical databases are independent and identically distributed random variables, and provide a good estimate of correlation and rate/price changes in the future.
Our VaR methodology should be interpreted in light of the limitations of our models, which include:
| · | Changes in market rates and prices may not be independent and identically distributed random variables or have a normal distribution. In particular, the normal distribution assumption may underestimate the probability of extreme market moves. |
| · | The historical data we use in our VaR model may not provide the best estimate of risk factor changes in the future, and any modifications in the data may be inadequate. In particular, the use of historical data may fail to capture the risk of possible extreme adverse market movements independent of the time range utilized. For example, the use of extended periods of historical data might erroneously lead to a significant decrease in volatility especially after the Asian crisis. We typically use 260 historical observations of market data depending on circumstances, but also monitor other ranges of market data in order to be more conservative. However, reliable historical risk factor data may not be readily available for certain instruments in our portfolio. |
| · | A one-day time horizon may not fully capture the market risk positions that cannot be liquidated or hedged within one day. |
| · | At present, we compute VaR at the close of business and trading positions may change substantially during the course of the trading day. |
Non-statistical Tools for Controlling Market Risk
In addition to VaR methodology, we seek to control market risk in our portfolio through certain non-statistical tools, which are approved by the A&L Committee. The A&L Committee sets certain limits based on guidance from our Board of Directors as to our business strategy, market volatility, liquidity of our assets and overall risk tolerance. Generally, the A&L Committee updates our market risk limits at least once a year.
139
Sensitivity Simulation
We use a sensitivity simulation above trading and available for sale portfolios, for evaluating the change in portfolio’s market value. This tool is complementary to VaR, like a form to measure portfolio’s sensitivity independent of volatility level. We assume 90 basis points in the available-for-sale portfolio, within a limit of 5.0% of regulatory capital.
Volume Limits
Net Foreign Currency Position: Maximum Net Position. We set an absolute limit on the size of our net foreign currency position. As of December 31, 2010, the limit in effect was US$25.0 million in net U.S. dollar positions, and the equivalent of US$15.0 million in net Euro positions, increasing to US$45.0 million and US$20.0 for Euro position in 2011. This limit is a useful measure in limiting our exposure to foreign exchange and interest rate risks. These limits are determined by the A&L Committee and are calculated and monitored daily by the Market Risk and Control Department.
Interest rate Sensitivity
For a non-trading portfolio we do gap analysis by means of sensitive the mismatches between assets and liabilities, estimating the risk:
Risk = åm Gapj * Drj * Durj
The following table sets forth the repricing of our interest-earning assets and interest bearing liabilities as of December 31, 2010 and may not reflect interest rate gap positions at other times. In addition, variations in interest rate sensitivity may exist within the repricing periods presented due to the differing repricing dates within the period. Variations may also arise among the different currencies in which interest rate positions are held.
140
| As of December 31, 2010 | ||||||||||||||||||||||||||||||||||||||
| Up to | 31-60 | 61-90 | 91-180 | 181-365 | Over | |||||||||||||||||||||||||||||||||
| 30 days | days | days | days | days | 1-3 years | 3 years | Total | |||||||||||||||||||||||||||||||
| (in millions of Ch$ as of December 31, 2010, except for percentages) | ||||||||||||||||||||||||||||||||||||||
| Interest-earning assets: | ||||||||||||||||||||||||||||||||||||||
| Current accounts in foreign banks | Ch$ | 79,680 | Ch$ | — | Ch$ | — | Ch$ | — | Ch$ | — | Ch$ | — | Ch$ | — | Ch$ | 79,680 | ||||||||||||||||||||||
| Financial investments | 58,602 | 19,170 | — | 1,479 | 33,016 | 85,313 | — | 197,580 | ||||||||||||||||||||||||||||||
| Investment under agreements to resell | 75,676 | — | — | — | — | — | — | 75,676 | ||||||||||||||||||||||||||||||
| Loans and receivables to banks | 5,033 | 9,392 | 190 | — | 8,411 | 40,972 | — | 63,998 | ||||||||||||||||||||||||||||||
| Loans and receivables to customers(1) | 708,348 | 140,142 | 297,683 | 376,020 | 513,675 | 1,133,393 | 2,195,719 | 5,364,980 | ||||||||||||||||||||||||||||||
| Financial investment available-for-sale | 20,297 | 1,730 | 170 | 12,739 | 51,344 | 433,304 | 226,664 | 746,248 | ||||||||||||||||||||||||||||||
| Total interest-earning assets | 947,636 | 170,434 | 298,043 | 390,238 | 606,446 | 1,692,982 | 2,422,664 | 6,528,162 | ||||||||||||||||||||||||||||||
| Interest-bearing liabilities: | ||||||||||||||||||||||||||||||||||||||
| Investments under agreements to repurchase | 189,350 | — | — | — | — | — | — | 189,350 | ||||||||||||||||||||||||||||||
| Time deposits and savings accounts | 1,748,638 | 607,273 | 525,560 | 382,695 | 272,670 | 148,996 | 14,622 | 3,700,454 | ||||||||||||||||||||||||||||||
| Borrowings from financial institutions | 173,494 | 12,263 | 17,206 | 76,740 | 145,080 | 78,909 | — | 503,692 | ||||||||||||||||||||||||||||||
| Debt issued | 7,383 | 1,123 | 3,158 | 104,699 | 18,002 | 218,861 | 862,209 | 1,215,435 | ||||||||||||||||||||||||||||||
| Other financial obligations | 142 | 301 | 168 | 2,055 | 2,494 | 11,606 | 6,894 | 23,660 | ||||||||||||||||||||||||||||||
| Total interest-bearing liabilities | Ch$ | 2,119,007 | Ch$ | 620,960 | Ch$ | 546,092 | Ch$ | 566,189 | Ch$ | 438,246 | Ch$ | 458,372 | Ch$ | 883,725 | Ch$ | 5,632, 591 | ||||||||||||||||||||||
Asset/liability gap | Ch$ | (1,171,371) | Ch$ | (450,526) | Ch$ | (248,049) | Ch$ | (175,951) | Ch$ | 168,200 | Ch$ | 1,234,610 | Ch$ | 1,538,658 | Ch$ | 895,571 | ||||||||||||||||||||||
Cumulative gap | Ch$ | (1,171,371) | Ch$ | (1,621,897) | Ch$ | (1,869,945) | Ch$ | (2,045,896) | Ch$ | (1,877,697) | Ch$ | (643,087) | Ch$ | 895,571 | Ch$ | — | ||||||||||||||||||||||
| Ratio of cumulative gap to cumulative total interest earning assets | (123.61) | % | (145.06) | % | (132.05) | % | (113.26) | % | (77.82) | % | (15.66) | % | (13.72) | % | ||||||||||||||||||||||||
| (1) | Does not include mortgage loans and past-due loans. |
A sudden increase of 25 basis points in the interest rate applicable to our interest rate gap would cause a decrease in the market value of these financial investments of Ch$10,887.0 million as of December 31, 2010.
Duration Analysis
We perform duration analysis by monitoring the changes in the present value of the assets in our portfolio associated with changes in the reference yield of 100 basis points, we perform duration analysis on a daily basis.
141
Stress Test
Scenario Analysis
We use a set of multiple scenarios to carry out a stress test of our assets and liabilities that aim to analyze the impact of extreme market conditions and to adopt policies and procedures in an effort to protect our capital and results against such contingencies. We apply this tool to measure interest rate risk relating to our trading and available-for-sale fixed rate portfolios, as well as exchange rate risk relating to our exposure to foreign currencies, and inflation risk relating to our gap in inflation indexed assets and liabilities.
We use historically correlated and non-correlated, hypothetical and prospective scenarios as possible sets of market conditions to analyze our portfolios under stress conditions.
Sensitivity Analysis
We apply sensitivity analysis above certain financial positions: currency gaps, mismatches between assets and liabilities in both our inflation-indexed (UF) and non inflation-indexed portfolios and banking book interest rate gaps. We perform a hypothetical simulation by calculating the potential loss that would be reflected in our financial results relating to an extreme movement of exchange rate, inflation index and interest rates.
The most important assumption utilized in our portfolio scenario simulations and sensitivity analysis is the usage of a 100 basis point shift in the yield curve. We use a 100 basis point shift since a sudden shift of this magnitude is considered realistic and would result in significant effects on our financial results.
Our scenario simulation methodology should be interpreted in light of the limitations of our models, which include:
| · | The scenario simulation assumes that the volumes remain on balance sheet and that they are always renewed at maturity, omitting the fact that credit risk considerations and pre-payments may affect the maturity of certain positions. |
| · | The model does not take into consideration the sensitivity of volumes to these shifts in interest rates. |
| · | The shift is simulated to occur in just one day, and the loss is assumed to happen in the same time period. |
As of December 31, 2010, we did not hold material positions in financial investments denominated in U.S. dollars.
As of December 31, 2010, a sudden increase of 100 basis points in the interest rate would cause a decrease in Corpbanca’s market value of Ch$43,549.0 million.
Disclosures Regarding Derivative Financial Instruments
We enter into transactions involving derivative instruments particularly foreign exchange contracts, as part of our asset and liability management and in acting as a dealer to satisfy our clients’ needs. These transactions arise from forward exchange contracts which are of two types: (i) transactions covering two foreign currencies, and (ii) transactions covering pesos against the U.S. dollar.
Foreign exchange forward contracts involve an agreement to exchange the currency of one country for the currency of another country at an agreed-upon price and settlement date. These contracts are generally standardized contracts, normally for periods between 1 and 180 days and are not traded in a secondary market; however, in the normal course of business and with the agreement of the original counterparty, they may be terminated or assigned to another counterparty.
When we enter into a forward exchange contract, we analyze and approve the credit risk (the risk that the counterparty might default on its obligations). Subsequently, on an ongoing basis, we monitor the possible losses involved in each contract. To manage the level of credit risk, we deal with counterparties of good credit standing, enter into master netting agreements whenever possible and, when appropriate, obtain collateral.
The Central Bank requires that foreign exchange forward contracts be made only in U.S. dollars and other major foreign currencies. Most of our forward contracts are made in U.S. dollars against the peso or the UF. In September 1997, the Central Bank changed its regulations with respect to foreign currency forward contracts. We may now enter into foreign currency forward contracts with companies organized and located outside of Chile, including foreign subsidiaries of Chilean companies.
Unrealized gains, losses, premiums and discounts arising from foreign exchange forward contracts are shown under other assets and other liabilities.
The following table summarizes our derivative portfolio as of December 31, 2008:
142
| Notional amounts | Gross | Gross | |||||||||
| Type of future operation | Up to 3 months | From 3 to 12 months | More than 12 months | Unrealized Gains | Unrealized Losses | ||||||
| (in millions of Ch$ as of December 31, 2008) | |||||||||||
| Derivatives held-for-trading | |||||||||||
| Foreign currency forwards | 1,812,586 | 983,058 | 307,939 | 178,597 | 163,634 | ||||||
| Interest rate swaps | — | 115,744 | 1,143,598 | 8,922 | 7,154 | ||||||
| Foreign currency swap | — | — | — | — | — | ||||||
| Foreign currency and interest rate swaps | — | — | 382,998 | 21,420 | 24,820 | ||||||
| Liquidity risk | 208,939 | 195,608 | |||||||||
The following table summarizes our derivative portfolio as of December 31, 2009:
| Notional amounts | Gross | Gross | |||||||||
| Type of future operation | Up to 3 months | From 3 to 12 months | More than 12 months | Unrealized Gains | Unrealized Losses | ||||||
| (in millions of Ch$ as of December 31, 2009) | |||||||||||
| Derivatives held-for-trading | |||||||||||
| Foreign currency forwards | 1,964,823 | 705,582 | 39,959 | 57,271 | 60,825 | ||||||
| Interest rate swaps | 35,498 | 358,087 | 1,973,385 | 37,564 | 38,897 | ||||||
| Foreign currency swap | 18 | 60,732 | 578,041 | 31,305 | 14,981 | ||||||
| Liquidity risk | 126,140 | 114,703 | |||||||||
The following table summarizes our derivative portfolio as of December 31, 2010:
| Notional amounts | Gross | Gross | |||||||||
| Type of future operation | Up to 3 months | From 3 to 12 months | More than 12 months | Unrealized Gains | Unrealized Losses | ||||||
| (in millions of Ch$ as of December 31, 2010) | |||||||||||
| Derivatives held-for-trading | |||||||||||
| Foreign currency Forwards | 3,628,811 | 2,423,162 | 443,209 | 79,048 | 91,868 | ||||||
| Interest rate swaps | 145,220 | 712,681 | 4,052,876 | 51,672 | 38,368 | ||||||
| Foreign currency swap | 66,983 | 95,380 | 1,058,631 | 72,644 | 44,325 | ||||||
| Options call of currency | 2,191 | 1,633 | — | 12 | 1 | ||||||
| Options put of currency | 3,513 | 491 | — | 254 | 2 | ||||||
| Liquidity risk | 203,630 | 174,564 | |||||||||
| Foreign currency forwards | 11,990 | — | — | 241 | — | ||||||
| Interest rate swaps | — | — | — | — | — | ||||||
| Foreign currency swaps | 13,056 | — | 21,443 | 196 | 697 | ||||||
| 437 | 697 | ||||||||||
| 204,067 | 175,261 | ||||||||||
Liquidity risk arises in the general funding for our financing, trading and investment activities. It includes the risk of unexpected increases in the cost of funding the portfolio of assets at appropriate maturities and rates, the risk of being unable to liquidate a position in a timely manner at a reasonable price and the risk that we will be required to repay liabilities earlier than anticipated. Our general policy is to maintain sufficient liquidity to ensure our ability to honor withdrawals of deposits, make repayments of other liabilities at maturity, extend loans and meet our working capital needs.
Regulatory Observance
The minimum amount of liquidity is determined by the reserve requirements set by the Central Bank. These reserve requirements are currently 9.0% of demand deposits and 3.6% of time deposits. We are currently in compliance with these requirements. In addition, we are subject to a technical requirement applicable to Chilean banks pursuant to which we must hold a certain amount of assets in cash or in highly liquid instruments, if the aggregate amount of the following liabilities exceeds 2.5 times the amount of our net capital base:
143
| · | Deposits in checking accounts, |
| · | Other demand deposits or obligations payable on demand and incurred in the ordinary course of business, |
| · | Other deposits unconditionally payable immediately or within a term of less than 30 days, and |
| · | Time deposits payable within ten days. |
Chilean regulations also require that gaps between assets and liabilities maturing within 30 days not exceed a bank’s net capital base and that gaps between assets and liabilities maturing within 90 days not exceed twice the bank’s net capital base.
As of December 31, 2010, the ratio of our gap between 30-day or less of liabilities and assets to capital and reserves was 0.0. As of December 31, 2010, the ratio of our gap between 90-day or less liabilities and assets to our capital and reserves was 1.3.
Internal Methods
In addition to the tools we use to control regulatory liquidity risk described above, we have also set internal liquidity limits. In particular, our Financial Risk Department measures two liquidity indicators:
Minimum Liquidity Requirement: In order to ensure that the bank will permanently hold enough liquid assets to meet all payments derived from deposits made by third parties in the bank, we consider a limit on the minimum amount of liquid assets to be held on a daily basis. The amount of money to be paid as a result of deposit payments for the next three-day period cannot rise above the total amount of liquid assets held by the bank as defined by the Chilean Central Bank in its liquidity facilities regulations. As of December 31, 2010 the amount of our liquid assets was Ch$380,995.0 million while deposits to be paid the next three days amounted to Ch$30,320.0 million.
Internal Liquidity Indicator (ILIC). We seek to ensure that, even under adverse conditions, we have access to the funds necessary to cover client needs, maturing liabilities and capital requirements. As part of our policy, we have developed an internal liquidity model which we refer to as the indicador de liquidez interna de contingencia (contingency internal liquidity indicator, or ILIC). The purpose of the ILIC model is to evaluate our funding capacity assuming a hypothetical scenario of illiquidity.
Our Financial Risk Department applies the ILIC model on a daily basis. The ILIC is based on a stress scenario which assumes that an unusually large proportion of liabilities will be withdrawn over the next 10 days and at the same time payment default on assets will grow at an unusually high rate. The proportion between income and expenses following such scenario must be over 1 for us to maintain a normal liquidity level. As of December 31, 2010, ILIC was 6.4.
Not applicable.
Not applicable.
On November 1, 2004, we completed an offer to exchange one newly registered ADS for each of our then outstanding Rule 144A ADSs. We did not receive any proceeds from the exchange.
On December 30, 2010, our Board of Directors agreed to hold an Extraordinary Shareholders Meeting on January 27, 2011, in order to submit to the shareholders for approval a proposal to increase the capital of the bank through the issuance of 40,042,815,984 new common shares. The new common shares would have no par value and represent 15.0% of the total capital stock of Corpbanca. On the same day, we informed the Chilean local authorities of the potential capital increase by filing an Hecho Esencial with the SVS.
A majority of our shareholders approved the proposed capital increase at the Extraordinary Shareholders Meeting held on January 27, 2011, and the Board of Directors was expressly authorized to determine the offering price for the new common shares and whether to offer them in Chile or abroad; in particular, the securities market in the United States through the issuance and listing of ADRs on the NYSE. In addition, a majority of the shareholders approved the retention of earnings in the amount of Ch$106,869.0 million.
On February 24, 2011, the proposal by the Board of Directors to distribute a dividend of 100.0% of the net income of the bank for fiscal year 2010 was approved by a majority of the shareholders present at the Ordinary Shareholders Meeting (“OSM”) held on such date. The total dividends distributed to our shareholders was Ch$119,043.0 million, payable to the 226,909,290,577 common shares outstanding as of the date of the OSM.
144
Disclosure Controls and Procedures
As of December 31, 2010, Corpbanca, under the supervision and with the participation of our management, including the Chief Executive Officer and the Chief Financial Officer, performed an evaluation of the effectiveness of the design and operation of our disclosure controls and procedures (as defined in Rule 13a-15(e) under the Exchange Act). There are inherent limitations to the effectiveness of any control system, including the possibility of human error and the circumvention or overriding of disclosure controls and procedures. Accordingly, even effective disclosure controls and procedures can provide only reasonable assurance of achieving their control objectives.
Based upon the evaluation, our Chief Executive Officer and Chief Financial Officer concluded that, as of the end of the period covered by this report, our disclosure controls and procedures are effective in ensuring that information relating to us, including our consolidated subsidiaries, required to be disclosed in the reports that we file under the Exchange Act is (1) recorded, processed, summarized and reported within the time periods specified in the SEC’s rules and forms, and (2) accumulated and communicated to the management, including principal financial officers as appropriate to allow timely decisions regarding required disclosure.
Management’s Annual Report on Internal Control Over Financial Reporting
Our management is responsible for establishing and maintaining adequate internal control over financial reporting as defined in Rule 13a-15(f) under the Exchange Act. Our internal control over financial reporting is a process designed to provide reasonable assurance regarding the reliability of financial reporting and the preparation of financial statements for external purposes in accordance with IFRS as issued by the International Accounting Standards Board (IFRS-IASB).
Our internal control over financial reporting includes those policies and procedures that:
| · | pertain to the maintenance of records that, in reasonable detail, accurately and fairly reflect the transactions and dispositions of our assets, |
| · | provide reasonable assurance that transactions are recorded as necessary to permit preparation of financial statements in accordance with IFRS-IASB and that our receipts and expenditures are being made only in accordance with authorizations of our management and directors, and |
| · | provide reasonable assurance regarding prevention or timely detection of unauthorized acquisition, use or disposition of our assets that could have a material effect on the financial statements. |
Because of its inherent limitations, internal control over financial reporting, no matter how well designed, may not prevent or detect misstatements. Projections of any evaluation of effectiveness to future periods are subject to the risk that controls may become inadequate because of changes in conditions, or that the degree of compliance with the policies or procedures may deteriorate.
Our management assessed the effectiveness of our internal control over financial reporting as of December 31, 2010 based on the criteria established in Internal Control—Integrated Framework issued by the Committee of Sponsoring Organizations of the Treadway Commission, (COSO). Based on this assessment, our management concluded that our internal control over financial reporting was effective as of December 31, 2010.
Our independent registered public accounting firm, Deloitte, has audited the consolidated financial statements included in this Annual Report, and as part of their audit, has issued their report, included herein, on the effectiveness of our internal control over financial reporting as of December 31, 2010.
Attestation Report of the Registered Public Accounting Firm
REPORT OF INDEPENDENT REGISTERED PUBLIC ACCOUNTING FIRM
To the Board of Directors and Shareholders of
Corpbanca
We have audited the internal control over financial reporting of CORPBANCA and its subsidiaries (the “Bank”) as of December 31, 2010, based on criteria established in Internal Control-Integrated Framework issued by the Committee of Sponsoring Organizations of the Treadway Commission. The Bank’s management is responsible for maintaining effective internal control over financial reporting and for its assessment of the effectiveness of internal control over financial reporting included in the accompanying Management’s Report on Internal Control Over Financial Reporting. Our responsibility is to express an opinion on the Bank’s internal control over financial reporting based on our audit.
145
We conducted our audit in accordance with the standards of the Public Company Accounting Oversight Board (United States of America). Those standards require that we plan and perform the audit to obtain reasonable assurance about whether effective internal control over financial reporting was maintained in all material respects. Our audit included obtaining an understanding of internal control over financial reporting, assessing the risk that a material weakness exist, testing and evaluating the design and operating effectiveness of internal control based on the assessed risk, and performing such other procedures as we considered necessary in the circumstances. We believe that our audit provides a reasonable basis for our opinion.
A bank’s internal control over financial reporting is a process designed by, or under the supervision of, the bank’s principal executive and principal financial officers, or persons performing similar functions, and effected by the bank’s board of directors, management, and other personnel to provide reasonable assurance regarding the reliability of financial reporting and the preparation of financial statements for external purposes in accordance with generally accepted accounting principles. A bank’s internal control over financial reporting includes those policies and procedures that (1) pertain to the maintenance of records that, in reasonable detail, accurately and fairly reflect the transactions and dispositions of the assets of the bank; (2) provide reasonable assurance that transactions are recorded as necessary to permit preparation of financial statements in accordance with generally accepted accounting principles and that receipts and expenditures of the bank are being made only in accordance with authorizations of management and directors of the bank; and (3) provide reasonable assurance regarding prevention or timely detection of unauthorized acquisition, use, or disposition of the bank’s assets that could have a material effect on the financial statements.
Because of the inherent limitations of internal control over financial reporting, including the possibility of collusion or improper management override of controls, material misstatements due to error or fraud may not be prevented or detected on a timely basis. Also, projections of any evaluation of the effectiveness of the internal control over financial reporting to future periods are subject to the risk that the controls may become inadequate because of changes in conditions, or that the degree of compliance with the policies or procedures may deteriorate.
In our opinion, the Bank maintained, in all material respects, effective internal control over financial reporting as of December 31, 2010, based on the criteria established in Internal Control-Integrated Framework issued by the Committee of Sponsoring Organizations of the Treadway Commission.
We have also audited, in accordance with the standards of the Public Company Accounting Oversight Board (United States of America), the consolidated financial statements as of and for the year ended December 31, 2010 of the Bank and our report dated April 12, 2011, expressed an unqualified opinion on those consolidated financial statements and included an explanatory paragraph stating that our audit comprehended the translation of Chilean peso amounts into U.S. dollar amounts and we are not aware of any modifications that should be made for such translation to be in conformity with the basis stated in Note 1y. Such U.S. dollar amounts are presented solely for the convenience of readers in the United States of America.
/s/Deloitte
Santiago, Chile
April 12, 2011
Changes in Internal Control over Financial Reporting
There were no significant changes in our internal controls over financial reporting identified in connection with the evaluation required by paragraph (d) of 17 CFR 240.a13a-15 or 240.15d-15 that occurred during the period covered by this Annual Report that have materially affected, or are reasonably likely to materially affect, our internal control over financial reporting.
We believe that each of the members of our Audit Committee qualifies as an “audit committee financial expert” within the meaning of this Item 16A, in that (i) each has an understanding of IFRS and financial statements, (ii) the ability to assess the general application of such principles in connection with the accounting for estimates, accruals and reserves, (iii) significant experience auditing, analyzing or evaluating financial statements that present a breadth and level of complexity of accounting issues that are generally comparable to the breadth and complexity of issues that can reasonably be expected to be raised by the financial statements and experience supervising persons engaged in such activities, (iv) an understanding of internal control over financial accounting and reporting, and (v) an understanding of the functions of an audit committee.
146
All members of our Audit Committee are considered to be independent according to applicable NYSE criteria and Rule 10A-3 promulgated under the Exchange Act.
We have adopted a code of ethics, as defined in Item 16B of Form 20-F under the Exchange Act. Our code of ethics applies to our Chief Executive Officer, Chief Financial Officer, principal accounting officer and persons performing similar functions, as well as to our directors and other employees without exception. A copy of our code of ethics, as amended, along with our Code of Conduct in the Securities Market, is attached as an exhibit to this Annual Report.
No waivers been granted to the code of ethics since its adoption that applies to the persons indicated above.
The following table sets forth the fees billed to us by our independent auditors during the fiscal years ended December 31, 2008, 2009 and 2010:
Year ended December 31, | ||||||
| 2008 | 2009 | 2010 | ||||
(in millions of Ch$ as of December 31, 2010) | |||||||||
| Audit fees | Ch$ | 385 | Ch$ | 607 | Ch$ | 490 | |||
| Audit-related fees | — | — | 169 | ||||||
| Tax fees | 6 | — | 46 | ||||||
| All other fees | — | 81 | 202 | ||||||
| Ch$ | 391 | Ch$ | 688 | Ch$ | 907 | ||||
Audit fees in the above table are the aggregate fees billed by Deloitte in connection with the audit of our financial statements and services that are normally provided by Deloitte in connection with statutory and regulatory filings or engagements.
Audit-related fees in the above table are the aggregate fees billed by Deloitte for the audit and review of our filings under the Securities Act.
Tax fees in the above table are the aggregate fees billed by Deloitte for tax compliance, tax advice, and tax planning.
Other services are fees billed to us by Deloitte in connection with consulting work and advice on accounting matters (which are unrelated to the auditing of the accounts).
Pre-approval Policies and Procedures
Our Audit Committee approves all audit, audit-related services, tax services and other services provided by Deloitte. Any services provided by Deloitte that are not specifically included within the scope of the audit must be pre-approved by the Audit Committee and the Directors Committee prior to any engagement.
Not applicable.
147
The following table sets out certain information concerning purchases of our shares registered under Section 12 of the Exchange Act by us or any affiliated purchaser during fiscal year 2010:
| Period | (a) Total number of shares purchased | (b) Average price paid per share (in Ch$) | (c) Total number of shares purchased as part of publicly announced plans or programs | (d) Maximum number of shares that may yet be purchased under the plans or programs | |||||
| January 2010 | — | — | — | 5,054,546,026 | |||||
| February 2010 | (5,052,027,491) | 3.5 | — | 2,518,535 | |||||
| March 2010 | — | — | — | 2,518,535 | |||||
| April 2010 | (2,518,535) | 4.5 | — | — | |||||
| May 2010 | — | — | — | — | |||||
| June 2010 | — | — | — | — | |||||
| July 2010 | — | — | — | — | |||||
| August 2010 | — | — | — | — | |||||
| September 2010 | — | — | — | — | |||||
| October 2010 | — | — | — | — | |||||
| November 2010 | — | — | — | — | |||||
| December 2010(1) | — | — | — | — | |||||
| Total | (5,054,546,026) | 3.5 | (1) | — | — |
| (1) | On December 30, 2010, our Board of Directors agreed to hold an Extraordinary Shareholders Meeting on January 27, 2011, in order to submit to the shareholders for approval a proposal to increase the capital of the bank through the issuance of 40,042,815,984 new common shares. The new common shares would have no par value and represent 15.0% of the total capital stock of Corpbanca. A majority of the shareholders of the bank approved the proposed capital increase at the Extraordinary Shareholders Meeting held on January 27, 2011, and the Board of Directors was expressly authorized to determine the offering price for the new common shares and whether to offer them in Chile or abroad; in particular, the securities market in the United States through the issuance and listing of ADRs on the NYSE. |
Not applicable.
Pursuant to Section 303A.11 of the Listed Company Manual of the New York Stock Exchange, “foreign private issuers” are required to provide a summary of the significant ways in which their corporate governance practices differ from those corporate governance standards required of U.S. companies by the New York Stock Exchange. As a Chilean bank, our corporate governance standards are governed by our by-laws, the General Banking Law, the Chilean Corporations Law, the Ley de Mercado de Valores No. 18,045, or the Securities Market Law, and the regulations issued by the Chilean Superintendency of Banks. The following chart notes these differences:
| NYSE Corporate Governance Standards | Corpbanca’s Practices | |
| Listed companies must have a majority of independent directors and independence test. | Publicly traded companies (sociedades anónimas abiertas) must designate at least one independent director and a Directors Committee, if they have a market capitalization equal to or greater than the equivalent of 1,500,000 unidades de fomento, and at least 12.5% of its issued shares with voting rights are held by shareholders who individually control or own less than 10% of such shares. Under Chilean law, directors elected by a group or class of shareholders have the same duties to the company and to the shareholders as do the remaining directors, and all transactions with the company in which a director has an interest, either personally (which includes the director’s spouse and certain relatives) or as a representative of a third party, requires a report from the Directors Committee and the prior approval by the Board of Directors and must be entered into the interest of the Company and on market terms and conditions. Such transactions must be reviewed by the Directors Committee and disclosed at the subsequent shareholders’ meeting. |
148
| Non-management directors must meet at regularly scheduled executive sessions without management. | Chilean Law establishes that our executive officers may not serve as directors and therefore, all of our directors are non-management. Our Board of Directors meets regularly on a monthly basis. | |
| Listed companies must have a nominating/corporate governance committee composed entirely of independent directors. The committee must have a written charter addressing the committee’s purpose and responsibilities, which must include: identifying, and selecting or recommending, qualified individuals to serve as board members; developing and recommending corporate governance guidelines; and overseeing the evaluation of the board and management. | Under Chilean law we are not required to have, and do not have, a nominating/corporate governance committee. Under Chilean law, the only committees that are required are the Audit Committee, the Directors Committee, the Anti-Money Laundering Committee and the Anti-Terrorism Finance Committee. | |
| Listed companies must have a compensation committee composed entirely of independent directors. The committee must have a written charter addressing an annual performance evaluation of the committee and addressing the committee’s purpose and responsibilities, which must include: (i) determining and approving the CEO’s compensation level based on an evaluation of the CEO’s performance in light of relevant corporate goals and objectives, (ii) making recommendations with respect to non-CEO executive officer compensation, and (iii) producing a committee report on executive officer compensation. | Under Chilean law we are not required to have a compensating committee. Our Board of Directors establishes the compensation of our Chief Executive Officer and does a performance evaluation. The Directors Committee examines the compensation program of executive officers. | |
| Shareholders must have the opportunity to vote on all equity-compensation plans and material revisions thereto, subject to limited exemptions. | Our compensation policies do not provide for equity compensation plans. | |
| Listed companies must adopt and disclose corporate governance guidelines. The guidelines must address: (i) director qualification standards, (ii) director responsibilities, (iii) director access to management, (iv) director compensation, (v) director orientation and continuing education, (vi) management succession; and (vii) annual performance evaluation of the board. | Under Chilean law we are not required to adopt or disclose our corporate governance guidelines. We follow corporate governance guidelines established by Chilean laws which include, among others: (i) active participation of directors in our main committees, (ii) the requirement that all employees must sign and be knowledgeable of our code of ethics, (iii) a separation of functions — our commercial segment is separated from the back office and risk segments, main credit decisions are taken in committee, (iv) monthly review by the audit committee of internal audit reports, and (v) the appointment of an officer who overseas compliance with the code of ethics. |
149
| Listed companies must adopt and disclose a code of business conduct and ethics for directors, officers and employees, and promptly disclose waivers thereof for directors or executive officers. | We have a code of business and ethics conduct which drives business and ethic conduct of our Chief Executive Officer, chief financial officer and each employee. This code must be signed by each of our employees and is published in our intranet; it is included as an exhibit in this Annual Report. |
See the following items at pages F-1 to F-129.
| (a) | Report of Independent Registered Public Accounting Firm |
| (b) | Consolidated Statements of Financial Position as of 2010 and 2009 |
| (c) | Consolidated Statements of Income for the three years ended December 31, 2010 |
| (d) | Consolidated Statement of Comprehensive Income for the three years ended December 31, 2010 |
| (e) | Consolidated Statements of Changes in Shareholders’ Equity for the three years ended December 31, 2010 |
| (f) | Consolidated Statements of Cash Flows for each of the three years ended December 31, 2010 |
| (g) | Notes to the Consolidated Financial Statements. |
Not applicable.
The following exhibits are filed as part of this Annual Report:
| Exhibit 1.1 | Articles of Incorporation and Bylaws (estatutos sociales) of Corpbanca, including amendment thereto (English language translation). | |
| Exhibit 2.(a).1** | Form of Amended and Restated Deposit Agreement, dated as of September 27, 2004, among Corpbanca, The Bank of New York, as depositary, and the registered holders and beneficial owners from time to time of American Depositary Shares evidenced by American Depositary Receipts issued thereunder, including a form of American Depositary Receipt. | |
| Exhibit 2.(a).2* | Form of Corpbanca Share Certificate (English language translation). | |
| Exhibit 4.(a).1* | Systems Operations Services Agreement, dated as of March 30, 2001, between IBM de Chile S.A.C. and Corpbanca (English language translation). | |
| Exhibit 4.(a).2* | Service Contract, dated as of July 6, 2001, between Corp Group Interhold S.A. and Corpbanca (English language translation). | |
| Exhibit 4.(a).3* | Software Consulting and Development Agreement, “IBS” Integrated Banking System, dated as of October 4, 2001, between Datapro, Inc. and Corpbanca (English language translation). | |
| Exhibit 4.(a).4* | Agreement to Participate in the Automated Teller Machine Network Operated by Redbanc S.A., dated as of April 1, 2001, among Redbanc S.A. and Corpbanca (English language translation). | |
| Exhibit 4.(a).5**** | Sublease Automatic Teller Machine Contract, dated as of November 26, 2008, among SMU S.A., Rendic Hermanos S.A., Supermercados Bryc S.A. and Distribuidora Super Diez S.A. and Corpbanca (English language translation). |
150
| Exhibit 8.1 | List of subsidiaries of Corpbanca. | |
| Exhibit 11.1**** | English language translation of Corpbanca’s Code of Ethics, as amended. | |
| Exhibit 11.2*** | English language translation of Corpbanca’s Code of Conduct in the Securities Market | |
| Exhibit 12.1 | Certification of the chief executive officer of Corpbanca required under Rule 13a-14(a) or Rule 15d-14(a), pursuant to Section 302 of the Sarbanes Oxley Act of 2002. | |
| Exhibit 12.2 | Certification of the chief financial officer of Corpbanca required under Rule 13a-14(a) or Rule 15d-14(a), pursuant to Section 302 of the Sarbanes Oxley Act of 2002. | |
| Exhibit 13.1 | Certification of the chief executive officer of Corpbanca required under Rule 13a-14(a) or Rule 15d-14(a), pursuant to 18 U.S.C. § 1350, as adopted pursuant to § 906 of the Sarbanes-Oxley Act of 2002. | |
| Exhibit 13.2 | Certification of the chief financial officer of Corpbanca required under Rule 13a-14(a) or Rule 15d-14(a), pursuant to 18 U.S.C. § 1350, as adopted pursuant to § 906 of the Sarbanes-Oxley Act of 2002. |
| * | Incorporated by reference to our Form 20-F (File No. 001-32305) filed on September 24, 2004. | |
| ** | Incorporated by reference to our registration statement on Form F-6 (File No. 333-119251) filed on September 24, 2004. | |
| *** | Incorporated by reference to our annual report on Form 20-F (File No. 001-32305) filed on June 29, 2007. | |
| **** | Incorporated by reference to our annual report on Form 20-F (File No. 001-32305) filed on June 30, 2009. |
151
INDEX TO THE CONSOLIDATED FINANCIAL STATEMENTS
Financial Statements of Corpbanca and Subsidiaries
| Page | |
| Report of Independent Registered Public Accounting Firm | F-2 |
| Consolidated Statements of Financial Position as of 2009 and 2010 | F-3 |
| Consolidated Statements of Income for the three years ended December 31, 2010 | F-4 |
| Consolidated Statement of Comprehensive Income for the three years ended December 31, 2010 | F-5 |
| Consolidated Statements of Changes in Shareholders’ Equity for the three years ended December 31, 2010 | F-6 |
| Consolidated Statements of Cash Flows for each of the three years ended December 31, 2010 | F-7 |
| Notes to the Consolidated Financial Statements | F-8 |
F-1
REPORT OF INDEPENDENT REGISTERED PUBLIC ACCOUNTING FIRM
To the Board of Directors and Shareholders of
Corpbanca
We have audited the accompanying consolidated statements of financial position of Corpbanca and subsidiaries (“Corpbanca” or “the Bank”) as of December 31, 2009 and 2010 and the corresponding consolidated statements of income, comprehensive income, changes in shareholders´ equity and cash flows for each of the three years in the period ended December 31, 2010, all expressed in million of Chilean pesos. These consolidated financial statements are the responsibility of the management of Corpbanca. Our responsibility is to express an opinion on these consolidated financial statements based on our audits.
We conducted our audits in accordance with the standard of the Public Company Accounting Oversight Board (United States of America). Those standards require that we plan and perform the audit to obtain reasonable assurance about whether the financial statements are free of material misstatement. An audit includes examining, on a test basis, evidence supporting the amounts and disclosures in the financial statements. An audit also includes assessing the accounting principles used and significant estimates made by management of the Bank, as well as evaluating the overall financial statement presentation. We believe that our audits provide a reasonable basis for our opinion.
In our opinion, the consolidated financial statements referred to above present fairly, in all material respects, the financial position of Corpbanca and subsidiaries as of December 31, 2009 and 2010 and the results of their operations and their cash flows for each of the three years in the period ended December 31, 2010, in conformity with International Financial Reporting Standards (IFRS) as issued by the International Accounting Standards Board (“IASB”).
Our audit also comprehended the translation of Chilean peso amounts into U.S. dollar amounts and we are not aware of any modifications that should be made for such translation to be in conformity with the basis stated in Note 1y. Such U.S. dollar amounts are presented solely for the convenience of readers in the United States of America.
We have also audited, in accordance with the standards of the Public Company Accounting Oversight Board (United States of America), the Bank’s internal control over financial reporting as of December 31, 2010, based on the criteria established in Internal Control - Integrated Framework issued by the Committee of Sponsoring Organizations of the Treadway Commission and our report dated April 12, 2011 expressed an unqualified opinion on the Bank’s internal control over financial reporting.
/s/Deloitte
Santiago, Chile
April 12, 2011
F-2
CORPBANCA AND SUBSIDIARIES
CONSOLIDATED STATEMENTS OF FINANCIAL POSITION
For the years ended December 31, 2009 and 2010
(In millions of Chilean pesos - MCh$)
| Notes | 12.31.2009 | 12.31.2010 | 12.31.2010 | |||||||||||||
| ASSETS | MCh$ | MCh$ | ThUS$ | |||||||||||||
| (Note 1y) | ||||||||||||||||
| Cash and deposits in banks | 5 | 110,331 | 202,339 | 432,552 | ||||||||||||
| Items in course of collection | 5 | 95,796 | 79,680 | 170,336 | ||||||||||||
| Trading portfolio financial assets | 6 | 76,156 | 197,580 | 422,378 | ||||||||||||
| Investments under agreements to resell | 7 | 51,970 | 75,676 | 161,777 | ||||||||||||
| Derivative financial instruments | 8 | 126,140 | 204,067 | 436,246 | ||||||||||||
| Loans and receivables from banks, net | 9 | 86,220 | 63,998 | 136,812 | ||||||||||||
| Loans and receivables from customers, net | 10 | 4,912,392 | 5,364,980 | 11,469,024 | ||||||||||||
| Financial investments available-for-sale | 11 | 737,162 | 746,248 | 1,595,297 | ||||||||||||
| Investments in other companies | 12 | 3,583 | 3,583 | 7,660 | ||||||||||||
| Intangible assets | 13 | 13,630 | 13,096 | 27,996 | ||||||||||||
| Property, plant and equipment, net | 14 | 55,212 | 53,430 | 114,220 | ||||||||||||
| Deferred income taxes | 15 | 19,060 | 21,956 | 46,937 | ||||||||||||
| Other assets | 16 | 92,307 | 104,207 | 222,769 | ||||||||||||
| TOTAL ASSETS | 6,379,959 | 7,130,840 | 15,244,004 | |||||||||||||
| LIABILITIES | ||||||||||||||||
| Current accounts and demand deposits | 17 | 496,270 | 612,064 | 1,308,444 | ||||||||||||
| Items in course of collection | 5 | 64,854 | 41,525 | 88,770 | ||||||||||||
| Investments under agreements to repurchase | 7 | 465,513 | 189,350 | 404,784 | ||||||||||||
| Time deposits and saving accounts | 17 | 3,316,045 | 3,700,454 | 7,910,672 | ||||||||||||
| Derivative financial instruments | 8 | 114,703 | 175,261 | 374,665 | ||||||||||||
| Borrowings from financial institutions | 18 | 362,403 | 503,692 | 1,076,771 | ||||||||||||
| Debt issued | 19 | 935,219 | 1,215,435 | 2,598,305 | ||||||||||||
| Other financial obligations | 19 | 26,853 | 23,660 | 50,579 | ||||||||||||
| Current income tax provision | 15 | 7,831 | 7,168 | 15,323 | ||||||||||||
| Deferred income taxes | 15 | 15,644 | 21,244 | 45,415 | ||||||||||||
| Provisions | 20 | 49,804 | 67,732 | 144,795 | ||||||||||||
| Other liabilities | 21 | 17,471 | 20,998 | 44,889 | ||||||||||||
| TOTAL LIABILITIES | 5,872,610 | 6,578,583 | 14,063,412 | |||||||||||||
| SHAREHOLDERS’ EQUITY | ||||||||||||||||
| Attributable to equity holders of the Bank: | ||||||||||||||||
| Capital | 326,038 | 342,379 | 731,923 | |||||||||||||
| Reserves | 25,054 | 26,406 | 56,450 | |||||||||||||
| Valuation gains (losses) | (6,557 | ) | (2,758 | ) | (5,896 | ) | ||||||||||
| Retained earnings: | 162,814 | 183,287 | 391,823 | |||||||||||||
| Retained earnings from prior periods | 119,176 | 120,259 | 257,085 | |||||||||||||
| Net income for the year | 86,192 | 122,550 | 261,982 | |||||||||||||
| Less: Accrual for mandatory dividends | (42,554 | ) | (59,522 | ) | (127,244 | ) | ||||||||||
| 507,349 | 549,314 | 1,174,301 | ||||||||||||||
| Non controlling interest | - | 2,943 | 6,291 | |||||||||||||
| TOTAL SHAREHOLDERS’ EQUITY | 507,349 | 552,257 | 1,180,592 | |||||||||||||
| 6,379,959 | 7,130,840 | 15,244,004 | ||||||||||||||
Notes 1 to 39 are an integral part of these consolidated financial statements
F-3
CORPBANCA AND SUBSIDIARIES
CONSOLIDATED STATEMENTS OF INCOME
For the years ended December 31, 2008, 2009 and 2010
(In millions of Chilean pesos - MCh$)
| Notes | 12.31.2008 | 12.31.2009 | 12.31.2010 | 12.31.2010 | ||||
| MCh$ | MCh$ | MCh$ | ThUS$ | |||||
| (Note 1 y) | ||||||||
| Interest income | 24 | 560,893 | 314,115 | 387,639 | 828,678 | |||
| Interest expense | 24 | (346,717) | (120,727) | (163,229) | (348,944) | |||
| Net interest income | 214,176 | 193,388 | 224,410 | 479,734 | ||||
| Income from service fees | 25 | 54,865 | 53,128 | 68,453 | 146,336 | |||
| Expenses from service fees | 25 | (12,813) | (9,867) | (10,232) | (21,874) | |||
| Net Service Fee Income | 42,052 | 43,261 | 58,221 | 124,462 | ||||
| Trading and investment income, net | 26 | 54,997 | 4,563 | (9,410) | (20,116) | |||
| Foreign exchange gains (losses), net | 27 | (42,887) | 49,635 | 44,611 | 95,367 | |||
| Other operating income | 32 | 7,820 | 5,087 | 8,832 | 18,881 | |||
| Trading and Investment, Foreign Exchange Gains and Other Operating Income | 19,930 | 59,285 | 44,033 | 94,132 | ||||
| Operating Income Before Loan Losses | 276,158 | 295,934 | 326,664 | 698,328 | ||||
| Provisions for loan losses | 28 | (54,983) | (71,271) | (52,351) | (111,914) | |||
Total Operating Income, Net of Loan Losses, Interest and Fees | 221,175 | 224,663 | 274,313 | 586,415 | ||||
| Personnel salaries expenses | 29 | (57,716) | (65,733) | (71,034) | (151,853) | |||
| Administration expenses | 30 | (54,651) | (44,592) | (46,793) | (100,032) | |||
| Depreciation and amortization | 31 | (6,832) | (6,310) | (7,117) | (15,214) | |||
| Impairment | 31 | (59) | (144) | (427) | (913) | |||
| Other operating expenses | 32 | (4,193) | (5,888) | (7,312) | (15,631) | |||
| Total Operating Expenses | (123,451) | (122,667) | (132,683) | (283,643) | ||||
| Total Net Operating Income | 97,724 | 101,996 | 141,630 | 302,772 | ||||
| Income attributable to investments in other companies | 12 | 262 | 445 | 296 | 633 | |||
| Income before income taxes | 97,986 | 102,441 | 141,926 | 303,405 | ||||
| Income taxes | 15 | (9,304) | (16,249) | (20,353) | (43,510) | |||
| Net income for the year | 88,682 | 86,192 | 121,573 | 259,895 | ||||
| Attributable to: | ||||||||
| Equity holders of the Bank | 88,682 | 86,192 | 122,550 | 261,982 | ||||
| Non controlling interest | - | - | (977) | (2,089) | ||||
| Earnings per share attributable to equity holders of the Bank | Ch$ | Ch$ | Ch$ | US$ | ||||
| Basic earnings per share | 23 | 0.392 | 0.390 | 0.540 | 1 | |||
| Diluted earning per share | 23 | 0.392 | 0.390 | 0.540 | 1 |
Notes 1 to 39 are an integral part of these consolidated financial statements
F-4
CORPBANCA AND SUBSIDIARIES
CONSOLIDATED STATEMENT OF COMPREHENSIVE INCOME
For the years ended December 31, 2008, 2009 and 2010
(In millions of Chilean pesos - MCh$)
| 12.31.2008 | 12.31.2009 | 12.31.2010 | 12.31.2010 | |||||
| MCh$ | MCh$ | MCh$ | ThUS$ | |||||
| (Note 1 y) | ||||||||
| Net income for the year | 88,682 | 86,192 | 122,550 | 261,982 | ||||
| Other Comprehensive Income | ||||||||
| Financial instruments available-for-sale | 1,229 | (7,580) | 4,836 | 10,338 | ||||
| Exchange differences on translation - New York Branch | - | (1,284) | (1,014) | (2,168) | ||||
| Hedge of net investment in foreign operation | - | - | 963 | 2,059 | ||||
| Other comprehensive income before income taxes | 1,229 | (8,864) | 4,785 | 10,229 | ||||
| Income tax relating to financial instruments available-for-sale, before tax | (209) | 1,289 | (822) | (1,757) | ||||
| Income tax due to hedge of net investment in foreign operation | - | - | (164) | (351) | ||||
| Total other comprehensive income (loss) | 1,020 | (7,575) | 3,799 | 8,121 | ||||
| Comprehensive income for the year | 89,702 | 78,617 | 126,349 | 270,103 | ||||
| Attributable to: | ||||||||
| Equity Holders of the bank | 89,702 | 78,617 | 127,326 | 272,192 | ||||
| Non Controlling interest | - | - | (977) | (2,089) |
Notes 1 to 39 are an integral part of these consolidated financial statements
F-5
CORPBANCA AND SUBSIDIARIES
STATEMENTS OF CHANGES IN SHAREHOLDERS’ EQUITY
For the years ended December 31, 2008, 2009 and 2010
(In millions of Chilean pesos - MCh$, except for number of shares)
| Number of shares | Paid-in Capital | Reserves | Valuation gains (losses) | Retained earnings | Total attributable to equity holders of the Bank | |||||||||
Financial investment available-for- sale | Hedge of net investment in foreign operation | Income tax other comprehensive income | Exchange differences on translation | Retained earnings from prior periods | Net income for the year | Accrual for mandatory dividends | Non controlling interest | Total Shareholders’ equity | ||||||
| (Millions) | MCh$ | MCh$ | MCh$ | MM$ | MCh$ | MCh$ | MCh$ | MCh$ | MCh$ | MCh$ | MCh$ | MCh$ | ||
| Balance as of January 1, 2008 | 226,909 | 314,398 | 24,651 | (2) | - | - | - | 164,920 | - | (25,524) | 478,443 | - | 478,443 | |
| Dividends paid | - | - | - | - | - | - | - | (51,049) | - | 25,524 | (25,525) | - | (25,525) | |
| Purchase of treasury shares (a) | (5,673) | (17,188) | - | - | - | - | - | - | - | - | (17,188) | - | (17,188) | |
| Accrual for mandatory dividends | - | - | - | - | - | - | - | - | - | (28,155) | (28,155) | - | (28,155) | |
| Comprehensive income for the period | - | - | - | 1,229 | - | (209) | - | - | 88,682 | - | 89,702 | 89,702 | ||
| Adjustment 2008 price-level restatement restitution (b) | - | 26,829 | 238 | - | - | - | - | (27,067) | - | - | - | - | - | |
| Balance as of December 31 2008 | 221,236 | 324,039 | 24,889 | 1,227 | - | (209) | - | 86,804 | 88,682 | (28,155) | 497,277 | - | 497,277 | |
| Distribution of prior year´s net income | - | - | - | - | - | - | - | 88,682 | (88,682) | - | - | - | - | |
| Balance as of December 31, 2008 | 221,236 | 324,039 | 24,889 | 1,227 | - | (209) | - | 175,486 | - | (28,155) | 497,277 | - | 497,277 | |
| Dividends paid | - | - | - | - | - | - | - | (56,310) | - | 28,155 | (28,155) | - | (28,155) | |
| Accrual for mandatory dividends | - | - | - | - | - | - | - | - | - | (42,554) | (42,554) | - | (42,554) | |
| Sale of treasury shares (a) | 618 | 1,999 | - | - | - | - | - | - | - | - | 1,999 | - | 1,999 | |
| Share premium | - | - | 165 | - | - | - | - | - | - | - | 165 | - | 165 | |
| Comprehensive income for the period | - | - | - | (7,580) | - | 1,289 | (1,284) | - | 86,192 | - | 78,617 | - | 78,617 | |
| Balance as of December 31 2009 | 221,854 | 326,038 | 25,054 | (6,353) | - | 1,080 | (1,284) | 119,176 | 86,192 | (42,554) | 507,349 | - | 507,349 | |
| Distribution of prior year’s net income | - | - | - | - | - | - | - | 86,192 | (86,192) | - | - | - | - | |
| Balance as of January 1, 2010 | 221,854 | 326,038 | 25,054 | (6,353) | - | 1,080 | (1,284) | 205,368 | - | (42,554) | 507,349 | - | 507,349 | |
Increase or decrease in capital and reserves | - | - | - | - | - | - | - | - | - | - | - | 3,920 | 3,920 | |
| Dividends paid | - | - | - | - | - | - | - | (85,109) | - | 42,554 | (42,555) | - | (42,555) | |
| Accrual for mandatory dividends | - | - | - | - | - | - | - | - | - | (59,522) | (59,522) | - | (59,522) | |
| Sale of treasury shares (a) | 5,055 | 16,341 | - | - | - | - | - | - | - | - | 16,341 | - | 16,341 | |
| Higher value of shares sold | - | - | 1,352 | - | - | - | - | - | - | - | 1,352 | - | 1,352 | |
| Comprehensive income for the period | - | - | - | 4,836 | 963 | (986) | (1,014) | - | 122,550 | - | 126,349 | (977) | 125,372 | |
| Balance as of December 31 2010 | 226,909 | 342,379 | 26,406 | (1,517) | 963 | 94 | (2,298) | 120,259 | 122,550 | (59,522) | 549,314 | 2,943 | 552,257 | |
Balance as of December 31 2010 ThUS$ (Note 1 y) | 226,909 | 731,923 | 56,450 | (3,243) | 2,059 | 201 | (4,913) | 257,085 | 261,982 | (127,244) | 1,174,300 | 6,291 | 1,180,591 | |
(a) See Note 23 to the consolidated financial statements. (b) “The December 31, 2008 paid-in-capital balance includes price-level restatement adjustments that were not reversed when we adopted IFRS in 2009. We elected not to reverse such price-level restatement adjustments based on SVS Circular N°456 which indicates that the impact of deflation shall apply to paid-in-capital accounts as paid-in-capital accounts during the transition period to IFRS accounting is set forth in the Company’s by laws, which were amended based on the distribution of the revalued equity and approved at the annual shareholder’s meeting held pursuant to Article 10, section 2 of Chilean Law N°18.046 Sociedades Anónimas.” Notes 1 to 39 are an integral part of these consolidated financial statements | ||||||||||||||
F-6
CORPBANCA AND SUBSIDIARIES
CONSOLIDATED STATEMENT OF CASH FLOWS
For the years ended December 31, 2008, 2009 and 2010
(In millions of Chilean pesos - MCh$)
| Notes | 12.31.2008 | 12.31.2009 | 12.31.2010 | 12.31.2010 | ||||||||||||||||
| MCh$ | MCh$ | MCh$ | ThUS$ | |||||||||||||||||
| CASH FLOW FROM OPERATING ACTIVITIES: | (Note 1.y) | |||||||||||||||||||
| Income before income taxes | 97,986 | 102,441 | 141,926 | 303,403 | ||||||||||||||||
| Non controlling Interest | - | - | (977 | ) | (2,089 | ) | ||||||||||||||
| Charges (credits) to income not representing cash flow: | ||||||||||||||||||||
| Depreciation and amortization | 31 | 6,832 | 6,310 | 7,117 | 15,214 | |||||||||||||||
| Provision for loan losses | 28 | 66,018 | 84,487 | 67,060 | 143,358 | |||||||||||||||
| Provisions and write-offs for assets received in lieu of payment | 32 | - | 468 | 27 | 58 | |||||||||||||||
| Contingency provisions | 32 | (1,288 | ) | 1,532 | 1,360 | 2,907 | ||||||||||||||
| Adjustment to market value for financial investments available-for-sale and derivatives | (9,221 | ) | 3,619 | 15,795 | 33,766 | |||||||||||||||
| Net interest income | 24 | (214,176 | ) | (193,388 | ) | (224,410 | ) | (479,734 | ) | |||||||||||
| Net fees and income from services | 25 | (42,052 | ) | (43,261 | ) | (58,221 | ) | (124,462 | ) | |||||||||||
| Net foreign exchange gains (losses) | 27 | 42,887 | (49,635 | ) | (44,611 | ) | (95,367 | ) | ||||||||||||
| Other charges (credits) to income not representing cash flows | (17,008 | ) | (21,989 | ) | 7,718 | 16,499 | ||||||||||||||
| Subtotals | (70,022 | ) | (109,416 | ) | (87,216 | ) | (186,447 | ) | ||||||||||||
Increase/decrease in operating assets and liabilities: Loans and receivables to customers and banks | (690,813 | ) | (82,465 | ) | (324,987 | ) | (694,743 | ) | ||||||||||||
| Investments under agreements to repurchase | 582 | (18,494 | ) | (28,329 | ) | (60,561 | ) | |||||||||||||
| Trading portfolio financial assets | 35,996 | 11,316 | (81,329 | ) | (173,862 | ) | ||||||||||||||
| Financial investments available-for-sale | (560,389 | ) | (120,228 | ) | (24,293 | ) | (51,933 | ) | ||||||||||||
| Other assets and liabilities | (15,252 | ) | 3,211 | (7,027 | ) | (15,022 | ) | |||||||||||||
| Time deposits and saving accounts | 981,802 | 94,241 | 462,280 | 988,242 | ||||||||||||||||
| Currents accounts and demand deposits | 21,729 | 138,368 | 115,853 | 247,666 | ||||||||||||||||
| Investments under agreements to resell | 262,580 | 114,148 | (281,176 | ) | (601,086 | ) | ||||||||||||||
| Dividends received from investments in other companies | 12 | 262 | 445 | 296 | 633 | |||||||||||||||
| Foreign borrowings obtained | 241,562 | 701,452 | 572,500 | 1,223,866 | ||||||||||||||||
| Repayment of foreign borrowings | (326,232 | ) | (737,194 | ) | (542,357 | ) | (1,159,428 | ) | ||||||||||||
| Net (decrease) increase of other obligations with banks | 149,987 | (53,738 | ) | 111,146 | 237,603 | |||||||||||||||
| Other borrowings | 12,716 | - | - | - | ||||||||||||||||
| Repayment of other borrowings | (9,884 | ) | (17,917 | ) | (3,396 | ) | (7,260 | ) | ||||||||||||
| Net cash (used in) provided by operating activities | 34,624 | (76,271 | ) | (118,035 | ) | (252,332 | ) | |||||||||||||
| CASH FLOW FROM INVESTING ACTIVITIES: | ||||||||||||||||||||
| Purchase of property, plant and equipment | (9,470 | ) | (11,056 | ) | (5,940 | ) | (12,698 | ) | ||||||||||||
| Proceeds from sales of property, plant and equipment | 84 | - | 286 | 611 | ||||||||||||||||
| Sale of assets received in lieu of payment or in foreclosure | 776 | 2,975 | 1,636 | 3,497 | ||||||||||||||||
| Net cash (used in) provided by investment activities | (8,610 | ) | (8,081 | ) | (4,018 | ) | (8,590 | ) | ||||||||||||
| CASH FLOW FROM FINANCING ACTIVITIES: | ||||||||||||||||||||
| Issued debt | 94,894 | 254,528 | 403,073 | 861,672 | ||||||||||||||||
| Redemption of issued debt | (86,995 | ) | (56,162 | ) | (60,095 | ) | (128,469 | ) | ||||||||||||
| Purchase of treasury shares | (17,953 | ) | - | - | - | |||||||||||||||
| Sale of Bank-issued shares | - | 2,164 | 16,341 | 34,933 | ||||||||||||||||
| Paid dividends | 23 | (55,592 | ) | (56,310 | ) | (85,109 | ) | (181,942 | ) | |||||||||||
| Net cash provided (used in) provided by financing activities | (65,646 | ) | 144,220 | 274,210 | 586,194 | |||||||||||||||
| NET INCREASE (DECREASE) IN CASH AND CASH EQUIVALENTS | (39,632 | ) | 59,868 | 152,157 | 325,275 | |||||||||||||||
| Cash and cash equivalents at beginning of year | 221,328 | 181,696 | 241,564 | 516,405 | ||||||||||||||||
| Cash and cash equivalents at end of year | 5 | 181,696 | 241,564 | 393,721 | 841,680 | |||||||||||||||
Net increase (decrease) in cash and cash equivalents | (39,632 | ) | 59,868 | 152,157 | 325,275 | |||||||||||||||
Notes 1 to 39 are an integral part of these consolidated financial statements,
F-7
CORPBANCA AND SUBSIDIARIES
NOTES TO THE CONSOLIDATED FINANCIAL STATEMENTS
As of December 31, 2008, 2009 and 2010
INDEX
Page Nº
| Note 1 | - | SUMMARY OF SIGNIFICANT ACCOUNTING POLICIES...................................................................................................................................................... | F-10 |
| Note 2 | - | ACCOUNTING CHANGES............................................................................................................................................................................................................. | F-38 |
| Note 3 | - | SIGNIFICANT EVENTS.................................................................................................................................................................................................................. | F-38 |
| Note 4 | - | BUSINESS SEGMENTS.................................................................................................................................................................................................................. | F-42 |
| Note 5 | - | CASH AND CASH EQUIVALENTS............................................................................................................................................................................................ | F-47 |
| Note 6 | - | TRADING PORTFOLIO FINANCIAL ASSETS......................................................................................................................................................................... | F-48 |
| Note 7 | - | INVESTMENTS UNDER AGREEMENTS TO RESELL............................................................................................................................................................ | F-49 |
| Note 8 | - | DERIVATIVE FINANCIAL INSTRUMENT AND HEDGE ACCOUNTING......................................................................................................................... | F-51 |
| Note 9 | - | LOANS AND RECEIVABLES TO BANKS................................................................................................................................................................................. | F-53 |
| Note 10 | - | LOANS AND RECEIVABLES FROM CUSTOMERS................................................................................................................................................................ | F-54 |
| Note 11 | - | INVESTMENT INSTRUMENTS.................................................................................................................................................................................................... | F-58 |
| Note 12 | - | INVESTMENTS IN OTHER COMPANIES................................................................................................................................................................................... | F-61 |
| Note 13 | - | INTANGIBLES................................................................................................................................................................................................................................... | F-62 |
| Note 14 | - | PROPERTY, PLANT AND EQUIPMENT...................................................................................................................................................................................... | F-64 |
| Note 15 | - | CURRENT TAXES........................................................................................................................................................................................................................... | F-65 |
| Note 16 | - | OTHER ASSETS............................................................................................................................................................................................................................... | F-67 |
| Note 17 | - | CURRENT ACCOUNTS, DEPOSITS AND SAVING ACCOUNTS.......................................................................................................................................... | F-69 |
| Note 18 | - | BORROWINGS FROM FINANCIAL INSTITUTIONS............................................................................................................................................................. | F-70 |
| Note 19 | - | DEBT INSTRUMENTS ISSUED AND OTHER OBLIGATIONS.............................................................................................................................................. | F-71 |
| Note 20 | - | PROVISIONS.................................................................................................................................................................................................................................... | F-74 |
| Note 21 | - | OTHER LIABILITIES...................................................................................................................................................................................................................... | F-75 |
| Note 22 | - | CONTINGENCIES, COMMITMENTS AND RESPONSIBILITIES........................................................................................................................................... | F-76 |
| Note 23 | - | SHAREHOLDERS´ EQUITY.......................................................................................................................................................................................................... | F-80 |
| Note 24 | - | INTEREST INCOME AND EXPENSES....................................................................................................................................................................................... | F-84 |
F-8
CORPBANCA AND SUBSIDIARIES
NOTES TO THE CONSOLIDATED FINANCIAL STATEMENTS
As of December 31, 2008, 2009 and 2010
| Note 25 | - | FEES AND INCOME FROM SERVICES................................................................................................................................................................................... | F-85 |
| Note 26 | - | NET TRADING AND INVESTMENT INCOME...................................................................................................................................................................... | F-86 |
| Note 27 | - | NET FOREIGN EXCHANGE INCOME (LOSSES).................................................................................................................................................................... | F-87 |
| Note 28 | - | PROVISION FOR LOAN LOSSES.............................................................................................................................................................................................. | F-87 |
| Note 29 | - | PERSONNEL SALARIES EXPENSES........................................................................................................................................................................................ | F-89 |
| Note 30 | - | ADMINISTRATION EXPENSES................................................................................................................................................................................................ | F-90 |
| Note 31 | - | DEPRECIATION, AMORTIZATION AND IMPAIRMENT................................................................................................................................................... | F-91 |
| Note 32 | - | OTHER OPERATING INCOME AND EXPENSES................................................................................................................................................................... | F-92 |
| Note 33 | - | RELATED PARTY TRANSACTIONS....................................................................................................................................................................................... | F-93 |
| Note 34 | - | FINANCIAL ASSETS AND LIABILITIES MEASURED AT FAIR VALUE........................................................................................................................ | F-98 |
| Note 35 | - | RISK MANAGEMENT................................................................................................................................................................................................................. | F-101 |
| Note 36 | - | MATURITY OF ASSETS AND LIABILITIES.......................................................................................................................................................................... | F-126 |
| Note 37 | - | LEASING......................................................................................................................................................................................................................................... | F-127 |
| Note 38 | - | FOREIGN CURRENCY POSITION.............................................................................................................................................................................................. | F-128 |
| Note 39 | - | SUBSEQUENT EVENTS............................................................................................................................................................................................................... | F-129 |
F-9
| NOTE 1 - | SUMMARY OF SIGNIFICANT ACCOUNTING POLICIES |
Corporate information
Corpbanca is a banking corporation organized pursuant to the laws of the Republic of Chile that provides a broad spectrum of general banking services to its clients, who are from natural persons to large corporations. Corpbanca and its subsidiaries (hereinafter jointly referred to as the “Bank” or “Corpbanca”) offer commercial and consumer banking services, including factoring, collections, leasing, securities and insurance brokerage, mutual funds and management of investment funds and bank investments.
Basis of preparation
These consolidated financial statements have been prepared in accordance with the International Financial Reporting Standards (IFRS/NIIF) as issued by the International Accounting Standards Board (IASB).
Chilean banks are subject to the regulatory supervision of the Superintendency of Banks and Financial Institutions (“SBIF”) under the provisions of the General Banking Act (“Act”) of 1997. The Act establishes that in accordance with legal regulations, Chilean Banks must abide by the accounting standards stipulated by the SBIF.
In the framework of the strategic plan, the SBIF, by means of Circular N°3,410 (2007) and Circular N°3,443 (2008) announced the “Compendium of Accounting Standards”, which contains the new accounting standards and reporting formats for the financial industry required to be adopted by banking institutions effective January 1, 2009. Banks are required to apply the new accounting and reporting to the 2009 financial statements and to retrospectively apply the new standards to January 1, 2008 and include an opening balance sheet for the reporting period ended December 31, 2008.
Although banks are required to apply IFRS as of January 1, 2009, certain exceptions introduced by the regulator prevent the banks from achieving full convergence. In those situations which are not addressed by the guidance issued by the SBIF, institutions must follow the generally accepted accounting principles issued by the Association of Chilean Accountants which coincide with IFRS as issued by the International Accounting Standard Board (IASB).
Therefore, in order to comply with requirements of the Securities and Exchange Commission (SEC), the Bank has prepared its financial statements under IFRS as issued by the International Accounting Standard Board (IASB).
The Notes to the financial statements contain information in addition to the one that has been presented in the statements of financial position, statements of comprehensive income, statements of income, statements of changes in shareholders’ equity, and statements of cash flow. The notes provide narrative descriptions of items presented in those statements in a clear, reliable and comparable manner.
The financial statements for the period ending December 31, 2009 were the first prepared according to the International Financial Reporting Standards issued by IASB. This legislation incorporates the following important aspects:
- Significant changes in accounting policies, valuation criteria, and forms of presentation of financial statements.
- A significant increase in the information included in the notes to the financial statements.
For purposes of these financial statements we use certain terms and conventions, References to “US$”, “US dollars” and “dollars” are to United States dollars, references to “Chilean pesos,” “pesos” or “Ch$” are to Chilean pesos and references to “UF” are to Unidades de Fomento, The UF is an inflation-indexed Chilean monetary unit with a value in Chilean pesos that changes daily to reflect changes in the official Consumer Price Index (“CPI”) of the Instituto Nacional de Estadísticas (the Chilean National Institute of Statistics) for the previous month.
F-10
CORPBANCA AND SUBSIDIARIES
NOTES TO THE CONSOLIDATED FINANCIAL STATEMENTS
As of December 31, 2009 and 2010
The UF is revalued in monthly cycles, Each day in the period beginning on the tenth day of the current month through the ninth day of the succeeding month, the nominal peso value of the UF is indexed up (or down in the event of deflation) in order to reflect a proportionate amount of the change in the Chilean Consumer Price Index during the prior calendar month, As of December 31, 2010, one UF equaled Ch$21,455.55 and as of December 31, 2009, one UF equaled Ch$20,942.88. In 2010, CPI rate was -2.3% in 2009 compared to 2.5%, The effect of any changes in the nominal peso value of our UF-denominated interest earning assets and interest bearing liabilities is reflected in our results of operations as an increase (or decrease, in the event of deflation) in interest income and expense, respectively.
The main accounting policies adopted in preparing these financial statements are described below.
| a) | Basis of consolidation |
The consolidated financial statements incorporate the financial statements of the Bank, its subsidiaries and the New York Branch that participate in the consolidation as of December 31, 2009 and 2010, and include the necessary adjustments and reclassifications to the financial statements of subsidiaries and the New York Branch to bring their accounting policies and valuation criteria into line with those applied by the Bank, in accordance with IFRS.
All significant intragroup balances, transactions, income and expenses are eliminated in full on consolidation.
For consolidation purposes, the financial statements of the New York Branch have been translated into Chilean pesos at the closing exchange rate of $467.78 per US$1 as of December 31, 2010 ($507.52 per US$1 as of December 31, 2009), pursuant to IAS 21 - The Effects of Changes in Foreign Exchange Rates.
Subsidiaries
Subsidiaries are those entities over which the Bank has the ability to exercise control. Control is presumed to exist when the Bank owns, directly or indirectly through subsidiaries, more than 50% of the voting power of an entity, or the Bank owns 50% or less of the voting power of an entity but it has the power over more than half of the voting rights by virtue of an agreement with other investors. Control is understood as the power to govern the financial and operating policies of an entity, so as to obtain benefits from its activities.
Assets and net operating income of subsidiaries represent a 1.7% and 11.5%, respectively, out of the total consolidated assets and operating income as of December 31, 2010 (1.7% and 8.2% in 2009, respectively).
The consolidated Group is detailed below:
| (Direct and indirect) | ||
| Ownership | ||
| 2009 | 2010 | |
| % | % | |
| Corpbanca Corredores de Bolsa S.A. | 100 | 100 |
| Corpbanca Administradora General de Fondos S.A. | 100 | 100 |
Corpbanca Asesorías Financieras S.A. 1 | 100 | 100 |
| Corpbanca Corredores de Seguros S.A. | 100 | 100 |
Corp Legal S.A. 1 | 100 | 100 |
Corpbanca Agencia de Valores S.A. 2 | 100 | 100 |
Corpbanca New York Branch 1- 3 | 100 | 100 |
SMU Corp S.A. 1- 4 | - | 51 |
F-11
CORPBANCA AND SUBSIDIARIES
NOTES TO THE CONSOLIDATED FINANCIAL STATEMENTS
As of December 31, 2009 and 2010
1. Companies regulated by the Superintendency of Banks and Financial Institutions (SBIF, in its Spanish acronym). The other companies are regulated by the Superintendency of Securities and Insurance (SVS, in its Spanish acronym).
2. Corpbanca Agencia de Valores S.A., was incorporated on November 16, 2009.
3. The New York Branch has officially began operations on May 4, 2009.
4. SMU Corp S.A., was incorporated on September 2, 2009. Its paid-in capital was fully paid on October 10, 2010.
Associates
Associates are entities over which the Bank has the ability to exercise significant influence but not control or joint control. It is presumed that the Bank has significant influence when it holds, directly or indirectly, more than 20% of the voting rights in an entity. Associates are accounted for using the equity method.
Special Purpose Entities (“SPE”)
SIC Interpretation 12 - Consolidation - Special purpose entities (SIC 12) addresses when a special purpose entity should be consolidated by a reporting entity under the consolidation principles in IAS 27. Under SIC 12, the Bank must consolidate a special purpose entity when, in substance, it controls the SPE. The control of an SPE by the Bank may be indicated if:
| · | in substance, the activities of the SPE are being conducted on behalf of the Bank according to its specific business needs so that the Bank obtains benefits from the SPE's operation, |
| · | in substance, the Bank has the decision-making power to obtain the majority of the benefits of the activities of the SPE or, by setting up an 'autopilot' mechanism, the Bank has delegated these decision-making powers |
| · | in substance, the Bank has rights to obtain the majority of the benefits of the SPE and therefore may be exposed to risks incidents to the activities of the SPE |
| · | in substance, the Bank retains the majority of the residual or ownership risks related to the SPE or its assets in order to obtain benefits from its activities |
Bank’s management has concluded that no SPE entities exist that require inclusion in the Bank’s consolidated financial statements for 2009 and 2010.
Investments in other companies
Investments in other entities are those where the Bank does neither have control nor exercise significant influence. Investments is these entities are measured at cost (See Note 12).
| b) | Non-controlling interest |
The non-controlling interest represents the equity and net income in a subsidiary not attributable, directly or indirectly, to the Bank. The non-controlling interest is disclosed as a separate line item within equity in the consolidated statement of financial position and as a separate line item within the consolidated financial statements income.
F-12
CORPBANCA AND SUBSIDIARIES
NOTES TO THE CONSOLIDATED FINANCIAL STATEMENTS
As of December 31, 2009 and 2010
| c) | Operating segments |
Corpbanca provides financial information by operating segments in accordance with IFRS 8 - Operating segments (IFRS 8) to disclose information to enable users of its financial statements to evaluate the nature and financial effects of its business activities in which it engages and the economic environments in which it operates so as to:
| · | Better understand the Bank’s performance; |
| · | Better evaluate its future cash projections; and |
| · | Better judge about the Bank as a whole |
The Bank discloses separate information for each operating segment that has been identified and that exceeds the quantitative thresholds established for a segment.
Operating segments with similar economic characteristics often have a similar long-term financial performance. Two or more segments may be aggregated into a single operating segment only if aggregation is consistent with the core principles of IFRS 8 and the segments have similar economic characteristics and are similar in each of the following respects:
| i. | the nature of the products and services; |
| ii. | the nature of the production processes; |
| iii. | the type or class of customers that use their products and services; |
| iv. | the methods used to distribute their products or provide their services; and |
| v. | if applicable, the nature of the regulatory environment, for example, banking, insurance, or utilities. |
The Bank reports separately information on each operating segment that meets any of the following quantitative thresholds:
| i. | Its reported revenue, including both sales to external customers and intersegment sales or transfers, is 10% or more of the combined revenue, internal and external, of all the operating segments. |
| ii. | The absolute amount of its reported profit or loss is 10% or more of the greater, in absolute terms, of the greater of: (i) the combined reported profit of all the operating segments that did not report a loss; and (ii) the combined reported loss of all the operating segments that reported a loss. |
| iii. | Its assets represent are 10% or more of the combined assets of all the operating segments. |
The operating segments identified by Corpbanca whose operating results are regularly used by Senior Management and the Board of Directors in assessing the bank’s performance and making operating, financing and investing decisions are described as follows:
Commercial banking:
| c.1 | Large Companies, Corporate, and Real Estate is generally comprised of those companies that belong to leading economic groups, specific sectors, and companies with annual sales in excess of US$30 million. It also includes real estate companies and financial institutions. |
F-13
| c.2 | Companies - includes a full range of financial products and services for companies with annual sales under US$10 million. Leasing and factoring have been included in this business activity. |
Retail banking:
| c.3 | Traditional and Private Banking - offers, among other products, checking accounts, consumer loans, credit cards and mortgage loans to middle and upper income segments. |
| c.4 | Lower income retail banking - which corresponds to Banco Condell, offers among other products, consumer loans, credit cards and mortgage loans to the low-to-middle income segments. |
Treasury and International:
| c.5 | Primarily includes treasury activities such as financial management, funding and liquidity, as well as international businesses. |
Non-banking financial services:
| c.6 | Services rendered by our subsidiaries, which include insurance brokerage, financial advisory service, asset management and securities brokerage. |
| d) | Functional currency and foreign currency |
The Bank has determined the Chilean Peso as its functional currency and the presentation currency for their consolidated financial statements. The functional currency is the currency of the primary economic environment in which the Bank operates. Consequently, all balances and transactions denominated in currencies other than Chilean Pesos are considered as denominated in “foreign currencies”.
For the purposes of presenting consolidated financial statements, the assets and liabilities of the foreign consolidated entities whose functional currencies are other than the Chilean Peso are translated into the presentation currency as follows:
| e.1 | Assets and liabilities are translated at the closing exchange rate as of December 31, 2010 and 2009. |
| e.2 | Income, expenses and cash flows are translated at the exchange rate at the date of the transactions. |
| e.3 | Net equity components are translated at the historical exchange rates. |
The resulting exchange differences of translating into Chilean pesos the functional currency balances of the consolidated entities whose functional currency is other than the Chilean Peso, are recorded and accumulated as a Exchange differences on translation” in the line item “Valuation gains (losses)” within equity. On the disposal of those foreign subsidiaries, all of the exchange differences accumulated in equity with in respect of that operations attributable to the equity holders of the Bank are reclassified to net income.
In preparing the financial statements of each individual group entity, transactions in currencies other than the Bank’s functional currency are recognized at the rates prevailing at the dates of the transactions. At the end of each reporting period, monetary items denominated in foreign currencies are retranslated at the closing exchange rates. Exchange differences on monetary items are recognized in net income in the period in which they arise. The amount of net foreign exchange gains and losses within statement of income includes the recognition of the effects of fluctuations in the exchange rates monetary on assets and liabilities denominated in foreign currencies, and it also includes foreign exchange gains or losses on current and future transactions performed by the Bank.
Assets and liabilities denominated in foreign currencies are translated into Chilean pesos using the exchange rate of $467.78 per US$1 as of December 31, 2010 ($507.52 per US$1 as of December 31, 2009).
F-14
The foreign exchange gain (losses) presented within consolidated statement of income for the years ended December 31, 2008, 2009 and 2010 of MCh$(42,887), MCh$49,635 and MCh$44,611, respectively, include the exchange differences for exchange rate fluctuations over monetary foreign currency-denominated assets and liabilities, and the gains (losses) obtained from the Bank’s exchange currencies operations.
F-15
CORPBANCA AND SUBSIDIARIES
NOTES TO THE CONSOLIDATED FINANCIAL STATEMENTS
As of December 31, 2009 and 2010
| e) | Assets and liabilities measurement and classification criteria |
e.1 The criteria for measuring the assets and liabilities presented in the statement of financial position are the following:
| • | Assets and liabilities measured at amortized cost: |
The amortized cost of a financial asset or financial liability is the amount at which the financial asset or financial liability is measured at initial recognition minus principal repayments, plus or minus the cumulative amortization using the effective interest method of any difference between the initial amount and the maturity amount, and minus any reduction (directly or through the use of an allowance account) for impairment or uncollectability.
The effective interest method is a method of calculating the amortized cost of a financial asset or a financial liability and of allocating the interest income or interest expense over the relevant period. The effective interest rate is the rate that exactly discounts estimated future cash payments and receipts through the expected life of the financial instrument or, when appropriate, a shorter period to the net carrying amount of the financial asset or financial liability.
| • | Assets measured at fair value: |
Fair value of an asset or liability is the amount for which an asset could be exchanged or a liability could be settled between knowledgeable, willing parties in an arm’s length transaction. The most objective evidence of the fair value of an asset or liability is the price that would be paid in an active market (“quoted price” or “market price”).
When there is no quoted market price in an active market to determine the amount of the fair value for a certain asset or liability, the price established in recent transactions of similar instruments is considered in order to estimate its fair value.
In those cases when fair value of a financial asset or a financial liability cannot be reliably measured, such asset or liability is measure at cost less any identified impairment losses at the end of each reporting period.
e.2 Classification of financial assets for measurement purposes
The financial assets are initially classified into the various categories used for management and measurement purposes.
Financial assets are included for measurement purposes in one of the following categories:
| - | Financial assets at fair value trough profit and loss (held for trading) - this category includes the financial assets acquired principally for the purpose of generating a profit in the short term from fluctuations in their prices. This category includes the trading portfolio financial assets and derivative financial instruments not designated and effective as hedging instruments. |
| - | Available-for-sale financial assets: this category includes debt and equity securities not classified as “held-to-maturity investments”, “loans and accounts receivable from banks and customers” or “financial assets at fair value through profit or loss”. |
| - | Loans and accounts receivable from banks and customers: this category includes financing granted to third parties, based on their nature, regardless of the type of borrower and the form of financing. Includes loans and accounts receivable from customers, interbank loans, and finance lease transactions in which the consolidated entities act as lessors. |
F-16
CORPBANCA AND SUBSIDIARIES
NOTES TO THE CONSOLIDATED FINANCIAL STATEMENTS
As of December 31, 2009 and 2010
e.3 Classification of financial assets for presentation purposes
Financial assets are classified by their nature into the following line items in the consolidated financial statements:
| - | Cash and deposits in banks: Cash balances, checking accounts and on-demand deposits with the Central Bank of Chile and other domestic and foreign financial institutions. Amounts placed in overnight transactions will continue to be reported in this line item and in the lines or items to which they correspond. If there is no special item for these transactions, they will be included with the reported accounts. |
| - | Items in course of collection: This item includes the values of swap instruments and balances of executed transactions which contractually defer the payment of purchase-sale transactions or the delivery of the foreign currency acquired. |
| - | Trading portfolio financial assets: This item includes financial instruments for trading purposes and investments in mutual funds which must be adjusted to their fair value in the same way as instruments acquired for trading. |
| - | Derivative financial instruments: This item includes the positive fair value of derivative financial instruments not designated as hedging instruments, including embedded derivatives separated from hybrid financial instruments. It also includes the positive fair value of derivatives designated as hedging instruments (See Note 8). |
| - | Loans and receivables from banks: This item includes the balances of transactions with domestic and foreign banks, including the Central Bank of Chile, other than those reflected in the preceding items. |
| - | Loans and accounts receivable from customers: This item includes loans that are non-derivative financial assets for which fixed or determined amounts are charged, that are not listed on an active market and which the Bank does not intend to sell immediately or in the short term. When the Bank is the lessor in a lease, and it substantially transfers the risks and benefits incidental to the leased asset, the transaction is presented in loans. |
| - | Financial investments available-for-sale: This item includes debt and equity securities not classified in any of the other categories. |
| - | Investment under agreements to resell: This item includes the balances of purchases of financial instruments under securities resale agreements. |
e.4 Classification of financial liabilities for measurement purposes
Financial liabilities are initially classified into the various categories used for management and measurement purposes.
Financial liabilities are classified for measurement purposes into one of the following categories:
| - | Financial liabilities at fair value through profit or loss (held for trading): Financial liabilities issued to generate a short-term profit from fluctuations in their prices, financial derivatives not deemed to qualify for hedge accounting and financial liabilities arising from definitive sales of financial assets purchased under resale agreements or borrowed (“short positions”). |
| - | Financial liabilities at amortized cost: financial liabilities, regardless of their type and maturity, not included in any of the aforementioned categories which arise from the borrowing activities of financial institutions, whatever their form and maturity. |
F-17
CORPBANCA AND SUBSIDIARIES
NOTES TO THE CONSOLIDATED FINANCIAL STATEMENTS
As of December 31, 2009 and 2010
e.5 Classification of financial liabilities for presentation purposes
Financial liabilities are classified by their nature into the following line items in the consolidated financial statements:
| - | Current accounts and demand deposits. This item includes all on-demand obligations except for term savings accounts, which are not considered on-demand instruments in view of their special characteristics. Obligations whose payment may be required during the period are deemed to be on-demand obligations; i.e., operations which become callable the day after the closing date are not treated as on-demand obligations. |
| - | Items in the course of collections: This item includes the balances of asset purchases that are not settled on the same day and for sales of foreign currencies not delivered. |
| - | Investments under agreements to repurchase: This item includes the balances of sales of financial instruments under securities repurchase and loan agreements. |
| - | Time deposits and saving accounts: This item shows the balances of deposit transactions in which a term at the end of which they become callable has been stipulated. |
| - | Derivative financial instruments: This item includes financial derivative contracts with negative fair values, whether they are for trading or for account hedging purposes, as set forth in Note 8. |
| - | Borrowings from financial institutions: This item includes obligations due to other domestic banks, foreign banks, or the Central Bank of Chile, which were not classified in any of the previous categories. |
| - | Debt issued: This encompasses three items. They are obligations under letters of credit, subordinated bonds, and senior bonds. |
| - | Other financial obligations: This item includes credit obligations to persons distinct from other domestic banks, foreign banks, or the Central Bank of Chile, for financing purposes or operations in the regular course of business. |
e.6 Measurement of financial assets and financial liabilities
| (i) | Measurement of financial assets |
| (a) | Financial assets at fair value through profit or loss |
Financial assets at fair value through profit and loss are initially measured at fair value. Transactions costs are recognized immediately in profit or loss. Subsequent to initial recognition financial assets at fair value through profit or loss are stated at fair value, with any gains or losses arising on remeasurement recognized in net income.
For “trading portfolio financial assets “ fair value is based on market prices or valuation models prevailing on the closing date of the financial statements. Gains or losses from changes in fair value, as well as gains or losses from their trading are included in line item “Trading and investment income” within the statement of income. Accrued interest income and indexation adjustments are also included as “Trading and investment income”.
All purchases and sales of trading instruments to be delivered within the deadline period established by market regulations and conventions are recognized on the trade date, which is the date on which the commitment is made to purchase or sale the asset.
For “derivative financial instruments” including foreign exchange forwards, interest rate futures, currency and interest rate swaps, interest rate options, and other derivative instruments, fair value is obtained from market quotes, discounted cash flow models and option valuation models, as appropriate. Derivatives contracts are presented on the statement of financial position as an asset when their change in fair value is positive and as a liability when is negative under line item “Derivative financial instruments” within the assets and liabilities section.
F-18
CORPBANCA AND SUBSIDIARIES
NOTES TO THE CONSOLIDATED FINANCIAL STATEMENTS
As of December 31, 2009 and 2010
Certain derivatives embedded in other financial instruments are treated as separate derivatives when their risk are not closely related to the economic characteristics and risks of the host contract and the host contract is not measured at fair value with changes in fair value recognized in net income.
On initial recognition, derivative contracts are designated by the Bank as a trading derivative or as a hedging instrument for hedge accounting purposes.
The changes in the fair value of trading derivatives are recorded in line item “Trading and investment income” within the consolidated statement of income.
If the derivative is designated as a hedging instrument in a hedge relationship, this may be: (1) a fair value hedge of assets or liabilities or firm commitments; (2) a hedge of cash flows related to recognized assets or liabilities or expected transactions; or (3) hedge of a net investment in a foreign operation.
A hedging relationship qualifies for hedge accounting if, and only if, all of the following conditions are met: (a) at the inception of the hedge there is formal designation and documentation of the hedging relationship; (b) the hedge is expected to be highly effective; (c) the effectiveness of the hedge can be reliably measured and; (d) the hedge is assessed on an ongoing basis and determined actually to have been highly effective throughout the financial reporting periods for which the hedge was designated.
Transactions with derivatives that do not qualify for hedge accounting are recognized and presented as trading derivatives, even if they provide an effective economic hedge for managing risk positions.
When a derivative instrument hedges the risk exposure to changes in the fair value of a recognized asset or liability, the asset or liability is recorded at its fair value with respect to the specific risk hedged. Gains or losses from measuring the fair value of the item hedged and the hedging derivative instrument are recognized in income.
If the hedged item in a fair value hedge is a firm commitment, the changes in the fair value of the firm commitment with respect to the hedged risk are recognized as assets or liabilities with the corresponding gain or loss recognized in income. The gains or losses from measuring the fair value of the hedging derivative instrument are also recorded in income. When an asset or liability is acquired or assumed as a result of the firm commitment, the initial carrying amount of the acquired asset or assumed liability is adjusted to include the cumulative change in the fair value of the firm commitment attributable to the hedged risk that was recognized in the statement of financial position.
When a derivative instrument hedges exposure to variability in cash flows of recognized assets or liabilities, or highly probable forecasted transactions, the effective portion of the changes in fair value with regard to the risk hedged is recognized in other comprehensive income. Any ineffective portion is immediately recognized in income. The accumulated gains or losses recognized in other comprehensive are reclassified to income in the same period or periods in which the assets or liabilities affect the income statement.
When a derivative instrument hedges exposure to variability in the amount of the Bank’s interest in the net assets of a foreign operation, the portion of the gain or loss on the hedging instrument that is determined to be an effective hedge are recognized in other comprehensive income and the ineffective portion is recognized in net income. The gain or loss on the hedging instrument relating to the effective portion of the hedge that has been recognized in other comprehensive income is reclassified from equity to net income as a reclassification adjustment on the disposal or period disposal of the foreign operation.
| (b) | Available-for-sale financial assets. |
Instruments available for sale are initially recognized at fair value, including transaction costs. Subsequent to initial recognition, available for sale investments are measured at fair value less any impairment losses. Gains or losses from changes in fair value are recognized in other comprehensive income within line item “Financial instruments available-for-sale”. When these investments are sold or impaired, the cumulative gains or losses previously accumulated in the financial investment available for sale reserve in equity are transferred to income and reported under line item “Trading and investment income”.
F-19
CORPBANCA AND SUBSIDIARIES
NOTES TO THE CONSOLIDATED FINANCIAL STATEMENTS
As of December 31, 2009 and 2010
All purchases and sales of investment instruments to be delivered within the deadline period established by market regulations and conventions are recognized on the trade date, which is the date on which the commitment is made to purchase or sell the asset.
Investment instruments designated as hedging instruments are measured using the requirements established for hedge accounting.
| (c) | Loans and accounts receivables from banks and customers |
Loans and accounts receivables measured at amortized cost using the effective interest rate method, less any impairment.
The amortized cost of a financial asset or financial liability is the amount at which the financial asset or financial liability is measured at initial recognition minus principal repayments, plus or minus the cumulative amortization using the effective interest method of any difference between the initial amount and the maturity amount, and minus any reduction (directly or through the use of an allowance account) for impairment or uncollectability.
The effective interest method is a method of calculating the amortized cost of a financial asset or a financial liability and of allocating the interest income or interest expense over the relevant period. The effective interest rate is the rate that exactly discounts estimated future cash payments and receipts through the expected life of the financial instrument or, when appropriate, a shorter period to the net carrying amount of the financial asset or financial liability.
| (ii) | Measurement of financial liabilities |
In general, financial liabilities are measured at amortized cost, as defined above, except for those financial liabilities designated as hedged items (or hedging instruments) in hedging relationships which are measured at fair value.
e.7 Valuation techniques
Financial instruments at fair value, determined on the basis of quotations in active markets, include government debt securities, private sector debt securities, shares, short positions, and fixed-income securities issued.
In cases where quotations cannot be observed. Management makes its best estimate of the price that the market would set using its own internal models, In most cases, these models use data based on observable market parameters as significant inputs and, in very specific cases, they use significant inputs not observable in market data. Various techniques are employed to make these estimates, including the extrapolation of observable market data and extrapolation techniques.
The best evidence of the fair value of a financial instrument on initial recognition is the transaction price, unless the value of the instrument can be obtained from other market transactions performed with the same or similar instruments or can be measured by using a valuation technique in which the variables used include only observable market date, mainly interest rates.
The main techniques used as of December 31, 2009 and 2010 by the Bank’s internal models to determine the fair value of the financial instruments are as follows:
| i. | In the valuation of financial instruments permitting static hedging (mainly “forwards” and “swaps”), the “present value” method is used. Estimated future cash flows are discounted using the interest rate curves of the related currencies. The interest rate curves are generally observable market data. |
F-20
CORPBANCA AND SUBSIDIARIES
NOTES TO THE CONSOLIDATED FINANCIAL STATEMENTS
As of December 31, 2009 and 2010
| ii. | In the valuation of financial instruments requiring dynamic hedging (mainly structured options and other structured instruments), the Black-Scholes model is normally used. Where appropriate, observable market inputs are used to obtain factors such as the bid-offer spread, exchange rates, volatility, correlation indexes and market liquidity. |
F-21
CORPBANCA AND SUBSIDIARIES
NOTES TO THE CONSOLIDATED FINANCIAL STATEMENTS
As of December 31, 2009 and 2010
| iii. | In the valuation of certain financial instruments exposed to interest rate risk, such as interest rate futures, caps and floors, the present value method (futures) and the Black-Scholes model (plain vanilla options) are used. The main inputs used in these models are observable market data, including the related interest rate curves, volatilities, correlations and exchange rates. |
The fair value of the financial instruments arising from the aforementioned internal models considers contractual terms and observable market data, which include interest rates, credit risk, exchange rates, the quoted market price of raw materials and shares, volatility and prepayments, among other things. The valuation models are not significantly subjective, since these methodologies can be adjusted and evaluated, as appropriate, through the internal calculation of fair value and the subsequent comparison with the related actively traded price.
e.8 Offsetting of financial instruments
Financial asset and liability balances are offset only if there is a legally enforceable right to offset the recorded amounts and intend either to settle them on a net basis or to realize the asset and settle the liability simultaneously.
e.9 Derecognition of financial assets and liabilities
The accounting treatment of financial asset transfers is conditioned by the degree and form in which risks and benefits associated to the assets are transferred to third parties:
| 1. | If the Bank transfers substantially all the risks and rewards to third parties, as in the case of unconditional sales of financial assets, sales under repurchase agreements at fair value at the date of repurchase, sales of financial assets with a purchased call option or written put option deeply out of the money, utilization of assets in which the assignor does not retain subordinated debt nor grants any credit enhancement to the new holders, and other similar cases, the transferred financial asset is removed form the Consolidated Statements of Financial Position and any rights or obligations retained or created in the transfer are simultaneously recorded. |
| 2. | If the Bank retains substantially all the risks and rewards associated with the transferred financial asset, as in the case of sales of financial assets under repurchase agreements to repurchase at a fixed price or at the sale price plus interest, securities lending agreements under which the borrower undertakes to return the same or similar assets, and other similar cases, the transferred financial asset is not removed from the Consolidated Statements of Financial Position and continues to be measured by the same criteria as those used before the transfer. However, the following items are recorded: |
| a) | An associated financial liability for an amount equal to the consideration received; this liability is subsequently measured at amortized cost. |
| b) | Both the income from the transferred (but not removed) financial asset as well as any expenses incurred on the new financial liability. |
| 3. | If the Bank neither transfers nor substantially retains all the risks and rewards associated with the transferred financial asset - as in the case of sales of financial assets with a purchased call option or written put option that is not deeply in or out of the money, securitization of assets in which the transferor retains a subordinated debt or other type of credit enhancement for a portion of the transferred asset, and other similar cases - the following distinction is made: |
| a) | If the assigning entity does not retain control of the conveyed financial assets: it is written-off the balance sheet and any right or obligation withheld or created as a consequence of such transfer is recognized. |
F-22
CORPBANCA AND SUBSIDIARIES
NOTES TO THE CONSOLIDATED FINANCIAL STATEMENTS
As of December 31, 2009 and 2010
| b) | If the assignor entity retains control of the conveyed financial asset: it continues to recognize it in the balance sheet for a value equal to its exposure to value changes that might be experienced and it recognizes a financial liability associated to the conveyed financial asset. The net value of the asset conveyed and the liability associated shall be the amortized cost of the rights & obligations withheld, if the conveyed asset is measured according to its amortized cost, or according to the fair value of the rights & obligations thus obtained, if the conveyed assets are measured at their fair value. |
In line with the foregoing, financial assets are only written-off the balance sheet when the rights over the cash flows that they generate are extinguished or when their implicit or ensuing risks and benefits have been substantially conveyed to third parties. Similarly financial liabilities are only write-off the balance sheet when the obligations that they generate are extinguished or when they are acquired with the intention of cancelling or placing them out again.
e.10 Impairment of financial assets
Financial assets, other than those measured at fair value through net income, are assessed for indicators of impairment at the end of each reporting period. Financial assets are considered to be impaired and impairment losses are incurred if, and only if, there is objective evidence of impairment as a result of one or more events that occurred after initial recognition of the asset (a ‘loss event’), and that loss events (or events) has an impact on the estimated future cash flows of a financial asset or group of financial assets that can be reliably estimated. It may not be possible to identify a single, discrete event that caused the impairment.
For certain categories of financial assets, such as loans and receivables from banks and customers assets that are assessed not to be impaired individually are, in addition, assessed for impairment on a collective basis. For loans and receivables from banks and customers that are deemed to be impaired, the interest accrual is suspended, when there are reasonable doubts as to their full recovery and/or the collection of the related interest for the amounts and on the dates initially agreed upon, after taking into account the guarantees received to secure (fully or partially) collection of the related balances. Collections relating to impaired loans and advances are used to recognize the accrued interest and the remainder, if any, to reduce the principal amount outstanding. The amount of the financial assets that would be deemed to be impaired had the conditions thereof not been renegotiated is not material with respect to the Group’s financial statements taken as a whole. For further information accounting policies on impairment for loans and receivables (See Note 1.f) allowances for loan losses herein below.
For financial assets carried at amortized cost, the amount of impairment loss recognized is the difference between the asset’s carrying amount and the present value of estimated future cash flows, discounted at the financial asset’s original effective interest rate.
For financial assets carried at cost, the amount of impairment loss recognized is the difference between the asset’s carrying amount and the present value of the estimated future cash flows discounted at the current market rate of return for a similar financial asset. Such impairment loss will not be reversed in subsequent periods.
An impairment loss relating to a financial asset available-for-sale is calculated based on its fair value.
The carrying amount of the financial asset is reduced by the impairment loss directly to all financial assets with the exception of loans and receivables from banks and customers, where the carrying amount is reduced through the use of an allowance account (‘allowances for loan losses’). When a loan and receivable is considered uncollectible, it is written off against the allowance account. Subsequent recoveries of amounts previously written off are credited against the allowance account. Changes in the carrying amount of the allowance account are recognized in profit or loss.
When an available-for-sale financial asset is considered to be impaired, cumulative gains and losses previously recognized in other comprehensive income is reclassified to income in the period.
F-23
CORPBANCA AND SUBSIDIARIES
NOTES TO THE CONSOLIDATED FINANCIAL STATEMENTS
As of December 31, 2009 and 2010
For financial assets measured at amortized cost, if, in a subsequent period, the amount of impairment loss decreases and the decrease can be related objectively to an event occurring after the impairment was recognized, the previously recognized impairment loss is reversed through net income to the extent that the carrying amount of the investment at the date the impairment is reversed does not exceed what the amortized cost would have been had the impairment not been recognized.
In respect of available-for-sale equity securities, impairment losses previously recognized in net income are not reversed through income. Any increase in fair value subsequent to an impairment loss is recognized in other comprehensive income and accumulated under the heading “financial instruments available-for-sale”. In respect of available-for-sale debt securities, impairment losses are subsequently reversed through net income if an increase in fair value of the investment can be objectively related to an event occurring after the recognition of the impairment loss.
| f) | Allowances for loan losses |
The allowances required to cover the risk of impairment losses of loans and receivables from banks and customers are determined and recognized on a monthly basis, considering the types of existing provisions, the evaluation models used and the types of operations.
The evaluation models, criteria and procedures to perform an overall assessment of credit risk and to determine the amount of provision to be recognized, are approved by the Bank’s Directors Committee and are defined in the Credit Policy.
Processes and compliance of the Policy are evaluated and supervised according to internal control procedures in order to ensure its compliance and to maintain an adequate level of provisions that would cover losses inherent.
Allowances are referred to as “individual” when correspond to debtors that are individually evaluated, as considering their size, complexity or level of exposure make it necessary to analyze them on a case-by-case basis and, are referred to as “group” when correspond to a large number of operations whose amounts are not individually significant and relate to individuals or small-size companies.
Allowances are classified as:
| · | Individual allowances over normal portfolio |
| · | Individual allowances over impaired portfolio |
| · | Group allowances over normal portfolio |
| · | Group allowances over impaired portfolio |
Our loan loss reserve is intended to cover losses in connection with impaired loans (including risks and other losses relating to certain performing loans and operations). A loan is considered to be an impaired loan -and therefore its carrying amount is adjusted to reflect the effect of its impairment- when there is objective evidence that events have occurred which, in the case of loans, give rise to a negative impact on the future cash flows that were estimated at the time the transaction was arranged.
As a general rule, the carrying amount of an impaired loan is adjusted with a charge to the consolidated income statement for the year in which the impairment becomes known, and the recoveries of previously recognized impairment losses are recognized in the consolidated income statement for the year in which the impairment is reversed or reduced.
The amount of the impairment losses incurred on these instruments relates to the positive difference between their respective carrying amounts and the present values of their expected future cash flows. The following is to be taken into consideration when estimating the future cash flows:
| · | all the amounts that are expected to be obtained over the residual life of the instrument, including, where appropriate, those which may result from the guarantees provided for the instrument (after deducting the costs required for foreclosure and subsequent sale); |
| · | the various types of risk to which each instrument is subject; and |
| · | the circumstances in which collections will foreseeably be made. |
F-24
CORPBANCA AND SUBSIDIARIES
NOTES TO THE CONSOLIDATED FINANCIAL STATEMENTS
As of December 31, 2009 and 2010
These cash flows are subsequently discounted using the instrument’s effective interest rate (if its contractual rate is fixed) or the effective contractual interest rate at the discount date (if it is variable).
The possible impairment losses on these assets are determined:
| · | individually, for all significant loans and for those which, although not significant, cannot be classified in homogenous groups of instruments of similar characteristics, i.e., by instrument type, debtor’s industry and geographical location, type of guarantee, age of past-due amounts, etc. |
| · | collectively, in all other cases. |
Criteria for determining impairment losses resulting from materialization of the insolvency risk of the obligors have been established. Under these criteria, a loan is impaired due to insolvency:
| · | when there is evidence of a deterioration of the obligor’s ability to pay, either because it is in arrears or for other reasons, and/or |
| · | when country risk materializes; country risk is considered to be the risk associated with debtors resident in a given country due to circumstances other than normal commercial risk. |
Similarly, different classifications of transactions have been established on the basis of the nature of the obligors, the conditions of the countries in which they reside, transaction status, type of associated guarantees, and time in arrears.
In addition to the recognition of identified losses, provisioning for the losses inherent in loans not measured at fair value through profit or loss and in contingent risks classified as standard is recognized taking into account the historical experience of impairment and the other circumstances known at the time of the assessment. For these purposes, inherent losses are the losses incurred at the date of the financial statements, calculated using statistical procedures that have not been allocated to specific transactions.
The Bank has implemented a methodology which complies with IFRS related to the determination of the level of allowances required to cover inherent losses. The aforementioned methodology takes as the first step the classification of portfolios considered as normal risk (debt instruments not valued at their fair value with changes in the income statement, as with contingent risks and contingent commitments). Once the portfolios have been classified in the aforementioned groups, the Bank based on its experience and the information available to it with respect to the Chilean banking sector, has determined the method and amount of the parameters that entities should apply in the calculation of the allowances for inherent losses in debt instruments and contingent risks classified as normal risk.
The Bank estimates the provisions to be made to create these allowances using models based on our own credit loss experience and management’s estimates of future credit losses. The Bank has developed internal risk models, based on historical information available for each country and type of risk (homogenous portfolios). These models produce a range of results that comprises the level of provisions that we arrive at using the model established by the Bank as explained above. These internal models may be applied in future periods but are subject to local regulatory review. In order for each internal model to be considered valid by the local regulator, the calculation should be methodologically correct, and be supported by historical information which covers at least one complete economic cycle and stored in databases which are consistent with information that has been audited by both the Bank’s internal audit function and external auditors.
The development of the internal model has led to the introduction of databases that can be used to accurately estimate the risk parameters required in the calculation of capital and incurred loss, following best practices in the market.
The estimates of the portfolio’s inherent risks and overall recovery vary with changes in the economy, individual industries, countries and individual borrowers’ or counterparties’ ability and willingness to repay their obligations. The degree to which any particular assumption affects the allowance for credit losses depends on the severity of the change and its relationship to the other assumptions.
F-25
CORPBANCA AND SUBSIDIARIES
NOTES TO THE CONSOLIDATED FINANCIAL STATEMENTS
As of December 31, 2009 and 2010
Key judgments used in determining the allowance for loan losses include: (i) risk ratings for pools of commercial loans and leases; (ii) market and collateral values and discount rates for individually evaluated loans; (iii) product type classifications for consumer and commercial loans and leases; (iv) loss rates used for consumer and commercial loans and leases; (v) adjustments made to assess current events and conditions; (vi) considerations regarding domestic, global and individual countries economic uncertainty; and (vii) overall credit conditions.
Responsibility of the Board of Directors
The models used are reviewed annually to ensure the best estimation of provisions at the end of the year, and their results are communicated to the Board of Directors who assessed them at least annually and, at the end of each reporting date, expressly states its conformity about the sufficiency of the level of provisions to cover against all losses that might be derived from the credits granted.
| g) | Impaired loan portfolio and write-offs |
The impaired loan portfolio includes those loans on which there is concrete evidence that debtors will not meet some of their contractual payment obligations - regardless the possibility to collect the amounts due by recurring to the collaterals - by exercising legal collection actions or by agreeing different contractual conditions.
Based on above, the Bank will maintain these loans in the impaired loan portfolio until debtors behavior or payment capacity is not recovered, without prejudice of writing off credits individually considered that meet the written-off conditions indicated below.
Impairment identification is provided on a monthly basis in a centralized manner by the Risk Classification and Provision System, as defined in the Credit Policy.
Write-offs
As a general rule, write-offs must be made when the contractual rights over cash flows expire. For loans, even when the foregoing has not occurred, write-offs must be made against the respective asset balances.
The write-offs remove the asset corresponding to the relevant transaction from the Statement of Financial Position, including the portion that may not have become due in the case of an installment loan or a leasing transaction (there are no partial write-offs).
Write-offs must always be recorded through a charge against the allowances for loan losses established.
Write-offs of loans and accounts receivable are based on due, past-due and current installments, and the term must run from the commencement of the arrears, i.e., the write-off must be recorded when the arrears on an installment or portion of a loan in a given transaction reaches the time limit for write-off stipulated below:
| Type of loans | Deadline |
| Consumer loans with or without collaterals | 6 months |
| Consumer leasing | 6 months |
| Other non-real estate leasing operations | 12 months |
| Other operations without collaterals | 24 months |
| Commercial loans with collaterals | 36 months |
| Real estate leasing (commercial and mortgage) | 36 months |
| Mortgage loans for mortgage | 48 months |
The deadline corresponds to the time elapsed since the date in which all or part of the debt in arrears became due.
Subsequent payments to be obtained from written-off operations shall be recognized in results as recoveries from written-off credits.
F-26
CORPBANCA AND SUBSIDIARIES
NOTES TO THE CONSOLIDATED FINANCIAL STATEMENTS
As of December 31, 2009 and 2010
Renegotiations of written-off credits shall not originate income, for as long as the operation continues to be classified as impaired; whereas any payments so received must be treated as recoveries of written-off credits.
A renegotiated credit may only re-enter the assets if it ceases to be classified as impaired, also recognizing the activation income as recovery of written-off credits.
| h) | Transactions Involving Repurchase Agreements and Securities Lending |
We enter into resale agreement transactions for investing purposes. Pursuant to these agreements, we purchase financial instruments, which are recorded as assets under the heading “Investments under agreement to resell”, and are measured according to the interest rate in the agreement.
We also enter into repurchase agreements as a form of financing. In this regard, investments sold subject to a repurchase obligation and which serve as security for the loan are recorded under the heading “Trading portfolio financial assets” or “Financial investments available-for-sale”, respectively. An investment repurchase obligation is classified as a liability and recorded as “Investments under agreement to repurchase” and is measured according to the interest rate in the agreement.
| i) | Revenue and expense recognition |
The most significant criteria used by the Bank to recognize revenue and expenses are summarized as follows:
i.1 Interest revenue, interest expense and similar items
Interest revenue and expense are recorded on an accrual basis using the effective interest method.
However, the recognition of accrued interest in the consolidated income statement is suspended for debt instruments individually classified as impaired and for the instruments for which impairment losses have been assessed collectively because they have payments more than three months past due. This interest is recognized as income, when collected, as a reversal of the related impairment losses.
Dividends received from investments in other companies are recognized in income when the right to receive them has been entitled, and are presented under item; “Income attributable to investments in other companies”.
The Company ceases accruing interest on the basis of contractual terms on the principal amount of any asset that is classified as an impaired asset. Thereafter, the bank recognizes the passage of time (financial effect) releasing provisions for loan losses by calculating the present value of the estimated future cash flows using the rate of interest used to discount the future cash flows for the purpose of measuring the impairment loss. On the other hand, any collected interest for any assets classified as impaired are accounted for on a cash basis.
i.2 Commissions, fees, and similar items
Fee and commission income and expenses are recorded in the consolidated statement of income based on criteria that differ according to their nature. The main criteria are:
| - | Those arising from transactions or services that are performed over a period of time are recorded over the life of such transactions or services. |
| - | Those originated by a specific act are recognized when the specific act has occurred. |
i.3 Non-finance income and expenses
Non-finance income and expenses are recognized on an accrual basis.
F-27
CORPBANCA AND SUBSIDIARIES
NOTES TO THE CONSOLIDATED FINANCIAL STATEMENTS
As of December 31, 2009 and 2010
i.4 Loan arrangement fees
Loan arrangement fees, mainly loan origination and application fees, are accrued and recorded in the consolidated statement of Income using the effective interest method.
| j) | Property, plant and equipment and leases |
Property, plant and equipment consist of buildings, land, furniture, vehicles, computer hardware and other fixtures owned by the Bank or acquired under finance leases. Assets are classified according to their use as follows:
Property, plant and equipment for own use
Property, plant and equipment for own use including, are measured at acquisition cost less accumulated depreciation and accumulated impairment losses. Property, plant and equipment it also includes assets received in lieu of payment which are intended to be held for continuing own use and assets acquired under finance .
Depreciation is calculated using the straight line method over the acquisition cost of assets minus their residual value.. The land on which buildings and other structures stand has an indefinite life and, therefore, is not subject to depreciation.
The Bank applies the following useful lives to the fixed assets that comprise its total assets:
| Item | Useful life (Years) |
| Buildings | 100 |
| Facilities | 10 |
| Furniture | 10 |
| Vehicles | 10 |
| Office equipment | 10 |
| Security instruments and implements | 5 |
| Other minor assets | 5 |
The consolidated entities assess at the end of each reporting date whether there is any indication that the carrying amount of any of their tangible assets exceeds its recoverable amount; if so, the carrying amount of the asset is reduced to its recoverable amount and future amortization charges are adjusted in proportion to the revised carrying amount and to the new remaining useful life, if the useful life needs to be re-estimated.
Similarly, if there is an indication of a recovery in the value of a tangible asset, the consolidated entities record the reversal of the impairment loss recognize in prior periods and adjust the future amortization charges accordingly. In no circumstance may the reversal of an impairment loss on an asset increase its carrying value above the one it would have had if no impairment losses had been recorded in prior years.
The estimated useful lives of the items of property, plant and equipment held for own use are reviewed at least at the end of each reporting period to determine significant changes therein. If changes are detected, the useful lives of the assets are adjusted by correcting the amortization charge to be recorded in the Consolidated Statement of Income in future years on the basis of the new useful lives.
Maintenance expenses are recorded as an expense in the period in which they are incurred.
F-28
CORPBANCA AND SUBSIDIARIES
NOTES TO THE CONSOLIDATED FINANCIAL STATEMENTS
As of December 31, 2009 and 2010
| k) | Assets received or awarded in lieu of payment |
Assets received or awarded in lieu of payment of loans and accounts receivable from customers are recorded, in the case of assets received in lieu of payment, at the price agreed by the parties, or otherwise, when the parties do not reach an agreement, at the amount at which the Bank is awarded those assets at a judicial auction, and are included within Property, Plant and Equipment.
These assets are subsequently measured at the lower of initially recorded value and net realization value, which corresponds to their fair value (determined through an independent appraisal) less cost to sell.
| l) | Leasing |
ll. Finance leases
Finance leases are leases that substantially transfer all the risks and rewards incidental to ownership of the leased asset to the lessee.
When the consolidated entities act as the lessor of an asset, the sum of the present value of the lease payments receivable from the lessee plus the guaranteed residual value, which is generally the exercise price of the lessee’s purchase option at the end of the lease term, is recorded as loans to third parties and is therefore included under “Loans and accounts receivable from customers” in the Consolidated Statements of Financial Position.
When the consolidated entities act as lessees, they show the cost of the leased assets in the Consolidated Statements of Financial Position based on the nature of the leased asset, and simultaneously record a liability for the same amount (which is the lower of the fair value of the leased asset and the sum of the present value of the lease payments payable to the lessor plus, if appropriate, the exercise of the purchase option). The depreciation policy for these assets is consistent with that for property, plant and equipment for own use.
In both cases, the finance revenues and finance expenses arising from these contracts is credited and debited, respectively, to “Interest income” and “Interest expense” in the Consolidated Statement of Income so as to achieve a constant rate of return over the lease term.
lll. Operating leases
In operating leases, ownership of the leased asset and substantially all the risks and rewards incidental thereto remain with the lessor.
When the consolidated entities act as the lessor, they present the acquisition cost of the leased assets under property, plant and equipment. The depreciation policy for these assets is consistent with that for similar items of property, plant and equipment held for own use. Income from operating leases is recorded on a straight line basis under “Other operating income” in the consolidated statement of income.
When the consolidated entities act as the lessees, the lease expenses, including any incentives granted by the lessor, are charged on a straight line basis to “Administrative and other expenses” in the consolidated statement of income.
| m) | Intangible assets |
Intangible assets are identified as non-monetary assets (separated from Other Assets) without a physical substance that arise as a result of a legal transaction or that are internally developed by the consolidated entities. These are assets whose cost may be reliably estimated and for which the consolidated entities consider it probable to recognize future economic benefits. The bank only has intangible assets with finite useful lives.
Intangible assets are initially recognized at their acquisition or production cost and are subsequently measured at cost less accumulated amortization and accumulated impairment losses. The amortization is calculated using the straight line method over the acquisition cost of assets minus their residual value.
F-29
CORPBANCA AND SUBSIDIARIES
NOTES TO THE CONSOLIDATED FINANCIAL STATEMENTS
As of December 31, 2009 and 2010
| n) | Contingent assets and liabilities |
Contingent are those operations or commitments in which the bank assumes a credit risk upon committing itself before third parties, before the occurrence of a future fact, to make a payment or disbursement that must be recovered from its clients.
The bank and its subsidiaries keep a record of the following balances -related to commitments or to liabilities of its own line of business- in memorandum accounts: Collaterals and guarantees, confirmed foreign letters of credit, documentary letters of credit issued, bank vouchers, inter-bank vouchers, freely disposable lines of credit, other credit commitments and other contingent.
| o) | Income and Deferred taxes |
Income tax expense represents the sum of the tax currently payable and deferred tax.
The tax currently payable is based on taxable income for the year , which differs from net income as reported in the consolidated statement of income because of items of income or expense that are taxable or deductible in other years and items that are never taxable or deductible.
Deferred tax is recognized on temporary differences between the carrying amount of assets and in the consolidated statement of financial position and their corresponding tax bases used in the computation of taxable income. Deferred tax liabilities are generally recognized for all taxable temporary differences. Deferred tax assets are generally recognized for all deductible temporary differences to the extent that is probable that taxable income will be available against which those deductible temporary differences can be utilized. Deferred tax assets and liabilities are not recognized if the temporary differences arise from goodwill or from initial recognition (other than in business combination) of other assets and liabilities that affects neither the taxable income nor the accounting income.
The carrying amount of deferred taxes is reviewed at the end of each reporting period and reduced to the extent that it is no longer probable that sufficient taxable income will be available to allow all or part of the asset to be recovered.
Deferred tax assets and liabilities are measured at the tax rates that are expected to apply in the period in which the liability is settled or the asset realized, based on tax rates that have been enacted or substantively enacted by the end of the reporting period. The future effects of changes in tax legislation or in tax rates is recognized in deferred taxes from the date the law approving such changes is enacted and published.
On July 31, 2010, Law No. 20,455 was enacted and published in the Diario Oficial. This law, among other things temporarily increases tax rates for commercial years 2011 and 2012 (20% and 18,5%, respectively), and returns back to 17% in 2013.
Current and deferred tax are recognized in net income, except when they relate to items that are recognized in other comprehensive income or directly in equity, in which case, the current and deferred tax are also recognized in other comprehensive income or directly in equity respectively.
| p) | Vacation expense |
The annual cost of employee vacations and benefits are recorded on an accrual basis.
| q) | Cash and cash equivalent |
For the preparation of the cash flow statement, the Bank applied the indirect method, in which, starting with the bank’s income before taxes, non-monetary transactions are subsequently incorporated, as well as income and expenses associated with cash flows classified as investing or financing activities.
F-30
CORPBANCA AND SUBSIDIARIES
NOTES TO THE CONSOLIDATED FINANCIAL STATEMENTS
As of December 31, 2009 and 2010
The preparation of the cash flow statements takes the following items into account:
| a) | Cash flows: the inflow or outflow of cash and cash equivalent, understanding as such the balances in items such as: Central Bank of Chile deposits, Domestic bank deposits, and Foreign bank deposits. |
| b) | Operating activities: they correspond to normal activities performed by Banks, as well as other activates that cannot be classified as either investments or financing. |
| c) | Investment activities: they correspond to the acquisition, sale or disposal by other means, of long-term assets and other investments not included in cash and cash equivalent. |
| d) | Financing activities: these are activities that produce changes in the size and composition of the net Shareholders’ equity and liabilities that are not part of operating activities or investments. |
In the statement of cash flow, cash and cash equivalents are defined as cash balances and bank deposits plus the net balance of items in course of collection. Cash and cash equivalents balances and their reconciliation to the cash flow statement are detailed in Note 5 of these financial statements.
The allowances for loan losses presented in the operating section does not agree to the amount presented in the statements of income because, for cash flow statement purposes, the allowances for loan losses excludes recoveries of assets previously written-off.
We consider that interest income and net fees and income from services do not represent cash flows. The impact of these factors is included under “Increase/decrease in operating assets and liabilities” within the operating activities section.
| r) | Use of estimates |
The preparation of the financial statements requires management to make estimates and assumptions that affect the carrying amounts of assets and liabilities reported. The estimates and associated assumptions are based on historical experience and other factors that are considered to be relevant. Actual results may differ from these estimates.
The estimates and underlying assumptions are reviewed on an ongoing basis. Revisions to accounting estimates are recognized in the period in which the estimate is revised if the revision only affect that period, or in the period of the revision and future periods if the revision affects both current and future periods.
In certain cases, generally accepted accounting principles require that assets or liabilities be recorded or disclosed at their fair values. The fair value is the amount for which an asset could be exchanged, or a liability settled, between knowledgeable, willing parties in an arm's length transaction. Where quoted market prices in active markets are available those have been used as the basis for fair value measurement. Where no quoted market prices in active markets are available, the Bank has estimated fair value based on the best information available, including the use of modeling and other valuation techniques.
The Bank has established allowances to cover inherent loan losses in accordance with IAS 39, which requires that, to estimate the allowances, they must be regularly evaluated taking into consideration factors such as changes in the nature and volume of the loan portfolio, trends in forecasted portfolio quality, credit quality and economic conditions that may adversely affect the borrowers’ ability to pay. Increases in the allowances for loan losses are reflected as “allowances for loan losses” in the Consolidated Statement of Income. Loans are written-off when management determines that a loan or a portion thereof is uncollectible. Write-offs are recorded as a reduction of the allowances for loan losses.
| s) | Mandatory dividends |
The Bank recognizes as a liability, the portion of net income to be distributed in compliance with the Corporations Law or pursuant to its dividend policy, which states that at least 50% of net income will be distributed.
F-31
CORPBANCA AND SUBSIDIARIES
NOTES TO THE CONSOLIDATED FINANCIAL STATEMENTS
As of December 31, 2009 and 2010
| t) | Factored receivables |
Factored receivables are valued at the purchase price of the loan. The price difference between the amounts disbursed and the actual value of the receivables is earned and recorded as interest income over the financing period. The transferor is responsible for payment of the loans if the receivables are not collected.
| u) | Earnings per share |
Basic earnings per share are determined by dividing the net income attributable to equity holders of the Bank in a period by the weighted average number of shares outstanding during the period.
Diluted earnings per share are determined in a similar manner as Basic Earnings, but the weighted average number of outstanding shares is adjusted to take into account the potential diluting effect of stock options, warrants, and convertible debt.
As of December 31, 2009 and 2010 the Bank did not have instruments that generated diluting effects on shareholders’ equity.
| v) | Temporary acquisition (assignment) of assets |
Purchases (sales) of financial assets under non-optional resale (repurchase) agreements at a fixed price (“repos”) are recorded in the Consolidated Statements of Financial Position financial assignments (receipts) based on the nature of the debtor (creditor) under “Deposits in the Central Bank of Chile,” “Deposits in financial institutions” or “Loans and accounts receivable from customers” (“Central Bank of Chile deposits,” “Deposits from financial institutions” or “Customer deposits”).
Differences between the purchase and sale prices are recorded as financial interest over the term of the contract.
| w) | Assets under management and investment funds managed by the Bank |
The assets managed by Corpbanca Administradora General de Fondos S.A. which are owned by third parties are not included in the Consolidated Statements of Financial Position. The relevant management fees are included in “Fee and commission income” in the Consolidated Statement of Income.
| x) | Application of new and revised International Financial Reporting Standards (IFRS) |
| (i) | New and revised IFRS effective in the current year |
The following new and revised IFRS have been adopted in these financial statements:
| Standards , Interpretations and Amendments | Effective date |
IFRS 1 Revised: First-time adoption of IFRS | Annual periods beginning on or after July 1, 2009. |
IFRS 3 Revised: Business Combinations. | Annual periods beginning on or after July 1, 2009. |
Amendment to IAS 39: Eligible hedged items. | Annual periods beginning on or after July 1, 2009. |
Amendment to IAS 27: Consolidated and separated financial statements. | Annual periods beginning on or after July 1, 2009. |
| Improvements to IFRS 2009 | Mostly annual periods beginning on or after July 1, 2009. |
F-32
CORPBANCA AND SUBSIDIARIES
NOTES TO THE CONSOLIDATED FINANCIAL STATEMENTS
As of December 31, 2009 and 2010
Amendment to IFRS 2:Group Cash-Settled Share-based Payments | Annual periods beginning on or after January 1, 2010. |
IFRIC 17: Distribution of Non-cash Assets to Owners | Annual periods beginning on or after July 1, 2009. |
IFRS 1 Revised - First-time adoption of International Financial Reporting Standards
The International Accounting Standards Board issued IFRS 1 in June 2003. IFRS 1 replaced SIC-8 First-time Application of IASs as the Primary Basis of Accounting. The Board developed the IFRS to address concerns about the full retrospective application of IFRSs required by SIC-8. Subsequently, IFRS 1 was amended many times to accommodate first-time adoption requirements resulting from new or amended IFRSs. As a result, the IFRS became more complex and less clear. In 2007, therefore, the Board proposed, as part of its annual improvements project, to change IFRS 1 to make it easier for the reader to understand and to design it to better accommodate future changes. The version of IFRS 1 issued in 2008 retains the substance of the previous version, but within a changed structure. It replaces the previous version and is effective for entities applying IFRSs for the first time for annual periods beginning on or after July 1, 2009. Earlier application is permitted. Management will not apply IFRS 1 (Revised) as its date of transition to IFRS was January 1, 2008, and is already applying full IFRS.
IFRS 3 Revised - Business combinations and IAS 27 Revised - Consolidated and separate financial statements
On January 10, 2008, the International Accounting Standards Board (IASB) issued IFRS 3 (revised 2008) Business Combinations and IAS 27 (revised 2008) Consolidated and Separate Financial Statements. The revised Standards are mandatory for business combinations in annual financial statements beginning on or after July 1, 2009, although limited earlier application is permitted. The revised International Financial Reporting Standard 3 Business Combinations (IFRS 3) is part of a joint effort by the International Accounting Standards Board (IASB) and the US Financial Accounting Standards Board (FASB) to improve financial reporting while promoting the international convergence of accounting standards. The application of these new IFRS has not had any material impact on the amounts reported for the current and prior years but may affect the accounting for future transactions or arrangements.
IFRS 2 - Share based payments
On June 18, 2009, the International Accounting Standards Board (IASB) issued amendments to IFRS 2 Share-based Payment. These amendments clarify the scope of IFRS 2, as well as the accounting for group cash-settled share-based payment transactions in the separate (or individual) financial statements of an entity receiving the goods or services when another group entity or shareholder has the obligation to settle the award. The application of these new IFRS has not had any material impact on the amounts reported for the current and prior years but may affect the accounting for future transactions or arrangements.
Amendment to IAS 39 - Financial instruments: Measurement and Recognition
On July 31, 2008, the International Accounting Standards Board (IASB) published amendments to IAS 39 Financial Instruments: Recognition and Measurement which provide clarification on two issues in relation to hedge accounting: (i) identifying inflation as a hedged risk or portion; making clear that inflation may only be hedged in the instance where changes in inflation are a contractually-specified portion of cash flows of a recognized financial instrument.; and (ii) hedging with options; making clear that the intrinsic value, not the time value, of an option reflects a one-sided risk and therefore an option designated in its entirety cannot be perfectly effective. The amendments are effective for annual periods beginning on or after July 1, 2009. The application of these amendment has not had any material impact on the amounts reported for the current and prior years but may affect the accounting for future transactions or arrangements.
F-33
CORPBANCA AND SUBSIDIARIES
NOTES TO THE CONSOLIDATED FINANCIAL STATEMENTS
As of December 31, 2009 and 2010
Improvements to IFRS - April 2009
On April 16, 2009, the International Accounting Standards Board (IASB) issued Improvements to IFRSs 2009 - incorporating amendments to 12 International Financial Reporting Standards (IFRSs). This is the second collection of amendments issued under the annual improvements process, which is designed to make necessary, but non-urgent, amendments to IFRS. The amendments are effective for annual periods beginning on or after July 1, 2009 and for annual periods beginning on or after January 1, 2010. The application of these amendments has not had any material impact on the amounts reported for the current and prior years but may affect the accounting for future transactions or arrangements.
IFRIC 17 - Distribution of non-cash assets to owners
On November 27, 2008, the International Financial Reporting Interpretations Committee (IFRIC) issued IFRIC 17 Distributions of Non-cash Assets to Owners. The Interpretation provides guidance on the appropriate accounting treatment when an entity distributes assets other than cash as dividends to its shareholders. The most significant conclusion reached by the IFRIC is that the dividend should be measured at the fair value of the assets distributed, and that any difference between this amount and the previous carrying amount of the assets distributed should be recognized in profit or loss when the entity settles the dividend payable. The application of these new Interpretation has not had any material impact on the amounts reported for the current and prior years but may affect the accounting for future transactions or arrangements.
| (ii) | New and revised IFRS in issue but not yet effective |
As of the date of issuance of these consolidated financial statements, the following accounting pronouncements have been issued by the IASB. These pronouncements are new pronouncements or amendments, revisions, modifications, or interpretations of existing pronouncements whose application are not yet effective
| New Standards | Mandatory application for: |
IFRS 9, Financial Instruments - Classification and Measurement | Annual periods beginning on or after January 1, 2013. |
| Amendments to Standards | Mandatory application for: |
IFRS 1 (Revised), First Time Adoption of IFRS - (i)Replacement of ‘fixed dates’ for certain exceptions with ‘the date of transition to IFRSs’ - (ii) Additional exemption for entities ceasing to suffer from severe hyperinflation | Annual periods beginning on or after July 1, 2011. |
IFRS 7, Financial Instruments: Disclosures - Amendments enhancing disclosures about transfers of financial assets | Annual periods beginning on or after July 1, 2011. |
IAS 12, Income Taxes - Limited scope amendment (recovery of underlying assets) | Annual periods beginning on or after January 1, 2012. |
IAS 24, Related Party Disclosures - Revised definition of related parties | Annual periods beginning on or after January 1, 2011. |
IAS 32, Financial Instruments: Presentation - Amendments relating to classification of rights issues | Annual periods beginning on or after February 1, 2010. |
Annual Improvements to IFRS 2010 - A collection of amendments to seven IFRSs | Mostly for annual periods beginning on or after January 1, 2011. |
| New Interpretations | Mandatory application for: |
IFRIC 19, Extinguishing Financial Liabilities with Equity Instruments | Annual periods beginning on or after July 1, 2010. |
| Amendments to Interpretations | Mandatory application for: |
IFRIC 14, The Limit on a Defined Benefit Asset, Minimum Funding Requirements and their Interaction. | Annual periods beginning on or after January 1, 2011. |
F-34
CORPBANCA AND SUBSIDIARIES
NOTES TO THE CONSOLIDATED FINANCIAL STATEMENTS
As of December 31, 2009 and 2010
IFRS 9, Financial Instruments
On November 12, 2009, the IASB issued IFRS 9 Financial Instruments (IFRS 9) as the first step in its project to replace IAS 39 Financial Instruments: Recognition and Measurement (IAS 39). Under this standard, all financial instruments are initially measured at fair value plus or minus, in the case of a financial asset or financial liability not at fair value through profit or loss, transaction costs. Moreover, IFRS 9 divides all financial assets that are currently in the scope of IAS 39 into two classifications - those measured at amortized cost and those measured at fair value. Classification is made at the time the financial asset is initially recognized, namely when the entity becomes a party to the contractual provisions of the instrument. As for debt instruments, a debt instrument that meets business model and cash flow characteristics tests can be measured at amortized cost (net of any write-down for impairment). All other debt instruments must be measured at fair value through profit or loss.
Additionally, on October 28, 2010, the IASB published a revised version of IFRS 9. The revised standard retains the requirements for classification and measurement of financial assets that were published in November 2009 but adds guidance on the classification and measurement of financial liabilities. As part of its restructuring of IFRS 9, the IASB also copied the guidance on derecognition of financial instruments and related implementation guidance from IAS 39 to IFRS 9.
The guidance included in IFRS 9 on the classification and measurement of financial liabilities is unchanged from the classification criteria for financial liabilities currently contained in IAS 39. In other words, financial liabilities will continue to be measured either wholly, or in part, at amortized cost or at fair value through profit or loss (FVTPL). The concept of bifurcating embedded derivatives from a financial liability host contract also remains unchanged. Financial liabilities held for trading would continue to be measured at FVTPL, and all other financial liabilities would be measured at amortized cost unless the fair value option is applied, using the existing criteria in IAS 39.
However, there are two differences compared to IAS 39:
| · | The presentation of the effects of changes in fair value attributable to a liability’s credit risk; and |
| · | The elimination of the cost exemption for derivative liabilities to be settled by delivery of unquoted equity |
Note that IFRS 9 introduces new requirements for classifying and measuring financial assets that must be applied starting January 1, 2013, with early adoption permitted. Management, in conformity with rules and regulations issued by the SBIF, will not early adopt this standard; instead, it will adopt this standard for the period starting January 1, 2013. Finally, Management has not had the opportunity to assess the potential impact associated with the adoption of this standard.
Amendments to IFRS 1, First Time Adoption of IFRS
On December 20, 2010, the IAS amended IFRS 1 First Time Adoption of IFRS to:
| · | Provide relief for first-time adopters of IFRSs from having to reconstruct transactions that occurred before their date of transition to IFRSs. This amendment replaces references to a fixed transition date of ‘January 1, 2004’ with ‘the date of transition to IFRSs’ so that first-time adopters of IFRS do not have to apply the derecognition requirements in IAS 39 retrospectively from an earlier date. It also relieves first-time adopters from recalculating ‘day 1’ gains and losses on transactions occurring before the date of transition to IFRS. |
| · | Provide guidance for entities emerging from severe hyperinflation either to resume presenting IFRS financial statements or to present IFRS financial statements for the first time. In accordance with the amendment, when an entity’s date of transition to IFRS is on or after the functional currency normalization date, the entity may elect to measure all assets and liabilities held before the functional currency normalization date at fair value on the date of transition to IFRS and use that fair value as the deemed cost of those assets and liabilities in the opening IFRS statement of financial position. Entities making use of this exemption should describe the circumstances of how, and why, their functional currency became subject to severe hyperinflation and the circumstances that led to those conditions ceasing. |
F-35
CORPBANCA AND SUBSIDIARIES
NOTES TO THE CONSOLIDATED FINANCIAL STATEMENTS
As of December 31, 2009 and 2010
The amendments require mandatory application for annual periods starting on or after July 1, 2011, with early adoption permitted. Management believes that these amendments will not have an impact on its financial statements as the Company is not a first time adopter.
Amendments to IFRS 7, Financial Instruments: Disclosure
On October 7, 2010, the IASB issued amendments to IFRS 7 Financial Instruments: Disclosure that increase the disclosure requirements for transactions involving transfers of financial assets. These amendments are intended to provide greater transparency around risk exposures of transactions where a financial asset is transferred but the transferor retains some level of continuing exposure (referred to as ‘continuing involvement’) in the asset. The amendments also require disclosure where transfers of financial assets are not evenly distributed throughout the period (e.g., where transfers occur near the end of a reporting period). The amendments are applicable for annual periods beginning on or after July 1, 2011, with early adoption allowed. Moreover, the disclosures are not required for any of the periods presented that start before the initial adoption date.
Management has not had the opportunity to consider the potential impact of the adoption of these amendments.
Amendments to IAS 12, Income Taxes
On December 20, 2010, the IASB published Deferred Tax: Recovery of Underlying Assets - Amendments to IAS 12. The amendments provide an exception to the general principle in IAS 12 Income Taxes (IAS 12) that the measurement of deferred tax assets and deferred tax liabilities should reflect the tax consequences that would follow from the manner in which the entity expects to recover the carrying amount of an asset.
Specifically, the amendments provide an exception to the general principles of IAS 12 for investment property measured using the fair value model in IAS 40 Investment Property (IAS 40). For the purposes of measuring deferred tax, the amendments introduce a rebuttable presumption that the carrying amount of such an asset will be recovered entirely through sale. The presumption can be rebutted if the investment property is depreciable and is held within a business model whose objective is to consume substantially all of the economic benefits over time, rather than through sale. The exception also applies to investment property acquired in a business combination if the acquirer applies the fair value model in IAS 40 subsequent to the business combination. The amendments also incorporate the requirements of SIC 21 Income Taxes - Recovery of Revalued Non-Depreciable Assets into IAS 12, i.e., deferred tax arising on a non-depreciable asset measured using the revaluation model in IAS 16 Property, Plant and Equipment should be based on the sale rate. The effective date of the amendments is for annual periods beginning on or after January 1, 2012. Earlier application is permitted.
Management believes that these amendments will be adopted in its financial statements for the period beginning January 1, 2012. Last, Management has not had the opportunity to consider the potential impact of the adoption of these amendments.
Amendments to IAS 24, Related Party Transactions
On November 4, 2009, the IASB issued Amendments to IAS 24 Related Party Disclosures. The revised standard simplifies the disclosure requirements for entities that are controlled, jointly controlled, or significantly influenced by a governmental entity (referred to as related government-related entities) and clarifies the definition of related entity.
The revised standard is effective for annual periods beginning on or after January 1, 2011 and requires retrospective application. Therefore, in the year of initial application, disclosures for the comparative period will need to be restated. Moreover, earlier application is permitted, either of the whole revised standard or of the partial exemption for government-related entities. If an entity applies either the whole standard or the partial exemption for a period beginning before January 1, 2011, it is required to disclose that fact.
Management has analyzed the impact of these amendments and considers that they will not lead to any change in the related parties currently defined by Management.
F-36
CORPBANCA AND SUBSIDIARIES
NOTES TO THE CONSOLIDATED FINANCIAL STATEMENTS
As of December 31, 2009 and 2010
Amendment to IAS 32, Financial Instruments: Presentation
On October 8, 2009, the IASB issued an amendment to IAS 32 Financial Instruments: Presentation entitled Classification of Rights Issues, on the classification of rights issues (e.g. rights, options, or warrants). Under the amendments, rights, options and warrants otherwise meeting the definition of equity instruments in IAS 32.11 issued to acquire a fixed number of an entity’s own non-derivative equity instruments for a fixed amount in any currency are classified as equity instruments provided the offer is made pro-rata to all existing owners of the same class of the entity’s own non-derivative equity instruments. The amendment is effective for annual periods beginning on or after February 1, 2010 with earlier application permitted.
Management believes that the amendment will be adopted in the financial statements for the period beginning on January 1, 2011. Last, Management does not have instruments issued with these characteristics, so this amendment will have no impact on its financial statements.
Annual Improvements to IFRS 2010
On May 6, 2010, the IASB issued Improvements to IFRSs 2010 - Incorporating amendments to seven International Financial Reporting Standards (IFRSs). This is the third collection of amendments issued under the annual improvements process, which is designed to make necessary, but non-urgent, amendments to IFRSs. The amendments are effective for annual periods starting on or after July 1, 2010 and for annual periods starting on or after January 1, 2011.
Management believes that these amendments will be adopted in its financial statements for the period beginning January 1, 2011. Last, Management has not had the opportunity to consider the potential impact of the adoption of these amendments.
IFRIC 19, Extinguishing Financial Liabilities with Equity Instruments
On November 26, 2009, the International Financial reporting Interpretations Committee (IFRIC) issued IFRIC 19 Extinguishment of Liabilities to Equity Instruments. This interpretation provides guidance on how to account for the extinction of financial liabilities by issuing equity instruments. The interpretation indicates that the issuance of equity instruments to extinguish an obligation constitutes paid consideration. This consideration should be measured at fair value of the equity instrument issued, unless that fair value is not readily determinable, in which case the equity instruments should be measured at fair value of the obligation extinguished. This interpretation is effective for annual periods beginning on or after July 1, 2010.
Management believes that this interpretation will be adopted in the consolidated financial statements for the period beginning on January 1, 2011. Last, Management estimates that this interpretation will not result in any change of accounting policies.
Amendment to IFRIC 14, IAS 19 - The Limit on a Defined Benefit Asset, Minimum Funding Requirements and their Interaction
On December 2009 the IASB issued Prepayments of Minimum Funding Requirements, amendments to IFRIC 14 IAS 19 - The Limit on a Defined Benefit Asset, Minimum Funding Requirements and their Interaction (IFRIC 14). The amendment has been made to remedy an unintended consequence of IFRIC 14 where the entities are prohibited in some circumstances to recognize as an asset the advance payments for minimum funding contributions. This amendment is effective for annual periods beginning on or after January 1, 2011.
Management believes that this amendment will be adopted in the consolidated financial statements for the period beginning on January 1, 2011. Further, Management has not had the opportunity to consider the potential impact of the adoption of this amendment.
F-37
CORPBANCA AND SUBSIDIARIES
NOTES TO THE CONSOLIDATED FINANCIAL STATEMENTS
As of December 31, 2009 and 2010
| y) | Convenience translation to U.S. dollars |
The Bank maintains its accounting records and prepares its consolidated financial statements in Chilean pesos. The U.S. dollar amounts disclosed in the accompanying financial statements are presented solely for the convenience of the reader at the December 31, 2010 closing exchange rate of Ch$467.78 per US$1.00. This translation should not be construed as representing that the Chilean peso amounts actually represent or have been, or could be, converted into U.S. dollars at such a rate or at any other rate.
No accounting changes with respect prior year.
| NOTE 3 - | SIGNIFICANT EVENTS |
As of December 31, 2010, have occurred the following significant events, which have had an impact on the Bank and subsidiaries’ operations, or in its financial statements:
CORPBANCA
a) Issuance and Placement of Bonds
1. On December 29, 2009, Corpbanca issued and placed bonds in international markets for US$17,150,000 under Regulation S - Rules governing offers and sales made outside the United States without registration under the Securities Act of 1933. The annual interest rate was 0.55063%. On March 29, 2010, bonds were fully paid for a total amount of US$17,173,608 (including US$23,608 of accrued interest).
These bonds were neither registered in the Registry of Securities at the Chilean Superintendency of Banks and Financial Institutions, nor with the U.S. Securities and Exchange Commission. As such, they were neither offered nor sold in the United States of America, or to persons in such country, nor were subject to a public offering in Chile.
On October 27, 2009, Corpbanca agreed to issue and place bonds in international markets, for a total sum of US$178,134,000 in two tranches; such bonds were placed on November 3, 2010 in accordance with Regulation S requirements under the Securities Act of 1933.
The first tranche was for US$168,079,000 at an interest rate of 3-month LIBOR + 0.3% annual and with maturity on February 3, 2011.
The second tranche was for US$10,055,000 at an interest rate of 3-month LIBOR + 0.5% annual and with maturity date on May 3, 2011.
Both tranches were neither registered in the Registry of Securities at the Chilean Superintendency of Banks and Financial Institutions, nor with the U.S. Securities and Exchange Commission. As such, the bonds were neither offered nor sold in the United States of America, or to persons in such country, nor were subject to a public offering in Chile.
b) Board of Directors
At a meeting held on January 26, 2010, the Board of Directors agreed to schedule a General Shareholders Meeting on February 16, 2010, in order to address matters within shareholder purview and, among other things, submit for shareholder approval and comments the Board of Directors’ proposed distribution of 100% of profits earned in 2009, which amount to $85,108,675,320, and would represent a dividend of $0.375082129784326 per share, paid upon the conclusion of the Meeting.
On May 27, 2010 don Segismundo Schulin-Zeuthen Serrano submitted his resignation to the position of Corpbanca Director.
F-38
CORPBANCA AND SUBSIDIARIES
NOTES TO THE CONSOLIDATED FINANCIAL STATEMENTS
As of December 31, 2009 and 2010
On September 28, 2010, our Board of Directors proceeded to appoint Gustavo Arriagada Morales as an Independent Director.
On December 30, 2010, at special session N. 2010/73, the Board of Directors agreed to schedule a Special Shareholders Meeting on January 27, 2001 in order to propose an increase in shareholder equity through the issuance of 40,042,815,984 shares comprising 15% of the Bank’s total newly-issued equity shares and to make the respective amendments to our bylaws, adopting, as necessary, any other applicable agreement, once such shares were placed, subscribed and paid for, in accordance with terms and conditions determined at the meeting or, upon delegation, by the Board of Directors. The shares may be offered in Chile and abroad, as determined by the Board of Directors, and especially in the securities markets of the United States of America, and/or in the New York Stock Exchange, through ADR mechanisms.
c) Hedging Net Foreign Investments
Corpbanca, parent company with operational and presentation currency defined as the Chilean peso, has a wholly-owned New York Branch, with operational currency defined as the US dollar, with a book value, as of January 4, 2010, that amounts to US$25,100,000. Since the operational currency (US dollar) of the NY Branch differs from the currency presented in parent company’s statement (Chilean peso), the financial statements of the NY Branch must be converted into Chilean pesos. Such accounting measures result in changes to the parent company’s equity which stem from currency fluctuations that must be reported directly in our financial statements, For that reason, we decided to hedge our net foreign investments through a forward exchange contract (USD-Ch$).
Fair value Hedging is conducted with the purpose of covering foreign exchange risk related to the currency in which foreign investments are held. Hedges of foreign investments, such as the one described above, are treated similarly to cash flow hedges for accounting purposes. Our hedging strategy contemplates the periodic renovation of the hedging instrument, so song as the hedge-for risk factor presents a relevant exposure.
The term of the hedging instrument will depend on the market conditions as of the date of the contract, with the maturity being higher than the residual difference between the date of contract signing and the next accounting closing date. We note that accounting standards allow us to hedge up to 100% of our foreign investment; however, it also allows for the hedging of a smaller portion of such net investment.
d) Options
The Chilean Superintendency of Banks and Financial Institutions, as of March 11, 2010, authorized Corpbanca to carry out option contract operations; as a result, as of December 31, 2010, we have Purchase call options for US$6,000,000, put option purchases for US$7,037,992, call option sales of US$1,137,992 and put option sales of US$1,000,000.
e) Sanctions
On September 16, 2010, the Chilean Superintendency of Banks and Financial Institutions imposed a penalty of Mch$6 on us because we failed to obtain prior authorization before contracting with a service provider.
f) Banco Do Brasil
As of September 29, 2010, Corp Group Interhold S.A. reports, in its capacity as indirect controller, that it has had informal and preliminary discussions with representatives from Banco Do Brasil with respect to a potential addition of such bank, through a capital increase, to Corpbanca’s securities holdings, as a minority shareholder owning no more than 10%. To date, no agreement has been entered into with Banco Do Brasil, and there has not been any subscription agreement or provision of non-public information, In addition, any agreement that may be reached with Banco Do Brasil, would be subject to applicable approval by competent Chilean authorities.
F-39
CORPBANCA AND SUBSIDIARIES
NOTES TO THE CONSOLIDATED FINANCIAL STATEMENTS
As of December 31, 2009 and 2010
g) Shareholder Equity Increases
On December 30, 2010, at special session N. 2010/73, the Board of Directors agreed to schedule a Special Shareholders Meeting on January 27, 2011 in order to propose an increase in shareholder equity through the issuance of 40,042,815,984 shares, which represented 15% of the Bank’s total newly-issued equity shares, and to make the respective amendments to our bylaws, adopting, as necessary, any other applicable agreement, once such shares were placed, subscribed and paid for, in accordance with terms and conditions determined at the meeting or, upon delegation, by the Board of Directors.
CORPBANCA ASESORIAS FINANCIERAS S.A.
a) Change in Corporate Name
On March 10, 2010, Corp Capital Asesorías Financieras S.A. changed its corporate name to Corpbanca Asesorías Financieras S.A.
b) Board of Directors
On August 16, 2010, at a special meeting of the Board of Directors it was announced that as of July 1, 2010, Mr. Claudio Chamorro Carrizo has submitted his resignation to the position of Director, and Mr. Cristián Canales Palacios has been subsequently appointed as a Director of the company.
CORPBANCA ADMINISTRADORA GENERAL DE FONDOS S.A.
a) Board of Directors
At our twentieth General Shareholders Meeting, which took place on February 26, 2010, the company’s board was up for renewal; our current Board of Directors was reelected and is still comprised of: Armando Ariño Joiro, Oscar Cerda Urrutia, Jorge Max Palazuelos, Claudio Chamorro Carrizo, and Pablo de la Cerda Merino.
At a General Shareholders Meeting, on March 16, 2010, the Board of Directors agreed to distribute to the Parent Company, the dividends from 2009 corresponding to Corpbanca Administradora General de Fondos S.A., which were paid out on March 31, 2010.
At the fourteenth General Shareholders Meeting, held on October 12, 2010, the company’s current Board of Directors was revoked and a new Board of Directors, was elected, comprised of: Gustavo Arriagada Morales, Santiago Suarez Molina, Oscar Cerda Urrutia, Pablo de la Cerda Merino, and Jorge Max Palazuelos.
According to the minutes corresponding Board of Directors General Meeting No. 241, held on October 21, 2010, the Board agreed to elect Mr. Gustavo Arriagada Morales as President of Corpbanca Administradora General de Fondos S.A, and Santiago Suarez Molina as its Vice-president. In addition, at the meeting it was agreed that the Board would be granted definite authority to determine the remuneration levels for the position of President and Vice-president of the Board of Directors. On that subject, the President indicated that as an Independent Director of the Parent Company, he could not receive remuneration according to Article 50 bis of the Ley de Sociedades Anónimas (Chilean Corporate law). As such, the Board agreed to establish a remuneration sum only for the position of Vice-president in an amount equivalent to the amount in pesos of 75 UFs.
b) Change in Corporate Name
According to the authorization provided by Exempt Resolution N. 258 issued by the Chilean Superintendency of Banks and Financial Institutions, dated April 30, 2010, the corporate name was changed to Corpbanca Administradora General de Fondos S.A.
F-40
CORPBANCA AND SUBSIDIARIES
NOTES TO THE CONSOLIDATED FINANCIAL STATEMENTS
As of December 31, 2009 and 2010
c) Financial Statements Based on IFRS
In accordance with the terms established by the Chilean Accounting Bar and Circular No. 544, dated October 2, 2009 and issued by the Chilean Superintendency of Securities and Insurance, the subsidiary must present, as of 2010, financial statements prepared in accordance with IFRS. The first financial statements that come under the new regulations are those prepared as of December 31, 2010. Taking into account the aforementioned, we must still prepare and present financial information for 2010 to the Superintendency of Securities and Insurance in accordance with local regulations.
CORPBANCA CORREDORES DE BOLSA S.A.
a) Board of Directors
At a general meeting on January 13, 2010, Mr. Cristián Canales Palacios was appointed as President of the Board of Directors, and Mr. Sebastian Cerda Norambuena was appointed as a Director of the company.
At our General Shareholders Meeting held on April 12, 2010, the company’s board was completely renewed and is now comprised of: Cristián Canales Palacios, Cristobal Prado Fernandez, Jose Francisco Sanchez Figueroa, Sebastian Cerda Norambuena, and Eugenio Gigogne Miqueles.
At our seventeenth General Shareholders Meeting, held on April 12, 2010, it was agreed that 2009 profits amounting to Chs$10,098.63366 (Chilean Pesos) per share would be distributed among our shareholders.
At our fifteenth General Shareholders Meeting, held on August 12, 2010, our shareholders agreed to increase in the company’s equity by Ch$55,000,002,381 through the issuance of 726,215 nominal shares, with a unique payment series and without nominal value, which were placed at a price of Ch$75,735.1505839 per share, Such shares were subscribed and paid for in September 2010.
At our Sixteenth Extraordinary General Meeting, held on October 13, 2010, the company proceeded to change the composition of the company’s Board of Directors and to elect a new one, being formed by the following: Hugo Lavados Montes, José Manuel Garrido Bouzo, Cristián Canales Palacios, Cristóbal Prado Fernández and José Francisco Sánchez Figueroa. The company also proceeded to fix remuneration for the Chairman and Vice-Chairman.
b) Change in Corporate Name
At our fourteenth General Shareholders Meeting, held on April 12, 2010, the shareholders agreed to change the corporate name of Corp Capital Corredores de Bolsa S.A. to Corpbanca Corredores de Bolsa S.A.
c) Filing of Financial Statements according to IFRS
As it is generally known, Chile is committed towards the development of a convergence plan in order to entirely adopt the International Financial Reporting Standards (“IFRS”). In conformity with what has been established by the Chilean Accounting Bar and the Chilean Superintendency of Securities and Insurance, through Circular No 544, dated October 2, 2009, as of 2010 the Company must present consolidated financial statements prepared under IFRS.
The first set of financial statements prepared under the new standards will be those corresponding to the year ended as of December 31, 2010. Such financial statements will be “pro forma”, in the sense that comparative figures for the prior year are excluded.
CORPBANCA CORREDORES DE SEGUROS S.A.
a) Board of Directors
At our thirteenth General Shareholders Meeting, held on April 29, 2010, a 100% distribution of the profits corresponding to the fiscal year 2009 was agreed-to. Such dividend was paid to the shareholders on June 30, 2010.
F-41
CORPBANCA AND SUBSIDIARIES
NOTES TO THE CONSOLIDATED FINANCIAL STATEMENTS
As of December 31, 2009 and 2010
CORPBANCA AGENCIA DE VALORES S.A.
a) Board of Directors
On April 5, 2010, the No. 2 Ordinary Meeting of the Board of Directors agreed to schedule a Special Shareholders Meeting on May 13, 2010 in order to submit for the approval of the shareholders, a proposal to change the corporate name of the company from Corp Capital Agencia de Valores for Corpbanca Agencia de Valores S.A.
At our first General Shareholders Meeting, held on April 30, 2010, the board of directors of the company was elected, resulting in the appointment of: Mario Chamorro Carrizo, Alvaro Barriga Oliva and Mauricio Santos Diaz.
At our third General Shareholders Meeting, held on September 9, 2010, the shareholders agreed to increase the capital stock of the company by Ch$605,789,560, through the issuance of 9,623 nominative shares, with a unique payment series and without nominal value, Such shares were subscribed and paid at a price of Ch$62,952,2561 during September 2010.
At our fourth Extraordinary General Meeting held on October 25, 2010, the company proceeded to modify its statutes creating the positions of Vice Chairman of the directory and the company also proceeded with the total renovation of the board, appointed from that date with the following: Patricio José Eguiguren Muñoz, Gustavo Alberto Favre Domínguez and Alvaro Barriga Oliva, The company finally agreed to set a monthly subsistence allowance for the Chairman and Vice-Chairman.
b) Filing of Financial Statements according to IFRS
According with the Accounting College and the Superintendence of Securities and Insurance, and in terms of Circular No 544 dated October 2, 2009, our affiliate must file as of the year 2010, financial statements consistent with IFRS. The first financial statements drafted in consistency with the new regulations will be the financial statements for the year ended on December 31, 2010. Such financial statements will be “pro forma” provided that they will not contain a comparative analysis with respect to the previous year. Pursuant to the above we will continue to file our financial information for the year 2010 according to local regulations.
CORPLEGAL S.A.
a) Board of Directors
At our General Shareholders Meeting, held on August 2010, the Board of Directors of the company was re-elected, resulting in the appointment of: Cristián Canales Palacios, Eugenio Gigogne Miqueles, Oscar Cerda Urrutia, Andrés Covacevich Cornejo, and Alvaro Barriga Oliva.
SMU CORP S.A.
a) Board of Directors
At our Special Shareholders Meeting, held on August 20, 2010, it was agreed that Mr. Eulogio Guzman Llona be appointed as Chief Executive Officer, after accepting the resignation of Ms. Luisa Astorino Morales, the previous Chief Executive Officer.
At our Special Shareholders Meeting, held on September 30, 2010, the Board of Directors of the company was re-elected, resulting in the appointment of: Jorge Andrés Saieh Guzmán, Jorge Id Sánchez, Mario Chamorro Carrizo, Juan Pablo Vega Walker, Marcelo Cáceres Rojas, and Gerardo Schlotfeldt Leighton.
| NOTE 4 - | BUSINESS SEGMENTS |
The segments information is defined by the Bank based on its different business units, which differ primarily in the risks and returns that affect them.
F-42
CORPBANCA AND SUBSIDIARIES
NOTES TO THE CONSOLIDATED FINANCIAL STATEMENTS
As of December 31, 2009 and 2010
The reportable segments and criteria used to report to the highest Bank authority on the operation’s decision making are in accordance with IFRS 8, Operating Segments.
The Bank’s business activities are primarily situated in the domestic market and have strategically aligned its operations into four divisions composed of six reporting segments based on its market segmentation and the needs of its customers and trading partners. The six reporting business segments are Large Companies and Corporate, Companies, Traditional and Private Banking, Lower Income Retail Banking, Treasury and International, and Non-banking Financial Services. The Bank manages these reporting segments using an internal profitability reporting system. Management reviews their segments on the basis of gross operational margin and only uses average balances to evaluate performance and allocate resources.
Descriptions of each business segment are as follows:
Commercial Banking
| · | Large Companies, Corporate, and Real Estate is generally comprised of those companies that belong to leading economic groups, specific sectors, and companies with annual sales in excess of US$30 million. It also includes real estate companies and financial institutions. |
| · | Companies - includes a full range of financial products and services to companies with annual sales of less than US$30 million. Leasing and factoring have been included in this business segment. |
Retail Banking
| · | Traditional and Private Banking - offers, among other products, checking accounts, consumer loans, credit cards and mortgage loans to middle and upper income segments. |
| · | Lower Income Retail Banking - offers, among other products, consumer loans, credit cards and mortgage loans to the traditionally underserved low-to-middle income segments. |
Treasury and International
| · | Primarily includes our treasury activities such as financial management, funding and liquidity as well as our international business. |
Non-Banking Financial Services
| · | These are services performed by our subsidiaries which include insurance brokerage, financial advisory services, asset management and securities brokerage. |
The segments accounting policies are the same as those described in the summary of accounting policies, and are customized to meet the needs of the Bank’s management. The Bank earns most of its income in the form of interest income, fee and commission income and income from financial operations.
Hence, this disclosure furnishes information on how the Bank is managed as of December 31, 2010. The information for the previous year (2009) has been prepared on the basis of the criteria in force at the closing date for these financial statements, to achieve a proper comparability of figures.
F-43
CORPBANCA AND SUBSIDIARIES
NOTES TO THE CONSOLIDATED FINANCIAL STATEMENTS
As of December 31, 2009 and 2010
The information disclosed below is consistent with the analysis and identification of:
| a) | Income statement: |
| As of December 31, 2008 | |||||||||
| Business Banking | Retail Banking | ||||||||
| Large Companies and Corporate | Companies | Traditional and Private Banking | Lower Income Retail Banking | Treasury and International | Non-banking Financial Services | Total | |||
| MCh$ | MCh$ | MCh$ | MCh$ | MCh$ | MCh$ | MCh$ | |||
| Net Interest Income | 21,525 | 39,104 | 51,612 | 29,820 | 61,775 | 10,340 | 214,176 | ||
| Net services fees income | 4,492 | 8,356 | 15,117 | 5,411 | 270 | 8,406 | 42,052 | ||
Trading and investment income, net | - | (5,059) | - | - | 60,056 | - | 54,997 | ||
Foreign exchange gains (losses), net | 2,810 | 4,656 | 62 | - | (50,415) | - | (42,887) | ||
| Other operating income | - | 459 | 700 | - | 194 | 6,467 | 7,820 | ||
| Provision for loan losses | (3,353) | (7,082) | (21,507) | (23,640) | - | 599 | (54,983) | ||
| Gross Operational Margin | 25,474 | 40,434 | 45,984 | 11,591 | 71,880 | 25,812 | 221,175 | ||
| Other income and expenses | - | - | - | - | - | - | 262 | ||
| Total Operating Expenses | - | - | - | - | - | - | (123,451) | ||
| Income before taxes | - | - | - | - | - | - | 97,986 | ||
| Averages Loans | 1,867,023 | 1,146,589 | 1,104,849 | 272,065 | 10,003 | - | 4,400,529 | ||
| Averages Investments | - | - | - | - | 189,844 | 189,844 | |||
| As of December 31, 2009 | |||||||||
| Business Banking | Retail Banking | ||||||||
| Large Companies and Corporate | Companies | Traditional and Private Banking | Lower Income Retail Banking | Treasury and International | Non-banking Financial Services | Total | |||
| MCh$ | MCh$ | MCh$ | MCh$ | MCh$ | MCh$ | MCh$ | |||
| Net Interest income | 37,932 | 49,816 | 56,237 | 22,443 | 11,106 | 15,854 | 193,388 | ||
| Net services fees income | 8,284 | 10,061 | 16,228 | 3,846 | (430) | 5,272 | 43,261 | ||
Trading and investment income, net | - | (3,500) | - | - | 6,204 | 1,859 | 4,563 | ||
Foreign exchange gains (losses), net | 8,603 | 887 | - | - | 36,969 | 3,176 | 49,635 | ||
| Other operating income | - | 2,490 | - | - | 227 | 2,370 | 5,087 | ||
| Provision for loan losses | (16,116) | (12,370) | (20,672) | (21,891) | - | (222) | (71,271) | ||
| Gross Operational Margin | 38,703 | 47,384 | 51,793 | 4,398 | 54,076 | 28,309 | 224,663 | ||
| Other income and expenses | - | - | - | - | - | - | 445 | ||
| Total Operating Expenses | - | - | - | - | - | - | (122,667) | ||
| Income before taxes | - | - | - | - | - | - | 102,441 | ||
| Averages Loans | 2,293,991 | 1,068,532 | 1,168,395 | 193,068 | 31,386 | - | 4,755,372 | ||
| Averages Investments | - | - | - | - | 515,830 | - | 515,830 | ||
F-44
CORPBANCA AND SUBSIDIARIES
NOTES TO THE CONSOLIDATED FINANCIAL STATEMENTS
As of December 31, 2009 and 2010
| As of December 31, 2010 | |||||||||
| Business Banking | Retail Banking | ||||||||
| Large Companies and Corporate | Companies | Traditional and Private Banking | Lower Income Retail Banking | Treasury and International | Non-banking Financial Services | Total | |||
| MCh$ | MCh$ | MCh$ | MCh$ | MCh$ | MCh$ | MCh$ | |||
| Net Interest Income | 36,363 | 48,132 | 54,457 | 20,667 | 62,717 | 2,074 | 224,410 | ||
| Net services fees income | 13,060 | 12,523 | 22,525 | 3,318 | (357) | 7,152 | 58,221 | ||
Trading and investment income, net | 758 | (2,564) | - | - | (11,324) | 3,720 | (9,410) | ||
Foreign exchange gains (losses), net | 9,024 | 4,063 | 72 | - | 28,646 | 2,806 | 44,611 | ||
| Other operating income | 3,657 | - | - | 185 | 4,990 | 8,832 | |||
| Provision for loan losses | (1,873) | (26,051) | (21,132) | (12,429) | 1,360 | 7,774 | (52,351) | ||
| Gross Operational Margin | 57,332 | 39,760 | 55,922 | 11,556 | 81,227 | 28,516 | 274,313 | ||
| Other income and expenses | 10 | 22 | 264 | 296 | |||||
| Total Operating Expenses | (9,152) | (16,715) | (54,170) | (19,784) | (12,173) | (20,689) | (132,683) | ||
| Income before taxes | 48,180 | 18,830 | 1,774 | (8,228) | 69,055 | 8,091 | 141,926 | ||
| Averages Loans | 2,493,947 | 1,138,838 | 1,297,209 | 147,617 | 89,003 | - | 5,166,615 | ||
| Averages Investments | - | - | - | - | 783,358 | - | 783,358 | ||
| b) | Assets and Liabilities |
| As of December 31, 2009 | |||||||||
| Business Banking | Retail Banking | ||||||||
| Large Companies and Corporate | Companies | Traditional and Private Banking | Lower Income Retail Banking | Treasury and International | Non-banking Financial Services | Total | |||
| MCh$ | MCh$ | MCh$ | MCh$ | MCh$ | MCh$ | MCh$ | |||
| Loans: | |||||||||
| Mortgage | 190 | 10,707 | 791,393 | 4,212 | - | 233 | 806,735 | ||
| Consumer | 65 | 1,462 | 251,322 | 175,138 | - | 64 | 428,051 | ||
| Commercial | 2,377,804 | 1,056,163 | 320,076 | 71 | 22,756 | - | 3,776,870 | ||
| Loans before allowances | 2,378,059 | 1,068,332 | 1,362,791 | 179,421 | 22,756 | 297 | 5,011,656 | ||
| Allowances for loan losses | (27,683) | (25,573) | (25,543) | (20,465) | - | - | (99,264) | ||
Loans net of allowances(*) | 2,350,376 | 1,042,759 | 1,337,248 | 158,956 | 22,756 | 297 | 4,912,392 | ||
| Trading portfolio financial assets | - | - | - | - | 54,867 | 21,289 | 76,156 | ||
| Investments under agreements to resell | - | - | - | - | 152 | 51,818 | 51,970 | ||
| Derivative financial instruments | - | - | - | - | 125,484 | 656 | 126,140 | ||
| Financial investments available-for-sale | - | - | - | - | 737,162 | - | 737,162 | ||
| Assets not included in segments | - | - | - | - | 476,139 | - | 476,139 | ||
| Total assets | 2,350,376 | 1,042,759 | 1,337,248 | 158,956 | 1,416,560 | 74,060 | 6,379,959 | ||
| Current Accounts and demand deposits | 74,946 | 145,879 | 106,665 | - | 588 | - | 328,078 | ||
| Other sight balances | 22,723 | 16,800 | 125,027 | 3,642 | - | - | 168,192 | ||
| Time Deposits and saving accounts | 544,388 | 189,955 | 323,616 | 5,984 | 2,252,102 | - | 3,316,045 | ||
| Investments under agreement to repurchase | - | - | - | - | 428,478 | 37,035 | 465,513 | ||
| Derivative financial instruments | - | - | - | - | 114,532 | 171 | 114,703 | ||
| Borrowings from financial institutions | - | - | - | - | 362,403 | - | 362,403 | ||
| Debt issued | - | - | - | - | 935,219 | - | 935,219 | ||
| Liabilities not included in segments | - | - | - | - | 182,457 | - | 182,457 | ||
| Equity | - | - | - | - | 507,349 | - | 507,349 | ||
| Total liabilities and equity | 642,057 | 352,634 | 555,308 | 9,626 | 4,783,128 | 37,206 | 6,379,959 | ||
F-45
CORPBANCA AND SUBSIDIARIES
NOTES TO THE CONSOLIDATED FINANCIAL STATEMENTS
As of December 31, 2009 and 2010
| As of December 31, 2010 | |||||||||
| Business Banking | Retail Banking | ||||||||
| Large Companies and Corporate | Companies | Traditional and Private Banking | Lower Income Retail Banking | Treasury and International | Non-banking Financial Services | Total | |||
| MCh$ | MCh$ | MCh$ | MCh$ | MCh$ | MCh$ | MCh$ | |||
| Loans: | |||||||||
| Mortgage | 162 | 11,045 | 1,016,778 | 4,654 | - | - | 1,032,639 | ||
| Consumer | 13 | 1,695 | 263,663 | 141,916 | - | 28 | 407,315 | ||
| Commercial | 2,441,677 | 1,197,045 | 358,775 | 74 | 31,472 | 198 | 4,029,241 | ||
| Loans before allowances | 2,441,852 | 1,209,785 | 1,639,216 | 146,644 | 31,472 | 226 | 5,469,195 | ||
| Allowances for loan losses | (33,437) | (27,817) | (27,553) | (15,408) | - | - | (104,215) | ||
Loans net of allowance(*) | 2,408,415 | 1,181,968 | 1,611,663 | 131,236 | 31,472 | 226 | 5,364,980 | ||
| Trading portfolio financial assets | - | - | - | - | 119,809 | 77,771 | 197,580 | ||
| Investments under agreements to resell | - | - | - | - | 39,556 | 36,120 | 75,676 | ||
| Derivative financial instruments | - | - | - | - | 203,833 | 234 | 204,067 | ||
| Financial investments available-for-sale | - | - | - | - | 728,293 | 17,955 | 746,248 | ||
| Assets not included in segments | - | - | - | - | - | 542,289 | 542,289 | ||
| Total assets | 2,408,415 | 1,181,968 | 1,611,663 | 131,236 | 1,122,963 | 674,595 | 7,130,840 | ||
| Current Accounts and demand deposits | 94,190 | 180,004 | 130,630 | - | 477 | - | 405,301 | ||
| Other sight balances | 21,515 | 27,748 | 27,514 | 5,170 | - | 124,816 | 206,763 | ||
| Time Deposits and saving accounts | 774,241 | 331,487 | 355,050 | 6,606 | 2,213,054 | 20,016 | 3,700,454 | ||
| Investments under agreement to repurchase | - | - | - | - | 155,322 | 34,028 | 189,350 | ||
| Derivative financial instruments | - | - | - | - | 175,204 | 57 | 175,261 | ||
| Borrowings from financial institutions | - | - | - | - | 409,902 | 93,790 | 503,692 | ||
| Debt issued | - | - | - | - | 1,215,435 | - | 1,215,435 | ||
| Liabilities not included in segments | - | - | - | - | - | 182,327 | 182,327 | ||
| Equity | - | - | - | - | - | 552,257 | 552,257 | ||
| Total liabilities and equity | 889,946 | 539,239 | 513,194 | 11,776 | 4,169,394 | 1,007,291 | 7,130,840 | ||
(*) Loans net of allowances include amounts due from Banks as of December 31, 2009 and 2010.
F-46
CORPBANCA AND SUBSIDIARIES
NOTES TO THE CONSOLIDATED FINANCIAL STATEMENTS
As of December 31, 2009 and 2010
| NOTE 5 - | CASH AND CASH EQUIVALENTS |
| a) | Detail of cash and cash equivalents |
The detail of the balances included under cash and cash equivalents is as follows:
| As of December 31, | |||||
| 2008 | 2009 | 2010 | |||
| MCh$ | MCh$ | MCh$ | |||
| Cash and deposits in banks | |||||
| Cash | 42,951 | 70,463 | 85,062 | ||
| Deposits in The Central Bank of Chile | 13,923 | 18,185 | 38,932 | ||
| Deposits in national banks | 1,656 | 1,872 | 3,029 | ||
| Foreign deposits | 22,796 | 19,811 | 75,316 | ||
| Subtotal Cash and deposits in banks | 81,326 | 110,331 | 202,339 | ||
| Items in course of collection, net | 31,527 | 30,942 | 38,155 | ||
| Highly liquid financial instruments (1) | 18,678 | 67,164 | 77,550 | ||
| Investments under agreements to resell (2) | 50,165 | 33,127 | 75,677 | ||
| Total cash and cash equivalents | 181,696 | 241,564 | 393,721 | ||
| (1) | Corresponds to those financial instruments in the trading portfolio and available-for-sale portfolio with maturities that do not exceed three months from its date of acquisition. |
| (2) | Corresponds to those investments purchased under agreements to resell with maturities that do not exceed three months from its date of acquisition. |
The level of cash and deposits at the Central Bank of Chile meets the monthly average reserve requirements.
| b) | Items in course of collection |
Items in course of collection correspond to those transactions where only the remaining settlement will increase or decrease the funds at the Central Bank of Chile or in foreign banks, usually within 12 or 24 hours following the close of each fiscal year.
Items in course of collection are detailed as follows:
| As of December 31, | |||||
| 2008 | 2009 | 2010 | |||
| MCh$ | MCh$ | MCh$ | |||
| Assets | |||||
| Outstanding notes from other banks | 33,651 | 34,555 | 36,526 | ||
| Funds receivable | 84,052 | 61,241 | 43,154 | ||
| Subtotal assets | 117,703 | 95,796 | 79,680 | ||
| Liabilities | |||||
| Funds Payable | 86,176 | 64,854 | 41,525 | ||
| Subtotal liabilities | 86,176 | 64,854 | 41,525 | ||
| Net items in course of collection | 31,527 | 30,942 | 38,155 | ||
F-47
CORPBANCA AND SUBSIDIARIES
NOTES TO THE CONSOLIDATED FINANCIAL STATEMENTS
As of December 31, 2009 and 2010
| NOTE 6 - | TRADING PORTFOLIO FINANCIAL ASSETS |
The detail of the financial instruments classified as trading financial assets is as follows:
| As of December 31, | |||
| 2009 | 2010 | ||
| MCh$ | MCh$ | ||
Chilean Central Bank and Government securities: | |||
| Chilean Central Bank - bonds | 260 | 88,077 | |
| Chilean - Central Bank notes | 589 | - | |
| Other Chilean Central Bank and government securities | 8,332 | 8 | |
| Other national institution securities: | |||
| Bonds | - | 2,998 | |
| Notes | - | - | |
| Other Securities | 54,788 | 71,379 | |
| Foreign Institution Securities: | |||
| Bonds | - | 1,922 | |
| Notes | - | - | |
| Other foreign Securities | 2,495 | 550 | |
| Mutual funds Investments: | |||
| Funds managed by related organizations | 9,692 | 32,646 | |
| Funds managed by third parties | - | - | |
| Total | 76,156 | 197,580 | |
As of December 31, 2010, Chilean Central Bank and Government securities includes investments purchased under agreements to resell to customers and financial institutions amounting to MCh$75,173 (MCh$4,000 in 2009).
As of December 31, 2010, investments purchased under agreement to resell have an average maturity of 18 days.
F-48
CORPBANCA AND SUBSIDIARIES
NOTES TO THE CONSOLIDATED FINANCIAL STATEMENTS
As of December 31, 2009 and 2010
| NOTE 7 - | INVESTMENTS UNDER AGREEMENTS TO RESELL |
| a) | The Bank purchases financial instruments agreeing to resell them at a future date. As of December 31, 2009 and 2010 the instruments acquired under agreements to resell are as follows: |
| Balances As of December 31, 2009 | |||||||
| Less than three months | More than three months and less than one year | More than one Year | Total | ||||
| MCh$ | MCh$ | MCh$ | MCh$ | ||||
| Government and Chilean Central Bank Securities: | |||||||
| Chilean Central Bank Securities | 152 | - | - | 152 | |||
| Treasury Bonds and Notes | - | - | 207 | 207 | |||
| Other fiscal securities | - | - | - | - | |||
| Other securities issued locally: | - | - | - | - | |||
| Other local bank securities | 18,034 | 18,170 | - | 36,204 | |||
| Bonds and company business papers | 14,755 | 466 | - | 15,221 | |||
| Other securities issued locally | 186 | - | - | 186 | |||
| Securities issued abroad: | - | - | - | - | |||
| Government and Central Bank securities | - | - | - | - | |||
| Other Securities issued abroad | - | - | - | - | |||
| Mutual Funds Investments: | - | - | - | - | |||
| Funds managed by related companies | - | - | - | - | |||
| Funds managed by third parties | - | - | - | - | |||
| Total | 33,127 | 18,636 | 207 | 51,970 | |||
| Balances As of December 31, 2010 | |||||||
| Less than three months | More than three months and less than one year | More than one Year | Total | ||||
| MCh$ | MCh$ | MCh$ | MCh$ | ||||
| Government and Chilean Central Bank Securities: | |||||||
| Chilean Central Bank Securities | - | - | - | - | |||
| Treasury Bonds and Notes | - | - | - | - | |||
| Other fiscal securities | - | - | - | - | |||
| Other securities issued locally: | |||||||
| Other local bank securities | 69,363 | - | - | 69,363 | |||
| Bonds and company business papers | |||||||
| Other securities issued locally | 5,433 | 880 | - | 6,313 | |||
| Securities issued abroad: | |||||||
| Government and Central Bank securities | - | - | - | - | |||
| Other Securities issued abroad | - | - | - | - | |||
| Mutual Funds Investments: | |||||||
| Funds managed by related companies | - | - | - | - | |||
| Funds managed by third parties | - | - | - | - | |||
| Total | 74,796 | 880 | - | 75,676 | |||
F-49
CORPBANCA AND SUBSIDIARIES
NOTES TO THE CONSOLIDATED FINANCIAL STATEMENTS
As of December 31, 2009 and 2010
b) | The Bank obtains funds by selling financial instruments and committing itself to buy them back at future dates, plus interest at a fixed rate. As of December 31, 2009 and 2010, the instruments sold under repurchase agreements are as follows: |
As of December 31, 2009 and 2010, investments under agreements to repurchase are the following:
| As of December 31, 2009 | |||||||
| Less than three months | More than three months and less than one year | More than one Year | Total | ||||
| MCh$ | MCh$ | MCh$ | MCh$ | ||||
| Government and Chilean Central Bank Securities: | |||||||
| Chilean Central Bank Securities | - | 424,378 | - | 424,378 | |||
| Treasury Bonds and Notes | - | - | - | - | |||
| Other fiscal securities | - | - | - | - | |||
| Other securities issued locally: | - | ||||||
| Other local bank securities | 39,648 | - | - | 39,648 | |||
| Bonds and company business papers | - | - | - | - | |||
| Other securities issued locally | 1,487 | - | - | 1,487 | |||
| Securities issued abroad: | - | ||||||
| Government and Central Bank securities | - | - | - | - | |||
| Other Securities issued abroad | - | - | - | - | |||
| Mutual Funds Investments: | - | ||||||
| Funds managed by related companies | - | - | - | - | |||
| Funds managed by third parties | - | - | - | - | |||
| Total | 41,135 | 424,378 | - | 465,513 | |||
| As of December 31, 2010 | |||||||
| Less than three months | More than three months and less than one year | More than one Year | Total | ||||
| MCh$ | MCh$ | MCh$ | MCh$ | ||||
| Government and Chilean Central Bank Securities: | |||||||
| Chilean Central Bank Securities | 155,322 | - | - | 155,322 | |||
| Treasury Bonds and Notes | - | - | - | - | |||
| Other fiscal securities | - | - | - | - | |||
| Other securities issued locally: | |||||||
| Other local bank securities | 24,904 | - | - | 24,904 | |||
| Bonds and company business papers | 2,222 | - | - | 2,222 | |||
| Other securities issued locally | - | - | - | - | |||
| Securities issued abroad: | |||||||
| Government and Central Bank securities | - | - | - | - | |||
| Other Securities issued abroad | 6,902 | - | - | 6,902 | |||
| Mutual Funds Investments: | |||||||
| Funds managed by related companies | - | - | - | - | |||
| Funds managed by third parties | - | - | - | - | |||
| Total | 189,350 | - | - | 189,350 | |||
F-50
CORPBANCA AND SUBSIDIARIES
NOTES TO THE CONSOLIDATED FINANCIAL STATEMENTS
As of December 31, 2009 and 2010
| NOTE 8 - | DERIVATIVE FINANCIAL INSTRUMENT AND HEDGE ACCOUNTING |
| a) | As of December 31, 2009 and 2010, the Bank holds the following portfolio of derivative instruments: |
| As of December 31, 2009 | ||||||
| Notional amount of contract with final | ||||||
| maturity in | Fair value | |||||
Cash Flow (CF) or Fair value | Up to 3 months | From 3 months to 1 year | Over one Year | Assets | Liabilities | |
| (FV) Hedge | MCh$ | MCh$ | MCh$ | MCh$ | MCh$ | |
| Derivatives held-for-hedging | - | - | - | - | - | |
| - | - | - | - | - | ||
| Derivatives held-for-trading | ||||||
| Foreign currency Forwards | 1,964,823 | 705,582 | 39,959 | 57,271 | 60,825 | |
| Interest rate Swaps | 35,498 | 358,087 | 1,973,385 | 37,564 | 38,897 | |
| Foreign currency Swaps | 18 | 60,732 | 578,041 | 31,305 | 14,981 | |
| Total derivatives held-for-trading | 2,000,339 | 1,124,401 | 2,591,385 | 126,140 | 114,703 | |
| Total derivative financial instruments | 2,000,339 | 1,124,401 | 2,591,385 | 126,140 | 114,703 | |
| As of December 31, 2010 | ||||||
| Notional amount of contract with final | ||||||
| maturity in | Fair value | |||||
Cash Flow (CF) or Fair value | Up to 3 months | From 3 months to 1 year | Over one Year | Assets | Liabilities | |
| (FV) Hedge | MCh$ | MCh$ | MCh$ | MCh$ | MCh$ | |
| Derivatives held-for-hedging | ||||||
| Foreign currency Forwards | FV | 11,991 | - | - | 241 | - |
| Foreign currency Swaps | FV | 13,056 | - | 21,443 | 196 | 697 |
| Total derivatives held-for-hedging | 25,047 | - | 21,443 | 437 | 697 | |
| Derivatives held-for-trading | ||||||
| Foreign currency Forwards | 3,628,811 | 2,423,162 | 443,209 | 79,048 | 91,868 | |
| Interest rate Swaps | 145,220 | 712,681 | 4,052,876 | 51,672 | 38,368 | |
| Foreign currency Swaps | 66,983 | 95,380 | 1,058,631 | 72,644 | 44,325 | |
| Foreign currency call options | 2,191 | 1,633 | - | 12 | 1 | |
| Foreign currency put options | 3,513 | 491 | - | 254 | 2 | |
| Total derivatives held-for-trading | 3,846,718 | 3,233,347 | 5,554,716 | 203,630 | 174,564 | |
| Total derivative financial instruments | 3,871,765 | 3,233,347 | 5,576,159 | 204,067 | 175,261 | |
F-51
CORPBANCA AND SUBSIDIARIES
NOTES TO THE CONSOLIDATED FINANCIAL STATEMENTS
As of December 31, 2009 and 2010
| b) | Hedge accounting |
Fair value hedges:
The Bank uses cross currency swap as hedging instruments to hedge its exposure in the fair value of the hedged item attributable to the interest rate. The hedging instruments adjust the effective cost of long-term issuance from a fixed rate to a floating rate, reducing the duration and altering the sensitivity to shorter lengths of the curve.
Below is a detail by maturity of hedged items and hedging instruments as of December 31, 2010 (in December 31, 2009 the Bank had no hedging derivatives) under fair value hedges.
| As of December 31, 2010 | |||||||
| Within 1 year | Between 1 and 3 years | Between 3 and 6 years | Over 6 years | ||||
| MCh$ | MCh$ | MCh$ | MCh$ | ||||
| Hedged Items | |||||||
| - | - | - | - | ||||
| Corporate Bonds | 21,443 | ||||||
Interbank loans | 13,056 | - | - | - | |||
| Total | 13,056 | - | - | 21,443 | |||
| Coverage element | |||||||
| Cross Currency Swap | 13,056 | - | - | 21,443 | |||
| Total | 13,056 | - | - | 21,443 | |||
As of December 31, 2010, a gain of MCh$11 for ineffectiveness of fair value hedges has been recognized under "Trading and investment income" in the consolidated statement of income.
| c) | Hedging net investment in foreign operations |
As discussed in Note 3 c), the Bank has entered into a hedging relationship to hedge the exposure to variability in cash flows attributable to foreign exchange risk in its net investment in its New York Branch. The bank is using as hedging instrument a forward exchange contract that expires on a 3-month period and is automatically renewed after expired. As of December 31, 2010, the effective portion of the gain or loss on the hedging instrument was a loss of MCh$799, after taxes, and has been recognized in other comprehensive income. The ineffective portion that has been recognized in net income was a loss of MCh$85.
F-52
CORPBANCA AND SUBSIDIARIES
NOTES TO THE CONSOLIDATED FINANCIAL STATEMENTS
As of December 31, 2009 and 2010
| NOTE 9 - | LOANS AND RECEIVABLES FROM BANKS |
| a) | As of December 31, 2009 and 2010, loans and receivable from banks are as follows: |
| As of December 31, | |||
| 2009 | 2010 | ||
| MCh$ | MCh$ | ||
| Local Banks | |||
| Non available deposits in the Central Bank of Chile | 63,600 | - | |
| Subtotal | 63,600 | - | |
| Foreign Banks | |||
| Loans to foreign banks | 9,037 | 50,994 | |
| Other debts with foreign banks | 13,589 | 13,193 | |
| Allowances and impairment for foreign bank loans | (6) | (189) | |
| Subtotal | 22,620 | 63,998 | |
| Total | 86,220 | 63,998 | |
| b) | The movement in the provisions for bank loans losses as of December 31, 2009 and 2010 are as follows: |
| As of December 31, 2009 | |||||
| Local Banks | Foreign Banks | Total | |||
| MCh$ | MCh$ | MCh$ | |||
| Balance as of January 1, 2009 | - | (25) | (25) | ||
| Write-offs | - | - | - | ||
| Established provisions | - | (6) | (6) | ||
| Released provisions | - | 25 | 25 | ||
| Impairment | - | - | - | ||
| Impairment reversal | - | - | - | ||
| Balances as of December 31, 2009 | - | (6) | (6) | ||
| As of December 31, 2010 | |||||
| Local Banks | Foreign Banks | Total | |||
| MCh$ | MCh$ | MCh$ | |||
| Balance as of January 1, 2010 | - | (6) | (6) | ||
| Write-offs | - | - | - | ||
| Established provisions | - | (196) | (196) | ||
| Released provisions | - | 13 | 13 | ||
| Impairment | - | - | - | ||
| Impairment reversal | - | - | - | ||
| Balances as of December 31, 2010 | - | (189) | (189) | ||
F-53
CORPBANCA AND SUBSIDIARIES
NOTES TO THE CONSOLIDATED FINANCIAL STATEMENTS
As of December 31, 2009 and 2010
| NOTE 10 - | LOANS AND RECEIVABLES FROM CUSTOMERS |
| a) | Loans and receivables from customers |
As of December 31, 2009 and 2010, the composition of the loan portfolio is as follows:
| As of December 31, 2009 | Assets before Allowances | Allowances established | |||||||
| Normal Portfolio | Impaired Portfolio | Total | Individual | Group | Total | Net Asset | |||
| MCh$ | MCh$ | MCh$ | MCh$ | MCh$ | MCh$ | MCh$ | |||
| Commercial loans: | |||||||||
| Commercial loans | 2,978,831 | 165,386 | 3,144,217 | 25,686 | 15,128 | 40,814 | 3,103,403 | ||
| Foreign trade loans | 163,683 | 69,795 | 233,478 | 14,799 | 597 | 15,396 | 218,082 | ||
| Current account debtors | 44,863 | 3,457 | 48,320 | 149 | 700 | 849 | 47,471 | ||
| Factoring operations | 50,034 | 3,514 | 53,548 | - | 286 | 286 | 53,262 | ||
| Leasing transactions | 264,971 | 30,886 | 295,857 | 1,263 | 885 | 2,148 | 293,709 | ||
| Other loans and receivables | 1,334 | 116 | 1,450 | 5 | 30 | 35 | 1,415 | ||
| Subtotals | 3,503,716 | 273,154 | 3,776,870 | 41,902 | 17,626 | 59,528 | 3,717,342 | ||
| Mortgage loans: | |||||||||
| Letters of credit loans | 134,979 | 9,728 | 144,707 | - | 1,501 | 1,501 | 143,206 | ||
| Endorsable mutual mortgage loans | 202,550 | 9,918 | 212,468 | - | 2,232 | 2,232 | 210,236 | ||
| Other mutual mortgage loans | 387,154 | 6,136 | 393,290 | - | 1,625 | 1,625 | 391,665 | ||
| Leasing transactions | 160 | - | 160 | - | - | - | 160 | ||
| Other loans and receivables | 53,300 | 2,810 | 56,110 | - | 681 | 681 | 55,429 | ||
| Subtotals | 778,143 | 28,592 | 806,735 | - | 6,039 | 6,039 | 800,696 | ||
| Consumer loans: | |||||||||
| Consumer loans | 273,389 | 21,007 | 294,396 | - | 21,789 | 21,789 | 272,607 | ||
| Current account debtors | 26,128 | 309 | 26,437 | - | 359 | 359 | 26,078 | ||
| Credit card debtors | 53,437 | 1,922 | 55,359 | - | 3,562 | 3,562 | 51,797 | ||
| Consumer leasing transactions | 503 | 20 | 523 | - | 6 | 6 | 517 | ||
| Other loans and receivables | 45,887 | 5,449 | 51,336 | - | 7,981 | 7,981 | 43,355 | ||
| Subtotals | 399,344 | 28,707 | 428,051 | - | 33,697 | 33,697 | 394,354 | ||
| Total | 4,681,203 | 330,453 | 5,011,656 | 41,902 | 57,362 | 99,264 | 4,912,392 | ||
F-54
CORPBANCA AND SUBSIDIARIES
NOTES TO THE CONSOLIDATED FINANCIAL STATEMENTS
As of December 31, 2009 and 2010
| As of December 31, 2010 | Assets before Allowances | Allowances Established | ||||||||
| Normal Portfolio | Impaired Portfolio | Total | Individual | Group | Total | Net Asset | ||||
| MCh$ | MCh$ | MCh$ | MCh$ | MCh$ | MCh$ | MCh$ | ||||
| Commercial loans: | ||||||||||
| Commercial loans | 3,184,812 | 182,679 | 3,367,491 | 37,354 | 10,771 | 48,125 | 3,319,366 | |||
| Foreign trade loans | 207,649 | 53,327 | 260,976 | 13,941 | 326 | 14,267 | 246,709 | |||
| Current account debtors | 45,456 | 6,906 | 52,362 | 171 | 486 | 657 | 51,705 | |||
| Factoring operations | 63,202 | 3,414 | 66,616 | 1,155 | 340 | 1,495 | 65,121 | |||
| Leasing transactions | 239,351 | 41,184 | 280,535 | 2,624 | 524 | 3,148 | 277,387 | |||
| Other loans and receivables | 1,213 | 48 | 1,261 | 6 | 8 | 14 | 1,247 | |||
| Subtotals | 3,741,683 | 287,558 | 4,029,241 | 55,251 | 12,455 | 67,706 | 3,961,535 | |||
| Mortgage loans: | ||||||||||
| Letters of credit loans | 115,206 | 7,727 | 122,933 | - | 1,542 | 1,542 | 121,391 | |||
| Endorsable mutual mortgage loans | 260,169 | 12,660 | 272,829 | - | 3,697 | 3,697 | 269,132 | |||
| Other mutual mortgage loans | 575,692 | 9,412 | 585,104 | - | 2,726 | 2,726 | 582,378 | |||
| Leasing transactions | 77 | 69 | 146 | - | - | - | 146 | |||
| Other loans and receivables | 48,492 | 3,135 | 51,627 | - | 972 | 972 | 50,655 | |||
| Subtotals | 999,636 | 33,003 | 1,032,639 | 8,937 | 8,937 | 1,023,702 | ||||
| Consumer loans: | ||||||||||
| Consumer loans | 257,018 | 19,278 | 276,296 | - | 18,601 | 18,601 | 257,695 | |||
| Current account debtors | 23,879 | 1,022 | 24,901 | - | 338 | 338 | 24,563 | |||
| Credit card debtors | 51,981 | 2,405 | 54,386 | - | 3,084 | 3,084 | 51,302 | |||
| Consumer leasing transactions | 621 | 87 | 708 | - | 6 | 6 | 702 | |||
| Other loans and receivables | 47,736 | 3,288 | 51,024 | - | 5,543 | 5,543 | 45,481 | |||
| Subtotals | 381,235 | 26,080 | 407,315 | - | 27,572 | 27,572 | 379,743 | |||
| Total | 5,122,554 | 346,641 | 5,469,195 | 55,251 | 48,964 | 104,215 | 5,364,980 | |||
Collateral held by the Bank in ensuring recovery of the interests reflected in its loan portfolio relate to mortgage type collateral (urban and rural properties, agricultural lands, maritime vessels and aircraft, mineral rights and other assets) and liens (inventories, agricultural goods, industrial goods, plantations and other property pledged as security). As of December 31, 2009 and 2010, the fair value of collateral held corresponds to 85.1% and 98.4% of assets covered, respectively.
As of December 31, 2009 and 2010, the fair value of collateral held for mortgage loans corresponds to 70.0% and 71.7% of the balance on loans receivable, respectively.
The Bank finances its customers’ asset purchases, both movable and real estate, through lease contracts that are included within loans and receivables from customers. As of December 31, 2010, MCh$198,024 corresponds to leases of movable assets (MCh$207,928 as of December 31, 2009) and MCh$83,366 to leases of real estate assets (MCh$88,612 as of December 31, 2009).
During 2010, the Bank has received assets such as homes, apartments, commercial and agricultural lands, among others, for a total of MCh$1,451 through the execution of guarantees (MCh$2,763 in 2009).
F-55
| b) | Portfolio characteristics |
As of December 31, 2009 and 2010, the loan portfolio before allowances for loan losses by customer economic activity is as follows:
| National Loans | Foreign Loans | Total | Distribution Percentage as of | |||||||||||||||||||||||||||||
| 2009 | 2010 | 2009 | 2010 | 2009 | 2010 | 2009 | 2010 | |||||||||||||||||||||||||
| MCh$ | MCh$ | MCh$ | MCh$ | MCh$ | MCh$ | % | % | |||||||||||||||||||||||||
| Commercial loans: | ||||||||||||||||||||||||||||||||
| Manufacturing | 234,016 | 441,037 | 201 | 2,440 | 234,217 | 443,477 | 4.67 | % | 8.11 | % | ||||||||||||||||||||||
| Mining | 83,855 | 64,229 | - | 32,069 | 83,855 | 96,298 | 1.67 | % | 1.76 | % | ||||||||||||||||||||||
| Electricity, gas and water | 239,087 | 218,569 | - | 28,954 | 239,087 | 247,523 | 4.77 | % | 4.53 | % | ||||||||||||||||||||||
| Agriculture and livestock | 151,272 | 156,951 | - | - | 151,272 | 156,951 | 3.02 | % | 2.87 | % | ||||||||||||||||||||||
| Forestry and wood extraction | 14,006 | 36,344 | - | 5,241 | 14,006 | 41,585 | 0.28 | % | 0.76 | % | ||||||||||||||||||||||
| Fishing | 68,281 | 58,347 | - | - | 68,281 | 58,347 | 1.36 | % | 1.07 | % | ||||||||||||||||||||||
| Transport | 184,558 | 162,175 | - | 1,062 | 184,558 | 163,237 | 3.68 | % | 2.98 | % | ||||||||||||||||||||||
| Communications | 48,739 | 43,350 | - | - | 48,739 | 43,350 | 0.97 | % | 0.79 | % | ||||||||||||||||||||||
| Construction | 510,805 | 457,376 | - | - | 510,805 | 457,376 | 10.18 | % | 8.36 | % | ||||||||||||||||||||||
| Commerce | 454,058 | 346,426 | 60,462 | 6,422 | 514,520 | 352,848 | 10.26 | % | 6.45 | % | ||||||||||||||||||||||
| Services | 1,621,353 | 1,896,212 | 305 | 40,038 | 1,621,658 | 1,936,250 | 32.33 | % | 35.40 | % | ||||||||||||||||||||||
| Others | 105,872 | 31,999 | - | - | 105,872 | 31,999 | 2.18 | % | 0.58 | % | ||||||||||||||||||||||
| Subtotals | 3,715,902 | 3,913,015 | 60,968 | 116,226 | 3,776,870 | 4,029,241 | 75.37 | % | 73.67 | % | ||||||||||||||||||||||
| Mortgage Loans | 806,735 | 1,032,639 | - | - | 806,735 | 1,032,639 | 16.10 | % | 18.88 | % | ||||||||||||||||||||||
| Consumer loans | 428,051 | 407,315 | - | - | 428,051 | 407,315 | 8.53 | % | 7.45 | % | ||||||||||||||||||||||
| Total | 4,950,688 | 5,352,969 | 60,968 | 116,226 | 5,011,656 | 5,469,195 | 100.00 | % | 100.00 | % | ||||||||||||||||||||||
F-56
| c) | Allowances |
The changes in allowances for loan losses during the years 2009 and 2010 are summarized as follows:
| Individual | Group | ||
| Allowances | Allowances | Total | |
| MCh$ | MCh$ | MCh$ | |
| Balances as January 1, 2009 | 22,335 | 53,152 | 75,487 |
| Impaired portfolio write-offs: | |||
| Commercial loans | (2,273) | (6,563) | (8,836) |
| Mortgage loans | - | (524) | (524) |
| Consumer loans | - | (51,412) | (51,412) |
| Total Write-offs | (2,273) | (58,499) | (60,772) |
| Established allowances | 33,038 | 71,280 | 104,318 |
| Released allowances | (11,198) | (8,571) | (19,769) |
| Impairment | - | - | - |
| Impairment reversal | - | - | - |
| Balances as of December 31, 2009 | 41,902 | 57,362 | 99,264 |
| Balances as January 1, 2010 | 41,902 | 57,362 | 99,264 |
| Impaired portfolio write-offs: | |||
| Commercial loans | (5,941) | (9,803) | (15,744) |
| Mortgage loans | - | (537) | (537) |
Consumer loans | - | (45,645) | (45,645) |
| Total Write-offs | (5,941) | (55,985) | (61,926) |
| Established allowances | 31,318 | 61,827 | 93,145 |
| Released allowances | (12,924) | (13,344) | (26,268) |
| Impairment | - | - | - |
| Impairment reversal | - | - | - |
| Balances as of December 31, 2010 | 54,355 | 49,860 | 104,215 |
F-57
CORPBANCA AND SUBSIDIARIES
NOTES TO THE CONSOLIDATED FINANCIAL STATEMENTS
As of December 31, 2009 and 2010
| NOTE 11 - | INVESTMENT INSTRUMENTS |
As of December 31, 2009 and 2010, the detail of financial investments available for sale is as follows:
| a) | Financial investments available-for-sale |
| As of December 31 | ||||||||
| 2009 | 2010 | |||||||
| MCh$ | MCh$ | |||||||
| Chilean Central Bank and Government Securities | ||||||||
| Chilean Central Bank securities | 548,073 | 543,901 | ||||||
| Chilean Treasury Bonds | 26,748 | - | ||||||
| Other government securities | 1,474 | 40,140 | ||||||
| Other financial instruments | ||||||||
| Promissory notes related to deposits in local banks | 146,934 | 123,226 | ||||||
| Chilean mortgage finance bonds | 1,827 | 1,553 | ||||||
| Chilean financial institution bonds | - | - | ||||||
| Other local investments | 4,100 | - | ||||||
| Financial instruments Issued abroad | ||||||||
| Foreign government and central bank instruments | - | - | ||||||
| Other foreign investments | 1,563 | 17,955 | ||||||
| Impairment Provision | - | - | ||||||
| Unquoted securities in active markets | ||||||||
| Chilean corporate bonds | 6,443 | 19,473 | ||||||
| Other investments | - | - | ||||||
| Impairment Provision | - | - | ||||||
| Total | 737,162 | 746,248 | ||||||
As of December 31, 2010, the portfolio of financial investments available-for-sale includes an unrealized gain (loss), net of taxes, recorded in other comprehensive income of MCh$1,259 (MCh$5,273 as of December 31, 2009).
F-58
CORPBANCA AND SUBSIDIARIES
NOTES TO THE CONSOLIDATED FINANCIAL STATEMENTS
As of December 31, 2009 and 2010
| b) | The movements of the investments available-for-sale portfolio as of December 31, 2009 and 2010 are as follows: |
| As of December 31, 2009 | ||||||||||||||||
| Cost | Gross unrealized gains | Gross unrealized losses | Fair Value | |||||||||||||
| MCh$ | MCh$ | MCh$ | MCh$ | |||||||||||||
| Chilean Central Bank and Government securities | ||||||||||||||||
| Chilean Central Bank and Government securities | 553,002 | 1,155 | (6,084 | ) | 548,073 | |||||||||||
| Chilean Central Bank Notes | 27,953 | - | (1,205 | ) | 26,748 | |||||||||||
Other Chilean Central Bank and Government securities | 1,514 | 4 | (44 | ) | 1,474 | |||||||||||
| Subtotals | 582,469 | 1,159 | (7,333 | ) | 576,295 | |||||||||||
Other Financial Instruments | ||||||||||||||||
| Promissory notes related to deposits in local banks | 147,123 | 118 | (307 | ) | 146,934 | |||||||||||
| Chilean mortgage finance bonds | 1,786 | 53 | (12 | ) | 1,827 | |||||||||||
| Chilean financial institution bonds | - | - | - | - | ||||||||||||
| Other local investments | 4,080 | 38 | (18 | ) | 4,100 | |||||||||||
| Subtotals | 152,989 | 209 | (337 | ) | 152,861 | |||||||||||
Financial instruments Issued abroad | ||||||||||||||||
| Foreign government and central bank instruments | - | - | - | - | ||||||||||||
| Other foreign investments | 1,515 | 48 | - | 1,563 | ||||||||||||
| impairment Provision | - | - | - | - | ||||||||||||
| Subtotals | 1,515 | 48 | - | 1,563 | ||||||||||||
| Unquoted securities in active markets | ||||||||||||||||
| Chilean corporate bonds | 6,472 | - | (29 | ) | 6,443 | |||||||||||
| Other investments | - | - | - | - | ||||||||||||
| Impairment Provision | - | - | - | - | ||||||||||||
| Subtotals | 6,472 | - | (29 | ) | 6,443 | |||||||||||
| Totals | 743,445 | 1,416 | (7,699 | ) | 737,162 | |||||||||||
F-59
CORPBANCA AND SUBSIDIARIES
NOTES TO THE CONSOLIDATED FINANCIAL STATEMENTS
As of December 31, 2009 and 2010
| As of December 31, 2010 | ||||||||||||||||
| Cost | Gross unrealized gains | Gross unrealized losses | Fair value | |||||||||||||
| MCh$ | MCh$ | MCh$ | MCh$ | |||||||||||||
| Chilean Central Bank and Government securities | ||||||||||||||||
| Chilean Central Bank and Government securities | 544,880 | 177 | (1,156 | ) | 543,901 | |||||||||||
| Chilean Central Bank Notes | - | - | - | - | ||||||||||||
Other Chilean Central Bank and Government securities | 40,136 | 4 | - | 40,140 | ||||||||||||
| Subtotals | 585,016 | 181 | (1,156 | ) | 584,041 | |||||||||||
Other Financial Instruments | ||||||||||||||||
| Promissory notes related to deposits in local banks | 123,226 | - | - | 123,226 | ||||||||||||
| Chilean mortgage finance bonds | 1,499 | 54 | - | 1,553 | ||||||||||||
| Chilean financial institution bonds | - | - | - | - | ||||||||||||
| Other local investments | - | - | - | - | ||||||||||||
| Subtotals | 124,725 | 54 | - | 124,779 | ||||||||||||
Financial instruments Issued abroad | ||||||||||||||||
| Foreign government and central bank instruments | 17,955 | - | - | 17,955 | ||||||||||||
| Other foreign investments | - | - | - | - | ||||||||||||
| impairment Provision | - | - | - | - | ||||||||||||
| Subtotals | 17,955 | - | - | 17,955 | ||||||||||||
| Unquoted securities in active markets | ||||||||||||||||
| Chilean corporate bonds | 19,457 | 16 | - | 19,473 | ||||||||||||
| Other investments | - | - | - | - | ||||||||||||
| Impairment Provision | - | - | - | - | ||||||||||||
| Subtotals | 19,457 | 16 | - | 19,473 | ||||||||||||
| Totals | 747,153 | 251 | (1,156 | ) | 746,248 | |||||||||||
All of the gains (losses) from available-for-sale portfolio correspond to the sale of instruments during each reported period and do not go through long-term figures.
| c) | Investments held-to-maturity |
As of December 31, 2009 and 2010, the Bank did not maintain investments designated as held-to maturity.
| d) | Impairment of Investment instruments |
As of December 31, 2009 and 2010, there are no indicators of impairment in the investment instrument .
All investments quoted in non-active markets and classified as available-for-sale have been recorded at their fair value.
F-60
CORPBANCA AND SUBSIDIARIES
NOTES TO THE CONSOLIDATED FINANCIAL STATEMENTS
As of December 31, 2009 and 2010
| NOTE 12 - | INVESTMENTS IN OTHER COMPANIES |
| a) | As of December 31, 2009 and 2010 the investments in other companies are detailed as follows: |
| December 31, 2009 | December 31, 2010 | |||||||||||||||
| Company | % | % | ||||||||||||||
| Share | MCh$ | Share | MCh$ | |||||||||||||
| Nexus S.A. | 12.9 | 1,057 | 12.90 | 1,057 | ||||||||||||
| Transbank S.A. | 8.7 | 939 | 8.72 | 939 | ||||||||||||
| Combanc S.A. | 4.7 | 135 | 4.72 | 135 | ||||||||||||
| Redbanc S.A. | 2.5 | 110 | 2.50 | 110 | ||||||||||||
| Sociedad Interbancaria de Depósitos de Valores S.A. | 3.9 | 75 | 3.91 | 75 | ||||||||||||
Shares or rights in other companies Santiago Stock Exchange shares | - | 1,056 | - | 1,056 | ||||||||||||
| Chilean Electronic Stock Exchange shares | - | 211 | - | 211 | ||||||||||||
| Total | - | 3,583 | - | 3,583 | ||||||||||||
During 2009 and 2010 the Bank received dividends from investment in other companies of MCh$445 and MCh$296 respectively.
| b) | The movements of investment in other companies as of December 31, 2009 and 2010, were the following: |
| 2009 | 2010 | |||||||
| MCh$ | MCh$ | |||||||
| Opening balance at January 1 | 3,699 | 3,583 | ||||||
| Investment acquisitions | - | - | ||||||
| Investment sales | (116 | ) | - | |||||
| Share on income | - | - | ||||||
| Dividends received | - | - | ||||||
| Exchange rate differences | - | - | ||||||
| Ending balance as of December 31, | 3,583 | 3,583 | ||||||
On May 26, 2009, the Bank sold 46% of its ownership interest in the company Combanc S.A. for a total of MCh$116, resulting in a gain of MCh$77 (See Note 32 a).
As of December 31, 2009 and 2010, the Bank's investments in other companies, does not have any indicators of impairment.
F-61
CORPBANCA AND SUBSIDIARIES
NOTES TO THE CONSOLIDATED FINANCIAL STATEMENTS
As of December 31, 2009 and 2010
| NOTE 13 - | INTANGIBLES |
| a) | Intangibles as of December 31, 2009 and 2010 consists of the following: |
| December 31, 2009 | |||||||||||
| Concept | Useful life years | Remaining amortization years | Final gross balance | Amortization for the Period | Final Net Balance | ||||||
| MCh$ | MCh$ | MCh$ | |||||||||
| Separately acquired Intangibles | |||||||||||
| Integrated banking system | 15 | 8 | 9,756 | (1,126) | 8,630 | ||||||
| Computer equipment system or software | 3 | 3 | 1,081 | (304) | 777 | ||||||
| IT Projects | 6 | 6 | 4,173 | (575) | 3,598 | ||||||
| Other Projects | 5 | 5 | 652 | (27) | 625 | ||||||
| Total | 15,662 | (2,032) | 13,630 | ||||||||
December 31, 2010 | |||||||||||
| Concept | Useful life years | Remaining amortization years | Final gross balance | Amortization for the Period | Final Net Balance | ||||||
| MCh$ | MCh$ | MCh$ | |||||||||
| Separately acquired intangibles | |||||||||||
| Integrated banking system | 15 | 7 | 8,813 | (1,156) | 7,657 | ||||||
| Computer equipment system or software | 3 | 2 | 731 | (266) | 465 | ||||||
| IT Projects | 6 | 5 | 5,540 | (854) | 4,686 | ||||||
| Other projects | 5 | 4 | 324 | (36) | 288 | ||||||
| Total | 15,408 | (2,312) | 13,096 | ||||||||
F-62
CORPBANCA AND SUBSIDIARIES
NOTES TO THE CONSOLIDATED FINANCIAL STATEMENTS
As of December 31, 2009 and 2010
| b) | The changes in the intangible assets during 2009 and 2010 is as follows: |
| Integrated banking system | Computer equipment system or software | IT Projects | Others | Total | |||||
| MCh$ | MCh$ | MCh$ | MCh$ | MCh$ | |||||
| Balance as of January 1, 2009 | 9,756 | 844 | 1,553 | 99 | 12,252 | ||||
| Purchases | 94 | 2,772 | - | 2,866 | |||||
| Retirements | - | - | (57) | - | (57) | ||||
| Amortization | (1,126) | (304) | (575) | (27) | (2,032) | ||||
| Other | - | 143 | (95) | 553 | 601 | ||||
| Balances as of December 31, 2009 | 8,630 | 777 | 3,598 | 625 | 13,630 |
| Integrated banking system | Computer equipment system or software | IT Projects | Others | Total | |||||
| MCh$ | MCh$ | MCh$ | MCh$ | MCh$ | |||||
| Balance as of January 1, 2010 | 8,630 | 777 | 3,598 | 625 | 13,630 | ||||
| Purchases | 183 | 391 | 1,816 | 183 | 2,573 | ||||
| Retirements | - | (245) | - | - | (245) | ||||
| Amortization | (1,156) | (266) | (854) | (36) | (2,312) | ||||
| Other | - | (192) | 126 | (484) | (550) | ||||
| Balances as of December 31, 2010 | 7,657 | 465 | 4,686 | 288 | 13,096 |
| c) | As of December 31, 2009 and 2010, the Bank has entered into the following contractual commitments for the acquisition of intangible asset: |
Invested Amount 2009 | Invested Amount 2010 | |
| MCh$ | MCh$ | |
| License detail: | ||
| Mac Online Empresas y Tele Ventas Ltda. | - | 12 |
| Ingram Micro Chile S.A. | 750 | - |
F-63
CORPBANCA AND SUBSIDIARIES
NOTES TO THE CONSOLIDATED FINANCIAL STATEMENTS
As of December 31, 2009 and 2010
| NOTE 14 - | PROPERTY, PLANT AND EQUIPMENT |
a) Property, plant and equipment as of December 31, 2009 and 2010 is as follows:
| December 31, 2009 | |||||||||
| Item | Useful life years | Remaining amortization years | Final gross balance | Depreciation and impairment for the Period | Final Net Balance | ||||
| MCh$ | MCh$ | MCh$ | |||||||
| Land and buildings | 21 | 20 | 47,947 | (2,452) | 45,495 | ||||
| Equipment | 5 | 4 | 5,541 | (823) | 4,718 | ||||
| Other | 6 | 5 | 6,002 | (1,003) | 4,999 | ||||
| Total | 59,490 | (4,278) | 55,212 | ||||||
| December 31, 2010 | |||||||||
| Item | Useful life years | Remaining amortization years | Final gross balance | Depreciation and impairment for the Period | Final Net Balance | ||||
| MCh$ | MCh$ | MCh$ | |||||||
| Land and buildings | 21 | 19 | 45,914 | (2,363) | 43,551 | ||||
| Equipment | 5 | 3 | 6,298 | (1,136) | 5,162 | ||||
| Other | 6 | 4 | 6,023 | (1,306) | 4,717 | ||||
| Total | 58,235 | (4,805) | 53,430 | ||||||
b) The changes in property, plant and equipment during 2009 and 2010 is as follows:
| 2009 | Land and buildings | Equipment | Other | Total | |||
| MCh$ | MCh$ | MCh$ | MCh$ | ||||
Balances as of January 1, 2009 | 45,579 | 1,981 | 3,671 | 51,231 | |||
| Purchases | 2,895 | 3,506 | 1,766 | 8,167 | |||
| Retirements | - | (101) | (7) | (108) | |||
| Depreciation | (2,452) | (823) | (1,003) | (4,278) | |||
| Other | (527) | 155 | 572 | 200 | |||
| Balances as of December 31, 2009 | 45,495 | 4,718 | 4,999 | 55,212 |
| 2010 | Land and buildings | Equipment | Other | Total | |||
| MCh$ | MCh$ | MCh$ | MCh$ | ||||
Balances as of January 1, 2010 | 45,495 | 4,718 | 4,999 | 55,212 | |||
| Purchases | 770 | 1,580 | 724 | 3,074 | |||
| Retirements | (287) | (3) | (56) | (346) | |||
| Depreciation | (2,362) | (1,136) | (1,307) | (4,805) | |||
| Other | (65) | 3 | 357 | 295 | |||
| Balances as of December 31, 2010 | 43,551 | 5,162 | 4,717 | 53,430 |
F-64
CORPBANCA AND SUBSIDIARIES
NOTES TO THE CONSOLIDATED FINANCIAL STATEMENTS
As of December 31, 2009 and 2010
c) As of December 31, 2009 and 2010, the Bank holds operating lease contracts that cannot be unilaterally terminated. The future payment information is detailed as follows:
| Future Operating Lease Payments | ||||
| Land, Buildings and Equipment | ||||
Up to 1 Year | From 1 to 5 Years | Over 5 Years | Total | |
| MCh$ | MCh$ | MCh$ | MCh$ | |
| As of December 31, 2009 | 4,234 | 15,498 | 22,988 | 42,720 |
| As of December 31, 2010 | 4,391 | 16,961 | 22,134 | 43,486 |
| d) | As of December 31, 2009 and 2010, the Bank holds finance lease contracts that cannot be rescinded unilaterally terminated. The future payment information is detailed as follows: |
| Future Financial Leasing Payments | ||||
| Land, Buildings & Equipment | ||||
Up to 1 Year | From 1 to 5 Years | Over 5 Years | Total | |
| MCh$ | MCh$ | MCh$ | MCh$ | |
| As of December 31, 2009 | 410 | 570 | - | 980 |
| As of December 31, 2010 | 897 | 2,515 | - | 3,412 |
| NOTE 15 - | CURRENT TAXES |
| a) | Current income tax provision |
At the end of each year the bank recognizes an Income Tax Provision, which is determined based on the currently applicable tax legislation. Income tax provision recognized as of December 31, 2010 was MCh$7,168 (MCh$7,831 as of December 31, 2009). The income tax provision (net of recoverable taxes) is as follows:
| As of December 31, | As of December 31, | |||
| 2009 | 2010 | |||
| MCh$ | MCh$ | |||
| Income tax. 17% tax rate | 16,858 | 18,753 | ||
| Less: | ||||
| Monthly Provisional Payment | (7,258) | (9,990) | ||
| Tax credit for training costs | (1,147) | (401) | ||
| Tax credit for donations | (273) | (426) | ||
| Tax credit for property taxes on leased real estate assets | (325) | (768) | ||
| Other taxes to be recovered (1) | (24) | - | ||
| Total | 7,831 | 7,168 | ||
| (1) | Corresponds to tax refunds of prior years. |
F-65
CORPBANCA AND SUBSIDIARIES
NOTES TO THE CONSOLIDATED FINANCIAL STATEMENTS
As of December 31, 2009 and 2010
| b) | Effect on income |
The tax expense for the years ended December 31, 2008, 2009 and 2010 is comprised of the following items:
| As of December 31, | |||||
| 2008 | 2009 | 2010 | |||
| MCh$ | MCh$ | MCh$ | |||
| Income Tax expense | |||||
| Current tax expense | (9,778) | (16,858) | (18,753) | ||
| Deferred taxes | |||||
| Temporary differences | 288 | 1,227 | (2,704) | ||
| Subtotal | (9,490) | (15,631) | (21,457) | ||
| Others | 186 | (618) | 1,104 | ||
| Net expense for income taxes | (9,304) | (16,249) | (20,353) | ||
| c) | Effective tax rate reconciliation |
The table below sets for a summary of the deferred tax effect on other comprehensive income for the years ended December 31, 2009 and 2010, which consists of the following items:
| As of December 31, | |||||
| 2009 | 2010 | ||||
| Tax Rate | Amount | Tax Rate | Amount | ||
| % | MCh$ | % | MCh$ | ||
Net income before taxes Rate change income tax | 17.0 - | 17,415 - | 17.0 (0.9) | 24,127 (1,308) | |
| Permanent Differences and others | (1.1) | (1,166) | (1.8) | (2,466) | |
| 15.9 | 16,249 | 14.3 | 20,353 | ||
| d) | Effect of deferred taxes on other comprehensive |
The table below sets for a summary of the deferred tax effect on other comprehensive income for the years ended December 31, 2008, 2009 and 2010, which consists of the following items:
| As of December 31, | ||||||
| 2008 | 2009 | 2010 | ||||
| MCh$ | MCh$ | MCh$ | ||||
Financial assets available-for-sale Hedge of a net investment in New York Branch Change of loan provisions rule of SBIF | (209) - - | 1,289 - - | (822) (164) 1,962 | |||
| Total charge to other comprehensive income | (209) | 1,289 | 986 | |||
F-66
CORPBANCA AND SUBSIDIARIES
NOTES TO THE CONSOLIDATED FINANCIAL STATEMENTS
As of December 31, 2009 and 2010
| e) | Effect of deferred taxes on income |
Below are the effects of deferred taxes on assets, liabilities, and income assigned as a result of timing differences:
| As of December 31, | |||||||
| 2009 | 2010 | ||||||
| Assets | Liabilities | Net | Assets | Liabilities | Net | ||
| Concepts: | MCh$ | MCh$ | MCh$ | MCh$ | MCh$ | MCh$ | |
| Provisions for loans losses | 13,942 | - | 13,942 | 16,069 | - | 16,069 | |
| Accrued interest and adjustment related to past-due loan portfolio | 3,019 | - | 3,019 | 4,471 | - | 4,471 | |
| Unearned Price differences | 104 | - | 104 | 111 | - | 111 | |
| Employees related provisions | 346 | - | 346 | 812 | - | 812 | |
| Other | 1,649 | - | 1,649 | 493 | - | 493 | |
| Depreciation of plant and equipment | - | (3,948) | (3,948) | - | (3,750) | (3,750) | |
| Leases and other | - | (11,696) | (11,696) | - | (17,494) | (17,494) | |
| Total net asset (liability) | 19,060 | (15,644) | 3,416 | 21,956 | (21,244) | 712 | |
On July 29, 2010 was enacted Law No. 20,455, "Amends several laws to obtain resources for financing the reconstruction of the country, " which was published in the “Diario Oficial” on July 31, 2010. This law, among other things, establishes a temporary increase of the tax rate for years 2011 and 2012 (to 20% and 18.5%, respectively) and back again to 17% by 2013.
As a result of these momentary changes in the tax rate its effect on deferred tax assets and liabilities to be reversed in those years for those calculated at the prevailing rate for the year 2010 of 17%, the Company recognizes a higher income or lower expenses net income tax of MCh$$1,308 at December 31, 2010.
| NOTE 16 - | OTHER ASSETS |
| a) | The detail of other assets is as follows: |
| As of December 31, | As of December 31, | |||||||
| 2009 | 2010 | |||||||
| MCh$ | MCh$ | |||||||
| Rentals in advance (1) | 23,311 | 22,739 | ||||||
| Accounts and Notes receivable | 32,323 | 40,174 | ||||||
| Prepaid expenses | 8,330 | 16,681 | ||||||
| Projects under development (2) | 6,540 | 10,163 | ||||||
| Assets for Leasing (3) | 3,629 | 3,132 | ||||||
| Assets received in lieu of payment (4) | 10,051 | 8,654 | ||||||
| Transactions in process (suspense accounts) | 657 | 34 | ||||||
| Other | 7,466 | 2,630 | ||||||
| Total | 92,307 | 104,207 | ||||||
| (1) | Rent paid in advance for SMU ATMs (See Note 33.b) |
| (2) | Information system and other projects under development. |
| (3) | Fixed assets available for delivery under the financial leases. Within this item, are included items recovered from leasing kept for sale, corresponding to computers, furniture, and transportation equipment. These assets are available for a sale and have a high probability of being sold. For most of such assets, it is expect to complete the sale within one year from the date when the assets are classified as a available for sale and/or lease assets recovered held for sale. |
F-67
CORPBANCA AND SUBSIDIARIES
NOTES TO THE CONSOLIDATED FINANCIAL STATEMENTS
As of December 31, 2009 and 2010
| (4) | The provisions for assets received in lieu of payment are recorded as a provision for the difference between initial value and any additions or currency restatement and its realizable value, where the former is greater. |
F-68
CORPBANCA AND SUBSIDIARIES
NOTES TO THE CONSOLIDATED FINANCIAL STATEMENTS
As of December 31, 2009 and 2010
| b) | The change due to received assets in lieu of payment during 2009 and 2010 is as follows: |
| As of December 31, | ||||||||
| 2009 | 2010 | |||||||
| MCh$ | MCh$ | |||||||
| Balance as of January 1 | 7,921 | 10,051 | ||||||
| Purchases | 3,362 | 6,269 | ||||||
| Sales | 1,145 | 7,666 | ||||||
| Provision | 87 | - | ||||||
| Balance as of December 31 | 10,051 | 8,654 | ||||||
| NOTE 17 - | CURRENT ACCOUNTS, DEMAND DEPOSITS, TIME DEPOSITS AND SAVING ACCOUNTS |
As of December 31, 2009 and 2010, current accounts and demands deposits consist of the following:
| As of December 31, | ||||||||
| 2009 | 2010 | |||||||
| MCh$ | MCh$ | |||||||
| a) Current accounts and demand deposits | ||||||||
Current Accounts | 328,078 | 405,301 | ||||||
| Other deposits and sight accounts | 39,319 | 46,676 | ||||||
| Other sight liabilities | 27,788 | 41,713 | ||||||
| Payments in advance from customers | 82,317 | 104,326 | ||||||
| Other sight liabilities | 18,768 | 14,048 | ||||||
| Total | 496,270 | 612,064 | ||||||
As of December 31, 2009 and 2010, time deposits and saving accounts consist of the following:
| b) Time deposits and saving accounts | As of December 31, | |||||||
| 2009 | 2010 | |||||||
Time deposits | 3,306,935 | 3,691,596 | ||||||
| Deposits due | - | - | ||||||
| Term Savings Accounts | 9,011 | 8,666 | ||||||
| Other term creditor Balances | 99 | 192 | ||||||
| Total | 3,316,045 | 3,700,454 | ||||||
F-69
CORPBANCA AND SUBSIDIARIES
NOTES TO THE CONSOLIDATED FINANCIAL STATEMENTS
As of December 31, 2009 and 2010
| NOTE 18 - | BORROWINGS FROM FINANCIAL INSTITUTIONS |
As of December 31, 2009 and 2010, borrowings from financial institutions include the following:
| As of December 31 | |||
| 2009 | 2010 | ||
| MCh$ | MCh$ | ||
| Loans obtained from financial institutions and the Chilean Central Bank | 4,008 | - | |
Subtotal | 4,008 | - | |
| Loans obtained from local financial institutions | |||
| Bank of Tokyo Mitsubishi (Chile) | 1,016 | 43,140 | |
Subtotal | 1,016 | 43,140 | |
| Loans obtained from foreign financial institutions | |||
| Banesto | 5,075 | - | |
| Bank of America | 11,381 | - | |
| Bank of Montreal Toronto | 890 | 16,536 | |
| Bank of New York | 2,538 | 38,902 | |
| OCBC Bank | - | 4,678 | |
| Royal Bank of Scotland | - | 4,678 | |
| BNP Paribas | - | 78,353 | |
| Citibank N.A. | 10,003 | 23,389 | |
| Commerzbank A.G. | 43,538 | 29,082 | |
| Credit Industriel et Comercial | 11,673 | 9,823 | |
| Dresdner Bank AG. | 5,125 | - | |
| ING Bank N.V. Amsterdam | 22,395 | 27,178 | |
| Intesa San Saolo SPA. | 15,326 | 9,356 | |
| JP Morgan Chase | 5,144 | 101,742 | |
| Landesbank Baden-Württemberg | 5,075 | - | |
| Standard Chartered Bank | 49,415 | 25,728 | |
| Sumitomo Bank | - | - | |
| Sumitomo Mitsui | 5,075 | 3,742 | |
| Toronto Dominion Bank | 12,726 | 23,389 | |
| Unicredito Italiano | 115 | - | |
| Wachovia Bank N.A. | 79,878 | - | |
| Bladex Pamana | - | 8,888 | |
| BAC Florida | 5,075 | - | |
| Banque Nationale du Canada | 5,129 | - | |
| Bayerische Hypove | 2,250 | - | |
| Banco Crédito del Peru | 15,733 | - | |
| Bladex | 25,376 | - | |
| Mercantil Commercebank | 12,688 | 18,711 | |
| The bank of Tokyo Mitsubishi | 1,523 | - | |
| Other banks | 4,233 | 36,377 | |
Subtotal | 357,379 | 460,552 | |
Total | 362,403 | 503,692 | |
F-70
CORPBANCA AND SUBSIDIARIES
NOTES TO THE CONSOLIDATED FINANCIAL STATEMENTS
As of December 31, 2009 and 2010
| NOTE 19 - | DEBT ISSUED AND OTHER FINANCIAL OBLIGATIONS |
As of December 31, 2009 and 2010, the composition of these items is as follows:
| As of December 31 | |||
| 2009 | 2010 | ||
| MCh$ | MCh$ | ||
| Debt issued | |||
| Letters of credit | 271,430 | 226,451 | |
| Bonds | 410,473 | 700,570 | |
| Subordinated bonds | 253,316 | 288,414 | |
| Subtotal | 935,219 | 1,215,435 | |
| Other financial obligations | |||
| Public Sector liabilities | 23,406 | 19,313 | |
| Borrowings from domestic financial institutions | 3,447 | 4,347 | |
| Subtotal | 26,853 | 23,660 | |
| Total | 962,072 | 1,239,095 | |
Debt issued and other financial obligations classified as long and short term as are follows:
| As of December 31, 2009 | |||||
| Long Term | Short Term | Total | |||
| MCh$ | MCh$ | MCh$ | |||
| Letters of credit | 240,247 | 31,183 | 271,430 | ||
| Bonds | 127,508 | 282,965 | 410,473 | ||
| Subordinated bonds | 236,824 | 16,492 | 253,316 | ||
| Debt issued | 604,579 | 330,640 | 935,219 | ||
| Other financial obligations | 23,406 | 3,447 | 26,853 |
| As of December 31, 2010 | |||||
| Long Term | Short Term | Total | |||
| MCh$ | MCh$ | MCh$ | |||
| Letters of credit | 219,067 | 7,384 | 226,451 | ||
| Bonds | 700,570 | - | 700,570 | ||
| Subordinated bonds | 288,414 | - | 288,414 | ||
| Debt issued | 1,208,051 | 7,384 | 1,215,435 | ||
| Other financial obligations | 21,847 | 1,813 | 23,660 |
F-71
CORPBANCA AND SUBSIDIARIES
NOTES TO THE CONSOLIDATED FINANCIAL STATEMENTS
As of December 31, 2009 and 2010
The detail of letter of credits by maturity is as follows:
| As of December 31 | |||
| 2009 | 2010 | ||
| MCh$ | MCh$ | ||
| Due within 1 year | 31,183 | 7,384 | |
| Due after 1 year but within 2 years | 25,286 | 4,280 | |
| Due after 2 years but within 3 years | 24,665 | 16,874 | |
| Due after 3 years but within 4 years | 23,966 | 44,212 | |
| Due after 4 years but within 5 years | 23,574 | 59,138 | |
| Due after 5 years | 142,756 | 94,563 | |
| Total mortgage finance bonds | 271,430 | 226,451 | |
The detail of bonds issued is as follows:
| As of December 31 | |||
| 2009 | 2010 | ||
| MCh$ | MCh$ | ||
| BCOR-D0405 | 168,703 | - | |
| BCOR-J0606 | 55,230 | 47,797 | |
| BCOR-K0707 | 42,261 | 43,411 | |
| BCOR-L0707 | 42,333 | 86,835 | |
| BCOR-M1207 | 560 | 106,930 | |
| Bonos- R0110 | - | 113,271 | |
| Bonos- AI0710 | - | 91,161 | |
| Bonos - AD0710 | - | 20,811 | |
| Bonos- Q0110 | - | 106,906 | |
| Time Deposits | 101,386 | 83,448 | |
| Total bonds | 410,473 | 700,570 | |
The detail of bonds issued by maturity is as follows:
| As of December 31 | |||
| 2009 | 2010 | ||
| MCh$ | MCh$ | ||
| Due within 1 year | 282,965 | 112,766 | |
| Due after 1 year but within 2 years | 12,187 | 68,742 | |
| Due after 2 years but within 3 years | 49,923 | 122,070 | |
| Due after 3 years but within 4 years | 10,069 | 21,086 | |
| Due after 4 years but within 5 years | 8,956 | 127,586 | |
| Due after 5 years | 46,373 | 248,320 | |
| Total bonds | 410,473 | 700,570 | |
F-72
CORPBANCA AND SUBSIDIARIES
NOTES TO THE CONSOLIDATED FINANCIAL STATEMENTS
As of December 31, 2009 and 2010
The detail of subordinated bonds is as follows:
| As of December 31 | |||
| 2009 | 2010 | ||
| MCh$ | MCh$ | ||
| Series UCOR-W1197 | 76 | 54 | |
| Series UCOR-X1197 | 8,829 | 6,264 | |
| Series UCOR-Y1197 | 9,186 | 8,972 | |
| Series UCOR-Z1197 | 21,343 | 20,851 | |
| Series UCOR-V0808 | 111,269 | 114,099 | |
| Series UCOR AA-0809 | 102,613 | 105,070 | |
| Series UCOR BN0710 | - | 27,560 | |
| Series UCOR BI0710 | - | 5,544 | |
| Total subordinated bonds | 253,316 | 288,414 | |
The detail of subordinated bonds by maturity is as follows:
| As of December 31 | |||
| 2009 | 2010 | ||
| MCh$ | MCh$ | ||
| Due within 1 year | 16,492 | 25,147 | |
| Due after 1 year but within 2 years | 15,599 | 17,110 | |
| Due after 2 years but within 3 years | 14,703 | 12,624 | |
| Due after 3 years but within 4 years | 11,331 | 11,908 | |
| Due after 4 years but within 5 years | 10,733 | 11,304 | |
| Due after 5 years | 184,458 | 210,321 | |
| Total subordinated bonds | 253,316 | 288,414 | |
The detail of other financial obligations by maturity is as follows:
| As of December 31 | |||
| 2009 | 2010 | ||
| MCh$ | MCh$ | ||
| Due within 1 year | 1,040 | 1,813 | |
| Due after 1 year but within 2 years | 942 | 469 | |
| Due after 2 years but within 3 years | 1,497 | 4,549 | |
| Due after 3 years but within 4 years | 3,433 | 7,260 | |
| Due after 4 years but within 5 years | 686 | 4,851 | |
| Due after 5 years | 15,808 | 371 | |
| Total long term obligations | 23,406 | 19,313 | |
| The detail of other short term financial obligations is as follows: | |||
| Amounts due to credit card operators | 3,447 | 4,347 | |
| Total short-term financial obligations | 3,447 | 4,347 | |
| Total other financial obligations | 26,853 | 23,660 | |
F-73
CORPBANCA AND SUBSIDIARIES
NOTES TO THE CONSOLIDATED FINANCIAL STATEMENTS
As of December 31, 2009 and 2010
| NOTE 20 - | PROVISIONS |
As of December 31, 2009 and 2010 the Bank has recorded the following changes in its provisions:
| a. | Other Provisions |
The provisions as of December 31, 2009 and 2010 are as follows:
| As of December 31 | |||
| 2009 | 2010 | ||
| MCh$ | MCh$ | ||
| Provisions for short-term employee benefits and salaries | 6,473 | 7,623 | |
| Accrual for mandatory dividends | 42,554 | 59,522 | |
| Allowances for contingencies | 777 | 587 | |
| Total | 49,804 | 67,732 | |
| b. | The provision balance changes during 2009 and 2010, were as follows: |
| Short-term benefits and staff salaries | Mandatory Dividends | Contingencies | Total | |
| MCh$ | MCh$ | MCh$ | MCh$ | |
| Balance as of January 1, 2009 | 3,902 | 28,155 | 370 | 32,427 |
| Application of provisions | 9,709 | - | - | 9,709 |
| Provisions released | (7,317) | 42,554 | 413 | 35,650 |
| Increase in existing provisions | (676) | (28,155) | (6) | (28,837) |
| Other changes | 855 | - | - | 855 |
| Balance as of December 31, 2009 | 6,473 | 42,554 | 777 | 49,804 |
| Short-term benefits and staff salaries | Mandatory Dividends | Contingencies | Total | |
| MCh$ | MCh$ | MCh$ | MCh$ | |
| Balance as of January 1, 2010 | 6,473 | 42,554 | 777 | 49,804 |
| Provisions released | (14,210) | 59,522 | 28 | 45,340 |
| Increase in existing provisions | 17,089 | (42,554) | (218) | (25,683) |
| Other changes | (1,729) | - | - | (1,729) |
| Balance as of December 31, 2010 | 7,623 | 59,522 | 587 | 67,732 |
F-74
CORPBANCA AND SUBSIDIARIES
NOTES TO THE CONSOLIDATED FINANCIAL STATEMENTS
As of December 31, 2009 and 2010
| c. | Provisions for short-term employee benefits and staff salaries |
| As of December 31 | |||
| 2009 | 2010 | ||
| MCh$ | MCh$ | ||
| Provision for severance indemnities | - | 154 | |
| Provision for other employee benefits | 4,431 | 4,370 | |
| Provision for Vacations | 2,042 | 3,099 | |
| Total | 6,473 | 7,623 | |
| d. | Provision for severance indemnities |
| As of December 31 | |||
| 2009 | 2010 | ||
| MCh$ | MCh$ | ||
| Present value of the liability at the beginning of fiscal year | 54 | - | |
| Increase in existing provision | 1,800 | 2,043 | |
| Payments | - | (2,043) | |
| Provision released | (1,854) | - | |
| Other | - | 154 | |
| Total | - | 154 | |
| NOTE 21 - | OTHER LIABILITIES |
As of December 31, 2009 and 2010, other liabilities are as follows:
| As of December 31 | |||
| 2009 | 2010 | ||
| MCh$ | MCh$ | ||
| Accounts and notes payable | 13,060 | 18,564 | |
| Dividends payable | 50 | 116 | |
| Deferred income | 37 | - | |
| Creditors for intermediation | 2,663 | 300 | |
| Provision for commissions and consulting fees | - | 558 | |
| Other liabilities | 1,661 | 1,460 | |
| Total | 17,471 | 20,998 | |
F-75
CORPBANCA AND SUBSIDIARIES
NOTES TO THE CONSOLIDATED FINANCIAL STATEMENTS
As of December 31, 2009 and 2010
| NOTE 22 - | CONTINGENCIES, COMMITMENTS AND RESPONSIBILITIES |
| a) | Off-balance commitments and responsibilities: |
The Bank, its subsidiaries and its New York branch maintain off-balance sheet accounts as follows:
| As of December 31 | As of December 31 | |||||||
| 2009 | 2010 | |||||||
| MCh$ | MCh$ | |||||||
| CONTINGENT LOANS | 906,956 | 1,052,282 | ||||||
| Collaterals and Guarantees | 15,137 | 35,440 | ||||||
| Collaterals and Guarantees in Chilean currency | - | - | ||||||
| Collaterals and Guarantees in foreign currency | 15,137 | 35,440 | ||||||
| Confirmed foreign letters of credit | 32,819 | 47,108 | ||||||
| Letters of credit | 31,614 | 63,969 | ||||||
| Performance bonds | 301,708 | 356,845 | ||||||
| Interbank letters of guarantee | - | - | ||||||
| Cleared lines of credit | 525,678 | 534,873 | ||||||
| Other credit commitments | - | 14,047 | ||||||
| Other contingent loans | - | - | ||||||
| THIRD PARTY OPERATIONS | 584,444 | 580,131 | ||||||
| Collections | 26,004 | 23,576 | ||||||
| Foreign Collections | 14,973 | 13,736 | ||||||
| Domestic Collections | 11,031 | 9,840 | ||||||
| Placement or sale of financial securities | - | - | ||||||
| Placement of public securities issues | - | - | ||||||
| Sale of bank transaction letters of credit | - | - | ||||||
| Other security sales | - | - | ||||||
| Transferred financial assets administered by the bank | 64,002 | 59,726 | ||||||
| Assets assigned to Insurance Companies | 64,002 | 59,726 | ||||||
| Securitized assets | - | - | ||||||
| Other assets assigned to third parties | - | - | ||||||
| Third party funds under management | 494,438 | 496,829 | ||||||
| Financial assets under management on behalf of third parties | 494,438 | 496,829 | ||||||
| Other assets under management on behalf of third parties | - | - | ||||||
| Financial assets acquired in own name | - | - | ||||||
| Other assets acquired in own name | - | - | ||||||
| SECURITIES CUSTODY | 328,075 | 383,742 | ||||||
| Securities in custody held by the bank | 73,130 | 129,201 | ||||||
| Securities in custody deposited in another entity | 169,768 | 170,911 | ||||||
| Bank-issued Securities | 85,177 | 83,630 | ||||||
| Term deposit notes | 85,177 | 83,630 | ||||||
| Saleable letters of credit | - | - | ||||||
| Other documents | - | - | ||||||
| COMMITMENTS | - | - | ||||||
| Underwriting transaction guarantees | - | - | ||||||
| Asset acquisition commitments | - | - | ||||||
| Total | 1,819,475 | 2,016,155 | ||||||
The information above only includes the most significant balances.
F-76
CORPBANCA AND SUBSIDIARIES
NOTES TO THE CONSOLIDATED FINANCIAL STATEMENTS
As of December 31, 2009 and 2010
| b) | Pending litigation |
b.1) Corpbanca
As of December 31, 2009 and 2010, there were lawsuits pending against the Bank relating to loans and other matters. the opinion of management and the Bank’s legal counsel, these lawsuits should not result in material losses.
b.2) Corpbanca Corredores de Bolsa S.A.
According to the Prosecutor’s Office, as of December 31, 2009 and 2010, there are no pending lawsuits against Corpbanca Corredores de Bolsa S.A. that may represent a significant risk of loss for the company.
Before the Fifth Crime Tribunal of Santiago is the fraud case Rol Nº149913-7. This criminal lawsuit filed by Banco del Estado de Chile, and which Corpbanca Corredores de Bolsa S.A. is not party to, claims the time deposit N°00243045 totaling MCh$43 (historical), was unduly confiscated, Concepción S.A. Corredores de Bolsa, currently named Corpbanca Corredores de Bolsa S.A. acquired the time deposit from its first beneficiary claiming “corpus delicti”. The above mentioned time deposit is entirely provisioned in the financial statements, and is presented net of allowances in Receivable Notes in the financial statements of the subsidiary Company.
| c) | Contingent loans |
The following table details the Bank's contractual obligations and related provision for contingent loans:
| As of December 31 | |||
| 2009 | 2010 | ||
| MCh$ | MCh$ | ||
| Sureties and guarantees | 15,137 | 35,440 | |
| Letters of credit | 31,614 | 63,969 | |
| Confirmed foreign letters of credit | 32,819 | 47,108 | |
| Performance bonds | 301,708 | 356,845 | |
| Amounts available on lines of credit and credit cards | 525,678 | 534,873 | |
| Other | - | 14,047 | |
| Total | 906,956 | 1,052,282 | |
| d) | Responsibilities |
The bank and its subsidiaries hold the following responsibilities under the normal course of business:
| As of December 31 | |||
| 2009 | 2010 | ||
| MCh$ | MCh$ | ||
| Notes under collection | 26,004 | 23,576 | |
| Financial assets transferred to and managed by the bank | 64,002 | 59,726 | |
| Third party resources managed by the bank | 494,438 | 496,829 | |
| Securities held in Custody | 328,075 | 383,742 | |
| Total | 912,519 | 963,873 | |
F-77
CORPBANCA AND SUBSIDIARIES
NOTES TO THE CONSOLIDATED FINANCIAL STATEMENTS
As of December 31, 2009 and 2010
| e) | Guarantees |
e.1) Corpbanca
Assets given as collateral
| As of December 31 | |||
| 2009 | 2010 | ||
| MCh$ | MCh$ | ||
| Assets given as collateral | 5,299 | 7,099 | |
| Total | 5,299 | 7,099 | |
Assets as collateral, guarantee credits given by Corpbanca Corredores de Bolsa S.A.
e.2) Corpbanca Corredores de Bolsa S.A.
As of December 31, 2009 and 2010, the Company has not real guarantees in constituted assets to third parties.
As of December 31, 2009 and 2010, the Company has not given personal guarantees.
| f) | Other Liabilities |
f.1) Corpbanca
| · | Corpbanca is authorized to pass on to its customers any obligations related to deferred customs duties originating from imports of assets for leasing, which are transfers that materialize prior to National Customs Service authorization. As of December 31, 2010, the Bank has not transferred any obligations related to deferred customs duties (MCh$92 in 2009) in deferred customs duty obligations to its customers. |
| · | As of December 31, 2010, leasing contracts signed, but for which assets have not yet been delivered, amounts to MCh$44,754 (MCh$44,652 in 2009). |
f.2) Corpbanca Corredores de Bolsa S.A
| · | Pursuant to Articles 30 and 31 of Law No. 18,045 (Securities Market Law), Corpbanca Corredores de Bolsa S.A. has given a guarantee from Compañía de Seguros de Crédito Continental S.A. for MCh$83.8 (UF4,000) that matures April 22, 2012, designating the Santiago Stock Exchange as depository and custodian of this guarantee. |
| · | On July 30, 2010, Corpbanca Corredores de Bolsa S.A. entered into an employee fidelity insurance policy with Chubb de Chile Compañía de Seguros Generales with coverage of US$10,000,000. The policy expires on July 30, 2011. |
| · | Corpbanca Corredores de Bolsa S.A. maintains fixed income securities in the Santiago Stock Exchange to guarantee transactions for the Securities Clearing and Settlement Systems, which amounted to MCh$3,417, in December 2009, these values were ensuring by the Service Clearing and Settlement System for Stock Trading (SCL) for $ 4,704 MM in 2009. Also in this area are delivered to ensure actions to guaranty simultaneous operations by $ 6,287 MM in 2010 (MM $ 17,617 in 2009). You can find the security provided for $ 140,000, to ensure operations with foreign traders in December 2010 for $ 66 and U.S. $ 100,000 equivalent to $ 52 MM in December 2009 during December 2009 and 2010, the company guarantees constituted by MM $ 49,516 MM in December 2010 and $ 50,744 respectively to secure credit for MM $ 49,500 in 2010 and MUS 100,000 in 2009. |
F-78
CORPBANCA AND SUBSIDIARIES
NOTES TO THE CONSOLIDATED FINANCIAL STATEMENTS
As of December 31, 2009 and 2010
f.3) Corpbanca Corredores de Seguros
| • | To comply with Article 58 d) of DFL 251 of 1930 which states that "Insurance brokers, in their business activities, must comply with the requirement to contract insurance policies as determined by the SVS, to correctly respond and fully comply with the obligations of their business and especially for damages that could result for insured parties that contract their policy through a broker", the Company has contracted the following policies with Consorcio Nacional de Seguros S.A. that took effect on April 15, 2010 and expire on April 14, 2011: |
| Policy | Insured item | Insured Amount(MCh$) | Insured Amount (UF) |
| 4323295 | Civil Liability | 1,287.3 | 60,000 |
| 4323304 | Guarantee | 10.7 | 500 |
f.4) Corpbanca Administradora General de Fondos S.A.
| · | As of March 9, 2010, Administradora General de Fondos has taken a new guarantee assurance policy in order to assure the obligations due to the administration of the new mutual fond Corp Asia Pacifico, which will have a validity until January 10, 2011 |
| · | As of May 4, 2010, Administradora General de Fondos took a new guarantee assurance policy, in order to assure the obligations go to the new mutual fund Corp Emea, which will have validity until January 10, 2011. |
| · | As of July 30, 2010, Corpbanca Administradora General de Fondos S.A. renew the assurance policy with Chubb from Chile Compañía de Seguros Generales S.A., in order to anticipate likely situation of functional unfaithfulness. His hedge arise to US$10,000,000. The expiration date is July 30, 2011. |
| · | As of January, 2011, Corpbanca Administradora General de Fondos S.A. has renewed the guarantee assurance policy for the “Administradoras Generales de Fondos” in order to assure the faithful accomplishment of the “Administradora” obligations, by the third parties mutual fund administration and the indemnity of the damage that arising from the nonobservance according the Article 226 from the Law N°18.045. The expiration date of the obligations is January 10, 2012. |
F-79
CORPBANCA AND SUBSIDIARIES
NOTES TO THE CONSOLIDATED FINANCIAL STATEMENTS
As of December 31, 2009 and 2010
| NOTE 23 - | SHAREHOLDERS’ EQUITY |
| a) | Movement in Shareholders’ equity accounts (attributable to equity holders of the Bank) |
As of December 31, 2008, the Bank was authorized to make the acquisition of shares of its own emission for 5,672,732,264 equivalent to 2.5% of the shares subscribed and paid.
As of December 31, 2009, the Bank has sold bank own issued shares that were acquired through a Public Offer during 2008. The offer for 5,672,732,264 shares took place between December 6, 2009 and February 18, 2010.
As of December 31, 2010 the repurchase of treasury shares process initiated in December 2009 is closed and there are no treasury shares available.
| Ordinary | Ordinary | ||
| Shares | Shares | ||
| 2009 | 2010 | ||
| (amount) | (amount) | ||
| Issued as of January 1 | 226,909,290,577 | 226,909,290,577 | |
| Issuance of paid shares | - | - | |
| Issuance of outstanding shares | - | - | |
| Repurchase of Bank's issued shares (treasury shares) | (5,672,732,264) | (5,672,732,264) | |
| Sale of bank own issued shares | 618,186,238 | 5,672,732,264 | |
| Total | 221,854,744,551 | 226,909,290,577 |
F-80
CORPBANCA AND SUBSIDIARIES
NOTES TO THE CONSOLIDATED FINANCIAL STATEMENTS
As of December 31, 2009 and 2010
Authorized, subscribed and paid shares
As of December 31, 2010, the Bank’s issued capital consists of 226,909,290,577 ordinary shares authorized, subscribed and paid with no par value.
The Board in its meeting dated September 8, 2009, agreed to call for an extraordinary shareholders meeting on October 15, 2009, in which the sale was approved of its own shares owned by the Bank, equivalent to 2.5% of capital share, a total of 5,672,732,264 shares acquired through the takeover bid in the year 2008, through preferential offer price of $3.50 in the period from December 6, 2009 and February 18, 2010.
The Board of Directors, in its Session dated on April 15, 2008, agreed to the following: “Agreement A: To set the price of the public tender of shares at $3.03 per share. Agreement B: the total amount of shares to be put up for tender will be 5,672,732,264 shares, equivalent to 2.5% of the total Corpbanca subscribed and paid stock. Agreement C: The share purchasing process shall be implemented through a Public Takeover Bid, consistent with Article 198, paragraph five of the Securities Market Law and Circular Nº1,514, dated January 5, 2001 of the Superintendence of Securities and Insurance and other regulations; on the Stock Exchange, Securities Exchange through the “Final Block Tender System” (Sistema de Ofertas a Firme en Bloque). Agreement D: All pertinent publications announcing the above mentioned public tender of shares shall be published in “La Tercera” and “Diario Financiero” daily newspapers on April 29, 2008. Agreement E: the bid will go into effect on April 30, 2008, and will run for a 30 day period. Agreement F: This public takeover bid call is understood to comply with all laws, rules and regulations to which reference has been made, as well as to the content of the resolutions adopted thereon by the Extraordinary Shareholders’ Meeting.
The Board of Directors at its session dated on September 8, 2009, agreed to call an Extraordinary Shareholders’ Meeting for October 15, 2009, at which the following agreements were confirmed:
| I) | Reduce the number of Directors from 11 to 9 and increase the number of Alternate Directors from 1 to 2, a proposal already authorized by the Superintendency of Banks and Financial Institutions. |
| II) | Election of Directors and Alternate Directors |
| III) | Disposal of Bank-issued shares, equivalent to 2.5% of capital stock, totaling 5,672,732,264 shares, acquired through a Public takeover bid (OPA) during 2008, via a Preferential Offer price of $3.50 during the period between December 6, 2009 and February 18, 2010. |
| IV) | Amendment of By-laws. |
Distribution of dividends
At the Bank’s Ordinary General Shareholders' meeting held on February 27, 2007, it was approved a modification to the dividend distribution policy, establishing that at least 50% out of net income would be distributed as dividends while the undistributed earnings would be included as "Retained earnings from prior periods", within line item "Retained earnings".
At the Bank’s Ordinary General Shareholder’s meeting held on February 26, 2009 it was agreed to a dividend distribution of MCh$56,310 (historical), equivalent to 100% of the net income for the year 2008.
At the Bank’s Ordinary General Shareholder’s meeting held on February 25, 2010 it was agreed to a dividend distribution of MCh$85,109 (historical) equivalent to 100% of the net income for the year 2009.
F-81
CORPBANCA AND SUBSIDIARIES
NOTES TO THE CONSOLIDATED FINANCIAL STATEMENTS
As of December 31, 2009 and 2010
| b) | List of major shareholders |
As of December 31, 2009 the shareholder composition is as follows:
| Common Stock | ||||
| N° of Shares | Share % | |||
| Corp Group Banking S.A. | 112,530,207,591 | 50.72247% | ||
| Compañía Inmobiliaria y de Inversiones Saga Limitada | 20,898,831,865 | 9.42005% | ||
| Inversiones Mineras del Cantabrico S.A. | 15,417,194,024 | 6.94923% | ||
| Inversiones La Punta S.A. | 5,686,087,838 | 2.56298% | ||
| Manufacturas Interamericana S.A. | 5,413,342,266 | 2.44004% | ||
| Cía. de Seguros Corpvida S.A. | 4,491,865,961 | 2.02469% | ||
| Moneda Sa Afi Para Pionero Fondo de Inversión | 4,232,215,102 | 1.90765% | ||
| Banchile C. de B. S.A. | 3,630,329,782 | 1.63635% | ||
| Celfin Capital S.A. C. de B. | 3,507,334,611 | 1.58091% | ||
| Banco de Chile por cuenta de terceros | 3,373,020,864 | 1.52037% | ||
| Inversiones Heracles Limitada | 3,279,769,354 | 1.47834% | ||
| AFP Provida S.A. para fondo de pension C | 2,319,975,027 | 1.04572% | ||
| Inmobiliaria e Inversiones Boquiñeni Ltda. | 2,294,225,537 | 1.03411% | ||
| Other Shareholders | 34,780,344,724 | 15.67707% | ||
| Total | 221,854,744,546 | 100.00000% | ||
As of December 31, 2010 the list of major shareholders as follows:
| Common Stock | ||||||||
| N° of Shares | Share % | |||||||
| Corp Group Banking S.A. | 112,530,207,591 | 49.59260 | % | |||||
| Compañía Inmobiliaria y de Inversiones Saga Limitada | 19,764,285,412 | 8.71021 | % | |||||
| SG Inversiones Bancarias Limitada | 8,282,189,106 | 3.65000 | % | |||||
| SN Holding S.A. | 5,413,342,266 | 2.38569 | % | |||||
| Banco de Chile por cuenta de terceros | 5,189,038,023 | 2.28683 | % | |||||
| Cía. de Seguros Corpvida S.A. | 4,686,703,589 | 2.06545 | % | |||||
| Moneda Sa Afi Para Pionero Fondo de Inversión | 4,028,519,000 | 1.77539 | % | |||||
| CRN Inmobiliaria Limitada | 3,790,725,224 | 1.67059 | % | |||||
| Banco Itau por cuenta de inversionistas | 3,689,619,584 | 1.62603 | % | |||||
| Corpbanca Corredores de Bolsa S.A. | 3,508,800,080 | 1.54634 | % | |||||
| Inversiones FMAD S.A. | 3,336,750,199 | 1.47052 | % | |||||
| Merrill Lynch Corredores de Bolsa S.A. | 2,827,817,924 | 1.24623 | % | |||||
| Inversiones JCSZ S.A. | 2,593,579,929 | 1.14300 | % | |||||
| Banchile C. de B. S.A. | 2,581,004,959 | 1.13746 | % | |||||
| Inmobiliaria e Inversiones Boquiñeni Ltda. | 2,353,758,526 | 1.03731 | % | |||||
| The Bank of New York según Circular 1375 de la SVS | 2,334,190,000 | 1.02869 | % | |||||
| Banco Santander por cuenta de Inv. Extranjeros | 2,329,465,743 | 1.02661 | % | |||||
| AFP Provida S.A. para fondo de pension C | 2,303,428,231 | 1.01513 | % | |||||
| Omega Fondo de Inversión Privado | 2,216,950,089 | 0.97702 | % | |||||
| Inversiones y Valores Limitada | 2,196,612,332 | 0.96806 | % | |||||
| Other Shareholders | 30,952,302,770 | 13.64083 | % | |||||
| Total | 226,909,290,577 | 100.00000 | % | |||||
F-82
CORPBANCA AND SUBSIDIARIES
NOTES TO THE CONSOLIDATED FINANCIAL STATEMENTS
As of December 31, 2009 and 2010
| c) | As of December 31, the diluted and basic earnings per share are the following: |
| 2009 | 2010 | |||||||||||||||
| N° Shares | Total | N° Shares | Total | |||||||||||||
| (in millions) | MCh$ | (in millions) | MCh$ | |||||||||||||
Basic and diluted earnings per share | ||||||||||||||||
| Basic earnings per share | ||||||||||||||||
| Net income for the year | - | 86,192 | - | 122,550 | ||||||||||||
| Weighted average number of shares outstanding | 221,278 | - | 226,852 | - | ||||||||||||
| Assumed conversion of convertible debt | - | - | - | - | ||||||||||||
| Adjusted number of shares | 221,278 | - | 226,852 | - | ||||||||||||
| Basic earnings per share (Chilean pesos) | - | 0.390 | - | 0.540 | ||||||||||||
| Diluted earnings per share | ||||||||||||||||
| Net income for the year | - | 86,192 | - | 122,550 | ||||||||||||
| Weighted average number of shares outstanding | 221,278 | - | 226,852 | - | ||||||||||||
| Diluted effect from: | ||||||||||||||||
| Assumed conversion of convertible debt | - | - | - | - | ||||||||||||
| Ordinary share conversion | - | - | - | - | ||||||||||||
| Option Rights | - | - | - | - | ||||||||||||
| Adjusted number of shares | 221,278 | - | 226,852 | - | ||||||||||||
| Diluted earnings per share (Chilean pesos) | - | 0.390 | - | 0.540 | ||||||||||||
F-83
CORPBANCA AND SUBSIDIARIES
NOTES TO THE CONSOLIDATED FINANCIAL STATEMENTS
As of December 31, 2009 and 2010
| NOTE 24 - | INTEREST INCOME AND EXPENSE |
| a) | The composition of interest income and adjustments for the years ended December 31, 2008, 2009 and 2010 is as follows: |
| As of December 31, | |||||||||||||||
| 2008 | 2009 | 2010 | |||||||||||||
| Interests | Adjustments (1) | Total | Interests | Adjustments (1) | Total | Interests | Adjustments (1) | Total | |||||||
| MCh$ | MCh$ | MCh$ | MCh$ | MCh$ | MCh$ | MCh$ | MCh$ | MCh$ | |||||||
| Normal Portfolio | |||||||||||||||
| Investments under agreements to resell | 7,763 | 4,692 | 12,455 | 2,342 | (608) | 1,734 | 2,876 | 746 | 3,622 | ||||||
| Loans and receivables from banks | 1,323 | - | 1,323 | 408 | - | 408 | 729 | - | 729 | ||||||
| Commercial loans | 217,619 | 92,429 | 310,048 | 208,321 | (31,275) | 177,046 | 158,281 | 21,177 | 179,458 | ||||||
| Mortgage Loans | 22,667 | 54,631 | 77,298 | 32,910 | (9,922) | 22,988 | 44,677 | 22,512 | 67,189 | ||||||
| Consumer Loans | 93,987 | 3,351 | 97,338 | 82,107 | (831) | 81,276 | 73,937 | 275 | 74,212 | ||||||
| Financial investments | 8,503 | 13,771 | 22,274 | 18,926 | (6,391) | 12,535 | 24,425 | 11,931 | 36,356 | ||||||
| Other interest income | 3,969 | 11 | 3,980 | 949 | (2) | 947 | 1 | 2,382 | 2,383 | ||||||
| Subtotals | 355,831 | 168,885 | 524,716 | 345,963 | (49,029) | 296,934 | 304,926 | 59,023 | 363,949 | ||||||
| Impaired loan portfolio | |||||||||||||||
| Interest Recovery | |||||||||||||||
| Commercial loans | 18,286 | 11,994 | 30,280 | 11,425 | (561) | 10,864 | 15,406 | 2,152 | 17,558 | ||||||
| Mortgage Loans | 730 | 1,329 | 2,059 | 875 | (439) | 436 | 1,679 | 626 | 2,305 | ||||||
| Consumer Loans | 3,790 | 48 | 3,838 | 5,904 | (23) | 5,881 | 2,634 | 1,193 | 3,827 | ||||||
| Financial investments | - | - | - | - | - | - | - | - | - | ||||||
| Other Income on interest | - | - | - | - | - | - | - | - | - | ||||||
| Subtotals | 22,806 | 13,371 | 36,177 | 18,204 | (1,023) | 17,181 | 19,719 | 3,971 | 23,690 | ||||||
| Total interest income | 378,637 | 182,256 | 560,893 | 364,167 | (50,052) | 314,115 | 324,645 | 62,994 | 387,639 | ||||||
| b) | The detail of suspended interest income recognition on the impaired loan portfolio for the years ended December 31, 2008, 2009 and 2010 is the following: |
| As of December 31, | |||||||||||||||
| 2008 | 2009 | 2010 | |||||||||||||
| Interest | Adjustments (1) | Total | Interests | Adjustments (1) | Total | Interests | Adjustments (1) | Total | |||||||
| MCh$ | MCh$ | MCh$ | MCh$ | MCh$ | MCh$ | MCh$ | MCh$ | MCh$ | |||||||
| Commercial loans | 2,490 | 686 | 3,176 | 3,813 | 109 | 3,922 | 5,807 | 473 | 6,280 | ||||||
| Mortgage Loans | 597 | 726 | 1,323 | 721 | 379 | 1,100 | 1,110 | 662 | 1,772 | ||||||
| Consumer Loans | 147 | 14 | 161 | 36 | (1) | 35 | 9 | 3 | 12 | ||||||
| Financial investments | - | - | - | - | - | - | - | - | - | ||||||
| Total | 3,234 | 1,426 | 4,660 | 4,570 | 487 | 5,057 | 6,926 | 1,138 | 8,064 | ||||||
F-84
CORPBANCA AND SUBSIDIARIES
NOTES TO THE CONSOLIDATED FINANCIAL STATEMENTS
As of December 31, 2009 and 2010
| c) | The detail of interest expenses for the years ended December 31, 2008, 2009 and 2010 is the following: |
| As of December 31, | |||||||||||||||
| 2008 | 2009 | 2010 | |||||||||||||
Interests | Adjustments (1) | Total | Interests | Adjustments (1) | Total | Interests | Adjustments (1) | Total | |||||||
| MCh$ | MCh$ | MCh$ | MCh$ | MCh$ | MCh$ | MCh$ | MCh$ | MCh$ | |||||||
| Demand Deposits | (8) | (86) | (94) | (10) | 22 | 12 | (19) | (40) | (59) | ||||||
| Investments under agreements to repurchase | (10,581) | (3,513) | (14,094) | (4,633) | 153 | (4,480) | (4,959) | (54) | (5,013) | ||||||
| Deposits and Time Deposits | (179,651) | (37,326) | (216,977) | (102,375) | 11,855 | (90,520) | (77,103) | (8,873) | (85,976) | ||||||
| Borrowings from financial institutions | (15,031) | - | (15,031) | (11,445) | - | (11,445) | (7,324) | - | (7,324) | ||||||
| Debt issued | (30,134) | (64,250) | (94,384) | (31,189) | 18,050 | (13,139) | (39,861) | (22,901) | (62,762) | ||||||
| Other financial obligations | (1,178) | (1,743) | (2,921) | (1,280) | 481 | (799) | (795) | (413) | (1,208) | ||||||
| Hedge accounting gains(losses) | 545 | 257 | 802 | (2) | (177) | (179) | 48 | (43) | 5 | ||||||
| Other interest expenses | - | (4,018) | (4,018) | - | (177) | (177) | - | (892) | (892) | ||||||
| Total Interest Expenses | (236,038) | (110,679) | (346,717) | (150,934) | 30,207 | (120,727) | (130,013) | (33,216) | (163,229) | ||||||
| (1) | The adjustments are a result of changes in the Unidades de Fomento (“UF”). The UF is an inflation-index Chilean monetary unit with a value in Chilean pesos that changes daily to reflect changes in the official Consumer Price Index (“CPI”) of the Instituto Nacional de Estadísticas (the Chilean National Institute of Statistics) for the previous month. The effect of any changes in the nominal peso value of our UF-denominated interest earning assets and interest bearing liabilities is reflected in our results of operations as an increase (or decrease, in the event of deflation) in interest income and expense, respectively. |
| NOTE 25 - | FEES AND INCOME FROM SERVICES |
Fees and income from services and the related expenses for the years ended December 31, 2008, 2009 and 2010 are summarized as follows:
| As of December 31, | |||||
| 2008 | 2009 | 2010 | |||
| MCh$ | MCh$ | MCh$ | |||
| a) Income from fees and services | |||||
| Lines of credit and overdrafts | 6,975 | 5,168 | 9,098 | ||
| Letters of credit and guarantees | 2,595 | 4,084 | 4,789 | ||
| Card services | 7,956 | 8,290 | 9,068 | ||
| Account administration | 4,730 | 5,281 | 6,698 | ||
| Collections, billings and payments | 8,771 | 8,529 | 8,587 | ||
| Management and brokerage commissions for securities | 4,696 | 2,136 | 3,931 | ||
| Investments in mutual funds and others | 6,835 | 6,466 | 8,188 | ||
| Insurance brokerage | 6,672 | 6,897 | 7,930 | ||
| Other fees earned | 3,190 | 2,511 | 6,384 | ||
| Other payments for services rendered | 2,445 | 3,766 | 3,780 | ||
| Total Income from fees and services | 54,865 | 53,128 | 68,453 | ||
F-85
CORPBANCA AND SUBSIDIARIES
NOTES TO THE CONSOLIDATED FINANCIAL STATEMENTS
As of December 31, 2009 and 2010
| b) | Expenses from services |
| As of December 31, | |||||
| 2008 | 2009 | 2010 | |||
| MCh$ | MCh$ | MCh$ | |||
| Credit card transactions | (7,215) | (6,911) | (6,557) | ||
| Brokerage | (3,411) | (394) | (467) | ||
| Commissions on interbank transactions | - | - | - | ||
| Other paid commissions | (1,243) | (547) | (838) | ||
| Transaction processing | (230) | (863) | (1,495) | ||
| Contract Services for customer benefits | (165) | (531) | - | ||
| Foreign trade | (192) | (296) | (68) | ||
| Expenses on return commissions | (187) | (99) | (131) | ||
| Commissions spent on Happy Ending benefits | (170) | (226) | (676) | ||
| Total expenses from services | (12,813) | (9,867) | (10,232) | ||
The fees earned through transactions with letters of credit are recorded under “Interest income” within the consolidated statement of income.
| NOTE 26 - | TRADING AND INVESTMENT INCOME |
Trading and investment income recognized on the consolidated statement of income for the years ended December 31, 2008, 2009 and 2010 is as follows:
| As of December 31, | |||||
| 2008 | 2009 | 2010 | |||
| MCh$ | MCh$ | MCh$ | |||
| Trading instruments | 2,598 | 2,612 | 6,856 | ||
| Derivative financial instruments | 48,954 | (26,124) | (14,327) | ||
| Other financial investments at fair value with effect on gain (losses) | 109 | (107) | 942 | ||
| Financial investments available-for-sale | 3,065 | 27,021 | (3,288) | ||
| Profit on bank-issued time deposit repurchase | 279 | 1,827 | 450 | ||
| Loss on bank-issued time deposit repurchase | (114) | (697) | (44) | ||
| Other | 106 | 31 | 1 | ||
| Total trading and investment income, net | 54,997 | 4,563 | (9,410) | ||
F-86
CORPBANCA AND SUBSIDIARIES
NOTES TO THE CONSOLIDATED FINANCIAL STATEMENTS
As of December 31, 2009 and 2010
| NOTE 27 - | NET FOREIGN EXCHANGE INCOME (LOSSES) |
This item includes the income earned from foreign currency trading, the differences arise from converting monetary items in a foreign currency to the functional currency and those generated by non-monetary assets in a foreign currency at the time of their divestiture.
The detail of net foreign exchange gains (losses) for the years ended December 31, 2008, 2009 and 2010 is as follows:
| As of December 31, | |||||
| 2008 | 2009 | 2010 | |||
| MCh$ | MCh$ | MCh$ | |||
| Gains (losses) of foreign currency exchange differences | |||||
| Net gains (losses) of foreign currency exchange positions | (46,406) | 51,208 | 45,700 | ||
| Other foreign currency exchange gains(losses) | (54) | 1,097 | (26) | ||
| Subtotals | (46,460) | 52,305 | 45,674 | ||
| Net earnings on exchange rate adjustments | |||||
| Adjustments to loan to customers | 5,122 | (4,150) | (775) | ||
| Adjustments to other liabilities | (1,549) | 1,480 | 318 | ||
| Fair value gains (losses) on hedging derivatives | - | - | (606) | ||
| Subtotals | 3,573 | (2,670) | (1,063) | ||
| Total | (42,887) | 49,635 | 44,611 | ||
| NOTE 28 - | PROVISION FOR LOAN LOSSES |
The changes in provision for loan losses recorded on the income statement for the years ended December 31, 2008, 2009 and 2010 is as follows:
For the year ended December 31, 2008 Loans and receivables from customers | |||||
| Loans and receivable from banks | Commercial loans | Mortgage Loans | Consumer Loans | Total | |
| MCh$ | MCh$ | MCh$ | MCh$ | MCh$ | |
| Established provision: | |||||
| Individual Analysis | (20) | (12,231) | - | - | (12,251) |
| Group Analysis | - | (10,983) | (3,459) | (48,253) | (62,695) |
| Charge to income for provisions established | (20) | (23,214) | (3,459) | (48,253) | (74,946) |
| Released provision: | |||||
| Individual Analysis | 117 | 7,411 | - | - | 7,528 |
| Group Analysis | - | 1,003 | 20 | 377 | 1,400 |
| Credit to income for provisions released | 117 | 8,414 | 20 | 377 | 8,928 |
| Recovery of assets previously written-off | - | 1,607 | 285 | 9,143 | 11,035 |
| Net charge to income | 97 | (13,193) | (3,154) | (38,733) | (54,983) |
F-87
CORPBANCA AND SUBSIDIARIES
NOTES TO THE CONSOLIDATED FINANCIAL STATEMENTS
As of December 31, 2009 and 2010
For the year ended December 31, 2009 Loans and receivables from customers | |||||
| Loans and receivables from banks | Commercial loans | Mortgage Loans | Consumer Loans | Total | |
| MCh$ | MCh$ | MCh$ | MCh$ | MCh$ | |
| Established provision: | |||||
| Individual Analysis | (6) | (33,669) | - | (826) | (34,501) |
| Group Analysis | - | (13,885) | (2,185) | (55,632) | (71,702) |
| Charge to income for provisions established | (6) | (47,554) | (2,185) | (56,458) | (106,203) |
| Released provisions: | |||||
| Individual Analysis | 25 | 11,509 | - | 25 | 11,559 |
| Group Analysis | - | 2,596 | 213 | 7,348 | 10,157 |
| Credit to income for provisions released | 25 | 14,105 | 213 | 7,373 | 21,716 |
| Recovery of assets previously written-off | - | 1,776 | 111 | 11,329 | 13,216 |
| Net charge to income | 19 | (31,673) | (1,861) | (37,756) | (71,271) |
For the year ended December 31, 2010 Loans and receivables from customers | |||||
| Loans and receivables from banks | Commercial loans | Mortgage Loans | Consumer Loans | Total | |
| MCh$ | MCh$ | MCh$ | MCh$ | MCh$ | |
| Provisions established: | |||||
| Individual Analysis | (196) | (31,163) | - | (2) | (31,361) |
| Group Analysis | - | (10,883) | (3,341) | (47,505) | (61,890) |
| Charge to income for provisions established | (196) | (42,297) | (3,341) | (47,507) | (93,341) |
| Provisions released: | |||||
| Individual Analysis | 13 | 12,349 | - | 1 | 12,363 |
| Group Analysis | 5,825 | 119 | 7,974 | 13,918 | |
| Credit to income for provisions released | 13 | 18,174 | 119 | 7,975 | 26,281 |
| Recovery of loans previously written-off | - | 2,726 | 90 | 11,893 | 14,709 |
Net charge to income | (183) | (21,397) | (3,132) | (27,639) | (52,351) |
F-88
CORPBANCA AND SUBSIDIARIES
NOTES TO THE CONSOLIDATED FINANCIAL STATEMENTS
As of December 31, 2009 and 2010
| NOTE 29 - | PERSONNEL SALARIES EXPENSES |
Personnel salaries expenses for the years ended December 31, 2008, 2009 and 2010 are as follows:
| As of December 31 | |||||
| 2008 | 2009 | 2010 | |||
| MCh$ | MCh$ | MCh$ | |||
| Personnel remunerations | (34,047) | (36,369) | (40,462) | ||
| Bonuses and gratifications/awards | (17,236) | (19,619) | (21,132) | ||
| Severance indemnities | (3,049) | (5,303) | (5,215) | ||
| Training Expenses | (609) | (493) | (718) | ||
| Other personnel expenses | (2,775) | (3,949) | (3,507) | ||
| Total | (57,716) | (65,733) | (71,034) | ||
F-89
CORPBANCA AND SUBSIDIARIES
NOTES TO THE CONSOLIDATED FINANCIAL STATEMENTS
As of December 31, 2009 and 2010
| NOTE 30 - | ADMINISTRATION EXPENSES |
Administration expenses for the years ended December 31, 2008, 2009 and 2010 are as follows:
| As of December 31, | |||||
| 2008 | 2009 | 2010 | |||
| MCh$ | MCh$ | MCh$ | |||
| Maintenance and repair of fixed assets | (1,260) | (1,585) | (1,693) | ||
| Office rentals | (4,245) | (5,466) | (5,853) | ||
| Equipment rentals | (1,426) | (2,128) | (2,216) | ||
| Insurance premiums | (219) | (415) | (256) | ||
| Office supplies | (1,102) | (914) | (906) | ||
| IT and communications expense | (2,092) | (2,938) | (3,067) | ||
| Lighting, heating and other services | (2,265) | (2,603) | (2,565) | ||
| Security Service and transportation of securities | (507) | (1,146) | (1,433) | ||
| Public relations expense and staff travel expenses | (1,421) | (939) | (977) | ||
| Legal and Notary Costs | (88) | (164) | (161) | ||
| Technical report fees | (6,168) | (7,339) | (7,279) | ||
| Professional services fees | (467) | (581) | (643) | ||
| Securities classification fees | (56) | (54) | (96) | ||
| Fines | (1) | (115) | (17) | ||
| Other administration expenses | (9,988) | (6,425) | (7,915) | ||
| Subtotal | (31,305) | (32,812) | (35,077) | ||
Subcontracted services | (15,732) | (4,449) | (3,288) | ||
| Data processing | (2,066) | (2,023) | (2,534) | ||
| Sales | (149) | (65) | (56) | ||
| Loan valuation | (12,425) | (1,596) | (104) | ||
| Others | (1,092) | (765) | (594) | ||
| Board of Directors Expenses | (219) | (186) | (564) | ||
| Remunerations | (216) | (186) | (564) | ||
| Other Board of Directors expenses | (3) | - | - | ||
Marketing and advertising | (5,266) | (4,553) | (5,021) | ||
Real estate taxes, contributions and levies | (2,129) | (2,592) | (2,843) | ||
| Real estate taxes | (273) | (287) | (293) | ||
| Patents | (465) | (521) | (549) | ||
| Other taxes | (27) | (25) | (53) | ||
| Contributions to SBIF | (1,364) | (1,759) | (1,948) | ||
| Total | (54,651) | (44,592) | (46,793) | ||
F-90
CORPBANCA AND SUBSIDIARIES
NOTES TO THE CONSOLIDATED FINANCIAL STATEMENTS
As of December 31, 2009 and 2010
| NOTE 31 - | DEPRECIATION, AMORTIZATION AND IMPAIRMENT |
| a) | Depreciation and amortization expenses for the years ended December 31, 2008, 2009 and 2010 are as follows: |
| For the years ended December 31, | |||||
| 2008 | 2009 | 2010 | |||
| MCh$ | MCh$ | MCh$ | |||
| Depreciation and amortization | |||||
| Depreciation of property, plant and equipment (Note 14) | (3,787) | (4,278) | (4,805) | ||
| Amortization of intangibles assets (Note 13) | (3,045) | (2,032) | (2,312) | ||
| Balances as of December 31, | (6,832) | (6,310) | (7,117) | ||
| b) | Impairment losses for the years ended December 31, 2008, 2009 and 2010 are detailed below: |
| For the years ended December 31, | |||||
| 2008 | 2009 | 2010 | |||
| MCh$ | MCh$ | MCh$ | |||
| Impairment of financial investments available-for-sale | - | - | - | ||
| Impairment of financial investments held-to-maturity | - | - | - | ||
| Impairment of property, plant and equipment | (59) | (144) | (427) | ||
| Total | (59) | (144) | (427) | ||
F-91
CORPBANCA AND SUBSIDIARIES
NOTES TO THE CONSOLIDATED FINANCIAL STATEMENTS
As of December 31, 2009 and 2010
| NOTE 32 - | OTHER OPERATING INCOME AND EXPENSES |
| a) | Other operating income |
The detail of other operating revenue is as follows:
| As of December 31, | |||||
| 2008 | 2009 | 2010 | |||
| MCh$ | MCh$ | MCh$ | |||
| Revenues for assets received in lieu of payment | |||||
| Gain on sales of assets received in lieu of payment | 1,657 | 1,160 | 859 | ||
| Subtotal | 1,657 | 1,160 | 859 | ||
| Contingency provisions released | |||||
| Other contingency provisions | 9 | - | 77 | ||
| Subtotals | 9 | - | 77 | ||
| Other Revenues | |||||
| Gain on sales of property, plant and equipment | 17 | 5 | 557 | ||
| Gain on sale of investment in other companies | 1,707 | 77 | - | ||
| Subtotal | 1,724 | 82 | 557 | ||
| Other income | 1,575 | 260 | 558 | ||
| Leasing contributions revenue | 1,122 | 1,187 | 1,594 | ||
| Other operating income -Subsidiaries | 376 | 1,073 | 3,123 | ||
| Gain on sales of leased assets | 125 | 661 | 645 | ||
| Other operating income -Leasing | 1,080 | 378 | 754 | ||
| Revenues from leasing loans expenses recovered | 152 | 286 | 665 | ||
| Subtotal | 4,430 | 3,845 | 7,339 | ||
| Total | 7,820 | 5,087 | 8,832 | ||
F-92
CORPBANCA AND SUBSIDIARIES
NOTES TO THE CONSOLIDATED FINANCIAL STATEMENTS
As of December 31, 2009 and 2010
| b) | Other operating expenses |
Other operating expenses for the years ended December 31, 2008, 2009 and 2010 are the following:
| As of December 31, | |||||
| 2008 | 2009 | 2010 | |||
| MCh$ | MCh$ | MCh$ | |||
| Provisions and expenses for assets received in lieu of payment | |||||
| - Provisions for assets received in lieu of payment | (3) | (246) | (27) | ||
| - Maintenance expenses of assets received in lieu of payment | (124) | (210) | (357) | ||
| Subtotal | (127) | (456) | (384) | ||
| Contingency provisions | |||||
| - Other contingency provisions | (906) | (1,532) | (1,360) | ||
| Subtotal | (906) | (1,532) | (1,360) | ||
| Other expenses | |||||
| - Other expenses | (3,160) | (3,900) | (5,568) | ||
| Subtotal | (3,160) | (3,900) | (5,568) | ||
| Total | (4,193) | (5,888) | (7,312) | ||
| NOTE 33 - | RELATED PARTY TRANSACTIONS |
Related parties are those individuals and entities that are related, directly or indirectly, to the Bank or its key management personnel.
The article 89 of the Corporations Act, which is also applicable to banks, states that any related party transaction must be made on terms equivalent to those that prevail in arm’s length transactions. Furthermore, article 84 of the General Banking Act imposes limits on loans that can be granted to related parties and prohibits lending to the Bank’s directors, managers, or representatives.
F-93
CORPBANCA AND SUBSIDIARIES
NOTES TO THE CONSOLIDATED FINANCIAL STATEMENTS
As of December 31, 2009 and 2010
Transactions that the Bank entered into with related parties as of December 31, 2009 and 2010 are specified below:
| a) | Loans granted to related parties |
Loan granted to related parties as of December 31, 2009 and 2010 are as fol1ows:
| 2009 | Operating Companies | Investment Companies | Individuals(1) | ||
| MCh$ | MCh$ | MCh$ | |||
| Loans and receivables to customers: | |||||
| Commercial loans | 197,804 | 3,732 | 844 | ||
| Mortgage Loans | - | - | 1,886 | ||
| Consumer Loans | 1,234 | - | 112 | ||
| Loans and receivables to customers - gross | 199,038 | 3,732 | 2,842 | ||
| Provision for loan losses | (335) | (13) | (11) | ||
| Loans and receivables to customers, net | 198,703 | 3,719 | 2,831 | ||
| Other | 545 | - | - |
| 2010 | Operating Companies | Investment Companies | Individuals(1) | ||
| MCh$ | MCh$ | MCh$ | |||
| Loans and receivables to customers: | |||||
| Commercial loans | 117,043 | 2,466 | 306 | ||
| Mortgage Loans | - | - | 4,184 | ||
| Consumer Loans | 1 | - | 1,931 | ||
| Loans and receivables to customers - gross | 117,044 | 2,466 | 6,421 | ||
| Provision for loan losses | (291) | (4) | (16) | ||
| Loans and receivables to customers, net | 116,753 | 2,462 | 6,405 | ||
| Others | 1,240 | - | - |
| (1) | Includes debt obligations that are equal to or greater than MCh$62.8 (UF3,000) indexed-liked units of account, equivalent to MCh$63 as of December 31, 2009. |
F-94
CORPBANCA AND SUBSIDIARIES
NOTES TO THE CONSOLIDATED FINANCIAL STATEMENTS
As of December 31, 2009 and 2010
| b) | Other transactions with related parties |
During the years ended December 31, 2009 and 2010, the Bank entered into the fol1owing transactions with related parties for amounts exceeding MCh$21.5 (UF1,000).
As of December 31, 2009:
| Company | Description | Balance Asset (Liability) | Effect on Statement of Income | |
| Income | (Expense) | |||
| MCh$ | MCh$ | MCh$ | ||
| Inmobiliaria Edificio Corpgroup S.A. | Corporate office rent and building costs | - | - | 2,389 |
| Transbank S.A. | Credit Card processing | - | - | 2,294 |
| Corp Group Interhold S.A. | Management advisory services | - | - | 2,078 |
| Operadora de Tarjeta de Crédito Nexus S.A. | Credit card processing | - | - | 1,153 |
| Redbanc S.A. | Automatic teller machine administration | - | - | 892 |
| Recaudaciones y Cobranzas S.A. | Office rent and credit collection | - | - | 695 |
| Empresa Periodística La Tercera S.A. | Advertising services | - | - | 363 |
| Asesorías Santa Josefina Ltda. | Financial advisory and management services | - | - | 139 |
| Inmobiliaria e Inversiones San Francisco Ltda. | Financial advisory services | - | - | 134 |
| Fundación Corpgroup Centro Cultural | Donations | - | - | 90 |
| Compañía de Seguros Vida Corp S.A. | Brokerage of insurance premiums and office rent | 79 | ||
| Inmobiliaria e Inversiones Boquiñeni Ltda. | Financial advisory services | - | - | 51 |
| SMU S.A., Rendic Hnos S.A. | Prepaid rent for space for ATMs | 23,311 | 38 | |
As of December 31, 2010:
| Company | Description | Balance Asset (Liability) | Effect on Statement of Income | |
| Income | (Expense) | |||
| MCh$ | MCh$ | MCh$ | ||
| Inmobiliaria Edificio Corpgroup S.A. | Corporate office rent and building costs | - | - | 2,445 |
| Transbank S.A. | Credit Card processing | - | - | 2,110 |
| Corp Group Interhold S.A. | Management advisory services | - | - | 1,931 |
| Operadora de Tarjeta de Crédito Nexus S.A. | Credit card processing | - | - | 922 |
| Redbanc S.A. | Automatic teller machine administration | - | - | 800 |
| Recaudaciones y Cobranzas S.A. | Office rent and credit collection | - | - | 792 |
| Empresa Periodística La Tercera S.A. | Advertising services | - | - | 372 |
| Compañía de Seguros Vida Corp S.A. | Brokerage of insurance premiums and office rent | - | - | 226 |
| Inmobiliaria e Inversiones San Francisco Ltda. | Financial advisory services | - | - | 174 |
| Asesorías Santa Josefina Ltda. | Financial advisory and management services | - | - | 146 |
| Fundación Corpgroup Centro Cultural | Donations | - | - | 133 |
| Inmobiliaria e Inversiones Boquiñeni Ltda. | Financial advisory services | - | - | 66 |
| Empresa Periodística La Tercera S.A. | Advertising services | - | - | 36 |
| SMU S.A., Rendic Hnos S.A. | Prepaid rent for space for ATMs | 22,739 | - | 15 |
These transactions were carried out at normal market prices prevailing at the day of the transactions.
F-95
CORPBANCA AND SUBSIDIARIES
NOTES TO THE CONSOLIDATED FINANCIAL STATEMENTS
As of December 31, 2009 and 2010
| c) | Other assets and liabilities with related parties |
| As of December 31, | ||
| 2009 | 2010 | |
| MCh$ | MCh$ | |
| ASSETS | ||
| Derivative financial instruments | - | 16,744 |
| LIABILITIES | ||
| Derivative financial instruments | - | 288 |
| Demand deposits | 5,553 | 2,189 |
| Deposits and other time deposits | 431 | 20,482 |
| d) | Operating income from related party transactions |
| As of December 31, | ||||||||
| 2008 | 2009 | 2010 | ||||||
| Type of recognized income or expense | Income | Expense | Income | Expense | Income | Expense | ||
| MCh$ | MCh$ | MCh$ | MCh$ | MCh$ | MCh$ | |||
| Interest revenue | 4,922 | 1,680 | 4,223 | 427 | 5,743 | 412 | ||
| Income and expenses on fees and services | 276 | 10 | 288 | 11 | 160 | 6 | ||
| Gain and Loss on trading | - | - | - | - | - | - | ||
| Gain and Loss on other financial transactions | - | - | - | - | - | - | ||
| Foreign currency exchanges | - | - | - | - | - | - | ||
| Operating support expense | - | 10,642 | - | 10,305 | - | 10,035 | ||
| Other income and expense | - | - | - | - | - | - | ||
| Total | 5,198 | 12,332 | 4,511 | 10,743 | 5,903 | 10,453 | ||
| e) | Contracts with related parties |
| 2009: | |
| Company | Description |
| Transbank S.A. | Credit card processing |
| Inmobiliaria Edificio Corpgroup S.A. | Corporate office rent and building costs |
| Corp Group Interhold S.A. | Management advisory services |
| Operadora de Tarjeta de Crédito Nexus S.A. | Credit card processing |
| Redbanc S.A. | Automatic teller machine administration |
| Recaudaciones y Cobranzas S.A. | Office rent and credit collection |
| Empresa Periodística La Tercera S.A. | Advertising services |
| Inmobiliaria e Inversiones San Francisco Ltda. | Financial advisory services |
| Asesorías Santa Josefina Ltda. | Financial advisory and management service |
| Compañía de Seguros de Vida Corp S.A. | Brokerage of insurance premiums and office rent |
| Fundación Corpgroup Centro Cultural | Donations |
| Inmobiliaria e Inversiones Boquiñeni Ltda. | Financial advisory services |
| SMU S.A Rendic Hermanos S.A. | Rental of ATM’s locations |
F-96
CORPBANCA AND SUBSIDIARIES
NOTES TO THE CONSOLIDATED FINANCIAL STATEMENTS
As of December 31, 2009 and 2010
| 2010: | ||
| Company | Description | |
| Transbank S.A. | Credit card processing | |
| Inmobiliaria Edificio Corpgroup S.A. | Corporate office rent and building costs | |
| Corp Group Interhold S.A. | Management advisory services | |
| Operadora de Tarjeta de Crédito Nexus S.A. | Credit card processing | |
| Redbanc S.A. | Automatic teller machine administration | |
| Recaudaciones y Cobranzas S.A. | Office rent and credit collection | |
| Proservicen S.A. | Promotional services | |
| Empresa Periodística La Tercera S.A. | Advertising services | |
| Inmobiliaria e Inversiones San Francisco Ltda. | Financial advisory services | |
| Asesorías Santa Josefina Ltda. | Financial advisory and management service | |
| Compañía de Seguros de Vida Corp S.A. | Brokerage of insurance premiums and office rent | |
| Fundación Corpgroup Centro Cultural | Donations | |
| Inmobiliaria e Inversiones Boquiñeni Ltda. | Financial advisory services | |
| SMU S.A Rendic Hermanos S.A. | Rental of ATM’s locations | |
| f) | Remunerations to members of the board and key management personnel |
Remunerations paid to key management personnel are sets forth in table below:
| 2009 | 2010 | |||||||
| MCh$ | MCh$ | |||||||
| Short term employee remuneration | 12,763 | 14,231 | ||||||
| Severance indemnities | 1,527 | 1,534 | ||||||
| Total | 14,290 | 15,765 | ||||||
For the years ended December 31, 2010, the members of the Board of Directors received remuneration for MCh$328.
For the years ended December 31, 2009 and 2008 the members of the Board did not received any remuneration.
For the years ended December 31, 2008, 2009 and 2010, the members of the Directors Committee and Audit Committee received remunerations for MCh$216, MCh$186 and MCh$148, respectively.
The Directors of subsidiary companies did not receive any remuneration during the years ended December 31, 2008, 2009 and 2010.
The total remuneration paid to key management personnel of the Bank for the years December 31, 2008, 2009 and 2010 was MCh$6,375, MCh$11,440 and MCh$13,755, respectively.
In addition, and as established in our Bonus Policy as established jointly by the Division Management - Human Resources and Development and the General Manager, certain bank executives were paid bonuses based on the completion of goals.
F-97
CORPBANCA AND SUBSIDIARIES
NOTES TO THE CONSOLIDATED FINANCIAL STATEMENTS
As of December 31, 2009 and 2010
| g) | Key management personnel |
As of December 31, 2009 and 2010, the composition of the Bank’s key management personnel is as follows:
| Number of Executives | ||
| Position | 2009 | 2010 |
| Directors | 37 | 44 |
| Chief Executive Officers | 7 | 8 |
| Division Managers | 12 | 13 |
| Department Managers | 62 | 77 |
| Deputy Managers | 102 | 125 |
| h) | Transactions with key management personnel |
During 2009 and 2010 transactions with key personnel were carried out as follows:
| Income | |||
| MCh$ | |||
| 2008 | 2009 | 2010 | |
| Credit Cards | 55 | 26 | 31 |
| Consumer loans | 25 | 10 | 26 |
| Commercial loans | 10 | 35 | 13 |
| Mortgages loans | 132 | 36 | 244 |
| NOTE 34 - | FINANCIAL ASSETS AND LIABILITIES MEASURED AT FAIR VALUE |
Fair value of an asset or liability is the amount for which an asset could be exchanged and liability could be settled between knowledgeable, willing parties in an arm’s length transaction. The most objective and usual reference of the fair value of an asset or liability is the price that would be paid in an active market (“quoted price” or “market price”).
For financial assets and financial liabilities with no active market, fair value is estimated by using recent similar transactions and, in the absence thereof, current values or other valuation techniques based on mathematical valuation models that have been sufficiently verified by the international financial community and pertinent regulatory bodies. These models take into account the specific features of the asset or liability to be valued and the different types of risks associated to the asset or liability.
These fair value assessments are subjective by nature, since their price estimation is based on a number of assumptions having an original axiomatic nature. For that reason, the fair value estimation process is affected by the variables that the assumptions are directed towards, such as interest rates, pre-payment options, covenants. As such, it is possible that such a fair value estimate might not entirely match one resulting from independent prices. However, they represent the best estimates available in many cases.
F-98
CORPBANCA AND SUBSIDIARIES
NOTES TO THE CONSOLIDATED FINANCIAL STATEMENTS
As of December 31, 2009 and 2010
Determination of the fair value of financial instruments
A summary of the fair value of the main financial assets and liabilities as of December 31, 2009 and 2010 is detailed below, including those that have not been presented at fair value in these Financial Statements.
| As at December 31, | |||||||
| 2009 | 2010 | ||||||
| Carrying Amount | Estimated Fair Value | Difference (loss)/gain | Carrying Amount | Estimated Fair Value | Difference (loss)/gain | ||
| MCh$ | MCh$ | MCh$ | MCh$ | MCh$ | MCh$ | ||
| ASSETS | |||||||
| Cash and due from banks | 110,331 | 110,331 | - | 202,339 | 202,339 | - | |
| Items in course of collection | 95,796 | 95,796 | - | 79,680 | 79,680 | - | |
| Trading portfolio financial assets | 76,156 | 76,156 | - | 197,580 | 197,580 | - | |
Investments under agreements to resell | 51,970 | 51,970 | - | 75,676 | 75,676 | - | |
| Derivative financial instruments | 126,140 | 126,140 | - | 204,067 | 204,067 | - | |
| Loans and receivables from banks | 86,220 | 86,220 | - | 63,998 | 63,998 | - | |
| Loans and receivables from customers | 4,912,392 | 5,052,682 | 131,206 | 5,364,980 | 5,469,983 | 105,003 | |
Financial investments available-for- sale | 737,162 | 737,162 | - | 746,248 | 746,248 | - | |
Financial investments held-to- maturity | - | - | - | - | - | - | |
LIABILITIES | |||||||
Current accounts and demand deposits | 496,270 | 496,270 | - | 612,064 | 612,064 | - | |
| Items in course of collection | 64,854 | 64,854 | - | 41,525 | 41,525 | - | |
Items under agreements to repurchase | 465,513 | 465,513 | - | 189,350 | 189,350 | - | |
| Time deposits and saving accounts | 3,316,045 | 3,393,520 | 77,475 | 3,700,454 | 3,639,847 | (60,607) | |
| Derivative financial instruments | 114,703 | 114,703 | - | 175,261 | 175,261 | - | |
Borrowings from financial institutions | 362,403 | 366,400 | 3,997 | 503,692 | 522,103 | 18,411 | |
| Debt issued | 935,219 | 949,700 | 14,481 | 1,215,435 | 1,323,193 | 107,758 | |
| Other financial obligations | 26,853 | 27,066 | 213 | 23,660 | 24,525 | 865 | |
In addition, the fair value estimates presented above, do not attempt to estimate the value of earnings generated by the Bank’s current or future business activities and, as such, do not represent the value of the Bank as an operational company, Below is a summary of the methods used to estimate the fair value of financial instruments:
a) Cash and Bank Deposits
Cash, bank deposits, and financial instruments included in other liabilities are recorded at their face value given their short-term and highly liquid nature.
| b) | Items in course of collection, trading instruments, available for sale investment instruments, resale agreements, and securities loans |
The estimated fair value of these financial instruments was determined by using quoted market prices, available dealer quotes, or market prices of financial instruments with similar characteristics or valuation models. Investments under agreements to repurchase which mature in less than one year are considered to have a fair value which is not materially different from their book value. For fair value estimates of debt investment or values representing debt and included within these items, we take into account variables and additional inputs, to the extent they are applicable, including estimated pre-payment rates and issuers’ credit risk.
F-99
CORPBANCA AND SUBSIDIARIES
NOTES TO THE CONSOLIDATED FINANCIAL STATEMENTS
As of December 31, 2009 and 2010
(c) Loans and accounts receivables to customers
For floating-rate loans that re-price frequently and have no significant change in credit risk, the estimated fair values are based on their carrying values. The estimated fair-values for certain mortgage loans, credit card loans, and other consumer loans are based on quoted market prices of similar loans, adjusted for differences in loan characteristics. Fair values of commercial loans are estimated using discounted cash flow analyses, using interest rates currently being offered for loans with similar terms to borrowers of similar credit quality. Fair values of uncharged loans are estimated using discounted cash flow analyses, derived from the liquidation of underlying guarantees, as applicable (or from other sources of payment), at an estimated discount rate.
(d) Deposits, other foreseeable obligations and term captures
The fair value disclosed for non-interest bearing deposits and savings accounts is the amount payable at the reporting date and, as a result, is equal to the carrying amount. Fair value for time deposits is estimated using a discounted cash flow calculation that applies interest rates currently offered to a schedule of aggregated expected monthly maturities on time deposits. The value of long-term relationships with depositors is not taken into account in estimating the disclosed fair values.
(e) Issued debt instruments, bank obligations, and other financial obligations
Fair values for these financial instruments are estimated using discounted cash flow analyses, using interest rates currently being offered for incremental current loans with similar types of loan agreements, with similar maturities.
(f) Financial instruments included in other assets
Fair values for these financial instruments are estimated using discounted cash flow analyses, based on discount rates implicit in transactions that generated these balances, which are similar to comparable instruments with similar risk assessments.
(g) Financial derivative contracts
The estimated fair value of forward currency contracts was determined by using quoted market prices of financial instruments with similar characteristics and valuation models.
The fair value of interest rate swaps represents the estimated amount that the Bank expects to receive or pay out in order to rescind the contracts or agreements, taking into account the payment term structure of the interest rate yield, underlying volatility, and credit risk for counterparties.
In the absence of market price quotes (direct or indirect) for a particular derivative instrument, current values or other valuation techniques based on mathematical valuation models such as Black-Scholes, Hull and Montecarlo simulations, taking into account the relevant variables, such as option volatility, underlying appreciable correlations, credit risk of the counterparty, volatility of the implicit price volatility, speed at which volatility returns to median value, and correlation between a market variable and its volatility, among others.
Fair value measurement and hierarchy levels
Based on hierarchy levels established by IAS 39 classified according to three level of valuation techniques. A Level 1 for those elements that have been valued through observable inflows or inputs; a Level 2 for elements valued through observable inputs and a Level 3 for unobservable inputs.
The financial assets and liabilities recognized at fair value in the financial statements are classified according to the following order of hierarchy:
Level 1: Inputs are quoted prices (unadjusted) in active markets for identical assets or liabilities that the Company has the ability to access at the measurement date.
F-100
CORPBANCA AND SUBSIDIARIES
NOTES TO THE CONSOLIDATED FINANCIAL STATEMENTS
As of December 31, 2009 and 2010
Level 2: Inputs are inputs other than quoted prices included within Level 1 that are observable for the asset or liability, either directly or indirectly.
Level 3: Inputs are unobservable inputs for the asset or liability.
| Fair Value Measurement at reporting date using | |||||||
| December 31, 2009 | Fair Value Amount | Quoted prices in Active Markets for identical assets (Level 1) | Significant Other observable inputs (Level 2) | Significant unobservable inputs (Level 3) | |||
| ASSETS | |||||||
| Trading securities | 76,156 | 9,182 | 66,974 | - | |||
| Available-for-sale securities | 737,162 | 574,821 | 162,341 | - | |||
| Derivatives | 126,140 | - | 126,140 | - | |||
| Total | 939,458 | 584,003 | 355,455 | - | |||
| LIABILITIES | |||||||
| Derivatives | 114,703 | - | 114,703 | - | |||
| Total | 114,703 | - | 114,703 | - | |||
| Fair Value Measurement at reporting date using | |||||||
| December 31, 2010 | Fair Value Amount | Quoted prices in Active Markets for identical assets (Level 1) | Significant Other observable inputs (Level 2) | Significant unobservable inputs (Level 3) | |||
| ASSETS | |||||||
| Trading securities | 197,580 | 88,085 | 109,495 | - | |||
| Available-for-sale securities | 746,248 | 584,041 | 162,207 | - | |||
| Derivatives | 204,067 | 204,067 | - | ||||
| Total | 1,147,895 | 672,126 | 475,769 | ||||
| LIABILITIES | |||||||
| Derivatives | 175,261 | - | 175,261 | - | |||
| Total | 175,261 | - | 175,261 | - | |||
For the years ended December 31, 2009 and 2010 there have been no reclassifications between levels as shown above.
| NOTE 35 - | RISK MANAGEMENT |
Introduction:
As part of its business activities, the Bank is exposed to various types of risks primarily in terms of financial instruments. A description of the Banks main business activities and policies with regard to risk management is as follows:
Risk Management Structure:
Board of Directors
At Corpbanca, the Board plays a leading role in the field of Corporate Governance, and is responsible for establishing and monitoring the Bank’s risk management structure, for which purpose it has a system of corporate governance aligned with international trends and Chilean regulations, mainly stemming from the Superintendence for Banks and Financial Institutions. One of the main functions of the Board is to monitor, assess, and lead senior management to ensure that actions conform to best practices. In order to do this, various committees, support areas, codes and manuals have been implemented, which provide staff behavior guidelines and allow them to assist in the development of the Bank’s risk management control related functions.
F-101
CORPBANCA AND SUBSIDIARIES
NOTES TO THE CONSOLIDATED FINANCIAL STATEMENTS
As of December 31, 2009 and 2010
Board of Directors’ Committee
The purpose of the Board of Directors’ Committee is to strengthen self-regulation within the Bank, enabling a more efficient Board performance by developing control work of all its activities. To this effect, among other functions, it is responsible for reviewing the accounting and financial reports of transactions with related parties and the remuneration and compensation plan systems for Managers and Senior Executives.
Credit Committees
These committees are comprised of executives belonging to the Management Offices of Business, Risk, and/or Directors, have as their main purpose the resolution of different operations and their respective conditions, which represent credit risks for the Bank. In addition, the Executive Committee, our highest recourse authority, assesses eventual amendments, modifications, and/or updates to our Credit Policies.
Auditing Committee
The purpose of the Auditing Committee is to encourage the effectiveness of the internal control systems at the Bank and their compliance with regulations. Furthermore, it should strengthen and support both the Bank’s Comptroller Management function as well as its autonomy from Management and in turn be the link with and coordinate all tasks between internal auditing and the External Auditors as well as being a nexus between these and the Board of Directors of the Bank.
Committee on the Prevention of Money Laundering and Terrorist Financing
This is an internal body assigned to the prevention of money laundering and terrorism financing, whose primary purpose is to plan and coordinate all policy procedures and compliance activities on the subject. It also monitors work conducted by the Compliance Officer, and its decisions relating to the improvement of any proposed control measures.
Compliance Committee
Its main purpose is to ensure the compliance with the rules set forth in the Codes of Conduct and other complimentary norms, creating and developing the necessary compliance procedures, as well as interpreting, managing and supervising the norms of action therein contained, and resolving any potential conflicts that may arise from the application of such rules and norms. The Compliance Committee is formed by one Officer, the Chief Executive Officer, the Legal Services Division Manager, the Organizational Development Division Manager and the Compliance Officer.
Comptroller
The Comptroller’s Division’s main purpose is to support the Board of Directors and Senior Management in safeguarding the maintenance, application, and performance of our internal control system, as well as to monitor general compliance with our rules and procedures.
Code of General Conduct and Market Information Management Handbook
Corpbanca’s goal is to continue advancing towards being the best bank and having first-class human resources. All employees and Directors of Corpbanca and its Subsidiaries are subject to ethical norms that are based on guiding principles and values designed to uphold the highest standards.
In response to our client’s trust and recognition, which are determining factor in the success of our institution, all employees and Officers must carefully ensure that trust, through the strict compliance with the Code of General Conduct adopted in 2008 by the Management and Auditors’ Committee.
F-102
CORPBANCA AND SUBSIDIARIES
NOTES TO THE CONSOLIDATED FINANCIAL STATEMENTS
As of December 31, 2009 and 2010
Main risks affecting the Bank:
Credit Risk:
Proper risk management, in all areas, and in particular with respect to Credit Risk, constitutes one of the fundamental pillars with respect to the performance of our portfolio, by ensuring that we maintain an adequate risk/return ratio.
Credit Risk management at Corpbanca is based on the following core elements:
| - | Credit Policies. |
| - | Credit Processes. |
| - | Solid risk culture consistent with our strategy. |
| - | Regulated, preventive, and forward-looking risk assessment. |
| - | Human Resources with high level of expertise in credit determinations. |
| - | Active involvement of the Credit Risk Manager during the approval process, using a segmented market structure. |
| - | Defined Tracking and Collections Processes, with the participation of Business, Risk, and Asset Rating and Control areas. |
| - | Risk culture transmission within the Bank, by offering internal and external Training programs for the Business and Risk sectors. |
| - | The Division Manager for Companies Credit Risk performs the “checks and balances” task with respect to the Business Areas. |
In addition, we have a Credit Committee structure relating to Debtor Risk Ratings, with powers that are principally vested in the committees involving the Risk Managers. The concurrence of Bank Directors is required with respect to certain amounts.
These committees define the levels of individual and collective exposure levels with clients, as well as any applicable mitigating conditions, including guarantees and credit agreements, among others.
Pursuant to our risk management tools, our portfolio is divided into:
Normal Risk Portfolio
Watch List Portfolio
Distressed Portfolio
Normal Risk Portfolio
The risk involved is reviewed in the following events:
| - | New credit proposals, including renewals of credit lines and special transactions. |
| - | As determined by the Asset Rating and Control Management Office. |
| - | Every time an account executive determines the occurrence of relevant changes to the debtor’s risk factors that merit higher risk treatment. |
| - | Through a monthly sample reflected by the warning signals system. |
| - | Through the regular review of our various centers of responsibility. |
Watch List Portfolio (“WL”)
It is important to note that credits included within these categories do not necessarily represent expected losses for us.
An asset in WL presents weaknesses that can be corrected. As such, it must receive special attention from the Business Areas and is subject to active control and monitoring measures by the Asset Rating and Control Management Office.
An asset in WL is managed by the Business Areas, which must comply with action plans established by the Watch List Committee.
F-103
CORPBANCA AND SUBSIDIARIES
NOTES TO THE CONSOLIDATED FINANCIAL STATEMENTS
As of December 31, 2009 and 2010
Portfolios in WL, in addition, are reviewed by the Watch List Committee, which is comprised by the Division Manager for Companies Credit Risk and/or the Credit Risk Managers, the Asset Rating and Control Manager, and the Business Area Managers, according to the following schedule:
Every 4 months Debtor review under the following strategies:
V1 Exit
V2 Guaranty
V3 Reduce
Every 6 months V4 Follow-up
V5 Structured Exit
In the event the loan remains unpaid,
The WL Committee conducts special surveillance reviews of all debtors with debts in excess of Ch$50 million.
The Manager of Risk of each business segment and the Asset Rating and Control Manager are responsible to oversee the follow-up and compliance by the account executive of the action and agreement plans of the Watch List Committee.
Plans of action
Everyone must have a defined action plan. The action plan is agreed to by account executives and the Asset Rating and Control Management Office (“GCCA”), and is reviewed by the Watch List Committee.
The action plans consist of:
Debtors with an exit plan The Bank takes a full risk exit decision. These debtors must have a defined payment plan............................................................................................................................................... | V1 | |
| Debtors with a plan to increase their guarantee hedging........................................................................................................................................................................................................ | V2 | |
Debtors with a plan to reduce exposure. Reduce debt to an amount at which the Bank feels comfortable............................................................................................................................................................................................ | V3 | |
Debtors with a monitoring plan. Lower degree of concern, for example: monitoring a company’s committed and not specified capitalization, specific payments arrears, payment of claims disputed by the insurance company......................................................................................................................................................................................................................................................................... | V4 | |
Debtors with a structured payment plan. A defined payment plan for the full debt, needing only control of timely paid installments.............................................................................................................................................. | V5 | |
Satisfactory Asset Debtors. Debtors who have exited the system due to satisfactorily complying with the action plans agreed................................................................................................................................ | V6 |
F-104
CORPBANCA AND SUBSIDIARIES
NOTES TO THE CONSOLIDATED FINANCIAL STATEMENTS
As of December 31, 2009 and 2010
Variables that determine the classification of a Watch List asset
1. Through an analysis of warning signs, that could include:
| · | Debtor Warning Signs |
Change of ownership, partners or guarantors
Issues among partners
Change in the marital status of guarantors
Changes in the ownership of fixed assets
Labor issues
Quality of financial information
| · | Other Warning Signs |
Reduction in sales
Reduction in the gross and operational margins
Increase in cash flow cycles (inventory and accounts receivable turnover ratios)
High retirement rates among partners
Increase in investments and account receivables corresponding to related entities
Structural changes in pertinent markets
| · | Payment Behavior |
Continued renewal requests
Continued internal overdrafts
Payment defaults for 30 days in the SF and/or Defaulted Portfolio
Challenged documents
2. Debtor Risk Rating.
Client merits rating 6 classification,
3. Debtor Analysis
Review of business circumstances and changes in the financial situation due to credit line renewals or requests for one-time credits.
Who obtains access to The Watch List
| · | Account Executives |
| · | Risk Managers |
| · | Approval Committees, as required, |
| · | Defaulted and Expired Portfolio Committees |
| · | Asset Rating and Control Manager |
| · | Business Managers |
Who grants access to the Watch List
The Asset Rating and Control Manager
The Asset Rating and Control Management, who grants the access, changes the plans under Watch List and/or excludes the clients from this segment.
F-105
CORPBANCA AND SUBSIDIARIES
NOTES TO THE CONSOLIDATED FINANCIAL STATEMENTS
As of December 31, 2009 and 2010
The Asset Rating and Control Management Office is the only body that can amend, modify or exclude a customer from the Watch List.
A customer is excluded from the Watch List upon request to the committee, which reviews the background and either approves or rejects. The Business Area is notified of Committee resolutions through a minute issued by the Asset Rating and Control Management Office.
Irregular Portfolio
Includes any portfolio managed by the Regularization Management Office. Notwithstanding its rating, any client who has a rating that is equal to or less than seven, as well as any client who has defaulted on a payment, must be transferred to the Regularization Management Office.
On a monthly basis, the Asset Rating and Control Management Office evaluates and ensures compliance with the aforementioned provision.
This portfolio is reviewed on a monthly basis by a Committee comprised of the Chief Executive Officer, the Division Manager for Companies Credit Risk, the Regularization Manager, the Regularization Sub-manager, and the Asset Rating and Control Manager.
The Asset Rating and Control Management Office’s analysts review the portfolios by analyzing the information provided under Exhibit 5.3 - Risky Credit Brief - which is sent by the Regularization Management Office, or through the Debtors Classification Sheet.
Financial Derivatives Agreements
We maintain strict controls over our open positions in derivative agreements negotiated directly with counterparties. In all cases, credit risk is limited to the fair value of those agreements that are favorable to us (active position), which represent a small fraction of the notional values of those instruments. This exposure to credit risk is managed as part of client loan limits, in addition to potential exposures due to market fluctuations. In order to mitigate risk, we usually operate with deposit margins of the counterparties.
Contingent Commitments
We use several instruments that, notwithstanding their exposure to credit risk, are not reflected in the Balance Sheet: personal guaranties, documented letters of credit, guaranty ballots and commitments to grant loans.
Backings and personal guaranties represent an irrevocable payment obligation. In the event that a guaranteed client defaults on obligations to third parties secured by us, it must make the corresponding payments, such that these transactions represent the same exposure to credit risk as a common loan.
Letters of credit are documented bank commitments on behalf of a client, which are guaranteed by assets in transit to which such letter is related, such that letter of credit are less risk than direct indebtedness. Guaranty ballots are contingent commitments that become effective only if a client defaults on its obligation to execute certain actions, as agreed with third parties.
F-106
CORPBANCA AND SUBSIDIARIES
NOTES TO THE CONSOLIDATED FINANCIAL STATEMENTS
As of December 31, 2009 and 2010
With respect to our commitments to grant loans, we are potentially exposed to losses in an amount equal to the total unused amount of the commitment. However, the probable amount of losses is less than the total unused amount of the commitment. We monitor the maturity of credit lines because, generally, long term commitments have a higher credit risk than short term commitments.
Financial Instruments
For these types of assets, we measure the probability of an unrecoverable issuer default by using internal and external ratings, such as independent risk rating agencies.
Maximum Exposure to Credit Risk
The following table presents the distribution, by financial asset, of our maximum exposure to credit risk, as of December 31, 2009 and 2010, for different balance sheet components, including derivatives, and without deducting security interests in personal or real property or other credit improvements.
| Maximum exposure | ||||
| Note | 2009 | 2010 | ||
| MCh$ | MCh$ | |||
| Loans and receivables from banks | 9 | 86,220 | 63,998 | |
| Loans and receivables from customers | 10 | 4,912,392 | 5,364,980 | |
| Derivative financial instruments | 8 | 126,140 | 204,067 | |
| Investments under agreements to resell | 7 | 51,970 | 75,676 | |
| Financial investments available-for-sale | 11 | 737,162 | 746,248 | |
| Financial investments held-to-maturity | 11 | - | - | |
| Other assets | 16 | 92,307 | 104,207 | |
| Contingent loans | 380,891 | 503,362 | ||
| Total | 6,387,082 | 7,062,538 | ||
F-107
CORPBANCA AND SUBSIDIARIES
NOTES TO THE CONSOLIDATED FINANCIAL STATEMENTS
As of December 31, 2009 and 2010
An analysis of credit risk concentration by industry of financial securities follows:
| 2009 | 2010 | ||||||
| Maximum gross exposure | Maximum net exposure | % | Maximum gross exposure | Maximum net exposure | % | ||
| MCh$ | MCh$ | MCh$ | MCh$ | ||||
| Manufacturing | 234,217 | 230,731 | 6.2% | 443,477 | 435,762 | 11.0% | |
| Mining | 83,855 | 82,607 | 2.2% | 96,298 | 94,623 | 2.4% | |
| Electricity, gas and water | 239,087 | 235,528 | 6.3% | 247,523 | 243,217 | 6.1% | |
| Agriculture and Livestock | 151,272 | 149,021 | 4.0% | 156,951 | 154,220 | 3.9% | |
| Forestry and wood extraction | 14,006 | 13,798 | 0.4% | 41,585 | 40,862 | 1.0% | |
| Fishing | 68,281 | 67,265 | 1.8% | 58,347 | 57,332 | 1.4% | |
| Transport | 184,558 | 181,811 | 4.9% | 163,237 | 160,397 | 4.1% | |
| Communications | 48,739 | 48,014 | 1.3% | 43,350 | 42,596 | 1.1% | |
| Construction | 510,805 | 503,202 | 13.5% | 457,376 | 449,419 | 11.3% | |
| Commerce | 514,520 | 506,862 | 13.6% | 352,848 | 346,709 | 8.8% | |
| Services | 1,621,658 | 1,597,521 | 42.9% | 1,936,250 | 1,904,956 | 48.1% | |
| Others | 105,872 | 104,296 | 2.8% | 31,989 | 31,442 | 0.8% | |
| Subtotal | 3,776,870 | 3,720,656 | 75.7% | 4,029,231 | 3,961,535 | 73.8% | |
| Mortgage Loans | 806,735 | 800,696 | 16.3% | 1,032,639 | 1,023,702 | 19.1% | |
| Consumer Loans | 428,051 | 394,354 | 8.0% | 407,315 | 379,743 | 7.1% | |
| Total | 5,011,656 | 4,915,706 | 100.0% | 5,469,185 | 5,364,980 | 100.0% | |
Guarantees
For purposes of credit risk mitigation, we hold guarantees in our favor. The main guarantees provided by the clients are included below:
For loans to companies, the main guarantees are: Machinery and/or equipment, Site-specific real estate development projects, and Sites or Urban Real Estate.
For loans to individuals, the main guarantees are: Houses, Apartments and Automobiles.
F-108
Credit quality by financial asset class
With regard to the quality of credits, these are described consistent with the standards issued by the Superintendence for Banks and Financial Institutions. A detail by credit quality is summarized as follows:
December 31, 2009
| Individual Portfolio | Group Portfolio | ||||||||||||||
| A1 | A2 | A3 | B1 | B2 | B3 | C | Impaired | Total | Normal | Impaired | Total | General Total | |||
| MCh$ | MCh$ | MCh$ | MCh$ | MCh$ | MCh$ | MCh$ | MCh$ | MCh$ | MCh$ | MCh$ | MCh$ | MCh$ | |||
| Loans and receivables to banks | 72,636 | 9,524 | 4,066 | - | - | - | - | - | 86,226 | - | - | - | 86,226 | ||
| Loans and receivable to customers | |||||||||||||||
| Commercial loans: | |||||||||||||||
| General Commercial loans | 9,005 | 24,269 | 1,301,811 | 891,532 | 503,887 | - | - | 115,519 | 2,846,023 | 248,326 | 49,867 | 298,193 | 3,144,216 | ||
| Foreign Trade loans | - | - | 57,910 | 47,411 | 45,758 | - | - | 68,736 | 219,815 | 12,603 | 1,059 | 13,662 | 233,477 | ||
| Lines of credit and overdrafts | - | - | 1,724 | 5,879 | 11,431 | - | - | 1,466 | 20,500 | 25,831 | 1,990 | 27,821 | 48,321 | ||
| Factored receivables | - | - | - | - | - | - | - | - | - | 50,034 | 3,514 | 53,548 | 53,548 | ||
| Leasing contracts | - | 22,435 | 27,013 | 82,705 | 103,085 | - | - | 23,554 | 258,792 | 29,733 | 7,332 | 37,065 | 295,857 | ||
| Other outstanding loans | - | - | 157 | 114 | 210 | - | - | 18 | 499 | 853 | 99 | 952 | 1,451 | ||
| Subtotal Commercial loans | 9,005 | 46,704 | 1,388,615 | 1,027,641 | 664,371 | - | - | 209,293 | 3,345,629 | 367,380 | 63,861 | 431,241 | 3,776,870 | ||
| Consumer loans | - | - | - | - | - | - | - | - | - | 399,344 | 28,707 | 428,051 | 428,051 | ||
| Mortgage loans | - | - | - | - | - | - | - | - | - | 778,143 | 28,592 | 806,735 | 806,735 | ||
| Total loans and receivable to customers | 9,005 | 46,704 | 1,388,615 | 1,027,641 | 664,371 | - | - | 209,293 | 3,345,629 | 1,544,867 | 121,160 | 1,666,027 | 5,011,656 | ||
| Financial investments | - | - | - | - | - | - | - | - | - | - | - | - | - | ||
F-109
CORPBANCA AND SUBSIDIARIES
NOTES TO THE CONSOLIDATED FINANCIAL STATEMENTS
As of December 31, 2009 and 2010
December 31, 2010
| Individual Portfolio | Group Portfolio | ||||||||||||||
| A1 | A2 | A3 | B1 | B2 | B3 | C | Impaired | Total | Normal | Impaired | Total | General Total | |||
| MCh$ | MCh$ | MCh$ | MCh$ | MCh$ | MCh$ | MCh$ | MCh$ | MCh$ | MCh$ | MCh$ | MCh$ | MCh$ | |||
| Loans and receivables to banks | 8,604 | - | 41,920 | 12,857 | 777 | - | - | 29 | 64,187 | - | - | - | 64,187 | ||
| Loans and receivable to customers | |||||||||||||||
| Commercial loans: | |||||||||||||||
| General Commercial loans | 76,742 | 38,027 | 1,239,111 | 897,967 | 727,483 | - | - | 115,575 | 3,094,905 | 205,482 | 67,104 | 272,586 | 3,367,491 | ||
| Foreign Trade loans | - | - | 48,093 | 72,944 | 69,549 | - | - | 51,998 | 242,584 | 17,063 | 1,329 | 18,392 | 260,976 | ||
| Lines of credit and overdrafts | - | - | 1,044 | 5,691 | 17,652 | - | - | 1,133 | 25,520 | 21,069 | 5,773 | 26,842 | 52,362 | ||
| Factored receivables | 461 | - | 16,871 | 9,360 | 32,156 | - | - | 1,615 | 60,463 | 4,354 | 1,799 | 6,153 | 66,616 | ||
| Leasing contracts | - | 22,349 | 18,569 | 61,219 | 117,040 | - | - | 30,495 | 249,672 | 20,174 | 10,689 | 30,863 | 280,535 | ||
| Other outstanding loans | - | - | 73 | 40 | 267 | - | - | 12 | 392 | 833 | 36 | 869 | 1,261 | ||
| Subtotal Commercial loans | 77,203 | 60,376 | 1,323,761 | 1,047,221 | 964,147 | - | - | 200,828 | 3,673,536 | 268,975 | 86,730 | 355,705 | 4,029,241 | ||
| Consumer loans | - | - | - | - | - | - | - | - | - | 381,235 | 26,080 | 407,315 | 407,315 | ||
| Mortgage loans | - | - | - | - | - | - | - | - | - | 999,636 | 33,003 | 1,032,639 | 1,032,639 | ||
| Total loans and receivable to customers | 77,203 | 60,376 | 1,323,761 | 1,047,221 | 964,147 | - | - | 200,828 | 3,673,536 | 1,649,846 | 145,813 | 1,795,659 | 5,469,195 | ||
| Financial investments | |||||||||||||||
F-110
The past due analysis by financial asset class is as follows:
| December 31, 2009 | |||||||
1-29 days | 30-89 days | 90 days or more | Total | ||||
| MCh$ | MCh$ | MCh$ | MCh$ | ||||
| Loans and receivables from banks | - | - | - | - | |||
| Loans and receivables from customers: | |||||||
| Commercial loans | 5,491 | 6,671 | 31,384 | 43,546 | |||
| Mortgage loans | 487 | 293 | 7,037 | 7,817 | |||
| Consumer loans | 1,109 | 2,548 | 3,251 | 6,908 | |||
| Financial investments | |||||||
| Total | 7,087 | 9,512 | 41,672 | 58,271 | |||
| December 31, 2010 | |||||||
1-29 days | 30-89 days | 90 days or more | Total | ||||
| MCh$ | MCh$ | MCh$ | MCh$ | ||||
| Loans and receivables from banks | |||||||
| Loans and receivables from customers: | |||||||
| Commercial loans | 5,846 | 5,277 | 37,633 | 48,756 | |||
| Mortgage loans | 622 | 590 | 6,711 | 7,923 | |||
| Consumer loans | 1,364 | 2,323 | 2,507 | 6,194 | |||
| Financial investments | |||||||
| Total | 7,832 | 8,190 | 46,851 | 62,873 | |||
The fair value of the guarantees over defaulted but not damaged assets was MCh$63,076 as of December 31, 2009 and MCh$143,855 as of December 31, 2010.
Liquidity Risk is the risk that an entity has difficulties in obtaining the necessary funds to meet its obligations with respect financial liabilities.
On a daily basis, we are exposed to cash capital requirements related, among others, to transfers from checking accounts, long-term deposit payments, guarantee payments, disbursements of transactions involving derivatives, etc. In accordance with regularly accepted baking practices, we do not maintain enough cash to cover the balance of such positions because, according to prior experience, only a minimum amount of funds will be withdrawn, something that can be foreseen with a high degree of certainty.
The Board of Directors sets limits on a minimum portion of funds set to expire and available funds to cover such payments, as well as over a minimum level of interbank transactions and other credit facilities that must be available in order to cover transfers at unexpected demand levels, all of which are reviewed periodically. In addition, we must comply with regulatory limits for any mismatch in tenor.
These limits affect mismatches between future flows of income and expenses considered individually, and are the following:
| (i) | mismatches of up to 30 days for all currencies [up to one time basic capital; |
| (ii) | mismatches of up to 30 days for foreign currencies representing up to one time the basic capital; and |
| (iii) | mismatches of up to 90 days for all currencies two times the basic capital. |
Considering the nature of transactions, we adopt an adjusted methodology in order to measure mismatches and compliance with its regulatory limits. This methodology allows us to consider, in the measurement of the mismatches, a part of on-demand deposits, deposits with fixed maturities, and saving accounts. Although contractually funds can be disbursed at any time, they tend to remain in the Bank for relatively long periods of time, a tendency that we can foresee with reasonable confidence.
F-111
CORPBANCA AND SUBSIDIARIES
NOTES TO THE CONSOLIDATED FINANCIAL STATEMENTS
As of December 31, 2009 and 2010
We are exposed to the effects of exchange rate volatility, which are stated or indexed in its financial and cash flow statements. The Board of Directors establishes limits on net exposure levels by currency and on hedging positions during the day and at closing, which are reviewed on a daily basis.
F-112
The following tables details assets and liabilities by currency as of December 31, 2009 and 2010:
| As of December 31, 2009 | US$ | Euros | Yens | Pounds | Other currencies | UF | Pesos | TC | Total |
| MCh$ | MCh$ | MCh$ | MCh$ | MCh$ | MCh$ | MCh$ | MCh$ | ||
| Cash and due from bank | 26,288 | 815 | 12 | 57 | 113 | - | 83,046 | - | 110,331 |
| Items in course of collection | 31,288 | 580 | 4,298 | 16 | - | - | 59,614 | - | 95,796 |
| Trading portfolio financial assets | 1,949 | - | - | - | - | 54,686 | 19,521 | - | 76,156 |
| Investments under agreements to resell | 152 | - | - | - | - | 23,189 | 28,629 | - | 51,970 |
| Derivative financial instruments | 13,663 | - | - | - | - | - | 112,477 | - | 126,140 |
| Loans and receivables to banks | 22,625 | - | - | - | - | - | 63,595 | - | 86,220 |
| Loans and receivables to customers | 554,670 | 632 | - | 61 | - | 1,916,877 | 2,425,815 | 14,337 | 4,912,392 |
| Financial investments available-for-sale | 5,663 | - | - | - | - | 391,007 | 340,492 | - | 737,162 |
| Financial investments held-to-maturity | - | - | - | - | - | - | - | - | - |
| Investments in other companies | - | - | - | - | - | - | 3,583 | - | 3,583 |
| Intangibles | 142 | - | - | - | - | - | 13,488 | - | 13,630 |
| Property, plant and equipment | 106 | - | - | - | - | - | 55,106 | - | 55,212 |
| Current income tax provision | - | - | - | - | - | - | - | - | - |
| Deferred income taxes | 1,947 | - | - | - | - | - | 17,113 | - | 19,060 |
| Other Assets | 5,384 | 81 | (4,068) | - | (98) | - | 91,008 | - | 92,307 |
| Total Assets | 663,877 | 2,108 | 242 | 134 | 15 | 2,385,759 | 3,313,487 | 14,337 | 6,379,959 |
| - | |||||||||
| Current accounts and demand deposits | (39,584) | (435) | (1) | (12) | (15) | (1,631) | (454,592) | - | (496,270) |
| Items in course of collection | (27,334) | (296) | (241) | (77) | - | - | (36,906) | - | (64,854) |
| Investments under agreements to repurchase | (1,487) | - | - | - | - | (2,169) | (461,857) | - | (465,513) |
| Time deposits and saving accounts | (402,767) | (632) | - | - | - | (283,980) | (2,628,665) | (1) | (3,316,045) |
| Derivative financial instruments | (14,930) | - | - | - | - | - | (99,773) | - | (114,703) |
| Borrowings from financial institutions | (357,290) | (744) | - | (45) | - | - | (4,294) | (30) | (362,403) |
| Debt issued | (101,386) | - | - | - | - | (833,612) | (221) | - | (935,219) |
| Other financial obligations | - | - | - | - | - | (17,763) | (4,060) | (5,030) | (26,853) |
| Current income tax provision | - | - | - | - | - | - | (7,831) | - | (7,831) |
| Deferred income taxes | - | - | - | - | - | - | (15,644) | - | (15,644) |
| Provisions | (118) | - | - | - | - | - | (49,686) | - | (49,804) |
| Other Liabilities | (191) | - | - | - | - | (14) | (17,266) | - | (17,471) |
| Total Liabilities | (945,087) | (2,107) | (242) | (134) | (15) | (1,139,169) | (3,780,795) | (5,061) | (5,872,610) |
| Net Assets (liabilities) | (281,210) | 1 | - | - | - | 1,246,590 | (471,122) | 9,276 | 503,535 |
| Contingent loans | 325,713 | 3,107 | 5,783 | - | - | 139,485 | 432,868 | - | 906,956 |
| Net asset (liability) position | 44,503 | 3,108 | 5,783 | - | - | 1,386,075 | (38,254) | 9,276 | 1,410,491 |
| As of December 31, 2009 | |||||||||
| Total Assets | 663,877 | 2,108 | 242 | 134 | 15 | 2,385,759 | 3,312,987 | 14,337 | 6,379,459 |
| Total Liabilities | (945,087) | (2,107) | (242) | (134) | (15) | (1,139,169) | (3,784,109) | (5,061) | (5,875,924) |
| Net Assets (liabilities) | (281,210) | 1 | - | - | - | 1,246,590 | (471,122) | 9,276 | 503,535 |
| Contingent loans | 325,713 | 3,107 | 5,783 | - | - | 139,485 | 432,868 | - | 906,956 |
| Net asset (liability) position | 44,503 | 3,108 | 5,783 | - | - | 1,386,075 | (38,254) | 9,276 | 1,410,491 |
The analysis, by contractual maturity, of assets and liabilities can be found in Note 36.
F-113
| As of December 31, 2010 | US$ | Euros | Yens | Pounds | Other currencies | UF | Pesos | TC | Total |
| MCh$ | MCh$ | MCh$ | MCh$ | MCh$ | MCh$ | MCh$ | MCh$ | ||
| Cash and due from bank | 73,966 | 7,433 | 89 | - | 413 | - | 120,438 | - | 202,339 |
| Items in course of collection | 16,765 | 810 | 1,648 | 532 | 1 | - | 59,924 | - | 79,680 |
| Trading portfolio financial assets | 1,922 | - | - | - | - | 45,666 | 149,992 | - | 197,580 |
| Investments under agreements to resell | 1,792 | - | - | - | - | 11,869 | 62,015 | - | 75,676 |
| Derivative financial instruments | 24,213 | - | - | - | - | - | 179,854 | - | 204,067 |
| Loans and receivables to banks | 64,023 | - | - | - | - | - | (25) | - | 63,998 |
| Loans and receivables to customers | 613,904 | 896 | - | 71 | - | 2,220,718 | 2,519,514 | 9,877 | 5,364,980 |
| Financial investments available-for-sale | 17,955 | - | - | - | - | 515,450 | 212,843 | - | 746,248 |
| Financial investments held-to-maturity | - | - | - | - | - | - | - | - | |
| Investments in other companies | - | - | - | - | - | - | 3,583 | - | 3,583 |
| Intangibles | 174 | - | - | - | - | - | 12,922 | - | 13,096 |
| Property, plant and equipment | 98 | - | - | - | - | - | 53,332 | - | 53,430 |
| Current income tax provision | - | - | - | - | - | - | - | - | |
| Deferred income taxes | 1,138 | - | - | - | - | - | 20,818 | - | 21,956 |
| Other Assets | 5,748 | - | - | - | - | 8 | 98,451 | - | 104,207 |
| Total Assets | 821,698 | 9,139 | 1,737 | 603 | 414 | 2,793,711 | 3,491,259 | 9,877 | 7,130,840 |
| Current accounts and demand deposits | (70,243) | (6,688) | - | (508) | (39) | (2,108) | (532,478) | - | (612,064) |
| Items in course of collection | (12,512) | (701) | (88) | (10) | (214) | - | (28,000) | - | (41,525) |
| Investments under agreements to repurchase | (10,213) | - | - | - | - | (4,946) | (174,191) | - | (189,350) |
| Time deposits and saving accounts | (590,730) | (609) | - | - | - | (371,817) | (2,737,297) | (1) | (3,700,454) |
| Derivative financial instruments | (19,504) | - | - | - | - | - | (155,757) | - | (175,261) |
| Borrowings from financial institutions | (462,896) | (13,387) | - | (71) | - | - | (27,287) | (51) | (503,692) |
| Debt issued | (83,328) | - | - | - | - | (1,131,913) | (194) | - | (1,215,435) |
| Other financial obligations | - | - | - | - | - | (14,412) | (4,959) | (4,289) | (23,660) |
| Current income tax provision | - | - | - | - | - | - | (7,168) | - | (7,168) |
| Deferred income taxes | - | - | - | - | - | - | (21,244) | - | (21,244) |
| Provisions | (862) | - | - | - | - | - | (78,885) | - | (67,732) |
| Other Liabilities | (454) | - | - | - | - | - | (20,544) | - | (20,998) |
| Total Liabilities | (1,250,742) | (21,385) | (88) | (589) | (253) | (1,525,196) | (3,788,004) | (4,341) | (6,578,583) |
| Net Assets (liabilities) | (429,044) | (12,246) | 1,649 | 14 | 161 | 1,268,515 | (296,745) | 5,536 | 552,257 |
| Contingent loans | 193,731 | 3,684 | 4,469 | 254 | - | 201,628 | 648,517 | - | - |
| Net asset (liability) position | (235,313) | (8,562) | 6,118 | 268 | 161 | 1,470,143 | 351,772 | 5,536 | 552,257 |
| As of December 31, 2010 | |||||||||
| Total Assets | 821,698 | 9,139 | 1,737 | 603 | 414 | 2,793,711 | 3,491,259 | 9,877 | 7,130,840 |
| Total Liabilities | (1,250,742) | (21,385) | (88) | (589) | (253) | (1,525,196) | (3,788,004) | (4,341) | (6,578,583) |
| Net Assets (liabilities) | (429,044) | (12,246) | 1,649 | 14 | 161 | 1,268,515 | (296,745) | 5,536 | 552,257 |
| Contingent loans | 193,731 | 3,684 | 4,469 | 254 | - | 201,628 | 648,517 | - | - |
| Net asset (liability) position | (235,313) | (8,562) | 6,118 | 268 | 161 | 1,470,143 | 349,290 | 5,536 | 552,257 |
The analysis, by contractual maturity, of assets and liabilities can be found in Note 36.
F-114
QUANTITATIVE AND QUALITATIVE DISCLOSURES ABOUT MARKET RISK
General
This section describes financial risks, liquidity risks, and market risks to which Corpbanca is exposed in its business activities. Additionally, it includes an explanation of the internal tools and the regulatory methods used to control these risks, the portfolios to which these risks apply, and quantitative information showing the level of exposure to financial risk assumed by us.
The main types of risks related to our business activities are market, liquidity, operational, and credit risks. The effectiveness with which we can manage the balance between risk and profitability is an important factor in determining our capability to generate sustainable profit growth on a long term basis. Our senior management focuses greatly on risk management.
Policies
Our policy with respect to managing its assets and liabilities seeks to maximize our net interest revenue and return on assets in a manner consistent with risk management related to interest rates, liquidity and currency, while remaining under any limits set forth by Chilean banking regulations and our internal policies relating to the limitation of risk.
Our assets and liabilities management policies are developed by the Committee of Assets and Liabilities (A&L Committee) in accordance with the guidelines set forth by the Board of Directors. The A&L Committee is comprised of eleven members, including two Vice-Presidents, one director, the Chief Executive Officer, the Division Manager - International and Treasury, the Financial Risk Manager, Chief Financial Officer, Retail Banking, Non-Banking Financial Services and Commercial Banking,. The role of the Financial Risk Manager and the A&L Committee is to ensure that treasury transactions are in constant compliance with all policies and internal limits, as well as all applicable regulations. The A&L Committee meets on a monthly basis. Three additional committees make part of our corporate governance on risk management: the interest rate and liquidity Management Committee, the Market Committee (meets every week), and the Daily Coordination Committee. These committees analyze our positions with respect to Bank assets and liabilities, reviewing and updating our base working scenario and defined strategies. Members of the Financial Risk Area are independent from the areas in charge of banking operations and from the International and Treasury Division.
The International and Treasury Division handles the business activities of the treasury department, in accordance with the guidelines set forth by the A&L Committee and Control of Credit Risk and Market Risk departments. Market Risk Management activities consist of: (i) applying VaR techniques (as below); (ii) determining the market value of the fixed income portfolios (including derivatives) and measuring daily profits and losses related to trading activities; (iii) reviewing, following-up and comparing the VaR and other relevant exposures against existing limits; and (iv), providing information regarding relevant activities to the A&L Committee, other members of the senior management, and the treasury and international division.
Our market risk analysis is focused on managing the exposure to risks related to: (i) interest rate risk relating to the fixed income portfolio (which is comprised of portfolios for “negotiation” and “available for sale”), and which mainly consists of government bonds, corporate bonds, mortgage notes issued by third parties and derived from interest rates and currency; (ii) interest rate risk related with asset and liability positions; (iii) liquidity; and (iv) net currency exchange position, which includes the totality of our assets and liabilities in foreign currency (mainly in US dollars), including derivatives that secure certain foreign currency gaps arising from investments and financings.
F-115
Market Risk
Definition
Represents the risk of losses related to adverse changes in market prices corresponding to assets and financial liabilities. This risk is closely related to the volatility of the market (interest market rates, exchange rates, and prices) and to its negative impact in the value of the assets and liabilities.
It is classified by:
Interest Rate
Risk of losses caused by adverse shifts in inter-temporal interest rate structure. This is generated by increases in the yield curve or decreases in the yield curve with respect to the risk free performance. These shifts have an impact on long and short term results.
Spread
Risk of losses related to adverse shifts in existing spreads on the yields of the different financial assets and liabilities, which can reflect particular liquidity conditions of those assets, deterioration of credit conditions, or specific pre-payment clauses the exercise of which can result in a deterioration of our capability to create future margin.
Exchange Rate
Risk of losses caused by adverse shifts in exchange rates. This risk is caused by financial mismatches between the assets and liabilities (in and off the balance sheet).
Optionality
Risk of financial losses related to positions in explicit or implicit options in the balance sheet, purchased or delivered, including, for example, those related to mortgage credits and education credits.
International and Treasury Division
The International and Treasury Division is responsible for providing the necessary resources to the business areas in order to ensure a healthy structure of financing and liquidity. Likewise, it must generate income through the development of financial solutions in treasury and foreign commerce products for clients in our different segments.
We have established different interrelated specialized units, through which investment and financing decisions are reached. These units not only support our business pillars, but also constitute units of business that determine the profitability of installed capital, complementing our traditional banking business.
Liquidity Management
We have a unit that is responsible for balance sheet management (in the International and Treasury Division), the purpose of which is to efficiently manage our balance sheet, ensuring a permanent and competitive financing of assets, the prompt payment of liabilities, and compliance with regulatory margins at all times.
Balance Sheet Management
We have a unit that is responsible for balance sheet management, the purpose of which is to efficiently manage the balance sheet, ensuring the generation of a sustainable financial margin by managing inflation and interest rate risk.
Our assets are comprised of mortgage (mainly fixed income), commercial and consumer loans.
Our liabilities include fixed rate deposits payable on demand and upon maturity to clients that, in most cases, have maturities of less than a year. The structure of long-term debt includes senior/subordinated loans.
F-116
We manage our balance sheet with the goal of maximizing net interest margin by maintaining a proportion of deposits payable on demand under which no interest is paid, as well as short term deposits, and by granting loans for longer periods which allow us to benefit from the slope of the yield curve within the context of the financial risk management previously agreed-to by senior management.
As a result of our long term financing policies and protection of the short term financial margin, our portfolio includes Chilean central bank bonds and notes and interest rate derivatives accounting hedging positions.
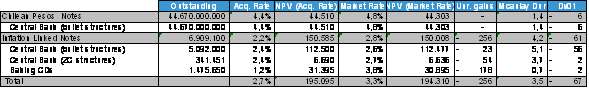
Exhibit 1: Assets and Liabilities Management Portfolio, December 2010. Figures in Million Chilean Pesos.
Portfolio Management
Additionally, we have a unit that is responsible for managing a portfolio of non-derivative financial instruments with the purpose of capturing differentials in the yield curve and/or shifts in rate structures to generate capital gains. Derivative instruments in this portfolio are only and exclusively utilized for hedging purposes (economic and accounting) or in order to capture premiums between the fixed income and the derivatives market.
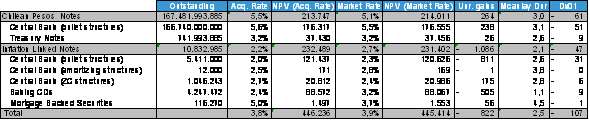
Exhibit 2: Investment Portfolio, December 2010. Figures in Million Chilean Pesos.
Trading Activities
We have a trading area that is responsible for the active trading of instruments of high liquidity, including central bank bonds, bank notes and/or corporate bonds, derived from interest rate or currency.
This area is responsible for (a) identifying short-term income opportunities by capturing transitory arbitrage opportunities in prices and yield curve differentials (base and spreads), (b) managing financial risks arising from transactions with clients, and (c) creating high added-value financial solutions by obtaining returns consistent with the financial risks of existing credits.
Financial Risk Management
The Bank has a Financial Risk Management Office (under the Management Division for Planning and Control), the main purpose of which is to identify, measure, and control financial risks, by permanently informing upper management of risk profiles and by anticipating scenarios that may compromise our short, medium or long term financial situation.
The Financial Risk Management Office is responsible for ensuring regulatory and internal compliance related to financial risks, ensuring compliance with the standards and recommendations of regulators and with good business practices provided by the Basel Committee.
F-117
On a daily basis, he Financial Risk Management Office reports on exposures and is responsible of reporting any excess above the limit structure approved by upper management.
Policies, limits and methodologies are approved annually by the A&L Committee and/or the Board of Directors.
The A&L Committee, a committee comprised of one Director, two Vice Presidents, all Division Managers, and the Division Manager for Risk Control and Management, is chaired by the Chief Executive Officer, and is the highest corporate body responsible of the review of the financial strategies.
The Board of Directors is responsible for approving policies and limits on an annual basis.
Market risk measurement is based on widely utilized and accepted tools.
Value at Risk
Historic simulation method that uses a level of confidence: 5% and 300 days of review.
The Financial Risk Management Office regularly uses contrast tests with the purpose of establishing the predicted quality of its model of value at risk (Test of the frequency of excesses of Chistoffersen).
As of December 31, 2010, the VaR reached a value of 282 Mio CLP
Net Interest margin and Market value sensitivity
We use the sensibility net interest margin and market value sensitivity to quantify the interest rate risk of the balance sheet.
Both measures include total assets and liabilities in the balance sheet with exception of the Trading Portfolios.
Interest rate sensitive items are represented:
| · | On a contractual basis in the case of fixed income products |
| · | Next date of repricing in the case of floating rate products |
Non-paid assets and cost-free liabilities are registered as non-interest-rate-sensitive:
| · | Cash flow |
| · | Other assets and liabilities |
| · | Deteriorated loans |
| · | Provisions |
| · | Capital and reserves |
Changes in equity are determined by assuming a parallel shift of 100 pbs under in interest rate structures. The calculation is made separately for national currency and foreign currency (USD and the rest of the currencies). The total risk is the sum of the absolute value of both items.
Stress Testing
The Financial Risk Management Office develops, and regularly informs the A&L Committee, stress test results that include parallel and non parallel shifts in the yield curve, volatility shocks and historical scenarios among others.
Fair Value
On a daily basis, we mark to market all our positions in financial instruments (trading and available for sale) and in derivative instruments. As of this date, we do not have classified instruments such as term investments.
F-118
All aspects related to the appreciation of financial and derivative instruments are included in the “Fair Value Policy” which is reviewed and approved annually by the Board of Directors.
In order to obtain fair values, we refer mainly to market quotes (yields on expiration, par rates, spot prices, currency forwards, and inflation forwards, among others). In the event such market quotes are not available, we refer to quotes for similar instruments, all of which are adjusted to represent, as precisely as possible, the value that an instrument would have in an arms-length, free market transaction. In cases in which no reliable market quotes or similar instruments are available, we use generally accepted valuation methods.
EXPOSURE DETAILS
Foreign Exchange Risk
The Bank is exposed to exchange rate volatility which is stated or indexed in our financial positions and cash flow statements. On an annual basis, our Board of Directors establishes limits for levels of net exposure related to currency holdings at the closing of any day, and such levels are reviewed daily by the Financial Risks Management Office.
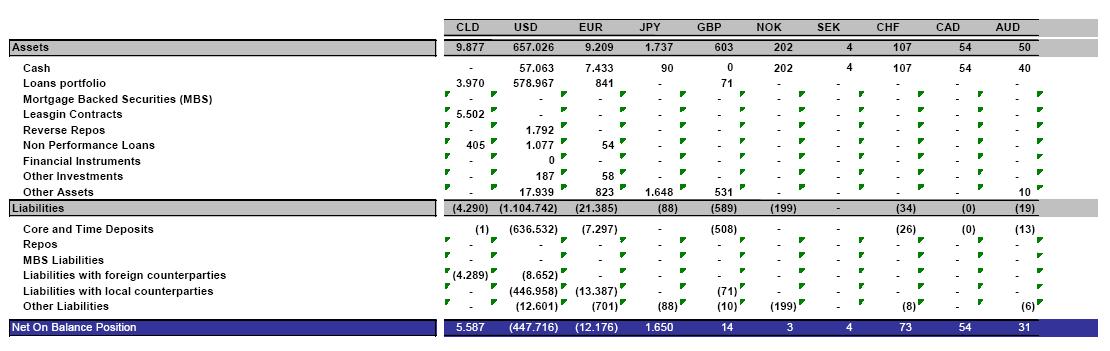
Exhibit 3: Balance Sheet Breakdown by main currencies, figures in Millions Chilean Pesos.
Interest Rate Risk (Banking Book)
We are exposed to volatility in market interest rates over structural exposures. As a result of changes in interest rates, margins may increase, but may also be reduced and generate losses in the event of adverse shifts.
The Board of Directors establishes the limits in the Banking Book, such limits must be reported on a monthly basis to the Chilean Superintendency of Banks and Financial Institutions. As of December 31 2010, such limits were: MCh$89,406, and of MCh$198,564, respectively, and MCh$45,617 and MCh$115,377, respectively.
F-119
The following exhibit shows the structural exposure generated by assets and liabilities mismatch.

Exhibit 4: Interest Rate Risk, Banking Book. Figures in Million Chilean Pesos.
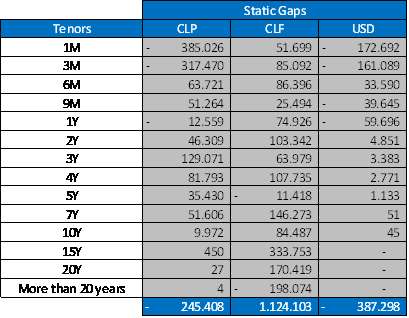
Exhibit 5: Static Interest Rate Gaps. Figures in Million Chilean Pesos.
Assuming that financial assets and liabilities as of December 31, 2010 remain until its expiration without any action on our part to modify the exposure to risk generated by interest rates, an immediate and sustained increase of market interest rates of 1% during the maturity will reduce the net profits in MCh$43,549.
F-120
Market Risks (Trading Book)
Market risk represents the possibility of losses due to unexpected changes in interest rates, foreign exchange rates, and inflation rates and other rates or prices.
The Central Bank of Chile sets the regulatory limits for the sum of: Interest Rate, Currency and Optionality risks in trading portfolio. We must permanently comply with such limits and report, on a weekly basis, to the Chilean Superintendency of Banks and Financial Institutions, our risk positions and compliance with such limits. In addition, we must report to the Chilean Superintendency of Banks and Financial Institutions, on a monthly basis, our consolidated risk positions with respect to our subsidiaries and foreign branches.
The regulatory limit establishes that the tier 1 plus tier 2 capital must be enough to cover an amount equal to 8% of the risk weighted assets for credit and market risk. As of December 31 2010, our exposure to interest rate risk in the trading book was MCh$21,240 for currency risk, and MCh$944 and MCh$2,116 for Optionality risk.
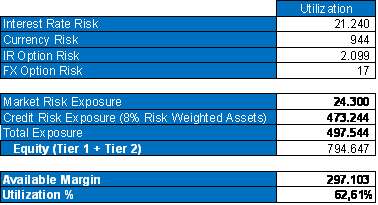
Exhibit 6:Trading Book. Figures in Millions Chilean Pesos.
LIQUIDITY RISK
The liquidity risk is related to the impossibility of:
a) Complying with contractual obligations in a timely manner;
b) Liquidating positions without significant losses caused by abnormal volumes of operation;
c) Avoiding regulatory penalties caused by the default of regulatory indexes; and
d) Financing business and treasury activities in a competitive fashion.
Two sources of risk are identified:
Endogenous: risk situations caused by controllable corporate decisions:
| · | High liquidity reached by reduced liquid assets or mismatches of material assets and liabilities. |
| · | Low diversification or high concentration of financial and commercial assets according to issuer, maturity, and risk factors. |
| · | Deficient management of security hedges, flows or credit in terms of hedging efficiency, correlation between changes in value, sensibility ratios of hedged items, and derivatives, among others. |
| · | Adverse corporate reputational effects that result in lack of or non competitive access to financing. |
F-121
Exogenous: risk situations caused by shifts in financial markets and which are not within our control:
| · | Extreme unexpected shifts or corrections/events in local and international markets. |
| · | Regulatory changes, intervention by currency authorities, among others. |
The Local Board of Directors delegates the management of Liquidity in the A&L Committee and, as such, this committee, which is chaired by the Chief Executive Officer, is the body responsible for approving and reviewing financing strategies and transfer prices to the business areas. Having monthly meetings, its responsibilities include:
| · | Setting objectives in connection with Liquidity Management |
| · | Evaluating and following-up on Liquidity Strategies |
| · | Creating a structure/situation of Liquidity |
| · | Setting the standards of action to reach a desired structure of liquidity |
| · | Reviewing, on a monthly basis, our liquidity and variable alerts, and the timely reporting of such review to the Board of Directors |
| · | Reviewing and approving, at the beginning of each fiscal year, the Management Policy of Liquidity |
| · | Reviewing and approving, at the beginning of each fiscal year, the structure of Liquidity limits |
| · | Reporting, through its President, to the rest of the company |
| · | Approving financing plans |
| · | Knowing and reviewing regulations set forth by regulatory bodies |
| · | Evaluating political/economics scenarios - local and worldwide |
Meanwhile, the Financial Risks Management Office is responsible for:
| · | Ensuring regulatory and internal liquidity compliance |
| · | Controlling and informing exposures, on a daily basis |
| · | Implementing limits policies and methodologies |
| · | Implementing liquidity risk measurement models |
We use the following tools for the measurement and control of liquidity risk:
| · | Cumulative Cash flow gaps |
| · | Proportion of Liquid Assets/Short term Liabilities |
| · | Concentration of depositors |
| · | Liquidity Stress Tests |
Finally, and based on our continuous monitoring, we review all aspects of the liquidity management process, in light of potential risks to which we may be exposed in this area. The liquidity Contingency plan is an integral component of our review and its purpose is to provide a framework that allows us to determine appropriate actions for liquidity crisis events, For such purposes, we have a “Liquidity Contingency Plan” that is reviewed and approved by the Board of Directors and the A&L Committee on a annual basis.
F-122
The accumulated mismatches as of December 31, 2010, are as follows:

Exhibit 7: Cumulative Cash Flow Gaps. Figures in Million Chilean Pesos.
COUNTERPARTY RISK
As a result of our client activity, we have counterparty exposures generated by the probability that our debtors default on their payments with respect to financial derivative agreements, as originally agreed. We set levels of credit risk by setting limits to the concentration of such risk in individual debtors, groups of debtors, and country and industry segments. Such risks are under permanent review by the Risk Division, and the limits per debtor, groups of debtors, products, and industry and country, are reviewed and approved at least once a year by our Board of Directors and our Senior Risk Committee.
Our exposure to credit risks is managed through a regular analysis of the debtors capacity and potential debtors to comply with their payment obligations in accordance with contractual terms of such loans, and is mitigated by obtaining guarantees.
We have strict controls over open positions in derivative agreements directly negotiated with counterparties, Our exposure to credit risk is managed as part of our limits for loans to clients, jointly with potential exposures caused by market fluctuations.
Operational Risk
Corpbanca adopts the Basel Committee’s definition of operational risk, which is presented below:
“The risk of loss resulting from inadequate or failed internal processes, people and systems, or from external events”
These risks, it not handled appropriately, can result in service unavailability, information deficiencies, financial losses, increased costs, loss of professional reputation or failure to maintain or increase market share.
For its operational risk management, Corpbanca has established and imposed an appropriate structure of responsibilities, which is detailed below:
F-123
OPERATIONAL RISK MANAGEMENT ROLES AND RESPONSIBILITIES
Board of Directors
The Board of Directors must ensure that the management mechanisms used to manage operational risk, such as the definition of roles and responsibilities (set out in this policy), are consistent with the guidelines laid out by our shareholders on this subject.
Operational Risk and Information Safety Committee
It is responsible for maintaining a visible commitment with respect to the management of operational risks, at the most senior executive level.
Area in charge of Operational Risk Management
Its mission is to identify, promote, implement and follow up on the execution of a policy framework for managing operational risk, which must be consistent with our approach, objectives and strategic goals.
Division Management
The Division Management areas are in charge of managing operational risk within their respective divisions. Their responsibilities, among others, include:
| · | Implementing operational risk policy in their respective business units. |
| · | The more significant operational risk management responsibilities within their respective divisions include the following activities: |
· | Risk awareness. |
· | Risk assessment (both qualitative and quantitative). |
· | Risk improvement. |
· | Providing direct support in the monitoring of their business unit’s operational risk. |
| I. | Operational Risk Management Process |
The Corpbanca Operational Risk Management model takes into account the following activities or roles:
III.1 Creation of Risk Awareness
Training and communication
Communicating and providing ongoing training with respect to the threats faced by our business, along with business-oriented training, are crucial to meeting objectives. Operational risks assessment is based on identifying potential threats to the business process, assessing their impact, and conducting a subsequent evaluation of the controls needed to mitigate operational risk.
III.2 Assessment
Operational risks assessment is based on identifying potential threats to the business process, assessing their impact, and conducting a subsequent evaluation of the controls needed to mitigate operational risk.
III.3 Improvement
Every Division Manager must ensure that operational risks are reviewed regularly and that any appropriate measures are taken.
F-124
Shareholders’ equity requirement
Consistent with Chile’s General Banking Law, we must maintain a ratio of at least 8%, net of required provisions between Effective Shareholders’ Equity and Consolidated Assets Weighted by risk, and a ratio of at least 3%, net of required provisions, between our Equity Base and Total Consolidated Assets. For such purposes, effective Equity is determined according to our Equity and Reserves or Equity Base with the following adjustments:
| a. | subordinated bonds with a 50% limit of the Equity Base are added, and |
| b. | the balance of Goodwill assets or surcharges paid, and investments in companies not involved in the consolidation are subtracted. |
Assets are weighted based on their risk categories, to which we assign a risk percentage based on the amount of capital needed to back each one of those assets. Five risk categories are applied (0%, 10%, 20%, 60% and 100%). For example, cash, deposits in other banks, and financial securities issued by the Central Bank of Chile have a 0% risk factor, which means that, consistent with current regulations, no capital is needed to back these assets. Fixed assets carry a 100% risk, which means that a mandatory capital equivalent of 8% of the value of these assets must be available.
In determining risk assets with conversion factors on [notional values], we take into account all derivative securities negotiated off-exchange, thereby obtaining a credit risk exposure amount (or “credit equivalent”). The off-balance contingent loans are also considered to be “credit equivalent” in terms of weighting.
For the year s ended December 31, 2009 and 2010 the ratio of assets and risk weighted assets is as follows:
| Consolidated Assets | Risk-Weighted Assets | ||||
| 2009 | 2010 | 2009 | 2010 | ||
| MCh$ | MCh$ | MCh$ | MCh$ | ||
| In-Balance Assets (net of provisions): | |||||
| Cash and deposits in banks | 110,331 | 202,339 | - | - | |
| Items in course of collection | 95,796 | 79,680 | 20,784 | 26,619 | |
| Trading portfolio financial assets | 76,156 | 197,580 | 21,980 | 48,456 | |
| Investments under agreements to resell | 51,970 | 75,676 | 22,842 | 52,931 | |
| Derivative financial instruments | 126,140 | 204,067 | 144,029 | 278,157 | |
| Loans and receivables from banks | 86,220 | 63,998 | 22,620 | 63,998 | |
| Loans and receivables from customers, net | 4,912,162 | 5,364,980 | 4,621,186 | 4,973,749 | |
| Financial investments available-for-sale | 737,162 | 746,248 | 446,803 | 50,819 | |
| Financial investments held-to-maturity | - | - | - | - | |
| Investments in other companies | 3,583 | 3,583 | 3,583 | 3,583 | |
| Intangible assets | 13,630 | 13,096 | 13,630 | 13,096 | |
| Property, plant and equipment, net | 55,212 | 53,430 | 55,212 | 53,429 | |
| Deferred income taxes | 19,060 | 21,956 | 1,906 | 2,196 | |
| Other assets | 92,307 | 104,207 | 87,712 | 104,207 | |
| Off-Balance sheet assets: | |||||
| Contingent loans | 380,891 | 503,362 | 228,534 | 302,017 | |
| Total risk-weighted assets | 6,760,850 | 7,634,202 | 5,695,416 | 5,973,257 | |
| Amount | Ratio | ||||
| 2009 | 2010 | 2009 | 2010 | ||
| MCh$ | MCh$ | ||||
| Basic Capital | 507,349 | 549,314 | 7.50% | 7.19% | |
| Effective Equity | 739,463 | 801,412 | 12.98% | 13.42% | |
F-125
| c) | As of December 31, 2010, the bank includes among its objectives, policies and management processes, the following information: |
| - | In consolidated terms, the bank holds a total equity of MCh$549,314. |
| - | During the year 2010, no increases in equity or extraordinary investments were realized, with the exception of the sale of bank issued shares described in Note 23. |
| - | At the regulatory level, the Bank closed the year 2010 with a solvency indicator of 9.21%, while the Basel Index was 13.42%. |
| NOTE 36 - | MATURITY OF ASSETS AND LIABILITIES |
a) Maturity of financial assets
Below are the main financial assets grouped according to their remaining terms, including interest accrued as of December 31, 2009 and 2010. As these are trading or available-for-sale securities, they are included at fair value and under the term at which they may be sold.
| As of December 31, 2009 | |||||||
| Up to 1 month | From 1 month to 3 months | From 3 months to 1 year | From 1 year to 3 years | From 3 years to 6 years | Over 6 years | TOTAL | |
| MCh$ | MCh$ | MCh$ | MCh$ | MCh$ | MCh$ | MCh$ | |
| Trading portfolio financial assets | 7,815 | 529 | 51,942 | 9,635 | 4,936 | 1,299 | 76,156 |
| Investments under agreements to resell | 17,521 | 15,606 | 18,636 | 58 | 149 | - | 51,970 |
| Derivative financial instruments | 20,628 | 18,967 | 46,505 | 10,282 | 27,257 | 2,501 | 126,140 |
| Loans and receivables from banks | 63,651 | 39 | 13,494 | - | 9,036 | - | 86,220 |
| Loans and receivables from customers(*) | 544,603 | 406,699 | 1,152,397 | 974,810 | 811,645 | 963,967 | 4,854,121 |
| Commercial loans | 506,828 | 381,091 | 1,035,439 | 743,848 | 627,200 | 384,965 | 3,679,371 |
| Mortgage loans | 1,535 | 5,589 | 25,653 | 71,113 | 113,375 | 575,614 | 792,879 |
| Consumer Loans | 36,240 | 20,019 | 91,305 | 159,849 | 71,070 | 3,388 | 381,871 |
| Financial investments available-for-sale | 7,792 | 45,439 | 101,812 | 148,783 | 331,534 | 101,802 | 737,162 |
| Financial investments held-to-maturity | - | - | - | - | - | - | - |
(*) Excluding the amounts for which the maturity date has expired, totaling MCh$58,271 as of December 31, 2009.
| As of December 31, 2010 | |||||||
| Up to 1 month | From 1 month to 3 months | From 3 months to 1 year | From 1 year to 3 years | From 3 years to 6 years | Over 6 years | TOTAL | |
| MCh$ | MCh$ | MCh$ | MCh$ | MCh$ | MCh$ | MCh$ | |
| Trading portfolio financial assets | 58,602 | 19,170 | 34,495 | 85,313 | - | - | 197,580 |
| Investments under agreements to resell | 75,676 | - | - | - | - | - | 75,676 |
| Derivative financial instruments | 15,492 | 10,323 | 60,280 | - | 62,942 | 55,030 | 204,067 |
| Loans and receivables from banks | 5,033 | 9,582 | 8,411 | 40,972 | - | - | 63,998 |
| Loans and receivables from customers(*) | 646,516 | 437,825 | 889,695 | 1,133,393 | 969,719 | 1,226,000 | 5,303,148 |
| Commercial loans | 601,542 | 414,327 | 754,970 | 887,936 | 766,156 | 487,763 | 3,912,694 |
| Mortgage loans | 7,735 | 1,608 | 32,986 | 91,995 | 146,503 | 736,077 | 1,016,904 |
| Consumer Loans | 37,239 | 21,890 | 101,739 | 153,462 | 57,060 | 2,160 | 373,550 |
| Financial investments available-for-sale | 20,297 | 1,901 | 64,082 | 433,304 | 166,201 | 60,463 | 746,248 |
| Financial investments held-to-maturity | - | - | - | - | - | - | - |
(*) Excluded the amounts for which the maturity date has expired, totaling MCh$61,832 as of December 31, 2010.
F-126
| b) | Maturity of financial liabilities |
Below are the main financial liabilities grouped according to their remaining terms, including interest accrued to December 31, 2009 and 2010:
| As of December 31, 2009 | |||||||||||||
| Up to 1 month | From 1 month to 3 months | From 3 months to 1 year | From 1 year to 3 years | From 3 years to 6 years | Over 6 years | TOTAL | |||||||
| MCh$ | MCh$ | MCh$ | MCh$ | MCh$ | MCh$ | MCh$ | |||||||
| Investments under agreements to repurchase | 47,760 | 14,131 | 403,415 | 58 | 149 | - | 465,513 | ||||||
| Time deposits and saving accounts (*) | 1,571,873 | 680,310 | 925,814 | 127,214 | 458 | 1,365 | 3,307,034 | ||||||
| Derivative financial instruments | 28,587 | 18,658 | 4,942 | 28,369 | 33,453 | 694 | 114,703 | ||||||
| Borrowings from financial institutions | 133,041 | 57,119 | 171,353 | 890 | - | - | 362,403 | ||||||
| Debt issued | 112,841 | 172,359 | 31,953 | 118,538 | 101,836 | 397,692 | 935,219 | ||||||
(*) Exclude term savings accounts totaling MCh$9,011 during 2009.
| As of December 31, 2010 | |||||||||||||
| Up to 1 month | From 1 month to 3 months | From 3 months to 1 year | From 1 year to 3 years | From 3 years to 6 years | Over 6 years | TOTAL | |||||||
| MCh$ | MCh$ | MCh$ | MCh$ | MCh$ | MCh$ | MCh$ | |||||||
| Investments under agreements to repurchase | 189,350 | - | - | - | - | - | 189,350 | ||||||
Time deposits and saving accounts (*) | 1,739,972 | 1,132,833 | 655,365 | 148,996 | 710 | 13,912 | 3,691,788 | ||||||
| Derivative financial instruments | 21,191 | 33,105 | 116,668 | 50,597 | (50,380) | 4,080 | 175,261 | ||||||
| Borrowings from financial institutions | 173,494 | 29,469 | 221,820 | 78,909 | - | - | 503,692 | ||||||
| Debt issued | 7,383 | 4,281 | 122,701 | 218,861 | 211,349 | 650,860 | 1,215,435 | ||||||
(*) Exclude term savings accounts totaling MCh$8,666 during 2010.
| NOTE 37 - | LEASING |
The following table reflects the maturity of leasing contracts as of December 31, 2009 and 2010.
| As of December 31 | |||
| 2009 | 2010 | ||
Net Leasing MCh$ | Net Leasing MCh$ | ||
| Up to 1 month | 826 | 11,054 | |
| From 1 month to 3 months | 694 | 13,168 | |
| From 3 months to 1 year | 8,156 | 55,897 | |
| From 1 year to 3 years | 80,737 | 89,603 | |
| From 3 years to 6 years | 90,458 | 42,292 | |
| Over 6 years | 113,515 | 66,221 | |
| Total | 294,386 | 278,235 | |
F-127
| NOTE 38 - | FOREIGN CURRENCY POSITION |
Assets and liabilities denominated in foreign currencies or indexed to changes in exchange rates are summarized below:
| Payable in | Payable in | ||||||||||
| Foreign currency | Chilean Pesos (*) | Total | |||||||||
| 12.31.2009 | 12.31.2010 | 12.31.2009 | 12.31.2010 | 12.31.2009 | 12.31.2010 | ||||||
| ThUS$ | ThUS$ | ThUS$ | ThUS$ | ThUS$ | ThUS$ | ||||||
| ASSETS | |||||||||||
| Cash and due from banks | 53,763 | 175,087 | - | - | 53,763 | 175,087 | |||||
| Items in course of collection | 71,293 | 42,233 | - | - | 71,293 | 42,233 | |||||
| Trading portfolio financial assets | 3,841 | 4,109 | - | - | 3,841 | 4,109 | |||||
| Financial investments available-for-sale | 11,157 | 38,383 | - | - | 11,157 | 38,383 | |||||
| Investments under agreements to resell | 300 | 3,831 | - | - | 300 | 3,831 | |||||
| Derivative financial instruments | 26,920 | 51,761 | - | - | 26,920 | 51,761 | |||||
| Loans and receivables to customers and banks | 1,138,848 | 1,314,445 | 28,249 | 28,249 | 1,167,097 | 1,335,560 | |||||
| Other assets | 2,560 | 12,286 | - | - | 2,560 | 12,286 | |||||
| Intangibles | 279 | 372 | - | - | 279 | 372 | |||||
| Premises and equipment | 207 | 208 | - | - | 207 | 208 | |||||
| Deferred income taxes | 3,837 | 2,434 | - | - | 3,837 | 2,434 | |||||
| TOTAL ASSETS | 1,313,005 | 1,645,149 | 28,249 | 28,249 | 1,341,254 | 1,666,264 | |||||
| LIABILITIES | |||||||||||
| Current accounts and demand deposits | 78,907 | 165,628 | - | - | 78,907 | 165,628 | |||||
| Items in course of collection | 55,070 | 28,911 | - | - | 55,070 | 28,911 | |||||
| Investments under agreements to repurchase | 2,930 | 21,833 | - | - | 2,930 | 21,833 | |||||
| Time deposits and saving accounts | 794,844 | 1,264,139 | 1 | 1 | 794,845 | 1,264,140 | |||||
| Derivative financial instruments | 29,417 | 41,695 | - | - | 29,417 | 41,695 | |||||
| Borrowings from financial institutions | 705,549 | 1,018,330 | 58 | 58 | 705,607 | 1,018,439 | |||||
| Debt issued | 199,768 | 178,134 | - | - | 199,768 | 178,134 | |||||
| Other financial obligations | - | - | 9,911 | 9,911 | 9,911 | 9,169 | |||||
| Deferred income taxes | - | - | - | - | - | - | |||||
| Provisions | 233 | 1,843 | - | - | 233 | 1,843 | |||||
| Other Liabilities | 376 | 970 | - | - | 376 | 970 | |||||
| TOTAL LIABILITIES | 1,867,094 | 2,721,483 | 9,970 | 9,970 | 1,877,064 | 2,730,762 | |||||
| * | Includes transactions expressed in foreign currencies payable in pesos or adjustable transactions due foreign currency exchange rate. |
F-128
| NOTE 39 - | SUBSEQUENT EVENTS |
On December 30, 2010, our Board of Directors agreed to hold an Extraordinary Shareholders Meeting on January 27, 2011, in order to submit to the shareholders for approval a proposal to increase the capital of the Bank through the issuance of 40,042,815,984 new common shares. The new common shares would have no par value and represent 15% of the total capital stock of Corpbanca. A majority of the shareholders of the Bank approved the proposed capital increase at the Extraordinary Shareholders Meeting held on January 27, 2011, and the Board of Directors was expressly authorized to determine the offering price for the new common shares and whether to offer them in Chile or abroad; in particular, the securities market in the United States through the issuance and listing of ADRs on the NYSE. Additionally it was approved the capitalization of the retained earning up to December 31, 2009 for Ch$106.869 million.
On February 24, 2011, the proposal by the Board of Directors to distribute a dividend of 100.0% of the net income of the Bank for fiscal year 2010 was approved by a majority of the shareholders present at the Ordinary Shareholders Meeting (“ESM”) held on such date. The total dividends distributed to the shareholders of the Bank was Ch$119,043 million, payable to the 226,909,290,577 common shares outstanding as of the date of the ESM.
In the period between January 1st and April 12th of 2011, date of issuance of these financial statements there are no other subsequent events that significantly affect them.
| Juan Vargas Matta | Mario Chamorro Carrizo |
| Accounting Manager | Chief Executive Officer |
F-129