|
Lazard Global Total Return & Income Fund, Inc. |
Investment Overview |
|
|
Dear Shareholders,
We are pleased to present this semi-annual report for Lazard Global Total Return & Income Fund, Inc. (“LGI” or the “Fund”), for the period ended June 30, 2005. LGI is a diversified, closed-end management investment company that began trading on the New York Stock Exchange (“NYSE”) on April 28, 2004. Its ticker symbol is “LGI.”
We are pleased with the returns that have been generated by LGI on its investments over the last year, and since inception, and believe that the Fund has provided investors with an attractive yield and diversification, backed by the extensive experience, commitment, and professional management of Lazard Asset Management LLC.
Portfolio Update (June 30, 2005)
For the six-months ended June 30, 2005, the Fund’s performance, as measured by the Net Asset Value per share (“NAV”), fell 3.4%, while the benchmark, the Morgan Stanley Capital International (MSCI®) World® Index lost 0.7%. Although the Fund underperformed the Index in this period, LGI’s historical performance has been very strong; the one-year and since-inception (fourteen-month period) annualized NAV returns of 12.7% and 11.5%, respectively, compare very favorably with the Index returns of 10.1% and 8.8% over these same periods. Shares of LGI ended the second quarter with a closing market price of $18.50, representing a 9.1% discount to the Fund’s NAV. The Fund’s net assets were $195.4 million as of June 30, 2005, with total leveraged assets of $284.6 million, representing 31.3% leverage.
We believe that LGI’s investment thesis remains sound, and we are encouraged by strong performance over the last year, and since-inception. However, NAV returns for the year-to-date have been weaker than hoped for, as a result of poor stock performance in the equity portfolio, as well as the strong dollar rally that negatively affected returns on both the equity strategy and the currency and debt strategy.
As of June 30, 2005, approximately 66.7% of the Fund’s total leveraged assets consisted of global equities and approximately 33.3% consisted of emerging market currency and debt instruments.
Declaration of Dividends
Pursuant to LGI’s level distribution policy, the Fund’s Board of Directors have declared a monthly dividend distribution of $0.1042 per share on the company’s outstanding stock, since July 23, 2004. This distribution level represents an annualized market yield of 6.8%, based on the share price of $18.50 at the close of the NYSE trading on June 30, 2005. LGI has met all of its dividend obligations without returning any of the Fund’s capital.
Additional Information
Please note that available on www.LazardNet.com, are frequent updates on the Fund’s performance, press releases, and a monthly fact sheet that provides information about the Fund’s major holdings, sector weightings, regional exposures, and other characteristics. You may also reach Lazard by phone at 1-800-828-5548.
On behalf of Lazard Asset Management LLC, we thank you for your investment in Lazard Global Total Return & Income Fund, Inc. and look forward to continuing to serve your investment needs in the future.
Message from the Portfolio Manager
Global Equity Portfolio
(66.7% of total leveraged assets)
The Fund’s equity portfolio is invested primarily in 35 to 45 equity securities of large, well-known global companies with strong financial productivity and attractive valuations. Examples include GlaxoSmith-Kline, a global, research-based pharmaceutical company based in the United Kingdom; Home Depot, a U.S.-based company that operates warehouse-style stores selling building materials, home improvement supplies, and lawn and garden products; Nokia Corp., the Finnish manufacturer of mobile telephones, enhanced communicators, entertainment and gaming devices, and media and imaging telephones; and Total SA, the French-based energy supplier that explores for, produces, refines, transports, and markets oil and natural gas.
These companies are all based in developed-market regions around the world. As of June 30, 42.4% of the global equity portfolio’s stocks were based in North America, 29.3% were from continental Europe (not
2
|
Lazard Global Total Return & Income Fund, Inc. |
Investment Overview (continued) |
|
|
including the U.K.), 22.5% were from the U.K., and 5.8% were from Japan. The global equity portfolio is similarly well diversified across a number of industry sectors. The top two sectors, by weight, at the end of June were financials (27.7%), which includes banks, insurance companies, and financial services companies, and information technology (15.9%), a sector that encompasses the design, development, installation, and implementation of information systems and applications, which includes hardware, software, IT services, and media-related companies. Other sectors included consumer discretionary, consumer staples, energy, health care, industrials, and telecommunications services.
Global Equity Market Review
Global markets were up modestly for the second quarter, after falling sharply in April and steadily recovering to end the quarter positive, in local currency terms. However, returns in U.S. dollars were depressed due to a strong rally in the dollar. Small-cap stocks outperformed large-cap stocks for both the second quarter and for the year-to-date. The euro continued to fall in June after Dutch and French voters soundly rejected the proposed European Union Constitution, calling into question the sustainability of European integration. Falling bond yields in June helped stocks, outweighing concerns that record oil prices would slow economic growth and hurt corporate earnings. Ten-year government bond yields hit record lows in Germany, Sweden, and Switzerland, amid worries that the global economy’s expansion may slow. Also in June, the Bank of England voted to hold the benchmark interest rate at 4.75%, underscoring increased anxiety about signs of faltering growth in the U.K. economy. In Japan, the government unexpectedly cut its estimate for first quarter economic growth due to sluggish export demand from overseas. From a sector perspective, defensive stocks were among the best performers for the quarter, as health care stocks outperformed, and utility stocks rose as investors sought yield. Energy stocks also did well with the price of oil rising to over $60 a barrel. Materials, industrials, and consumer discretionary stocks underperformed, reflecting concern that slower global economic growth may curtail demand. European markets were the best performers regionally, amid optimism that companies dependent on U.S. sales would benefit from the dollar’s advance. Although Japanese stocks moved lower, other Asia-Pacific markets performed well.
What Helped and What Hurt LGI
During the period, the Fund’s global equity portfolio benefited from an underweight position and from stock selection in consumer discretionary stocks. U.S. retail holding, Home Depot, outperformed after previous weakness, which had resulted from concerns over higher interest rates and their impact on the housing market. Stock selection in health care detracted from performance as German pharmaceuticals company, Schering AG, declined based on disappointing news regarding the effectiveness of its experimental cancer medicine. Stock selection in financials also detracted from performance as Japanese financial services company, Nomura, declined in the face of intensifying competitive pressures. However, the company is aggressively buying back stock and its valuation is at the low end of its historical range.
Emerging Market Currency and Debt Portfolio
(33.3% of total leveraged assets)
The Fund also seeks enhanced income through investments in short duration1 (typically, below one year) emerging market forward currency contracts and local currency debt instruments. As of June 30, this portfolio consisted of primarily forward currency contracts (92.1%) with a smaller allocation to sovereign debt obligations (7.9%). The average duration of the emerging market currency and debt portfolio was approximately 2.9 months as of June 30, with an average credit rating2 of A+.
As of June 30, the Fund’s emerging market currency and debt holdings were highly diversified across 27 countries within Eastern Europe (28.6%), Asia (29.7%), Latin America (11.9%), the Middle East (11.0%), Africa (7.9%), and the Commonwealth of Independent States and the Baltic countries (10.7%).
Emerging Market Currency and Debt Market Review
This year, the market’s attention seems to have shifted from structural global imbalances, which portend a continued U.S. dollar decline versus emerging market currencies, to the near-term prospects of higher U.S. interest rates and a relatively better growth outlook, both of which are supportive of the U.S. dollar. As of June 30, the U.S. dollar had surged versus both the euro and the yen, by 10.7% and 7.5%, respectively.
3
|
Lazard Global Total Return & Income Fund, Inc. |
Investment Overview (continued) |
|
|
Eastern European currencies were pressured by a wave of risk aversion, surrounding the Dutch and French “no” votes on the European Union Constitution. Following the vote, the market’s concern regarding European integration and the burgeoning status of the euro as a U.S. dollar-alternative reserve currency, was apparent in the single currency’s continued decline. In Russia, the central bank has stepped in to limit ruble appreciation by absorbing surplus U.S. dollars into foreign-exchange reserves.
Inflation is rising marginally, yet remains subdued in most of the Fund’s emerging market currency and debt portfolio’s 49-country opportunity set. Moderating global growth is the more pressing concern, particularly among emerging Asian policymakers, along with the threat of slowing demand for regional exports, while rising oil price pressures a higher import bill. Year-to-date, growth risks are overwhelming inflationary concerns, so domestic yields in Asia remain at record low levels, and officials are biased toward maintaining cheap currencies.
At the end of the period, the Fund’s emerging market currency and debt portfolio had a healthy yield cushion of 7.3% and we believe the portfolio is well positioned to benefit from a fundamentally weakening U.S.-dollar environment.
What Helped and What Hurt LGI
Brazil, Turkey, and Egypt posted noteworthy positive contributions to the Fund’s emerging market currency and debt portfolio performance during the second quarter. The Brazilian and Turkish positions returned 17% and 7%, respectively (in U.S. dollars). Investment selection in Turkey added significant value, further augmenting impressive 5.5% money-market gains.
In Egypt, attractive local 9% yields and sizeable U.S. dollar inflows (Suez canal revenues, tourism season, Gulf remittances) have pressured the pound modestly stronger. The National Bank of Egypt has actively accumulated foreign exchange reserves year-to-date, rapidly approaching its $20 billion near-term goal. Hence, more pronounced pound gains are anticipated as the central bank’s interventionist efforts retreat ahead of the September election. The Egyptian pound’s low correlation to the rest of the portfolio and low foreign exchange volatility make this, in our view, an attractive investment opportunity.
The second quarter presented a challenging environment for most emerging market currencies across the globe. While less than half of the portfolio’s positions contributed positively, the portfolio avoided the largest losers—a falling South African rand and the Hungarian forint’s decline—and it mitigated the impact of a negative Czech Republic return by significantly reducing the koruna exposure.
Negative returns were posted by core positions in the money markets of Slovakia, Poland, Romania, and Russia. Across Asia, regionally loose monetary policies (i.e., record low yields and strong money supply growth rates) aggravated currency declines. Positions in the South Korean won, Philippine peso, and Indonesian rupiah detracted from returns. In the Middle East, the Israeli shekel exposure was trimmed modestly but the remaining position detracted from performance. In Latin America, the portfolio’s cautious 1% exposure to the Mexican peso’s stellar 5.5% return limited upside. Larger weightings in the Colombian and Argentine pesos would have helped too, as they posted modestly positive returns.
4
|
Lazard Global Total Return & Income Fund, Inc. |
Investment Overview (continued) |
|
|
| |
1 | A measure of the average cash weighted term-to-maturity of the investment holdings. Duration is a measure of the price sensitivity of a bond to interest rate movements. Duration for a forward currency contract is equal to its term-to-maturity. |
| |
2 | Source: S&P, Moody’s and Fitch. Ratings for the forward currency contracts represent the counterparty credit rating. Ratings for the bonds represent the bond issuer rate. |
All returns are for the period ended June 30, 2005 and reflect reinvestment of all dividends and distributions, if any. Past performance is not indicative, nor a guarantee, of future results.
The performance data of the index and other market data have been prepared from sources and data that the Investment Manager believes to be reliable, but no representation is made as to their accuracy. The index is unmanaged, has no fees or costs and is not available for investment.
The views of the Fund’s management and the portfolio holdings described in this report are as of June 30, 2005; these views and portfolio holdings may have changed subsequent to this date. Nothing herein should be construed as a recommendation to buy, sell, or hold a particular investment. There is no assurance that the portfolio holdings discussed herein will remain in the Fund at the time you receive this report, or that portfolio holdings sold will have not been repurchased. The specific portfolio holdings may in aggregate represent only a small percentage of the Fund’s holdings. It should not be assumed that investments identified and discussed were, or will be, profitable, or that the investment decisions we make in the future will be profitable, or equal the performance of the investments discussed herein.
The views and opinions expressed are provided for general information only, and do not constitute specific tax, legal, or investment advice to, or recommendations for, any person. There can be no guarantee as to the accuracy of the outlooks for markets, sectors and securities as discussed herein. You should read the Fund’s prospectus for a more detailed discussion of the Fund’s investment objective, strategies, risks and fees.
5
|
|
Lazard Global Total Return & Income Fund, Inc. |
Investment Overview (continued) |
|
|
Comparison of Changes in Value of $10,000 Investment in
LGI and MSCI World Index* (unaudited)
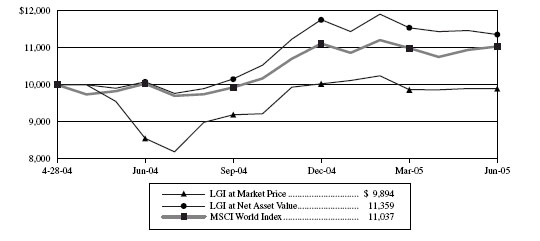
Total Return Information* (unaudited)
For the period ended June 30, 2005
| | | | | | | | | | | |
| | One | | Since | |
| | Year | | Inception** | |
| |
| |
| |
Market Price | | | | 15.72 | % | | | | (0.90 | )% | |
Net Asset Value | | | | 12.70 | | | | | 11.45 | | |
MSCI World Index | | | | 10.05 | | | | | 8.76 | | |
| |
* | All returns reflect reinvestment of all dividends and distributions, if any. Past performance is not indicative, nor a guarantee, of future results; the investment return, market price and net asset value of the Fund will fluctuate, so that an investor’s shares in the Fund, when sold, may be worth more or less than their original cost. The returns do not reflect the deduction of taxes that a stockholder would pay on the Fund’s distributions or on the sale of Fund shares. |
| |
| The performance data of the index has been prepared from sources and data that the Investment Manager believes to be reliable, but no representation is made as to its accuracy. The index is unmanaged, has no fees or costs and is not available for investment. The MSCI World Index represents market value-weighted average returns of selected securities listed on the stock exchanges of Europe, Australasia and Far East, New Zealand, Canada, and the United States. |
| |
** | The Fund’s inception date was April 28, 2004. |
6
|
|
Lazard Global Total Return & Income Fund, Inc. |
Investment Overview (concluded) |
|
Ten Largest Equity Holdings
June 30, 2005 (unaudited)
| | | | | | | |
| | | | Percentage of | |
Security | | Value | | Net Assets | |
| |
| |
| |
GlaxoSmithKline PLC ADR | | $ | 8,353,422 | | | | 4.27 | % | |
Exxon Mobil Corp. | | | 7,367,654 | | | | 3.77 | | |
Microsoft Corp. | | | 6,970,104 | | | | 3.57 | | |
Total SA Sponsored ADR | | | 6,788,985 | | | | 3.47 | | |
Johnson & Johnson | | | 6,779,500 | | | | 3.47 | | |
Nokia Oyj Sponsored ADR | | | 6,522,880 | | | | 3.34 | | |
General Electric Co. | | | 6,410,250 | | | | 3.28 | | |
Bank of America Corp. | | | 6,303,302 | | | | 3.23 | | |
Oracle Corp. | | | 6,296,400 | | | | 3.22 | | |
HSBC Holdings PLC Sponsored ADR | | | 6,077,295 | | | | 3.11 | | |
Portfolio Holdings Presented by Sector
June 30, 2005 (unaudited)
| | | | |
| | Percentage of | |
Sector | | Total Investments | |
| |
| |
Commercial Services | | | 1.4 | % |
Consumer Discretionary | | | 3.3 | |
Consumer Staples | | | 11.9 | |
Energy | | | 9.3 | |
Emerging Markets Debt Obligations | | | 3.1 | |
Financials | | | 21.8 | |
Health Care | | | 10.3 | |
Producer Manufacturing | | | 5.9 | |
Technology | | | 12.5 | |
Telecommunications | | | 2.1 | |
Short-Term Investments | | | 18.4 | |
| |
|
| |
Total Investments | | | 100.0 | % |
| |
|
| |
7
| | | | | | | |
Description | | Shares | | Value | |
|
|
|
|
|
|
|
|
Common Stocks—99.2% | | | | | | | |
Finland—3.3% | | | | | | | |
Nokia Oyj Sponsored ADR (c) | | | 392,000 | | $ | 6,522,880 | |
| | | | |
|
| |
France—6.5% | | | | | | | |
Societe Generale Sponsored ADR | | | 101,300 | | | 2,062,468 | |
Total SA Sponsored ADR (d) | | | 58,100 | | | 6,788,985 | |
Vivendi Universal SA Sponsored ADR | | | 124,800 | | | 3,909,984 | |
| | | | |
|
| |
Total France | | | | | | 12,761,437 | |
| | | | |
|
| |
Germany—3.7% | | | | | | | |
Schering AG ADR (d) | | | 56,800 | | | 3,503,992 | |
Siemens AG Sponsored ADR (d) | | | 50,600 | | | 3,676,090 | |
| | | | |
|
| |
Total Germany | | | | | | 7,180,082 | |
| | | | |
|
| |
Italy—2.3% | | | | | | | |
Eni SpA Sponsored ADR (d) | | | 35,700 | | | 4,576,740 | |
| | | | |
|
| |
Japan—5.7% | | | | | | | |
Canon, Inc. Sponsored ADR | | | 69,000 | | | 3,631,470 | |
Kao Corp. Sponsored ADR (d) | | | 15,400 | | | 3,630,396 | |
Nomura Holdings, Inc. ADR (d) | | | 332,600 | | | 3,974,570 | |
| | | | |
|
| |
Total Japan | | | | | | 11,236,436 | |
| | | | |
|
| |
Netherlands—2.6% | | | | | | | |
Heineken NV ADR (c), (d) | | | 163,750 | | | 5,059,875 | |
| | | | |
|
| |
Switzerland—10.7% | | | | | | | |
Credit Suisse Group Sponsored ADR (c), (d) | | | 150,200 | | | 5,878,828 | |
Nestle SA Sponsored ADR (d) | | | 57,400 | | | 3,669,582 | |
Novartis AG ADR (c), (d) | | | 82,800 | | | 3,928,032 | |
Swiss Re Sponsored ADR (d) | | | 55,200 | | | 3,390,936 | |
UBS AG (c) | | | 51,000 | | | 3,970,350 | |
| | | | |
|
| |
Total Switzerland | | | | | | 20,837,728 | |
| | | | |
|
| |
United Kingdom—22.3% | | | | | | | |
Barclays PLC Sponsored ADR (d) | | | 135,300 | | | 5,403,882 | |
BP PLC Sponsored ADR | | | 69,600 | | | 4,341,648 | |
Cadbury Schweppes PLC Sponsored ADR (c), (d) | | | 112,700 | | | 4,319,791 | |
Diageo PLC Sponsored ADR (d) | | | 101,100 | | | 5,995,230 | |
GlaxoSmithKline PLC ADR (c), (d) | | | 172,200 | | | 8,353,422 | |
HSBC Holdings PLC Sponsored ADR (c), (d) | | | 76,300 | | | 6,077,295 | |
Unilever PLC Sponsored ADR (d) | | | 95,500 | | | 3,710,175 | |
Vodafone Group PLC Sponsored ADR | | | 219,100 | | | 5,328,512 | |
| | | | |
|
| |
Total United Kingdom | | | | | | 43,529,955 | |
| | | | |
|
| |
United States—42.1% | | | | | | | |
Bank of America Corp. (c) | | | 138,200 | | | 6,303,302 | |
Cisco Systems, Inc. (a), (c) | | | 220,400 | | | 4,211,844 | |
Citigroup, Inc. (c) | | | 116,000 | | | 5,362,680 | |
Exxon Mobil Corp. (c) | | | 128,200 | | | 7,367,654 | |
First Data Corp. | | | 84,300 | | | 3,383,802 | |
General Electric Co. | | | 185,000 | | | 6,410,250 | |
Golden West Financial Corp. (d) | | | 31,200 | | | 2,008,656 | |
International Business Machines Corp. (c) | | | 42,600 | | | 3,160,920 | |
Johnson & Johnson (c) | | | 104,300 | | | 6,779,500 | |
JPMorgan Chase & Co. | | | 148,896 | | | 5,259,007 | |
Microsoft Corp. (c) | | | 280,600 | | | 6,970,104 | |
Oracle Corp. (a) | | | 477,000 | | | 6,296,400 | |
Pfizer, Inc. | | | 103,500 | | | 2,854,530 | |
The Coca-Cola Co. | | | 74,200 | | | 3,097,850 | |
The Home Depot, Inc. (c) | | | 107,600 | | | 4,185,640 | |
United Technologies Corp. | | | 88,000 | | | 4,518,800 | |
Wells Fargo & Co. | | | 67,000 | | | 4,125,860 | |
| | | | |
|
| |
Total United States | | | | | | 82,296,799 | |
| | | | |
|
| |
Total Common Stocks | | | | | | | |
(Identified cost $184,853,495) | | | | | | 194,001,932 | |
| | | | |
|
| |
| | | | | | | |
| | Principal | | | | |
| | Amount | | | | |
Description | | (000) (e) | | Value | |
|
|
|
|
|
|
Foreign Government Obligations—3.9% | | | | | | | |
Egypt—0.8% | | | | | | | |
Egypt Treasury Bills: | | | | | | | |
0.00%, 08/02/05 (f) | | | 2,800 | | | 479,178 | |
0.00%, 09/06/05 (f) | | | 2,050 | | | 348,066 | |
0.00%, 11/01/05 (f) | | | 4,000 | | | 669,763 | |
| | | | |
|
| |
Total Egypt | | | | | | 1,497,007 | |
| | | | |
|
| |
Turkey—3.1% | | | | | | | |
Turkey Government Bonds: | | | | | | | |
0.00%, 05/24/06 (f) | | | 6,871 | | | 4,484,028 | |
0.00%, 08/09/06 (f) | | | 1,709 | | | 1,079,620 | |
0.00%, 11/08/06 (f) | | | 897 | | | 547,187 | |
| | | | |
|
| |
Total Turkey | | | | | | 6,110,835 | |
| | | | |
|
| |
Total Foreign Government Obligations | | | | | | | |
(Identified cost $7,586,845) | | | | | | 7,607,842 | |
| | | | |
|
| |
The accompanying notes are an integral part of these financial statements.
8
|
|
Lazard Global Total Return & Income Fund, Inc. |
Portfolio of Investments (continued) |
June 30, 2005 (unaudited) |
|
| | | | | | | |
| | Principal | | | | |
| | Amount | | | | |
Description | | (000) | | Value | |
|
|
|
|
|
|
Short-Term Investments—23.3% | | | | | | | |
Repurchase Agreement—0.1% | | | | | | | |
State Street Bank and Trust Co., 2.60%, 07/01/05 (Dated 06/30/05, collateralized by $225,000 United States Treasury Note, 4.00%, 11/15/12, with a value of $228,656) Proceeds of $224,016 (c) | | $ | 224 | | $ | 224,000 | |
| | | | |
|
| |
Collateral for Securities on Loan—23.2% | | | | | | | |
State Street Navigator Securities Lending Prime Portfolio, 3.27% (g), (h) | | | 45,249 | | | 45,249,363 | |
| | | | |
|
| |
Total Short-Term Investments | | | | | | | |
(Identified cost $45,473,363) | | | | | | 45,473,363 | |
| | | | |
|
| |
Total Investments—126.4% | | | | | | | |
(Identified cost $237,913,703) (b) | | | | | | 247,083,137 | |
Liabilities in Excess of Cash and Other Assets—(26.4)% | | | | | | (51,646,046 | ) |
| | | | |
|
| |
Net Assets—100.0% | | | | | $ | 195,437,091 | |
| | | | |
|
| |
The accompanying notes are an integral part of these financial statements.
9
|
|
Lazard Global Total Return & Income Fund, Inc. |
Portfolio of Investments (continued) |
June 30, 2005 (unaudited) |
|
Forward Currency Contracts open at June 30, 2005:
| | | | | | | | | | | | | | | | | | | |
| | | | | | | | U.S. $ Cost | | U.S. $ | | | | | | | |
Forward Currency | | | Expiration | | | Foreign | | on Origination | | Current | | Unrealized | | Unrealized | |
Purchase Contracts | | | Date | | | Currency | | Date | | Value | | Appreciation | | Depreciation | |
| | |
| | |
| |
| |
| |
| |
| |
ARS | | | 07/26/05 | | | 2,207,800 | | $ | 760,000 | | $ | 762,587 | | $ | 2,587 | | $ | — | |
ARS | | | 02/23/06 | | | 2,940,745 | | | 986,000 | | | 991,067 | | | 5,067 | | | — | |
BRL | | | 07/06/05 | | | 3,047,296 | | | 1,289,042 | | | 1,287,410 | | | — | | | 1,632 | |
BRL | | | 08/09/05 | | | 9,733,248 | | | 3,808,000 | | | 4,056,496 | | | 248,496 | | | — | |
BRL | | | 08/12/05 | | | 3,178,750 | | | 1,249,754 | | | 1,323,048 | | | 73,294 | | | — | |
BRL | | | 09/28/05 | | | 2,907,714 | | | 986,000 | | | 1,187,026 | | | 201,026 | | | — | |
BRL | | | 10/05/05 | | | 288,355 | | | 101,000 | | | 117,413 | | | 16,413 | | | — | |
BRL | | | 11/03/05 | | | 2,015,904 | | | 736,000 | | | 812,407 | | | 76,407 | | | — | |
COP | | | 09/06/05 | | | 1,028,340,000 | | | 435,000 | | | 439,293 | | | 4,293 | | | — | |
COP | | | 09/07/05 | | | 3,806,196,000 | | | 1,603,959 | | | 1,625,792 | | | 21,833 | | | — | |
CZK | | | 07/13/05 | | | 16,145,000 | | | 654,412 | | | 650,594 | | | — | | | 3,818 | |
EGP | | | 07/14/05 | | | 1,439,715 | | | 246,000 | | | 247,766 | | | 1,766 | | | — | |
EGP | | | 07/18/05 | | | 2,962,381 | | | 505,000 | | | 509,348 | | | 4,348 | | | — | |
EGP | | | 08/17/05 | | | 3,460,275 | | | 585,000 | | | 591,010 | | | 6,010 | | | — | |
EGP | | | 08/29/05 | | | 1,410,120 | | | 240,000 | | | 240,214 | | | 214 | | | — | |
EGP | | | 09/06/05 | | | 3,262,320 | | | 552,000 | | | 554,801 | | | 2,801 | | | — | |
EGP | | | 09/08/05 | | | 2,677,230 | | | 453,000 | | | 455,110 | | | 2,110 | | | — | |
EGP | | | 12/14/05 | | | 3,296,710 | | | 553,000 | | | 548,551 | | | — | | | 4,449 | |
EGP | | | 02/28/06 | | | 5,443,460 | | | 908,000 | | | 895,381 | | | — | | | 12,619 | |
GHC | | | 07/25/05 | | | 4,134,144,000 | | | 448,000 | | | 451,334 | | | 3,334 | | | — | |
GHC | | | 08/08/05 | | | 4,980,396,000 | | | 543,000 | | | 541,509 | | | — | | | 1,491 | |
HRK | | | 07/05/05 | | | 705,000 | | | 123,747 | | | 116,662 | | | — | | | 7,085 | |
HRK | | | 07/28/05 | | | 14,323,313 | | | 2,361,751 | | | 2,368,841 | | | 7,090 | | | — | |
HRK | | | 08/08/05 | | | 2,636,030 | | | 440,513 | | | 435,827 | | | — | | | 4,686 | |
HRK | | | 08/31/05 | | | 5,880,930 | | | 1,004,000 | | | 971,705 | | | — | | | 32,295 | |
IDR | | | 07/11/05 | | | 11,139,480,000 | | | 1,164,000 | | | 1,141,340 | | | — | | | 22,660 | |
IDR | | | 08/11/05 | | | 18,326,540,000 | | | 1,913,000 | | | 1,877,719 | | | — | | | 35,281 | |
IDR | | | 09/12/05 | | | 2,424,158,000 | | | 251,000 | | | 248,377 | | | — | | | 2,623 | |
IDR | | | 09/20/05 | | | 24,883,200,000 | | | 2,560,000 | | | 2,549,508 | | | — | | | 10,492 | |
ILS | | | 07/07/05 | | | 9,847,028 | | | 2,229,297 | | | 2,149,895 | | | — | | | 79,402 | |
ILS | | | 07/11/05 | | | 4,812,336 | | | 1,104,000 | | | 1,050,643 | | | — | | | 53,357 | |
ILS | | | 07/11/05 | | | 1,891,000 | | | 421,346 | | | 412,849 | | | — | | | 8,497 | |
ILS | | | 08/03/05 | | | 2,078,810 | | | 470,000 | | | 453,780 | | | — | | | 16,220 | |
ILS | | | 08/08/05 | | | 2,746,545 | | | 614,000 | | | 599,530 | | | — | | | 14,470 | |
ILS | | | 09/06/05 | | | 7,910,178 | | | 1,727,000 | | | 1,726,446 | | | — | | | 554 | |
INR | | | 08/03/05 | | | 19,569,660 | | | 447,000 | | | 449,301 | | | 2,301 | | | — | |
INR | | | 09/06/05 | | | 170,703,120 | | | 3,892,000 | | | 3,913,459 | | | 21,459 | | | — | |
INR | | | 09/08/05 | | | 9,056,250 | | | 207,000 | | | 207,604 | | | 604 | | | — | |
ISK | | | 07/07/05 | | | 15,785,950 | | | 239,000 | | | 242,285 | | | 3,285 | | | — | |
KRW | | | 07/07/05 | | | 125,700,000 | | | 120,000 | | | 121,624 | | | 1,624 | | | — | |
KRW | | | 08/09/05 | | | 701,649,000 | | | 702,000 | | | 678,882 | | | — | | | 23,118 | |
KRW | | | 09/21/05 | | | 2,479,999,400 | | | 2,446,000 | | | 2,399,775 | | | — | | | 46,225 | |
KRW | | | 10/11/05 | | | 1,659,021,000 | | | 1,652,000 | | | 1,605,549 | | | — | | | 46,451 | |
KRW | | | 12/30/05 | | | 992,556,200 | | | 971,000 | | | 961,212 | | | — | | | 9,788 | |
KZT | | | 07/18/05 | | | 36,542,000 | | | 278,521 | | | 270,982 | | | — | | | 7,539 | |
KZT | | | 08/22/05 | | | 15,390,450 | | | 115,000 | | | 114,407 | | | — | | | 593 | |
KZT | | | 09/07/05 | | | 17,449,600 | | | 133,000 | | | 129,855 | | | — | | | 3,145 | |
KZT | | | 12/21/05 | | | 60,433,000 | | | 450,791 | | | 452,992 | | | 2,201 | | | — | |
The accompanying notes are an integral part of these financial statements.
10
|
|
Lazard Global Total Return & Income Fund, Inc. |
Portfolio of Investments (continued) |
June 30, 2005 (unaudited) |
|
Forward Currency Contracts open at June 30, 2005 (continued):
| | | | | | | | | | | | | | | | | | | |
| | | | | | | | U.S. $ Cost | | U.S. $ | | | | | | | |
Forward Currency | | | Expiration | | | Foreign | | on Origination | | Current | | Unrealized | | Unrealized | |
Purchase Contracts | | | Date | | | Currency | | Date | | Value | | Appreciation | | Depreciation | |
| | |
| | |
| |
| |
| |
| |
| |
MAD | | | 07/14/05 | | | 21,701,185 | | $ | 2,519,000 | | $ | 2,389,176 | | $ | — | | $ | 129,824 | |
MAD | | | 07/18/05 | | | 6,174,000 | | | 702,893 | | | 679,219 | | | — | | | 23,674 | |
MXN | | | 09/09/05 | | | 10,791,942 | | | 977,000 | | | 988,223 | | | 11,223 | | | — | |
PEN | | | 07/27/05 | | | 1,609,600 | | | 494,000 | | | 494,511 | | | 511 | | | — | |
PHP | | | 07/13/05 | | | 131,303,300 | | | 2,383,000 | | | 2,345,481 | | | — | | | 37,519 | |
PHP | | | 11/23/05 | | | 46,508,220 | | | 849,000 | | | 823,512 | | | — | | | 25,488 | |
PLN | | | 07/25/05 | | | 909,070 | | | 271,000 | | | 271,815 | | | 815 | | | — | |
PLN | | | 07/29/05 | | | 2,497,000 | | | 742,139 | | | 746,477 | | | 4,338 | | | — | |
PLN | | | 08/09/05 | | | 14,633,685 | | | 4,419,851 | | | 4,373,027 | | | — | | | 46,824 | |
ROL | | | 07/05/05 | | | 10,769,285,000 | | | 379,000 | | | 361,642 | | | — | | | 17,358 | |
ROL | | | 07/13/05 | | | 49,359,776,000 | | | 1,774,000 | | | 1,655,945 | | | — | | | 118,055 | |
ROL | | | 07/13/05 | | | 17,198,014,400 | | | 618,100 | | | 576,967 | | | — | | | 41,133 | |
ROL | | | 07/28/05 | | | 25,602,850,000 | | | 910,000 | | | 857,385 | | | — | | | 52,615 | |
ROL | | | 08/08/05 | | | 14,616,088,000 | | | 488,000 | | | 488,802 | | | 802 | | | — | |
ROL | | | 08/22/05 | | | 39,688,111,000 | | | 1,367,000 | | | 1,324,992 | | | — | | | 42,008 | |
ROL | | | 08/31/05 | | | 58,875,493,000 | | | 2,029,000 | | | 1,963,390 | | | — | | | 65,610 | |
RUB | | | 09/08/05 | | | 9,314,660 | | | 332,215 | | | 324,409 | | | — | | | 7,806 | |
RUB | | | 09/08/05 | | | 31,268,160 | | | 1,128,000 | | | 1,089,002 | | | — | | | 38,998 | |
RUB | | | 12/15/05 | | | 39,907,858 | | | 1,394,405 | | | 1,387,355 | | | — | | | 7,050 | |
RUB | | | 05/24/06 | | | 99,755,000 | | | 3,526,158 | | | 3,450,119 | | | — | | | 76,039 | |
RUB | | | 06/09/06 | | | 15,998,580 | | | 559,000 | | | 552,900 | | | — | | | 6,100 | |
SGD | | | 07/08/05 | | | 1,647,563 | | | 992,000 | | | 976,726 | | | — | | | 15,274 | |
SGD | | | 08/25/05 | | | 1,636,622 | | | 988,000 | | | 972,076 | | | — | | | 15,924 | |
SGD | | | 09/30/05 | | | 1,622,591 | | | 969,000 | | | 965,299 | | | — | | | 3,701 | |
SIT | | | 07/18/05 | | | 125,158,000 | | | 665,734 | | | 632,390 | | | — | | | 33,344 | |
SIT | | | 07/26/05 | | | 662,184,300 | | | 3,484,814 | | | 3,345,522 | | | — | | | 139,292 | |
SKK | | | 07/13/05 | | | 5,833,890 | | | 186,000 | | | 184,207 | | | — | | | 1,793 | |
SKK | | | 07/25/05 | | | 79,799,250 | | | 2,593,748 | | | 2,520,197 | | | — | | | 73,551 | |
SKK | | | 07/27/05 | | | 117,990,880 | | | 3,723,167 | | | 3,726,479 | | | 3,312 | | | — | |
THB | | | 08/18/05 | | | 48,180,975 | | | 1,219,000 | | | 1,164,554 | | | — | | | 54,446 | |
THB | | | 09/12/05 | | | 115,846,680 | | | 2,859,000 | | | 2,799,920 | | | — | | | 59,080 | |
THB | | | 09/16/05 | | | 29,912,520 | | | 731,000 | | | 722,961 | | | — | | | 8,039 | |
TRY | | | 08/08/05 | | | 644,442 | | | 470,671 | | | 476,679 | | | 6,008 | | | — | |
TRY | | | 08/22/05 | | | 1,381,000 | | | 990,461 | | | 1,017,121 | | | 26,660 | | | — | |
TWD | | | 07/05/05 | | | 1,567,000 | | | 50,000 | | | 49,559 | | | — | | | 441 | |
TWD | | | 07/11/05 | | | 26,977,440 | | | 868,000 | | | 853,106 | | | — | | | 14,894 | |
TWD | | | 07/11/05 | | | 4,736,870 | | | 151,000 | | | 149,794 | | | — | | | 1,206 | |
TWD | | | 09/08/05 | | | 60,358,455 | | | 1,935,000 | | | 1,912,004 | | | — | | | 22,996 | |
TZS | | | 08/09/05 | | | 212,440,000 | | | 188,000 | | | 186,296 | | | — | | | 1,704 | |
TZS | | | 08/23/05 | | | 225,120,740 | | | 199,000 | | | 196,372 | | | — | | | 2,628 | |
TZS | | | 09/06/05 | | | 383,461,000 | | | 338,000 | | | 332,731 | | | — | | | 5,269 | |
TZS | | | 09/15/05 | | | 317,346,400 | | | 280,000 | | | 274,434 | | | — | | | 5,566 | |
UAH | | | 07/13/05 | | | 2,461,960 | | | 488,000 | | | 490,643 | | | 2,643 | | | — | |
UAH | | | 08/31/05 | | | 1,313,130 | | | 259,000 | | | 260,570 | | | 1,570 | | | — | |
UAH | | | 09/20/05 | | | 1,851,960 | | | 366,000 | | | 366,798 | | | 798 | | | — | |
UAH | | | 12/15/05 | | | 3,896,120 | | | 758,000 | | | 760,149 | | | 2,149 | | | — | |
UAH | | | 04/10/06 | | | 1,711,950 | | | 339,000 | | | 328,725 | | | — | | | 10,275 | |
UAH | | | 05/12/06 | | | 1,435,380 | | | 282,000 | | | 274,419 | | | — | | | 7,581 | |
| | | | | | | |
|
| |
|
| |
|
| |
|
| |
Total Forward Currency Purchase Contracts | | $ | 99,915,489 | | $ | 99,023,286 | | $ | 769,392 | | $ | 1,661,595 | |
| |
|
| |
|
| |
|
| |
|
| |
The accompanying notes are an integral part of these financial statements.
11
|
|
Lazard Global Total Return & Income Fund, Inc. |
Portfolio of Investments (concluded) |
June 30, 2005 (unaudited) |
|
Forward Currency Contracts open at June 30, 2005 (concluded):
| | | | | | | | | | | | | | | | | | | |
| | | | | | | | U.S. $ Cost | | U.S. $ | | | | | | | |
Forward Currency | | | Expiration | | | Foreign | | on Origination | | Current | | Unrealized | | Unrealized | |
Sale Contracts | | | Date | | | Currency | | Date | | Value | | Appreciation | | Depreciation | |
| | |
| | |
| |
| |
| |
| |
| |
BRL | | | 07/06/05 | | | 3,047,296 | | $ | 1,253,000 | | $ | 1,287,410 | | $ | — | | $ | 34,410 | |
BRL | | | 10/06/05 | | | 3,382,069 | | | 1,381,000 | | | 1,376,629 | | | 4,371 | | | — | |
HRK | | | 07/05/05 | | | 705,000 | | | 116,510 | | | 116,662 | | | — | | | 152 | |
ILS | | | 07/07/05 | | | 9,847,028 | | | 2,150,898 | | | 2,149,895 | | | 1,003 | | | — | |
ILS | | | 07/11/05 | | | 3,732,101 | | | 852,000 | | | 814,803 | | | 37,197 | | | — | |
MAD | | | 07/14/05 | | | 8,517,128 | | | 944,302 | | | 937,687 | | | 6,615 | | | — | |
MAD | | | 07/14/05 | | | 13,184,058 | | | 1,451,669 | | | 1,451,489 | | | 180 | | | — | |
MAD | | | 07/18/05 | | | 6,174,000 | | | 680,181 | | | 679,219 | | | 962 | | | — | |
ROL | | | 07/05/05 | | | 10,769,285,000 | | | 360,285 | | | 361,642 | | | — | | | 1,357 | |
THB | | | 07/07/05 | | | 21,083,221 | | | 511,000 | | | 510,103 | | | 897 | | | — | |
THB | | | 08/25/05 | | | 32,439,400 | | | 812,000 | | | 784,052 | | | 27,948 | | | — | |
TRY | | | 08/08/05 | | | 1,255,000 | | | 899,319 | | | 928,295 | | | — | | | 28,976 | |
TWD | | | 07/05/05 | | | 1,567,000 | | | 49,494 | | | 49,559 | | | — | | | 65 | |
| | | | | | | |
|
| |
|
| |
|
| |
|
| |
Total Forward Currency Sale Contracts | | $ | 11,461,658 | | $ | 11,447,445 | | | 79,173 | | | 64,960 | |
| |
|
| |
|
| |
|
| |
|
| |
Gross unrealized appreciation/depreciation on Forward Currency Contracts | | $ | 848,565 | | $ | 1,726,555 | |
| |
|
| |
|
| |
The accompanying notes are an integral part of these financial statements.
12
|
|
Lazard Global Total Return & Income Fund, Inc. |
Notes to Portfolio of Investments |
June 30, 2005 (unaudited) |
|
| |
(a) | Non-income producing security. |
(b) | For federal income tax purposes, the aggregate cost was $237,913,703, aggregate gross unrealized appreciation was $15,577,732, aggregate gross unrealized depreciation was $6,408,298 and the net unrealized appreciation was $9,169,434. |
(c) | Segregated security for forward currency contracts. |
(d) | Security or portion thereof is out on loan. |
(e) | Principal amount denominated in respective country’s currency. |
(f) | Zero coupon security. |
(g) | Rate shown reflects 7 day yield as of June 30, 2005. |
(h) | Represents security purchased with cash collateral received for securities on loan. |
| | | | | |
Security Abbreviation: | | | |
ADR | — | American Depositary Receipt | | | |
| | | | | |
Currency Abbreviations: | | | |
ARS | — | Argentine Peso | MXN | — | Mexican Peso |
BRL | — | Brazilian Real | PEN | — | Peruvian New Sol |
COP | — | Colombian Peso | PHP | — | Philippine Peso |
CZK | — | Czech Koruna | PLN | — | Polish Zloty |
EGP | — | Egyptian Pound | ROL | — | Romanian Leu |
GHC | — | Ghanaian Cedi | RUB | — | Russian Ruble |
HRK | — | Croatian Kuna | SGD | — | Singapore Dollar |
IDR | — | Indonesian Rupiah | SIT | — | Slovenian Tolar |
ILS | — | Israeli Shekel | SKK | — | Slovenska Koruna |
INR | — | Indian Rupee | THB | — | Thai Baht |
ISK | — | Iceland Krona | TRY | — | New Turkish Lira |
KRW | — | South Korean Won | TWD | — | New Taiwan Dollar |
KZT | — | Kazakhstan Tenge | TZS | — | Tanzanian Schilling |
MAD | — | Moroccan Dirham | UAH | — | Ukranian Hryvnia |
Portfolio holdings by industry (as percentage of net assets):
| | | | |
Industry | | | | |
Aerospace & Defense | | | 2.3 | % |
Banking | | | 18.3 | |
Brewery | | | 2.6 | |
Business Services & Supplies | | | 1.7 | |
Computer Software | | | 6.8 | |
Computers & Business Equipment | | | 3.8 | |
Cosmetics & Toiletries | | | 1.9 | |
Diversified. | | | 5.2 | |
Drugs & Health Care | | | 9.5 | |
Financial Services | | | 7.5 | |
Food & Beverages | | | 10.6 | |
Insurance | | | 1.7 | |
Medical Products & Services | | | 3.5 | |
Multimedia | | | 2.0 | |
Oil & Gas | | | 11.8 | |
Retail | | | 2.1 | |
Semiconductors & Components | | | 1.9 | |
Telecommunications | | | 2.7 | |
Telecommunications Equipment | | | 3.3 | |
| |
|
| |
Subtotal | | | 99.2 | |
Foreign Government Obligations | | | 3.9 | |
Repurchase Agreement | | | 0.1 | |
Collateral for Securities on Loan | | | 23.2 | |
| |
|
| |
Total Investments | | | 126.4 | % |
| |
|
| |
The accompanying notes are an integral part of these financial statements.
13
|
|
Lazard Global Total Return & Income Fund, Inc. |
Statement of Assets and Liabilities |
June 30, 2005 (unaudited) |
|
| | | | |
ASSETS | | | | |
Investments in securities, at value (cost $237,913,703) | | $ | 247,083,137 | |
Cash | | | 589 | |
Receivables for: | | | | |
Dividends and interest | | | 402,064 | |
Income from securities loaned | | | 18,837 | |
Gross appreciation on forward currency contracts | | | 848,565 | |
| |
|
| |
Total assets | | | 248,353,192 | |
| |
|
| |
LIABILITIES | | | | |
Payables for: | | | | |
Management fees | | | 202,311 | |
Accrued directors’ fees | | | 20 | |
Amounts due upon return of securities on loan | | | 45,249,363 | |
Line of credit outstanding | | | 5,650,000 | |
Gross depreciation on forward currency contracts | | | 1,726,555 | |
Other accrued expenses and payables | | | 87,852 | |
| |
|
| |
Total liabilities | | | 52,916,101 | |
| |
|
| |
Net assets | | $ | 195,437,091 | |
| |
|
| |
| | | | |
NET ASSETS | | | | |
Paid in capital | | $ | 183,076,027 | |
Distributions in excess of net investment income | | | (834,601 | ) |
Accumulated undistributed net realized gain | | | 4,904,221 | |
Net unrealized appreciation (depreciation) on: | | | | |
Investments | | | 9,169,434 | |
Foreign currency | | | (877,990 | ) |
| |
|
| |
Net assets | | $ | 195,437,091 | |
| |
|
| |
| | | | |
Shares of common stock outstanding* | | | 9,605,237 | |
Net assets per share of common stock | | $ | 20.35 | |
Market value per share | | $ | 18.50 | |
* $0.001 par value, 500,000,000 shares authorized for the Fund.
The accompanying notes are an integral part of these financial statements.
14
|
|
Lazard Global Total Return & Income Fund, Inc. |
Statement of Operations |
For the six months ended June 30, 2005 (unaudited) |
|
| | | | |
INVESTMENT INCOME | | | | |
Income: | | | | |
Dividends (net of foreign withholding taxes of $309,971) | | $ | 2,948,123 | |
Interest | | | 263,305 | |
Income from securities loaned | | | 73,285 | |
| |
|
| |
Total investment income | | | 3,284,713 | |
| |
|
| |
Expenses: | | | | |
Management fees | | | 1,251,333 | |
Professional services | | | 58,818 | |
Shareholders’ reports | | | 51,916 | |
Custodian fees | | | 48,842 | |
Administration fees | | | 38,646 | |
Interest expense | | | 26,642 | |
Shareholders’ services | | | 21,017 | |
Shareholders’ meeting | | | 16,545 | |
Directors’ fees and expenses | | | 8,673 | |
Other | | | 17,005 | |
| |
|
| |
Total gross expenses | | | 1,539,437 | |
Expense reductions | | | (129 | ) |
| |
|
| |
Total net expenses | | | 1,539,308 | |
| |
|
| |
Net investment income | | | 1,745,405 | |
| |
|
| |
| | | | |
NET REALIZED AND UNREALIZED GAIN (LOSS) ON INVESTMENTS AND FOREIGN CURRENCY | | | | |
| | | | |
Net realized gain on: | | | | |
Investments (net of foreign capital gains taxes of $139,822) | | | 2,780,136 | |
Foreign currency | | | 1,819,154 | |
Net change in unrealized depreciation on: | | | | |
Investments | | | (9,946,285 | ) |
Foreign currency | | | (3,537,148 | ) |
| |
|
| |
Net realized and unrealized loss on investments and foreign currency | | | (8,884,143 | ) |
| |
|
| |
Net decrease in net assets resulting from operations | | $ | (7,138,738 | ) |
| |
|
| |
The accompanying notes are an integral part of these financial statements.
15
|
|
Lazard Global Total Return & Income Fund, Inc. |
Statement of Changes in Net Assets |
| |
|
| | | | | | | |
| | Six Months Ended
June 30, 2005
(unaudited) | | Period Ended
December 31, 2004** | |
| |
| |
| |
INCREASE (DECREASE) IN NET ASSETS | | | | | | | |
Operations: | | | | | | | |
Net investment income | | $ | 1,745,405 | | $ | 1,749,285 | |
Net realized gain on investments and foreign currency | | | 4,599,290 | | | 7,986,028 | |
Net change in unrealized appreciation (depreciation) on investments and foreign currency | | | (13,483,433 | ) | | 21,774,877 | |
| |
|
| |
|
| |
Net increase (decrease) in net assets resulting from operations | | | (7,138,738 | ) | | 31,510,190 | |
| |
|
| |
|
| |
Distributions to Stockholders: | | | | | | | |
From net investment income | | | (6,005,194 | ) | | (6,005,194 | ) |
| |
|
| |
|
| |
Net decrease in net assets resulting from distributions | | | (6,005,194 | ) | | (6,005,194 | ) |
| |
|
| |
|
| |
Capital Stock Transactions: | | | | | | | |
Proceeds from common shares issued in offering | | | — | | | 183,360,000 | |
Offering costs for common shares charged to paid in capital | | | — | | | (384,000 | ) |
| |
|
| |
|
| |
Net increase in net assets from capital stock transactions | | | — | | | 182,976,000 | |
| |
|
| |
|
| |
Total increase (decrease) in net assets | | | (13,143,932 | ) | | 208,480,996 | |
Net assets at beginning of period*** | | | 208,581,023 | | | 100,027 | |
| |
|
| |
|
| |
Net assets at end of period* | | $ | 195,437,091 | | $ | 208,581,023 | |
| |
|
| |
|
| |
| | | | | | | |
Transactions in Capital Shares: | | | | | | | |
Common shares outstanding at beginning of period*** | | | 9,605,237 | | | 5,237 | |
| |
|
| |
|
| |
Common shares issued in offering | | | — | | | 9,600,000 | |
| |
|
| |
|
| |
Net increase | | | — | | | 9,600,000 | |
| |
|
| |
|
| |
Common shares outstanding at end of period | | | 9,605,237 | | | 9,605,237 | |
| |
|
| |
|
| |
| |
* | Includes undistributed (distributions in excess of) net investment income of $(834,601) and $3,425,188, respectively. |
** | Fund commenced operations on April 28, 2004. |
*** | Represents initial seed capital on April 20, 2004. |
The accompanying notes are an integral part of these financial statements.
16
|
|
Lazard Global Total Return & Income Fund, Inc. |
Financial Highlights |
Selected data for a share of common stock outstanding throughout each period: |
|
| | | | | | | |
| | Six Months
Ended
6/30/05† | | For the Period
4/28/04* to
12/31/04 | |
| |
| |
| |
Net asset value, beginning of period | | $ | 21.72 | | $ | 19.06 | (a) |
| |
|
| |
|
| |
Income from investment operations: | | | | | | | |
Net investment income | | | 0.18 | | | 0.18 | |
Net realized and unrealized gain (loss) | | | (0.92 | ) | | 3.11 | |
| |
|
| |
|
| |
Total from investment operations | | | (0.74 | ) | | 3.29 | |
| |
|
| |
|
| |
Less distributions from: | | | | | | | |
Net investment income | | | (0.63 | ) | | (0.63 | ) |
| |
|
| |
|
| |
Total distributions | | | (0.63 | ) | | (0.63 | ) |
| |
|
| |
|
| |
Net asset value, end of period | | $ | 20.35 | | $ | 21.72 | |
| |
|
| |
|
| |
Market value, end of period | | $ | 18.50 | | $ | 19.37 | |
| |
|
| |
|
| |
Total Return based upon: | | | | | | | |
Net asset value (b) | | | (3.43 | )% | | 17.67 | % |
Market value (b) | | | (1.31 | )% | | 0.26 | % |
| |
Ratios and Supplemental Data: | | | | | | | |
Net assets, end of period (in thousands) | | $ | 195,437 | | $ | 208,581 | |
Ratios to average net assets: | | | | | | | |
Total expenses (c) | | | 1.54 | % | | 1.57 | % |
Net investment income (c) | | | 1.74 | % | | 1.40 | % |
Portfolio turnover rate | | | 7 | % | | 7 | % |
| |
† | Unaudited. |
* | Commencement of operations. |
(a) | Net of initial sales load, underwriting and offering costs of $0.94 per share. |
(b) | Total returns reflect reinvestment of all dividends and distributions, if any. Past performance is not indicative, nor a guarantee, of future results; the investment return, market price and net asset value of the Fund will fluctuate, so that an investor’s shares in the Fund, when sold, may be worth more or less than their original cost. The returns do not reflect the deduction of taxes that a stockholder would pay on the Fund’s distributions or on the sale of Fund shares. Periods of less than one year are not annualized. |
(c) | Annualized for periods of less than one year. |
The accompanying notes are an integral part of these financial statements.
17
1. Organization
Lazard Global Total Return & Income Fund, Inc. (the “Fund”) was incorporated in Maryland on January 27, 2004 and is registered under the Investment Company Act of 1940, as amended (the “Act”“), as a diversified, closed-end management investment company. The Fund trades on the New York Stock Exchange (“NYSE”) under the ticker symbol LGI and commenced operations on April 28, 2004. The Fund’s investment objective is total return, consisting of capital appreciation and income.
2. Significant Accounting Policies
The following is a summary of significant accounting policies:
(a) Valuation of Investments—Market values for securities listed on the NYSE, NASDAQ national market or other U.S. exchanges or markets are generally based on the closing market price on the principal exchange or market on which the security is traded, generally as of the close of regular trading on the NYSE (normally 4:00 p.m. Eastern time) on each valuation date; securities not traded on the valuation date are valued at the closing bid price. Any securities not listed, for which current over-the-counter market quotations or bids are readily available, are valued at the last quoted bid price or, if available, the mean of two such prices. Forward currency contracts are valued at the current cost of offsetting the contract. Securities listed on foreign exchanges are valued at the last reported sales price, except as described below.
If events materially affecting the value of securities occur between the close of the exchange or market on which the security is principally traded and the time when the Fund’s net asset value is calculated, such securities will be valued at their fair values as determined in good faith by or under the supervision of the Board of Directors. The effect of using fair value pricing is that the net asset value of the Fund will reflect the affected securities’ values as determined in the judgment of the Board of Directors or its designee instead of being determined by the market. Using a fair value pricing methodology to price securities may result in a value that is different from the most recent closing price of a security and from the prices used by other investment companies to calculate their portfolios’ net asset values.
Securities and other assets for which current market quotations are not readily available are valued at fair value as determined in good faith in accordance with procedures approved by the Board of Directors.
Bonds and other fixed-income securities that are not exchange-traded are valued on the basis of prices provided by pricing services which are based primarily on institutional trading in similar groups of securities, or by using brokers’ quotations.
Under these procedures, in the event that Lazard Asset Management LLC, the Fund’s investment manager (the “Investment Manager”) and a wholly-owned subsidiary of Lazard Frères & Co. LLC (“Lazard”), determines that a significant event has occurred after the close of a market on which a foreign security is traded but before the close of regular trading on the NYSE, such that current market quotations for a security or securities are not readily available, a Valuation Committee of the Investment Manager will evaluate a variety of factors to determine the fair value of the affected securities. These factors include, but are not limited to, the type of security, the value of comparable securities, observations from financial institutions and relevant news events. Input from the Investment Manager’s analysts will also be considered.
(b) Portfolio Securities Transactions and Investment Income—Portfolio securities transactions are accounted for on trade date. Realized gain (loss) on sales of investments are recorded on a specific identification basis. Dividend income is recorded on the ex-dividend date and interest income is accrued daily. The Fund amortizes premium and accretes discount on fixed-income securities using the effective yield method.
(c) Repurchase Agreements—In connection with transactions in repurchase agreements, the Fund’s custodian takes possession of the underlying collateral securities, the fair value of which at all times is required to be at least equal to the principal amount, plus accrued interest, of the repurchase transaction. If the seller defaults, and the fair value of the collateral declines, realization of the collateral by the Fund may be delayed or limited.
(d) Securities Lending—The Fund may lend portfolio securities to qualified borrowers in order to earn additional income. The terms of the lending agreements require that loans are secured at all times by cash, U.S. Government securities or irrevocable letters of credit in an amount at least equal to 102% of the market value of domestic securities loaned (105% in the case of foreign securities), plus accrued interest and dividends, determined on a daily basis. Cash collateral received is invested in State Street Navigator Securities Lending Prime Portfolio, a regulated investment company offered by State Street Bank and Trust Company (“State Street”). If the borrower defaults on its obligation to return the securities loaned because of insolvency or other reasons, the Fund could experience delays and costs in recovering the securities loaned or in gaining access to the collateral.
18
|
|
Lazard Global Total Return & Income Fund, Inc. |
Notes to Financial Statements (continued) |
June 30, 2005 (unaudited) |
|
At June 30, 2005, the value of the securities on loan was $44,290,947 and corresponding cash collateral received was $45,249,363.
In accordance with accounting principles generally accepted in the United States, cash received as collateral for securities lending transactions is included in the Portfolio of Investments. The related amount payable upon the return of the securities on loan, where cash is received as collateral, is shown on the Statement of Assets and Liabilities.
(e) Leveraging—The Fund intends to use leverage to invest Fund assets in currency investments, primarily using forward currency contracts and by borrowing under a credit facility with State Street, up to a maximum of 33 1/3% of the Fund’s total leveraged assets. If the assets of the Fund decline due to market conditions such that this 331/3% threshold will be exceeded, leverage risk will increase.
If the Fund is able to realize a higher return on the leveraged portion of its investment portfolio than the cost of such leverage together with other related expenses, the effect of the leverage will be to cause the Fund to realize a higher net return than if the Fund were not so leveraged. There is no assurance that any leveraging strategy the Fund employs will be successful.
Using leverage is a speculative investment technique and involves certain risks. These include higher volatility of net asset value, the likelihood of more volatility in the market value of Common Stock and, with respect to borrowings, the possibility either that the Fund’s return will fall if the interest rate on any borrowings rises, or that income will fluctuate because the interest rate of borrowings varies.
If the market value of the Fund’s portfolio declines, the leverage will result in a greater decrease in net asset value than if the Fund were not leveraged. A greater net asset value decrease also will tend to cause a greater decline in the market price of the Fund’s Common Stock. To the extent that the Fund is required or elects to prepay any borrowings, the Fund may need to liquidate investments to fund such prepayments. Liquidation at times of adverse economic conditions may result in capital loss and reduce returns.
(f) Foreign Currency Translation and Forward Currency Contracts—The accounting records of the Fund are maintained in U.S. dollars. Portfolio securities and other assets and liabilities denominated in a foreign currency are translated daily into U.S. dollars at the prevailing rates of exchange. Purchases and sales of securities, income receipts and expense payments are translated into U.S. dollars at the prevailing exchange rates on the respective transaction dates.
The Fund does not isolate the portion of operations resulting from changes in foreign exchange rates on investments from the fluctuations arising from changes in their market prices. Such fluctuations are included in net realized and unrealized gain (loss) on investments. Net realized gain (loss) on foreign currency transactions represents net foreign currency gain (loss) from forward currency contracts, disposition of foreign currencies, currency gain (loss) realized between the trade and settlement dates on securities transactions, and the difference between the amount of dividends, interest and foreign withholding taxes recorded on the Fund’s accounting records and the U.S. dollar equivalent amounts actually received or paid. Net unrealized foreign currency gain (loss) arises from changes in the value of assets and liabilities, other than investments in securities, as a result of changes in exchange rates.
A forward currency contract is an agreement between two parties to buy or sell currency at a set price on a future date. Upon entering into these contracts, risks may arise from the potential inability of counterparties to meet the terms of their contracts and from unanticipated movements in the value of the foreign currency relative to the U.S. dollar.
The U.S. dollar value of forward currency contracts is determined using forward exchange rates provided by quotation services. Daily fluctuations in the value of such contracts are recorded as unrealized gain (loss). When the contract is closed, the Fund records a realized gain (loss) equal to the difference between the value at the time it was opened and the value at the time it was closed. Such gain (loss) is disclosed in the realized and unrealized gain (loss) on foreign currency in the Fund’s accompanying Statement of Operations.
(g) Structured Investments—The Fund may invest in structured investments, whose values are linked either directly or inversely to changes in foreign currencies, interest rates, commodities, indices, or other underlying instruments. The Fund may use these investments to increase or decrease its exposure to different underlying instruments, to gain exposure to markets that might be difficult to invest in through conventional securities or for other purposes. Structured investments may be more volatile than their underlying instruments, but any loss is limited to the amount of the original investment.
(h) Federal Income Taxes—The Fund’s policy is to continue to qualify as a regulated investment company under Sub-chapter M of the Internal Revenue Code and to distribute all of its taxable income, including any net realized capital gains, to shareholders. Therefore, no federal income tax provision is required.
19
|
|
Lazard Global Total Return & Income Fund, Inc. |
Notes to Financial Statements (continued) |
June 30, 2005 (unaudited) |
|
At December 31, 2004, the Fund had no unused realized capital losses.
Under current tax law, certain capital and net foreign currency losses realized after October 31 within the taxable year may be deferred and treated as occurring on the first day of the following tax year. For the tax year ended December 31, 2004, the Fund elected to defer $1,880 of net capital and currency losses arising between November 1, 2004 and December 31, 2004.
(i) Dividends and Distributions—The Fund intends to declare and to pay dividends monthly from net investment income. Distributions to stockholders are recorded on the ex-dividend date. During any particular year, net realized gains from investment transactions in excess of available capital loss carryforwards would be taxable to the Fund if not distributed. The Fund intends to declare and distribute these amounts, at least annually, to stockholders; however, to avoid taxation, a second distribution may be required.
Income dividends and capital gains distributions are determined in accordance with federal income tax regulations which may differ from accounting principles generally accepted in the United States. These book/tax differences, which may result in distribution reclassifications, are primarily due to differing treatments of foreign currency transactions. Book/tax differences relating to shareholder distributions may result in reclassifications among certain capital accounts.
The Fund has implemented a Level Distribution Policy to seek to maintain a stable monthly distribution, subject to approval and oversight of the Fund’s Board of Directors. Under the Fund’s Level Distribution Policy, the Fund intends to make regular monthly distributions at a fixed rate per share. If for any monthly distribution, net investment income and net realized short-term capital gain were less than the amount of the distribution, the difference would generally be distributed from the Fund’s assets. In addition, in order to make such distributions, the Fund might have to sell a portion of its investment portfolio at a time when independent investment judgment might not dictate such actions.
(j) Estimates—The preparation of financial statements in conformity with accounting principles generally accepted in the United States requires the Fund to make estimates and assumptions that affect the reported amounts of assets and liabilities and disclosure of contingent assets and liabilities at the date of the financial statements and the reported amounts of increases and decreases in net assets from operations during the reporting period. Actual results could differ from those estimates.
3. Investment Management Agreement
The Fund has entered into an interim investment management agreement (the “Interim Management Agreement”) with the Investment Manager. Pursuant to the Interim Management Agreement, the Investment Manager regularly provides the Fund with investment research, advice and supervision and furnishes continuously an investment program for the Fund consistent with its investment objective and policies, including the purchase, retention and disposition of securities. The Interim Management Agreement requires all management fees earned by the Investment Manager to be escrowed pending shareholder approval of a new management agreement with the Investment Manager as a result of the initial public offering of securities of a parent company of the Investment Manager and other related changes in the structure of the Lazard organization which occurred on May 5, 2005.
The Fund has agreed to pay the Investment Manager an annual investment management fee of 0.85% of the Fund’s average daily “Total Leveraged Assets” (the Fund’s total assets including Financial Leverage (defined below)) for the services and facilities provided by the Investment Manager, payable on a monthly basis. The fee paid to the Investment Manager will be higher when the Investment Manager uses Currency Commitments and Borrowings (“Financial Leverage”) to make Currency Investments, rather than by reducing the percentage of “Net Assets” (the Fund’s assets without taking into account Financial Leverage) invested in Global Equity Investments for the purposes of making Currency Investments. “Global Equity Investments” refers to investments in the Fund’s global equity strategy consisting of equity securities of companies with market capitalizations of $5 billion or greater domiciled in those countries that comprise the Morgan Stanley Capital International (MSCI®) World® Index. “Currency Investments” refers to investments in the Fund’s emerging income strategy, consisting of emerging market currencies (primarily by entering into forward currency contracts), or instruments whose value is derived from the performance of an underlying emerging market currency, but also may invest in debt obligations, including government, government agency and corporate obligations and structured notes denominated in emerging market currencies. “Currency Commitments” are the aggregate financial exposures created by forward currency contracts in excess of that represented in the Fund’s Net Assets, and “Borrowings” refers to the borrowings under the Fund’s credit facility. Assuming Financial Leverage in the amount of 33 1/3% of the Fund’s Total Leveraged Assets, the annual fee payable to the Investment Manager would be 1.28% of Net Assets (i.e., not including amounts attributable to Financial Leverage).
20
|
|
Lazard Global Total Return & Income Fund, Inc. |
Notes to Financial Statements (continued) |
June 30, 2005 (unaudited) |
|
The following is an example of this calculation of the Investment Manager’s fee, using very simple illustrations. If the Fund had assets of $1,000, it could invest $1,000 in Global Equity Investments and enter into $500 in forward currency contracts (because the Fund would not have to pay money at the time it enters into the currency contracts). Similarly, the Fund could invest $1,000 in Global Equity Investments, borrow $500 and invest the $500 in foreign currency denominated bonds. In either case, the Investment Manager’s fee would be calculated based on $1,500 of assets, because the fee is calculated based on Total Leveraged Assets (Net Assets plus Financial Leverage). In our example, the Financial Leverage is in the form of either the forward currency contracts (Currency Commitments) or investments from Borrowings. The amount of the Financial Leverage outstanding, and therefore the amount of Total Leveraged Assets on which the Investment Manager’s fee is based, fluctuates daily based on changes in value of the Fund’s portfolio holdings, including changes in value of the currency involved in the forward currency contracts and foreign currency denominated bonds acquired with the proceeds of Borrowings. However, the Investment Manager’s fee will be the same regardless of whether Currency Investments are made with Currency Commitments or with Borrowings (without taking into account the cost of Borrowings).
This method of calculating the Investment Manager’s fee is different than the way closed-end investment companies typically calculate management fees. Traditionally, closed-end investment companies calculate management fees based on Net Assets plus Borrowings (excluding Financial Leverage obtained through Currency Commitments). The Investment Manager’s fee is different because the Fund’s leverage strategy is different than the leverage strategy employed by many other closed-end investment companies. Although the Fund may employ Borrowings in making Currency Investments, the Fund’s leverage strategy relies primarily on Currency Commitments, rather than relying exclusively on borrowing money or/and issuing preferred stock, as is the strategy employed by most closed-end investment companies. The Investment Manager’s fee would be lower if its fee were calculated only on Net Assets plus Borrowings, because the Investment Manager would not earn fees on Currency Investments made with Currency Commitments (forward currency contracts). Using the example above, where the Fund has assets of $1,000 and invests $1,000 in Global Equity Investments and $500 in forward currency contracts, the following table illustrates how the Investment Manager’s fee would be different if it did not earn management fees on these types of Currency Investments. A discussion of the review and approval by the Fund’s Board of Directors of the Fund’s investment management agreement (including the method of calculating the Investment Manager’s fee) is included below under “Board Consideration of Management Agreements.”
| | | | | | | |
| | Fund’s management | | Typical | |
| | fee based on | | management | |
| | Total Leveraged | | fee formula, | |
| | Assets (includes | | calculated excluding | |
| | | Currency | | | Currency | |
Beginning assets of $1,000 | | | Commitments) | | | Commitments | |
| | | | | | | |
Global Equity Investments (Net Assets) | | $ | 1,000 | | $ | 1,000 | |
Currency Commitments | | $ | 500 | | $ | 500 | |
Assets used to calculate management fee | | $ | 1,500 | | $ | 1,000 | |
Management fee (0.85%) | | $ | 12.75 | | $ | 8.50 | |
(a) Investment Manager Fee Conflict Risk—The fee paid to the Investment Manager for investment management services will be higher when the Fund uses Financial Leverage, whether through forward currency contracts or Borrowings, because the fee paid will be calculated on the basis of the Fund’s assets including this Financial Leverage. Consequently, the Investment Manager may have a financial interest for the Fund to utilize such Financial Leverage, which may create a conflict of interest between the Investment Manager and the stockholders of the Fund. The Fund has implemented procedures to monitor this potential conflict.
4. Administrative Agreement
The Fund has entered into an administrative agreement with State Street to provide certain administrative services. The Fund bears the cost of such services at a fixed annual rate of $37,500, plus 0.02% of average daily net assets up to $1 billion and 0.01% of average daily net assets over $1 billion.
5. Directors’ Compensation
Certain Directors of the Fund are Managing Directors or former employees of the Investment Manager. The Fund pays each Director who is not an employee or an affiliated person of the Investment Manager its allocated portion of a fixed fee of $50,000 per year, plus $2,500 per meeting attended ($1,000 per meeting attended by telephone) for the Fund, The Lazard Funds, Inc., Lazard Retirement Series, Inc. and Lazard World Dividend & Income Fund, Inc. (collectively, the “Lazard Funds”), each a registered management investment company advised by the Investment Manager, and reimburses such Directors for travel and other out of pocket expenses. In addition, the Chairman of the Audit Committees for the Lazard Funds also receives an annual fee of $5,000.
21
|
|
Lazard Global Total Return & Income Fund, Inc. |
Notes to Financial Statements (concluded) |
June 30, 2005 (unaudited) |
|
6. Securities Transactions and Transactions with Affiliates
Purchases and sales of portfolio securities (excluding short-term securities) for the period ended June 30, 2005 were $17,129,300 and $13,318,847, respectively.
For the period ended June 30, 2005, no brokerage commissions were paid to affiliates of the Investment Manager or other affiliates of the Fund for portfolio transactions executed on behalf of the Fund.
7. Line of Credit
The Fund has a $40 million Line of Credit Agreement (the “Agreement”) with State Street primarily to use leverage to invest Fund assets in Currency Investments. The Fund may borrow the lesser of $40 million or 33 1/3% of its Total Leveraged Assets. Interest on borrowings is payable at Federal Funds rate plus 0.50%, on an annualized basis. Under the Agreement, the Fund has agreed to pay a 0.10% per annum fee on the unused portion of the commitment, payable quarterly in arrears. During the period ended June 30, 2005, the Fund had borrowings under the Agreement as follows:
| | | | | |
Average Daily | | Maximum Daily | | Weighted Average | |
Loan Balance | | Loan Outstanding | | Interest Rate | |
| |
| |
| |
$2,950,000 | | $5,650,000 | | 3.461% | |
8. Foreign Securities Investment Risks
The Fund invests in securities of foreign entities and instruments denominated in foreign currencies which involve risks not typically involved in domestic investments. Foreign investments carry special risks, such as exposure to currency fluctuations, less developed or less efficient trading markets, political instability, a lack of company information, differing auditing and legal standards and, potentially, less liquidity. The Fund’s investments in emerging markets are exposed to additional volatility. The Fund’s performance will be influenced by political, social and economic factors affecting emerging markets. Emerging market countries generally have economic structures that are less diverse and mature, and political systems that are less stable, than those of developed countries.
22
The first Annual Meeting of Stockholders was held on April 27, 2005, to vote on the following proposal. The proposal received the required number of votes of stockholders and was adopted.
Proposal 1:
To elect the following Directors:
| |
(a) | three Class I Directors (William Katz, Robert M. Solmson and Charles Carroll) of the Fund, each to serve for a one-year term expiring at the 2006 Annual Meeting of Stockholders and until his successor is duly elected and qualified; |
| |
(b) | two Class II Directors (Kenneth S. Davidson and Lester Z. Lieberman) of the Fund, each to serve for a two-year term expiring at the 2007 Annual Meeting of Stockholders and until his successor is duly elected and qualified; and |
| |
(c) | three Class III Directors (John J. Burke, Richard Reiss, Jr. and Norman Eig) of the Fund, each to serve for a three-year term expiring at the 2008 Annual Meeting of Stockholders and until his successor is duly elected and qualified. |
| | | | |
| | For | | Withhold Authority |
| |
| |
|
(a) | Class I Directors | 6,757,898 | | 68,193 |
(b) | Class II Directors | 6,747,805 | | 78,286 |
(c) | Class III Directors | 6,752,455 | | 73,636 |
23
Unless you elect to receive distributions in cash (i.e., opt-out), all dividends, including any capital gain distributions, on your Common Stock will be automatically reinvested by the Plan Agent in additional Common Stock under the Fund’s Dividend Reinvestment Plan (the “Plan”). You may elect not to participate in the Plan by contacting the Plan Agent. If you do not participate, you will receive all distributions in cash, paid by check mailed directly to you by Computershare Shareholder Services, Inc., as dividend disbursing agent (the “Plan Agent”).
Under the Plan, the number of shares of Common Stock you will receive will be determined on the dividend or distribution payment date, as follows:
| |
(1) | If the Common Stock is trading at or above net asset value at the time of valuation, the Fund will issue new shares at a price equal to the greater of (i) net asset value per Common Share on that date or (ii) 95% of the Common Stock’s market price on that date. |
| |
(2) | If the Common Stock is trading below net asset value at the time of valuation, the Plan Agent will receive the dividend or distribution in cash and will purchase Common Stock in the open market, on the NYSE or elsewhere, for the participants’ accounts. It is possible that the market price for the Common Stock may increase before the Plan Agent has completed its purchases. Therefore, the average purchase price per share paid by the Plan Agent may exceed the market price at the time of valuation, resulting in the purchase of fewer shares than if the dividend or distribution had been paid in Common Stock issued by the Fund. The Plan Agent will use all dividends and distributions received in cash to purchase Common Stock in the open market within 30 days of the valuation date. Interest will not be paid on any uninvested cash payments. |
You may withdraw from the Plan at any time by giving written notice to the Plan Agent. If you withdraw or the Plan is terminated, you will receive whole shares in your account under the Plan and you will receive a cash payment for any fraction of a share in your account. If you wish, the Plan Agent will sell your shares and send you the proceeds, minus a $15 service fee plus $0.12 per share being liquidated (for processing and brokerage expenses).
The Plan Agent maintains all stockholders’ accounts in the Plan and gives written confirmation of all transactions in the accounts, including information you may need for tax records. Shares of Common Stock in your account will be held by the Plan Agent in non-certificated form. Any proxy you receive will include all Common Stock you have received under the Plan.
There is no brokerage charge for reinvestment of your dividends or distribution in Common Stock. However, all participants will pay a pro rata share of brokerage commissions incurred by the Plan Agent when it makes open market purchases.
Automatically reinvesting dividends and distributions does not mean that you do not have to pay income taxes due upon receiving dividends and distributions.
If you hold your Common Stock with a brokerage firm that does not participate in the Plan, you will not be able to participate in the Plan and any dividend reinvestment may be effected on different terms than those described above. Consult your financial advisor for more information.
The Fund reserves the right to amend or terminate the Plan if, in the judgment of the Board of Directors, the change is warranted. There is no direct service charge to participants in the Plan (other than the service charge when you direct the Plan Agent to sell your Common Stock held in a dividend reinvest account); however, the Fund reserves the right to amend the Plan to include a service charge payable by the participants. Additional information about the Plan may be obtained from the Plan Agent at P.O. Box 43010, Providence, Rhode Island 02940-3010.
24
|
|
Lazard Global Total Return & Income Fund, Inc. |
Board of Directors and Officers Information |
(unaudited) |
|
| | |
Name (Age)
Address(1) | Position(s) and Term
with the Fund(2) | Principal Occupation(s) During Past 5 Years
and Other Directorships Held |
|
|
|
Class I — Directors with Term Expiring in 2006 | |
Independent Directors: | | |
| | |
William Katz (50) | Director | Retired President and Chief Executive Officer, BBDO New York, an advertising agency; Retired Director, BBDO Worldwide. |
| | |
Robert M. Solmson (57) | Director | Former Chief Executive Officer and Chairman, RFS Hotel Investors, Inc.; Director, Lazard Alternative Strategies Fund, LLC; Director, Colonial Williamsburg Co.; Former Director, Morgan Keegan, Inc.; Former Director, Independent Bank, Memphis. |
| | |
Interested Director(3): | | |
| | |
Charles Carroll (44) | Director and President | Deputy Chairman and Head of Global Marketing of the Investment Manager. |
| | |
Class II — Directors with Term Expiring in 2007 | |
Independent Directors: | | |
| | |
Kenneth S. Davidson (60) | Director | President, Davidson Capital Management Corporation; Trustee, The Juilliard School; Chairman of the Board, Bridgehampton Chamber Music Festival; Trustee, American Friends of the National Gallery/London. |
| | |
Lester Z. Lieberman (75) | Director | Private Investor; Chairman, Healthcare Foundation of NJ; Director, Cives Steel Co.; Director, Northside Power Transmission Co.; Advisory Trustee, New Jersey Medical School; Director, Public Health Research Institute; Trustee Emeritus, Clarkson University; Council of Trustees, New Jersey Performing Arts Center. |
| | |
Interested Director(3): | | |
| | |
Ashish Bhutani (45) | Director | Chief Executive Officer of the Investment Manager since march 2004; previously Head of New Products and Strategic Planning of Lazard from June 2003 to March 2004; Co-Chief Executive Officer North America of Dresdner Kleinwort Wasserstein from 2001 to end of 2002, and was a member of its Global Corporate and Markets Board and the Global Executive Committee; Deputy Chairman of Wassenstein Perella Group from 1989 to 2001 and Chief Executive Officer of Wasserstein Perella Securities from 1995 to 2001. |
| | |
Class III — Directors with Term Expiring in 2008 | |
Independent Directors: | | |
| | |
John J. Burke (77) | Director | Lawyer and Private Investor; Director, Lazard Alternative Strategies Fund, LLC; Director, Pacific Steel & Recycling; Director, Sletten Construction Company; Trustee Emeritus, The University of Montana Foundation. |
| | |
Richard Reiss, Jr. (61) | Director | Chairman, Georgica Advisors LLC, an investment manager; Director, Lazard Alternative Strategies Fund, LLC; Director, O’Charley’s, Inc., a restaurant chain. |
| | |
Interested Director(3): | | |
| | |
Norman Eig (64) | Chairman of the Board | Private Investor; Senior Adviser of the Investment Manager from January 2005 to April 2005; Chairman of the Investment Manager from March 2004 to January 2005; previously Co-Chief Executive Officer of the Investment Manager and Member of the Management Committee of Lazard. |
| |
(1) | The address of each Director is Lazard Asset Management LLC, 30 Rockefeller Plaza, New York, New York 10112-6300. |
(2) | Each Director became a Director in February 2004, except that Mr. Solmson became a director in September 2004, Mr. Carroll became Director and President in June 2004 and Mr. Bhutani became a Director in July 2005, and serves as a Director for each of the Lazard Funds (total comprised of 19 investment portfolios). |
(3) | Mr. Eig, Mr. Carroll and Mr. Bhutani are “interested persons” (as defined in the Act) of the Fund (“Interested Directors”) because of their positions, or former position in the case of Mr. Eig, with the Investment Manager. |
The Fund’s Statement of Additional Information contains further information about the Directors and is available without charge by calling 800-828-5548.
25
|
|
Lazard Global Total Return & Income Fund, Inc. |
Board of Directors and Officers Information (concluded) |
(unaudited) |
|
| | |
Name (Age)
Address(1) | Position(s) and Term
with the Fund(2) | Principal Occupation(s) During Past 5 Years |
|
|
|
Officers: | | |
| | |
Nathan A. Paul (32) | Vice President and
Secretary | Managing Director and General Counsel of the Investment Manager; Associate at Schulte Roth & Zabel LLP, a law firm, from September 1997 to October 2000. |
| | |
John H. Blevins (40) | Chief Compliance
Officer | Senior Vice President and Chief Compliance Officer of the Investment Manager; Director of Compliance for North America, Citi Asset Management Group, from November 1999 to July 2000. |
| | |
Stephen St. Clair (46) | Treasurer | Vice President of the Investment Manager. |
| | |
Brian D. Simon (43) | Assistant Secretary | Director of Legal Affairs of the Investment Manager; Vice President, Law & Regulation at J. & W. Seligman & Co., from July 1999 to October 2002. |
| | |
David A. Kurzweil (31) | Assistant Secretary | Vice President of the Investment Manager; Associate at Kirkpatrick & Lockhart LLP, a law firm, from August 1999 to January 2003. |
| | |
Cesar A. Trelles (30) | Assistant Treasurer | Fund Administration Manager of the Investment Manager; Manager for Mutual Fund Finance Group at UBS Global Asset Management, from August 1998 to August 2004. |
| |
(1) | The address of each officer is Lazard Asset Management LLC, 30 Rockefeller Plaza, New York, New York 10112-6300. |
(2) | Each officer became an officer in February 2004, except that Mr. Blevins became an officer in September 2004 and Mr. Trelles became an officer in December 2004, and serves for an indefinite term, until his successor is elected and qualified. Each officer serves in the same capacity for the other Lazard Funds. |
26
|
|
Lazard Global Total Return & Income Fund, Inc. |
Other Information |
(unaudited) |
|
Proxy Voting
A description of the policies and procedures that the Fund uses to determine how to vote proxies relating to its portfolio securities is available (1) without charge, upon request, by calling (800) 823-6300 or (2) on the Securities and Exchange Commission (the “SEC”) website at www.sec.gov.
The Fund’s proxy voting record for the most recent 12-month period ended June 30 is available (1) without charge, upon request, by calling (800) 823-6300 or (2) on the SEC’s website at www.sec.gov. Information as of June 30 each year will generally be available by the following August 31.
Form N-Q
The Fund files a complete schedule of its portfolio holdings for the first and third quarters of its fiscal year with the SEC on Form N-Q. The Fund’s Form N-Q is available on the SEC’s website at www.sec.gov and may be reviewed and copied at the SEC’s Public Reference Room in Washington, DC. Information on the operation of the SEC’s Public Reference Room may be obtained by calling 1-800-SEC-0330.
Board Consideration of Management Agreements
At the meeting of the Fund’s Board of Directors held on February 15, 2005, the Board considered the approval of a new Management Agreement between the Fund and the Investment Manager (the “New Management Agreement”) as a result of the initial public offering of securities of a parent company of the Investment Manager and other related changes in the structure of the Lazard organization which occurred on May 5, 2005 (the “Restructuring”). The Directors who are not interested persons (as defined in the Act) of the Fund (the “Independent Directors”) were assisted in their review by independent legal counsel and met with counsel in executive session separate from representatives of the Investment Manager. Shareholders approved the New Management Agreement on August 11, 2005.
At a meeting of the Fund’s Board of Directors held on April 19, 2005, the Board considered the approval of the Interim Management Agreement under conclusions and determinations substantially identical to those described below for the New Management Agreement, largely by reference to information presented and discussed at the Board meeting on February 15, 2005 supporting the same conclusions and determinations for the Interim Management Agreement. Representatives of the Investment Manager had confirmed for the Board that there had been no significant changes in referenced information, and the Board confirmed its understanding of the application of this information.
Services Provided
Representatives of the Investment Manager gave a presentation to the Board about the nature, extent and quality of services that the Investment Manager provides the Fund, including a brief discussion of the Investment Manager and its clients (of which the Fund comprised approximately $300 million (leveraged) of the approximately $76 billion of total assets then under management by the Investment Manager and its global affiliates) and outlining the Investment Manager’s global structure, including technology and operational support, all of which provide realized benefits through investment in the Investment Manager’s investment advisory business. The Directors agreed that the Fund benefits from all of the services of the Investment Manager’s global platforms, and that such services would be different than those provided to a $4 billion fund complex such as that of the Fund and the other Lazard registered investment companies. The representatives of the Investment Manager reviewed the Fund’s market price performance, market discount to net asset value and trading activity.
The Directors discussed the nature, extent and quality of the services provided by the Investment Manager to the Fund. The Directors considered the various services provided by the Investment Manager to the Fund and considered the Investment Manager’s research and portfolio management capabilities and that the Investment Manager also provides oversight of day-to-day operations of the Fund, including fund accounting and administration and assistance in meeting legal and regulatory requirements. The Directors also considered the Investment Manager’s extensive administrative, accounting and compliance infrastructure.
Restructuring
The Directors assessed the implications of the Restructuring for the Investment Manager and its ability to continue to provide services to the Fund of the same scope and quality as are currently provided. In particular, the Board inquired as to the
27
|
|
Lazard Global Total Return & Income Fund, Inc. |
Other Information (continued) |
(unaudited) |
|
impact of the Restructuring on the Investment Manager’s personnel, management, facilities and financial capabilities, and received assurances in this regard from senior management of the Investment Manager that the Restructuring would not adversely affect the Investment Manager’s ability to fulfill its obligations under the New Management Agreement, and to operate its business in a manner consistent with past practices. The Board also considered that the New Management Agreement, and the fees paid thereunder, are substantively identical in all respects to the previous management agreement between the Fund and the Investment Manager (the “Previous Management Agreement”), except for the time periods covered by the agreements.
Comparative Performance and Fees and Expenses
The Directors reviewed and placed significant emphasis on the relative performance and advisory fees and expense ratio for the Fund, including comparative fee information prepared by Lipper.
The Directors noted that the Fund’s performance is above that of its benchmark index. The Directors also discussed the advisory fees and current expense ratio for the Fund, which were proposed to be the same under the New Management Agreement as under the Previous Management Agreement, and it was noted that they are generally within the median ranges of the Fund’s comparison group. An extended discussion of the fees to be charged and services to be provided under the New Management Agreement ensued. The Directors considered and evaluated the performance and expense ratio of the Fund. They agreed with the Investment Manager’s characterization of the Fund’s performance and the expense ratio compared to the Fund’s comparison group, and agreed that the fees charged were reasonable in light of the services provided by the Investment Manager and the Fund’s overall performance.
The Directors also considered the Investment Manager’s other accounts managed in the Investment Manager’s global equity strategy or emerging income strategy, the Fund’s investment strategies (“Similar Accounts”). The Directors discussed the fee paid to the Investment Manager compared to the fee paid to the Investment Manager by Similar Accounts. The Directors also reviewed the nature of the Similar Accounts and the differences, from the Investment Manager’s perspective, in management of the different types of Similar Accounts as compared to management of the Fund and the differences in managing an account in a single strategy as compared to pursuing an investment objective with two separate strategies. The Directors considered the relevance of the fee information provided for Similar Accounts managed by the Investment Manager to evaluate the appropriateness and reasonableness of the Fund’s advisory fee. A discussion ensued, as a consequence of which the Board recognized that any differences in fees paid by Similar Accounts was consistent with the differences in the services provided and in the application of the strategies.
Fee Calculation
The Board was reminded of the method of calculating the Fund’s management fee and considered that the method of calculation of management fees based on the Fund’s Total Leveraged Assets, pursuant to which the management fee borne by stockholders will increase to the extent the Investment Manager makes Currency Investments by incurring Financial Leverage rather than reducing the percentage of Net Assets invested in Global Equity Investments for the purposes of making Currency Investments, and considered the advantages of increased investment exposure through Financial Leverage. The Board considered the economic equivalence, and the similarities, from an investment management perspective, of Currency Investments (1) made with Currency Commitments and (2) made with the proceeds of Borrowings.
Representatives of the Investment Manager noted, and the Board considered, (1) that this method of calculating management fees is different than the way closed-end investment companies typically calculate management fees, (2) that traditionally closed-end funds calculate management fees based on Net Assets plus Borrowings (excluding Financial Leverage obtained through Currency Commitments), and (3) that the Investment Manager’s fee would be lower if its fee were calculated only on Net Assets plus Borrowings, because the Investment Manager would not earn fees on Currency Investments made with Currency Commitments (forward currency contracts or other derivative instruments whose value is derived from the performance of an underlying emerging market currency). The Board considered that the Investment Manager’s fee is different because the Fund’s leverage strategy is different than the leverage strategy employed by many other closed-end investment companies — that although the Fund may employ Borrowings in making Currency Investments, the Fund’s leverage strategy relies primarily on Currency Commitments rather than relying exclusively on borrowing money and/or issuing preferred stock, as for most closed-end investment companies. The Board discussed and considered the Fund’s use of Currency Commitments for leverage (rather than relying exclusively on borrowing money and/or issuing preferred stock) and
28
|
|
Lazard Global Total Return & Income Fund, Inc. |
Other Information (continued) |
(unaudited) |
|
the Investment Manager’s belief that forward currency contracts, or other derivative instruments whose value is derived from the performance of an underlying emerging market currency, often offer a more attractive way to gain exposure to emerging market interest rate opportunities and currencies than investments in debt obligations and the fact that there might not be a viable debt market in certain emerging market countries. The Board also discussed the Investment Manager’s view that foreign currency contracts present less counterparty and custody risks. The Board discussed and considered the Investment Manager’s extensive expertise with these instruments, as discussed in detail in previous meetings concerning the Previous Management Agreement.
The Investment Manager representatives reminded the Directors of the procedures that the Investment Manager had agreed to adopt for the Previous Management Agreement in order to evaluate possible conflicts of interest that may arise from the fee calculation methodology, including: (1) no less frequently than monthly, decisions regarding the amount of the Fund’s allocation to Currency Investments must be reviewed by a Managing Director of the Investment Manager not involved in the decision-making process and the Fund’s Chief Compliance Officer, and that such review be documented to include the basis therefor, documentation to be retained for six years, the first two years in an easily accessible place, (2) the Investment Manager must provide the Board with a quarterly report regarding these decisions and the reasons therefor and (3) the Investment Manager must deliver a quarterly certification to the Board, signed by a Managing Director of the Investment Manager and the Fund’s Chief Compliance Officer, that the procedures had been complied with during the previous quarter. The Investment Manager representatives stated that such procedures had been followed under the Previous Management Agreement, and that the Investment Manager would continue to follow those procedures.
Investment Manager Profitability and Economies of Scale
The Directors reviewed information prepared by the Investment Manager for the Fund concerning the costs to and profits realized by the Investment Manager and its affiliates resulting from the Previous Management Agreement, reviewing the dollar amount of expenses allocated and profit received by the Investment Manager and the method used to determine such expenses and profit. The representatives of the Investment Manager stated that neither the Investment Manager nor its affiliates, including Lazard, receive any significant indirect benefits from managing the Fund. The Investment Manager’s representatives stated that Lazard had not been used during the fiscal period ended December 31, 2004 for brokerage purposes for the Fund. The Investment Manager’s representatives noted that the Investment Manager does obtain soft dollar research, as reviewed by the Board each quarter. The Directors agreed that the information provided substantiated statements of the Investment Manager representatives.
It was noted that the profitability percentage for the Fund was within ranges determined by appropriate court cases not to be so disproportionately large that it bore no reasonable relationship to the services rendered and, given the overall performance and generally superior service levels, was thought not to be excessive, and the Board concurred with this analysis.
The Directors considered the Investment Manager’s estimated profitability with respect to the Fund under the Previous Management Agreement as part of their evaluation of whether the Fund’s fee under the New Management Agreement bears a reasonable relationship to the mix of services provided by the Investment Manager, including the nature, extent and quality of such services. The Directors evaluated the costs of the services to be provided and profits expected to be realized by the Investment Manager and its affiliates from the relationship with the Fund in light of the relevant circumstances. It was noted that a discussion of economies of scale should be predicated on increasing assets and that because the Fund is a closed-end fund without daily inflows and outflows of capital there were not at this time significant economies of scale to be realized by the Investment Manager in managing the Fund’s assets. The Directors also considered potential benefits to the Investment Manager and its affiliates from the Investment Manager acting as investment adviser to the Fund.
At the conclusion of these discussions, each of the Independent Directors expressed the opinion that he had been furnished with sufficient information to make an informed business decision with respect to approval of the New Management Agreement. Based on its discussions and considerations as described above, the Board made the following conclusions and determinations.
| |
• | The Board concluded that the nature, extent and quality of the services provided by the Investment Manager are adequate and appropriate, especially including the benefits of advisory and research services associated with a $76 billion asset management business. |
29
|
|
Lazard Global Total Return & Income Fund, Inc. |
Other Information (concluded) |
(unaudited) |
|
| |
• | The Board determined that the Restructuring of the Investment Manager’s parent companies would not be a detriment to the Investment Manager’s ability to continue to provide services to the Fund of the same scope and quality as provided under the Previous Management Agreement, and that the Restructuring would not adversely affect the Investment Manager’s ability to fulfill its obligations under the New Management Agreement, and to operate its business in a manner consistent with past practices. |
| |
• | The Board was satisfied with the Fund’s overall performance. |
| |
• | The Board concluded that the Fund’s fee paid to the Investment Manager, which was proposed to be the same under the New Management Agreement as under the Previous Management Agreement, was reasonable in light of comparative performance and expense and advisory fee information, costs of the services provided and profits to be realized and benefits derived or to be derived by the Investment Manager from the relationship with the Fund. |
| |
• | The Board determined that there were not at this time significant economies of scale to be realized by the Investment Manager managing the Fund’s assets and that, to the extent that material economies of scale had not been shared with the Fund, the Board would seek to do so. |
The Board considered these conclusions and determinations and, without any one factor being dispositive, determined that approval of the New Management Agreement, including the fee calculation methodology based on Total Leveraged Assets, was in the best interests of the Fund and its stockholders.
30
[This page intentionally left blank]
[This page intentionally left blank]
Lazard Global Total Return & Income Fund, Inc.
30 Rockefeller Plaza
New York, New York 10112-6300
Telephone: 800-828-5548
http://www.LazardNet.com
Investment Manager
Lazard Asset Management LLC
30 Rockefeller Plaza
New York, New York 10112-6300
Telephone: 800-823-6300
Custodian
State Street Bank and Trust Company
225 Franklin Street
Boston, Massachusetts 02110
Transfer Agent and Registrar
EquiServe Trust Company, N.A.
P.O Box 43010
Providence, Rhode Island 02940-3010
Dividend Disbursing Agent
Computershare Shareholder Services, Inc.
P.O Box 43010
Providence, Rhode Island 02940-3010
Independent Registered Public Accounting Firm
Deloitte & Touche LLP
Two World Financial Center
New York, New York 10281-1414
Legal Counsel
Stroock & Stroock & Lavan LLP
180 Maiden Lane
New York, New York 10038-4982
http://www.stroock.com
This report is intended only for the information of stockholders or those who have received the current prospectus covering shares of Common Stock of Lazard Global Total Return & Income Fund, Inc. which contains information about management fees and other costs.


| | |
Lazard Asset Management LLC | 30 Rockefeller Plaza | www.LazardNet.com |
| New York, NY 10112-6300 | |
ITEM 2. CODE OF ETHICS.
Not applicable.
ITEM 3. AUDIT COMMITTEE FINANCIAL EXPERT.
Not applicable.
ITEM 4. PRINCIPAL ACCOUNTANT FEES AND SERVICES.
Not applicable.
ITEM 5. AUDIT COMMITTEE OF LISTED REGISTRANTS.
Not applicable.
ITEM 6. SCHEDULE OF INVESTMENTS
Not applicable.
ITEM 7. DISCLOSURE OF PROXY VOTING POLICIES AND PROCEDURES FOR CLOSED END
MANAGEMENT INVESTMENT COMPANIES.
Not applicable.
ITEM 8. PORTFOLIO MANAGERS OF CLOSED-END MANAGEMENT INVESTMENT COMPANIES.
Not applicable.
ITEM 9. PURCHASES OF EQUITY SECURITIES BY CLOSED-END MANAGEMENT INVESTMENT
COMPANY AND AFFILIATED PURCHASERS.
Not applicable.
ITEM 10. SUBMISSION OF MATTERS TO A VOTE OF SECURITY HOLDERS.
The Registrant has a Nominating Committee (the "Committee") of the Board of Directors (the "Board"), which is currently comprised of all of the Directors who are not "interested persons" (as defined in the Investment Company Act of 1940, as amended) of the Registrant. The Committee's function is to select and nominate candidates for election to the Board. The Committee will consider recommendations for nominees from stockholders sent to the Secretary of the Registrant, 30 Rockefeller Plaza, New York, New York 10112. Nominations may be submitted only by a stockholder
or group of stockholders that, individually or as a group, has beneficially owned the lesser of (a) 1% of the Registrant's outstanding shares or (b) $500,000 of the Registrant's shares (calculated at market value) for at least one year prior to the date such stockholder or group submits a candidate for nomination. Not more than one nominee for Director may be submitted by such a stockholder or group each calendar year.
In evaluating potential nominees, including any nominees recommended by stockholders, the Committee takes into consideration the factors listed in the Nominating Committee Procedures and Charter, including character and integrity, business and professional experience, and whether the Committee believes that the person has the ability to apply sound and independent business judgment and would act in the interests of the Registrant and its stockholders. A nomination submission must include all information relating to the recommended nominee that is required to be disclosed in solicitations or proxy statements for the election of Directors, as well as information sufficient to evaluate the factors listed above. Nomination submissions must be accompanied by a written consent of the individual to stand for election if nominated by the Board and to serve if elected by the stockholders, and such additional information must be provided regarding the recommended nominee as reasonably requested by the Committee. A nomination submission must be received not less than 120 calendar days before the date of the Registrant's proxy statement released to stockholders in connection with the previous year's annual meeting.
ITEM 11. CONTROLS AND PROCEDURES.
(a) The Registrant's principal executive and principal financial officers have concluded, based on their evaluation of the Registrant's disclosure controls and procedures as of a date within 90 days of the filing date of this report, that the Registrant's disclosure controls and procedures are reasonably designed to ensure that information required to be disclosed by the Registrant on Form N-CSR is recorded, processed, summarized and reported within the required time periods and that information required to be disclosed by the Registrant in the reports that it files or submits on Form N-CSR is accumulated and communicated to the Registrant's management, including its principal executive and principal financial officers, as appropriate to allow timely decisions regarding required disclosure.
(b) There were no changes to the Registrant's internal control over financial reporting that occurred during the second fiscal quarter of the period covered by this report that have materially affected, or are reasonably likely to materially affect, the Registrant's internal control over financial reporting.
ITEM 12. EXHIBITS.| | |
| (a) (1) | Not applicable. |
| | |
| (a) (2) | Certifications of principal executive and principal financial officers as required by Rule 30a-2(a) under the Investment Company Act of 1940. |
| | |
| (a) (3) | Not applicable. |
| |
| (b) | Certifications of principal executive and principal financial officers as required by Rule 30a-2(b) under the Investment Company Act of 1940. |
SIGNATURES
Pursuant to the requirements of the Securities Exchange Act of 1934 and the Investment Company Act of 1940, the Registrant has duly caused this report to be signed on its behalf by the undersigned, thereunto duly authorized.
Lazard Global Total Return and Income Fund, Inc.
| By | /s/ Charles Carroll | |
| |
| |
| | Charles Carroll | |
| | Chief Executive Officer | |
| |
| Date | September 2, 2005 | |
Pursuant to the requirements of the Securities Exchange Act of 1934 and the Investment Company Act of 1940, this report has been signed below by the following persons on behalf of the Registrant and in the capacities and on the dates indicated.
| By | /s/ Charles Carroll | |
| |
| |
| | Charles Carroll | |
| | Chief Executive Officer | |
| |
| Date | September 2, 2005 | |
| | | |
| | | |
| By | /s/ Stephen St. Clair | |
| |
| |
| | Stephen St. Clair | |
| | Chief Financial Officer | |
| |
| Date | September 2, 2005 | |