Lazard Global Total Return & Income Fund, Inc.
Investment Overview
Dear Shareholder,
We are pleased to present this semi-annual report for Lazard Global Total Return & Income Fund, Inc. (“LGI” or the “Fund”), for the period ended June 30, 2006. LGI is a diversified, closed-end management investment company that began trading on the New York Stock Exchange (“NYSE”) on April 28, 2004. Its ticker symbol is “LGI.”
The Fund has been in operation for a little over two years, and we are pleased with LGI’s overall performance since inception. We believe that the Fund has provided investors with an attractive yield and diversification, backed by the extensive experience, commitment, and professional management of Lazard Asset Management LLC (the “Investment Manager” or “Lazard”).
Portfolio Update (as of June 30, 2006)
For the second quarter of 2006, the Fund’s Net Asset Value per share (“NAV”) performance was flat, outperforming the Morgan Stanley Capital International (MSCI®) World® Index, which declined 0.5% . Similarly, for the year-to-date, the NAV return of 8.2% has outperformed the benchmark return of 6.1% . And since inception, the Fund’s annualized NAV return of 13.3% compares favorably to the benchmark’s return of 12.4% . Shares of LGI ended the second quarter of 2006 with a market price of $19.58, representing an 11.8% discount to the Fund’s NAV of $22.19. The Fund’s net assets were $213.2 million as of June 30, 2006, with total leveraged assets of $297.0 million, representing 28.2% leverage.
We believe that LGI’s investment thesis remains sound. The Fund’s NAV returns, since its inception and in 2006, have outperformed the Index. Second quarter performance was affected by the sharp sell-off in global markets, which continued into early June. A rebound came late in the month and global markets ended the quarter roughly flat. While the smaller, short-duration currency and debt portion of the Fund has experienced only moderate positive returns thus far in 2006. It has been a meaningful positive contributor to performance for the Fund since its inception.
As of June 30, 2006, 65.7% of the Fund’s total leveraged assets consisted of global equities and 34.1% consisted of emerging markets currency and debt instruments, while the remaining 0.2% consisted of cash and other assets.
Declaration of Dividends
Pursuant to LGI’s level distribution policy, the Fund’s Board of Directors has declared a monthly dividend distribution of $0.1042 per share on the Fund’s outstanding stock each month since inception. The first dividend was paid on July 23, 2004. This distribution level represents an annualized market yield of 6.4% based on the share price of $19.58 at the close of NYSE trading on June 30, 2006. Since inception, LGI’s distributions have not included any return of capital to the Fund’s stockholders.
Additional Information
Please note that available on www.LazardNet.com are frequent updates on the Fund’s performance, press releases, and a monthly fact sheet that provides information about the Fund’s major holdings, sector weightings, regional exposures, and other characteristics. You may also reach Lazard by phone at 1-800-828-5548.
On behalf of Lazard, we thank you for your investment in Lazard Global Total Return & Income Fund, Inc. and look forward to continuing to serve your investment needs in the future.
Message from the Portfolio Managers
Global Equity Portfolio
(65.7% of total leveraged assets)
The Fund’s equity portfolio is invested primarily in equity securities of large, well-known global companies with strong financial productivity at attractive valuations. Examples include GlaxoSmithKline, a global, research-based pharmaceutical company based in the United Kingdom; Bank of America, a holding company that provides banking and non-banking financial services and products in the U.S. and internationally; Nokia Corp., the Finnish manufacturer of mobile telephones, enhanced communicators, entertainment and gaming devices, and media and imaging telephones; and Total SA, the French-based energy supplier that explores for, produces, refines, transports, and markets oil and natural gas.
Companies held in the global equity portfolio are all based in developed-market regions around the world.
2
Lazard Global Total Return & Income Fund, Inc.
Investment Overview (continued)
As of June 30, 47.2% of these stocks were based in North America, 22.9% were from continental Europe (not including the U.K.), 19.1% were from the U.K., and 10.8% were from Japan. The global equity portfolio is similarly well diversified across a number of industry sectors. The top two sectors, by weight, at June 30, were financials (31.3%), which includes banks, insurance companies, and financial services companies, and information technology (19.0%), a sector that encompasses industries involved in the design, development, installation, and implementation of information systems and applications, including hardware, software, IT services, and media-related companies. Other sectors in the portfolio include consumer discretionary, consumer staples, energy, health care, industrials, and telecommunications services. The average dividend yield on the global equity portfolio was 2.3% at June 30.
Global Equity Market Review
The rally in global equities continued through the first half of the second quarter, before stocks fell sharply amid concerns over a potential acceleration in inflation and its implications for future monetary policy. Comments from the newly installed Federal Reserve (“Fed”) Chairman, Benjamin Bernanke, regarding the “unwelcome” increase in prices, called into question the prevailing belief that the cycle of monetary tightening in the U.S. was nearing an end. Concerns that the Fed would continue to aggressively raise rates fueled fears of a material global economic slowdown and a sharp contraction in liquidity, as central banks around the world tightened monetary policy. Not surprisingly, the sectors of the market that had performed best in recent years, such as economically sensitive groups and companies in the fragile economies of Japan and Germany, were hardest hit in the sell-off. Smaller-cap stocks underperformed for the quarter, after significantly outperforming their larger peers in recent years. Smaller, less-liquid markets, such as Greece and Austria, also lagged in the decline. In contrast, the U.S. and U.K. markets proved resilient. From a sector perspective, defensive groups, such as utilities and consumer staples, outperformed. Commodity producers were volatile during the quarter and were particularly hard hit in the sell-off. However, they performed in line with the broad index for the overall quarter, thanks to their strength early in the period. Energy stocks outperformed, as the price of oil proved resilient and ended the quarter near an all-time high.
What Helped and What Hurt LGI
Stock selection in technology helped the Fund’s performance in the second quarter, as one of its global equity portfolio’s largest holdings, Oracle, reported better-than-expected earnings. The company’s latest results prove that it is doing a good job of executing its acquisition strategy. In addition, customers are embracing its broader product offerings, potentially helping the company to gain market share from its largest competitor. The company also announced that it plans to use the solid free cash flow that it has generated to repurchase $4 billion in stock over the year. Consumer discretionary holdings detracted from performance based on concerns that higher interest rates and a slowing housing market would hurt consumer spending. However, we believe that valuations in this sector are attractive.
Emerging Market Currency and Debt Portfolio
(34.1% of total leveraged assets)
The Fund also seeks enhanced income through investing in high-yielding, short-duration1 (typically, under one-year) emerging market forward currency contracts and local currency debt instruments. At June 30, this portfolio consisted primarily of forward currency contracts (81.3%), and a smaller allocation to sovereign debt obligations (14.1%) and structured notes (4.6%) and had an average duration of approximately 5.5 months, with an average yield of 8.8% .2
At June 30, the Fund’s emerging market currency and debt holdings were highly diversified across 30 countries within Eastern Europe (17.2%), Asia (27.0%), Latin America (21.3%), the Middle East (7.7%), Africa (16.9%), and the Commonwealth of Independent States and Baltic countries (9.2%), and with 1.0% in other assets.
Emerging Market Currency and Debt Market Review After a solid first quarter characterized by strong performance and buoyant risk appetite, emerging markets witnessed a tumultuous second quarter. As liquidity continued to be drained slowly by many central banks across the globe, market technicals, risk reduction, and consequent volatility were the important second-
3
Lazard Global Total Return & Income Fund, Inc.
Investment Overview (continued)
quarter themes. Emerging markets currencies experienced directional pressure on the massive outflow of foreign equity capital, and FX volatility rose in the second quarter. Losses were most significant across countries perceived to be overvalued, high-beta to global risk appetite, or simply crowded.During the past few years, a large number of emerging markets countries have experienced record dollar inflows from current account and/or capital account surpluses, which should have pressured their currencies stronger. Yet, in the growth versus inflation policy trade-off, most central banks chose growth, as central banks absorbed most inflows by increasing FX reserves and expanding money supply, preventing currency appreciation and preserving external competitiveness. Inflation has been rising (albeit from very low levels), and central bank officials are now being forced to take note of the immense size of their reserves (mostly in U.S. dollars) and the currency exposure this implies. Many of these countries are now curtailing these increasingly expensive intervention policies, and are hiking rates to address currency volatility and restore market confidence. Furthermore, rising rates in the developed markets have also pressured emerging market central bankers to tighten monetary policy.
What Helped and Hurt LGI
The portfolio’s large exposure to Russia was the top contributor to performance, driven primarily by the 3.2% appreciation of the currency. Russia continues to see massive dollar inflows, primarily due to oil exports. The Central Bank intervened by accumulating dollars to prevent these inflows from pressuring the ruble stronger. This led to increasing money supply and, consequently, rising inflation. However, with inflation already close to 11% in Russia, there has been a refocus on inflation control, allowing the ruble to appreciate.
Romania was also a leading contributor to performance. The National Bank of Romania has pursued its inflation-targeting policy with added fervor this year, after last year’s policy of easing rates to deter yield-seeking inflows (even in the face of persistent inflation) led to some loss of credibility. The Central Bank hiked rates in the second quarter and significantly raised reserve requirements.
Detracting from performance was the portfolio’s exposure to Turkey. While previously successful in controlling inflation, Turkey’s Central Bank came under scrutiny earlier in 2006. Turkey’s stock market has more than a 60% foreign-investor presence, led by hedge funds and private investors, and many of these investors rushed to the exits, when the stock market began to fall, and risk budgets were slashed. The Central Bank’s downplaying of the sell-off disappointed the already nervous market, and a subsequent release of the inflation numbers confirmed the market’s fears and fueled further panic selling. The Central Bank finally raised rates and announced it would intervene to support the currency. Turkish assets then recovered some of their losses, but still ended the quarter weaker.
Exposure to Colombia also hurt portfolio performance, as capital flight from the fixed income and equity markets led to a sell off in Colombia’s peso.
4
Lazard Global Total Return & Income Fund, Inc.
Investment Overview (continued)
Notes to Investment Overview:
| 1 | A measure of the average cash weighted term-to-maturity of the investment holdings. Duration is a measure of the price sensitivity of a bond to interest rate movements. Duration for a forward currency contract is equal to its term-to-maturity. |
| |
| 2 | The quoted yield excludes the implicit cost of borrowing for the forward currency contracts. |
| |
All returns reflect reinvestment of all dividends and distributions. Past performance is not indicative, nor a guarantee, of future results.
The performance data of the index and other market data have been prepared from sources and data that the Investment Manager believes to be reliable, but no representation is made as to their accuracy. The index is unmanaged, has no fees or costs and is not available for investment.
The views of the Fund’s management and the portfolio holdings described in this report are as of June 30, 2006; these views and portfolio holdings may have changed subsequent to this date. Nothing herein should be construed as a recommendation to buy, sell, or hold a particular investment. There is no assurance that the portfolio holdings discussed herein will remain in the Fund at the time you receive this report, or that portfolio holdings sold will have not been repurchased. The specific portfolio holdings discussed may in aggregate represent only a small percentage of the Fund’s holdings. It should not be assumed that investments identified and discussed were, or will be, profitable, or that the investment decisions we make in the future will be profitable, or equal the performance of the investments discussed herein.
The views and opinions expressed are provided for general information only, and do not constitute specific tax, legal, or investment advice to, or recommendations for, any person. There can be no guarantee as to the accuracy of the outlooks for markets, sectors and securities as discussed herein. You should read the Fund’s prospectus for a more detailed discussion of the Fund’s investment objective, strategies, risks and fees.
5
Lazard Global Total Return & Income Fund, Inc.
Investment Overview (continued)
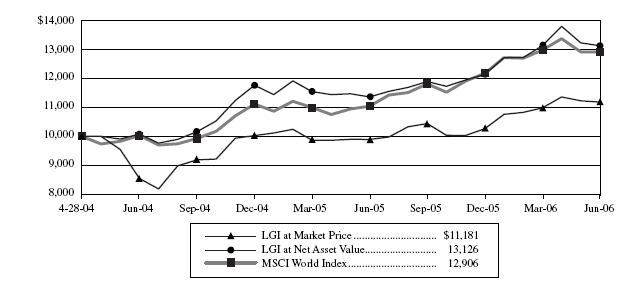
Comparison of Changes in Value of $10,000 Investment in
LGI and MSCI World Index* (unaudited)
| Average Annual Total Returns* | | | | | |
| Periods Ended June 30, 2006 | | | | | |
| (unaudited) | | | | | |
| | One | | Since |
| | Year | | Inception** |
|
| |
|
| Market Price | 13.00 | % | | 5.26 | % |
| Net Asset Value | 15.56 | | | 13.32 | |
| MSCI World Index | 16.93 | | | 12.44 | |
| * | All returns reflect reinvestment of all dividends and distributions. The performance quoted represents past performance. Current per- formance may be lower or higher than the performance quoted. Past performance is not indicative, nor a guarantee, of future results; the investment return, market price and net asset value of the Fund will fluctuate, so that an investor’s shares in the Fund, when sold, may be worth more or less than their original cost. The returns do not reflect the deduction of taxes that a stockholder would pay on the Fund’s distributions or on the sale of Fund shares. |
| |
| | The performance data of the index has been prepared from sources and data that the Investment Manager believes to be reliable, but no representation is made as to its accuracy. The MSCI World Index represents market value-weighted average returns of select- ed securities listed on the stock exchanges of Europe, Australasia and Far East, New Zealand, Canada, and the United States. The index is unmanaged, has no fees or costs and is not available for investment. |
| |
| ** | The Fund’s inception date was April 28, 2004. |
| |
6
Lazard Global Total Return & Income Fund, Inc.
Investment Overview (concluded)
| Ten Largest Equity Holdings | | | | | |
| June 30, 2006 (unaudited) | | | | | |
| | | | | Percentage of |
| Security | Value | | Net Assets |
|
|
| |
|
|
| Microsoft Corp. | $ | 7,605,120 | | 3.57 | % |
| Oracle Corp. | | 6,911,730 | | 3.24 | |
| Diageo PLC Sponsored ADR | | 6,829,305 | | 3.20 | |
| HSBC Holdings PLC Sponsored ADR | | 6,741,105 | | 3.16 | |
| Citigroup, Inc. | | 6,700,536 | | 3.14 | |
| Bank of America Corp. | | 6,647,420 | | 3.12 | |
| Exxon Mobil Corp. | | 6,447,885 | | 3.02 | |
| JPMorgan Chase & Co. | | 6,253,632 | | 2.93 | |
| Nomura Holdings, Inc. ADR | | 6,252,880 | | 2.93 | |
| Johnson & Johnson | | 6,249,656 | | 2.93 | |
| |
| |
| |
| Portfolio Holdings Presented by Sector | | | | | |
| June 30, 2006 (unaudited) | | | | | |
| | | | | Percentage of |
| Sector | | | | Total Investments |
| | | |
|
|
| Commercial Services | | | | 1.6 | % |
| Consumer Discretionary | | | | 3.4 | |
| Consumer Durables | | | | 0.8 | |
| Consumer Staples | | | | 9.8 | |
| Emerging Markets Debt Obligations | | | | 7.9 | |
| Energy | | | | 11.0 | |
| Financials | | | | 25.4 | |
| Health Care | | | | 6.4 | |
| Producer Manufacturing | | | | 6.2 | |
| Technology | | | | 14.6 | |
| Telecommunications | | | | 1.9 | |
| Short-Term Investment | | | | 11.0 | |
| | | | |
|
| |
| Total Investments | | | | 100.0 | % |
| | | | |
|
| |
7
Lazard Global Total Return & Income Fund, Inc.
Portfolio of Investments
June 30, 2006 (unaudited)
| Description | Shares | | | Value |
|
|
|
|
|
| Common Stocks—91.5% | | | | |
| Finland—1.8% | | | | |
| Nokia Oyj Sponsored ADR (c) | 192,800 | | $ | 3,906,128 |
| | |
|
|
| France—3.0% | | | | |
| Societe Generale Sponsored ADR | 72,000 | | | 2,116,080 |
| Total SA Sponsored ADR (c) | 64,000 | | | 4,193,280 |
| | |
|
|
| Total France | | | | 6,309,360 |
| | |
|
|
| Germany—2.1% | | | | |
| Siemens AG Sponsored ADR | 50,600 | | | 4,393,092 |
| | |
|
|
| Italy—2.0% | | | | |
| Eni SpA Sponsored ADR (c), (d) | 72,850 | | | 4,279,938 |
| | |
|
|
| Japan—9.9% | | | | |
| Canon, Inc. Sponsored ADR | 29,800 | | | 2,183,446 |
| Hoya Corp. Sponsored ADR (c), (d) | 54,300 | | | 1,914,075 |
| Mitsubishi UFJ Financial Group, Inc. ADR (c) | 323,100 | | | 4,507,245 |
| Mitsui Sumitomo Insurance Co., Ltd. ADR (d) | 17,600 | | | 2,212,413 |
| Nissan Motor Co., Ltd. Sponsored ADR (d) | 87,600 | | | 1,925,448 |
| Nomura Holdings, Inc. ADR (d) | 332,600 | | | 6,252,880 |
| Sumitomo Mitsui Financial Group, Inc. ADR (d) | 209,100 | | | 2,195,550 |
| | |
|
|
| Total Japan | | | | 21,191,057 |
| | |
|
|
| Netherlands—2.2% | | | | |
| Heineken NV ADR (d) | 225,600 | | | 4,778,208 |
| | |
|
|
| Sweden—0.9% | | | | |
| Telefonaktiebolaget LM Ericsson Sponsored ADR | 61,900 | | | 2,045,176 |
| | |
|
|
| Switzerland—8.9% | | | | |
| Credit Suisse Group Sponsored ADR | 73,400 | | | 4,109,666 |
| Nestle SA Sponsored ADR | 57,400 | | | 4,499,012 |
| Novartis AG ADR | 39,600 | | | 2,135,232 |
| Swiss Re Sponsored ADR (c), (d) | 55,200 | | | 3,851,304 |
| UBS AG | 21,400 | | | 2,347,580 |
| Zurich Financial Services AG ADR | 92,500 | | | 1,974,875 |
| | |
|
|
| Total Switzerland | | | | 18,917,669 |
| | |
|
|
| United Kingdom—17.5% | | | | |
| Barclays PLC Sponsored ADR (c), (d) . | 67,800 | | $ | 3,103,884 |
| BP PLC Sponsored ADR | 69,600 | | | 4,844,856 |
| Cadbury Schweppes PLC Sponsored ADR (c), (d) | 112,700 | | | 4,375,014 |
| Diageo PLC Sponsored ADR | 101,100 | | | 6,829,305 |
| GlaxoSmithKline PLC ADR (c) | 80,200 | | | 4,475,160 |
| HSBC Holdings PLC Sponsored ADR (d) | 76,300 | | | 6,741,105 |
| Tesco PLC Sponsored ADR (d) | 119,000 | | | 2,205,379 |
| Vodafone Group PLC Sponsored ADR | 219,100 | | | 4,666,830 |
| | |
|
|
| Total United Kingdom | | | | 37,241,533 |
| | |
|
|
| United States—43.2% | | | | |
| Bank of America Corp. (c) | 138,200 | | | 6,647,420 |
| Chevron Corp. | 73,400 | | | 4,555,204 |
| Cisco Systems, Inc. (a) | 220,400 | | | 4,304,412 |
| Citigroup, Inc. (c) | 138,900 | | | 6,700,536 |
| ConocoPhillips | 32,900 | | | 2,155,937 |
| Dell, Inc. (a) | 92,900 | | | 2,267,689 |
| Exxon Mobil Corp. (c) | 105,100 | | | 6,447,885 |
| First Data Corp. | 84,300 | | | 3,796,872 |
| General Electric Co. | 116,300 | | | 3,833,248 |
| Honeywell International, Inc. | 55,000 | | | 2,216,500 |
| International Business Machines Corp. | 53,100 | | | 4,079,142 |
| Johnson & Johnson (c) | 104,300 | | | 6,249,656 |
| JPMorgan Chase & Co. (c) | 148,896 | | | 6,253,632 |
| Mellon Financial Corp. | 60,400 | | | 2,079,572 |
| Microsoft Corp. (c) | 326,400 | | | 7,605,120 |
| Oracle Corp. (a), (c) | 477,000 | | | 6,911,730 |
| Pfizer, Inc. | 103,500 | | | 2,429,145 |
| The Coca-Cola Co. (c) | 74,200 | | | 3,192,084 |
| The Home Depot, Inc. | 165,500 | | | 5,923,245 |
| United Technologies Corp. | 68,900 | | | 4,369,638 |
| | |
|
|
| Total United States | | | | 92,018,667 |
| | |
|
|
| Total Common Stocks | | | | |
| (Identified cost $175,796,088) | | | | 195,080,828 |
| | | |
|
|
The accompanying notes are an integral part of these financial statements.
8
Lazard Global Total Return & Income Fund, Inc.
Portfolio of Investments (continued)
June 30, 2006 (unaudited)
| | Principal | | | | |
| | Amount | | | | |
| Description | (000) (e) | | | Value | |
|
| |
|
| |
| Foreign Government Obligations—6.4% | | | | | |
| Egypt—3.0% | | | | | |
| Egypt Treasury Bills: | | | | | |
| 0.00%, 07/18/06 | 7,475 | | $ | 1,293,129 | |
| 0.00%, 09/05/06 | 2,875 | | | 491,448 | |
| 0.00%, 09/12/06 | 3,775 | | | 644,197 | |
| 0.00%, 09/26/06 | 3,100 | | | 527,221 | |
| 0.00%, 10/17/06 | 6,800 | | | 1,150,659 | |
| 0.00%, 11/07/06 | 2,725 | | | 458,794 | |
| 0.00%, 02/27/07 | 11,700 | | | 1,917,926 | |
| | |
|
| |
| Total Egypt | | | | 6,483,374 | |
| | |
|
| |
| Mexico—0.3% | | | | | |
| Mexico Government Bond, | | | | | |
| 9.00%, 12/20/12 | 6,050 | | | 541,505 | |
| | |
|
| |
| Turkey—3.1% | | | | | |
| Turkey Government Bonds: | | | | | |
| 0.00%, 11/08/06 | 137 | | | 80,861 | |
| 0.00%, 03/07/07 | 4,242 | | | 2,331,858 | |
| 0.00%, 05/09/07 | 843 | | | 446,299 | |
| 0.00%, 06/27/07 | 5,020 | | | 2,593,114 | |
| 15.00%, 02/10/10 | 2,033 | | | 1,222,232 | |
| | |
|
| |
| Total Turkey | | | | 6,674,364 | |
| | |
|
| |
| Total Foreign Government Obligations | | | | | |
| (Identified cost $15,247,650) | | | | 13,699,243 | |
| | |
|
| |
| Structured Notes—2.5% | | | | | |
| Brazil—1.3% | | | | | |
| Citibank Brazil Inflation-Linked Bond NTN-B: | | | | | |
| 10.52%, 05/18/09 (f) | 927 | | $ | 900,495 | |
| 10.54%, 08/17/10 (f) | 1,029 | | | 990,925 | |
| 9.90%, 05/18/15 (f) | 989 | | | 872,711 | |
| | |
|
|
|
| Total Brazil | | | | 2,764,131 | |
| | |
|
|
|
| Colombia—0.2% | | | | | |
| Citibank Colombia TES Linked Deposit, | | | | | |
| 10.83%, 04/26/12 (f) | 397 | | | 371,768 | |
| | |
|
|
|
| Costa Rica—0.7% | | | | | |
| Citibank CRC Linked Deposit, | | | | | |
| 10.93%, 10/11/06 (f) | 1,511 | | | 1,563,604 | |
| | |
|
|
|
| Zambia—0.3% | | | | | |
| Smith Barney ZMK Linked Deposit, | | | | | |
| 13.00%, 09/29/06 | 1,941,300 | | | 553,866 | |
| | |
|
|
|
| Total Structured Notes | | | | | |
| (Identified cost $5,421,446) | | | | 5,253,369 | |
| | |
|
|
|
| |
| Description | Shares | | | Value | |
|
|
|
|
|
|
| Short-Term Investment—12.5% | | | | |
| Collateral for Securities | | | | | |
| on Loan—12.5% | | | | | |
| State Street Navigator Securities | | | | | |
| Lending Prime Portfolio, 5.07% | | | | | |
| (Identified cost $26,557,779) (g), (h) | 26,557,779 | | | 26,557,779 | |
| | |
|
|
|
| Total Investments—112.9% | | | | | |
| (Identified cost $223,022,963) (b) . | | | $ | 240,591,219 | |
| Liabilities in Excess of Cash | | | | | |
| and Other Assets—(12.9)% | | | | (27,424,301 | ) |
| | | |
|
|
|
| Net Assets—100.0% | | | $ | 213,166,918 | |
| | |
|
|
|
The accompanying notes are an integral part of these financial statements.
9
Lazard Global Total Return & Income Fund, Inc.
Portfolio of Investments (continued)
June 30, 2006 (unaudited)
Forward Currency Contracts open at June 30, 2006:
| | | | | | | U.S. $ Cost | | | U.S. $ | | | | |
| Forward Currency | | Expiration | | Foreign | | | on Origination | | | Current | | | Unrealized | Unrealized |
| Purchase Contracts | | Date | | Currency | | | Date | | | Value | | | Appreciation | Depreciation |
| |
| |
| |
|
| |
|
| |
|
|
|
| ARS | | 07/11/06 | | 3,693,148 | | $ | 1,195,000 | | $ | 1,195,031 | | $ | 31 | $ | — |
| ARS | | 07/12/06 | | 1,875,500 | | | 605,000 | | | 606,756 | | | 1,756 | — |
| ARS | | 07/14/06 | | 1,467,030 | | | 474,000 | | | 474,423 | | | 423 | — |
| ARS | | 07/17/06 | | 1,611,609 | | | 521,000 | | | 520,872 | | | — | 128 |
| ARS | | 07/28/06 | | 2,184,515 | | | 718,000 | | | 704,516 | | | — | 13,484 |
| BRL | | 09/01/06 | | 237,334 | | | 106,000 | | | 108,655 | | | 2,655 | — |
| BRL | | 10/06/06 | | 1,704,484 | | | 764,000 | | | 773,810 | | | 9,810 | — |
| BRL | | 12/20/06 | | 1,672,163 | | | 645,000 | | | 746,564 | | | 101,564 | — |
| BRL | | 12/28/06 | | 6,908,000 | | | 2,823,626 | | | 3,078,752 | | | 255,126 | — |
| BRL | | 01/31/07 | | 1,874,000 | | | 773,421 | | | 828,777 | | | 55,356 | — |
| BWP | | 07/05/06 | | 3,339,869 | | | 613,000 | | | 553,885 | | | — | 59,115 |
| BWP | | 07/10/06 | | 3,249,415 | | | 555,000 | | | 538,357 | | | — | 16,643 |
| BWP | | 07/19/06 | | 2,440,634 | | | 411,000 | | | 403,657 | | | — | 7,343 |
| BWP | | 07/20/06 | | 3,355,784 | | | 568,000 | | | 554,904 | | | — | 13,096 |
| BWP | | 08/22/06 | | 2,826,684 | | | 504,000 | | | 464,480 | | | — | 39,520 |
| BWP | | 09/05/06 | | 4,370,236 | | | 715,000 | | | 716,221 | | | 1,221 | — |
| CLP | | 07/17/06 | | 299,145,000 | | | 550,000 | | | 554,238 | | | 4,238 | — |
| CLP | | 07/20/06 | | 250,320,000 | | | 480,000 | | | 463,772 | | | — | 16,228 |
| COP | | 07/05/06 | | 4,528,865,250 | | | 1,971,000 | | | 1,753,535 | | | — | 217,465 |
| COP | | 07/10/06 | | 1,451,381,000 | | | 626,000 | | | 561,786 | | | — | 64,214 |
| COP | | 07/21/06 | | 329,216,000 | | | 128,000 | | | 127,342 | | | — | 658 |
| COP | | 07/27/06 | | 2,647,120,000 | | | 1,120,000 | | | 1,023,534 | | | — | 96,466 |
| COP | | 08/08/06 | | 1,828,688,250 | | | 709,000 | | | 706,621 | | | — | 2,379 |
| COP | | 08/11/06 | | 1,104,928,000 | | | 473,000 | | | 426,890 | | | — | 46,110 |
| COP | | 08/24/06 | | 703,905,000 | | | 281,000 | | | 271,778 | | | — | 9,222 |
| COP | | 09/08/06 | | 190,806,000 | | | 77,000 | | | 73,607 | | | — | 3,393 |
| COP | | 10/10/06 | | 1,395,221,500 | | | 601,000 | | | 537,134 | | | — | 63,866 |
| COP | | 11/17/06 | | 759,720,000 | | | 312,000 | | | 291,782 | | | — | 20,218 |
| COP | | 12/29/06 | | 5,317,340,000 | | | 1,999,000 | | | 2,036,847 | | | 37,847 | — |
| CSD | | 08/11/06 | | 36,821,000 | | | 525,939 | | | 546,518 | | | 20,579 | — |
| EUR | | 07/27/06 | | 623,000 | | | 781,148 | | | 798,145 | | | 16,997 | — |
| EUR | | 08/08/06 | | 1,413,000 | | | 1,781,835 | | | 1,811,666 | | | 29,831 | — |
| GHC | | 08/31/06 | | 3,110,810,000 | | | 335,000 | | | 337,062 | | | 2,062 | — |
| GHC | | 08/31/06 | | 5,922,351,000 | | | 629,836 | | | 641,697 | | | 11,861 | — |
| GHC | | 09/18/06 | | 2,077,498,000 | | | 221,364 | | | 224,619 | | | 3,255 | — |
| GHC | | 10/13/06 | | 1,667,326,000 | | | 178,000 | | | 179,669 | | | 1,669 | — |
| IDR | | 07/27/06 | | 5,628,700,000 | | | 595,000 | | | 607,654 | | | 12,654 | — |
| IDR | | 08/16/06 | | 24,025,680,000 | | | 2,724,000 | | | 2,593,726 | | | — | 130,274 |
| IDR | | 11/13/06 | | 4,817,605,000 | | | 541,000 | | | 520,091 | | | — | 20,909 |
| ILS | | 09/19/06 | | 9,093,832 | | | 2,024,000 | | | 2,048,881 | | | 24,881 | — |
| ILS | | 09/29/06 | | 2,418,504 | | | 528,000 | | | 544,865 | | | 16,865 | — |
| INR | | 07/05/06 | | 107,647,920 | | | 2,318,000 | | | 2,337,852 | | | 19,852 | — |
| INR | | 07/07/06 | | 24,790,990 | | | 553,000 | | | 538,374 | | | — | 14,626 |
| INR | | 08/17/06 | | 15,282,950 | | | 337,000 | | | 331,579 | | | — | 5,421 |
| INR | | 09/05/06 | | 84,591,250 | | | 1,829,000 | | | 1,834,487 | | | 5,487 | — |
| ISK | | 07/10/06 | | 38,243,400 | | | 520,000 | | | 502,241 | | | — | 17,759 |
| KRW | | 07/05/06 | | 1,087,218,000 | | | 1,122,000 | | | 1,146,198 | | | 24,198 | — |
| KRW | | 07/20/06 | | 162,690,000 | | | 170,000 | | | 171,601 | | | 1,601 | — |
| KRW | | 08/07/06 | | 1,054,011,000 | | | 1,113,000 | | | 1,112,374 | | | — | 626 |
| |
The accompanying notes are an integral part of these financial statements.10
Lazard Global Total Return & Income Fund, Inc.
Portfolio of Investments (continued)
June 30, 2006 (unaudited)
Forward Currency Contracts open at June 30, 2006 (continued):
| | | | | | | U.S. $ Cost | | | U.S. $ | | | | | |
| Forward Currency | | Expiration | | Foreign | | | on Origination | | | Current | | Unrealized | | | Unrealized |
| Purchase Contracts | | Date | | Currency | | | Date | | | Value | | Appreciation | | | Depreciation |
| |
| |
| |
|
| |
|
| |
| |
|
|
| KRW | | 08/08/06 | | 923,905,800 | | $ | 981,000 | | $ | 975,093 | | $ | — | | $ | 5,907 |
| KRW | | 08/28/06 | | 883,071,000 | | | 917,000 | | | 932,535 | | 15,535 | | | — |
| KZT | | 09/15/06 | | 35,479,850 | | | 297,500 | | | 300,544 | | 3,044 | | | — |
| KZT | | 12/15/06 | | 35,366,800 | | | 297,500 | | | 300,247 | | 2,747 | | | — |
| MXN | | 08/17/06 | | 12,599,000 | | | 1,118,618 | | | 1,113,334 | | — | | | 5,284 |
| MXN | | 11/24/06 | | 11,942,705 | | | 1,053,000 | | | 1,049,285 | | — | | | 3,715 |
| MXN | | 01/08/07 | | 5,795,933 | | | 519,000 | | | 507,799 | | — | | | 11,201 |
| MXN | | 03/30/07 | | 6,290,201 | | | 557,000 | | | 547,998 | | — | | | 9,002 |
| MYR | | 07/12/06 | | 3,063,420 | | | 837,000 | | | 834,299 | | — | | | 2,701 |
| MYR | | 07/31/06 | | 2,078,505 | | | 561,000 | | | 566,713 | | 5,713 | | | — |
| MYR | | 08/07/06 | | 2,043,108 | | | 551,000 | | | 557,257 | | 6,257 | | | — |
| MYR | | 08/14/06 | | 858,153 | | | 241,000 | | | 234,143 | | — | | | 6,857 |
| MYR | | 08/14/06 | | 4,442,880 | | | 1,204,000 | | | 1,212,221 | | 8,221 | | | — |
| MYR | | 11/10/06 | | 1,911,360 | | | 543,000 | | | 524,074 | | — | | | 18,926 |
| MYR | | 11/13/06 | | 2,908,000 | | | 790,432 | | | 797,472 | | 7,040 | | | — |
| NGN | | 08/10/06 | | 130,309,120 | | | 992,000 | | | 1,008,048 | | 16,048 | | | — |
| NGN | | 10/05/06 | | 148,162,900 | | | 1,135,000 | | | 1,136,296 | | 1,296 | �� | | — |
| PEN | | 08/23/06 | | 1,751,963 | | | 537,000 | | | 537,521 | | 521 | | | — |
| PHP | | 07/31/06 | | 133,407,500 | | | 2,482,000 | | | 2,506,317 | | 24,317 | | | — |
| PHP | | 08/11/06 | | 53,498,520 | | | 1,038,000 | | | 1,004,306 | | — | | | 33,694 |
| PHP | | 09/18/06 | | 34,848,030 | | | 651,000 | | | 652,614 | | 1,614 | | | — |
| PHP | | 06/26/07 | | 81,843,980 | | | 1,502,000 | | | 1,505,893 | | 3,893 | | | — |
| PLN | | 07/19/06 | | 2,309,823 | | | 719,000 | | | 725,215 | | 6,215 | | | — |
| PLN | | 07/24/06 | | 2,330,000 | | | 754,754 | | | 731,687 | | — | | | 23,067 |
| PLN | | 07/31/06 | | 2,494,104 | | | 816,000 | | | 783,428 | | — | | | 32,572 |
| PLN | | 08/14/06 | | 12,149,580 | | | 3,878,000 | | | 3,818,271 | | — | | | 59,729 |
| RON | | 07/10/06 | | 1,748,000 | | | 637,049 | | | 624,652 | | — | | | 12,397 |
| RON | | 07/12/06 | | 2,377,000 | | | 862,889 | | | 849,280 | | — | | | 13,609 |
| RON | | 07/19/06 | | 1,416,633 | | | 506,918 | | | 505,845 | | — | | | 1,073 |
| RON | | 07/19/06 | | 946,000 | | | 338,449 | | | 337,793 | | — | | | 656 |
| RON | | 07/24/06 | | 8,085,000 | | | 2,876,712 | | | 2,885,714 | | 9,002 | | | — |
| RON | | 07/26/06 | | 1,722,000 | | | 606,338 | | | 614,514 | | 8,176 | | | — |
| RON | | 07/31/06 | | 2,255,000 | | | 787,003 | | | 804,375 | | 17,372 | | | — |
| RUB | | 10/06/06 | | 14,598,120 | | | 509,000 | | | 544,671 | | 35,671 | | | — |
| RUB | | 02/01/07 | | 4,929,750 | | | 175,000 | | | 183,890 | | 8,890 | | | — |
| RUB | | 02/26/07 | | 6,131,270 | | | 227,000 | | | 228,697 | | 1,697 | | | — |
| RUB | | 02/26/07 | | 7,284,020 | | | 251,000 | | | 271,695 | | 20,695 | | | — |
| RUB | | 02/26/07 | | 42,336,000 | | | 1,470,000 | | | 1,579,138 | | 109,138 | | | — |
| RUB | | 05/24/07 | | 106,389,050 | | | 3,826,944 | | | 3,967,175 | | 140,231 | | | — |
| RUB | | 09/19/08 | | 21,264,250 | | | 725,000 | | | 781,880 | | 56,880 | | | — |
| SGD | | 07/13/06 | | 1,110,611 | | | 684,000 | | | 702,750 | | 18,750 | | | — |
| SGD | | 08/07/06 | | 1,053,911 | | | 673,000 | | | 667,651 | | — | | | 5,349 |
| SGD | | 08/07/06 | | 1,244,916 | | | 787,000 | | | 788,652 | | 1,652 | | | — |
| SGD | | 08/23/06 | | 1,977,000 | | | 1,222,362 | | | 1,253,324 | | 30,962 | | | — |
| SGD | | 08/28/06 | | 1,622,669 | | | 1,002,000 | | | 1,028,925 | | 26,925 | | | — |
| SGD | | 10/13/06 | | 2,227,539 | | | 1,389,000 | | | 1,415,684 | | 26,684 | | | — |
| SIT | | 07/24/06 | | 415,381,240 | | | 2,183,000 | | | 2,219,292 | | 36,292 | | | — |
| SKK | | 07/27/06 | | 38,561,184 | | | 1,296,000 | | | 1,283,877 | | — | | | 12,123 |
| SKK | | 08/28/06 | | 31,816,083 | | | 1,041,000 | | | 1,060,072 | | 19,072 | | | — |
The accompanying notes are an integral part of these financial statements.
11
Lazard Global Total Return & Income Fund, Inc.
Portfolio of Investments (concluded)
June 30, 2006 (unaudited)
Forward Currency Contracts open at June 30, 2006 (concluded):
| | | | | | | | U.S. $ Cost | | | U.S. $ | | | | | | |
| Forward Currency | | Expiration | | Foreign | | | on Origination | | | Current | | | Unrealized | | | Unrealized |
| Purchase Contracts | | Date | | Currency | | | Date | | | Value | | | Appreciation | | | Depreciation |
| |
| |
| |
|
| |
|
| |
|
| |
|
|
| THB | | 07/10/06 | | 61,171,440 | | $ | 1,598,000 | | $ | 1,602,761 | | $ | 4,761 | | $ | — |
| TRY | | 07/05/06 | | 940,085 | | | 637,000 | | | 590,495 | | | — | | | 46,505 |
| TRY | | 07/05/06 | | 1,027,301 | | | 671,000 | | | 645,278 | | | — | | | 25,722 |
| TRY | | 02/09/07 | | 1,428,000 | | | 869,406 | | | 820,085 | | | — | | | 49,321 |
| TZS | | 07/05/06 | | 134,366,000 | | | 111,600 | | | 106,994 | | | — | | | 4,606 |
| TZS | | 07/20/06 | | 384,605,000 | | | 305,000 | | | 305,646 | | | 646 | | | — |
| TZS | | 08/09/06 | | 453,601,000 | | | 367,125 | | | 359,335 | | | — | | | 7,790 |
| TZS | | 08/16/06 | | 258,841,000 | | | 211,535 | | | 204,785 | | | — | | | 6,750 |
| TZS | | 08/22/06 | | 198,954,000 | | | 158,909 | | | 157,230 | | | — | | | 1,679 |
| TZS | | 10/13/06 | | 758,249,000 | | | 617,040 | | | 593,736 | | | — | | | 23,304 |
| TZS | | 10/26/06 | | 473,088,000 | | | 384,000 | | | 369,545 | | | — | | | 14,455 |
| TZS | | 10/26/06 | | 447,902,000 | | | 364,000 | | | 349,872 | | | — | | | 14,128 |
| TZS | | 12/05/06 | | 782,207,000 | | | 615,766 | | | 606,482 | | | — | | | 9,284 |
| TZS | | 12/15/06 | | 442,737,000 | | | 346,880 | | | 342,640 | | | — | | | 4,240 |
| TZS | | 12/20/06 | | 695,237,000 | | | 547,000 | | | 537,557 | | | — | | | 9,443 |
| TZS | | 05/08/07 | | 520,053,000 | | | 396,684 | | | 390,528 | | | — | | | 6,156 |
| UAH | | 07/11/06 | | 2,850,000 | | | 563,966 | | | 569,031 | | | 5,065 | | | — |
| UAH | | 08/01/06 | | 2,040,000 | | | 404,553 | | | 406,374 | | | 1,821 | | | — |
| UAH | | 08/07/06 | | 1,063,440 | | | 211,000 | | | 211,674 | | | 674 | | | — |
| UAH | | 08/10/06 | | 1,582,990 | | | 311,000 | | | 314,966 | | | 3,966 | | | — |
| UAH | | 09/11/06 | | 2,671,200 | | | 525,000 | | | 529,270 | | | 4,270 | | | — |
| | | | | |
|
| |
|
| |
|
| |
|
|
| Total Forward Currency Purchase Contracts | $ | 99,411,101 | | $ | 99,404,265 | | $ | 1,353,572 | | $ | 1,360,408 |
| |
|
| |
|
| |
|
| |
|
|
| |
| | | | | | | U.S. $ Cost | | | U.S. $ | | | | | | |
| Forward Currency | | Expiration | | Foreign | | | on Origination | | | Current | | | Unrealized | | | Unrealized |
| Sale Contracts | | Date | | Currency | | | Date | | | Value | | | Appreciation | | | Depreciation |
| |
| |
| |
|
| |
|
| |
|
| |
|
|
| ARS | | 07/17/06 | | 1,611,609 | | $ | 519,171 | | $ | 520,872 | | $ | — | | $ | 1,701 |
| BRL | | 12/28/06 | | 1,643,477 | | | 711,000 | | | 732,463 | | | — | | | 21,463 |
| BWP | | 07/05/06 | | 3,339,869 | | | 551,078 | | | 553,885 | | | — | | | 2,807 |
| COP | | 07/05/06 | | 4,528,865,250 | | | 1,718,734 | | | 1,753,535 | | | — | | | 34,801 |
| COP | | 07/10/06 | | 1,451,381,000 | | | 563,206 | | | 561,786 | | | 1,420 | | | — |
| COP | | 10/10/06 | | 1,395,221,500 | | | 539,529 | | | 537,134 | | | 2,395 | | | — |
| EUR | | 08/08/06 | | 1,413,000 | | | 1,802,310 | | | 1,811,666 | | | — | | | 9,356 |
| INR | | 07/05/06 | | 82,180,540 | | | 1,783,432 | | | 1,784,762 | | | — | | | 1,330 |
| INR | | 07/05/06 | | 25,467,380 | | | 554,000 | | | 553,090 | | | 910 | | | — |
| INR | | 07/07/06 | | 24,790,990 | | | 537,999 | | | 538,374 | | | — | | | 375 |
| KRW | | 07/05/06 | | 1,087,218,000 | | | 1,146,854 | | | 1,146,198 | | | 656 | | | — |
| MXN | | 08/17/06 | | 6,223,300 | | | 542,951 | | | 549,933 | | | — | | | 6,982 |
| PEN | | 08/23/06 | | 1,751,963 | | | 532,997 | | | 537,521 | | | — | | | 4,524 |
| RUB | | 07/21/06 | | 20,883,043 | | | 779,000 | | | 778,389 | | | 611 | | | — |
| SKK | | 07/27/06 | | 23,903,264 | | | 781,148 | | | 795,848 | | | — | | | 14,700 |
| TRY | | 07/05/06 | | 706,000 | | | 449,939 | | | 443,460 | | | 6,479 | | | — |
| TRY | | 07/05/06 | | 1,358,000 | | | 869,120 | | | 853,000 | | | 16,120 | | | — |
| TRY | | 07/05/06 | | 725,912 | | | 474,050 | | | 455,967 | | | 18,083 | | | — |
| TRY | | 07/05/06 | | 623,208 | | | 460,000 | | | 391,456 | | | 68,544 | | | — |
| TRY | | 07/05/06 | | 985,749 | | | 719,000 | | | 619,178 | | | 99,822 | | | — |
| TRY | | 02/09/07 | | 1,428,000 | | | 994,637 | | | 820,085 | | | 174,552 | | | — |
| TZS | | 05/08/07 | | 520,053,000 | | | 392,197 | | | 390,528 | | | 1,669 | | | — |
| | | | | |
|
| |
|
| |
|
| |
|
|
| Total Forward Currency Sale Contracts | $ | 17,422,352 | | $ | 17,129,130 | | | 391,261 | | | 98,039 |
| | | |
|
| |
|
| |
|
| |
|
|
| Gross unrealized appreciation/depreciation on Forward Currency Contracts | $ | 1,744,833 | | $ | 1,458,447 |
| | | | |
|
| |
|
|
The accompanying notes are an integral part of these financial statements.
12
Lazard Global Total Return & Income Fund, Inc.
Notes to Portfolio of Investments
June 30, 2006 (unaudited)
| (a) | Non-income producing security. |
| |
| (b) | For federal income tax purposes, the aggregate cost was $223,022,963, aggregate gross unrealized appreciation was $25,279,128, aggregate gross unrealized depreciation was $7,710,872 and the net unrealized appreciation was $17,568,256. |
| |
| (c) | Segregated security for forward currency contracts. |
| |
| (d) | Security or portion thereof is out on loan. |
| |
| (e) | Principal amount denominated in respective country’s currency unless otherwise specified. |
| |
| (f) | Pursuant to Rule 144A under the Securities Act of 1933, these securities may only be traded among “qualified institutional buyers.” Principal amount denominated in U.S. dollar. |
| |
| (g) | Rate shown reflects 7 day yield as of June 30, 2006. |
| |
| (h) | Represents security purchased with cash collateral received for securities on loan. |
| |
| |
| |
| |
| Security Abbreviations: | | Portfolio holdings by industry (as percentage of net assets): |
| ADR | — American Depositary Receipt | | Industry | | |
| NTN-B | — Brazil Sovereign “Nota do Tesouro Nacional” | | Alcohol & Tobacco | 5.4 | % |
| TES | — Titulos de Tesoreria | | Automotive | 0.9 | |
| | | | | | Banking | 14.9 | |
| | | | | | Commercial Services | 1.8 | |
| Currency Abbreviations: | | | Computer Software | 6.8 | |
| | | | | | Drugs | 4.2 | |
| ARS | — Argentine Peso | MYR | — Malaysian Ringgit | | Energy Integrated | 12.4 | |
| BRL | — Brazilian Real | NGN | — Nigerian Naira | | Financial Services | 10.0 | |
| BWP | — Botswanian Pula | PEN | — Peruvian New Sol | | Food & Beverages | 5.7 | |
| CLP | — Chilean Peso | PHP | — Philippine Peso | | Insurance | 3.8 | |
| COP | — Colombian Peso | PLN | — Polish Zloty | | Manufacturing | 7.0 | |
| CRC | — Costa Rican Colon | RON | — Romanian Leu | | Medical Products | 2.9 | |
| CSD | — Serbian Dinar | RUB | — Russian Ruble | | Retail | 3.8 | |
| EUR | — Euro | SGD | — Singapore Dollar | | Semiconductors & Components | 1.9 | |
| GHC | — Ghanaian Cedi | SIT | — Slovenian Tolar | | Technology | 1.9 | |
| IDR | — Indonesian Rupiah | SKK | — Slovenska Koruna | | Technology Hardware | 5.9 | |
| ILS | — Israeli Shekel | THB | — Thai Baht | | Telecommunications | 2.2 | |
| INR | — Indian Rupee | TRY | — New Turkish Lira | | |
|
|
| ISK | — Iceland Krona | TZS | — Tanzanian Shilling | | Subtotal | 91.5 | |
| KRW | — South Korean Won | UAH | — Ukranian Hryvnia | | Foreign Government Obligations | 6.4 | |
| KZT | — Kazakhstanian Tenge | ZMK | — Zambian Kwacha | | Structured Notes | 2.5 | |
| MXN | — Mexican Peso | | | | Collateral for Securities on Loan | 12.5 | |
| | | | | | |
|
|
| | | | | | Total Investments | 112.9 | % |
| | | | | | |
|
|
| | | | | | | | |
The accompanying notes are an integral part of these financial statements.13
Lazard Global Total Return & Income Fund, Inc.
Statement of Assets and Liabilities
June 30, 2006 (unaudited)
| ASSETS | | | |
| Investments in securities, at value (cost $223,022,963) | $ | 240,591,219 | |
| Cash | | 58,960 | |
| Foreign currency, at value (cost $40,894) | | 41,278 | |
| Receivables for: | | | |
| Investments sold | | 1,905,861 | |
| Dividends and interest | | 759,643 | |
| Income from securities loaned | | 5,045 | |
| Gross appreciation on forward currency contracts | | 1,744,833 | |
|
|
|
|
| Total assets | | 245,106,839 | |
|
|
|
|
| LIABILITIES | | | |
| Payables for: | | | |
| Management fees | | 205,682 | |
| Accrued directors’ fees | | 1,291 | |
| Amounts due upon return of securities on loan | | 26,557,779 | |
| Investments purchased | | 1,920,467 | |
| Line of credit outstanding | | 1,650,000 | |
| Gross depreciation on forward currency contracts | | 1,458,447 | |
| Other accrued expenses and payables | | 146,255 | |
|
|
|
|
| Total liabilities | | 31,939,921 | |
|
|
|
|
| Net assets | $ | 213,166,918 | |
|
|
|
|
| NET ASSETS | | | |
| Paid in capital | $ | 183,076,027 | |
| Distributions in excess of net investment income | | (3,598,217 | ) |
| Accumulated undistributed net realized gain | | 15,834,656 | |
| Net unrealized appreciation on: | | | |
| Investments | | 17,568,256 | |
| Foreign currency and forward currency contracts | | 286,196 | |
|
|
|
|
| Net assets | $ | 213,166,918 | |
|
|
|
|
| |
| Shares of common stock outstanding* | | 9,605,237 | |
| Net assets per share of common stock | $ | 22.19 | |
| Market value per share | $ | 19.58 | |
* $0.001 par value, 500,000,000 shares authorized for the Fund.
The accompanying notes are an integral part of these financial statements.
14
Lazard Global Total Return & Income Fund, Inc.
Statement of Operations
For the six months ended June 30, 2006 (unaudited)
INVESTMENT INCOME
| Income: | | | |
| Dividends (net of foreign withholding taxes of $218,815) | $ | 3,221,348 | |
| Interest | | 712,703 | |
| Income from securities loaned | | 57,283 | |
|
|
|
|
| Total investment income | | 3,991,334 | |
|
|
|
|
| Expenses: | | | |
| Management fees | | 1,272,343 | |
| Professional services | | 53,661 | |
| Custodian fees | | 47,176 | |
| Shareholders’ reports | | 44,180 | |
| Administration fees | | 40,140 | |
| Shareholders’ services | | 21,344 | |
| Shareholders’ meeting | | 10,058 | |
| Directors’ fees and expenses | | 7,057 | |
| Other | | 32,614 | |
|
|
|
|
| Total gross expenses before interest expense | | 1,528,573 | |
| Interest expense | | 196,286 | |
|
|
|
|
| Total gross expenses | | 1,724,859 | |
| Expense reductions | | (3,410 | ) |
|
|
|
|
| Total net expenses | | 1,721,449 | |
|
|
|
|
| Net investment income | | 2,269,885 | |
|
|
|
|
| NET REALIZED AND UNREALIZED GAIN (LOSS) ON INVESTMENTS AND FOREIGN CURRENCY | | | |
| Net realized gain on: | | | |
| Investments (net of foreign capital gains taxes of $92,915) | | 12,110,685 | |
| Foreign currency and forward currency contracts | | 2,151,847 | |
| Net change in unrealized appreciation (depreciation) on: | | | |
| Investments | | (575,026 | ) |
| Foreign currency and forward currency contracts | | 547,380 | |
|
|
|
|
| Net realized and unrealized gain on investments and foreign currency | | 14,234,886 | |
|
|
|
|
| Net increase in net assets resulting from operations | $ | 16,504,771 | |
|
|
|
|
The accompanying notes are an integral part of these financial statements.
15
Lazard Global Total Return & Income Fund, Inc.
Statements of Changes in Net Assets
| | | Six Months Ended | | | | | |
| | | June 30, 2006 | | | | Year Ended | |
| | | (unaudited) | | | | December 31, 2005 | |
|
|
|
| |
|
|
|
| INCREASE (DECREASE) IN NET ASSETS | | | | | | | |
| Operations: | | | | | | | |
| Net investment income | $ | 2,269,885 | | | $ | 2,258,643 | |
| Net realized gain on investments and foreign currency | | 14,262,532 | | | | 7,730,842 | |
| Net change in unrealized depreciation on investments | | | | | | | |
| and foreign currency | | (27,646 | ) | | | (3,892,779 | ) |
|
|
|
| |
|
|
|
| Net increase in net assets resulting from operations | | 16,504,771 | | | | 6,096,706 | |
|
|
|
| |
|
|
|
| Distributions to Stockholders: | | | | | | | |
| From net investment income | | (6,005,194 | ) | | | (12,010,388 | ) |
|
|
|
| |
|
|
|
| Net decrease in net assets resulting from distributions | | (6,005,194 | ) | | | (12,010,388 | ) |
|
|
|
| |
|
|
|
| Capital Stock Transactions: | | | | | | | |
| Proceeds from common shares issued in offering | | — | | | | — | |
|
|
|
| |
|
|
|
| Net increase in net assets from capital stock transactions | | — | | | | — | |
|
|
|
| |
|
|
|
| Total increase (decrease) in net assets | | 10,499,577 | | | | (5,913,682 | ) |
| Net assets at beginning of period | | 202,667,341 | | | | 208,581,023 | |
|
|
|
| |
|
|
|
| Net assets at end of period* | $ | 213,166,918 | | | $ | 202,667,341 | |
|
|
|
| |
|
|
|
| *Includes undistributed (distributions in excess of) net investment income | $ | (3,598,217 | ) | | $ | 137,092 | |
|
|
|
| |
|
|
|
| |
| |
| |
| |
| Transactions in Capital Shares: | | | | | | | |
| Common shares outstanding at beginning of period | | 9,605,237 | | | | 9,605,237 | |
|
|
|
| |
|
|
|
| Common shares issued in offering | | — | | | | — | |
|
|
|
| |
|
|
|
| Net increase | | — | | | | — | |
|
|
|
| |
|
|
|
| Common shares outstanding at end of period | | 9,605,237 | | | | 9,605,237 | |
|
|
|
| |
|
|
|
The accompanying notes are an integral part of these financial statements.
16
Lazard Global Total Return & Income Fund, Inc.
Financial Highlights
Selected data for a share of common stock outstanding throughout each period:
| | Six Months | | | | | | | For the Period | |
| | Ended | | | Year Ended | | | 4/28/04* to | |
| | 6/30/06† | | | 12/31/05 | | | 12/31/04 | |
|
|
|
| |
|
|
| |
|
|
|
| Net asset value, beginning of period | $ | 21.10 | | | $ | 21.72 | | | $ | 19.06 | (a) |
|
|
|
| |
|
|
| |
|
|
|
| Income from investment operations: | | | | | | | | | | | |
| Net investment income | | 0.24 | | | | 0.23 | | | | 0.18 | |
| Net realized and unrealized gain | | 1.48 | | | | 0.40 | | | | 3.11 | |
|
|
|
| |
|
|
| |
|
|
|
| Total from investment operations | | 1.72 | | | | 0.63 | | | | 3.29 | |
|
|
|
| |
|
|
| |
|
|
|
| Less distributions from: | | | | | | | | | | | |
| Net investment income | | (0.63 | ) | | | (1.25 | ) | | | (0.63 | ) |
|
|
|
| |
|
|
| |
|
|
|
| Total distributions | | (0.63 | ) | | | (1.25 | ) | | | (0.63 | ) |
|
|
|
| |
|
|
| |
|
|
|
| Net asset value, end of period | $ | 22.19 | | | $ | 21.10 | | | $ | 21.72 | |
|
|
|
| |
|
|
| |
|
|
|
| Market value, end of period | $ | 19.58 | | | $ | 18.56 | | | $ | 19.37 | |
|
|
|
| |
|
|
| |
|
|
|
| Total Return based upon: | | | | | | | | | | | |
| Net asset value (b) | | 8.16 | % | | | 3.18 | % | | | 17.67 | % |
| Market value (b) | | 8.93 | % | | | 2.38 | % | | | 0.26 | % |
| |
| Ratios and Supplemental Data: | | | | | | | | | | | |
| Net assets, end of period (in thousands) | $ | 213,167 | | | $ | 202,667 | | | $ | 208,581 | |
| Ratios to average net assets: | | | | | | | | | | | |
| Net expenses (c) | | 1.62 | % | | | 1.63 | % | | | 1.57 | % |
| Gross expenses (c) | | 1.62 | % | | | 1.63 | % | | | 1.57 | % |
| Gross expenses excluding interest expense (c) | | 1.44 | % | | | 1.51 | % | | | 1.49 | % |
| Net investment income (c) | | 2.14 | % | | | 1.12 | % | | | 1.40 | % |
| Portfolio turnover rate | | 25 | % | | | 18 | % | | | 7 | % |
| † | | Unaudited. |
| * | | Commencement of operations. |
| (a) | | Net of initial sales load, underwriting and offering costs of $0.94 per share. |
| (b) | | Total return based on per share market price assumes the purchase of common shares at the market price on the first day and sales of common shares at the market price on the last day of the period indicated; dividends and distributions are assumed to be reinvested in accordance with the Fund’s Dividend Reinvestment Plan. The total return based on net asset value, or NAV, assumes the purchase of common shares at NAV on the first day and sales of common shares at NAV on the last day of the period indicated; distributions are assumed to be reinvested at NAV. Past performance is not idicative, nor a guarantee, of future results; the investment return, market price and net asset value of the Fund will fluctuate, so that an investor’s shares in the Fund, when sold, may be worth more or less than their orginal cost. The returns do not reflect the deduction of taxes that a stockholder would pay on the Fund’s distributions or on the sale of Fund shares. Periods of less than one year are not annualized. |
| (c) | | Annualized for periods of less than one year. |
The accompanying notes are an integral part of these financial statements.
17
Lazard Global Total Return & Income Fund, Inc.
Notes to Financial Statements
June 30, 2006 (unaudited)
1. Organization
Lazard Global Total Return & Income Fund, Inc. (the “Fund”) was incorporated in Maryland on January 27, 2004 and is registered under the Investment Company Act of 1940, as amended (the “Act”), as a diversified, closed-end management investment company. The Fund trades on the New York Stock Exchange (“NYSE”) under the ticker symbol LGI and commenced operations on April 28, 2004. The Fund’s investment objective is total return, consisting of capital appreciation and income.
2. Significant Accounting Policies
The following is a summary of significant accounting policies:
(a) Valuation of Investments—Market values for securities are generally based on the last reported sales price on the principal exchange or market on which the security is traded, generally as of the close of regular trading on the NYSE (normally 4:00 p.m. Eastern time) on each valuation date. Any securities not listed, for which current over-the-counter market quotations or bids are readily available, are valued at the last quoted bid price or, if available, the mean of two such prices. Forward currency contracts are valued at the current cost of offsetting the contract. Securities listed on foreign exchanges are valued at the last reported sales price except as described below; securities not traded on the valuation date are valued at the last quoted bid price.
Bonds and other fixed-income securities that are not exchange-traded are valued on the basis of prices provided by pricing services which are based primarily on institutional trading in similar groups of securities, or by using brokers’ quotations.
If a significant event affecting the value of securities occurs between the close of the exchange or market on which the security is principally traded and the time when the Fund’s net asset value is calculated, or when current market quotations otherwise are determined not to be readily available or reliable, such securities will be valued at their fair values as determined in good faith by or under the supervision of the Board of Directors. Fair valuing of foreign securities may be determined with the assistance of a pricing service, using correlations between the movement of prices of such securities and indices of domestic securities and other appropriate indicators, such as closing market prices of relevant ADRs or futures contracts. The Valuation Committee of the Investment Manager may evaluate a variety of factors to determine the fair value of securities for which current market quotations are determined not to be readily available or reliable. These factors include, but are not limited to, the type of security, the value of comparable securities, observations from financial institutions and relevant news events. Input from the Investment Manager’s analysts will also be considered. The effect of using fair value pricing is that the net asset value of the Fund will reflect the affected securities’ values as determined in the judgment of the Board of Directors, or its designee, instead of being determined by the market. Using a fair value pricing methodology to price securities may result in a value that is different from the most recent closing price of a security and from the prices used by other investment companies to calculate their portfolios’ net asset values.
(b) Portfolio Securities Transactions and Investment Income—Portfolio securities transactions are accounted for on trade date. Realized gain (loss) on sales of investments are recorded on a specific identification basis. Dividend income is recorded on the ex-dividend date and interest income is accrued daily. The Fund amortizes premiums and accretes discounts on fixed-income securities using the effective yield method.
(c) Repurchase Agreements—In connection with transactions in repurchase agreements, the Fund’s custodian takes possession of the underlying collateral securities, the fair value of which at all times is required to be at least equal to the principal amount, plus accrued interest, of the repurchase transaction. If the seller defaults, and the fair value of the collateral declines, realization of the collateral by the Fund may be delayed or limited.
(d) Securities Lending—The Fund may lend portfolio securities to qualified borrowers in order to earn additional income. The terms of the lending agreements require that loans are secured at all times by cash, U.S. Government securities or irrevocable letters of credit in an amount at least equal to 102% of the market value of domestic securities loaned (105% in the case of foreign securities), plus accrued interest and dividends, determined on a daily basis. Cash collateral received is invested in State Street Navigator Securities Lending Prime Portfolio, a regulated investment company offered by State Street Bank and Trust Company (“State Street”). If the borrower defaults on its obligation to return the securities loaned because of insolvency or other reasons, the Fund could experience delays and costs in recovering the securities loaned or in gaining access to the collateral.
At June 30, 2006, the value of the securities on loan was $25,939,111 and corresponding cash collateral received was $26,557,779.
18
Lazard Global Total Return & Income Fund, Inc.
Notes to Financial Statements (continued)
June 30, 2006 (unaudited)
In accordance with accounting principles generally accepted in the United States, cash received as collateral for securities lending transactions which is invested in income producing securities is included in the Portfolio of Investments. The related amount payable upon the return of the securities on loan, where cash is received as collateral, is shown on the Statement of Assets and Liabilities.(e) Leveraging—The Fund intends to use leverage to invest Fund assets in currency investments, primarily using forward currency contracts and by borrowing under a credit facility with State Street, up to a maximum of 33 1 / 3% of the Fund’s total leveraged assets. If the assets of the Fund decline due to market conditions such that this 33 1 / 3% threshold will be exceeded, leverage risk will increase.
If the Fund is able to realize a higher return on the leveraged portion of its investment portfolio than the cost of such leverage together with other related expenses, the effect of the leverage will be to cause the Fund to realize a higher net return than if the Fund were not so leveraged. There is no assurance that any leveraging strategy the Fund employs will be successful.
Using leverage is a speculative investment technique and involves certain risks. These include higher volatility of net asset value, the likelihood of more volatility in the market value of Common Stock and, with respect to borrowings, the possibility either that the Fund’s return will fall if the interest rate on any borrowings rises, or that income will fluctuate because the interest rate of borrowings varies.
If the market value of the Fund’s portfolio declines, the leverage will result in a greater decrease in net asset value than if the Fund were not leveraged. A greater net asset value decrease also will tend to cause a greater decline in the market price of the Fund’s Common Stock. To the extent that the Fund is required or elects to prepay any borrowings, the Fund may need to liquidate investments to fund such prepayments. Liquidation at times of adverse economic conditions may result in capital losses and may reduce returns.
(f) Foreign Currency Translation and Forward Currency Contracts—The accounting records of the Fund are maintained in U.S. dollars. Portfolio securities and other assets and liabilities denominated in a foreign currency are translated daily into U.S. dollars at the prevailing rates of exchange. Purchases and sales of securities, income receipts and expense payments are translated into U.S. dollars at the prevailing exchange rates on the respective transaction dates.
The Fund does not isolate the portion of operations resulting from changes in foreign exchange rates on investments from the fluctuations arising from changes in their market prices. Such fluctuations are included in net realized and unrealized gain (loss) on investments. Net realized gain (loss) on foreign currency transactions represents net foreign currency gain (loss) from forward currency contracts, disposition of foreign currencies, currency gain (loss) realized between the trade and settlement dates on securities transactions, and the difference between the amount of dividends, interest and foreign withholding taxes recorded on the Fund’s accounting records and the U.S. dollar equivalent amounts actually received or paid. Net unrealized foreign currency gain (loss) arises from changes in the value of assets and liabilities, other than investments in securities, as a result of changes in exchange rates.
A forward currency contract is an agreement between two parties to buy or sell currency at a set price on a future date. Upon entering into these contracts, risks may arise from the potential inability of counterparties to meet the terms of their contracts and from unanticipated movements in the value of the foreign currency relative to the U.S. dollar.
The U.S. dollar value of forward currency contracts is determined using forward exchange rates provided by quotation services. Daily fluctuations in the value of such contracts are recorded as unrealized gain (loss). When the contract is closed, the Fund records a realized gain (loss) equal to the difference between the value at the time it was opened and the value at the time it was closed. Such gain (loss) is disclosed in the realized and unrealized gain (loss) on foreign currency in the Fund’s accompanying Statement of Operations.
(g) Structured Investments—The Fund may invest in structured investments, whose values are linked either directly or inversely to changes in foreign currencies, interest rates, commodities, indices, or other underlying instruments. The Fund may use these investments to increase or decrease its exposure to different underlying instruments, to gain exposure to markets that might be difficult to invest in through conventional securities or for other purposes. Structured investments may be more volatile than their underlying instruments, but any loss is limited to the amount of the original investment.
(h) Federal Income Taxes—The Fund’s policy is to continue to qualify as a regulated investment company under Sub-chapter M of the Internal Revenue Code and to distribute all of its taxable income, including any net realized capital gains, to stockholders. Therefore, no federal income tax provision is required.
19
Lazard Global Total Return & Income Fund, Inc.
Notes to Financial Statements (continued)
June 30, 2006 (unaudited)
At December 31, 2005, the Fund had no unused capital loss carryforwards.Under current tax law, certain capital and net foreign currency losses realized after October 31 within the taxable year may be deferred and treated as occurring on the first day of the following tax year. For the tax year ended December 31, 2005, the Fund had no net capital and currency losses arising between November 1, 2005 and December 31, 2005.
(i) Dividends and Distributions—The Fund intends to declare and to pay dividends monthly from net investment income. Distributions to stockholders are recorded on the ex-dividend date. During any particular year, net realized gains from investment transactions in excess of available capital loss carryforwards would be taxable to the Fund if not distributed. The Fund intends to declare and distribute these amounts, at least annually, to stockholders; however, to avoid taxation, a second distribution may be required.
Income dividends and capital gains distributions are determined in accordance with federal income tax regulations which may differ from accounting principles generally accepted in the United States. These book/tax differences, which may result in distribution reclassifications, are primarily due to differing treatments of foreign currency transactions. Book/tax differences relating to shareholder distributions may result in reclassifications among certain capital accounts.
The Fund has implemented a Level Distribution Policy to seek to maintain a stable monthly distribution, subject to approval and oversight of the Fund’s Board of Directors. Under the Fund’s Level Distribution Policy, the Fund intends to make regular monthly distributions at a fixed rate per share. If for any monthly distribution, net investment income and net realized short-term capital gain were less than the amount of the distribution, the difference would generally be distributed from the Fund’s assets. In addition, in order to make such distributions, the Fund might have to sell a portion of its investment portfolio at a time when independent investment judgment might not dictate such actions.
(j) Expense Reductions—When the Fund leaves excess cash in a demand deposit account, it may receive credits which are available to offset custody expenses. The Statement of Operations reports gross custody expenses, and reports the amount of such credits separately as an expense reduction.
(k) Estimates—The preparation of financial statements in conformity with accounting principles generally accepted in the United States requires the Fund to make estimates and assumptions that affect the reported amounts of assets and liabilities and disclosure of contingent assets and liabilities at the date of the financial statements and the reported amounts of increases and decreases in net assets from operations during the reporting period. Actual results could differ from those estimates.
3. Investment Management Agreement
The Fund has entered into an investment management agreement (the “Management Agreement”) with the Investment Manager. Pursuant to the Management Agreement, the Investment Manager regularly provides the Fund with investment research, advice and supervision and furnishes continuously an investment program for the Fund consistent with its investment objective and policies, including the purchase, retention and disposition of securities.
The Fund has agreed to pay the Investment Manager an annual investment management fee of 0.85% of the Fund’s average daily “Total Leveraged Assets” (the Fund’s total assets including Financial Leverage (defined below)) for the services and facilities provided by the Investment Manager, payable on a monthly basis. The fee paid to the Investment Manager will be higher when the Investment Manager uses Currency Commitments and Borrowings (“Financial Leverage”) to make Currency Investments, rather than by reducing the percentage of “Net Assets” (the Fund’s assets without taking into account Financial Leverage) invested in Global Equity Investments for the purposes of making Currency Investments. “Global Equity Investments” refers to investments in the Fund’s global equity strategy consisting of equity securities of companies with market capitalizations of $5 billion or greater domiciled in those countries that comprise the Morgan Stanley Capital International (MSCI®) World® Index. “Currency Investments” refers to investments in the Fund’s emerging income strategy, consisting of emerging market currencies (primarily by entering into forward currency contracts), or instruments whose value is derived from the performance of an underlying emerging market currency, but also may invest in debt obligations, including government, government agency and corporate obligations and structured notes denominated in emerging market currencies. “Currency Commitments” are the aggregate financial exposures created by forward currency contracts in excess of that represented in the Fund’s Net Assets, and “Borrowings” refers to the borrowings under the Fund’s credit facility. Assuming Financial Leverage in the amount of 33 1 / 3% of the Fund’s Total Leveraged Assets, the annual fee payable to the Investment Manager would be 1.28% of Net Assets (i.e., not including amounts attributable to Financial Leverage).
20
Lazard Global Total Return & Income Fund, Inc.
Notes to Financial Statements (continued)
June 30, 2006 (unaudited)
The following is an example of this calculation of the Investment Manager’s fee, using very simple illustrations. If the Fund had assets of $1,000, it could invest $1,000 in Global Equity Investments and enter into $500 in forward currency contracts (because the Fund would not have to pay money at the time it enters into the currency contracts). Similarly, the Fund could invest $1,000 in Global Equity Investments, borrow $500 and invest the $500 in foreign currency denominated bonds. In either case, the Investment Manager’s fee would be calculated based on $1,500 of assets, because the fee is calculated based on Total Leveraged Assets (Net Assets plus Financial Leverage). In our example, the Financial Leverage is in the form of either the forward currency contracts (Currency Commitments) or investments from Borrowings. The amount of the Financial Leverage outstanding, and therefore the amount of Total Leveraged Assets on which the Investment Manager’s fee is based, fluctuates daily based on changes in value of the Fund’s portfolio holdings, including changes in value of the currency involved in the forward currency contracts and foreign currency denominated bonds acquired with the proceeds of Borrowings. However, the Investment Manager’s fee will be the same regardless of whether Currency Investments are made with Currency Commitments or with Borrowings (without taking into account the cost of Borrowings).This method of calculating the Investment Manager’s fee is different than the way closed-end investment companies typically calculate management fees. Traditionally, closed-end investment companies calculate management fees based on Net Assets plus Borrowings (excluding Financial Leverage obtained through Currency Commitments). The Investment Manager’s fee is different because the Fund’s leverage strategy is different than the leverage strategy employed by many other closed-end investment companies. Although the Fund may employ Borrowings in making Currency Investments, the Fund’s leverage strategy relies primarily on Currency Commitments, rather than relying exclusively on borrowing money or/and issuing preferred stock, as is the strategy employed by most closed-end investment companies. The Investment Manager’s fee would be lower if its fee were calculated only on Net Assets plus Borrowings, because the Investment Manager would not earn fees on Currency Investments made with Currency Commitments (forward currency contracts). Using the example above, where the Fund has assets of $1,000 and invests $1,000 in Global Equity Investments and $500 in forward currency contracts, the following table illustrates how the Investment Manager’s fee would be different if it did not earn management fees on these types of Currency Investments. A discussion of the most recent review and approval by the Fund’s Board of Directors of the Management Agreement (including the method of calculating the Investment Manager’s fee) is included in the Fund’s Semi-Annual Report dated June 30, 2005 under “Other Information—Board Consideration of Management Agreement.”
| | Fund’s management | | Typical |
| | fee based on | | management |
| | Total Leveraged | | fee formula, |
| | Assets (includes | | calculated excluding |
| | Currency | | Currency |
| Beginning assets of $1,000 | Commitments) | | Commitments |
| |
| Global Equity Investments | | | | | | | |
| (Net Assets) | $ | 1,000 | | | $ | 1,000 | |
| Currency Commitments | $ | 500 | | | $ | 500 | |
| Assets used to calculate | | | | | | | |
| management fee | $ | 1,500 | | | $ | 1,000 | |
| Management fee (0.85%) | $ | 12.75 | | | $ | 8.50 | |
Investment Manager Fee Conflict Risk—The fee paid to the Investment Manager for investment management services will be higher when the Fund uses Financial Leverage, whether through forward currency contracts or Borrowings, because the fee paid will be calculated on the basis of the Fund’s assets including this Financial Leverage. Consequently, the Investment Manager may have a financial interest for the Fund to utilize such Financial Leverage, which may create a conflict of interest between the Investment Manager and the stockholders of the Fund.
The Fund has implemented procedures to monitor this potential conflict.
4. Administrative Agreement
The Fund has entered into an administrative agreement with State Street to provide certain administrative services. The Fund bears the cost of such services at a fixed annual rate of $42,500, plus 0.02% of average daily net assets up to $1 billion and 0.01% of average daily net assets over $1 billion.
5. Directors’ Compensation
Certain Directors of the Fund are officers of the Investment Manager. The Fund pays each Director who is not an employee or an affiliated person of the Investment Manager its allocated portion of a fixed fee of $50,000 per year, plus $2,500 per meeting attended ($1,000 per meeting attended by telephone) for the Fund, The Lazard Funds, Inc., Lazard Retirement Series, Inc. and Lazard World Dividend & Income Fund, Inc. (collectively, the “Lazard Funds”), each a registered management investment company advised by the Investment Manager, and reimburses such Directors for travel and other out of pocket expenses.
21
Lazard Global Total Return & Income Fund, Inc.
Notes to Financial Statements (concluded)
June 30, 2006 (unaudited)
In addition, the Chairman of the Audit Committees for the Lazard Funds also receives an annual fee of $5,000.6. Securities Transactions and Transactions with Affiliates
Purchases and sales of portfolio securities (excluding short-term securities) for the period ended June 30, 2006 were $54,032,024 and $59,343,981, respectively.
For the period ended June 30, 2006, no brokerage commissions were paid to affiliates of the Investment Manager or other affiliates of the Fund for portfolio transactions executed on behalf of the Fund.
7. Line of Credit
The Fund has a $40 million Line of Credit Agreement (the “Agreement”) with State Street primarily to borrow to invest Fund assets in Currency Investments. The Fund may borrow the lesser of $40 million or 33 1 / 3% of its Total Leveraged Assets. Interest on borrowings is payable at the Federal Funds rate plus 0.50%, on an annualized basis. Under the Agreement, the Fund has agreed to pay a 0.10% per annum fee on the unused portion of the commitment, payable quarterly in arrears. During the period ended June 30, 2006, the Fund had borrowings under the Agreement as follows:
| Average Daily | | Maximum Daily | | Weighted Average |
| Loan Balance | | Loan Outstanding | | Interest Rate |
| $7,600,493 | | $17,250,000 | | 5.15% |
8. Foreign Securities Investment Risks
The Fund invests in securities of foreign entities and instruments denominated in foreign currencies which involve risks not typically involved in domestic investments. Foreign investments carry special risks, such as exposure to currency fluctuations, less developed or less efficient trading markets, political instability, a lack of company information, differing auditing and legal standards and, potentially, less liquidity. The Fund’s investments in emerging markets are exposed to additional volatility. The Fund’s performance will be influenced by political, social and economic factors affecting emerging markets. Emerging market countries generally have economic structures that are less diverse and mature, and political systems that are less stable, than those of developed countries.
22
Lazard Global Total Return & Income Fund, Inc.
Proxy Voting Results
(unaudited)
The Annual Meeting of Stockholders was held on April 26, 2006, to vote on the following proposal. The proposal received the required number of votes of stockholders and was adopted.
Election of the following Directors:
- two Class I Directors (Robert M. Solmson and Charles Carroll), each to serve for a three-year term expiring at the 2009 Annual Meeting and until his successor is duly elected and qualified;
- one Class III Director (Ashish Bhutani), to serve for a two-year term expiring at the 2008 Annual Meeting and until his successor is duly elected and qualified.
| Director | | For | | Withhold Authority | |
| Robert M. Solmson | | 6,974,224 | | 207,017 | |
| Charles Carroll | | 7,095,333 | | 85,908 | |
| Ashish Bhutani | | 6,977,124 | | 204,117 | |
23
Lazard Global Total Return & Income Fund, Inc.
Dividend Reinvestment Plan
(unaudited)
Unless you elect to receive distributions in cash (i.e., opt-out), all dividends, including any capital gain distributions, on your Common Stock will be automatically reinvested by Computershare Shareholder Services, Inc., as dividend disbursing agent (the “Plan Agent”), in additional Common Stock under the Fund’s Dividend Reinvestment Plan (the “Plan”). You may elect not to participate in the Plan by contacting the Plan Agent. If you do not participate, you will receive all distributions in cash, paid by check mailed directly to you by the Plan Agent.Under the Plan, the number of shares of Common Stock you will receive will be determined on the dividend or distribution payment date, as follows:
| (1) | If the Common Stock is trading at or above net asset value at the time of valuation, the Fund will issue new shares at a price equal to the greater of (i) net asset value per Common Share on that date or (ii) 95% of the Common Stock’s market price on that date. |
| |
| (2) | If the Common Stock is trading below net asset value at the time of valuation, the Plan Agent will receive the dividend or distribution in cash and will purchase Common Stock in the open market, on the NYSE or elsewhere, for the participants’ accounts. It is possible that the market price for the Common Stock may increase before the Plan Agent has completed its pur- chases. Therefore, the average purchase price per share paid by the Plan Agent may exceed the market price at the time of valuation, resulting in the pur- chase of fewer shares than if the dividend or distribution had been paid in Common Stock issued by the Fund. The Plan Agent will use all dividends and distributions received in cash to purchase Com- mon Stock in the open market within 30 days of the valuation date. Interest will not be paid on any unin- vested cash payments. |
| |
You may withdraw from the Plan at any time by giving written notice to the Plan Agent. If you withdraw or the Plan is terminated, you will receive whole shares in your account under the Plan and you will receive a cash payment for any fraction of a share in your account. If you wish, the Plan Agent will sell your shares and send you the proceeds, minus an initial $15 service fee plus $0.12 per share being liquidated (for processing and brokerage expenses).
The Plan Agent maintains all stockholders’ accounts in the Plan and gives written confirmation of all transactions in the accounts, including information you may need for tax records. Shares of Common Stock in your account will be held by the Plan Agent in non-certificated form. Any proxy you receive will include all Common Stock you have received under the Plan.
There is no brokerage charge for reinvestment of your dividends or distributions in newly-issued shares of Common Stock. However, all participants will pay a pro rata share of brokerage commissions incurred by the Plan Agent when it makes open market purchases.
Automatically reinvesting dividends and distributions does not mean that you do not have to pay income taxes due upon receiving dividends and distributions.
If you hold your Common Stock with a brokerage firm that does not participate in the Plan, you will not be able to participate in the Plan and any dividend reinvestment may be effected on different terms than those described above. Consult your financial advisor for more information.
The Fund reserves the right to amend or terminate the Plan if, in the judgment of the Board of Directors, the change is warranted. There is no direct service charge to participants in the Plan (other than the service charge when you direct the Plan Agent to sell your Common Stock held in a dividend reinvestment account); however, the Fund reserves the right to amend the Plan to include a service charge payable by the participants. Additional information about the Plan may be obtained from the Plan Agent at P.O. Box 43010, Providence, Rhode Island 02940-3010.
24
Lazard Global Total Return & Income Fund, Inc.
Board of Directors and Officers Information
(unaudited)
| Name (Age) | | Position(s) and Term | | Principal Occupation(s) During Past 5 Years |
| Address(1) | | with the Fund(2) | | and Other Directorships Held |
|
|
|
|
|
| |
| Board of Directors: |
| Class I — Directors with Term Expiring in 2009 | | |
| Independent Directors: | | |
| |
| Leon Pollack (65) | | Director | | Director, Lazard Alternative Strategies Fund, LLC; Former Managing Director, |
| | | since August 2006 | | Donaldson, Lufkin & Jenrette. |
| |
| Robert M. Solmson (58) | | Director | | Director, Lazard Alternative Strategies Fund, LLC; Director, Colonial |
| | | since September 2004 | | Williamsburg Co.; Former Chief Executive Officer and Chairman, RFS Hotel |
| | | | | Investors, Inc.; Former Director, Morgan Keegan, Inc.; Former Director, |
| | | | | Independent Bank, Memphis. |
| Interested Director(3): | | | | |
| |
| Charles Carroll (45) | | Chief Executive Officer, | | Deputy Chairman and Head of Global Marketing of the Investment Manager. |
| | | President and Director | | |
| | | since June 2004 | | |
| |
| Class II — Directors with Term Expiring in 2007 | | |
| Independent Directors: | | | | |
| |
| Kenneth S. Davidson (61) | | Director | | President, Davidson Capital Management Corporation; Trustee, The Juilliard |
| | | since February 2004 | | School; Chairman of the Board, Bridgehampton Chamber Music Festival; |
| | | | | Trustee, American Friends of the National Gallery/London; President, |
| | | | | Aquiline Advisors LLC. |
| |
| Lester Z. Lieberman (76) | | Director | | Private Investor; Chairman, Healthcare Foundation of New Jersey; Director, |
| | | since February 2004 | | Cives Steel Co.; Director, Northside Power Transmission Co.; Advisory |
| | �� | | | Trustee, New Jersey Medical School; Director, Public Health Research Insti- |
| | | | | tute; Trustee Emeritus, Clarkson University; Council of Trustees, New Jersey |
| | | | | Performing Arts Center. |
| |
| Class III — Directors with Term Expiring in 2008 | | |
| Independent Directors: | | | | |
| |
| John J. Burke (78) | | Director | | Lawyer and Private Investor; Director, Lazard Alternative Strategies Fund, |
| | | since February 2004 | | LLC; Director, Pacific Steel & Recycling; Director, Sletten Construction |
| | | | | Company; Trustee Emeritus, The University of Montana Foundation. |
| |
| Richard Reiss, Jr. (62) | | Director | | Chairman, Georgica Advisors LLC, an investment manager; Director, Lazard |
| | | since February 2004 | | Alternative Strategies Fund, LLC; Director, O’Charley’s, Inc., a restaurant chain. |
| |
| Interested Director(3): | | | | |
| |
| Ashish Bhutani (46) | | Director | | Chief Executive Officer of the Investment Manager; from 2001 to December |
| | | since July 2005 | | 2002, Co-Chief Executive Officer North America of Dresdner Kleinwort |
| | | | | Wasserstein and member of its Global Corporate and Markets Board and the |
| | | | | Global Executive Committee; from 1995 to 2001, Chief Executive Officer of |
| | | | | Wasserstein Perella Securities; and from 1989 to 2001, Deputy Chairman of |
| | | | | Wasserstein Perella Group. |
| (1) | The address of each Director is Lazard Asset Management LLC, 30 Rockefeller Plaza, New York, New York 10112-6300. |
| |
| (2) | Each Director also serves as a Director for each of the Lazard Funds (comprised of 24 investment portfolios). |
| |
| (3) | Messrs. Bhutani and Carroll are “interested persons” (as defined in the Act) of the Fund because of their positions with the Investment Manager. |
| |
The Fund’s Statement of Additional Information contains further information about the Directors and is available without charge by calling 800-828-5548.
25
Lazard Global Total Return & Income Fund, Inc.
Board of Directors and Officers Information (concluded)
(unaudited)
| Name (Age) | | Position(s) and Term | | |
| Address(1) | | with the Fund(2) | | Principal Occupation(s) During Past 5 Years |
|
|
|
| |
| Officers: | | | | |
| |
| Nathan A. Paul (33) | | Vice President | | Managing Director and General Counsel of the Investment Manager. |
| | | and Secretary | | |
| |
| Stephen St. Clair (47) | | Treasurer | | Vice President of the Investment Manager. |
| |
| Brian Kawakami (56) | | Chief Compliance Officer | | Senior Vice President and Chief Compliance Officer of the Investment |
| | | | | Manager; Chief Compliance Officer at INVESCO, from July 2002 to April |
| | | | | 2006; Chief Compliance Officer at Aeltus Investment Management, from |
| | | | | 1993 to July 2002. |
| |
| Brian D. Simon (44) | | Assistant Secretary | | Director of the Investment Manager; Vice President, Law & Regulations at J. & |
| | | | | W. Seligman & Co., from July 1999 to October 2002. |
| |
| David A. Kurzweil (32) | | Assistant Secretary | | Vice President of the Investment Manager; Associate at Kirkpatrick & |
| | | | | Lockhart LLP, a law firm, from August 1999 to January 2003. |
| |
| Cesar A. Trelles (31) | | Assistant Treasurer | | Fund Administration Manager of the Investment Manager; Manager for |
| | | | | Mutual Fund Finance Group at UBS Global Asset Management, from |
| | | | | August 1998 to August 2004. |
| (1) | The address of each officer is Lazard Asset Management LLC, 30 Rockefeller Plaza, New York, New York 10112-6300. |
| |
| (2) | Each officer became an officer in February 2004, except Messrs. Kawakami and Trelles, who became officers in August 2006 and December 2004, respectively. Each officer serves for an indefinite term, until his successor is elected and qualified, and serves in the same capacity for the other Lazard Funds. |
| |
26
Lazard Global Total Return & Income Fund, Inc.
Other Information
(unaudited)
Certifications
The Fund’s chief executive officer has certified to the NYSE, pursuant to the requirements of Section 303A.12(a) of the NYSE Listed Company Manual, that as of May 25, 2006 he was not aware of any violation by the Fund of applicable NYSE corporate governance listing standards. The Fund’s reports to the Securities and Exchange Commission (the “SEC”) on Forms N-CSR and N-Q contain certifications by the Fund’s chief executive officer and chief financial officer as required by Rule 30a-2(a) under the Act, including certifications regarding the quality of the Fund’s disclosures in such reports and certifications regarding the Fund’s disclosure controls and procedures and internal control over financial reporting.
Proxy Voting
A description of the policies and procedures used to determine how proxies relating to Fund portfolio securities are voted is available (1) without charge, upon request, by calling (800) 823-6300 or (2) on the SEC’s website at http://www.sec.gov.
The Fund’s proxy voting record for the most recent 12-month period ended June 30 is available (1) without charge, upon request, by calling (800) 823-6300 or (2) on the SEC’s website at http://www.sec.gov. Information as of June 30 each year will generally be available by the following August 31.
Form N-Q
The Fund files a complete schedule of its portfolio holdings for the first and third quarters of its fiscal year with the SEC on Form N-Q. The Fund’s Form N-Q is available on the SEC’s website at http://www.sec.gov and may be reviewed and copied at the SEC’s Public Reference Room in Washington, D.C. Information on the operation of the SEC’s Public Reference Room may be obtained by calling 1-800-SEC-0330.
27
Lazard Global Total Return & Income Fund, Inc.
30 Rockefeller Plaza
New York, New York 10112-6300
Telephone: 800-828-5548
http://www.LazardNet.com
Investment Manager
Lazard Asset Management LLC
30 Rockefeller Plaza
New York, New York 10112-6300
Telephone: 800-823-6300
Custodian
State Street Bank and Trust Company
One Lincoln Street
Boston, Massachusetts 02111
Transfer Agent and Registrar
Computershare Trust Company, N.A.
P.O Box 43010
Providence, Rhode Island 02940-3010
Dividend Disbursing Agent
Computershare Shareholder Services, Inc.
P.O Box 43010
Providence, Rhode Island 02940-3010
Independent Registered Public Accounting Firm
Deloitte & Touche LLP
Two World Financial Center
New York, New York 10281-1414
Legal Counsel
Stroock & Stroock & Lavan LLP
180 Maiden Lane
New York, New York 10038-4982
http://www.stroock.com
This report is intended only for the information of stockholders or those who have received the current prospectus covering shares of Common Stock of Lazard Global Total Return & Income Fund, Inc. which contains information about management fees and other costs.

| Lazard Asset Management LLC | | 30 Rockefeller Plaza | | www.LazardNet.com |
| | | | New York, NY 10112-6300 | | |
ITEM 2.  CODE OF ETHICS.

         Not applicable.

ITEM 3.  AUDIT COMMITTEE FINANCIAL EXPERT.

         Not applicable.

ITEM 4.  PRINCIPAL ACCOUNTANT FEES AND SERVICES.

         Not applicable.

ITEM 5.  AUDIT COMMITTEE OF LISTED REGISTRANTS.

         Not applicable.

ITEM 6.  SCHEDULE OF INVESTMENTS

         Not applicable.

ITEM 7.  DISCLOSURE OF PROXY VOTING POLICIES AND PROCEDURES FOR CLOSED END
MANAGEMENT INVESTMENT COMPANIES.

         Not applicable.

ITEM 8.  PORTFOLIO MANAGERS OF CLOSED-END MANAGEMENT INVESTMENT COMPANIES.

         Not  applicable.

ITEM 9.  PURCHASES OF EQUITY SECURITIES BY CLOSED-END MANAGEMENT INVESTMENT
COMPANY AND AFFILIATED PURCHASERS.

         Not applicable.

ITEM 10. SUBMISSION OF MATTERS TO A VOTE OF SECURITY HOLDERS.

         The Registrant has a Nominating Committee (the "Committee") of the
Board of Directors (the "Board"), which is currently comprised of all of the
Directors who are not "interested persons" (as defined in the Investment Company
Act of 1940, as amended) of the Registrant. The Committee's function is to
select and nominate candidates for election to the Board. The Committee will
consider recommendations for nominees from stockholders sent to the Secretary of
the Registrant, 30 Rockefeller Plaza, New York, New


York 10112. Nominations may be submitted only by a stockholder or group of
stockholders that, individually or as a group, has beneficially owned the lesser
of (a) 1% of the Registrant's outstanding shares or (b) $500,000 of the
Registrant's shares (calculated at market value) for at least one year prior to
the date such stockholder or group submits a candidate for nomination. Not more
than one nominee for Director may be submitted by such a stockholder or group
each calendar year.

In evaluating potential nominees, including any nominees recommended by
stockholders, the Committee takes into consideration the factors listed in the
Nominating Committee Procedures and Charter, including character and integrity,
business and professional experience, and whether the Committee believes that
the person has the ability to apply sound and independent business judgment and
would act in the interests of the Registrant and its stockholders. A nomination
submission must include all information relating to the recommended nominee that
is required to be disclosed in solicitations or proxy statements for the
election of Directors, as well as information sufficient to evaluate the factors
listed above. Nomination submissions must be accompanied by a written consent of
the individual to stand for election if nominated by the Board and to serve if
elected by the stockholders, and such additional information must be provided
regarding the recommended nominee as reasonably requested by the Committee. A
nomination submission must be received not less than 120 calendar days before
the date of the Registrant's proxy statement released to stockholders in
connection with the previous year's annual meeting.

ITEM 11.  CONTROLS AND PROCEDURES.

(a) The Registrant's principal executive and principal financial officers have
concluded, based on their evaluation of the Registrant's disclosure controls and
procedures as of a date within 90 days of the filing date of this report, that
the Registrant's disclosure controls and procedures are reasonably designed to
ensure that information required to be disclosed by the Registrant on Form N-CSR
is recorded, processed, summarized and reported within the required time periods
and that information required to be disclosed by the Registrant in the reports
that it files or submits on Form N-CSR is accumulated and communicated to the
Registrant's management, including its principal executive and principal
financial officers, as appropriate to allow timely decisions regarding required
disclosure.

(b) There were no changes to the Registrant's internal control over financial
reporting that occurred during the second fiscal quarter of the period covered
by this report that have materially affected, or are reasonably likely to
materially affect, the Registrant's internal control over financial reporting.

ITEM 12. EXHIBITS.

(a)(1) Not applicable.

(a)(2) Certifications of principal executive and principal financial officers as
required by Rule 30a-2(a) under the Investment Company Act of 1940.

(a)(3) Not applicable.

(b) Certifications of principal executive and principal financial officers as
required by Rule 30a-2(b) under the Investment Company Act of 1940.


SIGNATURES


Pursuant to the requirements of the Securities Exchange Act of 1934 and the
Investment Company Act of 1940, the registrant has duly caused this report to be
signed on its behalf by the undersigned, thereunto duly authorized.


Lazard Global Total Return and Income Fund, Inc.

By      /s/ CHARLES CARROLL
        Charles Carroll
        Chief Executive Officer

Date    September 6, 2006


Pursuant to the requirements of the Securities Exchange Act of 1934 and the
Investment Company Act of 1940, this report has been signed below by the
following persons on behalf of the registrant and in the capacities and on the
dates indicated.

By      /s/ CHARLES CARROLL
        Charles Carroll
        Chief Executive Officer

Date    September 6, 2006

By      /s/ STEPHEN ST. CLAIR
        Stephen St. Clair
        Chief Financial Officer

Date    September 6, 2006
