UNITED STATES
SECURITIES AND EXCHANGE COMMISSION
Washington, DC 20549
FORM N-CSR
CERTIFIED SHAREHOLDER REPORT OF REGISTERED
MANAGEMENT INVESTMENT COMPANY
Investment Company Act file number 811-21527
The Endowment Master Fund, L.P.
(Exact name of registrant as specified in charter)
4265 SAN FELIPE, SUITE 800, HOUSTON, TX 77027
(Address of principal executive offices) (Zip code)
| | |
| | With a copy to: |
| A. Haag Sherman | | George J. Zornada |
| The Endowment Master Fund, L.P. | | K & L Gates LLP |
| 4265 San Felipe, Suite 800 | | State Street Financial Center |
| Houston, TX 77027 | | One Lincoln St. |
| (Name and address of agent for service) | | Boston, MA 02111-2950 |
| | | (617) 261-3231 |
Registrant’s telephone number, including area code: 800-725-9456
Date of fiscal year end: 12/31/09
Date of reporting period: 12/31/09
Item 1. Reports to Stockholders.
the
ENDOWMENT FUND
The Endowment Master Fund, L.P.
Shareholders’ Report
December 31, 2009
TABLE OF CONTENTS

Dear TEF Partners:
As we enter a new decade and near our 7th anniversary, we thought this would be an opportune time to (a) review the goals and objectives of The Endowment Fund (the “Fund” or “TEF”) and (b) discuss the Fund’s performance in 2009.
The Goals of The Endowment Fund
Since inception of the Fund in 20031, our long-term goals have been to preserve the purchasing power of invested capital to support the future spending needs of our clients and to generate consistent, long-term, returns across market cycles. We endeavor to deliver real returns (returns above inflation) of 7%2, similar to the long-term return on equities, but to produce those returns with approximately half of the annualized volatility of equities, as measured by standard deviation of returns.
By lowering the standard deviation of returns through a diversified portfolio management approach, similar to the model employed by the most successful Endowment management programs, cumulative wealth is increased through more consistent compounding. The mathematics of loss are very debilitating to long-term investment returns, and the ability to “lose less” in down markets allows for greater wealth accumulation, even if the returns in good markets modestly lag traditional indices. Harry Markowitz won his Nobel Prize for demonstrating the power of diversification and the impact on long-term investment returns and some of the most successful investment programs have embraced this model effectively over the past few decades. The Fund is managed in accordance with these principles and we have constructed a highly diversified portfolio that we believe is designed to capitalize on the benefits of the Markowitz approach.
The Endowment Model is focused on long-term wealth preservation and growth, as opposed to seeking to maximize returns in any one particular short-term period. By reducing the volatility of returns over time, the portfolio should achieve higher long-term returns. However, there will be periods of time where the portfolio trails more concentrated investment strategies that exhibit much higher volatility. Those strategies will typically have “higher highs” and “lower lows” and when that is true they are more likely to ultimately generate inferior returns to the Endowment Model portfolio approach in the long term.
The Diversified Portfolio in 2009
By definition, a diversified portfolio will almost always lag a concentrated portfolio in an “up market” (conversely it will almost always lead in a “down market”). As we entered 2009, we believed that a high level of diversification and “hedging” in the portfolio was the prudent portfolio posture given the high level of uncertainty in the markets in the wake of the financial crisis. Our conservative posture was very successful in reducing volatility, and preserving capital, during a very tumultuous first quarter. However, that posture also limited upside participation during the subsequent market rally over the final two-thirds of the year.
1 The performance quoted for The Endowment Fund from April 2003 – March 2004 is that of an unregistered predecessor fund and is related performance only and does not reflect the performance of the feeder funds and/or The Endowment Fund. The Master Fund and the Feeder Funds’ performance may differ from that shown due to factors such as differences in cash flows, fees, expenses, performance calculation methods, portfolio size, number of underlying pooled investments, investment limitations, diversification requirements and other restrictions imposed on registered funds by the Investment Company Act of 1940, as amended (the “1940 Act”). Investors should not consider this related performance as indication of future performance, or as a substitute for the performance of the feeder funds and/or The Endowment Fund. Performance reflected is net of fees.
2 However, we cannot guarantee we will achieve this objective and past performance is no guarantee of future results.
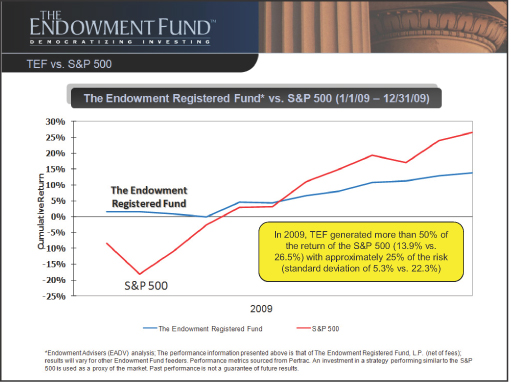
As shown in the graph above, the Fund3 produced a relatively stable stream of returns in 2009 and our high allocation to low volatility strategies and portfolio hedges generated a return profile with approximately 25% of the volatility4 of the S&P 500 Index. The “cost” of that reduced volatility was that the portfolio lagged the equity market over the entire year, capturing just over half of the index return. Given our goal is to generate consistent, long-term, returns we have never focused on single year returns and have not constructed the portfolio to be compared to the equity indices over short-term periods like quarters, or years. We are much more concerned with outperforming over longer periods of time by lowering the volatility of returns in the Fund. We achieved that goal very effectively as the Fund had less than 25% of the volatility of the S&P 500 during the year5. Lower volatility has been consistent since inception and the impact of the reduced volatility is shown in the table below. The Fund has significantly outperformed the equity market over rolling three and five year periods and has achieved those superior returns with dramatically less risk, as measured by the standard deviation of its returns.
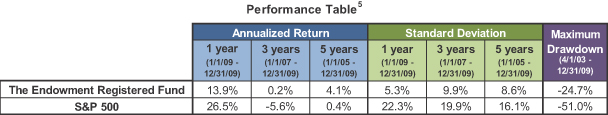
Another measure of superior risk adjusted returns is the ability of the Fund to limit the maximum drawdown of the portfolio to less than half of the drawdown of the S&P 500. From the maximum drawdown, the Fund needs to
3 The Endowment Fund has a variety of feeders, which all feed into a single “master” fund called The Endowment Master Fund, L.P. Each “feeder” fund has different expense ratios, which provide for slightly different returns from one “feeder” fund to the next. Accordingly, unless otherwise specified, the performance and standard volatility outlined herein are those of The Endowment Registered Fund, L.P., which is the largest “feeder” fund in The Endowment Fund complex. Your returns may vary, based on the feeder in which you invest and the timing of your investment. Please consult your capital account statement for the exact returns of your investment.
4 Please refer to the 1, 3 and 5 year TEF vs. S&P 500 performance comparisons in the Performance Table for more complete performance information.
5 Past performance is not a guarantee of future results.
recover approximately 33% to break even, while the equity index would have to rise just over 100% to recover the losses. We believe this is a critical distinction, one that means that the recovery rate for the Fund does not have to be as rapid or dramatic as the equity market to get an investor back to “even.”
Performance During the Financial Crisis and Market Rebound (October 2007 – December 2009)
Despite this fact, some investors have expressed concern that the Fund only captured 52% of the equity recovery in 2009 (TEF: 13.9% vs. the S&P 500: 26.5%). Lower volatility of returns means less downside in the bad periods (TEF lost significantly less than the S&P 500 in 2008, -24% vs. -37%) and less upside in the good periods, like the last half of 2009. However, the mathematics of loss is incontrovertible, as shown below.
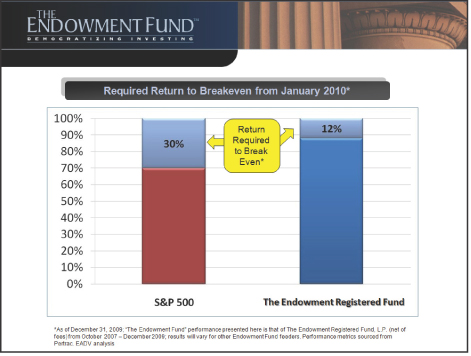
As of January 1, 2010, the S&P 500 still must generate a 30% return to recover the level it reached at the October 2007 peak. In contrast, The Endowment Fund needs to generate a 12% return in order to recover the losses it sustained during the financial crisis. Our diversified approach limited losses during the worst of the crisis in September and October of 2008, and again in January and February of 2009, and while our hedged posture also limited upside participation during the recent rally, we finished the two year period well ahead of the equity markets. A dollar invested in a strategy which performed similarly to the S&P 500 on January 1, 2008 is now only worth 80 cents, while that same dollar invested in the Fund is worth 87 cents.6 Diversification is a proven way to limit losses in a portfolio and the Fund embraces the elegantly simple math of long-term wealth generation, which focuses on producing a lower volatility stream of returns.
2009 in Review
2009 proved a year of two distinct investing climates. The first ten weeks of 2009 saw a continuation of the dramatic drawdown of the fourth quarter of 2008. The remainder of 2009 saw a dramatic rebound in the US and global equity markets. We wanted to provide a recap of 2009 and how our Fund performed in the first ten weeks, and then thereafter.
January – February 2009 in Review
The last few months of 2008 were very challenging for all investors and we learned many valuable lessons about the limits of hedging and the risks of the “unknown unknowns” like government intervention and accounting rule
6 The S&P 500 return from January 2008 – December 2009 was -20.32%, while the return for The Endowment Registered Fund was -13.5%.
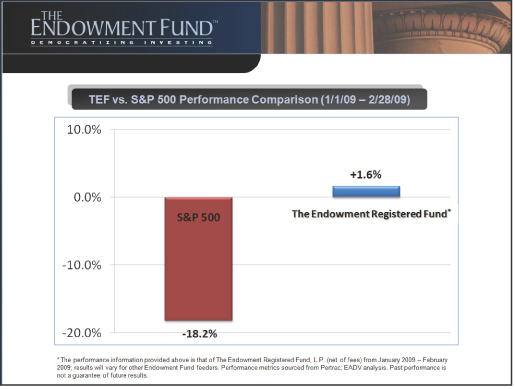
changes. We entered 2009 with large positions in credit (rather than equity) and significant hedges in the portfolio as we were concerned about continued fallout from the financial crisis. We believed that we could generate consistent returns in most market conditions by owning assets senior in the capital structure and wanted to limit equity exposure given the high degree of uncertainty in the market. Since TEF suffered a significant drawdown along with the rest of the industry in 2008, we are often asked the question “How will TEF perform if the market drops 20% again?” While past performance is no guarantee of future results, the chart below illustrates how The Endowment Fund performed during the 18% drawdown from January to February of 2009. Our hedged profile paid handsomely as we avoided most of the losses and dramatically reduced volatility in the portfolio.
The Great Equity Rally of 2009 – March to December
After the release of the Bank Stress Test Results in March, investors “got their nerve back”, animal spirits returned and equity markets surged in the following months. Our portfolio was positioned defensively and did not participate fully in the rally. While the Fund posted more consistent, linear returns of 12% over the balance of the year, stocks surged 55% from the nadir to finish 2009 up 26.5%.5
Our portfolio performance can be separated into three distinct blocks, Credit, Equity and Hedges. Our Credit portfolio (Enhanced Fixed Income (15%) and Arbitrage (18%)) performed quite well during the rally, rising nearly 24% and finished the year in line with equities, but with significantly lower volatility and risk. Our Equity portfolio (Domestic Equity (10%), International Equity (10%), Private Equity (12%), Energy (10%)) had mixed results with Domestic Equity and Private Equity rising around 10%, International Equity rising 22% and Energy surging 36%. The most challenging part of the portfolio were the hedges (which performed the best during the first part of the year) as Opportunistic Equity (13%), hedged Real Estate (5%) and Fixed Income (7%) struggled during the “melt-up.” Opportunistic Equity was flat, Real Estate was up modestly and Fixed Income (deflation hedge) lost 4%.5
Conclusion
The Fund (again, as evidenced by the performance of The Endowment Registered Fund, L.P.) has shown the ability to preserve capital during turbulent markets (yes, we learned a great deal during 2008) and also capture significant upside in bull markets. We believe TEF is an attractive solution for investors looking to
diversify a portion of their traditional equity exposure without giving up the potential ability to generate consistent real returns similar to long-term equity returns. On the heels of last year’s historic rally in the equity markets, valuations today are quite high by historic standards and expected returns over the next decade are low relative to history (GMO LLC now projects U.S. Equities to generate only 1.3% real returns over the next 7 years7). We believe there is a tremendous opportunity to “sell into strength” and reduce long equity exposure in client portfolios and replace that exposure with a portfolio that can generate similar returns with much lower volatility and more consistency.
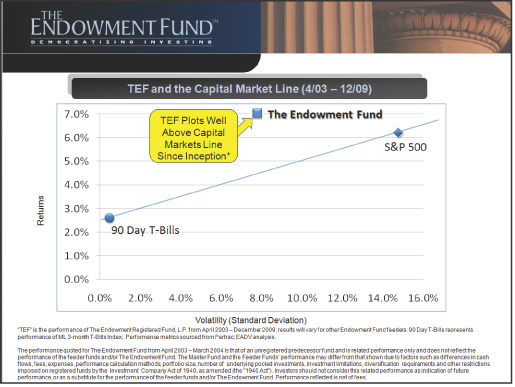
As the chart above illustrates quite nicely, since the Fund’s inception in 2003, the Fund has outperformed the S&P 500 by almost 1% per year on an annualized basis (7.1% net of fees vs. 6.2%) with approximately half the risk (8.0% vs. 14.8%) as measured by standard deviation. While no one can accurately predict the future, we are confident that the process inherent in the Endowment Model of investing is likely to generate consistent, long-term returns with low volatility for many decades to come. Past performance is no guarantee of future results.
The Endowment Fund Fees and Expenses
The Endowment Fund performance information presented in this document is net of fees and expenses. TEF fees are as follows: Management Fee: 1%, Servicing Fee: 1%. Fund Expenses vary by feeder and are listed below:
| | • | | Domestic Fund & Domestic QP Fund: 0.18% |
| | • | | Exempt Fund II8 : 1.43% |
| | • | | Exempt QP Fund II8: 1.22% |
7 GMO LLC. 7-Year Asset Class Return Forecast. As of 12/31/09. GMO is a privately held global investment management firm.
8 The Fund expenses shown are the expenses contained in the Private Placement Memorandum for the Fund. The actual expenses for the TEI Fund, Exempt Fund II and Exempt QP Fund II were lower than stated above (0.53%, 0.52% and 0.49%) after accounting for offshore withholding tax credit subsequently received.
We are grateful for your continued support and partnership. If you have any questions, please do not hesitate to call our Sales Desk at 1-800-725-9456.
Best regards,
| | |

| | 
|
Mark W. Yusko | | John A. Blaisdell |
Chief Investment Officer Endowment Advisers, L.P. | | Co-Chief Executive Officer |
| |

| | 
|
| Andrew B. Linbeck | | A. Haag Sherman |
Co-Chief Executive Officer | | Co-Chief Executive Officer |
The views expressed throughout this report are those of the Adviser and are current only through the end of the period of the report as stated on the cover. These views are subject to change at any time based upon market or other conditions, and the investment adviser disclaims any responsibility to update such views. These views may not be relied on as investment advice and, because investment decisions for a fund are based on many factors, may not be relied on as an indication of trading intent on behalf of the Fund. Portfolio information provided in the report may not be representative of the Fund’s current or future investments and may change due to active management.
Report of Independent Registered Public Accounting Firm
The Board of Directors and Partners
The Endowment Master Fund, L.P.:
We have audited the accompanying statement of assets, liabilities, and partners’ capital of The Endowment Master Fund, L.P. (the “Master Fund”), including the schedule of investments, as of December 31, 2009, and the related statement of operations for the year then ended, the statement of changes in partners’ capital for each of the years in the two-year period then ended, the statement of cash flows for the year then ended, and the financial highlights for each of the years in the five-year period then ended. These financial statements and financial highlights are the responsibility of the Master Fund’s management. Our responsibility is to express an opinion on these financial statements and financial highlights based on our audits.
We conducted our audits in accordance with the standards of the Public Company Accounting Oversight Board (United States). Those standards require that we plan and perform the audit to obtain reasonable assurance about whether the financial statements and financial highlights are free of material misstatement. An audit includes examining, on a test basis, evidence supporting the amounts and disclosures in the financial statements. Our procedures included confirmation of securities owned as of December 31, 2009, by correspondence with custodians and investees; or other appropriate auditing procedures. An audit also includes assessing the accounting principles used and significant estimates made by management, as well as evaluating the overall financial statement presentation. We believe that our audits provide a reasonable basis for our opinion.
In our opinion, the financial statements and financial highlights referred to above present fairly, in all material respects, the financial position of The Endowment Master Fund, L.P. as of December 31, 2009, the results of its operations and its cash flows for the year then ended, the changes in its partners’ capital for each of the years in the two-year period then ended and the financial highlights for each of the years in the five-year period then ended in conformity with U.S. generally accepted accounting principles.
KPMG LLP
Columbus, Ohio
February 26, 2010
THE ENDOWMENT MASTER FUND, L.P.
(A Limited Partnership)
Statement of Assets, Liabilities and Partners’ Capital
December 31, 2009
| | | |
| Assets | | | |
Investments in Investment Funds, at estimated fair value (cost $1,140,528,748) | | $ | 1,148,503,109 |
Investments in affiliated Investment Funds, at estimated fair value (cost $3,100,169,081) | | | 3,393,328,112 |
Investments in securities, at fair value (cost $475,178,323) | | | 470,477,680 |
| | | |
Total investments | | | 5,012,308,901 |
Cash and cash equivalents | | | 186,148,307 |
Prepaid contributions to Investment Funds | | | 102,391,759 |
Interest and dividends receivable | | | 629,640 |
Interest and dividends receivable from affiliated investments | | | 277,260 |
Receivable from investments sold | | | 252,007,689 |
Prepaids and other assets | | | 179,895 |
| | | |
Total assets | | | 5,553,943,451 |
| | | |
| Liabilities and Partners’ Capital | | | |
Contributions received in advance | | | 58,488,319 |
Withdrawals payable | | | 257,471,914 |
Investment Management Fees payable | | | 13,338,483 |
Offshore withholding tax payable | | | 9,986,850 |
Administration fees payable | | | 195,322 |
Payables to related parties | | | 103,285 |
Accounts payable and accrued expenses | | | 1,748,344 |
| | | |
Total liabilities | | | 341,332,516 |
| | | |
Partners’ capital | | | 5,212,610,935 |
| | | |
Total liabilities and partners’ capital | | $ | 5,553,943,451 |
| | | |
See accompanying notes to financial statements.
2
THE ENDOWMENT MASTER FUND, L.P.
(A Limited Partnership)
Schedule of Investments
December 31, 2009
| | | | | | | |
| | | Shares/
Par Value* | | Fair
Value | | % of
Partners’
Capital |
| | | | | | | |
Investments in Investment Funds | | | | | | | |
Limited Partnerships, Exempted Limited Partnerships and Limited Liability Companies | | | | | | | |
Cayman Islands | | | | | | | |
Arbitrage Strategies (0.67% of Partners’ Capital) | | | | | | | |
Montrica Global Opportunities Fund, L.P.(1)(2) | | 412,880 | | $ | 34,747,006 | | |
Domestic Equity (0.88% of Partners’ Capital) | | | | | | | |
Tiedemann/Falconer Partners, L.P.(3) | | | | | 45,831,080 | | |
Energy (0.78% of Partners’ Capital) | | | | | | | |
BlueGold Global Fund, L.P.(2) | | | | | 40,398,940 | | |
International Equity (4.04% of Partners’ Capital) | | | | | | | |
Algebris Global Finacials Fund, L.P.(2) | | | | | 65,902,226 | | |
Boyer Allan Greater China Fund, L.P.(3) | | | | | 33,145,460 | | |
S.R. Global Fund—Emerging Markets Portfolio (Class G, L.P.) | | | | | 37,758,192 | | |
S.R. Global Fund—International Portfolio (Class C, L.P.) | | | | | 73,800,951 | | |
Natural Resources (0.27% of Partners’ Capital) | | | | | | | |
Sentient Global Resources Fund III, L.P. | | | | | 14,000,000 | | |
Private Equity (2.29% of Partners’ Capital) | | | | | | | |
Carlyle Japan International Partners II, L.P. | | | | | 518,728 | | |
CJIP II Co-Invest, L.P. | | | | | 63,440 | | |
CX Partners Fund, Ltd.(2) | | | | | 3,526,463 | | |
Gavea Investment Fund II A, L.P. | | | | | 11,106,227 | | |
Gavea Investment Fund III, L.P. | | | | | 41,275,914 | | |
Hillcrest Fund, L.P.(3) | | | | | 1,128,542 | | |
Hony Capital Fund 2008, L.P. | | | | | 1,848,410 | | |
India Asset Recovery Fund, L.P.(1) | | | | | 1,230,253 | | |
J.C. Flowers III, L.P.(1) | | | | | 1,290,790 | | |
LC Fund IV, L.P.(2) | | | | | 3,538,836 | | |
New Horizon Capital III, L.P.(2) | | | | | 4,100,286 | | |
Orchid Asia IV, L.P.(1) | | | | | 7,716,545 | | |
Reservoir Capital Partners, L.P. | | | | | 3,157,838 | | |
Tiger Global Private Investment Partners IV, L.P.(1) | | | | | 7,371,726 | | |
Tiger Global Private Investment Partners V, L.P. | | | | | 7,627,216 | | |
Trustbridge Partners II, L.P.(2) | | | | | 17,645,511 | | |
Trustbridge Partners III, L.P.(2) | | | | | 6,418,556 | | |
Real Estate (0.65% of Partners’ Capital) | | | | | | | |
Forum European Realty Income III, L.P.(2) | | | | | 3,389,181 | | |
Phoenix Asia Real Estate Investments II, L.P.(1)(2) | | | | | 12,134,290 | | |
See accompanying notes to financial statements.
3
THE ENDOWMENT MASTER FUND, L.P.
(A Limited Partnership)
Schedule of Investments, continued
December 31, 2009
| | | | | | | |
| | | Shares/
Par Value* | | Fair
Value | | % of
Partners’
Capital |
| | | | | | | |
Limited Partnerships, Exempted Limited Partnerships and Limited Liability Companies (continued) | | | | | | | |
Cayman Islands (continued) | | | | | | | |
Real Estate (0.65% of Partners’ Capital) (continued) | | | | | | | |
Pheonix Real Estate Fund (T) L.P. | | | | $ | 18,552,438 | | |
| | | | | | | |
Total Cayman Islands | | | | | 499,225,045 | | |
| | | | | | | |
Guernsey | | | | | | | |
Private Equity (0.10% of Partners’ Capital) | | | | | | | |
Mid Europa Fund III LP | | | | | 5,460,688 | | |
| | | | | | | |
Total Guernsey | | | | | 5,460,688 | | |
| | | | | | | |
Republic of Mauritius | | | | | | | |
Real Estate (0.06% of Partners’ Capital) | | | | | | | |
Orbis Real Estate Fund I(1)(2) | | | | | 3,193,918 | | |
| | | | | | | |
Total Republic of Mauritius | | | | | 3,193,918 | | |
| | | | | | | |
Scotland | | | | | | | |
Private Equity (0.03% of Partners’ Capital) | | | | | | | |
Actis Umbrella Fund, L.P.(1) | | | | | 1,614,000 | | |
| | | | | | | |
Total Scotland | | | | | 1,614,000 | | |
| | | | | | | |
United Kingdom | | | | | | | |
Private Equity (0.13% of Partners’ Capital) | | | | | | | |
Darwin Private Equity I, L.P. | | | | | 2,626,172 | | |
Exponent Private Equity Partners II, L.P. | | | | | 3,935,062 | | |
Real Estate (0.10% of Partners’ Capital) | | | | | | | |
Benson Elliott Real Estate Partners II, L.P. | | | | | 1,702,943 | | |
Patron Capital L.P. II | | | | | 929,902 | | |
Patron Capital L.P. III | | | | | 2,364,465 | | |
| | | | | | | |
Total United Kingdom | | | | | 11,558,544 | | |
| | | | | | | |
United States | | | | | | | |
Arbitrage Strategies (14.31% of Partners’ Capital) | | | | | | | |
Black River Commodity Multi-Strategy Fund, LLC | | | | | 1,647,200 | | |
Eton Park Fund, L.P. | | | | | 69,105,373 | | |
Investcorp Silverback Arbitrage Fund, LLC(3) | | | | | 14,633,092 | | |
Kenmont Onshore Fund, L.P.(2) | | | | | 6,838,268 | | |
King Street Capital, L.P. | | | | | 25,772,946 | | |
Magnetar Capital Fund, L.P.(2) | | | | | 52,835,341 | | |
OZ Asia Domestic Partners, L.P.(2) | | | | | 21,215,327 | | |
Paulson Advantage Plus, L.P. | | | | | 125,991,843 | | |
Paulson Partners Enhanced, L.P.(2) | | | | | 62,076,060 | | |
See accompanying notes to financial statements.
4
THE ENDOWMENT MASTER FUND, L.P.
(A Limited Partnership)
Schedule of Investments, continued
December 31, 2009
| | | | | | | |
| | | Shares/
Par Value* | | Fair
Value | | % of
Partners’
Capital |
| | | | | | | |
Limited Partnerships, Exempted Limited Partnerships and Limited Liability Companies (continued) | | | | | | | |
United States (continued) | | | | | | | |
Arbitrage Strategies (14.31% of Partners’ Capital) (continued) | | | | | | | |
PIPE Equity Partners, L.L.C.(3) | | | | $ | 49,160,976 | | |
PIPE Select Fund, L.L.C.(3) | | | | | 54,096,983 | | |
PSAM WorldArb Partners, L.P.(2) | | | | | 40,726,688 | | |
Redbrick Capital, L.P.(2) | | | | | 44,433 | | |
Stark Investments Limited Partnership | | | | | 16,000,193 | | |
Stark Select Asset Fund, LLC | | | | | 5,452,027 | | |
Waterstone Market Neutral Fund, L.P.(3) | | | | | 99,885,299 | | |
Whitebox Multi-Strategy Fund, L.P.(2) | | 82,008 | | | 100,198,491 | | |
Domestic Equity (6.66% of Partners’ Capital) | | | | | | | |
Bonanza Partners, L.P.(2) | | | | | 1,041,811 | | |
Contrarian Equity Fund, L.P.(2) | | | | | 1,165,073 | | |
Empire Capital Partners Enchanced, L.P.(3) | | | | | 26,607,742 | | |
HealthCor, L.P.(2) | | | | | 78,511,767 | | |
Ithan Creek Partners, L.P.(2) | | | | | 62,308,137 | | |
Longhorn Onshore Investors, L.P.(2) | | | | | 40,537,561 | | |
Samlyn Onshore Fund, L.P.(2) | | | | | 94,955,663 | | |
Tiger Consumer Partners, L.P.(2) | | | | | 42,044,130 | | |
Energy (6.88% of Partners’ Capital) | | | | | | | |
ArcLight Energy Partners Fund IV, L.P.(1) | | | | | 9,500,000 | | |
CamCap Resources, L.P. | | | | | 235,784 | | |
Chilton Global Natural Resources Partners, L.P.(2) | �� | | | | 65,699,032 | | |
EnCap Energy Capital Fund VII-B, L.P. | | | | | 4,353,593 | | |
Encap Energy Infrastructure Fund | | | | | 945,000 | | |
Intervale Capital Fund, L.P.(2) | | | | | 11,200,495 | | |
Merit Energy Partners G, L.P. | | | | | 4,957,738 | | |
NGP Energy Technology Partners II, L.P. | | | | | 1,025,000 | | |
NGP IX Offshore Fund, L.P. | | | | | 7,973,575 | | |
NGP Midstream & Resources, L.P.(1) | | | | | 9,894,372 | | |
Quantum Parallel Partners V, L.P.(1) | | | | | 1,934,417 | | |
Southport Energy Plus Partners, L.P.(2) | | | | | 108,765,888 | | |
TPF II-A, L.P.(1) | | | | | 13,281,584 | | |
The Ospraie Fund, L.P. | | 31,614 | | | 3,775,055 | | |
Velite Energy, L.P.(2) | | | | | 115,196,350 | | |
Enhanced Fixed Income (12.04% of Partners’ Capital) | | | | | | | |
Anchorage Crossover Credit Fund II, L.P.(2) | | | | | 47,334,946 | | |
Ares Enhanced Credit Opportunities Fund, L.P. | | | | | 13,826,405 | | |
See accompanying notes to financial statements.
5
THE ENDOWMENT MASTER FUND, L.P.
(A Limited Partnership)
Schedule of Investments, continued
December 31, 2009
| | | | | | | |
| | | Shares/
Par Value* | | Fair
Value | | % of
Partners’
Capital |
| | | | | | | |
Limited Partnerships, Exempted Limited Partnerships and Limited Liability Companies (continued) | | | | | | | |
United States (continued) | | | | | | | |
Enhanced Fixed Income (12.04% of Partners’ Capital) (continued) | | | | | | | |
BDCM Partners I, L.P.(3) | | | | $ | 56,104,546 | | |
Contrarian Capital Fund I, L.P.(2) | | | | | 114,556,167 | | |
Halcyon European Structured Opportunities Fund, L.P.(3) | | | | | 2,122,848 | | |
Harbinger Capital Partners Fund I, L.P.(2) | | | | | 113,202,487 | | |
Investcorp Silverback Opportunistic Convertible Fund, LLC(3) | | | | | 28,645,035 | | |
Morgan Rio Capital Fund, L.P.(3) | | | | | 10,805,037 | | |
Ore Hill Fund II, L.P.(3) | | | | | 4,631,988 | | |
Prospect Harbor Credit Partners, L.P. | | | | | 43,122,235 | | |
Sorin Fund, L.P.(2) | | | | | 17,775,364 | | |
Standard Pacific Credit Opportunities Fund, L.P.(2) | | | | | 102,139,757 | | |
The Rohatyn Group Local Currency Opportunity Partners, L.P.(3) | | | | | 73,227,160 | | |
International Equity (5.43% of Partners’ Capital) | | | | | | | |
Dabroes Investment Fund L.P.(3) | | | | | 33,175,396 | | |
L-R Global Partners, L.P. | | | | | 428,445 | | |
Middle East North Africa Opportunities Fund, L.P.(3) | | 5,089 | | | 3,679,629 | | |
Monsoon India Inflection Fund, L.P. | | | | | 735,667 | | |
Monsoon India Inflection Fund 2, L.P. | | | | | 1,358,542 | | |
Penta Asia Domestic Partners, L.P. | | | | | 30,095,063 | | |
Skopos HG Fund, LLC(2) | | 262,504 | | | 37,290,645 | | |
Steel Partners Japan Strategic Fund, L.P.(2) | | | | | 27,426,237 | | |
Taiyo Fund, L.P. | | | | | 16,559,654 | | |
Tarpon All Equities Fund, LLC | | | | | 36,803,232 | | |
Tiger Asia Fund, L.P. | | | | | 46,053,832 | | |
Torrey Pines Fund, LLC(3) | | | | | 49,520,330 | | |
Natural Resources (0.01% of Partners’ Capital) | | | | | | | |
Tocqueville Gold Partners, L.P. | | | | | 526,615 | | |
Opportunistic Equity (13.37% of Partners’ Capital) | | | | | | | |
Atlas Institutional Fund, LLC(3) | | | | | 21,244,645 | | |
Corriente Partners, L.P.(2) | | | | | 42,867,486 | | |
Covepoint Emerging Markets Macro Fund, L.P.(2) | | | | | 63,761,021 | | |
Global GT, L.P. | | | | | 500,010 | | |
Global Undervalued Securities Fund (QP), L.P.(2) | | | | | 38,900,205 | | |
GMO Mean Reversion Fund (Onshore), L.P. | | | | | 35,541,851 | | |
Hayman Capital Partners, L.P.(2) | | | | | 35,978,288 | | |
See accompanying notes to financial statements.
6
THE ENDOWMENT MASTER FUND, L.P.
(A Limited Partnership)
Schedule of Investments, continued
December 31, 2009
| | | | | | | |
| | | Shares/
Par Value* | | Fair
Value | | % of
Partners’
Capital |
| | | | | | | |
Limited Partnerships, Exempted Limited Partnerships and Limited Liability Companies (continued) | | | | | | | |
United States (continued) | | | | | | | |
Opportunistic Equity (13.37% of Partners’ Capital) (continued) | | | | | | | |
Horseman Global Fund 2 L.P.(2) | | | | $ | 22,969,662 | | |
Miura Global Partners II, L.P.(2) | | | | | 58,773,242 | | |
NWI Explorer Global Macro Fund, L.P.(2) | | | | | 4,310,311 | | |
Pardus European Special Opportunities Fund, L.P.(2) | | | | | 9,952,831 | | |
Passport II, L.P.(2) | | | | | 58,662,250 | | |
R.G. Niederhoffer Global Fund, L.P.(3) | | | | | 26,594,262 | | |
Salem Global Opportunity Fund, L.P.(2) | | | | | 24,879,678 | | |
SCP Sakonnet Fund, L.P.(2) | | | | | 58,705,338 | | |
Tiger Global, L.P. | | | | | 44,513,459 | | |
Valiant Capital Partners, L.P.(2) | | | | | 94,003,401 | | |
Viking Global Equities, L.P. | | | | | 54,806,681 | | |
Private Equity (9.93% of Partners’ Capital) | | | | | | | |
ABRY Advanced Securities Fund, L.P. | | | | | 14,989,680 | | |
Accel-KKR Capital Partners III, L.P.(2) | | | | | 6,778,000 | | |
Advent Latin American Private Equity Fund IV-F, L.P. | | | | | 5,441,204 | | |
Audax Mezzanine Fund II, L.P.(1) | | | | | 4,759,407 | | |
BDCM Opportunity Fund II, L.P. | | | | | 4,834,445 | | |
Brazos Equity Fund II, L.P.(1) | | | | | 1,916,885 | | |
Brazos Equity Fund III, L.P. | | | | | 20,476 | | |
Capital Royalty Partners, L.P.(1) | | | | | 1,437,127 | | |
Carlyle Partners V, L.P.(1) | | | | | 3,806,876 | | |
Catterton Growth Partners, L.P.(2) | | | | | 6,442,971 | | |
CCM Small Cap Value Qualified Fund, L.P.(3) | | | | | 26,157,599 | | |
Chrysalis Ventures III, L.P. | | | | | 1,158,746 | | |
Crosslink Crossover Fund IV, L.P. | | | | | 1,793,711 | | |
Crosslink Crossover Fund V, L.P. | | | | | 23,022,260 | | |
Dace Ventures I, L.P.(2) | | | | | 1,016,195 | | |
Encore Consumer Capital Fund, L.P. | | | | | 2,217,381 | | |
European Divergence Fund, L.P.(3) | | | | | 89,262,288 | | |
Fairhaven Capital Partners, L.P. | | | | | 2,744,958 | | |
GMO Emerging Illiquid Fund, L.P.(1) | | | | | 8,271,849 | | |
Harbinger Capital Partners Special Situations Fund, L.P. | | | | | 19,291,789 | | |
HealthCor Partners Fund, L.P.(2) | | | | | 3,280,240 | | |
Integral Capital Partners VIII, L.P.(2) | | | | | 16,152,023 | | |
See accompanying notes to financial statements.
7
THE ENDOWMENT MASTER FUND, L.P.
(A Limited Partnership)
Schedule of Investments, continued
December 31, 2009
| | | | | | | |
| | | Shares/
Par Value* | | Fair
Value | | % of
Partners’
Capital |
| | | | | | | |
Limited Partnerships, Exempted Limited Partnerships and Limited Liability Companies (continued) | | | | | | | |
United States (continued) | | | | | | | |
Private Equity (9.93% of Partners’ Capital) (continued) | | | | | | | |
MatlinPatterson Global Opportunities Partners III, L.P. | | | | $ | 8,668,782 | | |
Monomoy Capital Partners, L.P.(1) | | | | | 2,841,107 | | |
Paulson Credit Opportunities, L.P.(2) | | | | | 129,216,188 | | |
Pine Brook Capital Partners, LP(1) | | | | | 7,124,710 | | |
Pinto America Growth Fund, L.P.(1) | | | | | 868,916 | | |
Private Equity Investment Fund IV, L.P.(1)(2) | | | | | 6,971,683 | | |
Private Equity Investors Fund V, L.P.(2) | | | | | 5,980,053 | | |
Q Funding III, L.P.(2) | | | | | 12,921,502 | | |
Q4 Funding, L.P.(2) | | | | | 36,403,334 | | |
Saints Capital VI, L.P.(2) | | | | | 8,114,436 | | |
Sanderling Venture Partners VI Co-Investment Fund, L.P. | | | | | 1,393,121 | | |
Sanderling Venture Partners VI, L.P. | | | | | 1,123,635 | | |
Silver Lake Partners III, L.P. | | | | | 3,038,484 | | |
Sterling Capital Partners II, L.P. | | | | | 1,694,002 | | |
Sterling Capital Partners III, L.P. | | | | | 3,224,594 | | |
Sterling Group Partners II, L.P.(1) | | | | | 1,421,986 | | |
Strategic Value Global Opportunities Fund I-A, L.P | | | | | 6,940,279 | | |
Tenaya Capital V, L.P. | | | | | 2,474,633 | | |
The Column Group, L.P. | | | | | 2,789,605 | | |
The Raptor Private Holdings, L.P. | | 12,072 | | | 5,937,266 | | |
The Resolute Fund II, L.P.(1) | | | | | 2,015,801 | | |
Trivest Fund IV, L.P.(2) | | | | | 5,773,050 | | |
Tuckerbrook SB Global Distressed Fund I, L.P.(2) | | | | | 6,667,136 | | |
VCFA Private Equity Partners IV, L.P.(1) | | | | | 2,363,539 | | |
VCFA Venture Partners V, L.P.(1) | | | | | 4,622,350 | | |
Voyager Capital Fund III, L.P. | | | | | 1,119,778 | | |
WestView Capital Partners II, L.P.(2) | | | | | 1,272,200 | | |
Real Estate (3.37% of Partners’ Capital) | | | | | | | |
Aslan Realty Partners III, L.L.C. | | | | | 518,930 | | |
CRM Windridge Partners, L.P.(2) | | | | | 15,288,746 | | |
Cypress Realty VI, L.P. | | | | | 5,110,848 | | |
DaVinci Corporate Opportunity Partners, L.P.(1) | | | | | 373,432 | | |
GTIS Brazil Real Estate Fund (Brazilian Real), LP(2) | | | | | 6,902,006 | | |
ING Clarion Global, L.P.(2) | | | | | 36,189,695 | | |
See accompanying notes to financial statements.
8
THE ENDOWMENT MASTER FUND, L.P.
(A Limited Partnership)
Schedule of Investments, continued
December 31, 2009
| | | | | | | |
| | | Shares/
Par Value* | | Fair
Value | | % of
Partners’
Capital |
| | | | | | | |
Limited Partnerships, Exempted Limited Partnerships and Limited Liability Companies (continued) | | | | | | | |
United States (continued) | | | | | | | |
Real Estate (3.37% of Partners’ Capital) (continued) | | | | | | | |
Monsoon Infrastructure & Realty Co-Invest, L.P.(2) | | | | $ | 10,601,602 | | |
MONY/Transwestern Mezzanine Realty Partners II, L.L.C. | | | | | 521,600 | | |
Northwood Real Estate Co-Investors L.P. | | | | | 268,844 | | |
Northwood Real Estate Partners L.P. | | | | | 765,049 | | |
Oak Hill REIT Plus Fund, L.P.(2) | | | | | 12,704,167 | | |
Parmenter Realty Fund III, L.P.(1) | | | | | 6,589,553 | | |
Square Mile Partners III L.P. | | | | | 5,059,497 | | |
TCW Special Mortgage Credits Fund II, L.P.(1) | | | | | 71,457,318 | | |
Transwestern Mezzanine Realty Partners III, L.L.C.(2) | | | | | 739,500 | | |
Woodbourne Daybreak Global Fund L.P.(2) | | | | | 2,499,513 | | |
| | | | | | | |
Total United States | | | | | 3,753,070,770 | | |
| | | | | | | |
Total Limited Partnerships, Exempted Limited
Partnerships and Limited Liability Companies | | | | | 4,274,122,965 | | 82.00% |
| | | | | | | |
Passive Foreign Investment Companies | | | | | | | |
Bermuda Limited Liability Company | | | | | | | |
Private Equity (0.25% of Partners’ Capital) | | | | | | | |
El Tejar Limited | | | | | 12,860,000 | | |
| | | | | | | |
Total Bermuda Limited Liability Company | | | | | 12,860,000 | | |
| | | | | | | |
Cayman Companies Limited by Shares | | | | | | | |
Arbitrage Strategies (2.81% of Partners’ Capital) | | | | | | | |
CRC Global Structured Credit Fund Ltd.(2) | | 41,819 | | | 56,051,925 | | |
Overseas CAP Partners, Inc.(3) | | 60,228 | | | 90,211,691 | | |
International Equity (0.99% of Partners’ Capital) | | | | | | | |
Quorum Fund Limited(2) | | 349,876 | | | 17,140,272 | | |
The Russian Prosperity Fund(2) | | 1,056,068 | | | 34,681,260 | | |
Natural Resources (0.18% of Partners’ Capital) | | | | | | | |
Ospraie Special Opportunities (Offshore) Ltd. | | | | | 9,579,616 | | |
| | | | | | | |
Total Cayman Companies Limited by Shares | | | | | 207,664,764 | | |
| | | | | | | |
Republic of Mauritius | | | | | | | |
International Equity (0.57% of Partners’ Capital) | | | | | | | |
India Capital Fund Ltd.(2) | | 597,747 | | | 29,823,743 | | |
| | | | | | | |
Total Republic of Mauritius | | | | | 29,823,743 | | |
| | | | | | | |
Total Passive Foreign Investment Companies | | | | | 250,348,507 | | 4.80% |
| | | | | | | |
See accompanying notes to financial statements.
9
THE ENDOWMENT MASTER FUND, L.P.
(A Limited Partnership)
Schedule of Investments, continued
December 31, 2009
| | | | | | | |
| | | Shares/
Par Value* | | Fair
Value | | % of
Partners’
Capital |
| | | | | | | |
Private Corporations | | | | | | | |
United States | | | | | | | |
Real Estate (0.33% of Partners’ Capital) | | | | | | | |
Legacy Partners Realty Fund II, Inc | | | | $ | 1,518,885 | | |
Legacy Partners Realty Fund III, Inc | | | | | 312,086 | | |
Net Lease Private REIT V, Inc(1) | | | | | 1,543,669 | | |
Net Lease Private REIT VI, Inc(1) | | | | | 3,985,109 | | |
Net Lease Private REIT VII, Inc(1)(2) | | | | | 5,000,000 | | |
Net Lease Private REIT VII-A, Inc(1)(2) | | | | | 5,000,000 | | |
| | | | | | | |
Total United States | | | | | 17,359,749 | | |
| | | | | | | |
Total Private Corporations | | | | | 17,359,749 | | 0.33% |
| | | | | | | |
Total Investments in Investment Funds
(Cost $4,240,697,829) | | | | | 4,541,831,221 | | 87.13% |
| | | | | | | |
Investments in Securities | | | | | | | |
Investments in Registered Investment Companies | | | | | | | |
Exchange Traded Funds | | | | | | | |
United States | | | | | | | |
Agencies (2.39% of Partners’ Capital) | | | | | | | |
iShares Barclays 20+ Year Treasury Bond Fund(1) | | 1,338,996 | | | 124,829,071 | | |
Domestic Equity (1.32% of Partners’ Capital) | | | | | | | |
iShares Russell 1000 Growth Index Fund(1) | | 931,290 | | | 46,424,806 | | |
Ultrashort Russell 2000 ProShares(1) | | 878,650 | | | 22,133,194 | | |
Natural Resources (2.07% of Partners’ Capital) | | | | | | | |
Market Vectors Gold Miners ETF(1) | | 797,662 | | | 36,859,961 | | |
SPDR Gold Trust | | 663,956 | | | 71,249,118 | | |
| | | | | | | |
Total United States | | | | | 301,496,150 | | |
| | | | | | | |
Total Exchange Traded Funds | | | | | 301,496,150 | | 5.78% |
| | | | | | | |
Open End Funds | | | | | | | |
United States | | | | | | | |
Arbitrage Strategies (0.21% of Partners’ Capital) | | | | | | | |
Fidelity Convertible Securities Fund(1) | | 488,710 | | | 10,653,868 | | |
Domestic Equity (1.22% of Partners’ Capital) | | | | | | | |
Hussman Strategic Growth Fund(1) | | 4,972,365 | | | 63,546,819 | | |
Enhanced Fixed Income (0.20% of Partners’ Capital) | | | | | | | |
Fidelity Floating Rate High Income Fund(1) | | 1,099,296 | | | 10,344,380 | | |
Fixed Income (0.09% of Partners’ Capital) | | | | | | | |
Wasatch Hoisington US Treasury Fund(1) | | 337,603 | | | 4,790,592 | | |
Natural Resources (0.75% of Partners’ Capital) | | | | | | | |
The Tocqueville Gold Fund | | 678,623 | | | 39,000,468 | | |
See accompanying notes to financial statements.
10
THE ENDOWMENT MASTER FUND, L.P.
(A Limited Partnership)
Schedule of Investments, continued
December 31, 2009
| | | | | | | | |
| | | Shares/
Par Value* | | Fair
Value | | % of
Partners’
Capital |
| | | | | | | | |
Investments in Registered Investment Companies (continued) | | | | | | | | |
Open End Funds (continued) | | | | | | | | |
United States (continued) | | | | | | | | |
Real Estate (0.03% of Partners’ Capital) | | | | | | | | |
Ultrashort Real Estate ProShares | | | 224,100 | | $ | 1,678,509 | | |
| | | | | | | | |
Total United States | | | | | | 130,014,636 | | |
| | | | | | | | |
Total Open End Funds | | | | | | 130,014,636 | | 2.50% |
| | | | | | | | |
Total Investments in Registered Investment Companies | | | | | | 431,510,786 | | 8.28% |
| | | | | | | | |
Call Options Purchased | | | | | | | | |
United States (0.74% of Partners’ Capital) | | | | | | | | |
CMS Capital- 10 Year One Look Cap (OTC) | | | | | | | | |
10 Year USD Swap Rate | | | | | | | | |
(Strike Rate 5.50%, Expiration 05/01/19) | | $ | 1,079,000,000 | | | 11,145,086 | | |
CMS Capital- 10 Year One Look Cap (OTC) | | | | | | | | |
10 Year USD Swap Rate | | | | | | | | |
(Strike Rate 5.62%, Expiration 05/02/19) | | $ | 714,285,714 | | | 7,074,512 | | |
CMS Capital- 10 Year One Look Cap (OTC) | | | | | | | | |
10 Year USD Swap Rate | | | | | | | | |
(Strike Rate 6.50%, Expiration 05/01/19) | | $ | 1,350,000,000 | | | 10,284,130 | | |
CMS Capital- 10 Year One Look Cap (OTC) | | | | | | | | |
10 Year USD Swap Rate | | | | | | | | |
(Strike Rate 6.62%, Expiration 05/02/19) | | $ | 877,192,983 | | | 6,438,166 | | |
PowerShares DB US Dollar Index Bullish Fund | | | | | | | | |
(Strike Price $24.00, Expiration 03/20/10) | | | 135,000 | | | 3,375,000 | | |
| | | | | | | | |
Total United States | | | | | | 38,316,894 | | |
| | | | | | | | |
Total Call Options Purchased | | | | | | 38,316,894 | | 0.74% |
| | | | | | | | |
Put Options Purchased | | | | | | | | |
United States (0.01% of Partners’ Capital) | | | | | | | | |
Domestic Equity | | | | | | | | |
iShares Russell 2000 Index Fund | | | | | | | | |
(Strike Price $54.00, Expiration 01/16/10) | | | 27,000 | | | 270,000 | | |
International Equity | | | | | | | | |
iShares MSCI Emerging Markets Index Fund | | | | | | | | |
(Strike Price $35.00, Expiration 01/16/10) | | | 38,000 | | | 190,000 | | |
Natural Resources | | | | | | | | |
Market Vectors Gold Miners ETF | | | | | | | | |
(Strike Price $38.00, Expiration 01/16/10) | | | 15,000 | | | 90,000 | | |
See accompanying notes to financial statements.
11
THE ENDOWMENT MASTER FUND, L.P.
(A Limited Partnership)
Schedule of Investments, continued
December 31, 2009
| | | | | | | |
| | | Shares/
Par Value* | | Fair
Value | | % of
Partners’
Capital |
| | | | | | | |
Put Options Purchased (continued) | | | | | | | |
United States (0.01% of Partners’ Capital) (continued) | | | | | | | |
Natural Resources (continued) | | | | | | | |
SPDR Gold Trust | | | | | | | |
(Strike Price $95.00, Expiration 01/16/10) | | 20,000 | | $ | 100,000 | | |
| | | | | | | |
Total United States | | | | | 650,000 | | |
| | | | | | | |
Total Put Options Purchased | | | | | 650,000 | | 0.01% |
| | | | | | | |
Total Investments in Securities (Cost $475,178,323) | | | | | 470,477,680 | | 9.03% |
| | | | | | | |
Total Investments (Cost $4,715,876,152) | | | | $ | 5,012,308,901 | | 96.16% |
| | | | | | | |
The Master Fund’s total outstanding capital commitments to Investment Funds as of December 31, 2009 were $951,813,066. For certain Investment Funds for which the Master Fund has a capital commitment, the Master Fund may be allocated its pro-rata share of expenses prior to having to fund a capital call for such expenses.
All securities are non-income producing unless noted with a (1).
Refer to Note 4, Investments in Portfolio Securities, for information regarding the liquidity of the Master Fund’s investments.
| * | Shares, par value, notional amounts or contracts is listed for each investment if it is applicable for that investment type. |
| (1) | Income producing security. |
| (2) | Affiliated investments. |
| (3) | Affiliated investments for which ownership exceeds 25%. |
See accompanying notes to financial statements.
12
THE ENDOWMENT MASTER FUND, L.P.
(A Limited Partnership)
Statement of Operations
Year Ended December 31, 2009
| | | | |
Investment income: | | | | |
Dividend income (net of foreign withholding tax of $80,196) | | $ | 10,486,042 | |
Interest income | | | 848,756 | |
Dividend income from affiliated investments | | | 904,260 | |
Interest income from affiliated investments | | | 245,291 | |
| | | | |
Total investment income | | | 12,484,349 | |
| | | | |
Expenses: | | | | |
Investment Management Fees | | | 50,501,255 | |
Administration fees | | | 2,329,428 | |
Legal fees | | | 740,497 | |
Professional fees | | | 1,083,443 | |
Custodian fees | | | 534,398 | |
Directors fees | | | 345,500 | |
Offshore withholding tax expense | | | 2,430,958 | |
Other expenses | | | 1,932,236 | |
| | | | |
Total expenses | | | 59,897,715 | |
| | | | |
Net investment loss | | | (47,413,366 | ) |
| | | | |
Net realized and unrealized gain (loss) from investments, affiliated investments, foreign currency transactions, options and redemptions in-kind: | | | | |
Net realized loss from investments, foreign currency transactions and options | | | (15,724,902 | ) |
Net realized loss from redemptions in-kind | | | (2,297,799 | ) |
Net realized loss from affiliated investments and foreign currency transactions | | | (28,864,561 | ) |
Change in unrealized appreciation/depreciation from investments | | | 799,921,746 | |
| | | | |
Net realized and unrealized gain from investments, affiliated investments, foreign currency transactions, options and redemptions in-kind | | | 753,034,484 | |
| | | | |
Net increase in partners’ capital resulting from operations | | $ | 705,621,118 | |
| | | | |
See accompanying notes to financial statements.
13
THE ENDOWMENT MASTER FUND, L.P.
(A Limited Partnership)
Statement of Changes in Partners’ Capital
Years Ended December 31, 2008 and December 31, 2009
| | | | |
Partners’ capital at December 31, 2007 | | $ | 3,269,968,680 | |
Contributions | | | 3,111,597,819 | |
Withdrawals | | | (366,685,155 | ) |
Net decrease in partners’ capital resulting from operations: | | | | |
Net investment loss | | | (55,604,043 | ) |
Net realized loss from investments, options sold, not yet purchased and foreign currency transactions | | | (331,392,248 | ) |
Net realized loss from affiliated investments | | | (19,691,837 | ) |
Change in unrealized appreciation/depreciation from investments | | | (945,007,976 | ) |
| | | | |
Net decrease in partners’ capital resulting from operations | | | (1,351,696,104 | ) |
| | | | |
Partners’ capital at December 31, 2008 | | | 4,663,185,240 | |
| | | | |
Contributions | | | 714,436,768 | |
Withdrawals | | | (870,632,191 | ) |
Net increase in partners’ capital resulting from operations: | | | | |
Net investment loss | | | (47,413,366 | ) |
Net realized loss from investments, foreign currency transactions and options | | | (15,724,902 | ) |
Net realized loss from redemptions in-kind | | | (2,297,799 | ) |
Net realized loss from affiliated investments and foreign currency transactions | | | (28,864,561 | ) |
Change in unrealized appreciation/depreciation from investments | | | 799,921,746 | |
| | | | |
Net increase in partners’ capital resulting from operations | | | 705,621,118 | |
| | | | |
Partners’ capital at December 31, 2009 | | $ | 5,212,610,935 | |
| | | | |
See accompanying notes to financial statements.
14
THE ENDOWMENT MASTER FUND, L.P.
(A Limited Partnership)
Statement of Cash Flows
Year Ended December 31, 2009
| | | | |
Cash flows from operating activities: | | | | |
Net increase in partners’ capital resulting from operations | | $ | 705,621,118 | |
Adjustments to reconcile net increase in partners’ capital resulting from operations to net cash provided by operating activities: | | | | |
Purchases of investments | | | (1,375,338,564 | ) |
Proceeds from disposition of investments | | | 1,493,223,429 | |
Net realized loss from investments, foreign currency transactions and options | | | 15,724,902 | |
Net realized loss from redemptions in-kind | | | 2,297,799 | |
Net realized loss from affiliated investments and foreign currency transactions | | | 28,864,561 | |
Change in unrealized appreciation/depreciation from investments | | | (799,921,746 | ) |
Decrease in prepaid contributions to Investment Funds | | | 62,608,241 | |
Increase in interest and dividends receivable | | | (108,673 | ) |
Decrease in interest and dividends receivable from affiliated investments | | | 139,604 | |
Decrease in receivable from investments sold | | | 93,111,921 | |
Increase in prepaids and other assets | | | (45,394 | ) |
Increase in Investment Management Fees payable | | | 1,210,436 | |
Decrease in offshore withholding tax payable | | | (3,216,474 | ) |
Decrease in administration fees payable | | | (293,623 | ) |
Increase in payable to related parties | | | 61,309 | |
Increase in accounts payable and accrued expenses | | | 572,803 | |
| | | | |
Net cash provided by operating activities | | | 224,511,649 | |
| | | | |
Cash flows from financing activities: | | | | |
Contributions | | | 712,740,444 | |
Withdrawals | | | (832,977,951 | ) |
| | | | |
Net cash used in financing activities | | | (120,237,507 | ) |
| | | | |
Net increase in cash and cash equivalents | | | 104,274,142 | |
Cash and cash equivalents at beginning of year | | | 81,874,165 | |
| | | | |
Cash and cash equivalents at end of year | | $ | 186,148,307 | |
| | | | |
Supplemental schedule of cash activity: | | | | |
Cash paid for interest | | $ | 12,479 | |
Cash paid for offshore withholding taxes | | | 16,221,914 | |
Supplemental schedule of noncash activity: | | | | |
Redemptions in-kind (Cost $16,601,081) | | $ | 14,303,282 | |
See accompanying notes to financial statements.
15
THE ENDOWMENT MASTER FUND, L.P.
(A Limited Partnership)
Notes to Financial Statements
December 31, 2009
(1) ORGANIZATION
The Endowment Master Fund, L.P. (the “Master Fund”) is a limited partnership organized under the laws of the state of Delaware. The Master Fund began operations in April 2003 (“Inception”). The Master Fund operated as an unregistered investment vehicle until March 10, 2004, at which time it registered as a non-diversified, closed-end management investment company under the Investment Company Act of 1940, as amended (the “1940 Act”). The Master Fund is the master fund in a master-feeder structure in which there are currently seven feeder funds.
The Master Fund’s investment objective is to preserve capital and to generate consistent long-term appreciation and returns across a market cycle (which is estimated to be five to seven years). The Master Fund pursues its investment objective by investing its assets in a variety of investment vehicles including but not limited to limited partnerships, limited liability companies, offshore corporations and other foreign investment vehicles (collectively, the “Investment Funds”), registered investment companies (including exchange traded funds) and direct investments in marketable securities and derivative instruments. The Master Fund is primarily a “fund of funds” and is intended to afford investors the ability to invest in a multi-manager portfolio, exhibiting a variety of investment styles and philosophies, in an attempt to achieve positive risk-adjusted returns over an extended period of time. The Master Fund’s investments are managed by a select group of investment managers identified by the Adviser, as hereinafter defined, to have investments that when grouped with other investments of the Master Fund result in a portfolio that is allocated more broadly across markets, asset classes, and risk profiles.
The Endowment Fund GP, L.P., a Delaware limited partnership, serves as the general partner of the Master Fund (the “General Partner”). To the fullest extent permitted by applicable law, the General Partner has irrevocably delegated to a board of directors (the “Board” and each member a “Director”) its rights and powers to monitor and oversee the business affairs of the Master Fund, including the complete and exclusive authority to oversee and establish policies regarding the management, conduct, and operation of the Master Fund’s business. A majority of the members of the Board are independent of the General Partner and its management. To the extent permitted by applicable law, the Board may delegate any of its rights, powers and authority to, among others, the officers of the Master Fund, the Adviser, or any committee of the Board.
The Board is authorized to engage an investment adviser and it has selected Endowment Advisers, L.P. (the “Adviser”), to manage the Master Fund’s portfolio and operations, pursuant to an investment management agreement (the “Investment Management Agreement”). The Adviser is a Delaware limited partnership that is registered as an investment adviser under the Investment Advisers Act of 1940, as amended. Under the Investment Management Agreement, the Adviser is responsible for the establishment of an investment committee (the “Investment Committee”), which is responsible for developing, implementing, and supervising the Master Fund’s investment program subject to the ultimate supervision of the Board.
Under the Master Fund’s organizational documents, the Master Fund’s officers and Directors are indemnified against certain liabilities arising out of the performance of their duties to the Master Fund. In the normal course of business, the Master Fund enters into contracts with service providers, which also provide for indemnifications by the Master Fund. The Master Fund’s maximum exposure under these arrangements is unknown, as this would involve any future potential claims that may be made against the Master Fund. However, based on experience, the General Partner expects that risk of loss to be remote.
16
THE ENDOWMENT MASTER FUND, L.P.
(A Limited Partnership)
Notes to Financial Statements, continued
December 31, 2009
(2) SUMMARY OF SIGNIFICANT ACCOUNTING POLICIES AND PRACTICES
(a) BASIS OF ACCOUNTING
The accounting and reporting policies of the Master Fund conform with U.S. generally accepted accounting principles (“GAAP”).
(b) CASH EQUIVALENTS
The Master Fund considers all unpledged temporary cash investments with a maturity date at the time of purchase of three months or less to be cash equivalents.
(c) INVESTMENT SECURITIES TRANSACTIONS
The Master Fund records security transactions on a trade-date basis.
Investments that are held by the Master Fund, including those that have been sold but not yet purchased, are marked to estimated fair value at the date of the financial statements, and the corresponding change in unrealized appreciation/depreciation is included in the Statement of Operations.
In general, distributions received from Investment Funds are accounted for as a reduction to cost and any proceeds received above the allocated cost basis results in a realized gain. Realized gains or losses on the disposition of investments are accounted for based on the first in first out (“FIFO”) method.
(d) VALUATION OF INVESTMENTS
The valuation of the Master Fund’s investments will be determined as of the close of business at the end of any fiscal period, generally monthly. The valuation of the Master Fund’s investments is calculated by Citi Fund Services Ohio, Inc., the Master Fund’s independent administrator (the “Independent Administrator”).
The Board has formed a valuation committee (the “Board Valuation Committee”) that is responsible for overseeing the Master Fund’s valuation policies, making recommendations to the Board on valuation-related matters, and overseeing implementation by the Adviser’s Valuation Committee (as defined below) of the Master Fund’s valuation policies that the Board of the Master Fund has approved for purposes of determining the value of securities held by the Master Fund, including the fair value of the Master Fund’s investments in Investment Funds.
The Board has also authorized the establishment of a valuation committee of the Adviser (the “Adviser Valuation Committee”). The Adviser’s Valuation Committee’s function, subject to the oversight of the Board Valuation Committee and the Board, is generally to review the Investment Funds’ valuation methodologies, valuation determinations, and any information provided to the Adviser’s Valuation Committee by the Adviser or the Independent Administrator.
Investments held by the Master Fund are valued as follows:
| | • | | INVESTMENT FUNDS—Investments in Investment Funds are ordinarily carried at estimated fair value based on the valuations provided to the Independent Administrator by the investment managers of such Investment Funds or the administrators of such Investment Funds. These Investment Funds |
17
THE ENDOWMENT MASTER FUND, L.P.
(A Limited Partnership)
Notes to Financial Statements, continued
December 31, 2009
| | value their underlying investments in accordance with policies established by such Investment Funds. Prior to investing in any Investment Fund, the Adviser’s Valuation Committee, as part of the due diligence process, conducts a review of the valuation methodologies employed by the Investment Fund to determine whether such methods are appropriate for the asset types. The Master Fund’s valuations utilize the available financial information supplied by each Investment Fund and are net of management and estimated performance incentive fees or allocations payable to the Investment Funds’ managers pursuant to the Investment Funds’ agreements. Generally, Investment Funds in which the Master Fund invests will use market value when available, and otherwise will use principles of fair value applied in good faith. The Adviser’s Valuation Committee will consider whether it is appropriate, in light of the relevant circumstances, to value interests at net asset value as reported by an Investment Fund for valuation purposes, or whether to adjust such reported value to reflect estimated fair value. Because of the inherent uncertainty of valuation, this estimated fair value may significantly differ from the value that would have been used had a ready market for the investments in Investment Funds existed and such differences may be significant. The Master Fund’s investments in Investment Funds are subject to the terms and conditions of the respective operating agreements and offering memoranda of such Investment Funds. |
| | • | | SECURITIES LISTED ON A SECURITIES EXCHANGE—Securities listed 1) on one or more of the national securities exchanges or the OTC Bulletin Board are valued at the last reported sales price on the date of determination; and 2) on the Nasdaq Stock Market are valued at the Nasdaq Official Closing Price (“NOCP”), at the close of trading on the primary exchanges or markets where such securities are traded for the business day as of which such value is being determined. If the last reported sales price or the NOCP is not available, the securities are valued at the mean between the “bid” and “ask” prices at the close of trading on that date. Securities traded on a foreign securities exchange will generally be valued at their closing prices on the exchange where such securities are primarily traded and translated into U.S. dollars at the current exchange rate. If an event occurs between the close of the foreign exchange and the valuation date of the Master Fund’s net asset value that would materially affect the value of the security and the net asset value of the Master Fund, the value of such security and the net asset value of the Master Fund will be adjusted to reflect the change in the estimated value of the security. |
| | • | | OPTIONS—Options that are listed on a securities exchange or traded over-the-counter are valued at the mean between the closing “bid” and “ask” prices for such options on the date of determination. |
| | • | | SECURITIES NOT ACTIVELY TRADED—The value of securities, derivatives or synthetic securities that are not actively traded on an exchange shall be determined by obtaining quotes from brokers that normally deal in such securities or by an unaffiliated pricing service that may use actual trade data or procedures using market indices, matrices, yield curves, specific trading characteristics of certain groups of securities, pricing models or a combination of these procedures. |
| | • | | OTHER—Where no value is readily available from an Investment Fund or other security or where a value supplied by an Investment Fund is deemed not to be indicative of the Investment Fund’s value, the Adviser’s Valuation Committee and/or the Board Valuation Committee, in consultation with the Independent Administrator or the Adviser will determine, in good faith, the estimated fair value of the Investment Fund or security. |
| | • | | FOREIGN CURRENCY TRANSACTIONS—The accounting records of the Master Fund are maintained in U.S. dollars. Investments of the Master Fund denominated in a foreign currency, if any, are translated into U.S. dollar amounts at current exchange rates on the date of valuation. Purchases and |
18
THE ENDOWMENT MASTER FUND, L.P.
(A Limited Partnership)
Notes to Financial Statements, continued
December 31, 2009
| | sales of investments and income and expense items denominated in foreign securities are translated into U.S. dollar amounts at the exchange rate on the respective dates of such transactions. The Master Fund does not isolate the realized or unrealized gains and losses attributable to changes in the exchange rates from gains and losses that arise from changes in the value of investments. |
(e) FAIR VALUE MEASUREMENTS
The Master Fund defines fair value as the price that would be received to sell an asset or paid to transfer a liability in an orderly transaction between market participants at the measurement date.
The inputs used to determine the fair value of the Master Fund’s investments are summarized in the three broad levels listed below:
| | • | | Level 1—quoted prices in active markets for identical assets. |
| | • | | Level 2—other significant inputs (including quoted prices of similar securities, interest |
rates, prepayment speeds, credit risk, etc.).
| | • | | Level 3—significant unobservable inputs (which may include the Master Fund’s own |
assumptions in determining the fair value of investments).
The inputs or methodology used to value investments are not necessarily an indication of the risk associated with investing in those securities.
When determining the fair value of the Master Fund’s investments, additional consideration is given to those assets or liabilities that have experienced a decrease in volume or level of activity in the primary market in which such investments normally trade (if any) for which circumstances have been identified that indicate that transactions in such markets may not be orderly.
19
THE ENDOWMENT MASTER FUND, L.P.
(A Limited Partnership)
Notes to Financial Statements, continued
December 31, 2009
The following is a summary categorization, as of December 31, 2009, of the Master Fund’s investments based on the level of inputs utilized in determining the value of such investments:
| | | | | | | | | | | |
| | | LEVEL 1
Quoted Prices | | LEVEL 2
Other Significant
Observable Inputs | | LEVEL 3
Significant
Unobservable Inputs | | Total |
| | | Investment
Securities | | Investment
Securities | | Investment
Funds | | Investments |
Assets | | | | | | | | | | | |
Limited Partnerships, Exempted Limited | | | | | | | | | | | |
Partnerships and Limited Liability Companies | | | | | | | | | | | |
Arbitrage Strategies | | | — | | — | | $ | 780,427,546 | | $ | 780,427,546 |
Domestic Equity | | | — | | — | | | 393,002,964 | | | 393,002,964 |
Energy | | | — | | — | | | 399,136,823 | | | 399,136,823 |
Enhanced Fixed Income | | | — | | — | | | 627,493,975 | | | 627,493,975 |
International Equity | | | — | | — | | | 493,733,501 | | | 493,733,501 |
Natural Resources | | | — | | — | | | 14,526,615 | | | 14,526,615 |
Opportunistic Equity | | | — | | — | | | 696,964,621 | | | 696,964,621 |
Private Equity | | | — | | — | | | 650,979,483 | | | 650,979,483 |
Real Estate | | | — | | — | | | 217,857,437 | | | 217,857,437 |
Passive Foreign Investment Companies | | | | | | | | | | | |
Arbitrage Strategies | | | — | | — | | | 146,263,616 | | | 146,263,616 |
International Equity | | | — | | — | | | 81,645,275 | | | 81,645,275 |
Natural Resources | | | — | | — | | | 9,579,616 | | | 9,579,616 |
Private Equity | | | — | | — | | | 12,860,000 | | | 12,860,000 |
Private Corporations | | | | | | | | | | | |
Real Estate | | | — | | — | | | 17,359,749 | | | 17,359,749 |
Investments in Registered Investment Companies | | | | | | | | | | | |
Arbitrage Strategies | | $ | 10,653,868 | | — | | | — | | | 10,653,868 |
Agencies | | | 124,829,071 | | — | | | — | | | 124,829,071 |
Domestic Equity | | | 132,104,819 | | — | | | — | | | 132,104,819 |
Enhanced Fixed Income | | | 10,344,380 | | — | | | — | | | 10,344,380 |
Fixed Income | | | 4,790,592 | | — | | | — | | | 4,790,592 |
Natural Resources | | | 147,109,547 | | — | | | — | | | 147,109,547 |
Real Estate | | | 1,678,509 | | — | | | — | | | 1,678,509 |
Call Options Purchased | | | — | | 38,316,894 | | | — | | | 38,316,894 |
Put Options Purchased | | | 650,000 | | — | | | — | | | 650,000 |
| | | | | | | | | | | |
Total Assets | | $ | 432,160,786 | | 38,316,894 | | $ | 4,541,831,221 | | $ | 5,012,308,901 |
| | | | | | | | | | | |
The categorization of investments amongst Levels 1 through 3 does not reflect the fact that many of the underlying investments held by the Investment Funds included in Level 3, if owned directly by the Master Fund, would be classified as Level 1 investments.
20
THE ENDOWMENT MASTER FUND, L.P.
(A Limited Partnership)
Notes to Financial Statements, continued
December 31, 2009
The following is a reconciliation of Level 3 investments for which significant unobservable inputs were used to determine fair value:
| | | | | | | | | | | | | | | | | | | | | |
| | | Investments |
| | | Balance as of
December 31,
2008 | | Net Realized
Gain (Loss) | | | Change in
Unrealized
Appreciation/
Depreciation | | | Gross
Purchases | | Gross
(Sales) | | | Balance as of
December 31,
2009 |
Investments | | | | | | | | | | | | | | | | | | | | | |
Limited Partnerships, Exempted Limited | | | | | | | | | | | | | | | | | | | | | |
Partnerships and Limited Liability Companies | | | | | | | | | | | | | | | | | | | | | |
Arbitrage Strategies | | $ | 778,186,928 | | $ | 34,843,147 | | | $ | 140,322,997 | | | $ | 133,723,463 | | $ | (306,648,989 | ) | | $ | 780,427,546 |
Domestic Equity | | | 366,450,287 | | | (16,511,223 | ) | | | 59,124,888 | | | | 78,774,765 | | | (94,835,753 | ) | | | 393,002,964 |
Energy | | | 297,835,081 | | | 4,846,248 | | | | 95,338,869 | | | | 67,864,194 | | | (66,747,569 | ) | | | 399,136,823 |
Enhanced Fixed Income | | | 712,823,535 | | | 28,542,419 | | | | 146,565,079 | | | | 130,238,588 | | | (390,675,646 | ) | | | 627,493,975 |
International Equity | | | 417,914,507 | | | (50,487,834 | ) | | | 122,625,461 | | | | 80,000,000 | | | (76,318,633 | ) | | | 493,733,501 |
Natural Resources | | | 6,900,383 | | | — | | | | 2,775,326 | | | | 4,850,906 | | | — | | | | 14,526,615 |
Opportunistic Equity | | | 450,958,373 | | | 313,173 | | | | 22,032,573 | | | | 273,546,549 | | | (49,886,047 | ) | | | 696,964,621 |
Private Equity | | | 494,486,978 | | | 2,854,020 | | | | 69,551,886 | | | | 157,384,895 | | | (73,298,296 | ) | | | 650,979,483 |
Real Estate | | | 236,660,636 | | | (12,372,752 | ) | | | 22,663,618 | | | | 48,375,666 | | | (77,469,731 | ) | | | 217,857,437 |
Passive Foreign Investment Companies | | | | | | | | | | | | | | | | | | | | | |
Arbitrage Strategies | | | 114,277,935 | | | — | | | | 16,985,681 | | | | 15,000,000 | | | — | | | | 146,263,616 |
International Equity | | | 40,163,837 | | | (13,111,120 | ) | | | 61,481,438 | | | | 10,000,000 | | | (16,888,880 | ) | | | 81,645,275 |
Natural Resources | | | 9,438,103 | | | — | | | | 141,513 | | | | — | | | — | | | | 9,579,616 |
Private Equity | | | 9,700,000 | | | — | | | | 3,160,000 | | | | — | | | — | | | | 12,860,000 |
Real Estate | | | 7,019,400 | | | (3,710,112 | ) | | | 2,980,600 | | | | — | | | (6,289,888 | ) | | | — |
Private Corporations | | | | | | | | | | | | | | | | | | | | | |
Real Estate | | | 22,091,745 | | | — | | | | (8,768,056 | ) | | | 4,036,060 | | | — | | | | 17,359,749 |
| | | | | | | | | | | | | | | | | | | | | |
Total Investments | | $ | 3,964,907,728 | | $ | (24,794,034 | ) | | $ | 756,981,873 | | | $ | 1,003,795,086 | | $ | (1,159,059,432 | ) | | $ | 4,541,831,221 |
| | | | | | | | | | | | | | | | | | | | | |
The net realized gain (loss) and change in unrealized appreciation/depreciation in the table above are reflected in the accompanying Statement of Operations. The change in unrealized appreciation/ depreciation from Level 3 investments held at December 31, 2009 is $723,282,372.
(f) INVESTMENT INCOME
For investments in securities, dividend income is recorded on the ex-dividend date, net of withholding taxes. Interest income is recorded as earned on the accrual basis and includes amortization of premiums or accretion of discounts.
21
THE ENDOWMENT MASTER FUND, L.P.
(A Limited Partnership)
Notes to Financial Statements, continued
December 31, 2009
(g) FUND EXPENSES
Unless otherwise voluntarily or contractually assumed by the Adviser or another party, the Master Fund bears all expenses incurred in its business, including, but not limited to, the following: all costs and expenses related to investment transactions and positions for the Master Fund’s account; legal fees; accounting, auditing and tax preparation fees; recordkeeping and custodial fees; costs of computing the Master Fund’s net asset value; fees for data and software providers; research expenses; costs of insurance; registration expenses; offering costs; expenses of meetings of the partners; directors fees; all costs with respect to communications to partners; transfer taxes, offshore withholding taxes and taxes withheld on non-U.S. dividends; interest and commitment fees on loans and debit balances; and other types of expenses as may be approved from time to time by the Board. Offering costs are amortized over a twelve-month period or less from the date they are incurred.
(h) INCOME TAXES
The Master Fund is organized and operated as a limited partnership and is not subject to income taxes as a separate entity. Such taxes are the responsibility of the individual partners. Accordingly, no provision for income taxes has been made in the Master Fund’s financial statements. Investments in foreign securities may result in foreign taxes being withheld by the issuer of such securities. For U.S. offshore withholding tax, the Master Fund may serve as withholding agent for its offshore feeder funds.
The Master Fund has evaluated the tax positions taken or expected to be taken in the course of preparing the Master Fund’s tax returns to determine whether the tax positions will “more-likely-than-not” be sustained by the Master Fund upon challenge by the applicable tax authority. Tax positions not deemed to meet the more-likely-than-not threshold and that would result in a tax benefit or expense to the Master Fund would be recorded as a tax benefit or expense in the current period. For the year ended December 31, 2009, the Master Fund did not recognize any amounts for unrecognized tax benefit/expense. A reconciliation of unrecognized tax benefit/expense is not provided herein, as the beginning and ending amounts of unrecognized tax benefit/expense are zero, with no interim additions, reductions or settlements. Tax positions taken in tax years which remain open under the statute of limitations (generally three years for federal income tax purposes) are subject to examination by tax authorities.
(i) USE OF ESTIMATES
The preparation of the financial statements in accordance with GAAP requires management to make estimates and assumptions relating to the reported amounts of assets and liabilities and the disclosure of contingent assets and liabilities at the date of the financial statements and the reported amounts of income and expenses during the reporting period. Actual results could differ from those estimates and such differences may be significant.
(j) DERIVATIVE INSTRUMENTS AND HEDGING ACTIVITIES
The Master Fund may purchase or sell options as part of an asset overlay strategy to create investment exposure consistent with the Master Fund’s investment objectives. The Master Fund has invested in call and put option contracts during the year to adjust its exposure to potential changes in interest rates and to better manage risk related to certain strategies in the Master Fund’s Portfolio. The Master Fund’s direct investments in derivatives during the year ended December 31, 2009, consisted of the purchase, sale, execution and expiration of call and put options.
22
THE ENDOWMENT MASTER FUND, L.P.
(A Limited Partnership)
Notes to Financial Statements, continued
December 31, 2009
Investment Funds in which the Master Fund invests will purchase and sell derivative securities and other financial instruments. The following is a summary of the fair value of derivative instruments held directly by the Master Fund as of December 31, 2009 and where such derivatives are recorded:
| | | | | |
| | | Asset Derivatives |
Primary Risk Exposure | | Statements of Assets and Liabilities | | Total Fair Value |
Options Contracts | | | | | |
Equity and Commodity Exposure: | | Investments in Securities, at fair value | | $ | 650,000 |
Interest Rate Exposure: | | Investments in Securities, at fair value | | | 38,316,894 |
The following is a summary of the effect of the Master Fund’s direct investments in derivative instruments on the Statement of Operations for the year ended December 31, 2009:
| | | | | | | | | |
Primary Risk Exposure | | Location of Gain (Loss)
from Derivatives
Recognized in Income | | Realized Gain
from Derivatives
Recognized in Income | | Change in Unrealized
Appreciation/Depreciation
from Derivatives
Recognized in Income | |
Options Contracts | | | | | | | | | |
Equity and Commodity Exposure: | | Net realized and unrealized gain (loss) from investments, affiliated investments, foreign currency transactions, options and redemptions in-kind | | $ | 2,990,490 | | $ | (20,587,945 | ) |
| | | |
Interest Rate Exposure: | | Net realized and unrealized gain (loss) from investments, affiliated investments, foreign currency transactions, options and redemptions in-kind | | | — | | | 7,032,449 | |
Volume of Derivative Activity
The monthly average fair value for the call and put options was $35,151,391 for the year ended December 31, 2009.
(k) RECENTLY ISSUED ACCOUNTING PRONOUNCEMENTS
In September 2009, the Financial Accounting Standards Board issued Accounting Standards Update 2009-12 to ASC 820-10-35, “Investments in Certain Entities that Calculate Net Asset Value Per Share (Or its Equivalent)” (“ASU 2009-12”), which became effective for interim and annual periods ending after December 15, 2009. ASU 2009-12 permits a reporting entity to measure the fair value of an investment that does not have a readily determinable fair value, based on the net asset value per share (the “NAV”) of the investment as a practical expedient, without further adjustment, unless it is probable that the investment will be sold at a value significantly different than the NAV. If the practical expedient NAV is not as of the reporting entity’s measurement date, then the NAV should be adjusted to reflect any significant events that may change the valuation. In using the NAV as a practical expedient, certain attributes of the investment, that may impact the fair value of the investment, are not considered in measuring fair value. Attributes of those investments include the investment strategies of the investees and may also include, but are not limited to, restrictions on the investor’s ability to redeem its investments at the measurement date and any unfunded commitments. The Master Fund
23
THE ENDOWMENT MASTER FUND, L.P.
(A Limited Partnership)
Notes to Financial Statements, continued
December 31, 2009
is permitted to invest in alternative investments that do not have a readily determinable fair value, and as such, has elected to use the NAV as calculated on the reporting entity’s measurement date as the fair value of the investment. A listing of the investments held by the Master Fund and their attributes as of December 31, 2009, that may qualify for these valuations are shown in the table below.
| | | | | | | | | | | | | | |
| Investment Category | | Investment Strategy | | Fair Value
(in 000’s) | | Unfunded
Commitments
(in 000’s) | | Remaining
Life * | | Redemption
Frequency* | | Notice
Period
(in Days)* | | Redemption Restrictions
and Terms* |
Arbitrage Strategies (a) | | Investments in a variety of securities with the intent of profiting from relative changes in the price of a set of securities, currencies or commodities. | | $926,691 | | N/A | | N/A | | Daily - Annually | | 0-92 | | 0-2 years; up to 5% redemption fee |
Domestic Equity (b) | | Investments in equity securities issued by U.S. companies. | | 393,003 | | N/A | | N/A | | Monthly - Annually | | 7-90 | | 0-3 years; up to 7% redemption fee |
Energy (c) | | Investments in securities issued by companies in the energy sector. | | 399,137 | | $151,600 | | up to 15 years | | Monthly - Quarterly | | 30-90 | | 0-15 years; up to 5% redemption fee |
Enhanced Fixed Income (d) | | Investments in non-traditional fixed income securities. | | 627,494 | | N/A | | N/A | | Monthly - Rolling 3 years | | 0-185 | | 0-3 years; up to 5% redemption fee |
International Equity (e) | | Investments in equity securities issued by foreign companies. | | 575,379 | | N/A | | N/A | | Monthly - Rolling 3 years | | 7-90 | | 0-3 years; up to 7.5% redemption fee |
Natural Resources (f) | | Investments with exposure to non-energy natural resources. | | 24,106 | | 13,200 | | up to 10 years | | Quarterly | | 90-180 | | 0-10 years; up to 3% redemption fee |
Opportunistic Equity (g) | | Investments in a variety of global markets across all security types. | | 696,965 | | N/A | | N/A | | Monthly - Bi-Annually | | 5-180 | | 0-4 years; up to 5 % redemption fee |
Private Equity (h) | | Investments in nonpublic companies. | | 663,839 | | 554,400 | | up to 10 years | | Quarterly - Annually | | 45-180 | | 0-10 years; up to 3% redemption fee |
Real Estate (i) | | Investments in REIT’s, private partnerships, and various real estate related mortgage securities. | | 235,217 | | 232,600 | | up to 10 years | | Monthly - Quarterly | | 45-60 | | 0-10 years; up to 3% redemption fee |
| | | | | $4,541,831 | | $951,800 | | | | | | | | |
| * | The information summarized in the table above represents the general terms for the specified asset class. Individual Investment Funds may have terms that are more or less restrictive than those terms indicated for the asset class as a whole. In addition, most Investment Funds have the flexibility, as provided for in their constituent documents, to modify and waive such terms. |
The Fund’s investments reflect their estimated fair value, which for marketable securities would generally be the last sales price on the primary exchange for such security and for Investment Funds, would generally be the net asset value as provided by the fund or its administrator. For each of the categories below, the fair value of the Investment Funds has been estimated using the net asset value of the Investment Funds.
| (a) | This category includes Investment Funds that invest using two primary Styles (Event-Driven and Relative Value). Event-Driven strategies typically will include investments in common and preferred equities and various types of debt (often based on the probability that a particular event will occur). These may include distressed or Special Situations investments (securities of companies that are experiencing difficult business situations). Relative Value strategies may include long and short positions in common and preferred equity, |
24
THE ENDOWMENT MASTER FUND, L.P.
(A Limited Partnership)
Notes to Financial Statements, continued
December 31, 2009
| | convertible securities, and various forms of senior and junior (typically unsecured) debt. Investments under this style may also include index options, options on futures contracts, and other derivatives. |
| (b) | This category includes Investment Funds that invest primarily in publicly-traded equity securities issued by U.S. companies. These securities will typically trade on one of the major U.S. stock exchanges. |
| (c) | This category includes Investment Funds that invest primarily in publicly-traded securities issued by companies in the energy sector, private investments in energy-related assets or companies, and futures in energy commodity markets. The Investment Funds include private funds which may hold long/ short equities, commodity trading advisors (“CTAs”) trading contracts on energy related commodities, mutual funds or exchange-traded funds, and private partnerships with private investments in their portfolios. The estimated remaining life of the investments in this asset class is greater than six years. |
| (d) | This category includes Investment Funds that invest primarily in the following sectors: secured leveraged loans, high yield bonds, distressed debt, structured credit, and global debt (typically less efficient areas of the global fixed income markets than traditional fixed income strategies). Generally these sectors may be heavily weighted to certain industries such as telecom and technology with lower credit rating ranges (including leveraged buyouts), may include distressed debt strategies and may include restricted securities and securities that may not be registered for which a market may not be readily available. |
| (e) | This category includes Investment Funds that invest primarily in publicly-traded equity securities issued by foreign companies or securities issued on U.S. stock exchanges that represent ownership of a foreign corporation. |
| (f) | This category includes Investment Funds that invest in assets with exposure to non-energy natural resources, including gold and other precious metals, industrial metals, and agricultural commodities. The Investment Funds may include private funds invested in long/ short equities; CTA’s trading contracts on agricultural commodities and private partnerships with private investments in their portfolios. The estimated remaining life of the investments in this asset class is greater than six years. |
| (g) | This category includes Investment Funds that invest in all global markets and across all security types including equities, fixed income, commodities, currencies, futures, and exchange-traded funds. Investment Funds in this category are typically private funds and may include global long/ short equity funds, global macro funds, and CTA’s. |
| (h) | This category includes private equity funds that invest primarily in companies in need of capital. These Investment Funds may vary widely as to sector, size, stage, duration, and liquidity. Certain of these Investment Funds may also focus on the secondary market, buying interests in existing private equity funds, often at a discount. Less than a quarter of the investments in this asset class have an estimated remaining life of less than three years; the majority of the remaining investments in this asset class have an estimated remaining life of greater than six years. |
| (i) | This category includes Investment Funds that invest in a) registered investment companies or managers that invest in real estate trusts (commonly known as “REITs”) and private partnerships that make investments in income producing properties, raw land held for development or appreciation, and various types of mortgage loans and common or preferred stock whose operations involve real estate. Less than a fifth of the investments in this asset class have an estimated remaining life of between three and six years; the remaining investments in this asset class have an estimated remaining life of greater than six years. |
25
THE ENDOWMENT MASTER FUND, L.P.
(A Limited Partnership)
Notes to Financial Statements, continued
December 31, 2009
(3) PARTNERS’ CAPITAL ACCOUNTS
(a) ISSUANCE OF INTERESTS
Upon receipt from an eligible investor of an initial or additional application for interests (the “Interests”), which will generally be accepted as of the first day of each month, the Master Fund will issue new Interests. The Interests have not been registered under the Securities Act of 1933, as amended (the “Securities Act”), or the securities laws of any state. The Master Fund issues Interests only in private placement transactions in accordance with Regulation D or other applicable exemptions under the Securities Act. No public market exists for the Interests, and none is expected to develop. The Master Fund is not required, and does not intend, to hold annual meetings of its partners. The Interests are subject to substantial restrictions on transferability and resale and may not be transferred or resold except as permitted under the Master Fund’s limited partnership agreement. The Master Fund reserves the right to reject any applications for subscription of Interests.
(b) ALLOCATION OF PROFITS AND LOSSES
For each fiscal period, generally monthly, net profits or net losses of the Master Fund are allocated among and credited to or debited against the capital accounts of all partners as of the last day of each fiscal period in accordance with the partners’ respective capital account ownership percentage for the fiscal period. Net profits or net losses are measured as the net change in the value of the partners’ capital of the Master Fund, including any change in unrealized appreciation or depreciation of investments and income, net of expenses, and realized gains or losses during a fiscal period. Net profits or net losses are allocated after giving effect for any initial or additional applications for Interests, which generally occur at the beginning of the month, or any repurchases of Interests.
(c) REPURCHASE OF INTERESTS
A partner will not be eligible to have the Master Fund repurchase all or any portion of an Interest at the partner’s discretion at any time. However, the Adviser expects that it will recommend to the Board that the Master Fund offer to repurchase Interests each calendar quarter, pursuant to written tenders by partners. However, the Board retains the sole discretion to accept or reject the recommendation of the Adviser and to determine the amount of Interests, if any, that will be purchased in any tender offer that it does approve. In the event Interests are repurchased, there will be a substantial period of time between the date as of which partners must accept the Master Fund’s offer to repurchase their Interests and the date they can expect to receive payment for their Interests from the Master Fund.
(4) INVESTMENTS IN PORTFOLIO SECURITIES
(a) INVESTMENT ACTIVITY
As of December 31, 2009, the Master Fund held investments in Investment Funds and securities. The $102,391,759 in prepaid contributions to Investment Funds as of December 31, 2009 represents funding of a portion of the January 2010 investments in such funds. The agreements related to investments in Investment Funds provide for compensation to the Investment Funds’ managers/general partners or advisers in the form of management fees of up to 2.5% annually of monthly average net assets. In addition, many Investment Funds also provide for performance incentive fees/allocations of up to 25% of an Investment Fund’s net profits, although it is possible that such ranges may be exceeded for certain investment managers. These management fees and incentive fees are in addition to the management fees charged by the Master Fund.
26
THE ENDOWMENT MASTER FUND, L.P.
(A Limited Partnership)
Notes to Financial Statements, continued
December 31, 2009
For the year ended December 31, 2009, the aggregate cost of purchases and proceeds from sales of investments (excluding short-term investments) were $1,317,646,094 and $1,449,826,268, respectively.
The cost of the Master Fund’s underlying investments for Federal income tax purposes is adjusted for items of taxable income allocated to the Master Fund from such investments. The allocated taxable income is generally reported to the Master Fund by its underlying investments on Schedules K-1, Forms 1099 or PFIC statements.
The underlying investments generally do not provide the Master Fund with tax reporting information until well after year end and as a result, the Master Fund is unable to calculate the year end tax cost of its investments until well after year end. The book cost and tax cost of the Master Fund’s investments as of December 31, 2008 was $4,880,651,489 and $5,262,384,153, respectively. The Master Fund’s book cost as of December 31, 2009 was $4,715,876,152 resulting in accumulated net unrealized appreciation of $296,432,749 consisting of $747,967,205 in gross unrealized appreciation and $451,534,456 in gross unrealized depreciation.
During the year ended December 31, 2009, certain investments were transferred in-kind in connection with the sale of investments. The fair value of these investments transferred-in-kind and related cost and realized gain (loss) are as follows:
| | | | | | | | | | | | |
Investments Transferred In-Kind | | Shares
Received | | Fair
Value | | Cost | | Realized
Gain (Loss) on
Transfers In-Kind | |
Cardionet, Inc. | | 1,372 | | $ | 36,193 | | $ | 21,609 | | $ | 14,584 | |
Stark Select Asset Fund, LLC | | — | | | 10,394,759 | | | 13,405,335 | | | (3,010,576 | ) |
PIPE Select Fund, L.L.C. | | — | | | 3,872,330 | | | 3,174,137 | | | 698,193 | |
| | | | | | | | | | | | |
| | | | $ | 14,303,282 | | $ | 16,601,081 | | $ | (2,297,799 | ) |
| | | | | | | | | | | | |
In general, most of the Investment Funds in which the Master Fund invests, other than Investment Funds investing primarily in private equity, energy and real estate transactions, provide for periodic redemptions ranging from monthly to annually, after a notice period, with lock-up provisions usually for a period of up to four years. Investment Funds may, depending on the Investment Fund’s governing documents, have the ability to deny or delay a redemption request.
27
THE ENDOWMENT MASTER FUND, L.P.
(A Limited Partnership)
Notes to Financial Statements, continued
December 31, 2009
(b) INVESTMENT FUND LIQUIDITY
Certain Investment Funds in which the Master Fund invests have limitations on liquidity which may result in limitations on redemptions including, but not limited to, lock-ups, notice periods and early redemption fees. The Master Fund’s investments are categorized in three levels of liquidity, as determined by the Master Fund. The categories and percent of investments in each are as follows at December 31, 2009:
| | | | | |
Liquidity Categories | | Percentage of
Investments | | | Category Definition |
Category 1 Funds | | 65.20 | % | | Securities or Investment Funds that have at least quarterly withdrawal rights after a maximum two-year lock up period. |
Category 2 Funds | | 10.00 | % | | Investment Funds that have at least annual withdrawal rights after a maximum three-year lock up period. |
Category 3 Funds | | 24.80 | % | | Investment Funds that do not meet the definition of Category 1 or 2 Funds. This may include investments for which redemptions can only occur as the underlying portfolio’s assets or investments are liquidated. |
| | | | | |
| | 100.00 | % | | |
| | | | | |
The expiration or implementation of lock-up periods on Master Fund investments in an Investment Fund could result in such investments moving from one liquidity category to another.
(c) AFFILIATED INVESTMENT FUNDS
At December 31, 2009, the Master Fund’s investments in certain Investment Funds were deemed to be investments in affiliated issuers under the 1940 Act, primarily because the Master Fund owns more than 5% of the Investment Funds’ total net assets. The activity resulting from investments in these funds, including interest and dividend payments as well as realized gains and losses, is identified in the Statement of Operations as transactions with affiliated investments. A listing of these affiliated Investment Funds (including 2009 activity) is shown below:
| | | | | | | | | | | | | | | | | | | | | | | | | | |
| | | | | | | | | 2009 Activity | | | | | 2009 Activity | |
Investment Funds | | Shares
12/31/2008 | | Shares
12/31/2009 | | Fair Value
12/31/2008 | | Cost of
Purchases | | Cost of
Sales* | | Change in
Appreciation/
Depreciation | | | Fair Value
12/31/2009 | | Interest/
Dividend
Income | | Realized
Gain/(Loss)
on Investments
and Foreign
Currency
Transactions | |
Accel-KKR Capital Partners III, L.P. | | | | | | $ | 4,792,904 | | $ | 2,137,228 | | | — | | $ | (152,132 | ) | | $ | 6,778,000 | | | | | | |
Ajeej MENA Fund | | 213,420 | | — | | | 14,126,141 | | | — | | $ | 16,751,043 | | | 2,624,902 | | | | — | | | | $ | (13,248,957 | ) |
Algebris Global Financials Fund, L.P. | | | | | | | 43,250,833 | | | 10,000,000 | | | — | | | 12,651,393 | | | | 65,902,226 | | | | | | |
Anchorage Crossover Credit Fund II, L.P. | | | | | | | 36,252,650 | | | 84,580,948 | | | 100,000,000 | | | 26,501,348 | | | | 47,334,946 | | | | | 15,419,053 | |
Anchorage Short Credit Fund, L.P. | | | | | | | 95,709,165 | | | — | | | 49,733,448 | | | (45,975,717 | ) | | | — | | | | | (9,383,142 | ) |
Atlas Institutional Fund, LLC | | | | | | | — | | | 20,000,000 | | | — | | | 1,244,645 | | | | 21,244,645 | | | | | | |
28
THE ENDOWMENT MASTER FUND, L.P.
(A Limited Partnership)
Notes to Financial Statements, continued
December 31, 2009
| | | | | | | | | | | | | | | | | | | | | | | | | | |
| | | | | | | | | 2009 Activity | | | | | 2009 Activity | |
Investment Funds | | Shares
12/31/2008 | | Shares
12/31/2009 | | Fair Value
12/31/2008 | | Cost of
Purchases | | Cost of
Sales* | | Change in
Appreciation/
Depreciation | | | Fair Value
12/31/2009 | | Interest/
Dividend
Income | | Realized
Gain/(Loss)
on Investments
and Foreign
Currency
Transactions | |
BDCM Partners I, L.P. | | | | | | $ | 54,263,547 | | | — | | | — | | $ | 1,840,999 | | | $ | 56,104,546 | | | | | | |
Benson Elliot Real Estate Partners III, L.P.*** | | | | | | | — | | | — | | | — | | | — | | | | — | | | | | | |
BlueGold Global Fund, L.P. | | | | | | | — | | $ | 40,000,000 | | | — | | | 398,940 | | | | 40,398,940 | | | | | | |
Bonanza Partners, L.P. | | | | | | | 4,263,370 | | | — | | $ | 2,978,533 | | | (243,026 | ) | | | 1,041,811 | | | | $ | (3,021,763 | ) |
Boyer Allan Greater China Fund, L.P. | | | | | | | 27,852,646 | | | — | | | — | | | 5,292,814 | | | | 33,145,460 | | | | | | |
Catterton Growth Partners, L.P. | | | | | | | 3,665,483 | | | 3,152,764 | | | 334,513 | | | (40,763 | ) | | | 6,442,971 | | | | | | |
CCM Small Cap Value Qualified Fund, L.P. | | | | | | | 4,506,912 | | | 10,142,631 | | | — | | | 11,508,056 | | | | 26,157,599 | | | | | | |
Chilton Global Natural Resources Partners, L.P. | | | | | | | 48,909,483 | | | — | | | — | | | 16,789,549 | | | | 65,699,032 | | | | | | |
Contrarian Capital Fund I, L.P. | | | | | | | 73,830,500 | | | 5,791,422 | | | — | | | 34,934,245 | | | | 114,556,167 | | | | | | |
Contrarian Equity Fund, L.P. | | | | | | | 2,482,038 | | | — | | | 159,437 | | | (1,157,528 | ) | | | 1,165,073 | | | | | 827,147 | |
Corriente Partners, L.P. | | | | | | | 80,242,542 | | | — | | | — | | | (37,375,056 | ) | | | 42,867,486 | | | | | | |
Covepoint Emerging Markets Macro Fund, L.P. | | | | | | | 32,714,019 | | | 10,000,000 | | | — | | | 21,047,002 | | | | 63,761,021 | | | | | | |
CRC Global Structured Credit Fund, Ltd. | | 41,819 | | 41,819 | | | 58,849,774 | | | — | | | — | | | (2,797,849 | ) | | | 56,051,925 | | | | | | |
CRM Windridge Partners, L.P. | | | | | | | — | | | 15,000,000 | | | — | | | 288,746 | | | | 15,288,746 | | | | | | |
Criterion Institutional Partners, L.P. | | | | | | | 12,405,432 | | | 9,774,765 | | | 24,724,523 | | | 2,544,326 | | | | — | | | | | 3,749,758 | |
CX Partners Fund, Ltd. | | | | | | | — | | | 4,114,614 | | | — | | | (588,151 | ) | | | 3,526,463 | | | | | | |
Dabroes Investment Fund LP | | | | | | | 9,481,494 | | | 25,000,000 | | | — | | | (1,306,098 | ) | | | 33,175,396 | | | | | | |
Dace Ventures I, L.P. | | | | | | | 1,038,927 | | | 337,807 | | | — | | | (360,539 | ) | | | 1,016,195 | | | | | | |
Diamond Hill Investment Partners II, L.P. | | | | | | | 30,247,231 | | | — | | | 29,094,459 | | | (1,152,772 | ) | | | — | | | | | (11,945,166 | ) |
Empire Capital Partners Enhanced, L.P. | | | | | | | 18,864,453 | | | — | | | — | | | 7,743,289 | | | | 26,607,742 | | | | | | |
European Divergence Fund, L.P. | | | | | | | 183,548,935 | | | — | | | 59,285,310 | | | (35,001,337 | ) | | | 89,262,288 | | | | | | |
Ferox Japan Fund Limited | | | | | | | 8,702,389 | | | — | | | 7,833,650 | | | (868,739 | ) | | | — | | | | | (2,166,350 | ) |
Forum European Realty Income III L.P. | | | | | | | 2,075,822 | | | 1,718,692 | | | — | | | (405,333 | ) | | | 3,389,181 | | | | | | |
FrontPoint Onshore Healthcare Fund 2X, L.P. | | | | | | | 8,430,585 | | | — | | | 10,545,530 | | | 2,114,945 | | | | — | | | | | 545,530 | |
Global Undervalued Securities Fund (QP), L.P. | | | | | | | 50,052,796 | | | — | | | 20,000,000 | | | 8,847,409 | | | | 38,900,205 | | | | | 5,690,848 | |
Gradient Europe Fund, L.P. | | | | | | | 8,595,584 | | | — | | | 8,304,768 | | | (290,816 | ) | | | — | | | | | (23,695,232 | ) |
GTIS Brazil Real Estate Fund (Brazilian Real) LP | | | | | | | 1,441,597 | | | 3,794,122 | | | — | | | 1,666,287 | | | | 6,902,006 | | | | | | |
Halcyon European Structured Opportunities Fund, L.P. | | | | | | | 17,556,591 | | | — | | | 11,409,574 | | | (4,024,169 | ) | | | 2,122,848 | | | | | (22,454,276 | ) |
Harbinger Capital Partners Fund I, L.P. | | | | | | | 78,080,706 | | | — | | | — | | | 35,121,781 | | | | 113,202,487 | | | | | | |
Hayman Capital Partners, L.P. | | | | | | | 41,851,331 | | | — | | | — | | | (5,873,043 | ) | | | 35,978,288 | | | | | | |
HealthCor, L.P. ** | | | | | | | 46,459,496 | | | 25,000,000 | | | — | | | 7,052,271 | | | | 78,511,767 | | | | | | |
HealthCor Partners Fund, L.P. | | | | | | | 2,436,471 | | | 706,087 | | | 4,926 | | | 142,608 | | | | 3,280,240 | | | | | | |
Hillcrest Fund, L.P. | | | | | | | 96,794 | | | 1,778,269 | | | — | | | (746,521 | ) | | | 1,128,542 | | | | | | |
HomeField Partners, L.P. | | | | | | | 16,357,040 | | | — | | | 16,036,882 | | | (320,158 | ) | | | — | | | | | (963,118 | ) |
Horseman Global Fund 2, L.P. | | | | | | | — | | | 30,000,000 | | | — | | | (7,030,338 | ) | | | 22,969,662 | | | | | | |
India Capital Fund, Ltd. | | 187,107 | | 597,747 | | | 4,744,728 | | | 10,000,000 | | | 137,837 | | | 15,216,852 | | | | 29,823,743 | | | | | | |
ING Clarion Global, L.P. | | | | | | | 39,908,540 | | | — | | | 10,000,000 | | | 6,281,155 | | | | 36,189,695 | | | | | 1,073,326 | |
ING Clarion U.S., L.P. | | | | | | | 41,613,957 | | | — | | | 46,971,946 | | | 5,357,989 | | | | — | | | | | 4,552,000 | |
Integral Capital Partners VIII, L.P. | | | | | | | 11,799,122 | | | — | | | — | | | 4,352,901 | | | | 16,152,023 | | | | | | |
Intervale Capital Fund, L.P. | | | | | | | 6,122,675 | | | 5,914,480 | | | — | | | (836,660 | ) | | | 11,200,495 | | | | | | |
Investcorp Silverback Arbitrage Fund, LLC | | | | | | | — | | | 14,283,002 | | | — | | | 350,090 | | | | 14,633,092 | | | | | | |
Investcorp Silverback Opportunistic Convertible Fund, LLC | | | | | | | — | | | 25,000,000 | | | 14,283,002 | | | 17,928,037 | | | | 28,645,035 | | | | | 7,265,216 | |
Ithan Creek Partners, L.P. | | | | | | | 50,395,785 | | | — | | | — | | | 11,912,352 | | | | 62,308,137 | | | | | | |
Kenmont Onshore Fund, L.P. | | | | | | | 12,570,773 | | | — | | | 5,295,399 | | | (437,106 | ) | | | 6,838,268 | | | | | (1,634,861 | ) |
LC Fund IV, L.P. | | | | | | | 677,387 | | | 2,428,207 | | | — | | | 433,242 | | | | 3,538,836 | | | | | | |
Longhorn Onshore Investors, L.P. | | | | | | | 46,131,502 | | | — | | | — | | | (5,593,941 | ) | | | 40,537,561 | | | | | | |
Magnetar Capital Fund, L.P. | | | | | | | 51,060,520 | | | — | | | 6,000,000 | | | 7,774,821 | | | | 52,835,341 | | | | | (1,246,574 | ) |
29
THE ENDOWMENT MASTER FUND, L.P.
(A Limited Partnership)
Notes to Financial Statements, continued
December 31, 2009
| | | | | | | | | | | | | | | | | | | | | | | | | | | |
| | | | | | | | | 2009 Activity | | | | | 2009 Activity | |
Investment Funds | | Shares
12/31/2008 | | Shares
12/31/2009 | | Fair Value
12/31/2008 | | Cost of
Purchases | | Cost of
Sales* | | Change in
Appreciation/
Depreciation | | | Fair Value
12/31/2009 | | Interest/
Dividend
Income | | Realized
Gain/(Loss)
on Investments
and Foreign
Currency
Transactions | |
Middle East North Africa Opportunities Fund, L.P. | | 54,686 | | 5,089 | | $ | 39,818,048 | | | — | | $ | 33,062,177 | | $ | (3,076,242 | ) | | $ | 3,679,629 | | | | | $ | (16,848,852 | ) |
Miura Global Partners II, L.P. | | | | | | | 62,106,527 | | | — | | | — | | | (3,333,285 | ) | | | 58,773,242 | | | | | | | |
Monsoon Infrastructure & Realty Co-Invest, L.P. | | | | | | | 5,375,000 | | $ | 1,050,000 | | | — | | | 4,176,602 | | | | 10,601,602 | | | | | | | |
Montrica Global Opportunities Fund, L.P. | | 495,632 | | 412,880 | | | 38,513,902 | | | — | | | 7,264,682 | | | 3,497,786 | | | | 34,747,006 | | $ | 146,189 | | | (1,462,504 | ) |
Morgan Rio Capital Fund, L.P. | | | | | | | — | | | 11,000,000 | | | — | | | (194,963 | ) | | | 10,805,037 | | | | | | | |
Net Lease Private REIT VII, Inc | | | | | | | 3,000,000 | | | 2,000,000 | | | — | | | — | | | | 5,000,000 | | | 452,130 | | | | |
Net Lease Private REIT VII-A, Inc | | | | | | | 3,000,000 | | | 2,000,000 | | | — | | | — | | | | 5,000,000 | | | 452,130 | | | | |
New Horizon Capital III, L.P. | | | | | | | — | | | 7,376,725 | | | 1,620,858 | | | (1,655,581 | ) | | | 4,100,286 | | | | | | | |
NWI Explorer Global Macro Fund, L.P. | | | | | | | 13,221,628 | | | — | | | 10,930,370 | | | 2,019,053 | | | | 4,310,311 | | | | | | (3,572,169 | ) |
Oak Hill REIT Plus Fund, L.P. | | | | | | | 12,368,041 | | | — | | | — | | | 336,126 | | | | 12,704,167 | | | | | | | |
Orbis Real Estate Fund I | | | | | | | 3,449,164 | | | 76,828 | | | 74,718 | | | (257,356 | ) | | | 3,193,918 | | | 37,358 | | | | |
Ore Hill Fund II, L.P. | | | | | | | 34,439,642 | | | — | | | 35,863,174 | | | 6,055,520 | | | | 4,631,988 | | | | | | (13,165,716 | ) |
Overseas CAP Partners, Inc. | | 45,229 | | 60,228 | | | 55,428,160 | | | 15,000,000 | | | — | | | 19,783,531 | | | | 90,211,691 | | | | | | | |
OZ Asia Domestic Partners, L.P. | | | | | | | 33,844,287 | | | 3,770,674 | | | 26,876,747 | | | 10,477,113 | | | | 21,215,327 | | | | | | (382,941 | ) |
Pantera Global Macro Fund, L.P. | | | | | | | 2,273,284 | | | 641,183 | | | 2,918,795 | | | 4,328 | | | | — | | | | | | (842,388 | ) |
Pardus European Special Opportunities Fund, L.P. | | | | | | | 5,620,882 | | | — | | | — | | | 4,331,950 | | | | 9,952,831 | | | | | | | |
Passport II, L.P. | | | | | | | 23,383,695 | | | 30,000,000 | | | — | | | 5,278,555 | | | | 58,662,250 | | | | | | | |
Paulson Credit Opportunities, L.P. | | | | | | | 56,547,795 | | | 40,000,000 | | | — | | | 32,668,393 | | | | 129,216,188 | | | | | | | |
Paulson Partners Enhanced, L.P. | | | | | | | 55,070,388 | | | — | | | — | | | 7,005,672 | | | | 62,076,060 | | | | | | | |
Phoenix Asia Real Estate Investments II, L.P. | | | | | | | 16,875,000 | | | 747,024 | | | 165,957 | | | (5,321,777 | ) | | | 12,134,290 | | | 33,536 | | | 108,457 | |
PIPE Equity Partners, L.L.C. | | | | | | | 96,281,525 | | | 10,000,000 | | | 61,872,330 | | | 4,751,781 | | | | 49,160,976 | | | | | | 698,193 | |
PIPE Select Fund L.L.C. | | | | | | | — | | | 61,872,330 | | | 8,502,539 | | | 727,192 | | | | 54,096,983 | | | | | | 1,263,892 | |
Private Equity Investment Fund IV, L.P. | | | | | | | 7,216,226 | | | 1,175,691 | | | 304,114 | | | (1,116,120 | ) | | | 6,971,683 | | | 28,208 | | | 156,906 | |
Private Equity Investment Fund V, L.P. | | | | | | | — | | | 6,115,535 | | | — | | | (135,482 | ) | | | 5,980,053 | | | | | | | |
PSAM WorldArb Partners, L.P. | | | | | | | 40,331,215 | | | — | | | 10,000,000 | | | 10,395,473 | | | | 40,726,688 | | | | | | (639,805 | ) |
Q Funding III, L.P. | | | | | | | 9,098,681 | | | — | | | — | | | 3,822,821 | | | | 12,921,502 | | | | | | | |
Q4 Funding, L.P. | | | | | | | 25,692,138 | | | — | | | — | | | 10,711,196 | | | | 36,403,334 | | | | | | | |
Quorum Fund Limited | | 349,876 | | 349,876 | | | 9,602,300 | | | — | | | — | | | 7,537,972 | | | | 17,140,272 | | | | | | | |
R.G. Niederhoffer Global Fund, L.P. | | | | | | | — | | | 30,000,000 | | | — | | | (3,405,738 | ) | | | 26,594,262 | | | | | | | |
Redbrick Capital, L.P. | | | | | | | 9,368,126 | | | — | | | 7,413,248 | | | (1,910,445 | ) | | | 44,433 | | | | | | (11,765,820 | ) |
Saints Capital VI, L.P. | | | | | | | 6,064,246 | | | 2,640,449 | | | 797,376 | | | 207,117 | | | | 8,114,436 | | | | | | 502,537 | |
Salem Global Opportunity Fund L.P. | | | | | | | — | | | 25,000,000 | | | — | | | (120,322 | ) | | | 24,879,678 | | | | | | | |
Samlyn Onshore Fund, L.P. | | | | | | | 35,114,053 | | | 44,000,000 | | | — | | | 15,841,610 | | | | 94,955,663 | | | | | | | |
SCP Sakonnet Fund, LP | | | | | | | 41,358,574 | | | — | | | — | | | 17,346,764 | | | | 58,705,338 | | | | | | | |
Skopos HG Fund, LLC | | 262,504 | | 262,504 | | | 14,476,137 | | | — | | | — | | | 22,814,508 | | | | 37,290,645 | | | | | | | |
Sorin Fund, L.P. | | | | | | | 34,795,950 | | | 3,866,217 | | | 21,287,444 | | | 400,641 | | | | 17,775,364 | | | | | | (9,286,699 | ) |
Southport Energy Plus Partners, L.P. | | | | | | | 86,958,671 | | | — | | | — | | | 21,807,217 | | | | 108,765,888 | | | | | | | |
Standard Pacific Credit Opportunities Fund, L.P. | | | | | | | 129,867,044 | | | — | | | 56,521,287 | | | 28,794,000 | | | | 102,139,757 | | | | | | 16,648,458 | |
Steel Partners Japan Strategic Fund, L.P. | | | | | | | 30,269,895 | | | — | | | — | | | (2,843,658 | ) | | | 27,426,237 | | | | | | | |
The Rohatyn Group Local Currency Opportunity Partners, L.P. | | | | | | | 73,350,704 | | | — | | | 10,000,000 | | | 9,876,456 | | | | 73,227,160 | | | | | | 1,921,808 | |
The Russian Prosperity Fund | | 1,056,068 | | 1,056,068 | | | 11,690,668 | | | — | | | — | | | 22,990,592 | | | | 34,681,260 | | | | | | | |
Tiedemann/Falconer Partners, L.P. | | | | | | | 49,754,374 | | | — | | | — | | | (3,923,294 | ) | | | 45,831,080 | | | | | | | |
Tiger Consumer Partners, L.P. | | | | | | | 33,301,757 | | | — | | | — | | | 8,742,373 | | | | 42,044,130 | | | | | | | |
Torrey Pines Fund, LLC | | | | | | | 56,882,204 | | | — | | | 5,000,000 | | | (2,361,874 | ) | | | 49,520,330 | | | | | | 2,077,856 | |
Transwestern Mezzanine Realty Partners III, L.L.C. | | | | | | | 2,894,714 | | | 1,378,529 | | | — | | | (3,533,743 | ) | | | 739,500 | | | | | | | |
Trivest Fund IV, L.P. | | | | | | | 6,032,460 | | | 584,194 | | | — | | | (843,604 | ) | | | 5,773,050 | | | | | | | |
Trustbridge Partners II, L.P. | | | | | | | 13,933,507 | | | 211,306 | | | — | | | 3,500,698 | | | | 17,645,511 | | | | | | | |
Trustbridge Partners III, L.P. | | | | | | | — | | | 6,986,968 | | | — | | | (568,412 | ) | | | 6,418,556 | | | | | | | |
Tuckerbrook SB Global Distressed Fund I, L.P. | | | | | | | 6,174,263 | | | 400,000 | | | — | | | 92,873 | | | | 6,667,136 | | | | | | | |
30
THE ENDOWMENT MASTER FUND, L.P.
(A Limited Partnership)
Notes to Financial Statements, continued
December 31, 2009
| | | | | | | | | | | | | | | | | | | | | | | | | | | |
| | | | | | | | | 2009 Activity | | | | | 2009 Activity | |
Investment Funds | | Shares
12/31/2008 | | Shares
12/31/2009 | | Fair Value
12/31/2008 | | Cost of
Purchases | | Cost of
Sales* | | Change in
Appreciation/
Depreciation | | | Fair Value
12/31/2009 | | Interest/
Dividend
Income | | Realized
Gain/(Loss)
on Investments
and Foreign
Currency
Transactions | |
Valiant Capital Partners, L.P. | | | | | | $ | 65,789,601 | | $ | 7,395,366 | | | — | | $ | 20,818,434 | | | $ | 94,003,401 | | | | | | | |
Velite Energy L.P. | | | | | | | 91,762,431 | | | — | | $ | 37,000,000 | | | 60,433,919 | | | | 115,196,350 | | | | | $ | 20,900,171 | |
Waterstone Market Neutral Fund, L.P. | | | | | | | 94,899,028 | | | — | | | 40,000,000 | | | 44,986,271 | | | | 99,885,299 | | | | | | 14,334,934 | |
Wells Street Global Partners, L.P. | | | | | | | 18,627,471 | | | — | | | 13,192,586 | | | (5,434,885 | ) | | | — | | | | | | (12,557,414 | ) |
Wells Street Offshore, Ltd | | 32,000 | | — | | | 7,019,400 | | | — | | | 6,289,888 | | | (729,512 | ) | | | — | | | | | | (3,710,112 | ) |
WestView Capital Partners II, L.P. | | | | | | | — | | | 1,583,815 | | | — | | | (311,615 | ) | | | 1,272,200 | | | | | | | |
Whitebox Multi-Strategy Fund, L.P. | | 90,000 | | 82,008 | | | 62,075,130 | | | 5,533 | | | 9,177,399 | | | 47,295,227 | | | | 100,198,491 | | | | | | 1,364,612 | |
Whitebox Special Opportunities Fund, L.P. | | | | | | | 53,250,000 | | | — | | | 91,577,717 | | | 38,327,717 | | | | — | | | | | | 41,577,717 | |
Woodbourne Daybreak Global Fund L.P. | | | | | | | 10,600,188 | | | — | | | 5,001,759 | | | (3,098,916 | ) | | | 2,499,513 | | | | | | (5,549,121 | ) |
| | | | | | | | | | | | | | | | | | | | | | | | | | | |
| | | | | | $ | 3,087,328,793 | | $ | 677,533,405 | | $ | 942,599,945 | | $ | 571,065,859 | | | $ | 3,393,328,112 | | $ | 1,149,551 | | $ | (28,864,561 | ) |
| | | | | | | | | | | | | | | | | | | | | | | | | | | |
| * | Sales include return of capital. |
| ** | Voting rights have been waived for these investments. |
| *** | Affiliated investment based on capital commitment. No contributions have been made as of December 31, 2009. |
(5) FINANCIAL INSTRUMENTS WITH OFF-BALANCE SHEET RISK
In the normal course of business, the Investment Funds in which the Master Fund invests trade various derivative securities and other financial instruments, and enter into various investment activities with off-balance sheet risk both as an investor and as a principal. The Master Fund’s risk of loss in these Investment Funds is limited to the value of the investment in, or commitment to, such Investment Funds. In addition, the Master Fund may from time to time invest directly in derivative securities or other financial instruments to gain greater or lesser exposure to a particular asset class.
During the year ended December 31, 2009, the Master Fund had no short option activity.
(6) DUE FROM BROKERS
The Master Fund conducts business with brokers for its investment activities. The clearing and depository operations for the investment activities are performed pursuant to agreements with the brokers. The Master Fund is subject to credit risk to the extent any broker with whom the Master Fund conducts business is unable to deliver cash balances or securities, or clear security transactions on the Master Fund’s behalf. The Master Fund monitors the financial condition of the brokers with which the Master Fund conducts business and believes the likelihood of loss under the aforementioned circumstances is remote.
(7) ADMINISTRATION AGREEMENT
In consideration for administrative, accounting, and recordkeeping services, the Master Fund will pay the Independent Administrator a monthly administration fee based on the month end partners’ capital of the Master Fund. The Master Fund is charged, on an annual basis, 6 basis points on partners’ capital of up to $2 billion, 5 basis points on partners’ capital between the amounts of $2 billion and $5 billion, 2 basis points on partners’
31
THE ENDOWMENT MASTER FUND, L.P.
(A Limited Partnership)
Notes to Financial Statements, continued
December 31, 2009
capital between the amounts of $5 billion and $15 billion, and 1.25 basis point for amounts over $15 billion. The asset based fees are payable monthly in arrears. The Independent Administrator will also provide the Master Fund with legal, compliance, transfer agency, and other investor related services at an additional cost.
The administration fees will be paid out of the Master Fund’s assets, which will decrease the net profits or increase the net losses of the partners in the Master Fund. As of December 31, 2009, the Master Fund had $5,212,610,935 in partners’ capital. The total administration fee incurred for the year ended December 31, 2009 was $2,329,428.
(8) RELATED PARTY TRANSACTIONS
(a) INVESTMENT MANAGEMENT FEE
In consideration of the advisory and other services provided by the Adviser to the Master Fund pursuant to the Investment Management Agreement, the Master Fund will pay the Adviser an investment management fee (the “Investment Management Fee”), equal to 1.00% on an annualized basis of the Master Fund’s partners’ capital calculated based on the Master Fund’s partners’ capital at the end of each month, payable quarterly in arrears. The Investment Management Fee will decrease the net profits or increase the net losses of the Master Fund that are credited to or debited against the capital accounts of its partners. For the year ended December 31, 2009, $50,501,255 was incurred for Investment Management Fees.
(b) PLACEMENT AGENTS
The Master Fund may engage one or more placement agents (each, a “Placement Agent”) to solicit investments in the Master Fund. Salient Capital, L.P., an affiliate of the Adviser, is a broker-dealer who has been engaged by the Master Fund to serve as a Placement Agent. A Placement Agent may engage one or more sub-placement agents. The Adviser or its affiliates may pay a fee out of their own resources to Placement Agents and sub-placement agents. As of December 31, 2009, the two largest nonaffiliated Sub-Placement Agents in the Endowment Fund Complex service approximately 85% of the feeder funds assets which are invested in the Master Fund. To the extent that substantial numbers of investors have a relationship with a particular Sub-Placement Agent, such Sub-Placement Agent may have the ability to influence investor behavior, which may affect the Funds.
(9) INDEBTEDNESS OF THE FUND
As a fundamental policy, the Master Fund may borrow up to, but not more than, 25% of the partners’ capital of the Master Fund (at the time such borrowings were made and after taking into account the investment and/or deployment of such proceeds) for the purpose of making investments, funding redemptions and for other working capital and general Master Fund purposes. For purposes of the Master Fund’s investment restrictions and certain investment limitations under the 1940 Act, including for example, the Master Fund’s leverage limitations, the Master Fund will not “look through” Investment Funds in which the Master Fund invests. Investment Funds may also use leverage, whether through borrowings, futures, or other derivative products and are not subject to the Master Fund’s investment restrictions. However, such borrowings by Investment Funds are without recourse to the Master Fund and the Master Fund’s risk of loss is limited to its investment in such Investment Funds, other than for some Investment Funds in which the Master Fund has made a capital commitment, for which the risk of loss is limited to the Master Fund’s total capital commitment. For some Investment Funds in which the Master Fund has made a capital commitment that will be funded over a period of time, such as private equity and real estate funds, the Master Fund, in certain instances, may commit to fund more than its initial capital commitment.
32
THE ENDOWMENT MASTER FUND, L.P.
(A Limited Partnership)
Notes to Financial Statements, continued
December 31, 2009
The rights of any lenders to the Master Fund to receive payments of interest or repayments of principal will be senior to those of the partners, and the terms of any borrowings may contain provisions that limit certain activities of the Master Fund.
On June 30, 2009, the Master Fund entered into a line of credit agreement (the “Agreement”) with Deutsche Bank Aktiengesellschaft (the “Lender”). The Agreement provides for a $250,000,000 credit facility, with available borrowing capacity subject to collateral allocation ratios as defined in the Agreement. Borrowings under the Agreement are secured by a portion of the Master Fund’s investments. The Agreement provides for an annual commitment fee with interest accruing at the three-month London Interbank Offered Rate (LIBOR) plus a spread of 1.75% per year, payable quarterly in arrears. As of December 31, 2009, there were no borrowings outstanding, and there were no borrowings under any agreements during the year ended December 31, 2009.
(10) FINANCIAL HIGHLIGHTS
| | | | | | | | | | | | | | | |
| | | Year ended
December 31,
2009 | | Year ended,
December 31,
2008 | | Year ended
December 31,
2007 | | Year ended
December 31,
2006 | | Year ended
December 31,
2005 |
Net investment loss to average partners’ capital1 | | | (0.95)% | | | (1.19)% | | | (0.63)% | | | (0.61)% | | | (0.44)% |
Expenses to average partners’ capital1,2 | | | 1.20% | | | 1.54% | | | 1.37% | | | 1.24% | | | 1.28% |
Portfolio turnover | | | 27.40% | | | 29.19% | | | 4.19% | | | 15.31% | | | 12.65% |
Total return3 | | | 14.96% | | | (23.46)% | | | 17.41% | | | 12.37% | | | 10.40% |
Partners’ capital, end of year (in 000’s) | | $ | 5,212,611 | | $ | 4,663,185 | | $ | 3,269,969 | | $ | 1,011,295 | | $ | 376,169 |
An investor’s return (and operating ratios) may vary from those reflected based on the timing of capital transactions.
| 1 | Ratios are calculated by dividing the indicated amount by average partners’ capital measured at the end of each month during the period. |
| 2 | Expense ratios do not include expenses of underlying Investment Funds. Expenses include offshore withholding tax, which is only allocable to investors investing through the offshore feeder funds. |
| 3 | Calculated as geometrically linked monthly returns for each month in the year. |
(11) SUBSEQUENT EVENTS
The Master Fund accepts initial or additional applications for Interests generally as of the first day of the month. Investor subscriptions for Interests totaled approximately $58,576,400 and $70,093,111 for January and February 2010, respectively.
Based on the partners’ capital of the Master Fund, the Adviser recommended to the Board that a tender offer in an amount of up to $519,000,000 be made for the quarter ending March 31, 2010 to those partners who elect to tender their Interests prior to the expiration of the tender offer period. The Board approved such recommendation and a tender offer notice with a February 19, 2010 expiration date was mailed to the partners in the Master Fund.
33
THE ENDOWMENT MASTER FUND, L.P.
(A Limited Partnership)
Supplemental Information
December 31, 2009
(Unaudited)
Directors and Officers
The Master Fund’s operations are managed under the direction and oversight of the Board. Each Director serves for an indefinite term or until he or she reaches mandatory retirement, if any, as established by the Board. The Board appoints the officers of the Master Fund who are responsible for the Master Fund’s day-to-day business decisions based on policies set by the Board. The officers serve at the pleasure of the Board.
The Directors and officers of the Master Fund may also be directors or officers of some or all of the other registered investment companies managed by the Adviser or its affiliates (the “Fund Complex”). The tables below show, for each Director and officer, his or her full name, address and age (as of December 31, 2009), the position held with the Master Fund, the length of time served in that position, his or her principal occupations during the last five years, the number of portfolios in the Fund Complex overseen by the Director, and other directorships held by such Director.
Interested Directors
| | | | | | | | | | |
| Name, Address and Age | | Position(s)
Held with
the Master
Fund | | Length of
Time
Served | | Principal
Occupation(s) During
the Past 5 Years | | Number of
Portfolios
in Fund
Complex(2)
Overseen
by Director | | Other
Directorships
Held by
Director |
John A. Blaisdell(1) Age: 49 Address: c/o The Endowment Master Fund L.P.
4265 San Felipe, Suite 800,
Houston, TX 77027 | | Director, Co-Principal Executive Officer | | Since January 2004 | | Member, Investment Committee of the Adviser, since 2002; Managing Director of Salient, since 2002 | | 3 | | None |
Andrew B. Linbeck(1) Age: 45 Address: c/o The Endowment Master Fund L.P.
4265 San Felipe, Suite 800,
Houston, TX 77027 | | Director, Co-Principal Executive Officer | | Since January 2004 | | Member, Investment Committee of the Adviser, since 2002; Managing Director of Salient, since 2002 | | 3 | | None |
A. Haag Sherman(1) Age: 44 Address: c/o The Endowment Master Fund L.P.
4265 San Felipe, Suite 800,
Houston, TX 77027 | | Director, Co-Principal Executive Officer | | Since January 2004 | | Member, Investment Committee of the Adviser, since 2002; Managing Director of Salient, since 2002 | | 3 | | PlainsCapital
Corporation,
since 2009 |
| (1) | This person’s status as an “interested” director arises from his affiliation with Salient Partners, L.P. (“Salient”), which itself is an affiliate of the Master Fund, the Endowment Registered Fund, L.P. (the “Registered Fund”), the Endowment TEI Fund, L.P. (the “TEI Fund”), and the Adviser. |
| (2) | The Fund Complex includes the Master Fund, the Registered Fund and the TEI Fund. |
34
THE ENDOWMENT MASTER FUND, L.P.
(A Limited Partnership)
Supplemental Information, continued
December 31, 2009
(Unaudited)
Independent Directors
| | | | | | | | | | |
| Name, Address and Age | | Position(s)
Held with
Master
Fund | | Length of
Time
Served | | Principal
Occupation(s) During
the Past 5 Years | | Number of
Portfolios
in Fund
Complex(1)
Overseen
by Director | | Other
Directorships
Held by
Director |
Jonathan P. Carroll Age: 48 Address: c/o The Endowment Master Fund L.P.
4265 San Felipe, Suite 800, Houston, TX 77027 | | Director | | Since January 2004 | | President of Lazarus Financial LLC (holding company) since 2006; private investor for the prior five years | | 3 | | Lazarus
Financial
LLC,
Lazarus
Energy
Holdings
LLC and
affiliates,
since 2006 |
Richard C. Johnson Age: 72 Address: c/o The Endowment Master Fund L.P.
4265 San Felipe, Suite 800, Houston, TX 77027 | | Director | | Since January 2004 | | Senior Counsel (retired) for Baker Botts LLP (law firm) since 2002; Managing Partner, Baker Botts, 1998 to 2002; practiced law at Baker Botts, 1966 to 2002 (1972 to 2002 as a partner) | | 3 | | None |
G. Edward Powell Age: 73 Address: c/o The Endowment Master Fund L.P.
4265 San Felipe, Suite 800, Houston, TX 77027 | | Director | | Since January 2004 | | Principal of Mills & Stowell (private equity) since 2002. Principal, Innovation Growth Partners (consulting), since 2002; consultant to emerging and middle market businesses, 1994-2002; Managing Partner, PriceWaterhouse & Co. (Houston Office, 1982 to 1994) | | 3 | | Energy
Services
International,
Inc., since
2004;
Therapy
Track, LLC,
since 2009 |
Scott E. Schwinger Age: 44 Address: c/o The Endowment Master Fund L.P.
4265 San Felipe, Suite 800, Houston, TX 77027 | | Director | | Since January 2004 | | President, The McNair Group (management), since 2006; Senior Vice President and Chief Financial Officer, the Houston Texans (professional football team), 1999 | | 3 | | The Make-
A-Wish
Foundation,
since 2008;
YES Prep
Public
Schools,
since 2001 |
35
THE ENDOWMENT MASTER FUND, L.P.
(A Limited Partnership)
Supplemental Information, continued
December 31, 2009
(Unaudited)
| | | | | | | | | | |
| Name, Address and Age | | Position(s)
Held with
Master
Fund | | Length of
Time
Served | | Principal
Occupation(s) During
the Past 5 Years | | Number of
Portfolios
in Fund
Complex(1)
Overseen
by Director | | Other
Directorships
Held by
Director |
Dr. Bernard Harris Age: 52 Address: c/o The Endowment
Master Fund L.P.
4265 San Felipe, Suite 800,
Houston, TX 77027 | | Director | | Since June 2009 | | Chief Executive Officer and Managing Partner, Vesalius Ventures, Inc (venture investing), since 2002; President of The Space Agency (marketing), since 1999; President of The Harris Foundation (non-profit), since 1998; Clinical scientist, flight surgeon and astronaut for NASA, 1986 to 1996 | | 3 | | U.S. Physical Therapy, Inc., since 2005; Sterling Bancshares, Inc., since 2007; RMD Networks, Inc., since 2006; Monebo Technologies Inc., since 2009; AG Technologies, since 2009; The Harris Foundation, Inc., since 1998; Houston Technology Center, since 2004; Greater Houston Community Foundation, 2004-2009; Communities in Schools, since 2007; ZOO SCORE “Counselors to America’s Small Business”, since 2009; American Telemedicine Association, since 2007; Houston Angel Network, since 2004; BioHouston, since 2006; The National Math and Science Initiative, and Space Agency, since 2008 |
| (1) | The Fund Complex includes the Master Fund, the Registered Fund and the TEI Fund. |
36
THE ENDOWMENT MASTER FUND, L.P.
(A Limited Partnership)
Supplemental Information, continued
December 31, 2009
(Unaudited)
Officers of the Fund Who Are Not Directors
| | | | |
| Name, Address and Age | | Position(s) Held with Fund | | Principal Occupation(s) During the
Past 5 Years |
Roy Washington Age: 58 Address: c/o The Endowment
Master Fund L.P.
4265 San Felipe, Suite 800,
Houston, TX 77027 | | Chief Compliance Officer | | Chief Counsel, Salient, since 2009, CCO, Salient, since 2007; Managing Director (2006-2007) of and Consultant (2003-2007) with Capital Forensics Consulting, Inc; President of RVW Consulting Group, Inc., 2002-2006 |
John E. Price Age: 42 Address: c/o The Endowment
Master Fund L.P.
4265 San Felipe, Suite 800,
Houston, TX 77027 | | Treasurer; Principal Financial Officer | | Director and Chief Financial Officer, Adviser, since 2003; Partner and Director, Salient, since 2003 |
Adam L. Thomas Age: 35 Address: c/o The Endowment
Master Fund L.P.
4265 San Felipe, Suite 800,
Houston, TX 77027 | | Secretary | | Director of Adviser, since 2004; Partner and Director, Salient, since 2002 |
Compensation for Directors
The Master Fund, the Registered Fund and the TEI Fund together pay each of the Directors who is not an “interested person” of the Adviser, as defined in the 1940 Act (the “Independent Directors”) an annual retainer of $25,000, which is paid quarterly, a fee of $5,000 per Board meeting, a fee of $1,250 per interim meeting, a fee of $1,250 per audit committee meeting to each audit committee member, a fee of $1,250 per Board Valuation Committee meeting to each Board Valuation Committee member and an annual fee of $10,000 for the audit committee chairman, which is paid quarterly. In the interest of retaining Independent Directors of high quality, the Board intends to periodically review such compensation and may modify it as the Board deems appropriate.
37
THE ENDOWMENT MASTER FUND, L.P.
(A Limited Partnership)
Supplemental Information, continued
December 31, 2009
(Unaudited)
Allocation of Investments
The following chart indicates the allocation of investments among the asset classes in the Master Fund as of December 31, 2009.
| | | | | |
Asset Class1 | | Fair Value | | % |
Arbitrage Strategies | | $ | 937,345,030 | | 18.70 |
Domestic Equity | | | 525,107,783 | | 10.48 |
Energy | | | 399,136,823 | | 7.96 |
Enhanced Fixed Income | | | 637,838,355 | | 12.72 |
International Equity | | | 575,378,776 | | 11.48 |
Natural Resources | | | 171,215,778 | | 3.42 |
Opportunistic Equity | | | 696,964,621 | | 13.91 |
Private Equity | | | 663,839,483 | | 13.24 |
Real Estate | | | 236,895,695 | | 4.73 |
Agencies | | | 124,829,071 | | 2.49 |
Fixed Income | | | 4,790,592 | | 0.10 |
Call Options Purchased | | | 38,316,894 | | 0.76 |
Put Options Purchased | | | 650,000 | | 0.01 |
| | | | | |
Total Investments | | $ | 5,012,308,901 | | 100.00 |
| | | | | |
| 1 | The complete list of investments included in the following asset class categories are included in the Schedule of Investments. |
Form N-Q Filings
The Master Fund files a complete schedule of portfolio holdings with the Securities and Exchange Commission for the first and third quarters of each fiscal year on Form N-Q. The Master Fund’s Form N-Q is available on the Securities and Exchange Commission website at http://www.sec.gov. The Master Fund’s Form N-Q may be reviewed and copied at the Securities and Exchange Commission Public Reference Room in Washington, DC and information regarding operation of the Public Reference Room may be obtained by calling 1-800-SEC-0330.
Proxy Voting Policies
A description of the policies and procedures that the Master Fund uses to determine how to vote proxies relating to portfolio securities is available (i) without charge, upon request, by calling 1-800-725-9456; and (ii) on the Securities and Exchange Commission website at http://www.sec.gov.
Information regarding how the Master Fund voted proxies relating to portfolio securities during the most recent 12-month period ended June 30 is available (i) without charge, upon request, by calling 1-800-725-9456; and (ii) on the Securities and Exchange Commission website at http://www.sec.gov.
Additional Information
The Master Fund’s private placement memorandum (the “PPM”) includes additional information about Directors of the Master Fund. The PPM is available, without charge, upon request by calling 1-800-725-9456.
38
Item 2. Code of Ethics.
(a) The registrant has adopted a code of ethics that applies to the registrant’s principal executive officer, principal financial officer, principal accounting officer or controller, or persons performing similar functions. This code of ethics is included as Exhibit 12(a)(1).
(b) During the period covered by the report, with respect to the registrant’s code of ethics that applies to its principal executive officer, principal financial officer, principal accounting officer or controller, or persons performing similar functions; there have been no amendments to, nor any waivers granted from, a provision that relates to any element of the code of ethics definition enumerated in paragraph (b) of this Item 2.
Item 3. Audit Committee Financial Expert.
3(a)(1) The registrant’s board of directors has determined that the registrant has at least one audit committee financial expert serving on its audit committee.
3(a)(2) The audit committee financial expert is G. Edward Powell, who is “independent” for purposes of this Item 3 of Form N-CSR.
Item 4. Principal Accountant Fees and Services.
| | | | | | |
| | | Current Year | | Previous Year |
Audit Fees | | $ | 130,000 | | $ | 125,000 |
Audit-Related Fees | | $ | 0 | | $ | 0 |
Tax Fees | | $ | 0 | | $ | 0 |
All Other Fees | | $ | 0 | | $ | 0 |
(e)(1) Disclose the audit committee’s pre-approval policies and procedures described in paragraph (c)(7) of Rule 2-01 of Regulation S-X.
The audit committee may delegate its authority to pre-approve audit and permissible non-audit services to one or more members of the committee. Any decision of such members to pre-approve services shall be presented to the full audit committee at its next regularly scheduled meeting.
(2) Disclose the percentage of services described in each of paragraphs (b) through (d) of this item that were approved by the audit committee pursuant to paragraph (c) (7)(i)(c) of Rule 2-01 of Regulation S-X.
| | |
Current Year | | Previous Year |
0% | | 0% |
(f) Not applicable.
(g) Disclose the aggregate non-audit fees billed by the registrant’s accountant for services rendered to registrant, and rendered to the registrant’s investment adviser (not including any sub-adviser whose role is primarily portfolio management and is subcontracted with or overseen by another investment adviser), and any entity controlling, controlled by, or under common control with the adviser that provides ongoing services to the registrant for each of the last two fiscal years of the registrant.
| | |
Current Year | | Previous Year |
$0 | | $0 |
(h) Not applicable.
Item 5. Audit Committee of Listed Registrants.
Not applicable.
Item 6. Investments.
(a) Schedule of Investments as of the close of the reporting period is included in the report to the shareholders filed under item 1 of this form.
(b) Not applicable.
Item 7. Disclosure of Proxy Voting Policies and Procedures for Closed-End Management Investment Companies.
A closed-end management investment company that is filing an annual report on this Form N-CSR must, unless it invests exclusively in non-voting securities, describe the policies and procedures that it uses to determine how to vote proxies relating to portfolio securities, including the procedures that the company uses when a vote presents a conflict between the interests of its shareholders, on the one hand, and those of the company’s investment adviser; principal underwriter; or any affiliated person (as defined in section 2(a)(3) of the Investment Company Act
of 1940 (15 U.S.C. 80a-2(a)(3)) and the rules thereunder) of the company, its investment adviser, or its principal underwriter, on the other. Include any policies and procedures of the company’s investment adviser, or any other third party, that the company uses, or that are used on the company’s behalf, to determine how to vote proxies relating to portfolio securities.
These policies are included as Exhibit 12(a)(4).
Item 8. Portfolio Managers of Closed-End Management Investment Companies.
The Adviser’s Investment Committee Members
As of the date of the filing, the Investment Committee is responsible for the day-to-day management of the Fund’s portfolio. The Endowment Master Fund, L.P. (the “Master Fund”), The Endowment TEI Fund, L.P. (the “TEI Fund”) and The Endowment Registered Fund, L.P. (the “Registered Fund”) are registered investment companies (collectively, the “Fund Complex” and each individually the “Fund”). The members of the Investment Committee (each an “Investment Committee Member”) are: Messrs. John A. Blaisdell, Andrew B. Linbeck, A. Haag Sherman and Mark W. Yusko.
Mr. Blaisdell has served as an Investment Committee Member since January 2004 and Managing Director of Salient Partners, L.P. (“Salient”) since December 2002. Previously, he held the position of Chief Executive Officer of Wincrest Ventures, L.P. (from 1997-2002). Mr. Linbeck has served as an Investment Committee Member since January 2004 and Managing Director of Salient since August 2002. Previously, he held the position of Partner and executive officer of The Redstone Companies, L.P. and certain affiliates thereof (from 1998-2002). Mr. Sherman has served as an Investment Committee Member since January 2004 and Managing Director of Salient since August 2002. Previously, he held the position of Partner and executive officer of Redstone (from 1998-2002). Mr. Yusko has served as an Investment Committee Member since January 2004. He is also President of Morgan Creek Capital Management (since July 2004) and Principal of Hatteras Capital Management (since September 2003). Previously, Mr. Yusko held the position of Chief Investment Officer of the University of North Carolina at Chapel Hill (from 1998-2004). Each member of the Investment Committee reviews asset allocation recommendations by the Adviser’s staff, manager due diligence and recommendations and, by a majority vote of the Investment Committee, determines asset allocation and manager selection.
The Adviser and certain other entities controlled by the Principals manage investment programs which are similar to that of the Fund, and the Adviser and/or the Principals may in the future serve as an investment adviser or otherwise manage or direct the investment activities of other registered and/or private investment vehicles with investment programs similar to the Funds.
Other Accounts Managed by the Investment Adviser
Certain Investment Committee Members, who are primarily responsible for the day-to-day management of the Fund, also manage other registered investment companies, other pooled investment vehicles and other accounts, as indicated below. The following tables identify, as of December 31, 2009: (i) the number of registered investment companies (including the Fund), other pooled investment vehicles and other accounts managed by the Investment Committee Member and the total assets of such companies, vehicles and accounts; and (ii) the number and total assets of such companies, vehicles and accounts with respect to which the advisory fee is based on performance.
| | | | | | | | | | | | |
Name of Investment Committee Member | | Registered Investment
Companies Managed by
Investment Committee Member | | Other Pooled Investment
Vehicles Managed by
Investment Committee Member | | Other Accounts Managed by
Investment Committee Member |
| | | Number | | Total Assets | | Number | | Total Assets | | Number | | Total Assets |
John A. Blaisdell | | 3 | | $5.554 billion | | 6 | | $555 million | | >1,090 | | >$1.184 billion (1) |
Andrew B. Linbeck | | 3 | | $5.554 billion | | 6 | | $555 million | | >1,090 | | >$1.184 billion (1) |
A. Haag Sherman | | 3 | | $5.554 billion | | 6 | | $555 million | | >1,090 | | >$1.184 billion (1) |
Mark W. Yusko | | 8 | | $6.85 billion | | 22 | | $2.6 billion | | 21 | | $1.44 billion (2) |
| (1) | Messrs. Blaisdell, Linbeck and Sherman serve as principal executive officers of Salient Partners, which owns Salient Trust Co., LTA, a trust company chartered under the laws of the state of Texas. In such capacities, Messrs. Blaisdell, Linbeck and Sherman have investment responsibilities on the clients of such entities. However, the number of accounts and asset figures cited in the table relate to the accounts and assets over which Messrs. Blaisdell, Linbeck and Sherman have discretion in their capacities as principal executive officers of such entities. |
| (2) | Mr. Yusko serves as the principal executive officer of Morgan Creek Capital Management, LLC, and a principal of Hatteras Capital Management, advisory firms located in North Carolina. The figure cited in the table reflects the advisory assets of Morgan Creek Capital Management, LLC. $1 billion included in Total Assets of Pooled Investment Vehicles Managed is also included in Total Assets of Other Accounts Managed by Investment Committee Member. |
| | | | | | | | | | | | | |
Name of Investment Committee Member | | Registered Investment
Companies Managed by
Investment Committee Member | | Other Pooled Investment
Vehicles Managed by
Investment Committee Member | | Other Accounts Managed by
Investment Committee Member |
| | | Number with
Performance-
Based Fees | | Total Assets
with
Performance
Based Fees | | Number with
Performance-
Based Fees | | Total Assets
with
Performance
Based Fees | | Number with
Performance-
Based Fees | | Total Assets
with
Performance
Based Fees |
John A. Blaisdell | | 0 | | 0 | | 1 | | $ | 112 million | | 0 | | 0 |
Andrew B. Linbeck | | 0 | | 0 | | 1 | | $ | 112 million | | 0 | | 0 |
A. Haag Sherman | | 0 | | 0 | | 1 | | $ | 112 million | | 0 | | 0 |
Mark W. Yusko | | 5 | | $1.3 billion | | 22 | | $ | 2.6 billion | | 21 | | $1.44 billion (1) |
| (1) | Mr. Yusko serves as the principal executive officer of Morgan Creek Capital Management, LLC, and a principal of Hatteras Capital Management, advisory firms located in North Carolina. The figure cited in the table reflects the advisory assets of Morgan Creek Capital Management, LLC. $1 billion included in Total Assets of Pooled Investment Vehicles Managed is also included in Total Assets of Other Accounts Managed by Investment Committee Member. |
Conflicts of Interest of the Adviser
From time to time, potential conflicts of interest may arise between an Investment Committee Member’s management of the investments of the Fund, on the one hand, and the management of other registered investment companies, pooled investment vehicles and other accounts (collectively, “other accounts”), on the other. The other accounts might have similar investment objectives or strategies as the Fund, track the same index the Fund tracks or otherwise hold, purchase, or sell securities that are eligible to be held, purchased or sold by the Fund. The other accounts might also have different investment objectives or strategies than the Fund.
Knowledge and Timing of Fund Trades. A potential conflict of interest may arise as a result of the Investment Committee Member’s day-to-day management of a Fund. Because of their positions with the Fund, the Investment Committee Members know the size, timing and possible market impact of the Fund’s trades. It is theoretically possible that the Investment Committee Members could use this information to the advantage of other accounts they manage and to the possible detriment of the Fund.
Investment Opportunities. A potential conflict of interest may arise as a result of the Investment Committee Member’s management of a number of accounts with varying investment guidelines. Often, an investment opportunity may be suitable for both the Fund and other accounts managed by the Investment Committee Member, but may not be available in sufficient quantities for both the Fund and the other accounts to participate fully. Similarly, there may be limited opportunity to sell an investment held by the Fund and other accounts. The Adviser has adopted policies and procedures reasonably designed to allocate investment opportunities on a fair and equitable basis over time.
Performance Fees. An Investment Committee Member may advise certain accounts with respect to which the advisory fee is based entirely or partially on performance. Performance fee arrangements may create a conflict of interest for the Investment Committee Member in that the Member may have an incentive to allocate the investment opportunities that he or she believes might be the most profitable to such other accounts instead of allocating them to the Fund.
Compensation to Investment Committee Members
Messrs. Blaisdell, Linbeck, Sherman and Yusko indirectly own equity interests in the Adviser. As it relates to the Fund and other funds within the Fund Complex, Messrs. Blaisdell, Linbeck, Sherman and Yusko receive all of their compensation based on the size of the Fund and the other funds within the Fund Complex and the management and servicing fees charged thereon. Accordingly, they believe that a significant driver of their compensation is the performance of the Fund and the Fund Complex, which has a significant bearing on the ability to raise additional assets. Messrs. Blaisdell, Linbeck, Sherman and Yusko also indirectly own equity in the general partner of another fund, and are compensated directly on performance (based on an incentive allocation) and the size of the fund’s asset base. In addition, Messrs. Blaisdell, Linbeck and Sherman are partners and principal executive officers of Salient and related affiliates and subsidiaries (collectively, the “Salient Group”), which pays them a base salary (but no bonus) and is obligated to make distributions of profits to them, as well as the other partners, on an annual basis. These individuals are responsible for the investment processes and management of the Salient Group. Messrs. Blaisdell, Linbeck and Sherman believe that to the extent that they are successful in their investment endeavors, the greater the number of assets over time and the more significant their compensation from the Salient Group.
Mr. Yusko is a partner of Morgan Creek Capital Management, which pays him a base salary and is anticipated to make distributions of profits above and beyond that which is necessary to operate the business. Mr. Yusko is chiefly responsible for the investment processes and management of Morgan Creek Capital Management. He believes that to the extent that he and the staff at Morgan Creek Capital Management are successful in their investment endeavors, the greater the number of assets over time and the more significant their compensation.
Securities Ownership of Investment Committee Members
The table below shows the dollar range of the interests of each Fund beneficially owned as of December 31, 2009 by each Investment Committee Member (1).
| | | | | | |
Investment Committee Member | | Master Fund | | Registered Fund | | TEI Fund |
John A. Blaisdell | | None (2) | | $100,001 to $500,000 | | $100,001 to $500,000 |
Andrew B. Linbeck | | None | | $500,001 to $1,000,000 | | $100,001 to $500,000 |
A. Haag Sherman | | None (2) | | $100,001 to $500,000 | | $50,001 to $100,000 |
Mark W. Yusko | | None (2) | | None | | None |
| (1) | Includes the portion of investments made by the Salient Group beneficially owned and personal investments. |
| (2) | $216,322, $150,209 and $2,033,184 represent indirect beneficial ownership in the Master Fund held by John. A. Blaisdell, A. Haag Sherman and Mark W. Yusko, respectively, through other feeder funds that invest in the Master Fund. |
Portfolio Manager Compensation
Mr. Adam L. Thomas has significant day-to-day duties in the management of the portfolio of the Master Fund, including providing analysis and recommendations on Asset Allocation and Investment Fund selection to the Investment Committee. Mr. Thomas indirectly owns equity interests in the Adviser. As it relates to the Fund and other funds within the Fund Complex, Mr. Thomas receives all of his compensation based on the size of the Fund and the other funds within the Fund Complex and the management and servicing fees charged thereon. Accordingly, he believes that a significant driver of his compensation is the performance of the Fund and the Fund Complex, which has a significant bearing on the ability to raise additional assets. Mr. Thomas also indirectly owns equity in the general partner of another fund, which is compensated directly on performance (based on an incentive allocation) and the size of the fund’s asset base (as of December 31, 2009, this fund’s asset base was approximately $112 million). In addition, Mr. Thomas is a partner and officer of entities within the Salient Group, which pay him a base salary and he may receive a bonus, and Salient is obligated to make distributions of profits to him, as well as the other partners, on an annual basis. Mr. Thomas believes that to the extent that he is successful in his investment endeavors, the greater the number of assets over time and the more significant his compensation from the Salient Group will be.
Securities Ownership of Portfolio Manager
The table below shows the dollar range of shares of the Fund beneficially owned as of December 31, 2009, by Mr. Thomas (1):
| | | | |
Master | | Registered | | TEI |
None (2) | | $50,001 to $100,000 | | None |
| (1) | Includes the portion of investments made by the Salient Group beneficially owned and personal investments. |
| (2) | $435,135 represents indirect beneficial ownership in the Master Fund held through other feeder funds that invest in the Master Fund. |
Item 9. Purchases of Equity Securities by Closed-End Management Investment Company and Affiliated Purchasers.
| | | | | | | | | |
Period | | (a)
Total Value
of Shares
(or Units)
Purchased | | (b)
Average Price
Paid per
Share
(or Unit) | | (c)
Total Number
of Shares
(or Units)
Purchases as
Part of
Publicly
Announced
Plans or
Programs | | (d)
Maximum Number
(or Approximate
Dollar Value) of
Shares (or Units)
that May Yet Be
Purchased Under
the Plans or
Programs |
January 1, 2009 through January 31, 2009 | | $ | — | | N/A | | N/A | | N/A |
February 1, 2009 through February 28, 2009 | | $ | — | | N/A | | N/A | | N/A |
March 1, 2009 through March 31, 2009 | | $ | 211,546,432 | | N/A | | N/A | | N/A |
April 1, 2009 through April 30, 2009 | | $ | — | | N/A | | N/A | | N/A |
May 1, 2009 through May 31, 2009 | | $ | — | | N/A | | N/A | | N/A |
June 1, 2009 through June 30, 2009 | | $ | 178,319,804 | | N/A | | N/A | | N/A |
July 1, 2009 through July 31, 2009 | | $ | — | | N/A | | N/A | | N/A |
August 1, 2009 through August 31, 2009 | | $ | — | | N/A | | N/A | | N/A |
September 1, 2009 through September 30, 2009 | | $ | 198,318,890 | | N/A | | N/A | | N/A |
October 1, 2009 through October 31, 2009 | | $ | — | | N/A | | N/A | | N/A |
November 1, 2009 through November 30, 2009 | | $ | — | | N/A | | N/A | | N/A |
December 1, 2009 through December 31, 2009 | | $ | 232,075,168 | | N/A | | N/A | | N/A |
| | | | | | | | | |
Total | | $ | 820,260,294 | | | | | | |
| | | | | | | | | |
Item 10. Submission of Matters to a Vote of Security Holders.
Not applicable.
Item 11. Controls and Procedures.
The registrant’s principal executive officer and principal financial officer have concluded, based on their evaluation of the registrant’s disclosure controls and procedures as conducted within 90 days of the filing date of this report, that these disclosure controls and procedures are adequately designed and are operating effectively to ensure that information required to be disclosed by the registrant on Form N-CSR is (i) accumulated and communicated to the investment company’s management, including its certifying officers, to allow timely decisions regarding required disclosure; and (ii) recorded, processed, summarized and reported within the time periods specified in the Securities and Exchange Commission’s rules and forms.
There were no changes in the registrant’s internal control over financial reporting (as defined in Rule 30a-3(d) under the Act (17 CFR 270.30a-3(d)) that occurred during the fourth fiscal quarter of the period covered by this report that have materially affected or are reasonably likely to materially affect the registrant’s internal control over financial reporting.
Item 12. Exhibits.
(a)(1) Code of ethics that is subject to Item 2 is attached hereto.
(a)(2) Certifications pursuant to Rule 30a-2(a) are attached hereto.
(a)(3) Not applicable.
(a)(4) Proxy voting policies and procedures pursuant to Item 7 are attached hereto.
(b) Certifications pursuant to Rule 30a-2(b) are furnished herewith.
SIGNATURES
Pursuant to the requirements of the Securities Exchange Act of 1934 and the Investment Company Act of 1940, the registrant has duly caused this report to be signed on its behalf by the undersigned, thereunto duly authorized.
| | |
| (Registrant) | | The Endowment Master Fund, L.P. |
| | |
| |
| By (Signature and Title) | | /s/ John A. Blaisdell |
| | John A. Blaisdell |
| | Co-Principal Executive Officer |
| | |
| |
| By (Signature and Title) | | /s/ Andrew B. Linbeck |
| | Andrew B. Linbeck |
| | Co-Principal Executive Officer |
| | |
| |
| By (Signature and Title) | | /s/ A. Haag Sherman |
| | A. Haag Sherman |
| | Co-Principal Executive Officer |
Pursuant to the requirements of the Securities Exchange Act of 1934 and the Investment Company Act of 1940, this report has been signed below by the following persons on behalf of the registrant and in the capacities and on the dates indicated.
| | |
| By (Signature and Title) | | /s/ John A. Blaisdell |
| | John A. Blaisdell |
| | Co-Principal Executive Officer |
| | |
| |
| By (Signature and Title) | | /s/ Andrew B. Linbeck |
| | Andrew B. Linbeck |
| | Co-Principal Executive Officer |
| | |
| |
| By (Signature and Title) | | /s/ A. Haag Sherman |
| | A. Haag Sherman |
| | Co-Principal Executive Officer |
| | |
| |
| By (Signature and Title) | | /s/ John E. Price |
| | John E. Price |
| | Principal Financial Officer |