UNITED STATES
SECURITIES AND EXCHANGE COMMISSION
Washington, DC 20549
FORM N-CSR
CERTIFIED SHAREHOLDER REPORT OF REGISTERED
MANAGEMENT INVESTMENT COMPANY
Investment Company Act file number 811-21527
The Endowment Master Fund, L.P.
(Exact name of registrant as specified in charter)
4265 SAN FELIPE, SUITE 800, HOUSTON, TX 77027
(Address of principal executive offices) (Zip code)
| | |
| | With a copy to: |
| John A. Blaisdell | | George J. Zornada |
| The Endowment Master Fund, L.P. | | K & L Gates LLP |
| 4265 San Felipe, Suite 800 | | State Street Financial Center |
| Houston, TX 77027 | | One Lincoln St. |
| (Name and address of agent for service) | | Boston, MA 02111-2950 |
| | (617) 261-3231 |
Registrant’s telephone number, including area code: 800-725-9456
Date of fiscal year end: 12/31/12
Date of reporting period: 12/31/12
Item 1. Reports to Stockholders.
the
ENDOWMENT FUND
The Endowment Master Fund, L.P.
Shareholders’ Report
December 31, 2012
TABLE OF CONTENTS

Dear TEF Partners,
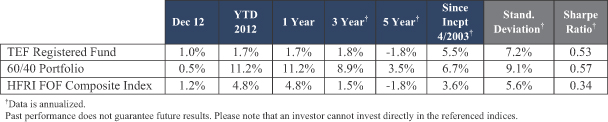
The goal of The Endowment Fund (“the Fund”)1 is to generate a high-quality return stream that targets approximately half the historical volatility of equities (8% target standard deviation) with very low correlation to traditional stocks and bonds. By pooling our investors’ capital together in an effort to achieve a size, scale, and portfolio structure similar in design to leading institutional portfolios, the Fund seeks to compound capital as efficiently as possible with a carefully managed volatility target.
Introducing Lee Partridge as Chief Investment Officer
As you may already be aware, Endowment Advisers, L.P. the registered investment adviser to The Endowment Fund, recently named Lee G. Partridge as the Fund’s Chief Investment Officer. Lee has already taken over the day-to-day management of the portfolio with a plan for improving the Fund’s liquidity profile and boosting risk-adjusted returns while maintaining a target portfolio volatility of approximately half that of the US equity market (roughly a 7-8% annualized standard deviation target).
Mr. Partridge has shown an ability to deliver results at the helm of a $9 billion dollar public pension fund as evidenced by his being named 2012 Small Public Fund Manager of the Year by Institutional Investor. His prior experience includes eight years as a key contributor to one of the largest and most respected public pension plans in the U.S, the Teachers Retirement System of Texas (“TRS”), culminating in his role as Deputy CIO. During his time at TRS, Mr. Partridge’s management responsibilities included risk management, quantitative analysis and asset allocation, and oversight of the external manager program, including hedge funds and private equity, energy and real estate.
We believe that Lee’s portfolio management style is ideally suited to the goals of improving the Fund’s performance and its liquidity profile, while also being consistent with the investment objectives and restrictions of the Fund. Lee’s philosophy is to build systematic, balanced risk portfolios that are implemented efficiently, target a specific level of overall volatility, and incur manager fees only for alpha. This mindset leads him to utilize a capital efficient, low-cost approach seeking to “harvest” returns from core asset classes like equities, credit, interest rates (government bonds) and commodities. Lee is a leader in the development and
1 The Endowment Fund has a variety of feeders, which all feed into a single “master” fund called The Endowment Master Fund, L.P. Each “feeder” fund has different expense ratios, which provide for slightly different returns from one “feeder” fund to the next. Accordingly, unless otherwise specified, the returns outlined herein are those of The Endowment Registered Fund, L.P., which is the largest “feeder” fund in The Endowment Fund complex. Your returns may vary, based on the feeder in which you invest and the timing of your investment. Please consult your capital account statement for the exact returns of your investment.
1
implementation of systematic, lower-cost, liquid replacements for certain traditionally high-fee hedge fund strategies like trend-followers or “managed futures” that profit from market momentum, as well as other alternative beta strategies. With the support of his investment team, Lee plans to implement some of those strategies directly in order to efficiently “gather” these potentially diversifying return streams. He also intends to focus the Fund’s hedge fund portfolio with larger allocations to fewer funds, primarily within the global macro and relative value style categories, which he believes are the most fertile ground for managers who “hunt” for excess return or alpha.
We believe that the combination of a more efficient, lower-cost portfolio, improved performance and ongoing management and maturation of a seasoned private equity portfolio will, over time, return the Fund to its target mix of private and non-private investments and boost risk-adjusted returns in the process.
Economic Overview – Deleveraging & Policy Risk
Nearly four years after the financial crisis ended in March 2009, the US economy continues to muddle-through its weakest recovery in more than sixty years. Unlike “normal” business cycles, the Federal Reserve has not been able to restore the economy to trend growth even after dropping its policy interest rate to zero and expanding its balance sheet by trillions of dollars through direct asset purchases (often called “quantitative easing” or “QE” for short). In response to unprecedented Fed policy action, economic growth is still running below its long term average, the money supply has only increased at a sluggish pace, and policymakers are more concerned about Japanese-style deflation than inflation.2 So what is going on today that is so different than every other business cycle in recent memory? Why is real GDP growth only running around 2% per year? We believe the answer has to do with what is currently happening in the credit markets, as you can see in the graph below.
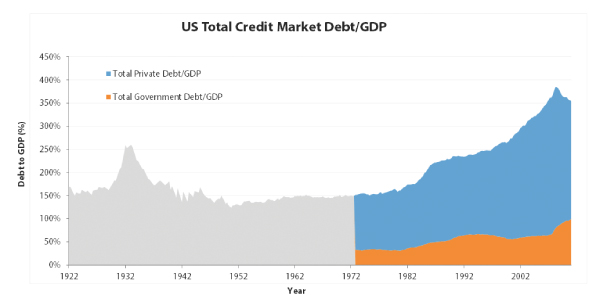
Source: Federal Reserve z.1 Report, Statistical Abstract of the United States. January 2013.
Credit typically acts like fuel for economic growth. As we saw in the United States from 1944 to 2009, credit expansion can drive unnaturally strong economic growth as cash flows and additional borrowing boost consumption and investment; while credit deleveraging, which last occurred in the United States from 1929 to
2 Koo, Richard, (2012). The World in Balance Sheet Recession: Causes, Cures, and Politics. Real World Economics Review, Issue 58, 19-37.
2
1943, can impose unnaturally weak economic growth as cash flows are diverted to retire debts incurred in previous years.
After the largest credit expansion in history and a truly global financial crisis, the United States economy – along with the rest of the developed world – has just begun a long process of deleveraging, which is already dragging on growth, suppressing interest rates, and distorting the market cycle. We believe understanding this deleveraging environment and its implications for investing is an important task for anyone who chooses to put capital at risk today.
Fortunately, balance sheet deleveraging is not uncommon throughout history.3 Although we have never seen the entire developed world simultaneously deleverage from such high private and public debt loads, there have been 32 relevant deleveraging episodes around the world since 1930 and all of them followed major financial crises. Building on insights from Carmen Reinhart and Kenneth Rogoff, recent research from the McKinsey Global Institute reveals that an economy can deleverage four ways: (1) belt-tightening or austerity, (2) default or restructuring, (3) inflation, and (4) rapid economic growth.4
| | (1) | Austerity: Reduces debt slowly relative to income by increasing savings and reducing spending. This process of slowly paying down debt typically takes many years, if not decades, and leads to below average real GDP growth. Central banks and federal governments typically play a key role in engineering this kind of deleveraging. Policy errors can result in the “default” path, but the right mix of monetary and fiscal policy can produce what many would refer to as “beautiful deleveraging.” Most economies have followed this deleveraging path since 1930, but rarely from such high private and public debt levels across the developed world. (Example: United States from 2009 to 2013) |
| | (2) | Default: Reduces outstanding debts through refusing or rescheduling debt payments. This process can be swift and painful since it often results in collapsing income and money supply. Defaults can lead to disorderly deleveraging and often bring on full-scale depression. The resulting fall in income typically leads to a rise in debt relative to income, meaning that another form of deleveraging must follow. Although the United States avoided this painful path in early 2009, it can still happen in the event of a major policy error. (Example: United States from 1929 to 1932) |
| | (3) | Inflation: Reduces debt to income as high inflation causes nominal incomes to rise faster than nominal debt. High inflation may boost nominal growth, but it typically slows real GDP growth over the same period. Although many investors are worried about inflation today, deleveraging basically “breaks” the credit creation process and most often prevents the self-reinforcing cycle of rising wages, spending, and prices. Throughout history, deleveraging through inflation has typically happened when central banks lose their credibility and a currency collapses. Despite widespread fears about the US Dollar, it is still the “cleanest dirty shirt” of the major reserve currencies. Thus, we believe high inflation or hyperinflation is a low probability outcome until the private sector deleverages enough for the credit creation process to resume. (Example: Spain from 1976 to 1980) |
| | (4) | Growth: Reduce debt to income through rapid real income growth. Deleveraging through growth has only happened once after a major financial crisis since 1930, and it happened as the United States was massively mobilizing for World War II. We believe this path is the least likely outcome for today’s deleveraging, although a “game changing” technological innovation could induce rapid growth, in theory. (Example: United States from 1933 to 1939) |
Now that credit expansion has given way to deleveraging in the United States (and across most of developed world) many investors are not prepared for an economic environment with potentially sluggish real GDP growth, zero interest rates, and little room for policy mistakes. We believe this deleveraging process has years to run and
3 The Great Deleveraging, (2012). UBS Financial Services Inc.
4 Roxburgh, Charles, Susan Lund, Tony Wimmer, Eric Amar, Charles Atkins, Ju-Hon Kwek, Richard Dobbs, James Manyika, (2010). Debt and Deleveraging: The Global Credit Bubble and its Economic Consequences.
3
will likely drag on today’s growth as current cash flows are used to retire debts incurred in the past. So far, the mix of debt reduction and policy intervention has been one of the most “beautiful” on record; but we believe this will continue to be a challenging task for policymakers with potential downside risk to markets as fiscal policy becomes less accommodative and the effects of aging demographics create additional challenges.
This long-term economic outlook is why we are focusing our resources at The Endowment Fund to improve the efficiency of the public investments portfolio and balance the Fund’s asset allocation to different economic scenarios. We believe these enhancements put the Fund in a better position to complement our investors’ existing portfolio allocations and deliver the potential risk/return results our investors expect.
Portfolio Update
We have made significant progress toward repositioning the portfolio to improve overall efficiency while simultaneously instituting a more intentional risk management structure for the fund. The efficiency is primarily driven by an emphasis on achieving what we would consider to be a meaningful level of diversification across asset classes and active strategies – consistent with the objectives of an endowment-style portfolio – while attempting to distinguish between market returns and active return streams that are principally driven by manager skill. Our goal is to manage our exposures to various asset classes through lower cost, direct investments while reserving more expensive hedge fund allocations for strategies that are characterized by the skill of the manager or her access to unique asset types that would not be available through lower cost alternatives.
Accordingly, we are in the process of redeeming from a number of hedge funds that we believe combine market returns and manager skill in a less efficient manner. Since December 31, 2012, we have identified redemptions from 16 hedge funds representing $450 million that did not meet our criteria. We will be making new commitments to hedge funds that will serve as a complement to the directly implement portfolio in the near future. Those funds will principally be categorized as either global opportunistic or arbitrage strategies that offer a complement to traditional equity, fixed income and commodity-related asset classes. Cash and cash equivalent levels have increased from $415 million on December 31, 2012 to $942 million on January 31, 2013; however, it is important to note that this increase in cash is being used to back our exposures to asset classes that are being managed through futures and swaps as an important part of our direct investment program. We believe this implementation framework has the advantage of greater liquidity, lower cost and greater precision in managing exposures.
The following table illustrates some of the changes we’ve made with respect to our asset allocation over the past month. The objective of these changes was to balance the risk exposure of the total portfolio across asset classes while simultaneously seeking to achieve an 8% standard deviation of returns across a variety of market environments.
| | | | | | | | | | | | |
| | | | 12/31/2012 | | | | 1/31/2013 | | | | Change | |
Domestic Equity | | | 14.55% | | | | 9.08% | | | | -5.47% | |
Int’l Equity | | | 8.14% | | | | 17.01% | | | | 8.88% | |
Global Opportunistic | | | 15.03% | | | | 9.40% | | | | -5.63% | |
Arbitrage Strategies | | | 9.03% | | | | 7.63% | | | | -1.40% | |
Real Estate | | | 6.28% | | | | 6.18% | | | | -0.10% | |
Energy | | | 6.58% | | | | 11.41% | | | | 4.83% | |
Natural Resources | | | 7.14% | | | | 13.49% | | | | 6.34% | |
Private Equity | | | 21.15% | | | | 20.96% | | | | -0.19% | |
Traditional Fixed Income | | | 10.12% | | | | 18.49% | | | | 8.38% | |
Enhanced Fixed Income | | | 12.45% | | | | 22.86% | | | | 10.41% | |
| | | 110.48% | | | | 136.52% | | | | 26.04% | |
4
Since we began discussing these changes with investors, one of the most frequent questions we’ve received has been: “are we moving away from a traditional fund-of-fund structure?” The answer is a definitive “yes” – as we see traditional fund-of-funds facing the same challenges of high cost structures, unpredictable risk profiles and opaque structures. The second most asked question is: “are we creating our own hedge fund?” The answer here is a definitive “no.” The Endowment Fund has always been positioned as an endowment-style portfolio – broadly diversified across both public and private assets that had both an actively managed element associated with them but also an active asset allocation component that was determined by the investment team at the fund. That remains the case today and we recognize that we must continue adapting to an ever changing investment landscape to add value to our investors. For us that simply means targeting diversification, lowering cost and managing risk as effectively as possible as we head into the future.
Private Investments Update & Outlook
As we have discussed in previous letters, a principal difference between university endowments and individual investors is their longer time-horizon in managing money. We believe that taking a multi-year outlook on valuation trends, investment themes, and strategies may potentially add value over time by cutting through the noise involved in shorter-term, often emotional trading. To that end, many of the largest university endowments such as Harvard, Yale, and the University of Texas have strategically built-up large, illiquid, and broadly diversified allocations to private strategies such as buyouts, venture capital, real estate, and energy/natural resources where many managers often have an information advantage due to the opaque nature of private markets and often times the ability to gain some level of direct control over their portfolio companies. In theory, these strategies should provide an illiquidity premium over public markets for patient investors willing to deploy capital at typically lower entry multiples (compared to private markets) and eventually exit at potential higher multiples (through initial public offerings or sales to strategic investors) after some sort of value-creation or turnaround process. The key ingredients are time, manager/management skill, and the prevailing market conditions at entry and exit.
Since inception, the Fund committed $1.51 billion to 108 positions. $1.12 billion of that capital has been called to date (representing roughly 74% of commitments) and is currently held at just over $1.06 billion. The private portfolio is valued relatively near cost at 1.2x initial cost today with the time and potential for that multiple to expand and contribute to the Fund’s overall return. By design, this portfolio is broadly diversified across strategies, geographies, and management companies; but we believe it has also benefited from good commitment timing. The Fund made over 75% of its commitments during, or immediately after, the global recession in 2007-2009, with an average vintage year of 2008 when P/E multiples were generally lower and credit spreads generally higher than in this current environment. Of course, the portfolio’s final multiple – and the extent to which it can contribute to the overall Fund’s performance – depends now on the exit environment, or the prevailing market conditions as our managers exit their underlying investments.
As we have discussed on recent investor calls, the private portfolio is moving into a new phase in its life-cycle where our underlying managers are actively pursuing exit strategies in many of their maturing portfolio companies and properties; and this shift from focusing primarily on value-enhancing activities to exit options is creating a trend where distributions are beginning to exceed capital calls across the portfolio. With favorable funding conditions supported by zero interest rate policies and open-ended quantitative easing commitments by key central banks, more political certainty after the recent US Congressional and Presidential elections, more clarity into tax treatment for companies and investors after the American Taxpayer Relief Act (passed on January 2, 2013 to reduce the impact of a “fiscal cliff”), and strong recent equity performance which typically supports demand for public offerings; based on our research we believe the conditions are favorable for heightened deal activity and the potential for higher exit multiples. Q4 2012 is supporting this notion across the private portfolio, but we are also seeing evidence in major deals covered by the news media.
While risks to domestic and global growth remain, we believe these forces are balanced, for now, by open-ended commitments to accommodative by major central banks. And in our view, the exit environment may remain
5
active throughout 2013. As IPO activity and strategic deals continue to build momentum this may prove supportive of managers seeking exits and could result in additional returns to the Fund as many managers are exiting companies at higher valuations than their previously stated net asset values.
Our private portfolio, which currently accounts for 32% of the overall Fund, contributed more than 200 basis points to the Fund’s headline return in 2012. Recent exits by the underlying managers in the private portfolio include the sale of a French IP network security firm to a strategic buyer in the cyber security industry, the sale of a Brazilian drugstore chain after a successful initial public offering, and the sale of two midstream natural gas companies with extensive assets in North Dakota’s Bakken shale and Oklahoma’s Woodford shale. In addition to these sale-oriented distributions, the Fund received large interest payments and dividends from several portfolio companies including a US-based satellite engineering firm, a Chinese pharmaceutical company, and a fast-growing IT firm providing outsourced support to Brazilian companies.
Though future performance in the private portfolio largely depends on the exit environment for our managers, we want to keep our investors up-to-date on recent activity. Please speak to your Financial Advisor or call our service desk at 1-800-725-9456 if you have any questions.
The Endowment Fund complex now stands at roughly $3.1 billion in assets under management from 13,823 limited partners.
We thank you for your continued support.
Regards,
Endowment Advisers, LP5
5 This letter is provided solely for informational purposes and is exclusively intended for use by existing Fund investors and/or pre-qualified prospective Fund investors with whom the Fund or an authorized intermediary acting on behalf of the Fund has a pre-existing substantive relationship. No other distribution or use of this newsletter has been authorized. Neither this letter nor the information contained therein constitutes an offer to sell or a solicitation of any offer to buy any securities. Any offering or solicitation will be made only to eligible investors and pursuant to the current version of the applicable Private Placement Memorandum and other governing documents, all of which must be read in their entirety.
6
Report of Independent Registered Public Accounting Firm
The Partners and Board of Directors The Endowment Master Fund, L.P.:
We have audited the accompanying statement of assets, liabilities and partners’ capital of The Endowment Master Fund, L.P. and subsidiary (the “Master Fund”), including the schedule of investments, as of December 31, 2012, and the related consolidated statements of operations and cash flows for the year then ended, the consolidated statements of changes in partners’ capital for each of the years in the two-year period then ended, and the consolidated financial highlights for each of the years in the five-year period then ended. These consolidated financial statements and financial highlights are the responsibility of the Master Fund’s management. Our responsibility is to express an opinion on these consolidated financial statements and financial highlights based on our audits.
We conducted our audits in accordance with the standards of the Public Company Accounting Oversight Board (United States). Those standards require that we plan and perform the audit to obtain reasonable assurance about whether the financial statements and financial highlights are free of material misstatement. An audit includes examining, on a test basis, evidence supporting the amounts and disclosures in the financial statements. Our procedures included confirmation of securities owned as of December 31, 2012, by correspondence with custodians and investees; or other appropriate auditing procedures. An audit also includes assessing the accounting principles used and significant estimates made by management, as well as evaluating the overall financial statement presentation. We believe that our audits provide a reasonable basis for our opinion.
In our opinion, the consolidated financial statements and financial highlights referred to above present fairly, in all material respects, the financial position of The Endowment Master Fund, L.P. and subsidiary as of December 31, 2012, the results of their operations and their cash flows for the year then ended, the changes in their partners’ capital for each of the years in the two-year period then ended and the financial highlights for each of the years in the five-year period then ended in conformity with U.S. generally accepted accounting principles.
KPMG LLP
Columbus, Ohio
March 1, 2013
7
THE ENDOWMENT MASTER FUND, L.P.
(A Limited Partnership)
Statement of Assets, Liabilities and Partners’ Capital
December 31, 2012
| | | | |
Assets | | | | |
Investments in Investment Funds, at fair value (cost $948,429,843) | | $ | 1,061,376,544 | |
Investments in affiliated Investment Funds, at fair value (cost $1,292,862,505) | | | 1,400,336,189 | |
Investments in securities, at fair value (cost $524,029,911) | | | 536,842,362 | |
Investments in derivative contracts, at fair value (cost $24,991,550) | | | 11,992,072 | |
| | | | |
Total investments | | | 3,010,547,167 | |
Cash and cash equivalents | | | 59,376,734 | |
Segregated cash balances with brokers | | | 48,096,357 | |
Dividends receivable | | | 30,285 | |
Dividends receivable from affiliated investments | | | 78,786 | |
Receivable from investments sold | | | 154,915,824 | |
Receivable from affiliated investments sold | | | 25,038,567 | |
Prepaids and other assets | | | 146,655 | |
| | | | |
Total assets | | | 3,298,230,375 | |
| | | | |
Liabilities and Partners’ Capital | | | | |
Withdrawals payable | | | 212,502,259 | |
Investment Management Fees payable | | | 8,032,387 | |
Offshore withholding tax payable | | | 3,909,994 | |
Administration fees payable | | | 301,773 | |
Payable to Adviser | | | 24,952 | |
Payable to Directors | | | 113,375 | |
Accounts payable and accrued expenses | | | 1,611,452 | |
| | | | |
Total liabilities | | | 226,496,192 | |
| | | | |
Partners’ capital | | | 3,071,734,183 | |
| | | | |
Total liabilities and partners’ capital | | $ | 3,298,230,375 | |
| | | | |
See accompanying notes to consolidated financial statements.
8
THE ENDOWMENT MASTER FUND, L.P.
(A Limited Partnership)
Schedule of Investments
December 31, 2012
| | | | | | | | | | |
| | | Shares | | | Fair
Value | | | % of
Partners’
Capital |
| | | | | | | | | | |
Investments in Investment Funds | | | | | | | | | | |
Limited Partnerships, Exempted Limited Partnerships and Limited Liability Companies | | | | | | | | | | |
Bermuda | | | | | | | | | | |
Natural Resources (0.47% Partners’ Capital) | | | | | | | | | | |
HFR HE Bristol Master Trust (Series D)(2) | | | 25,000 | | | $ | 14,554,217 | | | |
| | | | | | | | | | |
Total Bermuda | | | | | | | 14,554,217 | | | |
| | | | | | | | | | |
Cayman Islands | | | | | | | | | | |
Arbitrage Strategies (0.06% Partners’ Capital) | | | | | | | | | | |
Montrica Global Opportunities Fund, L.P.(2) | | | 33,558 | | | | 1,709,302 | | | |
Natural Resources (0.94% Partners’ Capital) | | | | | | | | | | |
Sentient Global Resources Fund III, L.P. | | | | | | | 23,500,000 | | | |
Sentient Global Resources Fund IV, L.P.(1) | | | | | | | 5,500,000 | | | |
Private Equity (9.54% Partners’ Capital) | | | | | | | | | | |
ABRY Advanced Securities Fund, L.P.(1) | | | | | | | 16,814,365 | | | |
CX Partners Fund Limited(1)(2) | | | | | | | 13,201,649 | | | |
Gavea Investment Fund II A, L.P. | | | | | | | 1,569,121 | | | |
Gavea Investment Fund III A, L.P. | | | | | | | 64,385,441 | | | |
Hillcrest Fund, L.P.(1)(3) | | | | | | | 11,037,970 | | | |
India Asset Recovery Fund, L.P.(1) | | | | | | | 320,465 | | | |
J.C. Flowers III, L.P.(1) | | | | | | | 8,661,509 | | | |
LC Fund IV, L.P.(2) | | | | | | | 25,438,063 | | | |
New Horizon Capital III, L.P.(1)(2) | | | | | | | 30,360,563 | | | |
Northstar Equity Partners III Limited | | | | | | | 4,481,983 | | | |
Orchid Asia IV, L.P.(1) | | | | | | | 11,897,734 | | | |
Reservoir Capital Partners (Cayman), L.P. | | | | | | | 12,249,549 | | | |
Tiger Global Private Investment Partners IV, L.P.(1) | | | | | | | 9,437,004 | | | |
Tiger Global Private Investment Partners V, L.P.(1) | | | | | | | 18,943,150 | | | |
Tiger Global Private Investment Partners VI, L.P.(1) | | | | | | | 8,609,598 | | | |
Trustbridge Partners II, L.P.(1)(2) | | | | | | | 18,128,802 | | | |
Trustbridge Partners III, L.P.(1)(2) | | | | | | | 30,761,365 | | | |
Trustbridge Partners IV, L.P. | | | | | | | 6,912,110 | | | |
Real Estate (1.38% Partners’ Capital) | | | | | | | | | | |
Forum European Realty Income III, L.P.(2) | | | | | | | 14,498,808 | | | |
Phoenix Asia Real Estate Investments II, L.P.(1)(2) | | | | | | | 13,837,318 | | | |
Phoenix Real Estate Fund (T) L.P. | | | | | | | 14,003,922 | | | |
| | | | | | | | | | |
Total Cayman Islands | | | | | | | 366,259,791 | | | |
| | | | | | | | | | |
See accompanying notes to consolidated financial statements.
9
THE ENDOWMENT MASTER FUND, L.P.
(A Limited Partnership)
Schedule of Investments, continued
December 31, 2012
| | | | | | | | |
| | | Shares | | Fair
Value | | | % of
Partners’
Capital |
| | | | | | | | |
Limited Partnerships, Exempted Limited Partnerships and Limited Liability Companies (continued) | | | | | | | | |
Guernsey | | | | | | | | |
Private Equity (0.25% Partners’ Capital) | | | | | | | | |
Mid Europa Fund III L.P. | | | | $ | 7,582,031 | | | |
| | | | | | | | |
Total Guernsey | | | | | 7,582,031 | | | |
| | | | | | | | |
Republic of Mauritius | | | | | | | | |
Real Estate (0.10% Partners’ Capital) | | | | | | | | |
Orbis Real Estate Fund I(2) | | | | | 2,988,770 | | | |
| | | | | | | | |
Total Republic of Mauritius | | | | | 2,988,770 | | | |
| | | | | | | | |
United Kingdom | | | | | | | | |
Private Equity (0.51% Partners’ Capital) | | | | | | | | |
Darwin Private Equity I, L.P.(1) | | | | | 7,079,493 | | | |
Sovereign Capital Limited Partnership III(2) | | | | | 8,448,021 | | | |
Real Estate (0.28% Partners’ Capital) | | | | | | | | |
Benson Elliott Real Estate Partners II, L.P. | | | | | 1,992,899 | | | |
Patron Capital L.P. II | | | | | 725,892 | | | |
Patron Capital L.P. III | | | | | 5,895,930 | | | |
| | | | | | | | |
Total United Kingdom | | | | | 24,142,235 | | | |
| | | | | | | | |
United States | | | | | | | | |
Arbitrage Strategies (6.87% Partners’ Capital) | | | | | | | | |
Citadel Wellington LLC | | | | | 56,694,635 | | | |
Eton Park Fund, L.P. | | | | | 29,794,506 | | | |
Investcorp Silverback Arbitrage Fund, LLC(3) | | | | | 17,607,743 | | | |
Kenmont Onshore Fund, L.P.(2) | | | | | 213,776 | | | |
King Street Capital, L.P. | | | | | 1,035,695 | | | |
Magnetar Capital Fund, L.P.(2) | | | | | 8,869,901 | | | |
Magnetar SPV, LLC (Series L)(3) | | | | | 13,008,600 | | | |
Millennium USA, L.P. | | | | | 25,927,424 | | | |
OZ Asia Domestic Partners, L.P.(1) | | | | | 2,937,530 | | | |
PIPE Equity Partners, L.L.C.(3) | | | | | 18,231,147 | | | |
PIPE Select Fund, L.L.C.(3) | | | | | 34,326,724 | | | |
Stark Investments Limited Partnership(1) | | | | | 374,701 | | | |
Stark Select Asset Fund, LLC | | | | | 2,059,656 | | | |
Domestic Equity (5.48% Partners’ Capital) | | | | | | | | |
CCM Small Cap Value Qualified Fund, L.P.(3) | | | | | 15,016,101 | | | |
Empire Capital Partners Enchanced, L.P.(1)(2) | | | | | 22,543,401 | | | |
HealthCor, L.P. | | | | | 13,269,063 | | | |
Hound Partners, L.P.(2) | | | | | 40,528,040 | | | |
Ithan Creek Partners, L.P. | | | | | 16,850,869 | | | |
See accompanying notes to consolidated financial statements.
10
THE ENDOWMENT MASTER FUND, L.P.
(A Limited Partnership)
Schedule of Investments, continued
December 31, 2012
| | | | | | | | | | |
| | | Shares | | | Fair
Value | | | % of
Partners’
Capital |
| | | | | | | | | | |
Limited Partnerships, Exempted Limited Partnerships and Limited Liability Companies (continued) | | | | | | | | | | |
United States (continued) | | | | | | | | | | |
Domestic Equity (5.48% Partners’ Capital) (continued) | | | | | | | | | | |
JAT Capital Domestic Fund, L.P. | | | | | | $ | 27,303,802 | | | |
Kior Shares Liquidating Capital Account | | | | | | | 1,498,841 | | | |
Samlyn Onshore Fund, L.P. | | | | | | | 2,497,134 | | | |
Tiger Consumer Partners, L.P. | | | | | | | 29,000,955 | | | |
Energy (6.88% Partners’ Capital) | | | | | | | | | | |
ArcLight Energy Partners Fund IV, L.P.(1) | | | | | | | 3,723,868 | | | |
ArcLight Energy Partners Fund V, L.P.(1) | | | | | | | 2,410,634 | | | |
CamCap Resources, L.P. | | | | | | | 408,074 | | | |
EnCap Energy Capital Fund VII-B, L.P.(1) | | | | | | | 4,911,187 | | | |
EnCap Energy Infrastructure TE Feeder, L.P.(1)(2) | | | | | | | 5,883,315 | | | |
Intervale Capital Fund, L.P.(2) | | | | | | | 12,192,477 | | | |
Merit Energy Partners G, L.P.(1) | | | | | | | 11,451,594 | | | |
NGP Energy Technology Partners II, L.P. | | | | | | | 5,445,472 | | | |
NGP IX Offshore Fund, L.P.(1) | | | | | | | 31,082,065 | | | |
NGP Midstream & Resources, L.P.(1) | | | | | | | 45,427,423 | | | |
Quantum Parallel Partners V, L.P. | | | | | | | 13,269,063 | | | |
Tenaska Power Fund II-A, L.P.(1) | | | | | | | 17,855,284 | | | |
The Energy & Minerals Group Fund II(1) | | | | | | | 5,083,225 | | | |
Velite Energy, L.P.(1)(2) | | | | | | | 52,142,437 | | | |
Enhanced Fixed Income (12.11% Partners’ Capital) | | | | | | | | | | |
BDCM Partners I, L.P.(3) | | | | | | | 52,228,921 | | | |
Bell Point Credit Opportunities Fund, L.P.(2) | | | | | | | 6,997,504 | | | |
Contrarian Capital Fund I, L.P. | | | | | | | 32,133,249 | | | |
Courage Special Situations Fund, L.P.(2) | | | | | | | 11,274,007 | | | |
Credit Distressed Blue Line Fund, L.P.(3) | | | | | | | 23,635,066 | | | |
Fortelus Special Situations Fund, L.P.(2) | | | | | | | 8,370,867 | | | |
Halcyon European Structured Opportunities Fund, L.P.(3) | | | | | | | 313,229 | | | |
Harbinger Capital Partners Fund I, L.P.(3) | | | | | | | 26,663,600 | | | |
Harbinger Capital Partners Fund II, L.P. | | | | | | | 2,129,203 | | | |
Harbinger Capital Partners Special Situations Fund, L.P.(2) | | | | | | | 3,057,321 | | | |
Harbinger Class L Holdings (U.S.), LLC | | | | | | | 286,404 | | | |
Harbinger Class LS Holdings (U.S.) Trust | | | 10,925 | | | | 1,881,375 | | | |
Harbinger Class PE Holdings (U.S.) Trust | | | 12 | | | | 1,972,048 | | | |
Indaba Capital Partners, L.P.(2) | | | | | | | 37,815,007 | | | |
Morgan Rio Capital Fund, L.P.(3) | | | | | | | 26,137,821 | | | |
Paulson Credit Opportunities, L.P. | | | | | | | 13,836,911 | | | |
See accompanying notes to consolidated financial statements.
11
THE ENDOWMENT MASTER FUND, L.P.
(A Limited Partnership)
Schedule of Investments, continued
December 31, 2012
| | | | | | | | | | |
| | | Shares | | | Fair
Value | | | % of
Partners’
Capital |
| | | | | | | | | | |
Limited Partnerships, Exempted Limited Partnerships and Limited Liability Companies (continued) | | | | | | | | | | |
United States (continued) | | | | | | | | | | |
Enhanced Fixed Income (12.11% Partners’ Capital) (continued) | | | | | | | | | | |
Prospect Harbor Credit Partners, L.P. | | | | | | $ | 3,445,003 | | | |
Providence MBS Fund L.P.(2) | | | | | | | 110,686,933 | | | |
Q Funding III, L.P.(2) | | | | | | | 6,954,231 | | | |
Q4 Funding, L.P. | | | | | | | 2,141,625 | | | |
Global Opportunistic (14.09% Partners’ Capital) | | | | | | | | | | |
Atlas Institutional Fund, LLC(2) | | | | | | | 27,572,983 | | | |
Corriente China Opportunity Partners II, L.P.(2) | | | | | | | 9,340,103 | | | |
Corriente China Opportunity Partners, L.P.(2) | | | | | | | 4,154,606 | | | |
EDF-MI Onshore, L.P.(3) | | | | | | | 19,918,214 | | | |
Falcon Edge Global, L.P.(2) | | | | | | | 50,076,564 | | | |
Hayman Capital Partners, L.P.(2) | | | | | | | 57,552,275 | | | |
Passport Global Strategies III, Ltd. | | | 1,211 | | | | 751,847 | | | |
Passport II, L.P.(2) | | | | | | | 35,193,648 | | | |
Senator Global Opportunity Fund L.P. | | | | | | | 19,019,330 | | | |
Tiger Global, L.P. | | | | | | | 51,937,660 | | | |
Valiant Capital Partners, L.P.(1)(2) | | | | | | | 133,357,975 | | | |
Viking Global Equities, L.P. | | | | | | | 23,966,138 | | | |
International Equity (1.86% Partners’ Capital) | | | | | | | | | | |
Penta Asia Domestic Partners, L.P. | | | | | | | 6,016,872 | | | |
Steel Partners Japan Strategic Fund, L.P. | | | | | | | 2,449,460 | | | |
TAEF Fund, LLC | | | | | | | 7,416,117 | | | |
Tybourne Equity (U.S.) Fund(2) | | | | | | | 41,247,237 | | | |
Natural Resources (0.00% Partners’ Capital) | | | | | | | | | | |
Tocqueville Gold Partners, L.P. | | | | | | | 24,662 | | | |
Private Equity (11.89% Partners’ Capital) | | | | | | | | | | |
Accel-KKR Capital Partners III, L.P. | | | | | | | 12,710,000 | | | |
Advent Latin American Private Equity Fund IV-F, L.P.(1) | | | | | | | 8,139,898 | | | |
Advent Latin American Private Equity Fund V-F, L.P. | | | | | | | 6,741,293 | | | |
Audax Mezzanine Fund II, L.P.(1) | | | | | | | 2,483,831 | | | |
Audax Mezzanine Fund III, L.P.(1) | | | | | | | 7,545,787 | | | |
BDCM Opportunity Fund II, L.P.(1) | | | | | | | 9,516,906 | | | |
Black River Commodity Multi-Strategy Fund, LLC | | | | | | | 865,037 | | | |
Capital Royalty Partners, L.P.(1) | | | | | | | 1,049,108 | | | |
Catterton Growth Partners, L.P.(1)(2) | | | | | | | 13,358,969 | | | |
CEF-Safety Kleen Liquidating Account(1) | | | 8,665 | | | | 162,773 | | | |
Chrysalis Ventures III, L.P. | | | | | | | 1,975,966 | | | |
See accompanying notes to consolidated financial statements.
12
THE ENDOWMENT MASTER FUND, L.P.
(A Limited Partnership)
Schedule of Investments, continued
December 31, 2012
| | | | | | | | | | |
| | | Shares | | | Fair
Value | | | % of
Partners’
Capital |
| | | | | | | | | | |
Limited Partnerships, Exempted Limited Partnerships and Limited Liability Companies (continued) | | | | | | | | | | |
United States (continued) | | | | | | | | | | |
Private Equity (11.89% Partners’ Capital) (continued) | | | | | | | | | | |
Crosslink Crossover Fund IV, L.P. | | | | | | $ | 967,216 | | | |
Crosslink Crossover Fund V, L.P. | | | | | | | 4,822,536 | | | |
Crosslink Crossover Fund VI, L.P. | | | | | | | 15,075,253 | | | |
Dace Ventures I, L.P.(2) | | | | | | | 1,633,643 | | | |
Fairhaven Capital Partners, L.P. | | | | | | | 7,619,853 | | | |
Garrison Opportunity Fund II A, LLC | | | | | | | 14,432,566 | | | |
Garrison Opportunity Fund, LLC(2) | | | | | | | 23,376,632 | | | |
HealthCor Partners Fund, L.P.(2) | | | | | | | 8,386,656 | | | |
Highland Credit Strategies Liquidation Vehicle Onshore | | | | | | | 2,811,406 | | | |
Integral Capital Partners VIII, L.P.(2) | | | | | | | 3,142,555 | | | |
L-R Global Partners, L.P. | | | | | | | 405,084 | | | |
MatlinPatterson Global Opportunities Partners III, L.P.(1) | | | | | | | 9,161,111 | | | |
Middle East North Africa Opportunities Fund, L.P.(3) | | | 5,089 | | | | 1,516,120 | | | |
Monomoy Capital Partners II, L.P.(1) | | | | | | | 5,012,412 | | | |
Monomoy Capital Partners, L.P. | | | | | | | 3,522,064 | | | |
Monsoon India Inflection Fund 2, L.P. | | | | | | | 410,432 | | | |
Monsoon India Inflection Fund, L.P. | | | | | | | 227,169 | | | |
Pine Brook Capital Partners, L.P.(1) | | | | | | | 17,677,555 | | | |
Pinto America Growth Fund, L.P.(1) | | | | | | | 1,680,840 | | | |
Private Equity Investment Fund IV, L.P.(1)(2) | | | | | | | 5,783,277 | | | |
Private Equity Investment Fund V, L.P.(1)(2) | | | | | | | 38,463,168 | | | |
Saints Capital VI, L.P.(1)(2) | | | | | | | 19,331,961 | | | |
Sanderling Venture Partners VI Co-Investment Fund, L.P. | | | | | | | 2,215,534 | | | |
Sanderling Venture Partners VI, L.P. | | | | | | | 1,550,465 | | | |
Sterling Capital Partners II, L.P.(1) | | | | | | | 2,075,665 | | | |
Sterling Group Partners II, L.P. | | | | | | | 1,147,336 | | | |
Sterling Group Partners III, L.P. | | | | | | | 10,654,649 | | | |
Strategic Value Global Opportunities Fund I-A, L.P. | | | | | | | 2,593,423 | | | |
Tenaya Capital V, L.P. | | | | | | | 7,571,639 | | | |
Tenaya Capital VI, L.P. | | | | | | | 917,601 | | | |
The Column Group, L.P. | | | | | | | 9,798,773 | | | |
The Founders Fund III, L.P. | | | | | | | 12,206,595 | | | |
The Founders Fund IV, L.P. | | | | | | | 4,690,842 | | | |
The Raptor Private Holdings, L.P. | | | 4,034 | | | | 2,160,418 | | | |
Trivest Fund IV, L.P.(1)(2) | | | | | | | 18,805,260 | | | |
See accompanying notes to consolidated financial statements.
13
THE ENDOWMENT MASTER FUND, L.P.
(A Limited Partnership)
Schedule of Investments, continued
December 31, 2012
| | | | | | | | | | | | |
| | | Shares | | | Fair
Value | | | % of
Partners’
Capital | |
| | | | | | | | | | | | |
Limited Partnerships, Exempted Limited Partnerships and Limited Liability Companies (continued) | | | | | | | | | | | | |
United States (continued) | | | | | | | | | | | | |
Private Equity (11.89% Partners’ Capital) (continued) | | | | | | | | | | | | |
Tuckerbrook SB Global Distressed Fund I, L.P.(2) | | | | | | $ | 5,734,262 | | | | | |
VCFA Private Equity Partners IV, L.P.(1) | | | | | | | 1,772,152 | | | | | |
VCFA Venture Partners V, L.P.(1) | | | | | | | 7,223,564 | | | | | |
Voyager Capital Fund III, L.P. | | | | | | | 3,281,684 | | | | | |
WestView Capital Partners II, L.P.(2) | | | | | | | 20,785,579 | | | | | |
Real Estate (4.28% Partners’ Capital) | | | | | | | | | | | | |
Aslan Realty Partners III, L.L.C. | | | | | | | 365,823 | | | | | |
Cypress Realty VI, L.P. | | | | | | | 6,116,905 | | | | | |
Florida Real Estate Value Fund, L.P.(1)(2) | | | | | | | 8,267,040 | | | | | |
GTIS Brazil Real Estate Fund (Brazilian Real), L.P.(2) | | | | | | | 23,955,679 | | | | | |
Lone Star Real Estate Fund II (U.S.) L.P. | | | | | | | 4,261,480 | | | | | |
Monsoon Infrastructure & Realty Co-Invest, L.P.(2) | | | | | | | 16,036,064 | | | | | |
Northwood Real Estate Co-Investors L.P.(1) | | | | | | | 6,156,436 | | | | | |
Northwood Real Estate Partners L.P.(1) | | | | | | | 12,277,097 | | | | | |
Parmenter Realty Fund III, L.P.(1) | | | | | | | 7,140,146 | | | | | |
Parmenter Realty Fund IV, L.P.(1)(2) | | | | | | | 4,066,506 | | | | | |
Pearlmark Mezzanine Realty Partners III, LLC(1)(2) | | | | | | | 16,113,000 | | | | | |
Pennybacker II, L.P.(1)(2) | | | | | | | 3,726,729 | | | | | |
SBC Latin America Housing US Fund, L.P.(1)(3) | | | | | | | 4,390,948 | | | | | |
Square Mile Partners III L.P.(1) | | | | | | | 18,478,657 | | | | | |
| | | | | | | | | | | | |
Total United States | | | | | | | 1,949,379,406 | | | | | |
| | | | | | | | | | | | |
Total Limited Partnerships, Exempted Limited Partnerships and Limited Liability Companies | | | | | | | 2,364,906,450 | | | | 76.99 | % |
| | | | | | | | | | | | |
Passive Foreign Investment Companies | | | | | | | | | | | | |
Bermuda Limited Liability Company | | | | | | | | | | | | |
Private Equity (0.10% Partners’ Capital) | | | | | | | | | | | | |
El Tejar Limited | | | 1,000,000 | | | | 3,000,000 | | | | | |
| | | | | | | | | | | | |
Total Bermuda Limited Liability Company | | | | | | | 3,000,000 | | | | | |
| | | | | | | | | | | | |
See accompanying notes to consolidated financial statements.
14
THE ENDOWMENT MASTER FUND, L.P.
(A Limited Partnership)
Schedule of Investments, continued
December 31, 2012
| | | | | | | | | | | | |
| | | Shares | | | Fair
Value | | | % of
Partners’
Capital | |
| | | | | | | | | | | | |
Passive Foreign Investment Companies (continued) | | | | | | | | | | | | |
Cayman Companies Limited by Shares, Exempted Companies and Limited Liability Companies | | | | | | | | | | | | |
Arbitrage Strategies (1.29% Partners’ Capital) | | | | | | | | | | | | |
CRC Credit Fund Ltd.(2) | | | 113,729 | | | $ | 32,253,833 | | | | | |
Overseas CAP Partners, Inc.(2) | | | 1,088 | | | | 7,432,940 | | | | | |
International Equity (0.85% Partners’ Capital) | | | | | | | | | | | | |
Quorum Fund Limited | | | 13,517 | | | | 819,194 | | | | | |
The Russian Prosperity Fund | | | 519,702 | | | | 25,278,305 | | | | | |
Natural Resources (0.29% Partners’ Capital) | | | | | | | | | | | | |
Ospraie Special Opportunities (Offshore), Ltd. | | | | | | | 8,910,279 | | | | | |
| | | | | | | | | | | | |
Total Cayman Companies Limited by Shares, Exempted Companies and Limited Liability Companies | | | | | | | 74,694,551 | | | | | |
| | | | | | | | | | | | |
Total Passive Foreign Investment Companies | | | | | | | 77,694,551 | | | | 2.53 | % |
| | | | | | | | | | | | |
Private Corporations | | | | | | | | | | | | |
United States | | | | | | | | | | | | |
Real Estate (0.62% Partners’ Capital) | | | | | | | | | | | | |
Legacy Partners Realty Fund II, Inc. | | | | | | | 3,037,000 | | | | | |
Legacy Partners Realty Fund III, Inc. | | | | | | | 6,914,000 | | | | | |
Net Lease Private REIT V, Inc.(1) | | | | | | | 1,543,669 | | | | | |
Net Lease Private REIT VI, Inc.(1) | | | | | | | 1,918,317 | | | | | |
Net Lease Private REIT VII, Inc.(1)(2) | | | | | | | 2,849,373 | | | | | |
Net Lease Private REIT VII-A, Inc.(1)(2) | | | | | | | 2,849,373 | | | | | |
| | | | | | | | | | | | |
Total Private Corporations | | | | | | | 19,111,732 | | | | 0.62 | % |
| | | | | | | | | | | | |
Total Investments in Investment Funds (Cost $2,241,292,348) | | | | | | | 2,461,712,733 | | | | 80.14 | % |
| | | | | | | | | | | | |
Investments in Securities | | | | | | | | | | | | |
Registered Investment Companies | | | | | | | | | | | | |
United States | | | | | | | | | | | | |
Exchange Traded Funds | | | | | | | | | | | | |
International Equity (4.08% Partners’ Capital) | | | | | | | | | | | | |
iShares MSCI EAFE Index Fund(1) | | | 527,000 | | | | 29,944,140 | | | | | |
iShares MSCI Japan Index Fund(1) | | | 3,267,000 | | | | 31,853,250 | | | | | |
Market Vectors Russia ETF(1) | | | 941,000 | | | | 28,201,770 | | | | | |
Vanguard MSCI Emerging Markets ETF(1) | | | 795,000 | | | | 35,401,350 | | | | | |
| | | | | | | | | | | | |
Total Exchange Traded Funds | | | | | | | 125,400,510 | | | | 4.08 | % |
| | | | | | | | | | | | |
See accompanying notes to consolidated financial statements.
15
THE ENDOWMENT MASTER FUND, L.P.
(A Limited Partnership)
Schedule of Investments, continued
December 31, 2012
| | | | | | | | | | | | |
| | | Shares | | | Fair
Value | | | % of
Partners’
Capital | |
| | | | | | | | | | | | |
Registered Investment Companies (continued) | | | | | | | | | | | | |
United States (continued) | | | | | | | | | | | | |
Money Market Funds (10.01% Partners’ Capital) | | | | | | | | | | | | |
JPMorgan 100% U.S. Treasury Securities Money Market Fund(1) | | | 307,280,491 | | | $ | 307,280,491 | | | | | |
| | | | | | | | | | | | |
Total Money Market Funds | | | | | | | 307,280,491 | | | | 10.01 | % |
| | | | | | | | | | | | |
Open End Funds | | | | | | | | | | | | |
Domestic Equity (3.39% Partners’ Capital) | | | | | | | | | | | | |
GMO Quality Fund IV(1) | | | 4,660,464 | | | | 104,161,361 | | | | | |
| | | | | | | | | | | | |
Total Open End Funds | | | | | | | 104,161,361 | | | | 3.39 | % |
| | | | | | | | | | | | |
Total Registered Investment Companies | | | | | | | 536,842,362 | | | | 17.48 | % |
| | | | | | | | | | | | |
Total Investments in Securities (Cost $524,029,911) | | | | | | | 536,842,362 | | | | 17.48 | % |
| | | | | | | | | | | | |
Derivative Contracts—Assets | | | | | | | | | | | | |
Call Options Purchased | | | | | | | | | | | | |
United States | | | | | | | | | | | | |
CMS 10 Year One Look Cap, 10 Year USD Swap Rate (Strike Rate 5.50%, Expiration 05/01/19) | | | 1,079,000,000 | | | | 3,560,700 | | | | | |
CMS 10 Year One Look Cap, 10 Year USD Swap Rate (Strike Rate 5.62%, Expiration 05/02/19) | | | 714,285,714 | | | | 3,035,714 | | | | | |
CMS 10 Year One Look Cap, 10 Year USD Swap Rate (Strike Rate 6.50%, Expiration 05/01/19) | | | 1,350,000,000 | | | | 2,632,500 | | | | | |
CMS 10 Year One Look Cap, 10 Year USD Swap Rate (Strike Rate 6.62%, Expiration 05/02/19) | | | 877,192,983 | | | | 2,763,158 | | | | | |
| | | | | | | | | | | | |
Total Call Options Purchased | | | | | | | 11,992,072 | | | | 0.39 | % |
| | | | | | | | | | | | |
Warrants Purchased | | | | | | | | | | | | |
United States | | | | | | | | | | | | |
Global Opportunistic (0.00% Partners’ Capital) | | | | | | | | | | | | |
Bally Total Fitness Holdings Corp. Warrants Exp. Sept. 2014, Strike Price $20.00 USD | | | 2 | | | | — | | | | | |
| | | | | | | | | | | | |
Total Warrants Purchased | | | | | | | — | | | | 0.00 | % |
| | | | | | | | | | | | |
Total Derivative Contracts—Assets (Cost $24,991,550) | | | | | | | 11,992,072 | | | | 0.39 | % |
| | | | | | | | | | | | |
Total Investments (Cost $2,790,313,809) | | | | | | $ | 3,010,547,167 | | | | 98.01 | % |
| | | | | | | | | | | | |
See accompanying notes to consolidated financial statements.
16
THE ENDOWMENT MASTER FUND, L.P.
(A Limited Partnership)
Schedule of Investments, continued
December 31, 2012
The Master Fund’s total outstanding capital commitments to Investment Funds as of December 31, 2012, were $390,926,988. For certain Investment Funds for which the Master Fund has a capital commitment, the Master Fund may be allocated its pro-rata share of expenses prior to having to fund a capital call for such expenses.
All Investment Funds and securities are non-income producing unless noted otherwise.
Refer to Note 5, Investments in Portfolio Securities, for information regarding the liquidity of the Master Fund’s investments.
| (1) | Income producing security |
| (2) | Affiliated investments (See Note 5 c) |
| (3) | Affiliated investments for which ownership exceeds 25% |
Futures Contracts Purchased:
| | | | | | | | | | | | | | |
Description | | Expiration
Date | | Number of
Contracts | | | Notional
Amount at
Value | | | Unrealized
Appreciation
(Depreciation) | |
CAC 40 10 Euro | | January 2013 | | | 426 | | | $ | 20,476,607 | | | $ | (33,487 | ) |
E-mini S&P 500 | | March 2013 | | | 2,800 | | | | 198,814,000 | | | | (1,036,896 | ) |
Gold 100 Oz | | February 2013 | | | 1,073 | | | | 179,813,340 | | | | (5,700,632 | ) |
Ultra Long Term U.S. Treasury Bond | | March 2013 | | | 1,950 | | | | 317,057,813 | | | | (6,723,012 | ) |
| | | | | | | | | | | | | | |
| | | | | | | | $ | 716,161,760 | | | $ | (13,494,027 | ) |
| | | | | | | | | | | | | | |
See accompanying notes to consolidated financial statements.
17
THE ENDOWMENT MASTER FUND, L.P.
(A Limited Partnership)
Consolidated Statement of Operations
Year Ended December 31, 2012
| | | | |
Investment income: | | | | |
Dividend income (net of foreign tax withholding of $65,672) | | $ | 16,863,014 | |
Interest income | | | 3,027,939 | |
Dividend income from affiliated investments | | | 4,265,385 | |
Interest income from affiliated investments | | | 1,250,028 | |
| | | | |
Total investment income | | | 25,406,366 | |
| | | | |
Expenses: | | | | |
Investment Management Fees | | | 38,703,653 | |
Administration fees | | | 2,115,865 | |
Professional fees | | | 1,806,465 | |
Custodian fees | | | 366,932 | |
Line of credit commitment fees | | | 3,286,112 | |
Directors fees | | | 481,125 | |
Interest expense | | | 121,561 | |
Offshore withholding tax expense | | | 7,457,763 | |
Other expenses | | | 1,403,862 | |
| | | | |
Total expenses | | | 55,743,338 | |
| | | | |
Net investment loss | | | (30,336,972 | ) |
| | | | |
Net realized and unrealized gain (loss) from investments: | | | | |
Net realized gain from investments and foreign currency translations | | | 236,860,829 | |
Net realized gain from purchased options contracts | | | 1,896,642 | |
Net realized loss from futures contracts | | | (21,473,556 | ) |
Net realized loss from redemptions in-kind | | | (1,112,455 | ) |
Net realized gain from affiliated investments | | | 56,413,884 | |
Change in unrealized appreciation/depreciation from investments | | | (144,614,669 | ) |
| | | | |
Net realized and unrealized gain from investments | | | 127,970,675 | |
| | | | |
Net increase in partners’ capital resulting from operations | | $ | 97,633,703 | |
| | | | |
See accompanying notes to consolidated financial statements.
18
THE ENDOWMENT MASTER FUND, L.P.
(A Limited Partnership)
Consolidated Statements of Changes in Partners’ Capital
Years Ended December 31, 2011 and December 31, 2012
| | | | |
Partners’ capital at December 31, 2010 | | $ | 5,355,785,091 | |
Contributions | | | 410,785,889 | |
Withdrawals | | | (1,306,626,016 | ) |
Net decrease in partners’ capital resulting from operations: | | | | |
Net investment loss | | | (37,665,078 | ) |
Net realized gain from investments, foreign currency translations and purchased options contracts | | | 147,551,885 | |
Net realized loss from written options contracts | | | (4,376,625 | ) |
Net realized gain from redemptions in-kind | | | 2,737,059 | |
Net realized gain from affiliated investments | | | 64,400,531 | |
Change in unrealized appreciation/depreciation from investments | | | (331,313,878 | ) |
| | | | |
Net decrease in partners’ capital resulting from operations | | | (158,666,106 | ) |
| | | | |
Partners’ capital at December 31, 2011 | | | 4,301,278,858 | |
| | | | |
Contributions | | | 132,053,507 | |
Withdrawals | | | (1,459,231,885 | ) |
Net increase in partners’ capital resulting from operations: | | | | |
Net investment loss | | | (30,336,972 | ) |
Net realized gain from investments and foreign currency translations | | | 236,860,829 | |
Net realized gain from purchased options contracts | | | 1,896,642 | |
Net realized loss from futures contracts | | | (21,473,556 | ) |
Net realized loss from redemptions in-kind | | | (1,112,455 | ) |
Net realized gain from affiliated investments | | | 56,413,884 | |
Change in unrealized appreciation/depreciation from investments | | | (144,614,669 | ) |
| | | | |
Net increase in partners’ capital resulting from operations | | | 97,633,703 | |
| | | | |
Partners’ capital at December 31, 2012 | | $ | 3,071,734,183 | |
| | | | |
See accompanying notes to consolidated financial statements.
19
THE ENDOWMENT MASTER FUND, L.P.
(A Limited Partnership)
Consolidated Statement of Cash Flows
Year Ended December 31, 2012
| | | | |
Cash flows from operating activities: | | | | |
Net increase in partners’ capital resulting from operations | | $ | 97,633,703 | |
Adjustments to reconcile net increase in partners’ capital resulting from operations to net cash provided by operating activities: | | | | |
Purchases of investments | | | (2,953,051,464 | ) |
Proceeds from disposition of investments | | | 4,564,276,865 | |
Net realized gain from investments and foreign currency translations | | | (236,860,829 | ) |
Net realized gain from purchased options contracts | | | (1,896,642 | ) |
Net realized loss from futures contracts | | | 21,473,556 | |
Net realized loss from redemptions in-kind | | | 1,112,455 | |
Net realized gain from affiliated investments | | | (56,413,884 | ) |
Change in unrealized appreciation/depreciation from investments | | | 144,614,669 | |
Accretion of discounts | | | (407,179 | ) |
Change in operating assets and liabilities: | | | | |
Deposit with brokers for futures contracts | | | (83,063,210 | ) |
Advanced contributions to Investment Funds | | | 17,630,116 | |
Interest and dividends receivable | | | 1,174,326 | |
Dividends receivable from affiliated investments | | | 155,912 | |
Receivable from investments sold | | | 151,360,144 | |
Receivable from affiliated investments sold | | | (25,038,567 | ) |
Prepaids and other assets | | | 7,291 | |
Payable for investments purchased | | | (153,661,120 | ) |
Investment Management Fees payable | | | (3,640,803 | ) |
Offshore withholding tax payable | | | 1,043,347 | |
Administration fees payable | | | (121,394 | ) |
Payable to Adviser | | | 10,212 | |
Payable to the Offshore TEI Fund | | | (48,750 | ) |
Payable to Directors | | | (9,625 | ) |
Accounts payable and accrued expenses | | | (217,682 | ) |
| | | | |
Net cash provided by operating activities | | | 1,486,061,447 | |
| | | | |
Cash flows from financing activities: | | | | |
Contributions | | | 107,006,958 | |
Withdrawals | | | (1,628,081,212 | ) |
| | | | |
Net cash used in financing activities | | | (1,521,074,254 | ) |
| | | | |
Net increase in cash and cash equivalents | | | (35,012,807 | ) |
Cash and cash equivalents at beginning of year | | | 94,389,541 | |
| | | | |
Cash and cash equivalents at end of year | | $ | 59,376,734 | |
| | | | |
Supplemental schedule of cash activity: | | | | |
Cash paid for offshore withholding taxes | | $ | 6,414,416 | |
Cash paid for interest | | | 120,815 | |
Supplemental schedule of noncash activity: | | | | |
Redemptions from Investment Funds in-kind (Cost $9,537,067) | | $ | 8,424,612 | |
See accompanying notes to consolidated financial statements.
20
THE ENDOWMENT MASTER FUND, L.P.
(A Limited Partnership)
Notes to Consolidated Financial Statements
December 31, 2012
(1) ORGANIZATION
The Endowment Master Fund, L.P. (the “Master Fund”) a Delaware limited partnership, commenced operations on April 1, 2003. The Master Fund operated as an unregistered investment vehicle until March 10, 2004, at which time it registered as a non-diversified, closed-end management investment company under the Investment Company Act of 1940, as amended (the “1940 Act”). The Master Fund is the master fund in a master-feeder structure in which there are currently nine feeder funds.
The Endowment Master Fund Holdings GP, LLC (the “Company”), is a wholly-owned limited liability company of the Master Fund. The Company functions as a special purpose entity, which owned a minority interest in AL Gulf Coast Terminals, LLC, an operating company, until November 18, 2012. As of December 31, 2012, the Company did not hold any direct investments. The financial statements of the Master Fund and the Company are consolidated and thus the consolidated financial statements present the combined operations of the Master Fund and the Company.
The Master Fund’s investment objective is to preserve capital and to generate consistent long-term appreciation and returns across a market cycle (which is estimated to be five to seven years). The Master Fund is primarily a “fund of funds” which pursues its investment objective by investing its assets in a variety of investment vehicles including, but not limited to, limited partnerships, limited liability companies, offshore corporations and other foreign investment vehicles (collectively, the “Investment Funds”), registered investment companies (including exchange-traded funds) and direct investments in marketable securities and derivative instruments. The Investment Funds are managed by a carefully selected group of investment managers, identified by the Adviser, as hereinafter defined. The various styles and strategies employed by the Investment Funds and supplemented by the Master Fund’s direct investments, serve to achieve a portfolio that is broadly allocated.
The Endowment Fund GP, L.P., a Delaware limited partnership, serves as the general partner of the Master Fund (the “General Partner”). To the fullest extent permitted by applicable law, the General Partner has irrevocably delegated to a board of directors (the “Board” and each member a “Director”) its rights and powers to monitor and oversee the business affairs of the Master Fund, including the complete and exclusive authority to oversee and establish policies regarding the management, conduct, and operation of the Master Fund’s business. A majority of the members of the Board are independent of the General Partner and its management. To the extent permitted by applicable law, the Board may delegate any of its rights, powers and authority to, among others, the officers of the Master Fund, the Adviser, as hereinafter defined, or any committee of the Board.
The Board is authorized to engage an investment adviser, and pursuant to an investment management agreement, (the “Investment Management Agreement”), it has selected Endowment Advisers, L.P. (the “Adviser”), to manage the Master Fund’s portfolio and operations The Adviser is a Delaware limited partnership that is registered as an investment adviser under the Investment Advisers Act of 1940, as amended. Under the Investment Management Agreement, the Adviser is responsible for the establishment of an investment committee (the “Investment Committee”), which is responsible for developing, implementing, and supervising the Master Fund’s investment program subject to the ultimate supervision of the Board.
Under the Master Fund’s organizational documents, the Master Fund’s Directors and officers are indemnified against certain liabilities arising out of the performance of their duties to the Master Fund. In the normal course of business, the Master Fund enters into contracts with service providers, which also provide for indemnifications by the Master Fund. The Master Fund’s maximum exposure under these arrangements is unknown, as this would involve any future potential claims that may be made against the Master Fund. However, based on experience, the General Partner expects that risk of loss to be remote.
21
THE ENDOWMENT MASTER FUND, L.P.
(A Limited Partnership)
Notes to Consolidated Financial Statements, continued
December 31, 2012
(2) SUMMARY OF SIGNIFICANT ACCOUNTING POLICIES
(a) BASIS OF ACCOUNTING
The accounting and reporting policies of the Master Fund conform with U.S. generally accepted accounting principles (“U.S. GAAP”).
(b) CASH EQUIVALENTS
The Master Fund considers all unpledged temporary cash investments with a maturity date at the time of purchase of three months or less to be cash equivalents.
(c) INVESTMENT SECURITIES TRANSACTIONS
The Master Fund records security transactions on a trade-date basis.
Investments that are held by the Master Fund, including those that have been sold short, are marked to fair value at the date of the consolidated financial statements, and the corresponding change in unrealized appreciation/depreciation is included in the Consolidated Statement of Operations.
Dividend income is recorded on the ex-dividend date. Other investment fund distributions are recorded based on the detail provided within the distribution notice, as applicable. Realized gains or losses on the disposition of investments are accounted for based on the first in first out (“FIFO”) method.
(d) VALUATION OF INVESTMENTS
The valuation of the Master Fund’s investments is determined as of the close of business at the end of each reporting period, generally monthly. The valuation of the Master Fund’s investments is calculated by Citi Fund Services Ohio, Inc., the Master Fund’s independent administrator (the “Independent Administrator”).
The Board has formed a valuation committee (the “Board Valuation Committee”) that is responsible for overseeing the Master Fund’s valuation policies, making recommendations to the Board on valuation-related matters, and overseeing implementation by the Adviser of such valuation policies.
The Board has authorized the Adviser to establish a valuation committee of the Adviser (the “Adviser Valuation Committee”). The function of the Adviser Valuation Committee, subject to the oversight of the Board Valuation Committee and the Board, is generally to review valuation methodologies, valuation determinations, and any information provided to the Adviser Valuation Committee by the Adviser or the Independent Administrator.
Investments currently held by the Master Fund are valued as follows:
| | • | | INVESTMENT FUNDS—Investments in Investment Funds are carried at fair value, using the net asset value (the “NAV”) as a practical expedient, as provided to the Independent Administrator by the investment managers of such Investment Funds or the administrators of such Investment Funds. These Investment Funds value their underlying investments in accordance with policies established by such Investment Funds. Prior to investing in any Investment Fund, the Adviser Valuation Committee, as part of the due diligence process, conducts a review of the valuation methodologies employed by the |
22
THE ENDOWMENT MASTER FUND, L.P.
(A Limited Partnership)
Notes to Consolidated Financial Statements, continued
December 31, 2012
| | Investment Fund to determine whether such methods are appropriate for the asset types. All of the Master Fund’s valuations utilize financial information supplied by each Investment Fund and are net of management and estimated performance incentive fees or allocations payable to the Investment Funds’ managers pursuant to the Investment Funds’ agreements. Generally, Investment Funds in which the Master Fund invests will use market value when available, and otherwise will use principles of fair value applied in good faith. The Adviser Valuation Committee will consider whether it is appropriate, in light of the relevant circumstances, to value interests at NAV as reported by an Investment Fund for valuation purposes, or whether to adjust such reported value to reflect an adjusted fair value. Because of the inherent uncertainty of valuation, fair value may differ significantly from the value that would have been used had readily available markets for the investments in Investment Funds existed. The Master Fund’s investments in Investment Funds are subject to the terms and conditions of the respective operating agreements and offering memoranda of such Investment Funds. Investment Funds are typically categorized as Level 2 or 3 in the fair value hierarchy based upon liquidity. |
| | • | | SECURITIES LISTED ON A SECURITIES EXCHANGE OR OVER-THE-COUNTER EXCHANGES—In general, the Master Fund values securities at their last sales price on the exchange or over-the-counter exchange on the valuation date. If the security is listed on more than one exchange, the Master Fund uses the price from the exchange that is considered to be the principal exchange where the security is principally traded. If there have been no sales for that day on the exchange where the security is principally traded, then the price of the security will be valued at the mean between the closing “bid” and “ask” prices on the valuation date. In these situations, valuations are typically categorized as Level 1 in the fair value hierarchy. Securities traded on a foreign securities exchange will generally be valued at their closing prices on the exchange where such securities are primarily traded and translated into U.S. dollars at the current exchange rate. If an event occurred between the close of the foreign exchange and the valuation date of the Master Fund’s net asset value that would materially affect the value of the security and the net asset value of the Master Fund, the value of such security and the net asset value of the Master Fund will be adjusted to reflect the change in the estimated value of the security. |
| | • | | DERIVATIVES—Derivatives are generally valued using independent pricing services or other procedures approved by the Board. Exchange traded futures contracts are valued using quoted final settlement prices from the national exchange on which they are principally traded and are typically categorized as Level 1 in the fair value hierarchy. Options that are listed on a securities exchange are generally valued at the closing “bid” and “ask” prices for options held long and short, respectively on the date of determination and are typically categorized as Level 2 in the fair value hierarchy. If no such sales price, bid or ask price is reported by such exchanges on the valuation date, the Adviser Valuation Committee and/or the Board Valuation Committee will determine the fair value in good faith using information that is available as such time. Such fair valued options are typically categorized as Level 2 or Level 3 in the fair value hierarchy, based upon the inputs used to value the options. |
| | • | | OTHER—Investments in open-end registered investment companies that do not trade on an exchange are valued at the end of the day NAV per share and are categorized as Level 1 in the fair value hierarchy. Where no value is readily available from an Investment Fund or other security or where a value supplied by an Investment Fund is deemed not to be indicative of the Investment Fund’s value, the Adviser Valuation Committee and/or the Board Valuation Committee, in consultation with the Independent Administrator or the Adviser will determine, in good faith, the fair value of the Investment Fund or security. Such fair valued investments are typically categorized as Level 2 or Level 3 in the fair value hierarchy, based upon the inputs used to value the investments. |
23
THE ENDOWMENT MASTER FUND, L.P.
(A Limited Partnership)
Notes to Consolidated Financial Statements, continued
December 31, 2012
Fixed-income securities are valued according to prices as furnished by an independent pricing service or broker/dealer quotes and are typically categorized as Level 2 in the fair value hierarchy.
| | • | | SECURITIES NOT ACTIVELY TRADED—The value of securities, derivatives or synthetic securities that are not actively traded on an exchange shall be determined by obtaining quotes from brokers that normally deal in such securities or by an unaffiliated pricing service that may use actual trade data or procedures using market indices, matrices, yield curves, specific trading characteristics of certain groups of securities, pricing models or a combination of these procedures. In each of these situations, valuations are typically categorized as Level 2 in the fair value hierarchy. Securities for which independent pricing services are not available are valued by the Adviser Valuation Committee and/or the Board Valuation Committee pursuant to the fair valuation procedures approved by the Board and are typically categorized as Level 2 or Level 3 in the fair value hierarchy, based upon the inputs used to value the investments. |
(e) FOREIGN CURRENCY
The accounting records of the Master Fund are maintained in U.S. dollars. Foreign currency amounts are translated into U.S. dollar amounts at current exchange rates on the date of valuation. Purchases and sales of investments and income and expense items denominated in foreign currencies are translated into U.S. dollar amounts at the exchange rate on the respective dates of such transactions.
(f) DERIVATIVE INSTRUMENTS AND HEDGING ACTIVITIES
All open derivative positions at year-end are presented in the Master Fund’s Schedule of Investments. In addition to the derivatives held by the Master Fund, the Investment Funds may have directly engaged in derivative transactions during the period. The following is a description of the derivative instruments that the Master Fund utilizes as part of an asset overlay strategy to create investment exposure consistent with the Master Fund’s investment objectives, including the primary underlying risk exposures related to each instrument type.
OPTIONS—During the year, the Master Fund entered into options contracts to speculate on the price movements of a financial instrument or for use as an economic hedge against certain positions held in the Master Fund’s portfolio. Options contracts purchased give the Master Fund the right, but not the obligation, to buy or sell the underlying instrument for a specified price upon exercise at any time during the option period. Options contracts written obligate the Master Fund to buy or sell the underlying instrument for a specified price upon exercise at any time during the option period. When the Master Fund writes an option contract, an amount equal to the premium received by the Master Fund is recorded as a liability and is subsequently adjusted to the current fair value of the option contract written.
FUTURES CONTRACTS—During the year, the Master Fund invested in futures contracts to gain exposure to, or hedge against, changes in the value of equities, commodities, interest rates or foreign markets. A futures contract represents a commitment for the future purchase or sale of an asset at a specified price on a specified date. Upon entering into a futures contract, the Master Fund is required to pledge to the broker an amount of cash and/or other assets equal to a certain percentage of the contract amount (initial margin deposit). In general, payments are made by the Master Fund to the broker if total value falls below the initial margin when marked to the closing price at the end of each day. The underlying securities are not physically delivered. The Master Fund recognizes a gain or loss equal to the daily fluctuations in the value of the underlying security. Should market conditions move unexpectedly, the Master Fund may not achieve the anticipated benefits of the futures contracts
24
THE ENDOWMENT MASTER FUND, L.P.
(A Limited Partnership)
Notes to Consolidated Financial Statements, continued
December 31, 2012
and may realize a loss. The use of futures transactions involve, to varying degrees, elements of market risk (generally equity price risk related to stock index or equity futures contracts, interest rate risk related to bond futures contracts, and commodity price risk related to commodity futures contracts) and exposure to loss. The face or contract amounts reflect the extent of the total exposure the Master Fund has in the particular classes of instruments. Among other risks, the use of futures contracts may cause the Master Fund to have imperfect correlation due to differences between movements in the price of the futures contracts and the market value of the underlying securities and the possibility of an illiquid market for a futures contract. Futures contracts may reduce the Master Fund’s exposure to counterparty risk since futures contracts are exchange-traded; and the exchange’s clearinghouse, as the counterparty to all exchange-traded futures, guarantees the futures against default.
On February 9, 2012, the Commodity Futures Trading Commission (“CFTC”) adopted amendments to its rules that altered the ability of the Master Fund to continue to claim certain exclusions. Prior to adopting these amendments, registered investment companies could engage in unlimited futures transactions and options thereon, provided that the investment advisor to the company claimed an exclusion from regulation as a commodity pool operator. In connection with its management of the Master Fund, the Adviser claimed such an exclusion from registration as a commodity pool operator and trading adviser under the Commodity Exchange Act, as amended (the “CEA”). Therefore, for the year ended December 31, 2012, neither the Master Fund nor the Adviser was subject to the registration and regulatory requirements of the CEA. On February 9, 2012, the CFTC adopted amendments to its rules that alter the ability of the Master Fund to continue to claim this exclusion. Certain aspects of the amended rule are yet to be determined, and such determination may dictate the appropriate course of action for the Master Fund with respect to its CFTC compliance obligations. Such regulatory aspects, when determined, may increase costs for the Master Fund.
On November 30, 2012 the CFTC issued relief for fund of fund operators who may otherwise be required to register with the CFTC as commodity pool operators by December 31, 2012 but do not have access to information from the investment funds in which they are invested in order to determine whether registration is required. This relief delays the registration date for such operators until the later of June 30, 2013 or six months from the date the CFTC issues revised guidance on the application of certain thresholds with respect to investments in commodities held by funds of funds. As of December 31, 2012, the Master Fund has filed as required with the CFTC in order to claim this no-action relief, which is effective upon receipt of the filing.
In addition, the CFTC, in conjunction with other federal regulators, also recently proposed stricter margin requirements for certain swap transactions. If adopted, the proposed requirements could increase the amount of margin necessary to conduct many swap transactions, limit the types of assets that can be used as collateral for such transactions, and impose other restrictions. The CFTC amendments and/or the rule proposals may affect the ability of the Master Fund to use futures contracts and may substantially increase regulatory compliance costs for the Adviser and the Master Fund. As of the date of this report, the ultimate impact of the CFTC amendments and/or rule proposals on the Master Fund is uncertain.
During the year ended December 31, 2012, the Master Fund’s direct investments in derivatives consisted of the purchase and sale of call options contracts and the purchase and sale of futures contracts. Investment Funds in which the Master Fund invests may also purchase and sell derivative instruments and other financial instruments.
25
THE ENDOWMENT MASTER FUND, L.P.
(A Limited Partnership)
Notes to Consolidated Financial Statements, continued
December 31, 2012
The following is a summary of the fair value of derivative instruments held directly by the Master Fund as of December 31, 2012. These derivatives are presented in the Schedule of Investments.
| | | | | | | | |
| | | Assets | | | Liabilities | |
| | | Total Fair Value | | | Unrealized Depreciation on
Futures Contracts | |
Equity Risk Exposure: | | | | | | | | |
Futures Contracts* | | $ | — | | | $ | 1,070,383 | |
Warrants Purchased | | | — | | | | — | |
| | |
Commodity Risk Exposure: | | | | | | | | |
Futures Contracts* | | | — | | | | 5,700,632 | |
| | |
Interest Rate Risk Exposure: | | | | | | | | |
Futures Contracts* | | | — | | | | 6,723,012 | |
Call Options Purchased | | | 11,992,072 | | | | — | |
| * | Includes cumulative appreciation/depreciation of futures contracts. |
The following is a summary of the effect of derivative instruments on the Consolidated Statement of Operations for the year ended December 31, 2012:
| | | | | | | | |
| | | Realized
Gain
(Loss) from
Derivatives | | | Change in
Unrealized
Appreciation/
Depreciation
from
Derivatives | |
Equity Risk Exposure: | | | | | | | | |
Futures Contracts | | $ | 4,214,082 | | | $ | (1,070,383 | ) |
Call Options Purchased | | | 1,896,642 | | | | — | |
Warrants Purchased | | | — | | | | — | |
| | |
Commodity Risk Exposure: | | | | | | | | |
Futures Contracts | | | (17,905,289 | ) | | | (5,700,632 | ) |
| | |
Interest Rate Risk Exposure: | | | | | | | | |
Futures Contracts | | | (7,782,349 | ) | | | (6,723,012 | ) |
Call Options Purchased | | | — | | | | (10,972,971 | ) |
Volume of Derivative Activity
The monthly average fair value of options purchased was $16,903,759 for the year ended December 31, 2012. The following is a summary of the average monthly notional value of futures contracts purchased and sold in the Master Fund for the year ended December 31, 2012, as well as the notional amount of futures contracts outstanding as of December 31, 2012:
| | | | | | | | |
| | | Monthly Average
Notional Amount | | | Notional Amount Outstanding
at December 31, 2012 | |
Futures contracts purchased | | $ | 844,325,146 | | | $ | 716,161,760 | |
Futures contracts sold | | | (171,817,687 | ) | | | — | |
| | | | | | | | |
Total | | $ | 672,507,459 | | | $ | 716,161,760 | |
| | | | | | | | |
26
THE ENDOWMENT MASTER FUND, L.P.
(A Limited Partnership)
Notes to Consolidated Financial Statements, continued
December 31, 2012
(g) INVESTMENT INCOME
For investments in securities, dividend income is recorded on the ex-dividend date, net of withholding taxes. Interest income is recorded as earned on the accrual basis and includes amortization of premiums or accretion of discounts.
(h) FUND EXPENSES
Unless otherwise voluntarily or contractually assumed by the Adviser or another party, the Master Fund bears all expenses incurred in its business including, but not limited to, the following: all costs and expenses related to investment transactions and positions for the Master Fund’s account; legal fees; accounting, auditing and tax preparation fees; recordkeeping and custodial fees; costs of computing the Master Fund’s net asset value; fees for data and software providers; research expenses; costs of insurance; registration expenses; offering costs; expenses of meetings of the partners; directors fees; all costs with respect to communications to partners; transfer taxes, offshore withholding taxes and taxes withheld on non-U.S. dividends; interest and commitment fees on loans and debit balances; and other types of expenses as may be approved from time to time by the Board. Offering costs are amortized over a twelve-month period or less from the date they are incurred.
(i) INCOME TAXES
The Master Fund is organized and operates as a limited partnership and is not subject to income taxes as a separate entity. Such taxes are the responsibility of the individual partners. Accordingly, no provision for income taxes has been made in the Master Fund’s consolidated financial statements. Investments in foreign securities may result in foreign taxes being withheld by the issuer of such securities. For U.S. offshore withholding tax, the Master Fund may serve as withholding agent for its offshore feeder funds.
For the current open tax year and for all major jurisdictions, management of the Master Fund has evaluated the tax positions taken or expected to be taken in the course of preparing the Master Fund’s tax returns to determine whether the tax positions will “more-likely-than-not” be sustained by the Master Fund upon challenge by the applicable tax authority. Tax positions not deemed to meet the more-likely-than-not threshold and that would result in a tax benefit or expense to the Master Fund would be recorded as a tax benefit or expense in the current period. For the year ended December 31, 2012, the Master Fund did not recognize any amounts for unrecognized tax benefit/expense. A reconciliation of unrecognized tax benefit/expense is not provided herein, as the beginning and ending amounts of unrecognized tax benefit/expense are zero, with no interim additions, reductions or settlements. Tax positions taken in tax years which remain open under the statute of limitations (generally three years for federal income tax purposes) are subject to examination by tax authorities.
(j) USE OF ESTIMATES
The preparation of the consolidated financial statements in accordance with U.S. GAAP requires management to make estimates and assumptions relating to the reported amounts of assets and liabilities and the disclosure of contingent assets and liabilities at the date of the consolidated financial statements and the reported amounts of income and expenses during the reporting period. Actual results could differ from those estimates and such differences may be significant.
27
THE ENDOWMENT MASTER FUND, L.P.
(A Limited Partnership)
Notes to Consolidated Financial Statements, continued
December 31, 2012
(k) RECENTLY ISSUED ACCOUNTING PRONOUNCEMENTS
In December 2011, the Financial Accounting Standards Board issued Accounting Standards Update No. 2011-11 “Disclosures about Offsetting Assets and Liabilities” (“ASU 2011-11”) requiring disclosures of both gross and net information related to offsetting and related arrangements enabling users of its financial statements to understand the effect of those arrangements on the entity’s financial position. The objective of this disclosure is to facilitate comparison between those entities that prepare their financial statements on the basis of U.S. GAAP and those entities that prepare their financial statements on the basis of International Financial Reporting Standards. ASU 2011-11 is effective for interim and annual periods beginning on or after January 1, 2013. The adoption of ASU 2011-11 will have no effect on the Master Fund’s net assets. At this time, management is evaluating any impact ASU 2011-11 may have on the Master Fund’s financial statement disclosures.
(3) FAIR VALUE MEASUREMENTS
The Master Fund defines fair value as the price that would be received to sell an asset or paid to transfer a liability in an orderly transaction between market participants at the measurement date under current market conditions.
The inputs used to determine the fair value of the Master Fund’s investments are summarized in the three broad levels listed below:
| | • | | Level 1—unadjusted quoted prices in active markets for identical assets |
| | • | | Level 2—investments with other significant observable inputs or investments that can be fully redeemed at the NAV in the “near term” |
| | • | | Level 3—investments with significant unobservable inputs (which may include the Master Fund’s own assumptions in determining the fair value of investments) or investments that cannot be fully redeemed at the NAV in the “near term”; these are investments that generally have one or more of the following characteristics: gated redemptions, suspended redemptions, or have lock-up periods greater than quarterly (or monthly for underlying investments where the Master Fund owns more than 25% of the investment Fund’s total net assets). |
The inputs or methodology used for valuing investments are not necessarily an indication of the risk associated with investing in those investments.
28
THE ENDOWMENT MASTER FUND, L.P.
(A Limited Partnership)
Notes to Consolidated Financial Statements, continued
December 31, 2012
The following is a summary categorization, as of December 31, 2012, of the Master Fund’s investments based on the level of inputs utilized in determining the value of such investments:
| | | | | | | | | | | | | | | | | | | | | | | | |
| | | LEVEL 1 | | | LEVEL 2 | | | LEVEL 3 | | | Total | |
| | | Investments | | | Other Financial
Instruments^ | | | Investments | | | Investments | | | Investments | | | Other Financial
Instruments^ | |
Investment Funds | | | | | | | | | | | | | | | | | | | | | | | | |
Limited Partnerships, Exempted Limited Partnerships and Limited Liability Companies | | | | | | | | | | | | | | | | | | | | | | | | |
Arbitrage Strategies | | $ | — | | | $ | — | | | $ | 87,524,836 | | | $ | 125,266,503 | | | $ | 212,791,339 | | | $ | — | |
Domestic Equity | | | — | | | | — | | | | 78,848,159 | | | | 89,660,048 | | | | 168,508,207 | | | | — | |
Energy | | | — | | | | — | | | | 52,142,437 | | | | 159,143,681 | | | | 211,286,118 | | | | — | |
Enhanced Fixed Income | | | — | | | | — | | | | 172,907,561 | | | | 199,052,762 | | | | 371,960,323 | | | | — | |
Global Opportunistic | | | — | | | | — | | | | 158,531,600 | | | | 274,309,743 | | | | 432,841,343 | | | | — | |
International Equity | | | — | | | | — | | | | 7,416,117 | | | | 49,713,569 | | | | 57,129,686 | | | | — | |
Natural Resources | | | — | | | | — | | | | 14,554,217 | | | | 29,024,662 | | | | 43,578,879 | | | | — | |
Private Equity | | | — | | | | — | | | | — | | | | 681,514,504 | | | | 681,514,504 | | | | — | |
Real Estate | | | — | | | | — | | | | — | | | | 185,296,050 | | | | 185,296,050 | | | | — | |
Passive Foreign Investment Companies | | | | | | | | | | | | | | | | | | | | | | | | |
Arbitrage Strategies | | | — | | | | — | | | | 7,432,940 | | | | 32,253,834 | | | | 39,686,774 | | | | — | |
International Equity | | | — | | | | — | | | | 25,278,305 | | | | 819,194 | | | | 26,097,499 | | | | — | |
Natural Resources | | | — | | | | — | | | | — | | | | 8,910,279 | | | | 8,910,279 | | | | — | |
Private Equity | | | — | | | | — | | | | — | | | | 3,000,000 | | | | 3,000,000 | | | | — | |
Private Corporations | | | | | | | | | | | | | | | | | | | | | | | | |
Real Estate | | | — | | | | — | | | | — | | | | 19,111,732 | | | | 19,111,732 | | | | — | |
Investment Securities | | | | | | | | | | | | | | | | | | | | | | | | |
Registered Investment Companies | | | | | | | | | | | | | | | | | | | | | | | | |
Domestic Equity | | | 104,161,361 | | | | — | | | | — | | | | — | | | | 104,161,361 | | | | — | |
International Equity | | | 125,400,510 | | | | — | | | | — | | | | — | | | | 125,400,510 | | | | — | |
Money Market Funds | | | 307,280,491 | | | | — | | | | — | | | | — | | | | 307,280,491 | | | | — | |
Derivative Instruments | | | | | | | | | | | | | | | | | | | | | | | | |
Call Options Purchased | | | — | | | | — | | | | 11,992,072 | | | | — | | | | 11,992,072 | | | | — | |
Warrants Purchased | | | | | | | | | | | | | | | | | | | | | | | | |
Global Opportunistic | | | — | | | | — | | | | — | | | | — | | | | — | | | | — | |
Futures Contracts | | | — | | | | (13,494,027 | ) | | | — | | | | — | | | | — | | | | (13,494,027 | ) |
| | | | | | | | | | | | | | | | | | | | | | | | |
Total | | $ | 536,842,362 | | | $ | (13,494,027 | ) | | $ | 616,628,244 | | | $ | 1,857,076,561 | | | $ | 3,010,547,167 | | | $ | (13,494,027 | ) |
| | | | | | | | | | | | | | | | | | | | | | | | |
| ^ | Other financial instruments include any derivative instruments not reflected in the Schedule of Investments as Investments in Securities, such as futures contracts. These financial instruments are generally recorded in the financial statements at the unrealized gain or loss on the financial instrument. |
The categorization of investments amongst Levels 1 through 3 does not reflect the fact that many of the underlying investments held by the Investment Funds included in Level 3, if owned directly by the Master Fund, may be classified as Level 1 or Level 2 investments.
29
THE ENDOWMENT MASTER FUND, L.P.
(A Limited Partnership)
Notes to Consolidated Financial Statements, continued
December 31, 2012
The following table is a summary of quantitative information about significant unobservable valuation inputs approved by the Adviser Valuation Committee for Level 3 Fair Value Measurements for investments held as of December 31, 2012:
| | | | | | | | | | |
| | | Fair Value as of
December 31, 2012 | | | Valuation Technique | | Liquidity of
Investments | | Adjustments
To NAV |
Investments | | | | | | | | | | |
Limited Partnerships, Exempted Limited Partnerships and Limited Liability Companies | | | | | | | | | | |
Arbitrage Strategies | | $ | 125,266,503 | | | NAV as Practical Expedient* | | Quarterly or Greater | | None |
Domestic Equity | | | 89,660,048 | | | NAV as Practical Expedient* | | Quarterly or Greater | | None |
Energy | | | 159,143,681 | | | NAV as Practical Expedient* | | N/A | | None |
Enhanced Fixed Income | | | 199,052,762 | | | NAV as Practical Expedient* | | Quarterly or Greater | | None |
Global Opportunistic | | | 274,309,743 | | | NAV as Practical Expedient* | | Monthly or Greater | | None |
International Equity | | | 49,713,569 | | | NAV as Practical Expedient* | | Quarterly or Greater | | None |
Natural Resources | | | 29,024,662 | | | NAV as Practical Expedient* | | N/A | | None |
Private Equity | | | 681,514,504 | | | NAV as Practical Expedient* | | N/A | | None |
Real Estate | | | 185,296,050 | | | NAV as Practical Expedient* | | N/A | | None |
Passive Foreign Investment Companies | | | | | | | | | | |
Arbitrage Strategies | | | 32,253,834 | | | NAV as Practical Expedient* | | N/A | | None |
International Equity | | | 819,194 | | | NAV as Practical Expedient* | | N/A | | None |
Natural Resources | | | 8,910,279 | | | NAV as Practical Expedient* | | N/A | | None |
Private Equity | | | 3,000,000 | | | NAV as Practical Expedient* | | N/A | | ** |
Private Corporations | | | | | | | | | | |
Real Estate | | | 19,111,732 | | | NAV as Practical Expedient* | | N/A | | None |
| | | | | | | | | | |
Total Investments | | $ | 1,857,076,561 | | | | | | | |
| | | | | | | | | | |
| * | Unobservable valuation input. |
| ** | Denotes that the NAV as provided by an investment manager or administrator of an Investment Fund has been adjusted. Adjustments to the practical expedient NAV were made for certain Investment Funds in this category because in the opinion of the Adviser Valuation Committee, the practical expedient NAV provided for these Investment Funds did not reflect such Investment Funds’ fair value at December 31, 2012. The amounts of such adjustments were deemed immaterial as a percentage of total investments. |
30
THE ENDOWMENT MASTER FUND, L.P.
(A Limited Partnership)
Notes to Consolidated Financial Statements, continued
December 31, 2012
The Master Fund discloses transfers between levels based on valuations at the end of the reporting period. Transfers that occurred between Levels 2 and 3 as of December 31, 2012, based on levels assigned to Investments on December 31, 2011, are included in the table below. The following is a reconciliation of Level 3 investments based upon the inputs used to determine fair value:
| | | | | | | | | | | | | | | | | | | | | | | | | | | | | | | | |
| | | Investments | |
| | | Balance as of
December 31,
2011 | | | Redemptions
In-Kind | | | Transfers
Out* | | | Gross
Purchases | | | Gross
Sales** | | | Net
Realized
Gain (Loss) | | | Change in
Unrealized
Appreciation/
Depreciation | | | Balance as of
December 31,
2012 | |
Investments^ | | | | | | | | | | | | | | | | | | | | | | | | | | | | | | | | |
Limited Partnerships, Exempted Limited Partnerships and Limited Liability Companies | | | | | | | | | | | | | | | | | | | | | | | | | | | | | | | | |
Arbitrage Strategies | | $ | 448,558,987 | | | $ | — | | | $ | (87,524,836 | ) | | $ | 25,000,000 | | | $ | (299,935,517 | ) | | $ | 73,001,581 | | | $ | (33,833,712 | ) | | $ | 125,266,503 | |
Domestic Equity | | | 195,638,926 | | | | 3,508,488 | | | | (78,848,159 | ) | | | 90,002,049 | | | | (129,188,655 | ) | | | 4,128,510 | | | | 4,418,889 | | | | 89,660,048 | |
Energy | | | 298,114,700 | | | | — | | | | (52,142,437 | ) | | | 40,324,052 | | | | (139,370,893 | ) | | | 36,873,058 | | | | (24,654,799 | ) | | | 159,143,681 | |
Enhanced Fixed Income | | | 609,181,578 | | | | 4,413,996 | | | | (172,907,561 | ) | | | 88,467,283 | | | | (358,022,971 | ) | | | 18,832,213 | | | | 9,088,224 | | | | 199,052,762 | |
Global Opportunistic | | | 703,060,246 | | | | 412,384 | | | | (158,531,600 | ) | | | 86,744,719 | | | | (331,906,184 | ) | | | (20,224,686 | ) | | | (5,245,136 | ) | | | 274,309,743 | |
International Equity | | | 143,191,213 | | | | — | | | | (7,416,117 | ) | | | 65,000,000 | | | | (154,244,059 | ) | | | 9,580,986 | | | | (6,398,454 | ) | | | 49,713,569 | |
Natural Resources | | | 46,001,399 | | | | — | | | | (14,554,217 | ) | | | 4,823,663 | | | | — | | | | — | | | | (7,246,183 | ) | | | 29,024,662 | |
Private Equity | | | 642,090,516 | | | | — | | | | — | | | | 118,475,898 | | | | (140,703,597 | ) | | | 38,195,040 | | | | 23,456,647 | | | | 681,514,504 | |
Real Estate | | | 189,471,429 | | | | — | | | | — | | | | 46,757,942 | | | | (57,479,475 | ) | | | (112,393 | ) | | | 6,658,547 | | | | 185,296,050 | |
Passive Foreign Investment Companies | | | | | | | | | | | | | | | | | | | | | | | | | | | | | | | | |
Arbitrage Strategies | | | 58,527,592 | | | | — | | | | (7,432,940 | ) | | | — | | | | (27,604,350 | ) | | | 5,129,592 | | | | 3,633,940 | | | | 32,253,834 | |
International Equity | | | 1,372,308 | | | | — | | | | — | | | | — | | | | (542,766 | ) | | | 208,845 | | | | (219,193 | ) | | | 819,194 | |
Natural Resources | | | 7,658,031 | | | | — | | | | — | | | | — | | | | — | | | | — | | | | 1,252,248 | | | | 8,910,279 | |
Private Equity | | | 12,860,000 | | | | — | | | | — | | | | — | | | | — | | | | — | | | | (9,860,000 | ) | | | 3,000,000 | |
Private Corporations | | | | | | | | | | | | | | | | | | | | | | | | | | | | | | | | |
Real Estate | | | 19,870,321 | | | | — | | | | — | | | | — | | | | (3,887,037 | ) | | | — | | | | 3,128,448 | | | | 19,111,732 | |
| | | | | | | | | | | | | | | | | | | | | | | | | | | | | | | | |
Total Investments | | $ | 3,375,597,246 | | | $ | 8,334,868 | | | $ | (579,357,867 | ) | | $ | 565,595,606 | | | $ | (1,642,885,504 | ) | | $ | 165,612,746 | | | $ | (35,820,534 | ) | | $ | 1,857,076,561 | |
| | | | | | | | | | | | | | | | | | | | | | | | | | | | | | | | |
| ^ | Investment category names may not match the December 31, 2011 audited financial statements due to categorical changes in strategy type from the Investment Committee. These changes are assumed to have been made on January 1, 2012. |
| * | Transfers from Level 3 to Level 2 in the fair value hierarchy generally relate to liquidity provisions of the Investment Funds. |
| ** | Includes Return of Capital and Capital Gain Distributions. |
The net realized gain (loss) and change in unrealized appreciation/depreciation in the table above are reflected in the accompanying Consolidated Statement of Operations. The change in unrealized appreciation/depreciation from Level 3 investments held at December 31, 2012, is $(74,261,216).
The Master Fund is permitted to invest in alternative investments that do not have a readily determinable fair value. For an investment that does not have a readily determinable fair value, the Master Fund uses the NAV
31
THE ENDOWMENT MASTER FUND, L.P.
(A Limited Partnership)
Notes to Consolidated Financial Statements, continued
December 31, 2012
reported by the Investment Fund as a practical expedient, without further adjustments, unless it is probable that the investment will be sold at a value significantly different than the NAV. If the practical expedient NAV is not as of the reporting entity’s measurement date, then the reported NAV is adjusted to reflect any significant events that would materially affect the value of the security and the NAV of the Master Fund as of the valuation date.
Certain Investment Funds in which the Master Fund invests have limitations on liquidity which may result in limitations on redemptions including, but not limited to, early redemption fees. Other than Investment Funds that are self-liquidating, such as Private Equity and some Energy, Natural Resources and Real Estate Funds, the Investment Funds in which the Master Fund invests have withdrawal rights ranging from monthly to annually, after a notice period, usually for a period of up to two years from the date of the initial investment or an additional investment. A listing of the investments held by the Master Fund and their attributes as of December 31, 2012, that may qualify for this valuation approach is shown in the table below.
| | | | | | | | | | | | | | | | |
| Investment Category | | Investment
Strategy | | Fair
Value
(in 000s) | | | Unfunded
Commitments
(in 000’s) | | Remaining
Life* | | Redemption
Frequency* | | Notice
Period
(in Days)* | | Redemption
Restrictions
and Terms* |
| Arbitrage Strategies(a) | | Investments in a variety of securities with the intent of profiting from relative changes in the price of a set of securities, currencies or commodities. | | $ | 252,479 | | | N/A | | N/A | | Quarterly | | 30-90 | | 0-2 years; up to 9% early redemption fee |
| Domestic Equity(b) | | Investments in equity securities issued by U.S. companies. | | | 168,508 | | | N/A | | N/A | | Quarterly - Annually | | 45-120 | | 0-3 years; up to 7% early redemption fee; possible 25% investor level gate |
| Energy (c) | | Investments in securities issued by companies in the energy sector. | | | 211,286 | | | $96,886 | | up to
15 years | | N/A | | N/A | | 0-15 years |
| Enhanced Fixed Income(d) | | Investments in non-traditional fixed income securities. | | | 371,960 | | | N/A | | N/A | | Quarterly | | 30-120 | | 0-3 years; up to 6% early redemption fee; possible 25% investor level gate |
| Global Opportunistic(e) | | Investments in a variety of global markets across all security types. | | | 432,841 | | | N/A | | N/A | | Monthly - Annually | | 45-90 | | 0-3 years; up to 6% early redemption fee; possible 25% investor level gate |
32
THE ENDOWMENT MASTER FUND, L.P.
(A Limited Partnership)
Notes to Consolidated Financial Statements, continued
December 31, 2012
| | | | | | | | | | | | | | | | |
| Investment Category | | Investment
Strategy | | Fair
Value
(in 000s) | | | Unfunded
Commitments
(in 000’s) | | Remaining
Life* | | Redemption
Frequency* | | Notice
Period
(in Days)* | | Redemption
Restrictions
and Terms* |
| International Equity(f) | | Investments in equity securities issued by foreign companies. | | $ | 83,227 | | | N/A | | N/A | | Weekly - Quarterly | | 7-90 | | 0-2 years; up to 5% early repurchase fee; possible 25% investor level gate |
| Natural Resources(g) | | Investments with exposure to non-energy natural resources. | | | 52,489 | | | $9,778 | | up to
10 years | | N/A | | N/A | | 0-10 years |
| Private Equity(h) | | Investments in nonpublic companies. | | | 684,515 | | | 220,563 | | up to
10 years | | N/A | | N/A | | 0-10 years |
| Real Estate(i) | | Investments in REITs, private partnerships, and various real estate related mortgage securities. | | | 204,408 | | | 63,700 | | up to
10 years | | N/A | | N/A | | 0-10 years |
| | | | $ | 2,461,713 | | | $390,927 | | | | | | | | |
| | | | | | | | | | | | | | | | |
| * | The information summarized in the table above represents the general terms for the specified asset class. Individual Investment Funds may have terms that are more or less restrictive than those terms indicated for the asset class as a whole. In addition, most Investment Funds have the flexibility, as provided for in their constituent documents, to modify and waive such terms. |
| (a) | This category includes Investment Funds that invest using two primary Styles (Event-Driven and Relative Value). Event-Driven strategies typically will include investments in common and preferred equities and various types of debt (often based on the probability that a particular event will occur). These may include distressed or Special Situations investments (securities of companies that are experiencing difficult business situations). Relative Value strategies may include long and short positions in common and preferred equity, convertible securities, and various forms of senior and junior (typically unsecured) debt. Investments under this style may also include index options, options on futures contracts, and other derivatives. |
| (b) | This category includes Investment Funds that invest primarily in publicly-traded equity securities issued by U.S. companies. These securities will typically trade on one of the major U.S. stock exchanges. Investment Funds in this category may include long/short funds, mutual funds and exchange-traded funds. |
| (c) | This category includes Investment Funds that invest primarily in publicly-traded securities issued by companies in the energy sector, private investments in energy-related assets or companies, and futures in energy commodity markets. The Investment Funds include private funds which may hold long/ short |
33
THE ENDOWMENT MASTER FUND, L.P.
(A Limited Partnership)
Notes to Consolidated Financial Statements, continued
December 31, 2012
| | equities, commodity trading advisers (“CTAs”) trading contracts on energy related commodities, mutual funds or exchange-traded funds, and private partnerships with private investments in their portfolios. The estimated remaining life of the private investments in this asset class is greater than six years. |
| (d) | This category includes Investment Funds that invest primarily in the following sectors: secured leveraged loans, high yield bonds, distressed debt, structured credit, and global debt (typically less efficient areas of the global fixed income markets than traditional fixed income strategies). Generally these sectors may be heavily weighted to certain industries such as telecom and technology with lower credit rating ranges (including leveraged buyouts), may include distressed debt strategies and may include restricted securities and securities that may not be registered for which a market may not be readily available. |
| (e) | This category includes Investment Funds that invest in global markets and across all security types including equities, fixed income, derivatives, commodities, currencies, futures, and exchange-traded funds. Investment Funds in this category are typically private funds and may include global long/short equity funds, global macro funds, and CTA’s. |
| (f) | This category includes Investment Funds that invest primarily in publicly-traded equity securities issued by foreign companies or securities issued on U.S. stock exchanges that represent ownership of a foreign corporation. Investment Funds in this category may include long/ short funds, mutual funds, and exchange-traded funds. |
| (g) | This category includes Investment Funds that invest primarily in assets with exposure to non-energy natural resources, including gold and other precious metals, industrial metals, and agricultural commodities. The Investment Funds may include private funds invested in long/ short equities; CTA’s trading contracts on agricultural commodities, mutual funds and exchange-traded funds, and private partnerships with private investments in their portfolios. The estimated remaining life of the private investments in this asset class is greater than six years. |
| (h) | This category includes private equity funds that invest primarily in non-publicly traded companies in need of capital. These Investment Funds may vary widely as to sector, size, stage, duration, and liquidity. Certain of these Investment Funds may also focus on the secondary market, buying interests in existing private equity funds, often at a discount. The majority of the investments in this asset class have an estimated remaining life of greater than six years. |
| (i) | This category includes Investment Funds that invest in real estate funds or managers that invest in real estate trusts (commonly known as “REITs”) and private partnerships that make investments in income producing properties, raw land held for development or appreciation, and various types of mortgage loans and common or preferred stock whose operations involve real estate. The private investments in this asset class have an estimated remaining life of greater than six years. |
(4) PARTNERS’ CAPITAL ACCOUNTS
(a) ISSUANCE OF INTERESTS
Upon receipt from an eligible investor of an initial or additional application for interests (the “Interests”), which will generally be accepted as of the first day of each month, the Master Fund will issue new Interests. The Interests have not been registered under the Securities Act, or the securities laws of any state. The Master Fund issues Interests only in private placement transactions in accordance with Regulation D or other applicable exemptions under the Securities Act. No public market exists for the Interests, and none is expected to develop. The Master Fund is not required, and does not intend, to hold annual meetings of its partners. The Interests are subject to substantial restrictions on transferability and resale and may not be transferred or resold except as permitted under the Master Fund’s limited partnership agreement. The Master Fund reserves the right to reject any applications for subscription of Interests.
34
THE ENDOWMENT MASTER FUND, L.P.
(A Limited Partnership)
Notes to Consolidated Financial Statements, continued
December 31, 2012
(b) ALLOCATION OF PROFITS AND LOSSES
For each fiscal period, generally monthly, net profits or net losses of the Master Fund are allocated among and credited to or debited against the capital accounts of all partners as of the last day of each fiscal period in accordance with the partners’ respective capital account ownership percentage for the fiscal period. Net profits or net losses are measured as the net change in the value of the partners’ capital of the Master Fund, including any change in unrealized appreciation or depreciation of investments and income, net of expenses, and realized gains or losses during a fiscal period. Net profits or net losses are allocated after giving effect for any initial or additional applications for Interests, which generally occur at the beginning of the month, or any repurchases of Interests.
(c) REPURCHASE OF INTERESTS
A partner will not be eligible to have the Master Fund repurchase all or any portion of an Interest at the partner’s discretion at any time. The Adviser generally recommends to the Board that the Master Fund offer to repurchase Interests each calendar quarter, pursuant to written tenders by partners. However, in the fourth quarter of 2012, the Adviser recommended and the Board determined that the Master Fund would make a 5% distribution to partners. As a result, each of the Master Fund’s partners received a 5% distribution of their capital account balance as of the end of the fourth quarter of 2012.
The Board retains the sole discretion to accept or reject the recommendation of the Adviser and to determine the amount of Interests, if any, that will be purchased in any tender offer that it does approve. In the event Interests are repurchased, there will be a substantial period of time between the date as of which partners must accept the Master Fund’s offer to repurchase their Interests and the date they can expect to receive payment for their Interests from the Master Fund. The Adviser recommended and the Board approved a tender offer for the Master Fund for the first quarter of 2013.
(5) INVESTMENTS IN PORTFOLIO SECURITIES
(a) INVESTMENT ACTIVITY
As of December 31, 2012, the Master Fund held investments in Investment Funds, securities and other derivatives. The agreements related to investments in Investment Funds provide for compensation to the Investment Funds’ managers/general partners or advisers in the form of management fees of up to 3.0% annually of monthly average net assets. In addition, many Investment Funds also provide for performance incentive fees/allocations of up to 30% of an Investment Fund’s net profits, although it is possible that such ranges may be exceeded for certain investment managers. These management fees and incentive fees are in addition to the management fees charged by the Master Fund.
For the year ended December 31, 2012, the aggregate cost of purchases and proceeds from sales of investments (excluding short-term investments) were $760,113,357 and $2,513,307,387, respectively.
The cost of the Master Fund’s underlying investments for Federal income tax purposes is adjusted for items of taxable income allocated to the Master Fund from such investments. The allocated taxable income is generally reported to the Master Fund by its underlying investments on Schedules K-1, Forms 1099 or PFIC statements, or a combination thereof.
35
THE ENDOWMENT MASTER FUND, L.P.
(A Limited Partnership)
Notes to Consolidated Financial Statements, continued
December 31, 2012
The underlying investments generally do not provide the Master Fund with tax reporting information until well after year end, and as a result, the Master Fund is unable to calculate the year end tax cost of its investments until well after year end. The Master Fund’s book cost as of December 31, 2012, was $2,790,313,809, resulting in accumulated net unrealized appreciation of $220,233,358 consisting of $463,409,845 in gross unrealized appreciation and $243,176,487 in gross unrealized depreciation.
During the year ended December 31, 2012, certain investments were received through a transfer in-kind in connection with the redemption of certain investments. The fair value of these investments transferred-in-kind, related cost and realized gain (loss) were as follows:
| | | | | | | | | | | | |
Investments Received from In-Kind Transfers | | Fair Value | | | Cost | | | Realized Gain (Loss) on
Transfers In-Kind | |
Artis Partners 2X (Institutional), L.P. | | $ | 3,338,607 | | | $ | 5,082,773 | | | $ | (1,744,166) | |
BDCM Partners I, L.P. | | | 4,413,996 | | | | 3,568,998 | | | | 844,998 | |
Kior Shares Liquidating Capital Account | | | 89,744 | | | | 185,316 | | | | (95,572) | |
Passport II, L.P. | | | 412,384 | | | | 545,253 | | | | (132,869) | |
Samlyn Onshore Fund, L.P. | | | 169,881 | | | | 154,727 | | | | 15,154 | |
| | | | | | | | | | | | |
| | $ | 8,424,612 | | | $ | 9,537,067 | | | $ | (1,112,455) | |
| | | | | | | | | | | | |
(b) INVESTMENT FUND LIQUIDITY
Certain Investment Funds in which the Master Fund invests have restrictions on liquidity which may result in limitations or restrictions on redemptions including, but not limited to, lock-ups, notice periods and early redemption fees. The Master Fund’s investments are grouped in three categories of liquidity, as determined by the Adviser. To better manage the Master Fund’s liquidity, the Adviser has also structured the portfolio’s capital into the liquidity categories listed below. The categories and percent of investments in each are as follows at December 31, 2012:
| | | | | | | | |
Liquidity Categories* | | Total Percentage of
Capital Invested
Allowed, per
Category | | Percentage of
Investments,
per Category | | | Withdrawal Rights |
Category 1 Assets(a) | | 10.00%-100.00%(b) | | | 52.1 | % | | Securities and derivatives activity or Investment Funds that settle three business days after trade date (“T+3”) and that have at least quarterly withdrawal rights and not more than a one-year lock-up period remaining. |
| | | |
Category 2 Assets(c) | | 0.00%-100.00%(b) | | | 12.9 | % | | Investment Funds that allow for periodic withdrawals at the time of investment but do not meet the qualifications for Category 1 Assets due to frequency of redemptions allowed or extended lock-up periods remaining. |
36
THE ENDOWMENT MASTER FUND, L.P.
(A Limited Partnership)
Notes to Consolidated Financial Statements, continued
December 31, 2012
| | | | | | | | |
Liquidity Categories* | | Total Percentage of
Capital Invested
Allowed, per
Category | | Percentage of
Investments,
per Category | | | Withdrawal Rights |
| | | |
Category 3 Assets(d) | | 0.00%-25.00%(b) | | | 35.0 | % | | Investment Funds that are self-liquidating (e.g., private equity funds), or that otherwise fail to meet the definition of Category 1 or 2 Assets. Also includes Investment Funds that only make distributions as the underlying portfolio’s assets or investments are liquidated (i.e., the investor in such Investment Funds does not have the right to request withdrawals on any specified periodic basis). |
| | | | | | | | |
| | | | | 100.00 | % | | |
| | | | | | | | |
* The expiration or implementation of lock-up periods on Master Fund investments in an Investment Fund could result in such investments moving from one liquidity category to another.
| (a) | Category 1 Assets are defined as cash, money market funds, and exchange-traded securities, including, but not limited to equities, bonds, notes, mutual funds, ETFs, options (including OTC), and derivatives. Investment Funds with investor-level gates, fund-level gates, redemption fees and/or penalties, sidepockets and/or special purpose vehicles housing less liquid investments may be included in this category as long as they have at least quarterly withdrawal rights with a year or less lockup remaining. |
| (b) | The Master Fund may not have less than 10% of its capital invested in cash and securities with T+3 liquidity, which are included in Category 1 Assets, or more than 25% of its capital invested in Category 3 Assets, with all remaining capital invested in Category 1 Assets or Category 2 Assets. |
| (c) | Category 2 Assets also may have investor-level gates, fund-level gates, redemption fees and/or penalties, sidepockets and/or special purpose vehicles housing less liquid investments. Sidepockets and/or special purpose vehicles (and any similar interest or investments, including certain types of distributions in-kind) remaining upon redemption from an Investment Fund categorized as Category 1 Assets or Category 2 Assets (collectively, “Residual Interests”), shall also each be conclusively deemed to be a Category 2 Asset unless the Adviser reasonably concludes that the majority of such Residual Interests will not become liquid within three years, in which case the Adviser will categorize such Residual Interests as Category 3 Assets. |
| (d) | Category 3 Assets may include, without limitation, private equity funds, real estate funds, or natural resources or energy funds that only make distributions when an investment is monetized or generates cash flow through distributions, dividends, etc. This category will be calculated as the lesser of: (a) the amount of called and invested capital or (b) the fair value of the interests in such Investment Funds. Any standard and customary audit hold-backs which remain after redeeming from an Investment Fund included in Category 1 Assets or Category 2 Assets will be classified as Category 1 Assets. Any other holdings which remain (e.g., “sidepockets” and/or other Residual Interests) will be classified as Category 2 Assets if the Adviser reasonably concludes that the majority of such holdings will become liquid within three years; otherwise, such holdings will be classified as Category 3 Assets. |
37
THE ENDOWMENT MASTER FUND, L.P.
(A Limited Partnership)
Notes to Consolidated Financial Statements, continued
December 31, 2012
(c) AFFILIATED INVESTMENT FUNDS
At December 31, 2012, the Master Fund’s investments in certain Investment Funds were deemed to be investments in affiliated issuers under the 1940 Act, primarily because the Master Fund owns 5% or more of the Investment Funds’ total net assets. The activity resulting from investments in these Investment Funds, including interest and dividend income as well as realized gains and losses, is identified in the Consolidated Statement of Operations as transactions with affiliated investments. A listing of these affiliated Investment Funds (including 2012 activity) is shown below:
| | | | | | | | | | | | | | | | | | | | | | | | | | | | | | | | | | | | | | | | |
| | | | For the Period 1/1/2012 through 12/31/2012 | | | | | | For the
Period
1/1/2012
through
12/31/2012 | |
Investment Funds | | Shares
12/31/2011 | | | Shares
12/31/2012 | | | Fair Value
12/31/2011 | | | Redemptions
In-Kind | | | Cost of
Purchases | | | Cost of
Sales* | | | Realized Gain
(Loss) on
Investments | | | Change in
Unrealized
Appreciation/
Depreciation | | | Fair Value
12/31/2012 | | | Interest/
Dividend
Income | |
Atlas Institutional Fund, LLC | | | | | | | | | | $ | 25,814,185 | | | $ | — | | | $ | — | | | $ | — | | | $ | — | | | $ | 1,758,798 | | | $ | 27,572,983 | | | $ | — | |
BDCM Partners I, L.P. | | | | | | | | | | | 50,600,994 | | | | 4,413,996 | | | | 38,467,283 | | | | (46,390,797 | ) | | | 1,418,819 | | | | 3,718,626 | | | | 52,228,921 | | | | — | |
Bell Point Credit Opportunities Fund, L.P. | | | | | | | | | | | 26,728,088 | | | | — | | | | — | | | | (21,385,022 | ) | | | (1,370,347 | ) | | | 3,024,785 | | | | 6,997,504 | | | | — | |
Catterton Growth Partners, L.P. | | | | | | | | | | | 10,614,364 | | | | — | | | | 2,577,190 | | | | (2,126,017 | ) | | | 1,473,950 | | | | 819,482 | | | | 13,358,969 | | | | 4,411 | |
CCM Small Cap Value Qualified Fund, L.P. | | | | | | | | | | | 23,556,080 | | | | — | | | | — | | | | (10,000,000 | ) | | | (881,612 | ) | | | 2,341,633 | | | | 15,016,101 | | | | — | |
Corriente China Opportunity Partners II, L.P. | | | | | | | | | | | 16,498,912 | | | | — | | | | — | | | | — | | | | — | | | | (7,158,809 | ) | | | 9,340,103 | | | | — | |
Corriente China Opportunity Partners, L.P. | | | | | | | | | | | 7,981,887 | | | | — | | | | — | | | | — | | | | — | | | | (3,827,281 | ) | | | 4,154,606 | | | | — | |
Courage Special Situations Fund, L.P. | | | | | | | | | | | 14,075,770 | | | | — | | | | — | | | | (5,000,000 | ) | | | 391,424 | | | | 1,806,813 | | | | 11,274,007 | | | | — | |
CRC Credit Fund Ltd. | | | 125,180 | | | | 113,729 | | | | 43,114,834 | | | | — | | | | — | | | | (12,708,722 | ) | | | 2,706,995 | | | | (859,274 | ) | | | 32,253,833 | | | | — | |
Credit Distressed Blue Line Fund, L.P. | | | | | | | | | | | 39,144,551 | | | | — | | | | — | | | | (10,031,778 | ) | | | 190,128 | | | | (5,667,835 | ) | | | 23,635,066 | | | | — | |
CX Partners Fund Limited | | | | | | | | | | | 9,279,323 | | | | — | | | | 5,615,043 | | | | — | | | | — | | | | (1,692,717 | ) | | | 13,201,649 | | | | 113,007 | |
Dace Ventures I, L.P. | | | | | | | | | | | 1,871,998 | | | | — | | | | 171,783 | | | | (613,426 | ) | | | 320,312 | | | | (117,024 | ) | | | 1,633,643 | | | | — | |
EDF-MI Onshore, L.P. | | | | | | | | | | | 133,391,327 | | | | — | | | | — | | | | (75,000,000 | ) | | | 10,461,905 | | | | (48,935,018 | ) | | | 19,918,214 | | | | — | |
Empire Capital Partners Enhanced, L.P. | | | | | | | | | | | — | | | | — | | | | 25,000,000 | | | | — | | | | — | | | | (2,456,599 | ) | | | 22,543,401 | | | | 52 | |
Encap Energy Infrastructure TE Feeder, L.P. | | | | | | | | | | | 9,211,892 | | | | — | | | | 2,276,804 | | | | (8,907,355 | ) | | | 4,907,034 | | | | (1,605,060 | ) | | | 5,883,315 | | | | 87,017 | |
Falcon Edge Global, L.P. | | | | | | | | | | | — | | | | — | | | | 50,000,000 | | | | — | | | | — | | | | 76,564 | | | | 50,076,564 | | | | — | |
Florida Real Estate Value Fund, L.P. | | | | | | | | | | | 6,236,666 | | | | — | | | | 2,104,010 | | | | (169,119 | ) | | | — | | | | 95,483 | | | | 8,267,040 | | | | 724,093 | |
Fortelus Special Situations Fund, L.P. | | | | | | | | | | | 30,336,726 | | | | — | | | | — | | | | (21,569,355 | ) | | | (6,955,931 | ) | | | 6,559,427 | | | | 8,370,867 | | | | — | |
Forum European Realty Income III, L.P. | | | | | | | | | | | 9,160,943 | | | | — | | | | 4,579,919 | | | | — | | | | — | | | | 757,946 | | | | 14,498,808 | | | | — | |
38
THE ENDOWMENT MASTER FUND, L.P.
(A Limited Partnership)
Notes to Consolidated Financial Statements, continued
December 31, 2012
| | | | | | | | | | | | | | | | | | | | | | | | | | | | | | | | | | | | | | | | |
| | | | For the Period 1/1/2012 through 12/31/2012 | | | | | | For the
Period
1/1/2012
through
12/31/2012 | |
Investment Funds | | Shares
12/31/2011 | | | Shares
12/31/2012 | | | Fair Value
12/31/2011 | | | Redemptions
In-Kind | | | Cost of
Purchases | | | Cost of
Sales* | | | Realized Gain
(Loss) on
Investments | | | Change in
Unrealized
Appreciation/
Depreciation | | | Fair Value
12/31/2012 | | | Interest/
Dividend
Income | |
Garrison Opportunity Fund, LLC | | | | | | | | | | $ | 21,328,827 | | | $ | — | | | $ | — | | | $ | — | | | $ | — | | | $ | 2,047,805 | | | $ | 23,376,632 | | | $ | — | |
GTIS Brazil Real Estate Fund (Brazilian Real), L.P. | | | | | | | | | | | 20,730,589 | | | | — | | | | 1,887,709 | | | | — | | | | — | | | | 1,337,381 | | | | 23,955,679 | | | | — | |
Halcyon European Structured Opportunities Fund, L.P. | | | | | | | | | | | 518,816 | | | | — | | | | — | | | | (152,692 | ) | | | (108,495 | ) | | | 55,600 | | | | 313,229 | | | | — | |
Harbinger Capital Partners Fund I, L.P. | | | | | | | | | | | 34,532,293 | | | | — | | | | — | | | | — | | | | — | | | | (7,868,693 | ) | | | 26,663,600 | | | | — | |
Harbinger Capital Partners Special Situations Fund, L.P. | | | | | | | | | | | 6,926,305 | | | | — | | | | — | | | | (710,681 | ) | | | 11,762 | | | | (3,170,065 | ) | | | 3,057,321 | | | | — | |
Hayman Capital Partners, L.P. | | | | | | | | | | | 29,748,598 | | | | — | | | | 30,000,000 | | | | (10,000,000 | ) | | | 1,105,088 | | | | 6,698,589 | | | | 57,552,275 | | | | — | |
HealthCor Partners Fund, L.P. | | | | | | | | | | | 6,509,326 | | | | — | | | | 1,427,317 | | | | — | | | | — | | | | 450,013 | | | | 8,386,656 | | | | — | |
HFR HE Bristol Master Trust (Series D) | | | 25,000 | | | | 25,000 | | | | 20,960,611 | | | | — | | | | — | | | | — | | | | — | | | | (6,406,394 | ) | | | 14,554,217 | | | | — | |
Hillcrest Fund, L.P. | | | | | | | | | | | 10,594,747 | | | | — | | | | 6,896,402 | | | | (5,159,014 | ) | | | 311,681 | | | | (1,605,846 | ) | | | 11,037,970 | | | | 118,275 | |
Hound Partners, L.P. | | | | | | | | | | | — | | | | — | | | | 35,000,000 | | | | — | | | | — | | | | 5,528,040 | | | | 40,528,040 | | | | — | |
Indaba Capital Partners, L.P. | | | | | | | | | | | 28,637,867 | | | | — | | | | — | | | | — | | | | — | | | | 9,177,140 | | | | 37,815,007 | | | | — | |
Integral Capital Partners VIII, L.P. | | | | | | | | | | | 3,743,963 | | | | — | | | | — | | | | — | | | | — | | | | (601,408 | ) | | | 3,142,555 | | | | — | |
Intervale Capital Fund, L.P. | | | | | | | | | | | 20,150,112 | | | | — | | | | 782,756 | | | | (11,693,325 | ) | | | 8,925,550 | | | | (5,972,616 | ) | | | 12,192,477 | | | | — | |
Investcorp Silverback Arbitrage Fund, LLC | | | | | | | | | | | 17,036,329 | | | | — | | | | — | | | | — | | | | — | | | | 571,414 | | | | 17,607,743 | | | | — | |
Kenmont Onshore Fund, L.P. | | | | | | | | | | | 958,631 | | | | — | | | | — | | | | (940,241 | ) | | | (4,211,892 | ) | | | 4,407,278 | | | | 213,776 | | | | — | |
LC Fund IV, L.P. | | | | | | | | | | | 19,623,358 | | | | — | | | | 1,697,096 | | | | (17,383 | ) | | | — | | | | 4,134,992 | | | | 25,438,063 | | | | — | |
Magnetar Capital Fund, L.P. | | | | | | | | | | | 6,988,058 | | | | — | | | | — | | | | — | | | | — | | | | 1,881,843 | | | | 8,869,901 | | | | — | |
Magnetar SPV, LLC (Series L) | | | | | | | | | | | 13,030,063 | | | | — | | | | — | | | | (1,636,130 | ) | | | 68,335 | | | | 1,546,332 | | | | 13,008,600 | | | | — | |
Middle East North Africa Opportunities Fund, L.P. | | | 5,089 | | | | 5,089 | | | | 1,577,000 | | | | — | | | | — | | | | — | | | | — | | | | (60,880 | ) | | | 1,516,120 | | | | — | |
Monsoon Infrastructure & Realty Co-Investors, L.P. | | | | | | | | | | | 14,339,446 | | | | — | | | | 1,950,000 | | | | — | | | | — | | | | (253,382 | ) | | | 16,036,064 | | | | — | |
Montrica Global Opportunities Fund, L.P. | | | 35,356 | | | | 33,558 | | | | 1,922,744 | | | | — | | | | — | | | | (21,688 | ) | | | (170,090 | ) | | | (21,664 | ) | | | 1,709,302 | | | | — | |
Morgan Rio Capital Fund, L.P.** | | | | | | | | | | | 24,480,064 | | | | — | | | | — | | | | — | | | | — | | | | 1,657,757 | | | | 26,137,821 | | | | — | |
Net Lease Private REIT VII, Inc. | | | | | | | | | | | 4,232,440 | | | | — | | | | — | | | | (1,383,067 | ) | | | — | | | | — | | | | 2,849,373 | | | | 439,239 | |
Net Lease Private REIT VII-A, Inc. | | | | | | | | | | | 4,232,440 | | | | — | | | | — | | | | (1,383,067 | ) | | | — | | | | — | | | | 2,849,373 | | | | 439,239 | |
39
THE ENDOWMENT MASTER FUND, L.P.
(A Limited Partnership)
Notes to Consolidated Financial Statements, continued
December 31, 2012
| | | | | | | | | | | | | | | | | | | | | | | | | | | | | | | | | | | | | | | | |
| | | | For the Period 1/1/2012 through 12/31/2012 | | | | | | For the
Period
1/1/2012
through
12/31/2012 | |
Investment Funds | | Shares
12/31/2011 | | | Shares
12/31/2012 | | | Fair Value
12/31/2011 | | | Redemptions
In-Kind | | | Cost of
Purchases | | | Cost of
Sales* | | | Realized Gain
(Loss) on
Investments | | | Change in
Unrealized
Appreciation/
Depreciation | | | Fair Value
12/31/2012 | | | Interest/
Dividend
Income | |
New Horizon Capital III, L.P. | | | | | | | | | | $ | 23,451,904 | | | $ | — | | | $ | 5,112,941 | | | $ | (1,409,282 | ) | | $ | — | | | $ | 3,205,000 | | | $ | 30,360,563 | | | $ | 248,120 | |
Orbis Real Estate Fund I | | | | | | | | | | | 2,982,985 | | | | — | | | | 364,286 | | | | (27,600 | ) | | | — | | | | (330,901 | ) | | | 2,988,770 | | | | — | |
Overseas CAP Partners, Inc. | | | 9,295 | | | | 1,088 | | | | 15,412,758 | | | | — | | | | — | | | | (14,895,627 | ) | | $ | 2,422,597 | | | | 4,493,212 | | | | 7,432,940 | | | | — | |
Parmenter Realty Fund IV, L.P. | | | | | | | | | | | 1,268,538 | | | | — | | | | 6,331,576 | | | | (3,328,040 | ) | | | 19,970 | | | | (225,538 | ) | | | 4,066,506 | | | | 231,194 | |
Passport II, L.P. | | | | | | | | | | | 49,240,774 | | | | — | | | | — | | | | (18,842,178 | ) | | | (5,313,008 | ) | | | 10,108,060 | | | | 35,193,648 | | | | — | |
Pearlmark Mezzanine Realty Partners III, LLC | | | | | | | | | | | 7,795,793 | | | | — | | | | 11,720,584 | | | | (4,805,564 | ) | | | 496,464 | | | | 905,723 | | | | 16,113,000 | | | | 1,156,016 | |
Pennybacker II, L.P. | | | | | | | | | | | 1,886,942 | | | | — | | | | 2,428,307 | | | | (501,358 | ) | | | — | | | | (87,162 | ) | | | 3,726,729 | | | | 52,735 | |
Phoenix Asia Real Estate Investments II, L.P. | | | | | | | | | | | 14,421,284 | | | | — | | | | 365,548 | | | | (307,974 | ) | | | 152,695 | | | | (794,235 | ) | | | 13,837,318 | | | | 174,226 | |
PIPE Equity Partners, L.L.C. | | | | | | | | | | | 21,413,300 | | | | — | | | | — | | | | (1,440,156 | ) | | | (1,414,715 | ) | | | (327,282 | ) | | | 18,231,147 | | | | — | |
PIPE Select Fund, L.L.C. | | | | | | | | | | | 41,723,033 | | | | — | | | | — | | | | (11,288,885 | ) | | | 605,570 | | | | 3,287,006 | | | | 34,326,724 | | | | — | |
Private Equity Investment Fund IV, L.P. | | | | | | | | | | | 6,249,295 | | | | — | | | | 394,786 | | | | (875,282 | ) | | | 203,923 | | | | (189,445 | ) | | | 5,783,277 | | | | 6,350 | |
Private Equity Investment Fund V, L.P.** | | | | | | | | | | | 27,878,519 | | | | — | | | | 9,633,159 | | | | (4,623,520 | ) | | | 2,130,285 | | | | 3,444,725 | | | | 38,463,168 | | | | 120,214 | |
Providence MBS Fund L.P. | | | | | | | | | | | 56,163,961 | | | | — | | | | 50,000,000 | | | | — | | | | — | | | | 4,522,972 | | | | 110,686,933 | | | | — | |
Q Funding III, L.P. | | | | | | | | | | | 12,686,971 | | | | — | | | | — | | | | (6,754,860 | ) | | | 1,788,595 | | | | (766,475 | ) | | | 6,954,231 | | | | — | |
Saints Capital VI, L.P. | | | | | | | | | | | 15,517,661 | | | | — | | | | 4,597,548 | | | | (2,058,819 | ) | | | 1,229,721 | | | | 45,850 | | | | 19,331,961 | | | | 78,260 | |
SBC Latin America Housing US Fund, L.P. | | | | | | | | | | | 3,780,352 | | | | — | | | | 4,370,449 | | | | (3,681,449 | ) | | | — | | | | (78,404 | ) | | | 4,390,948 | | | | 237,602 | |
Sovereign Capital Limited
Partnership III | | | | | | | | | | | 5,362,849 | | | | — | | | | 2,234,061 | | | | — | | | | — | | | | 851,111 | | | | 8,448,021 | | | | — | |
Trivest Fund IV, L.P. | | | | | | | | | | | 14,521,240 | | | | — | | | | 4,731,526 | | | | (1,195,135 | ) | | | 69,502 | | | | 678,127 | | | | 18,805,260 | | | | 572,109 | |
Trustbridge Partners II, L.P. | | | | | | | | | | | 21,807,104 | | | | — | | | | — | | | | (3,493,406 | ) | | | 1,671,446 | | | | (1,856,342 | ) | | | 18,128,802 | | | | 44,853 | |
Trustbridge Partners III, L.P. | | | | | | | | | | | 26,465,744 | | | | — | | | | 2,453,708 | | | | (415,315 | ) | | | — | | | | 2,257,228 | | | | 30,761,365 | | | | 504,258 | |
Tuckerbrook SB Global Distressed
Fund I, L.P. | | | | | | | | | | | 6,613,160 | | | | — | | | | — | | | | (1,150,000 | ) | | | — | | | | 271,102 | | | | 5,734,262 | | | | — | |
Tybourne Equity (U.S.) Fund | | | | | | | | | | | — | | | | — | | | | 40,000,000 | | | | — | | | | — | | | | 1,247,237 | | | | 41,247,237 | | | | — | |
Valiant Capital Partners, L.P. | | | | | | | | | | | 139,690,729 | | | | — | | | | 110,147 | | | | (9,490,703 | ) | | | 957,421 | | | | 2,090,381 | | | | 133,357,975 | | | | 164,035 | |
Velite Energy, L.P. | | | | | | | | | | | 76,962,836 | | | | — | | | | — | | | | (43,430,000 | ) | | | 32,798,802 | | | | (14,189,201 | ) | | | 52,142,437 | | | | 108 | |
40
THE ENDOWMENT MASTER FUND, L.P.
(A Limited Partnership)
Notes to Consolidated Financial Statements, continued
December 31, 2012
| | | | | | | | | | | | | | | | | | | | | | | | | | | | | | | | | | | | |
| | | | For the Period 1/1/2012 through 12/31/2012 | | | | | | For the
Period
1/1/2012
through
12/31/2012 | |
Investment
Funds | | Shares
12/31/2011 | | Shares
12/31/2012 | | Fair Value
12/31/2011 | | | Redemptions
In-Kind | | | Cost of
Purchases | | | Cost of
Sales* | | | Realized Gain
(Loss) on
Investments | | | Change in
Unrealized
Appreciation/
Depreciation | | | Fair Value
12/31/2012 | | | Interest/
Dividend
Income | |
Westview Capital Partners II, L.P. | | | | | | $ | 16,158,811 | | | $ | — | | | $ | 3,313,796 | | | $ | — | | | $ | — | | | $ | 1,312,972 | | | $ | 20,785,579 | | | $ | — | |
| | | | | | | | | | | | | | | | | | | | | | | | | | | | | | | | | | | | |
| | | | | | $ | 1,379,877,710 | | | $ | 4,413,996 | | | $ | 358,595,734 | | | $ | (381,014,032 | ) | | $ | 56,413,884 | | | $ | (17,951,103 | ) | | $ | 1,400,336,189 | | | $ | 5,515,413 | |
| | | | | | | | | | | | | | | | | | | | | | | | | | | | | | | | | | | | |
| * | Sales include return of capital. |
| ** | Voting rights have been waived for this investment. |
(6) FINANCIAL INSTRUMENTS WITH OFF-BALANCE SHEET RISK
In the normal course of business, the Investment Funds in which the Master Fund invests trade various derivative securities and other financial instruments, and enter into various investment activities with off-balance sheet risk both as an investor and as a principal. The Master Fund’s risk of loss in these Investment Funds is limited to the value of its investment in, or commitment to, such Investment Funds. In addition, the Master Fund may from time to time invest directly in derivative securities or other financial instruments to gain greater or lesser exposure to a particular asset class.
(7) DUE FROM BROKERS
The Master Fund conducts business with brokers for its investment activities. The clearing and depository operations for the investment activities are performed pursuant to agreements with the brokers. The Master Fund is subject to credit risk to the extent any broker with whom the Master Fund conducts business is unable to deliver cash balances or securities, or clear security transactions on the Master Fund’s behalf. The Master Fund monitors the financial condition of the brokers with which the Master Fund conducts business and believes the likelihood of loss under the aforementioned circumstances is remote.
(8) ADMINISTRATION AGREEMENT
In consideration for administrative, accounting, and recordkeeping services, the Master Fund pays the Independent Administrator a monthly administration fee based on the month-end partners’ capital of the Master Fund. The Master Fund is charged, on an annual basis, 6 basis points on partners’ capital of up to $2 billion, 5 basis points on partners’ capital between the amounts of $2 billion and $5 billion, 2 basis points on partners’ capital between the amounts of $5 billion and $15 billion, and 1.25 basis points for amounts over $15 billion. The administration fee is payable monthly in arrears. The Independent Administrator also provides the Master Fund with legal, compliance, transfer agency, and other investor related services at an additional cost.
The administration fees are paid out of the Master Fund’s assets, which decreases the net profits or increases the net losses of the partners in the Master Fund. As of December 31, 2012, the Master Fund had $3,071,734,183 in partners’ capital. The total administration fee incurred for the year ended December 31, 2012, was $2,115,865.
41
THE ENDOWMENT MASTER FUND, L.P.
(A Limited Partnership)
Notes to Consolidated Financial Statements, continued
December 31, 2012
(9) RELATED PARTY TRANSACTIONS
(a) INVESTMENT MANAGEMENT FEE
In consideration of the advisory and other services provided by the Adviser to the Master Fund pursuant to the Investment Management Agreement, the Master Fund pays the Adviser an investment management fee (the “Investment Management Fee”), equal to 1.00% on an annualized basis of the Master Fund’s partners’ capital calculated based on the Master Fund’s partners’ capital at the end of each month, payable quarterly in arrears. The Investment Management Fee decreases the net profits or increases the net losses of the Master Fund that are credited to or debited against the capital accounts of its partners. For the year ended December 31, 2012, $38,703,653 was incurred for Investment Management Fees.
(b) PLACEMENT AGENTS
The Master Fund may engage one or more placement agents (each, a “Placement Agent”) to solicit investments in the Master Fund. Salient Capital, L.P., an affiliate of the Adviser, is a broker-dealer who has been engaged by the Master Fund to serve as a Placement Agent. A Placement Agent may engage one or more sub-placement agents. The Adviser or its affiliates may pay a fee out of their own resources to Placement Agents and sub-placement agents. As of December 31, 2012, the two largest non-affiliated sub-placement agents service approximately 83% of the feeder funds assets which are invested in the Master Fund. To the extent that substantial numbers of investors have a relationship with a particular sub-placement agent, such sub-placement agent may have the ability to influence investor behavior, which may affect the Master Fund.
(10) INDEBTEDNESS OF THE FUND
As a fundamental policy, the Master Fund may borrow up to, but not more than, 25% of the partners’ capital of the Master Fund (at the time such borrowings were made and after taking into account the investment and/or deployment of such proceeds) for the purpose of making investments, funding redemptions and for other working capital and general Master Fund purposes. For purposes of the Master Fund’s investment restrictions and certain investment limitations under the 1940 Act, including for example, the Master Fund’s leverage limitations, the Master Fund will not “look through” Investment Funds in which the Master Fund invests. Investment Funds may also use leverage, whether through borrowings, futures, or other derivative products and are not subject to the Master Fund’s investment restrictions. However, such borrowings by Investment Funds are without recourse to the Master Fund and the Master Fund’s risk of loss is limited to its investment in such Investment Funds, other than for some Investment Funds in which the Master Fund has made a capital commitment, for which the risk of loss is limited to the Master Fund’s total capital commitment. For some Investment Funds in which the Master Fund has made a capital commitment that will be funded over a period of time, such as private equity, private energy and real estate funds, the Master Fund, in certain instances, may commit to fund more than its initial capital commitment. The rights of any lenders to the Master Fund to receive payments of interest or repayments of principal will be senior to those of the partners, and the terms of any borrowings may contain provisions that limit certain activities of the Master Fund.
The Master Fund maintains a line of credit agreement (the “Agreement”) with Deutsche Bank Aktiengesellschaft which provides a $500,000,000 credit facility, with available borrowing capacity subject to collateral allocation ratios as defined in the Agreement. Borrowings under the Agreement are secured by the Master Fund’s investments. The Agreement provides for a commitment fee of 0.65% plus interest accruing on any borrowed amounts at the three-month London Interbank Offered Rate (LIBOR) plus a spread of 1.10% per
42
THE ENDOWMENT MASTER FUND, L.P.
(A Limited Partnership)
Notes to Consolidated Financial Statements, continued
December 31, 2012
annum, payable quarterly in arrears. There were no borrowings during the year ended December 31, 2012. The current credit facility agreement expires on September 28, 2016.
(11) FINANCIAL HIGHLIGHTS
| | | | | | | | | | | | | | | | | | | | |
| | | Year ended
December 31,
2012 | | | Year ended
December 31,
2011 | | | Year ended
December 31,
2010 | | | Year ended
December 31,
2009 | | | Year ended
December 31,
2008 | |
Net investment loss to average partners’ capital1 | | | (0.81 | )% | | | (0.75 | )% | | | (0.84 | )% | | | (0.95 | )% | | | (1.19 | )% |
Expenses to average partners’ capital1,2 | | | 1.49 | % | | | 1.27 | % | | | 1.19 | % | | | 1.20 | % | | | 1.54 | % |
Portfolio turnover | | | 20.88 | % | | | 26.72 | % | | | 26.71 | % | | | 27.40 | % | | | 29.19 | % |
Total return3 | | | 2.50 | % | | | (3.18 | )% | | | 9.52 | % | | | 14.96 | % | | | (23.46 | )% |
Partners’ capital, end of period (000s) | | $ | 3,071,734 | | | $ | 4,301,279 | | | $ | 5,355,785 | | | $ | 5,212,611 | | | $ | 4,663,185 | |
An investor’s return (and operating ratios) may vary from those reflected based on the timing of capital transactions.
| 1 | Ratios are calculated by dividing the indicated amount by average partners’ capital measured at the end of each month during the period. |
| 2 | Expense ratios do not include expenses of acquired funds that are paid indirectly by the Master Fund as a result of its ownership in the underlying funds. Expenses include U.S. offshore withholding tax, which is only allocable to investors investing through the offshore feeder funds. |
| 3 | Calculated as geometrically linked monthly returns for each month in the period. |
(12) SUBSEQUENT EVENTS
The Master Fund accepts initial or additional applications for Interests generally as of the first day of the month.
Based on the partners’ capital of the Master Fund, the Adviser recommended to the Board that a tender offer in an amount of up to $160 million be made for the quarter ending March 31, 2013 to those partners who elect to tender their Interests prior to the expiration of the tender offer period. The Board approved such recommendation and partners in the Master Fund were notified of a tender offer with a February 21, 2013 expiration date (“Expiration Date”). In response to the number of partners electing to tender their Interests as of the Expiration Date, which amounted to approximately $1.1 billion, the Adviser, in its discretion, will pro-rate the amount elected to be tendered in accordance with the Master Fund’s repurchase procedures. The final amount that is accepted by the Master Fund will appear in the next report to partners.
Management of the Master Fund has evaluated the need for disclosures and/or adjustments resulting from subsequent events through the date the consolidated financial statements were issued. Based on this evaluation, no adjustments were required to the consolidated financial statements as of December 31, 2012.
43
THE ENDOWMENT MASTER FUND, L.P.
(A Limited Partnership)
Supplemental Information
December 31, 2012
(Unaudited)
Directors and Officers
The Master Fund’s operations are managed under the direction and oversight of the Board. Each Director serves for an indefinite term or until he or she reaches mandatory retirement, if any, as established by the Board. The Board appoints the officers of the Master Fund who are responsible for the Master Fund’s day-to-day business decisions based on policies set by the Board. The officers serve at the pleasure of the Board.
Compensation for Directors
The Master Fund, The Endowment Registered Fund, L.P., The Endowment Institutional Fund, L.P, and The Endowment Institutional TEI Fund W, L.P., together pay each of the Directors who is not an “interested person” of the Adviser, as defined in the 1940 Act (the “Independent Directors”) an annual retainer of $38,000, paid quarterly, an annual Board meeting fee of $15,000, a fee of $1,250 per informal Board meeting, a fee of $1,250 per telephonic Board meeting, an annual fee of $4,000 for membership on each committee, an annual fee of $5,000 for the audit committee chairman and $2,500 for each other committee chair, each of which is paid quarterly, and an annual fee of $7,500, paid quarterly, to the Lead Independent Director. There are currently six Independent Directors. In the interest of retaining Independent Directors of the highest quality, the Board intends to periodically review such compensation and may modify it as the Board deems appropriate. In addition, the Funds reimburse each Independent Director for travel and other expenses incurred in connection with attendance at such meetings. The Directors do not receive pension or retirement benefits from the Funds. Other officers (apart from the CCO) and Directors of the Funds receive no compensation from the Funds.
Interested Directors
| | | | | | | | | | |
| Name, Address and Age | | Position(s)
Held with
the Master
Fund | | Length of
Time
Served | | Principal
Occupation(s) During
the Past 5 Years | | Number of
Portfolios
in Fund
Complex
Overseen
by Director | | Other
Directorships
Held by
Director |
John A. Blaisdell (1) Age: 52 Address: c/o The Endowment
Master Fund L.P.
4265 San Felipe, Suite 800,
Houston, TX 77027 | | Director,
Co-
Principal
Executive
Officer | | Since
2004 | | Member, Investment Committee of the Adviser, since 2002;
Managing Director of Salient, since 2002 | | 5 | | Salient Alternative
Strategies Funds
(investment
companies) (three
funds) since 2010;
Salient MF Trust
(investment
company) (two
funds) since 2012;
Salient Midstream
& MLP Fund
(investment
company) since
2012; Salient
MLP & Energy
Infrastructure
Fund (investment
company)
since 2011 |
44
THE ENDOWMENT MASTER FUND, L.P.
(A Limited Partnership)
Supplemental Information, continued
December 31, 2012
(Unaudited)
| | | | | | | | | | |
| Name, Address and Age | | Position(s)
Held with
the Master
Fund | | Length of
Time
Served | | Principal
Occupation(s) During
the Past 5 Years | | Number of
Portfolios
in Fund
Complex
Overseen
by Director | | Other
Directorships
Held by
Director |
Andrew B. Linbeck1 Age: 48 Address: c/o The Endowment
Master Fund L.P.
4265 San Felipe, Suite 800,
Houston, TX 77027 | | Director,
Co-
Principal
Executive
Officer | | Since
2004 | | Member, Investment Committee of the Adviser, since 2002; Managing Director of Salient, since 2002 | | 5 | | Salient Alternative
Strategies Funds
(investment
companies) (three
funds) 2010-2012;
Salient Midstream
& MLP Fund
(investment
company) since
2012; Salient
MLP & Energy
Infrastructure
Fund, since 2011 |
A. Haag Sherman1 Age: 47 Address: c/o The Endowment
Master Fund L.P.
4265 San Felipe, Suite 800,
Houston, TX 77027 | | Director | | Since
2004 | | Member, Investment Committee of the Adviser, 2002-2011; Managing Director of Salient, 2002-2011 | | 5 | | Salient Alternative
Strategies Funds
(investment
companies) (three
funds) 2010-2012;
Salient Midstream
& MLP Fund
(investment
company) since
2012; Salient
MLP & Energy
Infrastructure
Fund (investment
company) since
2011; Plains
Capital
Corporation, since
2009; Blue
Dolphin Energy
Company, since
January 2012 |
| 1 | This person’s status as an “interested” director arises from his affiliation with Salient Partners, L.P., which itself is an affiliate of the Master Fund, The Endowment Registered Fund, L.P., The Endowment Institutional Fund, L.P., The Endowment TEI Fund, L.P., The Endowment Institutional TEI Fund W, L.P., and the Adviser. |
45
THE ENDOWMENT MASTER FUND, L.P.
(A Limited Partnership)
Supplemental Information, continued
December 31, 2012
(Unaudited)
Independent Directors
| | | | | | | | | | |
| Name, Address and Age | | Position(s)
Held with
the Master
Fund | | Length of
Time
Served | | Principal
Occupation(s) During
the Past 5 Years | | Number of
Portfolios
in Fund
Complex
Overseen
by Director | | Other
Directorships
Held by
Director |
Karin B. Bonding, CFA Age: 73 Address: c/o The
Endowment Master
Fund L.P.
4265 San Felipe, Suite 800,
Houston, TX 77027 | | Director | | Since
2010 | | Lecturer, University of Virginia, since 1996; President of Capital Markets Institute, Inc. (fee-only financial planner and investment advisor) since 1996. | | 5 | | Salient Alternative Strategies Funds (investment companies) (three funds); Salient MF Trust (investment company) (two funds) since 2012; Salient Midstream & MLP Fund (investment company) since 2012; Salient MLP & Energy Infrastructure Fund (investment company) since 2011; Brandes Investment Trust (investment companies) (four funds) 2006-2012; Credit Suisse Alternative Capital Funds (investment companies) (six funds) 2005-2010 |
Jonathan P. Carroll Age: 51 Address: c/o The Endowment Master
Fund L.P.
4265 San Felipe, Suite 800,
Houston, TX 77027 | | Director | | Since
2004 | | President of Lazarus Financial LLC (holding company) since 2006; private investor for the past six years | | 5 | | Salient Alternative Strategies Funds (investment companies) (three funds) since 2010; Salient MF Trust (investment company) (two funds) since 2012; Salient Midstream & MLP Fund (investment company) since 2012; Salient MLP & Energy Infrastructure Fund (investment company) since 2011 |
46
THE ENDOWMENT MASTER FUND, L.P.
(A Limited Partnership)
Supplemental Information, continued
December 31, 2012
(Unaudited)
| | | | | | | | | | |
| Name, Address and Age | | Position(s)
Held with
the Master
Fund | | Length of
Time
Served | | Principal
Occupation(s) During
the Past 5 Years | | Number of
Portfolios
in Fund
Complex
Overseen
by Director | | Other
Directorships
Held by
Director |
Dr. Bernard Harris Age: 56 Address: c/o The
Endowment Master
Fund L.P.
4265 San Felipe, Suite 800,
Houston, TX 77027 | | Director | | Since
2009 | | Chief Executive Officer and Managing Partner, Vesalius Ventures, Inc. (venture investing), since 2002; President of The Space Agency, since 1999; President of The Harris Foundation (non-profit), since 1998; clinical scientist, flight surgeon and astronaut for NASA, 1986 to 1996 | | 5 | | Salient Alternative Strategies Funds (investment companies) (three funds) since 2010; Salient MF Trust (investment company) (two funds) since 2012; Salient Midstream & MLP Fund (investment company) since 2012; Salient MLP & Energy Infrastructure Fund (investment company) since 2011; AG Technologies, since 2009; ZOO SCORE “Counselors to America’s Small Business”, since 2009; Greater Houston Community Foundation, 2004-2009; Monebo Technologies Inc., since 2009; The National Math and Science Initiative, and Space Agency, since 2008; Sterling Bancshares, Inc., since 2007; Communities in Schools, since 2007; American Telemedicine Association, since 2007; RMD Networks, Inc., since 2006; BioHouston, since 2006; U.S. Physical Therapy, Inc., since 2005; Houston Technology Center, since 2004; Houston Angel Network, since 2004; The Harris Foundation, Inc., since 1998 |
47
THE ENDOWMENT MASTER FUND, L.P.
(A Limited Partnership)
Supplemental Information, continued
December 31, 2012
(Unaudited)
| | | | | | | | | | |
| Name, Address and Age | | Position(s)
Held with
the Master
Fund | | Length of
Time
Served | | Principal
Occupation(s) During
the Past 5 Years | | Number of
Portfolios
in Fund
Complex
Overseen
by Director | | Other
Directorships
Held by
Director |
Richard C. Johnson Age: 75 Address: c/o The
Endowment Master
Fund L.P.
4265 San Felipe, Suite 800, Houston, TX 77027 | | Director | | Since
2004 | | Senior Counsel (retired) for Baker Botts LLP (law firm) since 2002; Managing Partner, Baker Botts, 1998 to 2002; practiced law at Baker Botts, 1966 to 2002 (1972 to 2002 as a partner) | | 5 | | Salient Alternative Strategies Funds (investment companies) (three funds) since 2010; Salient MF Trust (investment company) (two funds) since 2012; Salient Midstream & MLP Fund (investment company) since 2012; Salient MLP & Energy Infrastructure Fund (investment company) since 2011 |
G. Edward Powell Age: 76 Address: c/o The
Endowment Master
Fund L.P.
4265 San Felipe, Suite 800, Houston, TX 77027 | | Director | | Since
2004 | | Principal of Mills & Stowell (private equity) since 2002; Principal of Innovation Growth Partners (consulting), since 2002; Consultant to emerging and middle market businesses, 1994-2002; Managing Partner, PriceWaterhouse & Co. (Houston Office, 1982 to 1994) | | 5 | | Salient Alternative Strategies Funds (investment companies) (three funds) since 2010; Salient MF Trust (investment company) (two funds) since 2012; Salient Midstream & MLP Fund (investment company) since 2012; Salient MLP & Energy Infrastructure Fund (investment company) since 2011; Therapy Track, LLC, since 2009; Global Water Technologies, Inc.; Datavox Holdings, Inc.; Energy Services International, Inc., since 2004 |
48
THE ENDOWMENT MASTER FUND, L.P.
(A Limited Partnership)
Supplemental Information, continued
December 31, 2012
(Unaudited)
| | | | | | | | | | |
| Name, Address and Age | | Position(s)
Held with
the Master
Fund | | Length of
Time
Served | | Principal
Occupation(s) During
the Past 5 Years | | Number of
Portfolios
in Fund
Complex
Overseen
by Director | | Other
Directorships
Held by
Director |
Scott E. Schwinger Age: 47 Address: c/o The
Endowment Master
Fund L.P.
4265 San Felipe, Suite 800,
Houston, TX 77027 | | Director | | Since
2004 | | President, The McNair Group (management), since 2006; Senior Vice President and Chief Financial Officer, the Houston Texans (professional football team), 1999 | | 5 | | Salient Alternative Strategies Funds (investment companies) (three funds) since 2010; Salient MF Trust (investment company) (two funds) since 2012; Salient Midstream & MLP Fund (investment company) since 2012; Salient MLP & Energy Infrastructure Fund (investment company) since 2011; The Make-A-Wish Foundation, since 2008; YES Prep Public Schools, since 2001 |
49
THE ENDOWMENT MASTER FUND, L.P.
(A Limited Partnership)
Supplemental Information, continued
December 31, 2012
(Unaudited)
Officers of the Fund Who Are Not Directors
| | | | |
| Name, Address and Age | | Position(s) Held with the Master Fund | | Principal Occupation(s) During the
Past 5 Years |
Paul Bachtold Age: 39 Address: c/o The Endowment
Master Fund L.P.
4265 San Felipe, Suite 800,
Houston, TX 77027 | | Chief Compliance Officer (since 2010) | | Chief Compliance Officer, Salient (since 2010); Consultant, Chicago Investment Group (compliance consulting), 2009-2010; US Compliance Manager, Barclays Global Investors, 2005-2008 |
John E. Price Age: 45 Address: c/o The Endowment
Master Fund L.P.
4265 San Felipe, Suite 800, Houston, TX 77027 | | Treasurer; Principal Financial Officer (since 2004) | | Managing Director and Chief Financial Officer, Adviser, since 2003; Partner, Managing Director and Chief Financial Officer, Salient, since 2003 |
Adam L. Thomas Age: 38 Address: c/o The Endowment
Master Fund L.P.
4265 San Felipe, Suite 800,
Houston, TX 77027 | | Secretary (since 2004) | | Director of Adviser, since 2004; Partner and Director, Salient, since 2002 |
50
THE ENDOWMENT MASTER FUND, L.P.
(A Limited Partnership)
Supplemental Information, continued
December 31, 2012
(Unaudited)
Allocation of Investments
The following chart indicates the allocation of investments among the asset classes in the Master Fund as of December 31, 2012.
| | | | | | | | |
Asset Class1 | | Fair Value | | | % | |
Arbitrage Strategies | | $ | 252,478,113 | | | | 8.39 | |
Domestic Equity | | | 272,669,568 | | | | 9.06 | |
Energy | | | 211,286,118 | | | | 7.02 | |
Enhanced Fixed Income | | | 371,960,323 | | | | 12.36 | |
Global Opportunistic | | | 432,841,343 | | | | 14.38 | |
International Equity | | | 208,627,695 | | | | 6.93 | |
Natural Resources | | | 52,489,158 | | | | 1.74 | |
Private Equity | | | 684,514,504 | | | | 22.72 | |
Real Estate | | | 204,407,782 | | | | 6.79 | |
Call Options Purchased | | | 11,992,072 | | | | 0.40 | |
Money Market Funds | | | 307,280,491 | | | | 10.21 | |
| | | | | | | | |
Total Investments | | $ | 3,010,547,167 | | | | 100.00 | |
| | | | | | | | |
| 1 | The complete list of investments included in the following asset class categories is included in the Schedule of Investments of the Master Fund. |
Form N-Q Filings
The Master Fund files a complete schedule of portfolio holdings with the Securities and Exchange Commission for the first and third quarters of each fiscal year on Form N-Q. The Master Fund’s Form N-Q is available on the Securities and Exchange Commission website at http://www.sec.gov. The Master Fund’s Form N-Q may be reviewed and copied at the Securities and Exchange Commission Public Reference Room in Washington, DC and information regarding operation of the Public Reference Room may be obtained by calling 1-800-SEC-0330.
Proxy Voting Policies
A description of the policies and procedures that the Master Fund uses to determine how to vote proxies relating to portfolio securities is available (i) without charge, upon request, by calling 1-800-725-9456; and (ii) on the Securities and Exchange Commission website at http://www.sec.gov.
Information regarding how the Master Fund voted proxies relating to portfolio securities during the most recent 12-month period ended June 30 is available (i) without charge, upon request, by calling 1-800-725-9456; and (ii) on the Securities and Exchange Commission website at http://www.sec.gov.
Additional Information
The Master Fund’s private placement memorandum (the “PPM”) includes additional information about Directors of the Master Fund. The PPM is available, without charge, upon request by calling 1-800-725-9456.
51
THE ENDOWMENT MASTER FUND, L.P.
(A Limited Partnership)
Supplemental Information, continued
December 31, 2012
(Unaudited)
Privacy Policy
The Master Fund recognizes the importance of securing personal financial information. It is our policy to safeguard any personal and financial information that may be entrusted to us. The following is a description of the Master Fund’s policy regarding disclosure of nonpublic personal information.
We collect nonpublic personal information as follows:
We collect information about our investors, including, but not limited to, the investor’s name, address, telephone number, e-mail address, social security number and date of birth. We collect that information from subscription agreements, other forms of correspondence that we receive from investors, from personal conversations and from affiliated entities as permitted by law.
We receive information about investor transactions with us, including, but not limited to, account number, account balance, investment amounts, withdrawal amounts and other financial information.
We are permitted by law to disclose nonpublic information we collect, as described above, to the Master Fund’s service providers, including the Master Fund’s investment adviser, sub-advisers, servicing agent, independent administrator, custodian, legal counsel, accountant and auditor. We do not disclose any nonpublic information about our current or former investors to nonaffiliated third parties, except as required or permitted by law. We restrict access to investor nonpublic personal information to those persons who require such information to provide products or services to investors. We maintain physical, electronic and procedural safeguards that comply with federal standards to guard investors’ nonpublic personal information.
If an investor’s investment relationship with the Master Fund involves a financial intermediary, including, but not limited to, a broker-dealer, bank or trust company, the privacy policy of such investor’s financial intermediary would govern how any nonpublic personal information would be shared by them with nonaffiliated third parties.
52
Item 2. Code of Ethics.
(a) The registrant has adopted a code of ethics that applies to the registrant’s principal executive officer, principal financial officer, principal accounting officer or controller, or persons performing similar functions. This code of ethics is included as Exhibit 12(a)(1).
(b) During the period covered by the report, with respect to the registrant’s code of ethics that applies to its principal executive officer, principal financial officer, principal accounting officer or controller, or persons performing similar functions; there have been no amendments to, nor any waivers granted from, a provision that relates to any element of the code of ethics definition enumerated in paragraph (b) of this Item 2.
Item 3. Audit Committee Financial Expert.
3(a)(1) The registrant’s board of directors has determined that the registrant has at least one audit committee financial expert serving on its audit committee.
3(a)(2) The audit committee financial expert is G. Edward Powell, who is “independent” for purposes of this Item 3 of Form N-CSR.
Item 4. Principal Accountant Fees and Services.
| | | | | | | | |
| | | Current Year | | | Previous Year | |
Audit Fees | | $ | 134,000 | | | $ | 132,000 | |
Audit-Related Fees | | $ | 0 | | | $ | 0 | |
Tax Fees | | $ | 0 | | | $ | 0 | |
All Other Fees | | $ | 0 | | | $ | 0 | |
(e)(1) Disclose the audit committee’s pre-approval policies and procedures described in paragraph (c)(7) of Rule 2-01 of Regulation S-X.
The audit committee may delegate its authority to pre-approve audit and permissible non-audit services to one or more members of the committee. Any decision of such members to pre-approve services shall be presented to the full audit committee at its next regularly scheduled meeting.
(2) Disclose the percentage of services described in each of paragraphs (b) through (d) of this item that were approved by the audit committee pursuant to paragraph (c) (7)(i)(c) of Rule 2-01 of Regulation S-X.
| | | | | | | | |
| | | Current Year | | | Previous Year | |
| | | 0 | % | | | 0 | % |
(f) Not applicable.
(g) Disclose the aggregate non-audit fees billed by the registrant’s accountant for services rendered to registrant, and rendered to the registrant’s investment adviser (not including any sub-adviser whose role is primarily portfolio management and is subcontracted with or overseen by another investment adviser), and any entity controlling, controlled by, or under common control with the adviser that provides ongoing services to the registrant for each of the last two fiscal years of the registrant.
| | | | | | | | |
| | | Current Year | | | Previous Year | |
| | $ | 0 | | | $ | 0 | |
(h) Not applicable.
Item 5. Audit Committee of Listed Registrants.
Not applicable.
Item 6. Investments.
(a) Schedule of Investments as of the close of the reporting period is included in the report to the shareholders filed under item 1 of this form.
(b) Not applicable.
Item 7. Disclosure of Proxy Voting Policies and Procedures for Closed-End Management Investment Companies.
A closed-end management investment company that is filing an annual report on this Form N-CSR must, unless it invests exclusively in non-voting securities, describe the policies and procedures that it uses to determine how to vote proxies relating to portfolio securities, including the procedures that the company uses when a vote presents a conflict between the interests of its shareholders, on the one hand, and those of the company’s investment adviser; principal underwriter; or any affiliated person (as defined in section 2(a)(3) of the Investment Company Act
of 1940 (15 U.S.C. 80a-2(a)(3)) and the rules thereunder) of the company, its investment adviser, or its principal underwriter, on the other. Include any policies and procedures of the company’s investment adviser, or any other third party, that the company uses, or that are used on the company’s behalf, to determine how to vote proxies relating to portfolio securities.
These policies are included as Exhibit 12(a)(4).
Item 8. Portfolio Managers of Closed-End Management Investment Companies.
The Adviser’s Investment Committee Members
As of the date of the filing, the Investment Committee is responsible for the day-to-day management of the Fund’s portfolio. The Endowment Master Fund, L.P. (the “Master Fund”), The Endowment Institutional Fund, L.P. (the “Institutional Fund”), The Endowment Registered Fund, L.P. (the “Registered Fund”), The Endowment TEI Fund, L.P. (the “TEI Fund”) and The Endowment Institutional TEI Fund W, L.P. (the “Institutional TEI W Fund”) are registered investment companies (collectively, the “Fund Complex” and each individually the “Fund”). The members of the Investment Committee (each an “Investment Committee Member”) are: Messrs. John A. Blaisdell, Andrew B. Linbeck, Lee G. Partridge and Mark W. Yusko.
Mr. Blaisdell has served as an Investment Committee Member since January 2004 and Managing Director of Salient Partners, L.P. (“Salient”) since December 2002. Previously, he held the position of Chief Executive Officer of Wincrest Ventures, L.P. (from 1997-2002). Mr. Linbeck has served as an Investment Committee Member since January 2004 and Managing Director of Salient since August 2002. Previously, he held the position of Partner and executive officer of The Redstone Companies, L.P. and certain affiliates thereof (from 1998-2002). Mr. Partridge has served as an Investment Committee Member since 2011 and as a Managing Director & Chief Investment Officer of Salient since 2011. Prior to joining Salient, Mr. Partridge was the founder and CEO of Integrity Capital, LLC, which spanned traditional and alternative investment strategies and the Deputy Chief Investment Officer of the Teacher Retirement System of Texas, where he was responsible for global asset allocation, risk management, portfolio construction, external managers, hedge funds, derivative strategies, equity trading, futures trading and risk management. Mr. Yusko has served as an Investment Committee Member since January 2004. He is also President of Morgan Creek Capital Management (since July 2004) and Principal of Hatteras Capital Management (since September 2003). Previously, Mr. Yusko held the position of Chief Investment Officer of the University of North Carolina at Chapel Hill (from 1998-2004). Each member of the Investment Committee reviews asset allocation recommendations by the Adviser’s staff, manager due diligence and recommendations and, by a majority vote of the Investment Committee, determines asset allocation and manager selection.
The Adviser and certain other entities controlled by the Principals manage investment programs which are similar to that of the Fund, and the Adviser and/or the Principals may in the future serve as an investment adviser or otherwise manage or direct the investment activities of other registered and/or private investment vehicles with investment programs similar to the Funds.
Other Accounts Managed by the Investment Adviser
Certain Investment Committee Members, who are primarily responsible for the day-to-day management of the Fund, also manage other registered investment companies, other pooled investment vehicles and other accounts, as indicated below. The following tables identify, as of December 31, 2012: (i) the number of registered investment companies (including the Fund), other pooled investment vehicles and other accounts managed by the Investment Committee Member and the total assets of such companies, vehicles and accounts; and (ii) the number and total assets of such companies, vehicles and accounts with respect to which the advisory fee is based on performance.
| | | | | | | | | | | | | | | | | | |
Name of Investment Committee Member | | Registered Investment
Companies Managed by
Investment Committee Member (1) | | | Other Pooled Investment
Vehicles Managed by
Investment Committee
Member (1) | | | Other Accounts Managed by
Investment Committee Member | |
| | | Number | | Total Assets | | | Number | | Total Assets | | | Number | | Total Assets | |
John A. Blaisdell | | 12 | | | $3.78 billion | | | 21 | | $ | 1.18 billion | | | >1420 | | $ | 9.96 billion | (2) |
Andrew B. Linbeck | | 12 | | | $3.78 billion | | | 21 | | $ | 1.18 billion | | | >1420 | | $ | 9.96 billion | (2) |
Lee G. Partridge | | 9 | | | $3.28 billion | | | 14 | | $ | 588 million | | | >1420 | | $ | 9.62 billion | (2) |
Mark W. Yusko | | 11 | | | $4.40 billion | | | 31 | | $ | 1.50 billion | | | 18 | | $ | 1.60 billion | (3) |
| (1) | For registered investment companies and pooled investment vehicles managed, the number of vehicles reported for master-feeder structures includes both the master fund and feeder funds while the corresponding total assets reported reflect the assets of the master fund only. |
| (2) | Messrs. Blaisdell and Linbeck serve as principal executive officers, and Mr. Partridge serves as Chief Investment Officer, of Salient Partners, which owns Salient Trust Co., LTA, a trust company chartered under the laws of the state of Texas. In such capacities, Messrs. Blaisdell, Linbeck and Partridge have investment responsibilities on the clients of such entities. However, the number of accounts and asset figures cited in the table relate to the accounts and assets over which Messrs. Blaisdell, Linbeck and Partridge have discretion in their capacities as principal executive officers of such entities/clients. |
| (3) | Mr. Yusko serves as the principal executive officer of Morgan Creek Capital Management, LLC, and a principal of Hatteras Capital Management, advisory firms located in North Carolina. The figure cited in the table reflects the advisory assets of Morgan Creek Capital Management, LLC. $690 million included in Total Assets of Pooled Investment Vehicles Managed is also included in Total Assets of Other Accounts Managed by Investment Committee Member. |
| | | | | | | | | | | | | | | | | | |
Name of Investment Committee Member | | Registered Investment
Companies Managed by
Investment Committee
Member (1) | | | Other Pooled Investment
Vehicles Managed by
Investment Committee
Member (1) | | | Other Accounts Managed by
Investment Committee Member | |
| | | Number with
Performance-
Based Fees | | Total Assets
with
Performance
Based Fees | | | Number with
Performance-
Based Fees | | Total Assets
with
Performance
Based Fees | | | Number with
Performance-
Based Fees | | Total Assets
with
Performance
Based Fees | |
John A. Blaisdell | | 0 | | $ | 0 | | | 5 | | $ | 439.60 million | | | 3 | | $ | 8.77 billion | |
Andrew B. Linbeck | | 0 | | $ | 0 | | | 5 | | $ | 439.60 million | | | 3 | | $ | 8.77 billion | |
Lee G. Partridge | | 0 | | $ | 0 | | | 1 | | $ | 15.00 million | | | 1 | | $ | 8.71 billion | |
Mark W. Yusko | | 5 | | $ | 1.35 billion | | | 25 | | $ | 1.40 billion | | | 17 | | $ | 1.00 billion | (2) |
| (1) | For registered investment companies and pooled investment vehicles managed, the number of vehicles reported for master-feeder structures includes both the master fund and feeder funds while the corresponding total assets reported reflect the assets of the master fund only. |
| (2) | Mr. Yusko serves as the principal executive officer of Morgan Creek Capital Management, LLC, and a principal of Hatteras Capital Management, advisory firms located in North Carolina. The figure cited in the table reflects the advisory assets of Morgan Creek Capital Management, LLC. $690 million included in Total Assets of Pooled Investment Vehicles Managed is also included in Total Assets of Other Accounts Managed by Investment Committee Member. |
Conflicts of Interest of the Adviser
From time to time, potential conflicts of interest may arise between an Investment Committee Member’s management of the investments of the Fund, on the one hand, and the management of other registered investment companies, pooled investment vehicles and other accounts (collectively, “other accounts”), on the other. The other accounts might have similar investment objectives or strategies as the Fund, track the same index the Fund tracks or otherwise hold, purchase, or sell securities that are eligible to be held, purchased or sold by the Fund. The other accounts might also have different investment objectives or strategies than the Fund.
Knowledge and Timing of Fund Trades. A potential conflict of interest may arise as a result of the Investment Committee Member’s day-to-day management of a Fund. Because of their positions with the Fund, the Investment Committee Members know the size, timing and possible market impact of the Fund’s trades. It is theoretically possible that the Investment Committee Members could use this information to the advantage of other accounts they manage and to the possible detriment of the Fund.
Investment Opportunities. A potential conflict of interest may arise as a result of the Investment Committee Member’s management of a number of accounts with varying investment guidelines. Often, an investment opportunity may be suitable for both the Fund and other accounts managed by the Investment Committee Member, but may not be available in sufficient quantities for both the Fund and the other accounts to participate fully. Similarly, there may be limited opportunity to sell an investment held by the Fund and other accounts. The Adviser has adopted policies and procedures reasonably designed to allocate investment opportunities on a fair and equitable basis over time.
Performance Fees. An Investment Committee Member may advise certain accounts with respect to which the advisory fee is based entirely or partially on performance. Performance fee arrangements may create a conflict of interest for the Investment Committee Member in that the Member may have an incentive to allocate the investment opportunities that he or she believes might be the most profitable to such other accounts instead of allocating them to the Fund.
Compensation to Investment Committee Members
Messrs. Blaisdell, Linbeck, Partridge and Yusko indirectly own equity interests in the Adviser. As it relates to the Fund and other funds within the Fund Complex, Messrs. Blaisdell, Linbeck, Partridge and Yusko receive all of their compensation based on the size of the Fund and the other funds within the Fund Complex and the management and servicing fees charged thereon. Accordingly, they believe that a significant driver of their compensation is the performance of the Fund and the Fund Complex, which has a significant bearing on the ability to raise additional assets. Messrs. Blaisdell, Linbeck and Partridge also indirectly own equity in the advisers to other funds and are compensated based on the size of the funds’ asset bases and the management and servicing fees charged thereon. In addition, Messrs. Blaisdell, Linbeck and Partridge are partners and principal executive officers of Salient and related affiliates and subsidiaries (collectively, the “Salient Group”), which pays them a base salary (but no bonus) and is obligated to make distributions of profits to them, as well as the other partners, on an annual basis. These individuals are responsible for the investment processes and management of the Salient Group. Messrs. Blaisdell, Linbeck and Partridge believe that to the extent that they are successful in their investment endeavors, the greater the number of assets over time and the more significant their compensation from the Salient Group.
Mr. Yusko is a partner of Morgan Creek Capital Management, which pays him a base salary and is anticipated to make distributions of profits above and beyond that which is necessary to operate the business. Mr. Yusko is chiefly responsible for the investment processes and management of Morgan Creek Capital Management. He believes that to the extent that he and the staff at Morgan Creek Capital Management are successful in their investment endeavors, the greater the number of assets over time and the more significant their compensation.
Securities Ownership of Investment Committee Members
The table below shows the dollar range of the interests of each Fund beneficially owned as of December 31, 2012 by each Investment Committee Member.
| | | | | | | | | | |
Investment Committee Member | | Master Fund | | Institutional Fund | | Registered Fund | | TEI Fund | | Institutional TEI W
Fund |
John A. Blaisdell | | None | | Over $1,000,000 | | None | | $150,001 to $250,000 | | None |
Andrew B. Linbeck | | None | | Over $1,000,000 | | None | | $250,001 to $500,000 | | None |
Lee G. Partridge | | None | | None | | None | | None | | None |
Mark W. Yusko | | None (1) | | None | | None | | None | | None |
| (1) | $1,106,897 represents indirect beneficial ownership in the Master Fund held by Mark W. Yusko through other feeder funds that invest in the Master Fund. |
Portfolio Manager Compensation
Mr. Julian Hillery has significant day-to-day duties in the management of the portfolio of the Master Fund, including providing analysis and recommendations on Asset Allocation and Investment Fund selection to the Investment Committee. As it relates to the Fund and other funds within the Fund Complex, Mr. Hillery receives all of his compensation based on the size of the Fund and the other funds within the Fund Complex and the management and servicing fees charged thereon. Accordingly, he believes that a significant driver of his compensation is the performance of the Fund and the Fund Complex, which has a significant bearing on the ability to raise additional assets. Mr. Hillery believes that to the extent that he is successful in his investment endeavors, the greater the number of assets over time and the more significant his compensation from the Salient Group will be.
Securities Ownership of Portfolio Manager
The table below shows the dollar range of shares of the Fund beneficially owned as of December 31, 2012, by Mr. Hillery:
| | | | | | | | |
Master Fund | | Institutional Fund | | Registered Fund | | TEI Fund | | Institutional TEI W
Fund |
None | | None | | None | | None | | None |
Item 9. Purchases of Equity Securities by Closed-End Management Investment Company and Affiliated Purchasers.
Not applicable.
Item 10. Submission of Matters to a Vote of Security Holders.
Not applicable.
Item 11. Controls and Procedures.
The registrant’s principal executive officer and principal financial officer have concluded, based on their evaluation of the registrant’s disclosure controls and procedures as conducted within 90 days of the filing date of this report, that these disclosure controls and procedures are adequately designed and are operating effectively to ensure that information required to be disclosed by the registrant on Form N-CSR is (i) accumulated and communicated to the investment company’s management, including its certifying officers, to allow timely decisions regarding required disclosure; and (ii) recorded, processed, summarized and reported within the time periods specified in the Securities and Exchange Commission’s rules and forms.
There were no changes in the registrant’s internal control over financial reporting (as defined in Rule 30a-3(d) under the Act (17 CFR 270.30a-3(d)) that occurred during the fourth fiscal quarter of the period covered by this report that have materially affected or are reasonably likely to materially affect the registrant’s internal control over financial reporting.
Item 12. Exhibits.
(a)(1) Code of ethics that is subject to Item 2 is attached hereto.
(a)(2) Certifications pursuant to Rule 30a-2(a) are attached hereto.
(a)(3) Not applicable.
(a)(4) Proxy voting policies and procedures pursuant to Item 7 are attached hereto.
(b) Certifications pursuant to Rule 30a-2(b) are furnished herewith.
SIGNATURES
Pursuant to the requirements of the Securities Exchange Act of 1934 and the Investment Company Act of 1940, the registrant has duly caused this report to be signed on its behalf by the undersigned, thereunto duly authorized.
| | | | | | |
| (Registrant) | | The Endowment Master Fund, L.P. | | |
| | | | | | |
| | |
| By (Signature and Title) | | /s/ John A. Blaisdell | | |
| | | | John A. Blaisdell | | |
| | | | Co-Principal Executive Officer | | |
| | |
Date: | | February 25, 2013 | | |
| | |
| By (Signature and Title) | | /s/ Andrew B. Linbeck | | |
| | | | Andrew B. Linbeck | | |
| | | | Co-Principal Executive Officer | | |
| | |
Date: | | February 25, 2013 | | |
Pursuant to the requirements of the Securities Exchange Act of 1934 and the Investment Company Act of 1940, this report has been signed below by the following persons on behalf of the registrant and in the capacities and on the dates indicated.
| | | | | | |
| By (Signature and Title) | | /s/ John A. Blaisdell | | |
| | | | John A. Blaisdell | | |
| | | | Co-Principal Executive Officer | | |
| | |
| Date: | | February 25, 2013 | | |
| | |
| By (Signature and Title) | | /s/ Andrew B. Linbeck | | |
| | | | Andrew B. Linbeck | | |
| | | | Co-Principal Executive Officer | | |
| | |
| Date: | | February 25, 2013 | | |
| | |
| By (Signature and Title) | | /s/ John E. Price | | |
| | | | John E. Price | | |
| | | | Principal Financial Officer | | |
| | |
| Date: | | February 25, 2013 | | |