UNITED STATES
SECURITIES AND EXCHANGE COMMISSION
Washington, DC 20549
FORM N-CSR
CERTIFIED SHAREHOLDER REPORT OF REGISTERED
MANAGEMENT INVESTMENT COMPANY
Investment Company Act file number 811-21527
The Endowment Master Fund, L.P.
(Exact name of registrant as specified in charter)
4265 SAN FELIPE, 8TH FLOOR, HOUSTON, TX 77027
(Address of principal executive offices) (Zip code)
| | |
| | With a copy to: |
| John A. Blaisdell | | George J. Zornada |
| The Endowment Master Fund, L.P. | | K & L Gates LLP |
| 4265 San Felipe, 8th Floor | | State Street Financial Center |
| Houston, TX 77027 | | One Lincoln St. |
| (Name and address of agent for service) | | Boston, MA 02111-2950 |
| | | (617) 261-3231 |
Registrant’s telephone number, including area code: 800-725-9456
Date of fiscal year end: 12/31/15
Date of reporting period: 12/31/15
Item 1. Reports to Stockholders.
the
ENDOWMENT FUND
The Endowment Master Fund, L.P.
Shareholder Report
December 31, 2015
TABLE OF CONTENTS

Dear TEF Partners:
In a year where most major asset classes struggled, 2015 was a relatively good year for The Endowment Fund (the “Fund”)1 and for the core alternative strategies in which it invests. Thank you for the continued support with your investment in The Endowment Fund. Similar to past shareholder letters, we will provide an update on the performance of the Fund as well as give Shareholders a sense of our views of the environment for the Fund and its strategies in 2016 and beyond.
The goal of The Endowment Fund is to generate a high-quality return stream that targets approximately half the historical volatility of equities (8% target standard deviation) with very low correlation to traditional stocks and bonds.
Investment Performance in 2015
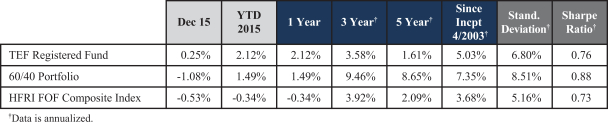
The Endowment Registered Fund returned 2.12% in 2015, which outpaced the HFRI FOF Composite Index by 2.46% (HFRI Fund of Funds Composite was -0.34% for 2015). The year’s performance was driven by the second and third quarters with marks of 2.66% and 1.20%, respectively. Both Q1 and Q4 detracted from the year’s performance with numbers of -0.40% for Q1 and -1.32% for Q4.
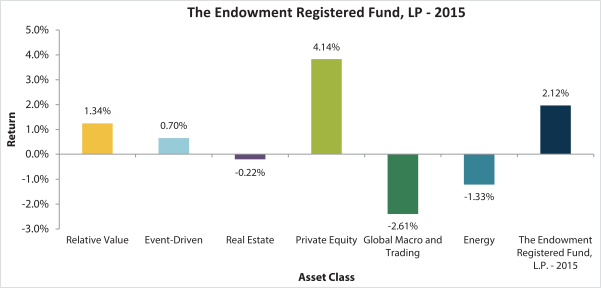
The mid-year positive performance is largely attributed to the Private Equity asset class, as it performed well with increases in fair value within the venture capital, growth equity, and buyout sub-asset classes. There were also two notable exits from the venture capital portfolio that contributed to the Fund’s performance. The Private Equity portfolio added 4.14% to the overall portfolio for the year (as a reminder, performance contribution is calculated by multiplying the return of the asset class by its allocation within the portfolio).^
The Fund’s most consistent performer for the year was the Relative Value asset class. The portfolio contributed positively to the Fund’s overall performance in 10 of the 12 months this year, with an overall contribution to Fund performance of 1.34%. In an otherwise lackluster year for public equity markets; the two largest positions in the portfolio each had gains in excess of 12.5% on the year.
Despite being the smallest asset class in the portfolio, the Event-Driven asset class contributed a meaningful 0.70% to overall performance. This was largely due to a single manager that had exposure to a wireless broadband company that went bankrupt in 2012. After disappointing news in 2014 of a proposed restructuring plan that
1 The Endowment Fund has a variety of feeders, which all feed into a single “master” fund called The Endowment Master Fund, L.P. Each “feeder” fund has different expense ratios, which provide for slightly different returns from one “feeder” fund to the next. Accordingly, unless otherwise specified, the returns outlined herein are those of The Endowment Registered Fund, L.P., which is the largest “feeder” fund in The Endowment Fund complex. Your returns may vary, based on the feeder in which you invest and the timing of your investment. Please consult your capital account statement for the exact returns of your investment.
^ Portfolio composition is subject to change.
would essentially wipe out the manager’s ownership in the company, the investment was marked down. Early in 2015, we received news of a valuation reversal based on increased probability of a favorable outcome for the manager as well as a higher-than-expected valuation for another piece of spectrum the company owns.^
The Global Macro and Trading and Energy asset classes detracted on the year with performance of -2.64% and -1.33%, respectively. The continued decline in oil prices paired with struggles across the majority of commodity markets negatively impacted the performance of these asset classes. With that said, we believe the recent turmoil in the energy sector may present unique distressed opportunities in the years ahead.
While the Real Estate asset class was essentially flat for the year, we did see an increase in the amount of volatility within the portfolio. As a group, domestically focused GPs contributed positively to asset class’ overall performance. However, GPs with an investment focus in foreign markets had a difficult year, most notably those that were heavily invested in Brazil. We believe a strong dollar and a collapse in commodity markets negatively impacted many of the emerging market economies, which in turn, affected their respective real estate markets.
Source: Endowment Advisers, L.P., December 2015.
Private Equity includes performance from prior periods received after the prior month end. Past performance is not indicative of future results. Performance is based on total return.
Economic Overview
The S&P 500 generated a +1.37% return for 2015, marking the worst performance year since 2008. While the S&P 500 was fairly flat, we did see an increase in volatility across several segments of the market. Consumer discretionary stocks led the market with a gain of 10.11% for the year, while energy stocks brought up the rear with a -21.12% return. The price of oil continued its downward trend from 2014 as the price of West Texas Intermediate Crude Oil closed out 2015 at $37.04/bbl. The dollar meaningfully strengthened relative to most all other currencies. Rates remain suppressed in spite of the Federal Reserve initiating their long awaited rate hike. And the Chinese market had a volatile year as we saw a tremendous run up in Chinese A shares in the first half of the year, followed by a sharp decline in the latter half of the year.
^ Portfolio Composition is subject to change.
Below are several themes we’ve noticed throughout 2015 that we believe will impact markets in 2016:
| | • | | The headwind of a rising dollar: The U.S. Dollar strengthened during 2015 against developed currencies like the Euro, the Pound, the Yen, etc., with an even further appreciation against almost all emerging market currencies. We believe this will continue to diminish the competitiveness of U.S. corporations and will further challenge emerging market companies who externally finance their operations in U.S. dollars. The Federal Reserves’ tightening of short-term interest rates may likely add further strength to the dollar as well. |
| | • | | Decline in interest rates: The overall decline in both nominal and real interest rates continues to paint a troubling picture of global deflationary pressure and low capital market returns. |
| | • | | Continued decline in energy prices: The sharp decline in energy prices witnessed last year has created stress in both stock and bond markets. We believe many energy companies will be forced to restructure balance sheets and consider strategic options as their asset bases have eroded. We believe this will present unique distressed opportunities in 2016 and beyond. |
| | • | | Slowing demand in China: Coupled with the decline in natural resources noted above, slowing demand from China represents meaningful challenges for a number of emerging market economies. Nearly all emerging market economies have shifted from accumulating to dispersing foreign exchange reserves. |
| | • | | Global debt: Global debt remains at record highs and exceeds 2007 levels that resulted in the financial crisis of 2008, while the methods for dealing with over-indebtedness – increasing taxes, decreasing expenditures, growing out of it, inflating out of it or restructuring it – seem either unpalatable or unattainable. |
As can be gleaned from the bullets above, we believe we enter 2016 with a number of headwinds facing the global economy. With that said, we believe that The Endowment Fund is well positioned because of the diversified nature of its private equity and hedge fund portfolios. We believe that emphasizing results that are driven by skill, diversification and premia like illiquidity are important to generating full cycle results that are not as sensitive to capital market returns, for which we have more limited potential return expectations on a going-forward basis. Further, we believe that maintaining investment in a mature private investments portfolio, which The Endowment Fund allows, may avoid many of the risks and pitfalls of new investments in multi-asset private portfolios. Lastly, we believe that providing access to exclusive top-tier hedge funds and co-investment opportunities allows the delivery of focused, diversifying exposures to core alternatives that are absolute return in nature and not as dependent on the rising and falling waves of the broader market.
We thank you for your continued support. If you have any questions, please do not hesitate to call our service desk at 1-800-725-9456.
Kindest Regards,
Endowment Advisers, L.P.2
2 This letter is provided solely for informational purposes and is exclusively intended for use by existing Fund investors and/or pre-qualified prospective Fund investors with whom the Fund or an authorized intermediary acting on behalf of the Fund has a pre-existing substantive relationship. No other distribution or use of this newsletter has been authorized. Neither this letter nor the information contained therein constitutes an offer to sell or a solicitation of any offer to buy any securities. Any offering or solicitation will be made only to eligible investors and pursuant to the current version of the applicable Private Placement Memorandum and other governing documents, all of which must be read in their entirety.
Report of Independent Registered Public Accounting Firm
The Partners and Board of Directors
The Endowment Master Fund, L.P.:
We have audited the accompanying statement of assets, liabilities and partners’ capital of The Endowment Master Fund, L.P. (the “Master Fund”), including the schedule of investments, as of December 31, 2015, and the related statements of operations and cash flows for the year then ended, the statements of changes in partners’ capital for each of the years in the two-year period then ended and the financial highlights for each of the years in the five-year period then ended. These financial statements and financial highlights are the responsibility of the Master Fund’s management. Our responsibility is to express an opinion on these financial statements and financial highlights based on our audits.
We conducted our audits in accordance with the standards of the Public Company Accounting Oversight Board (United States). Those standards require that we plan and perform the audits to obtain reasonable assurance about whether the financial statements and financial highlights are free of material misstatement. An audit includes examining, on a test basis, evidence supporting the amounts and disclosures in the financial statements. Our procedures included confirmation of securities owned as of December 31, 2015, by correspondence with custodians and investees or other appropriate auditing procedures. An audit also includes assessing the accounting principles used and significant estimates made by management, as well as evaluating the overall financial statement presentation. We believe that our audits provide a reasonable basis for our opinion.
In our opinion, the financial statements and financial highlights referred to above present fairly, in all material respects, the financial position of the Master Fund as of December 31, 2015, the results of its operations and its cash flows for the year then ended, the changes in its partners’ capital for each of the years in the two-year period then ended and the financial highlights for each of the years in the five-year period then ended in conformity with U.S. generally accepted accounting principles.
/s/ KPMG LLP
Columbus, Ohio
February 29, 2016
1
THE ENDOWMENT MASTER FUND, L.P.
(A Limited Partnership)
Statement of Assets, Liabilities and Partners’ Capital
December 31, 2015
| | | | |
Assets | | | | |
Investments in Investment Funds, at fair value (cost $259,759,457) | | $ | 295,023,881 | |
Investments in affiliated Investment Funds, at fair value ($46,546,069) | | | 31,676,267 | |
Investments in securities, at fair value ($4,373,058) | | | 3,744,574 | |
| | | | |
Total investments | | | 330,444,722 | |
Cash and cash equivalents | | | 19,916,134 | |
Advanced contributions to Investment Funds | | | 3,250,000 | |
Receivable from investments sold | | | 975,607 | |
Offshore withholding tax receivable | | | 1,523,168 | |
Unrealized gain on swap agreements | | | 12,306 | |
Prepaids and other assets | | | 13,939 | |
| | | | |
Total assets | | | 356,135,876 | |
| | | | |
Liabilities and Partners’ Capital | | | | |
Withdrawals payable | | | 3,227,801 | |
Credit facility | | | 35,989,694 | |
Investment Management Fees payable | | | 792,834 | |
Payable to affiliate | | | 133,533 | |
Offshore withholding tax payable | | | 276,587 | |
Administration fees payable | | | 47,626 | |
Payable to Adviser | | | 100,000 | |
Payable to Directors | | | 28,377 | |
Accounts payable and accrued expenses | | | 536,792 | |
| | | | |
Total liabilities | | | 41,133,244 | |
| | | | |
Partners’ capital | | | 315,002,632 | |
| | | | |
Total liabilities and partners’ capital | | $ | 356,135,876 | |
| | | | |
See accompanying notes to the financial statements.
2
THE ENDOWMENT MASTER FUND, L.P.
(A Limited Partnership)
Schedule of Investments
December 31, 2015
| | | | | | | | | | |
| | | Shares | | | Fair
Value | | | % of
Partners’
Capital |
Investments in Investment Funds | | | | | | | | | | |
Limited Partnerships, Exempted Limited Partnerships and Limited Liability Companies | | | | | | | | | | |
British Virgin Islands | | | | | | | | | | |
Private Equity (0.02% of Partners’ Capital) | | | | | | | | | | |
Penta Asia Domestic Partners, L.P. | | | | | | $ | 74,061 | | | |
| | | | | | | | | | |
Total British Virgin Islands | | | | | | | 74,061 | | | |
| | | | | | | | | | |
Cayman Islands | | | | | | | | | | |
Energy (1.54% of Partners’ Capital) | | | | | | | | | | |
Sentient Global Resources Fund III, L.P. | | | | | | | 3,383,009 | | | |
Sentient Global Resources Fund IV, L.P. | | | | | | | 1,467,639 | | | |
Global Macro and Trading (4.86% of Partners’ Capital) | | | | | | | | | | |
CCP Core Macro Fund LP | | | | | | | 6,289,079 | | | |
Cumulus Energy Fund, LP | | | 9,640 | | | | 9,015,440 | | | |
Private Equity (15.40% of Partners’ Capital) | | | | | | | | | | |
ABRY Advanced Securities Fund, L.P. | | | | | | | 35,217 | | | |
CX Partners Fund Ltd.(1) | | | | | | | 5,437,012 | | | |
Gavea Investment Fund II A, L.P. | | | | | | | 127,065 | | | |
Gavea Investment Fund III A, L.P.(1) | | | | | | | 1,582,374 | | | |
Hillcrest Fund, L.P. | | | | | | | 1,369,661 | | | |
India Asset Recovery Fund L.P. | | | | | | | 35,051 | | | |
J.C. Flowers III L.P.(1) | | | | | | | 2,279,121 | | | |
LC Fund IV, L.P.(1) | | | | | | | 4,250,206 | | | |
New Horizon Capital III, L.P.(1) | | | | | | | 4,661,564 | | | |
Northstar Equity Partners III(1) | | | | | | | 1,015,701 | | | |
Orchid Asia IV, L.P.(1) | | | | | | | 735,083 | | | |
Reservoir Capital Partners (Cayman), L.P. | | | | | | | 1,225,640 | | | |
Tiger Global Private Investment Partners IV, L.P.(1) | | | | | | | 1,593,337 | | | |
Tiger Global Private Investment Partners V, L.P.(1) | | | | | | | 3,659,291 | | | |
Tiger Global Private Investment Partners VI, L.P. | | | | | | | 2,232,634 | | | |
Trustbridge Partners II, L.P.(1) | | | | | | | 4,466,426 | | | |
Trustbridge Partners III, L.P.(1) | | | | | | | 6,613,814 | | | |
Trustbridge Partners IV, L.P.(1) | | | | | | | 3,881,565 | | | |
Trustbridge Partners V, L.P. | | | | | | | 3,322,038 | | | |
Real Estate (0.81% of Partners’ Capital) | | | | | | | | | | |
Forum European Realty Income III, L.P.(1) | | | | | | | 1,741,946 | | | |
Phoenix Asia Real Estate Investments II, L.P.(1) | | | | | | | 818,527 | | | |
Phoenix Real Estate Fund (T) L.P. | | | | | | | 4,266 | | | |
| | | | | | | | | | |
Total Cayman Islands | | | | | | | 71,242,706 | | | |
| | | | | | | | | | |
See accompanying notes to the financial statements.
3
THE ENDOWMENT MASTER FUND, L.P.
(A Limited Partnership)
Schedule of Investments, continued
December 31, 2015
| | | | | | | | |
| | | Shares | | Fair
Value | | | % of
Partners’
Capital |
Limited Partnerships, Exempted Limited Partnerships and Limited Liability Companies (continued) | | | | | | | | |
Guernsey | | | | | | | | |
Private Equity (0.27% of Partners’ Capital) | | | | | | | | |
Mid Europa Fund III LP | | | | $ | 851,924 | | | |
| | | | | | | | |
Total Guernsey | | | | | 851,924 | | | |
| | | | | | | | |
Republic of Mauritius | | | | | | | | |
Real Estate (0.68% of Partners’ Capital) | | | | | | | | |
ORBIS Real Estate Fund I(2) | | | | | 2,154,565 | | | |
| | | | | | | | |
Total Republic of Mauritius | | | | | 2,154,565 | | | |
| | | | | | | | |
United Kingdom | | | | | | | | |
Private Equity (1.35% of Partners’ Capital) | | | | | | | | |
Darwin Private Equity I L.P.(1) | | | | | 786,708 | | | |
Sovereign Capital Limited Partnership III | | | | | 3,470,718 | | | |
Real Estate (0.25% of Partners’ Capital) | | | | | | | | |
Benson Elliot Real Estate Partners II, L.P. | | | | | 159,272 | | | |
Patron Capital, L.P. II | | | | | 53,405 | | | |
Patron Capital, L.P. III | | | | | 582,711 | | | |
| | | | | | | | |
Total United Kingdom | | | | | 5,052,814 | | | |
| | | | | | | | |
United States | | | | | | | | |
Energy (9.22% of Partners’ Capital) | | | | | | | | |
ArcLight Energy Partners Fund IV, L.P.(1) | | | | | 384,744 | | | |
ArcLight Energy Partners Fund V, L.P.(1) | | | | | 779,344 | | | |
CamCap Resources, L.P. | | | | | 2,390 | | | |
EIV Capital Fund II, LP | | | | | 954,760 | | | |
EMG AE Permian Co-Investment, LP | | | | | 2,992,742 | | | |
EnCap Energy Capital Fund VII-B LP(1) | | | | | 400,552 | | | |
EnCap Energy Infrastructure TE Feeder, L.P.(1) | | | | | 470,492 | | | |
Energy & Minerals Group Fund II, L.P.(1) | | | | | 3,093,477 | | | |
Intervale Capital Fund, L.P.(1) | | | | | 804,347 | | | |
Merit Energy Partners G, L.P.(1) | | | | | 2,989,949 | | | |
Midstream & Resources Follow-On Fund, L.P.(1) | | | | | 3,426,347 | | | |
NGP Energy Technology Partners II, L.P.(1) | | | | | 958,653 | | | |
NGP IX Offshore Fund, L.P.(1) | | | | | 1,307,429 | | | |
NGP Midstream & Resources, L.P.(1) | | | | | 2,282,022 | | | |
Quantum Parallel Partners V, LP | | | | | 6,477,033 | | | |
Tenaska Power Fund II-A, L.P. | | | | | 1,688,850 | | | |
Tocqueville Gold Partners, L.P. | | | | | 24,040 | | | |
See accompanying notes to the financial statements.
4
THE ENDOWMENT MASTER FUND, L.P.
(A Limited Partnership)
Schedule of Investments, continued
December 31, 2015
| | | | | | | | | | |
| | | Shares | | | Fair
Value | | | % of
Partners’
Capital |
Limited Partnerships, Exempted Limited Partnerships and Limited Liability Companies (continued) | | | | | | | | | | |
United States (continued) | | | | | | | | | | |
Event-Driven (4.27% of Partners’ Capital) | | | | | | | | | | |
BDCM Partners I, L.P.(1) | | | | | | $ | 3,526,370 | | | |
Brevan Howard Argentina Fund, L.P. | | | | | | | 2,045,535 | | | |
Credit Distressed Blue Line Fund, L.P.(2) | | | | | | | 2,161,343 | | | |
Fortelus Special Situations Fund LP | | | | | | | 561,791 | | | |
Harbinger Capital Partners Fund I, L.P.(2) | | | | | | | 4,145,273 | | | |
Harbinger Capital Partners Fund II, L.P. | | | | | | | 311,736 | | | |
Harbinger Capital Partners Special Situations Fund, L.P. | | | | | | | 344,658 | | | |
Harbinger Class L Holdings (U.S.), LLC | | | | | | | 10,966 | | | |
Harbinger Class LS Holdings I (U.S.) Trust | | | 592 | | | | 109,001 | | | |
Harbinger Class PE Holdings (U.S.) Trust | | | 1 | | | | 149,138 | | | |
Prospect Harbor Credit Partners LP | | | | | | | 85,066 | | | |
Global Macro and Trading (12.53% of Partners’ Capital) | | | | | | | | | | |
Blueshift Energy Fund, LP(1)(2) | | | | | | | 8,233,139 | | | |
D.E. Shaw Heliant Fund, LLC | | | | | | | 14,660,396 | | | |
Kepos Alpha Fund LP | | | | | | | 16,567,980 | | | |
Passport Global Strategies III Ltd. | | | 348 | | | | 6,509 | | | |
Private Equity (28.71% of Partners’ Capital) | | | | | | | | | | |
Accel-KKR Capital Partners III, LP | | | | | | | 2,117,265 | | | |
Advent Latin American Private Equity Fund IV-F L.P. | | | | | | | 504,754 | | | |
Advent Latin American Private Equity Fund V-F L.P. | | | | | | | 1,780,124 | | | |
Artis Bracket Computing SPV, L.P. | | | | | | | 149,550 | | | |
Artis Juicy SPV, L.P. | | | | | | | 295,101 | | | |
Artis Ventures II, L.P. | | | | | | | 2,832,705 | | | |
Audax Mezzanine Fund II, L.P.(1) | | | | | | | 340,797 | | | |
Audax Mezzanine Fund III, L.P.(1) | | | | | | | 10,633,119 | | | |
BDCM Opportunity Fund II, L.P.(1) | | | | | | | 1,624,046 | | | |
Black River Commodity Multi-Strategy Fund LLC(1) | | | | | | | 20,592 | | | |
BLC Secured Credit Partners II(3) | | | | | | | 1,635,644 | | | |
BLC Secured Credit Partners LLC—Series 14-3C(1)(2) | | | | | | | 1,250,000 | | | |
Capital Royalty Partners LP | | | | | | | 137,766 | | | |
Catterton Growth Partners, L.P.(1) | | | | | | | 2,750,634 | | | |
CCM Small Cap Value Qualified Fund, L.P.(2) | | | | | | | 60,793 | | | |
Chrysalis Ventures III, L.P. | | | | | | | 374,261 | | | |
Column Group II, LP | | | | | | | 3,550,000 | | | |
Crosslink Crossover Fund IV, L.P. | | | | | | | 72,006 | | | |
Crosslink Crossover Fund V, L.P. | | | | | | | 512,600 | | | |
Crosslink Crossover Fund VI, L.P. | | | | | | | 3,168,938 | | | |
Dace Ventures I, LP | | | | | | | 202,361 | | | |
See accompanying notes to the financial statements.
5
THE ENDOWMENT MASTER FUND, L.P.
(A Limited Partnership)
Schedule of Investments, continued
December 31, 2015
| | | | | | | | | | |
| | | Shares | | | Fair
Value | | | % of
Partners’
Capital |
Limited Partnerships, Exempted Limited Partnerships and Limited Liability Companies (continued) | | | | | | | | | | |
United States (continued) | | | | | | | | | | |
Private Equity (28.71% of Partners’ Capital) (continued) | | | | | | | | | | |
Fairhaven Capital Partners, L.P. | | | | | | $ | 1,697,666 | | | |
Founders Fund III, LP | | | | | | | 4,146,536 | | | |
Founders Fund IV, LP | | | | | | | 5,029,545 | | | |
Garrison Opportunity Fund II A LLC | | | | | | | 1,826,699 | | | |
Garrison Opportunity Fund LLC | | | | | | | 1,710,223 | | | |
HealthCor Partners Fund, L.P. | | | | | | | 1,431,290 | | | |
Highland Credit Strategies Liquidation Vehicle Onshore | | | | | | | 280,052 | | | |
ILS Property & Casualty Master Fund Ltd. | | | | | | | 1,228,918 | | | |
Ithan Creek Partners, L.P.(1) | | | | | | | 1,227,578 | | | |
L-R Global Partners, L.P. | | | | | | | 62,759 | | | |
MatlinPatterson Global Opportunities Partners III L.P.(1) | | | | | | | 1,465,075 | | | |
Middle East North Africa Opportunities Fund, L.P.(2) | | | 728 | | | | 66,383 | | | |
Monomoy Capital Partners II, L.P.(1) | | | | | | | 1,660,052 | | | |
Monomoy Capital Partners, L.P. | | | | | | | 255,524 | | | |
Ovation Tax Lien Fund, LP(1)(2) | | | | | | | 3,990,000 | | | |
Pine Brook Capital Partners, L.P.(1) | | | | | | | 2,643,492 | | | |
Pinto America Growth Fund, L.P.(1) | | | | | | | 390,889 | | | |
Private Equity Investment Fund V, L.P. | | | | | | | 7,015,831 | | | |
Saints Capital VI, L.P. | | | | | | | 1,225,556 | | | |
Sanderling Venture Partners VI Co-Investment Fund, L.P. | | | | | | | 174,727 | | | |
Sanderling Venture Partners VI, L.P. | | | | | | | 183,877 | | | |
Sterling Capital Partners II, L.P. | | | | | | | 111,590 | | | |
Sterling Group Partners II, L.P. | | | | | | | 15,194 | | | |
Sterling Group Partners III, L.P. | | | | | | | 2,620,070 | | | |
Strattam Capital Investment Fund, L.P.(2) | | | | | | | 2,517,047 | | | |
TAEF Fund, LLC | | | | | | | 319,997 | | | |
Tenaya Capital V, LP | | | | | | | 704,000 | | | |
Tenaya Capital VI, LP | | | | | | | 1,270,000 | | | |
The Column Group, LP | | | | | | | 2,700,300 | | | |
The Raptor Private Holdings L.P. | | | 222 | | | | 113,598 | | | |
Triangle Peak Partners II Annex Fund, LP | | | | | | | 858,805 | | | |
Trivest Fund IV, L.P.(1) | | | | | | | 2,196,051 | | | |
Tuckerbrook SB Global Distressed Fund I, L.P. | | | | | | | 640,106 | | | |
Valiant Capital Partners LP | | | | | | | 659,778 | | | |
VCFA Private Equity Partners IV, L.P.(1) | | | | | | | 117,210 | | | |
VCFA Venture Partners V, L.P.(1) | | | | | | | 759,731 | | | |
Vortus NPR Co-investment | | | | | | | 247,953 | | | |
See accompanying notes to the financial statements.
6
THE ENDOWMENT MASTER FUND, L.P.
(A Limited Partnership)
Schedule of Investments, continued
December 31, 2015
| | | | | | | | | | |
| | | Shares | | Fair
Value | | | % of
Partners’
Capital | |
Limited Partnerships, Exempted Limited Partnerships and Limited Liability Companies (continued) | | | | | | | | | | |
United States (continued) | | | | | | | | | | |
Private Equity (28.71% of Partners’ Capital) (continued) | | | | | | | | | | |
Voyager Capital Fund III, L.P. | | | | $ | 525,336 | | | | | |
WestView Capital Partners II, L.P.(1) | | | | | 2,326,368 | | | | | |
Real Estate (4.67% of Partners’ Capital) | | | | | | | | | | |
Aslan Realty Partners III, L.L.C. | | | | | 20,436 | | | | | |
Cypress Realty VI Limited Partnership | | | | | 767,202 | | | | | |
Florida Real Estate Value Fund, L.P.(1) | | | | | 884,692 | | | | | |
GTIS Brazil Real Estate Fund (Brazilian Real) LP(1) | | | | | 2,023,741 | | | | | |
Lone Star Real Estate Fund II (U.S.), L.P. | | | | | 298,515 | | | | | |
Monsoon Infrastructure & Realty Co-Invest, L.P. | | | | | 2,743,137 | | | | | |
Northwood Real Estate Co-Investors LP(1) | | | | | 856,243 | | | | | |
Northwood Real Estate Partners LP(1) | | | | | 1,754,864 | | | | | |
Parmenter Realty Fund III, L.P.(1) | | | | | 170,335 | | | | | |
Parmenter Realty Fund IV, L.P.(1) | | | | | 1,196,312 | | | | | |
Pearlmark Mezzanine Realty Partners III, L.L.C.(1) | | | | | 837,500 | | | | | |
Pennybacker II, LP(1) | | | | | 636,755 | | | | | |
SBC Latin America Housing US Fund, LP | | | | | 1,668,298 | | | | | |
Square Mile Partners III LP(1) | | | | | 842,553 | | | | | |
Relative Value (18.30% of Partners’ Capital) | | | | | | | | | | |
Citadel Wellington LLC | | | | | 24,708,194 | | | | | |
Eton Park Fund, L.P. | | | | | 335,558 | | | | | |
King Street Capital, L.P. | | | | | 158,534 | | | | | |
Magnetar Capital Fund LP | | | | | 449,731 | | | | | |
Magnetar SLV LLC | | | | | 53,172 | | | | | |
Millennium USA LP | | | | | 26,007,774 | | | | | |
Napier Park IG Muni First Loss Fund, LP(2) | | | | | 2,015,800 | | | | | |
OZ Asia Domestic Partners, LP | | | | | 275,713 | | | | | |
PIPE Equity Partners, LLC(2) | | | | | 821,098 | | | | | |
PIPE Select Fund, LLC(2) | | | | | 2,625,182 | | | | | |
Stark Investments Ltd Partnership(1) | | | | | 7,843 | | | | | |
Stark Select Asset Fund, LLC | | | | | 174,549 | | | | | |
| | | | | | | | | | |
Total United States | | | | | 244,718,665 | | | | | |
| | | | | | | | | | |
Total Limited Partnerships, Exempted Limited Partnerships and Limited Liability Companies | | | | | 324,094,735 | | | | 102.89% | |
| | | | | | | | | | |
See accompanying notes to the financial statements.
7
THE ENDOWMENT MASTER FUND, L.P.
(A Limited Partnership)
Schedule of Investments, continued
December 31, 2015
| | | | | | | | | | | | |
| | | Shares | | | Fair
Value | | | % of
Partners’
Capital | |
Passive Foreign Investment Companies | | | | | | | | | | | | |
Cayman Companies Limited by Shares, Exempted Companies and Limited Liability Companies | | | | | | | | | | | | |
Energy (0.07% of Partners’ Capital) | | | | | | | | | | | | |
Ospraie Special Opportunities (Offshore) Ltd. | | | | | | $ | 208,307 | | | | | |
Private Equity (0.11% of Partners’ Capital) | | | | | | | | | | | | |
Q China Holdings Ltd. | | | 1,052 | | | | 108,950 | | | | | |
Q India Holdings Ltd. | | | 2,429 | | | | 177,440 | | | | | |
Quorum Fund Ltd. | | | 1,608 | | | | 68,919 | | | | | |
Relative Value (0.25% of Partners’ Capital) | | | | | | | | | | | | |
CRC Credit Fund Ltd. | | | 9,080 | | | | 802,914 | | | | | |
| | | | | | | | | | | | |
Total Cayman Companies Limited by Shares, Exempted Companies and Limited Liability Companies | | | | | | | 1,366,530 | | | | | |
| | | | | | | | | | | | |
Total Passive Foreign Investment Companies | | | | | | | 1,366,530 | | | | 0.43% | |
| | | | | | | | | | | | |
Private Corporations | | | | | | | | | | | | |
United States | | | | | | | | | | | | |
Real Estate (0.39% of Partners’ Capital) | | | | | | | | | | | | |
Legacy Partners Realty Fund II, Inc. | | | | | | | 186,186 | | | | | |
Legacy Partners Realty Fund III, Inc. | | | | | | | 906,549 | | | | | |
Net Lease Private REIT VI, Inc. | | | | | | | 34,748 | | | | | |
Net Lease Private REIT VII, Inc. | | | | | | | 55,700 | | | | | |
Net Lease Private REIT VII-A, Inc. | | | | | | | 55,700 | | | | | |
| | | | | | | | | | | | |
Total Private Corporations | | | | | | | 1,238,883 | | | | 0.39% | |
| | | | | | | | | | | | |
Total Investments in Investment Funds (Cost $306,305,526) | | | | | | | 326,700,148 | | | | 103.71% | |
| | | | | | | | | | | | |
Investments in Securities | | | | | | | | | | | | |
Common Stocks | | | | | | | | | | | | |
Japan | | | | | | | | | | | | |
Consumer Products (0.04% of Partners’ Capital) | | | | | | | | | | | | |
Aderans Co., Ltd.(1) | | | 15,700 | | | | 109,108 | | | | | |
United States | | | | | | | | | | | | |
Financials (0.46% of Partners’ Capital) | | | | | | | | | | | | |
Ellington Financial LLC(1) | | | 86,259 | | | | 1,447,426 | | | | | |
| | | | | | | | | | | | |
Total Common Stocks | | | | | | | 1,556,534 | | | | 0.50% | |
| | | | | | | | | | | | |
Preferred Stocks | | | | | | | | | | | | |
United States | | | | | | | | | | | | |
Food Technology (0.09% of Partners’ Capital) | | | | | | | | | | | | |
Credible Inc., Series A Preferred Stock | | | 19,842 | | | | 299,995 | | | | | |
See accompanying notes to the financial statements.
8
THE ENDOWMENT MASTER FUND, L.P.
(A Limited Partnership)
Schedule of Investments, continued
December 31, 2015
| | | | | | | | | | | | |
| | | Shares | | | Fair
Value | | | % of
Partners’
Capital | |
Preferred Stocks (continued) | | | | | | | | | | | | |
United States (continued) | | | | | | | | | | | | |
Professional Services (0.13% of Partners’ Capital) | | | | | | | | | | | | |
Hired, Inc., Series C Preferred Stock | | | 39,140 | | | $ | 399,995 | | | | | |
| | | | | | | | | | | | |
Total Preferred Stocks | | | | | | | 699,990 | | | | 0.22% | |
| | | | | | | | | | | | |
Registered Investment Company | | | | | | | | | | | | |
United States | | | | | | | | | | | | |
Closed-End Fund—Credit (0.12% of Partners’ Capital) | | | | | | | | | | | | |
Nexpoint Credit Strategies Fund(1) | | | 18,404 | | | | 376,178 | | | | | |
REIT Residential (0.10% of Partners’ Capital) | | | | | | | | | | | | |
Nexpoint Residential Trust, Inc.(1) | | | 23,978 | | | | 313,872 | | | | | |
| | | | | | | | | | | | |
Total Registered Investment Company | | | | | | | 690,050 | | | | 0.22% | |
| | | | | | | | | | | | |
Total Investments in Securities (Cost $3,673,058) | | | | | | | 2,946,574 | | | | 0.94% | |
| | | | | | | | | | | | |
Purchase Agreements | | | | | | | | | | | | |
Convertible Note Purchase Agreement | | | | | | | | | | | | |
United States | | | | | | | | | | | | |
Healthcare (0.25% of Partners’ Capital) | | | | | | | | | | | | |
Nuclea Biotechnologies, Inc.(4) | | | | | | | 798,000 | | | | | |
| | | | | | | | | | | | |
Total Purchase Agreements (Cost $700,000) | | | | | | | 798,000 | | | | 0.25% | |
| | | | | | | | | | | | |
Total Investments (Cost $310,678,584) | | | | | | $ | 330,444,722 | | | | 104.90% | |
| | | | | | | | | | | | |
The Master Fund’s total outstanding capital commitments to Investment Funds as of December 31, 2015 were $48,448,012. For certain Investment Funds for which the Master Fund has a capital commitment, the Master Fund may be allocated its pro-rata share of expenses prior to having to fund a capital call for such expenses.
All Investment Funds and securities are non-income producing unless noted otherwise.
| (1) | Income producing investment |
| (2) | Affiliated investments (See Note 5b) |
| (3) | Affiliated investments for which ownership exceeds 25% of the Investment Fund’s Capital (See Note 5b) |
| (4) | Security exempt from registration under Rule 144A of the Securities Act of 1933. The Security may be sold in transactions exempt from registration, normally to qualified institutional buyers. (See Note 2l) |
Total Return Swap Agreements:
| | | | | | | | | | | | | | |
Underlying Instrument | | Counterparty | | Maturity
Date | | | Notional
Amount at
Value | | | Unrealized
Gain (Loss) | |
Lyxor Swap | | Societe Generale | | | 8/19/2016 | | | $ | 3,186,903 | | | $ | 12,306 | |
| | | | | | | | | | | | | | |
See accompanying notes to the financial statements.
9
THE ENDOWMENT MASTER FUND, L.P.
(A Limited Partnership)
Statement of Operations
Year Ended December 31, 2015
| | | | |
Investment income: | | | | |
Dividend income (net of foreign tax withholding of $21,113) | | $ | 3,086,154 | |
Interest income | | | 1,151,863 | |
Dividend income from affiliated investments | | | 154,546 | |
Other Income | | | 7,429 | |
| | | | |
Total investment income | | | 4,399,992 | |
| | | | |
Expenses: | | | | |
Investment Management Fees | | | 3,209,422 | |
Administration fees | | | 192,035 | |
Professional fees | | | 273,092 | |
Consulting fees | | | 96,300 | |
Custodian fees | | | 18,692 | |
Directors fees | | | 101,508 | |
Interest expense | | | 950,191 | |
Offshore withholding tax expense | | | 238,115 | |
Other expenses | | | 270,630 | |
| | | | |
Total expenses | | | 5,349,985 | |
| | | | |
Net investment loss | | | (949,993 | ) |
| | | | |
Net realized and unrealized gain (loss): | | | | |
Net realized gain from investments and foreign currency translations | | | 22,172,807 | |
Net realized gain from redemptions in-kind | | | 196,190 | |
Net realized loss from affiliated Investment Funds | | | (155,295 | ) |
Change in unrealized appreciation/depreciation | | | (11,950,398 | ) |
| | | | |
Net realized and unrealized gain | | | 10,263,304 | |
| | | | |
Net increase in partners’ capital resulting from operations | | $ | 9,313,311 | |
| | | | |
See accompanying notes to the financial statements.
10
THE ENDOWMENT MASTER FUND, L.P.
(A Limited Partnership)
Statements of Changes in Partners’ Capital
Year Ended December 31, 2014 and
Year Ended December 31, 2015
| | | | |
Partners’ capital at December 31, 2013 | | $ | 2,064,041,426 | |
Contributions | | | 352,657 | |
Withdrawals | | | (24,684,806 | ) |
Transfer of Interests to The Endowment PMF Master Fund, L.P. | | | (1,723,272,229 | ) |
Net increase in partners’ capital resulting from operations: | | | | |
Net investment loss | | | (11,112,572 | ) |
Net realized gain from investments and foreign currency translations | | | 42,983,607 | |
Net realized gain from futures contracts | | | 7,029,230 | |
Net realized loss from purchased options | | | (9,921,550 | ) |
Net realized gain from swap agreements | | | 1,557,910 | |
Net realized gain from redemptions in-kind | | | 535,395 | |
Net realized loss from affiliated Investment Funds | | | (3,987,385 | ) |
Change in unrealized appreciation/depreciation | | | (24,361,486 | ) |
| | | | |
Net increase in partners’ capital resulting from operations | | | 2,723,149 | |
| | | | |
Partners’ capital at December 31, 2014 | | $ | 319,160,197 | |
| | | | |
Contributions | | | 261,351 | |
Withdrawals | | | (13,732,227 | ) |
Net increase in partners’ capital resulting from operations: | | | | |
Net investment loss | | | (949,993 | ) |
Net realized gain from investments and foreign currency translations | | | 22,172,807 | |
Net realized gain from redemptions in-kind | | | 196,190 | |
Net realized loss from affiliated Investment Funds | | | (155,295 | ) |
Change in unrealized appreciation/depreciation | | | (11,950,398 | ) |
| | | | |
Net increase in partners’ capital resulting from operations | | | 9,313,311 | |
| | | | |
Partners’ capital at December 31, 2015 | | $ | 315,002,632 | |
| | | | |
See accompanying notes to the financial statements.
11
THE ENDOWMENT MASTER FUND, L.P.
(A Limited Partnership)
Statement of Cash Flows
Year Ended December 31, 2015
| | | | |
Cash flows from operating activities: | | | | |
Net increase in partners’ capital resulting from operations | | $ | 9,313,311 | |
Adjustments to reconcile net increase in partners’ capital resulting from operations to net cash provided by operating activities: | | | | |
Purchases of investments | | | (71,064,526 | ) |
Proceeds from disposition of investments | | | 82,684,178 | |
Net realized gain from investments and foreign currency translations | | | (22,172,807 | ) |
Net realized gain from redemptions in-kind | | | (196,190 | ) |
Net realized loss from affiliated Investment Funds | | | 155,295 | |
Change in unrealized appreciation/depreciation from investments and foreign currency translations | | | 11,962,704 | |
Change in unrealized appreciation/depreciation from swap agreements | | | (12,306 | ) |
Change in operating assets and liabilities: | | | | |
Advanced contributions to Investment Funds | | | 2,750,000 | |
Interest and dividends receivable | | | 2,481 | |
Foreign currency, at value | | | 773,727 | |
Receivable from investments sold | | | 12,145,214 | |
Receivable from affiliated investments sold | | | 6,716 | |
Offshore withholding tax receivable | | | 42,717 | |
Prepaids and other assets | | | 16,793 | |
Investment Management Fees payable | | | (24,434 | ) |
Payable to affiliate | | | (288,472 | ) |
Offshore withholding tax payable | | | 276,587 | |
Administration fees payable | | | (23,055 | ) |
Payable to Adviser | | | (34,709 | ) |
Payable to Directors | | | (7,500 | ) |
Accounts payable and accrued expenses | | | (662,109 | ) |
| | | | |
Net cash provided by operating activities | | | 25,643,615 | |
| | | | |
Cash flows from financing activities: | | | | |
Borrowings on credit facility | | | (10,306 | ) |
Contributions | | | 261,351 | |
Withdrawals | | | (20,351,462 | ) |
| | | | |
Net cash used in financing activities | | | (20,100,417 | ) |
| | | | |
Effect of exchange rate changes in cash | | | (125,190 | ) |
| | | | |
Net change in cash and cash equivalents | | | 5,543,198 | |
Cash and cash equivalents at beginning of year | | | 14,498,126 | |
| | | | |
Cash and cash equivalents at end of year | | $ | 19,916,134 | |
| | | | |
Supplemental schedule of cash activity: | | | | |
Cash paid for offshore withholding taxes | | $ | 1,484,696 | |
Cash paid for interest | | | 950,191 | |
Supplemental schedule of noncash activity: | | | | |
Redemptions in-kind (Cost $7,798,116) | | $ | 7,994,306 | |
See accompanying notes to the financial statements.
12
THE ENDOWMENT MASTER FUND, L.P.
(A Limited Partnership)
Notes to Financial Statements
December 31, 2015
(1) ORGANIZATION
The Endowment Master Fund, L.P. (the “Master Fund”) a Delaware limited partnership, commenced operations on April 1, 2003. The Master Fund operated as an unregistered investment vehicle until March 10, 2004, at which time it registered as a non-diversified, closed-end management investment company under the Investment Company Act of 1940, as amended (the “1940 Act”). The Master Fund is the master fund in a master-feeder structure in which there are currently eight feeder funds.
The Master Fund’s investment objective is to preserve capital and to generate consistent long-term appreciation and returns across a market cycle (which is estimated to be five to seven years). The Master Fund is primarily a “fund of funds” which pursues its investment objective by investing its assets in a variety of investment vehicles including, but not limited to, limited partnerships, limited liability companies, hedge funds, offshore corporations and other foreign investment vehicles (collectively, the “Investment Funds”), registered investment companies (including exchange-traded funds) and direct investments in marketable securities and derivative instruments. The Investment Funds are managed by a carefully selected group of investment managers, identified by the Adviser, as hereinafter defined. The various styles and strategies employed by the Investment Funds and supplemented by the Master Fund’s direct investments, serve to achieve a portfolio that is broadly allocated.
The Endowment Fund GP, L.P., a Delaware limited partnership, serves as the general partner of the Master Fund (the “General Partner”). To the fullest extent permitted by applicable law, the General Partner has irrevocably delegated to a board of directors (the “Board” and each member a “Director”) its rights and powers to monitor and oversee the business affairs of the Master Fund, including the complete and exclusive authority to oversee and establish policies regarding the management, conduct, and operation of the Master Fund’s business. A majority of the members of the Board are independent of the General Partner and its management. To the extent permitted by applicable law, the Board may delegate any of its rights, powers and authority to, among others, the officers of the Master Fund, the Adviser, as hereinafter defined, or any committee of the Board.
The Board is authorized to engage an investment adviser, and pursuant to an investment management agreement, (the “Investment Management Agreement”), it has selected Endowment Advisers, L.P. (the “Adviser”), to manage the Master Fund’s portfolio and operations. The Adviser is a Delaware limited partnership that is registered as an investment adviser under the Investment Advisers Act of 1940, as amended. Under the Investment Management Agreement, the Adviser is responsible for the establishment of an investment committee (the “Investment Committee”), which is responsible for developing, implementing, and supervising the Master Fund’s investment program subject to the ultimate supervision of the Board.
Under the Master Fund’s organizational documents, the Master Fund’s Directors and officers are indemnified against certain liabilities arising out of the performance of their duties to the Master Fund. In the normal course of business, the Master Fund enters into contracts with service providers, which also provide for indemnifications by the Master Fund. The Master Fund’s maximum exposure under these arrangements is unknown, as this would involve any future potential claims that may be made against the Master Fund. However, based on experience, the General Partner expects that risk of loss to be remote.
On March 31, 2014 the Master Fund transferred in-kind a portfolio of Investment Funds to The Endowment PMF Master Fund, L.P. (the “PMF Master Fund”), in exchange for limited partnership interests (the “Interests”) of the PMF Master Fund totaling $1,723,272,229. The transfer was accounted for as a tax-free transaction
13
THE ENDOWMENT MASTER FUND, L.P.
(A Limited Partnership)
Notes to Financial Statements, continued
December 31, 2015
resulting in Investment Funds transferring to the PMF Master Fund with a total fair value of $1,490,836,309, consisting of total cost and accumulated appreciation of $1,317,376,887 and $173,459,422, respectively, and cash and other assets of $232,435,920.
(2) SUMMARY OF SIGNIFICANT ACCOUNTING POLICIES AND PRACTICES
(a) BASIS OF ACCOUNTING
The accounting and reporting policies of the Master Fund conform with U.S. generally accepted accounting principles (“U.S. GAAP”). The accompanying financial statements reflect the financial position of the Master Fund and the results of its operations. The Master Fund is an investment company that follows the investment company accounting and reporting guidance under Financial Accounting Standards Board (“FASB”) Accounting Standards Codification (“ASC”) Topic 946, “Financial Services-Investment Companies”.
(b) CASH EQUIVALENTS
The Master Fund considers all unpledged temporary cash investments with a maturity date at the time of purchase of three months or less to be cash equivalents.
(c) INVESTMENT SECURITIES TRANSACTIONS
The Master Fund records investment transactions on a trade-date basis.
Investments that are held by the Master Fund, including those that have been sold short, are marked to fair value at the date of the financial statements, and the corresponding change in unrealized appreciation/ depreciation is included in the Statement of Operations.
Dividend income is recorded on the ex-dividend date. Other investment fund distributions are recorded based on the detail provided with the distribution notice, as applicable. Realized gains or losses on the disposition of investments are accounted for based on the first in first out method.
(d) INVESTMENT VALUATION
The valuation of the Master Fund’s investments is determined as of the close of business at the end of each reporting period, generally monthly. The valuation of the Master Fund’s investments is calculated by UMB Fund Services, Inc., the Master Fund’s independent administrator (the “Administrator”).
The Board has formed a valuation committee (the “Board Valuation Committee”) that is responsible for overseeing the Master Fund’s valuation policies, making recommendations to the Board on valuation-related matters, and overseeing implementation by the Adviser of such valuation policies.
The Board has authorized the Adviser to establish a valuation committee of the Adviser (the “Adviser Valuation Committee”). The Adviser Valuation Committee’s function, subject to the oversight of the Board Valuation Committee and the Board, is generally to review valuation methodologies, valuation determinations, and any information provided to the Adviser Valuation Committee by the Adviser or the Administrator.
14
THE ENDOWMENT MASTER FUND, L.P.
(A Limited Partnership)
Notes to Financial Statements, continued
December 31, 2015
The Master Fund is not able to obtain complete underlying investment holding details on each of the Investment Funds in order to determine if the Master Fund’s proportional, aggregated, indirect share of any investments held by the Investment Funds exceeds 5% of partners’ capital of the Master Fund as of December 31, 2015.
Investments held by the Master Fund are valued as follows:
| | • | | INVESTMENT FUNDS—Investments in Investment Funds are carried at fair value, using the net asset value (the “NAV”) as a practical expedient, as provided to the Administrator by the investment managers of such Investment Funds or the administrators of such Investment Funds. These Investment Funds value their underlying investments in accordance with policies established by such Investment Funds. Prior to investing in any Investment Fund, the Adviser Valuation Committee, as part of the due diligence process, conducts a review of the valuation methodologies employed by the Investment Fund to determine whether such methods are appropriate for the asset types. All of the Master Fund’s valuations utilize financial information supplied by each Investment Fund and are net of management and estimated performance incentive fees or allocations payable to the Investment Funds’ managers pursuant to the Investment Funds’ agreements. Generally, Investment Funds in which the Master Fund invests will use market value when available, and otherwise will use principles of fair value applied in good faith. The Adviser Valuation Committee will consider whether it is appropriate, in light of the relevant circumstances, to value shares at NAV as reported by an Investment Fund for valuation purposes, or whether to adjust such reported value to reflect an adjusted fair value. Because of the inherent uncertainty of valuation, fair value may differ significantly from the value that would have been used had readily available markets for the investments in Investment Funds existed. The Master Fund’s investments in Investment Funds are subject to the terms and conditions of the respective operating agreements and offering memoranda of such Investment Funds. |
| | • | | SECURITIES LISTED ON A SECURITIES EXCHANGE OR OVER-THE-COUNTER EXCHANGES—In general, the Master Fund values these securities at their last sales price on the exchange or over-the-counter market on the valuation date. If the security is listed on more than one exchange, the Master Fund uses the price from the exchange that it considers to be the principal exchange on which the security is traded. If there have been no sales for that day on the exchange where the security is principally traded, then the price of the security will be valued at the mean between the closing bid and ask prices on the valuation date. In these situations, valuations are typically categorized as Level 1 in the fair value hierarchy. Securities traded on a foreign securities exchange will generally be valued at their closing prices on the exchange where such securities are primarily traded, and translated into U.S. dollars at the current exchange rate. If an event occurred between the close of the foreign exchange and the valuation date of the Master Fund’s NAV that would materially affect the value of the security and the NAV of the Master Fund, the value of such security and the NAV of the Master Fund will be adjusted to reflect the change in the estimated value of the security. Such fair valued securities are typically categorized as Level 2 in the fair value hierarchy, based upon the inputs used to value the securities. |
| | • | | DERIVATIVES—Exchange traded futures contracts are valued using quoted final settlement prices from the national exchange on which they are principally traded and are typically categorized as Level 1 in the fair value hierarchy. If no such sales price is reported by such exchange on the valuation date, the Adviser Valuation Committee will determine the fair value in good faith using information that is available at such time. Such fair valued investments are typically categorized as Level 2 or Level 3 in the fair value hierarchy, based upon the inputs used to value the investments. |
15
THE ENDOWMENT MASTER FUND, L.P.
(A Limited Partnership)
Notes to Financial Statements, continued
December 31, 2015
Options that are listed on a securities exchange are generally valued on the valuation date at the closing mid of posted market on the exchange on which they are listed and are typically categorized as Level 1 in fair value hierarchy. If on the valuation date the primary exchange is closed, the prior day price will be used. If no such price is reported, the fair value of such options will be determined in good faith using industry standard pricing models utilizing publicly available input information on the valuation date.
Such fair valued investments are typically categorized as Level 2 or Level 3 in the fair value hierarchy, based upon the inputs used to value the investments.
Options traded on an over-the-counter market are generally valued using the midpoint of the closing bid and ask price provided by an independent pricing service. If a quotation is not available from the independent pricing service, the price is obtained from a broker (typically the counterparty to the option) on the valuation date. If no such price is available on the valuation date, the Adviser Valuation Committee in conjunction with the Administrator will determine the fair value of such options in good faith using information that is available at such time. Such fair valued options are typically categorized as Level 2 or Level 3 in the fair value hierarchy, based upon the inputs used to value the investments.
Non exchange-traded derivatives, such as swap agreements, are valued based on procedures approved by the Board and are typically categorized as Level 2 in the fair value hierarchy. Credit default swaps and total return swaps are generally fair valued using evaluated quotes provided by an independent pricing service. If a quotation is not available from the independent pricing service, the price is obtained from a broker (typically the counterparty to the swap agreement) on the valuation date.
Forward foreign currency exchange contracts are valued at prices supplied by an approved Pricing Vendor. The Pricing Vendor will consider spot and forward market prices and various other relevant factors in determining the fair values. Such valuations are provided by a pricing service approved by the Board, and are typically categorized as Level 2 in the fair value hierarchy.
| | • | | OTHER—Investments in open-end registered investment companies (“RICs”) that do not trade on an exchange are valued at the end of day NAV per share and are categorized as Level 1 in the fair value hierarchy. Where no value is readily available from a RIC or other security, or where a value supplied by a RIC is deemed not to be indicative of the RIC’s value, the Adviser Valuation Committee and/or the Board Valuation Committee, in consultation with the Administrator or the Adviser, will determine, in good faith, the fair value of the RIC or other security. Such fair valued investments are typically categorized as Level 1 or Level 2 in the fair value hierarchy, based upon the inputs used to value the investments. |
Fixed-income securities are valued according to prices as furnished by an independent pricing service or broker/dealer quotes and are typically categorized as Level 2 in the fair value hierarchy. Fixed-income securities maturing within a relatively short time frame may be valued at amortized cost, which approximates market value, and are typically categorized as Level 2 in the fair value hierarchy.
| | • | | SECURITIES NOT ACTIVELY TRADED—The value of securities, derivatives or synthetic securities that are not actively traded on an exchange shall be determined by obtaining quotes from brokers that normally deal in such securities or by an unaffiliated pricing service that may use actual trade data or procedures using market indices, matrices, yield curves, specific trading characteristics of certain |
16
THE ENDOWMENT MASTER FUND, L.P.
(A Limited Partnership)
Notes to Financial Statements, continued
December 31, 2015
| | groups of securities, pricing models or a combination of these procedures pursuant to the valuation procedures approved by the Board. In each of these situations, valuations are typically categorized as Level 2 or Level 3 in the fair value hierarchy, based upon the inputs used to value the investments. |
(e) FOREIGN CURRENCY
The accounting records of the Master Fund are maintained in U.S. dollars. Foreign currency amounts and investments denominated in a foreign currency, if any, are translated into U.S. dollar amounts at current exchange rates on the valuation date. Purchases and sales of investments denominated in foreign currencies are translated into U.S. dollar amounts at the exchange rate on the respective dates of such transactions. The Master Fund does not segregate the results of operations resulting from changes in foreign exchange rates on investments from fluctuations arising from changes in market prices of securities held. Such fluctuations are included with the net realized and unrealized gain or loss from investments and foreign currency translations reported in the accompanying Statement of Operations and Statement of Changes in Partners’ Capital.
(f) DERIVATIVE INSTRUMENTS
All open derivative positions at period-end, if any, are presented in the Master Fund’s Schedules of Investments. The Investment Funds may have directly engaged in derivative transactions during the period. The following is a description of the derivative instruments the Master Fund utilizes as part of its investment strategy, including the primary underlying risk exposures related to each instrument type.
OPTIONS CONTRACTS—The Master Fund may invest in options contracts to speculate on the price movements of a financial instrument or for use as an economic hedge against certain positions held in the Master Fund’s portfolio. Options contracts purchased give the Master Fund the right, but not the obligation, to buy or sell the underlying instrument for a specified price upon exercise at any time during the option period. Options contracts written obligate the Master Fund to buy or sell the underlying instrument for a specified price upon exercise at any time during the option period. When the Master Fund writes an options contract, an amount equal to the premium received by the Master Fund is recorded as a liability and is subsequently adjusted to the current fair value of the option contract written.
FORWARD FOREIGN CURRENCY EXCHANGE CONTRACTS—The Master Fund may enter into forward foreign currency exchange contracts in connection with its investment objective in order to gain more or less exposure to foreign currencies. The forward foreign currency exchange contracts are adjusted by the daily exchange rate of the underlying currency and any gains or losses are recorded for financial statement purposes as unrealized gains or losses until the contract settlement date. The Master Fund could be exposed to risks if the counterparties to the contracts are unable to meet the terms of their contracts and from unanticipated movements in the value of a foreign currency relative to the U.S. dollar. The Master Fund remains subject to credit risk with respect to the amount it expects to receive from counterparties. However, the Master Fund has sought to mitigate these risks by generally requiring the posting of collateral at prearranged exposure levels to cover its exposure to the counterparty.
FUTURES CONTRACTS—The Master Fund may invest in futures contracts as part of its hedging strategy to manage exposure to interest rate, equity and market price movements, and commodity prices. A futures contract represents a commitment for the future purchase or sale of an asset at a specified price on a specified date. The underlying asset is not physically delivered. Futures contracts are valued at their quoted daily
17
THE ENDOWMENT MASTER FUND, L.P.
(A Limited Partnership)
Notes to Financial Statements, continued
December 31, 2015
settlement prices. Upon entering into a futures contract, the Master Fund is required to segregate liquid assets in accordance with the initial margin requirements of the clearinghouse to secure the Master Fund’s performance. The clearinghouse also requires daily settlement of variation margin representing changes in the value of each contract. Fluctuations in the value of the contracts are recorded as unrealized appreciation (depreciation) until the contracts are closed, when they are recorded as net realized gain (loss) from futures contracts. The primary risks associated with the use of futures contracts are imperfect correlation between changes in fair values of the underlying assets and the prices of futures contracts, and the possibility of an illiquid market. Counterparty risk involving futures is mitigated because a regulated clearinghouse is the counterparty.
SWAP AGREEMENTS—The Master Fund may invest in swap agreements, primarily credit default and total return swap agreements, as a part of its hedging strategy to manage credit and market risks.
A credit default swap agreement gives one party (the buyer) the right to recoup the economic value of a decline in the value of debt securities of the reference issuer if a credit event (a downgrade, bankruptcy or default) occurs. This value is obtained by delivering a debt security of the reference issuer to the party in return for a previously agreed upon payment from the other party (frequently, the par value of the debt security) or receipt of a net amount equal to the par value of the defaulted reference entity less its recovery value. The Master Fund is usually a net seller of credit default swap agreements.
The Master Fund as a seller of a credit default swap agreement would have the right to pay the par (or other agreed-upon) value of a referenced debt obligation to the counterparty in the event of a default or other credit event by the reference issuer with respect to its debt obligations. In return, the Master Fund would receive from the counterparty a periodic stream of payments over the term of the agreement provided that no event of default or other credit event has occurred. If no default or other credit event occurs, the Master Fund would keep the stream of payments and would have no further obligations to the counterparty. As a seller, the Master Fund is subject to investment exposure on the notional amount of the swap agreement.
A total return swap agreement is a bilateral financial contract agreement where one party (the payer) agrees to pay the other (the receiver) the total return on a specified asset or index in exchange for a fixed or floating rate of return. A total return swap agreement allows the receiver or payer to derive the economic benefit of owning or having short exposure to an asset without owning or shorting the underlying asset directly. The receiver is entitled to the amount, if any, by which the notional amount of the total return swap agreement would have increased in value had it been invested in the particular instruments, plus an amount equal to any dividends or interest that would have been received on those instruments. In return, the payer is entitled to an amount equal to a fixed or floating rate of interest (e.g., a LIBOR based rate) on the notional amount of the swap agreement plus the amount, if any, by which the notional amount would have decreased in value had it been invested in such instruments, less any dividends or interest. The amounts to which each party is entitled are normally netted against each other, at periodic settlement dates, resulting in a single amount that is either due to or from each party.
In addition to being exposed to the credit risk of the underlying reference entity, swap agreements are subject to counterparty risk, market risk and interest rate risk. Swap agreements utilized by the Master Fund may not perform as expected. Risks may arise as a result of the failure of the counterparty to perform under the agreement. The loss incurred by the failure of a counterparty is generally limited to the market value and premium amounts recorded. The Master Fund considers the creditworthiness of each counterparty to a swap agreement in evaluating potential credit risk, and will not enter into any swap agreement unless the Adviser believes the counterparty to the transaction is creditworthy. Additionally, risks may arise from the unanticipated
18
THE ENDOWMENT MASTER FUND, L.P.
(A Limited Partnership)
Notes to Financial Statements, continued
December 31, 2015
movements in interest rates or in the value of the underlying reference assets. The Master Fund may use various techniques to minimize credit risk including early termination or reset and payment. Collateral, in the form of cash, is held in broker segregated accounts for swap agreements.
The following is a summary of the fair value of derivative instruments held directly by the Master Fund as of December 31, 2015, and where such derivatives are recorded:
| | | | | | | | |
| | | Assets | | | Liabilities | |
| | | Unrealized Gain on
Swap Agreements | | | Unrealized Loss on
Swap Agreements | |
Equity Risk Exposure: | | | | |
Swap Agreements | | $ | 12,306 | | | $ | — | |
The following is a summary of the effect of derivative instruments on the Statement of Operations for the year ended December 31, 2015:
| | | | | | | | |
| | | Net Realized Gain
(Loss) from
Derivative
Instruments | | | Change in
Unrealized
Appreciation/
Depreciation from
Derivative
Instruments | |
Equity Risk Exposure: | | | | | | | | |
Swap Agreements | | $ | — | | | $ | 12,306 | |
As described above, the Master Fund utilized derivative instruments to achieve its investment objective during the year ended December 31, 2015. The Master Fund may enter into International Swap and Derivatives Association, Inc. Master Agreements (“ISDA Master Agreements”) or similar agreements with its derivative contract counterparties whereby the Master Fund may, under certain circumstances, offset with the counterparty certain derivative financial instruments’ payables and/or receivables with collateral held and/or posted and create one single net payment. Under the ISDA Master Agreements in place at December 31, 2015, the Master Fund is subject to master netting agreements that allow for amounts owed between the Master Fund and the counterparty to be netted. The party that has the larger payable pays the excess of the larger amount over the smaller amount to the other party. The master netting agreements do not apply to amounts owed to or from different counterparties. At December 31, 2015, the Master Fund did not hold any derivatives with applicable master netting agreements which were presented on a net basis in the financial statements.
As of December 31, 2015, the Master Fund had one total return swap agreement with Societe Generale as the counterparty with an unrealized gain of $12,306 as presented in the Statement of Assets, Liabilities, and Partners’ Capital.
The following is a summary of the average monthly notional value of swap agreements in the Master Fund for the year ended December 31, 2015, as well as the notional value of swap agreements outstanding as of December 31, 2015:
| | | | | | | | |
| | | Average Monthly
Notional Value | | | Notional Value
Outstanding at
December 31,
2015 | |
Total Return swap Agreements | | $ | 265,575 | | | $ | 3,186,903 | |
19
THE ENDOWMENT MASTER FUND, L.P.
(A Limited Partnership)
Notes to Financial Statements, continued
December 31, 2015
(g) CFTC REGULATION
On August 13, 2013, the Commodity Futures Trading Commission (“CFTC”) adopted rules to harmonize conflicting Securities and Exchange Commission (the “SEC”) and CFTC disclosure, reporting and recordkeeping requirements for RICs that do not meet an exemption from the definition of commodity pool. The harmonization rules provide that the CFTC will accept the SEC’s disclosure, reporting, and recordkeeping regime as substituted compliance for substantially all of the otherwise applicable CFTC regulations as long as such investment companies meet the applicable SEC requirements.
Previously, in November 2012, the CFTC issued relief for fund of fund operators, including advisers to RIC’s, that may otherwise be required to register with the CFTC as commodity pool operators but do not have access to information from the investment funds in which they are invested in order to determine whether such registration is required. This relief delayed the registration date for such operators until the later of June 30, 2013 or six months from the date the CFTC issues revised guidance on the application of certain thresholds with respect to investments in commodities held by funds of funds. In December 2012, the Master Fund filed as required with the CFTC in order to claim this no-action relief, which was effective upon receipt of the filing. Although the CFTC now has adopted harmonization rules applicable to investment companies that are deemed to be commodity pools, the CFTC has not yet issued guidance on how funds of funds are to determine whether they are deemed to be commodity pools. As of December 31, 2015, the Master Fund is not considered a commodity pool and continues to rely on the fund of fund no-action relief.
(h) INVESTMENT INCOME
For investments in securities, dividend income is recorded on the ex-dividend date, net of withholding taxes. Interest income is recorded as earned on the accrual basis and includes amortization of premiums or accretion of discounts.
(i) FUND EXPENSES
Unless otherwise voluntarily or contractually assumed by the Adviser or another party, the Master Fund bears all expenses incurred in its business including, but not limited to, the following: all costs and expenses related to investment transactions and positions for the Master Fund’s account; legal fees; accounting, auditing and tax preparation fees; recordkeeping and custodial fees; costs of computing the Master Fund’s net asset value; fees for data and software providers; research expenses; costs of insurance; registration expenses; offering costs; expenses of meetings of partners; directors fees; all costs with respect to communications to partners; transfer taxes; offshore withholding taxes and taxes withheld on non-U.S. dividends; interest and commitment fees on loans and debit balances; and other types of expenses as may be approved from time to time by the Board.
(j) INCOME TAXES
The Master Fund is organized and operates as a limited partnership and is not subject to income taxes as a separate entity. Such taxes are the responsibility of the individual partners. Accordingly, no provision for income taxes has been made in the Master Fund’s financial statements. Investments in foreign securities may result in foreign taxes being withheld by the issuer of such securities. For U.S. offshore withholding tax, the Master Fund may serve as withholding agent for its offshore feeder funds.
For the current open tax year and for all major jurisdictions, management of the Master Fund has evaluated the tax positions taken or expected to be taken in the course of preparing the Master Fund’s tax returns to
20
THE ENDOWMENT MASTER FUND, L.P.
(A Limited Partnership)
Notes to Financial Statements, continued
December 31, 2015
determine whether the tax positions will “more-likely-than-not” be sustained by the Master Fund upon challenge by the applicable tax authority. Tax positions not deemed to meet the more-likely-than-not threshold and that would result in a tax benefit or expense to the Master Fund would be recorded as a tax benefit or expense in the current period.
For the year ended December 31, 2015, the Master Fund did not recognize any amounts for unrecognized tax benefit/expense. A reconciliation of unrecognized tax benefit/expense is not provided herein, as the beginning and ending amounts of unrecognized tax benefit/expense are zero, with no interim additions, reductions or settlements. Tax positions taken in tax years which remain open under the statute of limitations (generally three years for federal income tax purposes) are subject to examination by federal and state tax jurisdictions.
(k) USE OF ESTIMATES
The financial statements have been prepared in conformity with U.S. GAAP, which requires management to make estimates and assumptions relating to the reported amounts of assets and liabilities and the disclosure of contingent assets and liabilities at the date of the financial statements and the reported amounts of income and expenses during the reporting period. Actual results may differ from those estimates and such differences may be significant.
(l) RESTRICTED SECURITIES
The Master Fund may invest a portion or all of the value of its assets in restricted securities and other investments that are illiquid. Restricted securities are securities that may not be sold to the public without an effective registration statement under the Securities Act of 1933 (the “Securities Act”) or, if they are unregistered, may be sold only in a privately negotiated transaction or pursuant to an exemption from registration. These may include restricted securities that can be offered and sold only to “qualified institutional buyers” under Rule 144A of the Securities Act. There is no limit to the percentage of an Investment Fund’s net assets that may be invested in illiquid securities.
The restricted securities held at December 31, 2015 are identified below and are also presented in the Master Fund’s Schedule of Investments.
| | | | | | | | | | | | | | | | | | | | |
Security | | % of
Partners’
Capital | | | Acquisition
Dates | | | Principal
Amount | | | Cost | | | Fair Value | |
Nuclea Biotechnologies, Inc.* | | | 0.2 | % | | | 1/5/15 | | | $ | 700,000 | | | $ | 700,000 | | | $ | 798,000 | |
| | | | | | | | | | | | | | | | | | | | |
Total Restricted Securities | | | 0.2 | % | | | | | | $ | 700,000 | | | $ | 700,000 | | | $ | 798,000 | |
| | | | | | | | | | | | | | | | | | | | |
| * | Security has been deemed illiquid by the Adviser based on procedures approved by the Board. |
(3) FAIR VALUE MEASUREMENTS
The Master Fund defines fair value as the price that would be received to sell an asset or paid to transfer a liability in an orderly transaction between market participants at the measurement date under current market conditions.
21
THE ENDOWMENT MASTER FUND, L.P.
(A Limited Partnership)
Notes to Financial Statements, continued
December 31, 2015
The inputs used to determine the fair value of the Master Fund’s investments are summarized in the three broad levels listed below:
| | • | | Level 1—unadjusted quoted prices in active markets for identical investments and registered investment companies where the value per share (unit) is determined and published and is the basis for current transactions for identical assets or liabilities at the valuation date |
| | • | | Level 2—investments with other significant observable inputs |
| | • | | Level 3—investments with significant unobservable inputs (which may include the Master Fund’s own assumptions in determining the fair value of investments) |
Changes in valuation techniques may result in transfers in or out of an assigned level within the disclosure hierarchy. The Master Fund discloses transfers between levels based on valuations at the end of the reporting period. The inputs or methodology used for valuing investments are not necessarily an indication of the risk associated with investing in those investments.
The Master Fund establishes valuation processes and procedures to ensure that the valuation techniques for investments categorized within Level 3 of the fair value hierarchy are fair, consistent, and appropriate. The Adviser is responsible for developing the Master Fund’s written valuation processes and procedures, conducting periodic reviews of the valuation policies, and evaluating the overall fairness and consistent application of the valuation policies. The Board Valuation Committee has authorized the Adviser to oversee the implementation of the Board approved valuation procedures by the Administrator. The Adviser Valuation Committee is comprised of various Master Fund personnel, which include members from the Master Fund’s portfolio management and operations groups. The Adviser Valuation Committee meets monthly or as needed, to determine the valuations of the Master Fund’s Level 3 investments. The valuations are supported by methodologies employed by the Investment Funds’ market data, industry accepted third party valuation models, or other methods the Adviser Valuation Committee deems to be appropriate, including the use of internal proprietary valuation models.
In April 2015, Financial Accounting Standards Board (“FASB”) issued Accounting Standards Update (“ASU”) 2015-07, Disclosures for Investments in Certain Entities That Calculate Net Asset Value per Share (or Its Equivalent), modifying Accounting Standards Codification (“ASC”) 820 Fair Value Measurement. The Master Fund has elected to early adopt and retrospectively apply ASU 2015-07. The impact of the early adoption of ASU 2015-07 has been reflected in the notes to the financial statements. Prior to this, investments valued using the practical expedient were categorized within the fair value hierarchy on the basis of whether the investment is redeemable with the investee at net asset value on the measurement date, never redeemable with the investee at net asset value, or redeemable with the investee at net asset value at a future date. The retroactive application of ASU 2015-07 results in the exclusion of any Investment Funds valued using NAV as practical expedient from the investment roll forward included in the December 31, 2014 audited financial statements. As a result of adopting ASU 2015-07, Investment Funds with a fair value of $326,700,148 are excluded from the fair value hierarchy as of December 31, 2015.
22
THE ENDOWMENT MASTER FUND, L.P.
(A Limited Partnership)
Notes to Financial Statements, continued
December 31, 2015
The following is a summary categorization of the Master Fund’s investments based on the level of inputs utilized in determining the value of such investments as of December 31, 2015:
| | | | | | | | | | | | | | | | | | | | | | | | | | | | | | | | | | | | |
| | | LEVEL 1 | | | LEVEL 2 | | | LEVEL 3 | | | INVESTMENTS VALUED
AT NAV AS A
PRACTICAL EXPEDIENT | | | TOTAL | |
| | | Investments | | | Other
Financial
Instruments^ | | | Investments | | | Other
Financial
Instruments^ | | | Investments | | | Other
Financial
Instruments^ | | | Investments | | | Investments | | | Other
Financial
Instruments^ | |
Investment Funds | | | | | | | | | | | | | | | | | | | | | | | | | | | | | | | | | | | | |
Limited Partnerships, Exempted Limited | | | | | | | | | | | | | | | | | | | | | | | | | | | | | | | | | | | | |
Partnerships and Limited Liability Companies | | | | | | | | | | | | | | | | | | | | | | | | | | | | | | | | | | | | |
Energy | | $ | — | | | $ | — | | | $ | — | | | $ | — | | | $ | — | | | $ | — | | | $ | 33,887,819 | | | $ | 33,887,819 | | | $ | — | |
Event-Driven | | | — | | | | — | | | | — | | | | — | | | | — | | | | — | | | | 13,450,877 | | | | 13,450,877 | | | | — | |
Global Macro and Trading | | | — | | | | — | | | | — | | | | — | | | | — | | | | — | | | | 54,772,543 | | | | 54,772,543 | | | | — | |
Private Equity | | | — | | | | — | | | | — | | | | — | | | | — | | | | — | | | | 144,135,073 | | | | 144,135,073 | | | | — | |
Real Estate | | | — | | | | — | | | | — | | | | — | | | | — | | | | — | | | | 20,215,275 | | | | 20,215,275 | | | | — | |
Relative Value | | | — | | | | — | | | | — | | | | — | | | | — | | | | — | | | | 57,633,148 | | | | 57,633,148 | | | | — | |
Passive Foreign Investment Companies | | | | | | | | | | | | | | | | | | | | | | | | | | | | | | | | | | | | |
Energy | | | — | | | | — | | | | — | | | | — | | | | — | | | | — | | | | 208,307 | | | | 208,307 | | | | — | |
Private Equity | | | — | | | | — | | | | — | | | | — | | | | — | | | | — | | | | 355,309 | | | | 355,309 | | | | — | |
Relative Value | | | — | | | | — | | | | — | | | | — | | | | — | | | | — | | | | 802,914 | | | | 802,914 | | | | — | |
Private Corporations | | | | | | | | | | | | | | | | | | | | | | | | | | | | | | | | | | | | |
Real Estate | | | — | | | | — | | | | — | | | | — | | | | — | | | | — | | | | 1,238,883 | | | | 1,238,883 | | | | — | |
Investment Securities | | | | | | | | | | | | | | | | | | | | | | | | | | | | | | | | | | | | |
Common Stocks | | | | | | | | | | | | | | | | | | | | | | | | | | | | | | | | | | | | |
Consumer Products | | | 109,108 | | | | — | | | | — | | | | — | | | | — | | | | — | | | | — | | | | 109,108 | | | | — | |
Financials | | | 1,447,426 | | | | — | | | | — | | | | — | | | | — | | | | — | | | | — | | | | 1,447,426 | | | | — | |
Preferred Stocks | | | | | | | | | | | | | | | | | | | | | | | | | | | | | | | | | | | | |
Food Technology | | | — | | | | — | | | | 299,995 | | | | — | | | | — | | | | — | | | | — | | | | 299,995 | | | | — | |
Professional Services | | | — | | | | — | | | | 399,995 | | | | — | | | | — | | | | — | | | | — | | | | 399,995 | | | | — | |
Registered Investment Company | | | | | | | | | | | | | | | | | | | | | | | | | | | | | | | | | | | | |
Closed-End Fund—Credit | | | 376,178 | | | | — | | | | — | | | | — | | | | — | | | | — | | | | — | | | | 376,178 | | | | — | |
REIT Residential | | | 313,872 | | | | — | | | | — | | | | — | | | | — | | | | — | | | | — | | | | 313,872 | | | | — | |
Convertible Note Purchase Agreement | | | | | | | | | | | | | | | | | | | | | | | | | | | | | | | | | | | | |
Healthcare | | | — | | | | — | | | | — | | | | — | | | | 798,000 | | | | — | | | | — | | | | 798,000 | | | | — | |
Derivative Instruments | | | | | | | | | | | | | | | | | | | | | | | | | | | | | | | | | | | | |
Swap Agreements | | | — | | | | — | | | | — | | | | 12,306 | | | | — | | | | — | | | | — | | | | — | | | | 12,306 | |
| | | | | | | | | | | | | | | | | | | | | | | | | | | | | | | | | | | | |
Total | | $ | 2,246,584 | | | $ | — | | | $ | 699,990 | | | $ | 12,306 | | | $ | 798,000 | | | $ | — | | | $ | 326,700,148 | | | $ | 330,444,722 | | | $ | 12,306 | |
| | | | | | | | | | | | | | | | | | | | | | | | | | | | | | | | | | | | |
| ^ | Other financial instruments include any derivative instruments not reflected in the Schedule of Investments as investments, such as swap agreements. These financial instruments are generally recorded in the financial statements at the unrealized gain or loss on the financial instrument. |
23
THE ENDOWMENT MASTER FUND, L.P.
(A Limited Partnership)
Notes to Financial Statements, continued
December 31, 2015
The following table is a summary of quantitative information about significant unobservable valuation inputs approved by the Adviser Valuation Committee for Level 3 fair value measurements for the investment held as of December 31, 2015:
| | | | | | | | | | | | |
| | | Fair Value as of
December 31, 2015 | | | Valuation
Technique | | Unobservable
Input | | Range of
Unobservable
Input | |
Investments | | | | | | | | | | | | |
Purchase Agreements | | | | | | | | | | | | |
Convertible Note Purchase Agreement | | | | | | | | | | | | |
Healthcare | | $ | 798,000 | | | Market Rate
Approach | | Market Interest
Rate | | | 14 | % |
| | | | | | | | | | | | |
Total Investments | | $ | 798,000 | | | | | | | | | |
| | | | | | | | | | | | |
The following is a reconciliation of the Level 3 investment held at December 31, 2015 based on the inputs used to determine fair value:
| | | | | | | | | | | | | | | | | | | | | | | | |
| | | Balance as of
December 31,
2014 | | | Gross
Purchases | | | Gross
Sales | | | Net
Realized
Gain (Loss) | | | Change in
Unrealized
Appreciation/
Depreciation | | | Balance as of
December 31,
2015 | |
Investments | | | | | | | | | | | | | | | | | | | | | | | | |
Purchase Agreements | | | | | | | | | | | | | | | | | | | | | | | | |
Convertible Note Purchase Agreement | | | | | | | | | | | | | | | | | | | | | | | | |
Healthcare | | $ | — | | | $ | 700,000 | | | $ | — | | | $ | — | | | $ | 98,000 | | | $ | 798,000 | |
| | | | | | | | | | | | | | | | | | | | | | | | |
Total Investments | | $ | — | | | $ | 700,000 | | | $ | — | | | $ | — | | | $ | 98,000 | | | $ | 798,000 | |
| | | | | | | | | | | | | | | | | | | | | | | | |
The change in unrealized appreciation/depreciation from Level 3 investments held at December 31, 2015 is $98,000.
The Master Fund is permitted to invest in alternative investments that may not have a readily determinable fair value. For an investment that does not have a readily determinable fair value, the Master Fund uses the NAV reported by the Investment Fund as a practical expedient, without further adjustment, unless it is probable that the investment will be sold at a value significantly different than the reported NAV. If the practical expedient NAV is not as of the reporting entity’s measurement date, then the NAV is adjusted to reflect any significant events that would materially affect the value of the investment and the NAV of the Master Fund as of the valuation date.
Certain Investment Funds in which the Master Fund invests have limitations on liquidity which may result in limitations on redemptions including, but not limited to, early redemption fees. Other than Investment Funds that are self-liquidating, such as Private Equity and some Energy, Natural Resources and Real Estate Funds, the Investment Funds in which the Master Fund invests have withdrawal rights ranging from monthly to annually, after a notice period, usually for a period of up to two years from the date of the initial investment or an additional investment. A listing of the investments held by the Master Fund and their attributes as of December 31, 2015, that qualify for this valuation approach is shown in the table below.
24
THE ENDOWMENT MASTER FUND, L.P.
(A Limited Partnership)
Notes to Financial Statements, continued
December 31, 2015
| | | | | | | | | | | | | | | | |
| Investment Category | | Investment
Strategy | | Fair Value
(in 000s) | | | Unfunded
Commitments
(in 000s) | | Remaining
Life* | | Redemption
Frequency* | | Notice
Period (in Days)* | | Redemption
Restrictions
and Terms* |
| Energy(a) | | Private investments in securities issued by companies in the energy and natural resources sectors. | | $ | 34,096 | | | $11,234 | | up to
15 years | | N/A | | N/A | | 0-15 years |
| Event-Driven(b) | | Strategies designed to profit from changes in the prices of securities of companies facing a major corporate event. | | | 13,451 | | | N/A | | N/A | | Quarterly | | 45-90 | | 0-5 years; up to 2.5% early withdrawal fee; possible 25% investor level gate; illiquid side pocket capital |
| Global Macro and Trading(c) | | Investments across global markets and security types seeking to profit from macroeconomic opportunities. Strategies can be discretionary or systematic. Includes commodity trading advisors. | | | 54,773 | | | N/A | | N/A | | Quarterly | | 30-90 | | 0-5 years; up to 6% early redemption fee; possible hard lock within first 12 months; illiquid side pocket capital |
| Private Equity(d) | | Investments in nonpublic companies. | | | 144,490 | | | 31,091 | | up to
10 years | | N/A | | N/A | | 0-10 years |
| Real Estate(e) | | Investments in REITs, private partnerships, and various real estate related mortgage securities. | | | 21,454 | | | 6,123 | | up to
10 years | | N/A | | N/A | | 0-10 years |
| Relative Value(f) | | Strategies seeking to profit from inefficiencies existing within capital structures, within markets, and across markets. | | | 58,436 | | | N/A | | N/A | | Quarterly | | 30-120 | | 0-5 years; up to 7% early redemption fee; possible 5% fund level gate; illiquid side pocket capital |
| | | | $ | 326,700 | | | $48,448 | | | | | | | | |
| | | | | | | | | | | | | | | | |
| * | The information summarized in the table above represents the general terms for the specified asset class. Individual Investment Funds may have terms that are more or less restrictive than those terms indicated for the asset class as a whole. In addition, most Investment Funds have the flexibility, as provided for in their constituent documents, to modify and waive such terms. |
| (a) | This category includes Investment Funds that invest primarily in privately issued securities by companies in the energy and natural resources sectors and private investments in energy-related assets or companies. The Investment Funds include private funds and private partnerships with private investments in their portfolios. |
| (b) | This category includes Investment Funds that invest primarily in the following securities: common stock, preferred stock, and many types of debt. Events include mergers, acquisitions, restructurings, spin-offs, and litigation. |
25
THE ENDOWMENT MASTER FUND, L.P.
(A Limited Partnership)
Notes to Financial Statements, continued
December 31, 2015
| (c) | This category includes Investment Funds that invest in global markets and across all security types including equities, fixed income, derivatives, commodities, currencies, futures, and exchange-traded funds. Investment Funds in this category are typically private funds and may include global macro funds, and commodity trading advisors. |
| (d) | This category includes private equity funds that invest primarily in non-publicly traded companies in need of capital. These Investment Funds may vary widely as to sector, size, stage, duration, and liquidity. Certain of these Investment Funds may also focus on the secondary market, buying interests in existing private equity funds, often at a discount. |
| (e) | This category includes Investment Funds that invest in registered investment companies or managers that invest in real estate trusts (commonly known as “REITs”) and private partnerships that make investments in income producing properties, raw land held for development or appreciation, and various types of mortgage loans and common or preferred stock whose operations involve real estate. |
| (f) | This category includes Investment Funds with low net exposure to most financial markets. Underlying strategies include Equity Market Neutral or Statistical Arbitrage, Capital Structure Arbitrage, Convertible Arbitrage, Volatility Arbitrage, and Credit Arbitrage. |
The following is a summary of the fair value as percentage of partners’ capital, and liquidity provisions for Investment Funds constituting greater than 5% of the Master Fund’s partners’ capital as of December 31, 2015:
| | | | | | | | | | |
Limited Partnerships,
Exempted Partnerships and
Limited Liability Companies | | Fair Value
as % of
Partners’
Capital | | | Investment Strategy | | Redemption
Frequency | | Redemption Restrictions
and Terms |
Citadel Wellington LLC | | | 7.85 | % | | Citadel Wellington LLC seeks to achieve consistently high risk-adjusted rates of return in connection with the strategies employed. Citadel Advisors LLC generally employs, for the benefit of Citadel Wellington LLC, complex proprietary investment strategies, based on quantitative analysis as well as fundamental research, taking both long and short positions in a broad range of investment instruments, including securities, options, futures, currencies, derivatives and other assets. | | Quarterly | | 5% fund level gate subject to quarterly withdrawal allowances |
| | | | |
Kepos Alpha Fund LP | | | 5.26 | % | | Kepos Alpha Fund Ltd. invests substantially all of its assets in Kepos Alpha Master Fund L.P., which seeks to provide investors with an attractive total return on invested capital over an entire three to five year market cycle while maintaining a low correlation with global equity markets. | | Quarterly | | None |
26
THE ENDOWMENT MASTER FUND, L.P.
(A Limited Partnership)
Notes to Financial Statements, continued
December 31, 2015
| | | | | | | | | | |
Limited Partnerships,
Exempted Partnerships and
Limited Liability Companies | | Fair Value
as % of
Partners’
Capital | | | Investment Strategy | | Redemption
Frequency | | Redemption Restrictions
and Terms |
| | | | |
Millenium USA LP | | | 8.26 | % | | Millenium USA, LP invests a substantial portion of its capital in Millenium Partners, L.P. (“MLP”) as a limited partner. The MLP is engaged in the business of trading equities, fixed income products, options, futures and other financial instruments. | | Quarterly | | Subject to a 25% investor level gate; 12 month soft lock with 4% early redemption fee. |
(4) PARTNERS’ CAPITAL ACCOUNTS
(a) ISSUANCE OF INTERESTS
Upon receipt from an eligible investor of an initial or additional application for interests (the “Interests”), which will generally be accepted as of the first day of each month, the Master Fund will issue new Interests. The Interests have not been registered under the Securities Act, or the securities laws of any state. The Master Fund issues Interests only in private placement transactions in accordance with Regulation D or other applicable exemptions under the Securities Act. No public market exists for the Interests, and none is expected to develop. The Master Fund is not required, and does not intend, to hold annual meetings of its partners. The Interests are subject to substantial restrictions on transferability and resale and may not be transferred or resold except as permitted under the Master Fund’s limited partnership agreement. The Master Fund reserves the right to reject any applications for subscription of Interests.
(b) ALLOCATION OF PROFITS AND LOSSES
For each fiscal period, generally monthly, net profits or net losses of the Master Fund are allocated among and credited to or debited against the capital accounts of all partners as of the last day of each fiscal period in accordance with the partners’ respective capital account ownership percentage for the fiscal period. Net profits or net losses are measured as the net change in the value of the partners’ capital of the Master Fund, including any change in unrealized appreciation or depreciation of investments and income, net of expenses, and realized gains or losses during a fiscal period. Net profits or net losses are allocated after giving effect for any initial or additional applications for Interests, which generally occur at the beginning of the month, or any repurchases of Interests.
(c) REPURCHASE OF INTERESTS
A partner will not be eligible to have the Master Fund repurchase all or any portion of an Interest at the partner’s discretion at any time. Periodically, the Adviser recommends to the Board that the Master Fund offer to repurchase Interests during the year, pursuant to written tenders by partners.
The Board retains the sole discretion to accept or reject the recommendation of the Adviser and to determine the amount of Interests, if any, that will be purchased in any tender offer that it does approve. In the event Interests are repurchased, there will be a substantial period of time between the date as of which partners must accept the Master Fund’s offer to repurchase their Interests and the date they can expect to receive payment for their Interests from the Master Fund.
27
THE ENDOWMENT MASTER FUND, L.P.
(A Limited Partnership)
Notes to Financial Statements, continued
December 31, 2015
(5) INVESTMENTS IN PORTFOLIO SECURITIES
(a) INVESTMENT ACTIVITY
As of December 31, 2015 the Master Fund held investments in Investment Funds and securities. The agreements related to investments in Investment Funds provide for compensation to the Investment Funds’ managers/general partners or advisers in the form of management fees of up to 3.0% annually of monthly average net assets. In addition, many Investment Funds also provide for performance incentive fees/allocations of up to 30% of an Investment Fund’s net profits, although it is possible that such ranges may be exceeded for certain investment managers. These management fees and incentive fees are in addition to the management fees charged by the Master Fund.
For the year ended December 31, 2015, the aggregate cost of purchases and proceeds from sales of investments (excluding short-term investments) were $71,064,526 and $42,883,946, respectively.
The cost of the Master Fund’s underlying investments for Federal income tax purposes is adjusted for items of taxable income allocated to the Master Fund from such investments. The allocated taxable income is generally reported to the Master Fund by its underlying investments on Schedules K-1, Forms 1099 or PFIC statements, or a combination thereof.
The underlying investments generally do not provide the Master Fund with tax reporting information until well after year end, and as a result, the Master Fund is unable to calculate the year end tax cost of its investments until such time. The Master Fund’s book cost as of December 31, 2015, was $310,678,584, resulting in accumulated net unrealized appreciation of $19,766,138 consisting of $67,181,541 in gross unrealized appreciation and $47,415,403 in gross unrealized depreciation.
During the year ended December 31, 2015, certain investments were received through a transfer-in-kind in connection with the redemption of certain investments. The fair value of these investments transferred-in-kind and related cost were as follows:
| | | | | | | | | | | | | | | | | | | | |
Investments Redeemed | | Fair Value | | | Cost | | | Realized
Gain
(Loss) on
Transfers In-
Kind | | | Unrealized
Gain
(Loss) on
Transfers In-
Kind | | | Investments
Received | |
Tiger Global Private Investment Partners V, L.P. | | $ | 7,994,306 | | | $ | 7,798,116 | | | $ | 196,190 | | | $ | — | | | | JD.com, Inc. | |
| | | | | | | | | | | | | | | | | | | | |
| | $ | 7,994,306 | | | $ | 7,798,116 | | | $ | 196,190 | | | $ | — | | | | | |
| | | | | | | | | | | | | | | | | | | | |
28
THE ENDOWMENT MASTER FUND, L.P.
(A Limited Partnership)
Notes to Financial Statements, continued
December 31, 2015
(b) AFFILIATED INVESTMENT FUNDS
At December 31, 2015, the Master Fund’s investments in certain Investment Funds were deemed to be investments in affiliated issuers under the 1940 Act, primarily because the Master Fund owns 5% or more of the Investment Funds’ total net assets. The activity resulting from investments in these Investment Funds, including interest and dividend income as well as realized gains and losses, is identified in the Statement of Operations as transactions with affiliated investments. A listing of these affiliated Investment Funds (including activity during the year ended December 31, 2015) is shown below:
| | | | | | | | | | | | | | | | | | | | | | | | | | | | | | | | | | | | |
Investment Funds | | Shares
12/31/2014 | | | Shares
12/31/2015 | | | Fair Value
12/31/2014 | | | Cost of
Purchases | | | Cost of
Sales* | | | Realized
Gain
(Loss) on
Investments | | | Change in
Unrealized
Appreciation/
Depreciation | | | Fair Value
12/31/2015 | | | Interest/
Dividend
Income | |
Blueshift Energy Fund, LP | | | | | | | | | | $ | 20,211,256 | | | $ | 2,000,000 | | | $ | (8,413,173 | ) | | $ | 3,570 | | | $ | (5,568,514 | ) | | $ | 8,233,139 | | | $ | — | |
BLC Secured Credit Partners II | | | | | | | | | | | — | | | | 1,609,568 | | | | — | | | | — | | | | 26,076 | | | | 1,635,644 | | | | — | |
BLC Secured Credit Partners LLC—Series 14-3C | | | | | | | | | | | — | | | | 1,250,000 | | | | (20,176 | ) | | | — | | | | 20,176 | | | | 1,250,000 | | | | — | |
CCM Small Cap Value Qualified Fund, L.P. | | | | | | | | | | | 293,162 | | | | — | | | | (206,185 | ) | | | — | | | | (26,184 | ) | | | 60,793 | | | | — | |
Credit Distressed Blue Line Fund, L.P | | | | | | | | | | | 1,626,518 | | | | — | | | | — | | | | — | | | | 534,825 | | | | 2,161,343 | | | | — | |
Harbinger Capital Partners Fund I, L.P. | | | | | | | | | | | 2,659,886 | | | | — | | | | — | | | | — | | | | 1,485,387 | | | | 4,145,273 | | | | — | |
Middle East North Africa Opportunities Fund, L.P. | | | 728 | | | | 728 | | | | 123,897 | | | | — | | | | — | | | | — | | | | (57,514 | ) | | | 66,383 | | | | — | |
Napier Park IG Muni First Loss Fund, LP | | | | | | | | | | | — | | | | 2,000,000 | | | | (41,711 | ) | | | — | | | | 57,511 | | | | 2,015,800 | | | | — | |
ORBIS Real Estate Fund I | | | | | | | | | | | 2,361,326 | | | | 52,643 | | | | (52,643 | ) | | | — | | | | (206,761 | ) | | | 2,154,565 | | | | — | |
Ovation Tax Lien Fund, LP | | | | | | | | | | | — | | | | 4,000,000 | | | | — | | | | — | | | | (10,000 | ) | | | 3,990,000 | | | | 154,546 | |
PIPE Equity Partners, LLC | | | | | | | | | | | 1,334,510 | | | | — | | | | (277,624 | ) | | | (133,155 | ) | | | (102,633 | ) | | | 821,098 | | | | — | |
PIPE Select Fund LLC | | | | | | | | | | | 3,113,587 | | | | — | | | | (304,960 | ) | | | (25,710 | ) | | | (157,735 | ) | | | 2,625,182 | | | | — | |
Strattam Capital Investment Fund, LP | | | | | | | | | | | — | | | | 2,517,047 | | | | — | | | | — | | | | — | | | | 2,517,047 | | | | — | |
| | | | | | | | | | | | | | | | | | | | | | | | | | | | | | | | | | | | |
| | | | | | | | | | $ | 31,724,142 | | | $ | 13,429,258 | | | $ | (9,316,472 | ) | | $ | (155,295 | ) | | $ | (4,005,366 | ) | | $ | 31,676,267 | | | $ | 154,546 | |
| | | | | | | | | | | | | | | | | | | | | | | | | | | | | | | | | | | | |
| * | Sales include return of capital |
(6) FINANCIAL INSTRUMENTS WITH OFF-BALANCE SHEET RISK
In the normal course of business, the Investment Funds in which the Master Fund invests may trade various derivative securities and other financial instruments, and may enter into various investment activities with off-balance sheet risk both as an investor and as a principal. The Master Fund’s risk of loss in these Investment Funds is limited to the value of its investment in such Investment Funds. In addition, by investing directly in derivative instruments, the Master Fund is subject to credit risk with respect to the net amount expected to be received from the other party. The Master Fund may be negatively impacted if the other party defaults or fails to perform its obligations under such agreement.
29
THE ENDOWMENT MASTER FUND, L.P.
(A Limited Partnership)
Notes to Financial Statements, continued
December 31, 2015
(7) ADMINISTRATION AGREEMENT
In consideration for administrative, accounting, and recordkeeping services, the Master Fund pays the Administrator a monthly administration fee based on the month-end partners’ capital of the Master Fund. The Master Fund is charged, on an annual basis, 6 basis points on partners’ capital of up to $2 billion, 5 basis points on partners’ capital between the amounts of $2 billion and $5 billion, 2 basis points on partners’ capital between the amounts of $5 billion and $15 billion, and 1.25 basis points for amounts over $15 billion. The administration fee is payable monthly in arrears. The Administrator also provides the Master Fund with, compliance, transfer agency, and other investor related services at an additional cost.
The administration fees are paid out of the Master Fund’s assets, which decreases the net profits or increases the net losses of the partners in the Master Fund. As of December 31, 2015, the Master Fund had $315,002,632 in partners’ capital. The total administration fee incurred for the year ended December 31, 2015, was $192,035.
(8) RELATED PARTY TRANSACTIONS
(a) INVESTMENT MANAGEMENT FEE
In consideration of the advisory and other services provided by the Adviser to the Master Fund pursuant to the Investment Management Agreement, the Master Fund pays the Adviser an investment management fee (the “Investment Management Fee”), equal to 1.00% on an annualized basis of the Master Fund’s partners’ capital calculated based on the Master Fund’s partners’ capital at the end of each month, payable quarterly in arrears. The Investment Management Fee decreases the net profits or increases the net losses of the Master Fund that are credited to or debited against the capital accounts of its partners. For the year ended December 31, 2015, $3,209,422 was incurred for Investment Management Fees.
(b) PLACEMENT AGENTS
The Master Fund may engage one or more placement agents (each, a “Placement Agent”) to solicit investments in the Master Fund. Salient Capital, L.P., an affiliate of the Adviser, is a broker-dealer who has been engaged by the Master Fund to serve as a Placement Agent. A Placement Agent may engage one or more sub-placement agents. The Adviser or its affiliates may pay a fee out of their own resources to Placement Agents and sub-placement agents. As of December 31, 2015, the two largest non-affiliated sub-placement agents service approximately 47.42% of the feeder funds assets which are invested in the Master Fund. To the extent that substantial numbers of investors have a relationship with a particular sub-placement agent, such sub-placement agent may have the ability to influence investor behavior, which may affect the Master Fund.
(9) FUND BORROWING
As a fundamental policy, the Master Fund may borrow up to, but not more than, 25% of the partners’ capital of the Master Fund (at the time such borrowings were made and after taking into account the investment and/or deployment of such proceeds) for the purpose of making investments, funding redemptions and for other working capital and general Master Fund purposes. For purposes of the Master Fund’s investment restrictions and certain investment limitations under the 1940 Act, including for example, the Master Fund’s leverage limitations, the Master Fund will not “look through” Investment Funds in which the Master Fund invests. Investment Funds may also use leverage, whether through borrowings, futures, or other derivative products and are not subject to the Master Fund’s investment restrictions. However, such borrowings by Investment Funds are without recourse to the Master Fund and the Master Fund’s risk of loss is limited to its investment in such Investment Funds, other
30
THE ENDOWMENT MASTER FUND, L.P.
(A Limited Partnership)
Notes to Financial Statements, continued
December 31, 2015
than for some Investment Funds in which the Master Fund has made a capital commitment, for which the risk of loss is limited to the Master Fund’s total capital commitment. For some Investment Funds in which the Master Fund has made a capital commitment that will be funded over a period of time, such as private equity, private energy and real estate funds, the Master Fund, in certain instances, may commit to fund more than its initial capital commitment. The rights of any lenders to the Master Fund to receive payments of interest or repayments of principal will be senior to those of the partners, and the terms of any borrowings may contain provisions that limit certain activities of the Master Fund.
The Master Fund entered into a line of credit agreement (the “Credit Agreement”) with Credit Suisse AG on October 29, 2014. The terms of the Credit Agreement provide a $60,000,000 secured revolving credit facility.
Borrowings under the Credit Agreement are secured by the Master Fund’s investments. The Credit Agreement provides for a commitment fee of 1.50% per annum on unused capacity above a certain threshold plus interest accruing on any borrowed amounts at the three month London Interbank Offered Rate (LIBOR) plus 2.24% per annum as defined in the Credit Agreement. The average principal balance and weighted average interest rate for the year ended December 31, 2015, was approximately $36,602,740 and 2.55% respectively. At December 31, 2015, the principal balance outstanding was $35,989,694 at an interest rate of 2.65%. The Credit Agreement expires on October 29, 2018.
(10) FINANCIAL HIGHLIGHTS
| | | | | | | | | | | | | | | | | | | | |
| | | Year ended
December 31,
2015 | | | Year ended
December 31,
2014 | | | Year ended
December 31,
2013 | | | Year ended
December 31,
2012 | | | Year ended
December 31,
2011 | |
Net investment loss to average partners’ capital1 | | | (0.30)% | | | | (1.79)% | | | | (0.74)% | | | | (0.81)% | | | | (0.75)% | |
Expenses to average partners’ capital1,2 | | | 1.67% | | | | 2.68% | | | | 1.37% | | | | 1.49% | | | | 1.27% | |
Portfolio turnover | | | 12.52% | | | | 16.96% | | | | 16.95% | | | | 20.88% | | | | 26.72% | |
Total return3 | | | 2.94% | | | | 6.43% | | | | 4.67% | | | | 2.50% | | | | (3.18)% | |
Partners’ capital, end of period (000s) | | $ | 315,003 | | | $ | 319,160 | | | $ | 2,064,041 | | | $ | 3,071,734 | | | $ | 4,301,279 | |
An investor’s return (and operating ratios) may vary from those reflected based on the timing of capital transactions.
| 1 | Ratios are calculated by dividing the indicated amount by average partners’ capital measured at the end of each month during the year. |
| 2 | Expense ratios do not include expenses of acquired funds that are paid indirectly by the Master Fund as a result of its ownership in the underlying funds. Expenses include U.S. offshore withholding tax, which is only allocable to investors investing through the offshore feeder funds. |
| 3 | Calculated as geometrically linked monthly returns for each month in the period. |
(11) SUBSEQUENT EVENTS
Based on the partners’ capital of the Master Fund, the Adviser recommended to the Board that a tender offer in an amount of up to $6,243,000 be made for the quarter ending March 31, 2016 to those partners who elect to
31
THE ENDOWMENT MASTER FUND, L.P.
(A Limited Partnership)
Notes to Financial Statements, continued
December 31, 2015
tender their Interests prior to the expiration of the tender offer period. The Board approved such recommendation and partners in the Master Fund were notified of a tender offer with a March 2, 2016 expiration date (“Expiration Date”). In response to the number of partners electing to tender their Interests as of the Expiration Date, which amounted to approximately $63 million, the Adviser, in its discretion, will pro-rate the amount elected to be tendered in accordance with the Master Fund’s repurchase procedures. The final amount that is accepted by the Master Fund will appear in the next report to partners.
Management of the Master Fund has evaluated the need for disclosures and/or adjustments resulting from subsequent events through the date the financial statements were issued. Based on this evaluation, no adjustments were required to the financial statements as of December 31, 2015.
32
THE ENDOWMENT MASTER FUND, L.P.
(A Limited Partnership)
Supplemental Information
December 31, 2015
Directors and Officers
The Master Fund’s operations are managed under the direction and oversight of the Board. Each Director serves for an indefinite term or until he or she reaches mandatory retirement, if any, as established by the Board. The Board appoints the officers of the Master Fund who are responsible for the Master Fund’s day-to-day business decisions based on policies set by the Board. The officers serve at the pleasure of the Board.
Compensation for Directors
The Master Fund, The Endowment Registered Fund, L.P., The Endowment Institutional Fund, L.P, The Endowment TEI Fund, L.P. and The Endowment Institutional TEI Fund W, L.P., together pay each of the Directors who is not an “interested person” of the Adviser, as defined in the 1940 Act (the “Independent Directors”) an annual retainer of $10,000, paid quarterly, an annual Board meeting fee of $3,000, a fee of $1,000 per informal Board meeting, a fee of $500 per telephonic Board meeting, an annual fee of $833 for each Compliance committee member and $625 for each Audit and Valuation committee member, an annual fee of $5,000 for the valuation committee chairman and $3,000 for each other committee chair, each of which is paid quarterly, and an annual fee of $5,000, paid quarterly, to the Lead Independent Director. There are currently six Independent Directors. In the interest of retaining Independent Directors of the highest quality, the Board intends to periodically review such compensation and may modify it as the Board deems appropriate.
The table below shows, for each Director and executive officer, his full name, address and age, the position held with the Fund, the length of time served in that position, his principal occupation during the last five years, and other directorships held by such Director. The address of each Director and officer is c/o The Endowment Fund, 4265 San Felipe, Suite 800, Houston, Texas 77027.
Interested Directors
| | | | | | | | |
| Name, and Year of Birth | | Position(s)
Held | | Principal
Occupation(s) During
the Past 5 Years | | Number of
Portfolios in
Fund Complex
Overseen by
Director | | Other Directorships Held
by Director |
John A. Blaisdell1 Year of birth: 1960 | | Director,
Co-Principal
Executive
Officer
(Since
2004) | | Managing Director of Salient, since 2002. | | The Endowment
Funds (5); The
Endowment
PMF Funds (3) | | Salient Alternative Strategies Funds (investment companies) (two funds) since 2010; Salient MF Trust (investment company) (four funds) since 2012; Salient Midstream & MLP Fund (investment company) since 2012. |
33
THE ENDOWMENT MASTER FUND, L.P.
(A Limited Partnership)
Supplemental Information, continued
December 31, 2015
| | | | | | | | |
| Name, and Year of Birth | | Position(s)
Held | | Principal
Occupation(s) During
the Past 5 Years | | Number of
Portfolios in
Fund Complex
Overseen by
Director | | Other Directorships Held
by Director |
Andrew Linbeck1 Year of birth: 1964 | | Director,
Co-Principal
Executive
Officer
(Since
2004) | | Managing Director of Salient, since 2002. | | The Endowment
Funds (5); The
Endowment
PMF Funds (3) | | Salient Alternative Strategies Funds (investment companies) (two funds) 2010-2012; Salient Midstream & MLP Fund (investment company) since 2012. |
| 1 | This person’s status as an “interested” director arises from his affiliation with Salient Partners, L.P., which itself is an affiliate of the Master Fund, The Endowment Registered Fund, L.P., The Endowment Institutional Fund, L.P., The Endowment TEI Fund, L.P., The Endowment Institutional TEI Fund W, L.P., and the Adviser. |
34
THE ENDOWMENT MASTER FUND, L.P.
(A Limited Partnership)
Supplemental Information, continued
December 31, 2015
Independent Directors
| | | | | | | | |
| Name and Year of Birth | | Position(s)
Held | | Principal
Occupation(s) During
the Past 5 Years | | Number of
Portfolios in
Fund Complex
Overseen by
Director | | Other Directorships Held
by Director |
Karin B. Bonding, CFA Year of birth: 1939 | | Director
(Since
2010) | | Lecturer, University of Virginia, since 1996; President of Capital Markets Institute, Inc. (fee-only financial planner and investment advisor) since 1996. | | The Endowment
Funds (5) | | Salient Alternative Strategies Funds (investment companies) (two funds) since 2010; Salient MF Trust (investment company) (four funds) since 2012; Salient Midstream & MLP Fund (investment company) since 2012; Brandes Investment Trust (investment companies) (four funds) 2006-2012; Credit Suisse Alternative Capital Funds (investment companies) (six funds) 2005-2010. |
Jonathan P. Carroll Year of birth: 1961 | | Director
(Since
2004) | | President, Lazarus Financial LLC (holding company) since 2006; President and CEO of Blue Dolphin Energy Company since 2012; private investor for the past five years. | | The Endowment
Funds (5); The
Endowment
PMF Funds (3) | | Salient Alternative Strategies Funds (investment companies) (two funds) since 2010; Salient MF Trust (investment company) (four funds) since 2012; Salient Midstream & MLP Fund (investment company) since 2012; LRR Energy, L.P. (energy company) since 2014. Blue Dolphin Energy Company (BDCO) (energy company), since 2014. |
35
THE ENDOWMENT MASTER FUND, L.P.
(A Limited Partnership)
Supplemental Information, continued
December 31, 2015
| | | | | | | | |
| Name and Year of Birth | | Position(s)
Held | | Principal
Occupation(s) During
the Past 5 Years | | Number of
Portfolios in
Fund Complex
Overseen by
Director | | Other Directorships Held
by Director |
Dr. Bernard Harris Year of birth: 1956 | | Director
(Since
2009) | | Chief Executive Officer and Managing Partner, Vesalius Ventures, Inc (venture investing), since 2002; President of The Space Agency (marketing), since 1999; President of The Harris Foundation (non-profit), since 1998; clinical scientist, flight surgeon and astronaut for NASA, 1986 to 1996. | | The Endowment
Funds (5) | | Salient Alternative Strategies Funds (investment companies) (two funds) since 2010; Salient MF Trust (investment company) (four funds) since 2012; Salient Midstream & MLP Fund (investment company) since 2012; Babson funds (three) since 2011; Greater Houston Community Foundation, 2004- 2009; Monebo Technologies Inc., since 2009; The National Math and Science Initiative, and Space Agency, since 2008; Communities in Schools, since 2007; American Telemedicine Association, since 2007; U.S. Physical Therapy, Inc., since 2005; Houston Technology Center, since 2004; Houston Angel Network, since 2004; The Harris Foundation, Inc., since 1998. |
Richard C. Johnson Year of birth: 1937 | | Director
(Since
2004) | | Senior Counsel (retired) for Baker Botts LLP (law firm) since 2002; Managing Partner, Baker Botts, 1998 to 2002; practiced law at Baker Botts, 1966 to 2002 (1972 to 2002 as a partner). | | The Endowment
Funds (5); The
Endowment
PMF Funds (3) | | Salient Alternative Strategies Funds (investment companies) (two funds) since 2010; Salient MF Trust (investment company) (four funds) since 2012; Salient Midstream & MLP Fund (investment company) since 2012. |
36
THE ENDOWMENT MASTER FUND, L.P.
(A Limited Partnership)
Supplemental Information, continued
December 31, 2015
| | | | | | | | |
| Name and Year of Birth | | Position(s)
Held | | Principal
Occupation(s) During
the Past 5 Years | | Number of
Portfolios in
Fund Complex
Overseen by
Director | | Other Directorships Held
by Director |
G. Edward Powell Year of birth: 1936 | | Director
(Since
2004) | | Principal of Mills & Stowell (private equity) since 2002. Managing Partner, PriceWaterhouse & Co. (Houston Office, 1982 to 1994). | | The Endowment
Funds (5);The Endowment
PMF Funds (3) | | Salient Alternative Strategies Funds (investment companies) (two funds) since 2010; Salient MF Trust (investment company) (four funds) since 2012; Salient Midstream & MLP Fund (investment company) since 2012; Energy Services International, Inc., since 2004; Therapy Track, LLC, since 2009; Global Water Technologies, Inc.; Datavox Holdings, Inc.; Energy Services International, Inc., 2004 to 2013. |
Scott E. Schwinger Year of birth: 1965 | | Director
(Since
2004) | | President, The McNair Group (management), since 2006; Senior Vice President and Chief Financial Officer, the Houston Texans (professional football team) (1999). | | The Endowment
Funds (5);The Endowment
PMF Funds (3) | | Salient Alternative Strategies Funds (investment companies) (two funds) since 2010; Salient MF Trust (investment company) (four funds) since 2012; Salient Midstream & MLP Fund (investment company) since 2012; The Make-A-Wish Foundation, since 2008. |
37
THE ENDOWMENT MASTER FUND, L.P.
(A Limited Partnership)
Supplemental Information, continued
December 31, 2015
Officers of the Fund Who Are Not Directors
| | | | |
| Name and Year of Birth | | Position(s) Held with the Fund | | Principal Occupation(s) During the
Past 5 Years |
Paul Bachtold Year of birth: 1973 | | Chief Compliance Officer (“CCO”) (Since 2010) | | CCO, Salient (since 2010); Consultant, Chicago Investment Group (compliance consulting), 2009-2010; US Compliance Manager, Barclays Global Investors, 2005-2008. |
Christopher R. Arnold Year of birth: 1977 | | Treasurer; Principal Financial Officer (Since 2015) | | Director of Fund Accounting, Salient (since 2010); Audit Manager, PricewaterhouseCoopers, LLP 2002-2009 |
Jeremy Radcliffe Year of birth: 1974 | | Secretary (Since 2013) | | Managing Director of Salient, since 2002. |
Allocation of Investments
The following chart indicates the allocation of investments among the asset classes in the Master Fund as of December 31, 2015.
| | | | | | | | |
Asset Class1 | | Fair Value | | | % | |
Closed-End Fund—Credit | | $ | 376,178 | | | | 0.11 | |
Consumer Products | | | 109,108 | | | | 0.03 | |
Energy | | | 34,096,126 | | | | 10.32 | |
Event-Driven | | | 13,450,877 | | | | 4.07 | |
Financials | | | 1,447,426 | | | | 0.44 | |
Food Technology | | | 299,995 | | | | 0.09 | |
Global Macro and Trading | | | 54,772,543 | | | | 16.58 | |
Healthcare | | | 798,000 | | | | 0.24 | |
Private Equity | | | 144,490,382 | | | | 43.73 | |
Professional Services | | | 399,995 | | | | 0.12 | |
Real Estate | | | 21,454,158 | | | | 6.49 | |
REIT Residential | | | 313,872 | | | | 0.10 | |
Relative Value | | | 58,436,062 | | | | 17.68 | |
| | | | | | | | |
Total Investments | | $ | 330,444,722 | | | | 100.00 | |
| | | | | | | | |
| 1 | The complete list of investments included in the following asset class categories is included in the Schedule of Investments of the Master Fund. |
38
THE ENDOWMENT MASTER FUND, L.P.
(A Limited Partnership)
Supplemental Information, continued
December 31, 2015
Form N-Q Filings
The Master Fund files a complete schedule of portfolio holdings with the Securities and Exchange Commission for the first and third quarters of each fiscal year on Form N-Q. The Master Fund’s Form N-Q is available on the Securities and Exchange Commission website at http://www.sec.gov. The Master Fund’s Form N-Q may be reviewed and copied at the Securities and Exchange Commission Public Reference Room in Washington, DC and information regarding operation of the Public Reference Room may be obtained by calling 1-800-SEC-0330.
Proxy Voting Policies
A description of the policies and procedures that the Master Fund uses to determine how to vote proxies relating to portfolio securities is available (i) without charge, upon request, by calling 1-800-725-9456; and (ii) on the Securities and Exchange Commission website at http://www.sec.gov.
Information regarding how the Master Fund voted proxies relating to portfolio securities during the most recent 12-month period ended June 30 is available (i) without charge, upon request, by calling 1-800-725-9456; and (ii) on the Securities and Exchange Commission website at http://www.sec.gov.
Additional Information
The Master Fund’s private placement memorandum (the “PPM”) includes additional information about Directors of the Master Fund. The PPM is available, without charge, upon request by calling 1-800-725-9456.
Privacy Policy (Unaudited)
The Master Fund recognizes the importance of securing personal financial information. It is our policy to safeguard any personal and financial information that may be entrusted to us. The following is a description of the Master Fund’s policy regarding disclosure of nonpublic personal information.
We collect nonpublic personal information as follows:
We collect information about our investors, including, but not limited to, the investor’s name, address, telephone number, e-mail address, social security number and date of birth. We collect that information from subscription agreements, other forms of correspondence that we receive from investors, from personal conversations and from affiliated entities as permitted by law.
We receive information about investor transactions with us, including, but not limited to, account number, account balance, investment amounts, withdrawal amounts and other financial information.
We are permitted by law to disclose nonpublic information we collect, as described above, to the Master Fund’s service providers, including the Master Fund’s investment adviser, sub-advisers, servicing agent, independent administrator, custodian, legal counsel, accountant and auditor. We do not disclose any nonpublic information about our current or former investors to nonaffiliated third parties, except as required or permitted by law. We restrict access to investor nonpublic personal information to those persons who require such information to provide products or services to investors. We maintain physical, electronic and procedural safeguards that comply with federal standards to guard investors’ nonpublic personal information.
39
THE ENDOWMENT MASTER FUND, L.P.
(A Limited Partnership)
Supplemental Information, continued
December 31, 2015
If an investor’s investment relationship with the Master Fund involves a financial intermediary, including, but not limited to, a broker-dealer, bank or trust company, the privacy policy of such investor’s financial intermediary would govern how any nonpublic personal information would be shared by them with nonaffiliated third parties.
40
Item 2. Code of Ethics.
(a) The registrant has adopted a code of ethics that applies to the registrant’s principal executive officer, principal financial officer, principal accounting officer or controller, or persons performing similar functions. This code of ethics is included as Exhibit 12(a)(1).
(b) During the period covered by the report, with respect to the registrant’s code of ethics that applies to its principal executive officer, principal financial officer, principal accounting officer or controller, or persons performing similar functions; there have been no amendments to, nor any waivers granted from, a provision that relates to any element of the code of ethics definition enumerated in paragraph (b) of this Item 2.
Item 3. Audit Committee Financial Expert.
3(a)(1) The registrant’s board of directors has determined that the registrant has at least one audit committee financial expert serving on its audit committee.
3(a)(2) The audit committee financial expert is G. Edward Powell, who is “independent” for purposes of this Item 3 of Form N-CSR.
Item 4. Principal Accountant Fees and Services.
| | | | | | | | |
| | | Current Year | | | Previous Year | |
Audit Fees | | $ | 139,000 | | | $ | 138.000 | |
Audit-Related Fees | | $ | 0 | | | $ | 0 | |
Tax Fees | | $ | 0 | | | $ | 0 | |
All Other Fees | | $ | 0 | | | $ | 0 | |
(e)(1) Disclose the audit committee’s pre-approval policies and procedures described in paragraph (c)(7) of Rule 2-01 of Regulation S-X.
The audit committee may delegate its authority to pre-approve audit and permissible non-audit services to one or more members of the committee. Any decision of such members to pre-approve services shall be presented to the full audit committee at its next regularly scheduled meeting.
(2) Disclose the percentage of services described in each of paragraphs (b) through (d) of this item that were approved by the audit committee pursuant to paragraph (c) (7)(i)(c) of Rule 2-01 of Regulation S-X.
| | | | |
| | | Current Year | | Previous Year |
| | 0% | | 0% |
(f) Not applicable.
(g) Disclose the aggregate non-audit fees billed by the registrant’s accountant for services rendered to registrant, and rendered to the registrant’s investment adviser (not including any sub-adviser whose role is primarily portfolio management and is subcontracted with or overseen by another investment adviser), and any entity controlling, controlled by, or under common control with the adviser that provides ongoing services to the registrant for each of the last two fiscal years of the registrant.
| | | | |
| | | Current Year | | Previous Year |
| | $0 | | $0 |
(h) Not applicable.
Item 5. Audit Committee of Listed Registrants.
Not applicable.
Item 6. Investments.
(a) Schedule of Investments as of the close of the reporting period is included in the report to the shareholders filed under item 1 of this form.
(b) Not applicable.
Item 7. Disclosure of Proxy Voting Policies and Procedures for Closed-End Management Investment Companies.
A closed-end management investment company that is filing an annual report on this Form N-CSR must, unless it invests exclusively in non-voting securities, describe the policies and procedures that it uses to determine how to vote proxies relating to portfolio securities, including the procedures that the company uses when a vote presents a conflict between the interests of its shareholders, on the one hand, and those of the company’s investment adviser; principal underwriter; or any affiliated person (as defined in section 2(a)(3) of the Investment Company Act of 1940 (15 U.S.C. 80a-2(a)(3)) and the rules thereunder) of the company, its investment adviser, or its principal underwriter, on the other. Include any policies and procedures of the company’s investment adviser, or any other third party, that the company uses, or that are used on the company’s behalf, to determine how to vote proxies relating to portfolio securities.
These policies are included as Exhibit 12(a)(4).
Item 8. Portfolio Managers of Closed-End Management Investment Companies.
The Adviser’s Investment Committee Members
As of the date of the filing, the Investment Committee is responsible for the day-to-day management of the Fund’s portfolio. The Endowment Master Fund, L.P. (the “Master Fund”), The Endowment Institutional Fund, L.P. (the “Institutional Fund”), The Endowment Registered Fund, L.P. (the “Registered Fund”), The Endowment TEI Fund, L.P. (the “TEI Fund”) and The Endowment Institutional TEI Fund W, L.P. (the “Institutional TEI W Fund”) are registered investment companies (collectively, the “Fund Complex” and each individually the “Fund”). The members of the Investment Committee (each an “Investment Committee Member”) are: Messrs. Lee G. Partridge, William B. Hunt and William R. Guinn.
Mr. Partridge has served as an Investment Committee Member since January 15, 2013, and has served as Chief Investment Officer of Salient Partners, L.P. (“Salient”), which owns Salient Trust Co., LTA, a trust company chartered under the laws of the State of Texas, since January 15, 2013. Mr. Hunt has served as an Investment Committee Member since 2014 and as Chief Risk Officer of Salient since 2014. He previously held positions as a Senior Analyst and Portfolio Manager of Iridian Asset Management (from 1996-2011) and Professor at Southern Methodist University (from 1991-2000). Mr. Guinn has served as an Investment Committee Member since 2014 and Director of Salient since 2013. Previously, he held the position of Director of Strategic Partnerships and Opportunistic Investments at the Teacher Retirement System of Texas (2009-2013). Each member of the Investment Committee reviews asset allocation recommendations made by the Adviser’s representatives, manager due diligence and recommendations and, by a majority vote of the Investment Committee, determines asset allocation and manager selection.
The Adviser and certain other entities controlled by the Principals manage investment programs which are similar to that of the Fund, and the Adviser and/or the Principals may in the future serve as an investment adviser or otherwise manage or direct the investment activities of other registered and/or private investment vehicles with investment programs similar to the Funds.
Other Accounts Managed by the Investment Adviser
Certain Investment Committee Members, who are primarily responsible for the day-to-day management of the Fund, also manage other registered investment companies, other pooled investment vehicles and other accounts, as indicated below. The following tables identify, as of December 31, 2015: (i) the number of registered investment companies, other pooled investment vehicles and other accounts managed by the Investment Committee Member and the total assets of such companies, vehicles and accounts; and (ii) the number and total assets of such companies, vehicles and accounts with respect to which the advisory fee is based on performance.
| | | | | | | | | | | | | | | | |
Name | | Number of Other
Accounts | | | Total Assets of Other
Accounts | | | Number of Other Accounts
Subject to a Performance
Fee | | | Total Assets of Other
Accounts Subject to
a Performance Fee | |
Lee Partridge | | | | | | | | | | | | | | | | |
Registered investment companies (1) | | | 10 | | | $ | 2.28 billion | | | | 0 | | | $ | — | |
Other pooled investment companies (1) | | | 15 | | | $ | 1.07 billion | | | | 3 | | | $ | 287.52 million | |
Other accounts | | | 371 | | | $ | 53.75 million | | | | 3 | | | $ | 53.75 million | |
William B. Hunt | | | | | | | | | | | | | | | | |
Registered investment companies (1) | | | 10 | | | $ | 2.28 billion | | | | 0 | | | $ | — | |
Other pooled investment companies (1) | | | 15 | | | $ | 1.07 billion | | | | 3 | | | $ | 287.52 million | |
Other accounts | | | 371 | | | $ | 53.75 million | | | | 3 | | | $ | 53.75 million | |
William R. Guinn | | | | | | | | | | | | | | | | |
Registered investment companies (1) | | | 10 | | | $ | 2.28 billion | | | | 0 | | | $ | — | |
Other pooled investment companies (1) | | | 15 | | | $ | 1.07 billion | | | | 3 | | | $ | 287.52 million | |
Other accounts | | | 371 | | | $ | 53.75 million | | | | 3 | | | $ | 53.75 million | |
| (1) | For registered investment companies and pooled investment vehicles managed, the number of vehicles reported for master-feeder structures includes both the master fund and feeder funds while the corresponding total assets reported reflect the assets of the master fund only. |
Conflicts of Interest of the Adviser
From time to time, potential conflicts of interest may arise between an Investment Committee Member’s management of the investments of the Fund, on the one hand, and the management of other registered investment companies, pooled investment vehicles and other accounts (collectively, “other accounts”), on the other. The other accounts might have similar investment objectives or strategies as the Fund, track the same index the Fund tracks or otherwise hold, purchase, or sell securities that are eligible to be held, purchased or sold by the Fund. The other accounts might also have different investment objectives or strategies than the Fund.
Knowledge and Timing of Fund Trades. A potential conflict of interest may arise as a result of the Investment Committee Member’s day-to-day management of a Fund. Because of their positions with the Fund, the Investment Committee Members know the size, timing and possible market impact of the Fund’s trades. It is theoretically possible that the Investment Committee Members could use this information to the advantage of other accounts they manage and to the possible detriment of the Fund.
Investment Opportunities. A potential conflict of interest may arise as a result of the Investment Committee Member’s management of a number of accounts with varying investment guidelines. Often, an investment opportunity may be suitable for both the Fund and other accounts managed by the Investment Committee Member, but may not be available in sufficient quantities for both the Fund and the other accounts to participate fully. Similarly, there may be limited opportunity to sell an investment held by the Fund and other accounts. The Adviser has adopted policies and procedures reasonably designed to allocate investment opportunities on a fair and equitable basis over time.
Performance Fees. An Investment Committee Member may advise certain accounts with respect to which the advisory fee is based entirely or partially on performance. Performance fee arrangements may create a conflict of interest for the Investment Committee Member in that the Member may have an incentive to allocate the investment opportunities that he or she believes might be the most profitable to such other accounts instead of allocating them to the Fund.
Compensation to Investment Committee Members
Messrs. Partridge, Hunt and Guinn, as partners of Salient, indirectly own equity interests in the Adviser as well as in the general partner of another fund who is compensated directly on performance (based on an incentive allocation) and the size of the fund’s asset base. In addition, Messrs. Hunt and Guinn receive compensation based on objective and subjective performance assessments of their work, which may take into account the size of the Master Fund and the other funds within the Fund Complex and the management and servicing fees charged thereon, as well as other funds managed by Salient affiliates for which they have significant involvement. Mr. Partridge is the Chief Investment Officer of Salient and related affiliates and subsidiaries (collectively, the “Salient Group”), which pays him a base salary and bonus based on the performance of the Salient Group. These individuals are responsible for the investment processes and management of the Salient Group. Mr. Partridge believes that to the extent that they are successful in their investment endeavors, the greater the number of assets over time and the more significant their compensation and equity value will be from the Salient Group.
Securities Ownership of Investment Committee Members
The table below shows the dollar range of the interests of each Fund beneficially owned as of December 31, 2015 by each Investment Committee Member.
| | | | | | | | | | |
Investment Committee Member | | Master Fund | | Registered Fund | | Institutional Fund | | TEI Fund | | Institutional TEI W Fund |
Lee G. Partridge | | None | | None | | None | | None | | None |
William B. Hunt | | None | | None | | None | | None | | None |
William R. Guinn | | None | | None | | None | | None | | None |
Item 9. Purchases of Equity Securities by Closed-End Management Investment Company and Affiliated Purchasers.
Not applicable.
Item 10. Submission of Matters to a Vote of Security Holders.
Not applicable.
Item 11. Controls and Procedures.
The registrant’s principal executive officer and principal financial officer have concluded, based on their evaluation of the registrant’s disclosure controls and procedures as conducted within 90 days of the filing date of this report, that these disclosure controls and procedures are adequately designed and are operating effectively to ensure that information required to be disclosed by the registrant on Form N-CSR is (i) accumulated and communicated to the investment company’s management, including its certifying officers, to allow timely decisions regarding required disclosure; and (ii) recorded, processed, summarized and reported within the time periods specified in the Securities and Exchange Commission’s rules and forms.
There were no changes in the registrant’s internal control over financial reporting (as defined in Rule 30a-3(d) under the Act (17 CFR 270.30a-3(d)) that occurred during the fourth fiscal quarter of the period covered by this report that have materially affected or are reasonably likely to materially affect the registrant’s internal control over financial reporting.
Item 12. Exhibits.
(a)(1) Code of ethics that is subject to Item 2 is attached hereto.
(a)(2) Certifications pursuant to Rule 30a-2(a) are attached hereto.
(a)(3) Not applicable.
(a)(4) Proxy voting policies and procedures pursuant to Item 7 are attached hereto.
(b) Certifications pursuant to Rule 30a-2(b) are furnished herewith.
SIGNATURES
Pursuant to the requirements of the Securities Exchange Act of 1934 and the Investment Company Act of 1940, the registrant has duly caused this report to be signed on its behalf by the undersigned, thereunto duly authorized.
| | |
| (Registrant) The Endowment Master Fund, L.P. |
| |
| By (Signature and Title) | | /s/ John A. Blaisdell |
| | John A. Blaisdell |
| | Co-Principal Executive Officer |
Date: February 25, 2016 |
| | |
| By (Signature and Title) | | /s/ Andrew B. Linbeck |
| | Andrew B. Linbeck |
| | Co-Principal Executive Officer |
Date: February 25, 2016 |
Pursuant to the requirements of the Securities Exchange Act of 1934 and the Investment Company Act of 1940, this report has been signed below by the following persons on behalf of the registrant and in the capacities and on the dates indicated.
| | |
| By (Signature and Title) | | /s/ John A. Blaisdell |
| | John A. Blaisdell |
| | Co-Principal Executive Officer |
Date: February 25, 2016 |
| | |
| By (Signature and Title) | | /s/ Andrew B. Linbeck |
| | Andrew B. Linbeck |
| | Co-Principal Executive Officer |
Date: February 25, 2016 |
| | |
| By (Signature and Title) | | /s/ Christopher R. Arnold |
| | Christopher R. Arnold |
| | Principal Financial Officer |
Date: February 25, 2016 |