 Regions Financial 2nd Quarter Earnings Conference Call July 21, 2009 Exhibit 99.3 *************** *************** *************** *************** *************** *************** *************** *************** *************** *************** *************** *************** *************** *************** *************** *************** *************** *************** *************** *************** *************** *************** *************** ********* |
Forward-Looking Statements The information contained in this presentation may include forward-looking statements which reflect Regions' current views with respect to future events and financial performance. The Private Securities Litigation Reform Act of 1995 ("the Act") provides a safe harbor for forward-looking statements which are identified as such and are accompanied by the identification of important factors that could cause actual results to differ materially from the forward-looking statements. For these statements, we, together with our subsidiaries, claim the protection afforded by the safe harbor in the Act. Forward-looking statements are not based on historical information, but rather are related to future operations, strategies, financial results, or other developments. Forward-looking statements are based on management's expectations as well as certain assumptions and estimates made by, and information available to, management at the time the statements are made. Those statements are based on general assumptions and are subject to various risks, uncertainties, and other factors that may cause actual results to differ materially from the views, beliefs and projections expressed in such statements. These risks, uncertainties and other factors include, but are not limited to, those described below: › In October 2008, Congress enacted, and the President signed into law, the Emergency Economic Stabilization Act of 2008, and on February 17, 2009, the American Recovery and Reinvestment Act of 2009 was signed into law. Additionally, the Department of the U.S. Treasury and federal banking regulators are implementing a number of programs to address capital and liquidity issues in the banking system, and may announce additional programs in the future, all of which may have significant effects on Regions and the financial services industry, the exact nature and extent of which cannot be determined at this time. › Until Regions is able to repay the outstanding preferred stock issued under the Troubled Asset Relief Program (“TARP”), the impact of compensation and other restrictions on recipients of TARP preferred stock. › The impact of possible additional loan losses and reserve build-up on earnings and capital. › Regions’ ability to manage fluctuations in the value of assets and liabilities and off-balance sheet exposure so as to maintain sufficient capital and liquidity to support Regions’ business. › Regions' ability to achieve the earnings expectations related to businesses that have been acquired or that may be acquired in the future. › Regions' ability to expand into new markets and to maintain profit margins in the face of competitive pressures. › Regions’ ability to keep pace with technological changes. › Regions' ability to develop competitive new products and services in a timely manner and the acceptance of such products and services by Regions' customers and potential customers. › Regions' ability to effectively manage credit risk, interest rate risk, market risk, operational risk, legal risk, liquidity risk, and regulatory and compliance risk. › The current stresses in the financial and real estate markets, including possible continued deterioration in property values. › The cost and other effects of material contingencies, including litigation contingencies. › The effects of increased competition from both banks and non-banks. › Possible changes in interest rates may affect funding costs and reduce earning asset yields, thus reducing margins. › Possible changes in general economic and business conditions in the United States in general and in the communities Regions serves in particular. › Possible changes in the creditworthiness of customers and the possible impairment of collectibility of loans. › The effects of geopolitical instability and risks such as terrorist attacks. › Possible changes in trade, monetary and fiscal policies, laws, and regulations, and other activities of governments, agencies, and similar organizations, including changes in accounting standards, may have an adverse effect on our business. › Possible changes in consumer and business spending and saving habits could affect Regions' ability to increase assets and to attract deposits. › The effects of weather and natural disasters such as droughts and hurricanes. The foregoing list of factors is not exhaustive; for discussion of these and other risks that may cause actual results to differ from expectations, please look under the caption “Forward-Looking Statements” in Regions’ Annual Report on Form 10-K for the year ended December 31, 2008 and Form 10-Q for the quarter ended March 31, 2009 (as amended), as on file with the Securities and Exchange Commission. The words "believe," "expect," "anticipate," "project," and similar expressions often signify forward-looking statements. You should not place undue reliance on any forward- looking statements, which speak only as of the date made. Regions assumes no obligation to update or revise any forward-looking statements that are made from time to time. |
Summary of Second Quarter 2009 Results › Loss per diluted share of $0.28 › Average customer deposits up $2.5 billion or 3%, including a $1.5 billion or 8% increase in average non-interest bearing deposits; Average loans declined 1% on lower overall demand › Credit quality › Annualized net charge-offs increased to 2.06% of average loans › Allowance for loan losses stands at 2.37% of loans with $912 million provision that exceeded net charge-offs by $421 million › Allowance for loan losses coverage of non-performing loans of 0.87x › Non-performing loans increased $977 million to $2.6 billion, excluding loans held for sale Net interest margin remained steady; net interest income rises by $22 million or 3% › Non-interest revenues, as adjusted, increased $71 million or 10% largely on stronger service charge and brokerage revenues › Non-interest expenses increase due to brokerage-related incentives and higher FDIC insurance premiums › Capital ratios strengthen post capital raise, with Tier 1 of 12.2% and Tier 1 Common equity of 8.1% Note: Comparisons are to previous quarter |
 Significant Earnings Drivers 11% increase versus 1Q09 (in millions) Pre-Tax After-tax Per Share Impact Significant Items: Trust preferred exchange gain 61 $ 0.04 $ VISA shares sale gain 80 0.06 Securities gains 108 0.08 Leveraged lease termination gain 189 0.13 FDIC special assessment (64) (0.05) Securities-related impaiment (69) (0.05) Remaining Net Items 494 0.35 Total Pre-Provision Net Revenue 799 0.57 Provision for loan losses (0.65) Leveraged lease termination tax impact (0.14) Preferred dividend expense (0.06) EPS available to common (0.28) $ |
 Credit Perspective Portion of the loan portfolio that is under stress comprises 8.4% of the total, down $4 billion since the beginning of 2008. 4Q 2007 2Q 2009 Change Loan % of Loan % of ($ in millions) Balance Portfolio Balance Portfolio $ % Homebuilder Land $ 2,926 2.2 % $ 1,273 1.3 % $(1,653) (56.5)% Lots 1,608 1.7 908 0.9 (700) (43.5) Residential Presold 618 0.6 252 0.3 (366) (59.2) Residential Spec 1,893 2.0 1,098 1.1 (795) (42.0) National Homebuilder / Other 160 0.2 255 0.3 95 59.4 Total Homebuilder $ 7,205 7.5 % $ 3,786 3.9 % $(3,419) (47.5)% FL 2nd Lien Home Equity $ 3,285 3.4 % $ 3,625 3.8 % $ 340 10.4 % Condominium 1,614 1.7 711 0.7 (903) (55.9) Total Stress Portfolio $ 12,104 12.6 % $ 8,122 8.4 % $(3,982) (32.9)% Remaining Loan Portfolio $ 83,275 86.4 % $ 88,027 91.6 % $ 4,752 5.7 % |
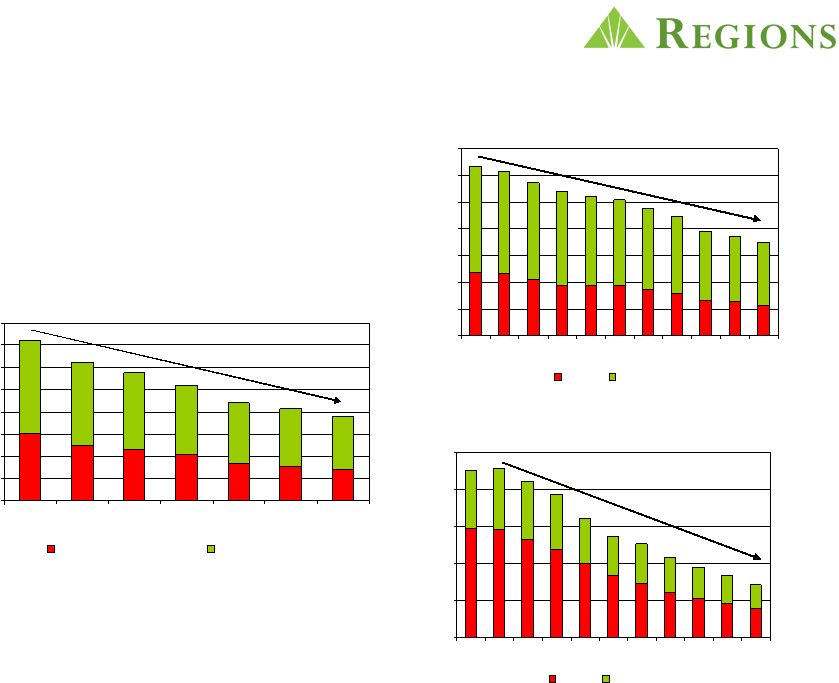 Homebuilder Portfolio – $3.8 billion $3.4 billion (47%) decrease since 12/31/2007 Land Portfolio – $3.5 billion $2.8 billion (45%) decrease since 12/31/2006 Condominium Portfolio – $711 million $1.5 billion (68%) decrease since 12/31/2006 Success in Reducing Most Problematic Exposures - 500 1,000 1,500 2,000 2,500 4Q06 1Q07 2Q07 3Q07 4Q07 1Q08 2Q08 3Q08 4Q08 1Q09 2Q09 Florida Other States - 1,000 2,000 3,000 4,000 5,000 6,000 7,000 8,000 4Q07 1Q08 2Q08 3Q08 4Q08 1Q09 2Q09 Florida / North GA-Atlanta Remaining Portfolio - 1,000 2,000 3,000 4,000 5,000 6,000 7,000 4Q06 1Q07 2Q07 3Q07 4Q07 1Q08 2Q08 3Q08 4Q08 1Q09 2Q09 Florida Other States |
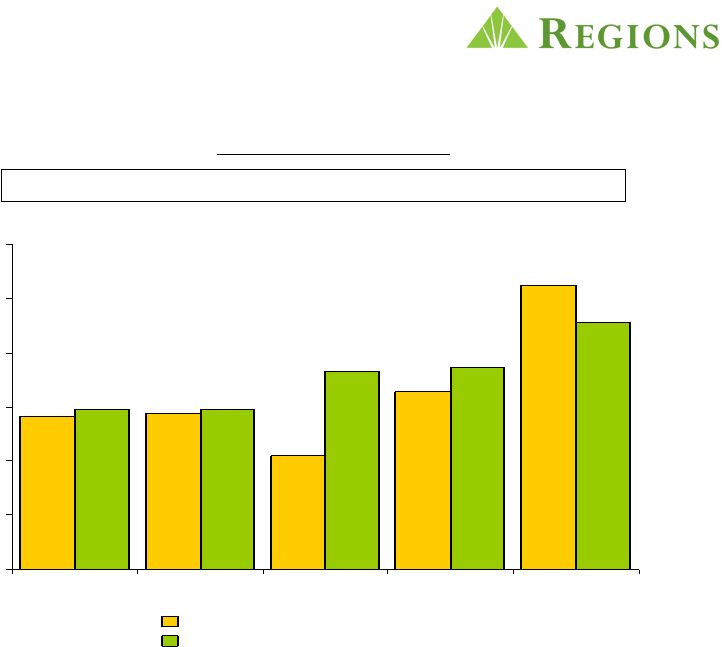 Non-Performing Loans Coverage Coverage Ratio (ALL/NPL) 1.04 0.87 1.13 1.74 1.02 Excludes loans held for sale $0 $500 $1,000 $1,500 $2,000 $2,500 $3,000 Q2 '08 Q3 '08 Q4 '08 Q1 '09 Q2 '09 Non-performing Loans Allowance for Loan Losses |
 Credit Costs (in millions) $ bps $ bps $ bps Net Charge-offs Valuation Losses 92 62 129 87 37 25 Other Losses 135 91 174 117 39 26 Business Services 227 153 303 204 76 51 Residential First Mortgage 39 102 51 131 12 29 Equity Lending 95 238 113 285 18 47 Other Consumer 29 246 24 218 (5) (27) Total Net Charge-offs 390 164 491 206 101 43 Provision Over Net Charge-Offs 35 421 386 Loan Loss Provision 425 912 487 Net Loss / (Gain) - HFS Sales (4) (2) 2 HFS Write-downs (1) - 5 5 OREO expense 25 24 (1) Total Credit Costs 446 939 493 (1) Reflects write-downs subsequent to initial move to held for sale 1Q09 2Q09 Variance |
 Non-performing Assets Rollforward ($ in millions) 2Q 2008 3Q 2008 4Q 2008 1Q 2009 2Q 2009 Beginning Non-Performing Assets* $ 1,204 $ 1,621 $ 1,642 $ 1,295 $ 1,935 Additions $ 730 $ 721 $ 1,004 $ 1,116 $ 1,758 Payments (52) (70) (82) (55) (116) Returned to Accruing Status (9) (19) (44) (34) (10) Charge-Offs / ORE Write-Downs (105) (180) (243) (215) (296) Net Additions $ 564 $ 452 $ 635 $ 812 $ 1,336 Dispositions (147) (173) (276) (81) (80) Moved to Held for Sale 0 (258) (706) (91) (134) Ending Non-Performing Assets* $ 1,621 $ 1,642 $ 1,295 $ 1,935 $ 3,057 * Excludes held for sale (1) Includes $211million of Other Real Estate Owned net additions (1) |
 Loan Trends ($ in millions) 3/31/2009 6/30/2009 $ Change % Change Commercial & Industrial 23,095 $ 22,707 $ (388) $ -2% Commercial Real Estate - Non Owner-Occupied 15,215 16,081 866 6% Commercial Real Estate - Owner-Occupied 11,773 11,983 210 2% Construction - Non Owner-Occupied 8,420 7,474 (946) -11% Construction - Owner-Occupied 1,524 1,198 (326) -21% Residential First Mortgage 15,708 15,593 (115) -1% Home Equity 16,115 15,940 (175) -1% Other consumer 4,798 4,406 (392) -8% 96,648 $ 95,382 $ (1,266) $ -1% Loan Portfolio - Average Balances |
 Outstanding Customer Deposit Growth (In millions) 3/31/2009 6/30/2009 % Change Low Cost Deposits $58,813 $60,865 3% Non-interest Bearing Deposits 18,896 20,421 8% Customer Deposits 91,627 94,086 3% Corporate Treasury Deposits 610 949 56% Total Deposits $92,237 $95,035 3% Deposit Portfolio - Average Balances $84.5 $94.1 $91.6 $87.9 $85.7 Total Customer Deposits 80 85 90 95 Q2 '08 Q3 '08 Q4 '08 Q1 '09 Q2 '09 $ in billions |
 Strong Deposit Growth has Decreased the Need for Wholesale Funding $75 $80 $85 $90 $95 $100 $105 3Q07 4Q07 1Q08 2Q08 3Q08 4Q08 1Q09 2Q09 Loans Customer Deposits Customer deposits up 10.9% Sept ’08 to June ‘09 |
 › Taxable-equivalent net interest income of $840 million - up $23 million › Steady net interest margin of 2.62%, declined 2 basis points › falling short-term interest rates have now flowed through the balance sheet › continued non-interest bearing deposit growth benefiting margin › precautionary pre-SCAP excess liquidity - an 8 bps drag to the linked quarter margin comparison › relief from tight liquidity environment allows banks to return to more normal deposit pricing structure As Expected - Net Interest Income and Margin Stabilized 1.50 1.75 2.00 2.25 2.50 2.75 3.00 3.25 3.50 3.75 4.00 4.25 4.50 4.75 5.00 5.25 5.50 5.75 6.00 Q2 '08 Q3 '08 Q4 '08 Q1 '09 Q2 '09 Loan Yields Deposit Costs Net Interest Margin |
 Non-Interest Revenues Higher › Service charges income higher reflecting higher level of customer transactions and account growth › Brokerage income increases on strong fixed income and improved equity market environment › Mortgage income remains solid but slowing as increasing mortgage rates dampen refinance activity 1Q09 2Q09 % Change Non-interest revenue (GAAP) 1,066 $ 1,199 $ Leveraged lease termination gains 323 189 Securities gains 53 108 VISA shares sale gain - 80 Trust preferred exchange gain - 61 Adjusted non-interest revenue 690 $ 761 $ 10% |
Solid Morgan Keegan results › Fixed Income Capital Markets remain strong › 8 National rank in municipal bond underwriting › Private Client, Equity Capital Markets and Asset Management revenues rebound versus prior quarter › Positive trends in account openings and customer asset inflows › Efficiency improvements continue th |
Non-interest Expenses › Salaries and benefits cost higher primarily due to brokerage- related incentive costs › Higher FDIC insurance expense ›$64 million of increase due to special assessment › $69 million other than temporary impairment charges on securities › Projected expense reduction of 2-4% in 2009 versus full year 2008 |
Capital Plan Execution Achieved – $2.5 Billion Requirement › Common Stock Offering $1.8 billion › Mandatory Convertible Preferred $ 278 million › Sale of Agency Mortgage Securities $66 million › Sale of Visa Shares $50 million › Trust Preferred Exchange $172 million › Deferred Tax Asset $213 million Note: Amounts shown net of expenses and taxes, as applicable |
 First Half Results vs. SCAP Stress Case * RF PPNR adjusted to exclude Q209 securities gains, Visa sale gain and gain on debt extinguishment. SCAP column includes $.4 million overage from 1Q09. (in millions) RF SCAP Difference Net Charge-offs (881) $ (2,300) $ 1,419 $ Provision Over Charge-offs (456) - (456) Total Loan Loss Provision (1,337) (2,300) 963 PPNR* 1,367 1,225 142 Pre-tax 30 $ (1,075) $ 1,105 $ |
 Capital Ratios Strengthened › Tier 1 and Total Risk-Based capital significantly strengthened › Tier 1 Capital $6.9 billion in excess of “Well Capitalized” minimums › Ratios compare favorably to peer group 1Q09 2Q09 (1) Total Risk-Based Capital Ratio 14.6% 16.3% Tier 1 Capital Ratio 10.4% 12.2% Tier 1 Common 6.5% 8.1% (1) Current quarter ratios are estimated |
 ********************* ********************* ********************* ********************* |