PART I
You should read this entire report carefully; including the risks described under Part I, Item 1A. Risk Factors and our consolidated financial statements and the notes to those consolidated financial statements included elsewhere in this report. Unless the context otherwise requires, references in this report to “Triangle,” the “Company,” “we,” “us,” “our,” or “ours” refer to Triangle Petroleum Corporation and its subsidiaries. Our fiscal year-end is January 31. As such, the fiscal years ended January 31, 2015, 2014, and 2013 are referred to in this annual report as fiscal year 2015, fiscal year 2014, and fiscal year 2013, respectively. The fiscal year ending January 31, 2016 is referred to in this annual report as fiscal year 2016.
ITEM 1. BUSINESS
Company Overview
We are an independent energy holding company with three principal lines of business: oil and natural gas exploration, development, and production; oilfield services; and midstream services. We conduct these activities in the Williston Basin of North Dakota and Montana through the Company’s two principal wholly-owned subsidiaries and our equity joint venture:
| · | | Triangle USA Petroleum Corporation (“TUSA”) conducts our exploration and production operations by acquiring and developing unconventional shale oil and natural gas resources; |
| · | | RockPile Energy Services, LLC (“RockPile”) is a provider of hydraulic pressure pumping and complementary services; and |
| · | | Caliber Midstream Partners, L.P. (“Caliber”) is our 28.3% owned joint venture with First Reserve Energy Infrastructure Fund (“FREIF”). Caliber provides crude oil, natural gas and fresh and produced water gathering, processing, and transportation services. |
Our primary focus at TUSA is to grow our production volumes through the efficient development of our operated Bakken Shale and Three Forks drilling inventory. We completed our first operated well in May 2012. From May 2012 through January 31, 2015, we have completed 96 gross (68.8 net) operated wells. Our average net daily production for the year ended January 31, 2015 was approximately 11,441 Boe/d, approximately 86% of which was operated production. At January 31, 2015, we had estimated proved reserves of approximately 58.9 MMboe, based on adjusted prices of $79.71 per Bbl for oil, $34.61 per Bbl for natural gas liquids, and $6.09 per Mcf for natural gas. We use pad drilling, which increases efficiencies while controlling costs and minimizing environmental impact. We also use advanced completion, collection, and production techniques designed to optimize reservoir production while reducing costs.
In an effort to better control key operations, reduce costs, and retain supply chain value in the Williston Basin, which we view as a historically resource-constrained and cost-heavy basin, we formed RockPile and entered into a joint venture arrangement with FREIF to form Caliber. RockPile’s services lower our realized well completion costs and affords us greater control over completion schedules and quality control. We expect that Caliber will reduce the cost and environmental impacts associated with trucking oil and water and reduce or eliminate the emissions generated by the flaring of produced natural gas from our operated wells. In addition to providing services to TUSA, RockPile and Caliber are focused on growing their respective businesses through securing independent, third-party contracts.
Triangle has two reportable operating segments. Our exploration and production operating segment and our oilfield services operating segment are managed separately because of the nature of their products and services. The focus of the exploration and production operating segment is finding and producing oil and natural gas. The focus of the oilfield services operating segment is pressure pumping and complementary services for both TUSA-operated wells and third-party-operated wells. See Part II. Item 8. Consolidated Financial Statements and Supplementary Data.
We were incorporated in the State of Nevada on December 11, 2003 under the name Peloton Resources Inc. On May 10, 2005, we changed our name to Triangle Petroleum Corporation. On November 30, 2012, we changed our state of incorporation from Nevada to Delaware.
Exploration, Development and Production
Williston Basin – United States. As of January 31, 2015, we held leasehold interests in approximately 126,037 net acres in the Williston Basin. Approximately 83,373 net acres are located in our core focus area in McKenzie and Williams Counties, North Dakota, and eastern Roosevelt and Sheridan Counties, Montana, which we refer to as our “Core Acreage.” Our Core Acreage has high oil saturation, is slightly over-pressured, and has the potential for multiple benches. We operate approximately 51,434 net acres in our Core Acreage. We also hold approximately 42,664 net undeveloped acres in the Station Prospect located in Sheridan and Roosevelt Counties, Montana. The majority of our Williston Basin leaseholds are held primarily under fee leases. These leases typically carry a primary term of three to five years with landowner royalties of approximately 16% to 20%. In most cases, we obtain “paid-up” fee leases, which do not require annual delay rentals.
As of January 31, 2015, we have completed a total of 96 gross (68.8 net) operated wells in the Williston Basin. As of that date we were running a four-rig drilling program. We have subsequently released two rigs upon expiration of the underlying contracts, and we currently plan to run an average of less than two rigs through fiscal year 2016. During fiscal year 2016, we anticipate drilling approximately 25 to 27 gross operated wells and completing approximately 27 to 29 gross operated wells in North Dakota or eastern Montana for completion in the Bakken Shale or Three Forks formations. We target the Middle Bakken formation between the Upper and Lower Bakken Shales at an approximate vertical depth of 10,300 to 11,300 feet. We also target the Three Forks formation, which is present immediately below the Lower Bakken Shale.
The operations of our non-operated leasehold positions are primarily conducted through agreements with major operators in the Williston Basin, including Oasis Petroleum, Slawson Exploration Company, Newfield Production Company, Statoil, Whiting Petroleum, and EOG Resources. These companies are experienced operators in the Williston Basin. As of the end of fiscal year 2015, we have an interest in 480 gross (26.5 net) non-operated wells, 412 gross (23.8 net) of which are producing and 68 gross (2.7 net) are in various stages of permitting, drilling or completion.
Discussed below are key aspects of our drilling program in our Core Acreage:
| · | | Long Laterals. Based upon our analysis of well costs and the performance from our operated wells and other operators’ wells, we believe long laterals (~10,000 feet) in our horizontal wells will generate higher rates of return than short laterals (~5,000 feet or less) for wells in our Core Acreage. Although utilizing long laterals is more expensive, we estimate that the additional costs of drilling the longer lateral and adding more fracture stimulation stages is more than offset by the associated incremental increase in oil production cash flows. Accordingly, we plan to continue drilling ~10,000 foot laterals throughout our Core Acreage position. |
| · | | Multi-Well Pads. We typically drill two or more wells per drilling rig visit to each pad. As we continue the development stage of our drilling, we expect the average number of wells drilled per pad to increase. We have designed our initial pads to accommodate the increased number of wells expected on each pad. We plan to continue capitalizing on the many benefits of pad drilling to increase our efficiencies and reduce costs. Pad drilling allows for the reduction of rig mobilization and demobilization costs, the aggregation of necessary infrastructure and distribution of costs for the same. Pad drilling also allows for increased efficiencies and cost savings when completing our wells using techniques such as zipper fracturing. Utilization of zipper fracturing techniques allows the simultaneous completion of two or more wells by alternating perforation and pressure pumping operations. We also perform other simultaneous operations on our well pads, allowing for continuous production from an existing well while drilling and completing another well on the same pad. Pad drilling also reduces the surface footprint of our operations. |
| · | | Wellbore Spacing. Consistent with other operators near our Core Acreage position, we are developing our wellbores on tighter spacing patterns. We have test drilled wellbores within 600 feet, laterally, of one another in the Middle Bakken formation, and these wells continue to perform well. These and other tests performed by Triangle and other operators suggest that up to eight Middle Bakken wells can be drilled per DSU without significant communication between wellbores. |
| · | | Contiguous Acreage. Our Core Acreage operated leasehold is largely contiguous and, by virtue of our high working interest and operatorship, we can control the development pace and location of surface facilities. We believe this strategy, combined with pad drilling, Caliber’s infrastructure, and efficiencies provided by RockPile, |
should maximize the efficiency of our drilling and completion program and minimize the capital costs of developing our acreage position. |
| · | | Acreage Held by Production. Our drilling activity has resulted in the vast majority of our operated drilling units being held by production. This provides increased flexibility in our capital program and allows us to more efficiently develop our leaseholds toward the proper ultimate spacing for each drilling unit. |
| · | | Infrastructure. As of January 31, 2015, we had 119 operated wells, 107 (90%) of which are currently connected to Caliber or third-party midstream pipelines and processing facilities for natural gas liquids, allowing for the reduction of flared volumes and the capture of additional revenue from the liquids-rich gas that is produced with our oil. Caliber had 93 of our operated wells connected to fresh water delivery and 89 operated wells connected to its oil and produced water gathering infrastructure. Most of our Core Acreage will soon be served by similar Caliber or third-party oil and natural gas gathering systems. The majority of our wells are also in the process of being connected to regional oil and natural gas pipelines. Moving produced fluids (oil, natural gas, and water) through pipelines eliminates trucking costs and associated environmental disturbance, and mitigates weather-related production interruptions. Following completion of Caliber’s Medium Haul Pipeline to Alexander, North Dakota in September 2014, a large portion of our production has access to various means of transportation to market, which helps maximize revenue while minimizing impacts to the environment. |
Reserves
Net Reserves of Crude Oil, Natural Gas, and Natural Gas Liquids at Fiscal Year-End 2015, 2014, and 2013. Approximately 99% of the Company’s proved reserves at January 31, 2015 are associated with properties located in our Core Acreage. Our proved reserves are located in the Bakken Shale and Three Forks formations. The table below summarizes our estimates of proved reserves as of January 31, 2015, 2014, and 2013, the estimated projected future cash flows (before income taxes) from those proved reserves, and the PV-10 Value of the proved reserves at January 31, 2015, 2014, and 2013:
| | | | | | | | | |
| | For the Years Ended January 31, |
| | 2015 | | 2014 | | 2013 |
Proved developed: | | | | | | | | | |
Oil (Mbbls) | | | 29,605 | | | 13,734 | | | 4,985 |
Natural gas (MMcf) | | | 24,136 | | | 10,930 | | | 5,906 |
NGL (Mbbls) | | | 2,350 | | | 1,440 | | | — |
Proved undeveloped: | | | | | | | | | |
Oil (Mbbls) | | | 18,486 | | | 18,182 | | | 7,555 |
Natural gas (MMcf) | | | 16,049 | | | 15,574 | | | 6,679 |
NGL (Mbbls) | | | 1,731 | | | 2,541 | | | — |
| | | | | | | | | |
Total proved oil reserves (Mbbls) | | | 48,091 | | | 31,916 | | | 12,540 |
Total proved natural gas reserves (MMcf) | | | 40,185 | | | 26,504 | | | 12,585 |
Total proved NGL reserves (Mbbls) | | | 4,081 | | | 3,981 | | | — |
Total proved oil, NGL and natural gas reserves (Mboe) | | | 58,870 | | | 40,314 | | | 14,637 |
| | | | | | | | | |
PV-10 Values (in thousands) of proved reserves: | | | | | | | | | |
PV-10 Value of proved developed reserves | | $ | 803,303 | | $ | 471,764 | | $ | 165,484 |
PV-10 Value of proved undeveloped reserves | | $ | 179,510 | | $ | 206,141 | | $ | 59,377 |
PV-10 Value of total proved reserves | | $ | 982,813 | | $ | 677,905 | | $ | 224,861 |
The increase in our total proved reserves in fiscal year 2015 of 18,556 Mboe resulted primarily from our drilling and completion activity on our Core Acreage. The gross number of proved undeveloped (“PUD”) locations decreased from 104 at fiscal year-end 2014 to 103 gross locations at fiscal year-end 2015, but the number of net PUD locations increased from 52.5 to 54.0 over the same period. These PUD locations offset our existing producing wells or are located in drill spacing units that offset producing wells. The small growth in net PUD locations from fiscal year-end 2014 to fiscal year-end 2015, as contrasted with the significant growth during the prior year period, resulted from revised drilling schedules reflecting current commodity prices and increased infill drilling.
In estimating proved reserves, Triangle used the SEC definition of proved reserves. Projected future cash flows were based on economic and operating conditions as of the respective January 31 estimation date except that future commodity prices used in the projections reflected a simple average of prices for our operated and non-operated properties on the first day of each of the twelve months in the year ended on the estimation date. Prices of $91.22 per Bbl for oil, $50.07 per barrel for natural gas liquids, and $4.20 per MMbtu for natural gas were adjusted for regional price differentials; gathering, transportation, and processing; and other factors to arrive at prices of $79.71 per Bbl for oil, $34.61 per barrel for natural gas liquids, and $6.09 per Mcf for natural gas, which were used in the calculation of proved reserves at January 31, 2015.
Volumes of reserves that will actually be recovered and cash flows that will actually be received from production may differ significantly from the proved reserve estimates and the related projected cash flows, respectively. Reserve engineering is a subjective process of estimating underground accumulations of oil and natural gas that cannot be measured in an exact way. The accuracy of any reserve estimate is a function of, among other things, the quality of available data, and engineering and geological interpretation and judgment. In addition, results of drilling, testing, and production subsequent to the date of an estimate may justify revision of such estimates, particularly for undeveloped locations where estimates may be more imprecise than for established producing oil and natural gas properties. Accordingly, reserve estimates are often different from the quantities that are ultimately recovered.
The following table reconciles (a) the standardized measure of discounted future net cash flows related to our proved oil and natural gas reserves (“Standardized Measure”), a measure calculated in accordance with generally accepted accounting principles (“GAAP”) to (b) the PV-10 Value (a non-GAAP financial measure) of our proved reserves. The difference is due to the fact that PV-10 Value excludes the impact of income taxes.
| | | | | | | | | |
| | For the Years Ended January 31, |
(in thousands) | | 2015 | | 2014 | | 2013 |
Standardized Measure, for total proved reserves | | $ | 821,492 | | $ | 573,235 | | $ | 211,352 |
Add back: Discounting at 10% per annum | | | 977,088 | | | 690,564 | | | 297,653 |
Future cash flows, after income taxes | | | 1,798,580 | | | 1,263,799 | | | 509,005 |
Add: future undiscounted income taxes | | | 394,538 | | | 364,340 | | | 87,313 |
Undiscounted future net cash flows before taxes | | | 2,193,118 | | | 1,628,139 | | | 596,318 |
Less: Discounting at 10% per annum | | | (1,210,305) | | | (950,234) | | | (371,457) |
PV-10 Value of total proved oil and natural gas reserves | | $ | 982,813 | | $ | 677,905 | | $ | 224,861 |
The Standardized Measure is presented more fully and discussed further in Part II. Item 8. Consolidated Financial Statements and Supplementary Data.
Proved Undeveloped Reserves. At January 31, 2015, we estimated proved undeveloped reserves of 22,892 Mboe, which represents 39% of our total proved reserves, as compared to 23,319 Mboe or 58% of our total proved reserves at January 31, 2014. In connection with our drilling and completion program, we incurred approximately $151.6 million (averaging $8.2 million per net well) related to the conversion of 8,461 Mboe (30 gross wells, 18.5 net wells) from proved undeveloped reserves to proved developed reserves.
Changes in our proved undeveloped reserves are summarized in the following table:
| | | | | | |
| | (Mboe) | | Gross Wells | | Net Wells |
Proved Undeveloped Reserves at January 31, 2014 | | 23,319 | | 104 | | 52.5 |
Became developed reserves in fiscal year 2015 | | (8,461) | | (30) | | (18.5) |
Revisions | | 1,676 | | (14) | | 4.7 |
Acquisitions | | 528 | | 6 | | 1.3 |
Extensions and discoveries of proved reserves | | 5,830 | | 37 | | 14.0 |
Proved Undeveloped Reserves at January 31, 2015 | | 22,892 | | 103 | | 54.0 |
At January 31, 2015, we have no proved undeveloped reserves that are scheduled for development five years or more beyond the date the reserves were initially recorded.
Reserve Estimation Methods. The process of estimating proved reserves involves exercising professional judgment to select estimation method(s) within three categories: (1) performance-based methods, (2) volumetric-based methods, and
(3) analogy. The selection of estimation method(s) considers (i) the geoscience and engineering data available at the time, (ii) the established or anticipated performance characteristics of the reservoir being evaluated, and (iii) the development stage and production history of the well, property or field.
For proved reserves estimated at January 31, 2015, 2014, and 2013, Triangle’s Reservoir Manager used the following general estimation methods:
| · | | Proved producing reserves attributable to producing wells were estimated by performance methods or by analogy. Performance methods included decline curve analysis, which utilized extrapolation of historical production through the estimation date where such historical data was considered to be definitive. Where such historical data was insufficient for extrapolation, the analogy method was used. |
| · | | Proved undeveloped reserves were estimated by the analogy method. |
Internal Controls over Reserve Estimation. The Company engaged Cawley, Gillespie & Associates, Inc. (“Cawley Gillespie”), an independent petroleum engineering firm, to perform an audit of Triangle’s internal estimates of proved reserves. Cawley Gillespie’s fiscal year-end 2015 reserves audit report was prepared based upon a review of property interests being appraised, production from such properties, current costs of operation and development, current prices for production, agreements relating to current and future operations and sale of production, geoscience and engineering data, and other information we provide to them. The internal reserve estimates and supporting schedules are prepared by our Reserve Engineer and reviewed by management prior to being provided to Cawley Gillespie.
Cawley Gillespie’s fiscal year-end 2015 reserves audit report (filed as Exhibit 99.1 to this annual report) states that Cawley Gillespie is a Texas Registered Engineering Firm (F-693), comprised of independent Registered Professional Engineers and Geologists. The firm has provided petroleum consulting services to the oil and gas industry for over 50 years. This audit was supervised by Mr. W. Todd Brooker, Senior Vice President at Cawley Gillespie and a State of Texas Licensed Professional Engineer (License #83462). Mr. Brooker received his Bachelor of Science degree in Petroleum Engineering from the University of Texas at Austin in 1989, and joined Cawley Gillespie as a Reservoir Engineer in 1992.
Our Reservoir Manager, Corey Meyer, is the technical person primarily responsible for overseeing the preparation of the Company’s reserves estimates. He has over 20 years of experience as a petroleum engineer and is a member of the Society of Petroleum Engineers. He holds an undergraduate degree in Petroleum Engineering from the Colorado School of Mines. The Company’s internal estimates of proved reserves are based on available geoscience and engineering data, including North Dakota online files of monthly production for wells in which we have an interest and wells adjacent to drill spacing units in which we have an interest. The internal reserve schedules and certain supporting schedules are reviewed by various members of management before our Reservoir Manager prepares a final internal summary of proved reserves and a final listing (by well and drilling location) of proved reserves, which is then provided to Cawley Gillespie.
Developed and Undeveloped Acreage
As of January 31, 2015, we had approximately 3,804 lease agreements representing approximately 248,258 gross (126,037 net) acres in the Williston Basin of North Dakota and Montana. The following table sets forth our gross and net acres of developed and undeveloped oil and natural gas leases:
| | | | | | | | | | | | |
| | Developed Acres | | Undeveloped Acres | | Total Acres |
| | Gross | | Net | | Gross | | Net | | Gross | | Net |
North Dakota | | 157,597 | | 61,227 | | 30,061 | | 12,165 | | 187,658 | | 73,392 |
Montana | | 6,662 | | 6,187 | | 53,938 | | 46,458 | | 60,600 | | 52,645 |
Total Williston Basin | | 164,259 | | 67,414 | | 83,999 | | 58,623 | | 248,258 | | 126,037 |
We are subject to lease expirations if we or the operator of our non-operated acreage do not commence the development of operations within the agreed terms of our leases. All of our leases for undeveloped acreage will expire at the end of their respective primary terms except for leases where we (i) make extension payment(s) under the lease terms, (ii) renew the existing lease, (iii) establish commercial production in paying quantities, or (iv) trigger some other “savings clause” in the relevant lease. Out of our 83,999 gross (58,623 net) undeveloped acres as of January 31, 2015, the portion of our net undeveloped acres that is subject to expiration over the next three years, if not successfully developed or renewed, is approximately 37% in fiscal year 2016, 34% in fiscal year 2017, and 23% in fiscal year 2018. We expect
to establish production from most of our Core Acreage prior to expiration of the applicable lease. However, there can be no guarantee we will do so.
Drilling and Other Exploratory and Development Activities
The following table presents the gross and net number of exploration wells and development wells drilled in the U.S. during fiscal years 2015, 2014, and 2013 targeting oil reserves, based on the date of first sales or the date the well became capable of selling. The number of wells drilled refers to the number of wells completed at any time during the year, regardless of when drilling was initiated. Well completion refers to installation of permanent equipment for production of oil or natural gas, or, in the case of a dry well, to reporting to the appropriate authority that the well has been abandoned after little or no production.
| | | | | | | | | | | | |
| | Fiscal Year 2015 | | Fiscal Year 2014 | | Fiscal Year 2013 |
| | Gross | | Net | | Gross | | Net | | Gross | | Net |
Productive exploratory wells: | | | | | | | | | | | | |
Operated by Triangle | | 17 | | 11.7 | | 9 | | 7.2 | | 6 | | 3.2 |
Operated by others | | 78 | | 3.3 | | 37 | | 2.0 | | 41 | | 0.6 |
Total | | 95 | | 15.0 | | 46 | | 9.2 | | 47 | | 3.8 |
| | | | | | | | | | | | |
Dry exploratory wells | | — | | — | | — | | — | | 1 | | — |
| | | | | | | | | | | | |
Productive development wells: | | | | | | | | | | | | |
Operated by Triangle | | 32 | | 22.8 | | 22 | | 16.3 | | 10 | | 6.9 |
Operated by others | | 18 | | 0.8 | | 44 | | 2.6 | | 14 | | 0.7 |
Total | | 50 | | 23.6 | | 66 | | 18.9 | | 24 | | 7.6 |
| | | | | | | | | | | | |
Dry development wells | | — | | — | | — | | — | | — | | — |
| | | | | | | | | | | | |
Total productive wells | | 145 | | 38.6 | | 112 | | 28.1 | | 71 | | 11.4 |
As of January 31, 2015, we had 531 gross productive wells and 111.9 net productive wells, all located in North Dakota except for 13 gross wells located in Roosevelt and Sheridan Counties, Montana. None of our gross productive wells had completions within multiple zones. Our count of productive wells does not include 75 gross (16.0 net) wells that were awaiting completion, in the process of completion, or awaiting flowback subsequent to fracture stimulation as of that date. Although we encounter and produce natural gas as a byproduct of drilling wells targeting crude oil, we have not participated in any wells specifically targeting natural gas reserves.
Costs Incurred and Capitalized Costs
The table below presents costs incurred in oil and natural gas acquisition, exploration, and development activities during fiscal years 2015, 2014, and 2013.
| | | | | | | | | |
| | For the Years Ended January 31, |
(in thousands) | | 2015 | | 2014 | | 2013 |
Property acquisition | | $ | 138,778 | | $ | 121,578 | | $ | 21,193 |
Exploration | | | 180,174 | | | 96,731 | | | 55,583 |
Development | | | 226,765 | | | 216,046 | | | 91,666 |
| | | | | | | | | |
Total | | $ | 545,717 | | $ | 434,355 | | $ | 168,442 |
We anticipate our unproved properties and properties under development costs at January 31, 2015 of $142.9 million will be included in the amortization computation over the next five years. We are unable to predict the future impact on amortization rates.
Oilfield Services
RockPile, our wholly-owned subsidiary initially capitalized in October 2011, is a provider of hydraulic pressure pumping and complementary services to oil and natural gas exploration and production companies primarily in the Williston Basin. RockPile purchased its first set of equipment, collectively known as a “spread”, in the first half of 2012.
RockPile’s first spread commenced 12-hour operations in July 2012 and 24-hour operations in September 2012. RockPile commenced 24-hour operations with a second spread in July 2013, with a third spread in April 2014, and with a fourth spread in September 2014. RockPile’s management team has extensive experience providing oilfield services. RockPile provides a variety of oilfield services including, but not limited to, pressure pumping, wireline, perforating, pump rental, and workover services.
The use of RockPile’s services lowers our realized well completion costs and affords us greater control over completion schedules and quality control. In fiscal year 2015, RockPile increased year-over-year completions by approximately 83%, completing 49 TUSA-operated wells and 99 third-party wells, as compared to 31 TUSA operated wells and 50 third-party wells in fiscal year 2014. RockPile contributed $288.5 million to our consolidated revenue for the year ended January 31, 2015. We believe that the breadth of RockPile’s services and the experience and expertise of its personnel give it a competitive advantage relative to many of its competitors in the region.
RockPile’s customers use hydraulic fracturing or pressure pumping services to enhance the production of oil and natural gas from formations with low permeability, which restricts the natural flow of hydrocarbons. Hydraulic fracturing involves pumping fluid down a well casing or tubing at sufficient pressure to cause the underground producing formation to fracture, allowing the oil or natural gas to flow more freely. A propping agent, or proppant, is suspended in the fracturing fluid and pumped into the fractures created by the fracturing process in the underground formation to prop the fractures open. Proppants generally consist of sand, bauxite, resin-coated sand or ceramic particles, and other engineered proprietary materials. The extremely high pressure required to stimulate wells in the areas in which we operate presents a challenging environment for achieving a successfully fractured horizontal well. As a result, an important element of the services RockPile provides to producers is assisting with well completion design, which includes determining the proper fluid, proppant, and injection specifications to maximize production.
In addition, RockPile’s workover rig division provides intervention and remedial services such as drill-outs, clean-outs, installation, and replacement of pumps, packers and frac strings, swabbing, and well repair and maintenance. As the Williston Basin matures, demand for remedial service is also expected to increase.
RockPile has historically operated primarily in the Williston Basin. While RockPile expects that the Williston Basin will remain the focus of its operations, RockPile has provided pressure pumping services in one other basin and is currently evaluating opportunities in other areas.
Midstream Services
Caliber is an energy infrastructure company that provides a full suite of midstream services to us and other producers in the Williston Basin. Caliber’s midstream services include crude oil and natural gas gathering, transportation, treating and processing, produced water transportation and disposal, and freshwater sourcing and transportation via pipeline.
Caliber was created in October 2012, and capitalized through initial funding commitments of $100.0 million in equity capital contributions ($70.0 million from FREIF, $30.0 million from Triangle). FREIF committed an additional $80.0 million in equity capital contributions in September 2013, followed by an equity capital contribution of $34.0 million in February 2015. Caliber is managed and governed by its general partner, Caliber Midstream GP, LLC, of which FREIF and Triangle each own a 50% non-economic interest and share governance equally. We currently hold a 28.3% Series A Units economic interest in Caliber.
Caliber’s operations are principally located in McKenzie County, North Dakota. Since its inception, Caliber has constructed over 250 miles of pipelines across its four service lines. Caliber’s crude oil infrastructure includes two stabilization facilities and an interconnection with the Enbridge pipeline at the Alexander Market Center. Caliber also owns and operates the Hay Butte Gas Plant, which consists of a mechanical refrigeration unit with a capacity of 10 MMcf per day. Processed natural gas and natural gas liquids are delivered via pipeline for further distribution downstream. Caliber also operates two produced water disposal wells. The disposal wells are connected to the produced water pipeline system or they can receive water from producers by truck. Finally, Caliber is completing construction of a 23 mile freshwater transportation pipeline to an intake facility on the Yellowstone River. The fresh water pipeline allows access to 13,200 acre feet per year of fresh water supply to Triangle and other producers for well completions and maintenance water.
As of January 31, 2015, we had connected 93 of our operated wells to one or more services provided by Caliber’s midstream system.
Pricing and Production Cost Information
The following table summarizes the volumes and realized prices for oil and natural gas produced and sold from the Bakken Shale and Three Forks formations properties in which we held an interest during the periods indicated. Realized prices presented below exclude the effects of hedges and derivative activities. Also presented is a summary of related production costs per Boe.
| | | | | | | | | |
| | For the Years Ended January 31, |
| | 2015 | | 2014 | | 2013 |
Net Sales Volume | | | | | | | | | |
Crude oil (Mbbls) | | | 3,511 | | | 1,754 | | | 452 |
Natural gas (MMcf) | | | 2,429 | | | 626 | | | 188 |
Natural gas liquids (Mbbls) | | | 260 | | | 70 | | | 5 |
Total barrels of oil equivalent (Mboe) | | | 4,176 | | | 1,929 | | | 488 |
| | | | | | | | | |
Average Sales Price Per Unit | | | | | | | | | |
Oil price (per Bbl) | | $ | 75.00 | | $ | 88.07 | | $ | 85.29 |
Natural gas price (per Mcf) | | $ | 5.27 | | $ | 4.39 | | $ | 4.78 |
Natural gas liquids price (per Bbl) | | $ | 32.26 | | $ | 46.72 | | $ | 36.01 |
Weighted average price (per Boe) | | $ | 68.13 | | $ | 83.22 | | $ | 81.15 |
| | | | | | | | | |
Operating Expenses Per Unit | | | | | | | | | |
Lease operating expenses (per Boe) | | $ | 6.15 | | $ | 7.49 | | $ | 7.31 |
Gathering, transportation and processing (per Boe) | | $ | 4.43 | | $ | 2.23 | | $ | 0.31 |
Production taxes (per Boe) | | $ | 7.13 | | $ | 9.33 | | $ | 9.20 |
Sales from our operated wells began in May 2012. Our net sales volumes from operated wells totaled 3,579 Mboe for fiscal year 2015. We sold crude oil, natural gas liquids, and natural gas through delivery points on Caliber’s and others’ gathering systems in fiscal year 2015.
Significant Customers
Oil, Natural Gas, and Natural Gas Liquids Customers. For wells that we operate, produced oil is sold at the wellhead, or a location nearby, under short term agreements with several purchasers. While the pricing terms of these agreements vary by purchaser, they all reflect a price determined by the current NYMEX West Texas Intermediate contract, less a discount that is either calculated, fixed, or a combination of calculated and fixed.
In fiscal year 2015, we made sales of operated well production directly to 18 oil purchasers, two NGL purchasers and three natural gas purchasers. In fiscal year 2015, we had revenues from three TUSA customers that exceeded 10% of our $573.0 million in total revenues for the year. For our top three TUSA customers, our fiscal year 2015 revenues were approximately $210.5 million or 37% of our total revenues.
Although a substantial portion of our production is purchased by, or through, these parties, we do not believe the loss of any one customer would have a material adverse effect on our business as other customers should be accessible to us. We regularly monitor the credit worthiness of customers and may require parental guarantees, letters of credit or prepayments when deemed necessary.
For our economic interests in wells operated by third-parties, substantially all of our sales of crude oil and natural gas in fiscal years 2015, 2014, and 2013 were sold (i) through arrangements made by the wells’ operators and (ii) at sales points at or close to the producing wells. These third-party operators include a variety of exploration and production companies ranging from large publicly-traded companies to small privately-owned companies. We do not believe the loss of any single operator’s customer would have a material adverse effect on our Company as a whole.
For our economic interests in wells operated by third-parties, we have the right to take and sell our proportionate share of production, rather than have the operator arrange such sale; however, we did not do so in fiscal years 2015, 2014,
or 2013. The operators collect the sales proceeds and pass on to us our proportionate share of sales, net of severance taxes and royalties paid either by the purchaser or the operator on our behalf.
Oilfield Services Customers. The ability of RockPile to acquire and retain business depends substantially upon the number of oil and natural gas wells being drilled, the depth and drilling conditions of such wells, and the number and design of well completions. These factors can be affected by changes in commodities prices, the overall economic environment, and industry trends and technological advancements. RockPile’s principal customers consist of independent oil and natural gas producers in need of horizontal well completion and oilfield services primarily in the Williston Basin. During fiscal year 2015, RockPile provided pressure pumping services for 49 wells operated by TUSA and 99 wells operated by third parties. We do not believe that the loss of any single customer would have a material adverse effect on our Company since there are numerous operators in the Williston Basin in need of pressure pumping and related services.
In fiscal year 2015, we made sales of pressure pumping and well completion services directly to 11 oilfield services customers. In fiscal year 2015, we had revenues from two oilfield services customers that exceeded 10% of our $573.0 million in total revenues for the year. For our top two oilfield services customers, our fiscal year 2015 revenues were approximately $152.3 million or 27% of our total revenues.
Delivery Commitments
In October 2012, TUSA entered into two midstream services agreements with Caliber North Dakota LLC (“Caliber North Dakota”), an affiliate of Caliber: one for crude oil gathering, stabilization, treating and redelivery, and one for (i) natural gas compression, gathering, dehydration, processing, and redelivery; (ii) produced water transportation and disposal services; and (iii) fresh water transportation for TUSA’s oil and natural gas completion and production operations. Under the agreements, TUSA committed to deliver minimum monthly revenues derived from the fees paid by TUSA to Caliber for volumes of oil, natural gas, produced water, and fresh water for a primary term of 15 years beginning on the in-service date of the Caliber facilities (occurred in April 2014). On September 12, 2013, TUSA and Caliber North Dakota amended and restated the two agreements. Under the amended and restated agreements, TUSA maintained the revenue commitments included in the original agreements and added a commitment to deliver additional minimum monthly revenues derived from the fees paid by TUSA to Caliber North Dakota related to an increased acreage dedication and increased firm volume commitment. The additional minimum monthly revenue commitments commenced on the in-service date of certain incremental Caliber North Dakota facilities (occurred in September 2014). The minimum commitment over the term of the agreements is $405.0 million, of which $359.2 million is outstanding at January 31, 2015. Also on September 12, 2013, TUSA and Caliber Measurement Services LLC (“Caliber Measurement”), another Caliber affiliate, entered into a gathering services agreement pursuant to which Caliber Measurement provides certain gathering-related measurement services to TUSA.
Competitors
In the Williston Basin, TUSA competes with a number of larger public and private exploration and production companies including, but not limited to, Continental Resources, Statoil, Enerplus Resources Corporation, Oasis Petroleum, Newfield Exploration, and Whiting Petroleum.
RockPile’s competition includes large integrated oilfield services companies, a significant number of regional competitors, and a limited number of smaller service companies. RockPile’s competitors include, but are not limited to, Halliburton, Schlumberger, Baker Hughes, PumpCo, Sanjel, and Liberty Oilfield Services.
Caliber competes with large and small-scale pipeline operators, producer-owned midstream systems, trucking companies, and other oilfield services companies.
Seasonality
There is little seasonality in the demand for crude oil produced in North Dakota. Generally, oil prices in the Williston Basin are impacted by global oil demand and by the availability of crude oil transportation capacity, storage, and related services and infrastructure. Generally, but not always, the demand for natural gas decreases during the summer months and increases during the winter months. Seasonal anomalies such as mild winters or cool summers sometime
lessen this fluctuation. In addition, certain natural gas users utilize natural gas storage facilities and purchase some of their anticipated winter requirements during lower demand periods, which can lessen seasonal demand fluctuations.
Certain of our drilling, completion, and other operations are subject to seasonal limitations. Our operations are conducted in areas subject to extreme weather conditions during certain parts of the year, primarily in the winter and the spring. During these periods, drilling, completion, and other operations can be delayed because of cold, snow, and other winter weather conditions. Additionally, certain state and local governments in our area of operations have enacted “frost laws” to protect their roadways during the spring as the ground thaws and makes the roads unstable. Passage over certain county roads is restricted by weight. For state roads, additional fees are required to obtain over-the-road permits. Frost laws result in logistical challenges that could potentially result in temporary interruptions in our operations. Complications from adverse weather conditions are one reason why we are in the process of having future crude oil, natural gas and produced water transported away from the wellhead by pipeline, rather than by truck, for our operated wells.
We do not currently believe that seasonal fluctuations will have a material impact on our performance.
Governmental Regulation
Our business is affected by numerous laws and regulations, including energy, environmental, conservation, tax, and other laws and regulations relating to the oil and natural gas industry. Governmental authorities have the power to enforce compliance with these laws and regulations, and violations are subject to injunctive action, as well as administrative, civil and criminal penalties. The effects of these laws and regulations, as well as other laws or regulations that may be adopted in the future, could have a material adverse impact on our business, financial condition and results of operations. In view of the many uncertainties concerning future laws and regulations, including their applicability to us, we cannot predict the overall effect of such laws and regulations on our future operations.
We believe that our operations comply in all material respects with applicable laws and regulations and that the existence and enforcement of such laws and regulations are generally no more restrictive on our operations than they are on other similar companies in the oil and natural gas industry.
Environmental Laws and Regulations. Like the oil and natural gas industry in general, our properties are subject to extensive and changing federal, state, and local laws and regulations designed to protect and preserve natural resources and the environment. The recent trend in environmental legislation and regulation affecting the oil and natural gas industry generally is toward stricter standards, and this trend is likely to continue. These laws and regulations often require a permit or other authorization before construction or drilling commences and for certain other activities; limit or prohibit access, especially in wilderness areas and areas with endangered or threatened plant or animal species; impose restrictions on construction, drilling, and other exploration and production activities; regulate air emissions, wastewater, and other production and waste streams from our operations; impose substantial liabilities for pollution that may result from our operations; and require the reclamation of certain lands.
The permits required for many of our operations are subject to revocation, modification and renewal by issuing authorities. Governmental authorities, and in some cases private parties, have the power to enforce compliance with environmental regulations, and violations are subject to fines, compliance orders, and other enforcement actions. We are not aware of any material noncompliance with applicable environmental laws and regulations, and we have no material commitments for capital expenditures to comply with applicable environmental requirements. However, given the complex regulatory requirements applicable to our operations, and the rapidly changing nature of environmental laws in our industry, we cannot predict our future exposure concerning such matters, and our future costs to achieve compliance or resolve potential violations could be significant.
Waste Disposal and Contamination Issues. The Comprehensive Environmental Response, Compensation, and Liability Act (“CERCLA”), also known as the “Superfund law,” and comparable state laws may impose joint and several and strict liability, without regard to fault, on certain classes of persons for the release of CERCLA “hazardous substances” into the environment. These persons include the current and former owners and operators of a site where a release occurred, and anyone who disposed or arranged for the disposal of a hazardous substance at a site. Under CERCLA, such persons may be subject to joint and several and strict liability for the costs of cleaning up hazardous substances released into the environment and for damages to natural resources. Strict liability means liability without fault such that in some situations we could be exposed to liability for clean-up costs and other damages as a result of conduct that was lawful at the time it occurred or otherwise without negligence on our part or for the conduct of third parties. These third
parties may include prior operators of properties we have acquired, operators of properties in which we have an interest and parties that provide transportation services for us. If exposed to joint and several liability, we could be responsible for more than our share of a particular clean-up, remediation or other obligation, and potentially for the entire obligation, even where other parties were involved in the activity giving rise to the liability. In addition, it is not uncommon for neighboring landowners and other third parties to file claims for personal injury and property damage allegedly caused by hazardous substances released into the environment. Such claims may be asserted under CERCLA, as well as state common law theories, or state laws that are modeled after CERCLA. In the course of our operations, we generate waste that may fall within CERCLA’s definition of “hazardous substances.” Therefore, governmental agencies or third parties could seek to hold us responsible for all or part of the costs to clean up a site at which such hazardous substances may have been released, or other damages resulting from a release.
The Federal Resource Conservation and Recovery Act (“RCRA”) and comparable state statutes govern the management, storage, treatment, disposal, and cleanup of solid and hazardous waste, and authorize substantial fines and penalties for noncompliance. Drilling fluids, produced waters and many of the other wastes associated with the exploration, development, and production of oil or gas currently are exempt under federal law from regulation as RCRA “hazardous” wastes and instead are regulated as non-hazardous “solid” wastes. It is possible, however, that oil and natural gas exploration and production wastes now classified as non-hazardous could be classified as hazardous wastes in the future. Any such change could result in an increase in our operating expenses, which could have a material adverse effect on the results of operations and financial position. Also, in the course of our operations, we generate some industrial wastes, such as paint wastes, waste solvents, and waste oils that may be regulated as hazardous wastes under RCRA and comparable state laws and regulations.
Regulation of Discharges to Water and Water Supplies. The Federal Water Pollution Control Act of 1972, as amended (the “Clean Water Act”), and analogous state laws, impose restrictions and strict controls on the discharge of “pollutants” into “waters of the United States,” including wetlands and other waters without appropriate permits. These controls generally have become more stringent over time, and it is possible that additional restrictions will be imposed in the future. Pollutants under the Clean Water Act are defined to include produced water and sand, drilling fluids, drill cuttings, and other substances related to the oil and natural gas industry. Federal and state regulatory agencies can impose administrative, civil, and criminal penalties for unauthorized discharges or noncompliance with discharge permits or other requirements of the Clean Water Act and analogous state laws and regulations. They also can impose substantial liability for the costs of removal or remediation associated with discharges of pollutants.
The Clean Water Act also regulates stormwater discharges from industrial properties and construction sites, and requires separate permits and implementation of a Stormwater Pollution Prevention Plan (“SWPPP”) establishing best management practices, training, and periodic monitoring of covered activities. Certain operations also are required to develop and implement Spill Prevention, Control, and Countermeasure (“SPCC”) plans or facility response plans to address potential oil spills from certain above-ground and underground storage tanks.
Our underground injection operations are subject to the federal Safe Drinking Water Act, as well as analogous state laws and regulations. Under Part C of the Safe Drinking Water Act, the Environmental Protection Agency (“EPA”) established the Underground Injection Control (“UIC”) program, which established the minimum program requirements for state programs regulating underground injection activities. The UIC program includes requirements for permitting, testing, monitoring, recordkeeping, and reporting of injection well activities, as well as a prohibition against the migration of fluid containing any contaminant into underground sources of drinking water. Federal and state regulations require permits from applicable regulatory agencies to operate underground injection wells. In addition, concerns regarding the underground disposal of produced water into Class II UIC wells, including potential seismic impacts, may result in stricter regulation and increased costs associated with oil and natural gas wastewater disposal.
Oil Spill Regulation. The British Petroleum crude oil spill in the Gulf of Mexico in 2010 and generally heightened industry scrutiny has resulted and may result in new state and federal safety and environmental laws, regulations, guidelines, and enforcement interpretations relating to water protection and specifically to oil spill prevention and enforcement. The Oil Pollution Act of 1990 (“OPA”), augments the Clean Water Act and imposes strict liability for owners and operators of facilities that are the source of a release of oil into waters of the United States. The OPA and its associated regulations impose a variety of requirements on responsible parties related to the prevention of oil spills and liability for damages resulting from such spills. For example, operators of oil and natural gas facilities must develop, implement, and maintain facility response plans, conduct annual spill training for employees, and provide varying degrees of financial assurance to cover costs that could be incurred in responding to oil spills. In addition, owners and operators
of oil and natural gas facilities may be subject to liability for cleanup costs and natural resource damages as well as a variety of public and private damages resulting from oil spills.
These and similar state laws also govern the management and disposal of produced waters from our extraction process. Currently, wastewater associated with oil and natural gas production from shale formations is prohibited from being directly discharged to waterways and other waters of the United States. While some of our wastewater is reused or re-injected, a significant amount still requires disposal. As a result, some wastewater is transported to third-party treatment plants. EPA is studying the potential impact of wastewater derived from hydraulic fracturing activities, and in 2015 plans to propose standards that such wastewater must meet before being transported to a treatment plant. We cannot predict the EPA’s future actions in this regard, but increased and more stringent future regulation of produced waters or other waste streams could have a material impact on our operations.
Our operations also could be adversely impacted if we are unable to locate sufficient amounts of water, or dispose of or recycle water, used in our exploration and production operations. Currently, the quantity of water required in certain completion operations, such as hydraulic fracturing, and changing regulations governing usage, may lead to water constraints and supply concerns (particularly in some parts of the country).
Air Emissions and Climate Change. EPA has finalized major new Clean Air Act (“CAA”) standards (New Source Performance Standards and National Emission Standards for Hazardous Air Pollutants) applicable to hydraulically fractured natural gas wells in August 2012 known as “Quad O.” The standards require, among other things, use of reduced emission completions, or green completions, to reduce volatile organic compound emissions during hydraulically fractured natural gas well completions as well as new controls applicable to a wide variety of storage tanks and other equipment, including compressors, controllers, and dehydrators. Following a legal challenge and several petitions for administrative reconsideration of the Quad O rules, EPA issued final amendments related to storage tanks, green completions, and other provisions of the rule in September 2013 and December 2014 respectively. Most key provisions in Quad O take effect in 2015. The rules associated with such standards are substantial and will likely increase future costs of our operations and will require us to make modifications to our operations or install new equipment. While the “green completion” requirements likely will not impact our operations since we primarily explore for and produce oil rather than natural gas, the storage vessel requirements apply to a wide array of storage vessels, including those holding condensate and crude oil. Applicability of these requirements depends on a tank’s potential to emit (PTE) Volatile Organic Compounds (VOCs), not whether it is a gas or oil well. Thus, while the green completion requirements may not apply to our operations, certain of our tanks may trigger the Quad O storage vessel requirements if they have a PTE that exceeds the applicable threshold.
Wells in the Bakken Shale and Three Forks formations in North Dakota produce natural gas as well as crude oil. Constraints in the current gas gathering network in certain areas have resulted in some of that natural gas being flared instead of gathered, processed and sold. The North Dakota Industrial Commission, the State’s chief energy regulator, recently issued an order to reduce the volume of natural gas flared from oil wells in the Bakken Shale and Three Forks formations. In addition, the Commission is requiring operators to develop gas capture plans that describe how much natural gas is expected to be produced, how it will be delivered to a processor and where it will be processed. Production caps or penalties will be imposed on certain wells that cannot meet the capture goals.
Climate change has emerged as an important topic in public policy debate. It is a complex issue, with some scientific research suggesting that rising global temperatures are the result of an increase in greenhouse gases (“GHGs”). Products produced by the oil and natural gas exploration and production industry are a source of certain GHGs, primarily carbon dioxide and methane, and future restrictions on the combustion of fossil fuels or the venting and release of fugitive emissions of natural gas could have a significant impact on our future operations. EPA has issued a notice of finding and determination that emissions of carbon dioxide, methane, and other GHGs present an endangerment to human health and the environment, which has allowed the EPA to begin regulating emissions of GHGs under existing provisions of the Clean Air Act. The EPA has begun to implement GHG-related reporting and permitting rules. In June 2014, however, the United States Supreme Court invalidated a portion of EPA’s GHG program in the case Utility Air Regulatory Group (“UARG”) v. EPA. Specifically, under the Supreme Court’s UARG opinion, sources subject to the federal Title V and/or the Prevention of Significant Deterioration (“PSD”) programs because of emissions of non-GHG pollutants may still be subject to GHG permitting, including requirements to install Best Available Control Technology (“BACT”). Sources that would be subject to Title V or PSD because of only GHG emissions, however, are no longer subject to GHG permitting requirements, including GHG BACT requirements. Upon remand, EPA currently is considering how to implement the Court’s decision.
The U.S. Congress has considered, and may in the future consider, “cap and trade” legislation that would establish an economy-wide cap on emissions of GHGs in the United States and would require most sources of GHG emissions to obtain GHG emission “allowances” corresponding to their annual emissions of GHGs. Similarly, President Obama has indicated that climate change and GHG regulation is a significant priority for his second term. The President issued a Climate Action Plan in June 2013 that, among other things, calls for a reduction in methane emissions from the oil and gas sector. In spring 2014, EPA issued five “Methane White Papers” exploring methane emissions from, and possible controls for, various aspects of the oil and natural gas production process. Building on these white papers, in January 2015, EPA announced a comprehensive strategy to further reduce methane emissions from the U.S. oil and gas industry, as part of the Obama Administration’s overall GHG reduction strategy. Proposed rules governing methane emission reductions are expected in 2015, with final rules expected in 2016. These rules likely will include some additional mandatory requirements, potentially including leak detection and repair obligations, controls for hydraulically fractured oil wells, as well as other control, monitoring, and recordkeeping requirements applicable to a variety of oil and gas facility processes and associated equipment.
In November 2013, the President released an Executive Order charging various federal agencies, including EPA, with devising and pursuing strategies to improve the country’s preparedness and resilience to climate change. In part through these executive actions, the direct regulation of methane emissions from the oil and gas sector continues to be a focus of regulation. Any laws or regulations that may be adopted to restrict or reduce emissions of GHGs would likely require us to incur increased operating costs and could have an adverse effect on demand for our production. For example, as part of state-level efforts to reduce these emissions, operating restrictions on emissions by drilling rigs and completion equipment could be enacted, leading to an increase in drilling and completion costs. Also, the emergence of trends such as a worldwide increase in hybrid power motor vehicle sales, and/or decreased personal motor vehicle use by individuals in response to regulatory changes and/or perceived negative impacts on the climate from GHGs could result in lower world-wide consumption of, and prices for, crude oil.
Any laws or regulations that may be adopted to restrict or reduce emissions of GHGs or flaring likely would require us to incur increased operating costs and could have an adverse effect on demand for our production. These or future federal, state, regional or international monitoring or regulatory requirements relating to climate change could require us to obtain permits or allowances for our GHG emissions, install new pollution controls, increase our operational costs, limit our operations, or adversely affect demand for the oil and natural gas we produce.
Regulation of Hydraulic Fracturing. Hydraulic fracturing, commonly known as “fracing,” is the primary well-completion method used in the Bakken Shale and Three Forks formations. Hydraulic fracturing is a process that creates fractures extending from the wellbore into a rock formation that enables oil or natural gas to move more easily through the otherwise impermeable rock to a production well. Fractures typically are created through the injection of water, chemicals, and sand (or some other type of “proppant”) into the rock formation. Although hydraulic fracturing has been an accepted practice in the oil and natural gas industry for many years, its use has dramatically increased in the last decade, and concerns over its potential environmental effects have received increasing attention from regulators and the public.
Several federal agencies, including the EPA, recently have asserted potential regulatory authority over hydraulic fracturing, and the EPA has commenced a study of the potential environmental impacts of hydraulic fracturing, with the results of the study anticipated to be available for review in 2015. Moreover, the EPA also is studying the potential impact of wastewater derived from hydraulic fracturing activities and in 2015 plans to propose standards that such wastewater must meet before being transported to a treatment plant.
On March 20, 2015, the BLM released a final rule that will regulate hydraulic fracturing on federal and Indian lands. The rule requires operators to: (i) submit detailed information about the proposed operation, including wellbore geology, the location of faults and fractures, the depths of all usable water, estimated volume of fluid to be used, and estimated direction and length of fractures, to the BLM before hydraulically fracturing an existing well; (ii) design and implement a casing and cementing program that follows best practices and meets performance standards to protect and isolate “usable” water; (iii) monitor cementing operations during well construction; (iv) take remedial action if there are indications of inadequate cementing, and demonstrate to the BLM that the remedial action was successful; (v) perform a successful mechanical integrity test prior to the hydraulic fracturing operation; (vi) monitor annulus pressure during a hydraulic fracturing operation; (vii) manage recovered fluids in rigid enclosed, covered or netted and screened above-ground storage tanks, with very limited exceptions that must be approved on a case-by-case basis; (viii) disclose the chemicals used to the
BLM and the public, with limited exceptions for material demonstrated to be trade secrets; and (ix) provide documentation of all of the above actions to the BLM.
In addition, Congress has considered, and may in the future consider, legislation that would amend the Safe Drinking Water Act to encompass hydraulic fracturing activities. In the past, such proposed legislation would have required hydraulic fracturing operations to meet permitting and financial assurance requirements, adhere to certain construction specifications, fulfill monitoring, reporting, and recordkeeping obligations, including disclosure of chemicals used in the hydraulic fracturing process, and meet plugging and abandonment requirements. Some states already have adopted, and other states are considering adopting, requirements that could restrict or impose additional requirements relating to hydraulic fracturing in certain circumstances. For example, Montana and North Dakota have enacted regulations requiring operators to disclose information about hydraulic fracturing fluids on a well-by-well basis, and require specific construction and testing requirements for wells that will be hydraulically fractured. In addition, in Montana, operators generally must obtain approval from the state before hydraulic fracturing occurs and submit a report after the work is completed. Some states, municipalities, and other local governmental bodies also have purported to regulate, and in some cases prohibit, hydraulic fracturing activities. For example, Vermont has banned the use of the technology.
Finally, the EPA is moving forward with Toxic Substances Control Act (“TSCA”) rulemaking, which will collect expansive information on the chemicals used in hydraulic fracturing fluid, including health-related data, from chemical manufacturers and processors. The EPA expects to issue an Advance Notice of Proposed Rulemaking (“ANPRM”) in 2015. The TSCA rulemaking follows the general trend of increased disclosure and transparency associated with the chemicals used in hydraulic fracturing among the various states (e.g., North Dakota), including widespread participation by industry in a publicly searchable registry website developed and maintained by the Ground Water Protection Council (“FracFocus”). In addition, on January 7, 2015, several national environmental advocacy groups filed a lawsuit requesting that EPA add the oil and gas extraction industry to the list of industries required to report releases of certain “toxic chemicals” under EPCRA’s Toxics Release Inventory (TRI) program. All of these initiatives present significant, but uncertain, risk of additional regulation of the oil and natural gas industry.
In addition, concerns have been raised about the potential for earthquakes associated with disposal of produced waters into Class II UIC wells. The EPA’s current regulatory requirements for such wells do not require the consideration of seismic impacts when issuing permits. We cannot predict the EPA’s future actions in this regard. Certain states, such as California and Ohio, where earthquakes have been alleged to be linked to UIC disposal activities, have proposed regulations that would require mandatory reviews of seismic data and related testing and monitoring as part of the future permitting process for UIC wells.
Regulation of Production of Natural Gas and Oil. The production of natural gas and oil is subject to regulation under a wide range of local, state and federal statutes, rules, orders and regulations. Federal, state and local statutes and regulations require permits for drilling operations, drilling bonds and reports concerning operations. The states in which we own and operate properties have regulations governing conservation matters, including provisions for the unitization or pooling of natural gas and oil properties, and the regulation of well spacing or density. The effect of these regulations is to limit the amount of natural gas and oil we can produce from our wells and to limit the number of wells or the locations at which we can drill, although we can apply for exceptions to such regulations, or to have reductions in well spacing or density. Moreover, each state generally imposes a production or severance tax with respect to the production and sale of oil, natural gas and NGLs within its jurisdiction.
The states in which we operate also regulate drilling and operating activities by requiring, among other things, permits for the drilling of wells, bonding requirements to drill or operate wells, limits on the location of wells, imposing requirements on the methods of drilling and casing wells, the surface use and restoration of properties upon which wells are drilled, and the plugging and abandonment of wells.
The failure to comply with these rules and regulations can result in substantial penalties. Our competitors in the oil and natural gas industry are subject to the same regulatory requirements and restrictions that affect our operations.
Regulation of Transportation and Sales of Natural Gas. The transportation and sale of natural gas in interstate commerce are regulated by the Federal Energy Regulatory Commission (“FERC”) under the Natural Gas Act of 1938, or NGA, the Natural Gas Policy Act of 1978, or NGPA, and regulations issued under those statutes. FERC regulates interstate natural gas transportation rates and service conditions, which affect the marketing of natural gas we produce, as well as the revenues we receive for sales of our natural gas. Since 1985, FERC has endeavored to make natural gas
transportation more accessible to natural gas buyers and sellers on an open and non-discriminatory basis. Although FERC’s orders do not directly regulate natural gas producers, they are intended to foster increased competition within all phases of the natural gas industry.
The Domenici Barton Energy Policy Act of 2005, or EP Act of 2005, amended the NGA to add an anti-market manipulation provision which makes it unlawful for any entity to engage in prohibited behavior to be prescribed by FERC, and furthermore provided FERC with additional civil penalty authority. The EP Act of 2005 provides FERC with the power to assess civil penalties of up to $1.0 million per day for violations of the NGA and increased FERC’s civil penalty authority under the NGPA to $1.0 million per violation per day. The civil penalty provisions are applicable to entities that engage in the sale of natural gas for resale in interstate commerce. On January 19, 2006, FERC issued Order No. 670, a rule implementing the anti-market manipulation provision of the EP Act of 2005, and subsequently denied rehearing. The rules make it unlawful to: (i) in connection with the purchase or sale of natural gas subject to the jurisdiction of FERC, or the purchase or sale of transportation services subject to the jurisdiction of FERC, for any entity, directly or indirectly, to use or employ any device, scheme or artifice to defraud; (ii) to make any untrue statement of material fact or omit to make any such statement necessary to make the statements made not misleading; or (iii) to engage in any act or practice that operates as a fraud or deceit upon any person. The new anti-market manipulation rule does not apply to activities that relate only to intrastate or other non-jurisdictional sales or gathering, but does apply to activities of gas pipelines and storage companies that provide interstate services, as well as otherwise non-jurisdictional entities to the extent the activities are conducted “in connection with” gas sales, purchases or transportation subject to FERC jurisdiction, which now includes the annual reporting requirements under Order No. 704.
On December 26, 2007, FERC issued Order No. 704, a final rule on the annual natural gas transaction reporting requirements, as amended by subsequent orders on rehearing. Under Order No. 704, wholesale buyers and sellers of more than 2.2 million MMbtus of physical natural gas in the previous calendar year, including natural gas gatherers and marketers, are now required to report, on May 1 of each year, aggregate volumes of natural gas purchased or sold at wholesale in the prior calendar year to the extent such transactions utilize, contribute to, or may contribute to the formation of price indices. It is the responsibility of the reporting entity to determine which individual transactions should be reported based on the guidance of Order No. 704. Order No. 704 also requires market participants to indicate whether they report prices to any index publishers, and if so, whether their reporting complies with FERC’s policy statement on price reporting.
Gathering services, which occur upstream of jurisdictional transmission services, are regulated by the states onshore and in state waters. In some cases, FERC has reclassified certain jurisdictional transmission facilities as non-jurisdictional gathering facilities, which has the tendency to increase our costs of getting gas to point of sale locations. State regulation of natural gas gathering facilities generally include various safety, environmental and, in some circumstances, nondiscriminatory-take requirements. Although nondiscriminatory-take regulation has not generally been affirmatively applied by state agencies, natural gas gathering may receive greater regulatory scrutiny in the future.
Section 1(b) of the NGA exempts natural gas gathering facilities from regulation by FERC as a natural gas company under the NGA. Although FERC has not made any formal determinations with respect to any of our facilities, we believe that the natural gas pipelines in our gathering systems meet the traditional tests FERC has used to establish a pipeline’s status as a gatherer not subject to regulation as a natural gas company. The distinction between FERC-regulated transmission services and federally unregulated gathering services, however, has been the subject of substantial litigation, and the FERC determines whether facilities are gathering facilities on a case-by-case basis, so the classification and regulation of our gathering facilities may be subject to change based on future determinations by FERC, the courts or Congress.
Intrastate natural gas transportation is also subject to regulation by state regulatory agencies. The basis for intrastate regulation of natural gas transportation and the degree of regulatory oversight and scrutiny given to intrastate natural gas pipeline rates and services varies from state to state. Insofar as such regulation within a particular state will generally affect all intrastate natural gas shippers within the state on a comparable basis, we believe that the regulation of similarly situated intrastate natural gas transportation in any states in which we operate and ship natural gas on an intrastate basis will not affect our operations in any way that is of material difference from those of our competitors. Like the regulation of interstate transportation rates, the regulation of intrastate transportation rates affects the marketing of natural gas that we produce, as well as the revenues we receive for sales of our natural gas.
The price at which we sell natural gas is not currently subject to federal rate regulation and, for the most part, is not subject to state regulation. In the past, the federal government has regulated the prices at which natural gas could be sold.
Deregulation of wellhead natural gas sales began with the enactment of the NGPA and culminated in adoption of the Natural Gas Wellhead Decontrol Act which removed all price controls affecting wellhead sales of natural gas effective January 1, 1993.
Our sales of natural gas are also subject to requirements under the Commodity Exchange Act, or CEA, and regulations promulgated thereunder by the Commodity Futures Trading Commission, or CFTC. The CEA prohibits any person from manipulating or attempting to manipulate the price of any commodity in interstate commerce or futures on such commodity. The CEA also prohibits knowingly delivering, or causing to be delivered, false or misleading or knowingly inaccurate reports concerning market information or conditions that affect or tend to affect the price of a commodity.
Changes in law and to FERC policies and regulations may adversely affect the availability and reliability of firm and/or interruptible transportation service on interstate pipelines, and we cannot predict what future action FERC will take. We do not believe, however, that any regulatory changes will affect us in a way that materially differs from the way they will affect other producers, gatherers and marketers with which we compete.
Employees
As of January 31, 2015, we had 562 full time employees compared to 332 full time employees at January 31, 2014. We are not a party to any collective bargaining agreements and have not experienced any strikes or work stoppages.
Offices
We maintain our principal office at 1200 17th Street, Suite 2600, Denver, Colorado, 80202, and our telephone number is 1-303-260-7125. We also own or lease field offices and facilities in North Dakota and Wyoming.
ITEM 1A. RISK FACTORS
You should carefully consider the following risk factors and all other information contained in this annual report in evaluating our business and prospects. The risks and uncertainties described below are not the only ones we face. Additional risks and uncertainties, other than those we describe below, that are not presently known to us or that we currently believe are immaterial may also impair our business operations. If any of the following risks occur, our business and financial results could be harmed. You should also refer to the other information contained in this annual report, including the Forward-Looking Statements section in Item 1, our consolidated financial statements and the related notes, and Management’s Discussion and Analysis of Financial Condition and Results of Operations for a further discussion of the risks, uncertainties and assumptions relating to our business. Except where the context otherwise indicates, references in this section to “we,” “our,” “ours,” and “us” includes our subsidiaries and our interest in Caliber.
The risks described below relating to oil and natural gas exploration, exploitation and development activities affect TUSA directly but also affect RockPile and Caliber because the materialization of those risks, whether experienced by TUSA or other customers or potential customers of RockPile or Caliber, may adversely affect demand for the products and services provided by RockPile and Caliber.
Risks Relating to Our Business
Oil and natural gas prices are volatile and change for reasons that are beyond our control. Decreases in the price we receive for our production adversely affect our business, financial condition, results of operations and liquidity.
Declines in the prices we receive for our production adversely affect many aspects of our business, including our financial condition, revenues, results of operations, liquidity, rate of growth, and the carrying value of our properties, all of which depend primarily or in part upon those prices. Declines in the prices we receive for our production also adversely affect our ability to finance capital expenditures, make acquisitions, raise capital, and satisfy our financial obligations. In addition, declines in prices reduce the amount of oil and natural gas that we can produce economically and the expected cash flows from that production and, as a result, adversely affect the quantity and present value of proved reserves. Among other things, a reduction in our reserves can limit the capital available to us, as the maximum amount of available borrowing under TUSA’s credit facility is, and the availability of other sources of capital likely will be, based to a significant degree on the estimated quantity and present value of those reserves. Declines in prices may also reduce the demand for services provided by RockPile and Caliber. The price of oil fell dramatically in the second half of fiscal year 2015, from a high of $107.26 per barrel in June 2014 to a low of $44.45 per barrel in January 2015, in each case based on WTI prices. This decline adversely affected TUSA’s revenue and profitability, and also led to a significant reduction in drilling activity in North Dakota, which adversely affected the revenue and profitability of both RockPile and Caliber. Lower commodity prices have persisted in calendar year 2015.
Oil and natural gas are commodities and their prices are subject to wide fluctuations in response to relatively minor changes in supply and demand. Prices have historically been volatile and are likely to continue to be volatile in the future. The prices of oil and natural gas are affected by a variety of factors that are beyond our control, including changes in the global supply and demand for oil and natural gas, domestic and foreign governmental regulations and taxes, the level of global oil and natural gas exploration activity and inventories, the price, availability and consumer acceptance of alternative fuel sources, the availability of refining capacity, technological advances affecting energy consumption, weather conditions, speculative activity, civil or political unrest in oil and natural gas producing regions, financial and commercial market uncertainty, and worldwide economic conditions. The significant decline in the price of oil that occurred in calendar year 2014 was due to a number of causes outside of our control, including increased overall U.S. production, concerns regarding worldwide economic conditions and a decision by the Organization of Petroleum Exporting Countries not to curtail supply in order to rebalance global crude oil fundamentals.
In addition to factors affecting the price of oil and natural gas generally, the prices we receive for our production are affected by factors specific to us and to the local markets where the production occurs. Pricing can be influenced by, among other things, local or regional supply and demand factors (such as refinery or pipeline capacity issues, trade restrictions and governmental regulations) and the terms of our sales contracts. The prices we receive for our production are often at a discount to the relevant benchmark prices on NYMEX. A negative difference between the benchmark price and the price received is called a differential. The differential may vary significantly due to market conditions, the quality and location of production, and other factors. Due to increasing production from the Williston Basin in recent years and
limits to the available takeaway capacity and related infrastructure, the differential applicable to oil produced there has been significant. We cannot accurately predict future differentials, and increases in differentials could have a material adverse effect on our results of operations, financial condition and cash flows. In addition, the difficulty involved in predicting the differential also makes it more difficult for us to effectively hedge our production.
Our planned operations will require additional capital that may not be available.
Our business is capital intensive and requires substantial expenditures to maintain currently producing wells, to make the acquisitions and conduct the exploration, exploitation and development activities necessary to replace our reserves, and to pay expenses and to satisfy our other obligations. In recent years, we have chosen to pursue projects that required capital expenditures substantially in excess of cash flows from operations. That fact has made us dependent on external financing. In addition, our existing asset base is small compared to many of our public company competitors, which may make financing more difficult. We anticipate that we will continue to make substantial capital expenditures for the acquisition, exploration, development and production of oil and natural gas reserves in the future and for future drilling programs. We cannot assure you that our cash flows from operations and other available sources of financing will be adequate for us to implement our capital plans and to satisfy our debt-related and other obligations. Debt or equity financing may not be available in a timely manner, on terms acceptable to us or at all. Moreover, future activities may require us to alter our capitalization significantly. Recent declines in commodity prices will likely make it more difficult for us to raise capital on acceptable terms. Our inability to access sufficient capital for our operations could have a material adverse effect on our business, financial condition, results of operations and prospects.
TUSA’s lenders can limit its borrowing capabilities under its credit facility, which may materially impact our operations.
At January 31, 2015, TUSA had $119.3 million outstanding under its credit facility, with a borrowing base of $435.0 million. The borrowing base under TUSA’s credit facility is redetermined semi-annually based upon a number of factors, including proved reserves growth. In addition, each of TUSA and the lenders may request an unscheduled borrowing base redetermination twice during each calendar year. Upon a redetermination, TUSA’s borrowing base could be substantially reduced, and if the new borrowing base is less than the amount of outstanding indebtedness under the credit facility, TUSA will be required to (i) pledge additional collateral, (ii) prepay the principal amount of the loans in an amount sufficient to eliminate the excess, (iii) prepay the excess in five equal monthly installments, or (iv) any combination of options (i) through (iii). TUSA uses cash flows from operations and bank borrowings to fund its exploration, development and acquisition activities. Recent declines in commodity prices significantly increase the risk of adverse changes in the borrowing base. A reduction in TUSA’s borrowing base could materially limit those activities and adversely affect our operations and financial results.
Our substantial level of indebtedness and debt service costs could limit our financial and operating activities, and adversely affect our ability to incur additional debt to fund future needs.
We have outstanding indebtedness under TUSA’s 6.75% Senior Notes, TUSA’s and RockPile’s credit facilities, and our Convertible Note. A significant portion of our cash flows will be required to pay interest and principal on our indebtedness, and we may not generate sufficient cash flows from operations, or have future borrowing capacity available, to enable us to repay our indebtedness or to fund other liquidity needs. Our ability to pay interest and principal on our indebtedness and to satisfy our other obligations will depend upon our future operating performance and financial condition and the availability of refinancing indebtedness, which will be affected by prevailing economic conditions and financial, business and other factors, many of which are beyond our control. We cannot assure you that our business will generate sufficient cash flows from operations, or that future borrowings will be available to us under our credit facilities or otherwise, in an amount sufficient to fund our liquidity needs.
A substantial decrease in our operating cash flows or an increase in our expenses could make it difficult for us to meet our debt service requirements and could require us to modify our operations, including by curtailing our exploration and drilling programs, selling assets, refinancing all or a portion of our existing debt, or obtaining additional financing. These alternative measures may not be successful and may not permit us to meet our scheduled debt service obligations. Our ability to restructure or refinance our debt will depend on the condition of the capital markets and our financial condition at such time. Any refinancing of our debt could be at higher interest rates and may require us to comply with more onerous covenants, which could further restrict our business operations. In the absence of adequate cash from operations and other available capital resources, we could face substantial liquidity problems and might be
required to dispose of material assets or operations to meet our debt service and other obligations. We may not be able to consummate these dispositions for fair market value, in a timely manner or at all. Furthermore, any proceeds that we could realize from any dispositions may not be adequate to meet our debt service or other obligations then due.
The terms of certain of our debt agreements require us to comply with specified financial covenants and ratios. Our ability to comply with these restrictions and covenants in the future is uncertain and will be affected by the levels of cash flows from operations and events or circumstances beyond our control. Our failure to comply with any of the restrictions and covenants under the agreements could result in a default under those agreements, which could cause all of our existing indebtedness to be immediately due and payable.
In addition to making it more difficult for us to satisfy our debt service obligations, our substantial indebtedness could limit our ability to incur additional indebtedness if needed for other purposes, including working capital, capital expenditures, acquisitions, and general corporate or other purposes, on satisfactory terms or at all. As a result, our indebtedness, and the terms of agreements governing that indebtedness, could increase our vulnerability to economic downturns and impair our ability to withstand sustained declines in commodity prices and limit our flexibility in planning for, or reacting to, changes in our business and the industry in which we operate.
Our estimated reserves are based on many assumptions that may turn out to be inaccurate. Any material inaccuracies in these reserve estimates or the relevant underlying assumptions will materially affect the quantity and present value of our reserves.
The reserve data included in this report represent estimates only. Estimating quantities of proved oil and natural gas reserves is a complex process that requires interpretations of available technical data and various estimates, including estimates based upon assumptions relating to economic factors, such as future commodity prices, production costs, severance and excise taxes, availability of capital, estimates of required capital expenditures, workover and remedial costs, and the assumed effect of governmental regulation. The assumptions underlying our estimates of our proved reserves could prove to be inaccurate, and any significant inaccuracy could materially affect, among other things, future estimates of our reserves, the economically recoverable quantities of oil and natural gas attributable to our properties, the classifications of reserves based on risk of recovery, and estimates of our future net cash flows.
At January 31, 2015, approximately 39% of our estimated net remaining proved reserves (Mboe) were proved undeveloped, or PUDs. Estimation of PUD reserves is almost always based on analogy to existing wells as contrasted with the performance data used to estimate producing reserves. Recovery of PUD reserves requires significant capital expenditures and successful drilling operations.
Additionally, SEC rules require that, subject to limited exceptions, PUD reserves may be recorded only if they relate to wells scheduled to be drilled within five years after the date of booking. This rule has limited and may continue to limit our potential to record additional PUD reserves as we pursue our drilling program. Moreover, we may be required to write-down our PUDs if we do not drill those wells within the required five-year time frame. Our PUD reserve estimates as of January 31, 2015 reflected our plans to make significant capital expenditures to convert our PUDs into proved developed reserves, including currently estimated expenditures of approximately $439.7 million during the five years ending on January 31, 2020. You should be aware that this estimate of our development costs may not be accurate, development may not occur as scheduled, and results may not be as estimated. If we choose not to develop PUDs, or if we are not otherwise able to successfully develop them, we will be required to remove the associated volumes from our reported proved reserves.
You should not assume that the present values referred to in this report represent the current market value of our estimated oil and natural gas reserves. The timing and success of development activities and related expenses, each of which is subject to numerous risks and uncertainties, will affect the timing and amount of actual future net cash flows from our proved reserves and their present value. In addition, our PV-10 and Standardized Measure estimates are based on assumed future prices and costs. Actual future prices and costs may be materially higher or lower than the assumed prices and costs. Further, the effect of derivative instruments is not reflected in these assumed prices. Also, the use of a 10% discount factor to calculate PV-10 and Standardized Measure may not necessarily represent the most appropriate discount factor given actual interest rates and risks to which our business, and the oil and natural gas industry in general, are subject.
Our investments in oil and natural gas properties may result in impairments.
We follow the full cost method of accounting for oil and natural gas properties. Accordingly, all costs associated with the acquisition, exploration and development of oil and natural gas properties, including costs of undeveloped leasehold, geological and geophysical expenses, dry holes, leasehold equipment and other costs directly related to acquisition, exploration and development activities, are capitalized. Capitalized costs of oil and natural gas properties also include estimated asset retirement costs recorded based on the fair value of the asset retirement obligation when incurred. The capitalized costs plus future development and dismantlement costs are depleted and charged to operations using the equivalent unit-of-production method based on proved oil and natural gas reserves as determined annually by an experienced petroleum engineer on our staff and audited by an independent petroleum engineering firm, and determined in interim quarterly periods by an experienced petroleum engineer on our staff. To the extent that such capitalized costs, net of their accumulated depreciation and amortization, exceed the sum of (i) the present value (discounting at 10% per annum) of estimated future net revenues from proved oil and natural gas reserves and (ii) the capitalized costs of unevaluated properties (both adjusted for income tax effects), such excess costs are charged to operations, which may have a material adverse effect on our business, financial condition and results of operations. We recognized such impairment expense in fiscal year 2012. Once incurred, such a write-down of oil and natural gas properties is not reversible at a later date, even if oil or natural gas prices substantially increase or if estimated proved reserves substantially increase. Although we had no impairments in fiscal years 2013, 2014 or 2015, there can be no assurance that that we will not recognize impairment expense in future periods.
Much of our net leasehold acreage is undeveloped, and that acreage may not ultimately be developed or become commercially productive, which could have a material adverse effect on our future oil and natural gas reserves and production and, therefore, our future cash flows and income.
Much of our net leasehold acreage is undeveloped acreage on which wells have not been drilled or completed to a point that would permit the production of commercial quantities of oil and natural gas. In addition, many of our oil and natural gas leases require us to drill wells that are commercially productive within specified periods of time, and if we are unsuccessful in drilling such wells, we could lose our rights under such leases. We intend to develop our leasehold acreage by implementing our exploration and development plan, but the funds needed to do so may not be available and our exploration and development activities may be unsuccessful. Our future oil and natural gas reserves and production, and therefore our future cash flows and income, are highly dependent on our success in developing our undeveloped leasehold acreage.
Oil and natural gas exploration, exploitation and development activities may not be successful and could result in a complete loss of a significant investment.
Exploration, exploitation and development activities are subject to many risks. For example, new wells we drill may not be productive and we may not recover all or any portion of our investment in such wells. The seismic data and other technologies we use do not allow us to know conclusively prior to drilling a well that oil or natural gas is present or that it can be produced economically. In addition, a productive well may become commercially unproductive in the event that water or other deleterious substances are encountered which impair or prevent the commercial production of oil and natural gas from the well. Similarly, decline rates from a productive well may exceed our estimates and may cause the well to become uneconomic. We engage in exploratory drilling, which increases these risks. Drilling for oil and natural gas often involves unprofitable efforts as a result of dry holes or wells that are productive but do not produce sufficient oil or natural gas to return a profit at then-realized prices after deducting drilling, operating and other costs. Moreover, even profitable development activity may be less successful than we, investors or analysts expect, potentially resulting in a decline in the market value of our securities. Cost-related risks are exacerbated in the Williston Basin because the drilling and completion of a well there generally costs significantly more than a typical onshore conventional well. The currently prevailing lower commodity price environment may reduce certain of these costs. However, TUSA may not be able to achieve the cost savings it anticipates. Moreover, RockPile, as a provider of completion services, will have its revenue and profitability reduced by cost reductions demanded by its customers. In addition, our exploration, exploitation and development activities may be curtailed, delayed or canceled as a result of numerous factors, including:
| · | | problems in delivery of our oil and natural gas to market; |
| · | | pressure or irregularities in geological formations; |
| · | | equipment failures or accidents; |
| · | | adverse weather conditions; |
| · | | reductions in oil and natural gas prices; |
| · | | compliance with environmental and other governmental requirements, including with respect to permitting issues; and |
| · | | costs of, or shortages or delays in the availability of, drilling rigs, equipment, qualified personnel and services. |
We expect that nearly all of the wells we drill in fiscal year 2016 will be drilled horizontally and will be hydraulically fractured. When drilling horizontal wells, the risks we face include, but are not limited to, failing to place our wellbore in the desired target producing zone, not staying in the desired drilling zone while drilling horizontally through the formation, failing to run casing the entire length of the wellbore and not being able to run tools and other equipment consistently through the horizontal wellbore. Risks we face while completing such wells include, but are not limited to, not being able to fracture stimulate the planned number of stages, failing to run tools the entire length of the wellbore during completion operations, and not successfully cleaning out the wellbore after completion of the final fracture stimulation stage. Because of the cost typically associated with this type of well, unsuccessful exploration or development activity affecting even a small number of these wells could have a significant impact on our results of operations.
We may not realize the benefits of integrating acquired properties.
The integration into our operations of previously acquired oil and natural gas properties, as well as any future acquired properties, is a significant undertaking and requires significant resources, as well as attention from our management team. We could encounter difficulties in the integration process, such as the need to revisit assumptions about reserves, future production, revenues, capital expenditures and operating costs, including synergies, the loss of commercial relationships or the need to address unanticipated liabilities. If we cannot successfully integrate acquired properties into our business, we may fail to realize the expected benefits of those acquisitions.
Acquisitions may prove to be unprofitable because of uncertainties in evaluating recoverable reserves and potential liabilities.
Our recent growth is due in large part to acquisitions of undeveloped leasehold interests and the drilling and completion of productive wells. We expect acquisitions will also contribute to our future growth. Successful acquisitions require an assessment of a number of factors, including estimates of recoverable reserves, exploration potential, future oil and natural gas prices, operating costs, title issues and potential environmental and other liabilities. Such assessments are inexact and their accuracy is inherently uncertain. In addition, many of these factors are subject to change and are beyond our control. In particular, the prices of and markets for oil and natural gas products may change from those anticipated at the time such assessments are made. In connection with our assessment of a potential acquisition, we perform a review of the acquired properties that we believe is generally consistent with industry practices. However, such a review will not reveal all existing or potential problems, and generally will not involve a review of seismic data or independent environmental testing. In addition, our review may not permit us to become sufficiently familiar with the properties to fully assess their capabilities and deficiencies, including any structural, subsurface and environmental problems that may exist or arise. As a result, we may assume unknown liabilities that could have a material adverse effect on our business, financial condition and results of operations.
We may be unable to successfully acquire additional leasehold interests or other oil and natural gas properties, which may inhibit our ability to grow our production.
Acquisitions of leasehold interests or other oil and natural gas properties have been an important element of our business, and we will continue to pursue acquisitions in the future. In recent years, we have pursued and consummated leasehold or other property acquisitions that have provided us opportunities to expand our acreage position and grow our production. Although we regularly engage in discussions and submit proposals regarding leasehold interests or other oil and natural gas properties, suitable acquisitions may not be available in the future on reasonable terms, or we may not possess sufficient capital to consummate attractive acquisitions.
Unless reserves are replaced as they are produced, our reserves and production will decline, which would adversely affect our future business, financial condition and results of operations. We may not be able to develop our identified drilling locations as planned.
Producing crude oil and natural gas reservoirs are generally characterized by declining production rates that vary depending upon reservoir characteristics and other factors. The rate of decline may change over time and may exceed our estimates. Our future reserves and production and, therefore, our cash flows and income, are highly dependent on our ability to efficiently develop and exploit our current reserves and to economically find or acquire additional recoverable reserves. We may not be able to develop, discover or acquire additional reserves to replace our current and future production at acceptable costs. Our failure to do so would adversely affect our future operations, financial condition and results of operations.
We have identified a number of well locations as an estimation of our future multi-year drilling activities on our existing acreage. These well locations represent a significant part of our growth strategy. Our ability to drill and develop these locations depends on a number of uncertainties, including crude oil prices, the availability and cost of capital, drilling and production costs, availability of drilling services and equipment, drilling results, lease expirations, midstream constraints, access to and availability of water sourcing and distribution systems, regulatory approvals, and other factors. Because of these factors, we do not know if the numerous potential well locations we have identified will ever be drilled or if we will be able to produce crude oil or natural gas from these or any other potential well locations. In addition, the number of drilling locations available to us will depend in part on the spacing of wells in our operating areas. An increase in well density in an area could result in additional locations in that area, but a reduced production performance from the area on a per-well basis. Further, certain of the horizontal wells we intend to drill in the future may require pooling of our lease interests with the interests of third parties. If these third parties are unwilling to pool their interests with ours, and we are unable to require such pooling on a timely basis or at all, this may limit the total locations we can drill. As such, our actual drilling activities may materially differ from those presently identified. Further, our inventory of drilling projects includes locations in addition to those that we currently classify as proved. The development of and results from these additional projects are more uncertain than those relating to proved locations.
No assurance can be given that defects in our title to oil and natural gas interests do not exist.
It is often not possible to determine title to an oil and natural gas interest without incurring substantial expense. The title review processes we have conducted with respect to certain interests we have acquired may not have been sufficient to detect all potential defects, and we have not conducted such a process with respect to all our properties. If a title defect does exist, it is possible that we may lose all or a portion of our interest in the properties to which the title defect relates. Our actual interest in certain properties may therefore vary from our records.
The results of our planned drilling in the Bakken Shale and Three Forks formations are subject to more uncertainties than drilling programs in more established formations and may not meet our expectations for production.
Part of our drilling strategy to maximize recoveries from the Bakken Shale and Three Forks formations involves the drilling of horizontal wells using completion techniques that have proven to be successful for other companies in these and other shale formations. Our experience with horizontal drilling in the Bakken Shale and Three Forks formations, like that of the industry in general, is limited. The ultimate success of these drilling and completion strategies and techniques in these formations will be better evaluated over time as more wells are drilled and longer-term production profiles are established. In addition, the decline rates in these formations may be higher than in other areas and in other shale formations, making overall production difficult to estimate until our experience in these formations increases. Accordingly, the results of our future drilling in the Bakken Shale and Three Forks formations are more uncertain than drilling results in some other formations with more established reserves and longer production histories. Further, access to adequate gathering systems or pipeline takeaway capacity and the availability of drilling rigs and other services may be more challenging in resource constrained plays such as the Williston Basin.
If our drilling results are less favorable than anticipated or we are unable to execute our drilling program because of capital constraints, lease expirations, lack of access to gathering systems and takeaway capacity or otherwise, or oil and natural gas prices decline further, the return on our investment in these areas may not be as attractive as we anticipate, and we could incur material write-downs of properties and the value of our undeveloped acreage could decline.
We rely on independent experts and technical or operational service providers over whom we may have limited control.
We use independent contractors to provide us with technical assistance and services. We rely upon the owners and operators of rigs and drilling equipment, and upon providers of oilfield services, to drill and develop certain of our prospects to production. In addition, we rely upon the services of other third parties to explore or analyze our prospects to determine a method in which the prospects may be developed in a cost-effective manner. Our limited control over the activities and business practices of these operators and service providers, any inability on our part to maintain satisfactory commercial relationships with them, or their failure to provide quality services could materially and adversely affect our business, financial condition, and results of operations.
Our agreements with operators and other joint venture partners, as well as other operational agreements that we may enter into, present a number of challenges that could have a material adverse effect on our business, financial condition or results of operations.
Our agreements with well operators and other joint venture partners, as well as other operational agreements (including agreements with mineral rights owners and suppliers of services, equipment and product transportation), represent a significant portion of our business. In addition, as part of our business strategy, we plan to enter into other similar transactions, some of which may be material. These transactions typically involve a number of risks and present financial, managerial and operational challenges, including the existence of unknown potential disputes, liabilities or contingencies that arise after entering into these arrangements related to the counterparties to such arrangements. We could experience financial or other setbacks if we encounter unanticipated problems in connection with such transactions, including problems related to execution or integration. Any of these risks could reduce our revenues or increase our expenses, which could adversely affect our business, financial condition or results of operations.
We may experience an increase in non-consenting working interest owners in our operated wells.
Our exploration and development agreements contain customary industry non-consent provisions. Pursuant to these provisions, if we, as operator, propose a well to be drilled and completed and a working interest owner elects not to participate, we assume the non-participating working interest owners’ share of the costs of such well. As a penalty for not participating, the portion of the well’s revenues that would otherwise would go to the non-participant flow to us until we receive from 150% to 300% of the capital that we provided to cover the non-participant's share. We have historically viewed non-consents by other working interest owners in our operated wells favorably as it has the effect of increasing our interest in our operated wells, despite the additional capital outlay. However, in the current depressed commodity pricing environment, we could experience a significant increase in the number of non-consenting working interest owners that either do not have the capital to participate or choose not to participate at current commodity prices. In either case, we would be required to assume their portion of the well’s expenses. The potential for such an increase makes it difficult to accurately predict our fiscal year 2016 capital expenditures and could require us to redirect capital budgeted for other expenditures. Further, redirecting capital to fund the expenses of non-participating working interest owners in our operated wells could cause us to non-consent in wells that we do not operate, and such wells may prove more successful than our operated wells.
We cannot control the activities on the properties we do not operate and are unable to ensure their proper operation and profitability.
Other companies’ operated properties represent a portion of our production. We have limited ability to exercise influence over, or control the risks associated with, operations of our non-operated properties. The failure of an operator of our non-operated wells to adequately perform operations, an operator’s breach of the applicable agreements, or an operator’s failure to act in our best interests could reduce our production and revenues. The success and timing of drilling and development activities on properties operated by others depends upon a number of factors outside of our control, including the operator’s expertise and financial resources, inclusion of other participants in drilling wells, and use of technology. In addition, we could be adversely affected by our lack of control over the timing and amount of capital expenditures related to non-operated properties.
We are subject to complex laws and regulations, including environmental laws and regulations that can adversely affect the cost, manner and feasibility of doing business and limit our growth.
Our operations and facilities are subject to extensive federal, state, local and foreign laws and regulations relating to exploration for, and the exploitation, development, production and transportation of, oil and natural gas, as well as environmental, safety and other matters. Existing laws or regulations, as currently interpreted or reinterpreted in the future, or future laws or regulations, may harm our business, results of operations and financial condition. Laws and regulations applicable to us include those relating to:
| · | | drilling bonds and other financial responsibility requirements; |
| · | | unitization and pooling of properties; |
| · | | habitat and endangered species protection; |
| · | | environmental, reclamation, and remediation obligations; |
| · | | the management and disposal of hazardous substances, oil field waste and other waste materials; |
| · | | the use of underground and above-ground storage tanks; |
| · | | transportation and drilling permits; |
| · | | the use of underground injection wells; |
| · | | hydraulic fracturing (including limitations on the use of this technology); |
| · | | the prevention of oil spills; |
| · | | the closure of production facilities; |
| · | | operational reporting; and |
Under these laws and regulations, we could be liable for:
| · | | property and natural resource damages; |
| · | | releases or discharges of hazardous materials; |
| · | | oil spill clean-up costs; |
| · | | other remediation and clean-up costs; |
| · | | plugging and abandonment costs; |
| · | | governmental sanctions, such as fines and penalties; and |
| · | | other environmental damages. |
These regulations have been changed frequently in the past and, in general, these changes have imposed more stringent requirements that have increased operating costs and required capital expenditures to remain in compliance. For example, in 2013, North Dakota, the primary state in which we conduct operations, amended its regulations to impose more stringent regulation of hydraulic fracturing, the disclosure of chemicals used in hydraulic fracturing and more rigorous regulation of pits. Any noncompliance with these laws and regulations could subject us to material administrative, civil, or criminal penalties or other liabilities, including suspension or termination of operations. Some environmental laws and regulations impose strict liability, under which we could be exposed to liability for clean-up costs and other damages for conduct that was not negligent and was lawful at the time it occurred, or for the conduct of prior owners or operators of properties we have acquired or other third parties, including, in some circumstances, operators of properties in which we have an interest and parties that provide transportation services for us. Similarly, some environmental laws and regulations impose joint and several liability, under which we could be held responsible for more than our proportionate share of liability for site remediation or other obligations, and potentially the entire obligation, even where other parties also have liability. In addition, we may be required to make large and unanticipated capital expenditures to comply with applicable laws and regulations, for example by installing and maintaining pollution control devices. Further, our plugging and abandonment obligations will be substantial and may exceed our estimates. Our operations could also be adversely affected by environmental and other laws and regulations that require us to obtain permits before
commencing drilling or other activities. Even when permits are granted in a timely manner, they may be subject to conditions that impose delays on a project, increase its costs or reduce its benefits to us.
In addition, any changes in applicable laws, regulations and/or administrative policies or practices may have a negative impact on our ability to operate and on our profitability. The laws, regulations, policies or current administrative practices of any government body, organization or regulatory agency in the United States or any other jurisdiction in which we operate may be changed, applied or interpreted in a manner that could fundamentally alter our ability to carry on our business or otherwise adversely affect our results of operations and financial condition.
Caliber’s operations may be subject to additional regulatory risks. For example, in the future its pipelines may be subject to siting, public necessity, rate and service regulations by FERC or various state regulatory bodies, depending upon jurisdiction. FERC generally regulates the transportation of natural gas, NGLs and crude oil in interstate commerce. FERC’s actions in any of these areas or modifications of its current regulations could adversely impact Caliber’s ability to compete for business, the costs it incurs in its operations, the construction of new facilities or its ability to recover the full cost of operating its pipelines. Other laws and actions by federal and state regulatory authorities could have similar effects on Caliber’s operations. For example, North Dakota adopted new regulations in December 2013 requiring operators to submit data to the state to track construction and reclamation of pipelines, and to track pipeline locations for surface owners.
Climate change laws and regulations restricting emissions of greenhouse gases could result in increased operating costs and reduced demand for the oil and natural gas we produce, while the physical effects of climate change could disrupt our production and cause us to incur significant costs in preparing for, or responding to, those effects.
Climate change has emerged as an important topic in public policy debate. It is a complex issue, with some scientific research suggesting that rising global temperatures are the result of an increase in GHGs. Products produced by the oil and natural gas exploration and production industry are a source of certain GHGs, namely carbon dioxide and methane, and future restrictions on the combustion of fossil fuels or the venting and release of fugitive emissions of natural gas could have a significant impact on our future operations. The EPA has issued a notice of finding and determination that emissions of carbon dioxide, methane and other GHGs present an endangerment to human health and the environment, which allows the EPA to regulate GHG emissions under existing provisions of the federal Clean Air Act. The EPA has begun to implement GHG-related reporting and permitting rules. Similarly, the U.S. Congress has considered and may in the future consider “cap and trade” legislation that would establish an economy-wide cap on GHG emissions in the United States and would require most sources of GHG emissions to obtain GHG emission “allowances” corresponding to their annual emissions of GHGs. Any laws or regulations that may be adopted to restrict or reduce GHG emissions would likely require us to incur increased operating costs and could have an adverse effect on demand for our production. These or future federal, state, regional or international monitoring or regulatory requirements relating to climate change could require us to obtain permits or allowances for our GHG emissions, install new pollution controls, increase our operational costs, limit our operations or adversely affect demand for the oil and natural gas we produce. See Item 1. Business – Governmental Regulation - Air Emissions and Climate Change for further discussion.
Many scientists have concluded that increasing concentrations of GHGs in the earth’s atmosphere may produce climate changes that have significant physical effects, such as increased frequency and severity of storms, floods, and other climatic events. If any such effects were to occur, they could have an adverse effect on our exploration and production operations. Significant physical effects of climate change could also have an indirect effect on our financing and operations by disrupting services or infrastructure provided to us by other parties. We may not be able to recover through insurance some or any of the damages, losses or costs that may result from potential physical effects of climate change and, as a result, this could have a material adverse effect on our business, financial condition and results of operations.
Hydraulic fracturing has recently come under increased scrutiny and could be the subject of further regulation, which could impact the timing and cost of development, as well as our investment in RockPile.
As discussed above in Item 1. Business – Governmental Regulation - Regulation of Hydraulic Fracturing, the regulatory landscape regarding hydraulic fracturing remains in flux. Depending on the legislation or regulations that ultimately may be adopted, exploration and production activities that employ hydraulic fracturing could be restricted or subject to additional regulation and permitting requirements. Individually or collectively, such new legislation or regulation could lead to operational delays or increased operating costs for TUSA and RockPile, and could result in additional burdens that could increase the costs and delay or curtail the development of unconventional oil and natural gas
resources from shale formations that are not commercially viable without hydraulic fracturing. Further, commercially prohibitive costs or a prohibition or moratorium on hydraulic fracturing in the areas in which RockPile operates could result in a complete loss of our investment in RockPile. As a result, such legislation or regulation could have a material adverse effect on our business, financial condition and results of operations.
The sale of our oil and natural gas production depends in part on gathering, transportation and processing facilities and services. Any limitation in the availability of, or our access to, those facilities or services would interfere with our ability to market the oil and natural gas that we produce and could adversely impact our drilling program, cash flows and results of operations.
We deliver oil and natural gas that may ultimately flow through gathering, processing and pipeline systems that Caliber does not own. The amount of oil and natural gas that we can produce and sell is subject to the accessibility, availability, proximity and capacity of these gathering, processing and pipeline systems. In particular, natural gas produced from the Bakken Shale has a high Btu content that requires natural gas processing to remove the natural gas liquids before it can be redelivered into transmission pipelines. Industry-wide in the Williston Basin, there is currently a shortage of natural gas gathering and processing capacity. Such shortage has limited our ability to sell our natural gas production. In addition, the use of alternative forms of transportation for oil production, such as trucks or rail, involve risks as well. For example, recent and well-publicized accidents involving trains delivering crude oil could result in increased levels of regulation and transportation costs.
The lack of available capacity in any of the gathering, processing and pipeline systems we use could result in our inability to realize the full economic potential of our production or in a reduction of the price offered for our production and could force us to reduce production in some circumstances. Any significant change in market factors or other conditions affecting these infrastructure systems and facilities, as well as any delays in constructing new infrastructure systems and facilities or any changes in regulatory requirements, could harm our business and, in turn, our financial condition, results of operations and cash flows.
Furthermore, weather conditions or natural disasters, actions by companies doing business in the areas in which we operate, or labor disputes may impair the distribution of oil and/or natural gas and in turn diminish our financial condition or ability to conduct our operations.
The lack of availability or high cost of drilling rigs, fracture stimulation crews, equipment, supplies, insurance, personnel and oilfield services could adversely affect our ability to execute our exploration and development plans on a timely basis and within our budget.
Our industry is cyclical and, from time to time, there is a shortage of drilling rigs, fracture stimulation crews, equipment, supplies, key infrastructure, insurance or qualified personnel. During these periods, the costs and delivery times of rigs, equipment and supplies are substantially greater. In addition, the demand for, and wage rates of, qualified crews rise as the number of active rigs and completion fleets in service increases. If increasing levels of exploration and production result from strong commodity prices in the future, the demand for oilfield services will likely rise, and the costs of these services will likely increase, while the quality of these services may suffer. Costs associated with hydraulic fracturing, such as costs relating to water and proppants, may be subject to similar pressures in areas such as the Williston Basin where hydraulic fracturing activities are widespread. Moreover, costs in the Williston Basin generally are high relative to many areas of the United States due to its rapid growth in recent years and its distance from major metropolitan areas. Conversely, while certain costs could potentially decrease when commodity prices fall, we may be unable to realize such potential reductions or they may be less significant than we project.
Our operations substantially depend on the availability of water. Restrictions on our ability to obtain, dispose of or recycle water may impact our ability to execute our drilling and development plans in a timely and cost-effective manner.
Water is an essential component of our drilling and hydraulic fracturing processes. If we are unable to obtain water to use in our operations from local sources, we may be unable to economically produce oil, NGLs and gas, which could have an adverse effect on our business, financial condition and results of operations.
Moreover, new environmental initiatives and regulations could include restrictions on disposal of waste, including, but not limited to, produced water, drilling fluids and other wastes associated with the exploration, development or
production of oil and natural gas. Compliance with environmental regulations and permit requirements for the withdrawal, storage and use of surface water or ground water necessary for hydraulic fracturing of our wells may increase our operating costs and cause delays, interruptions or cessation of our operations, the extent of which cannot be predicted, and all of which would have an adverse effect on our business, financial condition, results of operations and cash flows.
Constraints in the supply of, prices for, and availability of transportation of raw materials can have a material adverse effect on RockPile’s business.
High levels of demand for, or a shortage of, raw materials used in hydraulic fracturing operations, such as proppants, can trigger constraints in RockPile’s supply chain of those raw materials. Many of the raw materials essential to its business require the use of rail, storage, and trucking services to transport the materials to its jobsites. These services, particularly during times of high demand, may cause delays in the arrival of, or otherwise constrain its supply of, raw materials. These constraints could have a material adverse effect on RockPile’s business. In addition, price increases imposed by its vendors for such raw materials and the inability to pass these increases through to its customers could have a material adverse effect on RockPile’s business. Our other operations may be similarly adversely affected by shortages of these raw materials.
Growing Caliber’s business by constructing new pipelines and other infrastructure subjects it to construction risks and will require it to obtain rights of way at a reasonable cost. Such projects may not be profitable if costs are higher, or demand is less, than expected.
We intend to grow Caliber’s business through the construction of pipelines, treatment/processing facilities and other midstream infrastructure. The construction of this infrastructure requires significant amounts of capital, which may exceed our expectations, and will involve numerous regulatory, environmental, political and legal uncertainties and stringent, lengthy and occasionally unreasonable or impractical federal, state and local permitting, consent, or authorization requirements. As a result, new infrastructure may not be constructed as scheduled or as originally designed, which may require redesign and additional equipment, relocations of facilities or rerouting of pipelines, which in turn could subject Caliber to additional capital costs, additional expenses or penalties and may adversely affect Caliber’s operations. In addition, the coordination and monitoring of these projects requires skilled and experienced labor. Agreements with Caliber’s producer customers may contain substantial financial penalties and give the producers the right to terminate their contracts if construction deadlines are not achieved. Moreover, Caliber’s revenues may not increase immediately upon the expenditure of funds on a particular project. For instance, if Caliber builds a new pipeline, the construction may occur over an extended period of time, and Caliber may not receive any material increases in revenues until after completion of the project, if at all.
In addition, the construction of pipelines and other infrastructure may require Caliber to obtain rights-of-way or other property rights prior to construction. Caliber may be unable to obtain such rights-of-way or other property rights at a reasonable cost. If the cost of obtaining new or renewing rights-of-way or other property rights increases, it would adversely affect Caliber’s operations.
Furthermore, Caliber may have limited or no commitments from customers relating to infrastructure projects prior to their construction. If Caliber constructs facilities to capture anticipated future growth in production or satisfy anticipated market demand that does not materialize, the facilities may not operate as planned or may not be used at all. Caliber may rely on estimates of proved reserves in deciding to construct new pipelines and facilities, and those estimates may prove to be inaccurate because of the numerous uncertainties inherent in estimating quantities of proved reserves. As a result, new infrastructure projects may be unprofitable.
We do not insure against all potential operating risk. We might incur substantial losses from, and be subject to substantial liability claims for, uninsured or underinsured risks related to our operations.
Our operations are subject to the risks normally incident to the operation and development of oil and natural gas properties, the drilling of oil and natural gas wells, hydraulic fracturing and the provision of related services including:
environmental hazards, such as uncontrollable flows of oil, natural gas, brine, well fluids, toxic gas or other substances into the environment, including groundwater;
abnormally pressured formations;
fires and explosions;
personal injuries and death;
regulatory investigations and penalties;
well blowouts;
pipeline failures and ruptures;
casing collapse;
mechanical and operational problems that affect production; and
natural disasters.
We do not maintain insurance against all such risks. We generally elect not to obtain insurance if we believe that the cost of available insurance is excessive relative to the risks presented. In addition, pollution and environmental risks generally are not fully insurable. Also, certain risk events may not be detected or detectable within the period during which notice must be provided under the applicable insurance policy. Losses and liabilities arising from uninsured and underinsured events or in amounts in excess of existing insurance coverage could have a material adverse effect on our business, financial condition or results of operations.
We may have difficulty managing growth in our business, which could adversely affect our business plan, financial condition and results of operations.
Growth in accordance with our long-term business plan, if achieved, will place a significant strain on our financial, accounting, technical, operational and management resources. As we expand our activities and increase the number of projects we are evaluating or in which we participate, there will be additional demands on these resources. Our vertical integration strategy effectively increases the variety of these projects, which adds complexity and may require additional resources. The failure to continue to upgrade our technical, administrative, operating and financial control systems or the occurrence of unexpected expansion difficulties, including the failure to recruit and retain experienced managers, geologists, engineers and other professionals in the oil and natural gas industry, could have a material adverse effect on our business, financial condition and results of operations and our ability to timely execute our business plan.
Our lack of geographic diversification may increase the risk of an investment in us.
Our current business focus is on the oil and natural gas industry in a limited number of properties in North Dakota and Montana. RockPile and Caliber also focus on the Williston Basin areas of those states. Larger companies have the ability to manage their risk by diversification. However, we currently lack diversification in terms of the geographic scope of our business. As a result, we will likely be impacted more acutely by factors affecting our industry or the regions in which we operate than we would if our business were more diversified, and this may increase our risk profile.
We face strong competition from other companies.
We encounter competition from other companies involved in the oil and natural gas industry in all areas of our operations, including the acquisition of exploratory prospects and proven properties. Our competitors include major integrated oil and natural gas companies and numerous independent oil and natural gas companies. Many of our competitors have been engaged in the oil and natural gas business much longer than we have and possess substantially larger operating staffs and greater capital resources than we do. These companies may be able to pay more for exploratory projects and productive oil and natural gas properties and may be able to define, evaluate, bid for and purchase a greater number of properties and prospects than our financial or human resources permit. In addition, these companies may be able to expend greater resources on the existing and changing technologies that we believe are and will be increasingly important to attaining success in the industry, particularly in the Bakken Shale and Three Forks formations on which we focus. Such competitors may also be in a better position to secure oilfield services and equipment on a timelier basis or on more favorable terms. We may not be able to conduct our operations, evaluate and select suitable properties, and consummate transactions successfully in this highly competitive environment, which could adversely affect our business, financial condition, results of operations and prospects. Similarly, the market for RockPile’s services and products is characterized by continual technological developments to provide better and more reliable performance and services. If RockPile is not able to design, develop, and produce commercially competitive products, and to implement commercially competitive services in a timely manner in response to changes in technology, its business could be materially and adversely affected.
Seasonal weather conditions and other factors could adversely affect our ability to conduct drilling and completion activities.
Our operations could be adversely affected by weather conditions. In the Williston Basin, drilling and other oil and natural gas activities cannot be conducted as effectively during the winter months. Severe weather conditions limit and may temporarily halt operations during such conditions. Wet weather and spring thaw may make the ground unstable. Consequently, municipalities and state transportation departments enforce road bans that restrict the movement of rigs and other heavy equipment during certain periods, thereby reducing activity levels. Similarly, any drought or other condition resulting in a shortage or the unavailability of adequate supplies of water would impair our ability to conduct hydraulic fracturing operations. These constraints, and resulting shortages or cost increases, could delay or temporarily halt our oil and natural gas operations and materially increase our operating and capital costs, which could have a material adverse effect on our business, financial condition and results of operations.
If we are unable to retain or recruit qualified managerial, operations and field personnel, we may not be able to continue our operations.
Our success depends to a significant extent upon the continued services of our directors and officers and that of key managerial, operational, land, finance, legal and accounting staff. In order to successfully implement and manage our business plan, we will be dependent upon, among other things, successfully recruiting qualified managerial and field personnel having experience in required aspects of our business. Competition for qualified individuals is intense. We cannot assure you that we will be able to retain existing employees or that we will be able to find, attract and retain qualified personnel on acceptable terms.
We have restated our financial statements in the past and may be required to do so in the future.
We restated certain financial information in fiscal years 2013 and 2014 as a result of identifying distinct material weakness in our internal controls. In fiscal year 2014, we identified a material weakness in our controls over the accounting for equity investment derivatives. Our control for the accounting for equity investment derivatives was not designed to consider all of the relevant accounting literature applicable to our Caliber trigger units and warrants. This material weakness resulted in a material error in our accounting for equity investment derivatives, and we restated our previously issued quarterly financial statements for the three months ended October 31, 2013. We have implemented system and procedural changes to prevent previously identified material weaknesses from recurring. However, our vertical integration strategy and midstream joint venture investment create certain accounting issues relating to the relationship of our various businesses that are complex, increasing the risk that we may have to restate or correct financial disclosures in the future. If other deficiencies in our internal controls arise in the future, we may be unable to provide holders of our securities with required financial information in a timely and reliable manner.
The preparation of financial statements in accordance with GAAP involves making estimates, judgments, interpretations and assumptions that affect reported amounts of assets, liabilities, revenues, expenses and income. These estimates, judgments, interpretations and assumptions are often inherently imprecise or uncertain, and any necessary revisions to prior estimates, judgments, interpretations or assumptions could lead to further restatements. Any such restatement or correction may be highly time consuming, may require substantial attention from management and significant accounting costs, may result in adverse regulatory actions by the SEC or NYSE MKT, may result in stockholder litigation, may cause us to fail to meet our reporting obligations, and may cause investors to lose confidence in our reported financial information, leading to a decline in our stock price.
Certain U.S. federal income tax deductions currently available with respect to oil and natural gas exploration and development may be eliminated as a result of future legislation.
President Obama has proposed changes to U.S. tax laws that would eliminate certain key U.S. federal income tax incentives currently available to oil and natural gas exploration and production companies, including by (i) repealing the percentage depletion allowance for oil and natural gas wells, (ii) eliminating current deductions for intangible drilling and development costs, (iii) eliminating the deduction for certain domestic production activities, and (iv) extending the amortization period for certain geological and geophysical expenditures. It is unclear whether these or similar changes will be enacted and, if enacted, how soon any such changes could become effective. The passage of this legislation or any similar changes in U.S. federal income tax laws could increase the cost of exploration and development of natural gas
and oil resources. Any such changes could have an adverse effect on our financial position, results of operations and cash flows.
Our business could be negatively impacted by cybersecurity risks and other disruptions.
As an oil and natural gas producer, we face various security threats, including possible attempts by third parties to gain unauthorized access to sensitive information, or to render data or systems unusable, through unauthorized computer access, threats to the safety of our employees, and threats to the security of our infrastructure or third-party facilities and infrastructure, such as processing plants and pipelines. Our business partners, including vendors, service providers, operating partners, purchasers of our production, and financial institutions, face similar threats, including with respect to sensitive information of ours. There can be no assurance that the procedures and controls we or our business partners use to monitor these threats and mitigate exposure to them will be sufficient in preventing them from materializing. If any of these events were to materialize, they could lead to losses of sensitive information, critical infrastructure, personnel or capabilities essential to our operations and could have a material adverse effect on our reputation, financial condition, results of operations, and cash flows.
Aboriginal claims could have an adverse effect on us and our operations.
Aboriginal peoples have claimed aboriginal title and rights to portions of Montana where we operate. We are not aware that any claims have been made in respect to our property or assets in Montana or North Dakota. However, if a claim arose and was successful, it could have an adverse effect on us and our business operations, financial conditions or prospects.
Certain stockholders have significant influence on our major corporate decisions, including control over some matters that require stockholder approval, and could take actions that could be adverse to stockholders.
In connection with the issuance and sale to NGP Triangle Holdings, LLC (“NGP”) in July 2012 of our 5% convertible note with an initial principal amount of $120.0 million (the “Convertible Note”), we entered into an Investment Agreement with NGP and its parent company. Pursuant to the Investment Agreement, NGP is entitled to designate one director to our board of directors until the occurrence of a “Termination Event” (as defined in the Investment Agreement). The Investment Agreement further provides that, for so long as at least 50% of the original principal amount is outstanding and held by NGP, we will not take certain actions without the prior written consent of NGP. In addition, pursuant to the Convertible Note, for so long as at least 50% of the original principal amount is outstanding and held by NGP, we have agreed to (i) obtain the prior written consent of NGP before submitting certain resolutions or matters to a vote of the stockholders, or (ii) require the approval of stockholders as would be required to approve such resolution or matter if the then-outstanding Convertible Note held by NGP had been converted into shares of common stock immediately prior to the record date for such meeting of stockholders and NGP had voted all of such shares of common stock against such resolution or matter. The Convertible Note is convertible into shares of common stock at an initial conversion price of $8.00 per share, which, based on the initial principal amount, would allow the Convertible Note to be converted into 15,000,000 shares of common stock plus any shares issuable upon the conversion of accrued interest, which is paid-in-kind by adding to the principal balance on a quarterly basis.
In March 2013, we sold to two affiliates of NGP an aggregate of 9,300,000 shares of our common stock in a private placement (the “NGP Private Placement”). In connection with the NGP Private Placement, we entered into an amendment to the Investment Agreement to modify the definition of “Termination Event,” thereby strengthening NGP’s board seat designation right. As of April 1, 2015, NGP’s affiliates collectively held (i) 9,300,000 shares of our outstanding common stock and (ii) the Convertible Note with an outstanding principal balance of approximately $135.9 million. If NGP had fully converted the Convertible Note on April 1, 2015, NGP and its affiliates would have collectively held approximately 29% of our outstanding shares of common stock on that date. As a result of the Investment Agreement, as amended, and NGP’s current and potential holdings of our common stock, NGP has significant influence over us, our management, our policies, and certain matters requiring stockholder approval.
Further, in August 2013, we sold to ActOil Bakken, LLC (“ActOil”) 11,350,000 shares of our common stock in a private placement. As of April 1, 2015, ActOil held approximately 15% of our outstanding shares of common stock.
The interests of NGP and its affiliates, including in NGP’s capacity as a creditor, and ActOil may differ from the interests of our other stockholders, and the ability of NGP and ActOil to influence certain of our major corporate decisions
may harm the market price of our common stock by delaying, deferring or preventing transactions that are in the best interest of all stockholders or discouraging third-party investors.
Our limited partner interest in Caliber may be diluted.
In October 2012, a wholly-owned subsidiary of ours participated in the formation of Caliber, a joint venture with FREIF to provide crude oil, natural gas, and water transportation and related services to us and third-parties primarily in the Williston Basin. In connection with its investment in Caliber, our subsidiary received an initial 30% percent limited partner interest, as well as warrants to purchase additional limited partner interests at specified prices, trigger units, and trigger warrants. Based on initial anticipated funding commitments by the joint venture partners, full exercise and vesting of our warrants, trigger units, and trigger warrants would cause our ownership to increase to a 50% limited partner interest.
In September 2014, FREIF committed to providing an anticipated additional $80.0 million to Caliber in return for 8,000,000 limited partner units. The associated amendment to the joint venture agreement resulted in our 4,000,000 trigger units vesting and converting to limited partner units. FREIF and our subsidiary received the 8,000,000 and 4,000,000 limited partner units, respectively, on June 30, 2014. Following the conversion of our 4,000,000 trigger units and the issuance of 8,000,000 limited partner units to our joint venture partner, our limited partner interest in Caliber increased to 32%.
In February 2015, FREIF contributed an additional $34.0 million to Caliber in exchange for 2,720,000 limited partner units, which diluted our limited partner interest to 28.3%. In conjunction with the contribution, we received warrants to purchase an additional 3,626,667 limited partner units, and FREIF received warrants to purchase an additional 906,667 limited partner units. On a fully-diluted basis, assuming the exercise of all outstanding warrants and no further capital contributions, we and FREIF would each hold a 50% percent limited partner interest in Caliber.
We will be unable to increase our limited partner interest above 28.3% absent a cashless exercise of our warrants or a direct capital outlay to exercise our warrants or commit additional partnership approved capital. Further, if FREIF makes a partnership approved capital contribution and we choose not to invest additional capital in the joint venture, or if FREIF exercises its warrants and we do not exercise our warrants, we would be diluted below our 28.3% limited partner interest.
We do not control Caliber.
Caliber is managed and governed by its general partner, Caliber Midstream GP, LLC, of which FREIF and Triangle each own a 50% non-economic interest and share governance equally. Because we do not hold a controlling interest in Caliber, we do not have the ability to direct the activities of Caliber that most significantly impact Caliber’s growth and economic performance. If we and the other general partner disagree on significant matters relating to Caliber, such an impasse could adversely affects Caliber’s prospects and our investment therein.
Our derivative activities could result in financial losses or reduced income, or could limit our potential gains from increases in prices.
We use derivatives for a portion of our crude oil production to reduce exposure to adverse fluctuations in prices of crude oil and to achieve more predictable cash flows. These arrangements expose us to the risk of financial loss in some circumstances, including when sales are different than expected, when there is a change in the expected differential between the underlying price in the derivative agreement and actual prices that we receive, or if the counterparty to the derivative contract were to default on its contractual obligations.
In addition, derivative arrangements may limit the benefit from increases in the price for crude oil, and they may also require the use of our resources to meet cash margin requirements. Since we do not designate our derivatives as hedges, we do not currently qualify for use of hedge accounting; therefore, changes in the fair value of derivatives are recorded in our statements of operations, and our net income is subject to greater volatility than it would be if our derivative instruments qualified for hedge accounting. For instance, if the price of crude oil rises significantly, it could result in significant non-cash charges each quarter, which could have a material negative effect on our net income.
Additionally, the Dodd-Frank Wall Street Reform and Consumer Protection Act, or the Dodd-Frank Act, among other things, imposes restrictions on the use and trading of certain derivatives, including energy derivatives. The nature
and scope of those restrictions is in the process of being determined in significant part through implementing regulations adopted by the SEC, the Commodities Futures Trading Commission and other regulators. If, as a result of the Dodd-Frank Act or its implementing regulations, capital or margin requirements or other limitations relating to our commodity derivative activities are imposed, this could have an adverse effect on our ability to implement our hedging strategy. In particular, a requirement to post cash collateral in connection with our derivative positions would likely make it impracticable to implement our current hedging strategy. In addition, requirements and limitations imposed on our derivative counterparties could increase the costs of pursuing our hedging strategy.
Unrelated to our hedging activities with respect to crude oil prices, we hold warrants in Caliber that are classified as derivatives. For so long as such warrants remain outstanding, we will be required to estimate their fair market value on a quarterly basis. We currently use a modified market approach and Black-Scholes option pricing model to value the warrants. The associated model is based on several assumptions about future events. While we believe that our model and underlying assumptions are reasonable, there can be no assurance that the assumptions will ultimately prove to be accurate or that our model is the best model for valuing the warrants. If the model and underlying assumptions are flawed, then our accounting for the warrants may not reflect their true value.
Most of our commodity derivatives expire by December 31, 2015.
As of January 31, 2015, we had costless collar commodity derivative contracts for 4,356 Bbl/d with a weighted average put strike price of $86.85 and a weighted average call strike price of $98.63 (NYMEX). These contracts expire by December 31, 2015. Subsequent to January 31, 2015, the Company entered into crude oil swaps at a weighted average price of $60.07 for 1,500 Bbl/d (NYMEX), effective for the period from October 1, 2015 through December 31, 2016, and crude oil swaps at a weighted average price of $60.30 for 500 Bbl/d (NYMEX), effective for the period from January 1, 2016 through December 31, 2016. Once our costless collar contracts expire, our commodity derivatives may be limited to those contracts that we have entered into in a depressed pricing environment. As such, our crude oil production and sales for fiscal year 2017 and beyond may be largely unhedged, or hedged at depressed prices, which will expose us to continued volatility in crude oil market prices, whether favorable or unfavorable.
Risks Relating to Our Common Stock
The market price for our common stock may be highly volatile.
The market price for our common stock may be highly volatile and could be subject to wide fluctuations. Some of the factors that could negatively affect such share price include:
changes in oil and natural gas prices;
actual or anticipated fluctuations in our quarterly results of operations;
liquidity;
sales of common stock by our stockholders, directors, and officers;
changes in our cash flows from operations or earnings estimates;
publication of research reports about us or the oil and natural gas exploration and production industry generally;
increases in market interest rates which may increase our cost of capital;
changes in applicable laws or regulations, court rulings, and enforcement and legal actions;
changes in market valuations of similar companies;
adverse market reaction to any indebtedness we incur in the future;
additions or departures of key management personnel;
actions by our stockholders;
commencement of or involvement in litigation;
news reports relating to trends, concerns, technological or competitive developments, regulatory changes and other related issues in our industry, including adverse public sentiment regarding hydraulic fracturing;
speculation in the press or investment community regarding our business;
general market and economic conditions; and
domestic and international economic, legal and regulatory factors unrelated to our performance.
Financial markets have recently experienced significant price and volume fluctuations that have affected the market prices of securities that have, in many cases, been unrelated to the operating performance, underlying asset values or
prospects of the companies issuing those securities. Accordingly, the market price of our common stock may decline even if our results of operations, underlying asset values or prospects improve or remain consistent.
Future sales or other issuances of our common stock could depress the market for our common stock.
We may seek to raise additional funds through one or more public or private offerings of our common stock, in amounts and at prices and terms to be determined at the time of the offering. We may also use our common stock as consideration to make acquisitions, including acquisitions of additional leasehold interests. Any issuances of large quantities of our common stock could reduce the price of our common stock. In addition, to the extent that we issue equity securities to fund our business plan, our existing stockholders’ ownership will be diluted.
Issuances, or the availability for sale, of substantial amounts of our common stock could adversely affect the value of our common stock.
No prediction can be made as to the effect, if any, that future issuances of our common stock, or the availability of common stock for future sales, will have on the market price of our common stock. Sales of substantial amounts of our common stock in the public market and the availability of shares for future sale, including by one or more of our significant stockholders or shares of our common stock issuable upon exercise of outstanding options to acquire shares of our common stock, could adversely affect the prevailing market price of our common stock. This in turn would adversely affect the fair value of our common stock and could impair our future ability to raise capital through an offering of our equity securities.
The potential future issuance of preferred stock may not enhance stockholder value.
Our Certificate of Incorporation authorizes our board of directors to issue preferred stock without stockholder approval. Shares of preferred stock could be issued in a financing in which investors purchase preferred stock with rights, preferences and privileges that may be superior to those of our common stock. We could also use the preferred stock for potential strategic transactions, including, among other things, acquisitions, strategic partnerships, joint ventures, restructurings, business combinations and investments. We cannot provide assurances that any such transactions will be consummated on favorable terms or at all, that they will enhance stockholder value, or that they will not adversely affect our business or the trading price of the common stock. Further, the existence of outstanding preferred stock may make us a less attractive candidate for third party acquirers.
In the past, we have not paid dividends on our common stock and do not anticipate paying dividends on our common stock in the foreseeable future.
In the past, we have not paid dividends on our common stock and do not expect to declare or pay any cash or other dividends in the foreseeable future on our common stock, as we intend to use cash flows generated by operations to develop our business. Any future determination to pay cash dividends will be at the discretion of our board of directors and will be dependent upon our financial condition, results of operations, capital requirements, limits imposed by our debt agreements, and such other factors as our board of directors deems relevant.
Anti-takeover provisions could make a third-party acquisition of us difficult.
We are subject to Section 203 of the Delaware General Corporation Law, which generally prohibits certain business combination transactions between a corporation and an “interested stockholder” within three years of the time such stockholder became an interested stockholder, absent, in most cases, board or stockholder approval. An “interested stockholder” is any person who, together with affiliates and associates, is the owner of 15% or more of the outstanding voting stock of the corporation, and the term “business combination” encompasses a wide variety of transactions with or caused by an interested stockholder, including mergers, asset sales and other transactions in which the interested stockholder receives a benefit on other than a pro rata basis with other stockholders. Although a corporation can opt out of Section 203 in its certificate of incorporation, we have not done so. Section 203 may have an anti-takeover effect with respect to transactions not approved in advance by our board of directors, including by discouraging takeover attempts that might result in a premium being paid over the then-current market price of our common stock and that might be supported by a majority of our stockholders.
ITEM 1B. UNRESOLVED STAFF COMMENTS
None.
ITEM 2. PROPERTIES
The information required by Item 2. Properties is contained in Item 1. Business of this annual report.
ITEM 3. LEGAL PROCEEDINGS
From time to time, we may become involved in various lawsuits and legal proceedings which arise in the ordinary course of business. Litigation is subject to inherent uncertainties, and an adverse result in these or other matters may arise from time to time that may harm our business. We are currently not aware of any legal proceedings or claims that we believe will have, individually or in the aggregate, a material adverse effect on our business, financial condition or operating results.
ITEM 4. MINE SAFETY DISCLOSURES
Not applicable.
PART II
ITEM 5. MARKET FOR REGISTRANT’S COMMON EQUITY, RELATED STOCKHOLDER MATTERS AND ISSUER PURCHASES OF EQUITY SECURITIES
Market Information
Our common stock is traded on the NYSE MKT under the symbol “TPLM.” The table below sets forth the intraday high and low sales prices for our common stock in each quarter of the last two fiscal years:
| | | | | | |
| | Fiscal Year 2015 |
| | High | | Low |
February 1, 2014 to April 30, 2014 | | $ | 10.10 | | $ | 6.96 |
May 1, 2014 to July 31, 2014 | | $ | 12.48 | | $ | 9.05 |
August 1, 2014 to October 31, 2014 | | $ | 12.14 | | $ | 6.75 |
November 1, 2014 to January 31, 2015 | | $ | 8.10 | | $ | 3.10 |
| | | | | | |
| | Fiscal Year 2014 |
| | High | | Low |
February 1, 2013 to April 30, 2013 | | $ | 7.32 | | $ | 4.85 |
May 1, 2013 to July 31, 2013 | | $ | 7.93 | | $ | 5.10 |
August 1, 2013 to October 31, 2013 | | $ | 11.66 | | $ | 6.37 |
November 1, 2013 to January 31, 2014 | | $ | 11.36 | | $ | 7.46 |
Holders
Our 75,288,381 shares of common stock outstanding at April 1, 2015 were held by 17 stockholders of record. The number of holders was determined from the records of our transfer agent and does not include the thousands of beneficial owners of common stock whose shares are held in the names of various security brokers, dealers, and registered clearing agencies. The transfer agent of our common stock is Continental Stock Transfer & Trust Company, 17 Battery Place, New York, New York 10004.
Dividends
We have not paid any cash dividends in the past and we do not anticipate paying any cash dividends to stockholders in the foreseeable future. Any future determination to pay cash dividends will be at the discretion of our board of directors and will be dependent upon our financial condition, results of operations and capital requirements, limitations imposed by applicable law and the terms of our debt agreements, and such other factors as our board of directors deems relevant.
Sales of Unregistered Equity Securities
We had no sales of unregistered equity securities during fiscal year 2015.
Purchase of Equity Securities by the Issuer and Affiliated Purchasers
The following table summarizes our purchases of shares of our common stock during the fiscal quarter ended January 31, 2015:
| | | | | | | | | | |
| | | | | | | Total number of | | Maximum number | |
| | | | | | | shares purchased | | of shares that may | |
| | Total Number | | Average | | as part of publicly | | yet be purchased | |
| | of Shares | | Price Paid | | announced plans | | under the plans | |
| | Purchased | | Per Share | | (2) | | at month end | |
November 1, 2014 to November 30, 2014 | | 2,208,631 | | $ | 6.71 | | 2,201,700 | | 9,038,876 | (3) |
December 1, 2014 to December 31, 2014 | | 4,311,480 | | | 4.03 | | 4,298,300 | | 4,949,393 | (4) |
January 1, 2015 to January 31, 2015 | | 19,484 | | | 4.78 | | — | | 4,949,393 | |
| | 6,539,595 | (1) | $ | 4.94 | | 6,500,000 | | | |
| (1) | | Includes 39,595 shares of common stock surrendered by certain employees to the Company in satisfaction of their tax liability upon the vesting of their restricted stock units. The number of shares of common stock actually issued to such employees upon the vesting of their restricted stock units was net of the shares surrendered in satisfaction of their tax liability. The withheld shares are not issued or considered common stock repurchased under the repurchase program described below. |
| (2) | | As reported in Current Reports on Form 8-K filed with the SEC on September 11, 2014 and October 17, 2014, the Company’s Board of Directors approved a program authorizing the repurchase of outstanding shares of the Company’s common stock in amounts equal to the aggregate of (i) $25.0 million of the Company’s common stock (“Tranche 1”), (ii) up to the number of shares of common stock authorized for issuance under the Company’s 2014 Equity Incentive Plan and its CEO Stand-Alone Stock Option Agreement (“Tranche 2”), and (iii) up to the number of shares potentially issuable, at any given time, pursuant to the paid-in-kind interest accrued on the Convertible Note (“Tranche 3”). Shares repurchased under the program may be repurchased from time to time, in amounts and at prices that the Company deems appropriate, subject to market and business conditions and other considerations. The repurchase program may be executed using open market purchases pursuant to Rule 10b-18 under the Exchange Act, pursuant to a Rule 10b5-1 plan, in privately negotiated agreements, or other transactions. The repurchase program has no expiration date and may be suspended or discontinued at any time without prior notice. As of January 31, 2015, an aggregate of 11,431,744 shares of the Company’s common stock have been repurchased under the program. |
| (3) | | Includes the number of shares remaining available for repurchase pursuant to Tranche 2, plus the number of shares available for repurchase pursuant to Tranche 3 based on the paid-in-kind interest accrued on the Convertible Note as of September 30, 2014. All shares authorized for repurchase under Tranche 1, as well as a portion of the shares authorized for repurchase under Tranche 2, were exhausted during the fiscal quarter ended October 31, 2014. |
| (4) | | Includes an additional 208,817 shares potentially issuable pursuant to the paid-in-kind interest added to the principal balance of the Convertible Note on December 31, 2014. |
Performance Graph
The following graph compares our common stock’s performance with the performance of the Standard & Poor’s 500 Stock Index and the Dow Jones U.S. Oil and Gas Index for the period beginning January 31, 2010 through January 31, 2015. The graph assumes the value of the investment in our common stock and in each index was $100 on January 31, 2010 and that any dividends were reinvested. The common stock performance shown on the graph below is not indicative of future price performance. The information provided in this section is being furnished to, and not filed with, the SEC. As such, this information is neither subject to Regulation 14A or 14C nor to the liabilities of Section 18 of the Exchange Act.
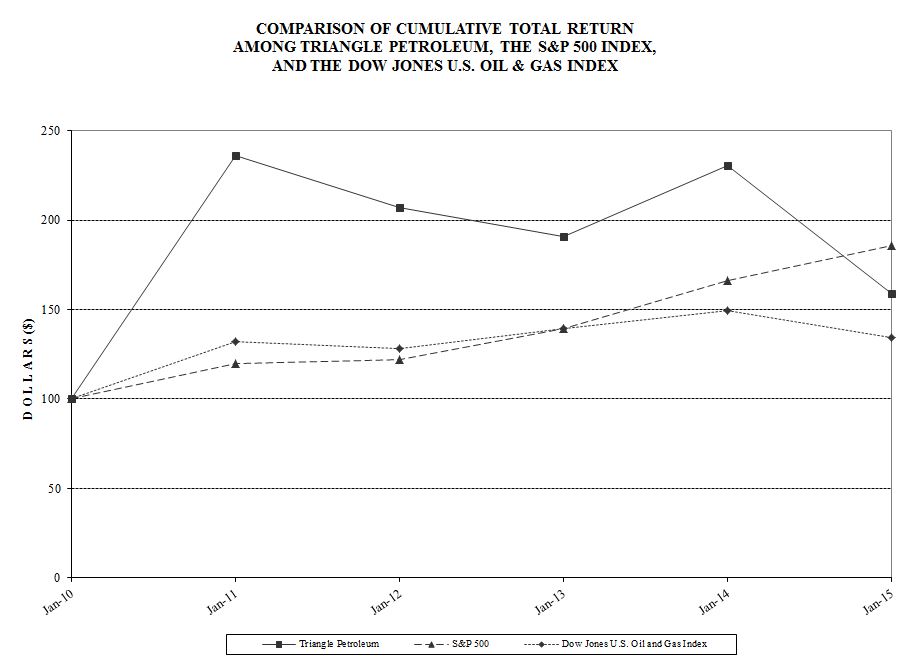
ITEM 6. SELECTED FINANCIAL DATA
The following table sets forth selected consolidated financial data as of and for the years ended January 31, 2011 through January 31, 2015. The data as of and for the years ended January 31 for the respective years was derived from our historical consolidated financial statements and the accompanying notes included elsewhere in this annual report on Form 10-K or in our prior annual reports on Form 10-K, as applicable.
The selected financial data set forth below should be read in conjunction with the consolidated financial statements and accompanying notes thereto provided in Item 8 of this Report.
| | | | | | | | | | | | | | | |
| | For the Years Ended January 31, |
(in thousands, except per share data) | | 2015 | | 2014 | | 2013 | | 2012 | | 2011 |
Operating results: | | | | | | | | | | | | | | | |
Oil, natural gas, and natural gas liquids sales | | $ | 284,502 | | $ | 160,548 | | $ | 39,614 | | $ | 8,136 | | $ | 564 |
Oilfield services | | | 288,453 | | | 98,199 | | | 20,747 | | | — | | | — |
Total revenue | | $ | 572,955 | | $ | 258,747 | | $ | 60,361 | | $ | 8,136 | | $ | 564 |
| | | | | | | | | | | | | | | |
Total operating expenses | | $ | 477,572 | | $ | 211,785 | | $ | 68,622 | | $ | 33,111 | | $ | 20,900 |
| | | | | | | | | | | | | | | |
Net income (loss) attributable to common stockholders | | $ | 93,397 | | $ | 73,480 | | $ | (13,760) | | $ | (24,278) | | $ | (20,277) |
| | | | | | | | | | | | | | | |
Income (loss) per share to common stockholders: | | | | | | | | | | | | | | | |
Basic | | $ | 1.12 | | $ | 1.07 | | $ | (0.31) | | $ | (0.60) | | $ | (1.63) |
Diluted | | $ | 0.97 | | $ | 0.91 | | $ | (0.31) | | $ | (0.60) | | $ | (1.63) |
| | | | | | | | | | | | | | | |
Total assets | | $ | 1,654,870 | | $ | 1,027,522 | | $ | 428,321 | | $ | 229,845 | | $ | 82,031 |
Long-term obligations | | $ | 838,010 | | $ | 345,054 | | $ | 148,788 | | $ | 83 | | $ | 1,404 |
| | | | | | | | | | | | | | | |
Cash flows data: | | | | | | | | | | | | | | | |
Net cash provided by (used in) operating activities | | $ | 200,817 | | $ | 82,436 | | $ | 2,764 | | $ | (12,766) | | $ | (3,541) |
Net cash used in investing activities | | $ | (577,019) | | $ | (455,566) | | $ | (179,712) | | $ | (111,046) | | $ | (16,100) |
Net cash provided by financing activities | | $ | 362,323 | | $ | 421,763 | | $ | 141,250 | | $ | 134,854 | | $ | 72,534 |
| | | | | | | | | | | | | | | |
Proved reserves: | | | | | | | | | | | | | | | |
Oil (Mbbls) | | | 48,091 | | | 31,916 | | | 12,540 | | | 1,365 | | | 1,236 |
Natural gas (MMcf) | | | 40,185 | | | 26,504 | | | 12,585 | | | 674 | | | — |
NGL (Mbbls) | | | 4,081 | | | 3,981 | | | — | | | — | | | — |
Total equivalent (MBoe) | | | 58,870 | | | 40,314 | | | 14,637 | | | 1,477 | | | 1,236 |
ITEM 7. MANAGEMENT’S DISCUSSION AND ANALYSIS OF FINANCIAL CONDITION AND RESULTS OF OPERATIONS
The following discussion is intended to assist in understanding our results of operations and our current financial condition. Our consolidated financial statements and the accompanying notes included elsewhere in this annual report contain additional information that should be referred to when reviewing this material.
Statements in this discussion may be forward-looking. These forward-looking statements involve risks and uncertainties that could cause actual results to differ from those expressed. We encourage you to revisit the Forward-Looking Statements section of this annual report.
Overview
We are an independent energy holding company with three principal lines of business: oil and natural gas exploration, development and production; oilfield services; and midstream services. We conduct these activities primarily in the Williston Basin of North Dakota and Montana through TUSA and RockPile, the Company’s two principal wholly-owned subsidiaries, and Caliber, our joint venture with FREIF.
Summary of Fiscal Year 2015 Highlights
During fiscal year 2015, we accomplished the following:
| · | | Production volumes totaled 4,176 Mboe for the year ended January 31, 2015, compared to 1,929 Mboe for the year ended January 31, 2014, an increase of 116%. |
| · | | Oil, natural gas and natural gas liquids sales in the year ended January 31, 2015 were $284.5 million compared to $160.5 million for the year ended January 31, 2014, an increase of 77%. |
| · | | Oilfield services revenue in fiscal year 2015 was $288.5 million compared to $98.2 million for fiscal year 2014 as RockPile increased its sales to third party customers. The total gross profit contribution from our oilfield services operations grew to $56.1 million for fiscal year 2015, as compared to $10.5 million for fiscal year 2014 and oilfield services gross profit percentages improved to 19.4% for fiscal year 2015 compared to 10.7% for fiscal year 2014. |
| · | | Income from operations was $95.4 million for the year ended January 31, 2015, compared to $47.0 million for the year ended January 31, 2014. |
| · | | Cash flows provided by operating activities were $200.8 million for the year ended January 31, 2015 compared to $82.4 million for the year ended January 31, 2014. |
| · | | TUSA spud 62 gross (43.9 net) operated wells and completed 49 gross (34.5 net) operated wells during the year ended January 31, 2015. |
| · | | TUSA acquired approximately 41,100 net acres in Williams County, North Dakota and Sheridan and Roosevelt Counties, Montana for approximately $90.4 million in June 2014. |
| · | | TUSA increased proved reserves from approximately 40,314 Mboe at January 31, 2014 to 58,870 Mboe at January 31, 2015, an increase of approximately 46%. |
| · | | TUSA issued $450.0 million aggregate principal amount of 6.75% Senior Notes due 2022 of which $429.5 was outstanding at January 31, 2015. |
| · | | TUSA and RockPile amended their credit facilities to provide for additional borrowing capacity and operational flexibility. |
| · | | RockPile completed 49 TUSA wells and 99 third-party wells in fiscal year 2015, as compared to 31 TUSA wells and 50 third-party wells in fiscal year 2014. |
| · | | RockPile deployed into service its third and fourth hydraulic fracturing spreads. |
| · | | Caliber flowed crude oil through its Alexander Market Center, providing stabilization as well as additional takeaway optionality via pipeline and truck to rail (both inbound and outbound loading services). |
Summary of Operating Results
The following table reflects the components of our production volumes, average realized prices, oil, natural gas and natural gas liquids revenues, and operating expenses for the periods indicated. No pro forma adjustments have been
made for the acquisitions and divestitures of oil and natural gas properties, which will affect the comparability of the data below. The information set forth below is not necessarily indicative of future results.
| | | | | | | | | |
| | For the Years Ended January 31, |
Oil and Natural Gas Operations | | 2015 | | 2014 | | 2013 |
Production volumes: | | | | | | | | | |
Crude oil (Mbbls) | | | 3,511 | | | 1,754 | | | 452 |
Natural gas (MMcf) | | | 2,429 | | | 626 | | | 188 |
Natural gas liquids (Mbbls) | | | 260 | | | 70 | | | 5 |
Total barrels of oil equivalent (Mboe) | | | 4,176 | | | 1,929 | | | 488 |
| | | | | | | | | |
Average daily production volumes (Boe/d) | | | 11,441 | | | 5,286 | | | 1,334 |
| | | | | | | | | |
Average realized prices: | | | | | | | | | |
Crude oil ($ per Bbl) | | $ | 75.00 | | $ | 88.07 | | $ | 85.29 |
Natural gas ($ per Mcf) | | $ | 5.27 | | $ | 4.39 | | $ | 4.78 |
Natural gas liquids ($ per Bbl) | | $ | 32.26 | | $ | 46.72 | | $ | 36.01 |
Total average realized price ($ per Boe) | | $ | 68.13 | | $ | 83.22 | | $ | 81.15 |
| | | | | | | | | |
Oil, natural gas and natural gas liquids revenues (in thousands): | | | | | | | | | |
Crude oil | | $ | 263,310 | | $ | 154,507 | | $ | 38,533 |
Natural gas | | | 12,804 | | | 2,748 | | | 899 |
Natural gas liquids | | | 8,388 | | | 3,293 | | | 182 |
Total oil, natural gas and natural gas liquids revenues | | $ | 284,502 | | $ | 160,548 | | $ | 39,614 |
| | | | | | | | | |
Operating expenses (in thousands): | | | | | | | | | |
Lease operating expenses | | $ | 25,703 | | $ | 14,454 | | $ | 3,566 |
Gathering, transportation and processing | | | 18,520 | | | 4,302 | | | 150 |
Production taxes | | | 29,774 | | | 18,006 | | | 4,492 |
Oil and natural gas amortization expense | | | 106,903 | | | 50,991 | | | 13,548 |
Accretion of asset retirement obligations | | | 167 | | | 56 | | | 184 |
Total operating expenses | | $ | 181,067 | | $ | 87,809 | | $ | 21,940 |
| | | | | | | | | |
Operating expenses per Boe: | | | | | | | | | |
Lease operating expenses | | $ | 6.15 | | $ | 7.49 | | $ | 7.31 |
Gathering, transportation and processing | | $ | 4.43 | | $ | 2.23 | | $ | 0.31 |
Production taxes | | $ | 7.13 | | $ | 9.33 | | $ | 9.20 |
Oil and natural gas amortization expense | | $ | 25.60 | | $ | 26.43 | | $ | 27.75 |
Results of operations for the year ended January 31, 2015 compared to the year ended January 31, 2014
Oil, Natural Gas and Natural Gas Liquids Revenues. Revenues from oil, natural gas and natural gas liquids production for the year ended January 31, 2015 increased 77% to $284.5 million from $160.5 million for the year ended January 31, 2014, primarily due to the significant increase in oil production from new wells and the acquisition of producing wells in the third quarter of fiscal year 2014 and the second quarter of fiscal year 2015, partially offset by normal production declines and pricing declines in oil and natural gas liquids. Average realized oil prices for the year ended January, 31 2015 decreased to $75.00 per barrel from $88.07 per barrel for the year ended January 31, 2014. In addition, during the year ended January 31, 2015, we experienced increases in both our volumes of natural gas and natural gas liquids sold as a result of expanding gathering, transportation and processing infrastructure.
Lease Operating Expenses. Lease operating expense decreased to $6.15 per Boe for the year ended January 31, 2015 from $7.49 per Boe for the year ended January 31, 2014. The cost decrease is primarily the result of efficiencies generated from operating more wells with labor and power costs spread across increased production.
Gathering, Transportation and Processing. Gathering, transportation and processing (“GTP”) expenses increased to $4.43 per Boe for the year ended January 31, 2015 from $2.23 per Boe for the year ended January 31, 2014, primarily
because in the third quarter of fiscal year 2014 we commenced gathering, transporting and processing significant amounts of our natural gas production that had previously been flared. Going forward, we expect our GTP costs to continue to increase (along with our revenues) as Caliber’s and others’ crude oil and natural gas gathering, transportation and processing infrastructure becomes available for operated wells, allowing us to sell oil, natural gas and natural gas liquids downstream, rather than selling at the wellhead or flaring wet natural gas at the wellhead.
Production Taxes. The 77% increase in oil, natural gas and natural gas liquids revenues for the year ended January 31, 2015 was the primary reason for the 65% increase in production taxes in fiscal year 2015 to $29.8 million from $18.0 million for fiscal year 2014. Production taxes decreased to $7.13 per Boe for the year ended January 31, 2015 from $9.33 per Boe for the year ended January 31, 2014 because natural gas and natural gas liquids are becoming a larger portion of our total Boe sales and natural gas and natural gas liquids have lower tax rates than crude oil.
Oil and Natural Gas Amortization. Oil and natural gas amortization expense increased 110% to $106.9 million for the year ended January 31, 2015 from $51.0 million for the year ended January 31, 2014. The increase is primarily related to increased production in fiscal year 2015 as compared to fiscal year 2014. On a per Boe basis our oil and natural gas amortization expense decreased by $0.83 from $26.43 for the year ended January 31, 2014 to $25.60 for the year ended January 31, 2015. This decrease was primarily due to increases in proved reserves from successful development operations, field extensions, and the acquisition of additional oil and natural gas properties.
Oilfield Services Gross Profit. RockPile commenced operations in July 2012. We formed RockPile with strategic objectives to have both greater control over one of our largest cost centers as well as to provide locally-sourced, high-quality completion services to TUSA and other operators in the Williston Basin. Since formation, RockPile has been focused on procuring new oilfield and complementary well completion equipment, building physical and supply chain infrastructure in North Dakota, recruiting and training employees, and establishing third-party customers. RockPile’s results of operations are affected by a number of variables including drilling and stimulation activity, pricing environment, service performance, equipment utilization, and the ability to secure and retain third-party customers.
For the year ended January 31, 2015, RockPile performed hydraulic fracturing, cased-hole wireline, pressure pumping and workover services for TUSA and 11 third-party customers. Equipment utilized to perform these services consisted of four spreads, six wireline trucks, and five workover rigs. Hydraulic fracturing services resulted in 148 total well completions: 49 for TUSA and 99 for third-parties. Pressure pumping direct costs include the cost of chemicals and proppant, labor (wages and benefits), logistics expenses, insurance, repairs and maintenance, and safety costs. Cost of goods sold as a percentage of revenue will vary based upon completion design and equipment utilization.
We recognized $56.1 million and $10.5 million of gross profit from oilfield services for the years ended January 31, 2015 and 2014, respectively, after elimination of $38.9 million and $31.9 million in fiscal year 2015 and fiscal year 2014, respectively, of intercompany gross profit.
The table below summarizes the RockPile contribution to our consolidated results for the years ended January 31, 2015 and 2014:
| | | | | | | | | | | | | | | | | | |
| | For the Year Ended January 31, 2015 | | For the Year Ended January 31, 2014 |
(in thousands) | | Oilfield Services | | Eliminations | | Consolidated | | Oilfield Services | | Eliminations | | Consolidated |
Revenues | | | | | | | | | | | | | | | | | | |
Oilfield services | | $ | 418,103 | | $ | (129,650) | | $ | 288,453 | | $ | 193,625 | | $ | (95,426) | | $ | 98,199 |
Total revenues | | | 418,103 | | | (129,650) | | | 288,453 | | | 193,625 | | | (95,426) | | | 98,199 |
Cost of sales | | | | | | | | | | | | | | | | | | |
Oilfield services | | | 301,142 | | | (84,854) | | | 216,288 | | | 142,339 | | | (60,012) | | | 82,327 |
Depreciation | | | 22,008 | | | (5,899) | | | 16,109 | | | 8,905 | | | (3,542) | | | 5,363 |
Total cost of sales | | | 323,150 | | | (90,753) | | | 232,397 | | | 151,244 | | | (63,554) | | | 87,690 |
Gross profit | | $ | 94,953 | | $ | (38,897) | | $ | 56,056 | | $ | 42,381 | | $ | (31,872) | | $ | 10,509 |
General and Administrative Expenses. The following table summarizes general and administrative expenses for the years ended January 31, 2015 and 2014:
| | | | | | | | | | | | | | | | | | | | | | | | |
| | For the Year Ended January 31, 2015 | | For the Year Ended January 31, 2014 |
| | Exploration and | | Oilfield | | | | | Consolidated | | Exploration and | | Oilfield | | | | | Consolidated |
(in thousands) | | Production | | Services | | Corporate | | Total | | Production | | Services | | Corporate | | Total |
Salaries and benefits | | $ | 6,028 | | $ | 14,620 | | $ | 11,559 | | $ | 32,207 | | $ | 3,541 | | $ | 6,894 | | $ | 6,864 | | $ | 17,299 |
Stock-based compensation | | | 1,155 | | | 509 | | | 6,255 | | | 7,919 | | | 1,127 | | | 590 | | | 6,113 | | | 7,830 |
Other general and administrative | | | 9,042 | | | 10,598 | | | 2,991 | | | 22,631 | | | 3,939 | | | 4,222 | | | 1,339 | | | 9,500 |
Total | | $ | 16,225 | | $ | 25,727 | | $ | 20,805 | | $ | 62,757 | | $ | 8,607 | | $ | 11,706 | | $ | 14,316 | | $ | 34,629 |
Total general and administrative expenses increased $28.2 million to $62.8 million for the year ended January 31, 2015 compared to $34.6 million for the year ended January 31, 2014. The increase in corporate general and administrative expenses is primarily a result of increased compensation and benefit costs for personnel due to the growth of the business. Salaries and benefits for the year ended January 31, 2015 also includes an accrual for a transaction bonus of $1.9 million due to our President and Chief Executive Officer. During the year ended January 31, 2015, we incurred a $1.3 million charge associated with the write off of software implementation costs associated with a land and accounting system conversion that is no longer contemplated.
Commodity Derivatives. We have entered into commodity derivative instruments, primarily costless collars and swaps, to reduce the effect of price changes on a portion of our future oil production. Our commodity derivative instruments are measured at fair value and are included in the accompanying consolidated balance sheets as derivative assets and liabilities. During the year ended January 31, 2015, we recognized a $64.1 million gain on our commodity derivative positions due to decreases in underlying crude oil prices, as compared to a gain of $1.1 million for the year ended January 31, 2014. The fair value of the open commodity derivative instruments will continue to change in value until the transactions are settled, and we will likely add to our hedging program. Therefore, we expect our net income to reflect the volatility of commodity price forward markets. Our cash flows will only be affected upon settlement of the transactions at the current market prices at that time. We recorded a realized commodity derivative gain of $11.4 million in fiscal year 2015, as compared to a realized commodity derivative loss of $4.6 million in fiscal year 2014.
Income from Equity Investment. Our equity investment in Caliber consists of Class A Units and equity derivative instruments. The Company recognized a gain in equity investment derivatives of $0.6 million in fiscal year 2015 and $39.8 million during fiscal year 2014 due to the increase in the fair value of the equity investment derivatives. The majority of the gain in fiscal year 2014 related to Class A Trigger Units that vested on June 30, 2014.�� In addition, during the year ended January 31, 2015, the Company recognized $1.4 million for its share of Caliber’s net income for the period. This income was offset by $1.3 million of intra-company gross profit recorded as a reduction of Triangle’s capitalized well costs attributable to services provided by Caliber and capitalized by the Company, resulting in recognized income of $0.1 million. During the year ended January 31, 2014, the Company recognized $2.2 million for its share of Caliber’s net income for the period. This income was completely offset by $2.2 million of intra-company profit gross recorded as a reduction of Triangle’s capitalized well costs attributable to services provided by Caliber and capitalized by the Company, resulting in no recognized income.
Interest Expense. The $25.1 million in interest expense for the year ended January 31, 2015 consists of (a) approximately $4.3 million in interest related to the TUSA credit facility, (b) approximately $6.6 million in accrued interest fees related to the Convertible Note, (c) approximately $16.2 million in interest related to the TUSA 6.75% Notes due 2022 (the “TUSA 6.75% Notes”), (d) approximately $2.7 million in interest expense associated with our RockPile credit facility and notes payable, and (e) approximately $0.2 million in interest expense related to our other debt, all net of approximately $4.9 million of capitalized interest which is generally incurred as exploratory wells are drilled and completed. Approximately $21.4 million of interest expense and capitalized interest was paid in cash.
The $7.1 million in interest expense for the year ended January 31, 2014 consists of (a) approximately $2.9 million in interest related to the TUSA credit facility, (b) approximately $6.2 million in accrued interest related to our Convertible Note, and (c) approximately $1.0 million in interest expense associated with RockPile’s credit facility and notes payable,
all net of approximately $3.0 million of capitalized interest. Approximately $3.6 million of interest expense and capitalized interest was paid in cash.
Income Taxes. Our fiscal year 2015 income tax provision was $45.5 million compared to $7.9 million in fiscal year 2014. Our effective tax rate of 32.8% for fiscal year 2015 was less than our U.S. blended statutory rate of 37.6% primarily due to a bad debt deduction taken for amounts owed by our Canadian subsidiary to Triangle that will not be realized because our Canadian operations have ceased except for certain reclamation activities. We expect future income tax expense to be similar to our U.S. blended statutory rate. During fiscal year 2014, the effective income tax rate of 10% was less than the U.S. blended statutory rate because Triangle reversed its valuation allowance. In fiscal year 2014, Triangle determined in its judgment, based upon all available evidence (both positive and negative), that it is more likely than not that the net U.S. deferred tax assets will be realized.
Results of operations for the year ended January 31, 2014 compared to the year ended January 31, 2013
Oil, Natural Gas and Natural Gas Liquids Revenues. Revenues from oil, natural gas and natural gas liquids production for the year ended January 31, 2014 increased 305% to $160.5 million from $39.6 million for the year ended January 31, 2013, primarily due to the significant increase in oil production from new wells and the acquisition of producing wells in the third quarter of fiscal year 2014, partially offset by normal production declines. Average realized oil prices for the year ended January, 31 2014 increased to $88.07 per barrel from $85.29 per barrel for the year ended January 31, 2013. In addition, during the year ended January 31, 2014, we experienced increases in both our volumes of natural gas and natural gas liquids sold as a result of expanding gathering, transportation and processing infrastructure.
Lease Operating Expenses. Lease operating expense increased to $7.49 per Boe for the year ended January 31, 2014 from $7.31 per Boe for the year ended January 31, 2013. The increase in LOE/Boe is primarily the result of a relatively high proportion of oil sales related to sales in fiscal year 2013 for new producing wells (when LOE/Boe is relatively low), and relatively low workover expenses in fiscal year 2013.
Gathering, Transportation and Processing. GTP expenses increased to $2.23 per Boe for the year ended January 31, 2014 from $0.31 per Boe for the year ended January 31, 2013, primarily because in the third quarter of fiscal year 2014 we commenced gathering, transporting and processing significant amounts of our natural gas production that had previously been flared. Going forward, we expect our GTP costs to continue to increase (along with our revenues) as Caliber’s crude oil and natural gas gathering, transportation and processing infrastructure becomes available for operated wells, allowing us to sell oil, natural gas, and natural gas liquids downstream, rather than selling at the wellhead or flaring wet natural gas at the wellhead.
Production Taxes. The 305% increase in oil, natural gas and natural gas liquids revenues for the year ended January 31, 2014 is the primary reason our production taxes increased approximately 301% to $18.0 million in fiscal year 2014 from $4.5 million for fiscal year 2013. Production taxes increased to $9.33 per Boe for the year ended January 31, 2014 from $9.20 per Boe for the year ended January 31, 2013. North Dakota production tax rates were 11.5% of oil revenue and approximately $0.08 per Mcf of natural gas.
Oil and Natural Gas Amortization. Oil and natural gas amortization expense increased 276% to $51.0 million for the year ended January 31, 2014 from $13.5 million for the year ended January 31, 2013. The increase is primarily related to increased production in fiscal year 2014 as compared to fiscal year 2013. On a per Boe basis, our oil and natural gas amortization expense decreased by $1.32 from $27.75 for the year ended January 31, 2013 to $26.43 for the year ended January 31, 2014. This decrease was primarily due to increases in proved reserves from successful development operations, field extensions, and the acquisition of additional oil and natural gas properties.
Oilfield Services Gross Profit. For the year ended January 31, 2014, RockPile performed hydraulic fracturing services, pressure pumping, and workover services for TUSA and six third-party customers. Equipment utilized to perform these services consisted of two spreads. Hydraulic fracturing services resulted in 81 total well completions: 31 for TUSA and 50 for third-parties. Pressure pumping direct costs include the cost of chemicals and proppant, labor (wages and benefits), logistics expenses, insurance, repairs and maintenance, and safety costs. Cost of goods sold as a percentage of revenue will vary based upon completion design and equipment utilization.
We recognized $10.5 million and $3.0 million of gross profit from oilfield services for the years ended January 31, 2014 and 2013, respectively, after elimination of $31.9 million and $11.8 million in fiscal year 2014 and fiscal year 2013, respectively, of intercompany gross profit.
The table below summarizes the RockPile contribution to our consolidated results for the years ended January 31, 2014 and 2013:
| | | | | | | | | | | | | | | | | | |
| | For the Year Ended January 31, 2014 | | For the Year Ended January 31, 2013 |
(in thousands) | | Oilfield Services | | Eliminations | | Consolidated | | Oilfield Services | | Eliminations | | Consolidated |
Revenues | | | | | | | | | | | | | | | | | | |
Oilfield services | | $ | 193,625 | | $ | (95,426) | | $ | 98,199 | | $ | 57,207 | | $ | (36,460) | | $ | 20,747 |
Total revenues | | | 193,625 | | | (95,426) | | | 98,199 | | | 57,207 | | | (36,460) | | | 20,747 |
Cost of sales | | | | | | | | | | | | | | | | | | |
Oilfield services | | | 142,339 | | | (60,012) | | | 82,327 | | | 39,534 | | | (22,928) | | | 16,606 |
Depreciation | | | 8,905 | | | (3,542) | | | 5,363 | | | 2,857 | | | (1,732) | | | 1,125 |
Total cost of sales | | | 151,244 | | | (63,554) | | | 87,690 | | | 42,391 | | | (24,660) | | | 17,731 |
Gross profit | | $ | 42,381 | | $ | (31,872) | | $ | 10,509 | | $ | 14,816 | | $ | (11,800) | | $ | 3,016 |
General and Administrative Expenses. The following table summarizes general and administrative expenses for the years ended January 31, 2014 and 2013:
| | | | | | | | | | | | | | | | | | | | | | | | |
| | For the Year Ended January 31, 2014 | | For the Year Ended January 31, 2013 |
| | Exploration and | | Oilfield | | | | | Consolidated | | Exploration and | | Oilfield | | | | | Consolidated |
(in thousands) | | Production | | Services | | Corporate | | Total | | Production | | Services | | Corporate | | Total |
Salaries and benefits | | $ | 3,541 | | $ | 6,894 | | $ | 6,864 | | $ | 17,299 | | $ | 4,367 | | $ | 8,422 | | $ | 1,959 | | $ | 14,748 |
Stock-based compensation | | | 1,127 | | | 590 | | | 6,113 | | | 7,830 | | | 2,507 | | | 617 | | | 3,342 | | | 6,466 |
Other general and administrative | | | 3,939 | | | 4,222 | | | 1,339 | | | 9,500 | | | 2,223 | | | 2,708 | | | 2,398 | | | 7,329 |
Total | | $ | 8,607 | | $ | 11,706 | | $ | 14,316 | | $ | 34,629 | | $ | 9,097 | | $ | 11,747 | | $ | 7,699 | | $ | 28,543 |
Total general and administrative expenses increased $6.1 million to $34.6 million for the year ended January 31, 2014 compared to $28.5 million for the year ended January 31, 2013. The increase in corporate general and administrative expenses is primarily a result of increased compensation and benefit costs for personnel due to the growth of the business.
Commodity Derivatives. We have entered into commodity derivative instruments, primarily costless collars and swaps, to reduce the effect of price changes on a portion of our future oil production. Our commodity derivative instruments are measured at fair value and are included in the accompanying consolidated balance sheets as derivative assets and liabilities. During the year ended January 31, 2014, we recognized a $1.1 million gain on our commodity derivative positions due to decreases in underlying crude oil prices, as compared to a loss of $3.6 million for year ended January 31, 2013. The fair value of the open commodity derivative instruments will continue to change in value until the transactions are settled, and we will likely add to our hedging program. Therefore, we expect our net income to reflect the volatility of commodity price forward markets. Our cash flows will only be affected upon settlement of the transactions at the current market prices at that time. We recorded a realized commodity derivative loss of $4.6 million in fiscal year 2014, and we had no realized commodity derivative gain or loss in fiscal year 2013.
Income from Equity Investment. Our equity investment in Caliber consists of Class A Units and equity derivative instruments. Due to the increase in the fair value of the equity investment derivatives during the year ended January 31, 2014, the Company recognized a gain in equity investment derivatives of $39.8 million. During the year ended January 31, 2014, the Company recognized $2.2 million for its share of Caliber’s net income for the period. This income, however, was completely offset by $2.2 million of intra-company gross profit recorded as a reduction of Triangle’s capitalized well costs attributable to services provided by Caliber and capitalized by the Company, resulting in no recognized income. During the year ended January 31, 2013, the Company recognized a $0.3 million loss for its share
of Caliber’s net loss for the period. Caliber was formed in October 2012 and began water transportation and disposal operations in January 2013.
Interest Expense. The $7.1 million in interest expense for the year ended January 31, 2014 consists of (a) approximately $2.9 million in interest related to the TUSA credit facility, (b) approximately $6.2 million in accrued interest related to the Convertible Note and (c) approximately $1.0 million in interest expense associated with RockPile’s credit facility and notes payable, all net of approximately $3.0 million of capitalized interest which is generally incurred as exploratory wells are drilled and completed. Approximately $3.6 million of interest expense and capitalized interest was paid in cash.
The $2.7 million in interest expense for the year ended January 31, 2013 is primarily related to our Convertible Note with NGP.
Income Taxes. Our fiscal year 2014 income tax provision was $7.9 million compared to zero provision in fiscal year 2013. As of fiscal year 2013, the Company placed a full valuation allowance against deferred income taxes. During fiscal year 2014, Triangle determined in its judgment, based upon all available evidence (both positive and negative), that it is more likely than not that the net U.S. deferred tax assets will be realized. Therefore, all deferred tax benefits were recognized in fiscal year 2014 and the full valuation allowance was removed as part of the effective tax rate.
Liquidity and Capital Resources
Our liquidity is highly dependent on the prices we receive for the oil, natural gas and natural gas liquids we produce. Commodity prices are market driven and are historically volatile. Prices received for production heavily influence our revenue, cash flows, profitability, access to capital and future rate of growth. In addition, commodity prices received by exploration and production companies in the Williston Basin may affect the level of drilling activity there, and therefore may affect the demand for services provided by RockPile and/or Caliber.
In fiscal year 2015, our average realized price for oil was $75.00 per barrel, a decrease of 15% over the average realized price for fiscal year 2014. This reflected a dramatic decrease in the price of oil that occurred over the second half of fiscal year 2015 and has continued into fiscal year 2016. Future prices for oil will likely continue to fluctuate due to supply and demand factors, seasonality and other geopolitical and economic factors. We manage volatility in commodity prices by maintaining flexibility in our capital investment program. In addition, we periodically hedge a portion of our oil production to mitigate our potential exposure to price declines and the corresponding negative impact on cash flows available for investment.
As of January 31, 2015, we had cash of approximately $67.9 million consisting primarily of cash held in bank accounts, as compared to approximately $81.8 million at January 31, 2014. At January 31, 2015, we also had available borrowing capacity of $315.7 million under the TUSA credit facility and $45.1 million under the RockPile credit facility.
As of January 31, 2015, we had approximately $800.1 million of long-term debt outstanding, of which $429.5 million was attributable to the TUSA 6.75% Notes, $135.9 million was attributable to our Convertible Note (which is convertible into the Company’s common stock at a conversion rate of one share per $8.00 of principal outstanding), $119.3 million was attributable to the TUSA credit facility, $104.9 million was attributable to the RockPile Credit Facility, and $10.6 million was attributable to other notes and mortgages outstanding.
Cash Flows
The following is a summary of our changes in cash and cash equivalents for the fiscal years ended January 31, 2015, 2014 and 2013:
| | | | | | | | | |
| | For the Years Ended January 31, |
(in thousands) | | 2015 | | 2014 | | 2013 |
Net cash provided by operating activities | | $ | 200,817 | | $ | 82,436 | | $ | 2,764 |
Net cash used in investing activities | | | (577,019) | | | (455,566) | | | (179,712) |
Net cash provided by financing activities | | | 362,323 | | | 421,763 | | | 141,250 |
Net increase (decrease) in cash and equivalents | | $ | (13,879) | | $ | 48,633 | | $ | (35,698) |
Net Cash Provided by Operating Activities. Cash flows provided by operating activities were $200.8 million for the year ended January 31, 2015, as compared to $82.4 million for the year ended January 31, 2014. The increase in operating cash flows was primarily due to higher oil revenues driven by higher sales volumes and increased contributions from RockPile, partially offset by related increases in operating expenses during the period.
Cash flows provided by operating activities were $82.4 million for the year ended January 31, 2014, as compared to $2.8 million for the year ended January 31, 2013. The increase in operating cash flows was primarily due to higher oil revenues driven by higher sales volumes, partially offset by increases in production expenses, production taxes, general and administrative expenses, and other expenses associated with the growth of our operations during the year.
Net Cash Used by Investing Activities. During the year ended January 31, 2015, we used $577.0 million in cash in investing activities compared to $455.6 million during the year ended January 31, 2014. During both years, our primary uses of cash flows in investing activities were related to our oil and natural gas property expenditures. During the years ended January 31, 2015 and 2014, we used $359.1 million and $279.5 million, respectively, on oil and natural gas property expenditures. During the years ended January 31, 2015 and 2014, we also used $138.8 million and $121.6 million, respectively, to acquire oil and natural gas properties. During the years ended January 31, 2015 and 2014, we spent $59.6 million and $27.4 million, respectively, on purchases of oilfield services equipment. During the years ended January 31, 2015 and 2014, we also spent $26.7 million and $10.9 million, respectively, on other property and equipment, namely facility construction and improvements.
During the year ended January 31, 2014, investing activities used $455.6 million in cash compared to $179.7 million for the year ended January 31, 2013. The increase in cash flows used in investing activities in fiscal year 2014 was primarily due to our acquisition of properties during the year ended January 31, 2014 and the associated increase in capital investment. Additionally, we invested our remaining commitment of $18.0 million in Caliber.
Net Cash Provided by Financing Activities. Cash flows provided by financing activities for the year ended January 31, 2015 totaled $362.3 million, as compared to $421.8 million for the year ended January 31, 2014. Our primary source of cash from financing activities during the year ended January 31, 2015 came from the issuance of $450.0 million of our TUSA 6.75% Notes, net of repayments on our credit facilities. We also used $76.8 million of cash to repurchase shares of our common stock in the open market and $13.9 million to repurchase and retire TUSA 6.75% Notes with a face value of $20.5 million. During the year ended January 31, 2014, in addition to net credit facility borrowings, we also had net proceeds of $245.4 million from issuances of our common stock.
Cash flows provided by financing activities for the year ended January 31, 2014 totaled $421.8 million, as compared to $141.3 million for the year ended January 31, 2013. Cash flows provided by financing activities for the year ended January 31, 2013 of $141.3 million were primarily a result of the proceeds from the $120.0 million Convertible Note.
Capital Requirements Outlook
Although our cash flows from operations have historically contributed minimally to funding our capital requirements, specifically with respect to our capital expenditure budget, our fiscal year 2015 cash flows from operations increased significantly over fiscal year 2014. Nonetheless, our fiscal year 2015 cash flows from operations were insufficient to cover our capital requirements for the year, and we continued to rely heavily on external financing activities. We believe that the lag time between initial investment and cash flows from such investment is typical of the oil and natural gas industry where upfront costs are significant and cash flows are delayed. This holds true across our businesses, including drilling and completion costs for TUSA and equipment costs for RockPile. While we are not obligated to fund any further equity commitment for Caliber, the lag time between investment in operations and cash flows is exacerbated in the midstream space where initial construction costs and project timelines are substantial. In a static oil and natural gas pricing environment, we expect that our cash flows from operations would continue to increase significantly as additional TUSA oil and natural gas wells commence production, RockPile’s oilfield services increase, and Caliber’s gathering and processing system becomes fully operational. However, we expect that current depressed oil and natural gas prices will reduce our fiscal year 2016 cash flows from operations as compared to fiscal year 2015.
In response to the current oil and natural gas pricing environment, we have significantly reduced discretionary capital expenditures, and we may further adjust such expenditures as market dynamics warrant. Nonetheless, we will likely remain dependent on borrowings under our credit facilities and, to a lesser extent, potential additional financings to fund the difference between cash flows from operations and our capital expenditures budget and other contractual commitments.
Although we expect that our operating cash flows and availability under our credit facilities will be largely sufficient for our capital requirements, any additional shortfall may be financed through additional debt or equity instruments. There can be no assurance that we will achieve our anticipated future cash flows from operations, that credit will be available when needed, or that we would be able to complete alternative transactions in the capital markets if needed.
We may also continue to pursue significant acquisition opportunities, which may require additional financing. Our ability to obtain additional financing on commercially reasonable terms is dependent on a number of factors, many of which we cannot control, including changes in our credit rating, interest rates, market perceptions of us and the oil and natural gas industry, and tax burdens due to new tax laws.
If our existing and potential sources of liquidity are not sufficient to allow us to satisfy our commitments and to undertake our currently planned expenditures, particularly if commodity prices remain depressed for an extended period of time, we have the flexibility to alter our development program or divest assets. Our operatorship of much of our acreage allows us the ability to adjust our drilling and completions schedules in response to changes in commodity prices or the oilfield services environment. Further, if we are not successful in obtaining sufficient funding on a timely basis on terms acceptable to us, we may be required to curtail our planned expenditures and/or restructure our operations (including further reducing our drilling rig count, which may result in termination fees depending on the timing and requirements of the underlying agreements), which may reduce anticipated future cash flows from operations. If we are unable to implement our planned exploration and drilling program, we may be unable to service our debt obligations or satisfy our contractual obligations.
Sources of Capital
Cash flows from operations. We have been able to increase our produced volumes on a quarter over quarter basis for the past three years. This increase is directly related to the successful development of our operated properties. If we are able to continue to drill and complete our wells as anticipated and they produce at rates similar to those generated by our existing wells, we would expect our production rates to continue to increase over time as we continue to develop our properties. However, due to the current oil and natural gas pricing environment, we have reduced our drilling rig count, and we plan to delay the completion of certain wells subject to a number of factors, including the price of oil and natural gas at the time, oilfield services and materials costs, and the availability of third party work for RockPile. Consequently, our production volume growth is expected to slow in fiscal year 2016, and the benefit we receive from any increased production is likely to be less than it was in fiscal year 2015 due to lower realized prices. If oil and natural gas prices recover sufficiently in fiscal year 2016, we may increase drilling and completion expenditures, which we expect would increase production volumes and cash flows from operations.
Cash flows from our oilfield services segment increased significantly in fiscal year 2015 primarily due to the addition of two hydraulic fracturing spreads, an expansion of RockPile’s complementary oilfield services, and a considerable increase in the amount of work RockPile performed for third parties. In an effort to remain competitive in the current oil and natural gas pricing environment, RockPile has reduced the fees that it charges to its customers. As a result of the margin compression on fees charged for services, as well as the likelihood for lower utilization of RockPile services by customers slowing their development operations, we anticipate that RockPile’s cash flow from operations in fiscal year 2016 will be substantially lower than in fiscal year 2015.
Credit facilities. As of January 31, 2015, our maximum credit available under the TUSA credit facility was $1.0 billion, subject to a borrowing base of $435.0 million. As of January 31, 2015, we had $315.7 million of borrowing capacity available. The borrowing base under the TUSA credit facility is subject to redetermination on a semi-annual basis by each May 1st and November 1st. In addition, each of TUSA and the lenders may request an unscheduled borrowing base redetermination twice during each calendar year. We anticipate limited, if any, borrowing base growth in fiscal year 2016, and our borrowing base is expected to be reduced if oil and natural gas prices do not rebound significantly in the near term. As of January 31, 2015, our maximum credit available under the RockPile credit facility was $150.0 million. As of January 31, 2015, we had $45.1 million of borrowing capacity available. Notwithstanding a potential borrowing base reduction under the TUSA credit facility, we expect that the substantial borrowing capacity available under our credit facilities will be sufficient to finance any difference between our cash flows from operations and our anticipated capital expenditures.
Securities Offerings. Historically, we have financed our operations, property acquisitions and other capital investments in part from the proceeds of public and private offerings of our equity and debt securities. We may from time
to time offer debt securities, common stock, preferred stock, warrants and other securities, or any combination of such securities, in amounts, at prices and on terms announced when and if the securities are offered. The specifics of any future public offerings, along with the use of proceeds of any securities offered, will be described in detail in a prospectus or a prospectus supplement at the time of such offering.
Asset Sales. In the past, our acquisition activities have significantly outpaced our asset sales, which have been generally limited to small, opportunistic divestitures or exchanges of leasehold interests. In the current depressed commodity pricing environment, we are strategically reviewing our assets to consider monetizing those that may garner attractive prices or are peripheral to our core businesses. Such assets include, but are not limited to, non-operated acreage, equity investments, equipment, and other real property interests. If commodity prices remain depressed for an extended period of time and we are unable to fund our operations from other sources of capital, we may be forced to sell portions of our operated Core Acreage or other assets at distressed prices.
Commodity Derivative Instruments
We utilize various derivative instruments in connection with anticipated crude oil sales to reduce the impact of product price fluctuations. Currently, we utilize costless collars and swaps. Current period settlements on commodity derivative instruments impact our liquidity, since we are either paying cash to, or receiving cash from, our counterparties. If actual commodity prices are higher than the fixed or ceiling prices in our derivative instruments, our cash flows will be lower than they would be if we had no derivative instruments. Conversely, if actual commodity prices are lower than the fixed or floor prices in our derivative instruments, our cash flows will be higher than if we had no derivative instruments.
Working Capital
As part of our cash management strategy, we periodically use available funds to reduce amounts borrowed under our credit facilities. However, due to certain restrictive covenants contained in our credit facilities regarding our ability to dividend or otherwise transfer funds from the borrower to Triangle, we seek to maintain sufficient liquidity at Triangle to manage foreseeable and unforeseeable consolidated cash requirements. Since our principal source of operating cash flows (proved reserves to be produced in later periods) is not considered working capital, we often have low or negative working capital. Our working capital was approximately $37.7 million as of January 31, 2015, as compared to approximately $35.5 million at January 31, 2014.
Off-Balance Sheet Arrangements
We have no off-balance sheet arrangements that have or are reasonably likely to have a material current or future effect on our financial condition, changes in financial condition, revenues or expenses, results of operations, liquidity, capital expenditures or capital resources.
Contractual Obligations as of January 31, 2015
The following table lists information with respect to our known contractual obligations as of January 31, 2015:
| | | | | | | | | | | | | | | |
(in thousands) | | Payments Due by Period |
| | | | | Less than | | | | | | More than |
Contractual Obligations | | Total | | 1 year | | 1 - 3 years | | 3 - 5 years | | 5 years |
Office leases (a) | | $ | 10,411 | | $ | 1,806 | | $ | 3,864 | | $ | 4,741 | | $ | — |
Drilling rigs (b) | | | 10,167 | | | 10,167 | | | — | | | — | | | — |
TUSA credit facilities (c) | | | 119,272 | | | — | | | — | | | 119,272 | | | — |
TUSA 6.75% notes | | | 429,500 | | | | | | | | | | | | 429,500 |
Convertible note principal (d) | | | 120,000 | | | — | | | — | | | — | | | 120,000 |
Convertible note interest (d) | | | 15,877 | | | — | | | — | | | — | | | 15,877 |
Oilfield services (e) | | | 2,296 | | | 1,001 | | | 1,242 | | | 53 | | | — |
RockPile credit facilities (f) | | | 104,887 | | | — | | | — | | | 104,887 | | | — |
Other notes payable (g) | | | 10,605 | | | 503 | | | 3,044 | | | 1,258 | | | 5,800 |
Midstream services (h) | | | 359,202 | | | 38,131 | | | 80,625 | | | 61,979 | | | 178,467 |
Asset retirement obligations (i) | | | 8,578 | | | 5,391 | | | — | | | — | | | 3,187 |
| | $ | 1,190,795 | | $ | 56,999 | | $ | 88,775 | | $ | 292,190 | | $ | 752,831 |
| (a) | | The Company leases office facilities in Denver, Colorado under operating lease agreements that expire in April 2020. |
| (b) | | As of January 31, 2015, the Company was subject to commitments on four drilling rig contracts. Two of the drilling rig contracts expire in the first quarter of fiscal year 2016, and the remaining contracts expire in the second and fourth quarters of fiscal year 2016. In the event of early termination of the contracts, the Company would be obligated to pay an aggregate amount of approximately $10.2 million as of January 31, 2015 as required under the terms of the contracts. |
| (c) | | Calculated based on our January 31, 2015 outstanding borrowings under the TUSA credit facility of $119.3 million and assumes no principal repayment until the maturity date of October 2018. |
| (d) | | Calculated based on our January 31, 2015 outstanding aggregate principal amount of the Convertible Note with no stated maturity date. The interest on the Convertible Note is payable in kind and added to the principal balance of the note. |
| (e) | | As of January 31, 2015, RockPile had various commitments for future expenditures relating to equipment for transportation, transloading and storage of bulk commodities and light vehicles, (ii) transloading services and track rental and (iii) transportation equipment management, logistics and maintenance. |
| (f) | | Calculated based on outstanding principal borrowings of $104.9 million under RockPile’s credit facility and assumes no principal repayment until the maturity date of March 2019. |
| (g) | | Includes RockPile obligations relating to (i) seller financed notes payable associated with the acquisition of Team Well Service and (ii) three notes payable associated with the redemption of B-1 Units. |
| (h) | | Amounts relate to agreements between TUSA and Caliber North Dakota described in Item 1. “Business - Delivery Commitments.” |
| (i) | | Amounts represent our estimate of future asset retirement obligations. Because these costs typically extend many years into the future, estimating these future costs requires management to make estimates and judgments that are subject to future revisions based upon numerous factors, including the rate of inflation, changing technology and the political and regulatory environment. |
As is customary in the oil and natural gas industry, the Company may at times have commitments in place to reserve or earn certain acreage positions or wells. If the Company does not meet such commitments, the acreage positions or wells may be lost.
Impact of Inflation and Pricing
Triangle’s transactions are denominated in U.S. dollars. Inflation in the context of oilfield services and goods has historically been significant in the Williston Basin, the primary area in which Triangle operates. As prices for oil and natural gas increased, associated costs rose. However, in the second half of fiscal year 2015, prices for oil and natural gas decreased dramatically, and associated costs declined as a result. Future higher prices for oil and natural gas may result in increases in the costs of materials, services and personnel. Changes in prices impact Triangle’s revenues, estimates of reserves, assessments of any impairment of oil and natural gas properties, as well as values of properties being acquired or sold. Price changes also have the potential to affect Triangle’s ability to raise capital, borrow money, and retain personnel.
Critical Accounting Policies
Use of Estimates. The preparation of financial statements in conformity with GAAP requires us to make appropriate accounting estimates and to make estimates and assumptions that affect the reported amounts of assets and liabilities, revenues and expenses and the disclosure of contingent assets and liabilities. We consider our critical accounting policies and related estimates to be those that require difficult, complex, or subjective judgment necessary in accounting for inherently uncertain matters and those that could significantly influence our financial results based on changes in those judgments. Changes in facts and circumstances may result in revised estimates and may differ materially from those estimates.
Full Cost Accounting Method. We use the full cost method of accounting for our oil and natural gas operations. All costs associated with property acquisition, exploration and development activities are capitalized. Exploration and development costs include dry hole costs, geological and geophysical costs, internal costs directly related to exploration and development activities, and other costs incurred for the purpose of finding oil and natural gas reserves. Salaries and benefits paid to employees directly involved in the exploration and development of properties, as well as other internal costs that can be directly identified with acquisition, exploration, and development activities, are also capitalized. Under the full cost method of accounting, no gain or loss is recognized upon the disposition of oil and natural gas properties unless such disposition would significantly alter the relationship between capitalized costs and proved reserves.
Amortization of proved oil and natural gas properties is computed on the units-of-production method, whereby capitalized costs, including future development costs and asset retirement obligations, are amortized over total estimated proved reserves. The capitalized costs of unproved properties, including those in connection with wells in progress, are excluded from the costs being amortized. We do not have major development projects that are excluded from costs being amortized. On a quarterly basis, we evaluate excluded costs for inclusion in the costs to be amortized resulting from the determination of proved reserves or impairments. To the extent that the evaluation indicates these properties are impaired, the amount of the impairment is added to the capitalized costs to be amortized. Expenditures for maintenance and repairs are charged to production expense in the period incurred.
Companies that follow the full cost method of accounting are required to make quarterly “ceiling test” calculations on country-wide cost pools. This test limits total capitalized costs for oil and natural gas properties (net of accumulated depreciation, depletion and amortization (“DD&A”) and deferred income taxes) to the sum of the present value (discounted at 10% per annum) of estimated future net cash flows from proved reserves, the cost of properties not being amortized, the lower of cost or estimated fair value of unproven properties included in the costs being amortized, and all related tax effects. Revenue calculations in the reserves are based on the unweighted average first-day-of-the-month prices for the prior twelve months. Changes in proved reserve estimates (whether based upon quantity revisions or commodity prices) will cause corresponding changes to the full cost ceiling limitation. If net capitalized costs subject to amortization exceed this limit, the excess would be charged to expense. Any recorded impairment of oil and natural gas properties is not reversible at a later date.
At January 31, 2015, the calculated value of the ceiling limitation approximated the carrying value of our oil and natural gas properties subject to the test and no impairment was necessary. However, Triangle will likely be required to recognize an impairment of oil and natural gas properties in future periods if oil and natural gas prices remain at current prices or continue to decline, or if there is a negative impact on one or more of the other components of the calculation, and such an impairment would likely be material.
Full Cost Accounting’s Non-recognition of Service Income with Third Parties in Certain Circumstances. Both the successful efforts accounting method and the full cost accounting method require the elimination of revenue, cost of sales and gross profit for intercompany transactions in consolidated financial statements. Hence, upon consolidation, Triangle eliminates RockPile’s revenues, costs of sales and gross profit on a well to the extent of Triangle’s working interest in the well.
Unlike the successful efforts accounting method, the full cost accounting method also restricts or eliminates recognition of service income with third parties in certain circumstances. The full cost accounting method’s Rule 4-10(c)(6)(iv)(C) is to be broadly applied such that Triangle may recognize no pressure pumping services income on behalf of third parties, as well as Triangle, with regard to a well operated by Triangle or a Triangle affiliate. If Triangle or a Triangle affiliate is the well’s operator, then no income earned on RockPile pressure pumping services for the well may be currently recognized in Triangle’s financial statements, regardless of how much economic interest Triangle may have in that well. Such income is credited to Triangle’s capitalized well costs and indirectly recognized later through a lower amortization rate as proved reserves are produced. Such income is pressure pumping revenue in excess of related expenses in providing pressure pumping services, including the portion of RockPile general and administrative expenses (i) identifiable with those pressure pumping services, and (ii) incurred in the period of service.
Where Triangle (or a Triangle affiliate) is not the well operator, the full cost accounting method’s Rule 4-10(c)(6)(iv)(A) restricts recognition of consolidated service income (such as pressure pumping) for a well to such income that exceeds Triangle’s share of costs incurred and estimated to be incurred in connection with the drilling and completion of the well, for Triangle’s related property interests acquired within the twelve-month period preceding engagement for the service. As a simplified example, if RockPile provides pressure pumping services on a well not operated by Triangle, but in which Triangle has a recently acquired 5% working interest for which Triangle’s share of well cost are $0.5 million (after elimination of consolidated intercompany profit), then Triangle cannot recognize the first $0.5 million of other pressure pumping income on the well. To the extent income cannot be currently recognized, Triangle charges such service income against service revenue and credits the well’s capitalized costs. The deferred income is indirectly recognized later through a lower amortization rate as proved reserves are produced.
Asset Retirement Obligations. We recognize the fair value of a liability for an asset retirement obligation in the period in which it is incurred. The associated asset retirement costs are capitalized as part of the carrying amount of the long-lived asset. Oil and natural gas producing companies incur this liability in connection with costs related to the plugging of wells, the removal of facilities and equipment and site restorations upon acquiring or drilling a successful well. Subsequent to initial measurement, the asset retirement liability is required to be accreted each period. Capitalized costs are depleted as a component of the full cost pool.
Estimates of Proved Oil and Natural Gas Reserves. Amortization of the capitalized costs of oil and natural gas properties, including estimated future development and abandonment costs, is provided for using the equivalent unit-of-production method based upon estimates of proved oil and natural gas reserves. Changes in our estimates of proved reserve quantities will cause corresponding changes in amortization expense for the revision period and for periods thereafter as the reserves are produced. In some cases, a reduction in reserve estimates will lead to a full cost ceiling limitation charge in the period of the revision.
The process of estimating quantities of oil and natural gas reserves is complex, requiring significant decisions and judgments in the evaluation of available geological, geophysical, engineering and economic data. The data for a given field may change substantially over time as a result of numerous factors including, but not limited to, additional development activity, evolving production history and varying economic conditions, particularly as to the economic viability of proved undeveloped reserves in light of upfront development costs. As a result, material revisions to existing reserve estimates may occur from time to time.
At January 31, 2015, 39% of our total proved reserves were categorized as proved undeveloped. All of these proved undeveloped reserves are located in the Bakken Shale formation or Three Forks formation in North Dakota or Montana. We review and update our reserve estimates at least quarterly.
Commodity Derivatives. The Company has entered into commodity derivative instruments, primarily utilizing swaps or costless collars to reduce the effect of price changes on a portion of our future oil production. The Company’s commodity derivative instruments are measured at fair value and are included in the accompanying consolidated balance sheets as derivative assets and liabilities. Unrealized gains and losses are recorded based on the changes in the fair values
of the derivative instruments. Both the unrealized and realized gains and losses resulting from the contract settlement of derivatives are recorded in the gain/loss on derivatives line on the consolidated statement of operations. We value our derivative instruments by obtaining independent market quotes, as well as using industry‑standard models that consider various assumptions, including quoted forward prices for commodities, risk free interest rates, and estimated volatility factors, as well as other relevant economic measures. The discount rate used in the fair values of these instruments includes a measure of nonperformance risk by the counterparty or us, as appropriate. We utilize our valuations to assess the reasonableness of counterparties’ valuations. The consideration of the factors results in an estimated exit-price for each derivative asset or liability under a market place participant’s view. Management believes that this approach provides a reasonable, non-biased, verifiable, and consistent methodology for valuing commodity derivative instruments.
Equity Investment. Triangle accounts for its investment in Caliber using the equity method of accounting. The equity method of accounting requires the investor to recognize its share of the earnings and losses of the investee in the periods in which they are reflected in the accounts of the investee.
The Company holds Class A (Series 1 through Series 4) Warrants in Caliber. Our equity investment derivatives are measured at fair value and are included on the consolidated balance sheets as derivative assets. Net gains and losses on equity investment derivatives are recorded based on the changes in the fair values of the derivative instruments and included in our consolidated statements of operations.
Income Taxes. Income taxes are recognized based on earnings reported for tax return purposes in addition to a provision for deferred income taxes. Deferred income taxes are accounted for using the liability method. Under this method, deferred tax assets and liabilities are determined by applying the enacted statutory tax rates in effect at the end of a reporting period to the cumulative temporary differences between the tax bases of assets and liabilities and their reported amounts in the Company’s consolidated financial statements. The effect on deferred taxes for a change in tax rates is recognized in income in the period that includes the enactment date. A valuation allowance for deferred tax assets is established when it is more likely than not that some portion of the benefit from deferred tax assets will not be realized. The Company’s uncertain tax positions must meet a more-likely-than-not realization threshold to be recognized, and any potential accrued interest and penalties related to unrecognized tax benefits are recognized within income tax expense.
We assess quarterly the likelihood of realization of our deferred tax assets. If we conclude that it is more likely than not that some portion or all of the deferred tax assets will not be realized under accounting standards, the tax asset would be reduced by a valuation allowance. We consider future taxable income in making such assessments. Numerous judgments and assumptions are inherent in the determination of future taxable income, including factors such as historical performance and future operating conditions (particularly as related to prevailing oil and natural gas prices).
Share-Based Compensation. Triangle recognizes compensation related to all equity-based awards in the consolidated financial statements based on their estimated grant-date fair value. We grant various types of equity-based awards including restricted stock units and stock options at Triangle, and restricted units at RockPile (“Series B Units”). The fair value of stock option and Series B Unit awards is determined using the Black-Scholes option pricing model. Service-based restricted stock units are valued using the market price of our common stock on the grant date. Compensation cost is recognized ratably over the applicable vesting period.
Revenue Recognition. All revenue is recognized when persuasive evidence of an arrangement exists, the service is complete, or the amount is fixed or determinable and collectability is reasonably assured, as follows:
Oil and Natural Gas Revenue. The Company recognizes revenues from the sale of crude oil and natural gas using the sales method of accounting. Revenues from the sale of crude oil and natural gas are recognized when the product is delivered at a fixed or determinable price, title and risk of ownership have transferred and collectability is reasonably assured.
Oilfield Services Revenue. The Company enters into arrangements with its customers to provide hydraulic fracturing and other services, which can be either on a spot market basis or under term contracts. We only enter into arrangements with customers for which we believe that collectability is reasonably assured. Revenue is recognized upon the completion of each job.
Intercompany revenues are eliminated in the consolidated financial statements, and under certain circumstances, service revenue is reduced when service income cannot be recognized under full cost accounting as discussed above.
Recently Issued Accounting Pronouncements. In April 2014, the FASB issued Accounting Standards Update (“ASU”) No. 2014-08, Presentation of Financial Statements (Topic 205) and Property, Plant, and Equipment (Topic 360): Reporting Discontinued Operations and Disclosures of Disposals of Components of an Entity. ASU 2014-08 modifies the criteria for disposals to qualify as discontinued operations and expands related disclosures. The guidance is effective for annual and interim reporting periods beginning after December 15, 2014. Adoption of this amendment will not have a material effect on our financial position or results of operations.
In May 2014, the FASB issued ASU 2014-09, Revenue from Contracts with Customers, issued as a new Topic, Accounting Standards Codification Topic 606. The new revenue recognition standard provides a five-step analysis of transactions to determine when and how revenue is recognized. The core principle of the guidance is that a company should recognize revenue to depict the transfer of promised goods or services to customers in an amount that reflects the consideration to which the entity expects to be entitled in exchange for those goods or services. This ASU is effective for the Company beginning in fiscal year 2017 and can be adopted by the Company either retrospectively or as a cumulative-effect adjustment as of the date of adoption. We are currently evaluating the effect that adopting this new accounting guidance will have on our consolidated results of operations, cash flows and financial position.
In August 2014, the FASB issued ASU No. 2014-15, which requires management of public and private companies to evaluate whether there are conditions and events that raise substantial doubt about the entity’s ability to continue as a going concern within one year after the financial statements are issued (or available to be issued when applicable) and, if so, to disclose that fact. Management will be required to make this evaluation for both annual and interim reporting periods, if applicable. ASU No. 2014-15 is effective for annual periods ending after December 15, 2016 and interim periods within annual periods beginning after December 15, 2016. The Company does not expect the adoption of this amendment to have a material impact on its consolidated financial statements.
ITEM 7A. QUANTITATIVE AND QUALITATIVE DISCLOSURES ABOUT MARKET RISK
Commodity Price Risk. Our primary market risk is related to changes in oil prices. The market price of oil has been highly volatile and is likely to continue to be highly volatile in the future, which will impact our prospective revenues from the sale of products or properties. Currently, we utilize swaps and costless collars to reduce the effect of price changes on a portion of our future oil production. We do not enter into derivative instruments for trading purposes. For accounting purposes, we mark our derivatives to fair value and recognize the changes in fair value under the gain (loss) from derivative activities line on the consolidated statements of operations.
We use costless collars to establish floor and ceiling prices on our anticipated future oil production. We neither receive nor pay net premiums when we enter into these arrangements. These contracts are settled on a monthly basis. When the settlement price (the market price for oil or natural gas during the settlement period) for a period is above the ceiling price, we pay our counterparty. When the settlement price for a period is below the floor price, our counterparty is required to pay us.
The use of derivatives involves the risk that the counterparties to such instruments will be unable to meet the financial terms of such contracts. TUSA is currently a party to derivative contracts with three counterparties. The Company has a netting arrangement with each counterparty that provides for the offset of payables against receivables from separate derivative arrangements with the counterparty in the event of contract termination. Although the instruments are valued using indices published by established exchanges, the instruments are traded directly with the counterparty. The derivative contracts may be terminated by a non-defaulting party in the event of a default by one of the parties to the agreement.
The objective of the Company’s use of derivative financial instruments is to achieve more predictable cash flows in an environment of volatile oil prices and to manage its exposure to commodity price risk. While the use of these derivative instruments reduces the downside risk of adverse price movements, these instruments may also limit the Company’s ability to benefit from favorable price movements. The Company may, from time to time, add incremental derivatives to hedge additional forecasted production, restructure existing derivative contracts or enter into new transactions to modify the terms of current contracts in order to realize the current value of the Company’s existing positions.
The Company’s commodity derivative contracts as of January 31, 2015 are summarized below:
| | | | | | | | | | | | |
| | Contract | | | | Quantity | | | Weighted Average | | | Weighted Average |
Term End Date | | Type | | Basis (1) | | (Bbl/d) | | | Put Strike | | | Call Strike |
Fiscal Year 2016 | | Collar | | NYMEX | | 4,356 | | | $ 86.85 | | | $ 98.63 |
| | | | | | | | | | | | |
| (1) | | NYMEX refers to West Texas Intermediate crude oil prices at Cushing, Oklahoma as quoted on the New York Mercantile Exchange. |
Subsequent to January 31, 2015, the Company entered into crude oil swaps for 1,500 Bbl/d at a weighted average price of $60.07 per barrel, effective for the period from October 1, 2015 through December 31, 2016, and crude oil swaps for 500 Bbl/d at a weighted average price of $60.30 per barrel, effective for the period from January 1, 2016 through December 31, 2016.
We determine the estimated fair value of derivative instruments using a market approach based on several factors, including quoted market prices in active markets, quotes from third-parties, the credit rating of each counterparty, and the Company’s own credit rating. The Company also performs an internal valuation to ensure the reasonableness of third‑party quotes. In consideration of counterparty credit risk, the Company assessed the possibility of whether the counterparty to the derivative would default by failing to make any contractually required payments. Additionally, the Company believes that it has substantial credit quality and the financial resources and willingness to meet its potential repayment obligations associated with the derivative transactions.
Changes in commodity futures price strips during fiscal year 2015 had an overall net positive impact on the fair value of our derivative contracts. For fiscal year 2015, we reported a gain on our derivative contracts of $64.1 million. The fair value of our derivative instruments at January 31, 2015 was a net asset of $62.2 million. This mark-to-market net
asset relates to derivative instruments with various terms that are scheduled to be realized over the period from January 31, 2015 through December 31, 2015. Over this period, actual realized derivative settlements may differ significantly, either positively or negatively, from the unrealized mark-to-market valuation at January 31, 2015. An assumed increase of 10% in the forward commodity prices used in the fiscal year-end valuation of our derivative instruments would result in a net derivative asset of approximately $54.8 million at January 31, 2015. Conversely, an assumed decrease of 10% in forward commodity prices would result in a net derivative asset of approximately $69.8 million at January 31, 2015.
Interest Rate Risk. As of January 31, 2015, we had $435.0 million of borrowing availability under the TUSA credit facility, of which $119.3 million was drawn at fiscal year-end. The credit facility bears interest at variable rates. Assuming we had the maximum amount outstanding at January 31, 2015 under the TUSA credit facility of $435.0 million, a 1.0% increase in interest rates would result in additional annualized interest expense of $4.4 million.
The Convertible Note and the TUSA 6.75% Notes bear interest at fixed rates.
As of January 31, 2015, RockPile had an aggregate of $150.0 million available for borrowing under its credit facility of which approximately $104.9 million of principal was outstanding as of such date. The credit facility bears interest at variable rates. Assuming RockPile had the maximum amount outstanding at January 31, 2015 under the credit facility of $150.0 million, a 1.0% interest rate increase would result in additional annualized interest expense of approximately $1.5 million.
ITEM 8. CONSOLIDATED FINANCIAL STATEMENTS AND SUPPLEMENTARY DATA
INDEX TO CONSOLIDATED FINANCIAL STATEMENTS
| | | |
Reports of Independent Registered Public Accounting Firm | | 61 | |
| | | |
Consolidated Balance Sheets as of January 31, 2015 and 2014 | | 62 | |
| | | |
Consolidated Statements of Operations for the years ended January 31, 2015, 2014, and 2013 | | 64 | |
| | | |
Consolidated Statements of Cash Flows for the years ended January 31, 2015, 2014, and 2013 | | 65 | |
| | | |
Consolidated Statement of Stockholders’ Equity for the years ended January 31, 2015, 2014, and 2013 | | 66 | |
| | | |
Notes to Consolidated Financial Statements | | 67 | |
All supplementary data is either omitted as not applicable or the information required is shown in the consolidated financial statements or related notes thereto.
Report of Independent Registered Public Accounting Firm
The Board of Directors and Stockholders
Triangle Petroleum Corporation:
We have audited the accompanying consolidated balance sheets of Triangle Petroleum Corporation and subsidiaries (the Company) as of January 31, 2015 and 2014, and the related consolidated statements of operations, stockholders’ equity, and cash flows for each of the years in the three-year period ended January 31, 2015. These consolidated financial statements are the responsibility of the Company’s management. Our responsibility is to express an opinion on these consolidated financial statements based on our audits.
We conducted our audits in accordance with the standards of the Public Company Accounting Oversight Board (United States). Those standards require that we plan and perform the audit to obtain reasonable assurance about whether the financial statements are free of material misstatement. An audit includes examining, on a test basis, evidence supporting the amounts and disclosures in the financial statements. An audit also includes assessing the accounting principles used and significant estimates made by management, as well as evaluating the overall financial statement presentation. We believe that our audits provide a reasonable basis for our opinion.
In our opinion, the consolidated financial statements referred to above present fairly, in all material respects, the financial position of Triangle Petroleum Corporation and subsidiaries as of January 31, 2015 and 2014, and the results of their operations and their cash flows for each of the years in the three‑year period ended January 31, 2015, in conformity with U.S. generally accepted accounting principles.
We also have audited, in accordance with the standards of the Public Company Accounting Oversight Board (United States), Triangle Petroleum Corporation’s internal control over financial reporting as of January 31, 2015, based on criteria established in Internal Control – Integrated Framework (2013) issued by the Committee of Sponsoring Organizations of the Treadway Commission (COSO), and our report dated April 13, 2015 expressed an unqualified opinion on the effectiveness of the Company’s internal control over financial reporting.
(signed) KPMG LLP
Denver, Colorado
April 13, 2015
Triangle Petroleum Corporation
Consolidated Balance Sheets
(In thousands, except share data)
| | | | | | |
| | January 31, 2015 | | January 31, 2014 |
ASSETS |
CURRENT ASSETS | | | | | | |
Cash and cash equivalents | | $ | 67,871 | | $ | 81,750 |
Accounts receivable | | | 164,438 | | | 106,463 |
Commodity derivatives | | | 62,248 | | | 955 |
Other current assets | | | 14,952 | | | 5,652 |
Total current assets | | | 309,509 | | | 194,820 |
| | | | | | |
PROPERTY, PLANT AND EQUIPMENT, AT COST | | | | | | |
Oil and natural gas properties, full cost method of accounting | | | | | | |
Proved properties | | | 1,153,584 | | | 629,051 |
Unproved properties and properties under development, not being amortized | | | 142,896 | | | 121,393 |
Total oil and natural gas properties | | | 1,296,480 | | | 750,444 |
Accumulated amortization | | | (170,390) | | | (67,657) |
Net oil and natural gas properties | | | 1,126,090 | | | 682,787 |
Oilfield services equipment, net | | | 87,549 | | | 46,585 |
Other property and equipment, net | | | 47,367 | | | 24,507 |
Net property, plant and equipment | | | 1,261,006 | | | 753,879 |
| | | | | | |
OTHER ASSETS | | | | | | |
Deferred loan costs | | | 14,038 | | | 3,207 |
Equity investment | | | 64,411 | | | 68,536 |
Commodity derivatives | | | — | | | 1,192 |
Other | | | 5,906 | | | 5,888 |
Total other assets | | | 84,355 | | | 78,823 |
| | | | | | |
Total assets | | $ | 1,654,870 | | $ | 1,027,522 |
See notes to consolidated financial statements.
Triangle Petroleum Corporation
Consolidated Balance Sheets
(In thousands, except share data)
| | | | | | |
| | January 31, 2015 | | January 31, 2014 |
LIABILITIES AND STOCKHOLDERS’ EQUITY |
CURRENT LIABILITIES | | | | | | |
Accounts payable and accrued capital expenditures | | $ | 176,182 | | $ | 109,599 |
Other accrued liabilities | | | 73,440 | | | 40,588 |
Current portion of long-term debt | | | 503 | | | 8,851 |
Interest payable | | | 2,250 | | | 268 |
Deferred income taxes | | | 19,467 | | | — |
Total current liabilities | | | 271,842 | | | 159,306 |
| | | | | | |
LONG-TERM LIABILITIES | | | | | | |
5% convertible note | | | 135,877 | | | 129,290 |
Borrowings on credit facilities | | | 224,159 | | | 196,065 |
TUSA 6.75% notes | | | 429,500 | | | — |
Other notes and mortgages payable | | | 10,102 | | | 9,002 |
Deferred income taxes | | | 33,974 | | | 8,262 |
Other | | | 4,398 | | | 2,435 |
Total liabilities | | | 1,109,852 | | | 504,360 |
| | | | | | |
COMMITMENTS AND CONTINGENCIES | | | | | | |
| | | | | | |
STOCKHOLDERS' EQUITY | | | | | | |
Common stock, $0.00001 par value, 140,000,000 shares authorized; 75,174,442 and 85,735,827 shares issued and outstanding at January 31, 2015 and January 31, 2014, respectively | | | 1 | | | 1 |
Additional paid-in capital | | | 545,017 | | | 571,701 |
Retained earnings (accumulated deficit) | | | — | | | (48,540) |
Total stockholders' equity | | | 545,018 | | | 523,162 |
| | | | | | |
Total liabilities and stockholders’ equity | | $ | 1,654,870 | | $ | 1,027,522 |
See notes to consolidated financial statements.
Triangle Petroleum Corporation
Consolidated Statements of Operations
(In thousands, except per share data)
| | | | | | | | | |
| | For the Years Ended January 31, |
| | 2015 | | 2014 | | 2013 |
REVENUES: | | | | | | | | | |
Oil, natural gas and natural gas liquids sales | | $ | 284,502 | | $ | 160,548 | | $ | 39,614 |
Oilfield services | | | 288,453 | | | 98,199 | | | 20,747 |
Total revenues | | | 572,955 | | | 258,747 | | | 60,361 |
EXPENSES: | | | | | | | | | |
Lease operating expenses | | | 25,703 | | | 14,454 | | | 3,566 |
Gathering, transportation and processing | | | 18,520 | | | 4,302 | | | 150 |
Production taxes | | | 29,774 | | | 18,006 | | | 4,492 |
Depreciation and amortization | | | 124,055 | | | 58,011 | | | 15,081 |
Accretion of asset retirement obligations | | | 167 | | | 56 | | | 184 |
Oilfield services | | | 216,596 | | | 82,327 | | | 16,606 |
General and administrative, net of amounts capitalized | | | 62,757 | | | 34,629 | | | 28,543 |
Total operating expenses | | | 477,572 | | | 211,785 | | | 68,622 |
| | | | | | | | | |
INCOME (LOSS) FROM OPERATIONS | | | 95,383 | | | 46,962 | | | (8,261) |
| | | | | | | | | |
OTHER INCOME (EXPENSE): | | | | | | | | | |
Interest expense, net | | | (25,100) | | | (7,132) | | | (2,672) |
Amortization of deferred loan costs | | | (3,149) | | | (554) | | | (146) |
Gain on extinguishment of debt | | | 6,610 | | | — | | | — |
Commodity derivatives gains (losses) | | | 64,050 | | | 1,082 | | | (3,570) |
Equity investment income (loss) | | | 81 | | | — | | | (283) |
Gain on equity investment derivatives | | | 553 | | | 39,785 | | | — |
Other income | | | 469 | | | 1,278 | | | 448 |
Total other income (expense) | | | 43,514 | | | 34,459 | | | (6,223) |
| | | | | | | | | |
INCOME (LOSS) BEFORE INCOME TAXES | | | 138,897 | | | 81,421 | | | (14,484) |
Income tax provision | | | 45,500 | | | 7,941 | | | — |
NET INCOME (LOSS) | | | 93,397 | | | 73,480 | | | (14,484) |
Less: net loss attributable to noncontrolling interest in subsidiary | | | — | | | — | | | 724 |
NET INCOME (LOSS) ATTRIBUTABLE TO COMMON STOCKHOLDERS | | $ | 93,397 | | $ | 73,480 | | $ | (13,760) |
| | | | | | | | | |
Earnings (loss) per common share outstanding: | | | | | | | | | |
Basic | | $ | 1.12 | | $ | 1.07 | | $ | (0.31) |
Diluted | | $ | 0.97 | | $ | 0.91 | | $ | (0.31) |
| | | | | | | | | |
Weighted average common shares outstanding: | | | | | | | | | |
Basic | | | 83,611 | | | 68,579 | | | 44,475 |
Diluted | | | 101,032 | | | 84,558 | | | 44,475 |
See notes to consolidated financial statements.
Triangle Petroleum Corporation
Consolidated Statements of Cash Flows
(In thousands)
| | | | | | | | | |
| | For the Years Ended January 31, |
| | 2015 | | 2014 | | 2013 |
CASH FLOWS FROM OPERATING ACTIVITIES: | | | | | | | | | |
Net income (loss) | | $ | 93,397 | | $ | 73,480 | | $ | (14,484) |
Adjustments to reconcile net income (loss) to net cash provided by operating activities: | | | | | | | | | |
Depreciation and amortization | | | 124,055 | | | 58,011 | | | 15,081 |
Share-based compensation | | | 7,919 | | | 7,830 | | | 6,637 |
Interest expense not paid in cash | | | 6,587 | | | 6,267 | | | 3,023 |
Amortization of deferred loan costs | | | 3,149 | | | 554 | | | 146 |
Gain on extinguishment of debt | | | (6,610) | | | — | | | — |
Accretion of asset retirement obligations | | | 167 | | | 56 | | | 184 |
Commodity derivatives (gains) losses | | | (64,050) | | | (1,082) | | | 3,570 |
Settlements of commodity derivative instruments | | | 11,422 | | | (4,643) | | | — |
Equity investment (income) loss | | | (81) | | | — | | | 283 |
Gain on equity investment derivatives | | | (553) | | | (39,785) | | | — |
Gain on securities held for investment | | | — | | | (1,040) | | | (204) |
Deferred income taxes | | | 45,500 | | | 7,941 | | | — |
Changes in related current assets and current liabilities: | | | | | | | | | |
Accounts receivable | | | (65,448) | | | (65,929) | | | (30,295) |
Other current assets | | | (9,926) | | | (3,579) | | | (2,694) |
Accounts payable and accrued liabilities | | | 57,233 | | | 44,840 | | | 21,762 |
Asset retirement expenditures | | | (2,206) | | | (484) | | | (253) |
Other | | | 262 | | | (1) | | | 8 |
Cash provided by operating activities | | | 200,817 | | | 82,436 | | | 2,764 |
CASH FLOWS FROM INVESTING ACTIVITIES: | | | | | | | | | |
Oil and natural gas property expenditures | | | (359,102) | | | (279,531) | | | (114,625) |
Acquisitions of oil and natural gas properties | | | (138,778) | | | (121,578) | | | (21,193) |
Purchases of oilfield services equipment | | | (59,624) | | | (27,414) | | | (16,535) |
Purchases of other property and equipment | | | (26,739) | | | (10,928) | | | (14,684) |
Sale of oil and natural gas properties | | | 1,500 | | | — | | | 3,265 |
Acquisition of oilfield services companies | | | — | | | (7,715) | | | — |
Equity investment in Caliber Midstream Partners, L.P. | | | — | | | (18,000) | | | (12,001) |
Purchase of equity investment derivative contracts | | | — | | | — | | | (3,889) |
Equity investment cash distribution | | | 6,080 | | | 3,150 | | | — |
Sale of marketable securities | | | — | | | 6,105 | | | — |
Other | | | (356) | | | 345 | | | (50) |
Cash used in investing activities | | | (577,019) | | | (455,566) | | | (179,712) |
CASH FLOWS FROM FINANCING ACTIVITIES: | | | | | | | | | |
Proceeds from credit facilities | | | 504,159 | | | 211,820 | | | 41,700 |
Repayments of credit facilities | | | (484,515) | | | (32,306) | | | (16,700) |
Proceeds from notes payable | | | 450,527 | | | 14,430 | | | 120,000 |
Repayments of other notes and mortgages payable | | | (416) | | | (5,876) | | | — |
Early extinguishment of repurchased debt | | | (13,890) | | | — | | | — |
Debt issuance costs | | | (13,980) | | | (2,670) | | | (1,270) |
Proceeds from issuance of common stock | | | — | | | 245,369 | | | — |
Stock offering costs | | | — | | | (7,072) | | | — |
Payments to settle tax on vested restricted stock units | | | (2,854) | | | (2,058) | | | (1,884) |
Issuance of common stock on exercise of options | | | 135 | | | 162 | | | 13 |
Common stock repurchased and retired | | | (76,843) | | | — | | | — |
Purchase of minority interest in RockPile | | | — | | | — | | | (609) |
Other | | | — | | | (36) | | | — |
Cash provided by financing activities | | | 362,323 | | | 421,763 | | | 141,250 |
| | | | | | | | | |
NET INCREASE (DECREASE) IN CASH AND EQUIVALENTS | | | (13,879) | | | 48,633 | | | (35,698) |
CASH AND EQUIVALENTS, BEGINNING OF PERIOD | | | 81,750 | | | 33,117 | | | 68,815 |
CASH AND EQUIVALENTS, END OF PERIOD | | $ | 67,871 | | $ | 81,750 | | $ | 33,117 |
See notes to consolidated financial statements.
NOTES TO CONSOLIDATED FINANCIAL STATEMENTS
1. DESCRIPTION OF BUSINESS
Triangle Petroleum Corporation (“Triangle,” the “Company,” “we,” “us,” “our,” or “ours”) is an independent energy holding company with three principal lines of business: oil and natural gas exploration, development, and production; oilfield services; and midstream services.
We hold leasehold interests and conduct our operations in the Williston Basin of North Dakota and Montana. Our core focus area is in McKenzie and Williams Counties, North Dakota, and eastern Roosevelt and Sheridan Counties, Montana. We conduct our exploration and production operations through our wholly-owned subsidiary, Triangle USA Petroleum Corporation (“TUSA”).
In June 2011, we formed RockPile Energy Services, LLC (“RockPile”), a wholly-owned subsidiary, which provides oilfield and complementary well completion services to oil and natural gas exploration and production companies predominantly in the Williston Basin. RockPile began operations in July 2012.
In September 2012, through our wholly-owned subsidiary, Triangle Caliber Holdings, LLC, we formed Caliber Midstream Partners, L.P. (“Caliber”), an unconsolidated joint venture with First Reserve Energy Infrastructure Fund (“FREIF”). Caliber was formed for the purpose of providing oil, natural gas and water transportation and related services to oil and natural gas exploration and production companies in the Williston Basin.
The Company, through its wholly-owned subsidiary, Elmworth Energy Corporation (“Elmworth”), previously conducted insignificant exploration and production activities in Canada. Elmworth has since sold all leasehold interests except for acreage in the Maritimes Basin of Nova Scotia. Elmworth has ceased all exploration and production activities in Canada except for reclaiming five wells, the drilling site and brine ponds on its Nova Scotia acreage. Elmworth has no proved reserves and its oil and natural gas properties were fully impaired as of January 31, 2012.
2. SUMMARY OF SIGNIFICANT ACCOUNTING POLICIES
Basis of Presentation. These consolidated financial statements and related notes are presented in accordance with accounting principles generally accepted in the United States of America (“GAAP”), and are expressed in U.S. dollars. Preparation in accordance with GAAP requires us to (i) adopt accounting policies within accounting rules set by the Financial Accounting Standards Board (“FASB”) and by the Securities and Exchange Commission (“SEC”), and (ii) make estimates and assumptions that affect the reported amounts of assets, liabilities, revenues, expenses, and other disclosed amounts.
No consolidated statement of comprehensive income (loss) is presented because the Company had no comprehensive income or loss activity in the periods presented.
Use of Estimates. In the course of preparing its consolidated financial statements, management makes various assumptions, judgments, and estimates to determine the reported amount of assets, liabilities, revenue, and expenses, and in the disclosures of commitments and contingencies. Changes in these assumptions, judgments and estimates will occur as a result of the passage of time and the occurrence of future events and, accordingly, actual results could differ from amounts initially established. Significant areas requiring the use of assumptions, judgments and estimates include (i) oil and natural gas reserves; (ii) cash flow estimates used in ceiling tests of oil and natural gas properties; (iii) depreciation and amortization; (iv) impairment of undeveloped properties and other assets; (v) assigning fair value and allocating purchase price in connection with business combinations; (vi) accrued revenue and related receivables; (vii) valuation of commodity derivative instruments and equity derivative instruments; (viii) accrued liabilities; (ix) valuation of share-based payments and (x) income taxes. Although management believes these estimates are reasonable, actual results could differ from these estimates. The Company has evaluated subsequent events and transactions for matters that may require recognition or disclosure in these financial statements.
Principles of Consolidation. The accounts of Triangle and its wholly-owned subsidiaries are presented in the accompanying consolidated financial statements. All intercompany transactions and balances are eliminated in
consolidation. Triangle generally uses the equity method of accounting for investments in entities in which Triangle has an ownership between 20% and 50% and exercises significant influence.
These consolidated financial statements include the accounts of the Company’s wholly-owned subsidiaries: (i) TUSA, incorporated in the State of Colorado, and its wholly-owned subsidiaries, (ii) RockPile, organized in the State of Delaware, and its wholly-owned subsidiaries, (iii) Elmworth, incorporated in the Province of Alberta, Canada, (iv) Triangle Real Estate Properties, LLC, organized in the State of Colorado, and its wholly-owned subsidiaries, (v) Integrated Operating Solutions, LLC, organized in the State of Colorado, (vi) Ranger Fabrication, LLC, organized in the State of Delaware, and its wholly-owned subsidiaries, and (vii) Triangle Caliber Holdings, LLC, organized in the State of Delaware, and its wholly-owned subsidiaries. Additionally, Triangle Caliber Holdings, LLC is a joint venture partner in Caliber. The investment in Caliber is accounted for utilizing the equity method of accounting.
Cash and Cash Equivalents. Cash and cash equivalents, including cash in banks in the United States and Canada, consist of highly liquid investments that are readily convertible into cash and have original maturities of three months or less when purchased.
Accounts Receivable and Credit Policies. The components of accounts receivable include the following (in thousands):
| | | | | | |
| | For the Years Ended January 31, |
| | | 2015 | | | 2014 |
Oil and natural gas sales | | $ | 21,445 | | $ | 25,866 |
Joint interest billings | | | 72,235 | | | 43,660 |
Oilfield services revenue | | | 59,408 | | | 29,109 |
Other | | | 11,350 | | | 7,828 |
Total accounts receivable | | $ | 164,438 | | $ | 106,463 |
The Company’s accounts receivable result primarily from (i) oil and natural gas purchasers, (ii) billings to joint working interest partners in properties operated by the Company and (iii) trade receivables for oilfield services revenue. The Company’s trade and accrued revenue receivables are dispersed among various customers and purchasers and most of the Company’s significant purchasers are large companies with strong credit ratings. If customers are considered a credit risk, letters of credit or parental guarantees are the primary security obtained to support the extension of credit. For most joint working interest partners, the Company may have the right of offset against related oil and natural gas revenues.
The following table provides the percentage of revenue derived from oil and natural gas sales to customers and oilfield services customers who comprise 10% or more of the Company’s consolidated annual revenue (the customers in each year are not necessarily the same from year to year):
| | | | | | | | | |
| | Fiscal Years Ended January 31, |
| | 2015 | | 2014 | | 2013 |
Oil & Gas Customer A | | | 13% | | | 22% | | | N/A |
Oil & Gas Customer B | | | 12% | | | 15% | | | N/A |
Oil & Gas Customer C | | | 12% | | | N/A | | | N/A |
Oilfield Services Customer A | | | 15% | | | N/A | | | N/A |
Oilfield Services Customer B | | | 12% | | | 13% | | | N/A |
Although a substantial portion of our oil and natural gas sales and our oilfield services revenues may be to a few large customers, we do not believe the loss of any one customer would have a material adverse effect on our exploration and production business as we believe that other purchasers would be available. While we believe that there are numerous operators in the Williston Basin in need of pressure pumping and related oilfield services, a severe and sustained downturn in commodities pricing could result in the loss of a significant customer. However, we do not believe that the loss of a significant customer would have a material adverse impact on the Company.
Inventories. Inventories, included in other current assets, consist of well equipment, sand, chemicals and/or ceramic proppant for hydraulic pressure pumping and complementary well completion services. Inventories are stated at the lower of cost or market (net realizable value) on an average cost basis with consideration given to deterioration, obsolescence and other factors utilized in evaluating net realizable value.
Oil and Natural Gas Properties. We use the full cost method of accounting for our oil and natural gas operations. All costs associated with property acquisition, exploration, and development activities in the United States and Canada are capitalized into a United States full cost pool and a Canadian full cost pool, respectively. The cost pools are amortized on a unit-of-production basis using proved oil and natural gas reserves. Exploration and development costs include dry hole costs, geological and geophysical costs, direct overhead related to exploration and development activities, and other costs incurred for the purpose of finding oil and natural gas reserves. Salaries and benefits paid to employees directly involved in the exploration and development of properties, as well as other internal costs that can be directly identified with acquisition, exploration, and development activities, are also capitalized. Expenditures for maintenance and repairs are charged to production expense in the period incurred. Under the full cost method of accounting, no gain or loss is recognized upon the disposition of oil and natural gas properties unless such disposition would significantly alter the relationship between capitalized costs and proved reserves.
The capitalized costs of unevaluated properties, including those of wells in progress, are excluded from the costs being amortized. We do not have major development projects that are excluded from costs being amortized. On a quarterly basis, we evaluate excluded costs for inclusion in the costs to be amortized resulting from the determination of proved reserves or impairments. To the extent that the evaluation indicates these properties are impaired, the amount of the impairment is added to the capitalized costs to be amortized.
Under the full cost method of accounting, we do not currently recognize consolidated service income (such as pressure pumping services) for wells that we operate, and we recognize consolidated service income for other wells to the extent such income exceeds our share of costs incurred and estimated to be incurred in connection with the drilling and completion of a well, for our related property interests acquired within the twelve-month period preceding performance of the service. To the extent income cannot be recognized currently, we charge such service income against service revenue and credit the well’s capitalized costs. The deferred income is indirectly recognized later through a lower amortization rate as proved reserves are produced.
Amortization of proved oil and natural gas properties is computed on the units-of-production method, whereby capitalized costs, including future development costs and asset retirement costs, are amortized over total estimated proved reserves by country-wide cost pool.
Companies that follow the full cost method of accounting are required to make quarterly “ceiling test” calculations for each full cost pool. This test ensures that the country-wide cost pool’s total capitalized costs for oil and natural gas properties (net of accumulated amortization and deferred income taxes) do not exceed the sum of (i) the present value discounted at 10% of estimated future net cash flows from the Company’s proved oil and natural gas reserves in that country, (ii) the pool’s cost of properties not being amortized, (iii) the lower of cost or estimated fair value of unproven properties included in the costs being amortized, and (iv) all related tax effects. If the cost pool’s net capitalized costs exceed this “ceiling,” the excess is charged to expense. Any recorded ceiling-test impairment of oil and natural gas properties is not reversible at a later date.
At January 31, 2015, the calculated value of the ceiling limitation approximated the carrying value of our oil and natural gas properties subject to the test and no impairment was necessary. However, Triangle will likely be required to recognize an impairment of oil and natural gas properties in future periods if oil and natural gas prices remain at current prices or continue to decline or if there is a negative impact on one or more of the other components of the calculation and such an impairment will likely be material.
Oil and Natural Gas Reserves. Amortization of the capitalized costs of oil and natural gas properties, including estimated future development and abandonment costs, is provided for using the equivalent unit-of-production method based upon estimates of proved oil and natural gas reserves. Changes in our estimates of proved reserve quantities will cause corresponding changes in amortization expense for the revision period and for periods thereafter as the reserves are produced. In some cases, a reduction in reserve estimates will lead to a full cost ceiling limitation charge in the period of the revision. The process of estimating quantities of oil and natural gas reserves is complex, requiring significant decisions and judgments in the evaluation of available geological, geophysical, engineering and economic data. The data for a given field may change substantially over time as a result of numerous factors including, but not limited to, additional development activity, evolving production history and varying economic conditions, particularly as to the economic
viability of proved undeveloped reserves in light of upfront development costs. As a result, material revisions to existing reserve estimates may occur from time to time.
Oilfield Services Equipment and Other Property and Equipment. Oilfield services equipment and other property and equipment as of January 31, 2014 and 2013 consisted of the following:
| | | | | | |
| | For the Years Ended January 31, |
(in thousands) | | 2015 | | 2014 |
Land | | $ | 7,888 | | $ | 2,512 |
Building and leasehold improvements | | | 33,625 | | | 18,388 |
Oilfield service equipment | | | 116,354 | | | 56,355 |
Vehicles | | | 4,811 | | | 2,288 |
Software, computers and office equipment | | | 5,327 | | | 3,016 |
Capital leases | | | 853 | | | — |
Total depreciable assets | | | 168,858 | | | 82,559 |
Accumulated depreciation | | | (35,189) | | | (12,800) |
Depreciable assets, net | | | 133,669 | | | 69,759 |
Assets not placed in service | | | 1,247 | | | 1,333 |
Total oilfield service equipment and other property & equipment, net | | $ | 134,916 | | $ | 71,092 |
Expenditures for replacements, renewals, and betterments are capitalized. Maintenance and repairs are charged to operations as incurred. Oilfield services equipment and other property and equipment are evaluated for impairment to determine if current circumstances and market conditions indicate the carrying amount may not be recoverable. We have not found or recognized any impairment losses on such property and equipment. Depreciation is recorded using the straight-line method (to the extent of estimated salvage values) over the estimated useful lives of the related assets ranging from 3-20 years.
Deferred Loan Costs. Deferred financing costs include origination, legal, engineering, and other fees incurred to issue debt. Deferred financing costs are amortized to interest expense using the effective interest method over the respective borrowing term.
Equity Investment. The Company accounts for its investments in unconsolidated entities by the equity method. The Company’s share of earnings (loss) in the unconsolidated entity is included in other income (loss) on the consolidated statements of operations after elimination of intra-company profits and losses. The Company records losses of the unconsolidated entities only to the extent of the Company’s investment.
We evaluate our equity method investment for impairment when there are indicators of impairment. If indicators suggest impairment, we will perform an impairment test to assess whether an adjustment is necessary. The impairment test considers whether the fair value of our equity method investment has declined and if any such decline is other than temporary. If a decline in fair value is determined to be other than temporary, the investment’s carrying value is written down to fair value.
Asset Retirement Obligations. We recognize the fair value of a liability for an asset retirement obligation in the period in which it is incurred. The associated asset retirement costs are capitalized as part of the carrying amount of the long-lived asset. Oil and natural gas producing companies incur this liability for their working interest in a well at the time the well is drilled or acquired. The liability reflects a discounted present value of estimated future costs related to the plugging of wells, the removal of facilities and equipment, and site restorations. Subsequent to initial measurement, the asset retirement liability is required to be accreted each period. Capitalized costs are depleted as a component of the full cost pool amortization base.
Derivative Instruments. The Company enters into derivative contracts, primarily costless collars and swaps, to hedge future crude oil and natural gas production in order to mitigate the risk of market price fluctuations. All derivative instruments are recorded on the balance sheet at fair value. The Company has elected not to apply hedge accounting to any of its derivative transactions and, consequently, the Company recognizes mark-to-market gains and losses in earnings
currently, rather than deferring such amounts in other comprehensive income for those commodity derivatives that qualify as cash flow hedges.
The Company holds equity investment derivatives (Class A Warrants (Series 1 through Series 4)) in Caliber. Our equity investment derivatives are measured at fair value and are included in equity investment on the consolidated balance sheet. Net gains and losses on equity investment derivatives are recorded based on the changes in the fair values of the derivative instruments and included in our consolidated statements of operations.
Income Taxes. Deferred income tax assets and liabilities are recognized for the future income tax consequences attributable to differences between the financial statement carrying amounts of existing assets and liabilities and their respective income tax bases. Deferred income tax assets and liabilities are measured using enacted tax rates expected to apply to taxable income in the years in which those temporary differences are expected to be recovered or settled. The effect on deferred income tax assets and liabilities of a change in income tax rates is recognized in income in the period that includes the enactment date. The measurement of deferred income tax assets is reduced, if necessary, by a valuation allowance if management believes that it is more likely than not that some portion or all of the net deferred tax assets will not be fully realized on future income tax returns. The ultimate realization of deferred tax assets is dependent upon the generation of future taxable income during the periods in which those temporary differences become deductible. Management considers the scheduled reversal of deferred tax liabilities, available taxes in carryback periods, tax planning strategies and projected future taxable income in making this assessment.
The Company recognizes the tax benefit from an uncertain tax position only if it is more likely than not that the tax position will be sustained on examination by the taxing authorities based on the technical merits of the position. The tax benefits recognized in the financial statements from such a position are measured based on the largest benefit that has a greater than fifty percent likelihood of being realized upon ultimate settlement. The Company’s policy is to recognize interest and/or penalties related to uncertain tax positions in interest expense.
Oil, Natural Gas and Natural Gas Liquids Revenue. The Company recognizes revenues from the sale of crude oil, natural gas and natural gas liquids when the product is delivered at a fixed or determinable price, title has transferred, and/or collectability is reasonably assured and evidenced by a contract. There were no oil or natural gas sales imbalances at January 31, 2015, 2014, or 2013.
Oilfield Services Revenue. The Company enters into arrangements with its customers to provide hydraulic fracturing services and other oilfield services, which can be either on a spot market basis or under term contracts. We only enter into arrangements with customers for which we believe collectability is reasonably assured. Revenue is recognized and customers are invoiced upon the completion of each job, which generally consists of numerous fracturing stages and complementary completion services. Once a job has been completed to the customer’s satisfaction, a field ticket is written that includes charges for the service performed and the chemicals and proppants consumed during the course of the service. The field ticket also includes charges for the mobilization of the equipment to the location, additional equipment used on the job, if any, and other miscellaneous consumables. Rates for services performed on a spot market basis are based on agreed-upon market rates.
Share-Based Compensation. Share-based compensation is measured at the estimated grant date fair value of the awards and is recognized over the requisite service period (usually the vesting period). The Company estimates forfeitures in calculating the cost related to stock-based compensation as opposed to recognizing these forfeitures and the corresponding reduction in expense as they occur. Compensation expense is then adjusted based on the actual number of awards for which the requisite service period is rendered.
Earnings per Share. Basic earnings per common share is computed by dividing net income (loss) attributable to the common stockholders by the weighted average number of common shares outstanding during the reporting period. Diluted net income per common share reflects increases in average shares outstanding from the potential dilution, under the treasury stock method, that could occur upon (i) exercise of stock options, (ii) vesting of restricted stock units, and (iii) conversion of convertible debt. The treasury stock method assumes exercise, vesting or conversion at the beginning of a period for securities outstanding at the end of a period. Also, the treasury stock method for calculating dilution assumes that the increase in the number of shares is reduced by the number of shares which could have been repurchased by the Company at the quarter’s average stock price using assumed proceeds from (a) the exercise cost of the options and (b) the
foregone future compensation expense of hypothetical early vesting of the outstanding restricted stock units. The assumed proceeds are adjusted for income tax effects. In the event of a net loss, no potential common shares are included in the calculation of shares outstanding, as their inclusion would be anti-dilutive.
The following table details the weighted average dilutive and anti-dilutive securities, which consist of options and unvested restricted stock, for the periods presented (in thousands):
| | | | | | | | | |
| | For the Years Ended January 31, |
| | 2015 | | 2014 | | 2013 |
Dilutive | | | 17,421 | | | 15,979 | | | — |
Anti-dilutive shares | | | 6,905 | | | 5,250 | | | 4,500 |
The table below sets forth the computations of net income (loss) per common share (basic and diluted) for the years ended January 31, 2015, 2014, and 2013:
| | | | | | | | | |
| | For the Years Ended January 31, |
(in thousands, except per share data) | | 2015 | | 2014 | | 2013 |
Net income (loss) attributable to common stockholders | | $ | 93,397 | | $ | 73,480 | | $ | (13,760) |
Effect of 5% convertible note conversion | | | 4,135 | | | 3,392 | | | — |
Net income (loss) attributable to common stockholders after effect of debt conversion | | $ | 97,532 | | $ | 76,872 | | $ | (13,760) |
| | | | | | | | | |
Basic weighted average common shares outstanding | | | 83,611 | | | 68,579 | | | 44,475 |
Effect of dilutive securities | | | 17,421 | | | 15,979 | | | — |
Diluted weighted average common shares outstanding | | | 101,032 | | | 84,558 | | | 44,475 |
| | | | | | | | | |
Basic net income (loss) per share | | $ | 1.12 | | $ | 1.07 | | $ | (0.31) |
Diluted net income (loss) per share | | $ | 0.97 | | $ | 0.91 | | $ | (0.31) |
New Pronouncements Issued But Not Yet Adopted. In April 2014, the FASB issued Accounting Standards Update (“ASU”) No. 2014-08, Presentation of Financial Statements (Topic 205) and Property, Plant, and Equipment (Topic 360): Reporting Discontinued Operations and Disclosures of Disposals of Components of an Entity. ASU 2014-08 modifies the criteria for disposals to qualify as discontinued operations and expands related disclosures. The guidance is effective for annual and interim reporting periods beginning after December 15, 2014. Adoption of this amendment will not have a material effect on our financial position or results of operations.
In May 2014, the FASB issued ASU 2014-09, Revenue from Contracts with Customers, issued as a new Topic, Accounting Standards Codification Topic 606. The new revenue recognition standard provides a five-step analysis of transactions to determine when and how revenue is recognized. The core principle of the guidance is that a company should recognize revenue to depict the transfer of promised goods or services to customers in an amount that reflects the consideration to which the entity expects to be entitled in exchange for those goods or services. This ASU is effective for the Company beginning in fiscal year 2017 and can be adopted by the Company either retrospectively or as a cumulative-effect adjustment as of the date of adoption. We are currently evaluating the effect that adopting this new accounting guidance will have on our consolidated results of operations, cash flows and financial position.
In August 2014, the FASB issued ASU No. 2014-15, which requires management of public and private companies to evaluate whether there are conditions and events that raise substantial doubt about the entity’s ability to continue as a going concern within one year after the financial statements are issued (or available to be issued when applicable) and, if so, to disclose that fact. Management will be required to make this evaluation for both annual and interim reporting periods, if applicable. ASU No. 2014-15 is effective for annual periods ending after December 15, 2016 and interim periods within annual periods beginning after December 15, 2016. The Company does not expect the adoption of this amendment to have a material impact on its consolidated financial statements.
Accounting standard-setting organizations frequently issue new or revised accounting rules. We regularly review new pronouncements to determine their impact, if any, on our consolidated financial statements. Other than the standards
discussed above, there are no significant accounting standards applicable to Triangle which have not been adopted.
Reclassifications. Certain amounts in the consolidated balance sheet as of January 31, 2014, and in our consolidated statement of operations for the years ended January 31, 2014 and 2013, have been reclassified to conform to the financial statement presentation for the period ended January 31, 2015. The balance sheet reclassifications relate to changes in the captions presented in the balance sheet. The statement of operations reclassifications relate to the break out of amortization of deferred loan costs from interest expense and amounts related to revisions in the Elmworth abandonment obligation were reclassified from accretion of asset retirement obligations to depreciation and amortization expense. Such reclassifications had no impact on consolidated total assets, stockholders’ equity or net income previously reported.
3. SEGMENT REPORTING
We conduct our operations within two reportable operating segments. We identified each segment based on management’s responsibility and the nature of their products, services, and costs. There are no major distinctions in geographical areas served as nearly all operations are in the Williston Basin of the United States. The Exploration and Production operating segment, consisting of TUSA and several insignificant oil and natural gas subsidiaries, is responsible for finding and producing oil and natural gas. The Oilfield Services segment, consisting of RockPile, is responsible for a variety of oilfield and complementary services for both Triangle-operated wells and wells operated by third-parties. Corporate and Other includes our corporate office and several subsidiaries that management does not consider to be part of the Exploration and Production or Oilfield Services segments. Also included in Corporate and Other are our results from our investment in Caliber, including any changes in the fair value of our equity investment derivatives.
Management evaluates the performance of our segments based upon net income (loss) before income taxes. The following tables present selected financial information for our operating segments for the years ended January 31, 2015, 2014, and 2013.
| | | | | | | | | | | | | | | |
| | For the Year Ended January 31, 2015 |
| | Exploration | | | | | Corporate | | | | | | |
| | and | | Oilfield | | and | | | | | Consolidated |
(in thousands) | | Production | | Services | | Other | | Eliminations | | Total |
Revenues: | | | | | | | | | | | | | | | |
Oil, natural gas and natural gas liquids sales | | $ | 284,502 | | $ | — | | $ | — | | $ | — | | $ | 284,502 |
Oilfield services for third parties | | | — | | | 294,526 | | | — | | | (6,073) | | | 288,453 |
Intersegment revenues | | | — | | | 123,577 | | | — | | | (123,577) | | | — |
Total revenues | | | 284,502 | | | 418,103 | | | — | | | (129,650) | | | 572,955 |
Expenses: | | | | | | | | | | | | | | | |
Lease operating and production taxes | | | 55,477 | | | — | | | — | | | — | | | 55,477 |
Gathering, transportation and processing | | | 18,520 | | | — | | | — | | | — | | | 18,520 |
Depreciation and amortization | | | 116,633 | | | 22,008 | | | 921 | | | (15,507) | | | 124,055 |
Accretion of asset retirement obligations | | | 167 | | | — | | | — | | | — | | | 167 |
Cost of oilfield services | | | — | | | 301,142 | | | 308 | | | (84,854) | | | 216,596 |
General and administrative, net of amounts capitalized: | | | | | | | | | | | | | | | |
Salaries and benefits | | | 6,028 | | | 14,620 | | | 11,559 | | | — | | | 32,207 |
Stock-based compensation | | | 1,155 | | | 509 | | | 6,255 | | | — | | | 7,919 |
Other general and administrative | | | 9,042 | | | 10,598 | | | 2,991 | | | — | | | 22,631 |
Total operating expenses | | | 207,022 | | | 348,877 | | | 22,034 | | | (100,361) | | | 477,572 |
Income (loss) from operations | | | 77,480 | | | 69,226 | | | (22,034) | | | (29,289) | | | 95,383 |
Other income (expense), net | | | 51,216 | | | (3,024) | | | (2,356) | | | (2,322) | | | 43,514 |
Net income (loss) before income taxes | | $ | 128,696 | | $ | 66,202 | | $ | (24,390) | | $ | (31,611) | | $ | 138,897 |
As of January 31, 2015: | | | | | | | | | | | | | | | |
Net oil and natural gas properties | | $ | 1,200,872 | | $ | — | | $ | — | | $ | (74,782) | | $ | 1,126,090 |
Oilfield services equipment - net | | $ | — | | $ | 87,549 | | $ | — | | $ | — | | $ | 87,549 |
Other property and equipment - net | | $ | 9,679 | | $ | 22,246 | | $ | 15,442 | | $ | — | | $ | 47,367 |
Total assets | | $ | 1,408,768 | | $ | 202,649 | | $ | 131,649 | | $ | (88,196) | | $ | 1,654,870 |
Total liabilities | | $ | 754,925 | | $ | 163,987 | | $ | 204,354 | | $ | (13,414) | | $ | 1,109,852 |
| | | | | | | | | | | | | | | |
| | For the Year Ended January 31, 2014 |
| | Exploration | | | | | Corporate | | | | | | |
| | and | | Oilfield | | and | | | | | Consolidated |
(in thousands) | | Production | | Services | | Other | | Eliminations | | Total |
Revenues: | | | | | | | | | | | | | | | |
Oil, natural gas and natural gas liquids sales | | $ | 160,548 | | $ | — | | $ | — | | $ | — | | $ | 160,548 |
Oilfield services for third parties | | | — | | | 102,606 | | | — | | | (4,407) | | | 98,199 |
Intersegment revenues | | | — | | | 91,019 | | | — | | | (91,019) | | | — |
Total revenues | | | 160,548 | | | 193,625 | | | — | | | (95,426) | | | 258,747 |
Expenses: | | | | | | | | | | | | | | | |
Lease operating and production taxes | | | 32,460 | | | — | | | — | | | — | | | 32,460 |
Gathering, transportation and processing | | | 4,302 | | | — | | | — | | | — | | | 4,302 |
Depreciation and amortization | | | 56,788 | | | 8,905 | | | 620 | | | (8,302) | | | 58,011 |
Accretion of asset retirement obligations | | | 56 | | | — | | | — | | | — | | | 56 |
Cost of oilfield services | | | — | | | 142,339 | | | — | | | (60,012) | | | 82,327 |
General and administrative, net of amounts capitalized: | | | | | | | | | | | | | | | |
Salaries and benefits | | | 3,541 | | | 6,894 | | | 6,864 | | | — | | | 17,299 |
Stock-based compensation | | | 1,127 | | | 590 | | | 6,113 | | | — | | | 7,830 |
Other general and administrative | | | 3,939 | | | 4,222 | | | 1,339 | | | — | | | 9,500 |
Total operating expenses | | | 102,213 | | | 162,950 | | | 14,936 | | | (68,314) | | | 211,785 |
Income (loss) from operations | | | 58,335 | | | 30,675 | | | (14,936) | | | (27,112) | | | 46,962 |
Other income (expense), net | | | (172) | | | (991) | | | 38,998 | | | (3,376) | | | 34,459 |
Net income (loss) before income taxes | | $ | 58,163 | | $ | 29,684 | | $ | 24,062 | | $ | (30,488) | | $ | 81,421 |
As of January 31, 2014: | | | | | | | | | | | | | | | |
Net oil and natural gas properties | | $ | 725,958 | | $ | — | | $ | — | | $ | (43,171) | | $ | 682,787 |
Oilfield services equipment - net | | $ | — | | $ | 46,585 | | $ | — | | $ | — | | $ | 46,585 |
Other property and equipment - net | | $ | 1,594 | | $ | 18,912 | | $ | 4,001 | | $ | — | | $ | 24,507 |
Total assets | | $ | 816,282 | | $ | 126,114 | | $ | 148,438 | | $ | (63,312) | | $ | 1,027,522 |
Total liabilities | | $ | 318,875 | | $ | 64,017 | | $ | 141,609 | | $ | (20,141) | | $ | 504,360 |
| | | | | | | | | | | | | | | |
| | For the Year Ended January 31, 2013 |
| | Exploration | | | | | Corporate | | | | | | |
| | and | | Oilfield | | and | | | | | Consolidated |
(in thousands) | | Production | | Services | | Other | | Eliminations | | Total |
Revenues: | | | | | | | | | | | | | | | |
Oil, natural gas and natural gas liquids sales | | $ | 39,614 | | $ | — | | $ | — | | $ | — | | $ | 39,614 |
Oilfield services for third parties | | | — | | | 22,535 | | | — | | | (1,788) | | | 20,747 |
Intersegment revenues | | | — | | | 34,672 | | | — | | | (34,672) | | | — |
Total revenues | | | 39,614 | | | 57,207 | | | — | | | (36,460) | | | 60,361 |
Expenses: | | | | | | | | | | | | | | | |
Lease operating and production taxes | | | 8,058 | | | — | | | — | | | — | | | 8,058 |
Gathering, transportation and processing | | | 150 | | | — | | | — | | | — | | | 150 |
Depreciation and amortization | | | 13,578 | | | 2,857 | | | 378 | | | (1,732) | | | 15,081 |
Accretion of asset retirement obligations | | | 184 | | | — | | | — | | | — | | | 184 |
Cost of oilfield services | | | — | | | 39,534 | | | — | | | (22,928) | | | 16,606 |
General and administrative, net of amounts capitalized: | | | | | | | | | | | | | | | |
Salaries and benefits | | | 4,367 | | | 8,422 | | | 1,959 | | | — | | | 14,748 |
Stock-based compensation | | | 2,507 | | | 617 | | | 3,342 | | | — | | | 6,466 |
Other general and administrative | | | 2,223 | | | 2,708 | | | 2,398 | | | — | | | 7,329 |
Total operating expenses | | | 31,067 | | | 54,138 | | | 8,077 | | | (24,660) | | | 68,622 |
Income (loss) from operations | | | 8,547 | | | 3,069 | | | (8,077) | | | (11,800) | | | (8,261) |
Other income (expense), net | | | (6,318) | | | 4 | | | 974 | | | (883) | | | (6,223) |
Net income (loss) before income taxes | | $ | 2,229 | | $ | 3,073 | | $ | (7,103) | | $ | (12,683) | | $ | (14,484) |
As of January 31, 2013: | | | | | | | | | | | | | | | |
Net oil and natural gas properties | | $ | 310,557 | | $ | — | | $ | — | | $ | (11,800) | | $ | 298,757 |
Oilfield services equipment - net | | $ | — | | $ | 18,878 | | $ | — | | $ | — | | $ | 18,878 |
Other property and equipment - net | | $ | 1,597 | | $ | 12,443 | | $ | 1,739 | | $ | — | | $ | 15,779 |
Total assets | | $ | 362,878 | | $ | 38,668 | | $ | 40,220 | | $ | (13,445) | | $ | 428,321 |
Total liabilities | | $ | 91,134 | | $ | 11,845 | | $ | 125,364 | | $ | (1,645) | | $ | 226,698 |
Certain income statement reclassifications were made as previously noted and to reflect the Exploration and Production depreciation and amortization expense gross rather than net of consolidating eliminations.
Eliminations and Other. For consolidation, intercompany revenues and expenses are eliminated with a corresponding reduction in Triangle’s capitalized well costs.
Under the full cost method of accounting, we deferred recognition of approximately an additional $123.6 million, $91.0 million and $34.7 million in oilfield services income for the years ended January 31, 2015, 2014, and 2013, respectively, and approximately $6.1 million, $4.4 million, and $1.8 million in oilfield services income for the years ended January 31, 2015, 2014, and 2013, respectively, associated with our non-operating partners’ share of costs charged by RockPile for well completion activities on properties we operate, by charging such oilfield services income against oilfield services revenue and crediting proved oil and natural gas properties.
In addition, we deferred approximately $1.3 million and $2.2 million of Caliber gross profit from our share of its income for the years ended January 31, 2015 and 2014, respectively, associated with services it provided which were capitalized by TUSA, by charging such gross profit against income from equity investment and crediting proved oil and natural gas properties.
The above deferred income is indirectly recognized in future periods through a lower amortization rate as proved reserves are produced.
4. LONG-TERM DEBT
As of January 31, 2015 and 2014, respectively, the Company’s long-term debt consisted of the following:
| | | | | | |
| | For the Years Ended January 31, |
| | 2015 | | 2014 |
5% convertible note | | $ | 135,877 | | $ | 129,290 |
TUSA credit facility due October 2018 | | | 119,272 | | | 183,000 |
RockPile credit facility due March 2019 | | | 104,887 | | | 21,515 |
TUSA 6.75% notes due July 2022 | | | 429,500 | | | — |
Other notes and mortgages payable | | | 10,605 | | | 9,403 |
Total debt | | | 800,141 | | | 343,208 |
Less current portion of debt: | | | | | | |
RockPile credit facility | | | — | | | (8,450) |
Other notes and mortgages payable | | | (503) | | | (401) |
Total long-term debt | | $ | 799,638 | | $ | 334,357 |
Convertible Note. On July 31, 2012, the Company sold to NGP Triangle Holdings, LLC a 5% convertible note with an initial principal amount of $120.0 million (the “Convertible Note”) that became convertible after November 16, 2012 into the Company’s common stock at a conversion rate of one share per $8.00 of note principal.
The Convertible Note accrues interest at a rate of 5.0% per annum, compounded quarterly, on each December 31, March 31, June 30 and September 30, and on the date of any redemption, conversion or exchange of the Convertible Note. Such interest is paid-in-kind by adding to the principal balance of the Convertible Note, provided that, after October 31, 2017, the Company has the option to make such interest payments in cash. As of January 31, 2015, $15.9 million of accrued interest has been added to the principal balance of the Convertible Note.
TUSA Credit Facility. On April 11, 2013, TUSA entered into an Amended and Restated Credit Agreement, which was subsequently amended on various dates. On November 25, 2014, TUSA entered into a Second Amended and Restated Credit Agreement, which provides for a $1.0 billion senior secured revolving credit facility, with a sublimit for the issuance of letters of credit equal to $15.0 million. As of November 25, 2014, the borrowing base was set by the lenders at $435.0 million. The TUSA credit facility has a maturity date of October 16, 2018.
Borrowings under the TUSA credit facility bear interest, at TUSA’s option, at either (i) the adjusted base rate (the highest of (A) the administrative agent’s prime rate, (B) the federal funds rate plus 0.50%, or (C) the one month eurodollar rate (as defined in the agreement) plus 1%), plus an applicable margin that ranges between 0.50% and 1.50%, depending on TUSA’s utilization percentage of the then effective borrowing base, or (ii) the eurodollar rate plus an applicable margin that ranges between 1.50% and 2.50%, depending on TUSA’s utilization percentage of the then effective borrowing base.
The lenders will redetermine the borrowing base under the TUSA credit facility on a semi-annual basis by the beginning of each May 1st and November 1st. In addition, each of TUSA and the lenders may request an unscheduled borrowing base redetermination twice during each calendar year. If at any time the borrowing base is less than the amount of outstanding credit exposure under the TUSA credit facility, TUSA will be required to (i) prepay the principal amount of the loans in an amount sufficient to eliminate the excess, (ii) pledge additional collateral, (iii) prepay the excess in three equal monthly installments, or (iv) any combination of options (i) through (iii). TUSA will pay a per annum fee on all letters of credit issued under the TUSA credit facility, which fee will equal the applicable margin for loans accruing interest based on the eurodollar rate and a fronting fee to the issuing lender equal to the greater of 0.125% of the letter of credit amount and $500 per letter of credit. TUSA will pay a commitment fee that ranges between 0.375% and 0.50% per annum on the unused availability under the TUSA credit facility. The TUSA credit facility is collateralized by certain of TUSA’s assets, including (1) at least 80% of the adjusted engineered value of TUSA’s oil and natural gas interests evaluated in determining the borrowing base for the facility, and (2) all of the personal property of TUSA and its subsidiaries. The obligations under the TUSA credit facility are guaranteed by TUSA’s domestic subsidiaries, but Triangle is not a guarantor.
The TUSA credit facility contains various covenants and restrictive provisions that may, among other things, limit TUSA’s ability to sell assets, incur additional indebtedness, pay dividends, make investments or loans and create liens. In
addition, the facility contains financial covenants requiring TUSA to maintain specified ratios of consolidated current assets to consolidated current liabilities and consolidated debt to consolidated EBITDAX. As of January 31, 2015, TUSA was in compliance with all covenants under the TUSA credit facility.
RockPile Credit Facility. On March 25, 2014, RockPile entered into a Credit Agreement to provide a $100.0 million senior secured revolving credit facility. On November 13, 2014, RockPile entered into Amendment No. 1 to Credit Agreement and Incremental Commitment Agreement, which amended the credit facility to increase the borrowing capacity under the facility from $100.0 million to $150.0 million. The RockPile credit facility has a maturity date of March 25, 2019.
Borrowings under the RockPile credit facility bear interest, at RockPile’s option, at either (i) the alternative base rate (the highest of (a) the administrative agent’s prime rate, (b) the federal funds rate plus 0.5%, or (c) the one-month adjusted Eurodollar rate (as defined in the agreement) plus 1.0%), plus an applicable margin that ranges between 1.5% and 2.25%, depending on RockPile’s leverage ratio as of the last day of RockPile’s most recently completed fiscal quarter, or (ii) the Eurodollar rate plus an applicable margin that ranges between 2.50% and 3.25%, depending on RockPile’s leverage ratio as of the last day of RockPile’s most recently completed fiscal quarter.
RockPile will pay a commitment fee that ranges between 0.375% and 0.50% per annum on the unused availability under the RockPile credit facility. RockPile will also pay a per annum fee on all letters of credit issued under the RockPile credit facility, which will equal the applicable margin for loans accruing interest based on the Eurodollar rate and a fronting fee to the issuing lender equal to 0.125% of the letter of credit amount. Triangle is not a guarantor under the RockPile credit facility.
The RockPile credit facility contains financial covenants requiring RockPile to maintain specified ratios of consolidated debt to EBITDA and Adjusted EBITDA to Fixed Charges. Amendment No. 1 also modified covenants in the RockPile credit facility related to certain restrictions on the payment of dividends and distributions and increased the amount of permitted capital expenditures. As of January 31, 2015, RockPile was in compliance with all financial covenants under the RockPile credit facility.
TUSA 6.75% Notes. On July 18, 2014, TUSA entered into an Indenture (the “Indenture”) among TUSA, a TUSA wholly-owned subsidiary as guarantor, and Wells Fargo Bank, National Association, as trustee, governing the terms of TUSA’s $450.0 million aggregate principal amount of TUSA 6.75% Notes due 2022 (the ”TUSA 6.75% Notes”).
The TUSA 6.75% Notes were issued in a private offering exempt from the registration requirements of the Securities Act of 1933, as amended (the “Securities Act”), to qualified institutional buyers in accordance with Rule 144A and to persons outside of the United States pursuant to Regulation S under the Securities Act. The TUSA 6.75% Notes are senior unsecured obligations of TUSA and are guaranteed on a senior unsecured basis by the initial guarantor and another TUSA wholly-owned subsidiary that became a guarantor of the TUSA 6.75% Notes in early December 2014. The TUSA 6.75% Notes have not been registered under the Securities Act and may not be offered or sold in the United States absent registration or an applicable exemption from registration requirements.
The TUSA 6.75% Notes bear interest at a rate of 6.75% per year, accruing from July 18, 2014. Interest on the TUSA 6.75% Notes is payable semiannually in arrears on January 15 and July 15 of each year, beginning on January 15, 2015. The TUSA 6.75% Notes will mature on July 15, 2022, subject to earlier repurchase or redemption in accordance with the terms of the Indenture. The Company incurred $10.5 million of offering costs which have been deferred and are being recognized on the effective interest method over the life of the notes.
TUSA may redeem some or all of the TUSA 6.75% Notes at any time prior to July 15, 2017 at a price equal to 100% of the principal amount of the notes redeemed plus accrued and unpaid interest, if any, to the redemption date and a make-whole premium set forth in the Indenture. On or after July 15, 2017, TUSA may redeem some or all of the TUSA 6.75% Notes at any time at redemption prices set forth in the Indenture, plus accrued and unpaid interest, if any, to the redemption date. In addition, at any time prior to July 15, 2017, TUSA may redeem up to 35% of the aggregate principal amount of the TUSA 6.75% Notes at a specified redemption price set forth in the Indenture plus accrued and unpaid interest, if any, to the redemption date, with the net cash proceeds of certain equity offerings. If TUSA experiences certain change of
control events, TUSA must offer to repurchase the TUSA 6.75% Notes at 101% of their principal amount, plus accrued and unpaid interest, if any, to the redemption date.
The Indenture permits TUSA to purchase TUSA 6.75% Notes in the open market. In fiscal year 2015, TUSA repurchased TUSA 6.75% Notes with a face value of $20.5 million for $13.9 million. TUSA immediately retired the repurchased notes and recognized a gain on extinguishment of debt of $6.6 million.
The Indenture contains covenants that, among other things, restrict TUSA’s ability and the ability of any guarantor subsidiary to sell certain assets; make certain dividends, distributions, investments and other restricted payments; incur certain additional indebtedness and issue preferred stock; create certain liens; enter into transactions with affiliates; designate subsidiaries as unrestricted subsidiaries, and consolidate, merge or sell substantially all of TUSA’s assets. These covenants are subject to a number of important exceptions and qualifications. As of January 31, 2015, TUSA was in compliance with all covenants under the TUSA 6.75% Notes.
Second Lien Credit Facility. On June 27, 2014, TUSA entered into a Second Lien Credit Agreement, which provided for a $60.0 million second priority secured credit facility, which was funded at signing. All borrowings under the second lien credit facility were scheduled to mature on October 16, 2019 (nine months after the maturity of the TUSA credit facility). Borrowings under the second lien credit facility bore interest, at our option, at either (i) LIBOR (subject to a floor) plus a margin of 7.0% or (ii) a base rate (subject to a floor) plus a margin of 6.0%. The second lien credit facility also provided that no prepayment fees would be payable for prepayments made during the first twelve months.
Upon issuance of the TUSA 6.75% Notes on July 18, 2014, TUSA terminated the second lien credit facility and repaid all amounts owing thereunder.
Future Maturities of Outstanding Debt. Scheduled annual maturities of long-term debt outstanding as of January 31, 2015 were as follows:
| | | |
For the Years Ending January 31, (in thousands): | | | |
2016 | | $ | 503 |
2017 | | | 1,450 |
2018 | | | 1,594 |
2019 | | | 119,852 |
2020 | | | 105,565 |
Thereafter | | | 571,177 |
| | $ | 800,141 |
5. HEDGING AND COMMODITY DERIVATIVE FINANCIAL INSTRUMENTS
Through TUSA, the Company has entered into commodity derivative instruments utilizing costless collars and swaps to reduce the effect of price changes on a portion of our future oil production. A collar requires us to pay the counterparty if the settlement price is above the ceiling price, and requires the counterparty to pay us if the settlement price is below the floor price. The objective of the Company’s use of derivative financial instruments is to achieve more predictable cash flows in an environment of volatile oil and natural gas prices and to manage its exposure to commodity price risk. While the use of these derivative instruments limits the downside risk of adverse price movements, such use may also limit the Company’s ability to benefit from favorable price movements. The Company may, from time to time, add incremental derivatives to hedge additional production, restructure existing derivative contracts, or enter into new transactions to modify the terms of current contracts in order to realize the current value of the Company’s existing positions. The Company does not enter into derivative contracts for speculative purposes.
The use of derivatives involves the risk that the counterparties to such instruments will be unable to meet the financial terms of such contracts. The Company’s derivative contracts are currently with three counterparties. The Company has netting arrangements with each counterparty that provide for the offset of payables against receivables from separate derivative arrangements with the same underlier with the counterparty in the event of contract termination. The derivative contracts may be terminated by a non-defaulting party in the event of default by one of the parties to the agreement.
The Company’s commodity derivative instruments are measured at fair value. The Company has not designated any of its derivative contracts as fair value or cash flow hedges. Therefore, the Company does not apply hedge accounting to its commodity derivative instruments. Net gains and losses on derivative activities are recorded based on the changes in the fair values of the derivative instruments. Net gains and losses on derivative activities are recorded in the commodity derivatives gains (losses) caption on the consolidated statements of operations. The Company’s cash flows are only impacted when the actual settlements under the commodity derivative contracts result in a payment to or from the counterparty. These settlements under the commodity derivative contracts are reflected as operating activities in the Company’s consolidated statements of cash flows.
The components of commodity derivative gains (losses) in the consolidated statements of operations are as follows (in thousands):
| | | | | | | | | |
| | For the Years Ended January 31, |
| | 2015 | | 2014 | | 2013 |
Realized commodity derivative gains (losses) | | $ | 11,422 | | $ | (4,643) | | $ | - |
Unrealized commodity derivative gains (losses) | | | 52,628 | | | 5,725 | | | (3,570) |
Commodity derivative gains (losses), net | | $ | 64,050 | | $ | 1,082 | | $ | (3,570) |
The Company’s commodity derivative contracts as of January 31, 2015 are summarized below:
| | | | | | | | | | | | |
| | Contract | | | | Quantity | | | Weighted Average | | | Weighted Average |
Term End Date | | Type | | Basis (1) | | (Bbl/d) | | | Put Strike | | | Call Strike |
Fiscal Year 2016 | | Collar | | NYMEX | | 4,356 | | | $ 86.85 | | | $ 98.63 |
| | | | | | | | | | | | |
| (1) | | “NYMEX” refers to West Texas Intermediate crude oil prices at Cushing, Oklahoma as quoted on the New York Mercantile Exchange. |
Subsequent to January 31, 2015, the Company entered into crude oil swaps for 1,500 Bbl/d at a weighted average price of $60.07 per barrel effective for the period from October 1, 2015 through December 31, 2016, and crude oil swaps for 500 Bbl/d at a weighted average price of $60.30 per barrel, effective for the period from January 1, 2016 through December 31, 2016.
The estimated fair values of commodity derivatives included in the consolidated balance sheets at January 31, 2015 and 2014 are summarized below. The net fair value of the Company’s commodity derivatives changed by $60.1 million from a net asset of $2.1 million at January 31, 2014 to a net asset of $62.2 million at January 31, 2015, primarily due to (i) changes in the futures prices for oil, which are used in the calculation of the fair value of commodity derivatives, (ii) settlement of commodity derivative positions during the current period and (iii) changes to the Company’s commodity derivative portfolio in fiscal year 2015. The Company does not offset asset and liability positions with the same counterparties within the consolidated financial statements; rather, all contracts are presented at their gross estimated fair value. As of the dates indicated, the Company’s derivative assets and liabilities are presented below (in thousands). These balances represent the estimated fair value of the contracts. The Company has not designated any of its derivative contracts as cash-flow hedging instruments for accounting purposes. The main headings represent the balance sheet captions for the contracts presented (in thousands).
| | | | | | |
| | For the Years Ended January 31, |
| | 2015 | | 2014 |
Current Assets: | | | | | | |
Crude oil derivative contracts | | $ | 62,248 | | $ | 955 |
| | | | | | |
Other Long-Term Assets: | | | | | | |
Crude oil derivative contracts | | | — | | | 1,192 |
| | | | | | |
Total derivative asset | | $ | 62,248 | | $ | 2,147 |
| | | | | | |
6. OIL AND NATURAL GAS PROPERTIES
The following table sets forth the capitalized costs incurred in our oil and natural gas production, exploration, and development activities in the United States for years ended January 31, 2015, 2014, and 2013:
| | | | | | | | | |
| | For the Years Ended January 31, |
(in thousands) | | 2015 | | 2014 | | 2013 |
Costs incurred during the period | | | | | | | | | |
Acquisition of properties: | | | | | | | | | |
Proved | | $ | 90,920 | | $ | 80,201 | | $ | 623 |
Unproved | | | 47,858 | | | 41,377 | | | 20,570 |
Exploration | | | 180,174 | | | 96,731 | | | 55,583 |
Development | | | 226,765 | | | 216,046 | | | 91,666 |
Oil and natural gas expenditures | | | 545,717 | | | 434,355 | | | 168,442 |
Asset retirement obligations, net | | | 1,818 | | | 676 | | | 370 |
| | $ | 547,535 | | $ | 435,031 | | $ | 168,812 |
During fiscal years 2015, 2014, and 2013, we acquired oil and natural gas properties, and participated in the drilling and/or completion of wells, for total consideration of approximately $545.7 million, $434.4 million, and $168.4 million, including $138.8 million, $121.6 million, and $21.2 million, respectively, for the acquisition of oil and natural gas properties. Total consideration paid includes common stock of $2.4 million and $1.2 million for fiscal years 2014 and 2013, respectively. During fiscal years 2015, 2014, and 2013, we capitalized $4.8 million, $3.7 million, and $2.0 million, respectively, of internal land, geology, and operations department costs directly associated with property acquisition, exploration (including lease record maintenance), and development. The internal land and geology department costs were capitalized to unevaluated properties.
The following table summarizes oil and natural gas property costs not being amortized at January 31, 2015, by year that the costs were incurred:
| | | | | | | | | | | | | | | |
| | | | | Fiscal Year Costs Incurred |
| | | | | | | | | | | | | | 2012 |
(in thousands) | | Total | | 2015 | | 2014 | | 2013 | | and prior |
Acquisition | | $ | 113,606 | | $ | 46,982 | | $ | 25,785 | | $ | 10,220 | | $ | 30,619 |
Exploration | | | 22,305 | | | 20,830 | | | 1,475 | | | — | | | — |
Capitalized interest | | | 6,985 | | | 4,899 | | | 2,086 | | | — | | | — |
Total | | $ | 142,896 | | $ | 72,711 | | $ | 29,346 | | $ | 10,220 | | $ | 30,619 |
The $142.9 million of costs not being amortized includes $17.1 million in costs for unevaluated wells in progress expected to be completed prior to January 31, 2016. On a quarterly basis, costs not being amortized are evaluated for inclusion in costs to be amortized. Upon evaluation of a well or well location having proved reserves, the associated costs are reclassified from unproved properties to proved properties and become subject to amortization over our proved reserves for the country-wide amortization base. Upon evaluation that costs of unproved properties are impaired or evaluation that a well or well location will not have proved reserves, the amount of cost impairment and well costs are reclassified from unproved properties to proved properties and become subject to amortization. The majority of the unproved oil and natural gas property costs, which are not subject to amortization, relate to oil and natural gas property acquisitions and leasehold acquisition costs as well as work-in-progress on various projects. The Company expects that substantially all of its unproved property costs as of January 31, 2015 will be reclassified to proved properties over the next five years.
Depreciation and amortization expense of oil and natural gas properties in the U.S. for fiscal years 2015, 2014, and 2013 was $106.9 million, $51.0 million and $13.5 million, respectively.
7. ACQUISITIONS
Kodiak Oil & Gas Property Acquisition. In August 2013, TUSA acquired interests in approximately 5,600 net acres of leaseholds and related producing properties along with various other related rights, permits, contracts, equipment and other assets, all located in McKenzie County, North Dakota, from Kodiak Oil & Gas Corporation (“Kodiak”). We
paid approximately $83.8 million in cash. In addition, the Company and Kodiak also agreed to exchange certain of Triangle’s oil and natural gas leasehold interests in Kodiak’s operated units for approximately 600 net acres of leasehold interests held by Kodiak in units then operated by the Company. The effective date for the acquisition and the exchange was July 1, 2013.
Marathon Oil & Gas Property Acquisition. In June 2014, we acquired from Marathon Oil Company (“Marathon”) certain oil and natural gas leaseholds and related producing properties located in Williams County, North Dakota, Sheridan County, Montana, and Roosevelt County, Montana comprising approximately 41,100 net acres and various other related rights, permits, contracts, equipment and other assets for approximately $90.4 million in cash, net of certain closing adjustments of $9.6 million. Transaction costs related to the acquisition incurred during the year ended January 31, 2015 of approximately $1.3 million are recorded in general and administrative expenses.
The acquisitions were accounted for using the acquisition method under ASC-805, Business Combinations, which requires the assets acquired and liabilities assumed to be recorded at fair value as of the acquisition date of June 30, 2014. The following table summarizes the purchase price and the estimated values of assets acquired and liabilities assumed:
| | | |
Purchase price (in thousands): | | | |
Cash | | $ | 90,352 |
Total consideration given | | $ | 90,352 |
| | | |
Fair value allocation of purchase price: | | | |
Oil and natural gas properties: | | | |
Proved properties | | $ | 71,044 |
Unproved properties | | | 20,262 |
Total oil and natural gas properties | | | 91,306 |
| | | |
Accounts payable | | | (469) |
Asset retirement obligations assumed | | | (485) |
Fair value of net assets acquired | | $ | 90,352 |
Pro Forma Financial Information. The following unaudited pro forma financial information represents the combined results for the Company and the properties acquired from Kodiak, in August of 2013, and Marathon, in June of 2014, as if the acquisitions had occurred on February 1, 2012.
| | | | | | | | | |
| | For the Years Ended January 31, |
(in thousands, except per share data) | | 2015 | | 2014 | | 2013 |
Operating revenues | | $ | 584,696 | | $ | 312,081 | | $ | 92,933 |
Net income (loss) | | $ | 96,438 | | $ | 91,579 | | $ | (2,407) |
| | | | | | | | | |
Earnings (loss) per common share | | | | | | | | | |
Basic | | $ | 1.15 | | $ | 1.22 | | $ | (0.04) |
Diluted | | $ | 1.00 | | $ | 1.04 | | $ | (0.04) |
| | | | | | | | | |
Weighted average common shares outstanding: | | | | | | | | | |
Basic | | | 83,611 | | | 75,047 | | | 55,794 |
Diluted | | | 101,032 | | | 91,026 | | | 55,794 |
For purposes of the pro forma information it was assumed that the net proceeds generated from the issuance of the Company’s common stock were utilized to fund the August 28, 2013 acquisition and that such issuance occurred on February 1, 2012. The pro forma information includes the effects of adjustments for depreciation, amortization and accretion expense of $3.4 million, $16.5 million and $12.6 million for fiscal years 2015, 2014 and 2013, respectively. The pro forma results do not include any cost savings that may result from the acquisition or any estimated costs that have been or will be incurred by the Company to integrate the properties acquired. The pro forma results are not necessarily indicative of what actually would have occurred if the transactions had been completed, or the common stock had been issued, as of the beginning of the period, nor are they necessarily indicative of future results.
Acquisition of Team Well Service, Inc. In October 2013, RockPile completed its acquisition of Team Well Service, Inc. (“Team Well”), an operator of well service rigs in North Dakota, in exchange for (i) $6.8 million in cash; (ii) unsecured seller notes of $0.8 million; and, (iii) contingent consideration of $1.5 million. The final purchase price allocation resulted in identifiable intangible assets and goodwill of approximately $3.9 million and $1.7 million, respectively. Transaction and other costs associated with the acquisition of net assets are expensed as incurred. Pro forma information has not been provided for the Team Well acquisition as the impact is immaterial to our consolidated financial statements.
8. ASSET RETIREMENT OBLIGATIONS
The Company’s asset retirement obligations (“ARO”) represent the estimated present value of the amounts expected to be incurred to plug, abandon, and remediate producing and shut-in properties at the end of their productive lives in accordance with applicable state and federal laws. The Company determines the estimated fair value of its ARO when incurred by calculating the present value of estimated cash flows related to plugging and abandonment liabilities. The significant inputs used to calculate such liabilities include estimates of costs to be incurred, the Company’s credit adjusted discount rates, inflation rates and estimated dates of abandonment. The asset retirement liability is accreted to its present value each period and the capitalized asset retirement cost is depleted as a component of the full cost pool using the units-of-production method.
The following tables reflect the change in ARO for the years ended January 31, 2015 and 2014:
| | | | | | |
| | For the Years Ended January 31, |
(in thousands) | | 2015 | | 2014 |
Balance at the beginning of the period | | $ | 4,629 | | $ | 3,422 |
Liabilities incurred | | | 1,821 | | | 944 |
Revision of estimates | | | 2,737 | | | 774 |
Sale of assets | | | (29) | | | (83) |
Liabilities settled | | | (747) | | | (484) |
Accretion | | | 167 | | | 56 |
Balance at the end of the period | | | 8,578 | | | 4,629 |
Less current portion of obligations | | | (5,391) | | | (3,333) |
Long-term ARO | | $ | 3,187 | | $ | 1,296 |
The current portion of ARO is classified with other accrued liabilities and the long-term ARO is classified in other long-term liabilities in the accompanying consolidated balance sheets.
A significant portion of the current obligations relates to the reclamation of man-made ponds holding produced formation water and the plugging and abandonment of well bores in the Maritimes Basin of Canada of $4.8 million and $2.0 million as of January 31, 2015 and January 31, 2014, respectively. Internal engineering re-assessment of Canadian ARO resulted in revisions $2.7 million and $1.0 million to the ARO during fiscal years 2015 and 2014. Since our Canadian oil and natural gas properties were fully impaired, the ARO revisions were expensed and included in depreciation and amortization expenses in the accompanying consolidated statements of operations for the years ended January 31, 2015 and 2014, respectively.
9. EQUITY INVESTMENT AND EQUITY INVESTMENT DERIVATIVES
Equity Investment. On October 1, 2012, Triangle Caliber Holdings, LLC (“Triangle Caliber Holdings”), a wholly-owned subsidiary of Triangle, entered into a joint venture with FREIF Caliber Holdings LLC (“FREIF Caliber Holdings”), a wholly-owned subsidiary of FREIF. The joint venture entity, Caliber, was formed to provide crude oil, natural gas and water transportation and related services to the Company and third parties primarily within the Williston Basin of North Dakota and Montana.
Pursuant to the terms of the October 1, 2012 Contribution Agreement (the “Contribution Agreement”), Triangle Caliber Holdings agreed to contribute $30.0 million to Caliber in exchange for 3,000,000 Class A Units; 4,000,000 Class A Trigger Units with certain performance conditions; 4,000,000 Series 1 Warrants and 1,600,000 Class A Trigger Unit Warrants with an exercise price of $14.69; 2,400,000 Series 2 Warrants with an exercise price of $24.00; and FREIF
Caliber Holdings agreed to contribute $70.0 million to Caliber in exchange for 7,000,000 Class A Units, with the general partner of Caliber being owned and controlled equally by Triangle Caliber Holdings and FREIF Caliber Holdings.
On September 12, 2013, Triangle Caliber Holdings and FREIF Caliber Holdings entered into an Amended and Restated Contribution Agreement (“A&R Contribution Agreement”), which amended and restated the Contribution Agreement. Pursuant to the terms of the A&R Contribution Agreement, FREIF Caliber Holdings agreed to contribute an additional $80.0 million to Caliber in exchange for an additional 8,000,000 Class A Units, to be issued no later than June 30, 2014, and 5,000,000 Series 5 Warrants with an exercise price of $32.00. Also pursuant to the terms of the A&R Contribution Agreement, Triangle Caliber Holdings received 3,000,000 Series 3 Warrants with an exercise price of $24.00; 2,000,000 Series 4 Warrants with an exercise price of $30.00; and the performance conditions associated with the 4,000,000 Class A Trigger Units granted in connection with the Contribution Agreement were removed and replaced with a provision to convert the 4,000,000 Class A Trigger Units into 4,000,000 Class A Units at the earlier of the commissioning of the Alexander gas processing facility or June 30, 2014. The conversion of the Class A Trigger Units on June 30, 2014 did not require any additional contribution of capital from Triangle Caliber Holdings. Additionally, the 1,600,000 Class A Trigger Unit Warrants granted in connection with the Contribution Agreement converted to 1,600,000 Series 1 Warrants on June 30, 2014 with an exercise price of $14.69.
Following the issuance of the additional 8,000,000 Class A Units to FREIF Caliber Holdings and the conversion by Triangle Caliber Holdings of its 4,000,000 Class A Trigger Units into 4,000,000 Class A Units, FREIF Caliber Holdings owned 15,000,000 Class A Units, representing an approximate sixty-eight percent (68%) limited partner interest in Caliber, and Triangle Caliber Holdings owned 7,000,000 Class A Units, representing an approximate thirty-two percent (32%) limited partner interest in Caliber.
The following summarizes the Company’s equity investment holdings in Caliber as of January 31, 2015 and 2014 and the strike prices for exercising warrants as of January 31, 2015:
| | | | | | | | | |
| Expiration | | Strike Price at | | As of January 31, |
| Date | | January 31, 2015 | | 2015 | | 2014 |
Class A Units | | — | | | — | | 7,000,000 | | 3,000,000 |
Class A Trigger Units | | — | | | — | | — | | 4,000,000 |
Class A Trigger Unit Warrants | | — | | | — | | — | | 1,600,000 |
Series 1 Warrants | | October 1, 2024 | | $ | 12.78 | | 5,600,000 | | 4,000,000 |
Series 2 Warrants | | October 1, 2024 | | $ | 22.09 | | 2,400,000 | | 2,400,000 |
Series 3 Warrants | | September 12, 2025 | | $ | 22.09 | | 3,000,000 | | 3,000,000 |
Series 4 Warrants | | September 12, 2025 | | $ | 28.09 | | 2,000,000 | | 2,000,000 |
The Company’s investment interest in Caliber is considered to be variable, and Caliber is considered to be a variable interest entity because the power to direct the activities that most significantly impact Caliber’s economic performance does not reside with the holders of equity investment at risk. The Company is not considered the primary beneficiary of Caliber since it does not have the power to direct the activities of Caliber that are considered most significant to its economic performance. Under the equity method, our investment will be adjusted each period for contributions made, distributions received, the change in the fair value of our holdings of equity investment derivatives of Caliber, our share of Caliber’s net income and accretion of any basis differences. Our maximum exposure to loss related to Caliber is limited to our equity investment. We evaluate our equity method investments for impairment when events or changes in circumstances indicate there is a loss in value of the investment that is other than a temporary decline.
The following summarizes the activities related to the Company’s equity investment in Caliber for the years ended January 31, 2015 and 2014:
| | | | | |
| For the Years Ended January 31, |
(in thousands) | 2015 | | 2014 |
Balance at beginning of year | $ | 68,536 | | $ | 11,768 |
| | | | | |
Capital contributions | | — | | | 18,000 |
Distributions | | (6,080) | | | (3,150) |
Equity investment share of net income before intra-company profit eliminations | | 1,402 | | | 2,184 |
Change in fair value of: | | | | | |
Class A Trigger Units (1) | | 1,745 | | | 38,091 |
Class A Trigger Unit Warrants (2) | | 532 | | | 234 |
Series 1 Warrants | | (1,241) | | | 926 |
Series 2 Warrants | | (254) | | | 254 |
Series 3 Warrants | | (207) | | | 207 |
Series 4 Warrants | | (22) | | | 22 |
Total changes in fair value | | 553 | | | 39,734 |
| | | | | |
Balance at end of year | $ | 64,411 | | $ | 68,536 |
| | | | | |
Fair value of trigger unit warrants and warrants at end of year | $ | 504 | | $ | 39,734 |
| (1) | | The change in value was prior to the vesting of the Class A Trigger Units into Class A Units on June 30, 2014. |
| (2) | | On June 30, 2014, the 1,600,000 Class A Trigger Unit Warrants then outstanding automatically converted into Series 1 Warrants upon the Company’s vesting of the Class A Trigger Units, resulting in an aggregate of 5,600,000 Series 1 Warrants outstanding. |
Equity Investment Derivatives. At January 31, 2015 and 2014, the Company held Class A (Series 1 through Series 4) Warrants to acquire additional ownership in Caliber. These instruments are considered to be equity investment derivatives and are valued using the following valuation techniques, which are generally less observable from objective sources.
At each period end, the fair value of the Class A (Series 1 through Series 4) Warrants were estimated using a Monte Carlo Simulation (“MCS”) model. An MCS model provides a numeric approach to stochastic stock movement to forecast the future price of the underlying Class A Units, as opposed to an analytic solution provided by Black-Scholes. For each MCS, the value of the Class A Units was forecasted at the end of each quarter based on a predetermined yield, and the strike price for the warrant is adjusted accordingly. The fair value of the underlying Class A Units was estimated employing primarily a discounted cash flows analysis. The resulting value represented a marketable minority value of Caliber. As the Class A Units represent a non-marketable equity interest in a private enterprise, an adjustment to our preliminary value estimates was made to account for the lack of liquidity.
The MCS model assumed that the Class A Warrants would be exercised at the earlier of (a) the contractual life of 12 years, and (b) the point at which the exercise price would be reduced to $5.00 per warrant (at which point it would be advantageous for Triangle to exercise early to capture future distributions on the Class A Units). The key inputs to the MCS model are the same as the Black-Scholes model previously used including 10-year historical volatilities for publicly-traded comparable companies, risk-free interest rates over the expected warrant term and dividend yields based on expected distributions. The change in fair value during the years ended January 31, 2015 and 2014 resulted in a $0.6 million and $39.8 million increase, respectively, in our equity investment account and as a gain on equity investment derivatives. Also included in the gain on equity investment derivatives during the year ended January 31, 2015 was a gain of $1.7 million associated with the change in fair value of the 4,000,000 million Class A Trigger Units which vested on June 30, 2014.
On January 31, 2015, Triangle Caliber Holdings entered into a series of agreements modifying its joint venture with FREIF. In connection with the modifications, Triangle Caliber Holdings entered into a Second Amended and Restated Contribution Agreement, dated January 31, 2015 (the “2nd A&R Contribution Agreement”), with FREIF, and the general partner of Caliber, owned and controlled equally between Triangle Caliber Holdings and FREIF. Pursuant to the terms of the 2nd A&R Contribution Agreement, FREIF agreed to contribute an additional $34.0 million to Caliber in exchange for 2,720,000 Class A Units. FREIF funded the $34.0 million contribution, and the additional 2,720,000 Class A Units were issued, on February 2, 2015. Triangle made no capital contribution to Caliber in connection with the 2nd A&R Contribution Agreement or the issuance of the 2,720,000 Class A Units. Following the issuance, FREIF holds 17,720,000 Class A Units, representing an approximate 71.7% Class A Units ownership interest in Caliber, and Triangle Caliber Holdings holds 7,000,000 Class A Units, representing an approximate 28.3% Class A Units ownership interest in Caliber. Triangle will recognize a gain in the first quarter of fiscal year 2016 of $4.2 million related to Caliber’s issuance of these 2,720,000 Class A Units to FREIF.
Also pursuant to the terms of the 2nd A&R Contribution Agreement, Triangle Caliber Holdings received warrants for the purchase of an additional 3,626,667 Class A Units, and FREIF received warrants for the purchase of an additional 906,667 Class A Units. The warrants received by Triangle Caliber Holdings on February 2, 2015 included 2,357,334 Series 1 through 4 warrants at strike prices and expiration dates noted above and 1,269,333 Series 6 warrants with a strike price of $12.50 and an expiration date of February 2, 2018. Triangle will also recognize a gain of $0.2 million in the first quarter of fiscal year 2016 related to the fair value of the warrants issued, which will be amortized over the lives of the related warrants.
10. CAPITAL STOCK
The Company had 106.4 million shares of common stock issued or reserved for issuance at January 31, 2015. At January 31, 2015, the Company had 75.2 million shares of common stock issued and outstanding. The Company also had 3.6 million shares of common stock reserved for issuance pursuant to outstanding awards under its 2011 Omnibus Incentive Plan and its 2014 Equity Incentive Plan (the “2014 Plan”). The Company also had 4.6 million shares of common stock reserved that remained available for issuance under the 2014 Plan, as well as 6.0 million shares of common stock reserved for issuance under the CEO Stand-Alone Stock Option Agreement. Lastly, the Company had 17.0 million shares of common stock reserved for issuance pursuant to the Convertible Note at January 31, 2015.
The Company’s Board of Directors (the “Board”) approved a program authorizing the repurchase of outstanding shares of the Company’s common stock in amounts equal to the aggregate of (i) $25.0 million of the Company’s common stock (“Tranche 1”), (ii) up to the number of shares of common stock authorized for issuance under the Company’s 2014 Equity Incentive Plan and its CEO Stand-Alone Stock Option Agreement (“Tranche 2”), and (iii) up to the number of shares potentially issuable, at any given time, pursuant to the paid-in-kind interest accrued on the Convertible Note (“Tranche 3”). The program stipulates that shares of common stock may be repurchased from time to time, in amounts and at prices that the Company deems appropriate, subject to market and business conditions and other considerations. The repurchase program has no expiration date and may be suspended or discontinued at any time without prior notice. During fiscal year 2015, the Company repurchased an aggregate of 11.4 million shares of the Company’s common stock under the program at a total cost of $76.8 million. The repurchased shares of common stock were immediately retired and charged to available retained earnings with the balance charged to additional paid-in capital. As of January 31, 2015, the number of shares of common stock remaining available for repurchase under the Board approved program is 4,949,393 shares.
11. SHARE-BASED COMPENSATION
The Company has granted equity awards to officers, directors, and certain employees of the Company including restricted stock units and stock options. In addition, RockPile has granted Series B Units which represent interests in future RockPile profits. The Company measures its awards based on the award’s grant date fair value which is recognized ratably over the applicable vesting period.
On May 27, 2014, the Board approved the 2014 Plan, which was approved by the Company’s stockholders on July 17, 2014. No additional awards may be granted under prior plans but all outstanding awards under prior plans shall continue in accordance with their applicable terms and conditions. The 2014 Plan authorizes the Company to issue stock options,
SARs, restricted stock, restricted stock units, cash awards, and other awards to any employees, officers, directors, and consultants of the Company and its subsidiaries. The maximum number of shares of common stock reserved for issuance under the 2014 Plan is 6.0 million shares, subject to adjustment for certain transactions.
For the years ended January 31, 2015, 2014, and 2013, the Company recorded share-based compensation related to restricted stock units, stock options and RockPile Series B Units as follows:
| | | | | | | | | |
| | For the Years Ended January 31, |
(in thousands) | | 2015 | | 2014 | | 2013 |
Restricted stock units | | $ | 6,254 | | $ | 7,496 | | $ | 6,639 |
Stock options | | | 2,299 | | | 1,135 | | | 60 |
Stock issued pursuant to termination agreements | | | — | | | — | | | 99 |
RockPile Series B Units | | | 509 | | | 590 | | | 617 |
| | | 9,062 | | | 9,221 | | | 7,415 |
Less amounts capitalized to oil and natural gas properties | | | (1,143) | | | (1,391) | | | (949) |
Compensation expense | | $ | 7,919 | | $ | 7,830 | | $ | 6,466 |
Restricted Stock Units. During the year ended January 31, 2015, the Company granted 1,523,700 restricted stock units as compensation to employees, officers, and directors. Restricted stock units vest over one to five years. As of January 31, 2015, there was approximately $19.8 million of total unrecognized compensation expense related to unvested restricted stock units. This compensation expense is expected to be recognized over the remaining vesting period of the related awards of approximately 4.0 years on a weighted average basis. When restricted stock units vest, the holder has the right to receive one share of the Company’s common stock per vesting unit.
The following table summarizes the status of restricted stock units outstanding:
| | | | | |
| | | | Weighted- |
| | Number of | | Average Award |
| | Shares | | Date Fair Value |
Restricted stock units outstanding - January 31, 2012 | | 2,488,342 | | $ | 7.02 |
Units granted | | 1,041,400 | | $ | 6.37 |
Units forfeited | | (5,600) | | $ | 7.59 |
Units vested | | (1,000,057) | | $ | 6.90 |
Restricted stock units outstanding - January 31, 2013 | | 2,524,085 | | $ | 6.68 |
Units granted | | 1,440,133 | | $ | 6.95 |
Units forfeited | | (141,909) | | $ | 6.58 |
Units vested | | (946,681) | | $ | 6.71 |
Restricted stock units outstanding - January 31, 2014 | | 2,875,628 | | $ | 6.62 |
Units granted | | 1,523,700 | | $ | 9.42 |
Units forfeited | | (394,921) | | $ | 7.21 |
Units vested | | (1,090,362) | | $ | 7.04 |
Restricted stock units outstanding - January 31, 2015 | | 2,914,045 | | $ | 7.92 |
Stock Options. The following table summarizes the status of stock options outstanding:
| | | | | |
| | | | Weighted |
| | Number of | | Average |
| | Shares | | Exercise Price |
Options outstanding - January 31, 2012 (142,500 exercisable) | | 235,833 | | $ | 1.50 |
Options exercised | | (4,167) | | $ | 3.00 |
Options outstanding - January 31, 2013 (231,666 exercisable) | | 231,666 | | $ | 1.48 |
Options forfeited | | (15,000) | | $ | 3.00 |
Options exercised | | (108,333) | | $ | 1.25 |
Options granted | | 6,000,000 | | $ | 11.25 |
Options outstanding - January 31, 2014 (108,333 exercisable) | | 6,108,333 | | $ | 11.07 |
Options forfeited | | — | | $ | — |
Options exercised | | (108,333) | | $ | 1.25 |
Options granted | | 700,000 | | $ | 14.00 |
Options outstanding - January 31, 2015 (600,000 exercisable) | | 6,700,000 | | $ | 11.54 |
The following table presents additional information related to the stock options outstanding at January 31, 2015:
| | | | | | | | | |
| | | Remaining | | | | | | |
Exercise Price | | Contractual Life | | Number of Shares |
per Share | | (years) | | Outstanding | | Exercisable |
$ | 7.50 | | 8.43 | | | 750,000 | | | 75,000 |
$ | 8.50 | | 8.43 | | | 750,000 | | | 75,000 |
$ | 10.00 | | 8.43 | | | 1,500,000 | | | 150,000 |
$ | 12.00 | | 8.43 | | | 1,500,000 | | | 150,000 |
$ | 15.00 | | 8.43 | | | 1,500,000 | | | 150,000 |
$ | 12.00 | | 6.61 | | | 233,333 | | | — |
$ | 14.00 | | 6.61 | | | 233,333 | | | — |
$ | 16.00 | | 9.61 | | | 233,334 | | | — |
| | | | | | 6,700,000 | | | 600,000 |
| | | | | | | | | |
Weighted average exercise price per share | $ | 11.54 | | $ | 11.25 |
| | | | | | | | | |
Weighted average remaining contractual life | | 8.34 | | | 8.43 |
Compensation expense related to stock options is calculated using the Black-Scholes valuation model. Expected volatility is generally based on the historical volatility of Triangle’s common stock. The expected term of the options is estimated based on factors such as vesting periods, contractual expiration dates, historical trends in the Company’s common stock price and historical exercise behavior. The risk-free rate for the expected term (from service inception to option exercise) of the options is based on the yields of U.S. Treasury instruments with lives comparable to the estimated expected option term or life.
The following assumptions were used for the Black-Scholes model to calculate the share-based compensation expense for the options granted in fiscal year 2015:
| | | |
Risk free rate | | 1.06 | % |
Dividend yield | | — | |
Expected volatility | | 54 | % |
Weighted average expected stock option life (years) | | 3.0 | |
As of January 31, 2015, there was approximately $18.6 million of total unrecognized compensation expense related to stock options. This compensation expense is expected to be recognized over the remaining vesting period of the related awards of approximately 3.3 years.
RockPile Share-Based Compensation. RockPile currently has two classes of equity; Series A Units which have an 8% preference and Series B Units, which are used for equity awards. RockPile approved a plan that includes provisions
allowing RockPile to make equity grants in the form of restricted units (Series B Units) pursuant to Restricted Unit Agreements. The plan authorizes RockPile to issue an aggregate of up to 6.0 million Series B Units in multiple series designated by a sequential number with the right to reissue forfeited or redeemed Series B Units.
The Series B Units are intended to constitute “profit interests” within the meaning of Internal Revenue Service Revenue Procedures 93‑27 and 2001‑43. Accordingly, the capital account associated with each Series B Unit at the time of its issuance shall be zero. RockPile may designate a “Liquidation Value” applicable to each tranche of a Series B Unit grant so as to constitute a net profits interest. The Liquidation Value shall equal the dollar amount per unit that would, in the reasonable determination of RockPile, be distributed with respect to the initial Series B Unit tranche if, immediately prior to the issuance of a new Series B Unit tranche, the assets of RockPile were sold for their fair market value and the proceeds (net of any liabilities) were distributed.
The Series A Units are entitled to a return of contributed capital and an 8% preferred return on such capital before Series B Units participate in profits. The initial Series B tranche (Series B‑1 Units) participates pro rata with the Series A Units once the preferred return has been achieved. However, no distributions shall be made with respect to any Series B‑1 Unit until total cumulative distributions to the Series A Units total $40.0 million. As of January 31, 2015, the $40.0 million cumulative distribution threshold has been met. Therefore, future distributions will be allocated to the Series B‑1 Units until the per unit profits distributed to the Series B‑1 Units is equivalent to the per unit profits distributed to the Series A Units. Thereafter, all further distributions will be distributed on a pro rata basis. Subsequently issued Series B Units will begin participating on a pro rata basis once the per unit profits allocated to the Series B‑1 Units reaches the Liquidation Value of the subsequent Series B Unit issuance. RockPile’s limited liability company agreement was amended on January 31, 2015 to permit distributions to holders of vested Series B Units as prepayment for future amounts payable to them upon a RockPile liquidity event. In the event a holder of vested Series B Units receives such a pre-liquidity event distribution, their capital account will be adjusted to reflect the prepayment.
Series B Units currently have a 7 to 52 month vesting schedule. Compensation costs are determined using a Black‑Scholes option pricing model based upon the grant date calculated fair market value of the award and is recognized ratably over the applicable vesting period.
A summary of the activity for RockPile’s Series B Units is as follows:
| | | | | | | | | | |
| | Series | | Series | | Series | | Series | | |
| | B-1 units | | B-2 units | | B-3 units | | B-4 units | | Total |
Units outstanding - January 31, 2012 | | — | | — | | — | | — | | — |
Units granted | | 3,100,000 | | 60,000 | | — | | — | | 3,160,000 |
Units outstanding - January 31, 2013 | | 3,100,000 | | 60,000 | | — | | — | | 3,160,000 |
Units granted | | — | | — | | 910,000 | | — | | 910,000 |
Units outstanding - January 31, 2014 | | 3,100,000 | | 60,000 | | 910,000 | | — | | 4,070,000 |
Units redeemed | | (180,000) | | — | | — | | — | | (180,000) |
Units granted | | — | | — | | — | | 1,412,000 | | 1,412,000 |
Units outstanding - January 31, 2015 | | 2,920,000 | | 60,000 | | 910,000 | | 1,412,000 | | 5,302,000 |
Vested | | 2,920,000 | | 30,000 | | 188,000 | | — | | 3,138,000 |
Unvested | | — | | 30,000 | | 722,000 | | 1,412,000 | | 2,164,000 |
As of January 31, 2015, there was approximately $2.6 million of unrecognized compensation expense related to unvested Series B Units. We expect to recognize such expense on a pro-rata basis on the Series B Units’ vesting schedule during the next five fiscal years.
12. FAIR VALUE MEASUREMENTS
The FASB’s ASC 820, Fair Value Measurement and Disclosure, establishes a hierarchy for inputs used in measuring fair value that maximizes the use of observable inputs and minimizes the use of unobservable inputs by requiring that the most observable inputs be used when available. Observable inputs are inputs that market participants would use in pricing the asset or liability developed based on market data obtained from sources independent of the Company. Unobservable inputs are inputs that reflect the Company’s assumptions of what market participants would use in pricing the asset or
liability developed based on the best information available in the circumstances. The hierarchy is broken down into three levels based on the reliability of the inputs as follows:
| · | | Level 1: Quoted prices are available in active markets for identical assets or liabilities; |
| · | | Level 2: Quoted prices in active markets for similar assets and liabilities that are observable for the asset or liability; and |
| · | | Level 3: Unobservable pricing inputs that are generally less observable from objective sources, such as discounted cash flows models or valuations. |
The financial assets and liabilities are classified based on the lowest level of input that is significant to the fair value measurement. The Company’s assessment of the significance of a particular input to the fair value measurement requires judgment, and may affect the valuation of the fair value of assets and liabilities and their placement within the fair value hierarchy levels.
The following table presents the Company’s financial assets and liabilities that were accounted for at fair value on a recurring basis as of January 31, 2015 and January 31, 2014, by level within the fair value hierarchy:
| | | | | | | | | | | | |
| | As of January 31, 2015 |
(in thousands) | | Level 1 | | Level 2 | | Level 3 | | Total |
Assets: | | | | | | | | | | | | |
Equity investment derivative assets | | $ | — | | $ | — | | $ | 504 | | $ | 504 |
Commodity derivative assets | | $ | — | | $ | 62,248 | | $ | — | | $ | 62,248 |
| | | | | | | | | | | | |
Liabilities: | | | | | | | | | | | | |
RockPile earn-out liability | | $ | — | | $ | (1,825) | | $ | — | | $ | (1,825) |
| | | | | | | | | | | | |
| | As of January 31, 2014 |
(in thousands) | | Level 1 | | Level 2 | | Level 3 | | Total |
Assets: | | | | | | | | | | | | |
Equity investment derivative assets | | $ | — | | $ | — | | $ | 39,734 | | $ | 39,734 |
Commodity derivative assets | | $ | — | | $ | 2,147 | | $ | — | | $ | 2,147 |
| | | | | | | | | | | | |
Liabilities: | | | | | | | | | | | | |
RockPile earn-out liability | | $ | — | | $ | (1,739) | | $ | — | | $ | (1,739) |
Commodity Derivative Instruments. The Company determines its estimate of the fair value of commodity derivative instruments using a market approach based on several factors, including quoted market prices in active markets, quotes from third-parties, the credit rating of each counterparty, and the Company’s own credit rating. In considering counterparty credit risk, the Company assessed the possibility of whether the counterparty to the derivative would default by failing to make any contractually required payments. The Company believes that each of its counterparties is creditworthy and has the financial resources and willingness to meet its potential repayment obligations associated with the derivative transactions. At January 31, 2015, commodity derivative instruments utilized by the Company consist of costless collars and swaps. The Company’s commodity derivative instruments are valued using public indices and are traded with third-party counterparties, but are not openly traded on an exchange. As such, the Company has classified these commodity derivative instruments as Level 2.
Caliber Class A (Series 1 through Series 4) Warrants. The Company determines its estimate of the fair value of Caliber Class A Warrants using a MCS model. For each MCS, the value of the Class A Units was forecasted at the end of each quarter based on a predetermined yield, and the strike price for the warrant is adjusted accordingly. The fair value of the underlying Class A Units was estimated employing primarily a discounted cash flows analysis. At January 31, 2015, the Company’s Caliber Class A Warrants are valued using valuation models that are generally less observable from objective sources. As such, the Company has classified these instruments as Level 3.
Earn-out Liability. The Company determined the estimated fair value of the earn-out liability relating to RockPile’s acquisition of Team Well using a market approach based on information derived from an analysis performed for RockPile by an independent third-party. This analysis used publicly available information from market participants in the same
industry, generally accepted methods for estimating an investor’s return requirements, and quoted market prices in active markets. As such, the earn-out liability has been classified as Level 2.
Summary of Level 3 Financial Assets and Liabilities. The following table presents the rollforward of the fair values of the Company’s Level 3 financial assets and liabilities:
| | | | | | | |
| | | Class A | | | |
| | | Trigger | | | |
(in thousands) | | | Units | | Warrants |
Balance at January 31, 2013 | | | $ | — | | $ | — |
Initial recognition of equity investment derivative assets | | | | 38,091 | | | 1,696 |
Balance at January 31, 2014 | | | | 38,091 | | | 1,696 |
Interest paid in-kind | | | | — | | | — |
Net unrecognized loss | | | | — | | | — |
Net unrealized gain | | | | 1,745 | | | (1,192) |
Conversion to Class A Units | | | | (39,836) | | | — |
Balance at January 31, 2015 | | | $ | — | | $ | 504 |
Fair Value of Financial Instruments. The Company’s financial instruments consist primarily of cash and cash equivalents, accounts receivable and payable, derivatives and Caliber Class A Warrants (discussed above) and long-term debt. The carrying values of cash equivalents and accounts receivable and payable are representative of their fair values due to their short-term maturities. The Convertible Note’s estimated fair value is based on discounted cash flows analysis and option pricing. The carrying amount of the Company’s revolving credit facilities approximated fair value because the interest rate of the facilities is variable. The fair value of other notes and mortgages payable is not significantly different than their carry values. The fair value of the TUSA 6.75% Notes is derived from quoted market prices. This disclosure does not impact our financial position, results of operations or cash flows.
| | | | | | | | | | | | |
| | January 31, 2015 | | January 31, 2014 |
| | Carrying | | Estimated | | Carrying | | Estimated |
(in thousands) | | Value | | Fair Value | | Value | | Fair Value |
5% convertible note | | $ | 135,877 | | $ | 137,790 | | $ | 129,290 | | $ | 169,170 |
Revolving credit facilities | | | 224,159 | | | 224,159 | | | 204,515 | | | 204,515 |
TUSA 6.75% notes | | | 429,500 | | | 303,871 | | | — | | | — |
Other notes and mortgages payable | | | 10,605 | | | 10,605 | | | 9,403 | | | 9,403 |
13. INCOME TAXES
The Company’s income tax provision (benefit) is composed of the following:
| | | | | | | | | |
| | For the Years Ended January 31, |
(in thousands) | | 2015 | | 2014 | | 2013 |
Current tax expense (benefit) | | $ | — | | $ | — | | $ | — |
Deferred tax expense (benefit) | | | | | | | | | |
Federal | | | 42,400 | | | 7,324 | | | (2,137) |
State | | | 3,100 | | | 617 | | | (223) |
Foreign | | | — | | | — | | | (83) |
Valuation allowance - United States and Canada | | | — | | | — | | | 2,443 |
Total income tax provision (benefit) | | $ | 45,500 | | $ | 7,941 | | $ | — |
| | | | | | | | | |
Income (loss) before income taxes | | $ | 138,897 | | $ | 81,421 | | $ | (14,484) |
Effective income tax rate | | | 33% | | | 10% | | | 0% |
A reconciliation of the income tax provision (benefit) computed by applying the federal statutory rate of 35.0% to the Company’s income tax provision (benefit) is as follows:
| | | | | | | | | |
| | For the Years Ended January 31, |
(in thousands) | | | 2015 | | | 2014 | | | 2013 |
Federal statutory tax expense (benefit) | | $ | 48,613 | | $ | 28,498 | | $ | (5,069) |
State income tax expense / (benefit), net of federal income tax benefit | | | 3,618 | | | 2,324 | | | (361) |
Permanent differences | | | 3,196 | | | 3,221 | | | 2,280 |
Difference in foreign tax rates | | | 539 | | | 164 | | | 28 |
Effect of tax rate change | | | (147) | | | (258) | | | (71) |
Credits | | | (338) | | | (100) | | | — |
State NOL adjustment | | | 1,061 | | | — | | | — |
Bad debt deduction for receivables from Elmworth | | | (14,517) | | | — | | | — |
Attribute reduction - cancellation of debt exclusion - Elmworth | | | 8,466 | | | — | | | — |
Changes in valuation allowance | | | (7,464) | | | (26,364) | | | 2,443 |
Other | | | 2,473 | | | 456 | | | 750 |
Provision for income taxes | | $ | 45,500 | | $ | 7,941 | | $ | — |
The difference in foreign tax rate of $0.5 million in fiscal year 2015 is a result of adjusting the U.S. blended statutory tax rate of 37.6% down to the Canadian statutory tax rate of 25.0%.
The components of Triangle’s net deferred income tax assets and liabilities are as follows for fiscal years 2015 and 2014:
| | | | | | |
| | For the Years Ended January 31, |
(in thousands) | | 2015 | | 2014 |
Current: | | | | | | |
Assets: | | | | | | |
Asset retirement obligations | | $ | 1,394 | | $ | 1,071 |
Accruals | | | 1,138 | | | 103 |
Total current assets | | | 2,532 | | | 1,174 |
Valuation allowance | | | (1,193) | | | (492) |
Total current assets after valuation allowance | | | 1,339 | | | 682 |
Liabilities: | | | | | | |
Hedging liabilities | | | (20,806) | | | (361) |
Total current liabilities | | | (20,806) | | | (361) |
Net current deferred income tax asset (liability) | | $ | (19,467) | | $ | 321 |
| | | | | | |
Non-Current: | | | | | | |
Assets: | | | | | | |
Canadian oil and natural gas properties | | $ | — | | $ | 6,080 |
United States net losses carried forward | | | 48,443 | | | 33,129 |
Canadian net losses carried forward | | | — | | | 1,905 |
Asset retirement obligations | | | 1,198 | | | 416 |
Stock-based compensation | | | 3,182 | | | 3,105 |
Property and equipment | | | — | | | 157 |
Other | | | 2,395 | | | 1,864 |
Total non-current assets | | | 55,218 | | | 46,656 |
Valuation allowance | | | — | | | (8,165) |
Total non-current assets after valuation allowance | | | 55,218 | | | 38,491 |
Liabilities: | | | | | | |
United States oil and natural gas properties | | | (56,531) | | | (29,536) |
Investment in Caliber | | | (32,661) | | | (16,766) |
Hedging liabilities | | | — | | | (451) |
Total deferred non-current income tax liability | | | (89,192) | | | (46,753) |
Net non-current deferred income tax liability | | $ | (33,974) | | $ | (8,262) |
| | | | | | |
Total net deferred income tax liability | | $ | (53,441) | | $ | (7,941) |
As of fiscal year 2013 the Company placed a full valuation allowance against deferred income taxes. During the year ended January 31, 2014, Triangle had determined in its judgment, based upon all available evidence (both positive and negative), that it is more likely than not that the net U.S. deferred tax assets will be realized. Therefore, all deferred tax benefits were recognized in fiscal year 2014 and the full valuation allowance removed as part of the effective tax rate.
Triangle has also determined in its judgment, based upon all available evidence (both positive and negative), that it is more likely than not that the net Canadian deferred tax assets will not be realized. Therefore, all remaining Canadian deferred tax assets will have a full valuation allowance placed against them. As a result of the cancellation of indebtedness related to the Elmworth intercompany, certain deferred tax assets and the related valuation allowance were reduced. The key negative evidence relating to the Canadian deferred tax assets considered in this determination includes the following: (i) a history of both book and tax losses; (ii) cumulative losses in recent years; (iii) an expectation of tax losses during the next four to five years. Therefore, the combination of historical/cumulative losses as well as an expectation of book and taxable losses in the foreseeable future is the basis for the placement of a full valuation allowance against all of the Canadian deferred tax assets.
The Company has net operating loss carryovers as of January 31, 2015 of $136.9 million for federal income tax purposes and $131.1 million for financial reporting purposes. The difference of $5.8 million relates to tax deductions for compensation expense for financial reporting purposes for which the benefit will not be recognized until the related
deductions reduce taxes payable. The United States NOL carryforwards begin expiring in 2024. Although certain tax years are closed under the statute of limitations, tax authorities can still adjust tax losses being carried forward to open tax years.
At January 31, 2015 and 2014, we have no unrecognized tax benefits that would impact our effective tax rate, and we have made no provisions for interest or penalties related to uncertain tax positions. The Company’s uncertain tax positions must meet a more-likely-than-not realization threshold to be recognized, and any potential accrued interest and penalties related to unrecognized tax benefits are recognized within income tax expense.
The tax years for fiscal years ending 2012 to 2015 remain open to examination by the Internal Revenue Service of the United States. We file tax returns with various state taxing authorities which remain open for examination for fiscal years 2012 to 2015, except for Colorado which is open for the fiscal years 2011 to 2015. We also file with various Canadian taxing authorities which remain open for fiscal years 2011 to 2015.
14. RELATED PARTY TRANSACTIONS
TUSA and an affiliate of Caliber have entered into certain midstream services agreements for (i) crude oil gathering, stabilization, treating and redelivery; (ii) natural gas compression, gathering, dehydration, processing and redelivery; (iii) produced water transportation and disposal services; and (iv) fresh water transportation for TUSA’s oil and natural gas drilling and production operations. The agreements also include an acreage dedication from TUSA and a firm volume commitment by the Caliber affiliate for each service line. TUSA has agreed to deliver minimum monthly revenues derived from the fees paid by TUSA to the Caliber affiliate for volumes of oil, natural gas, produced water, and fresh water for a primary term of 15 years beginning on the 2014 in-service dates for the Caliber facilities. The aggregate minimum revenue commitment over the term of the agreements is $405.0 million, of which $359.2 million was outstanding at January 31, 2015.
TUSA and an affiliate of Caliber have also entered into a gathering services agreement, pursuant to which the Caliber affiliate will provide certain gathering-related measurement services to TUSA, and a fresh water sales agreement, that will make available certain volumes of fresh water for purchase by TUSA at a set per barrel fee for a primary term of five years from the in-service date anticipated to be in the first half of fiscal year 2016. The fresh water sales agreement obligates TUSA to purchase all of the fresh water it requires for its drilling and operating activities exclusively from the Caliber affiliate, subject to availability, but it does not require TUSA to purchase a minimum volume of fresh water.
For the years ended January 31, 2015 and 2014, Caliber had $43.0 million and $15.6 million of revenue, respectively, of which $36.6 million and $15.0 million, respectively, were from TUSA. Also, TUSA sold one salt water disposal well to an affiliate of Caliber for $1.5 million in fiscal year 2015.
For the year ended January 31, 2015, Triangle received $0.9 million from Caliber for certain administrative services supplemental to those provided by Caliber employees. The administrative services were provided pursuant to the October 1, 2012 Services Agreement between Triangle and Caliber.
15. COMMITMENTS AND CONTINGENCIES
Triangle has entered into non-cancelable operating leases for office facilities and Rockpile has entered into various non-cancelable operating leases relating to (i) equipment for transportation, transloading and storage bulk commodities and light vehicles, (ii) transloading services and track rental and (iii) transportation equipment management, logistics and maintenance. Rent expense incurred under the non-cancelable operating leases was $1.8 million, $0.8 million, and $0.5 million for the fiscal years ended January 31, 2015, 2014, and 2013, respectively.
As of January 31, 2015, the future minimum lease payments under operating leases that have initial or remaining non-cancelable terms in excess of one year are:
| | | |
Fiscal Years Ending January 31, | | Annual Rental Amount (in thousands) |
2016 | | $ | 2,807 |
2017 | | $ | 2,749 |
2018 | | $ | 2,357 |
2019 | | $ | 2,108 |
2020 and thereafter | | $ | 2,686 |
As of January 31, 2015 the Company was subject to commitments on four drilling rig contracts. Two of the drilling rig contracts expire in first quarter of fiscal year 2016, and the remaining contracts expire in the second and fourth quarters of fiscal year 2016. In the event of early termination of the contracts, the Company would be obligated to pay an aggregate amount of approximately $10.2 million as of January 31, 2015 as required under the terms of the contracts.
CEO Transaction Bonus Program Pursuant to the Third Amended and Restated Employment Agreement, dated July 4, 2014 (the “Employment Agreement”), between the Company and Jonathan Samuels, our President and Chief Executive Officer, Mr. Samuels is entitled to a cash bonus payable upon a liquidity event involving RockPile or Caliber based on the percentage gain realized by the Company relative to its initial investment in the relevant entity (“Transaction Bonus”). The amount of this Transaction Bonus would be equivalent to 5% of that gain in Caliber for a Caliber liquidity event, and 3.5% of that gain in RockPile for a RockPile liquidity event. The right to the Transaction Bonus vests and becomes non-forfeitable in thirds on the first three anniversaries of the execution date of the Employment Agreement, with acceleration or forfeiture of the unvested portions of such right upon the occurrence of certain events.
On January 31, 2015, Triangle and Mr. Samuels entered into a First Amendment to Third Amended and Restated Employment Agreement (the “First Amendment”) that modified the Employment Agreement to permit Triangle’s Board to authorize distributions to Mr. Samuels pursuant to his Transaction Bonus program in advance of defined liquidity events. Any Board authorized distribution to Mr. Samuels related to the Transaction Bonus program would reduce any future award payable to Mr. Samuels following a liquidity event. There are no clawback provisions in the First Amendment that would require Mr. Samuels to repay Triangle for any excess distributions or payments received.
In connection with the First Amendment, the Board authorized the payment of a Transaction Bonus to Mr. Samuels of $1.9 million which has been recorded as a liability as of January 31, 2015. The payment of the Board authorized distribution will occur on the earlier of December 31, 2015 or when the WTI (NYMEX) price of oil exceeds $65 for 5 days over a consecutive 30 day period, subject to Mr. Samuel’s continuous employment with the Company through the applicable distribution date. Because consummation of a liquidity event involving RockPile or Caliber is contingent on many unknown factors, the Company has determined that the contingent liability associated with such a bonus is not probable at January 31, 2015, and, therefore, no amounts have been recorded in the accompanying consolidated balance sheets other than the Board authorized distribution.
16. SUPPLEMENTAL DISCLOSURES OF CASH FLOWS INFORMATION
| | | | | | | | | |
| | For the Years Ended January 31, |
(in thousands) | | 2015 | | 2014 | | 2013 |
Cash paid during the period for: | | | | | | | | | |
Interest expense | | $ | 19,713 | | $ | 1,419 | | $ | 75 |
Income taxes | | $ | 600 | | $ | — | | $ | — |
| | | | | | | | | |
Non-cash investing activities: | | | | | | | | | |
Additions (reductions) to oil and natural gas properties through: | | | | | | | | | |
Increased accounts payable and accrued liabilities | | $ | 47,838 | | $ | 30,785 | | $ | 36,654 |
Issuance of common stock | | $ | — | | $ | 2,438 | | $ | 1,204 |
Capitalized stock based compensation | | $ | 1,143 | | $ | 1,391 | | $ | 949 |
Change in asset retirement obligations | | $ | 1,818 | | $ | 673 | | $ | 1,869 |
Capitalized interest | | $ | 4,899 | | $ | 809 | | $ | — |
Acquisition of oilfield services equipment through notes payable and liabilities | | $ | — | | $ | 1,990 | | $ | — |
Purchase of minority interest in RockPile | | $ | — | | $ | — | | $ | 12,349 |
| | | | | | | | | |
Non-cash financing activities: | | | | | | | | | |
Notes payable issued for redemption of RockPile B Units | | $ | 1,041 | | $ | — | | $ | — |
17. QUARTERLY FINANCIAL INFORMATION (UNAUDITED)
The Company’s quarterly financial information for fiscal years 2015 and 2014 is as follows:
| | | | | | | | | | | | |
| | For the Year Ended January 31, 2015 (1) |
| | First | | Second | | Third | | Fourth |
(in thousands) | | Quarter | | Quarter | | Quarter | | Quarter |
Total revenue | | $ | 99,782 | | $ | 141,989 | | $ | 174,196 | | $ | 156,988 |
Income from operations (2) | | $ | 22,347 | | $ | 38,489 | | $ | 33,345 | | $ | 1,202 |
Net income | | $ | 14,542 | | $ | 14,552 | | $ | 25,398 | | $ | 38,905 |
Net income attributable to common stockholders | | $ | 14,542 | | $ | 14,552 | | $ | 25,398 | | $ | 38,905 |
Net income per common share - basic | | $ | 0.17 | | $ | 0.17 | | $ | 0.30 | | $ | 0.50 |
Net income per common share - diluted | | $ | 0.15 | | $ | 0.15 | | $ | 0.26 | | $ | 0.42 |
| | | | | | | | | | | | |
| | For the Year Ended January 31, 2014 (1) |
| | First | | Second | | Third | | Fourth |
(in thousands) | | Quarter | | Quarter | | Quarter | | Quarter |
Total revenue | | $ | 34,294 | | $ | 50,394 | | $ | 88,549 | | $ | 85,510 |
Income from operations (2) | | $ | 4,328 | | $ | 12,973 | | $ | 17,160 | | $ | 12,501 |
Net income | | $ | 5,211 | | $ | 6,799 | | $ | 47,221 | | $ | 14,249 |
Net income attributable to common stockholders | | $ | 5,211 | | $ | 6,799 | | $ | 47,221 | | $ | 14,249 |
Net income per common share - basic | | $ | 0.10 | | $ | 0.12 | | $ | 0.60 | | $ | 0.17 |
Net income per common share - diluted | | $ | 0.10 | | $ | 0.12 | | $ | 0.50 | | $ | 0.15 |
| (1) | | Amounts reported for the quarter period. |
| (2) | | There were immaterial reclassifications for the periods presented between operating expenses and other income (expense). |
18. SUPPLEMENTAL INFORMATION ON OIL AND NATURAL GAS EXPLORATION, DEVELOPMENT AND PRODUCTION ACTIVITIES (UNAUDITED)
Oil and Natural Gas Reserve Information. The following information concerning the Company’s oil and natural gas operations is provided pursuant to the FASB guidance regarding Oil and Gas Reserve Estimation and Disclosures.
At January 31, 2015, the Company’s oil and natural gas producing activities were conducted in the Williston Basin in the continental United States. All of our proved reserves are in the Bakken or Three Forks formations in the North Dakota counties of McKenzie, Williams, Stark, or Dunn, or in the Montana counties of Roosevelt, Sheridan, Madison or Richland. The Company has ceased all Canadian exploration and production activities and its oil and natural gas properties were fully impaired as of January 31, 2012.
Proved reserves are the estimated quantities of crude oil, natural gas, and natural gas liquids, which by analysis of geoscience and engineering data, can be estimated with reasonable certainty to be economically producible from a given date forward, from known reservoirs, and under existing economic conditions, operating methods, and government regulations prior to the time at which contracts providing the right to operate expire, unless evidence indicates that renewal is reasonably certain, regardless of whether deterministic or probabilistic methods are used for the estimation. Existing economic conditions include prices and costs at which economic producibility from a reservoir is to be determined, and the price to be used is the average price during the 12-month period prior to the ending date of the period covered by the report, determined as an unweighted arithmetic average of the first-day-of-the-month price for each month within such period, unless prices are defined by contractual arrangements, excluding escalations based upon future conditions. Such prices are also adjusted for regional price differentials; gathering, transportation, and processing; and other factors to arrive at prices utilized in the calculation of a standardized measure of discounted future net cash flows related to proved oil and natural gas reserves (“Standardized Measure”)
The table below presents a summary of changes in the Company’s estimated proved reserves for each of the years in the three-year period ended January 31, 2015. Cawley, Gillespie & Associates, Inc. (“Cawley Gillespie”) an independent petroleum engineering firm, audited our estimate as of January 31, 2015, January 31, 2014, and January 31, 2013 of proved reserves and undiscounted and discounted future cash flows (before income taxes) from those proved reserves. The Company emphasizes that reserve estimates are inherently imprecise and that estimates of new discoveries and undeveloped locations are more imprecise than estimates of established producing oil and natural gas properties. Accordingly, these estimates are expected to change as future information becomes available.
The reserve estimates presented in the following tables are expressed in thousands of barrels of oil (“Mbbls”), millions of cubic feet of natural gas (“MMcf”), thousands of barrels of natural gas liquids (“Mbbls”) and thousands of barrels of oil equivalent (“Mboe”).
| | | | | | |
| | Crude Oil | | Natural Gas | | NGL |
| | (Mbbls) | | (MMcf) | | (Mbbls) |
Total proved reserves at January 31, 2012 | | 1,365 | | 674 | | — |
Revisions of previous estimates | | 665 | | 1,832 | | — |
Purchase of reserves | | 230 | | 181 | | — |
Extensions, discoveries and other additions | | 10,960 | | 10,251 | | — |
Sale of reserves | | (229) | | (165) | | — |
Production | | (452) | | (188) | | — |
Total proved reserves at January 31, 2013 | | 12,539 | | 12,585 | | — |
Revisions of previous estimates | | 2,727 | | (859) | | 1,762 |
Purchase of reserves | | 6,836 | | 4,714 | | 690 |
Extensions, discoveries and other additions | | 12,059 | | 11,064 | | 1,599 |
Sale of reserves | | (491) | | (374) | | — |
Production | | (1,754) | | (626) | | (70) |
Total proved reserves at January 31, 2014 | | 31,916 | | 26,504 | | 3,981 |
Revisions of previous estimates | | 2,087 | | 1,475 | | (776) |
Purchase of reserves | | 3,655 | | 2,928 | | 7 |
Extensions, discoveries and other additions | | 13,946 | | 11,710 | | 1,129 |
Sale of reserves | | (2) | | (3) | | — |
Production | | (3,511) | | (2,429) | | (260) |
Total proved reserves at January 31, 2015 | | 48,091 | | 40,185 | | 4,081 |
| | | | | | |
Proved Developed Reserves included above: | | | | | | |
January 31, 2012 | | 538 | | 202 | | — |
January 31, 2013 | | 4,985 | | 5,906 | | — |
January 31, 2014 | | 13,734 | | 10,930 | | 1,440 |
January 31, 2015 | | 29,605 | | 24,136 | | 2,350 |
| | | | | | |
Proved Undeveloped Reserves included above: | | | | | | |
January 31, 2012 | | 827 | | 472 | | — |
January 31, 2013 | | 7,554 | | 6,679 | | — |
January 31, 2014 | | 18,182 | | 15,574 | | 2,541 |
January 31, 2015 | | 18,486 | | 16,049 | | 1,731 |
The following average prices are reflected in the calculation of the Standardized Measure:
| | | | | | | | | |
| | For the Years Ended January 31, |
| | 2015 | | 2014 | | 2013 |
Oil price per barrel | | $ | 79.71 | | $ | 93.09 | | $ | 84.76 |
| | | | | | | | | |
Natural gas price per Mcf | | $ | 6.09 | | $ | 3.99 | | $ | 5.23 |
| | | | | | | | | |
Natural gas liquids price per barrel | | $ | 34.61 | | $ | 44.10 | | $ | — |
Extensions and Discoveries in Fiscal Year 2015. The 13.9 million barrels of oil, 11.7 billion cubic feet of natural gas, and 1.1 million barrels of natural gas liquids of proved reserves added by extensions and discoveries in North Dakota in fiscal year 2015 are primarily due to our increased completion of wells, particularly operated wells, and other parties completing wells offsetting our properties. In fiscal year 2015, we participated in 145 gross (38.6 net) productive wells completed, and we added 37 gross (14.0 net) new proved undeveloped well locations discussed later in this Note.
Revisions in Fiscal Year 2015. The 2.1 million barrels upward revision in crude oil proved reserves in fiscal year 2015 was primarily due to longer production histories that favorably supported the increase in proved oil reserves. The
1.5 billion cubic feet upward revision in natural gas reserves and the 0.8 million barrels decrease in NGL reserves reflect agreements and arrangements at the end of fiscal year 2015 to have the majority of our proved natural gas reserves processed to extract NGLs and dry residue gas that Triangle would sell to third parties.
Purchases of Proved Properties in Fiscal Year 2015. The Company purchased certain proved properties which added reserves of 3.7 million barrels of oil and 2.9 billion cubic feet of natural gas proved reserves in fiscal year 2015.
Proved Undeveloped Reserves. At January 31, 2015, we had proved undeveloped oil and natural gas reserves of 22,892 Mboe, down 427 Mboe from 23,319 Mboe at January 31, 2014. Changes in our proved undeveloped reserves are summarized in the following table:
| | | | | | |
| | (Mboe) | | Gross Wells | | Net Wells |
Proved Undeveloped Reserves at January 31, 2012 | | 905 | | 17 | | 2.6 |
Became developed reserves in fiscal year 2013 | | (363) | | (9) | | (1.2) |
Traded for net acres in other drill spacing units | | (256) | | (5) | | (0.7) |
Revisions | | 66 | | (1) | | (0.1) |
Acquisition of additional interests in PUD location | | 172 | | — | | 0.3 |
Additional proved undeveloped locations | | 8,144 | | 57 | | 18.9 |
Proved Undeveloped Reserves at January 31, 2013 | | 8,668 | | 59 | | 19.8 |
Became developed reserves in fiscal year 2014 | | (3,701) | | (32) | | (7.9) |
Traded for net acres in other drill spacing units | | (353) | | (4) | | (0.8) |
Revisions | | 84 | | — | | — |
Acquisitions | | 5,466 | | 13 | | 11.8 |
Extensions and discoveries of proved reserves | | 13,155 | | 68 | | 29.6 |
Proved Undeveloped Reserves at January 31, 2014 | | 23,319 | | 104 | | 52.5 |
Became developed reserves in fiscal year 2015 | | (8,461) | | (30) | | (18.5) |
Revisions | | 1,676 | | (14) | | 4.7 |
Acquisitions | | 528 | | 6 | | 1.3 |
Extensions and discoveries of proved reserves | | 5,830 | | 37 | | 14.0 |
Proved Undeveloped Reserves at January 31, 2015 | | 22,892 | | 103 | | 54.0 |
During fiscal year 2015, we invested approximately $151.6 million (averaging $8.2 million per net well) related to the drilling and completion of the 30 gross (18.5 net) wells that converted 8,461 Mboe of proved undeveloped reserves to proved developed reserves.
For proved undeveloped (“PUD”) locations at January 31, 2015, the following table provides further information on the timing and status of operated and non-operated locations:
| | | | | | |
| | PUD | | Development Wells |
| | Locations | | Gross | | Net |
Proved undeveloped locations: | | | | | | |
For which Triangle operated wells are to be drilled and completed by January 31, 2020 | | 79 | | 79 | | 49.9 |
For which non-operated wells were in-progress at January 31, 2015 and are expected to be completed in fiscal year 2016 | | — | | — | | — |
That are non-operated wells with drilling permits | | 6 | | 6 | | 0.7 |
That are non-operated wells to be drilled by July 31, 2017 | | 18 | | 18 | | 3.4 |
| | 103 | | 103 | | 54.0 |
Standardized Measure of Discounted Future Net Cash Flows
Authoritative accounting guidance by the FASB requires the Company to calculate and disclose for January 31, 2015 and 2014 (i) a standardized measure of discounted future net cash flows relating to proved oil and natural gas reserves (“Standardized Measure”) and (ii) changes in the Standardized Measure for fiscal years 2015 and 2014. Under that accounting guidance:
| · | | Future cash inflows and production and development costs are determined by applying prices and costs, including transportation, quality, and basis differentials, to the fiscal year-end estimated future proved reserve quantities. |
| · | | Future cash inflows are proved reserves at the prices used in determining proved reserves, i.e., for crude oil, natural gas, or natural gas liquids, the average price during the year, determined as an unweighted arithmetic average of the first-day-of-the-month price for each month within the year, unless prices are defined by contractual arrangements, excluding escalations based upon future conditions. |
| · | | Future development and operating costs are determined based on estimates of expenditures to be incurred in developing and producing the proved reserves in place at the end of the period using fiscal year-end cost rates and assuming continuation of existing economic conditions. |
| · | | Estimated future income taxes are computed using the current statutory income tax rates and with consideration of other tax matters such as (i) tax basis of our oil and natural gas properties and (ii) net operating loss carryforwards relating to our oil and natural gas producing activities. The resulting future after-tax net cash flows are discounted at 10% per annum to arrive at the Standardized Measure. |
These assumptions do not necessarily reflect the Company’s expectations of actual net cash flows to be derived from those reserves, nor their present value. The limitations inherent in the reserve quantity estimation process, as discussed previously, are equally applicable to the Standardized Measure computations.
The following summary sets forth the Company’s Standardized Measure for January 31, 2015, 2014, and 2013:
| | | | | | | | | |
| | For the Years Ended January 31, |
(in thousands) | | 2015 | | 2014 | | 2013 |
Future cash inflows | | $ | 4,219,155 | | $ | 3,252,079 | | $ | 1,128,676 |
Future costs: | | | | | | | | | |
Production | | | (1,586,288) | | | (1,118,508) | | | (333,185) |
Development | | | (439,749) | | | (505,432) | | | (199,173) |
Future income tax expense | | | (394,538) | | | (364,340) | | | (87,313) |
Future net cash flows | | | 1,798,580 | | | 1,263,799 | | | 509,005 |
10% discount factor | | | (977,088) | | | (690,564) | | | (297,653) |
Standardized measure of discounted future net cash flows relating to proved reserves | | $ | 821,492 | | $ | 573,235 | | $ | 211,352 |
Because the estimated salvage value of equipment exceeds the related abandonment costs for well plugging and site restoration costs, future development costs at January 31, 2015 of $439.7 million does not include any net abandonment costs.
The principle sources of change in the Standardized Measure are shown in the following table:
| | | | | | | | | |
| | For the Years Ended January 31, |
(in thousands) | | 2015 | | 2014 | | 2013 |
Standardized measure, beginning of period | | $ | 573,235 | | $ | 211,352 | | $ | 29,428 |
Extensions and discoveries, net of future production and development costs | | | 312,185 | | | 333,140 | | | 193,107 |
Sales, net of production costs | | | (210,505) | | | (123,786) | | | (31,502) |
Previously estimated development costs incurred during the period | | | 121,282 | | | 66,724 | | | 10,368 |
Revision of quantity estimates | | | 24,115 | | | 73,598 | | | 15,910 |
Net change in prices, net of production costs | | | (141,200) | | | 19,173 | | | 2,779 |
Acquisition of reserves | | | 91,327 | | | 99,683 | | | 2,119 |
Divestiture of reserves | | | (72) | | | (7,341) | | | (3,273) |
Accretion of discount | | | 67,790 | | | 22,486 | | | 2,943 |
Changes in future development costs | | | 57,259 | | | 7,699 | | | 801 |
Change in income taxes | | | (56,652) | | | (91,161) | | | (13,509) |
Change in production timing and other | | | (17,272) | | | (38,332) | | | 2,181 |
Standardized measure, end of period | | $ | 821,492 | | $ | 573,235 | | $ | 211,352 |
We calculate the projected income tax effect using the “year-by-year” method for purposes of the supplemental oil and natural gas disclosures and use the “short-cut” method for the ceiling test calculation. Companies that follow the full cost accounting method are required to make quarterly “ceiling test” calculations. This test limits total capitalized costs for oil and natural gas properties (net of accumulated amortization and deferred income taxes) to no more than the sum of (i) the present value discounted at 10% of estimated future net cash flows from proved reserves, (ii) the cost of properties not being amortized, (iii) the lower of cost or estimated fair value of unproven properties included in the costs being amortized and (iv) all related tax effects.