Exhibit 99.2
Investment Corporation
Second Quarter Results & Conference Call August 09, 2005
Forward-looking Statements
This presentation may contain forward-looking statements under federal securities laws. These statements are based on management’s current expectations and beliefs and are subject to a number of trends and uncertainties that could cause actual results to differ materially from those described in the forward-looking statements. The risks and uncertainties that may cause our performance and results to vary include: (i) changes in overall economic conditions and interest rates; (ii) an inability to originate subprime hybrid/adjustable mortgage loans; (iii) increased delinquency rates in our portfolio; (iv) adverse changes in the securitization and whole loan market for mortgage loans; (v) declines in real estate values; (vi) limited cash flow to fund operations and dependence on short-term financing facilities; (vii) concentration of operations in California, Florida, New York and Texas; (viii) extensive government regulation; (ix) intense competition in the mortgage lending industry; and (x) an inability to comply with the federal tax requirements applicable to REITs and effectively operate within limitations imposed on REITs by federal tax rules. For a more complete discussion of these risks and uncertainties and information relating to the company, see the Form 10-K for the year ended December 31, 2004 and other filings with the SEC made by the company pursuant to the Securities Exchange Act of 1934. Aames Investment expressly disclaims any obligation to update or revise any forward-looking statements in this presentation.
Slide 2
2nd Quarter 2005 Highlights
Achieved targeted REIT Portfolio of $3.9 billion
Current leverage ratio of 12.3 x
Closed $1.1 billion securitization
100% core hybrid product
Paid quarterly dividend on August 08, 2005
$.034 per share
$1.6 billion in loan production
$236 million, or 17%, over 1Q05
Cost to originate of 2.33% for quarter
20% improvement from first quarter
Slide 3
2005 Strategic Initiatives Update
Value focused production
Focused on long-term ROA from REIT portfolio
Continue to enhance sales plat form and productivity
Expanded super retail branch transition Increase wholesale account executive levels
Reduce overall cost structure
Address competitive pressures through greater efficiencies Leverage technology
Maximize benefits from in-house servicing
Slide 4
Operating Overview
Slide 5
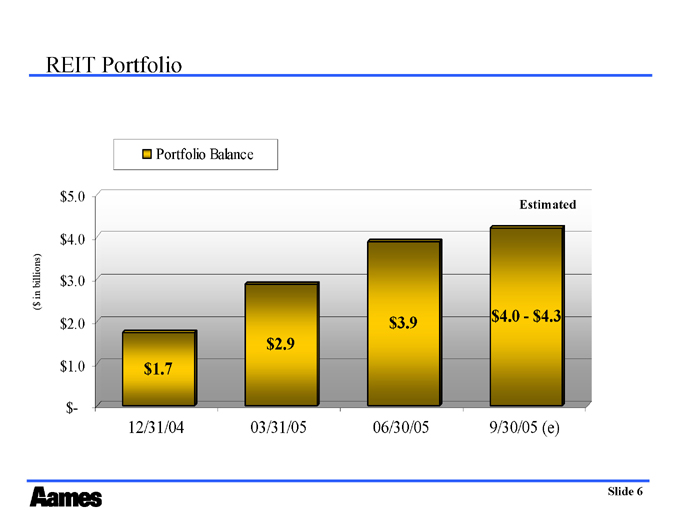
REIT Portfolio
Portfolio Balance $5.0 $4.0 $3.0 $2.0 $1.0 $- $1.7 $2.9 $3.9
Estimated $4.0 - $4.3
12/31/04
03/31/05
06/30/05
9/30/05 (e)
Slide 6 6
($ in billions)
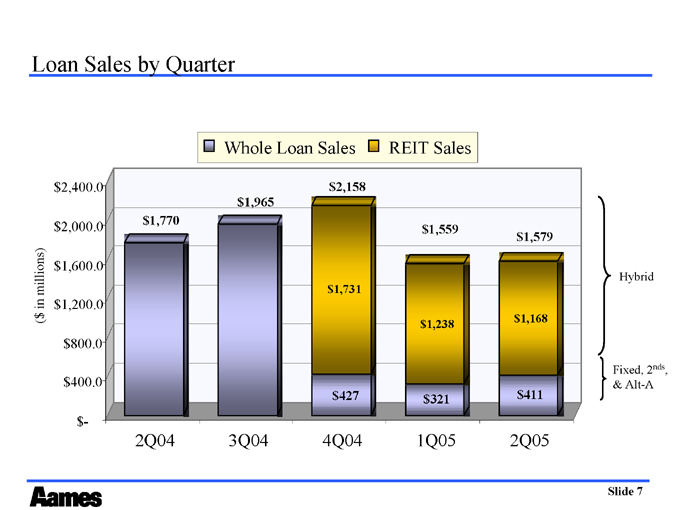
Loan Sales by Quarter
Whole Loan Sales REIT Sales $2,400.0 $2,000.0 $1,600.0 $1,200.0 $800.0 $400.0 $-
($ in millions) $1,770 $1,965
2Q04
3Q04 $2,158 $1,731 $427
4Q04 $1,559 $1,238 $321
1Q05 $1,579 $1,168 $411
2Q05
Hybrid
Fixed, 2 2nds nds,, & Alt-A -A
Slide 7
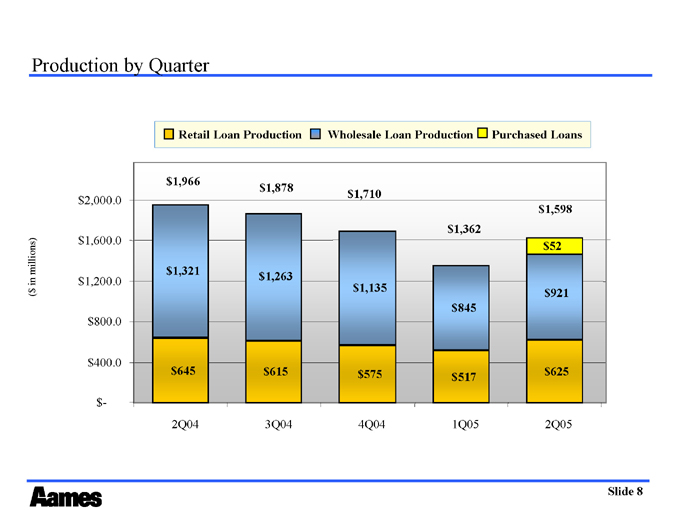
Production by Quarter
($ in millions) $2,000.0 $1,600.0 $1,200.0 $800.0 $400.0 $-
Retail Loan Production
Wholesale Loan Production
Purchased Loans $1,966 $1,321 $645
2Q04 $1,878 $1,263 $615
3Q04 $1,710 $1,135 $575
4Q04 $1,362 $845 $517
1Q05 $1,598 $52 $921 $625
2Q05
Slide 8
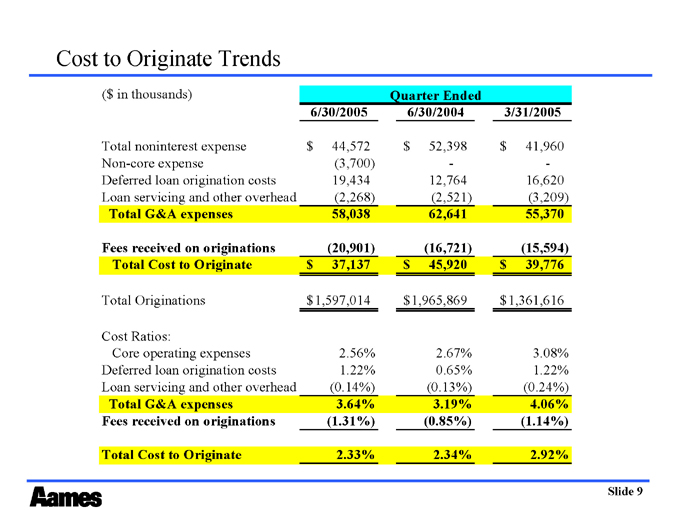
Cost to Originate Trends
(($ in thousands)
Quarter Ended
6/30/2005 6/30/2004 3/31/2005
Total noninterest expense $$ 44,572 $$ 52,398 $$ 41,960
Non-core expense - (3,700) - - - -
Deferred loan origination costs 19,434 12,764 16,620
Loan servicing and other overhead (2,268) (2,521) (3,209)
Total G&A expenses 58,038 62,641 55,370
Fees received on originations (20,901) (16,721) (15,594)
Total Cost to Originate $37,137 $45,920 $39,776
Total Originations $1,597,014 $1,965,869 $1,361,616
Cost Ratios:
Core operating expenses 2.56% 2. 2.67% 2. 3.08% 3.
Deferred loan origination costs 1.22% 1. 0.65% 0. 1.22% 1.
Loan servicing and other overhead (0.14%) . (0.13%) . (0.24%) .
Total G&A expenses 3.64% 3.19% 4.06%
Fees received on originations (1.31%) . (0.85%) . (1.14%) .
Total Cost to Originate 2.33% 2.34% 2.92%
Slide 9
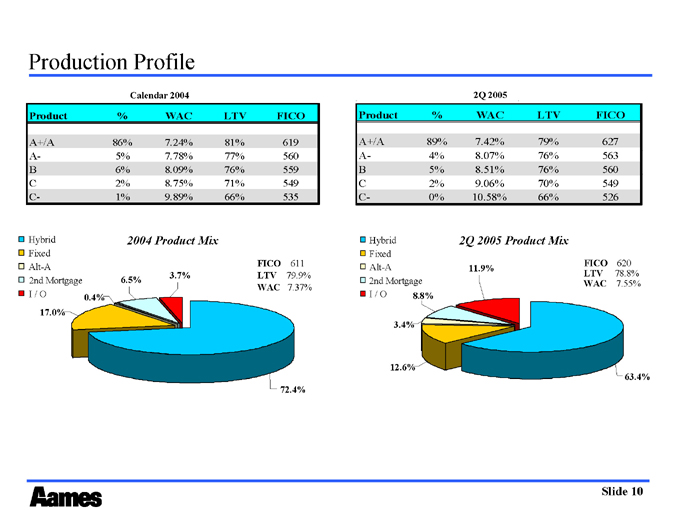
Production Profile
Calendar 2004
Product % WAC LTV FICO
A+/A 86% 7.24% 81% 619
A- 5% 7.78% 77% 560
B 6% 8.09% 76% 559
C 2% 8.75% 71% 549
C- 1% 9.89% 66% 535
2Q 2005
Product % WAC LTV FICO
A+/A 89% 7.42% 79% 627
A- 4% 8.07% 76% 563
B 5% 8.51% 76% 560
C 2% 9.06% 70% 549
C- 0% 10.58% 66% 526
Hybrid Fixed Alt-A 2nd Mortgage I / O
17.0%
0.4%
6.5%
2004 Product Mix
3.7%
FICO 611
LTV 79.9% WAC 7.37%
72.4%
2Q 2005 Product Mix
Hybrid Fixed Alt-A 2nd Mortgage I / O 8.8%
11.9%
FICO 620
LTV 78.8% WAC 7.55%
3.4%
12.6%
63.4%
Slide 10

Financial Review
Slide 11
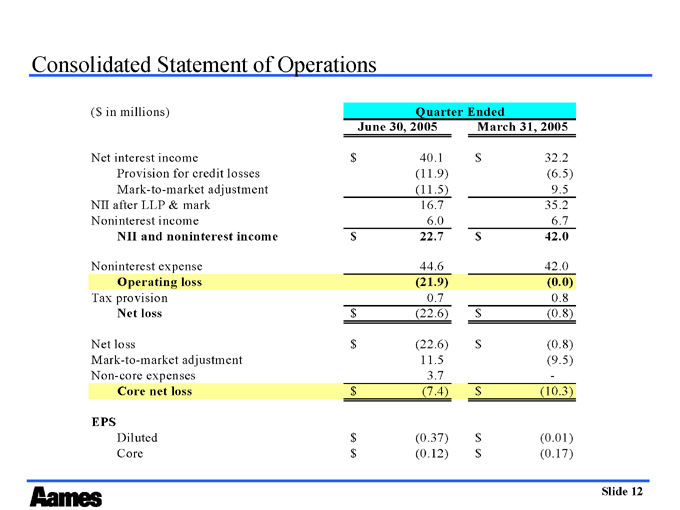
Consolidated Statement of Operations
($ in millions) Quarter Ended
June 30, 2005 March 31, 2005
Net interest income $40.1 $32.2
Provision for credit losses (11.9) (6.5)
Mark-to-market adjustment (11.5) 9.5
NII after LLP & mark 16.7 35.2
Noninterest income 6.0 6.7
NII and noninterest income $22.7 $42.0
Noninterest expense 44.6 42.0
Operating loss (21.9) (0.0)
Tax provision 0.7 0.8
Net loss $(22.6) $(0.8)
Net loss $(22.6) $(0.8)
Mark-to-market adjustment 11.5 (9.5)
Non-core expenses 3.7 -
Core net loss $(7.4) $(10.3)
EPS
Diluted $(0.37) $(0.01)
Core $(0.12) $(0.17)
Slide 12
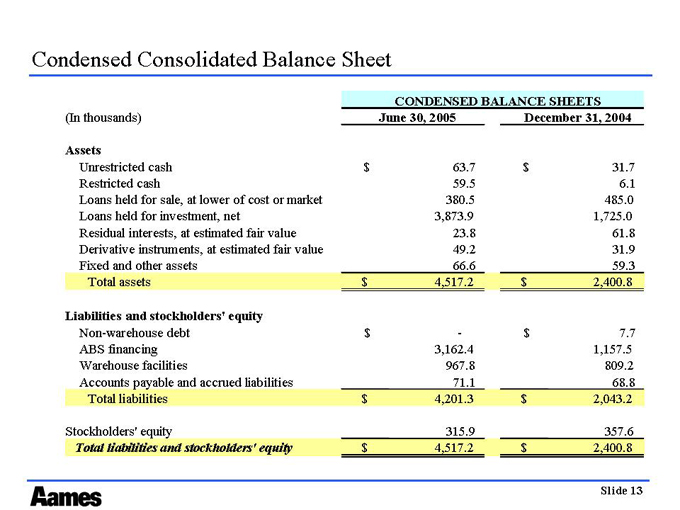
Condensed Consolidated Balance Sheet
CONDENSED BALANCE SHEETS
(In thousands) June 30, 2005 December 31, 2004
Assets
Unrestricted cash $63.7 $31.7
Restricted cash 59.5 6.1
Loans held for sale, at lower of cost or market 380.5 485.0
Loans held for investment, net 3,873.9 1,725.0
Residual interests, at estimated fair value 23.8 61.8
Derivative instruments, at estimated fair value 49.2 31.9
Fixed and other assets 66.6 59.3
Total assets $4,517.2 $2,400.8
Liabilities and stockholders’ equity
Non-warehouse debt - $$—- $7.7
ABS financing 3,162.4 1,157.5
Warehouse facilities 967.8 809.2
Accounts payable and accrued liabilities 71.1 68.8
Total liabilities $4,201.3 $2,043.2
Stockholders’ equity 315.9 357.6 .6
Total liabilities and stockholders’ equity $4,517.2 $2,400.8
Slide 13
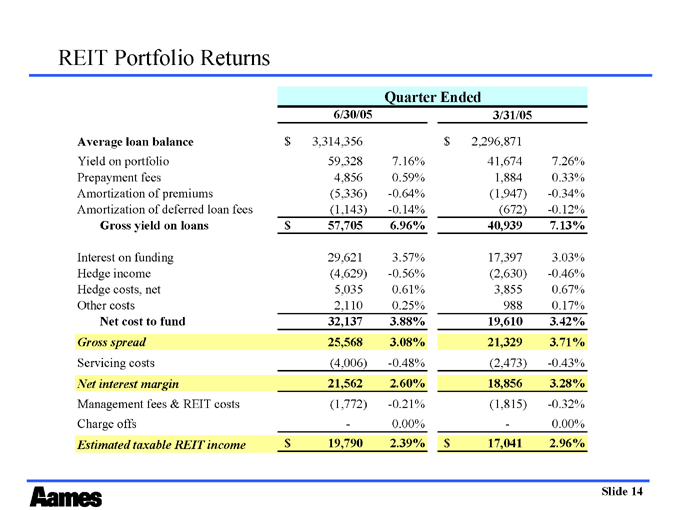
REIT Portfolio Returns
Quarter Ended
6/30/05 3/31/05
Average loan balance $3,314,356 $2,296,871
Yield on portfolio 59,328 7.16% 41,674 7.26%
Prepayment fees 4,856 0.59% 1,884 0.33%
Amortization of premiums (5,336) - -0.64% (1,947) -0.34%
Amortization of deferred loan fees (1,143) -0.14% (672) -0.12%
Gross yield on loans $57,705 6.96% 40,939 7.13%
Interest on funding 29,621 3.57% 17,397 3.03%
Hedge income (4,629) -0.56% (2,630) -0.46%
Hedge costs, net 5,035 0.61% 3,855 0.67%
Other costs 2,110 0.25% 988 0.17%
Net cost to fund 32,137 3.88% 19,610 3.42%
Gross spread 25,568 3.08% 21,329 3.71%
Servicing costs (4,006) -0.48% (2,473) -0.43%
Net interest margin 21,562 2.60% 18,856 3.28%
Management fees & REIT costs (1,772) -0.21% (1,815) -0.32%
Charge offs - 0.00% - 0.00%
Estimated taxable REIT income $19,790 2.39% $17,041 2.96%
Slide 14
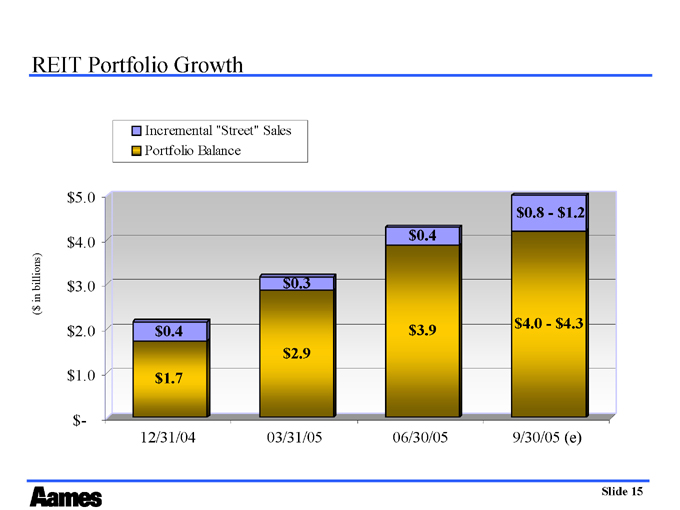
REIT Portfolio Growth
Incremental “Street” Sales
Portfolio Balance
($ in billions) $5.0 $4.0 $3.0 $2.0 $1.0 $ - $0.4 $0.3 $0.4 $0.8 - $1.2 $1.7 $2.9 $3.9 $4.0 - $4.3
12/31/04
03/31/05
06/30/05
9/30/05 (e)
Slide 15
2nd Quarter 2005 Summary and Current Outlook $0.34 dividend per share
Continued growth of REIT portfolio - $3.9 billion
Now at target leverage ratio
More efficient ways to increase production
Respond to competitive pressures
Targeted cost reductions
New products less vulnerable to prepayments - 40/30 loans
Slide 16