UNITED STATES
SECURITIES AND EXCHANGE COMMISSION
Washington, D.C. 20549
FORM N-CSR
CERTIFIED SHAREHOLDER REPORT OF REGISTERED
MANAGEMENT INVESTMENT COMPANIES
Investment Company Act file number: 811-09997
Baird Funds, Inc.
(Exact name of registrant as specified in charter)
777 East Wisconsin Avenue
Milwaukee, WI 53202
(Address of principal executive offices) (Zip code)
Charles M. Weber
Robert W. Baird & Co. Incorporated
777 East Wisconsin Avenue
Milwaukee, WI 53202
(Name and address of agent for service)
1-866-442-2473
Registrant's telephone number, including area code
Date of fiscal year end: December 31, 2007
Date of reporting period: December 31, 2007
Item 1. Reports to Stockholders.
Annual Report - Baird Funds
Baird Intermediate Bond Fund
Baird Aggregate Bond Fund
Baird Intermediate Municipal Bond Fund
Baird Core Plus Bond Fund
Baird Short-Term Bond Fund
TABLE OF CONTENTS
Page | |
| Letter to Shareholders | 1 |
| 2007 Bond Market Overview | 2 |
| Baird Intermediate Bond Fund | 6 |
| Baird Aggregate Bond Fund | 23 |
| Baird Intermediate Municipal Bond Fund | 42 |
| Baird Core Plus Bond Fund | 50 |
| Baird Short-Term Bond Fund | 64 |
| Additional Information on Fund Expenses | 77 |
| Statements of Assets and Liabilities | 79 |
| Statements of Operations | 80 |
| Statements of Changes in Net Assets | 81 |
| Financial Highlights | 86 |
| Notes to the Financial Statements | 95 |
| Report of Independent Registered Public Accounting Firm | 107 |
| Directors and Officers | 108 |
| Disclosure Regarding the Board of Directors’ Approval | |
| of the Investment Advisory Agreement for Baird Bond Funds | 111 |
| Additional Information | 115 |
This report has been prepared for shareholders and may be distributed to others only if preceded or accompanied by a current prospectus.
Cautionary Note on Analyses, Opinions and Outlooks: In this report we offer analyses and opinions on the performance of individual securities, companies, industries, sectors, markets, interest rates and governmental policies, including predictions, forecasts and outlooks regarding possible future events. These can generally be identified as such because the context of the statements may include such words as “believe,” “should,” “will,” “expects,” “anticipates,” “hopes” and words of similar effect. These statements reflect the portfolio managers’ good faith beliefs and judgments and involve risks and uncertainties, including the risk that the portfolio managers’ analyses, opinions and outlooks are or will prove to be inaccurate. It is inherently difficult to correctly assess and explain the performance of particular securities, sectors, markets, interest rate movements, governmental actions or general economic trends and conditions, and many unforeseen factors contribute to the performance of Baird Funds. Investors are, therefore, cautioned not to place undue reliance on subjective judgments contained in this report.
Baird Funds
1-866-442-2473
www.bairdfunds.com
February 27, 2008
Dear Shareholder,
Thank you for investing in the Baird Funds. We are pleased to report that the aggregate net assets of the eight mutual funds in our family have grown to more than $1.6 billion as of the end of 2007, representing an increase of 55% over the prior year. Also, in December 2007 the shareholders of the Funds elected two new directors, Cory Nettles and Marlyn Spear, to our Board. Their fresh perspectives and experience will complement the institutional knowledge of our three current directors. We look forward to working with the Board in the years to come.
In this Annual Report we review the bond market in 2007 and the performance and composition of each of the Baird Bond Funds. We hope you find this report both informative and helpful in achieving your investment goals. We appreciate your support and look forward to helping you achieve your investment goals. Thank you again for choosing Baird Funds.
Sincerely,

Mary Ellen Stanek, CFA
President
Baird Funds
2007 Bond Market Overview
2007 Summary
The year 2007 will go down in the record books as an extremely challenging year for the bond market. It was a volatile year in which risk was dramatically and violently repriced. Starting in the sub-prime mortgage sector, fear of principal losses quickly spread to all corners of the market resulting in significant and broad price declines across all non-Treasury sectors. Despite significant volatility and illiquidity, however, diversified investment grade bond portfolios provided strong nominal returns.
Volatility Returned
After declining steadily for several years, volatility returned to the bond market with a vengeance in 2007. Volatility spread swiftly through all sectors of the market in the latter half of the year as investors around the globe came to terms with direct and/or indirect exposure to a hitherto obscure, but suddenly ominous and seemingly ubiquitous sector of the mortgage market known as sub-prime. Leveraged sub-prime exposure in the form of asset-backed CDOs (collateralized debt obligations) resulted in large write-downs for several major financial institutions and market liquidity quickly dried up, amplifying volatility as these leveraged players struggled to de-lever. The contagion spread to SIVs (structured investment vehicles) and asset-backed commercial paper, sparking a general flight to quality as even the safety of money market vehicles was called into question. Credit spreads exploded and Treasury yields plummeted as investors sought safety and shelter from the far-reaching impact of sub-prime. Merrill’s Option Volatility Estimate or MOVE Index (below left), a measure of Treasury market volatility, jumped from a low of 51 basis points (bps) on May 15 to more than 154 bps on December 20. The option-adjusted spread (OAS) of Lehman’s Investment Grade Credit Index (below right), showing the difference between yields on investment grade corporate bonds and U.S. Treasuries, jumped from 89 bps on June 30 to 181 bps on December 31, which were levels not seen since late 2002.
Bond Market Volatility – MOVE Index | Lehman Credit Index – OAS |
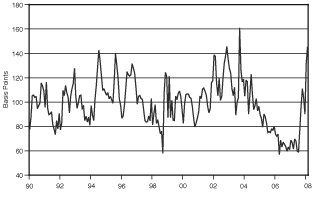 | 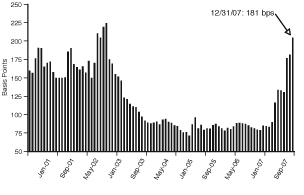 |
| Source: Bloomberg, Merrill Lynch | Source: Lehman Brothers |
Not Business as Usual
It was not business as usual in the back half of 2007 as high volatility and extremely limited liquidity stressed the bond market. The first two columns of the table on the next page show the increase in yield spreads (OAS over comparable Treasuries) on several non-Treasury sectors in the second half of the year while the third column shows the resulting underperformance versus similar duration Treasuries in 2007. Asset-backed securities, which include sub-prime home loans, bore the brunt of price declines with yield spreads widening from 74 bps to 242 bps, resulting in 634 bps of
Page 2
2007 Bond Market Overview
underperformance compared to Treasuries. Financial institutions were hit hard by the flight to quality, and spreads jumped from 88 bps to 220 bps, resulting in -687 bps of excess return, the worst year ever for this sector. Particularly in these two sectors, we believe “the baby was thrown out with the bath water” in 2007 and while real challenges lie ahead, we see attractive opportunities.
OAS and Excess Returns (bps) | |||
12/31/07 | 6/30/07 | 2007 Excess Return | |
OAS | OAS | versus US Treasuries | |
| U.S. Aggregate Index | 91 | 53 | -206 | |
| U.S. Agency | ||||
| (non-mortgage) Sector | 43 | 34 | -52 | |
| Mortgage and ABS Sectors | ||||
| Mortgage Backed Securities | 87 | 65 | -177 | |
| Asset-Backed Securities | 242 | 74 | -634 | |
| CMBS | 170 | 82 | -435 | |
| Credit Sectors | ||||
| U.S. Investment Grade | 181 | 89 | -464 | |
| Industrial | 181 | 104 | -383 | |
| Utility | 189 | 100 | -481 | |
| Financial Institutions | 220 | 88 | -687 | |
| U.S. High Yield | 569 | 292 | -777 | |
| Source: Lehman Brothers |
Fed Eases, Yield Curve Steepens
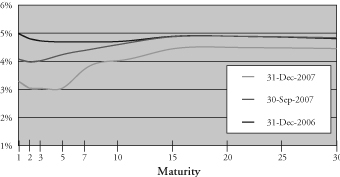
In response to the tightening in overall credit conditions that threatened economic growth, the Open Market Committee of the Federal Reserve Board (the Fed) cut its target for the Fed funds rate in 2007 by 100 bps from 5.25% to 4.25% with a 50 bp cut in September and 25 bp cuts in October and December. Treasury yields fell by more than 100 bps in the fourth quarter as a result of the flight to quality and the yield curve steepened significantly over the course of the year. The spread between 2 and 30-year Treasury yields rose to 140 bps on December 31 from 86 bps at the end of September and 0 bps at the end of 2006 (see chart and table below).
Treasury Yields
Source: Bloomberg
Dec 31, | Sep 30, | Dec 31, | Q4 | 2007 | |
Maturity | 2006 | 2007 | 2007 | Change | Change |
| 1 | 4.99% | 4.08% | 3.30% | -0.78 | -1.69 |
| 2 | 4.81% | 3.98% | 3.05% | -0.93 | -1.76 |
| 3 | 4.73% | 4.02% | 3.03% | -0.99 | -1.70 |
| 5 | 4.69% | 4.24% | 3.05% | -1.19 | -1.64 |
| 7 | 4.69% | 4.39% | 3.72% | -0.67 | -0.97 |
| 10 | 4.70% | 4.59% | 4.02% | -0.57 | -0.68 |
| 15 | 4.89% | 4.87% | 4.44% | -0.43 | -0.45 |
| 20 | 4.90% | 4.90% | 4.50% | -0.40 | -0.40 |
| 25 | 4.86% | 4.87% | 4.48% | -0.39 | -0.38 |
| 30 | 4.81% | 4.84% | 4.45% | -0.39 | -0.36 |
The Good News: Strong Returns
Despite a very challenging environment, the bond market produced strong nominal returns in 2007. The flight to quality made Treasuries the top performing sector for the year (generating total return of 9.01%) while asset-backed securities (ABS), beleaguered by sub-prime, was the weakest investment grade sector (total return of 2.21%). Weighed down by
Page 3
2007 Bond Market Overview
sharply wider credit spreads, corporate bonds generated a modest 4.56% return for the year, while the high yield sector returned just 1.87%. Municipals returned a modest 3.36% as limited demand in this sector had trouble keeping up with sizeable liquidations, primarily by hedge funds. The exceptional, if not surprising 11.63% return of Treasury – Inflation Protected Securities (TIPS) may reflect latent worries about inflation/stagflation despite current concerns of recession. Returns of various sectors and indices appear in the table below.
Total Returns of Selected Lehman Brothers Indices and Subsectors
Index/Sector | 2007 |
| LB Aggregate Index | 6.97% |
| LB Gov’t/Credit Index | 7.23% |
| LB Int. Gov’t/Credit Index | 7.39% |
| LB 1-3 yr. Gov’t/Credit Index | 6.83% |
| US Treasury Sector | 9.01% |
| Gov’t Agency Sector | 7.92% |
| Corporate Sector | 4.56% |
| MBS Sector | 6.90% |
| ABS Sector | 2.21% |
| Municipal Sector | 3.36% |
| TIPS | 11.63% |
| High Yield Sector | 1.87% |
Sub-Prime and Market Finance
Chosen as word of the year by the American Dialect Society, “sub-prime” certainly left its mark on the bond market and beyond in 2007. Representing just 10-15% of all outstanding mortgages, how did sub-prime securities have such a devastating impact on the entire global financial markets? The answer is leverage and concentration. Financial innovation created a way to package sub-prime ARMs (adjustable rate mortgages) with leverage into highly rated, albeit complex instruments (such as CDOs) that eventually found their way into some money market-like vehicles. When sub-prime ARMs began to falter, many stable value instruments started to quake, and investors began to run for the door. Attempts to de-lever increased downward price momentum which spread to other sectors and raised concerns about the integrity and viability of all asset-backed finance programs. Shown on the next page (at left) is the dramatic decline in asset-backed commercial paper (ABS CP) outstanding in the last months of 2007. We do not expect to see a resurgence of issuance in ABS CP or other similar short-term instruments (e.g. SIVs) used to finance longer-term assets any time soon. In regard to the outlook for sub-prime issues, we believe the distinction between fixed rate mortgages and ARMs is key (see chart on the next page, at right). As Fed Chairman Bernanke recently noted “even as delinquencies on sub-prime ARMs have soared, loss rates on sub-prime mortgages with fixed interest rates, though somewhat higher recently, remain in their historical range.”
Page 4
2007 Bond Market Overview
Sub-Prime Delinquency Rates | |
Asset-Backed Commercial Paper Outstanding | Fixed Rate vs. ARM (2005 Vintage) |
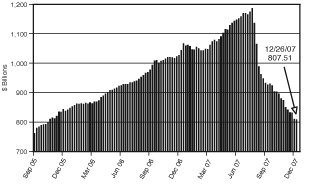 |  |
| Source: Bianco Research LLC | Source: JP Morgan |
2008 Outlook
We believe patience will be rewarded in 2008 as the market’s fear of loss in 2007 turns to an eye for opportunity. While the sub-prime “hangover” is weighing on home prices and slowing the economy, the Fed began the year with significant cuts in the target Fed funds rate to address recessionary risks, and we expect the Fed to continue easing rates as needed and do not believe a recession is necessarily inevitable. While significant price declines of certain securities in the ABS and finance sectors have been warranted, we believe the market’s general abandonment of these sectors in 2007 has resulted in many opportunities as attractive “babies” have gone out with the bath water. In particular, we see value in certain senior, AAA-rated, fixed-rate, non-Agency mortgage structures and also in bonds of several companies in the finance sector who, despite a decline in earnings, will be able to service their debt.
BAIRD ADVISORS
Mary Ellen Stanek, CFA
Gary A. Elfe, CFA
Charles B. Groeschell
Warren D. Pierson, CFA
Daniel A. Tranchita, CFA
M. Sharon deGuzman
Page 5
Baird Intermediate Bond Fund
The Baird Intermediate Bond Fund seeks an annual rate of total return, before Fund expenses, greater than the annual rate of total return of the Lehman Brothers Intermediate Government/Credit Bond Index. The Lehman Brothers Intermediate Government/Credit Bond Index is an unmanaged, market value weighted index of investment grade, fixed-rate debt issues, including government and corporate securities, with maturities between one and ten years.
The Fund delivered strong nominal returns in 2007 although it underperformed its benchmark index. The primary factors for the underperformance were:
| • | The Fund’s exposure to AAA-rated mortgage-backed and asset-backed securities which underperformed as general market prices on securities in these sectors weakened; |
| • | Weak performance of specific individual corporate issues, particularly those in the finance and brokerage sector; and |
| • | The Fund’s overweighting of BBB-rated corporate bonds relative to the benchmark, which generally did not perform as well as higher-rated bonds. |
The Fund maintained its duration-neutral strategy, holding a broadly diversified portfolio of over 270 securities at year-end.
The Fund ended 2007 with a yield advantage versus its benchmark index. This yield advantage, combined with exposure to specific sectors which we believe have superior total return potential (mortgage-backed and asset-backed securities), enhance the Fund’s prospects of adding value over its benchmark in the coming year.
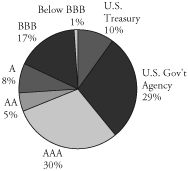
Portfolio Characteristics
Quality Distribution* | Sector Weightings* |
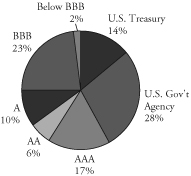 |  |
Net Assets: | $401,597,917 | Annualized Expense Ratio: | |||
SEC 30-Day Yield:** | Institutional Class: | 0.30% | |||
| Institutional Class: | 4.99% | Investor Class: | 0.55% | *** | |
| Investor Class: | 4.73% | Portfolio Turnover Rate: | 42.5% | ||
Average Effective Duration: | 3.79 years | Total Number of Holdings: | 276 | ||
Average Effective Maturity: | 4.75 years |
| * | Percentages shown are based on the Fund’s total net assets. | |
| ** | SEC yields are based on SEC guidelines and are calculated for the 30 days ended December 31, 2007. | |
| *** | Includes 0.25% 12b-1 fee. |
Page 6
Baird Intermediate Bond Fund
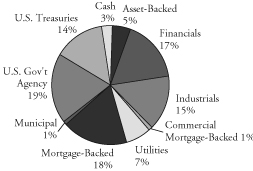
Baird Intermediate Bond Fund – Institutional Class
Value of a $25,000 Investment
Growth of a hypothetical investment of $25,000 made on the Fund’s inception date (9/29/00), assuming reinvestment of all distributions.
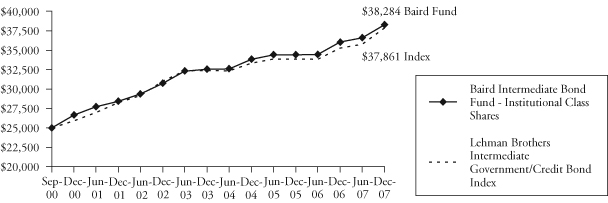
Baird Intermediate Bond Fund – Investor Class
Value of a $10,000 Investment
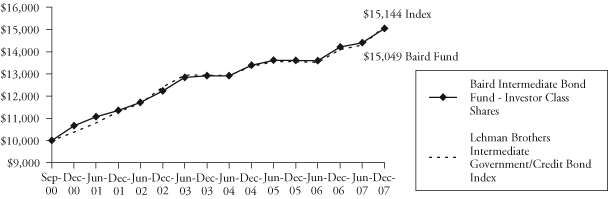
Growth of a hypothetical investment of $10,000 made on the Fund’s inception date (9/29/00), assuming reinvestment of all distributions.
Page 7
Baird Intermediate Bond Fund
Average Annual Total Returns
Since | |||
For the Periods Ended December 31, 2007 | One Year | Five Years | Inception(1) |
| Baird Intermediate Bond Fund – Institutional Class Shares | 6.24% | 4.49% | 6.05% |
| Baird Intermediate Bond Fund – Investor Class Shares | 5.89% | 4.23% | 5.80% |
Lehman Brothers Intermediate Government/Credit Bond Index(2) | 7.39% | 4.06% | 5.89% |
(1) | For the period from September 29, 2000 (commencement of operations) through December 31, 2007. |
(2) | The Lehman Brothers Intermediate Government/Credit Bond Index is an unmanaged, market value weighted index of investment grade, fixed-rate debt including government and corporate securities with maturities between one and 10 years. This index does not reflect any deduction for fees, expenses or taxes. A direct investment in an index is not possible. |
The returns shown in the table above and line graphs on the previous page reflect reinvestment of dividends and/or capital gains distributions in additional shares. The returns do not reflect the deduction of taxes that a shareholder would pay on Fund distributions or the redemption of Fund shares.
Past performance does not guarantee future results. Investment return and principal value will fluctuate so that an investor’s shares, when redeemed, may be worth more or less than their original cost.
For information about the performance of the Fund as of the most recent month-end, please call 1-866-44BAIRD or visit www.bairdfunds.com. Mutual fund performance changes over time and current performance may be lower or higher than that stated.
Page 8
Baird Intermediate Bond Fund
Schedule of Investments December 31, 2007 |
Principal | |||||||
Amount | Value | ||||||
LONG-TERM INVESTMENTS – 97.2% | |||||||
Asset Backed Securities – 5.4% | |||||||
| $ | 475,000 | American Express Credit | |||||
| Account Master Trust, | |||||||
| Series 2005-5, Class A, | |||||||
| 5.0675%, 02/15/2013 | $ | 472,256 | |||||
| 281,703 | Amresco Residential | ||||||
| Securities Mortgage | |||||||
| Loan Trust, | |||||||
| Series 1998-1, Class A6, | |||||||
| 6.51%, 08/25/2027 | 280,850 | ||||||
| 430,780 | Bayview Financial | ||||||
| Acquisition Trust, | |||||||
| Series 2005-B, Class 1A2, | |||||||
| 4.696%, 04/28/2039 | 428,677 | ||||||
| 10,200 | CitiFinancial Mortgage | ||||||
| Securities, Inc., | |||||||
| Series 2004-1, Class AF2, | |||||||
| 2.645%, 04/25/2034 | 9,937 | ||||||
| 2,467 | Contimortgage Home | ||||||
| Equity Trust, | |||||||
| Series 1999-1, Class A7, | |||||||
| 6.97%, 12/25/2013 | 2,458 | ||||||
| Countrywide Asset-Backed | |||||||
| Certificates: | |||||||
| 2,215,000 | Series 2006-S3, Class A2, | ||||||
| 6.085%, 06/25/2021 | 1,966,624 | ||||||
| 2,200,000 | Series 2005-12, Class 1A2, | ||||||
| 4.847%, 02/25/2036 | 2,186,475 | ||||||
| 4,000,000 | Series 2006-13, Class 1AF2, | ||||||
| 5.884%, 01/25/2037 | 3,927,686 | ||||||
| 375,000 | Series 2006-13, Class 1AF3, | ||||||
| 5.944%, 01/25/2037 | 361,041 | ||||||
| 1,380,000 | Series 2006-9, Class 1AF3, | ||||||
| 5.859%, 10/25/2046 | 1,341,453 | ||||||
| Delta Funding Home | |||||||
| Equity Loan Trust: | |||||||
| 151,286 | Series 1997-2, Class A6, | ||||||
| 7.04%, 06/25/2027 | 150,827 | ||||||
| 112,924 | Series 1999-1, Class A6F, | ||||||
| 6.34%, 12/15/2028 | 112,707 | ||||||
| 538,268 | Series 1999-2, Class A7F, | ||||||
| 7.03%, 08/15/2030 | 537,069 | ||||||
| Discover Card Master Trust I: | |||||||
| 150,000 | Series 2003-4, Class A1, | ||||||
| 5.14%, 05/15/2011 | 149,934 | ||||||
| 175,000 | Series 2005-2, Class A, | ||||||
| 5.06%, 04/17/2012 | 174,453 | ||||||
| 41,436 | Equivantage Home | ||||||
| Equity Loan Trust, | |||||||
| Series 1996-3, Class A3, | |||||||
| 7.70%, 09/25/2027 | 41,303 | ||||||
| GMAC Mortgage | |||||||
| Corporation Loan Trust: | |||||||
| 175,000 | Series 2003-J1, Class A2, | ||||||
| 5.25%, 03/25/2018 | 175,990 | ||||||
| 937,928 | Series 2004-GH1, Class A2, | ||||||
| 4.39%, 12/25/2025 | 926,820 | ||||||
| 1,631,502 | Series 2004-J4, Class A2, | ||||||
| 5.50%, 09/25/2034 | 1,635,557 | ||||||
| 250,000 | Series 2005-HE3, Class A2, | ||||||
| 5.015%, 02/25/2036 | 247,454 | ||||||
| Green Tree Financial | |||||||
| Corporation: | |||||||
| 1,095,487 | Series 1998-2, Class A5, | ||||||
| 6.24%, 11/01/2016 | 1,095,755 | ||||||
| 82,661 | Series 1993-4, Class A5, | ||||||
| 7.05%, 01/15/2019 | 86,242 | ||||||
| 1,412,166 | Series 1998-3, Class A5, | ||||||
| 6.22%, 03/01/2030 | 1,474,911 | ||||||
| 521,258 | Series 1998-4, Class A5, | ||||||
| 6.18%, 04/01/2030 | 512,263 | ||||||
The accompanying notes are an integral part of these financial statements.
Page 9
Baird Intermediate Bond Fund
Schedule of Investments December 31, 2007 |
Principal | |||||||
Amount | Value | ||||||
LONG-TERM INVESTMENTS – 97.2% (cont.) | |||||||
Asset Backed Securities – 5.4% (cont.) | |||||||
| $ | 2,833,425 | Series 1999-3, Class A6, | |||||
| 6.50%, 02/01/2031 | $ | 2,842,044 | |||||
| 88,673 | IMC Home Equity | ||||||
| Loan Trust, | |||||||
| Series 1998-1, Class A6, | |||||||
| 7.02%, 06/20/2029 | 88,446 | ||||||
| 225,287 | Oakwood Mortgage | ||||||
| Investors, Inc., | |||||||
| Series 1999-B, Class A3, | |||||||
| 6.45%, 11/15/2017 | 211,348 | ||||||
| 136,659 | Popular Asset Backed | ||||||
| Mortgage Pass Thru-Trust, | |||||||
| Series 2005-B, Class AF3, | |||||||
| 4.62%, 08/25/2035 | 136,199 | ||||||
| 22,846 | Residential Asset | ||||||
| Mortgage Products, Inc., | |||||||
| Series 2003-RS7, Class AI6, | |||||||
| 5.34%, 08/25/2033 | 22,632 | ||||||
| 215,703 | Structured Asset | ||||||
| Securities Corporation, | |||||||
| Series 2005-2XS, Class 1A2A, | |||||||
| 4.51%, 02/25/2035 | 211,129 | ||||||
| 21,810,540 | |||||||
Financial – 17.1% | |||||||
| 875,000 | Allfirst Financial, Inc. | ||||||
| Subordinated Notes, | |||||||
| 6.875%, 06/01/2009 | 908,718 | ||||||
| American General Finance | |||||||
| Corporation Notes: | |||||||
| 25,000 | 4.625%, 09/01/2010 | 24,799 | |||||
| 550,000 | 4.00%, 03/15/2011 | 533,785 | |||||
| 630,000 | AmSouth Bancorporation | ||||||
| Subordinated Debentures, | |||||||
| 6.75%, 11/01/2025 | 662,664 | ||||||
| 691,000 | AmSouth Bank NA | ||||||
| Subordinated Notes, | |||||||
| 6.45%, 02/01/2008 | 692,353 | ||||||
| 500,000 | AMVESCAP PLC Notes, | ||||||
5.375%, 02/27/2013 f | 478,890 | ||||||
| 1,335,000 | Anthem, Inc., | ||||||
| 6.80%, 08/01/2012 | 1,457,231 | ||||||
| 635,000 | Bank of America Corporation | ||||||
| Subordinated Notes, | |||||||
| 10.20%, 07/15/2015 | 799,784 | ||||||
| 1,150,000 | Bank of Tokyo- | ||||||
| Mitsubishi/UFJ NY, | |||||||
| 7.40%, 06/15/2011 | 1,243,774 | ||||||
| Bank One Corporation | |||||||
| Subordinated Notes: | |||||||
| 180,000 | 6.00%, 02/17/2009 | 181,606 | |||||
| 1,043,000 | 10.00%, 08/15/2010 | 1,179,372 | |||||
| 2,695,000 | BankAmerica Institutional, | ||||||
| 8.07%, 12/31/2026 | |||||||
| (Acquired 01/04/2006, | |||||||
| 06/01/2006, 10/11/2006, | |||||||
| 01/24/2007, 05/07/2007, | |||||||
| 09/21/2007 and 11/06/2007; | |||||||
| Cost $500,456, $682,331, | |||||||
| $417,508, $26,010, | |||||||
| $52,079, $104,000 and | |||||||
| $1,037,550, respectively)* | 2,824,527 | ||||||
| 480,000 | Bankers Trust Corporation | ||||||
| Subordinated Notes, | |||||||
| 7.375%, 05/01/2008 | 483,359 | ||||||
| 2,500,000 | Banponce Trust I, Series A, | ||||||
| 8.327%, 02/01/2027 | |||||||
| (Callable 03/06/2008) | 2,604,547 | ||||||
| 1,000,000 | Bear Stearns Company, Inc., | ||||||
| 6.40%, 10/02/2017 | 966,160 | ||||||
The accompanying notes are an integral part of these financial statements.
Page 10
Baird Intermediate Bond Fund
Schedule of Investments December 31, 2007 |
Principal | |||||||
Amount | Value | ||||||
LONG-TERM INVESTMENTS – 97.2% (cont.) | |||||||
Financial – 17.1% (cont.) | |||||||
| $ | 1,000,000 | BOI Capital Funding No. 2, | |||||
| 5.571%, 02/01/2049 | |||||||
| (Acquired 01/20/2006; | |||||||
Cost $1,000,000)* f | $ | 863,780 | |||||
| 300,000 | CIT Group Company | ||||||
| of Canada, | |||||||
5.20%, 06/01/2015 f | 256,847 | ||||||
| CIT Group, Inc.: | |||||||
| 200,000 | 5.40%, 01/30/2016 | 176,040 | |||||
| 1,500,000 | 6.10%, 03/15/2067 | ||||||
| (Callable 03/15/2017) | 1,089,149 | ||||||
| 1,000,000 | Compass Bank | ||||||
| Subordinated Notes, | |||||||
| 8.10%, 08/15/2009 | 1,046,102 | ||||||
| 1,760,000 | Corestates Capital Trust I, | ||||||
| 8.00%, 12/15/2026 | |||||||
| (Acquired 11/29/2005 | |||||||
| and 10/10/2007; | |||||||
| Cost $276,398 and | |||||||
| $1,555,065, respectively)* | 1,822,163 | ||||||
| 275,000 | Corp Andina De | ||||||
| Fomento Notes, | |||||||
7.375%, 01/18/2011 f | 293,370 | ||||||
| 1,900,000 | Countrywide | ||||||
| Financial Corporation | |||||||
| Subordinated Notes, | |||||||
| 6.25%, 05/15/2016 | 1,093,579 | ||||||
| 441,352 | First National | ||||||
| Bank of Chicago | |||||||
| Pass-Thru Certificates, | |||||||
| 8.08%, 01/05/2018 | 524,278 | ||||||
| 2,600,000 | First National Bank of | ||||||
| Omaha Subordinated Notes, | |||||||
| 7.32%, 12/01/2010 | 2,787,112 | ||||||
| 2,025,000 | First Union Capital, | ||||||
| 7.935%, 01/15/2027 | |||||||
| (Callable 03/06/2008) | 2,105,247 | ||||||
| 775,000 | FMR Corporation Notes, | ||||||
| 4.75%, 03/01/2013 | |||||||
| (Acquired 02/26/2003; | |||||||
| Cost $777,379)* | 789,744 | ||||||
| 800,000 | General Electric Capital | ||||||
| Corporation Notes, | |||||||
| 6.00%, 06/15/2012 | 838,670 | ||||||
| General Motors Acceptance | |||||||
| Corporation Notes: | |||||||
| 1,025,000 | 7.75%, 01/19/2010 | 956,140 | |||||
| 200,000 | 6.75%, 12/01/2014 | 161,310 | |||||
| 1,100,000 | Genworth Financial Inc. | ||||||
| Notes, 5.75%, 06/15/2014 | 1,103,999 | ||||||
| 1,975,000 | Glencore Funding LLC, | ||||||
| 6.00%, 04/15/2014 | |||||||
| (Acquired 03/31/2004, | |||||||
| 02/02/2005, 04/26/2006 | |||||||
| and 12/04/2006; Cost | |||||||
| $794,280, $146,738, | |||||||
| $282,792 and $720,432, | |||||||
| respectively)* | 1,986,562 | ||||||
| 775,000 | Goldman Sachs | ||||||
| Group, Inc. Bonds, | |||||||
| 5.15%, 01/15/2014 | 767,144 | ||||||
| 1,800,000 | Great West Life & | ||||||
| Annuity Insurance, | |||||||
| 7.153%, 05/16/2046 | |||||||
| (Acquired 05/16/2006 | |||||||
| and 11/08/2007; | |||||||
| Cost $1,000,000 and | |||||||
| $792,736, respectively)* | 1,802,804 | ||||||
The accompanying notes are an integral part of these financial statements.
Page 11
Baird Intermediate Bond Fund
Schedule of Investments December 31, 2007 |
Principal | |||||||
Amount | Value | ||||||
LONG-TERM INVESTMENTS – 97.2% (cont.) | |||||||
Financial – 17.1% (cont.) | |||||||
| $ | 1,195,000 | Health Care Service | |||||
| Corporation Notes, | |||||||
| 7.75%, 06/15/2011 | |||||||
| (Acquired 06/20/2001, | |||||||
| 01/26/2005 and | |||||||
| 10/19/2006; Cost $497,765, | |||||||
| $373,500 and $397,317, | |||||||
| respectively)* | $ | 1,335,025 | |||||
| 400,000 | Highmark, Inc. Notes, | ||||||
| 6.80%, 08/15/2013 | |||||||
| (Acquired 08/14/2003; | |||||||
| Cost $399,088)* | 438,348 | ||||||
| 25,000 | HSBC Finance | ||||||
| Corporation Notes, | |||||||
| 5.00%, 06/30/2015 | 23,843 | ||||||
| 1,050,000 | Istar Financial, Inc., | ||||||
| 5.95%, 10/15/2013 | 914,962 | ||||||
| 500,000 | J.P. Morgan Chase & | ||||||
| Company Subordinated | |||||||
| Notes, 6.625%, 03/15/2012 | 527,239 | ||||||
| Korea Development | |||||||
Bank Notes: f | |||||||
| 1,275,000 | 3.875%, 03/02/2009 | 1,255,218 | |||||
| 350,000 | 4.625%, 09/16/2010 | 347,004 | |||||
| 1,000,000 | 5.125%, 02/14/2011 | 1,002,678 | |||||
| Lehman Brothers | |||||||
| Holdings, Inc. Notes: | |||||||
| 846,000 | 8.50%, 08/01/2015 | 962,690 | |||||
| 50,000 | 6.50%, 07/19/2017 | 50,593 | |||||
| Lehman Brothers | |||||||
| Holdings Senior Notes, | |||||||
| 1,735,000 | 8.80%, 03/01/2015 | 1,979,026 | |||||
| 700,000 | Marsh & McLennan | ||||||
| Companies, Inc., | |||||||
| 5.375%, 07/15/2014 | 681,727 | ||||||
| 1,000,000 | Merrill Lynch & Co, Inc., | ||||||
| 5.70%, 05/02/2017 | 953,094 | ||||||
| 375,000 | Met Life Global | ||||||
| Funding Senior Notes, | |||||||
| 4.50%, 05/05/2010 | |||||||
| (Acquired 08/04/2005 and | |||||||
| 03/22/2007; Cost $123,925 | |||||||
| and $245,931, respectively)* | 377,854 | ||||||
| 1,000,000 | Morgan Stanley Dean | ||||||
| Witter Debentures, | |||||||
| 10.00%, 06/15/2008 | 1,018,910 | ||||||
| 25,000 | Morgan Stanley | ||||||
| Subordinated Notes, | |||||||
| 4.75%, 04/01/2014 | 23,421 | ||||||
| 1,530,000 | National Australia Bank | ||||||
| Ltd. Subordinated Notes, | |||||||
| Series A, 8.60%, | |||||||
05/19/2010 f | 1,652,903 | ||||||
| 350,000 | National Bank of Hungary | ||||||
| Yankee Debentures, | |||||||
8.875%, 11/01/2013 f | 426,679 | ||||||
| 534,000 | National City | ||||||
| Bank of Kentucky | |||||||
| Subordinated Notes, | |||||||
| 6.30%, 02/15/2011 | 548,640 | ||||||
| 1,100,000 | Navigators Group Inc. | ||||||
| Senior Unsecured Notes, | |||||||
| 7.00%, 05/01/2016 | 1,170,390 | ||||||
| 1,260,000 | NB Capital Trust IV, | ||||||
| 8.25%, 04/15/2027 | |||||||
| (Callable 03/06/2008) | 1,308,510 | ||||||
| 1,000,000 | North Fork Capital Trust II, | ||||||
| 8.00%, 12/15/2027 | |||||||
| (Callable 03/06/2008) | 942,239 | ||||||
| 800,000 | Phoenix Companies, | ||||||
| 6.675%, 02/16/2008 | 800,944 | ||||||
The accompanying notes are an integral part of these financial statements.
Page 12
Baird Intermediate Bond Fund
Schedule of Investments December 31, 2007 |
Principal | |||||||
Amount | Value | ||||||
LONG-TERM INVESTMENTS – 97.2% (cont.) | |||||||
Financial – 17.1% (cont.) | |||||||
| $ | 1,319,000 | PNC Funding | |||||
| Corporation, | |||||||
| 7.50%, 11/01/2009 | $ | 1,387,786 | |||||
| 1,100,000 | Popular North | ||||||
| America, Inc., | |||||||
| 4.25%, 04/01/2008 | 1,097,647 | ||||||
| 1,500,000 | Premium Asset | ||||||
| Senior Notes, | |||||||
| 4.125%, 03/12/2009 | |||||||
| (Acquired 12/20/2006 and | |||||||
| 05/10/2007; Cost $935,000 | |||||||
| and $480,000, respectively)* | 1,466,991 | ||||||
| 25,000 | Protective Life Corporation | ||||||
| Senior Notes, | |||||||
| 4.30%, 06/01/2013 | 24,074 | ||||||
| 775,000 | Residential Capital | ||||||
| Corporation, | |||||||
| 6.875%, 06/30/2015 | 468,875 | ||||||
| 546,000 | SAFECO Corporation | ||||||
| Senior Notes, | |||||||
| 7.25%, 09/01/2012 | 588,370 | ||||||
| 800,000 | Santander Central | ||||||
| Hispano Insurances, | |||||||
6.375%, 02/15/2011 f | 845,994 | ||||||
| SLM Corporation Notes: | |||||||
| 1,516,000 | 4.50%, 07/26/2010 | 1,390,472 | |||||
| 200,000 | 5.375%, 05/15/2014 | 177,815 | |||||
| 1,000,000 | St. Paul Travelers, Inc., | ||||||
| 6.25%, 06/20/2016 | 1,032,223 | ||||||
| 1,046,000 | Toll Road Inv. Part II, | ||||||
| 0.00%, 02/15/2011 | |||||||
| (Acquired 09/28/2004; | |||||||
| Cost $782,046)* ^ | 905,562 | ||||||
| 1,320,000 | Transamerica Finance | ||||||
| Corporation Debentures, | |||||||
| 0.00%, 03/01/2010 ^ | 1,194,418 | ||||||
| 550,000 | UFJ Finance Aruba AEC, | ||||||
6.75%, 07/15/2013 f | 597,504 | ||||||
| 870,000 | Union Planters | ||||||
| Corporation | |||||||
| Subordinated Notes, | |||||||
| 6.50%, 03/15/2008 | 874,335 | ||||||
| 500,000 | Washington Mutual Bank | ||||||
| Subordinated Notes, | |||||||
| 6.875%, 06/15/2011 | 471,767 | ||||||
| Westdeutsche Landesbank | |||||||
Subordinated Notes: f | |||||||
| 246,000 | 6.05%, 01/15/2009 | 249,321 | |||||
| 1,495,000 | 4.796%, 07/15/2015 | 1,513,704 | |||||
| 68,534,404 | |||||||
Industrial – 15.7% | |||||||
| 450,000 | Alcan, Inc. Notes, | ||||||
5.00%, 06/01/2015 f | 435,926 | ||||||
| 1,745,000 | American Standard Inc., | ||||||
| 7.375%, 02/01/2008 | 1,747,082 | ||||||
| 1,008,000 | Ameritech Capital | ||||||
| Funding Debentures, | |||||||
| 6.45%, 01/15/2018 | 1,059,943 | ||||||
| 300,000 | Bellsouth Corporation, | ||||||
| 4.75%, 11/15/2012 | 296,792 | ||||||
| Bunge Ltd. Finance | |||||||
| Corporation Notes: | |||||||
| 800,000 | 5.35%, 04/15/2014 | 774,584 | |||||
| 1,085,000 | 5.10%, 07/15/2015 | 1,027,637 | |||||
| 375,000 | Caesars Entertainment | ||||||
| Senior Notes, | |||||||
| 7.50%, 09/01/2009 | 398,419 | ||||||
| 1,250,000 | Clear Channel | ||||||
| Communications Senior | |||||||
| Unsubordinated Notes, | |||||||
| 5.50%, 12/15/2016 | 910,799 | ||||||
The accompanying notes are an integral part of these financial statements.
Page 13
Baird Intermediate Bond Fund
Schedule of Investments December 31, 2007 |
Principal | |||||||
Amount | Value | ||||||
LONG-TERM INVESTMENTS – 97.2% (cont.) | |||||||
Industrial – 15.7% (cont.) | |||||||
| $ | 125,000 | Comcast Cable | |||||
| Communication Holdings, | |||||||
| 8.375%, 03/15/2013 | $ | 140,235 | |||||
| 525,000 | Comcast Corporation, | ||||||
| 6.50%, 01/15/2017 | 547,392 | ||||||
| 50,000 | Comcast Corporation | ||||||
| Senior Subordinated Notes, | |||||||
| 10.625%, 07/15/2012 | 59,273 | ||||||
| 50,000 | Computer Sciences | ||||||
| Corporation Notes, | |||||||
| 6.25%, 03/15/2009 | 50,597 | ||||||
| 21,564 | Continental Airlines, Inc. | ||||||
| Pass-Thru Certificates, | |||||||
| Series 1998-1, | |||||||
| 6.541%, 03/15/2008 | 21,403 | ||||||
| 1,281,000 | COX Communications Inc., | ||||||
| 7.125%, 10/01/2012 | 1,366,149 | ||||||
| 1,700,000 | CSX Corporation, | ||||||
| 5.75%, 03/15/2013 | 1,721,066 | ||||||
| 775,000 | Daimler Finance NA LLC, | ||||||
| 4.75%, 01/15/2008 | 774,830 | ||||||
| 1,250,000 | Deutsche Telekom | ||||||
| International Finance BV, | |||||||
8.00%, 06/15/2010 f | 1,334,490 | ||||||
| 875,000 | Donnelley (R.R.) & Sons | ||||||
| Co., 6.125%, 01/15/2017 | 862,781 | ||||||
| 1,000,000 | D.R. Horton Inc. | ||||||
| Unsubordinated Notes, | |||||||
| 6.50%, 04/15/2016 | 867,623 | ||||||
| 1,775,000 | Fiserv, Inc. Notes, | ||||||
| 4.00%, 04/15/2008 | 1,770,440 | ||||||
| 623,000 | Ford Capital BV Debentures, | ||||||
9.50%, 06/01/2010 f | 587,177 | ||||||
| 300,000 | Ford Motor Company | ||||||
| Debentures, | |||||||
| 9.215%, 09/15/2021 | 250,500 | ||||||
| 300,000 | Gannett Company | ||||||
| Inc. Notes, | |||||||
| 4.125%, 06/15/2008 | 298,686 | ||||||
| 550,000 | General Motors Nova | ||||||
| Scotia Finance Company, | |||||||
6.85%, 10/15/2008 f | 541,750 | ||||||
| Halliburton Company Notes: | |||||||
| 475,000 | 5.625%, 12/01/2008 | 477,801 | |||||
| 675,000 | 5.50%, 10/15/2010 | 693,868 | |||||
| 1,275,000 | Hanson Australia Funding, | ||||||
5.25%, 03/15/2013 f | 1,272,089 | ||||||
| 650,000 | Hanson PLC Notes, | ||||||
6.125%, 08/15/2016 f | 655,178 | ||||||
| 975,000 | Hutchison Whampoa | ||||||
| International Limited, | |||||||
| 6.25%, 01/24/2014 | |||||||
| (Acquired 11/19/2003 | |||||||
| and 02/08/2005; | |||||||
| Cost $749,228 and | |||||||
| $244,602)*f | 1,013,512 | ||||||
| 1,000,000 | Ingersoll-Rand | ||||||
| Company Debentures, | |||||||
6.391%, 11/15/2027 f | 1,088,084 | ||||||
| 1,100,000 | Johnson Controls Inc. | ||||||
| Senior Notes, | |||||||
| 5.50%, 01/15/2016 | 1,083,872 | ||||||
| 675,000 | Laboratory Corporation | ||||||
| of America Holdings, | |||||||
| 5.50%, 02/01/2013 | 657,543 | ||||||
| 550,000 | Lafarge S.A. Notes, | ||||||
6.50%, 07/15/2016 f | 542,433 | ||||||
| 500,000 | Limited Brands, Inc., | ||||||
| 5.25%, 11/01/2014 | 448,787 | ||||||
| 400,000 | Marathon Oil Corporation, | ||||||
6.00%, 07/01/2012 f | 415,099 | ||||||
| 1,550,000 | Masco Corporation, | ||||||
| 6.125%, 10/03/2016 | 1,528,756 | ||||||
The accompanying notes are an integral part of these financial statements.
Page 14
Baird Intermediate Bond Fund
Schedule of Investments December 31, 2007 |
Principal | |||||||
Amount | Value | ||||||
LONG-TERM INVESTMENTS – 97.2% (cont.) | |||||||
Industrial – 15.7% (cont.) | |||||||
| $ | 650,000 | New York Telephone | |||||
| Company Debentures, | |||||||
| 8.625%, 11/15/2010 | $ | 712,483 | |||||
| 1,898,000 | Nextel Communications | ||||||
| Senior Notes, | |||||||
| 6.875%, 10/31/2013 | 1,869,762 | ||||||
| 700,000 | PCCW Capital II Ltd., | ||||||
| 6.00%, 07/15/2013 | |||||||
| (Acquired 07/10/2003; | |||||||
Cost $696,731)* f | 696,123 | ||||||
| 925,000 | Pearson Dollar Finance PLC, | ||||||
| 5.70%, 06/01/2014 | |||||||
| (Acquired 09/28/2005 | |||||||
| and 12/14/2007; Cost | |||||||
$618,138 and $321,181)* f | 935,621 | ||||||
| 1,850,000 | PEMEX Project | ||||||
| Funding Master Trust, | |||||||
9.125%, 10/13/2010 f | 2,044,250 | ||||||
| 1,770,000 | Plum Creek Timberlands, | ||||||
| 5.875%, 11/15/2015 | 1,745,156 | ||||||
| 1,500,000 | Premcor Refining | ||||||
| Group Inc. Senior Notes, | |||||||
| 9.50%, 02/01/2013 | 1,574,517 | ||||||
| Qwest Capital Funding, Inc.: | |||||||
| 350,000 | 7.00%, 08/03/2009 | 349,125 | |||||
| 100,000 | 7.25%, 02/15/2011 | 98,500 | |||||
| 1,000,000 | Reed Elsevier Capital Notes, | ||||||
| 4.625%, 06/15/2012 | 976,793 | ||||||
| 600,000 | SBC Communications, | ||||||
| Inc. Notes, 5.625%, | |||||||
| 06/15/2016 | 606,850 | ||||||
| 2,400,000 | Sealed Air Corporation | ||||||
| Senior Notes, | |||||||
| 5.375%, 04/15/2008 | |||||||
| (Acquired 04/09/2003, | |||||||
| 07/03/2007, and | |||||||
| 08/08/2007; Cost $646,490, | |||||||
| $1,497,435, and | |||||||
| $249,345, respectively)* | 2,398,637 | ||||||
| 500,000 | Sprint Nextel Corporation, | ||||||
| 6.00%, 12/01/2016 | 478,897 | ||||||
| 1,100,000 | Sunoco, Inc. Senior Notes, | ||||||
| 5.75%, 01/15/2017 | 1,093,102 | ||||||
| TCI Communications, | |||||||
| Inc. Debentures: | |||||||
| 550,000 | 7.875%, 08/01/2013 | 602,746 | |||||
| 583,000 | 8.75%, 08/01/2015 | 678,149 | |||||
Telecom Italia Capital: f | |||||||
| 1,360,000 | 4.95%, 09/30/2014 | 1,309,792 | |||||
| 650,000 | 5.25%, 10/01/2015 | 633,262 | |||||
| 756,000 | Tele-Communications, | ||||||
| Inc. Debentures, | |||||||
| 9.80%, 02/01/2012 | 873,216 | ||||||
| 1,650,000 | Telefonica | ||||||
| Emisiones, S.A.U., | |||||||
6.421%, 06/20/2016 f | 1,736,394 | ||||||
| 1,000,000 | Time Warner Cable, Inc., | ||||||
| 5.85%, 05/01/2017 | 1,002,468 | ||||||
| 250,000 | Time Warner | ||||||
| Companies, Inc., | |||||||
| 6.875%, 06/15/2018 | 262,157 | ||||||
| 1,275,000 | Time Warner Companies | ||||||
| Inc. Debentures, | |||||||
| 9.125%, 01/15/2013 | 1,448,499 | ||||||
| 1,470,000 | Transocean, Inc., | ||||||
6.625%, 04/15/2011 f | 1,521,922 | ||||||
| 275,000 | Tribune Company, | ||||||
| 5.25%, 08/15/2015 | 160,974 | ||||||
The accompanying notes are an integral part of these financial statements.
Page 15
Baird Intermediate Bond Fund
Schedule of Investments December 31, 2007 |
Principal | |||||||
Amount | Value | ||||||
LONG-TERM INVESTMENTS – 97.2% (cont.) | |||||||
Industrial – 15.7% (cont.) | |||||||
| $ | 500,000 | Tyco Electronics Group S.A., | |||||
| 6.55%, 10/01/2017 | |||||||
| (Acquired 09/26/2007; | |||||||
Cost $504,926)* f | $ | 514,285 | |||||
| Tyco International | |||||||
Group S.A.: f | |||||||
| 1,525,000 | 6.375%, 10/15/2011 | 1,578,216 | |||||
| 650,000 | 6.00%, 11/15/2013 | 668,096 | |||||
| United AirLines, Inc. | |||||||
| Pass-Thru Certificates: | |||||||
| 460,617 | Series 2001-1, | ||||||
| 6.201%, 09/01/2008 | 458,314 | ||||||
| 260,501 | Series 1991-A, | ||||||
| 10.02%, 03/22/2014 | 132,204 | ||||||
| 245,275 | Series 2000-2, | ||||||
| 7.762%, 12/31/2049 | 228,106 | ||||||
| 1,500,000 | Vale Overseas Limited, | ||||||
6.25%, 01/23/2017 f | 1,504,658 | ||||||
| 900,000 | Verizon Communications | ||||||
| Debentures, | |||||||
| 6.84%, 04/15/2018 | 976,409 | ||||||
| 250,000 | Verizon Communications | ||||||
| Senior Unsecured Notes, | |||||||
| 5.55%, 02/15/2016 | 252,683 | ||||||
| 1,050,000 | Viacom, Inc., | ||||||
| 7.70%, 07/30/2010 | 1,114,716 | ||||||
| Waste Management, Inc.: | |||||||
| 1,510,000 | 6.875%, 05/15/2009 | 1,550,264 | |||||
| 25,000 | 5.00%, 03/15/2014 | 24,626 | |||||
| 500,000 | Willamette Industries, | ||||||
| Inc. Notes, | |||||||
| 6.60%, 06/05/2012 | 522,431 | ||||||
| 63,056,999 | |||||||
Mortgage Backed Securities – 19.0% | |||||||
| Bank of America | |||||||
| Alternative Loan Trust: | |||||||
| 515,188 | Series 2003-11, Class 4A1, | ||||||
| 4.75%, 01/25/2019 | 507,622 | ||||||
| 1,497,708 | Series 2004-2, Class 5A1, | ||||||
| 5.50%, 03/25/2019 | 1,478,995 | ||||||
| 1,688,423 | Series 2004-11, Class 4A1, | ||||||
| 5.50%, 12/25/2019 | 1,702,670 | ||||||
| 298,146 | Series 2006-2, Class 7A1, | ||||||
| 6.00%, 03/25/2021 | 294,515 | ||||||
| 1,530,042 | Series 2006-3, Class 6A1, | ||||||
| 6.00%, 04/25/2036 | 1,517,980 | ||||||
| 1,060,707 | Bank of America | ||||||
| Funding Corporation, | |||||||
| Series 2003-3, Class 1A41, | |||||||
| 5.50%, 10/25/2033 | 1,047,095 | ||||||
| Citicorp Mortgage | |||||||
| Securities, Inc.: | |||||||
| 1,567,917 | Series 2004-5, Class 1A25, | ||||||
| 5.50%, 10/25/2014 | 1,577,347 | ||||||
| 1,405,845 | Series 2004-4, Class A5, | ||||||
| 5.50%, 06/25/2034 | 1,393,813 | ||||||
| Countrywide Alternative | |||||||
| Loan Trust: | |||||||
| 462,142 | Series 2005-5R, Class A2, | ||||||
| 4.75%, 12/25/2018 | 459,705 | ||||||
| 1,485,221 | Series 2005-50CB, | ||||||
| Class 4A1, 5.00%, | |||||||
| 11/25/2020 | 1,442,212 | ||||||
| 396,080 | Series 2005-85CB, | ||||||
| Class 3A1, 5.25%, | |||||||
| 02/25/2021 (Acquired | |||||||
| 09/26/2007, 09/26/2007, | |||||||
| and 10/11/2007; Cost | |||||||
| $106,286, $230,288 and | |||||||
| $52,981, respectively)* | 390,399 | ||||||
The accompanying notes are an integral part of these financial statements.
Page 16
Baird Intermediate Bond Fund
Schedule of Investments December 31, 2007 |
Principal | |||||||
Amount | Value | ||||||
LONG-TERM INVESTMENTS – 97.2% (cont.) | |||||||
Mortgage Backed Securities – 19.0% (cont.) | |||||||
| $ | 2,606,607 | Series 2006-7CB, | |||||
| Class 3A1, 5.25%, | |||||||
| 05/25/2021 | $ | 2,530,679 | |||||
| 24,592 | Series 2004-18CB, | ||||||
| 5.125%, 09/25/2034 | 24,528 | ||||||
| 50,000 | Series 2005-10CB, | ||||||
| Class 1A6, 5.50%, | |||||||
| 05/25/2035 | 49,945 | ||||||
| 212,156 | Series 2005-11CB, | ||||||
| Class 2A1, 5.50%, | |||||||
| 06/25/2035 | 204,881 | ||||||
| 1,943,746 | Series 2005-34CB, | ||||||
| Class 1A6, 5.50%, | |||||||
| 09/25/2035 | 1,940,500 | ||||||
| 1,675,667 | Countrywide Home | ||||||
| Loans, Inc., | |||||||
| Series 2003-18, Class A3, | |||||||
| 5.25%, 07/25/2033 | 1,674,538 | ||||||
| Credit Suisse First Boston | |||||||
| Mortgage Securities Corp.: | |||||||
| 3,776,899 | Series 1998-C2, Class A2, | ||||||
| 6.30%, 11/15/2030 | 3,798,959 | ||||||
| 140,291 | Series 2005-3, Class 3A27, | ||||||
| 5.50%, 07/25/2035 | 140,487 | ||||||
| Federal Gold Loan | |||||||
| Mortgage Corporation | |||||||
| (FGLMC) Pass-Thru | |||||||
| Certificates: | |||||||
| 68,492 | 4.50%, 01/01/2008 | 68,321 | |||||
| 1,807,603 | 6.00%, 06/01/2021 | 1,849,181 | |||||
| 56,505 | 6.00%, 07/01/2028 | 57,747 | |||||
| Federal Home Loan | |||||||
| Mortgage Corporation | |||||||
| (FHLMC): | |||||||
| 1,517,504 | Series 3033, Class LU, | ||||||
| 5.50%, 03/15/2013 | 1,546,602 | ||||||
| 1,561,139 | Series 2695, Class UA, | ||||||
| 5.50%, 09/15/2014 | 1,584,884 | ||||||
| 9,650,487 | Series R014, Class AL, | ||||||
| 5.50%, 10/15/2014 | 9,765,623 | ||||||
| 714,648 | Series R001, Class AE, | ||||||
| 4.375%, 04/15/2015 | 711,173 | ||||||
| 2,128,824 | Series R003, Class VA, | ||||||
| 5.50%, 08/15/2016 | 2,171,600 | ||||||
| 2,394,687 | Series 3122, Class VA, | ||||||
| 6.00%, 01/15/2017 | 2,462,951 | ||||||
| 1,873,666 | Series R010, Class VA, | ||||||
| 5.50%, 04/15/2017 | 1,914,314 | ||||||
| 603,467 | Series R009, Class AJ, | ||||||
| 5.75%, 12/15/2018 | 610,683 | ||||||
| 50,224 | Series 1395, Class G, | ||||||
| 6.00%, 10/15/2022 | 50,142 | ||||||
| 574,563 | Series 2970, Class DA, | ||||||
| 5.50%, 01/15/2023 | 582,679 | ||||||
| Federal National Mortgage | |||||||
| Association (FNMA): | |||||||
| 1,171,123 | Series 2006-B2, Class AB, | ||||||
| 5.50%, 05/25/2014 | 1,186,835 | ||||||
| 1,500,000 | Series 2003-24, Class PC, | ||||||
| 5.00%, 11/25/2015 | 1,501,047 | ||||||
| 1,178,257 | Series 2006-B1, Class AB, | ||||||
| 6.00%, 06/25/2016 | 1,195,266 | ||||||
| 50,000 | Series 2003-35, Class TD, | ||||||
| 5.00%, 12/25/2016 | 50,030 | ||||||
| 197,813 | Series 1991-137, Class H, | ||||||
| 7.00%, 10/25/2021 | 210,378 | ||||||
| 166,645 | Series 1992-136, Class PK, | ||||||
| 6.00%, 08/25/2022 | 170,957 | ||||||
| 86,822 | Series 1993-32, Class H, | ||||||
| 6.00%, 03/25/2023 | 87,912 | ||||||
The accompanying notes are an integral part of these financial statements.
Page 17
Baird Intermediate Bond Fund
Schedule of Investments December 31, 2007 |
Principal | |||||||
Amount | Value | ||||||
LONG-TERM INVESTMENTS – 97.2% (cont.) | |||||||
Mortgage Backed Securities – 19.0% (cont.) | |||||||
| $ | 215,539 | Series 2002-95, Class MD, | |||||
| 5.00%, 07/25/2026 | $ | 215,067 | |||||
| 122,437 | Series 2002-77, Class QP, | ||||||
| 5.00%, 09/25/2026 | 122,175 | ||||||
| 2,741,877 | Series 2004-W6, Class 1A6, | ||||||
| 5.50%, 07/25/2034 | 2,701,701 | ||||||
| 4,000,000 | Series 2004-W10, Class A24, | ||||||
| 5.00%, 08/25/2034 | 3,989,561 | ||||||
| Government National | |||||||
| Mortgage Association | |||||||
| (GNMA): | |||||||
| 108,586 | Series 2003-12, Class ON, | ||||||
| 4.00%, 02/16/2028 | 108,423 | ||||||
| 455,802 | Series 1999-4, Class ZB, | ||||||
| 6.00%, 02/20/2029 | 466,587 | ||||||
| J.P. Morgan Alternative | |||||||
| Loan Trust: | |||||||
| 1,517,166 | Series 2006-A1, Class 2A1, | ||||||
| 5.799%, 03/25/2036 | 1,508,582 | ||||||
| 3,000,000 | Series 2006-S2, Class A2, | ||||||
| 5.81%, 05/25/2036 | 2,990,480 | ||||||
| 862,793 | Lehman Mortgage Trust, | ||||||
| Series 2006-4, Class 3A1, | |||||||
| 5.00%, 08/25/2021 | 842,872 | ||||||
| Master Alternative | |||||||
| Loans Trust: | |||||||
| 2,507,693 | Series 2004-1, Class 1A1, | ||||||
| 5.00%, 01/25/2019 | 2,444,605 | ||||||
| 557,807 | Series 2004-3, Class 1A1, | ||||||
| 5.00%, 03/25/2019 | 556,065 | ||||||
| 321,270 | Series 2005-3, Class 4A1, | ||||||
| 5.50%, 03/25/2020 | 319,654 | ||||||
| 108,891 | Morgan Stanley Capital I, | ||||||
| Series 1998-CF1, Class A2, | |||||||
| 6.60%, 07/15/2032 | 108,929 | ||||||
| 458,779 | Salomon Brothers | ||||||
| Mortgage Securities VII, | |||||||
| Series 2003-UP2, Class A2, | |||||||
| 4.00%, 06/25/2033 | 448,085 | ||||||
| Washington Mutual: | |||||||
| 3,583,017 | Series 2004-CB3, Class 3A, | ||||||
| 5.50%, 10/25/2019 | 3,601,821 | ||||||
| 913,033 | Series 2004-CB4, Class 21A, | ||||||
| 5.50%, 12/25/2019 | 917,003 | ||||||
| Washington Mutual, Inc. | |||||||
| Pass-Thru Certificates: | |||||||
| 2,502,119 | Series 2004-CB1, | ||||||
| Class 5A, 5.00%, | |||||||
| 06/25/2019 | 2,491,955 | ||||||
| 1,363,963 | Series 2004-CB3, | ||||||
| Class 4A, 6.00%, | |||||||
| 10/25/2019 | 1,385,702 | ||||||
| 1,123,718 | Series 2004-CB4, | ||||||
| Class 22A, 6.00%, | |||||||
| 12/25/2019 | 1,144,666 | ||||||
| 76,319,128 | |||||||
Taxable Municipal Bonds – 0.5% | |||||||
| 915,000 | Tobacco Settlement | ||||||
| Authority Iowa, | |||||||
| 6.50%, 06/01/2023 | 871,812 | ||||||
| Tobacco Settlement | |||||||
| Financing Corporation: | |||||||
| 185,000 | Series 2001-A, Class A, | ||||||
| 5.92%, 06/01/2012 | 184,571 | ||||||
| 1,123,937 | Series 2001-A, Class A, | ||||||
| 6.36%, 05/15/2025 | 1,086,566 | ||||||
| 2,142,949 | |||||||
Utilities – 6.7% | |||||||
| 1,715,000 | Cilcorp Inc. Senior Notes, | ||||||
| 8.70%, 10/15/2009 | 1,802,122 | ||||||
The accompanying notes are an integral part of these financial statements.
Page 18
Baird Intermediate Bond Fund
Schedule of Investments December 31, 2007 |
Principal | |||||||
Amount | Value | ||||||
LONG-TERM INVESTMENTS – 97.2% (cont.) | |||||||
Utilities – 6.7% (cont.) | |||||||
| $ | 50,000 | Commonwealth Edison, | |||||
| 5.95%, 08/15/2016 | $ | 50,722 | |||||
| 1,877,000 | Consumers Energy | ||||||
| Company, Series C, | |||||||
| 4.25%, 04/15/2008 | 1,870,695 | ||||||
| 1,000,000 | Dominion Resources | ||||||
| Inc., Series C, | |||||||
| 5.15%, 07/15/2015 | 967,632 | ||||||
| 1,400,000 | Duke Capital LLC Notes, | ||||||
| 5.668%, 08/15/2014 | 1,391,235 | ||||||
| 600,000 | Energy Transfer Partners, | ||||||
| 5.65%, 08/01/2012 | 594,030 | ||||||
| 300,000 | Exelon Corporation | ||||||
| Senior Notes, | |||||||
| 6.75%, 05/01/2011 | 313,547 | ||||||
| 100,000 | FPL Group Capital, | ||||||
| Inc., Series B, | |||||||
| 5.551%, 02/16/2008 | 100,026 | ||||||
| 2,500,000 | Kinder Morgan Finance, | ||||||
5.70%, 01/05/2016 f | 2,263,003 | ||||||
| 366,001 | Kiowa Power Partners LLC, | ||||||
| 4.811%, 12/30/2013 | |||||||
| (Acquired 11/19/2004; | |||||||
| Cost $377,953)* | 366,638 | ||||||
| 300,000 | Korea Electric | ||||||
| Power Corporation, | |||||||
6.75%, 08/01/2027 f | 344,906 | ||||||
| 1,500,000 | MidAmerican Energy | ||||||
| Holdings Company | |||||||
| Senior Notes, | |||||||
| 7.52%, 09/15/2008 | 1,522,172 | ||||||
| 1,400,000 | National Grid PLC | ||||||
| Senior Unsecured Notes, | |||||||
6.30%, 08/01/2016 f | 1,429,257 | ||||||
| 25,000 | National Rural Utilities, | ||||||
| 4.375%, 10/01/2010 | 24,933 | ||||||
| 100,000 | NiSource Finance | ||||||
| Corporation, | |||||||
| 7.875%, 11/15/2010 | 106,082 | ||||||
| 1,800,000 | ONEOK, Inc. | ||||||
| Senior Notes, | |||||||
| 7.125%, 04/15/2011 | 1,905,910 | ||||||
| 400,000 | ONEOK Partners | ||||||
| LP Notes, | |||||||
| 5.90%, 04/01/2012 | 411,279 | ||||||
| 1,417,000 | Panhandle Eastern Pipeline | ||||||
| Senior Notes, | |||||||
| 4.80%, 08/15/2008 | 1,410,463 | ||||||
| 1,700,000 | PPL Energy Supply, LLC | ||||||
| Bonds, Series A | |||||||
| 5.70%, 10/15/2015 | 1,654,709 | ||||||
| 388,000 | PPL Energy Supply, LLC | ||||||
| Senior Notes, | |||||||
| 6.40%, 11/01/2011 | 397,191 | ||||||
| 900,000 | Progress Energy, Inc. | ||||||
| Senior Notes, | |||||||
| 6.85%, 04/15/2012 | 963,394 | ||||||
| 175,000 | PSE&G Energy Holdings | ||||||
| LLC Senior Notes, | |||||||
| 8.50%, 06/15/2011 | 182,370 | ||||||
| PSE&G Power LLC: | |||||||
| 275,000 | 7.75%, 04/15/2011 | 295,876 | |||||
| 425,000 | 5.00%, 04/01/2014 | 407,282 | |||||
| 813,204 | RGS (I&M) Funding | ||||||
| Corporation Debentures, | |||||||
| 9.82%, 12/07/2022 | 997,996 | ||||||
| 1,500,000 | Rockies Express Pipeline | ||||||
| LLC, 5.776%, 08/20/2009 | |||||||
| (Acquired 09/17/2007; | |||||||
| Cost $1,495,751)* | 1,500,408 | ||||||
| 800,000 | Transcontinental Gas Pipe | ||||||
| Line Corporation Senior | |||||||
| Notes, 8.875%, 07/15/2012 | 904,000 | ||||||
The accompanying notes are an integral part of these financial statements.
Page 19
Baird Intermediate Bond Fund
Schedule of Investments December 31, 2007 |
Principal | ||||||||
Amount | Value | |||||||
LONG-TERM INVESTMENTS – 97.2% (cont.) | ||||||||
Utilities – 6.7% (cont.) | ||||||||
| $ | 306,765 | Tristate Gen & Trans Assn, | ||||||
| Series 2003, 6.04%, | ||||||||
| 01/31/2018 (Acquired | ||||||||
| 10/14/2003; | ||||||||
| Cost $306,765)* | $ | 310,818 | ||||||
| Vectren Utility Holdings: | ||||||||
| 900,000 | 6.625%, 12/01/2011 | 952,956 | ||||||
| 525,000 | 5.25%, 08/01/2013 | 511,776 | ||||||
| 600,000 | Williams Companies, | |||||||
| Inc. Notes, | ||||||||
| 8.125%, 03/15/2012 | 653,250 | |||||||
| 325,000 | Yosemite Securities Trust I, | |||||||
| 8.25%, 11/15/2104 | ||||||||
| (Acquired 04/26/2001; | ||||||||
Cost $340,415)* f | 256,750 | |||||||
| 26,863,428 | ||||||||
U.S. Government Agency Issues – 18.6% | ||||||||
| Federal Home Loan | ||||||||
| Mortgage Corporation | ||||||||
| (FHLMC), | ||||||||
| 4,300,000 | 4.50%, 07/15/2013 | 4,401,798 | ||||||
| Federal National Mortgage | ||||||||
| Association (FNMA): | ||||||||
| 49,200,000 | 6.00%, 05/15/2011 | 52,796,815 | ||||||
| 17,100,000 | 4.375%, 03/15/2013 | 17,405,304 | ||||||
| 74,603,917 | ||||||||
U.S. Treasury Obligations – 14.2% | ||||||||
| 40,250,000 | U.S. Treasury Bonds, | |||||||
| 9.125%, 05/15/2018 | 56,919,175 | |||||||
| Total Long-Term | ||||||||
| Investments | ||||||||
| $(388,080,361) | 390,250,540 | |||||||
Shares | ||||||||
SHORT-TERM INVESTMENTS – 2.5% | ||||||||
Money Market Fund – 2.5% | ||||||||
| 10,285,629 | Short-Term Investment | |||||||
| Company Liquid Assets | ||||||||
| Portfolio – AIM Fund | 10,285,629 | |||||||
| Total Short-Term | ||||||||
| Investments | ||||||||
| (Cost $10,285,629) | 10,285,629 | |||||||
Principal | ||||||||
Amount | ||||||||
INVESTMENTS PURCHASED | ||||||||
WITH CASH PROCEEDS | ||||||||
FROM SECURITIES LENDING – 38.1% | ||||||||
Certificate of Deposit – 1.6% | ||||||||
| $ | 6,219,809 | Barclays Bank, | ||||||
| 5.15%, 2/12/08 | 6,222,546 | |||||||
Commercial Paper – 10.3% | ||||||||
| 4,664,856 | Alianz Finance | |||||||
| Corporation, | ||||||||
| 5.06%, 01/16/08 | 4,655,061 | |||||||
| Atlantic Asset | ||||||||
| Securitization Corp.: | ||||||||
| 932,971 | 6.13%, 01/04/08 | 932,485 | ||||||
| 1,554,952 | 5.447%, 01/25/08 | 1,549,852 | ||||||
| 1,554,952 | Barton Capital | |||||||
| Corporation, | ||||||||
| 5.835%, 01/10/08 | 1,552,915 | |||||||
| 1,554,952 | GovCo LLC, | |||||||
| 5.584%, 01/15/08 | 1,551,889 | |||||||
| 4,066,926 | KKR Atlantic Funding | |||||||
| Trust, 5.205%, 03/13/08 # | 4,002,071 | |||||||
| 2,795,182 | Kitty Hawk Funding | |||||||
| Corp., 5.323%, 01/25/08 | 2,786,014 | |||||||
| 6,219,809 | Kommunalkredit Austria | |||||||
| AG, 4.89%, 01/31/08 | 6,194,680 | |||||||
The accompanying notes are an integral part of these financial statements.
Page 20
Baird Intermediate Bond Fund
Schedule of Investments December 31, 2007 |
Principal | |||||||
Amount | Value | ||||||
INVESTMENTS PURCHASED | |||||||
WITH CASH PROCEEDS | |||||||
FROM SECURITIES LENDING – 38.1% (cont.) | |||||||
Commercial Paper – 10.3% (cont.) | |||||||
| $ | 3,172,559 | Rams Funding Three | |||||
| LLC, 5.386%, 02/11/08 | $ | 3,172,559 | |||||
| 1,554,952 | Ranger Funding Company | ||||||
| LLC, 5.456%, 01/11/08 | 1,552,714 | ||||||
| 2,176,934 | Sheffield Receivables, | ||||||
| 6.099%, 01/04/08 | 2,175,801 | ||||||
| 4,975,847 | Sigma Finance, | ||||||
| 4.62%, 02/11/08 | 4,841,996 | ||||||
| 1,554,952 | Thunder Bay Funding | ||||||
| LLC, 5.839%, 01/14/08 | 1,552,091 | ||||||
| 1,554,952 | Tulip Funding | ||||||
| Corporation, | |||||||
| 5.627%, 01/03/08 | 1,554,347 | ||||||
| 1,554,952 | Variable Funding | ||||||
| Capital Corporation, | |||||||
| 5.492%, 01/18/08 | 1,551,283 | ||||||
| 1,554,952 | Windmill Funding, | ||||||
| 6.136%, 01/10/08 | 1,552,915 | ||||||
| 41,178,673 | |||||||
Shares | |||||||
Money Market Mutual Funds – 3.6% | |||||||
| 7,335,661 | Merrill Lynch Premier | ||||||
| Institutional Fund | 7,335,661 | ||||||
| 7,276,911 | Reserve Primary Fund | 7,276,911 | |||||
| 14,612,572 | |||||||
Principal | |||||||
Amount | |||||||
Repurchase Agreements – 22.6% | |||||||
| $ | 7,774,760 | BNP Paribas, 4.70%, | |||||
| Dated 12/31/07, | |||||||
| Due 01/02/08, | |||||||
| (Collateralized by a | |||||||
| Fannie Mae Collateralized | |||||||
| Mortgage Obligation, | |||||||
| 6.00%, 11/01/37, valued | |||||||
| at $7,891,346. | |||||||
| Repurchase proceeds are | |||||||
| $7,776,790.) | 7,774,760 | ||||||
| 15,549,522 | Citigroup, 4.55%, Dated | ||||||
| 12/31/07, Due 01/02/08, | |||||||
| (Collateralized by various | |||||||
| AID – ISRAEL Government | |||||||
| Guaranteed Zero Coupon | |||||||
| Bonds, 09/15/13 – 11/15/21 | |||||||
| and U.S. Treasury Receipts, | |||||||
| 08/15/13, valued at | |||||||
| $15,901,294. | |||||||
| Repurchase proceeds | |||||||
| are $15,553,452.) | 15,549,522 | ||||||
| 15,549,522 | Citigroup, 4.55%, Dated | ||||||
| 12/31/07, Due 01/02/08, | |||||||
| (Collateralized by various | |||||||
| U.S. Treasury Receipts, | |||||||
| 08/15/08 – 08/15/13, | |||||||
| valued at $15,860,512. | |||||||
| Repurchase proceeds | |||||||
| are $15,553,452.) | 15,549,522 | ||||||
The accompanying notes are an integral part of these financial statements.
Page 21
Baird Intermediate Bond Fund
Schedule of Investments December 31, 2007 |
Principal | |||||||
Amount | Value | ||||||
INVESTMENTS PURCHASED | |||||||
WITH CASH PROCEEDS | |||||||
FROM SECURITIES LENDING – 38.1% (cont.) | |||||||
Repurchase Agreements – 22.6% (cont.) | |||||||
| $ | 5,908,818 | Credit Suisse, 4.64%, | |||||
| Dated 12/31/07, Due | |||||||
| 01/02/08, (Collateralized | |||||||
| by various collateralized | |||||||
| mortgage obligations, | |||||||
| 5.434–6.50%, | |||||||
| 11/25/36 – 01/15/49, | |||||||
| valued at $6,204,471. | |||||||
| Repurchase proceeds | |||||||
| are $5,910,342.) | $ | 5,908,818 | |||||
| 15,549,522 | Goldman Sachs, | ||||||
| 4.62%, Dated 12/31/07, | |||||||
| Due 01/02/08, | |||||||
| (Collateralized by a Wells | |||||||
| Fargo Collateralized | |||||||
| Mortgage Obligation, | |||||||
| 6.00%, 08/25/37, valued | |||||||
| at $15,844,585. | |||||||
| Repurchase proceeds | |||||||
| are $15,553,512.) | 15,549,522 | ||||||
| 7,774,760 | Morgan Stanley, 4.65%, | ||||||
| Dated 12/31/07, Due | |||||||
| 01/02/08, (Collateralized | |||||||
| by a Morgan Stanley | |||||||
| Senior Subordinated Note, | |||||||
| 4.955%, 09/26/08, valued | |||||||
| at $9,329,712. | |||||||
| Repurchase proceeds | |||||||
| are $7,776,768.) | 7,774,760 | ||||||
| 22,702,301 | Morgan Stanley, 4.85%, | ||||||
| Dated 12/31/07, Due | |||||||
| 01/02/08, (Collateralized | |||||||
| by a Fannie Mae | |||||||
| Collateralized Mortgage | |||||||
| Obligation, 5.315%, | |||||||
| 09/25/35, valued at | |||||||
| $23,162,568. Repurchase | |||||||
| proceeds are | |||||||
| $22,708,418.) | 22,702,301 | ||||||
| 90,809,205 | |||||||
| Total Investments | |||||||
| Purchased With Cash | |||||||
| Proceeds From | |||||||
| Securities Lending | |||||||
| (Cost $152,890,977) | 152,822,996 | ||||||
| Total Investments | |||||||
| (Cost $551,256,967) – | |||||||
| 137.8% | 553,359,165 | ||||||
| Liabilities in Excess of | |||||||
| Other Assets – (37.8)% | (151,761,248 | ) | |||||
| TOTAL NET | |||||||
| ASSETS – 100.0% | $ | 401,597,917 | |||||
| * | Restricted Security Deemed Liquid |
f | Foreign Security |
| ^ | Non-Income Producing |
| # | Fair Valued by Advisor |
The accompanying notes are an integral part of these financial statements.
Page 22
Baird Aggregate Bond Fund
The Baird Aggregate Bond Fund seeks an annual rate of total return, before Fund expenses, greater than the annual rate of total return of the Lehman Brothers Aggregate Bond Index. The Lehman Brothers Aggregate Bond Index is an unmanaged, market value weighted index of investment grade, fixed-rate debt issues, including government, corporate, asset-backed and mortgage-backed securities, with maturities of at least one year.
The Fund delivered strong nominal returns in 2007 although it underperformed its benchmark index. The primary factors for the underperformance were:
| • | The Fund’s overweight relative to the benchmark in AAA-rated mortgage-backed and asset-backed securities which underperformed as general market prices on securities in these sectors weakened; |
| • | Weak performance of specific individual corporate issues, particularly those in the finance and brokerage sector; and |
| • | The Fund’s overweighting of BBB-rated corporate bonds relative to the benchmark, which generally did not perform as well as higher-rated bonds. |
The Fund maintained its duration-neutral strategy, holding a broadly diversified portfolio of over 300 securities at year-end.
The Fund ended 2007 with a yield advantage versus its benchmark index. This yield advantage, combined with exposure to specific sectors which we believe have superior total return potential (asset-backed securities and collateralized mortgage-backed obligations), enhance the Fund’s prospects of adding value over its benchmark in the coming year.
Portfolio Characteristics
Quality Distribution* | Sector Weightings* |
 | 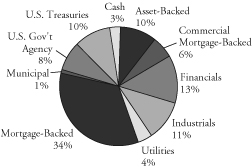 |
Net Assets: | $739,943,800 | Annualized Expense Ratio: | |||
SEC 30-Day Yield:** | Institutional Class: | 0.30% | |||
| Institutional Class: | 5.44% | Investor Class: | 0.55% | *** | |
| Investor Class: | 5.19% | Portfolio Turnover Rate: | 33.6% | ||
Average Effective Duration: | 4.41 years | Total Number of Holdings: | 346 | ||
Average Effective Maturity: | 6.52 years |
| * | Percentages shown are based on the Fund’s total net assets. | |
| ** | SEC yields are based on SEC guidelines and are calculated for the 30 days ended December 31, 2007. | |
| *** | Includes 0.25% 12b-1 fee. |
Page 23
Baird Aggregate Bond Fund
Baird Aggregate Bond Fund – Institutional Class
Value of a $25,000 Investment
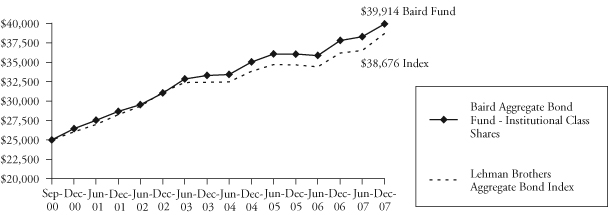
Growth of a hypothetical investment of $25,000 made on the Fund’s inception date (9/29/00), assuming reinvestment of all distributions.
Baird Aggregate Bond Fund – Investor Class
Value of a $10,000 Investment
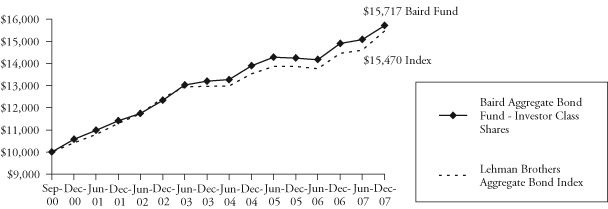
Growth of a hypothetical investment of $10,000 made on the Fund’s inception date (9/29/00), assuming reinvestment of all distributions.
Page 24
Baird Aggregate Bond Fund
Average Annual Total Returns
Since | |||
For the Periods Ended December 31, 2007 | One Year | Five Years | Inception(1) |
| Baird Aggregate Bond Fund – Institutional Class Shares | 5.61% | 5.16% | 6.66% |
| Baird Aggregate Bond Fund – Investor Class Shares | 5.45% | 4.94% | 6.43% |
Lehman Brothers Aggregate Bond Index(2) | 6.97% | 4.42% | 6.20% |
(1) | For the period from September 29, 2000 (commencement of operations) through December 31, 2007. |
(2) | The Lehman Brothers Aggregate Bond Index is an unmanaged, market value weighted index of investment grade, fixed-rate debt issues, including government, corporate, asset-backed, and mortgage-backed securities, with maturities of at least one year. This index does not reflect any deduction for fees, expenses or taxes. A direct investment in an index is not possible. |
The returns shown in the table above and line graphs on the previous page reflect reinvestment of dividends and/or capital gains distributions in additional shares. The returns do not reflect the deduction of taxes that a shareholder would pay on Fund distributions or the redemption of Fund shares.
Past performance does not guarantee future results. Investment return and principal value will fluctuate so that an investor’s shares, when redeemed, may be worth more or less than their original cost.
For information about the performance of the Fund as of the most recent month-end, please call 1-866-44BAIRD or visit www.bairdfunds.com. Mutual fund performance changes over time and current performance may be lower or higher than that stated.
Page 25
Baird Aggregate Bond Fund
Schedule of Investments December 31, 2007 |
Principal | |||||||
Amount | Value | ||||||
LONG-TERM INVESTMENTS – 95.9% | |||||||
Asset Backed Securities – 9.6% | |||||||
| $ | 8,000,000 | American Express Credit | |||||
| Account Master Trust, | |||||||
| Series 2005-5, Class A, | |||||||
| 5.0675%, 02/15/2013 | $ | 7,953,794 | |||||
| 5,000,000 | Bayview Financial | ||||||
| Acquisition, | |||||||
| 6.831%, 07/28/2037 | 4,821,608 | ||||||
| 2,000,000 | Bayview Financial | ||||||
| Acquisition Trust, | |||||||
| Series 2006-A, Class 1A2, | |||||||
| 5.483%, 02/28/2041 | 1,947,777 | ||||||
| Contimortgage Home | |||||||
| Equity Trust: | |||||||
| 3,338 | Series 1999-1, Class A7, | ||||||
| 6.97%, 12/25/2013 | 3,325 | ||||||
| 2,982 | Series 1997-2, Class A9, | ||||||
| 7.09%, 04/15/2028 | 2,976 | ||||||
| 33,511 | Series 1999-3, Class A8, | ||||||
| 5.884%, 05/25/2029 | 33,418 | ||||||
| Countrywide Asset-Backed | |||||||
| Certificates: | |||||||
| 105,955 | Series 2005-10, Class AF2, | ||||||
| 4.493%, 07/25/2026 | 105,621 | ||||||
| 4,100,000 | Series 2006-S2, Class A2, | ||||||
| 5.627%, 07/25/2027 | 3,912,219 | ||||||
| 2,000,000 | Series 2005-17, Class 1AF2, | ||||||
| 5.363%, 03/25/2030 | 1,984,022 | ||||||
| 1,500,000 | Series 2004-15, Class AF6, | ||||||
| 4.613%, 04/25/2035 | 1,462,700 | ||||||
| 5,050,000 | Series 2005-1, Class AF6, | ||||||
| 5.03%, 07/25/2035 | 4,947,547 | ||||||
| 5,020,000 | Series 2005-10, Class AF6, | ||||||
| 4.915%, 02/25/2036 | 4,844,133 | ||||||
| 2,000,000 | Series 2005-17, Class 1AF, | ||||||
| 5.564%, 05/25/2036 | 1,887,096 | ||||||
| 3,100,000 | Series 2007-S1, Class A6, | ||||||
| 5.693%, 11/25/2036 | 2,850,744 | ||||||
| 7,000,000 | Series 2006-13, | ||||||
| Class 1AF2, | |||||||
| 5.884%, 01/25/2037 | 6,873,450 | ||||||
| 1,500,000 | Series 2006-10, Class 1AF3, | ||||||
| 5.971%, 09/25/2046 | 1,457,720 | ||||||
| 1,931,632 | Credit Based Asset | ||||||
| Servicing and Securities, | |||||||
| Series 2005-CB8, Class AF2, | |||||||
| 5.303%, 12/25/2035 | 1,920,237 | ||||||
| 338,800 | Equivantage Home | ||||||
| Equity Loan Trust, | |||||||
| Series 1996-3, Class A3, | |||||||
| 7.70%, 09/25/2027 | 337,716 | ||||||
| GE Capital Mortgage | |||||||
| Services, Inc.: | |||||||
| 4,788 | Series 1997-HE4, Class A7, | ||||||
| 6.735%, 12/25/2028 | 4,773 | ||||||
| 61,570 | Series 1999-HE1, Class A7, | ||||||
| 6.265%, 04/25/2029 | 61,383 | ||||||
| 370,235 | GMAC Mortgage | ||||||
| Corporation Loan Trust, | |||||||
| Series 2004-GH1, Class A2, | |||||||
| 4.39%, 12/25/2025 | 365,850 | ||||||
| Green Tree Financial | |||||||
| Corporation: | |||||||
| 948,474 | Series 1998-2, Class A5, | ||||||
| 6.24%, 11/01/2016 | 948,705 | ||||||
| 1,102,511 | Series 1993-3, Class A7, | ||||||
| 6.40%, 10/15/2018 | 1,148,169 | ||||||
| 1,148,982 | Series 1993-4, Class A5, | ||||||
| 7.05%, 01/15/2019 | 1,198,759 | ||||||
| 197,178 | Series 1997-6, Class A8, | ||||||
| 7.07%, 01/15/2029 | 206,678 | ||||||
| 3,777,899 | Series 1999-3, Class A6, | ||||||
| 6.50%, 02/01/2031 | 3,789,392 | ||||||
The accompanying notes are an integral part of these financial statements.
Page 26
Baird Aggregate Bond Fund
Schedule of Investments December 31, 2007 |
Principal | |||||||
Amount | Value | ||||||
LONG-TERM INVESTMENTS – 95.9% (cont.) | |||||||
Asset Backed Securities – 9.6% (cont.) | |||||||
| $ | 1,976,517 | Series 1998-3, Class A5, | |||||
| 6.22%, 03/01/2030 | $ | 2,064,337 | |||||
| 1,174,133 | Series 1998-4, Class A5, | ||||||
| 6.18%, 04/01/2030 | 1,153,872 | ||||||
| 1,644,717 | GSAA Home Equity Trust, | ||||||
| Series 2005-1, Class AF2, | |||||||
| 4.316%, 11/25/2034 | 1,597,009 | ||||||
| 318,212 | IMC Home Equity | ||||||
| Loan Trust, | |||||||
| Series 1997-5, Class A10, | |||||||
| 6.88%, 11/20/2028 | 317,310 | ||||||
| 97,198 | Impac CMB Trust, | ||||||
| Series 2004-4, Class 2A2, | |||||||
| 5.749%, 09/25/2034 | 91,515 | ||||||
| 112,644 | Oakwood Mortgage | ||||||
| Investors, Inc., | |||||||
| Series 1999-B, Class A3, | |||||||
| 6.45%, 11/15/2017 | 105,674 | ||||||
| RAAC Series: | |||||||
| 156,096 | Series 2004-SP1, Class AI2, | ||||||
| 4.38%, 01/25/2022 | 155,182 | ||||||
| 1,263,903 | Series 2004-SP1, Class AI4, | ||||||
| 5.285%, 08/25/2027 | 1,250,086 | ||||||
| 3,000,000 | Renaissance Home | ||||||
| Equity Loan Trust, | |||||||
| Series 2007-1, Class AF3, | |||||||
| 5.612%, 04/25/2037 | 2,827,592 | ||||||
| Residential Asset | |||||||
| Mortgage Products, Inc.: | |||||||
| 1,489,580 | Series 2003-RS7, Class AI6, | ||||||
| 5.34%, 08/25/2033 | 1,475,602 | ||||||
| 1,000,000 | Series 2005-RS1, Class AI6, | ||||||
| 4.713%, 01/25/2035 | 943,664 | ||||||
| Residential Asset | |||||||
| Securities Corporation: | |||||||
| 296,454 | Series 2003-KS5, | ||||||
| Class AI6, 3.62%, | |||||||
| 07/25/2033 | 281,536 | ||||||
| 287,045 | Series 2004-KS2, | ||||||
| Class AI6, 4.30%, | |||||||
| 03/25/2034 | 272,540 | ||||||
| 2,600,000 | Stingray | ||||||
| Pass-Thru Certificates, | |||||||
| Series 2005, 5.902%, | |||||||
| 01/12/2015 (Acquired | |||||||
| 05/10/2007 and | |||||||
| 09/19/2007; Cost | |||||||
| $1,520,000 and | |||||||
| $775,000, respectively)* | 1,482,000 | ||||||
| Structured Asset | |||||||
| Securities Corporation: | |||||||
| 332,311 | Series 2004-11XS, | ||||||
| Class 1A3A, 4.76%, | |||||||
| 06/25/2034 | 330,910 | ||||||
| 24,959 | Series 2004-16XS, | ||||||
| Class A2, 4.91%, | |||||||
| 08/25/2034 | 24,886 | ||||||
| 1,500,000 | Series 2005-7XS, | ||||||
| Class 1A4B, 5.44%, | |||||||
| 04/25/2035 | 1,483,871 | ||||||
| 70,927,398 | |||||||
Financial – 12.6% | |||||||
| American General Finance | |||||||
| Corporation Notes, | |||||||
| 500,000 | 6.90%, 12/15/2017 | 500,500 | |||||
| American General Finance | |||||||
| Corporation Senior Notes, | |||||||
| 1,250,000 | 8.45%, 10/15/2009 | 1,306,644 | |||||
The accompanying notes are an integral part of these financial statements.
Page 27
Baird Aggregate Bond Fund
Schedule of Investments December 31, 2007 |
Principal | |||||||
Amount | Value | ||||||
LONG-TERM INVESTMENTS – 95.9% (cont.) | |||||||
Financial – 12.6% (cont.) | |||||||
| $ | 200,000 | AmSouth Bancorporation | |||||
| Subordinated Debentures, | |||||||
| 6.75%, 11/01/2025 | $ | 210,370 | |||||
| 275,000 | AMVESCAP PLC Notes, | ||||||
5.375%, 02/27/2013 f | 263,389 | ||||||
| 300,000 | BAC Capital Trust VI, | ||||||
| 5.625%, 03/08/2035 | 256,223 | ||||||
| 1,065,000 | Bank of America | ||||||
| Corporation Subordinated | |||||||
| Notes, 10.20%, 07/15/2015 | 1,341,371 | ||||||
| 1,435,000 | Bank of | ||||||
| Tokyo-Mitsubishi/UFJ NY, | |||||||
| 7.40%, 06/15/2011 | 1,552,014 | ||||||
| 929,000 | Bank One Corporation | ||||||
| Subordinated Notes, | |||||||
| 10.00%, 08/15/2010 | 1,050,467 | ||||||
| 330,000 | Bankers Trust Corporation | ||||||
| Subordinated Notes, | |||||||
| 7.25%, 10/15/2011 | 362,100 | ||||||
| 2,175,000 | Banponce Trust I, Series A, | ||||||
| 8.327%, 02/01/2027 | |||||||
| (Callable 03/06/2008) | 2,265,956 | ||||||
| 2,000,000 | Capmark Financial | ||||||
| Group, Inc., | |||||||
| 6.30%, 05/10/2017 | |||||||
| (Acquired 05/03/2007; | |||||||
| Cost $1,996,780)* | 1,490,926 | ||||||
| 325,000 | CIT Group | ||||||
| Company of Canada, | |||||||
5.20%, 06/01/2015 f | 278,251 | ||||||
| CIT Group, Inc.: | |||||||
| 500,000 | 5.40%, 01/30/2016 | 440,101 | |||||
| 1,670,000 | 6.10%, 03/15/2067 | ||||||
| (Callable 03/15/2017) | 1,212,585 | ||||||
| 2,000,000 | Citigroup Capital XXI, | ||||||
| 8.30%, 12/21/2077 | |||||||
| (Callable 12/21/2037) | 2,088,382 | ||||||
| 1,231,000 | Compass Bank | ||||||
| Subordinated Notes, | |||||||
| 8.10%, 08/15/2009 | 1,287,752 | ||||||
| Corp Andina De | |||||||
Fomento Notes: f | |||||||
| 50,000 | 7.375%, 01/18/2011 | 53,340 | |||||
| 340,000 | 5.75%, 01/12/2017 | 336,605 | |||||
| 3,575,000 | Countrywide Financial | ||||||
| Corporation Subordinated | |||||||
| Notes, 6.25%, 05/15/2016 | 2,057,656 | ||||||
| 1,000,000 | Credit Agricole S.A., | ||||||
| 6.637%, 05/29/2049 | |||||||
| (Acquired 05/23/2007; | |||||||
Cost $1,000,000)* f | 927,751 | ||||||
| 3,135,000 | First Empire Capital Trust I, | ||||||
| 8.234%, 02/01/2027 | |||||||
| (Callable 03/03/2008) | 3,270,962 | ||||||
| 725,000 | First Empire Capital Trust II, | ||||||
| 8.277%, 06/01/2027 | 756,709 | ||||||
| 728,232 | First National | ||||||
| Bank of Chicago | |||||||
| Pass-Thru Certificates, | |||||||
| 8.08%, 01/05/2018 | 865,059 | ||||||
| 3,975,000 | First National | ||||||
| Bank of Omaha | |||||||
| Subordinated Notes, | |||||||
| 7.32%, 12/01/2010 | 4,261,065 | ||||||
| 1,748,000 | First Union Capital, | ||||||
| 7.935%, 01/15/2027 | |||||||
| (Callable 03/06/2008) | 1,817,270 | ||||||
| 4,107,000 | First Union | ||||||
| Institutional Capital I, | |||||||
| 8.04%, 12/01/2026 | |||||||
| (Callable 03/06/2008) | 4,259,969 | ||||||
The accompanying notes are an integral part of these financial statements.
Page 28
Baird Aggregate Bond Fund
Schedule of Investments December 31, 2007 |
Principal | |||||||
Amount | Value | ||||||
LONG-TERM INVESTMENTS – 95.9% (cont.) | |||||||
Financial – 12.6% (cont.) | |||||||
| $ | 1,460,000 | First Union | |||||
| Institutional Capital II, | |||||||
| 7.85%, 01/01/2027 | |||||||
| (Callable 03/06/2008) | $ | 1,518,734 | |||||
| 2,500,000 | Fleet Capital Trust II, | ||||||
| 7.92%, 12/11/2026 | |||||||
| (Callable 03/06/2008) | 2,597,700 | ||||||
| 2,300,000 | FMR Corporation Notes, | ||||||
| 4.75%, 03/01/2013 | |||||||
| (Acquired 02/26/2003, | |||||||
| 03/15/2007, 07/31/2007, | |||||||
| 09/05/2007, and | |||||||
| 12/21/2007; Cost $250,768, | |||||||
| $415,463, $661,409, | |||||||
| $262,097, and $620,269, | |||||||
| respectively)* | 2,343,755 | ||||||
| General Motors Acceptance | |||||||
| Corporation Notes: | |||||||
| 100,000 | 7.25%, 03/02/2011 | 87,654 | |||||
| 150,000 | 6.75%, 12/01/2014 | 120,982 | |||||
| 1,575,000 | Glencore Funding LLC, | ||||||
| 6.00%, 04/15/2014 | |||||||
| (Acquired 03/31/2004, | |||||||
| 02/02/2005, 10/31/2005 | |||||||
| and 12/04/2006; Cost | |||||||
| $496,425, $122,281, | |||||||
| $231,168 and $695,590, | |||||||
| respectively)* | 1,584,220 | ||||||
| 1,180,000 | Goldman Sachs Capital I, | ||||||
| 6.345%, 02/15/2034 | 1,065,682 | ||||||
| 2,800,000 | Great West Life & | ||||||
| Annuity Insurance, | |||||||
| 7.153%, 05/16/2046 | |||||||
| (Acquired 05/16/2006 | |||||||
| and 11/08/2007; Cost | |||||||
| $1,000,000 and | |||||||
| $1,783,656, respectively)* | 2,804,362 | ||||||
| 500,000 | Health Care Service | ||||||
| Corporation Notes, | |||||||
| 7.75%, 06/15/2011 | |||||||
| (Acquired 06/20/2001 | |||||||
| and 01/26/2005; Cost | |||||||
| $150,908 and $345,000, | |||||||
| respectively)* | 558,588 | ||||||
| 1,950,000 | Highmark, Inc. Notes, | ||||||
| 6.80%, 08/15/2013 | |||||||
| (Acquired 08/14/2003, | |||||||
| 09/05/2007, and | |||||||
| 12/17/2007; Cost | |||||||
| $274,373, $754,725, and | |||||||
| $957,971, respectively)* | 2,136,948 | ||||||
| 2,100,000 | HSBC Holdings PLC, | ||||||
6.50%, 09/15/2037 f | 2,035,381 | ||||||
| 400,000 | HSBC USA Capital Trust I, | ||||||
| 7.808%, 12/15/2026 | |||||||
| (Acquired 03/08/2007; | |||||||
| Cost $415,969)* | 416,164 | ||||||
| 500,000 | HSBC USA Capital Trust II, | ||||||
| 8.38%, 05/15/2027 | |||||||
| (Callable 02/22/2008) | |||||||
| (Acquired 11/06/2007; | |||||||
| Cost $521,455)* | 521,823 | ||||||
| 900,000 | J.P. Morgan Chase & | ||||||
| Company Notes, | |||||||
| 5.875%, 03/15/2035 | 771,526 | ||||||
| 1,255,000 | Jefferies Group Inc., | ||||||
| 6.25%, 01/15/2036 | 1,121,802 | ||||||
The accompanying notes are an integral part of these financial statements.
Page 29
Baird Aggregate Bond Fund
Schedule of Investments December 31, 2007 |
Principal | |||||||
Amount | Value | ||||||
LONG-TERM INVESTMENTS – 95.9% (cont.) | |||||||
Financial – 12.6% (cont.) | |||||||
| Lehman Brothers | |||||||
| Holdings, Inc. Notes: | |||||||
| $ | 750,000 | 8.50%, 08/01/2015 | $ | 853,448 | |||
| 2,425,000 | 6.50%, 07/19/2017 | 2,453,753 | |||||
| 565,000 | Liberty Mutual Insurance | ||||||
| Notes, 7.697%, 10/15/2097 | |||||||
| (Acquired 03/26/2003; | |||||||
| Cost $361,510)* | 529,614 | ||||||
| 1,075,000 | Lincoln National | ||||||
| Corporation, 6.05%, | |||||||
| 04/20/2067 (Callable | |||||||
| 04/20/2017) | 1,003,576 | ||||||
| 300,000 | Marsh & McLennan | ||||||
| Companies, Inc., | |||||||
| 5.375%, 07/15/2014 | 292,168 | ||||||
| 1,000,000 | Merrill Lynch & Company, | ||||||
| 6.40%, 08/28/2017 | 1,015,958 | ||||||
| 1,174,000 | Mony Group, Inc., | ||||||
| 8.35%, 03/15/2010 | 1,279,350 | ||||||
| 475,000 | Morgan Stanley | ||||||
| Subordinated Notes, | |||||||
| 4.75%, 04/01/2014 | 445,006 | ||||||
| 510,000 | National Bank of Hungary | ||||||
| Yankee Debentures, | |||||||
8.875%, 11/01/2013 f | 621,733 | ||||||
| 1,996,000 | Navigators Group Inc. | ||||||
| Senior Unsecured Notes, | |||||||
| 7.00%, 05/01/2016 | 2,123,726 | ||||||
| 4,334,000 | NB Capital Trust IV, | ||||||
| 8.25%, 04/15/2027 | |||||||
| (Callable 03/06/2008) | 4,500,859 | ||||||
| 2,500,000 | North Fork Capital Trust II, | ||||||
| 8.00%, 12/15/2027 | |||||||
| (Callable 03/06/2008) | 2,355,597 | ||||||
| 1,100,000 | Phoenix Companies, | ||||||
| 6.675%, 02/16/2008 | 1,101,298 | ||||||
| 1,000,000 | Premium Asset | ||||||
| Senior Notes, | |||||||
| 4.125%, 03/12/2009 | |||||||
| (Acquired 12/20/2006; | |||||||
| Cost $935,000)* | 977,994 | ||||||
| 4,750,000 | Regions Financing | ||||||
| Trust II, | |||||||
| 6.625%, 05/15/2047 | 3,925,319 | ||||||
| 1,000,000 | Republic New York | ||||||
| Capital I, | |||||||
| 7.75%, 11/15/2026 | |||||||
| (Callable 03/06/2008) | 985,459 | ||||||
| 700,000 | Republic New York | ||||||
| Corporation Debentures, | |||||||
| 9.125%, 05/15/2021 | 869,808 | ||||||
| 3,225,000 | Residential Capital | ||||||
| Corporation, | |||||||
| 6.875%, 06/30/2015 | 1,951,125 | ||||||
| 500,000 | SLM Corporation Notes, | ||||||
| 5.625%, 08/01/2033 | 386,468 | ||||||
| 1,000,000 | St. Paul Travelers, Inc., | ||||||
| 6.75%, 06/20/2036 | 1,043,565 | ||||||
| 1,000,000 | Symetra Financial | ||||||
| Corporation Senior Notes, | |||||||
| 6.125%, 04/01/2016 | |||||||
| (Acquired 03/23/2006; | |||||||
| Cost $995,570)* | 995,736 | ||||||
| 3,500,000 | Transamerica Corporation | ||||||
| Debentures, | |||||||
| 9.375%, 03/01/2008 | 3,518,498 | ||||||
| 410,000 | UFJ Finance Aruba AEC, | ||||||
6.75%, 07/15/2013 f | 445,412 | ||||||
| 301,000 | United Mexican States Notes, | ||||||
6.75%, 09/27/2034 f | 332,454 | ||||||
| 2,000,000 | Washington Mutual, Inc., | ||||||
| 4.375%, 01/15/2008 | 1,993,918 | ||||||
The accompanying notes are an integral part of these financial statements.
Page 30
Baird Aggregate Bond Fund
Schedule of Investments December 31, 2007 |
Principal | |||||||
Amount | Value | ||||||
LONG-TERM INVESTMENTS – 95.9% (cont.) | |||||||
Financial – 12.6% (cont.) | |||||||
| $ | 650,000 | Washington Mutual | |||||
| Preferred Funding Trust I, | |||||||
| 6.534%, 03/29/2049 | |||||||
| (Callable 03/15/2011) | |||||||
| (Acquired 07/31/2007; | |||||||
| Cost $606,756)* | $ | 401,329 | |||||
| 2,380,000 | Westdeutsche Landesbank | ||||||
| Subordinated Notes, | |||||||
4.796%, 07/15/2015 f | 2,409,776 | ||||||
| 750,000 | Willis Group NA, | ||||||
| 5.625%, 07/15/2015 | 730,607 | ||||||
| 93,742,292 | |||||||
Industrial – 11.1% | |||||||
| 500,000 | Alcan, Inc., | ||||||
5.75%, 06/01/2035 f | 457,617 | ||||||
| 75,000 | American Standard Inc., | ||||||
| 7.375%, 02/01/2008 | 75,089 | ||||||
| Ameritech Capital | |||||||
| Funding Debentures: | |||||||
| 1,450,748 | 9.10%, 06/01/2016 | 1,656,808 | |||||
| 1,500,000 | 6.45%, 01/15/2018 | 1,577,296 | |||||
| 1,000,000 | Anadarko Petroleum | ||||||
| Corporation, | |||||||
| 6.45%, 09/15/2036 | 1,018,336 | ||||||
| AOL Time Warner, Inc.: | |||||||
| 1,100,000 | 7.625%, 04/15/2031 | 1,217,282 | |||||
| 250,000 | 7.70%, 05/01/2032 | 277,764 | |||||
| 1,050,000 | AT&T Wireless Services, | ||||||
| Inc. Senior Notes, | |||||||
| 8.75%, 03/01/2031 | 1,360,782 | ||||||
| 600,000 | British Telecom PLC, | ||||||
9.125%, 12/15/2030 f | 794,175 | ||||||
| 600,000 | Bunge Ltd. Finance | ||||||
| Corporation Notes, | |||||||
| 5.35%, 04/15/2014 | 580,938 | ||||||
| 375,000 | Caesars Entertainment | ||||||
| Senior Notes, | |||||||
| 7.50%, 09/01/2009 | 398,419 | ||||||
| 2,000,000 | Century Tel | ||||||
| Enterprises, Inc., | |||||||
| 6.30%, 01/15/2008 | 2,000,568 | ||||||
| 800,000 | Clear Channel | ||||||
| Communications Senior | |||||||
| Unsubordinated Notes, | |||||||
| 5.50%, 12/15/2016 | 582,911 | ||||||
| 1,000,000 | Comcast Corporation, | ||||||
| 6.95%, 08/15/2037 | 1,079,272 | ||||||
| 825,000 | Comcast Corporation | ||||||
| Senior Subordinated Notes, | |||||||
| 10.625%, 07/15/2012 | 978,013 | ||||||
| 580,000 | Conagra Foods, Inc. | ||||||
| Senior Unsecured Notes, | |||||||
| 5.819%, 06/15/2017 | 581,607 | ||||||
| 120,000 | ConAgra Foods, Inc. | ||||||
| Subordinated Notes, | |||||||
| 9.75%, 03/01/2021 | 159,479 | ||||||
| Continental Airlines, Inc. | |||||||
| Pass-Thru Certificates: | |||||||
| 16,847 | Series 1998-1, | ||||||
| 6.541%, 09/15/2009 | 16,721 | ||||||
| 119,511 | Series 2000-2, | ||||||
| 8.312%, 10/02/2012 | 117,419 | ||||||
| 419,759 | Series 1997-4, | ||||||
| 6.90%, 01/02/2018 | 426,055 | ||||||
| COX Communications, Inc.: | |||||||
| 1,000,000 | 7.75%, 11/01/2010 | 1,066,644 | |||||
| 1,775,000 | 7.125%, 10/01/2012 | 1,892,986 | |||||
| 2,000,000 | CVS Caremark Corp., | ||||||
| 5.75%, 06/01/2017 | 2,012,872 | ||||||
| 300,000 | Deutsche Telekom | ||||||
| International Finance BV, | |||||||
8.25%, 06/15/2030 f | 374,326 | ||||||
The accompanying notes are an integral part of these financial statements.
Page 31
Baird Aggregate Bond Fund
Schedule of Investments December 31, 2007 |
Principal | |||||||
Amount | Value | ||||||
LONG-TERM INVESTMENTS – 95.9% (cont.) | |||||||
Industrial – 11.1% (cont.) | |||||||
| $ | 1,500,000 | Donnelley (R.R.) | |||||
| & Sons Co., | |||||||
| 6.125%, 01/15/2017 | $ | 1,479,052 | |||||
| 1,000,000 | D.R. Horton Inc. | ||||||
| Unsubordinated Notes, | |||||||
| 6.50%, 04/15/2016 | 867,623 | ||||||
| 1,900,000 | Enel Finance International, | ||||||
| 6.80%, 09/15/2037 | |||||||
| (Acquired 09/13/2007; | |||||||
Cost $1,894,965)* f | 1,908,940 | ||||||
| 635,000 | FedEx Corporation, | ||||||
| 9.65%, 06/15/2012 | 744,508 | ||||||
| 690,908 | FedEx Corporation | ||||||
| Pass-Thru Certificates, | |||||||
| Series 1998-1, | |||||||
| 6.845%, 01/15/2019 | 781,493 | ||||||
| 3,400,000 | Fiserv, Inc., | ||||||
| 6.125%, 11/20/2012 | 3,460,517 | ||||||
| 475,000 | Ford Capital BV Debentures, | ||||||
9.50%, 06/01/2010 f | 447,687 | ||||||
| 403,000 | Ford Motor Company | ||||||
| Debentures, | |||||||
| 9.215%, 09/15/2021 | 336,505 | ||||||
| 650,000 | Health Management | ||||||
| Association, | |||||||
| 6.125%, 04/15/2016 | 563,482 | ||||||
| 625,000 | Hutchison Whampoa | ||||||
| International Limited, | |||||||
| 6.25%, 01/24/2014 | |||||||
| (Acquired 06/02/2004 | |||||||
| and 02/08/2005; Cost | |||||||
| $333,834 and $298,958, | |||||||
respectively)* f | 649,687 | ||||||
| 850,000 | Johnson Controls Inc., | ||||||
| Senior Notes, | |||||||
| 6.00%, 01/15/2036 | 810,183 | ||||||
| 1,000,000 | Jones Intercable, Inc., | ||||||
| 7.625%, 04/15/2008 | 1,005,902 | ||||||
| 650,000 | Knight-Ridder, Inc., | ||||||
| 5.75%, 09/01/2017 | 475,324 | ||||||
| 400,000 | Laboratory Corporation | ||||||
| of America, | |||||||
| 5.625%, 12/15/2015 | 393,672 | ||||||
| 900,000 | Lafarge S.A. Notes, | ||||||
7.125%, 07/15/2036 f | 874,677 | ||||||
| 1,000,000 | Masco Corporation, | ||||||
| 6.125%, 10/03/2016 | 986,294 | ||||||
| 1,500,000 | Nextel Communications, | ||||||
| 7.375%, 08/01/2015 | 1,476,929 | ||||||
| 320,000 | Pactiv Corporation, | ||||||
| 7.95%, 12/15/2025 | 361,942 | ||||||
| 400,000 | PCCW Capital II Ltd., | ||||||
| 6.00%, 07/15/2013 | |||||||
| (Acquired 07/10/2003; | |||||||
Cost $398,132)* f | 397,784 | ||||||
| 2,800,000 | PEMEX Project Funding | ||||||
| Master Trust, | |||||||
| 5.75%, 03/01/2018 | |||||||
| (Acquired 10/17/2007; | |||||||
| Cost $2,780,848)* | 2,793,000 | ||||||
| 1,145,000 | Plum Creek Timberlands, | ||||||
| 5.875%, 11/15/2015 | 1,128,929 | ||||||
| 2,000,000 | Premcor Refining Group, | ||||||
| 7.50%, 06/15/2015 | 2,071,340 | ||||||
| 2,000,000 | Premcor Refining | ||||||
| Group Inc. Senior Notes, | |||||||
| 9.50%, 02/01/2013 | 2,099,356 | ||||||
| Qwest Capital Funding, Inc.: | |||||||
| 300,000 | 7.00%, 08/03/2009 | 299,250 | |||||
| 200,000 | 7.25%, 02/15/2011 | 197,000 | |||||
| 2,000,000 | Santander Perpetual, | ||||||
| 6.671%, 10/29/2049 | |||||||
(Callable 10/24/2017) f | 2,005,376 | ||||||
The accompanying notes are an integral part of these financial statements.
Page 32
Baird Aggregate Bond Fund
Schedule of Investments December 31, 2007 |
Principal | ||||||||
Amount | Value | |||||||
LONG-TERM INVESTMENTS – 95.9% (cont.) | ||||||||
Industrial – 11.1% (cont.) | ||||||||
| $ | 5,370,000 | Sealed Air Corporation | ||||||
| Senior Notes, 5.375%, | ||||||||
| 04/15/2008 (Acquired | ||||||||
| 04/09/2003, 06/04/2007, | ||||||||
| 06/06/2007, 07/03/2007, | ||||||||
| and 09/21/2007; Cost | ||||||||
| $248,650, $2,494,950, | ||||||||
| $249,488, $1,667,144, | ||||||||
| and $698,425, | ||||||||
| respectively)* | $ | 5,366,950 | ||||||
| 1,500,000 | SK Telecom, | |||||||
| 6.625%, 07/20/2027 | ||||||||
| (Acquired 07/13/2007; | ||||||||
| Cost $1,482,015)* | 1,588,791 | |||||||
| Sprint Capital Corporation: | ||||||||
| 1,725,000 | 6.125%, 11/15/2008 | 1,727,137 | ||||||
| 358,000 | 8.75%, 03/15/2032 | 403,537 | ||||||
| 957,083 | System Energy Resources, | |||||||
| 5.129%, 01/15/2014 | ||||||||
| (Acquired 06/27/2006; | ||||||||
| Cost $915,015)* | 980,206 | |||||||
| 1,000,000 | Target Corporation, | |||||||
| 6.50%, 10/15/2037 | 1,005,101 | |||||||
| 680,000 | TCI Communications, | |||||||
| Inc. Debentures, | ||||||||
| 7.875%, 08/01/2013 | 745,213 | |||||||
| 2,100,000 | Telecom Italia Capital, | |||||||
7.20%, 07/18/2036 f | 2,315,384 | |||||||
| 2,075,000 | Telefonica Emisones S.A., | |||||||
6.221%, 07/03/2017 f | 2,155,908 | |||||||
| 1,000,000 | Teva Pharmaceutical | |||||||
| Finance LLC, | ||||||||
| 5.55%, 02/01/2016 | 988,189 | |||||||
| 75,000 | Thomson Corporation, | |||||||
5.75%, 02/01/2008 f | 74,980 | |||||||
| 1,000,000 | Time Warner Cable, Inc., | |||||||
| 6.55%, 05/01/2037 | 1,020,696 | |||||||
| 3,000,000 | Tyco Electronics Group | |||||||
| S.A., 6.55%, 10/01/2017 | ||||||||
| (Acquired 09/20/2007; | ||||||||
Cost $2,989,950)* f | 3,085,713 | |||||||
| Tyco International | ||||||||
Group S.A.: f | ||||||||
| 1,468,000 | 6.125%, 01/15/2009 | 1,486,258 | ||||||
| 925,000 | 6.375%, 10/15/2011 | 957,279 | ||||||
| 300,000 | 6.00%, 11/15/2013 | 308,352 | ||||||
| United AirLines, Inc. | ||||||||
| Pass-Thru Certificates: | ||||||||
| 506,679 | Series 2001-1, | |||||||
| 6.201%, 09/01/2008 | 504,146 | |||||||
| 269,803 | Series 2000-2, | |||||||
| 7.762%, 12/31/2049 | 250,917 | |||||||
| 472,298 | U.S. Airways | |||||||
| Pass-Thru Certificate, | ||||||||
| Series 1998-1, | ||||||||
| 6.85%, 01/30/2018 | 466,394 | |||||||
Vale Overseas Limited: f | ||||||||
| 350,000 | 8.25%, 01/17/2034 | 405,243 | ||||||
| 1,450,000 | 6.875%, 11/21/2036 | 1,466,836 | ||||||
| 1,200,000 | Verizon Communications | |||||||
| Debentures, | ||||||||
| 6.84%, 04/15/2018 | 1,301,879 | |||||||
| 675,000 | Viacom, Inc., | |||||||
| 7.70%, 07/30/2010 | 716,603 | |||||||
| 1,875,000 | Vodafone Group PLC, | |||||||
6.15%, 02/27/2037 f | 1,851,788 | |||||||
| 500,000 | Vulcan Materials, | |||||||
| 7.15%, 11/30/2037 | 515,072 | |||||||
| 1,000,000 | Wal-Mart Stores, | |||||||
| 5.25%, 09/01/2035 | 887,014 | |||||||
| 81,895,417 | ||||||||
The accompanying notes are an integral part of these financial statements.
Page 33
Baird Aggregate Bond Fund
Schedule of Investments December 31, 2007 |
Principal | |||||||
Amount | Value | ||||||
LONG-TERM INVESTMENTS – 95.9% (cont.) | |||||||
Mortgage Backed Securities – 39.6% | |||||||
| Bank of America | |||||||
| Alternative Loan Trust: | |||||||
| $ | 590,991 | Series 2003-4, Class 2A1, | |||||
| 5.00%, 06/25/2018 | $ | 576,418 | |||||
| 915,891 | Series 2003-11, Class 4A1, | ||||||
| 4.75%, 01/25/2019 | 902,439 | ||||||
| 641,100 | Series 2004-6, Class 4A1, | ||||||
| 5.00%, 07/25/2019 | 622,590 | ||||||
| 666,075 | Series 2004-11, Class 4A1, | ||||||
| 5.50%, 12/25/2019 | 671,695 | ||||||
| 1,062,183 | Series 2005-2, Class 4A1, | ||||||
| 5.50%, 03/25/2020 | 1,040,274 | ||||||
| 4,761,844 | Series 2005-4, Class 3A1, | ||||||
| 5.50%, 05/25/2020 | 4,692,361 | ||||||
| 3,713,108 | Series 2005-10, Class 5A1, | ||||||
| 5.25%, 11/25/2020 | 3,692,128 | ||||||
| 4,625,204 | Series 2007-1, Class 4A1, | ||||||
| 6.098%, 04/25/2022 | 4,617,784 | ||||||
| 1,876,876 | Series 2003-11, Class 2A1, | ||||||
| 6.00%, 01/25/2034 | 1,830,693 | ||||||
| 1,044,014 | Series 2005-2, Class 1CB2, | ||||||
| 5.50%, 03/25/2035 | 1,025,744 | ||||||
| 1,414,855 | Series 2005-9, Class 1CB3, | ||||||
| 5.50%, 10/25/2035 | 1,402,799 | ||||||
| 800,781 | Series 2005-11, Class 1CB4, | ||||||
| 5.50%, 12/25/2035 | 800,222 | ||||||
| 2,586,750 | Series 2006-5, Class CB7, | ||||||
| 6.00%, 06/25/2036 | 2,563,849 | ||||||
| Chase Mortgage Finance | |||||||
| Corporation: | |||||||
| 1,520,276 | Series 2003-S13, Class A11, | ||||||
| 5.50%, 11/25/2033 | 1,531,111 | ||||||
| 6,000,000 | Series 2006-A1, Class 2A3, | ||||||
| 6.00%, 09/25/2036 | 5,935,583 | ||||||
| 731,218 | Citicorp Mortgage | ||||||
| Securities, Inc., | |||||||
| Series 2004-3, Class A2, | |||||||
| 5.25%, 05/25/2034 | 728,330 | ||||||
| 1,795,431 | Citigroup Mortgage | ||||||
| Loan Trust, Inc., | |||||||
| Series 2005-9, Class 2A2, | |||||||
| 5.50%, 11/25/2035 | 1,797,239 | ||||||
| Countrywide Alternative | |||||||
| Loan Trust: | |||||||
| 1,687,751 | Series 2005-50CB, | ||||||
| Class 4A1, 5.00%, | |||||||
| 11/25/2020 | 1,638,877 | ||||||
| 4,040,241 | Series 2006-7CB, | ||||||
| Class 3A1, 5.25%, | |||||||
| 05/25/2021 | 3,922,552 | ||||||
| 1,870,961 | Series 2006-J5, Class 3A1, | ||||||
| 6.132%, 07/25/2021 | 1,878,427 | ||||||
| 2,410,785 | Series 2006-43CB, | ||||||
| Class 2A1, 6.00%, | |||||||
| 02/25/2022 | 2,413,420 | ||||||
| 5,726,359 | Series 2002-11, Class A4, | ||||||
| 6.25%, 10/25/2032 | 5,683,357 | ||||||
| 3,000,000 | Series 2005-10CB, | ||||||
| Class 1A6, 5.50%, | |||||||
| 05/25/2035 | 2,996,704 | ||||||
| 3,628,326 | Series 2005-34CB, | ||||||
| Class 1A6, 5.50%, | |||||||
| 09/25/2035 | 3,622,267 | ||||||
| 834,721 | Countrywide Home | ||||||
| Loans, Inc., | |||||||
| Series 2003-39, Class A5, | |||||||
| 5.00%, 05/25/2012 | 835,594 | ||||||
| 1,493,452 | CS First Boston Mortgage | ||||||
| Securities Corp., | |||||||
| Series 2004-4, Class 2A5, | |||||||
| 5.50%, 06/25/2015 | 1,476,541 | ||||||
The accompanying notes are an integral part of these financial statements.
Page 34
Baird Aggregate Bond Fund
Schedule of Investments December 31, 2007 |
Principal | |||||||
Amount | Value | ||||||
LONG-TERM INVESTMENTS – 95.9% (cont.) | |||||||
Mortgage Backed Securities – 39.6% (cont.) | |||||||
| $ | 2,271,486 | Deutsche Securities Inc. | |||||
| Mortgage, Series 2006-AR5, | |||||||
| Class 21A, 6.00%, | |||||||
| 10/25/2021 | $ | 2,281,036 | |||||
| 6,895,523 | DLJ Commercial | ||||||
| Mortgage Corporation, | |||||||
| Series 1999-CG3, | |||||||
| Class A1B, 7.34%, | |||||||
| 10/10/2032 | 7,149,731 | ||||||
| Federal Gold Loan | |||||||
| Mortgage Corporation | |||||||
| (FGLMC): | |||||||
| 1,673,738 | 6.00%, 06/01/2020 | 1,712,993 | |||||
| 905,512 | 5.00%, 06/01/2023 | 897,133 | |||||
| 1,833,576 | 6.50%, 06/01/2029 | 1,900,115 | |||||
| 7,238,133 | 5.50%, 01/01/2036 | 7,225,997 | |||||
| 5,334,892 | 6.00%, 12/01/2036 | 5,415,107 | |||||
| Federal Home Loan | |||||||
| Mortgage Corporation | |||||||
| (FHLMC): | |||||||
| 228,204 | 6.50%, 07/01/2014 | 236,418 | |||||
| 844,116 | 5.50%, 11/01/2022 | 849,413 | |||||
| 697,108 | 5.50%, 07/01/2023 | 700,836 | |||||
| 7,300,499 | 5.50%, 04/01/2037 | 7,285,428 | |||||
| 1,099,917 | Series 3124, Class VP, | ||||||
| 6.00%, 06/15/2014 | 1,128,737 | ||||||
| 497,506 | Series 2695, Class UA, | ||||||
| 5.50%, 09/15/2014 | 505,073 | ||||||
| 3,305,450 | Series R007, Class AC, | ||||||
| 5.875%, 05/15/2016 | 3,350,540 | ||||||
| 3,962,563 | Series R003, Class VA, | ||||||
| 5.50%, 08/15/2016 | 4,042,187 | ||||||
| 2,456,799 | Series 3097, Class MC, | ||||||
| 6.00%, 11/15/2016 | 2,527,732 | ||||||
| 689,760 | Series 2391, Class QR, | ||||||
| 5.50%, 12/15/2016 | 701,717 | ||||||
| 6,762,253 | Series R009, Class AJ, | ||||||
| 5.75%, 12/15/2018 | 6,843,110 | ||||||
| 193,975 | Series 206, Class E, | ||||||
| 0.00%, 07/15/2019^ | 177,757 | ||||||
| 975,947 | Series R010, Class AB, | ||||||
| 5.50%, 12/15/2019 | 986,703 | ||||||
| 118,261 | Series 141, Class D, | ||||||
| 5.00%, 05/15/2021 | 117,740 | ||||||
| 94,035 | Series 1074, Class I, | ||||||
| 6.75%, 05/15/2021 | 93,882 | ||||||
| 592,325 | Series 1081, Class K, | ||||||
| 7.00%, 05/15/2021 | 630,796 | ||||||
| 104,610 | Series 163, Class F, | ||||||
| 6.00%, 07/15/2021 | 104,138 | ||||||
| 196,220 | Series 188, Class H, | ||||||
| 7.00%, 09/15/2021 | 195,351 | ||||||
| 86,719 | Series 1286, Class A, | ||||||
| 6.00%, 05/15/2022 | 86,579 | ||||||
| 2,600,000 | Series 1694, Class PK, | ||||||
| 6.50%, 03/15/2024 | 2,737,308 | ||||||
| 24,856 | Series 2141, Class N, | ||||||
| 5.55%, 11/15/2027 | 24,869 | ||||||
| 1,075,000 | Series 2664, Class LG, | ||||||
| 5.50%, 07/15/2028 | 1,081,071 | ||||||
| Federal National Mortgage | |||||||
| Association (FNMA): | |||||||
| 1,281,706 | 5.50%, 07/01/2015 | 1,319,465 | |||||
| 2,244,108 | 5.00%, 02/01/2018 | 2,249,511 | |||||
| 2,777,227 | 5.00%, 12/01/2019 | 2,784,170 | |||||
| 856,852 | 5.50%, 01/01/2023 | 862,784 | |||||
| 2,658,386 | 5.50%, 07/01/2023 | 2,675,072 | |||||
| 3,138,569 | 6.00%, 03/01/2026 | 3,196,331 | |||||
| 7,681,128 | 6.00%, 05/01/2026 | 7,822,490 | |||||
| 665,010 | 6.00%, 03/01/2033 | 677,504 | |||||
| 520,742 | 5.00%, 11/01/2033 | 508,871 | |||||
| 914,578 | 6.00%, 11/01/2034 | 929,995 | |||||
| 5,399,044 | 5.50%, 02/01/2035 | 5,399,342 | |||||
The accompanying notes are an integral part of these financial statements.
Page 35
Baird Aggregate Bond Fund
Schedule of Investments December 31, 2007 |
Principal | |||||||
Amount | Value | ||||||
LONG-TERM INVESTMENTS – 95.9% (cont.) | |||||||
Mortgage Backed Securities – 39.6% (cont.) | |||||||
| $ | 7,377,634 | 5.50%, 02/01/2035 | $ | 7,378,041 | |||
| 3,878,055 | 5.00%, 11/01/2035 | 3,786,038 | |||||
| 27,735,489 | 5.50%, 04/01/2036 | 27,718,570 | |||||
| 2,260,327 | 5.50%, 11/01/2036 | 2,257,885 | |||||
| 1,975,003 | 6.00%, 08/01/2037 | 1,989,141 | |||||
| 7,374,417 | Series 2006-B2, Class AB, | ||||||
| 5.50%, 05/25/2014 | 7,473,349 | ||||||
| 1,000,000 | Series 2003-27, Class OJ, | ||||||
| 5.00%, 07/25/2015 | 1,000,492 | ||||||
| 500,000 | Series 2003-24, Class PC, | ||||||
| 5.00%, 11/25/2015 | 500,349 | ||||||
| 94,388 | Series 2002-56, Class MC, | ||||||
| 5.50%, 09/25/2017 | 96,016 | ||||||
| 498,215 | Series 1989-37, Class G, | ||||||
| 8.00%, 07/25/2019 | 542,787 | ||||||
| 88,168 | Series 1989-94, Class G, | ||||||
| 7.50%, 12/25/2019 | 94,861 | ||||||
| 22,762 | Series 1990-58, Class J, | ||||||
| 7.00%, 05/25/2020 | 24,151 | ||||||
| 249,170 | Series 1990-76, Class G, | ||||||
| 7.00%, 07/25/2020 | 257,880 | ||||||
| 94,486 | Series 1990-105, Class J, | ||||||
| 6.50%, 09/25/2020 | 98,864 | ||||||
| 36,373 | Series 1990-108, Class G, | ||||||
| 7.00%, 09/25/2020 | 37,972 | ||||||
| 58,833 | Series 1991-1, Class G, | ||||||
| 7.00%, 01/25/2021 | 60,918 | ||||||
| 80,653 | Series 1991-86, Class Z, | ||||||
| 6.50%, 07/25/2021 | 84,179 | ||||||
| 312,369 | Series 2003-28, Class KA, | ||||||
| 4.25%, 03/25/2022 | 307,838 | ||||||
| 37,421 | Series G92-30, Class Z, | ||||||
| 7.00%, 06/25/2022 | 39,460 | ||||||
| 949,995 | Series 1993-58, Class H, | ||||||
| 5.50%, 04/25/2023 | 965,921 | ||||||
| 21,111 | Series 2003-17, Class QR, | ||||||
| 4.50%, 11/25/2025 | 21,040 | ||||||
| 596,806 | Series 1998-66, Class C, | ||||||
| 6.00%, 12/25/2028 | 605,906 | ||||||
| 98,093 | Series 2003-44, Class AB, | ||||||
| 3.75%, 05/25/2033 | 93,052 | ||||||
| 3,064,017 | Series 2004-W6, Class 1A4, | ||||||
| 5.50%, 07/25/2034 | 3,064,362 | ||||||
| 5,424,148 | Series 2004-W6, Class 1A6, | ||||||
| 5.50%, 07/25/2034 | 5,344,669 | ||||||
| 7,750,000 | Series 2004-W10, | ||||||
| Class A24, 5.00%, | |||||||
| 08/25/2034 | 7,729,775 | ||||||
| First Horizon Alternative | |||||||
| Mortgage Securities: | |||||||
| 1,269,198 | Series 2005-FA7, Class 2A1, | ||||||
| 5.00%, 09/25/2020 | 1,228,264 | ||||||
| 1,968,875 | Series 2006-FA6, Class 3A1, | ||||||
| 5.75%, 11/25/2021 | 1,957,268 | ||||||
| 3,543,781 | Series 2006-FA8, Class 2A1, | ||||||
| 5.75%, 02/25/2037 | 3,474,966 | ||||||
| 2,800,000 | First Union National Bank | ||||||
| Commercial Mortgage | |||||||
| Securities Inc., | |||||||
| Series 2001-C4, Class A2, | |||||||
| 6.223%, 12/12/2033 | 2,932,624 | ||||||
| GE Capital Commercial | |||||||
| Mortgage Corporation: | |||||||
| 6,351,554 | Series 2000-1, Class A2, | ||||||
| 6.496%, 01/15/2033 | 6,624,339 | ||||||
| 2,865,000 | Series 2002-3A, Class AZ, | ||||||
| 4.996%, 12/10/2037 | 2,888,497 | ||||||
| 6,200,000 | Series 2004-C3, Class A4, | ||||||
| 5.189%, 07/10/2039 | 6,262,784 | ||||||
The accompanying notes are an integral part of these financial statements.
Page 36
Baird Aggregate Bond Fund
Schedule of Investments December 31, 2007 |
Principal | |||||||
Amount | Value | ||||||
LONG-TERM INVESTMENTS – 95.9% (cont.) | |||||||
Mortgage Backed Securities – 39.6% (cont.) | |||||||
| $ | 10,100,000 | GMAC Commercial | |||||
| Mortgage Securities, Inc., | |||||||
| Series 2003-C1, Class A2, | |||||||
| 4.079%, 05/10/2036 | $ | 9,725,584 | |||||
| Government National | |||||||
| Mortgage Association | |||||||
| (GNMA): | |||||||
| 800,000 | Series 2004-78, Class C, | ||||||
| 4.658%, 04/16/2029 | 790,037 | ||||||
| 535,602 | 6.00%, 11/20/2033 | 547,192 | |||||
| 1,285,000 | Series 2004-100, Class B, | ||||||
| 4.603%, 02/16/2043 | 1,261,522 | ||||||
| 1,517,166 | J.P. Morgan Alternative | ||||||
| Loan Trust, | |||||||
| Series 2006-A1, Class 2A1, | |||||||
| 5.799%, 03/25/2036 | 1,508,582 | ||||||
| J.P. Morgan Mortgage Trust: | |||||||
| 3,100,000 | Series 2006-A7, Class 2A4R, | ||||||
| 5.457%, 01/25/2037 | 3,102,635 | ||||||
| 2,828,134 | Series 2006-A7, Class 2A2, | ||||||
| 5.83%, 01/25/2037 | 2,831,000 | ||||||
| 6,100,000 | Series 2007-A2, Class 2A3, | ||||||
| 5.715%, 04/25/2037 | 6,105,571 | ||||||
| Master Alternative | |||||||
| Loans Trust: | |||||||
| 3,510,770 | Series 2004-1, Class 1A1, | ||||||
| 5.00%, 01/25/2019 | 3,422,448 | ||||||
| 2,478,265 | Series 2004-4, Class 4A1, | ||||||
| 5.00%, 04/25/2019 | 2,464,332 | ||||||
| 934,789 | Series 2003-5, Class 6A1, | ||||||
| 6.00%, 08/25/2033 | 926,025 | ||||||
| 779,558 | Residential Accredit | ||||||
| Loans, Inc., | |||||||
| Series 2004-QS6, Class A1, | |||||||
| 5.00%, 05/25/2019 | 760,013 | ||||||
| 800,000 | Residential Funding | ||||||
| Mortgage Security I, | |||||||
| Series 2003-S11, | |||||||
| Class A2, | |||||||
| 4.00%, 06/25/2018 | 769,030 | ||||||
| 1,777,768 | Salomon Brothers | ||||||
| Mortgage Securities VII, | |||||||
| Series 2003-UP2, Class A2, | |||||||
| 4.00%, 06/25/2033 | 1,736,330 | ||||||
| 1,850,000 | Wachovia Bank | ||||||
| Commercial Mortgage Trust, | |||||||
| Series 2003-C3, Class A2, | |||||||
| 4.867%, 02/15/2035 | 1,845,721 | ||||||
| Washington Mutual, Inc. | |||||||
| Pass-Thru Certificates: | |||||||
| 2,619,084 | Series 2004-CB1, Class 5A, | ||||||
| 5.00%, 06/25/2019 | 2,608,446 | ||||||
| 4,721,512 | Series 2004-CB2, Class 7A, | ||||||
| 5.50%, 08/25/2019 | 4,692,919 | ||||||
| 1,677,675 | Series 2004-CB3, Class 4A, | ||||||
| 6.00%, 10/25/2019 | 1,704,414 | ||||||
| 1,114,861 | Series 2004-CB4, | ||||||
| Class 21A, | |||||||
| 5.50%, 12/25/2019 | 1,119,709 | ||||||
| 293,177,798 | |||||||
Taxable Municipal Bonds – 1.1% | |||||||
| 1,000,000 | Cuyahoga County | ||||||
| Ohio Industrial | |||||||
| Development Revenue, | |||||||
| 9.125%, 10/01/2023 | 1,181,450 | ||||||
| 4,225,000 | Tobacco Settlement | ||||||
| Authority Iowa, | |||||||
| 6.50%, 06/01/2023 | 4,025,580 | ||||||
The accompanying notes are an integral part of these financial statements.
Page 37
Baird Aggregate Bond Fund
Schedule of Investments December 31, 2007 |
Principal | |||||||
Amount | Value | ||||||
LONG-TERM INVESTMENTS – 95.9% (cont.) | |||||||
Taxable Municipal Bonds – 1.1% (cont.) | |||||||
| Tobacco Settlement | |||||||
| Financing Corporation: | |||||||
| $ | 300,000 | Series 2001-A, Class A, | |||||
| 5.92%, 06/01/2012 | $ | 299,304 | |||||
| 2,550,008 | Series 2001-A, Class A, | ||||||
| 6.36%, 05/15/2025 | 2,465,220 | ||||||
| 7,971,554 | |||||||
Utilities – 4.1% | |||||||
| 466,000 | Beaver Valley Funding | ||||||
| Corporation Debentures, | |||||||
| 9.00%, 06/01/2017 | 524,958 | ||||||
| 1,000,000 | Canadian | ||||||
| National Resources, | |||||||
6.25%, 03/15/2038 f | 977,070 | ||||||
| 1,000,000 | Duke Capital LLC Notes, | ||||||
| 5.668%, 08/15/2014 | 993,739 | ||||||
| 750,000 | Energy Transfer Partners, | ||||||
| 5.65%, 08/01/2012 | 742,537 | ||||||
| 300,000 | Exelon Corporation | ||||||
| Senior Notes, | |||||||
| 6.75%, 05/01/2011 | 313,546 | ||||||
| 2,500,000 | FPL Group Capital, Inc., | ||||||
| 7.30%, 09/01/2067 | |||||||
| (Callable 09/01/2017) | 2,554,490 | ||||||
| Kinder Morgan Energy | |||||||
| Partners Senior Notes: | |||||||
| 600,000 | 6.30%, 02/01/2009 | 607,762 | |||||
| 2,250,000 | 6.95%, 01/15/2038 | 2,361,366 | |||||
| 900,000 | Kinder Morgan Finance, | ||||||
5.70%, 01/05/2016 f | 814,681 | ||||||
| 219,601 | Kiowa Power Partners LLC, | ||||||
| 4.811%, 12/30/2013 | |||||||
| (Acquired 11/19/2004; | |||||||
| Cost $226,772)* | 219,983 | ||||||
| Korea Electric Power | |||||||
Corporation: f | |||||||
| 100,000 | 7.75%, 04/01/2013 | 111,271 | |||||
| 2,165,000 | 6.75%, 08/01/2027 | 2,489,072 | |||||
| 1,035,000 | MidAmerican Energy | ||||||
| Holdings Company | |||||||
| Senior Notes, | |||||||
| 7.52%, 09/15/2008 | 1,050,298 | ||||||
| 1,325,000 | National Grid PLC | ||||||
| Senior Unsecured Notes, | |||||||
6.30%, 08/01/2016 f | 1,352,690 | ||||||
| 2,025,000 | NiSource Finance | ||||||
| Corporation, | |||||||
| 7.875%, 11/15/2010 | 2,148,161 | ||||||
| 625,000 | ONEOK, Inc. Senior Notes, | ||||||
| 7.125%, 04/15/2011 | 661,774 | ||||||
| 875,000 | Pacific Gas & Electric | ||||||
| Company 1st Mortgage, | |||||||
| 6.05%, 03/01/2034 | 873,546 | ||||||
| 1,170,000 | Panhandle Eastern | ||||||
| Pipeline Senior Notes, | |||||||
| 4.80%, 08/15/2008 | 1,164,603 | ||||||
| 1,000,000 | Plains All American | ||||||
| Pipeline Senior Notes, | |||||||
| 5.625%, 12/15/2013 | 1,019,639 | ||||||
| 300,000 | PPL Energy Supply, | ||||||
| LLC Senior Notes, | |||||||
| 6.40%, 11/01/2011 | 307,106 | ||||||
| 175,000 | PSE&G Energy Holdings | ||||||
| LLC Senior Notes, | |||||||
| 8.50%, 06/15/2011 | 182,370 | ||||||
| PSE&G Power LLC: | |||||||
| 250,000 | 7.75%, 04/15/2011 | 268,979 | |||||
| 350,000 | 5.00%, 04/01/2014 | 335,409 | |||||
| 1,578,572 | RGS (I&M) Funding | ||||||
| Corporation Debentures, | |||||||
| 9.82%, 12/07/2022 | 1,937,286 | ||||||
The accompanying notes are an integral part of these financial statements.
Page 38
Baird Aggregate Bond Fund
Schedule of Investments December 31, 2007 |
Principal | |||||||
Amount | Value | ||||||
LONG-TERM INVESTMENTS – 95.9% (cont.) | |||||||
Utilities – 4.1% (cont.) | |||||||
| $ | 2,200,000 | Rockies Express Pipeline | |||||
| LLC, 6.448%, 08/20/2009 | |||||||
| (Acquired 09/17/2007; | |||||||
| Cost $2,193,767)* | $ | 2,200,598 | |||||
| 1,400,000 | Southern Natural Gas, | ||||||
| 5.90%, 04/01/2017 | |||||||
| (Acquired 03/14/2007; | |||||||
| Cost $1,397,676)* | 1,376,994 | ||||||
| 700,000 | Transcontinental Gas | ||||||
| Pipe Line Corporation | |||||||
| Senior Notes, | |||||||
| 8.875%, 07/15/2012 | 791,000 | ||||||
| 175,294 | Tristate Gen & Trans Assn, | ||||||
| Series 2003, 6.04%, | |||||||
| 01/31/2018 (Acquired | |||||||
| 10/14/2003; | |||||||
| Cost $175,294)* | 177,611 | ||||||
| Vectren Utility Holdings: | |||||||
| 500,000 | 6.625%, 12/01/2011 | 529,420 | |||||
| 500,000 | 5.25%, 08/01/2013 | 487,406 | |||||
| 550,000 | Williams Companies, | ||||||
| Inc. Notes, | |||||||
| 8.125%, 03/15/2012 | 598,813 | ||||||
| 30,174,178 | |||||||
U.S. Government Agency Issues – 7.8% | |||||||
| Federal National Mortgage | |||||||
| Association (FNMA): | |||||||
| 51,375,000 | 6.00%, 05/15/2011 | 55,130,821 | |||||
| 2,148,763 | 5.50%, 09/01/2034 | 2,148,881 | |||||
| 57,279,702 | |||||||
U.S. Treasury Obligations – 10.0% | |||||||
| 61,825,000 | U.S. Treasury Bonds, | ||||||
| 6.25%, 08/15/2023 | 74,020,971 | ||||||
| Total Long-Term | |||||||
| Investments | |||||||
| (Cost $705,960,491) | 709,189,310 | ||||||
Shares | |||||||
SHORT-TERM INVESTMENTS – 3.1% | |||||||
Money Market Fund – 3.1% | |||||||
| 23,045,979 | Short-Term Investment | ||||||
| Company Liquid Assets | |||||||
| Portfolio – AIM Fund | 23,045,979 | ||||||
| Total Short-Term | |||||||
| Investments | |||||||
| (Cost $23,045,979) | 23,045,979 | ||||||
Principal | |||||||
Amount | |||||||
INVESTMENTS PURCHASED | |||||||
WITH CASH PROCEEDS FROM | |||||||
SECURITIES LENDING – 29.2% | |||||||
Certificate of Deposit – 1.2% | |||||||
| $ | 8,795,938 | Barclays Bank, | |||||
| 5.15%, 2/12/08 | 8,799,808 | ||||||
Commercial Paper – 7.9% | |||||||
| 6,596,954 | Alianz Finance Corporation, | ||||||
| 5.06%, 01/16/08 | 6,583,100 | ||||||
| Atlantic Asset | |||||||
| Securitization Corp.: | |||||||
| 1,319,391 | 6.13%, 01/04/08 | 1,318,705 | |||||
| 2,198,985 | 5.447%, 01/25/08 | 2,191,772 | |||||
| 2,198,985 | Barton Capital Corporation, | ||||||
| 5.835%, 01/10/08 | 2,196,104 | ||||||
| 2,198,985 | GovCo LLC, | ||||||
| 5.584%, 01/15/08 | 2,194,653 | ||||||
The accompanying notes are an integral part of these financial statements.
Page 39
Baird Aggregate Bond Fund
Schedule of Investments December 31, 2007 |
Principal | |||||||
Amount | Value | ||||||
INVESTMENTS PURCHASED | |||||||
WITH CASH PROCEEDS FROM | |||||||
SECURITIES LENDING – 29.2% (cont.) | |||||||
Commercial Paper – 7.9% (cont.) | |||||||
| $ | 5,751,372 | KKR Atlantic | |||||
| Funding Trust, | |||||||
| 5.205%, 03/13/08 # | $ | 5,659,655 | |||||
| 3,952,895 | Kitty Hawk Funding Corp., | ||||||
| 5.323%, 01/25/08 | 3,939,929 | ||||||
| 8,795,938 | Kommunalkredit Austria | ||||||
| AG, 4.89%, 01/31/08 | 8,760,403 | ||||||
| 4,486,575 | Rams Funding Three LLC, | ||||||
| 5.386%, 02/11/08 | 4,486,575 | ||||||
| 2,198,985 | Ranger Funding Company | ||||||
| LLC, 5.456%, 01/11/08 | 2,195,818 | ||||||
| 3,078,578 | Sheffield Receivables, | ||||||
| 6.099%, 01/04/08 | 3,076,977 | ||||||
| 7,036,750 | Sigma Finance, | ||||||
| 4.62%, 02/11/08 | 6,847,462 | ||||||
| 2,198,985 | Thunder Bay Funding | ||||||
| LLC, 5.839%, 01/14/08 | 2,194,938 | ||||||
| 2,198,985 | Tulip Funding | ||||||
| Corporation, 5.627%, | |||||||
| 01/03/08 | 2,198,127 | ||||||
| 2,198,985 | Variable Funding Capital | ||||||
| Corporation, 5.492%, | |||||||
| 01/18/08 | 2,193,795 | ||||||
| 2,198,985 | Windmill Funding, | ||||||
| 6.136%, 01/10/08 | 2,196,104 | ||||||
| 58,234,117 | |||||||
Shares | |||||||
Money Market Mutual Funds – 2.8% | |||||||
| 10,373,958 | Merrill Lynch Premier | ||||||
| Institutional Fund | 10,373,958 | ||||||
| 10,290,872 | Reserve Primary Fund | 10,290,872 | |||||
| 20,664,830 | |||||||
Principal | |||||||
Amount | |||||||
Repurchase Agreements – 17.3% | |||||||
| $ | 10,994,922 | BNP Paribas, 4.70%, | |||||
| Dated 12/31/07, Due | |||||||
| 01/02/08, (Collateralized | |||||||
| by a Fannie Mae | |||||||
| Collateralized Mortgage | |||||||
| Obligation, 6.00%, | |||||||
| 11/01/37, valued at | |||||||
| $11,159,795. | |||||||
| Repurchase proceeds | |||||||
| are $10,997,793.) | 10,994,922 | ||||||
| 21,989,845 | Citigroup, 4.55%, Dated | ||||||
| 12/31/07, Due 01/02/08, | |||||||
| (Collateralized by various | |||||||
| AID – ISRAEL Government | |||||||
| Guaranteed Zero Coupon | |||||||
| Bonds, 09/15/13 – 11/15/21 | |||||||
| and U.S. Treasury Receipts, | |||||||
| 08/15/13, valued at | |||||||
| $22,487,316. | |||||||
| Repurchase proceeds | |||||||
| are $21,995,404.) | 21,989,845 | ||||||
| 21,989,845 | Citigroup, 4.55%, Dated | ||||||
| 12/31/07, Due 01/02/08, | |||||||
| (Collateralized by various | |||||||
| U.S. Treasury Receipts, | |||||||
| 08/15/08 – 08/15/13, valued | |||||||
| at $22,429,642. | |||||||
| Repurchase proceeds | |||||||
| are $21,995,404.) | 21,989,845 | ||||||
The accompanying notes are an integral part of these financial statements.
Page 40
Baird Aggregate Bond Fund
Schedule of Investments December 31, 2007 |
Principal | |||||||
Amount | Value | ||||||
INVESTMENTS PURCHASED | |||||||
WITH CASH PROCEEDS FROM | |||||||
SECURITIES LENDING – 29.2% (cont.) | |||||||
Repurchase Agreements – 17.3% (cont.) | |||||||
| $ | 8,356,141 | Credit Suisse, 4.64%, | |||||
| Dated 12/31/07, Due | |||||||
| 01/02/08, (Collateralized | |||||||
| by various collateralized | |||||||
| mortgage obligations, | |||||||
| 5.434–6.50%, | |||||||
| 11/25/36 – 01/15/49, | |||||||
| valued at $8,774,248. | |||||||
| Repurchase proceeds | |||||||
| are $8,358,296.) | $ | 8,356,141 | |||||
| 21,989,845 | Goldman Sachs, 4.62%, | ||||||
| Dated 12/31/07, Due | |||||||
| 01/02/08, (Collateralized | |||||||
| by a Wells Fargo | |||||||
| Collateralized Mortgage | |||||||
| Obligation, 6.00%, | |||||||
| 08/25/37, valued at | |||||||
| $22,407,120. | |||||||
| Repurchase proceeds | |||||||
| are $21,995,489.) | 21,989,845 | ||||||
| 10,994,922 | Morgan Stanley, 4.65%, | ||||||
| Dated 12/31/07, Due | |||||||
| 01/02/08, (Collateralized | |||||||
| by a Morgan Stanley Senior | |||||||
| Subordinated Note, | |||||||
| 4.955%, 09/26/08, valued | |||||||
| at $13,193,907. | |||||||
| Repurchase proceeds | |||||||
| are $10,997,763.) | 10,994,922 | ||||||
| 32,105,174 | Morgan Stanley, 4.85%, | ||||||
| Dated 12/31/07, Due | |||||||
| 01/02/08, (Collateralized | |||||||
| by a Fannie Mae | |||||||
| Collateralized Mortgage | |||||||
| Obligation, 5.315%, | |||||||
| 09/25/35, valued at | |||||||
| $32,756,074. | |||||||
| Repurchase proceeds | |||||||
| are $32,113,824.) | 32,105,174 | ||||||
| 128,420,694 | |||||||
| Total Investments | |||||||
| Purchased With Cash | |||||||
| Proceeds From | |||||||
| Securities Lending | |||||||
| (Cost $216,212,786) | 216,119,449 | ||||||
| Total Investments | |||||||
| (Cost $945,219,256) – | |||||||
| 128.2% | 948,354,738 | ||||||
| Liabilities in Excess of | |||||||
| Other Assets – (28.2)% | (208,410,938 | ) | |||||
| TOTAL NET | |||||||
| ASSETS – 100.0% | $ | 739,943,800 | |||||
| ^ | Non Income Producing |
| * | Restricted Security Deemed Liquid |
f | Foreign Security |
| # | Fair Valued by Advisor |
The accompanying notes are an integral part of these financial statements.
Page 41
Baird Intermediate Municipal Bond Fund
The Baird Intermediate Municipal Bond Fund seeks current income that is substantially exempt from federal income tax. A secondary objective is to provide total return with relatively low volatility of principal. The Fund strives to achieve an annual rate of return, before Fund expenses, greater than the annual rate of the total return of the Lehman Brothers 7-Year General Obligation Bond Index. The Lehman Brothers 7-Year General Obligation Bond Index is an unmanaged, market value weighted index consisting of investment grade state and local general obligation bonds that have been issued as part of an offering of at least $50 million; have a minimum amount outstanding of at least $5 million; have been issued within the last five years; and have a maturity of six to eight years.
The Fund generated solid positive investment returns in 2007 that were in line with its benchmark index. The Fund’s focus on high quality issues helped the Fund’s relative performance as high quality issues outperformed low quality issues significantly in 2007. The Fund’s minimal exposure to shorter maturities detracted slightly from the Fund’s relative performance as the yield curve steepened significantly in 2007. We continue to emphasize high quality, intermediate holdings for the Fund and are optimistic regarding the Fund’s relative performance prospects for the coming year.
Portfolio Characteristics
Quality Distribution* | Sector Weightings* |
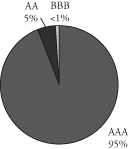 |  |
Net Assets: | $106,980,227 | Annualized Expense Ratio: | |||
SEC 30-Day Yield:** | Institutional Class: | 0.30% | |||
| Institutional Class: | 3.49% | Investor Class: | 0.55% | *** | |
| Investor Class: | 3.25% | Portfolio Turnover Rate: | 5.6% | ||
Average Effective Duration: | 4.94 years | Total Number of Holdings: | 73 | ||
Average Effective Maturity: | 5.83 years |
| * | Percentages shown are based on the Fund’s total net assets. | |
| ** | SEC yields are based on SEC guidelines and are calculated for the 30 days ended December 31, 2007. | |
| *** | Includes 0.25% 12b-1 fee. |
Page 42
Baird Intermediate Municipal Bond Fund
Baird Intermediate Municipal Bond Fund –
Institutional Class
Value of a $25,000 Investment
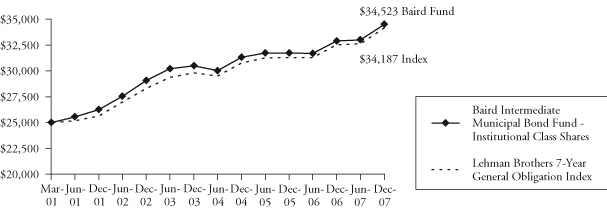
Growth of a hypothetical investment of $25,000 made on the Fund’s inception date (3/30/01), assuming reinvestment of all distributions.
Baird Intermediate Municipal Bond Fund –
Investor Class
Value of a $10,000 Investment
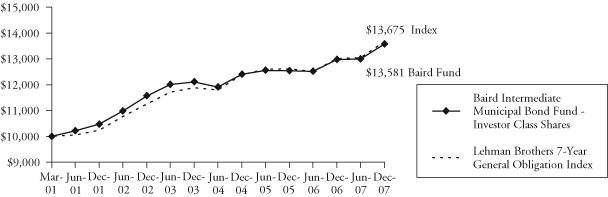
Growth of a hypothetical investment of $10,000 made on the Fund’s inception date (3/30/01), assuming reinvestment of all distributions.
Page 43
Baird Intermediate Municipal Bond Fund
Average Annual Total Returns
Since | |||
For the Periods Ended December 31, 2007 | One Year | Five Years | Inception(1) |
| Baird Intermediate Municipal Bond Fund – Institutional Class Shares | 4.93% | 3.50% | 4.89% |
| Baird Intermediate Municipal Bond Fund – Investor Class Shares | 4.68% | 3.26% | 4.63% |
Lehman Brothers 7-Year General Obligation Bond Index(2) | 5.08% | 4.00% | 4.77% |
(1) | For the period from March 30, 2001 (commencement of operations) through December 31, 2007. |
(2) | The Lehman Brothers 7-Year General Obligation Bond Index is an unmanaged, market value weighted index comprised of investment grade state and local general obligation bonds that have been issued as part of an offering of at least $50 million, have a minimum amount outstanding of at least $5 million, have been issued within the last five years and have a maturity of six to eight years. This index does not reflect any deduction for fees, expenses or taxes. A direct investment in an index is not possible. |
The returns shown in the table above and line graphs on the previous page reflect reinvestment of dividends and/or capital gains distributions in additional shares. The returns do not reflect the deduction of taxes that a shareholder would pay on Fund distributions or the redemption of Fund shares.
Past performance does not guarantee future results. Investment return and principal value will fluctuate so that an investor’s shares, when redeemed, may be worth more or less than their original cost.
For information about the performance of the Fund as of the most recent month-end, please call 1-866-44BAIRD or visit www.bairdfunds.com. Mutual fund performance changes over time and current performance may be lower or higher than that stated.
Page 44
Baird Intermediate Municipal Bond Fund
Schedule of Investments December 31, 2007 |
Principal | |||||||
Amount | Value | ||||||
MUNICIPAL BONDS – 95.4% | |||||||
Arizona – 5.2% | |||||||
| $ | 1,415,000 | Arizona Health Facilities | |||||
| Authority Hospital | |||||||
| Revenue, 6.375%, | |||||||
| 12/01/2037 (Pre-refunded | |||||||
| to 12/01/2012) | $ | 1,618,534 | |||||
| 2,375,000 | Arizona School Facilities | ||||||
| Board Revenue, 5.75%, | |||||||
| 07/01/2018 (Pre-refunded | |||||||
| to 07/01/2014) | 2,699,140 | ||||||
| 1,000,000 | Pima County Arizona | ||||||
| Industrial Development | |||||||
| Authority, 7.125%, | |||||||
| 07/01/2024 (Pre-refunded | |||||||
| to 07/01/2014) | 1,198,600 | ||||||
| 5,516,274 | |||||||
Arkansas – 0.4% | |||||||
| 400,000 | Springdale Arkansas Sales | ||||||
| & Use Tax Revenue, 4.00%, | |||||||
| 07/01/2016 (Pre-refunded | |||||||
| to various dates) | 401,440 | ||||||
California – 0.8% | |||||||
| 500,000 | Golden State Tobacco | ||||||
| Securitization Corporation, | |||||||
| 6.25%, 06/01/2033 | 548,095 | ||||||
| 290,000 | Santa Rosa California | ||||||
| Hospital Revenue, 10.30%, | |||||||
| 03/01/2011 (ETM) | 323,460 | ||||||
| 871,555 | |||||||
Colorado – 5.0% | |||||||
| 2,000,000 | Adams County Colorado | ||||||
| Single Family Mortgage | |||||||
| Revenue, 8.875%, | |||||||
| 08/01/2012 (ETM) | 2,470,760 | ||||||
| 70,000 | Colorado Springs Colorado | ||||||
| Utilities Revenue, 5.80%, | |||||||
| 11/15/2010 (ETM) | 73,142 | ||||||
| 2,550,000 | Denver Colorado | ||||||
| Convention Center & | |||||||
| Hotel Authority Revenue, | |||||||
| 5.00%, 12/01/2024 | |||||||
| (Pre-refunded to | |||||||
| 12/01/2013) | 2,776,619 | ||||||
| 5,320,521 | |||||||
Delaware – 1.5% | |||||||
| 1,500,000 | Delaware State Economic | ||||||
| Development Authority | |||||||
| Revenue, 6.75%, | |||||||
| 01/01/2013 (ETM) | 1,637,475 | ||||||
Florida – 10.9% | |||||||
| 5,000,000 | Coral Gables Florida | ||||||
| Health Facility Authority | |||||||
| Hospital Revenue, 5.00%, | |||||||
| 08/15/2029 (Pre-refunded | |||||||
| to 08/15/2014) | 5,463,900 | ||||||
| 2,355,000 | Dade County Florida | ||||||
| Health Facility Authority | |||||||
| Hospital Revenue, 5.75%, | |||||||
| 05/01/2021 (ETM) | 2,673,867 | ||||||
| 1,600,000 | Islands at Doral (SW) | ||||||
| Community Development | |||||||
| District, 6.375%, | |||||||
| 05/01/2035 (Pre-refunded | |||||||
| to 05/01/2013) | 1,807,200 | ||||||
| 300,000 | Jacksonville Florida Health | ||||||
| Facility Authority Hospital | |||||||
| Revenue, 11.50%, | |||||||
| 10/01/2012 (ETM) | 406,026 | ||||||
The accompanying notes are an integral part of these financial statements.
Page 45
Baird Intermediate Municipal Bond Fund
Schedule of Investments December 31, 2007 |
Principal | |||||||
Amount | Value | ||||||
MUNICIPAL BONDS – 95.4% (cont.) | |||||||
Florida – 10.9% (cont.) | |||||||
| $ | 150,000 | Orange County Florida | |||||
| Health Revenue, 8.75%, | |||||||
| 10/01/2009 (ETM) | $ | 159,831 | |||||
| 1,000,000 | Orlando Florida Utilities | ||||||
| Commission Water & | |||||||
| Electric Revenue, 6.75%, | |||||||
| 10/01/2017 (ETM) | 1,184,590 | ||||||
| 11,695,414 | |||||||
Georgia – 1.1% | |||||||
| 1,020,000 | Fulton County Georgia | ||||||
| Hospital Authority | |||||||
| Revenue, 7.875%, | |||||||
| 10/01/2013 (ETM) | 1,173,367 | ||||||
Illinois – 5.3% | |||||||
| 1,000,000 | Chicago Illinois General | ||||||
| Obligation Project and | |||||||
| Refunding, 5.00%, | |||||||
| 01/01/2017 (FSA Insured) | 1,087,070 | ||||||
| 1,440,000 | Chicago Illinois | ||||||
| Metropolitan Water | |||||||
| Reclamation District | |||||||
| General Obligation, | |||||||
| 7.00%, 12/01/2010 (ETM) | 1,595,822 | ||||||
| 1,430,000 | Cook County Illinois | ||||||
| School District No. 100, | |||||||
| 8.10%, 12/01/2016 (ETM) | 1,911,467 | ||||||
| 1,000,000 | Lake County Community | ||||||
| High School District | |||||||
| No. 128, | |||||||
| 5.00%, 01/01/2013 | 1,072,410 | ||||||
| 5,666,769 | |||||||
Indiana – 0.3% | |||||||
| 285,000 | Indiana Toll Road | ||||||
| Commission, 9.00%, | |||||||
| 01/01/2015 (ETM) | 357,045 | ||||||
Iowa – 1.5% | |||||||
| 1,010,000 | Des Moines Iowa | ||||||
| Metropolitan Wastewater | |||||||
| Reclamation Authority, | |||||||
| 5.00%, 06/01/2015 | |||||||
| (MBIA Insured) | 1,089,649 | ||||||
| 470,000 | Muscatine Iowa Electric | ||||||
| Revenue, 6.70%, | |||||||
| 01/01/2013 (ETM) | 506,345 | ||||||
| 1,595,994 | |||||||
Louisiana – 2.9% | |||||||
| 400,000 | Houma-Terrebonne | ||||||
| Public Trust Financing | |||||||
| Authority, 7.30%, | |||||||
| 04/01/2010 (ETM) | 434,452 | ||||||
| 1,000,000 | Houma-Terrebonne | ||||||
| Public Trust Financing | |||||||
| Authority Single Family | |||||||
| Mortgage Revenue, 7.30%, | |||||||
| 04/01/2011 (ETM) | 1,119,980 | ||||||
| 1,450,000 | Jefferson Parish | ||||||
| Louisiana Home Mortgage | |||||||
| Authority, 7.10%, | |||||||
| 08/01/2010 (ETM) | 1,592,056 | ||||||
| 3,146,488 | |||||||
Massachusetts – 5.9% | |||||||
| 5,745,000 | Massachusetts State, | ||||||
| 5.00%, 08/01/2020 | |||||||
| (Pre-refunded to | |||||||
| 08/01/2016) | 6,338,171 | ||||||
Michigan – 1.0% | |||||||
| 1,000,000 | Cornell Township Michigan | ||||||
| Economic Development | |||||||
| Revenue, 5.875%, | |||||||
| 05/01/2018 (Pre-refunded | |||||||
| to 05/01/2012) | 1,105,490 | ||||||
The accompanying notes are an integral part of these financial statements.
Page 46
Baird Intermediate Municipal Bond Fund
Schedule of Investments December 31, 2007 |
Principal | |||||||
Amount | Value | ||||||
MUNICIPAL BONDS – 95.4% (cont.) | |||||||
Minnesota – 0.6% | |||||||
| $ | 600,000 | Western Minnesota | |||||
| Municipal Power | |||||||
| Agency, 6.375%, | |||||||
| 01/01/2016 (ETM) | $ | 659,748 | |||||
Mississippi – 0.9% | |||||||
| 600,000 | Mississippi | ||||||
| Housing Financial | |||||||
| Corporation, 0.00%, | |||||||
| 06/01/2015 (ETM) ^ | 456,300 | ||||||
| 475,000 | Mississippi State, 6.20%, | ||||||
| 02/01/2008 (ETM) | 476,145 | ||||||
| 932,445 | |||||||
Missouri – 2.2% | |||||||
| 2,000,000 | St. Louis County Industrial | ||||||
| Development Authority, | |||||||
| 6.625%, 11/15/2035 | |||||||
| (Pre-refunded to | |||||||
| 11/15/2013) | 2,336,720 | ||||||
Nevada – 2.0% | |||||||
| 1,965,000 | Reno Nevada Capital | ||||||
| Improvement Revenue, | |||||||
| 5.50%, 06/01/2019 | |||||||
| (Pre-refunded to | |||||||
| 06/01/2012) | 2,145,996 | ||||||
New Jersey – 3.6% | |||||||
| 1,000,000 | New Jersey State | ||||||
| Transportation Trust Fund | |||||||
| Authority, 6.00%, | |||||||
| 12/15/2017 (Pre-refunded | |||||||
| 12/15/2011) | 1,104,600 | ||||||
| New Jersey State Turnpike | |||||||
| Authority: (ETM) | |||||||
| 262,000 | 6.75%, 01/01/2009 | 264,402 | |||||
| 130,000 | 6.50%, 01/01/2016 | 150,478 | |||||
| 2,000,000 | Tobacco Settlement | ||||||
| Financing Corporation, | |||||||
| 6.25%, 06/01/2043 | |||||||
| (Pre-refunded to | |||||||
| 06/01/2013) | 2,281,480 | ||||||
| 3,800,960 | |||||||
New York – 1.2% | |||||||
| 1,000,000 | New York, New York, | ||||||
| 5.00%, 03/01/2016 | |||||||
| (FGIC Insured) | 1,077,790 | ||||||
| 225,000 | TSASC Inc. New York, | ||||||
| 4.75%, 06/01/2022 | 212,859 | ||||||
| 1,290,649 | |||||||
North Carolina – 0.2% | |||||||
| 225,000 | North Carolina | ||||||
| Eastern Municipal Power | |||||||
| Agency Power Systems | |||||||
| Revenue, 6.40%, | |||||||
| 01/01/2021 (ETM) | 269,597 | ||||||
Ohio – 0.2% | |||||||
| 150,000 | Miamisburg Ohio Water | ||||||
| Revenue, 7.00%, | |||||||
| 11/15/2016 (ETM) | 174,281 | ||||||
Oklahoma – 2.5% | |||||||
| 2,360,000 | Tulsa County Oklahoma | ||||||
| Home Financing Authority | |||||||
| Single Family Mortgage | |||||||
| Revenue, 6.90%, | |||||||
| 08/01/2011 (ETM) | 2,656,086 | ||||||
Pennsylvania – 2.1% | |||||||
| 780,000 | Philadelphia Pennsylvania | ||||||
| Gas Works, 7.00%, | |||||||
| 05/15/2020 (ETM) | 935,634 | ||||||
The accompanying notes are an integral part of these financial statements.
Page 47
Baird Intermediate Municipal Bond Fund
Schedule of Investments December 31, 2007 |
Principal | |||||||
Amount | Value | ||||||
MUNICIPAL BONDS – 95.4% (cont.) | |||||||
Pennsylvania – 2.1% (cont.) | |||||||
| $ | 1,160,000 | Pittsburgh Pennsylvania | |||||
| Water & Sewer | |||||||
| Authority, 7.25%, | |||||||
| 09/01/2014 (ETM) | $ | 1,313,143 | |||||
| 2,248,777 | |||||||
South Carolina – 0.3% | |||||||
| 285,000 | Greenville South | ||||||
| Carolina Waterworks | |||||||
| Revenue, 7.00%, | |||||||
| 02/01/2010 (ETM) | 307,281 | ||||||
South Dakota – 0.7% | |||||||
| 665,000 | Heartland Consumers | ||||||
| Power District, 7.00%, | |||||||
| 01/01/2016 (ETM) | 752,348 | ||||||
Tennessee – 2.0% | |||||||
| 335,000 | Metropolitan Government | ||||||
| Nashville & Davidson | |||||||
| County Tennessee H&E, | |||||||
| 6.10%, 07/01/2010 (ETM) | 347,532 | ||||||
| 1,545,000 | Metropolitan Government | ||||||
| Nashville & Davidson | |||||||
| County Tennessee Water | |||||||
| & Sewer Revenue, 6.50%, | |||||||
| 12/01/2014 (ETM) | 1,815,792 | ||||||
| 2,163,324 | |||||||
Texas – 33.2% | |||||||
| 1,125,000 | Barbers Hill Texas | ||||||
| Independent School | |||||||
| District General Obligation, | |||||||
| 5.00%, 02/15/2017 | |||||||
| (PSF Guaranteed) | 1,207,687 | ||||||
| 1,000,000 | Copperas Cove Texas | ||||||
| Independent School District, | |||||||
| 5.00%, 08/15/2016 | |||||||
| (PSF Guaranteed) | 1,084,160 | ||||||
| 1,500,000 | Cypress-Fairbanks Texas | ||||||
| Independent School | |||||||
| District, 5.00%, | |||||||
| 02/15/2017 | |||||||
| (PSF Guaranteed) | 1,623,525 | ||||||
| 1,625,000 | Frisco Texas Independent | ||||||
| School District, | |||||||
| 6.00%, 08/15/2018 | |||||||
| (PSF Guaranteed) | 1,881,571 | ||||||
| 1,000,000 | Georgetown Texas | ||||||
| Independent School | |||||||
| District, 5.00%, | |||||||
| 02/15/2016 | |||||||
| (PSF Guaranteed) | 1,079,320 | ||||||
| 2,000,000 | Harris County Texas, | ||||||
| 5.25%, 10/01/2017 | |||||||
| (Pre-refunded to | |||||||
| 10/01/2013) | 2,199,080 | ||||||
| 1,720,000 | Harris County Texas | ||||||
| Health Facilities | |||||||
| Development Corporation | |||||||
| Hospital Revenue, 5.50%, | |||||||
| 10/01/2019 (ETM) | 1,959,476 | ||||||
| 5,050,000 | Houston Texas Health | ||||||
| Corporate Retirement | |||||||
| Facilities Revenue, 7.125%, | |||||||
| 02/15/2034 (Pre-refunded | |||||||
| to 02/15/2014) | 6,087,219 | ||||||
| 1,920,000 | Houston Texas Sewer | ||||||
| System Revenue, 9.375%, | |||||||
| 10/01/2013 (ETM) | 2,308,301 | ||||||
| 1,315,000 | La Porte Texas | ||||||
| Independent School District, | |||||||
| 5.00%, 02/15/2018 | |||||||
| (MBIA Insured) | 1,401,527 | ||||||
The accompanying notes are an integral part of these financial statements.
Page 48
Baird Intermediate Municipal Bond Fund
Schedule of Investments December 31, 2007 |
Principal | |||||||
Amount | Value | ||||||
MUNICIPAL BONDS – 95.4% (cont.) | |||||||
Texas – 33.2% (cont.) | |||||||
| $ | 1,735,000 | Lufkin Texas Independent | |||||
| School District, | |||||||
| 5.00%, 08/15/2015 | |||||||
| (PSF Guaranteed) | $ | 1,875,709 | |||||
| 1,050,000 | Magnolia Texas | ||||||
| Independent School District, | |||||||
| 5.00%, 08/15/2016 | |||||||
| (PSF Guaranteed) | 1,149,855 | ||||||
| 1,265,000 | Mission Consolidation | ||||||
| Independent School District, | |||||||
| 5.00%, 02/15/2019 | |||||||
| (PSF Guaranteed) | 1,347,427 | ||||||
| 1,295,000 | Rockwall Texas Independent | ||||||
| School District, | |||||||
| 5.00%, 02/15/2015 | |||||||
| (PSF Guaranteed) | 1,410,385 | ||||||
| 775,000 | Sam Rayburn Texas | ||||||
| Municipal Power Agency, | |||||||
| 6.00%, 09/01/2010 (ETM) | 814,812 | ||||||
| 1,565,000 | San Antonio Texas Electric | ||||||
| & Gas Revenue, 5.65%, | |||||||
| 02/01/2019 (ETM) | 1,782,551 | ||||||
| 2,000,000 | San Antonio Texas | ||||||
| Independent School District, | |||||||
| 5.00%, 08/15/2017 | |||||||
| (PSF Guaranteed) | 2,155,940 | ||||||
| 575,000 | Socorro Texas Independent | ||||||
| School District, | |||||||
| 5.25%, 08/15/2012 | |||||||
| (PSF Guaranteed) | 621,581 | ||||||
| 345,000 | Texas Public Building | ||||||
| Authority Revenue, 7.125%, | |||||||
| 08/01/2011 (ETM) | 370,609 | ||||||
| 1,900,000 | Trinity River Authority Texas | ||||||
| Revenue, 5.50%, 02/01/2021 | |||||||
| (MBIA Insured) | 2,092,869 | ||||||
| 1,000,000 | University of Houston | ||||||
| Texas, 5.25%, 02/15/2012 | |||||||
| (FSA Insured) | 1,074,400 | ||||||
| 35,528,004 | |||||||
Utah – 0.7% | |||||||
| 605,000 | Salt Lake City Utah | ||||||
| Hospital Revenue, 8.125%, | |||||||
| 05/15/2015 (ETM) | 699,604 | ||||||
Washington – 1.2% | |||||||
| 1,000,000 | Snohomish County | ||||||
| Washington Public Utilities | |||||||
| Revenue, 6.80%, | |||||||
| 01/01/2020 (ETM) | 1,245,860 | ||||||
| Total Municipal Bonds | |||||||
| (Cost $100,318,199) | 102,037,683 | ||||||
Shares | |||||||
SHORT-TERM INVESTMENTS – 3.0% | |||||||
Money Market Fund – 3.0% | |||||||
| 3,215,600 | Fidelity Institutional | ||||||
| Tax-Exempt Portfolio | 3,215,600 | ||||||
| Total Short-Term | |||||||
| Investments | |||||||
| (Cost $3,215,600) | 3,215,600 | ||||||
| Total Investments | |||||||
| (Cost $103,533,799) – | |||||||
| 98.4% | 105,253,283 | ||||||
| Other Assets in Excess | |||||||
| of Liabilities – 1.6% | 1,726,944 | ||||||
| TOTAL NET | |||||||
| ASSETS – 100.0% | $ | 106,980,227 | |||||
ETM – Escrowed to Maturity
^ Non-Income Producing
The accompanying notes are an integral part of these financial statements.
Page 49
Baird Core Plus Bond Fund
The Baird Core Plus Bond Fund seeks an annual rate of total return, before Fund expenses, greater than the annual rate of total return of the Lehman Brothers U.S. Universal Bond Index. The Lehman Brothers U.S. Universal Bond Index is an unmanaged, market value weighted index of fixed income securities issued in U.S. dollars, including U.S. government and investment grade debt, non-investment grade debt, asset-backed and mortgage-backed securities, Eurobonds, 144A securities and emerging market debt, with maturities of at least one year.
The Fund delivered strong nominal returns in 2007 although it underperformed its benchmark index. The primary factors for the underperformance were:
| • | The Fund’s overweight relative to the benchmark in AAA-rated mortgage-backed and asset-backed securities which underperformed as general market prices on securities in these sectors weakened; |
| • | Weak performance of specific individual corporate issues, particularly those in the finance and brokerage sector; and |
| • | The Fund’s overweighting of BBB-rated corporate bonds relative to the benchmark, which generally did not perform as well as higher-rated bonds. |
The Fund’s underweighting of below investment grade emerging market issuers was a positive for the portfolio’s performance in 2007. The Fund maintained its duration-neutral strategy, holding a broadly diversified portfolio of 200 securities at year-end.
The Fund ended 2007 with a yield advantage versus its benchmark index. This yield advantage, combined with exposure to specific sectors which we believe have superior total return potential (asset-backed securities and collateralized mortgage-backed obligations), enhance the Fund’s prospects of adding value over its benchmark in the coming year.
Portfolio Characteristics
Quality Distribution* | Sector Weightings* |
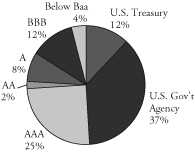 |  |
Net Assets: | $116,895,555 | Annualized Expense Ratio: | |||
SEC 30-Day Yield:** | Institutional Class: | 0.30% | |||
| Institutional Class: | 5.32% | Investor Class: | 0.55% | *** | |
| Investor Class: | 5.07% | Portfolio Turnover Rate: | 47.4% | ||
Average Effective Duration: | 4.49 years | Total Number of Holdings: | 200 | ||
Average Effective Maturity: | 6.85 years |
| * | Percentages shown are based on the Fund’s total net assets. | |
| ** | SEC yields are based on SEC guidelines and are calculated for the 30 days ended December 31, 2007. | |
| *** | Includes 0.25% 12b-1 fee. |
Page 50
Baird Core Plus Bond Fund
Baird Core Plus Bond Fund – Institutional Class
Value of a $25,000 Investment
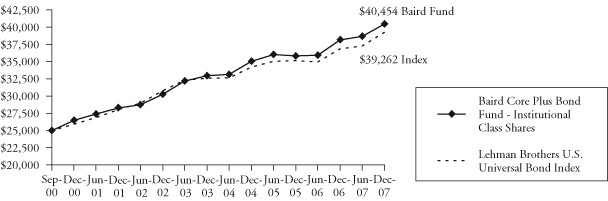
Growth of a hypothetical investment of $25,000 made on the Fund’s inception date (9/29/00), assuming reinvestment of all distributions.
Baird Core Plus Bond Fund – Investor Class
Value of a $10,000 Investment
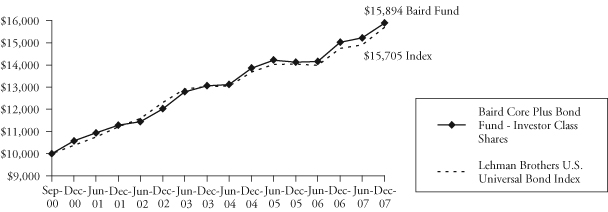
Growth of a hypothetical investment of $10,000 made on the Fund’s inception date (9/29/00), assuming reinvestment of all distributions.
Page 51
Baird Core Plus Bond Fund
Average Annual Total Returns
Since | |||
For the Periods Ended December 31, 2007 | One Year | Five Years | Inception(1) |
| Baird Core Plus Bond Fund – Institutional Class Shares | 5.99% | 5.99% | 6.86% |
| Baird Core Plus Bond Fund – Investor Class Shares | 5.80% | 5.73% | 6.59% |
Lehman Brothers U.S. Universal Bond Index(2) | 6.50% | 4.99% | 6.42% |
(1) | For the period from September 29, 2000 (commencement of operations) through December 31, 2007. |
(2) | The Lehman Brothers U.S. Universal Bond Index is an unmanaged, market value weighted index of fixed income securities issued in U.S. dollars, including U.S. government and investment grade debt, non-investment grade debt, asset-backed and mortgage-backed securities, Eurobonds, 144A securities and emerging market debt, with maturities of at least one year. This index does not reflect any deduction for fees, expenses or taxes. A direct investment in an index is not possible. |
The returns shown in the table above and line graphs on the previous page reflect reinvestment of dividends and/or capital gains distributions in additional shares. The returns do not reflect the deduction of taxes that a shareholder would pay on Fund distributions or the redemption of Fund shares.
Past performance does not guarantee future results. Investment return and principal value will fluctuate so that an investor’s shares, when redeemed, may be worth more or less than their original cost.
For information about the performance of the Fund as of the most recent month-end, please call 1-866-44BAIRD or visit www.bairdfunds.com. Mutual fund performance changes over time and current performance may be lower or higher than that stated.
Page 52
Baird Core Plus Bond Fund
Schedule of Investments December 31, 2007 |
Principal | |||||||
Amount | Value | ||||||
LONG-TERM INVESTMENTS – 96.4% | |||||||
Asset Backed Securities – 10.3% | |||||||
| $ | 900,000 | American Express Credit | |||||
| Account Master Trust, | |||||||
| Series 2005-5, Class A, | |||||||
| 5.0675%, 02/15/2013 | $ | 894,802 | |||||
| 282,214 | Amresco Residential | ||||||
| Securities Mortgage | |||||||
| Loan Trust, | |||||||
| Series 1998-2, Class A6, | |||||||
| 6.405%, 12/25/2027 | 281,292 | ||||||
| 600,000 | Bayview Financial | ||||||
| Acquisition Trust, | |||||||
| Series 2007-A, | |||||||
| 6.205%, 05/28/2037 | 579,131 | ||||||
| 57,049 | Contimortgage Home | ||||||
| Equity Loan Trust, | |||||||
| Series 1997-5, Class A6, | |||||||
| 6.87%, 03/15/2024 | 56,940 | ||||||
| Countrywide Asset-Backed | |||||||
| Certificates: | |||||||
| 600,000 | Series 2005-10, Class AF6, | ||||||
| 4.915%, 02/25/2036 | 578,980 | ||||||
| 1,000,000 | Series 2005-13, Class AF3, | ||||||
| 5.43%, 04/25/2036 | 966,261 | ||||||
| 400,000 | Series 2006-S9, Class A3, | ||||||
| 5.728%, 08/25/2036 | 375,925 | ||||||
| 1,000,000 | Series 2006-13, Class 1AF2, | ||||||
| 5.884%, 01/25/2037 | 981,921 | ||||||
| 1,300,000 | Series 2006-10, Class 1AF3, | ||||||
| 5.971%, 09/25/2046 | 1,263,357 | ||||||
| 616,000 | Series 2006-9, Class 1AF3, | ||||||
| 5.859%, 10/25/2046 | 598,793 | ||||||
| 475,000 | Discover Card Master Trust I, | ||||||
| Series 2005-2, Class A, | |||||||
| 5.06%, 04/17/2012 | 473,515 | ||||||
| 1,500,000 | GMAC Commercial | ||||||
| Mortgage Securities, Inc., | |||||||
| Series 2003-C1, Class A2, | |||||||
| 4.079%, 05/10/2036 | 1,444,394 | ||||||
| GMAC Mortgage | |||||||
| Corporation Loan Trust: | |||||||
| 19,022 | Series 2004-HE5, Class A3, | ||||||
| 3.97%, 09/25/2034 | 18,910 | ||||||
| 500,000 | Series 2005-HE3, Class A2, | ||||||
| 3.526%, 02/25/2036 | 494,908 | ||||||
| Green Tree Financial | |||||||
| Corporation: | |||||||
| 35,149 | Series 1997-1, Class A5, | ||||||
| 6.86%, 03/15/2028 | 36,903 | ||||||
| 102,118 | Series 1997-4, Class A5, | ||||||
| 6.88%, 02/15/2029 | 107,354 | ||||||
| 303,306 | Series 1998-3, Class A5, | ||||||
| 6.22%, 03/01/2030 | 316,783 | ||||||
| 397,459 | Series 1998-4, Class A5, | ||||||
| 6.18%, 04/01/2030 | 390,600 | ||||||
| 64,368 | Oakwood Mortgage | ||||||
| Investors, Inc., | |||||||
| Series 1999-B, Class A3, | |||||||
| 6.45%, 11/15/2017 | 60,385 | ||||||
| Renaissance Home | |||||||
| Equity Loan Trust: | |||||||
| 519,000 | Series 2006-2, Class AF3, | ||||||
| 5.797%, 08/25/2036 | 515,849 | ||||||
| 500,000 | Series 2007-1, Class AF2, | ||||||
| 5.512%, 04/25/2037 | 490,082 | ||||||
| 278,847 | Residential Asset | ||||||
| Mortgage Products, Inc., | |||||||
| Series 2003-RS10, Class AI7, | |||||||
| 4.85%, 11/25/2033 | 273,543 | ||||||
The accompanying notes are an integral part of these financial statements.
Page 53
Baird Core Plus Bond Fund
Schedule of Investments December 31, 2007 |
Principal | |||||||
Amount | Value | ||||||
LONG-TERM INVESTMENTS – 96.4% (cont.) | |||||||
Asset Backed Securities – 10.3% (cont.) | |||||||
| $ | 381,155 | Residential Asset | |||||
| Securities Corporation, | |||||||
| Series 2003-KS5, | |||||||
| Class AI6, 3.62%, | |||||||
| 07/25/2033 | $ | 361,975 | |||||
| 400,000 | Stingray Pass-Thru | ||||||
| Certificates, Series 2005, | |||||||
| 5.902%, 01/12/2015 | |||||||
| (Acquired 05/10/2007, | |||||||
| Cost $380,000)* | 228,000 | ||||||
| 300,000 | Structured Asset Securities | ||||||
| Corporation, Series | |||||||
| 2005-7XS, Class 1A4B, | |||||||
| 5.44%, 04/25/2035 | 296,774 | ||||||
| 12,087,377 | |||||||
Financial – 9.9% | |||||||
| 1,000,000 | American General Finance | ||||||
| Corporation Notes, | |||||||
| 6.90%, 12/15/2017 | 1,001,000 | ||||||
| 500,000 | Bancwest Corporation, | ||||||
| 8.30%, 01/15/2011 | 551,666 | ||||||
| 300,000 | Bank of America | ||||||
| Corporation | |||||||
| Subordinated Notes, | |||||||
| 10.20%, 07/15/2015 | 377,851 | ||||||
| 200,000 | Banponce Trust I, Series A, | ||||||
| 8.327%, 02/01/2027 | |||||||
| (Callable 03/06/2008) | 208,364 | ||||||
| 170,000 | Capmark Financial Group, | ||||||
| Inc., 5.875%, 05/10/2012 | |||||||
| (Acquired 08/06/2007; | |||||||
| Cost $152,024)* | 134,566 | ||||||
| CIT Group, Inc.: | |||||||
| 250,000 | 7.625%, 11/30/2012 | 253,401 | |||||
| 400,000 | 6.10%, 03/15/2067 | ||||||
| (Callable 03/15/2017) | 290,439 | ||||||
| 700,000 | Citigroup Capital XXI, | ||||||
| 8.30%, 12/21/2077 | |||||||
| (Callable 12/21/2037) | 730,934 | ||||||
| 625,000 | Countrywide Financial | ||||||
| Corporation | |||||||
| Subordinated Notes, | |||||||
| 6.25%, 05/15/2016 | 359,730 | ||||||
| 424,000 | Equitable Cos, Inc., | ||||||
| 6.50%, 04/01/2008 | 425,920 | ||||||
| 500,000 | Export-Import | ||||||
| Bank Korea Notes, | |||||||
4.625%, 03/16/2010 f | 499,658 | ||||||
| 500,000 | First Empire | ||||||
| Capital Trust I, | |||||||
| 8.234%, 02/01/2027 | |||||||
| (Callable 03/03/2008) | 521,684 | ||||||
| 600,000 | First National | ||||||
| Bank of Omaha | |||||||
| Subordinated Notes, | |||||||
| 7.32%, 12/01/2010 | 643,179 | ||||||
| 250,000 | First Union Capital, | ||||||
| 7.935%, 01/15/2027 | |||||||
| (Callable 03/06/2008) | 259,907 | ||||||
| General Motors Acceptance | |||||||
| Corporation Notes: | |||||||
| 75,000 | 7.75%, 01/19/2010 | 69,961 | |||||
| 250,000 | 6.75%, 12/01/2014 | 201,637 | |||||
| 350,000 | Glencore Funding LLC, | ||||||
| 6.00%, 04/15/2014 | |||||||
| (Acquired 03/31/2004 | |||||||
| and 12/04/2006; Cost | |||||||
| $148,928 and $198,740, | |||||||
| respectively)* | 352,049 | ||||||
The accompanying notes are an integral part of these financial statements.
Page 54
Baird Core Plus Bond Fund
Schedule of Investments December 31, 2007 |
Principal | |||||||
Amount | Value | ||||||
LONG-TERM INVESTMENTS – 96.4% (cont.) | |||||||
Financial – 9.9% (cont.) | |||||||
| $ | 30,000 | Goldman Sachs Group LP, | |||||
| 8.00%, 03/01/2013 | |||||||
| (Acquired 05/19/2006; | |||||||
| Cost $33,031)* | $ | 33,136 | |||||
| 100,000 | Health Care Service | ||||||
| Corporation Notes, | |||||||
| 7.75%, 06/15/2011 | |||||||
| (Acquired 01/26/2005; | |||||||
| Cost $115,000)* | 111,717 | ||||||
| 300,000 | Istar Financial, Inc., | ||||||
| 5.85%, 03/15/2017 | 246,584 | ||||||
| 300,000 | Jefferies Group, Inc., | ||||||
| 6.45%, 06/08/2027 | 278,703 | ||||||
| 400,000 | Lehman Brothers | ||||||
| Holdings Senior Notes, | |||||||
| 8.80%, 03/01/2015 | 456,260 | ||||||
| 375,000 | Liberty Mutual | ||||||
| Insurance Notes, | |||||||
| 7.697%, 10/15/2097 | |||||||
| (Acquired 03/26/2003; | |||||||
| Cost $239,982)* | 351,514 | ||||||
| 500,000 | Manufacturer & | ||||||
| Traders Trust Co., | |||||||
| 6.625%, 12/04/2017 | 499,861 | ||||||
| 100,000 | Marsh & McLennan | ||||||
| Companies, Inc., | |||||||
| 5.375%, 07/15/2014 | 97,389 | ||||||
| 300,000 | Martin Marietta | ||||||
| Materials, Inc., | |||||||
| 6.25%, 05/01/2037 | 281,639 | ||||||
| 475,000 | Popular North | ||||||
| America Inc., | |||||||
| 5.65%, 04/15/2009 | 479,650 | ||||||
| 100,000 | Principal Financial | ||||||
| Group (AU) Senior Notes, | |||||||
| 8.20%, 08/15/2009 | |||||||
| (Acquired 09/16/2005; | |||||||
Cost $112,015)* f | 106,067 | ||||||
| 1,300,000 | Regions Financing Trust II, | ||||||
| 6.625%, 05/15/2077 | |||||||
| (Callable 05/15/2027) | 1,074,298 | ||||||
| 375,000 | Residential | ||||||
| Capital Corporation, | |||||||
| 6.875%, 06/30/2015 | 226,875 | ||||||
| 200,000 | Santander Financial | ||||||
| Issuances, | |||||||
6.375%, 02/15/2011 f | 211,499 | ||||||
| 300,000 | Travelers Companies, Inc., | ||||||
| 6.25%, 03/15/2067 | 281,336 | ||||||
| 11,618,474 | |||||||
Industrial – 11.6% | |||||||
| 300,000 | AOL Time Warner, Inc., | ||||||
| 7.625%, 04/15/2031 | 331,986 | ||||||
| 100,000 | AT&T Wireless Services, | ||||||
| Inc. Senior Notes, | |||||||
| 8.75%, 03/01/2031 | 129,598 | ||||||
| 443,210 | Atlas Air, Inc. | ||||||
| Pass-Thru Certificates, | |||||||
| Series 2000-1, | |||||||
| 8.707%, 01/02/2019 | 460,938 | ||||||
| Bunge Limited Finance | |||||||
| Corporation Notes: | |||||||
| 150,000 | 5.35%, 04/15/2014 | 145,234 | |||||
| 100,000 | 5.10%, 07/15/2015 | 94,713 | |||||
| 375,000 | Clear Channel | ||||||
| Communications, | |||||||
| 4.50%, 01/15/2010 | 346,875 | ||||||
The accompanying notes are an integral part of these financial statements.
Page 55
Baird Core Plus Bond Fund
Schedule of Investments December 31, 2007 |
Principal | |||||||
Amount | Value | ||||||
LONG-TERM INVESTMENTS – 96.4% (cont.) | |||||||
Industrial – 11.6% (cont.) | |||||||
| Continental Airlines, Inc. | |||||||
| Pass-Thru Certificates: | |||||||
| $ | 78,170 | Series 1998-1, | |||||
| 6.541%, 09/15/2009 | $ | 77,584 | |||||
| 204,875 | Series 2000-2, | ||||||
| 8.312%, 10/02/2012 | 201,290 | ||||||
| 64,318 | Series 1997-4, | ||||||
| 6.90%, 01/02/2018 | 65,283 | ||||||
| 100,000 | COX Communications | ||||||
| Inc. Notes, | |||||||
| 7.875%, 08/15/2009 | 104,622 | ||||||
| 100,000 | Deutsche Telekom | ||||||
| International Finance BV, | |||||||
8.25%, 06/15/2030 f | 124,775 | ||||||
| 250,000 | Donnelley (R.R.) & Sons | ||||||
| Co., 6.125%, 01/15/2017 | 246,509 | ||||||
| 400,000 | Enel Finance International, | ||||||
| 6.80%, 09/15/2037 | |||||||
| (Acquired 09/13/2007; | |||||||
Cost $398,940)* f | 401,882 | ||||||
| 353,418 | Federal Express Corporation | ||||||
| Pass-Thru Certificates, | |||||||
| Series B2, 7.110%, | |||||||
| 01/02/2014 | 388,332 | ||||||
| 500,000 | First Data Corporation, | ||||||
| 9.875%, 09/24/2015 | |||||||
| (Callable 09/30/2011) | |||||||
| (Acquired 10/17/2007; | |||||||
| Cost $479,375)* | 465,000 | ||||||
| 475,000 | Fiserv, Inc., | ||||||
| 6.125%, 11/20/2012 | 483,455 | ||||||
| 400,000 | Ford Motor | ||||||
| Company Debentures, | |||||||
| 9.215%, 09/15/2021 | 334,000 | ||||||
| 175,000 | General Motors Nova | ||||||
| Scotia Finance Company, | |||||||
6.85%, 10/15/2008 f | 172,375 | ||||||
| 350,000 | Hanson PLC Notes, | ||||||
6.125%, 08/15/2016 f | 352,788 | ||||||
| 350,000 | Health Management | ||||||
| Association, | |||||||
| 6.125%, 04/15/2016 | 303,414 | ||||||
| 150,000 | Hutchison Whampoa | ||||||
| International Limited, | |||||||
| 6.25%, 01/24/2014 | |||||||
| (Acquired 06/23/2005; | |||||||
Cost $161,474)* f | 155,925 | ||||||
| 322,000 | Marathon Oil | ||||||
| Corporation Debentures, | |||||||
| 9.125%, 01/15/2013 | 381,932 | ||||||
| 350,000 | New York Telephone | ||||||
| Company Debentures, | |||||||
| 8.625%, 11/15/2010 | 383,645 | ||||||
| 200,000 | PCCW Capital II Ltd., | ||||||
| 6.00%, 07/15/2013 | |||||||
| (Acquired 07/10/2003; | |||||||
Cost $199,066)* f | 198,892 | ||||||
| 400,000 | PEMEX Project | ||||||
| Funding Master Trust, | |||||||
9.125%, 10/13/2010 f | 442,000 | ||||||
| 300,000 | Plum Creek Timberlands, | ||||||
| 5.875%, 11/15/2015 | 295,789 | ||||||
| 500,000 | Sealed Air Corporation | ||||||
| Senior Notes, | |||||||
| 5.375%, 04/15/2008 | |||||||
| (Acquired 09/27/2007; | |||||||
| Cost $499,100)* | 499,716 | ||||||
| 200,000 | SK Telecom, | ||||||
| 6.625%, 07/20/2027 | |||||||
| (Acquired 07/13/2007; | |||||||
Cost $197,602)* f | 211,839 | ||||||
The accompanying notes are an integral part of these financial statements.
Page 56
Baird Core Plus Bond Fund
Schedule of Investments December 31, 2007 |
Principal | |||||||
Amount | Value | ||||||
LONG-TERM INVESTMENTS – 96.4% (cont.) | |||||||
Industrial – 11.6% (cont.) | |||||||
| $ | 300,000 | Sprint Capital | |||||
| Corporation, | |||||||
| 8.75%, 03/15/2032 | $ | 338,159 | |||||
| 250,000 | Sungard Data Systems | ||||||
| Inc. Notes, | |||||||
| 3.75%, 01/15/2009 | 242,500 | ||||||
| 175,000 | TCI Communications, | ||||||
| Inc. Debentures, | |||||||
| 7.875%, 08/01/2013 | 191,783 | ||||||
| 350,000 | Telecom Italia Capital, | ||||||
7.20%, 07/18/2036 f | 385,897 | ||||||
| 200,000 | Telefonica | ||||||
| Emisiones, S.A.U., | |||||||
6.421%, 06/20/2016 f | 210,472 | ||||||
| 92,000 | Time Warner Companies, | ||||||
| Inc., 6.875%, 06/15/2018 | 96,474 | ||||||
| 25,000 | Time Warner Entertainment | ||||||
| Senior Notes, | |||||||
| 8.875%, 10/01/2012 | 28,068 | ||||||
| 500,000 | Transocean Inc., | ||||||
6.80%, 03/15/2038 f | 510,174 | ||||||
| 500,000 | Tyco Electronics Group S.A., | ||||||
| 7.125%, 10/01/2037 | |||||||
| (Acquired 09/20/2007; | |||||||
Cost $497,720)* f | 526,374 | ||||||
| Tyco International | |||||||
Group S.A.: f | |||||||
| 150,000 | 6.125%, 01/15/2009 | 151,866 | |||||
| 50,000 | 6.00%, 11/15/2013 | 51,392 | |||||
| United AirLines, Inc. | |||||||
| Pass-Thru Certificates: | |||||||
| 259,098 | Series 2001-1, | ||||||
| 6.201%, 09/01/2008 | 257,802 | ||||||
| 73,583 | Series 2000-2, | ||||||
| 7.762%, 12/31/2049 | 68,432 | ||||||
| 250,000 | Univision | ||||||
| Communication, Inc., | |||||||
| 3.875%, 10/15/2008 | 244,062 | ||||||
| 921,311 | U.S. Airways Pass-Thru | ||||||
| Trust, Series 1998-1, | |||||||
| 7.35%, 07/30/2019 | 829,180 | ||||||
Vale Overseas Limited: f | |||||||
| 100,000 | 8.25%, 01/17/2034 | 115,784 | |||||
| 125,000 | 6.875%, 11/21/2036 | 126,451 | |||||
| 150,000 | Viacom, Inc., | ||||||
| 7.70%, 07/30/2010 | 159,245 | ||||||
| 150,000 | Viacom, Inc. | ||||||
| Senior Notes, | |||||||
| 6.25%, 04/30/2016 | 150,911 | ||||||
| 500,000 | Vodafone Group PLC, | ||||||
6.15%, 02/27/2037 f | 493,810 | ||||||
| 500,000 | Vulcan Materials, | ||||||
| 7.15%, 11/30/2037 | 515,073 | ||||||
| 13,494,300 | |||||||
Mortgage Backed Securities – 35.3% | |||||||
| Bank of America | |||||||
| Alternative Loan Trust: | |||||||
| 187,444 | Series 2005-2, Class 4A1, | ||||||
| 5.50%, 03/25/2020 | 183,578 | ||||||
| 376,381 | Series 2006-2, Class 6A1, | ||||||
| 5.50%, 03/25/2021 | 366,208 | ||||||
| 700,000 | Chase Mortgage Finance | ||||||
| Corporation, Series | |||||||
| 2006-A1, Class 2A3, | |||||||
| 6.00%, 09/25/2036 | 692,485 | ||||||
| Citigroup Mortgage | |||||||
| Loan Trust, Inc.: | |||||||
| 253,899 | Series 2005-9, Class 2A2, | ||||||
| 5.50%, 11/25/2035 | 254,155 | ||||||
| 368,071 | Series 2005-9, Class 22A2, | ||||||
| 6.00%, 11/25/2035 | 367,975 | ||||||
The accompanying notes are an integral part of these financial statements.
Page 57
Baird Core Plus Bond Fund
Schedule of Investments December 31, 2007 |
Principal | |||||||
Amount | Value | ||||||
LONG-TERM INVESTMENTS – 96.4% (cont.) | |||||||
Mortgage Backed Securities – 35.3% (cont.) | |||||||
| Countrywide Alternative | |||||||
| Loan Trust: | |||||||
| $ | 372,372 | Series 2006-7CB, | |||||
| Class 3A1, 5.25%, | |||||||
| 05/25/2021 | $ | 361,526 | |||||
| 321,438 | Series 2006-43CB, | ||||||
| Class 2A1, 6.00%, | |||||||
| 02/25/2022 | 321,789 | ||||||
| 425,531 | Deutsche Securities Inc. | ||||||
| Mortgage, Series 2006-AR5, | |||||||
| Class 21A, 6.00%, | |||||||
| 10/25/2021 | 427,320 | ||||||
| 967,114 | DLJ Commercial Mortgage | ||||||
| Corporation, Series | |||||||
| 1999-CG3, Class A1B, | |||||||
| 7.34%, 10/10/2032 | 1,002,767 | ||||||
| Federal Gold Loan | |||||||
| Mortgage Corporation | |||||||
| (FGLMC): | |||||||
| 609,699 | 5.50%, 11/01/2017 | 618,382 | |||||
| 612,585 | 5.00%, 12/01/2020 | 613,186 | |||||
| 314,366 | 6.00%, 06/01/2021 | 321,597 | |||||
| 167,769 | 6.50%, 12/01/2028 | 173,904 | |||||
| 80,939 | 6.50%, 06/01/2029 | 83,876 | |||||
| Federal Home Loan Mortgage | |||||||
| Corporation (FHLMC): | |||||||
| 1,077,287 | 5.00%, 05/01/2021 | 1,078,344 | |||||
| 1,963,210 | 5.50%, 04/01/2037 | 1,959,158 | |||||
| 351,514 | Series 3122, Class VA, | ||||||
| 6.00%, 01/15/2017 | 361,534 | ||||||
| 2,904,183 | Series R010, Class VA, | ||||||
| 5.50%, 04/15/2017 | 2,967,187 | ||||||
| 2,173,700 | Series R010, Class AB, | ||||||
| 5.50%, 12/15/2019 | 2,197,656 | ||||||
| 17,005 | Series 1053, Class G, | ||||||
| 7.00%, 03/15/2021 | 16,951 | ||||||
| 37,174 | Series 136, Class E, | ||||||
| 6.00%, 04/15/2021 | 37,073 | ||||||
| 300,000 | Series 2673, Class NC, | ||||||
| 5.50%, 05/15/2021 | 304,515 | ||||||
| 257,142 | Series 2804, Class VC, | ||||||
| 5.00%, 07/15/2021 | 255,277 | ||||||
| 34,863 | Series 1122, Class G, | ||||||
| 7.00%, 08/15/2021 | 34,806 | ||||||
| 81,662 | Series 1186, Class I, | ||||||
| 7.00%, 12/15/2021 | 85,834 | ||||||
| 208,064 | Series 3132, Class MA, | ||||||
| 5.50%, 12/15/2023 | 210,405 | ||||||
| 172,465 | Series 2598, Class QC, | ||||||
| 4.50%, 06/15/2027 | 171,346 | ||||||
| Federal National Mortgage | |||||||
| Association (FNMA): | |||||||
| 256,947 | 5.00%, 02/01/2018 | 257,566 | |||||
| 179,074 | 5.00%, 10/01/2018 | 179,522 | |||||
| 178,942 | 5.00%, 11/01/2018 | 179,389 | |||||
| 144,508 | 5.50%, 03/01/2023 | 145,415 | |||||
| 862,082 | 5.50%, 07/01/2023 | 867,493 | |||||
| 1,181,596 | 5.50%, 12/01/2023 | 1,189,013 | |||||
| 313,857 | 6.00%, 03/01/2026 | 319,633 | |||||
| 131,215 | 6.50%, 09/01/2028 | 136,004 | |||||
| 255,874 | 6.50%, 02/01/2029 | 265,213 | |||||
| 213,409 | 5.50%, 01/01/2032 | 213,788 | |||||
| 210,709 | 5.50%, 02/01/2035 | 210,720 | |||||
| 2,238,877 | 5.50%, 02/01/2035 | 2,239,001 | |||||
| 4,280,557 | 5.50%, 04/01/2036 | 4,277,945 | |||||
| 1,975,003 | 6.00%, 08/01/2037 | 1,989,141 | |||||
| 16,808 | Series 1989-94, Class G, | ||||||
| 7.50%, 12/25/2019 | 18,084 | ||||||
| 68,429 | Series 1990-15, Class J, | ||||||
| 7.00%, 02/25/2020 | 71,283 | ||||||
| 13,269 | Series 1991-21, Class J, | ||||||
| 7.00%, 03/25/2021 | 14,023 | ||||||
The accompanying notes are an integral part of these financial statements.
Page 58
Baird Core Plus Bond Fund
Schedule of Investments December 31, 2007 |
Principal | |||||||
Amount | Value | ||||||
LONG-TERM INVESTMENTS – 96.4% (cont.) | |||||||
Mortgage Backed Securities – 35.3% (cont.) | |||||||
| $ | 252,565 | Series 1991-43, Class J, | |||||
| 7.00%, 05/25/2021 | $ | 267,998 | |||||
| 327,347 | Series 1991-65, Class Z, | ||||||
| 6.50%, 06/25/2021 | 343,313 | ||||||
| 514,960 | Series 1992-129, Class L, | ||||||
| 6.00%, 07/25/2022 | 528,488 | ||||||
| 100,388 | Series 1993-32, Class H, | ||||||
| 6.00%, 03/25/2023 | 101,649 | ||||||
| 536,659 | Series 1993-58, Class H, | ||||||
| 5.50%, 04/25/2023 | 545,655 | ||||||
| 216,208 | Series 2003-31, Class KG, | ||||||
| 4.50%, 12/25/2028 | 216,302 | ||||||
| 47,067 | Series 2003-44, Class AB, | ||||||
| 3.75%, 05/25/2033 | 44,648 | ||||||
| 846,405 | Series 2004-W6, | ||||||
| Class 1A6, 5.50%, | |||||||
| 07/25/2034 | 834,003 | ||||||
| First Horizon Alternative | |||||||
| Mortgage Securities: | |||||||
| 319,493 | Series 2006-FA6, Class 3A1, | ||||||
| 5.75%, 11/25/2021 | 317,609 | ||||||
| 531,567 | Series 2006-FA8, Class 2A1, | ||||||
| 5.75%, 02/25/2037 | 521,245 | ||||||
| 825,000 | First Union National Bank | ||||||
| Commercial Mortgage | |||||||
| Securities Inc., | |||||||
| Series 2001-C4, Class A2, | |||||||
| 6.223%, 12/12/2033 | 864,077 | ||||||
| GE Capital Commercial | |||||||
| Mortgage Corporation: | |||||||
| 773,066 | Series 2000-1, Class A2, | ||||||
| 6.496%, 01/15/2033 | 806,268 | ||||||
| 600,000 | Series 2004-C3, Class A4, | ||||||
| 5.189%, 07/10/2039 | 606,076 | ||||||
| Government National | |||||||
| Mortgage Association | |||||||
| (GNMA): | |||||||
| 148,556 | 6.00%, 12/20/2028 | 152,133 | |||||
| 54,498 | 6.50%, 01/20/2029 | 56,540 | |||||
| 142,827 | 6.00%, 11/20/2033 | 145,918 | |||||
| 821,263 | Series 2003-2, Class PB, | ||||||
| 5.50%, 03/20/2032 | 831,678 | ||||||
| J.P. Morgan Mortgage Trust: | |||||||
| 500,000 | Series 2006-A7, Class 2A4R, | ||||||
| 5.457%, 01/25/2037 | 500,425 | ||||||
| 700,000 | Series 2007-A2, Class 2A3, | ||||||
| 5.715%, 04/25/2037 | 700,639 | ||||||
| Master Alternative | |||||||
| Loans Trust: | |||||||
| 1,003,077 | Series 2004-1, Class 1A1, | ||||||
| 5.00%, 01/25/2019 | 977,842 | ||||||
| 601,760 | Series 2005-3, Class 4A1, | ||||||
| 5.50%, 03/25/2020 | 598,734 | ||||||
| 184,125 | Series 2003-5, Class 6A1, | ||||||
| 6.00%, 08/25/2033 | 182,399 | ||||||
| 1,250,000 | Wachovia Bank | ||||||
| Commercial Mortgage | |||||||
| Trust, Series 2003-C3, | |||||||
| Class A2, 4.867%, | |||||||
| 02/15/2035 | 1,247,108 | ||||||
| Washington Mutual, Inc. | |||||||
| Pass-Thru Certificates: | |||||||
| 204,852 | Series 2004-CB1, Class 5A, | ||||||
| 5.00%, 06/25/2019 | 204,020 | ||||||
| 662,163 | Series 2004-CB2, Class 7A, | ||||||
| 5.50%, 08/25/2019 | 658,153 | ||||||
| 218,234 | Series 2004-CB3, Class 4A, | ||||||
| 6.00%, 10/25/2019 | 221,712 | ||||||
The accompanying notes are an integral part of these financial statements.
Page 59
Baird Core Plus Bond Fund
Schedule of Investments December 31, 2007 |
Principal | |||||||
Amount | Value | ||||||
LONG-TERM INVESTMENTS – 96.4% (cont.) | |||||||
Mortgage Backed Securities – 35.3% (cont.) | |||||||
| $ | 1,200,000 | Washington Mutual | |||||
| Preferred Funding Trust III, | |||||||
| 6.895%, 06/29/2049 | |||||||
| (Callable 06/15/2012) | |||||||
| (Acquired 12/12/2007; | |||||||
| Cost $726,000)* | $ | 708,000 | |||||
| 41,224,699 | |||||||
Taxable Municipal Bonds – 0.6% | |||||||
| 500,000 | Tobacco Settlement | ||||||
| Authority Iowa, | |||||||
| 6.50%, 06/01/2023 | 476,400 | ||||||
| 261,849 | Tobacco Settlement | ||||||
| Financing Corporation, | |||||||
| Series 2001-A, Class A, | |||||||
| 6.36%, 05/15/2025 | 253,143 | ||||||
| 729,543 | |||||||
Utilities – 3.9% | |||||||
| 165,000 | Cilcorp Inc. Senior Notes, | ||||||
| 8.70%, 10/15/2009 | 173,382 | ||||||
| 200,000 | Commonwealth Edison, | ||||||
| 5.40%, 12/15/2011 | 202,122 | ||||||
| 150,000 | Energy Transfer Partners, | ||||||
| 5.65%, 08/01/2012 | 148,507 | ||||||
| 1,000,000 | FPL Group Capital, Inc., | ||||||
| 7.30%, 09/01/2067 | |||||||
| (Callable 09/01/2017) | 1,021,796 | ||||||
| 250,000 | Kinder Morgan Energy | ||||||
| Partners Senior Notes, | |||||||
| 6.95%, 01/15/2038 | 262,374 | ||||||
| 300,000 | Kinder Morgan Finance, | ||||||
5.70%, 01/05/2016 f | 271,560 | ||||||
| 73,200 | Kiowa Power Partners LLC, | ||||||
| 4.811%, 12/30/2013 | |||||||
| (Acquired 11/19/2004; | |||||||
| Cost $81,129)* | 73,328 | ||||||
| 400,000 | ONEOK, Inc. | ||||||
| Senior Notes, | |||||||
| 7.125%, 04/15/2011 | 423,536 | ||||||
| 50,000 | Pacific Gas & Electric | ||||||
| Company 1st Mortgage, | |||||||
| 6.05%, 03/01/2034 | 49,917 | ||||||
| 300,000 | Pepco Holdings, Inc., | ||||||
| 6.125%, 06/01/2017 | 305,147 | ||||||
| 200,000 | PPL Energy Supply LLC, | ||||||
| 6.20%, 05/15/2016 | 200,835 | ||||||
| 200,000 | PSE&G Energy Holdings | ||||||
| LLC Senior Notes, | |||||||
| 8.50%, 06/15/2011 | 208,423 | ||||||
| 287,013 | RGS (I&M) Funding | ||||||
| Corporation Debentures, | |||||||
| 9.82%, 12/07/2022 | 352,234 | ||||||
| 300,000 | Southern Natural Gas, | ||||||
| 5.90%, 04/01/2017 | |||||||
| (Acquired 03/14/2007; | |||||||
| Cost $299,502)* | 295,070 | ||||||
| 87,647 | Tristate Gen & Trans Assn, | ||||||
| Series 2003, 6.04%, | |||||||
| 01/31/2018 (Acquired | |||||||
| 10/14/2003; Cost $89,596)* | 88,805 | ||||||
| 200,000 | TXU Corporation, | ||||||
| 6.375%, 01/01/2008 | 200,000 | ||||||
| Williams Cos. Inc. Notes: | |||||||
| 100,000 | 7.125%, 09/01/2011 | 105,625 | |||||
| 200,000 | 7.875%, 09/01/2021 | 221,750 | |||||
| 4,604,411 | |||||||
U.S. Government Agency Issues – 15.1% | |||||||
| 16,400,000 | Federal National Mortgage | ||||||
| Association (FNMA), | |||||||
| 6.00%, 05/15/2011 | 17,598,938 | ||||||
The accompanying notes are an integral part of these financial statements.
Page 60
Baird Core Plus Bond Fund
Schedule of Investments December 31, 2007 |
Principal | |||||||
Amount | Value | ||||||
LONG-TERM INVESTMENTS – 96.4% (cont.) | |||||||
U.S. Treasury Obligations – 9.7% | |||||||
| $ | 9,425,000 | U.S. Treasury Bond, | |||||
| 6.25%, 08/15/2023 | $ | 11,284,232 | |||||
| Total Long-Term | |||||||
| Investments | |||||||
| (Cost $112,069,688) | 112,641,974 | ||||||
Shares | |||||||
SHORT-TERM INVESTMENTS – 2.3% | |||||||
Money Market Fund – 2.3% | |||||||
| 2,714,893 | Short-Term Investment | ||||||
| Company Liquid Assets | |||||||
| Portfolio – AIM Fund | 2,714,893 | ||||||
| Total Short-Term | |||||||
| Investments | |||||||
| (Cost $2,714,893) | 2,714,893 | ||||||
Principal | |||||||
Amount | |||||||
INVESTMENTS PURCHASED | |||||||
WITH CASH PROCEEDS FROM | |||||||
SECURITIES LENDING – 36.2% | |||||||
Certificate of Deposit – 1.5% | |||||||
| $ | 1,721,872 | Barclays Bank, | |||||
| 5.15%, 2/12/08 | 1,722,630 | ||||||
Commercial Paper – 9.8% | |||||||
| 1,291,404 | Alianz Finance Corporation, | ||||||
| 5.06%, 01/16/08 | 1,288,692 | ||||||
| Atlantic Asset | |||||||
| Securitization Corp.: | |||||||
| 258,281 | 6.13%, 01/04/08 | 258,147 | |||||
| 430,468 | 5.447%, 01/25/08 | 429,056 | |||||
| 430,468 | Barton Capital | ||||||
| Corporation, | |||||||
| 5.835%, 01/10/08 | 429,904 | ||||||
| 430,468 | GovCo LLC, | ||||||
| 5.584%, 01/15/08 | 429,620 | ||||||
| 1,125,875 | KKR Atlantic | ||||||
| Funding Trust, | |||||||
| 5.205%, 03/13/08 # | 1,107,921 | ||||||
| 773,809 | Kitty Hawk | ||||||
| Funding Corp., | |||||||
| 5.323%, 01/25/08 | 771,271 | ||||||
| 1,721,872 | Kommunalkredit Austria | ||||||
| AG, 4.89%, 01/31/08 | 1,714,916 | ||||||
| 878,281 | Rams Funding Three LLC, | ||||||
| 5.386%, 02/11/08 | 878,281 | ||||||
| 430,468 | Ranger Funding Company | ||||||
| LLC, 5.456%, 01/11/08 | 429,848 | ||||||
| 602,655 | Sheffield Receivables, | ||||||
| 6.099%, 01/04/08 | 602,342 | ||||||
| 1,377,498 | Sigma Finance, | ||||||
| 4.62%, 02/11/08 | 1,340,443 | ||||||
| 430,468 | Thunder Bay Funding | ||||||
| LLC, 5.839%, 01/14/08 | 429,676 | ||||||
| 430,468 | Tulip Funding | ||||||
| Corporation, | |||||||
| 5.627%, 01/03/08 | 430,300 | ||||||
| 430,468 | Variable Funding | ||||||
| Capital Corporation, | |||||||
| 5.492%, 01/18/08 | 429,452 | ||||||
| 430,468 | Windmill Funding, | ||||||
| 6.136%, 01/10/08 | 429,904 | ||||||
| 11,399,773 | |||||||
The accompanying notes are an integral part of these financial statements.
Page 61
Baird Core Plus Bond Fund
Schedule of Investments December 31, 2007 |
Shares | Value | ||||||
INVESTMENTS PURCHASED | |||||||
WITH CASH PROCEEDS FROM | |||||||
SECURITIES LENDING – 36.2% (cont.) | |||||||
Money Market Mutual Funds – 3.4% | |||||||
| 2,030,782 | Merrill Lynch Premier | ||||||
| Institutional Fund | $ | 2,030,782 | |||||
| 2,014,517 | Reserve Primary Fund | 2,014,517 | |||||
| 4,045,299 | |||||||
Principal | |||||||
Amount | |||||||
Repurchase Agreements – 21.5% | |||||||
| $ | 2,152,341 | BNP Paribas, 4.70%, | |||||
| Dated 12/31/07, Due | |||||||
| 01/02/08, (Collateralized | |||||||
| by a Fannie Mae | |||||||
| Collateralized Mortgage | |||||||
| Obligation, 6.00%, | |||||||
| 11/01/37, valued at | |||||||
| $2,184,615. | |||||||
| Repurchase proceeds | |||||||
| are $2,152,903.) | 2,152,341 | ||||||
| 4,304,681 | Citigroup, 4.55%, | ||||||
| Dated 12/31/07, Due | |||||||
| 01/02/08, (Collateralized | |||||||
| by various AID – ISRAEL | |||||||
| Government Guaranteed | |||||||
| Zero Coupon Bonds, | |||||||
| 09/15/13 – 11/15/21 and | |||||||
| U.S. Treasury Receipts, | |||||||
| 08/15/13, valued at | |||||||
| $4,402,065. Repurchase | |||||||
| proceeds are $4,305,769.) | 4,304,681 | ||||||
| 4,304,681 | Citigroup, 4.55%, | ||||||
| Dated 12/31/07, Due | |||||||
| 01/02/08, (Collateralized | |||||||
| by various U.S. Treasury | |||||||
| Receipts, 08/15/08 – 08/15/13, | |||||||
| valued at $4,390,775. | |||||||
| Repurchase proceeds | |||||||
| are $4,305,769.) | 4,304,681 | ||||||
| 1,635,779 | Credit Suisse, 4.64%, | ||||||
| Dated 12/31/07, Due | |||||||
| 01/02/08, (Collateralized | |||||||
| by various collateralized | |||||||
| mortgage obligations, | |||||||
| 5.434–6.50%, | |||||||
| 11/25/36 – 01/15/49, | |||||||
| valued at $1,717,626. | |||||||
| Repurchase proceeds | |||||||
| are $1,636,200.) | 1,635,779 | ||||||
| 4,304,681 | Goldman Sachs, 4.62%, | ||||||
| Dated 12/31/07, Due | |||||||
| 01/02/08, (Collateralized | |||||||
| by a Wells Fargo | |||||||
| Collateralized Mortgage | |||||||
| Obligation, 6.00%, | |||||||
| 08/25/37, valued at | |||||||
| $4,386,366. | |||||||
| Repurchase proceeds | |||||||
| are $4,305,786.) | 4,304,681 | ||||||
| 2,152,341 | Morgan Stanley, 4.65%, | ||||||
| Dated 12/31/07, Due | |||||||
| 01/02/08, (Collateralized | |||||||
| by a Morgan Stanley Senior | |||||||
| Subordinated Note, | |||||||
| 4.955%, 09/26/08, | |||||||
| valued at $2,582,809. | |||||||
| Repurchase proceeds | |||||||
| are $2,152,897.) | 2,152,341 | ||||||
The accompanying notes are an integral part of these financial statements.
Page 62
Baird Core Plus Bond Fund
Schedule of Investments December 31, 2007 |
Principal | ||||||||
Amount | Value | |||||||
Repurchase Agreements – 21.5% (cont.) | ||||||||
| $ | 6,284,834 | Morgan Stanley, 4.85%, | ||||||
| Dated 12/31/07, Due | ||||||||
| 01/02/08, (Collateralized | ||||||||
| by a Fannie Mae | ||||||||
| Collateralized Mortgage | ||||||||
| Obligation, 5.315%, | ||||||||
| 09/25/35, valued at | ||||||||
| $6,412,253. | ||||||||
| Repurchase proceeds | ||||||||
| are $6,286,528.) | $ | 6,284,834 | ||||||
| 25,139,338 | ||||||||
| Total Investments | ||||||||
| Purchased With Cash | ||||||||
| Proceeds From | ||||||||
| Securities Lending | ||||||||
| (Cost $42,315,525) | 42,307,040 | |||||||
| Total Investments | ||||||||
| (Cost $157,100,106) – | ||||||||
| 134.9% | 157,663,907 | |||||||
| Liabilities in Excess of | ||||||||
| Other Assets – (34.9)% | (40,768,352 | ) | ||||||
| TOTAL NET | ||||||||
| ASSETS – 100.0% | $ | 116,895,555 | ||||||
| * | Restricted Security Deemed Liquid |
f | Foreign Security |
| # | Fair Valued by Advisor |
The accompanying notes are an integral part of these financial statements.
Page 63
Baird Short-Term Bond Fund
The Baird Short-Term Bond Fund seeks an annual rate of total return, before Fund expenses, greater than the annual rate of total return of the Lehman Brothers 1-3 Year Government/Credit Bond Index. The Lehman Brothers 1-3 Year Government/Credit Bond Index is an unmanaged, market value weighted index of investment grade, fixed-rate debt issues, including government and corporate securities, with maturities between one and three years.
The Fund delivered strong nominal returns in 2007 although it underperformed its benchmark index. The primary factors for the underperformance were:
| • | The Fund’s exposure to AAA-rated mortgage-backed and asset-backed securities which underperformed as general market prices on securities in these sectors weakened; |
| • | Weak performance of specific individual corporate issues, particularly those in the finance and brokerage sector; and |
| • | The Fund’s overweighting of BBB-rated corporate bonds relative to the benchmark, which generally did not perform as well as higher-rated bonds. |
The Fund maintained its duration-neutral strategy, holding a broadly diversified portfolio of over 150 securities at year end.
The Fund ended 2007 with a yield advantage versus its benchmark index. This yield advantage, combined with exposure to specific sectors which we believe have superior total return potential (mortgage-backed and asset-backed securities), enhance the Fund’s prospects of adding value over its benchmark in the coming year.
Portfolio Characteristics
Quality Distribution* | Sector Weightings* |
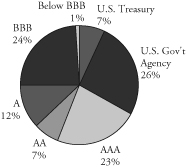 |  |
Net Assets: | $199,090,483 | Annualized Expense Ratio: | |||
SEC 30-Day Yield:** | Institutional Class: | 0.30% | |||
| Institutional Class: | 5.13% | Portfolio Turnover Rate: | 36.6% | ||
Average Effective Duration: | 1.71 years | Total Number of Holdings: | 167 | ||
Average Effective Maturity: | 1.87 years |
| * | Percentages shown are based on the Fund’s total net assets. | |
| ** | SEC yields are based on SEC guidelines and are calculated for the 30 days ended December 31, 2007. |
Page 64
Baird Short-Term Bond Fund
Baird Short-Term Bond Fund – Institutional Class*
Value of a $25,000 Investment
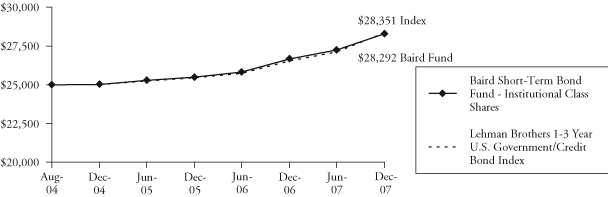
Growth of a hypothetical investment of $25,000 made on the Fund’s inception date (8/31/04), assuming reinvestment of all distributions.
* The Baird Short-Term Bond Fund is currently offering only the Institutional Class shares to investors.
Page 65
Baird Short-Term Bond Fund
Average Annual Total Returns
For the Periods Ended December 31, 2007 | One Year | Since Inception(1) |
| Baird Short-Term Bond Fund – Institutional Class | 6.08% | 3.78% |
Lehman Brothers 1-3 Year Government/Credit Bond Index(2) | 6.83% | 3.85% |
(1) | For the period from August 31, 2004 (commencement of operations) to December 31, 2007. |
(2) | The Lehman Brothers 1-3 Year Government/Credit Bond Index is an unmanaged, market value weighted index of investment grade, fixed-rate debt including government and corporate securities with maturities between one and three years. This index does not reflect any deduction for fees, expenses or taxes. A direct investment in an index is not possible. |
The returns shown in the table above and the line graph on the previous page reflect reinvestment of dividends and/or capital gains distributions in additional shares. Returns do not reflect the deduction of taxes that a shareholder would pay on Fund distributions or the redemption of Fund shares.
Past performance does not guarantee future results. Investment returns and principal value will fluctuate so that an investor’s shares, when redeemed, may be worth more or less than their original cost.
For information about the performance of the Fund as of the most recent month-end, please call 1-866-44BAIRD or visit www.bairdfunds.com. Mutual fund performance changes over time and current performance may be lower or higher than that stated.
Page 66
Baird Short-Term Bond Fund
Schedule of Investments December 31, 2007 |
Principal | |||||||
Amount | Value | ||||||
LONG-TERM INVESTMENTS – 98.3% | |||||||
Asset Backed Securities – 11.3% | |||||||
| $ | 686,667 | AESOP Funding II LLC, | |||||
| Series 2005-1A, Class A1, | |||||||
| 3.95%, 04/20/2009 | |||||||
| (Acquired 02/17/2005 | |||||||
| and 07/27/2007; | |||||||
| Cost $399,964 and | |||||||
| $624,881, respectively)* | $ | 685,635 | |||||
| 240,624 | Bayview Financial | ||||||
| Acquisition Trust, | |||||||
| Series 2005-B, Class 1A2, | |||||||
| 4.696%, 04/28/2039 | 239,449 | ||||||
| 448,796 | CitiFinancial Mortgage | ||||||
| Securities, Inc., | |||||||
| Series 2004-1, Class AF2, | |||||||
| 2.645%, 04/25/2034 | 437,221 | ||||||
| 40,167 | CNH Equipment Trust, | ||||||
| Series 2005-A, Class A3, | |||||||
| 4.02%, 04/15/2009 | 40,150 | ||||||
| Countrywide Asset-Backed | |||||||
| Certificates: | |||||||
| 1,500,000 | Series 2006-S7, Class A2, | ||||||
| 5.571%, 11/25/2035 | 1,410,119 | ||||||
| 1,153,000 | Series 2005-12, Class 1A2, | ||||||
| 4.847%, 02/25/2036 | 1,145,911 | ||||||
| 2,025,000 | Series 2005-13, Class AF2, | ||||||
| 5.294%, 04/25/2036 | 2,008,146 | ||||||
| 70,637 | Series 2005-10, Class AF2, | ||||||
| 4.493%, 07/25/2036 | 70,414 | ||||||
| 2,000,000 | Series 2006-13, | ||||||
| Class 1AF2, 5.884%, | |||||||
| 01/25/2037 | 1,963,843 | ||||||
| 1,245,000 | Series 2006-13, | ||||||
| Class 1AF3, 5.944%, | |||||||
| 01/25/2037 | 1,198,658 | ||||||
| 1,500,000 | Series 2006-9, Class 1AF3, | ||||||
| 5.859%, 10/25/2046 | 1,458,101 | ||||||
| Discover Card | |||||||
| Master Trust I: | |||||||
| 550,000 | Series 2003-4, Class A1, | ||||||
| 5.14%, 05/15/2011 | 549,759 | ||||||
| 1,225,000 | Series 2005-2, Class A, | ||||||
| 5.06%, 04/17/2012 | 1,221,171 | ||||||
| 2,734,911 | Ford Credit Auto | ||||||
| Owner Trust, | |||||||
| Series 2005-B, Class A4, | |||||||
| 4.38%, 01/15/2010 | 2,730,764 | ||||||
| 3,500,000 | GMAC Mortgage | ||||||
| Corporation Loan Trust, | |||||||
| Series 2005-HE3, Class A2, | |||||||
| 5.01%, 02/25/2036 | 3,464,357 | ||||||
| Green Tree Financial | |||||||
| Corporation: | |||||||
| 70,345 | Series 1998-2, Class A5, | ||||||
| 6.24%, 11/01/2016 | 70,362 | ||||||
| 773,083 | Series 1998-3, Class A5, | ||||||
| 6.22%, 03/01/2030 | 807,433 | ||||||
| 1,142,814 | Series 1999-3, Class A6, | ||||||
| 6.50%, 02/01/2031 | 1,146,291 | ||||||
| 1,500,000 | Renaissance Home | ||||||
| Equity Loan Trust, | |||||||
| Series 2007-2, Class AF2, | |||||||
| 5.675%, 06/25/2037 | 1,429,186 | ||||||
| 374,680 | Residential Asset | ||||||
| Mortgage Products, Inc., | |||||||
| Series 2003-RS7, | |||||||
| Class AI6, 5.34%, | |||||||
| 08/25/2033 | 371,164 | ||||||
| 7,282 | Residential Asset | ||||||
| Securities Corporation, | |||||||
| Series 2004-KS4, | |||||||
| Class AI3, 3.08%, | |||||||
| 08/25/2029 | 7,256 | ||||||
The accompanying notes are an integral part of these financial statements.
Page 67
Baird Short-Term Bond Fund
Schedule of Investments December 31, 2007 |
Principal | |||||||
Amount | Value | ||||||
LONG-TERM INVESTMENTS – 98.3% (cont.) | |||||||
Asset Backed Securities – 11.3% (cont.) | |||||||
| $ | 5,167 | Residential Funding | |||||
| Mortgage Securities, | |||||||
| Series 2003-HS3, | |||||||
| Class AI2, 3.15%, | |||||||
| 07/25/2018 | $ | 5,146 | |||||
| 22,460,536 | |||||||
Financial – 19.8% | |||||||
| 1,000,000 | American General Finance | ||||||
| Corporation Notes, | |||||||
| 4.00%, 03/15/2011 | 970,518 | ||||||
| 250,000 | Bank Tokyo – | ||||||
| Mitsubishi UFJ Ltd., | |||||||
8.40%, 04/15/2010 f | 267,920 | ||||||
| 251,000 | Bank United Notes, | ||||||
| 8.00%, 03/15/2009 | 245,054 | ||||||
| 472,000 | Bankers Trust Corporation | ||||||
| Subordinated Notes, | |||||||
| 7.375%, 05/01/2008 | 475,303 | ||||||
| 383,000 | Bayerische Landesbank | ||||||
| Yankee Deposit Notes, | |||||||
5.65%, 02/01/2009 f | 387,309 | ||||||
| 1,550,000 | Bear Stearns Co. | ||||||
| Incorporated, | |||||||
| 2.875%, 07/02/2008 | 1,524,926 | ||||||
| 1,156,000 | BNY Capital I Notes, | ||||||
| 7.97%, 12/31/2026 | |||||||
| (Callable 02/01/2008) | 1,197,466 | ||||||
| 500,000 | Capital One Bank Notes, | ||||||
| 4.875%, 05/15/2008 | 497,124 | ||||||
| 500,000 | Charles Schwab Corporation | ||||||
| Senior Notes, | |||||||
| 8.05%, 03/01/2010 | 534,198 | ||||||
| Citifinancial Debentures: | |||||||
| 1,000,000 | 10.00%, 12/01/2008 | 1,045,161 | |||||
| 375,000 | 10.00%, 05/15/2009 | 399,642 | |||||
| Compass Bank | |||||||
| Subordinated Notes: | |||||||
| 1,000,000 | 6.45%, 05/01/2009 | 1,015,414 | |||||
| 850,000 | 8.10%, 08/15/2009 | 889,187 | |||||
| 388,000 | Corestates Capital Trust I, | ||||||
| 8.00%, 12/15/2026 | |||||||
| (Acquired 01/26/2006 | |||||||
| and 05/31/2006; Cost | |||||||
| $211,938 & $196,930, | |||||||
| respectively)* | 401,704 | ||||||
| 1,000,000 | Countrywide Home | ||||||
| Loans Notes, | |||||||
| 4.125%, 09/15/2009 | 733,519 | ||||||
| 537,000 | Credit Suisse First Boston | ||||||
| USA Inc. Senior Notes, | |||||||
| 6.50%, 06/01/2008 | 539,813 | ||||||
| 175,000 | Export-Import | ||||||
| Bank Korea Notes, | |||||||
4.625%, 03/16/2010 f | 174,880 | ||||||
| 1,000,000 | First Empire Capital Trust I, | ||||||
| 8.234%, 02/01/2027 | |||||||
| (Callable 03/03/2008) | 1,043,369 | ||||||
| 1,500,000 | First National Bank of | ||||||
| Omaha Subordinated Notes, | |||||||
| 7.32%, 12/01/2010 | 1,607,949 | ||||||
| 800,000 | First Union Capital, | ||||||
| 7.935%, 01/15/2027 | |||||||
| (Callable 03/06/2008) | 831,702 | ||||||
| 200,000 | Franchise Finance | ||||||
| Corporation Notes, | |||||||
| 7.07%, 01/15/2008 | 200,127 | ||||||
| 273,000 | Goldman Sachs | ||||||
| Group, Inc. Senior | |||||||
| Unsubordinated Notes, | |||||||
| 7.80%, 01/28/2010 | 288,283 | ||||||
| 350,000 | HSBC Finance Corporation, | ||||||
| 4.98%, 05/21/2008 | 349,959 | ||||||
The accompanying notes are an integral part of these financial statements.
Page 68
Baird Short-Term Bond Fund
Schedule of Investments December 31, 2007 |
Principal | |||||||
Amount | Value | ||||||
LONG-TERM INVESTMENTS – 98.3% (cont.) | |||||||
Financial – 19.8% (cont.) | |||||||
| $ | 1,500,000 | HSBC USA Capital Trust | |||||
| II, 8.38%, 05/15/2027 | |||||||
| (Callable 02/28/2008) | |||||||
| (Acquired 11/06/2007; | |||||||
| Cost $1,562,192)* | $ | 1,565,471 | |||||
| 575,000 | Key Bank NA | ||||||
| Subordinated Notes, | |||||||
| 6.50%, 10/15/2027 | |||||||
| (Callable and Putable | |||||||
| 04/15/2008) | 577,102 | ||||||
| 600,000 | Korea Development | ||||||
| Bank Notes, | |||||||
3.875%, 03/02/2009 f | 590,691 | ||||||
| 400,000 | Lehman Brothers | ||||||
| Holdings, Inc. Notes, | |||||||
| 3.50%, 08/07/2008 | 394,558 | ||||||
| 1,300,000 | Marsh & McLennan Cos, | ||||||
| Inc., 3.625%, 02/15/2008 | 1,296,837 | ||||||
| 2,671,000 | MBNA Capital Series A, | ||||||
| 8.278%, 12/01/2026 | |||||||
| (Callable 03/03/2008) | 2,777,421 | ||||||
| 438,000 | Morgan Stanley, | ||||||
| 8.00%, 06/15/2010 | 467,824 | ||||||
| 720,000 | NB Capital Trust IV, | ||||||
| 8.25%, 04/15/2027 | |||||||
| (Callable 03/03/2008) | 747,720 | ||||||
| 625,000 | New York Life | ||||||
| Global Funding, | |||||||
| 3.875%, 01/15/2009 | |||||||
| (Acquired 01/23/2006; | |||||||
| Cost $608,075)* | 621,375 | ||||||
| 1,000,000 | North Fork Capital Trust II, | ||||||
| 8.00%, 12/15/2027 | |||||||
| (Callable 03/03/2008) | 942,239 | ||||||
| 1,200,000 | Phoenix Companies, | ||||||
| 6.675%, 02/16/2008 | 1,201,416 | ||||||
| 1,333,000 | PNC Financial Services | ||||||
| Subordinated Notes, | |||||||
| 9.65%, 06/15/2009 | 1,431,213 | ||||||
| 1,050,000 | PNC Funding | ||||||
| Corporation, | |||||||
| 6.125%, 02/15/2009 | 1,056,957 | ||||||
| Popular North | |||||||
| America, Inc.: | |||||||
| 1,530,000 | 4.25%, 04/01/2008 | 1,526,727 | |||||
| 365,000 | 4.70%, 06/30/2009 | 361,403 | |||||
| 1,500,000 | Premium Asset Senior | ||||||
| Notes, 4.125%, 03/12/2009 | |||||||
| (Acquired 05/10/2007; | |||||||
| Cost $1,440,000)* | 1,466,991 | ||||||
| 275,000 | Principal Life Global, | ||||||
| 3.625%, 04/30/2008 | |||||||
| (Acquired 08/17/2005; | |||||||
| Cost $268,452)* | 273,266 | ||||||
| 455,000 | Republic New York | ||||||
| Corporation Subordinated | |||||||
| Notes, 9.70%, 02/01/2009 | 476,577 | ||||||
| 1,050,000 | Residential | ||||||
| Capital Corporation, | |||||||
| 6.125%, 11/21/2008 | 834,750 | ||||||
| 550,000 | Santander Financial | ||||||
| Issuances, | |||||||
6.375%, 02/15/2011 f | 581,621 | ||||||
| 1,200,000 | Transamerica | ||||||
| Corporation Debentures, | |||||||
| 9.375%, 03/01/2008 | 1,206,342 | ||||||
| 850,000 | Unum Group, | ||||||
| 5.859%, 05/15/2009 | 865,457 | ||||||
| 185,000 | Wachovia Corporation, | ||||||
| 6.30%, 04/15/2008 | 185,336 | ||||||
| 1,000,000 | Washington Mutual, Inc., | ||||||
| 4.375%, 01/15/2008 | 996,959 | ||||||
The accompanying notes are an integral part of these financial statements.
Page 69
Baird Short-Term Bond Fund
Schedule of Investments December 31, 2007 |
Principal | |||||||
Amount | Value | ||||||
LONG-TERM INVESTMENTS – 98.3% (cont.) | |||||||
Financial – 19.8% (cont.) | |||||||
| $ | 1,175,000 | Western Financial Bank | |||||
| Subordinated Debentures, | |||||||
| 9.625%, 05/15/2012 | |||||||
| (Callable 05/15/2009) | $ | 1,263,763 | |||||
| 39,330,543 | |||||||
Industrial – 16.4% | |||||||
| 1,500,000 | American Standard Inc., | ||||||
| 7.375%, 02/01/2008 | 1,501,790 | ||||||
| 150,000 | BellSouth | ||||||
| Telecommunication | |||||||
| Debentures, | |||||||
| 5.875%, 01/15/2009 | 151,427 | ||||||
| 225,000 | British Telecom PLC Notes, | ||||||
8.625%, 12/15/2010 f | 246,904 | ||||||
| 1,050,000 | Bunge Limited Finance | ||||||
| Corporation, | |||||||
| 4.375%, 12/15/2008 | 1,043,067 | ||||||
| 874,000 | Cadbury Schweppes | ||||||
| U.S. Finance Notes, | |||||||
| 3.875%, 10/01/2008 | |||||||
| (Acquired 08/30/2005 | |||||||
| and 02/14/2007; Cost | |||||||
| $685,461 and $170,084, | |||||||
| respectively)* | 868,705 | ||||||
| 500,000 | Clear Channel | ||||||
| Communications | |||||||
| Senior Notes, | |||||||
| 7.65%, 09/15/2010 | 513,598 | ||||||
| 450,000 | Comcast Cable | ||||||
| Communications, Inc. | |||||||
| Notes, 6.20%, 11/15/2008 | 453,662 | ||||||
| 1,570,000 | Computer Sciences | ||||||
| Corporation Notes, | |||||||
| 3.50%, 04/15/2008 | 1,560,552 | ||||||
| COX Communications | |||||||
| Inc. Notes: | |||||||
| 1,000,000 | 3.875%, 10/01/2008 | 988,723 | |||||
| 581,000 | 7.875%, 08/15/2009 | 607,852 | |||||
| 1,000,000 | Daimler Finance NA LLC, | ||||||
| 4.75%, 01/15/2008 | 999,781 | ||||||
| 662,000 | Devon Energy | ||||||
| Corporation Debentures, | |||||||
| 10.125%, 11/15/2009 | 726,143 | ||||||
| 1,000,000 | Donnelley (R.R.) | ||||||
| & Sons Notes, | |||||||
| 3.75%, 04/01/2009 | 982,225 | ||||||
| Fiserv Inc.: | |||||||
| 1,000,000 | 3.00%, 06/27/2008 | 990,538 | |||||
| 500,000 | 6.125%, 11/20/2012 | 508,899 | |||||
| 1,423,000 | FMC Corporation Notes, | ||||||
| 7.00%, 05/15/2008 | 1,430,343 | ||||||
| 300,000 | Ford Motor Credit | ||||||
| Company Senior Notes, | |||||||
| 4.95%, 01/15/2008 | 299,800 | ||||||
| Halliburton | |||||||
| Company Notes: | |||||||
| 225,000 | 5.625%, 12/01/2008 | 226,327 | |||||
| 500,000 | 5.50%, 10/15/2010 | 513,976 | |||||
| 675,000 | International Paper | ||||||
| Company Notes, | |||||||
| 4.00%, 04/01/2010 | 668,337 | ||||||
| 1,000,000 | Johnson Controls Inc. | ||||||
| Notes, 6.30%, 02/01/2008 | 1,000,463 | ||||||
| 395,000 | Macy’s Retail Holdings | ||||||
| Inc., 6.625%, 09/01/2008 | 398,007 | ||||||
| 1,371,000 | Marathon Oil Corporation | ||||||
| Notes, 6.85%, 03/01/2008 | 1,375,219 | ||||||
| 450,000 | News America Holdings, | ||||||
| 7.375%, 10/17/2008 | 457,162 | ||||||
The accompanying notes are an integral part of these financial statements.
Page 70
Baird Short-Term Bond Fund
Schedule of Investments December 31, 2007 |
Principal | |||||||
Amount | Value | ||||||
LONG-TERM INVESTMENTS – 98.3% (cont.) | |||||||
Industrial – 16.4% (cont.) | |||||||
| PEMEX Project Funding | |||||||
Master Trust: f | |||||||
| $ | 7,000 | 6.125%, 08/15/2008 | $ | 7,022 | |||
| 400,000 | 9.125%, 10/13/2010 | 442,000 | |||||
| 1,640,000 | Premcor Refining Group | ||||||
| Inc. Senior Notes, | |||||||
| 9.50%, 02/01/2013 | |||||||
| (Callable 02/01/2008) | 1,721,472 | ||||||
| 1,575,000 | Sealed Air Corporation | ||||||
| Senior Notes, | |||||||
| 5.375%, 04/15/2008 | |||||||
| (Acquired 07/07/2006 | |||||||
| and 05/04/2007; | |||||||
| Cost $989,890 and | |||||||
| $574,425, respectively)* | 1,574,105 | ||||||
| Sprint Capital | |||||||
| Corporation Notes: | |||||||
| 1,000,000 | 6.125%, 11/15/2008 | 1,001,239 | |||||
| 500,000 | 6.375%, 05/01/2009 | 502,521 | |||||
| 1,500,000 | Telecom Italia Capital, | ||||||
4.00%, 11/15/2008 f | 1,480,631 | ||||||
| 1,145,000 | Thomson Corporation, | ||||||
5.75%, 02/01/2008 f | 1,144,691 | ||||||
| 750,000 | Time Warner Companies, | ||||||
| Inc. Debentures, | |||||||
| 7.48%, 01/15/2008 | 750,227 | ||||||
| 1,600,000 | Transocean Inc., | ||||||
5.341%, 09/05/2008 f | |||||||
| (Callable 02/28/2008) | 1,592,022 | ||||||
| 383,848 | United AirLines, Inc. | ||||||
| Pass-Thru Certificates, | |||||||
| Series 2001-1, | |||||||
| 6.201%, 09/01/2008 | 381,929 | ||||||
| 1,600,000 | Viacom, Inc. Senior Notes, | ||||||
| 7.70%, 07/30/2010 | 1,698,614 | ||||||
| 1,105,000 | Vodafone Group PLC, | ||||||
7.75%, 02/15/2010 f | 1,165,652 | ||||||
| Waste Management, Inc.: | |||||||
| 550,000 | 6.50%, 11/15/2008 | 557,084 | |||||
| 200,000 | 6.875%, 05/15/2009 | 205,333 | |||||
| 32,738,042 | |||||||
Mortgage Backed Securities – 17.7% | |||||||
| 906,186 | Bank of America | ||||||
| Alternative Loan Trust, | |||||||
| Series 2003-4, Class 2A1, | |||||||
| 5.00%, 06/25/2018 | 883,841 | ||||||
| Citicorp Mortgage | |||||||
| Securities, Inc.: | |||||||
| 248,209 | Series 2003-11, Class 2A8, | ||||||
| 5.50%, 12/25/2033 | 248,344 | ||||||
| 731,218 | Series 2004-3, Class A2, | ||||||
| 5.25%, 05/25/2034 | 728,330 | ||||||
| 424,633 | Series 2004-4, Class A2, | ||||||
| 5.25%, 06/25/2034 | 416,572 | ||||||
| Countrywide Alternative | |||||||
| Loan Trust: | |||||||
| 1,350,201 | Series 2005-50CB, | ||||||
| Class 4A1, 5.00%, | |||||||
| 11/25/2020 | 1,311,101 | ||||||
| 1,895,152 | Series 2005-34CB, | ||||||
| Class 1A6, 5.50%, | |||||||
| 09/25/2035 | 1,891,987 | ||||||
| 897,314 | Series 2005-73CB, | ||||||
| Class 1A7, 5.50%, | |||||||
| 01/25/2036 | 894,039 | ||||||
| 1,362,382 | Series 2006-28CB, | ||||||
| Class A17, 6.00%, | |||||||
| 10/25/2036 | 1,359,872 | ||||||
| 1,581,947 | Credit Suisse First Boston | ||||||
| Mortgage Securities Corp., | |||||||
| Series 1998-C2, Class A2, | |||||||
| 6.30%, 11/15/2030 | 1,591,187 | ||||||
The accompanying notes are an integral part of these financial statements.
Page 71
Baird Short-Term Bond Fund
Schedule of Investments December 31, 2007 |
Principal | |||||||
Amount | Value | ||||||
LONG-TERM INVESTMENTS – 98.3% (cont.) | |||||||
Mortgage Backed Securities – 17.7% (cont.) | |||||||
| Deutsche Alternative | |||||||
| Securities Inc. Mortgage: | |||||||
| $ | 854,643 | Series 2003-3, Class 2A5, | |||||
| 5.00%, 10/25/2033 | $ | 849,437 | |||||
| 2,075,000 | Series 2005-4, Class A2, | ||||||
| 5.05%, 09/25/2035 | 2,057,559 | ||||||
| 1,692,450 | DLJ Commercial | ||||||
| Mortgage Corporation, | |||||||
| Series 1999-CG3, | |||||||
| Class A1B, 7.34%, | |||||||
| 10/10/2032 | 1,754,843 | ||||||
| Federal Home Loan | |||||||
| Mortgage Corporation | |||||||
| (FHLMC): | |||||||
| 82,669 | Series 2548, Class HA, | ||||||
| 4.50%, 01/15/2010 | 82,449 | ||||||
| 565,078 | Series 2835, Class VK, | ||||||
| 5.50%, 11/15/2012 | 572,363 | ||||||
| 870,310 | Series 3033, Class LU, | ||||||
| 5.50%, 03/15/2013 | 886,998 | ||||||
| 2,396,513 | Series 3124, Class VP, | ||||||
| 6.00%, 06/15/2014 | 2,459,307 | ||||||
| 3,547,259 | Series R014, Class AL, | ||||||
| 5.50%, 10/15/2014 | 3,589,580 | ||||||
| 293,715 | Series 2789, Class VM, | ||||||
| 5.50%, 04/15/2015 | 298,014 | ||||||
| 1,000,000 | Series 2390, Class PW, | ||||||
| 6.00%, 04/15/2015 | 1,011,228 | ||||||
| 202,374 | Series 2541, Class JB, | ||||||
| 5.00%, 02/15/2016 | 202,694 | ||||||
| 574,563 | Series 2970, Class DA, | ||||||
| 5.50%, 01/15/2023 | 582,679 | ||||||
| Federal National Mortgage | |||||||
| Association (FNMA): | |||||||
| 1,000,000 | Series 2003-27, Class OJ, | ||||||
| 5.00%, 07/25/2015 | 1,000,492 | ||||||
| 1,152,729 | Series 2003-24, Class LC, | ||||||
| 5.00%, 12/25/2015 | 1,153,142 | ||||||
| 807,948 | Series 2006-B1, Class AB, | ||||||
| 6.00%, 06/25/2016 | 819,611 | ||||||
| 36,440 | Series 2002-77, Class QP, | ||||||
| 5.00%, 09/25/2026 | 36,362 | ||||||
| 1,768,552 | Series 2004-W6, Class 1A4, | ||||||
| 5.50%, 07/25/2034 | 1,768,751 | ||||||
| 2,000,000 | Series 2004-W10, | ||||||
| Class A24, 5.00%, | |||||||
| 08/25/2034 | 1,994,781 | ||||||
| 2,000,000 | J.P. Morgan | ||||||
| Alternative Loan Trust, | |||||||
| Series 2006-S2, Class A2, | |||||||
| 5.81%, 05/25/2036 | 1,993,654 | ||||||
| 624,234 | Merrill Lynch Mortgage | ||||||
| Investors Inc., | |||||||
| Series 2005-A8, Class A1C1, | |||||||
| 5.25%, 08/25/2036 | 621,293 | ||||||
| 976,810 | Residential Accredit Loans | ||||||
| Inc., Series 2003-QS17, | |||||||
| Class CB3, 5.50%, | |||||||
| 09/25/2033 | 973,156 | ||||||
| Washington Mutual, Inc. | |||||||
| Pass-Thru Certificates: | |||||||
| 640,725 | Series 2004-CB4, | ||||||
| Class 21A, 5.50%, | |||||||
| 12/25/2019 | 643,511 | ||||||
| 561,859 | Series 2004-CB4, | ||||||
| Class 22A, 6.00%, | |||||||
| 12/25/2019 | 572,333 | ||||||
| 35,249,510 | |||||||
Taxable Municipal Bonds – 2.2% | |||||||
| 505,591 | Educational Enhancement | ||||||
| Funding Corporation, | |||||||
| 6.72%, 06/01/2025 | 501,162 | ||||||
The accompanying notes are an integral part of these financial statements.
Page 72
Baird Short-Term Bond Fund
Schedule of Investments December 31, 2007 |
Principal | |||||||
Amount | Value | ||||||
LONG-TERM INVESTMENTS – 98.3% (cont.) | |||||||
Taxable Municipal Bonds – 2.2% (cont.) | |||||||
| $ | 650,000 | Missouri State Housing | |||||
| Development Revenue | |||||||
| Bond, 5.74%, | |||||||
| 03/01/2037 | $ | 654,303 | |||||
| 1,500,000 | Pennsylvania State | ||||||
| Turnpike Commission, | |||||||
| 5.29%, 10/15/2009 | 1,508,085 | ||||||
| 385,000 | Redding California | ||||||
| Redevelopment Agency | |||||||
| Tax Allocation, | |||||||
| 6.00%, 09/01/2010 | 390,629 | ||||||
| 370,000 | Richmond Joint Powers | ||||||
| Financing Authority Tax | |||||||
| Allocation, | |||||||
| 7.35%, 09/01/2010 | 382,569 | ||||||
| 886,259 | Tobacco Settlement | ||||||
| Financing Corporation, | |||||||
| Series 2001-A, Class A, | |||||||
| 6.36%, 05/15/2025 | 856,790 | ||||||
| 4,293,538 | |||||||
Utilities – 6.3% | |||||||
| 1,000,000 | Baltimore Gas & Electric | ||||||
| Company Notes, | |||||||
| 5.78%, 10/01/2008 | 1,003,697 | ||||||
| 940,000 | Cilcorp Inc. Senior Notes, | ||||||
| 8.70%, 10/15/2009 | 987,752 | ||||||
| 1,610,000 | Commonwealth | ||||||
| Edison Notes, | |||||||
| 3.70%, 02/01/2008 | 1,607,957 | ||||||
| 1,500,000 | Consumers Energy | ||||||
| Company, Series C, | |||||||
| 4.25%, 04/15/2008 | 1,494,962 | ||||||
| 255,000 | Dominion Resources Inc., | ||||||
| 5.687%, 05/15/2008 | 255,564 | ||||||
| 1,000,000 | Kinder Morgan Energy | ||||||
| Partners Senior Notes, | |||||||
| 6.30%, 02/01/2009 | 1,012,936 | ||||||
| 500,000 | MidAmerican Energy | ||||||
| Holdings Company | |||||||
| Senior Notes, | |||||||
| 7.52%, 09/15/2008 | 507,390 | ||||||
| 1,000,000 | NiSource Finance | ||||||
| Corporation, | |||||||
| 7.875%, 11/15/2010 | 1,060,820 | ||||||
| 1,682,000 | Panhandle Eastern | ||||||
| Pipeline Senior Notes, | |||||||
| 4.80%, 08/15/2008 | 1,674,241 | ||||||
| 1,000,000 | Pepco Holdings, Inc. | ||||||
| Notes, 6.246%, | |||||||
| 06/01/2010 (Callable | |||||||
| 03/03/2008) | 997,551 | ||||||
| 350,000 | PPL Capital Funding | ||||||
| Trust I, Series A, | |||||||
| 4.33%, 03/01/2009 | 347,446 | ||||||
| 250,000 | PSE&G Power LLC, | ||||||
| 3.75%, 04/01/2009 | 247,110 | ||||||
| 598,000 | Texas-New Mexico Power | ||||||
| Co., 6.125%, 06/01/2008 | |||||||
| (Callable 03/03/2008) | 596,616 | ||||||
| 750,000 | TXU Corporation, | ||||||
| 6.375%, 01/01/2008 | 750,000 | ||||||
| 12,544,042 | |||||||
U.S. Government Agency Issues – 17.6% | |||||||
| 1,000,000 | Federal Home Loan | ||||||
| Bank (FHLB), | |||||||
| 4.70%, 10/07/2010 | 1,000,057 | ||||||
The accompanying notes are an integral part of these financial statements.
Page 73
Baird Short-Term Bond Fund
Schedule of Investments December 31, 2007 |
Principal | |||||||
Amount | Value | ||||||
LONG-TERM INVESTMENTS – 98.3% (cont.) | |||||||
U.S. Government Agency Issues – 17.6% (cont.) | |||||||
| Federal National Mortgage | |||||||
| Association (FNMA): | |||||||
| $ | 26,500,000 | 6.00%, 05/15/2011 | $ | 28,437,309 | |||
| 5,000,000 | 4.375%, 03/15/2013 | 5,089,270 | |||||
| 600,405 | 5.50%, 07/01/2015 | 617,857 | |||||
| 35,144,493 | |||||||
U.S. Treasury Obligations – 7.0% | |||||||
| 13,250,000 | U.S. Treasury Note, | ||||||
| 4.875%, 04/30/2011 | 13,955,973 | ||||||
| Total Long-Term | |||||||
| Investments | |||||||
| (Cost $194,420,318) | 195,716,677 | ||||||
Shares | |||||||
SHORT-TERM INVESTMENTS – 1.3% | |||||||
Money Market Fund – 1.3% | |||||||
| 2,594,783 | Short-Term Investment | ||||||
| Company Liquid Assets | |||||||
| Portfolio – AIM Fund | 2,594,783 | ||||||
| Total Short-Term | |||||||
| Investments | |||||||
| (Cost $2,594,783) | 2,594,783 | ||||||
Principal | |||||||
Amount | |||||||
INVESTMENTS PURCHASED | |||||||
WITH CASH PROCEEDS FROM | |||||||
SECURITIES LENDING – 27.1% | |||||||
Certificate of Deposit – 1.1% | |||||||
| $ | 2,199,380 | Barclays Bank, | |||||
| 5.15%, 2/12/08 | 2,200,347 | ||||||
Commercial Paper – 7.3% | |||||||
| 1,649,535 | Alianz Finance | ||||||
| Corporation, | |||||||
| 5.06%, 01/16/08 | 1,646,071 | ||||||
| Atlantic Asset | |||||||
| Securitization Corp.: | |||||||
| 329,907 | 6.13%, 01/04/08 | 329,735 | |||||
| 549,845 | 5.447%, 01/25/08 | 548,041 | |||||
| 549,845 | Barton Capital | ||||||
| Corporation, | |||||||
| 5.835%, 01/10/08 | 549,125 | ||||||
| 549,845 | GovCo LLC, | ||||||
| 5.584%, 01/15/08 | 548,762 | ||||||
| 1,438,101 | KKR Atlantic | ||||||
| Funding Trust, | |||||||
| 5.205%, 03/13/08 # | 1,415,168 | ||||||
| 988,401 | Kitty Hawk | ||||||
| Funding Corp., | |||||||
| 5.323%, 01/25/08 | 985,159 | ||||||
| 2,199,380 | Kommunalkredit Austria | ||||||
| AG, 4.89%, 01/31/08 | 2,190,494 | ||||||
| 1,121,845 | Rams Funding Three | ||||||
| LLC, 5.386%, 02/11/08 | 1,121,845 | ||||||
| 549,845 | Ranger Funding Company | ||||||
| LLC, 5.456%, 01/11/08 | 549,053 | ||||||
| 769,783 | Sheffield Receivables, | ||||||
| 6.099%, 01/04/08 | 769,383 | ||||||
| 1,759,504 | Sigma Finance, | ||||||
| 4.62%, 02/11/08 | 1,712,173 | ||||||
| 549,845 | Thunder Bay Funding | ||||||
| LLC, 5.839%, 01/14/08 | 548,833 | ||||||
| 549,845 | Tulip Funding Corporation, | ||||||
| 5.627%, 01/03/08 | 549,630 | ||||||
The accompanying notes are an integral part of these financial statements.
Page 74
Baird Short-Term Bond Fund
Schedule of Investments December 31, 2007 |
Principal | |||||||
Amount | Value | ||||||
INVESTMENTS PURCHASED | |||||||
WITH CASH PROCEEDS FROM | |||||||
SECURITIES LENDING – 27.1% (cont.) | |||||||
Commercial Paper – 7.3% (cont.) | |||||||
| $ | 549,845 | Variable Funding | |||||
| Capital Corporation, | |||||||
| 5.492%, 01/18/08 | $ | 548,547 | |||||
| 549,845 | Windmill Funding, | ||||||
| 6.136%, 01/10/08 | 549,125 | ||||||
| 14,561,144 | |||||||
Shares | |||||||
Money Market Mutual Funds – 2.6% | |||||||
| 2,593,956 | Merrill Lynch Premier | ||||||
| Institutional Fund | 2,593,956 | ||||||
| 2,573,180 | Reserve Primary Fund | 2,573,180 | |||||
| 5,167,136 | |||||||
Principal | |||||||
Amount | |||||||
Repurchase Agreements – 16.1% | |||||||
| $ | 2,749,225 | BNP Paribas, 4.70%, | |||||
| Dated 12/31/07, Due | |||||||
| 01/02/08, (Collateralized | |||||||
| by a Fannie Mae | |||||||
| Collateralized Mortgage | |||||||
| Obligation, 6.00%, | |||||||
| 11/01/37, valued at | |||||||
| $2,790,450. | |||||||
| Repurchase proceeds | |||||||
| are $2,749,943.) | 2,749,225 | ||||||
| 5,498,449 | Citigroup, 4.55%, Dated | ||||||
| 12/31/07, Due 01/02/08, | |||||||
| (Collateralized by various | |||||||
| AID – ISRAEL | |||||||
| Government Guaranteed | |||||||
| Zero Coupon Bonds, | |||||||
| 09/15/13 – 11/15/21 | |||||||
| and U.S. Treasury | |||||||
| Receipts, 08/15/13, | |||||||
| valued at $5,622,839. | |||||||
| Repurchase proceeds | |||||||
| are $5,499,839.) | 5,498,449 | ||||||
| 5,498,449 | Citigroup, 4.55%, Dated | ||||||
| 12/31/07, Due 01/02/08, | |||||||
| (Collateralized by various | |||||||
| U.S. Treasury Receipts, | |||||||
| 08/15/08 – 08/15/13, | |||||||
| valued at $5,608,418. | |||||||
| Repurchase proceeds | |||||||
| are $5,499,839.) | 5,498,449 | ||||||
| 2,089,411 | Credit Suisse, 4.64%, | ||||||
| Dated 12/31/07, Due | |||||||
| 01/02/08, (Collateralized | |||||||
| by various collateralized | |||||||
| mortgage obligations, | |||||||
| 5.434–6.50%, | |||||||
| 11/25/36 – 01/15/49, | |||||||
| valued at $2,193,956. | |||||||
| Repurchase proceeds | |||||||
| are $2,089,949.) | 2,089,411 | ||||||
The accompanying notes are an integral part of these financial statements.
Page 75
Baird Short-Term Bond Fund
Schedule of Investments December 31, 2007 |
Principal | |||||||
Amount | Value | ||||||
INVESTMENTS PURCHASED | |||||||
WITH CASH PROCEEDS FROM | |||||||
SECURITIES LENDING – 27.1% (cont.) | |||||||
Repurchase Agreements – 16.1% (cont.) | |||||||
| $ | 5,498,449 | Goldman Sachs, 4.62%, | |||||
| Dated 12/31/07, Due | |||||||
| 01/02/08, (Collateralized | |||||||
| by a Wells Fargo | |||||||
| Collateralized Mortgage | |||||||
| Obligation, 6.00%, | |||||||
| 08/25/37, valued at | |||||||
| $5,602,787. | |||||||
| Repurchase proceeds | |||||||
| are $5,499,861.) | $ | 5,498,449 | |||||
| 2,749,225 | Morgan Stanley, 4.65%, | ||||||
| Dated 12/31/07, Due | |||||||
| 01/02/08, (Collateralized | |||||||
| by a Morgan Stanley Senior | |||||||
| Subordinated Note, | |||||||
| 4.955%, 09/26/08, valued | |||||||
| at $3,299,070. | |||||||
| Repurchase proceeds | |||||||
| are $2,749,935.) | 2,749,225 | ||||||
| 8,027,736 | Morgan Stanley, 4.85%, | ||||||
| Dated 12/31/07, Due | |||||||
| 01/02/08, (Collateralized | |||||||
| by a Fannie Mae | |||||||
| Collateralized Mortgage | |||||||
| Obligation, 5.315%, | |||||||
| 09/25/35, valued at | |||||||
| $8,190,490. Repurchase | |||||||
| proceeds are $8,029,899.) | 8,027,736 | ||||||
| 32,110,944 | |||||||
| Total Investments | |||||||
| Purchased With Cash | |||||||
| Proceeds From | |||||||
| Securities Lending | |||||||
| (Cost $54,066,475) | 54,039,571 | ||||||
| Total Investments | |||||||
| (Cost $251,081,576) – | |||||||
| 126.7% | 252,351,031 | ||||||
| Liabilities in Excess of | |||||||
| Other Assets – (26.7)% | (53,260,548 | ) | |||||
| TOTAL NET | |||||||
| ASSETS – 100.0% | $ | 199,090,483 | |||||
| * | Restricted Security Deemed Liquid |
f | Foreign Security |
| # | Fair Valued by Advisor |
The accompanying notes are an integral part of these financial statements.
Page 76
Baird Funds, Inc.
Additional Information on Fund Expenses December 31, 2007 |
Example
As a shareholder of a mutual fund, you incur two types of costs: (1) transaction costs, which may include sales charges (loads) on purchase payments, reinvested dividends, or other distributions; redemption fees; and exchange fees; and (2) ongoing costs, such as management fees; distribution and/or service (12b-1) fees; and other fund expenses. Although the Funds do not charge any sales loads, redemption fees, or other transaction fees, you will be assessed fees for outgoing wire transfers, returned checks and stop payment orders at prevailing rates charged by U.S. Bancorp Fund Services, LLC, the Funds’ transfer agent. If you request that a redemption be made by wire transfer, currently the Funds’ transfer agent charges a $15.00 fee.
This Example is intended to help you understand your ongoing costs (in dollars) of investing in each Fund and to compare these costs with the ongoing costs of investing in other mutual funds. The Example is based on an investment of $1,000 invested at the beginning of the period and held for the entire period (7/1/07 – 12/31/07).
Actual Expenses
The third and fourth columns of the following table provide information about account values based on actual returns and actual expenses. You may use the information in these columns, together with the amount you invested, to estimate the expenses that you paid over the period. Simply divide your account value by $1,000 (for example, an $8,600 account value divided by $1,000 = 8.6), then multiply the result by the number in the fourth column entitled “Expenses Paid During Period’’ to estimate the expenses you paid on your account during this period.
Hypothetical Example for Comparison Purposes
The fifth and sixth columns of the following table provide information about hypothetical account values and hypothetical expenses based on the Funds’ actual expense ratios and an assumed rate of return of 5% per year before expenses, which is not the Funds’ actual return. The hypothetical account values and expenses may not be used to estimate the actual ending account balance or expenses you paid for the period. You may use this information to compare the ongoing costs of investing in the Funds and other mutual funds. To do so, compare this 5% hypothetical example with the 5% hypothetical examples that appear in the shareholder reports of the other mutual funds. Please note that the expenses shown in the table are meant to highlight your ongoing costs only and do not reflect any transactional costs. Therefore, the sixth column of the table (entitled “Expenses Paid During Period”) is useful in comparing ongoing costs only, and will not help you determine the relative total costs of owning different mutual funds. In addition, if these transactional costs were included, your costs could have been higher.
Page 77
Baird Funds, Inc.
Additional Information on Fund Expenses December 31, 2007 |
Actual vs. Hypothetical Returns
For the Six Months Ended December 31, 2007
Hypothetical (5% return | ||||||
Actual | before expenses) | |||||
Fund’s | Beginning | Ending | Expenses | Ending | Expenses | |
Annualized | Account | Account | Paid | Account | Paid | |
Expense | Value | Value | During | Value | During | |
Ratio(1) | 7/1/07 | 12/31/07 | Period(1) | 12/31/07 | Period(1) | |
Baird Intermediate Bond Fund | ||||||
| Institutional Class | 0.30% | $1,000.00 | $1,046.10 | $1.55 | $1,023.69 | $1.53 |
| Investor Class | 0.55% | $1,000.00 | $1,044.40 | $2.83 | $1,022.43 | $2.80 |
Baird Aggregate Bond Fund | ||||||
| Institutional Class | 0.30% | $1,000.00 | $1,043.10 | $1.55 | $1,023.69 | $1.53 |
| Investor Class | 0.55% | $1,000.00 | $1,042.00 | $2.83 | $1,022.43 | $2.80 |
Baird Intermediate Municipal | ||||||
Bond Fund | ||||||
| Institutional Class | 0.30% | $1,000.00 | $1,046.00 | $1.55 | $1,023.69 | $1.53 |
| Investor Class | 0.55% | $1,000.00 | $1,044.90 | $2.83 | $1,022.43 | $2.80 |
Baird Core Plus Bond Fund | ||||||
| Institutional Class | 0.30% | $1,000.00 | $1,045.80 | $1.55 | $1,023.69 | $1.53 |
| Investor Class | 0.55% | $1,000.00 | $1,044.40 | $2.83 | $1,022.43 | $2.80 |
Baird Short-Term Bond Fund | ||||||
| Institutional Class | 0.30% | $1,000.00 | $1,038.50 | $1.55 | $1,023.69 | $1.53 |
(1) | Expenses are equal to the Fund’s annualized expense ratio multiplied by the average account value over the period, multiplied by 184 days and divided by 365 to reflect the one-half year period. |
Page 78
Baird Funds, Inc.
Statements of Assets and Liabilities December 31, 2007 |
Baird | ||||||||||||||||||||||
Baird | Baird | Intermediate | Baird | Baird | ||||||||||||||||||
Intermediate | Aggregate | Municipal | Core Plus | Short-Term | ||||||||||||||||||
Bond Fund | Bond Fund | Bond Fund | Bond Fund | Bond Fund | ||||||||||||||||||
ASSETS: | ||||||||||||||||||||||
| Investments, at value (cost $460,447,762; | ||||||||||||||||||||||
| $816,798,562; $103,533,799; $131,960,768; | ||||||||||||||||||||||
| & $218,970,632, respectively) | $ | 462,549,960 | $ | 819,934,044 | $ | 105,253,283 | $ | 132,524,569 | $ | 220,240,087 | ||||||||||||
| Repurchase agreements | ||||||||||||||||||||||
| (cost $90,809,205; $128,420,694; $0; | ||||||||||||||||||||||
| $25,139,338; & $32,110,944, respectively) | 90,809,205 | 128,420,694 | — | 25,139,338 | 32,110,944 | |||||||||||||||||
| Uninvested cash | — | 7,950 | — | — | 8,577 | |||||||||||||||||
| Interest receivable | 4,326,811 | 7,358,830 | 1,722,767 | 1,130,601 | 1,960,974 | |||||||||||||||||
| Receivable for investments sold | 12,689 | 7,613 | — | 2,538 | 21,590 | |||||||||||||||||
| Receivable for Fund shares sold | 205,000 | 1,874,075 | 71,586 | 490,089 | 279,422 | |||||||||||||||||
| Total assets | 557,903,665 | 957,603,206 | 107,047,636 | 159,287,135 | 254,621,594 | |||||||||||||||||
LIABILITIES: | ||||||||||||||||||||||
| Payable for collateral received for | ||||||||||||||||||||||
| securities loaned (See Note 6) | 152,890,977 | 216,212,786 | — | 42,315,525 | 54,066,475 | |||||||||||||||||
| Payable for securities purchased | 3,280,814 | 1,184,195 | — | — | 1,346,394 | |||||||||||||||||
| Payable for Fund shares repurchased | 6,903 | 75,425 | 36,729 | 47,356 | 67,883 | |||||||||||||||||
| Payable to Advisor and Distributor | 104,968 | 187,000 | 30,680 | 28,699 | 50,359 | |||||||||||||||||
| Payable to the Custodian | 22,086 | — | — | — | — | |||||||||||||||||
| Total liabilities | 156,305,748 | 217,659,406 | 67,409 | 42,391,580 | 55,531,111 | |||||||||||||||||
NET ASSETS | $ | 401,597,917 | $ | 739,943,800 | $ | 106,980,227 | $ | 116,895,555 | $ | 199,090,483 | ||||||||||||
NET ASSETS CONSIST OF: | ||||||||||||||||||||||
| Capital stock | $ | 401,769,131 | $ | 737,918,666 | $ | 105,570,714 | $ | 116,217,690 | $ | 198,032,162 | ||||||||||||
| Accumulated undistributed | ||||||||||||||||||||||
| net investment income | 196,255 | 317,945 | 31,987 | 47,200 | 87,188 | |||||||||||||||||
| Accumulated net realized gain (loss) | ||||||||||||||||||||||
| on investments sold | (2,469,667 | ) | (1,428,293 | ) | (341,958 | ) | 66,864 | (298,322 | ) | |||||||||||||
| Net unrealized appreciation on investments | 2,102,198 | 3,135,482 | 1,719,484 | 563,801 | 1,269,455 | |||||||||||||||||
NET ASSETS | $ | 401,597,917 | $ | 739,943,800 | $ | 106,980,227 | $ | 116,895,555 | $ | 199,090,483 | ||||||||||||
INSTITUTIONAL CLASS SHARES | ||||||||||||||||||||||
| Net Assets | $ | 398,321,566 | $ | 725,580,384 | $ | 106,583,763 | $ | 114,421,895 | $ | 199,090,483 | ||||||||||||
| Shares outstanding ($0.01 par value, | ||||||||||||||||||||||
| unlimited shares authorized) | 37,508,864 | 68,824,772 | 9,967,430 | 11,194,054 | 20,081,007 | |||||||||||||||||
| Net asset value, offering and | ||||||||||||||||||||||
| redemption price per share | $ | 10.62 | $ | 10.54 | $ | 10.69 | $ | 10.22 | $ | 9.91 | ||||||||||||
INVESTOR CLASS SHARES | ||||||||||||||||||||||
| Net Assets | $ | 3,276,351 | $ | 14,363,416 | $ | 396,464 | $ | 2,473,660 | ||||||||||||||
| Shares outstanding ($0.01 par value, | ||||||||||||||||||||||
| unlimited shares authorized) | 299,064 | 1,332,735 | 36,379 | 235,607 | ||||||||||||||||||
| Net asset value, offering and | ||||||||||||||||||||||
| redemption price per share | $ | 10.96 | $ | 10.78 | $ | 10.90 | $ | 10.50 | ||||||||||||||
The accompanying notes are an integral part of these financial statements.
Page 79
Baird Funds, Inc.
Statements of Operations ��Year Ended December 31, 2007 |
Baird | ||||||||||||||||||||
Baird | Baird | Intermediate | Baird | Baird | ||||||||||||||||
Intermediate | Aggregate | Municipal | Core Plus | Short-Term | ||||||||||||||||
Bond Fund | Bond Fund | Bond Fund | Bond Fund | Bond Fund | ||||||||||||||||
INVESTMENT INCOME: | ||||||||||||||||||||
| Interest income | $ | 18,807,519 | $ | 28,863,118 | $ | 2,954,975 | $ | 3,923,628 | $ | 8,975,965 | ||||||||||
| Income from securities lending (Note 6) | 120,271 | 154,562 | — | 19,953 | 47,072 | |||||||||||||||
| Other income | 625 | 61,846 | 2,563 | 581 | 49,424 | |||||||||||||||
| Total investment income | 18,928,415 | 29,079,526 | 2,957,538 | 3,944,162 | 9,072,461 | |||||||||||||||
EXPENSES: | ||||||||||||||||||||
| Investment advisory fee | 872,183 | 1,282,165 | 197,632 | 172,649 | 427,748 | |||||||||||||||
| Administration fee | 174,437 | 256,433 | 39,526 | 34,530 | 85,549 | |||||||||||||||
| Distribution expense – | ||||||||||||||||||||
| Investor Class Shares (Note 8) | 3,680 | 13,601 | 1,127 | 1,768 | — | |||||||||||||||
| Total expenses | 1,050,300 | 1,552,199 | 238,285 | 208,947 | 513,297 | |||||||||||||||
NET INVESTMENT INCOME | 17,878,115 | 27,527,327 | 2,719,253 | 3,735,215 | 8,559,164 | |||||||||||||||
REALIZED AND UNREALIZED | ||||||||||||||||||||
GAIN ON INVESTMENTS: | ||||||||||||||||||||
| Net realized gain (loss) on investments | 834,207 | (304,693 | ) | 159 | 197,335 | 12,120 | ||||||||||||||
| Change in unrealized | ||||||||||||||||||||
| appreciation/depreciation on investments | 2,719,097 | 3,082,857 | 1,596,614 | 426,220 | 1,756,196 | |||||||||||||||
| Net realized and unrealized | ||||||||||||||||||||
| gain on investments | 3,553,304 | 2,778,164 | 1,596,773 | 623,555 | 1,768,316 | |||||||||||||||
NET INCREASE IN NET ASSETS | ||||||||||||||||||||
RESULTING FROM OPERATIONS | $ | 21,431,419 | $ | 30,305,491 | $ | 4,316,026 | $ | 4,358,770 | $ | 10,327,480 | ||||||||||
The accompanying notes are an integral part of these financial statements.
Page 80
Baird Funds, Inc.
Statements of Changes in Net Assets |
Baird Intermediate Bond Fund | ||||||||
| Year Ended | Year Ended | |||||||
| December 31, 2007 | December 31, 2006 | |||||||
OPERATIONS: | ||||||||
| Net investment income | $ | 17,878,115 | $ | 13,559,600 | ||||
| Net realized gain (loss) on investments | 834,207 | (1,654,036 | ) | |||||
| Change in unrealized appreciation/depreciation on investments | 2,719,097 | 1,569,947 | ||||||
| Net increase in net assets resulting from operations | 21,431,419 | 13,475,511 | ||||||
CAPITAL SHARE TRANSACTIONS: | ||||||||
| Proceeds from shares sold | 136,300,912 | 111,704,742 | ||||||
| Shares issued to holders in reinvestment of dividends | 15,901,882 | 11,932,463 | ||||||
| Cost of shares redeemed | (82,165,056 | ) | (30,115,437 | ) | ||||
| Net increase in net assets resulting | ||||||||
| from capital share transactions | 70,037,738 | 93,521,768 | ||||||
DISTRIBUTIONS TO | ||||||||
INSTITUTIONAL CLASS SHAREHOLDERS: | ||||||||
| From net investment income | (17,835,145 | ) | (13,507,486 | ) | ||||
DISTRIBUTIONS TO | ||||||||
INVESTOR CLASS SHAREHOLDERS: | ||||||||
| From net investment income | (78,708 | ) | (77,646 | ) | ||||
TOTAL INCREASE IN NET ASSETS | 73,555,304 | 93,412,147 | ||||||
NET ASSETS: | ||||||||
| Beginning of year | 328,042,613 | 234,630,466 | ||||||
| End of year (including undistributed net investment | ||||||||
| income of $196,255 and $207,297, respectively) | $ | 401,597,917 | $ | 328,042,613 | ||||
The accompanying notes are an integral part of these financial statements.
Page 81
Baird Funds, Inc.
Statements of Changes in Net Assets |
Baird Aggregate Bond Fund | ||||||||
| Year Ended | Year Ended | |||||||
| December 31, 2007 | December 31, 2006 | |||||||
OPERATIONS: | ||||||||
| Net investment income | $ | 27,527,327 | $ | 13,269,201 | ||||
| Net realized loss on investments | (304,693 | ) | (888,625 | ) | ||||
| Change in unrealized appreciation/depreciation on investments | 3,082,857 | 639,350 | ||||||
| Net increase in net assets resulting from operations | 30,305,491 | 13,019,926 | ||||||
CAPITAL SHARE TRANSACTIONS: | ||||||||
| Proceeds from shares sold | 448,144,815 | 155,486,669 | ||||||
| Shares issued to holders in reinvestment of dividends | 21,538,963 | 11,939,014 | ||||||
| Cost of shares redeemed | (69,473,413 | ) | (58,822,570 | ) | ||||
| Net increase in net assets resulting | ||||||||
| from capital share transactions | 400,210,365 | 108,603,113 | ||||||
DISTRIBUTIONS TO | ||||||||
INSTITUTIONAL CLASS SHAREHOLDERS: | ||||||||
| From net investment income | (27,032,183 | ) | (13,106,942 | ) | ||||
| From realized gains | — | (120,758 | ) | |||||
| Total Distributions | (27,032,183 | ) | (13,227,700 | ) | ||||
DISTRIBUTIONS TO | ||||||||
INVESTOR CLASS SHAREHOLDERS: | ||||||||
| From net investment income | (296,350 | ) | (60,662 | ) | ||||
| From realized gains | — | (525 | ) | |||||
| Total Distributions | (296,350 | ) | (61,187 | ) | ||||
TOTAL INCREASE IN NET ASSETS | 403,187,323 | 108,334,152 | ||||||
NET ASSETS: | ||||||||
| Beginning of year | 336,756,477 | 228,422,325 | ||||||
| End of year (including undistributed net investment | ||||||||
| income of $317,945 and $177,153, respectively) | $ | 739,943,800 | $ | 336,756,477 | ||||
The accompanying notes are an integral part of these financial statements.
Page 82
Baird Funds, Inc.
Statements of Changes in Net Assets |
Baird Intermediate Municipal Bond Fund | ||||||||
| Year Ended | Year Ended | |||||||
| December 31, 2007 | December 31, 2006 | |||||||
OPERATIONS: | ||||||||
| Net investment income | $ | 2,719,253 | $ | 2,561,679 | ||||
| Net realized gain (loss) on investments | 159 | (106,983 | ) | |||||
| Change in unrealized appreciation/depreciation on investments | 1,596,614 | 81,453 | ||||||
| Net increase in net assets resulting from operations | 4,316,026 | 2,536,149 | ||||||
CAPITAL SHARE TRANSACTIONS: | ||||||||
| Proceeds from shares sold | 53,013,622 | 36,672,168 | ||||||
| Shares issued to holders in reinvestment of dividends | 2,233,256 | 2,042,052 | ||||||
| Cost of shares redeemed | (15,363,447 | ) | (28,525,030 | ) | ||||
| Net increase in net assets resulting | ||||||||
| from capital share transactions | 39,883,431 | 10,189,190 | ||||||
DISTRIBUTIONS TO | ||||||||
INSTITUTIONAL CLASS SHAREHOLDERS: | ||||||||
| From net investment income | (2,682,064 | ) | (2,536,465 | ) | ||||
DISTRIBUTIONS TO | ||||||||
INVESTOR CLASS SHAREHOLDERS: | ||||||||
| From net investment income | (14,673 | ) | (34,881 | ) | ||||
TOTAL INCREASE IN NET ASSETS | 41,502,720 | 10,153,993 | ||||||
NET ASSETS: | ||||||||
| Beginning of year | 65,477,507 | 55,323,514 | ||||||
| End of year (including undistributed net investment | ||||||||
| income of $31,987 and $9,471, respectively) | $ | 106,980,227 | $ | 65,477,507 | ||||
The accompanying notes are an integral part of these financial statements.
Page 83
Baird Funds, Inc.
Statements of Changes in Net Assets |
Baird Core Plus Bond Fund | ||||||||
| Year Ended | Year Ended | |||||||
| December 31, 2007 | December 31, 2006 | |||||||
OPERATIONS: | ||||||||
| Net investment income | $ | 3,735,215 | $ | 1,758,723 | ||||
| Net realized gain (loss) on investments | 197,335 | (55,454 | ) | |||||
| Change in unrealized appreciation/depreciation on investments | 426,220 | 405,659 | ||||||
| Net increase in net assets resulting from operations | 4,358,770 | 2,108,928 | ||||||
CAPITAL SHARE TRANSACTIONS: | ||||||||
| Proceeds from shares sold | 67,804,431 | 35,731,850 | ||||||
| Shares issued to holders in reinvestment of dividends | 3,528,244 | 1,429,836 | ||||||
| Cost of shares redeemed | (6,913,616 | ) | (18,311,499 | ) | ||||
| Other capital contributions (Note 3) | — | 71 | ||||||
| Net increase in net assets resulting | ||||||||
| from capital share transactions | 64,419,059 | 18,850,258 | ||||||
DISTRIBUTIONS TO | ||||||||
INSTITUTIONAL CLASS SHAREHOLDERS: | ||||||||
| From net investment income | (3,684,505 | ) | (1,727,098 | ) | ||||
DISTRIBUTIONS TO | ||||||||
INVESTOR CLASS SHAREHOLDERS: | ||||||||
| From net investment income | (37,714 | ) | (15,311 | ) | ||||
TOTAL INCREASE IN NET ASSETS | 65,055,610 | 19,216,777 | ||||||
NET ASSETS: | ||||||||
| Beginning of year | 51,839,945 | 32,623,168 | ||||||
| End of year (including undistributed net investment | ||||||||
| income of $47,200 and $33,503, respectively) | $ | 116,895,555 | $ | 51,839,945 | ||||
The accompanying notes are an integral part of these financial statements.
Page 84
Baird Funds, Inc.
Statements of Changes in Net Assets |
Baird Short-Term Bond Fund | ||||||||
| Year Ended | Year Ended | |||||||
| December 31, 2007 | December 31, 2006 | |||||||
OPERATIONS: | ||||||||
| Net investment income | $ | 8,559,164 | $ | 5,655,808 | ||||
| Net realized gain (loss) on investments | 12,120 | (247,795 | ) | |||||
| Change in unrealized appreciation/depreciation on investments | 1,756,196 | 518,820 | ||||||
| Net increase in net assets resulting from operations | 10,327,480 | 5,926,833 | ||||||
CAPITAL SHARE TRANSACTIONS: | ||||||||
| Proceeds from shares sold | 66,497,728 | 79,434,155 | ||||||
| Shares issued to holders in reinvestment of dividends | 8,380,412 | 5,464,609 | ||||||
| Cost of shares redeemed | (26,222,181 | ) | (33,715,361 | ) | ||||
| Other capital contributions (Note 3) | 6,289 | — | ||||||
| Net increase in net assets resulting | ||||||||
| from capital share transactions | 48,662,248 | 51,183,403 | ||||||
DISTRIBUTIONS TO | ||||||||
INSTITUTIONAL CLASS SHAREHOLDERS: | ||||||||
| From net investment income | (8,503,956 | ) | (5,563,493 | ) | ||||
TOTAL INCREASE IN NET ASSETS | 50,485,772 | 51,546,743 | ||||||
NET ASSETS: | ||||||||
| Beginning of period | 148,604,711 | 97,057,968 | ||||||
| End of period (including undistributed net investment | ||||||||
| income of $87,188 and $78,385, respectively) | $ | 199,090,483 | $ | 148,604,711 | ||||
The accompanying notes are an integral part of these financial statements.
Page 85
Baird Funds, Inc.
Financial Highlights |
Baird Intermediate Bond Fund – Institutional Class | ||||||||||||||||||||
Year Ended December 31, | ||||||||||||||||||||
| 2007 | 2006 | 2005 | 2004 | 2003 | ||||||||||||||||
| Per Share Data: | ||||||||||||||||||||
| Net asset value, beginning of period | $ | 10.52 | $ | 10.55 | $ | 10.83 | $ | 10.88 | $ | 10.86 | ||||||||||
| Income from investment operations: | ||||||||||||||||||||
| Net investment income | 0.54 | 0.51 | 0.46 | 0.47 | (1) | 0.49 | ||||||||||||||
| Net realized and unrealized | ||||||||||||||||||||
| gains (losses) on investments | 0.10 | (0.03 | ) | (0.27 | ) | (0.05 | ) | 0.14 | ||||||||||||
| Total from investment operations | 0.64 | 0.48 | 0.19 | 0.42 | 0.63 | |||||||||||||||
| Less distributions: | ||||||||||||||||||||
| Dividends from net investment income | (0.54 | ) | (0.51 | ) | (0.47 | ) | (0.47 | ) | (0.49 | ) | ||||||||||
| Distributions from net realized gains | — | — | — | (0.00 | )(2) | (0.12 | ) | |||||||||||||
| Total distributions | (0.54 | ) | (0.51 | ) | (0.47 | ) | (0.47 | ) | (0.61 | ) | ||||||||||
| Net asset value, end of period | $ | 10.62 | $ | 10.52 | $ | 10.55 | $ | 10.83 | $ | 10.88 | ||||||||||
| Total return | 6.24 | % | 4.70 | % | 1.77 | % | 3.91 | % | 5.89 | % | ||||||||||
| Supplemental data and ratios: | ||||||||||||||||||||
| Net assets, end of period | $ | 398,321,566 | $ | 326,835,399 | $ | 231,800,807 | $ | 191,563,699 | $ | 149,836,855 | ||||||||||
| Ratio of expenses to average net assets | 0.30 | % | 0.30 | % | 0.30 | % | 0.30 | % | 0.30 | % | ||||||||||
| Ratio of net investment income | ||||||||||||||||||||
| to average net assets | 5.13 | % | 4.90 | % | 4.34 | % | 4.32 | % | 4.39 | % | ||||||||||
Portfolio turnover rate(3) | 42.5 | % | 44.8 | % | 42.1 | % | 44.8 | % | 64.4 | % | ||||||||||
(1) | Calculated using average shares outstanding during the period. |
(2) | Amount is less than $0.01. |
(3) | Portfolio turnover is calculated on the basis of the Fund as a whole without distinguishing between the classes of shares issued. |
The accompanying notes are an integral part of these financial statements.
Page 86
Baird Funds, Inc.
Financial Highlights |
Baird Intermediate Bond Fund – Investor Class | ||||||||||||||||||||
Year Ended December 31, | ||||||||||||||||||||
| 2007 | 2006 | 2005 | 2004 | 2003 | ||||||||||||||||
| Per Share Data: | ||||||||||||||||||||
| Net asset value, beginning of period | $ | 10.85 | $ | 10.86 | $ | 11.13 | $ | 11.17 | $ | 11.13 | ||||||||||
| Income from investment operations: | ||||||||||||||||||||
| Net investment income | 0.52 | 0.50 | (1) | 0.45 | 0.45 | (1) | 0.48 | |||||||||||||
| Net realized and unrealized | ||||||||||||||||||||
| gains (losses) on investments | 0.10 | (0.03 | ) | (0.28 | ) | (0.05 | ) | 0.14 | ||||||||||||
| Total from investment operations | 0.62 | 0.47 | 0.17 | 0.40 | 0.62 | |||||||||||||||
| Less distributions: | ||||||||||||||||||||
| Dividends from net investment income | (0.51 | ) | (0.48 | ) | (0.44 | ) | (0.44 | ) | (0.46 | ) | ||||||||||
| Distributions from net realized gains | — | — | — | (0.00 | )(2) | (0.12 | ) | |||||||||||||
| Total distributions | (0.51 | ) | (0.48 | ) | (0.44 | ) | (0.44 | ) | (0.58 | ) | ||||||||||
| Net asset value, end of period | $ | 10.96 | $ | 10.85 | $ | 10.86 | $ | 11.13 | $ | 11.17 | ||||||||||
| Total return | 5.89 | % | 4.47 | % | 1.56 | % | 3.65 | % | 5.61 | % | ||||||||||
| Supplemental data and ratios: | ||||||||||||||||||||
| Net assets, end of period | $ | 3,276,351 | $ | 1,207,214 | $ | 2,829,659 | $ | 3,012,328 | $ | 1,321,648 | ||||||||||
| Ratio of expenses to average net assets | 0.55 | % | 0.55 | % | 0.55 | % | 0.55 | % | 0.55 | % | ||||||||||
| Ratio of net investment income | ||||||||||||||||||||
| to average net assets | 4.88 | % | 4.65 | % | 4.09 | % | 4.07 | % | 4.14 | % | ||||||||||
Portfolio turnover rate(3) | 42.5 | % | 44.8 | % | 42.1 | % | 44.8 | % | 64.4 | % | ||||||||||
(1) | Calculated using average shares outstanding during the period. |
(2) | Amount is less than $0.01. |
(3) | Portfolio turnover is calculated on the basis of the Fund as a whole without distinguishing between the classes of shares issued. |
The accompanying notes are an integral part of these financial statements.
Page 87
Baird Funds, Inc.
Financial Highlights |
Baird Aggregate Bond Fund – Institutional Class | ||||||||||||||||||||
Year Ended December 31, | ||||||||||||||||||||
| 2007 | 2006 | 2005 | 2004 | 2003 | ||||||||||||||||
| Per Share Data: | ||||||||||||||||||||
| Net asset value, beginning of period | $ | 10.51 | $ | 10.54 | $ | 10.74 | $ | 10.71 | $ | 10.69 | ||||||||||
| Income from investment operations: | ||||||||||||||||||||
| Net investment income | 0.54 | 0.52 | 0.49 | (1) | 0.49 | (1) | 0.56 | |||||||||||||
| Net realized and unrealized | ||||||||||||||||||||
| gains (losses) on investments | 0.03 | (0.03 | ) | (0.19 | ) | 0.07 | 0.20 | |||||||||||||
| Total from investment operations | 0.57 | 0.49 | 0.30 | 0.56 | 0.76 | |||||||||||||||
| Less distributions: | ||||||||||||||||||||
| Dividends from net investment income | (0.54 | ) | (0.52 | ) | (0.49 | ) | (0.50 | ) | (0.56 | ) | ||||||||||
| Distributions from net realized gains | — | (0.00 | )(2) | (0.01 | ) | (0.03 | ) | (0.18 | ) | |||||||||||
| Total distributions | (0.54 | ) | (0.52 | ) | (0.50 | ) | (0.53 | ) | (0.74 | ) | ||||||||||
| Net asset value, end of period | $ | 10.54 | $ | 10.51 | $ | 10.54 | $ | 10.74 | $ | 10.71 | ||||||||||
| Total return | 5.61 | % | 4.88 | % | 2.85 | % | 5.30 | % | 7.19 | % | ||||||||||
| Supplemental data and ratios: | ||||||||||||||||||||
| Net assets, end of period | $ | 725,580,384 | $ | 334,907,855 | $ | 227,132,399 | $ | 115,382,862 | $ | 91,550,534 | ||||||||||
| Ratio of expenses to average net assets | 0.30 | % | 0.30 | % | 0.30 | % | 0.30 | % | 0.30 | % | ||||||||||
| Ratio of net investment income | ||||||||||||||||||||
| to average net assets | 5.37 | % | 5.11 | % | 4.56 | % | 4.58 | % | 4.85 | % | ||||||||||
Portfolio turnover rate(3) | 33.6 | % | 52.4 | % | 46.0 | % | 72.6 | % | 106.7 | % | ||||||||||
(1) | Calculated using average shares outstanding during the period. |
(2) | Amount is less than $0.01. |
(3) | Portfolio turnover is calculated on the basis of the Fund as a whole without distinguishing between the classes of shares issued. |
The accompanying notes are an integral part of these financial statements.
Page 88
Baird Funds, Inc.
Financial Highlights |
Baird Aggregate Bond Fund – Investor Class | ||||||||||||||||||||
Year Ended December 31, | ||||||||||||||||||||
| 2007 | 2006 | 2005 | 2004 | 2003 | ||||||||||||||||
| Per Share Data: | ||||||||||||||||||||
| Net asset value, beginning of period | $ | 10.73 | $ | 10.75 | $ | 10.95 | $ | 10.88 | $ | 10.84 | ||||||||||
| Income from investment operations: | ||||||||||||||||||||
| Net investment income | 0.53 | 0.50 | 0.47 | (1) | 0.48 | (1) | 0.55 | |||||||||||||
| Net realized and unrealized | ||||||||||||||||||||
| gains (losses) on investments | 0.04 | (0.02 | ) | (0.19 | ) | 0.07 | 0.19 | |||||||||||||
| Total from investment operations | 0.57 | 0.48 | 0.28 | 0.55 | 0.74 | |||||||||||||||
| Less distributions: | ||||||||||||||||||||
| Dividends from net investment income | (0.52 | ) | (0.50 | ) | (0.47 | ) | (0.45 | ) | (0.52 | ) | ||||||||||
| Distributions from net realized gains | — | (0.00 | )(2) | (0.01 | ) | (0.03 | ) | (0.18 | ) | |||||||||||
| Total distributions | (0.52 | ) | (0.50 | ) | (0.48 | ) | (0.48 | ) | (0.70 | ) | ||||||||||
| Net asset value, end of period | $ | 10.78 | $ | 10.73 | $ | 10.75 | $ | 10.95 | $ | 10.88 | ||||||||||
| Total return | 5.45 | % | 4.61 | % | 2.54 | % | 5.20 | % | 6.95 | % | ||||||||||
| Supplemental data and ratios: | ||||||||||||||||||||
| Net assets, end of period | $ | 14,363,416 | $ | 1,848,622 | $ | 1,289,926 | $ | 708,858 | $ | 719,844 | ||||||||||
| Ratio of expenses to average net assets | 0.55 | % | 0.55 | % | 0.55 | % | 0.55 | % | 0.55 | % | ||||||||||
| Ratio of net investment income | ||||||||||||||||||||
| to average net assets | 5.12 | % | 4.86 | % | 4.31 | % | 4.33 | % | 4.60 | % | ||||||||||
Portfolio turnover rate(3) | 33.6 | % | 52.4 | % | 46.0 | % | 72.6 | % | 106.7 | % | ||||||||||
(1) | Calculated using average shares outstanding during the period. |
(2) | Amount is less than $0.01. |
(3) | Portfolio turnover is calculated on the basis of the Fund as a whole without distinguishing between the classes of shares issued. |
The accompanying notes are an integral part of these financial statements.
Page 89
Baird Funds, Inc.
Financial Highlights |
Baird Intermediate Municipal Bond Fund – Institutional Class | ||||||||||||||||||||
Year Ended December 31, | ||||||||||||||||||||
| 2007 | 2006 | 2005 | 2004 | 2003 | ||||||||||||||||
| Per Share Data: | ||||||||||||||||||||
| Net asset value, beginning of period | $ | 10.55 | $ | 10.56 | $ | 10.81 | $ | 10.91 | $ | 10.86 | ||||||||||
| Income from investment operations: | ||||||||||||||||||||
Net investment income(1) | 0.37 | 0.39 | 0.39 | 0.40 | 0.42 | |||||||||||||||
| Net realized and unrealized | ||||||||||||||||||||
| gains (losses) on investments | 0.14 | (0.01 | ) | (0.25 | ) | (0.11 | ) | 0.10 | ||||||||||||
| Total from investment operations | 0.51 | 0.38 | 0.14 | 0.29 | 0.52 | |||||||||||||||
| Less distributions: | ||||||||||||||||||||
| Dividends from net investment income | (0.37 | ) | (0.39 | ) | (0.39 | ) | (0.39 | ) | (0.43 | ) | ||||||||||
| Distributions from net realized gains | — | — | — | — | (0.04 | ) | ||||||||||||||
| Total distributions | (0.37 | ) | (0.39 | ) | (0.39 | ) | (0.39 | ) | (0.47 | ) | ||||||||||
| Net asset value, end of period | $ | 10.69 | $ | 10.55 | $ | 10.56 | $ | 10.81 | $ | 10.91 | ||||||||||
| Total return | 4.93 | % | 3.69 | % | 1.33 | % | 2.69 | % | 4.91 | % | ||||||||||
| Supplemental data and ratios: | ||||||||||||||||||||
| Net assets, end of period | $ | 106,583,763 | $ | 64,932,629 | $ | 53,831,848 | $ | 36,889,211 | $ | 30,234,195 | ||||||||||
| Ratio of expenses to average net assets | 0.30 | % | 0.30 | % | 0.30 | % | 0.30 | % | 0.30 | % | ||||||||||
| Ratio of net investment income | ||||||||||||||||||||
| to average net assets | 3.44 | % | 3.72 | % | 3.64 | % | 3.70 | % | 3.88 | % | ||||||||||
Portfolio turnover rate(2) | 5.6 | % | 25.1 | % | 13.7 | % | 4.2 | % | 17.7 | % | ||||||||||
(1) | Calculated using average shares outstanding during the period. |
(2) | Portfolio turnover is calculated on the basis of the Fund as a whole without distinguishing between the classes of shares issued. |
The accompanying notes are an integral part of these financial statements.
Page 90
Baird Funds, Inc.
Financial Highlights |
Baird Intermediate Municipal Bond Fund – Investor Class | ||||||||||||||||||||
Year Ended December 31, | ||||||||||||||||||||
| 2007 | 2006 | 2005 | 2004 | 2003 | ||||||||||||||||
| Per Share Data: | ||||||||||||||||||||
| Net asset value, beginning of period | $ | 10.75 | $ | 10.75 | $ | 10.99 | $ | 11.09 | $ | 11.02 | ||||||||||
| Income from investment operations: | ||||||||||||||||||||
Net investment income(1) | 0.35 | 0.37 | 0.37 | 0.38 | 0.40 | |||||||||||||||
| Net realized and unrealized | ||||||||||||||||||||
| gains (losses) on investments | 0.14 | (0.01 | ) | (0.25 | ) | (0.12 | ) | 0.10 | ||||||||||||
| Total from investment operations | 0.49 | 0.36 | 0.12 | 0.26 | 0.50 | |||||||||||||||
| Less distributions: | ||||||||||||||||||||
| Dividends from net investment income | (0.34 | ) | (0.36 | ) | (0.36 | ) | (0.36 | ) | (0.39 | ) | ||||||||||
| Distributions from net realized gains | — | — | — | — | (0.04 | ) | ||||||||||||||
| Total distributions | (0.34 | ) | (0.36 | ) | (0.36 | ) | (0.36 | ) | (0.43 | ) | ||||||||||
| Net asset value, end of period | $ | 10.90 | $ | 10.75 | $ | 10.75 | $ | 10.99 | $ | 11.09 | ||||||||||
| Total return | 4.68 | % | 3.44 | % | 1.13 | % | 2.40 | % | 4.69 | % | ||||||||||
| Supplemental data and ratios: | ||||||||||||||||||||
| Net assets, end of period | $ | 396,464 | $ | 544,878 | $ | 1,491,666 | $ | 4,611,766 | $ | 756,792 | ||||||||||
| Ratio of expenses to average net assets | 0.55 | % | 0.55 | % | 0.55 | % | 0.55 | % | 0.55 | % | ||||||||||
| Ratio of net investment income | ||||||||||||||||||||
| to average net assets | 3.19 | % | 3.47 | % | 3.39 | % | 3.45 | % | 3.63 | % | ||||||||||
Portfolio turnover rate(2) | 5.6 | % | 25.1 | % | 13.7 | % | 4.2 | % | 17.7 | % | ||||||||||
(1) | Calculated using average shares outstanding during the period. |
(2) | Portfolio turnover is calculated on the basis of the Fund as a whole without distinguishing between the classes of shares issued. |
The accompanying notes are an integral part of these financial statements.
Page 91
Baird Funds, Inc.
Financial Highlights |
Baird Core Plus Bond Fund – Institutional Class | ||||||||||||||||||||
Year Ended December 31, | ||||||||||||||||||||
| 2007 | 2006 | 2005 | 2004 | 2003 | ||||||||||||||||
| Per Share Data: | ||||||||||||||||||||
| Net asset value, beginning of period | $ | 10.16 | $ | 10.06 | $ | 10.38 | $ | 10.45 | $ | 10.45 | ||||||||||
| Income from investment operations: | ||||||||||||||||||||
| Net investment income | 0.54 | (1) | 0.55 | (1) | 0.51 | (1) | 0.54 | 0.56 | ||||||||||||
| Net realized and unrealized | ||||||||||||||||||||
| gains (losses) on investments | 0.05 | 0.09 | (0.28 | ) | 0.10 | 0.36 | ||||||||||||||
| Total from investment operations | 0.59 | 0.64 | 0.23 | 0.64 | 0.92 | |||||||||||||||
| Less distributions: | ||||||||||||||||||||
| Dividends from net investment income | (0.53 | ) | (0.54 | ) | (0.54 | ) | (0.53 | ) | (0.56 | ) | ||||||||||
| Distributions from net realized gains | — | — | (0.01 | ) | (0.18 | ) | (0.36 | ) | ||||||||||||
| Total distributions | (0.53 | ) | (0.54 | ) | (0.55 | ) | (0.71 | ) | (0.92 | ) | ||||||||||
| Net asset value, end of period | $ | 10.22 | $ | 10.16 | $ | 10.06 | $ | 10.38 | $ | 10.45 | ||||||||||
| Total return | 5.99 | % | 6.58 | % | 2.23 | % | 6.29 | % | 8.94 | % | ||||||||||
| Supplemental data and ratios: | ||||||||||||||||||||
| Net assets, end of period | $ | 114,421,895 | $ | 51,551,017 | $ | 32,173,459 | $ | 32,495,641 | $ | 42,709,634 | ||||||||||
| Ratio of expenses to average net assets | 0.30 | % | 0.30 | % | 0.30 | % | 0.30 | % | 0.30 | % | ||||||||||
| Ratio of net investment income | ||||||||||||||||||||
| to average net assets | 5.41 | % | 5.49 | % | 4.92 | % | 4.85 | % | 4.56 | % | ||||||||||
Portfolio turnover rate(2) | 47.4 | % | 62.0 | % | 37.6 | % | 52.5 | % | 103.1 | % | ||||||||||
(1) | Calculated using average shares outstanding during the period. |
(2) | Portfolio turnover is calculated on the basis of the Fund as a whole without distinguishing between the classes of shares issued. |
The accompanying notes are an integral part of these financial statements.
Page 92
Baird Funds, Inc.
Financial Highlights |
Baird Core Plus Bond Fund – Investor Class | ||||||||||||||||||||
Year Ended December 31, | ||||||||||||||||||||
| 2007 | 2006 | 2005 | 2004 | 2003 | ||||||||||||||||
| Per Share Data: | ||||||||||||||||||||
| Net asset value, beginning of period | $ | 10.42 | $ | 10.30 | $ | 10.62 | $ | 10.67 | $ | 10.65 | ||||||||||
| Income from investment operations: | ||||||||||||||||||||
| Net investment income | 0.53 | (1) | 0.54 | (1) | 0.49 | (1) | 0.53 | 0.53 | (1) | |||||||||||
| Net realized and unrealized | ||||||||||||||||||||
| gains (losses) on investments | 0.06 | 0.09 | (0.29 | ) | 0.10 | 0.37 | ||||||||||||||
| Total from investment operations | 0.59 | 0.63 | 0.20 | 0.63 | 0.90 | |||||||||||||||
| Less distributions: | ||||||||||||||||||||
| Dividends from net investment income | (0.51 | ) | (0.51 | ) | (0.51 | ) | (0.50 | ) | (0.52 | ) | ||||||||||
| Distributions from net realized gains | — | — | (0.01 | ) | (0.18 | ) | (0.36 | ) | ||||||||||||
| Total distributions | (0.51 | ) | (0.51 | ) | (0.52 | ) | (0.68 | ) | (0.88 | ) | ||||||||||
| Net asset value, end of period | $ | 10.50 | $ | 10.42 | $ | 10.30 | $ | 10.62 | $ | 10.67 | ||||||||||
| Total return | 5.80 | % | 6.34 | % | 1.93 | % | 6.09 | % | 8.60 | % | ||||||||||
| Supplemental data and ratios: | ||||||||||||||||||||
| Net assets, end of period | $ | 2,473,660 | $ | 288,928 | $ | 449,709 | $ | 125,847 | $ | 124,481 | ||||||||||
| Ratio of expenses to average net assets | 0.55 | % | 0.55 | % | 0.55 | % | 0.55 | % | 0.55 | % | ||||||||||
| Ratio of net investment income | ||||||||||||||||||||
| to average net assets | 5.16 | % | 5.24 | % | 4.67 | % | 4.60 | % | 4.31 | % | ||||||||||
Portfolio turnover rate(2) | 47.4 | % | 62.0 | % | 37.6 | % | 52.5 | % | 103.1 | % | ||||||||||
(1) | Calculated using average shares outstanding during the period. |
(2) | Portfolio turnover is calculated on the basis of the Fund as a whole without distinguishing between the classes of shares issued. |
The accompanying notes are an integral part of these financial statements.
Page 93
Baird Funds, Inc.
Financial Highlights |
Baird Short-Term Bond Fund – Institutional Class | ||||||||||||||||
August 31, 2004(1) | ||||||||||||||||
| Year Ended December 31, | through | |||||||||||||||
| 2007 | 2006 | 2005 | December 31, 2004 | |||||||||||||
| Per Share Data: | ||||||||||||||||
| Net asset value, beginning of period | $ | 9.81 | $ | 9.79 | $ | 9.93 | $ | 10.00 | ||||||||
| Income from investment operations: | ||||||||||||||||
| Net investment income | 0.48 | 0.43 | 0.33 | 0.08 | ||||||||||||
| Net realized and unrealized | ||||||||||||||||
| gains (losses) on investments | 0.10 | 0.02 | (0.15 | ) | (0.07 | ) | ||||||||||
| Total from investment operations | 0.58 | 0.45 | 0.18 | 0.01 | ||||||||||||
| Less distributions: | �� | |||||||||||||||
| Dividends from net investment income | (0.48 | ) | (0.43 | ) | (0.32 | ) | (0.08 | ) | ||||||||
| Net asset value, end of period | $ | 9.91 | $ | 9.81 | $ | 9.79 | $ | 9.93 | ||||||||
| Total return | 6.08 | % | 4.65 | % | 1.85 | % | 0.10 | %(2) | ||||||||
| Supplemental data and ratios: | ||||||||||||||||
| Net assets, end of period | $ | 199,090,483 | $ | 148,604,711 | $ | 97,057,968 | $ | 31,973,000 | ||||||||
| Ratio of expenses to average net assets | 0.30 | % | 0.30 | % | 0.30 | % | 0.30 | %(3) | ||||||||
| Ratio of net investment income | ||||||||||||||||
| to average net assets | 5.00 | % | 4.48 | % | 3.52 | % | 2.60 | %(3) | ||||||||
Portfolio turnover rate(4) | 36.6 | % | 41.1 | % | 31.8 | % | 16.7 | %(2) | ||||||||
(1) | Commencement of operations. |
(2) | Not annualized. |
(3) | Annualized. |
(4) | Portfolio turnover is calculated on the basis of the Fund as a whole without distinguishing between the classes of shares issued. |
The accompanying notes are an integral part of these financial statements.
Page 94
Baird Funds, Inc.
Notes to the Financial Statements December 31, 2007 |
1. | ORGANIZATION |
Baird Funds, Inc. (the “Corporation”) was incorporated on June 9, 2000 as a Wisconsin corporation and is registered as an open-end investment management company under the Investment Company Act of 1940, as amended (the “1940 Act”). The accompanying financial statements include the Baird Intermediate Bond Fund, Baird Aggregate Bond Fund, Baird Intermediate Municipal Bond Fund, Baird Core Plus Bond Fund and Baird Short-Term Bond Fund (each, a “Fund” and collectively, the “Funds”), five of the eight portfolios comprising the Corporation, each of which is diversified within the meaning of the 1940 Act. Robert W. Baird & Co. Incorporated (“Baird” or the “Advisor”) serves as investment advisor to the Funds.
The Baird Intermediate Bond Fund, Baird Aggregate Bond Fund and Baird Core Plus Bond Fund commenced operations with the sale of both Institutional and Investor class shares on September 29, 2000. The Baird Intermediate Municipal Bond Fund commenced operations with the sale of both Institutional and Investor class shares on March 30, 2001. The Baird Short-Term Bond Fund commenced operations with the sale of Institutional Class Shares on August 31, 2004. The Institutional Class Shares are not subject to a distribution and service (12b-1) fee, while the Investor Class Shares are subject to a distribution and service (12b-1) fee up to 0.25%.
The investment objective of the Baird Intermediate Bond Fund is to provide an annual rate of total return, before Fund expenses, greater than the annual rate of total return of the Lehman Brothers Intermediate Government/Credit Bond Index. The Lehman Brothers Intermediate Government/Credit Bond Index is an unmanaged, market value weighted index of investment grade, fixed-rate debt, including government and corporate securities, with maturities between one and ten years.
The investment objective of the Baird Aggregate Bond Fund is to provide an annual rate of total return, before Fund expenses, greater than the annual rate of total return of the Lehman Brothers Aggregate Bond Index. The Lehman Brothers Aggregate Bond Index is an unmanaged, market value weighted index of investment grade, fixed-rate debt issues, including government, corporate, asset-backed, and mortgage-backed securities, with maturities of at least one year.
The primary investment objective of the Baird Intermediate Municipal Bond Fund is to provide current income that is substantially exempt from federal income tax. A secondary objective is to provide total return with relatively low volatility of principal.
The investment objective of the Baird Core Plus Bond Fund is to provide an annual rate of total return, before Fund expenses, greater than the annual rate of total return of the Lehman Brothers U.S. Universal Bond Index. The Lehman Brothers U.S. Universal Bond Index is an unmanaged, market value weighted index of fixed income securities issued in U.S. dollars, including U.S. government and investment grade debt, non-investment grade debt, asset-backed and mortgage-backed securities, Eurobonds, 144A securities and emerging market debt, with maturities of at least one year.
The investment objective of the Baird Short-Term Bond Fund is to provide an annual rate of total return, before Fund expenses, greater than the annual rate of total return of the Lehman Brothers 1-3 Year Government/Credit Bond Index. The Lehman Brothers 1-3 Year Government/Credit Bond Index is an unmanaged, market value weighted index of investment grade, fixed-rate debt including government and corporate securities with maturities between one and three years.
Page 95
Baird Funds, Inc.
Notes to the Financial Statements December 31, 2007 |
2. | SIGNIFICANT ACCOUNTING POLICIES |
The following is a summary of significant accounting policies consistently followed by the Funds in the preparation of their financial statements. These policies are in conformity with accounting principles generally accepted in the United States of America.
| a) | Investment Valuation– Debt securities are valued by an independent pricing service using valuation methods that approximate market value, such as matrix pricing and other analytical pricing models, market transactions and dealer quotations. Debt securities purchased with a remaining maturity of 60 days or less are valued at acquisition cost, plus or minus any amortized discount or premium. Investments in mutual funds are valued at their stated net asset value. Common stocks that are listed on a securities exchange (other than NASDAQ) are valued at the last quoted sales price. Securities traded on NASDAQ are valued at the NASDAQ Official Closing Price. Price information on listed stocks is taken from the exchange where the security is primarily traded. Securities that were not traded on the valuation date, as well as stocks that are not listed on an exchange, including NASDAQ, are valued at the average of the current bid and asked price. Other assets and securities for which no quotations are readily available are valued at fair value as determined in good faith by the Advisor in accordance with procedures approved by the Corporation’s Board of Directors. In accordance with such procedures, the Advisor may use broker quotes or, if the broker quotes are unavailable or deemed to be unreliable, fair value will be determined by a valuation committee of the Advisor. In determining fair value, the valuation committee takes into account all relevant factors and available information. Consequently, the price of the security used by a Fund to calculate its NAV may differ from quoted or published prices for the same security. Fair value pricing involves subjective judgments and there is no single standard for determining a security’s fair value. As a result, different mutual funds could reasonably arrive at a different fair value for the same security. It is possible that the fair value determined for a security is materially different from the value that could be realized upon the sale of that security or from the values that other mutual funds may determine. |
| In September 2006, the Financial Accounting Standards Board (FASB) issued Statement of Financial Accounting Standards (“SFAS”) No. 157, “Fair Value Measurements”. SFAS No. 157 defines fair value, establishes a framework for measuring fair value in accordance with GAAP, and expands disclosure about fair value measurements. SFAS No. 157 is effective for financial statements issued for fiscal years beginning after November 15, 2007. Management has determined that SFAS No. 157 will have no material impact on the Funds’ financial statements. | |
| b) | Unregistered Securities– Four of the Funds own certain investment securities which are unregistered and thus restricted with respect to resale. These securities are valued by the Advisor after giving due consideration to pertinent factors including recent private sales, market conditions and the issuer’s financial performance. The value of such securities for the Baird Intermediate Bond, Baird Aggregate Bond, Baird Core Plus Bond and Baird Short-Term Bond Funds were $22,996,551 (5.73% of net assets), $37,917,467 (5.12% of net assets), $4,941,880 (4.23% of net assets) and $7,457,252 (3.75% of net assets), respectively, at December 31, 2007. Restricted securities may be deemed to be liquid as determined by the Advisor based on several factors. All of the restricted securities held by the Funds as of December 31, 2007 consist of securities issued pursuant to Rule 144A under the Securities Act of 1933 and have been deemed to be liquid. |
Page 96
Baird Funds, Inc.
Notes to the Financial Statements December 31, 2007 |
2. | SIGNIFICANT ACCOUNTING POLICIES (cont.) |
| c) | Foreign Securities– The Funds may invest in U.S. dollar-denominated debt obligations of foreign companies and foreign governments. Investing in securities of foreign companies and foreign governments involves special risks and considerations not typically associated with investing in U.S. companies and the U.S. government. These risks include currency rate fluctuations, political and economic instability and differences in financial reporting standards and less strict regulation of securities markets. Moreover, securities of many foreign companies and foreign governments and their markets may be less liquid and their prices more volatile than those of securities of comparable U.S. companies and the U.S. government. Occasionally, events that affect these values and exchange rates may occur after the close of the exchange on which such securities are traded. If such events materially affect the value of a Fund’s securities, these securities may be valued at their fair value pursuant to procedures adopted by the Board of Directors. |
| d) | Federal Income Taxes– The Funds intend to continue to qualify as regulated investment companies as provided in subchapter M of the Internal Revenue Code and to distribute substantially all of their taxable income to their shareholders in a manner which results in no tax cost to the Funds. Therefore, no federal income or excise tax provision is recorded. |
| Effective June 29, 2007, the Funds adopted Financial Accounting Standards Board (FASB) Interpretation No. 48 (FIN 48),“Accounting for Uncertainty in Income Taxes,” a clarification of FASB Statement No. 109, “Accounting for Income Taxes.” FIN 48 establishes financial reporting rules regarding recognition and measurement of tax positions taken or expected to be taken on a tax return. Management has determined that FIN 48 had no material impact on the Funds’ financial statements. | |
| e) | Allocation of Income and Expenses– Each Fund is charged for those expenses directly attributable to it. Expenses directly attributable to a class of shares, such as Rule 12b-1 distribution fees, are charged to that class of shares. Income, expenses and realized and unrealized gains and losses are allocated to the classes based on their respective net assets. Expenses that are not directly attributable to a Fund are allocated among the Funds in the series in proportion to their assets. |
| f) | Distributions to Shareholders– Dividends from net investment income are declared and paid monthly. Distributions of net realized capital gains, if any, are declared and paid at least annually. |
| g) | Use of Estimates– The preparation of financial statements in conformity with accounting principles generally accepted in the United States of America requires management to make estimates and assumptions that affect the reported amounts of assets and liabilities and disclosure of contingent assets and liabilities at the date of the financial statements and the reported amounts of revenues and expenses during the reporting period. Actual results could differ from those estimates. |
| h) | Other– Investment and shareholder transactions are recorded on trade date. The Funds determine the gain or loss realized from investment transactions by comparing the original cost of the security lot sold with the net sales proceeds. Dividend income is recognized on the ex-dividend date and interest income is recognized on an accrual basis. Premiums and discounts on the purchase of securities are amortized/accreted using the effective interest |
Page 97
Baird Funds, Inc.
Notes to the Financial Statements December 31, 2007 |
2. | SIGNIFICANT ACCOUNTING POLICIES (cont.) |
| method. Accounting principles generally accepted in the United States of America require that permanent financial reporting and tax differences be reclassified in the capital accounts. | |
| i) | Guarantees and Indemnifications– In the normal course of business, the Funds enter into contracts with service providers that contain general indemnification clauses. The Funds’ maximum exposure under these arrangements is unknown and would involve future claims against the Funds that have not yet occurred. Based on experience, the Funds would expect the risk of loss to be remote. |
3. | CAPITAL SHARE TRANSACTIONS |
The following table summarizes the capital share transactions of each Fund for the past two fiscal periods:
BAIRD INTERMEDIATE BOND FUND
| Year Ended | Year Ended | ||||||||||||||||
| December 31, 2007 | December 31, 2007 | ||||||||||||||||
Institutional Class Shares | Shares | Amount | Investor Class Shares | Shares | Amount | ||||||||||||
| Shares sold | 12,492,799 | $ | 131,741,260 | Shares sold | 418,169 | $ | 4,559,652 | ||||||||||
| Shares issued to | Shares issued to | ||||||||||||||||
| shareholders in | shareholders in | ||||||||||||||||
| reinvestment of dividends | 1,507,264 | 15,863,327 | reinvestment of dividends | 3,551 | 38,555 | ||||||||||||
| Shares redeemed | (7,553,800 | ) | (79,615,418 | ) | Shares redeemed | (233,940 | ) | (2,549,638 | ) | ||||||||
| Net increase | 6,446,263 | $ | 67,989,169 | Net increase | 187,780 | $ | 2,048,569 | ||||||||||
| Shares Outstanding: | Shares Outstanding: | ||||||||||||||||
| Beginning of period | 31,062,601 | Beginning of period | 111,284 | ||||||||||||||
| End of period | 37,508,864 | End of period | 299,064 | ||||||||||||||
| Year Ended | Year Ended | ||||||||||||||||
| December 31, 2006 | December 31, 2006 | ||||||||||||||||
Institutional Class Shares | Shares | Amount | Investor Class Shares | Shares | Amount | ||||||||||||
| Shares sold | 10,666,486 | $ | 111,623,242 | Shares sold | 7,531 | $ | 81,500 | ||||||||||
| Shares issued to | Shares issued to | ||||||||||||||||
| shareholders in | shareholders in | ||||||||||||||||
| reinvestment of dividends | 1,136,626 | 11,873,363 | reinvestment of dividends | 5,495 | 59,100 | ||||||||||||
| Shares redeemed | (2,710,776 | ) | (28,370,722 | ) | Shares redeemed | (162,273 | ) | (1,744,715 | ) | ||||||||
| Net increase | 9,092,336 | $ | 95,125,883 | Net decrease | (149,247 | ) | $ | (1,604,115 | ) | ||||||||
| Shares Outstanding: | Shares Outstanding: | ||||||||||||||||
| Beginning of period | 21,970,265 | Beginning of period | 260,531 | ||||||||||||||
| End of period | 31,062,601 | End of period | 111,284 | ||||||||||||||
Page 98
Baird Funds, Inc.
Notes to the Financial Statements December 31, 2007 |
3. | CAPITAL SHARE TRANSACTIONS (cont.) |
BAIRD AGGREGATE BOND FUND
| Year Ended | Year Ended | ||||||||||||||||
| December 31, 2007 | December 31, 2007 | ||||||||||||||||
Institutional Class Shares | Shares | Amount | Investor Class Shares | Shares | Amount | ||||||||||||
| Shares sold | 41,427,251 | $ | 434,719,171 | Shares sold | 1,252,836 | $ | 13,425,644 | ||||||||||
| Shares issued to | Shares issued to | ||||||||||||||||
| shareholders in | shareholders in | ||||||||||||||||
| reinvestment of dividends | 2,027,863 | 21,251,571 | reinvestment of dividends | 26,802 | 287,392 | ||||||||||||
| Shares redeemed | (6,509,144 | ) | (68,196,197 | ) | Shares redeemed | (119,156 | ) | (1,277,216 | ) | ||||||||
| Net increase | 36,945,970 | $ | 387,774,545 | Net increase | 1,160,482 | $ | 12,435,820 | ||||||||||
| Shares Outstanding: | Shares Outstanding: | ||||||||||||||||
| Beginning of period | 31,878,802 | Beginning of period | 172,253 | ||||||||||||||
| End of period | 68,824,772 | End of period | 1,332,735 | ||||||||||||||
| Year Ended | Year Ended | ||||||||||||||||
| December 31, 2006 | December 31, 2006 | ||||||||||||||||
Institutional Class Shares | Shares | Amount | Investor Class Shares | Shares | Amount | ||||||||||||
| Shares sold | 14,798,845 | $ | 154,503,654 | Shares sold | 91,604 | $ | 983,015 | ||||||||||
| Shares issued to | Shares issued to | ||||||||||||||||
| shareholders in | shareholders in | ||||||||||||||||
| reinvestment of dividends | 1,141,334 | 11,883,604 | reinvestment of dividends | 5,207 | 55,410 | ||||||||||||
| Shares redeemed | (5,615,794 | ) | (58,350,968 | ) | Shares redeemed | (44,506 | ) | (471,602 | ) | ||||||||
| Net increase | 10,324,385 | $ | 108,036,290 | Net increase | 52,305 | $ | 566,823 | ||||||||||
| Shares Outstanding: | Shares Outstanding: | ||||||||||||||||
| Beginning of period | 21,554,417 | Beginning of period | 119,948 | ||||||||||||||
| End of period | 31,878,802 | End of period | 172,253 | ||||||||||||||
Page 99
Baird Funds, Inc.
Notes to the Financial Statements December 31, 2007 |
3. | CAPITAL SHARE TRANSACTIONS (cont.) |
BAIRD INTERMEDIATE MUNICIPAL BOND FUND
| Year Ended | Year Ended | ||||||||||||||||
| December 31, 2007 | December 31, 2007 | ||||||||||||||||
Institutional Class Shares | Shares | Amount | Investor Class Shares | Shares | Amount | ||||||||||||
| Shares sold | 5,030,032 | $ | 52,803,596 | Shares sold | 19,670 | $ | 210,026 | ||||||||||
| Shares issued to | Shares issued to | ||||||||||||||||
| shareholders in | shareholders in | ||||||||||||||||
| reinvestment of dividends | 210,783 | 2,218,657 | reinvestment of dividends | 1,362 | 14,599 | ||||||||||||
| Shares redeemed | (1,425,472 | ) | (14,983,722 | ) | Shares redeemed | (35,316 | ) | (379,725 | ) | ||||||||
| Net increase | 3,815,343 | $ | 40,038,531 | Net decrease | (14,284 | ) | $ | (155,100 | ) | ||||||||
| Shares Outstanding: | Shares Outstanding: | ||||||||||||||||
| Beginning of period | 6,152,087 | Beginning of period | 50,663 | ||||||||||||||
| End of period | 9,967,430 | End of period | 36,379 | ||||||||||||||
| Year Ended | Year Ended | ||||||||||||||||
| December 31, 2006 | December 31, 2006 | ||||||||||||||||
Institutional Class Shares | Shares | Amount | Investor Class Shares | Shares | Amount | ||||||||||||
| Shares sold | 3,475,609 | $ | 36,579,100 | Shares sold | 8,603 | $ | 93,068 | ||||||||||
| Shares issued to | Shares issued to | ||||||||||||||||
| shareholders in | shareholders in | ||||||||||||||||
| reinvestment of dividends | 191,986 | 2,016,861 | reinvestment of dividends | 2,354 | 25,191 | ||||||||||||
| Shares redeemed | (2,611,483 | ) | (27,462,382 | ) | Shares redeemed | (98,994 | ) | (1,062,648 | ) | ||||||||
| Net increase | 1,056,112 | $ | 11,133,579 | Net decrease | (88,037 | ) | $ | (944,389 | ) | ||||||||
| Shares Outstanding: | Shares Outstanding: | ||||||||||||||||
| Beginning of period | 5,095,975 | Beginning of period | 138,700 | ||||||||||||||
| End of period | 6,152,087 | End of period | 50,663 | ||||||||||||||
Page 100
Baird Funds, Inc.
Notes to the Financial Statements December 31, 2007 |
3. | CAPITAL SHARE TRANSACTIONS (cont.) |
BAIRD CORE PLUS BOND FUND
| Year Ended | Year Ended | ||||||||||||||||
| December 31, 2007 | December 31, 2007 | ||||||||||||||||
Institutional Class Shares | Shares | Amount | Investor Class Shares | Shares | Amount | ||||||||||||
| Shares sold | 6,443,996 | $ | 65,545,679 | Shares sold | 216,335 | $ | 2,258,752 | ||||||||||
| Shares issued to | Shares issued to | ||||||||||||||||
| shareholders in | shareholders in | ||||||||||||||||
| reinvestment of dividends | 345,048 | 3,498,155 | reinvestment of dividends | 2,890 | 30,089 | ||||||||||||
| Shares redeemed | (670,165 | ) | (6,795,048 | ) | Shares redeemed | (11,342 | ) | (118,568 | ) | ||||||||
| Net increase | 6,118,879 | $ | 62,248,786 | Net increase | 207,883 | $ | 2,170,273 | ||||||||||
| Shares Outstanding: | Shares Outstanding: | ||||||||||||||||
| Beginning of period | 5,075,175 | Beginning of period | 27,724 | ||||||||||||||
| End of period | 11,194,054 | End of period | 235,607 | ||||||||||||||
| Year Ended | Year Ended | ||||||||||||||||
| December 31, 2006 | December 31, 2006 | ||||||||||||||||
Institutional Class Shares | Shares | Amount | Investor Class Shares | Shares | Amount | ||||||||||||
| Shares sold | 3,548,621 | $ | 35,649,048 | Shares sold | 8,089 | $ | 82,802 | ||||||||||
| Shares issued to | Shares issued to | ||||||||||||||||
| shareholders in | shareholders in | ||||||||||||||||
| reinvestment of dividends | 141,751 | 1,416,531 | reinvestment of dividends | 1,301 | 13,305 | ||||||||||||
| Shares redeemed | (1,814,933 | ) | (18,051,110 | ) | Shares redeemed | (25,330 | ) | (260,389 | ) | ||||||||
| Other capital | Other capital | ||||||||||||||||
contributions(1) | — | 71 | contributions(1) | — | 0 | (2) | |||||||||||
| Net increase | 1,875,439 | $ | 19,014,540 | Net decrease | (15,940 | ) | $ | (164,282 | ) | ||||||||
| Shares Outstanding: | Shares Outstanding: | ||||||||||||||||
| Beginning of period | 3,199,736 | Beginning of period | 43,664 | ||||||||||||||
| End of period | 5,075,175 | End of period | 27,724 | ||||||||||||||
| (1) | Reimbursement for NAV break. |
| (2) | Amount is less than $1. |
Page 101
Baird Funds, Inc.
Notes to the Financial Statements December 31, 2007 |
3. | CAPITAL SHARE TRANSACTIONS (cont.) |
BAIRD SHORT-TERM BOND FUND
| Year Ended | Year Ended | ||||||||||||||||
| December 31, 2007 | December 31, 2006 | ||||||||||||||||
Institutional Class Shares | Shares | Amount | Institutional Class Shares | Shares | Amount | ||||||||||||
| Shares sold | 6,742,388 | $ | 66,497,728 | Shares sold | 8,124,186 | $ | 79,434,155 | ||||||||||
| Shares issued to | Shares issued to | ||||||||||||||||
| shareholders in | shareholders in | ||||||||||||||||
| reinvestment of dividends | 851,838 | 8,380,412 | reinvestment of dividends | 559,203 | 5,464,609 | ||||||||||||
| Shares redeemed | (2,660,382 | ) | (26,222,181 | ) | Shares redeemed | (3,449,049 | ) | (33,715,361 | ) | ||||||||
| Other capital | Other capital | ||||||||||||||||
contributions(1) | — | 6,289 | contributions(1) | — | — | ||||||||||||
| Net increase | 4,933,844 | $ | 48,662,248 | Net increase | 5,234,340 | $ | 51,183,403 | ||||||||||
| Shares Outstanding: | Shares Outstanding: | ||||||||||||||||
| Beginning of period | 15,147,163 | Beginning of period | 9,912,823 | ||||||||||||||
| End of period | 20,081,007 | End of period | 15,147,163 | ||||||||||||||
| (1) | Reimbursement by Advisor for misallocation of ALIGN Program trades. |
4. | INVESTMENT TRANSACTIONS AND INCOME TAX INFORMATION |
During the year ended December 31, 2007, purchases and sales of investment securities (excluding short-term investments) were as follows:
| Baird | ||||||||||||||||||||
| Baird | Baird | Intermediate | Baird | Baird | ||||||||||||||||
| Intermediate | Aggregate | Municipal | Core Plus | Short-Term | ||||||||||||||||
| Bond Fund | Bond Fund | Bond Fund | Bond Fund | Bond Fund | ||||||||||||||||
| Purchases: | ||||||||||||||||||||
| U.S. Government | $ | 144,364,679 | $ | 248,520,117 | $ | — | $ | 53,238,140 | $ | 30,199,054 | ||||||||||
| Other | $ | 77,431,590 | $ | 313,622,326 | $ | 42,418,600 | $ | 41,051,192 | $ | 97,479,497 | ||||||||||
| Sales: | ||||||||||||||||||||
| U.S. Government | $ | 84,079,717 | $ | 100,486,017 | $ | — | $ | 22,563,086 | $ | 18,630,731 | ||||||||||
| Other | $ | 65,966,767 | $ | 77,727,042 | $ | 4,223,856 | $ | 9,480,003 | $ | 59,019,331 | ||||||||||
Page 102
Baird Funds, Inc.
Notes to the Financial Statements December 31, 2007 |
4. | INVESTMENT TRANSACTIONS AND INCOME TAX INFORMATION (cont.) |
At December 31, 2007, gross unrealized appreciation and depreciation of investments and distributable ordinary income and long-term capital gains for federal tax purposes were as follows:
Intermediate | ||||||||||||||||||||
Intermediate | Aggregate | Municipal | Core Plus | Short-Term | ||||||||||||||||
Bond Fund | Bond Fund | Bond Fund | Bond Fund | Bond Fund | ||||||||||||||||
| Cost of Investments | $ | 551,302,135 | $ | 945,985,895 | $ | 103,539,198 | $ | 157,144,708 | $ | 251,081,576 | ||||||||||
| Gross unrealized appreciation | $ | 7,121,328 | $ | 12,624,792 | $ | 2,519,032 | $ | 1,908,797 | $ | 2,285,683 | ||||||||||
| Gross unrealized depreciation | (5,064,298 | ) | (10,255,949 | ) | (804,947 | ) | (1,389,598 | ) | (1,016,228 | ) | ||||||||||
| Net unrealized | ||||||||||||||||||||
| appreciation/depreciation | $ | 2,057,030 | $ | 2,368,843 | $ | 1,714,085 | $ | 519,199 | $ | 1,269,455 | ||||||||||
| Undistributed ordinary income | $ | 196,255 | $ | 317,945 | $ | 31,987 | $ | 158,666 | $ | 87,188 | ||||||||||
| Undistributed long-term capital gain | — | — | — | — | — | |||||||||||||||
| Total distributable earnings | $ | 196,255 | $ | 317,945 | $ | 31,987 | $ | 158,666 | $ | 87,188 | ||||||||||
| Other accumulated losses | $ | (2,424,499 | ) | $ | (661,654 | ) | $ | (336,559 | ) | $ | — | $ | (298,322 | ) | ||||||
| Total accumulated earnings (losses) | $ | (171,214 | ) | $ | 2,025,134 | $ | 1,409,513 | $ | 677,865 | $ | 1,058,321 | |||||||||
On the Statements of Asset and Liabilities, the following adjustments were made for permanent tax adjustments:
Undistributed Net | Accumulated Net | Paid In | ||||||||||
Investment Income (Loss) | Realized Gain (Loss) | Capital | ||||||||||
| Baird Intermediate Bond Fund | $ | 24,696 | $ | (24,695 | ) | $ | (1 | ) | ||||
| Baird Aggregate Bond Fund | (58,002 | ) | 58,002 | — | ||||||||
| Baird Intermediate Municipal Bond Fund | 1 | (1,457 | ) | 1,456 | ||||||||
| Baird Core Plus Bond Fund | 701 | (702 | ) | 1 | ||||||||
| Baird Short-Term Bond Fund | (46,405 | ) | 46,404 | 1 | ||||||||
The permanent differences primarily relate to reclasses from paydown gains and losses from asset backed securities.
Page 103
Baird Funds, Inc.
Notes to the Financial Statements December 31, 2007 |
| 4. | INVESTMENT TRANSACTIONS AND INCOME TAX INFORMATION (cont.) |
The tax components of dividends paid during the periods ended December 31, 2007 and December 31, 2006 were:
2007 | 2006 | |||||||||||||||
Ordinary | Long-Term | Ordinary | Long-Term | |||||||||||||
Income | Capital Gains | Income | Capital Gains | |||||||||||||
Distributions | Distributions | Distributions | Distributions | |||||||||||||
| Baird Intermediate Bond Fund | $ | 17,913,853 | $ | — | $ | 13,585,132 | $ | — | ||||||||
| Baird Aggregate Bond Fund | $ | 27,328,533 | $ | — | $ | 13,167,714 | $ | 121,173 | ||||||||
| Baird Intermediate Municipal Bond Fund | $ | — | $ | — | $ | — | $ | — | ||||||||
| Baird Core Plus Bond Fund | $ | 3,722,219 | $ | — | $ | 1,742,409 | $ | — | ||||||||
| Baird Short-Term Bond Fund | $ | 8,503,956 | $ | — | $ | 5,563,493 | $ | — | ||||||||
For the periods ended December 31, 2007 and December 31, 2006, distributions of $2,696,737 and $2,571,346, respectively, from the Baird Intermediate Municipal Bond Fund were tax-exempt.
Under the current tax law, capital losses realized after October 31 may be deferred and treated as occurring on the first day of the following fiscal year. For the year ended December 31, 2007, Baird Intermediate Municipal Bond Fund elected to defer capital losses occurring between November 1, 2007 and December 31, 2007 in the amount of $17,267. Baird Intermediate Bond Fund, Baird Aggregate Bond Fund, Baird Core Plus Bond Fund and Baird Short-Term Bond Fund deferred no capital losses between November 1, 2007 and December 31, 2007.
At December 31, 2007, accumulated net realized capital loss carryovers and the year(s) in which the capital loss carryovers expire were:
Capital Loss Carryover | Year of Expiration | |||||||
| Baird Intermediate Bond Fund | $ | 717,737 | 2013 | |||||
| 1,706,762 | 2014 | |||||||
| Baird Aggregate Bond Fund | 661,654 | 2014 | ||||||
| Baird Intermediate Municipal Bond Fund | 6,626 | 2012 | ||||||
| 184,660 | 2013 | |||||||
| 51,283 | 2014 | |||||||
| 76,723 | 2015 | |||||||
| Baird Core Plus Bond Fund | — | — | ||||||
| Baird Short-Term Bond Fund | 49,136 | 2013 | ||||||
| 249,186 | 2014 | |||||||
To the extent these Funds realize future net capital gains, those gains will be offset by any unused capital loss carryovers.
Page 104
Baird Funds, Inc.
Notes to the Financial Statements December 31, 2007 |
5. | INVESTMENT ADVISORY AND OTHER AGREEMENTS |
The Funds have entered into an Investment Advisory Agreement with Baird for the provision of investment advisory services. Pursuant to the Investment Advisory Agreement, the Advisor is entitled to receive a fee, calculated daily and payable monthly, at the annual rate of 0.25% for the Funds as applied to the respective Fund’s average daily net assets. Certain officers of the Advisor are also officers of the Funds.
The Funds have entered into an Administration Agreement with Baird. Under the Administration Agreement, the Advisor assumes and pays all expenses of the applicable Fund other than the investment advisory fees and fees under the 12b-1 plan. Pursuant to the Administration Agreement, the Advisor is entitled to receive a fee, calculated daily and payable monthly, at the annual rate of 0.05% for the Funds as applied to the respective Fund’s average daily net assets.
U.S. Bancorp Fund Services, LLC serves as transfer agent, administrator, and accounting services agent for the Funds. U.S. Bank, N.A. serves as custodian for the Funds.
Baird (the “Distributor”) is the distributor of the Funds pursuant to a distribution agreement.
6. | SECURITIES LENDING |
Each Fund may lend up to one-third of its total assets (including such loans) to borrowers under terms of participation in a securities lending program administered by U.S. Bancorp Asset Management, an affiliate of the Funds’ custodian, transfer agent and administrator. The securities lending agreement requires that loans are collateralized at all times in an amount equal to at least 102% of the market value of any loaned securities at the time of the loan, plus accrued interest.
The Funds receive compensation in the form of fees and earn interest on the cash collateral. The amount of fees depends on a number of factors including the type of security, length of the loan and credit standing of the borrower. Each Fund continues to receive interest payments or dividends on the securities loaned during the borrowing period. Each Fund has the right under the terms of the securities lending agreement to recover the securities from the borrower on demand.
As of December 31, 2007, the Baird Intermediate Bond Fund, Baird Aggregate Bond Fund, Baird Core Plus Bond Fund and Baird Short-Term Bond Fund had loaned securities that were collateralized by cash equivalents. The cash collateral is invested by the custodian in accordance with approved investment guidelines. Those guidelines require the cash collateral to be invested in readily marketable, high quality, short-term obligations; however, such investments are subject to risk of payment delays or default on the part of the issuer or counterparty or otherwise may not generate sufficient interest to support the costs associated with securities lending. A Fund could also experience delays in recovering its securities and possible loss of income or value if the borrower fails to return the borrowed securities, although this risk is mitigated by the collateral and by contract with the securities lending agent.
Page 105
Baird Funds, Inc.
Notes to the Financial Statements December 31, 2007 |
6. | SECURITIES LENDING (cont.) |
As of December 31, 2007, the market value of the securities on loan and payable on collateral due to broker were as follows:
Market Value of | Payable on Collateral | |||||||
Securities on Loan | due to Broker | |||||||
| Baird Intermediate Bond Fund | $ | 150,203,527 | $ | 152,890,977 | ||||
| Baird Aggregate Bond Fund | 212,039,450 | 216,212,786 | ||||||
| Baird Core Plus Bond Fund | 41,509,439 | 42,315,525 | ||||||
| Baird Short-Term Bond Fund | 53,029,545 | 54,066,475 | ||||||
The Funds receive cash as collateral in return for securities lent as part of a securities lending program. The collateral is invested in short-term securities including repurchase agreements, commercial paper, master notes and money market funds. The schedules of investments for the Funds include the particular cash collateral holdings as of December 31, 2007. Interest income earned on collateral investments during the year ended December 31, 2007 for Baird Intermediate Bond Fund, Baird Aggregate Bond Fund, Baird Core Plus Bond Fund, and Baird Short-Term Bond Fund were $120,271, $154,562, $19,953, and $47,072, respectively.
7. | LINE OF CREDIT |
The Corporation maintains an uncommitted, senior secured line of credit (“LOC”) with U.S. Bank, N.A. to provide the Funds a temporary liquidity source to meet unanticipated redemptions. Under the terms of the LOC, borrowings for each Fund are limited to one-third of the total assets (including the amount borrowed) of the respective Fund, or as otherwise indicated within the Funds’ agreement with the Bank. The Bank charges interest at the Bank’s Prime Rate less 1%. During the year ended December 31, 2007, the Baird Bond Funds did not draw upon the line of credit.
8. | DISTRIBUTION AND SHAREHOLDER SERVICE PLAN |
The Funds have adopted a distribution and shareholder service plan (the “Plan”) pursuant to Rule 12b-1 under the 1940 Act. The Plan allows the Funds to compensate the Distributor for the costs incurred in distributing the Funds’ Investor Class Shares, including amounts paid to brokers or dealers, at an annual rate not to exceed 0.25% of the average daily net assets of the Funds’ Investor Class Shares. The Baird Intermediate Bond, Baird Aggregate Bond, Baird Intermediate Municipal Bond and Baird Core Plus Bond Funds incurred $3,680, $13,601, $1,127 and $1,768, respectively, in fees pursuant to the Plan during the year ending December 31, 2007.
Page 106
Report of Independent Registered Public Accounting Firm
To the Shareholders and
Board of Directors of
Baird Funds, Inc.:
We have audited the accompanying statements of assets and liabilities of Baird Intermediate Bond Fund, Baird Aggregate Bond Fund, Baird Intermediate Municipal Bond Fund, Baird Core Plus Bond Fund and Baird Short-Term Bond Fund (five of the portfolios constituting Baird Funds, Inc., hereafter referred to as the “Funds”), including the schedules of investments as of December 31, 2007, the related statements of operations for the year then ended, the statements of changes in net assets for each of the two years in the period then ended, and the financial highlights for each of the three years in the period then ended. These financial statements and financial highlights are the responsibility of the Funds’ management. Our responsibility is to express an opinion on these financial statements and financial highlights based on our audits. The financial highlights for each of the two years in the period ended December 31, 2004 were audited by other auditors. Those auditors expressed an unqualified opinion on those financial highlights in their report dated February 22, 2005.
We conducted our audits in accordance with the standards of the Public Company Accounting Oversight Board (United States). Those standards require that we plan and perform the audit to obtain reasonable assurance about whether the financial statements are free of material misstatement. The Funds were not required to have, nor were we engaged to perform an audit of its internal control over financial reporting. Our audit included consideration of internal control over financial reporting as a basis for designing audit procedures that are appropriate in the circumstances, but not for the purpose of expressing an opinion on the effectiveness of the Funds’ internal control over financial reporting. Accordingly, we express no such opinion. An audit also includes examining, on a test basis, evidence supporting the amounts and disclosures in the financial statements and financial highlights. Our procedures included confirmation of securities owned as of December 31, 2007, by correspondence with the custodian and brokers. An audit also includes assessing the accounting principles used and significant estimates made by management, as well as evaluating the overall financial statement presentation. We believe that our audits provide a reasonable basis for our opinion.
In our opinion, the financial statements and financial highlights referred to above present fairly, in all material respects, the financial position of each of the aforementioned funds of Baird Funds, Inc. as of December 31, 2007, the results of their operations for the year then ended, and the changes in their net assets for each of the two years in the period then ended, and the financial highlights for each of the three years in the period then ended, in conformity with accounting principles generally accepted in the United States of America.

Chicago, Illinois
February 27, 2008
Page 107
Baird Funds, Inc.
Directors & Officers as of December 31, 2007 |
| Number of | |||||
| Portfolios | Other | ||||
| Positions | Term of Office | Principal | in Complex | Directorships | |
| Held with | and Length of | Occupation(s) | Overseen | Held | |
Name, Address and Age | the Funds | Time Served | During Past 5 Years | by Director | by Director |
| G. Frederick Kasten, Jr.* | Director | Indefinite; | Retired; Chairman, the Adviser (January 2000-December | 8 | Director of Regal-Beloit |
| 777 East Wisconsin Avenue | and | Since September | 2005); Chairman and CEO, the Adviser (January 1998- | Corporation, a | |
| Milwaukee, WI 53202 | Chairman | 2000 | January 2000); President, Chairman and CEO, the | manufacturing | |
| Age: 68 | Adviser (June 1983-January 1998); President, the Adviser | company | |||
| (January 1979-January 1983) | |||||
| John W. Feldt | Independent | Indefinite; | Retired; Senior Vice President-Finance, University of | 8 | Director of Thompson |
| c/o University of | Director | Since September | Wisconsin Foundation (1985-2006); Vice President- | Plumb Funds, Inc., a | |
| Wisconsin Foundation | 2000 | Finance, University of Wisconsin Foundation (1980-1985); | mutual fund complex | ||
| 1848 University Avenue | Associate Director, University of Wisconsin Foundation | (2 portfolios); Director | |||
| Madison, WI 53705 | (1967-1980) | of Nakoma Mutual | |||
| Age: 65 | Funds, a mutual fund | ||||
| complex (1 portfolio) | |||||
| George C. Kaiser** | Independent | Indefinite; | CEO, George C. Kaiser & Co., a business consulting | 8 | None |
| 759 N. Milwaukee Street | Director | Since September | company, since 1999; Chairman and CEO, Hanger Tight | ||
| Milwaukee, WI 53202 | 2000 | Company, a manufacturing company (1988-1999); | |||
| Age: 74 | Chairman and CEO, Interstore Transfer Systems, Ltd., a | ||||
| manufacturing company (1992-1999); Chairman, | |||||
| International Retail Services Group, Ltd. (1995-1999); | |||||
| Executive Vice President, Arandell Schmidt Co., a catalog | |||||
| printer company (1984-1987); various positions Arthur | |||||
| Anderson & Co. (1957-1964, 1967-1984), most recently | |||||
| serving as Partner (1969-1984); Secretary of Administration, | |||||
| State of Wisconsin (1965-1967) | |||||
| Frederick P. Stratton, Jr. | Independent | Indefinite; | Retired; Chairman Emeritus, Briggs & Stratton | 8 | Director of Weyco |
| 10134 N. Port Washington | Director | Since May | Corporation, a manufacturing company, since 2003; | Group, Inc., a men’s | |
| Road, #2B | 2004 | Chairman of the Board, Briggs & Stratton Corporation | footwear distributor; | ||
| Mequon, WI 53092 | (2001-2002); Chairman and CEO, Briggs & Stratton | Wisconsin Energy | |||
| Age: 68 | Corporation (1986-2001) | Corporation and its | |||
| subsidiaries Wisconsin | |||||
| Electric Power | |||||
| Company and | |||||
| Wisconsin Gas LLC |
| * | Prior to January 1, 2008, Mr. Kasten was considered an “interested person” of the Corporation (as defined in the 1940 Act) because he had served as Chairman of the Board of the Adviser until December 31, 2005. As of January 1, 2008, Mr. Kasten is no longer an “interested person” because more than two years have elapsed since he last served as Chairman of the Adviser and he does not own any shares of capital stock of the Adviser (or its affiliates), having redeemed his remaining interest in Baird Financial Corporation, the Adviser’s parent company in May 2007. | |
| ** | Mr. Kaiser retired as a director effective December 31, 2007. |
Page 108
Baird Funds, Inc.
Directors & Officers as of December 31, 2007 |
| Number of | |||||
| Portfolios | Other | ||||
| Positions | Term of Office | Principal | in Complex | Directorships | |
| Held with | and Length of | Occupation(s) | Overseen | Held | |
Name, Address and Age | the Funds | Time Served | During Past 5 Years | by Director | by Director |
| Marlyn J. Spear | Independent | Indefinite; | Chief Investment Officer, Building Trades United | 8 | Management Trustee of |
| P.O. Box 530 | Director | Since January | Pension Trust Fund since July 1989; Investment Officer, | AFL-CIO Housing | |
| 500 Elm Grove Road | Nominee | 2008*** | Northwestern Mutual Financial Network (1988-1989); | Investment Trust | |
| Elm Grove, WI 53122 | Assistant Vice-President, Firstar Trust Company | ||||
| Age: 54 | (1978-1987); Financial Analyst, Harco Holdings, Inc. | ||||
| (1976-1978) | |||||
| Cory L. Nettles**** | Director | Indefinite; | Managing Director, Generation Growth Capital, Inc. | 8 | Director of Weyco |
| Generation Growth Capital, Inc. | Nominee | Since January | (since March 2007); Of Counsel, Quarles & Brady LLP | Group, Inc., a men’s | |
| 411 East Wisconsin Avenue | 2008*** | (since March 2007); Partner, Quarles & Brady LLP | footwear distributor; | ||
| Suite 1710 | (January 2005 – March 2007); Secretary, Wisconsin | Director of The Private | |||
| Milwaukee, WI 53202 | Department of Commerce (January 2003 – January | Bank, a financial | |||
| Age: 37 | 2005); Associate, Quarles & Brady LLP (July 1996 – | institution | |||
| December 2002) | |||||
| *** | Ms. Spear and Mr. Nettles were elected as directors effective January 1, 2008. | |
| **** | Mr. Nettles is an “interested person” of the Corporation (as defined in the 1940 Act) because of his employment with the law firm, Quarles & Brady LLP, which provides legal services to the Adviser. The legal services that Quarles & Brady LLP has provided to the Adviser include litigation, real estate and miscellaneous securities related matters that did not relate to the Corporation or the Funds. |
Additional information about the Funds’ directors is available in the Statement of Additional Information which may be obtained without charge, upon request, by calling 1-866-44BAIRD, or at www.bairdfunds.com.
Page 109
Baird Funds, Inc.
Directors & Officers as of December 31, 2007 |
| Position(s) | Term of Office | Principal | ||
| Held with | and Length of | Occupation(s) | ||
Name, Address, and Age | the Funds | Time Served | During Past 5 Years | |
| Mary Ellen Stanek | President | Re-elected by | Managing Director, the Advisor, and Chief Investment Officer, Baird Advisors, a department of | |
| 777 East Wisconsin Avenue | Board annually; | the Advisor, since March 2000; President and CEO, Firstar Investment Research & Management | ||
| Milwaukee, WI 53202 | Since | Company, LLC (“FIRMCO”) (November 1998-February 2000); President, Firstar Funds, Inc. | ||
| Age: 51 | September 2000 | (December 1998-February 2000); President and Chief Operating Officer, FIRMCO | ||
| (March 1994-November 1998) | ||||
| J. Bary Morgan | Senior | Re-elected by | Chief Investment Officer, Baird Investment Management, a department of the Advisor, since | |
| 777 East Wisconsin Avenue | Vice President | Board annually; | January 2004; Managing Director, the Advisor since January 2001; Director, Baird Investment | |
| Milwaukee, WI 53202 | Since | Management (January 2001-January 2004); Senior Vice President, the Advisor (January 2000- | ||
| Age: 42 | February 2003 | January 2001); First Vice President, the Advisor (January 1996-January 2000) | ||
| Todd S. Nichol | Vice President | Re-elected by | Chief Compliance Officer, the Advisor since October 2004; Assistant Compliance Director, the | |
| 777 East Wisconsin Avenue | and Chief | Board annually; | Advisor since August 2002; Senior Vice President, the Advisor since January 2005; First Vice | |
| Milwaukee, WI 53202 | Compliance | Since | President, the Advisor (January 2004-January 2005); Vice President, the Advisor (August 2002- | |
| Age: 45 | Officer | August 2004 | January 2004); Vice President – Risk Management, BNY Clearing Services, LLC, a division of | |
| The Bank of New York (August 1995-August 2002) | ||||
| Russell P. Schwei | Vice President | Re-elected by | Operations Director, the Advisor since July 1992; Managing Director, the Advisor since January | |
| 777 East Wisconsin Avenue | Board annually; | 1997; Chief Financial Officer and Managing Director, the Advisor (February 1999-December | ||
| Milwaukee, WI 53202 | Since | 1999) | ||
| Age: 48 | September 2000 | |||
| Leonard M. Rush | Treasurer | Re-elected by | Chief Financial Officer, the Advisor since January 2000 | |
| 777 East Wisconsin Avenue | Board annually; | |||
| Milwaukee, WI 53202 | Since | |||
| Age: 61 | September 2000 | |||
| Charles M. Weber | Secretary | Re-elected by | Senior Vice President and Associate General Counsel, the Advisor since July 2005; Partner, | |
| 777 East Wisconsin Avenue | Board annually; | Quarles & Brady LLP, a law firm (October 1998-June 2005) | ||
| Milwaukee, WI 53202 | Since | |||
| Age: 44 | September 2005 | |||
| Laura E. Piotrowski | Assistant | Re-elected by | Senior Vice President and Controller of Capital Markets and Asset Management, the Advisor since | |
| 777 East Wisconsin Avenue | Treasurer | Board annually; | January 2003; First Vice President, the Advisor (January 2001-January 2003); Vice President, the | |
| Milwaukee, WI 53202 | Since | Advisor (January 1999-January 2001) | ||
| Age: 37 | August 2007 | |||
| Robert A. Johnson | AML | Re-elected by | Compliance Officer, the Advisor since 1998, and AML Compliance Officer, the Advisor since | |
| 777 East Wisconsin Avenue | Compliance | Board annually; | January 2004 | |
| Milwaukee, WI 53202 | Officer | Since | ||
| Age 44 | August 2004 | |||
| Bret T. Reese | Assistant | Re-elected by | Vice President and Associate General Counsel, the Advisor since June 2005; Senior Financial | |
| 777 East Wisconsin Avenue | Secretary | Board annually; | Analyst, the Advisor (August 2004-June 2005); Financial Analyst, Stark & Roth, Inc., a hedge fund | |
| Milwaukee, WI 53202 | Since | (June 2001-August 2002) | ||
| Age: 38 | August 2006 | |||
Page 110
Baird Funds, Inc.
DISCLOSURE REGARDING THE BOARD OF DIRECTORS’ APPROVAL OF THE INVESTMENT ADVISORY AGREEMENT FOR BAIRD BOND FUNDS
The Board of Directors (the “Board”) of Baird Funds, Inc. (the “Corporation”) met on July 30, 2007 to consider the annual renewal of the Investment Advisory Agreement with Robert W. Baird & Co. Incorporated (“Baird” or the “Advisor”) for management of the Baird Intermediate Bond, Aggregate Bond, Intermediate Municipal Bond, Core Plus Bond and Short-Term Bond Funds (the “Funds”). The Board reviewed and discussed several documents that had been provided prior to the meeting, including the Investment Advisory Agreement, memoranda provided by outside legal counsel and the Secretary of the Funds discussing the Board’s fiduciary obligations and factors the Board should assess in considering the renewal of the Investment Advisory Agreement, information in response to a request from the Directors who are not “interested persons” of the Corporation or the Advisor (“Independent Directors”), within the meaning of the Investment Company Act of 1940 (the “1940 Act”), from the Advisor (including its Form ADV, Annual Report and statement of financial condition), a profitability analysis, comparative information about the Funds’ performance for periods ended June 30, 2007, management fees and expense ratios, and other pertinent information. The Independent Directors met separately in executive session with outside legal counsel to consider the Investment Advisory Agreement. The Board also received information periodically throughout the year that was relevant to its Investment Advisory Agreement renewal process, including performance, management fee and other expense information. Based on its evaluation of information provided by the Advisor, in conjunction with the Funds’ other service providers, the Board, including a majority of the Independent Directors, approved the continuation of the Investment Advisory Agreement for an additional one-year period.
In considering the Investment Advisory Agreement and reaching its conclusions, the Board reviewed and analyzed various factors that it determined were relevant, including the factors below.
Nature, Extent and Quality of Services Provided to the Funds
The Board analyzed the nature, extent and quality of the services provided by the Advisor to the Funds. The Board reviewed and considered the Advisor’s significant role in establishing the Funds and the construction of their investment objectives, principal strategies, investment limitations and fee structures. The Board noted the Advisor’s overall reputation and positive name recognition, the depth of the Advisor’s personnel, resources and commitment to the Funds, and the experience, credentials and continuity of the portfolio management teams employed to manage the Funds’ investments. The Board further noted that the Advisor has approximately $13.5 billion of assets under discretionary management, and has strong relationships with numerous institutional accounts. The Funds provide an opportunity for smaller institutional and retail accounts to receive the same professional advice from the Advisor that it offers to its larger institutional clients and to achieve the same level of portfolio diversification needed for prudent risk management. The Board considered the Advisor’s disciplined investment decision-making process used for the Funds. The Board also considered other services that the Advisor provided for the Funds in its capacity as their investment advisor, such as providing some of its key personnel available to serve as officers of the Funds, selecting broker-dealers for execution of portfolio transactions, ensuring adherence to the Fund’s investment policies and restrictions, providing support services to the Board and the Audit Committee of the Board and overseeing the Funds’ other service providers. In addition, the Board considered that the Advisor provides administrative services to each of the Bond Funds at an annual rate of 0.05% of the Fund’s average daily net assets, and is responsible for paying each Fund’s custody, transfer agency, accounting, printing, auditing, legal and director fees and other
Page 111
Baird Funds, Inc.
DISCLOSURE REGARDING THE BOARD OF DIRECTORS’ APPROVAL OF THE INVESTMENT ADVISORY AGREEMENT FOR BAIRD BOND FUNDS (cont.)
ordinary expenses (except for advisory and 12b-1 fees), which has the effect of capping the Funds’ expense ratios at 0.55% and 0.30% for Investor and Institutional Class shares, respectively. The Board further noted that the Advisor, in its capacity as a registered broker-dealer, also serves as distributor and principal underwriter of shares of the Funds and spends time and effort marketing the Funds. The Board also considered the strength of the Advisor’s compliance department, including the Funds’ chief compliance officer, and the fact that the Advisor has not experienced any significant legal, compliance or regulatory difficulties since the Funds were launched. The Board concluded that the nature, extent and quality of the services provided by the Advisor to the Funds were appropriate and that each Fund was likely to continue to benefit from services provided under the Investment Advisory Agreement.
Investment Performance of the Advisor and the Funds
In considering the investment performance of each Fund, the Board reviewed information as of June 30, 2007 regarding the Fund’s performance in comparison to its benchmark index and its peer groups as determined by Lipper. With respect to each Fund’s performance relative to its benchmark index, the Board noted that the Baird Intermediate Bond Fund (both Institutional and Investor Class shares) had outperformed the Lehman Brothers Intermediate Government/Credit Index for the one-year, three-year, five-year and since inception periods ended June 30, 2007; the Baird Aggregate Bond Fund (both Institutional and Investor Class shares) had outperformed the Lehman Brothers Aggregate Bond Index for the one-year, three-year, five-year and since inception periods ended June 30, 2007; the Baird Core Plus Bond Fund (both Institutional and Investor Classes) had outperformed the Lehman Brothers U.S. Universal Bond Index for the one-year, three-year, five-year and since inception periods ending June 30, 2007; and the Short-Term Bond Fund had outperformed the Lehman Brothers 1-3 Year Government/Credit Bond Index for the one-year and since inception (8/31/04) periods ended June 30, 2007. The Board also noted that, while the performance of the Baird Intermediate Municipal Bond Fund was comparable but lower than the Lehman Brothers 7-Year General Obligation Bond Index for each of the three-year and five-year periods ended June 30, 2007, the Institutional Class of that Fund had outperformed the Index for the one-year and since inception periods (3/31/01) through June 30, 2007.
The Board also reviewed information regarding the performance of each Fund relative to other mutual funds with a similar investment objective as determined by Lipper. The Board observed that the performance of the Institutional and Investor Class shares of the Baird Intermediate Bond Fund over the one-year, three-year, five-year and since inception periods ended June 30, 2007 were better than the Lipper Intermediate Investment Grade Debt Funds average; the performance of the Institutional and Investor Class shares of the Baird Aggregate Bond Fund over the one-year, three-year, five-year and since inception periods ended June 30, 2007 was better than the Lipper Intermediate Investment Grade Debt Funds average (in the top quartile for the one-year, three-year, five-year and since inception periods); the performance of the Institutional and Investor Class shares of the Baird Intermediate Municipal Bond Fund over the one-year, three-year, five-year and since inception periods ended June 30, 2007 was better than the Lipper Intermediate Municipal Debt Funds average (in the top quartile for the since inception period); the performance of the Institutional and Investor Class shares of the Baird Core Plus Bond Fund over the one-year, three-year, five-year and since inception periods ended June 30, 2007 was better than the Lipper Intermediate Investment Grade Debt Funds average (in the top quartile for all periods); and the performance of the Baird Short-Term Bond Fund for the one-year and since inception periods ended June 30, 2007 was better than the Lipper Short-Term Investment Grade Debt Funds average.
Page 112
Baird Funds, Inc.
DISCLOSURE REGARDING THE BOARD OF DIRECTORS’ APPROVAL OF THE INVESTMENT ADVISORY AGREEMENT FOR BAIRD BOND FUNDS (cont.)
The Board also considered the Advisor’s quarterly portfolio commentaries and reviews explaining the Funds’ performance, the Advisor’s consistent and disciplined investment decision process and the investment strategies it employs for the Funds. After considering all of the information, the Board concluded that, although past performance is not a guarantee of future results, each Fund and its shareholders were likely to benefit from the Advisor’s continued management.
Costs of Services Provided and Profits Realized by the Advisor
The Board examined the fee and expense information for each of the Funds, including a comparison of such information to other similarly situated mutual funds as determined by Lipper. The Board noted that each Fund’s advisory fee and total expense ratio (for both its Investor Class and Institutional Class shares) were significantly lower than the average and median advisory fees and expense ratios for all mutual funds in its Lipper category.
The Board also reviewed and considered investment management fees charged by the Advisor to other investment advisory clients and found that the fee paid by the Funds (0.25%) was less than the fee that the Advisor charges on the first $25 million (0.30%) of a separately managed account and the same as the fee that the Advisor charges on the next $25 million. The Board noted and discussed the extent of the significant additional services provided to the Funds that the Advisor did not provide in the other advisory relationships. Those services included certain administrative services, oversight of the Fund’s other service providers, director support, risk management, regulatory compliance and various other services.
The Board considered the fees realized, and the costs incurred, by the Advisor in providing investment management services to the Funds and the profitability to the Advisor of having a relationship with the Funds. The Board noted the unique expense structure of the Funds whereby the Institutional Class shareholders were charged only a management fee and an administration fee and the Adviser incurred all of the other expenses on behalf of each Fund and that the Investor Class shareholders incurred the same expenses as the Institutional Class shareholders plus a 0.25% 12b-1 fee. This structure means that the annual expense ratio for each Fund (as a percentage of average daily net assets) is 0.55% for Investor Class shares and 0.30% for Institutional Class shares. The Advisor informed the Board that the profits realized by the Advisor (as a percentage of revenue) from its relationship with the Funds were less than those realized by the Advisor on its investment advisory business as a whole, particularly since the 0.05% administration fee payable to the Advisor by each Fund was considerably less than the Fund’s expenses that the Advisor is required to pay.
The Board concluded that the profits realized by the Advisor from its relationship with the Funds were appropriate. The Board also reviewed and considered the general financial condition of the Advisor and determined it to be sound. In light of all of the information that it received and considered, the Board concluded that the management fee and total expense ratio of each Fund were reasonable with respect to the services provided and the performance of the Fund.
Economies of Scale and Fee Levels Reflecting Those Economies
The Board noted that the Funds’ advisory fee structure does not contain any breakpoint reductions as the Funds grow in size. However, the Board recognized that the Advisor essentially bears all of the Funds’ expenses other than management, 12b-1 and administration fees. The Board also recognized that the advisory fee rates paid by the Funds were designed to be lower than the fees otherwise charged by the Advisor to its separately managed account clients and to be comparable to the second or third breakpoint advisory fee levels paid by other comparable mutual funds.
Page 113
Baird Funds, Inc.
DISCLOSURE REGARDING THE BOARD OF DIRECTORS’ APPROVAL OF THE INVESTMENT ADVISORY AGREEMENT FOR BAIRD BOND FUNDS (cont.)
Benefits Derived from the Relationship with the Funds
The Board noted that the Advisor does not have any soft dollar arrangements and does not realize any other tangible benefits in connection with its management of the Funds. The Board believed that the Funds generally benefit from their association with the Advisor and the use of the “Baird” name. The Board concluded that the other benefits realized by the Advisor from its relationship with the Funds were appropriate.
After consideration of the above factors, the Board, including a majority of the Independent Directors, approved the renewal of the Investment Advisory Agreement with the Funds as being in the best interests of each Fund and its shareholders.
Page 114
Additional Information
Proxy Voting
A description of the policies and procedures that the Funds use to determine how to vote proxies relating to portfolio securities is available without charge, upon request, by calling toll free, 1-866-44BAIRD, or by accessing the Funds’ website at www.bairdfunds.com; and by accessing the SEC’s website at www.sec.gov.
Each Fund’s proxy voting record for the most recent 12-month period ended June 30, if applicable, is available without charge, upon request, by calling toll free, 1-866-44BAIRD, or by accessing the Funds’ website at www.bairdfunds.com; and by accessing the SEC’s website at www.sec.gov. The Funds generally do not vote proxies because the securities held in their portfolios, consisting of bonds and other fixed-income securities, are not entitled to vote.
Portfolio Holdings Disclosure
The Funds file a complete schedule of portfolio holdings with the SEC for the first and third quarters of each fiscal year on Form N-Q. The Funds’ Forms N-Q are available on the SEC website at www.sec.gov and may be reviewed and copied at the SEC’s Public Reference Room in Washington, D.C. Information on the operation of the Public Reference Room may be obtained by calling 1-800-732-0330. The Funds’ Forms N-Q may also be obtained by calling toll-free 1-866-44BAIRD.
Results of Special Meeting of Shareholders
The Funds held a special meeting of shareholders on December 19, 2007 relating to the election of directors. The shareholders elected each of the five persons nominated, including three current directors, John W. Feldt, G. Frederick Kasten, Jr. and Frederick P. Stratton, Jr.; and two director nominees, Cory L. Nettles and Marlyn J. Spear. A total of 102,756,959 shares were represented at the meeting, either in person or by proxy, constituting 69.6% of the shares eligible to vote. The voting results were as follows:
For | Against/Withheld | Abstentions/Broker Non Votes | |
| John W. Feldt | 102,675,068 | 81,891 | 0 |
| G. Frederick Kasten, Jr. | 102,674,460 | 82,499 | 0 |
| Frederick P. Stratton, Jr. | 102,672,540 | 84,419 | 0 |
| Cory L. Nettles | 102,677,551 | 79,408 | 0 |
| Marlyn J. Spear | 102,677,551 | 79,408 | 0 |
Page 115
(This Page Intentionally Left Blank.)
(This Page Intentionally Left Blank.)
Baird Funds, Inc.
c/o U.S. Bancorp Fund Services, LLC
P.O. Box 701
Milwaukee, WI 53201-0701
1-866-44BAIRD
Board of Directors
G. Frederick Kasten, Jr. (Chairman)
John W. Feldt
George C. Kaiser (retired 12-31-07)
Frederick P. Stratton, Jr.
Cory L. Nettles (effective 1-1-08)
Marlyn J. Spear (effective 1-1-08)
Investment Advisor and Distributor
Robert W. Baird & Co. Incorporated
777 East Wisconsin Avenue
Milwaukee, WI 53202
Administrator and Transfer Agent
U.S. Bancorp Fund Services, LLC
P.O. Box 701
615 East Michigan Street
Milwaukee, WI 53202
Custodian
U.S. Bank, N.A.
1555 N. RiverCenter Drive, Suite 302
Milwaukee, WI 53212
Legal Counsel
Godfrey & Kahn, S.C.
780 North Water Street
Milwaukee, WI 53202
Independent Registered Public Accounting Firm
Grant Thornton LLP
175 West Jackson Boulevard, 13th Floor
Chicago, IL 60604
Annual Report - Baird Funds
Baird LargeCap Fund
Baird MidCap Fund
Baird SmallCap Fund
TABLE OF CONTENTS
Page | |
| Letter to Shareholders | 1 |
| 2007 Economic and Stock Market Commentary | 2 |
| Baird LargeCap Fund | 4 |
| Baird MidCap Fund | 12 |
| Baird SmallCap Fund | 21 |
| Additional Information on Fund Expenses | 28 |
| Statements of Assets and Liabilities | 30 |
| Statements of Operations | 31 |
| Statements of Changes in Net Assets | 32 |
| Financial Highlights | 35 |
| Notes to the Financial Statements | 41 |
| Report of Independent Registered Public Accounting Firm | 50 |
| Directors and Officers | 51 |
| Disclosure Regarding the Board of Directors’ Approval | |
| of the Investment Advisory Agreement for Baird Equity Funds | 54 |
| Additional Information | 58 |
This report has been prepared for shareholders and may be distributed to others only if preceded or accompanied by a current prospectus.
Cautionary Note on Analyses, Opinions and Outlooks: In this report we offer analyses and opinions on the performance of individual securities, companies, industries, sectors, markets, interest rates and governmental policies, including predictions, forecasts and outlooks regarding possible future events. These can generally be identified as such because the context of the statements may include such words as “believe,” “should,” “will,” “expects,” “anticipates,” “hopes” and words of similar effect. These statements reflect the portfolio managers’ good faith beliefs and judgments and involve risks and uncertainties, including the risk that the portfolio managers’ analyses, opinions and outlooks are or will prove to be inaccurate. It is inherently difficult to correctly assess and explain the performance of particular securities, sectors, markets, interest rate movements, governmental actions or general economic trends and conditions, and many unforeseen factors contribute to the performance of Baird Funds. Investors are, therefore, cautioned not to place undue reliance on subjective judgments contained in this report.
Baird Funds, Inc.
1-866-442-2473
www.bairdfunds.com
February 27, 2008
Dear Shareholder,
Thank you for investing in the Baird Funds. We are pleased to report that the aggregate net assets of the eight mutual funds in our family have grown to more than $1.6 billion as of the end of 2007, representing an increase of 55% over the prior year. Also, in December 2007 the shareholders of the Funds elected two new directors, Cory Nettles and Marlyn Spear, to our Board. Their fresh perspectives and experience will complement the institutional knowledge of our three current directors. We look forward to working with the Board in the years to come.
In this Annual Report we review the equities market in 2007 and the performance and composition of each of the Baird Equity Funds. We hope you find this report both informative and helpful in achieving your investment goals. We appreciate your support and look forward to helping you achieve your investment goals. Thank you again for choosing Baird Funds.
Sincerely,
Mary Ellen Stanek, CFA
President
Baird Funds
2007 Economic and Stock Market Commentary
The Dow Jones Industrial Average and the S&P 500 Stock Index, the primary benchmarks used to assess the performance of the stock markets generally, posted positive total returns for 2007 of 8.91% and 5.49%, respectively.
2007 was a year in which volatility reigned. The S&P 500 and DJIA reached all time highs in early October before retreating at the end of the year, having surpassed their own respective record highs several times on their way to those peaks. Such record returns came on the heels of a 4-1/2 year trend in which equity markets benefited from strong economic conditions, positive job growth, historically low interest rates and contained inflation. The second quarter saw 10% annual corporate profit growth and robust private equity investment in publicly traded companies, while the Institute for Supply Management (ISM) manufacturing index reached its highest level in fourteen months.
As the year wore on, however, concerns surrounding the continuing deterioration in housing and a tightening credit environment increased and compounded the on-going effects of high oil prices. In such environments, the broad market may be influenced by, and respond aggressively to, short-term considerations. Accordingly, heightened levels of risk aversion and mixed forward economic indicators combined with several rounds of reductions in the Federal Reserve’s federal funds and discount rates produced wild oscillations in the various market indices. The Dow Jones Industrial Average experienced its first fourth-quarter drop in 10 years.
Even with this challenging backdrop, growth stocks emerged to a leadership position over their value counterparts early in 2007, and maintained that lead for the entire year. This development represented the reversal of several years of value outperformance.
Despite a very challenging environment, the bond market produced strong nominal returns in 2007. The flight to quality made Treasuries the top performing fixed income sector. In looking back at the year, 2007 will go down in the record books as an extremely difficult year for the bond market. It was a volatile year in which risk was dramatically and violently repriced.
International markets were generally favorable for the year. Foreign sales and good growth in the emerging economies helped buffer the effects of the U.S. weakness.
Outlook for 2008
Although recent economic news has been disappointing and increases the odds of a recession in 2008, we still do not anticipate a recession this year given solid global growth, monetary stimulus from an accommodative Fed and potential fiscal stimulus. While the recent rise in the unemployment rate from 4.7% to 5% in December is of a magnitude that has historically been associated with recessions, the ISM manufacturing index is not yet at levels associated with past recessions. The key indicator to watch regarding the risk of a recession is the trend in employment. Even if employment continues to slow, a recession should be avoided so long as employment growth stays in positive territory.
A second factor in the recession debate is the Federal Reserve which has already cut the federal funds rate 225 basis points since September 18, 2007. The Fed has been fighting a two-headed monster since this past summer. High oil and food prices have caused the Consumer Price Index (CPI) to rise to uncomfortable levels, which has made the Fed reluctant to stimulate the economy too much for fear of increasing inflation. However, even with the interest rate cuts, the Core CPI is only slightly ahead of the Fed’s comfort level and the odds favor an easing in inflationary pressures in the months ahead.
Page 2
2007 Economic and Stock Market Commentary
In addition, the Fed has been using a variety of other tools in its attempt to stabilize the credit markets. Since it takes up to a year for the full effect of rate cuts to be felt in the economy, the precise level of future cuts is harder to predict.
Regarding the equity markets, valuations are quite reasonable, interest rates are coming down and there is plenty of liquidity on the sidelines. Hence, we expect stock prices will be higher in 2008, albeit not without continued volatility. The recent price swings we have experienced will likely continue as the markets handicap the probability of different economic scenarios. Corporate profits from the fourth quarter of 2007 have declined from levels experienced a year earlier. That performance, combined with the third quarter’s decline, represent the first back to back quarters of negative growth in nearly six years. In addition, corporate profits for the first two quarters of 2008 are expected to be relatively weak overall. This situation would be positive for growth companies since investors tend to flock to companies with stable growth rates during tumultuous periods. In fact, large-cap growth funds continued to outpace the results from value funds for the fourth quarter and led for the full year for the first time since 1999. An uncertain economic environment combined with an increase in investor risk aversion has historically been a strong environment for quality growth companies. Hence, your Baird Investment Management portfolio strategy should benefit from investors focusing again on company fundamentals amidst the market volatility.
Page 3
Baird LargeCap Fund
Portfolio Managers’ Commentary
Stock market performance trends in 2007 exhibited significant volatility with both record highs in benchmark indices and considerable concern regarding mixed economic indicators. Growth stocks overtook value for the first time in several years, and decisively outperformed their value counterparts for the year. The large cap markets turned in their fifth year of positive returns, and the Russell 1000 Growth® Index led Russell’s style indices for the year.
The Baird LargeCap Fund’s equity performance trailed the Russell 1000 Growth® Index, the Fund’s primary benchmark, but outperformed the S&P 500 Index in 2007. Specifically, the Fund’s Institutional Class shares provided a 9.63% total return in 2007 (9.29% for Investor Class shares), lagging the 11.81% return of the Russell 1000 Growth® Index, but exceeding the 5.49% return of the S&P 500.
Energy and Industrial sector names provided healthy relative contribution with no names in the portfolio’s lowest contributing quintile, and nearly 80% of them in the top half. Energy stocks Schlumberger Ltd., Weatherford International Ltd. and Southwestern Energy were the third, fourth and fifth strongest contributors with total annual returns of 57%, 71% and 59%, respectively.
Stock selection in the Health Care and Consumer Staples sectors accounted for the bulk of the Fund’s underperformance versus the Russell 1000 Growth® Index during the year, with disappointing results from holdings Walgreen Co., Sysco Corp., Genentech and Celgene Corp. (-16%, -13%, -17% and -31%, respectively, for the year), with positive contributors in the sectors unable to offset the weight of weaker names.
Many of the year’s buys and sells involved replacement of a name whose growth prospects appeared to have deteriorated relative with another company in the same sector. Energy holding BJ Services was eliminated in favor of the aforementioned Weatherford International, a company with greater geographic diversity; Costco was purchased to replace Pepsico in the Consumer Staples sector, based on our belief in its greater long-term growth opportunities; Cardinal Health was replaced with Cytyc Corp., a company poised to benefit from acquisition by existing holding Hologic; and Capital One Financial made way for Northern Trust Corp., which boasts a conservative balance sheet and relatively low credit exposure. These new additions gained 71%, 27%, 17%, and 20% from the times of their respective purchases. The eliminated positions returned -7%, 7%, -1% and -12% for the part of the year they spent in the portfolio, and -17%, 24%, -10% and -38% for the full year.
Although recent economic news has been disappointing and increases the odds of a recession in 2008, we still do not anticipate a recession this year given solid global growth, monetary stimulus from an accommodative Fed and potential fiscal stimulus. As always, our goal is to be fully invested in high quality growth companies that typically demonstrate the ability to expand earnings, not only during economic upturns, but also when economic activity slows.
Portfolio Managers:
Douglas E. Guffy
Ken Hemauer, CFA
J. Bary Morgan, CFA
Page 4
Baird LargeCap Fund
A December 31, 2007 summary of the Fund’s top 10 holdings and equity sector analysis compared to the Russell 1000® Growth Index is shown below.
Top 10 Holdings* | ||
| Microsoft Corporation | 2.9% | |
| Danaher Corporation | 2.8% | |
| Electronic Arts Inc. | 2.8% | |
| Emerson Electric Company | 2.8% | |
| Abbott Laboratories | 2.7% | |
| Iron Mountain Incorporated | 2.7% | |
| Hologic, Inc. | 2.7% | |
| Cisco Systems, Inc. | 2.6% | |
| Johnson Controls, Inc. | 2.5% | |
| Corning Incorporated | 2.5% | |
Net Assets: | $28,384,788 | |
Portfolio Turnover Rate: | 72.2% | |
Number of Equity Holdings: | 49 | |
Annualized Portfolio Expense Ratio:*** | ||
| INSTITUTIONAL CLASS: | 0.75% | |
| INVESTOR CLASS: | 1.00% | **** |
Equity Sector Analysis**

| * | The Fund’s portfolio composition is subject to change and there is no assurance that the Fund will continue to hold any particular security. Percentages shown relate to the Fund’s total net assets as of December 31, 2007. | |
| ** | Percentages shown in parentheses relate to the Fund’s total equity investments as of December 31, 2007, and may not add up to 100% due to rounding. | |
| *** | The Advisor has contractually agreed to limit the Fund’s total annual fund operating expenses to 0.75% of average daily net assets for the Institutional Class shares and 1.00% of average daily net assets for the Investor Class shares, at least through April 30, 2009. | |
| **** | Includes 0.25% 12b-1 fee. |
Page 5
Baird LargeCap Fund
Baird LargeCap Fund – Institutional Class
Value of a $25,000 Investment
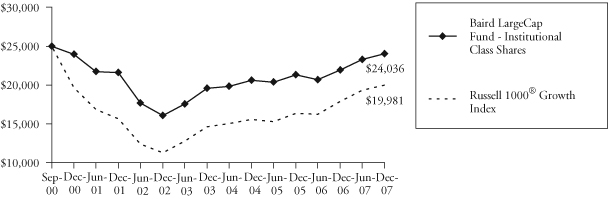
Growth of a hypothetical investment of $25,000 made on the Fund’s inception date (9/29/00), assuming reinvestment of all distributions.
Baird LargeCap Fund – Investor Class
Value of a $10,000 Investment
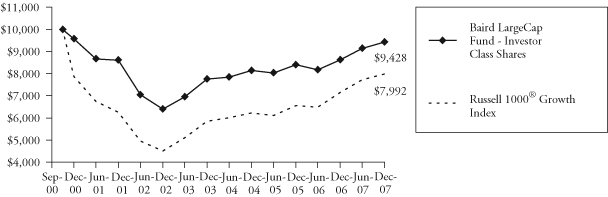
Growth of a hypothetical investment of $10,000 made on the Fund’s inception date (9/29/00), assuming reinvestment of all distributions.
Page 6
Baird LargeCap Fund
Average Annual Total Returns
For the Periods Ended December 31, 2007 | One Year | Five Years | Since Inception(1) |
| Baird LargeCap Fund – Institutional Class Shares | 9.63% | 8.36% | -0.54% |
| Baird LargeCap Fund – Investor Class Shares | 9.29% | 8.05% | -0.81% |
Russell 1000® Growth Index(2) | 11.81% | 12.10% | -3.05% |
(1) | For the period from September 29, 2000 (commencement of operations) through December 31, 2007. |
(2) | The Russell 1000® Growth Index measures the performance of those Russell 1000® companies with higher price-to-book ratios and higher forecasted growth rates. The Russell 1000® Index consists of the 1,000 largest companies in the Russell 3000® Index, which represents approximately 90% of the total market capitalization of the Russell 3000® Index, which in turn is comprised of the 3,000 largest U.S. domiciled publicly traded common stocks by market capitalization. These indices do not reflect any deduction for fees, expenses or taxes. A direct investment in an index is not possible. |
The returns shown in the table above and line graphs on the previous page reflect reinvestment of dividends and/or capital gains distributions in additional shares. The returns do not reflect the deduction of taxes that a shareholder would pay on Fund distributions or the redemption of Fund shares.
Past performance does not guarantee future results. Investment return and principal value will fluctuate so that an investor’s shares, when redeemed, may be worth more or less than their original cost.
For information about the performance of the Fund as of the most recent month-end, please call 1-866-44BAIRD or visit www.bairdfunds.com. Mutual fund performance changes over time and current performance may be lower or higher than that stated.
Page 7
Baird LargeCap Fund
Schedule of Investments December 31, 2007 |
Shares | Value | ||||||
COMMON STOCKS – 96.4% | |||||||
Aerospace & Defense – 2.0% | |||||||
| 9,275 | Honeywell | ||||||
| International, Inc. | $ | 571,062 | |||||
Auto Components – 2.5% | |||||||
| 19,677 | Johnson Controls, Inc. | 709,159 | |||||
Biotechnology – 5.4% | |||||||
| 7,700 | Celgene Corporation* | 355,817 | |||||
| 7,592 | Genentech, Inc.* | 509,195 | |||||
| 14,727 | Gilead Sciences, Inc.* | 677,589 | |||||
| 1,542,601 | |||||||
Capital Markets – 4.6% | |||||||
| 6,444 | Northern Trust Corporation | 493,482 | |||||
| 7,376 | State Street Corporation | 598,931 | |||||
| 3,575 | T. Rowe Price Group, Inc. | 217,646 | |||||
| 1,310,059 | |||||||
Chemicals – 4.2% | |||||||
| 11,768 | Ecolab, Inc. | 602,639 | |||||
| 6,684 | Praxair, Inc. | 592,938 | |||||
| 1,195,577 | |||||||
Commercial Banks – 0.9% | |||||||
| 9,335 | Marshall & Ilsley | ||||||
| Corporation | 247,191 | ||||||
Communications Equipment – 5.1% | |||||||
| 27,196 | Cisco Systems, Inc.* | 736,196 | |||||
| 29,248 | Corning Incorporated* | 701,660 | |||||
| 1,437,856 | |||||||
Computers & Peripherals – 5.9% | |||||||
| 3,299 | Apple Computer, Inc.* | 653,466 | |||||
| 11,325 | Hewlett-Packard Company | 571,686 | |||||
| 17,972 | Network Appliance, Inc.* | 448,581 | |||||
| 1,673,733 | |||||||
Electrical Equipment – 5.1% | |||||||
| 17,952 | Agilent Technologies, Inc.* | 659,556 | |||||
| 13,930 | Emerson Electric Company | 789,274 | |||||
| 1,448,830 | |||||||
Energy Equipment & Services – 4.5% | |||||||
| 6,181 | Schlumberger Limited f | 608,025 | |||||
| 9,945 | Weatherford | ||||||
International Ltd.* f | 682,227 | ||||||
| 1,290,252 | |||||||
Food & Staples Retailing – 6.3% | |||||||
| 6,483 | Costco Wholesale Corp. | 452,254 | |||||
| 16,650 | Sysco Corporation | 519,647 | |||||
| 11,448 | Walgreen Company | 435,940 | |||||
| 9,450 | Whole Foods Market, Inc. | 385,560 | |||||
| 1,793,401 | |||||||
Health Care Equipment & Supplies – 4.2% | |||||||
| 11,001 | Hologic, Inc.* | 755,109 | |||||
| 10,892 | St Jude Medical, Inc.* | 442,651 | |||||
| 1,197,760 | |||||||
Insurance – 1.5% | |||||||
| 6,000 | Principal Financial | ||||||
| Group, Inc. | 413,040 | ||||||
Internet Software & Services – 1.0% | |||||||
| 8,525 | eBay Inc.* | 282,945 | |||||
IT Services – 6.7% | |||||||
| 20,913 | Iron Mountain | ||||||
| Incorporated* | 774,199 | ||||||
| 12,123 | Paychex, Inc. | 439,095 | |||||
| 28,376 | Western Union Company | 688,969 | |||||
| 1,902,263 | |||||||
Life Science Tools & Services – 1.5% | |||||||
| 7,300 | Thermo Fisher | ||||||
| Scientific, Inc.* | 421,064 | ||||||
Machinery – 7.9% | |||||||
| 9,200 | Danaher Corporation | 807,208 | |||||
| 10,620 | Illinois Tool Works, Inc. | 568,595 | |||||
| 9,214 | ITT Industries, Inc. | 608,493 | |||||
| 3,750 | Joy Global Inc. | 246,825 | |||||
| 2,231,121 | |||||||
The accompanying notes are an integral part of these financial statements.
Page 8
Baird LargeCap Fund
Schedule of Investments December 31, 2007 |
Shares | Value | ||||||
COMMON STOCKS – 96.4% (cont.) | |||||||
Media – 1.7% | |||||||
| 15,275 | The Walt | ||||||
| Disney Company | $ | 493,077 | |||||
Multiline Retail – 2.9% | |||||||
| 11,955 | Kohl’s Corporation* | 547,539 | |||||
| 5,372 | Target Corporation | 268,600 | |||||
| 816,139 | |||||||
Oil & Gas – 2.3% | |||||||
| 11,906 | Southwestern | ||||||
| Energy Company* | 663,402 | ||||||
Personal Products – 1.7% | |||||||
| 12,150 | Avon Products, Inc. | 480,290 | |||||
Pharmaceuticals – 4.8% | |||||||
| 13,881 | Abbott Laboratories | 779,418 | |||||
| 9,106 | Allergan, Inc. | 584,969 | |||||
| 1,364,387 | |||||||
Semiconductor & Semiconductor Equipment – 2.4% | |||||||
| 20,484 | Texas Instruments | ||||||
| Incorporated* | 684,166 | ||||||
Software – 8.0% | |||||||
| 15,069 | Adobe Systems, | ||||||
| Incorporated* | 643,898 | ||||||
| 13,649 | Electronic Arts Inc.* | 797,238 | |||||
| 23,479 | Microsoft Corporation | 835,852 | |||||
| 2,276,988 | |||||||
Specialty Retail – 2.0% | |||||||
| 24,250 | Staples, Inc. | 559,448 | |||||
Trading Companies & Distributors – 1.3% | |||||||
| 8,941 | Fastenal Company | 361,395 | |||||
| Total Common Stocks | |||||||
| (Cost $22,747,358) | 27,367,206 | ||||||
SHORT-TERM INVESTMENTS – 2.9% | |||||||
Money Market Fund – 2.9% | |||||||
| 827,900 | Short-Term Investment | ||||||
| Company Liquid Assets | |||||||
| Portfolio – AIM Fund | 827,900 | ||||||
| Total Short-Term | |||||||
| Investments | |||||||
| (Cost $827,900) | 827,900 | ||||||
Principal | |||||||
Amount | |||||||
INVESTMENTS PURCHASED | |||||||
WITH CASH PROCEEDS FROM | |||||||
SECURITIES LENDING – 38.0% | |||||||
Certificate of Deposit – 1.6% | |||||||
| $ | 438,033 | Barclays Bank, | |||||
| 5.15%, 2/12/08 | 438,226 | ||||||
Commercial Paper – 10.2% | |||||||
| 328,524 | Alianz Finance Corporation, | ||||||
| 5.06%, 01/16/08 | 327,834 | ||||||
| Atlantic Asset | |||||||
| Securitization Corp.: | |||||||
| 65,705 | 6.13%, 01/04/08 | 65,671 | |||||
| 109,508 | 5.447%, 01/25/08 | 109,149 | |||||
| 109,508 | Barton Capital Corporation, | ||||||
| 5.835%, 01/10/08 | 109,365 | ||||||
| 109,508 | GovCo LLC, | ||||||
| 5.584%, 01/15/08 | 109,292 | ||||||
| 286,415 | KKR Atlantic Funding Trust, | ||||||
| 5.205%, 03/13/08 # | 281,847 | ||||||
| 196,852 | Kitty Hawk Funding Corp., | ||||||
| 5.323%, 01/25/08 | 196,206 | ||||||
| 438,033 | Kommunalkredit Austria | ||||||
| AG, 4.89%, 01/31/08 | 436,263 | ||||||
| 223,429 | Rams Funding Three LLC, | ||||||
| 5.386%, 02/11/08 | 223,429 | ||||||
The accompanying notes are an integral part of these financial statements.
Page 9
Baird LargeCap Fund
Schedule of Investments December 31, 2007 |
Principal | |||||||
Amount | Value | ||||||
INVESTMENTS PURCHASED | |||||||
WITH CASH PROCEEDS FROM | |||||||
SECURITIES LENDING – 38.0% (cont.) | |||||||
Commercial Paper – 10.2% (cont.) | |||||||
| $ | 109,508 | Ranger Funding Company | |||||
| LLC, 5.456%, 01/11/08 | $ | 109,350 | |||||
| 153,311 | Sheffield Receivables, | ||||||
| 6.099%, 01/04/08 | 153,232 | ||||||
| 350,426 | Sigma Finance, | ||||||
| 4.62%, 02/11/08 | 341,000 | ||||||
| 109,508 | Thunder Bay Funding LLC, | ||||||
| 5.839%, 01/14/08 | 109,307 | ||||||
| 109,508 | Tulip Funding Corporation, | ||||||
| 5.627%, 01/03/08 | 109,465 | ||||||
| 109,508 | Variable Funding | ||||||
| Capital Corporation, | |||||||
| 5.492%, 01/18/08 | 109,250 | ||||||
| 109,508 | Windmill Funding, | ||||||
| 6.136%, 01/10/08 | 109,365 | ||||||
| 2,900,025 | |||||||
Shares | |||||||
Money Market Mutual Funds – 3.6% | |||||||
| 516,617 | Merrill Lynch Premier | ||||||
| Institutional Fund | 516,617 | ||||||
| 512,479 | Reserve Primary Fund | 512,479 | |||||
| 1,029,096 | |||||||
Principal | |||||||
Amount | |||||||
Repurchase Agreements – 22.6% | |||||||
| $ | 547,541 | BNP Paribas, 4.70%, Dated | |||||
| 12/31/07, Due 01/02/08, | |||||||
| (Collateralized by a Fannie | |||||||
| Mae Collateralized Mortgage | |||||||
| Obligation, 6.00%, 11/01/37, | |||||||
| valued at $555,751. | |||||||
| Repurchase proceeds | |||||||
| are $547,684.) | 547,541 | ||||||
| 1,095,081 | Citigroup, 4.55%, Dated | ||||||
| 12/31/07, Due 01/02/08, | |||||||
| (Collateralized by various | |||||||
| AID – ISRAEL Government | |||||||
| Guaranteed Zero Coupon | |||||||
| Bonds, 09/15/13 – 11/15/21 | |||||||
| and U.S. Treasury Receipts, | |||||||
| 08/15/13, valued at | |||||||
| $1,119,855. Repurchase | |||||||
| proceeds are $1,095,358.) | 1,095,081 | ||||||
| 1,095,081 | Citigroup, 4.55%, Dated | ||||||
| 12/31/07, Due 01/02/08, | |||||||
| (Collateralized by various | |||||||
| U.S. Treasury Receipts, | |||||||
| 8/15/08 – 8/15/13, valued | |||||||
| at $1,116,983. Repurchase | |||||||
| proceeds are $1,095,358.) | 1,095,081 | ||||||
| 416,131 | Credit Suisse, 4.64%, Dated | ||||||
| 12/31/07, Due 01/02/08, | |||||||
| (Collateralized by various | |||||||
| collateralized mortgage | |||||||
| obligations, 5.434 – 6.50%, | |||||||
| 11/25/36 – 01/15/49, valued | |||||||
| at $436,952. Repurchase | |||||||
| proceeds are $416,238.) | 416,131 | ||||||
The accompanying notes are an integral part of these financial statements.
Page 10
Baird LargeCap Fund
Schedule of Investments December 31, 2007 |
Principal | |||||||
Amount | Value | ||||||
INVESTMENTS PURCHASED | |||||||
WITH CASH PROCEEDS FROM | |||||||
SECURITIES LENDING – 38.0% (cont.) | |||||||
Repurchase Agreements – 22.6% (cont.) | |||||||
| $ | 1,095,081 | Goldman Sachs, 4.62%, | |||||
| Dated 12/31/07, Due | |||||||
| 01/02/08, (Collateralized by | |||||||
| a Wells Fargo Collateralized | |||||||
| Mortgage Obligation, | |||||||
| 6.00%, 08/25/37, valued at | |||||||
| $1,115,861. Repurchase | |||||||
| proceeds are $1,095,362.) | $ | 1,095,081 | |||||
| 547,541 | Morgan Stanley, 4.65%, | ||||||
| Dated 12/31/07, Due | |||||||
| 01/02/08, (Collateralized by | |||||||
| a Morgan Stanley Senior | |||||||
| Subordinated Note, 4.955%, | |||||||
| 09/26/08, valued at | |||||||
| $657,049. Repurchase | |||||||
| proceeds are $547,682.) | 547,541 | ||||||
| 1,598,819 | Morgan Stanley, 4.85%, | ||||||
| Dated 12/31/07, Due | |||||||
| 01/02/08, (Collateralized by | |||||||
| a Fannie Mae Collateralized | |||||||
| Mortgage Obligation, | |||||||
| 5.315%, 09/25/35, valued | |||||||
| at $1,631,233. Repurchase | |||||||
| proceeds are $1,599,250.) | 1,598,819 | ||||||
| 6,395,275 | |||||||
| Total Investments Purchased | |||||||
| With Cash Proceeds From | |||||||
| Securities Lending | |||||||
| (Cost $10,767,539) | 10,762,622 | ||||||
| Total Investments | |||||||
| (Cost $34,342,797) – | |||||||
| 137.3% | 38,957,728 | ||||||
| Liabilities in Excess of | |||||||
| Other Assets – (37.3)% | (10,572,940 | ) | |||||
| TOTAL NET | |||||||
| ASSETS – 100.0% | $ | 28,384,788 | |||||
| * | Non-Income Producing |
f | Foreign Security |
| # | Fair Valued by Advisor |
The accompanying notes are an integral part of these financial statements.
Page 11
Baird MidCap Fund
Portfolio Managers’ Commentary
Stock market performance trends in 2007 exhibited significant volatility with both record highs in benchmark indices and considerable concern regarding mixed economic indicators. Growth stocks overtook value for the first time in several years, and decisively outperformed their value counterparts for the year.
The Baird MidCap Fund’s equity performance outperformed the broad market benchmarks in 2007. Specifically, the Fund’s Institutional Class shares provided a 20.89% total return in 2007 (20.61% for Investor Class shares), exceeding the 11.43% and 7.98% respective returns of the Russell Midcap Growth® Index, the Fund’s primary benchmark, and the S&P MidCap 400 Index.
Generally speaking, portfolio holdings contributing positively to the portfolio outnumbered those contributing negatively by more than 2:1. Our stock selection added value in the majority of the sectors in which we invest, but the Consumer Discretionary and Information Technology sectors were the two standouts. Gamestop Corp., Consumer Discretionary holding, and Activision, an Information Technology name, were the top two contributing stocks for the year. Strong results from these and other securities in those sectors, including Chipotle Mexican Grill, Dolby Laboratories, Navteq Corp. and Alliance Data Systems (125%, 72%, 102%, 44%, 64% and 25%, respectively, for the year), propelled the portfolio’s outperformance. Four of the Fund’s holdings were bought out during the year, adding significant value to the portfolio in each case. Such buy-out activity may not recur in 2008.
The Consumer Staples and Financials sectors were the only negative contributors for the year. In 2007, Financial stocks faced the challenging scenario of a credit crunch and fallout in the domestic housing market. Though most of our exposure was with regional banks, which faced less pressure than did the larger cap commercial and multi-national banks, it proved difficult for any financial institution to escape unscathed. The Financials sector was responsible for the greatest absolute and relative negative contribution for the year. Only two Financial holdings, Investors Financial Services which was bought out in the first quarter, and Eaton Vance Corp., with respective portfolio returns of 40% and 39%, were in the top half of the portfolio’s contributors. Meanwhile, three of the portfolio’s four lowest contributors were Financial stocks: Zions Bancorporation, East West Bancorp and Marshall & Ilsley Corp. (-42%, -31% and -28%).
Buyouts made room for new holdings, Akamai Technologies and Lamar Advertising Co. Oceaneering International, also a new holding for the Fund in 2007, “graduated” from the Baird SmallCap Fund as it grew too large for that strategy’s investment guidelines. This energy service company grew 28% from the time of purchase to the end of the year.
Chipotle Mexican Grill, referenced above, was purchased in February and sold in October after the stock price had doubled to a valuation well above both historical highs and the company’s peer group.
Other holdings were eliminated on slowing growth or deteriorating fundamentals, including Consumer Discretionary holdings Williams-Sonoma and Chico’s FAS, and IT stock Cognizant Technology. These holdings returned 8%, -47% and 10%, respectively, during the portion of the year spent in the portfolio, but -16%, -56% and -12% for the entire year.
Page 12
Baird MidCap Fund
Although recent economic news has been disappointing and increases the odds of a recession in 2008, we still do not anticipate a recession this year given solid global growth, monetary stimulus from an accommodative Fed and potential fiscal stimulus. As always, our goal is to be fully invested in high quality growth companies that typically demonstrate the ability to expand earnings, not only during economic upturns, but also when economic activity slows.
Portfolio Managers:
Greg Edwards, CFA
J. Bary Morgan, CFA
Chuck Severson, CFA
Page 13
Baird MidCap Fund
A December 31, 2007 summary of the Fund’s top 10 holdings and equity sector analysis compared to the Russell Midcap® Growth Index is shown below.
Top 10 Holdings* | ||
| United Natural Foods, Inc. | 3.1% | |
| Covance Inc. | 2.8% | |
| Smith International, Inc. | 2.7% | |
| Harsco Corporation | 2.7% | |
| Advance Auto Parts, Inc. | 2.7% | |
| Cephalon, Inc. | 2.6% | |
| Logitech Intl. S.A. | 2.6% | |
| Dolby Laboratories, Inc. | 2.6% | |
| Global Payments, Inc. | 2.6% | |
| Harris Corporation | 2.6% | |
Net Assets: | $41,400,391 | |
Portfolio Turnover Rate: | 72.3% | |
Number of Equity Holdings: | 44 | |
Annualized Portfolio Expense Ratio:*** | ||
| INSTITUTIONAL CLASS: | 0.85% | |
| INVESTOR CLASS: | 1.10% | **** |
Equity Sector Analysis**
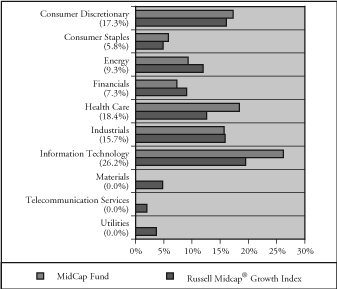
| * | The Fund’s portfolio composition is subject to change and there is no assurance that the Fund will continue to hold any particular security. Percentages shown relate to the Fund’s total net assets as of December 31, 2007. | |
| ** | Percentages shown in parentheses relate to the Fund’s total equity investments as of December 31, 2007, and may not add up to 100% due to rounding. | |
| *** | The Advisor has contractually agreed to limit the Fund’s total annual fund operating expenses to 0.85% of average daily net assets for the Institutional Class shares and 1.10% of average daily net assets for the Investor Class shares, at least through April 30, 2009. | |
| **** | Includes 0.25% 12b-1 fee. |
Page 14
Baird MidCap Fund
Baird MidCap Fund – Institutional Class
Value of a $25,000 Investment
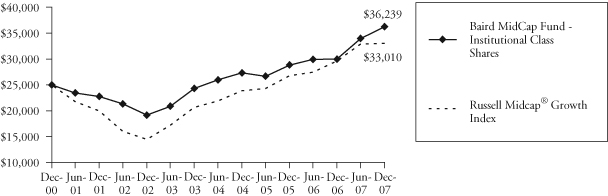
Growth of a hypothetical investment of $25,000 made on the Fund’s inception date (12/29/00), assuming reinvestment of all distributions.
Baird MidCap Fund – Investor Class
Value of a $10,000 Investment
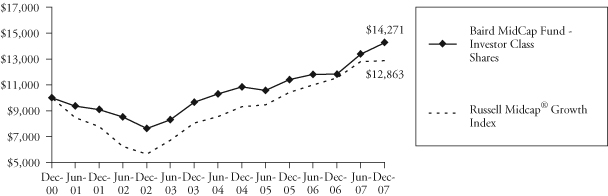
Growth of a hypothetical investment of $10,000 made on the Fund’s inception date (12/29/00), assuming reinvestment of all distributions.
Page 15
Baird MidCap Fund
Average Annual Total Returns
For the Periods Ended December 31, 2007 | One Year | Five Years | Since Inception(1) |
| Baird MidCap Fund – Institutional Class Shares | 20.89% | 13.61% | 5.44% |
| Baird MidCap Fund – Investor Class Shares | 20.61% | 13.34% | 5.21% |
Russell Midcap® Growth Index(2) | 11.43% | 17.90% | 3.66% |
(1) | For the period from December 29, 2000 (commencement of operations) through December 31, 2007. |
(2) | The Russell Midcap® Growth Index measures the performance of those Russell Midcap® Index companies with higher price-to-book ratios and higher forecasted growth rates. The Russell Midcap® Index consists of the 800 smallest companies in the Russell 1000® Index, which represent approximately 31% of the total market capitalization of the Russell 1000® Index. The Russell 1000® Index consists of the largest companies in the Russell 3000® Index, which in turn is comprised of the 3,000 largest U.S. domiciled publicly traded common stocks by market capitalization. These indices do not reflect any deduction for fees, expenses or taxes. A direct investment in an index is not possible. |
The returns shown in the table above and line graphs on the previous page reflect reinvestment of dividends and/or capital gains distributions in additional shares. The returns do not reflect the deduction of taxes that a shareholder would pay on Fund distributions or the redemption of Fund shares.
Past performance does not guarantee future results. Investment return and principal value will fluctuate so that an investor’s shares, when redeemed, may be worth more or less than their original cost.
For information about the performance of the Fund as of the most recent month-end, please call 1-866-44BAIRD or visit www.bairdfunds.com. Mutual fund performance changes over time and current performance may be lower or higher than that stated.
Page 16
Baird MidCap Fund
Schedule of Investments December 31, 2007 |
Shares | Value | ||||||
COMMON STOCKS – 94.9% | |||||||
Auto Components – 2.2% | |||||||
| 52,324 | Gentex Corporation | $ | 929,797 | ||||
Biotechnology – 2.6% | |||||||
| 15,267 | Cephalon, Inc.* | 1,095,560 | |||||
Capital Markets – 2.2% | |||||||
| 19,868 | Eaton Vance Corporation | 902,206 | |||||
Commercial Banks – 4.8% | |||||||
| 35,826 | East West Bancorp, Inc. | 868,064 | |||||
| 21,519 | Marshall & | ||||||
| Ilsley Corporation | 569,823 | ||||||
| 11,346 | Zions Bancorporation | 529,745 | |||||
| 1,967,632 | |||||||
Commercial Services & Supplies – 2.0% | |||||||
| 14,211 | Stericycle, Inc.* | 844,133 | |||||
Communications Equipment – 5.2% | |||||||
| 21,740 | Dolby Laboratories, Inc.* | 1,080,913 | |||||
| 16,857 | Harris Corporation | 1,056,597 | |||||
| 2,137,510 | |||||||
Computers & Peripherals – 2.6% | |||||||
| 29,763 | Logitech Intl S.A.* f | 1,090,516 | |||||
Electrical Equipment – 4.3% | |||||||
| 15,645 | Roper Industries, Inc. | 978,438 | |||||
| 26,000 | Trimble Navigation | ||||||
| Limited* | 786,240 | ||||||
| 1,764,678 | |||||||
Energy Equipment & Services – 6.6% | |||||||
| 17,762 | Cameron International | ||||||
| Corporation* | 854,885 | ||||||
| 11,277 | Oceaneering | ||||||
| International, Inc.* | 759,506 | ||||||
| 15,229 | Smith International, Inc. | 1,124,662 | |||||
| 2,739,053 | |||||||
Food & Staples Retailing – 5.5% | |||||||
| 40,181 | United Natural Foods, Inc.* | 1,274,541 | |||||
Food & Staples Retailing – 5.5% (cont.) | |||||||
| 24,481 | Whole Foods Market, Inc. | 998,825 | |||||
| 2,273,366 | |||||||
Health Care Equipment & Supplies – 7.9% | |||||||
| 12,904 | Gen-Probe, Incorporated* | 812,049 | |||||
| 12,309 | Hologic, Inc.* | 844,890 | |||||
| 10,619 | IDEXX Laboratories, Inc.* | 622,592 | |||||
| 18,573 | ResMed, Inc.* | 975,640 | |||||
| 3,255,171 | |||||||
Health Care Providers & Services – 2.2% | |||||||
| 21,007 | VCA Antech, Inc.* | 929,140 | |||||
Health Care Technology – 2.0% | |||||||
| 14,368 | Cerner Corporation* | 810,355 | |||||
Hotels, Restaurants & Leisure – 1.9% | |||||||
| 34,097 | The Cheesecake Factory | ||||||
| Incorporated* | 808,440 | ||||||
Household Durables – 2.3% | |||||||
| 12,725 | Harman International | ||||||
| Industries, Incorporated | 937,960 | ||||||
Internet Software & Services – 1.8% | |||||||
| 21,374 | Akamai Technologies, Inc.* | 739,540 | |||||
IT Services – 4.9% | |||||||
| 22,845 | Global Payments, Inc. | 1,062,749 | |||||
| 25,669 | Iron Mountain | ||||||
| Incorporated* | 950,266 | ||||||
| 2,013,015 | |||||||
Life Sciences Tools & Services – 2.8% | |||||||
| 13,233 | Covance Inc.* | 1,146,242 | |||||
Machinery – 8.5% | |||||||
| 6,101 | Bucyrus International, | ||||||
| Inc. – Class A | 606,378 | ||||||
| 17,501 | Harsco Corporation | 1,121,289 | |||||
| 14,564 | Joy Global Inc. | 958,603 | |||||
| 17,433 | Oshkosh Truck | ||||||
| Corporation | 823,884 | ||||||
| 3,510,154 | |||||||
The accompanying notes are an integral part of these financial statements.
Page 17
Baird MidCap Fund
Schedule of Investments December 31, 2007 |
Shares | Value | ||||||
COMMON STOCKS – 94.9% (cont.) | |||||||
Media – 1.7% | |||||||
| 14,781 | Lamar Advertising | ||||||
| Co. – Class A | $ | 710,523 | |||||
Office Electronics – 2.3% | |||||||
| 26,988 | Zebra Technologies | ||||||
| Corporation – Class A* | 936,484 | ||||||
Oil & Gas – 2.2% | |||||||
| 16,505 | Southwestern | ||||||
| Energy Company* | 919,659 | ||||||
Semiconductor & Semiconductor Equipment – 1.9% | |||||||
| 25,682 | Microchip Technology | ||||||
| Incorporated | 806,928 | ||||||
Software – 4.3% | |||||||
| 32,495 | Activision, Inc.* | 965,102 | |||||
| 21,541 | Citrix Systems, Inc.* | 818,773 | |||||
| 1,783,875 | |||||||
Specialty Retail – 8.2% | |||||||
| 28,949 | Advance Auto Parts, Inc. | 1,099,773 | |||||
| 24,279 | Dick’s Sporting Goods, Inc.* | 673,985 | |||||
| 14,813 | Gamestop Corporation – | ||||||
| Class A* | 920,035 | ||||||
| 19,712 | Tractor Supply Company* | 708,449 | |||||
| 3,402,242 | |||||||
Trading Companies & Distributors – 2.0% | |||||||
| 20,491 | Fastenal Company | 828,246 | |||||
| Total Common Stocks | |||||||
| (Cost $30,806,033) | 39,282,425 | ||||||
SHORT-TERM INVESTMENTS – 4.9% | |||||||
Money Market Fund – 4.9% | |||||||
| 2,040,673 | Short-Term Investment | ||||||
| Company Liquid Assets | |||||||
| Portfolio – AIM Fund | 2,040,673 | ||||||
| Total Short-Term | |||||||
| Investments | |||||||
| (Cost $2,040,673) | 2,040,673 | ||||||
Principal | |||||||
Amount | |||||||
INVESTMENTS PURCHASED | |||||||
WITH CASH PROCEEDS FROM | |||||||
SECURITIES LENDING – 37.1% | |||||||
Certificate of Deposit – 1.5% | |||||||
| $ | 624,969 | Barclays Bank, | |||||
| 5.15%, 2/12/08 | 625,244 | ||||||
Commercial Paper – 10.0% | |||||||
| 468,727 | Alianz Finance Corporation, | ||||||
| 5.06%, 01/16/08 | 467,742 | ||||||
| Atlantic Asset | |||||||
| Securitization Corp.: | |||||||
| 93,745 | 6.13%, 01/04/08 | 93,697 | |||||
| 156,242 | 5.447%, 01/25/08 | 155,730 | |||||
| 156,242 | Barton Capital Corporation, | ||||||
| 5.835%, 01/10/08 | 156,037 | ||||||
| 156,242 | GovCo LLC, | ||||||
| 5.584%, 01/15/08 | 155,934 | ||||||
| 408,646 | KKR Atlantic Funding Trust, | ||||||
| 5.205%, 03/13/08 # | 402,130 | ||||||
| 280,861 | Kitty Hawk Funding Corp., | ||||||
| 5.323%, 01/25/08 | 279,940 | ||||||
| 624,969 | Kommunalkredit Austria | ||||||
| AG, 4.89%, 01/31/08 | 622,444 | ||||||
| 318,780 | Rams Funding Three LLC, | ||||||
| 5.386%, 02/11/08 | 318,780 | ||||||
The accompanying notes are an integral part of these financial statements.
Page 18
Baird MidCap Fund
Schedule of Investments December 31, 2007 |
Principal | |||||||
Amount | Value | ||||||
INVESTMENTS PURCHASED | |||||||
WITH CASH PROCEEDS FROM | |||||||
SECURITIES LENDING – 37.1% (cont.) | |||||||
Commercial Paper – 10.0% (cont.) | |||||||
| $ | 156,242 | Ranger Funding Company | |||||
| LLC, 5.456%, 01/11/08 | $ | 156,017 | |||||
| 218,739 | Sheffield Receivables, | ||||||
| 6.099%, 01/04/08 | 218,625 | ||||||
| 499,975 | Sigma Finance, | ||||||
| 4.62%, 02/11/08 | 486,526 | ||||||
| 156,242 | Thunder Bay Funding LLC, | ||||||
| 5.839%, 01/14/08 | 155,955 | ||||||
| 156,242 | Tulip Funding Corporation, | ||||||
| 5.627%, 01/03/08 | 156,181 | ||||||
| 156,242 | Variable Funding | ||||||
| Capital Corporation, | |||||||
| 5.492%, 01/18/08 | 155,873 | ||||||
| 156,242 | Windmill Funding, | ||||||
| 6.136%, 01/10/08 | 156,037 | ||||||
| 4,137,648 | |||||||
Shares | |||||||
Money Market Mutual Funds – 3.6% | |||||||
| 737,090 | Merrill Lynch Premier | ||||||
| Institutional Fund | 737,090 | ||||||
| 731,187 | Reserve Primary Fund | 731,187 | |||||
| 1,468,277 | |||||||
Principal | |||||||
Amount | |||||||
Repurchase Agreements – 22.0% | |||||||
| $ | 781,211 | BNP Paribas, 4.70%, Dated | |||||
| 12/31/07, Due 01/02/08, | |||||||
| (Collateralized by a Fannie | |||||||
| Mae Collateralized | |||||||
| Mortgage Obligation, | |||||||
| 6.00%, 11/01/37, valued | |||||||
| at $792,925. Repurchase | |||||||
| proceeds are $781,415.) | 781,211 | ||||||
| 1,562,422 | Citigroup, 4.55%, Dated | ||||||
| 12/31/07, Due 01/02/08, | |||||||
| (Collateralized by various | |||||||
| AID – ISRAEL Government | |||||||
| Guaranteed Zero Coupon | |||||||
| Bonds, 09/15/13 – 11/15/21 | |||||||
| and U.S. Treasury Receipts, | |||||||
| 08/15/13, valued at | |||||||
| $1,597,768. Repurchase | |||||||
| proceeds are $1,562,817.) | 1,562,422 | ||||||
| 1,562,422 | Citigroup, 4.55%, Dated | ||||||
| 12/31/07, Due 01/02/08, | |||||||
| (Collateralized by various | |||||||
| U.S. Treasury Receipts, | |||||||
| 08/15/08 – 08/15/13, valued | |||||||
| at $1,593,670. Repurchase | |||||||
| proceeds are $1,562,817.) | 1,562,422 | ||||||
| 593,720 | Credit Suisse, 4.64%, Dated | ||||||
| 12/31/07, Due 01/02/08, | |||||||
| (Collateralized by various | |||||||
| collateralized mortgage | |||||||
| obligations, 5.434 – 6.50%, | |||||||
| 11/25/36 – 01/15/49, valued | |||||||
| at $623,428. Repurchase | |||||||
| proceeds are $593,873.) | 593,720 | ||||||
The accompanying notes are an integral part of these financial statements.
Page 19
Baird MidCap Fund
Schedule of Investments December 31, 2007 |
Principal | |||||||
Amount | Value | ||||||
INVESTMENTS PURCHASED | |||||||
WITH CASH PROCEEDS FROM | |||||||
SECURITIES LENDING – 37.1% (cont.) | |||||||
Repurchase Agreements – 22.0% (cont.) | |||||||
| $ | 1,562,422 | Goldman Sachs, 4.62%, | |||||
| Dated 12/31/07, Due | |||||||
| 01/02/08, (Collateralized by | |||||||
| a Wells Fargo Collateralized | |||||||
| Mortgage Obligation, | |||||||
| 6.00%, 08/25/37, valued | |||||||
| at $1,592,070. Repurchase | |||||||
| proceeds are $1,562,823.) | $ | 1,562,422 | |||||
| 781,211 | Morgan Stanley, 4.65%, | ||||||
| Dated 12/31/07, Due | |||||||
| 01/02/08, (Collateralized | |||||||
| by a Morgan Stanley Senior | |||||||
| Subordinated Note, 4.955%, | |||||||
| 09/26/08, valued at | |||||||
| $937,453. Repurchase | |||||||
| proceeds are $781,413.) | 781,211 | ||||||
| 2,281,136 | Morgan Stanley, 4.85%, | ||||||
| Dated 12/31/07, Due | |||||||
| 01/02/08, (Collateralized by | |||||||
| a Fannie Mae Collateralized | |||||||
| Mortgage Obligation, | |||||||
| 5.315%, 09/25/35, valued | |||||||
| at $2,327,383. Repurchase | |||||||
| proceeds are $2,281,750.) | 2,281,136 | ||||||
| 9,124,544 | |||||||
| Total Investments Purchased | |||||||
| With Cash Proceeds From | |||||||
| Securities Lending | |||||||
| (Cost $15,362,634) | 15,355,713 | ||||||
| Total Investments | |||||||
| (Cost $48,209,340) – | |||||||
| 136.9% | 56,678,811 | ||||||
| Liabilities in Excess of | |||||||
| Other Assets – (36.9)% | (15,278,420 | ) | |||||
| TOTAL NET | |||||||
| ASSETS – 100.0% | $ | 41,400,391 | |||||
| * | Non-Income Producing |
f | Foreign Security |
| # | Fair Valued by Advisor |
The accompanying notes are an integral part of these financial statements.
Page 20
Baird SmallCap Fund
Portfolio Managers’ Commentary
Stock market performance trends in 2007 exhibited significant volatility with both record highs in benchmark indices and considerable concern regarding mixed economic indicators. Growth stocks overtook value for the first time in several years, and decisively outperformed their value counterparts for the year.
The Baird SmallCap Fund’s equity performance trailed the broad market benchmarks in 2007. Specifically, the Fund’s Institutional Class shares provided a -3.18% total return in 2007 (-3.21% for Investor Class shares), lagging the 7.05% and -0.30% respective returns of the Russell 2000 Growth® Index, the Fund’s primary benchmark, and the S&P SmallCap 600 Index.
A particular feature of performance in 2007 was the strength of the largest stocks in the small cap universe. At year-end, over 10% of the assets in the Russell 2000 Growth® Index consisted of stocks whose capitalizations were greater than $3 billion, with the largest holding exceeding $8 billion. This largest quintile provided the only positive contribution to benchmark performance in the fourth quarter. Unfortunately, BIM’s small cap portfolio was unable to take full advantage of this trend due to our adherence to our own portfolio guidelines. The BIM small cap team typically begins to trim stocks that exceed $2 billion in capitalization, and sells outright at $3 billion. We maintain these guidelines because we believe that it is in our clients’ best interests to maintain asset allocation parameters by remaining a true small cap product. For the year, BIM’s holdings in the largest market cap quintile did provide positive contribution, exceeding that of the benchmark. However, our underweight at that cap size kept this group of holdings from countering the drag represented by the smaller quintiles.
Energy and Information Technology sector names provided healthy absolute and relative contribution with 80% of the portfolio’s names falling in the top half of portfolio contribution. Energy stock Dawson Geophysical and IT holdings Sigma Designs, Plexus Corp. and Secure Computing Corp. were among the sectors’ strongest contributors (with returns of 96%, 70%, 10% and 20%, respectively, for the year). Technology firm Open Solutions was acquired by two private equity firms, selling at nearly double the price at which it entered the portfolio.
Stock selection in the Consumer Discretionary, Industrials and Financials sectors accounted for the bulk of the Fund’s underperformance versus the Russell 2000 Growth® Index during the year. In 2007, Financial stocks faced the challenging scenario of a credit crunch and fallout in the domestic housing market, troubles which tended to overflow into the Industrials sector as well. Though most of our financial exposure was with regional banks, which faced less pressure than did the larger cap commercial and multi-national banks, it proved difficult for any financial institution to escape unscathed. The Consumer sectors reflected the overall concerns engendered by a greater part of household spending devoted to energy and a climate of generalized economic concern. With eight of the ten weakest contributors coming from these three sectors, it was difficult for positive contributors in each group to offset the weight of weaker names. Holdings whose results were disappointing included Watsco, Wintrust Financial Corp., Marlin Business Services and Hibbett Sports (-20%, -30%, -50% and -35%, respectively, for the year).
Page 21
Baird SmallCap Fund
New holdings during the year were well distributed across sectors, and encompassed both the top and bottom contributing stocks: Illumina, Inc., which returned 84% for the year, and Spartan Motors, which lost 56%. Sales of stocks whose growth opportunities appeared inhibited or possessed deteriorating fundamentals included Salix Pharmaceuticals, Rackable Systems, and Varian Semiconductor Equipment Associates. These holdings returned 5%, -54% and 42% respectively during the portion of the year spent in the portfolio, but -35%, -68% and -22% for the entire year.
Although recent economic news has been disappointing and increases the odds of a recession in 2008, we still do not anticipate a recession this year given solid global growth, monetary stimulus from an accommodative Fed and potential fiscal stimulus. As always, our goal is to be fully invested in high quality growth companies that typically demonstrate the ability to expand earnings, not only during economic upturns, but also when economic activity slows.
Portfolio Managers:
Greg Edwards, CFA
Chuck Severson, CFA
Page 22
Baird SmallCap Fund
A December 31, 2007 summary of the Fund’s top 10 holdings and equity sector analysis compared to the Russell 2000® Growth Index is shown below.
Top 10 Holdings* | ||
| Forrester Research, Inc. | 3.1% | |
| United Natural Foods, Inc. | 3.0% | |
| Healthways, Inc. | 2.9% | |
| TomoTherapy Inc. | 2.9% | |
| Tractor Supply Company | 2.7% | |
| Secure Computing Corporation | 2.7% | |
| ESCO Technologies, Inc. | 2.6% | |
| DTS, Inc. | 2.6% | |
| Heartland Payment Systems, Inc. | 2.6% | |
| SRA International, Inc. - Class A | 2.4% | |
Net Assets: | $26,857,247 | |
Portfolio Turnover Rate: | 92.9% | |
Number of Equity Holdings: | 44 | |
Annualized Portfolio Expense Ratio:*** | ||
| INSTITUTIONAL CLASS: | 0.95% | |
| INVESTOR CLASS: | 1.20% | **** |
Equity Sector Analysis**
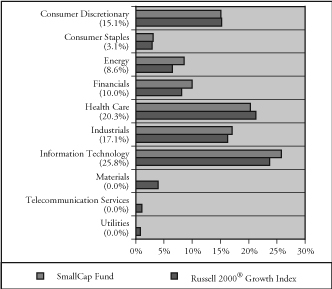
| * | The Fund’s portfolio composition is subject to change and there is no assurance that the Fund will continue to hold any particular security. Percentages shown relate to the Fund’s total net assets as of December 31, 2007. | |
| ** | Percentages shown in parentheses relate to the Fund’s total equity investments as of December 31, 2007, and may not add up to 100% due to rounding. | |
| *** | The Advisor has contractually agreed to limit the Fund’s total annual fund operating expenses to 0.95% of average daily net assets for the Institutional Class shares and 1.20% of average daily net assets for the Investor Class shares, at least through April 30, 2009. | |
| **** | Includes 0.25% 12b-1 fee. |
Page 23
Baird SmallCap Fund
Baird SmallCap Fund – Institutional Class
Value of a $25,000 Investment
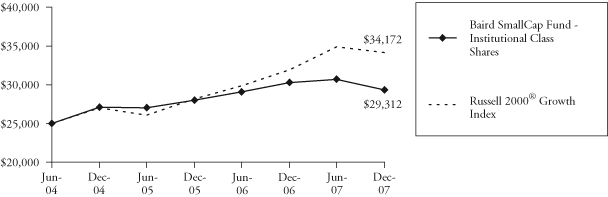
Growth of a hypothetical investment of $25,000 made on the Fund’s inception date (6/30/04), assuming reinvestment of all distributions.
Baird SmallCap Fund – Investor Class
Value of a $10,000 Investment

Growth of a hypothetical investment of $10,000 made on the Fund’s inception date (6/30/04), assuming reinvestment of all distributions.
Page 24
Baird SmallCap Fund
Average Annual Total Returns
For the Periods Ended December 31, 2007 | One Year | Since Inception(1) |
| Baird SmallCap Fund – Institutional Class Shares | -3.18% | 4.65% |
| Baird SmallCap Fund – Investor Class Shares | -3.21% | 4.47% |
Russell 2000® Growth Index(2) | 7.05% | 9.34% |
(1) | For the period from June 30, 2004 (commencement of operations) through December 31, 2007. |
(2) | The Russell 2000® Growth Index measures the performance of those Russell 2000® Index companies with higher price-to-book and higher forecasted growth rates. The Russell 2000® Index consists of the 2,000 smallest U.S. domiciled publicly-traded common stocks that are included in the Russell 3000® Index. These common stocks represent approximately 10% of the U.S. equity market. These indices do not reflect any deduction for fees, expenses or taxes. A direct investment in an index is not possible. |
The returns shown in the table above and line graphs on the previous page reflect reinvestment of dividends and/or capital gains distributions in additional shares. The returns do not reflect the deduction of taxes that a shareholder would pay on Fund distributions or the redemption of Fund shares.
Past performance does not guarantee future results. Investment return and principal value will fluctuate so that an investor’s shares, when redeemed, may be worth more or less than their original cost.
For information about the performance of the Fund as of the most recent month-end, please call 1-866-44BAIRD or visit www.bairdfunds.com. Mutual fund performance changes over time and current performance may be lower or higher than that stated.
Page 25
Baird SmallCap Fund
Schedule of Investments December 31, 2007 |
Shares | Value | ||||||
COMMON STOCKS – 96.1% | |||||||
Automobile Parts & Equipment – 1.4% | |||||||
| 48,698 | Spartan Motors, Inc. | $ | 372,053 | ||||
Commercial Banks – 7.0% | |||||||
| 18,887 | Boston Private | ||||||
| Financial Holdings, Inc. | 511,460 | ||||||
| 19,483 | Pinnacle Financial | ||||||
| Partners, Inc.* | 495,258 | ||||||
| 24,853 | United Community | ||||||
| Banks, Inc. | 392,677 | ||||||
| 14,908 | Wintrust Financial | ||||||
| Corporation | 493,902 | ||||||
| 1,893,297 | |||||||
Commercial Services & Supplies – 3.7% | |||||||
| 15,112 | Brady Corporation – | ||||||
| Class A | 530,280 | ||||||
| 37,372 | Marlin Business | ||||||
| Services Corporation* | 450,706 | ||||||
| 980,986 | |||||||
Communications Equipment – 1.7% | |||||||
| 17,498 | Dycom Industries, Inc.* | 466,322 | |||||
Computer & Peripherals – 2.1% | |||||||
| 10,341 | Sigma Designs, Inc.* | 570,823 | |||||
Construction & Engineering – 2.0% | |||||||
| 22,466 | EMCOR Group, Inc.* | 530,872 | |||||
Distributors – 2.3% | |||||||
| 29,423 | LKQ Corporation* | 618,471 | |||||
Diversified Financial Services – 2.6% | |||||||
| 25,851 | Heartland Payment | ||||||
| Systems, Inc.* | 692,807 | ||||||
Electronic Equipment & Instruments – 8.9% | |||||||
| 27,040 | Daktronics, Inc. | 610,293 | |||||
| 27,433 | DTS, Inc.* | 701,462 | |||||
| 30,423 | Insight Enterprises, Inc.* | 554,916 | |||||
| 19,686 | Plexus Corp.* | 516,954 | |||||
| 2,383,625 | |||||||
Energy Equipment & Services – 8.3% | |||||||
| 15,706 | CARBO Ceramics, Inc. | 584,263 | |||||
| 7,158 | Dawson Geophysical | ||||||
| Company* | 511,511 | ||||||
| 9,939 | Dril-Quip, Inc.* | 553,205 | |||||
| 36,178 | ION Geophysical | ||||||
| Corporation* | 570,889 | ||||||
| 2,219,868 | |||||||
Food & Staples Retailing – 3.0% | |||||||
| 25,252 | United Natural | ||||||
| Foods, Inc.* | 800,993 | ||||||
Health Care Equipment & Supplies – 7.2% | |||||||
| 33,199 | Natus Medical | ||||||
| Incorporated* | 642,401 | ||||||
| 61,635 | Regeneration | ||||||
| Technologies, Inc.* | 534,992 | ||||||
| 39,173 | TomoTherapy Inc.* | 766,224 | |||||
| 1,943,617 | |||||||
Health Care Providers & Services – 12.3% | |||||||
| 32,204 | Allscripts Healthcare | ||||||
| Solutions, Inc.* | 625,402 | ||||||
| 23,858 | HealthExtras, Inc.* | 622,217 | |||||
| 13,319 | Healthways, Inc.* | 778,362 | |||||
| 29,623 | Nighthawk Radiology | ||||||
| Holdings, Inc.* | 623,564 | ||||||
| 23,064 | Providence Service | ||||||
| Corporation* | 649,021 | ||||||
| 3,298,566 | |||||||
Hotels, Restaurants & Leisure – 4.5% | |||||||
| 23,456 | Jack in the Box, Inc.* | 604,461 | |||||
| 54,487 | Texas Roadhouse, | ||||||
| Inc. – Class A* | 602,626 | ||||||
| 1,207,087 | |||||||
IT Services – 5.5% | |||||||
| 29,426 | Forrester Research, Inc.* | 824,517 | |||||
The accompanying notes are an integral part of these financial statements.
Page 26
Baird SmallCap Fund
Schedule of Investments December 31, 2007 |
Shares | Value | ||||||
COMMON STOCKS – 96.1% (cont.) | |||||||
IT Services – 5.5% (cont.) | |||||||
| 22,266 | SRA International, | ||||||
| Inc. – Class A* | $ | 655,734 | |||||
| 1,480,251 | |||||||
Machinery – 4.9% | |||||||
| 17,692 | ESCO Technologies, Inc.* | 706,618 | |||||
| 11,136 | Kaydon Corporation | 607,357 | |||||
| 1,313,975 | |||||||
Road & Rail – 1.7% | |||||||
| 31,612 | Knight Transportation, Inc. | 468,174 | |||||
Software – 6.5% | |||||||
| 38,581 | Cogent Inc.* | 430,178 | |||||
| 74,367 | Secure Computing | ||||||
| Corporation* | 713,923 | ||||||
| 21,666 | VASCO Data Security | ||||||
| International, Inc.* | 604,915 | ||||||
| 1,749,016 | |||||||
Specialty Retail – 6.4% | |||||||
| 27,238 | Cabela’s, Incorporated* | 410,477 | |||||
| 28,630 | Hibbett Sporting | ||||||
| Goods, Inc.* | 572,027 | ||||||
| 20,277 | Tractor Supply Company* | 728,755 | |||||
| 1,711,259 | |||||||
Trading Companies & Distributors – 4.1% | |||||||
| 18,692 | Applied Industrial | ||||||
| Technologies, Inc. | 542,442 | ||||||
| 15,508 | Watsco, Inc. | 570,074 | |||||
| 1,112,516 | |||||||
| Total Common Stocks | |||||||
| (Cost $25,028,855) | 25,814,578 | ||||||
SHORT-TERM INVESTMENTS – 2.5% | |||||||
Money Market Fund – 2.5% | |||||||
| 666,642 | Short-Term Investment | ||||||
| Company Liquid Assets | |||||||
| Portfolio – AIM Fund | 666,642 | ||||||
| Total Short-Term | |||||||
| Investments | |||||||
| (Cost $666,642) | 666,642 | ||||||
| Total Investments | |||||||
| (Cost $25,695,497) – | |||||||
| 98.6% | 26,481,220 | ||||||
| Other Assets in Excess of | |||||||
| Liabilities – 1.4% | 376,027 | ||||||
| TOTAL NET | |||||||
| ASSETS – 100.0% | $ | 26,857,247 | |||||
| * | Non-Income Producing |
The accompanying notes are an integral part of these financial statements.
Page 27
Baird Funds, Inc.
Additional Information on Fund Expenses December 31, 2007 (Unaudited) |
Example
As a shareholder of a mutual fund, you incur two types of costs: (1) transaction costs, which may include sales charges (loads) on purchase payments, reinvested dividends, or other distributions; redemption fees; and exchange fees; and (2) ongoing costs, such as management fees; distribution and/or service (12b-1) fees; and other fund expenses. Although the Funds do not charge any sales loads, redemption fees, or other transaction fees, you will be assessed fees for outgoing wire transfers, returned checks and stop payment orders at prevailing rates charged by U.S. Bancorp Fund Services, LLC, the Fund’s transfer agent. If you request that a redemption be made by wire transfer, currently the Fund’s transfer agent charges a $15.00 fee.
This Example is intended to help you understand your ongoing costs (in dollars) of investing in each Fund and to compare these costs with the ongoing costs of investing in other mutual funds. The Example is based on an investment of $1,000 invested at the beginning of the period and held for the entire period (7/1/07 – 12/31/07).
Actual Expenses
The third and fourth columns of the following table provide information about account values based on actual returns and actual expenses. You may use the information in these columns, together with the amount you invested, to estimate the expenses that you paid over the period. Simply divide your account value by $1,000 (for example, an $8,600 account value divided by $1,000 – 8.6), then multiply the result by the number in the fourth column entitled “Expenses Paid During Period’’ to estimate the expenses you paid on your account during this period.
Hypothetical Example for Comparison Purposes
The fifth and sixth columns of the following table provide information about hypothetical account values and hypothetical expenses based on the Funds’ actual expense ratios and an assumed rate of return of 5% per year before expenses, which is not the Funds’ actual return. The hypothetical account values and expenses may not be used to estimate the actual ending account balance or expenses you paid for the period. You may use this information to compare the ongoing costs of investing in the Funds and other mutual funds. To do so, compare this 5% hypothetical example with the 5% hypothetical examples that appear in the shareholder reports of the other mutual funds. Please note that the expenses shown in the table are meant to highlight your ongoing costs only and do not reflect any transactional costs. Therefore, the sixth column of the table (entitled “Expenses Paid During Period”) is useful in comparing ongoing costs only, and will not help you determine the relative total costs of owning different mutual funds. In addition, if these transactional costs were included, your costs could have been higher.
Page 28
Baird Funds, Inc.
Additional Information on Fund Expenses December 31, 2007 (Unaudited) |
Actual vs. Hypothetical Returns
For the Six Months Ended December 31, 2007
Hypothetical (5% return | ||||||
Actual | before expenses) | |||||
Fund’s | Beginning | Ending | Expenses | Ending | Expenses | |
Annualized | Account | Account | Paid | Account | Paid | |
Expense | Value | Value | During | Value | During | |
Ratio(1) | 7/1/07 | 12/31/07 | Period(1) | 12/31/07 | Period(1) | |
Baird LargeCap Fund | ||||||
| Institutional Class | 0.75% | $1,000.00 | $1,032.10 | $3.84 | $1,021.42 | $3.82 |
| Investor Class | 1.00% | $1,000.00 | $1,031.10 | $5.12 | $1,020.16 | $5.09 |
Baird MidCap Fund | ||||||
| Institutional Class | 0.85% | $1,000.00 | $1,067.10 | $4.43 | $1,020.92 | $4.33 |
| Investor Class | 1.10% | $1,000.00 | $1,066.60 | $5.73 | $1,019.66 | $5.60 |
Baird SmallCap Fund | ||||||
| Institutional Class | 0.95% | $1,000.00 | $954.70 | $4.68 | $1,020.42 | $4.84 |
| Investor Class | 1.20% | $1,000.00 | $953.60 | $5.91 | $1,019.16 | $6.11 |
(1) | Expenses are equal to the Fund’s annualized expense ratio multiplied by the average account value over the period, multiplied by 184 days and divided by 365 to reflect the one-half year period. |
Page 29
Baird Funds, Inc.
Statements of Assets and Liabilities December 31, 2007 |
Baird LargeCap | Baird MidCap | Baird SmallCap | ||||||||||
Fund | Fund | Fund | ||||||||||
ASSETS: | ||||||||||||
| Investments, at value (cost $27,947,522; | $ | 32,562,453 | $ | 47,554,267 | $ | 26,481,220 | ||||||
| $39,084,796; and $25,695,497, respectively) | ||||||||||||
| Repurchase agreements (cost $6,395,275; | 6,395,275 | 9,124,544 | — | |||||||||
| $9,124,544; and $0, respectively) | ||||||||||||
| Dividends receivable | 18,769 | 3,260 | 4,197 | |||||||||
| Interest receivable | 2,648 | 5,092 | 4,069 | |||||||||
| Receivable for investments sold | 210,615 | — | 1,713,788 | |||||||||
| Receivable for fund shares sold | — | 717,900 | — | |||||||||
| Other assets | 8,372 | 6,130 | 10,863 | |||||||||
| Total assets | 39,198,132 | 57,411,193 | 28,214,137 | |||||||||
LIABILITIES: | ||||||||||||
| Payable for collateral received for securities loaned | 10,767,539 | 15,362,634 | — | |||||||||
| Payable to Advisor and Distributor | 8,408 | 20,300 | 14,326 | |||||||||
| Payable for securities purchased | — | 583,922 | 1,193,521 | |||||||||
| Payable for fund shares repurchased | 3,313 | 2,692 | 105,764 | |||||||||
| Accrued expenses and other liabilities | 34,084 | 41,254 | 43,279 | |||||||||
| Total liabilities | 10,813,344 | 16,010,802 | 1,356,890 | |||||||||
NET ASSETS | $ | 28,384,788 | $ | 41,400,391 | $ | 26,857,247 | ||||||
NET ASSETS CONSIST OF: | ||||||||||||
| Capital stock | $ | 25,230,144 | $ | 33,340,135 | $ | 25,560,802 | ||||||
| Accumulated undistributed net investment income | 6,245 | — | — | |||||||||
| Accumulated net realized gain (loss) on investments sold | (1,466,532 | ) | (409,215 | ) | 510,722 | |||||||
| Net unrealized appreciation on investments | 4,614,931 | 8,469,471 | 785,723 | |||||||||
NET ASSETS | $ | 28,384,788 | $ | 41,400,391 | $ | 26,857,247 | ||||||
INSTITUTIONAL CLASS SHARES | ||||||||||||
| Net Assets | $ | 27,644,009 | $ | 36,616,547 | $ | 26,599,596 | ||||||
| Shares outstanding | ||||||||||||
| ($0.01 par value, unlimited shares authorized) | 2,963,382 | 3,805,128 | 2,674,982 | |||||||||
| Net asset value, offering and redemption price per share | $ | 9.33 | $ | 9.62 | $ | 9.94 | ||||||
INVESTOR CLASS SHARES | ||||||||||||
| Net Assets | $ | 740,779 | $ | 4,783,844 | $ | 257,651 | ||||||
| Shares outstanding | ||||||||||||
| ($0.01 par value, unlimited shares authorized) | 79,724 | 508,873 | 26,092 | |||||||||
| Net asset value, offering and redemption price per share | $ | 9.29 | $ | 9.40 | $ | 9.87 | ||||||
The accompanying notes are an integral part of these financial statements.
Page 30
Baird Funds, Inc.
Statements of Operations Year Ended December 31, 2007 |
Baird LargeCap | Baird MidCap | Baird SmallCap | ||||||||||
Fund | Fund | Fund | ||||||||||
INVESTMENT INCOME: | ||||||||||||
| Dividends (net of foreign taxes withheld | ||||||||||||
| of $1,637, $0, and $0, respectively) | $ | 244,527 | $ | 209,884 | $ | 151,316 | ||||||
| Interest | 34,342 | 70,492 | 94,211 | |||||||||
| Income from securities lending (Note 6) | 8,608 | 30,032 | 15,130 | |||||||||
| Total investment income | 287,477 | 310,408 | 260,657 | |||||||||
EXPENSES: | ||||||||||||
| Investment advisory fees | 186,613 | 294,138 | 361,742 | |||||||||
| Administration fees | 10,569 | 14,273 | 16,092 | |||||||||
| Shareholder servicing fees | 17,358 | 18,185 | 62,128 | |||||||||
| Fund accounting fees | 25,817 | 27,919 | 28,687 | |||||||||
| Professional fees | 26,528 | 26,540 | 26,516 | |||||||||
| Federal and state registration | 29,140 | 28,126 | 33,356 | |||||||||
| Directors fees | 8,450 | 8,450 | 8,450 | |||||||||
| Custody fees | 5,533 | 7,672 | 9,306 | |||||||||
| Reports to shareholders | 3,090 | 7,829 | 10,665 | |||||||||
| Distribution fees – Investor Class Shares (Note 8) | 2,333 | 11,606 | 6,393 | |||||||||
| Interest expense (Note 7) | 1,052 | 155 | 226 | |||||||||
| Miscellaneous expenses | 1,655 | 3,670 | 4,285 | |||||||||
| Total expenses | 318,138 | 448,563 | 567,846 | |||||||||
| Expense reimbursement by Advisor | (100,379 | ) | (103,600 | ) | (157,169 | ) | ||||||
| Total expenses | 217,759 | 344,963 | 410,677 | |||||||||
NET INVESTMENT INCOME (LOSS) | 69,718 | (34,555 | ) | (150,020 | ) | |||||||
REALIZED AND UNREALIZED | ||||||||||||
GAIN (LOSS) ON INVESTMENTS: | ||||||||||||
| Net realized gain on investments | 1,295,539 | 6,233,273 | 4,700,765 | |||||||||
| Change in unrealized appreciation/depreciation on investments | 1,311,455 | 1,141,357 | (6,003,303 | ) | ||||||||
| Net realized and unrealized gain (loss) on investments | 2,606,994 | 7,374,630 | (1,302,538 | ) | ||||||||
NET INCREASE (DECREASE) IN NET ASSETS | ||||||||||||
RESULTING FROM OPERATIONS | $ | 2,676,712 | $ | 7,340,075 | $ | (1,452,558 | ) | |||||
The accompanying notes are an integral part of these financial statements.
Page 31
Baird Funds, Inc.
Statements of Changes in Net Assets |
Baird LargeCap Fund | ||||||||
| Year Ended | Year Ended | |||||||
| December 31, 2007 | December 31, 2006 | |||||||
OPERATIONS: | ||||||||
| Net investment income | $ | 69,718 | $ | 112,242 | ||||
| Net realized gain on investments | 1,295,539 | 3,822,130 | ||||||
| Change in unrealized appreciation/depreciation on investments | 1,311,455 | (3,222,372 | ) | |||||
| Net increase in net assets resulting from operations | 2,676,712 | 712,000 | ||||||
CAPITAL SHARE TRANSACTIONS: | ||||||||
| Proceeds from shares sold | 6,164,640 | 8,900,784 | ||||||
| Shares issued to holders in reinvestment of dividends | 62,978 | 112,014 | ||||||
| Cost of shares redeemed | (8,986,143 | ) | (10,858,598 | ) | ||||
| Net decrease in net assets resulting | ||||||||
| from capital share transactions | (2,758,525 | ) | (1,845,800 | ) | ||||
DISTRIBUTIONS TO | ||||||||
INSTITUTIONAL CLASS SHAREHOLDERS: | ||||||||
| From net investment income | (63,676 | ) | (110,900 | ) | ||||
DISTRIBUTIONS TO | ||||||||
INVESTOR CLASS SHAREHOLDERS: | ||||||||
| From net investment income | — | (1,174 | ) | |||||
TOTAL DECREASE IN NET ASSETS | (145,489 | ) | (1,245,874 | ) | ||||
NET ASSETS: | ||||||||
| Beginning of year | 28,530,277 | 29,776,151 | ||||||
| End of year (including undistributed net investment income | ||||||||
| of $6,245 and $203, respectively) | $ | 28,384,788 | $ | 28,530,277 | ||||
The accompanying notes are an integral part of these financial statements.
Page 32
Baird Funds, Inc.
Statements of Changes in Net Assets |
Baird MidCap Fund | ||||||||
| Year Ended | Year Ended | |||||||
| December 31, 2007 | December 31, 2006 | |||||||
OPERATIONS: | ||||||||
| Net investment loss | $ | (34,555 | ) | $ | (134,222 | ) | ||
| Net realized gain on investments | 6,233,273 | 5,175,206 | ||||||
| Change in unrealized appreciation/depreciation on investments | 1,141,357 | (5,482,914 | ) | |||||
| Net increase (decrease) in net assets resulting from operations | 7,340,075 | (441,930 | ) | |||||
CAPITAL SHARE TRANSACTIONS: | ||||||||
| Proceeds from shares sold | 10,258,071 | 27,770,122 | ||||||
| Shares issued to holders in reinvestment of dividends | 5,849,724 | 6,860,350 | ||||||
| Cost of shares redeemed | (13,209,733 | ) | (80,341,536 | ) | ||||
| Net increase (decrease) in net assets resulting | ||||||||
| from capital share transactions | 2,898,062 | (45,711,064 | ) | |||||
DISTRIBUTIONS TO | ||||||||
INSTITUTIONAL CLASS SHAREHOLDERS: | ||||||||
| From net realized gains | (5,482,243 | ) | (5,953,538 | ) | ||||
DISTRIBUTIONS TO | ||||||||
INVESTOR CLASS SHAREHOLDERS: | ||||||||
| From net realized gains | (436,338 | ) | (990,249 | ) | ||||
TOTAL INCREASE (DECREASE) IN NET ASSETS | 4,319,556 | (53,096,781 | ) | |||||
NET ASSETS: | ||||||||
| Beginning of year | 37,080,835 | 90,177,616 | ||||||
| End of year | $ | 41,400,391 | $ | 37,080,835 | ||||
The accompanying notes are an integral part of these financial statements.
Page 33
Baird Funds, Inc.
Statements of Changes in Net Assets |
Baird SmallCap Fund | ||||||||
| Year Ended | Year Ended | |||||||
| December 31, 2007 | December 31, 2006 | |||||||
OPERATIONS: | ||||||||
| Net investment loss | $ | (150,020 | ) | $ | (293,827 | ) | ||
| Net realized gain on investments | 4,700,765 | 1,686,398 | ||||||
| Change in unrealized appreciation/depreciation on investments | (6,003,303 | ) | 2,986,275 | |||||
| Net increase (decrease) in net assets resulting from operations | (1,452,558 | ) | 4,378,846 | |||||
CAPITAL SHARE TRANSACTIONS: | ||||||||
| Proceeds from shares sold | 9,958,827 | 36,379,202 | ||||||
| Shares issued to holders in reinvestment of dividends | 3,777,282 | 420,515 | ||||||
| Cost of shares redeemed | (53,006,968 | ) | (16,364,194 | ) | ||||
| Net increase (decrease) in net assets resulting | ||||||||
| from capital share transactions | (39,270,859 | ) | 20,435,523 | |||||
DISTRIBUTIONS TO | ||||||||
INSTITUTIONAL CLASS SHAREHOLDERS: | ||||||||
| From net realized gains | (4,092,370 | ) | (425,164 | ) | ||||
DISTRIBUTIONS TO | ||||||||
INVESTOR CLASS SHAREHOLDERS: | ||||||||
| From net realized gains | (39,140 | ) | (50,691 | ) | ||||
TOTAL INCREASE (DECREASE) IN NET ASSETS | (44,854,927 | ) | 24,338,514 | |||||
NET ASSETS: | ||||||||
| Beginning of year | 71,712,174 | 47,373,660 | ||||||
| End of year | $ | 26,857,247 | $ | 71,712,174 | ||||
The accompanying notes are an integral part of these financial statements.
Page 34
Baird Funds, Inc.
Financial Highlights |
Baird LargeCap Fund – Institutional Class | ||||||||||||||||||||
Year Ended December 31, | ||||||||||||||||||||
| 2007 | 2006 | 2005 | 2004 | 2003 | ||||||||||||||||
| Per Share Data: | ||||||||||||||||||||
| Net asset value, beginning of period | $ | 8.53 | $ | 8.33 | $ | 8.13 | $ | 7.78 | $ | 6.41 | ||||||||||
| Income from investment operations: | ||||||||||||||||||||
| Net investment income | 0.02 | 0.04 | 0.04 | (1) | 0.06 | (1) | 0.02 | |||||||||||||
| Net realized and unrealized | ||||||||||||||||||||
| gains on investments | 0.80 | 0.20 | 0.24 | 0.35 | 1.37 | |||||||||||||||
| Total from investment operations | 0.82 | 0.24 | 0.28 | 0.41 | 1.39 | |||||||||||||||
| Less distributions: | ||||||||||||||||||||
| Dividends from net investment income | (0.02 | ) | (0.04 | ) | (0.08 | ) | (0.06 | ) | (0.02 | ) | ||||||||||
| Net asset value, end of period | $ | 9.33 | $ | 8.53 | $ | 8.33 | $ | 8.13 | $ | 7.78 | ||||||||||
| Total return | 9.63 | % | 2.89 | % | 3.39 | % | 5.21 | % | 21.75 | % | ||||||||||
| Supplemental data and ratios: | ||||||||||||||||||||
| Net assets, end of period | $ | 27,644,009 | $ | 27,442,329 | $ | 27,375,626 | $ | 64,754,140 | $ | 59,743,783 | ||||||||||
| Ratio of expenses to average net assets | 0.75 | % | 0.75 | % | 0.75 | % | 0.75 | % | 0.75 | % | ||||||||||
| Ratio of expenses to average | ||||||||||||||||||||
| net assets (before waivers) | 1.10 | % | 1.12 | % | 0.93 | % | 0.93 | % | 0.95 | % | ||||||||||
| Ratio of net investment income | ||||||||||||||||||||
| to average net assets | 0.25 | % | 0.44 | % | 0.46 | % | 0.72 | % | 0.34 | % | ||||||||||
| Ratio of net investment income (loss) | ||||||||||||||||||||
| to average net assets (before waivers) | (0.10 | %) | 0.07 | % | 0.28 | % | 0.54 | % | 0.14 | % | ||||||||||
Portfolio turnover rate(2) | 72.2 | % | 63.9 | % | 28.6 | % | 23.2 | % | 24.8 | % | ||||||||||
(1) | Calculated using average shares outstanding during the period. |
(2) | Portfolio turnover is calculated on the basis of the Fund as a whole without distinguishing between the classes of shares issued. |
The accompanying notes are an integral part of these financial statements.
Page 35
Baird Funds, Inc.
Financial Highlights |
Baird LargeCap Fund – Investor Class | ||||||||||||||||||||
Year Ended December 31, | ||||||||||||||||||||
| 2007 | 2006 | 2005 | 2004 | 2003 | ||||||||||||||||
| Per Share Data: | ||||||||||||||||||||
| Net asset value, beginning of period | $ | 8.50 | $ | 8.29 | $ | 8.09 | $ | 7.75 | $ | 6.40 | ||||||||||
| Income from investment operations: | ||||||||||||||||||||
| Net investment income | 0.00 | (1) | 0.01 | 0.02 | (2) | 0.04 | (2) | 0.01 | ||||||||||||
| Net realized and unrealized | ||||||||||||||||||||
| gains on investments | 0.79 | 0.21 | 0.23 | 0.35 | 1.35 | |||||||||||||||
| Total from investment operations | 0.79 | 0.22 | 0.25 | 0.39 | 1.36 | |||||||||||||||
| Less distributions: | ||||||||||||||||||||
| Dividends from net investment income | — | (0.01 | ) | (0.05 | ) | (0.05 | ) | (0.01 | ) | |||||||||||
| Net asset value, end of period | $ | 9.29 | $ | 8.50 | $ | 8.29 | $ | 8.09 | $ | 7.75 | ||||||||||
| Total return | 9.29 | % | 2.64 | % | 3.15 | % | 5.00 | % | 21.20 | % | ||||||||||
| Supplemental data and ratios: | ||||||||||||||||||||
| Net assets, end of period | $ | 740,779 | $ | 1,087,948 | $ | 2,400,525 | $ | 1,900,053 | $ | 634,160 | ||||||||||
| Ratio of expenses to average net assets | 1.00 | % | 1.00 | % | 1.00 | % | 1.00 | % | 1.00 | % | ||||||||||
| Ratio of expenses to average | ||||||||||||||||||||
| net assets (before waivers) | 1.35 | % | 1.37 | % | 1.18 | % | 1.18 | % | 1.20 | % | ||||||||||
| Ratio of net investment income | ||||||||||||||||||||
| to average net assets | 0.00 | % | 0.19 | % | 0.21 | % | 0.47 | % | 0.09 | % | ||||||||||
| Ratio of net investment income (loss) | ||||||||||||||||||||
| to average net assets (before waivers) | (0.35 | %) | (0.18 | %) | 0.03 | % | 0.29 | % | (0.11 | %) | ||||||||||
Portfolio turnover rate(3) | 72.2 | % | 63.9 | % | 28.6 | % | 23.2 | % | 24.8 | % | ||||||||||
(1) | Amount is less than $0.01. |
(2) | Calculated using average shares outstanding during the period. |
(3) | Portfolio turnover is calculated on the basis of the Fund as a whole without distinguishing between the classes of shares issued. |
The accompanying notes are an integral part of these financial statements.
Page 36
Baird Funds, Inc.
Financial Highlights |
Baird MidCap Fund – Institutional Class | ||||||||||||||||||||
Year Ended December 31, | ||||||||||||||||||||
| 2007 | 2006 | 2005 | 2004 | 2003 | ||||||||||||||||
| Per Share Data: | ||||||||||||||||||||
| Net asset value, beginning of period | $ | 9.33 | $ | 11.12 | $ | 10.91 | $ | 9.72 | $ | 7.66 | ||||||||||
| Income from investment operations: | ||||||||||||||||||||
| Net investment loss | (0.01 | )(1) | (0.02 | )(1) | (0.02 | )(1) | (0.04 | )(1) | (0.07 | ) | ||||||||||
| Net realized and unrealized | ||||||||||||||||||||
| gains on investments | 1.99 | 0.46 | 0.63 | 1.25 | 2.13 | |||||||||||||||
| Total from investment operations | 1.98 | 0.44 | 0.61 | 1.21 | 2.06 | |||||||||||||||
| Less distributions: | ||||||||||||||||||||
| Distributions from net realized gains | (1.69 | ) | (2.23 | ) | (0.40 | ) | (0.02 | ) | — | |||||||||||
| Net asset value, end of period | $ | 9.62 | $ | 9.33 | $ | 11.12 | $ | 10.91 | $ | 9.72 | ||||||||||
| Total return | 20.89 | % | 3.93 | % | 5.56 | % | 12.44 | % | 26.89 | % | ||||||||||
| Supplemental data and ratios: | ||||||||||||||||||||
| Net assets, end of period | $ | 36,616,547 | $ | 32,057,214 | $ | 85,670,669 | $ | 86,476,869 | $ | 28,629,656 | ||||||||||
| Ratio of expenses to average net assets | 0.85 | % | 0.85 | % | 0.85 | % | 0.85 | % | 1.20 | % | ||||||||||
| Ratio of expenses to average | ||||||||||||||||||||
| net assets (before waivers) | 1.11 | % | 1.01 | % | 0.98 | % | 1.05 | % | 1.20 | % | ||||||||||
| Ratio of net investment loss | ||||||||||||||||||||
| to average net assets | (0.06 | %) | (0.17 | %) | (0.21 | %) | (0.43 | %) | (0.81 | %) | ||||||||||
| Ratio of net investment loss | ||||||||||||||||||||
| to average net assets (before waivers) | (0.32 | %) | (0.33 | %) | (0.34 | %) | (0.63 | %) | (0.81 | %) | ||||||||||
Portfolio turnover rate(2) | 72.3 | % | 78.6 | % | 77.4 | % | 77.9 | % | 81.8 | % | ||||||||||
(1) | Calculated using average shares outstanding during the period. |
(2) | Portfolio turnover is calculated on the basis of the Fund as a whole without distinguishing between the classes of shares issued. |
The accompanying notes are an integral part of these financial statements.
Page 37
Baird Funds, Inc.
Financial Highlights |
Baird MidCap Fund – Investor Class | ||||||||||||||||||||
Year Ended December 31, | ||||||||||||||||||||
| 2007 | 2006 | 2005 | 2004 | 2003 | ||||||||||||||||
| Per Share Data: | ||||||||||||||||||||
| Net asset value, beginning of period | $ | 9.17 | $ | 10.99 | $ | 10.82 | $ | 9.65 | $ | 7.63 | ||||||||||
| Income from investment operations: | ||||||||||||||||||||
| Net investment loss | (0.04 | )(1) | (0.04 | ) | (0.05 | )(1) | (0.07 | )(1) | (0.09 | ) | ||||||||||
| Net realized and unrealized | ||||||||||||||||||||
| gains on investments | 1.96 | 0.45 | 0.62 | 1.26 | 2.11 | |||||||||||||||
| Total from investment operations | 1.92 | 0.41 | 0.57 | 1.19 | 2.02 | |||||||||||||||
| Less distributions: | ||||||||||||||||||||
| Distributions from net realized gains | (1.69 | ) | (2.23 | ) | (0.40 | ) | (0.02 | ) | — | |||||||||||
| Net asset value, end of period | $ | 9.40 | $ | 9.17 | $ | 10.99 | $ | 10.82 | $ | 9.65 | ||||||||||
| Total return | 20.61 | % | 3.73 | % | 5.24 | % | 12.32 | % | 26.47 | % | ||||||||||
| Supplemental data and ratios: | ||||||||||||||||||||
| Net assets, end of period | $ | 4,783,844 | $ | 5,023,621 | $ | 4,506,947 | $ | 3,944,857 | $ | 959,209 | ||||||||||
| Ratio of expenses to average net assets | 1.10 | % | 1.10 | % | 1.10 | % | 1.10 | % | 1.45 | % | ||||||||||
| Ratio of expenses to average | ||||||||||||||||||||
| net assets (before waivers) | 1.36 | % | 1.26 | % | 1.23 | % | 1.30 | % | 1.45 | % | ||||||||||
| Ratio of net investment loss | ||||||||||||||||||||
| to average net assets | (0.31 | %) | (0.42 | %) | (0.46 | %) | (0.68 | %) | (1.06 | %) | ||||||||||
| Ratio of net investment loss | ||||||||||||||||||||
| to average net assets (before waivers) | (0.57 | %) | (0.58 | %) | (0.59 | %) | (0.88 | %) | (1.06 | %) | ||||||||||
Portfolio turnover rate(2) | 72.3 | % | 78.6 | % | 77.4 | % | 77.9 | % | 81.8 | % | ||||||||||
(1) | Calculated using average shares outstanding during the period. |
(2) | Portfolio turnover is calculated on the basis of the Fund as a whole without distinguishing between the classes of shares issued. |
The accompanying notes are an integral part of these financial statements.
Page 38
Baird Funds, Inc.
Financial Highlights |
Baird SmallCap Fund – Institutional Class | ||||||||||||||||
June 30, 2004(1) | ||||||||||||||||
| Year Ended December 31, | through | |||||||||||||||
| 2007 | 2006 | 2005 | December 31, 2004 | |||||||||||||
| Per Share Data: | ||||||||||||||||
| Net asset value, beginning of period | $ | 12.03 | $ | 11.20 | $ | 10.84 | $ | 10.00 | ||||||||
| Income from investment operations: | ||||||||||||||||
Net investment loss(2) | (0.05 | ) | (0.05 | ) | (0.06 | ) | (0.03 | ) | ||||||||
| Net realized and unrealized | ||||||||||||||||
| gains (losses) on investments | (0.28 | ) | 0.96 | 0.42 | 0.87 | |||||||||||
| Total from investment operations | (0.33 | ) | 0.91 | 0.36 | 0.84 | |||||||||||
| Less distributions: | ||||||||||||||||
| Distributions from net realized gains | (1.76 | ) | (0.08 | ) | — | — | ||||||||||
| Net asset value, end of period | $ | 9.94 | $ | 12.03 | $ | 11.20 | $ | 10.84 | ||||||||
| Total return | (3.18 | %) | 8.13 | % | 3.32 | % | 8.40 | %(3) | ||||||||
| Supplemental data and ratios: | ||||||||||||||||
| Net assets, end of period | $ | 26,599,596 | $ | 64,008,514 | $ | 45,010,093 | $ | 17,331,262 | ||||||||
| Ratio of expenses to average net assets | 0.95 | % | 0.95 | % | 0.95 | % | 0.95 | %(4) | ||||||||
| Ratio of expenses to average | ||||||||||||||||
| net assets (before waivers) | 1.32 | % | 1.23 | % | 1.31 | % | 1.89 | %(4) | ||||||||
| Ratio of net investment loss | ||||||||||||||||
| to average net assets | (0.34 | %) | (0.46 | %) | (0.57 | %) | (0.65 | %)(4) | ||||||||
| Ratio of net investment loss | ||||||||||||||||
| to average net assets (before waivers) | (0.71 | %) | (0.74 | %) | (0.93 | %) | (1.59 | %)(4) | ||||||||
Portfolio turnover rate(5) | 92.9 | % | 52.8 | % | 56.4 | % | 34.7 | %(3) | ||||||||
(1) | Commencement of operations. |
(2) | Calculated using average shares outstanding during the period. |
(3) | Not annualized. |
(4) | Annualized. |
(5) | Portfolio turnover is calculated on the basis of the Fund as a whole without distinguishing between the classes of shares issued. |
The accompanying notes are an integral part of these financial statements.
Page 39
Baird Funds, Inc.
Financial Highlights |
Baird SmallCap Fund – Investor Class | ||||||||||||||||
June 30, 2004(1) | ||||||||||||||||
| Year Ended December 31, | through | |||||||||||||||
| 2007 | 2006 | 2005 | December 31, 2004 | |||||||||||||
| Per Share Data: | ||||||||||||||||
| Net asset value, beginning of period | $ | 11.96 | $ | 11.16 | $ | 10.83 | $ | 10.00 | ||||||||
| Income from investment operations: | ||||||||||||||||
Net investment loss(2) | (0.06 | ) | (0.08 | ) | (0.09 | ) | (0.05 | ) | ||||||||
| Net realized and unrealized | ||||||||||||||||
| gains (losses) on investments | (0.27 | ) | 0.96 | 0.42 | 0.88 | |||||||||||
| Total from investment operations | (0.33 | ) | 0.88 | 0.33 | 0.83 | |||||||||||
| Less distributions: | ||||||||||||||||
| Distributions from net realized gains | (1.76 | ) | (0.08 | ) | — | — | ||||||||||
| Net asset value, end of period | $ | 9.87 | $ | 11.96 | $ | 11.16 | $ | 10.83 | ||||||||
| Total return | (3.21 | %) | 7.89 | % | 3.05 | % | 8.30 | %(3) | ||||||||
| Supplemental data and ratios: | ||||||||||||||||
| Net assets, end of period | $ | 257,651 | $ | 7,703,660 | $ | 2,363,567 | $ | 68,184 | ||||||||
| Ratio of expenses to average net assets | 1.20 | % | 1.20 | % | 1.20 | % | 1.20 | %(4) | ||||||||
| Ratio of expenses to average | ||||||||||||||||
| net assets (before waivers) | 1.57 | % | 1.48 | % | 1.56 | % | 2.14 | %(4) | ||||||||
| Ratio of net investment loss | ||||||||||||||||
| to average net assets | (0.59 | %) | (0.71 | %) | (0.82 | %) | (0.90 | %)(4) | ||||||||
| Ratio of net investment loss | ||||||||||||||||
| to average net assets (before waivers) | (0.96 | %) | (0.99 | %) | (1.18 | %) | (1.84 | %)(4) | ||||||||
Portfolio turnover rate(5) | 92.9 | % | 52.8 | % | 56.4 | % | 34.7 | %(3) | ||||||||
(1) | Commencement of operations. |
(2) | Calculated using average shares outstanding during the period. |
(3) | Not annualized. |
(4) | Annualized. |
(5) | Portfolio turnover is calculated on the basis of the Fund as a whole without distinguishing between the classes of shares issued. |
The accompanying notes are an integral part of these financial statements.
Page 40
Baird Funds, Inc.
Notes to the Financial Statements December 31, 2007 |
1. | ORGANIZATION |
Baird Funds, Inc. (the “Corporation”) was incorporated on June 9, 2000 as a Wisconsin corporation and is registered as an open-end management investment company under the Investment Company Act of 1940, as amended (the “1940 Act”). The accompanying financial statements include the Baird LargeCap Fund, the Baird MidCap Fund and the Baird SmallCap Fund (each a “Fund” and collectively the “Funds”), three of the eight portfolios comprising the Corporation. Pursuant to the 1940 Act, the Funds are “diversified” series of the Corporation. The investment advisor to the Funds is Robert W. Baird & Co. Incorporated (“Baird” or the “Advisor”).
The Baird LargeCap Fund commenced operations with the sale of both Institutional and Investor Class Shares on September 29, 2000. The Baird MidCap Fund commenced operations with the sale of both Institutional and Investor Class Shares on December 29, 2000. The Baird SmallCap Fund commenced operations with the sale of both Institutional and Investor Class Shares on June 30, 2004. The Institutional Class Shares are not subject to a distribution and service (12b-1) fee, while the Investor Class Shares are subject to a distribution and service (12b-1) fee up to 0.25%.
The Baird LargeCap Fund seeks long-term growth of capital through investments in equity securities of large-capitalization companies. Dividend income is a secondary consideration.
The Baird MidCap Fund seeks long-term growth of capital through investments in equity securities of mid-capitalization companies.
The Baird SmallCap Fund seeks long-term growth of capital through investments in equity securities of small-capitalization companies.
On December 31, 2007, one shareholder related to the Advisor held 47% of the Baird LargeCap Fund, 15% of the Baird MidCap Fund, and 43% of the Baird SmallCap Fund.
2. | SIGNIFICANT ACCOUNTING POLICIES |
The following is a summary of significant accounting policies consistently followed by the Funds in the preparation of their financial statements. These policies are in conformity with accounting principles generally accepted in the United States of America.
| a) | Investment Valuation– Common stocks that are listed on a securities exchange (other than NASDAQ) are valued at the last quoted sales price. Securities traded on NASDAQ are valued at the NASDAQ Official Closing Price. Price information on listed stocks is taken from the exchange where the security is primarily traded. Securities that were not traded on the valuation date, as well as stocks that are not listed on an exchange, including NASDAQ, are valued at the average of the current bid and asked price. Debt securities are valued by an independent pricing service using valuation methods that approximate market values, such as matrix pricing and other analytical pricing models, market transactions and dealer quotations. Debt securities purchased with a remaining maturity of 60 days or less are valued at acquisition cost plus or minus any amortized discount or premium. Investments in mutual funds are valued at their stated net asset value. Other assets and securities for which no quotations are readily available are valued at fair value |
Page 41
Baird Funds, Inc.
Notes to the Financial Statements December 31, 2007 |
2. | SIGNIFICANT ACCOUNTING POLICIES (cont.) |
| as determined in good faith by the Advisor in accordance with procedures approved by the Corporation’s Board of Directors. In accordance with such procedures, the Advisor may use broker quotes or, if the broker quotes are unavailable or deemed to be unreliable, fair value will be determined by a valuation committee of the Advisor. In determining fair value, the valuation committee takes into account all relevant factors and available information. Consequently, the price of the security used by a Fund to calculate its NAV may differ from quoted or published prices for the same security. Fair value pricing involves subjective judgments and there is no single standard for determining a security’s fair value. As a result, different mutual funds could reasonably arrive at a different fair value for the same security. It is possible that the fair value determined for a security is materially different from the value that could be realized upon the sale of that security or from the values that other mutual funds may determine. | |
| In September 2006, the Financial Accounting Standards Board (FASB) issued Statement of Financial Accounting Standards (“SFAS”) No. 157, “Fair Value Measurements.” SFAS No. 157 defines fair value, establishes a framework for measuring fair value in accordance with GAAP, and expands disclosure about fair value measurements. SFAS No. 157 is effective for financial statements issued for fiscal years beginning after November 15, 2007. Management has determined that SFAS No. 157 will have no material impact on the Funds’ financial statements. | |
| b) | Foreign Securities– Investing in securities of foreign companies and foreign governments involves special risks and considerations not typically associated with investing in U.S. companies and the U.S. government. These risks include revaluation of currencies and future adverse political and economic developments. Moreover, securities of many foreign companies and foreign governments and their markets may be less liquid and their prices more volatile than those of securities of comparable U.S. companies and the U.S. government. Occasionally, events that affect those values and exchange rates may occur after the close of the exchange on which such securities are traded. If such events materially affect the value of a Fund’s securities, these securities may be valued at their fair value pursuant to procedures adopted by the Board of Directors. All the foreign securities owned by the Funds as of December 31, 2007 are traded on the New York Stock Exchange or NASDAQ. |
| c) | Federal Income Taxes– The Funds intend to continue to qualify as regulated investment companies as provided in subchapter M of the Internal Revenue Code and to distribute substantially all of their taxable income to their shareholders in a manner which results in no tax cost to the Funds. Therefore, no federal income or excise tax provision is recorded. |
| Effective June 29, 2007, the Funds adopted Financial Accounting Standards Board (FASB) Interpretation No. 48 (FIN 48),“Accounting for Uncertainty in Income Taxes,” a clarification of FASB Statement No. 109, “Accounting for Income Taxes.” FIN 48 establishes financial reporting rules regarding recognition and measurement of tax positions taken or expected to be taken on a tax return. Management has determined that FIN 48 had no material impact on the Funds’ financial statements. | |
| d) | Distributions to Shareholders– Dividends from net investment income, if any, are declared and paid annually. Distributions of net realized gains, if any, are declared and paid at least annually. |
Page 42
Baird Funds, Inc.
Notes to the Financial Statements December 31, 2007 |
2. | SIGNIFICANT ACCOUNTING POLICIES (cont.) |
| e) | Allocation of Income and Expenses– Each Fund is charged for those expenses directly attributable to it. Expenses directly attributable to a class of shares, such as Rule 12b-1 distribution fees, are charged to that class of shares. Income, expenses, and realized and unrealized gains and losses are allocated to the classes based on their respective net assets. Expenses that are not directly attributable to a Fund are allocated among the Funds in the series in proportion to their assets. |
| f) | Use of Estimates– The preparation of financial statements in conformity with accounting principles generally accepted in the United States requires management to make estimates and assumptions that affect the reported amounts of assets and liabilities and disclosure of contingent assets and liabilities at the date of the financial statements and the reported amounts of revenues and expenses during the reporting period. Actual results could differ from those estimates. |
| g) | Other– Investment and shareholder transactions are recorded on trade date. The Funds determine the gain or loss realized from investment transactions by comparing the original cost of the security lot sold with the net sales proceeds. Dividend income is recognized on the ex-dividend date and interest income is recognized on an accrual basis. Accounting principles generally accepted in the United States require that permanent financial reporting and tax differences be reclassified in the capital accounts. |
| h) | Guarantees and Indemnifications– In the normal course of business, the Funds enter into contracts with service providers that contain general indemnification clauses. The Funds’ maximum exposure under these arrangements is unknown and this would involve future claims against the Funds that have not yet occurred. Based on experience, the Funds would expect the risk of loss to be remote. |
3. | CAPITAL SHARE TRANSACTIONS |
The following table summarizes the capital share transactions of each Fund for the past two fiscal periods:
BAIRD LARGECAP FUND
| Year Ended | Year Ended | ||||||||||||||||
| December 31, 2007 | December 31, 2007 | ||||||||||||||||
Institutional Class Shares | Shares | Amount | Investor Class Shares | Shares | Amount | ||||||||||||
| Shares sold | 688,671 | $ | 6,011,411 | Shares sold | 16,768 | $ | 153,229 | ||||||||||
| Shares issued to | Shares issued to | ||||||||||||||||
| shareholders in | shareholders in | ||||||||||||||||
| reinvestment of dividends | 6,609 | 62,978 | reinvestment of dividends | — | — | ||||||||||||
| Shares redeemed | (948,994 | ) | (8,396,303 | ) | Shares redeemed | (65,062 | ) | (589,840 | ) | ||||||||
| Net decrease | (253,714 | ) | $ | (2,321,914 | ) | Net decrease | (48,294 | ) | $ | (436,611 | ) | ||||||
| Shares Outstanding: | Shares Outstanding: | ||||||||||||||||
| Beginning of period | 3,217,096 | Beginning of period | 128,018 | ||||||||||||||
| End of period | 2,963,382 | End of period | 79,724 | ||||||||||||||
Page 43
Baird Funds, Inc.
Notes to the Financial Statements December 31, 2007 |
3. | CAPITAL SHARE TRANSACTIONS (cont.) |
| Year Ended | Year Ended | ||||||||||||||||
| December 31, 2006 | December 31, 2006 | ||||||||||||||||
Institutional Class Shares | Shares | Amount | Investor Class Shares | Shares | Amount | ||||||||||||
| Shares sold | 1,011,084 | $ | 8,494,502 | Shares sold | 48,746 | $ | 406,282 | ||||||||||
| Shares issued to | Shares issued to | ||||||||||||||||
| shareholders in | shareholders in | ||||||||||||||||
| reinvestment of dividends | 12,995 | 110,843 | reinvestment of dividends | 138 | 1,171 | ||||||||||||
| Shares redeemed | (1,094,378 | ) | (9,118,187 | ) | Shares redeemed | (210,595 | ) | (1,740,411 | ) | ||||||||
| Net decrease | (70,299 | ) | $ | (512,842 | ) | Net decrease | (161,711 | ) | $ | (1,332,958 | ) | ||||||
| Shares Outstanding: | Shares Outstanding: | ||||||||||||||||
| Beginning of period | 3,287,395 | Beginning of period | 289,729 | ||||||||||||||
| End of period | 3,217,096 | End of period | 128,018 | ||||||||||||||
BAIRD MIDCAP FUND
| Year Ended | Year Ended | ||||||||||||||||
| December 31, 2007 | December 31, 2007 | ||||||||||||||||
Institutional Class Shares | Shares | Amount | Investor Class Shares | Shares | Amount | ||||||||||||
| Shares sold | 489,977 | $ | 4,956,364 | Shares sold | 541,128 | $ | 5,301,707 | ||||||||||
| Shares issued to | Shares issued to | ||||||||||||||||
| shareholders in | shareholders in | ||||||||||||||||
| reinvestment of | reinvestment of | ||||||||||||||||
| distributions | 552,386 | 5,413,386 | dividends | 45,594 | 436,338 | ||||||||||||
| Shares redeemed | (673,826 | ) | (6,830,431 | ) | Shares redeemed | (625,959 | ) | (6,379,302 | ) | ||||||||
| Net increase | 368,537 | $ | 3,539,319 | Net decrease | (39,237 | ) | $ | (641,257 | ) | ||||||||
| Shares Outstanding: | Shares Outstanding: | ||||||||||||||||
| Beginning of period | 3,436,591 | Beginning of period | 548,110 | ||||||||||||||
| End of period | 3,805,128 | End of period | 508,873 | ||||||||||||||
Page 44
Baird Funds, Inc.
Notes to the Financial Statements December 31, 2007 |
3. | CAPITAL SHARE TRANSACTIONS (cont.) |
| Year Ended | Year Ended | ||||||||||||||||
| December 31, 2006 | December 31, 2006 | ||||||||||||||||
Institutional Class Shares | Shares | Amount | Investor Class Shares | Shares | Amount | ||||||||||||
| Shares sold | 2,109,560 | $ | 24,906,207 | Shares sold | 250,734 | $ | 2,863,915 | ||||||||||
| Shares issued to | Shares issued to | ||||||||||||||||
| shareholders in | shareholders in | ||||||||||||||||
| reinvestment of dividends | 625,975 | 5,870,101 | reinvestment of dividends | 107,988 | 990,249 | ||||||||||||
| Shares redeemed | (7,000,989 | ) | (77,918,215 | ) | Shares redeemed | (220,539 | ) | (2,423,321 | ) | ||||||||
| Net decrease | (4,265,454 | ) | $ | (47,141,907 | ) | Net increase | 138,183 | $ | 1,430,843 | ||||||||
| Shares Outstanding: | Shares Outstanding: | ||||||||||||||||
| Beginning of period | 7,702,045 | Beginning of period | 409,927 | ||||||||||||||
| End of period | 3,436,591 | End of period | 548,110 | ||||||||||||||
BAIRD SMALLCAP FUND
| Year Ended | Year Ended | ||||||||||||||||
| December 31, 2007 | December 31, 2007 | ||||||||||||||||
Institutional Class Shares | Shares | Amount | Investor Class Shares | Shares | Amount | ||||||||||||
| Shares sold | 706,785 | $ | 8,361,658 | Shares sold | 135,581 | $ | 1,597,169 | ||||||||||
| Shares issued to | Shares issued to | ||||||||||||||||
| shareholders in | shareholders in | ||||||||||||||||
| reinvestment | reinvestment of | ||||||||||||||||
| of distributions | 362,943 | 3,738,313 | dividends | 3,809 | 38,969 | ||||||||||||
| Shares redeemed | (3,714,283 | ) | (44,019,889 | ) | Shares redeemed | (757,636 | ) | (8,987,079 | ) | ||||||||
| Net decrease | (2,644,555 | ) | $ | (31,919,918 | ) | Net decrease | (618,246 | ) | $ | (7,350,941 | ) | ||||||
| Shares Outstanding: | Shares Outstanding: | ||||||||||||||||
| Beginning of period | 5,319,537 | Beginning of period | 644,338 | ||||||||||||||
| End of period | 2,674,982 | End of period | 26,092 | ||||||||||||||
Page 45
Baird Funds, Inc.
Notes to the Financial Statements December 31, 2007 |
3. | CAPITAL SHARE TRANSACTIONS (cont.) |
| Year Ended | Year Ended | ||||||||||||||||
| December 31, 2006 | December 31, 2006 | ||||||||||||||||
Institutional Class Shares | Shares | Amount | Investor Class Shares | Shares | Amount | ||||||||||||
| Shares sold | 2,601,055 | $ | 30,531,287 | Shares sold | 501,916 | $ | 5,847,915 | ||||||||||
| Shares issued to | Shares issued to | ||||||||||||||||
| shareholders in | shareholders in | ||||||||||||||||
| reinvestment of dividends | 30,717 | 369,831 | reinvestment of dividends | 4,238 | 50,684 | ||||||||||||
| Shares redeemed | (1,330,621 | ) | (15,510,501 | ) | Shares redeemed | (73,644 | ) | (853,693 | ) | ||||||||
| Net increase | 1,301,151 | $ | 15,390,617 | Net increase | 432,510 | $ | 5,044,906 | ||||||||||
| Shares Outstanding: | Shares Outstanding: | ||||||||||||||||
| Beginning of period | 4,018,386 | Beginning of period | 211,828 | ||||||||||||||
| End of period | 5,319,537 | End of period | 644,338 | ||||||||||||||
4. | INVESTMENT TRANSACTIONS AND INCOME TAX INFORMATION |
During the year ended December 31, 2007, purchases and sales of investment securities (excluding short-term investments) were as follows:
| Baird | Baird | Baird | |
LargeCap Fund | MidCap Fund | SmallCap Fund | |
| Purchases: | $20,185,809 | $27,404,840 | $38,215,064 |
| Sales: | $23,156,481 | $31,521,543 | $78,255,821 |
At December 31, 2007, accumulated earnings/losses on a tax basis were as follows:
LargeCap | MidCap | SmallCap | ||||||||||
Fund | Fund | Fund | ||||||||||
| Cost of Investments | $ | 34,426,448 | $ | 48,475,275 | $ | 25,998,394 | ||||||
| Gross unrealized appreciation | $ | 5,217,270 | $ | 10,052,205 | $ | 3,491,802 | ||||||
| Gross unrealized depreciation | (685,990 | ) | (1,848,669 | ) | (3,008,976 | ) | ||||||
| Net unrealized appreciation | $ | 4,531,280 | $ | 8,203,536 | $ | 482,826 | ||||||
| Undistributed ordinary income | $ | 6,245 | $ | — | $ | 31,259 | ||||||
| Undistributed long-term capital gain | — | — | 782,360 | |||||||||
| Total distributable earnings | $ | 6,245 | $ | — | $ | 813,619 | ||||||
| Other accumulated losses | $ | (1,382,881 | ) | $ | (143,280 | ) | $ | — | ||||
| Total accumulated earnings | $ | 3,154,644 | $ | 8,060,256 | $ | 1,296,445 | ||||||
Page 46
Baird Funds, Inc.
Notes to the Financial Statements December 31, 2007 |
4. | INVESTMENT TRANSACTIONS AND INCOME TAX INFORMATION (cont.) |
Undistributed income or net realized gains for financial statement purposes may differ from amounts recognized for federal income tax purposes due to differences in the recognition and characterization of income, expense and capital gain items.
Under the current tax law, capital losses realized after October 31 may be deferred and treated as occurring on the first day of the following fiscal year. For the year ended December 31, 2007, the Baird MidCap Fund elected to defer capital losses occurring between November 1, 2007 and December 31, 2007 in the amount of $143,280.
At December 31, 2007, the Baird LargeCap Fund had accumulated net realized capital loss carryovers of $1,167,011 that expire in 2012 and $215,870 that expire in 2011. To the extent the Funds realize future net capital gains, taxable distributions to shareholders will be offset by any unused capital loss carryovers. During the year ended December 31, 2007, the Baird LargeCap Fund utilized $1,318,603 in capital loss carryovers from previous years.
During the year ended December 31, 2007, the Funds paid the following dividends:
Ordinary Income Dividends | Net Long-Term Capital Gains | |||||||
| Baird LargeCap Fund | $ | 63,676 | — | |||||
| Baird MidCap Fund | 970,880 | $ | 4,947,701 | |||||
| Baird SmallCap Fund | 221,455 | 3,910,055 | ||||||
During the year ended December 31, 2006, the Funds paid the following dividends:
Ordinary Income Dividends | Net Long-Term Capital Gains | |||||||
| Baird LargeCap Fund | $ | 112,074 | — | |||||
| Baird MidCap Fund | 355,507 | $ | 6,588,280 | |||||
| Baird SmallCap Fund | — | 475,855 | ||||||
5. | INVESTMENT ADVISORY AND OTHER AGREEMENTS |
The Funds have entered into an Investment Advisory Agreement with Baird for the provision of investment advisory services. Pursuant to the Investment Advisory Agreement, the Advisor is entitled to receive a fee, calculated daily and payable monthly, at the annual rate of 0.65% for the Baird LargeCap Fund, 0.75% for the Baird MidCap Fund and 0.85% for the Baird SmallCap Fund as applied to the respective Fund’s average daily net assets. Certain officers of the Advisor are also officers of the Funds.
For the years ended December 31, 2007 and 2008 and through April 30, 2009, the Advisor has contractually agreed to waive its investment advisory fee and/or reimburse the Funds’ operating expenses (exclusive of brokerage, taxes, and extraordinary expenses) to the extent necessary to ensure that each Fund’s annual operating expenses do not exceed the following percentages of average daily net assets:
Page 47
Baird Funds, Inc.
Notes to the Financial Statements December 31, 2007 |
5. | INVESTMENT ADVISORY AND OTHER AGREEMENTS (cont.) |
Institutional Class Shares | Investor Class Shares | |
| Baird LargeCap Fund | 0.75% | 1.00% |
| Baird MidCap Fund | 0.85% | 1.10% |
| Baird SmallCap Fund | 0.95% | 1.20% |
To the extent that the Advisor reimburses or absorbs fees and expenses, it may seek payment of such amounts for three years after the year in which expenses were reimbursed or absorbed. A Fund will make no such payment, however, if its total annual operating expenses exceed the expense limits in effect at the time the expenses were reimbursed or at the time these payments are proposed.
| Fiscal Period Ended December 31, | |||
2007 | 2006 | 2005 | |
Reimbursed / Absorbed Expenses Subject | |||
to Recovery by Advisor Until: | 2010 | 2009 | 2008 |
Baird LargeCap Fund | $100,379 | $ 98,794 | $109,024 |
Baird MidCap Fund | $103,600 | $117,213 | $129,774 |
Baird SmallCap Fund | $157,169 | $168,361 | $104,335 |
U.S. Bancorp Fund Services, LLC serves as transfer agent, administrator, and accounting services agent for the Funds. U.S. Bank, N.A. serves as custodian for the Funds.
Robert W. Baird & Co. Incorporated (the “Distributor”) is the sole distributor of the Funds pursuant to a distribution agreement.
No commissions were earned by the Distributor for services rendered as a registered broker-dealer in securities transactions for the Baird LargeCap Fund, Baird MidCap Fund and Baird SmallCap Fund for the year ended December 31 2007.
6. | SECURITIES LENDING |
Each Fund may lend up to one-third of its total assets (including such loans) to borrowers under terms of participation in a securities lending program administered by U.S. Bancorp Asset Management, an affiliate of the Funds’ custodian, transfer agent and administrator. The securities lending agreement requires that loans are collateralized at all times in an amount equal to at least 102% of the market value of any loaned securities at the time of the loan, plus accrued interest.
The Funds receive compensation in the form of fees and earn interest on the cash collateral. The amount of fees depends on a number of factors including the type of security, length of the loan and credit standing of the borrower. Each Fund continues to receive interest payments or dividends on the securities loaned during the borrowing period. Each Fund has the right under the terms of the securities lending agreement to recover the securities from the borrower on demand.
As of December 31, 2007, the Baird LargeCap and Baird MidCap Funds had loaned securities that were collateralized by cash equivalents. The cash collateral is invested by the custodian in accordance with approved investment guidelines.
Page 48
Baird Funds, Inc.
Notes to the Financial Statements December 31, 2007 |
6. | SECURITIES LENDING (cont.) |
Those guidelines require the cash collateral to be invested in readily marketable, high quality, short-term obligations; however, such investments are subject to risk of payment delays or default on the part of the issuer or counterparty or otherwise may not generate sufficient interest to support the costs associated with securities lending. A Fund could also experience delays in recovering its securities and possible loss of income or value if the borrower fails to return the borrowed securities, although this risk is mitigated by the collateral and by contract with the securities lending agent.
As of December 31, 2007, the market value of the securities on loan and payable on collateral due to broker were as follows:
Market Value of | Payable on Collateral | |||||||
Securities on Loan | due to Broker | |||||||
| Baird LargeCap Fund | $ | 10,416,725 | $ | 10,767,539 | ||||
| Baird MidCap Fund | 14,830,692 | 15,362,634 | ||||||
| Baird SmallCap Fund | — | — | ||||||
The Funds receive cash as collateral in return for securities lent as part of a securities lending program. The collateral is invested in short-term securities including repurchase agreements, commercial paper, master notes and money market funds. The schedules of investments for the Funds include the particular cash collateral holdings as of December 31, 2007. Interest income earned on collateral investments during the year ended December 31, 2007 for Baird LargeCap Fund, Baird MidCap Fund and Baird SmallCap Fund were $8,608, $30,032 and $15,130, respectively.
7. | LINE OF CREDIT |
The Corporation maintains an uncommitted, senior secured line of credit (“LOC”) with U.S. Bank, N.A. (the “Bank”) to provide the Funds a temporary liquidity source to meet unanticipated redemptions. Under the terms of the LOC, borrowings for each Fund are limited to one-third of the total assets (including the amount borrowed) of the respective Fund, or as otherwise indicated within the Funds’ agreement with the Bank. The Bank charges interest at the Bank’s Prime Rate less 1% (weighted average rate of 7.08% during 2007). For the year ended December 31, 2007, the Baird LargeCap Fund, Baird MidCap Fund and Baird SmallCap Fund incurred $1,052, $155, and $226 in interest charges, respectively, on average daily loan balances of $14,164, $973 and $3,082, respectively.
8. | DISTRIBUTION AND SHAREHOLDER SERVICE PLAN |
The Funds have adopted a distribution and shareholder service plan (the “Plan”) pursuant to Rule 12b-1 under the 1940 Act. The Plan allows the Funds to compensate the Distributor for the costs incurred in distributing the Funds’ Investor Class Shares, including amounts paid to brokers or dealers, at an annual rate not to exceed 0.25% of the average daily net assets of the Funds’ Investor Class Shares. The Baird LargeCap Fund, Baird MidCap Fund and Baird SmallCap Fund incurred $2,333, $11,606 and $6,393, respectively, in fees pursuant to the Plan during the year ended December 31, 2007.
Page 49
Report of Independent Registered Public Accounting Firm
To the Shareholders and
Board of Directors of
Baird Funds, Inc.:
We have audited the accompanying statements of assets and liabilities of Baird LargeCap Fund, Baird MidCap Fund and Baird SmallCap Fund (three of the portfolios constituting Baird Funds, Inc., hereafter referred to as the “Funds”), including the schedules of investments as of December 31, 2007, the related statements of operations for the year then ended, the statements of changes in net assets for each of the two years in the period then ended, and the financial highlights for each of the three years in the period then ended. These financial statements and financial highlights are the responsibility of the Funds’ management. Our responsibility is to express an opinion on these financial statements and financial highlights based on our audits. The financial highlights for each of the two years in the period ended December 31, 2004 were audited by other auditors. Those auditors expressed an unqualified opinion on those financial highlights in their report dated February 22, 2005.
We conducted our audits in accordance with the standards of the Public Company Accounting Oversight Board (United States). Those standards require that we plan and perform the audit to obtain reasonable assurance about whether the financial statements are free of material misstatement. The Funds were not required to have, nor were we engaged to perform an audit of its internal control over financial reporting. Our audit included consideration of internal control over financial reporting as a basis for designing audit procedures that are appropriate in the circumstances, but not for the purpose of expressing an opinion on the effectiveness of the Funds’ internal control over financial reporting. Accordingly, we express no such opinion. An audit also includes examining, on a test basis, evidence supporting the amounts and disclosures in the financial statements and financial highlights. Our procedures included confirmation of securities owned as of December 31, 2007, by correspondence with the custodian and brokers. An audit also includes assessing the accounting principles used and significant estimates made by management, as well as evaluating the overall financial statement presentation. We believe that our audits provide a reasonable basis for our opinion.
In our opinion, the financial statements and financial highlights referred to above present fairly, in all material respects, the financial position of each of the aforementioned funds of Baird Funds, Inc. as of December 31, 2007, the results of their operations for the year then ended, the changes in their net assets for each of the two years in the period then ended, and the financial highlights for each of the three years in the period then ended, in conformity with accounting principles generally accepted in the United States of America.
Chicago, Illinois
February 27, 2008
Page 50
Baird Funds, Inc.
Directors & Officers as of December 31, 2007 |
| Number of | |||||
| Portfolios | Other | ||||
| Positions | Term of Office | Principal | in Complex | Directorships | |
| Held with | and Length of | Occupation(s) | Overseen | Held |
Name, Address and Age | the Funds | Time Served | During Past 5 Years | by Director | by Director |
| G. Frederick Kasten, Jr.* | Director | Indefinite; | Retired; Chairman, the Advisor (January 2000-December | 8 | Director of Regal-Beloit |
| 777 East Wisconsin Avenue | and | Since September | 2005); Chairman and CEO, the Advisor (January 1998- | Corporation, a | |
| Milwaukee, WI 53202 | Chairman | 2000 | January 2000); President, Chairman and CEO, the | manufacturing | |
| Age: 68 | Advisor (June 1983-January 1998); President, the Advisor | company | |||
| (January 1979-January 1983) | |||||
| John W. Feldt | Independent | Indefinite; | Retired; Senior Vice President-Finance, University of | 8 | Director of Thompson |
| c/o University of | Director | Since September | Wisconsin Foundation (1985-2006); Vice President- | Plumb Funds, Inc., a | |
| Wisconsin Foundation | 2000 | Finance, University of Wisconsin Foundation (1980-1985); | mutual fund complex | ||
| 1848 University Avenue | Associate Director, University of Wisconsin Foundation | (2 portfolios); Director | |||
| Madison, WI 53705 | (1967-1980) | of Nakoma Mutual | |||
| Age: 65 | Funds, a mutual fund | ||||
| complex (1 portfolio) | |||||
| George C. Kaiser** | Independent | Indefinite; | CEO, George C. Kaiser & Co., a business consulting | 8 | None |
| 759 N. Milwaukee Street | Director | Since September | company, since 1999; Chairman and CEO, Hanger Tight | ||
| Milwaukee, WI 53202 | 2000 | Company, a manufacturing company (1988-1999); | |||
| Age: 74 | Chairman and CEO, Interstore Transfer Systems, Ltd., a | ||||
| manufacturing company (1992-1999); Chairman, | |||||
| International Retail Services Group, Ltd. (1995-1999); | |||||
| Executive Vice President, Arandell Schmidt Co., a catalog | |||||
| printer company (1984-1987); various positions Arthur | |||||
| Anderson & Co. (1957-1964, 1967-1984), most recently | |||||
| serving as Partner (1969-1984); Secretary of Administration, | |||||
| State of Wisconsin (1965-1967) | |||||
| Frederick P. Stratton, Jr. | Independent | Indefinite; | Retired; Chairman Emeritus, Briggs & Stratton | 8 | Director of Weyco |
| 10134 N. Port Washington | Director | Since May | Corporation, a manufacturing company, since 2003; | Group, Inc., a men’s | |
| Road, #2B | 2004 | Chairman of the Board, Briggs & Stratton Corporation | footwear distributor; | ||
| Mequon, WI 53092 | (2001-2002); Chairman and CEO, Briggs & Stratton | Wisconsin Energy | |||
| Age: 68 | Corporation (1986-2001) | Corporation and its | |||
| subsidiaries Wisconsin | |||||
| Electric Power | |||||
| Company and | |||||
| Wisconsin Gas LLC | |||||
| * | Prior to January 1, 2008, Mr. Kasten was considered an “interested person” of the Corporation (as defined in the 1940 Act) because he had served as Chairman of the Board of the Adviser until December 31, 2005. As of January 1, 2008, Mr. Kasten is no longer an “interested person” because more than two years have elapsed since he last served as Chairman of the Adviser and he does not own any shares of capital stock of the Adviser (or its affiliates), having redeemed his remaining interest in Baird Financial Corporation, the Adviser’s parent company in May 2007. | |
| ** | Mr. Kaiser retired as a director effective December 31, 2007. |
Page 51
Baird Funds, Inc.
Directors & Officers as of December 31, 2007 |
| Number of | |||||
| Portfolios | Other | ||||
| Positions | Term of Office | Principal | in Complex | Directorships | |
| Held with | and Length of | Occupation(s) | Overseen | Held | |
Name, Address and Age | the Funds | Time Served | During Past 5 Years | by Director | by Director |
| Marlyn J. Spear | Independent | Indefinite; | Chief Investment Officer, Building Trades United | 8 | Management Trustee of | |
| P.O. Box 530 | Director | Since January | Pension Trust Fund since July 1989; Investment Officer, | AFL-CIO Housing | ||
| 500 Elm Grove Road | Nominee | 2008*** | Northwestern Mutual Financial Network (1988-1989); | Investment Trust | ||
| Elm Grove, WI 53122 | Assistant Vice-President, Firstar Trust Company | |||||
| Age: 54 | (1978-1987); Financial Analyst, Harco Holdings, Inc. | |||||
| (1976-1978) | ||||||
| Cory L. Nettles**** | Director | Indefinite; | Managing Director, Generation Growth Capital, Inc. | 8 | Director of Weyco | |
| Generation Growth Capital, Inc. | Nominee | Since January | (since March 2007); Of Counsel, Quarles & Brady LLP | Group, Inc., a men’s | ||
| 411 East Wisconsin Avenue, | 2008*** | (since March 2007); Partner, Quarles & Brady LLP | footwear distributor; | |||
| Suite 1710, | (January 2005 – March 2007); Secretary, Wisconsin | Director of The Private | ||||
| Milwaukee, WI 53202 | Department of Commerce (January 2003 – January | Bank, a financial | ||||
| Age: 37 | 2005); Associate, Quarles & Brady LLP (July 1996 – | institution | ||||
| December 2002) |
| *** | Ms. Spear and Mr. Nettles were elected as directors effective January 1, 2008. | |
| **** | Mr. Nettles is an “interested person” of the Corporation (as defined in the 1940 Act) because of his employment with the law firm, Quarles & Brady LLP, which provides legal services to the Adviser. The legal services that Quarles & Brady LLP has provided to the Adviser include litigation, real estate and miscellaneous securities related matters that did not relate to the Corporation or the Funds. |
Additional information about the Funds’ directors is available in the Statement of Additional Information which may be obtained without charge, upon request, by calling 1-866-44BAIRD, or at www.bairdfunds.com.
Page 52
Baird Funds, Inc.
Directors & Officers as of December 31, 2007 |
| Position(s) | Term of Office | Principal | |
| Held with | and Length of | Occupation(s) | |
Name, Address, and Age | the Funds | Time Served | During Past 5 Years |
| Mary Ellen Stanek | President | Re-elected by | Managing Director, the Advisor, and Chief Investment Officer, Baird Advisors, a department of |
| 777 East Wisconsin Avenue | Board annually; | the Advisor, since March 2000; President and CEO, Firstar Investment Research & Management | |
| Milwaukee, WI 53202 | Since | Company, LLC (“FIRMCO”) (November 1998-February 2000); President, Firstar Funds, Inc. | |
| Age: 51 | September 2000 | (December 1998-February 2000); President and Chief Operating Officer, FIRMCO | |
| (March 1994-November 1998) | |||
| J. Bary Morgan | Senior | Re-elected by | Chief Investment Officer, Baird Investment Management, a department of the Advisor, since |
| 777 East Wisconsin Avenue | Vice President | Board annually; | January 2004; Managing Director, the Advisor since January 2001; Director, Baird Investment |
| Milwaukee, WI 53202 | Since | Management (January 2001-January 2004); Senior Vice President, the Advisor (January 2000- | |
| Age: 42 | February 2003 | January 2001); First Vice President, the Advisor (January 1996-January 2000) | |
| Todd S. Nichol | Vice President | Re-elected by | Chief Compliance Officer, the Advisor since October 2004; Assistant Compliance Director, the |
| 777 East Wisconsin Avenue | and Chief | Board annually; | Advisor since August 2002; Senior Vice President, the Advisor since January 2005; First Vice |
| Milwaukee, WI 53202 | Compliance | Since | President, the Advisor (January 2004-January 2005); Vice President, the Advisor (August 2002- |
| Age: 45 | Officer | August 2004 | January 2004); Vice President – Risk Management, BNY Clearing Services, LLC, a division of |
| The Bank of New York (August 1995-August 2002) | |||
| Russell P. Schwei | Vice President | Re-elected by | Operations Director, the Advisor since July 1992; Managing Director, the Advisor since January |
| 777 East Wisconsin Avenue | Board annually; | 1997; Chief Financial Officer and Managing Director, the Advisor (February 1999-December | |
| Milwaukee, WI 53202 | Since | 1999) | |
| Age: 48 | September 2000 | ||
| Leonard M. Rush | Treasurer | Re-elected by | Chief Financial Officer, the Advisor since January 2000 |
| 777 East Wisconsin Avenue | Board annually; | ||
| Milwaukee, WI 53202 | Since | ||
| Age: 61 | September 2000 | ||
| Charles M. Weber | Secretary | Re-elected by | Senior Vice President and Associate General Counsel, the Advisor since July 2005; Partner, |
| 777 East Wisconsin Avenue | Board annually; | Quarles & Brady LLP, a law firm (October 1998-June 2005) | |
| Milwaukee, WI 53202 | Since | ||
| Age: 44 | September 2005 | ||
| Laura E. Piotrowski | Assistant | Re-elected by | Senior Vice President and Controller of Capital Markets and Asset Management, the Advisor since |
| 777 East Wisconsin Avenue | Treasurer | Board annually; | January 2003; First Vice President, the Advisor (January 2001-January 2003); Vice President, the |
| Milwaukee, WI 53202 | Since | Advisor (January 1999-January 2001) | |
| Age: 37 | August 2007 | ||
| Robert A. Johnson | AML | Re-elected by | Compliance Officer, the Advisor since 1998, and AML Compliance Officer, the Advisor since |
| 777 East Wisconsin Avenue | Compliance | Board annually; | January 2004 |
| Milwaukee, WI 53202 | Officer | Since | |
| Age 44 | August 2004 | ||
| Bret T. Reese | Assistant | Re-elected by | Vice President and Associate General Counsel, the Advisor since June 2005; Senior Financial |
| 777 East Wisconsin Avenue | Secretary | Board annually; | Analyst, the Advisor (August 2004-June 2005); Financial Analyst, Stark & Roth, Inc., a hedge fund |
| Milwaukee, WI 53202 | Since | (June 2001-August 2002) | |
| Age: 38 | August 2006 |
Page 53
Baird Funds, Inc.
DISCLOSURE REGARDING THE BOARD OF DIRECTORS’ APPROVAL OF THE INVESTMENT ADVISORY AGREEMENT FOR BAIRD EQUITY FUNDS
The Board of Directors (the “Board”) of Baird Funds, Inc. (the “Corporation”) met on July 30, 2007 to consider the annual renewal of the Investment Advisory Agreement with Robert W. Baird & Co. Incorporated (“Baird” or the “Advisor”) for management of the Baird LargeCap, MidCap and SmallCap Funds (the “Funds”). The Board reviewed and discussed several documents that had been provided prior to the meeting, including the Investment Advisory Agreement, memoranda provided by outside legal counsel and the Secretary of the Funds discussing the Board’s fiduciary obligations and factors the Board should assess in considering the renewal of the Investment Advisory Agreement, information in response to a request from the Directors who are not “interested persons” of the Corporation or the Advisor (“Independent Directors”), within the meaning of the Investment Company Act of 1940 (the “1940 Act”), from the Advisor (including its Form ADV, Annual Report and statement of financial condition), a profitability analysis, comparative information about the Funds’ performance for periods ended June 30, 2007, management fees and expense ratios, and other pertinent information. The Independent Directors met separately in executive session with outside legal counsel to consider the Investment Advisory Agreement. The Board also received information periodically throughout the year that was relevant to its Investment Advisory Agreement renewal process, including performance, management fee and other expense information. Based on its evaluation of information provided by the Advisor, in conjunction with the Funds’ other service providers, the Board, including a majority of the Independent Directors, approved the continuation of the Investment Advisory Agreement for an additional one-year period.
In considering the Investment Advisory Agreement and reaching its conclusions, the Board reviewed and analyzed various factors that it determined were relevant, including the factors below.
Nature, Extent and Quality of Services Provided to the Funds
The Board analyzed the nature, extent and quality of the services provided by the Advisor to the Funds. The Board reviewed and considered the Advisor’s significant role in establishing the Funds and the construction of their investment objectives, principal strategies, investment limitations and fee structures. The Board noted the Advisor’s overall reputation and positive name recognition, the depth of the Advisor’s personnel, resources and commitment to the Funds, and the experience, credentials and continuity of the portfolio management teams employed to manage the Funds’ investments. The Board noted that Baird Investment Management, a department of the Advisor, had hired additional research analysts and restructured the LargeCap Fund’s investment team in response to the departures of certain individuals in May 2006. The Board further noted that the Advisor has approximately $13.5 billion of assets under discretionary management, and has strong relationships with numerous institutional accounts. The Funds provide an opportunity for smaller institutional and retail accounts to receive the same professional advice from the Advisor that it offers to its larger institutional clients and to achieve the same level of portfolio diversification needed for prudent risk management. The Board considered the Advisor’s disciplined investment decision-making process used for the Funds. The Board also considered other services that the Advisor provided for the Funds in its capacity as their investment advisor, such as providing some of its key personnel available to serve as officers of the Funds, selecting broker-dealers for execution of portfolio transactions,
Page 54
Baird Funds, Inc.
DISCLOSURE REGARDING THE BOARD OF DIRECTORS’ APPROVAL OF THE INVESTMENT ADVISORY AGREEMENT FOR BAIRD EQUITY FUNDS (cont.)
ensuring adherence to the Fund’s investment policies and restrictions, providing support services to the Board and the Audit Committee of the Board and overseeing the Funds’ other service providers. The Board further noted that the Advisor, in its capacity as a registered broker-dealer, also serves as distributor and principal underwriter of shares of the Funds and spends time and effort marketing the Funds. The Board also considered the strength of the Advisor’s compliance department, including the Funds’ chief compliance officer, and the fact that the Advisor has not experienced any significant legal, compliance or regulatory difficulties since the Funds were launched. The Board concluded that the nature, extent and quality of the services provided by the Advisor to the Funds were appropriate and that each Fund was likely to continue to benefit from services provided under the Investment Advisory Agreement.
Investment Performance of the Advisor and the Funds
In considering the investment performance of each Fund, the Board reviewed information as of June 30, 2007 regarding the Fund’s performance in comparison to its benchmark index and its peer groups as determined by Lipper. With respect to the Baird LargeCap Fund (both Institutional and Investor Class shares), the Board observed that the Fund had outperformed its primary benchmark, the Russell 1000 Growth Index, for the period from inception (9/29/00) through June 30, 2007, but lagged the index for the one-year, three-year and five-year periods then ended. The Board further noted that, for the period from the Fund’s inception through June 30, 2007, the Fund (Institutional Class shares) had performed above the Lipper Large Cap Growth Funds average, while performing below the Lipper peer group average for the one-year, three-year and five-year periods. The Board recognized that the investment strategy of the LargeCap Fund focused on producing long-term risk adjusted return.
The Board noted that the Baird MidCap Fund (both Institutional and Investor Class shares) had outperformed the Russell MidCap Growth Index, its primary benchmark, for the period from the Fund’s inception through June 30, 2007, while acknowledging that the Fund had underperformed that benchmark for the one-year, three-year and five-year periods ended June 30, 2007. The Board further noted that, for the period from the Fund’s inception through June 30, 2007, the Fund had performed above the Lipper Mid Cap Growth Funds average, and that for the one-year, three-year and five-year periods then ended the Fund had performed below the Lipper Mid Cap Growth Funds average.
With respect to the Baird SmallCap Fund, the Board observed that the Fund had underperformed its benchmark index, the Russell 2000 Growth Index, for the one-year, three-year and since inception periods ended June 30, 2007. They also noted that the Fund had performed below the Lipper Small Cap Core Funds average for each of the periods. The Board referred to commentary by the Advisor with respect to the Advisor’s focus on low-risk, high quality growth stocks as opposed to investments that could be considered more speculative.
The Board also considered the Advisor’s quarterly portfolio commentaries and reviews explaining the Funds’ performance, the Advisor’s consistent and disciplined investment decision process and the investment strategies it employs for the Funds. After considering all of the information, the Board concluded that, although past performance is not a guarantee of future results, each Fund and its shareholders were likely to benefit from the Advisor’s continued management.
Page 55
Baird Funds, Inc.
DISCLOSURE REGARDING THE BOARD OF DIRECTORS’ APPROVAL OF THE INVESTMENT ADVISORY AGREEMENT FOR BAIRD EQUITY FUNDS (cont.)
Costs of Services Provided and Profits Realized by the Advisor
The Board examined the fee and expense information for each of the Funds, including a comparison of such information to other similarly situated mutual funds as determined by Lipper. The Board noted that each Fund’s advisory fee was either equal to or slightly lower than the average and median for the universe of all mutual funds in its Lipper category. The Board also reviewed and considered management fees charged by the Advisor to other investment advisory clients and found that the investment management fee paid by the Funds was 10 basis points (or 0.10%) less than what the Advisor charges on the first $5 million of a separately managed account. The Board recognized the extent of the significant additional services provided to each Fund that the Advisor did not provide to its other clients, such as certain administrative services, oversight of the Fund’s other service providers, director support, risk management, regulatory compliance and various other services.
The Board also examined the total expense ratio of each Fund relative to all other mutual funds in its Lipper category. The Board noted that each Fund’s total expense ratio (both for its Institutional and Investor Class shares), after fee waivers and expense reimbursements by the Advisor, was not only lower than the average and median expense ratios for all funds in its Lipper category, but in the lowest quartile (other than Investor Class shares of the SmallCap Fund, which was in the second lowest quartile) and compared favorably to the average and median expense ratios for institutional class shares of other similarly sized funds in its Lipper category. Each Fund’s total expense ratio was also significantly below its Morningstar category average.
The Board considered the fees realized, and the costs incurred, by the Advisor in providing investment management services to the Funds and the profitability to the Advisor of having a relationship with the Funds. The Board noted that the Advisor had waived significant fees and/or reimbursed expenses for the Funds since their respective inception dates and that this was likely to continue in the future in order to maintain the competitiveness of the Funds’ expense ratios. The Advisor informed the Board that the profits realized by the Advisor (as a percentage of revenue) from its relationship with the Fund have generally been less than those realized by the Advisor on its investment advisory business as a whole.
The Board concluded that the profits realized by the Advisor from its relationship with the Funds were appropriate. The Board also reviewed and considered the general financial condition of the Advisor and determined it to be sound. The Independent Directors also reviewed the brokerage commissions paid by the Funds and noted that, due to the relatively low turnover of the Funds, that there was little added expense from brokerage commissions. In light of all of the information that it received and considered, the Board concluded that the management fee and total expense ratio of each Fund were reasonable with respect to the services provided and the performance of the Fund.
Economies of Scale and Fee Levels Reflecting Those Economies
The Board noted that the Funds’ advisory fee structure does not contain any breakpoint reductions as the Funds grow in size. However, the Board recognized that the Advisor has been waiving fees and/or reimbursing expenses for the Funds since their inception and anticipates that the Advisor will continue to do so for the foreseeable future. The Board also recognized that the advisory fee rates paid by the Funds were designed to be lower than the fees otherwise charged by the
Page 56
Baird Funds, Inc.
DISCLOSURE REGARDING THE BOARD OF DIRECTORS’ APPROVAL OF THE INVESTMENT ADVISORY AGREEMENT FOR BAIRD EQUITY FUNDS (cont.)
Advisor to its separately managed account clients and to be comparable to the second or third breakpoint advisory fee levels paid by other comparable mutual funds.
Benefits Derived from the Relationship with the Funds
The Board noted that the Advisor derives ancillary benefits from its association with the Equity Funds in the form of research products and services received from unaffiliated broker-dealers who execute portfolio trades for the Funds. However, the Board determined that such products and services have been used for legitimate purposes relating to the Funds by providing assistance in the Advisor’s investment decision-making process. The Board believed that the Funds generally benefit from their association with the Advisor and the use of the “Baird” name. The Board concluded that the other benefits realized by the Advisor from its relationship with the Funds were appropriate.
After consideration of the above factors, the Board, including a majority of the Independent Directors, approved the renewal of the Investment Advisory Agreement with the Funds as being in the best interests of each Fund and its shareholders.
Page 57
Additional Information
Proxy Voting
A description of the policies and procedures that the Funds use to determine how to vote proxies relating to portfolio securities is available without charge, upon request, by calling toll free, 1-866-44BAIRD, or by accessing the Funds’ website at www.bairdfunds.com; and by accessing the SEC’s website at www.sec.gov.
Each Fund’s proxy voting record for the most recent 12-month period ended June 30 is available without charge, upon request, by calling toll free, 1-866-44BAIRD, or by accessing the Funds’ website at www.bairdfunds.com; and by accessing the SEC’s website at www.sec.gov.
Portfolio Holdings Disclosure
The Funds file a complete schedule of portfolio holdings with the SEC for the first and third quarters of each fiscal year on Form N-Q. The Funds’ Forms N-Q are available on the SEC website at www.sec.gov and may be reviewed and copied at the SEC’s Public Reference Room in Washington, D.C. Information on the operation of the Public Reference Room may be obtained by calling 1-800-732-0330. The Funds’ Forms N-Q may also be obtained by calling toll-free 1-866-44BAIRD.
Qualified Dividend Income/Dividends Received Deduction
For the fiscal year ended December 31, 2007, certain dividends paid by the Funds may be subject to a maximum tax rate of 15%, as provided for by the Jobs and Growth Tax Relief Reconciliation Act of 2003. The percentage of dividends declared from ordinary income designated as qualified dividend income was as follows:
| Large Cap | 100.00% |
| Mid Cap | 100.00% |
| Small Cap | 78.13% |
For corporate shareholders, the percent of ordinary income distributions qualifying for the corporate dividends received deduction for the fiscal year ended December 31, 2007 was as follows:
| Large Cap | 100.00% |
| Mid Cap | 100.00% |
| Small Cap | 78.20% |
Page 58
Additional Information (cont.)
Results of Special Meeting of Shareholders
The Funds held a special meeting of shareholders on December 19, 2007 relating to the election of directors. The shareholders elected each of the five persons nominated, including three current directors, John W. Feldt, G. Frederick Kasten, Jr. and Frederick P. Stratton, Jr.; and two director nominees, Cory L. Nettles and Marlyn J. Spear. A total of 102,756,959 shares were represented at the meeting, either in person or by proxy, constituting 69.6% of the shares eligible to vote. The voting results were as follows:
For | Against/Withheld | Abstentions/Broker Non Votes | |
| John W. Feldt | 102,675,068 | 81,891 | 0 |
| G. Frederick Kasten, Jr. | 102,674,460 | 82,499 | 0 |
| Frederick P. Stratton, Jr. | 102,672,540 | 84,419 | 0 |
| Cory L. Nettles | 102,677,551 | 79,408 | 0 |
| Marlyn J. Spear | 102,677,551 | 79,408 | 0 |
Page 59
(This Page Intentionally Left Blank.)
(This Page Intentionally Left Blank.)
Baird Funds, Inc.
c/o U.S. Bancorp Fund Services, LLC
P.O. Box 701
Milwaukee, WI 53201-0701
1-866-44BAIRD
Board of Directors
G. Frederick Kasten, Jr. (Chairman)
John W. Feldt
George C. Kaiser (retired 12-31-07)
Frederick P. Stratton, Jr.
Cory L. Nettles (effective 1-1-08)
Marlyn J. Spear (effective 1-1-08)
Investment Advisor and Distributor
Robert W. Baird & Co. Incorporated
777 East Wisconsin Avenue
Milwaukee, WI 53202
Administrator and Transfer Agent
U.S. Bancorp Fund Services, LLC
P.O. Box 701
615 East Michigan Street
Milwaukee, WI 53202
Custodian
U.S. Bank, N.A.
1555 N. RiverCenter Drive, Suite 302
Milwaukee, WI 53212
Legal Counsel
Godfrey & Kahn, S.C.
780 North Water Street
Milwaukee, WI 53202
Independent Registered Public Accounting Firm
Grant Thornton LLP
175 West Jackson Boulevard, 13th Floor
Chicago, IL 60604
Item 2. Code of Ethics.
As of the end of the period covered by this report, the Registrant has adopted a code of ethics that applies to the President, Treasurer, and Assistant Treasurer of the Registrant. The Registrant has not made any amendments to its code of ethics during the period covered by this report. The Registrant has not granted any waivers from any provisions of the code of ethics during the period covered by this report.
Item 3. Audit Committee Financial Expert.
The Registrant’s board of directors has determined that John W. Feldt, Frederick P. Stratton, Jr., and Marlyn J. Spear, members of the audit committee, each qualify as an “audit committee financial expert” as such term is defined in paragraph (b) of Item 3 of Form N-CSR. Mr. Feldt, Mr. Stratton, and Ms. Spear are each “independent” as such term is defined in paragraph (a)(2) of Item 3 of Form N-CSR.
Item 4. Principal Accountant Fees and Services.
Fees Billed by Grant Thornton LLP. The aggregate fees billed for professional services by Grant Thornton LLP (“GT”) during the last two fiscal years were as follows:
| FYE 12/31/2007 | FYE 12/31/2006 | |
| Audit Fees | $109,200 | $105,000 |
| Audit-Related Fees | - | - |
| Tax Fees | $26,400 | $25,200 |
| All Other Fees | - | - |
In the above table, “audit fees” are fees billed for professional services for the audit of the Registrant’s annual financial statements or for services that are normally provided by the accountant in connection with statutory and regulatory filings or engagements. “Tax fees” are fees billed for professional services rendered for tax compliance, tax advice and tax planning, and specifically relate to GT's review of the Registrant’s federal and state tax returns.
The audit committee has adopted pre-approval policies and procedures that require the audit committee to pre-approve all audit and non-audit services rendered to the Registrant, as well as all non-audit services provided to the Registrant’s investment adviser and any entity affiliated with the Registrant’s investment adviser with respect to any engagement that relates directly to the operations and financial reporting of the Registrant. In accordance with its policies and procedures, the audit committee pre-approved all audit and tax services provided by GT during fiscal 2007. During the past two fiscal years, the Registrant did not receive any non-audit services from GT pursuant to any waivers of the pre-approval requirement under paragraph (c)(7)(i)(C) of Rule 2-01 of Regulation S-X. All of GT’s hours spent on auditing the Registrant’s financial statements were attributed to work performed by full-time permanent employees of GT.
During the last two fiscal years, GT has served as the auditor to Robert W. Baird & Co. Incorporated (“RWB”), the Registrant’s investment adviser, and has rendered non-audit services to RWB and its affiliates. The non-audit services consisted of review of state and federal tax returns for investment partnerships and a foundation affiliated with RWB; advice provided to RWB’s foreign affiliate about foreign tax and repatriation matters; verification and related analytical services provided in 2006 to RWB in connection with its various GIPS composite performance presentations; and a 2006 analysis regarding RWB’s ownership and sale of certain securities. None of the RWB affiliates provides ongoing services to the Registrant. GT charged the following amounts for such non-audit services to RWB and its affiliates: $267,080 in 2007 and $267,400 in 2006. The Audit Committee has concluded that the provision of these audit services to RWB and non-audit services to RWB-affiliates is compatible with GT’s independence.
Item 5. Audit Committee of Listed Registrants.
Not applicable because the Registrant is not a "listed issuer" within the meaning of Rule 10A-3 under the Securities Exchange Act of 1934.
Item 6. Schedule of Investments.
The Schedules of Investments are included as part of the reports to shareholders filed under Item 1 of this Form N-CSR.
Item 7. Disclosure of Proxy Voting Policies and Procedures for Closed-End Management Investment Companies.
Not applicable because the Registrant is not a closed-end management investment company.
Item 8. Portfolio Managers of Closed-End Management Investment Companies.
Not applicable because the Registrant is not a closed-end management investment company.
Item 9. Purchases of Equity Securities by Closed-End Management Investment Company and Affiliated Purchasers.
Not applicable because the Registrant is not a closed-end management investment company.
Item 10. Submission of Matters to a Vote of Security Holders.
There have been no material changes to the procedures by which shareholders may recommend nominees to the Registrant’s board of directors.
Item 11. Controls and Procedures.
| (a) | The Registrant’s management, with the participation of its principal executive and principal financial officers, has evaluated the effectiveness of the Registrant's disclosure controls and procedures (as defined in Rule 30a-3(c) under the Investment Company Act of 1940 (the “Act”)), as of a date within 90 days prior to the filing date of this Form N-CSR. Based on such evaluation, the Registrant's principal executive and principal financial officers have concluded that the design and operation of the Registrant's disclosure controls and procedures are effective in providing reasonable assurance that the information required to be disclosed on Form N-CSR is recorded, processed, summarized and reported within the applicable time periods. |
| (b) | There were no changes in the Registrant's internal control over financial reporting (as defined in Rule 30a-3(d) under the Act) that occurred during the second fiscal quarter of the period covered by this report that has materially affected, or is reasonably likely to materially affect, the Registrant's internal control over financial reporting. |
Item 12. Exhibits.
| (a) | (1) Code of ethics. |
Incorporated by reference to the Registrant’s Form N-CSR filed on March 9, 2004.
(2) Certifications pursuant to Section 302 of the Sarbanes-Oxley Act of 2002. Filed herewith.
(3) Any written solicitation to purchase securities under Rule 23c-1 under the Act sent or given during the period covered by the report by or on behalf of the registrant to 10 or more persons. Not applicable because the Registrant is not a closed-end management investment company.
(b) Certification pursuant to Section 906 of the Sarbanes-Oxley Act of 2002. Furnished herewith.
SIGNATURES
Pursuant to the requirements of the Securities Exchange Act of 1934 and the Investment Company Act of 1940, the registrant has duly caused this report to be signed on its behalf by the undersigned, thereunto duly authorized.
BAIRD FUNDS, INC.
By: /s/Mary Ellen Stanek
Mary Ellen Stanek, President
Date: March 7, 2008
Pursuant to the requirements of the Securities Exchange Act of 1934 and the Investment Company Act of 1940, this report has been signed below by the following persons on behalf of the registrant and in the capacities and on the dates indicated.
By: /s/Mary Ellen Stanek
Mary Ellen Stanek, President
Date: March 7, 2008
By: /s/Leonard M. Rush
Leonard M. Rush, Treasurer
Date: March 10, 2008